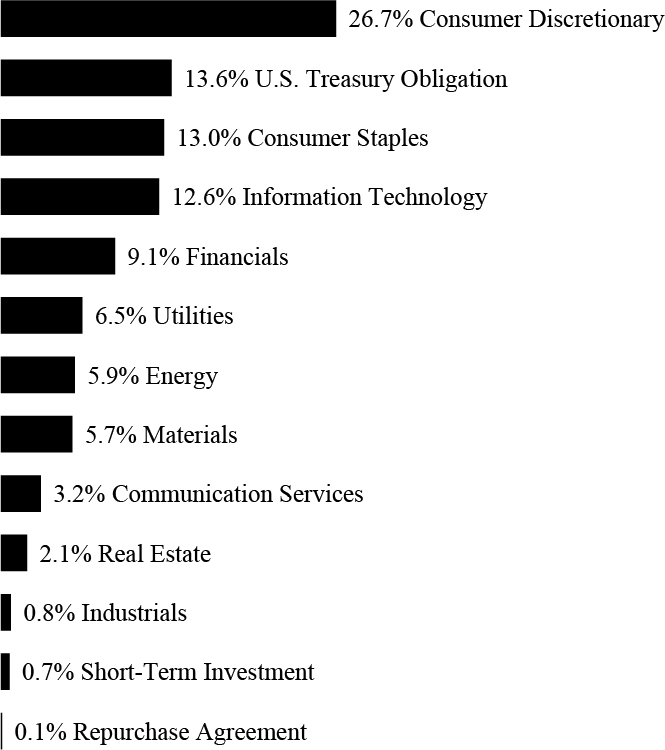
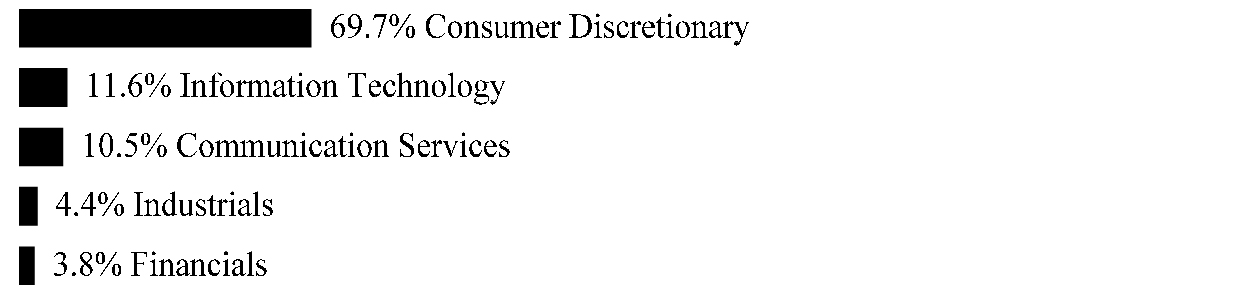
| Global X MSCI China Consumer Discretionary ETF (ticker: CHIQ) |
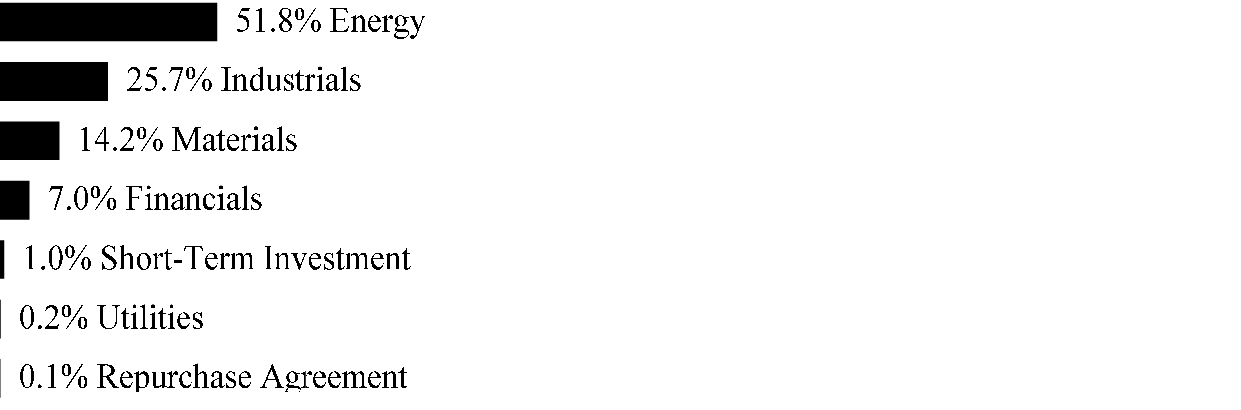
| Global X MSCI China Energy ETF (ticker: CHIE) |
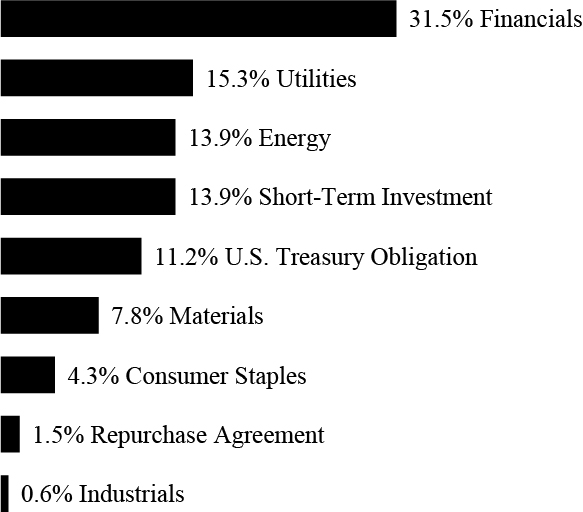
| Global X MSCI China Financials ETF (ticker: CHIX) |
| Global X MSCI China Industrials ETF (ticker: CHII) |
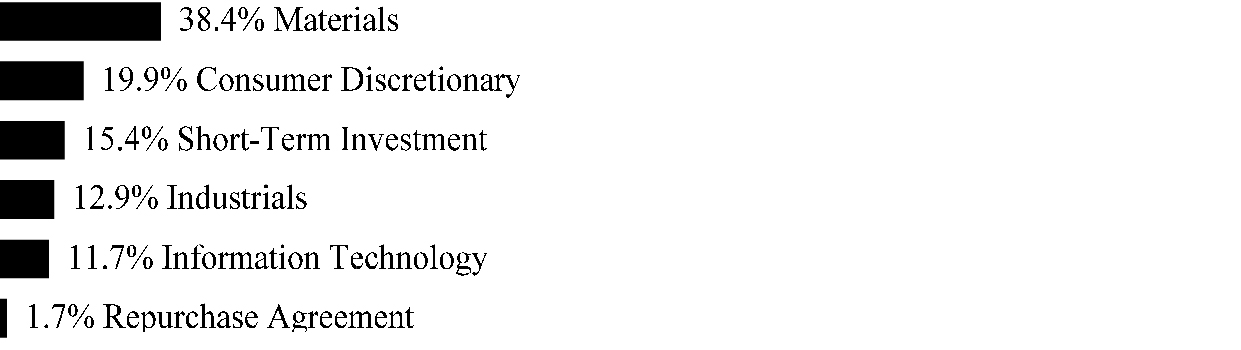
| Global X MSCI China Materials ETF (ticker: CHIM) |
| Global X MSCI China Communication Services ETF (ticker: CHIC) |
| Global X MSCI China Consumer Staples ETF (ticker: CHIS) |
| Global X MSCI China Health Care ETF (ticker: CHIH) |
| Global X MSCI China Information Technology ETF (ticker: CHIK) |
| Global X MSCI China Real Estate ETF (ticker: CHIR) |
| Global X MSCI China Utilities ETF (ticker: CHIU) |
| Global X MSCI China Large-Cap 50 ETF (ticker: CHIL) |
| Global X FTSE Southeast Asia ETF (ticker: ASEA) |
| Global X MSCI Colombia ETF (ticker: GXG) |
| Global X MSCI Argentina ETF (ticker: ARGT) |
| Global X MSCI Greece ETF (ticker: GREK) |
| Global X MSCI Norway ETF (ticker: NORW) |
| Global X FTSE Nordic Region ETF (ticker: GXF) |
| Global X MSCI Nigeria ETF (ticker: NGE) |
| Global X MSCI Next Emerging & Frontier ETF (ticker: EMFM) |
| Global X MSCI Portugal ETF (ticker: PGAL) |
| Global X MSCI Pakistan ETF (ticker: PAK) |
| Global X DAX Germany ETF (ticker: DAX) |
Semi-Annual Report
April 30, 2020
Beginning on January 1, 2021, as permitted by regulations adopted by the Securities and Exchange Commission, paper copies of the Funds’ (defined below) shareholder reports will no longer be sent by mail, unless you specifically request paper copies of the reports from your financial intermediary (such as a broker-dealer or bank). Instead, shareholder reports will be available on the Funds’ website (www.globalxetfs.com), and you will be notified by mail each time a report is posted and provided with a website link to access the report.
If you already elected to receive shareholder reports electronically, you will not be affected by this change and you need not take any action. You may elect to receive shareholder reports and other communications from the Funds electronically anytime by contacting your financial intermediary.
You may elect to receive all future Fund shareholder reports in paper free of charge. Please contact your financial intermediary to inform them that you wish to continue receiving paper copies of Fund shareholder reports and for details about whether your election to receive reports in paper will apply to all funds held with your financial intermediary.
| Schedules of Investments | |
| Global X MSCI China Consumer Discretionary ETF | 1 |
| Global X MSCI China Energy ETF | 6 |
| Global X MSCI China Financials ETF | 9 |
| Global X MSCI China Industrials ETF | 15 |
| Global X MSCI China Materials ETF | 21 |
| Global X MSCI China Communication Services ETF | 25 |
| Global X MSCI China Consumer Staples ETF | 28 |
| Global X MSCI China Health Care ETF | 31 |
| Global X MSCI China Information Technology ETF | 35 |
| Global X MSCI China Real Estate ETF | 39 |
| Global X MSCI China Utilities ETF | 42 |
| Global X MSCI China Large-Cap 50 ETF | 44 |
| Global X FTSE Southeast Asia ETF | 48 |
| Global X MSCI Colombia ETF | 53 |
| Global X MSCI Argentina ETF | 57 |
| Global X MSCI Greece ETF | 62 |
| Global X MSCI Norway ETF | 66 |
| Global X FTSE Nordic Region ETF | 72 |
| Global X MSCI Nigeria ETF | 75 |
| Global X MSCI Next Emerging & Frontier ETF | 77 |
| Global X MSCI Portugal ETF | 93 |
| Global X MSCI Pakistan ETF | 97 |
| Global X DAX Germany ETF | 100 |
| Statements of Assets and Liabilities | 103 |
| Statements of Operations | 109 |
| Statements of Changes in Net Assets | 115 |
| Financial Highlights | 127 |
| Notes to Financial Statements | 141 |
| Disclosure of Fund Expenses | 168 |
| Approval of Investment Advisory Agreement | 171 |
| Supplemental Information | 175 |
Shares are bought and sold at market price (not NAV) and are not individually redeemed from a Fund. Shares may only be redeemed directly from a Fund by Authorized Participants, in very large creation/redemption units. Brokerage commissions will reduce returns.
The Funds file their complete schedules of Fund holdings with the Securities and Exchange Commission (the “SEC” or “Commission”) for the first and third quarters of each fiscal year on Form N-PORT. The Funds’ Forms N-PORT are available on the Commission’s website at https://www.sec.gov, and may be reviewed and copied at the Commission’s Public Reference Room in Washington, DC. Information on the operation of the Public Reference Room may be obtained by calling 1-800-SEC-0330.
A description of the policies and procedures that Global X Funds uses to determine how to vote proxies relating to Fund securities, as well as information relating to how the Funds voted proxies relating to Fund securities during the most recent 12-month period ended June 30, is available (i) without charge, upon request, by calling 1-888-493-8631; and (ii) on the Commission’s website at https://www.sec.gov.
| | |
| Schedule of Investments |
| April 30, 2020 (Unaudited) |
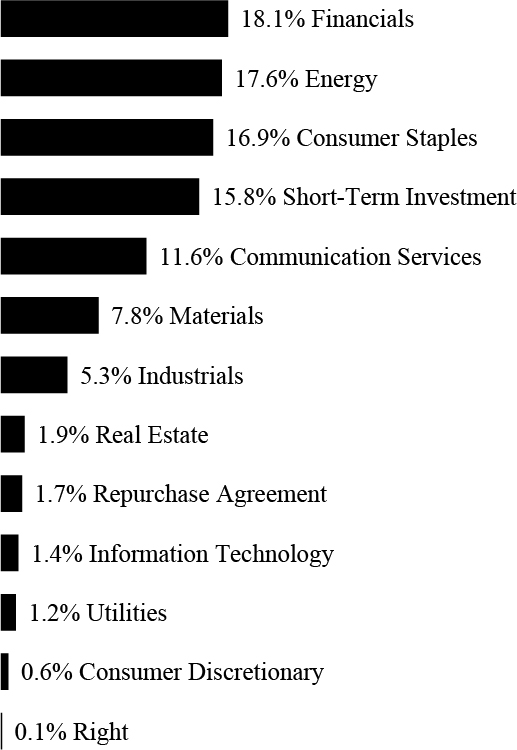
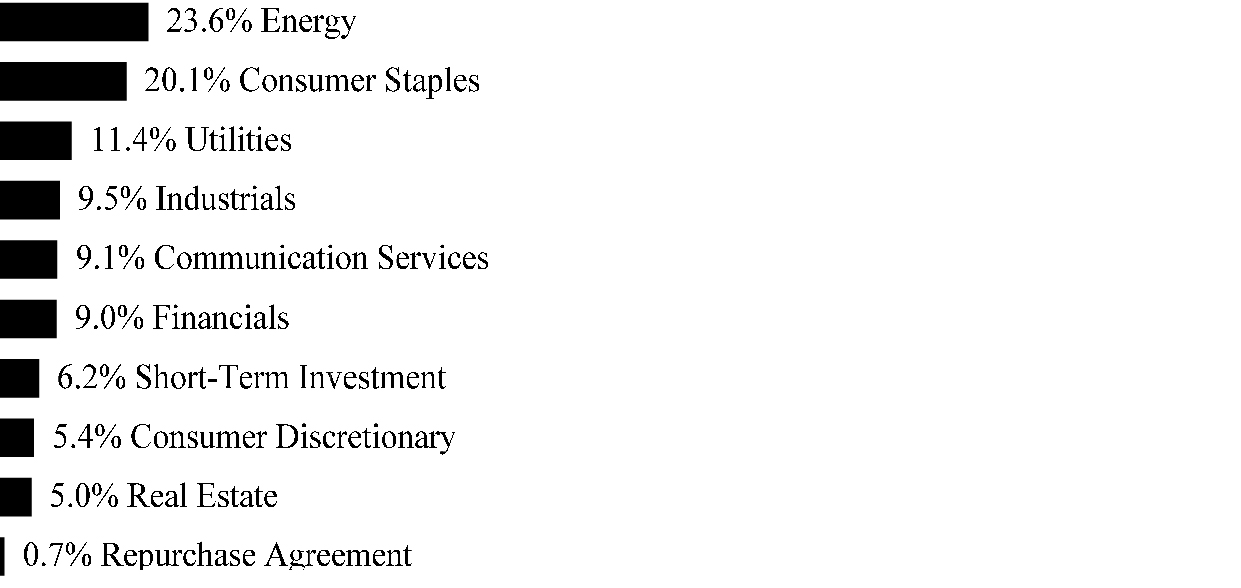
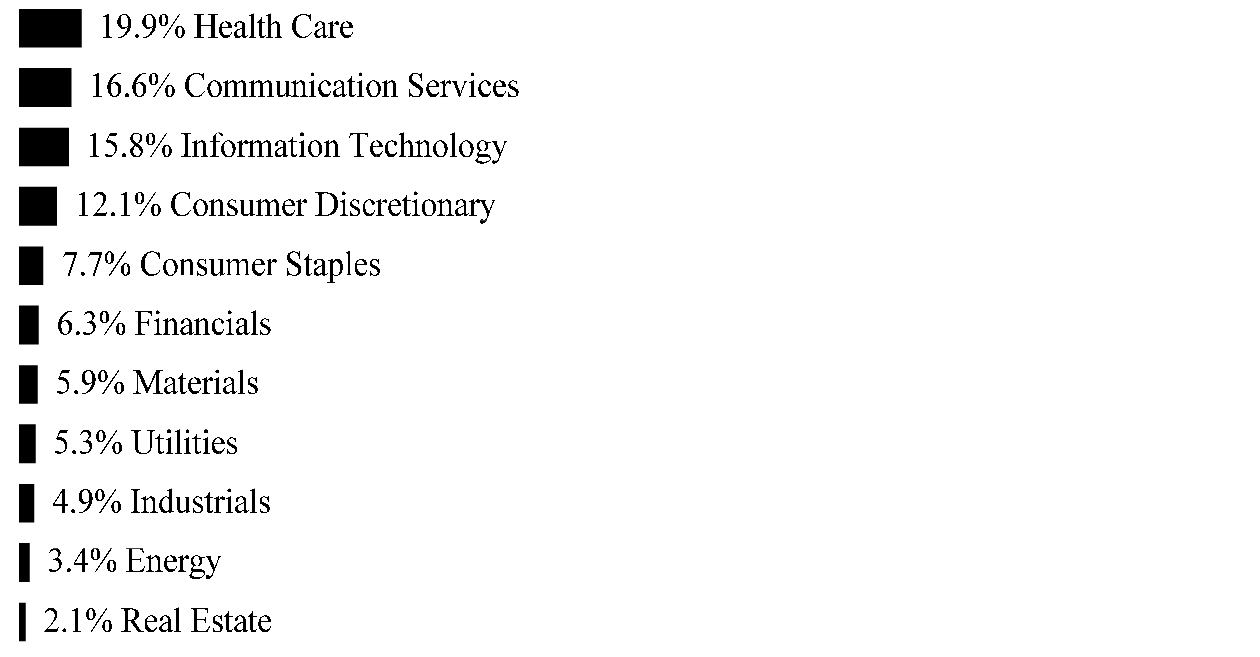
| Global X MSCI China Consumer Discretionary ETF | |
Sector Weightings †:
† Sector weightings percentages are based on the total market value of investments. Repurchase agreements purchased from cash collateral received for securities lending activity are included in total investments. Please see Note 2 and 7 in Notes to Financial Statements for more detailed information.
| | | | | | | |
| COMMON STOCK — 100.0% | | | | | | |
| CHINA— 100.0% | | | | | | |
| Consumer Discretionary — 100.0% | | | | | | |
Alibaba Group Holding ADR * | | | 59,752 | | | $ | 12,109,938 | |
ANTA Sports Products | | | 571,696 | | | | 4,826,601 | |
BAIC BluePark New Energy Technology, Cl A * | | | 221,100 | | | | 171,635 | |
BAIC Motor, Cl H | | | 1,561,600 | | | | 688,910 | |
Baozun ADR *(A) | | | 41,629 | | | | 1,325,467 | |
| Bosideng International Holdings | | | 3,097,400 | | | | 843,036 | |
| Brilliance China Automotive Holdings | | | 2,906,400 | | | | 2,703,070 | |
BTG Hotels Group, Cl A | | | 62,100 | | | | 143,916 | |
BYD, Cl A | | | 103,494 | | | | 879,047 | |
BYD, Cl H (A) | | | 615,300 | | | | 3,873,231 | |
| Changzhou Xingyu Automotive Lighting Systems, Cl A | | | 17,700 | | | | 248,751 | |
China East Education Holdings * | | | 523,800 | | | | 845,934 | |
| China Education Group Holdings | | | 577,100 | | | | 972,212 | |
| China Grand Automotive Services Group, Cl A | | | 457,653 | | | | 223,661 | |
| China International Travel Service, Cl A | | | 112,658 | | | | 1,457,029 | |
| Chongqing Changan Automobile, Cl A | | | 219,283 | | | | 301,309 | |
Dongfeng Motor Group, Cl H | | | 2,601,946 | | | | 1,728,511 | |
| Fuyao Glass Industry Group, Cl A | | | 114,251 | | | | 320,288 | |
| Fuyao Glass Industry Group, Cl H | | | 485,000 | | | | 1,069,805 | |
| The accompanying notes are an integral part of the financial statements. | |
| | | | | | | |
| COMMON STOCK — continued | | | | | | | | |
| Consumer Discretionary — continued | | | | | | | | |
Geely Automobile Holdings | | | 2,712,200 | | | $ | 4,240,245 | |
GOME Electrical Appliances Holding (A) | | | 9,264,200 | | | | 1,075,516 | |
Great Wall Motor, Cl H | | | 2,973,597 | | | | 1,986,911 | |
| Gree Electric Appliances of Zhuhai, Cl A | | | 173,200 | | | | 1,343,773 | |
| Guangzhou Automobile Group, Cl A | | | 132,240 | | | | 183,580 | |
| Guangzhou Automobile Group, Cl H | | | 2,827,423 | | | | 2,549,380 | |
Haidilao International Holding (A) | | | 355,300 | | | | 1,546,805 | |
Haier Electronics Group | | | 1,213,900 | | | | 3,343,085 | |
Haier Smart Home, Cl A | | | 348,619 | | | | 763,477 | |
| Hangzhou Robam Appliances, Cl A | | | 52,232 | | | | 235,880 | |
HLA, Cl A | | | 187,903 | | | | 170,353 | |
| Huayu Automotive Systems, Cl A | | | 179,717 | | | | 519,343 | |
Huazhu Group ADR | | | 111,101 | | | | 4,000,747 | |
JD.com ADR * | | | 267,156 | | | | 11,514,424 | |
Li Ning | | | 1,421,000 | | | | 4,481,667 | |
Liaoning Cheng Da, Cl A * | | | 84,800 | | | | 211,539 | |
Luckin Coffee ADR *(A)(B)(C)(D) | | | 80,807 | | | | 354,743 | |
Meituan Dianping, Cl B * | | | 485,400 | | | | 6,499,258 | |
NavInfo, Cl A | | | 110,900 | | | | 230,932 | |
New Oriental Education & Technology Group ADR * | | | 59,259 | | | | 7,565,004 | |
Nexteer Automotive Group | | | 833,200 | | | | 432,058 | |
Ningbo Joyson Electronic, Cl A * | | | 72,900 | | | | 210,149 | |
NIO ADR *(A) | | | 630,113 | | | | 2,148,685 | |
Oppein Home Group, Cl A | | | 15,725 | | | | 236,944 | |
Pinduoduo ADR * | | | 123,677 | | | | 5,867,237 | |
SAIC Motor, Cl A | | | 447,700 | | | | 1,198,627 | |
Shandong Linglong Tyre, Cl A | | | 67,732 | | | | 207,820 | |
| Shanghai Jinjiang International Hotels, Cl A | | | 43,027 | | | | 178,706 | |
| | | | | | | |
| COMMON STOCK — continued | | | | | | | | |
| Consumer Discretionary — continued | | | | | | | | |
| Shanghai Yuyuan Tourist Mart Group, Cl A | | | 206,726 | | | $ | 222,558 | |
| Shenzhen Overseas Chinese Town, Cl A | | | 464,500 | | | | 429,011 | |
| Shenzhou International Group Holdings | | | 386,862 | | | | 4,508,695 | |
| Songcheng Performance Development, Cl A | | | 82,600 | | | | 349,035 | |
Suning.com, Cl A | | | 531,400 | | | | 633,824 | |
| Suofeiya Home Collection, Cl A | | | 58,400 | | | | 155,941 | |
TAL Education Group ADR * | | | 158,151 | | | | 8,570,203 | |
TCL, Cl A | | | 773,605 | | | | 508,478 | |
| Topsports International Holdings | | | 1,188,400 | | | | 1,493,098 | |
Trip.com Group ADR * | | | 208,007 | | | | 5,358,260 | |
Vipshop Holdings ADR * | | | 329,442 | | | | 5,248,011 | |
Visual China Group, Cl A | | | 43,500 | | | | 108,021 | |
Wanxiang Qianchao, Cl A | | | 174,272 | | | | 122,693 | |
| Weifu High-Technology Group, Cl A | | | 53,300 | | | | 152,515 | |
Wuchan Zhongda Group, Cl A | | | 323,100 | | | | 214,199 | |
Yum China Holdings | | | 153,479 | | | | 7,437,592 | |
Zhejiang Semir Garment, Cl A | | | 113,787 | | | | 115,087 | |
Zhejiang Supor, Cl A | | | 30,900 | | | | 288,368 | |
| Zhejiang Wanfeng Auto Wheel, Cl A | | | 138,600 | | | | 125,655 | |
Zhongsheng Group Holdings | | | 545,500 | | | | 2,202,448 | |
| TOTAL COMMON STOCK | | | | | | | | |
(Cost $133,289,793) | | | | | | | 136,272,931 | |
| | | | | | | | | |
SHORT-TERM INVESTMENT(E)(F) — 5.7% | | | | | | | | |
| Fidelity Investments Money Market Government Portfolio, Cl Institutional, 0.160% | | | | | | | | |
(Cost $7,726,824) | | | 7,726,824 | | | | 7,726,824 | |
| | | | | | | |
REPURCHASE AGREEMENT(E) — 0.6% | | | | | | | | |
| BNP Paribas | | | | | | | | |
| 0.030%, dated 04/30/20, to be repurchased on 05/01/20, repurchase price $834,658 (collateralized by U.S. Treasury Obligations, ranging in par value $201,348 - $649,504, 1.500%, 08/15/2026, with a total market value of $850,852) | | | | | | | | |
(Cost $834,657) | | $ | 834,657 | | | $ | 834,657 | |
| TOTAL INVESTMENTS — 106.3% | | | | | | | | |
(Cost $141,851,274) | | | | | | $ | 144,834,412 | |
Percentages are based on Net Assets of $136,274,676.
| * | Non-income producing security. |
| (A) | This security or a partial position of this security is on loan at April 30, 2020. The total value of securities on loan at April 30, 2020 was $8,021,713. |
| (B) | Level 3 security in accordance with fair value hierarchy. |
| (C) | Security considered illiquid. The total value of such securities as of April 30, 2020 was $354,743 and represented 0.3% of Net Assets. |
| (D) | Security is fair valued using methods determined in good faith by the Fair Value Committee of the Fund. The total value of such securities as of April 30, 2020 was $354,743 and represents 0.3% of Net Assets. |
| (E) | Security was purchased with cash collateral held from securities on loan. The total value of such securities as of April 30, 2020 was $8,561,481. |
| (F) | The rate reported on the Schedule of Investments is the 7-day effective yield as of April 30, 2020. |
| ADR — American Depositary Receipt |
| Cl — Class |
The following is a summary of the level of inputs used as of April 30, 2020, in valuing the Fund’s investments carried at value:
| Investments in Securities | | | | | | | | | | | | |
| Common Stock | | $ | 77,125,137 | | | $ | 58,793,051 | | | $ | 354,743 | | | $ | 136,272,931 | |
| Short-Term Investment | | | 7,726,824 | | | | — | | | | — | | | | 7,726,824 | |
| Repurchase Agreement | | | — | | | | 834,657 | | | | — | | | | 834,657 | |
| Total Investments in Securities | | $ | 84,851,961 | | | $ | 59,627,708 | | | $ | 354,743 | | | $ | 144,834,412 | |
(1) | A reconciliation of Level 3 investments and disclosures of significant unobservable inputs are presented when the Fund has a significant amount of Level 3 investments at the beginning and/or end of the period in relation to Net Assets. Management has concluded that Level 3 investments are not material in relation to Net Assets. |
For the period ended April 30, 2020, the transfers in and out of Level 3 were due to changes in the availability of observable inputs to determine fair value. Transfers between levels are recognized at period end.
Amounts designated as “—“ are $0 or have been rounded to $0.
| | |
| Schedule of Investments |
| April 30, 2020 (Unaudited) |
| Global X MSCI China Energy ETF | |
Sector Weightings †:
† Sector weightings percentages are based on the total market value of investments.
| | | | | | | |
| COMMON STOCK — 100.0% | | | | | | |
| CHINA— 98.3% | | | | | | |
| Energy — 98.3% | | | | | | |
Anton Oilfield Services Group | | | 533,300 | | | $ | 33,364 | |
China Coal Energy, Cl H | | | 179,841 | | | | 48,020 | |
| China Merchants Energy Shipping, Cl A | | | 61,700 | | | | 59,258 | |
China Oilfield Services, Cl H | | | 53,786 | | | | 41,767 | |
| China Petroleum & Chemical, Cl A | | | 3,650 | | | | 2,306 | |
| China Petroleum & Chemical, Cl H | | | 313,097 | | | | 158,318 | |
China Shenhua Energy, Cl A | | | 3,600 | | | | 8,124 | |
China Shenhua Energy, Cl H | | | 89,030 | | | | 159,172 | |
| China Suntien Green Energy, Cl H | | | 220,900 | | | | 51,005 | |
CNOOC | | | 111,585 | | | | 126,521 | |
| COSCO SHIPPING Energy Transportation, Cl A | | | 54,400 | | | | 65,348 | |
| COSCO SHIPPING Energy Transportation, Cl H | | | 112,100 | | | | 73,602 | |
Guanghui Energy, Cl A | | | 116,750 | | | | 41,677 | |
Honghua Group * | | | 938,800 | | | | 28,821 | |
| Inner Mongolia Yitai Coal, Cl B | | | 83,694 | | | | 51,723 | |
| Offshore Oil Engineering, Cl A | | | 58,975 | | | | 41,353 | |
PetroChina, Cl A | | | 3,800 | | | | 2,390 | |
PetroChina, Cl H | | | 385,463 | | | | 138,725 | |
Shaanxi Coal Industry, Cl A | | | 55,136 | | | | 58,890 | |
Shandong Xinchao Energy, Cl A * | | | 148,300 | | | | 37,814 | |
| Shanxi Lu’an Environmental Energy Development, Cl A | | | 56,365 | | | | 45,352 | |
Shanxi Meijin Energy, Cl A * | | | 39,800 | | | | 37,436 | |
| | | | | | | |
| COMMON STOCK — continued | | | | | | | | |
| Energy — continued | | | | | | | | |
| Shanxi Xishan Coal & Electricity Power, Cl A | | | 66,126 | | | $ | 44,307 | |
Sinopec Kantons Holdings | | | 147,600 | | | | 65,495 | |
Wison Engineering Services | | | 484,600 | | | | 48,758 | |
| Yantai Jereh Oilfield Services Group, Cl A | | | 10,100 | | | | 35,654 | |
Yanzhou Coal Mining, Cl A | | | 40,464 | | | | 47,518 | |
Yanzhou Coal Mining, Cl H | | | 104,225 | | | | 79,052 | |
TOTAL CHINA | | | | | | | 1,631,770 | |
| HONG KONG — 1.7% | | | | | | | | |
| Energy — 1.7% | | | | | | | | |
China LNG Group * | | | 864,700 | | | | 27,327 | |
| TOTAL COMMON STOCK | | | | | | | | |
(Cost $2,242,707) | | | | | | | 1,659,097 | |
| | | | | | | | | |
| U.S. TREASURY OBLIGATION — 6.0% | | | | | | | | |
| United States Treasury Bill | | | | | | | | |
0.061%, 05/14/20(A) | | | | | | | | |
(Cost $99,998) | | $ | 100,000 | | | | 99,997 | |
| TOTAL INVESTMENTS — 106.0% | | | | | | | | |
(Cost $2,342,705) | | | | | | $ | 1,759,094 | |
Percentages are based on Net Assets of $1,659,669.
| * | Non-income producing security. |
| (A) | The rate reported on the Schedule of Investments is the effective yield at time of purchase. |
Cl — Class
The following is a summary of the level of inputs used as of April 30, 2020, in valuing the Fund’s investments carried at value:
| Investments in Securities | | | | | | | | | | | | |
| Common Stock | | $ | 169,119 | | | $ | 1,489,978 | | | $ | — | | | $ | 1,659,097 | |
| U.S. Treasury Obligation | | | — | | | | 99,997 | | | | — | | | | 99,997 | |
| Total Investments in Securities | | $ | 169,119 | | | $ | 1,589,975 | | | $ | — | | | $ | 1,759,094 | |
For the period ended April 30, 2020, there were no transfers in or out of Level 3.
Amounts designated as “—“ are $0 or have been rounded to $0.
| | |
| Schedule of Investments |
| April 30, 2020 (Unaudited) |
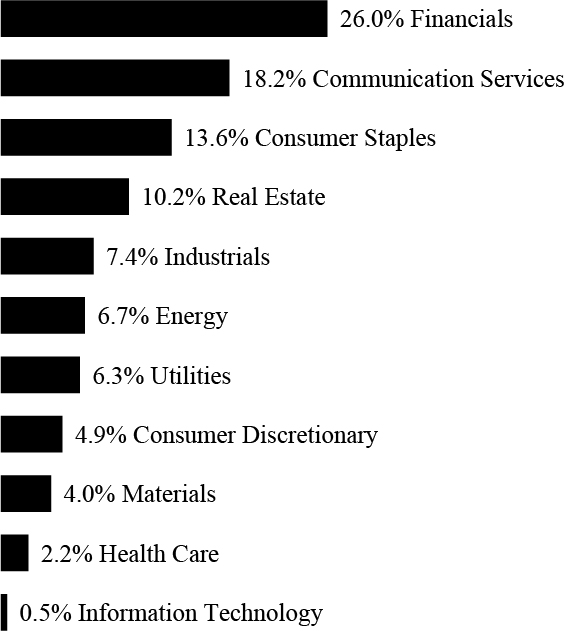
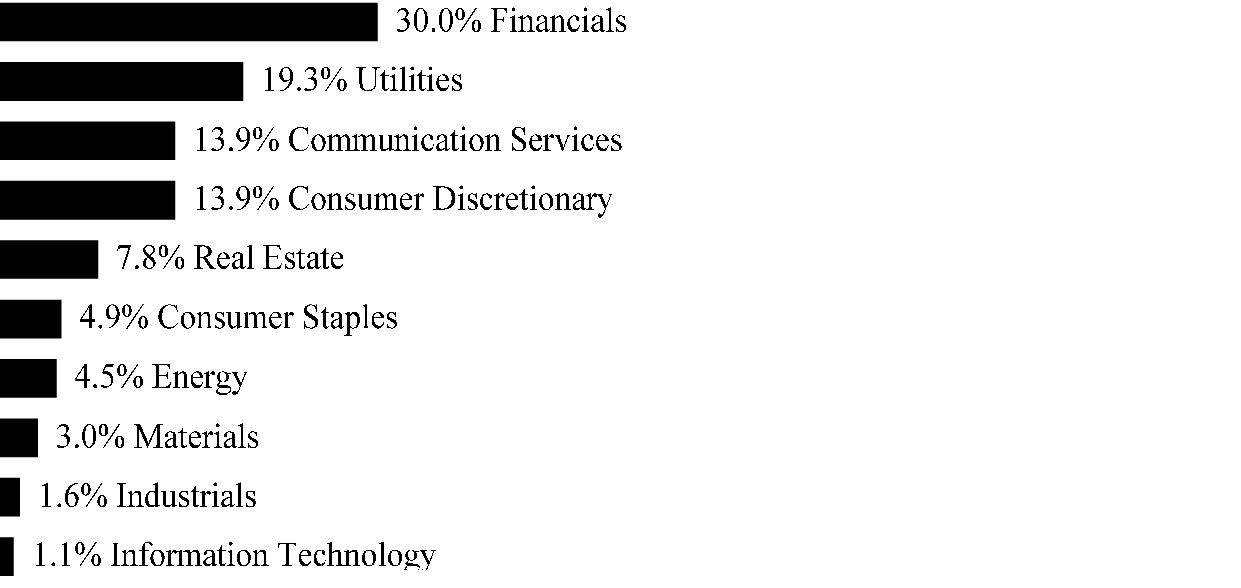
| Global X MSCI China Financials ETF | |
Sector Weightings †:
† Sector weightings percentages are based on the total market value of investments. Repurchase agreements purchased from cash collateral received for securities lending activity are included in total investments. Please see Note 2 and 7 in Notes to Financial Statements for more detailed information.
| | | | | | | |
| COMMON STOCK — 99.9% | | | | | | |
| CHINA— 99.9% | | | | | | |
| Financials — 99.9% | | | | | | |
| Agricultural Bank of China, Cl A | | | 461,500 | | | $ | 226,195 | |
| Agricultural Bank of China, Cl H | | | 3,441,288 | | | | 1,447,122 | |
Anxin Trust, Cl A (A)(B)(C) | | | 91,200 | | | | 28,506 | |
Avic Capital, Cl A | | | 90,500 | | | | 50,382 | |
Bank of Beijing, Cl A | | | 145,000 | | | | 102,290 | |
Bank of Chengdu, Cl A | | | 44,700 | | | | 49,073 | |
Bank of China, Cl H | | | 8,122,034 | | | | 3,111,629 | |
Bank of China Ltd., Cl A | | | 250,700 | | | | 123,586 | |
| Bank of Communications, Cl A | | | 261,100 | | | | 191,590 | |
| Bank of Communications, Cl H | | | 1,244,871 | | | | 790,053 | |
Bank of Guiyang, Cl A | | | 42,820 | | | | 47,919 | |
Bank of Hangzhou, Cl A | | | 50,445 | | | | 59,168 | |
Bank of Jiangsu, Cl A | | | 87,300 | | | | 74,694 | |
Bank of Nanjing, Cl A | | | 68,284 | | | | 74,384 | |
Bank of Ningbo, Cl A | | | 39,300 | | | | 145,023 | |
Bank of Shanghai, Cl A | | | 95,698 | | | | 110,754 | |
Caitong Securities, Cl A | | | 40,400 | | | | 54,654 | |
Changjiang Securities, Cl A | | | 58,400 | | | | 52,697 | |
| China Cinda Asset Management, Cl H | | | 1,941,600 | | | | 378,184 | |
| China Citic Bank Corp Ltd., Cl H | | | 1,319,622 | | | | 645,142 | |
| China CITIC Bank Corp Ltd., Cl A | | | 66,600 | | | | 49,058 | |
| | | | | | | |
| COMMON STOCK — continued | | | | | | | | |
| Financials — continued | | | | | | | | |
China Construction Bank, Cl A | | | 7,700 | | | $ | 7,014 | |
China Construction Bank, Cl H | | | 4,239,226 | | | | 3,455,972 | |
China Everbright | | | 240,400 | | | | 367,778 | |
China Everbright Bank, Cl A | | | 266,200 | | | | 140,654 | |
China Everbright Bank, Cl H | | | 838,600 | | | | 355,891 | |
China Galaxy Securities, Cl H | | | 828,200 | | | | 423,055 | |
| China Huarong Asset Management, Cl H | | | 2,349,300 | | | | 263,648 | |
| China International Capital, Cl H | | | 271,000 | | | | 416,689 | |
China Life Insurance, Cl H | | | 696,140 | | | | 1,485,247 | |
China Life Insurance, Cl A | | | 10,302 | | | | 41,650 | |
China Merchants Bank, Cl A | | | 120,629 | | | | 599,612 | |
China Merchants Bank, Cl H | | | 416,034 | | | | 1,993,675 | |
| China Merchants Securities, Cl A | | | 41,700 | | | | 109,162 | |
| China Minsheng Banking, Cl A | | | 235,600 | | | | 196,574 | |
| China Minsheng Banking, Cl H | | | 1,041,326 | | | | 779,079 | |
| China Pacific Insurance Group, Cl A | | | 43,200 | | | | 188,298 | |
| China Pacific Insurance Group, Cl H | | | 323,312 | | | | 1,071,819 | |
| China Reinsurance Group, Cl H | | | 1,843,100 | | | | 216,350 | |
| China Taiping Insurance Holdings | | | 270,530 | | | | 455,749 | |
| Chongqing Rural Commercial Bank, Cl H | | | 733,600 | | | | 320,794 | |
CITIC Securities, Cl A | | | 65,800 | | | | 220,907 | |
CITIC Securities, Cl H | | | 319,996 | | | | 617,508 | |
CSC Financial, Cl A | | | 21,500 | | | | 106,566 | |
Dongxing Securities, Cl A | | | 35,100 | | | | 53,301 | |
East Money Information, Cl A | | | 48,700 | | | | 125,831 | |
Everbright Securities, Cl A | | | 40,557 | | | | 64,231 | |
Far East Horizon | | | 498,500 | | | | 402,537 | |
First Capital Securities, Cl A | | | 56,200 | | | | 55,409 | |
Founder Securities, Cl A | | | 71,900 | | | | 72,518 | |
| | | | | | | |
| COMMON STOCK — continued | | | | | | | | |
| Financials — continued | | | | | | | | |
GF Securities Ltd., Cl A | | | 46,400 | | | $ | 90,114 | |
GF Securities Ltd., Cl H | | | 337,300 | | | | 368,524 | |
Guosen Securities, Cl A | | | 36,245 | | | | 54,886 | |
Guotai Junan Securities, Cl A | | | 49,744 | | | | 119,227 | |
Guotai Junan Securities, Cl H | | | 226,700 | | | | 326,349 | |
Guoyuan Securities, Cl A | | | 41,600 | | | | 48,145 | |
Haitong Securities Ltd., Cl A | | | 55,600 | | | | 101,523 | |
Haitong Securities Ltd., Cl H | | | 539,200 | | | | 491,740 | |
| Hithink RoyalFlush Information Network, Cl A | | | 5,800 | | | | 98,141 | |
Huaan Securities Ltd., Cl A | | | 54,600 | | | | 56,075 | |
Huatai Securities Ltd., Cl A | | | 48,300 | | | | 124,114 | |
Huatai Securities Ltd., Cl H | | | 308,100 | | | | 513,477 | |
Huaxi Securities, Cl A | | | 35,400 | | | | 51,049 | |
Huaxia Bank, Cl A | | | 90,000 | | | | 83,634 | |
| Hubei Biocause Pharmaceutical, Cl A | | | 90,900 | | | | 70,950 | |
| Industrial & Commercial Bank of China, Cl A | | | 14,200 | | | | 10,399 | |
| Industrial & Commercial Bank of China, Cl H | | | 4,979,037 | | | | 3,384,719 | |
Industrial Bank, Cl A | | | 136,600 | | | | 321,601 | |
Industrial Securities, Cl A | | | 69,200 | | | | 59,110 | |
| Jiangsu Changshu Rural Commercial Bank, Cl A | | | 35,000 | | | | 35,400 | |
Nanjing Securities, Cl A | | | 34,600 | | | | 67,393 | |
| New China Life Insurance C, Cl A | | | 14,617 | | | | 93,073 | |
| New China Life Insurance C, Cl H | | | 146,211 | | | | 507,340 | |
Noah Holdings ADR * | | | 8,506 | | | | 236,127 | |
Northeast Securities, Cl A | | | 33,700 | | | | 38,907 | |
Orient Securities, Cl A | | | 50,600 | | | | 67,377 | |
Pacific Securities, Cl A | | | 91,600 | | | | 42,171 | |
| | | | | | | |
| COMMON STOCK — continued | | | | | | | | |
| Financials — continued | | | | | | | | |
People’s Insurance Group of China, Cl A * | | | 52,300 | | | $ | 47,045 | |
| People’s Insurance Group of China, Cl H | | | 1,453,200 | | | | 476,130 | |
| PICC Property & Casualty, Cl H | | | 879,463 | | | | 842,894 | |
Ping An Bank, Cl A | | | 8,300 | | | | 16,378 | |
| Ping An Insurance Group of China, Cl H | | | 301,714 | | | | 3,101,847 | |
| Ping An Insurance Group of China, Cl A | | | 1,800 | | | | 18,986 | |
| Postal Savings Bank of China, Cl H | | | 1,168,500 | | | | 700,887 | |
SDIC Capital, Cl A | | | 35,200 | | | | 59,536 | |
Sealand Securities, Cl A * | | | 66,610 | | | | 40,762 | |
Shanghai AJ Group, Cl A | | | 27,000 | | | | 30,254 | |
| Shanghai Pudong Development Bank, Cl A | | | 193,214 | | | | 290,942 | |
Shanxi Securities, Cl A | | | 42,600 | | | | 42,725 | |
| Shenwan Hongyuan Group, Cl A | | | 154,100 | | | | 95,394 | |
Sinolink Securities, Cl A | | | 40,500 | | | | 55,707 | |
SooChow Securities, Cl A | | | 53,380 | | | | 58,451 | |
Southwest Securities, Cl A | | | 77,000 | | | | 49,302 | |
Western Securities, Cl A | | | 42,000 | | | | 47,299 | |
Zheshang Securities, Cl A | | | 30,400 | | | | 42,288 | |
ZhongAn Online P&C Insurance, Cl H *(D) | | | 99,400 | | | | 343,627 | |
| TOTAL COMMON STOCK | | | | | | | | |
(Cost $43,563,989) | | | | | | | 36,241,640 | |
| | | | | | | | | |
SHORT-TERM INVESTMENT(E)(F) — 0.6% | | | | | | | | |
| Fidelity Investments Money Market Government Portfolio, Cl Institutional, 0.160% | | | | | | | | |
(Cost $232,292) | | | 232,292 | | | | 232,292 | |
| | | | | | | | | |
| | | | | | | |
REPURCHASE AGREEMENT(E) — 0.1% | | | | | | | | |
| BNP Paribas | | | | | | | | |
| 0.030%, dated 04/30/20, to be repurchased on 05/01/20, repurchase price $25,092 (collateralized by U.S. Treasury Obligations, ranging in par value $6,053 - $19,526, 1.500%, 08/15/2026, with a total market value of $25,579) | | | | | | | | |
(Cost $25,092) | | $ | 25,092 | | | $ | 25,092 | |
| TOTAL INVESTMENTS — 100.6% | | | | | | | | |
(Cost $43,821,373) | | | | | | $ | 36,499,024 | |
Percentages are based on Net Assets of $36,269,311.
| * | Non-income producing security. |
| (A) | Level 3 security in accordance with fair value hierarchy. |
| (B) | Security considered illiquid. The total value of such securities as of April 30, 2020 was $28,506 and represented 0.1% of Net Assets. |
| (C) | Security is fair valued using methods determined in good faith by the Fair Value Committee of the Fund. The total value of such securities as of April 30, 2020 was $28,506 and represents 0.1% of Net Assets. |
| (D) | This security or a partial position of this security is on loan at April 30, 2020. The total value of securities on loan at April 30, 2020 was $244,446. |
| (E) | Security was purchased with cash collateral held from securities on loan. The total value of such securities as of April 30, 2020 was $257,384. |
| (F) | The rate reported on the Schedule of Investments is the 7-day effective yield as of April 30, 2020. |
| ADR — American Depositary Receipt |
| Cl — Class |
| Ltd. — Limited |
The following is a summary of the level of inputs used as of April 30, 2020, in valuing the Fund’s investments carried at value:
| Investments in Securities | | | | | | | | | | | | |
| Common Stock | | $ | 1,309,835 | | | $ | 34,903,299 | | | $ | 28,506 | | | $ | 36,241,640 | |
| Short-Term Investment | | | 232,292 | | | | — | | | | — | | | | 232,292 | |
| Repurchase Agreement | | | — | | | | 25,092 | | | | — | | | | 25,092 | |
| Total Investments in Securities | | $ | 1,542,127 | | | $ | 34,928,391 | | | $ | 28,506 | | | $ | 36,499,024 | |
(1) | A reconciliation of Level 3 investments and disclosures of significant unobservable inputs are presented when the Fund has a significant amount of Level 3 investments at the beginning and/or end of the period in relation to Net Assets. Management has concluded that Level 3 investments are not material in relation to Net Assets. |
For the period ended April 30, 2020, the transfers in and out of Level 3 were due to changes in the availability of observable inputs to determine fair value. Transfers between levels are recognized at period end.
Amounts designated as “—“ are $0 or have been rounded to $0.
| | |
| Schedule of Investments |
| April 30, 2020 (Unaudited) |
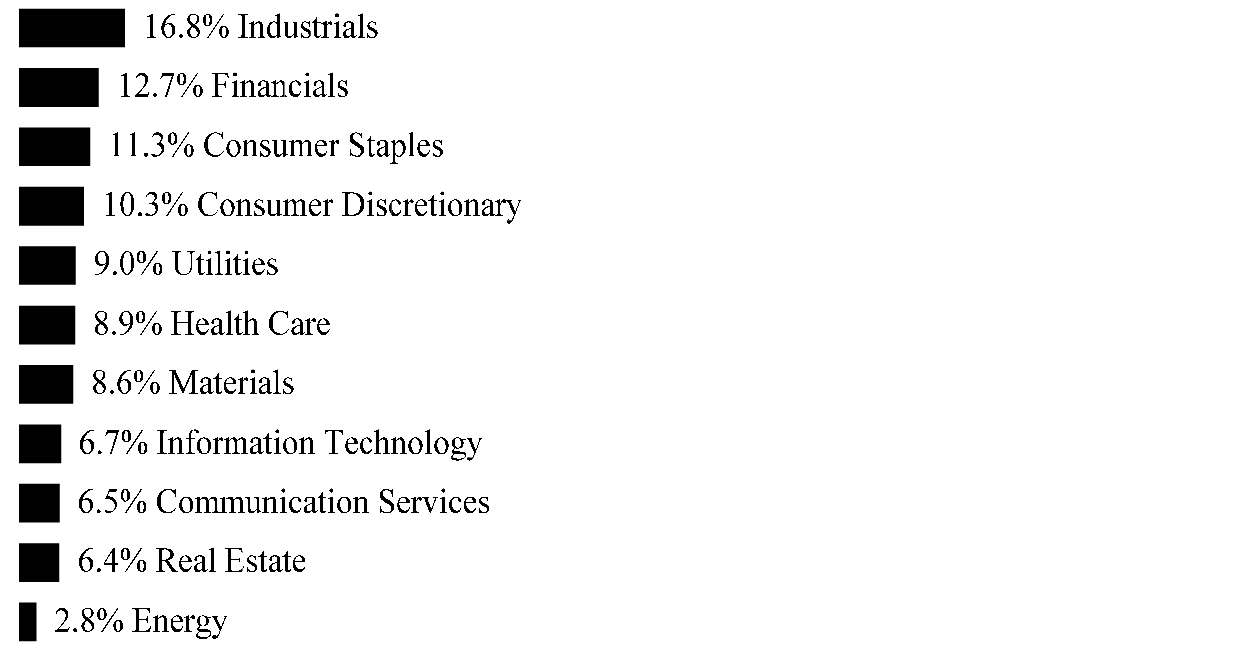
| Global X MSCI China Industrials ETF | |
Sector Weightings †:
† Sector weightings percentages are based on the total market value of investments.
| | | | | | | |
| COMMON STOCK — 100.1% | | | | | | |
| CHINA— 98.8% | | | | | | |
| Industrials — 98.8% | | | | | | |
51job ADR * | | | 448 | | | $ | 26,853 | |
| AECC Aero-Engine Control, Cl A | | | 1,200 | | | | 2,206 | |
AECC Aviation Power, Cl A | | | 2,300 | | | | 8,064 | |
Air China, Cl A | | | 4,100 | | | | 4,211 | |
Air China, Cl H | | | 30,800 | | | | 22,130 | |
A-Living Services, Cl H | | | 7,250 | | | | 39,933 | |
AVIC Aircraft, Cl A | | | 2,900 | | | | 7,238 | |
| AVIC Electromechanical Systems, Cl A | | | 3,700 | | | | 4,335 | |
AVIC Shenyang Aircraft, Cl A * | | | 1,000 | | | | 4,744 | |
| AviChina Industry & Technology, Cl H | | | 42,090 | | | | 16,614 | |
AVICOPTER, Cl A | | | 600 | | | | 3,758 | |
| Beijing Capital International Airport, Cl H | | | 28,531 | | | | 19,211 | |
| Beijing New Building Materials, Cl A | | | 1,700 | | | | 6,148 | |
| Beijing Originwater Technology, Cl A | | | 3,300 | | | | 4,460 | |
BEST ADR * | | | 3,371 | | | | 18,102 | |
Bohai Leasing, Cl A * | | | 6,100 | | | | 2,368 | |
| Centre Testing International Group, Cl A | | | 800 | | | | 1,938 | |
China Aerospace Times Electronics, Cl A * | | | 2,800 | | | | 2,586 | |
China Avionics Systems, Cl A | | | 1,300 | | | | 2,550 | |
| China Communications Construction, Cl A | | | 2,500 | | | | 2,854 | |
| China Communications Construction, Cl H | | | 74,743 | | | | 50,038 | |
| China Communications Services, Cl H | | | 40,700 | | | | 28,928 | |
| China Conch Venture Holdings | | | 27,400 | | | | 131,480 | |
China COSCO Holdings, Cl H * | | | 44,132 | | | | 12,752 | |
China Eastern Airlines, Cl A | | | 9,600 | | | | 5,956 | |
China Eastern Airlines, Cl H | | | 31,000 | | | | 12,916 | |
| | | | | | | |
| COMMON STOCK — continued | | | | | | | | |
| Industrials — continued | | | | | | | | |
China Everbright International | | | 62,250 | | | $ | 36,214 | |
China Gezhouba Group, Cl A | | | 4,200 | | | | 3,885 | |
| China International Marine Containers Group, Cl A | | | 1,360 | | | | 1,431 | |
China Lesso Group Holdings | | | 18,300 | | | | 26,014 | |
China Meheco, Cl A | | | 1,100 | | | | 2,233 | |
| China Merchants Holdings International | | | 23,031 | | | | 29,708 | |
| China National Chemical Engineering, Cl A | | | 5,100 | | | | 4,457 | |
| China Railway Construction, Cl A | | | 11,800 | | | | 16,348 | |
| China Railway Construction, Cl H | | | 33,301 | | | | 36,513 | |
China Railway Group, Cl A | | | 20,600 | | | | 17,100 | |
China Railway Group, Cl H | | | 63,898 | | | | 38,410 | |
| China Railway Hi-tech Industry, Cl A | | | 2,300 | | | | 3,190 | |
| China Shipbuilding Industry, Cl A | | | 23,600 | | | | 13,941 | |
China Southern Airlines, Cl A | | | 8,900 | | | | 6,808 | |
China Southern Airlines, Cl H | | | 27,700 | | | | 13,828 | |
China Spacesat, Cl A | | | 1,100 | | | | 5,123 | |
| China State Construction Engineering, Cl A | | | 42,500 | | | | 31,547 | |
| China State Construction International Holdings | | | 33,810 | | | | 26,167 | |
Citic Pacific | | | 98,300 | | | | 102,328 | |
| Contemporary Amperex Technology, Cl A | | | 2,200 | | | | 44,995 | |
COSCO Pacific | | | 29,530 | | | | 15,732 | |
| COSCO SHIPPING Development, Cl A | | | 7,200 | | | | 1,968 | |
COSCO SHIPPING Holdings, Cl A * | | | 6,700 | | | | 3,417 | |
| Country Garden Services Holdings | | | 20,600 | | | | 95,661 | |
CRRC | | | 73,753 | | | | 39,101 | |
CRRC, Cl A | | | 24,600 | | | | 21,570 | |
Dalian Port PDA, Cl A | | | 8,100 | | | | 1,985 | |
| | | | | | | |
| COMMON STOCK — continued | | | | | | | | |
| Industrials — continued | | | | | | | | |
Daqin Railway, Cl A | | | 15,300 | | | $ | 15,562 | |
Dongfang Electric, Cl A | | | 2,500 | | | | 3,049 | |
Eve Energy, Cl A | | | 1,000 | | | | 9,562 | |
Fangda Carbon New Material, Cl A * | | | 2,488 | | | | 2,943 | |
Fosun International | | | 43,300 | | | | 54,849 | |
Greentown Service Group | | | 18,600 | | | | 24,713 | |
Guangshen Railway, Cl A | | | 5,100 | | | | 1,712 | |
| Guangzhou Baiyun International Airport, Cl A | | | 2,100 | | | | 4,700 | |
Guoxuan High-Tech, Cl A | | | 1,200 | | | | 3,884 | |
Haitian International Holdings | | | 10,726 | | | | 19,259 | |
| Hefei Meiya Optoelectronic Technology, Cl A | | | 700 | | | | 4,170 | |
Hongfa Technology, Cl A | | | 800 | | | | 3,709 | |
| Inner Mongolia First Machinery Group, Cl A | | | 1,800 | | | | 2,443 | |
Jiangsu Expressway, Cl H | | | 20,619 | | | | 24,602 | |
| Jiangsu Hengli Hydraulic, Cl A | | | 900 | | | | 8,848 | |
| Jiangsu Zhongtian Technology, Cl A | | | 3,200 | | | | 5,063 | |
Juneyao Airlines, Cl A * | | | 1,700 | | | | 2,377 | |
| Metallurgical Corp of China, Cl A | | | 18,400 | | | | 6,699 | |
| Metallurgical Corp of China, Cl H | | | 49,700 | | | | 8,655 | |
NARI Technology, Cl A | | | 4,700 | | | | 13,382 | |
Ningbo Zhoushan Port, Cl A | | | 9,100 | | | | 4,293 | |
| Power Construction Corp of China, Cl A | | | 13,200 | | | | 6,675 | |
Sany Heavy Industry, Cl A | | | 8,600 | | | | 23,938 | |
SF Holding, Cl A | | | 1,600 | | | | 10,605 | |
| Shanghai Construction Group, Cl A | | | 9,200 | | | | 4,288 | |
Shanghai Electric Group, Cl A | | | 8,400 | | | | 5,771 | |
Shanghai Electric Group, Cl H | | | 44,971 | | | | 13,922 | |
Shanghai Industrial Holdings | | | 8,239 | | | | 13,986 | |
| Shanghai International Airport, Cl A | | | 1,000 | | | | 10,015 | |
| | | | | | | |
| COMMON STOCK — continued | | | | | | | | |
| Industrials — continued | | | | | | | | |
| Shanghai International Port Group, Cl A | | | 8,800 | | | $ | 5,211 | |
| Shanghai M&G Stationery, Cl A | | | 900 | | | | 6,554 | |
| Shanghai Mechanical and Electrical Industry, Cl A | | | 800 | | | | 1,685 | |
| Shanghai Tunnel Engineering, Cl A | | | 2,800 | | | | 2,269 | |
| Shanghai Waigaoqiao Free Trade Zone Group, Cl A | | | 800 | | | | 1,626 | |
Shenzhen Airport, Cl A | | | 2,100 | | | | 2,454 | |
Shenzhen Expressway, Cl H | | | 12,000 | | | | 13,668 | |
| Shenzhen Inovance Technology, Cl A | | | 1,700 | | | | 7,882 | |
| Shenzhen International Holdings | | | 16,406 | | | | 31,448 | |
| Siasun Robot & Automation, Cl A | | | 1,600 | | | | 2,987 | |
Sinochem International, Cl A | | | 2,800 | | | | 1,967 | |
| Sinopec Engineering Group, Cl H | | | 23,800 | | | | 11,328 | |
Sinotrans, Cl A | | | 4,600 | | | | 2,124 | |
Sinotrans, Cl H | | | 34,900 | | | | 8,509 | |
Sinotruk Hong Kong | | | 11,600 | | | | 23,372 | |
Spring Airlines, Cl A | | | 900 | | | | 4,736 | |
Sunwoda Electronic, Cl A | | | 1,600 | | | | 3,262 | |
| Suzhou Gold Mantis Construction Decoration, Cl A | | | 2,400 | | | | 2,740 | |
TangShan Port Group, Cl A | | | 6,200 | | | | 2,003 | |
TBEA, Cl A | | | 3,400 | | | | 3,627 | |
| Tian Di Science & Technology, Cl A | | | 4,300 | | | | 1,852 | |
| Tus Environmental Science And Technology Development, Cl A | | | 1,500 | | | | 1,719 | |
Weichai Power, Cl A | | | 6,200 | | | | 11,769 | |
Weichai Power, Cl H | | | 32,796 | | | | 57,365 | |
| XCMG Construction Machinery, Cl A | | | 8,100 | | | | 6,368 | |
Xiamen C & D, Cl A | | | 2,600 | | | | 3,083 | |
| | | | | | | |
| COMMON STOCK — continued | | | | | | | | |
| Industrials — continued | | | | | | | | |
| Xinjiang Goldwind Science & Technology, Cl A | | | 3,547 | | | $ | 5,014 | |
| Xinjiang Goldwind Science & Technology, Cl H | | | 12,971 | | | | 12,733 | |
Yunda Holding, Cl A | | | 1,500 | | | | 6,283 | |
Zhejiang Chint Electrics, Cl A | | | 2,200 | | | | 7,760 | |
| Zhejiang Dingli Machinery, Cl A | | | 350 | | | | 3,900 | |
Zhejiang Expressway, Cl H | | | 24,140 | | | | 18,154 | |
| Zhejiang Sanhua Intelligent Controls, Cl A | | | 2,900 | | | | 9,050 | |
| Zhejiang Weixing New Building Materials, Cl A | | | 1,600 | | | | 2,765 | |
Zhengzhou Yutong Bus, Cl A | | | 2,300 | | | | 4,249 | |
| Zhuzhou CRRC Times Electric, Cl H | | | 9,223 | | | | 28,434 | |
| Zoomlion Heavy Industry Science and Technology | | | 23,800 | | | | 19,157 | |
| Zoomlion Heavy Industry Science and Technology, Cl A | | | 6,600 | | | | 5,984 | |
ZTO Express Cayman ADR | | | 5,337 | | | | 158,829 | |
TOTAL CHINA | | | | | | | 1,899,641 | |
| SINGAPORE— 1.3% | | | | | | | | |
| Industrials — 1.3% | | | | | | | | |
BOC Aviation | | | 3,520 | | | | 23,815 | |
| TOTAL COMMON STOCK | | | | | | | | |
(Cost $2,241,820) | | | | | | | 1,923,456 | |
| TOTAL INVESTMENTS — 100.1% | | | | | | | | |
(Cost $2,241,820) | | | | | | $ | 1,923,456 | |
Percentages are based on Net Assets of $1,922,491.
| * | Non-income producing security. |
| ADR — American Depositary Receipt |
| Cl — Class |
The following is a summary of the level of inputs used as of April 30, 2020, in valuing the Fund’s investments carried at value:
| Investments in Securities | | | | | | | | | | | | |
| Common Stock | | $ | 375,402 | | | $ | 1,548,054 | | | $ | — | | | $ | 1,923,456 | |
| Total Investments in Securities | | $ | 375,402 | | | $ | 1,548,054 | | | $ | — | | | $ | 1,923,456 | |
For the period ended April 30, 2020, there were no transfers in or out of Level 3.
Amounts designated as “—“ are $0 or have been rounded to $0.
| | |
| Schedule of Investments |
| April 30, 2020 (Unaudited) |
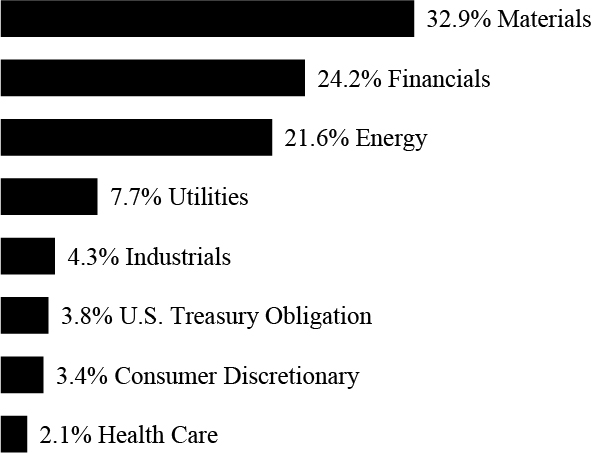
| Global X MSCI China Materials ETF | |
Sector Weightings †:
† Sector weightings percentages are based on the total market value of investments.
| | | | | | | |
| COMMON STOCK — 99.9% | | | | | | |
| CHINA— 95.8% | | | | | | |
| Materials — 95.8% | | | | | | |
Aluminum Corp of China, Cl A * | | | 26,800 | | | $ | 10,820 | |
Aluminum Corp of China, Cl H * | | | 161,239 | | | | 34,318 | |
Angang Steel, Cl A | | | 15,010 | | | | 5,592 | |
Anhui Conch Cement, Cl A | | | 500 | | | | 4,247 | |
Anhui Conch Cement, Cl H | | | 20,220 | | | | 159,103 | |
Baoshan Iron & Steel, Cl A | | | 37,500 | | | | 25,870 | |
BBMG, Cl A | | | 21,000 | | | | 9,608 | |
BBMG, Cl H | | | 108,640 | | | | 27,607 | |
| Beijing Oriental Yuhong Waterproof Technology, Cl A | | | 3,100 | | | | 16,968 | |
| Beijing Sanju Environmental Protection and New Material, Cl A | | | 5,500 | | | | 3,249 | |
China Hongqiao Group | | | 74,300 | | | | 36,995 | |
China Jushi, Cl A | | | 7,200 | | | | 8,975 | |
China Lumena New Materials *(A)(B)(C) | | | 48 | | | | — | |
China Molybdenum, Cl A | | | 35,800 | | | | 17,648 | |
China Molybdenum, Cl H | | | 144,554 | | | | 43,633 | |
| China National Building Material, Cl H | | | 130,400 | | | | 164,002 | |
| China Northern Rare Earth Group High-Tech, Cl A | | | 8,000 | | | | 10,233 | |
| China Resources Cement Holdings | | | 89,200 | | | | 120,815 | |
China Zhongwang Holdings | | | 78,300 | | | | 18,887 | |
Ganfeng Lithium, Cl A | | | 2,900 | | | | 19,024 | |
GEM, Cl A | | | 8,700 | | | | 5,718 | |
| Guangdong HEC Technology Holding, Cl A | | | 6,200 | | | | 5,902 | |
Hengli Petrochemical, Cl A | | | 11,920 | | | | 23,859 | |
Hengyi Petrochemical, Cl A | | | 6,000 | | | | 10,446 | |
| | | | | | | |
| COMMON STOCK — continued | | | | | | | | |
| Materials — continued | | | | | | | | |
Hesteel, Cl A | | | 24,000 | | | $ | 6,970 | |
Huaxin Cement, Cl A | | | 2,800 | | | | 10,531 | |
Hunan Valin Steel, Cl A * | | | 8,800 | | | | 4,974 | |
| Inner Mongolia BaoTou Steel Union, Cl A | | | 92,900 | | | | 14,213 | |
| Inner Mongolia Junzheng Energy & Chemical Industry Group, Cl A | | | 17,300 | | | | 7,033 | |
| Jiangsu Yangnong Chemical, Cl A | | | 700 | | | | 7,467 | |
Jiangxi Copper, Cl A | | | 4,500 | | | | 8,159 | |
Jiangxi Copper, Cl H | | | 47,091 | | | | 46,044 | |
| Jinduicheng Molybdenum, Cl A | | | 7,600 | | | | 6,363 | |
| Lee & Man Paper Manufacturing | | | 57,900 | | | | 35,700 | |
Lomon Billions Group, Cl A | | | 4,200 | | | | 9,912 | |
Luxi Chemical Group, Cl A | | | 3,500 | | | | 3,887 | |
Maanshan Iron & Steel, Cl A | | | 16,900 | | | | 6,272 | |
Maanshan Iron & Steel, Cl H | | | 43,125 | | | | 13,963 | |
Nanjing Iron & Steel, Cl A * | | | 9,400 | | | | 4,248 | |
Pangang Group Vanadium Titanium & Resources, Cl A * | | | 17,700 | | | | 5,015 | |
Real Gold Mining *(A)(B)(C) | | | 97,864 | | | | — | |
| Rongsheng Petro Chemical, Cl A | | | 10,800 | | | | 18,252 | |
| Sansteel Minguang Fujian, Cl A | | | 5,100 | | | | 5,252 | |
Shandong Gold Mining, Cl A | | | 5,200 | | | | 26,732 | |
| Shandong Hualu Hengsheng Chemical, Cl A | | | 3,500 | | | | 8,245 | |
| Shandong Nanshan Aluminum, Cl A | | | 24,600 | | | | 7,283 | |
| Shandong Sinocera Functional Material, Cl A | | | 2,000 | | | | 6,550 | |
| Shandong Sun Paper Industry JSC, Cl A | | | 5,700 | | | | 6,742 | |
| Shanxi Taigang Stainless Steel, Cl A | | | 11,800 | | | | 5,483 | |
| Shanying International Holding, Cl A | | | 10,700 | | | | 4,578 | |
| Shenghe Resources Holding, Cl A | | | 3,700 | | | | 3,585 | |
| | | | | | | |
| COMMON STOCK — continued | | | | | | | | |
| Materials — continued | | | | | | | | |
| Shenzhen Zhongjin Lingnan Nonfemet, Cl A | | | 10,100 | | | $ | 4,993 | |
| Sichuan Hebang Biotechnology | | | 20,700 | | | | 3,988 | |
| Sinopec Shanghai Petrochemical, Cl A | | | 13,500 | | | | 7,688 | |
| Sinopec Shanghai Petrochemical, Cl H | | | 145,350 | | | | 39,936 | |
Tangshan Jidong Cement, Cl A | | | 2,800 | | | | 8,024 | |
Tianqi Lithium, Cl A | | | 3,350 | | | | 7,859 | |
Tongkun Group, Cl A * | | | 3,800 | | | | 6,325 | |
| Tongling Nonferrous Metals Group, Cl A | | | 29,800 | | | | 8,189 | |
Transfar Zhilian, Cl A | | | 6,700 | | | | 5,827 | |
| Wanhua Chemical Group, Cl A | | | 6,300 | | | | 40,159 | |
| Weihai Guangwei Composites, Cl A | | | 1,100 | | | | 8,527 | |
Xiamen Tungsten, Cl A | | | 2,900 | | | | 4,626 | |
| Xinjiang Zhongtai Chemical, Cl A | | | 5,100 | | | | 3,395 | |
| Xinxing Ductile Iron Pipes, Cl A | | | 9,300 | | | | 4,558 | |
Xinyu Iron & Steel, Cl A | | | 6,700 | | | | 3,834 | |
Yintai Gold, Cl A | | | 4,100 | | | | 9,542 | |
Yunnan Energy New Material | | | 1,400 | | | | 10,870 | |
Yunnan Tin, Cl A * | | | 3,500 | | | | 4,185 | |
Zhaojin Mining Industry | | | 43,584 | | | | 49,249 | |
Zhejiang Huayou Cobalt, Cl A | | | 2,730 | | | | 13,319 | |
| Zhejiang Jiahua Energy Chemical Industry, Cl A | | | 3,400 | | | | 4,195 | |
Zhejiang Juhua, Cl A | | | 6,200 | | | | 5,656 | |
| Zhejiang Longsheng Group, Cl A | | | 8,200 | | | | 14,055 | |
Zhongjin Gold, Cl A | | | 9,900 | | | | 11,780 | |
Zijin Mining Group, Cl A | | | 39,800 | | | | 22,044 | |
Zijin Mining Group, Cl H | | | 211,359 | | | | 87,244 | |
TOTAL CHINA | | | | | | | 1,457,039 | |
| | | | | | | |
| COMMON STOCK — continued | | | | | | | | |
| HONG KONG— 4.1% | | | | | | | | |
| Materials — 4.1% | | | | | | | | |
Nine Dragons Paper Holdings | | | 63,670 | | | $ | 61,597 | |
| TOTAL COMMON STOCK | | | | | | | | |
(Cost $1,762,751) | | | | | | | 1,518,636 | |
| TOTAL INVESTMENTS — 99.9% | | | | | | | | |
(Cost $1,762,751) | | | | | | $ | 1,518,636 | |
Percentages are based on Net Assets of $1,520,146.
| * | Non-income producing security. |
| (A) | Level 3 security in accordance with fair value hierarchy. |
| (B) | Security considered illiquid. The total value of such securities as of April 30, 2020 was $0 and represented 0.0% of Net Assets. |
| (C) | Security is fair valued using methods determined in good faith by the Fair Value Committee of the Fund. The total value of such securities as of April 30, 2020 was $0 and represents 0.0% of net assets. |
Cl — Class
The following is a summary of the level of inputs used as of April 30, 2020, in valuing the Fund’s investments carried at value:
| Investments in Securities | | | | | | | | | | | | |
| Common Stock | | $ | 210,002 | | | $ | 1,308,634 | | | $ | — | | | $ | 1,518,636 | |
| Total Investments in Securities | | $ | 210,002 | | | $ | 1,308,634 | | | $ | — | | | $ | 1,518,636 | |
(1) | A reconciliation of Level 3 investments and disclosures of significant unobservable inputs are presented when the Fund has a significant amount of Level 3 investments at the beginning and/or end of the period in relation to Net Assets. Management has concluded that Level 3 investments are not material in relation to Net Assets. |
For the period ended April 30, 2020, there were no transfers in or out of Level 3.
Amounts designated as “—“ are $0 or have been rounded to $0.
| | |
| Schedule of Investments |
| April 30, 2020 (Unaudited) |
| Global X MSCI China Communication Services ETF | |
Sector Weightings †:
† Sector weightings percentages are based on the total market value of investments.
| | | | | | | |
COMMON STOCK — 99.9% | | | | | | |
| CHINA— 97.7% | | | | | | |
| Communication Services — 97.7% | | | | | | |
58.com ADR * | | | 10,682 | | | $ | 554,930 | |
Autohome ADR | | | 7,271 | | | | 597,312 | |
Baidu ADR * | | | 12,941 | | | | 1,306,135 | |
Beijing Enlight Media, Cl A | | | 211,400 | | | | 318,327 | |
China Film, Cl A | | | 174,781 | | | | 328,302 | |
China Literature * | | | 800 | | | | 3,596 | |
China Mobile | | | 204,900 | | | | 1,650,597 | |
| China South Publishing & Media Group, Cl A | | | 196,072 | | | | 303,579 | |
China Telecom, Cl H | | | 1,467,200 | | | | 505,321 | |
China Tower, Cl H * | | | 3,115,300 | | | | 699,223 | |
China Unicom Hong Kong | | | 635,700 | | | | 410,825 | |
| China United Network Communications, Cl A | | | 497,600 | | | | 367,948 | |
| Chinese Universe Publishing and Media Group, Cl A | | | 157,850 | | | | 268,549 | |
| CITIC Guoan Information Industry, Cl A | | | 524,000 | | | | 241,240 | |
| Focus Media Information Technology, Cl A | | | 456,700 | | | | 311,827 | |
| G-bits Network Technology Xiamen, Cl A | | | 6,410 | | | | 343,929 | |
Giant Network Group, Cl A | | | 135,400 | | | | 327,407 | |
HUYA ADR * | | | 18,684 | | | | 303,241 | |
iQIYI ADR * | | | 23,399 | | | | 397,081 | |
JOYY ADR * | | | 8,081 | | | | 492,618 | |
Mango Excellent Media, Cl A | | | 66,920 | | | | 440,423 | |
Momo ADR | | | 16,711 | | | | 402,401 | |
NanJi E-Commerce, Cl A * | | | 226,400 | | | | 438,089 | |
NetEase ADR | | | 4,162 | | | | 1,435,723 | |
Oriental Pearl Group, Cl A | | | 269,600 | | | | 344,096 | |
| | |
| Schedule of Investments |
| April 30, 2020 (Unaudited) |
| Global X MSCI China Communication Services ETF | |
| | | | | | | |
| COMMON STOCK — continued | | | | | | | | |
| Communication Services — continued | | | | | | | | |
Perfect World, Cl A | | | 67,440 | | | $ | 451,775 | |
SINA * | | | 12,885 | | | | 435,126 | |
Tencent Holdings | | | 32,865 | | | | 1,767,813 | |
Tencent Music Entertainment Group ADR * | | | 292 | | | | 3,332 | |
Wanda Film Holding, Cl A | | | 139,700 | | | | 330,482 | |
Weibo ADR * | | | 10,277 | | | | 385,696 | |
| Wuhu Sanqi Interactive Entertainment Network Technology Group, Cl A | | | 90,951 | | | | 465,877 | |
Youzu Interactive, Cl A | | | 109,900 | | | | 289,565 | |
| | | | | | | | 16,922,385 | |
| Information Technolgy — 0.0% | | | | | | | | |
National Agricultural Holdings *(A)(B)(C) | | | 204,200 | | | | 3 | |
TOTAL CHINA | | | | | | | 16,922,388 | |
| HONG KONG — 2.2% | | | | | | | | |
| Communication Services — 2.2% | | | | | | | | |
Alibaba Pictures Group * | | | 2,842,600 | | | | 381,343 | |
| TOTAL COMMON STOCK | | | | | | | | |
(Cost $18,875,363) | | | | | | | 17,303,731 | |
| TOTAL INVESTMENTS — 99.9% | | | | | | | | |
(Cost $18,875,363) | | | | | | $ | 17,303,731 | |
Percentages are based on Net Assets of $17,314,051.
| * | Non-income producing security. |
| (A) | Level 3 security in accordance with fair value hierarchy. |
| (B) | Security considered illiquid. The total value of such securities as of April 30, 2020 was $3 and represented 0.0% of Net Assets. |
| (C) | Security is fair valued using methods determined in good faith by the Fair Value Committee of the Fund. The total value of such securities as of April 30, 2020 was $3 and represents 0.0% of Net Assets. |
| | |
| Schedule of Investments |
| April 30, 2020 (Unaudited) |
| Global X MSCI China Communication Services ETF | |
| ADR — American Depositary Receipt |
| Cl — Class |
The following is a summary of the level of inputs used as of April 30, 2020, in valuing the Fund’s investments carried at value:
| Investments in Securities | | | | | | | | | | | | |
| Common Stock | | $ | 9,928,608 | | | $ | 7,375,120 | | | $ | 3 | | | $ | 17,303,731 | |
| Total Investments in Securities | | $ | 9,928,608 | | | $ | 7,375,120 | | | $ | 3 | | | $ | 17,303,731 | |
(1) | A reconciliation of Level 3 investments and disclosures of significant unobservable inputs are presented when the Fund has a significant amount of Level 3 investments at the beginning and/or end of the period in relation to Net Assets. Management has concluded that Level 3 investments are not material in relation to Net Assets. |
For the period ended April 30, 2020, there were no transfers in or out of Level 3.
Amounts designated as “—“ are $0 or have been rounded to $0.
| | |
| Schedule of Investments |
| April 30, 2020 (Unaudited) |
| Global X MSCI China Consumer Staples ETF | |
Sector Weightings †:
† Sector weightings percentages are based on the total market value of investments.
| | | | | | | |
| COMMON STOCK — 99.7% | | | | | | |
| CHINA— 99.7% | | | | | | |
| Consumer Staples — 99.7% | | | | | | |
Angel Yeast, Cl A | | | 3,954 | | | $ | 20,802 | |
Anhui Gujing Distillery, Cl A | | | 1,676 | | | | 32,025 | |
Anhui Kouzi Distillery, Cl A | | | 2,600 | | | | 15,178 | |
| Beijing Dabeinong Technology Group, Cl A | | | 52,400 | | | | 67,250 | |
| Beijing Shunxin Agriculture, Cl A | | | 3,297 | | | | 25,398 | |
Beijing Yanjing Brewery, Cl A | | | 12,600 | | | | 10,638 | |
By-health, Cl A | | | 7,000 | | | | 18,483 | |
China Mengniu Dairy | | | 128,800 | | | | 459,387 | |
| China Resources Beer Holdings | | | 99,300 | | | | 473,292 | |
Chongqing Brewery, Cl A | | | 2,072 | | | | 15,979 | |
| Chongqing Fuling Zhacai Group, Cl A | | | 3,700 | | | | 17,438 | |
Dali Foods Group | | | 193,200 | | | | 118,875 | |
| Foshan Haitian Flavouring & Food, Cl A | | | 11,161 | | | | 194,355 | |
| Fujian Sunner Development, Cl A | | | 4,600 | | | | 14,160 | |
Guangdong Haid Group, Cl A | | | 6,891 | | | | 42,121 | |
Heilongjiang Agriculture, Cl A | | | 8,100 | | | | 19,529 | |
Henan Shuanghui Investment & Development, Cl A * | | | 19,340 | | | | 110,708 | |
Hengan International Group | | | 52,700 | | | | 470,077 | |
Inner Mongolia Yili Industrial Group, Cl A * | | | 32,029 | | | | 132,665 | |
| Jiangsu King’s Luck Brewery JSC, Cl A | | | 5,500 | | | | 25,399 | |
| Jiangsu Yanghe Brewery Joint-Stock, Cl A | | | 8,044 | | | | 112,171 | |
| Jiangxi Zhengbang Technology, Cl A | | | 11,100 | | | | 29,073 | |
| Jonjee Hi-Tech Industrial And Commercial Holding, Cl A | | | 3,600 | | | | 24,142 | |
| | |
| Schedule of Investments |
| April 30, 2020 (Unaudited) |
| Global X MSCI China Consumer Staples ETF | |
| | | | | | | |
| COMMON STOCK — continued | | | | | | | | |
| Consumer Staples — continued | | | | | | | | |
Juewei Food, Cl A | | | 2,700 | | | $ | 20,256 | |
Kweichow Moutai, Cl A | | | 3,154 | | | | 565,493 | |
| Laobaixing Pharmacy Chain JSC, Cl A | | | 1,400 | | | | 15,090 | |
Luzhou Laojiao, Cl A | | | 8,947 | | | | 100,340 | |
Muyuan Foodstuff, Cl A | | | 9,800 | | | | 176,860 | |
New Hope Liuhe, Cl A | | | 28,800 | | | | 134,222 | |
Shanghai Jahwa United, Cl A | | | 3,000 | | | | 13,782 | |
| Shanxi Xinghuacun Fen Wine Factory, Cl A | | | 6,149 | | | | 93,472 | |
Sichuan Swellfun, Cl A | | | 2,268 | | | | 14,811 | |
Sun Art Retail Group | | | 189,600 | | | | 315,986 | |
Tech-Bank Food, Cl A | | | 5,600 | | | | 9,964 | |
| Tingyi Cayman Islands Holding | | | 130,200 | | | | 230,426 | |
Toly Bread, Cl A * | | | 2,500 | | | | 17,381 | |
Tongwei, Cl A | | | 29,600 | | | | 63,357 | |
Tsingtao Brewery, Cl A | | | 3,000 | | | | 22,417 | |
Tsingtao Brewery, Cl H | | | 32,200 | | | | 195,841 | |
Uni-President China Holdings | | | 124,300 | | | | 125,224 | |
Want Want China Holdings | | | 373,800 | | | | 268,090 | |
Wens Foodstuffs Group | | | 26,087 | | | | 111,711 | |
Wuliangye Yibin, Cl A | | | 15,706 | | | | 302,068 | |
Yifeng Pharmacy Chain, Cl A | | | 1,673 | | | | 22,455 | |
Yihai International Holding | | | 36,540 | | | | 292,232 | |
Yonghui Superstores, Cl A | | | 63,100 | | | | 90,815 | |
| Yuan Longping High-tech Agriculture, Cl A | | | 6,000 | | | | 13,803 | |
| TOTAL COMMON STOCK | | | | | | | | |
(Cost $5,101,138) | | | | | | | 5,665,241 | |
| TOTAL INVESTMENTS — 99.7% | | | | | | | | |
(Cost $5,101,138) | | | | | | $ | 5,665,241 | |
Percentages are based on Net Assets of $5,680,125.
| * | Non-income producing security. |
| | |
| Schedule of Investments |
| April 30, 2020 (Unaudited) |
| Global X MSCI China Consumer Staples ETF | |
The following is a summary of the level of inputs used as of April 30, 2020, in valuing the Fund’s investments carried at value:
| Investments in Securities | | | | | | | | | | | | |
| Common Stock | | $ | 1,328,433 | | | $ | 4,336,808 | | | $ | — | | | $ | 5,665,241 | |
| Total Investments in Securities | | $ | 1,328,433 | | | $ | 4,336,808 | | | $ | — | | | $ | 5,665,241 | |
For the period ended April 30, 2020, there were no transfers in or out of Level 3.
Amounts designated as “—“ are $0 or have been rounded to $0.
| | |
| Schedule of Investments |
| April 30, 2020 (Unaudited) |
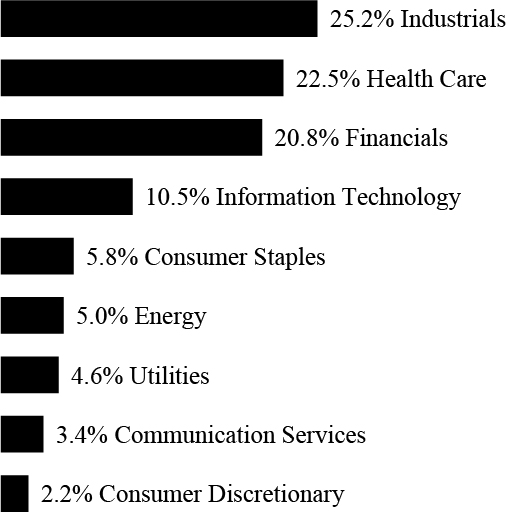
| Global X MSCI China Health Care ETF | |
Sector Weightings †:
† Sector weightings percentages are based on the total market value of investments.
| | | | | | | |
| COMMON STOCK — 99.9% | | | | | | |
| CHINA— 88.1% | | | | | | |
| Health Care — 88.1% | | | | | | |
3SBio * | | | 74,800 | | | $ | 76,707 | |
Aier Eye Hospital Group, Cl A | | | 9,230 | | | | 58,039 | |
Alibaba Health Information Technology * | | | 184,300 | | | | 445,990 | |
| Asymchem Laboratories Tianjin, Cl A | | | 580 | | | | 15,506 | |
Autobio Diagnostics, Cl A | | | 700 | | | | 13,347 | |
| Beijing SL Pharmaceutical, Cl A | | | 3,000 | | | | 4,734 | |
| Beijing Tiantan Biological Products, Cl A | | | 2,500 | | | | 12,069 | |
Beijing Tongrentang, Cl A | | | 6,540 | | | | 23,791 | |
Betta Pharmaceuticals, Cl A | | | 1,000 | | | | 13,372 | |
BGI Genomics, Cl A | | | 900 | | | | 13,417 | |
| Changchun High & New Technology Industry Group, Cl A | | | 500 | | | | 42,205 | |
| Chengdu Kanghong Pharmaceutical Group, Cl A | | | 1,600 | | | | 8,699 | |
| China Medical System Holdings | | | 78,900 | | | | 94,041 | |
| China National Accord Medicines, Cl A | | | 900 | | | | 5,263 | |
| China National Medicines, Cl A | | | 1,600 | | | | 7,071 | |
| China Resources Double Crane Pharmaceutical, Cl A | | | 3,000 | | | | 5,431 | |
| China Resources Pharmaceutical Group | | | 95,000 | | | | 60,046 | |
| China Resources Sanjiu Medical & Pharmaceutical, Cl A | | | 2,400 | | | | 9,876 | |
| China Traditional Chinese Medicine Holdings | | | 141,500 | | | | 62,789 | |
| Chongqing Zhifei Biological Products, Cl A | | | 3,700 | | | | 41,490 | |
CSPC Pharmaceutical Group | | | 178,900 | | | | 355,384 | |
Dong-E-E-Jiao, Cl E | | | 3,100 | | | | 13,613 | |
| | |
| Schedule of Investments |
| April 30, 2020 (Unaudited) |
| Global X MSCI China Health Care ETF | |
| | | | | | | |
| COMMON STOCK — continued | | | | | | | | |
| Health Care — continued | | | | | | | | |
Genscript Biotech * | | | 53,200 | | | $ | 94,976 | |
| Guangzhou Baiyunshan Pharmaceutical Holdings, Cl A | | | 6,500 | | | | 28,452 | |
| Guangzhou Kingmed Diagnostics Group, Cl A | | | 1,000 | | | | 9,774 | |
| Guizhou Bailing Group Pharmaceutical, Cl A | | | 4,400 | | | | 5,136 | |
| Hangzhou Tigermed Consulting, Cl A | | | 2,016 | | | | 21,990 | |
Hansoh Pharmaceutical Group * | | | 22,800 | | | | 88,525 | |
Huadong Medicine, Cl A | | | 8,380 | | | | 23,682 | |
| Hualan Biological Engineering, Cl A | | | 5,070 | | | | 27,916 | |
| Hubei Jumpcan Pharmaceutical, Cl A | | | 1,600 | | | | 4,696 | |
Innovent Biologics * | | | 47,000 | | | | 232,808 | |
Jafron Biomedical, Cl A | | | 1,000 | | | | 15,755 | |
Jiangsu Hengrui Medicine, Cl A * | | | 13,400 | | | | 176,532 | |
| Jiangsu Yuyue Medical Equipment & Supply, Cl A | | | 2,100 | | | | 10,322 | |
| Jilin Aodong Pharmaceutical Group, Cl A | | | 2,500 | | | | 5,457 | |
Jinyu Bio-Technology, Cl A | | | 2,600 | | | | 8,806 | |
| Joincare Pharmaceutical Group Industry, Cl A | | | 4,100 | | | | 7,277 | |
| Jointown Pharmaceutical Group, Cl A | | | 9,100 | | | | 23,113 | |
| Lepu Medical Technology Beijing, Cl A | | | 5,000 | | | | 26,993 | |
| Livzon Pharmaceutical Group, Cl A | | | 1,400 | | | | 7,889 | |
Luye Pharma Group | | | 84,500 | | | | 41,202 | |
| Meinian Onehealth Healthcare Holdings, Cl A | | | 17,320 | | | | 28,068 | |
| Nanjing King-Friend Biochemical Pharmaceutical, Cl A | | | 1,500 | | | | 12,290 | |
Ovctek China, Cl A | | | 1,000 | | | | 9,329 | |
Ping An Healthcare and Technology * | | | 16,000 | | | | 221,662 | |
| Shandong Buchang Pharmaceuticals, Cl A | | | 5,510 | | | | 17,179 | |
| Shandong Weigao Group Medical Polymer, Cl H | | | 112,800 | | | | 171,986 | |
| | |
| Schedule of Investments |
| April 30, 2020 (Unaudited) |
| Global X MSCI China Health Care ETF | |
| | | | | | | |
| COMMON STOCK — continued | | | | | | | | |
| Health Care — continued | | | | | | | | |
| Shanghai Fosun Pharmaceutical Group, Cl A | | | 5,600 | | | $ | 26,678 | |
| Shanghai Fosun Pharmaceutical Group, Cl H | | | 32,000 | | | | 122,182 | |
| Shanghai Pharmaceuticals Holding, Cl A | | | 4,900 | | | | 12,841 | |
| Shanghai Pharmaceuticals Holding, Cl H | | | 49,100 | | | | 86,516 | |
| Shanghai RAAS Blood Products, Cl A | | | 4,600 | | | | 5,519 | |
| Shenzhen Hepalink Pharmaceutical Group, Cl A | | | 2,500 | | | | 7,827 | |
| Shenzhen Kangtai Biological Products, Cl A | | | 1,743 | | | | 33,085 | |
| Shenzhen Mindray Bio-Medical Electronics, Cl A | | | 2,482 | | | | 90,113 | |
Shenzhen Salubris Pharmaceuticals, Cl A * | | | 4,100 | | | | 10,872 | |
| Shijiazhuang Yiling Pharmaceutical, Cl A | | | 3,400 | | | | 13,861 | |
| Sichuan Kelun Pharmaceutical, Cl A | | | 6,600 | | | | 18,184 | |
Sinopharm Group, Cl H | | | 70,300 | | | | 190,434 | |
| Tasly Pharmaceutical Group, Cl A | | | 7,300 | | | | 14,488 | |
| Tonghua Dongbao Pharmaceutical, Cl A | | | 9,800 | | | | 17,603 | |
Topchoice Medical, Cl A | | | 800 | | | | 13,911 | |
Walvax Biotechnology, Cl A | | | 4,000 | | | | 22,931 | |
| Winning Health Technology Group, Cl A | | | 3,900 | | | | 14,049 | |
WuXi AppTec, Cl A | | | 4,300 | | | | 61,990 | |
WuXi AppTec, Cl H | | | 8,600 | | | | 121,473 | |
Wuxi Biologics Cayman * | | | 28,740 | | | | 448,579 | |
Yifan Pharmaceutical, Cl A | | | 3,000 | | | | 7,934 | |
Yunnan Baiyao Group, Cl A | | | 5,110 | | | | 65,379 | |
Zai Lab ADR * | | | 1,572 | | | | 98,596 | |
| Zhangzhou Pientzehuang Pharmaceutical, Cl A | | | 2,040 | | | | 40,529 | |
| Zhejiang Conba Pharmaceutical, Cl A | | | 5,900 | | | | 4,313 | |
| Zhejiang Huahai Pharmaceutical, Cl A | | | 3,100 | | | | 11,374 | |
| | |
| Schedule of Investments |
| April 30, 2020 (Unaudited) |
| Global X MSCI China Health Care ETF | |
| | | | | | | |
| COMMON STOCK — continued | | | | | | | | |
| Health Care — continued | | | | | | | | |
Zhejiang NHU, Cl A | | | 5,900 | | | $ | 22,808 | |
| Zhejiang Wolwo Bio-Pharmaceutical, Cl A | | | 1,200 | | | | 8,858 | |
TOTAL CHINA | | | | | | | 4,297,622 | |
| HONG KONG— 11.8% | | | | | | | | |
| Health Care — 11.8% | | | | | | | | |
Hutchison China MediTech ADR * | | | 3,581 | | | | 77,027 | |
Sino Biopharmaceutical | | | 296,400 | | | | 433,569 | |
SSY Group | | | 94,900 | | | | 67,328 | |
TOTAL HONG KONG | | | | | | | 577,924 | |
| TOTAL COMMON STOCK | | | | | | | | |
(Cost $4,403,228) | | | | | | | 4,875,546 | |
| TOTAL INVESTMENTS — 99.9% | | | | | | | | |
(Cost $4,403,228) | | | | | | $ | 4,875,546 | |
Percentages are based on Net Assets of $4,880,814.
| * | Non-income producing security. |
| ADR — American Depositary Receipt |
| Cl — Class |
The following is a summary of the level of inputs used as of April 30, 2020, in valuing the Fund’s investments carried at value:
| Investments in Securities | | | | | | | | | | | | |
| Common Stock | | $ | 905,794 | | | $ | 3,969,752 | | | $ | — | | | $ | 4,875,546 | |
| Total Investments in Securities | | $ | 905,794 | | | $ | 3,969,752 | | | $ | — | | | $ | 4,875,546 | |
For the period ended April 30, 2020, there were no transfers in or out of Level 3.
Amounts designated as “—“ are $0 or have been rounded to $0.
| | |
| Schedule of Investments |
| April 30, 2020 (Unaudited) |
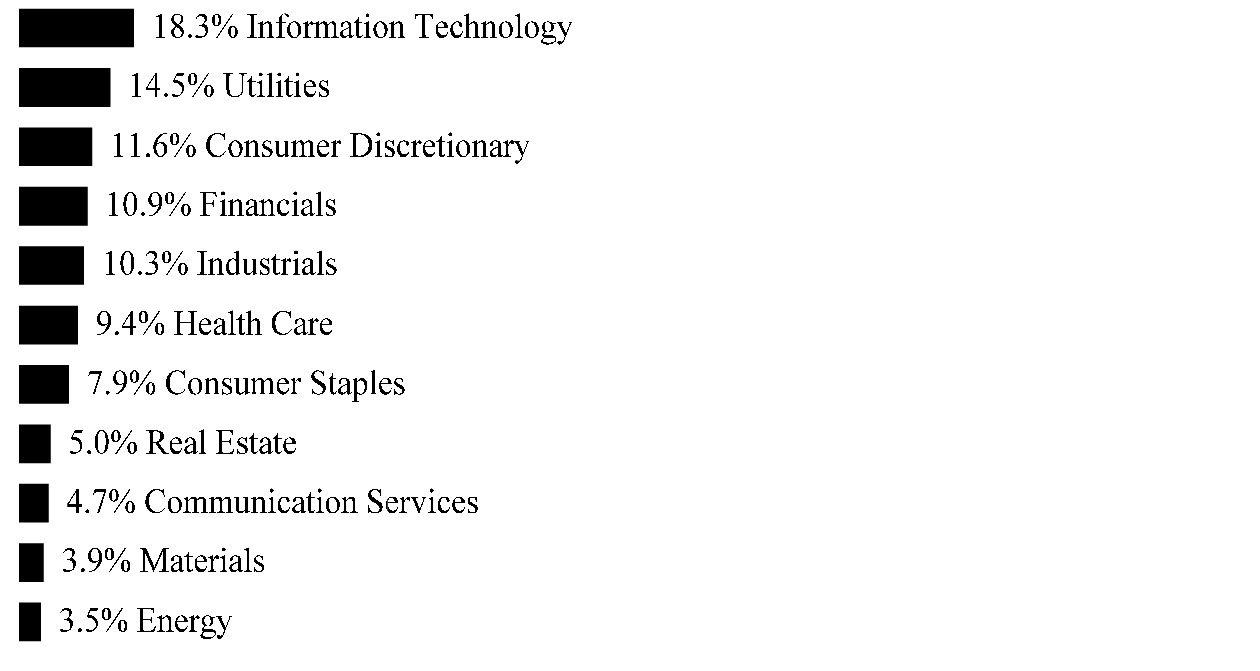
| Global X MSCI China Information Technology ETF | |
Sector Weightings †:
† Sector weightings percentages are based on the total market value of investments.
| | | | | | | |
| COMMON STOCK — 99.7% | | | | | | |
| CHINA— 98.0% | | | | | | |
| Information Technology — 98.0% | | | | | | |
360 Security Technology, Cl A | | | 12,959 | | | $ | 34,255 | |
AAC Technologies Holdings | | | 85,000 | | | | 416,099 | |
Accelink Technologies, Cl A | | | 3,000 | | | | 12,622 | |
Aisino, Cl A | | | 19,000 | | | | 46,212 | |
| AVIC Jonhon Optronic Technology, Cl A | | | 4,600 | | | | 23,347 | |
| Beijing Shiji Information Technology, Cl A | | | 9,000 | | | | 39,089 | |
| Beijing Sinnet Technology, Cl A | | | 6,600 | | | | 25,477 | |
BOE Technology Group, Cl A | | | 233,000 | | | | 124,102 | |
BYD Electronic International | | | 101,300 | | | | 234,422 | |
| Chaozhou Three-Circle Group, Cl A | | | 15,100 | | | | 44,534 | |
| China Greatwall Technology Group, Cl A | | | 13,600 | | | | 22,791 | |
| China National Software & Service, Cl A | | | 2,000 | | | | 23,430 | |
| China Railway Signal & Communication, Cl H | | | 250,200 | | | | 123,610 | |
| China TransInfo Technology, Cl A | | | 6,000 | | | | 19,795 | |
| Dawning Information Industry, Cl A | | | 4,000 | | | | 27,379 | |
DHC Software, Cl A | | | 33,100 | | | | 63,815 | |
| Fiberhome Telecommunication Technologies, Cl A | | | 4,100 | | | | 18,469 | |
| Foxconn Industrial Internet, Cl A | | | 31,000 | | | | 64,509 | |
GCL System Integration Technology, Cl A * | | | 20,100 | | | | 7,175 | |
GDS Holdings ADR * | | | 7,564 | | | | 433,568 | |
| Gigadevice Semiconductor Beijing, Cl A | | | 1,660 | | | | 65,329 | |
Glodon, Cl A | | | 5,000 | | | | 37,213 | |
GoerTek, Cl A | | | 33,900 | | | | 92,921 | |
| | | | | | | |
| COMMON STOCK — continued | | | | | | | | |
| Information Technology — continued | | | | | | | | |
| GRG Banking Equipment, Cl A | | | 10,100 | | | $ | 18,714 | |
| Guangzhou Haige Communications Group, Cl A | | | 23,900 | | | | 40,999 | |
| Hangzhou Hikvision Digital Technology, Cl A | | | 60,300 | | | | 273,851 | |
| Hangzhou Silan Microelectronics, Cl A | | | 5,200 | | | | 10,445 | |
Hengtong Optic-electric, Cl A | | | 19,900 | | | | 46,851 | |
Holitech Technology, Cl A | | | 17,100 | | | | 13,202 | |
Hua Hong Semiconductor | | | 74,600 | | | | 144,921 | |
| Hubei Kaile Science & Technology, Cl A | | | 7,000 | | | | 15,003 | |
Hundsun Technologies, Cl A | | | 8,370 | | | | 121,661 | |
Hytera Communications, Cl A | | | 10,100 | | | | 9,386 | |
Iflytek | | | 18,600 | | | | 87,686 | |
Inspur Electronic Information Industry, Cl A * | | | 7,152 | | | | 42,045 | |
Kingboard Holdings | | | 90,000 | | | | 221,971 | |
| Kingdee International Software Group | | | 291,400 | | | | 423,999 | |
Kingsoft | | | 104,700 | | | | 363,975 | |
Legend Holdings, Cl H | | | 36,350 | | | | 42,481 | |
Lenovo Group | | | 852,400 | | | | 464,005 | |
Lens Technology, Cl A | | | 31,100 | | | | 80,489 | |
Leyard Optoelectronic, Cl A * | | | 12,200 | | | | 9,661 | |
Lingyi iTech Guangdong, Cl A * | | | 30,100 | | | | 39,569 | |
| LONGi Green Energy Technology, Cl A | | | 29,650 | | | | 129,405 | |
| Luxshare Precision Industry, Cl A | | | 36,650 | | | | 245,619 | |
| NAURA Technology Group, Cl A | | | 2,380 | | | | 51,303 | |
| Newland Digital Technology, Cl A | | | 5,200 | | | | 12,191 | |
Ninestar, Cl A | | | 10,600 | | | | 45,107 | |
O-film Tech, Cl A | | | 28,000 | | | | 60,289 | |
Sanan Optoelectronics, Cl A | | | 37,600 | | | | 116,965 | |
Sangfor Technologies, Cl A | | | 1,510 | | | | 40,966 | |
| | | | | | | |
| COMMON STOCK — continued | | | | | | | | |
| Information Technology — continued | | | | | | | | |
Semiconductor Manufacturing International * | | | 352,600 | | | $ | 674,058 | |
| Shanghai 2345 Network Holding Group, Cl A | | | 62,010 | | | | 26,177 | |
| Shanghai Baosight Software, Cl A | | | 3,600 | | | | 25,855 | |
Shengyi Technology, Cl A | | | 11,100 | | | | 51,040 | |
Shennan Circuits, Cl A | | | 1,630 | | | | 53,892 | |
| Shenzhen Goodix Technology, Cl A | | | 2,150 | | | | 71,952 | |
| Shenzhen Kingdom Sci-Tech, Cl A | | | 4,100 | | | | 9,920 | |
| Shenzhen Sunway Communication, Cl A | | | 4,100 | | | | 23,987 | |
| Sunny Optical Technology Group | | | 61,860 | | | | 878,545 | |
| Suzhou Dongshan Precision Manufacturing, Cl A | | | 14,200 | | | | 53,386 | |
| Tianjin Zhonghuan Semiconductor, Cl A | | | 12,800 | | | | 31,133 | |
Tianma Microelectronics, Cl A | | | 21,100 | | | | 42,383 | |
Travelsky Technology, Cl H | | | 125,000 | | | | 220,901 | |
| Tunghsu Optoelectronic Technology, Cl A | | | 61,200 | | | | 24,101 | |
| Unigroup Guoxin Microelectronics, Cl A | | | 2,400 | | | | 20,936 | |
Unisplendour, Cl A | | | 9,867 | | | | 58,229 | |
| Universal Scientific Industrial Shanghai, Cl A | | | 5,000 | | | | 12,664 | |
Venustech Group, Cl A | | | 3,700 | | | | 21,594 | |
Visionox Technology, Cl A * | | | 5,200 | | | | 8,957 | |
Wangsu Science & Technology, Cl A * | | | 24,300 | | | | 28,226 | |
| Westone Information Industry, Cl A | | | 3,100 | | | | 9,920 | |
Will Semiconductor, Cl A | | | 3,130 | | | | 86,229 | |
Wingtech Technology, Cl A * | | | 5,240 | | | | 79,208 | |
Wuhan Guide Infrared, Cl A | | | 4,100 | | | | 23,749 | |
| WUS Printed Circuit Kunshan, Cl A | | | 7,200 | | | | 27,395 | |
| Wuxi Lead Intelligent Equipment, Cl A | | | 8,000 | | | | 43,063 | |
Xiaomi, Cl B * | | | 615,500 | | | | 809,832 | |
Xinyi Solar Holdings | | | 441,100 | | | | 277,667 | |
| | | | | | | |
| COMMON STOCK — continued | | | | | | | | |
| Information Technology — continued | | | | | | | | |
| Yealink Network Technology, Cl A | | | 2,200 | | | $ | 28,213 | |
| Yonyou Network Technology, Cl A | | | 18,120 | | | | 119,100 | |
Zhejiang Dahua Technology, Cl A * | | | 31,100 | | | | 74,321 | |
Zhongji Innolight, Cl A | | | 2,500 | | | | 22,970 | |
ZTE, Cl A * | | | 27,100 | | | | 157,740 | |
ZTE, Cl H | | | 94,800 | | | | 271,473 | |
TOTAL CHINA | | | | | | | 9,541,738 | |
| HONG KONG — 1.7% | | | | | | | | |
| Information Technology — 1.7% | | | | | | | | |
| Kingboard Laminates Holdings | | | 166,300 | | | | 162,817 | |
| TOTAL COMMON STOCK | | | | | | | | |
(Cost $10,433,626) | | | | | | | 9,704,555 | |
| TOTAL INVESTMENTS — 99.7% | | | | | | | | |
(Cost $10,433,626) | | | | | | $ | 9,704,555 | |
Percentages are based on Net Assets of $9,730,287.
| * | Non-income producing security. |
| ADR — American Depositary Receipt |
| Cl — Class |
The following is a summary of the level of inputs used as of April 30, 2020, in valuing the Fund’s investments carried at value:
| Investments in Securities | | | | | | | | | | | | |
| Common Stock | | $ | 2,797,898 | | | $ | 6,906,657 | | | $ | — | | | $ | 9,704,555 | |
| Total Investments in Securities | | $ | 2,797,898 | | | $ | 6,906,657 | | | $ | — | | | $ | 9,704,555 | |
For the period ended April 30, 2020, there were no transfers in or out of Level 3.
Amounts designated as “—“ are $0 or have been rounded to $0.
| | |
| Schedule of Investments |
| April 30, 2020 (Unaudited) |
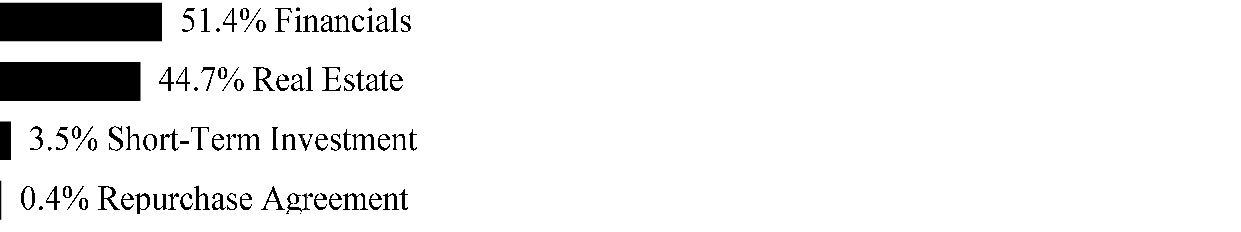
| Global X MSCI China Real Estate ETF | |
Sector Weightings †:
† Sector weightings percentages are based on the total market value of investments.
| | | | | | | |
| COMMON STOCK — 99.9% | | | | | | |
| CHINA— 98.0% | | | | | | |
| Real Estate — 98.0% | | | | | | |
Agile Group Holdings | | | 141,600 | | | $ | 159,640 | |
| Beijing Capital Development, Cl A | | | 9,100 | | | | 8,559 | |
China Aoyuan Group | | | 130,100 | | | | 152,381 | |
China Enterprise | | | 15,200 | | | | 9,108 | |
China Evergrande Group | | | 149,800 | | | | 265,887 | |
| China Fortune Land Development, Cl A | | | 16,000 | | | | 54,260 | |
China Jinmao Holdings Group | | | 488,400 | | | | 340,831 | |
| China Merchants Shekou Industrial Zone Holdings, Cl A | | | 36,500 | | | | 88,518 | |
| China Overseas Land & Investment | | | 228,900 | | | | 840,030 | |
China Resources Land | | | 181,300 | | | | 743,689 | |
China Vanke, Cl A | | | 10,700 | | | | 40,621 | |
China Vanke, Cl H | | | 94,500 | | | | 314,498 | |
CIFI Holdings Group | | | 284,700 | | | | 216,306 | |
Country Garden Holdings | | | 597,100 | | | | 769,448 | |
| Financial Street Holdings, Cl A | | | 31,900 | | | | 31,361 | |
Gemdale, Cl A | | | 32,900 | | | | 62,590 | |
| Grandjoy Holdings Group, Cl A | | | 10,800 | | | | 8,246 | |
| Greenland Holdings Group, Cl A | | | 56,900 | | | | 45,621 | |
Guangzhou R&F Properties | | | 136,400 | | | | 172,076 | |
| Jiangsu Zhongnan Construction Group, Cl A | | | 15,200 | | | | 17,419 | |
Jinke Properties Group, Cl A | | | 52,000 | | | | 58,634 | |
Kaisa Group Holdings | | | 297,700 | | | | 113,668 | |
KWG Group Holdings | | | 139,500 | | | | 205,498 | |
Logan Property Holdings | | | 138,600 | | | | 218,118 | |
| | | | | | | |
| COMMON STOCK — continued | | | | | | | | |
| Real Estate — continued | | | | | | | | |
Longfor Group Holdings | | | 153,700 | | | $ | 778,180 | |
Oceanwide Holdings, Cl A | | | 36,900 | | | | 18,295 | |
| Poly Developments and Holdings Group, Cl A | | | 55,253 | | | | 127,109 | |
| RiseSun Real Estate Development, Cl A | | | 36,900 | | | | 42,340 | |
Seazen Group | | | 222,600 | | | | 215,641 | |
Seazen Holdings, Cl A | | | 12,800 | | | | 57,587 | |
| Shanghai Lujiazui Finance & Trade Zone Development, Cl B | | | 129,234 | | | | 107,652 | |
| Shanghai Zhangjiang High-Tech Park Development, Cl A | | | 11,000 | | | | 20,755 | |
Shenzhen Investment | | | 356,500 | | | | 116,345 | |
Shimao Property Holdings | | | 105,400 | | | | 425,551 | |
Shui On Land | | | 513,400 | | | | 90,728 | |
| Sichuan Languang Development, Cl A | | | 9,600 | | | | 7,915 | |
Sino-Ocean Group Holding | | | 363,500 | | | | 95,654 | |
SOHO China | | | 291,500 | | | | 139,126 | |
Sunac China Holdings | | | 148,500 | | | | 658,949 | |
Tahoe Group, Cl A (A)(B)(C) | | | 12,100 | | | | 7,603 | |
Xinhu Zhongbao, Cl A | | | 90,900 | | | | 40,432 | |
Yango Group, Cl A | | | 16,400 | | | | 16,239 | |
Yuexiu Property | | | 767,300 | | | | 145,495 | |
Yuzhou Properties | | | 240,600 | | | | 102,418 | |
Zhenro Properties Group | | | 116,000 | | | | 74,367 | |
TOTAL CHINA | | | | | | | 8,225,388 | |
| | | | | | | |
| COMMON STOCK — continued | | | | | | | | |
| HONG KONG— 1.9% | | | | | | | | |
| Real Estate — 1.9% | | | | | | | | |
Wharf Holdings | | | 82,800 | | | $ | 156,578 | |
| TOTAL COMMON STOCK | | | | | | | | |
(Cost $8,773,531) | | | | | | | 8,381,966 | |
| TOTAL INVESTMENTS — 99.9% | | | | | | | | |
(Cost $8,773,531) | | | | | | $ | 8,381,966 | |
Percentages are based on Net Assets of $8,389,727.
| (A) | Level 3 security in accordance with fair value hierarchy. |
| (B) | Security considered illiquid. The total value of such securities as of April 30, 2020 was $7,603 and represented 0.1% of Net Assets. |
| (C) | Security is fair valued using methods determined in good faith by the Fair Value Committee of the Fund. The total value of such securities as of April 30, 2020 was $7,603 and represents 0.1% of Net Assets. |
The following is a summary of the level of inputs used as of April 30, 2020, in valuing the Fund’s investments carried at value:
| Investments in Securities | | | | | | | | | | | | |
| Common Stock | | $ | 429,325 | | | $ | 7,945,038 | | | $ | 7,603 | | | $ | 8,381,966 | |
| Total Investments in Securities | | $ | 429,325 | | | $ | 7,945,038 | | | $ | 7,603 | | | $ | 8,381,966 | |
(1) | A reconciliation of Level 3 investments and disclosures of significant unobservable inputs are presented when the Fund has a significant amount of Level 3 investments at the beginning and/or end of the period in relation to Net Assets. Management has concluded that Level 3 investments are not material in relation to Net Assets. |
For the period ended April 30, 2020, the transfers in and out of Level 3 were due to changes in the availability of observable inputs to determine fair value. Transfers between levels are recognized at period end.
Amounts designated as “—“ are $0 or have been rounded to $0.
| | |
| Schedule of Investments |
| April 30, 2020 (Unaudited) |
| Global X MSCI China Utilities ETF | |
Sector Weightings †:
† Sector weightings percentages are based on the total market value of investments.
| | | | | | | |
| COMMON STOCK — 100.2% | | | | | | |
| CHINA— 100.2% | | | | | | |
| Utilities — 100.2% | | | | | | |
Beijing Enterprises Holdings | | | 14,200 | | | $ | 50,463 | |
| Beijing Enterprises Water Group | | | 129,900 | | | | 50,269 | |
CGN Power, Cl H | | | 247,600 | | | | 61,961 | |
| Chengdu Xingrong Environment, Cl A | | | 19,300 | | | | 13,205 | |
China Gas Holdings | | | 47,600 | | | | 175,913 | |
| China Longyuan Power Group, Cl H | | | 107,200 | | | | 53,515 | |
| China National Nuclear Power, Cl A | | | 40,800 | | | | 25,026 | |
| China Power International Development | | | 209,900 | | | | 42,509 | |
China Resources Gas Group | | | 24,450 | | | | 138,140 | |
| China Resources Power Holdings | | | 47,600 | | | | 56,427 | |
China Yangtze Power, Cl A | | | 41,200 | | | | 101,841 | |
| Datang International Power Generation, Cl H | | | 180,000 | | | | 26,237 | |
ENN Energy Holdings | | | 10,930 | | | | 123,507 | |
GD Power Development, Cl A | | | 76,000 | | | | 21,424 | |
Guangdong Investment | | | 62,600 | | | | 130,168 | |
| Huadian Power International, Cl A | | | 39,000 | | | | 20,275 | |
| Huadian Power International, Cl H | | | 96,800 | | | | 33,589 | |
| Huaneng Power International, Cl A | | | 16,900 | | | | 10,103 | |
| Huaneng Power International, Cl H | | | 115,500 | | | | 43,504 | |
Hubei Energy Group, Cl A | | | 28,100 | | | | 14,808 | |
| Inner Mongolia MengDian HuaNeng Thermal Power, Cl A | | | 37,600 | | | | 13,475 | |
Kunlun Energy | | | 77,400 | | | | 50,420 | |
SDIC Power Holdings, Cl A | | | 22,600 | | | | 24,619 | |
| | | | | | | |
| COMMON STOCK — continued | | | | | | | | |
| Utilities — continued | | | | | | | | |
Shanghai Electric Power, Cl A | | | 17,000 | | | $ | 17,724 | |
Shenergy, Cl A | | | 25,400 | | | | 19,070 | |
Shenzhen Energy Group, Cl A | | | 21,400 | | | | 16,643 | |
| Sichuan Chuantou Energy, Cl A | | | 17,700 | | | | 22,491 | |
Towngas China | | | 53,800 | | | | 26,718 | |
| TOTAL COMMON STOCK | | | | | | | | |
(Cost $1,505,850) | | | | | | | 1,384,044 | |
| TOTAL INVESTMENTS — 100.2% | | | | | | | | |
(Cost $1,505,850) | | | | | | $ | 1,384,044 | |
Percentages are based on Net Assets of $1,381,222.
Cl — Class
The following is a summary of the level of inputs used as of April 30, 2020, in valuing the Fund’s investments carried at value:
| Investments in Securities | | | | | | | | | | | | |
| Common Stock | | $ | 44,656 | | | $ | 1,339,388 | | | $ | — | | | $ | 1,384,044 | |
| Total Investments in Securities | | $ | 44,656 | | | $ | 1,339,388 | | | $ | — | | | $ | 1,384,044 | |
For the period ended April 30, 2020, there were no transfers in or out of Level 3.
Amounts designated as “—“ are $0 or have been rounded to $0.
| | |
| Schedule of Investments |
| April 30, 2020 (Unaudited) |
| Global X MSCI China Large-Cap 50 ETF | |
Sector Weightings †:
† Sector weightings percentages are based on the total market value of investments.
| | | | | | | |
| COMMON STOCK — 99.9% | | | | | | |
| CHINA— 99.0% | | | | | | |
| Communication Services — 19.4% | | | | | | |
Baidu ADR * | | | 645 | | | $ | 65,100 | |
China Mobile | | | 13,960 | | | | 112,456 | |
China Tower, Cl H * | | | 106,700 | | | | 23,949 | |
NetEase ADR | | | 198 | | | | 68,302 | |
Tencent Holdings | | | 5,030 | | | | 270,564 | |
| | | | | | | | 540,371 | |
| Consumer Discretionary — 22.4% | | | | | | | | |
Alibaba Group Holding ADR * | | | 1,200 | | | | 243,203 | |
ANTA Sports Products | | | 2,800 | | | | 23,639 | |
Geely Automobile Holdings | | | 13,000 | | | | 20,324 | |
JD.com ADR * | | | 1,761 | | | | 75,899 | |
Meituan Dianping, Cl B * | | | 2,400 | | | | 32,135 | |
New Oriental Education & Technology Group ADR * | | | 422 | | | | 53,873 | |
| Shenzhou International Group Holdings | | | 2,700 | | | | 31,468 | |
| | | | | | | |
| COMMON STOCK — continued | | | | | | | | |
| Consumer Discretionary — continued | | | | | | | | |
TAL Education Group ADR * | | | 1,027 | | | $ | 55,653 | |
Trip.com Group ADR * | | | 1,281 | | | | 32,999 | |
Yum China Holdings | | | 1,116 | | | | 54,081 | |
| | | | | | | | 623,274 | |
| Consumer Staples — 9.1% | | | | | | | | |
China Mengniu Dairy | | | 10,300 | | | | 36,737 | |
| Foshan Haitian Flavouring & Food, Cl A | | | 1,700 | | | | 29,603 | |
Kweichow Moutai, Cl A | | | 779 | | | | 139,670 | |
Wuliangye Yibin, Cl A | | | 2,505 | | | | 48,178 | |
| | | | | | | | 254,188 | |
| Energy — 3.1% | | | | | | | | |
| China Petroleum & Chemical, Cl H | | | 68,700 | | | | 34,738 | |
CNOOC | | | 44,700 | | | | 50,683 | |
| | | | | | | | 85,421 | |
| Financials — 26.8% | | | | | | | | |
| Agricultural Bank of China, Cl H | | | 82,500 | | | | 34,693 | |
Bank of China, Cl H | | | 195,400 | | | | 74,860 | |
China Construction Bank, Cl H | | | 203,800 | | | | 166,146 | |
China Life Insurance, Cl H | | | 21,350 | | | | 45,551 | |
China Merchants Bank, Cl H | | | 11,150 | | | | 53,432 | |
| China Pacific Insurance Group, Cl H | | | 8,550 | | | | 28,344 | |
CITIC Securities, Cl A | | | 7,500 | | | | 25,179 | |
| Industrial & Commercial Bank of China, Cl H | | | 148,700 | | | | 101,085 | |
Industrial Bank, Cl A | | | 14,100 | | | | 33,196 | |
Ping An Bank, Cl A | | | 13,900 | | | | 27,428 | |
| Ping An Insurance Group of China, Cl H | | | 12,140 | | | | 124,809 | |
| Shanghai Pudong Development Bank, Cl A | | | 20,600 | | | | 31,020 | |
| | | | | | | | 745,743 | |
| | | | | | | |
| COMMON STOCK — continued | | | | | | | | |
| Health Care — 4.4% | | | | | | | | |
CSPC Pharmaceutical Group | | | 11,500 | | | $ | 22,845 | |
Jiangsu Hengrui Medicine, Cl A * | | | 3,080 | | | | 40,575 | |
| Shenzhen Mindray Bio-Medical Electronics, Cl A | | | 800 | | | | 29,045 | |
Wuxi Biologics Cayman * | | | 1,900 | | | | 29,656 | |
| | | | | | | | 122,121 | |
| Industrials — 2.0% | | | | | | | | |
| China State Construction Engineering, Cl A | | | 32,400 | | | | 24,050 | |
| Contemporary Amperex Technology, Cl A | | | 1,500 | | | | 30,678 | |
| | | | | | | | 54,728 | |
| Information Technology — 4.3% | | | | | | | | |
| Hangzhou Hikvision Digital Technology, Cl A | | | 6,600 | | | | 29,974 | |
| Luxshare Precision Industry, Cl A | | | 4,000 | | | | 26,807 | |
| Sunny Optical Technology Group | | | 2,240 | | | | 31,813 | |
Xiaomi, Cl B * | | | 23,200 | | | | 30,525 | |
| | | | | | | | 119,119 | |
| Real Estate — 6.2% | | | | | | | | |
| China Overseas Land & Investment | | | 12,000 | | | | 44,038 | |
China Resources Land | | | 9,400 | | | | 38,559 | |
China Vanke, Cl A | | | 7,000 | | | | 26,575 | |
Country Garden Holdings | | | 19,200 | | | | 24,742 | |
Sunac China Holdings | | | 8,650 | | | | 38,383 | |
| | | | | | | | 172,297 | |
| Utilities — 1.3% | | | | | | | | |
China Yangtze Power, Cl A | | | 14,800 | | | | 36,584 | |
TOTAL CHINA | | | | | | | 2,753,846 | |
| | | | | | | |
| COMMON STOCK — continued | | | | | | | | |
| HONG KONG — 0.9% | | | | | | | | |
| Health Care — 0.9% | | | | | | | | |
Sino Biopharmaceutical | | | 18,000 | | | $ | 26,330 | |
| TOTAL COMMON STOCK | | | | | | | | |
(Cost $2,587,606) | | | | | | | 2,780,176 | |
| TOTAL INVESTMENTS — 99.9% | | | | | | | | |
(Cost $2,587,606) | | | | | | $ | 2,780,176 | |
Percentages are based on Net Assets of $2,782,939.
| * | Non-income producing security. |
| ADR — American Depositary Receipt |
| Cl — Class |
The following is a summary of the level of inputs used as of April 30, 2020, in valuing the Fund’s investments carried at value:
| Investments in Securities | | | | | | | | | | | | |
| Common Stock | | $ | 867,795 | | | $ | 1,912,381 | | | $ | — | | | $ | 2,780,176 | |
| Total Investments in Securities | | $ | 867,795 | | | $ | 1,912,381 | | | $ | — | | | $ | 2,780,176 | |
For the period ended April 30, 2020, there were no transfers in or out of Level 3.
Amounts designated as “—“ are $0 or have been rounded to $0.
| | |
| Schedule of Investments |
| April 30, 2020 (Unaudited) |
| Global X FTSE Southeast Asia ETF | |
Sector Weightings †:
† Sector weightings percentages are based on the total market value of investments. Repurchase agreements purchased from cash collateral received for securities lending activity are included in total investments. Please see Note 2 and 7 in Notes to Financial Statements for more detailed information.
| | | | | | | |
| COMMON STOCK — 99.8% | | | | | | |
| INDONESIA— 18.4% | | | | | | |
| Communication Services — 3.6% | | | | | | |
| Telekomunikasi Indonesia Persero | | | 3,050,100 | | | $ | 717,671 | |
| Consumer Discretionary — 1.7% | | | | | | | | |
Astra International | | | 1,318,081 | | | | 341,150 | |
| Consumer Staples — 1.8% | | | | | | | | |
Gudang Garam | | | 30,400 | | | | 92,579 | |
Hanjaya Mandala Sampoerna | | | 583,500 | | | | 62,567 | |
Unilever Indonesia | | | 371,880 | | | | 206,878 | |
| | | | | | | | 362,024 | |
| Financials — 11.3% | | | | | | | | |
Bank Central Asia | | | 634,296 | | | | 1,102,289 | |
Bank Mandiri | | | 1,216,780 | | | | 364,830 | |
| | | | | | | |
| COMMON STOCK — continued | | | | | | | | |
| Financials — continued | | | | | | | | |
| Bank Negara Indonesia Persero | | | 488,100 | | | $ | 134,535 | |
Bank Rakyat Indonesia Persero | | | 3,477,600 | | | | 638,242 | |
| | | | | | | | 2,239,896 | |
TOTAL INDONESIA | | | | | | | 3,660,741 | |
| MALAYSIA— 19.3% | | | | | | | | |
| Communication Services — 2.6% | | | | | | | | |
Axiata Group | | | 289,888 | | | | 265,618 | |
DiGi.com | | | 241,800 | | | | 260,919 | |
| | | | | | | | 526,537 | |
| Consumer Staples — 1.3% | | | | | | | | |
Sime Darby Plantation | | | 232,396 | | | | 267,526 | |
| Financials — 9.3% | | | | | | | | |
CIMB Group Holdings | | | 459,375 | | | | 368,568 | |
Malayan Banking | | | 394,531 | | | | 694,558 | |
Public Bank | | | 203,699 | | | | 775,951 | |
| | | | | | | | 1,839,077 | |
| Health Care — 1.2% | | | | | | | | |
IHH Healthcare | | | 193,380 | | | | 236,104 | |
| Materials — 1.2% | | | | | | | | |
Petronas Chemicals Group | | | 187,024 | | | | 243,566 | |
| Utilities — 3.7% | | | | | | | | |
Tenaga Nasional | | | 256,645 | | | | 730,543 | |
TOTAL MALAYSIA | | | | | | | 3,843,353 | |
| PHILIPPINES— 6.0% | | | | | | | | |
| Financials — 1.3% | | | | | | | | |
BDO Unibank | | | 127,550 | | | | 255,555 | |
| Industrials — 1.2% | | | | | | | | |
Ayala | | | 21,350 | | | | 246,493 | |
| Real Estate — 3.5% | | | | | | | | |
Ayala Land | | | 514,200 | | | | 325,902 | |
| | | | | | | |
| COMMON STOCK — continued | | | | | | | | |
| Real Estate — continued | | | | | | | | |
SM Prime Holdings | | | 593,700 | | | $ | 365,100 | |
| | | | | | | | 691,002 | |
TOTAL PHILIPPINES | | | | | | | 1,193,050 | |
| SINGAPORE— 30.6% | | | | | | | | |
| Communication Services — 4.9% | | | | | | | | |
| Singapore Telecommunications | | | 489,304 | | | | 983,683 | |
| Consumer Discretionary — 0.5% | | | | | | | | |
Jardine Cycle & Carriage | | | 6,618 | | | | 94,543 | |
| Consumer Staples — 1.6% | | | | | | | | |
Wilmar International | | | 126,651 | | | | 321,193 | |
| Financials — 21.9% | | | | | | | | |
DBS Group Holdings | | | 118,383 | | | | 1,678,571 | |
Oversea-Chinese Banking | | | 226,566 | | | | 1,454,967 | |
United Overseas Bank | | | 84,497 | | | | 1,220,906 | |
| | | | | | | | 4,354,444 | |
| Real Estate — 1.7% | | | | | | | | |
CapitaLand * | | | 162,818 | | | | 348,144 | |
TOTAL SINGAPORE | | | | | | | 6,102,007 | |
| THAILAND— 25.5% | | | | | | | | |
| Communication Services — 2.3% | | | | | | | | |
Advanced Info Service NVDR | | | 73,461 | | | | 449,553 | |
| Consumer Staples — 3.8% | | | | | | | | |
CP ALL NVDR | | | 343,073 | | | | 752,841 | |
| Energy — 6.4% | | | | | | | | |
PTT NVDR | | | 940,440 | | | | 1,031,853 | |
| PTT Exploration & Production NVDR | | | 91,310 | | | | 238,470 | |
| | | | | | | | 1,270,323 | |
| Financials — 3.9% | | | | | | | | |
Bangkok Bank | | | 14,300 | | | | 45,965 | |
Bangkok Bank NVDR | | | 17,611 | | | | 56,608 | |
| | | | | | | |
| COMMON STOCK — continued | | | | | | | | |
| Financials — continued | | | | | | | | |
Kasikornbank NVDR | | | 132,408 | | | $ | 352,965 | |
Siam Commercial Bank NVDR (A) | | | 156,931 | | | | 332,244 | |
| | | | | | | | 787,782 | |
| Health Care — 1.9% | | | | | | | | |
| Bangkok Dusit Medical Services NVDR | | | 586,000 | | | | 376,721 | |
| Industrials — 2.7% | | | | | | | | |
Airports of Thailand NVDR | | | 282,200 | | | | 542,944 | |
| Materials — 3.0% | | | | | | | | |
Siam Cement NVDR | | | 55,326 | | | | 591,649 | |
| Utilities — 1.5% | | | | | | | | |
| Gulf Energy Development NVDR | | | 254,100 | | | | 304,323 | |
TOTAL THAILAND | | | | | | | 5,076,136 | |
| TOTAL COMMON STOCK | | | | | | | | |
(Cost $25,805,086) | | | | | | | 19,875,287 | |
| | | | | | | | | |
SHORT-TERM INVESTMENT(B)(C) — 1.1% | | | | | | | | |
| Fidelity Investments Money Market Government Portfolio, Cl Institutional, 0.160% | | | | | | | | |
(Cost $210,626) | | | 210,626 | | | | 210,626 | |
| | | | | | | | | |
REPURCHASE AGREEMENT(B) — 0.1% | | | | | | | | |
| BNP Paribas | | | | | | | | |
| 0.030%, dated 04/30/20, to be repurchased on 05/01/20, repurchase price $22,752 (collateralized by U.S. Treasury Obligations, ranging in par value $5,489 - $17,705, 1.500%, 08/15/2026, with a total market value of $23,194) | | | | | | | | |
(Cost $22,752) | | $ | 22,752 | | | | 22,752 | |
| TOTAL INVESTMENTS — 101.0% | | | | | | | | |
(Cost $26,038,464) | | | | | | $ | 20,108,665 | |
Percentages are based on Net Assets of $19,905,793.
| * | Non-income producing security. |
| (A) | This security or a partial position of this security is on loan at April 30, 2020. The total value of securities on loan at April 30, 2020 was $222,564. |
| (B) | Security was purchased with cash collateral held from securities on loan. The total value of such securities as of April 30, 2020 was $233,378. |
| (C) | The rate reported on the Schedule of Investments is the 7-day effective yield as of April 30, 2020. |
| Cl — Class |
| NVDR — Non-Voting Depositary Receipt |
The following is a summary of the level of inputs used as of April 30, 2020, in valuing the Fund’s investments carried at value:
| Investments in Securities | | | | | | | | | | | | |
| Common Stock | | $ | 19,875,287 | | | $ | — | | | $ | — | | | $ | 19,875,287 | |
| Short-Term Investment | | | 210,626 | | | | — | | | | — | | | | 210,626 | |
| Repurchase Agreement | | | — | | | | 22,752 | | | | — | | | | 22,752 | |
| Total Investments in Securities | | $ | 20,085,913 | | | $ | 22,752 | | | $ | — | | | $ | 20,108,665 | |
For the period ended April 30, 2020, there were no transfers in or out of Level 3.
Amounts designated as “—“ are $0 or have been rounded to $0.
| | |
| Schedule of Investments |
| April 30, 2020 (Unaudited) |
| Global X MSCI Colombia ETF | |
Sector Weightings †:
† Sector weightings percentages are based on the total market value of investments. Repurchase agreements purchased from cash collateral received for securities lending activity are included in total investments. Please see Note 2 and 7 in Notes to Financial Statements for more detailed information.
| | | | | | | |
| COMMON STOCK — 89.5% | | | | | | |
| CHILE— 6.4% | | | | | | |
| Energy — 2.9% | | | | | | |
Empresas COPEC | | | 180,613 | | | $ | 1,127,359 | |
| Utilities — 3.5% | | | | | | | | |
Enel Americas | | | 8,502,283 | | | | 1,393,367 | |
TOTAL CHILE | | | | | | | 2,520,726 | |
| COLOMBIA— 81.6% | | | | | | | | |
| Consumer Staples — 5.9% | | | | | | | | |
Grupo Nutresa | | | 412,463 | | | | 2,321,364 | |
| Energy — 16.1% | | | | | | | | |
Canacol Energy | | | 531,640 | | | | 1,351,157 | |
Ecopetrol ADR (A) | | | 476,498 | | | | 4,979,404 | |
| | | | | | | | 6,330,561 | |
| Financials — 35.7% | | | | | | | | |
Banco de Bogota | | | 83,532 | | | | 1,363,909 | |
BanColombia | | | 339,475 | | | | 2,192,927 | |
| | | | | | | |
| COMMON STOCK — continued | | | | | | | | |
| Financials — continued | | | | | | | | |
BanColombia ADR (A) | | | 198,604 | | | $ | 5,183,564 | |
Financiera Colombiana * | | | 269,519 | | | | 1,774,033 | |
| Grupo Aval Acciones y Valores ADR | | | 272,358 | | | | 1,143,904 | |
| Grupo de Inversiones Suramericana | | | 431,851 | | | | 2,370,986 | |
| | | | | | | | 14,029,323 | |
| Materials — 6.6% | | | | | | | | |
Cementos Argos | | | 1,143,824 | | | | 1,136,631 | |
Cemex Latam Holdings * | | | 1,025,996 | | | | 471,162 | |
Grupo Argos | | | 427,144 | | | | 1,004,750 | |
| | | | | | | | 2,612,543 | |
| Utilities — 17.3% | | | | | | | | |
Celsia ESP | | | 1,663,130 | | | | 1,782,084 | |
Grupo Energia Bogota ESP | | | 4,322,743 | | | | 2,470,360 | |
Interconexion Electrica | | | 543,173 | | | | 2,522,100 | |
| | | | | | | | 6,774,544 | |
TOTAL COLOMBIA | | | | | | | 32,068,335 | |
| UNITED STATES— 1.5% | | | | | | | | |
| Materials — 1.5% | | | | | | | | |
Tecnoglass (A) | | | 142,076 | | | | 573,987 | |
| TOTAL COMMON STOCK | | | | | | | | |
(Cost $57,447,907) | | | | | | | 35,163,048 | |
| | | | | | | | | |
| U.S. TREASURY OBLIGATION — 15.3% | | | | | | | | |
| United States Treasury Bill | | | | | | | | |
0.065%, 05/14/20(B) | | | | | | | | |
(Cost $5,999,859) | | $ | 6,000,000 | | | | 5,999,826 | |
| | | | | | | | | |
| | | | | | | |
| PREFERRED STOCK — 10.4% | | | | | | | | |
| COLOMBIA— 10.4% | | | | | | | | |
| Financials — 7.2% | | | | | | | | |
Banco Davivienda | | | 223,608 | | | $ | 1,638,417 | |
Grupo Aval Acciones y Valores(C) | | | 1,431,941 | | | | 308,699 | |
Grupo de Inversiones Suramericana(C) | | | 180,461 | | | | 869,237 | |
| | | | | | | | 2,816,353 | |
| Industrials — 0.7% | | | | | | | | |
Avianca Holdings(C) | | | 2,233,206 | | | | 286,582 | |
| Materials — 2.5% | | | | | | | | |
Cementos Argos(C) | | | 684,019 | | | | 558,433 | |
Grupo Argos(C) | | | 214,163 | | | | 442,570 | |
| | | | | | | | 1,001,003 | |
| TOTAL PREFERRED STOCK | | | | | | | | |
(Cost $8,939,353) | | | | | | | 4,103,938 | |
| | | | | | | | | |
SHORT-TERM INVESTMENT(D)(E) — 18.9% | | | | | | | | |
| Fidelity Investments Money Market Government Portfolio, Cl Institutional, 0.160% | | | | | | | | |
(Cost $7,427,397) | | | 7,427,397 | | | | 7,427,397 | |
| | | | | | | | | |
REPURCHASE AGREEMENT(D) — 2.0% | | | | | | | | |
| BNP Paribas | | | | | | | | |
| 0.030%, dated 04/30/20, to be repurchased on 05/01/20, repurchase price $802,314 (collateralized by U.S. Treasury Obligations, ranging in par value $193,546 - $624,335, 1.500%, 08/15/2026, with a total market value of $817,881) | | | | | | | | |
(Cost $802,313) | | $ | 802,313 | | | | 802,313 | |
| TOTAL INVESTMENTS — 136.1% | | | | | | | | |
(Cost $80,616,829) | | | | | | $ | 53,496,522 | |
Percentages are based on Net Assets of $39,303,442.
| * | Non-income producing security. |
| (A) | This security or a partial position of this security is on loan at April 30, 2020. The total value of securities on loan at April 30, 2020 was $8,014,770. |
| (B) | The rate reported on the Schedule of Investments is the effective yield at time of purchase. |
| (C) | There’s currently no stated interest rate. |
| (D) | Security was purchased with cash collateral held from securities on loan. The total value of such securities as of April 30, 2020 was $8,229,710. |
| (E) | The rate reported on the Schedule of Investments is the 7-day effective yield as of April 30, 2020. |
| ADR — American Depositary Receipt |
| Cl — Class |
The following is a summary of the level of inputs used as of April 30, 2020, in valuing the Fund’s investments carried at value:
| Investments in Securities | | | | | | | | | | | | |
| Common Stock | | $ | 35,163,048 | | | $ | — | | | $ | — | | | $ | 35,163,048 | |
| U.S. Treasury Obligation | | | — | | | | 5,999,826 | | | | — | | | | 5,999,826 | |
| Preferred Stock | | | 4,103,938 | | | | — | | | | — | | | | 4,103,938 | |
| Short-Term Investment | | | 7,427,397 | | | | — | | | | — | | | | 7,427,397 | |
| Repurchase Agreement | | | — | | | | 802,313 | | | | — | | | | 802,313 | |
| Total Investments in Securities | | $ | 46,694,383 | | | $ | 6,802,139 | | | $ | — | | | $ | 53,496,522 | |
For the period ended April 30, 2020, there were no transfers in or out of Level 3.
Amounts designated as “—“ are $0 or have been rounded to $0.
| | |
| Schedule of Investments |
| April 30, 2020 (Unaudited) |
| Global X MSCI Argentina ETF | |
Sector Weightings †:
† Sector weightings percentages are based on the total market value of investments. Repurchase agreements purchased from cash collateral received for securities lending activity are included in total investments. Please see Note 2 and 7 in Notes to Financial Statements for more detailed information.
| | | | | | | |
| COMMON STOCK — 95.5% | | | | | | |
| ARGENTINA— 77.1% | | | | | | |
| Communication Services — 3.8% | | | | | | |
Telecom Argentina ADR | | | 205,726 | | | $ | 1,413,338 | |
| Consumer Discretionary — 28.3% | | | | | | | | |
Despegar.com * | | | 137,432 | | | | 948,281 | |
MercadoLibre * | | | 16,670 | | | | 9,727,111 | |
| | | | | | | | 10,675,392 | |
| Energy — 6.5% | | | | | | | | |
| Transportadora de Gas del Sur ADR | | | 273,386 | | | | 1,252,108 | |
YPF ADR | | | 313,803 | | | | 1,205,004 | |
| | | | | | | | 2,457,112 | |
| | | | | | | |
| COMMON STOCK — continued | | | | | | | | |
| Financials — 10.6% | | | | | | | | |
Banco BBVA Argentina ADR | | | 305,668 | | | $ | 797,794 | |
Banco Macro ADR | | | 88,476 | | | | 1,443,044 | |
Grupo Financiero Galicia ADR | | | 176,487 | | | | 1,256,587 | |
Grupo Supervielle ADR (A) | | | 303,348 | | | | 512,658 | |
| | | | | | | | 4,010,083 | |
| Industrials — 0.9% | | | | | | | | |
America Airports * | | | 136,283 | | | | 347,522 | |
| Information Technology — 14.7% | | | | | | | | |
Globant * | | | 47,890 | | | | 5,539,436 | |
| Materials — 2.3% | | | | | | | | |
Loma Negra Cia Industrial Argentina ADR * | | | 243,273 | | | | 880,648 | |
| Real Estate — 2.5% | | | | | | | | |
Cresud SACIF y A ADR * | | | 138,954 | | | | 440,484 | |
IRSA Inversiones y Representaciones ADR * | | | 98,443 | | | | 323,877 | |
| IRSA Propiedades Comerciales ADR | | | 27,115 | | | | 173,265 | |
| | | | | | | | 937,626 | |
| Utilities — 7.5% | | | | | | | | |
Central Puerto ADR (A) | | | 424,964 | | | | 1,032,662 | |
Empresa Distribuidora Y Comercializadora Norte ADR * | | | 87,111 | | | | 261,333 | |
Pampa Energia ADR * | | | 150,807 | | | | 1,556,328 | |
| | | | | | | | 2,850,323 | |
TOTAL ARGENTINA | | | | | | | 29,111,480 | |
| BRAZIL— 5.7% | | | | | | | | |
| Consumer Discretionary — 2.9% | | | | | | | | |
Arcos Dorados Holdings, Cl A | | | 288,938 | | | | 1,100,854 | |
| Consumer Staples — 2.8% | | | | | | | | |
Adecoagro * | | | 263,697 | | | | 1,052,151 | |
TOTAL BRAZIL | | | | | | | 2,153,005 | |
| | | | | | | |
| COMMON STOCK — continued | | | | | | | | |
| CANADA— 4.3% | | | | | | | | |
| Materials — 4.3% | | | | | | | | |
SSR Mining * | | | 92,430 | | | $ | 1,623,073 | |
| CHILE— 8.0% | | | | | | | | |
| Consumer Staples — 8.0% | | | | | | | | |
Cencosud | | | 1,372,718 | | | | 1,658,487 | |
Cia Cervecerias Unidas | | | 192,491 | | | | 1,381,564 | |
TOTAL CHILE | | | | | | | 3,040,051 | |
| UNITED KINGDOM— 0.4% | | | | | | | | |
| Energy — 0.4% | | | | | | | | |
Phoenix Global Resources PLC * | | | 1,524,632 | | | | 150,002 | |
| TOTAL COMMON STOCK | | | | | | | | |
(Cost $80,978,026) | | | | | | | 36,077,611 | |
| | | | | | | | | |
| U.S. TREASURY OBLIGATION — 15.9% | | | | | | | | |
| United States Treasury Bill | | | | | | | | |
0.065%, 05/14/20(B) | | | | | | | | |
(Cost $5,999,859) | | $ | 6,000,000 | | | | 5,999,827 | |
| | | | | | | | | |
| PREFERRED STOCK — 4.3% | | | | | | | | |
| CHILE— 4.3% | | | | | | | | |
| Consumer Staples — 4.3% | | | | | | | | |
Embotelladora Andina (C) | | | | | | | | |
(Cost $1,922,829) | | | 679,943 | | | | 1,621,836 | |
| | | | | | | | | |
SHORT-TERM INVESTMENT(D)(E) — 0.8% | | | | | | | | |
| Fidelity Investments Money Market Government Portfolio, Cl Institutional, 0.160% | | | | | | | | |
(Cost $287,697) | | | 287,697 | | | | 287,697 | |
| | | | | | | |
REPURCHASE AGREEMENT(D) — 0.1% | | | | | | | | |
| BNP Paribas | | | | | | | | |
| 0.030%, dated 04/30/20, to be repurchased on 05/01/20, repurchase price $31,077 (collateralized by U.S. Treasury Obligations, ranging in par value $7,497 - $24,183, 1.500%, 08/15/2026, with a total market value of $31,680) | | | | | | | | |
(Cost $31,077) | | $ | 31,077 | | | $ | 31,077 | |
| TOTAL INVESTMENTS — 116.6% | | | | | | | | |
(Cost $89,219,488) | | | | | | $ | 44,018,048 | |
Percentages are based on Net Assets of $37,758,726.
| * | Non-income producing security. |
| (A) | This security or a partial position of this security is on loan at April 30, 2020. The total value of securities on loan at April 30, 2020 was $290,747. |
| (B) | The rate reported on the Schedule of Investments is the effective yield at time of purchase. |
| (C) | There’s currently no stated interest rate. |
| (D) | Security was purchased with cash collateral held from securities on loan. The total value of such securities as of April 30, 2020 was $318,774. |
| (E) | The rate reported on the Schedule of Investments is the 7-day effective yield as of April 30, 2020. |
| ADR — American Depositary Receipt |
| Cl — Class |
| PLC — Public Limited Company |
The following is a summary of the level of inputs used as of April 30, 2020, in valuing the Fund’s investments carried at value:
| Investments in Securities | | | | | | | | | | | | |
| Common Stock | | $ | 36,077,611 | | | $ | — | | | $ | — | | | $ | 36,077,611 | |
| U.S. Treasury Obligation | | | — | | | | 5,999,827 | | | | — | | | | 5,999,827 | |
| Preferred Stock | | | 1,621,836 | | | | — | | | | — | | | | 1,621,836 | |
| Short-Term Investment | | | 287,697 | | | | — | | | | — | | | | 287,697 | |
| Repurchase Agreement | | | — | | | | 31,077 | | | | — | | | | 31,077 | |
| Total Investments in Securities | | $ | 37,987,144 | | | $ | 6,030,904 | | | $ | — | | | $ | 44,018,048 | |
For the period ended April 30, 2020, there were no transfers in or out of Level 3.
Amounts designated as “—“ are $0 or have been rounded to $0.
| | |
| Schedule of Investments |
| April 30, 2020 (Unaudited) |
| | |
Sector Weightings †:
† Sector weightings percentages are based on the total market value of investments. Repurchase agreements purchased from cash collateral received for securities lending activity are included in total investments. Please see Note 2 and 7 in Notes to Financial Statements for more detailed information.
| | | | | | | |
| COMMON STOCK — 99.9% | | | | | | |
| GREECE— 90.9% | | | | | | |
| Communication Services — 18.9% | | | | | | |
| Hellenic Telecommunications Organization | | | 2,050,398 | | | $ | 27,174,247 | |
| Consumer Discretionary — 15.3% | | | | | | | | |
FF Group *(A)(B)(C) | | | 452,712 | | | | 119,006 | |
FF Group ADR *(A)(B)(C) | | | 200,300 | | | | 52,653 | |
JUMBO | | | 132,207 | | | | 2,069,287 | |
JUMBO ADR | | | 340,000 | | | | 5,321,646 | |
OPAP | | | 940,759 | | | | 8,449,407 | |
OPAP ADR (D) | | | 1,404,900 | | | | 6,048,095 | |
| | | | | | | | 22,060,094 | |
| Consumer Staples — 2.3% | | | | | | | | |
Sarantis | | | 394,986 | | | | 3,374,507 | |
| | | | | | | |
| COMMON STOCK — continued | | | | | | | | |
| Energy — 11.1% | | | | | | | | |
Capital Product Partners (E) | | | 212,814 | | | $ | 2,070,680 | |
Hellenic Petroleum | | | 625,461 | | | | 4,144,667 | |
| Motor Oil Hellas Corinth Refineries | | | 282,739 | | | | 4,152,871 | |
| Motor Oil Hellas Corinth Refineries ADR | | | 368,300 | | | | 2,704,795 | |
Tsakos Energy Navigation | | | 829,854 | | | | 2,862,996 | |
| | | | | | | | 15,936,009 | |
| Financials — 19.5% | | | | | | | | |
Alpha Bank AE * | | | 11,855,523 | | | | 8,661,249 | |
Eurobank Ergasias * | | | 22,143,564 | | | | 8,930,284 | |
| Hellenic Exchanges - Athens Stock Exchange | | | 705,868 | | | | 2,636,403 | |
National Bank of Greece * | | | 3,130,380 | | | | 4,248,175 | |
Piraeus Bank * (D) | | | 2,787,066 | | | | 3,718,164 | |
| | | | | | | | 28,194,275 | |
| Industrials — 10.5% | | | | | | | | |
Aegean Airlines | | | 391,031 | | | | 2,518,387 | |
Ellaktor * | | | 1,595,109 | | | | 1,554,943 | |
GEK Terna Holding Real Estate Construction * | | | 754,865 | | | | 4,812,007 | |
Mytilineos Holdings | | | 411,287 | | | | 3,063,288 | |
Mytilineos Holdings ADR | | | 426,200 | | | | 3,174,380 | |
| | | | | | | | 15,123,005 | |
| Real Estate — 3.0% | | | | | | | | |
LAMDA Development * | | | 662,360 | | | | 4,352,906 | |
| Utilities — 10.3% | | | | | | | | |
| Athens Water Supply & Sewage | | | 481,228 | | | | 3,573,671 | |
Holding ADMIE IPTO | | | 1,373,802 | | | | 3,084,693 | |
Public Power * | | | 1,143,602 | | | | 3,319,363 | |
Terna Energy | | | 511,737 | | | | 4,781,122 | |
| | | | | | | | 14,758,849 | |
TOTAL GREECE | | | | | | | 130,973,892 | |
| | | | | | | |
| COMMON STOCK — continued | | | | | | | | |
| MONACO— 3.0% | | | | | | | | |
| Energy — 3.0% | | | | | | | | |
GasLog | | | 470,296 | | | $ | 2,172,768 | |
GasLog Partners | | | 350,193 | | | | 2,108,162 | |
TOTAL MONACO | | | | | | | 4,280,930 | |
| UNITED STATES— 6.0% | | | | | | | | |
| Energy — 2.3% | | | | | | | | |
Dorian LPG * | | | 349,726 | | | | 3,318,900 | |
| Materials — 3.7% | | | | | | | | |
Titan Cement International * | | | 383,777 | | | | 5,330,061 | |
TOTAL UNITED STATES | | | | | | | 8,648,961 | |
| TOTAL COMMON STOCK | | | | | | | | |
(Cost $241,554,369) | | | | | | | 143,903,783 | |
| | | | | | | | | |
SHORT-TERM INVESTMENT(F)(G) — 2.6% | | | | | | | | |
| Fidelity Investments Money Market Government Portfolio, Cl Institutional, 0.160% | | | | | | | | |
(Cost $3,802,086) | | | 3,802,086 | | | | 3,802,086 | |
| | | | | | | | | |
REPURCHASE AGREEMENT(F) — 0.3% | | | | | | | | |
| BNP Paribas | | | | | | | | |
| 0.030%, dated 04/30/20, to be repurchased on 05/01/20, repurchase price $410,704 (collateralized by U.S. Treasury Obligations, ranging in par value $99,076 - $319,597, 1.500%, 08/15/2026, with a total market value of $418,673) | | | | | | | | |
(Cost $410,704) | | $ | 410,704 | | | | 410,704 | |
| TOTAL INVESTMENTS — 102.8% | | | | | | | | |
(Cost $245,767,159) | | | | | | $ | 148,116,573 | |
Percentages are based on Net Assets of $144,034,454.
| * | Non-income producing security. |
| (A) | Level 3 security in accordance with fair value hierarchy. |
| (B) | Security considered illiquid. The total value of such securities as of April 30, 2020 was $171,659 and represented 0.1% of Net Assets. |
| (C) | Security is fair valued using methods determined in good faith by the Fair Value Committee of the Fund. The total value of such securities as of April 30, 2020 was $171,659 and represents 0.1% of Net Assets. |
| (D) | This security or a partial position of this security is on loan at April 30, 2020. The total value of securities on loan at April 30, 2020 was $3,930,024. |
| (E) | Security considered Master Limited Partnership. At April 30, 2020, these securities amounted to $2,070,680 or 1.4% of net assets. |
| (F) | Security was purchased with cash collateral held from securities on loan. The total value of such securities as of April 30, 2020 was $4,212,790. |
| (G) | The rate reported on the Schedule of Investments is the 7-day effective yield as of April 30, 2020. |
| ADR — American Depositary Receipt |
| Cl — Class |
The following is a summary of the level of inputs used as of April 30, 2020, in valuing the Fund’s investments carried at value:
| Investments in Securities | | | | | | | | | | | | |
| Common Stock | | $ | 143,732,124 | | | $ | — | | | $ | 171,659 | | | $ | 143,903,783 | |
| Short-Term Investment | | | 3,802,086 | | | | — | | | | — | | | | 3,802,086 | |
| Repurchase Agreement | | | — | | | | 410,704 | | | | — | | | | 410,704 | |
| Total Investments in Securities | | $ | 147,534,210 | | | $ | 410,704 | | | $ | 171,659 | | | $ | 148,116,573 | |
(1) | A reconciliation of Level 3 investments and disclosures of significant unobservable inputs are presented when the Fund has a significant amount of Level 3 investments at the beginning and/or end of the period in relation to Net Assets. Management has concluded that Level 3 investments are not material in relation to Net Assets. |
For the period ended April 30, 2020, there were no transfers in or out of Level 3.
Amounts designated as “—“ are $0 or have been rounded to $0.
| | |
| Schedule of Investments |
| April 30, 2020 (Unaudited) |
| | |
Sector Weightings †:
† Sector weightings percentages are based on the total market value of investments. Repurchase agreements purchased from cash collateral received for securities lending activity are included in total investments. Please see Note 2 and 7 in Notes to Financial Statements for more detailed information.
| | | Shares | | | Value | |
| COMMON STOCK — 99.8% | | | | | | |
| FAROE ISLANDS— 2.5% | | | | | | |
| Consumer Staples — 2.5% | | | | | | |
Bakkafrost P/F * | | | 18,651 | | | $ | 924,378 | |
| FRANCE— 1.5% | | | | | | | | |
| Communication Services — 1.5% | | | | | | | | |
Adevinta, Cl B * | | | 64,917 | | | | 538,352 | |
| NORWAY— 93.9% | | | | | | | | |
| Communication Services — 12.5% | | | | | | | | |
Schibsted, Cl B | | | 36,259 | | | | 706,408 | |
Telenor | | | 252,314 | | | | 3,882,400 | |
| | | | | | | | 4,588,808 | |
| | | Shares | | | Value | |
| COMMON STOCK — continued | | | | | | | | |
| Consumer Discretionary — 0.7% | | | | | | | | |
Europris (A) | | | 57,326 | | | $ | 211,476 | |
XXL * | | | 44,554 | | | | 44,992 | |
| | | | | | | | 256,468 | |
| Consumer Staples — 18.0% | | | | | | | | |
Austevoll Seafood | | | 37,375 | | | | 292,394 | |
Grieg Seafood | | | 18,427 | | | | 181,393 | |
Leroy Seafood Group (A) | | | 111,685 | | | | 594,732 | |
Mowi (A) | | | 149,508 | | | | 2,567,496 | |
Norway Royal Salmon | | | 4,744 | | | | 96,462 | |
Orkla | | | 233,158 | | | | 2,115,854 | |
Salmar | | | 19,017 | | | | 744,338 | |
| | | | | | | | 6,592,669 | |
| Energy — 19.4% | | | | | | | | |
Aker BP | | | 40,098 | | | | 667,414 | |
Aker Solutions * | | | 62,828 | | | | 41,498 | |
BW Energy * | | | 14,201 | | | | 17,703 | |
BW Offshore * | | | 33,230 | | | | 94,297 | |
DNO International (A) | | | 267,855 | | | | 122,060 | |
Equinor (A) | | | 354,614 | | | | 4,977,654 | |
Frontline | | | 38,128 | | | | 361,150 | |
Hoegh LNG Holdings | | | 22,888 | | | | 24,994 | |
Kvaerner | | | 42,400 | | | | 26,387 | |
Ocean Yield | | | 28,966 | | | | 75,536 | |
Odfjell Drilling * | | | 36,400 | | | | 30,275 | |
Petroleum Geo-Services * | | | 153,473 | | | | 55,490 | |
TGS Nopec Geophysical | | | 41,511 | | | | 639,549 | |
| | | | | | | | 7,134,007 | |
| Financials — 21.9% | | | | | | | | |
Aker, Cl A (A) | | | 8,944 | | | | 237,525 | |
Axactor * | | | 47,420 | | | | 31,089 | |
B2Holding | | | 75,115 | | | | 30,356 | |
DnB | | | 330,579 | | | | 4,017,585 | |
| | | Shares | | | Value | |
| COMMON STOCK — continued | | | | | | | | |
| Financials — continued | | | | | | | | |
Gjensidige Forsikring | | | 73,633 | | | $ | 1,304,126 | |
Norwegian Finance Holding | | | 40,080 | | | | 215,508 | |
Protector Forsikring (A) | | | 30,495 | | | | 103,395 | |
Sbanken | | | 27,564 | | | | 147,536 | |
Sparebank 1 Nord Norge | | | 43,318 | | | | 260,258 | |
Sparebank 1 Oestlandet | | | 11,487 | | | | 94,081 | |
SpareBank 1 SMN | | | 49,806 | | | | 365,033 | |
SpareBank 1 SR-Bank * | | | 52,911 | | | | 337,309 | |
Storebrand | | | 171,429 | | | | 862,215 | |
| | | | | | | | 8,006,016 | |
| Industrials — 6.4% | | | | | | | | |
Golden Ocean Group | | | 40,173 | | | | 144,267 | |
Kongsberg Gruppen | | | 22,660 | | | | 292,243 | |
NEL, Cl A * | | | 272,947 | | | | 337,193 | |
Norwegian Air Shuttle * | | | 63,764 | | | | 31,933 | |
Stolt-Nielsen | | | 12,700 | | | | 108,738 | |
TOMRA Systems | | | 35,318 | | | | 1,176,397 | |
Veidekke | | | 26,360 | | | | 235,754 | |
Wallenius Wilhelmsen, Cl B | | | 37,527 | | | | 41,348 | |
| | | | | | | | 2,367,873 | |
| Information Technology — 1.7% | | | | | | | | |
Atea | | | 33,478 | | | | 293,846 | |
Nordic Semiconductor * | | | 57,291 | | | | 338,604 | |
| | | | | | | | 632,450 | |
| Materials — 9.5% | | | | | | | | |
Borregaard | | | 42,097 | | | | 392,566 | |
Elkem | | | 47,653 | | | | 80,156 | |
Norsk Hydro | | | 446,576 | | | | 1,143,582 | |
Yara International (A) | | | 54,422 | | | | 1,860,121 | |
| | | | | | | | 3,476,425 | |
| Real Estate — 2.3% | | | | | | | | |
Entra | | | 56,502 | | | | 713,217 | |
| | | Shares | | | Value | |
| COMMON STOCK — continued | | | | | | | | |
| Real Estate — continued | | | | | | | | |
Selvaag Bolig | | | 29,958 | | | $ | 124,440 | |
| | | | | | | | 837,657 | |
| Utilities — 1.5% | | | | | | | | |
Fjordkraft Holding | | | 10,542 | | | | 71,177 | |
Scatec Solar | | | 31,765 | | | | 465,306 | |
| | | | | | | | 536,483 | |
TOTAL NORWAY | | | | | | | 34,428,856 | |
| SINGAPORE— 0.3% | | | | | | | | |
| Energy — 0.3% | | | | | | | | |
BW LPG | | | 37,650 | | | | 129,386 | |
| UNITED ARAB EMIRATES— 0.1% | | | | | | | | |
| Energy — 0.1% | | | | | | | | |
Borr Drilling *(A) | | | 27,442 | | | | 19,468 | |
| UNITED KINGDOM— 1.5% | | | | | | | | |
| Energy — 1.5% | | | | | | | | |
FLEX LNG (A) | | | 9,083 | | | | 47,195 | |
Subsea 7 | | | 88,475 | | | | 491,915 | |
TOTAL UNITED KINGDOM | | | | | | | 539,110 | |
| TOTAL COMMON STOCK | | | | | | | | |
(Cost $59,279,887) | | | | | | | 36,579,550 | |
| | | | | | | | | |
| RIGHT — 0.0% | | | | | | | | |
| | | Number of
Rights | | | | | |
| Norway — 0.0% | | | | | | | | |
XXL(B)(C)(D) | | | 20,673 | | | | 10,762 | |
| | | | | | | | | |
TOTAL RIGHT (Cost $–) | | | | | | | 10,762 | |
| | | Shares/Face Amount | | | Value | |
SHORT-TERM INVESTMENT(E)(F) — 19.1% | | | | | | | | |
| Fidelity Investments Money Market Government Portfolio, Cl Institutional, 0.160% | | | | | | | | |
(Cost $7,018,618) | | | 7,018,618 | | | $ | 7,018,618 | |
| | | | | | | | | |
REPURCHASE AGREEMENT(E) — 2.1% | | | | | | | | |
| BNP Paribas | | | | | | | | |
| 0.030%, dated 04/30/20, to be repurchased on 05/01/20, repurchase price $758,157 (collateralized by U.S. Treasury Obligations, ranging in par value $182,893 - $589,973, 1.500%, 08/15/2026, with a total market value of $772,866) | | | | | | | | |
(Cost $758,156) | | $ | 758,156 | | | | 758,156 | |
| TOTAL INVESTMENTS — 121.0% | | | | | | | | |
(Cost $67,056,661) | | | | | | $ | 44,367,086 | |
Percentages are based on Net Assets of $36,666,177.
| * | Non-income producing security. |
| (A) | This security or a partial position of this security is on loan at April 30, 2020. The total value of securities on loan at April 30, 2020 was $7,517,374. |
| (B) | Security considered illiquid. The total value of such securities as of April 30, 2020 was $10,762 and represented 0.0% of Net Assets. |
| (C) | Security is fair valued using methods determined in good faith by the Fair Value Committee of the Fund. The total value of such securities as of April 30, 2020 was $10,762 and represents 0.0% of Net Assets. |
| (D) | Level 3 security in accordance with fair value hierarchy. |
| (E) | Security was purchased with cash collateral held from securities on loan. The total value of such securities as of April 30, 2020 was $7,776,774. |
| (F) | The rate reported on the Schedule of Investments is the 7-day effective yield as of April 30, 2020. |
Cl — Class
The following is a summary of the level of inputs used as of April 30, 2020, in valuing the Fund’s investments carried at value:
| Investments in Securities | | | | | | | | | | | | |
| Common Stock | | $ | 36,579,550 | | | $ | — | | | $ | — | | | $ | 36,579,550 | |
| Right | | | — | | | | — | | | | 10,762 | | | | 10,762 | |
| Short-Term Investment | | | 7,018,618 | | | | — | | | | — | | | | 7,018,618 | |
| Repurchase Agreement | | | — | | | | 758,156 | | | | — | | | | 758,156 | |
| Total Investments in Securities | | $ | 43,598,168 | | | $ | 758,156 | | | $ | 10,762 | | | $ | 44,367,086 | |
(1) | A reconciliation of Level 3 investments and disclosures of significant unobservable inputs are presented when the Fund has a significant amount of Level 3 investments at the beginning and/or end of the period in relation to Net Assets. Management has concluded that Level 3 investments are not material in relation to Net Assets. |
For the period ended April 30, 2020, the transfers in and out of Level 3 were due to changes in the availability of observable inputs to determine fair value. Transfers between levels are recognized at period end.
Amounts designated as “—“ are $0 or have been rounded to $0.
| | |
| Schedule of Investments |
| April 30, 2020 (Unaudited) |
| Global X FTSE Nordic Region ETF | |
Sector Weightings †:
† Sector weightings percentages are based on the total market value of investments.
| | | | | | | |
| COMMON STOCK — 99.2% | | | | | | |
| DENMARK— 37.0% | | | | | | |
| Consumer Staples — 2.2% | | | | | | |
Carlsberg, Cl B | | | 3,024 | | | $ | 381,227 | |
| Financials — 1.4% | | | | | | | | |
Danske Bank | | | 19,821 | | | | 235,152 | |
| Health Care — 22.3% | | | | | | | | |
Coloplast, Cl B | | | 3,978 | | | | 629,060 | |
Novo Nordisk, Cl B | | | 49,711 | | | | 3,169,960 | |
| | | | | | | | 3,799,020 | |
| Industrials — 7.8% | | | | | | | | |
A P Moller - Maersk, Cl B | | | 192 | | | | 190,854 | |
DSV PANALPINA | | | 6,071 | | | | 626,296 | |
Vestas Wind Systems | | | 5,848 | | | | 503,344 | |
| | | | | | | | 1,320,494 | |
| Utilities — 3.3% | | | | | | | | |
Orsted | | | 5,645 | | | | 570,580 | |
TOTAL DENMARK | | | | | | | 6,306,473 | |
| | | | | | | |
| COMMON STOCK — continued | | | | | | | | |
| FINLAND— 18.1% | | | | | | | | |
| Energy — 2.6% | | | | | | | | |
Neste | | | 12,418 | | | $ | 439,735 | |
| Financials — 6.5% | | | | | | | | |
Nordea Bank Abp * | | | 96,471 | | | | 617,822 | |
Sampo, Cl A * | | | 14,671 | | | | 485,932 | |
| | | | | | | | 1,103,754 | |
| Industrials — 4.2% | | | | | | | | |
Kone, Cl B | | | 11,717 | | | | 709,958 | |
| Information Technology — 3.6% | | | | | | | | |
Nokia | | | 167,733 | | | | 610,680 | |
| Utilities — 1.2% | | | | | | | | |
Fortum | | | 12,820 | | | | 212,733 | |
TOTAL FINLAND | | | | | | | 3,076,860 | |
| NORWAY— 6.4% | | | | | | | | |
| Communication Services — 1.8% | | | | | | | | |
Telenor | | | 19,308 | | | | 297,096 | |
| Energy — 2.4% | | | | | | | | |
Equinor | | | 29,400 | | | | 412,683 | |
| Financials — 2.2% | | | | | | | | |
DnB | | | 31,182 | | | | 378,960 | |
TOTAL NORWAY | | | | | | | 1,088,739 | |
| SWEDEN— 37.7% | | | | | | | | |
| Communication Services — 1.6% | | | | | | | | |
Telia | | | 77,716 | | | | 268,543 | |
| Consumer Discretionary — 2.1% | | | | | | | | |
Hennes & Mauritz, Cl B | | | 26,164 | | | | 364,847 | |
| Consumer Staples — 3.5% | | | | | | | | |
Essity, Cl B | | | 18,195 | | | | 591,460 | |
| | | | | | | |
| COMMON STOCK — continued | | | | | | | | |
| Financials — 10.6% | | | | | | | | |
Investor, Cl B | | | 13,599 | | | $ | 683,904 | |
Skandinaviska Enskilda Banken, Cl A * | | | 42,811 | | | | 352,141 | |
Svenska Handelsbanken, Cl A | | | 44,334 | | | | 409,878 | |
Swedbank, Cl A | | | 29,948 | | | | 353,715 | |
| | | | | | | | 1,799,638 | |
| Industrials — 13.1% | | | | | | | | |
Assa Abloy, Cl B | | | 27,468 | | | | 495,100 | |
Atlas Copco, Cl A | | | 18,833 | | | | 654,234 | |
Sandvik | | | 32,216 | | | | 499,046 | |
Volvo, Cl B | | | 44,836 | | | | 579,088 | |
| | | | | | | | 2,227,468 | |
| Information Technology — 6.8% | | | | | | | | |
Hexagon, Cl B | | | 7,591 | | | | 378,571 | |
| Telefonaktiebolaget LM Ericsson, Cl B | | | 89,437 | | | | 779,250 | |
| | | | | | | | 1,157,821 | |
TOTAL SWEDEN | | | | | | | 6,409,777 | |
| TOTAL COMMON STOCK | | | | | | | | |
(Cost $19,003,326) | | | | | | | 16,881,849 | |
| TOTAL INVESTMENTS — 99.2% | | | | | | | | |
(Cost $19,003,326) | | | | | | $ | 16,881,849 | |
Percentages are based on Net Assets of $17,020,417.
| * | Non-income producing security. |
As of April 30, 2020, all of the Fund’s investments were considered Level 1, in accordance with authoritative guidance on fair value measurements and disclosure under U.S. GAAP.
For the period ended April 30, 2020, there were no transfers in or out of Level 3.
| | |
| Schedule of Investments |
| April 30, 2020 (Unaudited) |
| Global X MSCI Nigeria ETF | |
Sector Weightings †:
† Sector weightings percentages are based on the total market value of investments.
| | | | | | | |
| COMMON STOCK — 98.5% | | | | | | |
| NIGERIA— 95.7% | | | | | | |
| Communication Services — 5.6% | | | | | | |
Nigeria Communications | | | 5,666,143 | | | $ | 1,652,625 | |
| Consumer Staples — 26.2% | | | | | | | | |
Dangote Sugar Refinery | | | 37,739,109 | | | | 1,223,573 | |
Flour Mills of Nigeria | | | 24,022,814 | | | | 1,313,748 | |
Nestle Nigeria | | | 1,211,123 | | | | 2,902,280 | |
Nigerian Breweries | | | 12,750,569 | | | | 996,138 | |
UAC of Nigeria | | | 38,739,565 | | | | 696,101 | |
Unilever Nigeria | | | 24,647,104 | | | | 673,944 | |
| | | | | | | | 7,805,784 | |
| Financials — 45.1% | | | | | | | | |
Access Bank | | | 67,702,942 | | | | 1,163,644 | |
FBN Holdings | | | 113,264,967 | | | | 1,356,820 | |
Fidelity Bank | | | 176,888,874 | | | | 824,560 | |
First City Monument Bank | | | 171,109,376 | | | | 766,428 | |
Guaranty Trust Bank | | | 66,031,216 | | | | 3,611,082 | |
Stanbic IBTC Holdings | | | 17,063,251 | | | | 1,266,413 | |
Sterling Bank | | | 212,093,700 | | | | 706,979 | |
United Bank for Africa | | | 87,003,212 | | | | 1,370,754 | |
Zenith Bank | | | 62,245,336 | | | | 2,317,990 | |
| | | | | | | | 13,384,670 | |
| | |
| Schedule of Investments |
| April 30, 2020 (Unaudited) |
| Global X MSCI Nigeria ETF | |
| | | | | | | |
| COMMON STOCK — continued | | | | | | | | |
| Materials — 16.3% | | | | | | | | |
Dangote Cement | | | 11,501,848 | | | $ | 3,893,855 | |
Lafarge Africa * | | | 30,621,105 | | | | 940,961 | |
| | | | | | | | 4,834,816 | |
| Utilities — 2.5% | | | | | | | | |
Transnational Corp of Nigeria | | | 432,691,712 | | | | 743,689 | |
TOTAL NIGERIA | | | | | | | 28,421,584 | |
| TOGO— 2.8% | | | | | | | | |
| Financials — 2.8% | | | | | | | | |
Ecobank Transnational * | | | 71,328,071 | | | | 826,588 | |
| TOTAL COMMON STOCK | | | | | | | | |
(Cost $43,141,986) | | | | | | | 29,248,172 | |
| TOTAL INVESTMENTS — 98.5% | | | | | | | | |
(Cost $43,141,986) | | | | | | $ | 29,248,172 | |
Percentages are based on Net Assets of $29,701,617.
| * | Non-income producing security. |
As of April 30, 2020, all of the Fund’s investments were considered Level 1, in accordance with authoritative guidance on fair value measurements and disclosure under U.S. GAAP.
For the period ended April 30, 2020, there were no transfers in or out of Level 3.
| | |
| Schedule of Investments |
| April 30, 2020 (Unaudited) |
| Global X MSCI Next Emerging & Frontier ETF | |
Sector Weightings †:
† Sector weightings percentages are based on the total market value of investments.
| | | | | | | |
| COMMON STOCK — 99.7% | | | | | | |
| ARGENTINA— 0.1% | | | | | | |
| Energy — 0.1% | | | | | | |
YPF ADR | | | 5,017 | | | $ | 19,265 | |
| BAHRAIN— 0.7% | | | | | | | | |
| Financials — 0.7% | | | | | | | | |
Ahli United Bank BSC | | | 125,507 | | | | 79,533 | |
| GFH FINANCIAL GROUP BSC | | | 68,140 | | | | 11,149 | |
TOTAL BAHRAIN | | | | | | | 90,682 | |
| BANGLADESH— 1.1% | | | | | | | | |
| Communication Services — 0.2% | | | | | | | | |
GrameenPhone (A)(B)(C) | | | 9,276 | | | | 27,990 | |
| Financials — 0.1% | | | | | | | | |
BRAC Bank *(A)(B)(C) | | | 20,592 | | | | 8,300 | |
| Health Care — 0.8% | | | | | | | | |
Square Pharmaceuticals (A)(B)(C) | | | 50,642 | | | | 110,385 | |
TOTAL BANGLADESH | | | | | | | 146,675 | |
| | | | | | | |
| COMMON STOCK — continued | | | | | | | | |
| CHILE— 1.7% | | | | | | | | |
| Consumer Discretionary — 0.4% | | | | | | | | |
SACI Falabella | | | 22,164 | | | $ | 60,450 | |
| Consumer Staples — 0.4% | | | | | | | | |
Cencosud | | | 42,834 | | | | 51,751 | |
| Financials — 0.9% | | | | | | | | |
Banco de Chile | | | 580,439 | | | | 51,102 | |
Banco de Credito e Inversiones | | | 632 | | | | 23,435 | |
Banco Santander Chile | | | 842,508 | | | | 36,130 | |
| | | | | | | | 110,667 | |
TOTAL CHILE | | | | | | | 222,868 | |
| COLOMBIA— 0.1% | | | | | | | | |
| Financials — 0.1% | | | | | | | | |
| Grupo de Inversiones Suramericana | | | 2,978 | | | | 16,350 | |
| CZECH REPUBLIC— 0.8% | | | | | | | | |
| Financials — 0.1% | | | | | | | | |
Komercni Banka | | | 970 | | | | 20,598 | |
| Utilities — 0.7% | | | | | | | | |
CEZ | | | 4,751 | | | | 88,759 | |
TOTAL CZECH REPUBLIC | | | | | | | 109,357 | |
| EGYPT— 0.6% | | | | | | | | |
| Financials — 0.6% | | | | | | | | |
| Commercial International Bank Egypt S.A.E. | | | 18,366 | | | | 74,572 | |
| ESTONIA— 0.2% | | | | | | | | |
| Industrials — 0.2% | | | | | | | | |
Tallink Grupp | | | 21,172 | | | | 15,769 | |
Tallinna Sadam | | | 6,398 | | | | 12,018 | |
TOTAL ESTONIA | | | | | | | 27,787 | |
| | | | | | | |
| COMMON STOCK — continued | | | | | | | | |
| GREECE— 1.3% | | | | | | | | |
| Communication Services — 0.7% | | | | | | | | |
| Hellenic Telecommunications Organization | | | 7,080 | | | $ | 93,833 | |
| Consumer Discretionary — 0.4% | | | | | | | | |
OPAP | | | 5,772 | | | | 51,841 | |
| Financials — 0.2% | | | | | | | | |
Alpha Bank AE * | | | 17,712 | | | | 12,940 | |
Eurobank Ergasias * | | | 33,161 | | | | 13,373 | |
| | | | | | | | 26,313 | |
TOTAL GREECE | | | | | | | 171,987 | |
| INDONESIA— 9.0% | | | | | | | | |
| Communication Services — 2.1% | | | | | | | | |
| Telekomunikasi Indonesia Persero | | | 1,180,135 | | | | 277,679 | |
| Consumer Discretionary — 0.9% | | | | | | | | |
Astra International | | | 484,067 | | | | 125,288 | |
| Consumer Staples — 2.0% | | | | | | | | |
Charoen Pokphand Indonesia | | | 173,000 | | | | 53,499 | |
Gudang Garam | | | 11,154 | | | | 33,968 | |
| Indofood CBP Sukses Makmur TBK | | | 54,100 | | | | 35,915 | |
Indofood Sukses Makmur | | | 101,900 | | | | 44,699 | |
Unilever Indonesia | | | 182,795 | | | | 101,689 | |
| | | | | | | | 269,770 | |
| Energy — 0.3% | | | | | | | | |
United Tractors | | | 39,350 | | | | 43,120 | |
| Financials — 2.8% | | | | | | | | |
Bank Central Asia | | | 104,058 | | | | 180,834 | |
Bank Mandiri | | | 192,136 | | | | 57,608 | |
| Bank Negara Indonesia Persero | | | 79,300 | | | | 21,857 | |
Bank Rakyat Indonesia Persero | | | 587,470 | | | | 107,818 | |
| | | | | | | | 368,117 | |
| | | | | | | |
| COMMON STOCK — continued | | | | | | | | |
| Health Care — 0.4% | | | | | | | | |
Kalbe Farma | | | 489,300 | | | $ | 47,368 | |
| Materials — 0.5% | | | | | | | | |
Indocement Tunggal Prakarsa | | | 42,700 | | | | 33,442 | |
Semen Indonesia Persero | | | 68,900 | | | | 36,824 | |
| | | | | | | | 70,266 | |
TOTAL INDONESIA | | | | | | | 1,201,608 | |
| JORDAN— 0.1% | | | | | | | | |
| Financials — 0.1% | | | | | | | | |
Arab Bank (A)(B)(C) | | | 2,322 | | | | 15,398 | |
| KAZAKHSTAN— 0.5% | | | | | | | | |
| Energy — 0.3% | | | | | | | | |
NAC Kazatomprom JSC GDR | | | 3,153 | | | | 47,295 | |
| Financials — 0.2% | | | | | | | | |
Halyk Savings Bank of Kazakhstan JSC GDR * | | | 2,301 | | | | 20,709 | |
TOTAL KAZAKHSTAN | | | | | | | 68,004 | |
| KENYA— 2.1% | | | | | | | | |
| Communication Services — 1.9% | | | | | | | | |
Safaricom | | | 983,200 | | | | 261,270 | |
| Financials — 0.2% | | | | | | | | |
Equity Group Holdings | | | 64,500 | | | | 22,643 | |
TOTAL KENYA | | | | | | | 283,913 | |
| KUWAIT— 8.0% | | | | | | | | |
| Communication Services — 2.3% | | | | | | | | |
| Mobile Telecommunications KSC | | | 176,108 | | | | 301,769 | |
| Financials — 3.9% | | | | | | | | |
Boubyan Bank KSCP | | | 20,734 | | | | 33,518 | |
Burgan Bank SAK | | | 17,789 | | | | 11,963 | |
Gulf Bank KSCP | | | 34,731 | | | | 24,254 | |
Kuwait Finance House | | | 98,958 | | | | 190,686 | |
| | | | | | | |
| COMMON STOCK — continued | | | | | | | | |
| Financials — continued | | | | | | | | |
National Bank of Kuwait SAK | | | 106,021 | | | $ | 253,998 | |
| | | | | | | | 514,419 | |
| Industrials — 1.2% | | | | | | | | |
Agility Public Warehousing KSC * | | | 79,388 | | | | 165,039 | |
| Real Estate — 0.6% | | | | | | | | |
Mabanee SAK | | | 42,171 | | | | 86,714 | |
TOTAL KUWAIT | | | | | | | 1,067,941 | |
| LUXEMBOURG— 0.1% | | | | | | | | |
| Financials — 0.1% | | | | | | | | |
Reinet Investments SCA | | | 992 | | | | 16,022 | |
| MALAYSIA— 7.7% | | | | | | | | |
| Communication Services — 1.9% | | | | | | | | |
Axiata Group | | | 79,867 | | | | 73,181 | |
DiGi.com | | | 91,602 | | | | 98,845 | |
Maxis | | | 69,176 | | | | 88,159 | |
| | | | | | | | 260,185 | |
| Consumer Staples — 1.0% | | | | | | | | |
Nestle Malaysia | | | 2,070 | | | | 67,444 | |
PPB Group | | | 16,500 | | | | 63,160 | |
| | | | | | | | 130,604 | |
| Financials — 1.9% | | | | | | | | |
CIMB Group Holdings | | | 63,690 | | | | 51,100 | |
Hong Leong Bank | | | 8,300 | | | | 25,672 | |
Public Bank | | | 40,510 | | | | 154,315 | |
RHB Bank | | | 20,500 | | | | 22,645 | |
| | | | | | | | 253,732 | |
| Industrials — 0.3% | | | | | | | | |
Malaysia Airports Holdings | | | 28,300 | | | | 34,552 | |
| Utilities — 2.6% | | | | | | | | |
Petronas Gas | | | 23,189 | | | | 83,049 | |
| | | | | | | |
| COMMON STOCK — continued | | | | | | | | |
| Utilities — continued | | | | | | | | |
Tenaga Nasional | | | 91,983 | | | $ | 261,831 | |
| | | | | | | | 344,880 | |
TOTAL MALAYSIA | | | | | | | 1,023,953 | |
| MEXICO— 6.1% | | | | | | | | |
| Communication Services — 0.6% | | | | | | | | |
Grupo Televisa | | | 71,511 | | | | 76,917 | |
| Consumer Staples — 2.4% | | | | | | | | |
| Kimberly-Clark de Mexico, Cl A | | | 44,900 | | | | 64,192 | |
Wal-Mart de Mexico | | | 107,011 | | | | 260,539 | |
| | | | | | | | 324,731 | |
| Financials — 0.8% | | | | | | | | |
| Grupo Financiero Banorte, Cl O | | | 34,144 | | | | 94,516 | |
| Grupo Financiero Inbursa, Cl O | | | 29,600 | | | | 18,026 | |
| | | | | | | | 112,542 | |
| Industrials — 1.3% | | | | | | | | |
| Grupo Aeroportuario del Pacifico, Cl B | | | 10,500 | | | | 66,413 | |
| Grupo Aeroportuario del Sureste, Cl B | | | 6,125 | | | | 62,097 | |
Promotora y Operadora de Infraestructura * | | | 6,617 | | | | 46,530 | |
| | | | | | | | 175,040 | |
| Real Estate — 0.6% | | | | | | | | |
Fibra Uno Administracion ‡ | | | 93,600 | | | | 77,718 | |
| Utilities — 0.4% | | | | | | | | |
| Infraestructura Energetica Nova | | | 15,640 | | | | 49,094 | |
TOTAL MEXICO | | | | | | | 816,042 | |
| MOROCCO— 2.4% | | | | | | | | |
| Communication Services — 1.8% | | | | | | | | |
Maroc Telecom | | | 17,966 | | | | 234,605 | |
| Consumer Staples — 0.3% | | | | | | | | |
Cosumar | | | 2,301 | | | | 42,024 | |
| | | | | | | |
| COMMON STOCK — continued | | | | | | | | |
| Financials — 0.3% | | | | | | | | |
Attijariwafa Bank | | | 957 | | | $ | 34,587 | |
Banque Centrale Populaire | | | 588 | | | | 12,171 | |
| | | | | | | | 46,758 | |
TOTAL MOROCCO | | | | | | | 323,387 | |
| NIGERIA— 0.8% | | | | | | | | |
| Financials — 0.3% | | | | | | | | |
Guaranty Trust Bank | | | 334,550 | | | | 18,296 | |
Zenith Bank | | | 355,651 | | | | 13,244 | |
| | | | | | | | 31,540 | |
| Materials — 0.5% | | | | | | | | |
Dangote Cement | | | 204,272 | | | | 69,155 | |
TOTAL NIGERIA | | | | | | | 100,695 | |
| OMAN— 0.4% | | | | | | | | |
| Communication Services — 0.3% | | | | | | | | |
| Oman Telecommunications SAOG | | | 14,859 | | | | 24,697 | |
Ooredoo | | | 14,000 | | | | 15,198 | |
| | | | | | | | 39,895 | |
| Financials — 0.1% | | | | | | | | |
BankMuscat SAOG | | | 18,437 | | | | 15,514 | |
TOTAL OMAN | | | | | | | 55,409 | |
| PERU— 1.0% | | | | | | | | |
| Financials — 1.0% | | | | | | | | |
Credicorp | | | 888 | | | | 132,330 | |
| PHILIPPINES— 4.7% | | | | | | | | |
| Financials — 0.5% | | | | | | | | |
BDO Unibank | | | 25,150 | | | | 50,390 | |
Metropolitan Bank & Trust | | | 22,974 | | | | 17,797 | |
| | | | | | | | 68,187 | |
| Industrials — 1.3% | | | | | | | | |
Aboitiz Equity Ventures | | | 58,973 | | | | 48,549 | |
| | | | | | | |
| COMMON STOCK — continued | | | | | | | | |
| Industrials — continued | | | | | | | | |
SM Investments | | | 7,098 | | | $ | 118,981 | |
| | | | | | | | 167,530 | |
| Information Technology — 0.5% | | | | | | | | |
PLDT | | | 2,511 | | | | 64,705 | |
| Real Estate — 2.4% | | | | | | | | |
Ayala Land | | | 217,770 | | | | 138,023 | |
SM Prime Holdings | | | 298,227 | | | | 183,397 | |
| | | | | | | | 321,420 | |
TOTAL PHILIPPINES | | | | | | | 621,842 | |
| POLAND— 2.4% | | | | | | | | |
| Communication Services — 0.4% | | | | | | | | |
Cyfrowy Polsat | | | 7,661 | | | | 47,285 | |
| Consumer Staples — 0.4% | | | | | | | | |
Dino Polska * | | | 1,415 | | | | 59,659 | |
| Energy — 0.4% | | | | | | | | |
| Polskie Gornictwo Naftowe i Gazownictwo | | | 51,930 | | | | 46,561 | |
| Financials — 1.2% | | | | | | | | |
Bank Polska Kasa Opieki | | | 2,178 | | | | 27,339 | |
| Powszechna Kasa Oszczednosci Bank Polski | | | 11,130 | | | | 59,155 | |
| Powszechny Zaklad Ubezpieczen | | | 7,977 | | | | 58,328 | |
Santander Bank Polska | | | 458 | | | | 18,027 | |
| | | | | | | | 162,849 | |
TOTAL POLAND | | | | | | | 316,354 | |
| QATAR— 3.8% | | | | | | | | |
| Energy — 0.5% | | | | | | | | |
Qatar Fuel QSC | | | 14,388 | | | | 63,266 | |
| Financials — 1.2% | | | | | | | | |
Commercial Bank PSQC | | | 25,365 | | | | 27,866 | |
Masraf Al Rayan QSC | | | 46,932 | | | | 49,226 | |
| Qatar International Islamic Bank QSC | | | 9,454 | | | | 20,824 | |
| | | | | | | |
| COMMON STOCK — continued | | | | | | | | |
| Financials — continued | | | | | | | | |
Qatar Islamic Bank SAQ | | | 14,763 | | | $ | 62,807 | |
| | | | | | | | 160,723 | |
| Industrials — 0.8% | | | | | | | | |
Industries Qatar QSC | | | 53,463 | | | | 103,519 | |
| Materials — 0.5% | | | | | | | | |
| Mesaieed Petrochemical Holding | | | 129,481 | | | | 64,011 | |
| Real Estate — 0.3% | | | | | | | | |
Barwa Real Estate | | | 55,363 | | | | 43,488 | |
| Utilities — 0.5% | | | | | | | | |
Qatar Electricity & Water QSC | | | 15,683 | | | | 65,041 | |
TOTAL QATAR | | | | | | | 500,048 | |
| ROMANIA— 1.2% | | | | | | | | |
| Energy — 0.4% | | | | | | | | |
| Societatea Nationala de Gaze Naturale ROMGAZ | | | 9,312 | | | | 58,837 | |
| Financials — 0.4% | | | | | | | | |
Banca Transilvania | | | 89,521 | | | | 38,629 | |
BRD-Groupe Societe Generale | | | 5,507 | | | | 14,118 | |
| | | | | | | | 52,747 | |
| Real Estate — 0.2% | | | | | | | | |
NEPI Rockcastle | | | 5,444 | | | | 23,685 | |
| Utilities — 0.2% | | | | | | | | |
Societatea Energetica Electrica | | | 11,116 | | | | 24,210 | |
TOTAL ROMANIA | | | | | | | 159,479 | |
| SAUDI ARABIA— 11.9% | | | | | | | | |
| Communication Services — 2.3% | | | | | | | | |
Etihad Etisalat * | | | 9,188 | | | | 68,145 | |
Saudi Telecom | | | 9,942 | | | | 239,879 | |
| | | | | | | | 308,024 | |
| | | | | | | |
| COMMON STOCK — continued | | | | | | | | |
| Consumer Discretionary — 0.4% | | | | | | | | |
Jarir Marketing | | | 1,478 | | | $ | 58,097 | |
| Consumer Staples — 1.2% | | | | | | | | |
Almarai JSC | | | 6,255 | | | | 81,790 | |
Savola Group | | | 6,555 | | | | 70,699 | |
| | | | | | | | 152,489 | |
| Energy — 1.9% | | | | | | | | |
Saudi Arabian Oil | | | 29,826 | | | | 251,396 | |
| Financials — 4.0% | | | | | | | | |
Al Rajhi Bank | | | 13,418 | | | | 204,397 | |
Alinma Bank * | | | 10,451 | | | | 44,420 | |
Arab National Bank | | | 6,402 | | | | 34,849 | |
Bank AlBilad | | | 3,947 | | | | 23,924 | |
Banque Saudi Fransi | | | 5,856 | | | | 48,267 | |
Riyad Bank | | | 12,841 | | | | 58,203 | |
Samba Financial Group | | | 10,540 | | | | 65,345 | |
Saudi British Bank | | | 7,666 | | | | 50,345 | |
| | | | | | | | 529,750 | |
| Materials — 1.4% | | | | | | | | |
Saudi Arabian Fertilizer | | | 4,084 | | | | 77,003 | |
Saudi Kayan Petrochemical * | | | 17,742 | | | | 41,012 | |
Yanbu National Petrochemical | | | 5,484 | | | | 65,721 | |
| | | | | | | | 183,736 | |
| Utilities — 0.7% | | | | | | | | |
Saudi Electricity | | | 20,825 | | | | 94,614 | |
TOTAL SAUDI ARABIA | | | | | | | 1,578,106 | |
| SOUTH AFRICA— 5.4% | | | | | | | | |
| Communication Services — 0.2% | | | | | | | | |
MultiChoice Group * | | | 6,114 | | | | 29,040 | |
| Consumer Discretionary — 2.4% | | | | | | | | |
Mr Price Group | | | 3,585 | | | | 25,768 | |
| | | | | | | |
| COMMON STOCK — continued | | | | | | | | |
| Consumer Discretionary — continued | | | | | | | | |
Naspers, Cl N | | | 1,851 | | | $ | 292,175 | |
| | | | | | | | 317,943 | |
| Consumer Staples — 0.8% | | | | | | | | |
Clicks Group | | | 3,669 | | | | 46,092 | |
Shoprite Holdings | | | 6,577 | | | | 38,366 | |
Tiger Brands | | | 2,531 | | | | 24,890 | |
| | | | | | | | 109,348 | |
| Financials — 1.7% | | | | | | | | |
Absa Group | | | 4,393 | | | | 21,839 | |
Capitec Bank Holdings | | | 310 | | | | 15,226 | |
Discovery | | | 2,698 | | | | 14,250 | |
Nedbank Group | | | 2,537 | | | | 14,810 | |
Old Mutual | | | 28,900 | | | | 21,118 | |
PSG Group | | | 971 | | | | 8,407 | |
Remgro | | | 3,244 | | | | 24,200 | |
RMB Holdings | | | 5,196 | | | | 14,995 | |
Sanlam | | | 11,528 | | | | 37,211 | |
Standard Bank Group | | | 7,966 | | | | 44,300 | |
| | | | | | | | 216,356 | |
| Industrials — 0.2% | | | | | | | | |
Bidvest Group | | | 4,065 | | | | 33,323 | |
| Real Estate — 0.1% | | | | | | | | |
Redefine Properties ‡ | | | 76,238 | | | | 9,423 | |
TOTAL SOUTH AFRICA | | | | | | | 715,433 | |
| THAILAND— 10.5% | | | | | | | | |
| Communication Services — 1.4% | | | | | | | | |
Advanced Info Service NVDR | | | 19,834 | | | | 121,376 | |
Intouch Holdings PCL NVDR | | | 36,500 | | | | 60,354 | |
| | | | | | | | 181,730 | |
| Consumer Discretionary — 0.3% | | | | | | | | |
Home Product Center NVDR | | | 96,060 | | | | 40,378 | |
| | | | | | | |
| COMMON STOCK — continued | | | | | | | | |
| Consumer Staples — 1.8% | | | | | | | | |
Berli Jucker NVDR | | | 19,690 | | | $ | 24,494 | |
CP ALL NVDR | | | 97,172 | | | | 213,235 | |
| | | | | | | | 237,729 | |
| Energy — 2.2% | | | | | | | | |
PTT NVDR | | | 190,350 | | | | 208,853 | |
| PTT Exploration & Production NVDR | | | 22,650 | | | | 59,154 | |
Thai Oil NVDR | | | 18,430 | | | | 23,354 | |
| | | | | | | | 291,361 | |
| Financials — 0.5% | | | | | | | | |
Bangkok Bank NVDR | | | 3,500 | | | | 11,250 | |
Kasikornbank NVDR | | | 12,670 | | | | 33,775 | |
Krung Thai Bank NVDR | | | 25,300 | | | | 8,601 | |
| Siam Commercial Bank NVDR | | | 5,970 | | | | 12,639 | |
| | | | | | | | 66,265 | |
| Health Care — 1.0% | | | | | | | | |
| Bangkok Dusit Medical Services NVDR | | | 159,810 | | | | 102,737 | |
Bumrungrad Hospital NVDR | | | 7,200 | | | | 26,147 | |
| | | | | | | | 128,884 | |
| Industrials — 1.6% | | | | | | | | |
Airports of Thailand NVDR | | | 71,720 | | | | 137,987 | |
| Bangkok Expressway & Metro NVDR | | | 124,000 | | | | 36,217 | |
| BTS Group Holdings PCL NVDR | | | 113,900 | | | | 40,484 | |
| | | | | | | | 214,688 | |
| Real Estate — 0.6% | | | | | | | | |
Central Pattana NVDR * | | | 36,500 | | | | 55,278 | |
Land & Houses NVDR | | | 135,700 | | | | 31,036 | |
| | | | | | | | 86,314 | |
| Utilities — 1.1% | | | | | | | | |
Electricity Generating | | | 4,800 | | | | 42,429 | |
Energy Absolute NVDR | | | 27,300 | | | | 33,962 | |
Global Power Synergy NVDR | | | 11,600 | | | | 25,276 | |
| | | | | | | |
| COMMON STOCK — continued | | | | | | | | |
| Utilities — continued | | | | | | | | |
| Gulf Energy Development NVDR | | | 43,500 | | | $ | 52,098 | |
| | | | | | | | 153,765 | |
TOTAL THAILAND | | | | | | | 1,401,114 | |
| TURKEY— 2.5% | | | | | | | | |
| Communication Services — 0.5% | | | | | | | | |
Turkcell Iletisim Hizmetleri | | | 31,943 | | | | 63,753 | |
| Consumer Staples — 0.7% | | | | | | | | |
BIM Birlesik Magazalar | | | 12,550 | | | | 99,384 | |
| Energy — 0.4% | | | | | | | | |
| Tupras Turkiye Petrol Rafinerileri | | | 3,750 | | | | 48,716 | |
| Financials — 0.6% | | | | | | | | |
Akbank Turk | | | 36,504 | | | | 30,762 | |
Turkiye Garanti Bankasi | | | 29,459 | | | | 35,151 | |
Turkiye Is Bankasi, Cl C | | | 19,852 | | | | 14,059 | |
| | | | | | | | 79,972 | |
| Materials — 0.3% | | | | | | | | |
| Eregli Demir ve Celik Fabrikalari | | | 40,305 | | | | 46,651 | |
TOTAL TURKEY | | | | | | | 338,476 | |
| UNITED ARAB EMIRATES— 4.0% | | �� | | | | | | |
| Communication Services — 1.6% | | | | | | | | |
| Emirates Telecommunications Group PJSC | | | 51,233 | | | | 216,197 | |
| Financials — 1.4% | | | | | | | | |
| Abu Dhabi Commercial Bank PJSC | | | 35,539 | | | | 42,959 | |
Dubai Islamic Bank PJSC | | | 21,018 | | | | 21,000 | |
| National Bank of Abu Dhabi PJSC | | | 35,785 | | | | 113,013 | |
| | | | | | | | 176,972 | |
| Real Estate — 1.0% | | | | | | | | |
Aldar Properties PJSC | | | 115,237 | | | | 57,099 | |
| | | | | | | |
| COMMON STOCK — continued | | | | | | | | |
| Real Estate — continued | | | | | | | | |
Emaar Properties PJSC | | | 103,350 | | | $ | 76,814 | |
| | | | | | | | 133,913 | |
| TOTAL UNITED ARAB EMIRATES | | | | | | | 527,082 | |
| VIETNAM— 8.5% | | | | | | | | |
| Consumer Staples — 2.5% | | | | | | | | |
Masan Group * | | | 33,170 | | | | 83,247 | |
Saigon Beer Alcohol Beverage | | | 5,200 | | | | 36,177 | |
Vietnam Dairy Products JSC | | | 49,890 | | | | 210,812 | |
| | | | | | | | 330,236 | |
| Energy — 0.1% | | | | | | | | |
| Vietnam National Petroleum Group | | | 6,700 | | | | 11,525 | |
| Financials — 0.3% | | | | | | | | |
| Bank for Foreign Trade of Vietnam JSC | | | 8,460 | | | | 24,554 | |
| Bank for Investment and Development of Vietnam JSC | | | 3,580 | | | | 5,440 | |
Saigon Thuong Tin Commercial JSB * | | | 11,470 | | | | 4,455 | |
| | | | | | | | 34,449 | |
| Industrials — 0.5% | | | | | | | | |
Vietjet Aviation JSC * | | | 13,130 | | | | 64,728 | |
| Materials — 0.7% | | | | | | | | |
Hoa Phat Group JSC * | | | 109,550 | | | | 100,530 | |
| Real Estate — 4.3% | | | | | | | | |
No Va Land Investment Group * | | | 18,860 | | | | 42,825 | |
Vincom Retail JSC | | | 75,430 | | | | 74,371 | |
Vingroup JSC * | | | 68,410 | | | | 268,338 | |
Vinhomes JSC | | | 68,570 | | | | 186,139 | |
| | | | | | | | 571,673 | |
| Utilities — 0.1% | | | | | | | | |
PetroVietnam Gas JSC | | | 4,160 | | | | 11,257 | |
| | | | | | | | |
| COMMON STOCK — continued | | | | | | | | |
TOTAL VIETNAM | | | | | | $ | 1,124,398 | |
| TOTAL COMMON STOCK | | | | | | | | |
(Cost $16,402,221) | | | | | | | 13,266,577 | |
| TOTAL INVESTMENTS — 99.7% | | | | | | | | |
(Cost $16,402,221) | | | | | | $ | 13,266,577 | |
Percentages are based on Net Assets of $13,303,082.
| * | Non-income producing security. |
| ‡ | Real Estate Investment Trust |
| (A) | Level 3 security in accordance with fair value hierarchy. |
| (B) | Security considered illiquid. The total value of such securities as of April 30, 2020 was $162,073 and represented 1.2% of Net Assets. |
| (C) | Security is fair valued using methods determined in good faith by the Fair Value Committee of the Fund. The total value of such securities as of April 30, 2020 was $162,073 and represents 1.2% of Net Assets. |
| ADR — American Depositary Receipt |
| Cl — Class |
| GDR — Global Depositary Receipt |
| NVDR — Non-Voting Depositary Receipt |
| PJSC — Public Joint Stock Company |
The following is a summary of the level of inputs used as of April 30, 2020, in valuing the Fund’s investments carried at value:
| Investments in Securities | | | | | | | | | | | | |
| Common Stock | | $ | 11,980,106 | | | $ | 1,124,398 | | | $ | 162,073 | | | $ | 13,266,577 | |
| Total Investments in Securities | | $ | 11,980,106 | | | $ | 1,124,398 | | | $ | 162,073 | | | $ | 13,266,577 | |
| | | Investments in Common Stock | |
| Beginning Balance as of October 31, 2019 | | $ | ‒ | |
| Transfers out of Level 3 | | ‒ | |
| Transfers into Level 3 | | | 162,073 | |
| Net purchases | | ‒ | |
| Net sales | | ‒ | |
| Realized gain/(loss) | | ‒ | |
| Change in unrealized appreciation/(depreciation) | |
| ‒ | |
| Ending Balance as of April 30, 2020 | | $ | 162,073 | |
For the period ended April 30, 2020, the transfers in and out of Level 3 were due to changes in the availability of observable inputs to determine fair value. Transfers between levels are recognized at period end.
Amounts designated as “—“ are $0 or have been rounded to $0.
| | |
| Schedule of Investments |
| April 30, 2020 (Unaudited) |
| Global X MSCI Portugal ETF | |
Sector Weightings †:
† Sector weightings percentages are based on the total market value of investments. Repurchase agreements purchased from cash collateral received for securities lending activity are included in total investments. Please see Note 2 and 7 in Notes to Financial Statements for more detailed information.
| | | | | | | |
| COMMON STOCK — 99.9% | | | | | | |
| NETHERLANDS— 2.5% | | | | | | |
| Communication Services — 2.5% | | | | | | |
Altice Europe * | | | 94,735 | | | $ | 377,180 | |
| PORTUGAL— 92.3% | | | | | | | | |
| Communication Services — 5.9% | | | | | | | | |
NOS SGPS (A) | | | 181,386 | | | | 676,281 | |
Pharol SGPS *(A) | | | 1,212,718 | | | | 92,981 | |
Sonaecom | | | 64,845 | | | | 123,939 | |
| | | | | | | | 893,201 | |
| Consumer Discretionary — 0.9% | | | | | | | | |
Ibersol SGPS | | | 30,155 | | | | 132,446 | |
| Consumer Staples — 10.2% | | | | | | | | |
Jeronimo Martins | | | 46,708 | | | | 788,622 | |
Sonae (A) | | | 942,223 | | | | 738,925 | |
| | | | | | | | 1,527,547 | |
| | | | | | | |
| COMMON STOCK — continued | | | | | | | | |
| Energy — 21.8% | | | | | | | | |
Galp Energia | | | 281,789 | | | $ | 3,245,393 | |
| Financials — 3.1% | | | | | | | | |
Banco Comercial Portugues, Cl R (A) | | | 4,147,153 | | | | 463,323 | |
Banco Espirito Santo *(B)(C)(D) | | | 2,085,614 | | | | — | |
BANIF - Banco Internacional do Funchal *(B)(C)(D) | | | 55,479,410 | | | | 12 | |
| | | | | | | | 463,335 | |
| Industrials — 5.9% | | | | | | | | |
CTT-Correios de Portugal | | | 217,091 | | | | 511,228 | |
Mota-Engil | | | 174,056 | | | | 219,240 | |
Sonae Capital | | | 182,471 | | | | 98,132 | |
Teixeira Duarte * | | | 367,681 | | | | 48,327 | |
| | | | | | | | 876,927 | |
| Materials — 16.3% | | | | | | | | |
Altri (A) | | | 114,485 | | | | 604,407 | |
Corticeira Amorim SGPS | | | 61,285 | | | | 645,748 | |
Navigator (A) | | | 253,708 | | | | 659,704 | |
| Ramada Investimentos E Industria | | | 13,272 | | | | 45,064 | |
Semapa-Sociedade de Investimento e Gestao * | | | 48,115 | | | | 474,304 | |
| | | | | | | | 2,429,227 | |
| Utilities — 28.2% | | | | | | | | |
Energias de Portugal | | | 811,762 | | | | 3,423,130 | |
| REN - Redes Energeticas Nacionais | | | 286,728 | | | | 777,283 | |
| | | | | | | | 4,200,413 | |
TOTAL PORTUGAL | | | | | | | 13,768,489 | |
| SPAIN— 5.1% | | | | | | | | |
| Utilities — 5.1% | | | | | | | | |
EDP Renovaveis | | | 61,380 | | | | 752,972 | |
| TOTAL COMMON STOCK | | | | | | | | |
(Cost $23,395,764) | | | | | | | 14,898,641 | |
| | | | | | | |
SHORT-TERM INVESTMENT(E)(F) — 14.2% | | | | | | | | |
| Fidelity Investments Money Market Government Portfolio, Cl Institutional, 0.160% | | | | | | | | |
(Cost $2,115,580) | | | 2,115,580 | | | $ | 2,115,580 | |
| | | | | | | | | |
REPURCHASE AGREEMENT(E) — 1.5% | | | | | | | | |
| BNP Paribas | | | | | | | | |
| 0.030%, dated 04/30/20, to be repurchased on 05/01/20 repurchase price $228,527 (collateralized by U.S. Treasury Obligations, ranging in par value $55,128 - $177,832, 1.500%, 08/15/2026, with a total market value of $232,960) | | | | | | | | |
(Cost $228,527) | | $ | 228,527 | | | | 228,527 | |
| TOTAL INVESTMENTS — 115.6% | | | | | | | | |
(Cost $25,739,871) | | | | | | $ | 17,242,748 | |
Percentages are based on Net Assets of $14,920,472.
| * | Non-income producing security. |
| (A) | This security or a partial position of this security is on loan at April 30, 2020. The total value of securities on loan at April 30, 2020 was $2,188,640. |
| (B) | Level 3 security in accordance with fair value hierarchy. |
| (C) | Security considered illiquid. The total value of such securities as of April 30, 2020 was $12 and represented 0.0% of Net Assets. |
| (D) | Security is fair valued using methods determined in good faith by the Fair Value Committee of the Fund. The total value of such securities as of April 30, 2020 was $12 and represents 0.0% of Net Assets. |
| (E) | Security was purchased with cash collateral held from securities on loan. The total value of such securities as of April 30, 2020 was $2,344,107. |
| (F) | The rate reported on the Schedule of Investments is the 7-day effective yield as of April 30, 2020. |
The following is a summary of the level of inputs used as of April 30, 2020, in valuing the Fund’s investments carried at value:
| Investments in Securities | | | | | | | | | | | | |
| Common Stock | | $ | 14,898,629 | | | $ | — | | | $ | 12 | | | $ | 14,898,641 | |
| Short-Term Investment | | | 2,115,580 | | | | — | | | | — | | | | 2,115,580 | |
| Repurchase Agreement | | | — | | | | 228,527 | | | | — | | | | 228,527 | |
| Total Investments in Securities | | $ | 17,014,209 | | | $ | 228,527 | | | $ | 12 | | | $ | 17,242,748 | |
(1) | A reconciliation of Level 3 investments and disclosures of significant unobservable inputs are presented when the Fund has a significant amount of Level 3 investments at the beginning and/or end of the period in relation to Net Assets. Management has concluded that Level 3 investments are not material in relation to Net Assets. |
For the period ended April 30, 2020, there were no transfers in or out of Level 3.
Amounts designated as “—“ are $0 or have been rounded to $0.
| | |
| Schedule of Investments |
| April 30, 2020 (Unaudited) |
| Global X MSCI Pakistan ETF | |
Sector Weightings †:
† Sector weightings percentages are based on the total market value of investments.
| | | | | | | |
| COMMON STOCK — 99.6% | | | | | | |
| PAKISTAN— 99.6% | | | | | | |
| Consumer Discretionary — 3.5% | | | | | | |
Honda Atlas Cars Pakistan | | | 342,350 | | | $ | 365,458 | |
Nishat Mills | | | 1,460,200 | | | | 699,986 | |
PAK Suzuki Motor | | | 279,300 | | | | 286,745 | |
| | | | | | | | 1,352,189 | |
| Energy — 22.4% | | | | | | | | |
Oil & Gas Development | | | 4,298,940 | | | | 2,824,232 | |
Pakistan Oilfields | | | 736,134 | | | | 1,458,360 | |
Pakistan Petroleum | | | 4,537,876 | | | | 2,584,220 | |
Pakistan State Oil | | | 1,728,014 | | | | 1,663,850 | |
| | | | | | | | 8,530,662 | |
| Financials — 25.1% | | | | | | | | |
Bank Al Habib | | | 4,220,200 | | | | 1,513,878 | |
Bank Alfalah | | | 4,773,060 | | | | 896,725 | |
Habib Bank | | | 3,777,950 | | | | 2,371,480 | |
MCB Bank | | | 2,765,740 | | | | 2,822,563 | |
National Bank of Pakistan | | | 3,555,900 | | | | 628,588 | |
United Bank | | | 1,975,590 | | | | 1,318,456 | |
| | | | | | | | 9,551,690 | |
| | |
| Schedule of Investments |
| April 30, 2020 (Unaudited) |
| Global X MSCI Pakistan ETF | |
| | | | | | | |
| COMMON STOCK — continued | | | | | | | | |
| Health Care — 2.2% | | | | | | | | |
Searle | | | 728,416 | | | $ | 842,169 | |
| Industrials — 4.5% | | | | | | | | |
Millat Tractors | | | 187,900 | | | | 819,999 | |
Pak Elektron | | | 2,802,200 | | | | 420,920 | |
Pakistan International Bulk Terminal * | | | 7,450,987 | | | | 439,974 | |
| | | | | | | | 1,680,893 | |
| Materials — 34.0% | | | | | | | | |
DG Khan Cement | | | 2,174,660 | | | | 1,174,960 | |
Engro | | | 2,111,349 | | | | 4,051,421 | |
Engro Fertilizers | | | 3,482,300 | | | | 1,338,853 | |
Fauji Cement | | | 5,857,200 | | | | 622,333 | |
Fauji Fertilizer | | | 3,110,400 | | | | 2,168,116 | |
Fauji Fertilizer Bin Qasim | | | 2,891,500 | | | | 297,128 | |
International Steels | | | 1,490,500 | | | | 509,210 | |
Lucky Cement | | | 688,460 | | | | 2,019,512 | |
Maple Leaf Cement Factory | | | 4,652,318 | | | | 817,474 | |
| | | | | | | | 12,999,007 | |
| Utilities — 7.9% | | | | | | | | |
Hub Power | | | 3,441,742 | | | | 1,807,196 | |
K-Electric * | | | 20,027,200 | | | | 375,881 | |
Kot Addu Power | | | 2,587,848 | | | | 371,779 | |
SUI Northern Gas Pipeline | | | 1,425,600 | | | | 470,504 | |
| | | | | | | | 3,025,360 | |
TOTAL PAKISTAN | | | | | | | 37,981,970 | |
| TOTAL COMMON STOCK | | | | | | | | |
(Cost $49,796,068) | | | | | | | 37,981,970 | |
| | |
| Schedule of Investments |
| April 30, 2020 (Unaudited) |
| Global X MSCI Pakistan ETF | |
| | | | | | | |
| U.S. TREASURY OBLIGATION — 3.9% | | | | | | |
| United States Treasury Bill | | | | | | |
0.060%, 05/14/20(A) | | | | | | |
(Cost $1,499,968) | | $ | 1,500,000 | | | $ | 1,499,957 | |
| TOTAL INVESTMENTS — 103.5% | | | | | | | | |
(Cost $51,296,036) | | | | | | $ | 39,481,927 | |
Percentages are based on Net Assets of $38,146,850.
| * | Non-income producing security. |
| (A) | The rate reported on the Schedule of Investments is the effective yield at time of purchase. |
The following is a summary of the level of inputs used as of April 30, 2020, in valuing the Fund’s investments carried at value:
| Investments in Securities | | | | | | | | | | | | |
| Common Stock | | $ | 37,981,970 | | | $ | — | | | $ | — | | | $ | 37,981,970 | |
| U.S. Treasury Obligation | | | — | | | | 1,499,957 | | | | — | | | | 1,499,957 | |
| Total Investments in Securities | | $ | 37,981,970 | | | $ | 1,499,957 | | | $ | — | | | $ | 39,481,927 | |
For the period ended April 30, 2020, there were no transfers in or out of Level 3.
Amounts designated as “—“ are $0 or have been rounded to $0.
| | |
| Schedule of Investments |
| April 30, 2020 (Unaudited) |
| | |
Sector Weightings †:
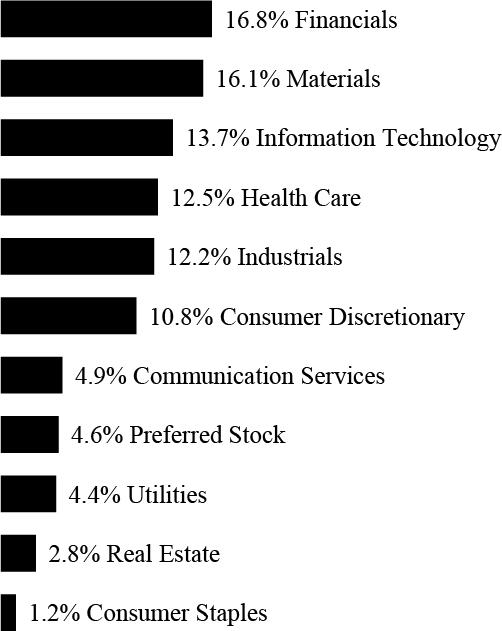
† Sector weightings percentages are based on the total market value of investments.
| | | | | | | |
| COMMON STOCK — 94.6% | | | | | | |
| GERMANY— 85.1% | | | | | | |
| Communication Services — 4.9% | | | | | | |
Deutsche Telekom | | | 45,333 | | | $ | 661,631 | |
| Consumer Discretionary — 10.8% | | | | | | | | |
adidas | | | 2,643 | | | | 605,610 | |
Bayerische Motoren Werke | | | 4,772 | | | | 282,508 | |
Continental * | | | 1,600 | | | | 135,292 | |
Daimler | | | 12,566 | | | | 434,034 | |
| | | | | | | | 1,457,444 | |
| Consumer Staples — 1.1% | | | | | | | | |
Beiersdorf | | | 1,459 | | | | 152,741 | |
| Financials — 16.6% | | | | | | | | |
Allianz | | | 6,164 | | | | 1,140,183 | |
Deutsche Bank | | | 30,703 | | | | 227,938 | |
Deutsche Boerse | | | 2,742 | | | | 425,720 | |
| | |
| Schedule of Investments |
| April 30, 2020 (Unaudited) |
| | |
| | | | | | | |
| COMMON STOCK — continued | | | | | | | | |
| Financials — continued | | | | | | | | |
| Muenchener Rueckversicherungs-Gesellschaft in Muenchen | | | 2,099 | | | $ | 461,647 | |
| | | | | | | | 2,255,488 | |
| Health Care — 12.4% | | | | | | | | |
Bayer | | | 14,565 | | | | 959,418 | |
Fresenius & KGaA | | | 6,119 | | | | 265,606 | |
| Fresenius Medical Care & KGaA | | | 3,040 | | | | 238,608 | |
Merck KGaA | | | 1,923 | | | | 223,475 | |
| | | | | | | | 1,687,107 | |
| Industrials — 12.1% | | | | | | | | |
Deutsche Lufthansa | | | 6,737 | | | | 60,198 | |
Deutsche Post | | | 14,692 | | | | 436,903 | |
MTU Aero Engines | | | 780 | | | | 106,194 | |
Siemens | | | 11,218 | | | | 1,040,472 | |
| | | | | | | | 1,643,767 | |
| Information Technology — 13.5% | | | | | | | | |
Infineon Technologies | | | 18,684 | | | | 346,875 | |
SAP | | | 11,128 | | | | 1,327,818 | |
Wirecard | | | 1,698 | | | | 168,128 | |
| | | | | | | | 1,842,821 | |
| Materials — 6.5% | | | | | | | | |
BASF | | | 13,590 | | | | 694,914 | |
Covestro | | | 2,325 | | | | 78,129 | |
HeidelbergCement | | | 2,169 | | | | 103,058 | |
| | | | | | | | 876,101 | |
| Real Estate — 2.8% | | | | | | | | |
Vonovia | | | 7,584 | | | | 374,220 | |
| Utilities — 4.4% | | | | | | | | |
E.ON | | | 33,172 | | | | 332,305 | |
RWE | | | 9,179 | | | | 263,811 | |
| | | | | | | | 596,116 | |
| | |
| Schedule of Investments |
| April 30, 2020 (Unaudited) |
| | |
| | | | | | | |
| COMMON STOCK — continued | | | | | | | | |
TOTAL GERMANY | | | | | | $ | 11,547,436 | |
| UNITED KINGDOM— 9.5% | | | | | | | | |
| Materials — 9.5% | | | | | | | | |
Linde | | | 6,961 | | | | 1,284,711 | |
| TOTAL COMMON STOCK | | | | | | | | |
(Cost $16,807,771) | | | | | | | 12,832,147 | |
| | | | | | | | | |
| PREFERRED STOCK — 4.5% | | | | | | | | |
| GERMANY— 4.5% | | | | | | | | |
| Consumer Discretionary — 2.8% | | | | | | | | |
Volkswagen(A) | | | 2,736 | | | | 384,243 | |
| Consumer Staples — 1.7% | | | | | | | | |
Henkel & KGaA(A) | | | 2,599 | | | | 230,696 | |
| TOTAL PREFERRED STOCK | | | | | | | | |
(Cost $949,879) | | | | | | | 614,939 | |
| TOTAL INVESTMENTS — 99.1% | | | | | | | | |
(Cost $17,757,650) | | | | | | $ | 13,447,086 | |
Percentages are based on Net Assets of $13,569,849.
| * | Non-income producing security. |
| (A) | There’s currently no stated interest rate. |
As of April 30, 2020, all of the Fund’s investments were considered Level 1, in accordance with authoritative guidance on fair value measurements and disclosure under U.S. GAAP.
For the period ended April 30, 2020, there were no transfers in or out of Level 3.
| | |
Statements of Assets and Liabilities |
| April 30, 2020 (Unaudited) |
|
| | | Global X MSCI China Consumer Discretionary ETF | | | Global X MSCI China Energy ETF | | | Global X MSCI China Financials ETF | | | Global X MSCI China Industrials ETF | |
| Assets: | | | | | | | | | | | | |
| Cost of Investments | | $ | 141,016,617 | | | $ | 2,342,705 | | | $ | 43,796,281 | | | $ | 2,241,820 | |
| Cost of Repurchase Agreement | | | 834,657 | | | | — | | | | 25,092 | | | | — | |
| Cost of Foreign Currency | | | 9,884 | | | | 20 | | | | 941 | | | | 30 | |
| Investments, at Value | | $ | 143,999,755 | * | | $ | 1,759,094 | | | $ | 36,473,932 | * | | $ | 1,923,456 | |
| Repurchase Agreement, at Value | | | 834,657 | | | | — | | | | 25,092 | | | | — | |
| Cash | | | 44,295 | | | | — | | | | 44,790 | | | | — | |
| Foreign Currency, at Value | | | 9,884 | | | | 21 | | | | 944 | | | | 31 | |
| Dividend and Interest Receivable | | | 18,971 | | | | — | | | | 1,515 | | | | — | |
| Total Assets | | | 144,907,562 | | | | 1,759,115 | | | | 36,546,273 | | | | 1,923,487 | |
| Liabilities: | | | | | | | | | | | | | | | | |
| Obligation to Return Securities Lending Collateral | | | 8,561,481 | | | | — | | | | 257,384 | | | | — | |
| Payable due to Investment Adviser | | | 71,405 | | | | 882 | | | | 19,576 | | | | 983 | |
| Unrealized Depreciation on Spot Contracts | | | — | | | | — | | | | 2 | | | | — | |
| Cash Overdraft | | | — | | | | 98,564 | | | | — | | | | 13 | |
| Total Liabilities | | | 8,632,886 | | | | 99,446 | | | | 276,962 | | | | 996 | |
| Net Assets | | $ | 136,274,676 | | | $ | 1,659,669 | | | $ | 36,269,311 | | | $ | 1,922,491 | |
| Net Assets Consist of: | | | | | | | | | | | | | | | | |
| Paid-in Capital | | $ | 207,819,667 | | | $ | 3,789,904 | | | $ | 52,105,434 | | | $ | 5,042,038 | |
| Total Distributable Loss | | | (71,544,991 | ) | | | (2,130,235 | ) | | | (15,836,123 | ) | | | (3,119,547 | ) |
| Net Assets | | $ | 136,274,676 | | | $ | 1,659,669 | | | $ | 36,269,311 | | | $ | 1,922,491 | |
| Outstanding Shares of Beneficial Interest | | | | | | | | | | | | | | | | |
| (unlimited authorization — no par value) | | | 7,750,000 | | | | 200,000 | | | | 2,550,000 | | | | 150,000 | |
| Net Asset Value, Offering and Redemption Price Per Share | | $ | 17.58 | | | $ | 8.30 | | | $ | 14.22 | | | $ | 12.82 | |
| *Includes Market Value of Securities on Loan | | $ | 8,021,713 | | | $ | — | | | $ | 244,446 | | | $ | — | |
| | | Global X MSCI China Materials ETF | | | Global X MSCI China Communication Services ETF | | | Global X MSCI China Consumer Staples ETF | | | Global X MSCI China Health Care ETF | |
| Assets: | | | | | | | | | | | | |
| Cost of Investments | | $ | 1,762,751 | | | $ | 18,875,363 | | | $ | 5,101,138 | | | $ | 4,403,228 | |
| Cost of Foreign Currency | | | 114 | | | | 12 | | | | 4 | | | | 6 | |
| Investments, at Value | | $ | 1,518,636 | | | $ | 17,303,731 | | | $ | 5,665,241 | | | $ | 4,875,546 | |
| Cash | | | 1,197 | | | | 19,940 | | | | 17,495 | | | | 8,431 | |
| Foreign Currency, at Value | | | 124 | | | | 12 | | | | 4 | | | | 6 | |
| Dividend and Interest Receivable | | | 971 | | | | 92 | | | | — | | | | — | |
| Total Assets | | | 1,520,928 | | | | 17,323,775 | | | | 5,682,740 | | | | 4,883,983 | |
| Liabilities: | | | | | | | | | | | | | | | | |
| Payable due to Investment Adviser | | | 782 | | | | 9,724 | | | | 2,615 | | | | 3,169 | |
| Total Liabilities | | | 782 | | | | 9,724 | | | | 2,615 | | | | 3,169 | |
| Net Assets | | $ | 1,520,146 | | | $ | 17,314,051 | | | $ | 5,680,125 | | | $ | 4,880,814 | |
| Net Assets Consist of: | | | | | | | | | | | | | | | | |
| Paid-in Capital | | $ | 3,818,673 | | | $ | 25,148,222 | | | $ | 4,930,917 | | | $ | 4,017,132 | |
| Total Distributable Earnings/(Loss) | | | (2,298,527 | ) | | | (7,834,171 | ) | | | 749,208 | | | | 863,682 | |
| Net Assets | | $ | 1,520,146 | | | $ | 17,314,051 | | | $ | 5,680,125 | | | $ | 4,880,814 | |
| Outstanding Shares of Beneficial Interest | | | | | | | | | | | | | | | | |
| (unlimited authorization — no par value) | | | 99,971 | | | | 750,000 | | | | 250,002 | | | | 250,002 | |
| Net Asset Value, Offering and Redemption Price Per Share | | $ | 15.21 | | | $ | 23.09 | | | $ | 22.72 | | | $ | 19.52 | |
| | | Global X MSCI China Information Technology ETF | | | Global X MSCI China Real Estate ETF | | | Global X MSCI China Utilities ETF | | | Global X MSCI China Large-Cap 50 ETF | |
| Assets: | | | | | | | | | | | | |
| Cost of Investments | | $ | 10,433,626 | | | $ | 8,773,531 | | | $ | 1,505,850 | | | $ | 2,587,606 | |
| Cost of Foreign Currency | | | 8 | | | | 9 | | | | 7 | | | | 3 | |
| Investments, at Value | | $ | 9,704,555 | | | $ | 8,381,966 | | | $ | 1,384,044 | | | $ | 2,780,176 | |
| Cash | | | 30,206 | | | | 12,675 | | | | — | | | | 3,399 | |
| Foreign Currency, at Value | | | 8 | | | | 9 | | | | 8 | | | | 3 | |
| Total Assets | | | 9,734,769 | | | | 8,394,650 | | | | 1,384,052 | | | | 2,783,578 | |
| Liabilities: | | | | | | | | | | | | | | | | |
| Payable due to Investment Adviser | | | 4,482 | | | | 4,923 | | | | 703 | | | | 639 | |
| Cash Overdraft | | | — | | | | — | | | | 2,127 | | | | — | |
| Total Liabilities | | | 4,482 | | | | 4,923 | | | | 2,830 | | | | 639 | |
| Net Assets | | $ | 9,730,287 | | | $ | 8,389,727 | | | $ | 1,381,222 | | | $ | 2,782,939 | |
| Net Assets Consist of: | | | | | | | | | | | | | | | | |
| Paid-in Capital | | $ | 9,982,503 | | | $ | 8,557,103 | | | $ | 1,502,076 | | | $ | 2,627,889 | |
| Total Distributable Earnings/(Loss) | | | (252,216 | ) | | | (167,376 | ) | | | (120,854 | ) | | | 155,050 | |
| Net Assets | | $ | 9,730,287 | | | $ | 8,389,727 | | | $ | 1,381,222 | | | $ | 2,782,939 | |
| Outstanding Shares of Beneficial Interest | | | | | | | | | | | | | | | | |
| (unlimited authorization — no par value) | | | 500,002 | | | | 500,002 | | | | 100,002 | | | | 100,002 | |
| Net Asset Value, Offering and Redemption Price Per Share | | $ | 19.46 | | | $ | 16.78 | | | $ | 13.81 | | | $ | 27.83 | |
| | | Global X FTSE Southeast Asia ETF | | | Global X MSCI Colombia ETF | | | Global X MSCI Argentina ETF | | | Global X MSCI Greece ETF | |
| Assets: | | | | | | | | | | | | |
| Cost of Investments | | $ | 26,015,712 | | | $ | 79,814,516 | | | $ | 89,188,411 | | | $ | 245,356,455 | |
| Cost of Repurchase Agreement | | | 22,752 | | | | 802,313 | | | | 31,077 | | | | 410,704 | |
| Cost of Foreign Currency | | | 20,932 | | | | 21,499 | | | | — | | | | 5,244 | |
| Investments, at Value | | $ | 20,085,913 | * | | $ | 52,694,209 | * | | $ | 43,986,971 | * | | $ | 147,705,869 | * |
| Repurchase Agreement, at Value | | | 22,752 | | | | 802,313 | | | | 31,077 | | | | 410,704 | |
| Cash | | | — | | | | — | | | | — | | | | 164,181 | |
| Foreign Currency, at Value | | | 20,932 | | | | 22,110 | | | | — | | | | 5,340 | |
| Dividend and Interest Receivable | | | 70,010 | | | | 446,581 | | | | 62 | | | | 42,384 | |
| Receivable for Investment Securities Sold | | | — | | | | 1,140,928 | | | | — | | | | 1,937,178 | |
| Reclaim Receivable | | | — | | | | — | | | | 2,134 | | | | — | |
| Total Assets | | | 20,199,607 | | | | 55,106,141 | | | | 44,020,244 | | | | 150,265,656 | |
| Liabilities: | | | | | | | | | | | | | | | | |
| Obligation to Return Securities Lending Collateral | | | 233,378 | | | | 8,229,710 | | | | 318,774 | | | | 4,212,790 | |
| Payable due to Investment Adviser | | | 10,327 | | | | 20,018 | | | | 17,662 | | | | 63,287 | |
| Unrealized Depreciation on Spot Contracts | | | 5 | | | | — | | | | — | | | | — | |
| Payable for Capital Shares Redeemed | | | — | | | | 1,142,563 | | | | — | | | | 1,918,974 | |
| Cash Overdraft | | | 50,104 | | | | 6,410,408 | | | | 5,925,082 | | | | 36,151 | |
| Total Liabilities | | | 293,814 | | | | 15,802,699 | | | | 6,261,518 | | | | 6,231,202 | |
| Net Assets | | $ | 19,905,793 | | | $ | 39,303,442 | | | $ | 37,758,726 | | | $ | 144,034,454 | |
| Net Assets Consist of: | | | | | | | | | | | | | | | | |
| Paid-in Capital | | $ | 32,218,878 | | | $ | 147,506,724 | | | $ | 93,725,358 | | | $ | 467,224,894 | |
| Total Distributable Loss | | | (12,313,085 | ) | | | (108,203,282 | ) | | | (55,966,632 | ) | | | (323,190,440 | ) |
| Net Assets | | $ | 19,905,793 | | | $ | 39,303,442 | | | $ | 37,758,726 | | | $ | 144,034,454 | |
| Outstanding Shares of Beneficial Interest | | | | | | | | | | | | | | | | |
| (unlimited authorization — no par value) | | | 1,650,000 | | | | 1,720,000 | | | | 2,074,975 | | | | 7,616,667 | |
| Net Asset Value, Offering and Redemption Price Per Share | | $ | 12.06 | | | $ | 22.85 | | | $ | 18.20 | | | $ | 18.91 | |
| *Includes Market Value of Securities on Loan | | $ | 222,564 | | | $ | 8,014,770 | | | $ | 290,747 | | | $ | 3,930,024 | |
| | | Global X MSCI Norway ETF | | | Global X FTSE Nordic Region ETF | | | Global X MSCI Nigeria ETF | | | Global X MSCI Next Emerging & Frontier ETF | |
| Assets: | | | | | | | | | | | | |
| Cost of Investments | | $ | 66,298,505 | | | $ | 19,003,326 | | | $ | 43,141,986 | | | $ | 16,402,221 | |
| Cost of Repurchase Agreement | | | 758,156 | | | | — | | | | — | | | | — | |
| Cost of Foreign Currency | | | — | | | | 4,722 | | | | 1,709,348 | | | | 40,329 | |
| Investments, at Value | | $ | 43,608,930 | * | | $ | 16,881,849 | | | $ | 29,248,172 | | | $ | 13,266,577 | |
| Repurchase Agreement, at Value | | | 758,156 | | | | — | | | | — | | | | — | |
| Cash | | | 72,690 | | | | — | | | | — | | | | — | |
| Foreign Currency, at Value | | | — | | | | 4,722 | | | | 1,703,749 | | | | 40,291 | |
| Dividend and Interest Receivable | | | 16,831 | | | | 17,164 | | | | 146,731 | | | | 45,368 | |
| Receivable for Investment Securities Sold | | | — | | | | — | | | | 68,339 | | | | — | |
| Reclaim Receivable | | | — | | | | 127,295 | | | | — | | | | — | |
| Total Assets | | | 44,456,607 | | | | 17,031,030 | | | | 31,166,991 | | | | 13,352,236 | |
| Liabilities: | | | | | | | | | | | | | | | | |
| Obligation to Return Securities Lending Collateral | | | 7,776,774 | | | | — | | | | — | | | | — | |
| Payable due to Investment Adviser | | | 13,656 | | | | 6,515 | | | | 15,829 | | | | 4,954 | |
| Unrealized Depreciation on Spot Contracts | | | — | | | | 36 | | | | — | | | | — | |
| Cash Overdraft | | | — | | | | 4,062 | | | | 1,449,545 | | | | 44,200 | |
| Total Liabilities | | | 7,790,430 | | | | 10,613 | | | | 1,465,374 | | | | 49,154 | |
| Net Assets | | $ | 36,666,177 | | | $ | 17,020,417 | | | $ | 29,701,617 | | | $ | 13,303,082 | |
| Net Assets Consist of: | | | | | | | | | | | | | | | | |
| Paid-in Capital | | $ | 96,996,603 | | | $ | 23,928,889 | | | $ | 71,678,136 | | | $ | 41,006,424 | |
| Total Distributable Loss | | | (60,330,426 | ) | | | (6,908,472 | ) | | | (41,976,519 | ) | | | (27,703,342 | ) |
| Net Assets | | $ | 36,666,177 | | | $ | 17,020,417 | | | $ | 29,701,617 | | | $ | 13,303,082 | |
| Outstanding Shares of Beneficial Interest | | | | | | | | | | | | | | | | |
| (unlimited authorization — no par value) | | | 4,150,000 | | | | 860,000 | | | | 2,962,135 | | | | 850,000 | |
| Net Asset Value, Offering and Redemption Price Per Share | | $ | 8.84 | | | $ | 19.79 | | | $ | 10.03 | | | $ | 15.65 | |
| *Includes Market Value of Securities on Loan | | $ | 7,517,374 | | | $ | — | | | $ | — | | | $ | — | |
| | | Global X MSCI Portugal ETF | | | Global X MSCI Pakistan ETF | | | Global X DAX Germany ETF | |
| Assets: | | | | | | | | | |
| Cost of Investments | | $ | 25,511,344 | | | $ | 51,296,036 | | | $ | 17,757,650 | |
| Cost of Repurchase Agreement | | | 228,527 | | | | — | | | | — | |
| Cost of Foreign Currency | | | — | | | | 167,323 | | | | — | |
| Investments, at Value | | $ | 17,014,221 | * | | $ | 39,481,927 | | | $ | 13,447,086 | |
| Repurchase Agreement, at Value | | | 228,527 | | | | — | | | | — | |
| Foreign Currency, at Value | | | — | | | | 168,191 | | | | — | |
| Dividend and Interest Receivable | | | 86,715 | | | | 165,964 | | | | 55,812 | |
| Receivable for Investment Securities Sold | | | — | | | | — | | | | 2,317,859 | |
| Reclaim Receivable | | | — | | | | — | | | | 110,277 | |
| Total Assets | | | 17,329,463 | | | | 39,816,082 | | | | 15,931,034 | |
| Liabilities: | | | | | | | | | | | | |
| Obligation to Return Securities Lending Collateral | | | 2,344,107 | | | | — | | | | — | |
| Payable due to Investment Adviser | | | 6,395 | | | | 19,834 | | | | 2,451 | |
| Payable for Capital Shares Redeemed | | | — | | | | — | | | | 2,291,925 | |
| Cash Overdraft | | | 58,489 | | | | 1,649,398 | | | | 66,809 | |
| Total Liabilities | | | 2,408,991 | | | | 1,669,232 | | | | 2,361,185 | |
| Net Assets | | $ | 14,920,472 | | | $ | 38,146,850 | | | $ | 13,569,849 | |
| Net Assets Consist of: | | | | | | | | | | | | |
| Paid-in Capital | | $ | 36,488,400 | | | $ | 82,515,287 | | | $ | 18,980,537 | |
| Total Distributable Loss | | | (21,567,928 | ) | | | (44,368,437 | ) | | | (5,410,688 | ) |
| Net Assets | | $ | 14,920,472 | | | $ | 38,146,850 | | | $ | 13,569,849 | |
| Outstanding Shares of Beneficial Interest | | | | | | | | | | | | |
| (unlimited authorization — no par value) | | | 1,700,000 | | | | 1,562,500 | | | | 600,000 | |
| Net Asset Value, Offering and Redemption Price Per Share | | $ | 8.78 | | | $ | 24.41 | | | $ | 22.62 | |
| *Includes Market Value of Securities on Loan | | $ | 2,188,640 | | | $ | — | | | $ | — | |
| | |
|
| For the period ended April 30, 2020 (Unaudited) |
|
| | | Global X MSCI China Consumer Discretionary ETF | | | Global X MSCI China Energy ETF | | | Global X MSCI China Financials ETF | | | Global X MSCI China Industrials ETF | |
| Investment Income: | | | | | | | | | | | | |
| Dividend Income | | $ | 110,499 | | | $ | 17,331 | | | $ | 19,669 | | | $ | 1,871 | |
| Interest Income | | | 935 | | | | 15 | | | | 631 | | | | 8 | |
| Security Lending Income | | | 301,435 | | | | — | | | | 19,509 | | | | — | |
| Less: Foreign Taxes Withheld | | | (1,549 | ) | | | (1,733 | ) | | | (1,995 | ) | | | (6 | ) |
| Total Investment Income | | | 411,320 | | | | 15,613 | | | | 37,814 | | | | 1,873 | |
Supervision and Administration Fees(1) | | | 500,763 | | | | 5,056 | | | | 172,250 | | | | 6,317 | |
Custodian Fees(2) | | | 2,322 | | | | 60 | | | | 377 | | | | 60 | |
| Total Expenses | | | 503,085 | | | | 5,116 | | | | 172,627 | | | | 6,377 | |
| Net Investment Income (Loss) | | | (91,765 | ) | | | 10,497 | | | | (134,813 | ) | | | (4,504 | ) |
| Net Realized Loss on: | | | | | | | | | | | | | | | | |
Investments(3) | | | (875,643 | ) | | | (47,064 | ) | | | (4,321,499 | ) | | | (87,059 | ) |
| Foreign Currency Transactions | | | (11,768 | ) | | | (135 | ) | | | (4,184 | ) | | | (273 | ) |
| Net Realized Loss on Investments and Foreign Currency Transactions | | | (887,411 | ) | | | (47,199 | ) | | | (4,325,683 | ) | | | (87,332 | ) |
| Net Change in Unrealized Appreciation (Depreciation) on: | | | | | | | | | | | | | | | | |
| Investments | | | (450,998 | ) | | | (287,489 | ) | | | 529,082 | | | | 100,342 | |
| Foreign Currency Translations | | | — | | | | 7 | | | | 1 | | | | — | |
| Net Change in Unrealized Appreciation (Depreciation) on Investments and Foreign Currency Translations | | | (450,998 | ) | | | (287,482 | ) | | | 529,083 | | | | 100,342 | |
| Net Realized and Unrealized Gain (Loss) on Investments and Foreign Currency Transactions and Translations | | | (1,338,409 | ) | | | (334,681 | ) | | | (3,796,600 | ) | | | 13,010 | |
| Net Increase (Decrease) in Net Assets Resulting from Operations | | $ | (1,430,174 | ) | | $ | (324,184 | ) | | $ | (3,931,413 | ) | | $ | 8,506 | |
| (1) | The Supervision and Administration fees reflect the supervisory and administrative fee, which includes fees paid by the Funds for the investment advisory services provided by the Adviser. (See Note 3 in Notes to Financial Statements.) |
| (2) | See Note 2 in the Notes to Financial Statements. |
| (3) | Includes realized gains/(losses) as a result of in-kind transactions. (See Note 4 in Notes to Financial Statements). |
| | |
|
| For the period ended April 30, 2020 (Unaudited) |
|
| | | Global X MSCI China Materials ETF | | | Global X MSCI China Communication Services ETF | | | Global X MSCI China Consumer Staples ETF | | | Global X MSCI China Health Care ETF | |
| Investment Income: | | | | | | | | | | | | |
| Dividend Income | | $ | 2,929 | | | $ | 62,228 | | | $ | 2,836 | | | $ | 2,023 | |
| Interest Income | | | 39 | | | | 199 | | | | — | | | | — | |
| Security Lending Income | | | — | | | | 248 | | | | — | | | | — | |
| Less: Foreign Taxes Withheld | | | (27 | ) | | | — | | | | (140 | ) | | | (160 | ) |
| Total Investment Income | | | 2,941 | | | | 62,675 | | | | 2,696 | | | | 1,863 | |
Supervision and Administration Fees(1) | | | 5,667 | | | | 67,868 | | | | 13,630 | | | | 11,990 | |
Custodian Fees(2) | | | 72 | | | | 238 | | | | 47 | | | | 47 | |
| Total Expenses | | | 5,739 | | | | 68,106 | | | | 13,677 | | | | 12,037 | |
| Net Investment Loss | | | (2,798 | ) | | | (5,431 | ) | | | (10,981 | ) | | | (10,174 | ) |
| Net Realized Gain (Loss) on: | | | | | | | | | | | | | | | | |
Investments(3) | | | (129,232 | ) | | | (116,357 | ) | | | 198,820 | | | | 407,126 | |
| Foreign Currency Transactions | | | (591 | ) | | | (2,891 | ) | | | (2,724 | ) | | | (1,928 | ) |
| Net Realized Gain (Loss) on Investments and Foreign Currency Transactions | | | (129,823 | ) | | | (119,248 | ) | | | 196,096 | | | | 405,198 | |
| Net Change in Unrealized Appreciation (Depreciation) on: | | | | | | | | | | | | | | | | |
| Investments | | | 324,415 | | | | 914,438 | | | | 163,335 | | | | 238,025 | |
| Foreign Currency Translations | | | 7 | | | | (8 | ) | | | — | | | | — | |
| Net Change in Unrealized Appreciation on Investments and Foreign Currency Translations | | | 324,422 | | | | 914,430 | | | | 163,335 | | | | 238,025 | |
| Net Realized and Unrealized Gain on Investments and Foreign Currency Transactions and Translations | | | 194,599 | | | | 795,182 | | | | 359,431 | | | | 643,223 | |
| Net Increase in Net Assets Resulting from Operations | | $ | 191,801 | | | $ | 789,751 | | | $ | 348,450 | | | $ | 633,049 | |
| (1) | The Supervision and Administration fees reflect the supervisory and administrative fee, which includes fees paid by the Funds for the investment advisory services provided by the Adviser. (See Note 3 in Notes to Financial Statements.) |
| (2) | See Note 2 in the Notes to Financial Statements. |
| (3) | Includes realized gains/(losses) as a result of in-kind transactions. (See Note 4 in Notes to Financial Statements). |
| | |
|
| For the period ended April 30, 2020 (Unaudited) |
|
| | | Global X MSCI China Information Technology ETF | | | Global X MSCI China Real Estate ETF | | | Global X MSCI China Utilities ETF | | | Global X MSCI China Large-Cap 50 ETF | |
| Investment Income: | | | | | | | | | | | | |
| Dividend Income | | $ | 1,424 | | | $ | 10,875 | | | $ | 405 | | | $ | 2,040 | |
| Total Investment Income | | | 1,424 | | | | 10,875 | | | | 405 | | | | 2,040 | |
Supervision and Administration Fees(1) | | | 21,335 | | | | 20,797 | | | | 4,704 | | | | 4,074 | |
Custodian Fees(2) | | | 152 | | | | 73 | | | | 26 | | | | 4 | |
| Total Expenses | | | 21,487 | | | | 20,870 | | | | 4,730 | | | | 4,078 | |
| Net Investment Loss | | | (20,063 | ) | | | (9,995 | ) | | | (4,325 | ) | | | (2,038 | ) |
| Net Realized Gain (Loss) on: | | | | | | | | | | | | | | | | |
Investments(3) | | | 526,308 | | | | 269,466 | | | | 6,990 | | | | (16,988 | ) |
| Foreign Currency Transactions | | | (4,494 | ) | | | (3,144 | ) | | | (77 | ) | | | (7 | ) |
| Net Realized Gain (Loss) on Investments and Foreign Currency Transactions | | | 521,814 | | | | 266,322 | | | | 6,913 | | | | (16,995 | ) |
| Net Change in Unrealized Appreciation (Depreciation) on: | | | | | | | | | | | | | | | | |
| Investments | | | (782,727 | ) | | | (601,697 | ) | | | (176,057 | ) | | | 75,216 | |
| Foreign Currency Translations | | | (1 | ) | | | 7 | | | | — | | | | 3 | |
| Net Change in Unrealized Appreciation (Depreciation) on Investments and Foreign Currency Translations | | | (782,728 | ) | | | (601,690 | ) | | | (176,057 | ) | | | 75,219 | |
| Net Realized and Unrealized Gain (Loss) on Investments and Foreign Currency Transactions and Translations | | | (260,914 | ) | | | (335,368 | ) | | | (169,144 | ) | | | 58,224 | |
| Net Increase (Decrease) in Net Assets Resulting from Operations | | $ | (280,977 | ) | | $ | (345,363 | ) | | $ | (173,469 | ) | | $ | 56,186 | |
| (1) | The Supervision and Administration fees reflect the supervisory and administrative fee, which includes fees paid by the Funds for the investment advisory services provided by the Adviser. (See Note 3 in Notes to Financial Statements.) |
| (2) | See Note 2 in the Notes to Financial Statements. |
| (3) | Includes realized gains/(losses) as a result of in-kind transactions. (See Note 4 in Notes to Financial Statements). |
| | |
|
| For the period ended April 30, 2020 (Unaudited) |
|
| | | Global X FTSE Southeast Asia ETF | | | Global X MSCI Colombia ETF | | | Global X MSCI Argentina ETF | | | Global X MSCI Greece ETF | |
| Investment Income: | | | | | | | | | | | | |
| Dividend Income | | $ | 440,737 | | | $ | 1,457,851 | | | $ | 298,380 | | | $ | 3,847,588 | |
| Interest Income | | | 237 | | | | 718 | | | | 830 | | | | 4,462 | |
| Security Lending Income | | | 55 | | | | 1,608 | | | | 6,955 | | | | 863,428 | |
| Less: Foreign Taxes Withheld | | | (34,535 | ) | | | (44,090 | ) | | | (11,692 | ) | | | (119,629 | ) |
| Total Investment Income | | | 406,494 | | | | 1,416,087 | | | | 294,473 | | | | 4,595,849 | |
Supervision and Administration Fees(1) | | | 78,804 | | | | 188,604 | | | | 182,441 | | | | 718,787 | |
Custodian Fees(2) | | | 159 | | | | 584 | | | | 536 | | | | 50,575 | |
| Total Expenses | | | 78,963 | | | | 189,188 | | | | 182,977 | | | | 769,362 | |
| Net Investment Income | | | 327,531 | | | | 1,226,899 | | | | 111,496 | | | | 3,826,487 | |
| Net Realized Gain (Loss) on: | | | | | | | | | | | | | | | | |
Investments(3) | | | (711,793 | ) | | | (32,842 | ) | | | (4,969,673 | ) | | | (19,556,584 | ) |
| Foreign Currency Transactions | | | (12,738 | ) | | | (131,476 | ) | | | 12,325 | | | | (18,269 | ) |
| Net Realized Loss on Investments and Foreign Currency Transactions | | | (724,531 | ) | | | (164,318 | ) | | | (4,957,348 | ) | | | (19,574,853 | ) |
| Net Change in Unrealized Appreciation (Depreciation) on: | | | | | | | | | | | | | | | | |
| Investments | | | (5,968,217 | ) | | | (27,378,718 | ) | | | (3,347,265 | ) | | | (91,281,010 | ) |
| Foreign Currency Translations | | | 1,027 | | | | 783 | | | | (52 | ) | | | 9 | |
| Net Change in Unrealized Depreciation on Investments and Foreign Currency Translations | | | (5,967,190 | ) | | | (27,377,935 | ) | | | (3,347,317 | ) | | | (91,281,001 | ) |
| Net Realized and Unrealized Loss on Investments and Foreign Currency Transactions and Translations | | | (6,691,721 | ) | | | (27,542,253 | ) | | | (8,304,665 | ) | | | (110,855,854 | ) |
| Net Decrease in Net Assets Resulting from Operations | | $ | (6,364,190 | ) | | $ | (26,315,354 | ) | | $ | (8,193,169 | ) | | $ | (107,029,367 | ) |
| (1) | The Supervision and Administration fees reflect the supervisory and administrative fee, which includes fees paid by the Funds for the investment advisory services provided by the Adviser. (See Note 3 in Notes to Financial Statements.) |
| (2) | See Note 2 in the Notes to Financial Statements. |
| (3) | Includes realized gains/(losses) as a result of in-kind transactions. (See Note 4 in Notes to Financial Statements). |
| | |
|
| For the period ended April 30, 2020 (Unaudited) |
|
| | | Global X MSCI Norway ETF | | | Global X FTSE Nordic Region ETF | | | Global X MSCI Nigeria ETF | | | Global X MSCI Next Emerging & Frontier ETF | |
| Investment Income: | | | | | | | | | | | | |
| Dividend Income | | $ | 750,486 | | | $ | 173,227 | | | $ | 1,723,445 | | | $ | 292,111 | |
| Interest Income | | | 507 | | | | 423 | | | | 425 | | | | 155 | |
| Security Lending Income | | | 34,059 | | | | 1,870 | | | | — | | | | — | |
| Less: Foreign Taxes Withheld | | | (163,427 | ) | | | (27,498 | ) | | | (172,344 | ) | | | (18,559 | ) |
| Total Investment Income | | | 621,625 | | | | 148,022 | | | | 1,551,526 | | | | 273,707 | |
Supervision and Administration Fees(1) | | | 147,361 | | | | 43,971 | | | | 120,383 | | | | 40,020 | |
Custodian Fees(2) | | | 14 | | | | 639 | | | | 37,111 | | | | 15,692 | |
| Total Expenses | | | 147,375 | | | | 44,610 | | | | 157,494 | | | | 55,712 | |
| Net Investment Income | | | 474,250 | | | | 103,412 | | | | 1,394,032 | | | | 217,995 | |
| Net Realized Loss on: | | | | | | | | | | | | | | | | |
Investments(3) | | | (6,425,911 | ) | | | (11,400 | ) | | | (3,110,810 | ) | | | (889,467 | ) |
| Foreign Currency Transactions | | | (10,535 | ) | | | (2,619 | ) | | | (54,378 | ) | | | (1,742 | ) |
| Net Realized Loss on Investments and Foreign Currency Transactions | | | (6,436,446 | ) | | | (14,019 | ) | | | (3,165,188 | ) | | | (891,209 | ) |
| Net Change in Unrealized Appreciation (Depreciation) on: | | | | | | | | | | | | | | | | |
| Investments | | | (5,293,158 | ) | | | (856,953 | ) | | | (5,420,526 | ) | | | (3,222,886 | ) |
| Foreign Currency Translations | | | 282 | | | | (1,657 | ) | | | (9,535 | ) | | | (186 | ) |
| Net Change in Unrealized Depreciation on Investments and Foreign Currency Translations | | | (5,292,876 | ) | | | (858,610 | ) | | | (5,430,061 | ) | | | (3,223,072 | ) |
| Net Realized and Unrealized Loss on Investments and Foreign Currency Transactions and Translations | | | (11,729,322 | ) | | | (872,629 | ) | | | (8,595,249 | ) | | | (4,114,281 | ) |
| Net Decrease in Net Assets Resulting from Operations | | $ | (11,255,072 | ) | | $ | (769,217 | ) | | $ | (7,201,217 | ) | | $ | (3,896,286 | ) |
| (1) | The Supervision and Administration fees reflect the supervisory and administrative fee, which includes fees paid by the Funds for the investment advisory services provided by the Adviser. (See Note 3 in Notes to Financial Statements.) |
| (2) | See Note 2 in the Notes to Financial Statements. |
| (3) | Includes realized gains/(losses) as a result of in-kind transactions. (See Note 4 in Notes to Financial Statements). |
| | |
|
| For the period ended April 30, 2020 (Unaudited) |
|
| | | Global X MSCI Portugal ETF | | | Global X MSCI Pakistan ETF | | | Global X DAX Germany ETF | |
| Investment Income: | | | | | | | | | |
| Dividend Income | | $ | 50,665 | | | $ | 1,113,476 | | | $ | 151,423 | |
| Interest Income | | | 363 | | | | 572 | | | | — | |
| Security Lending Income | | | 11,068 | | | | — | | | | — | |
| Less: Foreign Taxes Withheld | | | (7,600 | ) | | | (193,311 | ) | | | (14,242 | ) |
| Total Investment Income | | | 54,496 | | | | 920,737 | | | | 137,181 | |
Supervision and Administration Fees(1) | | | 51,946 | | | | 168,908 | | | | 38,104 | |
Custodian Fees(2) | | | 3,549 | | | | 36,173 | | | | 76 | |
| Total Expenses | | | 55,495 | | | | 205,081 | | | | 38,180 | |
| Waiver of Supervision and Administration Fees | | | – | | | | – | | | | (21,169 | ) |
| Net Expenses | | | 55,495 | | | | 205,081 | | | | 17,011 | |
| Net Investment Income (Loss) | | | (999 | ) | | | 715,656 | | | | 120,170 | |
| Net Realized Gain (Loss) on: | | | | | | | | | | | | |
Investments(3) | | | (484,508 | ) | | | (14,995,677 | ) | | | (7,005 | ) |
| Foreign Currency Transactions | | | 162 | | | | (157,898 | ) | | | (206 | ) |
| Net Realized Loss on Investments and Foreign Currency Transactions | | | (484,346 | ) | | | (15,153,575 | ) | | | (7,211 | ) |
| Net Change in Unrealized Appreciation (Depreciation) on: | | | | | | | | | | | | |
| Investments | | | (2,530,535 | ) | | | 10,121,665 | | | | (3,443,571 | ) |
| Foreign Currency Translations | | | (1,562 | ) | | | 2,086 | | | | (1,354 | ) |
| Net Change in Unrealized Appreciation (Depreciation) on Investments and Foreign Currency Translations | | | (2,532,097 | ) | | | 10,123,751 | | | | (3,444,925 | ) |
| Net Realized and Unrealized Loss on Investments and Foreign Currency Transactions and Translations | | | (3,016,443 | ) | | | (5,029,824 | ) | | | (3,452,136 | ) |
| Net Decrease in Net Assets Resulting from Operations | | $ | (3,017,442 | ) | | $ | (4,314,168 | ) | | $ | (3,331,966 | ) |
| (1) | The Supervision and Administration fees reflect the supervisory and administrative fee, which includes fees paid by the Funds for the investment advisory services provided by the Adviser. (See Note 3 in Notes to Financial Statements.) |
| (2) | See Note 2 in the Notes to Financial Statements. |
| (3) | Includes realized gains/(losses) as a result of in-kind transactions. (See Note 4 in Notes to Financial Statements). |
| | |
Statements of Changes in Net Assets
|
| | | Global X MSCI China Consumer Discretionary ETF | | | Global X MSCI China Energy ETF | |
| | | Period Ended April 30, 2020
(Unaudited) | | | Year Ended October 31, 2019 | | | Period Ended April 30, 2020
(Unaudited) | | | Year Ended October 31, 2019 | |
| Operations: | | | | | | | | | | | | |
| Net Investment Income (Loss) | | $ | (91,765 | ) | | $ | 1,457,518 | | | $ | 10,497 | | | $ | 56,817 | |
Net Realized Loss on Investments and Foreign Currency Transactions(1) | | | (887,411 | ) | | | (20,246,748 | ) | | | (47,199 | ) | | | (263,806 | ) |
| Net Change in Unrealized Appreciation (Depreciation) on Investments and Foreign Currency Translations | | | (450,998 | ) | | | 56,137,252 | | | | (287,482 | ) | | | 14,295 | |
| Net Increase (Decrease) in Net Assets Resulting from Operations | | | (1,430,174 | ) | | | 37,348,022 | | | | (324,184 | ) | | | (192,694 | ) |
| Distributions | | | (1,252,988 | ) | | | (3,541,990 | ) | | | (43,218 | ) | | | (123,563 | ) |
| Capital Share Transactions: | | | | | | | | | | | | | | | | |
| Issued | | | 10,706,901 | | | | 26,355,509 | | | | 463,155 | | | | — | |
| Redeemed | | | (28,234,654 | ) | | | (23,778,436 | ) | | | — | | | | (1,074,531 | ) |
| Increase (Decrease) in Net Assets from Capital Share Transactions | | | (17,527,753 | ) | | | 2,577,073 | | | | 463,155 | | | | (1,074,531 | ) |
| Total Increase (Decrease) in Net Assets | | | (20,210,915 | ) | | | 36,383,105 | | | | 95,753 | | | | (1,390,788 | ) |
| Net Assets: | | | | | | | | | | | | | | | | |
| Beginning of Period | | | 156,485,591 | | | | 120,102,486 | | | | 1,563,916 | | | | 2,954,704 | |
| End of Period | | $ | 136,274,676 | | | $ | 156,485,591 | | | $ | 1,659,669 | | | $ | 1,563,916 | |
| Share Transactions: | | | | | | | | | | | | | | | | |
| Issued | | | 550,000 | | | | 1,600,000 | | | | 50,000 | | | | — | |
| Redeemed | | | (1,650,000 | ) | | | (1,600,000 | ) | | | — | | | | (100,000 | ) |
| Net Increase (Decrease) in Shares Outstanding from Share Transactions | | | (1,100,000 | ) | | | — | | | | 50,000 | | | | (100,000 | ) |
| (1) | Includes realized gains (losses) as a result of in-kind redemptions. (See Note 4 in Notes to Financial Statements.) |
| | | Global X MSCI China Financials ETF | | | Global X MSCI China Industrials ETF | |
| | | Period Ended April 30, 2020
(Unaudited) | | | Year Ended October 31, 2019 | | | Period Ended April 30, 2020
(Unaudited) | | | Year Ended October 31, 2019 | |
| Operations: | | | | | | | | | | | | |
| Net Investment Income (Loss) | | $ | (134,813 | ) | | $ | 2,815,432 | | | $ | (4,504 | ) | | $ | 40,829 | |
Net Realized Loss on Investments and Foreign Currency Transactions(1) | | | (4,325,683 | ) | | | (2,761,859 | ) | | | (87,332 | ) | | | (373,576 | ) |
| Net Change in Unrealized Appreciation (Depreciation) on Investments and Foreign Currency Translations | | | 529,083 | | | | (5,721,964 | ) | | | 100,342 | | | | 300,844 | |
| Net Increase (Decrease) in Net Assets Resulting from Operations | | | (3,931,413 | ) | | | (5,668,391 | ) | | | 8,506 | | | | (31,903 | ) |
| Distributions | | | (1,692,791 | ) | | | (2,438,433 | ) | | | (24,432 | ) | | | (67,864 | ) |
| Capital Share Transactions: | | | | | | | | | | | | | | | | |
| Issued | | | 3,252,389 | | | | 78,511,082 | | | | — | | | | — | |
| Redeemed | | | (21,518,736 | ) | | | (41,027,907 | ) | | | — | | | | — | |
| Increase (Decrease) in Net Assets from Capital Share Transactions | | | (18,266,347 | ) | | | 37,483,175 | | | | — | | | | — | |
| Total Increase (Decrease) in Net Assets | | | (23,890,551 | ) | | | 29,376,351 | | | | (15,926 | ) | | | (99,767 | ) |
| Net Assets: | | | | | | | | | | | | | | | | |
| Beginning of Period | | | 60,159,862 | | | | 30,783,511 | | | | 1,938,417 | | | | 2,038,184 | |
| End of Period | | $ | 36,269,311 | | | $ | 60,159,862 | | | $ | 1,922,491 | | | $ | 1,938,417 | |
| Share Transactions: | | | | | | | | | | | | | | | | |
| Issued | | | 200,000 | | | | 4,500,000 | | | | — | | | | — | |
| Redeemed | | | (1,450,000 | ) | | | (2,700,000 | ) | | | — | | | | — | |
| Net Increase (Decrease) in Shares Outstanding from Share Transactions | | | (1,250,000 | ) | | | 1,800,000 | | | | — | | | | — | |
| (1) | Includes realized gains (losses) as a result of in-kind redemptions. (See Note 4 in Notes to Financial Statements.) |
| | | Global X MSCI China Materials ETF | | | Global X MSCI China Communication Services ETF | |
| | | Period Ended April 30, 2020
(Unaudited) | | | Year Ended October 31, 2019 | | | Period Ended April 30, 2020
(Unaudited) | | | Year Ended October 31, 2019 | |
| Operations: | | | | | | | | | | | | |
| Net Investment Income (Loss) | | $ | (2,798 | ) | | $ | 78,356 | | | $ | (5,431 | ) | | $ | 98,084 | |
Net Realized Loss on Investments and Foreign Currency Transactions(1) | | | (129,823 | ) | | | (431,845 | ) | | | (119,248 | ) | | | (323,084 | ) |
| Net Change in Unrealized Appreciation on Investments and Foreign Currency Translations | | | 324,422 | | | | 283,201 | | | | 914,430 | | | | 609,088 | |
| Net Increase (Decrease) in Net Assets Resulting from Operations | | | 191,801 | | | | (70,288 | ) | | | 789,751 | | | | 384,088 | |
| Distributions | | | (40,346 | ) | | | (149,448 | ) | | | (69,770 | ) | | | (115,344 | ) |
| Capital Share Transactions: | | | | | | | | | | | | | | | | |
| Issued | | | — | | | | — | | | | — | | | | 3,542,417 | |
| Redeemed | | | (806,413 | ) | | | — | | | | (4,477,142 | ) | | | (7,384,857 | ) |
| Decrease in Net Assets from Capital Share Transactions | | | (806,413 | ) | | | — | | | | (4,477,142 | ) | | | (3,842,440 | ) |
| Total Decrease in Net Assets | | | (654,958 | ) | | | (219,736 | ) | | | (3,757,161 | ) | | | (3,573,696 | ) |
| Net Assets: | | | | | | | | | | | | | | | | |
| Beginning of Period | | | 2,175,104 | | | | 2,394,840 | | | | 21,071,212 | | | | 24,644,908 | |
| End of Period | | $ | 1,520,146 | | | $ | 2,175,104 | | | $ | 17,314,051 | | | $ | 21,071,212 | |
| Share Transactions: | | | | | | | | | | | | | | | | |
| Issued | | | — | | | | — | | | | — | | | | 150,000 | |
| Redeemed | | | (50,000 | ) | | | — | | | | (200,000 | ) | | | (300,000 | ) |
| Net Decrease in Shares Outstanding from Share Transactions | | | (50,000 | ) | | | — | | | | (200,000 | ) | | | (150,000 | ) |
| (1) | Includes realized gains (losses) as a result of in-kind redemptions. (See Note 4 in Notes to Financial Statements.) |
| | | Global X MSCI China Consumer Staples ETF | | | Global X MSCI China Health Care ETF | |
| | | Period Ended April 30, 2020
(Unaudited) | | | Period Ended October 31, 2019(1) | | | Period Ended April 30, 2020
(Unaudited) | | | Period Ended October 31, 2019(1) | |
| Operations: | | | | | | | | | | | | |
| Net Investment Income (Loss) | | $ | (10,981 | ) | | $ | 27,628 | | | $ | (10,174 | ) | | $ | 9,374 | |
Net Realized Gain on Investments and Foreign Currency Transactions(2) | | | 196,096 | | | | 203,706 | | | | 405,198 | | | | 100,560 | |
| Net Change in Unrealized Appreciation on Investments and Foreign Currency Translations | | | 163,335 | | | | 400,768 | | | | 238,025 | | | | 234,293 | |
| Net Increase in Net Assets Resulting from Operations | | | 348,450 | | | | 632,102 | | | | 633,049 | | | | 344,227 | |
| Distributions | | | (90,153 | ) | | | (13,493 | ) | | | (16,314 | ) | | | (2,880 | ) |
| Capital Share Transactions: | | | | | | | | | | | | | | | | |
| Issued | | | 7,591,388 | | | | 2,441,052 | | | | 3,558,820 | | | | 3,099,609 | |
| Redeemed | | | (4,278,090 | ) | | | (951,131 | ) | | | (1,950,081 | ) | | | (785,616 | ) |
| Increase in Net Assets from Capital Share Transactions | | | 3,313,298 | | | | 1,489,921 | | | | 1,608,739 | | | | 2,313,993 | |
| Total Increase in Net Assets | | | 3,571,595 | | | | 2,108,530 | | | | 2,225,474 | | | | 2,655,340 | |
| Net Assets: | | | | | | | | | | | | | | | | |
| Beginning of Period | | | 2,108,530 | | | | — | | | | 2,655,340 | | | | — | |
| End of Period | | $ | 5,680,125 | | | $ | 2,108,530 | | | $ | 4,880,814 | | | $ | 2,655,340 | |
| Share Transactions: | | | | | | | | | | | | | | | | |
| Issued | | | 350,000 | | | | 150,002 | | | | 200,000 | | | | 200,002 | |
| Redeemed | | | (200,000 | ) | | | (50,000 | ) | | | (100,000 | ) | | | (50,000 | ) |
| Net Increase in Shares Outstanding from Share Transactions | | | 150,000 | | | | 100,002 | | | | 100,000 | | | | 150,002 | |
| (1) | The Fund commenced operations on December 7, 2018. |
| (2) | Includes realized gains (losses) as a result of in-kind redemptions. (See Note 4 in Notes to Financial Statements.) |
| | | Global X MSCI China Information Technology ETF | | | Global X MSCI China Real Estate ETF | |
| | | Period Ended April 30, 2020
(Unaudited) | | | Period Ended October 31, 2019(1) | | | Period Ended April 30, 2020
(Unaudited) | | | Period Ended October 31, 2019(1) | |
| Operations: | | | | | | | | | | | | |
| Net Investment Income (Loss) | | $ | (20,063 | ) | | $ | 22,228 | | | $ | (9,995 | ) | | $ | 65,807 | |
Net Realized Gain (Loss) on Investments and Foreign Currency Transactions(2) | | | 521,814 | | | | 125,893 | | | | 266,322 | | | | (28,873 | ) |
| Net Change in Unrealized Appreciation (Depreciation) on Investments and Foreign Currency Translations | | | (782,728 | ) | | | 53,657 | | | | (601,690 | ) | | | 210,125 | |
| Net Increase (Decrease) in Net Assets Resulting from Operations | | | (280,977 | ) | | | 201,778 | | | | (345,363 | ) | | | 247,059 | |
| Distributions | | | (33,137 | ) | | | (12,360 | ) | | | (42,830 | ) | | | (26,242 | ) |
| Capital Share Transactions: | | | | | | | | | | | | | | | | |
| Issued | | | 13,954,948 | | | | 3,298,330 | | | | 12,160,121 | | | | 1,502,246 | |
| Redeemed | | | (5,702,612 | ) | | | (1,695,683 | ) | | | (5,105,264 | ) | | | — | |
| Increase in Net Assets from Capital Share Transactions | | | 8,252,336 | | | | 1,602,647 | | | | 7,054,857 | | | | 1,502,246 | |
| Total Increase in Net Assets | | | 7,938,222 | | | | 1,792,065 | | | | 6,666,664 | | | | 1,723,063 | |
| Net Assets: | | | | | | | | | | | | | | | | |
| Beginning of Period | | | 1,792,065 | | | | — | | | | 1,723,063 | | | | — | |
| End of Period | | $ | 9,730,287 | | | $ | 1,792,065 | | | $ | 8,389,727 | | | $ | 1,723,063 | |
| Share Transactions: | | | | | | | | | | | | | | | | |
| Issued | | | 650,000 | | | | 200,002 | | | | 700,000 | | | | 100,002 | |
| Redeemed | | | (250,000 | ) | | | (100,000 | ) | | | (300,000 | ) | | | — | |
| Net Increase in Shares Outstanding from Share Transactions | | | 400,000 | | | | 100,002 | | | | 400,000 | | | | 100,002 | |
| (1) | The Fund commenced operations on December 7, 2018. |
| (2) | Includes realized gains (losses) as a result of in-kind redemptions. (See Note 4 in Notes to Financial Statements.) |
| | | Global X MSCI China Utilities ETF | | | Global X MSCI China Large-Cap 50 ETF | |
| | | Period Ended April 30, 2020
(Unaudited) | | | Period Ended October 31, 2019(1) | | | Period Ended April 30, 2020
(Unaudited) | | | Period Ended October 31, 2019(1) | |
| Operations: | | | | | | | | | | | | |
| Net Investment Income (Loss) | | $ | (4,325 | ) | | $ | 32,847 | | | $ | (2,038 | ) | | $ | 54,725 | |
Net Realized Gain (Loss) on Investments and Foreign Currency Transactions(2) | | | 6,913 | | | | 3,972 | | | | (16,995 | ) | | | 96,014 | |
| Net Change in Unrealized Appreciation (Depreciation) on Investments and Foreign Currency Translations | | | (176,057 | ) | | | 54,251 | | | | 75,219 | | | | 117,351 | |
| Net Increase (Decrease) in Net Assets Resulting from Operations | | | (173,469 | ) | | | 91,070 | | | | 56,186 | | | | 268,090 | |
| Distributions | | | (26,143 | ) | | | (12,312 | ) | | | (33,229 | ) | | | (21,830 | ) |
| Capital Share Transactions: | | | | | | | | | | | | | | | | |
| Issued | | | — | | | | 1,502,076 | | | | — | | | | 3,902,789 | |
| Redeemed | | | — | | | | — | | | | — | | | | (1,389,067 | ) |
| Increase in Net Assets from Capital Share Transactions | | | — | | | | 1,502,076 | | | | — | | | | 2,513,722 | |
| Total Increase (Decrease) in Net Assets | | | (199,612 | ) | | | 1,580,834 | | | | 22,957 | | | | 2,759,982 | |
| Net Assets: | | | | | | | | | | | | | | | | |
| Beginning of Period | | | 1,580,834 | | | | — | | | | 2,759,982 | | | | — | |
| End of Period | | $ | 1,381,222 | | | $ | 1,580,834 | | | $ | 2,782,939 | | | $ | 2,759,982 | |
| Share Transactions: | | | | | | | | | | | | | | | | |
| Issued | | | — | | | | 100,002 | | | | — | | | | 150,002 | |
| Redeemed | | | — | | | | — | | | | — | | | | (50,000 | ) |
| Net Increase in Shares Outstanding from Share Transactions | | | — | | | | 100,002 | | | | — | | | | 100,002 | |
| (1) | The Fund commenced operations on December 7, 2018. |
| (2) | Includes realized gains (losses) as a result of in-kind redemptions. (See Note 4 in Notes to Financial Statements.) |
| | | Global X FTSE Southeast Asia ETF | | | Global X MSCI Colombia ETF | |
| | | Period Ended April 30, 2020
(Unaudited) | | | Year Ended October 31, 2019 | | | Period Ended April 30, 2020
(Unaudited) | | | Year Ended October 31, 2019 | |
| Operations: | | | | | | | | | | | | |
| Net Investment Income | | $ | 327,531 | | | $ | 587,288 | | | $ | 1,226,899 | | | $ | 2,194,900 | |
Net Realized Loss on Investments and Foreign Currency Transactions(1) | | | (724,531 | ) | | | (208,036 | ) | | | (164,318 | ) | | | (1,132,564 | ) |
| Net Change in Unrealized Appreciation (Depreciation) on Investments and Foreign Currency Translations | | | (5,967,190 | ) | | | 1,253,888 | | | | (27,377,935 | ) | | | 9,637,684 | |
| Net Increase (Decrease) in Net Assets Resulting from Operations | | | (6,364,190 | ) | | | 1,633,140 | | | | (26,315,354 | ) | | | 10,700,020 | |
| Distributions | | | (266,006 | ) | | | (911,494 | ) | | | (1,100,517 | ) | | | (3,425,053 | ) |
| Capital Share Transactions: | | | | | | | | | | | | | | | | |
| Issued | | | 787,099 | | | | 7,987,304 | | | | — | | | | 7,168,432 | |
| Redeemed | | | (574,260 | ) | | | — | | | | (5,562,631 | ) | | | (24,443,712 | ) |
| Increase (Decrease) in Net Assets from Capital Share Transactions | | | 212,839 | | | | 7,987,304 | | | | (5,562,631 | ) | | | (17,275,280 | ) |
| Total Increase (Decrease) in Net Assets | | | (6,417,357 | ) | | | 8,708,950 | | | | (32,978,502 | ) | | | (10,000,313 | ) |
| Net Assets: | | | | | | | | | | | | | | | | |
| Beginning of Period | | | 26,323,150 | | | | 17,614,200 | | | | 72,281,944 | | | | 82,282,257 | |
| End of Period | | $ | 19,905,793 | | | $ | 26,323,150 | | | $ | 39,303,442 | | | $ | 72,281,944 | |
| Share Transactions: | | | | | | | | | | | | | | | | |
| Issued | | | 50,000 | | | | 500,000 | | | | — | | | | 750,000 | |
| Redeemed | | | (50,000 | ) | | | — | | | | (175,000 | ) | | | (2,650,000 | ) |
| Net Increase (Decrease) in Shares Outstanding from Share Transactions | | | — | | | | 500,000 | | | | (175,000 | ) | | | (1,900,000 | ) |
| (1) | Includes realized gains (losses) as a result of in-kind redemptions. (See Note 4 in Notes to Financial Statements.) |
| | | Global X MSCI Argentina ETF | | | Global X MSCI Greece ETF | |
| | | Period Ended April 30, 2020
(Unaudited) | | | Year Ended October 31, 2019 | | | Period Ended April 30, 2020
(Unaudited) | | | Year Ended October 31, 2019 | |
| Operations: | | | | | | | | | | | | |
| Net Investment Income | | $ | 111,496 | | | $ | 947,404 | | | $ | 3,826,487 | | | $ | 7,261,688 | |
Net Realized Gain (Loss) on Investments and Foreign Currency Transactions(1) | | | (4,957,348 | ) | | | 4,097,803 | | | | (19,574,853 | ) | | | 7,147,977 | |
| Net Change in Unrealized Appreciation (Depreciation) on Investments and Foreign Currency Translations | | | (3,347,317 | ) | | | (13,779,241 | ) | | | (91,281,001 | ) | | | 66,702,125 | |
| Net Increase (Decrease) in Net Assets Resulting from Operations | | | (8,193,169 | ) | | | (8,734,034 | ) | | | (107,029,367 | ) | | | 81,111,790 | |
| Distributions | | | (231,396 | ) | | | (1,862,692 | ) | | | (5,975,000 | ) | | | (7,386,717 | ) |
| Capital Share Transactions: | | | | | | | | | | | | | | | | |
| Issued | | | 12,847,721 | | | | 23,447,588 | | | | 3,882,203 | | | | 122,188,425 | |
| Redeemed | | | (26,145,941 | ) | | | (42,760,305 | ) | | | (85,683,422 | ) | | | (114,974,004 | ) |
| Increase (Decrease) in Net Assets from Capital Share Transactions | | | (13,298,220 | ) | | | (19,312,717 | ) | | | (81,801,219 | ) | | | 7,214,421 | |
| Total Increase (Decrease) in Net Assets | | | (21,722,785 | ) | | | (29,909,443 | ) | | | (194,805,586 | ) | | | 80,939,494 | |
| Net Assets: | | | | | | | | | | | | | | | | |
| Beginning of Period | | | 59,481,511 | | | | 89,390,954 | | | | 338,840,040 | | | | 257,900,546 | |
| End of Period | | $ | 37,758,726 | | | $ | 59,481,511 | | | $ | 144,034,454 | | | $ | 338,840,040 | |
| Share Transactions: | | | | | | | | | | | | | | | | |
| Issued | | | 550,000 | | | | 850,000 | | | | 150,000 | | | | 14,000,000 | |
| Redeemed | | | (1,200,000 | ) | | | (1,650,000 | ) | | | (3,866,666 | ) | | | (13,600,000 | ) |
| Net Increase (Decrease) in Shares Outstanding from Share Transactions | | | (650,000 | ) | | | (800,000 | ) | | | (3,716,666 | ) | | | 400,000 | |
| (1) | Includes realized gains (losses) as a result of in-kind redemptions. (See Note 4 in Notes to Financial Statements.) |
| | | Global X MSCI Norway ETF | | | Global X FTSE Nordic Region ETF | |
| | | Period Ended April 30, 2020
(Unaudited) | | | Year Ended October 31, 2019 | | | Period Ended April 30, 2020
(Unaudited) | | | Year Ended October 31, 2019 | |
| Operations: | | | | | | | | | | | | |
| Net Investment Income | | $ | 474,250 | | | $ | 3,192,473 | | | $ | 103,412 | | | $ | 66,437 | |
Net Realized Loss on Investments and Foreign Currency Transactions(1) | | | (6,436,446 | ) | | | (609,830 | ) | | | (14,019 | ) | | | (577,358 | ) |
| Net Change in Unrealized Appreciation (Depreciation) on Investments and Foreign Currency Translations | | | (5,292,876 | ) | | | (16,892,602 | ) | | | (858,610 | ) | | | 1,690,864 | |
| Net Increase (Decrease) in Net Assets Resulting from Operations | | | (11,255,072 | ) | | | (14,309,959 | ) | | | (769,217 | ) | | | 1,179,943 | |
| Distributions | | | (486,366 | ) | | | (6,822,589 | ) | | | (15,937 | ) | | | (946,666 | ) |
| Return of Capital | | | — | | | | — | | | | — | | | | (410,291 | ) |
| Capital Share Transactions: | | | | | | | | | | | | | | | | |
| Issued | | | 2,525,244 | | | | 28,417,866 | | | | 1,049,832 | | | | — | |
| Redeemed | | | (32,440,864 | ) | | | (92,433,481 | ) | | | — | | | | (7,216,000 | ) |
| Increase (Decrease) in Net Assets from Capital Share Transactions | | | (29,915,620 | ) | | | (64,015,615 | ) | | | 1,049,832 | | | | (7,216,000 | ) |
| Total Increase (Decrease) in Net Assets | | | (41,657,058 | ) | | | (85,148,163 | ) | | | 264,678 | | | | (7,393,014 | ) |
| Net Assets: | | | | | | | | | | | | | | | | |
| Beginning of Period | | | 78,323,235 | | | | 163,471,398 | | | | 16,755,739 | | | | 24,148,753 | |
| End of Period | | $ | 36,666,177 | | | $ | 78,323,235 | | | $ | 17,020,417 | | | $ | 16,755,739 | |
| Share Transactions: | | | | | | | | | | | | | | | | |
| Issued | | | 300,000 | | | | 2,150,000 | | | | 50,000 | | | | — | |
| Redeemed | | | (2,850,000 | ) | | | (7,150,000 | ) | | | — | | | | (350,000 | ) |
| Net Increase (Decrease) in Shares Outstanding from Share Transactions | | | (2,550,000 | ) | | | (5,000,000 | ) | | | 50,000 | | | | (350,000 | ) |
| (1) | Includes realized gains (losses) as a result of in-kind redemptions. (See Note 4 in Notes to Financial Statements.) |
| | | Global X MSCI Nigeria ETF | | | Global X MSCI Next Emerging & Frontier ETF | |
| | | Period Ended April 30, 2020
(Unaudited) | | | Year Ended October 31, 2019 | | | Period Ended April 30, 2020
(Unaudited) | | | Year Ended October 31, 2019 | |
| Operations: | | | | | | | | | | | | |
| Net Investment Income | | $ | 1,394,032 | | | $ | 2,080,153 | | | $ | 217,995 | | | $ | 429,655 | |
Net Realized Loss on Investments and Foreign Currency Transactions(1) | | | (3,165,188 | ) | | | (4,923,709 | ) | | | (891,209 | ) | | | (1,596,752 | ) |
| Net Change in Unrealized Appreciation (Depreciation) on Investments and Foreign Currency Translations | | | (5,430,061 | ) | | | (7,368,323 | ) | | | (3,223,072 | ) | | | 1,576,445 | |
| Net Increase (Decrease) in Net Assets Resulting from Operations | | | (7,201,217 | ) | | | (10,211,879 | ) | | | (3,896,286 | ) | | | 409,348 | |
| Distributions | | | (235,024 | ) | | | (3,827,441 | ) | | | (216,934 | ) | | | (725,137 | ) |
| Capital Share Transactions: | | | | | | | | | | | | | | | | |
| Issued | | | 5,547,617 | | | | 6,742,660 | | | | 759,524 | | | | 5,248,374 | |
| Redeemed | | | (970,502 | ) | | | (817,591 | ) | | | (1,420,678 | ) | | | — | |
| Increase (Decrease) in Net Assets from Capital Share Transactions | | | 4,577,115 | | | | 5,925,069 | | | | (661,154 | ) | | | 5,248,374 | |
| Total Increase (Decrease) in Net Assets | | | (2,859,126 | ) | | | (8,114,251 | ) | | | (4,774,374 | ) | | | 4,932,585 | |
| Net Assets: | | | | | | | | | | | | | | | | |
| Beginning of Period | | | 32,560,743 | | | | 40,674,994 | | | | 18,077,456 | | | | 13,144,871 | |
| End of Period | | $ | 29,701,617 | | | $ | 32,560,743 | | | $ | 13,303,082 | | | $ | 18,077,456 | |
| Share Transactions: | | | | | | | | | | | | | | | | |
| Issued | | | 400,000 | | | | 450,000 | | | | 50,000 | | | | 250,000 | |
| Redeemed | | | (100,000 | ) | | | (50,000 | ) | | | (100,000 | ) | | | — | |
| Net Increase (Decrease) in Shares Outstanding from Share Transactions | | | 300,000 | | | | 400,000 | | | | (50,000 | ) | | | 250,000 | |
| (1) | Includes realized gains (losses) as a result of in-kind redemptions. (See Note 4 in Notes to Financial Statements.) |
| | | Global X MSCI Portugal ETF | | | Global X MSCI Pakistan ETF | |
| | | Period Ended April 30, 2020
(Unaudited) | | | Year Ended October 31, 2019 | | | Period Ended April 30, 2020
(Unaudited) | | | Year Ended October 31, 2019 | |
| Operations: | | | | | | | | | | | | |
| Net Investment Income (Loss) | | $ | (999 | ) | | $ | 806,252 | | | $ | 715,656 | | | $ | 1,786,076 | |
Net Realized Loss on Investments and Foreign Currency Transactions(1) | | | (484,346 | ) | | | (1,490,574 | ) | | | (15,153,575 | ) | | | (5,515,582 | ) |
| Net Change in Unrealized Appreciation (Depreciation) on Investments and Foreign Currency Translations | | | (2,532,097 | ) | | | 1,251,984 | | | | 10,123,751 | | | | (8,397,889 | ) |
| Net Increase (Decrease) in Net Assets Resulting from Operations | | | (3,017,442 | ) | | | 567,662 | | | | (4,314,168 | ) | | | (12,127,395 | ) |
| Distributions | | | (151,264 | ) | | | (1,885,103 | ) | | | (991,676 | ) | | | (2,425,569 | ) |
| Capital Share Transactions: | | | | | | | | | | | | | | | | |
| Issued | | | — | | | | 5,527,566 | | | | 13,578,502 | | | | 16,333,858 | |
| Redeemed | | | (4,397,327 | ) | | | (7,018,798 | ) | | | (11,930,272 | ) | | | — | |
| Increase (Decrease) in Net Assets from Capital Share Transactions | | | (4,397,327 | ) | | | (1,491,232 | ) | | | 1,648,230 | | | | 16,333,858 | |
| Total Increase (Decrease) in Net Assets | | | (7,566,033 | ) | | | (2,808,673 | ) | | | (3,657,614 | ) | | | 1,780,894 | |
| Net Assets: | | | | | | | | | | | | | | | | |
| Beginning of Period | | | 22,486,505 | | | | 25,295,178 | | | | 41,804,464 | | | | 40,023,570 | |
| End of Period | | $ | 14,920,472 | | | $ | 22,486,505 | | | $ | 38,146,850 | | | $ | 41,804,464 | |
| Share Transactions: | | | | | | | | | | | | | | | | |
| Issued | | | — | | | | 500,000 | | | | 425,000 | | | | 2,450,000 | |
| Redeemed | | | (400,000 | ) | | | (650,000 | ) | | | (450,000 | ) | | | — | |
| Net Increase (Decrease) in Shares Outstanding from Share Transactions | | | (400,000 | ) | | | (150,000 | ) | | | (25,000 | ) | | | 2,450,000 | |
| (1) | Includes realized gains (losses) as a result of in-kind redemptions. (See Note 4 in Notes to Financial Statements.) |
| | | Global X DAX Germany ETF | |
| | | Period Ended April 30, 2020
(Unaudited) | | | Year Ended October 31, 2019* | |
| Operations: | | | | | | |
| Net Investment Income | | $ | 120,170 | | | $ | 404,378 | |
Net Realized Loss on Investments and Foreign Currency Transactions(1) | | | (7,211 | ) | | | (573,031 | ) |
| Net Change in Unrealized Appreciation (Depreciation) on Investments and Foreign Currency Translations | | | (3,444,925 | ) | | | 1,686,382 | |
| Net Increase (Decrease) in Net Assets Resulting from Operations | | | (3,331,966 | ) | | | 1,517,729 | |
| Distributions | | | (1,814 | ) | | | (666,693 | ) |
| Return of Capital | | | — | | | | (10,877 | ) |
| Capital Share Transactions: | | | | | | | | |
| Issued | | | 2,825,060 | | | | — | |
| Redeemed | | | (2,291,925 | ) | | | (1,320,546 | ) |
| Increase (Decrease) in Net Assets from Capital Share Transactions | | | 533,135 | | | | (1,320,546 | ) |
| Total Decrease in Net Assets | | | (2,800,645 | ) | | | (480,387 | ) |
| Net Assets: | | | | | | | | |
| Beginning of Period | | | 16,370,494 | | | | 16,850,881 | |
| End of Period | | $ | 13,569,849 | | | $ | 16,370,494 | |
| Share Transactions: | | | | | | | | |
| Issued | | | 100,000 | | | | — | |
| Redeemed | | | (100,000 | ) | | | (50,000 | ) |
| Net Decrease in Shares Outstanding from Share Transactions | | | — | | | | (50,000 | ) |
| * | The financial statements include the financial information of the Predecessor Fund through December 21, 2018 (See Note 1 in Notes to Financial Statements). |
| (1) | Includes realized gains (losses) as a result of in-kind redemptions. (See Note 4 in Notes to Financial Statements.) |
Selected Per Share Data & Ratios
For a Share Outstanding Throughout the Period
| | | Net
Asset Value, Beginning
of Period
($) | | | Net Investment Income (Loss)
($)* | | | Net Realized and Unrealized Gain (Loss) on Investments
($) | | | Total from Operations
($) | | | Distribution from Net Investment Income ($) | |
| Global X MSCI China Consumer Discretionary ETF | | | | | | | | | | | | | | | |
| 2020 (Unaudited) | | | 17.68 | | | | (0.01 | ) | | 0.05 | ^
| | | 0.04 | | | | (0.14 | ) |
| 2019 | | | 13.57 | | | | 0.16 | | | | 4.35 | | | | 4.51 | | | | (0.40 | ) |
| 2018 | | | 17.44 | | | | 0.20 | | | | (3.95 | ) | | | (3.75 | ) | | | (0.12 | ) |
| 2017 | | | 11.97 | | | | 0.24 | | | | 5.40 | | | | 5.64 | | | | (0.17 | ) |
| 2016 | | | 13.72 | | | | 0.20 | | | | (1.36 | ) | | | (1.16 | ) | | | (0.59 | ) |
| 2015 | | | 13.82 | | | | 0.53 | | | | (0.37 | ) | | | 0.16 | | | | (0.26 | ) |
| Global X MSCI China Energy ETF | | | | | | | | | | | | | | | | | | | | |
| 2020 (Unaudited) | | | 10.43 | | | | 0.06 | | | | (1.90 | ) | | | (1.84 | ) | | | (0.29 | ) |
| 2019 | | | 11.82 | | | | 0.30 | | | | (1.12 | ) | | | (0.82 | ) | | | (0.57 | ) |
| 2018 | | | 11.69 | | | | 0.49 | | | | 0.05 | | | | 0.54 | | | | (0.41 | ) |
| 2017 | | | 10.56 | | | | 0.41 | | | | 0.93 | | | | 1.34 | | | | (0.21 | ) |
| 2016 | | | 11.61 | | | | 0.22 | | | | (0.94 | ) | | | (0.72 | ) | | | (0.33 | ) |
| 2015 | | | 15.03 | | | | 0.22 | | | | (3.31 | ) | | | (3.09 | ) | | | (0.33 | ) |
| Global X MSCI China Financials ETF | | | | | | | | | | | | | | | | | | | | |
| 2020 (Unaudited) | | | 15.83 | | | | (0.04 | ) | | | (1.12 | ) | | | (1.16 | ) | | | (0.45 | ) |
| 2019 | | | 15.39 | | | | 0.67 | | | | 0.65 | | | | 1.32 | | | | (0.88 | ) |
| 2018 | | | 17.63 | | | | 0.48 | | | | (2.38 | ) | | | (1.90 | ) | | | (0.34 | ) |
| 2017 | | | 13.80 | | | | 0.39 | | | | 3.70 | | | | 4.09 | | | | (0.26 | ) |
| 2016 | | | 14.90 | | | | 0.25 | | | | (0.62 | ) | | | (0.37 | ) | | | (0.73 | ) |
| 2015 | | | 13.50 | | | | 0.54 | | | | 1.02 | | | | 1.56 | | | | (0.16 | ) |
| Total from Distributions ($) | | | Net
Asset Value,
End of
Period ($) | | | Total Return (%)** | | | Net Assets End of Period ($)(000) | | | Ratio of Expenses to Average Net Assets (%) | | | Ratio of Net Investment Income (Loss) to Average Net Assets (%) | | | Portfolio Turnover (%)†† | |
| | | | | | | | | | | | | | | | | | | | |
| | (0.14 | ) | | | 17.58 | | | | 0.19 | | | | 136,275 | | | | 0.65 | † | | | (0.12 | )† | | | 13.94 | |
| | (0.40 | ) | | | 17.68 | | | | 34.20 | | | | 156,486 | | | | 0.65 | | | | 1.03 | | | | 83.41 | |
| | (0.12 | ) | | | 13.57 | | | | (21.70 | ) | | | 120,102 | | | | 0.65 | | | | 1.11 | | | | 17.92 | |
| | (0.17 | ) | | | 17.44 | | | | 47.90 | | | | 156,050 | | | | 0.65 | | | | 1.67 | | | | 34.72 | |
| | (0.59 | ) | | | 11.97 | | | | (8.57 | ) | | | 73,023 | | | | 0.65 | | | | 1.71 | | | | 38.13 | |
| | (0.26 | ) | | | 13.72 | | | | 1.34 | | | | 93,951 | | | | 0.65 | | | | 3.86 | | | | 24.57 | |
| | | | | | | | | | | | | | | | | | | | | | | | | | | |
| | (0.29 | ) | | | 8.30 | | | | (18.29 | ) | | | 1,660 | | | | 0.66 | † | | | 1.35 | † | | | 15.73 | |
| | (0.57 | ) | | | 10.43 | | | | (7.04 | ) | | | 1,564 | | | | 0.66 | | | | 2.67 | | | | 109.41 | |
| | (0.41 | ) | | | 11.82 | | | | 4.77 | | | | 2,955 | | | | 0.65 | | | | 4.00 | | | | 14.60 | |
| | (0.21 | ) | | | 11.69 | | | | 13.13 | | | | 1,754 | | | | 0.65 | | | | 3.82 | | | | 11.85 | |
| | (0.33 | ) | | | 10.56 | | | | (6.11 | ) | | | 1,583 | | | | 0.65 | | | | 2.19 | | | | 22.19 | |
| | (0.33 | ) | | | 11.61 | | | | (20.89 | ) | | | 1,741 | | | | 0.65 | | | | 1.66 | | | | 15.62 | |
| | | | | | | | | | | | | | | | | | | | | | | | | | | |
| | (0.45 | ) | | | 14.22 | | | | (7.72 | ) | | | 36,269 | | | | 0.65 | † | | | (0.51 | )† | | | 9.57 | |
| | (0.88 | ) | | | 15.83 | | | | 8.95 | | | | 60,160 | | | | 0.66 | | | | 4.11 | | | | 54.17 | |
| | (0.34 | ) | | | 15.39 | | | | (11.04 | ) | | | 30,784 | | | | 0.66 | | | | 2.67 | | | | 15.09 | |
| | (0.26 | ) | | | 17.63 | | | | 30.32 | | | | 50,251 | | | | 0.65 | | | | 2.58 | | | | 19.12 | |
| | (0.73 | ) | | | 13.80 | | | | (2.56 | ) | | | 28,289 | | | | 0.65 | | | | 1.92 | | | | 18.43 | |
| | (0.16 | ) | | | 14.90 | | | | 11.50 | | | | 57,358 | | | | 0.65 | | | | 3.34 | | | | 15.88 | |
| ^ | The amount shown for a share outstanding throughout the period does not accord with the aggregate net gains on investments for the period because of the sales and repurchases of fund shares in relation to fluctuating market value of the investments of the Fund. |
| * | Per share data calculated using average shares method. |
| ** | Total Return is for the period indicated and has not been annualized. The return shown does not reflect the deduction of taxes that a shareholder would pay on Fund distributions or the redemption of Fund shares. |
| † | Annualized. |
| †† | Portfolio turnover rate is for the period indicated and periods of less than one year have not been annualized. Excludes effect of in-kind transfers. |
Selected Per Share Data & Ratios
For a Share Outstanding Throughout the Period
| | | Net
Asset Value, Beginning
of Period
($) | | | Net Investment Income (Loss)
($)* | | | Net Realized and Unrealized Gain (Loss) on Investments
($) | | | Total from Operations
($) | | | Distribution from Net Investment Income ($) | |
| Global X MSCI China Industrials ETF | | | | | | | | | | | | | | | |
| 2020 (Unaudited) | | | 12.92 | | | | (0.03 | ) | | | 0.09 | | | | 0.06 | | | | (0.16 | ) |
| 2019 | | | 13.59 | | | | 0.27 | | | | (0.49 | ) | | | (0.22 | ) | | | (0.45 | ) |
| 2018 | | | 16.06 | | | | 0.29 | | | | (2.41 | ) | | | (2.12 | ) | | | (0.35 | ) |
| 2017 | | | 12.57 | | | | 0.24 | | | | 3.45 | | | | 3.69 | | | | (0.20 | ) |
| 2016 | | | 14.44 | | | | 0.18 | | | | (1.71 | ) | | | (1.53 | ) | | | (0.34 | ) |
| 2015 | | | 12.93 | | | | 0.21 | | | | 1.40 | | | | 1.61 | | | | (0.10 | ) |
| Global X MSCI China Materials ETF | | | | | | | | | | | | | | | | | | | | |
| 2020 (Unaudited) | | | 14.50 | | | | (0.02 | ) | | | 1.13 | | | | 1.11 | | | | (0.40 | ) |
| 2019 | | | 15.97 | | | | 0.52 | | | | (0.99 | ) | | | (0.47 | ) | | | (1.00 | ) |
| 2018 | | | 21.59 | | | | 0.46 | | | | (5.84 | ) | | | (5.38 | ) | | | (0.24 | ) |
| 2017 | | | 13.42 | | | | 0.38 | | | | 7.95 | | | | 8.33 | | | | (0.16 | ) |
| 2016 | | | 13.29 | | | | 0.16 | | | | 0.68 | | | | 0.84 | | | | (0.71 | ) |
| 2015 | | | 14.80 | | | | 0.40 | | | | (1.70 | ) | | | (1.30 | ) | | | (0.21 | ) |
| Global X MSCI China Communication Services ETF | | | | | | | | | | | | | | | | | | | | |
| 2020 (Unaudited) | | | 22.18 | | | | (0.01 | ) | | | 1.00 | | | | 0.99 | | | | (0.08 | ) |
| 2019 | | | 22.40 | | | | 0.09 | | | | (0.21 | ) | | | (0.12 | ) | | | (0.10 | ) |
| 2018 | | | 29.24 | | | | 0.07 | | | | (6.23 | ) | | | (6.16 | ) | | | (0.68 | ) |
| 2017 | | | 23.23 | | | | 0.28 | | | | 6.69 | | | | 6.97 | | | | (0.96 | ) |
| 2016 | | | 22.01 | | | | 0.45 | | | | 0.91 | | | | 1.36 | | | | (0.14 | ) |
| 2015 | | | 23.48 | | | | 0.12 | | | | (1.52 | ) | | | (1.40 | ) | | | (0.07 | ) |
| Total from Distributions ($) | | | Net
Asset Value,
End of
Period ($) | | | Total Return (%)** | | | Net Assets End of Period ($)(000) | | | Ratio of Expenses to Average Net Assets (%) | | | Ratio of Net Investment Income (Loss) to Average Net Assets (%) | | | Portfolio Turnover (%)†† | |
| | | | | | | | | | | | | | | | | | | | |
| | (0.16 | ) | | | 12.82 | | | | 0.40 | | | | 1,922 | | | | 0.66 | † | | | (0.46 | )† | | | 14.48 | |
| | (0.45 | ) | | | 12.92 | | | | (1.66 | ) | | | 1,938 | | | | 0.66 | | | | 1.99 | | | | 80.17 | |
| | (0.35 | ) | | | 13.59 | | | | (13.44 | ) | | | 2,038 | | | | 0.66 | | | | 1.92 | | | | 18.28 | |
| | (0.20 | ) | | | 16.06 | | | | 29.88 | | | | 4,015 | | | | 0.65 | | | | 1.68 | | | | 21.53 | |
| | (0.34 | ) | | | 12.57 | | | | (10.60 | ) | �� | | 3,770 | | | | 0.65 | | | | 1.47 | | | | 14.08 | |
| | (0.10 | ) | | | 14.44 | | | | 12.49 | | | | 7,222 | | | | 0.65 | | | | 1.38 | | | | 23.87 | |
| | | | | | | | | | | | | | | | | | | | | | | | | | | |
| | (0.40 | ) | | | 15.21 | | | | 7.42 | | | | 1,520 | | | | 0.66 | † | | | (0.32 | )† | | | 22.23 | |
| | (1.00 | ) | | | 14.50 | | | | (3.13 | ) | | | 2,175 | | | | 0.66 | | | | 3.30 | | | | 65.67 | |
| | (0.24 | ) | | | 15.97 | | | | (25.20 | ) | | | 2,395 | | | | 0.66 | | | | 2.27 | | | | 26.95 | |
| | (0.16 | ) | | | 21.59 | | | | 62.79 | | | | 5,397 | | | | 0.65 | | | | 2.19 | | | | 49.80 | |
| | (0.71 | ) | | | 13.42 | | | | 6.84 | | | | 1,342 | | | | 0.65 | | | | 1.31 | | | | 26.33 | |
| | (0.21 | ) | | | 13.29 | | | | (8.95 | ) | | | 1,329 | | | | 0.65 | | | | 2.39 | | | | 28.59 | |
| | | | | | | | | | | | | | | | | | | | | | | | | | | |
| | (0.08 | ) | | | 23.09 | | | | 4.43 | | | | 17,314 | | | | 0.65 | † | | | (0.05 | )† | | | 15.12 | |
| | (0.10 | ) | | | 22.18 | | | | (0.54 | ) | | | 21,071 | | | | 0.66 | | | | 0.39 | | | | 114.67 | |
| | (0.68 | ) | | | 22.40 | | | | (21.70 | ) | | | 24,645 | | | | 0.65 | | | | 0.24 | | | | 33.79 | |
| | (0.96 | ) | | | 29.24 | | | | 31.56 | | | | 19,007 | | | | 0.65 | | | | 1.14 | | | | 42.59 | |
| | (0.14 | ) | | | 23.23 | | | | 6.20 | | | | 13,940 | | | | 0.65 | | | | 2.09 | | | | 42.02 | |
| | (0.07 | ) | | | 22.01 | | | | (5.94 | ) | | | 15,404 | | | | 0.65 | | | | 0.52 | | | | 44.95 | |
| * | Per share data calculated using average shares method. |
| ** | Total Return is for the period indicated and has not been annualized. The return shown does not reflect the deduction of taxes that a shareholder would pay on Fund distributions or the redemption of Fund shares. |
| † | Annualized. |
| †† | Portfolio turnover rate is for the period indicated and periods of less than one year have not been annualized. Excludes effect of in-kind transfers. |
Selected Per Share Data & Ratios
For a Share Outstanding Throughout the Period
| | | Net
Asset Value, Beginning
of Period
($) | | | Net Investment Income (Loss)
($)* | | | Net Realized and Unrealized Gain (Loss) on Investments
($) | | | Total from Operations
($) | | | Distribution from Net Investment Income ($) | | | Distribution from Capital Gains ($) | |
| Global X MSCI China Consumer Staples ETF | | | | | | | | | | | | | | | | | | |
| 2020 (Unaudited) | | | 21.08 | | | | (0.06 | ) | | | 2.30 | | | | 2.24 | | | | (0.09 | ) | | | (0.51 | ) |
2019(1) | | | 15.00 | | | | 0.28 | | | | 5.93 | | | | 6.21 | | | | (0.13 | ) | | | — | |
| Global X MSCI China Health Care ETF | | | | | | | | | | | | | | | | | | | | | | | | |
| 2020 (Unaudited) | | | 17.70 | | | | (0.05 | ) | | | 1.98 | | | | 1.93 | | | | (0.04 | ) | | | (0.07 | ) |
2019(1) | | | 15.00 | | | | 0.09 | | | | 2.64 | | | | 2.73 | | | | (0.03 | ) | | | — | |
| Global X MSCI China Information Technology ETF | | | | | | | | | | | | | | | | | | | | | | | | |
| 2020 (Unaudited) | | | 17.92 | | | | (0.06 | ) | | | 1.82 | | | | 1.76 | | | | (0.06 | ) | | | (0.16 | ) |
2019(1) | | | 15.00 | | | | 0.19 | | | | 2.81 | | | | 3.00 | | | | (0.08 | ) | | | — | |
| Global X MSCI China Real Estate ETF | | | | | | | | | | | | | | | | | | | | | | | | |
| 2020 (Unaudited) | | | 17.23 | | | | (0.03 | ) | | | 0.01 | | | | (0.02 | ) | | | (0.43 | ) | | | — | |
2019(1) | | | 15.00 | | | | 0.67 | | | | 1.82 | | | | 2.49 | | | | (0.26 | ) | | | — | |
| Global X MSCI China Utilities ETF | | | | | | | | | | | | | | | | | | | | | | | | |
| 2020 (Unaudited) | | | 15.81 | | | | (0.04 | ) | | | (1.69 | ) | | | (1.73 | ) | | | (0.21 | ) | | | (0.06 | ) |
2019(1) | | | 15.00 | | | | 0.33 | | | | 0.60 | | | | 0.93 | | | | (0.12 | ) | | | — | |
| Global X MSCI China Large-Cap 50 ETF | | | | | | | | | | | | | | | | | | | | | | | | |
| 2020 (Unaudited) | | | 27.60 | | | | (0.02 | ) | | | 0.58 | | | | 0.56 | | | | (0.33 | ) | | | — | |
2019(1) | | | 25.00 | | | | 0.55 | | | | 2.27 | | | | 2.82 | | | | (0.22 | ) | | | — | |
| Total from Distributions ($) | | | Net
Asset Value,
End of
Period ($) | | | Total Return (%)** | | | Net Assets End of Period ($)(000) | | | Ratio of Expenses to Average Net Assets (%) | | | Ratio of Net Investment Income (Loss) to Average Net Assets (%) | | | Portfolio Turnover (%)†† | |
| | | | | | | | | | | | | | | | | | | | |
| | (0.60 | ) | | | 22.72 | | | | 10.78 | | | | 5,680 | | | | 0.65 | † | | | (0.52 | )† | | | 77.65 | |
| | (0.13 | ) | | | 21.08 | | | | 41.48 | | | | 2,109 | | | | 0.67 | † | | | 1.66 | † | | | 29.25 | |
| | | | | | | | | | | | | | | | | | | | | | | | | | | |
| | (0.11 | ) | | | 19.52 | | | | 10.97 | | | | 4,881 | | | | 0.65 | † | | | (0.55 | )† | | | 33.28 | |
| | (0.03 | ) | | | 17.70 | | | | 18.22 | | | | 2,655 | | | | 0.66 | † | | | 0.60 | † | | | 12.20 | |
| | | | | | | | | | | | | | | | | | | | | | | | | | | |
| | (0.22 | ) | | | 19.46 | | | | 9.80 | | | | 9,730 | | | | 0.65 | † | | | (0.61 | )† | | | 40.03 | |
| | (0.08 | ) | | | 17.92 | | | | 20.06 | | | | 1,792 | | | | 0.66 | † | | | 1.29 | † | | | 36.75 | |
| | | | | | | | | | | | | | | | | | | | | | | | | | | |
| | (0.43 | ) | | | 16.78 | | | | (0.48 | ) | | | 8,390 | | | | 0.65 | † | | | (0.31 | )† | | | 13.28 | |
| | (0.26 | ) | | | 17.23 | | | | 16.56 | | | | 1,723 | | | | 0.65 | † | | | 4.44 | † | | | 14.00 | |
| | | | | | | | | | | | | | | | | | | | | | | | | | | |
| | (0.27 | ) | | | 13.81 | | | | (11.16 | ) | | | 1,381 | | | | 0.65 | † | | | (0.60 | )† | | | 19.27 | |
| | (0.12 | ) | | | 15.81 | | | | 6.24 | | | | 1,581 | | | | 0.66 | † | | | 2.42 | † | | | 28.26 | |
| | | | | | | | | | | | | | | | | | | | | | | | | | | |
| | (0.33 | ) | | | 27.83 | | | | 1.96 | | | | 2,783 | | | | 0.29 | † | | | (0.15 | )† | | | 10.59 | |
| | (0.22 | ) | | | 27.60 | | | | 11.27 | | | | 2,760 | | | | 0.29 | † | | | 2.26 | † | | | 12.46 | |
| (1) | The Fund commenced operations on December 7, 2018. |
| * | Per share data calculated using average shares method. |
| ** | Total Return is for the period indicated and has not been annualized. The return shown does not reflect the deduction of taxes that a shareholder would pay on Fund distributions or the redemption of Fund shares. |
| † | Annualized. |
| †† | Portfolio turnover rate is for the period indicated and periods of less than one year have not been annualized. Excludes effect of in-kind transfers. |
Amounts designated as “—” are either $0 or have been rounded to $0.
Selected Per Share Data & Ratios
For a Share Outstanding Throughout the Period
| | | Net
Asset Value, Beginning
of Period
($) | | | Net Investment Income
($)* | | | Net Realized and Unrealized Gain (Loss) on Investments
($) | | | Total from Operations
($) | | | Distribution from Net Investment Income ($) | |
| Global X FTSE Southeast Asia ETF | | | | | | | | | | | | | | | |
| 2020 (Unaudited) | | | 15.95 | | | | 0.19 | | | | (3.92 | ) | | | (3.73 | ) | | | (0.16 | ) |
| 2019 | | | 15.32 | | | | 0.44 | | | | 0.91 | | | | 1.35 | | | | (0.72 | ) |
| 2018 | | | 15.91 | | | | 0.49 | | | | (0.81 | ) | | | (0.32 | ) | | | (0.27 | ) |
| 2017 | | | 13.72 | | | | 0.32 | | | | 2.23 | | | | 2.55 | | | | (0.36 | ) |
| 2016 | | | 13.07 | | | | 0.31 | | | | 0.78 | | | | 1.09 | | | | (0.44 | ) |
| 2015 | | | 16.76 | | | | 0.34 | | | | (3.61 | ) | | | (3.27 | ) | | | (0.42 | ) |
| Global X MSCI Colombia ETF | | | | | | | | | | | | | | | | | | | | |
2020(1) (Unaudited) | | | 38.16 | | | | 0.66 | | | | (15.39 | ) | | | (14.73 | ) | | | (0.58 | ) |
2019(1) | | | 34.72 | | | | 1.04 | | | | 3.96 | | | | 5.00 | | | | (1.56 | ) |
2018(1) | | | 38.24 | | | | 0.84 | | | | (3.64 | ) | | | (2.80 | ) | | | (0.72 | ) |
2017(1) | | | 36.88 | | | | 0.72 | | | | 1.16 | | | | 1.88 | | | | (0.52 | ) |
2016(1) | | | 35.16 | | | | 0.64 | | | | 1.56 | | | | 2.20 | | | | (0.48 | ) |
2015(1) | | | 69.68 | | | | 1.24 | | | | (34.12 | ) | | | (32.88 | ) | | | (1.64 | ) |
| Global X MSCI Argentina ETF | | | | | | | | | | | | | | | | | | | | |
| 2020 (Unaudited) | | | 21.83 | | | | 0.04 | | | | (3.59 | ) | | | (3.55 | ) | | | (0.08 | ) |
| 2019 | | | 25.36 | | | | 0.29 | | | | (3.26 | ) | | | (2.97 | ) | | | (0.56 | ) |
| 2018 | | | 32.05 | | | | 0.35 | | | | (6.87 | ) | | | (6.52 | ) | | | (0.17 | ) |
| 2017 | | | 23.69 | | | | 0.07 | | | | 8.37 | | | | 8.44 | | | | (0.08 | ) |
| 2016 | | | 19.81 | | | | 0.15 | | | | 3.89 | | | | 4.04 | | | | (0.16 | ) |
| 2015 | | | 21.18 | | | | 0.11 | | | | (1.39 | ) | | | (1.28 | ) | | | (0.09 | ) |
| Total from Distributions ($) | | | Net
Asset Value,
End of
Period ($) | | | Total Return (%)** | | | Net Assets End of Period ($)(000) | | | Ratio of Expenses to Average Net Assets (%) | | | Ratio of Net Investment Income to Average Net Assets (%) | | | Portfolio Turnover (%)†† | |
| | | | | | | | | | | | | | | | | | | | |
| | (0.16 | ) | | | 12.06 | | | | (23.65 | ) | | | 19,906 | | | | 0.65 | † | | | 2.70 | † | | | 3.87 | |
| | (0.72 | ) | | | 15.95 | | | | 8.94 | | | | 26,323 | | | | 0.65 | | | | 2.76 | | | | 7.01 | |
| | (0.27 | ) | | | 15.32 | | | | (2.15 | ) | | | 17,614 | | | | 0.65 | | | | 2.94 | | | | 11.98 | |
| | (0.36 | ) | | | 15.91 | | | | 19.19 | | | | 14,320 | | | | 0.65 | | | | 2.23 | | | | 7.78 | |
| | (0.44 | ) | | | 13.72 | | | | 8.75 | | | | 12,349 | | | | 0.65 | | | | 2.40 | | | | 12.94 | |
| | (0.42 | ) | | | 13.07 | | | | (19.97 | ) | | | 14,376 | | | | 0.65 | | | | 2.26 | | | | 24.06 | |
| | | | | | | | | | | | | | | | | | | | | | | | | | | |
| | (0.58 | ) | | | 22.85 | | | | (39.24 | ) | | | 39,303 | | | | 0.61 | † | | | 3.97 | † | | | 8.53 | |
| | (1.56 | ) | | | 38.16 | | | | 15.05 | | | | 72,282 | | | | 0.62 | | | | 2.81 | | | | 18.05 | |
| | (0.72 | ) | | | 34.72 | | | | (7.55 | ) | | | 82,282 | | | 0.62 | @ | | | 2.01 | | | | 39.15 | |
| | (0.52 | ) | | | 38.24 | | | | 5.24 | | | | 92,984 | | | 0.62 | @ | | | 1.83 | | | | 40.93 | |
| | (0.48 | ) | | | 36.88 | | | | 6.55 | | | | 88,760 | | | 0.65 | @ | | | 1.82 | | | | 37.60 | |
| | (1.64 | ) | | | 35.16 | | | | (47.93 | ) | | | 66,616 | | | 0.61 | @ | | | 2.80 | | | | 66.93 | |
| | | | | | | | | | | | | | | | | | | | | | | | | | | |
| | (0.08 | ) | | | 18.20 | | | | (16.39 | ) | | | 37,759 | | | | 0.59 | † | | | 0.36 | † | | | 26.53 | |
| | (0.56 | ) | | | 21.83 | | | | (12.08 | ) | | | 59,482 | | | | 0.60 | | | | 1.08 | | | | 28.88 | |
| | (0.17 | ) | | | 25.36 | | | | (20.48 | ) | | | 89,391 | | | | 0.60 | ‡ | | | 1.07 | | | | 34.46 | |
| | (0.08 | ) | | | 32.05 | | | | 35.79 | | | | 183,468 | | | | 0.65 | ‡ | | | 0.24 | | | | 24.45 | |
| | (0.16 | ) | | | 23.69 | | | | 20.65 | | | | 90,602 | | | | 0.74 | | | | 0.69 | | | | 20.88 | |
| | (0.09 | ) | | | 19.81 | | | | (6.04 | ) | | | 15,355 | | | | 0.74 | | | | 0.58 | | | | 26.88 | |
| (1) | Per share amounts have been adjusted for a 1 for 4 reverse share split on April 28, 2020 (See Note 9 in the Notes to Financial Statements). |
| * | Per share data calculated using average shares method. |
| ** | Total Return is for the period indicated and has not been annualized. The return shown does not reflect the deduction of taxes that a shareholder would pay on Fund distributions or the redemption of Fund shares. |
| † | Annualized. |
| †† | Portfolio turnover rate is for the period indicated and periods of less than one year have not been annualized. Excludes effect of in-kind transfers. |
| @ | The ratio of Expenses to Average Net Assets includes the effect of a waiver. If these offsets were excluded, the ratio would have been 0.68%, 0.81%, 0.84% and 0.79% for the years ended October 31, 2018, 2017, 2016 and 2015, respectively. |
| ‡ | The ratio of Expenses to Average Net Assets includes the effect of a waiver. If these offsets were excluded, the ratios would have been 0.66% and 0.74% for the years ended October 31, 2018 and 2017. |
Selected Per Share Data & Ratios
For a Share Outstanding Throughout the Period
| | | Net
Asset Value, Beginning
of Period
($) | | | Net Investment Income
($)* | | | Net Realized and Unrealized Gain (Loss) on Investments
($) | | | Total from Operations
($) | | | Distribution from Net Investment Income ($) | | | Return of Capital ($) | |
| Global X MSCI Greece ETF | | | | | | | | | | | | | | | | | | |
2020(1) (Unaudited) | | | 29.91 | | | | 0.38 | | | | (10.82 | ) | | | (10.44 | ) | | | (0.56 | ) | | | — | |
2019(1) | | | 23.04 | | | | 0.63 | | | | 6.87 | | | | 7.50 | | | | (0.63 | ) | | | — | |
2018(1) | | | 27.90 | | | | 0.57 | | | | (4.77 | ) | | | (4.20 | ) | | | (0.66 | ) | | | — | |
2017(1) | | | 22.05 | | | | 0.45 | | | | 5.85 | | | | 6.30 | | | | (0.45 | ) | | | — | |
2016(1) | | | 31.23 | | | | 0.39 | | | | (9.21 | ) | | | (8.82 | ) | | | (0.36 | ) | | | — | |
2015(1) | | | 47.52 | | | | 0.54 | | | | (16.44 | ) | | | (15.90 | ) | | | (0.39 | ) | | | — | |
| Global X MSCI Norway ETF | | | | | | | | | | | | | | | | | | | | | | | | |
| 2020 (Unaudited) | | | 11.69 | | | | 0.09 | | | | (2.86 | ) | | | (2.77 | ) | | | (0.08 | ) | | | — | |
| 2019 | | | 13.97 | | | | 0.42 | | | | (1.80 | ) | | | (1.38 | ) | | | (0.90 | ) | | | — | |
| 2018 | | | 13.50 | | | | 0.37 | | | | 0.48 | | | | 0.85 | | | | (0.38 | ) | | | — | |
| 2017 | | | 11.07 | | | | 0.41 | | | | 2.34 | | | | 2.75 | | | | (0.32 | ) | | | — | |
| 2016 | | | 10.75 | | | | 0.35 | | | | 0.34 | | | | 0.69 | | | | (0.37 | ) | | | — | |
| 2015 | | | 14.82 | | | | 0.34 | | | | (3.58 | ) | | | (3.24 | ) | | | (0.83 | ) | | | — | |
| Global X FTSE Nordic Region ETF | | | | | | | | | | | | | | | | | | | | | | | | |
| 2020 (Unaudited) | | | 20.69 | | | | 0.12 | | | | (1.00 | ) | | | (0.88 | ) | | | (0.02 | ) | | | — | |
| 2019 | | | 20.82 | | | | 0.06 | | | | 1.02 | | | | 1.08 | | | | (0.84 | ) | | | (0.37 | ) |
| 2018 | | | 23.89 | | | | 0.63 | | | | (2.87 | ) | | | (2.24 | ) | | | (0.83 | ) | | | — | |
| 2017 | | | 19.38 | | | | 0.51 | | | | 4.72 | | | | 5.23 | | | | (0.72 | ) | | | — | |
| 2016 | | | 22.29 | | | | 0.63 | | | | (2.91 | ) | | | (2.28 | ) | | | (0.63 | ) | | | — | |
| 2015 | | | 24.36 | | | | 0.59 | | | | (1.81 | ) | | | (1.22 | ) | | | (0.85 | ) | | | — | |
| Total from Distributions ($) | | | Net
Asset Value,
End of
Period ($) | | | Total Return (%)** | | | Net Assets End of Period ($)(000) | | | Ratio of Expenses to Average Net Assets (%) | | | Ratio of Net Investment Income to Average Net Assets (%) | | | Portfolio Turnover (%)†† | |
| | | | | | | | | | | | | | | | | | | | |
| | (0.56 | ) | | | 18.91 | | | | (35.61 | ) | | | 144,034 | | | | 0.59 | † | | | 2.93 | † | | | 16.12 | |
| | (0.63 | ) | | | 29.91 | | | | 33.57 | | | | 338,840 | | | | 0.57 | | | | 2.43 | | | | 12.67 | |
| | (0.66 | ) | | | 23.04 | | | | (15.63 | ) | | | 257,901 | | | | 0.59 | | | | 1.98 | | | | 16.38 | |
| | (0.45 | ) | | | 27.90 | | | | 29.04 | | | | 349,788 | | | | 0.61 | | | | 1.69 | | | | 21.59 | |
| | (0.36 | ) | | | 22.05 | | | | (28.33 | ) | | | 245,561 | | | | 0.62 | | | | 1.71 | | | | 76.19 | |
| | (0.39 | ) | | | 31.23 | | | | (33.66 | ) | | | 314,907 | | | | 0.62 | | | | 1.61 | | | | 29.35 | |
| | | | | | | | | | | | | | | | | | | | | | | | | | | |
| | (0.08 | ) | | | 8.84 | | | | (23.92 | ) | | | 36,666 | | | | 0.50 | † | | | 1.61 | † | | | 3.94 | |
| | (0.90 | ) | | | 11.69 | | | | (9.77 | ) | | | 78,323 | | | | 0.50 | | | | 3.36 | | | | 9.63 | |
| | (0.38 | ) | | | 13.97 | | | | 6.47 | | | | 163,471 | | | | 0.50 | | | | 2.64 | | | | 9.55 | |
| | (0.32 | ) | | | 13.50 | | | | 25.53 | | | | 164,736 | | | | 0.50 | | | | 3.41 | | | | 9.53 | |
| | (0.37 | ) | | | 11.07 | | | | 6.86 | | | | 113,997 | | | | 0.50 | | | | 3.39 | | | | 16.62 | |
| | (0.83 | ) | | | 10.75 | | | | (22.50 | ) | | | 65,024 | | | | 0.50 | | | | 2.76 | | | | 16.05 | |
| | | | | | | | | | | | | | | | | | | | | | | | | | | |
| | (0.02 | ) | | | 19.79 | | | | (4.27 | ) | | | 17,020 | | | | 0.51 | † | | | 1.18 | † | | | 0.54 | |
| | (1.21 | ) | | | 20.69 | | | | 5.44 | | | | 16,756 | | | | 0.56 | | | | 0.30 | | | | 4.27 | |
| | (0.83 | ) | | | 20.82 | | | | (9.67 | ) | | | 24,149 | | | | 0.58 | | | | 2.80 | | | | 7.37 | |
| | (0.72 | ) | | | 23.89 | | | | 27.97 | | | | 38,464 | | | | 0.55 | | | | 2.37 | | | | 6.79 | |
| | (0.63 | ) | | | 19.38 | | | | (10.54 | ) | | | 40,899 | | | | 0.51 | | | | 3.01 | | | | 10.90 | |
| | (0.85 | ) | | | 22.29 | | | | (5.05 | ) | | | 52,596 | | | | 0.50 | | | | 2.53 | | | | 7.76 | |
| (1) | Per share amounts have been adjusted for a 1 for 3 reverse share split on April 28, 2020 (See Note 9 in the Notes to Financial Statements). |
| * | Per share data calculated using average shares method. |
| ** | Total Return is for the period indicated and has not been annualized. The return shown does not reflect the deduction of taxes that a shareholder would pay on Fund distributions or the redemption of Fund shares. |
| † | Annualized. |
| †† | Portfolio turnover rate is for the period indicated and periods of less than one year have not been annualized. Excludes effect of in-kind transfers. |
Amounts designated as “—” are either $0 or have been rounded to $0.
Selected Per Share Data & Ratios
For a Share Outstanding Throughout the Period
| | | Net
Asset Value, Beginning
of Period
($) | | | Net Investment Income
($)* | | | Net Realized and Unrealized Gain (Loss) on Investments
($) | | | Total from Operations
($) | | | Distribution from Net Investment Income ($) | | | Total from Distributions ($) | |
| Global X MSCI Nigeria ETF | | | | | | | | | | | | | | | | | | |
| 2020 (Unaudited) | | | 12.23 | | | | 0.48 | | | | (2.60 | ) | | | (2.12 | ) | | | (0.08 | ) | | | (0.08 | ) |
| 2019 | | | 17.98 | | | | 0.87 | | | | (4.96 | ) | | | (4.09 | ) | | | (1.66 | ) | | | (1.66 | ) |
| 2018 | | | 21.43 | | | | 0.73 | | | | (3.76 | ) | | | (3.03 | ) | | | (0.42 | ) | | | (0.42 | ) |
2017(1) | | | 17.24 | | | | 0.54 | | | | 4.07 | | | | 4.61 | | | | (0.42 | ) | | | (0.42 | ) |
2016(1) | | | 31.76 | | | | 0.86 | | | | (14.16 | ) | | | (13.30 | ) | | | (1.22 | ) | | | (1.22 | ) |
2015(1) | | | 52.08 | | | | 1.37 | | | | (20.47 | ) | | | (19.10 | ) | | | (1.22 | ) | | | (1.22 | ) |
| Global X MSCI Next Emerging & Frontier ETF | | | | | | | | | | | | | | | | | | | | | | | | |
| 2020 (Unaudited) | | | 20.09 | | | | 0.25 | | | | (4.45 | ) | | | (4.20 | ) | | | (0.24 | ) | | | (0.24 | ) |
| 2019 | | | 20.22 | | | | 0.55 | | | | 0.31 | | | | 0.86 | | | | (0.99 | ) | | | (0.99 | ) |
| 2018 | | | 23.28 | | | | 0.59 | | | | (3.24 | ) | | | (2.65 | ) | | | (0.41 | ) | | | (0.41 | ) |
| 2017 | | | 20.15 | | | | 0.40 | | | | 3.21 | | | | 3.61 | | | | (0.48 | ) | | | (0.48 | ) |
| 2016 | | | 19.27 | | | | 0.20 | | | | 1.14 | | | | 1.34 | | | | (0.46 | ) | | | (0.46 | ) |
| 2015 | | | 25.55 | | | | 0.49 | | | | (6.37 | ) | | | (5.88 | ) | | | (0.40 | ) | | | (0.40 | ) |
| Global X MSCI Portugal ETF | | | | | | | | | | | | | | | | | | | | | | | | |
| 2020 (Unaudited) | | | 10.71 | | | | — | | | | (1.85 | ) | | | (1.85 | ) | | | (0.08 | ) | | | (0.08 | ) |
| 2019 | | | 11.24 | | | | 0.36 | | | | (0.11 | ) | | | 0.25 | | | | (0.78 | ) | | | (0.78 | ) |
| 2018 | | | 12.49 | | | | 0.36 | | | | (1.25 | ) | | | (0.89 | ) | | | (0.36 | ) | | | (0.36 | ) |
| 2017 | | | 9.88 | | | | 0.36 | | | | 2.65 | | | | 3.01 | | | | (0.40 | ) | | | (0.40 | ) |
| 2016 | | | 10.85 | | | | 0.42 | | | | (0.93 | ) | | | (0.51 | ) | | | (0.46 | ) | | | (0.46 | ) |
| 2015 | | | 12.65 | | | | 0.30 | | | | (1.87 | ) | | | (1.57 | ) | | | (0.23 | ) | | | (0.23 | ) |
Net
Asset Value,
End of
Period ($) | | | Total Return (%)** | | | Net Assets End of Period ($)(000) | | | Ratio of Expenses to Average Net Assets (%) | | | Ratio of Net Investment Income (Loss) to Average Net Assets (%) | | | Portfolio Turnover (%)†† | |
| | | | | | | | | | | | | | | | | |
| | 10.03 | | | | (17.47 | ) | | | 29,702 | | | | 0.89 | † | | | 7.88 | † | | | 17.94 | |
| | 12.23 | | | | (24.55 | ) | | | 32,561 | | | | 0.89 | | | | 5.70 | | | | 45.62 | |
| | 17.98 | | | | (14.46 | ) | | | 40,675 | | | | 0.88 | | | | 3.29 | | | | 62.52 | |
| | 21.43 | | | | 27.52 | | | | 64,559 | | | | 1.07 | | | | 2.99 | | | | 21.07 | |
| | 17.24 | | | | (43.30 | ) | | | 28,009 | | | 1.02 | @
| | | 3.80 | | | | 29.61 | |
| | 31.76 | | | | (37.25 | ) | | | 24,623 | | | 0.68 | @ | | | 3.72 | | | | 34.00 | |
| | | | | | | | | | | | | | | | | | | | | | | |
| | 15.65 | | | | (21.18 | ) | | | 13,303 | | | | 0.68 | † | | | 2.67 | † | | | 17.36 | |
| | 20.09 | | | | 4.29 | | | | 18,077 | | | | 0.66 | | | | 2.66 | | | | 78.67 | |
| | 20.22 | | | | (11.66 | ) | | | 13,145 | | | | 0.55 | | | | 2.54 | | | | 14.62 | |
| | 23.28 | | | | 18.53 | | | | 16,294 | | | | 0.56 | | | | 1.89 | | | | 7.93 | |
| | 20.15 | | | | 7.33 | | | | 15,112 | | | | 0.56 | | | | 1.13 | | | | 9.35 | |
| | 19.27 | | | | (23.29 | ) | | | 106,925 | | | | 0.58 | | | | 2.22 | | | | 19.72 | |
| | | | | | | | | | | | | | | | | | | | | | | |
| | 8.78 | | | | (17.47 | ) | | | 14,920 | | | | 0.59 | † | | | (0.01 | )† | | | 13.14 | |
| | 10.71 | | | | 2.72 | | | | 22,487 | | | | 0.58 | | | | 3.41 | | | | 20.74 | |
| | 11.24 | | | | (7.26 | ) | | | 25,295 | | | | 0.57 | | | | 2.91 | | | | 21.05 | |
| | 12.49 | | | | 31.88 | | | | 63,705 | | | | 0.60 | | | | 3.31 | | | | 25.31 | |
| | 9.88 | | | | (4.86 | ) | | | 25,694 | | | | 0.61 | | | | 4.26 | | | | 27.20 | |
| | 10.85 | | | | (12.39 | ) | | | 37,449 | | | | 0.61 | | | | 2.68 | | | | 35.26 | |
| (1) | Per share amounts have been adjusted for a 1 for 4 reverse share split on March 16, 2017 (See Note 9 in the Notes to Financial Statements). |
| * | Per share data calculated using average shares method. |
| ** | Total Return is for the period indicated and has not been annualized. The return shown does not reflect the deduction of taxes that a shareholder would pay on Fund distributions or the redemption of Fund shares. |
| † | Annualized. |
| †† | Portfolio turnover rate is for the period indicated and periods of less than one year have not been annualized. Excludes effect of in-kind transfers. |
| @ | The ratio of Expenses to Average Net Assets includes the effect of a waiver. If these offsets were excluded, the ratio would have been 1.10% and 0.92%, for the years and or period ended October 31, 2016 and 2015, respectively. |
Amounts designated as “—” are either $0 or have been rounded to $0.
Selected Per Share Data & Ratios
For a Share Outstanding Throughout the Period
| | | Net
Asset Value, Beginning
of Period
($) | | | Net Investment Income
($)* | | | Net Realized and Unrealized Gain (Loss) on Investments
($) | | | Total from Operations
($) | | | Distribution from Net Investment Income ($) | | | Distribution from Capital Gains ($) | | | Return of Capital ($) | |
| Global X MSCI Pakistan ETF | | | | | | | | | | | | | | | | | | | | | |
2020(2) (Unaudited) | | | 26.32 | | | | 0.41 | | | | (1.78 | ) | | | (1.37 | ) | | | (0.54 | ) | | | — | | | | — | |
2019(2) | | | 41.04 | | | | 1.52 | | | | (13.88 | ) | | | (12.36 | ) | | | (2.36 | ) | | | — | | | | — | |
2018(2) | | | 54.24 | | | | 1.88 | | | | (10.72 | ) | | | (8.84 | ) | | | (1.76 | ) | | | (2.60 | ) | | | — | |
2017(2) | | | 60.92 | | | | 3.00 | | | | (7.60 | ) | | | (4.60 | ) | | | (2.08 | ) | | | — | | | | — | |
2016(2) | | | 56.68 | | | | 2.32 | | | | 3.60 | | | | 5.92 | | | | (1.48 | ) | | | (0.20 | ) | | | — | |
2015(1)(2) | | | 61.12 | | | | 1.40 | | | | (5.84 | ) | | | (4.44 | ) | | | — | | | | — | | | | — | |
Global X DAX Germany ETF(3) | | | | | | | | | | | | | | | | | | | | | | | | | | | | |
| 2020 (Unaudited) | | | 27.28 | | | | 0.18 | | | | (4.84 | ) | | | (4.66 | ) | | | — | | | | — | | | | — | |
2019(4) | | | 25.92 | | | | 0.67 | | | | 1.82 | | | | 2.49 | | | | (1.11 | ) | | | — | | | | (0.02 | ) |
2018(4) | | | 31.25 | | | | 0.77 | | | | (5.75 | )‡ | | | (4.98 | ) | | | (0.35 | ) | | | — | | | | — | |
2017(4) | | | 24.73 | | | | 0.48 | | | | 6.91 | | | | 7.39 | | | | (0.83 | ) | | | — | | | | (0.04 | ) |
2016(4) | | | 25.82 | | | | 0.45 | | | | (1.33 | ) | | | (0.88 | ) | | | (0.21 | ) | | | — | | | | — | |
2015(4) | | | 25.73 | | | | 0.73 | | | | (0.37 | ) | | | 0.36 | | | | (0.27 | ) | | | — | | | | — | |
| Total from Distributions ($) | | | Net
Asset Value,
End of
Period ($) | | | Total Return (%)** | | | Net Assets End of Period ($)(000) | | | Ratio of Expenses to Average Net Assets (%) | | | Ratio of Net Investment Income to Average Net Assets (%) | | | Portfolio Turnover (%)†† | |
| | | | | | | | | | | | | | | | | | | | |
| | (0.54 | ) | | | 24.41 | | | | (5.62 | ) | | | 38,147 | | | | 0.83 | † | | | 2.88 | † | | | 35.25 | |
| | (2.36 | ) | | | 26.32 | | | | (30.73 | ) | | | 41,804 | | | | 0.88 | | | | 5.14 | | | | 19.09 | |
| | (4.36 | ) | | | 41.04 | | | | (17.53 | ) | | | 40,024 | | | | 0.87 | | | | 3.84 | | | | 44.05 | |
| | (2.08 | ) | | | 54.24 | | | | (8.25 | ) | | | 53,576 | | | | 0.89 | | | | 4.64 | | | | 65.51 | |
| | (1.68 | ) | | | 60.92 | | | | 10.87 | | | | 10,664 | | | | 0.91 | | | | 4.01 | | | | 21.22 | |
| | — | | | | 56.68 | | | | (7.26 | ) | | | 5,667 | | | | 0.90 | † | | | 4.43 | † | | | 19.31 | |
| | | | | | | | | | | | | | | | | | | | | | | | | | | |
| | — | | | | 22.62 | | | | (17.07 | ) | | | 13,570 | | | | 0.20 | + | | | 1.42 | † | | | 3.43 | |
| | (1.13 | ) | | | 27.28 | | | | 9.98 | | | | 16,370 | | | | 0.21 | + | | | 2.65 | | | | 15.36 | |
| | (0.35 | ) | | | 25.92 | | | (16.05) | @ | | | 16,851 | | | | 0.20 | | | | 2.57 | | | | 7.00 | |
| | (0.87 | ) | | | 31.25 | | | | 30.40 | | | | 17,186 | | | | 0.38 | | | | 1.74 | | | | 9.00 | |
| | (0.21 | ) | | | 24.73 | | | | (3.41 | ) | | | 13,601 | | | | 0.45 | | | | 1.86 | | | | 14.00 | |
| | (0.27 | ) | | | 25.82 | | | | 1.34 | | | | 15,494 | | | | 0.45 | | | | 2.70 | | | | 9.00 | |
| (1) | The Fund commenced operations on April 22, 2015. |
| (2) | Per share amounts have been adjusted for a 1 for 4 reverse share split on April 28, 2020 (See Note 9 in the Notes to Financial Statements). |
| (3) | The financial statements include the financial information of the Predecessor Fund through December 21, 2018 (See Note 1 in Notes to Financial Statements). |
| (4) | As a result of the Reorganization, the Fund assumed the performance and accounting history of the Predecessor Fund. Accordingly, performance figures for the Fund for periods prior to the date of the Reorganization represent the performance of the Predecessor Fund (See Note 1 in Notes to Financial Statements). |
| * | Per share data calculated using average shares method. |
| ** | Total Return is for the period indicated and has not been annualized. The return shown does not reflect the deduction of taxes that a shareholder would pay on Fund distributions or the redemption of Fund shares. |
| † | Annualized. |
| †† | Portfolio turnover rate is for the period indicated and periods of less than one year have not been annualized. Excludes effect of in-kind transfers. |
| + | The ratio of Expenses to Average Net Assets includes the effect of a waiver. If these offsets were excluded, the ratio would have been 0.45% and 0.46% for the period ended April 30, 2020 and year ended October 31, 2019, respectively. |
| ‡ | Includes a $0.10 gain per share derived from a payment from the prior administrator of the Predecessor Fund. |
| @ | Before payment from the prior administrator of the Predecessor Fund for the loss resulting from an error, the total return for the period would have been (16.37%). |
Amounts designated as “—” are either $0 or have been rounded to $0.
| | |
Notes to Financial Statements (unaudited) |
| |
|
1. ORGANIZATION
The Global X Funds (the “Trust”) is a Delaware statutory trust formed on March 6, 2008. The Trust is registered under the Investment Company Act of 1940, as amended, as an open-end management investment company. As of April 30, 2020, the Trust had eighty-three portfolios, seventy-two of which were operational. The financial statements herein and the related notes pertain to the Global X MSCI China Consumer Discretionary ETF, Global X MSCI China Energy ETF, Global X MSCI China Financials ETF, Global X MSCI China Industrials ETF, Global X MSCI China Materials ETF, Global X MSCI China Communication Services ETF, Global X MSCI China Consumer Staples ETF, Global X MSCI China Health Care ETF, Global X MSCI China Information Technology ETF, Global X MSCI China Real Estate ETF, Global X MSCI China Utilities ETF, Global X MSCI China Large-Cap 50 ETF, Global X FTSE Southeast Asia ETF, Global X MSCI Colombia ETF, Global X MSCI Argentina ETF, Global X MSCI Greece ETF, Global X MSCI Norway ETF, Global X FTSE Nordic Region ETF, Global X MSCI Nigeria ETF, Global X MSCI Next Emerging & Frontier ETF, Global X MSCI Portugal ETF, Global X MSCI Pakistan ETF and Global X DAX Germany ETF (each a “Fund”, and collectively, the “Funds”). Each Fund (except for the Global X MSCI Next Emerging & Frontier ETF) has elected non-diversified status.
On December 24, 2018, the shareholders of the Horizons DAX Germany ETF (the “Predecessor Fund”) approved a proposed agreement and plan of reorganization (the “Reorganization”) that provided for (a) the transfer of all the assets to the Global X DAX Germany ETF (the “Germany Fund”) and the assumption of certain of the liabilities of the Predecessor Fund; (b) the issuance of shares of the Germany Fund to the shareholders of the Predecessor Fund; and (c) the liquidation and termination of the Predecessor Fund. The effective date of the Reorganization was December 24, 2018. The Germany Fund had no operations prior to the Reorganization. The Predecessor Fund had substantially similar investment objectives, investment strategies, policies and restrictions as those of the Germany Fund. The financial statements and financial highlights include the financial information of the Predecessor Fund through December 21, 2018.
Effective December 6, 2018, the Global X China Consumer ETF changed its name to Global X MSCI China Consumer Discretionary ETF, and its underlying index was changed to MSCI China Consumer Discretionary 10/50 Index.
Effective December 6, 2018, the Global X China Energy ETF changed its name to Global X MSCI China Energy ETF, and its underlying index was changed to MSCI China Energy IMI Plus 10/50 Index.
| | |
Notes to Financial Statements (unaudited) (continued) |
| |
|
1. ORGANIZATION (continued)
Effective December 6, 2018, the Global X China Financials ETF changed its name to Global X MSCI China Financials ETF, and its underlying index was changed to MSCI China Financials 10/50 Index.
Effective December 6, 2018, the Global X China Industrials ETF changed its name to Global X MSCI China Industrials ETF, and its underlying index was changed to MSCI China Industrials 10/50 Index.
Effective December 6, 2018, the Global X China Materials ETF changed its name to Global X MSCI China Materials ETF, and its underlying index was changed to MSCI China Materials 10/50 Index.
Effective December 6, 2018, the Global X NASDAQ China Technology ETF changed its name to Global X MSCI China Communication Services ETF, and its underlying index was changed to MSCI China Communication Services 10/50 Index.
Effective January 16, 2019, the Global X Next Emerging & Frontier ETF changed its name to Global X MSCI Next Emerging & Frontier ETF, and its underlying index was changed to the MSCI Select Emerging and Frontier Markets Access Index.
2. SIGNIFICANT ACCOUNTING POLICIES
The following is a summary of the Significant Accounting Policies followed by the Funds.
USE OF ESTIMATES — The Funds are investment companies that apply the accounting and reporting guidance issued in Topic 946 by the U.S. Financial Accounting Standards Board. The preparation of financial statements in conformity with U.S. generally accepted accounting principles (“U.S. GAAP”) requires management to make estimates and assumptions that affect the reported amounts of assets and liabilities and disclosure of contingent assets and liabilities at the date of the financial statements and the reported amounts of increases and decreases in net assets from operations during the reporting period. Actual results could differ from those estimates.
RETURN OF CAPITAL ESTIMATES — Distributions received by the Funds from underlying Master Limited Partnership (“MLP”) and real estate investment trust (“REIT”) investments generally are comprised of income and return of capital. The Funds record investment income and return of capital based on estimates made at the time such distributions are received. Such estimates are based on historical information available from the MLPs, REITs and other industry sources. These estimates may subsequently be revised based on information received from the MLPs and REITs after their tax reporting periods are concluded.
2. SIGNIFICANT ACCOUNTING POLICIES (continued)
SECURITY VALUATION — Securities listed on a securities exchange, market or automated quotation system for which quotations are readily available (except for securities traded on NASDAQ and the Nigerian Stock Exchange), including securities traded over the counter, are valued at the last quoted sale price on the primary exchange or market (foreign or domestic) on which they are traded (or at approximately 4:00 pm if a security’s primary exchange is normally open at that time), or, if there is no such reported sale, at the most recent mean between the quoted bid and asked prices, which approximate fair value (absent both bid and asked prices on such exchange, the bid price may be used).
For securities traded on NASDAQ and the Nigerian Stock Exchange, the Official Closing Price will be used. If available, debt securities are priced based upon valuations provided by independent, third-party pricing agents. Such values generally reflect the last reported sales price if the security is actively traded. The third-party pricing agents may also value debt securities at an evaluated bid price by employing methodologies that utilize actual market transactions, broker-supplied valuations, or other methodologies designed to identify the market value for such securities. Debt obligations with remaining maturities of sixty days or less will be valued at their market value. The prices for foreign securities are reported in local currency and converted to U.S. dollars using currency exchange rates. Prices for most securities held by the Funds are provided daily by recognized independent pricing agents. If a security price cannot be obtained from an independent, third-party pricing agent, the Funds seek to obtain a bid price from at least one independent broker.
Securities for which market prices are not “readily available” are valued in accordance with Fair Value Procedures established by the Board of Trustees (the “Board”). The Funds’ Fair Value Procedures are implemented through a Fair Value Committee (the “Committee”) designated by the Board. Some of the more common reasons that may necessitate that a security be valued using the Fair Value Procedures include: the security’s trading has been halted or suspended; the security has been de-listed from its primary trading exchange; the security’s primary trading market is temporarily closed at a time when, under normal conditions, it would be open; the security has not been traded for an extended period of time; the security’s primary pricing source is not able or willing to provide a price; or trading of the security is subject to local government-imposed restrictions. In addition, the Funds may fair value a security if an event that may materially affect the value of the Funds’ security that traded outside of the United States (a “Significant Event”) has occurred between the time of the security’s last close and the time that the Funds calculate their net asset values. A Significant Event may relate to a single issuer or to an entire market sector. Events that may be Significant Events include: government actions, natural disasters, armed conflict, acts of terrorism and significant market fluctuations. If Global X Management Company LLC, the Funds’ investment
2. SIGNIFICANT ACCOUNTING POLICIES (continued)
adviser (the “Adviser”), becomes aware of a Significant Event that has occurred with respect to a security or group of securities after the closing of the exchange or market on which the security or securities principally trade, but before the time at which the Funds calculate their net asset values, it may request that a Committee meeting be called.
When a security is valued in accordance with the Fair Value Procedures, the Committee will determine the value after taking into consideration relevant information reasonably available to the Committee. As of April 30, 2020, there were securities valued using Fair Value Procedures of $354,743, $28,506, $0, $3, $7,603, $171,659, $10,762, $162,073 and $12 in Global X MSCI China Consumer Discretionary ETF, Global X MSCI China Financials ETF, Global X MSCI China Materials ETF, Global X MSCI China Communication Services ETF, Global X MSCI China Real Estate ETF, Global X MSCI Greece ETF, Global X MSCI Norway ETF, Global X MSCI Next Emerging & Frontier ETF and Global X MSCI Portugal ETF, respectively. There were no other securities priced using the Fair Value Procedures.
In accordance with the authoritative guidance on fair value measurements and disclosure under U.S. GAAP, the Funds disclose the fair value of their investments in a hierarchy that prioritizes the inputs to valuation techniques used to measure the fair value. The objective of a fair value measurement is to determine the price that would be received upon the sale of an asset or paid to transfer a liability in an orderly transaction between market participants at the measurement date (an exit price). Accordingly, the fair value hierarchy gives the highest priority to quoted prices (unadjusted) in active markets for identical assets or liabilities (Level 1) and the lowest priority to unobservable inputs (Level 3). The three levels of the fair value hierarchy are described below:
Level 1 – Unadjusted quoted prices in active markets for identical, unrestricted assets or liabilities that the Funds have the ability to access at the measurement date
Level 2 – Other significant observable inputs (including quoted prices in non-active markets, quoted prices for similar investments, fair value of investments for which the Funds have the ability to fully redeem tranches at net asset value as of the measurement date or within the near term, and short-term investments valued at amortized cost)
Level 3 – Significant unobservable inputs (including the Funds’ own assumptions in determining the fair value of investments, fair value of investments for which the Funds do not have the ability to fully redeem tranches at net asset value as of the measurement date or within the near term)
2. SIGNIFICANT ACCOUNTING POLICIES (continued)
Investments are classified within the level of the lowest significant input considered in determining fair value. Investments classified within Level 3 whose fair value measurement considers several inputs may include Level 1 or Level 2 inputs as components of the overall fair value measurement. For the period ended April 30, 2020, there have been no significant changes to the Funds’ fair valuation methodologies.
The following table summarizes the quantitative inputs and assumptions used for items categorized as material Level 3 investments as of April 30, 2020. The disclosures below also include qualitative information on the sensitivity of the fair value measurements to changes in the significant unobservable inputs.
| Assets | Fair Value at 04/30/20 | Valuation Technique(s) | Unobservable Input | Discount Percentage |
| Common Stock | $15,398 | Discount from the Last Traded Price | Last Traded Price Comparability Adjustment % | 0.1% |
| Common Stock | $110,385 | Discount from the Last Traded Price | Last Traded Price Comparability Adjustment % | -7.3% |
| Common Stock | $8,300 | Discount from the Last Traded Price | Last Traded Price Comparability Adjustment % | -7.3% |
| Common Stock | $27,990 | Discount from the Last Traded Price | Last Traded Price Comparability Adjustment % | -7.3% |
The unobservable inputs used to determine fair value of Level 3 assets may have similar or diverging impacts on valuation. Significant increases and decreases in these inputs in isolation and interrelationships between those inputs could result in significantly higher or lower fair value measurement.
DUE TO/FROM BROKERS — Due to/from brokers includes cash and collateral balances with the Funds’ clearing brokers or counterparties at April 30, 2020. The Funds continuously monitor the credit standing of each broker or counterparty with whom they conduct business. In the event a broker or counterparty is unable to fulfill its obligations, the Funds would be subject to counterparty credit risk.
REPURCHASE AGREEMENTS — Securities pledged as collateral for repurchase agreements by BNP Paribas are held by Brown Brothers Harriman & Co. (“BBH”), the Funds’ custodian (“Custodian”), and are designated as being held on each Fund’s behalf by the custodian under a book-entry system. Each Fund monitors the adequacy of the collateral on a daily basis and can require the seller to provide additional collateral in the event the market value of the securities pledged falls below the carrying value of the repurchase agreement, including accrued interest. It is the Funds’ policy to only enter into repurchase agreements with banks and other financial institutions which are deemed by the Adviser to be creditworthy. The Fund bears the risk of loss in the event that the counterparty to a repurchase agreement defaults on its obligations and the Fund is prevented from exercising its rights to dispose of the underlying securities received as collateral and the risk of a possible decline in the value of the underlying securities
2. SIGNIFICANT ACCOUNTING POLICIES (continued)
during the period. For financial statement purposes, the Funds record the securities lending collateral (included in repurchase agreements, at value or restricted cash) as an asset and the obligation to return securities lending collateral as a liability on the Statements of Assets and Liabilities.
Repurchase agreements are entered into by the Funds under Master Repurchase Agreements (“MRA”) which permit the Funds, under certain circumstances, including an event of default (such as bankruptcy or insolvency), to offset payables and/or receivables under the MRA with collateral held and/or posted to the counterparty and create one single net payment due to or from the Funds.
As of April 30, 2020, the open repurchase agreements by counterparty which are subject to an MRA on a net payment basis are as follows:
| | | Repurchase Agreements | | | Fair Value of Non-cash Collateral Received(1) | | | Cash Collateral Received | | | Net Amount(2) | |
| Global X MSCI China Consumer Discretionary ETF | | | | | | | | | | | | |
| BNP Paribas | | $ | 834,657 | | | $ | 834,657 | | | $ | - | | | $ | - | |
| Global X China Financials ETF | | | | | | | | | | | | | | | | |
| BNP Paribas | | | 25,092 | | | | 25,092 | | | | - | | | | - | |
| Global X FTSE Southeast Asia ETF | | | | | | | | | | | | | | | | |
| BNP Paribas | | | 22,752 | | | | 22,752 | | | | - | | | | - | |
| Global X MSCI Colombia ETF | | | | | | | | | | | | | | | | |
| BNP Paribas | | | 802,313 | | | | 802,313 | | | | - | | | | - | |
| Global X MSCI Argentina ETF | | | | | | | | | | | | | | | | |
| BNP Paribas | | | 31,077 | | | | 31,077 | | | | - | | | | - | |
| Global X MSCI Greece ETF | | | | | | | | | | | | | | | | |
| BNP Paribas | | | 410,704 | | | | 410,704 | | | | - | | | | - | |
| Global X Norway ETF | | | | | | | | | | | | | | | | |
| BNP Paribas | | | 758,156 | | | | 758,156 | | | | - | | | | - | |
| Global X MSCI Portugal ETF | | | | | | | | | | | | | | | | |
| BNP Paribas | | | 228,527 | | | | 228,527 | | | | - | | | | - | |
(1) | Excess collateral received is not presented in the table above. Please refer to the Schedule of Investments for the market value of the collateral received for each Fund. |
(2) | Net Amount represents the net amount receivable due from the counterparty in the event of default. |
FEDERAL INCOME TAXES — It is each Fund’s intention to qualify or continue to qualify as a regulated investment company for Federal income tax purposes by complying with the appropriate provisions of Subchapter M of the Internal Revenue Code of 1986, as amended. Accordingly, no provisions for Federal income taxes have been made in the financial statements.
The Funds evaluate tax positions taken or expected to be taken in the course of preparing the Funds’ tax returns to determine whether it is “more-likely-than-not” (i.e., greater than
2. SIGNIFICANT ACCOUNTING POLICIES (continued)
50 percent) that each tax position will be sustained upon examination by a taxing authority based on the technical merits of the position. Tax positions not deemed to meet the more-likely-than-not threshold are recorded as a tax benefit or expense in the current year.
If the Funds have foreign tax filings that have not been made, the tax years that remain subject to examination may date back to the inception of each Fund.
The Funds did not record any tax provision in the current period. However, management’s conclusions regarding tax positions may be subject to review and adjustment at a later date based on factors including, but not limited to, examination by tax authorities (i.e., the last three tax year ends, as applicable), and on-going analysis of and changes to tax laws, regulations and interpretations thereof.
As of and during the period ended April 30, 2020, the Funds did not have a liability for any unrecognized tax benefits as income tax expense in the Statement of Operations. During the period, the Funds did not incur any interest or penalties.
SECURITY TRANSACTIONS AND INVESTMENT INCOME — Security transactions are accounted for on the trade date for financial reporting purposes. Costs used in determining realized gains and losses on the sale of investment securities are based on specific identification. Dividend income is recorded on the ex-dividend date. Interest income is recognized on the accrual basis from the settlement date.
FOREIGN CURRENCY TRANSACTIONS AND TRANSLATION — The books and records of the Funds are maintained in U.S. dollars. Investment securities and other assets and liabilities denominated in a foreign currency are translated into U.S. dollars on the date of valuation. Purchases and sales of investment securities, income and expenses are translated into U.S. dollars at the relevant rates of exchange prevailing on the respective dates of such transactions. The Funds do not isolate that portion of realized or unrealized gains and losses resulting from changes in the foreign exchange rate from fluctuations arising from changes in the market prices of the securities. These gains and losses are included in net realized and unrealized gains and losses on investments on the Statement of Operations. Net realized and unrealized gains and losses on foreign currency transactions and translations represent net foreign exchange gains or losses from foreign currency spot contracts, disposition of foreign currencies, currency gains or losses realized between trade and settlement dates on securities transactions and the difference between the amount of the investment income and foreign withholding taxes recorded on the Funds’ books and the U.S. dollar equivalent amounts actually received or paid.
DIVIDENDS AND DISTRIBUTIONS TO SHAREHOLDERS — The Funds distribute their net investment income on a pro rata basis. Any net investment income and net
2. SIGNIFICANT ACCOUNTING POLICIES (continued)
realized capital gains are distributed at least annually. All distributions are recorded on the ex-dividend date.
CASH OVERDRAFT CHARGES — Per the terms of an agreement with BBH, if a Fund has a cash overdraft on a given day, it will be assessed an overdraft charge of LIBOR plus 2.00%. Cash overdraft charges are included in custodian fees on the Statements of Operations.
CREATION UNITS — The Funds issue and redeem their shares (“Shares”) on a continuous basis at Net Asset Value (“NAV”) and only in large blocks of 50,000 Shares, referred to as “Creation Units”. Purchasers of Creation Units (“Authorized Participants”) at NAV must pay a standard creation transaction fee per transaction. The fee is a single charge and will be the same regardless of the number of Creation Units purchased by an Authorized Participant on the same day. An Authorized Participant who holds Creation Units and wishes to redeem at NAV would also pay a standard redemption fee per transaction to BBH on the date of such redemption, regardless of the number of Creation Units redeemed that day. If a Creation Unit is purchased or redeemed for cash, an additional variable fee may be charged. The following table discloses Creation Unit breakdown:
2. SIGNIFICANT ACCOUNTING POLICIES (continued)
| | | Creation Unit Shares | | | Creation Fee | | | Value at April 30, 2020 | | | Redemption Fee | |
| | | | | | | | | | | | | |
| Global X MSCI China Consumer Discretionary ETF | | | 50,000 | | | $ | 1,600 | | | $ | 879,000 | | | $ | 1,600 | |
| Global X MSCI China Energy ETF | | | 50,000 | | | | 800 | | | | 415,000 | | | | 800 | |
| Global X MSCI China Financials ETF | | | 50,000 | | | | 1,800 | | | | 711,000 | | | | 1,800 | |
| Global X MSCI China Industrials ETF | | | 50,000 | | | | 1,500 | | | | 641,000 | | | | 1,500 | |
| Global X MSCI China Materials ETF | | | 50,000 | | | | 1,200 | | | | 760,500 | | | | 1,200 | |
| Global X MSCI China Communication Services ETF | | | 50,000 | | | | 800 | | | | 1,154,500 | | | | 800 | |
| Global X MSCI China Consumer Staples ETF | | | 50,000 | | | | 1,000 | | | | 1,136,000 | | | | 1,000 | |
| Global X MSCI China Health Care ETF | | | 50,000 | | | | 1,000 | | | | 976,000 | | | | 1,000 | |
| Global X MSCI China Information Technology ETF | | | 50,000 | | | | 1,200 | | | | 973,000 | | | | 1,200 | |
| Global X MSCI China Real Estate ETF | | | 50,000 | | | | 1,200 | | | | 839,000 | | | | 1,200 | |
| Global X MSCI China Utilities ETF | | | 50,000 | | | | 1,000 | | | | 690,500 | | | | 1,000 | |
| Global X MSCI China Large Cap 50 ETF | | | 50,000 | | | | 1,300 | | | | 1,391,500 | | | | 1,300 | |
| Global X FTSE Southeast Asia ETF | | | 50,000 | | | | 2,100 | | | | 603,000 | | | | 2,100 | |
| Global X MSCI Colombia ETF | | | 50,000 | | | | 2,000 | | | | 1,142,500 | | | | 2,000 | |
| Global X MSCI Argentina ETF | | | 50,000 | | | | 500 | | | | 910,000 | | | | 500 | |
| Global X MSCI Greece ETF | | | 50,000 | | | | 500 | | | | 945,500 | | | | 500 | |
| Global X MSCI Norway ETF | | | 50,000 | | | | 1,200 | | | | 442,000 | | | | 1,200 | |
| Global X FTSE Nordic Region ETF | | | 50,000 | | | | 1,000 | | | | 989,500 | | | | 1,000 | |
| Global X MSCI Nigeria ETF | | | 50,000 | | | | 2,000 | | | | 501,500 | | | | 2,000 | |
| Global X MSCI Next Emerging & Frontier ETF | | | 50,000 | | | | 9,500 | | | | 782,500 | | | | 9,500 | |
| Global X MSCI Portugal ETF | | | 50,000 | | | | 1,000 | | | | 439,000 | | | | 1,000 | |
| Global X MSCI Pakistan ETF | | | 50,000 | | | | 2,800 | | | | 1,220,500 | | | | 2,800 | |
| Global X DAX Germany ETF | | | 50,000 | | | | 500 | | | | 1,131,000 | | | | 500 | |
3. RELATED PARTIES AND SERVICE PROVIDER TRANSACTIONS
On July 2, 2018, the Adviser consummated a transaction pursuant to which it became an indirect, wholly-owned subsidiary of Mirae Asset Global Investments Co., Ltd. (“Mirae”). In this manner, the Adviser is ultimately controlled by Mirae, which is a leading financial services company in Korea and is the headquarters for the Mirae Asset Global Investments Group.
The Adviser serves as the investment adviser and the administrator for the Funds. Subject to the supervision of the Board, the Adviser is responsible for managing the investment activities of the Funds and the Funds’ business affairs and other administrative matters and provides or causes to be furnished all supervisory, administrative and other services reasonably necessary for the operation of the Funds, including certain distribution services (provided pursuant to a separate distribution services agreement), certain shareholder and distribution-related services (provided pursuant to a separate Rule 12b-1 Plan and related agreements) and investment advisory services (provided pursuant to a separate Investment Advisory Agreement), under what is essentially an “all-in” fee structure.
For the Adviser’s service to the Funds, under the Supervision and Administration Agreement, each Fund pays a monthly fee to the Adviser at the annual rate below (stated as a percentage of the average daily net assets of the Fund). In addition, the Funds bear other expenses, directly and indirectly that are not covered by the Supervision and Administration Agreement, which may vary and affect the total expense ratios of the Funds, such as taxes, brokerage fees, commissions, custodian fees and other transaction expenses, interest expenses, acquired fund fees and extraordinary expenses (such as litigation and indemnification expenses). In addition, the Funds pay custodial fees that are not covered by the Supervision and Administration Agreement.
3. RELATED PARTIES AND SERVICE PROVIDER TRANSACTIONS (continued)
| | Supervision and Administration Fee |
| Global X MSCI China Consumer Discretionary ETF | 0.65% |
| Global X MSCI China Energy ETF | 0.65% |
| Global X MSCI China Financials ETF | 0.65% |
| Global X MSCI China Industrials ETF | 0.65% |
| Global X MSCI China Materials ETF | 0.65% |
| Global X MSCI China Communication Services ETF | 0.65% |
| Global X MSCI China Consumer Staples ETF | 0.65% |
| Global X MSCI China Health Care ETF | 0.65% |
| Global X MSCI China Information Technology ETF | 0.65% |
| Global X MSCI China Real Estate ETF | 0.65% |
| Global X MSCI China Utilities ETF | 0.65% |
| Global X MSCI China Large-Cap 50 ETF | 0.29% |
| Global X FTSE Southeast Asia ETF | 0.65% |
| Global X MSCI Colombia ETF* | 0.61% |
| Global X MSCI Argentina ETF** | 0.59% |
| Global X MSCI Greece ETF | 0.55% |
| Global X MSCI Norway ETF | 0.50% |
| Global X FTSE Nordic Region ETF | 0.50% |
| Global X MSCI Nigeria ETF | 0.68% |
| Global X MSCI Next Emerging & Frontier ETF | 0.49% |
| Global X MSCI Portugal ETF | 0.55% |
| Global X MSCI Pakistan ETF | 0.68% |
| Global X DAX Germany ETF*** | 0.45% |
* Pursuant to an expense limitation agreement in existence between the Global X MSCI Colombia ETF (the “ Colombia Fund”) and the Adviser prior to March 1, 2018, the Adviser agreed to waive or reimburse fees and/or limit fund expenses to the extent necessary to assure that the operating expenses of the Colombia Fund (exclusive of taxes, brokerage fees, commissions, custodian fees, and other transaction expenses, interest and extraordinary expenses (such as litigation and indemnification expenses)) (“Total Annual Fund Operating Expenses”) would not exceed 0.61% of the Colombia Fund’s average daily net assets per year until at least March 1, 2018. Pursuant to the expense limitation agreement, the Colombia Fund (at a later date) could reimburse the Adviser for the fees and expenses it waived or reimbursed and/or limited during any of the prior three fiscal years, provided that, among other things, any reimbursement made to the Adviser would not cause Total Annual Fund Operating Expenses to exceed the maximum permitted rate during the period in which it is paid and the Board had approved such reimbursement to the Adviser. Although the Board voted on December 19, 2017 to permanently reduce the Colombia Fund’s fees to 0.61% and end the expense limitation agreement as of March 1, 2018, prior waived or reimbursed fees are still subject to recoupment. As of April 30, 2020, the amounts of waivers/reimbursements subject to recoupment for the Colombia Fund were $61,948 (expiring 2021) and $92,171 (expiring 2020). As of April 30, 2020, there had been no recoupment of previously waived and reimbursed fees.
3. RELATED PARTIES AND SERVICE PROVIDER TRANSACTIONS (continued)
** Pursuant to an expense limitation agreement in existence between the Global X MSCI Argentina ETF (the “Argentina Fund”) and the Adviser prior to May 1, 2018, the Adviser agreed to waive or reimburse fees and/or limit Fund expenses to the extent necessary to assure that the operating expenses of the Argentina Fund (exclusive of taxes, brokerage fees, commissions, custodian fees, and other transaction expenses, interest and extraordinary expenses (such as litigation and indemnification expenses)) (“Total Annual Fund Operating Expenses”) would not exceed 0.59% of the Argentina Fund’s average daily net assets per year until at least May 1, 2018. Pursuant to the expense limitation agreement, the Argentina Fund (at a later date) could reimburse the Adviser for the fees and expenses it waived or reimbursed and/or limited during any of the prior three fiscal years, provided that, among other things, any reimbursement made to the Adviser would not cause Total Annual Fund Operating Expenses of the Argentina Fund to exceed 0.59% during the period in which it is paid and the Board had approved such reimbursement to the Adviser. Although the Board voted on December 19, 2017 to permanently reduce the Argentina Fund’s fees to 0.59% and end the expense limitation agreement as of March 1, 2018, prior waived or reimbursed fees are still subject to recoupment. As of April 30, 2020, the amounts of waivers/reimbursements subject to recoupment for the Argentina Fund were $105,611 (expiring 2021) and $123,845 (expiring 2020). As of April 30, 2020, there had been no recoupment of previously waived and reimbursed fees.
*** Effective August 1, 2017, Horizons ETFs Management (US) LLC (the “Predecessor Adviser”), contractually agreed to waive a portion of its management fee, which was 0.45% of the average daily net assets of the Predecessor Fund, and/or reimburse fees or expenses to 0.20% of the average daily net assets until July 31, 2019. The Board approved an Expense Limitation Agreement whereby the Adviser, effective as of the Reorganization, contractually agreed to reimburse or waive fees and/or limit the Germany Fund’s expenses to the extent necessary to assure that operating expenses (exclusive of taxes, brokerage fees, commissions, custodian fees, and other transaction expenses, interest, and extraordinary expenses (such as litigation and indemnification expenses)) will not exceed 0.20% of the Germany Fund’s average daily net assets per year until at least March 1, 2021.
SEI Investments Global Funds Services (“SEIGFS”) serves as sub-administrator to the Funds. As sub-administrator, SEIGFS provides the Funds with the required general administrative services, including, without limitation: office space, equipment, and personnel; clerical and general back office services; bookkeeping, internal accounting and secretarial services; the calculation of NAV; and assistance with the preparation and filing of reports, registration statements, proxy statements and other materials required to be filed or furnished by the Funds under federal and state securities laws. As compensation for these services, SEIGFS receives certain out-of-pocket costs, transaction fees and asset-based fees which are accrued daily and paid monthly by the Adviser.
SEI Investments Distribution Co. (“SIDCO”) serves as each Fund’s underwriter and distributor of Creation Units pursuant to a Distribution Agreement. SIDCO has no obligation to sell any specific quantity of Fund Shares. SIDCO bears the following costs and expenses relating to the distribution of Shares: (i) the costs of processing and maintaining records of creations of Creation Units; (ii) all costs of maintaining the records required of a registered broker/dealer; (iii) the expenses of maintaining its registration or qualification as a dealer or broker under Federal or state laws; (iv) filing
3. RELATED PARTIES AND SERVICE PROVIDER TRANSACTIONS (continued)
fees; and (v) all other expenses incurred in connection with the distribution services as contemplated in the Distribution Agreement. SIDCO receives no fee for its distribution services under the Distribution Agreement, rather the Adviser compensates SIDCO for certain expenses, out-of-pocket costs, and transaction fees.
BBH serves as transfer agent and Custodian of the Funds’ assets. As Custodian, BBH has agreed to (1) make receipts and disbursements of money on behalf of the Funds, (2) collect and receive all income and other payments and distributions on account of the Funds’ portfolio investments, (3) respond to correspondence from shareholders, security brokers and others relating to its duties; and (4) make periodic reports to the Funds concerning the Funds’ operations. BBH does not exercise any supervisory function over the purchase and sale of securities. As compensation for these services, BBH receives certain out-of-pocket costs, transaction fees and asset-based fees which are accrued daily and paid monthly by the Adviser from its fees. As transfer agent, BBH has agreed to (1) issue and redeem shares of each Fund, (2) make dividend and other distributions to shareholders of each Fund, (3) respond to correspondence by shareholders and others relating to its duties; (4) maintain shareholder accounts, and (5) make periodic reports to the Funds. As compensation for these services, BBH receives certain out of-pocket costs, transaction fees and asset-based fees which are accrued daily and paid monthly by the Adviser from its fees.
4. INVESTMENT TRANSACTIONS
For the period ended April 30, 2020, the purchases and sales of investments in securities, excluding in-kind transactions, long-term U.S. Government and short-term securities were:
| | | | | | | |
| | | Purchases | | | | |
| Global X MSCI China Consumer Discretionary ETF | | $ | 22,049,506 | | | $ | 21,073,402 | |
| Global X MSCI China Energy ETF | | | 672,817 | | | | 240,405 | |
| Global X MSCI China Financials ETF | | | 4,932,130 | | | | 6,995,547 | |
| Global X MSCI China Industrials ETF | | | 278,103 | | | | 307,487 | |
| Global X MSCI China Materials ETF | | | 385,295 | | | | 728,644 | |
| Global X MSCI China Communication Services ETF | | | 3,084,698 | | | | 4,481,520 | |
| Global X MSCI China Consumer Staples ETF | | | 8,544,620 | | | | 2,984,762 | |
| Global X MSCI China Health Care ETF | | | 4,144,272 | | | | 1,235,524 | |
| Global X MSCI China Information Technology ETF | | | 13,887,952 | | | | 2,648,689 | |
| Global X MSCI China Real Estate ETF | | | 12,427,429 | | | | 847,470 | |
| Global X MSCI China Utilities ETF | | | 278,724 | | | | 300,108 | |
| Global X MSCI China Large Cap 50 ETF | | | 293,754 | | | | 327,534 | |
| Global X FTSE Southeast Asia ETF | | | 1,052,254 | | | | 929,436 | |
| Global X MSCI Colombia ETF | | | 5,183,706 | | | | 8,534,459 | |
| Global X MSCI Argentina ETF | | | 15,710,278 | | | | 16,855,702 | |
| Global X MSCI Greece ETF | | | 41,813,212 | | | | 43,539,397 | |
| Global X MSCI Norway ETF | | | 2,478,204 | | | | 2,354,051 | |
| Global X FTSE Nordic Region ETF | | | 380,904 | | | | 94,156 | |
| Global X MSCI Nigeria ETF | | | 11,046,220 | | | | 6,193,222 | |
| Global X MSCI Next Emerging & Frontier ETF | | | 2,827,274 | | | | 3,176,545 | |
| Global X MSCI Portugal ETF | | | 2,469,592 | | | | 2,575,638 | |
| Global X MSCI Pakistan ETF | | | 18,259,867 | | | | 16,784,306 | |
| Global X DAX Germany ETF | | | 670,367 | | | | 558,137 | |
During the period ended April 30, 2020, there were no purchases or sales of long-term U.S. Government securities for the Funds.
4. INVESTMENT TRANSACTIONS (continued)
For the period ended April 30, 2020, in-kind transactions associated with creations and redemptions were:
| | | | | | | | | | |
| | | Purchases | | | Sales and Maturities | | | Realized Gain/(Loss) | |
| Global X MSCI China Consumer Discretionary ETF | | $ | 5,242,830 | | | $ | 25,044,197 | | | $ | 4,003,369 | |
| Global X MSCI China Financials ETF | | | 21,345 | | | | 18,005,336 | | | | (2,491,285 | ) |
| Global X MSCI China Materials ETF | | | - | | | | 503,499 | | | | 9,330 | |
| Global X MSCI China Communication Services ETF | | | - | | | | 3,140,071 | | | | 229,405 | |
| Global X MSCI China Consumer Staples ETF | | | - | | | | 2,359,647 | | | | 217,114 | |
| Global X MSCI China Health Care ETF | | | 102,216 | | | | 1,431,871 | | | | 477,251 | |
| Global X MSCI China Information Technology ETF | | | 552,610 | | | | 3,622,313 | | | | 435,527 | |
| Global X MSCI China Real Estate ETF | | | - | | | | 4,584,008 | | | | 282,367 | |
| Global X FTSE Southeast Asia ETF | | | 644,892 | | | | 460,399 | | | | (11,727 | ) |
| Global X MSCI Colombia ETF | | | - | | | | 2,083,246 | | | | 214,092 | |
| Global X MSCI Argentina ETF | | | 11,622,517 | | | | 23,758,513 | | | | 3,742,485 | |
| Global X MSCI Greece ETF | | | 3,885,829 | | | | 85,365,568 | | | | (14,254,595 | ) |
| Global X MSCI Norway ETF | | | 2,535,504 | | | | 32,553,830 | | | | (5,283,204 | ) |
| Global X FTSE Nordic Region ETF | | | 1,049,333 | | | | - | | | | - | |
| Global X MSCI Next Emerging & Frontier ETF | | | 333,226 | | | | 625,784 | | | | (171,539 | ) |
| Global X MSCI Portugal ETF | | | - | | | | 4,393,067 | | | | 374,625 | |
| Global X DAX Germany ETF | | | 2,825,937 | | | | 2,283,301 | | | | 189,578 | |
For the year ended October 31, 2019, in-kind transactions associated with creations and redemptions were:
| | | | | | | | | | |
| | | Purchases | | | Sales and Maturities | | | | |
| Global X MSCI China Consumer Discretionary ETF | | $ | 14,227,232 | | | $ | 21,430,344 | | | $ | 1,136,331 | |
| Global X MSCI China Energy ETF | | | - | | | | 849,880 | | | | (49,384 | ) |
| Global X MSCI China Financials ETF | | | 4,496,360 | | | | 35,637,848 | | | | (2,187,542 | ) |
| Global X MSCI China Communication Services ETF | | | 2,928,502 | | | | 6,119,465 | | | | 1,537,083 | |
| Global X MSCI China Consumer Staples ETF | | | 644,217 | | | | 733,187 | | | | 127,698 | |
| Global X MSCI China Health Care ETF | | | 688,666 | | | | 767,285 | | | | 94,400 | |
| Global X MSCI China Information Technology ETF | | | 1,912,081 | | | | 1,351,005 | | | | 127,520 | |
| Global X MSCI China Large-Cap 50 ETF | | | 1,184,305 | | | | 1,230,981 | | | | 114,167 | |
| Global X FTSE Southeast Asia ETF | | | 6,485,264 | | | | - | | | | - | |
| Global X MSCI Colombia ETF | | | 2,630,689 | | | | 9,119,282 | | | | 2,450,328 | |
| Global X MSCI Argentina ETF | | | 22,008,833 | | | | 40,005,941 | | | | 4,436,996 | |
| Global X MSCI Greece ETF | | | 121,989,870 | | | | 114,890,905 | | | | 18,314,024 | |
| Global X MSCI Norway ETF | | | 28,402,701 | | | | 92,279,600 | | | | 3,925,448 | |
| Global X FTSE Nordic Region ETF | | | - | | | | 7,264,558 | | | | (17,968 | ) |
| Global X MSCI Next Emerging & Frontier ETF | | | 2,917,400 | | | | - | | | | - | |
| Global X MSCI Portugal ETF | | | 5,525,084 | | | | 7,024,100 | | | | 448,381 | |
| Global X DAX Germany ETF | | | - | | | | 1,308,110 | | | | 57,684 | |
5. TAX INFORMATION
The amount and character of income and capital gain distributions to be paid, if any, are determined in accordance with Federal income tax regulations, which may differ from U.S. GAAP. As a result, net investment income (loss) and net realized gain (loss) on investment transactions for a reporting period may differ significantly from distributions during such period. These book/tax differences may be temporary or permanent. To the extent these differences are permanent in nature, they are charged or credited to undistributed net investment income (loss), accumulated net realized gain (loss) or paid-in capital, as appropriate, in the period that the differences arise.
The tax character of dividends and distributions declared during the periods ended October 31, 2019 and 2018 were as follows:
| Global X Funds | | Ordinary Income | | | Long-Term Capital Gain | | | Return of Capital | | | Totals | |
| Global X MSCI China Consumer Discretionary ETF | | | | | | | | | | | | |
| 2019 | | $ | 3,541,990 | | | $ | – | | | $ | – | | | $ | 3,541,990 | |
| 2018 | | | 1,451,475 | | | | – | | | | – | | | | 1,451,475 | |
| Global X MSCI China Energy ETF | | | | | | | | | | | | | | | | |
| 2019 | | $ | 123,563 | | | $ | – | | | $ | – | | | $ | 123,563 | |
| 2018 | | | 61,751 | | | | – | | | | – | | | | 61,751 | |
| Global X MSCI China Financials ETF | | | | | | | | | | | | | | | | |
| 2019 | | $ | 2,438,433 | | | $ | – | | | $ | – | | | $ | 2,438,433 | |
| 2018 | | | 957,793 | | | | – | | | | – | | | | 957,793 | |
| Global X MSCI China Industrials ETF | | | | | | | | | | | | | | | | |
| 2019 | | $ | 67,864 | | | $ | – | | | $ | – | | | $ | 67,864 | |
| 2018 | | | 86,463 | | | | – | | | | – | | | | 86,463 | |
| Global X MSCI China Materials ETF | | | | | | | | | | | | | | | | |
| 2019 | | $ | 149,448 | | | $ | – | | | $ | – | | | $ | 149,448 | |
| 2018 | | | 58,997 | | | | – | | | | – | | | | 58,997 | |
| Global X MSCI China Communication Services ETF | | | | | | | | | | | | | | | | |
| 2019 | | $ | 115,344 | | | $ | – | | | $ | – | | | $ | 115,344 | |
| 2018 | | | 578,519 | | | | – | | | | – | | | | 578,519 | |
| Global X MSCI China Consumer Staples ETF | | | | | | | | | | | | | | | | |
| 2019 | | $ | 13,493 | | | $ | – | | | $ | – | | | $ | 13,493 | |
| Global X MSCI China Health Care ETF | | | | | | | | | | | | | | | | |
| 2019 | | $ | 2,880 | | | $ | – | | | $ | – | | | $ | 2,880 | |
| Global X MSCI China Information Technology ETF | | | | | | | | | | | | | | | | |
| 2019 | | $ | 12,360 | | | $ | – | | | $ | – | | | $ | 12,360 | |
| Global X MSCI China Real Estate ETF | | | | | | | | | | | | | | | | |
| 2019 | | $ | 26,242 | | | $ | – | | | $ | – | | | $ | 26,242 | |
| Global X MSCI China Utilities ETF | | | | | | | | | | | | | | | | |
| 2019 | | $ | 12,312 | | | $ | – | | | $ | – | | | $ | 12,312 | |
| Global X MSCI China Large-Cap 50 ETF | | | | | | | | | | | | | | | | |
| 2019 | | $ | 21,830 | | | $ | – | | | $ | – | | | $ | 21,830 | |
| Global X FTSE Southeast Asia ETF | | | | | | | | | | | | | | | | |
| 2019 | | $ | 911,494 | | | $ | – | | | $ | – | | | $ | 911,494 | |
| 2018 | | | 284,000 | | | | – | | | | – | | | | 284,000 | |
5. TAX INFORMATION (continued)
| Global X Funds | | Ordinary Income | | | Long-Term Capital Gain | | | Return of Capital | | | Totals | |
| Global X MSCI Colombia ETF | | | | | | | | | | | | |
| 2019 | | $ | 3,425,053 | | | $ | – | | | $ | – | | | $ | 3,425,053 | |
| 2018 | | | 1,748,612 | | | | – | | | | – | | | | 1,748,612 | |
| Global X MSCI Argentina ETF | | | | | | | | | | | | | | | | |
| 2019 | | $ | 1,862,692 | | | $ | – | | | $ | – | | | $ | 1,862,692 | |
| 2018 | | | 1,050,485 | | | | – | | | | – | | | | 1,050,485 | |
| Global X MSCI Greece ETF | | | | | | | | | | | | | | | | |
| 2019 | | $ | 7,386,717 | | | $ | – | | | $ | – | | | $ | 7,386,717 | |
| 2018 | | | 8,523,662 | | | | – | | | | – | | | | 8,523,662 | |
| Global X MSCI Norway ETF | | | | | | | | | | | | | | | | |
| 2019 | | $ | 6,822,589 | | | $ | – | | | $ | – | | | $ | 6,822,589 | |
| 2018 | | | 4,071,466 | | | | – | | | | – | | | | 4,071,466 | |
| Global X FTSE Nordic Region ETF | | | | | | | | | | | | | | | | |
| 2019 | | $ | 946,666 | | | $ | – | | | $ | 410,291 | | | $ | 1,356,957 | |
| 2018 | | | 1,206,770 | | | | – | | | | – | | | | 1,206,770 | |
| Global X MSCI Nigeria ETF | | | | | | | | | | | | | | | | |
| 2019 | | $ | 3,827,441 | | | $ | – | | | $ | – | | | $ | 3,827,441 | |
| 2018 | | | 1,360,193 | | | | – | | | | – | | | | 1,360,193 | |
| Global X MSCI Next Emerging & Frontier ETF | | | | | | | | | | | | | | | | |
| 2019 | | $ | 725,137 | | | $ | – | | | $ | – | | | $ | 725,137 | |
| 2018 | | | 288,733 | | | | – | | | | – | | | | 288,733 | |
| Global X MSCI Portugal ETF | | | | | | | | | | | | | | | | |
| 2019 | | $ | 1,885,103 | | | $ | – | | | $ | – | | | $ | 1,885,103 | |
| 2018 | | | 1,558,591 | | | | – | | | | – | | | | 1,558,591 | |
| Global X MSCI Pakistan ETF | | | | | | | | | | | | | | | | |
| 2019 | | $ | 2,425,569 | | | $ | – | | | $ | – | | | $ | 2,425,569 | |
| 2018 | | | 2,761,116 | | | | 1,522,382 | | | | – | | | | 4,283,498 | |
| Global X DAX Germany ETF | | | | | | | | | | | | | | | | |
| 2019 | | $ | 666,693 | | | $ | – | | | $ | 10,877 | | | $ | 677,570 | |
| 2018 | | | 244,615 | | | | – | | | | – | | | | 244,615 | |
5. TAX INFORMATION (continued)
As of October 31, 2019, the components of tax basis distributable earnings (accumulated losses) were as follows:
| | | Global X Funds | |
| | | Global X MSCI China Consumer Discretionary ETF | | | Global X MSCI China Energy ETF | | | Global X MSCI China Financials ETF | | | Global X MSCI China Industrials ETF | |
| Undistributed Ordinary Income | | $ | 1,217,721 | | | $ | 28,861 | | | $ | 1,692,783 | | | $ | 16,234 | |
| Capital Loss Carryforwards | | | (70,574,152 | ) | | | (1,440,717 | ) | | | (3,663,221 | ) | | | (2,682,255 | ) |
| Unrealized Appreciation (Depreciation) on Investments and Foreign Currency | | | 494,608 | | | | (350,975 | ) | | | (8,241,478 | ) | | | (437,597 | ) |
| Other Temporary Differences | | | (6 | ) | | | (2 | ) | | | (3 | ) | | | (3 | ) |
| Total Accumulated Losses | | $ | (68,861,829 | ) | | $ | (1,762,833 | ) | | $ | (10,211,919 | ) | | $ | (3,103,621 | ) |
| | | Global X Funds | |
| | | Global X MSCI China Materials ETF | | | Global X MSCI China Communication Services ETF | | | Global X MSCI China Consumer Staples ETF | | | Global X MSCI China Health Care ETF | |
| Undistributed Ordinary Income | | $ | 40,341 | | | $ | 53,587 | | | $ | 90,144 | | | $ | 16,303 | |
| Capital Loss Carryforwards | | | (1,870,804 | ) | | | (5,361,305 | ) | | | – | | | | – | |
| Unrealized Appreciation (Depreciation) on Investments and Foreign Currency | | | (619,522 | ) | | | (3,246,435 | ) | | | 400,768 | | | | 230,644 | |
| Other Temporary Differences | | | 3 | | | | 1 | | | | (1 | ) | | | – | |
| Total Distributable Earnings (Accumulated Losses) | | $ | (2,449,982 | ) | | $ | (8,554,152 | ) | | $ | 490,911 | | | $ | 246,947 | |
5. TAX INFORMATION (continued)
| | | Global X Funds | |
| | | Global X MSCI China Information Technology ETF | | | Global X MSCI China Real Estate ETF | | | Global X MSCI China Utilities ETF | | | Global X MSCI China Large-Cap 50 ETF | |
| Undistributed Ordinary Income | | $ | 33,127 | | | $ | 40,833 | | | $ | 26,137 | | | $ | 32,517 | |
| Capital Loss Carryforwards | | | – | | | | (29,885 | ) | | | – | | | | (17,717 | ) |
| Unrealized Appreciation on Investments and Foreign Currency | | | 28,771 | | | | 209,870 | | | | 52,622 | | | | 117,293 | |
| Other Temporary Differences | | | – | | | | (1 | ) | | | (1 | ) | | | – | |
| Total Distributable Earnings | | $ | 61,898 | | | $ | 220,817 | | | $ | 78,758 | | | $ | 132,093 | |
| | | Global X Funds | |
| | | Global X FTSE Southeast Asia ETF | | | Global X MSCI Colombia ETF | | | Global X MSCI Argentina ETF | | | Global X MSCI Greece ETF | |
| Undistributed Ordinary Income | | $ | 220,714 | | | $ | 658,738 | | | $ | 89,459 | | | $ | 4,229,808 | |
| Capital Loss Carryforwards | | | (5,648,692 | ) | | | (74,202,710 | ) | | | (3,248,456 | ) | | | (144,201,514 | ) |
| Unrealized Depreciation on Investments and Foreign Currency | | | (254,908 | ) | | | (7,243,434 | ) | | | (44,383,066 | ) | | | (70,214,352 | ) |
| Other Temporary Differences | | | (3 | ) | | | (5 | ) | | | (4 | ) | | | (15 | ) |
| Total Accumulated Losses | | $ | (5,682,889 | ) | | $ | (80,787,411 | ) | | $ | (47,542,067 | ) | | $ | (210,186,073 | ) |
5. TAX INFORMATION (continued)
| | | Global X Funds | |
| | | Global X MSCI Norway ETF | | | Global X FTSE Nordic Region ETF | | | Global X MSCI Nigeria ETF | | | Global X MSCI Next Emerging & Frontier ETF | |
| Undistributed Ordinary Income | | $ | 292,316 | | | $ | – | | | $ | 209,558 | | | $ | 198,470 | |
| Capital Loss Carryforwards | | | (29,680,156 | ) | | | (4,605,508 | ) | | | (20,481,323 | ) | | | (23,664,979 | ) |
| Unrealized Depreciation on Investments and Foreign Currency | | | (19,201,136 | ) | | | (1,517,810 | ) | | | (14,268,514 | ) | | | (123,613 | ) |
| Other Temporary Differences | | | (12 | ) | | | – | | | | 1 | | | | – | |
| Total Accumulated Losses | | $ | (48,588,988 | ) | | $ | (6,123,318 | ) | | $ | (34,540,278 | ) | | $ | (23,590,122 | ) |
| | | Global X Funds | |
| | | Global X MSCI Portugal ETF | | | Global X MSCI Pakistan ETF | | | Global X DAX Germany ETF | |
| Undistributed Ordinary Income | | $ | 151,260 | | | $ | 703,677 | | | $ | – | |
| Capital Loss Carryforwards | | | (11,970,309 | ) | | | (10,924,297 | ) | | | (1,121,982 | ) |
| Unrealized Depreciation on Investments and Foreign Currency | | | (6,580,174 | ) | | | (28,841,972 | ) | | | (954,925 | ) |
| Other Temporary Differences | | | 1 | | | | (1 | ) | | | (1 | ) |
| Total Accumulated Losses | | $ | (18,399,222 | ) | | $ | (39,062,593 | ) | | $ | (2,076,908 | ) |
5. TAX INFORMATION (continued)
For taxable years beginning after December 22, 2010, a registered investment company (“RIC”) is permitted to carry forward net capital losses to offset capital gains realized in later years, and the losses carried forward retain their original character as either long-term or short-term losses. Losses carried forward under these new provisions are as follows:
| | | Short-Term Loss | | | Long-Term Loss | | | Total | |
| Global X MSCI China Consumer Discretionary ETF | | $ | 19,009,293 | | | $ | 51,564,859 | | | $ | 70,574,152 | |
| Global X MSCI China Energy ETF | | | 224,287 | | | | 1,216,430 | | | | 1,440,717 | |
| Global X MSCI China Financials ETF | | | 3,442,142 | | | | 221,079 | | | | 3,663,221 | |
| Global X MSCI China Industrials ETF | | | 406,706 | | | | 2,275,549 | | | | 2,682,255 | |
| Global X MSCI China Materials ETF | | | 150,261 | | | | 1,720,543 | | | | 1,870,804 | |
| Global X MSCI China Communication Services ETF | | | 3,685,498 | | | | 1,675,807 | | | | 5,361,305 | |
| Global X MSCI China Real Estate ETF | | | 29,885 | | | | – | | | | 29,885 | |
| Global X MSCI China Large-Cap 50 ETF | | | 17,717 | | | | – | | | | 17,717 | |
| Global X FTSE Southeast Asia ETF | | | 1,913,326 | | | | 3,735,366 | | | | 5,648,692 | |
| Global X MSCI Colombia ETF | | | 23,807,584 | | | | 50,395,126 | | | | 74,202,710 | |
| Global X MSCI Argentina ETF | | | 3,248,456 | | | | – | | | | 3,248,456 | |
| Global X MSCI Greece ETF | | | 67,823,891 | | | | 76,377,623 | | | | 144,201,514 | |
| Global X MSCI Norway ETF | | | 8,943,250 | | | | 20,736,906 | | | | 29,680,156 | |
| Global X FTSE Nordic Region ETF | | | 1,446,721 | | | | 3,158,787 | | | | 4,605,508 | |
| Global X MSCI Nigeria ETF | | | 5,871,520 | | | | 14,609,803 | | | | 20,481,323 | |
| Global X MSCI Next Emerging & Frontier ETF | | | 5,582,673 | | | | 18,032,306 | | | | 23,614,979 | |
| Global X MSCI Portugal ETF | | | 3,571,291 | | | | 8,399,018 | | | | 11,970,309 | |
| Global X MSCI Pakistan ETF | | | 1,285,889 | | | | 9,638,408 | | | | 10,924,297 | |
| Global X DAX Germany ETF | | | 543,196 | | | | 578,786 | | | | 1,121,982 | |
During the year ended October 31, 2019 the following Funds utilized capital loss carryforwards to offset capital gains amounting to:
| | | Short-Term Loss | | | Long-Term Loss | | | Total | |
| Global X MSCI China Financials ETF | | $ | – | | | $ | 686,095
| | | $ | 686,095
| |
| Global X MSCI Argentina ETF | | | 547,637
| | | | 422,844
| | | | 970,481
| |
5. TAX INFORMATION (continued)
The Federal tax cost and aggregate gross unrealized appreciation and depreciation on investments held by the Funds at April 30, 2020 were as follows:
| Global X Funds | | Federal Tax Cost | | | Aggregated Gross Unrealized Appreciation | | | Aggregated Gross Unrealized Depreciation | | | Net Unrealized Appreciation (Depreciation) | |
| Global X MSCI China Consumer Discretionary ETF | | $ | 141,851,274 | | | $ | 23,180,897 | | | $ | (20,197,759 | ) | | $ | 2,983,138 | |
| Global X MSCI China Energy ETF | | | 2,342,705 | | | | 51,463 | | | | (635,074 | ) | | | (583,611 | ) |
| Global X MSCI China Financials ETF | | | 43,821,373 | | | | 361,423 | | | | (7,683,772 | ) | | | (7,322,349 | ) |
| Global X MSCI China Industrials ETF | | | 2,241,820 | | | | 281,050 | | | | (599,414 | ) | | | (318,364 | ) |
| Global X MSCI China Materials ETF | | | 1,762,751 | | | | 224,927 | | | | (469,042 | ) | | | (244,115 | ) |
| Global X MSCI China Communication Services ETF | | | 18,875,363 | | | | 2,275,177 | | | | (3,846,809 | ) | | | (1,571,632 | ) |
| Global X MSCI China Consumer Staples ETF | | | 5,101,138 | | | | 748,482 | | | | (184,379 | ) | | | 564,103 | |
| Global X MSCI China Health Care ETF | | | 4,403,228 | | | | 744,059 | | | | (271,741 | ) | | | 472,318 | |
| Global X MSCI China Information Technology ETF | | | 10,433,626 | | | | 474,878 | | | | (1,203,949 | ) | | | (729,071 | ) |
| Global X MSCI China Real Estate ETF | | | 8,773,531 | | | | 284,941 | | | | (676,506 | ) | | | (391,565 | ) |
| Global X MSCI China Utilities ETF | | | 1,505,850 | | | | 85,355 | | | | (207,161 | ) | | | (121,806 | ) |
| Global X MSCI China Large Cap 50 ETF | | | 2,587,606 | | | | 402,411 | | | | (209,841 | ) | | | 192,570 | |
| Global X FTSE Southeast Asia ETF | | | 26,038,464 | | | | 199,514 | | | | (6,129,313 | ) | | | (5,929,799 | ) |
| Global X MSCI Colombia ETF | | | 80,616,829 | | | | 1,174,314 | | | | (28,294,621 | ) | | | (27,120,307 | ) |
| Global X MSCI Argentina ETF | | | 89,219,488 | | | | 5,642,303 | | | | (50,843,743 | ) | | | (45,201,440 | ) |
| Global X MSCI Greece ETF | | | 245,767,159 | | | | 3,777,252 | | | | (101,427,838 | ) | | | (97,650,586 | ) |
| Global X MSCI Norway ETF | | | 67,056,661 | | | | 540,479 | | | | (23,230,054 | ) | | | (22,689,575 | ) |
| Global X FTSE Nordic Region ETF | | | 19,003,326 | | | | 2,544,320 | | | | (4,665,797 | ) | | | (2,121,477 | ) |
| Global X MSCI Nigeria ETF | | | 43,141,986 | | | | 300,673 | | | | (14,194,487 | ) | | | (13,893,814 | ) |
| Global X MSCI Next Emerging & Frontier ETF | | | 16,402,221 | | | | 411,680 | | | | (3,547,324 | ) | | | (3,135,644 | ) |
| Global X MSCI Portugal ETF | | | 25,739,871 | | | | 361,388 | | | | (8,858,511 | ) | | | (8,497,123 | ) |
| Global X MSCI Pakistan ETF | | | 51,296,036 | | | | 488,640 | | | | (12,302,749 | ) | | | (11,814,109 | ) |
| Global X DAX Germany ETF | | | 17,757,650 | | | | 768,315 | | | | (5,078,879 | ) | | | (4,310,564 | ) |
6. CONCENTRATION OF RISKS
The Funds invest in securities of foreign issuers in several countries. These investments may involve certain considerations and risks not typically associated with investments in the United States as a result of, among other factors, the possibility of future political and economic developments and the level of governmental supervision and regulation of securities markets in the respective countries.
The securities markets of emerging market countries are less liquid and subject to greater price volatility, and have a smaller market capitalization than the U.S. securities markets.
6. CONCENTRATION OF RISKS (continued)
In certain countries, there may be fewer publicly traded securities and the market may be dominated by a few issuers or sectors. Issuers and securities markets in such countries are not subject to as extensive and frequent accounting, financial and other reporting requirements or as comprehensive government regulations or issuers and securities markets in the U.S. In particular, the assets and profits appearing on the financial statements of emerging market country issuers may not reflect their financial position or results of operations in the same manner as financial statements for U.S. issuers. Substantially less information may be publicly available about emerging market country issuers than is available about issuers in the United States.
The Funds may be subject to taxes imposed by countries in which they invest. Such taxes are generally based on either income, gains earned or gains repatriated. The Funds accrue and apply such taxes to net investment income, net realized gains and net unrealized gains as income and/or capital gains are earned.
The Funds use a replication strategy. A replication strategy is an indexing strategy that involves investing in the securities of the underlying index in approximately the same proportions as the underlying index. Each Fund may utilize a representative sampling strategy with respect to its underlying index when a replication strategy might be detrimental to its shareholders, such as when there are practical difficulties or substantial costs involved in compiling a portfolio of equity securities to follow its underlying index, or, in certain instances, when securities in the underlying index become temporarily illiquid, unavailable or less liquid, or due to legal restrictions (such as diversification requirements that apply to a Fund but not the underlying indexes).
Certain Funds may invest in commodity related securities, which are susceptible to fluctuations in certain commodity markets. Any negative changes in commodity markets could have a great impact on those securities.
Please refer to each Fund’s prospectus and statement of additional information (“SAI”) for a more complete description of risks.
7. LOANS OF PORTFOLIO SECURITIES
The Funds may lend portfolio securities having a market value up to one-third of the Funds’ total assets. Security loans made pursuant to a securities lending agreement with BBH are initially required to be secured by collateral equal to at least 102% of the value of domestic equity securities and ADRs and 105% of the value of foreign equity securities (other than ADRs). Such collateral received in connection with these loans will be cash and can be invested in repurchase agreements, short-term investments or U.S. Treasury obligations and is recognized in the Schedule of Investments and Statement of Assets and Liabilities. The obligation to return securities lending collateral is also
7. LOANS OF PORTFOLIO SECURITIES (continued)
recognized as a liability in the Statement of Assets and Liabilities. It is the Funds’ policy to obtain additional collateral from or return excess collateral to the borrower by the end of the next business day, following the valuation date of the securities loaned. Therefore, the value of the collateral held may be temporarily less than the value of the securities on loan.
Lending securities entails a risk of loss to the Funds if and to the extent that the market value of the securities loans were to increase and the borrower did not increase the collateral accordingly, and the borrower fails to return the securities. In the event the borrower may not provide additional collateral when required or may not return the securities when due, the security lending agency agreement requires the lending agent to indemnify the Funds by replacing either the security or the security’s current market value to the Funds. The Funds could suffer a loss if the value of an investment purchased with cash collateral falls below the market value of loaned securities or if the value of an investment purchased with cash collateral falls below the value of the original cash collateral received. The Funds could also experience delays and costs in gaining access to the collateral. The Funds bear the risk of any deficiency in the amount of the collateral available for return to the borrower due to any loss on the collateral invested.
As of April 30, 2020 the value of the securities on loan was $8,021,713, $244,446, $222,564, $8,014,770, $290,747, $3,930,024, $7,517,374 and $2,188,640 for the Global X MSCI China Consumer Discretionary ETF, Global X MSCI China Financials ETF, Global X FTSE Southeast Asia ETF, Global X MSCI Colombia ETF, Global X MSCI Argentina ETF, Global X MSCI Greece ETF, Global X MSCI Norway ETF and Global X MSCI Portugal ETF, respectively. The cash collateral received from securities on loan was $8,561,481, $257,384, $233,378, $8,229,710, $318,774, $4,212,790, $7,776,774 and $2,344,107 for the Global X MSCI China Consumer Discretionary ETF, Global X MSCI China Financials ETF, Global X FTSE Southeast Asia ETF, Global X MSCI Colombia ETF, Global X MSCI Argentina ETF, Global X MSCI Greece ETF, Global X MSCI Norway ETF and Global X MSCI Portugal ETF, respectively.
7. LOANS OF PORTFOLIO SECURITIES (continued)
At April 30, 2020, the following Funds had securities on loan, by counterparty:
| | | Market Value | | | Cash Collateral | |
| Global X MSCI China Consumer Discretionary ETF | | | | |
| Barclays Capital | | $ | 319,069 | | | $ | 335,704 | |
| BofA Securities, Inc. | | | 1,107,644 | | | | 1,165,266 | |
| Citigroup | | | 1,296,567 | | | | 1,406,832 | |
| Credit Suisse | | | 636,988 | | | | 700,500 | |
| Morgan Stanley and Co. | | | 4,661,445 | | | | 4,953,179 | |
| Global X China Financials ETF | | | | | | | | |
| JPMorgan | | | 244,446 | | | | 257,384 | |
| Global X FTSE Southeast Asia ETF | | | | | | | | |
| Morgan Stanley and Co. | | | 222,564 | | | | 233,378 | |
| Global X MSCI Colombia ETF | | | | | | | | |
| Goldman Sachs | | | 8,014,770 | | | | 8,229,710 | |
| Global X MSCI Argentina ETF | | | | | | | | |
| Credit Suisse | | | 46,542 | | | | 47,882 | |
| JPMorgan | | | 74,191 | | | | 87,800 | |
| Goldman Sachs | | | 170,014 | | | | 183,092 | |
| Global X MSCI Greece ETF | | | | | | | | |
| Barclays Capital | | | 97,724 | | | | 102,150 | |
| BofA Securities, Inc. | | | 73,615 | | | | 76,950 | |
| Credit Suisse | | | 854,646 | | | | 935,315 | |
| UBS AG London Branch | | | 2,904,039 | | | | 3,098,375 | |
| Global X MSCI Norway ETF | | | | | | | | |
| Barclays Capital | | | 150,910 | | | | 161,178 | |
| BofA Securities, Inc. | | | 5,699,658 | | | | 5,883,281 | |
| Credit Suisse | | | 171,558 | | | | 177,327 | |
| JPMorgan | | | 89,289 | | | | 94,052 | |
| Morgan Stanley and Co. | | | 61,642 | | | | 61,146 | |
| UBS AG London Branch | | | 1,344,317 | | | | 1,399,790 | |
| Global X MSCI Portugal ETF | | | | | | | | |
| BofA Securities, Inc. | | | 22,825 | | | | 26,794 | |
| JPMorgan | | | 24,918 | | | | 29,250 | |
| Morgan Stanley and Co. | | | 2,129,396 | | | | 2,276,048 | |
| UBS AG London Branch | | | 11,501 | | | | 12,015 | |
7. LOANS OF PORTFOLIO SECURITIES (continued)
(1) | It is the Funds’ policy to obtain additional collateral from or return excess collateral to the borrower by the end of the next business day, following the valuation date of the securities loaned. Therefore, the value of the collateral held may be temporarily less than the value of the securities on loan. |
8. CONTRACTUAL OBLIGATIONS
The Funds enter into contracts in the normal course of business that contain a variety of indemnifications. The Funds’ maximum exposure under these contracts is unknown. However, the Funds have not had prior gains or losses pursuant to these contracts. Management has reviewed the Funds’ existing contracts and expects the risk of loss to be remote.
Pursuant to the Trust’s organizational documents, the Trustees of the Trust and the Trust’s officers are indemnified against certain liabilities that may arise out of the performance of their duties.
9. REVERSE SHARE SPLIT
Effective April 28, 2020, each of the Global X MSCI Colombia ETF, Global X MSCI Greece ETF and Global X MSCI Pakistan ETF executed a reverse share split for shareholders of record after the close of markets on April 27, 2020. The effect of this transaction for each Fund was to divide the number of outstanding Shares of the Fund by the applicable ratio below, resulting in a corresponding increase in the NAV per Share. The capital share activity presented in the statement of changes in net assets for each of the years in the period then ended, and per share data in the financial highlights for each of the years in the period then ended, have been given retroactive effect to reflect these reverse share splits. There were no changes in net assets, results of operations or total return as a result of these transactions. The details of the reverse splits are as follows:
| Fund Name | | Ratio | |
| | | | |
| Global X MSCI Colombia ETF | | 1:4 | |
| Global X MSCI Greece ETF | | 1:3 | |
| Global X MSCI Pakistan ETF | | 1:4 | |
Effective March 16, 2017, the Global X MSCI Nigeria ETF executed a 1-for-4 reverse share split for shareholders of record after the close of markets on March 15, 2017. The effect of this transaction was to divide the number of outstanding shares of the Fund by four, resulting in a corresponding increase in the NAV per share. The per share data in the financial highlights for each of the years in the period then ended have been given retroactive effect to reflect these reverse share splits. There were no changes in net assets, results of operations or total return as a result of this transaction.
| | |
Notes to Financial Statements (unaudited) (concluded) |
| |
|
10. REGULATORY MATTERS
On August 17, 2018, the Securities & Exchange Commission adopted amendments to Regulation S-X. These changes are effective for periods after November 5, 2018. The updates to registered investment companies were mainly focused on simplifying the presentation of distributable earnings by eliminating the need to present the components of distributable earnings on a book basis in the Statements of Assets and Liabilities. The update also impacted the presentation of undistributed net investment income and distributions to shareholders on the Statements of Changes in Net Assets. The amounts presented in the current Statements of Changes in Net Assets represent the aggregated total distributions of net investment income and realized capital gains, except for distributions classified as return of capital which are still presented separately.
11. NEW ACCOUNTING PRONOUNCEMENT
In August 2018, the Financial Accounting Standards Board (“FASB”) issued Accounting Standards Update 2018-13, Fair Value Measurement (Topic 820). The new guidance includes additions and modifications to disclosures requirements for fair value measurements. For public entities, the amendments are effective for financial statements issued for fiscal years beginning after December 15, 2019, and interim periods within those fiscal years. Management elected to early adopt the removal of certain disclosures and delay the adoption of additional disclosures until the effective date.
12. SUBSEQUENT EVENTS
The Funds have been evaluated by management regarding the need for additional disclosures and/or adjustments resulting from subsequent events. Based on this evaluation, no additional disclosures were required to the financial statements.
| | |
Disclosure of Fund Expenses (unaudited)
|
ETFs such as the Funds have operating expenses. As a shareholder of an ETF, your investment is affected by these ongoing costs, which include (among others) costs for portfolio management, administrative services, brokerage fees, and shareholder reports like this one. It is important for you to understand the impact of these costs on your investment returns. In addition, a shareholder is responsible for brokerage fees incurred in the purchase or sale of share of the Fund on the secondary market.
Operating expenses such as these are deducted from an ETF’s gross income and directly reduce your final investment return. These expenses are expressed as a percentage of the ETF’s average net assets; this percentage is known as the ETF’s expense ratio.
The following examples use the expense ratio and are intended to help you understand the ongoing costs (in dollars) of investing in a Fund and to compare these costs with those of other funds. The examples are based on an investment of $1,000 made at the beginning of the period shown and held for the entire period from November 1, 2019 through April 30, 2020.
The table on the next page illustrates the Funds’ costs in two ways:
Actual Fund Return. This section helps you to estimate the actual expenses that a Fund incurred over the period. The “Expenses Paid During Period” column shows the actual dollar expense cost incurred by a $1,000 investment in the Fund, and the “Ending Account Value” number is derived from deducting that expense cost from the Fund’s gross investment return.
You can use this information, together with the actual amount you invested in the Funds, to estimate the expenses you paid over that period. Simply divide your actual account value by $1,000 to arrive at a ratio (for example, an $8,600 account value divided by $1,000 = 8.6), then multiply that ratio by the number shown for your Funds under “Expenses Paid During Period.”
Hypothetical 5% Return. This section helps you compare a Fund’s costs with those of other funds. It assumes that the Funds had an annual 5% return before expenses during the year, but that the expense ratio (Column 3) for the period is unchanged. This example is useful in making comparisons because the Securities and Exchange Commission requires all funds to make this 5% calculation. You can assess your Fund’s comparative cost by comparing the hypothetical result for your Fund in the “Expenses Paid During Period” column with those that appear in the same charts in the shareholder reports for other funds.
NOTE: Because the return is set at 5% for comparison purposes — NOT your Fund’s actual return — the account values shown may not apply to your specific investment.
| | |
Disclosure of Fund Expenses (unaudited) (continued)
|
| | | Beginning Account Value 11/1/2019 | | | Ending Account
Value 4/30/2020 | | | Annualized Expense Ratios | | | Expenses Paid During Period(1) | |
| | | | | | | | | | | | | |
| Global X MSCI China Consumer Discretionary ETF | | | | | | | | | | | | |
| Actual Fund Return | | $ | 1,000.00 | | | $ | 1,001.90 | | | | 0.65 | % | | $ | 3.24 | |
| Hypothetical 5% Return | | | 1,000.00 | | | | 1,021.63 | | | | 0.65 | | | | 3.27 | |
| | | | | | | | | | | | | | | | | |
| Global X MSCI China Energy ETF | | | | | | | | | | | | | | | | |
| Actual Fund Return | | $ | 1,000.00 | | | $ | 817.10 | | | | 0.66 | % | | $ | 2.98 | |
| Hypothetical 5% Return | | | 1,000.00 | | | | 1,021.58 | | | | 0.66 | | | | 3.32 | |
| | | | | | | | | | | | | | | | | |
| Global X MSCI China Financials ETF | | | | | | | | | | | | | | | | |
| Actual Fund Return | | $ | 1,000.00 | | | $ | 922.80 | | | | 0.65 | % | | $ | 3.11 | |
| Hypothetical 5% Return | | | 1,000.00 | | | | 1,021.63 | | | | 0.65 | | | | 3.27 | |
| | | | | | | | | | | | | | | | | |
| Global X MSCI China Industrials ETF | | | | | | | | | | | | | | | | |
| Actual Fund Return | | $ | 1,000.00 | | | $ | 1,004.00 | | | | 0.66 | % | | $ | 3.29 | |
| Hypothetical 5% Return | | | 1,000.00 | | | | 1,021.58 | | | | 0.66 | | | | 3.32 | |
| | | | | | | | | | | | | | | | | |
| Global X MSCI China Materials ETF | | | | | | | | | | | | | | | | |
| Actual Fund Return | | $ | 1,000.00 | | | $ | 1,074.20 | | | | 0.66 | % | | $ | 3.40 | |
| Hypothetical 5% Return | | | 1,000.00 | | | | 1,021.58 | | | | 0.66 | | | | 3.32 | |
| | | | | | | | | | | | | | | | | |
| Global X MSCI China Communication Services ETF | | | | | | | | | | | | | | | | |
| Actual Fund Return | | $ | 1,000.00 | | | $ | 1,044.30 | | | | 0.65 | % | | $ | 3.30 | |
| Hypothetical 5% Return | | | 1,000.00 | | | | 1,021.63 | | | | 0.65 | | | | 3.27 | |
| | | | | | | | | | | | | | | | | |
| Global X MSCI China Consumer Staples ETF | | | | | | | | | | | | | | | | |
| Actual Fund Return | | $ | 1,000.00 | | | $ | 1,107.80 | | | | 0.65 | % | | $ | 3.41 | |
| Hypothetical 5% Return | | | 1,000.00 | | | | 1,021.63 | | | | 0.65 | | | | 3.27 | |
| | | | | | | | | | | | | | | | | |
| Global X MSCI China Health Care ETF | | | | | | | | | | | | | | | | |
| Actual Fund Return | | $ | 1,000.00 | | | $ | 1,109.70 | | | | 0.65 | % | | $ | 3.41 | |
| Hypothetical 5% Return | | | 1,000.00 | | | | 1,021.63 | | | | 0.65 | | | | 3.27 | |
| | | | | | | | | | | | | | | | | |
| Global X MSCI China Information Technology ETF | | | | | | | | | | | | | | | | |
| Actual Fund Return | | $ | 1,000.00 | | | $ | 1,098.00 | | | | 0.65 | % | | $ | 3.39 | |
| Hypothetical 5% Return | | | 1,000.00 | | | | 1,021.63 | | | | 0.65 | | | | 3.27 | |
| | | | | | | | | | | | | | | | | |
| Global X MSCI China Real Estate ETF | | | | | | | | | | | | | | | | |
| Actual Fund Return | | $ | 1,000.00 | | | $ | 995.20 | | | | 0.65 | % | | $ | 3.22 | |
| Hypothetical 5% Return | | | 1,000.00 | | | | 1,021.63 | | | | 0.65 | | | | 3.27 | |
| | | | | | | | | | | | | | | | | |
| Global X MSCI China Utilities ETF | | | | | | | | | | | | | | | | |
| Actual Fund Return | | $ | 1,000.00 | | | $ | 888.40 | | | | 0.65 | % | | $ | 3.05 | |
| Hypothetical 5% Return | | | 1,000.00 | | | | 1,021.63 | | | | 0.65 | | | | 3.27 | |
| | | | | | | | | | | | | | | | | |
| Global X MSCI China Large-Cap 50 ETF | | | | | | | | | | | | | | | | |
| Actual Fund Return | | $ | 1,000.00 | | | $ | 1,019.60 | | | | 0.29 | % | | $ | 1.46 | |
| Hypothetical 5% Return | | | 1,000.00 | | | | 1,023.42 | | | | 0.29 | | | | 1.46 | |
| | |
Disclosure of Fund Expenses (unaudited) (concluded)
|
| | | Beginning Account Value 11/1/2019 | | | Ending Account Value 4/30/2020 | | | Annualized Expense Ratios | | | Expenses Paid During Period(1) | |
| | | | | | | | | | | | | |
| Global X FTSE Southeast Asia ETF | | | | | | | | | | | | |
| Actual Fund Return | | $ | 1,000.00 | | | $ | 763.50 | | | | 0.65 | % | | $ | 2.85 | |
| Hypothetical 5% Return | | | 1,000.00 | | | | 1,021.63 | | | | 0.65 | | | | 3.27 | |
| | | | | | | | | | | | | | | | | |
| Global X MSCI Colombia ETF | | | | | | | | | | | | | | | | |
| Actual Fund Return | | $ | 1,000.00 | | | $ | 607.60 | | | | 0.61 | % | | $ | 2.44 | |
| Hypothetical 5% Return | | | 1,000.00 | | | | 1,021.83 | | | | 0.61 | | | | 3.07 | |
| | | | | | | | | | | | | | | | | |
| Global X MSCI Argentina ETF | | | | | | | | | | | | | | | | |
| Actual Fund Return | | $ | 1,000.00 | | | $ | 836.10 | | | | 0.59 | % | | $ | 2.69 | |
| Hypothetical 5% Return | | | 1,000.00 | | | | 1,021.93 | | | | 0.59 | | | | 2.97 | |
| | | | | | | | | | | | | | | | | |
| Global X MSCI Greece ETF | | | | | | | | | | | | | | | | |
| Actual Fund Return | | $ | 1,000.00 | | | $ | 643.90 | | | | 0.59 | % | | $ | 2.41 | |
| Hypothetical 5% Return | | | 1,000.00 | | | | 1,021.93 | | | | 0.59 | | | | 2.97 | |
| | | | | | | | | | | | | | | | | |
| Global X MSCI Norway ETF | | | | | | | | | | | | | | | | |
| Actual Fund Return | | $ | 1,000.00 | | | $ | 760.80 | | | | 0.50 | % | | $ | 2.19 | |
| Hypothetical 5% Return | | | 1,000.00 | | | | 1,022.38 | | | | 0.50 | | | | 2.51 | |
| | | | | | | | | | | | | | | | | |
| Global X FTSE Nordic Region ETF | | | | | | | | | | | | | | | | |
| Actual Fund Return | | $ | 1,000.00 | | | $ | 957.30 | | | | 0.51 | % | | $ | 2.48 | |
| Hypothetical 5% Return | | | 1,000.00 | | | | 1,022.33 | | | | 0.51 | | | | 2.56 | |
| | | | | | | | | | | | | | | | | |
| Global X MSCI Nigeria ETF | | | | | | | | | | | | | | | | |
| Actual Fund Return | | $ | 1,000.00 | | | $ | 825.30 | | | | 0.89 | % | | $ | 4.04 | |
| Hypothetical 5% Return | | | 1,000.00 | | | | 1,020.44 | | | | 0.89 | | | | 4.47 | |
| | | | | | | | | | | | | | | | | |
| Global X MSCI Next Emerging & Frontier ETF | | | | | | | | | | | | | | | | |
| Actual Fund Return | | $ | 1,000.00 | | | $ | 788.20 | | | | 0.68 | % | | $ | 3.02 | |
| Hypothetical 5% Return | | | 1,000.00 | | | | 1,021.48 | | | | 0.68 | | | | 3.42 | |
| | | | | | | | | | | | | | | | | |
| Global X MSCI Portugal ETF | | | | | | | | | | | | | | | | |
| Actual Fund Return | | $ | 1,000.00 | | | $ | 825.30 | | | | 0.59 | % | | $ | 2.68 | |
| Hypothetical 5% Return | | | 1,000.00 | | | | 1,021.93 | | | | 0.59 | | | | 2.97 | |
| | | | | | | | | | | | | | | | | |
| Global X MSCI Pakistan ETF | | | | | | | | | | | | | | | | |
| Actual Fund Return | | $ | 1,000.00 | | | $ | 943.80 | | | | 0.83 | % | | $ | 4.01 | |
| Hypothetical 5% Return | | | 1,000.00 | | | | 1,020.74 | | | | 0.83 | | | | 4.17 | |
| | | | | | | | | | | | | | | | | |
| Global X DAX Germany ETF | | | | | | | | | | | | | | | | |
| Actual Fund Return | | $ | 1,000.00 | | | $ | 829.30 | | | | 0.20 | % | | $ | 0.91 | |
| Hypothetical 5% Return | | | 1,000.00 | | | | 1,023.87 | | | | 0.20 | | | | 1.01 | |
(1) | Expenses are equal to the Fund’s annualized expense ratio multiplied by the average account value over the period, multiplied by 182/366 (to reflect the one-half year period). |
| | |
Approval of Investment Advisory Agreement (unaudited)
|
Section 15(c) of the Investment Company Act of 1940, as amended (“1940 Act”), requires that the board of trustees of an exchange-traded fund (“ETF”), including a majority of those trustees who are not “interested persons” of the ETF, as defined in the 1940 Act (“Independent Trustees”), consider on an initial basis and periodically thereafter (as required by the 1940 Act), at an in person meeting called for such purpose, the terms of each ETF’s investment advisory agreement and whether to approve entering into, or renewing, each agreement.
At a Board meeting of the Global X Funds (the “Trust”) held in person on November 15, 2019, called for such purpose, the Board of Trustees (the “Board”) (including the Trust’s Independent Trustees, voting separately) considered and unanimously approved the continuation of (i) the Investment Advisory Agreement (“Renewal Investment Advisory Agreement”) for each Fund included in this Semi-Annual Report (each, a “Renewal Fund”); and (ii) the Supervision and Administration Agreement between the Trust (“Renewal Supervision and Administration Agreement”), on behalf of each Renewal Fund, and Global X Management Company LLC (“Global X Management”). The Renewal Investment Advisory Agreement and the Renewal Supervision and Administration Agreement are referred to herein as the “Renewal Agreements.”
In advance of the Board meeting, the Board (including the Trust’s Independent Trustees) and the Independent Trustees’ independent legal counsel requested (in writing) detailed information from Global X Management in connection with the Board’s consideration of the Renewal Agreements and received and reviewed written responses from Global X Management and supporting materials relating to those requests for information. In the course of their consideration of the Renewal Agreements, the Trust’s Independent Trustees were advised by their independent legal counsel and, in addition to meeting with management of Global X Management, the Independent Trustees met separately in executive session with their counsel.
RENEWAL AGREEMENTS
In determining to approve the continuation of the Renewal Agreements for the Renewal Funds, the Board considered a variety of factors, including the factors discussed in greater detail below.
Nature, Extent and Quality of Services
With respect to this factor, the Board considered:
| • | the terms of the Renewal Agreements and the range of services that would continue to be provided to each Renewal Fund in accordance with the Renewal Agreements; |
| • | Global X Management’s key personnel and the portfolio managers who would continue to provide investment advisory, supervision and administrative services to each Renewal Fund; |
| | |
Approval of Investment Advisory Agreement (unaudited) (continued) |
| • | Global X Management’s responsibilities under the Renewal Agreements, among other things, to: (i) manage the investment operations of the Renewal Funds and the composition of the Renewal Funds’ assets, including the purchase, retention and disposition of their holdings, (ii) provide quarterly reports to the Trust’s officers and the Board and other reports as the Board deems necessary or appropriate, (iii) vote proxies, exercise consents, and exercise all other rights relating to securities and assets held by the Renewal Funds, (iv) select broker-dealers to execute portfolio transactions for the Renewal Funds when necessary, (v) assist in the preparation and filing of reports and proxy statements (if any) to the shareholders of the Renewal Funds, and the periodic updating of the registration statement, prospectuses, statement of additional information, and other reports and documents for the Renewal Funds that are required to be filed by the Trust with the U.S. Securities and Exchange Commission and other regulatory and governmental bodies, and (vi) monitor anticipated purchases and redemptions of the shares (including Creation Units) of the Renewal Funds by shareholders and new investors; |
| • | the nature, extent and quality of all of the services (including advisory, administrative and compliance services) that have been provided by Global X Management or made available to the Renewal Funds; and |
| • | the quality of Global X Management’s resources and personnel that would continue to be made available to the Renewal Funds, including Global X Management’s experience and the professional qualifications of Global X Management’s key personnel. |
Based on these considerations, the Board concluded that it was satisfied with the nature, extent and quality of the services provided to the Renewal Funds by Global X Management.
Performance
The Board considered the performance of each Renewal Fund. The Board examined the performance of the Renewal Funds for the one-year, three-year, five-year and since-inception periods, as applicable. Also, the Board considered the total return and investments performance of the Renewal Funds relative to (i) the performance of unaffiliated comparable ETFs and/or other registered funds, which performance information is publicly available from such registered funds as well as other third party sources; and (ii) the performance of pertinent indexes. The Board considered instances of under-performance and over-performance with respect to the competitor funds. The Board also considered the Renewal Funds’ tracking against their underlying indexes in absolute terms.
Based on these considerations and comparisons, the Board concluded that the investment performance of the Renewal Funds did not adversely affect the Board’s approval of the continuance of the Renewal Agreements.
| | |
Approval of Investment Advisory Agreement (unaudited) (continued) |
Cost of Services and Profitability
The Board considered Global X Management’s cost to provide investment management, supervision and administrative and related services to the Renewal Funds. In this regard, the Board considered the management fee (“Management Fee”) that has been borne or is expected to be borne by the Renewal Funds under the Renewal Agreements for the various investment advisory, supervisory and administrative services that the Renewal Funds require under a unitary fee structure (including the types of fees and expenses that are not included within the unitary fee and would be borne by the Renewal Funds).
In addition, the Board considered expected profitability to Global X Management, as applicable, from all services provided or expected to be provided to the Renewal Funds and all aspects of Global X Management’s relationship with the Renewal Funds. In connection with these considerations, Global X Management provided the Board with financial information regarding its operations and the services provided to the Renewal Funds and discussed with the Board its current and expected, as applicable, profitability with respect to the Renewal Funds.
Based on these considerations, the Board concluded that the Management Fee rate paid by the Renewal Funds to Global X Management, in light of the nature, extent and quality of the services provided, was reasonable and in the best interests of the Renewal Funds’ shareholders.
Comparison of Fees and Services
With respect to this factor, the Board considered:
| • | comparative information with respect to the Management Fee paid to Global X Management by the Renewal Funds. In connection with this consideration, Global X Management provided the Board with comparative expense data for the Renewal Funds, including fees and expenses paid by unaffiliated similar specialized and/or focused ETFs and/or other comparable registered funds. The Board considered Global X Management’s detailed explanation of the fee structures of any Renewal Fund that was above the average or median for its peer group; |
| • | the structure of the unitary Management Fee (which includes as one component the investment advisory fee for the Renewal Funds) and the current total expense ratios for the Renewal Funds. In this regard, the Board took into consideration that the purpose of adopting a unitary Management Fee structure for the Renewal Funds was to create a simple, all-inclusive fee that would provide a level of predictability with respect to the overall expense ratios (i.e., the total fees) of the Renewal Funds and that the proposed Management Fees for the Renewal Funds were set at competitive levels to make the Renewal Funds viable in the marketplace; and |
| • | that, under the unified Management Fee structure, Global X Management is responsible for most ordinary expenses of the Renewal Funds, including the costs of various third-party services required by the Renewal Funds, including investment advisory, administrative, audit, certain custody, portfolio accounting, legal, transfer agency and printing costs, but that the Renewal Funds would bear other expenses not |
| | |
Approval of Investment Advisory Agreement (unaudited) (concluded) |
covered under the proposed all-inclusive Management Fee, such as taxes, brokerage fees, commissions, and other transaction expenses, interest expenses, and extraordinary expenses.
Based on these considerations, the Board concluded that the services received and the fees charged under the Renewal Agreements were reasonable on a comparative basis.
Economies of Scale
With respect to this factor, the Board considered:
| • | the extent to which economies of scale would be realized as the Renewal Funds grow and whether the unitary Management Fee for the Renewal Funds reflected these economies of scale; |
| • | the significant investment of time, personnel and other resources that Global X Management has made and intends to continue to make in the Renewal Funds in order to seek to assure that the Renewal Funds are attractive to investors; and |
| • | that the unitary Management Fee would provide a high level of certainty as to the total level of expenses for the Renewal Funds and their shareholders. |
Based on these considerations, the Board concluded that the unitary Management Fee for the Renewal Funds appropriately addressed economies of scale.
Other Benefits
In considering the Renewal Agreements, in addition to the factors discussed above, the Board considered any other benefits realized by Global X Management as a result of its relationships with the Renewal Funds and concluded that, in the exercise of the Board’s business judgement, all information the Board considered supported approval of the continuation of the Renewal Agreements.
Conclusion
After full consideration of the factors above, as well as other factors that were instructive in their consideration, the Board, including all of the Trust’s Independent Trustees voting separately, concluded, in the exercise of its business judgement, that the Renewal Agreements were fair and reasonable and in the best interest of each Renewal Fund.
In reaching this decision, the Board did not assign relative weights to the factors discussed above nor did the Board deem any one factor or group of them to be controlling in and of themselves. Each member of the Board may have assigned different weights to the various factors.
| | |
Supplemental Information (unaudited)
|
NAV is the price per Share at which the Funds issue and redeem Shares. It is calculated in accordance with the standard formula for valuing mutual fund shares. The “Market Price” of the Funds generally is determined using the midpoint between the highest bid and the lowest offer on the stock exchange on which the Shares of the Funds are listed for trading, as of the time that the Funds’ NAV is calculated. The Funds’ Market Price may be at, above or below their NAV. The NAV of the Funds will fluctuate with changes in the market value of the Funds’ holdings. The Market Price of the Funds will fluctuate in accordance with changes in their NAV, as well as market supply and demand.
Premiums or discounts are the differences (expressed as a percentage) between the NAV and Market Price of the Funds on a given day, generally at the time NAV is calculated. A premium is the amount that the Funds are trading above the reported NAV, expressed as a percentage of the NAV. A discount is the amount that the Funds are trading below the reported NAV, expressed as a percentage of the NAV.
Further information regarding premiums and discounts is available on the Funds’ website at www.globalxetfs.com.
605 Third Avenue, 43rd floor
New York, NY 10158
1-888-493-8631
www.globalxetfs.com
Investment Adviser and Administrator:
Global X Management Company LLC
605 Third Avenue, 43rd floor
New York, NY 10158
Distributor:
SEI Investments Distribution Co.
One Freedom Valley Drive
Oaks, PA 19456
Sub-Administrator:
SEI Investments Global Funds Services
One Freedom Valley Drive
Oaks, PA 19456
Counsel for Global X Funds and the Independent Trustees:
Stradley Ronon Stevens & Young, LLP
2000 K Street, N.W.
Suite 700
Washington, DC 20006
Custodian and Transfer Agent:
Brown Brothers Harriman & Co.
50 Post Office Square
Boston, MA 02110
Independent Registered Public Accounting Firm:
PricewaterhouseCoopers LLP
Two Commerce Square
Suite 1800
2001 Market Street
Philadelphia, PA 19103
This information must be preceded or accompanied by a prospectus for the funds described.
GLX-SA-002-0900

Global X SuperDividend® ETF (ticker: SDIV) |
Global X SuperDividend® U.S. ETF (ticker: DIV) |
Global X MSCI SuperDividend® Emerging Markets ETF (ticker: SDEM) |
Global X MSCI SuperDividend® EAFE ETF (ticker: EFAS) |
Global X SuperDividend® REIT ETF (ticker: SRET) |
| Global X SuperIncome™ Preferred ETF (ticker: SPFF) |
| Global X YieldCo & Renewable Energy Income ETF (ticker: YLCO) |
| Global X Social Media ETF (ticker: SOCL) |
| Global X E-commerce ETF (ticker: EBIZ) |
Global X Guru® Index ETF (ticker: GURU) |
| Global X Scientific Beta U.S. ETF (ticker: SCIU) |
| Global X Scientific Beta Europe ETF (ticker: SCID) |
| Global X Scientific Beta Japan ETF (ticker: SCIJ) |
| Global X Scientific Beta Asia ex-Japan ETF (ticker: SCIX) |
Global X S&P 500® Catholic Values ETF (ticker: CATH) |
Global X NASDAQ 100® Covered Call ETF (ticker: QYLD) |
Global X S&P 500® Covered Call ETF (ticker: HSPX) |
| Global X Russell 2000 Covered Call ETF (ticker: RYLD) |
Semi-Annual Report
April 30, 2020
Beginning on January 1, 2021, as permitted by regulations adopted by the Securities and Exchange Commission, paper copies of the Funds’ (defined below) shareholder reports will no longer be sent by mail, unless you specifically request paper copies of the reports from your financial intermediary (such as a broker-dealer or bank). Instead, shareholder reports will be available on the Funds’ website (www.globalxetfs.com), and you will be notified by mail each time a report is posted and provided with a website link to access the report.
If you already elected to receive shareholder reports electronically, you will not be affected by this change and you need not take any action. You may elect to receive shareholder reports and other communications from the Funds electronically anytime by contacting your financial intermediary.
You may elect to receive all future Fund shareholder reports in paper free of charge. Please contact your financial intermediary to inform them that you wish to continue receiving paper copies of Fund shareholder reports and for details about whether your election to receive reports in paper will apply to all funds held with your financial intermediary.
| Schedules of Investments | |
Global X SuperDividend® ETF | 1 |
Global X SuperDividend® U.S. ETF | 10 |
Global X MSCI SuperDividend® Emerging Markets ETF | 15 |
Global X MSCI SuperDividend® EAFE ETF | 20 |
Global X SuperDividend® REIT ETF | 26 |
| Global X SuperIncome™ Preferred ETF | 30 |
| Global X YieldCo & Renewable Energy Income ETF | 34 |
| Global X Social Media ETF | 38 |
| Global X E-commerce ETF | 42 |
Global X Guru® Index ETF | 46 |
| Global X Scientific Beta U.S. ETF | 50 |
| Global X Scientific Beta Europe ETF | 64 |
| Global X Scientific Beta Japan ETF | 89 |
| Global X Scientific Beta Asia ex-Japan ETF | 98 |
Global X S&P 500® Catholic Values ETF | 106 |
Global X NASDAQ 100® Covered Call ETF | 122 |
Global X S&P 500® Covered Call ETF | 128 |
| Global X Russell 2000 Covered Call ETF | 147 |
| Statements of Assets and Liabilities | 149 |
| Statements of Operations | 154 |
| Statements of Changes in Net Assets | 159 |
| Financial Highlights | 169 |
| Notes To Financials | 179 |
| Disclosure of Fund Expenses | 204 |
| Approval of Investment Advisory Agreement | 207 |
| Supplemental Information | 211 |
Shares are bought and sold at market price (not NAV) and are not individually redeemed from a Fund. Shares may only be redeemed directly from a Fund by Authorized Participants, in very large creation/redemption units. Brokerage commissions will reduce returns.
The Funds file their complete schedules of Fund holdings with the Securities and Exchange Commission (the “SEC” or “Commission”) for the first and third quarters of each fiscal year on Form N-PORT. The Funds’ Forms N-PORT are available on the Commission’s website at https://www.sec.gov/, and may be reviewed and copied at the Commission’s Public Reference Room in Washington, DC. Information on the operation of the Public Reference Room may be obtained by calling 1-800-SEC-0330.
A description of the policies and procedures that the Global X Funds use to determine how to vote proxies relating to Fund securities, as well as information relating to how the Funds voted proxies relating to Fund securities during the most recent 12-month period ended June 30, is available (i) without charge, upon request, by calling 1-888-493-8631; and (ii) on the Commission’s website at https://www.sec.gov/.
| | |
| Schedule of Investments |
| April 30, 2020 (Unaudited) |
| Global X SuperDividend® ETF | |
Sector Weightings †:
† Sector weightings percentages are based on the total market value of investments. Repurchase agreements purchased from cash collateral received for securities lending activity are included in total investments. Please see Note 2 and 7 in Notes to Financial Statements for more detailed information.
| | | | | | | |
| COMMON STOCK — 99.7% | | | | | | |
| ARGENTINA— 1.9% | | | | | | |
| Communication Services — 0.8% | | | | | | |
Telecom Argentina ADR | | | 689,578 | | | $ | 4,737,401 | |
| Energy — 1.1% | | | | | | | | |
Transportadora de Gas del Sur ADR * (A) | | | 1,371,744 | | | | 6,282,587 | |
TOTAL ARGENTINA | | | | | | | 11,019,988 | |
| AUSTRALIA— 10.9% | | | | | | | | |
| Consumer Discretionary — 1.1% | | | | | | | | |
Harvey Norman Holdings (A) | | | 3,550,889 | | | | 6,462,840 | |
| Energy — 2.9% | | | | | | | | |
New Hope | | | 8,767,032 | | | | 8,867,937 | |
Whitehaven Coal | | | 6,447,884 | | | | 7,682,988 | |
| | | | | | | | 16,550,925 | |
| | | | | | | |
| COMMON STOCK — continued | | | | | | | | |
| Financials — 4.5% | | | | | | | | |
Bank of Queensland (A) | | | 1,717,205 | | | $ | 5,857,353 | |
Bendigo and Adelaide Bank | | | 1,534,589 | | | | 6,570,696 | |
National Australia Bank | | | 538,353 | | | | 5,977,705 | |
Perpetual | | | 343,265 | | | | 6,764,529 | |
| | | | | | | | 25,170,283 | |
| Industrials — 1.1% | | | | | | | | |
Westpac Banking | | | 557,138 | | | | 5,938,253 | |
| Materials — 1.3% | | | | | | | | |
Alumina | | | 6,656,464 | | | | 7,561,093 | |
TOTAL AUSTRALIA | | | | | | | 61,683,394 | |
| BRAZIL— 1.0% | | | | | | | | |
| Energy — 1.0% | | | | | | | | |
Enauta Participacoes | | | 3,223,900 | | | | 5,437,387 | |
| CANADA— 1.6% | | | | | | | | |
| Energy — 0.8% | | | | | | | | |
Vermilion Energy (A) | | | 873,762 | | | | 4,309,205 | |
| Materials — 0.8% | | | | | | | | |
Chemtrade Logistics Income Fund (A) | | | 1,254,069 | | | | 4,722,114 | |
TOTAL CANADA | | | | | | | 9,031,319 | |
| CHINA— 8.4% | | | | | | | | |
| Consumer Discretionary — 0.8% | | | | | | | | |
China ZhengTong Auto Services Holdings (A) | | | 30,145,400 | | | | 4,705,145 | |
| Materials — 3.9% | | | | | | | | |
China Zhongwang Holdings (A) | | | 23,939,200 | | | | 5,774,546 | |
Maanshan Iron & Steel, Cl H (A) | | | 22,240,400 | | | | 7,200,837 | |
| Sinopec Shanghai Petrochemical, Cl H | | | 31,838,200 | | | | 8,747,717 | |
| | | | | | | | 21,723,100 | |
| Real Estate — 3.7% | | | | | | | | |
Agile Group Holdings | | | 5,667,800 | | | | 6,389,878 | |
| C&D International Investment Group | | | 5,588,000 | | | | 7,972,200 | |
| | | | | | | |
| COMMON STOCK — continued | | | | | | | | |
| Real Estate — continued | | | | | | | | |
Yuzhou Properties | | | 15,808,502 | | | $ | 6,729,322 | |
| | | | | | | | 21,091,400 | |
TOTAL CHINA | | | | | | | 47,519,645 | |
| CZECH REPUBLIC— 0.9% | | | | | | | | |
| Financials — 0.9% | | | | | | | | |
Moneta Money Bank | | | 2,345,257 | | | | 4,913,693 | |
| HONG KONG— 1.1% | | | | | | | | |
| Consumer Discretionary — 1.1% | | | | | | | | |
Pacific Textiles Holdings | | | 12,734,200 | | | | 6,406,236 | |
| INDONESIA— 2.0% | | | | | | | | |
| Energy — 2.0% | | | | | | | | |
Bukit Asam | | | 47,740,800 | | | | 6,017,748 | |
Indo Tambangraya Megah | | | 10,770,000 | | | | 5,213,042 | |
TOTAL INDONESIA | | | | | | | 11,230,790 | |
| MALAYSIA— 2.5% | | | | | | | | |
| Consumer Staples — 1.4% | | | | | | | | |
| British American Tobacco Malaysia | | | 2,726,200 | | | | 8,026,440 | |
| Industrials — 1.1% | | | | | | | | |
AirAsia Group | | | 31,503,700 | | | | 5,971,050 | |
TOTAL MALAYSIA | | | | | | | 13,997,490 | |
| MEXICO— 2.1% | | | | | | | | |
| Materials — 1.1% | | | | | | | | |
Alpek, Cl A * | | | 12,475,429 | | | | 6,004,553 | |
| Real Estate — 1.0% | | | | | | | | |
PLA Administradora Industrial S de RL ‡ | | | 5,389,394 | | | | 5,656,487 | |
TOTAL MEXICO | | | | | | | 11,661,040 | |
| NETHERLANDS— 3.6% | | | | | | | | |
| Financials — 1.1% | | | | | | | | |
Van Lanschot Kempen | | | 393,909 | | | | 6,040,292 | |
| | | | | | | |
| COMMON STOCK — continued | | | | | | | | |
| Industrials — 1.7% | | | | | | | | |
PostNL | | | 5,781,021 | | | $ | 9,934,853 | |
| Real Estate — 0.8% | | | | | | | | |
Wereldhave ‡ (A) | | | 505,132 | | | | 4,426,178 | |
TOTAL NETHERLANDS | | | | | | | 20,401,323 | |
| NEW ZEALAND— 2.0% | | | | | | | | |
| Energy — 1.1% | | | | | | | | |
Z Energy | | | 3,104,668 | | | | 5,937,806 | |
| Industrials — 0.9% | | | | | | | | |
Air New Zealand | | | 6,231,719 | | | | 5,171,056 | |
TOTAL NEW ZEALAND | | | | | | | 11,108,862 | |
| NIGERIA— 1.1% | | | | | | | | |
| Financials — 1.1% | | | | | | | | |
Zenith Bank | | | 175,089,243 | | | | 6,520,251 | |
| NORWAY— 2.3% | | | | | | | | |
| Energy — 2.3% | | | | | | | | |
Ocean Yield | | | 2,012,752 | | | | 5,248,748 | |
SFL | | | 698,049 | | | | 7,880,973 | |
TOTAL NORWAY | | | | | | | 13,129,721 | |
| PORTUGAL— 2.6% | | | | | | | | |
| Materials — 2.6% | | | | | | | | |
Altri | | | 1,494,282 | | | | 7,888,848 | |
Portucel | | | 2,613,749 | | | | 6,796,394 | |
TOTAL PORTUGAL | | | | | | | 14,685,242 | |
| RUSSIA— 8.9% | | | | | | | | |
| Communication Services — 2.5% | | | | | | | | |
Mobile TeleSystems ADR | | | 837,792 | | | | 7,179,877 | |
VEON ADR | | | 4,094,691 | | | | 7,001,922 | |
| | | | | | | | 14,181,799 | |
| | | | | | | |
| COMMON STOCK — continued | | | | | | | | |
| Energy — 1.0% | | | | | | | | |
Tatneft PJSC ADR | | | 132,817 | | | $ | 5,926,295 | |
| Materials — 5.4% | | | | | | | | |
Evraz | | | 2,191,445 | | | | 7,330,616 | |
| MMC Norilsk Nickel PJSC ADR | | | 263,020 | | | | 7,306,696 | |
Novolipetsk Steel PJSC GDR | | | 447,074 | | | | 7,712,026 | |
Severstal PAO GDR | | | 669,791 | | | | 7,997,304 | |
| | | | | | | | 30,346,642 | |
TOTAL RUSSIA | | | | | | | 50,454,736 | |
| SINGAPORE— 1.4% | | | | | | | | |
| Real Estate — 1.4% | | | | | | | | |
Sasseur Real Estate Investment Trust ‡ | | | 14,747,700 | | | | 7,700,192 | |
| SOUTH AFRICA— 4.2% | | | | | | | | |
| Energy — 1.2% | | | | | | | | |
Exxaro Resources (A) | | | 1,122,873 | | | | 6,591,720 | |
| Materials — 1.6% | | | | | | | | |
Kumba Iron Ore | | | 461,148 | | | | 8,856,603 | |
| Real Estate — 1.4% | | | | | | | | |
Hyprop Investments ‡ * (A) | | | 2,804,971 | | | | 2,901,957 | |
Redefine Properties ‡ | | | 22,886,960 | | | | 2,828,935 | |
Vukile Property Fund ‡ | | | 8,481,478 | | | | 2,498,492 | |
| | | | | | | | 8,229,384 | |
TOTAL SOUTH AFRICA | | | | | | | 23,677,707 | |
| THAILAND— 1.5% | | | | | | | | |
| Communication Services — 1.5% | | | | | | | | |
Jasmine International NVDR | | | 71,292,999 | | | | 8,725,708 | |
| TURKEY— 2.4% | | | | | | | | |
| Materials — 2.4% | | | | | | | | |
| Eregli Demir ve Celik Fabrikalari | | | 5,768,159 | | | | 6,676,358 | |
Iskenderun Demir ve Celik | | | 7,019,457 | | | | 6,899,445 | |
TOTAL TURKEY | | | | | | | 13,575,803 | |
| | | | | | | |
| COMMON STOCK — continued | | | | | | | | |
| UNITED KINGDOM— 8.1% | | | | | | | | |
| Communication Services — 1.2% | | | | | | | | |
BT Group, Cl A | | | 4,772,346 | | | $ | 6,985,756 | |
| Consumer Discretionary — 1.8% | | | | | | | | |
Marston’s | | | 7,602,643 | | | | 3,621,037 | |
Persimmon | | | 231,928 | | | | 6,450,571 | |
| | | | | | | | 10,071,608 | |
| Consumer Staples — 1.4% | | | | | | | | |
Imperial Brands | | | 382,629 | | | | 8,103,356 | |
| Industrials — 1.4% | | | | | | | | |
Royal Mail | | | 3,828,026 | | | | 8,039,434 | |
| Information Technology — 1.0% | | | | | | | | |
Micro Focus International | | | 913,016 | | | | 5,547,424 | |
| Real Estate — 1.3% | | | | | | | | |
Hammerson ‡ | | | 4,025,056 | | | | 3,583,356 | |
NewRiver REIT ‡ | | | 4,147,021 | | | | 3,509,903 | |
| | | | | | | | 7,093,259 | |
TOTAL UNITED KINGDOM | | | | | | | 45,840,837 | |
| UNITED STATES— 29.2% | | | | | | | | |
| Communication Services — 1.2% | | | | | | | | |
Gannett | | | 2,152,909 | | | | 2,432,787 | |
National CineMedia | | | 1,269,180 | | | | 4,188,294 | |
| | | | | | | | 6,621,081 | |
| Consumer Staples — 3.1% | | | | | | | | |
B&G Foods (A) | | | 509,752 | | | | 9,899,384 | |
Vector Group | | | 722,084 | | | | 7,726,299 | |
| | | | | | | | 17,625,683 | |
| Energy — 3.4% | | | | | | | | |
Diversified Gas & Oil | | | 8,813,571 | | | | 10,516,698 | |
EnLink Midstream | | | 2,400,749 | | | | 5,329,663 | |
| | | | | | | |
| COMMON STOCK — continued | | | | | | | | |
| Energy — continued | | | | | | | | |
Targa Resources | | | 245,539 | | | $ | 3,182,185 | |
| | | | | | | | 19,028,546 | |
| Financials — 14.2% | | | | | | | | |
AG Mortgage Investment Trust ‡ | | | 537,511 | | | | 1,714,660 | |
AGNC Investment ‡ | | | 458,036 | | | | 5,688,807 | |
Annaly Capital Management ‡ | | | 896,892 | | | | 5,605,575 | |
Apollo Commercial Real Estate Finance ‡ | | | 505,997 | | | | 4,123,875 | |
Arbor Realty Trust ‡ | | | 677,239 | | | | 4,666,177 | |
ARMOUR Residential REIT ‡ | | | 417,986 | | | | 3,694,996 | |
BGC Partners, Cl A | | | 1,734,256 | | | | 5,367,522 | |
Chimera Investment ‡ (A) | | | 392,413 | | | | 3,049,049 | |
Colony Credit Real Estate ‡ | | | 673,627 | | | | 3,240,146 | |
Granite Point Mortgage Trust ‡ | | | 513,027 | | | | 2,554,874 | |
Invesco Mortgage Capital ‡ (A) | | | 475,523 | | | | 1,445,590 | |
KKR Real Estate Finance Trust ‡ | | | 412,685 | | | | 6,512,169 | |
Ladder Capital, Cl A ‡ | | | 512,389 | | | | 4,073,493 | |
MFA Financial ‡ | | | 1,102,230 | | | | 1,928,903 | |
New Residential Investment ‡ | | | 508,279 | | | | 3,095,419 | |
New York Mortgage Trust ‡ | | | 1,367,292 | | | | 2,980,697 | |
PennyMac Mortgage Investment Trust ‡ | | | 377,027 | | | | 3,921,081 | |
Ready Capital ‡ | | | 582,250 | | | | 3,883,608 | |
Starwood Property Trust ‡ | | | 354,719 | | | | 4,590,064 | |
TPG RE Finance Trust ‡ | | | 418,587 | | | | 3,218,934 | |
Two Harbors Investment ‡ | | | 586,682 | | | | 2,681,137 | |
Western Asset Mortgage Capital ‡ | | | 788,829 | | | | 2,405,928 | |
| | | | | | | | 80,442,704 | |
| Industrials — 1.0% | | | | | | | | |
Macquarie Infrastructure | | | 207,642 | | | | 5,728,843 | |
| Real Estate — 6.3% | | | | | | | | |
CoreCivic ‡ | | | 505,102 | | | | 6,626,938 | |
GEO Group ‡ | | | 482,036 | | | | 6,112,216 | |
| | | | | | | |
| COMMON STOCK — continued | | | | | | | | |
| Real Estate — continued | | | | | | | | |
Global Net Lease ‡ | | | 421,200 | | | $ | 6,061,068 | |
Macerich ‡ (A) | | | 407,177 | | | | 3,041,612 | |
Sabra Health Care ‡ | | | 408,440 | | | | 5,236,201 | |
Service Properties Trust ‡ | | | 518,742 | | | | 3,594,882 | |
Tanger Factory Outlet Centers ‡ (A) | | | 678,684 | | | | 5,103,704 | |
| | | | | | | | 35,776,621 | |
TOTAL UNITED STATES | | | | | | | 165,223,478 | |
| TOTAL COMMON STOCK | | | | | | | | |
(Cost $916,089,280) | | | | | | | 563,944,842 | |
| | | | | | | | | |
SHORT-TERM INVESTMENT(B)(C) — 8.0% | | | | | | | | |
| Fidelity Investments Money Market Government Portfolio, Cl Institutional, 0.160% | | | | | | | | |
(Cost $45,269,485) | | | 45,269,485 | | | | 45,269,485 | |
| | | | | | | | | |
REPURCHASE AGREEMENT(B) — 0.9% | | | | | | | | |
| BNP Paribas | | | | | | | | |
| 0.030%, dated 04/30/20, to be repurchased on 05/01/20, repurchase price $4,890,048 (collateralized by U.S. Treasury Obligations, ranging in par value $1,179,647 - $3,805,277, 1.500%, 08/15/2026, with a total market value of $4,984,924) | | | | | | | | |
(Cost $4,890,044) | | $ | 4,890,044 | | | | 4,890,044 | |
| TOTAL INVESTMENTS — 108.6% | | | | | | | | |
(Cost $966,248,809) | | | | | | $ | 614,104,371 | |
Percentages are based on Net Assets of $565,229,212.
| ‡ | Real Estate Investment Trust |
| * | Non-income producing security. |
| (A) | This security or a partial position of this security is on loan at April 30, 2020. The total value of securities on loan at April 30, 2020 was $47,494,529. |
| (B) | Security was purchased with cash collateral held from securities on loan. The total value of such securities as of April 30, 2020 was $50,159,529. |
| (C) | The rate reported on the Schedule of Investments is the 7-day effective yield as of April 30, 2020. |
| ADR — American Depositary Receipt |
| Cl — Class |
| GDR — Global Depositary Receipt |
| NVDR — Non-Voting Depositary Receipt |
| PJSC — Public Joint Stock Company |
| REIT — Real Estate Investment Trust |
The following is a summary of the level of inputs used as of April 30, 2020, in valuing the Fund’s investments carried at value:
| Investments in Securities | | | | | | | | | | | | |
| Common Stock | | $ | 563,944,842 | | | $ | — | | | $ | — | | | $ | 563,944,842 | |
| Short-Term Investment | | | 45,269,485 | | | | — | | | | — | | | | 45,269,485 | |
| Repurchase Agreement | | | — | | | | 4,890,044 | | | | — | | | | 4,890,044 | |
| Total Investments in Securities | | $ | 609,214,327 | | | $ | 4,890,044 | | | $ | — | | | $ | 614,104,371 | |
For the period ended April 30, 2020, there have been no transfers in or out of Level 3.
| | |
| Schedule of Investments |
| April 30, 2020 (Unaudited) |
| Global X SuperDividend® U.S. ETF | |
Sector Weightings †:
† Sector weightings percentages are based on the total market value of investments. Repurchase agreements purchased from cash collateral received for securities lending activity are included in total investments. Please see Note 2 and 7 in Notes to Financial Statements for more detailed information.
| | | | | | | |
| COMMON STOCK — 77.8% | |
| NORWAY— 2.7% | | | | | | |
| Energy — 2.7% | | | | |
SFL | | | 945,791 | | | $ | 10,677,981 | |
| UNITED STATES— 75.1% | | | | | | | | |
| Communication Services — 9.7% | | | | | |
AT&T | | | 316,714 | | | | 9,650,276 | |
Cinemark Holdings | | | 383,836 | | | | 5,481,178 | |
Meredith | | | 391,013 | | | | 5,798,722 | |
National CineMedia | | | 1,582,976 | | | | 5,223,821 | |
Verizon Communications | | | 210,638 | | | | 12,101,153 | |
| | | | | | | | 38,255,150 | |
| Consumer Discretionary — 4.1% | | | | | |
Buckle (A) | | | 477,734 | | | | 7,314,108 | |
H&R Block | | | 522,382 | | | | 8,697,660 | |
| | | | | | | | 16,011,768 | |
| | | | | | | |
| COMMON STOCK — continued | |
| Consumer Staples — 21.4% | | | | | |
Altria Group | | | 275,887 | | | $ | 10,828,565 | |
B&G Foods (A) | | | 912,287 | | | | 17,716,614 | |
Coty, Cl A | | | 1,082,527 | | | | 5,899,772 | |
General Mills | | | 226,093 | | | | 13,540,710 | |
Kraft Heinz | | | 453,898 | | | | 13,766,726 | |
Philip Morris International | | | 142,415 | | | | 10,624,159 | |
Universal | | | 244,520 | | | | 11,827,432 | |
| | | | | | | | 84,203,978 | |
| Energy — 7.2% | | | | | |
Chevron | | | 111,333 | | | | 10,242,636 | |
Exxon Mobil | | | 204,222 | | | | 9,490,196 | |
Kinder Morgan | | | 549,539 | | | | 8,369,479 | |
| | | | | | | | 28,102,311 | |
| Financials — 6.9% | | | | | |
AG Mortgage Investment Trust ‡ | | | 742,085 | | | | 2,367,251 | |
Chimera Investment ‡ (A) | | | 553,393 | | | | 4,299,864 | |
MFA Financial ‡ | | | 1,540,014 | | | | 2,695,025 | |
New Residential Investment ‡ | | | 702,527 | | | | 4,278,389 | |
New York Mortgage Trust ‡ | | | 1,956,107 | | | | 4,264,313 | |
PennyMac Mortgage Investment Trust ‡ | | | 526,506 | | | | 5,475,663 | |
Two Harbors Investment ‡ | | | 780,883 | | | | 3,568,635 | |
| | | | | | | | 26,949,140 | |
| Industrials — 8.3% | | | | | |
Covanta Holding | | | 804,144 | | | | 6,256,241 | |
Ennis | | | 580,533 | | | | 10,803,719 | |
KAR Auction Services | | | 535,691 | | | | 8,024,651 | |
Macquarie Infrastructure | | | 278,767 | | | | 7,691,181 | |
| | | | | | | | 32,775,792 | |
| Real Estate — 5.3% | | | | | |
Diversified Healthcare Trust ‡ | | | 1,566,880 | | | | 4,872,996 | |
Global Net Lease ‡ | | | 565,679 | | | | 8,140,121 | |
Macerich ‡ (A) | | | 527,251 | | | | 3,938,565 | |
| | | | | | | |
| COMMON STOCK — continued | |
| Real Estate — continued | | | | | |
Service Properties Trust ‡ | | | 548,728 | | | $ | 3,802,685 | |
| | | | | | | | 20,754,367 | |
| Utilities — 12.2% | | | | | |
CenterPoint Energy | | | 474,945 | | | | 8,088,314 | |
Dominion Energy | | | 137,041 | | | | 10,569,972 | |
Duke Energy | | | 120,571 | | | | 10,207,541 | |
PPL | | | 349,797 | | | | 8,891,839 | |
TerraForm Power, Cl A | | | 580,612 | | | | 10,056,200 | |
| | | | | | | | 47,813,866 | |
| | | | | | | | 294,866,372 | |
| TOTAL COMMON STOCK | | | | | | | | |
(Cost $429,680,545) | | | | | | | 305,544,353 | |
| | |
MASTER LIMITED PARTNERSHIPS — 21.6% | |
| Consumer Discretionary — 1.8% | | | | | |
Cedar Fair | | | 236,405 | | | | 6,817,920 | |
| Energy — 15.3% | | | | | |
CrossAmerica Partners | | | 643,294 | | | | 8,266,328 | |
Delek Logistics Partners | | | 409,111 | | | | 8,022,667 | |
Enable Midstream Partners | | | 1,581,966 | | | | 7,182,126 | |
KNOT Offshore Partners | | | 647,396 | | | | 9,180,075 | |
NGL Energy Partners | | | 1,308,862 | | | | 7,918,615 | |
PBF Logistics | | | 575,279 | | | | 4,970,410 | |
Phillips 66 Partners | | | 196,071 | | | | 8,342,821 | |
USA Compression Partners | | | 786,944 | | | | 6,303,422 | |
| | | | | | | | 60,186,464 | |
| Financials — 2.7% | | | | | |
Compass Diversified Holdings | | | 533,384 | | | | 10,715,685 | |
| | | | | | | |
| MASTER LIMITED PARTNERSHIPS — continued | |
| Industrials — 1.8% | | | | | |
| Fortress Transportation & Infrastructure Investors | | | 601,579 | | | $ | 7,074,569 | |
| TOTAL MASTER LIMITED PARTNERSHIPS | | | | | | | | |
(Cost $108,458,109) | | | | | | | 84,794,638 | |
| | |
SHORT-TERM INVESTMENT(B)(C) — 6.6% | |
| Fidelity Investments Money Market Government Portfolio, Cl Institutional, 0.160% | | | | | | | | |
(Cost $25,923,956) | | | 25,923,956 | | | | 25,923,956 | |
| | |
REPURCHASE AGREEMENT(B) — 0.7% | |
| BNP Paribas | | | | | | | | |
| 0.030%, dated 04/30/20, to be repurchased on 05/01/20, repurchase price $2,800,327 (collateralized by U.S. Treasury Obligations, ranging in par value $675,535 - $2,179,124, 1.500%, 08/15/2026, with a total market value of $2,854,659) | | | | | | | | |
(Cost $2,800,325) | | $ | 2,800,325 | | | | 2,800,325 | |
| TOTAL INVESTMENTS — 106.7% | | | | | | | | |
(Cost $566,862,935) | | | | | | $ | 419,063,272 | |
Percentages are based on Net Assets of $392,917,377.
| ‡ | Real Estate Investment Trust |
| (A) | This security or a partial position of this security is on loan at April 30, 2020. The total value of securities on loan at April 30, 2020 was $26,520,238. |
| (B) | Security was purchased with cash collateral held from securities on loan. The total value of such securities as of April 30, 2020 was $28,724,281. |
| (C) | The rate reported on the Schedule of Investments is the 7-day effective yield as of April 30, 2020. |
Cl — Class
The following is a summary of the level of inputs used as of April 30, 2020, in valuing the Fund’s investments carried at value:
| Investments in Securities | | | | | | | | | | | | |
| Common Stock | | $ | 305,544,353 | | | $ | — | | | $ | — | | | $ | 305,544,353 | |
| Master Limited Partnerships | | | 84,794,638 | | | | — | | | | — | | | | 84,794,638 | |
| Short-Term Investment | | | 25,923,956 | | | | — | | | | — | | | | 25,923,956 | |
| Repurchase Agreement | | | — | | | | 2,800,325 | | | | — | | | | 2,800,325 | |
| Total Investments in Securities | | $ | 416,262,947 | | | $ | 2,800,325 | | | $ | — | | | $ | 419,063,272 | |
For the period ended April 30, 2020, there have been no transfers in or out of Level 3.
| | |
| Schedule of Investments |
| April 30, 2020 (Unaudited) |
| Global X MSCI SuperDividend® Emerging Markets ETF | |
Sector Weightings †:
† Sector weightings percentages are based on the total market value of investments.
| | | | | | | |
| COMMON STOCK — 95.9% | |
| ARGENTINA— 1.6% | | | | | | |
| Financials — 1.6% | | | | |
Banco Macro ADR | | | 14,736 | | | $ | 240,344 | |
| BRAZIL— 4.8% | | | | | | | | |
| Consumer Discretionary — 1.8% | | | | | |
Petrobras Distribuidora | | | 74,400 | | | | 268,419 | |
| Information Technology — 1.1% | | | | | |
Cielo | | | 228,500 | | | | 171,376 | |
| Utilities — 1.9% | | | | | |
Engie Brasil Energia | | | 39,221 | | | | 283,436 | |
TOTAL BRAZIL | | | | | | | 723,231 | |
| CHILE— 1.8% | | | | | | | | |
| Utilities — 1.8% | | | | | |
Colbun | | | 1,889,073 | | | | 276,818 | |
| CHINA— 23.5% | | | | | | | | |
| Energy — 1.8% | | | | | |
Yanzhou Coal Mining, Cl H | | | 352,300 | | | | 267,212 | |
| | | | | | | |
| COMMON STOCK — continued | |
| Financials — 2.2% | | | | | |
| Bank of Communications CO, Cl H | | | 515,580 | | | $ | 327,211 | |
| Information Technology — 1.8% | | | | | |
Lenovo Group | | | 499,600 | | | | 271,958 | |
| Materials — 7.5% | | | | | |
China Zhongwang Holdings | | | 788,700 | | | | 190,248 | |
Maanshan Iron & Steel, Cl H | | | 864,200 | | | | 279,804 | |
Nanjing Iron & Steel, Cl A * | | | 771,500 | | | | 348,629 | |
| Sansteel Minguang Fujian, Cl A | | | 303,400 | | | | 312,453 | |
| | | | | | | | 1,131,134 | |
| Real Estate — 10.2% | | | | | |
Agile Group Holdings | | | 306,600 | | | | 345,661 | |
Guangzhou R&F Properties | | | 215,700 | | | | 272,117 | |
KWG Group Holdings | | | 379,200 | | | | 558,599 | |
Yuzhou Properties | | | 829,300 | | | | 353,014 | |
| | | | | | | | 1,529,391 | |
TOTAL CHINA | | | | | | | 3,526,906 | |
| INDONESIA— 1.6% | | | | | | | | |
| Energy — 1.6% | | | | | |
Bukit Asam | | | 1,961,500 | | | | 247,248 | |
| MALAYSIA— 0.8% | | | | | | | | |
| Industrials — 0.8% | | | | | |
AirAsia Group | | | 669,500 | | | | 126,894 | |
| MEXICO— 1.8% | | | | | | | | |
| Real Estate — 1.8% | | | | | |
Fibra Uno Administracion ‡ | | | 318,200 | | | | 264,209 | |
| PAKISTAN— 2.3% | | | | | | | | |
| Financials — 2.3% | | | | | |
MCB Bank | | | 336,010 | | | | 342,914 | |
| | | | | | | |
| COMMON STOCK — continued | |
| QATAR— 2.3% | | | | | | | | |
| Real Estate — 2.3% | | | | | |
Barwa Real Estate | | | 437,416 | | | $ | 343,590 | |
| RUSSIA— 19.4% | | | | | | | | |
| Communication Services — 2.1% | | | | | |
Mobile TeleSystems ADR | | | 36,163 | | | | 309,917 | |
| Energy — 5.9% | | | | | |
Gazprom PJSC | | | 128,890 | | | | 331,164 | |
LUKOIL PJSC | | | 5,027 | | | | 328,103 | |
Tatneft PJSC | | | 30,930 | | | | 230,044 | |
| | | | | | | | 889,311 | |
| Materials — 11.4% | | | | | |
Alrosa PJSC | | | 304,750 | | | | 256,332 | |
| Magnitogorsk Iron & Steel Works PJSC | | | 601,300 | | | | 327,366 | |
MMC Norilsk Nickel PJSC | | | 1,930 | | | | 534,459 | |
Novolipetsk Steel PJSC | | | 165,250 | | | | 286,796 | |
PhosAgro PJSC GDR | | | 25,843 | | | | 312,183 | |
| | | | | | | | 1,717,136 | |
TOTAL RUSSIA | | | | | | | 2,916,364 | |
| SOUTH AFRICA— 7.8% | | | | | | | | |
| Communication Services — 1.0% | | | | | |
Telkom SOC | | | 134,225 | | | | 150,706 | |
| Energy — 1.5% | | | | | |
Exxaro Resources | | | 39,404 | | | | 231,317 | |
| Financials — 2.5% | | | | | |
Absa Group | | | 34,025 | | | | 169,152 | |
Liberty Holdings | | | 56,302 | | | | 216,133 | |
| | | | | | | | 385,285 | |
| Real Estate — 2.8% | | | | | |
Fortress REIT, Cl A ‡ | | | 293,170 | | | | 161,551 | |
Growthpoint Properties ‡ | | | 237,184 | | | | 179,907 | |
| | | | | | | |
| COMMON STOCK — continued | |
| Real Estate — continued | | | | | |
Redefine Properties ‡ | | | 588,537 | | | $ | 72,746 | |
| | | | | | | | 414,204 | |
TOTAL SOUTH AFRICA | | | | | | | 1,181,512 | |
| TAIWAN— 17.4% | | | | | | | | |
| Information Technology — 17.4% | | | | | |
Inventec | | | 529,100 | | | | 418,134 | |
Lite-On Technology | | | 294,200 | | | | 460,051 | |
Micro-Star International | | | 164,000 | | | | 512,905 | |
Nanya Technology | | | 143,400 | | | | 313,453 | |
Walsin Technology | | | 71,200 | | | | 510,000 | |
Yageo | | | 31,400 | | | | 412,873 | |
TOTAL TAIWAN | | | | | | | 2,627,416 | |
| THAILAND— 1.9% | | | | | | | | |
| Real Estate — 1.9% | | | | | |
Land & Houses NVDR | | | 1,235,200 | | | | 282,506 | |
| TURKEY— 6.0% | | | | | | | | |
| Energy — 1.7% | | | | | |
| Tupras Turkiye Petrol Rafinerileri | | | 20,278 | | | | 263,430 | |
| Industrials — 1.8% | | | | | |
TAV Havalimanlari Holding | | | 105,558 | | | | 274,863 | |
| Materials — 2.5% | | | | | |
| Eregli Demir ve Celik Fabrikalari | | | 321,361 | | | | 371,959 | |
TOTAL TURKEY | | | | | | | 910,252 | |
| UNITED ARAB EMIRATES— 2.9% | | | | | | | | |
| Real Estate — 2.9% | | | | | |
Aldar Properties PJSC | | | 891,992 | | | | 441,977 | |
| TOTAL COMMON STOCK | | | | | | | | |
(Cost $18,278,654) | | | | | | | 14,452,181 | |
| | | | | | | |
PREFERRED STOCK — 3.7% | |
| BRAZIL— 3.7% | | | | | | | | |
| Communication Services — 2.1% | | | | | |
Telefonica Brasil(A) | | | 36,500 | | | $ | 307,802 | |
| Financials — 1.6% | | | | | |
Itausa - Investimentos Itau(A) | | | 146,915 | | | | 244,257 | |
TOTAL BRAZIL | | | | | | | 552,059 | |
| TOTAL PREFERRED STOCK | | | | | | | | |
(Cost $874,401) | | | | | | | 552,059 | |
| TOTAL INVESTMENTS — 99.6% | | | | | | | | |
(Cost $19,153,055) | | | | | | $ | 15,004,240 | |
Percentages are based on Net Assets of $15,064,556.
| * | Non-income producing security. |
| ‡ | Real Estate Investment Trust |
| (A) | There is currently no stated rate. |
| ADR — American Depositary Receipt |
| Cl — Class |
| GDR — Global Depositary Receipt |
| NVDR — Non-Voting Depositary Receipt |
| PJSC — Public Joint Stock Company |
| REIT — Real Estate Investment Trust |
The following is a summary of the level of inputs used as of April 30, 2020, in valuing the Fund’s investments carried at value:
| Investments in Securities | | | | | | | | | | | | |
| Common Stock | | $ | 11,237,728 | | | $ | 3,214,453 | | | $ | — | | | $ | 14,452,181 | |
| Preferred Stock | | | 552,059 | | | | — | | | | — | | | | 552,059 | |
| Total Investments in Securities | | | | | | | | | | | | | | | | |
For the period ended April 30, 2020, there have been no transfers in or out of Level 3.
| | |
| Schedule of Investments |
| April 30, 2020 (Unaudited) |
| Global X MSCI SuperDividend® EAFE ETF | |
Sector Weightings †:
† Sector weightings percentages are based on the total market value of investments.
| | | | | | | |
| COMMON STOCK — 99.7% | |
| AUSTRALIA— 12.3% | | | | | | |
| Consumer Discretionary — 1.8% | | | | |
Harvey Norman Holdings | | | 69,368 | | | $ | 126,254 | |
| Financials — 5.2% | | | | | |
| Australia & New Zealand Banking Group | | | 9,912 | | | | 109,670 | |
Bendigo and Adelaide Bank | | | 24,697 | | | | 105,746 | |
| Commonwealth Bank of Australia | | | 3,586 | | | | 147,181 | |
| | | | | | | | 362,597 | |
| Industrials — 1.6% | | | | | |
Westpac Banking | | | 10,246 | | | | 109,207 | |
| Materials — 1.8% | | | | | |
Alumina | | | 110,051 | | | | 125,007 | |
| Real Estate — 1.9% | | | | | |
Stockland ‡ | | | 67,395 | | | | 127,076 | |
TOTAL AUSTRALIA | | | | | | | 850,141 | |
| | | | | | | |
| COMMON STOCK — continued | |
| FINLAND— 6.3% | | | | | | | | |
| Financials — 4.3% | | | | | |
Nordea Bank Abp * | | | 24,701 | | | $ | 159,932 | |
Sampo, Cl A * | | | 4,144 | | | | 137,257 | |
| | | | | | | | 297,189 | |
| Utilities — 2.0% | | | | | |
Fortum | | | 8,512 | | | | 141,247 | |
TOTAL FINLAND | | | | | | | 438,436 | |
| FRANCE— 14.1% | | | | | | | | |
| Communication Services — 1.7% | | | | | |
Eutelsat Communications | | | 10,237 | | | | 114,817 | |
| Consumer Discretionary — 1.7% | | | | | |
Renault | | | 5,944 | | | | 117,879 | |
| Consumer Staples — 2.8% | | | | | |
Casino Guichard Perrachon | | | 5,151 | | | | 193,122 | |
| Energy — 1.7% | | | | | |
Total | | | 3,327 | | | | 119,708 | |
| Financials — 2.9% | | | | | |
Credit Agricole | | | 14,574 | | | | 116,242 | |
Societe Generale | | | 5,407 | | | | 84,452 | |
| | | | | | | | 200,694 | |
| Real Estate — 3.3% | | | | | |
ICADE ‡ | | | 2,132 | | | | 163,813 | |
Unibail-Rodamco-Westfield ‡ | | | 1,159 | | | | 68,195 | |
| | | | | | | | 232,008 | |
TOTAL FRANCE | | | | | | | 978,228 | |
| GERMANY— 2.3% | | | | | | | | |
| Communication Services — 2.3% | | | | | |
| Telefonica Deutschland Holding | | | 56,489 | | | | 160,559 | |
| | | | | | | |
| COMMON STOCK — continued | |
| HONG KONG— 9.9% | | | | | | | | |
| Communication Services — 5.5% | | | | | |
HKT Trust & HKT | | | 118,320 | | | $ | 190,170 | |
PCCW | | | 313,665 | | | | 192,188 | |
| | | | | | | | 382,358 | |
| Consumer Discretionary — 1.6% | | | | | |
Yue Yuen Industrial Holdings | | | 65,700 | | | | 105,597 | |
| Utilities — 2.8% | | | | | |
| HK Electric Investments & HK Electric Investments | | | 189,370 | | | | 195,419 | |
TOTAL HONG KONG | | | | | | | 683,374 | |
| ITALY— 4.4% | | | | | | | | |
| Financials — 2.2% | | | | | |
Poste Italiane | | | 17,672 | | | | 150,049 | |
| Utilities — 2.2% | | | | | |
Snam | | | 34,897 | | | | 156,255 | |
TOTAL ITALY | | | | | | | 306,304 | |
| JAPAN— 1.3% | | | | | | | | |
| Consumer Discretionary — 1.3% | | | | | |
Nissan Motor | | | 26,000 | | | | 89,913 | |
| NETHERLANDS— 4.0% | | | | | | | | |
| Energy — 1.4% | | | | | |
Royal Dutch Shell, Cl A | | | 5,603 | | | | 93,643 | |
| Financials — 2.6% | | | | | |
ABN AMRO Bank | | | 12,292 | | | | 94,244 | |
ING Groep | | | 15,907 | | | | 87,254 | |
| | | | | | | | 181,498 | |
TOTAL NETHERLANDS | | | | | | | 275,141 | |
| NEW ZEALAND— 2.9% | | | | | | | | |
| Communication Services — 2.9% | | | | | |
Spark New Zealand | | | 74,180 | | | | 203,198 | |
| | | | | | | |
| COMMON STOCK — continued | |
| PORTUGAL— 3.1% | | | | | | | | |
| Utilities — 3.1% | | | | | |
Energias de Portugal | | | 51,516 | | | $ | 217,239 | |
| RUSSIA— 1.2% | | | | | | | | |
| Materials — 1.2% | | | | | |
Evraz | | | 24,874 | | | | 83,206 | |
| SINGAPORE— 2.6% | | | | | | | | |
| Real Estate — 2.6% | | | | | |
Ascendas Real Estate Investment Trust ‡ | | | 86,113 | | | | 181,683 | |
| SPAIN— 4.8% | | | | | | | | |
| Utilities — 4.8% | | | | | |
Enagas | | | 7,486 | | | | 174,566 | |
Endesa | | | 7,240 | | | | 160,582 | |
TOTAL SPAIN | | | | | | | 335,148 | |
| SWEDEN— 4.5% | | | | | | | | |
| Financials — 4.5% | | | | | |
| Skandinaviska Enskilda Banken, Cl A | | | 19,981 | | | | 164,354 | |
Swedbank, Cl A | | | 12,214 | | | | 144,259 | |
TOTAL SWEDEN | | | | | | | 308,613 | |
| SWITZERLAND— 2.6% | | | | | | | | |
| Financials — 2.6% | | | | | |
Zurich Insurance Group | | | 565 | | | | 179,894 | |
| UNITED KINGDOM— 23.4% | | | | | | | | |
| Communication Services — 1.5% | | | | | |
BT Group, Cl A | | | 68,846 | | | | 100,777 | |
| Consumer Discretionary — 7.5% | | | | | |
Barratt Developments | | | 23,423 | | | | 153,337 | |
Persimmon | | | 6,826 | | | | 189,850 | |
Taylor Wimpey | | | 94,933 | | | | 176,083 | |
| | | | | | | | 519,270 | |
| | | | | | | |
| COMMON STOCK — continued | |
| Consumer Staples — 2.1% | | | | | |
Imperial Brands | | | 6,738 | | | $ | 142,698 | |
| Energy — 1.5% | | | | | |
BP | | | 25,474 | | | | 100,604 | |
| Financials — 5.6% | | | | | |
HSBC Holdings | | | 21,930 | | | | 113,412 | |
Legal & General Group | | | 50,451 | | | | 130,200 | |
Standard Life Aberdeen | | | 53,154 | | | | 148,239 | |
| | | | | | | | 391,851 | |
| Information Technology — 1.1% | | | | | |
Micro Focus International | | | 12,519 | | | | 76,065 | |
| Utilities — 4.1% | | | | | |
Centrica | | | 152,669 | | | | 76,835 | |
SSE | | | 13,375 | | | | 210,882 | |
| | | | | | | | 287,717 | |
TOTAL UNITED KINGDOM | | | | | | | 1,618,982 | |
| TOTAL COMMON STOCK | | | | | | | | |
(Cost $9,499,199) | | | | | | | 6,910,059 | |
| TOTAL INVESTMENTS — 99.7% | | | | | | | | |
(Cost $9,499,199) | | | | | | $ | 6,910,059 | |
Percentages are based on Net Assets of $6,932,422.
| ‡ | Real Estate Investment Trust |
| * | Non-income producing security. |
Cl — Class
The following is a summary of the level of inputs used as of April 30, 2020, in valuing the Fund’s investments carried at value:
| Investments in Securities | | | | | | | | | | | | |
| Common Stock | | $ | 6,226,685 | | | $ | 683,374 | | | $ | — | | | $ | 6,910,059 | |
| Total Investments in Securities | | $ | 6,226,685 | | | $ | 683,374 | | | $ | — | | | $ | 6,910,059 | |
For the period ended April 30, 2020, there have been no transfers in or out of Level 3.
| | |
| Schedule of Investments |
| April 30, 2020 (Unaudited) |
| Global X SuperDividend® REIT ETF | |
Sector Weightings †:
† Sector weightings percentages are based on the total market value of investments. Repurchase agreements purchased from cash collateral received for securities lending activity are included in total investments. Please see Note 2 and 7 in Notes to Financial Statements for more detailed information.
| | | | | | | |
| COMMON STOCK — 96.1% | |
| FRANCE— 2.4% | | | | | | |
| Real Estate — 2.4% | | | | |
Unibail-Rodamco-Westfield ‡ | | | 122,674 | | | $ | 7,218,094 | |
| SINGAPORE— 6.3% | | | | | | | | |
| Real Estate — 6.3% | | | | | |
Mapletree North Asia Commercial Trust ‡ | | | 2,934,000 | | | | 1,969,617 | |
Frasers Logistics & Industrial Trust ‡ | | | 2,611,000 | | | | 1,966,087 | |
Manulife US Real Estate Investment Trust ‡ | | | 20,803,589 | | | | 15,082,602 | |
TOTAL SINGAPORE | | | | | | | 19,018,306 | |
| SOUTH AFRICA— 0.6% | | | | | | | | |
| Real Estate — 0.6% | | | | | |
Growthpoint Properties ‡ | | | 2,205,740 | | | | 1,673,072 | |
| UNITED STATES— 87.2% | | | | | | | | |
| Financials — 51.5% | | | | | |
AGNC Investment ‡ | | | 933,958 | | | | 11,599,758 | |
Annaly Capital Management ‡ | | | 2,229,041 | | | | 13,931,506 | |
Apollo Commercial Real Estate Finance ‡ | | | 1,176,648 | | | | 9,589,681 | |
Arbor Realty Trust ‡ | | | 257,683 | | | | 1,775,436 | |
| | | | | | | |
COMMON STOCK — continued | |
| Financials — continued | | | | | |
ARMOUR Residential REIT ‡ | | | 1,120,064 | | | $ | 9,901,366 | |
Blackstone Mortgage Trust, Cl A ‡ | | | 566,284 | | | | 13,324,663 | |
Chimera Investment ‡ (A) | | | 1,020,564 | | | | 7,929,782 | |
Granite Point Mortgage Trust ‡ | | | 910,921 | | | | 4,536,387 | |
Invesco Mortgage Capital ‡ | | | 968,774 | | | | 2,945,073 | |
KKR Real Estate Finance Trust ‡ | | | 1,016,062 | | | | 16,033,459 | |
Ladder Capital, Cl A ‡ | | | 1,151,872 | | | | 9,157,382 | |
MFA Financial ‡ | | | 2,132,803 | | | | 3,732,405 | |
New Residential Investment ‡ | | | 1,024,217 | | | | 6,237,482 | |
New York Mortgage Trust ‡ | | | 2,656,823 | | | | 5,791,874 | |
PennyMac Mortgage Investment Trust ‡ | | | 736,049 | | | | 7,654,910 | |
Ready Capital ‡ | | | 1,433,496 | | | | 9,561,418 | |
Redwood Trust ‡ | | | 1,213,023 | | | | 4,973,394 | |
Starwood Property Trust ‡ | | | 841,345 | | | | 10,887,004 | |
TPG RE Finance Trust ‡ | | | 818,173 | | | | 6,291,750 | |
Two Harbors Investment ‡ | | | 1,114,339 | | | | 5,092,529 | |
| | | | | | | | 160,947,259 | |
| Real Estate — 37.1% | | | | | |
Apple Hospitality REIT ‡ | | | 1,094,033 | | | | 10,590,239 | |
Brookfield Property REIT, Cl A ‡ (A) | | | 1,105,596 | | | | 10,829,313 | |
CoreCivic ‡ | | | 140,058 | | | | 1,837,561 | |
EPR Properties ‡ | | | 293,542 | | | | 8,636,006 | |
Gaming and Leisure Properties ‡ | | | 457,039 | | | | 12,906,780 | |
GEO Group ‡ | | | 138,901 | | | | 1,761,265 | |
Global Net Lease ‡ | | | 843,623 | | | | 12,139,735 | |
Industrial Logistics Properties Trust ‡ | | | 102,276 | | | | 1,911,538 | |
Iron Mountain ‡ | | | 74,155 | | | | 1,793,068 | |
Kite Realty Group Trust ‡ | | | 173,888 | | | | 1,778,874 | |
MGM Growth Properties, Cl A ‡ | | | 73,100 | | | | 1,839,927 | |
Office Properties Income Trust ‡ | | | 54,862 | | | | 1,503,219 | |
Omega Healthcare Investors ‡ | | | 483,257 | | | | 14,086,941 | |
RLJ Lodging Trust ‡ | | | 1,034,139 | | | | 9,607,151 | |
| | | | | | | |
COMMON STOCK — continued | |
| Real Estate — continued | | | | | |
RPT Realty ‡ | | | 1,442,007 | | | $ | 9,834,488 | |
Service Properties Trust ‡ | | | 729,278 | | | | 5,053,897 | |
SITE Centers ‡ | | | 307,848 | | | | 1,865,559 | |
Tanger Factory Outlet Centers ‡ | | | 238,731 | | | | 1,795,257 | |
Taubman Centers ‡ | | | 41,595 | | | | 1,792,745 | |
| | | | | | | | 111,563,563 | |
TOTAL UNITED STATES | | | | | | | 272,098,803 | |
| TOTAL COMMON STOCK | | | | | | | | |
(Cost $551,880,264) | | | | | | | 300,420,294 | |
| | |
SHORT-TERM INVESTMENT(B)(C) — 3.7% | |
| Fidelity Investments Money Market Government Portfolio, Cl Institutional, 0.160% | | | | | | | | |
(Cost $10,957,034) | | | 10,957,034 | | | | 10,957,034 | |
| | |
REPURCHASE AGREEMENT(B) — 0.4% | |
| BNP Paribas | | | | | | | | |
| 0.030%, dated 04/30/20, to be repurchased on 05/01/20, repurchase price $1,183,588 (collateralized by U.S. Treasury Obligations, ranging in par value $285,522 - $921,030, 1.500%, 08/15/2026, with a total market value of $1,206,552) | | | | | | | | |
(Cost $1,183,587) | | $ | 1,183,587 | | | | 1,183,587 | |
| TOTAL INVESTMENTS — 104.1% | | | | | | | | |
(Cost $564,020,885) | | | | | | $ | 312,560,915 | |
Percentages are based on Net Assets of $299,829,756.
| ‡ | Real Estate Investment Trust |
| (A) | This security or a partial position of this security is on loan at April 30, 2020. The total value of securities on loan at April 30, 2020 was $11,172,668. |
| (B) | Security was purchased with cash collateral held from securities on loan. The total value of such securities as of April 30, 2020 was $12,140,621. |
| (C) | The rate reported on the Schedule of Investments is the 7-day effective yield as of April 30, 2020. |
Cl — Class
REIT — Real Estate Investment Trust
The following is a summary of the level of inputs used as of April 30, 2020, in valuing the Fund’s investments carried at value:
| Investments in Securities | | | | | | | | | | | | |
| Common Stock | | $ | 300,420,294 | | | $ | — | | | $ | — | | | $ | 300,420,294 | |
| Short-Term Investment | | | 10,957,034 | | | | — | | | | — | | | | 10,957,034 | |
| Repurchase Agreement | | | — | | | | 1,183,587 | | | | — | | | | 1,183,587 | |
| Total Investments in Securities | | $ | 311,377,328 | | | $ | 1,183,587 | | | $ | — | | | $ | 312,560,915 | |
For the period ended April 30, 2020, there have been no transfers in or out of Level 3.
| | |
| Schedule of Investments |
| April 30, 2020 (Unaudited) |
| Global X SuperIncome™ Preferred ETF | |
Sector Weightings †:
† Sector weightings percentages are based on the total market value of investments.
| | | | | | | |
| PREFERRED STOCK — 99.8% | |
| BERMUDA— 1.3% | | | | | | |
| Financials — 1.3% | | | | |
| Enstar Group, 7.000%, VAR ICE LIBOR USD 3 Month+4.015% | | | 89,976 | | | $ | 2,237,703 | |
| GERMANY— 2.2% | | | | | | | | |
| Financials — 2.2% | | | | | |
| Deutsche Bank Contingent Capital Trust II, 6.550% | | | 150,845 | | | | 3,822,412 | |
| UNITED KINGDOM— 3.8% | | | | | | | | |
| Financials — 3.8% | | | | | |
HSBC Holdings, 6.200% | | | 252,764 | | | | 6,498,563 | |
| UNITED STATES— 92.5% | | | | | | | | |
| Consumer Staples — 1.6% | | | | | |
CHS, Ser 4, 7.500% | | | 102,987 | | | | 2,709,588 | |
| Energy — 6.6% | | | | | |
| Crestwood Equity Partners, 9.250% | | | 341,676 | | | | 2,357,564 | |
| Energy Transfer Operating, 7.625%, VAR ICE LIBOR USD 3 Month+4.738% | | | 87,834 | | | | 1,840,122 | |
| Energy Transfer Operating, 7.600%, VAR ICE LIBOR USD 3 Month+5.161% | | | 158,559 | | | | 3,353,523 | |
| | | | | | | |
| PREFERRED STOCK — continued | |
| Energy — continued | | | | | |
| Energy Transfer Operating, 7.375%, VAR ICE LIBOR USD 3 Month+4.530% | | | 89,299 | | | $ | 1,871,707 | |
| NuStar Logistics, 7.953%, VAR ICE LIBOR USD 3 Month+6.734% | | | 95,860 | | | | 1,829,009 | |
| | | | | | | | 11,251,925 | |
| Financials — 67.3% | | | | | |
AGNC Investment, 7.000%, VAR ICE LIBOR USD 3 Month+5.111%‡ | | | 68,351 | | | | 1,572,073 | |
AGNC Investment, 6.500%, VAR ICE LIBOR USD 3 Month+4.993%‡ | | | 85,930 | | | | 1,929,129 | |
AGNC Investment, 6.125%, VAR ICE LIBOR USD 3 Month+4.697%‡ | | | 123,961 | | | | 2,697,391 | |
| American Equity Investment Life Holding, 5.950%, VAR US Treas Yield Curve Rate T Note Const Mat 5 Yr+4.322% | | | 84,192 | | | | 1,955,780 | |
Annaly Capital Management, 6.950%, VAR ICE LIBOR USD 3 Month+4.993%‡ | | | 190,705 | | | | 4,294,677 | |
Annaly Capital Management, 6.750%, VAR ICE LIBOR USD 3 Month+4.989%‡ | | | 118,472 | | | | 2,660,881 | |
Annaly Capital Management, Ser D, 7.500%‡ | | | 111,067 | | | | 2,717,809 | |
| Athene Holding, 6.350%, VAR ICE LIBOR USD 3 Month+4.253% | | | 182,666 | | | | 4,433,304 | |
Athene Holding, 5.625% | | | 76,913 | | | | 1,785,151 | |
Bank of America, 6.200% | | | 211,522 | | | | 5,520,724 | |
Brighthouse Financial, 6.600% | | | 88,488 | | | | 2,209,546 | |
Capital One Financial, 6.200% | | | 106,024 | | | | 2,719,515 | |
Charles Schwab, 5.950% | | | 142,718 | | | | 3,729,221 | |
| Citigroup, 6.875%, VAR ICE LIBOR USD 3 Month+4.130% | | | 175,856 | | | | 4,811,420 | |
| Citigroup, Ser J, 7.125%, VAR ICE LIBOR USD 3 Month+4.040% | | | 111,304 | | | | 3,043,052 | |
Equitable Holdings, 5.250% | | | 157,602 | | | | 3,801,360 | |
| | | | | | | |
| PREFERRED STOCK — continued | |
| Financials — continued | | | | | |
| Fifth Third Bancorp, 6.625%, VAR ICE LIBOR USD 3 Month+3.710% | | | 86,929 | | | $ | 2,321,004 | |
| GMAC Capital Trust I, Ser 2, 7.477%, VAR ICE LIBOR USD 3 Month+5.785% | | | 383,834 | | | | 8,655,457 | |
| Goldman Sachs Group, 6.375%, VAR ICE LIBOR USD 3 Month+3.550% | | | 136,423 | | | | 3,521,078 | |
Goldman Sachs Group, 6.300% | | | 127,532 | | | | 3,361,743 | |
| Hartford Financial Services Group, 7.875%, VAR ICE LIBOR USD 3 Month+5.596% | | | 117,657 | | | | 3,146,148 | |
| Huntington Bancshares, 6.250% | | | 122,497 | | | | 3,146,948 | |
JPMorgan Chase, 6.150% | | | 219,663 | | | | 5,669,502 | |
KKR, 6.750% | | | 66,558 | | | | 1,723,187 | |
| Morgan Stanley, Ser E, 7.125%, VAR ICE LIBOR USD 3 Month+4.320% | | | 141,303 | | | | 3,843,442 | |
| Morgan Stanley, Ser F, 6.875%, VAR ICE LIBOR USD 3 Month+3.940% | | | 139,299 | | | | 3,762,466 | |
| New York Community Bancorp, 6.375%, VAR ICE LIBOR USD 3 Month+3.821% | | | 105,014 | | | | 2,620,099 | |
| Regions Financial, Ser A, 6.375% | | | 101,264 | | | | 2,558,941 | |
| Regions Financial, Ser B, 6.375%, VAR ICE LIBOR USD 3 Month+3.536% | | | 97,068 | | | | 2,628,602 | |
| Reinsurance Group of America, 6.200%, VAR ICE LIBOR USD 3 Month+4.370% | | | 79,616 | | | | 2,016,673 | |
Synchrony Financial, 5.625% | | | 171,864 | | | | 3,581,646 | |
| Synovus Financial, 5.875%, VAR US Treas Yield Curve Rate T Note Const Mat 5 Yr+4.127% | | | 79,038 | | | | 1,701,688 | |
| US Bancorp, 6.500%, VAR ICE LIBOR USD 3 Month+4.468% | | | 219,400 | | | | 5,925,994 | |
| Wells Fargo, 6.625%, VAR ICE LIBOR USD 3 Month+3.690% | | | 161,292 | | | | 4,308,109 | |
| | | | | | | | 114,373,760 | |
| | | | | | | |
| PREFERRED STOCK — continued | |
| Health Care — 3.2% | | | | | |
Avantor, 6.250%* | | | 95,580 | | | $ | 5,503,497 | |
| Information Technology — 4.7% | | | | | |
Broadcom, 8.000%* | | | 7,872 | | | | 8,009,288 | |
| Real Estate — 3.5% | | | | | |
Monmouth Real Estate Investment, 6.125%‡ | | | 73,052 | | | | 1,785,391 | |
VEREIT, Ser F, 6.700%‡ | | | 172,008 | | | | 4,222,796 | |
| | | | | | | | 6,008,187 | |
| Utilities — 5.6% | | | | | |
CenterPoint Energy, 7.000%* | | | 107,568 | | | | 3,640,101 | |
| NiSource, 6.500%, VAR US Treas Yield Curve Rate T Note Const Mat 5 Yr+3.632% | | | 95,726 | | | | 2,639,166 | |
Sempra Energy, 6.750%* | | | 31,443 | | | | 3,185,490 | |
| | | | | | | | 9,464,757 | |
TOTAL UNITED STATES | | | | | | | 157,321,002 | |
| TOTAL PREFERRED STOCK | | | | | | | | |
(Cost $175,855,287) | | | | | | | 169,879,680 | |
| TOTAL INVESTMENTS — 99.8% | | | | | | | | |
(Cost $175,855,287) | | | | | | $ | 169,879,680 | |
Percentages are based on Net Assets of $170,294,556.
| * | Non-income producing security. |
| ‡ | Real Estate Investment Trust |
| ICE — Intercontinental Exchange |
| LIBOR — London Interbank Offered Rate |
| Ser — Series |
| USD — U.S. Dollar |
| VAR – Variable Rate |
As of April 30, 2020, all of the Fund’s investments were considered Level 1, in accordance with authoritative guidance on fair value measurements and disclosure under U.S. GAAP.
For the period ended April 30, 2020, there have been no transfers in or out of Level 3.
| | |
| Schedule of Investments |
| April 30, 2020 (Unaudited) |
| Global X YieldCo & Renewable Energy Income ETF | |
Sector Weightings †:
† Sector weightings percentages are based on the total market value of investments.
| | | | | | | |
| COMMON STOCK — 89.8% | |
| AUSTRALIA— 5.2% | | | | | | |
| Utilities — 5.2% | | | | |
AGL Energy | | | 216,846 | | | $ | 2,407,791 | |
| BRAZIL— 4.2% | | | | | | | | |
| Utilities — 4.2% | | | | | |
Engie Brasil Energia | | | 276,892 | | | | 2,000,999 | |
| CANADA— 13.5% | | | | | | | | |
| Utilities — 13.5% | | | | | |
Algonquin Power & Utilities | | | 160,811 | | | | 2,234,531 | |
Boralex | | | 33,409 | | | | 648,240 | |
Innergex Renewable Energy | | | 60,304 | | | | 811,029 | |
Northland Power | | | 67,711 | | | | 1,456,156 | |
TransAlta Renewables | | | 92,047 | | | | 996,715 | |
TOTAL CANADA | | | | | | | 6,146,671 | |
| CHILE— 12.3% | | | | | | | | |
| Utilities — 12.3% | | | | | |
Colbun | | | 6,075,145 | | | | 890,230 | |
Enel Americas | | | 17,420,555 | | | | 2,854,906 | |
Enel Chile | | | 24,092,091 | | | | 1,959,426 | |
TOTAL CHILE | | | | | | | 5,704,562 | |
| | | | | | | |
| COMMON STOCK — continued | |
| CHINA— 1.9% | | | | | | | | |
| Industrials — 0.6% | | | | | |
| Xinjiang Goldwind Science & Technology, Cl H | | | 266,641 | | | $ | 261,745 | |
| Utilities — 1.3% | | | | | |
| China Longyuan Power Group, Cl H | | | 1,156,500 | | | | 577,329 | |
TOTAL CHINA | | | | | | | 839,074 | |
| DENMARK— 6.4% | | | | | | | | |
| Utilities — 6.4% | | | | | |
Orsted | | | 29,516 | | | | 2,983,387 | |
| GERMANY— 1.3% | | | | | | | | |
| Utilities — 1.3% | | | | | |
Encavis | | | 47,407 | | | | 582,598 | |
| ITALY— 5.8% | | | | | | | | |
| Utilities — 5.8% | | | | | |
ACEA | | | 74,452 | | | | 1,243,599 | |
ERG | | | 52,105 | | | | 935,960 | |
Falck Renewables | | | 100,810 | | | | 495,333 | |
TOTAL ITALY | | | | | | | 2,674,892 | |
| NEW ZEALAND— 9.3% | | | | | | | | |
| Utilities — 9.3% | | | | | |
Contact Energy | | | 248,882 | | | | 965,814 | |
Mercury NZ | | | 472,494 | | | | 1,330,719 | |
Meridian Energy | | | 711,770 | | | | 1,971,674 | |
TOTAL NEW ZEALAND | | | | | | | 4,268,207 | |
| PORTUGAL— 6.0% | | | | | | | | |
| Utilities — 6.0% | | | | | |
Energias de Portugal | | | 654,504 | | | | 2,759,987 | |
| RUSSIA— 2.8% | | | | | | | | |
| Utilities — 2.8% | | | | | |
RusHydro PJSC | | | 149,039,900 | | | | 1,269,934 | |
| | | | | | | |
| COMMON STOCK — continued | |
| SPAIN— 1.8% | | | | | | | | |
| Utilities — 1.8% | | | | | |
Atlantica Yield | | | 35,207 | | | $ | 842,856 | |
| THAILAND— 0.7% | | | | | | | | |
| Utilities — 0.7% | | | | | |
BCPG NVDR | | | 689,400 | | | | 345,179 | |
| UNITED STATES— 18.6% | | | | | | | | |
| Financials — 1.4% | | | | | |
Hannon Armstrong Sustainable Infrastructure Capital ‡ | | | 23,214 | | | | 649,760 | |
| Utilities — 17.2% | | | | | |
Avista | | | 23,310 | | | | 1,003,262 | |
Clearway Energy, Cl A | | | 11,925 | | | | 222,998 | |
Hawaiian Electric Industries | | | 38,070 | | | | 1,502,623 | |
IDACORP | | | 17,612 | | | | 1,616,429 | |
NextEra Energy Partners | | | 22,711 | | | | 1,142,136 | |
NorthWestern | | | 17,511 | | | | 1,010,210 | |
TerraForm Power, Cl A | | | 79,362 | | | | 1,374,550 | |
| | | | | | | | 7,872,208 | |
TOTAL UNITED STATES | | | | | | | 8,521,968 | |
| TOTAL COMMON STOCK | | | | | | | | |
(Cost $43,153,047) | | | | | | | 41,348,105 | |
| | |
MASTER LIMITED PARTNERSHIP — 6.2% | |
| Utilities — 6.2% | | | | | |
| Brookfield Renewable Partners (A) | | | | | | | | |
(Cost $2,337,714) | | | 60,726 | | | | 2,873,331 | |
| | |
CLOSED-END FUNDS — 3.9% | |
| UNITED KINGDOM— 3.9% | | | | | | | | |
| Utilities — 3.9% | |
Greencoat UK Wind | | | 525,847 | | | | 896,752 | |
| Renewables Infrastructure Group | | | 567,025 | | | | 881,149 | |
| | | | | | | | |
| CLOSED-END FUNDS — continued | |
| TOTAL CLOSED-END FUNDS | | | | | | | | |
(Cost $1,811,716) | | | | | | $ | 1,777,901 | |
| TOTAL INVESTMENTS — 99.9% | | | | | | | | |
(Cost $47,302,477) | | | | | | $ | 45,999,337 | |
Percentages are based on Net Assets of $46,036,880.
| ‡ | Real Estate Investment Trust |
| (A) | Security considered Master Limited Partnership. At April 30, 2020, these securities amounted to $2,873,331 or 6.2% of net assets. |
Cl — Class
NVDR — Non-Voting Depositary Receipt
PJSC — Public Joint Stock Company
The following is a summary of the level of inputs used as of April 30, 2020, in valuing the Fund’s investments carried at value:
| Investments in Securities | | | | | | | | | | | | |
| Common Stock | | $ | 40,509,031 | | | $ | 839,074 | | | $ | — | | | $ | 41,348,105 | |
| Master Limited Partnership | | | 2,873,331 | | | | — | | | | — | | | | 2,873,331 | |
| Closed-End Funds | | | 1,777,901 | | | | — | | | | — | | | | 1,777,901 | |
| Total Investments in Securities | | $ | 45,160,263 | | | $ | 839,074 | | | $ | — | | | $ | 45,999,337 | |
For the period ended April 30, 2020, there have been no transfers in or out of Level 3.
| | |
| Schedule of Investments |
| April 30, 2020 (Unaudited) |
| Global X Social Media ETF | |
Sector Weightings †:
† Sector weightings percentages are based on the total market value of investments. Repurchase agreements purchased from cash collateral received for securities lending activity are included in total investments. Please see Note 2 and 7 in Notes to Financial Statements for more detailed information.
| | | | | | | |
| COMMON STOCK — 100.0% | |
| CHINA— 28.0% | | | | | | |
| Communication Services — 27.9% | | | | |
Baidu ADR * | | | 48,746 | | | $ | 4,919,934 | |
Bilibili ADR * | | | 27,928 | | | | 764,948 | |
HUYA ADR * | | | 17,813 | | | | 289,105 | |
JOYY ADR * | | | 30,237 | | | | 1,843,247 | |
Momo ADR | | | 36,949 | | | | 889,732 | |
NetEase ADR | | | 18,651 | | | | 6,433,849 | |
SINA * | | | 30,578 | | | | 1,032,619 | |
Tencent Holdings | | | 261,915 | | | | 14,088,445 | |
Tencent Music Entertainment Group ADR * | | | 91,602 | | | | 1,045,179 | |
Weibo ADR * (A) | | | 46,635 | | | | 1,750,212 | |
| | | | | | | | 33,057,270 | |
| Information Technology — 0.1% | | | | | |
Meitu * | | | 1,010,400 | | | | 186,378 | |
TOTAL CHINA | | | | | | | 33,243,648 | |
| GERMANY— 1.9% | | | | | | | | |
| Communication Services — 1.9% | | | | | |
New Work | | | 1,304 | | | | 310,650 | |
United Internet | | | 56,970 | | | | 1,962,460 | |
TOTAL GERMANY | | | | | | | 2,273,110 | |
| | | | | | | |
| COMMON STOCK — continued | |
| JAPAN— 6.2% | | | | | | |
| Communication Services — 6.2% | | | | |
DeNA | | | 51,471 | | | $ | 637,762 | |
Gree | | | 54,935 | | | | 218,846 | |
Kakaku.com | | | 63,180 | | | | 1,299,818 | |
LINE * | | | 22,970 | | | | 1,132,014 | |
Mixi | | | 20,330 | | | | 353,044 | |
Nexon | | | 229,284 | | | | 3,739,386 | |
TOTAL JAPAN | | | | | | | 7,380,870 | |
| RUSSIA— 5.8% | | | | | | | | |
| Communication Services — 5.8% | | | | | |
Mail.Ru Group GDR * | | | 88,931 | | | | 1,600,758 | |
Yandex, Cl A * | | | 139,353 | | | | 5,264,756 | |
TOTAL RUSSIA | | | | | | | 6,865,514 | |
| SOUTH KOREA— 11.4% | | | | | | | | |
| Communication Services — 11.4% | | | | | |
AfreecaTV | | | 3,353 | | | | 165,937 | |
Com2uSCorp | | | 3,870 | | | | 339,850 | |
Kakao | | | 20,816 | | | | 3,143,456 | |
NAVER | | | 60,407 | | | | 9,791,442 | |
TOTAL SOUTH KOREA | | | | | | | 13,440,685 | |
| TAIWAN— 0.1% | | | | | | | | |
| Consumer Discretionary — 0.1% | | | | | |
PChome Online | | | 47,244 | | | | 156,651 | |
| UNITED STATES— 46.6% | | | | | | | | |
| Communication Services — 46.4% | | | | | |
Alphabet, Cl A * | | | 4,187 | | | | 5,638,633 | |
ANGI Homeservices, Cl A * (A) | | | 42,569 | | | | 288,405 | |
Facebook, Cl A * | | | 58,049 | | | | 11,883,211 | |
Glu Mobile * | | | 60,994 | | | | 475,753 | |
IAC * | | | 22,652 | | | | 5,062,269 | |
| | | | | | | |
| COMMON STOCK — continued | |
| Communication Services — continued | | | | | |
Match Group * (A) | | | 26,886 | | | $ | 2,069,147 | |
Meet Group * | | | 38,643 | | | | 238,427 | |
Pinterest, Cl A * | | | 76,814 | | | | 1,586,977 | |
Snap, Cl A * (A) | | | 507,610 | | | | 8,939,012 | |
Spotify Technology * | | | 44,542 | | | | 6,751,231 | |
Twitter * | | | 278,986 | | | | 8,001,318 | |
Yelp, Cl A * (A) | | | 33,772 | | | | 754,804 | |
Zynga, Cl A * | | | 432,907 | | | | 3,264,119 | |
| | | | | | | | 54,953,306 | |
| Consumer Discretionary — 0.2% | | | | | |
Groupon, Cl A * | | | 234,030 | | | | 285,517 | |
TOTAL UNITED STATES | | | | | | | 55,238,823 | |
| TOTAL COMMON STOCK | | | | | | | | |
(Cost $110,384,189) | | | | | | | 118,599,301 | |
| | |
SHORT-TERM INVESTMENT(B)(C) — 10.1% | |
| Fidelity Investments Money Market Government Portfolio, Cl Institutional, 0.160% | | | | | | | | |
(Cost $11,933,272) | | | 11,933,272 | | | | 11,933,272 | |
| | |
REPURCHASE AGREEMENT(B) — 1.1% | |
| BNP Paribas | | | | | | | | |
| 0.030%, dated 04/30/20, to be repurchased on 05/01/20, repurchase price $1,289,042 (collateralized by U.S. Treasury Obligations, ranging in par value $310,052 - $1,003,091, 1.500%, 08/15/2026, with a total market value of $1,314,052) | | | | | | | | |
(Cost $1,289,041) | | $ | 1,289,041 | | | | 1,289,041 | |
| TOTAL INVESTMENTS — 111.2% | | | | | | | | |
(Cost $123,606,502) | | | | | | $ | 131,821,614 | |
Percentages are based on Net Assets of $118,582,738.
| * | Non-income producing security. |
| (A) | This security or a partial position of this security is on loan at April 30, 2020. The total value of securities on loan at April 30, 2020 was $7,044,337. |
| (B) | Security was purchased with cash collateral held from securities on loan. The total value of such securities as of April 30, 2020 was $13,222,312. |
| (C) | The rate reported on the Schedule of Investments is the 7-day effective yield as of April 30, 2020. |
| ADR — American Depositary Receipt |
| Cl — Class |
| GDR — Global Depositary Receipt |
The following is a summary of the level of inputs used as of April 30, 2020, in valuing the Fund’s investments carried at value:
| Investments in Securities | | | | | | | | | | | | |
| Common Stock | | $ | 90,883,792 | | | $ | 27,715,509 | | | $ | — | | | $ | 118,599,301 | |
| Short-Term Investment | | | 11,933,272 | | | | — | | | | — | | | | 11,933,272 | |
| Repurchase Agreement | | | — | | | | 1,289,041 | | | | — | | | | 1,289,041 | |
| Total Investments in Securities | | $ | 102,817,064 | | | $ | 29,004,550 | | | $ | — | | | $ | 131,821,614 | |
For the period ended April 30, 2020, there have been no transfers in or out of Level 3.
| | |
| Schedule of Investments |
| April 30, 2020 (Unaudited) |
| | |
Sector Weightings †:
† Sector weightings percentages are based on the total market value of investments.
| | | | | | | |
| COMMON STOCK — 100.0% | |
| ARGENTINA— 3.8% | | | | | | |
| Consumer Discretionary — 3.8% | | | | |
MercadoLibre * | | | 679 | | | $ | 396,203 | |
| CANADA— 6.1% | | | | | | | | |
| Information Technology — 6.1% | | | | | |
Shopify, Cl A * | | | 1,005 | | | | 635,451 | |
| CHINA— 25.6% | | | | | | | | |
| Communication Services — 7.5% | | | | | |
58.com ADR * | | | 6,522 | | | | 338,818 | |
NetEase ADR | | | 1,269 | | | | 437,754 | |
| | | | | | | | 776,572 | |
| Consumer Discretionary — 17.3% | | | | | |
Alibaba Group Holding ADR * | | | 1,952 | | | | 395,612 | |
Baozun ADR * | | | 3,630 | | | | 115,579 | |
JD.com ADR * | | | 10,984 | | | | 473,410 | |
Trip.com Group ADR * | | | 11,542 | | | | 297,322 | |
Uxin ADR | | | 16,874 | | | | 27,167 | |
Vipshop Holdings ADR * | | | 29,790 | | | | 474,555 | |
| | | | | | | | 1,783,645 | |
| Financials — 0.8% | | | | | |
LexinFintech Holdings ADR * | | | 9,374 | | | | 79,023 | |
TOTAL CHINA | | | | | | | 2,639,240 | |
| | | | | | | |
| COMMON STOCK — continued | |
| GERMANY— 1.1% | | | | | | | | |
| Consumer Discretionary — 1.1% | | | | | |
Jumia Technologies ADR * | | | 5,634 | | | $ | 24,733 | |
Rocket Internet * | | | 4,584 | | | | 96,551 | |
TOTAL GERMANY | | | | | | | 121,284 | |
| JAPAN— 4.4% | | | | | | | | |
| Consumer Discretionary — 4.4% | | | | | |
Rakuten | | | 53,080 | | | | 454,681 | |
| SOUTH KOREA— 0.3% | | | | | | | | |
| Information Technology — 0.3% | | | | | |
Cafe24 * | | | 742 | | | | 26,856 | |
| UNITED KINGDOM— 6.4% | | | | | | | | |
| Consumer Discretionary — 6.4% | | | | | |
ASOS * | | | 3,973 | | | | 119,972 | |
Ocado Group * | | | 26,287 | | | | 532,007 | |
TOTAL UNITED KINGDOM | | | | | | | 651,979 | |
| UNITED STATES— 52.3% | | | | | | | | |
| Communication Services — 3.0% | | | | | |
ANGI Homeservices, Cl A * | | | 5,560 | | | | 37,669 | |
TripAdvisor | | | 7,839 | | | | 156,545 | |
Yelp, Cl A * | | | 4,891 | | | | 109,314 | |
| | | | | | | | 303,528 | |
| Consumer Discretionary — 36.7% | | | | | |
Amazon.com * | | | 239 | | | | 591,285 | |
Booking Holdings * | | | 212 | | | | 313,881 | |
eBay | | | 12,519 | | | | 498,632 | |
Etsy * | | | 8,688 | | | | 563,590 | |
Expedia Group | | | 4,008 | | | | 284,488 | |
Groupon, Cl A * | | | 34,926 | | | | 42,610 | |
Lands’ End * | | | 2,014 | | | | 17,139 | |
Overstock.com * | | | 3,667 | | | | 46,278 | |
| | | | | | | |
| COMMON STOCK — continued | |
| Consumer Discretionary — continued | | | | | |
Overstock.com, Ser A1 (A)(B)(C) | | | 367 | | | $ | 3,665 | |
PetMed Express | | | 1,390 | | | | 55,002 | |
Qurate Retail, Cl A * | | | 28,124 | | | | 226,539 | |
Shutterstock | | | 1,394 | | | | 52,972 | |
Stamps.com * | | | 1,217 | | | | 192,615 | |
Wayfair, Cl A * | | | 4,291 | | | | 532,255 | |
Williams-Sonoma | | | 5,702 | | | | 352,612 | |
| | | | | | | | 3,773,563 | |
| Financials — 3.0% | | | | | |
eHealth * | | | 1,603 | | | | 171,040 | |
LendingTree * | | | 581 | | | | 144,884 | |
| | | | | | | | 315,924 | |
| Industrials — 4.4% | | | | | |
CoStar Group * | | | 691 | | | | 447,948 | |
| Information Technology — 5.2% | | | | | |
GoDaddy, Cl A * | | | 6,093 | | | | 423,037 | |
LivePerson * | | | 4,532 | | | | 108,496 | |
| | | | | | | | 531,533 | |
TOTAL UNITED STATES | | | | | | | 5,372,496 | |
| TOTAL COMMON STOCK | | | | | | | | |
(Cost $9,712,926) | | | | | | | 10,298,190 | |
| TOTAL INVESTMENTS — 100.0% | | | | | | | | |
(Cost $9,712,926) | | | | | | $ | 10,298,190 | |
Percentages are based on Net Assets of $10,297,628.
| * | Non-income producing security. |
| (A) | Level 3 security in accordance with fair value hierarchy. |
| (B) | Security considered illiquid. The total value of such securities as of April 30, 2020 was $3,665 and represented 0.0% of Net Assets. |
| (C) | Security is fair valued using methods determined in good faith by the Fair Value Committee of the Fund. The total value of such securities as of April 30, 2020 was $3,665 and represents 0.0% of net assets. |
| ADR — American Depositary Receipt |
| Cl — Class |
| Ser — Series |
The following is a summary of the level of inputs used as of April 30, 2020, in valuing the Fund’s investments carried at value:
| Investments in Securities | | | | | | | | | | | | |
| Common Stock | | $ | 10,267,669 | | | $ | 26,856 | | | $ | 3,665 | | | $ | 10,298,190 | |
| Total Investments in Securities | | | | | | | | | | | | | | | | |
| (1) | A reconciliation of Level 3 investments and disclosures of significant unobservable inputs are presented when the Fund has a significant amount of Level 3 investments at the beginning and/or end of the period in relation to Net Assets. Management has concluded that Level 3 investments are not material in relation to Net Assets. |
| | |
| Schedule of Investments |
| April 30, 2020 (Unaudited) |
| | |
Sector Weightings †:
† Sector weightings percentages are based on the total market value of investments.
| | | | | | | |
| COMMON STOCK — 98.4% | |
| CHINA— 4.3% | | | | | | |
| Consumer Discretionary — 4.3% | | | | |
Alibaba Group Holding ADR * | | | 5,075 | | | $ | 1,028,550 | |
JD.com ADR * | | | 26,558 | | | | 1,144,650 | |
TOTAL CHINA | | | | | | | 2,173,200 | |
| NETHERLANDS— 1.6% | | | | | | | | |
| Information Technology — 1.6% | | | | | |
NXP Semiconductors | | | 8,157 | | | | 812,192 | |
| UNITED KINGDOM— 2.1% | | | | | | | | |
| Communication Services — 2.1% | | | | | |
Liberty Global * | | | 57,304 | | | | 1,049,236 | |
| UNITED STATES— 90.4% | | | | | | | | |
| Communication Services — 14.5% | | | | | |
Alphabet, Cl C * | | | 733 | | | | 988,568 | |
Charter Communications, Cl A * | | | 2,084 | | | | 1,032,060 | |
| | |
| Schedule of Investments |
| April 30, 2020 (Unaudited) |
| | |
| | | | | | | |
| COMMON STOCK — continued | |
| Communication Services — continued | | | | | |
Facebook, Cl A * | | | 5,204 | | | $ | 1,065,311 | |
IAC * | | | 4,684 | | | | 1,046,780 | |
Liberty Broadband, Cl C * | | | 8,131 | | | | 997,511 | |
Netflix * | | | 2,930 | | | | 1,230,161 | |
Zillow Group, Cl C * | | | 21,493 | | | | 944,832 | |
| | | | | | | | 7,305,223 | |
| Consumer Discretionary — 7.8% | | | | | |
Amazon.com * | | | 522 | | | | 1,291,428 | |
Caesars Entertainment * | | | 76,366 | | | | 737,696 | |
Chipotle Mexican Grill, Cl A * | | | 1,209 | | | | 1,062,167 | |
DR Horton | | | 18,028 | | | | 851,282 | |
| | | | | | | | 3,942,573 | |
| Consumer Staples — 7.7% | | | | | |
Constellation Brands, Cl A | | | 5,468 | | | | 900,525 | |
Mondelez International, Cl A | | | 18,755 | | | | 964,757 | |
Post Holdings * | | | 10,437 | | | | 958,639 | |
Procter & Gamble | | | 8,836 | | | | 1,041,499 | |
| | | | | | | | 3,865,420 | |
| Energy — 1.9% | | | | | |
Cheniere Energy * | | | 20,270 | | | | 946,406 | |
| Financials — 6.3% | | | | | |
Arch Capital Group * | | | 23,371 | | | | 561,605 | |
Citigroup | | | 14,142 | | | | 686,735 | |
Franklin Resources | | | 46,254 | | | | 871,426 | |
S&P Global | | | 3,623 | | | | 1,061,104 | |
| | | | | | | | 3,180,870 | |
| Health Care — 19.9% | | | | | |
Alexion Pharmaceuticals * | | | 10,868 | | | | 1,167,984 | |
Allergan | | | 5,620 | | | | 1,052,851 | |
Bausch Health * | | | 40,168 | | | | 727,844 | |
Baxter International | | | 11,988 | | | | 1,064,295 | |
| | |
| Schedule of Investments |
| April 30, 2020 (Unaudited) |
| | |
| | | | | | | |
| COMMON STOCK — continued | |
| Health Care — continued | | | | | |
Cigna | | | 5,059 | | | $ | 990,451 | |
DaVita * | | | 12,963 | | | | 1,024,206 | |
Immunomedics * | | | 60,691 | | | | 1,843,793 | |
Neurocrine Biosciences * | | | 10,686 | | | | 1,048,724 | |
UnitedHealth Group | | | 3,742 | | | | 1,094,423 | |
| | | | | | | | 10,014,571 | |
| Industrials — 4.9% | | | | | |
Delta Air Lines | | | 18,914 | | | | 490,061 | |
Howmet Aerospace | | | 33,394 | | | | 436,460 | |
| Spirit Aerosystems Holdings, Cl A | | | 16,132 | | | | 357,485 | |
United Airlines Holdings * | | | 13,772 | | | | 407,376 | |
XPO Logistics * | | | 11,704 | | | | 781,125 | |
| | | | | | | | 2,472,507 | |
| Information Technology — 14.2% | | | | | |
Adobe * | | | 2,936 | | | | 1,038,287 | |
Apple | | | 3,430 | | | | 1,007,734 | |
Coupa Software * | | | 6,655 | | | | 1,171,879 | |
| Fidelity National Information Services | | | 7,092 | | | | 935,364 | |
NortonLifeLock | | | 53,951 | | | | 1,147,538 | |
Palo Alto Networks * | | | 4,507 | | | | 885,670 | |
salesforce.com * | | | 5,867 | | | | 950,161 | |
| | | | | | | | 7,136,633 | |
| Materials — 5.9% | | | | | |
Arconic * | | | 8,211 | | | | 71,600 | |
Berry Global Group * | | | 26,575 | | | | 1,057,419 | |
Martin Marietta Materials | | | 4,237 | | | | 806,004 | |
Sherwin-Williams | | | 1,907 | | | | 1,022,858 | |
| | | | | | | | 2,957,881 | |
| Real Estate — 2.0% | | | | | |
American Tower, Cl A ‡ | | | 4,350 | | | | 1,035,300 | |
| | |
| Schedule of Investments |
| April 30, 2020 (Unaudited) |
| | |
| | | | | | | |
| COMMON STOCK — continued | |
| Utilities — 5.3% | | | | | |
Essential Utilities | | | 20,747 | | | $ | 867,017 | |
FirstEnergy | | | 21,339 | | | | 880,661 | |
Vistra Energy | | | 48,147 | | | | 940,792 | |
| | | | | | | | 2,688,470 | |
TOTAL UNITED STATES | | | | | | | 45,545,854 | |
| TOTAL COMMON STOCK | | | | | | | | |
(Cost $48,523,959) | | | | | | | 49,580,482 | |
| | |
MASTER LIMITED PARTNERSHIP — 1.5% | |
| Energy — 1.5% | | | | | |
| Enterprise Products Partners | | | | | | | | |
(Cost $1,026,793) | | | 42,419 | | | | 744,878 | |
| TOTAL INVESTMENTS — 99.9% | | | | | | | | |
(Cost $49,550,752) | | | | | | $ | 50,325,360 | |
Percentages are based on Net Assets of $50,360,356.
| * | Non-income producing security. |
| ‡ | Real Estate Investment Trust |
| ADR — American Depositary Receipt |
| Cl — Class |
| S&P — Standard & Poor’s |
As of April 30, 2020, all of the Fund’s investments were considered Level 1, in accordance with authoritative guidance on fair value measurements and disclosure under U.S. GAAP.
For the period ended April 30, 2020, there have been no transfers in or out of Level 3.
| | |
| Schedule of Investments |
| April 30, 2020 (Unaudited) |
| Global X Scientific Beta U.S. ETF | |
Sector Weightings †:
† Sector weightings percentages are based on the total market value of investments.
| | | | | | | |
COMMON STOCK — 99.6% | | | | | | |
| ISRAEL— 0.4% | | | | | | |
| Information Technology — 0.4% | | | | | | |
Check Point Software Technologies * | | | 1,131 | | | $ | 119,592 | |
| UNITED KINGDOM— 0.4% | | | | | | | | |
| Materials — 0.4% | | | | | | | | |
Linde | | | 687 | | | | 126,401 | |
| UNITED STATES— 98.8% | | | | | | | | |
| Communication Services — 4.7% | | | | | | | | |
Activision Blizzard | | | 1,976 | | | | 125,931 | |
Alphabet, Cl A * | | | 52 | | | | 70,029 | |
AT&T | | | 3,858 | | | | 117,553 | |
CenturyLink | | | 1,191 | | | | 12,648 | |
Charter Communications, Cl A * | | | 234 | | | | 115,884 | |
Comcast, Cl A | | | 3,005 | | | | 113,078 | |
Electronic Arts * | | | 1,194 | | | | 136,426 | |
Facebook, Cl A * | | | 545 | | | | 111,567 | |
| | | | | | | |
| COMMON STOCK — continued | | | | | | | | |
| Communication Services — continued | | | | | | | | |
Fox, Cl A | | | 1,376 | | | $ | 35,597 | |
IAC * | | | 788 | | | | 176,102 | |
Sirius XM Holdings | | | 5,048 | | | | 29,834 | |
T-Mobile US * | | | 1,945 | | | | 170,771 | |
Verizon Communications | | | 1,019 | | | | 58,542 | |
ViacomCBS, Cl B | | | 232 | | | | 4,004 | |
Walt Disney | | | 1,193 | | | | 129,023 | |
| | | | | | | | 1,406,989 | |
| Consumer Discretionary — 11.5% | | | | | | | | |
Advance Auto Parts | | | 425 | | | | 51,387 | |
Aptiv | | | 447 | | | | 31,089 | |
AutoZone * | | | 106 | | | | 108,154 | |
Best Buy | | | 1,425 | | | | 109,340 | |
BorgWarner | | | 916 | | | | 26,170 | |
Burlington Stores * | | | 86 | | | | 15,711 | |
Carnival | | | 1,474 | | | | 23,437 | |
Chipotle Mexican Grill, Cl A * | | | 133 | | | | 116,847 | |
Darden Restaurants | | | 693 | | | | 51,137 | |
Dollar General | | | 583 | | | | 102,200 | |
Dollar Tree * | | | 855 | | | | 68,118 | |
Domino’s Pizza | | | 53 | | | | 19,182 | |
DR Horton | | | 3,641 | | | | 171,928 | |
eBay | | | 2,925 | | | | 116,503 | |
Expedia Group | | | 244 | | | | 17,319 | |
Ford Motor | | | 7,603 | | | | 38,699 | |
General Motors | | | 1,990 | | | | 44,357 | |
Genuine Parts | | | 531 | | | | 42,098 | |
Hasbro | | | 576 | | | | 41,593 | |
Home Depot | | | 482 | | | | 105,958 | |
Kohl’s | | | 1,104 | | | | 20,380 | |
Las Vegas Sands | | | 1,010 | | | | 48,500 | |
Lear | | | 388 | | | | 37,888 | |
| | | | | | | |
| COMMON STOCK — continued | | | | | | | | |
| Consumer Discretionary — continued | | | | | | | | |
Lennar, Cl A | | | 2,767 | | | $ | 138,544 | |
LKQ * | | | 1,562 | | | | 40,846 | |
Lowe’s | | | 681 | | | | 71,335 | |
Lululemon Athletica * | | | 500 | | | | 111,740 | |
Macy’s | | | 2,347 | | | | 13,753 | |
McDonald’s | | | 369 | | | | 69,210 | |
MGM Resorts International | | | 3,146 | | | | 52,947 | |
Mohawk Industries * | | | 598 | | | | 52,456 | |
NIKE, Cl B | | | 1,779 | | | | 155,093 | |
Norwegian Cruise Line Holdings * | | | 976 | | | | 16,006 | |
NVR * | | | 38 | | | | 117,800 | |
O’Reilly Automotive * | | | 185 | | | | 71,473 | |
PVH | | | 919 | | | | 45,242 | |
Ross Stores | | | 847 | | | | 77,382 | |
Royal Caribbean Cruises | | | 519 | | | | 24,274 | |
Tapestry | | | 2,263 | | | | 33,674 | |
Target | | | 2,132 | | | | 233,966 | |
Tiffany | | | 1,166 | | | | 147,499 | |
TJX | | | 3,602 | | | | 176,678 | |
Tractor Supply | | | 464 | | | | 47,063 | |
Ulta Beauty * | | | 229 | | | | 49,904 | |
VF | | | 1,497 | | | | 86,976 | |
Whirlpool | | | 728 | | | | 81,347 | |
Wynn Resorts | | | 462 | | | | 39,515 | |
Yum! Brands | | | 1,187 | | | | 102,592 | |
| | | | | | | | 3,465,310 | |
| Consumer Staples — 7.9% | | | | | | | | |
Archer-Daniels-Midland | | | 1,903 | | | | 70,677 | |
Brown-Forman, Cl B | | | 1,986 | | | | 123,529 | |
Bunge | | | 1,566 | | | | 62,123 | |
Church & Dwight | | | 1,291 | | | | 90,357 | |
Clorox | | | 405 | | | | 75,508 | |
| | | | | | | |
| COMMON STOCK — continued | | | | | | | | |
| Consumer Staples — continued | | | | | | | | |
Coca-Cola | | | 1,644 | | | $ | 75,443 | |
Colgate-Palmolive | | | 1,236 | | | | 86,854 | |
Conagra Brands | | | 3,068 | | | | 102,594 | |
Constellation Brands, Cl A | | | 246 | | | | 40,514 | |
Costco Wholesale | | | 437 | | | | 132,411 | |
Estee Lauder, Cl A | | | 728 | | | | 128,419 | |
Hershey | | | 952 | | | | 126,073 | |
Hormel Foods | | | 1,613 | | | | 75,569 | |
JM Smucker | | | 796 | | | | 91,468 | |
Kellogg | | | 487 | | | | 31,899 | |
Kimberly-Clark | | | 598 | | | | 82,811 | |
Kraft Heinz | | | 1,914 | | | | 58,052 | |
Kroger | | | 2,481 | | | | 78,424 | |
McCormick | | | 216 | | | | 33,878 | |
Molson Coors Beverage, Cl B | | | 576 | | | | 23,622 | |
Mondelez International, Cl A | | | 2,053 | | | | 105,606 | |
PepsiCo | | | 614 | | | | 81,226 | |
Procter & Gamble | | | 646 | | | | 76,144 | |
Sysco | | | 1,880 | | | | 105,788 | |
Tyson Foods, Cl A | | | 2,335 | | | | 145,214 | |
Walgreens Boots Alliance | | | 875 | | | | 37,879 | |
Walmart | | | 1,930 | | | | 234,591 | |
| | | | | | | | 2,376,673 | |
| Energy — 3.4% | | | | | | | | |
Apache | | | 3,084 | | | | 40,339 | |
Cabot Oil & Gas | | | 2,248 | | | | 48,602 | |
Chevron | | | 844 | | | | 77,648 | |
Concho Resources | | | 701 | | | | 39,761 | |
ConocoPhillips | | | 1,184 | | | | 49,846 | |
Devon Energy | | | 1,753 | | | | 21,860 | |
EOG Resources | | | 516 | | | | 24,515 | |
Exxon Mobil | | | 1,067 | | | | 49,583 | |
| | | | | | | |
| COMMON STOCK — continued | | | | | | | | |
| Energy — continued | | | | | | | | |
Hess | | | 2,095 | | | $ | 101,901 | |
HollyFrontier | | | 485 | | | | 16,024 | |
Kinder Morgan | | | 5,442 | | | | 82,882 | |
Marathon Oil | | | 9,883 | | | | 60,484 | |
National Oilwell Varco | | | 2,893 | | | | 36,567 | |
Noble Energy | | | 4,252 | | | | 41,712 | |
Occidental Petroleum | | | 1,627 | | | | 27,008 | |
ONEOK | | | 528 | | | | 15,803 | |
Phillips 66 | | | 1,895 | | | | 138,657 | |
Targa Resources | | | 2,824 | | | | 36,599 | |
Valero Energy | | | 1,770 | | | | 112,130 | |
Williams | | | 567 | | | | 10,983 | |
| | | | | | | | 1,032,904 | |
| Financials — 10.8% | | | | | | | | |
Aflac | | | 1,860 | | | | 69,266 | |
Alleghany | | | 165 | | | | 88,062 | |
Allstate | | | 857 | | | | 87,174 | |
Ally Financial | | | 2,333 | | | | 38,238 | |
American Express | | | 216 | | | | 19,710 | |
American International Group | | | 3,025 | | | | 76,926 | |
Annaly Capital Management ‡ | | | 11,320 | | | | 70,750 | |
Aon | | | 401 | | | | 69,241 | |
Arch Capital Group * | | | 3,598 | | | | 86,460 | |
Arthur J Gallagher | | | 981 | | | | 77,008 | |
Bank of America | | | 5,035 | | | | 121,092 | |
Bank of New York Mellon | | | 689 | | | | 25,865 | |
Berkshire Hathaway, Cl B * | | | 300 | | | | 56,208 | |
Capital One Financial | | | 327 | | | | 21,177 | |
Chubb | | | 847 | | | | 91,484 | |
Cincinnati Financial | | | 1,120 | | | | 73,696 | |
Citigroup | | | 817 | | | | 39,673 | |
Citizens Financial Group | | | 1,257 | | | | 28,144 | |
| | | | | | | |
| COMMON STOCK — continued | | | | | | | | |
| Financials — continued | | | | | | | | |
CME Group, Cl A | | | 507 | | | $ | 90,353 | |
Comerica | | | 547 | | | | 19,068 | |
Everest Re Group | | | 381 | | | | 65,963 | |
FactSet Research Systems | | | 242 | | | | 66,550 | |
Fidelity National Financial | | | 2,000 | | | | 54,100 | |
Fifth Third Bancorp | | | 3,914 | | | | 73,153 | |
Franklin Resources | | | 1,093 | | | | 20,592 | |
Globe Life | | | 705 | | | | 58,050 | |
Goldman Sachs Group | | | 118 | | | | 21,644 | |
| Hartford Financial Services Group | | | 3,075 | | | | 116,819 | |
Intercontinental Exchange | | | 1,429 | | | | 127,824 | |
JPMorgan Chase | | | 713 | | | | 68,277 | |
KeyCorp | | | 834 | | | | 9,716 | |
Lincoln National | | | 553 | | | | 19,615 | |
Loews | | | 1,429 | | | | 49,529 | |
M&T Bank | | | 394 | | | | 44,160 | |
Markel * | | | 60 | | | | 51,950 | |
MarketAxess Holdings | | | 141 | | | | 64,156 | |
Marsh & McLennan | | | 784 | | | | 76,307 | |
MetLife | | | 618 | | | | 22,297 | |
Morgan Stanley | | | 805 | | | | 31,741 | |
MSCI, Cl A | | | 459 | | | | 150,093 | |
Nasdaq | | | 534 | | | | 58,564 | |
PNC Financial Services Group | | | 697 | | | | 74,349 | |
Principal Financial Group | | | 320 | | | | 11,651 | |
Prudential Financial | | | 315 | | | | 19,647 | |
Raymond James Financial | | | 336 | | | | 22,149 | |
Regions Financial | | | 8,173 | | | | 87,860 | |
S&P Global | | | 364 | | | | 106,608 | |
State Street | | | 789 | | | | 49,739 | |
Synchrony Financial | | | 1,494 | | | | 29,566 | |
T Rowe Price Group | | | 224 | | | | 25,901 | |
| | | | | | | |
| COMMON STOCK — continued | | | | | | | | |
| Financials — continued | | | | | | | | |
Travelers | | | 435 | | | $ | 44,026 | |
Truist Financial | | | 1,019 | | | | 38,029 | |
Unum Group | | | 1,699 | | | | 29,648 | |
US Bancorp | | | 1,167 | | | | 42,595 | |
Wells Fargo | | | 1,745 | | | | 50,692 | |
Willis Towers Watson | | | 523 | | | | 93,246 | |
Zions Bancorp | | | 965 | | | | 30,504 | |
| | | | | | | | 3,256,905 | |
| Health Care — 9.4% | | | | | | | | |
Abbott Laboratories | | | 1,192 | | | | 109,771 | |
Agilent Technologies | | | 1,109 | | | | 85,016 | |
Alexion Pharmaceuticals * | | | 204 | | | | 21,924 | |
Allergan | | | 245 | | | | 45,898 | |
Anthem | | | 283 | | | | 79,447 | |
Baxter International | | | 1,279 | | | | 113,550 | |
Boston Scientific * | | | 1,576 | | | | 59,068 | |
Bristol-Myers Squibb | | | 746 | | | | 45,364 | |
Centene * | | | 659 | | | | 43,876 | |
Cerner | | | 437 | | | | 30,324 | |
Cooper | | | 342 | | | | 98,051 | |
Danaher | | | 731 | | | | 119,489 | |
DENTSPLY SIRONA | | | 2,017 | | | | 85,601 | |
Edwards Lifesciences * | | | 312 | | | | 67,860 | |
Elanco Animal Health * | | | 1,456 | | | | 35,978 | |
Eli Lilly | | | 237 | | | | 36,650 | |
Gilead Sciences | | | 665 | | | | 55,860 | |
Henry Schein * | | | 541 | | | | 29,517 | |
Hologic * | | | 1,899 | | | | 95,140 | |
Humana | | | 132 | | | | 50,400 | |
IDEXX Laboratories * | | | 395 | | | | 109,652 | |
IQVIA Holdings * | | | 724 | | | | 103,235 | |
Johnson & Johnson | | | 205 | | | | 30,758 | |
| | | | | | | |
| COMMON STOCK — continued | | | | | | | | |
| Health Care — continued | | | | | | | | |
Laboratory Corp of America Holdings * | | | 739 | | | $ | 121,529 | |
Medtronic | | | 636 | | | | 62,093 | |
Merck | | | 959 | | | | 76,087 | |
Mettler-Toledo International * | | | 114 | | | | 82,073 | |
Mylan * | | | 814 | | | | 13,651 | |
Perrigo | | | 1,272 | | | | 67,798 | |
Pfizer | | | 1,417 | | | | 54,356 | |
Quest Diagnostics | | | 767 | | | | 84,454 | |
ResMed | | | 589 | | | | 91,483 | |
STERIS | | | 667 | | | | 95,048 | |
Stryker | | | 337 | | | | 62,827 | |
Thermo Fisher Scientific | | | 344 | | | | 115,130 | |
UnitedHealth Group | | | 129 | | | | 37,729 | |
| Universal Health Services, Cl B | | | 666 | | | | 70,389 | |
Varian Medical Systems * | | | 173 | | | | 19,788 | |
Veeva Systems, Cl A * | | | 320 | | | | 61,056 | |
Waters * | | | 71 | | | | 13,277 | |
Zimmer Biomet Holdings | | | 468 | | | | 56,020 | |
Zoetis, Cl A | | | 603 | | | | 77,974 | |
| | | | | | | | 2,815,191 | |
| Industrials — 10.3% | | | | | | | | |
3M
| | | 145 | | | | 22,028 | |
AMETEK | | | 555 | | | | 46,548 | |
CH Robinson Worldwide | | | 399 | | | | 28,289 | |
Cintas | | | 373 | | | | 82,743 | |
Copart * | | | 558 | | | | 44,701 | |
CoStar Group * | | | 322 | | | | 208,740 | |
Cummins | | | 665 | | | | 108,728 | |
Delta Air Lines | | | 1,359 | | | | 35,211 | |
Dover | | | 919 | | | | 86,064 | |
Eaton | | | 1,210 | | | | 101,035 | |
Emerson Electric | | | 716 | | | | 40,834 | |
| | | | | | | |
| COMMON STOCK — continued | | | | | | | | |
| Industrials — continued | | | | | | | | |
| Expeditors International of Washington | | | 703 | | | $ | 50,338 | |
Fastenal | | | 2,382 | | | | 86,276 | |
FedEx | | | 219 | | | | 27,763 | |
Fortive | | | 407 | | | | 26,048 | |
| Fortune Brands Home & Security | | | 735 | | | | 35,427 | |
Honeywell International | | | 506 | | | | 71,802 | |
Howmet Aerospace | | | 4,057 | | | | 53,025 | |
Huntington Ingalls Industries | | | 205 | | | | 39,239 | |
IDEX | | | 375 | | | | 57,611 | |
IHS Markit | | | 2,036 | | | | 137,023 | |
Illinois Tool Works | | | 522 | | | | 84,825 | |
Jacobs Engineering Group | | | 1,381 | | | | 114,278 | |
JB Hunt Transport Services | | | 502 | | | | 50,762 | |
Johnson Controls International | | | 1,719 | | | | 50,040 | |
Kansas City Southern | | | 1,069 | | | | 139,558 | |
L3Harris Technologies | | | 785 | | | | 152,055 | |
Masco | | | 1,264 | | | | 51,875 | |
Nielsen Holdings | | | 1,024 | | | | 15,083 | |
Norfolk Southern | | | 536 | | | | 91,710 | |
Raytheon Technologies | | | 1,140 | | | | 73,883 | |
Republic Services, Cl A | | | 1,351 | | | | 105,837 | |
Rockwell Automation | | | 94 | | | | 17,811 | |
Roper Technologies | | | 312 | | | | 106,401 | |
Snap-On | | | 476 | | | | 62,018 | |
Southwest Airlines | | | 799 | | | | 24,969 | |
Stanley Black & Decker | | | 471 | | | | 51,904 | |
Textron | | | 1,159 | | | | 30,551 | |
Trane Technologies | | | 1,091 | | | | 95,375 | |
Union Pacific | | | 507 | | | | 81,013 | |
Verisk Analytics, Cl A | | | 699 | | | | 106,828 | |
Waste Management | | | 680 | | | | 68,014 | |
WW Grainger | | | 150 | | | | 41,337 | |
| | | | | | | |
| COMMON STOCK — continued | | | | | | | | |
| Industrials — continued | | | | | | | | |
Xylem | | | 1,095 | | | $ | 78,731 | |
| | | | | | | | 3,084,331 | |
| Information Technology — 17.8% | | | | | | | | |
Accenture, Cl A | | | 417 | | | | 77,224 | |
Adobe * | | | 182 | | | | 64,363 | |
Advanced Micro Devices * | | | 1,523 | | | | 79,790 | |
Akamai Technologies * | | | 1,708 | | | | 166,889 | |
Amdocs | | | 1,145 | | | | 73,784 | |
Amphenol, Cl A | | | 517 | | | | 45,630 | |
Analog Devices | | | 956 | | | | 104,778 | |
ANSYS * | | | 581 | | | | 152,123 | |
Apple | | | 259 | | | | 76,094 | |
Applied Materials | | | 2,029 | | | | 100,801 | |
Broadcom | | | 618 | | | | 167,861 | |
Broadridge Financial Solutions | | | 809 | | | | 93,844 | |
Cadence Design Systems * | | | 1,941 | | | | 157,473 | |
CDW | | | 715 | | | | 79,222 | |
Cisco Systems | | | 1,041 | | | | 44,118 | |
Citrix Systems | | | 511 | | | | 74,100 | |
| Cognizant Technology Solutions, Cl A | | | 1,532 | | | | 88,887 | |
Corning | | | 2,398 | | | | 52,780 | |
DXC Technology | | | 1,584 | | | | 28,718 | |
F5 Networks * | | | 786 | | | | 109,458 | |
| Fidelity National Information Services | | | 617 | | | | 81,376 | |
Fiserv * | | | 1,189 | | | | 122,538 | |
Fortinet * | | | 274 | | | | 29,521 | |
Gartner * | | | 262 | | | | 31,128 | |
GoDaddy, Cl A * | | | 660 | | | | 45,824 | |
Hewlett Packard Enterprise | | | 3,436 | | | | 34,566 | |
Intel | | | 1,243 | | | | 74,555 | |
| International Business Machines | | | 512 | | | | 64,287 | |
Intuit | | | 303 | | | | 81,752 | |
| | | | | | | |
| COMMON STOCK — continued | | | | | | | | |
| Information Technology — continued | | | | | | | | |
Juniper Networks | | | 2,610 | | | $ | 56,376 | |
Keysight Technologies * | | | 1,010 | | | | 97,738 | |
KLA | | | 893 | | | | 146,532 | |
Lam Research | | | 344 | | | | 87,816 | |
Marvell Technology Group | | | 5,457 | | | | 145,920 | |
Mastercard, Cl A | | | 316 | | | | 86,890 | |
Maxim Integrated Products | | | 871 | | | | 47,888 | |
Microchip Technology | | | 1,281 | | | | 112,382 | |
Micron Technology * | | | 3,579 | | | | 171,398 | |
Microsoft | | | 509 | | | | 91,218 | |
Motorola Solutions | | | 712 | | | | 102,393 | |
NetApp | | | 326 | | | | 14,269 | |
NortonLifeLock | | | 5,945 | | | | 126,450 | |
Okta, Cl A * | | | 448 | | | | 67,782 | |
Paychex | | | 782 | | | | 53,583 | |
Paycom Software * | | | 230 | | | | 60,035 | |
Qorvo * | | | 1,404 | | | | 137,634 | |
QUALCOMM | | | 1,335 | | | | 105,025 | |
salesforce.com * | | | 221 | | | | 35,791 | |
Seagate Technology | | | 1,370 | | | | 68,432 | |
ServiceNow * | | | 349 | | | | 122,687 | |
Skyworks Solutions | | | 1,922 | | | | 199,657 | |
Splunk * | | | 618 | | | | 86,743 | |
SS&C Technologies Holdings | | | 339 | | | | 18,699 | |
Synopsys * | | | 987 | | | | 155,077 | |
TE Connectivity | | | 938 | | | | 68,906 | |
Texas Instruments | | | 609 | | | | 70,687 | |
Twilio, Cl A * | | | 459 | | | | 51,546 | |
VeriSign * | | | 597 | | | | 125,065 | |
Visa, Cl A | | | 464 | | | | 82,926 | |
Western Digital | | | 2,277 | | | | 104,924 | |
Western Union | | | 2,466 | | | | 47,027 | |
| | | | | | | | 5,352,980 | |
| | | | | | | |
| COMMON STOCK — continued | | | | | | | | |
| Materials — 3.5% | | | | | | | | |
Air Products & Chemicals | | | 414 | | | $ | 93,390 | |
Albemarle | | | 416 | | | | 25,555 | |
Ball | | | 1,135 | | | | 74,445 | |
Celanese, Cl A | | | 631 | | | | 52,417 | |
Corteva | | | 3,259 | | | | 85,353 | |
Dow | | | 686 | | | | 25,169 | |
DuPont de Nemours | | | 597 | | | | 28,071 | |
Eastman Chemical | | | 754 | | | | 45,625 | |
Ecolab | | | 436 | | | | 84,366 | |
| Freeport-McMoRan Copper & Gold | | | 4,541 | | | | 40,097 | |
| International Flavors & Fragrances | | | 362 | | | | 47,433 | |
International Paper | | | 1,098 | | | | 37,606 | |
Mosaic | | | 1,004 | | | | 11,556 | |
Newmont | | | 4,281 | | | | 254,634 | |
Nucor | | | 715 | | | | 29,451 | |
Packaging Corp of America | | | 144 | | | | 13,917 | |
PPG Industries | | | 715 | | | | 64,944 | |
Westrock | | | 1,110 | | | | 35,731 | |
| | | | | | | | 1,049,760 | |
| Real Estate — 5.0% | | | | | | | | |
Alexandria Real Estate Equities ‡ | | | 619 | | | | 97,239 | |
AvalonBay Communities ‡ | | | 353 | | | | 57,521 | |
CBRE Group, Cl A * | | | 1,416 | | | | 60,789 | |
Duke Realty ‡ | | | 2,816 | | | | 97,715 | |
Equity Residential ‡ | | | 1,099 | | | | 71,501 | |
Essex Property Trust ‡ | | | 533 | | | | 130,105 | |
Federal Realty Investment Trust ‡ | | | 168 | | | | 13,989 | |
Healthpeak Properties ‡ | | | 3,064 | | | | 80,093 | |
Host Hotels & Resorts ‡ | | | 2,794 | | | | 34,394 | |
Mid-America Apartment Communities ‡ | | | 630 | | | | 70,510 | |
ProLogis ‡ | | | 1,324 | | | | 118,141 | |
Public Storage ‡ | | | 649 | | | | 120,357 | |
| | | | | | | |
| COMMON STOCK — continued | | | | | | | | |
| Real Estate — continued | | | | | | | | |
Realty Income ‡ | | | 1,480 | | | $ | 81,282 | |
Regency Centers ‡ | | | 1,521 | | | | 66,787 | |
SL Green Realty ‡ | | | 651 | | | | 34,535 | |
Sun Communities ‡ | | | 635 | | | | 85,344 | |
UDR ‡ | | | 1,751 | | | | 65,610 | |
Vornado Realty Trust ‡ | | | 441 | | | | 19,325 | |
Welltower ‡ | | | 1,836 | | | | 94,058 | |
Weyerhaeuser ‡ | | | 906 | | | | 19,814 | |
WP Carey ‡ | | | 1,214 | | | | 79,857 | |
| | | | | | | | 1,498,966 | |
| Utilities — 14.5% | | | | | | | | |
Alliant Energy | �� | | 1,868 | | | | 90,691 | |
Ameren | | | 3,026 | | | | 220,142 | |
American Electric Power | | | 2,208 | | | | 183,507 | |
American Water Works | | | 870 | | | | 105,870 | |
Atmos Energy | | | 1,308 | | | | 133,377 | |
CenterPoint Energy | | | 3,003 | | | | 51,141 | |
CMS Energy | | | 3,441 | | | | 196,447 | |
Consolidated Edison | | | 2,444 | | | | 192,587 | |
Dominion Energy | | | 4,183 | | | | 322,635 | |
DTE Energy | | | 1,406 | | | | 145,858 | |
Duke Energy | | | 4,187 | | | | 354,471 | |
Edison International | | | 2,731 | | | | 160,337 | |
Entergy | | | 2,404 | | | | 229,606 | |
Evergy | | | 2,435 | | | | 142,277 | |
Eversource Energy | | | 1,324 | | | | 106,847 | |
Exelon | | | 2,091 | | | | 77,534 | |
FirstEnergy | | | 4,732 | | | | 195,290 | |
NextEra Energy | | | 775 | | | | 179,118 | |
NiSource | | | 4,250 | | | | 106,718 | |
Pinnacle West Capital | | | 1,276 | | | | 98,239 | |
PPL | | | 4,590 | | | | 116,678 | |
| | | | | | | |
| COMMON STOCK — continued | | | | | | | | |
| Utilities — continued | | | | | | | | |
| Public Service Enterprise Group | | | 2,419 | | | $ | 122,667 | |
Sempra Energy | | | 954 | | | | 118,153 | |
Southern | | | 5,275 | | | | 299,251 | |
WEC Energy Group | | | 2,647 | | | | 239,686 | |
Xcel Energy | | | 2,503 | | | | 159,091 | |
| | | | | | | | 4,348,218 | |
TOTAL UNITED STATES | | | | | | | 29,688,227 | |
| TOTAL COMMON STOCK | | | | | | | | |
(Cost $33,680,145) | | | | | | | 29,934,220 | |
| TOTAL INVESTMENTS — 99.6% | | | | | | | | |
(Cost $33,680,145) | | | | | | $ | 29,934,220 | |
Percentages are based on Net Assets of $30,064,743.
| ‡ | Real Estate Investment Trust |
| * | Non-income producing security. |
| Cl — Class |
| S&P — Standard & Poor’s |
As of April 30, 2020, all of the Fund’s investments were considered Level 1, in accordance with authoritative guidance on fair value measurements and disclosure under U.S. GAAP.
For the period ended April 30, 2020, there have been no transfers in or out of Level 3.
| | |
| Schedule of Investments |
| April 30, 2020 (Unaudited) |
| Global X Scientific Beta Europe ETF | |
Sector Weightings †:
† Sector weightings percentages are based on the total market value of investments.
| | | | | | | |
| COMMON STOCK — 98.8% | | | | | | |
| AUSTRALIA— 0.6% | | | | | | |
| Materials — 0.6% | | | | | | |
BHP Group | | | 597 | | | $ | 10,062 | |
Glencore | | | 1,024 | | | | 1,900 | |
Rio Tinto | | | 288 | | | | 13,385 | |
TOTAL AUSTRALIA | | | | | | | 25,347 | |
| AUSTRIA— 1.1% | | | | | | | | |
| Energy — 0.1% | | | | | | | | |
OMV | | | 158 | | | | 5,174 | |
| Financials — 0.2% | | | | | | | | |
Erste Group Bank | | | 307 | | | | 6,666 | |
Raiffeisen Bank International | | | 287 | | | | 4,945 | |
| | | | | | | | 11,611 | |
| Industrials — 0.1% | | | | | | | | |
ANDRITZ * | | | 165 | | | | 5,422 | |
| | | | | | | |
| COMMON STOCK — continued | | | | | | | | |
| Materials — 0.3% | | | | | | | | |
voestalpine | | | 169 | | | $ | 3,498 | |
Wienerberger | | | 413 | | | | 7,713 | |
| | | | | | | | 11,211 | |
| Real Estate — 0.4% | | | | | | | | |
IMMOFINANZ | | | 389 | | | | 7,192 | |
Verbund | | | 143 | | | | 6,478 | |
| | | | | | | | 13,670 | |
TOTAL AUSTRIA | | | | | | | 47,088 | |
| BELGIUM— 2.6% | | | | | | | | |
| Communication Services — 0.3% | | | | | | | | |
Proximus | | | 502 | | | | 10,705 | |
| Consumer Staples — 0.3% | | | | | | | | |
Colruyt | | | 211 | | | | 12,623 | |
| Financials — 0.9% | | | | | | | | |
Ackermans & van Haaren | | | 63 | | | | 8,343 | |
Ageas | | | 401 | | | | 14,428 | |
Groupe Bruxelles Lambert | | | 103 | | | | 8,222 | |
Sofina | | | 34 | | | | 8,007 | |
| | | | | | | | 39,000 | |
| Health Care — 0.5% | | | | | | | | |
UCB | | | 237 | | | | 21,686 | |
| Materials — 0.2% | | | | | | | | |
Solvay | | | 110 | | | | 8,583 | |
| Real Estate — 0.4% | | | | | | | | |
Cofinimmo ‡ | | | 82 | | | | 11,406 | |
Warehouses De Pauw CVA ‡ | | | 182 | | | | 4,984 | |
| | | | | | | | 16,390 | |
TOTAL BELGIUM | | | | | | | 108,987 | |
| | | | | | | |
| COMMON STOCK — continued | | | | | | | | |
| CHILE— 0.2% | | | | | | | | |
| Materials — 0.2% | | | | | | | | |
Antofagasta | | | 828 | | | $ | 8,491 | |
| DENMARK— 3.8% | | | | | | | | |
| Consumer Staples — 0.5% | | | | | | | | |
Carlsberg, Cl B | | | 76 | | | | 9,581 | |
Royal Unibrew | | | 158 | | | | 12,226 | |
| | | | | | | | 21,807 | |
| Financials — 0.5% | | | | | | | | |
Danske Bank | | | 594 | | | | 7,047 | |
Jyske Bank | | | 276 | | | | 7,457 | |
Tryg | | | 130 | | | | 3,442 | |
| | | | | | | | 17,946 | |
| Health Care — 1.6% | | | | | | | | |
Coloplast, Cl B | | | 208 | | | | 32,893 | |
Demant * | | | 121 | | | | 2,891 | |
Genmab * | | | 35 | | | | 8,415 | |
GN Store Nord | | | 198 | | | | 9,050 | |
H Lundbeck | | | 114 | | | | 4,153 | |
Novo Nordisk, Cl B | | | 191 | | | | 12,179 | |
| | | | | | | | 69,581 | |
| Industrials — 0.4% | | | | | | | | |
A P Moller - Maersk, Cl B | | | 6 | | | | 5,964 | |
DSV PANALPINA | | | 91 | | | | 9,388 | |
ISS | | | 325 | | | | 4,848 | |
| | | | | | | | 20,200 | |
| Information Technology — 0.2% | | | | | | | | |
SimCorp | | | 70 | | | | 6,475 | |
| Materials — 0.3% | | | | | | | | |
Christian Hansen Holding | | | 58 | | | | 4,997 | |
Novozymes, Cl B | | | 119 | | | | 5,829 | |
| | | | | | | | 10,826 | |
| | | | | | | |
| COMMON STOCK — continued | | | | | | | | |
| Utilities — 0.3% | | | | | | | | |
Orsted | | | 126 | | | $ | 12,736 | |
TOTAL DENMARK | | | | | | | 159,571 | |
| FINLAND— 4.2% | | | | | | | | |
| Communication Services — 0.7% | | | | | | | | |
Elisa | | | 436 | | | | 26,476 | |
| Consumer Discretionary — 0.3% | | | | | | | | |
Nokian Renkaat | | | 490 | | | | 10,484 | |
| Consumer Staples — 0.5% | | | | | | | | |
Kesko, Cl B | | | 1,324 | | | | 21,535 | |
| Energy — 0.3% | | | | | | | | |
Neste | | | 314 | | | | 11,119 | |
| Financials — 0.2% | | | | | | | | |
Nordea Bank Abp * | | | 852 | | | | 5,456 | |
Sampo, Cl A * | | | 131 | | | | 4,339 | |
| | | | | | | | 9,795 | |
| Health Care — 0.4% | | | | | | | | |
Orion, Cl B | | | 309 | | | | 15,697 | |
| Industrials — 0.5% | | | | | | | | |
Kone, Cl B | | | 156 | | | | 9,453 | |
Konecranes, Cl A * | | | 127 | | | | 2,760 | |
Metso | | | 151 | | | | 4,189 | |
Valmet | | | 240 | | | | 5,494 | |
| | | | | | | | 21,896 | |
| Information Technology — 0.5% | | | | | | | | |
Nokia | | | 4,881 | | | | 17,771 | |
TietoEVRY | | | 244 | | | | 5,944 | |
| | | | | | | | 23,715 | |
| Materials — 0.4% | | | | | | | | |
Huhtamaki | | | 100 | | | | 3,737 | |
Stora Enso, Cl R | | | 459 | | | | 5,430 | |
| | | | | | | |
| COMMON STOCK — continued | | | | | | | | |
| Materials — continued | | | | | | | | |
UPM-Kymmene | | | 296 | | | $ | 8,189 | |
| | | | | | | | 17,356 | |
| Utilities — 0.4% | | | | | | | | |
Fortum | | | 1,071 | | | | 17,772 | |
TOTAL FINLAND | | | | | | | 175,845 | |
| FRANCE— 15.4% | | | | | | | | |
| Communication Services — 1.6% | | | | | | | | |
Bollore | | | 2,380 | | | | 6,314 | |
Eutelsat Communications | | | 633 | | | | 7,100 | |
Iliad | | | 42 | | | | 6,256 | |
JCDecaux | | | 97 | | | | 2,010 | |
Lagardere SCA | | | 481 | | | | 7,797 | |
Orange | | | 627 | | | | 7,647 | |
Publicis Groupe | | | 199 | | | | 5,913 | |
Ubisoft Entertainment * | | | 79 | | | | 5,877 | |
Vivendi | | | 813 | | | | 17,547 | |
| | | | | | | | 66,461 | |
| Consumer Discretionary — 2.6% | | | | | | | | |
Accor | | | 142 | | | | 3,938 | |
Christian Dior | | | 17 | | | | 6,618 | |
| Cie Generale des Etablissements Michelin SCA, Cl B | | | 257 | | | | 25,081 | |
Elior Group | | | 470 | | | | 3,107 | |
EssilorLuxottica | | | 206 | | | | 25,416 | |
Hermes International | | | 19 | | | | 13,897 | |
Kering | | | 10 | | | | 5,041 | |
| LVMH Moet Hennessy Louis Vuitton | | | 20 | | | | 7,721 | |
Peugeot | | | 699 | | | | 10,010 | |
Renault | | | 102 | | | | 2,023 | |
Valeo | | | 136 | | | | 3,154 | |
| | | | | | | | 106,006 | |
| | | | | | | |
| COMMON STOCK — continued | | | | | | | | |
| Consumer Staples — 1.6% | | | | | | | | |
Carrefour | | | 421 | | | $ | 6,223 | |
Casino Guichard Perrachon | | | 224 | | | | 8,398 | |
Danone | | | 127 | | | | 8,800 | |
L’Oreal | | | 35 | | | | 10,170 | |
Pernod Ricard | | | 170 | | | | 25,901 | |
Remy Cointreau | | | 58 | | | | 6,467 | |
| | | | | | | | 65,959 | |
| Energy — 0.1% | | | | | | | | |
Total | | | 167 | | | | 6,009 | |
| Financials — 1.3% | | | | | | | | |
Amundi | | | 73 | | | | 4,845 | |
AXA | | | 945 | | | | 16,764 | |
BNP Paribas | | | 90 | | | | 2,826 | |
CNP Assurances | | | 452 | | | | 4,666 | |
Credit Agricole | | | 1,389 | | | | 11,079 | |
Eurazeo | | | 120 | | | | 5,739 | |
Natixis | | | 1,012 | | | | 2,395 | |
SCOR | | | 193 | | | | 5,433 | |
Societe Generale | | | 164 | | | | 2,562 | |
Wendel | | | 17 | | | | 1,452 | |
| | | | | | | | 57,761 | |
| Health Care — 0.7% | | | | | | | | |
BioMerieux | | | 65 | | | | 8,066 | |
Ipsen | | | 21 | | | | 1,558 | |
Sanofi | | | 146 | | | | 14,263 | |
Sartorius Stedim Biotech * | | | 21 | | | | 5,037 | |
| | | | | | | | 28,924 | |
| Industrials — 3.4% | | | | | | | | |
Aeroports de Paris | | | 18 | | | | 1,763 | |
Air France-KLM * | | | 899 | | | | 4,576 | |
Alstom | | | 756 | | | | 30,936 | |
Bouygues | | | 273 | | | | 8,405 | |
| | | | | | | |
| COMMON STOCK — continued | | | | | | | | |
| Industrials — continued | | | | | | | | |
Bureau Veritas | | | 183 | | | $ | 3,796 | |
Cie de Saint-Gobain | | | 235 | | | | 6,232 | |
Dassault Aviation | | | 3 | | | | 2,448 | |
Eiffage | | | 96 | | | | 7,855 | |
Elis | | | 118 | | | | 1,460 | |
Getlink | | | 453 | | | | 5,770 | |
Legrand | | | 127 | | | | 8,558 | |
Rexel | | | 424 | | | | 3,971 | |
Safran | | | 88 | | | | 8,118 | |
Schneider Electric | | | 148 | | | | 13,529 | |
Societe BIC | | | 113 | | | | 5,654 | |
Teleperformance | | | 100 | | | | 22,399 | |
Vinci | | | 43 | | | | 3,518 | |
| | | | | | | | 138,988 | |
| Information Technology — 1.2% | | | | | | | | |
Alten | | | 79 | | | | 5,685 | |
Capgemini | | | 85 | | | | 7,982 | |
Dassault Systemes | | | 107 | | | | 15,652 | |
Ingenico Group | | | 122 | | | | 15,327 | |
Sopra Steria Group | | | 61 | | | | 7,223 | |
| | | | | | | | 51,869 | |
| Materials — 0.4% | | | | | | | | |
Air Liquide | | | 78 | | | | 9,919 | |
Arkema | | | 96 | | | | 7,960 | |
| | | | | | | | 17,879 | |
| Real Estate — 1.1% | | | | | | | | |
Covivio ‡ | | | 144 | | | | 9,014 | |
Gecina ‡ | | | 107 | | | | 13,958 | |
ICADE ‡ | | | 97 | | | | 7,453 | |
Klepierre ‡ | | | 399 | | | | 8,065 | |
Nexity | | | 92 | | | | 2,822 | |
| | | | | | | |
| COMMON STOCK — continued | | | | | | | | |
| Real Estate — continued | | | | | | | | |
Unibail-Rodamco-Westfield ‡ | | | 41 | | | $ | 2,412 | |
| | | | | | | | 43,724 | |
| Utilities — 1.4% | | | | | | | | |
Electricite de France | | | 561 | | | | 4,470 | |
Engie | | | 852 | | | | 9,242 | |
Rubis SCA | | | 339 | | | | 15,209 | |
Suez | | | 1,271 | | | | 14,360 | |
Veolia Environnement | | | 581 | | | | 12,400 | |
| | | | | | | | 55,681 | |
TOTAL FRANCE | | | | | | | 639,261 | |
| GERMANY— 10.7% | | | | | | | | |
| Communication Services — 1.2% | | | | | | | | |
Deutsche Telekom | | | 681 | | | | 9,939 | |
Freenet | | | 145 | | | | 2,748 | |
Scout24 | | | 357 | | | | 23,344 | |
| Telefonica Deutschland Holding | | | 3,119 | | | | 8,865 | |
United Internet | | | 73 | | | | 2,515 | |
| | | | | | | | 47,411 | |
| Consumer Discretionary — 1.3% | | | | | | | | |
adidas | | | 25 | | | | 5,728 | |
Bayerische Motoren Werke | | | 188 | | | | 11,130 | |
Continental * | | | 52 | | | | 4,397 | |
Daimler | | | 256 | | | | 8,842 | |
Fielmann | | | 114 | | | | 7,461 | |
HUGO BOSS | | | 63 | | | | 1,751 | |
Puma | | | 145 | | | | 9,114 | |
Zalando * | | | 110 | | | | 5,360 | |
| | | | | | | | 53,783 | |
| Consumer Staples — 0.4% | | | | | | | | |
Beiersdorf | | | 102 | | | | 10,678 | |
| | | | | | | |
| COMMON STOCK — continued | | | | | | | | |
| Consumer Staples — continued | | | | | | | | |
METRO | | | 437 | | | $ | 3,795 | |
| | | | | | | | 14,473 | |
| Financials — 0.9% | | | | | | | | |
Aareal Bank | | | 141 | | | | 2,304 | |
Allianz | | | 40 | | | | 7,399 | |
Commerzbank | | | 513 | | | | 1,896 | |
Hannover Rueck | | | 98 | | | | 15,618 | |
| Muenchener Rueckversicherungs-Gesellschaft in Muenchen | | | 42 | | | | 9,237 | |
| | | | | | | | 36,454 | |
| Health Care — 1.6% | | | | | | | | |
Bayer | | | 65 | | | | 4,282 | |
Carl Zeiss Meditec * | | | 66 | | | | 6,502 | |
Evotec * | | | 97 | | | | 2,398 | |
| Fresenius Medical Care & KGaA | | | 307 | | | | 24,096 | |
Gerresheimer | | | 80 | | | | 6,383 | |
Merck KGaA | | | 148 | | | | 17,199 | |
Siemens Healthineers | | | 118 | | | | 5,196 | |
| | | | | | | | 66,056 | |
| Industrials — 1.6% | | | | | | | | |
Brenntag | | | 213 | | | | 9,610 | |
Deutsche Lufthansa | | | 568 | | | | 5,075 | |
Deutsche Post | | | 174 | | | | 5,174 | |
| Fraport Frankfurt Airport Services Worldwide | | | 63 | | | | 2,763 | |
GEA Group | | | 410 | | | | 9,422 | |
HOCHTIEF | | | 47 | | | | 3,694 | |
Knorr-Bremse | | | 68 | | | | 6,320 | |
OSRAM Licht | | | 264 | | | | 10,959 | |
Rheinmetall | | | 82 | | | | 5,552 | |
Siemens | | | 78 | | | | 7,235 | |
| | | | | | | | 65,804 | |
| | | | | | | |
| COMMON STOCK — continued | | | | | | | | |
| Information Technology — 1.1% | | | | | | | | |
Bechtle | | | 120 | | | $ | 17,376 | |
Infineon Technologies | | | 205 | | | | 3,806 | |
Nemetschek | | | 88 | | | | 5,542 | |
SAP | | | 73 | | | | 8,711 | |
Siltronic | | | 48 | | | | 4,121 | |
Software | | | 177 | | | | 6,281 | |
| | | | | | | | 45,837 | |
| Materials — 1.2% | | | | | | | | |
Aurubis | | | 116 | | | | 6,066 | |
BASF | | | 130 | | | | 6,647 | |
Covestro | | | 126 | | | | 4,234 | |
Evonik Industries | | | 446 | | | | 10,973 | |
HeidelbergCement | | | 157 | | | | 7,460 | |
LANXESS | | | 147 | | | | 7,239 | |
Symrise, Cl A | | | 97 | | | | 9,808 | |
| | | | | | | | 52,427 | |
| Real Estate — 1.1% | | | | | | | | |
Aroundtown | | | 1,058 | | | | 5,690 | |
Deutsche EuroShop | | | 228 | | | | 3,286 | |
Deutsche Wohnen | | | 228 | | | | 9,240 | |
LEG Immobilien | | | 47 | | | | 5,397 | |
TAG Immobilien | | | 421 | | | | 9,199 | |
Vonovia | | | 305 | | | | 15,050 | |
| | | | | | | | 47,862 | |
| Utilities — 0.3% | | | | | | | | |
Uniper | | | 478 | | | | 12,827 | |
TOTAL GERMANY | | | | | | | 442,934 | |
| IRELAND— 2.3% | | | | | | | | |
| Consumer Discretionary — 0.4% | | | | | | | | |
Flutter Entertainment | | | 138 | | | | 16,884 | |
| | | | | | | |
| COMMON STOCK — continued | | | | | | | | |
| Consumer Staples — 0.8% | | | | | | | | |
Glanbia | | | 658 | | | $ | 6,976 | |
Kerry Group, Cl A | | | 239 | | | | 27,408 | |
| | | | | | | | 34,384 | |
| Financials — 0.1% | | | | | | | | |
AIB Group | | | 908 | | | | 1,243 | |
Bank of Ireland Group | | | 1,318 | | | | 2,661 | |
| | | | | | | | 3,904 | |
| Health Care — 0.1% | | | | | | | | |
UDG Healthcare | | | 586 | | | | 4,642 | |
| Industrials — 0.2% | | | | | | | | |
Kingspan Group | | | 139 | | | | 7,079 | |
| Materials — 0.7% | | | | | | | | |
CRH | | | 501 | | | | 15,118 | |
Smurfit Kappa Group | | | 366 | | | | 11,473 | |
| | | | | | | | 26,591 | |
TOTAL IRELAND | | | | | | | 93,484 | |
| ITALY— 5.4% | | | | | | | | |
| Communication Services — 0.1% | | | | | | | | |
Telecom Italia * | | | 11,219 | | | | 4,443 | |
| Consumer Discretionary — 0.1% | | | | | | | | |
Moncler | | | 53 | | | | 1,991 | |
Pirelli & C | | | 583 | | | | 2,269 | |
| | | | | | | | 4,260 | |
| Consumer Staples — 0.3% | | | | | | | | |
Davide Campari-Milano | | | 1,470 | | | | 11,383 | |
| Energy — 0.2% | | | | | | | | |
Eni | | | 577 | | | | 5,507 | |
Saipem * | | | 1,867 | | | | 4,787 | |
| | | | | | | | 10,294 | |
| | | | | | | |
| COMMON STOCK — continued | | | | | | | | |
| Financials — 1.2% | | | | | | | | |
BPER Banca | | | 1,088 | | | $ | 2,684 | |
Intesa Sanpaolo | | | 3,095 | | | | 4,824 | |
| Mediobanca Banca di Credito Finanziario | | | 1,565 | | | | 9,065 | |
Poste Italiane | | | 2,085 | | | | 17,703 | |
UniCredit | | | 1,115 | | | | 8,584 | |
| Unione di Banche Italiane SCpA | | | 2,147 | | | | 6,135 | |
| | | | | | | | 48,995 | |
| Health Care — 0.4% | | | | | | | | |
DiaSorin | | | 41 | | | | 6,974 | |
Recordati | | | 158 | | | | 6,865 | |
| | | | | | | | 13,839 | |
| Industrials — 0.5% | | | | | | | | |
Leonardo | | | 1,289 | | | | 8,886 | |
Prysmian | | | 627 | | | | 11,792 | |
| | | | | | | | 20,678 | |
| Information Technology — 0.2% | | | | | | | | |
Assicurazioni Generali | | | 629 | | | | 8,967 | |
| Utilities — 2.4% | | | | | | | | |
| A2A | | | 7,633 | | | | 10,388 | |
Enel | | | 4,244 | | | | 28,989 | |
Hera | | | 3,731 | | | | 13,804 | |
Italgas | | | 536 | | | | 2,997 | |
Snam | | | 5,531 | | | | 24,766 | |
Terna Rete Elettrica Nazionale | | | 2,905 | | | | 18,200 | |
| | | | | | | | 99,144 | |
TOTAL ITALY | | | | | | | 222,003 | |
| JORDAN— 0.2% | | | | | | | | |
| Health Care — 0.2% | | | | | | | | |
Hikma Pharmaceuticals | | | 306 | | | | 9,148 | |
| | | | | | | |
| COMMON STOCK — continued | | | | | | | | |
| LUXEMBOURG— 0.1% | | | | | | | | |
| Energy — 0.1% | | | | | | | | |
Tenaris | | | 458 | | | $ | 3,207 | |
| Materials — 0.0% | | | | | | | | |
ArcelorMittal | | | 186 | | | | 2,038 | |
TOTAL LUXEMBOURG | | | | | | | 5,245 | |
| NETHERLANDS— 6.4% | | | | | | | | |
| Communication Services — 0.2% | | | | | | | | |
Koninklijke KPN | | | 4,471 | | | | 10,343 | |
| Consumer Discretionary — 0.2% | | | | | | | | |
Just Eat Takeaway.com * | | | 83 | | | | 8,456 | |
| Consumer Staples — 1.0% | | | | | | | | |
Heineken | | | 88 | | | | 7,482 | |
Koninklijke Ahold Delhaize | | | 1,300 | | | | 31,553 | |
| | | | | | | | 39,035 | |
| Energy — 0.6% | | | | | | | | |
Koninklijke Vopak | | | 189 | | | | 10,893 | |
Royal Dutch Shell, Cl A | | | 316 | | | | 5,281 | |
SBM Offshore | | | 762 | | | | 9,644 | |
| | | | | | | | 25,818 | |
| Financials — 0.9% | | | | | | | | |
ABN AMRO Bank | | | 248 | | | | 1,901 | |
ASR Nederland | | | 180 | | | | 4,840 | |
Euronext | | | 92 | | | | 7,719 | |
EXOR | | | 142 | | | | 7,760 | |
ING Groep | | | 338 | | | | 1,854 | |
NN Group | | | 370 | | | | 10,703 | |
| | | | | | | | 34,777 | |
| Health Care — 0.4% | | | | | | | | |
Aegon | | | 886 | | | | 2,281 | |
Koninklijke Philips | | | 312 | | | | 13,572 | |
| | | | | | | | 15,853 | |
| | | | | | | |
| COMMON STOCK — continued | | | | | | | | |
| Industrials — 1.0% | | | | | | | | |
Aalberts * | | | 233 | | | $ | 6,559 | |
Boskalis Westminster | | | 190 | | | | 3,299 | |
IMCD | | | 112 | | | | 9,902 | |
Randstad | | | 70 | | | | 2,808 | |
Signify | | | 438 | | | | 8,930 | |
Wolters Kluwer | | | 150 | | | | 11,028 | |
| | | | | | | | 42,526 | |
| Information Technology — 0.9% | | | | | | | | |
ASML Holding | | | 35 | | | | 10,376 | |
BE Semiconductor Industries | | | 297 | | | | 12,218 | |
NXP Semiconductors | | | 167 | | | | 16,628 | |
| | | | | | | | 39,222 | |
| Materials — 1.2% | | | | | | | | |
Akzo Nobel | | | 211 | | | | 15,993 | |
ASM International | | | 173 | | | | 19,034 | |
Koninklijke DSM | | | 110 | | | | 13,464 | |
| | | | | | | | 48,491 | |
TOTAL NETHERLANDS | | | | | | | 264,521 | |
| NORWAY— 1.9% | | | | | | | | |
| Communication Services — 0.1% | | | | | | | | |
Telenor | | | 319 | | | | 4,909 | |
| Consumer Staples — 0.9% | | | | | | | | |
Mowi | | | 815 | | | | 13,996 | |
Orkla | | | 2,496 | | | | 22,651 | |
| | | | | | | | 36,647 | |
| Energy — 0.2% | | | | | | | | |
Equinor | | | 672 | | | | 9,433 | |
TGS Nopec Geophysical | | | 81 | | | | 1,248 | |
| | | | | | | | 10,681 | |
| Financials — 0.4% | | | | | | | | |
DnB | | | 571 | | | | 6,939 | |
| | | | | | | |
| COMMON STOCK — continued | | | | | | | | |
| Financials — continued | | | | | | | | |
Gjensidige Forsikring | | | 273 | | | $ | 4,835 | |
Storebrand | | | 786 | | | | 3,953 | |
| | | | | | | | 15,727 | |
| Materials — 0.3% | | | | | | | | |
Norsk Hydro | | | 2,556 | | | | 6,545 | |
Yara International | | | 85 | | | | 2,905 | |
| | | | | | | | 9,450 | |
TOTAL NORWAY | | | | | | | 77,414 | |
| PORTUGAL— 1.0% | | | | | | | | |
| Consumer Staples — 0.2% | | | | | | | | |
Jeronimo Martins | | | 491 | | | | 8,290 | |
| Energy — 0.3% | | | | | | | | |
Galp Energia | | | 1,084 | | | | 12,485 | |
| Utilities — 0.5% | | | | | | | | |
Energias de Portugal | | | 5,120 | | | | 21,590 | |
TOTAL PORTUGAL | | | | | | | 42,365 | |
| SOUTH AFRICA— 0.3% | | | | | | | | |
| Materials — 0.3% | | | | | | | | |
Anglo American | | | 682 | | | | 12,174 | |
| SPAIN— 3.6% | | | | | | | | |
| Communication Services — 0.1% | | | | | | | | |
Telefonica | | | 1,125 | | | | 5,151 | |
| Consumer Discretionary — 0.2% | | | | | | | | |
Industria de Diseno Textil | | | 407 | | | | 10,365 | |
| Consumer Staples — 0.2% | | | | | | | | |
Viscofan | | | 108 | | | | 6,914 | |
| Energy — 0.2% | | | | | | | | |
Repsol | | | 693 | | | | 6,311 | |
| | | | | | | |
| COMMON STOCK — continued | | | | | | | | |
| Financials — 0.3% | | | | | | | | |
| Banco Bilbao Vizcaya Argentaria | | | 768 | | | $ | 2,512 | |
Banco Santander | | | 920 | | | | 2,053 | |
Bankinter | | | 568 | | | | 2,342 | |
Mapfre | | | 3,273 | | | | 5,990 | |
| | | | | | | | 12,897 | |
| Industrials — 0.4% | | | | | | | | |
| ACS Actividades de Construccion y Servicios | | | 89 | | | | 2,220 | |
Aena SME | | | 49 | | | | 6,199 | |
Ferrovial | | | 349 | | | | 8,715 | |
| | | | | | | | 17,134 | |
| Information Technology — 0.1% | | | | | | | | |
Amadeus IT Group, Cl A | | | 87 | | | | 4,185 | |
| Materials — 0.1% | | | | | | | | |
Acerinox | | | 572 | | | | 4,339 | |
| Real Estate — 0.4% | | | | | | | | |
Inmobiliaria Colonial Socimi ‡ | | | 468 | | | | 4,511 | |
Merlin Properties Socimi ‡ | | | 1,292 | | | | 11,972 | |
| | | | | | | | 16,483 | |
| Utilities — 1.6% | | | | | | | | |
Acciona | | | 105 | | | | 10,397 | |
Enagas | | | 406 | | | | 9,468 | |
Endesa | | | 775 | | | | 17,190 | |
Iberdrola | | | 1,526 | | | | 15,277 | |
Naturgy Energy Group | | | 663 | | | | 11,698 | |
| | | | | | | | 64,030 | |
TOTAL SPAIN | | | | | | | 147,809 | |
| SWEDEN— 7.8% | | | | | | | | |
| Communication Services — 0.4% | | | | | | | | |
Tele2, Cl B | | | 347 | | | | 4,498 | |
Telia | | | 3,302 | | | | 11,410 | |
| | | | | | | | 15,908 | |
| | | | | | | |
| COMMON STOCK — continued | | | | | | | | |
| Consumer Discretionary — 0.5% | | | | | | | | |
Dometic Group | | | 1,262 | | | $ | 8,494 | |
Hennes & Mauritz, Cl B | | | 505 | | | | 7,042 | |
Husqvarna, Cl B | | | 589 | | | | 3,568 | |
| | | | | | | | 19,104 | |
| Consumer Staples — 1.2% | | | | | | | | |
AAK | | | 355 | | | | 5,832 | |
Essity, Cl B | | | 566 | | | | 18,399 | |
ICA Gruppen * | | | 463 | | | | 20,203 | |
Swedish Match | | | 148 | | | | 9,177 | |
| | | | | | | | 53,611 | |
| Energy — 0.1% | | | | | | | | |
Lundin Energy | | | 166 | | | | 4,312 | |
| Financials — 1.5% | | | | | | | | |
Industrivarden, Cl C | | | 523 | | | | 10,827 | |
Investor, Cl B | | | 279 | | | | 14,030 | |
Kinnevik | | | 328 | | | | 6,784 | |
L E Lundbergforetagen, Cl B | | | 228 | | | | 9,622 | |
| Skandinaviska Enskilda Banken, Cl A | | | 1,784 | | | | 14,674 | |
| | | | | | | | 55,937 | |
| Health Care — 0.4% | | | | | | | | |
Getinge, Cl B | | | 660 | | | | 12,711 | |
Swedish Orphan Biovitrum * | | | 252 | | | | 4,902 | |
| | | | | | | | 17,613 | |
| Industrials — 1.7% | | | | | | | | |
Alfa Laval | | | 264 | | | | 4,960 | |
Assa Abloy, Cl B | | | 614 | | | | 11,067 | |
Atlas Copco, Cl A | | | 162 | | | | 5,628 | |
Epiroc, Cl A | | | 741 | | | | 7,444 | |
Nibe Industrier, Cl B | | | 422 | | | | 7,900 | |
Sandvik | | | 223 | | | | 3,454 | |
Securitas, Cl B | | | 518 | | | | 6,123 | |
| | | | | | | |
| COMMON STOCK — continued | | | | | | | | |
| Industrials — continued | | | | | | | | |
Skanska, Cl B | | | 217 | | | $ | 4,158 | |
SKF, Cl B | | | 388 | | | | 6,179 | |
Trelleborg, Cl B | | | 554 | | | | 7,135 | |
Volvo, Cl B | | | 471 | | | | 6,083 | |
| | | | | | | | 70,131 | |
| Information Technology — 0.6% | | | | | | | | |
Hexagon, Cl B | | | 359 | | | | 17,904 | |
| Telefonaktiebolaget LM Ericsson, Cl B | | | 875 | | | | 7,624 | |
| | | | | | | | 25,528 | |
| Materials — 0.7% | | | | | | | | |
BillerudKorsnas | | | 671 | | | | 8,488 | |
Boliden | | | 451 | | | | 9,249 | |
Svenska Cellulosa, Cl B | | | 1,198 | | | | 12,909 | |
| | | | | | | | 30,646 | |
| Real Estate — 0.7% | | | | | | | | |
Castellum | | | 548 | | | | 9,619 | |
Fabege | | | 839 | | | | 10,046 | |
Fastighets Balder, Cl B * | | | 228 | | | | 9,011 | |
| | | | | | | | 28,676 | |
TOTAL SWEDEN | | | | | | | 321,466 | |
| SWITZERLAND— 9.8% | | | | | | | | |
| Communication Services — 0.5% | | | | | | | | |
| Sunrise Communications Group | | | 154 | | | | 12,334 | |
Swisscom | | | 14 | | | | 7,279 | |
| | | | | | | | 19,613 | |
| Consumer Discretionary — 0.3% | | | | | | | | |
Cie Financiere Richemont | | | 127 | | | | 7,214 | |
Dufry | | | 58 | | | | 1,889 | |
Swatch Group | | | 32 | | | | 6,404 | |
| | | | | | | | 15,507 | |
| | | | | | | |
| COMMON STOCK — continued | | | | | | | | |
| Consumer Staples — 1.2% | | | | | | | | |
Barry Callebaut | | | 5 | | | $ | 9,802 | |
| Chocoladefabriken Lindt & Spruengli | | | 1 | | | | 7,797 | |
Coca-Cola HBC | | | 221 | | | | 5,617 | |
Nestle | | | 232 | | | | 24,493 | |
| | | | | | | | 47,709 | |
| Financials — 1.9% | | | | | | | | |
Baloise Holding | | | 54 | | | | 8,085 | |
Cembra Money Bank | | | 62 | | | | 5,894 | |
Credit Suisse Group | | | 293 | | | | 2,649 | |
Helvetia Holding | | | 93 | | | | 8,513 | |
Pargesa Holding | | | 137 | | | | 9,745 | |
Partners Group Holding | | | 5 | | | | 3,936 | |
Swiss Life Holding | | | 20 | | | | 7,085 | |
Swiss Re | | | 269 | | | | 19,414 | |
UBS Group | | | 370 | | | | 3,964 | |
Zurich Insurance Group | | | 27 | | | | 8,597 | |
| | | | | | | | 77,882 | |
| Health Care — 1.7% | | | | | | | | |
Alcon * | | | 107 | | | | 5,647 | |
Mediclinic International | | | 581 | | | | 1,901 | |
Novartis | | | 121 | | | | 10,313 | |
Roche Holding | | | 53 | | | | 18,421 | |
Sonova Holding | | | 85 | | | | 15,351 | |
Straumann Holding | | | 4 | | | | 3,035 | |
Tecan Group | | | 21 | | | | 6,776 | |
Vifor Pharma | | | 59 | | | | 8,867 | |
| | | | | | | | 70,311 | |
| Industrials — 1.7% | | | | | | | | |
Adecco Group | | | 140 | | | | 6,137 | |
DKSH Holding * | | | 72 | | | | 4,066 | |
dormakaba Holding | | | 9 | | | | 4,500 | |
Flughafen Zurich | | | 15 | | | | 1,851 | |
| | | | | | | |
| COMMON STOCK — continued | | | | | | | | |
| Industrials — continued | | | | | | | | |
Geberit | | | 30 | | | $ | 13,462 | |
Georg Fischer | | | 6 | | | | 4,473 | |
Kuehne + Nagel International | | | 71 | | | | 10,155 | |
Schindler Holding | | | 43 | | | | 9,557 | |
SGS | | | 4 | | | | 9,056 | |
VAT Group | | | 55 | | | | 9,072 | |
| | | | | | | | 72,329 | |
| Information Technology — 0.5% | | | | | | | | |
Logitech International | | | 109 | | | | 5,253 | |
STMicroelectronics | | | 571 | | | | 14,829 | |
| | | | | | | | 20,082 | |
| Materials — 1.2% | | | | | | | | |
Clariant * | | | 589 | | | | 10,902 | |
EMS-Chemie Holding | | | 14 | | | | 9,073 | |
Givaudan | | | 4 | | | | 13,400 | |
LafargeHolcim | | | 186 | | | | 7,716 | |
Sika | | | 37 | | | | 6,122 | |
| | | | | | | | 47,213 | |
| Real Estate — 0.8% | | | | | | | | |
PSP Swiss Property | | | 136 | | | | 15,810 | |
Swiss Prime Site | | | 192 | | | | 18,242 | |
| | | | | | | | 34,052 | |
TOTAL SWITZERLAND | | | | | | | 404,698 | |
| UNITED KINGDOM— 20.9% | | | | | | | | |
| Communication Services — 1.3% | | | | | | | | |
Auto Trader Group | | | 1,783 | | | | 10,316 | |
Informa | | | 2,235 | | | | 12,382 | |
Pearson | | | 908 | | | | 5,266 | |
Rightmove | | | 1,865 | | | | 11,706 | |
Vodafone Group | | | 12,505 | | | | 17,688 | |
| | | | | | | | 57,358 | |
| | | | | | | |
| COMMON STOCK — continued | | | | | | | | |
| Consumer Discretionary — 4.1% | | | | | | | | |
B&M European Value Retail | | | 637 | | | $ | 2,674 | |
Barratt Developments | | | 2,117 | | | | 13,859 | |
Bellway | | | 318 | | | | 10,682 | |
Berkeley Group Holdings | | | 315 | | | | 16,619 | |
Burberry Group | | | 316 | | | | 5,540 | |
Compass Group | | | 1,848 | | | | 31,141 | |
Dixons Carphone | | | 3,574 | | | | 3,501 | |
Fiat Chrysler Automobiles | | | 366 | | | | 3,213 | |
GVC Holdings | | | 1,184 | | | | 11,260 | |
Inchcape | | | 1,009 | | | | 6,383 | |
JD Sports Fashion | | | 275 | | | | 1,836 | |
Kingfisher | | | 5,447 | | | | 10,807 | |
Marks & Spencer Group | | | 3,747 | | | | 4,353 | |
MoneySuperMarket.com | | | 1,363 | | | | 5,460 | |
Persimmon | | | 501 | | | | 13,934 | |
Playtech | | | 1,095 | | | | 3,224 | |
SSP Group | | | 881 | | | | 3,116 | |
Taylor Wimpey | | | 5,185 | | | | 9,617 | |
WH Smith | | | 312 | | | | 4,931 | |
Whitbread | | | 103 | | | | 3,872 | |
William Hill | | | 2,602 | | | | 3,745 | |
| | | | | | | | 169,767 | |
| Consumer Staples — 1.5% | | | | | | | | |
Britvic | | | 745 | | | | 6,883 | |
Diageo | | | 341 | | | | 11,829 | |
J Sainsbury | | | 1,718 | | | | 4,293 | |
Tate & Lyle | | | 2,060 | | | | 18,506 | |
Tesco | | | 1,420 | | | | 4,211 | |
Unilever | | | 121 | | | | 6,041 | |
WM Morrison Supermarkets | | | 4,850 | | | | 11,195 | |
| | | | | | | | 62,958 | |
| | | | | | | |
| COMMON STOCK — continued | | | | | | | | |
| Energy — 0.5% | | | | | | | | |
BP | | | 1,547 | | | $ | 6,110 | |
Great Portland Estates ‡ | | | 1,085 | | | | 9,262 | |
Subsea 7 | | | 597 | | | | 3,319 | |
| | | | | | | | 18,691 | |
| Financials — 2.4% | | | | | | | | |
3i Group | | | 894 | | | | 8,840 | |
Aviva | | | 837 | | | | 2,553 | |
Barclays | | | 2,198 | | | | 2,936 | |
Close Brothers Group | | | 135 | | | | 1,858 | |
Direct Line Insurance Group | | | 1,647 | | | | 5,661 | |
HSBC Holdings | | | 2,588 | | | | 13,385 | |
IG Group Holdings | | | 741 | | | | 7,052 | |
Jupiter Fund Management | | | 779 | | | | 2,148 | |
Lloyds Banking Group | | | 5,184 | | | | 2,108 | |
Man Group | | | 1,035 | | | | 1,742 | |
Phoenix Group Holdings | | | 1,693 | | | | 12,834 | |
Quilter | | | 3,256 | | | | 5,062 | |
Royal Bank of Scotland Group | | | 1,469 | | | | 2,048 | |
RSA Insurance Group | | | 1,189 | | | | 5,417 | |
Schroders | | | 134 | | | | 4,486 | |
Standard Chartered | | | 1,223 | | | | 6,286 | |
Standard Life Aberdeen | | | 3,175 | | | | 8,854 | |
TP ICAP | | | 1,974 | | | | 8,451 | |
| | | | | | | | 101,721 | |
| Health Care — 0.8% | | | | | | | | |
ConvaTec Group | | | 1,181 | | | | 3,164 | |
GlaxoSmithKline | | | 531 | | | | 11,125 | |
Smith & Nephew | | | 946 | | | | 18,591 | |
| | | | | | | | 32,880 | |
| Industrials — 5.1% | | | | | | | | |
Aggreko | | | 835 | | | | 4,834 | |
Ashtead Group | | | 113 | | | | 3,100 | |
| | | | | | | |
| COMMON STOCK — continued | | | | | | | | |
| Industrials — continued | | | | | | | | |
BAE Systems | | | 2,916 | | | $ | 18,700 | |
Balfour Beatty | | | 981 | | | | 3,212 | |
Bunzl | | | 373 | | | | 8,128 | |
DCC | | | 46 | | | | 3,283 | |
easyJet | | | 341 | | | | 2,594 | |
Experian | | | 484 | | | | 14,505 | |
Ferguson | | | 201 | | | | 14,543 | |
Firstgroup * | | | 5,894 | | | | 4,970 | |
Hays | | | 1,080 | | | | 1,478 | |
Howden Joinery Group | | | 1,286 | | | | 8,519 | |
IMI | | | 205 | | | | 2,140 | |
Intertek Group | | | 125 | | | | 7,489 | |
Meggitt | | | 2,102 | | | | 7,405 | |
National Express Group | | | 2,123 | | | | 7,316 | |
RELX | | | 1,205 | | | | 27,306 | |
Rentokil Initial | | | 3,479 | | | | 20,814 | |
Rotork | | | 1,338 | | | | 4,196 | |
Royal Mail | | | 2,310 | | | | 4,851 | |
Signature Aviation | | | 3,478 | | | | 8,588 | |
Smiths Group | | | 483 | | | | 7,557 | |
Spirax-Sarco Engineering | | | 122 | | | | 13,430 | |
Travis Perkins | | | 791 | | | | 10,371 | |
| | | | | | | | 209,329 | |
| Information Technology — 1.2% | | | | | | | | |
Avast | | | 1,083 | | | | 6,259 | |
AVEVA Group | | | 117 | | | | 5,269 | |
Dialog Semiconductor * | | | 136 | | | | 4,283 | |
Electrocomponents | | | 998 | | | | 7,276 | |
Halma | | | 357 | | | | 9,411 | |
Micro Focus International | | | 266 | | | | 1,616 | |
Sage Group | | | 932 | | | | 7,524 | |
| | | | | | | |
| COMMON STOCK — continued | | | | | | | | |
| Information Technology — continued | | | | | | | | |
Spectris | | | 242 | | | $ | 8,141 | |
| | | | | | | | 49,779 | |
| Materials — 0.4% | | | | | | | | |
Croda International | | | 73 | | | | 4,495 | |
Mondi | | | 438 | | | | 7,790 | |
Victrex | | | 108 | | | | 2,719 | |
| | | | | | | | 15,004 | |
| Real Estate — 1.4% | | | | | | | | |
British Land ‡ | | | 1,249 | | | | 6,374 | |
Capital & Counties Properties ‡ | | | 693 | | | | 1,454 | |
Derwent London ‡ | | | 365 | | | | 14,300 | |
Hammerson ‡ | | | 1,976 | | | | 1,759 | |
Land Securities Group ‡ | | | 1,162 | | | | 9,703 | |
Segro ‡ | | | 987 | | | | 10,328 | |
Shaftesbury ‡ | | | 691 | | | | 5,230 | |
Tritax Big Box REIT ‡ | | | 3,404 | | | | 5,178 | |
Unite Group ‡ | | | 788 | | | | 8,702 | |
| | | | | | | | 63,028 | |
| Utilities — 2.2% | | | | | | | | |
Centrica | | | 7,004 | | | | 3,525 | |
National Grid | | | 1,723 | | | | 20,294 | |
Pennon Group | | | 2,099 | | | | 29,018 | |
SSE | | | 1,885 | | | | 29,721 | |
United Utilities Group | | | 640 | | | | 7,283 | |
| | | | | | | | 89,841 | |
TOTAL UNITED KINGDOM | | | | | | | 870,356 | |
| UNITED STATES— 0.5% | | | | | | | | |
| Consumer Discretionary — 0.1% | | | | | | | | |
Carnival | | | 357 | | | | 4,933 | |
| Consumer Staples — 0.4% | | | | | | | | |
Coca-Cola European Partners | | | 352 | | | | 13,953 | |
| | | | | | | |
| COMMON STOCK — continued | | | | | | | | |
TOTAL UNITED STATES | | | | | | $ | 18,886 | |
| TOTAL COMMON STOCK | | | | | | | | |
(Cost $5,019,800) | | | | | | | 4,097,093 | |
| | | | | | | | | |
PREFERRED STOCK — 0.6% | | | | | | | | |
| GERMANY— 0.6% | | | | | | | | |
| Consumer Discretionary — 0.1% | | | | | | | | |
Porsche Automobil Holding(A) | | | 57 | | | | 2,874 | |
Volkswagen(A) | | | 22 | | | | 3,089 | |
| | | | | | | | 5,963 | |
| Consumer Staples — 0.4% | | | | | | | | |
Henkel & KGaA(A) | | | 160 | | | | 14,203 | |
| Materials — 0.1% | | | | | | | | |
FUCHS PETROLUB(A) | | | 154 | | | | 5,981 | |
TOTAL GERMANY | | | | | | | 26,147 | |
| TOTAL PREFERRED STOCK | | | | | | | | |
(Cost $33,146) | | | | | | | 26,147 | |
| TOTAL INVESTMENTS — 99.4% | | | | | | | | |
(Cost $5,052,946) | | | | | | $ | 4,123,240 | |
Percentages are based on Net Assets of $4,146,500.
| * | Non-income producing security. |
| ‡ | Real Estate Investment Trust |
| (A) | There is currently no stated rate. |
| Cl — Class |
| REIT — Real Estate Investment Trust |
As of April 30, 2020, all of the Fund’s investments were considered Level 1, in accordance with authoritative guidance on fair value measurements and disclosure under U.S. GAAP.
For the period ended April 30, 2020, there have been no transfers in or out of Level 3.
| | |
| Schedule of Investments |
| April 30, 2020 (Unaudited) |
| Global X Scientific Beta Japan ETF | |
Sector Weightings †:
† Sector weightings percentages are based on the total market value of investments.
| | | | | | | |
| COMMON STOCK — 99.8% | | | | | | |
| JAPAN— 99.8% | | | | | | |
| Communication Services — 5.7% | | | | | | |
Dentsu Group | | | 330 | | | $ | 7,030 | |
Hakuhodo DY Holdings | | | 684 | | | | 7,688 | |
KDDI | | | 868 | | | | 25,236 | |
Konami Holdings | | | 90 | | | | 2,866 | |
| Nippon Telegraph & Telephone | | | 1,704 | | | | 38,929 | |
NTT DOCOMO | | | 935 | | | | 27,525 | |
Softbank | | | 400 | | | | 5,476 | |
Square Enix Holdings | | | 281 | | | | 11,575 | |
Toho | | | 380 | | | | 12,580 | |
| | | | | | | | 138,905 | |
| Consumer Discretionary — 13.3% | | | | | | | | |
Asics | | | 680 | | | | 6,569 | |
Bandai Namco Holdings | | | 370 | | | | 18,792 | |
Bridgestone | | | 434 | | | | 13,709 | |
Casio Computer | | | 1,063 | | | | 16,999 | |
| | | | | | | |
COMMON STOCK — continued | | | | | | | | |
| Consumer Discretionary — continued | | | | | | | | |
Denso | | | 250 | | | $ | 8,912 | |
Haseko | | | 550 | | | | 6,079 | |
Honda Motor | | | 312 | | | | 7,617 | |
Isetan Mitsukoshi Holdings | | | 1,470 | | | | 9,045 | |
Isuzu Motors | | | 611 | | | | 4,713 | |
J Front Retailing | | | 962 | | | | 7,998 | |
JTEKT | | | 245 | | | | 1,824 | |
Marui Group | | | 140 | | | | 2,320 | |
Mazda Motor | | | 1,716 | | | | 9,821 | |
Mitsubishi Motors | | | 2,653 | | | | 7,567 | |
Nikon | | | 1,190 | | | | 11,206 | |
Nissan Motor | | | 2,914 | | | | 10,077 | |
Nitori Holdings | | | 40 | | | | 6,179 | |
Oriental Land | | | 65 | | | | 8,315 | |
| Pan Pacific International Holdings | | | 464 | | | | 9,034 | |
Panasonic | | | 1,420 | | | | 10,979 | |
Rinnai | | | 99 | | | | 7,564 | |
Sega Sammy Holdings | | | 1,260 | | | | 15,447 | |
Sekisui Chemical | | | 716 | | | | 9,173 | |
Sekisui House | | | 681 | | | | 11,836 | |
Stanley Electric | | | 390 | | | | 9,027 | |
Subaru | | | 200 | | | | 4,068 | |
Sumitomo Electric Industries | | | 641 | | | | 6,675 | |
Sumitomo Rubber Industries | | | 1,229 | | | | 12,102 | |
Toyota Industries | | | 167 | | | | 8,480 | |
Toyota Motor | | | 192 | | | | 11,968 | |
USS | | | 350 | | | | 5,597 | |
Yamada Denki | | | 4,898 | | | | 23,452 | |
Yamaha | | | 235 | | | | 9,625 | |
Yamaha Motor | | | 487 | | | | 6,390 | |
| | | | | | | | 319,159 | |
| | | | | | | |
COMMON STOCK — continued | | | | | | | | |
| Consumer Staples — 13.2% | | | | | | | | |
Aeon | | | 578 | | | $ | 11,737 | |
Ajinomoto | | | 1,011 | | | | 18,114 | |
Asahi Group Holdings | | | 100 | | | | 3,497 | |
| Coca-Cola Bottlers Japan Holdings | | | 517 | | | | 9,404 | |
Ezaki Glico | | | 266 | | | | 11,716 | |
FamilyMart | | | 320 | | | | 5,485 | |
Kao | | | 251 | | | | 19,520 | |
Kewpie | | | 514 | | | | 10,272 | |
Kirin Holdings | | | 362 | | | | 7,036 | |
Kobayashi Pharmaceutical | | | 109 | | | | 10,132 | |
Lawson | | | 245 | | | | 12,761 | |
Lion | | | 777 | | | | 16,357 | |
MEIJI Holdings | | | 110 | | | | 7,684 | |
NH Foods | | | 651 | | | | 23,468 | |
Nichirei | | | 310 | | | | 7,787 | |
Nisshin Seifun Group | | | 360 | | | | 5,663 | |
Nissin Foods Holdings | | | 192 | | | | 15,872 | |
Pigeon | | | 230 | | | | 8,248 | |
Seven & i Holdings | | | 290 | | | | 9,635 | |
Shiseido | | | 187 | | | | 11,153 | |
Suntory Beverage & Food | | | 397 | | | | 15,055 | |
Toyo Suisan Kaisha | | | 577 | | | | 27,841 | |
Tsuruha Holdings | | | 128 | | | | 17,214 | |
Unicharm | | | 270 | | | | 9,973 | |
Yakult Honsha | | | 72 | | | | 4,222 | |
Yamazaki Baking | | | 580 | | | | 10,300 | |
| | | | | | | | 310,146 | |
| Energy — 0.4% | | | | | | | | |
Idemitsu Kosan | | | 278 | | | | 6,421 | |
Inpex | | | 564 | | | | 3,645 | |
| | | | | | | | 10,066 | |
| | | | | | | |
COMMON STOCK — continued | | | | | | | | |
| Financials — 6.7% | | | | | | | | |
Aozora Bank | | | 334 | | | $ | 6,038 | |
Bank of Kyoto | | | 64 | | | | 2,220 | |
Chiba Bank | | | 1,093 | | | | 5,131 | |
Concordia Financial Group | | | 1,000 | | | | 3,105 | |
Daiwa Securities Group | | | 1,804 | | | | 7,565 | |
Fukuoka Financial Group | | | 222 | | | | 3,218 | |
Japan Post Bank | | | 1,450 | | | | 13,545 | |
Japan Post Holdings | | | 2,290 | | | | 18,519 | |
| Mitsubishi UFJ Financial Group | | | 900 | | | | 3,655 | |
| Mitsubishi UFJ Lease & Finance | | | 2,352 | | | | 11,416 | |
Mizuho Financial Group | | | 7,422 | | | | 8,731 | |
| MS&AD Insurance Group Holdings | | | 300 | | | | 8,759 | |
Nomura Holdings | | | 1,300 | | | | 5,468 | |
ORIX | | | 301 | | | | 3,628 | |
Resona Holdings | | | 1,100 | | | | 3,467 | |
Shinsei Bank | | | 656 | | | | 8,006 | |
Shizuoka Bank | | | 1,030 | | | | 6,299 | |
Sompo Holdings | | | 370 | | | | 12,110 | |
| Sumitomo Mitsui Financial Group | | | 451 | | | | 11,995 | |
| Sumitomo Mitsui Trust Holdings | | | 212 | | | | 6,267 | |
Tokio Marine Holdings | | | 290 | | | | 13,793 | |
| | | | | | | | 162,935 | |
| Health Care — 7.0% | | | | | | | | |
Alfresa Holdings | | | 375 | | | | 7,568 | |
Astellas Pharma | | | 510 | | | | 8,520 | |
Chugai Pharmaceutical | | | 68 | | | | 8,146 | |
Daiichi Sankyo | | | 113 | | | | 7,801 | |
Hisamitsu Pharmaceutical | | | 89 | | | | 4,228 | |
Hoya | | | 160 | | | | 14,762 | |
Kyowa Kirin | | | 239 | | | | 5,628 | |
M3
| | | 200 | | | | 7,275 | |
| | | | | | | |
COMMON STOCK — continued | | | | | | | | |
| Health Care — continued | | | | | | | | |
Medipal Holdings | | | 642 | | | $ | 12,571 | |
Olympus | | | 700 | | | | 11,295 | |
Otsuka Holdings | | | 509 | | | | 20,253 | |
Shionogi | | | 70 | | | | 3,881 | |
Sumitomo Dainippon Pharma | | | 318 | | | | 4,455 | |
Suzuken | | | 203 | | | | 7,897 | |
Sysmex | | | 100 | | | | 6,958 | |
| Taisho Pharmaceutical Holdings | | | 166 | | | | 10,447 | |
Takeda Pharmaceutical | | | 213 | | | | 7,734 | |
Terumo | | | 524 | | | | 17,503 | |
| | | | | | | | 166,922 | |
| Industrials — 20.1% | | | | | | | | |
AGC | | | 225 | | | | 5,679 | |
Amada | | | 1,377 | | | | 12,658 | |
ANA Holdings | | | 512 | | | | 11,017 | |
Central Japan Railway | | | 72 | | | | 11,450 | |
Dai Nippon Printing | | | 520 | | | | 11,136 | |
Daikin Industries | | | 54 | | | | 7,072 | |
East Japan Railway | | | 156 | | | | 11,485 | |
Fuji Electric | | | 419 | | | | 10,164 | |
Hankyu Hanshin Holdings | | | 340 | | | | 11,764 | |
Hino Motors | | | 1,343 | | | | 8,113 | |
ITOCHU | | | 1,265 | | | | 25,139 | |
Japan Airport Terminal | | | 146 | | | | 6,042 | |
Kajima | | | 780 | | | | 8,242 | |
Kawasaki Heavy Industries | | | 185 | | | | 2,844 | |
Keihan Holdings | | | 160 | | | | 7,249 | |
Keio | | | 90 | | | | 5,134 | |
Keisei Electric Railway | | | 291 | | | | 8,871 | |
Kintetsu Group Holdings | | | 221 | | | | 10,664 | |
Kurita Water Industries | | | 650 | | | | 18,419 | |
Kyushu Railway | | | 589 | | | | 15,990 | |
| | | | | | | |
COMMON STOCK — continued | | | | | | | | |
| Industrials — continued | | | | | | | | |
LIXIL Group | | | 1,160 | | | $ | 14,189 | |
Marubeni | | | 1,192 | | | | 5,841 | |
MISUMI Group | | | 163 | | | | 3,942 | |
Mitsubishi | | | 462 | | | | 9,937 | |
Mitsubishi Electric | | | 639 | | | | 8,010 | |
Mitsubishi Heavy Industries | | | 627 | | | | 16,203 | |
Mitsui | | | 953 | | | | 13,493 | |
Mitsui OSK Lines | | | 443 | | | | 7,842 | |
Nagoya Railroad | | | 674 | | | | 19,507 | |
Nankai Electric Railway | | | 231 | | | | 5,193 | |
Nippon Express | | | 135 | | | | 6,678 | |
Nippon Yusen | | | 697 | | | | 9,321 | |
NSK | | | 899 | | | | 6,288 | |
Obayashi | | | 1,294 | | | | 11,520 | |
Odakyu Electric Railway | | | 219 | | | | 4,860 | |
Recruit Holdings | | | 97 | | | | 2,886 | |
Secom | | | 128 | | | | 10,779 | |
Shimizu | | | 1,643 | | | | 12,845 | |
Sohgo Security Services | | | 61 | | | | 2,949 | |
Sojitz | | | 3,563 | | | | 8,396 | |
Sumitomo | | | 785 | | | | 9,018 | |
Sumitomo Heavy Industries | | | 296 | | | | 6,350 | |
THK | | | 293 | | | | 7,143 | |
Tobu Railway | | | 408 | | | | 13,983 | |
Tokyu | | | 410 | | | | 6,227 | |
Toppan Printing | | | 866 | | | | 13,054 | |
Toshiba | | | 330 | | | | 8,292 | |
Toyota Tsusho | | | 240 | | | | 5,808 | |
West Japan Railway | | | 168 | | | | 10,474 | |
Yaskawa Electric | | | 100 | | | | 3,334 | |
| | | | | | | | 473,494 | |
| | | | | | | |
COMMON STOCK — continued | |
| Information Technology — 13.6% | | | | | |
Advantest | | | 350 | | | $ | 17,248 | |
Alps Alpine | | | 363 | | | | 3,812 | |
Brother Industries | | | 739 | | | | 12,688 | |
Canon | | | 453 | | | | 9,678 | |
Disco | | | 70 | | | | 15,940 | |
FUJIFILM Holdings | | | 401 | | | | 19,271 | |
Fujitsu | | | 362 | | | | 35,664 | |
Hamamatsu Photonics | | | 462 | | | | 20,435 | |
Hirose Electric | | | 66 | | | | 7,326 | |
Hitachi | | | 205 | | | | 6,213 | |
Konica Minolta | | | 2,254 | | | | 8,874 | |
Kyocera | | | 195 | | | | 10,538 | |
NEC | | | 882 | | | | 34,353 | |
Nomura Research Institute | | | 405 | | | | 9,976 | |
NTT Data | | | 600 | | | | 6,200 | |
Obic | | | 30 | | | | 4,550 | |
Omron | | | 60 | | | | 3,569 | |
Otsuka | | | 308 | | | | 13,955 | |
Renesas Electronics * | | | 3,144 | | | | 17,053 | |
Ricoh | | | 2,036 | | | | 14,089 | |
Rohm | | | 151 | | | | 9,687 | |
Seiko Epson | | | 1,002 | | | | 11,497 | |
Shimadzu | | | 266 | | | | 6,679 | |
SUMCO | | | 200 | | | | 2,899 | |
Tokyo Electron | | | 20 | | | | 4,290 | |
Trend Micro | | | 217 | | | | 11,100 | |
Yokogawa Electric | | | 470 | | | | 6,505 | |
| | | | | | | | 324,089 | |
| Materials — 7.1% | | | | | |
Air Water | | | 332 | | | | 4,520 | |
Asahi Kasei | | | 1,306 | | | | 9,343 | |
Daicel | | | 1,053 | | | | 8,626 | |
| | | | | | | |
COMMON STOCK — continued | |
| Materials — continued | | | | | |
DIC | | | 270 | | | $ | 6,373 | |
JFE Holdings | | | 559 | | | | 3,785 | |
JSR | | | 742 | | | | 14,155 | |
Kaneka | | | 240 | | | | 6,262 | |
Kobe Steel | | | 838 | | | | 2,860 | |
Kuraray | | | 924 | | | | 9,375 | |
Mitsubishi Chemical Holdings | | | 622 | | | | 3,591 | |
Mitsubishi Gas Chemical | | | 718 | | | | 8,923 | |
Mitsubishi Materials | | | 529 | | | | 10,962 | |
Mitsui Chemicals | | | 465 | | | | 9,245 | |
Nippon Steel | | | 312 | | | | 2,661 | |
Nissan Chemical | | | 90 | | | | 3,484 | |
Oji Holdings | | | 2,369 | | | | 12,185 | |
Sumitomo Chemical | | | 876 | | | | 2,736 | |
Sumitomo Metal Mining | | | 130 | | | | 3,305 | |
Taiheiyo Cement | | | 227 | | | | 4,539 | |
Teijin | | | 790 | | | | 12,744 | |
Toray Industries | | | 1,970 | | | | 9,195 | |
Tosoh | | | 1,158 | | | | 14,392 | |
Toyo Seikan Group Holdings | | | 519 | | | | 5,344 | |
| | | | | | | | 168,605 | |
| Real Estate — 6.7% | | | | | |
Advance Residence Investment ‡ | | | 4 | | | | 12,307 | |
Daiwa House Industry | | | 100 | | | | 2,579 | |
Daiwa House REIT Investment, Cl A ‡ | | | 6 | | | | 14,617 | |
GLP J-Reit ‡ | | | 5 | | | | 6,485 | |
Japan Hotel REIT Investment, Cl A ‡ | | | 13 | | | | 4,376 | |
Japan Prime Realty Investment ‡ | | | 5 | | | | 13,980 | |
Japan Real Estate Investment ‡ | | | 2 | | | | 10,923 | |
Japan Retail Fund Investment ‡ | | | 14 | | | | 15,501 | |
Nippon Building Fund ‡ | | | 3 | | | | 18,039 | |
Nippon Prologis REIT ‡ | | | 5 | | | | 13,822 | |
| | | | | | | |
COMMON STOCK — continued | |
| Real Estate — continued | | | | | |
Nomura Real Estate Master Fund ‡ | | | 5 | | | $ | 5,779 | |
Orix JREIT ‡ | | | 11 | | | | 13,342 | |
Tokyo Tatemono | | | 900 | | | | 10,344 | |
Tokyu Fudosan Holdings | | | 1,100 | | | | 5,503 | |
United Urban Investment ‡ | | | 12 | | | | 12,209 | |
| | | | | | | | 159,806 | |
| Utilities — 6.0% | | | | | |
Chubu Electric Power | | | 655 | | | | 8,934 | |
Chugoku Electric Power | | | 2,162 | | | | 29,234 | |
Electric Power Development | | | 491 | | | | 9,918 | |
Kansai Electric Power | | | 1,090 | | | | 11,263 | |
Kyushu Electric Power | | | 2,502 | | | | 19,958 | |
Osaka Gas | | | 505 | | | | 9,440 | |
Toho Gas | | | 521 | | | | 25,628 | |
Tohoku Electric Power | | | 1,295 | | | | 12,268 | |
Tokyo Electric Power Holdings * | | | 1,297 | | | | 4,403 | |
Tokyo Gas | | | 609 | | | | 13,429 | |
| | | | | | | | 144,475 | |
| TOTAL COMMON STOCK | | | | | | | | |
(Cost $2,823,127) | | | | | | | 2,378,602 | |
| TOTAL INVESTMENTS — 99.8% | | | | | | | | |
(Cost $2,823,127) | | | | | | $ | 2,378,602 | |
Percentages are based on Net Assets of $2,383,791.
| * | Non-income producing security. |
| ‡ | Real Estate Investment Trust |
| Cl — Class |
| REIT — Real Estate Investment Trust |
As of April 30, 2020, all of the Fund’s investments were considered Level 1, in accordance with authoritative guidance on fair value measurements and disclosure under U.S. GAAP.
For the period ended April 30, 2020, there have been no transfers in or out of Level 3.
| | |
| Schedule of Investments |
| April 30, 2020 (Unaudited) |
| Global X Scientific Beta Asia ex-Japan ETF | |
Sector Weightings †:
† Sector weightings percentages are based on the total market value of investments.
| | | | | | | |
COMMON STOCK — 99.9% | | | | | | |
| AUSTRALIA— 40.3% | | | | | | |
| Communication Services — 1.7% | | | | | | |
SEEK | | | 883 | | | $ | 10,065 | |
Telstra | | | 11,542 | | | | 23,047 | |
| | | | | | | | 33,112 | |
| Consumer Discretionary — 3.0% | | | | | | | | |
Crown Resorts | | | 3,686 | | | | 23,867 | |
Star Entertainment Grp | | | 6,826 | | | | 13,541 | |
TABCORP Holdings | | | 2,497 | | | | 5,264 | |
Wesfarmers | | | 639 | | | | 15,768 | |
| | | | | | | | 58,440 | |
| Consumer Staples — 2.6% | | | | | | | | |
Coca-Cola Amatil | | | 3,434 | | | | 19,515 | |
Coles Group | | | 531 | | | | 5,392 | |
Treasury Wine Estates | | | 1,053 | | | | 6,997 | |
Woolworths Group | | | 754 | | | | 17,648 | |
| | | | | | | | 49,552 | |
| | | | | | | |
| COMMON STOCK — continued | | | | | | | | |
| Energy — 2.9% | | | | | | | | |
Caltex Australia | | | 1,072 | | | $ | 17,490 | |
Origin Energy | | | 2,487 | | | | 9,053 | |
Santos | | | 5,101 | | | | 16,498 | |
Woodside Petroleum | | | 546 | | | | 8,025 | |
Worley | | | 1,091 | | | | 6,428 | |
| | | | | | | | 57,494 | |
| Financials — 2.9% | | | | | | | | |
Bank of Queensland | | | 935 | | | | 3,189 | |
Bendigo and Adelaide Bank | | | 809 | | | | 3,464 | |
CIMIC Group | | | 355 | | | | 5,727 | |
Macquarie Group | | | 83 | | | | 5,579 | |
Medibank Pvt | | | 6,013 | | | | 10,629 | |
National Australia Bank | | | 1,108 | | | | 12,303 | |
QBE Insurance Group | | | 1,660 | | | | 9,183 | |
Suncorp Group | | | 875 | | | | 5,265 | |
| | | | | | | | 55,339 | |
| Health Care — 3.8% | | | | | | | | |
Ansell | | | 1,608 | | | | 30,056 | |
Cochlear | | | 72 | | | | 8,697 | |
CSL | | | 46 | | | | 9,319 | |
Ramsay Health Care | | | 240 | | | | 9,838 | |
Sonic Healthcare | | | 877 | | | | 15,611 | |
| | | | | | | | 73,521 | |
| Industrials — 4.9% | | | | | | | | |
ALS | | | 2,795 | | | | 12,462 | |
Aurizon Holdings | | | 12,158 | | | | 37,332 | |
Brambles | | | 2,499 | | | | 18,128 | |
Downer EDI | | | 1,075 | | | | 2,935 | |
Qube Holdings (A)(B) (C) | | | 8,752 | | | | 12,978 | |
Sydney Airport | | | 1,234 | | | | 5,090 | |
Transurban Group | | | 797 | | | | 7,201 | |
| | | | | | | | 96,126 | |
| | | | | | | |
| COMMON STOCK — continued | | | | | | | | |
| Information Technology — 0.7% | | | | | | | | |
Computershare | | | 1,270 | | | $ | 10,127 | |
Link Administration Holdings | | | 1,531 | | | | 3,799 | |
| | | | | | | | 13,926 | |
| Materials — 8.7% | | | | | | | | |
BHP Group | | | 580 | | | | 12,284 | |
BlueScope Steel | | | 1,781 | | | | 11,952 | |
Boral | | | 3,127 | | | | 6,183 | |
Fortescue Metals Group | | | 4,280 | | | | 33,512 | |
Iluka Resources | | | 918 | | | | 4,616 | |
Incitec Pivot | | | 13,399 | | | | 20,966 | |
Newcrest Mining (A) (B) (C) | | | 1,576 | | | | 28,301 | |
Orica | | | 2,057 | | | | 24,133 | |
Orora | | | 7,657 | | | | 12,883 | |
Rio Tinto | | | 159 | | | | 9,110 | |
South32 | | | 5,510 | | | | 7,161 | |
| | | | | | | | 171,101 | |
| Real Estate — 4.9% | | | | | | | | |
Dexus ‡ | | | 1,739 | | | | 10,429 | |
Goodman Group ‡ | | | 1,631 | | | | 14,042 | |
GPT Group ‡ | | | 6,123 | | | | 16,957 | |
Lendlease Group | | | 1,414 | | | | 11,442 | |
Mirvac Group ‡ | | | 9,704 | | | | 14,231 | |
Scentre Group ‡ | | | 7,557 | | | | 11,528 | |
Stockland ‡ | | | 2,392 | | | | 4,510 | |
Vicinity Centres ‡ | | | 14,282 | | | | 13,932 | |
| | | | | | | | 97,071 | |
| Utilities — 4.2% | | | | | | | | |
AGL Energy | | | 1,224 | | | | 13,591 | |
APA Group | | | 2,068 | | | | 14,785 | |
AusNet Services | | | 22,918 | | | | 28,133 | |
Spark Infrastructure Group | | | 21,494 | | | | 26,596 | |
| | | | | | | | 83,105 | |
| | | | | | | |
| COMMON STOCK — continued | | | | | | | | |
TOTAL AUSTRALIA | | | | | | $ | 788,787 | |
| CHINA— 3.1% | | | | | | | | |
| Consumer Staples — 2.8% | | | | | | | | |
Wilmar International | | | 21,454 | | | | 54,409 | |
| Health Care — 0.3% | | | | | | | | |
CSPC Pharmaceutical Group | | | 3,400 | | | | 6,754 | |
| Information Technology 0.00% | | | | | | | | |
Hanergy Thin Film Power Group *(A)(B)(C) | | | 29,000 | | | | — | |
TOTAL CHINA | | | | | | | 61,163 | |
| HONG KONG— 25.2% | | | | | | | | |
| Communication Services — 1.7% | | | | | | | | |
PCCW | | | 53,445 | | | | 32,747 | |
| Consumer Discretionary — 0.7% | | | | | | | | |
Yue Yuen Industrial Holdings | | | 8,371 | | | | 13,454 | |
| Consumer Staples — 1.6% | | | | | |
| Dairy Farm International Holdings | | | 2,827 | | | | 13,541 | |
WH Group | | | 18,700 | | | | 18,043 | |
| | | | | | | | 31,584 | |
| Industrials — 3.8% | | | | | |
Jardine Matheson Holdings | | | 475 | | | | 20,881 | |
Jardine Strategic Holdings | | | 629 | | | | 13,555 | |
MTR | | | 2,400 | | | | 13,328 | |
NWS Holdings | | | 14,497 | | | | 15,110 | |
Techtronic Industries | | | 1,500 | | | | 11,426 | |
| | | | | | | | 74,300 | |
| Information Technology — 0.9% | | | | | |
ASM Pacific Technology | | | 1,800 | | | | 18,296 | |
| Real Estate — 11.9% | | | | | |
CK Asset Holdings | | | 1,143 | | | | 7,225 | |
Hang Lung Group | | | 9,497 | | | | 21,560 | |
Hang Lung Properties | | | 9,983 | | | | 21,402 | |
| | | | | | | |
| COMMON STOCK — continued | |
| Real Estate — continued | | | | | |
Henderson Land Development | | | 1,524 | | | $ | 6,232 | |
Hongkong Land Holdings | | | 3,200 | | | | 13,472 | |
Hysan Development | | | 6,485 | | | | 21,581 | |
Link REIT ‡ | | | 5,135 | | | | 46,102 | |
New World Development | | | 4,273 | | | | 5,043 | |
Sino Land | | | 8,498 | | | | 11,883 | |
Sun Hung Kai Properties | | | 427 | | | | 5,861 | |
Swire Pacific, Cl A | | | 2,246 | | | | 14,747 | |
Swire Properties | | | 7,104 | | | | 19,931 | |
Wharf Holdings | | | 8,230 | | | | 15,563 | |
Wharf Real Estate Investment | | | 770 | | | | 3,253 | |
Wheelock | | | 2,791 | | | | 20,431 | |
| | | | | | | | 234,286 | |
| Utilities — 4.6% | | | | | |
CLP Holdings | | | 3,557 | | | | 37,991 | |
Hong Kong & China Gas | | | 7,124 | | | | 12,737 | |
Power Assets Holdings | | | 5,916 | | | | 39,568 | |
| | | | | | | | 90,296 | |
TOTAL HONG KONG | | | | | | | 494,963 | |
| NEW ZEALAND— 9.5% | | | | | | | | |
| Communication Services — 2.2% | | | | | |
Spark New Zealand | | | 16,104 | | | | 44,113 | |
| Health Care — 1.2% | | | | | |
Fisher & Paykel Healthcare | | | 1,361 | | | | 22,998 | |
| Information Technology — 1.2% | | | | | |
Xero * | | | 449 | | | | 23,379 | |
| Materials — 0.8% | | | | | |
Fletcher Building | | | 7,098 | | | | 16,203 | |
| Utilities — 4.1% | | | | | |
Contact Energy | | | 8,920 | | | | 34,615 | |
| | | | | | | |
| COMMON STOCK — continued | |
| Utilities — continued | | | | | |
Meridian Energy | | | 15,968 | | | $ | 44,233 | |
| | | | | | | | 78,848 | |
TOTAL NEW ZEALAND | | | | | | | 185,541 | |
| SINGAPORE— 20.0% | | | | | | | | |
| Communication Services — 1.3% | | | | | |
Singapore Press Holdings | | | 13,073 | | | | 14,116 | |
| Singapore Telecommunications | | | 6,300 | | | | 12,665 | |
| | | | | | | | 26,781 | |
| Consumer Discretionary — 0.7% | | | | | |
Genting Singapore | | | 25,035 | | | | 13,961 | |
| Financials — 3.7% | | | | | |
City Developments | | | 2,685 | | | | 15,183 | |
Oversea-Chinese Banking | | | 763 | | | | 4,900 | |
Singapore Exchange | | | 6,979 | | | | 47,842 | |
United Overseas Bank | | | 310 | | | | 4,479 | |
| | | | | | | | 72,404 | |
| Industrials — 4.8% | | | | | |
ComfortDelGro | | | 17,638 | | | | 20,674 | |
Keppel | | | 3,082 | | | | 13,093 | |
SATS | | | 5,618 | | | | 13,090 | |
Singapore Airlines | | | 4,002 | | | | 17,370 | |
| Singapore Technologies Engineering | | | 11,156 | | | | 27,183 | |
| | | | | | | | 91,410 | |
| Information Technology — 1.2% | | | | | |
Venture | | | 2,167 | | | | 24,399 | |
| Real Estate — 8.3% | | | | | |
Ascendas Real Estate Investment Trust ‡ | | | 12,487 | | | | 26,345 | |
CapitaLand * | | | 10,527 | | | | 22,509 | |
CapitaLand Commercial Trust ‡ | | | 29,689 | | | | 33,956 | |
CapitaLand Mall Trust ‡ | | | 15,736 | | | | 21,127 | |
Mapletree Commercial Trust ‡ | | | 18,847 | | | | 26,241 | |
| | | | | | | |
| COMMON STOCK — continued | |
| Real Estate — continued | | | | | |
Suntec Real Estate Investment Trust ‡ | | | 22,876 | | | $ | 22,751 | |
UOL Group | | | 2,224 | | | | 10,791 | |
| | | | | | | | 163,720 | |
TOTAL SINGAPORE | | | | | | | 392,675 | |
| THAILAND— 0.9% | | | | | | | | |
| Consumer Staples — 0.9% | | | | | |
Thai Beverage | | | 34,205 | | | | 16,766 | |
| UNITED KINGDOM— 0.7% | | | | | | | | |
| Industrials — 0.7% | | | | | |
CK Hutchison Holdings | | | 1,928 | | | | 14,275 | |
| UNITED STATES— 0.2% | | | | | | | | |
| Consumer Discretionary — 0.2% | | | | | |
Samsonite International | | | 4,800 | | | | 4,056 | |
| TOTAL COMMON STOCK | | | | | | | | |
(Cost $2,389,375) | | | | | | | 1,958,226 | |
| TOTAL INVESTMENTS — 99.9% | | | | | | | | |
(Cost $2,389,375) | | | | | | $ | 1,958,226 | |
Percentages are based on Net Assets of $1,960,778.
| * | Non-income producing security. |
| ‡ | Real Estate Investment Trust |
| (A) | Level 3 security in accordance with fair value hierarchy. |
| (B) | Security considered illiquid. The total value of such securities as of April 30, 2020 was $41,280 and represented 2.1% of Net Assets. |
| (C) | Security is fair valued using methods determined in good faith by the Fair Value Committee of the Fund. The total value of such securities as of April 30, 2020 was $41,280 and represents 2.1% of Net Assets. |
| Cl — Class |
| REIT — Real Estate Investment Trust |
The following is a summary of the level of inputs used as of April 30, 2020, in valuing the Fund’s investments carried at value:
| Investments in Securities | | | | | | | | | | | | |
| Common Stock | | $ | 1,458,348 | | | $ | 458,598 | | | $ | 41,280 | | | $ | 1,958,226 | |
| Total Investments in Securities | | $ | 1,458,348 | | | $ | 458,598 | | | $ | 41,280 | | | $ | 1,958,226 | |
| (1) | A reconciliation of Level 3 investments and disclosures of significant unobservable inputs are presented when the Fund has a significant amount of Level 3 investments at the beginning and/or end of the period in relation to Net Assets. Management has concluded that Level 3 investments are not material in relation to Net Assets. |
For the period ended April 30, 2020, there have been no transfers in or out of Level 3.
| | |
| Schedule of Investments |
| April 30, 2020 (Unaudited) |
| Global X S&P 500® Catholic Values ETF | |
Sector Weightings †:
† Sector weightings percentages are based on the total market value of investments.
| | | | | | | |
COMMON STOCK — 99.9% | | | | | | |
| UNITED KINGDOM— 0.6% | | | | | | |
| Energy — 0.0% | | | | | | |
TechnipFMC | | | 5,824 | | | $ | 51,892 | |
| Materials — 0.6% | | | | | | | | |
Amcor | | | 19,774 | | | | 177,373 | |
Linde | | | 7,057 | | | | 1,298,418 | |
| | | | | | | | 1,475,791 | |
TOTAL UNITED KINGDOM | | | | | | | 1,527,683 | |
| UNITED STATES— 99.3% | | | | | | | | |
| Communication Services — 11.0% | | | | | | | | |
Activision Blizzard | | | 10,016 | | | | 638,320 | |
Alphabet, Cl A * | | | 3,911 | | | | 5,266,944 | |
Alphabet, Cl C * | | | 3,956 | | | | 5,335,299 | |
AT&T | | | 95,707 | | | | 2,916,192 | |
CenturyLink | | | 12,722 | | | | 135,108 | |
Charter Communications, Cl A * | | | 2,062 | | | | 1,021,164 | |
| | | | | | | |
| COMMON STOCK — continued | | | | | | | | |
| Communication Services — continued | | | | | | | | |
Comcast, Cl A | | | 59,536 | | | $ | 2,240,341 | |
Discovery, Cl A * | | | 2,039 | | | | 45,714 | |
Discovery, Cl C * | | | 4,465 | | | | 91,131 | |
DISH Network, Cl A * | | | 3,233 | | | | 80,874 | |
Electronic Arts * | | | 3,826 | | | | 437,159 | |
Facebook, Cl A * | | | 31,821 | | | | 6,514,076 | |
Fox, Cl A | | | 4,523 | | | | 117,010 | |
Fox, Cl B | | | 2,074 | | | | 53,011 | |
Interpublic Group | | | 5,147 | | | | 87,396 | |
Netflix * | | | 5,712 | | | | 2,398,183 | |
News, Cl A | | | 5,044 | | | | 49,986 | |
News, Cl B | | | 1,556 | | | | 15,902 | |
Omnicom Group | | | 2,993 | | | | 170,691 | |
Take-Two Interactive Software * | | | 1,463 | | | | 177,096 | |
T-Mobile US * | | | 4,952 | | | | 434,786 | |
Twitter * | | | 9,705 | | | | 278,339 | |
Verizon Communications | | | 54,209 | | | | 3,114,307 | |
ViacomCBS, Cl B | | | 7,271 | | | | 125,497 | |
Walt Disney | | | 23,603 | | | | 2,552,664 | |
| | | | | | | | 34,297,190 | |
| Consumer Discretionary — 10.7% | | | | | | | | |
Advance Auto Parts | | | 912 | | | | 110,270 | |
Amazon.com * | | | 5,514 | | | | 13,641,635 | |
Aptiv | | | 3,485 | | | | 242,382 | |
AutoZone * | | | 341 | | | | 347,929 | |
Best Buy | | | 2,994 | | | | 229,730 | |
Booking Holdings * | | | 547 | | | | 809,872 | |
BorgWarner | | | 2,671 | | | | 76,310 | |
Capri Holdings * | | | 2,068 | | | | 31,537 | |
CarMax * | | | 2,337 | | | | 172,120 | |
Carnival | | | 5,995 | | | | 95,321 | |
Chipotle Mexican Grill, Cl A * | | | 320 | | | | 281,136 | |
| | | | | | | |
| COMMON STOCK — continued | | | | | | | | |
| Consumer Discretionary — continued | | | | | | | | |
Darden Restaurants | | | 1,620 | | | $ | 119,540 | |
Dollar General | | | 3,408 | | | | 597,422 | |
Dollar Tree * | | | 3,153 | | | | 251,200 | |
DR Horton | | | 4,468 | | | | 210,978 | |
eBay | | | 10,902 | | | | 434,227 | |
Expedia Group | | | 1,701 | | | | 120,737 | |
Ford Motor | | | 51,691 | | | | 263,107 | |
Gap | | | 2,872 | | | | 23,321 | |
Garmin | | | 1,599 | | | | 129,775 | |
General Motors | | | 16,850 | | | | 375,587 | |
Genuine Parts | | | 1,948 | | | | 154,438 | |
H&R Block | | | 2,751 | | | | 45,804 | |
Hanesbrands | | | 4,878 | | | | 48,487 | |
Harley-Davidson | | | 2,228 | | | | 48,637 | |
Hasbro | | | 1,560 | | | | 112,648 | |
Hilton Worldwide Holdings | | | 3,806 | | | | 288,152 | |
Home Depot | | | 14,592 | | | | 3,207,759 | |
Kohl’s | | | 2,232 | | | | 41,203 | |
L Brands | | | 3,116 | | | | 37,049 | |
Las Vegas Sands | | | 4,406 | | | | 211,576 | |
Leggett & Platt | | | 1,756 | | | | 61,688 | |
Lennar, Cl A | | | 3,708 | | | | 185,660 | |
LKQ * | | | 4,094 | | | | 107,058 | |
Lowe’s | | | 10,295 | | | | 1,078,401 | |
Marriott International, Cl A | | | 3,613 | | | | 328,566 | |
McDonald’s | | | 9,903 | | | | 1,857,406 | |
Mohawk Industries * | | | 857 | | | | 75,176 | |
NIKE, Cl B | | | 16,292 | | | | 1,420,337 | |
Nordstrom | | | 1,497 | | | | 28,114 | |
Norwegian Cruise Line Holdings * | | | 2,814 | | | | 46,150 | |
NVR * | | | 46 | | | | 142,600 | |
O’Reilly Automotive * | | | 1,017 | | | | 392,908 | |
| | | | | | | |
| COMMON STOCK — continued | | | | | | | | |
| Consumer Discretionary — continued | | | | | | | | |
PulteGroup | | | 3,662 | | | $ | 103,525 | |
PVH | | | 1,092 | | | | 53,759 | |
Ralph Lauren, Cl A | | | 728 | | | | 53,712 | |
Ross Stores | | | 4,766 | | | | 435,422 | |
Royal Caribbean Cruises | | | 2,289 | | | | 107,057 | |
Starbucks | | | 15,495 | | | | 1,188,931 | |
Tapestry | | | 3,740 | | | | 55,651 | |
Target | | | 6,831 | | | | 749,633 | |
Tiffany | | | 1,439 | | | | 182,034 | |
TJX | | | 15,969 | | | | 783,279 | |
Tractor Supply | | | 1,638 | | | | 166,142 | |
Ulta Beauty * | | | 730 | | | | 159,082 | |
Under Armour, Cl A * | | | 2,472 | | | | 25,758 | |
Under Armour, Cl C * | | | 2,496 | | | | 23,138 | |
VF | | | 4,310 | | | | 250,411 | |
Whirlpool | | | 817 | | | | 91,292 | |
Wynn Resorts | | | 1,332 | | | | 113,926 | |
Yum! Brands | | | 4,091 | | | | 353,585 | |
| | | | | | | | 33,380,290 | |
| Consumer Staples — 7.3% | | | | | |
Altria Group | | | 47,456 | | | | 1,862,648 | |
Brown-Forman, Cl B | | | 4,538 | | | | 282,264 | |
Campbell Soup | | | 4,624 | | | | 231,108 | |
Clorox | | | 3,065 | | | | 571,439 | |
Coca-Cola | | | 98,554 | | | | 4,522,642 | |
Conagra Brands | | | 13,133 | | | | 439,168 | |
Constellation Brands, Cl A | | | 4,122 | | | | 678,852 | |
Costco Wholesale | | | 11,140 | | | | 3,375,420 | |
Coty, Cl A | | | 7,257 | | | | 39,551 | |
Estee Lauder, Cl A | | | 5,474 | | | | 965,613 | |
General Mills | | | 14,869 | | | | 890,504 | |
Hormel Foods | | | 7,392 | | | | 346,315 | |
| | | | | | | |
| COMMON STOCK — continued | |
| Consumer Staples — continued | | | | | |
JM Smucker | | | 3,065 | | | $ | 352,199 | |
Kellogg | | | 6,790 | | | | 444,745 | |
Kimberly-Clark | | | 8,503 | | | | 1,177,495 | |
Kraft Heinz | | | 15,631 | | | | 474,088 | |
Kroger | | | 19,511 | | | | 616,743 | |
Lamb Weston Holdings | | | 3,953 | | | | 242,556 | |
McCormick | | | 3,239 | | | | 508,005 | |
Molson Coors Beverage, Cl B | | | 5,075 | | | | 208,126 | |
Mondelez International, Cl A | | | 37,243 | | | | 1,915,781 | |
Monster Beverage * | | | 9,454 | | | | 584,352 | |
Sysco | | | 12,984 | | | | 730,610 | |
Tyson Foods, Cl A | | | 7,223 | | | | 449,198 | |
Walgreens Boots Alliance | | | 18,715 | | | | 810,172 | |
| | | | | | | | 22,719,594 | |
| Energy — 3.1% | | | | | |
Apache | | | 5,001 | | | | 65,413 | |
Baker Hughes, Cl A | | | 9,319 | | | | 130,000 | |
Cabot Oil & Gas | | | 5,849 | | | | 126,455 | |
Chevron | | | 24,378 | | | | 2,242,776 | |
Concho Resources | | | 2,598 | | | | 147,359 | |
ConocoPhillips | | | 14,490 | | | | 610,029 | |
Devon Energy | | | 5,459 | | | | 68,074 | |
Diamondback Energy | | | 1,976 | | | | 86,035 | |
EOG Resources | | | 7,444 | | | | 353,664 | |
Exxon Mobil | | | 54,573 | | | | 2,536,008 | |
Halliburton | | | 11,485 | | | | 120,593 | |
Helmerich & Payne | | | 1,454 | | | | 28,746 | |
Hess | | | 3,416 | | | | 166,154 | |
HollyFrontier | | | 2,119 | | | | 70,012 | |
Kinder Morgan | | | 25,274 | | | | 384,923 | |
Marathon Oil | | | 10,974 | | | | 67,161 | |
Marathon Petroleum | | | 8,583 | | | | 275,343 | |
| | | | | | | |
| COMMON STOCK — continued | |
| Energy — continued | | | | | |
National Oilwell Varco | | | 5,033 | | | $ | 63,617 | |
Noble Energy | | | 6,542 | | | | 64,177 | |
Occidental Petroleum | | | 11,561 | | | | 191,913 | |
ONEOK | | | 5,272 | | | | 157,791 | |
Phillips 66 | | | 5,997 | | | | 438,800 | |
Pioneer Natural Resources | | | 2,230 | | | | 199,161 | |
Schlumberger | | | 17,777 | | | | 299,008 | |
Valero Energy | | | 5,331 | | | | 337,719 | |
Williams | | | 15,887 | | | | 307,731 | |
| | | | | | | | 9,538,662 | |
| Financials — 10.8% | | | | | |
Aflac | | | 9,591 | | | | 357,169 | |
Allstate | | | 4,233 | | | | 430,581 | |
American Express | | | 8,850 | | | | 807,563 | |
American International Group | | | 11,149 | | | | 283,519 | |
Ameriprise Financial | | | 1,811 | | | | 208,156 | |
Aon | | | 3,075 | | | | 530,960 | |
Arthur J Gallagher | | | 2,362 | | | | 185,417 | |
Assurant | | | 765 | | | | 81,274 | |
Bank of America | | | 108,731 | | | | 2,614,981 | |
Bank of New York Mellon | | | 11,209 | | | | 420,786 | |
Berkshire Hathaway, Cl B * | | | 26,056 | | | | 4,881,851 | |
BlackRock, Cl A | | | 1,561 | | | | 783,684 | |
Capital One Financial | | | 6,074 | | | | 393,352 | |
Cboe Global Markets | | | 1,469 | | | | 145,989 | |
Charles Schwab | | | 15,162 | | | | 571,911 | |
Chubb | | | 5,888 | | | | 635,963 | |
Cincinnati Financial | | | 1,971 | | | | 129,692 | |
Citigroup | | | 28,150 | | | | 1,366,964 | |
Citizens Financial Group | | | 6,081 | | | | 136,154 | |
CME Group, Cl A | | | 4,596 | | | | 819,053 | |
Comerica | | | 1,995 | | | | 69,546 | |
| | | | | | | |
| COMMON STOCK — continued | |
| Financials — continued | | | | | |
Discover Financial Services | | | 4,158 | | | $ | 178,669 | |
E*TRADE Financial | | | 3,086 | | | | 125,322 | |
Everest Re Group | | | 535 | | | | 92,625 | |
Fifth Third Bancorp | | | 8,926 | | | | 166,827 | |
First Republic Bank | | | 2,113 | | | | 220,365 | |
Franklin Resources | | | 3,947 | | | | 74,361 | |
Globe Life | | | 1,381 | | | | 113,712 | |
Goldman Sachs Group | | | 4,175 | | | | 765,779 | |
| Hartford Financial Services Group | | | 4,587 | | | | 174,260 | |
Huntington Bancshares | | | 14,052 | | | | 129,840 | |
Intercontinental Exchange | | | 7,280 | | | | 651,196 | |
Invesco | | | 5,310 | | | | 45,772 | |
JPMorgan Chase | | | 41,874 | | | | 4,009,853 | |
KeyCorp | | | 13,158 | | | | 153,291 | |
Lincoln National | | | 2,728 | | | | 96,762 | |
Loews | | | 3,554 | | | | 123,182 | |
M&T Bank | | | 1,759 | | | | 197,149 | |
MarketAxess Holdings | | | 459 | | | | 208,850 | |
Marsh & McLennan | | | 6,488 | | | | 631,477 | |
MetLife | | | 10,025 | | | | 361,702 | |
Moody’s | | | 2,184 | | | | 532,678 | |
Morgan Stanley | | | 15,246 | | | | 601,150 | |
MSCI, Cl A | | | 1,077 | | | | 352,179 | |
Nasdaq | | | 1,500 | | | | 164,505 | |
Northern Trust | | | 2,828 | | | | 223,864 | |
People’s United Financial | | | 4,764 | | | | 60,455 | |
PNC Financial Services Group | | | 5,799 | | | | 618,579 | |
Principal Financial Group | | | 3,463 | | | | 126,088 | |
Progressive | | | 7,674 | | | | 593,200 | |
Prudential Financial | | | 5,230 | | | | 326,195 | |
Raymond James Financial | | | 1,642 | | | | 108,241 | |
Regions Financial | | | 12,864 | | | | 138,288 | |
| | | | | | | |
| COMMON STOCK — continued | |
| Financials — continued | | | | | |
S&P Global | | | 3,173 | | | $ | 929,308 | |
State Street | | | 4,819 | | | | 303,790 | |
SVB Financial Group * | | | 702 | | | | 135,605 | |
Synchrony Financial | | | 8,180 | | | | 161,882 | |
T Rowe Price Group | | | 3,008 | | | | 347,815 | |
Travelers | | | 3,445 | | | | 348,668 | |
Truist Financial | | | 17,426 | | | | 650,338 | |
Unum Group | | | 2,893 | | | | 50,483 | |
US Bancorp | | | 19,183 | | | | 700,180 | |
Wells Fargo | | | 49,790 | | | | 1,446,400 | |
Willis Towers Watson | | | 1,708 | | | | 304,519 | |
Zions Bancorp | | | 2,529 | | | | 79,942 | |
| | | | | | | | 33,679,911 | |
| Health Care — 14.3% | | | | | |
AbbVie | | | 42,817 | | | | 3,519,557 | |
ABIOMED * | | | 1,230 | | | | 235,238 | |
Alexion Pharmaceuticals * | | | 6,227 | | | | 669,216 | |
Align Technology * | | | 2,021 | | | | 434,212 | |
AmerisourceBergen, Cl A | | | 4,344 | | | | 389,483 | |
Anthem | | | 7,332 | | | | 2,058,312 | |
Baxter International | | | 14,983 | | | | 1,330,191 | |
Biogen Idec * | | | 5,384 | | | | 1,598,133 | |
Boston Scientific * | | | 40,062 | | | | 1,501,524 | |
Cardinal Health | | | 8,245 | | | | 407,963 | |
Cerner | | | 8,976 | | | | 622,845 | |
Cigna | | | 10,811 | | | | 2,116,578 | |
CVS Health | | | 38,605 | | | | 2,376,137 | |
DaVita * | | | 2,840 | | | | 224,388 | |
DENTSPLY SIRONA | | | 6,164 | | | | 261,600 | |
Edwards Lifesciences * | | | 6,040 | | | | 1,313,700 | |
Eli Lilly | | | 24,463 | | | | 3,782,958 | |
Gilead Sciences | | | 36,856 | | | | 3,095,904 | |
| | | | | | | |
| COMMON STOCK — continued | |
| Health Care — continued | | | | |
Henry Schein * | | | 4,173 | | | $ | 227,679 | |
Hologic * | | | 7,386 | | | | 370,039 | |
Humana | | | 3,972 | | | | 1,516,589 | |
IDEXX Laboratories * | | | 2,413 | | | | 669,849 | |
Incyte * | | | 5,630 | | | | 549,826 | |
Intuitive Surgical * | | | 3,310 | | | | 1,691,012 | |
IQVIA Holdings * | | | 5,059 | | | | 721,363 | |
Laboratory Corp of America Holdings * | | | 2,820 | | | | 463,749 | |
McKesson | | | 4,672 | | | | 659,920 | |
Medtronic | | | 38,809 | | | | 3,788,922 | |
Mettler-Toledo International * | | | 687 | | | | 494,599 | |
Quest Diagnostics | | | 3,696 | | | | 406,967 | |
Regeneron Pharmaceuticals * | | | 2,348 | | | | 1,234,766 | |
ResMed | | | 4,277 | | | | 664,304 | |
Stryker | | | 9,317 | | | | 1,736,967 | |
Teleflex | | | 1,279 | | | | 428,977 | |
Varian Medical Systems * | | | 2,509 | | | | 286,979 | |
Waters * | | | 1,961 | | | | 366,707 | |
Zimmer Biomet Holdings | | | 6,351 | | | | 760,215 | |
Zoetis, Cl A | | | 13,922 | | | | 1,800,254 | |
| | | | | | | | 44,777,622 | |
| Industrials — 8.3% | | | | | |
3M
| | | 11,736 | | | | 1,782,933 | |
Alaska Air Group | | | 2,475 | | | | 80,487 | |
Allegion | | | 1,922 | | | | 193,238 | |
American Airlines Group | | | 7,658 | | | | 91,973 | |
AMETEK | | | 4,594 | | | | 385,299 | |
AO Smith | | | 2,803 | | | | 118,791 | |
Caterpillar | | | 11,217 | | | | 1,305,433 | |
CH Robinson Worldwide | | | 2,570 | | | | 182,213 | |
Cintas | | | 1,712 | | | | 379,773 | |
Copart * | | | 4,015 | | | | 321,642 | |
| | | | | | | |
| COMMON STOCK — continued | |
| Industrials — continued | | | | |
CSX | | | 15,919 | | | $ | 1,054,315 | |
Cummins | | | 3,107 | | | | 507,995 | |
Deere | | | 6,467 | | | | 938,103 | |
Delta Air Lines | | | 11,770 | | | | 304,960 | |
Dover | | | 2,731 | | | | 255,758 | |
Eaton | | | 8,314 | | | | 694,219 | |
Emerson Electric | | | 12,496 | | | | 712,647 | |
Equifax | | | 2,412 | | | | 335,027 | |
| Expeditors International of Washington | | | 3,242 | | | | 232,143 | |
Fastenal | | | 12,307 | | | | 445,759 | |
FedEx | | | 4,888 | | | | 619,652 | |
Flowserve | | | 2,622 | | | | 73,862 | |
Fortive | | | 6,068 | | | | 388,352 | |
| Fortune Brands Home & Security | | | 2,946 | | | | 141,997 | |
Howmet Aerospace | | | 8,324 | | | | 108,795 | |
IDEX | | | 1,480 | | | | 227,372 | |
IHS Markit | | | 7,998 | | | | 538,266 | |
Illinois Tool Works | | | 6,109 | | | | 992,713 | |
JB Hunt Transport Services | | | 1,746 | | | | 176,556 | |
Johnson Controls International | | | 15,725 | | | | 457,755 | |
Kansas City Southern | | | 1,980 | | | | 258,489 | |
Masco | | | 5,904 | | | | 242,300 | |
Nielsen Holdings | | | 6,888 | | | | 101,460 | |
Norfolk Southern | | | 5,416 | | | | 926,678 | |
PACCAR | | | 6,848 | | | | 474,087 | |
Parker-Hannifin | | | 2,601 | | | | 411,270 | |
Pentair | | | 3,288 | | | | 113,732 | |
Quanta Services | | | 2,998 | | | | 109,007 | |
Republic Services, Cl A | | | 4,094 | | | | 320,724 | |
Robert Half International | | | 2,526 | | | | 119,404 | |
Rockwell Automation | | | 2,282 | | | | 432,393 | |
Rollins | | | 2,795 | | | | 111,800 | |
| | | | | | | |
| COMMON STOCK — continued | |
| Industrials — continued | | | | | |
Roper Technologies | | | 2,104 | | | $ | 717,527 | |
Snap-On | | | 1,110 | | | | 144,622 | |
Southwest Airlines | | | 9,705 | | | | 303,281 | |
Stanley Black & Decker | | | 3,143 | | | | 346,359 | |
Trane Technologies | | | 4,987 | | | | 435,964 | |
TransDigm Group | | | 1,059 | | | | 384,501 | |
Union Pacific | | | 14,098 | | | | 2,252,719 | |
United Airlines Holdings * | | | 4,393 | | | | 129,945 | |
United Parcel Service, Cl B | | | 14,183 | | | | 1,342,563 | |
United Rentals * | | | 1,603 | | | | 205,986 | |
Verisk Analytics, Cl A | | | 3,176 | | | | 485,388 | |
Waste Management | | | 7,928 | | | | 792,958 | |
| Westinghouse Air Brake Technologies | | | 3,547 | | | | 200,122 | |
WW Grainger | | | 858 | | | | 236,448 | |
Xylem | | | 3,610 | | | | 259,559 | |
| | | | | | | | 25,907,314 | |
| Information Technology — 25.8% | | | | | |
Accenture, Cl A | | | 8,247 | | | | 1,527,262 | |
Adobe * | | | 6,542 | | | | 2,313,513 | |
Advanced Micro Devices * | | | 15,791 | | | | 827,290 | |
Akamai Technologies * | | | 2,197 | | | | 214,669 | |
Alliance Data Systems | | | 585 | | | | 29,291 | |
Amphenol, Cl A | | | 3,827 | | | | 337,771 | |
Analog Devices | | | 4,856 | | | | 532,218 | |
ANSYS * | | | 1,091 | | | | 285,657 | |
Apple | | | 55,567 | | | | 16,325,585 | |
Applied Materials | | | 12,190 | | | | 605,599 | |
Arista Networks * | | | 708 | | | | 155,264 | |
Autodesk * | | | 2,912 | | | | 544,923 | |
Automatic Data Processing | | | 5,627 | | | | 825,425 | |
Broadcom | | | 5,420 | | | | 1,472,180 | |
Broadridge Financial Solutions | | | 1,578 | | | | 183,048 | |
| | | | | | | |
| COMMON STOCK — continued | |
| Information Technology — continued | | | | | |
Cadence Design Systems * | | | 3,669 | | | $ | 297,666 | |
CDW | | | 1,885 | | | | 208,858 | |
Cisco Systems | | | 55,851 | | | | 2,366,966 | |
Citrix Systems | | | 1,652 | | | | 239,557 | |
| Cognizant Technology Solutions, Cl A | | | 7,360 | | | | 427,027 | |
DXC Technology | | | 3,412 | | | | 61,860 | |
F5 Networks * | | | 823 | | | | 114,611 | |
| Fidelity National Information Services | | | 8,186 | | | | 1,079,652 | |
Fiserv * | | | 7,986 | | | | 823,037 | |
FleetCor Technologies * | | | 1,107 | | | | 267,064 | |
FLIR Systems | | | 1,820 | | | | 78,988 | |
Fortinet * | | | 1,960 | | | | 211,170 | |
Gartner * | | | 1,227 | | | | 145,780 | |
Global Payments | | | 3,906 | | | | 648,474 | |
Hewlett Packard Enterprise | | | 17,510 | | | | 176,151 | |
HP | | | 19,636 | | | | 304,554 | |
Intel | | | 58,392 | | | | 3,502,353 | |
| International Business Machines | | | 11,519 | | | | 1,446,326 | |
Intuit | | | 3,359 | | | | 906,292 | |
IPG Photonics * | | | 516 | | | | 66,734 | |
Jack Henry & Associates | | | 1,057 | | | | 172,872 | |
Juniper Networks | | | 4,732 | | | | 102,211 | |
Keysight Technologies * | | | 2,518 | | | | 243,667 | |
KLA | | | 2,107 | | | | 345,738 | |
Lam Research | | | 1,948 | | | | 497,285 | |
Mastercard, Cl A | | | 11,669 | | | | 3,208,624 | |
Maxim Integrated Products | | | 3,480 | | | | 191,330 | |
Microchip Technology | | | 3,137 | | | | 275,209 | |
Micron Technology * | | | 14,431 | | | | 691,101 | |
Microsoft | | | 101,462 | | | | 18,183,004 | |
Motorola Solutions | | | 2,188 | | | | 314,656 | |
NetApp | | | 3,124 | | | | 136,737 | |
| | | | | | | |
| COMMON STOCK — continued | |
| Information Technology — continued | | | | | |
NortonLifeLock | | | 8,148 | | | $ | 173,308 | |
NVIDIA | | | 8,122 | | | | 2,373,899 | |
Oracle | | | 28,382 | | | | 1,503,395 | |
Paychex | | | 4,255 | | | | 291,553 | |
PayPal Holdings * | | | 15,947 | | | | 1,961,481 | |
Qorvo * | | | 1,638 | | | | 160,573 | |
QUALCOMM | | | 15,027 | | | | 1,182,174 | |
salesforce.com * | | | 11,788 | | | | 1,909,067 | |
Seagate Technology | | | 3,214 | | | | 160,539 | |
Skyworks Solutions | | | 2,366 | | | | 245,780 | |
Synopsys * | | | 1,985 | | | | 311,883 | |
TE Connectivity | | | 4,350 | | | | 319,551 | |
Texas Instruments | | | 12,130 | | | | 1,407,929 | |
VeriSign * | | | 1,357 | | | | 284,278 | |
Visa, Cl A | | | 22,959 | | | | 4,103,231 | |
Western Digital | | | 3,901 | | | | 179,758 | |
Western Union | | | 6,070 | | | | 115,755 | |
Xerox Holdings | | | 2,734 | | | | 50,005 | |
Xilinx | | | 3,371 | | | | 294,625 | |
| | | | | | | | 80,944,033 | |
| Materials — 1.9% | | | | | |
Air Products & Chemicals | | | 2,805 | | | | 632,752 | |
Albemarle | | | 1,454 | | | | 89,319 | |
Avery Dennison | | | 1,095 | | | | 120,877 | |
Ball | | | 4,350 | | | | 285,316 | |
Celanese, Cl A | | | 1,605 | | | | 133,327 | |
CF Industries Holdings | | | 3,012 | | | | 82,830 | |
Corteva | | | 9,643 | | | | 252,550 | |
Dow | | | 9,639 | | | | 353,655 | |
DuPont de Nemours | | | 9,642 | | | | 453,367 | |
Eastman Chemical | | | 1,829 | | | | 110,673 | |
Ecolab | | | 3,254 | | | | 629,649 | |
| | | | | | | |
| COMMON STOCK — continued | |
| Materials — continued | | | | | |
FMC | | | 1,768 | | | $ | 162,479 | |
| Freeport-McMoRan Copper & Gold | | | 19,590 | | | | 172,980 | |
| International Flavors & Fragrances | | | 1,347 | | | | 176,497 | |
International Paper | | | 5,200 | | | | 178,100 | |
| LyondellBasell Industries, Cl A | | | 3,199 | | | | 185,382 | |
Martin Marietta Materials | | | 863 | | | | 164,168 | |
Mosaic | | | 4,644 | | | | 53,452 | |
Newmont | | | 10,704 | | | | 636,674 | |
Nucor | | | 4,007 | | | | 165,048 | |
Packaging Corp of America | | | 1,227 | | | | 118,590 | |
PPG Industries | | | 3,014 | | | | 273,762 | |
Sealed Air | | | 1,932 | | | | 55,236 | |
Sherwin-Williams | | | 1,043 | | | | 559,434 | |
Vulcan Materials | | | 1,717 | | | | 193,970 | |
Westrock | | | 3,363 | | | | 108,255 | |
| | | | | | | | 6,348,342 | |
| Real Estate — 2.9% | | | | | |
Alexandria Real Estate Equities ‡ | | | 1,498 | | | | 235,321 | |
American Tower, Cl A ‡ | | | 5,976 | | | | 1,422,289 | |
Apartment Investment & Management, Cl A ‡ | | | 1,906 | | | | 71,799 | |
AvalonBay Communities ‡ | | | 1,814 | | | | 295,591 | |
Boston Properties ‡ | | | 2,002 | | | | 194,554 | |
CBRE Group, Cl A * | | | 4,063 | | | | 174,425 | |
Crown Castle International ‡ | | | 5,420 | | | | 864,111 | |
Digital Realty Trust ‡ | | | 3,421 | | | | 511,405 | |
Duke Realty ‡ | | | 4,602 | | | | 159,689 | |
Equinix ‡ | | | 1,087 | | | | 733,942 | |
Equity Residential ‡ | | | 4,790 | | | | 311,637 | |
Essex Property Trust ‡ | | | 891 | | | | 217,493 | |
Extra Space Storage ‡ | | | 1,663 | | | | 146,743 | |
Federal Realty Investment Trust ‡ | | | 913 | | | | 76,026 | |
Healthpeak Properties ‡ | | | 6,242 | | | | 163,166 | |
| | | | | | | |
| COMMON STOCK — continued | |
| Real Estate — continued | | | | | |
Host Hotels & Resorts ‡ | | | 9,678 | | | $ | 119,136 | |
Iron Mountain ‡ | | | 3,512 | | | | 84,920 | |
Kimco Realty ‡ | | | 5,540 | | | | 60,441 | |
Mid-America Apartment Communities ‡ | | | 1,424 | | | | 159,374 | |
ProLogis ‡ | | | 9,590 | | | | 855,716 | |
Public Storage ‡ | | | 1,969 | | | | 365,151 | |
Realty Income ‡ | | | 4,453 | | | | 244,559 | |
Regency Centers ‡ | | | 2,039 | | | | 89,532 | |
SBA Communications, Cl A ‡ | | | 1,481 | | | | 429,372 | |
Simon Property Group ‡ | | | 3,970 | | | | 265,077 | |
SL Green Realty ‡ | | | 1,184 | | | | 62,811 | |
UDR ‡ | | | 3,590 | | | | 134,517 | |
Ventas ‡ | | | 4,713 | | | | 152,466 | |
Vornado Realty Trust ‡ | | | 2,255 | | | | 98,814 | |
Welltower ‡ | | | 5,500 | | | | 281,765 | |
Weyerhaeuser ‡ | | | 9,842 | | | | 215,245 | |
| | | | | | | | 9,197,087 | |
| Utilities — 3.2% | | | | | |
AES | | | 8,672 | | | | 114,904 | |
Alliant Energy | | | 3,047 | | | | 147,932 | |
Ameren | | | 3,200 | | | | 232,800 | |
American Electric Power | | | 6,481 | | | | 538,636 | |
American Water Works | | | 2,349 | | | | 285,850 | |
Atmos Energy | | | 1,494 | | | | 152,343 | |
CenterPoint Energy | | | 6,368 | | | | 108,447 | |
CMS Energy | | | 3,728 | | | | 212,832 | |
Consolidated Edison | | | 4,123 | | | | 324,892 | |
Dominion Energy | | | 10,476 | | | | 808,014 | |
DTE Energy | | | 2,396 | | | | 248,561 | |
Duke Energy | | | 9,377 | | | | 793,857 | |
Edison International | | | 4,362 | | | | 256,093 | |
Entergy | | | 2,432 | | | | 232,280 | |
| | | | | | | |
| COMMON STOCK — continued | |
| Utilities — continued | | | | | |
Evergy | | | 3,183 | | | $ | 185,983 | |
Eversource Energy | | | 4,153 | | | | 335,147 | |
Exelon | | | 12,440 | | | | 461,275 | |
FirstEnergy | | | 6,622 | | | | 273,290 | |
NextEra Energy | | | 6,442 | | | | 1,488,874 | |
NiSource | | | 4,583 | | | | 115,079 | |
NRG Energy | | | 3,507 | | | | 117,590 | |
Pinnacle West Capital | | | 1,456 | | | | 112,097 | |
PPL | | | 9,276 | | | | 235,796 | |
| Public Service Enterprise Group | | | 6,665 | | | | 337,982 | |
Sempra Energy | | | 3,520 | | | | 435,952 | |
Southern | | | 13,305 | | | | 754,793 | |
WEC Energy Group | | | 4,123 | | | | 373,338 | |
Xcel Energy | | | 6,771 | | | | 430,365 | |
| | | | | | | | 10,115,002 | |
TOTAL UNITED STATES | | | | | | | 310,905,047 | |
| TOTAL COMMON STOCK | | | | | | | | |
(Cost $290,819,951) | | | | | | | 312,432,730 | |
| TOTAL INVESTMENTS — 99.9% | | | | | | | | |
(Cost $290,819,951) | | | | | | $ | 312,432,730 | |
Percentages are based on Net Assets of $312,826,616.
| ‡ | Real Estate Investment Trust |
| * | Non-income producing security. |
| Cl — Class |
| S&P — Standard & Poor’s |
As of April 30, 2020, all of the Fund’s investments were considered Level 1, in accordance with authoritative guidance on fair value measurements and disclosure under U.S. GAAP.
For the period ended April 30, 2020, there have been no transfers in or out of Level 3.
| | |
| Schedule of Investments |
| April 30, 2020 (Unaudited) |
| Global X NASDAQ 100® Covered Call ETF | |
Sector Weightings †:
† Sector weightings percentages are based on the total market value of investments.
| | | | | | | |
COMMON STOCK — 103.8% (A) | | | | | | |
| ARGENTINA— 0.3% | | | | | | |
| Consumer Discretionary — 0.3% | | | | | | |
MercadoLibre * | | | 5,032 | | | $ | 2,936,222 | |
| CHINA— 1.2% | | | | | | | | |
| Communication Services — 0.6% | | | | | | | | |
Baidu ADR * | | | 27,927 | | | | 2,818,672 | |
NetEase ADR | | | 7,354 | | | | 2,536,836 | |
| | | | | | | | 5,355,508 | |
| Consumer Discretionary — 0.6% | | | | | | | | |
JD.com ADR * | | | 99,171 | | | | 4,274,270 | |
Trip.com Group ADR * | | | 51,750 | | | | 1,333,080 | |
| | | | | | | | 5,607,350 | |
TOTAL CHINA | | | | | | | 10,962,858 | |
| ISRAEL— 0.2% | | | | | | | | |
| Information Technology — 0.2% | | | | | | | | |
Check Point Software Technologies * | | | 15,189 | | | | 1,606,085 | |
| | | | | | | |
| COMMON STOCK — continued | | | | | | | | |
| NETHERLANDS— 0.5% | | | | | | | | |
| Information Technology — 0.5% | | | | | | | | |
ASML Holding, Cl G | | | 7,436 | | | $ | 2,144,765 | |
NXP Semiconductors | | | 28,162 | | | | 2,804,090 | |
TOTAL NETHERLANDS | | | | | | | 4,948,856 | |
| UNITED KINGDOM— 0.1% | | | | | | | | |
| Communication Services — 0.1% | | | | | | | | |
Liberty Global * | | | 52,318 | | | | 957,942 | |
Liberty Global, Cl A * | | | 20,709 | | | | 402,169 | |
TOTAL UNITED KINGDOM | | | | | | | 1,360,111 | |
| UNITED STATES— 101.7% | | | | | | | | |
| Communication Services — 20.4% | | | | | | | | |
Activision Blizzard | | | 81,945 | | | | 5,222,355 | |
Alphabet, Cl A * | | | 28,391 | | | | 38,234,160 | |
Alphabet, Cl C * | | | 28,262 | | | | 38,115,829 | |
Charter Communications, Cl A * | | | 22,290 | | | | 11,038,677 | |
Comcast, Cl A | | | 479,278 | | | | 18,035,231 | |
Electronic Arts * | | | 29,555 | | | | 3,376,954 | |
Facebook, Cl A * | | | 198,740 | | | | 40,684,066 | |
Fox, Cl A | | | 34,650 | | | | 896,396 | |
Fox, Cl B | | | 25,558 | | | | 653,262 | |
Netflix * | | | 46,251 | | | | 19,418,482 | |
Sirius XM Holdings | | | 445,429 | | | | 2,632,485 | |
Take-Two Interactive Software * | | | 11,275 | | | | 1,364,839 | |
T-Mobile US * | | | 90,809 | | | | 7,973,030 | |
| | | | | | | | 187,645,766 | |
| Consumer Discretionary — 16.6% | | | | | | | | |
Amazon.com * | | | 41,209 | | | | 101,951,066 | |
Booking Holdings * | | | 4,381 | | | | 6,486,377 | |
Dollar Tree * | | | 23,730 | | | | 1,890,569 | |
eBay | | | 82,219 | | | | 3,274,783 | |
Expedia Group | | | 15,491 | | | | 1,099,551 | |
| | | | | | | |
| COMMON STOCK — continued | | | | | | | | |
| Consumer Discretionary — continued | | | | | | | | |
Lululemon Athletica * | | | 12,420 | | | $ | 2,775,622 | |
Marriott International, Cl A | | | 32,969 | | | | 2,998,201 | |
O’Reilly Automotive * | | | 7,645 | | | | 2,953,569 | |
Ross Stores | | | 36,583 | | | | 3,342,224 | |
Starbucks | | | 125,184 | | | | 9,605,368 | |
Tesla * | | | 19,513 | | | | 15,256,824 | |
Ulta Beauty * | | | 6,571 | | | | 1,431,952 | |
| | | | | | | | 153,066,106 | |
| Consumer Staples — 5.8% | | | | | | | | |
Costco Wholesale | | | 46,693 | | | | 14,147,979 | |
Kraft Heinz | | | 131,076 | | | | 3,975,535 | |
Mondelez International, Cl A | | | 152,841 | | | | 7,862,141 | |
Monster Beverage * | | | 54,421 | | | | 3,363,762 | |
PepsiCo | | | 147,147 | | | | 19,466,077 | |
Walgreens Boots Alliance | | | 95,613 | | | | 4,139,087 | |
| | | | | | | | 52,954,581 | |
| Health Care — 8.0% | | | | | | | | |
Alexion Pharmaceuticals * | | | 22,247 | | | | 2,390,885 | |
Align Technology * | | | 7,843 | | | | 1,685,069 | |
Amgen | | | 62,795 | | | | 15,021,820 | |
Biogen Idec * | | | 18,586 | | | | 5,516,882 | |
BioMarin Pharmaceutical * | | | 17,913 | | | | 1,648,354 | |
Cerner | | | 31,565 | | | | 2,190,295 | |
DexCom * | | | 9,871 | | | | 3,308,759 | |
Gilead Sciences | | | 133,948 | | | | 11,251,632 | |
IDEXX Laboratories * | | | 8,634 | | | | 2,396,798 | |
Illumina * | | | 15,709 | | | | 5,011,642 | |
Incyte * | | | 21,631 | | | | 2,112,483 | |
Intuitive Surgical * | | | 12,297 | | | | 6,282,292 | |
Regeneron Pharmaceuticals * | | | 11,482 | | | | 6,038,154 | |
Seattle Genetics * | | | 17,246 | | | | 2,366,669 | |
| | | | | | | |
| COMMON STOCK — continued | | | | | | | | |
| Health Care — continued | | | | | | | | |
Vertex Pharmaceuticals * | | | 27,323 | | | $ | 6,863,538 | |
| | | | | | | | 74,085,272 | |
| Industrials — 2.2% | | | | | | | | |
Cintas | | | 10,383 | | | | 2,303,261 | |
Copart * | | | 23,219 | | | | 1,860,074 | |
CoStar Group * | | | 3,685 | | | | 2,388,838 | |
CSX | | | 83,497 | | | | 5,530,006 | |
Fastenal | | | 57,567 | | | | 2,085,077 | |
PACCAR | | | 34,803 | | | | 2,409,412 | |
United Airlines Holdings * | | | 28,284 | | | | 836,641 | |
Verisk Analytics, Cl A | | | 16,511 | | | | 2,523,376 | |
| | | | | | | | 19,936,685 | |
| Information Technology — 46.0% | | | | | | | | |
Adobe * | | | 51,106 | | | | 18,073,126 | |
Advanced Micro Devices * | | | 124,624 | | | | 6,529,051 | |
Analog Devices | | | 39,489 | | | | 4,327,994 | |
ANSYS * | | | 9,326 | | | | 2,441,827 | |
Apple | | | 362,183 | | | | 106,409,365 | |
Applied Materials | | | 98,599 | | | | 4,898,398 | |
Autodesk * | | | 23,518 | | | | 4,400,923 | |
Automatic Data Processing | | | 46,049 | | | | 6,754,928 | |
Broadcom | | | 41,994 | | | | 11,406,410 | |
Cadence Design Systems * | | | 28,215 | | | | 2,289,083 | |
CDW | | | 14,307 | | | | 1,585,216 | |
Cisco Systems | | | 447,787 | | | | 18,977,213 | |
Citrix Systems | | | 13,056 | | | | 1,893,251 | |
| Cognizant Technology Solutions, Cl A | | | 59,074 | | | | 3,427,473 | |
Fiserv * | | | 72,265 | | | | 7,447,631 | |
Intel | | | 452,443 | | | | 27,137,532 | |
Intuit | | | 27,669 | | | | 7,465,373 | |
KLA | | | 15,901 | | | | 2,609,195 | |
Lam Research | | | 15,543 | | | | 3,967,817 | |
| | | Shares/Number of Contracts | | | | |
| COMMON STOCK — continued | |
| Information Technology — continued | | | | | |
Maxim Integrated Products | | | 30,091 | | | $ | 1,654,403 | |
Microchip Technology | | | 23,947 | | | | 2,100,870 | |
Micron Technology * | | | 118,125 | | | | 5,657,006 | |
Microsoft | | | 629,033 | | | | 112,729,004 | |
NetApp | | | 25,999 | | | | 1,137,976 | |
NVIDIA | | | 64,600 | | | | 18,881,289 | |
Paychex | | | 36,020 | | | | 2,468,090 | |
PayPal Holdings * | | | 124,133 | | | | 15,268,359 | |
QUALCOMM | | | 121,069 | | | | 9,524,498 | |
Skyworks Solutions | | | 17,006 | | | | 1,766,583 | |
Splunk * | | | 16,972 | | | | 2,382,190 | |
Synopsys * | | | 15,118 | | | | 2,375,340 | |
Texas Instruments | | | 98,960 | | | | 11,486,288 | |
VeriSign * | | | 11,818 | | | | 2,475,753 | |
Western Digital | | | 33,259 | | | | 1,532,575 | |
Workday, Cl A * | | | 18,081 | | | | 2,782,666 | |
Xilinx | | | 25,294 | | | | 2,210,696 | |
Zoom Video Communications, Cl A * | | | 12,224 | | | | 1,652,318 | |
| | | | | | | | 440,127,709 | |
| Utilities — 0.8% | | | | | |
Exelon | | | 104,281 | | | | 3,866,739 | |
Xcel Energy | | | 54,296 | | | | 3,451,054 | |
| | | | | | | | 7,317,793 | |
TOTAL UNITED STATES | | | | | | | 937,278,678 | |
| TOTAL COMMON STOCK | | | | | | | | |
(Cost $753,515,315) | | | | | | | 956,948,044 | |
| TOTAL INVESTMENTS — 103.8% | | | | | | | | |
(Cost $753,515,315) | | | | | | $ | 956,948,044 | |
WRITTEN OPTION— (3.9)%(1) | | | | | | | | |
| (Premiums Received $33,753,480) | | | (1,063 | ) | | $ | (36,120,740 | ) |
Percentages are based on Net Assets of $922,084,914.
A list of the exchange traded option contracts held by the Fund at April 30, 2020, is as follows:
Description | | Number of Contracts | | | Notional Amount+ | | | Exercise Price | | Expiration Date | | Value | |
WRITTEN OPTION — (3.9)% | | | | | | | | | | | | | |
| Call Options | | | | | | | | | | | | | |
May 20 Calls on NDX* | | (1,063) |
| | $ | (33,753,480 | ) | | $ | 339.80 | | 05/16/20 | | $ | (36,120,740 | ) |
| Total Written Option | | | | | $ | (33,753,480 | ) | | | | | | | $ | (36,120,740 | ) |
| * | Non-income producing security. |
| + | Represents cost. |
| (A) | All or a portion of these securities has been segregated as collateral for written options contracts. The aggregate market value of collateral at April 30, 2020 was $955,124,706. |
| (1) | Refer to table on following page for details on Options Contracts. |
| ADR — American Depositary Receipt |
| Cl — Class |
NDX — Nasdaq 100® Index |
As of April 30, 2020, all of the Fund’s investments were considered Level 1, in accordance with authoritative guidance on fair value measurements and disclosure under U.S. GAAP.
For the period ended April 30, 2020, there have been no transfers in or out of Level 3.
| | |
| Schedule of Investments |
| April 30, 2020 (Unaudited) |
| Global X S&P 500® Covered Call ETF | |
Sector Weightings †:
† Sector weightings percentages are based on the total market value of investments.
| | | | | | | |
COMMON STOCK — 102.1%(A) | | | | | | |
| UNITED KINGDOM— 0.5% | | | | | | |
| Energy — 0.0% | | | | | | |
TechnipFMC | | | 2,337 | | | $ | 20,823 | |
| Materials — 0.5% | | | | | | | | |
Amcor | | | 8,128 | | | | 72,908 | |
Linde | | | 2,414 | | | | 444,152 | |
| | | | | | | | 517,060 | |
TOTAL UNITED KINGDOM | | | | | | | 537,883 | |
| UNITED STATES— 101.6% | | | | | | | | |
| Communication Services — 11.1% | | | | | | | | |
Activision Blizzard | | | 3,425 | | | | 218,275 | |
Alphabet, Cl A * | | | 1,354 | | | | 1,823,432 | |
Alphabet, Cl C * | | | 1,351 | | | | 1,822,040 | |
| | | | | | | |
| COMMON STOCK — continued | | | | | | | | |
| Communication Services — continued | | | | | | | | |
AT&T | | | 32,970 | | | $ | 1,004,596 | |
CenturyLink | | | 5,202 | | | | 55,245 | |
Charter Communications, Cl A * | | | 703 | | | | 348,147 | |
Comcast, Cl A | | | 20,466 | | | | 770,136 | |
Discovery, Cl A * | | | 837 | | | | 18,766 | |
Discovery, Cl C * | | | 1,774 | | | | 36,207 | |
DISH Network, Cl A * | | | 1,295 | | | | 32,394 | |
Electronic Arts * | | | 1,290 | | | | 147,395 | |
Facebook, Cl A * | | | 10,880 | | | | 2,227,245 | |
Fox, Cl A | | | 1,873 | | | | 48,454 | |
Fox, Cl B | | | 841 | | | | 21,496 | |
Interpublic Group | | | 2,101 | | | | 35,675 | |
Live Nation Entertainment * | | | 552 | | | | 24,768 | |
Netflix * | | | 1,976 | | | | 829,624 | |
News, Cl A | | | 2,060 | | | | 20,415 | |
News, Cl B | | | 668 | | | | 6,827 | |
Omnicom Group | | | 1,128 | | | | 64,330 | |
Take-Two Interactive Software * | | | 536 | | | | 64,883 | |
T-Mobile US * | | | 1,684 | | | | 147,855 | |
Twitter * | | | 3,761 | | | | 107,865 | |
Verizon Communications | | | 18,670 | | | | 1,072,592 | |
ViacomCBS, Cl B | | | 2,343 | | | | 40,440 | |
Walt Disney | | | 8,129 | | | | 879,151 | |
| | | | | | | | 11,868,253 | |
| Consumer Discretionary — 10.7% | | | | | | | | |
Advance Auto Parts | | | 359 | | | | 43,407 | |
Amazon.com * | | | 1,885 | | | | 4,663,490 | |
Aptiv | | | 1,117 | | | | 77,688 | |
AutoZone * | | | 109 | | | | 111,215 | |
Best Buy | | | 979 | | | | 75,119 | |
Booking Holdings * | | | 187 | | | | 276,866 | |
BorgWarner | | | 1,097 | | | | 31,341 | |
| | | | | | | |
COMMON STOCK — continued | | | | | | | | |
| Consumer Discretionary — continued | | | | | | | | |
Capri Holdings * | | | 820 | | | $ | 12,505 | |
CarMax * | | | 842 | | | | 62,013 | |
Carnival | | | 2,054 | | | | 32,659 | |
Chipotle Mexican Grill, Cl A * | | | 125 | | | | 109,819 | |
Darden Restaurants | | | 665 | | | | 49,070 | |
Dollar General | | | 1,133 | | | | 198,615 | |
Dollar Tree * | | | 1,027 | | | | 81,821 | |
DR Horton | | | 1,476 | | | | 69,697 | |
eBay | | | 3,366 | | | | 134,068 | |
Expedia Group | | | 664 | | | | 47,131 | |
Ford Motor | | | 16,932 | | | | 86,184 | |
Gap | | | 1,174 | | | | 9,533 | |
Garmin | | | 626 | | | | 50,806 | |
General Motors | | | 5,533 | | | | 123,331 | |
Genuine Parts | | | 610 | | | | 48,361 | |
H&R Block | | | 1,120 | | | | 18,648 | |
Hanesbrands | | | 1,953 | | | | 19,413 | |
Harley-Davidson | | | 894 | | | | 19,516 | |
Hasbro | | | 597 | | | | 43,110 | |
Hilton Worldwide Holdings | | | 1,305 | | | | 98,802 | |
Home Depot | | | 4,923 | | | | 1,082,223 | |
Kohl’s | | | 907 | | | | 16,743 | |
L Brands | | | 1,299 | | | | 15,445 | |
Las Vegas Sands | | | 1,454 | | | | 69,821 | |
Leggett & Platt | | | 711 | | | | 24,978 | |
Lennar, Cl A | | | 1,428 | | | | 71,500 | |
LKQ * | | | 1,677 | | | | 43,853 | |
Lowe’s | | | 3,434 | | | | 359,711 | |
Marriott International, Cl A | | | 1,277 | | | | 116,130 | |
McDonald’s | | | 3,392 | | | | 636,203 | |
MGM Resorts International | | | 2,531 | | | | 42,597 | |
Mohawk Industries * | | | 343 | | | | 30,088 | |
| | | | | | | |
| COMMON STOCK — continued | | | | | | | | |
| Consumer Discretionary — continued | | | | | | | | |
Newell Brands | | | 2,080 | | | $ | 28,870 | |
NIKE, Cl B | | | 5,604 | | | | 488,557 | |
Nordstrom | | | 614 | | | | 11,531 | |
Norwegian Cruise Line Holdings * | | | 888 | | | | 14,563 | |
NVR * | | | 18 | | | | 55,800 | |
O’Reilly Automotive * | | | 333 | | | | 128,651 | |
PulteGroup | | | 1,483 | | | | 41,924 | |
PVH | | | 412 | | | | 20,283 | |
Ralph Lauren, Cl A | | | 298 | | | | 21,986 | |
Ross Stores | | | 1,599 | | | | 146,085 | |
Royal Caribbean Cruises | | | 775 | | | | 36,247 | |
Starbucks | | | 5,301 | | | | 406,746 | |
Tapestry | | | 1,558 | | | | 23,183 | |
Target | | | 2,262 | | | | 248,232 | |
Tiffany | | | 460 | | | | 58,190 | |
TJX | | | 5,420 | | | | 265,851 | |
Tractor Supply | | | 496 | | | | 50,309 | |
Ulta Beauty * | | | 242 | | | | 52,737 | |
Under Armour, Cl A * | | | 1,000 | | | | 10,420 | |
Under Armour, Cl C * | | | 1,031 | | | | 9,557 | |
VF | | | 1,421 | | | | 82,560 | |
Whirlpool | | | 307 | | | | 34,304 | |
Wynn Resorts | | | 397 | | | | 33,955 | |
Yum! Brands | | | 1,326 | | | | 114,606 | |
| | | | | | | | 11,488,667 | |
| Consumer Staples — 7.5% | | | | | | | | |
Altria Group | | | 8,374 | | | | 328,679 | |
Archer-Daniels-Midland | | | 2,619 | | | | 97,270 | |
Brown-Forman, Cl B | | | 923 | | | | 57,411 | |
Campbell Soup | | | 686 | | | | 34,286 | |
Church & Dwight | | | 1,061 | | | | 74,259 | |
Clorox | | | 550 | | | | 102,542 | |
| | | | | | | |
| COMMON STOCK — continued | | | | | | | | |
| Consumer Staples — continued | | | | | | | | |
Coca-Cola | | | 17,390 | | | $ | 798,027 | |
Colgate-Palmolive | | | 3,832 | | | | 269,275 | |
Conagra Brands | | | 2,122 | | | | 70,960 | |
Constellation Brands, Cl A | | | 737 | | | | 121,377 | |
Costco Wholesale | | | 1,989 | | | | 602,667 | |
Coty, Cl A | | | 1,313 | | | | 7,156 | |
Estee Lauder, Cl A | | | 986 | | | | 173,930 | |
General Mills | | | 2,677 | | | | 160,326 | |
Hershey | | | 702 | | | | 92,966 | |
Hormel Foods | | | 1,187 | | | | 55,611 | |
JM Smucker | | | 486 | | | | 55,846 | |
Kellogg | | | 1,071 | | | | 70,150 | |
Kimberly-Clark | | | 1,527 | | | | 211,459 | |
Kraft Heinz | | | 2,695 | | | | 81,739 | |
Kroger | | | 3,518 | | | | 111,204 | |
Lamb Weston Holdings | | | 585 | | | | 35,896 | |
McCormick | | | 537 | | | | 84,223 | |
Molson Coors Beverage, Cl B | | | 994 | | | | 40,764 | |
Mondelez International, Cl A | | | 6,453 | | | | 331,942 | |
Monster Beverage * | | | 1,671 | | | | 103,284 | |
PepsiCo | | | 6,289 | | | | 831,972 | |
Philip Morris International | | | 7,001 | | | | 522,275 | |
Procter & Gamble | | | 11,266 | | | | 1,327,924 | |
Sysco | | | 2,238 | | | | 125,932 | |
Tyson Foods, Cl A | | | 1,349 | | | | 83,894 | |
Walgreens Boots Alliance | | | 3,314 | | | | 143,463 | |
Walmart | | | 6,398 | | | | 777,677 | |
| | | | | | | | 7,986,386 | |
| Energy — 3.1% | | | | | | | | |
Apache | | | 2,047 | | | | 26,775 | |
Baker Hughes, Cl A | | | 2,835 | | | | 39,548 | |
Cabot Oil & Gas | | | 2,138 | | | | 46,223 | |
| | | | | | | |
| COMMON STOCK — continued | | | | | | | | |
| Energy — continued | | | | | | | | |
Chevron | | | 8,522 | | | $ | 784,024 | |
Concho Resources | | | 1,037 | | | | 58,819 | |
ConocoPhillips | | | 4,866 | | | | 204,859 | |
Devon Energy | | | 1,503 | | | | 18,742 | |
Diamondback Energy | | | 812 | | | | 35,354 | |
EOG Resources | | | 2,547 | | | | 121,008 | |
Exxon Mobil | | | 19,079 | | | | 886,601 | |
Halliburton | | | 3,949 | | | | 41,465 | |
Helmerich & Payne | | | 594 | | | | 11,743 | |
Hess | | | 1,271 | | | | 61,821 | |
HollyFrontier | | | 799 | | | | 26,399 | |
Kinder Morgan | | | 8,579 | | | | 130,658 | |
Marathon Oil | | | 4,538 | | | | 27,773 | |
Marathon Petroleum | | | 3,206 | | | | 102,848 | |
National Oilwell Varco | | | 2,059 | | | | 26,026 | |
Noble Energy | | | 2,600 | | | | 25,506 | |
Occidental Petroleum | | | 4,296 | | | | 71,314 | |
ONEOK | | | 1,861 | | | | 55,700 | |
Phillips 66 | | | 1,951 | | | | 142,755 | |
Pioneer Natural Resources | | | 862 | | | | 76,985 | |
Schlumberger | | | 6,742 | | | | 113,400 | |
Valero Energy | | | 1,788 | | | | 113,270 | |
Williams | | | 5,427 | | | | 105,121 | |
| | | | | | | | 3,354,737 | |
| Financials — 10.8% | | | | | | | | |
Aflac | | | 3,446 | | | | 128,329 | |
Allstate | | | 1,432 | | | | 145,663 | |
American Express | | | 2,996 | | | | 273,385 | |
American International Group | | | 3,792 | | | | 96,431 | |
Ameriprise Financial | | | 615 | | | | 70,688 | |
Aon | | | 1,041 | | | | 179,750 | |
Arthur J Gallagher | | | 800 | | | | 62,800 | |
| | | | | | | |
| COMMON STOCK — continued | | | | | | | | |
| Financials — continued | | | | | | | | |
Assurant | | | 292 | | | $ | 31,022 | |
Bank of America | | | 36,510 | | | | 878,065 | |
Bank of New York Mellon | | | 3,704 | | | | 139,048 | |
Berkshire Hathaway, Cl B * | | | 8,840 | | | | 1,656,262 | |
BlackRock, Cl A | | | 526 | | | | 264,073 | |
Capital One Financial | | | 2,043 | | | | 132,305 | |
Cboe Global Markets | | | 466 | | | | 46,311 | |
Charles Schwab | | | 5,077 | | | | 191,504 | |
Chubb | | | 2,021 | | | | 218,288 | |
Cincinnati Financial | | | 645 | | | | 42,441 | |
Citigroup | | | 9,807 | | | | 476,228 | |
Citizens Financial Group | | | 1,892 | | | | 42,362 | |
CME Group, Cl A | | | 1,604 | | | | 285,849 | |
Comerica | | | 809 | | | | 28,202 | |
Discover Financial Services | | | 1,546 | | | | 66,431 | |
E*TRADE Financial | | | 931 | | | | 37,808 | |
Everest Re Group | | | 215 | | | | 37,223 | |
Fifth Third Bancorp | | | 3,682 | | | | 68,817 | |
First Republic Bank | | | 727 | | | | 75,819 | |
Franklin Resources | | | 1,480 | | | | 27,883 | |
Globe Life | | | 572 | | | | 47,099 | |
Goldman Sachs Group | | | 1,423 | | | | 261,007 | |
| Hartford Financial Services Group | | | 1,690 | | | | 64,203 | |
Huntington Bancshares | | | 5,076 | | | | 46,902 | |
Intercontinental Exchange | | | 2,482 | | | | 222,015 | |
Invesco | | | 2,191 | | | | 18,886 | |
JPMorgan Chase | | | 14,168 | | | | 1,356,728 | |
KeyCorp | | | 4,397 | | | | 51,225 | |
Lincoln National | | | 1,005 | | | | 35,647 | |
Loews | | | 1,184 | | | | 41,037 | |
M&T Bank | | | 627 | | | | 70,274 | |
MarketAxess Holdings | | | 163 | | | | 74,167 | |
| | | | | | | |
| COMMON STOCK — continued | | | | | | | | |
| Financials — continued | | | | | | | | |
Marsh & McLennan | | | 2,249 | | | $ | 218,895 | |
MetLife | | | 3,591 | | | | 129,563 | |
Moody’s | | | 720 | | | | 175,608 | |
Morgan Stanley | | | 5,180 | | | | 204,247 | |
MSCI, Cl A | | | 372 | | | | 121,644 | |
Nasdaq | | | 487 | | | | 53,409 | |
Northern Trust | | | 1,010 | | | | 79,952 | |
People’s United Financial | | | 1,928 | | | | 24,466 | |
PNC Financial Services Group | | | 1,948 | | | | 207,793 | |
Principal Financial Group | | | 1,261 | | | | 45,913 | |
Progressive | | | 2,603 | | | | 201,212 | |
Prudential Financial | | | 1,756 | | | | 109,522 | |
Raymond James Financial | | | 686 | | | | 45,221 | |
Regions Financial | | | 3,984 | | | | 42,828 | |
S&P Global | | | 1,094 | | | | 320,411 | |
State Street | | | 1,774 | | | | 111,833 | |
SVB Financial Group * | | | 271 | | | | 52,349 | |
Synchrony Financial | | | 2,932 | | | | 58,024 | |
T Rowe Price Group | | | 1,023 | | | | 118,290 | |
Travelers | | | 1,133 | | | | 114,671 | |
Truist Financial | | | 5,964 | | | | 222,576 | |
Unum Group | | | 1,205 | | | | 21,027 | |
US Bancorp | | | 6,333 | | | | 231,155 | |
Wells Fargo | | | 17,304 | | | | 502,681 | |
Willis Towers Watson | | | 564 | | | | 100,556 | |
WR Berkley | | | 719 | | | | 38,826 | |
Zions Bancorp | | | 932 | | | | 29,461 | |
| | | | | | | | 11,574,310 | |
| Health Care — 15.6% | | | | | | | | |
Abbott Laboratories | | | 7,967 | | | | 733,681 | |
AbbVie | | | 6,655 | | | | 547,041 | |
ABIOMED * | | | 231 | | | | 44,179 | |
| | | | | | | |
| COMMON STOCK — continued | | | | | | | | |
| Health Care — continued | | | | | | | | |
Agilent Technologies | | | 1,356 | | | $ | 103,951 | |
Alexion Pharmaceuticals * | | | 967 | | | | 103,924 | |
Align Technology * | | | 306 | | | | 65,744 | |
Allergan | | | 1,468 | | | | 275,015 | |
AmerisourceBergen, Cl A | | | 756 | | | | 67,783 | |
Amgen | | | 2,676 | | | | 640,153 | |
Anthem | | | 1,135 | | | | 318,628 | |
Baxter International | | | 2,273 | | | | 201,797 | |
Becton Dickinson | | | 1,211 | | | | 305,814 | |
Biogen Idec * | | | 807 | | | | 239,542 | |
Boston Scientific * | | | 6,217 | | | | 233,013 | |
Bristol-Myers Squibb | | | 10,558 | | | | 642,032 | |
Cardinal Health | | | 1,253 | | | | 61,998 | |
Centene * | | | 2,593 | | | | 172,642 | |
Cerner | | | 1,489 | | | | 103,322 | |
Cigna | | | 1,673 | | | | 327,540 | |
Cooper | | | 212 | | | | 60,780 | |
CVS Health | | | 5,834 | | | | 359,083 | |
Danaher | | | 2,873 | | | | 469,621 | |
DaVita * | | | 377 | | | | 29,787 | |
DENTSPLY SIRONA | | | 892 | | | | 37,856 | |
Edwards Lifesciences * | | | 929 | | | | 202,057 | |
Eli Lilly | | | 3,804 | | | | 588,250 | |
Gilead Sciences | | | 5,686 | | | | 477,624 | |
HCA Healthcare | | | 1,167 | | | | 128,230 | |
Henry Schein * | | | 723 | | | | 39,447 | |
Hologic * | | | 1,099 | | | | 55,060 | |
Humana | | | 591 | | | | 225,656 | |
IDEXX Laboratories * | | | 374 | | | | 103,822 | |
Illumina * | | | 654 | | | | 208,646 | |
Incyte * | | | 773 | | | | 75,491 | |
Intuitive Surgical * | | | 516 | | | | 263,614 | |
| | | | | | | |
| COMMON STOCK — continued | | | | | | |
| Health Care — continued | | | | | | |
IQVIA Holdings * | | | 790 | | | $ | 112,646 | |
Johnson & Johnson | | | 11,897 | | | | 1,785,026 | |
Laboratory Corp of America Holdings * | | | 414 | | | | 68,082 | |
McKesson | | | 706 | | | | 99,722 | |
Medtronic | | | 6,036 | | | | 589,295 | |
Merck | | | 11,488 | | | | 911,458 | |
Mettler-Toledo International * | | | 105 | | | | 75,594 | |
Mylan * | | | 2,604 | | | | 43,669 | |
PerkinElmer | | | 609 | | | | 55,133 | |
Perrigo | | | 699 | | | | 37,257 | |
Pfizer | | | 24,967 | | | | 957,734 | |
Quest Diagnostics | | | 572 | | | | 62,983 | |
Regeneron Pharmaceuticals * | | | 355 | | | | 186,687 | |
ResMed | | | 630 | | | | 97,852 | |
STERIS | | | 427 | | | | 60,847 | |
Stryker | | | 1,439 | | | | 268,273 | |
Teleflex | | | 231 | | | | 77,477 | |
Thermo Fisher Scientific | | | 1,805 | | | | 604,097 | |
UnitedHealth Group | | | 4,279 | | | | 1,251,479 | |
| Universal Health Services, Cl B | | | 391 | | | | 41,325 | |
Varian Medical Systems * | | | 362 | | | | 41,406 | |
Vertex Pharmaceuticals * | | | 1,151 | | | | 289,131 | |
Waters * | | | 274 | | | | 51,238 | |
Zimmer Biomet Holdings | | | 981 | | | | 117,426 | |
Zoetis, Cl A | | | 2,129 | | | | 275,301 | |
| | | | | | | | 16,673,961 | |
| Industrials — 8.2% | | | | | | | | |
| 3M | | | 2,580 | | | | 391,954 | |
Alaska Air Group | | | 657 | | | | 21,366 | |
Allegion | | | 504 | | | | 50,672 | |
American Airlines Group | | | 2,072 | | | | 24,885 | |
AMETEK | | | 1,127 | | | | 94,521 | |
| | | | | | | |
| COMMON STOCK — continued | | | | | | |
| Industrials — continued | | | | | | |
AO Smith | | | 775 | | | $ | 32,844 | |
Boeing | | | 2,398 | | | | 338,166 | |
Carrier Global * | | | 4,147 | | | | 73,443 | |
Caterpillar | | | 2,472 | | | | 287,691 | |
CH Robinson Worldwide | | | 563 | | | | 39,917 | |
Cintas | | | 417 | | | | 92,503 | |
Copart * | | | 877 | | | | 70,256 | |
CSX | | | 3,464 | | | | 229,421 | |
Cummins | | | 669 | | | | 109,381 | |
Deere | | | 1,399 | | | | 202,939 | |
Delta Air Lines | | | 2,679 | | | | 69,413 | |
Dover | | | 732 | | | | 68,552 | |
Eaton | | | 1,826 | | | | 152,471 | |
Emerson Electric | | | 2,686 | | | | 153,183 | |
Equifax | | | 518 | | | | 71,950 | |
| Expeditors International of Washington | | | 859 | | | | 61,509 | |
Fastenal | | | 2,574 | | | | 93,230 | |
FedEx | | | 1,058 | | | | 134,122 | |
Flowserve | | | 718 | | | | 20,226 | |
Fortive | | | 1,278 | | | | 81,792 | |
| Fortune Brands Home & Security | | | 805 | | | | 38,801 | |
General Dynamics | | | 1,035 | | | | 135,192 | |
General Electric | | | 39,013 | | | | 265,288 | |
Honeywell International | | | 3,210 | | | | 455,499 | |
Howmet Aerospace | | | 1,680 | | | | 21,958 | |
Huntington Ingalls Industries | | | 206 | | | | 39,430 | |
IDEX | | | 392 | | | | 60,223 | |
IHS Markit | | | 1,762 | | | | 118,583 | |
Illinois Tool Works | | | 1,301 | | | | 211,413 | |
Ingersoll Rand * | | | 1,686 | | | | 49,029 | |
Jacobs Engineering Group | | | 682 | | | | 56,435 | |
JB Hunt Transport Services | | | 461 | | | | 46,616 | |
| | | | | | | |
| COMMON STOCK — continued | | | | | | |
| Industrials — continued | | | | | | |
Johnson Controls International | | | 3,570 | | | $ | 103,923 | |
Kansas City Southern | | | 462 | | | | 60,314 | |
L3Harris Technologies | | | 983 | | | | 190,407 | |
Lockheed Martin | | | 1,115 | | | | 433,802 | |
Masco | | | 1,443 | | | | 59,221 | |
Nielsen Holdings | | | 1,853 | | | | 27,295 | |
Norfolk Southern | | | 1,159 | | | | 198,305 | |
Northrop Grumman | | | 700 | | | | 231,469 | |
Old Dominion Freight Line | | | 482 | | | | 70,030 | |
Otis Worldwide * | | | 2,073 | | | | 105,536 | |
PACCAR | | | 1,512 | | | | 104,676 | |
Parker-Hannifin | | | 573 | | | | 90,603 | |
Pentair | | | 877 | | | | 30,335 | |
Quanta Services | | | 802 | | | | 29,161 | |
Raytheon Technologies | | | 6,594 | | | | 427,330 | |
Republic Services, Cl A | | | 908 | | | | 71,133 | |
Robert Half International | | | 665 | | | | 31,434 | |
Rockwell Automation | | | 520 | | | | 98,530 | |
Rollins | | | 729 | | | | 29,160 | |
Roper Technologies | | | 460 | | | | 156,874 | |
Snap-On | | | 309 | | | | 40,260 | |
Southwest Airlines | | | 2,353 | | | | 73,531 | |
Stanley Black & Decker | | | 715 | | | | 78,793 | |
Textron | | | 1,217 | | | | 32,080 | |
Trane Technologies | | | 1,110 | | | | 97,036 | |
TransDigm Group | | | 225 | | | | 81,693 | |
Union Pacific | | | 3,119 | | | | 498,385 | |
United Airlines Holdings * | | | 964 | | | | 28,515 | |
United Parcel Service, Cl B | | | 3,138 | | | | 297,043 | |
United Rentals * | | | 401 | | | | 51,529 | |
Verisk Analytics, Cl A | | | 718 | | | | 109,732 | |
Waste Management | | | 1,731 | | | | 173,135 | |
| | | | | | | |
| COMMON STOCK — continued | | | | | | |
| Industrials — continued | | | | | | |
| Westinghouse Air Brake Technologies | | | 827 | | | $ | 46,659 | |
WW Grainger | | | 185 | | | | 50,982 | |
Xylem | | | 763 | | | | 54,860 | |
| | | | | | | | 8,728,645 | |
| Information Technology — 26.2% | | | | | | | | |
Accenture, Cl A | | | 2,855 | | | | 528,717 | |
Adobe * | | | 2,182 | | | | 771,642 | |
Advanced Micro Devices * | | | 5,233 | | | | 274,157 | |
Akamai Technologies * | | | 809 | | | | 79,047 | |
Alliance Data Systems | | | 259 | | | | 12,968 | |
Amphenol, Cl A | | | 1,375 | | | | 121,357 | |
Analog Devices | | | 1,633 | | | | 178,977 | |
ANSYS * | | | 413 | | | | 108,136 | |
Apple | | | 18,905 | | | | 5,554,289 | |
Applied Materials | | | 4,115 | | | | 204,433 | |
Arista Networks * | | | 280 | | | | 61,404 | |
Autodesk * | | | 976 | | | | 182,639 | |
Automatic Data Processing | | | 1,934 | | | | 283,698 | |
Broadcom | | | 1,783 | | | | 484,299 | |
Broadridge Financial Solutions | | | 578 | | | | 67,048 | |
Cadence Design Systems * | | | 1,224 | | | | 99,303 | |
CDW | | | 697 | | | | 77,228 | |
Cisco Systems | | | 19,129 | | | | 810,687 | |
Citrix Systems | | | 497 | | | | 72,070 | |
| Cognizant Technology Solutions, Cl A | | | 2,412 | | | | 139,944 | |
Corning | | | 3,455 | | | | 76,045 | |
DXC Technology | | | 1,353 | | | | 24,530 | |
F5 Networks * | | | 299 | | | | 41,639 | |
| Fidelity National Information Services | | | 2,755 | | | | 363,357 | |
Fiserv * | | | 2,551 | | | | 262,906 | |
FleetCor Technologies * | | | 389 | | | | 93,846 | |
FLIR Systems | | | 734 | | | | 31,856 | |
| | | | | | | |
| COMMON STOCK — continued | | | | | | |
| Information Technology — continued | | | | | | |
Fortinet * | | | 610 | | | $ | 65,721 | |
Gartner * | | | 371 | | | | 44,079 | |
Global Payments | | | 1,337 | | | | 221,969 | |
Hewlett Packard Enterprise | | | 6,617 | | | | 66,567 | |
HP | | | 6,856 | | | | 106,337 | |
Intel | | | 19,643 | | | | 1,178,187 | |
| International Business Machines | | | 3,981 | | | | 499,854 | |
Intuit | | | 1,166 | | | | 314,598 | |
IPG Photonics * | | | 210 | | | | 27,159 | |
Jack Henry & Associates | | | 393 | | | | 64,275 | |
Juniper Networks | | | 1,740 | | | | 37,584 | |
Keysight Technologies * | | | 811 | | | | 78,480 | |
KLA | | | 754 | | | | 123,724 | |
Lam Research | | | 644 | | | | 164,400 | |
Leidos Holdings | | | 671 | | | | 66,302 | |
Mastercard, Cl A | | | 4,006 | | | | 1,101,530 | |
Maxim Integrated Products | | | 1,367 | | | | 75,158 | |
Microchip Technology | | | 1,064 | | | | 93,345 | |
Micron Technology * | | | 4,934 | | | | 236,289 | |
Microsoft | | | 34,534 | | | | 6,188,838 | |
Motorola Solutions | | | 753 | | | | 108,289 | |
NetApp | | | 964 | | | | 42,194 | |
NortonLifeLock | | | 2,562 | | | | 54,494 | |
NVIDIA | | | 2,759 | | | | 806,401 | |
Oracle | | | 9,746 | | | | 516,246 | |
Paychex | | | 1,388 | | | | 95,106 | |
Paycom Software * | | | 233 | | | | 60,818 | |
PayPal Holdings * | | | 5,285 | | | | 650,055 | |
Qorvo * | | | 512 | | | | 50,191 | |
QUALCOMM | | | 5,124 | | | | 403,105 | |
salesforce.com * | | | 3,995 | | | | 646,990 | |
Seagate Technology | | | 980 | | | | 48,951 | |
| | | | | | | |
| COMMON STOCK — continued | | | | | | |
| Information Technology — continued | | | | | | |
ServiceNow * | | | 842 | | | $ | 295,997 | |
Skyworks Solutions | | | 734 | | | | 76,248 | |
Synopsys * | | | 657 | | | | 103,228 | |
TE Connectivity | | | 1,607 | | | | 118,050 | |
Texas Instruments | | | 4,201 | | | | 487,610 | |
VeriSign * | | | 450 | | | | 94,271 | |
Visa, Cl A | | | 7,732 | | | | 1,381,863 | |
Western Digital | | | 1,280 | | | | 58,982 | |
Western Union | | | 1,836 | | | | 35,013 | |
Xerox Holdings | | | 1,128 | | | | 20,631 | |
Xilinx | | | 1,098 | | | | 95,965 | |
Zebra Technologies, Cl A * | | | 226 | | | | 51,903 | |
| | | | | | | | 28,063,219 | |
| Materials — 2.1% | | | | | | | | |
Air Products & Chemicals | | | 982 | | | | 221,520 | |
Albemarle | | | 595 | | | | 36,551 | |
Avery Dennison | | | 345 | | | | 38,084 | |
Ball | | | 1,429 | | | | 93,728 | |
Celanese, Cl A | | | 640 | | | | 53,165 | |
CF Industries Holdings | | | 1,235 | | | | 33,962 | |
Corteva | | | 3,245 | | | | 84,986 | |
Dow | | | 3,249 | | | | 119,206 | |
DuPont de Nemours | | | 3,260 | | | | 153,285 | |
Eastman Chemical | | | 762 | | | | 46,109 | |
Ecolab | | | 1,115 | | | | 215,752 | |
FMC | | | 518 | | | | 47,604 | |
| Freeport-McMoRan Copper & Gold | | | 7,365 | | | | 65,033 | |
| International Flavors & Fragrances | | | 454 | | | | 59,488 | |
International Paper | | | 1,663 | | | | 56,958 | |
| LyondellBasell Industries, Cl A | | | 1,167 | | | | 67,628 | |
Martin Marietta Materials | | | 264 | | | | 50,221 | |
Mosaic | | | 1,904 | | | | 21,915 | |
| | | | | | | |
| COMMON STOCK — continued | | | | | | |
| Materials — continued | | | | | | |
Newmont | | | 3,651 | | | $ | 217,161 | |
Nucor | | | 1,588 | | | | 65,410 | |
Packaging Corp of America | | | 510 | | | | 49,291 | |
PPG Industries | | | 1,129 | | | | 102,547 | |
Sealed Air | | | 742 | | | | 21,214 | |
Sherwin-Williams | | | 365 | | | | 195,775 | |
Vulcan Materials | | | 568 | | | | 64,167 | |
Westrock | | | 1,382 | | | | 44,487 | |
| | | | | | | | 2,225,247 | |
| Real Estate — 3.0% | | | | | | | | |
Alexandria Real Estate Equities ‡ | | | 578 | | | | 90,798 | |
American Tower, Cl A ‡ | | | 1,992 | | | | 474,096 | |
Apartment Investment & Management, Cl A ‡ | | | 831 | | | | 31,304 | |
AvalonBay Communities ‡ | | | 664 | | | | 108,199 | |
Boston Properties ‡ | | | 698 | | | | 67,832 | |
CBRE Group, Cl A * | | | 1,675 | | | | 71,908 | |
Crown Castle International ‡ | | | 1,861 | | | | 296,699 | |
Digital Realty Trust ‡ | | | 1,166 | | | | 174,305 | |
Duke Realty ‡ | | | 1,559 | | | | 54,097 | |
Equinix ‡ | | | 380 | | | | 256,576 | |
Equity Residential ‡ | | | 1,528 | | | | 99,412 | |
Essex Property Trust ‡ | | | 285 | | | | 69,568 | |
Extra Space Storage ‡ | | | 547 | | | | 48,267 | |
Federal Realty Investment Trust ‡ | | | 389 | | | | 32,392 | |
Healthpeak Properties ‡ | | | 2,535 | | | | 66,265 | |
Host Hotels & Resorts ‡ | | | 2,866 | | | | 35,280 | |
Iron Mountain ‡ | | | 1,483 | | | | 35,859 | |
Kimco Realty ‡ | | | 2,283 | | | | 24,908 | |
Mid-America Apartment Communities ‡ | | | 484 | | | | 54,169 | |
ProLogis ‡ | | | 3,303 | | | | 294,727 | |
Public Storage ‡ | | | 662 | | | | 122,768 | |
Realty Income ‡ | | | 1,524 | | | | 83,698 | |
| | | | | | | |
| COMMON STOCK — continued | | | | | | |
| Real Estate — continued | | | | | | |
Regency Centers ‡ | | | 845 | | | $ | 37,104 | |
SBA Communications, Cl A ‡ | | | 498 | | | | 144,380 | |
Simon Property Group ‡ | | | 1,502 | | | | 100,289 | |
SL Green Realty ‡ | | | 410 | | | | 21,750 | |
UDR ‡ | | | 1,460 | | | | 54,706 | |
Ventas ‡ | | | 1,929 | | | | 62,403 | |
Vornado Realty Trust ‡ | | | 680 | | | | 29,798 | |
Welltower ‡ | | | 1,764 | | | | 90,370 | |
Weyerhaeuser ‡ | | | 3,474 | | | | 75,976 | |
| | | | | | | | 3,209,903 | |
| Utilities — 3.3% | | | | | | | | |
AES | | | 3,574 | | | | 47,355 | |
Alliant Energy | | | 1,247 | | | | 60,542 | |
Ameren | | | 1,067 | | | | 77,624 | |
American Electric Power | | | 2,195 | | | | 182,426 | |
American Water Works | | | 791 | | | | 96,257 | |
Atmos Energy | | | 612 | | | | 62,406 | |
CenterPoint Energy | | | 2,738 | | | | 46,628 | |
CMS Energy | | | 1,227 | | | | 70,050 | |
Consolidated Edison | | | 1,465 | | | | 115,442 | |
Dominion Energy | | | 3,683 | | | | 284,070 | |
DTE Energy | | | 836 | | | | 86,727 | |
Duke Energy | | | 3,262 | | | | 276,161 | |
Edison International | | | 1,564 | | | | 91,822 | |
Entergy | | | 865 | | | | 82,616 | |
Evergy | | | 973 | | | | 56,852 | |
Eversource Energy | | | 1,426 | | | | 115,078 | |
Exelon | | | 4,308 | | | | 159,741 | |
FirstEnergy | | | 2,503 | | | | 103,299 | |
NextEra Energy | | | 2,199 | | | | 508,233 | |
NiSource | | | 1,839 | | | | 46,177 | |
NRG Energy | | | 1,359 | | | | 45,567 | |
| | | Shares/Number of Contracts | | | | |
| COMMON STOCK — continued | | | | | | |
| Utilities — continued | | | | | | |
Pinnacle West Capital | | | 603 | | | $ | 46,425 | |
PPL | | | 3,663 | | | | 93,114 | |
| Public Service Enterprise Group | | | 2,223 | | | | 112,728 | |
Sempra Energy | | | 1,248 | | | | 154,565 | |
Southern | | | 4,686 | | | | 265,837 | |
WEC Energy Group | | | 1,391 | | | | 125,955 | |
Xcel Energy | | | 2,320 | | | | 147,459 | |
| | | | | | | | 3,561,156 | |
TOTAL UNITED STATES | | | | | | | 108,734,484 | |
| TOTAL COMMON STOCK | | | | | | | | |
(Cost $109,871,586) | | | | | | | 109,272,367 | |
| TOTAL INVESTMENTS — 102.1% | | | | | | | | |
(Cost $109,871,586) | | | | | | $ | 109,272,367 | |
WRITTEN OPTION— (2.4)%(1) | | | | | | | | |
| UNITED STATES— (2.4)% | | | | | | | | |
| (Premiums Received $2,678,493) | | | (374 | ) | | $ | (2,618,000 | ) |
Percentages are based on Net Assets of $106,998,994.
A list of the exchange traded option contracts held by the Fund at April 30, 2020, is as follows:
| Description | | Number of Contracts | | | Notional Amount+ | | | Exercise Price | | Expiration Date | | Value | |
WRITTEN OPTION — (2.4)% | | | | | | | | | | | | | |
| Call Options | | | | | | | | | | | | | |
May 20 Calls on SPX* | | (374) |
| | $ | (2,678,493 | ) | | $ | 70.00 | | 05/16/20 | | $ | (2,618,000 | ) |
| Total Written Option | | | | | $ | (2,678,493 | ) | | | | | | | $ | (2,618,000 | ) |
| ‡ | Real Estate Investment Trust |
| * | Non-income producing security. |
| (A) | All or a portion of these securities has been segregated as collateral for written options contracts. The aggregate market value of collateral at April 30, 2020 was $109,276,272. |
| (1) | Refer to table below for details on Options Contracts. |
| + | Represents Cost. |
As of April 30, 2020, all of the Fund’s investments were considered Level 1, in accordance with authoritative guidance on fair value measurements and disclosure under U.S. GAAP.
For the period ended April 30, 2020, there have been no transfers in or out of Level 3.
| | |
| Schedule of Investments |
| April 30, 2020 (Unaudited) |
| Global X Russell 2000 Covered Call ETF | |
Sector Weightings †:
† Sector weightings percentages are based on the total market value of investments.
| | | Shares/Number
of Contracts | | | | |
EXCHANGE TRADED FUND — 108.8%‡(A) | | | | | | |
| Vanguard Russell 2000 ETF | | | | | | |
(Cost $14,826,110) | | | 122,378 | | | $ | 12,844,795 | |
| | | | | | | | | |
| TOTAL INVESTMENTS — 108.8% | | | | | | | | |
(Cost $14,826,110) | | | | | | $ | 12,844,795 | |
WRITTEN OPTION— (9.0)%(1) | | | | | | | | |
| UNITED STATES— (9.0)% | | | | | | | | |
(Premiums Received $700,565) | | | (97 | ) | | $ | (1,061,180 | ) |
Percentages are based on Net Assets of $11,802,952.
A list of the exchange traded option contracts held by the Fund at April 30, 2020, is as follows:
| Description | | Number of Contracts | | | Notional Amount+ | | | Exercise Price | | Expiration Date | | Value | |
WRITTEN OPTION — (9.0)% | | | | | | | | | | | | | |
| Call Options | | | | | | | | | | | | | |
May 20 Calls on RUT* | | (97) |
| | $ | (700,565 | ) | | $ | 109.40 | | 05/16/20 | | $ | (1,061,180 | ) |
| Total Written Option | | | | | $ | (700,565 | ) | | | | | | | $ | (1,061,180 | ) |
| + | Represents Cost. |
| ‡ | For financial information on the Vanguard Russell 2000 ETF, please go to theSecurities Exchange Commission’s website at http://www.sec.gov. |
| * | Non-Income producing security. |
| (A) | All or a portion of these securities has been segregated as collateral for written options contracts. The aggregate market value of collateral at April 30, 2020 was $12,848,466. |
| (1) | Refer to table below for details on Options Contracts. |
| ETF — Exchange Traded Fund |
| RUT — Russell 2000 Index |
| | |
| Schedule of Investments |
| April 30, 2020 (Unaudited) |
| Global X Russell 2000 Covered Call ETF | |
As of April 30, 2020, all of the Fund’s investments were considered Level 1, in accordance with authoritative guidance on fair value measurements and disclosure under U.S. GAAP.
For the period ended April 30, 2020, there have been no transfers in or out of Level 3.
| | |
Statements of Assets and Liabilities |
| April 30, 2020 (Unaudited) |
|
| | | Global X SuperDividend® ETF | | | Global X SuperDividend® U.S. ETF | | | Global X MSCI SuperDividend® Emerging Markets ETF | | | Global X MSCI SuperDividend® EAFE ETF | |
| Assets: | | | | | | | | | | | | |
| Cost of Investments | | $ | 961,358,765 | | | $ | 564,062,610 | | | $ | 19,153,055 | | | $ | 9,499,199 | |
| Cost of Repurchase Agreement | | | 4,890,044 | | | | 2,800,325 | | | | — | | | | — | |
| Cost of Foreign Currency | | | 2,021,009 | | | | — | | | | 23,702 | | | | — | |
| Investments, at Value | | $ | 609,214,327 | * | | $ | 416,262,947 | * | | $ | 15,004,240 | | | $ | 6,910,059 | |
| Repurchase Agreement, at Value | | | 4,890,044 | | | | 2,800,325 | | | | — | | | | — | |
| Cash | | | — | | | | 732,786 | | | | 26,235 | | | | — | |
| Foreign Currency, at Value | | | 1,987,451 | | | | — | | | | 21,914 | | | | 3 | |
| Dividend and Interest Receivable | | | 3,366,603 | | | | 1,970,017 | | | | 19,128 | | | | 26,348 | |
| Reclaim Receivable | | | 417,700 | | | | 8,115 | | | | 607 | | | | 9,116 | |
| Unrealized Appreciation on Spot Contracts | | | 761 | | | | — | | | | — | | | | — | |
| Receivable for Investment Securities Sold | | | — | | | | 769,565 | | | | — | | | | — | |
| Total Assets | | | 619,876,886 | | | | 422,543,755 | | | | 15,072,124 | | | | 6,945,526 | |
| Liabilities: | | | | | | | | | | | | | | | | |
| Obligation to Return Securities Lending Collateral | | | 50,159,529 | | | | 28,724,281 | | | | — | | | | — | |
| Payable for Investment Securities Purchased | | | 1,571,552 | | | | — | | | | — | | | | — | |
| Payable due to Investment Adviser | | | 244,959 | | | | 128,265 | | | | 7,568 | | | | 2,943 | |
| Payable for Capital Shares Redeemed | | | — | | | | 773,832 | | | | — | | | | — | |
| Cash Overdraft | | | 2,671,634 | | | | — | | | | — | | | | 10,161 | |
| Total Liabilities | | | 54,647,674 | | | | 29,626,378 | | | | 7,568 | | | | 13,104 | |
| Net Assets | | $ | 565,229,212 | | | $ | 392,917,377 | | | $ | 15,064,556 | | | $ | 6,932,422 | |
| Net Assets Consist of: | | | | | | | | | | | | | | | | |
| Paid-in Capital | | $ | 1,279,984,616 | | | $ | 655,536,074 | | | $ | 23,679,552 | | | $ | 11,148,900 | |
| Total Distributable Loss | | | (714,755,404 | ) | | | (262,618,697 | ) | | | (8,614,996 | ) | | | (4,216,478 | ) |
| Net Assets | | $ | 565,229,212 | | | $ | 392,917,377 | | | $ | 15,064,556 | | | $ | 6,932,422 | |
| Outstanding Shares of Beneficial Interest | | | | | | | | | | | | | | | | |
| (unlimited authorization — no par value) | | | 54,400,000 | | | | 26,050,000 | | | | 1,550,000 | | | | 600,000 | |
| Net Asset Value, Offering and Redemption Price Per Share | | $ | 10.39 | | | $ | 15.08 | | | $ | 9.72 | | | $ | 11.55 | |
| *Includes Market Value of Securities on Loan | | $ | 47,494,529 | | | $ | 26,520,238 | | | $ | — | | | $ | — | |
| | | Global X SuperDividend® REIT ETF | | | Global X SuperIncome™ Preferred ETF | | | Global X YieldCo & Renewable Energy Income ETF | | | | |
| Assets: | | | | | | | | | | | | |
| Cost of Investments | | $ | 562,837,298 | | | $ | 175,855,287 | | | $ | 47,302,477 | | | $ | 122,317,461 | |
| Cost of Repurchase Agreement | | | 1,183,587 | | | | — | | | | — | | | | 1,289,041 | |
| Cost of Foreign Currency | | | — | | | | — | | | | 281 | | | | — | |
| Investments, at Value | | $ | 311,377,328 | * | | $ | 169,879,680 | | | $ | 45,999,337 | | | $ | 130,532,573 | * |
| Repurchase Agreement, at Value | | | 1,183,587 | | | | — | | | | — | | | | 1,289,041 | |
| Cash | | | 469,822 | | | | 98,455 | | | | 31,345 | | | | 5,188 | |
| Foreign Currency, at Value | | | — | | | | — | | | | 558 | | | | — | |
| Receivable for Investment Securities Sold | | | 24,091,793 | | | | — | | | | — | | | | — | |
| Dividend and Interest Receivable | | | 665,248 | | | | 426,431 | | | | 13,770 | | | | 35,999 | |
| Unrealized Appreciation on Spot Contracts | | | — | | | | — | | | | 3 | | | | — | |
| Receivable for Capital Shares Sold | | | — | | | | 3,713,588 | | | | — | | | | — | |
| Reclaim Receivable | | | — | | | | — | | | | 15,558 | | | | — | |
| Total Assets | | | 337,787,778 | | | | 174,118,154 | | | | 46,060,571 | | | | 131,862,801 | |
| Liabilities: | | | | | | | | | | | | | | | | |
| Obligation to Return Securities Lending Collateral | | | 12,140,621 | | | | — | | | | — | | | | 13,222,313 | |
| Payable for Investment Securities Purchased | | | 25,559,232 | | | | 3,747,495 | | | | — | | | | — | |
| Payable due to Investment Adviser | | | 125,204 | | | | 76,103 | | | | 23,691 | | | | 57,748 | |
| Cash Overdraft | | | — | | | | — | | | | — | | | | 2 | |
| Due to Broker | | | 132,965 | | | | — | | | | — | | | | — | |
| Total Liabilities | | | 37,958,022 | | | | 3,823,598 | | | | 23,691 | | | | 13,280,063 | |
| Net Assets | | $ | 299,829,756 | | | $ | 170,294,556 | | | $ | 46,036,880 | | | $ | 118,582,738 | |
| Net Assets Consist of: | | | | | | | | | | | | | | | | |
| Paid-in Capital | | $ | 588,553,619 | | | $ | 247,681,333 | | | $ | 48,634,419 | | | $ | 140,305,564 | |
| Total Distributable Loss | | | (288,723,863 | ) | | | (77,386,777 | ) | | | (2,597,539 | ) | | | (21,722,826 | ) |
| Net Assets | | $ | 299,829,756 | | | $ | 170,294,556 | | | $ | 46,036,880 | | | $ | 118,582,738 | |
| Outstanding Shares of Beneficial Interest | | | | | | | | | | | | | | | | |
| (unlimited authorization — no par value) | | | 41,250,000 | | | | 16,050,000 | | | | 3,500,000 | | | | 3,450,000 | |
| Net Asset Value, Offering and Redemption Price Per Share | | $ | 7.27 | | | $ | 10.61 | | | $ | 13.15 | | | $ | 34.37 | |
| *Includes Market Value of Securities on Loan | | $ | 11,172,668 | | | $ | — | | | $ | — | | | $ | 7,044,337 | |
| | | | | | | | | Global X Scientific Beta U.S. ETF | | | Global X Scientific Beta Europe ETF | |
| Assets: | | | | | | | | | | | | |
| Cost of Investments | | $ | 9,712,926 | | | $ | 49,550,752 | | | $ | 33,680,145 | | | $ | 5,052,946 | |
| Cost of Foreign Currency | | | — | | | | — | | | | — | | | | — | |
| Investments, at Value | | $ | 10,298,190 | | | $ | 50,325,360 | | | $ | 29,934,220 | | | $ | 4,123,240 | |
| Cash | | | — | | | | 33,396 | | | | 112,467 | | | | — | |
| Dividend and Interest Receivable | | | 2,737 | | | | 29,253 | | | | 38,848 | | | | 8,482 | |
| Receivable for Investment Securities Sold | | | — | | | | — | | | | 12,279,635 | | | | — | |
| Reclaim Receivable | | | — | | | | 832 | | | | 1,839 | | | | 29,770 | |
| Total Assets | | | 10,300,927 | | | | 50,388,841 | | | | 42,367,009 | | | | 4,161,492 | |
| Liabilities: | | | | | | | | | | | | | | | | |
| Payable due to Investment Adviser | | | 3,233 | | | | 28,485 | | | | 11,066 | | | | 1,220 | |
| Payable for Capital Shares Redeemed | | | — | | | | — | | | | 12,291,200 | | | | — | |
| Unrealized Depreciation on Spot Contracts | | | — | | | | — | | | | — | | | | 14 | |
| Cash Overdraft | | | 66 | | | | — | | | | — | | | | 13,758 | |
| Total Liabilities | | | 3,299 | | | | 28,485 | | | | 12,302,266 | | | | 14,992 | |
| Net Assets | | $ | 10,297,628 | | | $ | 50,360,356 | | | $ | 30,064,743 | | | $ | 4,146,500 | |
| Net Assets Consist of: | | | | | | | | | | | | | | | | |
| Paid-in Capital | | $ | 9,516,380 | | | $ | 71,248,175 | | | $ | 36,181,054 | | | $ | 6,156,754 | |
| Total Distributable Earnings/(Loss) | | | 781,248 | | | | (20,887,819 | ) | | | (6,116,311 | ) | | | (2,010,254 | ) |
| Net Assets | | $ | 10,297,628 | | | $ | 50,360,356 | | | $ | 30,064,743 | | | $ | 4,146,500 | |
| Outstanding Shares of Beneficial Interest | | | | | | | | | | | | | | | | |
| (unlimited authorization — no par value) | | | 550,002 | | | | 1,600,000 | | | | 1,000,000 | | | | 200,000 | |
| Net Asset Value, Offering and Redemption Price Per Share | | $ | 18.72 | | | $ | 31.48 | | | $ | 30.06 | | | $ | 20.73 | |
| | | Global X Scientific Beta Japan ETF | | | Global X Scientific Beta Asia ex-Japan ETF | | | Global X S&P 500® Catholic Values ETF | |
| Assets: | | | | | | | | | |
| Cost of Investments | | $ | 2,823,127 | | | $ | 2,389,375 | | | $ | 290,819,951 | |
| Cost of Foreign Currency | | | 76 | | | | — | | | | — | |
| Investments, at Value | | $ | 2,378,602 | | | $ | 1,958,226 | | | $ | 312,432,730 | |
| Cash | | | — | | | | — | | | | 190,489 | |
| Foreign Currency, at Value | | | 76 | | | | — | | | | — | |
| Dividend and Interest Receivable | | | 24,807 | | | | 3,660 | | | | 269,517 | |
| Reclaim Receivable | | | — | | | | — | | | | 3,923 | |
| Total Assets | | | 2,403,485 | | | | 1,961,886 | | | | 312,896,659 | |
| Liabilities: | | | | | | | | | | | | |
| Payable due to Investment Adviser | | | 719 | | | | 574 | | | | 70,043 | |
| Cash Overdraft | | | 18,975 | | | | 534 | | | | — | |
| Total Liabilities | | | 19,694 | | | | 1,108 | | | | 70,043 | |
| Net Assets | | $ | 2,383,791 | | | $ | 1,960,778 | | | $ | 312,826,616 | |
| Net Assets Consist of: | | | | | | | | | | | | |
| Paid-in Capital | | $ | 3,542,318 | | | $ | 2,967,109 | | | $ | 286,597,715 | |
| Total Distributable Earnings/(Loss) | | | (1,158,527 | ) | | | (1,006,331 | ) | | | 26,228,901 | |
| Net Assets | | $ | 2,383,791 | | | $ | 1,960,778 | | | $ | 312,826,616 | |
| Outstanding Shares of Beneficial Interest | | | | | | | | | | | | |
| (unlimited authorization — no par value) | | | 100,000 | | | | 100,000 | | | | 8,750,000 | |
| Net Asset Value, Offering and Redemption Price Per Share | | $ | 23.84 | | | $ | 19.61 | | | $ | 35.75 | |
| | | Global X NASDAQ 100® Covered Call ETF | | | Global X S&P 500® Covered Call ETF | | | Global X Russell 2000 Covered Call ETF | |
| Assets: | | | | | | | | | |
| Cost of Investments | | $ | 753,515,315 | | | $ | 109,871,586 | | | $ | 14,826,110 | |
| Investments, at Value | | $ | 956,948,044 | | | $ | 109,272,367 | | | $ | 12,844,795 | |
| Cash | | | 1,487,120 | | | | 298,222 | | | | 23,952 | |
| Receivable for Investment Securities Sold | | | 4,602,804 | | | | — | | | | — | |
| Receivable for Capital Shares Sold | | | 2,006,718 | | | | — | | | | — | |
| Dividend and Interest Receivable | | | 92,345 | | | | 99,694 | | | | — | |
| Reclaim Receivable | | | — | | | | 1,486 | | | | — | |
| Total Assets | | | 965,137,031 | | | | 109,671,769 | | | | 12,868,747 | |
| Liabilities: | | | | | | | | | | | | |
| Options written at value (Premiums received $33,753,480, $2,678,493 and $700,565 respectively) | | | 36,120,740 | | | | 2,618,000 | | | | 1,061,180 | |
| Payable for Investment Securities Purchased | | | 6,500,587 | | | | — | | | | — | |
| Payable due to Investment Adviser | | | 430,790 | | | | 54,775 | | | | 4,615 | |
| Total Liabilities | | | 43,052,117 | | | | 2,672,775 | | | | 1,065,795 | |
| Net Assets | | $ | 922,084,914 | | | $ | 106,998,994 | | | $ | 11,802,952 | |
| Net Assets Consist of: | | | | | | | | | | | | |
| Paid-in Capital | | $ | 1,066,505,656 | | | $ | 132,740,175 | | | $ | 15,893,094 | |
| Total Distributable Loss | | | (144,420,742 | ) | | | (25,741,181 | ) | | | (4,090,142 | ) |
| Net Assets | | $ | 922,084,914 | | | $ | 106,998,994 | | | $ | 11,802,952 | |
| Outstanding Shares of Beneficial Interest | | | | | | | | | | | | |
| (unlimited authorization — no par value) | | | 45,950,000 | | | | 2,600,000 | | | | 650,000 | |
| Net Asset Value, Offering and Redemption Price Per Share | | $ | 20.07 | | | $ | 41.15 | | | $ | 18.16 | |
| | |
|
| For the period ended April 30, 2020 (Unaudited) |
|
| | | Global X SuperDividend® ETF | | | Global X SuperDividend® U.S. ETF | | | Global X MSCI SuperDividend® Emerging Markets ETF | | | Global X MSCI SuperDividend® EAFE ETF | |
| Investment Income: | | | | | | | | | | | | |
| Dividend Income | | $ | 42,081,243 | | | $ | 20,541,573 | | | $ | 385,860 | | | $ | 286,334 | |
| Interest Income | | | 5,545 | | | | 4,635 | | | | 89 | | | | 29 | |
| Security Lending Income | | | 381,020 | | | | 574,245 | | | | — | | | | — | |
| Less: Foreign Taxes Withheld | | | (1,591,078 | ) | | | — | | | | (45,549 | ) | | | (11,830 | ) |
| Total Investment Income | | | 40,876,730 | | | | 21,120,453 | | | | 340,400 | | | | 274,533 | |
Supervision and Administration Fees(1) | | | 2,376,502 | | | | 1,136,630 | | | | 56,361 | | | | 35,514 | |
Custodian Fees(2) | | | 33,299 | | | | 11,263 | | | | 1,948 | | | | 626 | |
| Total Expenses | | | 2,409,801 | | | | 1,147,893 | | | | 58,309 | | | | 36,140 | |
| Net Investment Income | | | 38,466,929 | | | | 19,972,560 | | | | 282,091 | | | | 238,393 | |
| Net Realized Gain (Loss) on: | | | | | | | | | | | | | | | | |
Investments(3) | | | (73,819,534 | ) | | | (50,916,548 | ) | | | (478,341 | ) | | | (1,027,693 | ) |
| Foreign Currency Transactions | | | 228,424 | | | | — | | | | (11,309 | ) | | | (5,815 | ) |
| Net Realized Loss on Investments and Foreign Currency Transactions | | | (73,591,110 | ) | | | (50,916,548 | ) | | | (489,650 | ) | | | (1,033,508 | ) |
| Net Change in Unrealized Appreciation (Depreciation) on: | | | | | | | | | | | | | | | | |
| Investments | | | (316,233,106 | ) | | | (160,247,156 | ) | | | (4,132,099 | ) | | | (3,095,673 | ) |
| Foreign Capital Gains Tax on Appreciated Securities | | | — | | | | — | | | | 2,333 | | | | — | |
| Foreign Currency Translations | | | (377,503 | ) | | | — | | | | (7,113 | ) | | | (1,727 | ) |
| Net Change in Unrealized Depreciation on Investments and Foreign Currency Translations | | | (316,610,609 | ) | | | (160,247,156 | ) | | | (4,136,879 | ) | | | (3,097,400 | ) |
| Net Realized and Unrealized Loss on Investments and Foreign Currency Transactions and Translations | | | (390,201,719 | ) | | | (211,163,704 | ) | | | (4,626,529 | ) | | | (4,130,908 | ) |
| Net Decrease in Net Assets Resulting from Operations | | $ | (351,734,790 | ) | | $ | (191,191,144 | ) | | $ | (4,344,438 | ) | | $ | (3,892,515 | ) |
| (1) | The Supervision and Administration fees reflect the supervisory and administrative fee, which includes fees paid by the Funds for the investment advisory services provided by the Adviser. (See Note 3 in Notes to Financial Statements.) |
| (2) | See Note 2 in the Notes to Financial Statements. |
| (3) | Includes realized gains (losses) as a result of in-kind redemptions. (See Note 4 in Notes to Financial Statements.) |
| | | Global X SuperDividend® REIT ETF | | | Global X SuperIncome™ Preferred ETF | | | Global X YieldCo & Renewable Energy Income ETF | | | | |
| Investment Income: | | | | | | | | | | | | |
| Dividend Income | | $ | 12,489,634 | | | $ | 6,515,701 | | | $ | 535,863 | | | $ | 264,325 | |
| Interest Income | | | 2,520 | | | | 2,803 | | | | 258 | | | | 576 | |
| Security Lending Income | | | 82,017 | | | | 7,885 | | | | — | | | | 33,259 | |
| Less: Foreign Taxes Withheld | | | (107,747 | ) | | | — | | | | (52,068 | ) | | | (10,627 | ) |
| Total Investment Income | | | 13,466,424 | | | | 6,526,389 | | | | 484,053 | | | | 287,533 | |
Supervision and Administration Fees(1) | | | 1,168,519 | | | | 556,038 | | | | 119,541 | | | | 391,864 | |
Custodian Fees(2) | | | 13,359 | | | | 1,960 | | | | 973 | | | | 556 | |
| Total Expenses | | | 1,181,878 | | | | 557,998 | | | | 120,514 | | | | 392,420 | |
| Net Investment Income (Loss) | | | 12,284,546 | | | | 5,968,391 | | | | 363,539 | | | | (104,887 | ) |
| Net Realized Gain (Loss) on: | | | | | | | | | | | | | | | | |
Investments(3) | | | (28,555,818 | ) | | | (12,835,502 | ) | | | 160,607 | | | | 2,212,973 | |
| Foreign Currency Transactions | | | (2,033 | ) | | | — | | | | 3,926 | | | | (13,188 | ) |
| Net Realized Gain (Loss) on Investments and Foreign Currency Transactions | | | (28,557,851 | ) | | | (12,835,502 | ) | | | 164,533 | | | | 2,199,785 | |
| Net Change in Unrealized Appreciation on: | | | | | | | | | | | | | | | | |
| Investments | | | (263,834,904 | ) | | | (8,790,067 | ) | | | (4,394,565 | ) | | | 6,991,625 | |
| Foreign Currency Translations | | | (3,417 | ) | | | — | | | | (2,732 | ) | | | 277 | |
| Net Change in Unrealized Appreciation (Depreciation) on Investments and Foreign Currency Translations | | | (263,838,321 | ) | | | (8,790,067 | ) | | | (4,397,297 | ) | | | 6,991,902 | |
| Net Realized and Unrealized Gain (Loss) on Investments and Foreign Currency Transactions and Translations | | | (292,396,172 | ) | | | (21,625,569 | ) | | | (4,232,764 | ) | | | 9,191,687 | |
| Net Increase (Decrease) in Net Assets Resulting from Operations | | $ | (280,111,626 | ) | | $ | (15,657,178 | ) | | $ | (3,869,225 | ) | | $ | 9,086,800 | |
| (1) | The Supervision and Administration fees reflect the supervisory and administrative fee, which includes fees paid by the Funds for the investment advisory services provided by the Adviser. (See Note 3 in Notes to Financial Statements.) |
| (2) | See Note 2 in the Notes to Financial Statements. |
| (3) | Includes realized gains (losses) as a result of in-kind redemptions. (See Note 4 in Notes to Financial Statements.) |
| | | | | | | | | Global X Scientific Beta U.S. ETF | | | Global X Scientific Beta Europe ETF | |
| Investment Income: | | | | | | | | | | | | |
| Dividend Income | | $ | 28,674 | | | $ | 747,287 | | | $ | 1,065,456 | | | $ | 53,274 | |
| Interest Income | | | — | | | | 428 | | | | 743 | | | | — | |
| Security Lending Income | | | — | | | | 129 | | | | — | | | | — | |
| Less: Foreign Taxes Withheld | | | (99 | ) | | | (4,022 | ) | | | — | | | | (6,466 | ) |
| Total Investment Income | | | 28,575 | | | | 743,822 | | | | 1,066,199 | | | | 46,808 | |
Supervision and Administration Fees(1) | | | 15,638 | | | | 205,077 | | | | 85,555 | | | | 8,978 | |
Custodian Fees(2) | | | 721 | | | | 539 | | | | 119 | | | | 55 | |
| Total Expenses | | | 16,359 | | | | 205,616 | | | | 85,674 | | | | 9,033 | |
| Net Investment Income | | | 12,216 | | | | 538,206 | | | | 980,525 | | | | 37,775 | |
| Net Realized Gain (Loss) on: | | | | | | | | | | | | | | | | |
Investments(3) | | | 236,476 | | | | 165,221 | | | | 3,437,400 | | | | (55,043 | ) |
| Foreign Currency Transactions | | | 1,366 | | | | — | | | | — | | | | 339 | |
| Net Realized Gain (Loss) on Investments and Foreign Currency Transactions | | | 237,842 | | | | 165,221 | | | | 3,437,400 | | | | (54,704 | ) |
| Net Change in Unrealized Appreciation on: | | | | | | | | | | | | | | | | |
| Investments | | | 647,537 | | | | (5,170,045 | ) | | | (14,242,011 | ) | | | (777,166 | ) |
| Foreign Currency Translations | | | — | | | | — | | | | — | | | | 243 | |
| Net Change in Unrealized Appreciation (Depreciation) on Investments and Foreign Currency Translations | | | 647,537 | | | | (5,170,045 | ) | | | (14,242,011 | ) | | | (776,923 | ) |
| Net Realized and Unrealized Gain (Loss) on Investments and Foreign Currency Transactions and Translations | | | 885,379 | | | | (5,004,824 | ) | | | (10,804,611 | ) | | | (831,627 | ) |
| Net Increase (Decrease) in Net Assets Resulting from Operations | | $ | 897,595 | | | $ | (4,466,618 | ) | | $ | (9,824,086 | ) | | $ | (793,852 | ) |
* The Fund commenced operations on November 27, 2018.
| (1) | The Supervision and Administration fees reflect the supervisory and administrative fee, which includes fees paid by the Funds for the investment advisory services provided by the Adviser. (See Note 3 in Notes to Financial Statements.) |
| (2) | See Note 2 in the Notes to Financial Statements. |
| (3) | Includes realized gains (losses) as a result of in-kind redemptions. (See Note 4 in Notes to Financial Statements.) |
| | | Global X Scientific Beta Japan ETF | | | Global X Scientific Beta Asia ex-Japan ETF | | | Global X S&P 500® Catholic Values ETF | |
| Investment Income: | | | | | | | | | |
| Dividend Income | | $ | 35,633 | | | $ | 36,332 | | | $ | 2,953,558 | |
| Interest Income | | | 12 | | | | 27 | | | | 2,407 | |
| Less: Foreign Taxes Withheld | | | (3,593 | ) | | | (1,273 | ) | | | — | |
| Total Investment Income | | | 32,052 | | | | 35,086 | | | | 2,955,965 | |
Supervision and Administration Fees(1) | | | 4,992 | | | | 4,253 | | | | 425,493 | |
Custodian Fees(2) | | | 17 | | | | 36 | | | | 414 | |
| Total Expenses | | | 5,009 | | | | 4,289 | | | | 425,907 | |
| Net Investment Income | | | 27,043 | | | | 30,797 | | | | 2,530,058 | |
| Net Realized Gain (Loss) on: | | | | | | | | | | | | |
Investments(3) | | | (16,338 | ) | | | (13,826 | ) | | | 4,275,375 | |
| Foreign Currency Transactions | | | 175 | | | | (636 | ) | | | — | |
| Net Realized Gain (Loss) on Investments and Foreign Currency Transactions | | | (16,163 | ) | | | (14,462 | ) | | | 4,275,375 | |
| Net Change in Unrealized Appreciation (Depreciation) on: | | | | | | | | | | | | |
| Investments | | | (398,645 | ) | | | (425,636 | ) | | | (14,095,805 | ) |
| Foreign Currency Translations | | | 314 | | | | (8 | ) | | | — | |
| Net Change in Unrealized Depreciation on Investments and Foreign Currency Translations | | | (398,331 | ) | | | (425,644 | ) | | | (14,095,805 | ) |
| Net Realized and Unrealized Loss on Investments and Foreign Currency Transactions and Translations | | | (414,494 | ) | | | (440,106 | ) | | | (9,820,430 | ) |
| Net Decrease in Net Assets Resulting from Operations | | $ | (387,451 | ) | | $ | (409,309 | ) | | $ | (7,290,372 | ) |
| (1) | The Supervision and Administration fees reflect the supervisory and administrative fee, which includes fees paid by the Funds for the investment advisory services provided by the Adviser. (See Note 3 in Notes to Financial Statements.) |
| (2) | See Note 2 in the Notes to Financial Statements. |
| (3) | Includes realized gains (losses) as a result of in-kind redemptions. (See Note 4 in Notes to Financial Statements.) |
| | | Global X NASDAQ 100® Covered Call ETF | | | Global X S&P 500® Covered Call ETF | | | Global X Russell 2000 Covered Call ETF | |
| Investment Income: | | | | | | | | | |
| Dividend Income | | $ | 4,789,210 | | | $ | 1,453,739 | | | $ | 68,789 | |
| Less: Foreign Taxes Withheld | | | (6,145 | ) | | | — | | | | — | |
| Total Investment Income | | | 4,783,065 | | | | 1,453,739 | | | | 68,789 | |
Supervision and Administration Fees(1) | | | 2,692,991 | | | | 452,295 | | | | 33,365 | |
Custodian Fees(2) | | | 26,147 | | | | 4,017 | | | | 270 | |
| Broker Fees | | | 685,891 | | | | 83,700 | | | | 10,238 | |
| Total Expenses | | | 3,405,029 | | | | 540,012 | | | | 43,873 | |
| Waiver of Supervision and Administration Fees | | | (445 | ) | | | (82 | ) | | | (7,410 | ) |
| Net Expenses | | | 3,404,584 | | | | 539,930 | | | | 36,463 | |
| Net Investment Income | | | 1,378,481 | | | | 913,809 | | | | 32,326 | |
| Net Realized Gain (Loss) on: | | | | | | | | | | | | |
Investments(3) | | | 11,298,923 | | | | 10,826,914 | | | | (264,511 | ) |
| Written Options | | | (197,560,501 | ) | | | (15,286,657 | ) | | | (897,490 | ) |
| Net Realized Loss on Investments and Written Options | | | (186,261,578 | ) | | | (4,459,743 | ) | | | (1,162,001 | ) |
| Net Change in Unrealized Appreciation (Depreciation) on: | | | | | | | | | | | | |
| Investments | | | 82,846,032 | | | | (18,268,056 | ) | | | (2,082,017 | ) |
| Written Options | | | 6,453,881 | | | | 238,240 | | | | (320,316 | ) |
| Net Change in Unrealized Appreciation (Depreciation) on Investments and Written Options | | | 89,299,913 | | | | (18,029,816 | ) | | | (2,402,333 | ) |
| Net Realized and Unrealized Loss on Investments and Written Options | | | (96,961,665 | ) | | | (22,489,559 | ) | | | (3,564,334 | ) |
| Net Decrease in Net Assets Resulting from Operations | | $ | (95,583,184 | ) | | $ | (21,575,750 | ) | | $ | (3,532,008 | ) |
| (1) | The Supervision and Administration fees reflect the supervisory and administrative fee, which includes fees paid by the Funds for the investment advisory services provided by the Adviser. (See Note 3 in Notes to Financial Statements.) |
| (2) | See Note 2 in the Notes to Financial Statements. |
| (3) | Includes realized gains (losses) as a result of in-kind redemptions. (See Note 4 in Notes to Financial Statements.) |
| | |
Statements of Changes in Net Assets
|
| | | Global X SuperDividend® ETF | | | Global X SuperDividend® U.S. ETF | |
| | | Period Ended April 30, 2020
(Unaudited) | | | Year Ended October 31, 2019 | | | Period Ended April 30, 2020
(Unaudited) | | | Year Ended October 31, 2019 | |
| Operations: | | | | | | | | | | | | |
| Net Investment Income | | $ | 38,466,929 | | | $ | 64,130,890 | | | $ | 19,972,560 | | | $ | 22,224,114 | |
Net Realized Loss on Investments and Foreign Currency Transactions(1) | | | (73,591,110 | ) | | | (135,671,968 | ) | | | (50,916,548 | ) | | | (8,535,081 | ) |
| Net Change in Unrealized Appreciation (Depreciation) on Investments and Foreign Currency Translations | | | (316,610,609 | ) | | | 59,731,560 | | | | (160,247,156 | ) | | | 2,304,041 | |
| Net Increase (Decrease) in Net Assets Resulting from Operations | | | (351,734,790 | ) | | | (11,809,518 | ) | | | (191,191,144 | ) | | | 15,993,074 | |
| Distributions | | | (37,943,910 | ) | | | (71,080,700 | ) | | | (22,181,125 | ) | | | (29,513,428 | ) |
| Return of Capital | | | – | | | | (10,387,010 | ) | | | – | | | | (5,156,842 | ) |
| Capital Share Transactions: | | | | | | | | | | | | | | | | |
| Issued | | | 52,081,219 | | | | 166,372,434 | | | | 89,787,958 | | | | 163,958,810 | |
| Redeemed | | | (29,283,816 | ) | | | (53,952,618 | ) | | | (28,382,761 | ) | | | (13,708,213 | ) |
| Increase in Net Assets from Capital Share Transactions | | | 22,797,403 | | | | 112,419,816 | | | | 61,405,197 | | | | 150,250,597 | |
| Total Increase (Decrease) in Net Assets | | | (366,881,297 | ) | | | 19,142,588 | | | | (151,967,072 | ) | | | 131,573,401 | |
| Net Assets: | | | | | | | | | | | | | | | | |
| Beginning of Period | | | 932,110,509 | | | | 912,967,921 | | | | 544,884,449 | | | | 413,311,048 | |
| End of Period | | $ | 565,229,212 | | | $ | 932,110,509 | | | $ | 392,917,377 | | | $ | 544,884,449 | |
| Share Transactions: | | | | | | | | | | | | | | | | |
| Issued | | | 3,200,000 | | | | 9,400,000 | | | | 4,500,000 | | | | 7,100,000 | |
| Redeemed | | | (2,850,000 | ) | | | (3,250,000 | ) | | | (1,800,000 | ) | | | (600,000 | ) |
| Net Increase in Shares Outstanding from Share Transactions | | | 350,000 | | | | 6,150,000 | | | | 2,700,000 | | | | 6,500,000 | |
| (1) | Includes realized gains (losses) as a result of in-kind redemptions. (See Note 4 in Notes to Financial Statements.) |
| | | Global X MSCI SuperDividend® Emerging Markets ETF | | | Global X MSCI SuperDividend® EAFE ETF | |
| | | Period Ended April 30, 2020
(Unaudited) | | | Year Ended October 31, 2019 | | | Period Ended April 30, 2020
(Unaudited) | | | Year Ended October 31, 2019 | |
| Operations: | | | | | | | | | | | | |
| Net Investment Income | | $ | 282,091 | | | $ | 1,151,826 | | | $ | 238,393 | | | $ | 482,026 | |
Net Realized Loss on Investments and Foreign Currency Transactions(1) | | | (489,650 | ) | | | (1,791,400 | ) | | | (1,033,508 | ) | | | (83,566 | ) |
| Net Change in Unrealized Appreciation (Depreciation) on Investments and Foreign Currency Translations | | | (4,136,879 | ) | | | 1,734,662 | | | | (3,097,400 | ) | | | 1,256,336 | |
| Net Increase (Decrease) in Net Assets Resulting from Operations | | | (4,344,438 | ) | | | 1,095,088 | | | | (3,892,515 | ) | | | 1,654,796 | |
| Distributions | | | (657,825 | ) | | | (1,146,140 | ) | | | (390,755 | ) | | | (547,298 | ) |
| Capital Share Transactions: | | | | | | | | | | | | | | | | |
| Issued | | | 2,578,041 | | | | 7,384,916 | | | | — | | | | 16,548,006 | |
| Redeemed | | | — | | | | (2,105,142 | ) | | | (7,311,425 | ) | | | (3,916,333 | ) |
| Increase (Decrease) in Net Assets from Capital Share Transactions | | | 2,578,041 | | | | 5,279,774 | | | | (7,311,425 | ) | | | 12,631,673 | |
| Total Increase (Decrease) in Net Assets | | | (2,424,222 | ) | | | 5,228,722 | | | | (11,594,695 | ) | | | 13,739,171 | |
| Net Assets: | | | | | | | | | | | | | | | | |
| Beginning of Period | | | 17,488,778 | | | | 12,260,056 | | | | 18,527,117 | | | | 4,787,946 | |
| End of Period | | $ | 15,064,556 | | | $ | 17,488,778 | | | $ | 6,932,422 | | | $ | 18,527,117 | |
| Share Transactions: | | | | | | | | | | | | | | | | |
| Issued | | | 200,000 | | | | 550,000 | | | | — | | | | 1,100,000 | |
| Redeemed | | | — | | | | (150,000 | ) | | | (550,000 | ) | | | (250,000 | ) |
| Net Increase (Decrease) in Shares Outstanding from Share Transactions | | | 200,000 | | | | 400,000 | | | | (550,000 | ) | | | 850,000 | |
| (1) | Includes realized gains (losses) as a result of in-kind redemptions. (See Note 4 in Notes to Financial Statements.) |
| | | Global X SuperDividend® REIT ETF | | | Global X SuperIncome™ Preferred ETF | |
| | | Period Ended April 30, 2020
(Unaudited) | | | Year Ended October 31, 2019 | | | Period Ended April 30, 2020
(Unaudited) | | | Year Ended October 31, 2019 | |
| Operations: | | | | | | | | | | | | |
| Net Investment Income | | $ | 12,284,546 | | | $ | 14,117,753 | | | $ | 5,968,391 | | | $ | 10,751,860 | |
Net Realized Gain (Loss) on Investments and Foreign Currency Transactions(1) | | | (28,557,851 | ) | | | 1,195,882 | | | | (12,835,502 | ) | | | (2,026,921 | ) |
| Net Change in Unrealized Appreciation (Depreciation) on Investments and Foreign Currency Translations | | | (263,838,321 | ) | | | 14,954,001 | | | | (8,790,067 | ) | | | 6,821,972 | |
| Net Increase (Decrease) in Net Assets Resulting from Operations | | | (280,111,626 | ) | | | 30,267,636 | | | | (15,657,178 | ) | | | 15,546,911 | |
| Distributions | | | (17,615,790 | ) | | | (16,433,940 | ) | | | (5,850,575 | ) | | | (11,905,843 | ) |
| Return of Capital | | | — | | | | — | | | | — | | | | (83,858 | ) |
| Capital Share Transactions: | | | | | | | | | | | | | | | | |
| Issued | | | 322,395,721 | | | | 232,547,489 | | | | 15,324,152 | | | | 35,371,469 | |
| Redeemed | | | (89,628,116 | ) | | | — | | | | (24,613,835 | ) | | | (23,990,686 | ) |
| Increase (Decrease) in Net Assets from Capital Share Transactions | | | 232,767,605 | | | | 232,547,489 | | | | (9,289,683 | ) | | | 11,380,783 | |
| Total Increase (Decrease) in Net Assets | | | (64,959,811 | ) | | | 246,381,185 | | | | (30,797,436 | ) | | | 14,937,993 | |
| Net Assets: | | | | | | | | | | | | | | | | |
| Beginning of Period | | | 364,789,567 | | | | 118,408,382 | | | | 201,091,992 | | | | 186,153,999 | |
| End of Period | | $ | 299,829,756 | | | $ | 364,789,567 | | | $ | 170,294,556 | | | $ | 201,091,992 | |
| Share Transactions: | | | | | | | | | | | | | | | | |
| Issued | | | 23,550,000 | | | | 15,700,000 | | | | 1,350,000 | | | | 3,050,000 | |
| Redeemed | | | (6,100,000 | ) | | | — | | | | (2,450,000 | ) | | | (2,100,000 | ) |
| Net Increase (Decrease) in Shares Outstanding from Share Transactions | | | 17,450,000 | | | | 15,700,000 | | | | (1,100,000 | ) | | | 950,000 | |
| (1) | Includes realized gains (losses) as a result of in-kind redemptions. (See Note 4 in Notes to Financial Statements.) |
| | | Global X YieldCo & Renewable Energy Income ETF | | | Global X Social Media ETF | |
| | | Period Ended April 30, 2020
(Unaudited) | | | Year Ended October 31, 2019 | | | Period Ended April 30, 2020
(Unaudited) | | | Year Ended October 31, 2019 | |
| Operations: | | | | | | | | | | | | |
| Net Investment Income (Loss) | | $ | 363,539 | | | $ | 187,149 | | | $ | (104,887 | ) | | $ | (438,706 | ) |
Net Realized Gain on Investments and Foreign Currency Transactions(1) | | | 164,533 | | | | 190,826 | | | | 2,199,785 | | | | 1,679,999 | |
| Net Change in Unrealized Appreciation (Depreciation) on Investments and Foreign Currency Translations | | | (4,397,297 | ) | | | 3,484,245 | | | | 6,991,902 | | | | 11,082,048 | |
| Net Increase (Decrease) in Net Assets Resulting from Operations | | | (3,869,225 | ) | | | 3,862,220 | | | | 9,086,800 | | | | 12,323,341 | |
| Distributions | | | (518,560 | ) | | | (644,590 | ) | | | — | | | | — | |
| Capital Share Transactions: | | | | | | | | | | | | | | | | |
| Issued | | | 24,219,732 | | | | 9,218,950 | | | | 4,197 | | | | 6,158,958 | |
| Redeemed | | | — | | | | (1,787,815 | ) | | | (11,797,388 | ) | | | (26,689,127 | ) |
| Increase (Decrease) in Net Assets from Capital Share Transactions | | | 24,219,732 | | | | 7,431,135 | | | | (11,793,191 | ) | | | (20,530,169 | ) |
| Total Increase (Decrease) in Net Assets | | | 19,831,947 | | | | 10,648,765 | | | | (2,706,391 | ) | | | (8,206,828 | ) |
| Net Assets: | | | | | | | | | | | | | | | | |
| Beginning of Period | | | 26,204,933 | | | | 15,556,168 | | | | 121,289,129 | | | | 129,495,957 | |
| End of Period | | $ | 46,036,880 | | | $ | 26,204,933 | | | $ | 118,582,738 | | | $ | 121,289,129 | |
| Share Transactions: | | | | | | | | | | | | | | | | |
| Issued | | | 1,600,000 | | | | 700,000 | | | | — | | | | 200,000 | |
| Redeemed | | | — | | | | (150,000 | ) | | | (350,000 | ) | | | (850,000 | ) |
| Net Increase (Decrease) in Shares Outstanding from Share Transactions | | | 1,600,000 | | | | 550,000 | | | | (350,000 | ) | | | (650,000 | ) |
| (1) | Includes realized gains (losses) as a result of in-kind redemptions. (See Note 4 in Notes to Financial Statements.) |
| | | | | | | |
| | | Period Ended April 30, 2020
(Unaudited) | | | Period Ended October 31, 2019(1) | | | Period Ended April 30, 2020
(Unaudited) | | | Year Ended October 31, 2019 | |
| Operations: | | | | | | | | | | | | |
| Net Investment Income (Loss) | | $ | 12,216 | | | $ | (6,429 | ) | | $ | 538,206 | | | $ | 214,681 | |
Net Realized Gain on Investments and Foreign Currency Transactions(2) | | | 237,842 | | | | 274,775 | | | | 165,221 | | | | 1,800,709 | |
| Net Change in Unrealized Appreciation (Depreciation) on Investments and Foreign Currency Translations | | | 647,537 | | | | (62,273 | ) | | | (5,170,045 | ) | | | 5,386,322 | |
| Net Increase (Decrease) in Net Assets Resulting from Operations | | | 897,595 | | | | 206,073 | | | | (4,466,618 | ) | | | 7,401,712 | |
| Distributions | | | (11,908 | ) | | | — | | | | (100,709 | ) | | | (310,767 | ) |
| Return of Capital | | | — | | | | — | | | | — | | | | (82,434 | ) |
| Capital Share Transactions: | | | | | | | | | | | | | | | | |
| Issued | | | 6,812,393 | | | | 4,225,143 | | | | — | | | | 1,570,034 | |
| Redeemed | | | (917,260 | ) | | | (914,408 | ) | | | (1,206,315 | ) | | | (9,624,431 | ) |
| Increase (Decrease) in Net Assets from Capital Share Transactions | | | 5,895,133 | | | | 3,310,735 | | | | (1,206,315 | ) | | | (8,054,397 | ) |
| Total Increase (Decrease) in Net Assets | | | 6,780,820 | | | | 3,516,808 | | | | (5,773,642 | ) | | | (1,045,886 | ) |
| Net Assets: | | | | | | | | | | | | | | | | |
| Beginning of Period | | | 3,516,808 | | | | — | | | | 56,133,998 | | | | 57,179,884 | |
| End of Period | | $ | 10,297,628 | | | $ | 3,516,808 | | | $ | 50,360,356 | | | $ | 56,133,998 | |
| Share Transactions: | | | | | | | | | | | | | | | | |
| Issued | | | 400,000 | | | | 250,002 | | | | — | | | | 50,000 | |
| Redeemed | | | (50,000 | ) | | | (50,000 | ) | | | (50,000 | ) | | | (300,000 | ) |
| Net Increase (Decrease) in Shares Outstanding from Share Transactions | | | 350,000 | | | | 200,002 | | | | (50,000 | ) | | | (250,000 | ) |
| (1) | The Fund commenced operations on November 27, 2018 |
| (2) | Includes realized gains (losses) as a result of in-kind redemptions. (See Note 4 in Notes to Financial Statements.) |
| | | Global X Scientific Beta U.S. ETF | | | Global X Scientific Beta Europe ETF | |
| | | Period Ended April 30, 2020
(Unaudited) | | | Year Ended October 31, 2019 | | | Period Ended April 30, 2020
(Unaudited) | | | Year Ended October 31, 2019 | |
| Operations: | | | | | | | | | | | | |
| Net Investment Income | | $ | 980,525 | | | $ | 1,827,231 | | | $ | 37,775 | | | $ | 139,576 | |
Net Realized Gain (Loss) on Investments and Foreign Currency Transactions(1) | | | 3,437,400 | | | | 1,173,339 | | | | (54,704 | ) | | | (591,557 | ) |
| Net Change in Unrealized Appreciation (Depreciation) on Investments and Foreign Currency Translations | | | (14,242,011 | ) | | | 8,393,384 | | | | (776,923 | ) | | | 828,669 | |
| Net Increase (Decrease) in Net Assets Resulting from Operations | | | (9,824,086 | ) | | | 11,393,954 | | | | (793,852 | ) | | | 376,688 | |
| Distributions | | | (968,239 | ) | | | (3,062,493 | ) | | | (39,957 | ) | | | (423,851 | ) |
| Capital Share Transactions: | | | | | | | | | | | | | | | | |
| Issued | | | 3,338,615 | | | | 1,686,481 | | | | — | | | | — | |
| Redeemed | | | (62,197,821 | ) | | | (36,888,553 | ) | | | — | | | | (4,906,432 | ) |
| Decrease in Net Assets from Capital Share Transactions | | | (58,859,206 | ) | | | (35,202,072 | ) | | | — | | | | (4,906,432 | ) |
| Total Decrease in Net Assets | | | (69,651,531 | ) | | | (26,870,611 | ) | | | (833,809 | ) | | | (4,953,595 | ) |
| Net Assets: | | | | | | | | | | | | | | | | |
| Beginning of Period | | | 99,716,274 | | | | 126,586,885 | | | | 4,980,309 | | | | 9,933,904 | |
| End of Period | | $ | 30,064,743 | | | $ | 99,716,274 | | | $ | 4,146,500 | | | $ | 4,980,309 | |
| Share Transactions: | | | | | | | | | | | | | | | | |
| Issued | | | 100,000 | | | | 50,000 | | | | — | | | | — | |
| Redeemed | | | (2,050,000 | ) | | | (1,200,000 | ) | | | — | | | | (200,000 | ) |
| Net Decrease in Shares Outstanding from Share Transactions | | | (1,950,000 | ) | | | (1,150,000 | ) | | | — | | | | (200,000 | ) |
| (1) | Includes realized gains (losses) as a result of in-kind redemptions. (See Note 4 in Notes to Financial Statements.) |
| | | Global X Scientific Beta Japan ETF | | | Global X Scientific Beta Asia ex-Japan ETF | |
| | | Period Ended April 30, 2020
(Unaudited) | | | Year Ended October 31, 2019 | | | Period Ended April 30, 2020
(Unaudited) | | | Year Ended October 31, 2019 | |
| Operations: | | | | | | | | | | | | |
| Net Investment Income | | $ | 27,043 | | | $ | 57,717 | | | $ | 30,797 | | | $ | 93,456 | |
Net Realized Loss on Investments and Foreign Currency Transactions(1) | | | (16,163 | ) | | | (361,003 | ) | | | (14,462 | ) | | | (305,150 | ) |
| Net Change in Unrealized Appreciation (Depreciation) on Investments and Foreign Currency Translations | | | (398,331 | ) | | | 387,449 | | | | (425,644 | ) | | | 406,137 | |
| Net Increase (Decrease) in Net Assets Resulting from Operations | | | (387,451 | ) | | | 84,163 | | | | (409,309 | ) | | | 194,443 | |
| Distributions | | | (65,595 | ) | | | (176,524 | ) | | | (66,678 | ) | | | (210,319 | ) |
| Capital Share Transactions: | | | | | | | | | | | | | | | | |
| Issued | | | — | | | | — | | | | — | | | | 1,143,206 | |
| Redeemed | | | — | | | | (5,479,512 | ) | | | — | | | | (2,173,540 | ) |
| Decrease in Net Assets from Capital Share Transactions | | | — | | | | (5,479,512 | ) | | | — | | | | (1,030,334 | ) |
| Total Decrease in Net Assets | | | (453,046 | ) | | | (5,571,873 | ) | | | (475,987 | ) | | | (1,046,210 | ) |
| Net Assets: | | | | | | | | | | | | | | | | |
| Beginning of Period | | | 2,836,837 | | | | 8,408,710 | | | | 2,436,765 | | | | 3,482,975 | |
| End of Period | | $ | 2,383,791 | | | $ | 2,836,837 | | | $ | 1,960,778 | | | $ | 2,436,765 | |
| Share Transactions: | | | | | | | | | | | | | | | | |
| Issued | | | — | | | | — | | | | — | | | | 50,000 | |
| Redeemed | | | — | | | | (200,000 | ) | | | — | | | | (100,000 | ) |
| Net Decrease in Shares Outstanding from Share Transactions | | | — | | | | (200,000 | ) | | | — | | | | (50,000 | ) |
| (1) | Includes realized gains (losses) as a result of in-kind redemptions. (See Note 4 in Notes to Financial Statements.) |
| | | Global X S&P 500® Catholic Values ETF | | | Global X NASDAQ 100® Covered Call ETF | |
| | | Period Ended April 30, 2020
(Unaudited) | | | Year Ended October 31, 2019 | | | Period Ended April 30, 2020
(Unaudited) | | | Year Ended October 31, 2019 | |
| Operations: | | | | | | | | | | | | |
| Net Investment Income | | $ | 2,530,058 | | | $ | 3,782,250 | | | $ | 1,378,481 | | | $ | 1,351,100 | |
Net Realized Gain (Loss) on Investments and Written Options(1) | | | 4,275,375 | | | | 6,721,506 | | | | (186,261,578 | ) | | | (20,251,238 | ) |
| Net Change in Unrealized Appreciation (Depreciation) on Investments and Written Options | | | (14,095,805 | ) | | | 21,644,396 | | | | 89,299,913 | | | | 73,301,428 | |
| Net Increase (Decrease) in Net Assets Resulting from Operations | | | (7,290,372 | ) | | | 32,148,152 | | | | (95,583,184 | ) | | | 54,401,290 | |
| Distributions | | | (2,497,519 | ) | | | (4,718,097 | ) | | | (48,837,565 | ) | | | (42,482,025 | ) |
| Return of Capital | | | — | | | | — | | | | — | | | | (12,331,150 | ) |
| Capital Share Transactions: | | | | | | | | | | | | | | | | |
| Issued | | | 58,419,299 | | | | 126,239,636 | | | | 342,092,203 | | | | 391,863,250 | |
| Redeemed | | | (11,315,564 | ) | | | (25,948,245 | ) | | | (43,622,896 | ) | | | (18,616,590 | ) |
| Increase in Net Assets from Capital Share Transactions | | | 47,103,735 | | | | 100,291,391 | | | | 298,469,307 | | | | 373,246,660 | |
| Total Increase in Net Assets | | | 37,315,844 | | | | 127,721,446 | | | | 154,048,558 | | | | 372,834,775 | |
| Net Assets: | | | | | | | | | | | | | | | | |
| Beginning of Period | | | 275,510,772 | | | | 147,789,326 | | | | 768,036,356 | | | | 395,201,581 | |
| End of Period | | $ | 312,826,616 | | | $ | 275,510,772 | | | $ | 922,084,914 | | | $ | 768,036,356 | |
| Share Transactions: | | | | | | | | | | | | | | | | |
| Issued | | | 1,650,000 | | | | 3,750,000 | | | | 14,950,000 | | | | 17,250,000 | |
| Redeemed | | | (300,000 | ) | | | (750,000 | ) | | | (2,250,000 | ) | | | (850,000 | ) |
| Net Increase in Shares Outstanding from Share Transactions | | | 1,350,000 | | | | 3,000,000 | | | | 12,700,000 | | | | 16,400,000 | |
| (1) | Includes realized gains (losses) as a result of in-kind redemptions. (See Note 4 in Notes to Financial Statements.) |
| | | Global X S&P 500® Covered Call ETF | | | Global X Russell 2000 Covered Call ETF | |
| | | Period Ended April 30, 2020
(Unaudited) | | | Year Ended October 31, 2019 | | | Period Ended April 30, 2020
(Unaudited) | | | Period Ended October 31, 2019(1) | |
| Operations: | | | | | | | | | | | | |
| Net Investment Income | | $ | 913,809 | | | $ | 1,148,589 | | | $ | 32,326 | | | $ | 18,162 | |
Net Realized Gain (Loss) on Investments and Written Options(2) | | | (4,459,743 | ) | | | (837,062 | ) | | | (1,162,001 | ) | | | 222,010 | |
| Net Change in Unrealized Appreciation (Depreciation) on Investments and Written Options | | | (18,029,816 | ) | | | 9,025,817 | | | | (2,402,333 | ) | | | 60,403 | |
| Net Increase (Decrease) in Net Assets Resulting from Operations | | | (21,575,750 | ) | | | 9,337,344 | | | | (3,532,008 | ) | | | 300,575 | |
| Distributions | | | (4,191,923 | ) | | | (5,450,400 | ) | | | (601,129 | ) | | | (257,580 | ) |
| Return of Capital | | | — | | | | (780,262 | ) | | | — | | | | — | |
| Capital Share Transactions: | | | | | | | | | | | | | | | | |
| Issued | | | 42,130,031 | | | | 64,332,407 | | | | 7,102,706 | | | | 8,790,388 | |
| Redeemed | | | (42,716,458 | ) | | | (11,786,529 | ) | | | — | | | | — | |
| Increase (Decrease) in Net Assets from Capital Share Transactions | | | (586,427 | ) | | | 52,545,878 | | | | 7,102,706 | | | | 8,790,388 | |
| Total Increase (Decrease) in Net Assets | | | (26,354,100 | ) | | | 55,652,560 | | | | 2,969,569 | | | | 8,833,383 | |
| Net Assets: | | | | | | | | | | | | | | | | |
| Beginning of Period | | | 133,353,094 | | | | 77,700,534 | | | | 8,833,383 | | | | — | |
| End of Period | | $ | 106,998,994 | | | $ | 133,353,094 | | | $ | 11,802,952 | | | $ | 8,833,383 | |
| Share Transactions: | | | | | | | | | | | | | | | | |
| Issued | | | 850,000 | | | | 1,350,000 | | | | 300,000 | | | | 350,000 | |
| Redeemed | | | (950,000 | ) | | | (250,000 | ) | | | — | | | | — | |
| Net Increase (Decrease) in Shares Outstanding from Share Transactions | | | (100,000 | ) | | | 1,100,000 | | | | 300,000 | | | | 350,000 | |
| (1) | The Fund commenced operations on April 17, 2019 |
| (2) | Includes realized gains (losses) as a result of in-kind redemptions. (See Note 4 in Notes to Financial Statements.) |
This page is intentionally left blank.
Selected Per Share Data & Ratios
For a Share Outstanding Throughout the Period
| | | Net
Asset Value, Beginning
of Period
($) | | | Net Investment Income
($)* | | | Net Realized and Unrealized Gain (Loss) on Investments
($) | | | Total from Operations
($) | | | Distribution from Net Investment Income ($) | | | Distribution from Capital Gains ($) | |
Global X SuperDividend® ETF | | | | | | | | | | | | | | | | | | |
| 2020 (Unaudited) | | | 17.25 | | | | 0.70 | | | | (6.87 | ) | | | (6.17 | ) | | | (0.69 | ) | | | — | |
| 2019 | | | 19.06 | | | | 1.24 | | | | (1.47 | ) | | | (0.23 | ) | | | (1.38 | ) | | | — | |
| 2018 | | | 21.51 | | | | 1.35 | | | | (2.26 | ) | | | (0.91 | ) | | | (1.43 | ) | | | — | |
| 2017 | | | 20.43 | | | | 1.08 | | | | 1.45 | | | | 2.53 | | | | (1.22 | ) | | | — | |
| 2016 | | | 20.65 | | | | 1.15 | | | | 0.08 | | | | 1.23 | | | | (1.30 | ) | | | — | |
| 2015 | | | 24.24 | | | | 1.26 | | | | (3.36 | ) | | | (2.10 | ) | | | (1.44 | ) | | | (0.05 | ) |
Global X SuperDividend® U.S. ETF | | | | | | | | | | | | | | | | | | | | | | | | |
| 2020 (Unaudited) | | | 23.34 | | | | 0.80 | | | | (8.16 | ) | | | (7.36 | ) | | | (0.90 | ) | | | — | |
| 2019 | | | 24.53 | | | | 1.12 | | | | (0.56 | ) | | | 0.56 | | | | (1.49 | ) | | | — | |
| 2018 | | | 25.18 | | | | 1.07 | | | | (0.17 | ) | | | 0.90 | | | | (1.35 | ) | | | — | |
| 2017 | | | 24.00 | | | | 0.79 | | | | 1.94 | | | | 2.73 | | | | (0.96 | ) | | | — | |
| 2016 | | | 25.23 | | | | 0.92 | #
| | | (0.40 | ) | | | 0.52 | | | | (1.07 | ) | | | — | |
| 2015 | | | 29.60 | | | | 1.71 | | | | (4.19 | ) | | | (2.48 | ) | | | (1.23 | ) | | | — | |
Global X MSCI SuperDividend® Emerging Markets ETF | | | | | | | | | | | | | | | | | | | | | | | | |
| 2020 (Unaudited) | | | 12.95 | | | | 0.20 | | | | (2.97 | ) | | | (2.77 | ) | | | (0.46 | ) | | | — | |
| 2019 | | | 12.91 | | | | 0.87 | | | | 0.05 | | | | 0.92 | | | | (0.88 | ) | | | — | |
| 2018 | | | 15.94 | | | | 0.90 | | | | (3.02 | ) | | | (2.12 | ) | | | (0.91 | ) | | | — | |
| 2017 | | | 14.96 | | | | 0.83 | | | | 0.91 | | | | 1.74 | | | | (0.76 | ) | | | — | |
| 2016 | | | 13.73 | | | | 0.59 | | | | 1.41 | | | | 2.00 | | | | (0.77 | ) | | | — | |
2015(2) | | | 14.90 | | | | 0.66 | | | | (1.34 | ) | | | (0.68 | ) | | | (0.49 | ) | | | — | |
Global X MSCI SuperDividend® EAFE ETF | | | | | | | | | | | | | | | | | | | | | | | | |
| 2020 (Unaudited) | | | 16.11 | | | | 0.28 | | | | (4.42 | ) | | | (4.14 | ) | | | (0.42 | ) | | | — | |
| 2019 | | | 15.96 | | | | 0.82 | | | | 0.36 | | | | 1.18 | | | | (1.03 | ) | | | — | |
| 2018 | | | 18.13 | | | | 1.12 | | | | (2.04 | ) | | | (0.92 | ) | | | (1.10 | ) | | | (0.15 | ) |
2017(1) | | | 14.87 | | | | 0.81 | | | | 3.04 | | | | 3.85 | | | | (0.59 | ) | | | — | |
| Return of Capital ($) | | | Total from Distributions ($) | | | Net
Asset Value,
End of
Period ($) | | | Total Return (%)** | | | Net Assets End of Period ($)(000) | | | Ratio of Expenses to Average Net Assets (%) | | | Ratio of Net Investment Income to Average Net Assets (%) | | | Portfolio Turnover (%)†† | |
| | | | | | | | | | | | | | | | | | | | | | | |
| | — | | | | (0.69 | ) | | | 10.39 | | | | (36.95 | ) | | | 565,229 | | | | 0.59 | † | | | 9.40 | † | | | 50.95 | |
| | (0.20 | ) | | | (1.58 | ) | | | 17.25 | | | | (1.02 | ) | | | 932,111 | | | | 0.59 | | | | 7.03 | | | | 56.85 | |
| | (0.11 | ) | | | (1.54 | ) | | | 19.06 | | | | (4.65 | ) | | | 912,968 | | | | 0.59 | | | | 6.48 | | | | 59.48 | |
| | (0.23 | ) | | | (1.45 | ) | | | 21.51 | | | | 12.69 | | | | 992,893 | | | | 0.58 | | | | 5.07 | | | | 67.38 | |
| | (0.15 | ) | | | (1.45 | ) | | | 20.43 | | | | 6.23 | | | | 801,816 | | | | 0.58 | | | | 5.67 | | | | 39.06 | |
| | — | | | | (1.49 | ) | | | 20.65 | | | | (9.01 | ) | | | 880,666 | | | | 0.58 | | | | 5.58 | | | | 26.12 | |
| | | | | | | | | | | | | | | | | | | | | | | | | | | | | | | |
| | — | | | | (0.90 | ) | | | 15.08 | | | | (32.49 | ) | | | 392,917 | | | | 0.46 | † | | | 7.92 | † | | | 55.88 | |
| | (0.26 | ) | | | (1.75 | ) | | | 23.34 | | | | 2.61 | | | | 544,884 | | | | 0.46 | | | | 4.83 | | | | 60.00 | |
| | (0.20 | ) | | | (1.55 | ) | | | 24.53 | | | | 3.66 | | | | 413,311 | | | | 0.46 | | | | 4.31 | | | | 33.25 | |
| | (0.59 | ) | | | (1.55 | ) | | | 25.18 | | | | 11.64 | | | | 425,579 | | | | 0.45 | | | | 3.15 | | | | 53.01 | |
| | (0.68 | ) | | | (1.75 | ) | | | 24.00 | | | | 2.13 | | | | 338,397 | | | | 0.45 | | | | 3.77# | | | | 53.45 | |
| | (0.66 | ) | | | (1.89 | ) | | | 25.23 | | | | (8.67 | ) | | | 274,999 | | | | 0.45 | | | | 6.25 | | | | 42.51 | |
| | | | | | | | | | | | | | | | | | | | | | | | | | | | | | | |
| | — | | | | (0.46 | ) | | | 9.72 | | | | (22.08 | ) | | | 15,065 | | | | 0.67 | † | | | 3.26 | † | | | 19.35 | |
| | — | | | | (0.88 | ) | | | 12.95 | | | | 7.14 | | | | 17,489 | | | | 0.66 | | | | 6.51 | | | | 66.65 | |
| | — | | | | (0.91 | ) | | | 12.91 | | | | (14.10 | ) | | | 12,260 | | | | 0.67 | | | | 5.89 | | | | 79.52 | |
| | — | | | | (0.76 | ) | | | 15.94 | | | | 11.95 | | | | 12,748 | | | | 0.66 | | | | 5.25 | | | | 122.32 | |
| | — | | | | (0.77 | ) | | | 14.96 | | | | 15.58 | | | | 3,740 | | | | 0.65 | | | | 4.49 | | | | 64.83 | |
| | — | | | | (0.49 | ) | | | 13.73 | | | | (4.89 | ) | | | 3,433 | | | | 0.65 | † | | | 6.72 | † | | | 1.25 | |
| | | | | | | | | | | | | | | | | | | | | | | | | | | | | | | |
| | — | | | | (0.42 | ) | | | 11.55 | | | | (26.27 | ) | | | 6,932 | | | | 0.56 | † | | | 3.70 | † | | | 8.36 | |
| | — | | | | (1.03 | ) | | | 16.11 | | | | 7.81 | | | | 18,527 | | | | 0.56 | | | | 5.23 | | | | 29.81 | |
| | — | | | | (1.25 | ) | | | 15.96 | | | | (5.59 | ) | | | 4,788 | | | | 0.56 | | | | 6.36 | | | | 52.96 | |
| | — | | | | (0.59 | ) | | | 18.13 | | | | 26.19 | | | | 1,813 | | | | 0.56 | † | | | 4.97 | † | | | 45.40 | |
| * | Per share data calculated using average shares method. |
| ** | Total Return is for the period indicated and has not been annualized. The return shown does not reflect the deduction of taxes that a shareholder would pay on Fund distributions or the redemption of Fund shares. |
| # | Effective November 1, 2015, the Fund changed its method for estimating the characterization of amounts distributed by master limited partnerships, which correspondingly impacted the financial highlight ratios and per share disclosures to the extent that the fund recorded investment income that differed from amounts previously estimated. |
| † | Annualized. |
| †† | Portfolio turnover rate is for the period indicated and periods of less than one year have not been annualized. Excludes effect of in-kind transfers. |
| (1) | The Fund commenced operations on November 14, 2016. |
| (2) | The Fund commenced operations on March 16, 2015. |
Amounts designated as “—” are $0 or have been rounded to $0.
Selected Per Share Data & Ratios
For a Share Outstanding Throughout the Period
| | | Net
Asset Value, Beginning
of Period
($) | | | Net Investment Income (Loss)
($)* | | | Net Realized and Unrealized Gain (Loss) on Investments
($) | | | Total from Operations
($) | | | Distribution from Net Investment Income ($) | | | Return of Capital ($) | |
Global X SuperDividend® REIT ETF | | | | | | | | | | | | | | | | | | |
| 2020 (Unaudited) | | | 15.33 | | | | 0.38 | | | | (7.87 | ) | | | (7.49 | ) | | | (0.57 | ) | | | — | |
| 2019 | | | 14.62 | | | | 0.99 | | | | 0.91 | | | | 1.90 | | | | (1.19 | ) | | | — | |
| 2018 | | | 15.29 | | | | 0.92 | | | | (0.28 | ) | | | 0.64 | | | | (1.31 | ) | | | — | |
| 2017 | | | 14.60 | | | | 0.86 | | | | 0.96 | | | | 1.82 | | | | (1.13 | ) | | | — | |
| 2016 | | | 13.18 | | | | 0.91 | | | | 1.72 | | | | 2.63 | | | | (1.21 | ) | | | — | |
2015(1) | | | 15.12 | | | | 0.63 | | | | (1.95 | ) | | | (1.32 | ) | | | (0.62 | ) | | | — | |
Global X SuperIncome™ Preferred ETF | | | | | | | | | | | | | | | | | | | | | | | | |
| 2020 (Unaudited) | | | 11.73 | | | | 0.35 | | | | (1.13 | ) | | | (0.78 | ) | | | (0.34 | ) | | | — | |
| 2019 | | | 11.49 | | | | 0.66 | | | | 0.32 | | | | 0.98 | | | | (0.73 | ) | | | (0.01 | ) |
| 2018 | | | 12.44 | | | | 0.78 | | | | (0.88 | ) | | | (0.10 | ) | | | (0.85 | ) | | | — | |
| 2017 | | | 13.16 | | | | 0.82 | | | | (0.65 | ) | | | 0.17 | | | | (0.85 | ) | | | (0.04 | ) |
| 2016 | | | 13.49 | | | | 0.91 | | | | (0.33 | ) | | | 0.58 | | | | (0.91 | ) | | | — | |
| 2015 | | | 14.74 | | | | 0.95 | | | | (1.21 | ) | | | (0.26 | ) | | | (0.99 | ) | | | — | |
| Global X YieldCo & Renewable Energy Income ETF | | | | | | | | | | | | | | | | | | | | | | | | |
| 2020 (Unaudited) | | | 13.79 | | | | 0.14 | | | | (0.55 | ) | | | (0.41 | ) | | | (0.23 | ) | | | — | |
| 2019 | | | 11.52 | | | | 0.13 | | | | 2.61 | | | | 2.74 | | | | (0.47 | ) | | | — | |
| 2018 | | | 12.53 | | | | 0.37 | | | | (0.80 | ) | | | (0.43 | ) | | | (0.50 | ) | | | (0.08 | ) |
| 2017 | | | 11.16 | | | | 0.28 | | | | 1.59 | | | | 1.87 | | | | (0.50 | ) | | | — | |
| 2016 | | | 11.06 | | | | 0.41 | # | | | 0.35 | | | | 0.76 | | | | (0.48 | ) | | | (0.18 | ) |
2015(2) | | | 15.19 | | | | 0.20 | | | | (4.19 | ) | | | (3.99 | ) | | | (0.14 | ) | | | — | |
| Global X Social Media ETF | | | | | | | | | | | | | | | | | | | | | | | | |
| 2020 (Unaudited) | | | 31.92 | | | | (0.03 | ) | | | 2.48 | | | | 2.45 | | | | — | | | | — | |
| 2019 | | | 29.10 | | | | (0.10 | ) | | | 2.92 | | | | 2.82 | | | | — | | | | — | |
| 2018 | | | 32.67 | | | | (0.06 | ) | | | (3.02 | ) | | | (3.08 | ) | | | (0.49 | ) | | | — | |
| 2017 | | | 23.53 | | | | 0.10 | | | | 9.08 | | | | 9.18 | | | | (0.04 | ) | | | — | |
| 2016 | | | 19.29 | | | | 0.02 | | | | 4.22 | | | | 4.24 | | | | — | | | | — | |
| 2015 | | | 19.30 | | | | 0.01 | | | | (0.01 | ) | | | — | | | | (0.01 | ) | | | — | |
| Total from Distributions ($) | | | Net
Asset Value,
End of
Period ($) | | | Total Return (%)** | | | Net Assets End of Period ($)(000) | | | Ratio of Expenses to Average Net Assets (%) | | | Ratio of Net Investment Income (Loss) to Average Net Assets (%) | | | Portfolio Turnover (%)†† | |
| | | | | | | | | | | | | | | | | | | | |
| | (0.57 | ) | | | 7.27 | | | | (50.35 | ) | | | 299,830 | | | | 0.59 | † | | | 6.08 | † | | | 69.20 | |
| | (1.19 | ) | | | 15.33 | | | | 13.68 | | | | 364,790 | | | | 0.59 | | | | 6.71 | | | | 34.16 | |
| | (1.31 | ) | | | 14.62 | | | | 4.30 | | | | 118,408 | | | | 0.59 | | | | 6.15 | | | | 41.61 | |
| | (1.13 | ) | | | 15.29 | | | | 13.00 | | | | 51,986 | | | | 0.58 | | | | 5.74 | | | | 54.96 | |
| | (1.21 | ) | | | 14.60 | | | | 21.01 | | | | 34,302 | | | | 0.56 | | | | 6.23 | | | | 16.87 | |
| | (0.62 | ) | | | 13.18 | | | | (8.86 | ) | | | 3,954 | | | | 0.54 | † | | | 7.20 | † | | | 1.45 | |
| | | | | | | | | | | | | | | | | | | | | | | | | | | |
| | (0.34 | ) | | | 10.61 | | | | (6.77 | ) | | | 170,295 | | | | 0.58 | † | | | 6.23 | † | | | 53.02 | |
| | (0.74 | ) | | | 11.73 | | | | 8.87 | | | | 201,092 | | | | 0.58 | | | | 5.72 | | | | 55.98 | |
| | (0.85 | ) | | | 11.49 | | | | (0.87 | ) | | | 186,154 | | | | 0.58 | | | | 6.48 | | | | 105.48 | |
| | (0.89 | ) | | | 12.44 | | | | 1.31 | | | | 236,331 | | | | 0.58 | | | | 6.39 | | | | 45.12 | |
| | (0.91 | ) | | | 13.16 | | | | 4.44 | | | | 232,206 | | | | 0.58 | | | | 6.81 | | | | 47.62 | |
| | (0.99 | ) | | | 13.49 | | | | (1.95 | ) | | | 235,427 | | | | 0.58 | | | | 6.68 | | | | 76.54 | |
| | | | | | | | | | | | | | | | | | | | | | | | | | | |
| | (0.23 | ) | | | 13.15 | | | | (3.16 | ) | | | 46,037 | | | | 0.66 | † | | | 1.98 | † | | | 17.24 | |
| | (0.47 | ) | | | 13.79 | | | | 24.34 | | | | 26,205 | | | | 0.65 | | | | 1.01 | | | | 87.06 | |
| | (0.58 | ) | | | 11.52 | | | | (3.50 | ) | | | 15,556 | | | | 0.65 | | | | 3.07 | | | | 33.50 | |
| | (0.50 | ) | | | 12.53 | | | | 17.30 | | | | 20,046 | | | | 0.65 | | | | 2.37 | | | | 25.99 | |
| | (0.66 | ) | | | 11.16 | | | | 7.25 | | | | 6,695 | | | | 0.66 | | | | 3.78 | #
| | | 40.25 | |
| | (0.14 | ) | | | 11.06 | | | | (26.39 | ) | | | 3,319 | | | | 0.65 | † | | | 3.72 | † | | | 22.97 | |
| | | | | | | | | | | | | | | | | | | | | | | | | | | |
| | — | | | | 34.37 | | | | 7.68 | | | | 118,583 | | | | 0.65 | † | | | (0.17 | )† | | | 0.76 | |
| | — | | | | 31.92 | | | | 9.69 | | | | 121,289 | | | | 0.65 | | | | (0.33 | ) | | | 16.92 | |
| | (0.49 | ) | | | 29.10 | | | | (9.61 | ) | | | 129,496 | | | | 0.65 | | | | (0.16 | ) | | | 21.36 | |
| | (0.04 | ) | | | 32.67 | | | | 39.09 | | | | 164,998 | | | | 0.65 | | | | 0.35 | | | | 41.40 | |
| | | *** | | | 23.53 | | | | 21.99 | | | | 134,111 | | | | 0.65 | | | | 0.12 | | | | 39.89 | |
| | (0.01 | ) | | | 19.29 | | | | — | | | | 77,145 | | | | 0.65 | | | | 0.04 | | | | 26.51 | |
| * | Per share data calculated using average shares method. |
| ** | Total Return is for the period indicated and has not been annualized. The return shown does not reflect the deduction of taxes that a shareholder would pay on Fund distributions or the redemption of Fund shares. |
| *** | Amount rounds to less than $0.005. |
| # | Effective November 1, 2015, the Fund changed its method for estimating the characterization of amounts distributed by master limited partnerships, which correspondingly impacted the financial highlight ratios and per share disclosures to the extent that the fund recorded investment income that differed from amounts previously estimated. |
| † | Annualized. |
| †† | Portfolio turnover rate is for the period indicated and periods of less than one year have not been annualized. Excludes effect of in-kind transfers. |
| (1) | The Fund commenced operations on March 16, 2015. |
| (2) | The Fund commenced operations on May 27, 2015. |
Amounts designated as “—” are $0 or have been rounded to $0.
Selected Per Share Data & Ratios
For a Share Outstanding Throughout the Period
| | | Net
Asset Value, Beginning
of Period
($) | | | Net Investment Income (Loss)
($)* | | | Net Realized and Unrealized Gain (Loss) on Investments
($) | | | Total from Operations
($) | | | Distribution from Net Investment Income ($) | | | Return of Capital ($) | |
| Global X E-commerce ETF | | | | | | | | | | | | | | | | | | |
| 2020 (Unaudited) | | | 17.58 | | | | 0.03 | | | | 1.14 | | | | 1.17 | | | | (0.03 | ) | | | — | |
2019(1) | | | 15.00 | | | | (0.05 | ) | | | 2.63 | | | | 2.58 | | | | — | | | | — | |
Global X Guru® Index ETF | | | | | | | | | | | | | | | | | | | | | | | | |
| 2020 (Unaudited) | | | 34.02 | | | | 0.33 | | | | (2.81 | ) | | | (2.48 | ) | | | (0.06 | ) | | | — | |
| 2019 | | | 30.09 | | | | 0.12 | | | | 4.02 | | | | 4.14 | | | | (0.17 | ) | | | (0.04 | ) |
| 2018 | | | 28.70 | | | | 0.11 | | | | 1.44 | | | | 1.55 | | | | (0.16 | ) | | | — | |
| 2017 | | | 23.14 | | | | 0.14 | | | | 5.47 | | | | 5.61 | | | | (0.05 | ) | | | — | |
| 2016 | | | 23.96 | | | | 0.12 | #
| | | (0.83 | ) | | | (0.71 | ) | | | (0.09 | ) | | | (0.02 | ) |
| 2015 | | | 26.30 | | | | 0.10 | | | | (2.16 | ) | | | (2.06 | ) | | | (0.28 | ) | | | — | |
| Global X Scientific Beta U.S. ETF | | | | | | | | | | | | | | | | | | | | | | | | |
| 2020 (Unaudited) | | | 33.80 | | | | 0.36 | | | | (3.76 | ) | | | (3.40 | ) | | | (0.34 | ) | | | — | |
| 2019 | | | 30.87 | | | | 0.57 | | | | 3.27 | | | | 3.84 | | | | (0.91 | ) | | | — | |
| 2018 | | | 30.04 | | | | 0.52 | | | | 0.77 | | | | 1.29 | | | | (0.46 | ) | | | — | |
| 2017 | | | 25.46 | | | | 0.48 | | | | 4.44 | | | | 4.92 | | | | (0.34 | ) | | | — | |
| 2016 | | | 24.67 | | | | 0.46 | | | | 0.62 | | | | 1.08 | | | | (0.29 | ) | | | — | |
2015(2) | | | 24.90 | | | | 0.18 | | | | (0.41 | ) | | | (0.23 | ) | | | — | | | | — | |
| Global X Scientific Beta Europe ETF | | | | | | | | | | | | | | | | | | | | | | | | |
| 2020 (Unaudited) | | | 24.90 | | | | 0.19 | | | | (4.16 | ) | | | (3.97 | ) | | | (0.20 | ) | | | — | |
| 2019 | | | 24.83 | | | | 0.63 | | | | 1.24 | | | | 1.87 | | | | (1.80 | ) | | | — | |
| 2018 | | | 28.43 | | | | 0.72 | | | | (2.91 | ) | | | (2.19 | ) | | | (1.41 | ) | | | — | |
| 2017 | | | 22.63 | | | | 0.61 | | | | 5.87 | | | | 6.48 | | | | (0.68 | ) | | | — | |
| 2016 | | | 24.41 | | | | 0.66 | | | | (2.10 | ) | | | (1.44 | ) | | | (0.34 | ) | | | — | |
2015(2) | | | 24.89 | | | | 0.25 | | | | (0.73 | ) | | | (0.48 | ) | | | — | | | | — | |
| Total from Distributions ($) | | | Net
Asset Value,
End of
Period ($) | | | Total Return (%)** | | | Net Assets End of Period ($)(000) | | | Ratio of Expenses to Average Net Assets (%) | | | Ratio of Net Investment Income (Loss) to Average Net Assets (%) | | | Portfolio Turnover (%)†† | |
| | | | | | | | | | | | | | | | | | | | |
| | (0.03 | ) | | | 18.72 | | | | 6.68 | | | | 10,298 | | | | 0.53 | † | | | 0.40 | † | | | 22.54 | |
| | — | | | | 17.58 | | | | 17.20 | | | | 3,517 | | | | 0.68 | † | | | (0.32 | )† | | | 23.50 | |
| | | | | | | | | | | | | | | | | | | | | | | | | | | |
| | (0.06 | ) | | | 31.48 | | | | (7.31 | ) | | | 50,360 | | | | 0.75 | † | | | 1.97 | † | | | 61.08 | |
| | (0.21 | ) | | | 34.02 | | | | 13.90 | | | | 56,134 | | | | 0.75 | | | | 0.38 | | | | 126.44 | |
| | (0.16 | ) | | | 30.09 | | | | 5.40 | | | | 57,180 | | | | 0.75 | | | | 0.36 | | | | 112.64 | |
| | (0.05 | ) | | | 28.70 | | | | 24.30 | | | | 55,956 | | | | 0.75 | | | | 0.54 | | | | 94.71 | |
| | (0.11 | ) | | | 23.14 | | | | (2.97 | ) | | | 59,013 | | | | 0.75 | | | | 0.52# | | | | 102.07 | |
| | (0.28 | ) | | | 23.96 | | | | (7.94 | ) | | | 184,505 | | | | 0.75 | | | | 0.39 | | | | 129.71 | |
| | | | | | | | | | | | | | | | | | | | | | | | | | | |
| | (0.34 | ) | | | 30.06 | | | | (10.20 | ) | | | 30,065 | | | | 0.19 | † | | | 2.19 | † | | | 19.02 | |
| | (0.91 | ) | | | 33.80 | | | | 12.97 | | | | 99,716 | | | | 0.19 | ‡ | | | 1.79 | | | | 45.16 | |
| | (0.46 | ) | | | 30.87 | | | | 4.28 | | | | 126,587 | | | | 0.19 | ‡ | | | 1.64 | | | | 38.94 | |
| | (0.34 | ) | | | 30.04 | | | | 19.52 | | | | 135,184 | | | | 0.19 | ‡ | | | 1.69 | | | | 28.46 | |
| | (0.29 | ) | | | 25.46 | | | | 4.43 | | | | 66,202 | | | | 0.20 | ‡ | | | 1.82 | | | | 32.54 | |
| | — | | | | 24.67 | | | | (0.92 | ) | | | 2,467 | | | | 0.35 | † | | | 1.55 | † | | | 20.90 | |
| | | | | | | | | | | | | | | | | | | | | | | | | | | |
| | (0.20 | ) | | | 20.73 | | | | (16.11 | ) | | | 4,147 | | | | 0.38 | † | | | 1.60 | † | | | 10.64 | |
| | (1.80 | ) | | | 24.90 | | | | 8.45 | | | | 4,980 | | | | 0.39 | | | | 2.62 | | | | 36.82 | |
| | (1.41 | ) | | | 24.83 | | | | (8.21 | ) | | | 9,934 | | | | 0.39 | | | | 2.61 | | | | 45.07 | |
| | (0.68 | ) | | | 28.43 | | | | 29.54 | | | | 21,323 | | | | 0.38 | | | | 2.41 | | | | 26.52 | |
| | (0.34 | ) | | | 22.63 | | | | (5.96 | ) | | | 12,447 | | | | 0.38 | | | | 2.89 | | | | 35.72 | |
| | — | | | | 24.41 | | | | (1.93 | ) | | | 2,441 | | | | 0.38 | † | | | 2.22 | † | | | 17.53 | |
| * | Per share data calculated using average shares method. |
| ** | Total Return is for the period indicated and has not been annualized. The return shown does not reflect the deduction of taxes that a shareholder would pay on Fund distributions or the redemption of Fund shares. |
| # | Effective November 1, 2015, the Fund changed its method for estimating the characterization of amounts distributed by master limited partnerships, which correspondingly impacted the financial highlight ratios and per share disclosures to the extent that the fund recorded investment income that differed from amounts previously estimated. |
| † | Annualized. |
| †† | Portfolio turnover rate is for the period indicated and periods of less than one year have not been annualized. Excludes effect of in-kind transfers. |
| ‡ | The ratio of Expenses to Average Net Assets includes the effect of a waiver. If these offsets were excluded,the ratio would have been 0.22%, 0.30%, 0.35% and 0.35% for the years ended October 31, 2019, 2018,2017 and 2016, respectively. |
| (1) | The Fund commenced operations on November 27, 2018. |
| (2) | The Fund commenced operations on May 12, 2015. |
Amounts designated as “—” are $0 or have been rounded to $0.
Selected Per Share Data & Ratios
For a Share Outstanding Throughout the Period
| | | Net
Asset Value, Beginning
of Period
($) | | | Net Investment Income
($)* | | | Net Realized and Unrealized Gain (Loss) on Investments
($) | | | Total from Operations
($) | | | Distribution from Net Investment Income ($) | | | Distribution from Capital Gains ($) | |
| Global X Scientific Beta Japan ETF | | | | | | | | | | | | | | | | | | |
| 2020 (Unaudited) | | | 28.37 | | | | 0.27 | | | | (4.14 | ) | | | (3.87 | ) | | | (0.66 | ) | | | — | |
| 2019 | | | 28.03 | | | | 0.42 | | | | 0.76 | | | | 1.18 | | | | (0.84 | ) | | | — | |
| 2018 | | | 31.47 | | | | 0.48 | | | | (2.56 | ) | | | (2.08 | ) | | | (1.36 | ) | | | — | |
| 2017 | | | 27.38 | | | | 0.47 | | | | 4.36 | | | | 4.83 | | | | (0.74 | ) | | | — | |
| 2016 | | | 25.19 | | | | 0.44 | | | | 1.97 | | | | 2.41 | | | | (0.21 | ) | | | (0.01 | ) |
2015(1) | | | 25.07 | | | | 0.12 | | | | — | | | | 0.12 | | | | — | | | | — | |
| Global X Scientific Beta Asia ex-Japan ETF | | | | | | | | | | | | | | | | | | | | | | | | |
| 2020 (Unaudited) | | | 24.37 | | | | 0.31 | | | | (4.40 | ) | | | (4.09 | ) | | | (0.67 | ) | | | — | |
| 2019 | | | 23.22 | | | | 0.87 | | | | 1.83 | | | | 2.70 | | | | (1.55 | ) | | | — | |
| 2018 | | | 25.71 | | | | 0.96 | | | | (2.33 | ) | | | (1.37 | ) | | | (1.12 | ) | | | — | |
| 2017 | | | 22.96 | | | | 0.92 | | | | 2.85 | | | | 3.77 | | | | (1.02 | ) | | | — | |
| 2016 | | | 21.63 | | | | 0.80 | | | | 1.15 | | | | 1.95 | | | | (0.62 | ) | | | — | |
2015(1) | | | 24.89 | | | | 0.44 | | | | (3.70 | ) | | | (3.26 | ) | | | — | | | | — | |
Global X S&P 500® Catholic Values ETF | | | | | | | | | | | | | | | | | | | | | | | | |
| 2020 (Unaudited) | | | 37.23 | | | | 0.32 | | | | (1.47 | ) | | | (1.15 | ) | | | (0.31 | ) | | | (0.02 | ) |
| 2019 | | | 33.59 | | | | 0.58 | | | | 3.92 | | | | 4.50 | | | | (0.81 | ) | | | (0.05 | ) |
| 2018 | | | 31.83 | | | | 0.58 | | | | 1.60 | | | | 2.18 | | | | (0.41 | ) | | | (0.01 | ) |
| 2017 | | | 25.74 | | | | 0.48 | | | | 5.74 | | | | 6.22 | | | | (0.13 | ) | | | | *** |
2016(2) | | | 25.14 | | | | 0.24 | | | | 0.36 | | | | 0.60 | | | | — | | | | — | |
| Total from Distributions ($) | | | Net
Asset Value,
End of
Period ($) | | | Total Return (%)** | | | Net Assets End of Period ($)(000) | | | Ratio of Expenses to Average Net Assets (%) | | | Ratio of Net Investment Income to Average Net Assets (%) | | | Portfolio Turnover (%)†† | |
| | | | | | | | | | | | | | | | | | | | |
| | (0.66 | ) | | | 23.84 | | | | (14.01 | ) | | | 2,384 | | | | 0.38 | † | | | 2.06 | † | | | 10.90 | |
| | (0.84 | ) | | | 28.37 | | | | 4.50 | | | | 2,837 | | | | 0.40 | | | | 1.54 | | | | 46.64 | |
| | (1.36 | ) | | | 28.03 | | | | (7.09 | ) | | | 8,409 | | | | 0.39 | | | | 1.56 | | | | 42.93 | |
| | (0.74 | ) | | | 31.47 | | | | 18.17 | | | | 17,309 | | | | 0.39 | | | | 1.64 | | | | 17.80 | |
| | (0.22 | ) | | | 27.38 | | | | 9.63 | | | | 13,688 | | | | 0.38 | | | | 1.75 | | | | 82.57 | |
| | — | | | | 25.19 | | | | 0.48 | | | | 2,519 | | | | 0.38 | † | | | 1.02 | † | | | 20.31 | |
| | | | | | | | | | | | | | | | | | | | | | | | | | | |
| | (0.67 | ) | | | 19.61 | | | | (17.35 | ) | | | 1,961 | | | | 0.38 | † | | | 2.75 | † | | | 12.17 | |
| | (1.55 | ) | | | 24.37 | | | | 12.17 | | | | 2,437 | | | | 0.38 | | | | 3.60 | | | | 42.04 | |
| | (1.12 | ) | | | 23.22 | | | | (5.78 | ) | | | 3,483 | | | | 0.38 | | | | 3.76 | | | | 42.88 | |
| | (1.02 | ) | | | 25.71 | | | | 17.43 | | | | 3,857 | | | | 0.38 | | | | 3.86 | | | | 53.22 | |
| | (0.62 | ) | | | 22.96 | | | | 9.29 | | | | 2,296 | | | | 0.38 | | | | 3.61 | | | | 74.44 | |
| | — | | | | 21.63 | | | | (13.10 | ) | | | 2,163 | | | | 0.38 | † | | | 4.17 | † | | | 59.21 | |
| | | | | | | | | | | | | | | | | | | | | | | | | | | |
| | (0.33 | ) | | | 35.75 | | | | (3.18 | ) | | | 312,827 | | | | 0.29 | † | | | 1.73 | † | | | 6.25 | |
| | (0.86 | ) | | | 37.23 | | | | 13.86 | | | | 275,511 | | | | 0.29 | | | | 1.66 | | | | 8.54 | |
| | (0.42 | ) | | | 33.59 | | | | 6.86 | | | | 147,789 | | | 0.29 | @ | | | 1.72 | | | | 4.33 | |
| | (0.13 | ) | | | 31.83 | | | | 24.27 | | | | 114,581 | | | 0.29 | @
| | | 1.64 | | | | 6.09 | |
| | — | | | | 25.74 | | | | 2.39 | | | | 39,899 | | | 0.29 | @†
| | | 1.75 | † | | | 2.80 | |
| @ | The ratio of Expenses to Average Net Assets includes the effect of a waiver. If these offsets were excluded, the ratio would have been 0.32%, 39% and 0.39%, for the years ended October 31, 2018, 2017 and 2016, respectively. |
| * | Per share data calculated using average shares method. |
| ** | Total Return is for the period indicated and has not been annualized. The return shown does not reflect the deduction of taxes that a shareholder would pay on Fund distributions or the redemption of Fund shares. |
| *** | Amount rounds to less than $0.005. |
| † | Annualized. |
| †† | Portfolio turnover rate is for the period indicated and periods of less than one year have not been annualized. Excludes effect of in-kind transfers. |
| (1) | The Fund commenced operations on May 12, 2015. |
| (2) | The Fund commenced operations on April 18, 2016. |
Amounts designated as “—” are $0 or have been rounded to $0.
Selected Per Share Data & Ratios
For a Share Outstanding Throughout the Period
| | | Net
Asset Value, Beginning
of Period
($) | | | Net Investment Income
($)* | | | Net Realized and Unrealized Gain (Loss) on Investments
($) | | | Total from Operations
($) | | | Distribution from Net Investment Income ($) | | | Distribution from Capital Gains ($) | |
Global X NASDAQ 100® Covered Call ETF(1) | | | | | | | | | | | | | | | | | | |
| 2020 (Unaudited) | | | 23.10 | | | | 0.03 | | | | (1.88 | ) | | | (1.85 | ) | | | (1.18 | ) | | | — | |
| 2019 | | | 23.45 | | | | 0.06 | | | | 1.95 | | | | 2.01 | | | | (1.83 | ) | | | — | |
| 2018 | | | 24.30 | | | | 0.07 | | | | 1.71 | | | | 1.78 | | | | (0.87 | ) | | | (0.11 | ) |
| 2017 | | | 22.06 | | | | 0.12 | | | | 3.93 | | | | 4.05 | | | | (1.81 | ) | | | — | |
| 2016 | | | 23.51 | | | | 0.15 | | | | 0.53 | | | | 0.68 | | | | (1.06 | ) | | | — | |
| 2015 | | | 24.04 | | | | 0.16 | | | | 1.47 | | | | 1.63 | | | | (1.92 | ) | | | — | |
Global X S&P 500® Covered Call ETF(1) | | | | | | | | | | | | | | | | | | | | | | | | |
| 2020 (Unaudited) | | | 49.39 | | | | 0.31 | | | | (7.14 | ) | | | (6.83 | ) | | | (1.41 | ) | | | — | |
| 2019 | | | 48.56 | | | | 0.56 | | | | 3.30 | | | | 3.86 | | | | (2.27 | ) | | | (0.39 | ) |
| 2018 | | | 50.10 | | | | 0.62 | | | | 1.88 | | | | 2.50 | | | | (0.22 | ) | | | (1.22 | ) |
2017(2) | | | 47.62 | | | | 0.34 | | | | 2.67 | | | | 3.01 | | | | (0.53 | ) | | | — | |
2017(3) | | | 43.11 | | | | 0.66 | | | | 5.39 | | | | 6.05 | | | | (1.54 | ) | | | — | |
2016(3) | | | 45.39 | | | | 0.70 | | | | (0.90 | ) | | | (0.20 | ) | | | (1.50 | ) | | | — | |
| Global X Russell 2000 Covered Call ETF | | | | | | | | | | | | | | | | | | | | | | | | |
| 2020 (Unaudited) | | | 25.24 | | | | 0.06 | | | | (5.95 | ) | | | (5.89 | ) | | | (1.02 | ) | | | (0.17 | ) |
2019(4) | | | 25.00 | | | | 0.09 | | | | 1.37 | | | | 1.46 | | | | (1.22 | ) | | | — | |
| Return of Capital ($) | | | Total from Distributions ($) | | | Net
Asset Value,
End of
Period ($) | | | Total Return (%)** | | | Net Assets End of Period ($)(000) | | | Ratio of Expenses to Average Net Assets (%) | | | Ratio of Net Investment Income to Average Net Assets (%) | | | Portfolio Turnover (%)†† | |
| | | | | | | | | | | | | | | | | | | | | | | |
| | — | | | | (1.18 | ) | | | 20.07 | | | | (8.28 | ) | | | 922,085 | | | | 0.76 | ‡† | | | 0.31 | † | | | 45.19 | |
| | (0.53 | ) | | | (2.36 | ) | | | 23.10 | | | | 9.39 | | | | 768,036 | | | | 0.85 | ‡ | | | 0.26 | | | | 11.82 | |
| | (1.65 | ) | | | (2.63 | ) | | | 23.45 | | | | 7.44 | | | | 395,202 | | | 0.68 | ^^ | | | 0.30 | | | | 15.00 | |
| | — | | | | (1.81 | ) | | | 24.30 | | | | 19.04 | | | | 157,980 | | | | 0.60 | | | | 0.53 | | | | 4.00 | |
| | (1.07 | ) | | | (2.13 | ) | | | 22.06 | | | | 3.32 | | | | 52,952 | | | | 0.60 | | | | 0.69 | | | | 9.00 | |
| | (0.24 | ) | | | (2.16 | ) | | | 23.51 | | | | 7.25 | | | | 22,337 | | | | 0.60 | | | | 0.67 | | | | 13.00 | |
| | | | | | | | | | | | | | | | | | | | | | | | | | | | | | | |
| | — | | | | (1.41 | ) | | | 41.15 | | | | (14.11 | ) | | | 106,999 | | | 0.78 | ^† | | | 1.31 | † | | | 34.59 | |
| | (0.37 | ) | | | (3.03 | ) | | | 49.39 | | | | 8.40 | | | | 133,353 | | | 0.87 | ^
| | | 1.16 | | | | 3.92 | |
| | (2.60 | ) | | | (4.04 | ) | | | 48.56 | | | | 4.97 | | | | 77,701 | | | | 0.65 | | | | 1.22 | | | | 4.00 | |
| | — | | | | (0.53 | ) | | | 50.10 | | | | 6.35 | | | | 62,628 | | | | 0.65 | † | | | 1.39 | † | | | 8.00 | |
| | — | | | | (1.54 | ) | | | 47.62 | | | | 14.29 | | | | 64,413 | | | | 0.65 | | | | 1.46 | | | | 21.00 | |
| | (0.58 | ) | | | (2.08 | ) | | | 43.11 | | | | (0.29 | ) | | | 60,459 | | | | 0.65 | | | | 1.61 | | | | 7.00 | |
| | | | | | | | | | | | | | | | | | | | | | | | | | | | | | | |
| | — | | | | (1.19 | ) | | | 18.16 | | | | (24.06 | ) | | | 11,803 | | | | 0.66 | † | | | 0.58 | † | | | 14.46 | |
| | — | | | | (1.22 | ) | | | 25.24 | | | | 5.99 | | | | 8,833 | | | | 0.82 | †# | | | 0.68 | † | | | 5.82 | |
| * | Per share data calculated using average shares method. |
| ** | Total Return is for the period indicated and has not been annualized. The return shown does not reflect the deduction of taxes that a shareholder would pay on Fund distributions or the redemption of Fund shares. |
| † | Annualized. |
| †† | Portfolio turnover rate is for the period indicated and periods of less than one year have not been annualized. Excludes effect of in-kind transfers. |
| ‡ | Excluding broker fees on written options, the ratio of expenses to average net assets would have been 0.61% and 0.60% for the period ended April 30, 2020 and year ended October 31, 2019, respectively. |
| ^ | Excluding broker fees on written options, the ratio of expenses to average net assets would have been 0.66% and 0.65% for the period ended April 30, 2020 and year ended October 31, 2019, respectively. |
| ^^ | Includes excise tax. If this excise expense was not included, the ratio would have been 0.60%. |
| # | Excluding broker fees on written options, the ratio of expenses to average net assets would have been 0.60% and 0.60% for the period ended April 30, 2020 and year ended October 31, 2019, respectively. The ratio of Expenses to Average Net Assets includes the effect of a waiver. If these offsets were excluded, the ratio would have been 0.79% and 0.97% for the period ended April 30, 2020 and year ended October 31, 2019, respectively. |
| (1) | The financial statements include the financial information of the Predecessor Funds through December 21, 2018 (See Note 1 in Notes to Financial Statements). As a result of the Reorganization, the Fund assumed the performance and accounting history of the Predecessor Fund. Accordingly, performance figures for the Fund for periods prior to the date of the Reorganization represent the performance of the Predecessor Fund. |
| (2) | Effective October 31, 2017, the Predecessor Fund changed its fiscal year end from April 30 to October 31. The information presented is from May 1, 2017 through October 31, 2017. |
| (3) | For the year or period ended April 30. |
| (4) | The Fund commenced operations on April 17, 2019. |
Amounts designated as “—” are $0 or have been rounded to $0.
| | |
Notes to Financial Statements (unaudited) |
| |
|
1. ORGANIZATION
The Global X Funds (the “Trust”) is a Delaware statutory trust formed on March 6, 2008. The Trust is registered under the Investment Company Act of 1940, as amended, as an open-end management investment company. As of April 30, 2020, the Trust had eighty-three portfolios, seventy-two of which were operational. The financial statements herein and the related notes pertain to the Global X SuperDividend® ETF, Global X SuperDividend® U.S. ETF, Global X MSCI SuperDividend® Emerging Markets ETF, Global X MSCI SuperDividend® EAFE ETF, Global X SuperDividend® REIT ETF, Global X SuperIncome™ Preferred ETF, Global X YieldCo & Renewable Energy Income ETF, Global X Social Media ETF, Global X E-commerce ETF, Global X Guru® Index ETF, Global X Scientific Beta U.S. ETF, Global X Scientific Beta Europe ETF, Global X Scientific Beta Japan ETF, Global X Scientific Beta Asia ex-Japan ETF, Global X S&P 500® Catholic Values ETF, Global X Nasdaq 100® Covered Call ETF, Global X S&P 500® Covered Call ETF, and Global X Russell 2000 Covered Call ETF (each a “Fund”, collectively, the “Funds”). Each Fund (except the Global X SuperDividend® ETF, Global X SuperDividend® U.S. ETF, Global X MSCI SuperDividend® Emerging Markets ETF, Global X SuperDividend® REIT ETF, Global X SuperIncomeTM Preferred ETF, Global X Guru® Index ETF, Global X Scientific Beta U.S. ETF, Global X Scientific Beta Europe ETF, Global X Scientific Beta Japan ETF, Global X Scientific Beta Asia ex-Japan ETF, Global X S&P 500® Catholic Values ETF, Global X S&P 500® Covered Call ETF and Global X Russell 2000 Covered Call ETF) has elected non-diversified status.
Effective November 19, 2018, the Global X YieldCo Index ETF was renamed the Global X YieldCo & Renewable Energy Income ETF, and its underlying index was changed to the Index YieldCo & Renewable Energy Income Index.
On December 24, 2018, the shareholders of the Horizons NASDAQ 100® Covered Call ETF and Horizons S&P 500® Covered Call ETF (together, the “Predecessor Funds”) approved a proposed agreement and plan of reorganization (the “Reorganization”) that provided for (a) the transfer of all the assets and assumption of certain of the liabilities of each Predecessor Fund to the Global X Nasdaq 100® Covered Call ETF and the Global X S&P 500® Covered Call ETF (together, the “Successor Funds”), respectively; (b) the issuance of shares of the Successor Fund to the shareholders of the corresponding Predecessor Fund; and (c) the liquidation and termination of the Predecessor Fund. The effective date of the Reorganization of each Predecessor Fund was December 24, 2018. The Successor Funds had no operations prior to the Reorganization. The Predecessor Funds had substantially similar investment objectives, investment strategies, policies and restrictions as those of the Successor Funds. The financial statements and financial highlights include the financial information of the Predecessor Funds through December 21, 2018.
| | |
Notes to Financial Statements (unaudited) (continued) |
| |
|
2. SIGNIFICANT ACCOUNTING POLICIES
The following is a summary of the significant accounting policies followed by the Funds:
USE OF ESTIMATES – The Funds are investment companies that apply the accounting and reporting guidance issued in Topic 946 by the U.S. Financial Accounting Standards Board. The preparation of financial statements in conformity with U.S. generally accepted accounting principles (“U.S. GAAP”) requires management to make estimates and assumptions that affect the reported amounts of assets and liabilities and disclosure of contingent assets and liabilities at the date of the financial statements and the reported amounts of increases and decreases in net assets from operations during the reporting period. Actual results could materially differ from those estimates.
RETURN OF CAPITAL ESTIMATES – Distributions received by the Funds from underlying master limited partnership (“MLP”) and real estate investment trust (“REIT”) investments generally are comprised of income and return of capital. The Funds record investment income and return of capital based on estimates made at the time such distributions are received. Such estimates are based on historical information available from the MLPs, REITs and other industry sources. These estimates may subsequently be revised based on information received from the MLPs and REITs after their tax reporting periods are concluded.
MLPs – Certain Funds may invest in MLPs. MLPs are publicly traded partnerships engaged in the transportation, storage and processing of minerals and natural resources. By confining their operations to these specific activities, their interests, or units, are able to trade on public securities exchanges exactly like the shares of a corporation, without entity level taxation. To qualify as an MLP and to not be taxed as a corporation, a partnership must receive at least 90% of its income from qualifying sources as set forth in Section 7704(d) of the Internal Revenue Code of 1986, as amended (the “Code”). These qualifying sources include natural resource-based activities such as the processing, transportation and storage of mineral or natural resources. MLPs generally have two classes of owners: the general partner and limited partners. The general partner of an MLP is typically owned by a major energy company, an investment fund, the direct management of the MLP, or is an entity owned by one or more of such parties. The general partner may be structured as a private or publicly traded corporation or other entity.
The general partner typically controls the operations and management of the MLP through an up to 2% equity interest in the MLP plus, in many cases, ownership of common units and subordinated units.
Limited partners typically own the remainder of the partnership through ownership of common units, and have a limited role in the partnership’s operations and management. MLPs are typically structured such that common units and general partner interests have first priority to receive quarterly cash distributions up to an established minimum amount (“minimum quarterly distributions” or “MQD”). Common and general partner interests
2. SIGNIFICANT ACCOUNTING POLICIES (continued)
also accrue arrearages in distributions to the extent the MQD is not paid. Once common and general partner interests have been paid, subordinated units receive distributions of up to the MQD; however, subordinated units do not accrue arrearages. Distributable cash in excess of the MQD is paid to both common and subordinated units and is distributed to both common and subordinated units generally on a pro rata basis. The general partner is also eligible to receive incentive distributions if the general partner operates the business in a manner which results in distributions paid per common unit surpassing specified target levels. As the general partner increases cash distributions to the limited partners, the general partner receives an increasingly higher percentage of the incremental cash distributions.
SECURITY VALUATION - Securities listed on a securities exchange, market or automated quotation system for which quotations are readily available (except for securities traded on NASDAQ), including securities traded over the counter, are valued at the last quoted sale price on the primary exchange or market (foreign or domestic) on which they are traded (or at approximately 4:00 pm EST if a security’s primary exchange is normally open at that time), or, if there is no such reported sale, at the most recent mean between the quoted bid and asked prices, which approximates fair value (absent both bid and asked prices on such exchange, the bid price may be used).
For securities traded on NASDAQ, the NASDAQ official closing price will be used. If available, debt securities are priced based upon valuations provided by independent, third-party pricing agents. Such values generally reflect the last reported sales price if the security is actively traded. The third-party pricing agents may also value debt securities at an evaluated bid price by employing methodologies that utilize actual market transactions, broker-supplied valuations, or other methodologies designed to identify the market value for such securities. Debt obligations with remaining maturities of sixty days or less may be valued at their amortized cost, which approximates market value. The prices for foreign securities are reported in local currency and converted to U.S. dollars using currency exchange rates as of the reporting date. The exchange rates used by the Trust for valuation are captured as of the New York or London close each day. Prices for most securities held in the Funds are provided daily by recognized independent pricing agents. If a security price cannot be obtained from an independent, third-party pricing agent, the Funds seek to obtain a bid price from at least one independent broker.
Securities for which market prices are not “readily available” are valued in accordance with fair value procedures (the “Fair Value Procedures”) established by the Board of Trustees (the “Board”) of the Trust. The Funds’ Fair Value Procedures are implemented through a fair value committee (the “Committee”) designated by the Board. Some of the more common reasons that may necessitate that a security be valued using the Fair Value Procedures include: the security’s trading has been halted or suspended; the security has
2. SIGNIFICANT ACCOUNTING POLICIES (continued)
been de-listed from its primary trading exchange; the security’s primary trading market is temporarily closed at a time when, under normal conditions, it would be open; the security has not been traded for an extended period of time; the security’s primary pricing source is not able or willing to provide a price; the security’s primary pricing source is not able or willing to provide a price; or trading of the security is subject to local government-imposed restrictions. In addition, the Funds may fair value a security if an event that may materially affect the value of the Funds’ security that is traded outside the United States (a “Significant Event”) has occurred between the time of the security’s last close and the time that the Funds calculate their net asset values. A Significant Event may relate to a single issuer or to an entire market sector. Events that may be Significant Events include: government actions, natural disasters, armed conflict, acts of terrorism and significant market fluctuations. If Global X Management Company LLC, the Funds’ investment advisor (the “Adviser”), becomes aware of a Significant Event that has occurred with respect to a security or group of securities after the closing of the exchange or market on which the security or securities principally trade, but before the time at which the Funds calculate their net asset values, it may request that a Committee meeting be called. When a security is valued in accordance with the Fair Value Procedures, the Committee will determine the value after taking into consideration all relevant information reasonably available to the Committee. As of April 30, 2020, Global X E-commerce ETF and Global X Scientific Beta Asia ex-Japan ETF have fair valued securities valued at $3,665 and $41,280, respectively. There were no other securities priced using the Fair Value Procedures.
In accordance with the authoritative guidance on fair value measurements and disclosure under U.S. GAAP, the Funds disclose the fair value of their investments in a hierarchy that prioritizes the inputs to valuation techniques used to measure the fair value. The objective of a fair value measurement is to determine the price that would be received to sell an asset or paid to transfer a liability in an orderly transaction between market participants at the measurement date (an exit price). Accordingly, the fair value hierarchy gives the highest priority to quoted prices (unadjusted) in active markets for identical assets or liabilities (Level 1) and the lowest priority to unobservable inputs (Level 3). The three levels of the fair value hierarchy are described below:
Level 1 – Unadjusted quoted prices in active markets for identical, unrestricted assets or liabilities that the Funds have the ability to access at the measurement date
Level 2 – Other significant observable inputs (including quoted prices in non-active markets, quoted prices for similar investments, fair value of investments for which the Funds have the ability to fully redeem tranches at net asset value as of the measurement date or within the near term, and short-term investments valued at amortized cost)
2. SIGNIFICANT ACCOUNTING POLICIES (continued)
Level 3 – Significant unobservable inputs (including the Funds’ own assumptions in determining the fair value of investments, and fair value of investments for which the Funds do not have the ability to fully redeem tranches at net asset value as of the measurement date or within the near term)
Investments are classified within the level of the lowest significant input considered in determining fair value. Investments classified within Level 3 whose fair value measurement considers several inputs may include Level 1 or Level 2 inputs as components of the overall fair value measurement.
For the period ended April 30, 2020, there have been no significant changes to the Funds’ fair valuation methodologies.
The unobservable inputs used to determine fair value of Level 3 assets may have similar or diverging impacts on valuation. Significant increases and decreases in these inputs in isolation and interrelationships between those inputs could result in significantly higher or lower fair value measurement.
DUE TO/FROM BROKERS – Due to/from brokers includes cash and collateral balances with the Funds’ clearing brokers or counterparties at April 30, 2020. The Funds continuously monitor the credit standing of each broker or counterparty with whom they conduct business. In the event a broker or counterparty is unable to fulfill its obligations, the Funds would be subject to counterparty credit risk.
REPURCHASE AGREEMENTS - Securities pledged as collateral for repurchase agreements by BNP Paribas are held by Brown Brothers Harriman & Co. (“BBH”), the Funds’ custodian (“Custodian”), and are designated as being held on each Fund’s behalf by its custodian under a book-entry system. Each Fund monitors the adequacy of the collateral on a daily basis and can require the seller to provide additional collateral in the event the market value of the securities pledged falls below the carrying value of the repurchase agreement, including accrued interest.
It is the Funds’ policy to only enter into repurchase agreements with banks and other financial institutions which are deemed by the Adviser to be creditworthy. The Funds bear the risk of loss in the event that the counterparty to a repurchase agreement defaults on its obligations, and the Funds are prevented from exercising their rights to dispose of the underlying securities received as collateral and the risk of a possible decline in the value of the underlying securities during the period. For financial statement purposes, the Funds record the securities lending collateral (included in Repurchase Agreements, at value or restricted cash) as an asset and the obligation to return securities lending collateral as a liability on the Statements of Assets and Liabilities.
Repurchase agreements are entered into by the Funds under Master Repurchase Agreements (“MRA”) which permit the Funds, under certain circumstances, including an
2. SIGNIFICANT ACCOUNTING POLICIES (continued)
event of default (such as bankruptcy or insolvency), to offset payables and/or receivables under an MRA with collateral held and/or posted to the counterparty and create one single net payment due to or from the Funds.
As of April 30, 2020, the open repurchase agreements by counterparty which are subject to an MRA on a net payment basis are as follows:
| | | Repurchase Agreements | | | Fair Value of Non-cash Collateral Received(1) | | | Cash Collateral Received | | | Net Amount(2) | |
Global X SuperDividend® ETF | | | | | | | | | | | | |
| RBC Capital Markets | | $ | 4,890,044 | | | $ | 4,890,044 | | | $ | — | | | $ | — | |
Global X SuperDividend® U.S. ETF | | | | | | | | | | | | | | | | |
| RBC Capital Markets | | | 2,830,325 | | | | 2,830,325 | | | | — | | | | — | |
Global X SuperDividend® REIT ETF | | | | | | | | | | | | | | | | |
| RBC Capital Markets | | | 1,183,587 | | | | 1,183,587 | | | | — | | | | — | |
| Global X Social Media ETF | | | | | | | | | | | | | | | | |
| RBC Capital Markets | | | 1,289,041 | | | | 1,289,041 | | | | — | | | | — | |
(1) Excess collateral received is not presented in the table above. Please refer to the Schedule of Investments for the market value of the collateral received for each Fund.
(2) Net Amount represents the net amount receivable due from the counterparty in the event of default.
FEDERAL INCOME TAXES – It is each Fund’s intention to qualify, or continue to qualify, as a regulated investment company for Federal income tax purposes by complying with the appropriate provisions of Subchapter M of the Internal Revenue Code of 1986, as amended. Accordingly, no provisions for Federal income taxes have been made in the financial statements except as described below.
The Funds evaluate tax positions taken or expected to be taken in the course of preparing the Funds’ tax returns to determine whether it is “more-likely-than-not” (i.e., greater than 50 percent) that each tax position will be sustained upon examination by a taxing authority based on the technical merits of the position. Tax positions not deemed to meet the more-likely-than-not threshold are recorded as a tax benefit or expense in the current year. The Funds did not record any tax provisions in the current period; however, management’s conclusions regarding tax positions may be subject to review and adjustment at a later date based on factors including, but not limited to, examination by tax authorities (i.e., the last three tax year ends, as applicable), on-going analysis of and changes to tax laws, regulations and interpretations thereof.
If a Fund has foreign tax filings that have not been made, the tax years that remain subject to examination may date back to the inception of the Fund.
2. SIGNIFICANT ACCOUNTING POLICIES (continued)
As of and during the reporting period ended April 30, 2020, the Funds did not have a liability for any unrecognized tax benefits. The Funds recognize interest and penalties, if any, related to unrecognized tax benefits as income tax expense in the Statement of Operations. During the reporting period, the Funds did not incur any interest or penalties.
SECURITY TRANSACTIONS AND INVESTMENT INCOME – Security transactions are accounted for on the trade date for financial reporting purposes. Costs used in determining realized gains and losses on the sale of investment securities are based on specific identification. Dividend income is recorded on the ex-dividend date. Interest income is recognized on the accrual basis from the settlement date.
FOREIGN CURRENCY TRANSACTIONS AND TRANSLATION – The books and records of the Funds are maintained in U.S. dollars. Investment securities and other assets and liabilities denominated in a foreign currency are translated into U.S. dollars on the date of valuation. Purchases and sales of investment securities, income and expenses are translated into U.S. dollars at the relevant rates of exchange prevailing on the respective dates of such transactions. The Funds do not isolate that portion of realized or unrealized gains and losses resulting from changes in the foreign exchange rate from fluctuations arising from changes in the market prices of the securities. These gains and losses are included in net realized and unrealized gains and losses on investments on the Statement of Operations. Net realized and unrealized gains and losses on foreign currency transactions and translations represent net foreign exchange gains or losses from foreign currency spot contracts, disposition of foreign currencies, currency gains or losses realized between trade and settlement dates on securities transactions and the difference between the amount of the investment income and foreign withholding taxes recorded on the Funds’ books and the U.S. dollar equivalent amounts actually received or paid.
DIVIDENDS AND DISTRIBUTIONS TO SHAREHOLDERS – The Funds distribute their net investment income on a pro rata basis. Any net investment income and net realized capital gains are distributed at least annually. All distributions are recorded on ex-dividend date.
INVESTMENTS IN REITs – With respect to the Funds, dividend income is recorded based on the income included in distributions received from REIT investments using published REIT reclassifications, including some management estimates when actual amounts are not available. Distributions received in excess of these estimated amounts are recorded as a reduction of the cost of investments or reclassified to capital gains. The actual amounts of income, return of capital, and capital gains are only determined by each REIT after its fiscal year end, and may differ from the estimated amounts.
2. SIGNIFICANT ACCOUNTING POLICIES (continued)
CREATION UNITS – The Funds issue and redeem their shares (“Shares”) on a continuous basis at Net Asset Value (“NAV”) and only in large blocks of 50,000 Shares, referred to as “Creation Units”. Purchasers of Creation Units (“Authorized Participants”) at NAV must pay a standard creation transaction fee per transaction. The fee is a single charge and will be the same regardless of the number of Creation Units purchased by an Authorized Participant on the same day.
An Authorized Participant who holds Creation Units and wishes to redeem at NAV would also pay a standard redemption fee per transaction to BBH, on the date of such redemption, regardless of the number of Creation Units redeemed that day.
If a Creation Unit is purchased or redeemed for cash, an additional variable fee may be charged. The following table discloses Creation Unit breakdown:
| | Creation Unit Shares | | | Creation Fee | | | Value at April 30, 2020 | | | Redemption Fee | |
Global X SuperDividend® ETF | | | 50,000 | | | $ | 2,000 | | | $ | 519,500 | | | $ | 2,000 | |
Global X SuperDividend® U.S. ETF | | | 50,000 | | | | 250 | | | | 754,000 | | | | 250 | |
Global X MSCI SuperDividend® Emerging Markets ETF | | | 50,000 | | | | 3,000 | | | | 486,000 | | | | 3,000 | |
Global X MSCI SuperDividend® EAFE ETF | | | 50,000 | | | | 1,000 | | | | 577,500 | | | | 1,000 | |
Global X SuperDividend® REIT ETF | | | 50,000 | | | | 250 | | | | 363,500 | | | | 250 | |
| Global X SuperIncome™ Preferred ETF | | | 50,000 | | | | 300 | | | | 530,500 | | | | 300 | |
| Global X YieldCo & Renewable Energy Income ETF | | | 50,000 | | | | 500 | | | | 657,500 | | | | 500 | |
| Global X Social Media ETF | | | 50,000 | | | | 300 | | | | 1,718,500 | | | | 300 | |
| Global X E-commerce ETF | | | 50,000 | | | | 500 | | | | 936,000 | | | | 500 | |
Global X Guru® Index ETF | | | 50,000 | | | | 250 | | | | 1,574,000 | | | | 250 | |
| Global X Scientific Beta U.S. ETF | | | 50,000 | | | | 1,500 | | | | 1,503,000 | | | | 1,500 | |
| Global X Scientific Beta Europe ETF | | | 50,000 | | | | 8,900 | | | | 1,036,500 | | | | 8,900 | |
| Global X Scientific Beta Japan ETF | | | 50,000 | | | | 2,800 | | | | 1,192,000 | | | | 2,800 | |
| Global X Scientific Beta Asia ex-Japan ETF | | | 50,000 | | | | 2,800 | | | | 980,500 | | | | 2,800 | |
Global X S&P 500® Catholic Values ETF | | | 50,000 | | | | 1,300 | | | | 1,787,500 | | | | 1,300 | |
Global X NASDAQ 100® Covered Call ETF | | | 50,000 | | | | 500 | | | | 1,003,500 | | | | 500 | |
Global X S&P 500® Covered Call ETF | | | 50,000 | | | | 2,000 | | | | 2,057,500 | | | | 2,000 | |
Global X Russell 2000® Covered Call ETF | | | 50,000 | | | | 250 | | | | 908,000 | | | | 250 | |
CASH OVERDRAFT CHARGES – Per the terms of an agreement with BBH, if a Fund has a cash overdraft on a given day, it will be assessed an overdraft charge of LIBOR plus 2.00%. Cash overdraft charges are included in custodian fees on the Statement of Operations.
3. RELATED PARTY TRANSACTIONS AND SERVICE PROVIDER TRANSACTIONS
On July 2, 2018, the Adviser consummated a transaction pursuant to which it became an indirect, wholly-owned subsidiary of Mirae Asset Global Investments Co., Ltd. (“Mirae”). In this manner, the Adviser is ultimately controlled by Mirae, which is a leading financial services company in Korea and is the headquarters for the Mirae Asset Global Investments Group.
The Adviser serves as the investment adviser and the administrator for the Funds. Subject to the supervision of the Board, the Adviser is responsible for managing the investment activities of the Funds and the Funds’ business affairs and other administrative matters and provides, or causes to be furnished, all supervisory, administrative and other services reasonably necessary for the operation of the Funds, including certain distribution services (provided pursuant to a separate Distribution Agreement), certain shareholder and distribution-related services (provided pursuant to a separate Rule 12b-1 Plan and related agreements) and investment advisory services (provided pursuant to a separate Investment Advisory Agreement), under what is essentially an “all-in” fee structure. For the Adviser’s service to the Funds, under the Supervision and Administration Agreement, each Fund pays a monthly fee to the Adviser at the annual rate below (stated as a percentage of the average daily net assets of the Fund). In addition, the Funds bear other expenses, directly and indirectly, that are not covered by the Supervision and Administration Agreement, which may vary and affect the total expense ratios of the Funds, such as taxes, brokerage fees, commissions, custodian fees, acquired fund fees, and other transaction expenses, interest expenses and extraordinary expenses (such as litigation and indemnification expenses).
The following table discloses supervision and administration fees pursuant to the Supervision and Administration Agreement:
3. RELATED PARTY TRANSACTIONS AND SERVICE PROVIDER TRANSACTIONS (continued)
| | | Supervision and Administration Fee | |
Global X SuperDividend® ETF | | 0.58% | |
Global X SuperDividend® U.S. ETF | | 0.45% | |
Global X MSCI SuperDividend® Emerging Markets ETF | | 0.65% | |
Global X MSCI SuperDividend® EAFE ETF | | 0.55% | |
Global X SuperDividend® REIT ETF | | 0.58% | |
Global X SuperIncomeTM Preferred ETF | | 0.58% | |
| Global X YieldCo & Renewable Energy Income ETF | | 0.65% | |
| Global X Social Media ETF | | 0.65% | |
| Global X E-commerce ETF* | | 0.50% | |
Global X Guru® Index ETF | | 0.75% | |
| Global X Scientific Beta U.S. ETF** | | 0.19% | |
| Global X Scientific Beta Europe ETF | | 0.38% | |
| Global X Scientific Beta Japan ETF | | 0.38% | |
| Global X Scientific Beta Asia ex-Japan ETF | | 0.38% | |
Global X S&P 500® Catholic Values ETF*** | | 0.29% | |
Global X NASDAQ 100® Covered Call ETF**** | | 0.60% | |
Global X S&P 500® Covered Call ETF***** | | 0.65% | |
Global X Russell 2000® Covered Call ETF****** | | 0.60% | |
* Prior to November 18, 2019, the Supervision and Administration Fee for the Global X E-commerce ETF was 0.68%.
** Pursuant to an expense limitation agreement in existence between the Global X Scientific Beta U.S. ETF (the “Fund”) and the Adviser prior to March 1, 2019, the Adviser contractually agreed to reimburse or waive fees and/or limit fund expenses to the extent necessary to assure that the operating expenses of the Fund (exclusive of taxes, brokerage fees, commissions, and other transaction expenses, interest, and extraordinary expenses (such as litigation and indemnification expenses)) (“Total Annual Fund Operating Expenses”) would not exceed 0.19% of the Fund’s average daily net assets per year until March 1, 2019. Pursuant to the expense limitation agreement, the Fund (at a later date) may reimburse the Adviser for the fees it reimbursed or waived and/or limited pursuant to the expense limitation agreement during any of the prior three fiscal years, provided that, among other things, reimbursement to be made to the Adviser does not cause Total Annual Fund Operating Expenses of the Fund to exceed 0.19% during the year in which it is paid and the Board of Trustees has approved such reimbursement to the Adviser. Although the Board voted on November 13, 2018, to permanently reduce the Fund’s fees to 0.19% and end the expense limitation agreement as of March 1, 2019, prior waived or reimbursed fees are still subject to recoupment. As of April 30, 2020, the amounts of waivers/reimbursements subject to recoupment for Global X Scientific Beta U.S. ETF were $96,560 expiring in 2022, $155,018 expiring in 2021 and $32,075 expiring 2020. As of April 30, 2020, there had been no recoupment of previously waived and reimbursed fees.
3. RELATED PARTY TRANSACTIONS AND SERVICE PROVIDER TRANSACTIONS (continued)
*** Pursuant to an expense limitation agreement in existence between the Global X S&P 500® Catholic Values ETF (the “Fund”) and the Adviser prior to March 1, 2018, the Adviser agreed to waive or reimburse fees and/or limit fund expenses to the extent necessary to assure that the operating expenses of the Fund (exclusive of taxes, brokerage fees, commissions, and other transaction expenses and extraordinary expenses (such as litigation and indemnification expenses)) (“Total Annual Fund Operating Expenses”) would not exceed 0.29% of the Fund’s average daily net assets per year until at least March 1, 2018. Pursuant to the expense limitation agreement, the Fund (at a later date) could reimburse the Adviser for the fees and expenses it waived or reimbursed and/or limited during any of the prior three fiscal years, provided that, among other things, any reimbursement made to the Adviser would not cause Total Annual Fund Operating Expenses to exceed the maximum permitted rate during the period in which it is paid and the Board had approved such reimbursement to the Adviser. Although the Board voted on December 19, 2017, to permanently reduce the Fund’s fees to 0.29% and end the expense limitation agreement as of March 1, 2018, prior waived or reimbursed fees are still subject to recoupment. As of April 30, 2020, the amounts of waivers/reimbursements subject to recoupment for the Fund were $43,032 expiring 2021 and $51,701 expiring 2020. As of April 30, 2020 there had been no recoupment of previously waived and reimbursed fees.
**** Pursuant to an expense limitation agreement in existence between the Global X NASDAQ 100® Covered Call ETF (the “Fund”) and the Adviser, the Adviser agreed to waive or reimburse fees and/or limit Fund expenses to the extent necessary to assure that the operating expenses of the Fund (exclusive of taxes, commissions, and other transaction expenses, interest, and extraordinary expenses (such as litigation and indemnification expenses)) will not exceed 0.60% of the Fund’s average daily net assets per year, effective March 1, 2020, until at least March 1, 2021.
***** Pursuant to an expense limitation agreement in existence between the Global X S&P 500® Covered Call ETF (the “Fund”) and the Adviser, the Adviser agreed to reimburse or waive fees and/or limit Fund expenses to the extent necessary to assure that the operating expenses of the Fund (exclusive of taxes, commissions, and other transaction expenses, interest, and extraordinary expenses (such as litigation and indemnification expenses)) will not exceed 0.65% of the Fund’s average daily net assets per year, effective March 1, 2020, until at least March 1, 2021.
****** Pursuant to an amended and restated expense limitation agreement in existence between the Global X Russell 2000® Covered Call ETF (the “Fund”) and the Adviser, the Adviser agreed to waive or reimburse fees and/or limit fund expenses to the extent necessary to assure that the operating expenses of the Fund (exclusive of taxes, commissions, and other transaction expenses and extraordinary expenses (such as litigation and indemnification expenses)) (“Total Annual Fund Operating Expenses”) will not exceed 0.60% of the Fund’s average daily net assets per year, effective March 1, 2020, until at least March 1, 2021.
SEI Investments Global Funds Services (“SEIGFS”) serves as sub-administrator to the Funds. As sub-administrator, SEIGFS provides the Funds with required general administrative services, including, without limitation: office space, equipment, and personnel; clerical and general back office services; bookkeeping, internal accounting and secretarial services; the calculation of NAV; and assistance with the preparation and filing of reports, registration statements, proxy statements, and other materials required to be filed or furnished by the Funds under federal and state securities laws. As
3. RELATED PARTY TRANSACTIONS AND SERVICE PROVIDER TRANSACTIONS (continued)
compensation for these services, SEIGFS receives certain out-of-pocket costs, transaction fees, and asset-based fees which are accrued daily and paid monthly by the Adviser.
SEI Investments Distribution Co. (“SIDCO”) serves as each Fund’s underwriter and distributor of Creation Units pursuant to a distribution agreement. SIDCO has no obligation to sell any specific quantity of Fund Shares.
SIDCO bears the following costs and expenses relating to the distribution of Shares: (1) the costs of processing and maintaining records of creations of Creation Units; (2) all costs of maintaining the records required of a registered broker/dealer; (3) the expenses of maintaining its registration or qualification as a dealer or broker under Federal or state laws; (4) filing fees; and (5) all other expenses incurred in connection with the distribution services as contemplated in the distribution agreement. SIDCO receives no fee from the Funds for its distribution services under the distribution agreement, rather, the Adviser compensates SIDCO for certain expenses, out-of-pocket costs, and transaction fees.
BBH serves as custodian and transfer agent of the Funds’ assets. As custodian, BBH has agreed to (1) make receipts and disbursements of money on behalf of the Funds, (2) collect and receive all income and other payments and distributions on account of the Funds’ portfolio investments, (3) respond to correspondence from shareholders, security brokers and others relating to its duties; and (4) make periodic reports to the Funds concerning the Funds’ operations. BBH does not exercise any supervisory function over the purchase and sale of securities. As transfer agent, BBH has agreed to (1) issue and redeem Shares of each Fund, (2) make dividend and other distributions to shareholders of each Fund, (3) respond to correspondence by shareholders and others relating to its duties; (4) maintain shareholder accounts, and (5) make periodic reports to the Funds. As compensation for these services, BBH receives certain out-of-pocket costs, transaction fees and asset-based fees which are accrued daily and paid monthly by the Adviser from its fees.
4. INVESTMENT TRANSACTIONS
For the period ended April 30, 2020, the purchases and sales of investments in securities, excluding in-kind transactions, long-term U.S. Government and short-term securities, were:
| | | Purchases | | | Sales and Maturities | |
Global X SuperDividend® ETF | | $ | 390,234,343 | | | $ | 384,727,612 | |
Global X SuperDividend® U.S. ETF | | | 243,166,509 | | | | 256,816,231 | |
Global X MSCI SuperDividend® Emerging Markets ETF | | | 4,351,840 | | | | 3,302,046 | |
Global X MSCI SuperDividend® EAFE ETF | | | 1,083,154 | | | | 1,278,136 | |
Global X SuperDividend® REIT ETF | | | 178,884,507 | | | | 181,070,447 | |
| Global X SuperIncome™ Preferred ETF | | | 86,423,038 | | | | 86,444,323 | |
| Global X YieldCo & Renewable Energy Income ETF | | | 11,197,189 | | | | 6,338,452 | |
| Global X Social Media ETF | | | 907,871 | | | | 2,020,871 | |
| Global X E-commerce ETF | | | 488,569 | | | | 481,795 | |
Global X Guru® Index ETF | | | 33,176,734 | | | | 32,673,494 | |
| Global X Scientific Beta U.S. ETF | | | 12,494,809 | | | | 12,447,829 | |
| Global X Scientific Beta Europe ETF | | | 508,007 | | | | 500,316 | |
| Global X Scientific Beta Japan ETF | | | 286,056 | | | | 308,507 | |
| Global X Scientific Beta Asia ex-Japan ETF | | | 269,912 | | | | 300,148 | |
Global X S&P 500® Catholic Values ETF | | | 7,326,626 | | | | 6,887,541 | |
Global X NASDAQ 100® Covered Call ETF | | | 62,893,968 | | | | 134,780,491 | |
Global X S&P 500® Covered Call ETF | | | 3,902,245 | | | | 11,822,604 | |
Global X Russell 2000® Covered Call ETF | | | 554,621 | | | | 1,658,514 | |
For the period ended April 30, 2020, there were no purchases and sales of long-term U.S. Government securities.
4. INVESTMENT TRANSACTIONS (continued)
For the period ended April 30, 2020, in-kind transactions associated with creations and redemptions were:
| | | Purchases | | | Sales and Maturities | | | Realized Gain/(Loss) | |
Global X SuperDividend® ETF | | $ | 49,777,191 | | | $ | 27,787,216 | | | $ | (9,224,904 | ) |
Global X SuperDividend® U.S. ETF | | | 89,346,049 | | | | 23,401,983 | | | | 1,164,382 | |
Global X MSCI SuperDividend® Emerging Markets ETF | | | 1,152,350 | | | | — | | | | — | |
Global X MSCI SuperDividend® EAFE ETF | | | — | | | | 7,299,955 | | | | (733,618 | ) |
Global X SuperDividend® REIT ETF | | | 322,100,963 | | | | 89,324,465 | | | | 16,612,541 | |
| Global X SuperIncome™ Preferred ETF | | | 15,277,954 | | | | 24,598,288 | | | | (2,550,720 | ) |
| Global X YieldCo & Renewable Energy Income ETF | | | 19,326,796 | | | | — | | | | — | |
| Global X Social Media ETF | | | — | | | | 10,559,714 | | | | 1,966,522 | |
| Global X E-commerce ETF | | | 6,809,040 | | | | 919,339 | | | | 262,959 | |
Global X Guru® Index ETF | | | — | | | | 1,204,327 | | | | (262,710 | ) |
| Global X Scientific Beta U.S. ETF | | | 3,327,692 | | | | 62,142,868 | | | | 2,514,935 | |
| Global X Scientific Beta Europe ETF | | | — | | | | — | | | | — | |
| Global X Scientific Beta Japan ETF | | | — | | | | — | | | | — | |
| Global X Scientific Beta Asia ex-Japan ETF | | | — | | | | — | | | | — | |
Global X S&P 500® Catholic Values ETF | | | 58,168,010 | | | | 11,304,413 | | | | 3,831,858 | |
Global X NASDAQ 100® Covered Call ETF | | | 355,259,169 | | | | 44,239,657 | | | | 18,049,387 | |
Global X S&P 500® Covered Call ETF | | | 42,683,377 | | | | 43,252,692 | | | | 13,206,843 | |
Global X Russell 2000® Covered Call ETF | | | 7,290,181 | | | | — | | | | — | |
For the year or period ended October 31, 2019, in-kind transactions associated with creations and redemptions were:
| | | Purchases | | | Sales and Maturities | | | Realized Gain/(Loss) | |
Global X SuperDividend® ETF | | $ | 159,532,230 | | | $ | 51,670,555 | | | $ | 3,130,258 | |
Global X SuperDividend® U.S. ETF | | | 162,330,008 | | | | 10,936,835 | | | | 1,467,887 | |
Global X MSCI SuperDividend® Emerging Markets ETF | | | 4,785,344 | | | | 1,348,969 | | | | 204,853 | |
Global X MSCI SuperDividend® EAFE ETF | | | 16,543,011 | | | | 3,918,835 | | | | 297,261 | |
Global X SuperDividend® REIT ETF | | | 232,009,138 | | | | — | | | | 2,340,737 | |
| Global X SuperIncome™ Preferred ETF | | | 35,254,234 | | | | 23,945,663 | | | | 421,606 | |
| Global X YieldCo & Renewable Energy Income ETF | | | 7,668,802 | | | | 1,112,529 | | | | 86,352 | |
| Global X Social Media ETF | | | 5,555,728 | | | | 23,964,734 | | | | 4,282,069 | |
| Global X E-commerce ETF | | | 4,222,945 | | | | 915,083 | | | | 310,512 | |
Global X Guru® Index ETF | | | 1,570,297 | | | | 9,615,875 | | | | 1,456,153 | |
| Global X Scientific Beta U.S. ETF | | | 1,688,338 | | | | 36,865,680 | | | | 5,531,690 | |
| Global X Scientific Beta Europe ETF | | | — | | | | 4,887,777 | | | | (88,518 | ) |
| Global X Scientific Beta Japan ETF | | | — | | | | 5,420,190 | | | | 93,771 | |
| Global X Scientific Beta Asia ex-Japan ETF | | | 1,140,394 | | | | 2,167,909 | | | | (137,752 | ) |
Global X S&P 500® Catholic Values ETF | | | 125,994,006 | | | | 25,909,462 | | | | 7,602,498 | |
Global X NASDAQ 100® Covered Call ETF | | | 400,390,591 | | | | 19,208,117 | | | | 7,515,508 | |
Global X S&P 500® Covered Call ETF | | | 64,563,871 | | | | 11,666,563 | | | | 4,316,460 | |
Global X Russell 2000® Covered Call ETF | | | 6,972,490 | | | | — | | | | — | |
4. INVESTMENT TRANSACTIONS (continued)
To the extent consistent with its investment policies, certain Funds may either purchase or write options.
When a Fund purchases an option, the premium paid by it is recorded as an asset of the Fund. When a Fund writes an option, an amount equal to the net premium (the premium less the commission) received by the Fund is included in the liability section of the Fund’s statement of assets and liabilities as a deferred credit. The amount of this asset or deferred credit will be subsequently marked-to-market to reflect the current value of the option purchased or written. The current value of the traded option is the last sale price or, in the absence of a sale, the current bid price. If an option purchased by a Fund expires unexercised, the Fund realizes a loss equal to the premium paid. If a Fund enters into a closing sale transaction on an option purchased by it, the Fund will realize a gain if the premium received by the Fund on the closing transaction is more than the premium paid to purchase the option, or a loss if it is less. If an option written by a Fund expires on the stipulated expiration date or if a Fund enters into a closing purchase transaction, it will realize a gain (or loss if the cost of a closing purchase transaction exceeds the net premium received when the option is sold) and the deferred credit related to such option will be eliminated. If an option written by a Fund is exercised, the proceeds of the sale will be increased by the net premium originally received and the Fund will realize a gain or loss.
Risks may arise from an imperfect correlation between the change in market value of the securities held and the prices of options relating to the securities purchased or sold and from possible lack of a liquid secondary market for an option. The maximum exposure to loss for any purchased option is limited to the premium initially paid for the option. Written uncovered call options subject a fund to unlimited risk of loss. Written covered call options limit the upside potential of a security above the strike price. Put options written expose a fund to risk of loss if the value of the security declines below the strike price.
Global X NASDAQ 100® Covered Call ETF, Global X S&P 500® Covered Call ETF and Global X Russell 2000 Covered Call ETF may write covered call and/or put options that correspond to their respective reference index. By writing a covered call option, the Funds, in exchange for the premium, forego the opportunity for capital appreciation above the strike price should the market of the price of the underlying security increase. Conversely, by writing a put option, the Funds, in exchange for the premium, accept the risk of having to purchase a security at a fixed strike price even should the price of the underlying security decrease, exposing the Fund to downside risk in the underlying security.
When the written option expires, is terminated or is sold, the Funds will record a gain or loss. The net realized gain or loss on options contracts is reflected in the Statements of Operations and the net unrealized gains/(losses) are included as a component of the net
4. INVESTMENT TRANSACTIONS (continued)
change in unrealized appreciation/(depreciation) on options contracts in the Statement of Operations.
For the period ended April 30, 2020, the monthly average notional value of the written options contracts held by the Global X NASDAQ 100® Covered Call ETF, Global X S&P 500® Covered Call ETF, and Global X Russell 2000 Covered Call ETF were $22,969,047, $1,469,841, and $344,402, respectively.
5. TAX INFORMATION
The Global X SuperDividend® REIT ETF has a tax year that ends on December 31. The following tax disclosures are representative as of April 30, 2020. Accordingly, the disclosures are for informational use by shareholders and are subject to change attributable to activity through the end of the tax year ending December 31, 2019.
The amount and character of income and capital gain distributions to be paid, if any, are determined in accordance with Federal income tax regulations, which may differ from U.S. GAAP. As a result, net investment income (loss) and net realized gain (loss) on investment transactions for a reporting period may differ significantly from distributions during such period. These book/tax differences may be temporary or permanent. To the extent these differences are permanent in nature, they are charged or credited to undistributed net investment income (loss), accumulated net realized gain (loss) or paid-in capital, as appropriate, in the period that the differences arise.
The tax character of dividends and distributions declared during the years or periods ended October 31, 2019 and October 31, 2018 were as follows:
| Global X Funds | | Ordinary Income | | | Long-Term Capital Gain | | | Return of Capital | | | Totals | |
Global X SuperDividend® ETF | | | | | | | | | | | | |
| 2019 | | $ | 71,080,700 | | | $ | — | | | $ | 10,387,010 | | | $ | 81,467,710 | |
| 2018 | | | 65,545,294 | | | | — | | | | 5,188,066 | | | | 70,733,360 | |
Global X SuperDividend® U.S. ETF | | | | | | | | | | | | | | | | |
| 2019 | | $ | 29,513,428 | | | $ | — | | | $ | 5,156,842 | | | $ | 34,670,270 | |
| 2018 | | | 22,214,715 | | | | — | | | | 3,376,555 | | | | 25,591,270 | |
Global X MSCI SuperDividend® Emerging Markets ETF | | | | | | | | | | | | | | | | |
| 2019 | | $ | 1,146,140 | | | $ | — | | | $ | — | | | $ | 1,146,140 | |
| 2018 | | | 855,368 | | | | — | | | | — | | | | 855,368 | |
Global X MSCI SuperDividend® EAFE ETF | | | | | | | | | | | | | | | | |
| 2019 | | $ | 547,298 | | | $ | — | | | $ | — | | | $ | 547,298 | |
| 2018 | | | 295,154 | | | | — | | | | — | | | | 295,154 | |
Global X SuperDividend® REIT ETF | | | | | | | | | | | | | | | | |
| 2019 | | $ | 7,369,085 | | | $ | — | | | $ | — | | | $ | 7,369,085 | |
| 2018 | | | 3,906,264 | | | | — | | | | — | | | | 3,906,264 | |
5. TAX INFORMATION (continued)
| Global X Funds | | Ordinary Income | | | Long-Term Capital Gain | | | Return of Capital | | | Totals | |
Global X SuperIncome™ Preferred ETF | | | | | | | | | | | | |
| 2019 | | $ | 11,905,843 | | | $ | — | | | $ | 83,858 | | | $ | 11,989,701 | |
| 2018 | | | 14,835,000 | | | | — | | | | — | | | | 14,835,000 | |
| Global X YieldCo & Renewable Energy Income ETF | | | | | | | | | | | | | | | | |
| 2019 | | $ | 644,590 | | | $ | — | | | $ | — | | | $ | 644,590 | |
| 2018 | | | 843,401 | | | | — | | | | 154,396 | | | | 997,797 | |
| Global X Social Media ETF | | | | | | | | | | | | | | | | |
| 2019 | | $ | — | | | $ | — | | | $ | — | | | $ | — | |
| 2018 | | | 2,573,545 | | | | — | | | | — | | | | 2,573,545 | |
| Global X E-commerce ETF | | | | | | | | | | | | | | | | |
| 2019 | | $ | — | | | $ | — | | | $ | — | | | $ | — | |
Global X Guru® Index ETF | | | | | | | | | | | | | | | | |
| 2019 | | $ | 310,767 | | | $ | — | | | $ | 82,434 | | | $ | 393,201 | |
| 2018 | | | 302,653 | | | | — | | | | — | | | | 302,653 | |
| Global X Scientific Beta U.S. ETF | | | | | | | | | | | | | | | | |
| 2019 | | $ | 3,062,493 | | | $ | — | | | $ | — | | | $ | 3,062,493 | |
| 2018 | | | 1,913,894 | | | | — | | | | — | | | | 1,913,894 | |
| Global X Scientific Beta Europe ETF | | | | | | | | | | | | | | | | |
| 2019 | | $ | 423,851 | | | $ | — | | | $ | — | | | $ | 423,851 | |
| 2018 | | | 494,437 | | | | — | | | | — | | | | 494,437 | |
| Global X Scientific Beta Japan ETF | | | | | | | | | | | | | | | | |
| 2019 | | $ | 176,524 | | | $ | — | | | $ | — | | | $ | 176,524 | |
| 2018 | | | 339,465 | | | | — | | | | — | | | | 339,465 | |
| Global X Scientific Beta Asia ex-Japan ETF | | | | | | | | | | | | | | | | |
| 2019 | | $ | 210,319 | | | $ | — | | | $ | — | | | $ | 210,319 | |
| 2018 | | | 167,280 | | | | — | | | | — | | | | 167,280 | |
Global X S&P 500® Catholic Values ETF | | | | | | | | | | | | | | | | |
| 2019 | | $ | 4,530,406 | | | $ | 187,691 | | | $ | — | | | $ | 4,718,097 | |
| 2018 | | | 1,665,617 | | | | 23,055 | | | | — | | | | 1,688,672 | |
| Global X NASDAQ 100® Covered Call ETF | | | | | | | | | | | | | | | | |
| 2019 | | $ | 40,380,150 | | | $ | 2,101,875 | | | $ | 12,331,150 | | | $ | 54,813,175 | |
| 2018 | | | 8,264,567 | | | | 795,059 | | | | 17,698,697 | | | | 26,758,323 | |
Global X S&P 500® Covered Call ETF | | | | | | | | | | | | | | | | |
| 2019 | | $ | 4,867,892 | | | $ | 582,508 | | | $ | 780,262 | | | $ | 6,230,662 | |
| 2018 | | | 1,551,694 | | | | 330,858 | | | | 3,049,443 | | | | 4,931,995 | |
| Global X Russell 2000 Covered Call ETF | | | | | | | | | | | | | | | | |
| 2019 | | $ | 158,257 | | | $ | 99,323 | | | $ | — | | | $ | 257,580 | |
5. TAX INFORMATION (continued)
As of October 31, 2019, the components of tax basis distributable earnings (accumulated losses) were as follows:
| | | Global X Funds | |
| | | Global X SuperDividend® ETF | | | Global X SuperDividend® U.S. ETF | | | Global X MSCI SuperDividend® Emerging Markets ETF | | | Global X MSCI SuperDividend® EAFE ETF | |
| Undistributed Ordinary Income | | $ | – | | | $ | – | | | $ | 153,453 | | | $ | 34,602 | |
| Capital Loss Carryforwards | | | (281,822,507 | ) | | | (54,987,089 | ) | | | (3,672,269 | ) | | | (422,592 | ) |
| Unrealized Appreciation (Depreciation) on Investments and Foreign Currency | | | (43,291,328 | ) | | | 5,740,654 | | | | (93,917 | ) | | | 454,785 | |
| Other Temporary Differences | | | 37,131 | | | | 7 | | | | – | | | | (3 | ) |
| Total Distributable Earnings (Accumulated Losses) | | $ | (325,076,704 | ) | | $ | (49,246,428 | ) | | $ | (3,612,733 | ) | | $ | 66,792 | |
| | | Global X Funds | |
| | | Global X SuperDividend® REIT ETF(1) | | | Global X SuperIncome™ Preferred ETF | | | Global X YieldCo & Renewable Energy Income ETF | | | Global X Social Media ETF | |
| Undistributed Ordinary Income | | $ | – | | | $ | – | | | $ | 23,496 | | | $ | – | |
| Capital Loss Carryforwards | | | (1,523,254 | ) | | | (58,493,702 | ) | | | (831,842 | ) | | | (30,480,743 | ) |
| Unrealized Appreciation (Depreciation) on Investments and Foreign Currency | | | (12,236,773 | ) | | | 2,857,547 | | | | 2,598,592 | | | | 85,867 | |
| Late Year Loss Deferral | | | – | | | | – | | | | – | | | | (414,750 | ) |
| Other Temporary Differences | | | (658,111 | ) | | | (242,869 | ) | | | – | | | | – | |
| Total Distributable Earnings (Accumulated Losses) | | $ | (14,418,138 | ) | | $ | (55,879,024 | ) | | $ | 1,790,246 | | | $ | (30,809,626 | ) |
(1) The Global X SuperDividend® REIT ETF has a tax year that ends on December 31.
5. TAX INFORMATION (continued)
| | | Global X Fund | |
| | | Global X E-commerce ETF | | | Global X Guru® Index ETF | | | Global X Scientific Beta U.S. ETF | | | Global X Scientific Beta Europe ETF | |
| Undistributed Ordinary Income | | $ | – | | | $ | – | | | $ | 584,800 | | | $ | 28,792 | |
| Capital Loss Carryforwards | | | (956 | ) | | | (22,227,150 | ) | | | (5,933,099 | ) | | | (1,022,121 | ) |
| Unrealized Appreciation (Depreciation) on Investments and Foreign Currency | | | (98,569 | ) | | | 5,906,661 | | | | 10,024,311 | | | | (183,104 | ) |
| Late Year Loss Deferral | | | (4,913 | ) | | | – | | | | – | | | | – | |
| Other Temporary Differences | | | (1 | ) | | | (3 | ) | | | 2 | | | | (12 | ) |
| Total Distributable Earnings (Accumulated Losses) | | $ | (104,439 | ) | | $ | (16,320,492 | ) | | $ | 4,676,014 | | | $ | (1,176,445 | ) |
| | | Global X Funds | |
| | | Global X Scientific Beta Japan ETF | | | Global X Scientific Beta Asia ex-Japan ETF | | | Global X S&P 500® Catholic Values ETF | | | Global X NASDAQ 100® Covered Call ETF | |
| Undistributed Ordinary Income | | $ | 59,854 | | | $ | 57,849 | | | $ | 1,501,864 | | | $ | – | |
| Undistributed Long-Term Capital Gain | | | – | | | | – | | | | 109,497 | | | | – | |
| Capital Loss Carryforwards | | | (673,928 | ) | | | (506,863 | ) | | | – | | | | – | |
| Unrealized Appreciation (Depreciation) on Investments and Foreign Currency | | | (91,398 | ) | | | (81,330 | ) | | | 34,405,428 | | | | – | |
| Other Temporary Differences | | | (9 | ) | | | – | | | | 3 | | | | 7 | |
| Total Distributable Earnings (Accumulated Losses) | | $ | (705,481 | ) | | $ | (530,344 | ) | | $ | 36,016,792 | | | $ | 7 | |
| | | Global X Funds | |
| | | Global X S&P 500® Covered Call ETF | | | Global X Russell 2000 Covered Call ETF | |
| Undistributed Ordinary Income | | $ | – | | | $ | – | |
| Undistributed Long-Term Capital Gain | | | – | | | | 74,655 | |
| Unrealized Appreciation on Investments and Foreign Currency | | | – | | | | 93,152 | |
| Other Temporary Differences | | | 26,492 | | | | (124,812 | ) |
| Total Distributable Earnings | | $ | 26,492 | | | $ | 42,995 | |
5. TAX INFORMATION (continued)
For taxable years beginning after December 22, 2010, a RIC is permitted to carry forward net capital losses to offset capital gains realized in later years, and the losses carried forward retain their original character as either long-term or short-term losses. Losses carried forward under these provisions are as follows:
| Global X Funds | | Short-Term Loss | | | Long-Term Loss | | | Total | |
Global X SuperDividend® ETF | | $ | 113,887,686 | | | $ | 167,934,821 | | | $ | 281,822,507 | |
Global X SuperDividend® U.S. ETF | | | 54,987,089 | | | | — | | | | 54,987,089 | |
Global X MSCI SuperDividend® Emerging Markets ETF | | | 2,830,905 | | | | 841,364 | | | | 3,672,269 | |
Global X MSCI SuperDividend® EAFE ETF | | | 115,549 | | | | 307,043 | | | | 422,592 | |
| Global X SuperIncome™ Preferred ETF | | | 15,368,042 | | | | 43,125,660 | | | | 58,493,702 | |
| Global X YieldCo & Renewable Energy Income ETF | | | 151,818 | | | | 680,024 | | | | 831,842 | |
| Global X Social Media ETF | | | 9,904,721 | | | | 20,576,022 | | | | 30,480,743 | |
| Global X E-commerce ETF | | | 956 | | | | — | | | | 956 | |
Global X Guru® Index ETF | | | 22,227,150 | | | | — | | | | 22,227,150 | |
| Global X Scientific Beta U.S. ETF | | | 5,810,669 | | | | 122,430 | | | | 5,933,099 | |
| Global X Scientific Beta Europe ETF | | | 753,064 | | | | 269,057 | | | | 1,022,121 | |
| Global X Scientific Beta Japan ETF | | | 491,326 | | | | 182,602 | | | | 673,928 | |
| Global X Scientific Beta Asia ex-Japan ETF | | | 384,751 | | | | 122,112 | | | | 506,863 | |
During the year ended October 31, 2019, the following Funds utilized capital loss carryforwards to offset capital gains amounting to:
| Global X Funds | | Short-Term Loss | | | Long-Term Loss | | | Total | |
| Global X SuperDividend® U.S. ETF | | $ | — | | | $ | 6,609,240 | | | $ | 6,609,240 | |
| Global X SuperIncome™ Preferred ETF | | | 56,496 | | | | — | | | | 56,496 | |
| Global X YieldCo & Renewable Energy Income ETF | | | 385,282 | | | | — | | | | 385,282 | |
| Global X Social Media ETF | | | 337,457 | | | | — | | | | 337,457 | |
Global X Guru® Index ETF | | | 342,150 | | | | — | | | | 342,150 | |
| Global X Scientific Beta U.S. ETF | | | — | | | | 172,383 | | | | 172,383 | |
Global X NASDAQ 100® Covered Call ETF | | | 4,403,752 | | | | — | | | | 4,403,752 | |
5. TAX INFORMATION (continued)
The Federal tax cost and aggregate gross unrealized appreciation and depreciation on investments held by the Funds at April 30, 2020 were as follows:
| Global X Funds | | Federal Tax Cost | | | Aggregated Gross Unrealized Appreciation | | | Aggregated Gross Unrealized Depreciation | | | Net Unrealized Appreciation (Depreciation) | |
Global X SuperDividend® ETF | | $ | 966,248,809 | | | $ | 5,367,841 | | | $ | (357,512,279 | ) | | $ | (352,144,438 | ) |
Global X SuperDividend® U.S. ETF | | | 566,862,935 | | | | 9,515,227 | | | | (157,314,890 | ) | | | (147,799,663 | ) |
Global X MSCI SuperDividend® Emerging Markets ETF | | | 19,153,055 | | | | 818,576 | | | | (4,967,391 | ) | | | (4,148,815 | ) |
Global X MSCI SuperDividend® EAFE ETF | | | 9,499,199 | | | | 56,219 | | | | (2,645,359 | ) | | | (2,589,140 | ) |
Global X SuperDividend® REIT ETF | | | 564,020,885 | | | | 138,551 | | | | (251,598,521 | ) | | | (251,491,970 | ) |
Global X SuperIncome™ Preferred ETF | | | 175,855,287 | | | | 2,276,122 | | | | (8,251,729 | ) | | | (5,975,607 | ) |
| Global X YieldCo & Renewable Energy Income ETF | | | 47,302,477 | | | | 1,861,461 | | | | (3,164,601 | ) | | | (1,303,140 | ) |
| Global X Social Media ETF | | | 123,606,502 | | | | 23,548,462 | | | | (15,333,350 | ) | | | 8,215,112 | |
| Global X E-commerce ETF | | | 9,712,926 | | | | 1,140,677 | | | | (555,413 | ) | | | 585,264 | |
Global X Guru® Index ETF | | | 49,550,752 | | | | 6,689,519 | | | | (5,914,911 | ) | | | 774,608 | |
| Global X Scientific Beta U.S. ETF | | | 33,680,145 | | | | 1,931,188 | | | | (5,677,113 | ) | | | (3,745,925 | ) |
| Global X Scientific Beta Europe ETF | | | 5,052,946 | | | | 231,879 | | | | (1,161,585 | ) | | | (929,706 | ) |
| Global X Scientific Beta Japan ETF | | | 2,823,127 | | | | 116,443 | | | | (560,968 | ) | | | (444,525 | ) |
| Global X Scientific Beta Asia ex-Japan ETF | | | 2,389,375 | | | | 68,156 | | | | (499,305 | ) | | | (431,149 | ) |
Global X S&P 500® Catholic Values ETF | | | 290,819,951 | | | | 46,797,198 | | | | (25,184,419 | ) | | | 21,612,779 | |
Global X NASDAQ 100® Covered Call ETF | | | 753,515,315 | | | | 216,733,210 | | | | (13,300,481 | ) | | | 203,432,729 | |
Global X S&P 500® Covered Call ETF | | | 109,871,586 | | | | 11,148,516 | | | | (11,747,735 | ) | | | (599,219 | ) |
| Global X Russell 2000 Covered Call ETF | | | 14,826,110 | | | | – | | | | (1,981,315 | ) | | | (1,981,315 | ) |
The Funds invest in securities of foreign issuers in various countries. These investments may involve certain considerations and risks not typically associated with investments in the United States as a result of, among other factors, the possibility of future political and economic developments, the level of governmental supervision and regulation of securities markets in the respective countries.
6. CONCENTRATION OF RISKS
The securities markets of emerging countries are less liquid, subject to greater price volatility, and have a smaller market capitalization than those of United States securities markets. In certain countries, there may be fewer publicly traded securities and the market may be dominated by a few issuers or sectors. Issuers and securities markets in such countries are not subject to as extensive and frequent accounting, financial and other reporting requirements or as comprehensive government regulations as are issuers and securities markets in the U.S. In particular, the assets and profits appearing on the financial statements of emerging country issuers may not reflect their financial position or results of operations in the same manner as financial statements for U.S. issuers.
6. CONCENTRATION OF RISKS (continued)
Substantially less information may be publicly available about emerging country issuers than is available about issuers in the United States.
The Funds may be subject to taxes imposed by countries in which they invest. Such taxes are generally based on either income or gains earned or repatriated. The Funds accrue and apply such taxes to net investment income, net realized gains and net unrealized gains as income and/or capital gains are earned.
Except for the Global X Russell 2000® Covered Call Fund, which uses a representative sampling strategy, the Funds use a replication strategy. A replication strategy is an indexing strategy that involves investing in the securities of an underlying index in approximately the same proportions as in the underlying index. A representative sampling strategy is an indexing strategy that involves investing in a representative sample of securities (including indirect investments through underlying ETFs) that collectively has an investment profile similar to an underlying index in terms of key risk factors, performance attributes and other characteristics. Each Fund may utilize a representative sampling strategy with respect to its underlying indices when a replication strategy might be detrimental to its shareholders, such as when there are practical difficulties or substantial costs involved in compiling a portfolio of equity securities to follow their underlying indices, or, in certain instances, when securities in the underlying indices become temporarily illiquid, unavailable or less liquid, or due to legal restrictions (such as diversification requirements that apply to a Fund but not the underlying indices).
Please refer to each Fund’s prospectus and statement of additional information (“SAI”) for a more complete description of risks.
7. LOANS OF PORTFOLIO SECURITIES
The Funds may lend portfolio securities having a market value up to one-third of the Funds’ total assets. Security loans made pursuant to a securities lending agreement with BBH are initially required to be secured by collateral equal to at least 102% of the value of domestic equity securities and American Depositary Receipts (“ADRs”) and 105% of the value of foreign equity securities (other than ADRs). Such collateral received in connection with these loans will be cash and can be invested in repurchase agreements, short term investments or U.S. Treasury obligations and is recognized in the Schedule of Investments and Statement of Assets and Liabilities. The obligation to return securities lending collateral is also recognized as a liability in the Statement of Assets and Liabilities. It is the Funds’ policy to obtain additional collateral from or return excess collateral to the borrower by the end of the next business day, following the valuation date of the securities loaned. Therefore, the value of the collateral held may be temporarily less than the value of the securities on loan.
Lending securities entails a risk of loss to the Funds if and to the extent that the market value of the securities loans were to increase and the borrower did not increase the collateral accordingly, and the borrower fails to return the securities. In the event the
7. LOANS OF PORTFOLIO SECURITIES (continued)
borrower may not provide additional collateral when required or may not return the securities when due, the securities lending agency agreement requires the lending agent to indemnify the Funds by replacing either the security or the security’s current market value to the Funds. The Funds could suffer a loss if the value of an investment purchased with cash collateral falls below the market value of loaned securities or if the value of an investment purchased with cash collateral falls below the value of the original cash collateral received. The Funds could also experience delays and costs in gaining access to the collateral. The Funds bear the risk of any deficiency in the amount of the collateral available for return to the borrower due to any loss on the collateral invested.
As of April 30, 2020, the value of securities on loan was $47,494,529, $26,520,238, $11,172,668 and $7,044,337 for the Global X SuperDividend® ETF, Global X SuperDividend® U.S. ETF, Global X SuperDividend® REIT ETF and Global X Social Media ETF, respectively, and the cash collateral received from securities on loan was $50,159,529, $28,724,281, $12,140,621 and $13,222,313 for Global X SuperDividend® ETF, Global X SuperDividend® U.S. ETF, Global X SuperDividend® REIT ETF and Global X Social Media ETF, respectively.
As of April 30, 2020, the following Funds had securities on loan, by counterparty:
| | | Market Value | | | Cash Collateral | |
Global X SuperDividend® ETF | | | | | | |
| Barclays Capital | | $ | 2,334,549 | | | $ | 2,425,785 | |
| BNP Prime Brokerage | | | 2,399,711 | | | | 2,632,049 | |
| BOFA Securities, Inc. | | | 7,395,133 | | | | 7,739,895 | |
| Citigroup | | | 6,567,155 | | | | 6,956,614 | |
| Credit Suisse | | | 991,267 | | | | 1,056,877 | |
| Goldman Sachs & Co. | | | 14,997,673 | | | | 15,676,766 | |
| JPMorgan | | | 7,977,344 | | | | 8,552,377 | |
| Morgan Stanley | | | 4,794,915 | | | | 5,080,331 | |
| National Financial Services | | | 150 | | | | 159 | |
| Scotia Capital | | | 21,068 | | | | 21,620 | |
| UBS Securities LLC | | | 15,186 | | | | 16,656 | |
| Wells Fargo Securities, LLC | | | 376 | | | | 400 | |
Global X SuperDividend® U.S. ETF | | | | | | | | |
| Barclays Capital | | | 6,484,339 | | | | 6,761,475 | |
| BOFA Securities, Inc. | | | 3,852,811 | | | | 4,017,479 | |
| Goldman Sachs & Co. | | | 2,502,925 | | | | 2,605,070 | |
| JPMorgan | | | 4,709,385 | | | | 5,887,200 | |
| Morgan Stanley | | | 5,126,877 | | | | 5,415,415 | |
| National Financial Services | | | 3,129,142 | | | | 3,271,880 | |
| UBS AG | | | 642,802 | | | | 690,797 | |
| UBS Securities LLC | | | 71,957 | | | | 74,965 | |
7. LOANS OF PORTFOLIO SECURITIES (continued)
Global X SuperDividend® REIT ETF | | | | | | | | |
| BOFA Securities, Inc. | | $ | 4,427,340 | | | $ | 4,859,000 | |
| Goldman Sachs & Co. | | | 4,086,230 | | | | 4,390,412 | |
| National Financial Services | | | 2,420,100 | | | | 2,631,349 | |
| Scotia Capital | | | 238,998 | | | | 259,860 | |
| Global X Social Media ETF | | | | | | | | |
| Barclays Capital | | | 1,266,376 | | | | 1,336,968 | |
| BOFA Securities, Inc. | | | - | | | | 273,226 | |
| Citigroup | | | 308 | | | | 325 | |
| Credit Suisse | | | - | | | | 3,726,266 | |
| Goldman Sachs & Co. | | | 5,492,901 | | | | 6,687,388 | |
| Morgan Stanley | | | 284,752 | | | | 1,198,139 | |
8. CONTRACTUAL OBLIGATIONS
The Funds enter into contracts in the normal course of business that contain a variety of indemnifications. The Funds’ maximum exposure under these contracts is unknown; however, the Funds have not had prior gains or losses pursuant to these contracts. Management has reviewed the Funds’ existing contracts and expects the risk of loss to be remote.
Pursuant to the Trust’s organizational documents, the Trustees of the Trust and the Trust’s officers are indemnified against certain liabilities that may arise out of the performance of their duties.
9. REGULATORY MATTERS
On August 17, 2018, the Commission adopted amendments to Regulation S-X. These changes are effective for periods after November 5, 2018. The updates to RICs were mainly focused on simplifying the presentation of distributable earnings by eliminating the need to present the components of distributable earnings on a book basis in the Statement of Assets and Liabilities. The update also impacted the presentation of undistributed net investment income and distributions to shareholders on the Statements of Changes in Net Assets. The amounts presented in the current Statements of Changes in Net Assets represent the aggregated total distributions of net investment income and realized capital gains, except for distributions classified as return of capital which are still presented separately.
| | |
Notes to Financial Statements (unaudited) (concluded) |
| |
|
10. NEW ACCOUNTING PRONOUNCEMENTS
In August 2018, the Financial Accounting Standards Board (“FASB”) issued Accounting Standards Update 2018-13, Fair Value Measurement (Topic 820). The new guidance includes additions and modifications to disclosure requirements for fair value measurements. For public entities, the amendments are effective for financial statements issued for fiscal years beginning after December 15, 2019, and interim periods within those fiscal years. Management elected to early adopt the removal of certain disclosures and delay the adoption of additional disclosure until the effective date.
11. SUBSEQUENT EVENTS
The Funds have been evaluated by management regarding the need for additional disclosures and/or adjustments resulting from subsequent events. Based on this evaluation, no additional adjustments were required to the financial statements.
| | |
Disclosure of Fund Expenses (unaudited)
|
All ETFs (such as the Funds) have operating expenses. As a shareholder of an ETF, your investment is affected by these ongoing costs, which include (among others) costs for ETF management, administrative services, commissions, and shareholder reports like this one. It is important for you to understand the impact of these costs on your investment returns. In addition, a shareholder is responsible for brokerage fees as a result of the shareholder’s investment in a Fund.
Operating expenses such as these are deducted from the Funds’ gross income and directly reduce their final investment returns. These expenses are expressed as a percentage of the Funds’ average net assets; this percentage is known as the Funds’ expense ratio.
The following examples use the expense ratio and are intended to help you understand the ongoing costs (in dollars) of investing in a Fund and to compare these costs with those of other funds. The examples are based on an investment of $1,000 made at the beginning of the period shown and held for the entire period (November 1, 2019 through April 30, 2020).
The table on the next page illustrates the Funds’ costs in two ways:
Actual Fund Return. This section helps you to estimate the actual expenses that your Fund incurred over the period. The “Expenses Paid During Period” column shows the actual dollar expense cost incurred by a $1,000 investment in the Fund, and the “Ending Account Value” number is derived from deducting that expense cost from the Fund’s gross investment return.
You can use this information, together with the actual amount you invested in the Fund, to estimate the expenses you paid over that period. Simply divide your actual account value by $1,000 to arrive at a ratio (for example, an $8,600 account value divided by $1,000 = 8.6), then multiply that ratio by the number shown for your Fund under “Expenses Paid During Period.”
Hypothetical 5% Return. This section helps you compare your Fund’s costs with those of other funds. It assumes that the Fund had an annual 5% return before expenses during the year, but that the expense ratio (Column 3) for the period is unchanged. This example is useful in making comparisons because the Securities and Exchange Commission requires all funds to make this 5% calculation. You can assess your Fund’s comparative cost by comparing the hypothetical result for your Fund in the “Expenses Paid During Period” column with those that appear in the same charts in the shareholder reports for other funds.
NOTE: Because the return is set at 5% for comparison purposes — NOT your Fund’s actual return — the account values shown may not apply to your specific investment.
| | |
Disclosure of Fund Expenses (unaudited) (continued)
|
| | | Beginning Account Value 11/1/2019 | | | Ending Account Value 4/30/2020 | | | Annualized Expense Ratios | | | Expenses Paid During Period(1) | |
| | | | | | | | | | | | | |
Global X SuperDividend® ETF | | | | | | | | | | | | |
| Actual Fund Return | | $ | 1,000.00 | | | $ | 630.50 | | | | 0.59 | % | | $ | 2.39 | |
| Hypothetical 5% Return | | | 1,000.00 | | | | 1,021.93 | | | | 0.59 | | | | 2.97 | |
| | | | | | | | | | | | | | | | | |
Global X SuperDividend® U.S. ETF | | | | | | | | | | | | | | | | |
| Actual Fund Return | | $ | 1,000.00 | | | $ | 675.10 | | | | 0.46 | % | | $ | 1.92 | |
| Hypothetical 5% Return | | | 1,000.00 | | | | 1,022.58 | | | | 0.46 | | | | 2.31 | |
| | | | | | | | | | | | | | | | | |
Global X MSCI SuperDividend® Emerging Markets ETF | | | | | | | | | | | | | | | | |
| Actual Fund Return | | $ | 1,000.00 | | | $ | 779.20 | | | | 0.67 | % | | $ | 2.96 | |
| Hypothetical 5% Return | | | 1,000.00 | | | | 1,021.53 | | | | 0.67 | | | | 3.37 | |
| | | | | | | | | | | | | | | | | |
Global X MSCI SuperDividend® EAFE ETF | | | | | | | | | | | | | | | | |
| Actual Fund Return | | $ | 1,000.00 | | | $ | 737.30 | | | | 0.56 | % | | $ | 2.42 | |
| Hypothetical 5% Return | | | 1,000.00 | | | | 1,022.08 | | | | 0.56 | | | | 2.82 | |
| | | | | | | | | | | | | | | | | |
Global X SuperDividend® REIT ETF | | | | | | | | | | | | | | | | |
| Actual Fund Return | | $ | 1,000.00 | | | $ | 496.50 | | | | 0.59 | % | | $ | 2.20 | |
| Hypothetical 5% Return | | | 1,000.00 | | | | 1,021.93 | | | | 0.59 | | | | 2.97 | |
| | | | | | | | | | | | | | | | | |
Global X SuperIncome™ Preferred ETF | | | | | | | | | | | | | | | | |
| Actual Fund Return | | $ | 1,000.00 | | | $ | 932.30 | | | | 0.58 | % | | $ | 2.79 | |
| Hypothetical 5% Return | | | 1,000.00 | | | | 1,021.98 | | | | 0.58 | | | | 2.92 | |
| | | | | | | | | | | | | | | | | |
| Global X YieldCo & Renewable Energy Income ETF | | | | | | | | | | | | | | | | |
| Actual Fund Return | | $ | 1,000.00 | | | $ | 968.40 | | | | 0.66 | % | | $ | 3.23 | |
| Hypothetical 5% Return | | | 1,000.00 | | | | 1,021.58 | | | | 0.66 | | | | 3.32 | |
| | | | | | | | | | | | | | | | | |
| Global X Social Media ETF | | | | | | | | | | | | | | | | |
| Actual Fund Return | | $ | 1,000.00 | | | $ | 1,076.80 | | | | 0.65 | % | | $ | 3.36 | |
| Hypothetical 5% Return | | | 1,000.00 | | | | 1,021.63 | | | | 0.65 | | | | 3.27 | |
| | | | | | | | | | | | | | | | | |
| Global X E-commerce ETF | | | | | | | | | | | | | | | | |
| Actual Fund Return | | $ | 1,000.00 | | | $ | 1,066.80 | | | | 0.53 | % | | $ | 2.72 | |
| Hypothetical 5% Return | | | 1,000.00 | | | | 1,022.23 | | | | 0.53 | | | | 2.66 | |
| | | | | | | | | | | | | | | | | |
Global X Guru® Index ETF | | | | | | | | | | | | | | | | |
| Actual Fund Return | | $ | 1,000.00 | | | $ | 926.90 | | | | 0.75 | % | | $ | 3.59 | |
| Hypothetical 5% Return | | | 1,000.00 | | | | 1,021.13 | | | | 0.75 | | | | 3.77 | |
| | | | | | | | | | | | | | | | | |
| Global X Scientific Beta U.S. ETF | | | | | | | | | | | | | | | | |
| Actual Fund Return | | $ | 1,000.00 | | | $ | 898.00 | | | | 0.19 | % | | $ | 0.90 | |
| Hypothetical 5% Return | | | 1,000.00 | | | | 1,023.92 | | | | 0.19 | | | | 0.96 | |
| | |
Disclosure of Fund Expenses (unaudited) (concluded)
|
| | | Beginning Account Value 11/1/2019 | | | Ending Account Value 4/30/2020 | | | Annualized Expense Ratios | | | Expenses Paid During Period(1) | |
| | | | | | | | | | | | | |
| Global X Scientific Beta Europe ETF | | | | | | | | | | | | |
| Actual Fund Return | | $ | 1,000.00 | | | $ | 838.90 | | | | 0.38 | % | | $ | 1.74 | |
| Hypothetical 5% Return | | | 1,000.00 | | | | 1,022.97 | | | | 0.38 | | | | 1.91 | |
| | | | | | | | | | | | | | | | | |
| Global X Scientific Beta Japan ETF | | | | | | | | | | | | | | | | |
| Actual Fund Return | | $ | 1,000.00 | | | $ | 859.90 | | | | 0.38 | % | | $ | 1.76 | |
| Hypothetical 5% Return | | | 1,000.00 | | | | 1,022.97 | | | | 0.38 | | | | 1.91 | |
| | | | | | | | | | | | | | | | | |
| Global X Scientific Beta Asia ex-Japan ETF | | | | | | | | | | | | | | | | |
| Actual Fund Return | | $ | 1,000.00 | | | $ | 826.50 | | | | 0.38 | % | | $ | 1.73 | |
| Hypothetical 5% Return | | | 1,000.00 | | | | 1,022.97 | | | | 0.38 | | | | 1.91 | |
| | | | | | | | | | | | | | | | | |
Global X S&P 500® Catholic Values ETF | | | | | | | | | | | | | | | | |
| Actual Fund Return | | $ | 1,000.00 | | | $ | 968.20 | | | | 0.29 | % | | $ | 1.42 | |
| Hypothetical 5% Return | | | 1,000.00 | | | | 1,023.42 | | | | 0.29 | | | | 1.46 | |
| | | | | | | | | | | | | | | | | |
Global X NASDAQ 100® Covered Call ETF | | | | | | | | | | | | | | | | |
| Actual Fund Return | | $ | 1,000.00 | | | $ | 917.20 | | | | 0.76 | % | | $ | 3.62 | |
| Hypothetical 5% Return | | | 1,000.00 | | | | 1,021.08 | | | | 0.76 | | | | 3.82 | |
| | | | | | | | | | | | | | | | | |
Global X S&P 500® Covered Call ETF | | | | | | | | | | | | | | | | |
| Actual Fund Return | | $ | 1,000.00 | | | $ | 858.90 | | | | 0.78 | % | | $ | 3.61 | |
| Hypothetical 5% Return | | | 1,000.00 | | | | 1,020.99 | | | | 0.78 | | | | 3.92 | |
| | | | | | | | | | | | | | | | | |
| Global X Russell 2000 Covered Call ETF | | | | | | | | | | | | | | | | |
| Actual Fund Return | | $ | 1,000.00 | | | $ | 759.40 | | | | 0.66 | % | | $ | 2.89 | |
| Hypothetical 5% Return | | | 1,000.00 | | | | 1,021.58 | | | | 0.66 | | | | 3.32 | |
| (1) | Expenses are equal to the Fund’s annualized expense ratio multiplied by the average account value over the period, multiplied 182/366 (to reflect the one-half year period), unless otherwise noted. |
| | |
Approval of Investment Advisory Agreement (unaudited)
|
Section 15(c) of the Investment Company Act of 1940, as amended (“1940 Act”), requires that the board of trustees of an exchange-traded fund (“ETF”), including a majority of those trustees who are not “interested persons” of the ETF, as defined in the 1940 Act (“Independent Trustees”), consider on an initial basis and periodically thereafter (as required by the 1940 Act), at an in person meeting called for such purpose, the terms of each ETF’s investment advisory agreement and whether to approve entering into, or renewing, each agreement.
At a Board meeting of the Global X Funds (the “Trust”) held in person on November 15, 2019, called for such purpose, the Board of Trustees (the “Board”) (including the Trust’s Independent Trustees, voting separately) considered and unanimously approved the continuation of (i) the Investment Advisory Agreement (“Renewal Investment Advisory Agreement”) for each Fund included in this Semi-Annual Report (each, a “Renewal Fund”); and (ii) the Supervision and Administration Agreement between the Trust (“Renewal Supervision and Administration Agreement”), on behalf of each Renewal Fund, and Global X Management Company LLC (“Global X Management”). The Renewal Investment Advisory Agreement and the Renewal Supervision and Administration Agreement are referred to herein as the “Renewal Agreements.”
In advance of the Board meeting, the Board (including the Trust’s Independent Trustees) and the Independent Trustees’ independent legal counsel requested (in writing) detailed information from Global X Management in connection with the Board’s consideration of the Renewal Agreements and received and reviewed written responses from Global X Management and supporting materials relating to those requests for information. In the course of their consideration of the Renewal Agreements, the Trust’s Independent Trustees were advised by their independent legal counsel and, in addition to meeting with management of Global X Management, the Independent Trustees met separately in executive session with their counsel.
RENEWAL AGREEMENTS
In determining to approve the continuation of the Renewal Agreements for the Renewal Funds, the Board considered a variety of factors, including the factors discussed in greater detail below.
Nature, Extent and Quality of Services
With respect to this factor, the Board considered:
| • | the terms of the Renewal Agreements and the range of services that would continue to be provided to each Renewal Fund in accordance with the Renewal Agreements; |
| • | Global X Management’s key personnel and the portfolio managers who would continue to provide investment advisory, supervision and administrative services to each Renewal Fund; |
| • | Global X Management’s responsibilities under the Renewal Agreements, among other things, to: (i) manage the investment operations of the Renewal Funds and |
| | |
Approval of Investment Advisory Agreement (unaudited)
|
| | the composition of the Renewal Funds’ assets, including the purchase, retention and disposition of their holdings, (ii) provide quarterly reports to the Trust’s officers and the Board and other reports as the Board deems necessary or appropriate, (iii) vote proxies, exercise consents, and exercise all other rights relating to securities and assets held by the Renewal Funds, (iv) select broker-dealers to execute portfolio transactions for the Renewal Funds when necessary, (v) assist in the preparation and filing of reports and proxy statements (if any) to the shareholders of the Renewal Funds, and the periodic updating of the registration statement, prospectuses, statement of additional information, and other reports and documents for the Renewal Funds that are required to be filed by the Trust with the U.S. Securities and Exchange Commission and other regulatory and governmental bodies, and (vi) monitor anticipated purchases and redemptions of the shares (including Creation Units) of the Renewal Funds by shareholders and new investors; |
| • | the nature, extent and quality of all of the services (including advisory, administrative and compliance services) that have been provided by Global X Management or made available to the Renewal Funds; and |
| • | the quality of Global X Management’s resources and personnel that would continue to be made available to the Renewal Funds, including Global X Management’s experience and the professional qualifications of Global X Management’s key personnel. |
Based on these considerations, the Board concluded that it was satisfied with the nature, extent and quality of the services provided to the Renewal Funds by Global X Management.
Performance
The Board considered the performance of each Renewal Fund. The Board examined the performance of the Renewal Funds for the one-year, three-year, five-year and since inception periods, as applicable. Also, the Board considered the total return and investments performance of the Renewal Funds relative to (i) the performance of unaffiliated comparable ETFs and/or other registered funds, which performance information is publicly available from such registered funds as well as other third party sources; and (ii) the performance of pertinent indexes.
The Board considered instances of under-performance and over-performance with respect to the competitor funds. The Board also considered the Renewal Funds’ tracking against their underlying indexes in absolute terms.
Based on these considerations and comparisons, the Board concluded that the investment performance of the Renewal Funds did not adversely affect the Board’s approval of the continuance of the Renewal Agreements.
Cost of Services and Profitability
The Board considered Global X Management’s cost to provide investment management, supervision and administrative and related services to the Renewal Funds. In this regard, the Board considered the management fee (“Management Fee”) that has been borne or is expected to be borne by the Renewal Funds under the Renewal Agreements for the
| | |
Approval of Investment Advisory Agreement (unaudited)
|
various investment advisory, supervisory and administrative services that the Renewal Funds require under a unitary fee structure (including the types of fees and expenses that are not included within the unitary fee and would be borne by the Renewal Funds).
In addition, the Board considered expected profitability to Global X Management, as applicable, from all services provided or expected to be provided to the Renewal Funds and all aspects of Global X Management’s relationship with the Renewal Funds. In connection with these considerations, Global X Management provided the Board with financial information regarding its operations and the services provided to the Renewal Funds and discussed with the Board its current and expected, as applicable, profitability with respect to the Renewal Funds.
Based on these considerations, the Board concluded that the Management Fee rate paid by the Renewal Funds to Global X Management, in light of the nature, extent and quality of the services provided, was reasonable and in the best interests of the Renewal Funds’ shareholders.
Comparison of Fees and Services
With respect to this factor, the Board considered:
| • | comparative information with respect to the Management Fee paid to Global X Management by the Renewal Funds. In connection with this consideration, Global X Management provided the Board with comparative expense data for the Renewal Funds, including fees and expenses paid by unaffiliated similar specialized and/or focused ETFs and/or other comparable registered funds. The Board considered Global X Management’s detailed explanation of the fee structures of any Renewal Fund that was above the average or median for its peer group; |
| • | the structure of the unitary Management Fee (which includes as one component the investment advisory fee for the Renewal Funds) and the current total expense ratios for the Renewal Funds. In this regard, the Board took into consideration that the purpose of adopting a unitary Management Fee structure for the Renewal Funds was to create a simple, all-inclusive fee that would provide a level of predictability with respect to the overall expense ratios (i.e., the total fees) of the Renewal Funds and that the proposed Management Fees for the Renewal Funds were set at competitive levels to make the Renewal Funds viable in the marketplace; and |
| • | that, under the unified Management Fee structure, Global X Management is responsible for most ordinary expenses of the Renewal Funds, including the costs of various third-party services required by the Renewal Funds, including investment advisory, administrative, audit, certain custody, portfolio accounting, legal, transfer agency and printing costs, but that the Renewal Funds would bear other expenses not covered under the proposed all-inclusive Management Fee, such as taxes, brokerage fees, commissions, and other transaction expenses, interest expenses, and extraordinary expenses. |
Based on these considerations, the Board concluded that the services received and the fees charged under the Renewal Agreements were reasonable on a comparative basis.
| | |
Approval of Investment Advisory Agreement (unaudited)
|
Economies of Scale
With respect to this factor, the Board considered:
| • | the extent to which economies of scale would be realized as the Renewal Funds grow and whether the unitary Management Fee for the Renewal Funds reflected these economies of scale; |
| • | the significant investment of time, personnel and other resources that Global X Management has made and intends to continue to make in the Renewal Funds in order to seek to assure that the Renewal Funds are attractive to investors; and |
| • | that the unitary Management Fee would provide a high level of certainty as to the total level of expenses for the Renewal Funds and their shareholders. |
Based on these considerations, the Board concluded that the unitary Management Fee for the Renewal Funds appropriately addressed economies of scale.
Other Benefits
In considering the Renewal Agreements, in addition to the factors discussed above, the Board considered any other benefits realized by Global X Management as a result of its relationships with the Renewal Funds and concluded that, in the exercise of the Board’s business judgement, all information the Board considered supported approval of the continuation of the Renewal Agreements.
Conclusion
After full consideration of the factors above, as well as other factors that were instructive in their consideration, the Board, including all of the Trust’s Independent Trustees voting separately, concluded, in the exercise of its business judgement, that the Renewal Agreements were fair and reasonable and in the best interest of each Renewal Fund. In reaching this decision, the Board did not assign relative weights to the factors discussed above nor did the Board deem any one factor or group of them to be controlling in and of themselves. Each member of the Board may have assigned different weights to the various factors.
| | |
Supplemental Information (unaudited)
|
NAV is the price per Share at which the Funds issue and redeem Shares. It is calculated in accordance with the standard formula for valuing mutual fund shares. The “Market Price” of the Funds generally is determined using the midpoint between the highest bid and the lowest offer on the stock exchange on which the Shares of the Funds are listed for trading, as of the time that the Funds’ NAV is calculated. The Funds’ Market Price may be at, above or below their NAV. The NAV of the Funds will fluctuate with changes in the market value of the Funds’ holdings. The Market Price of the Funds will fluctuate in accordance with changes in its NAV, as well as market supply and demand.
Premiums or discounts are the differences (expressed as a percentage) between the NAV and Market Price of the Funds on a given day, generally at the time NAV is calculated. A premium is the amount that the Funds are trading above the reported NAV, expressed as a percentage of the NAV. A discount is the amount that the Funds are trading below the reported NAV, expressed as a percentage of the NAV.
Further information regarding premiums and discounts is available on the Funds’ website at www.globalxetfs.com
605 3rd Avenue, 43rd Floor
New York, NY 10158
1-888-493-8631
www.globalxetfs.com
Investment Adviser and Administrator:
Global X Management Company LLC
605 3rd Avenue, 43rd Floor
New York, NY 10158
Distributor:
SEI Investments Distribution Co.
One Freedom Valley Drive
Oaks, PA 19456
Sub-Administrator:
SEI Investments Global Funds Services
One Freedom Valley Drive
Oaks, PA 19456
Counsel for Global X Funds and the Independent Trustees:
Stradley Ronon Stevens & Young, LLP
2000 K Street, N.W.
Suite 700
Washington, DC 20006
Custodian and Transfer Agent:
Brown Brothers Harriman & Co.
50 Post Office Square
Boston, MA 02110
Independent Registered Public Accounting Firm:
PricewaterhouseCoopers LLP
Two Commerce Square
Suite 1800
Philadelphia, PA 19103
This information must be preceded or accompanied by a current prospectus for the Funds described.
GLX-SA-003-0900