UNITED STATES
SECURITIES AND EXCHANGE COMMISSION
Washington, D.C. 20549
________
FORM N-CSRS
________
CERTIFIED SHAREHOLDER REPORT OF REGISTERED MANAGEMENT
INVESTMENT COMPANIES
Investment Company Act file number 811-22209
Global X Funds
(Exact name of registrant as specified in charter)
________
399 Park Avenue, Floor 32
New York, NY 10022
(Address of principal executive offices) (Zip code)
SEI Investments Global Funds Services
One Freedom Valley Drive
Oaks, PA 19456
(Name and address of agent for service)
Registrant’s telephone number, including area code: (888) 493-8631
Date of fiscal year end: October 31, 2012
Date of reporting period: April 30, 2012
Item 1. Reports to Stockholders.

Global X Silver Miners ETF (ticker: SIL)
Global X Gold Explorers ETF (ticker: GLDX)
Global X Pure Gold Miners ETF (ticker: GGGG)
Global X Copper Miners ETF (ticker: COPX)
Global X Aluminum ETF (ticker: ALUM)
Global X Uranium ETF (ticker: URA)
Global X Lithium ETF (ticker: LIT)
Global X Fertilizers/Potash ETF (ticker: SOIL)
Global X S&P/TSX Venture 30 Canada ETF (ticker: TSXV)
Semi-Annual Report
April 30, 2012
Table of Contents
| Schedule of Investments | |
| Global X Silver Miners ETF | 1 |
| Global X Gold Explorers ETF | 4 |
| Global X Pure Gold Miners ETF | 6 |
| Global X Copper Miners ETF | 9 |
| Global X Aluminum ETF | 12 |
| Global X Uranium ETF | 15 |
| Global X Lithium ETF | 17 |
| Global X Fertilizers/Potash ETF | 20 |
| Global X S&P/TSX Venture 30 Canada ETF | 23 |
| Statements of Assets and Liabilities | 25 |
| Statements of Operations | 28 |
| Statements of Changes in Net Assets | 30 |
| Financial Highlights | 35 |
| Notes to Financial Statements | 37 |
| Disclosure of Fund Expenses | 49 |
| Approval of Investment Advisory Agreement | 51 |
| Supplemental Information | 55 |
| Notice to Shareholders | 56 |
The Funds file their complete schedules of Fund holdings with the Securities and Exchange Commission (the “Commission”) for the first and third quarters of each fiscal year on Form N-Q within sixty days after the end of the period. The Funds’ Forms N-Q are available on the Commission’s website at http://www.sec.gov, and may be reviewed and copied at the Commission's Public Reference Room in Washington, DC. Information on the operation of the Public Reference Room may be obtained by calling 1-800-SEC-0330.
A description of the policies and procedures that Global X Funds uses to determine how to vote proxies relating to Fund securities, as well as information relating to how the Funds voted proxies relating to Fund securities during the most recent 12-month period ended June 30, will be available (i) without charge, upon request, by calling 1-888-GXFund-1; and (ii) on the Commission’s website at http://www.sec.gov.
| Schedule of Investments | April 30, 2012 (Unaudited) |
| | |
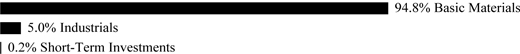
| Global X Silver Miners ETF |
Sector Weightings†:

† Percentages based on total investments. Short-Term Investments include a Repurchase Agreement held as collateral for securities lending activity. Please see Note 8 in Notes to Financial Statements for more detailed information.
| | | Shares | | | Value | |
| COMMON STOCK — 100.5% | | | | | | | | |
| | | | | | | | | |
| AUSTRALIA—0.3% | | | | | | | | |
| Basic Materials — 0.3% | | | | | | | | |
| Alcyone Resources * (A) | | | 12,236,302 | | | $ | 764,976 | |
| | | | | | | | | |
| CANADA—50.0% | | | | | | | | |
| Basic Materials — 50.0% | | | | | | | | |
| Alexco Resource * | | | 570,325 | | | | 3,644,377 | |
| Aurcana * (B) | | | 5,182,488 | | | | 5,508,541 | |
| Bear Creek Mining * | | | 888,740 | | | | 3,013,898 | |
| Endeavour Silver * (B) | | | 1,016,805 | | | | 9,425,782 | |
| Excellon Resources * | | | 3,164,099 | | | | 1,729,628 | |
| First Majestic Silver * | | | 946,015 | | | | 14,881,888 | |
| Fortuna Silver Mines * | | | 1,468,657 | | | | 6,169,891 | |
| Great Panther Silver * (B) | | | 1,583,057 | | | | 3,573,637 | |
| Impact Silver * | | | 685,381 | | | | 1,006,026 | |
| MAG Silver * | | | 517,726 | | | | 5,192,792 | |
| Minco Silver * | | | 361,572 | | | | 739,359 | |
| Orko Silver * (B) | | | 1,516,031 | | | | 2,608,951 | |
| Pan American Silver | | | 1,507,072 | | | | 29,402,975 | |
| Scorpio Mining * (B) | | | 2,305,461 | | | | 2,450,508 | |
| Silver Standard Resources * | | | 950,270 | | | | 13,702,893 | |
| Silver Wheaton (B) | | | 1,240,953 | | | | 37,886,295 | |
| Silvercorp Metals (B) | | | 1,947,796 | | | | 13,498,226 | |
| Silvermex Resources * | | | 7,850 | | | | 4,291 | |
| US Silver * | | | 726,544 | | | | 1,213,542 | |
| Wildcat Silver * | | | 1,086,389 | | | | 1,473,666 | |
| TOTAL CANADA | | | | | | | 157,127,166 | |
| | | | | | | | | |
| MEXICO—24.0% | | | | | | | | |
| Basic Materials — 24.0% | | | | | | | | |
| Fresnillo | | | 1,481,510 | | | | 37,507,800 | |
| Industrias Penoles (B) | | | 808,814 | | | | 37,895,062 | |
| TOTAL MEXICO | | | | | | | 75,402,862 | |
| | | | | | | | | |
| PERU—4.8% | | | | | | | | |
| Basic Materials — 4.8% | | | | | | | | |
| Hochschild Mining | | | 1,832,888 | | | | 14,932,484 | |
The accompanying notes are an integral part of the financial statements.
| Schedule of Investments | April 30, 2012 (Unaudited) |
| | |
| Global X Silver Miners ETF |
| | | Shares/Face
Amount | | | Value | |
| COMMON STOCK — continued | | | | | | | | |
| | | | | | | | | |
| UNITED KINGDOM— 4.8% | | | | | | | | |
| Basic Materials — 4.8% | | | | | | | | |
| Arian Silver * | | | 3,469,712 | | | $ | 1,386,916 | |
| Polymetal International * | | | 929,483 | | | | 13,802,411 | |
| TOTAL UNITED KINGDOM | | | | | | | 15,189,327 | |
| | | | | | | | | |
| UNITED STATES— 16.6% | | | | | | | | |
| Basic Materials — 16.6% | | | | | | | | |
| Coeur d'Alene Mines * | | | 668,075 | | | | 14,397,016 | |
| Golden Minerals * (B) | | | 248,098 | | | | 1,853,292 | |
| Hecla Mining | | | 3,352,756 | | | | 14,349,796 | |
| McEwen Mining * | | | 1,558,661 | | | | 5,907,325 | |
| Mines Management * | | | 284,859 | | | | 504,201 | |
| Revett Minerals * | | | 258,477 | | | | 1,078,023 | |
| Tahoe Resources * | | | 748,859 | | | | 14,092,513 | |
| TOTAL UNITED STATES | | | | | | | 52,182,166 | |
| TOTAL COMMON STOCK | | | | | | | | |
| (Cost $359,810,590) | | | | | | | 315,598,981 | |
| | | | | | | | | |
| REPURCHASE AGREEMENT — 4.1% | | | | | | | | |
| Merrill Lynch | | | | | | | | |
| 0.170%, dated 04/30/12, to be repurchased on 05/01/12, repurchase price $12,775,713 (collateralized by U.S. Treasury Notes, par value $12,741,800, 1.500%, 08/31/2018, with total market value $13,031,248)(C) | | $ | 12,775,653 | | | | 12,775,653 | |
| | | | | | | | | |
| TOTAL REPURCHASE AGREEMENT | | | | | | | | |
| (Cost $12,775,653) | | | | | | | 12,775,653 | |
| | | | | | | | | |
| TIME DEPOSIT — 0.1% | | | | | | | | |
| Brown Brothers Harriman, 0.030% | | | | | | | | |
| (Cost $401,003) | | | 401,003 | | | | 401,003 | |
| | | | | | | | | |
| TOTAL INVESTMENTS — 104.7% | | | | | | | | |
| (Cost $372,987,246) | | | | | | $ | 328,775,637 | |
Percentages are based on Net Assets of $314,047,428.
| * | Non-income producing security. |
| (A) | Security is fair valued using methods determined in good faith by the Fair Value Committee of the Fund. The total value of such securities as of April 30, 2012, was $764,976 and represents 0.2% of net assets. |
| (B) | This security or a partial position of this security is on loan at April 30, 2012. The total value of securities on loan at April 30, 2012 was $12,244,009. |
| (C) | These securities were purchased with cash collateral held from securities on loan. The total value of such securities as of April 30, 2012 was $12,775,653. |
The accompanying notes are an integral part of the financial statements.
| Schedule of Investments | April 30, 2012 (Unaudited) |
| | |
| Global X Silver Miners ETF |
The following is a summary of the inputs used as of April 30, 2012, in valuing the Fund's investments carried at value:
| Investments in Securities | | Level 1 | | | Level 2 | | | Level 3 | | | Total | |
| Common Stock | | | | | | | | | | | | | | | | |
| Australia | | $ | — | | | $ | — | | | $ | 764,976 | | | $ | 764,976 | |
| Canada | | | 157,127,166 | | | | — | | | | — | | | | 157,127,166 | |
| Mexico | | | 75,402,862 | | | | — | | | | — | | | | 75,402,862 | |
| Peru | | | 14,932,484 | | | | — | | | | — | | | | 14,932,484 | |
| United Kingdom | | | 15,189,327 | | | | — | | | | — | | | | 15,189,327 | |
| United States | | | 52,182,166 | | | | — | | | | — | | | | 52,182,166 | |
| Total Common Stock | | | 314,834,005 | | | | — | | | | 764,976 | | | | 315,598,981 | |
| Repurchase Agreement | | | — | | | | 12,775,653 | | | | — | | | | 12,775,653 | |
| Time Deposit | | | — | | | | 401,003 | | | | — | | | | 401,003 | |
| Total Investments in Securities | | $ | 314,834,005 | | | $ | 13,176,656 | | | $ | 764,976 | | | $ | 328,775,637 | |
The following is a reconciliation of investments in which significant unobservable inputs (Level 3) were used in determining fair value:
| | | Common Stock - | |
| | | Australia | |
| Beginning Balance as of November 1, 2011 | | $ | - | |
| Accrued discounts/premiums | | | - | |
| Realized gain/(loss) | | | - | |
| Change in unrealized appreciation/(depreciation) | | | - | |
| Net purchases | | | - | |
| Net sales | | | - | |
| Transfers into Level 3 | | | 764,976 | |
| Transfers out of Level 3 | | | - | |
| Ending Balance as of April 30, 2012 | | $ | 764,976 | |
For the period ended April 30, 2012, there have been no transfers between Level 1 & Level 2 assets and liabilities.
For the period ended April 30, 2012 Transfer between Level 1 and Level 3 assets and liabilities totaled $764,976.
The reason for the transfer was a temporary trading suspension of the investment’s shares, which necessitated a fair value determination by the Fair Value Committee at the end of the reporting period.
The accompanying notes are an integral part of the financial statements.
| Schedule of Investments | April 30, 2012 (Unaudited) |
| | |
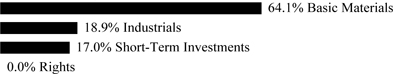
| Global X Gold Explorers ETF |
Sector Weightings†:

† Percentages based on total investments.
| | | Shares | | | Value | |
| | | | | | | | | |
| COMMON STOCK — 100.0% | | | | | | | | |
| | | | | | | | | |
| AUSTRALIA—7.8% | | | | | | | | |
| Basic Materials — 7.8% | | | | |
| Ampella Mining * | | | 981,305 | | | $ | 1,088,930 | |
| Gryphon Minerals * | | | 1,231,674 | | | | 1,219,174 | |
| TOTAL AUSTRALIA | | | | | | | 2,308,104 | |
| | | | | | | | | |
| CANADA—92.2% | | | | | | | | |
| Basic Materials — 92.2% | | | | |
| Atac Resources * | | | 371,975 | | | | 1,027,982 | |
| Canaco Resources * | | | 782,910 | | | | 737,062 | |
| Chesapeake Gold * | | | 169,414 | | | | 2,229,470 | |
| Continental Gold * | | | 190,982 | | | | 1,424,849 | |
| Exeter Resource * | | | 431,846 | | | | 1,031,692 | |
| Extorre Gold Mines * | | | 199,293 | | | | 847,326 | |
| Gold Canyon Resources * | | | 491,915 | | | | 831,602 | |
| International Tower Hill Mines * | | | 363,462 | | | | 1,379,746 | |
| Kaminak Gold, Cl A * | | | 396,573 | | | | 710,568 | |
| Keegan Resources * | | | 382,349 | | | | 1,238,565 | |
| Levon Resources * | | | 902,762 | | | | 603,151 | |
| Lydian International, Cl A * | | | 373,177 | | | | 887,752 | |
| Newstrike Capital * | | | 419,934 | | | | 973,477 | |
| Novagold Resources * | | | 184,471 | | | | 1,322,657 | |
| Paramount Gold and Silver * | | | 601,303 | | | | 1,467,179 | |
| Pretium Resources * | | | 106,592 | | | | 1,800,901 | |
| Rainy River Resources * | | | 207,567 | | | | 974,957 | |
| Rubicon Minerals * | | | 415,651 | | | | 1,266,497 | |
| Sabina Gold & Silver * | | | 411,506 | | | | 1,145,560 | |
| Seabridge Gold * | | | 86,911 | | | | 1,456,628 | |
| Torex Gold Resources * | | | 841,909 | | | | 1,465,894 | |
| Trelawney Mining and Exploration * | | | 503,085 | | | | 1,665,322 | |
| Volta Resources * | | | 723,250 | | | | 622,324 | |
| TOTAL CANADA | | | | | | | 27,111,161 | |
| TOTAL COMMON STOCK | | | | | | | | |
| (Cost $42,872,618) | | | | | | | 29,419,265 | |
The accompanying notes are an integral part of the financial statements.
| Schedule of Investments | April 30, 2012 (Unaudited) |
| | |
| Global X Gold Explorers ETF |
| | | Face Amount | | | Value | |
| TIME DEPOSIT — 0.1% | | | | | | | | |
| Brown Brothers Harriman, 0.030% | | | | | | | | |
| (Cost $25,219) | | $ | 25,219 | | | $ | 25,219 | |
| TOTAL INVESTMENTS — 100.1% | | | | | | | | |
| (Cost $42,897,837) | | | | | | $ | 29,444,484 | |
Percentages are based on Net Assets of $29,413,006.
| * | Non-income producing security. |
Cl — Class
The following is a summary of the inputs used as of April 30, 2012, in valuing the Fund's investments carried at value:
| Investments in Securities | | Level 1 | | | Level 2 | | | Level 3 | | | Total | |
| Common Stock | | $ | 29,419,265 | | | $ | — | | | $ | — | | | $ | 29,419,265 | |
| Time Deposit | | | — | | | | 25,219 | | | | — | | | | 25,219 | |
| Total Investments in Securities | | $ | 29,419,265 | | | $ | 25,219 | | | $ | — | | | $ | 29,444,484 | |
|
For the period ended April 30, 2012, there have been no transfers between Level 1 & Level 2 assets and liabilities.
For the period ended April 30, 2012, there were no Level 3 assets and liabilities.
The accompanying notes are an integral part of the financial statements.
| Schedule of Investments | April 30, 2012 (Unaudited) |
| | |
| Global X Pure Gold Miners ETF |
Sector Weightings†:

† Percentages based on total investments.
| | | Shares | | | Value | |
| COMMON STOCK — 99.7% | | | | | | | | |
| | | | | | | | | |
| AUSTRALIA—5.8% | | | | | | | | |
| Basic Materials — 5.8% | | | | | | | | |
| Medusa Mining | | | 20,442 | | | $ | 122,685 | |
| Perseus Mining * | | | 53,804 | | | | 145,759 | |
| TOTAL AUSTRALIA | | | | | | | 268,444 | |
| | | | | | | | | |
| CANADA—40.7% | | | | | | | | |
| Basic Materials — 40.7% | | | | | | | | |
| Alamos Gold | | | 13,840 | | | | 253,305 | |
| Aurizon Mines * | | | 18,965 | | | | 102,519 | |
| B2Gold * | | | 41,938 | | | | 158,353 | |
| Centerra Gold | | | 13,111 | | | | 169,752 | |
| Detour Gold * | | | 9,427 | | | | 232,657 | |
| Eldorado Gold | | | 19,257 | | | | 272,914 | |
| Kinross Gold | | | 24,765 | | | | 221,866 | |
| Kirkland Lake Gold * | | | 7,100 | | | | 92,717 | |
| Osisko Mining * | | | 21,395 | | | | 220,263 | |
| SEMAFO | | | 33,606 | | | | 170,777 | |
| TOTAL CANADA | | | | | | | 1,895,123 | |
| | | | | | | | | |
| CHINA—3.2% | | | | | | | | |
| Basic Materials — 3.2% | | | | | | | | |
| Real Gold Mining (A) (B) | | | 36,500 | | | | 10,444 | |
| Zhaojin Mining Industry | | | 99,484 | | | | 139,251 | |
| TOTAL CHINA | | | | | | | 149,695 | |
| | | | | | | | | |
| JERSEY—4.4% | | | | | | | | |
| Basic Materials — 4.4% | | | | | | | | |
| Randgold Resources ADR | | | 2,303 | | | | 205,312 | |
| | | | | | | | | |
| SOUTH AFRICA— 13.0% | | | | | | | | |
| Basic Materials — 13.0% | | | | | | | | |
| AngloGold Ashanti ADR | | | 5,948 | | | | 204,492 | |
| Gold Fields ADR | | | 15,714 | | | | 202,239 | |
| Harmony Gold Mining ADR | | | 20,566 | | | | 199,490 | |
| TOTAL SOUTH AFRICA | | | | | | | 606,221 | |
The accompanying notes are an integral part of the financial statements.
| Schedule of Investments | April 30, 2012 (Unaudited) |
| | |
| Global X Pure Gold Miners ETF |
| | | Shares/Face
Amount | | | Value | |
| COMMON STOCK — continued | | | | | | | | |
| | | | | | | | | |
| TURKEY—6.3% | | | | | | | | |
| Basic Materials — 6.3% | | | | |
| Koza Altin Isletmeleri | | | 13,546 | | | $ | 293,095 | |
| | | | | | | | | |
| UNITED KINGDOM— 5.0% | | | | | | | | |
| Basic Materials — 5.0% | | | | |
| African Barrick Gold | | | 13,232 | | | | 77,157 | |
| Petropavlovsk | | | 20,342 | | | | 157,406 | |
| TOTAL UNITED KINGDOM | | | | | | | 234,563 | |
| | | | | | | | | |
| UNITED STATES— 21.3% | | | | | | | | |
| | | | | | | | | |
| Basic Materials — 21.3% | | | | | | | | |
| Alacer Gold * | | | 27,531 | | | | 222,957 | |
| Allied Nevada Gold * | | | 7,910 | | | | 231,684 | |
| Centamin * | | | 125,466 | | | | 139,683 | |
| Gold Resource | | | 5,775 | | | | 156,618 | |
| Polyus Gold International GDR * | | | 77,691 | | | | 239,288 | |
| TOTAL UNITED STATES | | | | | | | 990,230 | |
| TOTAL COMMON STOCK | | | | | | | | |
| (Cost $5,590,958) | | | | | | | 4,642,683 | |
| | | | | | | | | |
| TIME DEPOSIT — 0.3% | | | | | | | | |
| Brown Brothers Harriman, 0.030% | | | | | | | | |
| (Cost $11,824) | | $ | 11,824 | | | | 11,824 | |
| | | | | | | | | |
| TOTAL INVESTMENTS — 100.0% | | | | | | | | |
| (Cost $5,602,782) | | | | | | $ | 4,654,507 | |
| | | | | | | | | |
| Percentages are based on Net Assets of $4,654,399. |
| * | Non-income producing security. |
| ADR — American Depositary Receipt |
| GDR — Global Depositary Receipt |
| (A) | Security is fair valued using methods determined in good faith by the Fair Value Committee of the Fund. The total value of such security as of April 30, 2012 was $10,444 and represents 0.2% of Net Assets. |
| (B) | Securities considered illiquid. The total value of such security as of April 30, 2011 was $10,444 and represents 0.2% of Net Assets. |
The accompanying notes are an integral part of the financial statements.
| Schedule of Investments | April 30, 2012 (Unaudited) |
| | |
| Global X Pure Gold Miners ETF |
The following is a summary of the inputs used as of April 30, 2012, in valuing the Fund's investments carried at value:
| Investments in Securities | | Level 1 | | | Level 2 | | | Level 3 | | | Total | |
| Common Stock | | | | | | | | | | | | | | | | |
| Australia | | $ | 268,444 | | | $ | — | | | $ | — | | | $ | 268,444 | |
| Canada | | | 1,895,123 | | | | — | | | | — | | | | 1,895,123 | |
| China | | | 139,251 | | | | — | | | | 10,444 | | | | 149,695 | |
| Jersey | | | 205,312 | | | | — | | | | — | | | | 205,312 | |
| South Africa | | | 606,221 | | | | — | | | | — | | | | 606,221 | |
| Turkey | | | 293,095 | | | | — | | | | — | | | | 293,095 | |
| United Kingdom | | | 234,563 | | | | — | | | | — | | | | 234,563 | |
| United States | | | 990,230 | | | | — | | | | — | | | | 990,230 | |
| Total Common Stock | | | 4,632,239 | | | | — | | | | 10,444 | | | | 4,642,683 | |
| Time Deposit | | | — | | | | 11,824 | | | | — | | | | 11,824 | |
| Total Investments in Securities | | $ | 4,632,239 | | | $ | 11,824 | | | $ | 10,444 | | | $ | 4,654,507 | |
The following is a reconciliation of investments in which significant unobservable inputs (Level 3) were used in determining fair value:
| | | Common Stock - | |
| | | China | |
| | | | |
| Beginning Balance as of November 1, 2011 | | $ | 17,433 | |
| Accrued discounts/premiums | | | - | |
| Realized gain/(loss) | | | - | |
| Change in unrealized appreciation/(depreciation) | | | (18,693 | ) |
| Net purchases | | | 11,704 | |
| Net sales | | | - | |
| Transfers into Level 3 | | | - | |
| Transfers out of Level 3 | | | - | |
| Ending Balance as of April 30, 2012 | | $ | 10,444 | |
Net change in unrealized appreciation (depreciation) from investments (Level 3) still held as of April 30, 2012 was $ (18,693).
For the period ended April 30, 2012, there have been no transfers between Level 1 & Level 2 assets and liabilities.
The accompanying notes are an integral part of the financial statements.
| Schedule of Investments | April 30, 2012 (Unaudited) |
| | |
| Global X Copper Miners ETF |
Sector Weightings†:

† Percentages based on total investments. Short-Term Investments include a Repurchase Agreement held as collateral for securities lending activity. Please see Note 8 in Notes to Financial Statements for more detailed information.
| | | Shares | | | Value | |
| COMMON STOCK — 100.0% |
| |
| AUSTRALIA—8.9% | | | | | | | | |
| Basic Materials — 8.9% | | | | |
| Cudeco * | | | 265,324 | | | $ | 945,473 | |
| OZ Minerals | | | 155,301 | | | | 1,509,740 | |
| Straits Resources * | | | 563,816 | | | | 458,225 | |
| TOTAL AUSTRALIA | | | | | | | 2,913,438 | |
| | | | | | | | | |
| CANADA—45.8% | | | | | | | | |
| Basic Materials — 45.8% | | | | | | | | |
| Augusta Resource * | | | 113,771 | | | | 290,116 | |
| Capstone Mining * | | | 525,922 | | | | 1,570,552 | |
| Copper Mountain Mining (CAD) * | | | 171,348 | | | | 744,124 | |
| Copper Mountain Mining (USD) * | | | 12,300 | | | | 52,496 | |
| Duluth Metals * | | | 121,538 | | | | 255,908 | |
| First Quantum Minerals | | | 73,045 | | | | 1,517,319 | |
| HudBay Minerals, Cl B | | | 145,116 | | | | 1,527,769 | |
| Imperial Metals * | | | 60,950 | | | | 944,005 | |
| Inmet Mining | | | 27,294 | | | | 1,501,398 | |
| Ivanhoe Mines * (A) | | | 126,768 | | | | 1,484,453 | |
| Katanga Mining * | | | 520,961 | | | | 432,442 | |
| Lumina Copper * | | | 38,846 | | | | 523,006 | |
| Lundin Mining * | | | 349,010 | | | | 1,695,853 | |
| Mercator Minerals * (A) | | | 505,817 | | | | 609,326 | |
| Northern Dynasty Minerals * | | | 99,279 | | | | 559,934 | |
| Taseko Mines * | | | 376,453 | | | | 1,317,585 | |
| TOTAL CANADA | | | | | | | 15,026,286 | |
| | | | | | | | | |
| CHINA—4.7% | | | | | | | | |
| Basic Materials — 4.7% | | | | | | | | |
| Jiangxi Copper, Cl H | | | 634,639 | | | | 1,534,523 | |
| | | | | | | | | |
| MEXICO—4.7% | | | | | | | | |
| Basic Materials — 4.7% | | | | | | | | |
| Grupo Mexico, Cl B | | | 504,368 | | | | 1,554,618 | |
The accompanying notes are an integral part of the financial statements.
| Schedule of Investments | April 30, 2012 (Unaudited) |
| | |
| Global X Copper Miners ETF |
| | | Shares/Number
of Warrants | | | Value | |
| COMMON STOCK — continued |
| |
| PERU—4.9% | | | | | | | | |
| Basic Materials — 4.9% | | | | |
| Southern Copper | | | 48,785 | | | $ | 1,604,051 | |
| | | | | | | | | |
| POLAND—4.7% | | | | | | | | |
| Basic Materials — 4.7% | | | | |
| KGHM Polska Miedz | | | 35,060 | | | | 1,543,249 | |
| | | | | | | | | |
| SOUTH AFRICA— 1.0% | | | | | | | | |
| Basic Materials — 1.0% | | | | |
| Palabora Mining | | | 16,476 | | | | 328,530 | |
| | | | | | | | | |
| SWITZERLAND—5.1% | | | | | | | | |
| Basic Materials — 5.1% | | | | |
| Xstrata | | | 86,805 | | | | 1,658,816 | |
| | | | | | | | | |
| TURKEY—0.8% | | | | | | | | |
| Basic Materials — 0.8% | | | | |
| Park Elektrik Uretim Madencilik Sanayi ve Ticaret * | | | 85,510 | | | | 263,894 | |
| | | | | | | | | |
| UNITED KINGDOM— 14.6% | | | | | | | | |
| Basic Materials — 14.6% | | | | |
| Antofagasta | | | 85,416 | | | | 1,637,124 | |
| Kazakhmys | | | 109,532 | | | | 1,530,511 | |
| Vedanta Resources | | | 82,418 | | | | 1,627,815 | |
| TOTAL UNITED KINGDOM | | | | | | | 4,795,450 | |
| | | | | | | | | |
| UNITED STATES— 4.8% | | | | | | | | |
| Basic Materials — 4.8% | | | | | | | | |
| Freeport-McMoRan Copper & Gold | | | 41,306 | | | | 1,582,020 | |
| TOTAL COMMON STOCK | | | | | | | | |
| (Cost $37,922,869) | | | | | | | 32,804,875 | |
| | | | | | | | | |
| WARRANTS — 0.0% |
| |
| Canada — 0.0% |
| Duluth Exploration, Expires 1/18/13(B) | | | | | | | | |
| (Cost $–) | | | 11,771 | | | | — | |
The accompanying notes are an integral part of the financial statements.
| Schedule of Investments | April 30, 2012 (Unaudited) |
| | |
| Global X Copper Miners ETF |
| | | Face Amount | | | Value | |
| REPURCHASE AGREEMENT — 1.9% |
| Merrill Lynch | | | | | | | | |
0.170%, dated 04/30/12, to be repurchased 05/01/12, repurchase price $637,128 (collateralized by U.S. Treasury Notes, par value $635,500, 1.500%, 08/31/2018, with total market value $649,936)(C) | | $ | 637,125 | | | $ | 637,125 | |
| | | | | | | | | |
| TOTAL REPURCHASE AGREEMENT | | | | | | | | |
| (Cost $637,125) | | | | | | | 637,125 | |
| | | | | | | | | |
| TIME DEPOSIT — 0.0% |
| Brown Brothers Harriman, 0.030% | | | | | | | | |
| (Cost $16,301) | | | 16,301 | | | | 16,301 | |
| | | | | | | | | |
| TOTAL INVESTMENTS — 101.9% | | | | | | | | |
| (Cost $38,576,295) | | | | | | $ | 33,458,301 | |
Percentages are based on Net Assets of $32,841,533.
* Non-income producing security.
CAD — Canadian Dollar
Cl — Class
USD — U.S. Dollar
| (A) | This security or a partial position of this security is on loan at April 30, 2012. The total value of securities on loan at April 30, 2012 was $590,625. |
| (B) | Securities considered illiquid. The total value of such securities as of April 30, 2012 was $— and represented 0.0% of Net Assets. |
| (C) | These securities were purchased with cash collateral held from securities on loan. The total value of such securities as of April 30, 2012 was $637,125. |
Amounts designated as “—“ are $0 or have been rounded to $0.
The following is a summary of the inputs used as of April 30, 2012, in valuing the Fund's investments carried at value:
| Investments in Securities | | Level 1 | | | Level 2 | | | Level 3 | | | Total | |
| Common Stock | | $ | 32,804,875 | | | $ | — | | | $ | — | | | $ | 32,804,875 | |
| Warrants | | | — | | | | — | | | | — | | | | — | |
| Repurchase Agreement | | | — | | | | 637,125 | | | | — | | | | 637,125 | |
| Time Deposit | | | — | | | | 16,301 | | | | — | | | | 16,301 | |
| Total Investments in Securities | | $ | 32,804,875 | | | $ | 653,426 | | | $ | — | | | $ | 33,458,301 | |
For the period ended April 30, 2012, there have been no transfers between Level 1 & Level 2 assets and liabilities.
For the period ended April 30, 2012, there were no Level 3 assets and liabilities.
The accompanying notes are an integral part of the financial statements.
| Schedule of Investments | April 30, 2012 (Unaudited) |
| | |
| Global X Aluminum ETF |
Sector Weightings†:
† Percentages based on total investments.
| | | Shares | | | Value | |
| COMMON STOCK — 99.9% | | | | | | | | |
| | | | | | | | | |
| AUSTRALIA—4.2% | | | | | | | | |
| Basic Materials — 4.2% | | | | | | | | |
| Alumina | | | 89,157 | | | $ | 107,761 | |
| | | | | | | | | |
| CANADA—3.2% | | | | | | | | |
| Basic Materials — 3.2% | | | | |
| Orbite Aluminae, * | | | 39,075 | | | | 81,089 | |
| | | | | | | | | |
| CHINA—16.0% | | | | | | | | |
| Basic Materials — 11.0% | | | | |
| Aluminum Corp of China, Cl H * | | | 236,453 | | | | 114,895 | |
| China Hongqiao Group * | | | 224,312 | | | | 139,930 | |
| XinRen Aluminum Holdings * | | | 99,100 | | | | 26,827 | |
| Industrials — 5.0% | | | | |
| China Zhongwang Holdings | | | 311,518 | | | | 128,483 | |
| TOTAL CHINA | | | | | | | 410,135 | |
| | | | | | | | | |
| GREECE—3.6% | | | | | | | | |
| Basic Materials — 3.6% | | | | | | | | |
| Mytilineos Holdings | | | 27,259 | | | | 93,093 | |
| | | | | | | | | |
| HONG KONG— 5.3% | | | | | | | | |
| Basic Materials — 5.3% | | | | | | | | |
| Minmetals Resources * | | | 264,574 | | | | 135,038 | |
| | | | | | | | | |
| JAPAN—14.7% | | | | | | | | |
| Basic Materials — 14.7% | | | | | | | | |
| Alconix | | | 1,541 | | | | 34,954 | |
| Nippon Light Metal | | | 91,269 | | | | 134,892 | |
| Sky Aluminum | | | 26,146 | | | | 78,268 | |
| Sumitomo Light Metal Industries | | | 123,758 | | | | 127,106 | |
| TOTAL JAPAN | | | | | | | 375,220 | |
| | | | | | | | | |
| MALAYSIA—1.9% | | | | | | | | |
| Basic Materials — 1.9% | | | | | | | | |
| Press Metal | | | 71,740 | | | | 50,024 | |
The accompanying notes are an integral part of the financial statements.
| Schedule of Investments | April 30, 2012 (Unaudited) |
| | |
| Global X Aluminum ETF |
| | | Shares/Face
Amount | | | Value | |
| COMMON STOCK — continued | | | | | | | | |
| | | | | | | | | |
| NORWAY—4.4% | | | | | | | | |
| Basic Materials — 4.4% | | | | | | | | |
| Norsk Hydro | | | 23,045 | | | $ | 112,105 | |
| | | | | | | | | |
| RUSSIA—4.7% | | | | | | | | |
| Basic Materials — 4.7% | | | | | | | | |
| United RUSAL * | | | 171,581 | | | | 121,410 | |
| | | | | | | | | |
| SINGAPORE—3.7% | | | | | | | | |
| Basic Materials — 3.7% | | | | | | | | |
| Midas Holdings | | | 319,580 | | | | 94,260 | |
| | | | | | | | | |
| SOUTH KOREA— 1.0% | | | | | | | | |
| Basic Materials — 1.0% | | | | | | | | |
| Dayou Smart Aluminium | | | 10,930 | | | | 25,146 | |
| | | | | | | | | |
| UNITED KINGDOM— 14.7% | | | | | | | | |
| Basic Materials — 14.7% | | | | | | | | |
| Rio Tinto | | | 6,751 | | | | 376,072 | |
| | | | | | | | | |
| UNITED STATES— 22.5% | | | | | | | | |
| Basic Materials — 22.5% | | | | | | | | |
| Alcoa | | | 25,353 | | | | 246,684 | |
| Century Aluminum * | | | 12,409 | | | | 114,163 | |
| Kaiser Aluminum | | | 2,398 | | | | 126,063 | |
| Noranda Aluminum Holding | | | 8,403 | | | | 89,240 | |
| TOTAL UNITED STATES | | | | | | | 576,150 | |
| TOTAL COMMON STOCK | | | | | | | | |
| (Cost $3,700,066) | | | | | | | 2,557,503 | |
| | | | | | | | | |
| TIME DEPOSIT — 0.2% | | | | | | | | |
| Brown Brothers Harriman, 0.030% | | | | | | | | |
| (Cost $5,495) | | $ | 5,495 | | | | 5,495 | |
| | | | | | | | | |
| TOTAL INVESTMENTS — 100.1% | | | | | | | | |
| (Cost $3,705,561) | | | | | | $ | 2,562,998 | |
| | | | | | | | | |
| Percentages are based on Net Assets of $2,559,618. |
|
| * | Non-income producing security. |
| Cl — Class |
The accompanying notes are an integral part of the financial statements.
| Schedule of Investments | April 30, 2012 (Unaudited) |
| | |
| Global X Aluminum ETF |
The following is a summary of the inputs used as of April 30, 2012, in valuing the Fund's investments carried at value:
| Investments in Securities | | Level 1 | | | Level 2 | | | Level 3 | | | Total | |
| Common Stock | | $ | 2,557,503 | | | $ | — | | | $ | — | | | $ | 2,557,503 | |
| Time Deposit | | | — | | | | 5,495 | | | | — | | | | 5,495 | |
| Total Investments in Securities | | $ | 2,557,503 | | | $ | 5,495 | | | $ | — | | | $ | 2,562,998 | |
For the period ended April 30, 2012, there have been no transfers between Level 1 & Level 2 assets and liabilities
For the period ended April 30, 2012, there were no Level 3 assets and liabilities.
The accompanying notes are an integral part of the financial statements.
| Schedule of Investments | April 30, 2012 (Unaudited) |
| | |
| Global X Uranium ETF |
Sector Weightings†:

† Percentages based on total investments. Short-Term Investments include a Repurchase Agreement held as collateral for securities lending activity. Please see Note 8 in Notes to Financial Statements for more detailed information.
| | | Shares | | | Value | |
| COMMON STOCK — 98.0% |
| |
| AUSTRALIA—31.6% | | | | | | | | |
| Basic Materials — 31.6% | | | | | | | | |
| Azimuth Resources * (A) | | | 9,949,571 | | | $ | 6,790,349 | |
| Bannerman Resources * | | | 11,647,135 | | | | 2,366,465 | |
| Berkeley Resources * | | | 3,902,573 | | | | 1,545,187 | |
| Energy Resources of Australia (A) | | | 5,325,219 | | | | 8,933,255 | |
| Greenland Minerals & Energy * (A) | | | 8,972,769 | | | | 4,768,075 | |
| Paladin Energy * (A) | | | 18,433,218 | | | | 30,634,321 | |
| TOTAL AUSTRALIA | | | | | | | 55,037,652 | |
| | | | | | | | | |
| CANADA—48.7% | | | | | | | | |
| Basic Materials — 48.7% | | | | |
| Cameco | | | 1,865,523 | | | | 41,281,908 | |
| Denison Mines * (A) | | | 4,816,143 | | | | 8,824,435 | |
| Laramide Resources * | | | 1,665,579 | | | | 1,804,089 | |
| Mega Uranium * | | | 7,688,586 | | | | 1,790,125 | |
| Rockgate Capital * (A) | | | 11,780,208 | | | | 7,870,565 | |
| Uex * | | | 4,674,019 | | | | 3,312,055 | |
| Uranium One * (A) | | | 6,785,477 | | | | 19,713,842 | |
| TOTAL CANADA | | | | | | | 84,597,019 | |
| | | | | | | | | |
| UNITED STATES— 17.7% | | | | | | | | |
| Basic Materials — 17.7% | | | | | | | | |
| Uranerz Energy * (A) | | | 4,172,689 | | | | 7,302,206 | |
| Uranium Energy * (A) | | | 2,606,503 | | | | 7,689,184 | |
| Uranium Resources * (A) | | | 3,327,204 | | | | 2,894,667 | |
| Ur-Energy * (A) | | | 6,988,601 | | | | 7,617,575 | |
| USEC * (A) | | | 6,218,127 | | | | 5,233,176 | |
| TOTAL UNITED STATES | | | | | | | 30,736,808 | |
| TOTAL COMMON STOCK | | | | | | | | |
| (Cost $281,849,489) | | | | | | | 170,371,479 | |
The accompanying notes are an integral part of the financial statements.
| Schedule of Investments | April 30, 2012 (Unaudited) |
| | |
| Global X Uranium ETF |
| | | Face Amount | | | Value | |
| REPURCHASE AGREEMENT — 25.1% |
| Merrill Lynch | | | | | | | | |
0.170%, dated 04/30/12, to be repurchased on 05/01/12, repurchase price $43,679,029 (collateralized by U.S. Treasury Notes, par value $44,573,100, 0.000%, 09/13/2012, with total market value $44,552,463)(B) | | $ | 43,678,823 | | | $ | 43,678,823 | |
| | | | | | | | | |
| TOTAL REPURCHASE AGREEMENT | | | | | | | | |
| (Cost $43,678,823) | | | | | | | 43,678,823 | |
| | | | | | | | | |
| U.S. TREASURY OBLIGATION (C) — 6.9% |
| United States Treasury Bills | | | | | | | | |
| 0.045%, 05/10/12 | | | | | | | | |
| (Cost $11,999,865) | | | 12,000,000 | | | | 11,999,856 | |
| | | | | | | | | |
| TIME DEPOSIT — 0.1% |
| Brown Brothers Harriman, 0.030% | | | | | | | | |
| (Cost $221,563) | | | 221,563 | | | | 221,563 | |
| TOTAL INVESTMENTS — 130.1% | | | | | | | | |
| (Cost $337,749,740) | | | | | | $ | 226,271,721 | |
| | | | | | | | | |
| Percentages are based on Net Assets of $173,862,063 |
| * | Non-income producing security. |
| (A) | This security or a partial position of this security is on loan at April 30, 2012. The total value of securities on loan at April 30, 2012 was $36,433,234. |
| (B) | These securities were purchased with cash collateral held from securities on loan. The total value of such securities as of April 30, 2012 was $43,678,823. |
| (C) | The rate reported is the effective yield at time of purchase. |
The following is a summary of the inputs used as of April 30, 2012, in valuing the Fund's investments carried at value:
| Investments in Securities | | Level 1 | | | Level 2 | | | Level 3 | | | Total | |
| Common Stock | | $ | 170,371,479 | | | $ | — | | | $ | — | | | $ | 170,371,479 | |
| Repurchase Agreement | | | — | | | | 43,678,823 | | | | — | | | | 43,678,823 | |
| U.S. Treasury Obligation | | | — | | | | 11,999,856 | | | | — | | | | 11,999,856 | |
| Time Deposit | | | — | | | | 221,563 | | | | — | | | | 221,563 | |
| Total Investments in Securities | | $ | 170,371,479 | | | $ | 55,900,242 | | | $ | — | | | $ | 226,271,721 | |
For the period ended April 30, 2012, there have been no transfers between Level 1 & Level 2 assets and liabilities.
For the period ended April 30, 2012, there were no Level 3 assets and liabilities.
The accompanying notes are an integral part of the financial statements.
| Schedule of Investments | April 30, 2012 (Unaudited) |
| | |
| Global X Lithium ETF |
Sector Weightings†:
† Percentages based on total investments. Short-Term Investments include a Repurchase Agreement held as collateral for securities lending activity. Please see Note 8 in Notes to Financial Statements for more detailed information.
| | | Shares | | | Value | |
| COMMON STOCK — 99.8% |
| |
| AUSTRALIA—13.0% | | | | | | | | |
| Basic Materials — 13.0% | | | | | | | | |
| Galaxy Resources * (A) | | | 4,424,206 | | | $ | 3,157,711 | |
| Orocobre * (A) | | | 2,315,798 | | | | 3,619,415 | |
| Reed Resources * | | | 7,465,129 | | | | 1,594,548 | |
| Talison Lithium * | | | 990,157 | | | | 3,297,683 | |
| TOTAL AUSTRALIA | | | | | | | 11,669,357 | |
| | | | | | | | | |
| CANADA—13.3% | | | | | | | | |
| Basic Materials — 12.6% | | | | | | | | |
| Avalon Rare Metals * (A) | | | 1,229,201 | | | | 3,098,356 | |
| Canada Lithium * (A) | | | 7,433,887 | | | | 4,289,432 | |
| Lithium Americas * | | | 1,534,180 | | | | 1,894,720 | |
| Lithium One * | | | 1,612,816 | | | | 2,024,489 | |
| Industrials — 0.7% | | | | | | | | |
| Electrovaya * (A) | | | 780,656 | | | | 600,596 | |
| TOTAL CANADA | | | | | | | 11,907,593 | |
| | | | | | | | | |
| CHILE—19.6% | | | | | | | | |
| Basic Materials — 19.6% | | | | |
| Sociedad Quimica y Minera de Chile ADR (A) | | | 301,858 | | | | 17,595,303 | |
| | | | | | | | | |
| CHINA—1.1% | | | | | | | | |
| Industrials — 1.1% | | | | |
| China BAK Battery * | | | 1,327,011 | | | | 1,021,798 | |
| | | | | | | | | |
| FRANCE—4.4% | | | | | | | | |
| Industrials — 4.4% | | | | |
| Saft Groupe | | | 143,414 | | | | 3,956,196 | |
| | | | | | | | | |
| HONG KONG— 1.1% | | | | | | | | |
| Industrials — 1.1% | | | | | | | | |
| Coslight Technology International Group | | | 3,428,967 | | | | 1,012,075 | |
The accompanying notes are an integral part of the financial statements.
| Schedule of Investments | April 30, 2012 (Unaudited) |
| | |
| Global X Lithium ETF |
| | | Shares/Number of Rights/Face Amount | | | Value | |
| COMMON STOCK — continued | | | | | | | | |
| | | | | | | | | |
| JAPAN—4.3% | | | | | | | | |
| Industrials — 4.3% | | | | | | | | |
| GS Yuasa (A) | | | 742,774 | | | $ | 3,851,559 | |
| | | | | | | | | |
| UNITED STATES— 43.0% | | | | | | | | |
| Basic Materials — 31.8% | | | | | | | | |
| FMC | | | 172,736 | | | | 19,078,691 | |
| Rockwood Holdings * | | | 171,280 | | | | 9,478,635 | |
| Industrials — 11.2% | | | | | | | | |
| A123 Systems * (A) | | | 1,693,360 | | | | 1,727,227 | |
| Exide Technologies * | | | 1,511,883 | | | | 4,354,223 | |
| Ultralife * | | | 377,232 | | | | 1,897,477 | |
| Valence Technology * (A) | | | 2,739,475 | | | | 1,999,817 | |
| TOTAL UNITED STATES | | | | | | | 38,536,070 | |
| TOTAL COMMON STOCK | | | | | | | | |
| (Cost $101,774,403) | | | | | | | 89,549,951 | |
| | | | | | | | | |
| RIGHTS — 0.1% | | | | | | | | |
| | | | | | | | | |
| Australia — 0.1% | | | | | | | | |
| Reed Resources, Expires 05/02/2012 | | | | | | | | |
| (Cost $–) | | | 5,750,046 | | | | 29,956 | |
| | | | | | | | | |
| REPURCHASE AGREEMENT — 15.3% | | | | | | | | |
| Merrill Lynch | | | | | | | | |
0.170%, dated 04/30/12, to be repurchased on 05/01/12, repurchase price $13,760,565 (collateralized by U.S. Treasury Notes, par value $14,002,700, 0.250%-1.500%, 12/15/2014-08/31/2018, with total market value $14,035,760)(B) | | $ | 13,760,500 | | | | 13,760,500 | |
| | | | | | | | | |
| TOTAL REPURCHASE AGREEMENT | | | | | | | | |
| (Cost $13,760,500) | | | | | | | 13,760,500 | |
| | | | | | | | | |
| U.S. TREASURY OBLIGATION (C) — 5.0% | | | | | | | | |
| United States Treasury Bills | | | | | | | | |
| 0.045%, 05/10/12 | | | | | | | | |
| (Cost $4,499,949) | | | 4,500,000 | | | | 4,499,946 | |
| | | | | | | | | |
| TIME DEPOSIT — 0.0% | | | | | | | | |
| Brown Brothers Harriman, 0.030% | | | | | | | | |
| (Cost $24,151) | | | 24,151 | | | | 24,151 | |
| | | | | | | | | |
| TOTAL INVESTMENTS — 120.2% | | | | | | | | |
| (Cost $120,059,003) | | | | | | $ | 107,864,504 | |
The accompanying notes are an integral part of the financial statements.
| Schedule of Investments | April 30, 2012 (Unaudited) |
Percentages are based on Net Assets of $89,701,263.
* Non-income producing security.
ADR — American Depositary Receipt
| (A) | This security or a partial position of this security is on loan at April 30, 2012. The total value of securities on loan at April 30, 2012 was $9,517,176. |
| (B) | These securities were purchased with cash collateral held from securities on loan. The total value of such securities as of April 30, 2012 was $13,760,500. |
| (C) | The rate reported is the effective yield at time of purchase. |
The following is a summary of the inputs used as of April 30, 2012, in valuing the Fund's investments carried at value:
| Investments in Securities | | Level 1 | | | Level 2 | | | Level 3 | | | Total | |
| Common Stock | | $ | 89,549,951 | | | $ | — | | | $ | — | | | $ | 89,549,951 | |
| Rights | | | 29,956 | | | | — | | | | — | | | | 29,956 | |
| Repurchase Agreement | | | — | | | | 13,760,500 | | | | — | | | | 13,760,500 | |
| U.S. Treasury Obligation | | | — | | | | 4,499,946 | | | | — | | | | 4,499,946 | |
| Time Deposit | | | — | | | | 24,151 | | | | — | | | | 24,151 | |
| Total Investments in Securities | | $ | 89,579,907 | | | $ | 18,284,597 | | | $ | — | | | $ | 107,864,504 | |
For the period ended April 30, 2012, there have been no transfers between Level 1 & Level 2 assets and liabilities.
For the period ended April 30, 2012, there were no Level 3 assets and liabilities.
The accompanying notes are an integral part of the financial statements.
| Schedule of Investments | April 30, 2012 (Unaudited) |
| Global X Fertilizers/Potash ETF |
Sector Weightings†:

† Percentages based on total investments.
| | | Shares | | | Value | |
| COMMON STOCK — 99.7% | | | | | | | | |
| | | | | | | | | |
| AUSTRALIA—9.5% | | | | | | | | |
| | | | | | | | | |
| Basic Materials — 9.5% | | | | | | | | |
| Incitec Pivot | | | 384,314 | | | $ | 1,309,424 | |
| Nufarm | | | 261,322 | | | | 1,339,638 | |
TOTAL AUSTRALIA | | | | | | | 2,649,062 | |
| | | | | | | | | |
| CANADA—11.3% | | | | | | | | |
| Basic Materials — 11.3% | | | | | | | | |
| Agrium | | | 18,225 | | | | 1,605,446 | |
| Allana Potash * | | | 258,193 | | | | 133,298 | |
| Migao * | | | 60,026 | | | | 171,355 | |
| Potash Corp of Saskatchewan | | | 29,101 | | | | 1,237,258 | |
TOTAL CANADA | | | | | | | 3,147,357 | |
| | | | | | | | | |
| CHILE—4.7% | | | | | | | | |
| Basic Materials — 4.7% | | | | | | | | |
| Sociedad Quimica y Minera de Chile ADR | | | 22,300 | | | | 1,299,867 | |
| | | | | | | | | |
| CHINA—4.2% | | | | | | | | |
| Basic Materials — 4.2% | | | | | | | | |
| China BlueChemical | | | 1,621,814 | | | | 1,160,133 | |
| | | | | | | | | |
| GERMANY—4.2% | | | | | | | | |
| Basic Materials — 4.2% | | | | | | | | |
| K+S | | | 23,407 | | | | 1,169,792 | |
| | | | | | | | | |
| HONG KONG— 2.5% | | | | | | | | |
| Basic Materials — 2.5% | | | | | | | | |
| Sinofert Holdings | | | 3,175,654 | | | | 691,725 | |
| | | | | | | | | |
| ISRAEL—9.6% | | | | | | | | |
| Basic Materials — 9.6% | | | | | | | | |
| Israel Chemicals | | | 120,767 | | | | 1,385,464 | |
| The Israel Corp | | | 1,975 | | | | 1,290,524 | |
TOTAL ISRAEL | | | | | | | 2,675,988 | |
| | | | | | | | | |
| JAPAN—1.4% | | | | | | | | |
| Basic Materials — 1.4% | | | | | | | | |
| Nihon Nohyaku | | | 87,769 | | | | 397,951 | |
The accompanying notes are an integral part of the financial statements.
| Schedule of Investments | April 30, 2012 (Unaudited) |
| Global X Fertilizers/Potash ETF |
| | | Shares/Face
Amount | | | Value | |
| COMMON STOCK — continued | | | | | | | | |
| | | | | | | | | |
| NORWAY—5.5% | | | | | | | | |
| Basic Materials — 5.5% | | | | | | | | |
| Yara International | | | 31,355 | | | $ | 1,537,904 | |
| | | | | | | | | |
| RUSSIA—4.3% | | | | | | | | |
| Basic Materials — 4.3% | | | | | | | | |
| Uralkali GDR | | | 31,380 | | | | 1,187,733 | |
| | | | | | | | | |
| SOUTH KOREA— 1.1% | | | | | | | | |
| Basic Materials — 1.1% | | | | | | | | |
| Namhae Chemical | | | 35,947 | | | | 296,451 | |
| | | | | | | | | |
| SWITZERLAND—5.5% | | | | | | | | |
| Basic Materials — 5.5% | | | | | | | | |
| Syngenta | | | 4,328 | | | | 1,519,676 | |
| | | | | | | | | |
| TAIWAN—4.7% | | | | | | | | |
| Basic Materials — 4.7% | | | | | | | | |
| Taiwan Fertilizer | | | 546,779 | | | | 1,310,390 | |
| | | | | | | | | |
| TURKEY—2.2% | | | | | | | | |
| Basic Materials — 2.2% | | | | | | | | |
| Bagfas Bandirma Gubre Fabrik | | | 3,195 | | | | 360,205 | |
| Gubre Fabrikalari * | | | 35,913 | | | | 251,519 | |
TOTAL TURKEY | | | | | | | 611,724 | |
| | | | | | | | | |
| UNITED STATES— 29.0% | | | | | | | | |
| Basic Materials — 29.0% | | | | | | | | |
| CF Industries Holdings | | | 9,064 | | | | 1,749,896 | |
| Intrepid Potash * | | | 54,727 | | | | 1,359,966 | |
| Mosaic | | | 24,022 | | | | 1,268,842 | |
| Scotts Miracle-Gro, Cl A | | | 28,737 | | | | 1,505,819 | |
| Terra Nitrogen | | | 8,046 | | | | 2,156,328 | |
TOTAL UNITED STATES | | | | | | | 8,040,851 | |
| TOTAL COMMON STOCK | | | | | | | | |
| (Cost $29,017,287) | | | | | | | 27,696,604 | |
| | | | | | | | | |
| TIME DEPOSIT — 0.0% | | | | | | | | |
| Brown Brothers Harriman, 0.030% | | | | | | | | |
| (Cost $2,770) | | $ | 2,770 | | | | 2,770 | |
| TOTAL INVESTMENTS — 99.7% | | | | | | | | |
| (Cost $29,020,057) | | | | | | $ | 27,699,374 | |
| | | | | | | | | |
| Percentages are based on Net Assets of $27,772,782. | | | | | | | | |
The accompanying notes are an integral part of the financial statements.
| Schedule of Investments | April 30, 2012 (Unaudited) |
| Global X Fertilizers/Potash ETF |
| * | Non-income producing security. |
ADR — American Depositary Receipt
Cl — Class
GDR — Global Depositary Receipt
The following is a summary of the inputs used as of April 30, 2012, in valuing the Fund's investments carried at value:
| Investments in Securities | | Level 1 | | | Level 2 | | | Level 3 | | | Total | |
| Common Stock | | $ | 27,696,604 | | | $ | — | | | $ | — | | | $ | 27,696,604 | |
| Time Deposit | | | — | | | | 2,770 | | | | — | | | | 2,770 | |
| Total Investments in Securities | | $ | 27,696,604 | | | $ | 2,770 | | | $ | — | | | $ | 27,699,374 | |
For the period ended April 30, 2012, there have been no transfers between Level 1 & Level 2 assets and liabilities.
For the period ended April 30, 2012, there were no Level 3 assets and liabilities.
The accompanying notes are an integral part of the financial statements.
| Schedule of Investments | April 30, 2012 (Unaudited) |
| Global X S&P/TSX Venture 30 Canada ETF |
Sector Weightings†:
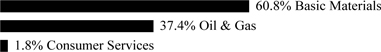
† Percentages based on total investments.
| | | Shares | | | Value | |
| COMMON STOCK — 100.0% | | | | | | | | |
| CANADA—100.0% | | | | | | | | |
| Basic Materials — 60.8% | | | | | | | | |
| Atac Resources * | | | 38,507 | | | $ | 106,417 | |
| Aurcana * | | | 66,801 | | | | 71,004 | |
| Barisan Gold * | | | 4,920 | | | | 921 | |
| Bear Creek Mining * | | | 24,722 | | | | 83,837 | |
| Belo Sun Mining * | | | 58,995 | | | | 66,887 | |
| Canaco Resources * | | | 122,734 | | | | 115,546 | |
| CB Gold * | | | 63,722 | | | | 63,216 | |
| Copper Fox Metals * | | | 42,805 | | | | 45,065 | |
| Galway Resources * | | | 39,694 | | | | 49,826 | |
| Gold Canyon Resources * | | | 23,579 | | | | 39,861 | |
| Hana Mining * | | | 33,107 | | | | 46,250 | |
| Kaminak Gold, Cl A * | | | 36,553 | | | | 65,495 | |
| Lumina Copper * | | | 4,942 | | | | 66,537 | |
| PMI Gold * | | | 61,079 | | | | 56,884 | |
| Quest Rare Minerals * | | | 21,238 | | | | 42,354 | |
| Rio Alto Mining * | | | 59,592 | | | | 253,968 | |
| Roxgold * | | | 39,304 | | | | 40,981 | |
| Sandstorm Gold * | | | 89,525 | | | | 163,127 | |
| Trelawney Mining and Exploration * | | | 60,712 | | | | 200,970 | |
| | | | | | | | 1,579,146 | |
| Consumer Services — 1.8% | | | | | | | | |
| Intertainment Media * | | | 93,942 | | | | 46,598 | |
| Oil & Gas — 37.4% | | | | | | | | |
| Africa Oil * | | | 40,797 | | | | 225,491 | |
| Americas Petrogas * | | | 36,391 | | | | 100,569 | |
| Arcan Resources * | | | 28,765 | | | | 103,663 | |
| CGX Energy * | | | 55,325 | | | | 45,364 | |
| Madalena Ventures * | | | 54,857 | | | | 29,432 | |
| Painted Pony Petroleum, Cl A * | | | 24,401 | | | | 196,868 | |
| Petrofrontier * | | | 28,135 | | | | 41,298 | |
| Pinecrest Energy * | | | 62,042 | | | | 164,549 | |
The accompanying notes are an integral part of the financial statements.
| Schedule of Investments | April 30, 2012 (Unaudited) |
| Global X S&P/TSX Venture 30 Canada ETF |
| | | Shares | | | Value | |
| COMMON STOCK — continued | | | | | | | | |
| Oil & Gas — continued | | | | | | | | |
| Renegade Petroleum * | | | 17,612 | | | $ | 63,826 | |
| | | | | | | | 971,060 | |
TOTAL CANADA | | | | | | | 2,596,804 | |
| TOTAL COMMON STOCK | | | | | | | | |
| (Cost $3,073,612) | | | | | | | 2,596,804 | |
| TOTAL INVESTMENTS — 100.0% | | | | | | | | |
| (Cost $3,073,612) | | | | | | $ | 2,596,804 | |
Percentages are based on Net Assets of $2,595,788.
* Non-income producing security.
Cl — Class
The following is a summary of the inputs used as of April 30, 2012, in valuing the Fund's investments carried at value:
| Investments in Securities | | Level 1 | | | Level 2 | | | Level 3 | | | Total | |
| Common Stock | | $ | 2,596,804 | | | $ | — | | | $ | — | | | $ | 2,596,804 | |
| Total Investments in Securities | | $ | 2,596,804 | | | $ | — | | | $ | — | | | $ | 2,596,804 | |
For the period ended April 30, 2012, there have been no transfers between Level 1 & Level 2 assets and liabilities.
For the period ended April 30, 2012, there were no Level 3 assets and liabilities.
The accompanying notes are an integral part of the financial statements.
| Statements of Assets and Liabilities |
| April 30, 2012 (Unaudited) |
| | | Global X Silver
Miners ETF | | | Global X Gold
Explorers ETF | | | Global X Pure
Gold Miners ETF | |
| Assets: | | | | | | | | | | | | |
| Cost of Investments | | $ | 360,211,593 | | | $ | 42,897,837 | | | $ | 5,602,782 | |
| Cost of Repurchase Agreement | | | 12,775,653 | | | | — | | | | — | |
| Cost of Foreign Currency | | | 15,029 | | | | 608 | | | | 2,107 | |
| Market Value of Securities on Loan | | | 12,244,009 | | | | — | | | | — | |
| Investments at Value | | $ | 315,999,984 | | | $ | 29,444,484 | | | $ | 4,654,507 | |
| Repurchase Agreement | | | 12,775,653 | | | | — | | | | — | |
| Foreign Currency at Value | | | 15,113 | | | | 611 | | | | 2,115 | |
| Receivable for Investment Securities Sold | | | 31,215,006 | | | | — | | | | — | |
| Receivable for Capital Shares Sold | | | 7,399,000 | | | | 1,374,500 | | | | — | |
| Dividend and Interest Receivable | | | 617,774 | | | | — | | | | — | |
| Total Assets | | | 368,022,530 | | | | 30,819,595 | | | | 4,656,622 | |
| | | | | | | | | | | | | |
| Liabilities: | | | | | | | | | | | | |
| Payable for Investment Securities Purchased | | | 38,906,080 | | | | 1,392,331 | | | | — | |
| Obligation to Return Securities Lending Collateral | | | 12,775,653 | | | | — | | | | — | |
| Payable for Capital Shares Redeemed | | | 2,131,000 | | | | — | | | | — | |
| Payable due to Investment Adviser | | | 162,369 | | | | 14,258 | | | | 2,223 | |
| | | | | | | | | | | | | |
| Total Liabilities | | | 53,975,102 | | | | 1,406,589 | | | | 2,223 | |
| | | | | | | | | | | | | |
| Net Assets | | $ | 314,047,428 | | | $ | 29,413,006 | | | $ | 4,654,399 | |
| | | | | | | | | | | | | |
| Net Assets Consist of: | | | | | | | | | | | | |
| | | | | | | | | | | | | |
| Paid-in Capital | | $ | 381,148,094 | | | $ | 45,101,605 | | | $ | 5,885,500 | |
| Undistributed (Distributions in Excess of) Net Investment Income | | | 351,177 | | | | (729,890 | ) | | | (86,108 | ) |
| Accumulated Net Realized Loss on Investments and Foreign Currency Translations | | | (23,230,034 | ) | | | (1,505,308 | ) | | | (196,727 | ) |
| Net Unrealized Depreciation on Investments | | | (44,211,609 | ) | | | (13,453,353 | ) | | | (948,275 | ) |
| Net Unrealized Appreciation (Depreciation) on Foreign Currency Translations | | | (10,200 | ) | | | (48 | ) | | | 9 | |
| | | | | | | | | | | | | |
| Net Assets | | $ | 314,047,428 | | | $ | 29,413,006 | | | $ | 4,654,399 | |
| Outstanding Shares of Beneficial Interest (unlimited authorization — no par value) | | | 14,700,000 | | | | 3,100,000 | | | | 400,000 | |
| | | | | | | | | | | | | |
| Net Asset Value, Offering and Redemption Price Per Share | | $ | 21.36 | | | $ | 9.49 | | | $ | 11.64 | |
The accompanying notes are an integral part of the financial statements.
| Statements of Assets and Liabilities |
| April 30, 2012 (Unaudited) |
| | | Global X Copper
Miners ETF | | | Global X
Aluminum ETF | | | Global X Uranium
ETF | |
| Assets: | | | | | | | | | | | | |
| Cost of Investments | | $ | 37,939,170 | | | $ | 3,705,561 | | | $ | 294,070,917 | |
| Cost of Repurchase Agreement | | | 637,125 | | | | — | | | | 43,678,823 | |
| Cost of Foreign Currency | | | 31,025 | | | | — | | | | 136,219 | |
| Market Value of Securities on Loan | | | 590,625 | | | | — | | | | 36,433,234 | |
| Investments at Value | | $ | 32,821,176 | | | $ | 2,562,998 | | | $ | 182,592,898 | |
| Repurchase Agreement | | | 637,125 | | | | — | | | | 43,678,823 | |
| Foreign Currency at Value | | | 32,433 | | | | — | | | | 137,681 | |
| Receivable for Investment Securities Sold | | | 4,270,984 | | | | — | | | | 3,135,703 | |
| Dividend and Interest Receivable | | | 48,687 | | | | 7,594 | | | | 94,198 | |
| Reclaim Receivable | | | 11,938 | | | | — | | | | — | |
| Total Assets | | | 37,822,343 | | | | 2,570,592 | | | | 229,639,303 | |
| | | | | | | | | | | | | |
| Liabilities: | | | | | | | | | | | | |
| | | | | | | | | | | | | |
| Payable for Investment Securities Purchased | | | 3,641,493 | | | | — | | | | — | |
| Obligation to Return Securities Lending Collateral | | | 637,125 | | | | — | | | | 43,678,823 | |
| Payable for Capital Shares Redeemed | | | 684,500 | | | | — | | | | — | |
| Payable due to Investment Adviser | | | 17,692 | | | | 1,490 | | | | 98,567 | |
| Due to Custodian | | | — | | | | — | | | | 11,999,850 | |
| Overdraft of Foreign Currency* | | | — | | | | 9,484 | | | | — | |
| | | | | | | | | | | | | |
| Total Liabilities | | | 4,980,810 | | | | 10,974 | | | | 55,777,240 | |
| | | | | | | | | | | | | |
| Net Assets | | $ | 32,841,533 | | | $ | 2,559,618 | | | $ | 173,862,063 | |
| | | | | | | | | | | | | |
| *Proceeds of Foreign Currency | | $ | — | | | $ | 9,485 | | | $ | — | |
| | | | | | | | | | | | | |
| Net Assets Consist of: | | | | | | | | | | | | |
| | | | | | | | | | | | | |
| Paid-in Capital | | $ | 41,448,377 | | | $ | 4,242,676 | | | $ | 342,746,555 | |
| Undistributed (Distributions in Excess of) Net Investment Income/(Accumulated Net Investment Loss) | | | (320,475 | ) | | | 24,720 | | | | (335,214 | ) |
| Accumulated Net Realized Loss on Investments and Foreign Currency Translations | | | (3,167,153 | ) | | | (565,470 | ) | | | (57,078,186 | ) |
| Net Unrealized Depreciation on Investments | | | (5,117,994 | ) | | | (1,142,563 | ) | | | (111,478,019 | ) |
| Net Unrealized Appreciation (Depreciation) on Foreign Currency Translations | | | (1,222 | ) | | | 255 | | | | 6,927 | |
| Net Assets | | $ | 32,841,533 | | | $ | 2,559,618 | | | $ | 173,862,063 | |
| | | | | | | | | | | | | |
| Outstanding Shares of Beneficial Interest (unlimited authorization — no par value) | | | 2,400,000 | | | | 250,000 | | | | 19,450,000 | |
| | | | | | | | | | | | | |
| Net Asset Value, Offering and Redemption Price Per Share | | $ | 13.68 | | | $ | 10.24 | | | $ | 8.94 | |
The accompanying notes are an integral part of the financial statements.
| Statements of Assets and Liabilities |
| April 30, 2012 (Unaudited) |
| | | Global X Lithium
ETF | | | Global X
Fertilizers/Potash
ETF | | | Global X S&P/TSX
Venture 30 Canada
ETF | |
| Assets: | | | | | | | | | | | | |
| Cost of Investments | | $ | 106,298,503 | | | $ | 29,020,057 | | | $ | 3,073,612 | |
| Cost of Repurchase Agreement | | | 13,760,500 | | | | — | | | | — | |
| Cost of Foreign Currency | | | 23,148 | | | | 57,344 | | | | 1,733 | |
| Market Value of Securities on Loan | | | 9,517,176 | | | | — | | | | — | |
| Investments at Value | | $ | 94,104,004 | | | $ | 27,699,374 | | | $ | 2,596,804 | |
| Repurchase Agreement | | | 13,760,500 | | | | — | | | | — | |
| Foreign Currency at Value | | | 23,513 | | | | 57,303 | | | | 1,755 | |
| Dividend and Interest Receivable | | | 130,373 | | | | 57,215 | | | | — | |
| Reclaim Receivable | | | — | | | | 7,630 | | | | — | |
| Total Assets | | | 108,018,390 | | | | 27,821,522 | | | | 2,598,559 | |
| | | | | | | | | | | | | |
| Liabilities: | | | | | | | | | | | | |
| | | | | | | | | | | | | |
| Payable for Investment Securities Purchased | | | — | | | | 33,141 | | | | — | |
| Obligation to Return Securities Lending Collateral | | | 13,760,500 | | | | — | | | | — | |
| Payable due to Investment Adviser | | | 56,683 | | | | 15,599 | | | | 1,573 | |
| Due to Custodian | | | 4,499,944 | | | | — | | | | 1,198 | |
| Total Liabilities | | | 18,317,127 | | | | 48,740 | | | | 2,771 | |
| | | | | | | | | | | | | |
| Net Assets | | $ | 89,701,263 | | | $ | 27,772,782 | | | $ | 2,595,788 | |
| | | | | | | | | | | | | |
| Net Assets Consist of: | | | | | | | | | | | | |
| | | | | | | | | | | | | |
| Paid-in Capital | | $ | 124,236,582 | | | $ | 31,750,000 | | | $ | 4,112,312 | |
| Undistributed (Distributions in Excess of) Net Investment Income | | | (7,940 | ) | | | 31,492 | | | | (102,641 | ) |
| Accumulated Net Realized Loss on Investments and Foreign Currency Translations | | | (22,335,844 | ) | | | (2,688,218 | ) | | | (937,096 | ) |
| Net Unrealized Depreciation on Investments | | | (12,194,499 | ) | | | (1,320,683 | ) | | | (476,808 | ) |
| Net Unrealized Appreciation on Foreign Currency Translations | | | 2,964 | | | | 191 | | | | 21 | |
| | | | | | | | | | | | | |
| Net Assets | | $ | 89,701,263 | | | $ | 27,772,782 | | | $ | 2,595,788 | |
| Outstanding Shares of Beneficial Interest (unlimited authorization — no par value) | | | 5,600,000 | | | | 2,000,000 | | | | 250,000 | |
| | | | | | | | | | | | | |
| Net Asset Value, Offering and Redemption Price Per Share | | $ | 16.02 | | | $ | 13.89 | | | $ | 10.38 | |
The accompanying notes are an integral part of the financial statements.
| Statements of Operations |
| For the six months ended April 30, 2012 (Unaudited) |
| | | Global X Silver
Miners ETF | | | Global X Gold
Explorers ETF | | | Global X Pure
Gold Miners
ETF | | | Global X
Copper Miners
ETF | | | Global X
Aluminum
ETF | |
| Investment Income: | | | | | | | | | | | | | | | | | | | | |
| Dividend Income | | $ | 2,155,670 | | | $ | 1 | | | $ | 15,949 | | | $ | 279,144 | | | $ | 47,501 | |
| Interest Income | | | — | | | | 5 | | | | 9 | | | | — | | | | 8 | |
| Security Lending Income | | | 111,103 | | | | — | | | | — | | | | 8,217 | | | | — | |
| Less: Foreign Taxes Withheld | | | (192,346 | ) | | | — | | | | (1,799 | ) | | | (11,239 | ) | | | (1,383 | ) |
| Total Investment Income | | | 2,074,427 | | | | 6 | | | | 14,159 | | | | 276,122 | | | | 46,126 | |
| Supervision and Administration Fees(1) | | | 1,097,319 | | | | 85,922 | | | | 14,576 | | | | 126,013 | | | | 10,272 | |
| Total Expenses | | | 1,097,319 | | | | 85,922 | | | | 14,576 | | | | 126,013 | | | | 10,272 | |
| Net Expenses | | | 1,097,319 | | | | 85,922 | | | | 14,576 | | | | 126,013 | | | | 10,272 | |
| Net Investment Income (Loss) | | | 977,108 | | | | (85,916 | ) | | | (417 | ) | | | 150,109 | | | | 35,854 | |
| | | | | | | | | | | | | | | | | | | | | |
| Net Realized Gain (Loss) on: | | | | | | | | | | | | | | | | | | | | |
| Investments | | | (8,208,764 | )(2) | | | (1,259,801 | )(2) | | | (194,128 | )(2) | | | (2,823,997 | )(2) | | | (525,830 | )(2) |
| Foreign Currency Transactions | | | (48,784 | ) | | | (4,878 | ) | | | (184 | ) | | | 12,238 | | | | (872 | ) |
| Net Realized Loss on Investments | | | (8,257,548 | ) | | | (1,264,679 | ) | | | (194,312 | ) | | | (2,811,759 | ) | | | (526,702 | ) |
| | | | | | | | | | | | | | | | | | | | | |
| Net Change in Unrealized Appreciation (Depreciation) on: | | | | | | | | | | | | | | | | | | | | |
| Investments | | | (26,401,455 | ) | | | (6,956,893 | ) | | | (833,992 | ) | | | 1,627,730 | | | | 382,305 | |
| Foreign Currency Transactions | | | 49,635 | | | | (50 | ) | | | (88 | ) | | | (4,803 | ) | | | 292 | |
| | | | | | | | | | | | | | | | | | | | | |
| Net Change in Unrealized Appreciation (Depreciation) on Investments | | | (26,351,820 | ) | | | (6,956,943 | ) | | | (834,080 | ) | | | 1,622,927 | | | | 382,597 | |
| | | | | | | | | | | | | | | | | | | | | |
| Net Realized and Unrealized Loss on Investments | | | (34,609,368 | ) | | | (8,221,622 | ) | | | (1,028,392 | ) | | | (1,188,832 | ) | | | (144,105 | ) |
| | | | | | | | | | | | | | | | | | | | | |
| Net Decrease in Net Assets Resulting from Operations | | $ | (33,632,260 | ) | | $ | (8,307,538 | ) | | $ | (1,028,809 | ) | | $ | (1,038,723 | ) | | $ | (108,251 | ) |
| (1) | The Supervision and Administration fees reflect the supervisory and administrative fee, which includes fees paid by the Funds for the investment advisory services provided by the Adviser. (See Note 3 in Notes to Financial Statements.) |
| (2) | Includes realized gain/(loss) as a result of in-kind transactions. (See Note 4 in Notes to Financial Statements.) |
The accompanying notes are an integral part of the financial statements.
| Statements of Operations |
| For the six months ended April 30, 2012 (Unaudited) |
| | | Global X
Uranium ETF | | | Global X
Lithium ETF | | | Global X
Fertilizers/Potash
ETF | | | Global X
S&P/TSX
Venture 30
Canada ETF | |
| Investment Income: | | | | | | | | | | | | | | | | |
| Dividend Income | | $ | 358,513 | | | $ | 378,285 | | | $ | 235,797 | | | $ | — | |
| Security Lending Income | | | 386,119 | | | | 202,495 | | | | — | | | | — | |
| Less: Foreign Taxes Withheld | | | (54,380 | ) | | | (42,360 | ) | | | (21,935 | ) | | | — | |
| Total Investment Income | | | 690,252 | | | | 538,420 | | | | 213,862 | | | | — | |
| Supervision and Administration Fees(1) | | | 631,624 | | | | 361,642 | | | | 96,976 | | | | 10,312 | |
| Total Expenses | | | 631,624 | | | | 361,642 | | | | 96,976 | | | | 10,312 | |
| Net Expenses | | | 631,624 | | | | 361,642 | | | | 96,976 | | | | 10,312 | |
| Net Investment Income (Loss) | | | 58,628 | | | | 176,778 | | | | 116,886 | | | | (10,312 | ) |
| Net Realized Gain (Loss) on: | | | | | | | | | | | | | | | | |
| Investments | | | (33,704,779 | )(2) | | | (14,807,829 | )(2) | | | (2,713,618 | )(2) | | | (426,176 | ) |
| Foreign Currency Transactions | | | 238,587 | | | | (20,243 | ) | | | 7,516 | | | | 562 | |
| Net Realized Loss on Investments | | | (33,466,192 | ) | | | (14,828,072 | ) | | | (2,706,102 | ) | | | (425,614 | ) |
| Net Change in Unrealized Appreciation on: | | | | | | | | | | | | | | | | |
| Investments | | | 10,885,128 | | | | 14,788,075 | | | | 1,574,877 | | | | 221,774 | |
| Foreign Currency Transactions | | | 11,003 | | | | 3,273 | | | | 78 | | | | 21 | |
| Net Change in Unrealized Appreciation on Investments | | | 10,896,131 | | | | 14,791,348 | | | | 1,574,955 | | | | 221,795 | |
| Net Realized and Unrealized Loss on Investments | | | (22,570,061 | ) | | | (36,724 | ) | | | (1,131,147 | ) | | | (203,819 | ) |
| Net Increase (Decrease) in Net Assets Resulting from Operations | | $ | (22,511,433 | ) | | $ | 140,054 | | | $ | (1,014,261 | ) | | $ | (214,131 | ) |
| (1) | The Supervision and Administration fees reflect the supervisory and administrative fee, which includes fees paid by the Funds for the investment advisory services provided by the Adviser. (See Note 3 in Notes to Financial Statements.) |
| (2) | Includes realized loss as a result of in-kind transactions. (See Note 4 in Notes to Financial Statements.) |
The accompanying notes are an integral part of the financial statements.
| Statements of Changes in Net Assets |
| |
| | | Global X Silver Miners ETF | | | Global X Gold Explorers ETF | |
| | | Period Ended April 30, 2012
(Unaudited) | | | Year Ended October 31, 2011
(Audited) | | | Period Ended April 30, 2012
(Unaudited) | | | Period Ended October 31, 2011(1) (Audited) | |
| Operations: | | | | | | | | | | | | | | | | |
| Net Investment Income (Loss) | | $ | 977,108 | | | $ | 697,307 | | | $ | (85,916 | ) | | $ | (150,769 | ) |
| Net Realized Gain (Loss) on Investments and Foreign Currency Transactions | | | (8,257,548 | )(2) | | | 49,906,688 | (2) | | | (1,264,679 | )(2) | | | 596,087 | (2) |
| Net Change in Unrealized Depreciation on Investments and Foreign Currency Transactions | | | (26,351,820 | ) | | | (47,167,356 | ) | | | (6,956,943 | ) | | | (6,496,458 | ) |
| Net Increase (Decrease) in Net Assets Resulting from Operations | | | (33,632,260 | ) | | | 3,436,639 | | | | (8,307,538 | ) | | | (6,051,140 | ) |
| Dividends and Distributions: | | | | | | | | | | | | | | | | |
| Net Investment Income | | | (528,916 | ) | | | (3,208,369 | ) | | | (545,816 | ) | | | — | |
| Total Dividends and Distributions | | | (528,916 | ) | | | (3,208,369 | ) | | | (545,816 | ) | | | — | |
| Capital Share Transactions: | | | | | | | | | | | | | | | | |
| Issued | | | 26,016,500 | | | | 449,418,000 | | | | 10,874,500 | | | | 41,769,000 | |
| Redeemed | | | (40,913,500 | ) | | | (258,212,500 | ) | | | — | | | | (8,326,000 | ) |
| Increase (Decrease) in Net Assets from Capital Share Transactions | | | (14,897,000 | ) | | | 191,205,500 | | | | 10,874,500 | | | | 33,443,000 | |
| Total Increase (Decrease) in Net Assets | | | (49,058,176 | ) | | | 191,433,770 | | | | 2,021,146 | | | | 27,391,860 | |
| Net Assets: | | | | | | | | | | | | | | | | |
| Beginning of Period | | | 363,105,604 | | | | 171,671,834 | | | | 27,391,860 | | | | — | |
| End of Period | | $ | 314,047,428 | | | $ | 363,105,604 | | | $ | 29,413,006 | | | $ | 27,391,860 | |
| Undistributed (Distributions in Excess of) Net Investment Income/(Accumulated Net Investment Loss) | | $ | 351,177 | | | $ | (97,015 | ) | | $ | (729,890 | ) | | $ | (98,158 | ) |
| | | | | | | | | | | | | | | | | |
| Share Transactions: | | | | | | | | | | | | | | | | |
| Issued | | | 1,200,000 | | | | 17,400,000 | | | | 1,050,000 | | | | 2,550,000 | |
| Redeemed | | | (1,850,000 | ) | | | (10,550,000 | ) | | | — | | | | (500,000 | ) |
| Net Increase (Decrease) in Shares Outstanding from Share Transactions | | | (650,000 | ) | | | 6,850,000 | | | | 1,050,000 | | | | 2,050,000 | |
| (1) | Commenced operations on November 3, 2010. |
| (2) | Includes realized gain/(loss) as a result of in-kind transactions. (See Note 4 in Notes to Financial Statements.) |
The accompanying notes are an integral part of the financial statements.
| Statements of Changes in Net Assets |
| |
| | | Global X Pure Gold Miners ETF | | | Global X Copper Miners ETF | |
| | | Period Ended April 30, 2012
(Unaudited) | | | Period Ended October 31, 2011(1) (Audited) | | | Period Ended
April 30, 2012
(Unaudited) | | | Year Ended
October 31,
2011
(Audited) | |
| Operations: | | | | | | | | | | | | | | | | |
| Net Investment Income (Loss) | | $ | (417 | ) | | $ | 2,200 | | | $ | 150,109 | | | $ | 1,506,098 | |
| Net Realized Loss on Investments and Foreign Currency Transactions | | | (194,312 | )(2) | | | (3,528 | ) | | | (2,811,759 | )(2) | | | (8,078,425 | )(2) |
| Net Change in Unrealized Appreciation (Depreciation) on Investments and Foreign Currency Transactions | | | (834,080 | ) | | | (114,186 | ) | | | 1,622,927 | | | | (7,506,184 | ) |
| Net Decrease in Net Assets Resulting from Operations | | | (1,028,809 | ) | | | (115,514 | ) | | | (1,038,723 | ) | | | (14,078,511 | ) |
| Dividends and Distributions: | | | | | | | | | | | | | | | | |
| Net Investment Income | | | (86,778 | ) | | | — | | | | (1,669,576 | ) | | | (388,853 | ) |
| Net Realized Gains | | | — | | | | — | | | | (1,004,381 | ) | | | — | |
| Total Dividends and Distributions | | | (86,778 | ) | | | — | | | | (2,673,957 | ) | | | (388,853 | ) |
| Capital Share Transactions: | | | | | | | | | | | | | | | | |
| Issued | | | 636,000 | | | | 5,249,500 | | | | 1,521,000 | | | | 116,788,000 | |
| Redeemed | | | — | | | | — | | | | (10,484,000 | ) | | | (86,732,000 | ) |
| Increase (Decrease) in Net Assets from Capital Share Transactions | | | 636,000 | | | | 5,249,500 | | | | (8,963,000 | ) | | | 30,056,000 | |
| Total Increase (Decrease) in Net Assets | | | (479,587 | ) | | | 5,133,986 | | | | (12,675,680 | ) | | | 15,588,636 | |
| Net Assets: | | | | | | | | | | | | | | | | |
| Beginning of Period | | | 5,133,986 | | | | — | | | | 45,517,213 | | | | 29,928,577 | |
| End of Period | | $ | 4,654,399 | | | $ | 5,133,986 | | | $ | 32,841,533 | | | $ | 45,517,213 | |
| Undistributed (Distributions in Excess of) Net Investment Income | | $ | (86,108 | ) | | $ | 1,087 | | | $ | (320,475 | ) | | $ | 1,198,992 | |
| | | | | | | | | | | | | | | | | |
| Share Transactions: | | | | | | | | | | | | | | | | |
| Issued | | | 50,000 | | | | 350,000 | | | | 100,000 | | | | 6,150,000 | |
| Redeemed | | | — | | | | — | | | | (750,000 | ) | | | (4,900,000 | ) |
| Net Increase (Decrease) in Shares Outstanding from Share Transactions | | | 50,000 | | | | 350,000 | | | | (650,000 | ) | | | 1,250,000 | |
| (1) | Commenced operations on March 14, 2011. |
| (2) | Includes realized loss as a result of in-kind transactions. (See Note 4 in Notes to Financial Statements.) |
The accompanying notes are an integral part of the financial statements.
| Statements of Changes in Net Assets |
| |
| | | Global X Aluminum ETF | | | Global X Uranium ETF | |
| | | Period Ended
April 30, 2012
(Unaudited) | | | Period Ended October 31, 2011(1) (Audited) | | | Period Ended
April 30, 2012
(Unaudited) | | | Period Ended October 31, 2011(2) (Audited) | |
| Operations: | | | | | | | | | | | | | | | | |
| Net Investment Income | | $ | 35,854 | | | $ | 30,803 | | | $ | 58,628 | | | $ | 2,123,060 | |
| Net Realized Loss on Investments and Foreign Currency Transactions | | | (526,702 | )(3) | | | (110,145 | )(3) | | | (33,466,192 | )(3) | | | (19,773,756 | )(3) |
| Net Change in Unrealized Appreciation (Depreciation) on Investments and Foreign Currency Transactions | | | 382,597 | | | | (1,524,905 | ) | | | 10,896,131 | | | | (122,367,223 | ) |
| Net Decrease in Net Assets Resulting from Operations | | | (108,251 | ) | | | (1,604,247 | ) | | | (22,511,433 | ) | | | (140,017,919 | ) |
| Dividends and Distributions: | | | | | | | | | | | | | | | | |
| Net Investment Income | | | (31,384 | ) | | | — | | | | — | | | | (2,682,085 | ) |
| Total Dividends and Distributions | | | (31,384 | ) | | | — | | | | — | | | | (2,682,085 | ) |
| Capital Share Transactions: | | | | | | | | | | | | | | | | |
| Issued | | | — | | | | 5,989,000 | | | | 11,519,000 | | | | 406,784,000 | |
| Redeemed | | | (1,023,500 | ) | | | (662,000 | ) | | | (14,494,500 | ) | | | (64,735,000 | ) |
| Increase (Decrease) in Net Assets from Capital Share Transactions | | | (1,023,500 | ) | | | 5,327,000 | | | | (2,975,500 | ) | | | 342,049,000 | |
| Total Increase (Decrease) in Net Assets | | | (1,163,135 | ) | | | 3,722,753 | | | | (25,486,933 | ) | | | 199,348,996 | |
| Net Assets: | | | | | | | | | | | | | | | | |
| Beginning of Period | | | 3,722,753 | | | | — | | | | 199,348,996 | | | | — | |
| End of Period | | $ | 2,559,618 | | | $ | 3,722,753 | | | $ | 173,862,063 | | | $ | 199,348,996 | |
| Undistributed (Distributions in Excess of) Net Investment Income/(Accumulated Net Investment Loss) | | $ | 24,720 | | | $ | 20,250 | | | $ | (335,214 | ) | | $ | (393,842 | ) |
| | | | | | | | | | | | | | | | | |
| Share Transactions: | | | | | | | | | | | | | | | | |
| Issued | | | — | | | | 400,000 | | | | 1,150,000 | | | | 23,900,000 | |
| Redeemed | | | (100,000 | ) | | | (50,000 | ) | | | (1,450,000 | ) | | | (4,150,000 | ) |
| Net Increase (Decrease) in Shares Outstanding from Share Transactions | | | (100,000 | ) | | | 350,000 | | | | (300,000 | ) | | | 19,750,000 | |
| (1) | Commenced operations on January 4, 2011. |
| (2) | Commenced operations on November 4, 2010. |
| (3) | Includes realized gain/(loss) as a result of in-kind transactions. See Note 4 in Notes to Financial Statements.) |
The accompanying notes are an integral part of the financial statements.
| Statements of Changes in Net Assets |
| |
| | | Global X Lithium ETF | | | Global X Fertilizers/Potash ETF | |
| | | Period Ended
April 30, 2012
(Unaudited) | | | Year Ended
October 31, 2011
(Audited) | | | Period Ended
April 30, 2012
(Unaudited) | | | Period Ended October 31, 2011(1) (Audited) | |
| Operations: | | | | | | | | | | | | | | | | |
| Net Investment Income (Loss) | | $ | 176,778 | | | $ | (324,650 | ) | | $ | 116,886 | | | $ | 91,659 | |
| Net Realized Gain (Loss) on Investments and Foreign Currency Transactions | | | (14,828,072 | )(2) | | | (1,456,429 | )(2) | | | (2,706,102 | )(2) | | | 59,099 | |
| Net Change in Unrealized Appreciation (Depreciation) on Investments and Foreign Currency Transactions | | | 14,791,348 | | | | (34,183,005 | ) | | | 1,574,955 | | | | (2,895,447 | ) |
| Net Increase (Decrease) in Net Assets Resulting from Operations | | | 140,054 | | | | (35,964,084 | ) | | | (1,014,261 | ) | | | (2,744,689 | ) |
| Dividends and Distributions: | | | | | | | | | | | | | | | | |
| Net Investment Income | | | (114,415 | ) | | | (1,533,031 | ) | | | (185,936 | ) | | | — | |
| Net Realized Gains | | | — | | | | (105,326 | ) | | | (32,332 | ) | | | — | |
| Total Dividends and Distributions | | | (114,415 | ) | | | (1,638,357 | ) | | | (218,268 | ) | | | — | |
| Capital Share Transactions: | | | | | | | | | | | | | | | | |
| Issued | | | 11,963,500 | | | | 140,851,000 | | | | 2,052,500 | | | | 37,904,500 | |
| Redeemed | | | (29,588,500 | ) | | | (74,264,500 | ) | | | (8,207,000 | ) | | | — | |
| Increase (Decrease) in Net Assets from Capital Share Transactions | | | (17,625,000 | ) | | | 66,586,500 | | | | (6,154,500 | ) | | | 37,904,500 | |
| Total Increase (Decrease) in Net Assets | | | (17,599,361 | ) | | | 28,984,059 | | | | (7,387,029 | ) | | | 35,159,811 | |
| Net Assets: | | | | | | | | | | | | | | | | |
| Beginning of Period | | | 107,300,624 | | | | 78,316,565 | | | | 35,159,811 | | | | — | |
| End of Period | | $ | 89,701,263 | | | $ | 107,300,624 | | | $ | 27,772,782 | | | $ | 35,159,811 | |
| Undistributed (Distributions in Excess of) Net Investment Income | | $ | (7,940 | ) | | $ | (70,303 | ) | | $ | 31,492 | | | $ | 100,542 | |
| | | | | | | | | | | | | | | | | |
| Share Transactions: | | | | | | | | | | | | | | | | |
| Issued | | | 750,000 | | | | 6,550,000 | | | | 150,000 | | | | 2,500,000 | |
| Redeemed | | | (1,900,000 | ) | | | (3,750,000 | ) | | | (650,000 | ) | | | — | |
| Net Increase (Decrease) in Shares Outstanding from Share Transactions | | | (1,150,000 | ) | | | 2,800,000 | | | | (500,000 | ) | | | 2,500,000 | |
| (1) | Commenced operations on May 25, 2011. |
| (2) | Includes realized gain/(loss) as a result of in-kind transactions. See Note 4 in Notes to Financial Statements.) |
The accompanying notes are an integral part of the financial statements.
| Statements of Changes in Net Assets |
| |
| | Global X S&P/TSX Venture 30
Canada ETF | |
| | | Period Ended
April 30, 2012
(Unaudited) | | | Period Ended October 31, 2011(1) (Audited) | |
| Operations: | | | | | | | | |
| Net Investment Loss | | $ | (10,312 | ) | | $ | (16,092 | ) |
| Net Realized Loss on Investments and Foreign Currency Transactions | | | (425,614 | ) | | | (403,595 | )(2) |
| Net Change in Unrealized Appreciation (Depreciation) on Investments and Foreign Currency Transactions | | | 221,795 | | | | (698,582 | ) |
| Net Decrease in Net Assets Resulting from Operations | | | (214,131 | ) | | | (1,118,269 | ) |
| Dividends and Distributions: | | | | | | | | |
| Net Investment Income | | | (71,812 | ) | | | — | |
| Total Dividends and Distributions | | | (71,812 | ) | | | — | |
| Capital Share Transactions: | | | | | | | | |
| Issued | | | — | | | | 6,060,000 | |
| Redeemed | | | — | | | | (2,060,000 | ) |
| Increase in Net Assets from Capital Share Transactions | | | — | | | | 4,000,000 | |
| Total Increase (Decrease) in Net Assets | | | (285,943 | ) | | | 2,881,731 | |
| Net Assets: | | | | | | | | |
| Beginning of Period | | | 2,881,731 | | | | — | |
| End of Period | | $ | 2,595,788 | | | $ | 2,881,731 | |
| Distributions in Excess of Net Investment Income/(Accumulated Net Investment Loss) | | $ | (102,641 | ) | | $ | (20,517 | ) |
| | | | | | | | | |
| Share Transactions: | | | | | | | | |
| Issued | | | — | | | | 400,000 | |
| Redeemed | | | — | | | | (150,000 | ) |
| Net Increase in Shares Outstanding from Share Transactions | | | — | | | | 250,000 | |
| (1) | Commenced operations on March 16, 2011. |
| (2) | Includes realized gain as a result of in-kind transactions. |
The accompanying notes are an integral part of the financial statements.
Selected Per Share Data & Ratios
For a Share Outstanding Throughout the Period
| | | Net Asset Value, Beginning of Period ($) | | | Net Investment Income (Loss) ($)* | | | Net Realized and Unrealized Gain (Loss) on Investments ($) | | | Total from Operations ($) | | | Distribution from Net Investment Income ($) | | | Distribution from Capital Gains ($) | | | Total from Distributions ($) | | | Net Asset Value, End of Period ($) | | | Total Return (%)** | | | Net Assets End of Period ($)(000) | | | Ratio of Expenses to Average Net Assets (%) | | | Ratio of Net Investment Income (Loss) to Average Net Assets (%) | | | Portfolio Turnover (%) | |
| Global X Silver Miners ETF |
| 2012(Unaudited) | | | 23.66 | | | | 0.07 | | | | (2.33 | ) | | | (2.26 | ) | | | (0.04 | ) | | | — | | | | (0.04 | ) | | | 21.36 | | | | (9.56 | ) | | | 314,047 | | | | 0.65 | † | | | 0.58 | † | | | 14.03 | †† |
| 2011 | | | 20.20 | | | | 0.04 | | | | 3.66 | | | | 3.70 | | | | (0.24 | ) | | | — | | | | (0.24 | ) | | | 23.66 | | | | 18.20 | | | | 363,106 | | | | 0.65 | | | | 0.16 | | | | 26.50 | |
| 2010(1) | | | 14.50 | | | | 0.05 | | | | 5.65 | | | | 5.70 | | | | — | | | | — | | | | — | | | | 20.20 | | | | 39.31 | | | | 171,672 | | | | 0.65 | † | | | 0.61 | † | | | 0.35 | †† |
| Global X Gold Explorers ETF |
| 2012(Unaudited) | | | 13.36 | | | | (0.04 | ) | | | (3.58 | ) | | | (3.62 | ) | | | (0.25 | ) | | | — | | | | (0.25 | ) | | | 9.49 | | | | (27.21 | ) | | | 29,413 | | | | 0.65 | † | | | (0.65 | )† | | | 22.85 | †† |
| 2011(2) | | | 15.49 | | | | (0.10 | ) | | | (2.03 | ) | | | (2.13 | ) | | | — | | | | — | | | | — | | | | 13.36 | | | | (13.75 | ) | | | 27,392 | | | | 0.65 | † | | | (0.65 | )† | | | 29.96 | †† |
| Global X Pure Gold Miners ETF |
| 2012(Unaudited) | | | 14.67 | | | | — | | | | (2.78 | ) | | | (2.78 | ) | | | (0.25 | ) | | | — | | | | (0.25 | ) | | | 11.64 | | | | (19.00 | ) | | | 4,654 | | | | 0.59 | † | | | (0.02 | )† | | | 11.86 | †† |
| 2011(3) | | | 15.15 | | | | 0.01 | | | | (0.49 | ) | | | (0.48 | ) | | | — | | | | — | | | | — | | | | 14.67 | | | | (3.17 | ) | | | 5,134 | | | | 0.59 | † | | | 0.10 | † | | | 7.61 | †† |
| Global X Copper Miners ETF |
| 2012(Unaudited) | | | 14.92 | | | | 0.05 | | | | (0.38 | ) | | | (0.33 | ) | | | (0.57 | ) | | | (0.34 | ) | | | (0.91 | ) | | | 13.68 | | | | (1.69 | ) | | | 32,842 | | | | 0.65 | † | | | 0.78 | † | | | 18.37 | †† |
| 2011 | | | 16.63 | | | | 0.35 | | | | (1.97 | ) | | | (1.62 | ) | | | (0.09 | ) | | | — | | | | (0.09 | ) | | | 14.92 | | | | (9.85 | ) | | | 45,517 | | | | 0.65 | | | | 1.91 | | | | 15.78 | |
| 2010(1) | | | 14.40 | | | | — | | | | 2.23 | | | | 2.23 | | | | — | | | | — | | | | — | | | | 16.63 | | | | 15.49 | | | | 29,929 | | | | 0.65 | † | | | 0.06 | † | | | 1.36 | †† |
| Global X Aluminum ETF |
| 2012(Unaudited) | | | 10.64 | | | | 0.12 | | | | (0.42 | ) | | | (0.30 | ) | | | (0.10 | ) | | | — | | | | (0.10 | ) | | | 10.24 | | | | (2.64 | ) | | | 2,560 | | | | 0.69 | † | | | 2.41 | † | | | 13.41 | †† |
| 2011(4) | | | 15.27 | | | | 0.09 | | | | (4.72 | ) | | | (4.63 | ) | | | — | | | | — | | | | — | | | | 10.64 | | | | (30.32 | ) | | | 3,723 | | | | 0.69 | † | | | 0.84 | † | | | 15.47 | †† |
| (1) | The Fund commenced operations on April 19, 2010. |
| (2) | The Fund commenced operations on November 3, 2010. |
| (3) | The Fund commenced operations on March 14, 2011. |
| (4) | The Fund commenced operations on January 4, 2011. |
| * | Per share data calculated using average shares method. |
| ** | Total Return is for the period indicated and has not been annualized. The return shown does not reflect the deduction of taxes that a shareholder would pay on Fund distributions or the redemption of Fund shares. |
| †† | Portfolio turnover rate is for the period indicated and has not been annualized. Excludes effect of in-kind transfers. |
Amounts designated as “—” are either $0 or have been rounded to $0.
The accompanying notes are an integral part of the financial statements.
Selected Per Share Data & Ratios
For a Share Outstanding Throughout the Period
| | Net Asset
Value,
Beginning
of Period
($) | | | Net
Investment
Income
(Loss) ($)* | | | Net
Realized
and
Unrealized
Gain (Loss)
on
Investments
($) | | | Total from
Operations
($) | | | Distribution
from Net
Investment
Income ($) | | | Distribution
from
Capital
Gains ($) | | | Total from
Distributions
($) | | | Net
Asset
Value,
End of
Period
($) | | | Total
Return
(%)** | | | Net
Assets
End of
Period
($)(000) | | | Ratio of
Expenses
to
Average
Net
Assets
(%) | | | Ratio of
Net
Investment
Income
(Loss) to
Average
Net Assets
(%) | | | Portfolio
Turnover
(%) | |
| Global X Uranium ETF |
| 2012(Unaudited) | | | 10.09 | | | | — | | | | (1.15 | ) | | | (1.15 | ) | | | — | | | | — | | | | — | | | | 8.94 | | | | (11.40 | ) | | | 173,862 | | | | 0.69 | † | | | 0.06 | † | | | 37.29 | †† |
| 2011(1) | | | 16.78 | | | | 0.15 | | | | (6.45 | ) | | | (6.30 | ) | | | (0.39 | ) | | | — | | | | (0.39 | ) | | | 10.09 | | | | (38.70 | ) | | | 199,349 | | | | 0.69 | † | | | 1.10 | † | | | 24.17 | †† |
| Global X Lithium ETF |
| 2012(Unaudited) | | | 15.90 | | | | 0.03 | | | | 0.11 | (5) | | | 0.14 | | | | (0.02 | ) | | | — | | | | (0.02 | ) | | | 16.02 | | | | 0.89 | | | | 89,701 | | | | 0.75 | † | | | 0.37 | † | | | 22.42 | †† |
| 2011 | | | 19.83 | | | | (0.04 | ) | | | (3.62 | ) | | | (3.66 | ) | | | (0.25 | ) | | | (0.02 | ) | | | (0.27 | ) | | | 15.90 | | | | (18.86 | ) | | | 107,301 | | | | 0.75 | | | | (0.22 | ) | | | 24.87 | |
| 2010(2) | | | 15.51 | | | | (0.03 | ) | | | 4.35 | | | | 4.32 | | | | — | | | | — | | | | — | | | | 19.83 | | | | 27.85 | | | | 78,317 | | | | 0.75 | † | | | (0.62 | )† | | | 5.55 | †† |
| Global X Fertilizers/Potash ETF |
| 2012(Unaudited) | | | 14.06 | | | | 0.06 | | | | (0.12 | ) | | | (0.06 | ) | | | (0.09 | ) | | | (0.02 | ) | | | (0.11 | ) | | | 13.89 | | | | (0.32 | ) | | | 27,773 | | | | 0.69 | † | | | 0.83 | † | | | 13.61 | †† |
| 2011(3) | | | 15.05 | | | | 0.06 | | | | (1.05 | ) | | | (0.99 | ) | | | — | | | | — | | | | — | | | | 14.06 | | | | (6.58 | ) | | | 35,160 | | | | 0.69 | † | | | 0.90 | † | | | 7.55 | †† |
| Global X S&P/TSX Venture 30 Canada ETF |
| 2012(Unaudited) | | | 11.53 | | | | (0.04 | ) | | | (0.82 | ) | | | (0.86 | ) | | | (0.29 | ) | | | — | | | | (0.29 | ) | | | 10.38 | | | | (7.27 | ) | | | 2,596 | | | | 0.75 | † | | | (0.76 | )† | | | 76.77 | †† |
| 2011(4) | | | 15.04 | | | | (0.07 | ) | | | (3.44 | ) | | | (3.51 | ) | | | — | | | | — | | | | — | | | | 11.53 | | | | (23.34 | ) | | | 2,882 | | | | 0.75 | † | | | (0.77 | )† | | | 28.23 | †† |
| (1) | The Fund commenced operations on November 4, 2010. |
| (2) | The Fund commenced operations on July 22, 2010. |
| (3) | The Fund commenced operations on May 25, 2011. |
| (4) | The Fund commenced operations on March 16, 2011. |
| (5) | The amount shown for a share outstanding throughout the period does not accord with the aggregate net gains on investments for the period because of the sales and repurchases of fund shares in relation to fluctuating market value of the investments of the Fund. |
| * | Per share data calculated using average shares method. |
| ** | Total Return is for the period indicated and has not been annualized. The return shown does not reflect the deduction of taxes that a shareholder would pay on Fund distributions or the redemption of Fund shares. |
| †† | Portfolio turnover rate is for the period indicated and has not been annualized. Excludes effect of in-kind transfers. |
Amounts designated as “—” are either $0 or have been rounded to $0.
The accompanying notes are an integral part of the financial statements.
Notes to Financial Statements
|
April 30, 2012 (unaudited)
1. ORGANIZATION
The Global X Funds (the “Trust”) is a Delaware Statutory Trust formed on March 6, 2008. The Trust is registered under the Investment Company Act of 1940, as amended, as an open-end management investment company with eighty-seven portfolios as of April 30, 2012. The financial statements herein and the related notes pertain to the Global X Silver Miners ETF, Global X Gold Explorers ETF, Global X Pure Gold Miners ETF, Global X Copper Miners ETF, Global X Aluminum ETF, Global X Uranium ETF, Global X Lithium ETF, Global X Fertilizers/Potash ETF and Global X S&P/TSX Venture 30 Canada ETF (the “Funds”). Each Fund is non-diversified.
2. SIGNIFICANT ACCOUNTING POLICIES
The following is a summary of the Significant Accounting Policies followed by the Funds.
USE OF ESTIMATES — The preparation of financial statements in conformity with U.S. Generally Accepted Accounting Principles (“U.S. GAAP”) requires management to make estimates and assumptions that affect the reported amounts of assets and liabilities and disclosure of contingent assets and liabilities at the date of the financial statements and the reported amounts of increases and decreases in net assets from operations during the reporting period. Actual results could differ from those estimates, and could have a material impact to the Funds.
SECURITY VALUATION — Securities listed on a securities exchange, market or automated quotation system for which quotations are readily available (except for securities traded on NASDAQ), including securities traded over the counter, are valued at the last quoted sale price on the primary exchange or market (foreign or domestic) on which they are traded (or at approximately 4:00 pm if a security’s primary exchange is normally open at that time), or, if there is no such reported sale, at the most recent mean between the quoted bid and asked prices (absent both bid and asked prices on such exchange, the bid price may be used).
For securities traded on NASDAQ, the NASDAQ Official Closing Price will be used. If available, debt securities are priced based upon valuations provided by independent, third-party pricing agents. Such values generally reflect the last reported sales price if the security is actively traded. The third-party pricing agents may also value debt securities at an evaluated bid price by employing methodologies that utilize actual market transactions, broker-supplied valuations, or other methodologies designed to identify the market value for such securities. Debt obligations with remaining maturities of sixty days or less may be valued at their amortized cost, which approximates market value. The prices for foreign securities are reported in local currency and converted to U.S. dollars using currency exchange rates. Prices for most securities held in the Funds are provided daily by recognized independent pricing agents. If a security price cannot be obtained from an independent, third-party pricing agent, the Funds seek to obtain a bid price from at least one independent broker.
Securities for which market prices are not “readily available” are valued in accordance with Fair Value Procedures established by the Board of Directors (the “Board”). The Funds’ Fair Value Procedures are implemented through a Fair Value Committee (the “Committee”) designated by the Board. Some of the more common reasons that may necessitate that a security be valued using Fair Value Procedures include: the security's trading has been halted or suspended; the security has been
Notes to Financial Statements (continued)
|
April 30, 2012 (unaudited)
2. SIGNIFICANT ACCOUNTING POLICIES (continued)
SECURITY VALUATION (continued)
de-listed from a national exchange; the security's primary trading market is temporarily closed at a time when under normal conditions it would be open; the security has not been traded for an extended period of time; the security's primary pricing source is not able or willing to provide a price; or trading of the security is subject to local government-imposed restrictions. When a security is valued in accordance with the Fair Value Procedures, the Committee will determine the value after taking into consideration relevant information reasonably available to the Committee. As of April 30, 2012, there were $764,976 and $10,444 of fair valued securities in the Global X Silver Miners ETF and Global X Pure Gold Miners ETF, respectively. There were no other securities priced using the fair value procedures.
For securities that principally trade on a foreign market or exchange, a significant gap in time can exist between the time of a particular security's last trade and the time at which the Fund’s calculated their net asset value. The closing prices of such securities may no longer reflect their market value at the time the Funds calculated net asset value if an event that could materially affect the value of those securities (a “Significant Event”) has occurred between the time of the security's last close and the time that the Funds calculate net asset value. A Significant Event may relate to a single issuer or to an entire market sector. If Global X Management Company LLC (the “Adviser”) becomes aware of a Significant Event that has occurred with respect to a security or group of securities after the closing of the exchange or market on which the security or securities principally trade, but before the time at which the Funds calculate net asset value, it may request that a Committee meeting be called. In addition, the Funds’ Sub-administrator, SEI Investments Global Funds Services (“SEIGFS”), monitors price movements among certain selected indices, securities and/or baskets of securities that may be an indicator that the closing prices received earlier from foreign exchanges or markets may not reflect market value at the time the Funds calculate net asset value. If price movements in a monitored index or security exceed levels established by the Sub-administrator, the Sub-administrator notifies the Adviser that such limits have been exceeded. In such event, the Adviser makes the determination whether a Committee meeting should be called based on the information provided.
In accordance with the authoritative guidance on fair value measurements and disclosure under U.S. GAAP, the Funds disclose the fair value of their investments in a hierarchy that prioritizes the inputs to valuation techniques used to measure the fair value. The objective of a fair value measurement is to determine the price that would be received to sell an asset or paid to transfer a liability in an orderly transaction between market participants at the measurement date (an exit price). Accordingly, the fair value hierarchy gives the highest priority to quoted prices (unadjusted) in active markets for identical assets or liabilities (Level 1) and the lowest priority to unobservable inputs (Level 3). The three levels of the fair value hierarchy are described below:
The three levels of the fair value hierarchy are described below:
Level 1 – Unadjusted quoted prices in active markets for identical, unrestricted assets or liabilities that the Fund has the ability to access at the measurement date
Notes to Financial Statements (continued)
|
April 30, 2012 (unaudited)
2. SIGNIFICANT ACCOUNTING POLICIES (continued)
SECURITY VALUATION (concluded)
Level 2 – Other significant observable inputs (including quoted prices for similar investments, fair value of investments for which the Fund has the ability to fully redeem tranches at net asset value as of the measurement date or within the near term, and short-term investments valued at amortized cost)
Level 3 – Significant unobservable inputs (including the Fund’s own assumptions in determining the fair value of investments, fair value of investments for which the Fund does not have the ability to fully redeem tranches at net asset value as of the measurement date or within the near term)
Investments are classified within the level of the lowest significant input considered in determining fair value. Investments classified within Level 3 whose fair value measurement considers several inputs may include Level 1 or Level 2 inputs as components of the overall fair value measurement.
For the period ended April 30, 2012 there has been no significant changes to the Funds’ fair valuation methodologies.
FEDERAL INCOME TAXES — It is each Fund’s intention to qualify or continue to qualify as a regulated investment company for Federal income tax purposes by complying with the appropriate provisions of Subchapter M of the Internal Revenue Code of 1986, as amended. Accordingly, no provisions for Federal income taxes have been made in the financial statements.
The Funds evaluate tax positions taken or expected to be taken in the course of preparing the Funds’ tax returns to determine whether it is “more-likely-than-not” (i.e., greater than 50 percent) that each tax position will be sustained upon examination by a taxing authority based on the technical merits of the position. Tax positions not deemed to meet the more-likely-than-not threshold are recorded as a tax benefit or expense in the current year. The Funds did not record any tax provision in the current period. However, management’s conclusions regarding tax positions may be subject to review and adjustment at a later date based on factors including, but not limited to, examination by tax authorities (i.e., the last three tax year ends, as applicable), on-going analysis of and changes to tax laws, regulations and interpretations thereof.
SECURITY TRANSACTIONS AND INVESTMENT INCOME — Security transactions are accounted for on the trade date for financial reporting purposes. Costs used in determining realized gains and losses on the sale of investment securities are based on specific identification. Dividend income is recorded on the ex-dividend date. Interest income is recognized on the accrual basis from the settlement date.
FOREIGN CURRENCY TRANSLATION — The books and records of the Funds are maintained in U.S. dollars. Investment securities and other assets and liabilities denominated in a foreign currency are translated into U.S. dollars on the date of valuation. Purchases and sales of investment securities, income and expenses are translated into U.S. dollars at the relevant rates of exchange prevailing on the respective dates of such transactions. The Funds’ do not isolate that portion of realized or unrealized gains and losses resulting from changes in the foreign exchange rate from fluctuations arising from changes in the market prices of the securities. These gains and losses are included in net
| Notes to Financial Statements (continued) |
| April 30, 2012 (unaudited) |
2. SIGNIFICANT ACCOUNTING POLICIES (concluded)
realized and unrealized gains and losses on investments on the Statement of Operations. Net realized and unrealized gains and losses on foreign currency transactions represent net foreign exchange gains or losses from foreign currency exchange contracts, disposition of foreign currencies, currency gains or losses realized between trade and settlement dates on securities transactions and the difference between the amount of the investment income and foreign withholding taxes recorded on the Funds’ books and the U.S. dollar equivalent amounts actually received or paid.
DIVIDENDS AND DISTRIBUTIONS TO SHAREHOLDERS — The Funds distribute their net investment income on a pro rata basis. Any net realized capital gains are distributed annually. All distributions are recorded on ex-dividend date.
CREATION UNITS — The Funds issue and redeem shares (“Shares”) at Net Asset Value (“NAV”) and only in large blocks of Shares, (each block of Shares for a Fund is called a “Creation Unit” or multiples thereof). Purchasers of Creation Units (“Authorized Participants“) at NAV must pay a standard creation transaction fee per transaction. The fee is a single charge and will be the same regardless of the number of Creation Units purchased by an investor on the same day. An Authorized Participant who holds Creation Units and wishes to redeem at NAV would also pay a standard Redemption Fee per transaction on the date of such redemption, regardless of the number of Creation Units redeemed that day.
If a Creation Unit is purchased or redeemed for cash, a higher Transaction Fee will be charged. The following table discloses Creation Unit breakdown:
| | | Creation | | | Transaction | | | | | | Redemption | |
| | | Unit Shares | | | Fee | | | Value | | | Fee | |
| Global X Silver Miners ETF | | | 50,000 | | | $ | 1,000 | | | $ | 1,068,000 | | | $ | 1,000 | |
| Global X Gold Explorers ETF | | | 50,000 | | | | 1,000 | | | | 474,500 | | | | 1,000 | |
| Global X Pure Gold Miners ETF | | | 50,000 | | | | 1,000 | | | | 582,000 | | | | 1,000 | |
| Global X Copper Miners ETF | | | 50,000 | | | | 1,000 | | | | 684,000 | | | | 1,000 | |
| Global X Aluminum ETF | | | 50,000 | | | | 1,000 | | | | 512,000 | | | | 1,000 | |
| Global X Uranium ETF | | | 50,000 | | | | 1,000 | | | | 447,000 | | | | 1,000 | |
| Global X Lithium ETF | | | 50,000 | | | | 1,000 | | | | 801,000 | | | | 1,000 | |
| Global X Fertilizers/Potash ETF | | | 50,000 | | | | 1,000 | | | | 694,500 | | | | 1,000 | |
| Global X S&P/TSX Venture 30 Canada ETF | | | 50,000 | | | | 1,000 | | | | 519,000 | | | | 1,000 | |
3. RELATED PARTY TRANSACTIONS
The Adviser serves as the investment adviser and the administrator for the Funds. Subject to the supervision of the Board of Trustees, the Adviser is responsible for managing the investment activities of the Funds and the Funds’ business affairs and other administrative matters and provides or causes to be furnished all supervisory, administrative and other services reasonably necessary for the operation of the Funds, including certain distribution services (provided pursuant to a separate Distribution Agreement), certain shareholder and distribution-related services (provided pursuant to
| Notes to Financial Statements (continued) |
| April 30, 2012 (unaudited) |
3. RELATED PARTY TRANSACTIONS (continued)
a separate Rule 12b-1 Plan and related agreements) and investment advisory services (provided pursuant to a separate Investment Advisory Agreement), under what is essentially an "all-in" fee structure. For its service to the Funds, under the Supervision and Administration Agreement, each Fund pays a monthly fee to the Adviser at the annual rate (stated as a percentage of the average daily net assets of the Fund). In addition, the Funds bear other expenses that are not covered by the Supervision and Administration Agreement, which may vary and affect the total expense ratios of the Funds, such as taxes, brokerage fees, commissions, acquired fund fees and other transaction expenses, interest expenses, and extraordinary expenses (such as litigation and indemnification expenses).
| | | Supervision and | |
| | | Administration Fee | |
| Global X Silver Miners ETF | | | 0.65 | % |
| Global X Gold Explorers ETF | | | 0.65 | % |
| Global X Pure Gold Miners ETF | | | 0.59 | % |
| Global X Copper Miners ETF | | | 0.65 | % |
| Global X Aluminum ETF | | | 0.69 | % |
| Global X Uranium ETF | | | 0.69 | % |
| Global X Lithium ETF | | | 0.75 | % |
| Global X Fertilizer/Potash ETF | | | 0.69 | % |
| Global X S&P/TSX Venture 30 Canada ETF | | | 0.75 | % |
The Adviser and MCCA Lithium ETF, LLC (“MCCA”), a single purpose limited liability firm, have entered into an agreement, pursuant to which MCCA has agreed to assist the Adviser, in its capacity as sponsor of the Global X Lithium ETF, by providing initial capital and additional financial resources to the Adviser in connection with the listing, launch and the continuing operation of the Global X Lithium Fund. In return, the Adviser has agreed to compensate MCCA for its financial assistance to the Adviser with respect to the Global X Lithium ETF by sharing with MCCA fifty percent (50%) of the Adviser’s Net Profits with respect to the Global X Lithium ETF. For this purpose, the term Net Profits means, for any calendar quarter, the total management fees received by the Adviser with respect to the Global X Lithium ETF less direct expenses, marketing expenses and overhead expenses for the Global X Lithium ETF during such quarter. In the event that there are no Net Profits with respect to the Global X Lithium ETF in any calendar quarter, MCCA shall pay fifty percent of the negative shortfall in Net Profits to the Adviser. The agreement between the parties does not contemplate that MCCA or any of its affiliates will be involved directly or indirectly in the distribution of shares of the Global X Lithium ETF.
SEIGFS serves as Sub-Administrator to the Funds. As Sub-Administrator, SEIGFS provides the Funds with the required general administrative services, including, without limitation: office space, equipment, and personnel; clerical and general back office services; bookkeeping, internal accounting and secretarial services; the calculation of NAV; and assistance with the preparation and filing of reports, registration statements, proxy statements and other materials required to be filed or furnished by the Funds under federal and state securities laws. As compensation for these services, the Sub-Administrator receives certain out-of-pocket costs, transaction fees and asset-based fees which are accrued daily and paid monthly by the Adviser.
| Notes to Financial Statements (continued) |
| April 30, 2012 (unaudited) |
3. RELATED PARTY TRANSACTIONS (concluded)
SEI Investments Distribution Co. (“SIDCO”) serves as each Funds underwriter and distributor of Shares pursuant to a Distribution Agreement. Under the Distribution Agreement, SIDCO, as agent, receives orders to create and redeem Shares in Creation Unit Aggregations and transmits such orders to the Trust’s custodian and transfer agent. The Distributor has no obligation to sell any specific quantity of Fund Shares. SIDCO bears the following costs and expenses relating to the distribution of Shares: (i) the costs of processing and maintaining records of creations of Creation Units; (ii) all costs of maintaining the records required of a registered broker/dealer; (iii) the expenses of maintaining its registration or qualification as a dealer or broker under Federal or state laws; (iv) filing fees; and (v) all other expenses incurred in connection with the distribution services as contemplated in the Distribution Agreement. SIDCO receives no fee for its distribution services under the Distribution Agreement.
4. INVESTMENT TRANSACTIONS
For the period ended April 30, 2012, the purchases and sales of investments in securities, excluding in-kind transactions, long-term U.S. Government and short-term securities were:
| | | | | | Sales and | |
| | | Purchases | | | Maturities | |
| Global X Silver Miners ETF | | $ | 48,449,497 | | | $ | 48,260,874 | |
| Global X Gold Explorers ETF | | | 6,253,940 | | | | 6,895,512 | |
| Global X Pure Gold Miners ETF | | | 591,218 | | | | 670,712 | |
| Global X Copper Miners ETF | | | 7,280,626 | | | | 9,754,394 | |
| Global X Aluminum ETF | | | 410,144 | | | | 479,317 | |
| Global X Uranium ETF | | | 69,634,947 | | | | 72,967,179 | |
| Global X Lithium ETF | | | 21,835,726 | | | | 21,802,072 | |
| Global X Fertilizers/Potash ETF | | | 3,880,917 | | | | 4,589,772 | |
| Global X S&P/TSX Venture 30 Canada ETF | | | 2,138,312 | | | | 2,259,445 | |
For the period ended April 30, 2012, in-kind transactions associated with creations and redemptions were:
| | | | | | Sales and | | | Realized | |
| | | Purchases | | | Maturities | | | Gain/(Loss) | |
| Global X Silver Miners ETF | | $ | 25,983,806 | | | $ | 38,760,812 | | | $ | 2,217,613 | |
| Global X Gold Explorers ETF | | | 10,887,023 | | | | - | | | | - | |
| Global X Pure Gold Miners ETF | | | 628,887 | | | | - | | | | - | |
| Global X Copper Miners ETF | | | 1,523,248 | | | | 10,478,708 | | | | (2,232,358 | ) |
| Global X Aluminum ETF | | | - | | | | 954,402 | | | | (343,399 | ) |
| Global X Uranium ETF | | | 11,548,993 | | | | 14,494,262 | | | | 848,207 | |
| Global X Lithium ETF | | | - | | | | 17,578,682 | | | | (7,591,999 | ) |
| Global X Fertilizers/Potash ETF | | | 1,913,044 | | | | 7,383,094 | | | | (1,972,412 | ) |
| Global X S&P/TSX Venture 30 Canada ETF | | | - | | | | - | | | | - | |
During the period ended April 30, 2012, there were no purchases or sales of long-term U.S. Government securities for the Funds.
| Notes to Financial Statements (continued) |
| April 30, 2012 (unaudited) |
5. TAX INFORMATION
The amount and character of income and capital gain distributions to be paid, if any, are determined in accordance with Federal income tax regulations, which may differ from U.S. GAAP. As a result, net investment income (loss) and net realized gain (loss) on investment transactions for a reporting period may differ significantly from distributions during such period. These book/tax differences may be temporary or permanent. To the extent these differences are permanent in nature, they are charged or credited to undistributed net investment income (loss), accumulated net realized gain (loss) or paid-in capital, as appropriate, in the period that the differences arise.
The tax character of dividends and distributions paid during the last period ended October 31, 2011 and 2010 were as follows:
Global X
Funds | | Ordinary
Income | | | Long-Term
Capital Gain | | | Totals | |
| | | | |
| Global X Silver Miners ETF | | | | | | | | | | | | |
| 2011 | | $ | 3,208,369 | | | $ | – | | | $ | 3,208,369 | |
| 2010 | | | – | | | | – | | | | – | |
| Global X Copper Miners ETF | | | | | | | | | | | | |
| 2011 | | $ | 388,853 | | | $ | – | | | $ | 388,853 | |
| 2010 | | | – | | | | – | | | | – | |
| Global X Uranium ETF | | | | | | | | | | | | |
| 2011 | | $ | 2,442,914 | | | $ | 239,171 | | | $ | 2,682,085 | |
| Global X Lithium ETF | | | | | | | | | | | | |
| 2011 | | $ | 1,638,357 | | | $ | – | | | $ | 1,638,357 | |
| 2010 | | | – | | | | – | | | | – | |
As of October 31, 2011, the Components of Tax Basis Distributable Earnings (Accumulated Losses) were as follows:
| | | Global X Funds | |
| | | Global X Silver
Miners ETF | | | Global X Gold
Explorers ETF | | | Global X Pure
Gold Miners ETF | |
| Undistributed Ordinary Income | | $ | – | | | $ | 545,816 | | | $ | 89,967 | |
| Capital Loss Carryforwards | | | (8,433,466 | ) | | | (130,976 | ) | | | – | |
| Unrealized Depreciation on Investments and Foreign Currency | | | (24,506,024 | ) | | | (7,250,085 | ) | | | (205,481 | ) |
| Total Accumulated Losses | | $ | (32,939,490 | ) | | $ | (6,835,245 | ) | | $ | (115,514 | ) |
| | | Global X Funds | |
| | | Global X Copper
Miners ETF | | | Global X
Aluminum ETF | | | Global X Uranium
ETF | |
| Undistributed Ordinary Income | | $ | 2,582,213 | | | $ | 20,251 | | | $ | – | |
| Undistributed Long-Term Capital Gain | | | 15,799 | | | | – | | | | – | |
| Capital Loss Carryforwards | | | – | | | | (14,836 | ) | | | (12,705,798 | ) |
| Unrealized Depreciation on Investments and Foreign Currency | | | (7,492,168 | ) | | | (1,548,838 | ) | | | (133,623,067 | ) |
| Other Temporary Differences | | | (8 | ) | | | – | | | | (44,194 | ) |
| Total Accumulated Losses | | $ | (4,894,164 | ) | | $ | (1,543,423 | ) | | $ | (146,373,059 | ) |
| Notes to Financial Statements (continued) |
| April 30, 2012 (unaudited) |
5. TAX INFORMATION (continued)
| | | Global X Funds | |
| | | Global X Lithium
ETF | | | Global X
Fertilizers/Potash
ETF | | | Global X
S&P/TSX Venture
30 Canada ETF | |
| Undistributed Ordinary Income | | $ | – | | | $ | 132,874 | | | $ | 71,812 | |
| Capital Loss Carryforwards | | | (7,329,311 | ) | | | – | | | | (506,011 | ) |
| Unrealized Depreciation on Investments and Foreign Currency | | | (27,231,647 | ) | | | (2,877,563 | ) | | | (796,382 | ) |
| Total Accumulated Losses | | $ | (34,560,958 | ) | | $ | (2,744,689 | ) | | $ | (1,230,581 | ) |
For Federal income tax purposes, capital loss carryforwards represent realized losses of the Funds that may be carried forward for a maximum period of eight years and applied against future gains. As of October 31, 2011, the Funds that had capital loss carryforwards are listed below.
| | | Global X
Silver Miners
ETF | | | Global X
Uranium ETF | | | Global X
Lithium ETF | |
| Oct. 2019 | | $ | 8,433,466 | | | $ | 12,705,798 | | | $ | 7,329,311 | |
| Total | | $ | 8,433,466 | | | $ | 12,705,798 | | | $ | 7,329,311 | |
During the fiscal year ended October 31, 2011, Global X Copper Miners ETF utilized $10,213 of capital loss carry forwards to offset capital gains.
Under the recently enacted Regulated Investment Company Modernization Act of 2010, the Funds will be permitted to carry forward capital losses incurred in taxable years beginning after December 22, 2010 for an unlimited period. However, any losses incurred during those future taxable years will be required to be used prior to the losses incurred in pre-enactment taxable years. As a result of this ordering rule, preenactment capital loss carryforwards may be more likely to expire unused. Additionally, post-enactment capital losses that are carried forward will retain their character as either short-term or long-term capital losses rather than being considered all short-term as under previous law. Losses carried forward under these new provisions are as follows:
| | | Short-Term | | | Long-Term | | | | |
| Global X Funds | | Loss | | | Loss | | | Total | |
| Global X Gold Explorers ETF | | $ | 130,976 | | | | - | | | $ | 130,976 | |
| Global X Aluminum | | | 14,836 | | | | - | | | | 14,836 | |
| Global X S&P/TSX Venture 30 Canada ETF | | | 506,011 | | | | - | | | | 506,011 | |
| Notes to Financial Statements (continued) |
| April 30, 2012 (unaudited) |
5. TAX INFORMATION (concluded)
The Federal tax cost and aggregate gross unrealized appreciation and depreciation on investments held by the Funds at April 30, 2012 were as follows:
| Global X Funds | | Federal Tax
Cost | | | Aggregated
Gross
Unrealized
Appreciation | | | Aggregated
Gross
Unrealized
Depreciation | | | Net Unrealized
Depreciation | |
| Global X Silver Miners ETF | | $ | 372,987,246 | | | $ | 16,827,606 | | | $ | (61,039,215 | ) | | $ | (44,211,609 | ) |
| Global X Gold Explorers ETF | | | 42,897,837 | | | | 157,767 | | | | (13,611,120 | ) | | | (13,453,353 | ) |
| Global X Pure Gold Miners ETF | | | 5,602,782 | | | | 172,056 | | | | (1,120,331 | ) | | | (948,275 | ) |
| Global X Copper ETF | | | 38,576,295 | | | | 1,049,330 | | | | (6,167,324 | ) | | | (5,117,994 | ) |
| Global X Aluminum ETF | | | 3,705,561 | | | | 13,944 | | | | (1,156,507 | ) | | | (1,142,563 | ) |
| Global X Uranium ETF | | | 337,749,740 | | | | – | | | | (111,478,019 | ) | | | (111,478,019 | ) |
| Global X Lithium ETF | | | 120,059,003 | | | | 12,074,868 | | | | (24,269,367 | ) | | | (12,194,499 | ) |
| Global X Fertilizers/Potash ETF | | | 29,020,057 | | | | 1,948,927 | | | | (3,269,610 | ) | | | (1,320,683 | ) |
| Global X S&P/TSX Venture 30 Canada ETF | | | 3,073,612 | | | | 279,914 | | | | (756,722 | ) | | | (476,808 | ) |
The preceding differences between book and tax cost are primarily due to mark to market treatment of passive foreign investment companies and wash sales.
6. CONCENTRATION OF RISKS
The Funds invest in securities of foreign issuers in several countries. These investments may involve certain considerations and risks not typically associated with investments in the United States as a result of, among other factors, the possibility of future political and economic developments and the level of governmental supervision and regulation of securities markets in the respective countries.
The securities markets of emerging countries are less liquid and subject to greater price volatility, and have a smaller market capitalization, than the U.S. securities markets. In certain countries, there may be fewer publicly traded securities and the market may be dominated by a few issues or sectors. Issuers and securities markets in such countries are not subject to as extensive and frequent accounting, financial and other reporting requirements or as comprehensive government regulations as are issuers and securities markets in the U.S. In particular, the assets and profits appearing on the financial statements of emerging country issuers may not reflect their financial position or results of operations in the same manner as financial statements for U.S. issuers. Substantially less information may be publicly available about emerging country issuers than is available about issuers in the United States.
The Funds may be subject to taxes imposed by countries in which it invests. Such taxes are generally based on either income or gains earned or repatriated. The Funds accrue and apply such taxes to net investment income, net realized gains and net unrealized gains as income and/or capital gains are earned.
The Funds use a replication strategy. A replication strategy is an indexing strategy that involves investing in the securities of the Underlying Index in approximately the same proportions as in the Underlying Index. The Funds may utilize a representative sampling strategy with respect to its Underlying Index when a replication strategy might be detrimental to its shareholders, such as when
| Notes to Financial Statements (continued) |
| April 30, 2012 (unaudited) |
6. CONCENTRATION OF RISKS (concluded)
there are practical difficulties or substantial costs involved in compiling a portfolio of equity securities to follow its Underlying Index, or, in certain instances, when securities in the Underlying Index become temporarily illiquid, unavailable or less liquid, or due to legal restrictions (such as diversification requirements that apply to the Funds but not the Underlying Indexes).
Commodity related securities, are susceptible to fluctuations in certain commodity markets. Any negative changes in commodity markets could have a great impact on these Funds.
7. OTHER
At April 30, 2012, the total Shares outstanding that were held by Authorized Participants were as follows. The Authorized Participants have entered into an agreement with the Funds’ Distributor.
| | | | | | Percentage of | |
| | | Authorized | | | Shares | |
| | | Participants | | | Outstanding | |
| Global X Silver Miners ETF | | | 5 | | | | 100 | % |
| Global X Gold Explorers ETF | | | 4 | | | | 100 | % |
| Global X Pure Gold Miners ETF | | | 3 | | | | 100 | % |
| Global X Copper Miners ETF | | | 4 | | | | 100 | % |
| Global X Aluminum ETF | | | 2 | | | | 100 | % |
| Global X Uranium ETF | | | 7 | | | | 100 | % |
| Global X Lithium ETF | | | 4 | | | | 100 | % |
| Global X Fertilizers/Potash ETF | | | 4 | | | | 100 | % |
| Global X S&P/TSX Venture 30 Canada ETF | | | 2 | | | | 100 | % |
Pursuant to the Trust’s organizational documents, the Trustees of the Trust and the Trust’s officers are indemnified against certain liabilities that may arise out of the performance of their duties.
8. LOANS OF PORTFOLIO SECURITIES
The Funds may lend portfolio securities having a market value up to one-third of the Funds’ total assets. Such loans are secured by collateral equal to no less than the market value of the loaned securities determined daily. Such collateral will be cash or debt securities issued or guaranteed by the U.S. Government or any agencies. Cash collateral received in connection with these loans is invested in short-term money market instruments. It is the Funds’ policy to obtain additional collateral from or return excess collateral to the borrower by the end of the next business day, following the valuation date of the securities loaned. Therefore, the value of the collateral held may be temporarily less than the value of the securities on loan. Lending securities entails a risk of loss to the Funds if and to the extent that the market value of the securities loans were to increase and the borrower did not increase the collateral accordingly, and the borrower fails to return the securities. The Funds could also experience delays and costs in gaining access to the collateral. The Funds bear the risk of any deficiency in the amount of the collateral available for return to the borrower due to any loss on the collateral invested. As of April 30, 2012, the value of securities on loan was $12,244,009, $590,625, $36,433,234 and $9,517,176 for the Global X Silver Miners ETF, Global X Copper Miners ETF, Global X Uranium ETF and Global X Lithium ETF, respectively.
| Notes to Financial Statements (concluded) |
| April 30, 2012 (unaudited) |
9. CONTRACTUAL OBLIGATIONS
The Funds enter into contracts in the normal course of business that contain a variety of indemnifications. The Funds maximum exposure under these arrangements is unknown. However the Funds have not had prior gains or losses pursuant to these contracts. Management has reviewed the Funds’ existing contracts and expects the risk of loss to be remote.
10. NEW ACCOUNTING PROUNCEMENTS
In May 2011, the FASB issued ASU No. 2011-04 “Amendments to Achieve Common Fair Value Measurement and Disclosure Requirements in U.S. GAAP and International Financial Reporting Standards (“IFRS”)”. ASU 2011-04 includes common requirements for measurement of and disclosure about fair value between U.S. GAAP and IFRS. ASU 2011-04 will require reporting entities to disclose the following information for fair value measurements categorized within Level 3 of the fair value hierarchy: quantitative information about the unobservable inputs used in the fair value measurement, the valuation processes used by the reporting entity, and a narrative description of the sensitivity of the fair value measurement to changes in unobservable inputs and the interrelationships between those unobservable inputs. In addition, ASU 2011-04 will require reporting entities to make disclosures about amounts and reasons for all transfers in and out of Level 1 and Level 2 fair value measurements. The new and revised disclosures are effective for interim and annual reporting periods beginning after December 15, 2011. Adoption of ASU 2011-04 will not materially affect the Funds’ financial condition or results of operations.
11. SUBSEQUENT EVENT
The Funds have been evaluated the need for additional disclosures and/or adjustments resulting from subsequent events. Based on this evaluation, no additional disclosure or adjustments were required to the financial statements as the date the financial statements were issued.
Subsequent to half-year end, on May 25, 2012, the Board of Trustees of the Trust (including the Independent Trustees) initially considered and unanimously approved the Investment Advisory Agreement and the Supervision and Administration Agreement for the Global X Top Guru Holdings Index ETF, Global X Top Value Guru Holdings Index ETF, and Global X Top Activist Investor Holdings Index ETF.
Subsequent to half-year end, on May 25, 2012, the Board of Trustees of the Trust determined that it is in the best interest of the Global X S&P/TSX Venture 30 Canada ETF to modify the Fund’s investment objective and strategies and to change the Fund’s name. The Fund will be renamed the Global X Junior Miners ETF and will pursue the investment objective and strategies outlined below. These changes are scheduled to go into effect on or about September 3, 2012.
The Fund currently seeks to provide investment results that correspond generally to the price and yield performance, before fees and expenses, of the S&P/TSX Venture 30 Index. The S&P/TSX Venture 30 Index is a free-float adjusted, modified capitalization-weighted index designed to provide exposure to the 30 most liquid securities on the TSX Venture Exchange. The TSX Venture exchange is Canada’s junior listings market for emerging companies. Currently the Fund is mostly comprised of small-capitalization companies based in Canada that operate within the mining and energy sectors. Upon implementation of the change, the Fund’s new objective will be to provide
| Notes to Financial Statements (concluded) |
| April 30, 2012 (unaudited) |
11. SUBSEQUENT EVENT (continued)
investment results that correspond generally to the price and yield performance, before fees and expenses, of the Solactive Junior Miners Index. The Solactive Junior Miners Index is designed to track the market performance of small-capitalization mining companies globally, and therefore the geographic scope of the Fund will expand accordingly. The Fund intends to focus its investments on small-capitalization mining companies including those engaged in mining, producing, smelting, and/or refining materials including but not limited to gold, silver, copper, aluminum, titanium and nickel.
This change is intended to position the Fund to benefit from the growth of commodity consumption around the world by investing in companies that are key elements of the commodity supply chain. This change also allows the Fund to diversify its investments geographically, although the change will increase the Fund’s exposure to emerging markets which may increase the risk of the Fund’s investments. These risks will be described in an updated Summary Prospectus and Statutory Prospectus that will be available at the time the changes described herein become effective.
The Fund also expects to gain certain cost efficiencies associated with the change in investment objective, and upon implementation of the change the total annual expense ratio of the Fund will be reduced from 0.75% to 0.69%.
Subsequent to half-year end, the following investment portfolio of the Trust commenced operations.
| Fund Name | Commenced Operations |
| Global X Top Guru Holdings Index ETF | 06/04/2012 |
| Disclosure of Fund Expenses (unaudited) |
| |
All Exchange Traded Funds (“ETF”) have operating expenses. As a shareholder of an ETF, your investment is affected by these ongoing costs, which include (among others) costs for ETF management, administrative services, brokerage fees, and shareholder reports like this one. It is important for you to understand the impact of these costs on your investment returns.
Operating expenses such as these are deducted from an ETF’s gross income and directly reduce your final investment return. These expenses are expressed as a percentage of the ETF’s average net assets; this percentage is known as the ETF’s expense ratio.
The following examples use the expense ratio and are intended to help you understand the ongoing costs (in dollars) of investing in your Fund and to compare these costs with those of other funds. The examples are based on an investment of $1,000 made at the beginning of the period shown and held for the entire period.
The table on the next page illustrates your Fund’s costs in two ways:
Actual Fund Return. This section helps you to estimate the actual expenses that your Fund incurred over the period. The “Expenses Paid During Period” column shows the actual dollar expense cost incurred by a $1,000 investment in the Fund, and the “Ending Account Value” number is derived from deducting that expense cost from the Fund’s gross investment return.
You can use this information, together with the actual amount you invested in the Funds, to estimate the expenses you paid over that period. Simply divide your actual account value by $1,000 to arrive at a ratio (for example, an $8,600 account value divided by $1,000 = 8.6), then multiply that ratio by the number shown for your Funds under “Expenses Paid During Period.”
Hypothetical 5% Return. This section helps you compare your Fund’s costs with those of other funds. It assumes that the Funds had an annual 5% return before expenses during the year, but that the expense ratio (Column 3) for the period is unchanged. This example is useful in making comparisons because the Securities and Exchange Commission requires all funds to make this 5% calculation. You can assess your Fund’s comparative cost by comparing the hypothetical result for your Fund in the “Expense Paid During Period” column with those that appear in the same charts in the shareholder reports for other funds.
NOTE: Because the return is set at 5% for comparison purposes — NOT your Fund’s actual return — the account values shown may not apply to your specific investment.
| Disclosure of Fund Expenses (unaudited) (concluded) |
| |
| | | Beginning
Account
Value
11/1/2011 | | | Ending
Account
Value
4/30/2012 | | | Annualized
Expense
Ratios | | | Expenses
Paid
During
Period(1) | |
| Global X Silver Miners ETF | | | | | | | | | | | | | | | | |
| Actual Fund Return | | $ | 1,000.00 | | | $ | 904.40 | | | | 0.65 | % | | $ | 3.08 | |
| Hypothetical 5% Return | | | 1,000.00 | | | | 1,021.63 | | | | 0.65 | | | | 3.27 | |
| Global X Gold Explorers ETF | | | | | | | | | | | | | | | | |
| Actual Fund Return | | $ | 1,000.00 | | | | 727.90 | | | | 0.65 | | | | 2.79 | |
| Hypothetical 5% Return | | | 1,000.00 | | | | 1,021.63 | | | | 0.65 | | | | 3.27 | |
| Global X Pure Gold Miners ETF | | | | | | | | | | | | | | | | |
| Actual Fund Return | | $ | 1,000.00 | | | | 810.00 | | | | 0.59 | | | | 2.66 | |
| Hypothetical 5% Return | | | 1,000.00 | | | | 1,021.93 | | | | 0.59 | | | | 2.97 | |
| Global X Copper Miners ETF | | | | | | | | | | | | | | | | |
| Actual Fund Return | | $ | 1,000.00 | | | | 983.10 | | | | 0.65 | | | | 3.20 | |
| Hypothetical 5% Return | | | 1,000.00 | | | | 1,021.63 | | | | 0.65 | | | | 3.27 | |
| Global X Aluminum ETF | | | | | | | | | | | | | | | | |
| Actual Fund Return | | $ | 1,000.00 | | | | 973.60 | | | | 0.69 | | | | 3.39 | |
| Hypothetical 5% Return | | | 1,000.00 | | | | 1,021.43 | | | | 0.69 | | | | 3.47 | |
| Global X Uranium ETF | | | | | | | | | | | | | | | | |
| Actual Fund Return | | $ | 1,000.00 | | | | 886.00 | | | | 0.69 | | | | 3.24 | |
| Hypothetical 5% Return | | | 1,000.00 | | | | 1,021.43 | | | | 0.69 | | | | 3.47 | |
| Global X Lithium ETF | | | | | | | | | | | | | | | | |
| Actual Fund Return | | $ | 1,000.00 | | | | 1,008.90 | | | | 0.75 | | | | 3.75 | |
| Hypothetical 5% Return | | | 1,000.00 | | | | 1,021.13 | | | | 0.75 | | | | 3.77 | |
| Global X Fertilizers/Potash ETF | | | | | | | | | | | | | | | | |
| Actual Fund Return | | $ | 1,000.00 | | | | 996.80 | | | | 0.69 | | | | 3.43 | |
| Hypothetical 5% Return | | | 1,000.00 | | | | 1,021.43 | | | | 0.69 | | | | 3.47 | |
| Global X S&P/TSX Venture 30 Canada ETF | | | | | | | | | | | | | | | | |
| Actual Fund Return | | $ | 1,000.00 | | | | 927.30 | | | | 0.75 | | | | 3.59 | |
| Hypothetical 5% Return | | | 1,000.00 | | | | 1,021.13 | | | | 0.75 | | | | 3.77 | |
| (1) | Expenses are equal to the Fund’s annualized expense ratio multiplied by the average account value over the period, multiplied 182/366 (to reflect the one-half year period.) |
| Approval of Investment Advisory Agreement (unaudited) |
| |
Section 15(c) of the Investment Company Act of 1940, as amended ("1940 Act"), requires that each mutual fund’s board of trustees, including a majority of those trustees who are not "interested persons" of the mutual fund, as defined in the 1940 Act ("Independent Trustees"), consider on an initial basis and periodically thereafter (as required by the 1940 Act), at an in person meeting called for such purpose, the terms of each fund’s investment advisory agreement and approve each agreement with such changes as the Independent Trustees deem appropriate.
At a quarterly Board meeting held on November 11, 2011, the Board of Trustees (including the Independent Trustees) considered and unanimously approved the continuation of (i) the Investment Advisory Agreement ("Renewal Investment Advisory Agreement") for each Fund covered by this Semi-Annual Report and other series of the Trust (each a "Renewal Fund") and (ii) the Supervision and Administration Agreement between the Trust ("Renewal Supervision and Administration Agreement"), on behalf of each Renewal Fund, and Global X Management Company ("Global X Management"). The Renewal Investment Advisory Agreement and the Renewal Supervision and Administration Agreement are referred to herein as the "Renewal Agreements."
In advance of the Board meeting, the Board (including the Independent Trustees) requested (in writing) detailed information from Global X Management in connection with their consideration of the Renewal Agreements and received and reviewed written responses from Global X Management and supporting materials relating to those requests for information.
In determining to approve the continuation of the Renewal Agreements for each Renewal Fund, the Board concluded that the Renewal Agreements were fair and reasonable and in the best interests of each Renewal Fund and its shareholders, respectively. In approving the continuation of the Renewal Agreements for each Renewal Fund, the Board considered among other things the following categories of material factors. In addition, the Board based their determinations regarding the continuation of each of the Renewal Fund Agreements on their consideration of all of the materials provided to them by Global X Management and each Renewal Fund’s other service providers throughout the year.
In reaching this decision, the Board did not assign relative weights to the factors discussed below nor did the Board deem any one factor or group of them to be controlling in and of themselves. Certain factors considered by the Board (including the Independent Trustees) with respect to the approval of the continuation of the Renewal Agreements are discussed separately below.
RENEWAL AGREEMENTS
Nature, extent and quality of services
With respect to this factor, the Board considered:
• the terms of the Renewal Agreements and the range of services that would continue to be provided to each Renewal Fund in accordance with the Renewal Agreements;
• Global X Management’s key personnel and the portfolio managers who would continue to provide investment advisory, supervision and administrative services to each Renewal Fund. In connection with these considerations, the Board noted that Global X Management had significantly increased its support staff and operational resources since the inception of each Renewal Fund;
• Global X Management’s responsibilities under the Renewal Agreements, among other things,
| Approval of Investment Advisory Agreement (unaudited) (continued) |
| |
to: (i) manage the investment operations of each Renewal Fund and the composition of each Renewal Fund’s assets, including the purchase, retention and disposition of its holdings, (ii) provide quarterly reports to the Trust’s officers and Board and other reports as the Board deems necessary or appropriate, (iii) vote proxies, exercise consents, and exercise all other rights relating to securities and assets held by each Renewal Fund, (iv) select broker- dealers to execute portfolio transactions for each Renewal Fund when necessary, (v) assist in the preparation and filing of reports and proxy statements (if any) to the shareholders of each Renewal Fund, the periodic updating of the registration statement, prospectuses, statement of additional information, and other reports and documents for each Renewal Fund that are required to be filed by the Trust with the SEC and other regulatory and governmental bodies, and (vi) monitor anticipated purchases and redemptions of the shares (including creation units) of each Renewal Fund by shareholders and new investors;
• the nature, extent and quality of the all of the services (including advisory, administrative and compliance services) that have been provided by Global X Management or made available to each Renewal Fund and the adequacy of Global X Management’s personnel resources that would continue to be made available to each Renewal Fund; and
• Global X Management’s experience and the professional qualifications of Global X Management’s key personnel.
Based on these considerations, the Board concluded that it was satisfied with the nature, extent and quality of the services provided to each Renewal Funds by Global X Management.
Performance
With respect to this fact, the Board considered each Renewal Fund’s total return and investment performance relative to (i) the performance of unaffiliated comparable specialized and/or focused exchange-traded funds and other registered funds in the same classification as each of the Renewal Funds, which performance information is publicly available from such registered funds as well as other third party sources; and (ii) the performance of comparable registered funds, pertinent indexes, and pertinent registered fund performance rankings. The Board noted that most of the Renewal Funds had only been in operations for a few months and that some Renewal Funds had not yet commenced operations. The Board observed that, for the Renewal Funds that had not commenced operations, meaningful data relating to investment performance was not available and, therefore, could not be a factor in approving the Renewal Agreements for the non- operational Renewal Funds.
Based on these considerations and comparisons, the Board concluded that the investment performance of each operational Renewal Fund did not adversely affect the Board approval of the continuance of the Renewal Agreements.
Cost of Services and Profitability
The Board considered Global X Management’s cost to provide investment management and related services to each Renewal Fund. In this regard, the Board considered the Management Fee that has been borne by each Renewal Fund under the Renewal Agreements for the various investment advisory, supervisory and administrative services that each Renewal Fund requires under a unitary fee structure (including the types of fees and expenses that are not included within the unitary fee and would be borne by each Renewal Fund).
| Approval of Investment Advisory Agreement (unaudited) (continued) |
| |
In addition, the Board considered the current and expected profitability to Global X Management from all services provided to the Renewal Funds and all aspects of Global X Management’s relationship with each of the Renewal Funds. In connection with these considerations, the Global X Management provided the Board with financial information regarding its operations and services to the Renewal Funds and discussed with the Board its current and expected profitability with respect to the Renewal Funds. Global X Management noted that it was likely that it would not generate profits in the upcoming year from its services to certain of the newer or smaller Renewal Funds because of the small amount of assets under management for those Renewal Funds.
Based on these considerations, the Board concluded that the profits anticipated to be realized by Global X Management from its relationship with each of the Renewal Funds would not be excessive and should not preclude approval of the continuance of each Renewal Agreement.
Comparison of Fees and Services
With respect to this factor, the Board considered:
• comparative information with respect to the Management Fee paid to Global X Management by each of the Renewal Funds. In connection with this consideration, Global X Management provided the Board with detailed comparative expense data for each of the Renewal Funds, including fees and expenses paid by unaffiliated comparable specialized and/or focused exchange-traded funds and other comparable registered funds and fees and expenses paid by other funds that are series of the Trust under the same unified Management Fee structure;
• the structure of the unified Management Fee structure (which includes as one component the investment advisory fee for each Renewal Fund) and the current total expense ratios for each of the Renewal Funds. In this regard, the Board took into consideration that the purpose of adopting a unitary Management Fee structure for the Renewal Funds was to create a simple, all-inclusive fee that would provide a level of predictability with respect to the overall expense ratio (i.e., the total fees) of each of the Renewal Funds and that the proposed Management Fee for each Renewal Fund was set at a competitive fee to make each Renewal Fund viable in the marketplace; and
• that Global X Management is responsible for most ordinary expenses of the Renewal Funds, including the costs of various third-party services required by the Funds, including investment advisory, administrative, audit, certain custody, portfolio accounting, legal, transfer agency and printing costs, but that each Renewal Fund would bear other expenses not covered under the proposed all-inclusive Management Fee, such as asset-based custody fees for certain of the Renewal Funds, taxes, brokerage fees, commissions, and other transaction expenses, interest expenses, and extraordinary expenses.
Based on these considerations, the Board concluded that the Management Fee and total expense ratio of each Renewal Fund should not preclude approval of the Renewal Agreements.
Economies of Scale
With respect to this factor, the Board considered:
• the extent to which economies of scale would be realized as the Renewal Funds grow and whether the unitary Management Fee for each Renewal Fund reflected these economies of scale;
• the significant investment of time, personnel and other resources that Global X Management
| Approval of Investment Advisory Agreement (unaudited) (concluded) |
| |
has made and intends to make in the Renewal Funds in order to seek to assure that the Renewal Funds are attractive to investors; and
• that the proposed unitary Management Fee would provide a high level of certainty as to the total level of expenses for the Renewal Funds and their shareholders.
Based on these considerations, the Board concluded that continuation of the unitary Management Fee for each Renewal Fund was reasonable.
Other Benefits
The Board considered any other benefits realized by Global X Management as a result from its relations relationships with each Renewal Fund and concluded that all information it considered supported approval of the continuation of the Renewal Agreements.
| Supplemental Information (unaudited) |
| |
Net asset value, or “NAV”, is the price per Share at which the Funds issue and redeems Shares. It is calculated in accordance with the standard formula for valuing mutual fund shares. The “Market Price” of the Funds generally is determined using the midpoint between the highest bid and the lowest offer on the stock exchange on which the Shares of the Funds are listed for trading, as of the time that the Funds’ NAV is calculated. The Funds’ Market Price may be at, above or below their NAV. The NAV of the Funds will fluctuate with changes in the market value of their Funds holdings. The Market Price of the Funds will fluctuate in accordance with changes in its NAV, as well as market supply and demand.
Premiums or discounts are the differences (expressed as a percentage) between the NAV and Market Price of the Funds on a given day, generally at the time NAV is calculated. A premium is the amount that the Funds are trading above the reported NAV, expressed as a percentage of the NAV. A discount is the amount that the Funds are trading below the reported NAV, expressed as a percentage of the NAV.
Further information regarding premiums and discounts is available on the Funds’ website at GlobalXFunds.com.
| notice to shareholders (unaudited) |
| |
For shareholders that do not have a February 27, 2012 tax year end, this notice is for informational purposes only. For shareholders with a February 27, 2012 tax year end, please consult your tax advisor as to the pertinence of this notice. For the fiscal year ended February 27, 2012, the liquidated Funds have designated the following items with regard to distributions paid during the year.
| | | Long-Term
Capital Gain
Distributions | | | Ordinary
Income
Distributions | | | Total
Distributions | | | Qualifying
for
Corporate
Dividends
Received
Deduction (1) | | | Qualifying
Dividend
Income (2) | | | Interest
Related
Dividends (3) | | | Short Term
Capital
Gain
Dividends(4) | |
| Global X Oil Equities ETF | | | 0.00 | % | | | 100.00 | % | | | 100.00 | % | | | 58.48 | % | | | 100.00 | % | | | 0.00 | % | | | 0.00 | % |
(1) Qualifying dividends represent dividends which qualify for the corporate dividends received deduction and is reflected as a percentage of ordinary income distributions (the total of short term capital gain and net investment income distributions).
(2) The percentage in this column represents the amount of "Qualifying Dividend Income" as created by the Jobs and Growth Relief Reconciliation Act of 2003 and is reflected as a percentage of ordinary income distributions (the total of short term capital gain and net investment income distributions). It is the intention of each of the aforementioned funds to designate the maximum amount permitted by law.
(3) The percentage in this column represents the amount of "Interest Related Dividends" as created by the American Jobs Creation Act of 2004 and is reflected as a percentage of net investment income distributions that is exempt from U.S. withholding tax when paid for foreign investors.
(4) The percentage in this column represents the amount of "Short-Term Capital Gain Dividends" as created by the American Jobs Creation Act of 2004 and is reflected as a percentage of short-term capital gain distributions that is exempt from U.S. withholding tax when paid to foreign investors.
For the short period ended February 27, 2012, the Funds designate all distributions in the short period as ordinary income distributions
On February 27, 2012, the Funds paid per share income distributions to the shareholders of record on February 21, 2012:
| | | Net Investment Income | |
| Global X Oil Equities ETF | | | 0.0031 | |

399 Park Ave, 32nd floor
New York, NY 10022
1-888-GXFund-1
(1-888-493-8631)
www.globalxfunds.com
Investment Adviser:
Global X Management Company LLC
399 Park Avenue, 32nd floor
New York, NY 10022
Distributor:
SEI Investments Distribution Co.
One Freedom Valley Drive
Oaks, PA 19456
Sub-Administrator:
SEI Investments Global Funds Services
One Freedom Valley Drive
Oaks, PA 19456
Counsel for the Independent Trustees:
Dechert LLP
1175 I Street N.W.
Washington, DC 20007
This information must be preceded or accompanied by a current prospectus for the Funds described.
Global X China Consumer ETF (ticker: CHIQ)
Global X China Energy ETF (ticker: CHIE)
Global X China Financials ETF (ticker: CHIX)
Global X China Industrials ETF (ticker: CHII)
Global X China Materials ETF (ticker: CHIM)
Global X NASDAQ China Technology ETF (ticker: QQQC)
Global X FTSE ASEAN 40 ETF (ticker: ASEA)
Global X FTSE Andean 40 ETF (ticker: AND)
Global X FTSE Colombia 20 ETF (ticker: GXG)
Global X Brazil Mid Cap ETF (ticker: BRAZ)
Global X Brazil Consumer ETF (ticker: BRAQ)
Global X Brazil Financials ETF (ticker: BRAF)
Global X FTSE Argentina 20 ETF (ticker: ARGT)
Global X FTSE Greece 20 ETF (ticker: GREK)
Global X FTSE Norway 30 ETF (ticker: NORW)
Global X FTSE Nordic Region ETF (ticker: GXF)
Semi Annual Report
April 30, 2012
| Schedules of Investments | |
| Global X China Consumer ETF | 1 |
| Global X China Energy ETF | 4 |
| Global X China Financials ETF | 6 |
| Global X China Industrials ETF | 8 |
| Global X China Materials ETF | 11 |
| Global X NASDAQ China Technology ETF | 13 |
| Global X FTSE ASEAN 40 ETF | 15 |
| Global X FTSE Andean 40 ETF | 18 |
| Global X FTSE Colombia 20 ETF | 21 |
| Global X Brazil Mid Cap ETF | 23 |
| Global X Brazil Consumer ETF | 27 |
| Global X Brazil Financials ETF | 30 |
| Global X FTSE Argentina 20 ETF | 32 |
| Global X FTSE Greece 20 ETF | 34 |
| Global X FTSE Norway 30 ETF | 36 |
| Global X FTSE Nordic Region ETF | 38 |
| Statements of Assets and Liabilities | 41 |
| Statements of Operations | 45 |
| Statements of Changes in Net Assets | 49 |
| Financial Highlights | 57 |
| Notes to Financial Statements | 60 |
| Disclosure of Fund Expenses | 73 |
| Approval of Investment Advisory Agreement | 76 |
| Supplemental Information | 81 |
| Notice to Shareholders | 82 |
The Funds file their complete schedules of Fund holdings with the Securities and Exchange Commission (the “Commission”) for the first and third quarters of each fiscal year on Form N-Q within sixty days after the end of the period. The Funds’ Forms N-Q are available on the Commission’s website at http://www.sec.gov, and may be reviewed and copied at the Commission's Public Reference Room in Washington, DC. Information on the operation of the Public Reference Room may be obtained by calling 1-800-SEC-0330.
A description of the policies and procedures that Global X Funds uses to determine how to vote proxies relating to Fund securities, as well as information relating to how the Funds voted proxies relating to Fund securities during the most recent 12-month period ended June 30, will be available (i) without charge, upon request, by calling 1-888-GXFund-1; and (ii) on the Commission’s website at http://www.sec.gov.
| Schedule of Investments | April 30, 2012 (Unaudited) |
| Global X China Consumer ETF |
Sector Weightings†:
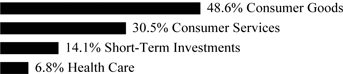
† Percentages based on total investments. Short-Term Investments include a Repurchase Agreement held as collateral
for securities lending activity. Please see Note 8 in Notes to Financial Statements for more detailed information.
| | | Shares | | | Value | |
| COMMON STOCK— 99.8% | | | | | | | | |
| | | | | | | | | |
| CHINA—81.5% | | | | | | | | |
| | | | | | | | | |
| Consumer Goods — 44.1% | | | | | | | | |
| 361 Degrees International (A) | | | 2,383,120 | | | $ | 755,605 | |
| Anta Sports Products (A) | | | 2,120,115 | | | | 2,095,891 | |
| China Yurun Food Group | | | 3,766,916 | | | | 4,821,132 | |
| Dongfeng Motor Group, Cl H | | | 3,284,043 | | | | 6,476,108 | |
| Great Wall Motor, Cl H (A) | | | 2,843,681 | | | | 6,142,833 | |
| Guangzhou Automobile Group, Cl H * | | | 6,054,568 | | | | 6,718,931 | |
| Hengan International Group | | | 600,159 | | | | 6,354,593 | |
| Li Ning (A) | | | 942,326 | | | | 867,188 | |
| Prime Success International Group | | | 1,655,898 | | | | 2,364,761 | |
| Shenzhou International Group Holdings | | | 815,407 | | | | 1,534,409 | |
| Tingyi Cayman Islands Holding | | | 2,217,677 | | | | 5,916,740 | |
| Tsingtao Brewery, Cl H | | | 795,020 | | | | 4,826,283 | |
| Uni-President China Holdings (A) | | | 2,658,896 | | | | 2,416,041 | |
| Want Want China Holdings | | | 5,340,681 | | | | 6,553,110 | |
| Zhongpin (A) * | | | 64,592 | | | | 609,748 | |
| | | | | | | | 58,453,373 | |
| Consumer Services — 29.6% | | | | | | | | |
| Air China, Cl H | | | 5,512,083 | | | | 3,999,797 | |
| Ajisen China Holdings (A) | | | 1,288,148 | | | | 1,444,438 | |
| China Southern Airlines, Cl H * | | | 4,907,005 | | | | 2,207,272 | |
| Focus Media Holding ADR (A) | | | 104,257 | | | | 2,490,700 | |
| Golden Eagle Retail Group (A) | | | 1,705,565 | | | | 4,473,491 | |
| GOME Electrical Appliances Holding (A) | | | 30,196,679 | | | | 5,448,803 | |
| Home Inns & Hotels Management ADR(A) * | | | 37,704 | | | | 895,847 | |
| Intime Department Store Group | | | 3,207,429 | | | | 4,051,324 | |
| New Oriental Education & Technology Group ADR * | | | 190,930 | | | | 5,103,559 | |
| Parkson Retail Group | | | 3,789,697 | | | | 4,239,728 | |
| PCD Stores Group | | | 7,736,127 | | | | 957,213 | |
| Peak Sport Products (A) | | | 1,695,713 | | | | 395,589 | |
| Wumart Stores, Cl H | | | 1,425,262 | | | | 3,295,573 | |
| Youku.com ADR (A) * | | | 13,159 | | | | 316,342 | |
| | | | | | | | 39,319,676 | |
| Health Care — 7.8% | | | | | | | | |
| Shandong Weigao Group Medical Polymer, Cl H | | | 4,515,197 | | | | 5,220,150 | |
The accompanying notes are an integral part of the financial statements.
| Schedule of Investments | April 30, 2012 (Unaudited) |
| Global X China Consumer ETF |
| | | Shares/Face
Amount | | | Value | |
| COMMON STOCK — continued | | | | | | | | |
| | | | | | | | | |
| Health Care — continued | | | | | | | | |
| Sinopharm Group, Cl H | | | 1,991,991 | | | $ | 5,224,751 | |
| | | | | | | | 10,444,901 | |
TOTAL CHINA | | | | | | | 108,217,950 | |
| | | | | | | | | |
| HONG KONG— 18.3% | | | | | | | | |
| Consumer Goods — 12.4% | | | | | | | | |
| AviChina Industry & Technology, Cl H | | | 5,499,954 | | | | 2,537,791 | |
| Bosideng International Holdings | | | 7,760,936 | | | | 2,240,660 | |
| China Agri-Industries Holdings | | | 4,345,680 | | | | 3,203,816 | |
| China Foods | | | 2,004,668 | | | | 2,170,379 | |
| China Resources Enterprise | | | 1,765,174 | | | | 6,415,795 | |
| | | | | | | | 16,568,441 | |
| Consumer Services — 5.9% | | | | | | | | |
| China Dongxiang Group(A) | | | 7,458,119 | | | | 1,009,328 | |
| China Travel International Investment Hong Kong | | | 7,486,733 | | | | 1,505,327 | |
| Chow Tai Fook Jewelry Group * | | | 2,964,625 | | | | 4,462,996 | |
| New World Department Store China | | | 1,063,951 | | | | 726,794 | |
| | | | | | | | 7,704,445 | |
TOTAL HONG KONG | | | | | | | 24,272,886 | |
| TOTAL COMMON STOCK | | | | | | | | |
| (Cost $135,116,224) | | | | | | | 132,490,836 | |
| | | | | | | | | |
| REPURCHASE AGREEMENT — 16.2% | | | | | | | | |
| Merrill Lynch | | | | | | | | |
| 0.170%, dated 04/30/12, to be repurchased on 05/01/12, repurchase price $21,503,650 (collateralized by U.S. Treasury Notes, par value $21,969,800, 0.250%, 12/15/14, with a total market value of $21,933,677) (B) | | | | | | | | |
(Cost $21,503,548) | | $ | 21,503,548 | | | | 21,503,548 | |
| | | | | | | | | |
| TOTAL REPURCHASE AGREEMENT | | | | | | | | |
| (Cost $21,503,548) | | | | | | | 21,503,548 | |
| | | | | | | | | |
| TIME DEPOSIT — 0.1% | | | | | | | | |
| Brown Brothers Harriman, 0.030% | | | | | | | | |
| (Cost $152,100) | | | 152,100 | | | | 152,100 | |
| TOTAL INVESTMENTS — 116.1% | | | | | | | | |
| (Cost $156,771,872) | | | | | | $ | 154,146,484 | |
Percentages are based on Net Assets of $132,792,585.
| * | Non-income producing security. |
| ADR — American Depositary Receipt |
| Cl — Class |
The accompanying notes are an integral part of the financial statements.
| Schedule of Investments | April 30, 2012 (Unaudited) |
| Global X China Consumer ETF |
| (A) | This security or a partial position of this security is on loan at April 30, 2012. The total value of securities on loan at April 30, 2012 was $21,435,648. |
| (B) | This security was purchased with cash collateral held from securities on loan. The total value of such securities as of April 30, 2012 was $21,503,548. |
The following is a summary of the inputs used as of April 30, 2012, in valuing the Fund's investments carried at value:
| Investments in Securities | | Level 1 | | | Level 2 | | | Level 3 | | | Total | |
| Common Stock | | $ | 132,490,836 | | | $ | — | | | $ | — | | | $ | 132,490,836 | |
| Repurchase Agreement | | | — | | | | 21,503,548 | | | | — | | | | 21,503,548 | |
| Time Deposit | | | — | | | | 152,100 | | | | — | | | | 152,100 | |
| Total Investments in Securities | | $ | 132,490,836 | | | $ | 21,655,648 | | | $ | — | | | $ | 154,146,484 | |
For the period ended April 30, 2012, there have been no transfers between Level 1 and Level 2 investments.
For the period ended April 30, 2012, there were no Level 3 investments.
The accompanying notes are an integral part of the financial statements.
| Schedule of Investments | April 30, 2012 (Unaudited) |
| Global X China Energy ETF |
Sector Weightings †:

† Percentages based on total investments.
| | | Shares | | | Value | |
| COMMON STOCK — 99.9% |
| |
| CHINA— 63.5% | | | | | | | | |
| | | | | | | | | |
| Energy — 52.4% | | | | | | | | |
| China Coal Energy, Cl H | | | 203,904 | | | $ | 234,163 | |
| China Longyuan Power Group, Cl H | | | 240,687 | | | | 190,163 | |
| China Oilfield Services, Cl H | | | 152,880 | | | | 247,882 | |
| China Petroleum & Chemical, Cl H | | | 437,024 | | | | 470,896 | |
| China Shenhua Energy, Cl H | | | 111,501 | | | | 495,087 | |
| JA Solar Holdings ADR * | | | 14,033 | | | | 18,243 | |
| LDK Solar ADR * | | | 13,167 | | | | 41,871 | |
| PetroChina, Cl H | | | 327,931 | | | | 497,054 | |
| Suntech Power Holdings ADR * | | | 16,180 | | | | 40,774 | |
| Tianneng Power International | | | 55,415 | | | | 27,427 | |
| Trina Solar ADR * | | | 3,281 | | | | 23,820 | |
| Yanzhou Coal Mining, Cl H * | | | 105,697 | | | | 220,967 | |
| Yingli Green Energy Holding ADR * | | | 6,622 | | | | 24,104 | |
| | | | | | | | 2,532,451 | |
| Utilities — 11.1% | | | | |
| Datang International Power Generation, Cl H | | | 280,589 | | | | 99,814 | |
| ENN Energy Holdings | | | 64,683 | | | | 227,597 | |
| Huadian Power International, Cl H | | | 137,768 | | | | 31,785 | |
| Huaneng Power International, Cl H | | | 300,400 | | | | 178,103 | |
| | | | | | | | 537,299 | |
TOTAL CHINA | | | | | | | 3,069,750 | |
| | | | | | | | | |
| HONG KONG— 36.4% | | | | | | | | |
| | | | | | | | | |
| Energy — 26.6% | | | | |
| Beijing Enterprises Holdings | | | 36,694 | | | | 205,257 | |
| China Gas Holdings | | | 281,693 | | | | 140,145 | |
| CNOOC | | | 232,325 | | | | 495,274 | |
| Kunlun Energy | | | 125,122 | | | | 220,614 | |
| Shougang Fushan Resources Group | | | 409,642 | | | | 143,611 | |
| United Energy Group * | | | 348,731 | | | | 75,961 | |
| | | | | | | | 1,280,862 | |
| Utilities — 9.8% | | | | |
| China Power International Development | | | 143,640 | | | | 32,584 | |
| China Resources Power Holdings | | | 127,240 | | | | 232,221 | |
| GCL-Poly Energy Holdings | | | 813,609 | | | | 210,778 | |
| | | | | | | | 475,583 | |
The accompanying notes are an integral part of the financial statements.
| Schedule of Investments | April 30, 2012 (Unaudited) |
| Global X China Energy ETF |
| | | Value | |
| COMMON STOCK — continued | | | | |
| | | | | |
TOTAL HONG KONG | | $ | 1,756,445 | |
| TOTAL COMMON STOCK | | | | |
| (Cost $4,876,543) | | | 4,826,195 | |
| TOTAL INVESTMENTS — 99.9% | | | | |
| (Cost $4,876,543) | | $ | 4,826,195 | |
Percentages are based on Net Assets of $4,829,740.
| * | Non-income producing security. |
| | |
| ADR — American Depositary Receipt |
| Cl — Class |
The following is a summary of the inputs used as of April 30, 2012, in valuing the Fund's investments carried at value:
| Investments in Securities | | Level 1 | | | Level 2 | | | Level 3 | | | Total | |
| Common Stock | | $ | 4,826,195 | | | $ | — | | | $ | — | | | $ | 4,826,195 | |
| Total Investments in Securities | | $ | 4,826,195 | | | $ | — | | | $ | — | | | $ | 4,826,195 | |
For the period ended April 30, 2012, there have been no transfers between Level 1 and Level 2 investments.
For the period ended April 30, 2012, there were no Level 3 investments.
The accompanying notes are an integral part of the financial statements.
| Schedule of Investments | April 30, 2012 (Unaudited) |
| Global X China Financials ETF |
Sector Weightings †:

† Percentages based on total investments.
| | | Shares | | | Value | |
| COMMON STOCK — 99.9% |
| |
| CHINA— 84.5% | | | | | | | | |
| | | | | | | | | |
| Financials — 84.5% | | | | | | | | |
| Agile Property Holdings | | | 114,753 | | | $ | 149,974 | |
| Agricultural Bank of China, Cl H | | | 1,159,894 | | | | 551,644 | |
| Bank of China, Cl H | | | 2,620,695 | | | | 1,097,776 | |
| Bank of Communications, Cl H | | | 377,784 | | | | 292,152 | |
| China Citic Bank, Cl H | | | 757,953 | | | | 482,595 | |
| China Construction Bank, Cl H | | | 1,398,318 | | | | 1,088,571 | |
| China Life Insurance, Cl H | | | 178,368 | | | | 482,781 | |
| China Merchants Bank, Cl H | | | 248,761 | | | | 539,931 | |
| China Minsheng Banking, Cl H | | | 514,154 | | | | 533,461 | |
| China Pacific Insurance Group, Cl H | | | 163,762 | | | | 535,063 | |
| Chongqing Rural Commercial Bank, Cl H * | | | 234,467 | | | | 108,490 | |
| CITIC Securities, Cl H * | | | 62,114 | | | | 130,494 | |
| Country Garden Holdings * | | | 399,964 | | | | 173,726 | |
| Evergrande Real Estate Group | | | 376,736 | | | | 218,021 | |
| Greentown China Holdings | | | 50,656 | | | | 35,322 | |
| Guangzhou R&F Properties | | | 88,856 | | | | 118,648 | |
| Industrial & Commercial Bank of China, Cl H | | | 1,653,503 | | | | 1,103,948 | |
| Kaisa Group Holdings * | | | 192,232 | | | | 40,633 | |
| Longfor Properties | | | 116,314 | | | | 184,995 | |
| PICC Property & Casualty, Cl H | | | 363,564 | | | | 455,940 | |
| Ping An Insurance Group, Cl H | | | 65,666 | | | | 549,287 | |
| Renhe Commercial Holdings | | | 916,477 | | | | 53,155 | |
| Shimao Property Holdings | | | 118,904 | | | | 157,238 | |
| Shui On Land | | | 222,496 | | | | 93,201 | |
| Sino-Ocean Land Holdings | | | 381,117 | | | | 177,820 | |
| Soho China | | | 177,547 | | | | 137,989 | |
TOTAL CHINA | | | | | | | 9,492,855 | |
| | | | | | | | | |
| HONG KONG— 15.4% | | | | | | | | |
| | | | | | | | | |
| Financials — 15.4% | | | | |
| China Everbright | | | 81,198 | | | | 128,934 | |
| China Overseas Land & Investment | | | 247,232 | | | | 535,975 | |
| China Resources Land | | | 180,776 | | | | 348,101 | |
| China Taiping Insurance Holdings * | | | 71,673 | | | | 149,468 | |
| Franshion Properties China | | | 281,558 | | | | 77,660 | |
| Hopson Development Holdings | | | 64,109 | | | | 38,588 | |
The accompanying notes are an integral part of the financial statements.
| Schedule of Investments | April 30, 2012 (Unaudited) |
| Global X China Financials ETF |
| | | Shares/Face
Amount | | | Value | |
| COMMON STOCK — continued |
| |
| Financials — continued | | | | | | | | |
| KWG Property Holding | | | 108,447 | | | $ | 71,705 | |
| New China Life Insurance, Cl H * | | | 55,567 | | | | 251,026 | |
| Poly Hong Kong Investments | | | 157,707 | | | | 82,526 | |
| Shenzhen Investment | | | 183,921 | | | | 42,906 | |
TOTAL HONG KONG | | | | | | | 1,726,889 | |
| TOTAL COMMON STOCK | | | | | | | | |
| (Cost $11,187,162) | | | | | | | 11,219,744 | |
| | | | | | | | | |
| TIME DEPOSIT — 0.1% | | | | | | | | |
| Brown Brothers Harriman, 0.030% | | | | | | | | |
| (Cost $13,263) | | $ | 13,263 | | | | 13,263 | |
| TOTAL INVESTMENTS — 100.0% | | | | | | | | |
| (Cost $11,200,425) | | | | | | $ | 11,233,007 | |
Percentages are based on Net Assets of $11,234,177.
| * | Non-income producing security. |
The following is a summary of the inputs used as of April 30, 2012, in valuing the Fund's investments carried at value:
| Investments in Securities | | Level 1 | | | Level 2 | | | Level 3 | | | Total | |
| Common Stock | | $ | 11,219,744 | | | $ | — | | | $ | — | | | $ | 11,219,744 | |
| Time Deposit | | | — | | | | 13,263 | | | | — | | | | 13,263 | |
| Total Investments in Securities | | $ | 11,219,744 | | | $ | 13,263 | | | $ | — | | | $ | 11,233,007 | |
For the period ended April 30, 2012, there have been no transfers between Level 1 and Level 2 investments.
For the period ended April 30, 2012, there were no Level 3 investments.
The accompanying notes are an integral part of the financial statements.
| Schedule of Investments | April 30, 2012 (Unaudited) |
Global X China Industrials ETF
Sector Weightings †:

† Percentages based on total investments.
| | | Shares | | | Value | |
| COMMON STOCK — 99.8% |
| CHINA— 85.6% | | | | | | | | |
| Industrials — 85.6% | | | | | | | | |
| Anhui Conch Cement, Cl H | | | 68,274 | | | $ | 228,793 | |
| Asia Cement China Holdings | | | 54,973 | | | | 27,137 | |
| BBMG, Cl H | | | 131,370 | | | | 113,445 | |
| Byd, Cl H | | | 79,395 | | | | 209,267 | |
| China Communications Construction, Cl H | | | 233,951 | | | | 235,198 | |
| China COSCO Holdings, Cl H | | | 304,672 | | | | 176,709 | |
| China Liansu Group Holdings | | | 106,582 | | | | 67,037 | |
| China National Building Material, Cl H | | | 160,975 | | | | 217,437 | |
| China National Materials | | | 135,446 | | | | 52,372 | |
| China Railway Construction, Cl H | | | 222,850 | | | | 177,794 | |
| China Railway Group, Cl H | | | 496,739 | | | | 197,194 | |
| China Rongsheng Heavy Industry Group | | | 355,025 | | | | 88,772 | |
| China Shanshui Cement Group | | | 232,354 | | | | 188,371 | |
| China Shipping Container Lines, Cl H * | | | 442,856 | | | | 144,410 | |
| China Shipping Development, Cl H | | | 153,010 | | | | 99,592 | |
| China South Locomotive and Rolling Stock | | | 217,560 | | | | 175,536 | |
| China Zhongwang Holdings | | | 594,790 | | | | 245,317 | |
| Dongfang Electric, Cl H | | | 40,130 | | | | 109,394 | |
| First Tractor, Cl H | | | 45,448 | | | | 42,410 | |
| Guangshen Railway, Cl H | | | 177,253 | | | | 65,796 | |
| Haitian International Holdings | | | 69,200 | | | | 79,647 | |
| Harbin Power Equipment, Cl H | | | 79,594 | | | | 82,993 | |
| Jiangsu Expressway, Cl H | | | 126,487 | | | | 124,716 | |
| Metallurgical Corp of China, Cl H | | | 338,960 | | | | 75,580 | |
| Sany Heavy Equipment International Holdings | | | 101,830 | | | | 78,617 | |
| Shanghai Electric Group, Cl H | | | 330,043 | | | | 166,327 | |
| Sinotruk Hong Kong | | | 159,727 | | | | 97,376 | |
| Weichai Power, Cl H * | | | 47,744 | | | | 224,916 | |
| Yangzijiang Shipbuilding Holdings | | | 211,109 | | | | 201,300 | |
| Zhuzhou CSR Times Electric, Cl H | | | 53,850 | | | | 152,694 | |
TOTAL CHINA | | | | | | | 4,146,147 | |
| HONG KONG— 14.2% | | | | | | | | |
| Industrials — 14.2% | | | | |
| Beijing Capital International Airport, Cl H | | | 175,123 | | | | 114,436 | |
| China High Speed Transmission Equipment Group | | | 134,150 | | | | 65,012 | |
The accompanying notes are an integral part of the financial statements.
| Schedule of Investments | April 30, 2012 (Unaudited) |
Global X China Industrials ETF
| | | Shares/Face
Amount | | | Value | |
| COMMON STOCK — continued |
| Industrials — continued | | | | | | | | |
| China Resources Cement Holdings | | | 204,758 | | | $ | 162,568 | |
| Citic Resources Holdings * | | | 285,141 | | | | 47,042 | |
| Shanghai Industrial Holdings | | | 70,119 | | | | 234,524 | |
| Shenzhen International Holdings | | | 930,568 | | | | 63,568 | |
TOTAL HONG KONG | | | | | | | 687,150 | |
| TOTAL COMMON STOCK | | | | | | | | |
| (Cost $6,543,435) | | | | | | | 4,833,297 | |
| |
| TIME DEPOSIT — 0.2% |
| Brown Brothers Harriman, 0.030% | | | | | | | | |
| (Cost $8,468) | | $ | 8,468 | | | | 8,468 | |
| TOTAL INVESTMENTS — 100.0% | | | | | | | | |
| (Cost $6,551,903) | | | | | | $ | 4,841,765 | |
Percentages are based on Net Assets of $4,840,585.
| * | Non-income producing security. |
Cl — Class
The following is a summary of the inputs used as of April 30, 2012, in valuing the Fund’s investments carried at value:
| Investments in Securities | | Level 1 | | | Level 2 | | | Level 3 | | | Total | |
| Common Stock | | $ | 4,833,297 | | | $ | — | | | $ | — | | | $ | 4,833,297 | |
| Time Deposit | | | — | | | | 8,468 | | | | — | | | | 8,468 | |
| Total Investments in Securities | | $ | 4,833,297 | | | $ | 8,468 | | | $ | — | | | $ | 4,841,765 | |
The accompanying notes are an integral part of the financial statements.
| Schedule of Investments | April 30, 2012 (Unaudited) |
Global X China Industrials ETF
The following is a reconciliation of investments in which significant unobservable inputs (Level 3) were used in determining fair value:
| | | China | |
| | | Investments in | |
| | | Common Stock | |
| | | | |
| Beginning Balance as of November 1, 2011 | | $ | 3,848 | |
| Accrued discounts/premiums | | | - | |
| Realized gain/(loss) | | | - | |
| Change in unrealized appreciation/(depreciation) | | | - | |
| Net purchases | | | - | |
| Net sales | | | - | |
| Transfers into Level 3 | | | - | |
| Transfers out of Level 3 | | | (3,848 | ) |
| Ending Balance as of April 30, 2012 | | $ | - | |
For the period ended April 30, 2012, there have been no transfers between Level 1 and Level 2 investments.
For the period ended April 30, 2012, transfers between Level 1 and Level 3 assets and liabilities totaled $3,848.
The investment presented above was considered a Level 3 investment at the beginning of the reporting period. The reason for the transfer was a temporary trading suspension of the investment’s shares, which necessitated a fair value determination by the Fair Value Committee at the end of the prior reporting period. The investment has resumed trading and was transferred to Level 1. The Fund’s policy is to transfer investments into/out of Level 3 at the end of the reporting period.
The accompanying notes are an integral part of the financial statements.
| Schedule of Investments | April 30, 2012 (Unaudited) |
Global X China Materials ETF
Sector Weightings †:

† Percentages based on total investments.
| | | Shares | | | Value | |
| COMMON STOCK — 99.8% |
| CHINA — 72.8% | | | | | | | | |
| Basic Materials — 72.8% | | | | | | | | |
| Aluminum Corp of China, Cl H * | | | 273,640 | | | $ | 132,964 | |
| Angang Steel, Cl H | | | 193,764 | | | | 132,612 | |
| China BlueChemical | | | 174,107 | | | | 124,544 | |
| China Hongqiao Group * | | | 204,744 | | | | 127,723 | |
| China Molybdenum, Cl H | | | 288,727 | | | | 112,385 | |
| China Rare Earth Holdings * | | | 245,006 | | | | 64,420 | |
| China Vanadium Titano - Magnetite Mining | | | 199,620 | | | | 45,540 | |
| Dongyue Group | | | 137,185 | | | | 102,730 | |
| Gulf Resources * | | | 6,722 | | | | 14,654 | |
| Hidili Industry International Development | | | 227,363 | | | | 77,950 | |
| Hunan Non-Ferrous Metal, Cl H | | | 371,854 | | | | 108,796 | |
| Jiangxi Copper, Cl H | | | 54,661 | | | | 132,167 | |
| Lingbao Gold, Cl H | | | 64,198 | | | | 31,856 | |
| Maanshan Iron & Steel, Cl H | | | 419,766 | | | | 118,485 | |
| Real Gold Mining (A) (B) | | | 97,864 | | | | 28,002 | |
| Sinopec Shanghai Petrochemical, Cl H | | | 359,204 | | | | 125,002 | |
| Sinopec Yizheng Chemical Fibre, Cl H | | | 338,878 | | | | 77,746 | |
| Xinjiang Xinxin Mining Industry, Cl H | | | 156,094 | | | | 42,652 | |
| Yongye International * | | | 8,879 | | | | 28,502 | |
| Zhaojin Mining Industry | | | 85,456 | | | | 119,615 | |
| Zijin Mining Group, Cl H * | | | 336,238 | | | | 109,643 | |
TOTAL CHINA | | | | | | | 1,857,988 | |
| HONG KONG— 27.0% | | | | | | | | |
| Basic Materials — 27.0% | | | | | | | | |
| China Lumena New Materials | | | 682,965 | | | | 124,998 | |
| Citic Pacific | | | 77,339 | | | | 127,392 | |
| Fufeng Group | | | 164,402 | | | | 66,747 | |
| Kinetic Mines and Energy * | | | 354,265 | | | | 45,204 | |
| North Mining Shares, Cl C * | | | 632,169 | | | | 20,044 | |
| Shougang Concord International Enterprises | | | 1,160,526 | | | | 62,075 | |
| Sinofert Holdings | | | 402,160 | | | | 87,599 | |
| Yingde Gases | | | 133,812 | | | | 155,566 | |
TOTAL HONG KONG | | | | | | | 689,625 | |
The accompanying notes are an integral part of the financial statements.
| Schedule of Investments | April 30, 2012 (Unaudited) |
Global X China Materials ETF
| | | Value | |
| COMMON STOCK — continued | | | | |
| TOTAL COMMON STOCK | | | | |
| (Cost $3,533,733) | | $ | 2,547,613 | |
| TOTAL INVESTMENTS — 99.8% | | | | |
| (Cost $3,533,733) | | $ | 2,547,613 | |
Percentages are based on Net Assets of $2,551,586.
| * | Non-income producing security. |
Cl — Class
| (A) | Securities considered illiquid. The total value of such securities as of April 30, 2012 was $28,002 and represented 1.1% of Net Assets. |
| (B) | Security is fair valued using methods determined in good faith by the Fair Value Committee of the Fund. The total value of such securities as of April 30, 2012, was $28,002 and represents 1.1% of net assets. |
The following is a summary of the inputs used as of April 30, 2012, in valuing the Fund’s investments carried at value:
| Investments in Securities | | Level 1 | | | Level 2 | | | Level 3 | | | Total | |
| Common Stock | | $ | 2,519,611 | | | $ | — | | | $ | 28,002 | | | $ | 2,547,613 | |
| Total Investments in Securities | | $ | 2,519,611 | | | $ | — | | | $ | 28,002 | | | $ | 2,547,613 | |
The following is a reconciliation of investments in which significant unobservable inputs (Level 3) were used in determining fair value:
| | | China | |
| | | Investments in | |
| | | Common Stock | |
| | | | |
| Beginning Balance as of November 1, 2011 | | $ | 74,830 | |
| Accrued discounts/premiums | | | - | |
| Realized gain/(loss) | | | (51,187 | ) |
| Change in unrealized appreciation/(depreciation) | | | 4,309 | |
| Net purchases | | | 36,244 | |
| Net sales | | | (36,194 | ) |
| Transfers into Level 3 | | | - | |
| Transfers out of Level 3 | | | - | |
| Ending Balance as of April 30, 2012 | | $ | 28,002 | |
Net change in unrealized appreciation/(depreciation) from investments (Level 3) still held as of April 30, 2012 is $4,309.
For the period ended April 30, 2012, there have been no transfers between Level 1 and Level 2 assets and liabilities.
For the period ended April 30, 2012, there have been no transfers between Level 2 and Level 3 assets and liabilities.
The accompanying notes are an integral part of the financial statements.
| Schedule of Investments | April 30, 2012 (Unaudited) |
Global X NASDAQ China Technology ETF
Sector Weightings †:

† Percentages based on total investments.
| | | Shares | | | Value | |
| COMMON STOCK — 99.9% |
| CHINA — 76.0% | | | | | | | | |
| Technology — 76.0% | | | | | | | | |
| 21Vianet Group ADR * | | | 8,366 | | | $ | 109,846 | |
| AsiaInfo Holdings * | | | 14,876 | | | | 187,438 | |
| AutoNavi Holdings ADR * | | | 2,592 | | | | 30,586 | |
| Baidu ADR * | | | 2,782 | | | | 369,171 | |
| China Communications Services, Cl H | | | 198,040 | | | | 101,845 | |
| China Wireless Technologies | | | 444,730 | | | | 67,638 | |
| iSoftStone Holdings ADR * | | | 11,870 | | | | 94,722 | |
| Kingdee International Software Group | | | 520,305 | | | | 116,016 | |
| Lenovo Group | | | 429,256 | | | | 412,733 | |
| NetEase ADR * | | | 3,627 | | | | 218,781 | |
| Qihoo 360 Technology ADR * | | | 7,903 | | | | 194,177 | |
| Semiconductor Manufacturing International * | | | 3,596,331 | | | | 178,457 | |
| SINA * | | | 5,587 | | | | 326,895 | |
| Sky-mobi ADR * | | | 2,139 | | | | 6,374 | |
| Sohu.com * | | | 3,853 | | | | 198,699 | |
| Spreadtrum Communications ADR | | | 9,938 | | | | 137,145 | |
| Tencent Holdings | | | 14,599 | | | | 458,744 | |
| VanceInfo Technologies ADR * | | | 11,048 | | | | 143,071 | |
| ZTE, Cl H | | | 63,556 | | | | 154,167 | |
TOTAL CHINA | | | | | | | 3,506,505 | |
| HONG KONG— 23.9% | | | | | | | | |
| Technology — 23.9% | | | | | | | | |
| ASM Pacific Technology | | | 26,981 | | | | 365,489 | |
| Comba Telecom Systems Holdings | | | 126,388 | | | | 70,047 | |
| Digital China Holdings | | | 94,640 | | | | 179,555 | |
| Foxconn International Holdings * | | | 270,550 | | | | 128,324 | |
| TCL Communication Technology Holdings | | | 153,994 | | | | 61,529 | |
| VODone | | | 748,511 | | | | 107,087 | |
| VTech Holdings | | | 16,871 | | | | 189,179 | |
TOTAL HONG KONG | | | | | | | 1,101,210 | |
| TOTAL COMMON STOCK | | | | | | | | |
| (Cost $4,226,030) | | | | | | | 4,607,715 | |
The accompanying notes are an integral part of the financial statements.
| Schedule of Investments | April 30, 2012 (Unaudited) |
Global X NASDAQ China Technology ETF
| | | Face Amount | | | Value | |
| TIME DEPOSIT — 0.1% |
| Brown Brothers Harriman, 0.030% | | | | | | | | |
| (Cost $6,299) | | $ | 6,299 | | | $ | 6,299 | |
| TOTAL INVESTMENTS — 100.0% | | | | | | | | |
| (Cost $4,232,329) | | | | | | $ | 4,614,014 | |
Percentages are based on Net Assets of $4,614,097.
| * | Non-income producing security. |
ADR — American Depositary Receipt
Cl — Class
The following is a summary of the inputs used as of April 30, 2012, in valuing the Fund’s investments carried at value:
| Investments in Securities | | Level 1 | | | Level 2 | | | Level 3 | | | Total | |
| Common Stock | | $ | 4,607,715 | | | $ | — | | | $ | — | | | $ | 4,607,715 | |
| Time Deposit | | | — | | | | 6,299 | | | | — | | | | 6,299 | |
| Total Investments in Securities | | $ | 4,607,715 | | | $ | 6,299 | | | $ | — | | | $ | 4,614,014 | |
|
For the period ended April 30, 2012, there have been no transfers between Level 1 and Level 2 investments.
For the period ended April 30, 2012, there were no Level 3 investments.
The accompanying notes are an integral part of the financial statements.
| Schedule of Investments | April 30, 2012 (Unaudited) |
Global X FTSE ASEAN 40 ETF
Sector Weightings †:

† Percentages based on total investments.
| | | Shares | | | Value | |
| COMMON STOCK — 99.3% |
| INDONESIA — 21.3% | | | | | | | | |
| Consumer Goods — 8.2% | | | | | | | | |
| Astra International | | | 237,494 | | | $ | 1,834,729 | |
| Gudang Garam | | | 45,557 | | | | 293,452 | |
| Unilever Indonesia | | | 122,200 | | | | 263,932 | |
| | | | | | | | 2,392,113 | |
| Financials — 7.2% | | | | | | | | |
| Bank Central Asia | | | 963,207 | | | | 838,437 | |
| Bank Mandiri | | | 728,132 | | | | 586,277 | |
| Bank Rakyat Indonesia Persero | | | 959,954 | | | | 694,597 | |
| | | | | | | | 2,119,311 | |
| Industrials — 2.4% | | | | | | | | |
| United Tractors | | | 219,041 | | | | 705,469 | |
| Telecommunications — 2.5% | | | | | | | | |
| Telekomunikasi Indonesia ADR | | | 19,918 | | | | 721,231 | |
| Utilities — 1.0% | | | | | | | | |
| Perusahaan Gas Negara | | | 776,300 | | | | 282,967 | |
TOTAL INDONESIA | | | | | | | 6,221,091 | |
| MALAYSIA — 29.0% | | | | | | | | |
| Basic Materials — 1.9% | | | | | | | | |
| Petronas Chemicals Group | | | 251,284 | | | | 542,262 | |
| Consumer Goods — 2.2% | | | | | | | | |
| IOI | | | 378,145 | | | | 652,319 | |
| Consumer Services — 2.5% | | | | | | | | |
| Genting | | | 217,884 | | | | 744,521 | |
| Financials — 12.3% | | | | | | | | |
| CIMB Group Holdings | | | 437,796 | | | | 1,072,065 | |
| Malayan Banking | | | 451,594 | | | | 1,287,923 | |
The accompanying notes are an integral part of the financial statements.
| Schedule of Investments | April 30, 2012 (Unaudited) |
Global X FTSE ASEAN 40 ETF
| | | Shares | | | Value | |
| COMMON STOCK — continued |
| Financials — continued | | | | | | | | |
| Public Bank | | | 277,740 | | | $ | 1,255,613 | |
| | | | | | | | 3,615,601 | |
| Industrials — 3.9% | | | | | | | | |
| Sime Darby | | | 353,726 | | | | 1,138,563 | |
| Oil & Gas — 1.2% | | | | | | | | |
| Petronas Gas | | | 61,902 | | | | 343,263 | |
| Telecommunications — 4.2% | | | | | | | | |
| Axiata Group | | | 497,732 | | | | 873,416 | |
| Maxis | | | 179,600 | | | | 363,236 | |
| | | | | | | | 1,236,652 | |
| Utilities — 0.8% | | | | | | | | |
| Tenaga Nasional | | | 108,000 | | | | 229,491 | |
TOTAL MALAYSIA | | | | | | | 8,502,672 | |
| PHILIPPINES—0.7% | | | | | | | | |
| Telecommunications — 0.7% | | | | | | | | |
| Philippine Long Distance Telephone ADR | | | 3,474 | | | | 210,941 | |
| SINGAPORE—36.2% | | | | | | | | |
| Consumer Goods — 2.7% | | | | | | | | |
| Wilmar International | | | 200,447 | | | | 788,830 | |
| Consumer Services — 5.2% | | | | | | | | |
| Genting Singapore * | | | 479,110 | | | | 669,786 | |
| Jardine Cycle & Carriage | | | 11,162 | | | | 425,464 | |
| Singapore Airlines | | | 46,737 | | | | 404,110 | |
| | | | | | | | 1,499,360 | |
| Financials — 18.7% | | | | | | | | |
| CapitaLand | | | 249,993 | | | | 593,923 | |
| City Developments | | | 54,200 | | | | 444,111 | |
| DBS Group Holdings | | | 138,353 | | | | 1,560,734 | |
| Oversea-Chinese Banking | | | 201,798 | | | | 1,461,099 | |
| United Overseas Bank | | | 92,157 | | | | 1,433,553 | |
| | | | | | | | 5,493,420 | |
| Industrials — 1.0% | | | | | | | | |
| Singapore Technologies Engineering | | | 121,600 | | | | 295,771 | |
| Oil & Gas — 3.2% | | | | | | | | |
| Keppel | | | 104,825 | | | | 936,013 | |
| Telecommunications — 5.4% | | | | | | | | |
| Singapore Telecommunications | | | 625,028 | | | | 1,575,828 | |
TOTAL SINGAPORE | | | | | | | 10,589,222 | |
The accompanying notes are an integral part of the financial statements.
| Schedule of Investments | April 30, 2012 (Unaudited) |
Global X FTSE ASEAN 40 ETF
| | | Shares/Face
Amount | | | Value | |
| COMMON STOCK — continued |
| THAILAND — 12.1% | | | | | | | | |
| Financials — 4.6% | | | | | | | | |
| Bangkok Bank | | | 37,508 | | | $ | 232,977 | |
| Kasikornbank | | | 91,896 | | | | 488,618 | |
| Siam Commercial Bank | | | 122,028 | | | | 615,100 | |
| | | | | | | | 1,336,695 | |
| Industrials — 0.9% | | | | | | | | |
| Siam Cement | | | 23,708 | | | | 269,847 | |
| Oil & Gas — 4.7% | | | | | | | | |
| PTT | | | 67,189 | | | | 766,938 | |
| PTT Exploration & Production | | | 103,692 | | | | 598,547 | |
| | | | | | | | 1,365,485 | |
| Telecommunications — 1.9% | | | | | | | | |
| Advanced Info Service | | | 94,300 | | | | 561,200 | |
TOTAL THAILAND | | | | | | | 3,533,227 | |
| TOTAL COMMON STOCK | | | | | | | | |
| (Cost $28,535,933) | | | | | | | 29,057,153 | |
| |
| TIME DEPOSIT — 0.0% |
| Brown Brothers Harriman, 0.030% | | | | | | | | |
| (Cost $8,383) | | $ | 8,383 | | | | 8,383 | |
| TOTAL INVESTMENTS — 99.3% | | | | | | | | |
| (Cost $28,544,316) | | | | | | $ | 29,065,536 | |
Percentages are based on Net Assets of $29,272,941.
| * | Non-income producing security. |
ADR — American Depositary Receipt
The following is a summary of the inputs used as of April 30, 2012, in valuing the Fund’s investments carried at value:
| Investments in Securities | | Level 1 | | | Level 2 | | | Level 3 | | | Total | |
| Common Stock | | $ | 29,057,153 | | | $ | — | | | $ | — | | | $ | 29,057,153 | |
| Time Deposit | | | — | | | | 8,383 | | | | — | | | | 8,383 | |
| Total Investments in Securities | | $ | 29,057,153 | | | $ | 8,383 | | | $ | — | | | $ | 29,065,536 | |
For the period ended April 30, 2012, there have been no transfers between Level 1 and Level 2 investments.
For the period ended April 30, 2012, there were no Level 3 investments.
The accompanying notes are an integral part of the financial statements.
| Schedule of Investments | April 30, 2012 (Unaudited) |
Global X FTSE Andean 40 ETF
Sector Weightings †:
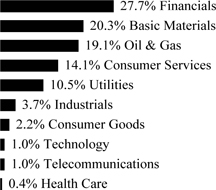
† Percentages based on total investments.
| | | Shares | | | Value | |
| COMMON STOCK — 98.1% |
| CHILE — 49.1% | | | | | | | | |
| Basic Materials — 8.9% | | | | | | | | |
| CAP | | | 4,997 | | | $ | 209,625 | |
| Empresas CMPC | | | 50,505 | | | | 207,600 | |
| Sociedad Quimica y Minera de Chile ADR | | | 5,532 | | | | 322,460 | |
| | | | | | | | 739,685 | |
| Consumer Goods — 2.2% | | | | | | | | |
| Cia Cervecerias Unidas ADR | | | 1,166 | | | | 83,509 | |
| Embotelladora Andina ADR, Cl B | | | 1,451 | | | | 47,158 | |
| Vina Concha y Toro ADR | | | 1,282 | | | | 53,831 | |
| | | | | | | | 184,498 | |
| Consumer Services — 11.4% | | | | | | | | |
| Cencosud | | | 40,406 | | | | 257,379 | |
| Lan Airlines ADR | | | 11,652 | | | | 328,470 | |
| Ripley | | | 45,182 | | | | 50,388 | |
| SACI Falabella | | | 32,006 | | | | 314,056 | |
| | | | | | | | 950,293 | |
| Financials — 9.3% | | | | | | | | |
| Banco de Chile ADR | | | 2,671 | | | | 250,059 | |
| Banco de Credito e Inversiones | | | 1,851 | | | | 133,164 | |
| Banco Santander Chile ADR | | | 3,272 | | | | 267,682 | |
| Corpbanca ADR | | | 3,868 | | | | 77,786 | |
| Parque Arauco | | | 24,622 | | | | 47,838 | |
| | | | | | | | 776,529 | |
| Health Care — 0.3% | | | | | | | | |
| CFR Pharmaceuticals | | | 120,029 | | | | 29,964 | |
| Industrials — 1.9% | | | | | | | | |
| Cia Sud Americana de Vapores * | | | 306,723 | | | | 36,034 | |
The accompanying notes are an integral part of the financial statements.
| Schedule of Investments | April 30, 2012 (Unaudited) |
Global X FTSE Andean 40 ETF
| | | Shares | | | Value | |
| COMMON STOCK — continued |
| Industrials — continued | | | | | | | | |
| Salfacorp | | | 20,300 | | | $ | 51,890 | |
| Sigdo Koppers | | | 14,318 | | | | 34,238 | |
| Sociedad Matriz SAAM * | | | 342,490 | | | | 40,949 | |
| | | | | | | | 163,111 | |
| Oil & Gas — 4.1% | | | | | | | | |
| Empresas COPEC | | | 21,233 | | | | 344,692 | |
| Technology — 1.0% | | | | | | | | |
| Sonda | | | 27,002 | | | | 80,433 | |
| Telecommunications — 1.0% | | | | | | | | |
| ENTEL Chile | | | 4,330 | | | | 85,957 | |
| Utilities — 9.0% | | | | | | | | |
| AES Gener | | | 112,991 | | | | 71,508 | |
| Colbun | | | 322,124 | | | | 91,637 | |
| Empresa Nacional de Electricidad ADR | | | 6,297 | | | | 343,942 | |
| Enersis ADR | | | 12,022 | | | | 243,686 | |
| | | | | | | | 750,773 | |
TOTAL CHILE | | | | | | | 4,105,935 | |
| COLOMBIA—32.9% | | | | | | | | |
| Consumer Services — 2.7% | | | | | | | | |
| Almacenes Exito | | | 13,658 | | | | 221,643 | |
| Financials — 12.0% | | | | | | | | |
| BanColombia ADR | | | 10,956 | | | | 743,145 | |
| Grupo de Inversiones Suramericana | | | 14,195 | | | | 257,420 | |
| | | | | | | | 1,000,565 | |
| Industrials — 1.7% | | | | | | | �� | |
| Cementos Argos | | | 21,105 | | | | 146,099 | |
| Oil & Gas — 15.0% | | | | | | | | |
| Ecopetrol ADR | | | 13,658 | | | | 883,672 | |
| Pacific Rubiales Energy (CAD) | | | 12,893 | | | | 369,882 | |
| | | | | | | | 1,253,554 | |
| Utilities — 1.5% | | | | | | | | |
| Interconexion Electrica | | | 19,658 | | | | 127,158 | |
TOTAL COLOMBIA | | | | | | | 2,749,019 | |
| PERU—16.1% | | | | | | | | |
| Basic Materials — 11.4% | | | | | | | | |
| Cia de Minas Buenaventura ADR | | | 9,633 | | | | 397,554 | |
| Southern Copper | | | 12,282 | | | | 403,832 | |
| Volcan Cia Minera SAA | | | 123,339 | | | | 148,539 | |
| | | | | | | | 949,925 | |
The accompanying notes are an integral part of the financial statements.
| Schedule of Investments | April 30, 2012 (Unaudited) |
Global X FTSE Andean 40 ETF
| | | Shares | | | Value | |
| COMMON STOCK — continued |
| Financials — 4.7% | | | | | | | | |
| Credicorp | | | 1,142 | | | $ | 148,632 | |
| Credicorp Ltd. | | | 1,856 | | | | 242,969 | |
| | | | | | | | 391,601 | |
TOTAL PERU | | | | | | | 1,341,526 | |
| TOTAL COMMON STOCK | | | | | | | | |
| (Cost $7,741,264) | | | | | | | 8,196,480 | |
| |
| PREFERRED STOCK — 1.7% |
| COLOMBIA—1.7% | | | | | | | | |
| Financials — 1.7% | | | | | | | | |
| Banco Davivienda | | | 3,160 | | | | 36,542 | |
| Grupo Aval Acciones y Valores | | | 143,473 | | | | 102,982 | |
| TOTAL PREFERRED STOCK | | | | | | | | |
| (Cost $146,633) | | | | | | | 139,524 | |
| TOTAL INVESTMENTS — 99.8% | | | | | | | | |
| (Cost $7,887,897) | | | | | | $ | 8,336,004 | |
Percentages are based on Net Assets of $8,356,110.
| * | Non-income producing security. |
ADR — American Depositary Receipt
CAD — Canadian Dollar
Cl — Class
Ltd. — Limited
The following is a summary of the inputs used as of April 30, 2012, in valuing the Fund’s investments carried at value:
| Investments in Securities | | Level 1 | | | Level 2 | | | Level 3 | | | Total | |
| Common Stock | | $ | 8,196,480 | | | $ | — | | | $ | — | | | $ | 8,196,480 | |
| Preferred Stock | | | 139,524 | | | | — | | | | — | | | | 139,524 | |
| Total Investments in Securities | | $ | 8,336,004 | | | $ | — | | | $ | — | | | $ | 8,336,004 | |
|
For the period ended April 30, 2012, there have been no transfers between Level 1 & Level 2 investments.
For the period ended April 30, 2012, there were no Level 3 investments.
The accompanying notes are an integral part of the financial statements.
| Schedule of Investments | April 30, 2012 (Unaudited) |
Global X FTSE Colombia 20 ETF
Sector Weightings †:
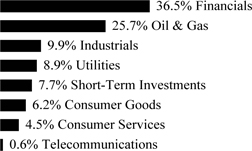
| † | Percentages based on total investments. Short-Term Investments include a Repurchase Agreement held as collateral for securities lending activity. Please see Note 8 in Notes to Financial Statements for more detailed information. |
| | | Shares | | | Value | |
| COMMON STOCK — 95.7% |
| COLOMBIA—95.7% | | | | | | | | |
| Consumer Goods — 6.6% | | | | | | | | |
| Fabricato * | | | 72,274,304 | | | $ | 3,649,845 | |
| Grupo Nutresa | | | 674,395 | | | | 8,273,142 | |
| | | | | | | | 11,922,987 | |
| Consumer Services — 4.9% | | | | | | | | |
| Almacenes Exito | | | 544,271 | | | | 8,832,460 | |
| Financials — 35.7% | | | | | | | | |
| BanColombia ADR | | | 352,129 | | | | 23,884,910 | |
| Bolsa de Valores de Colombia * | | | 197,248,673 | | | | 3,816,532 | |
| Celsia ESP | | | 3,258,800 | | | | 8,820,161 | |
| Financiera Colombiana | | | 439,418 | | | | 8,552,093 | |
| Grupo Aval Acciones y Valores | | | 13,731,847 | | | | 9,895,395 | |
| Grupo de Inversiones Suramericana | | | 461,842 | | | | 8,375,305 | |
| Interbolsa * | | | 1,091,381 | | | | 1,455,274 | |
| | | | | | | | 64,799,670 | |
| Industrials — 10.6% | | | | | | | | |
| Cementos Argos | | | 1,342,856 | | | | 9,295,863 | |
| Inversiones Argos | | | 869,756 | | | | 8,389,707 | |
| Tableros y Maderas de Caldas | | | 268,317,949 | | | | 1,552,925 | |
| | | | | | | | 19,238,495 | |
| Oil & Gas — 27.6% | | | | | | | | |
| Canacol Energy (CAD) * | | | 6,505,916 | | | | 5,071,170 | |
| Ecopetrol ADR (A) | | | 438,400 | | | | 28,364,480 | |
| Pacific Rubiales Energy (CAD) | | | 567,789 | | | | 16,289,052 | |
| Pacific Rubiales Energy (USD) | | | 8,018 | | | | 230,678 | |
| | | | | | | | 49,955,380 | |
| Telecommunications — 0.7% | | | | | | | | |
| Empresa de Telecomunicaciones de Bogota | | | 4,498,506 | | | | 1,230,313 | |
The accompanying notes are an integral part of the financial statements.
| Schedule of Investments | April 30, 2012 (Unaudited) |
Global X FTSE Colombia 20 ETF
| | | Shares/Face Amount | | | Value | |
| COMMON STOCK — continued |
| Utilities — 9.6% | | | | | | | | |
| Interconexion Electrica | | | 1,300,742 | | | $ | 8,413,883 | |
| Isagen | | | 6,364,194 | | | | 8,901,450 | |
| | | | | | | | 17,315,333 | |
TOTAL COLOMBIA | | | | | | | 173,294,638 | |
| TOTAL COMMON STOCK | | | | | | | | |
| (Cost $153,215,582) | | | | | | | 173,294,638 | |
| |
| PREFERRED STOCK — 3.5% |
| COLOMBIA—3.5% | | | | | | | | |
| Financials — 3.5% | | | | | | | | |
| Banco Davivienda (Cost $5,938,178) | | | 544,987 | | | | 6,302,180 | |
| |
| REPURCHASE AGREEMENT — 8.3% |
| Merrill Lynch | | | | | | | | |
0.170%, dated 04/30/12, to be repurchased on 05/01/12, repurchase price $14,990,121 (collateralized by U.S. Treasury Notes, par value $15,315,100,
0.250%, 12/15/14, with a total market value of $15,289,919) (B) | | | | | | | | |
(Cost $14,990,050) | | $ | 14,990,050 | | | | 14,990,050 | |
| | | | | | | | | |
| TOTAL REPURCHASE AGREEMENT | | | | | | | | |
| (Cost $14,990,050) | | | | | | | 14,990,050 | |
| TOTAL INVESTMENTS — 107.5% | | | | | | | | |
| (Cost $174,143,810) | | | | | | $ | 194,586,868 | |
Percentages are based on Net Assets of $181,032,316.
| * | Non-income producing security. |
ADR — American Depositary Receipt
CAD — Canadian Dollar
USD — United States Dollar
| (A) | This security or a partial position of this security is on loan at April 30, 2012. The total value of securities on loan at April 30, 2012 was $14,600,099. |
| (B) | This security was purchased with cash collateral held from securities on loan. The total value of such securities as of April 30, 2012 was $14,990,050. |
The following is a summary of the inputs used as of April 30, 2012, in valuing the Fund’s investments carried at value:
| Investments in Securities | | Level 1 | | | Level 2 | | | Level 3 | | | Total | |
| Common Stock | | $ | 173,294,638 | | | $ | — | | | $ | — | | | $ | 173,294,638 | |
| Preferred Stock | | | 6,302,180 | | | | — | | | | — | | | | 6,302,180 | |
| Repurchase Agreement | | | — | | | | 14,990,050 | | | | — | | | | 14,990,050 | |
| Total Investments in Securities | | $ | 179,596,818 | | | $ | 14,990,050 | | | $ | — | | | $ | 194,586,868 | |
For the period ended April 30, 2012, there have been no transfers between Level 1 & Level 2 investments.
For the period ended April 30, 2012, there were no Level 3 investments.
The accompanying notes are an integral part of the financial statements.
| Schedule of Investments | April 30, 2012 (Unaudited) |
Global X Brazil Mid Cap ETF
Sector Weightings (unaudited)†:

† Percentages based on total investments.
| | | Shares | | | Value | |
| COMMON STOCK — 84.9% |
| BRAZIL — 84.9% | | | | | | | | |
| Basic Materials — 2.3% | | | | | | | | |
| Fibria Celulose ADR * | | | 69,732 | | | $ | 553,672 | |
| Consumer Goods — 10.6% | | | | | | | | |
| Cia Hering | | | 20,456 | | | | 507,926 | |
| Cosan, Cl A | | | 24,386 | | | | 337,502 | |
| Cosan Industria e Comercio | | | 22,748 | | | | 395,851 | |
| Hypermarcas | | | 56,179 | | | | 365,164 | |
| JBS * | | | 97,331 | | | | 381,430 | |
| Natura Cosmeticos | | | 25,365 | | | | 573,130 | |
| | | | | | | | 2,561,003 | |
| Consumer Services — 9.0% | | | | | | | | |
| Cia Brasileira de Distribuicao Grupo Pao de Acucar ADR | | | 23,926 | | | | 1,125,240 | |
| Gol Linhas Aereas Inteligentes ADR | | | 20,436 | | | | 108,311 | |
| Lojas Renner | | | 18,312 | | | | 581,884 | |
| TAM ADR * | | | 15,385 | | | | 376,163 | |
| | | | | | | | 2,191,598 | |
| Financials — 12.5% | | | | | | | | |
| BR Malls Participacoes | | | 61,378 | | | | 758,631 | |
| Cyrela Brazil Realty Empreendimentos e Participacoes | | | 40,457 | | | | 326,008 | |
| MRV Engenharia e Participacoes | | | 48,411 | | | | 282,926 | |
| Multiplan Empreendimentos Imobiliarios | | | 10,678 | | | | 251,524 | |
| PDG Realty Empreendimentos e Participacoes | | | 167,444 | | | | 393,541 | |
| Porto Seguro | | | 15,150 | | | | 148,706 | |
| Redecard | | | 53,824 | | | | 896,808 | |
| | | | | | | | 3,058,144 | |
| Industrials — 8.6% | | | | | | | | |
| All America Latina Logistica | | | 72,810 | | | | 329,644 | |
| CCR | | | 32,989 | | | | 255,792 | |
| Duratex | | | 36,025 | | | | 211,673 | |
The accompanying notes are an integral part of the financial statements.
| Schedule of Investments | April 30, 2012 (Unaudited) |
Global X Brazil Mid Cap ETF
| | | Shares | | | Value | |
| COMMON STOCK — continued |
| Industrials — continued | | | | | | | | |
| Embraer ADR | | | 27,586 | | | $ | 955,579 | |
| Weg | | | 33,314 | | | | 351,989 | |
| | | | | | | | 2,104,677 | |
| Telecommunications — 9.2% | | | | | | | | |
| Oi ADR * | | | 8,109 | | | | 54,087 | |
| Oi * | | | 5,710 | | | | 38,343 | |
| Tim Participacoes ADR | | | 72,056 | | | | 2,156,636 | |
| | | | | | | | 2,249,066 | |
| Utilities — 32.7% | | | | | | | | |
| Cia de Saneamento Basico do Estado de Sao Paulo ADR | | | 17,699 | | | | 1,401,053 | |
| Cia Energetica de Minas Gerais ADR | | | 58,871 | | | | 1,452,347 | |
| Cia Paranaense de Energia ADR | | | 19,110 | | | | 478,705 | |
| CPFL Energia ADR | | | 71,699 | | | | 2,021,912 | |
| EDP - Energias do Brasil | | | 35,655 | | | | 248,593 | |
| Tractebel Energia | | | 30,436 | | | | 522,928 | |
| Ultrapar Participacoes ADR | | | 82,821 | | | | 1,875,067 | |
| | | | | | | | 8,000,605 | |
TOTAL BRAZIL | | | | | | | 20,718,765 | |
| TOTAL COMMON STOCK | | | | | | | | |
| (Cost $18,503,733) | | | | | | | 20,718,765 | |
| |
| PREFERRED STOCK — 13.5% |
| BRAZIL—13.5% | | | | | | | | |
| Basic Materials — 2.5% | | | | | | | | |
| Metalurgica Gerdau | | | 40,047 | | | | 487,207 | |
| Suzano Papel e Celulose | | | 33,427 | | | | 125,736 | |
| | | | | | | | 612,943 | |
| Consumer Services — 1.7% | | | | | | | | |
| Lojas Americanas | | | 43,656 | | | | 407,668 | |
| Financials — 3.3% | | | | | | | | |
| Banco do Estado do Rio Grande do Sul | | | 26,699 | | | | 230,411 | |
| Bradespar | | | 31,616 | | | | 572,560 | |
| | | | | | | | 802,971 | |
| Telecommunications — 3.4% | | | | | | | | |
| Oi* | | | 58,554 | | | | 351,725 | |
| Oi ADR | | | 27,712 | | | | 496,876 | |
| | | | | | | | 848,601 | |
| Utilities — 2.6% | | | | | | | | |
| AES Tiete | | | 14,447 | | | | 200,847 | |
| Cia Energetica de Sao Paulo | | | 22,228 | | | | 422,719 | |
| | | | | | | | 623,566 | |
The accompanying notes are an integral part of the financial statements.
| Schedule of Investments | April 30, 2012 (Unaudited) |
Global X Brazil Mid Cap ETF
| | | Face
Amount/Number
of Warrants | | | Value | |
| PREFERRED STOCK — continued |
TOTAL BRAZIL | | | | | | $ | 3,295,749 | |
| TOTAL PREFERRED STOCK | | | | | | | | |
| (Cost $3,610,813) | | | | | | | 3,295,749 | |
| |
| CORPORATE OBLIGATIONS — 0.5% |
| Hypermarcas | | | | | | | | |
| 11.300%, 10/15/18(1) (2) | | $ | 59,000 | | | | 31,465 | |
| 3.000%, 10/15/18(1) (2) | | | 59,000 | | | | 31,464 | |
| Marfrig Alimentos, Convertible | | | | | | | | |
| 1.040%, 07/15/15(1) (2) (3) | | | 12 | | | | 63,817 | |
| TOTAL CORPORATE OBLIGATIONS | | | | | | | | |
| (Cost $141,511) | | | | | | | 126,746 | |
| |
| WARRANTS — 0.0% |
| Hypermarcas | | | | | | | | |
| Strike Price $ 29.48, Expires 10/15/15*(1) (2) | | | | | | | | |
| (Cost $–) | | | 59 | | | | — | |
| TOTAL INVESTMENTS — 98.9% | | | | | | | | |
| (Cost $22,256,057) | | | | | | $ | 24,141,260 | |
Percentages are based on Net Assets of $24,404,350.
| * | Non-income producing security. |
ADR — American Depositary Receipt
Cl — Class
| (1) | Securities considered illiquid. The total value of such securities as of April 30, 2012 was 126,746 and represented 0.5% of Net Assets. |
| (2) | Security is fair valued using methods determined in good faith by the Fair Value Committee of the Fund. The total value of such securities as of April 30, 2012, was $126,746 and represents 0.5% of net assets. |
| (3) | Floating rate security - Rate disclosed is the rate in effect on April 30, 2012. |
| | Amounts designated as "—" are either $0 or have been rounded to $0. |
The following is a summary of the inputs used as of April 30, 2012, in valuing the Fund’s investments carried at value:
| Investments in Securities | | Level 1 | | | Level 2 | | | Level 3 | | | Total | |
| Common Stock | | $ | 20,718,765 | | | $ | — | | | $ | — | | | $ | 20,718,765 | |
| Preferred Stock | | | 3,295,749 | | | | — | | | | — | | | | 3,295,749 | |
| Corporate Obligations | | | — | | | | — | | | | 126,746 | | | | 126,746 | |
| Warrants | | | — | | | | — | | | | — | | | | — | |
| Total Investments in Securities | | $ | 24,014,514 | | | $ | — | | | $ | 126,746 | | | $ | 24,141,260 | |
The accompanying notes are an integral part of the financial statements.
| Schedule of Investments | April 30, 2012 (Unaudited) |
Global X Brazil Mid Cap ETF
The following is a reconciliation of investments in which significant unobservable inputs (Level 3) were used in determining fair value:
| | | Brazil | |
| | | Investments in | |
| | | Corporate | |
| | | Obligations | |
| | | | | |
| Beginning Balance as of November 1, 2011 | | $ | 140,750 | |
| Accrued discounts/premiums | | | - | |
| Realized gain/(loss) | | | - | |
| Change in unrealized appreciation/(depreciation) | | | (14,004 | ) |
| Net purchases | | | - | |
| Net sales | | | - | |
| Transfers into Level 3 | | | - | |
| Transfers out of Level 3 | | | - | |
| Ending Balance as of April 30, 2012 | | $ | 126,746 | |
Net change in unrealized appreciation/(depreciation) from investments still held as of April 30, 2012 is $(14,004).
For the period ended April 30, 2012, there have been no transfers between Level 1 and Level 2 assets and liabilities.
For the period ended April 30, 2012, there have been no transfers between Level 2 and Level 3 assets and liabilities.
The accompanying notes are an integral part of the financial statements.
| Schedule of Investments | April 30, 2012 (Unaudited) |
Global X Brazil Consumer ETF
Sector Weightings †:
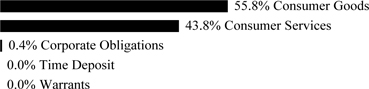
† Percentages based on total investments.
| | | Shares | | | Value | |
| COMMON STOCK — 87.6% |
| BRAZIL — 87.6% | | | | | | | | |
| Consumer Goods — 48.9% | | | | | | | | |
| Arezzo Industria e Comercio | | | 35,322 | | | $ | 546,281 | |
| BRF - Brasil Foods ADR | | | 66,477 | | | | 1,225,171 | |
| Cia Hering | | | 61,378 | | | | 1,524,025 | |
| Cosan, Cl A | | | 113,088 | | | | 1,565,138 | |
| Cosan Industria e Comercio | | | 89,439 | | | | 1,556,379 | |
| Gafisa ADR | | | 184,756 | | | | 679,902 | |
| Hypermarcas | | | 293,030 | | | | 1,904,699 | |
| JBS * | | | 397,394 | | | | 1,557,345 | |
| M Dias Branco | | | 35,700 | | | | 1,030,087 | |
| Marfrig Alimentos | | | 104,420 | | | | 577,935 | |
| Natura Cosmeticos | | | 68,247 | | | | 1,542,060 | |
| Sao Martinho | | | 28,531 | | | | 342,166 | |
| SLC Agricola | | | 40,510 | | | | 400,180 | |
| Souza Cruz | | | 107,169 | | | | 1,665,318 | |
| | | | | | | | 16,116,686 | |
| Consumer Services — 38.7% | | | | | | | | |
| Anhanguera Educacional Participacoes | | | 121,288 | | | | 1,604,744 | |
| B2W Cia Global Do Varejo * | | | 55,022 | | | | 236,120 | |
| Cia Brasileira de Distribuicao Grupo Pao de Acucar ADR | | | 36,408 | | | | 1,712,268 | |
| Gol Linhas Aereas Inteligentes ADR | | | 113,928 | | | | 603,818 | |
| Localiza Rent a Car | | | 88,415 | | | | 1,512,121 | |
| Lojas Renner | | | 44,510 | | | | 1,414,354 | |
| Marisa Lojas | | | 39,380 | | | | 465,457 | |
| Multiplus | | | 36,778 | | | | 800,331 | |
| Raia Drogasil | | | 191,147 | | | | 2,043,688 | |
| Restoque Comercio e Confeccoes de Roupas | | | 34,382 | | | | 659,267 | |
| TAM ADR * | | | 69,511 | | | | 1,699,544 | |
| | | | | | | | 12,751,712 | |
TOTAL BRAZIL | | | | | | | 28,868,398 | |
| TOTAL COMMON STOCK | | | | | | | | |
| (Cost $27,678,066) | | | | | | | 28,868,398 | |
The accompanying notes are an integral part of the financial statements.
| Schedule of Investments | April 30, 2012 (Unaudited) |
Global X Brazil Consumer ETF
| | | Shares/Face
Amount/Number
of Warrants | | | Value | |
| PREFERRED STOCK — 11.8% |
| BRAZIL—11.8% | | | | | | | | |
| Consumer Goods — 6.7% | | | | | | | | |
| Alpargatas, | | | 74,873 | | | $ | 602,940 | |
| Cia de Bebidas das Americas | | | 38,715 | | | | 1,625,256 | |
| | | | | | | | 2,228,196 | |
| Consumer Services — 5.1% | | | | | | | | |
| Lojas Americanas | | | 159,030 | | | | 1,485,053 | |
| Saraiva Livreiros Editores | | | 14,857 | | | | 179,190 | |
| | | | | | | | 1,664,243 | |
TOTAL BRAZIL | | | | | | | 3,892,439 | |
| TOTAL PREFERRED STOCK | | | | | | | | |
| (Cost $3,146,303) | | | | | | | 3,892,439 | |
| |
| CORPORATE OBLIGATIONS — 0.4% |
| Hypermarcas | | | | | | | | |
| 11.300%, 10/15/18(1) (2) | | $ | 84,000 | | | | 44,797 | |
| 3.000%, 10/15/18(1) (2) | | | 84,000 | | | | 44,797 | |
| Marfrig Alimentos, Convertible | | | | | | | | |
| 1.04%, 07/15/15(1) (2) (3) | | | 6 | | | | 31,889 | |
| TOTAL CORPORATE OBLIGATION | | | | | | | | |
| (Cost $136,027) | | | | | | | 121,483 | |
| |
| WARRANTS — 0.0% |
| Hypermarcas | | | | | | | | |
| Strike Price $29.48, Expires 10/15/15*(1) (2) | | | | | | | | |
| (Cost $–) | | | 84 | | | | — | |
| |
| TIME DEPOSIT — 0.0% |
| Brown Brothers Harriman, 0.030% | | | | | | | | |
| (Cost $4,993) | | $ | 4,993 | | | | 4,993 | |
| TOTAL INVESTMENTS — 99.8% | | | | | | | | |
| (Cost $30,965,389) | | | | | | $ | 32,887,313 | |
| | | | | | | | |
| Percentages are based on Net Assets of $32,953,702. |
| * | Non-income producing security. |
ADR — American Depositary Receipt
Cl — Class
| (1) | Securities are fair valued using methods determined in good faith by the Fair Value Committee of the Board of Trustees. The total value of such securities as of April 30, 2012, was $121,483 and represented 0.4% of Net Assets. |
| (2) | Securities considered illiquid. The total value of such securities as of April 30, 2012 was $121,483 and represented 0.4% of Net Assets. |
| (3) | Floating rate security. Rate disclosed is the rate in effect on April 30, 2012. |
The accompanying notes are an integral part of the financial statements.
| Schedule of Investments | April 30, 2012 (Unaudited) |
Global X Brazil Consumer ETF
The following is a summary of the inputs used as of April 30, 2012, in valuing the Fund’s investments carried at value:
| Investments in Securities | | Level 1 | | | Level 2 | | | Level 3 | | | Total | |
| Common Stock | | $ | 28,868,398 | | | $ | — | | | $ | — | | | $ | 28,868,398 | |
| Preferred Stock | | | 3,892,439 | | | | — | | | | — | | | | 3,892,439 | |
| Corporate Obligations | | | — | | | | — | | | | 121,483 | | | | 121,483 | |
| Warrants | | | — | | | | — | | | | — | | | | — | |
| Time Deposit | | | — | | | | 4,993 | | | | — | | | | 4,993 | |
| Total Investments in Securities | | $ | 32,760,837 | | | $ | 4,993 | | | $ | 121,483 | | | $ | 32,887,313 | |
The following is a reconciliation of investments in which significant unobservable inputs (Level 3) were used in determining fair value:
| | | Brazil | |
| | | Investments in | |
| | | Corporate | |
| | | Obligations | |
| | | | |
| Beginning Balance as of November 1, 2011 | | $ | 134,905 | |
| Accrued discounts/premiums | | | - | |
| Realized gain/(loss) | | | - | |
| Change in unrealized appreciation/(depreciation) | | | (13,422 | ) |
| Net purchases | | | - | |
| Net sales | | | - | |
| Transfers into Level 3 | | | - | |
| Transfers out of Level 3 | | | - | |
| Ending Balance as of April 30, 2012 | | $ | 121,483 | |
Net change in unrealized appreciation/(depreciation) from investments still held as of April 30, 2012 is $(13,422).
For the period ended April 30, 2012, there have been no transfers between Level 1 and Level 2 assets and liabilities.
For the period ended April 30, 2012, there have been no transfers between Level 2 and Level 3 assets and liabilities.
The accompanying notes are an integral part of the financial statements.
| Schedule of Investments | April 30, 2012 (Unaudited) |
Global X Brazil Financials ETF
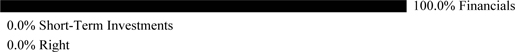
| † Percentages based on total investments. | |
| | |
| | | Shares | | | Value | |
| COMMON STOCK — 94.1% |
| BRAZIL — 94.1% | | | | | | | | |
| Financials — 94.1% | | | | | | | | |
| Banco Bradesco ADR | | | 24,216 | | | $ | 388,182 | |
| Banco do Brasil | | | 30,482 | | | | 378,197 | |
| Banco Santander Brasil ADR | | | 51,850 | | | | 418,429 | |
| BM&F Bovespa | | | 34,368 | | | | 192,020 | |
| BR Malls Participacoes | | | 15,854 | | | | 195,955 | |
| BR Properties | | | 12,118 | | | | 151,304 | |
| Brasil Brokers Participacoes | | | 11,234 | | | | 38,426 | |
| Brookfield Incorporacoes | | | 15,884 | | | | 41,915 | |
| CETIP - Mercados Organizados | | | 12,359 | | | | 189,974 | |
| Cielo | | | 8,694 | | | | 261,177 | |
| Cyrela Brazil Realty Empreendimentos e Participacoes | | | 19,939 | | | | 160,671 | |
| Even Construtora e Incorporadora | | | 15,668 | | | | 58,524 | |
| Ez Tec Empreendimentos e Participacoes | | | 3,678 | | | | 40,617 | |
| Iguatemi Empresa de Shopping Centers | | | 2,201 | | | | 47,989 | |
| Itau Unibanco Holding ADR | | | 22,337 | | | | 350,468 | |
| MRV Engenharia e Participacoes | | | 23,877 | | | | 139,543 | |
| Multiplan Empreendimentos Imobiliarios | | | 5,119 | | | | 120,580 | |
| PDG Realty Empreendimentos e Participacoes | | | 52,038 | | | | 122,304 | |
| Porto Seguro | | | 7,664 | | | | 75,227 | |
| Redecard | | | 11,598 | | | | 193,244 | |
| Rossi Residencial | | | 12,974 | | | | 54,315 | |
| Sul America | | | 22,051 | | | | 181,158 | |
TOTAL BRAZIL | | | | | | | 3,800,219 | |
| TOTAL COMMON STOCK | | | | | | | | |
| (Cost $4,401,024) | | | | | | | 3,800,219 | |
| |
| PREFERRED STOCK — 4.2% |
| BRAZIL—4.2% | | | | | | | | |
| Financials — 4.2% | | | | | | | | |
| Banco ABC Brasil | | | 3,799 | | | | 23,817 | |
| Banco do Estado do Rio Grande do Sul | | | 12,795 | | | | 110,420 | |
| Banco Industrial e Comercial | | | 4,682 | | | | 14,541 | |
| Banco Panamericano | | | 6,794 | | | | 22,134 | |
| | | | | | | | 170,912 | |
The accompanying notes are an integral part of the financial statements.
| Schedule of Investments | April 30, 2012 (Unaudited) |
Global X Brazil Financials ETF
| | | Shares/Number
of Rights/Face
Amount | | | Value | |
| PREFERRED STOCK — continued |
TOTAL BRAZIL | | | | | | $ | 170,912 | |
| TOTAL PREFERRED STOCK | | | | | | | | |
| (Cost $211,448) | | | | | | | 170,912 | |
| |
| RIGHTS — 0.0% |
| Brazil — 0.0% |
Banco Panamericano SA, Expires 5/11/12*
(Cost $—) | | | 10,951 | | | | 632 | |
| | | | | | | | | |
| TIME DEPOSIT — 0.0% |
| Brown Brothers Harriman, 0.030% | | | | | | | | |
| (Cost $570) | | $ | 570 | | | | 570 | |
| TOTAL INVESTMENTS — 98.3% | | | | | | | | |
| (Cost $4,613,042) | | | | | | $ | 3,972,333 | |
| | | | | | | | | |
| Percentages are based on Net Assets of $4,039,495. |
*Non-income producing
ADR — American Depositary Receipt
The following is a summary of the inputs used as of April 30, 2012, in valuing the Fund’s investments carried at value:
| Investments in Securities | | Level 1 | | | Level 2 | | | Level 3 | | | Total | |
| Common Stock | | $ | 3,800,219 | | | $ | — | | | $ | — | | | $ | 3,800,219 | |
| Preferred Stock | | | 170,912 | | | | — | | | | — | | | | 170,912 | |
| Rights | | | 632 | | | | — | | | | — | | | | 632 | |
| Time Deposit | | | — | | | | 570 | | | | — | | | | 570 | |
| Total Investments in Securities | | $ | 3,971,763 | | | $ | 570 | | | $ | — | | | $ | 3,972,333 | |
For the period ended April 30, 2012, there have been no transfers between Level 1 & Level 2 investments.
For the period ended April 30, 2012, there were no Level 3 investments.
Amounts designated as “—“ are either $0 or have been rounded to $0.
The accompanying notes are an integral part of the financial statements.
| Schedule of Investments | April 30, 2012 (Unaudited) |
Global X FTSE Argentina 20 ETF
Sector Weightings †:
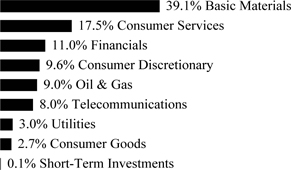
† Percentages based on total investments.
| | | Shares | | | Value | |
| COMMON STOCK — 99.9% | | | | | | | | |
| ARGENTINA — 78.2% | | | | | | | | |
| Basic Materials — 21.9% | | | | | | | | |
| Tenaris ADR | | | 18,559 | | | $ | 727,327 | |
| Consumer Discretionary — 9.6% | | | | | | | | |
| Arcos Dorados Holdings, Cl A | | | 17,789 | | | | 317,890 | |
| Consumer Goods — 2.7% | | | | | | | | |
| Cresud SACIF y A ADR | | | 9,473 | | | | 89,804 | |
| Consumer Services — 13.0% | | | | | | | | |
| MercadoLibre | | | 4,465 | | | | 431,944 | |
| Financials — 11.0% | | | | | | | | |
| Banco Macro ADR | | | 9,363 | | | | 144,377 | |
| BBVA Banco Frances ADR * | | | 13,034 | | | | 63,476 | |
| Grupo Financiero Galicia ADR | | | 18,135 | | | | 101,375 | |
| IRSA Inversiones y Representaciones ADR | | | 7,128 | | | | 56,169 | |
| | | | | | | | 365,397 | |
| Oil & Gas — 9.0% | | | | | | | | |
| Petrobras Argentina ADR * | | | 9,953 | | | | 113,364 | |
| Transportadora de Gas del Sur ADR | | | 10,331 | | | | 28,410 | |
| YPF ADR | | | 10,803 | | | | 157,508 | |
| | | | | | | | 299,282 | |
| Telecommunications — 8.0% | | | | | | | | |
| Nortel Inversora ADR * | | | 7,162 | | | | 120,680 | |
| Telecom Argentina ADR * | | | 10,020 | | | | 146,592 | |
| | | | | | | | 267,272 | |
| Utilities — 3.0% | | | | | | | | |
| Empresa Distribuidora Y Comercializadora Norte ADR * | | | 2,934 | | | | 8,069 | |
| Pampa Energia ADR | | | 13,608 | | | | 91,990 | |
| | | | | | | | 100,059 | |
| TOTAL ARGENTINA | | | | | | | 2,598,975 | |
The accompanying notes are an integral part of the financial statements.
| Schedule of Investments | April 30, 2012 (Unaudited) |
Global X FTSE Argentina 20 ETF
| | | Shares/Face
Amount | | | Value | |
| COMMON STOCK — continued | | | | | | | | |
| CANADA — 17.2% | | | | | | | | |
| Basic Materials — 17.2% | | | | | | | | |
| Goldcorp | | | 3,255 | | | $ | 124,536 | |
| Pan American Silver | | | 9,309 | | | | 181,619 | |
| Silver Standard Resources * | | | 9,005 | | | | 129,852 | |
| Yamana Gold | | | 9,145 | | | | 134,431 | |
| TOTAL CANADA | | | | | | | 570,438 | |
| CHILE—4.5% | | | | | | | | |
| Consumer Services — 4.5% | | | | | | | | |
| Cencosud | | | 23,519 | | | | 149,812 | |
| TOTAL COMMON STOCK | | | | | | | | |
| (Cost $4,593,667) | | | | | | | 3,319,225 | |
| | | | | | | | | |
| TIME DEPOSIT — 0.1% | | | | | | | | |
| Brown Brothers Harriman, 0.030% | | | | | | | | |
| (Cost $4,812) | | $ | 4,812 | | | | 4,812 | |
| TOTAL INVESTMENTS — 100.0% | | | | | | | | |
| (Cost $4,598,479) | | | | | | $ | 3,324,037 | |
| | | | | | | | | |
| Percentages are based on Net Assets of $3,323,335. | | | | | | | | |
| * | Non-income producing security. |
ADR — American Depositary Receipt
Cl — Class
The following is a summary of the inputs used as of April 30, 2012, in valuing the Fund’s investments carried at value: |
| Investments in Securities | | Level 1 | | | Level 2 | | | Level 3 | | | Total | |
| Common Stock | | $ | 3,319,225 | | | $ | — | | | $ | — | | | $ | 3,319,225 | |
| Time Deposit | | | — | | | | 4,812 | | | | — | | | | 4,812 | |
| Total Investments in Securities | | $ | 3,319,225 | | | $ | 4,812 | | | $ | — | | | $ | 3,324,037 | |
For the period ended April 30, 2012, there have been no transfers between Level 1 and Level 2 investments.
For the period ended April 30, 2012, there were no Level 3 investments.
The accompanying notes are an integral part of the financial statements.
| Schedule of Investments | April 30, 2012 (Unaudited) |
Global X FTSE Greece 20 ETF
Sector Weightings †

† Percentages based on total investments.
| | | Shares | | | Value | |
| COMMON STOCK — 97.9% | | | | | | | | |
| CYPRUS — 4.8% | | | | | | | | |
| Financials — 4.8% | | | | | | | | |
| Bank of Cyprus | | | 232,253 | | | $ | 138,345 | |
| GREECE — 93.1% | | | | | | | | |
| Basic Materials — 2.1% | | | | | | | | |
| Mytilineos Holdings | | | 18,045 | | | | 61,626 | |
| Consumer Goods — 20.8% | | | | |
| Coca Cola Hellenic Bottling ADR | | | 25,370 | | | | 499,281 | |
| JUMBO | | | 22,017 | | | | 106,958 | |
| | | | | | | | 606,239 | |
| Consumer Services — 15.0% | | | | |
| Folli Follie Group | | | 7,576 | | | | 70,198 | |
| OPAP | | | 41,330 | | | | 369,281 | |
| | | | | | | | 439,479 | |
| Financials — 27.2% | | | | |
| Alpha Bank AE * | | | 78,371 | | | | 109,964 | |
| EFG Eurobank Ergasias | | | 93,821 | | | | 74,763 | |
| Marfin Investment Group | | | 130,666 | | | | 51,197 | |
| Marfin Popular Bank * | | | 366,575 | | | | 98,017 | |
| National Bank of Greece ADR * | | | 157,236 | | | | 358,498 | |
| Piraeus Bank | | | 258,289 | | | | 88,893 | |
| TT Hellenic Postbank | | | 25,509 | | | | 13,506 | |
| | | | | | | | 794,838 | |
| Industrials — 9.6% | | | | | | | | |
| Ellaktor | | | 30,010 | | | | 48,861 | |
| Titan Cement | | | 7,009 | | | | 135,920 | |
| Viohalco | | | 22,612 | | | | 92,189 | |
| | | | | | | | 276,970 | |
The accompanying notes are an integral part of the financial statements.
| Schedule of Investments | April 30, 2012 (Unaudited) |
Global X FTSE Greece 20 ETF
| | | Shares/Face
Amount | | | Value | |
| COMMON STOCK — continued |
| Oil & Gas — 8.3% | | | | |
| Hellenic Petroleum | | | 18,939 | | | $ | 139,136 | |
| Motor Oil Hellas Corinth Refineries | | | 12,542 | | | | 102,931 | |
| | | | | | | | 242,067 | |
| Telecommunications — 7.1% | | | | |
| Hellenic Telecommunications Organization | | | 63,610 | | | | 207,975 | |
| Utilities — 3.0% | | | | |
| Public Power | | | 26,270 | | | | 88,325 | |
| TOTAL GREECE | | | | | | | 2,717,519 | |
| TOTAL COMMON STOCK | | | | | | | | |
| (Cost $3,175,098) | | | | | | | 2,855,864 | |
| |
| TIME DEPOSIT — 0.1% |
| Brown Brothers Harriman, 0.030% | | | | | | | | |
| (Cost $2,835) | | $ | 2,835 | | | | 2,835 | |
| TOTAL INVESTMENTS — 98.0% | | | | | | | | |
| (Cost $3,177,933) | | | | | | $ | 2,858,699 | |
| |
| Percentages are based on Net Assets of $2,917,820. |
* Non-income producing security.
ADR — American Depositary Receipt
The following is a summary of the inputs used as of April 30, 2012, in valuing the Fund’s investments carried at value:
| Investments in Securities | | Level 1 | | | Level 2 | | | Level 3 | | | Total | |
| Common Stock | | $ | 2,855,864 | | | $ | — | | | $ | — | | | $ | 2,855,864 | |
| Time Deposit | | | — | | | | 2,835 | | | | — | | | | 2,835 | |
| Total Investments in Securities | | $ | 2,855,864 | | | $ | 2,835 | | | $ | — | | | $ | 2,858,699 | |
For the period ended April 30, 2012, there have been no transfers between Level 1 & Level 2 investments.
For the period ended April 30, 2012, there were no Level 3 investments.
The accompanying notes are an integral part of the financial statements.
| Schedule of Investments | April 30, 2012 (Unaudited) |
Global X FTSE Norway 30 ETF
Sector Weightings †
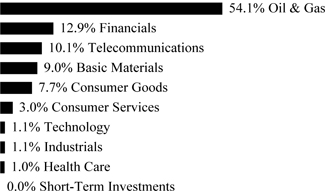
† Percentages based on total investments.
| | | Shares | | | Value | |
| COMMON STOCK — 98.3% | | | | | | | | |
| NORWAY — 97.7% | | | | | | | | |
| Basic Materials — 8.9% | | | | | | | | |
| Norsk Hydro | | | 452,007 | | | $ | 2,198,844 | |
| Yara International | | | 50,941 | | | | 2,498,561 | |
| | | | | | | | 4,697,405 | |
| Consumer Goods — 7.5% | | | | | | | | |
| Aker, Cl A | | | 14,804 | | | | 483,727 | |
| Cermaq | | | 35,468 | | | | 484,335 | |
| Marine Harvest | | | 1,371,246 | | | | 703,479 | |
| Orkla | | | 320,519 | | | | 2,354,488 | |
| | | | | | | | 4,026,029 | |
| Consumer Services — 3.0% | | | | | | | | |
| Schibsted | | | 41,424 | | | | 1,580,104 | |
| Financials — 12.7% | | | | | | | | |
| DnB | | | 419,855 | | | | 4,526,521 | |
| Gjensidige Forsikring | | | 102,312 | | | | 1,153,098 | |
| Storebrand | | | 232,300 | | | | 1,044,000 | |
| | | | | | | | 6,723,619 | |
| Health Care — 1.0% | | | | | | | | |
| Algeta * | | | 21,708 | | | | 513,592 | |
| Industrials — 1.1% | | | | | | | | |
| Tomra Systems | | | 75,649 | | | | 589,547 | |
| Oil & Gas — 52.6% | | | | | | | | |
| Aker Solutions | | | 105,526 | | | | 1,793,202 | |
| Archer * | | | 93,440 | | | | 195,111 | |
| BW Offshore | | | 258,785 | | | | 359,490 | |
| Det Norske Oljeselskap * | | | 32,723 | | | | 470,294 | |
| DNO International * | | | 523,343 | | | | 830,790 | |
The accompanying notes are an integral part of the financial statements.
| Schedule of Investments | April 30, 2012 (Unaudited) |
Global X FTSE Norway 30 ETF
| | | Shares/Face Amount | | | Value | |
| COMMON STOCK — continued | | | | | | | | |
| Oil & Gas — continued | | | | | | | | |
| Fred Olsen Energy | | | 13,634 | | | $ | 565,329 | |
| Golar LNG | | | 30,674 | | | | 1,134,674 | |
| Petroleum Geo-Services * | | | 111,369 | | | | 1,680,377 | |
| ProSafe | | | 117,607 | | | | 917,560 | |
| Renewable Energy * | | | 249,069 | | | | 142,314 | |
| Seadrill | | | 121,461 | | | | 4,701,004 | |
| Statoil | | | 385,220 | | | | 10,285,188 | |
| Statoil Fuel & Retail | | | 76,634 | | | | 687,610 | |
| Subsea 7 | | | 98,469 | | | | 2,551,648 | |
| TGS Nopec Geophysical | | | 53,386 | | | | 1,542,918 | |
| | | | | | | | 27,857,509 | |
| Technology — 1.0% | | | | | | | | |
| Atea | | | 50,821 | | | | 541,693 | |
| Telecommunications — 9.9% | | | | | | | | |
| Telenor | | | 286,086 | | | | 5,258,869 | |
| TOTAL NORWAY | | | | | | | 51,788,367 | |
| UNITED STATES— 0.6% | | | | | | | | |
| Oil & Gas — 0.6% | | | | | | | | |
| Kvaerner | | | 105,476 | | | | 311,473 | |
| TOTAL COMMON STOCK | | | | | | | | |
| (Cost $53,484,757) | | | | | | | 52,099,840 | |
| | | | | | | | | |
| TIME DEPOSIT — 0.0% | | | | | | | | |
| Brown Brothers Harriman, 0.030% | | | | | | | | |
| (Cost $5,622) | | $ | 5,622 | | | | 5,622 | |
| TOTAL INVESTMENTS — 98.3% | | | | | | | | |
| (Cost $53,490,379) | | | | | | $ | 52,105,462 | |
| | | | | | | | | |
| Percentages are based on Net Assets of $53,000,472. | | | | | | | | |
| * | Non-income producing security. |
Cl — Class
The following is a summary of the inputs used as of April 30, 2012, in valuing the Fund’s investments carried at value:
| Investments in Securities | | Level 1 | | | Level 2 | | | Level 3 | | | Total | |
| Common Stock | | $ | 52,099,840 | | | $ | — | | | $ | — | | | $ | 52,099,840 | |
| Time Deposit | | | — | | | | 5,622 | | | | — | | | | 5,622 | |
| Total Investments in Securities | | $ | 52,099,840 | | | $ | 5,622 | | | $ | — | | | $ | 52,105,462 | |
For the period April 30, 2012, there have been no transfers between Level 1 & Level 2 investments.
For the period April 30, 2012, there were no Level 3 investments.
The accompanying notes are an integral part of the financial statements.
| Schedule of Investments | April 30, 2012 (Unaudited) |
Global X FTSE Nordic Region ETF
Sector Weightings †
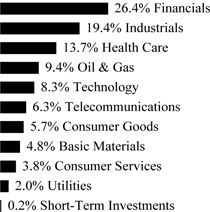
† Percentages based on total investments.
| | | Shares | | | Value | |
| COMMON STOCK — 99.3% | | | | | | | | |
| DENMARK — 21.7% | | | | | | | | |
| Consumer Goods — 2.1% | | | | | | | | |
| Carlsberg, Cl B | | | 6,375 | | | $ | 549,455 | |
| Financials — 3.2% | | | | | | | | |
| Danske Bank * | | | 50,643 | | | | 822,244 | |
| Health Care — 13.6% | | | | | | | | |
| Novo Nordisk ADR | | | 23,747 | | | | 3,491,284 | |
| Industrials — 2.8% | | | | | | | | |
| A P Moller - Maersk, Cl B | | | 90 | | | | 703,961 | |
| TOTAL DENMARK | | | | | | | 5,566,944 | |
| FINLAND—11.2% | | | | | | | | |
| Basic Materials — 1.4% | | | | | | | | |
| UPM-Kymmene | | | 27,837 | | | | 356,318 | |
| Financials — 3.2% | | | | | | | | |
| Sampo, Cl A | | | 30,447 | | | | 810,082 | |
| Industrials — 2.1% | | | | | | | | |
| Kone, Cl B | | | 8,861 | | | | 548,344 | |
| Technology — 2.5% | | | | | | | | |
| Nokia ADR | | | 176,484 | | | | 644,166 | |
| Utilities — 2.0% | | | | | | | | |
| Fortum | | | 23,842 | | | | 512,843 | |
| TOTAL FINLAND | | | | | | | 2,871,753 | |
| NORWAY—20.3% | | | | | | | | |
| Basic Materials — 3.3% | | | | | | | | |
| Norsk Hydro | | | 55,384 | | | | 269,423 | |
The accompanying notes are an integral part of the financial statements.
| Schedule of Investments | April 30, 2012 (Unaudited) |
Global X FTSE Nordic Region ETF
| | | Shares | | | Value | |
| COMMON STOCK — continued |
| Basic Materials — continued | | | | |
| Yara International | | | 11,708 | | | $ | 574,256 | |
| | | | | | | | 843,679 | |
| Consumer Goods — 1.6% | | | | | | | | |
| Orkla | | | 55,086 | | | | 404,654 | |
| Financials — 2.8% | | | | | | | | |
| DnB | | | 66,123 | | | | 712,882 | |
| Oil & Gas — 9.4% | | | | | | | | |
| Seadrill | | | 19,129 | | | | 740,365 | |
| Statoil ADR | | | 61,709 | | | | 1,660,589 | |
| | | | | | | | 2,400,954 | |
| Telecommunications — 3.2% | | | | | | | | |
| Telenor | | | 45,055 | | | | 828,207 | |
| TOTAL NORWAY | | | | | | | 5,190,376 | |
| SWEDEN — 46.1% | | | | | | | | |
| Consumer Goods — 2.0% | | | | | | | | |
| Svenska Cellulosa, Cl B | | | 32,280 | | | | 511,481 | |
| Consumer Services — 3.8% | | | | | | | | |
| Hennes & Mauritz, Cl B | | | 28,186 | | | | 968,287 | |
| Financials — 17.2% | | | | | | | | |
| Investor, Cl B | | | 24,219 | | | | 482,845 | |
| Nordea Bank | | | 145,480 | | | | 1,290,020 | |
| Skandinaviska Enskilda Banken, Cl A | | | 117,947 | | | | 795,988 | |
| Svenska Handelsbanken, Cl A | | | 29,743 | | | | 963,805 | |
| Swedbank, Cl A | | | 52,461 | | | | 868,717 | |
| | | | | | | | 4,401,375 | |
| Industrials — 14.3% | | | | |
| Atlas Copco, Cl A | | | 34,218 | | | | 814,557 | |
| Sandvik | | | 60,513 | | | | 958,837 | |
| Scania, Cl B | | | 21,931 | | | | 448,324 | |
| SKF, Cl B | | | 21,946 | | | | 520,790 | |
| Volvo, Cl B | | | 66,797 | | | | 926,232 | |
| | | | | | | | 3,668,740 | |
| Technology — 5.8% | | | | | | | | |
| Ericsson ADR | | | 148,045 | | | | 1,479,710 | |
| Telecommunications — 3.0% | | | | | | | | |
| TeliaSonera | | | 117,676 | | | | 786,631 | |
| TOTAL SWEDEN | | | | | | | 11,816,224 | |
| TOTAL COMMON STOCK | | | | | | | | |
| (Cost $27,697,252) | | | | | | | 25,445,297 | |
The accompanying notes are an integral part of the financial statements.
| Schedule of Investments | April 30, 2012 (Unaudited) |
Global X FTSE Nordic Region ETF
| | | Face Amount | | | Value | |
| TIME DEPOSIT — 0.2% |
| Brown Brothers Harriman, 0.030% | | | | | | | | |
| (Cost $42,923) | | $ | 42,923 | | | $ | 42,923 | |
| TOTAL INVESTMENTS — 99.5% | | | | | | | | |
| (Cost $27,740,175) | | | | | | $ | 25,488,220 | |
| |
| Percentages are based on Net Assets of $25,612,575. |
| * | Non-income producing security. |
ADR — American Depositary Receipt
Cl — Class
The following is a summary of the inputs used as of April 30, 2012, in valuing the Fund’s investments carried at value:
| Investments in Securities | | Level 1 | | | Level 2 | | | Level 3 | | | Total | |
| Common Stock | | $ | 25,445,297 | | | $ | — | | | $ | — | | | $ | 25,445,297 | |
| Time Deposit | | | — | | | | 42,923 | | | | — | | | | 42,923 | |
| Total Investments in Securities | | $ | 25,445,297 | | | $ | 42,923 | | | $ | — | | | $ | 25,488,220 | |
For the period ended April 30, 2012, there have been no transfers between Level 1 & Level 2 investments.
For the period ended April 30, 2012, there were no Level 3 investments.
The accompanying notes are an integral part of the financial statements.
Statements of Assets and Liabilities
April 30, 2012 (Unaudited)
| | | Global X China Consumer ETF | | | Global X China Energy ETF | | | Global X China Financials ETF | | | Global X China Industrials ETF | |
| Assets: | | | | | | | | | | | | | | | | |
| Cost of Investments | | $ | 135,268,324 | | | $ | 4,876,543 | | | $ | 11,200,425 | | | $ | 6,551,903 | |
| Cost of Repurchase Agreement | | | 21,503,548 | | | | — | | | | — | | | | — | |
| Cost of Foreign Currency | | | 66,816 | | | | — | | | | 1,124 | | | | 577 | |
| Market Value of Securities on Loan | | | 19,216,219 | | | | — | | | | — | | | | — | |
| Investments at Value | | $ | 132,642,936 | | | $ | 4,826,195 | | | $ | 11,233,007 | | | $ | 4,841,765 | |
| Repurchase Agreement | | | 21,503,548 | | | | — | | | | — | | | | — | |
| Foreign Currency at Value | | | 66,835 | | | | — | | | | 1,125 | | | | 579 | |
| Receivable for Investment Securities Sold | | | 16,458,176 | | | | 956,129 | | | | 2,122,552 | | | | 427,595 | |
| Receivable for Capital Shares Sold | | | 9,925,500 | | | | — | | | | — | | | | — | |
| Dividend and Interest Receivable | | | 69,565 | | | | — | | | | — | | | | — | |
| Total Assets | | | 180,666,560 | | | | 5,782,324 | | | | 13,356,684 | | | | 5,269,939 | |
| | | | | | | | | | | | | | | | | |
| Liabilities: | | | | | | | | | | | | | | | | |
| | | | | | | | | | | | | | | | | |
| Payable for Investment Securities Purchased | | | 14,859,332 | | | | 264,235 | | | | 945,740 | | | | 426,796 | |
| Obligation to Return Securities Lending Collateral | | | 21,503,548 | | | | — | | | | — | | | | — | |
| Payable for Capital Shares Redeemed | | | 11,440,500 | | | | 682,500 | | | | 1,170,000 | | | | — | |
| Payable due to Investment Adviser | | | 70,595 | | | | 2,903 | | | | 6,767 | | | | 2,558 | |
| Due to Custodian | | | — | | | | 2,946 | | | | — | | | | — | |
| Total Liabilities | | | 47,873,975 | | | | 952,584 | | | | 2,122,507 | | | | 429,354 | |
| | | | | | | | | | | | | | | | | |
| Net Assets | | $ | 132,792,585 | | | $ | 4,829,740 | | | $ | 11,234,177 | | | $ | 4,840,585 | |
| | | | | | | | | | | | | | | | | |
| Net Assets Consist of: | | | | | | | | | | | | | | | | |
| Paid-in Capital | | $ | 158,993,021 | | | $ | 5,244,360 | | | $ | 11,605,697 | | | $ | 7,119,053 | |
| Distributions in Excess of Net Investment Income | | | (984,334 | ) | | | (17,392 | ) | | | (42,870 | ) | | | (20,701 | ) |
| Accumulated Net Realized Loss on Investments and Foreign Currency Translations | | | (22,590,359 | ) | | | (346,879 | ) | | | (361,230 | ) | | | (547,648 | ) |
| Net Unrealized Appreciation (Depreciation) on Investments | | | (2,625,388 | ) | | | (50,348 | ) | | | 32,582 | | | | (1,710,138 | ) |
| Net Unrealized Appreciation (Depreciation) on Foreign Currency Translations | | | (355 | ) | | | (1 | ) | | | (2 | ) | | | 19 | |
| Net Assets | | $ | 132,792,585 | | | $ | 4,829,740 | | | $ | 11,234,177 | | | $ | 4,840,585 | |
| Outstanding Shares of Beneficial Interest | | | | | | | | | | | | | | | | |
| (unlimited authorization — no par value) | | | 8,700,000 | | | | 350,000 | | | | 950,000 | | | | 400,000 | |
| | | | | | | | | | | | | | | | | |
| Net Asset Value, Offering and Redemption Price Per Share | | $ | 15.26 | | | $ | 13.80 | | | $ | 11.83 | | | $ | 12.10 | |
The accompanying notes are an integral part of the financial statements.
Statements of Assets and Liabilities
April 30, 2012 (Unaudited)
| | | Global X China
Materials ETF | | | Global X NASDAQ
China Technology
ETF | | | Global X FTSE
ASEAN 40 ETF | | | Global X FTSE
Andean 40 ETF | |
| Assets: | | | | | | | | | | | | | | | | |
| Cost of Investments | | $ | 3,533,733 | | | $ | 4,232,329 | | | $ | 28,544,316 | | | $ | 7,887,897 | |
| Cost of Foreign Currency | | | 1,816 | | | | 2,593 | | | | 68,071 | | | | 11,661 | |
| Investments at Value | | $ | 2,547,613 | | | $ | 4,614,014 | | | $ | 29,065,536 | | | $ | 8,336,004 | |
| Foreign Currency at Value | | | 1,817 | | | | 2,594 | | | | 69,415 | | | | 11,675 | |
| Receivable for Investment Securities Sold | | | 135,871 | | | | — | | | | — | | | | — | |
| Dividend and Interest Receivable | | | — | | | | — | | | | 153,414 | | | | 60,136 | |
| Total Assets | | | 2,685,301 | | | | 4,616,608 | | | | 29,288,365 | | | | 8,407,815 | |
| | | | | | | | | | | | | | | | | |
| Liabilities: | | | | | | | | | | | | | | | | |
| Payable for Investment Securities Purchased | | | 131,692 | | | | — | | | | — | | | | — | |
| Payable due to Investment Adviser | | | 1,423 | | | | 2,511 | | | | 15,424 | | | | 4,496 | |
| Due to Custodian | | | 600 | | | | — | | | | — | | | | 47,209 | |
| Total Liabilities | | | 133,715 | | | | 2,511 | | | | 15,424 | | | | 51,705 | |
| | | | | | | | | | | | | | | | | |
| Net Assets | | $ | 2,551,586 | | | $ | 4,614,097 | | | $ | 29,272,941 | | | $ | 8,356,110 | |
| | | | | | | | | | | | | | | | | |
| Net Assets Consist of: | | | | | | | | | | | | | | | | |
| Paid-in Capital | | $ | 4,357,294 | | | $ | 4,810,925 | | | $ | 29,182,557 | | | $ | 8,039,000 | |
| Undistributed (Distributions in Excess of) Net Investment Income/(Accumulated Net Investment Loss) | | | (7,075 | ) | | | (12,106 | ) | | | 181,814 | | | | 76,320 | |
| Accumulated Net Realized Loss on Investments and Foreign Currency Translations | | | (812,514 | ) | | | (566,408 | ) | | | (614,685 | ) | | | (207,332 | ) |
| Net Unrealized Appreciation (Depreciation) on Investments | | | (986,120 | ) | | | 381,685 | | | | 521,220 | | | | 448,107 | |
| Net Unrealized Appreciation on Foreign Currency Translations | | | 1 | | | | 1 | | | | 2,035 | | | | 15 | |
| Net Assets | | $ | 2,551,586 | | | $ | 4,614,097 | | | $ | 29,272,941 | | | $ | 8,356,110 | |
| Outstanding Shares of Beneficial Interest | | | | | | | | | | | | | | | | |
| (unlimited authorization — no par value) | | | 300,000 | | | | 300,000 | | | | 1,800,000 | | | | 550,000 | |
| | | | | | | | | | | | | | | | | |
| Net Asset Value, Offering and Redemption Price Per Share | | $ | 8.51 | | | $ | 15.38 | | | $ | 16.26 | | | $ | 15.19 | |
The accompanying notes are an integral part of the financial statements.
Statements of Assets and Liabilities
April 30, 2012 (Unaudited)
| | | Global X FTSE
Colombia 20 ETF | | | Global X Brazil
Mid Cap ETF | | | Global X Brazil Consumer ETF | | | Global X Brazil Financials ETF | |
| Assets: | | | | | | | | | | | | | | | | |
| Cost of Investments | | $ | 159,153,760 | | | $ | 22,256,057 | | | $ | 30,965,389 | | | $ | 4,613,042 | |
| Cost of Repurchase Agreement | | | 14,990,050 | | | | — | | | | — | | | | — | |
| Cost of Foreign Currency | | | 615,062 | | | | 14,804 | | | | 53,042 | | | | 5,251 | |
| Market Value of Securities on Loan | | | 14,666,764 | | | | — | | | | — | | | | — | |
| Investments at Value | | $ | 179,596,818 | | | $ | 24,141,260 | | | $ | 32,887,313 | | | $ | 3,972,333 | |
| Repurchase Agreement | | | 14,990,050 | | | | — | | | | — | | | | — | |
| Foreign Currency at Value | | | 615,098 | | | | 14,652 | | | | 52,544 | | | | 5,248 | |
| Receivable for Capital Shares Sold | | | 5,593,000 | | | | — | | | | — | | | | — | |
| Dividend and Interest Receivable | | | 1,427,549 | | | | 272,622 | | | | 37,760 | | | | 22,253 | |
| Receivable for Investment Securities Sold | | | 944,089 | | | | — | | | | — | | | | 42,742 | |
| Total Assets | | | 203,166,604 | | | | 24,428,534 | | | | 32,977,617 | | | | 4,042,576 | |
| | | | | | | | | | | | | | | | | |
| Liabilities: | | | | | | | | | | | | | | | | |
| Payable for Investment Securities Purchased | | | 5,587,210 | | | | — | | | | — | | | | — | |
| Obligation to Return Securities Lending Collateral | | | 14,990,050 | | | | — | | | | — | | | | — | |
| Due to Custodian | | | 1,262,797 | | | | 10,143 | | | | — | | | | — | |
| Payable due to Custody | | | 210,610 | | | | — | | | | — | | | | — | |
| Payable due to Investment Adviser | | | 83,621 | | | | 14,041 | | | | 23,915 | | | | 3,081 | |
| Total Liabilities | | | 22,134,288 | | | | 24,184 | | | | 23,915 | | | | 3,081 | |
| | | | | | | | | | | | | | | | | |
| Net Assets | | $ | 181,032,316 | | | $ | 24,404,350 | | | $ | 32,953,702 | | | $ | 4,039,495 | |
| | | | | | | | | | | | | | | | | |
| Net Assets Consist of: | | | | | | | | | | | | | | | | |
| Paid-in Capital | | $ | 176,239,828 | | | $ | 24,607,841 | | | $ | 32,759,893 | | | $ | 5,356,523 | |
| Undistributed Net Investment Income | | | 1,000,918 | | | | 279,905 | | | | 133,309 | | | | 44,337 | |
| Accumulated Net Realized Loss on Investments and Foreign Currency Translations | | | (16,650,756 | ) | | | (2,366,743 | ) | | | (1,859,434 | ) | | | (720,232 | ) |
| Net Unrealized Appreciation (Depreciation) on Investments | | | 20,443,058 | | | | 1,885,203 | | | | 1,921,924 | | | | (640,709 | ) |
| Net Unrealized Depreciation on Foreign Currency Translations | | | (732 | ) | | | (1,856 | ) | | | (1,990 | ) | | | (424 | ) |
| Net Assets | | $ | 181,032,316 | | | $ | 24,404,350 | | | $ | 32,953,702 | | | $ | 4,039,495 | |
| Outstanding Shares of Beneficial Interest | | | | | | | | | | | | | | | | |
| (unlimited authorization — no par value) | | | 8,080,000 | | | | 1,450,000 | | | | 1,800,000 | | | | 300,000 | |
| | | | | | | | | | | | | | | | | |
| Net Asset Value, Offering and Redemption Price Per Share | | $ | 22.40 | | | $ | 16.83 | | | $ | 18.31 | | | $ | 13.46 | |
The accompanying notes are an integral part of the financial statements.
Statements of Assets and Liabilities
April 30, 2012 (Unaudited)
| | | Global X FTSE Argentina 20 ETF | | | Global X FTSE
Greece 20 ETF | | | Global X FTSE
Norway 30 ETF | | | Global X FTSE
Nordic Region ETF | |
| Assets: | | | | | | | | | | | | | | | | |
| Cost of Investments | | $ | 4,598,479 | | | $ | 3,177,933 | | | $ | 53,490,379 | | | $ | 27,740,175 | |
| Cost of Foreign Currency | | | — | | | | — | | | | 51,842 | | | | 40,700 | |
| Investments at Value | | $ | 3,324,037 | | | $ | 2,858,699 | | | $ | 52,105,462 | | | $ | 25,488,220 | |
| Foreign Currency at Value | | | — | | | | — | | | | 51,941 | | | | 40,787 | |
| Dividend and Interest Receivable | | | 1,803 | | | | — | | | | 359,192 | | | | 72,280 | |
| Receivable for Investment Securities Sold | | | — | | | | 61,368 | | | | 505,469 | | | | — | |
| Reclaim Receivable | | | — | | | | — | | | | — | | | | 21,620 | |
| Total Assets | | | 3,325,840 | | | | 2,920,067 | | | | 53,022,064 | | | | 25,622,907 | |
| | | | | | | | | | | | | | | | | |
| Liabilities: | | | | | | | | | | | | | | | | |
| Payable due to Investment Adviser | | | 2,080 | | | | 1,324 | | | | 21,592 | | | | 10,332 | |
| Payable due to Custody | | | 425 | | | | 923 | | | | — | | | | — | |
| Total Liabilities | | | 2,505 | | | | 2,247 | | | | 21,592 | | | | 10,332 | |
| | | | | | | | | | | | | | | | | |
| Net Assets | | $ | 3,323,335 | | | $ | 2,917,820 | | | $ | 53,000,472 | | | $ | 25,612,575 | |
| | | | | | | | | | | | | | | | | |
| Net Assets Consist of: | | | | | | | | | | | | | | | | |
| Paid-in Capital | | $ | 5,219,000 | | | $ | 3,030,000 | | | $ | 62,586,485 | | | $ | 27,954,632 | |
| Undistributed (Distributions in Excess of) Net Investment Income | | | (6,164 | ) | | | (7,214 | ) | | | 430,133 | | | | 441,741 | |
| Accumulated Net Realized Gain (Loss) on Investments and Foreign Currency Translations | | | (615,059 | ) | | | 214,283 | | | | (8,631,662 | ) | | | (531,716 | ) |
| Net Unrealized Depreciation on Investments | | | (1,274,442 | ) | | | (319,234 | ) | | | (1,384,917 | ) | | | (2,251,955 | ) |
| Net Unrealized Appreciation (Depreciation) on Foreign Currency Translations | | | — | | | | (15 | ) | | | 433 | | | | (127 | ) |
| Net Assets | | $ | 3,323,335 | | | $ | 2,917,820 | | | $ | 53,000,472 | | | $ | 25,612,575 | |
| Outstanding Shares of Beneficial Interest | | | | | | | | | | | | | | | | |
| (unlimited authorization — no par value) | | | 350,000 | | | | 200,000 | | | | 3,700,000 | | | | 1,410,000 | |
| | | | | | | | | | | | | | | | | |
| Net Asset Value, Offering and Redemption Price Per Share | | $ | 9.50 | | | $ | 14.59 | | | $ | 14.32 | | | $ | 18.16 | |
The accompanying notes are an integral part of the financial statements.
Statements of Operations
For the period ended April 30, 2012 (Unaudited)
| | | Global X China
Consumer ETF | | | Global X
China Energy
ETF | | | Global X
China
Financials
ETF | | | Global X
China
Industrials
ETF | |
| Investment Income: | | | | | | | | | | | | | | | | |
| Dividend Income | | $ | 160,040 | | | $ | 316 | | | $ | 3,740 | | | $ | — | |
| Security Lending Income | | | 438,282 | | | | — | | | | — | | | | — | |
| Less: Foreign Taxes Withheld | | | (11,346 | ) | | | (1,134 | ) | | | (620 | ) | | | (66 | ) |
| Total Investment Income | | | 586,976 | | | | (818 | ) | | | 3,120 | | | | (66 | ) |
| Supervision and Administration Fees(1) | | | 437,316 | | | | 16,574 | | | | 45,990 | | | | 14,958 | |
| Total Expenses | | | 437,316 | | | | 16,574 | | | | 45,990 | | | | 14,958 | |
| Net Expenses | | | 437,316 | | | | 16,574 | | | | 45,990 | | | | 14,958 | |
| Net Investment Income (Loss) | | | 149,660 | | | | (17,392 | ) | | | (42,870 | ) | | | (15,024 | ) |
| Net Realized Gain (Loss) on: | | | | | | | | | | | | | | | | |
| Investments | | | (18,748,926 | )(2) | | | (286,264 | )(2) | | | 457,953 | (2) | | | (448,929 | ) |
| Foreign Currency Transactions | | | 516 | | | | (54 | ) | | | 47 | | | | (58 | ) |
| Net Realized Gain (Loss) on Investments | | | (18,748,410 | ) | | | (286,318 | ) | | | 458,000 | | | | (448,987 | ) |
| Net Change in Unrealized Appreciation (Depreciation) on: | | | | | | | | | | | | | | | | |
| Investments | | | 19,551,170 | | | | 338,469 | | | | 675,500 | | | | 755,602 | |
| Foreign Currency Transactions | | | (1,178 | ) | | | (11 | ) | | | (570 | ) | | | 44 | |
| Net Change in Unrealized Appreciation on Investments | | | 19,549,992 | | | | 338,458 | | | | 674,930 | | | | 755,646 | |
| Net Realized and Unrealized Gain on Investments | | | 801,582 | | | | 52,140 | | | | 1,132,930 | | | | 306,659 | |
| Net Increase in Net Assets Resulting from Operations | | $ | 951,242 | | | $ | 34,748 | | | $ | 1,090,060 | | | $ | 291,635 | |
| (1) | The Supervision and Administration fees reflect the supervisory and administrative fee, which includes fees paid by the Funds for the investment advisory services provided by the Adviser. (See Note 3 in Notes to Financial Statements.) |
| (2) | Includes realized gains/(losses) as a result of in-kind transactions (see Note 4 in Notes to Financial Statements). |
The accompanying notes are an integral part of the financial statements.
Statements of Operations
For the period ended April 30, 2012 (Unaudited)
| | | Global X
China
Materials
ETF | | | Global X
NASDAQ
China
Technology
ETF | | | Global X
FTSE ASEAN
40 ETF | | | Global X
FTSE
Andean 40
ETF | |
| Investment Income: | | | | | | | | | | | | | | | | |
| Dividend Income | | $ | 2,015 | | | $ | 2,938 | | | $ | 539,280 | | | $ | 130,181 | |
| Less: Foreign Taxes Withheld | | | (202 | ) | | | (517 | ) | | | (21,284 | ) | | | (14,059 | ) |
| Total Investment Income | | | 1,813 | | | | 2,421 | | | | 517,996 | | | | 116,122 | |
| Supervision and Administration Fees(1) | | | 8,888 | | | | 14,528 | | | | 78,974 | | | | 24,910 | |
| Total Expenses | | | 8,888 | | | | 14,528 | | | | 78,974 | | | | 24,910 | |
| Net Expenses | | | 8,888 | | | | 14,528 | | | | 78,974 | | | | 24,910 | |
| Net Investment Income (Loss) | | | (7,075 | ) | | | (12,107 | ) | | | 439,022 | | | | 91,212 | |
| Net Realized Gain (Loss) on: | | | | | | | | | | | | | | | | |
| Investments | | | (809,709 | )(2) | | | (323,945 | ) | | | (623,246 | )(2) | | | (72,478 | ) |
| Foreign Currency Transactions | | | 7 | | | | 147 | | | | 15,592 | | | | 1,259 | |
| Net Realized Loss on Investments | | | (809,702 | ) | | | (323,798 | ) | | | (607,654 | ) | | | (71,219 | ) |
| Net Change in Unrealized Appreciation (Depreciation) on: | | | | | | | | | | | | | | | | |
| Investments | | | 479,769 | | | | 393,637 | | | | 1,862,838 | | | | 909,325 | |
| Foreign Currency Transactions | | | (33 | ) | | | (58 | ) | | | 1,549 | | | | (15 | ) |
| Net Change in Unrealized Appreciation on Investments | | | 479,736 | | | | 393,579 | | | | 1,864,387 | | | | 909,310 | |
| Net Realized and Unrealized Gain (Loss) on Investments | | | (329,966 | ) | | | 69,781 | | | | 1,256,733 | | | | 838,091 | |
| Net Increase (Decrease) in Net Assets Resulting from Operations | | $ | (337,041 | ) | | $ | 57,674 | | | $ | 1,695,755 | | | $ | 929,303 | |
| (1) | The Supervision and Administration fees reflect the supervisory and administrative fee, which includes fees paid by the Funds for the investment advisory services provided by the Adviser. (See Note 3 in Notes to Financial Statements.) |
| (2) | Includes realized losses as a result of in-kind transactions (see Note 4 in Notes to Financial Statements). |
The accompanying notes are an integral part of the financial statements.
Statements of Operations
For the period ended April 30, 2012 (Unaudited)
| | | Global X FTSE
Colombia 20
ETF | | | Global X Brazil
Mid Cap ETF | | | Global X Brazil
Consumer ETF | | | Global X
Brazil
Financials
ETF | |
| Investment Income: | | | | | | | | | | | | | | | | |
| Dividend Income | | $ | 2,751,807 | | | $ | 445,977 | | | $ | 260,226 | | | $ | 106,926 | |
| Interest Income | | | — | | | | 1,981 | | | | 2,980 | | | | — | |
| Security Lending Income | | | 9,148 | | | | — | | | | — | | | | — | |
| Less: Foreign Taxes Withheld | | | (48,663 | ) | | | — | | | | — | | | | — | |
| Total Investment Income | | | 2,712,292 | | | | 447,958 | | | | 263,206 | | | | 106,926 | |
| Supervision and Administration Fees(1) | | | 474,129 | | | | 81,063 | | | | 129,896 | | | | 22,771 | |
| Custodian Fees | | | 77,816 | | | | — | | | | — | | | | — | |
| Total Expenses | | | 551,945 | | | | 81,063 | | | | 129,896 | | | | 22,771 | |
| Waiver of Supervision and Administration Fees | | | (8,092 | ) | | | — | | | | — | | | | — | |
| Net Expenses | | | 543,853 | | | | 81,063 | | | | 129,896 | | | | 22,771 | |
| Net Investment Income | | | 2,168,439 | | | | 366,895 | | | | 133,310 | | | | 84,155 | |
| Net Realized Gain (Loss) on: | | | | | | | | | | | | | | | | |
| Investments | | | (3,942,210 | )(2) | | | (1,271,080 | )(2) | | | (1,056,322 | )(2) | | | (596,617 | )(2) |
| Foreign Currency Transactions | | | 87,317 | | | | (71,220 | ) | | | 27,772 | | | | (8,267 | ) |
| Net Realized Loss on Investments | | | (3,854,893 | ) | | | (1,342,300 | ) | | | (1,028,550 | ) | | | (604,884 | ) |
| Net Change in Unrealized Appreciation (Depreciation) on: | | | | | | | | | | | | | | | | |
| Investments | | | 24,543,990 | | | | 3,284,144 | | | | 4,190,498 | | | | 159,038 | |
| Foreign Currency Transactions | | | (4,611 | ) | | | (1,689 | ) | | | 551 | | | | (1,050 | ) |
| Net Change in Unrealized Appreciation on Investments | | | 24,539,379 | | | | 3,282,455 | | | | 4,191,049 | | | | 157,988 | |
| Net Realized and Unrealized Gain (Loss) on Investments | | | 20,684,486 | | | | 1,940,155 | | | | 3,162,499 | | | | (446,896 | ) |
| Net Increase (Decrease) in Net Assets Resulting from Operations | | $ | 22,852,925 | | | $ | 2,307,050 | | | $ | 3,295,809 | | | $ | (362,741 | ) |
| (1) | The Supervision and Administration fees reflect the supervisory and administrative fee, which includes fees paid by the Funds for the investment advisory services provided by the Adviser. (See Note 3 in Notes to Financial Statements.) |
| (2) | Includes realized gains/(losses) as a result of in-kind transactions (see Note 4 in Notes to Financial Statements). |
The accompanying notes are an integral part of the financial statements.
| Statements of Operations |
| For the period ended April 30, 2012 (Unaudited) |
| | | Global X
FTSE
Argentina 20
ETF | | | Global X
FTSE Greece
20 ETF(1) | | | Global X FTSE
Norway 30 ETF | | | Global X
FTSE Nordic
Region ETF | |
| Investment Income: | | | | | | | | | | | | | | | | |
| Dividend Income | | $ | 40,985 | | | $ | 3,012 | | | $ | 1,166,429 | | | $ | 655,303 | |
| Interest Income | | | 1 | | | | 30 | | | | — | | | | 5 | |
| Less: Foreign Taxes Withheld | | | (1,080 | ) | | | (2 | ) | | | (237,769 | ) | | | (104,075 | ) |
| Total Investment Income | | | 39,906 | | | | 3,040 | | | | 928,660 | | | | 551,233 | |
| Supervision and Administration Fees(2) | | | 14,206 | | | | 4,620 | | | | 133,909 | | | | 61,791 | |
| Custodian Fees | | | 164 | | | | 923 | | | | — | | | | — | |
| Total Expenses | | | 14,370 | | | | 5,543 | | | | 133,909 | | | | 61,791 | |
| Net Expenses | | | 14,370 | | | | 5,543 | | | | 133,909 | | | | 61,791 | |
| Net Investment Income (Loss) | | | 25,536 | | | | (2,503 | ) | | | 794,751 | | | | 489,442 | |
| Net Realized Gain (Loss) on: | | | | | | | | | | | | | | | | |
| Investments | | | (178,968 | ) | | | 205,108 | (3) | | | (4,897,102 | )(3) | | | (496,428 | )(3) |
| Foreign Currency Transactions | | | (130 | ) | | | 9,175 | | | | (12,858 | ) | | | (9,620 | ) |
| Net Realized Gain (Loss) on Investments | | | (179,098 | ) | | | 214,283 | | | | (4,909,960 | ) | | | (506,048 | ) |
| Net Change in Unrealized Appreciation (Depreciation) on: | | | | | | | | | | | | | | | | |
| Investments | | | (277,370 | ) | | | (319,234 | ) | | | 4,392,922 | | | | 1,457,033 | |
| Foreign Currency Transactions | | | 29 | | | | (15 | ) | | | (1,174 | ) | | | (289 | ) |
| Net Change in Unrealized Appreciation (Depreciation) on Investments | | | (277,341 | ) | | | (319,249 | ) | | | 4,391,748 | | | | 1,456,744 | |
| Net Realized and Unrealized Gain (Loss) on Investments | | | (456,439 | ) | | | (104,966 | ) | | | (518,212 | ) | | | 950,696 | |
| Net Increase (Decrease) in Net Assets Resulting from Operations | | $ | (430,903 | ) | | $ | (107,469 | ) | | $ | 276,539 | | | $ | 1,440,138 | |
| (1) | The Fund commenced operations on December 7, 2011. |
| (2) | The Supervision and Administration fees reflect the supervisory and administrative fee, which includes fees paid by the Funds for the investment advisory services provided by the Adviser. (See Note 3 in Notes to Financial Statements.) |
| (3) | Includes realized gains/(losses) as a result of in-kind transactions (see Note 4 in Notes to Financial Statements). |
The accompanying notes are an integral part of the financial statements.
| Statements of Changes in Net Assets |
| |
| | | Global X China Consumer ETF | | | Global X China Energy ETF | |
| | | Period Ended
April 30, 2012
(Unaudited) | | | Year Ended
October 31, 2011
(Audited) | | | Period Ended
April 30, 2012
(Unaudited) | | | Year Ended
October 31,
2011
(Audited)1 | |
| Operations: | | | | | | | | | | | | | | | | |
| Net Investment Income (Loss) | | $ | 149,660 | | | $ | 1,713,956 | | | $ | (17,392 | ) | | $ | 125,627 | |
| Net Realized Loss on Investments and Foreign Currency Transactions | | | (18,748,410 | )(1) | | | (11,421,805 | ) | | | (286,318 | )(1) | | | (321,687 | )(1) |
| Net Change in Unrealized Appreciation (Depreciation) on Investments and Foreign Currency Transactions | | | 19,549,992 | | | | (43,411,698 | ) | | | 338,458 | | | | (602,939 | ) |
| Net Increase (Decrease) in Net Assets Resulting from Operations | | | 951,242 | | | | (53,119,547 | ) | | | 34,748 | | | | (798,999 | ) |
| Dividends and Distributions: | | | | | | | | | | | | | | | | |
| Net Investment Income | | | (487,644 | ) | | | (1,734,529 | ) | | | (78,332 | ) | | | (61,491 | ) |
| Total Dividends and Distributions | | | (487,644 | ) | | | (1,734,529 | ) | | | (78,332 | ) | | | (61,491 | ) |
| Capital Share Transactions: | | | | | | | | | | | | | | | | |
| Issued | | | 50,342,500 | | | | 91,602,500 | | | | 1,388,000 | | | | 5,637,000 | |
| Redeemed | | | (54,871,500 | ) | | | (74,765,500 | ) | | | (1,336,500 | ) | | | (4,672,000 | ) |
| Increase (Decrease) in Net Assets from Capital Share Transactions | | | (4,529,000 | ) | | | 16,837,000 | | | | 51,500 | | | | 965,000 | |
| Total Increase (Decrease) in Net Assets | | | (4,065,402 | ) | | | (38,017,076 | ) | | | 7,916 | | | | 104,510 | |
| Net Assets: | | | | | | | | | | | | | | | | |
| Beginning of Period | | | 136,857,987 | | | | 174,875,063 | | | | 4,821,824 | | | | 4,717,314 | |
| End of Period | | $ | 132,792,585 | | | $ | 136,857,987 | | | $ | 4,829,740 | | | $ | 4,821,824 | |
| Undistributed (Distributions in Excess of) Net Investment Income | | $ | (984,334 | ) | | $ | (646,350 | ) | | $ | (17,392 | ) | | $ | 78,332 | |
| | | | | | | | | | | | | | | | | |
| Share Transactions: | | | | | | | | | | | | | | | | |
| Issued | | | 3,450,000 | | | | 4,800,000 | | | | 100,000 | | | | 350,000 | |
| Redeemed | | | (3,700,000 | ) | | | (4,450,000 | ) | | | (100,000 | ) | | | (300,000 | ) |
| Net Increase (Decrease) in Shares Outstanding from Share Transactions | | | (250,000 | ) | | | 350,000 | | | | — | | | | 50,000 | |
| (1) | Includes realized gains/(losses) as a result of in-kind transactions (see Note 4 in Notes to Financial Statements). |
The accompanying notes are an integral part of the financial statements.
| Statements of Changes in Net Assets |
| |
| | | Global X China Financials ETF | | | Global X China Industrials ETF | |
| | | Period Ended
April 30, 2012
(Unaudited) | | | Year Ended
October 31, 2011
(Audited) | | | Period Ended
April 30, 2012
(Unaudited) | | | Year Ended
October 31, 2011
(Audited) | |
| Operations: | | | | | | | | | | | | | | | | |
| Net Investment Income (Loss) | | $ | (42,870 | ) | | $ | 40,125 | | | $ | (15,024 | ) | | $ | 69,662 | |
| Net Realized Gain (Loss) on Investments and Foreign Currency Transactions | | | 458,000 | (1) | | | (1,776,172 | )(1) | | | (448,987 | ) | | | 366,392 | (1) |
| Net Change in Unrealized Appreciation (Depreciation) on Investments and Foreign Currency Transactions | | | 674,930 | | | | (3,649,321 | ) | | | 755,646 | | | | (3,006,105 | ) |
| Net Increase (Decrease) in Net Assets Resulting from Operations | | | 1,090,060 | | | | (5,385,368 | ) | | | 291,635 | | | | (2,570,051 | ) |
| Dividends and Distributions: | | | | | | | | | | | | | | | | |
| Net Investment Income | | | (14,611 | ) | | | (1,177,311 | ) | | | (8,938 | ) | | | (149,711 | ) |
| Total Dividends and Distributions | | | (14,611 | ) | | | (1,177,311 | ) | | | (8,938 | ) | | | (149,711 | ) |
| Capital Share Transactions: | | | | | | | | | | | | | | | | |
| Issued | | | 3,928,000 | | | | 7,974,500 | | | | — | | | | 839,000 | |
| Redeemed | | | (4,693,000 | ) | | | (60,646,500 | ) | | | — | | | | (6,411,500 | ) |
| Decrease in Net Assets from Capital Share Transactions | | | (765,000 | ) | | | (52,672,000 | ) | | | — | | | | (5,572,500 | ) |
| Total Increase (Decrease) in Net Assets | | | 310,449 | | | | (59,234,679 | ) | | | 282,697 | | | | (8,292,262 | ) |
| Net Assets: | | | | | | | | | | | | | | | | |
| Beginning of Period | | | 10,923,728 | | | | 70,158,407 | | | | 4,557,888 | | | | 12,850,150 | |
| End of Period | | $ | 11,234,177 | | | $ | 10,923,728 | | | $ | 4,840,585 | | | $ | 4,557,888 | |
| Undistributed (Distributions in Excess of) Net Investment Income | | $ | (42,870 | ) | | $ | 14,611 | | | $ | (20,701 | ) | | $ | 3,261 | |
| | | | | | | | | | | | | | | | | |
| Share Transactions: | | | | | | | | | | | | | | | | |
| Issued | | | 350,000 | | | | 750,000 | | | | — | | | | 50,000 | |
| Redeemed | | | (400,000 | ) | | | (4,500,000 | ) | | | — | | | | (400,000 | ) |
| Net Decrease in Shares Outstanding from Share Transactions | | | (50,000 | ) | | | (3,750,000 | ) | | | — | | | | (350,000 | ) |
| (1) | Includes realized gains as a result of in-kind transactions (see Note 4 in Notes to Financial Statements). |
The accompanying notes are an integral part of the financial statements.
| Statements of Changes in Net Assets |
| |
| | | Global X China Materials ETF | | | Global X NASDAQ China
Technology ETF | |
| | | Period Ended
April 30, 2012
(Unaudited) | | | Year Ended
October 31, 2011
(Audited) | | | Period Ended
April 30, 2012
(Unaudited) | | | Year Ended
October 31, 2011
(Audited) | |
| Operations: | | | | | | | | | | | | | | | | |
| Net Investment Income (Loss) | | $ | (7,075 | ) | | $ | 7,175 | | | $ | (12,107 | ) | | $ | 128,974 | |
| Net Realized Gain (Loss) on Investments and Foreign Currency Transactions | | | (809,702 | )(1) | | | 11,778,378 | (1) | | | (323,798 | ) | | | (583,543 | )(1) |
| Net Change in Unrealized Appreciation (Depreciation) on Investments and Foreign Currency Transactions | | | 479,736 | | | | (12,377,520 | ) | | | 393,579 | | | | (505,794 | ) |
| Net Increase (Decrease) in Net Assets Resulting from Operations | | | (337,041 | ) | | | (591,967 | ) | | | 57,674 | | | | (960,363 | ) |
| Dividends and Distributions: | | | | | | | | | | | | | | | | |
| Net Investment Income | | | — | | | | (336,120 | ) | | | (57,614 | ) | | | (7,571 | ) |
| Net Realized Gains | | | — | | | | — | | | | — | | | | (38,309 | ) |
| Total Dividends and Distributions | | | — | | | | (336,120 | ) | | | (57,614 | ) | | | (45,880 | ) |
| Capital Share Transactions: | | | | | | | | | | | | | | | | |
| Issued | | | 898,000 | | | | 2,226,000 | | | | 1,391,000 | | | | 3,666,000 | |
| Redeemed | | | (884,000 | ) | | | (56,065,000 | ) | | | (1,391,000 | ) | | | (2,347,000 | ) |
| Increase (Decrease) in Net Assets from Capital Share Transactions | | | 14,000 | | | | (53,839,000 | ) | | | — | | | | 1,319,000 | |
| Total Increase (Decrease) in Net Assets | | | (323,041 | ) | | | (54,767,087 | ) | | | 60 | | | | 312,757 | |
| Net Assets: | | | | | | | | | | | | | | | | |
| Beginning of Period | | | 2,874,627 | | | | 57,641,714 | | | | 4,614,037 | | | | 4,301,280 | |
| End of Period | | $ | 2,551,586 | | | $ | 2,874,627 | | | $ | 4,614,097 | | | $ | 4,614,037 | |
| Undistributed (Distributions in Excess of) Net Investment Income/(Accumulated Net Investment Loss) | | $ | (7,075 | ) | | $ | — | | | $ | (12,106 | ) | | $ | 57,615 | |
| | | | | | | | | | | | | | | | | |
| Share Transactions: | | | | | | | | | | | | | | | | |
| Issued | | | 100,000 | | | | 150,000 | | | | 100,000 | | | | 200,000 | |
| Redeemed | | | (100,000 | ) | | | (3,800,000 | ) | | | (100,000 | ) | | | (150,000 | ) |
| Net Increase (Decrease) in Shares Outstanding from Share Transactions | | | — | | | | (3,650,000 | ) | | | — | | | | 50,000 | |
| (1) | Includes realized gains/(losses) as a result of in-kind transactions (see Note 4 in Notes to Financial Statements). |
The accompanying notes are an integral part of the financial statements.
| Statements of Changes in Net Assets |
| |
| | | Global X FTSE ASEAN 40 ETF | | | Global X FTSE Andean 40 ETF | |
| | | Period Ended
April 30, 2012
(Unaudited) | | | Period Ended
October 31, 2011(1)
(Audited) | | | Period Ended
April 30, 2012
(Unaudited) | | | Period Ended
October 31,
2011(2)
(Audited) | |
| Operations: | | | | | | | | | | | | | | | | |
| Net Investment Income | | $ | 439,022 | | | $ | 261,942 | | | $ | 91,212 | | | $ | 89,965 | |
| Net Realized Loss on Investments and Foreign Currency Transactions | | | (607,654 | )(3) | | | (16,578 | )(3) | | | (71,219 | ) | | | (120,736 | ) |
| Net Change in Unrealized Appreciation (Depreciation) on Investments and Foreign Currency Transactions | | | 1,864,387 | | | | (1,341,132 | ) | | | 909,310 | | | | (461,188 | ) |
| Net Increase (Decrease) in Net Assets Resulting from Operations | | | 1,695,755 | | | | (1,095,768 | ) | | | 929,303 | | | | (491,959 | ) |
| Dividends and Distributions: | | | | | | | | | | | | | | | | |
| Net Investment Income | | | (517,046 | ) | | | — | | | | (120,234 | ) | | | — | |
| Total Dividends and Distributions | | | (517,046 | ) | | | — | | | | (120,234 | ) | | | — | |
| Capital Share Transactions: | | | | | | | | | | | | | | | | |
| Issued | | | 6,287,000 | | | | 25,223,500 | | | | 741,000 | | | | 7,298,000 | |
| Redeemed | | | (1,455,000 | ) | | | (865,500 | ) | | | — | | | | — | |
| Increase in Net Assets from Capital Share Transactions | | | 4,832,000 | | | | 24,358,000 | | | | 741,000 | | | | 7,298,000 | |
| Total Increase in Net Assets | | | 6,010,709 | | | | 23,262,232 | | | | 1,550,069 | | | | 6,806,041 | |
| Net Assets: | | | | | | | | | | | | | | | | |
| Beginning of Period | | | 23,262,232 | | | | — | | | | 6,806,041 | | | | — | |
| End of Period | | $ | 29,272,941 | | | $ | 23,262,232 | | | $ | 8,356,110 | | | $ | 6,806,041 | |
| Undistributed Net Investment Income | | $ | 181,814 | | | $ | 259,838 | | | $ | 76,320 | | | $ | 105,342 | |
| | | | | | | | | | | | | | | | | |
| Share Transactions: | | | | | | | | | | | | | | | | |
| Issued | | | 400,000 | | | | 1,550,000 | | | | 50,000 | | | | 500,000 | |
| Redeemed | | | (100,000 | ) | | | (50,000 | ) | | | — | | | | — | |
| Net Increase in Shares Outstanding from Share Transactions | | | 300,000 | | | | 1,500,000 | | | | 50,000 | | | | 500,000 | |
| (1) | Commenced operations on February 16, 2011. |
| (2) | Commenced operations on February 2, 2011. |
| (3) | Includes realized gains(losses) as a result of in-kind transactions (see Note 4 in Notes to Financial Statements). |
The accompanying notes are an integral part of the financial statements.
| Statements of Changes in Net Assets |
| |
| | | Global X FTSE Colombia 20 ETF | | | Global X Brazil Mid Cap ETF | |
| | | Period Ended
April 30, 2012
(Unaudited) | | | Year Ended
October 31, 2011
(Audited) | | | Period Ended
April 30, 2012
(Unaudited) | | | Year Ended
October 31, 2011
(Audited) | |
| Operations: | | | | | | | | | | | | | | | | |
| Net Investment Income | | $ | 2,168,439 | | | $ | 2,223,163 | | | $ | 366,895 | | | $ | 784,859 | |
| Net Realized Loss on Investments and Foreign Currency Transactions | | | (3,854,893 | )(3) | | | (9,552,321 | )(1) | | | (1,342,300 | )(3) | | | (1,230,665 | )(1) |
| Net Change in Unrealized Appreciation (Depreciation) on Investments and Foreign Currency Transactions | | | 24,539,379 | | | | (26,025,026 | ) | | | 3,282,455 | | | | (3,993,422 | ) |
| Net Increase (Decrease) in Net Assets Resulting from Operations | | | 22,852,925 | | | | (33,354,184 | ) | | | 2,307,050 | | | | (4,439,228 | ) |
| Dividends and Distributions: | | | | | | | | | | | | | | | | |
| Net Investment Income | | | (1,467,527 | ) | | | (1,100,701 | ) | | | (495,614 | ) | | | (417,712 | ) |
| Net Realized Gains | | | — | | | | (643,516 | ) | | | — | | | | (35,267 | ) |
| Total Dividends and Distributions | | | (1,467,527 | ) | | | (1,744,217 | ) | | | (495,614 | ) | | | (452,979 | ) |
| Capital Share Transactions: | | | | | | | | | | | | | | | | |
| Issued | | | 37,298,500 | | | | 108,003,500 | | | | — | | | | 6,216,500 | |
| Redeemed | | | (19,264,500 | ) | | | (127,647,100 | ) | | | (736,500 | ) | | | (7,237,000 | ) |
| Increase (Decrease) in Net Assets from Capital Share Transactions | | | 18,034,000 | | | | (19,643,600 | ) | | | (736,500 | ) | | | (1,020,500 | ) |
| Total Increase (Decrease) in Net Assets | | | 39,419,398 | | | | (54,742,001 | ) | | | 1,074,936 | | | | (5,912,707 | ) |
| Net Assets: | | | | | | | | | | | | | | | | |
| Beginning of Period | | | 141,612,918 | | | | 196,354,919 | | | | 23,329,414 | | | | 29,242,121 | |
| End of Period | | $ | 181,032,316 | | | $ | 141,612,918 | | | $ | 24,404,350 | | | $ | 23,329,414 | |
| Undistributed Net Investment Income | | $ | 1,000,918 | | | $ | 300,006 | | | $ | 279,905 | | | $ | 408,624 | |
| | | | | | | | | | | | | | | | | |
| Share Transactions: | | | | | | | | | | | | | | | | |
| Issued | | | 1,750,000 | | | | 5,130,000 | (2) | | | — | | | | 350,000 | |
| Redeemed | | | (1,050,000 | ) | | | (6,290,000 | )(2) | | | (50,000 | ) | | | (450,000 | ) |
| Net Increase (Decrease) in Shares Outstanding from Share Transactions | | | 700,000 | | | | (1,160,000 | ) | | | (50,000 | ) | | | (100,000 | ) |
| (1) | Includes realized gains(losses) as a result of in-kind transactions (see Note 4 in Notes to Financial Statements). |
| (2) | Adjusted to reflect the effect of a 2 for 1 share split on April 12, 2011 (See Note 8 in the Notes to Financial Statements). |
The accompanying notes are an integral part of the financial statements.
| Statements of Changes in Net Assets |
| |
| | | Global X Brazil Consumer ETF | | | Global X Brazil Financials ETF | |
| | | Period Ended
April 30, 2012
(Unaudited) | | | Year Ended
October 31,
2011
(Audited) | | | Period Ended
April 30, 2012
(Unaudited) | | | Year Ended
October 31,
2011
(Audited) | |
| Operations: | | | | | | | | | | | | | | | | |
| Net Investment Income | | $ | 133,310 | | | $ | 450,464 | | | $ | 84,155 | | | $ | 243,939 | |
| Net Realized Loss on Investments and Foreign Currency Transactions | | | (1,028,550 | )(1) | | | (960,806 | )(1) | | | (604,884 | )(1) | | | (149,055 | )(1) |
| Net Change in Unrealized Appreciation (Depreciation) on Investments and Foreign Currency Transactions | | | 4,191,049 | | | | (4,582,124 | ) | | | 157,988 | | | | (1,294,635 | ) |
| Net Increase (Decrease) in Net Assets Resulting from Operations | | | 3,295,809 | | | | (5,092,466 | ) | | | (362,741 | ) | | | (1,199,751 | ) |
| Dividends and Distributions: | | | | | | | | | | | | | | | | |
| Net Investment Income | | | (392,931 | ) | | | (34,888 | ) | | | (256,178 | ) | | | (49,172 | ) |
| Net Realized Gains | | | — | | | | (23,091 | ) | | | — | | | | — | |
| Total Dividends and Distributions | | | (392,931 | ) | | | (57,979 | ) | | | (256,178 | ) | | | (49,172 | ) |
| Capital Share Transactions: | | | | | | | | | | | | | | | | |
| Issued | | | 11,827,000 | | | | 18,461,000 | | | | — | | | | 1,676,000 | |
| Redeemed | | | (11,137,500 | ) | | | (8,883,500 | ) | | | (2,803,000 | ) | | | (795,000 | ) |
| Increase (Decrease) in Net Assets from Capital Share Transactions | | | 689,500 | | | | 9,577,500 | | | | (2,803,000 | ) | | | 881,000 | |
| Total Increase (Decrease) in Net Assets | | | 3,592,378 | | | | 4,427,055 | | | | (3,421,919 | ) | | | (367,923 | ) |
| Net Assets: | | | | | | | | | | | | | | | | |
| Beginning of Period | | | 29,361,324 | | | | 24,934,269 | | | | 7,461,414 | | | | 7,829,337 | |
| End of Period | | $ | 32,953,702 | | | $ | 29,361,324 | | | $ | 4,039,495 | | | $ | 7,461,414 | |
| Undistributed Net Investment Income | | $ | 133,309 | | | $ | 392,930 | | | $ | 44,337 | | | $ | 216,360 | |
| | | | | | | | | | | | | | | | | |
| Share Transactions: | | | | | | | | | | | | | | | | |
| Issued | | | 650,000 | | | | 1,000,000 | | | | — | | | | 100,000 | |
| Redeemed | | | (600,000 | ) | | | (500,000 | ) | | | (200,000 | ) | | | (50,000 | ) |
| Net Increase (Decrease) in Shares Outstanding from Share Transactions | | | 50,000 | | | | 500,000 | | | | (200,000 | ) | | | 50,000 | |
| (1) | Includes realized gains/(losses) as a result of in-kind transactions (see Note 4 in Notes to Financial Statements). |
The accompanying notes are an integral part of the financial statements.
| Statements of Changes in Net Assets |
| |
| | | Global X FTSE Argentina 20
ETF | | | Global X FTSE
Greece 20 ETF | |
| | | Period Ended
April 30, 2012
(Unaudited) | | | Period Ended
October 31,
2011(1)
(Audited) | | | Period Ended
April 30,
2012(2)
(Unaudited) | |
| Operations: | | | | | | | | | | | | |
| Net Investment Income (Loss) | | $ | 25,536 | | | $ | 70,834 | | | $ | (2,503 | ) |
| Net Realized Gain (Loss) on Investments and Foreign Currency Transactions | | | (179,098 | ) | | | (435,681 | ) | | | 214,283 | (3) |
| Net Change in Unrealized Appreciation (Depreciation) on Investments and Foreign Currency Transactions | | | (277,341 | ) | | | (997,101 | ) | | | (319,249 | ) |
| Net Decrease in Net Assets Resulting from Operations | | | (430,903 | ) | | | (1,361,948 | ) | | | (107,469 | ) |
| Dividends and Distributions: | | | | | | | | | | | | |
| Net Investment Income | | | (102,814 | ) | | | — | | | | (4,711 | ) |
| Total Dividends and Distributions | | | (102,814 | ) | | | — | | | | (4,711 | ) |
| Capital Share Transactions: | | | | | | | | | | | | |
| Issued | | | — | | | | 5,219,000 | | | | 4,750,000 | |
| Redeemed | | | — | | | | — | | | | (1,720,000 | ) |
| Increase in Net Assets from Capital Share Transactions | | | — | | | | 5,219,000 | | | | 3,030,000 | |
| Total Increase (Decrease) in Net Assets | | | (533,717 | ) | | | 3,857,052 | | | | 2,917,820 | |
| Net Assets: | | | | | | | | | | | | |
| Beginning of Period | | | 3,857,052 | | | | — | | | | — | |
| End of Period | | $ | 3,323,335 | | | $ | 3,857,052 | | | $ | 2,917,820 | |
| Undistributed (Distributions in Excess of) Net Investment Income | | $ | (6,164 | ) | | $ | 71,114 | | | $ | (7,214 | ) |
| | | | | | | | | | | | | |
| Share Transactions: | | | | | | | | | | | | |
| Issued | | | — | | | | 350,000 | | | | 300,000 | |
| Redeemed | | | — | | | | — | | | | (100,000 | ) |
| Net Increase in Shares Outstanding from Share Transactions | | | — | | | | 350,000 | | | | 200,000 | |
| (1) | Commenced operations on March 2, 2011. |
| (2) | Commenced operations on December 7, 2011. |
| (3) | Includes realized gains as a result of in-kind transactions (see Note 4 in Notes to Financial Statements). |
The accompanying notes are an integral part of the financial statements.
| Statements of Changes in Net Assets |
| |
| | | Global X FTSE Norway 30 ETF | | | Global X FTSE Nordic Region
ETF | |
| | | Period Ended
April 30, 2012
(Unaudited) | | | Period Ended
October 31, 2011(1)
(Audited) | | | Period Ended
April 30, 2012
(Unaudited) | | | Year Ended
October 31,
2011
(Audited) | |
| Operations: | | | | | | | | | | | | | | | | |
| Net Investment Income | | $ | 794,751 | | | $ | 1,248,076 | | | $ | 489,442 | | | $ | 751,628 | |
| Net Realized Gain (Loss) on Investments and Foreign Currency Transactions | | | (4,909,960 | )(1) | | | (3,824,884 | )(1) | | | (506,048 | )(1) | | | 158,319 | (1) |
| Net Change in Unrealized Appreciation (Depreciation) on Investments and Foreign Currency Transactions | | | 4,391,748 | | | | (5,776,232 | ) | | | 1,456,744 | | | | (5,267,093 | ) |
| Net Increase (Decrease) in Net Assets Resulting from Operations | | | 276,539 | | | | (8,353,040 | ) | | | 1,440,138 | | | | (4,357,146 | ) |
| Dividends and Distributions: | | | | | | | | | | | | | | | | |
| Net Investment Income | | | (1,360,544 | ) | | | (6,983 | ) | | | (742,231 | ) | | | (150,580 | ) |
| Net Realized Gains | | | — | | | | — | | | | (90,580 | ) | | | — | |
| Total Dividends and Distributions | | | (1,360,544 | ) | | | (6,983 | ) | | | (832,811 | ) | | | (150,580 | ) |
| Capital Share Transactions: | | | | | | | | | | | | | | | | |
| Issued | | | 2,918,500 | | | | 95,823,000 | | | | — | | | | 23,507,000 | |
| Redeemed | | | (23,541,000 | ) | | | (12,756,000 | ) | | | (3,999,500 | ) | | | (2,678,000 | ) |
| Increase (Decrease) in Net Assets from Capital Share Transactions | | | (20,622,500 | ) | | | 83,067,000 | | | | (3,999,500 | ) | | | 20,829,000 | |
| Total Increase (Decrease) in Net Assets | | | (21,706,505 | ) | | | 74,706,977 | | | | (3,392,173 | ) | | | 16,321,274 | |
| Net Assets: | | | | | | | | | | | | | | | | |
| Beginning of Period | | | 74,706,977 | | | | — | | | | 29,004,748 | | | | 12,683,474 | |
| End of Period | | $ | 53,000,472 | | | $ | 74,706,977 | | | $ | 25,612,575 | | | $ | 29,004,748 | |
| Undistributed Net Investment Income | | $ | 430,133 | | | $ | 995,926 | | | $ | 441,741 | | | $ | 694,530 | |
| | | | | | | | | | | | | | | | | |
| Share Transactions: | | | | | | | | | | | | | | | | |
| Issued | | | 200,000 | | | | 6,200,000 | | | | — | | | | 1,150,000 | |
| Redeemed | | | (1,850,000 | ) | | | (850,000 | ) | | | (250,000 | ) | | | (150,000 | ) |
| Net Increase (Decrease) in Shares Outstanding from Share Transactions | | | (1,650,000 | ) | | | 5,350,000 | | | | (250,000 | ) | | | 1,000,000 | |
| (1) | Includes realized gains/(losses) as a result of in-kind transactions (see Note 4 in Notes to Financial Statements). |
The accompanying notes are an integral part of the financial statements.
Selected Per Share Data & Ratios
For a Share Outstanding Throughout the Period
| | | | | | | | | Net | | | | | | | | | | | | | | | | | | | | | | | | | | | Ratio of | | | | |
| | | | | | | | | Realized | | | | | | | | | | | | | | | | | | | | | | | | Ratio of | | | Net | | | | |
| | | | | | | | | and | | | | | | | | | | | | | | | Net | | | | | | | | | Expenses | | | Investment | | | | |
| | | Net Asset | | | | | | Unrealized | | | | | | | | | | | | | | | Asset | | | | | | Net | | | to | | | Income | | | | |
| | | Value, | | | Net | | | Gain (Loss) | | | | | | Distribution | | | Distribution | | | | | | Value, | | | | | | Assets | | | Average | | | (Loss) to | | | | |
| | | Beginning | | | Investment | | | on | | | Total from | | | from Net | | | from | | | Total from | | | End of | | | Total | | | End of | | | Net | | | Average | | | Portfolio | |
| | | of Period | | | Income | | | Investments | | | Operations | | | Investment | | | Capital | | | Distributions | | | Period | | | Return | | | Period | | | Assets | | | Net Assets | | | Turnover | |
| | | ($) | | | (Loss) ($)* | | | ($) | | | ($) | | | Income ($) | | | Gains ($) | | | ($) | | | ($) | | | (%)** | | | ($)(000) | | | (%) | | | (%) | | | (%) | |
| Global X China Consumer ETF(1) |
| 2012(Unaudited) | | | 15.29 | | | | 0.02 | | | | 0.01 | | | | 0.03 | | | | (0.06 | ) | | | — | | | | (0.06 | ) | | | 15.26 | | | | 0.28 | | | | 132,793 | | | | 0.65 | † | | | 0.22 | † | | | 11.44 | †† |
| 2011 | | | 20.33 | | | | 0.17 | | | | (5.02 | ) | | | (4.85 | ) | | | (0.19 | ) | | | — | | | | (0.19 | ) | | | 15.29 | | | | (23.99 | ) | | | 136,858 | | | | 0.65 | | | | 0.98 | | | | 12.37 | |
| 2010 | | | 15.65 | | | | 0.17 | | | | 4.51 | | | | 4.68 | | | | — | | | | — | | | | — | | | | 20.33 | | | | 29.90 | | | | 174,875 | | | | 0.65 | † | | | 1.03 | † | | | 3.91 | †† |
| Global X China Energy ETF(2) |
| 2012(Unaudited) | | | 13.78 | | | | (0.05 | ) | | | 0.33 | | | | 0.28 | | | | (0.26 | ) | | | — | | | | (0.26 | ) | | | 13.80 | | | | 2.17 | | | | 4,830 | | | | 0.65 | † | | | (0.68 | )† | | | 5.83 | †† |
| 2011 | | | 15.72 | | | | 0.27 | | | | (2.07 | ) | | | (1.80 | ) | | | (0.14 | ) | | | — | | | | (0.14 | ) | | | 13.78 | | | | (11.57 | ) | | | 4,822 | | | | 0.65 | | | | 1.70 | | | | 11.39 | |
| 2010 | | | 15.02 | | | | 0.23 | | | | 0.47 | | | | 0.70 | | | | — | | | | — | | | | — | | | | 15.72 | | | | 4.66 | | | | 4,717 | | | | 0.65 | † | | | 1.80 | † | | | 20.55 | †† |
| Global X China Financials ETF(3) |
| 2012(Unaudited) | | | 10.92 | | | | (0.03 | ) | | | 0.95 | | | | 0.92 | | | | (0.01 | ) | | | — | | | | (0.01 | ) | | | 11.83 | | | | 8.45 | | | | 11,234 | | | | 0.65 | † | | | (0.61 | )† | | | 7.45 | †† |
| 2011 | | | 14.77 | | | | 0.03 | | | | (3.56 | ) | | | (3.53 | ) | | | (0.32 | ) | | | — | | | | (0.32 | ) | | | 10.92 | | | | (24.29 | ) | | | 10,924 | | | | 0.65 | | | | 0.25 | | | | 41.54 | |
| 2010 | | | 14.90 | | | | 0.27 | | | | (0.40 | ) | | | (0.13 | ) | | | — | | | | — | | | | — | | | | 14.77 | | | | (0.87 | ) | | | 70,158 | | | | 0.65 | † | | | 2.26 | † | | | 14.42 | †† |
| Global X China Industrials ETF(1) |
| 2012(Unaudited) | | | 11.39 | | | | (0.04 | ) | | | 0.77 | | | | 0.73 | | | | (0.02 | ) | | | — | | | | (0.02 | ) | | | 12.10 | | | | 6.55 | | | | 4,841 | | | | 0.65 | † | | | (0.65 | )† | | | 10.83 | †† |
| 2011 | | | 17.13 | | | | 0.13 | | | | (5.64 | ) | | | (5.51 | ) | | | (0.23 | ) | | | — | | | | (0.23 | ) | | | 11.39 | | | | (32.56 | ) | | | 4,558 | | | | 0.65 | | | | 0.88 | | | | 20.13 | |
| 2010 | | | 15.50 | | | | 0.08 | | | | 1.55 | | | | 1.63 | | | | — | | | | — | | | | — | | | | 17.13 | | | | 10.52 | | | | 12,850 | | | | 0.65 | † | | | 0.61 | † | | | 12.74 | †† |
| Global X China Materials ETF(4) |
| 2012(Unaudited) | | | 9.58 | | | | (0.02 | ) | | | (1.05 | ) | | | (1.07 | ) | | | — | | | | — | | | | — | | | | 8.51 | | | | (11.17 | ) | | | 2,552 | | | | 0.65 | | | | (0.52 | )† | | | 5.05 | †† |
| 2011 | | | 14.59 | | | | 0.01 | | | | (4.88 | ) | | | (4.87 | ) | | | (0.14 | ) | | | — | | | | (0.14 | ) | | | 9.58 | | | | (33.69 | ) | | | 2,875 | | | | 0.65 | | | | 0.05 | | | | 36.82 | |
| 2010 | | | 14.95 | | | | 0.02 | | | | (0.38 | ) | | | (0.36 | ) | | | — | | | | — | | | | — | | | | 14.59 | | | | (2.41 | ) | | | 57,642 | | | | 0.65 | † | | | 0.23 | † | | | 6.13 | †† |
| Global X NASDAQ China Technology ETF(5) |
| 2012(Unaudited) | | | 15.38 | | | | (0.04 | ) | | | 0.23 | | | | 0.19 | | | | (0.19 | ) | | | — | | | | (0.19 | ) | | | 15.38 | | | | 1.45 | | | | 4,614 | | | | 0.65 | † | | | (0.54 | )† | | | 54.64 | †† |
| 2011 | | | 17.21 | | | | 0.38 | | | | (2.05 | ) | | | (1.67 | ) | | | (0.03 | ) | | | (0.13 | ) | | | (0.16 | ) | | | 15.38 | | | | (9.81 | ) | | | 4,614 | | | | 0.65 | | | | 2.26 | | | | 16.79 | |
| 2010 | | | 14.90 | | | | 0.03 | | | | 2.28 | | | | 2.31 | | | | — | | | | — | | | | — | | | | 17.21 | | | | 15.50 | | | | 4,301 | | | | 0.65 | † | | | 0.24 | † | | | 5.15 | †† |
| Global X FTSE ASEAN 40 ETF(6) |
| 2012(Unaudited) | | | 15.51 | | | | 0.66 | | | | 0.46 | | | | 1.12 | | | | (0.37 | ) | | | — | | | | (0.37 | ) | | | 16.26 | | | | 7.53 | | | | 29,273 | | | | 0.65 | | | | 3.62 | † | | | 7.01 | †† |
| 2011 | | | 15.08 | | | | 0.38 | | | | 0.05 | | | | 0.43 | | | | — | | | | — | | | | — | | | | 15.51 | | | | 2.85 | | | | 23,262 | | | | 0.65 | † | | | 3.46 | † | | | 2.68 | †† |
| (1) | The Fund commenced operations on November 30, 2009. |
| (2) | The Fund commenced operations on December 15, 2009. |
| (3) | The Fund commenced operations on December 10, 2009. |
| (4) | The Fund commenced operations on January 12, 2010. |
| (5) | The Fund commenced operations on December 8, 2009. |
| (6) | The Fund commenced operations on February 16, 2011. |
| * | Per share data calculated using average shares method. |
| ** | Total Return is for the period indicated and has not been annualized. The return shown does not reflect the deduction of taxes that a shareholder would pay on Fund distributions or the redemption of Fund shares. |
| †† | Portfolio turnover rate is for the period indicated and has not been annualized. Excludes effect of in-kind transfers. |
Amounts designated as “—” are either $0 or have been rounded to $0.
The accompanying notes are an integral part of the financial statements.
Selected Per Share Data & Ratios
For a Share Outstanding Throughout the Period
| | | | | | | | | Net | | | | | | | | | | | | | | | | | | | | | | | | | | | | | | | |
| | | | | | | | | Realized | | | | | | | | | | | | | | | | | | | | | | | | Ratio of | | | Ratio of | | | | |
| | | | | | | | | and | | | | | | | | | | | | | | | Net | | | | | | | | | Expenses | | | Net | | | | |
| | | Net Asset | | | | | | Unrealized | | | | | | | | | | | | | | | Asset | | | | | | Net | | | to | | | Investment | | | | |
| | | Value, | | | Net | | | Gain (Loss) | | | | | | Distribution | | | Distribution | | | | | | Value, | | | | | | Assets | | | Average | | | Income to | | | | |
| | | Beginning | | | Investment | | | on | | | Total from | | | from Net | | | from | | | Total from | | | End of | | | Total | | | End of | | | Net | | | Average | | | Portfolio | |
| | | of Period | | | Income | | | Investments | | | Operations | | | Investment | | | Capital | | | Distributions | | | Period | | | Return | | | Period | | | Assets | | | Net Assets | | | Turnover | |
| | | ($) | | | ($)* | | | ($) | | | ($) | | | Income ($) | | | Gains ($) | | | ($) | | | ($) | | | (%)** | | | ($)(000) | | | (%) | | | (%) | | | (%) | |
| Global X FTSE Andean 40 ETF(1) |
| 2012(Unaudited) | | | 13.61 | | | | 0.18 | | | | 1.64 | | | | 1.82 | | | | (0.24 | ) | | | — | | | | (0.24 | ) | | | 15.19 | | | | 13.77 | | | | 8,356 | | | | 0.72 | † | | | 2.64 | † | | | 11.33 | †† |
| 2011 | | | 14.88 | | | | 0.19 | | | | (1.46 | ) | | | (1.27 | ) | | | — | | | | — | | | | — | | | | 13.61 | | | | (8.53 | ) | | | 6,806 | | | | 0.72 | † | | | 1.81 | † | | | 15.83 | †† |
| Global X FTSE Colombia 20 ETF(2) | | | | | | | | | | | | | | | | | | | | | | | | | | | | | |
| 2012(Unaudited) | | | 19.19 | | | | 0.31 | | | | 3.11 | | | | 3.42 | | | | (0.21 | ) | | | — | | | | (0.21 | ) | | | 22.40 | | | | 18.15 | | | | 181,032 | | | | 0.78† | @ | | | 3.11 | † | | | 16.56 | †† |
| 2011(8) | | | 22.99 | | | | 0.29 | | | | (3.88 | ) | | | (3.59 | ) | | | (0.13 | ) | | | (0.08 | ) | | | (0.21 | ) | | | 19.19 | | | | (15.69 | ) | | | 141,643 | | | | 0.81 | | | | 1.39 | | | | 63.11 | |
| 2010(7) | | | 13.92 | | | | 0.16 | | | | 9.44 | | | | 9.60 | | | | (0.53 | ) | | | — | | | | (0.53 | ) | | | 22.99 | | | | 71.28 | | | | 196,355 | | | | 0.86 | | | | 0.77 | | | | 40.95 | |
| 2009(7) | | | 7.50 | | | | 0.25 | | | | 6.17 | | | | 6.42 | | | | — | | | | — | | | | — | | | | 13.92 | | | | 85.60 | | | | 6,960 | | | | 0.86 | † | | | 2.93 | † | | | 1.94 | †† |
| Global X Brazil Mid Cap ETF(3) |
| 2012(Unaudited) | | | 15.55 | | | | 0.25 | | | | 1.37 | | | | 1.62 | | | | (0.34 | ) | | | — | | | | (0.34 | ) | | | 16.83 | | | | 10.85 | | | | 24,404 | | | | 0.69 | † | | | 3.13 | † | | | 16.99 | †† |
| 2011 | | | 18.28 | | | | 0.46 | | | | (2.94 | ) | | | (2.48 | ) | | | (0.23 | ) | | | (0.02 | ) | | | (0.25 | ) | | | 15.55 | | | | (13.73 | ) | | | 23,329 | | | | 0.69 | | | | 2.68 | | | | 16.90 | |
| 2010 | | | 15.16 | | | | 0.08 | | | | 3.04 | | | | 3.12 | | | | — | | | | — | | | | — | | | | 18.28 | | | | 20.58 | | | | 29,242 | | | | 0.69 | † | | | 1.24 | † | | | 2.69 | †† |
| Global X Brazil Consumer ETF(4) |
| 2012(Unaudited) | | | 16.78 | | | | 0.07 | | | | 1.68 | | | | 1.75 | | | | (0.22 | ) | | | — | | | | (0.22 | ) | | | 18.31 | | | | 10.72 | | | | 32,954 | | | | 0.77 | † | | | 0.79 | † | | | 31.48 | †† |
| 2011 | | | 19.95 | | | | 0.28 | | | | (3.42 | ) | | | (3.14 | ) | | | (0.02 | ) | | | (0.01 | ) | | | (0.03 | ) | | | 16.78 | | | | (7.16 | ) | | | 29,361 | | | | 0.77 | | | | 1.53 | | | | 37.28 | |
| 2010 | | | 15.48 | | | | — | | | | 4.47 | | | | 4.47 | | | | — | | | | — | | | | — | | | | 19.95 | | | | 28.88 | | | | 24,934 | | | | 0.77 | † | | | 0.07 | † | | | 4.72 | †† |
| Global X Brazil Financials ETF(5) |
| 2012(Unaudited) | | | 14.92 | | | | 0.21 | | | | (1.03 | ) | | | (0.82 | ) | | | (0.64 | ) | | | — | | | | (0.64 | ) | | | 13.46 | | | | (5.29 | ) | | | 4,039 | | | | 0.77 | † | | | 2.85 | † | | | 10.10 | †† |
| 2011 | | | 17.40 | | | | 0.46 | | | | (2.85 | ) | | | (2.39 | ) | | | (0.09 | ) | | | — | | | | (0.09 | ) | | | 14.92 | | | | (13.80 | ) | | | 7,461 | | | | 0.77 | | | | 2.85 | | | | 37.24 | |
| 2010 | | | 15.08 | | | | 0.05 | | | | 2.27 | | | | 2.32 | | | | — | | | | — | | | | — | | | | 17.40 | | | | 15.38 | | | | 7,829 | | | | 0.77 | † | | | 1.15 | † | | | — | †† |
| Global X FTSE Argentina 20 ETF(6) |
| 2012(Unaudited) | | | 11.02 | | | | 0.07 | | | | (1.30 | ) | | | (1.23 | ) | | | (0.29 | ) | | | — | | | | (0.29 | ) | | | 9.50 | | | | (11.36 | ) | | | 3,323 | | | | 0.75 | † | | | 1.33 | † | | | 14.68 | †† |
| 2011 | | | 14.93 | | | | 0.23 | | | | (4.14 | ) | | | (3.91 | ) | | | — | | | | — | | | | — | | | | 11.02 | | | | (26.19 | ) | | | 3,857 | | | | 0.75 | † | | | 2.53 | † | | | 40.86 | †† |
| (1) | The Fund commenced operations on February 2, 2011. |
| (2) | The Fund commenced operations on February 5, 2009. |
| (3) | The Fund commenced operations on June 21, 2010. |
| (4) | The Fund commenced operations on July 7, 2010. |
| (5) | The Fund commenced operations on July 28, 2010. |
| (6) | The Fund commenced operations on March 2, 2011. |
| (7) | Per share amounts have been restated for a 2 for 1 share split on April 12, 2011. (See Note 8 in Notes to Financial Statements) |
| (8) | Per share amounts have been adjusted for a 2 for 1 share split on April 12, 2011. (See Note 8 in Notes to Financial Statements) |
| * | Per share data calculated using average shares method. |
| ** | Total Return is for the period indicated and has not been annualized. The return shown does not reflect the deduction of taxes that a shareholder would pay on Fund distributions or the redemption of Fund shares. |
| †† | Portfolio turnover rate is for the period indicated and has not been annualized. Excludes effect of in-kind transfers. |
| @ | The Ratio of Expenses to Average Net Assets includes the effect of a waiver. If these expense offsets were excluded, the ratio would have been 0.79%, 0.83%, 0.86% and 0.86% for the periods ended April 30, 2012, October 31, 2011, October 31, 2010 and October 31, 2009, respectively. |
Amounts designated as “—” are either $0 or have been rounded to $0.
The accompanying notes are an integral part of the financial statements.
Selected Per Share Data & Ratios
For a Share Outstanding Throughout the Period
| | | | | | | | | Net | | | | | | | | | | | | | | | | | | | | | | | | | | | Ratio of | | | | |
| | | | | | | | | Realized | | | | | | | | | | | | | | | | | | | | | | | | Ratio of | | | Net | | | | |
| | | | | | | | | and | | | | | | | | | | | | | | | Net | | | | | | | | | Expenses | | | Investment | | | | |
| | | Net Asset | | | | | | Unrealized | | | | | | | | | | | | | | | Asset | | | | | | Net | | | to | | | Income | | | | |
| | | Value, | | | Net | | | Gain (Loss) | | | | | | Distribution | | | Distribution | | | | | | Value, | | | | | | Assets | | | Average | | | (Loss) to | | | | |
| | | Beginning | | | Investment | | | on | | | Total from | | | from Net | | | from | | | Total from | | | End of | | | Total | | | End of | | | Net | | | Average | | | Portfolio | |
| | | of Period | | | Income | | | Investments | | | Operations | | | Investment | | | Capital | | | Distributions | | | Period | | | Return | | | Period | | | Assets | | | Net Assets | | | Turnover | |
| | | ($) | | | (Loss) ($)* | | | ($) | | | ($) | | | Income ($) | | | Gains ($) | | | ($) | | | ($) | | | (%)** | | | ($)(000) | | | (%) | | | (%) | | | (%) | |
| Global X FTSE Greece 20 ETF(1) |
| 2012(Unaudited) | | | 15.18 | | | | (0.02 | ) | | | (0.54 | ) | | | (0.56 | ) | | | (0.03 | ) | | | — | | | | (0.03 | ) | | | 14.59 | | | | (3.67 | ) | | | 2,918 | | | | 0.66 | † | | | (0.30 | )† | | | 12.82 | †† |
| Global X FTSE Norway 30 ETF(2) |
| 2012(Unaudited) | | | 13.96 | | | | 0.20 | | | | 0.52 | ‡ | | | 0.72 | | | | (0.36 | ) | | | — | | | | (0.36 | ) | | | 14.32 | | | | 5.56 | | | | 53,000 | | | | 0.50 | † | | | 2.97 | † | | | 13.30 | †† |
| 2011 | | | 14.80 | | | | 0.44 | | | | (1.27 | ) | | | (0.83 | ) | | | (0.01 | ) | | | — | | | | (0.01 | ) | | | 13.96 | | | | (5.62 | ) | | | 74,707 | | | | 0.50 | † | | | 3.03 | † | | | 24.26 | †† |
| Global X FTSE Nordic Region ETF (3) |
| 2012(Unaudited) | | | 17.47 | | | | 0.34 | | | | 0.94 | | | | 1.28 | | | | (0.53 | ) | | | (0.06 | ) | | | (0.59 | ) | | | 18.16 | | | | 7.93 | | | | 25,613 | | | | 0.50 | † | | | 3.96 | † | | | 4.42 | †† |
| 2011 | | | 19.22 | | | | 0.53 | | | | (2.11 | ) | | | (1.58 | ) | | | (0.17 | ) | | | — | | | | (0.17 | ) | | | 17.47 | | | | (8.34 | ) | | | 29,005 | | | | 0.50 | | | | 2.74 | | | | 3.59 | |
| 2010 | | | 16.07 | | | | 0.32 | | | | 2.84 | | | | 3.16 | | | | (0.01 | ) | | | — | | | | (0.01 | ) | | | 19.22 | | | | 19.68 | | | | 12,683 | | | | 0.50 | | | | 1.91 | | | | 4.07 | |
| 2009 | | | 14.50 | | | | (0.02 | ) | | | 1.59 | | | | 1.57 | | | | .— | | | | — | | | | — | | | | 16.07 | | | | 10.83 | | | | 3,375 | | | | 0.50 | † | | | (0.50 | )† | | | 0.70 | †† |
| (1) | The Fund commenced operations on December 7, 2011. |
| (2) | The Fund commenced operations on November 9, 2010. |
| (3) | The Fund commenced operations on August 17, 2009. |
| * | Per share data calculated using average shares method. |
| ** | Total Return is for the period indicated and has not been annualized. The return shown does not reflect the deduction of taxes that a shareholder would pay on Fund distributions or the redemption of Fund shares. |
| †† | Portfolio turnover rate is for the period indicated and has not been annualized. Excludes effect of in-kind transfers. |
| ‡ | The amount shown for a share outstanding throughout the period does not accord with the aggregate gains on investments for the period because of the sales and repurchases of fund shares in relation to fluctuating market value of the investments of the Fund.. |
Amounts designated as “—” are either $0 or have been rounded to $0.
The accompanying notes are an integral part of the financial statements.
| Notes to Financial Statements |
| April 30, 2012 (unaudited) |
1. ORGANIZATION
The Global X Funds (the "Trust") is a Delaware Statutory Trust formed on March 6, 2008. The Trust is registered under the Investment Company Act of 1940, as amended, as an open-end management investment company with eighty-seven portfolios as of April 30, 2012. The financial statements herein and the related notes pertain to the Global X China Consumer ETF, Global X China Energy ETF, Global X China Financials ETF, Global X China Industrials ETF, Global X China Materials ETF, Global X NASDAQ China Technology ETF, Global X FTSE ASEAN 40 ETF, Global X FTSE Andean 40 ETF, Global X FTSE Colombia 20 ETF, Global X Brazil Mid Cap ETF, Global X Brazil Consumer ETF, Global X Brazil Financials ETF, Global X FTSE Argentina 20 ETF, Global X FTSE Greece 20 ETF, Global X FTSE Norway 30 ETF and Global X FTSE Nordic Region ETF (each a “Fund”, collectively, the “Funds”). Each Fund is non-diversified.
2. SIGNIFICANT ACCOUNTING POLICIES
The following is a summary of the Significant Accounting Policies followed by the Funds.
USE OF ESTIMATES — The preparation of financial statements in conformity with U.S. Generally Accepted Accounting Principles ("U.S. GAAP") requires management to make estimates and assumptions that affect the reported amounts of assets and liabilities and disclosure of contingent assets and liabilities at the date of the financial statements and the reported amounts of increases and decreases in net assets from operations during the reporting period. Actual results could differ from those estimates, and could have a material impact to the Funds.
SECURITY VALUATION — Securities listed on a securities exchange, market or automated quotation system for which quotations are readily available (except for securities traded on NASDAQ), including securities traded over the counter, are valued at the last quoted sale price on the primary exchange or market (foreign or domestic) on which they are traded (or at approximately 4:00 pm if a security’s primary exchange is normally open at that time), or, if there is no such reported sale, at the most recent mean between the quoted bid and asked prices (absent both bid and asked prices on such exchange, the bid price may be used).
For securities traded on NASDAQ, the NASDAQ Official Closing Price will be used. If available, debt securities are priced based upon valuations provided by independent, third-party pricing agents. Such values generally reflect the last reported sales price if the security is actively traded. The third-party pricing agents may also value debt securities at an evaluated bid price by employing methodologies that utilize actual market transactions, broker-supplied valuations, or other methodologies designed to identify the market value for such securities. Debt obligations with remaining maturities of sixty days or less may be valued at their amortized cost, which approximates market value. The prices for foreign securities are reported in local currency and converted to U.S. dollars using currency exchange rates. Prices for most securities held in the Funds are provided daily by recognized independent pricing agents. If a security price cannot be obtained from an independent, third-party pricing agent, the Funds seek to obtain a bid price from at least one independent broker.
| Notes to Financial Statements (continued) |
| April 30, 2012 (unaudited) |
2. SIGNIFICANT ACCOUNTING POLICIES (continued)
SECURITY VALUATION (continued)
Securities for which market prices are not "readily available" are valued in accordance with Fair Value Procedures established by the Board of Trustees (the “Board”). The Funds’ Fair Value Procedures are implemented through a Fair Value Committee (the "Committee") designated by the Board. Some of the more common reasons that may necessitate that a security be valued using Fair Value Procedures include: the security's trading has been halted or suspended; the security has been de-listed from a national exchange; the security's primary trading market is temporarily closed at a time when under normal conditions it would be open; the security has not been traded for an extended period of time; the security's primary pricing source is not able or willing to provide a price; or trading of the security is subject to local government-imposed restrictions. When a security is valued in accordance with the Fair Value Procedures, the Committee will determine the value after taking into consideration relevant information reasonably available to the Committee. As of April 30, 2012, there were securities valued using Fair Value Procedures of $28,002, $126,746 and $121,483 in Global X China Materials ETF, Global X Brazil Mid Cap ETF and Global X Brazil Consumer ETF Funds, respectively. There were no other securities priced using the Fair Value Procedures.
For securities that principally trade on a foreign market or exchange, a significant gap in time can exist between the time of a particular security's last trade and the time at which the Funds calculated their net asset value. The closing prices of such securities may no longer reflect their market value at the time the Funds calculated net asset value if an event that could materially affect the value of those securities (a “Significant Event”) has occurred between the time of the security's last close and the time that the Funds calculate net asset value. A Significant Event may relate to a single issuer or to an entire market sector. If Global X Management Company LLC (the “Adviser”) becomes aware of a Significant Event that has occurred with respect to a security or group of securities after the closing of the exchange or market on which the security or securities principally trade, but before the time at which the Funds calculate net asset value, it may request that a Committee meeting be called. In addition, the Funds’ Sub-administrator, SEI Investments Global Funds Services (“SEIGFS”), monitors price movements among certain selected indices, securities and/or baskets of securities that may be an indicator that the closing prices received earlier from foreign exchanges or markets may not reflect market value at the time the Funds calculate net asset value. If price movements in a monitored index or security exceed levels established by the Sub-administrator, the Sub-administrator notifies the Adviser that such limits have been exceeded. In such event, the Adviser makes the determination whether a Committee meeting should be called based on the information provided.
In accordance with the authoritative guidance on fair value measurements and disclosure under U.S. GAAP, the Funds disclose the fair value of their investments in a hierarchy that prioritizes the inputs to valuation techniques used to measure the fair value. The objective of a fair value measurement is to determine the price that would be received to sell an asset or paid to transfer a liability in an orderly transaction between market participants at the measurement date (an exit price). Accordingly, the fair value hierarchy gives the highest priority to quoted prices (unadjusted) in active markets for identical assets or liabilities (Level 1) and the lowest priority to unobservable inputs (Level 3). The three levels of the fair value hierarchy are described below:
Level 1 – Unadjusted quoted prices in active markets for identical, unrestricted assets or liabilities that the Funds have the ability to access at the measurement date
| Notes to Financial Statements (continued) |
| April 30, 2012 (unaudited) |
2. SIGNIFICANT ACCOUNTING POLICIES (continued)
SECURITY VALUATION (concluded)
Level 2 – Other significant observable inputs (including quoted prices for similar investments, fair value of investments for which the Funds have the ability to fully redeem tranches at net asset value as of the measurement date or within the near term, and short-term investments valued at amortized cost)
Level 3 – Significant unobservable inputs (including the Funds’ own assumptions in determining the fair value of investments, fair value of investments for which the Funds do not have the ability to fully redeem tranches at net asset value as of the measurement date or within the near term)
Investments are classified within the level of the lowest significant input considered in determining fair value. Investments classified within Level 3 whose fair value measurement considers several inputs may include Level 1 or Level 2 inputs as components of the overall fair value measurement.
For the period ended April 30, 2012, there have been no significant changes to the Funds’ fair valuation methodologies.
FEDERAL INCOME TAXES — It is each Fund’s intention to qualify or continue to qualify as regulated investment company for Federal income tax purposes by complying with the appropriate provisions of Subchapter M of the Internal Revenue Code of 1986, as amended. Accordingly, no provisions for Federal income taxes have been made in the financial statements.
The Funds evaluate tax positions taken or expected to be taken in the course of preparing the Funds’ tax returns to determine whether it is "more-likely-than-not" (i.e., greater than 50 percent) that each tax position will be sustained upon examination by a taxing authority based on the technical merits of the position. Tax positions not deemed to meet the more-likely-than-not threshold are recorded as a tax benefit or expense in the current year. The Funds did not record any tax provision in the current period. However, management’s conclusions regarding tax positions may be subject to review and adjustment at a later date based on factors including, but not limited to, examination by tax authorities (i.e., the last three tax year ends, as applicable), on-going analysis of and changes to tax laws, regulations and interpretations thereof.
As of and during the period ended April 30, 2012, the Funds did not have a liability for any unrecognized tax benefits. The Funds recognize interest and penalties, if any, related to unrecognized tax benefits as income tax expense in the Statement of Operations. During the period, the Funds did not incur any interest or penalties.
SECURITY TRANSACTIONS AND INVESTMENT INCOME — Security transactions are accounted for on the trade date for financial reporting purposes. Costs used in determining realized gains and losses on the sale of investment securities are based on specific identification. Dividend income is recorded on the ex-dividend date. Interest income is recognized on the accrual basis from the settlement date.
| Notes to Financial Statements (continued) |
| April 30, 2012 (unaudited) |
2. SIGNIFICANT ACCOUNTING POLICIES (concluded)
FOREIGN CURRENCY TRANSLATION — The books and records of the Funds are maintained in U.S. dollars. Investment securities and other assets and liabilities denominated in a foreign currency
are translated into U.S. dollars on the date of valuation. Purchases and sales of investment securities, income and expenses are translated into U.S. dollars at the relevant rates of exchange prevailing on the respective dates of such transactions. The Funds do not isolate that portion of realized or unrealized gains and losses resulting from changes in the foreign exchange rate from fluctuations arising from changes in the market prices of the securities. These gains and losses are included in net realized and unrealized gains and losses on investments on the Statement of Operations. Net realized and unrealized gains and losses on foreign currency transactions represent net foreign exchange gains or losses from foreign currency exchange contracts, disposition of foreign currencies, currency gains or losses realized between trade and settlement dates on securities transactions and the difference between the amount of the investment income and foreign withholding taxes recorded on the Funds’ books and the U.S. dollar equivalent amounts actually received or paid.
DIVIDENDS AND DISTRIBUTIONS TO SHAREHOLDERS — The Funds distribute their net investment income on a pro rata basis. Any net realized capital gains are distributed annually. All distributions are recorded on ex-dividend date.
CREATION UNITS — The Funds issue and redeem shares ("Shares") at Net Asset Value (“NAV”) and only in large blocks of Shares, (each block of Shares for a Fund is called a "Creation Unit" or multiples thereof). Purchasers of Creation Units ("Authorized Participants") at NAV must pay a standard creation transaction fee per transaction. The fee is a single charge and will be the same regardless of the number of Creation Units purchased by an investor on the same day. An Authorized Participant who holds Creation Units and wishes to redeem at NAV would also pay a standard Redemption Fee per transaction on the date of such redemption, regardless of the number of Creation Units redeemed that day.
If a Creation Unit is purchased or redeemed for cash, a higher Transaction Fee will be charged. The following table discloses Creation Unit breakdown:
| | | Creation Unit | | | Transaction | | | | | | Redemption | |
| | | Shares | | | Fee | | | Value | | | Fee | |
| Global X China Consumer ETF | | | 50,000 | | | $ | 1,900 | | | $ | 763,000 | | | $ | 1,900 | |
| Global X China Energy ETF | | | 50,000 | | | | 1,900 | | | | 690,000 | | | | 1,900 | |
| Global X China Financials ETF | | | 50,000 | | | | 1,900 | | | | 591,500 | | | | 1,900 | |
| Global X China Industrials ETF | | | 50,000 | | | | 1,900 | | | | 605,000 | | | | 1,900 | |
| Global X China Materials ETF | | | 50,000 | | | | 1,900 | | | | 425,500 | | | | 1,900 | |
| Global X NASDAQ China Technology ETF | | | 50,000 | | | | 1,900 | | | | 769,000 | | | | 1,900 | |
| Global X FTSE ASEAN 40 ETF | | | 50,000 | | | | 2,300 | | | | 813,000 | | | | 2,300 | |
| Global X FTSE Andean 40 ETF | | | 50,000 | | | | 2,300 | | | | 759,500 | | | | 2,300 | |
| Global X FTSE Colombia 20 ETF | | | 50,000 | | | | 2,500 | | | | 1,120,000 | | | | 2,500 | |
| Global X Brazil Mid Cap ETF | | | 50,000 | | | | 1,900 | | | | 841,500 | | | | 1,900 | |
| Global X Brazil Consumer ETF | | | 50,000 | | | | 1,500 | | | | 915,500 | | | | 1,500 | |
| Global X Brazil Financials ETF | | | 50,000 | | | | 1,500 | | | | 673,000 | | | | 1,500 | |
| Global X FTSE Argentina ETF | | | 50,000 | | | | 1,000 | | | | 475,000 | | | | 1,000 | |
| Global X FTSE Greece 20 ETF | | | 50,000 | | | | 1,000 | | | | 729,500 | | | | 1,000 | |
| Global X FTSE Norway 30 ETF | | | 50,000 | | | | 1,400 | | | | 716,000 | | | | 1,400 | |
| Global X FTSE Nordic Region ETF | | | 50,000 | | | | 1,400 | | | | 908,000 | | | | 1,400 | |
| Notes to Financial Statements (continued) |
| April 30, 2012 (unaudited) |
3. RELATED PARTY TRANSACTIONS
The Adviser serves as the investment adviser and the administrator for the Funds. Subject to the supervision of the Board of Trustees, the Adviser is responsible for managing the investment activities of the Funds and the Funds’ business affairs and other administrative matters and provides or causes to be furnished all supervisory, administrative and other services reasonably necessary for the operation of the Funds, including certain distribution services (provided pursuant to a separate Distribution Agreement), certain shareholder and distribution-related services (provided pursuant to a separate Rule 12b-1 Plan and related agreements) and investment advisory services (provided pursuant to a separate Investment Advisory Agreement), under what is essentially an "all-in" fee structure. For its service to the Funds, under the Supervision and Administration Agreement, each Fund pays a monthly fee to the Adviser at the annual rate (stated as a percentage of the average daily net assets of the Fund). In addition, the Funds bear other expenses that are not covered by the Supervision and Administration Agreement, which may vary and affect the total expense ratios of the Funds, such as taxes, brokerage fees, commissions and other transaction expenses, interest expenses, acquired fund fees and extraordinary expenses (such as litigation and indemnification expenses). In addition, the Global X FTSE Colombia 20 ETF, Global X FTSE Argentina 20 ETF and Global X FTSE Greece 20 ETF pay custodial fees that are not covered by the Supervision and Administration Agreement.
| | | Supervision and | |
| | | Administration | |
| | | Fee | |
| Global X China Consumer ETF | | | 0.65 | % |
| Global X China Energy ETF | | | 0.65 | % |
| Global X China Financials ETF | | | 0.65 | % |
| Global X China Industrials ETF | | | 0.65 | % |
| Global X China Materials ETF | | | 0.65 | % |
| Global X NASDAQ China Technology ETF | | | 0.65 | % |
| Global X FTSE ASEAN 40 ETF | | | 0.65 | % |
| Global X FTSE Andean 40 ETF | | | 0.72 | % |
| Global X FTSE Colombia 20 ETF* | | | 0.68 | % |
| Global X Brazil Mid Cap ETF | | | 0.69 | % |
| Global X Brazil Consumer ETF | | | 0.77 | % |
| Global X Brazil Financials ETF | | | 0.77 | % |
| Global X FTSE Argentina ETF* | | | 0.74 | % |
| Global X FTSE Greece 20 ETF* | | | 0.55 | % |
| Global X FTSE Norway 30 ETF | | | 0.50 | % |
| Global X FTSE Nordic Region ETF | | | 0.50 | % |
*The Global X FTSE Colombia 20 ETF, Global X FTSE Argentina 20 ETF and Global X FTSE Greece 20 ETF paid 0.10%, 0.01% and 0.11%, respectively in Custody Fees(in addition to the Supervision and Administration Fee) during the period ended April 30, 2012.
The Adviser and InterBolsa S.A. ("InterBolsa"), one of the leading broker-dealers located in Colombia, entered into an agreement, pursuant to which InterBolsa has agreed to provide certain marketing, marketing-related and other services and allows the use of InterBolsa’s name and brand with respect to the Global X FTSE Colombia 20 ETF. Under this agreement, InterBolsa agreed to make an initial payment to the Adviser regarding certain start up expenses for the Fund and the Adviser has agreed to share with InterBolsa fifty percent (50%) of the Adviser’s legitimate profits and losses with respect to the Global X FTSE Colombia 20 ETF.
| Notes to Financial Statements (continued) |
| April 30, 2012 (unaudited) |
3. RELATED PARTY TRANSACTIONS (concluded)
SEIGFS serves as Sub-Administrator to the Funds. As Sub-Administrator, SEIGFS provides the Funds with the required general administrative services, including, without limitation: office space, equipment, and personnel; clerical and general back office services; bookkeeping, internal accounting and secretarial services; the calculation of NAV; and assistance with the preparation and filing of reports, registration statements, proxy statements and other materials required to be filed or furnished by the Funds under federal and state securities laws. As compensation for these services, the Sub-Administrator receives certain out-of-pocket costs, transaction fees and asset-based fees which are accrued daily and paid monthly by the Adviser.
SEI Investments Distribution Co. (“SIDCO”) serves as each Funds underwriter and distributor of Shares pursuant to a Distribution Agreement. Under the Distribution Agreement, SIDCO, as agent, receives orders to create and redeem Shares in Creation Unit Aggregations and transmits such orders to the Trust’s custodian and transfer agent. The Distributor has no obligation to sell any specific quantity of Fund Shares. SIDCO bears the following costs and expenses relating to the distribution of Shares: (i) the costs of processing and maintaining records of creations of Creation Units; (ii) all costs of maintaining the records required of a registered broker/dealer; (iii) the expenses of maintaining its registration or qualification as a dealer or broker under Federal or state laws; (iv) filing fees; and (v) all other expenses incurred in connection with the distribution services as contemplated in the Distribution Agreement. SIDCO receives no fee for its distribution services under the Distribution Agreement
4. INVESTMENT TRANSACTIONS
For the period ended April 30, 2012, the purchases and sales of investments in securities, excluding in-kind transactions, long-term U.S. Government and short-term securities were:
| | | Purchases | | | Sales and
Maturities | |
| Global X China Consumer ETF | | $ | 15,373,359 | | | $ | 15,753,603 | |
| Global X China Energy ETF | | | 294,360 | | | | 383,099 | |
| Global X China Financials ETF | | | 1,010,601 | | | | 1,113,463 | |
| Global X China Industrials ETF | | | 498,285 | | | | 525,765 | |
| Global X China Materials ETF | | | 154,188 | | | | 135,869 | |
| Global X NASDAQ China Technology ETF | | | 2,452,655 | | | | 2,501,052 | |
| Global X FTSE ASEAN 40 ETF | | | 2,888,891 | | | | 1,747,186 | |
| Global X FTSE Andean 40 ETF | | | 1,043,550 | | | | 803,125 | |
| Global X FTSE Colombia 20 ETF | | | 33,002,903 | | | | 23,781,520 | |
| Global X Brazil Mid Cap ETF | | | 4,001,634 | | | | 4,802,904 | |
| Global X Brazil Consumer ETF | | | 10,633,270 | | | | 10,481,643 | |
| Global X Brazil Financials ETF | | | 592,505 | | | | 2,885,763 | |
| Global X FTSE Argentina 20 ETF | | | 560,863 | | | | 631,304 | |
| Global X FTSE Greece 20 ETF | | | 2,476,860 | | | | 273,678 | |
| Global X FTSE Norway 30 ETF | | | 7,419,073 | | | | 8,802,467 | |
| Global X FTSE Nordic Region ETF | | | 1,117,604 | | | | 1,572,054 | |
During the period ended April 30, 2012, there were no purchases or sales of long-term U.S. Government securities for the Funds.
| Notes to Financial Statements (continued) |
| April 30, 2012 (unaudited) |
4. INVESTMENT TRANSACTIONS (continued)
For the period ended April 30, 2012, in-kind transactions associated with creations and redemptions were:
| | | | | | Sales and | | | Realized | |
| | | Purchases | | | Maturities | | | Gain/(Loss) | |
| Global X China Consumer ETF | | $ | 40,407,971 | | | $ | 44,964,518 | | | $ | (14,546,290 | ) |
| Global X China Energy ETF | | | 1,387,260 | | | | 1,337,430 | | | | (69,263 | ) |
| Global X China Financials ETF | | | 3,926,565 | | | | 4,696,096 | | | | 841,052 | |
| Global X China Materials ETF | | | 898,865 | | | | 884,664 | | | | (757,417 | ) |
| Global X FTSE ASEAN 40 ETF | | | 4,442,349 | | | | 1,021,509 | | | | (207,923 | ) |
| Global X FTSE Andean 40 ETF | | | 459,612 | | | | - | | | | - | |
| Global X FTSE Colombia 20 ETF | | | 14,960,448 | | | | 6,101,840 | | | | (863,953 | ) |
| Global X Brazil Mid Cap ETF | | | - | | | | 388,110 | | | | (30,742 | ) |
| Global X Brazil Consumer ETF | | | 3,168,878 | | | | 2,934,702 | | | | 662,817 | |
| Global X Brazil Financials ETF | | | - | | | | 749,909 | | | | (130,497 | ) |
| Global X FTSE Greece 20 ETF | | | 2,485,208 | | | | 1,718,402 | | | | 195,351 | |
| Global X FTSE Norway 30 ETF | | | 2,919,793 | | | | 23,520,629 | | | | (3,922,152 | ) |
| Global X FTSE Nordic Region ETF | | | - | | | | 3,998,162 | | | | 22,341 | |
5. TAX INFORMATION
The amount and character of income and capital gain distributions to be paid, if any, are determined in accordance with Federal income tax regulations, which may differ from U.S. GAAP. As a result, net investment income (loss) and net realized gain (loss) on investment transactions for a reporting period may differ significantly from distributions during such period. These book/tax differences may be temporary or permanent. To the extent these differences are permanent in nature, they are charged or credited to undistributed net investment income (loss), accumulated net realized gain (loss) or paid-in capital, as appropriate, in the period that the differences arise.
The tax character of dividends and distributions paid during the last period ended October 31, 2011 and 2010 were as follows:
| Global X Funds | | Ordinary Income | | | Long-Term
Capital Gain | | | Totals | |
| Global X China Consumer ETF | | | | | | | | | |
| 2011 | | $ | 1,734,529 | | | $ | – | | | $ | 1,734,529 | |
| 2010 | | | – | | | | – | | | | – | |
| Global X China Energy ETF | | | | | | | | | |
| 2011 | | $ | 61,491 | | | $ | – | | | $ | 61,491 | |
| 2010 | | | – | | | | – | | | | – | |
| Global X China Financials ETF | | | | | | | | | |
| 2011 | | $ | 1,177,311 | | | $ | – | | | $ | 1,177,311 | |
| 2010 | | | – | | | | – | | | | – | |
| Global X China Industrials ETF | | | | | | | | | |
| 2011 | | $ | 149,711 | | | $ | – | | | $ | 149,711 | |
| 2010 | | | – | | | | – | | | | – | |
| Global X China Materials ETF | | | | | | | | | |
| 2011 | | $ | 336,120 | | | $ | – | | | $ | 336,120 | |
| 2010 | | | – | | | | – | | | | – | |
| Global X NASDAQ China Technology ETF | | | | | | |
| 2011 | | $ | 45,880 | | | $ | – | | | $ | 45,880 | |
| 2010 | | | – | | | | – | | | | – | |
| Notes to Financial Statements (continued) |
| April 30, 2012 (unaudited) |
5. TAX INFORMATION (continued)
| | | | | | Long-Term | | | | |
| Global X Funds | | Ordinary Income | | | Capital Gain | | | Totals | |
| Global X FTSE Colombia 20 ETF | | | | | | | | | | | | |
| 2011 | | $ | 1,288,147 | | | $ | 456,070 | | | $ | 1,744,217 | |
| 2010 | | | 264,734 | | | | – | | | | 264,734 | |
| Global X Brazil Mid Cap ETF | | | | | | | | | | | | |
| 2011 | | $ | 452,979 | | | $ | – | | | $ | 452,979 | |
| 2010 | | | – | | | | – | | | | – | |
| Global X Brazil Consumer ETF | | | | | | | | | | | | |
| 2011 | | $ | 57,979 | | | $ | – | | | $ | 57,979 | |
| 2010 | | | – | | | | – | | | | – | |
| Global X Brazil Financials ETF | | | | | | | | | | | | |
| 2011 | | $ | 49,172 | | | $ | – | | | $ | 49,172 | |
| 2010 | | | – | | | | – | | | | – | |
| Global X FTSE Norway 30 ETF | | | | | | | | | | | | |
| 2011 | | $ | 6,983 | | | $ | – | | | $ | 6,983 | |
| Global X FTSE Nordic Region ETF | | | | | | | | | | | | |
| 2011 | | $ | 150,580 | | | $ | – | | | $ | 150,580 | |
| 2010 | | | 2,158 | | | | – | | | | 2,158 | |
As of October 31, 2011, the Components of Tax Basis Distributable Earnings (Accumulated Losses) were as follows:
| | | Global X Funds | |
| | | Global X China
Consumer ETF | | | Global X China
Energy ETF | | | Global X China
Financials ETF | |
| Undistributed Ordinary Income | | $ | 418,113 | | | $ | 78,332 | | | $ | 14,611 | |
| Capital Loss Carryforwards | | | (1,514,329 | ) | | | (33,911 | ) | | | (551,954 | ) |
| Unrealized Depreciation on Investments and Foreign Currency | | | (24,503,355 | ) | | | (415,457 | ) | | | (909,626 | ) |
| Other Temporary Differences | | | (1,064,463 | ) | | | – | | | | – | |
| Total Accumulated Losses | | $ | (26,664,034 | ) | | $ | (371,036 | ) | | $ | (1,446,969 | ) |
| | | Global X China
Industrials ETF | | | Global X China
Materials ETF | | | Global X
NASDAQ China
Technology ETF | |
| Undistributed Ordinary Income | | $ | 3,261 | | | $ | – | | | $ | 57,614 | |
| Capital Loss Carryforwards | | | (94,810 | ) | | | – | | | | (236,466 | ) |
| Unrealized Depreciation on Investments and Foreign Currency | | | (2,469,616 | ) | | | (1,468,667 | ) | | | (18,036 | ) |
| Total Accumulated Losses | | $ | (2,561,165 | ) | | $ | (1,468,667 | ) | | $ | (196,888 | ) |
| | | Global X FTSE
ASEAN 40 ETF | | | Global X FTSE
Andean 40 ETF | | | Global X FTSE
Colombia 20 ETF | |
| Undistributed Ordinary Income | | $ | 265,345 | | | $ | 105,342 | | | $ | 1,305,906 | |
| Capital Loss Carryforwards | | | – | | | | (120,886 | ) | | | (8,249,654 | ) |
| Unrealized Depreciation on Investments and Foreign Currency | | | (1,353,670 | ) | | | (476,415 | ) | | | (9,649,162 | ) |
| Total Accumulated Losses | | $ | (1,088,325 | ) | | $ | (491,959 | ) | | $ | (16,592,910 | ) |
| | | | | | | | | | | | | |
| | | Global X Brazil
Mid Cap ETF | | | Global X Brazil
Consumer ETF | | | Global X Brazil
Financials ETF | |
| Undistributed Ordinary Income | | $ | 431,261 | | | $ | 392,931 | | | $ | 218,222 | |
| Capital Loss Carryforwards | | | (918,379 | ) | | | (563,593 | ) | | | – | |
| Unrealized Depre.lciation on Investments and Foreign Currency | | | (1,527,809 | ) | | | (2,538,407 | ) | | | (916,331 | ) |
| Total Accumulated Losses | | $ | (2,014,927 | ) | | $ | (2,709,069 | ) | | $ | (698,109 | ) |
| Notes to Financial Statements (continued) |
| April 30, 2012 (unaudited) |
5. TAX INFORMATION (continued)
| | | Global X Funds | |
| | | Global X FTSE
Argentina 20 ETF | | | Global X FTSE
Norway 30 ETF | | | Global X FTSE
Nordic Region ETF | |
| Undistributed Ordinary Income | | $ | 71,114 | | | $ | 995,925 | | | $ | 788,538 | |
| Undistributed Long-Term Capital Gain | | | – | | | | – | | | | 7,708 | |
| Capital Loss Carryforwards | | | (414,683 | ) | | | (1,802,290 | ) | | | – | |
| Unrealized Depreciation on Investments and Foreign Currency | | | (1,018,378 | ) | | | (7,695,643 | ) | | | (3,745,630 | ) |
| Other Temporary Differences | | | – | | | | – | | | | – | |
| Total Accumulated Losses | | $ | (1,361,947 | ) | | $ | (8,502,008 | ) | | $ | (2,949,384 | ) |
For Federal income tax purposes, capital loss carryforwards represent realized losses of the Funds that may be carried forward for a maximum period of eight years and applied against future gains. As of October 31, 2011, the Funds that had capital loss carryforwards are listed below.
| | | Global X
China
Consumer
ETF | | | Global X
China
Energy
ETF | | | Global X
China
Financials
ETF | | | Global X
China
Industrials
ETF | | | Global X
NASDAQ China
Technology ETF | |
| Oct. 2019 | | $ | 1,341,121 | | | $ | 33,911 | | | $ | — | | | $ | — | | | $ | 236,466 | |
| Oct. 2018 | | | 173,208 | | | | — | | | | 551,954 | | | | 94,810 | | | | — | |
| Total | | $ | 1,514,329 | | | $ | 33,911 | | | $ | 551,954 | | | $ | 94,810 | | | $ | 236,466 | |
| | | Global X
FTSE
Colombia 20
ETF | | | Global X
Brazil Mid
Cap ETF | | | Global X
Brazil
Consumer
ETF | | | Global X
FTSE
Norway 30
ETF | | | | | |
| Oct. 2019 | | $ | 8,249,654 | | | $ | 918,379 | | | $ | 563,593 | | | $ | 1,802,290 | | | | | |
| Oct. 2018 | | | — | | | | — | | | | — | | | | — | | | | | |
| Total | | $ | 8,249,654 | | | $ | 918,379 | | | $ | 563,593 | | | $ | 1,802,290 | | | | | |
Fort the year ended October 31, 2011, Global X China Financials ETF, Global X China Industrials ETF, Global X Brazil Financials ETF and Global X FTSE Nordic Region ETF utilized $74,505, $125,310, $3, and $7,319, respectively of capital loss carryforwards.
Under the recently enacted Regulated Investment Company Modernization Act of 2010, the Funds will be permitted to carry forward capital losses incurred in taxable years beginning after December 22, 2010 for an unlimited period. However, any losses incurred during those future taxable years will be required to be used prior to the losses incurred in pre-enactment taxable years. As a result of this ordering rule, preenactment capital loss carryforwards may be more likely to expire unused. Additionally, post-enactment capital losses that are carried forward will retain their character as either short-term or long-term capital losses rather than being considered all short-term as under previous law. Losses carried forward under these new provisions are as follows:
| Global X Funds | | Short-Term
Loss | | | Long-Term
Loss | | | Total | |
| Global X FTSE Andrean 40 ETF | | | 120,886 | | | | - | | | | 120,886 | |
| Global X FTSE Argentina 20 ETF | | | 414,683 | | | | - | | | | 414,683 | |
| Notes to Financial Statements (continued) |
| April 30, 2012 (unaudited) |
5. TAX INFORMATION (concluded)
The Federal tax cost and aggregate gross unrealized appreciation and depreciation on investments held by the Funds at April 30, 2012 were as follows:
| Global X Funds | | Federal Tax
Cost | | | Aggregated
Gross
Unrealized
Appreciation | | | Aggregated
Gross
Unrealized
Depreciation | | | Net
Unrealized
Appreciation
(Depreciation) | |
| Global X China Consumer ETF | | $ | 156,771,872 | | | $ | 15,186,476 | | | $ | (17,811,864 | ) | | $ | (2,625,388 | ) |
| Global X China Energy ETF | | | 4,876,543 | | | | 515,319 | | | | (565,667 | ) | | | (50,348 | ) |
| Global X China Financials ETF | | | 11,200,425 | | | | 741,300 | | | | (708,718 | ) | | | 32,582 | |
| Global X China Industrials ETF | | | 6,551,903 | | | | 326,175 | | | | (2,036,313 | ) | | | (1,710,138 | ) |
| Global X China Materials ETF | | | 3,533,733 | | | | 89,252 | | | | (1,075,372 | ) | | | (986,120 | ) |
| Global X NASDAQ China Technology ETF | | | 4,232,329 | | | | 832,099 | | | | (450,414 | ) | | | 381,685 | |
| Global X FTSE ASEAN 40 ETF | | | 28,544,316 | | | | 1,358,284 | | | | (837,064 | ) | | | 521,220 | |
| Global X FTSE Andean 40 ETF | | | 7,887,897 | | | | 774,298 | | | | (326,191 | ) | | | 448,107 | |
| Global X FTSE Colombia 20 ETF | | | 174,143,810 | | | | 23,352,876 | | | | (2,909,818 | ) | | | 20,443,058 | |
| Global X Brazil Mid Cap ETF | | | 22,256,057 | | | | 4,360,594 | | | | (2,475,391 | ) | | | 1,885,203 | |
| Global X Brazil Consumer ETF | | | 30,965,389 | | | | 5,348,716 | | | | (3,426,792 | ) | | | 1,921,924 | |
| Global X Brazil Financials ETF | | | 4,613,042 | | | | 349,026 | | | | (989,735 | ) | | | (640,709 | ) |
| Global X FTSE Argentina 20 ETF | | | 4,598,479 | | | | 198,558 | | | | (1,473,000 | ) | | | (1,274,442 | ) |
| Global X FTSE Greece 20 ETF | | | 3,177,933 | | | | 90,558 | | | | (409,792 | ) | | | (319,234 | ) |
| Global X FTSE Norway 30 ETF | | | 53,490,379 | | | | 3,466,641 | | | | (4,851,558 | ) | | | (1,384,917 | ) |
| Global X FTSE Nordic Region ETF | | | 27,740,175 | | | | 1,686,522 | | | | (3,938,477 | ) | | | (2,251,955 | ) |
The preceding differences between book and tax cost are primarily due to mark to market treatment of passive foreign investment companies and wash sales.
6. CONCENTRATION OF RISKS
The Funds invest in securities of foreign issuers in several countries. These investments may involve certain considerations and risks not typically associated with investments in the United States as a result of, among other factors, the possibility of future political and economic developments and the level of governmental supervision and regulation of securities markets in the respective countries.
The securities markets of emerging countries are less liquid and subject to greater price volatility, and have a smaller market capitalization, than the U.S. securities markets. In certain countries, there may be fewer publicly traded securities and the market may be dominated by a few issues or sectors. Issuers and securities markets in such countries are not subject to as extensive and frequent accounting, financial and other reporting requirements or as comprehensive government regulations as are issuers and securities markets in the U.S. In particular, the assets and profits appearing on the financial statements of emerging country issuers may not reflect their financial position or results of operations in the same manner as financial statements for U.S. issuers. Substantially less information may be publicly available about emerging country issuers than is available about issuers in the United States.
The Funds may be subject to taxes imposed by countries in which it invests. Such taxes are generally based on either income or gains earned or repatriated. The Funds accrue and apply such taxes to net investment income, net realized gains and net unrealized gains as income and/or capital gains are earned.
| Notes to Financial Statements (continued) |
| April 30, 2012 (unaudited) |
6. CONCENTRATION OF RISKS (continued)
The Funds use a replication strategy. A replication strategy is an indexing strategy that involves investing in the securities of the Underlying Index in approximately the same proportions as in the Underlying Index. The Funds may utilize a representative sampling strategy with respect to its Underlying Index when a replication strategy might be detrimental to its shareholders, such as when there are practical difficulties or substantial costs involved in compiling a portfolio of equity securities to follow its Underlying Index, or, in certain instances, when securities in the Underlying Index become temporarily illiquid, unavailable or less liquid, or due to legal restrictions (such as diversification requirements that apply to the Funds but not the Underlying Indexes).
Certain Funds may invest in commodity related securities, which are susceptible to fluctuations in certain commodity markets. Any negative changes in commodity markets could have a great impact on those securities.
7. OTHER
At April 30, 2012, the total Shares outstanding that were held by Authorized Participants were as follows. The Authorized Participants have entered into an agreement with the Funds’ Distributor.
| | | Authorized
Participants | | | Percentage of
Shares
Outstanding | |
| Global X China Consumer ETF | | | 5 | | | | 100% | |
| Global X China Energy ETF | | | 2 | | | | 100% | |
| Global X China Financials ETF | | | 3 | | | | 100% | |
| Global X China Industrials ETF | | | 1 | | | | 100% | |
| Global X China Materials ETF | | | 2 | | | | 100% | |
| Global X NASDAQ China Technology ETF | | | 2 | | | | 100% | |
| Global X FTSE ASEAN 40 ETF | | | 3 | | | | 100% | |
| Global X FTSE Andean 40 ETF | | | 3 | | | | 100% | |
| Global X FTSE Colombia 20 ETF | | | 5 | | | | 100% | |
| Global X Brazil Mid Cap ETF | | | 3 | | | | 100% | |
| Global X Brazil Consumer ETF | | | 3 | | | | 100% | |
| Global X Brazil Financials ETF | | | 2 | | | | 100% | |
| Global X FTSE Argentina 20 ETF | | | 3 | | | | 100% | |
| Global X FTSE Greece 20 ETF | | | 3 | | | | 100% | |
| Global X FTSE Norway 30 ETF | | | 6 | | | | 100% | |
| Global X FTSE Nordic Region ETF | | | 3 | | | | 100% | |
Pursuant to the Trust’s organizational documents, the Trustees of the Trust and the Trust’s officers are indemnified against certain liabilities that may arise out of the performance of their duties.
| Notes to Financial Statements (concluded) |
| April 30, 2012 (unaudited) |
8. LOANS OF PORTFOLIO SECURITIES
The Funds may lend portfolio securities having a market value up to one-third of the Funds’ total assets. Such loans are secured by collateral equal to no less than the market value of the loaned securities determined daily. Such collateral will be cash or debt securities issued or guaranteed by the U.S. Government or any agencies. Cash collateral received in connection with these loans is invested in short-term money market instruments. It is the Funds’ policy to obtain additional collateral from or return excess collateral to the borrower by the end of the next business day, following the valuation date of the securities loaned. Therefore, the value of the collateral held may be temporarily less than the value of the securities on loan. Lending securities entails a risk of loss to the Funds if and to the extent that the market value of the securities loans were to increase and the borrower did not increase the collateral accordingly, and the borrower fails to return the securities. The Funds could also experience delays and costs in gaining access to the collateral. The Funds bear the risk of any deficiency in the amount of the collateral available for return to the borrower due to any loss on the collateral invested. As of April 30, 2012, the value of the securities on loan was $19,216,219 and $14,666,764 for the Global X China Consumer ETF and Global X FTSE Colombia 20 ETF, respectively.
9. CONTRACTUAL OBLIGATIONS
The Funds enter into contracts in the normal course of business that contain a variety of indemnifications. The Funds maximum exposure under these arrangements is unknown. However the Funds have not had prior gains or losses pursuant to these contracts. Management has reviewed the Funds’ existing contracts and expects the risk of loss to be remote.
10. NEW ACCOUNTING PROUNCEMENT
In May 2011, the Financial Accounting Standards Board issued Accounting Standards Updates (“ASU”) No. 2011-04 “Amendments to Achieve Common Fair Value Measurement and Disclosure Requirements in U.S. GAAP and International Financial Reporting Standards (“IFRS”).” ASU 2011-04 includes common requirements for measurement of and disclosure about fair value between U.S. GAAP and IFRS.ASU 2011-04 will require reporting entities to disclose the following information for fair value measurements categorized within Level 3 of the fair value hierarchy: quantitative information about the unobservable inputs used in the fair value measurement, the valuation processes used by the reporting entity, and a narrative description of the sensitivity of the fair value measurement to changes in unobservable inputs and the interrelationships between those unobservable inputs. In addition, ASU 2011-04 will require reporting entities to make disclosures about amounts and reasons for all transfers in and out of Level 1 and Level 2 fair value measurements. The new and revised disclosures are effective for interim and annual reporting periods beginning after December 15, 2011. Adoption of ASU 2011-04 will not materially affect the Funds’ financial condition or results of operations.
11. SUBSEQUENT EVENT
The Funds have evaluated the need for additional disclosures and/or adjustments resulting from subsequent events. Based on this evaluation, no additional disclosures or adjustments were required to the financial statements as of the date the financial statements were issued.
| Notes to Financial Statements (concluded) |
| April 30, 2012 (unaudited) |
11. SUBSEQUENT EVENT (continued)
Subsequent to half-year end, on May 25, 2012, the Board of Trustees of the Trust (including the Independent Trustees) initially considered and unanimously approved the Investment Advisory Agreement and the Supervision and Administration Agreement for the Global X Top Guru Holdings Index ETF, Global X Top Value Guru Holdings Index ETF, and Global X Top Activist Investor Holdings Index ETF.
Subsequent to half-year end, on May 25, 2012, the Board of Trustees of the Trust determined that it is in the best interest of the Global X S&P/TSX Venture 30 Canada ETF to modify the Fund’s investment objective and strategies and to change the Fund’s name. The Fund will be renamed the Global X Junior Miners ETF and will pursue the investment objective and strategies outlined below. These changes are scheduled to go into effect on or about September 3, 2012.
The Fund currently seeks to provide investment results that correspond generally to the price and yield performance, before fees and expenses, of the S&P/TSX Venture 30 Index. The S&P/TSX Venture 30 Index is a free-float adjusted, modified capitalization-weighted index designed to provide exposure to the 30 most liquid securities on the TSX Venture Exchange. The TSX Venture exchange is Canada’s junior listings market for emerging companies. Currently the Fund is mostly comprised of small-capitalization companies based in Canada that operate within the mining and energy sectors. Upon implementation of the change, the Fund’s new objective will be to provide investment results that correspond generally to the price and yield performance, before fees and expenses, of the Solactive Junior Miners Index. The Solactive Junior Miners Index is designed to track the market performance of small-capitalization mining companies globally, and therefore the geographic scope of the Fund will expand accordingly. The Fund intends to focus its investments on small-capitalization mining companies including those engaged in mining, producing, smelting, and/or refining materials including but not limited to gold, silver, copper, aluminum, titanium and nickel.
This change is intended to position the Fund to benefit from the growth of commodity consumption around the world by investing in companies that are key elements of the commodity supply chain. This change also allows the Fund to diversify its investments geographically, although the change will increase the Fund’s exposure to emerging markets which may increase the risk of the Fund’s investments. These risks will be described in an updated Summary Prospectus and Statutory Prospectus that will be available at the time the changes described herein become effective.
The Fund also expects to gain certain cost efficiencies associated with the change in investment objective, and upon implementation of the change the total annual expense ratio of the Fund will be reduced from 0.75% to 0.69%.
Subsequent to half-year end, the following investment portfolio of the Trust commenced operations.
| Fund Name | Commenced Operations |
| Global X Top Guru Holdings Index ETF | 06/04/2012 |
| Disclosure of Fund Expenses (unaudited) |
All Exchange Traded Funds (“ETF”) have operating expenses. As a shareholder of an ETF, your investment is affected by these ongoing costs, which include (among others) costs for ETF management, administrative services, brokerage fees, and shareholder reports like this one. It is important for you to understand the impact of these costs on your investment returns. In addition, a shareholder is responsible for brokerage fees as a result of their investment in the Fund.
Operating expenses such as these are deducted from an ETF’s gross income and directly reduce your final investment return. These expenses are expressed as a percentage of the ETF’s average net assets; this percentage is known as the ETF’s expense ratio.
The following examples use the expense ratio and are intended to help you understand the ongoing costs (in dollars) of investing in your Fund and to compare these costs with those of other funds. The examples are based on an investment of $1,000 made at the beginning of the period shown and held for the entire period.
The table on the next page illustrates your Fund’s costs in two ways:
Actual Fund Return. This section helps you to estimate the actual expenses that your Fund incurred over the period. The “Expenses Paid During Period” column shows the actual dollar expense cost incurred by a $1,000 investment in the Fund, and the “Ending Account Value” number is derived from deducting that expense cost from the Fund’s gross investment return.
You can use this information, together with the actual amount you invested in the Funds, to estimate the expenses you paid over that period. Simply divide your actual account value by $1,000 to arrive at a ratio (for example, an $8,600 account value divided by $1,000 = 8.6), then multiply that ratio by the number shown for your Funds under “Expenses Paid During Period.”
Hypothetical 5% Return. This section helps you compare your Fund’s costs with those of other funds. It assumes that the Funds had an annual 5% return before expenses during the year, but that the expense ratio (Column 3) for the period is unchanged. This example is useful in making comparisons because the Securities and Exchange Commission requires all funds to make this 5% calculation. You can assess your Fund’s comparative cost by comparing the hypothetical result for your Fund in the “Expense Paid During Period” column with those that appear in the same charts in the shareholder reports for other funds.
NOTE: Because the return is set at 5% for comparison purposes — NOT your Fund’s actual return — the account values shown may not apply to your specific investment.
| Disclosure of Fund Expenses (unaudited)(continued) |
| | | Beginning
Account
Value
11/1/2011 | | | Ending
Account
Value
4/30/2012 | | | Annualized
Expense
Ratios | | | Expenses
Paid
During
Period(1) | |
| Global X China Consumer ETF | | | | | | | | | | | | | | | | |
| Actual Fund Return | | $ | 1,000.00 | | | $ | 1,002.80 | | | | 0.65 | % | | $ | 3 .24 | |
| Hypothetical 5% Return | | | 1,000.00 | | | | 1,021.63 | | | | 0.65 | | | | 3 .27 | |
| Global X China Energy ETF | | | | | | | | | | | | | | | | |
| Actual Fund Return | | $ | 1,000.00 | | | $ | 1,021.70 | | | | 0.65 | % | | $ | 3 .27 | |
| Hypothetical 5% Return | | | 1,000.00 | | | | 1,021.63 | | | | 0.65 | | | | 3 .27 | |
| Global X China Financials ETF | | | | | | | | | | | | | | | | |
| Actual Fund Return | | $ | 1,000.00 | | | $ | 1,084.50 | | | | 0.65 | % | | $ | 3 .37 | |
| Hypothetical 5% Return | | | 1,000.00 | | | | 1,021.63 | | | | 0.65 | | | | 3 .27 | |
| Global X China Industrials ETF | | | | | | | | | | | | | | | | |
| Actual Fund Return | | $ | 1,000.00 | | | $ | 1,065.50 | | | | 0.65 | % | | $ | 3 .34 | |
| Hypothetical 5% Return | | | 1,000.00 | | | | 1,021.63 | | | | 0.65 | | | | 3 .27 | |
| Global X China Materials ETF | | | | | | | | | | | | | | | | |
| Actual Fund Return | | $ | 1,000.00 | | | $ | 888.30 | | | | 0.65 | % | | $ | 3 .05 | |
| Hypothetical 5% Return | | | 1,000.00 | | | | 1,021.63 | | | | 0.65 | | | | 3 .27 | |
| Global X NASDAQ China Technology ETF | | | | | | | | | | | | | | | | |
| Actual Fund Return | | $ | 1,000.00 | | | $ | 1,014.50 | | | | 0.65 | % | | $ | 3 .26 | |
| Hypothetical 5% Return | | | 1,000.00 | | | | 1,021.63 | | | | 0.65 | | | | 3 .27 | |
| Global X FTSE ASEAN 40 ETF | | | | | | | | | | | | | | | | |
| Actual Fund Return | | $ | 1,000.00 | | | $ | 1,075.30 | | | | 0.65 | % | | $ | 3 .35 | |
| Hypothetical 5% Return | | | 1,000.00 | | | | 1,021.28 | | | | 0.65 | | | | 3 .27 | |
| Global X FTSE Andean 40 ETF | | | | | | | | | | | | | | | | |
| Actual Fund Return | | $ | 1,000.00 | | | $ | 1,137.70 | | | | 0.72 | % | | $ | 3 .83 | |
| Hypothetical 5% Return | | | 1,000.00 | | | | 1,021.28 | | | | 0.72 | | | | 3 .62 | |
| Global X FTSE Colombia 20 ETF | | | | | | | | | | | | | | | | |
| Actual Fund Return | | $ | 1,000.00 | | | $ | 1,181.50 | | | | 0.78 | % | | $ | 4 .23 | |
| Hypothetical 5% Return | | | 1,000.00 | | | | 1,020.98 | | | | 0.78 | | | | 3 .92 | |
| Global X Brazil Mid Cap ETF | | | | | | | | | | | | | | | | |
| Actual Fund Return | | $ | 1,000.00 | | | $ | 1,108.50 | | | | 0.69 | % | | $ | 3 .62 | |
| Hypothetical 5% Return | | | 1,000.00 | | | | 1,021.43 | | | | 0.69 | | | | 3 .47 | |
| Global X Brazil Consumer ETF | | | | | | | | | | | | | | | | |
| Actual Fund Return | | $ | 1,000.00 | | | $ | 1,107.20 | | | | 0.77 | % | | $ | 4 .03 | |
| Hypothetical 5% Return | | | 1,000.00 | | | | 1,021.03 | | | | 0.77 | | | | 3 .87 | |
| Global X Brazil Financials ETF | | | | | | | | | | | | | | | | |
| Actual Fund Return | | $ | 1,000.00 | | | $ | 947.10 | | | | 0.77 | % | | $ | 3 .73 | |
| Hypothetical 5% Return | | | 1,000.00 | | | | 1,021.03 | | | | 0.77 | | | | 3 .87 | |
| Global X FTSE Argentina 20 ETF | | | | | | | | | | | | | | | | |
| Actual Fund Return | | $ | 1,000.00 | | | $ | 886.40 | | | | 0.75 | % | | $ | 3 .52 | |
| Hypothetical 5% Return | | | 1,000.00 | | | | 1,021.13 | | | | 0.75 | | | | 3 .77 | |
| Global X FTSE Greece 20 ETF(2) | | | | | | | | | | | | | | | | |
| Actual Fund Return | | $ | 1,000.00 | | | $ | 963.30 | | | | 0.66 | % | | $ | 2 .57 | |
| Hypothetical 5% Return | | | 1,000.00 | | | | 1,017.19 | | | | 0.66 | | | | 2 .64 | |
| Disclosure of Fund Expenses (unaudited)(concluded) |
| | | Beginning
Account
Value
11/1/2011 | | | Ending
Account
Value
4/30/2012 | | | Annualized
Expense
Ratios | | | Expenses
Paid
During
Period(1) | |
| Global X FTSE Norway 30 ETF | | | | | | | | | | | | | | | | |
| Actual Fund Return | | $ | 1,000.00 | | | $ | 1,055.60 | | | | 0.50 | % | | $ | 2 .56 | |
| Hypothetical 5% Return | | | 1,000.00 | | | | 1,022.38 | | | | 0.50 | | | | 2 .51 | |
| Global X FTSE Nordic Region ETF | | | | | | | | | | | | | | | | |
| Actual Fund Return | | $ | 1,000.00 | | | $ | 1,079.30 | | | | 0.50 | % | | $ | 2 .59 | |
| Hypothetical 5% Return | | | 1,000.00 | | | | 1,022.37 | | | | 0.50 | | | | 2 .52 | |
| (1) | Expenses are equal to the Fund’s annualized expense ratio multiplied by the average account value over the period, multiplied 182/366 (to reflect the one-half year period.) |
| (2) | Expenses are equal to the Fund’s annualized expense ratio multiplied by the average account value over the period, multiplied 145/366 (to reflect the period from inception to date.) |
Approval Of Investment Advisory Agreement (unaudited)
Section 15(c) of the Investment Company Act of 1940, as amended ("1940 Act"), requires that each mutual fund’s board of trustees, including a majority of those trustees who are not "interested persons" of the mutual fund, as defined in the 1940 Act ("Independent Trustees"), consider on an initial basis and periodically thereafter (as required by the 1940 Act), at an in person meeting called for such purpose, the terms of each fund’s investment advisory agreement and approve each agreement with such changes as the Independent Trustees deem appropriate.
At a quarterly Board meeting held on November 11, 2011, the Board of Trustees (including the Independent Trustees) considered and unanimously approved the continuation of (i) the Investment Advisory Agreement ("Renewal Investment Advisory Agreement") for each Fund covered by this Semi-Annual Report (each a "Renewal Fund") and (ii) the Supervision and Administration Agreement between the Trust ("Renewal Supervision and Administration Agreement"), on behalf of each Renewal Fund, and Global X Management Company ("Global X Management"). The Renewal Investment Advisory Agreement and the Renewal Supervision and Administration Agreement are referred to herein as the "Renewal Agreements."
In advance of the Board meeting, the Board (including the Independent Trustees) requested (in writing) detailed information from Global X Management in connection with their consideration of the Renewal Agreements and received and reviewed written responses from Global X Management and supporting materials relating to those requests for information.
In determining to approve the continuation of the Renewal Agreements for each Renewal Fund, the Board concluded that the Renewal Agreements were fair and reasonable and in the best interests of each Renewal Fund and its shareholders, respectively. In approving the continuation of the Renewal Agreements for each Renewal Fund (as applicable), the Board considered among other things the following categories of material factors. In addition, the Board based their determinations regarding the continuation of each of the Renewal Fund Agreements on their consideration of all of the materials provided to them by Global X Management and each Renewal Fund’s other service providers throughout the year.
In reaching this decision, the Board did not assign relative weights to the factors discussed below nor did the Board deem any one factor or group of them to be controlling in and of themselves. Certain factors considered by the Board (including the Independent Trustees) with respect to the approval of the continuation of the Renewal Agreements are discussed below.
RENEWAL AGREEMENTS
Nature, extent and quality of services
With respect to this factor, the Board considered:
| • | the terms of the Renewal Agreements and the range of services that would continue to be provided to each Renewal Fund in accordance with the Renewal Agreements; |
| Approval Of Investment Advisory Agreement (unaudited) (continued) |
| |
| • | Global X Management’s key personnel and the portfolio managers who would continue to provide investment advisory, supervision and administrative services to each Renewal Fund. In connection with these considerations, the Board noted that Global X Management had significantly increased its support staff and operational resources since the inception of each Renewal Fund; |
| • | Global X Management’s responsibilities under the Renewal Agreements, among other things, to: (i) manage the investment operations of each Renewal Fund and the composition of each Renewal Fund’s assets, including the purchase, retention and disposition of its holdings, (ii) provide quarterly reports to the Trust’s officers and Board and other reports as the Board deems necessary or appropriate, (iii) vote proxies, exercise consents, and exercise all other rights relating to securities and assets held by each Renewal Fund, (iv) select broker- dealers to execute portfolio transactions for each Renewal Fund when necessary, (v) assist in the preparation and filing of reports and proxy statements (if any) to the shareholders of each Renewal Fund, the periodic updating of the registration statement, prospectuses, statement of additional information, and other reports and documents for each Renewal Fund that are required to be filed by the Trust with the SEC and other regulatory and governmental bodies, and (vi) monitor anticipated purchases and redemptions of the shares (including creation units) of each Renewal Fund by shareholders and new investors; |
| • | the nature, extent and quality of the all of the services (including advisory, administrative and compliance services) that have been provided by Global X Management or made available to each Renewal Fund and the adequacy of Global X Management’s personnel resources that would continue to be made available to each Renewal Fund; and |
| • | Global X Management’s experience and the professional qualifications of Global X Management’s key personnel. |
Based on these considerations, the Board concluded that it was satisfied with the nature, extent and quality of the services provided to each Renewal Funds by Global X Management.
| Approval Of Investment Advisory Agreement (unaudited) (concluded) |
| |
Performance
With respect to this fact, the Board considered each Renewal Fund’s total return and investment performance relative to (i) the performance of unaffiliated comparable specialized and/or focused exchange-traded funds and other registered funds in the same classification as each of the Renewal Funds, which performance information is publicly available from such registered funds as well as other third party sources; and (ii) the performance of comparable registered funds, pertinent indexes, and pertinent registered fund performance rankings. The Board noted that some of the Renewal Funds had only been in operations for a few months and that some Renewal Funds had not yet commenced operations. The Board observed that, for the Renewal Funds that had not commenced operations, meaningful data relating to investment performance was not available and, therefore, could not be a factor in approving the Renewal Agreements for the non- operational Renewal Funds.
Based on these considerations and comparisons, the Board concluded that the investment performance of each operational Renewal Fund did not adversely affect the Board approval of the continuance of the Renewal Agreements.
Cost of Services and Profitability
The Board considered Global X Management’s cost to provide investment management and related services to each Renewal Fund. In this regard, the Board considered the Management Fee that has been borne by each Renewal Fund under the Renewal Agreements for the various investment advisory, supervisory and administrative services that each Renewal Fund requires under a unitary fee structure (including the types of fees and expenses that are not included within the unitary fee and would be borne by each Renewal Fund).
In addition, the Board considered the current and expected profitability to Global X Management from all services provided to the Renewal Funds and all aspects of Global X Management’s relationship with each of the Renewal Funds. In connection with these considerations, the Global X Management provided the Board with financial information regarding its operations and services to the Renewal Funds and discussed with the Board its current and expected profitability with respect to the Renewal Funds. Global X Management noted that it was likely that it would not generate profits in the upcoming year from its services to certain of the newer or smaller Renewal Funds because of the small amount of assets under management for those Renewal Funds.
Based on these considerations, the Board concluded that the profits anticipated to be realized by Global X Management from its relationship with each of the Renewal Funds would not be excessive and should not preclude approval of the continuance of each Renewal Agreement.
| Approval Of Investment Advisory Agreement (unaudited) (continued) |
| |
Comparison of Fees and Services
With respect to this factor, the Board considered:
• comparative information with respect to the Management Fee paid to Global X Management by each of the Renewal Funds. In connection with this consideration, Global X Management provided the Board with detailed comparative expense data for each of the Renewal Funds, including fees and expenses paid by unaffiliated comparable specialized and/or focused exchange-traded funds and other comparable registered funds and fees and expenses paid by other funds that are series of the Trust under the same unified Management Fee structure;
• the structure of the unified Management Fee structure (which includes as one component the investment advisory fee for each Renewal Fund) and the current total expense ratios for each of the Renewal Funds. In this regard, the Board took into consideration that the purpose of adopting a unitary Management Fee structure for the Renewal Funds was to create a simple, all-inclusive fee that would provide a level of predictability with respect to the overall expense ratio (i.e., the total fees) of each of the Renewal Funds and that the proposed Management Fee for each Renewal Fund was set at a competitive fee to make each Renewal Fund viable in the marketplace; and
• that Global X Management is responsible for most ordinary expenses of the Renewal Funds, including the costs of various third-party services required by the Funds, including investment advisory, administrative, audit, certain custody, portfolio accounting, legal, transfer agency and printing costs, but that each Renewal Fund would bear other expenses not covered under the all-inclusive Management Fee, such as asset-based custody fees for certain of the Renewal Funds, taxes, brokerage fees, commissions, and other transaction expenses, interest expenses, and extraordinary expenses.
Based on these considerations, the Board concluded that the proposed Management Fee and total expense ratio of each Renewal Fund should not preclude approval of the Renewal Agreements.
Economies of Scale
With respect to this factor, the Board considered:
• the extent to which economies of scale would be realized as the Renewal Funds grow and whether the unitary Management Fee for each Renewal Fund reflected these economies of scale;
• the significant investment of time, personnel and other resources that Global X Management has made and intends to make in the Renewal Funds in order to seek to assure that the Renewal Funds are attractive to investors; and
| Approval Of Investment Advisory Agreement (unaudited) (continued) |
| |
• that the unitary Management Fee would provide a high level of certainty as to the total level of expenses for the Renewal Funds and their shareholders.
Based on these considerations, the Board concluded that continuation of the unitary
Management Fee for each Renewal Fund was reasonable.
Other Benefits
The Board considered any other benefits realized by Global X Management as a result from its relations relationships with each Renewal Fund and concluded that all information it considered supported approval of the continuation of the Renewal Agreements.
| Supplemental Information (unaudited) |
| |
Net asset value, or “NAV”, is the price per Share at which the Funds issue and redeem Shares. It is calculated in accordance with the standard formula for valuing mutual fund shares. The “Market Price” of the Funds generally is determined using the midpoint between the highest bid and the lowest offer on the stock exchange on which the Shares of the Funds are listed for trading, as of the time that the Funds’ NAV is calculated. The Funds’ Market Price may be at, above or below their NAV. The NAV of the Funds will fluctuate with changes in the market value of their Funds holdings. The Market Price of the Funds will fluctuate in accordance with changes in its NAV, as well as market supply and demand.
Premiums or discounts are the differences (expressed as a percentage) between the NAV and Market Price of the Funds on a given day, generally at the time NAV is calculated. A premium is the amount that the Funds are trading above the reported NAV, expressed as a percentage of the NAV. A discount is the amount that the Funds are trading below the reported NAV, expressed as a percentage of the NAV.
Further information regarding premiums and discounts is available on the Funds’ website at GlobalXFunds.com.
| Notice to Shareholders (unaudited) |
| |
For shareholders that do not have a February 27, 2012 tax year end, this notice is for informational purposes only. For shareholders with a February 27, 2012 tax year end, please consult your tax advisor as to the pertinence of this notice. For the fiscal year ended February 27, 2012, the liquidated Funds have designated the following items with regard to distributions paid during the year.
| | | Long-Term
Capital Gain
Distributions | | | Ordinary
Income
Distributions | | | Total
Distributions | | | Qualifying
for
Corporate
Dividends
Received
Deduction (1) | | | Qualifying
Dividend
Income (2) | | | Interest
Related
Dividends (3) | | | Short Term
Capital
Gain
Dividends(4) | |
| Global X Russell Emerging Markets Growth ETF | | | 0.00 | % | | | 100.00 | % | | | 100.00 | % | | | 0.00 | % | | | 100.00 | % | | | 0.00 | % | | | 0.00 | % |
| Global X Russell Emerging Markets Value ETF | | | 0.00 | % | | | 100.00 | % | | | 100.00 | % | | | 0.00 | % | | | 44.01 | % | | | 0.00 | % | | | 100.00 | % |
| Global X Mexico Small-Cap ETF | | | 0.00 | % | | | 100.00 | % | | | 100.00 | % | | | 0.00 | % | | | 59.07 | % | | | 0.00 | % | | | 100.00 | % |
(1) Qualifying dividends represent dividends which qualify for the corporate dividends received deduction and is reflected as a percentage of ordinary income distributions (the total of short term capital gain and net investment income distributions).
(2) The percentage in this column represents the amount of "Qualifying Dividend Income" as created by the Jobs and Growth Relief Reconciliation Act of 2003 and is reflected as a percentage of ordinary income distributions (the total of short term capital gain and net investment income distributions). It is the intention of each of the aforementioned funds to designate the maximum amount permitted by law.
(3) The percentage in this column represents the amount of "Interest Related Dividends" as created by the American Jobs Creation Act of 2004 and is reflected as a percentage of net investment income distributions that is exempt from U.S. withholding tax when paid for foreign investors.
(4) The percentage in this column represents the amount of "Short-Term Capital Gain Dividends" as created by the American Jobs Creation Act of 2004 and is reflected as a percentage of short-term capital gain distributions that is exempt from U.S. withholding tax when paid to foreign investors.
For the short period ended February 27, 2012, the Funds designate all distributions in the short period as ordinary income distributions
399 Park Ave, 32nd floor
New York, NY 10022
1-888-GXFund-1
(1-888-493-8631)
www.globalxfunds.com
Investment Adviser:
Global X Management Company LLC
399 Park Ave, 32nd floor
New York, NY 10022
Distributor:
SEI Investments Distribution Co.
One Freedom Valley Drive
Oaks, PA 19456
Sub-Administrator:
SEI Investments Global Funds Services
One Freedom Valley Drive
Oaks, PA 19456
Counsel for the Independent Trustees:
Dechert LLP
1175 I Street N.W.
Washington, DC 20007
This information must be preceded or accompanied by a prospectus for the funds described.
Global X SuperDividend ETF (ticker: SDIV)
Global X MLP ETF (ticker: MLPA)
Global X Canada Preferred ETF (ticker: CNPF)
Global X Social Media Index ETF (ticker: SOCL)
Global X Auto ETF (ticker: VROM)
Global X NASDAQ 500 ETF (ticker: QQQV)
Global X NASDAQ 400 Mid Cap ETF (ticker: QQQM)
Semi Annual Report
April 30, 2012
Table of Contents
| Schedule of Investments | | |
| Global X Super Dividend ETF | | 1 |
| Global X MLP ETF | | 7 |
| Global X Canada Preferred ETF | | 9 |
| Global X Social Media ETF | | 11 |
| Global X Auto ETF | | 14 |
| Global X NASDAQ 500 ETF | | 18 |
| Global X NASDAQ 400 Midcap ETF | | 34 |
| Statements of Assets and Liabilities | | 47 |
| Statements of Operations | | 49 |
| Statements of Changes in Net Assets | | 51 |
| Financial Highlights | | 54 |
| Notes to Financial Statements | | 55 |
| Disclosure of Fund Expenses | | 67 |
| Approval of Investment Advisory Agreement | | 69 |
| Supplemental Information | | 76 |
| Notice to Shareholders | | 77 |
The Funds file their complete schedules of Fund holdings with the Securities and Exchange Commission (the “Commission”) for the first and third quarters of each fiscal year on Form N-Q within sixty days after the end of the period. The Funds’ Forms N-Q are available on the Commission’s website at http://www.sec.gov, and may be reviewed and copied at the Commission's Public Reference Room in Washington, DC. Information on the operation of the Public Reference Room may be obtained by calling 1-800-SEC-0330.
A description of the policies and procedures that Global X Funds uses to determine how to vote proxies relating to Fund securities, as well as information relating to how the Funds voted proxies relating to Fund securities during the most recent 12-month period ended June 30, will be available (i) without charge, upon request, by calling 1-888-GXFund-1; and (ii) on the Commission’s website at http://www.sec.gov.
| Schedule of Investments | April 30, 2012 (Unaudited) |
| | |
| Global X SuperDividend ETF |
Sector Weightings†:
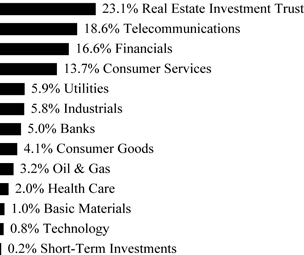
† Percentages based on total investments.
| | | Shares | | | Value | |
| COMMON STOCK — 98.3% | | | | | | | | |
| AUSTRALIA—24.8% | | | | | | | | |
| Banks — 5.0% | | | | | | | | |
| Bank of Queensland | | | 79,129 | | | $ | 615,065 | |
| Bendigo and Adelaide Bank | | | 68,889 | | | | 540,494 | |
| Commonwealth Bank of Australia | | | 11,076 | | | | 599,766 | |
| National Australia Bank | | | 24,198 | | | | 636,126 | |
| Westpac Banking | | | 26,632 | | | | 630,739 | |
| | | | | | | | 3,022,190 | |
| Consumer Goods — 2.1% | | | | | | | | |
| Fleetwood | | | 44,116 | | | | 603,542 | |
| GUD Holdings | | | 77,336 | | | | 683,320 | |
| | | | | | | | 1,286,862 | |
| Consumer Services — 9.5% | | | | | | | | |
| APN News & Media | | | 757,364 | | | | 662,873 | |
| David Jones | | | 235,749 | | | | 611,640 | |
| Metcash | | | 136,917 | | | | 564,936 | |
| Myer Holdings | | | 274,835 | | | | 672,955 | |
| Navitas | | | 193,832 | | | | 797,754 | |
| Seven West Media | | | 166,374 | | | | 513,125 | |
| Southern Cross Media Group | | | 501,809 | | | | 703,246 | |
| TABCORP Holdings | | | 200,200 | | | | 598,677 | |
| Tatts Group | | | 223,249 | | | | 600,144 | |
| | | | | | | | 5,725,350 | |
The accompanying notes are an integral part of the financial statements.
| Schedule of Investments | April 30, 2012 (Unaudited) |
| | |
| Global X SuperDividend ETF |
| | | Shares | | | Value | |
| COMMON STOCK — continued | | | | | | | | |
| | | | | | | | | |
| Financials — 3.3% | | | | | | | | |
| IOOF Holdings | | | 99,304 | | | $ | 644,616 | |
| Perpetual | | | 24,200 | | | | 642,987 | |
| QBE Insurance Group | | | 48,382 | | | | 697,696 | |
| | | | | | | | 1,985,299 | |
| Industrials — 0.8% | | | | | | | | |
| GWA Group | | | 246,105 | | | | 503,883 | |
| Oil & Gas — 1.1% | | | | | | | | |
| APA Group | | | 116,536 | | | | 633,836 | |
| Telecommunications — 1.0% | | | | | | | | |
| Telstra | | | 163,103 | | | | 601,605 | |
| Utilities — 2.0% | | | | | | | | |
| DUET Group | | | 310,974 | | | | 599,435 | |
| Spark Infrastructure Group | | | 398,731 | | | | 602,413 | |
| | | | | | | | 1,201,848 | |
TOTAL AUSTRALIA | | | | | | | 14,960,873 | |
| | | | | | | | | |
| AUSTRIA—0.9% | | | | | | | | |
| Telecommunications — 0.9% | | | | | | | | |
| Telekom Austria | | | 51,716 | | | | 567,229 | |
| BELGIUM—0.9% | | | | | | | | |
| Telecommunications — 0.9% | | | | | | | | |
| Belgacom | | | 19,350 | | | | 549,666 | |
| BERMUDA—1.1% | | | | | | | | |
| Industrials — 1.1% | | | | | | | | |
| Ship Finance International | | | 48,804 | | | | 675,935 | |
| BRAZIL—0.8% | | | | | | | | |
| Utilities — 0.8% | | | | | | | | |
| Light | | | 38,500 | | | | 497,269 | |
| CANADA—5.0% | | | | | | | | |
| Consumer Services — 1.0% | | | | | | | | |
| Parkland Fuel | | | 42,797 | | | | 605,661 | |
| Health Care — 1.0% | | | | | | | | |
| CML HealthCare | | | 56,489 | | | | 611,295 | |
| Oil & Gas — 1.0% | | | | | | | | |
| NAL Energy | | | 81,835 | | | | 627,939 | |
| Real Estate Investment Trust — 0.9% | | | | | | | | |
| Extendicare | | | 68,194 | | | | 559,165 | |
| Utilities — 1.1% | | | | | | | | |
| Just Energy Group | | | 48,528 | | | | 638,136 | |
The accompanying notes are an integral part of the financial statements.
| Schedule of Investments | April 30, 2012 (Unaudited) |
| | |
| Global X SuperDividend ETF |
| | | Shares | | | Value | |
| COMMON STOCK — continued | | | | | | | | |
TOTAL CANADA | | | | | | $ | 3,042,196 | |
| CHINA—1.2% | | | | | | | | |
| Financials — 1.2% | | | | | | | | |
| Greentown China Holdings | | | 1,001,635 | | | | 698,426 | |
| CZECH REPUBLIC— 1.0% | | | | | | | | |
| Telecommunications — 1.0% | | | | | | | | |
| Telefonica Czech Republic | | | 30,631 | | | | 617,723 | |
| FRANCE—0.9% | | | | | | | | |
| Telecommunications — 0.9% | | | | | | | | |
| France Telecom | | | 40,287 | | | | 551,143 | |
| GERMANY—1.3% | | | | | | | | |
| Telecommunications — 1.3% | | | | | | | | |
| Freenet | | | 43,550 | | | | 756,905 | |
| HUNGARY—1.0% | | | | | | | | |
| Telecommunications — 1.0% | | | | | | | | |
| Magyar Telekom Telecommunications | | | 244,936 | | | | 617,350 | |
| ITALY—0.8% | | | | | | | | |
| Consumer Services — 0.8% | | | | | | | | |
| Mediaset | | | 193,565 | | | | 460,430 | |
| NEW ZEALAND— 2.2% | | | | | | | | |
| Telecommunications — 2.2% | | | | | | | | |
| Chorus * | | | 217,599 | | | | 610,338 | |
| Telecom Corp of New Zealand | | | 344,341 | | | | 740,567 | |
TOTAL NEW ZEALAND | | | | | | | 1,350,905 | |
| NORWAY—1.0% | | | | | | | | |
| Oil & Gas — 1.0% | | | | | | | | |
| Seadrill | | | 15,462 | | | | 598,438 | |
| POLAND—2.0% | | | | | | | | |
| Basic Materials — 1.0% | | | | | | | | |
| KGHM Polska Miedz | | | 14,230 | | | | 626,367 | |
| Telecommunications — 1.0% | | | | | | | | |
| Telekomunikacja Polska | | | 115,584 | | | | 604,807 | |
TOTAL POLAND | | | | | | | 1,231,174 | |
| SINGAPORE—5.4% | | | | | | | | |
| Industrials — 1.1% | | | | | | | | |
| Venture | | | 94,033 | | | | 653,482 | |
The accompanying notes are an integral part of the financial statements.
| Schedule of Investments | April 30, 2012 (Unaudited) |
| | |
| Global X SuperDividend ETF |
| | | Shares | | | Value | |
| COMMON STOCK — continued | | | | | | | | |
| Real Estate Investment Trust — 3.2% | | | | | | | | |
| Ascendas | | | 382,808 | | | $ | 643,427 | |
| Mapletree Logistics Trust | | | 846,529 | | | | 670,382 | |
| Suntec | | | 608,150 | | | | 643,779 | |
| | | | | | | | 1,957,588 | |
| Telecommunications — 1.1% | | | | | | | | |
| StarHub | | | 261,512 | | | | 674,120 | |
TOTAL SINGAPORE | | | | | | | 3,285,190 | |
| SPAIN—1.7% | | | | | | | | |
| Consumer Services — 0.8% | | | | | | | | |
| Antena 3 de Television | | | 93,131 | | | | 493,109 | |
| Telecommunications — 0.9% | | | | | | | | |
| Telefonica | | | 35,080 | | | | 511,252 | |
TOTAL SPAIN | | | | | | | 1,004,361 | |
| TAIWAN—1.8% | | | | | | | | |
| Industrials — 1.0% | | | | | | | | |
| U-Ming Marine Transport | | | 352,471 | | | | 598,544 | |
| Technology — 0.8% | | | | | | | | |
| Macronix International | | | 1,404,796 | | | | 463,640 | |
TOTAL TAIWAN | | | | | | | 1,062,184 | |
| TURKEY—1.0% | | | | | | | | |
| Consumer Goods — 1.0% | | | | | | | | |
| Ford Otomotiv Sanayi | | | 62,611 | | | | 575,754 | |
| UNITED KINGDOM— 7.5% | | | | | | | | |
| Consumer Services — 1.6% | | | | | | | | |
| Firstgroup | | | 126,300 | | | | 399,287 | |
| Halfords Group | | | 117,116 | | | | 522,877 | |
| | | | | | | | 922,164 | |
| Financials — 4.1% | | | | | | | | |
| Aviva | | | 108,723 | | | | 543,632 | |
| Provident Financial | | | 38,710 | | | | 726,229 | |
| RSA Insurance Group | | | 339,319 | | | | 578,216 | |
| Standard Life | | | 169,733 | | | | 615,929 | |
| | | | | | | | 2,464,006 | |
| Industrials — 0.9% | | | | | | | | |
| Interserve | | | 122,393 | | | | 568,484 | |
| Telecommunications — 0.9% | | | | | | | | |
| Cable & Wireless Communications | | | 1,036,399 | | | | 554,883 | |
TOTAL UNITED KINGDOM | | | | | | | 4,509,537 | |
The accompanying notes are an integral part of the financial statements.
| Schedule of Investments | April 30, 2012 (Unaudited) |
| | |
| Global X SuperDividend ETF |
| | | Shares | | | Value | |
| COMMON STOCK — continued | | | | | | | | |
| UNITED STATES— 36.0% | | | | | | | | |
| Consumer Goods — 0.9% | | | | | | | | |
| Vector Group | | | 32,961 | | | $ | 571,873 | |
| Financials — 7.9% | | | | | | | | |
| Apollo Investment | | | 83,663 | | | | 606,557 | |
| Ares Capital | | | 37,082 | | | | 594,795 | |
| BGC Partners, Cl A | | | 91,440 | | | | 637,337 | |
| BlackRock Kelso Capital | | | 63,583 | | | | 613,576 | |
| Fifth Street Finance | | | 59,093 | | | | 580,293 | |
| PennantPark Investment | | | 56,354 | | | | 588,900 | |
| Prospect Capital | | | 54,401 | | | | 594,059 | |
| Solar Capital | | | 26,316 | | | | 546,320 | |
| | | | | | | | 4,761,837 | |
| Health Care — 1.0% | | | | | | | | |
| PDL BioPharma | | | 95,028 | | | | 597,726 | |
| Industrials — 0.9% | | | | | | | | |
| Coretronic | | | 654,712 | | | | 552,533 | |
| Real Estate Investment Trust — 18.8% | | | | | | | | |
| American Capital Agency | | | 19,385 | | | | 605,587 | |
| Annaly Capital Management | | | 36,093 | | | | 589,038 | |
| Anworth Mortgage Asset | | | 90,811 | | | | 612,066 | |
| ARMOUR Residential | | | 84,664 | | | | 590,955 | |
| Capstead Mortgage | | | 44,591 | | | | 612,234 | |
| Chimera Investment | | | 203,628 | | | | 588,485 | |
| CommonWealth | | | 28,781 | | | | 539,644 | |
| CreXus Investment | | | 53,283 | | | | 558,939 | |
| CYS Investments | | | 44,316 | | | | 608,459 | |
| Getty Realty | | | 34,913 | | | | 552,324 | |
| Hatteras Financial | | | 21,129 | | | | 615,488 | |
| Hospitality Properties Trust | | | 23,905 | | | | 659,300 | |
| Invesco Mortgage Capital | | | 37,829 | | | | 667,303 | |
| Investors Real Estate Trust | | | 78,685 | | | | 568,106 | |
| Medical Properties Trust | | | 61,077 | | | | 572,902 | |
| MFA Financial | | | 79,508 | | | | 586,769 | |
| Omega Healthcare Investors | | | 27,601 | | | | 590,937 | |
| Starwood Property Trust | | | 29,772 | | | | 621,341 | |
| Two Harbors Investment | | | 59,998 | | | | 627,579 | |
| | | | | | | | 11,367,456 | |
| Telecommunications — 5.5% | | | | | | | | |
| CenturyLink | | | 15,708 | | | | 605,700 | |
| Consolidated Communications Holdings | | | 31,363 | | | | 606,874 | |
The accompanying notes are an integral part of the financial statements.
| Schedule of Investments | April 30, 2012 (Unaudited) |
| | |
| Global X SuperDividend ETF |
| | | Shares/Face
Amount | | | Value | |
| COMMON STOCK — continued | | | | | | | | |
| Telecommunications — continued | | | | | | | | |
| Frontier Communications | | | 137,914 | | | $ | 557,172 | |
| Koninklijke KPN | | | 57,780 | | | | 518,633 | |
| VimpelCom ADR | | | 49,514 | | | | 504,548 | |
| Windstream | | | 47,858 | | | | 537,924 | |
| | | | | | | | 3,330,851 | |
| Utilities — 1.0% | | | | | | | | |
| Atlantic Power | | | 41,162 | | | | 587,523 | |
TOTAL UNITED STATES | | | | | | | 21,769,799 | |
| TOTAL COMMON STOCK | | | | | | | | |
| (Cost $61,122,615) | | | | | | | 59,382,487 | |
| | | | | | | | | |
| PREFERRED STOCK — 0.9% | | | | | | | | |
| BRAZIL—0.9% | | | | | | | | |
| Utilities — 0.9% | | | | | | | | |
| AES Tiete | | | | | | | | |
| (Cost $625,405) | | | 41,451 | | | | 576,267 | |
| | | | | | | | | |
| TIME DEPOSIT — 0.2% | | | | | | | | |
| Brown Brothers Harriman, 0.030% | | | | | | | | |
| (Cost $114,253) | | $ | 114,253 | | | | 114,253 | |
| TOTAL INVESTMENTS — 99.4% | | | | | | | | |
| (Cost $61,862,273) | | | | | | $ | 60,073,007 | |
Percentages are based on Net Assets of $60,411,795.
| * | Non-income producing security. |
ADR — American Depositary Receipt
Cl — Class
The following is a summary of the inputs used as of April 30, 2012, in valuing the Fund's investments carried at value:
| Investments in Securities | | Level 1 | | | Level 2 | | | Level 3 | | | Total | |
| Common Stock | | $ | 59,382,487 | | | $ | — | | | $ | — | | | $ | 59,382,487 | |
| Preferred Stock | | | 576,267 | | | | — | | | | — | | | | 576,267 | |
| Time Deposit | | | — | | | | 114,253 | | | | — | | | | 114,253 | |
| Total Investments in Securities | | $ | 59,958,754 | | | $ | 114,253 | | | $ | — | | | $ | 60,073,007 | |
For the period ended April 30, 2012, there have been no transfers between Level 1 and Level 2 investments.
For the period ended April 30, 2012, there were no Level 3 investments.
The accompanying notes are an integral part of the financial statements.
| Schedule of Investments | April 30, 2012 (Unaudited) |
| | |
| Global X MLP ETF |
Sector Weightings †:
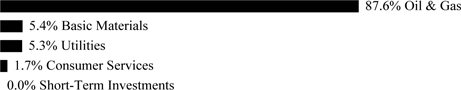
† Percentages based on total investments.
| | | Shares | | | Value | |
| MASTER LIMITED PARTNERSHIPS — 100.7% | | | | | | | | |
| Basic Materials — 5.4% | | | | | | | | |
| Alliance Resource Partners | | | 1,309 | | | $ | 84,535 | |
| Natural Resource Partners | | | 3,122 | | | | 77,894 | |
| Penn Virginia Resource Partners | | | 4,921 | | | | 125,436 | |
| | | | | | | | 287,865 | |
| Consumer Services — 1.7% | | | | | | | | |
| Suburban Propane Partners | | | 2,135 | | | | 90,802 | |
| Oil & Gas — 88.3% | | | | | | | | |
| Atlas Pipeline Partners | | | 2,940 | | | | 102,782 | |
| Boardwalk Pipeline Partners | | | 5,075 | | | | 140,222 | |
| BreitBurn Energy Partners | | | 4,102 | | | | 78,061 | |
| Buckeye Partners | | | 4,522 | | | | 255,267 | |
| Chesapeake Midstream Partners | | | 3,332 | | | | 95,562 | |
| El Paso Pipeline Partners | | | 7,385 | | | | 250,130 | |
| Enbridge Energy Partners | | | 8,624 | | | | 266,482 | |
| Energy Transfer Partners | | | 5,852 | | | | 290,435 | |
| Enterprise Products Partners | | | 5,348 | | | | 275,636 | |
| EV Energy Partner | | | 2,212 | | | | 140,396 | |
| Genesis Energy | | | 3,276 | | | | 101,425 | |
| Kinder Morgan Energy Partners | | | 3,150 | | | | 259,686 | |
| Magellan Midstream Partners | | | 3,808 | | | | 269,682 | |
| MarkWest Energy Partners | | | 4,480 | | | | 269,472 | |
| NuStar Energy | | | 4,403 | | | | 242,121 | |
| ONEOK Partners | | | 4,816 | | | | 268,540 | |
| Plains All American Pipeline | | | 3,437 | | | | 281,593 | |
| Regency Energy Partners * | | | 7,196 | | | | 181,195 | |
| Spectra Energy Partners | | | 2,219 | | | | 72,073 | |
| Sunoco Logistics Partners | | | 4,004 | | | | 162,923 | |
| Targa Resources Partners | | | 4,732 | | | | 203,618 | |
| TC Pipelines | | | 2,254 | | | | 98,883 | |
| Western Gas Partners | | | 3,045 | | | | 142,384 | |
| Williams Partners | | | 4,536 | | | | 260,548 | |
| | | | | | | | 4,709,116 | |
The accompanying notes are an integral part of the financial statements.
| Schedule of Investments | April 30, 2012 (Unaudited) |
| | |
| Global X MLP ETF |
| | | Shares/Face
Amount | | | Value | |
| MASTER LIMITED PARTNERSHIPS — continued | | | | | | | | |
| Utilities — 5.3% | | | | | | | | |
| AmeriGas Partners | | | 3,787 | | | $ | 153,449 | |
| Inergy | | | 6,734 | | | | 131,246 | |
| | | | | | | | 284,695 | |
| TOTAL MASTER LIMITED PARTNERSHIPS | | | | | | | | |
| (Cost $5,212,422) | | | | | | | 5,372,478 | |
| | | | | | | | | |
| TIME DEPOSIT — 0.0% | | | | | | | | |
| Brown Brothers Harriman, 0.030% | | | | | | | | |
| (Cost $1,977) | | $ | 1,977 | | | | 1,977 | |
| TOTAL INVESTMENTS — 100.7% | | | | | | | | |
| (Cost $5,214,399) | | | | | | $ | 5,374,455 | |
Percentages are based on Net Assets of $5,335,571.
| * | Non-income producing security. |
The following is a summary of the inputs used as of April 30, 2012, in valuing the Fund's investments carried at value:
| Investments in Securities | | Level 1 | | | Level 2 | | | Level 3 | | | Total | |
| Master Limited Partnerships | | $ | 5,372,478 | | | $ | — | | | $ | — | | | $ | 5,372,478 | |
| Time Deposit | | | — | | | | 1,977 | | | | — | | | | 1,977 | |
| Total Investments in Securities | | $ | 5,372,478 | | | $ | 1,977 | | | $ | — | | | $ | 5,374,455 | |
For the period ended April 30, 2012, there have been no transfers between Level 1 and Level 2 investments.
For the period ended April 30, 2012, there were no Level 3 investments.
The accompanying notes are an integral part of the financial statements.
| Schedule of Investments | April 30, 2012 (Unaudited) |
| | |
| Global X Canada Preferred ETF |
Sector Weightings †:
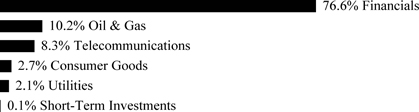
† Percentages based on total investments.
| | | Shares | | | Value | |
| PREFERRED STOCK — 98.9% | | | | | | | | |
| CANADA—98.9% | | | | | | | | |
| Consumer Goods — 2.7% | | | | | | | | |
| George Weston, 0.048% | | | 7,483 | | | $ | 179,907 | |
| RONA, 0.053%(A) | | | 6,463 | | | | 159,375 | |
| | | | | | | | 339,282 | |
| Financials — 75.8% | | | | | | | | |
| Bank of Montreal, 0.045%(A) | | | 34,525 | | | | 912,967 | |
| Bank of Nova Scotia, 0.053%(A) | | | 33,546 | | | | 886,739 | |
| Brookfield Asset Management, 0.070%(A) | | | 22,496 | | | | 601,499 | |
| Brookfield Office Properties, 0.062%(A) | | | 22,862 | | | | 603,986 | |
| Canadian Imperial Bank of Commerce, 0.065%(A) | | | 20,799 | | | | 556,777 | |
| Fairfax Financial Holdings, 0.050%(A) | | | 24,081 | | | | 603,983 | |
| Great-West Lifeco, 0.052%(A) | | | 24,815 | | | | 617,454 | |
| HSBC Bank Canada, 0.066%(A) | | | 9,826 | | | | 270,654 | |
| Husky Energy, 0.045%(A) | | | 11,285 | | | | 298,961 | |
| Manulife Financial, 0.056%(A) | | | 38,262 | | | | 1,000,595 | |
| Power Financial, 0.044%(A) | | | 19,974 | | | | 508,886 | |
| Royal Bank of Canada, 0.063%(A) | | | 38,246 | | | | 1,020,877 | |
| Sun Life Financial, 0.048% | | | 24,449 | | | | 586,415 | |
| Toronto-Dominion Bank, 0.049%(A) | | | 38,241 | | | | 1,026,399 | |
| | | | | | | | 9,496,192 | |
| Oil & Gas — 10.1% | | | | | | | | |
| AltaGas, 0.050%(A) | | | 7,512 | | | | 198,855 | |
| TransCanada, 0.044%(A) | | | 40,834 | | | | 1,069,278 | |
| | | | | | | | 1,268,133 | |
| Telecommunications — 8.2% | | | | | | | | |
| BCE, 0.048%(A) | | | 18,658 | | | | 427,711 | |
| Bell Aliant, 0.049%(A) | | | 11,272 | | | | 291,428 | |
| Shaw Communications, 0.045%(A) | | | 11,755 | | | | 305,224 | |
| | | | | | | | 1,024,363 | |
| Utilities — 2.1% | | | | | | | | |
| TransAlta, 0.046%(A) | | | 11,271 | | | | 258,428 | |
The accompanying notes are an integral part of the financial statements.
| Schedule of Investments | April 30, 2012 (Unaudited) |
| | |
| Global X Canada Preferred ETF |
| | | Shares/Face
Amount | | | Value | |
| PREFERRED STOCK — continued | | | | | | | | |
TOTAL CANADA | | | | | | $ | 12,386,398 | |
| TOTAL PREFERRED STOCK | | | | | | | | |
| (Cost $12,311,374) | | | | | | | 12,386,398 | |
| | | | | | | | | |
| TIME DEPOSIT — 0.1% | | | | | | | | |
| Brown Brothers Harriman, 0.030% | | | | | | | | |
| (Cost $11,316) | | $ | 11,316 | | | | 11,316 | |
| TOTAL INVESTMENTS — 99.0% | | | | | | | | |
| (Cost $12,322,690) | | | | | | $ | 12,397,714 | |
Percentages are based on Net Assets of $12,520,672.
| (A) | Floating rate security - Rate disclosed is the rate in effect on April 30, 2012. |
The following is a summary of the inputs used as of April 30, 2012, in valuing the Fund's investments carried at value:
| Investments in Securities | | Level 1 | | | Level 2 | | | Level 3 | | | Total | |
| Preferred Stock | | $ | 12,386,398 | | | $ | — | | | $ | — | | | $ | 12,386,398 | |
| Time Deposit | | | — | | | | 11,316 | | | | — | | | | 11,316 | |
| Total Investments in Securities | | $ | 12,386,398 | | | $ | 11,316 | | | $ | — | | | $ | 12,397,714 | |
For the period ended April 30, 2012, there have been no transfers between Level 1 and Level 2 investments.
For the period ended April 30, 2012, there were no Level 3 investments.
The accompanying notes are an integral part of the financial statements.
| Schedule of Investments | April 30, 2012 (Unaudited) |
| | |
| Global X Social Media ETF |
Sector Weightings †:

† Percentages based on total investments.
| | | Shares | | | Value | |
| COMMON STOCK — 99.0% | | | | | | | | |
| CHINA—29.8% | | | | | | | | |
| Technology — 29.8% | | | | | | | | |
| NetEase ADR * | | | 12,336 | | | $ | 744,108 | |
| Renren ADR * | | | 96,663 | | | | 589,644 | |
| SINA * | | | 21,489 | | | | 1,257,321 | |
| Sky-mobi ADR * | | | 28,543 | | | | 85,058 | |
| Tencent Holdings | | | 49,188 | | | | 1,545,634 | |
| Youku.com ADR * | | | 5,135 | | | | 123,446 | |
TOTAL CHINA | | | | | | | 4,345,211 | |
| GERMANY—1.7% | | | | | | | | |
| Technology — 1.7% | | | | | | | | |
| XING | | | 3,404 | | | | 253,680 | |
| INDIA—1.1% | | | | | | | | |
| Technology — 1.1% | | | | | | | | |
| Rediff.Com India ADR * | | | 24,989 | | | | 156,181 | |
| ITALY—1.3% | | | | | | | | |
| Technology — 1.3% | | | | | | | | |
| Buongiorno * | | | 86,205 | | | | 184,401 | |
| JAPAN—21.0% | | | | | | | | |
| Technology — 21.0% | | | | | | | | |
| Dena | | | 36,005 | | | | 1,128,764 | |
| Mixi | | | 56 | | | | 145,401 | |
| Nexon * | | | 44,892 | | | | 856,906 | |
| Gree | | | 34,685 | | | | 934,462 | |
TOTAL JAPAN | | | | | | | 3,065,533 | |
The accompanying notes are an integral part of the financial statements.
| Schedule of Investments | April 30, 2012 (Unaudited) |
| | |
| Global X Social Media ETF |
| | | Shares/Face
Amount | | | Value | |
| COMMON STOCK — continued | | | | | | | | |
| NETHERLANDS—4.2% | | | | | | | | |
| Technology — 4.2% | | | | | | | | |
| Yandex, Cl A * | | | 26,084 | | | $ | 618,712 | |
| RUSSIA—4.8% | | | | | | | | |
| Technology — 4.8% | | | | | | | | |
| Mail.ru Group GDR * | | | 16,102 | | | | 696,412 | |
| TAIWAN—0.8% | | | | | | | | |
| Technology — 0.8% | | | | | | | | |
| PChome Online | | | 19,231 | | | | 109,295 | |
| UNITED STATES— 34.3% | | | | | | | | |
| Consumer Services — 6.5% | | | | | | | | |
| Angie's List * | | | 7,440 | | | | 103,788 | |
| Groupon, Cl A * | | | 35,508 | | | | 380,291 | |
| Nutrisystem | | | 24,981 | | | | 289,280 | |
| Yelp, Cl A * | | | 7,554 | | | | 172,684 | |
| | | | | | | | 946,043 | |
| Technology — 27.8% | | | | | | | | |
| Changyou.com ADR * | | | 6,010 | | | | 145,562 | |
| Demand Media * | | | 32,227 | | | | 267,806 | |
| Google, Cl A * | | | 1,139 | | | | 689,357 | |
| LinkedIn, Cl A * | | | 14,375 | | | | 1,558,969 | |
| Quepasa * | | | 15,317 | | | | 58,205 | |
| Pandora Media * | | | 50,448 | | | | 433,853 | |
| United Online | | | 78,777 | | | | 373,403 | |
| Zynga, Cl A * | | | 63,029 | | | | 525,662 | |
| | | | | | | | 4,052,817 | |
TOTAL UNITED STATES | | | | | | | 4,998,860 | |
| TOTAL COMMON STOCK | | | | | | | | |
| (Cost $13,856,706) | | | | | | | 14,428,285 | |
| | | | | | | | | |
| TIME DEPOSIT — 0.0% | | | | | | | | |
| Brown Brothers Harriman, 0.030% | | | | | | | | |
| (Cost $3,673) | | $ | 3,673 | | | | 3,673 | |
| TOTAL INVESTMENTS — 99.0% | | | | | | | | |
| (Cost $13,860,379) | | | | | | $ | 14,431,958 | |
Percentages are based on Net Assets of $14,578,087.
| * | Non-income producing security. |
ADR — American Depositary Receipt
Cl — Class
GDR — Global Depositary Receipt
The accompanying notes are an integral part of the financial statements.
| Schedule of Investments | April 30, 2012 (Unaudited) |
| | |
| Global X Social Media ETF |
The following is a summary of the inputs used as of April 30, 2012, in valuing the Fund's investments carried at value:
| Investments in Securities | | Level 1 | | | Level 2 | | | Level 3 | | | Total | |
| Common Stock | | $ | 14,428,285 | | | $ | — | | | $ | — | | | $ | 14,428,285 | |
| Time Deposit | | | — | | | | 3,673 | | | | — | | | | 3,673 | |
| Total Investments in Securities | | $ | 14,428,285 | | | $ | 3,673 | | | $ | — | | | $ | 14,431,958 | |
For the period ended April 30, 2012, there have been no transfers between Level 1 and Level 2 investments.
For the period ended April 30, 2012, there were no Level 3 investments.
The accompanying notes are an integral part of the financial statements.
| Schedule of Investments | April 30, 2012 (Unaudited) |
| | |
| Global X Auto ETF |
Sector Weightings †:

† Percentages based on total investments.
| | | Shares | | | Value | |
| COMMON STOCK — 96.4% | | | | | | | | |
| CANADA—1.7% | | | | | | | | |
| Consumer Goods — 1.7% | | | | | | | | |
| Magna International | | | 1,921 | | | $ | 84,183 | |
| CHINA—5.7% | | | | | | | | |
| Consumer Goods — 4.2% | | | | | | | | |
| Dongfeng Motor Group, Cl H | | | 74,300 | | | | 146,519 | |
| Guangzhou Automobile Group, Cl H * | | | 52,600 | | | | 58,372 | |
| | | | | | | | 204,891 | |
| Industrials — 1.5% | | | | | | | | |
| Byd, Cl H | | | 28,743 | | | | 75,760 | |
TOTAL CHINA | | | | | | | 280,651 | |
| FRANCE—4.8% | | | | | | | | |
| Consumer Goods — 4.8% | | | | | | | | |
| Cie Generale des Etablissements Michelin, Cl B | | | 1,592 | | | | 118,895 | |
| Peugeot | | | 1,498 | | | | 17,985 | |
| Renault | | | 1,559 | | | | 70,835 | |
| Valeo | | | 595 | | | | 29,220 | |
TOTAL FRANCE | | | | | | | 236,935 | |
| GERMANY—18.7% | | | | | | | | |
| Consumer Goods — 18.7% | | | | | | | | |
| Bayerische Motoren Werke | | | 3,020 | | | | 287,065 | |
| Continental | | | 834 | | | | 80,832 | |
| Daimler | | | 7,766 | | | | 429,337 | |
| Volkswagen | | | 728 | | | | 124,263 | |
TOTAL GERMANY | | | | | | | 921,497 | |
| HONG KONG— 0.6% | | | | | | | | |
| Consumer Goods — 0.6% | | | | | | | | |
| Brilliance China Automotive Holdings * | | | 18,600 | | | | 20,185 | |
| Geely Automobile Holdings | | | 31,800 | | | | 11,845 | |
TOTAL HONG KONG | | | | | | | 32,030 | |
| INDIA—2.3% | | | | | | | | |
| Industrials — 2.3% | | | | | | | | |
| Tata Motors ADR | | | 3,757 | | | | 111,771 | |
The accompanying notes are an integral part of the financial statements.
| Schedule of Investments | April 30, 2012 (Unaudited) |
| | |
| Global X Auto ETF |
| | | Shares | | | Value | |
| COMMON STOCK — continued | | | | | | | | |
| INDONESIA—2.4% | | | | | | | | |
| Consumer Goods — 2.4% | | | | | | | | |
| Astra International | | | 15,650 | | | $ | 120,902 | |
| ITALY—1.4% | | | | | | | | |
| Consumer Goods — 1.4% | | | | | | | | |
| Fiat | | | 7,000 | | | | 33,802 | |
| Pirelli & C | | | 2,800 | | | | 34,098 | |
TOTAL ITALY | | | | | | | 67,900 | |
| JAPAN—25.3% | | | | | | | | |
| Consumer Goods — 24.7% | | | | | | | | |
| Aisin Seiki | | | 740 | | | | 26,360 | |
| Bridgestone | | | 2,635 | | | | 62,872 | |
| Daihatsu Motor | | | 750 | | | | 14,260 | |
| Denso | | | 1,842 | | | | 60,192 | |
| Fuji Heavy Industries | | | 2,550 | | | | 19,579 | |
| GS Yuasa | | | 1,400 | | | | 7,260 | |
| Honda Motor ADR | | | 7,276 | | | | 262,227 | |
| JTEKT | | | 700 | | | | 7,742 | |
| Mazda Motor | | | 6,700 | | | | 10,993 | |
| Mitsubishi Motors * | | | 15,600 | | | | 17,585 | |
| Nissan Motor | | | 9,455 | | | | 99,003 | |
| NSK | | | 2,100 | | | | 14,571 | |
| Suzuki Motor | | | 1,585 | | | | 37,660 | |
| Toyota Industries | | | 672 | | | | 19,131 | |
| Toyota Motor ADR | | | 6,876 | | | | 562,319 | |
| | | | | | | | 1,221,754 | |
| Industrials — 0.6% | | | | | | | | |
| Isuzu Motors | | | 4,900 | | | | 28,170 | |
TOTAL JAPAN | | | | | | | 1,249,924 | |
| SOUTH KOREA— 12.4% | | | | | | | | |
| Consumer Goods — 12.4% | | | | | | | | |
| Hankook Tire | | | 752 | | | | 31,873 | |
| Hyundai Mobis | | | 529 | | | | 143,938 | |
| Hyundai Motor | | | 1,222 | | | | 290,328 | |
| Kia Motors | | | 2,006 | | | | 148,037 | |
TOTAL SOUTH KOREA | | | | | | | 614,176 | |
| SWEDEN—1.0% | | | | | | | | |
| Consumer Goods — 1.0% | | | | | | | | |
| Autoliv | | | 767 | | | | 48,121 | |
The accompanying notes are an integral part of the financial statements.
| Schedule of Investments | April 30, 2012 (Unaudited) |
| | |
| Global X Auto ETF |
| | | Shares/Face
Amount | | | Value | |
| COMMON STOCK — continued | | | | | | | | |
| UNITED STATES— 20.1% | | | | | | | | |
| Consumer Goods — 20.1% | | | | | | | | |
| BorgWarner * | | | 919 | | | $ | 72,638 | |
| Ford Motor | | | 32,860 | | | | 370,661 | |
| General Motors * | | | 6,081 | | | | 139,863 | |
| Gentex | | | 1,189 | | | | 26,122 | |
| Genuine Parts | | | 1,323 | | | | 85,704 | |
| Goodyear Tire & Rubber * | | | 2,070 | | | | 22,728 | |
| Johnson Controls | | | 5,910 | | | | 188,943 | |
| Tesla Motors * | | | 306 | | | | 10,138 | |
| TRW Automotive Holdings * | | | 884 | | | | 40,408 | |
| WABCO Holdings * | | | 571 | | | | 35,990 | |
TOTAL UNITED STATES | | | | | | | 993,195 | |
| TOTAL COMMON STOCK | | | | | | | | |
| (Cost $4,952,339) | | | | | | | 4,761,285 | |
| | | | | | | | | |
| PREFERRED STOCK — 3.3% | | | | | | | | |
| GERMANY—3.3% | | | | | | | | |
| Consumer Goods — 3.3% | | | | | | | | |
| Porsche Automobil Holding | | | | | | | | |
| (Cost $170,057) | | | 2,654 | | | | 162,006 | |
| | | | | | | | | |
| TIME DEPOSIT — 0.1% | | | | | | | | |
| Brown Brothers Harriman, 0.030% | | | | | | | | |
| (Cost $5,139) | | $ | 5,139 | | | | 5,139 | |
| TOTAL INVESTMENTS — 99.8% | | | | | | | | |
| (Cost $5,127,535) | | | | | | $ | 4,928,430 | |
Percentages are based on Net Assets of $4,936,550
| * | Non-income producing security. |
ADR — American Depositary Receipt
Cl — Class
The accompanying notes are an integral part of the financial statements.
| Schedule of Investments | April 30, 2012 (Unaudited) |
| | |
| Global X Auto ETF |
The following is a summary of the inputs used as of April 30, 2012, in valuing the Fund's investments carried at value:
| Investments in Securities | | Level 1 | | | Level 2 | | | Level 3 | | | Total | |
| Common Stock | | $ | 4,761,285 | | | $ | — | | | $ | — | | | $ | 4,761,285 | |
| Preferred Stock | | | 162,006 | | | | — | | | | — | | | | 162,006 | |
| Time Deposit | | | — | | | | 5,139 | | | | — | | | | 5,139 | |
| Total Investments in Securities | | $ | 4,923,291 | | | $ | 5,139 | | | $ | — | | | $ | 4,928,430 | |
For the period ended April 30, 2012, there have been no transfers between Level 1 and Level 2 investments.
For the period ended April 30, 2012, there were no Level 3 investments.
The accompanying notes are an integral part of the financial statements.
| Schedule of Investments | April 30, 2012 (Unaudited) |
| Sector Weightings†: | |
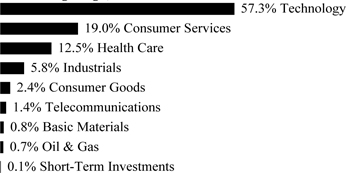 | |
| † Percentages based on total investments. | |
| | | Shares | | | Value | |
| COMMON STOCK — 99.9% | | | | | | | | |
| | | | | | | | | |
| ARGENTINA—0.1% | | | | | | | | |
| Consumer Services — 0.1% | | | | | | | | |
| MercadoLibre | | | 17 | | | $ | 1,645 | |
| BERMUDA—0.4% | | | | | | | | |
| Consumer Services — 0.0% | | | | | | | | |
| Central European Media Enterprises, Cl A * | | | 22 | | | | 174 | |
| Oil & Gas — 0.1% | | | | | | | | |
| Energy XXI Bermuda | | | 28 | | | | 1,055 | |
| Golar LNG | | | 25 | | | | 925 | |
| | | | | | | | 1,980 | |
| Technology — 0.3% | | | | | | | | |
| Marvell Technology Group * | | | 234 | | | | 3,512 | |
TOTAL BERMUDA | | | | | | | 5,666 | |
| BRITISH VIRGIN ISLANDS— 0.0% | | | | | | | | |
| Industrials — 0.0% | | | | | | | | |
| UTi Worldwide | | | 38 | | | | 633 | |
| CANADA—0.7% | | | | | | | | |
| Basic Materials — 0.2% | | | | | | | | |
| Methanex | | | 36 | | | | 1,266 | |
| Pan American Silver | | | 41 | | | | 800 | |
| Silver Standard Resources * | | | 31 | | | | 447 | |
| | | | | | | | 2,513 | |
| Consumer Goods — 0.2% | | | | | | | | |
| Lululemon Athletica * | | | 40 | | | | 2,965 | |
| Industrials — 0.0% | | | | | | | | |
| Westport Innovations * | | | 17 | | | | 532 | |
The accompanying notes are an integral part of the financial statements.
| Schedule of Investments | April 30, 2012 (Unaudited) |
| | | Shares | | | Value | |
| COMMON STOCK — continued | | | | | | | | |
| | | | | | | | | |
| Technology — 0.3% | | | | | | | | |
| Open Text * | | | 22 | | | $ | 1,232 | |
| Research In Motion * | | | 197 | | | | 2,817 | |
| | | | | | | | 4,049 | |
TOTAL CANADA | | | | | | | 10,059 | |
| CHINA—1.4% | | | | | | | | |
| Consumer Goods — 0.0% | | | | | | | | |
| Perfect World ADR | | | 15 | | | | 183 | |
| Consumer Services — 0.1% | | | | | | | | |
| Focus Media Holding ADR | | | 47 | | | | 1,123 | |
| Home Inns & Hotels Management ADR * | | | 12 | | | | 285 | |
| | | | | | | | 1,408 | |
| Industrials — 0.0% | | | | | | | | |
| Hollysys Automation Technologies * | | | 21 | | | | 208 | |
| Technology — 1.3% | | | | | | | | |
| AsiaInfo Holdings * | | | 28 | | | | 353 | |
| Baidu ADR * | | | 103 | | | | 13,668 | |
| Ctrip.com International ADR * | | | 55 | | | | 1,192 | |
| NetEase ADR * | | | 29 | | | | 1,749 | |
| Sohu.com * | | | 15 | | | | 774 | |
| Spreadtrum Communications ADR | | | 14 | | | | 193 | |
| | | | | | | | 17,929 | |
TOTAL CHINA | | | | | | | 19,728 | |
| GREECE—0.0% | | | | | | | | |
| Industrials — 0.0% | | | | | | | | |
| DryShips * | | | 160 | | | | 506 | |
| HONG KONG— 0.1% | | | | | | | | |
| Consumer Services — 0.1% | | | | | | | | |
| Melco Crown Entertainment ADR * | | | 68 | | | | 1,055 | |
| INDIA—0.1% | | | | | | | | |
| Technology — 0.1% | | | | | | | | |
| Infosys ADR | | | 34 | | | | 1,610 | |
| IRELAND—0.8% | | | | | | | | |
| Consumer Services — 0.1% | | | | | | | | |
| Ryanair Holdings ADR * | | | 44 | | | | 1,481 | |
| Health Care — 0.4% | | | | | | | | |
| Alkermes * | | | 50 | | | | 865 | |
| Amarin ADR * | | | 41 | | | | 501 | |
| ICON ADR * | | | 23 | | | | 510 | |
| Shire ADR | | | 17 | | | | 1,658 | |
The accompanying notes are an integral part of the financial statements.
| Schedule of Investments | April 30, 2012 (Unaudited) |
| | | Shares | | | Value | |
| COMMON STOCK — continued | | | | | | | | |
| | | | | | | | | |
| Health Care — continued | | | | | | | | |
| Warner Chilcott, Cl A * | | | 96 | | | $ | 2,088 | |
| | | | | | | | 5,622 | |
| Technology — 0.3% | | | | | | | | |
| Seagate Technology | | | 160 | | | | 4,922 | |
TOTAL IRELAND | | | | | | | 12,025 | |
| ISRAEL—1.3% | | | | | | | | |
| Health Care — 0.8% | | | | | | | | |
| Teva Pharmaceutical Industries ADR | | | 266 | | | | 12,167 | |
| Technology — 0.5% | | | | | | | | |
| Check Point Software Technologies * | | | 78 | | | | 4,534 | |
| Mellanox Technologies * | | | 15 | | | | 879 | |
| NICE Systems ADR * | | | 15 | | | | 576 | |
| RADWARE * | | | 8 | | | | 308 | |
| | | | | | | | 6,297 | |
TOTAL ISRAEL | | | | | | | 18,464 | |
| JERSEY—0.1% | | | | | | | | |
| Basic Materials — 0.1% | | | | | | | | |
| Randgold Resources ADR | | | 24 | | | | 2,140 | |
| NETHERLANDS—0.3% | | | | | | | | |
| Health Care — 0.1% | | | | | | | | |
| QIAGEN * | | | 90 | | | | 1,506 | |
| Industrials — 0.0% | | | | | | | | |
| VistaPrint * | | | 15 | | | | 559 | |
| Technology — 0.2% | | | | | | | | |
| ASML Holding, Cl G | | | 45 | | | | 2,295 | |
TOTAL NETHERLANDS | | | | | | | 4,360 | |
| RUSSIA—0.0% | | | | | | | | |
| Consumer Services — 0.0% | | | | | | | | |
| CTC Media | | | 59 | | | | 639 | |
| SINGAPORE—0.4% | | | | | | | | |
| Industrials — 0.2% | | | | | | | | |
| Flextronics International * | | | 284 | | | | 1,891 | |
| Technology — 0.2% | | | | | | | | |
| Avago Technologies | | | 93 | | | | 3,207 | |
TOTAL SINGAPORE | | | | | | | 5,098 | |
| SWEDEN—0.1% | | | | | | | | |
| Technology — 0.1% | | | | | | | | |
| Ericsson ADR | | | 85 | | | | 850 | |
The accompanying notes are an integral part of the financial statements.
| Schedule of Investments | April 30, 2012 (Unaudited) |
| | | Shares | | | Value | |
| COMMON STOCK — continued | | | | | | | | |
| SWITZERLAND—0.3% | | | | | | | | |
| Technology — 0.3% | | | | | | | | |
| Garmin | | | 73 | | | $ | 3,440 | |
| Logitech International * | | | 71 | | | | 721 | |
TOTAL SWITZERLAND | | | | | | | 4,161 | |
| TAIWAN—0.0% | | | | | | | | |
| Technology — 0.0% | | | | | | | | |
| Silicon Motion Technology ADR * | | | 12 | | | | 204 | |
| Siliconware Precision Industries ADR | | | 39 | | | | 228 | |
TOTAL TAIWAN | | | | | | | 432 | |
| UNITED KINGDOM— 0.7% | | | | | | | | |
| Technology — 0.1% | | | | | | | | |
| ARM Holdings ADR | | | 54 | | | | 1,368 | |
| Telecommunications — 0.6% | | | | | | | | |
| Vodafone Group ADR | | | 333 | | | | 9,267 | |
TOTAL UNITED KINGDOM | | | | | | | 10,635 | |
| UNITED STATES— 93.1% | | | | | | | | |
| Basic Materials — 0.5% | | | | | | | | |
| A Schulman | | | 13 | | | | 320 | |
| Century Aluminum * | | | 37 | | | | 340 | |
| Globe Specialty Metals | | | 29 | | | | 387 | |
| Royal Gold | | | 21 | | | | 1,301 | |
| Sigma-Aldrich | | | 47 | | | | 3,332 | |
| Steel Dynamics | | | 83 | | | | 1,060 | |
| | | | | | | | 6,740 | |
| Consumer Goods — 2.2% | | | | | | | | |
| Activision Blizzard | | | 432 | | | | 5,560 | |
| Crocs * | | | 33 | | | | 667 | |
| Deckers Outdoor * | | | 15 | | | | 765 | |
| Diamond Foods | | | 7 | | | | 146 | |
| Electronic Arts * | | | 124 | | | | 1,907 | |
| Fossil * | | | 24 | | | | 3,136 | |
| Gentex | | | 55 | | | | 1,208 | |
| Green Mountain Coffee Roasters * | | | 58 | | | | 2,828 | |
| Hain Celestial Group * | | | 17 | | | | 804 | |
| Hasbro | | | 52 | | | | 1,910 | |
| Herman Miller | | | 22 | | | | 430 | |
| Iconix Brand Group * | | | 28 | | | | 429 | |
| Interface, Cl A | | | 21 | | | | 297 | |
| iRobot * | | | 10 | | | | 236 | |
| LKQ * | | | 55 | | | | 1,840 | |
The accompanying notes are an integral part of the financial statements.
| Schedule of Investments | April 30, 2012 (Unaudited) |
| | | Shares | | | Value | |
| COMMON STOCK — continued | | | | | | | | |
| | | | | | | | | |
| Consumer Goods — continued | | | | | | | | |
| Mattel | | | 131 | | | $ | 4,402 | |
| Monster Beverage * | | | 68 | | | | 4,417 | |
| Pool | | | 18 | | | | 664 | |
| Sanderson Farms | | | 7 | | | | 361 | |
| Select Comfort * | | | 20 | | | | 578 | |
| Snyders-Lance | | | 26 | | | | 673 | |
| Steven Madden * | | | 15 | | | | 648 | |
| Take-Two Interactive Software * | | | 33 | | | | 465 | |
| TiVo * | | | 45 | | | | 486 | |
| True Religion Apparel | | | 10 | | | | 272 | |
| | | | | | | | 35,129 | |
| Consumer Services — 18.6% | | | | | | | | |
| Acxiom * | | | 32 | | | | 439 | |
| Allegiant Travel, Cl A * | | | 7 | | | | 411 | |
| Amazon.com * | | | 172 | | | | 39,887 | |
| AMC Networks, Cl A * | | | 21 | | | | 892 | |
| Ameristar Casinos | | | 11 | | | | 198 | |
| Ancestry.com * | | | 17 | | | | 454 | |
| Apollo Group, Cl A * | | | 56 | | | | 1,972 | |
| Ascena Retail Group * | | | 60 | | | | 1,229 | |
| Avis Budget Group * | | | 39 | | | | 513 | |
| Beacon Roofing Supply * | | | 18 | | | | 480 | |
| Bebe Stores | | | 31 | | | | 254 | |
| Bed Bath & Beyond * | | | 95 | | | | 6,687 | |
| BJ's Restaurants * | | | 11 | | | | 475 | |
| Blue Nile * | | | 5 | | | | 151 | |
| Buffalo Wild Wings * | | | 7 | | | | 587 | |
| Capella Education * | | | 6 | | | | 196 | |
| Career Education * | | | 29 | | | | 207 | |
| Casey's General Stores | | | 15 | | | | 845 | |
| Charter Communications, Cl A * | | | 42 | | | | 2,540 | |
| Cheesecake Factory * | | | 23 | | | | 724 | |
| Children's Place Retail Stores * | | | 10 | | | | 460 | |
| Clean Energy Fuels * | | | 27 | | | | 519 | |
| Comcast, Cl A | | | 791 | | | | 23,991 | |
| comScore * | | | 11 | | | | 219 | |
| Constant Contact * | | | 11 | | | | 266 | |
| Copart * | | | 54 | | | | 1,426 | |
| Costco Wholesale | | | 169 | | | | 14,901 | |
| Cracker Barrel Old Country Store | | | 9 | | | | 518 | |
| Digital Generation * | | | 11 | | | | 102 | |
| DIRECTV, Cl A * | | | 293 | | | | 14,436 | |
The accompanying notes are an integral part of the financial statements.
| Schedule of Investments | April 30, 2012 (Unaudited) |
| | | Shares | | | Value | |
| COMMON STOCK — continued | | | | | | | | |
| | | | | | | | | |
| Consumer Services — continued | | | | | | | | |
| Discovery Communications, Cl A * | | | 53 | | | $ | 2,884 | |
| DISH Network, Cl A | | | 78 | | | | 2,494 | |
| Dollar Tree * | | | 48 | | | | 4,879 | |
| DreamWorks Animation SKG, Cl A * | | | 28 | | | | 504 | |
| eBay * | | | 487 | | | | 19,991 | |
| Education Management * | | | 49 | | | | 608 | |
| Expedia | | | 49 | | | | 2,089 | |
| Finish Line, Cl A | | | 20 | | | | 445 | |
| Fred's, Cl A | | | 15 | | | | 215 | |
| Grand Canyon Education * | | | 17 | | | | 296 | |
| Hibbett Sports * | | | 10 | | | | 597 | |
| HSN | | | 23 | | | | 890 | |
| Jack in the Box * | | | 19 | | | | 432 | |
| JetBlue Airways * | | | 113 | | | | 537 | |
| Jos A Bank Clothiers * | | | 11 | | | | 523 | |
| Lamar Advertising, Cl A * | | | 30 | | | | 955 | |
| Liberty Global, Cl A * | | | 60 | | | | 2,989 | |
| Liberty Interactive, Cl A * | | | 221 | | | | 4,164 | |
| Liberty Media - Liberty Capital, Cl A * | | | 28 | | | | 2,448 | |
| Liquidity Services * | | | 11 | | | | 587 | |
| Monro Muffler Brake | | | 12 | | | | 495 | |
| National CineMedia | | | 21 | | | | 300 | |
| Netflix * | | | 19 | | | | 1,523 | |
| News, Cl A | | | 665 | | | | 13,034 | |
| OpenTable * | | | 9 | | | | 402 | |
| Orchard Supply Hardware Stores, Cl A * | | | 3 | | | | 64 | |
| O'Reilly Automotive * | | | 54 | | | | 5,695 | |
| Panera Bread, Cl A * | | | 11 | | | | 1,737 | |
| Penn National Gaming * | | | 30 | | | | 1,349 | |
| PetSmart | | | 43 | | | | 2,505 | |
| PF Chang's China Bistro | | | 10 | | | | 397 | |
| priceline.com * | | | 19 | | | | 14,456 | |
| Pricesmart | | | 10 | | | | 825 | |
| Rent-A-Center, Cl A | | | 25 | | | | 855 | |
| Ross Stores | | | 88 | | | | 5,420 | |
| Rue21 * | | | 10 | | | | 304 | |
| Scientific Games, Cl A * | | | 34 | | | | 345 | |
| Sears Holdings * | | | 41 | | | | 2,205 | |
| Shuffle Master * | | | 21 | | | | 371 | |
| Shutterfly * | | | 13 | | | | 404 | |
| Sinclair Broadcast Group, Cl A | | | 20 | | | | 206 | |
| Sirius XM Radio * | | | 1,573 | | | | 3,555 | |
The accompanying notes are an integral part of the financial statements.
| Schedule of Investments | April 30, 2012 (Unaudited) |
| | | Shares | | | Value | |
| COMMON STOCK — continued | | | | | | | | |
| | | | | | | | | |
| Consumer Services — continued | | | | | | | | |
| SkyWest | | | 20 | | | $ | 180 | |
| Staples | | | 272 | | | | 4,189 | |
| Starbucks | | | 284 | | | | 16,296 | |
| Stewart Enterprises, Cl A | | | 33 | | | | 209 | |
| Strayer Education | | | 5 | | | | 493 | |
| Texas Roadhouse, Cl A | | | 27 | | | | 466 | |
| Titan Machinery * | | | 8 | | | | 285 | |
| Tractor Supply | | | 27 | | | | 2,657 | |
| Travelzoo * | | | 6 | | | | 156 | |
| Ulta Salon Cosmetics & Fragrance | | | 22 | | | | 1,940 | |
| United Natural Foods * | | | 19 | | | | 937 | |
| Urban Outfitters * | | | 64 | | | | 1,853 | |
| ValueClick * | | | 28 | | | | 593 | |
| VCA Antech * | | | 32 | | | | 757 | |
| Viacom, Cl B | | | 90 | | | | 4,175 | |
| WebMD Health, Cl A * | | | 22 | | | | 500 | |
| Whole Foods Market | | | 67 | | | | 5,566 | |
| Wynn Resorts | | | 48 | | | | 6,403 | |
| Zumiez * | | | 12 | | | | 440 | |
| | | | | | | | 269,048 | |
| Health Care — 11.2% | | | | | | | | |
| ABIOMED * | | | 15 | | | | 365 | |
| Acorda Therapeutics * | | | 15 | | | | 379 | |
| Akorn * | | | 35 | | | | 425 | |
| Alexion Pharmaceuticals * | | | 70 | | | | 6,322 | |
| Align Technology * | | | 30 | | | | 951 | |
| Amgen | | | 338 | | | | 24,035 | |
| Amylin Pharmaceuticals * | | | 55 | | | | 1,425 | |
| Ariad Pharmaceuticals * | | | 51 | | | | 831 | |
| Auxilium Pharmaceuticals * | | | 17 | | | | 305 | |
| Biogen Idec * | | | 92 | | | | 12,329 | |
| BioMarin Pharmaceutical * | | | 42 | | | | 1,457 | |
| Bio-Reference Labs * | | | 11 | | | | 235 | |
| Bruker * | | | 62 | | | | 932 | |
| Cadence Pharmaceuticals * | | | 31 | | | | 115 | |
| Catalyst Health Solutions * | | | 19 | | | | 1,641 | |
| Celgene * | | | 180 | | | | 13,126 | |
| Cepheid * | | | 23 | | | | 883 | |
| Cubist Pharmaceuticals * | | | 22 | | | | 930 | |
| Cyberonics * | | | 11 | | | | 421 | |
| Dendreon * | | | 56 | | | | 652 | |
| DENTSPLY International | | | 53 | | | | 2,176 | |
The accompanying notes are an integral part of the financial statements.
| Schedule of Investments | April 30, 2012 (Unaudited) |
| | | Shares | | | Value | |
| COMMON STOCK — continued | | | | | | | | |
| | | | | | | | | |
| Health Care — continued | | | | | | | | |
| DexCom * | | | 26 | | | $ | 255 | |
| Endo Pharmaceuticals Holdings * | | | 45 | | | | 1,581 | |
| Endologix * | | | 22 | | | | 330 | |
| Exelixis * | | | 48 | | | | 230 | |
| Express Scripts Holding * | | | 186 | | | | 10,377 | |
| Gen-Probe * | | | 18 | | | | 1,468 | |
| Gilead Sciences * | | | 300 | | | | 15,603 | |
| Grifols ADR * | | | 71 | | | | 672 | |
| Halozyme Therapeutics * | | | 40 | | | | 324 | |
| Healthcare Services Group | | | 24 | | | | 509 | |
| Henry Schein * | | | 35 | | | | 2,686 | |
| HMS Holdings * | | | 35 | | | | 842 | |
| Hologic * | | | 98 | | | | 1,874 | |
| Human Genome Sciences * | | | 69 | | | | 1,015 | |
| Idenix Pharmaceuticals * | | | 41 | | | | 360 | |
| IDEXX Laboratories * | | | 22 | | | | 1,934 | |
| Illumina * | | | 49 | | | | 2,182 | |
| Immunogen * | | | 28 | | | | 357 | |
| Impax Laboratories * | | | 24 | | | | 591 | |
| Incyte * | | | 47 | | | | 1,066 | |
| Insulet * | | | 18 | | | | 321 | |
| Integra LifeSciences Holdings * | | | 12 | | | | 447 | |
| Intermune * | | | 21 | | | | 219 | |
| Intuitive Surgical * | | | 15 | | | | 8,673 | |
| Isis Pharmaceuticals * | | | 37 | | | | 296 | |
| Life Technologies * | | | 69 | | | | 3,199 | |
| LifePoint Hospitals * | | | 21 | | | | 819 | |
| Lincare Holdings | | | 38 | | | | 927 | |
| Magellan Health Services * | | | 13 | | | | 576 | |
| MAKO Surgical * | | | 16 | | | | 661 | |
| Masimo * | | | 23 | | | | 509 | |
| Medicines * | | | 21 | | | | 464 | |
| Medivation * | | | 13 | | | | 1,051 | |
| Meridian Bioscience | | | 16 | | | | 329 | |
| Merit Medical Systems * | | | 16 | | | | 212 | |
| Momenta Pharmaceuticals * | | | 20 | | | | 318 | |
| Mylan * | | | 161 | | | | 3,495 | |
| Myriad Genetics * | | | 33 | | | | 858 | |
| Nektar Therapeutics * | | | 44 | | | | 335 | |
| NuVasive * | | | 14 | | | | 232 | |
| NxStage Medical * | | | 21 | | | | 357 | |
| Onyx Pharmaceuticals * | | | 23 | | | | 1,047 | |
The accompanying notes are an integral part of the financial statements.
| Schedule of Investments | April 30, 2012 (Unaudited) |
| | | Shares | | | Value | |
| COMMON STOCK — continued | | | | | | | | |
| | | | | | | | | |
| Health Care — continued | | | | | | | | |
| Optimer Pharmaceuticals * | | | 18 | | | $ | 266 | |
| PAREXEL International * | | | 23 | | | | 620 | |
| Patterson | | | 46 | | | | 1,568 | |
| PDL BioPharma | | | 52 | | | | 327 | |
| Perrigo | | | 36 | | | | 3,776 | |
| PSS World Medical * | | | 20 | | | | 479 | |
| Questcor Pharmaceuticals * | | | 24 | | | | 1,078 | |
| Quidel * | | | 13 | | | | 215 | |
| Regeneron Pharmaceuticals * | | | 33 | | | | 4,464 | |
| Rigel Pharmaceuticals * | | | 26 | | | | 201 | |
| Salix Pharmaceuticals * | | | 23 | | | | 1,136 | |
| Seattle Genetics * | | | 44 | | | | 870 | |
| Sequenom * | | | 38 | | | | 194 | |
| Sirona Dental Systems * | | | 22 | | | | 1,111 | |
| Spectrum Pharmaceuticals * | | | 18 | | | | 191 | |
| Targacept * | | | 13 | | | | 62 | |
| Theravance * | | | 31 | | | | 671 | |
| Thoratec * | | | 23 | | | | 801 | |
| United Therapeutics * | | | 21 | | | | 919 | |
| Vertex Pharmaceuticals * | | | 79 | | | | 3,040 | |
| ViroPharma * | | | 31 | | | | 674 | |
| Vivus * | | | 34 | | | | 824 | |
| Volcano * | | | 20 | | | | 543 | |
| Wright Medical Group * | | | 15 | | | | 279 | |
| | | | | | | | 163,845 | |
| Industrials — 5.6% | | | | | | | | |
| Acacia Research * | | | 15 | | | | 615 | |
| Aegion, Cl A * | | | 15 | | | | 274 | |
| Aerovironment * | | | 8 | | | | 195 | |
| Arkansas Best | | | 10 | | | | 154 | |
| Atlas Air Worldwide Holdings * | | | 10 | | | | 460 | |
| Automatic Data Processing | | | 185 | | | | 10,290 | |
| BE Aerospace * | | | 38 | | | | 1,787 | |
| Cardtronics * | | | 17 | | | | 448 | |
| Ceradyne | | | 11 | | | | 278 | |
| CH Robinson Worldwide | | | 63 | | | | 3,764 | |
| Cintas | | | 50 | | | | 1,959 | |
| Cognex | | | 16 | | | | 644 | |
| Coinstar * | | | 12 | | | | 753 | |
| Euronet Worldwide * | | | 21 | | | | 454 | |
| Expeditors International of Washington | | | 80 | | | | 3,200 | |
| Fastenal | | | 112 | | | | 5,244 | |
The accompanying notes are an integral part of the financial statements.
| Schedule of Investments | April 30, 2012 (Unaudited) |
| | | Shares | | | Value | |
| COMMON STOCK — continued | | | | | | | | |
| | | | | | | | | |
| Industrials — continued | | | | | | | | |
| FEI * | | | 15 | | | $ | 753 | |
| Fiserv * | | | 54 | | | | 3,796 | |
| FLIR Systems | | | 62 | | | | 1,392 | |
| Foster Wheeler * | | | 45 | | | | 1,035 | |
| Heartland Express | | | 36 | | | | 498 | |
| Hub Group, Cl A * | | | 14 | | | | 490 | |
| II-VI * | | | 24 | | | | 490 | |
| IPG Photonics * | | | 18 | | | | 871 | |
| Itron * | | | 16 | | | | 653 | |
| Jack Henry & Associates | | | 33 | | | | 1,121 | |
| JB Hunt Transport Services | | | 47 | | | | 2,601 | |
| Kforce * | | | 13 | | | | 188 | |
| Landstar System | | | 18 | | | | 964 | |
| Lincoln Electric Holdings | | | 32 | | | | 1,568 | |
| Mantech International, Cl A | | | 9 | | | | 283 | |
| Mobile Mini * | | | 17 | | | | 321 | |
| Molex | | | 37 | | | | 1,021 | |
| National Instruments | | | 45 | | | | 1,224 | |
| Newport * | | | 14 | | | | 239 | |
| Nordson | | | 26 | | | | 1,402 | |
| Old Dominion Freight Line * | | | 22 | | | | 978 | |
| PACCAR | | | 142 | | | | 6,100 | |
| Paychex | | | 138 | | | | 4,275 | |
| Plexus * | | | 15 | | | | 486 | |
| Power-One * | | | 47 | | | | 201 | |
| Resources Connection | | | 17 | | | | 221 | |
| Rofin-Sinar Technologies * | | | 11 | | | | 277 | |
| RR Donnelley & Sons | | | 71 | | | | 888 | |
| Sanmina-SCI * | | | 31 | | | | 276 | |
| Schnitzer Steel Industries, Cl A | | | 9 | | | | 359 | |
| Silgan Holdings | | | 27 | | | | 1,185 | |
| Stericycle * | | | 33 | | | | 2,858 | |
| Swisher Hygiene * | | | 65 | | | | 146 | |
| Sykes Enterprises * | | | 19 | | | | 301 | |
| TeleTech Holdings * | | | 22 | | | | 333 | |
| Tetra Tech * | | | 24 | | | | 641 | |
| Trimas * | | | 13 | | | | 286 | |
| Trimble Navigation * | | | 46 | | | | 2,490 | |
| TTM Technologies * | | | 31 | | | | 320 | |
| United Stationers | | | 18 | | | | 510 | |
| Universal Display * | | | 16 | | | | 720 | |
| Veeco Instruments * | | | 17 | | | | 513 | |
| Verisk Analytics, Cl A * | | | 51 | | | | 2,496 | |
The accompanying notes are an integral part of the financial statements.
| Schedule of Investments | April 30, 2012 (Unaudited) |
| | | Shares | | | Value | |
| COMMON STOCK — continued | | | | | | | | |
| | | | | | | | | |
| Industrials — continued | | | | | | | | |
| Werner Enterprises | | | 28 | | | $ | 661 | |
| Woodward | | | 25 | | | | 1,040 | |
| Zebra Technologies, Cl A * | | | 22 | | | | 853 | |
| | | | | | | | 80,843 | |
| Oil & Gas — 0.6% | | | | | | | | |
| Approach Resources * | | | 9 | | | | 323 | |
| ATP Oil & Gas * | | | 20 | | | | 151 | |
| Carrizo Oil & Gas * | | | 15 | | | | 421 | |
| Chart Industries * | | | 11 | | | | 841 | |
| Crosstex Energy | | | 18 | | | | 268 | |
| First Solar * | | | 33 | | | | 607 | |
| GeoResources * | | | 10 | | | | 377 | |
| GT Advanced Technologies * | | | 47 | | | | 306 | |
| Gulfport Energy * | | | 17 | | | | 446 | |
| Hercules Offshore * | | | 53 | | | | 269 | |
| Lufkin Industries | | | 12 | | | | 922 | |
| Patterson-UTI Energy | | | 60 | | | | 970 | |
| Petroleum Development * | | | 9 | | | | 310 | |
| Rex Energy * | | | 17 | | | | 179 | |
| Rosetta Resources * | | | 20 | | | | 1,005 | |
| SunPower, Cl A * | | | 37 | | | | 208 | |
| Tesco * | | | 15 | | | | 245 | |
| TransGlobe Energy * | | | 28 | | | | 385 | |
| | | | | | | | 8,233 | |
| Technology — 53.6% | | | | | | | | |
| ACI Worldwide * | | | 13 | | | | 518 | |
| Acme Packet * | | | 24 | | | | 674 | |
| Adobe Systems * | | | 188 | | | | 6,309 | |
| ADTRAN | | | 25 | | | | 763 | |
| Advent Software * | | | 20 | | | | 540 | |
| Akamai Technologies * | | | 73 | | | | 2,380 | |
| Allscripts Healthcare Solutions * | | | 73 | | | | 809 | |
| Altera | | | 124 | | | | 4,411 | |
| Amkor Technology * | | | 82 | | | | 424 | |
| ANSYS * | | | 34 | | | | 2,280 | |
| Apple * | | | 354 | | | | 206,821 | |
| Applied Materials | | | 499 | | | | 5,983 | |
| Ariba * | | | 35 | | | | 1,337 | |
| Arris Group * | | | 46 | | | | 595 | |
| Aruba Networks * | | | 39 | | | | 824 | |
| Aspen Technology * | | | 36 | | | | 712 | |
| athenahealth * | | | 12 | | | | 869 | |
The accompanying notes are an integral part of the financial statements.
| Schedule of Investments | April 30, 2012 (Unaudited) |
| | | Shares | | | Value | |
| COMMON STOCK — continued | | | | | | | | |
| | | | | | | | | |
| Technology — continued | | | | | | | | |
| Atmel * | | | 177 | | | $ | 1,570 | |
| Autodesk * | | | 88 | | | | 3,465 | |
| BMC Software * | | | 68 | | | | 2,806 | |
| Brightpoint * | | | 26 | | | | 159 | |
| Broadcom, Cl A | | | 180 | | | | 6,588 | |
| Brocade Communications Systems * | | | 176 | | | | 975 | |
| Brooks Automation | | | 24 | | | | 282 | |
| CA | | | 195 | | | | 5,152 | |
| Cadence Design Systems * | | | 101 | | | | 1,179 | |
| Cavium * | | | 19 | | | | 556 | |
| Cerner * | | | 65 | | | | 5,271 | |
| Ceva * | | | 9 | | | | 199 | |
| Ciena * | | | 35 | | | | 519 | |
| Cirrus Logic * | | | 25 | | | | 684 | |
| Cisco Systems | | | 2,073 | | | | 41,771 | |
| Citrix Systems * | | | 72 | | | | 6,164 | |
| Clearwire, Cl A * | | | 94 | | | | 138 | |
| Cogent Communications Group * | | | 18 | | | | 337 | |
| Cognizant Technology Solutions, Cl A * | | | 115 | | | | 8,432 | |
| CommVault Systems * | | | 17 | | | | 885 | |
| Compuware * | | | 84 | | | | 732 | |
| Comtech Telecommunications | | | 12 | | | | 371 | |
| Comverse Technology * | | | 79 | | | | 510 | |
| Concur Technologies * | | | 21 | | | | 1,188 | |
| Cree * | | | 39 | | | | 1,205 | |
| CSG Systems International * | | | 13 | | | | 187 | |
| Cymer * | | | 12 | | | | 622 | |
| Cypress Semiconductor | | | 72 | | | | 1,116 | |
| DealerTrack Holdings * | | | 16 | | | | 477 | |
| Dell * | | | 702 | | | | 11,492 | |
| Digital River * | | | 16 | | | | 301 | |
| Diodes * | | | 16 | | | | 357 | |
| EarthLink | | | 41 | | | | 333 | |
| Ebix | | | 14 | | | | 286 | |
| EchoStar, Cl A * | | | 15 | | | | 436 | |
| Electronics for Imaging * | | | 18 | | | | 321 | |
| Entegris * | | | 52 | | | | 460 | |
| Entropic Communications * | | | 33 | | | | 140 | |
| Equinix * | | | 18 | | | | 2,956 | |
| EZchip Semiconductor * | | | 10 | | | | 402 | |
| F5 Networks * | | | 31 | | | | 4,152 | |
| Finisar * | | | 35 | | | | 578 | |
The accompanying notes are an integral part of the financial statements.
| Schedule of Investments | April 30, 2012 (Unaudited) |
| | | Shares | | | Value | |
| COMMON STOCK — continued | | | | | | | | |
| | | | | | | | | |
| Technology — continued | | | | | | | | |
| Fortinet * | | | 59 | | | $ | 1,541 | |
| Google, Cl A * | | | 99 | | | | 59,918 | |
| Harmonic * | | | 43 | | | | 203 | |
| Hittite Microwave * | | | 12 | | | | 642 | |
| IAC | | | 31 | | | | 1,493 | |
| iGATE * | | | 22 | | | | 428 | |
| Infinera * | | | 41 | | | | 294 | |
| Informatica * | | | 41 | | | | 1,887 | |
| Insight Enterprises * | | | 17 | | | | 345 | |
| Integrated Device Technology * | | | 57 | | | | 386 | |
| Intel | | | 1,963 | | | | 55,749 | |
| InterDigital | | | 16 | | | | 443 | |
| Intersil, Cl A | | | 47 | | | | 483 | |
| Intuit | | | 117 | | | | 6,782 | |
| Ixia * | | | 27 | | | | 340 | |
| j2 Global | | | 18 | | | | 465 | |
| JDA Software Group * | | | 16 | | | | 462 | |
| JDS Uniphase * | | | 87 | | | | 1,057 | |
| KLA-Tencor | | | 64 | | | | 3,338 | |
| Kulicke & Soffa Industries * | | | 28 | | | | 367 | |
| Lam Research * | | | 48 | | | | 1,999 | |
| Lattice Semiconductor * | | | 45 | | | | 246 | |
| Linear Technology | | | 86 | | | | 2,813 | |
| LogMein * | | | 9 | | | | 324 | |
| Maxim Integrated Products | | | 113 | | | | 3,342 | |
| MedAssets * | | | 23 | | | | 290 | |
| Mentor Graphics * | | | 44 | | | | 636 | |
| Merge Healthcare * | | | 29 | | | | 125 | |
| Micrel | | | 24 | | | | 261 | |
| Microchip Technology | | | 72 | | | | 2,544 | |
| Micron Technology * | | | 386 | | | | 2,544 | |
| MICROS Systems * | | | 31 | | | | 1,762 | |
| Microsemi * | | | 32 | | | | 689 | |
| Microsoft | | | 3,244 | | | | 103,873 | |
| MKS Instruments | | | 20 | | | | 553 | |
| MModal * | | | 20 | | | | 255 | |
| Monotype Imaging Holdings * | | | 14 | | | | 199 | |
| NetApp * | | | 144 | | | | 5,592 | |
| NETGEAR * | | | 13 | | | | 500 | |
| Netscout Systems * | | | 16 | | | | 331 | |
| NIC | | | 25 | | | | 280 | |
| Novellus Systems * | | | 28 | | | | 1,309 | |
The accompanying notes are an integral part of the financial statements.
| Schedule of Investments | April 30, 2012 (Unaudited) |
| | | Shares | | | Value | |
| COMMON STOCK — continued | | | | | | | | |
| | | | | | | | | |
| Technology — continued | | | | | | | | |
| Nuance Communications * | | | 118 | | | $ | 2,884 | |
| NVIDIA * | | | 226 | | | | 2,938 | |
| OmniVision Technologies * | | | 21 | | | | 387 | |
| ON Semiconductor * | | | 170 | | | | 1,404 | |
| Oracle | | | 1,923 | | | | 56,517 | |
| Parametric Technology * | | | 44 | | | | 949 | |
| Pegasystems | | | 13 | | | | 483 | |
| PMC - Sierra * | | | 89 | | | | 629 | |
| Polycom * | | | 68 | | | | 902 | |
| Power Integrations | | | 11 | | | | 417 | |
| Progress Software * | | | 27 | | | | 625 | |
| QLogic * | | | 41 | | | | 707 | |
| QUALCOMM | | | 636 | | | | 40,602 | |
| Quality Systems | | | 21 | | | | 785 | |
| Quest Software * | | | 34 | | | | 791 | |
| Rambus * | | | 42 | | | | 214 | |
| RF Micro Devices * | | | 105 | | | | 455 | |
| Riverbed Technology * | | | 58 | | | | 1,144 | |
| Rovi * | | | 43 | | | | 1,230 | |
| SanDisk * | | | 91 | | | | 3,368 | |
| Sapient | | | 52 | | | | 623 | |
| Semtech * | | | 24 | | | | 654 | |
| Silicon Image * | | | 30 | | | | 180 | |
| Silicon Laboratories * | | | 18 | | | | 639 | |
| SINA * | | | 25 | | | | 1,463 | |
| Skyworks Solutions * | | | 69 | | | | 1,873 | |
| Sonus Networks * | | | 106 | | | | 300 | |
| Sourcefire * | | | 11 | | | | 561 | |
| STEC * | | | 18 | | | | 149 | |
| Stratasys * | | | 8 | | | | 410 | |
| Super Micro Computer * | | | 14 | | | | 247 | |
| SXC Health Solutions * | | | 24 | | | | 2,174 | |
| Symantec * | | | 289 | | | | 4,774 | |
| Synaptics * | | | 14 | | | | 430 | |
| Synchronoss Technologies * | | | 15 | | | | 469 | |
| Synopsys * | | | 57 | | | | 1,711 | |
| Tech Data * | | | 19 | | | | 1,022 | |
| Tellabs | | | 137 | | | | 516 | |
| Tessera Technologies | | | 20 | | | | 313 | |
| Texas Instruments | | | 250 | | | | 7,985 | |
| TIBCO Software * | | | 64 | | | | 2,106 | |
| TriQuint Semiconductor * | | | 62 | | | | 303 | |
The accompanying notes are an integral part of the financial statements.
| Schedule of Investments | April 30, 2012 (Unaudited) |
| | | Shares/Face Amount | | | Value | |
| COMMON STOCK — continued | | | | | | | | |
| | | | | | | | | |
| Technology — continued | | | | | | | | |
| Ultimate Software Group * | | | 10 | | | $ | 772 | |
| Ultratech * | | | 10 | | | | 319 | |
| United Online | | | 34 | | | | 161 | |
| VeriSign | | | 67 | | | | 2,754 | |
| ViaSat * | | | 16 | | | | 773 | |
| Volterra Semiconductor * | | | 9 | | | | 296 | |
| Websense * | | | 15 | | | | 311 | |
| Xilinx | | | 101 | | | | 3,674 | |
| Yahoo! * | | | 487 | | | | 7,568 | |
| | | | | | | | 782,054 | |
| Telecommunications — 0.8% | | | | | | | | |
| Frontier Communications | | | 380 | | | | 1,535 | |
| Leap Wireless International * | | | 30 | | | | 168 | |
| NII Holdings * | | | 64 | | | | 896 | |
| SBA Communications, Cl A * | | | 44 | | | | 2,364 | |
| tw telecom inc, Cl A * | | | 58 | | | | 1,263 | |
| Virgin Media | | | 124 | | | | 3,045 | |
| Windstream | | | 191 | | | | 2,147 | |
| | | | | | | | 11,418 | |
TOTAL UNITED STATES | | | | | | | 1,357,310 | |
| TOTAL COMMON STOCK | | | | | | | | |
| (Cost $1,260,423) | | | | | | | 1,457,016 | |
| | | | | | | | | |
| PREFERRED STOCK — 0.0% | | | | | | | | |
| | | | | | | | | |
| UNITED STATES— 0.0% | | | | | | | | |
| Consumer Goods — 0.0% | | | | | | | | |
| Orchard Supply Hardware Stores * | | | | | | | | |
| (Cost $6)* | | | 3 | | | | 6 | |
| | | | | | | | | |
| TIME DEPOSIT — 0.1% | | | | | | | | |
| | | | | | | | | |
| Brown Brothers Harriman, 0.030% | | | | | | | | |
| (Cost $1,875) | | $ | 1,875 | | | | 1,875 | |
| TOTAL INVESTMENTS — 100.0% | | | | | | | | |
| (Cost $1,262,304) | | | | | | $ | 1,458,897 | |
| | | | | | | | | |
| Percentages are based on Net Assets of $1,458,739. | | | | | | | | |
|
| * | Non-income producing security. |
| ADR — American Depositary Receipt |
| Cl — Class |
| |
The accompanying notes are an integral part of the financial statements.
| Schedule of Investments | April 30, 2012 (Unaudited) |
| The following is a summary of the inputs used as of April 30, 2012, in valuing the Fund's investments carried at value: |
| |
| Investments in Securities | | | Level 1 | | | | Level 2 | | | | Level 3 | | | | Total | |
| Common Stock | | $ | 1,457,016 | | | $ | — | | | $ | — | | | $ | 1,457,016 | |
| Preferred Stock | | | 6 | | | | — | | | | — | | | | 6 | |
| Time Deposit | | | — | | | | 1,875 | | | | — | | | | 1,875 | |
| Total Investments in Securities | | $ | 1,457,022 | | | $ | 1,875 | | | $ | — | | | $ | 1,458,897 | |
For the period ended April 30, 2012, there have been no transfers between Level 1 and Level 2 investments.
For the period ended April 30, 2012, there were no Level 3 investments.
The accompanying notes are an integral part of the financial statements.
| Schedule of Investments | April 30, 2012 (Unaudited) |
| Global X NASDAQ 400 Midcap ETF |
| Sector Weightings†: | |
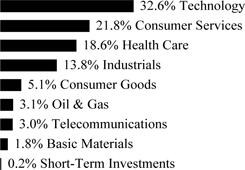 | |
| † Percentages based on total investments. | |
| | |
| | | Shares | | | Value | |
| COMMON STOCK — 99.8% | | | | | | | | |
| ARGENTINA—0.5% | | | | | | | | |
| Consumer Services — 0.5% | | | | | | | | |
| MercadoLibre | | | 72 | | | $ | 6,965 | |
| BERMUDA—0.8% | | | | | | | | |
| Consumer Services — 0.1% | | | | | | | | |
| Central European Media Enterprises, Cl A * | | | 93 | | | | 735 | |
| Oil & Gas — 0.7% | | | | | | | | |
| Energy XXI Bermuda | | | 127 | | | | 4,786 | |
| Golar LNG | | | 133 | | | | 4,918 | |
| | | | | | | | 9,704 | |
TOTAL BERMUDA | | | | | | | 10,439 | |
| BRITISH VIRGIN ISLANDS— 0.2% | | | | | | | | |
| Industrials — 0.2% | | | | | | | | |
| UTi Worldwide | | | 169 | | | | 2,817 | |
| CANADA—2.2% | | | | | | | | |
| Basic Materials — 0.8% | | | | | | | | |
| Methanex | | | 152 | | | | 5,344 | |
| Pan American Silver | | | 180 | | | | 3,512 | |
| Silver Standard Resources * | | | 131 | | | | 1,889 | |
| | | | | | | | 10,745 | |
| Consumer Goods — 0.9% | | | | | | | | |
| Lululemon Athletica * | | | 176 | | | | 13,049 | |
| Industrials — 0.1% | | | | | | | | |
| Westport Innovations * | | | 74 | | | | 2,316 | |
| Technology — 0.4% | | | | | | | | |
| Open Text * | | | 93 | | | | 5,207 | |
TOTAL CANADA | | | | | | | 31,317 | |
The accompanying notes are an integral part of the financial statements.
| Schedule of Investments | April 30, 2012 (Unaudited) |
| Global X NASDAQ 400 Midcap ETF |
| | | Shares | | | Value | |
| COMMON STOCK — continued | | | | | | | | |
| CHINA—1.5% | | | | | | | | |
| Consumer Goods — 0.1% | | | | | | | | |
| Perfect World ADR | | | 70 | | | $ | 855 | |
| Consumer Services — 0.4% | | | | | | | | |
| Focus Media Holding ADR | | | 206 | | | | 4,921 | |
| Home Inns & Hotels Management ADR * | | | 49 | | | | 1,164 | |
| | | | | | | | 6,085 | |
| Industrials — 0.1% | | | | | | | | |
| Hollysys Automation Technologies * | | | 93 | | | | 923 | |
| Technology — 0.9% | | | | | | | | |
| AsiaInfo Holdings * | | | 117 | | | | 1,474 | |
| NetEase ADR * | | | 124 | | | | 7,480 | |
| Sohu.com * | | | 63 | | | | 3,249 | |
| Spreadtrum Communications ADR | | | 66 | | | | 911 | |
| | | | | | | | 13,114 | |
TOTAL CHINA | | | | | | | 20,977 | |
| GREECE—0.2% | | | | | | | | |
| Industrials — 0.2% | | | | | | | | |
| DryShips * | | | 695 | | | | 2,196 | |
| HONG KONG— 0.3% | | | | | | | | |
| Consumer Services — 0.3% | | | | | | | | |
| Melco Crown Entertainment ADR * | | | 295 | | | | 4,579 | |
| IRELAND—1.6% | | | | | | | | |
| Consumer Services — 0.5% | | | | | | | | |
| Ryanair Holdings ADR * | | | 195 | | | | 6,566 | |
| Health Care — 1.1% | | | | | | | | |
| Alkermes * | | | 212 | | | | 3,668 | |
| Amarin ADR * | | | 177 | | | | 2,161 | |
| ICON ADR * | | | 96 | | | | 2,129 | |
| Shire ADR | | | 83 | | | | 8,097 | |
| | | | | | | | 16,055 | |
TOTAL IRELAND | | | | | | | 22,621 | |
| ISRAEL—0.5% | | | | | | | | |
| Technology — 0.5% | | | | | | | | |
| Mellanox Technologies * | | | 64 | | | | 3,750 | |
| NICE Systems ADR * | | | 64 | | | | 2,459 | |
| RADWARE * | | | 34 | | | | 1,308 | |
TOTAL ISRAEL | | | | | | | 7,517 | |
The accompanying notes are an integral part of the financial statements.
| Schedule of Investments | April 30, 2012 (Unaudited) |
| Global X NASDAQ 400 Midcap ETF |
| | | Shares | | | Value | |
| COMMON STOCK — continued | | | | | | | | |
| NETHERLANDS—1.3% | | | | | | | | |
| Health Care — 0.4% | | | | | | | | |
| QIAGEN * | | | 390 | | | $ | 6,525 | |
| Industrials — 0.2% | | | | | | | | |
| VistaPrint * | | | 68 | | | | 2,536 | |
| Technology — 0.7% | | | | | | | | |
| ASML Holding, Cl G | | | 191 | | | | 9,739 | |
TOTAL NETHERLANDS | | | | | | | 18,800 | |
| RUSSIA—0.2% | | | | | | | | |
| Consumer Services — 0.2% | | | | | | | | |
| CTC Media | | | 258 | | | | 2,794 | |
| SWEDEN—0.3% | | | | | | | | |
| Technology — 0.3% | | | | | | | | |
| Ericsson ADR | | | 367 | | | | 3,668 | |
| SWITZERLAND—0.2% | | | | | | | | |
| Technology — 0.2% | | | | | | | | |
| Logitech International * | | | 310 | | | | 3,147 | |
| TAIWAN—0.4% | | | | | | | | |
| Technology — 0.4% | | | | | | | | |
| Silicon Motion Technology ADR * | | | 229 | | | | 3,897 | |
| Siliconware Precision Industries ADR | | | 166 | | | | 968 | |
TOTAL TAIWAN | | | | | | | 4,865 | |
| UNITED KINGDOM— 0.4% | | | | | | | | |
| Technology — 0.4% | | | | | | | | |
| ARM Holdings ADR | | | 229 | | | | 5,801 | |
| UNITED STATES— 89.2% | | | | | | | | |
| Basic Materials — 1.0% | | | | | | | | |
| A Schulman | | | 53 | | | | 1,304 | |
| Century Aluminum * | | | 159 | | | | 1,463 | |
| Globe Specialty Metals | | | 124 | | | | 1,654 | |
| Royal Gold | | | 88 | | | | 5,452 | |
| Steel Dynamics | | | 358 | | | | 4,572 | |
| | | | | | | | 14,445 | |
| Consumer Goods — 4.1% | | | | | | | | |
| Crocs * | | | 146 | | | | 2,949 | |
| Deckers Outdoor * | | | 64 | | | | 3,264 | |
| Diamond Foods | | | 36 | | | | 752 | |
| Gentex | | | 233 | | | | 5,119 | |
| Hain Celestial Group * | | | 72 | | | | 3,406 | |
| Hasbro | | | 229 | | | | 8,413 | |
The accompanying notes are an integral part of the financial statements.
| Schedule of Investments | April 30, 2012 (Unaudited) |
| Global X NASDAQ 400 Midcap ETF |
| | | Shares | | | Value | |
| COMMON STOCK — continued | | | | | | | | |
| Consumer Goods — continued | | | | | | | | |
| Herman Miller | | | 96 | | | $ | 1,875 | |
| Iconix Brand Group * | | | 120 | | | | 1,841 | |
| Interface, Cl A | | | 95 | | | | 1,345 | |
| iRobot * | | | 43 | | | | 1,015 | |
| LKQ * | | | 239 | | | | 7,994 | |
| Pool | | | 79 | | | | 2,916 | |
| Sanderson Farms | | | 36 | | | | 1,858 | |
| Select Comfort * | | | 92 | | | | 2,657 | |
| Snyders-Lance | | | 111 | | | | 2,873 | |
| Steven Madden * | | | 70 | | | | 3,025 | |
| Take-Two Interactive Software * | | | 142 | | | | 2,002 | |
| TiVo * | | | 198 | | | | 2,136 | |
| True Religion Apparel | | | 44 | | | | 1,195 | |
| | | | | | | | 56,635 | |
| Consumer Services — 19.8% | | | | | | | | |
| Acxiom * | | | 140 | | | | 1,922 | |
| Allegiant Travel, Cl A * | | | 31 | | | | 1,822 | |
| AMC Networks, Cl A * | | | 94 | | | | 3,995 | |
| Ameristar Casinos | | | 53 | | | | 953 | |
| Ancestry.com * | | | 78 | | | | 2,083 | |
| Ascena Retail Group * | | | 262 | | | | 5,366 | |
| Avis Budget Group * | | | 173 | | | | 2,277 | |
| Beacon Roofing Supply * | | | 76 | | | | 2,029 | |
| Bebe Stores | | | 137 | | | | 1,123 | |
| BJ's Restaurants * | | | 46 | | | | 1,987 | |
| Blue Nile * | | | 25 | | | | 757 | |
| Buffalo Wild Wings * | | | 31 | | | | 2,599 | |
| Capella Education * | | | 26 | | | | 850 | |
| Career Education * | | | 126 | | | | 898 | |
| Casey's General Stores | | | 63 | | | | 3,550 | |
| Charter Communications, Cl A * | | | 184 | | | | 11,127 | |
| Cheesecake Factory * | | | 95 | | | | 2,993 | |
| Children's Place Retail Stores * | | | 44 | | | | 2,023 | |
| Clean Energy Fuels * | | | 116 | | | | 2,232 | |
| comScore * | | | 50 | | | | 996 | |
| Constant Contact * | | | 48 | | | | 1,160 | |
| Copart * | | | 240 | | | | 6,338 | |
| Cracker Barrel Old Country Store | | | 38 | | | | 2,186 | |
| Digital Generation * | | | 44 | | | | 408 | |
| Discovery Communications, Cl A * | | | 235 | | | | 12,789 | |
| DISH Network, Cl A | | | 340 | | | | 10,870 | |
| DreamWorks Animation SKG, Cl A * | | | 120 | | | | 2,161 | |
The accompanying notes are an integral part of the financial statements.
| Schedule of Investments | April 30, 2012 (Unaudited) |
| Global X NASDAQ 400 Midcap ETF |
| | | Shares | | | Value | |
| COMMON STOCK — continued | | | | | | | | |
| | | | | | | | | |
| Consumer Services — continued | | | | | | | | |
| Education Management * | | | 210 | | | $ | 2,604 | |
| Finish Line, Cl A | | | 90 | | | | 2,003 | |
| Fred's, Cl A | | | 66 | | | | 945 | |
| Grand Canyon Education * | | | 73 | | | | 1,270 | |
| Hibbett Sports * | | | 45 | | | | 2,687 | |
| HSN | | | 97 | | | | 3,754 | |
| Jack in the Box * | | | 80 | | | | 1,818 | |
| JetBlue Airways * | | | 486 | | | | 2,308 | |
| Jos A Bank Clothiers * | | | 45 | | | | 2,140 | |
| Lamar Advertising, Cl A * | | | 126 | | | | 4,009 | |
| Liberty Global, Cl A * | | | 257 | | | | 12,801 | |
| Liberty Media - Liberty Capital, Cl A * | | | 189 | | | | 16,526 | |
| Liquidity Services * | | | 47 | | | | 2,507 | |
| Monro Muffler Brake | | | 50 | | | | 2,063 | |
| National CineMedia | | | 90 | | | | 1,286 | |
| OpenTable * | | | 39 | | | | 1,744 | |
| Panera Bread, Cl A * | | | 49 | | | | 7,738 | |
| Penn National Gaming * | | | 130 | | | | 5,847 | |
| PetSmart | | | 187 | | | | 10,895 | |
| PF Chang's China Bistro | | | 39 | | | | 1,548 | |
| Pricesmart | | | 50 | | | | 4,127 | |
| Rent-A-Center, Cl A | | | 107 | | | | 3,661 | |
| Rue21 * | | | 41 | | | | 1,244 | |
| Scientific Games, Cl A * | | | 150 | | | | 1,524 | |
| Shuffle Master * | | | 90 | | | | 1,590 | |
| Shutterfly * | | | 57 | | | | 1,774 | |
| Sinclair Broadcast Group, Cl A | | | 87 | | | | 894 | |
| SkyWest | | | 88 | | | | 791 | |
| Stewart Enterprises, Cl A | | | 145 | | | | 916 | |
| Strayer Education | | | 20 | | | | 1,974 | |
| Texas Roadhouse, Cl A | | | 120 | | | | 2,070 | |
| Titan Machinery * | | | 35 | | | | 1,247 | |
| Tractor Supply | | | 117 | | | | 11,514 | |
| Travelzoo * | | | 154 | | | | 3,998 | |
| Ulta Salon Cosmetics & Fragrance | | | 100 | | | | 8,818 | |
| United Natural Foods * | | | 79 | | | | 3,894 | |
| Urban Outfitters * | | | 240 | | | | 6,950 | |
| ValueClick * | | | 124 | | | | 2,626 | |
| VCA Antech * | | | 142 | | | | 3,360 | |
| Viacom, Cl B | | | 835 | | | | 38,736 | |
| WebMD Health, Cl A * | | | 98 | | | | 2,230 | |
| Zumiez * | | | 51 | | | | 1,870 | |
| | | | | | | | 279,795 | |
The accompanying notes are an integral part of the financial statements.
| Schedule of Investments | April 30, 2012 (Unaudited) |
| Global X NASDAQ 400 Midcap ETF |
| | | Shares | | | Value | |
| COMMON STOCK — continued |
| | | | | | | | | |
| Health Care — 17.1% | | | | | | | | |
| ABIOMED * | | | 64 | | | $ | 1,557 | |
| Acorda Therapeutics * | | | 66 | | | | 1,666 | |
| Akorn * | | | 156 | | | | 1,892 | |
| Align Technology * | | | 129 | | | | 4,091 | |
| Amylin Pharmaceuticals * | | | 238 | | | | 6,167 | |
| Ariad Pharmaceuticals * | | | 216 | | | | 3,521 | |
| Auxilium Pharmaceuticals * | | | 79 | | | | 1,416 | |
| BioMarin Pharmaceutical * | | | 178 | | | | 6,177 | |
| Bio-Reference Labs * | | | 45 | | | | 959 | |
| Bruker * | | | 272 | | | | 4,088 | |
| Cadence Pharmaceuticals * | | | 131 | | | | 483 | |
| Catalyst Health Solutions * | | | 81 | | | | 6,996 | |
| Cepheid * | | | 100 | | | | 3,841 | |
| Cubist Pharmaceuticals * | | | 100 | | | | 4,228 | |
| Cyberonics * | | | 46 | | | | 1,762 | |
| Dendreon * | | | 243 | | | | 2,831 | |
| DexCom * | | | 109 | | | | 1,067 | |
| Endo Pharmaceuticals Holdings * | | | 192 | | | | 6,747 | |
| Endologix * | | | 93 | | | | 1,393 | |
| Exelixis * | | | 210 | | | | 1,008 | |
| Gen-Probe * | | | 81 | | | | 6,606 | |
| Grifols ADR * | | | 303 | | | | 2,866 | |
| Halozyme Therapeutics * | | | 169 | | | | 1,367 | |
| Healthcare Services Group | | | 109 | | | | 2,313 | |
| HMS Holdings * | | | 157 | | | | 3,778 | |
| Hologic * | | | 427 | | | | 8,164 | |
| Human Genome Sciences * | | | 299 | | | | 4,398 | |
| Idenix Pharmaceuticals * | | | 175 | | | | 1,535 | |
| IDEXX Laboratories * | | | 94 | | | | 8,265 | |
| Illumina * | | | 203 | | | | 9,040 | |
| Immunogen * | | | 125 | | | | 1,594 | |
| Impax Laboratories * | | | 107 | | | | 2,632 | |
| Incyte * | | | 206 | | | | 4,672 | |
| Insulet * | | | 78 | | | | 1,393 | |
| Integra LifeSciences Holdings * | | | 47 | | | | 1,750 | |
| Intermune * | | | 91 | | | | 950 | |
| Isis Pharmaceuticals * | | | 163 | | | | 1,304 | |
| LifePoint Hospitals * | | | 92 | | | | 3,590 | |
| Lincare Holdings | | | 161 | | | | 3,928 | |
| Magellan Health Services * | | | 54 | | | | 2,391 | |
| MAKO Surgical * | | | 68 | | | | 2,809 | |
| Masimo * | | | 99 | | | | 2,191 | |
| Medicines * | | | 87 | | | | 1,922 | |
The accompanying notes are an integral part of the financial statements.
| Schedule of Investments | April 30, 2012 (Unaudited) |
| Global X NASDAQ 400 Midcap ETF |
| | | Shares | | | Value | |
| COMMON STOCK — continued |
| |
| Health Care — continued | | | | | | | | |
| Medivation * | | | 57 | | | $ | 4,610 | |
| Meridian Bioscience | | | 67 | | | | 1,377 | |
| Merit Medical Systems * | | | 68 | | | | 899 | |
| Momenta Pharmaceuticals * | | | 83 | | | | 1,318 | |
| Myriad Genetics * | | | 140 | | | | 3,641 | |
| Nektar Therapeutics * | | | 188 | | | | 1,433 | |
| NuVasive * | | | 61 | | | | 1,011 | |
| NxStage Medical * | | | 90 | | | | 1,530 | |
| Onyx Pharmaceuticals * | | | 104 | | | | 4,733 | |
| Optimer Pharmaceuticals * | | | 77 | | | | 1,140 | |
| PAREXEL International * | | | 96 | | | | 2,586 | |
| Patterson | | | 199 | | | | 6,784 | |
| PDL BioPharma | | | 230 | | | | 1,447 | |
| PSS World Medical * | | | 88 | | | | 2,106 | |
| Questcor Pharmaceuticals * | | | 102 | | | | 4,580 | |
| Quidel * | | | 54 | | | | 892 | |
| Regeneron Pharmaceuticals * | | | 145 | | | | 19,613 | |
| Rigel Pharmaceuticals * | | | 116 | | | | 897 | |
| Salix Pharmaceuticals * | | | 96 | | | | 4,742 | |
| Seattle Genetics * | | | 187 | | | | 3,697 | |
| Sequenom * | | | 161 | | | | 824 | |
| Sirona Dental Systems * | | | 93 | | | | 4,697 | |
| Spectrum Pharmaceuticals * | | | 80 | | | | 850 | |
| Targacept * | | | 55 | | | | 261 | |
| Theravance * | | | 139 | | | | 3,008 | |
| Thoratec * | | | 97 | | | | 3,377 | |
| United Therapeutics * | | | 96 | | | | 4,200 | |
| ViroPharma * | | | 134 | | | | 2,914 | |
| Vivus * | | | 146 | | | | 3,536 | |
| Volcano * | | | 86 | | | | 2,335 | |
| Wright Medical Group * | | | 64 | | | | 1,192 | |
| | | | | | | | 237,578 | |
| Industrials — 13.0% | | | | |
| Acacia Research * | | | 70 | | | | 2,870 | |
| Aegion, Cl A * | | | 64 | | | | 1,168 | |
| Aerovironment * | | | 38 | | | | 924 | |
| Arkansas Best | | | 42 | | | | 644 | |
| Atlas Air Worldwide Holdings * | | | 42 | | | | 1,934 | |
| BE Aerospace * | | | 168 | | | | 7,901 | |
| Cardtronics * | | | 70 | | | | 1,845 | |
| Ceradyne | | | 42 | | | | 1,064 | |
| Cintas | | | 218 | | | | 8,539 | |
The accompanying notes are an integral part of the financial statements.
| Schedule of Investments | April 30, 2012 (Unaudited) |
| Global X NASDAQ 400 Midcap ETF |
| | | Shares | | | Value | |
| COMMON STOCK — continued |
| |
| Industrials — continued | | | | | | | | |
| Cognex | | | 69 | | | $ | 2,777 | |
| Coinstar * | | | 50 | | | | 3,140 | |
| Euronet Worldwide * | | | 86 | | | | 1,860 | |
| FEI * | | | 68 | | | | 3,412 | |
| FLIR Systems | | | 260 | | | | 5,840 | |
| Foster Wheeler * | | | 191 | | | | 4,393 | |
| Heartland Express | | | 155 | | | | 2,144 | |
| Hub Group, Cl A * | | | 61 | | | | 2,135 | |
| II-VI * | | | 102 | | | | 2,082 | |
| IPG Photonics * | | | 78 | | | | 3,775 | |
| Itron * | | | 66 | | | | 2,693 | |
| Jack Henry & Associates | | | 141 | | | | 4,789 | |
| JB Hunt Transport Services | | | 204 | | | | 11,287 | |
| Kforce * | | | 61 | | | | 883 | |
| Landstar System | | | 79 | | | | 4,232 | |
| Lincoln Electric Holdings | | | 140 | | | | 6,861 | |
| Mantech International, Cl A | | | 39 | | | | 1,226 | |
| Mobile Mini * | | | 74 | | | | 1,396 | |
| Molex | | | 160 | | | | 4,414 | |
| National Instruments | | | 197 | | | | 5,358 | |
| Newport * | | | 63 | | | | 1,075 | |
| Nordson | | | 113 | | | | 6,091 | |
| Old Dominion Freight Line * | | | 94 | | | | 4,180 | |
| Plexus * | | | 59 | | | | 1,910 | |
| Power-One * | | | 199 | | | | 852 | |
| Resources Connection | | | 78 | | | | 1,012 | |
| Rofin-Sinar Technologies * | | | 46 | | | | 1,159 | |
| RR Donnelley & Sons | | | 308 | | | | 3,853 | |
| Sanmina-SCI * | | | 131 | | | | 1,166 | |
| Schnitzer Steel Industries, Cl A | | | 40 | | | | 1,595 | |
| Silgan Holdings | | | 115 | | | | 5,045 | |
| Swisher Hygiene * | | | 284 | | | | 639 | |
| Sykes Enterprises * | | | 81 | | | | 1,284 | |
| TeleTech Holdings * | | | 94 | | | | 1,424 | |
| Tetra Tech * | | | 102 | | | | 2,724 | |
| Trimas * | | | 57 | | | | 1,254 | |
| Trimble Navigation * | | | 206 | | | | 11,153 | |
| TTM Technologies * | | | 134 | | | | 1,384 | |
| United Stationers | | | 76 | | | | 2,155 | |
| Universal Display * | | | 74 | | | | 3,328 | |
| Veeco Instruments * | | | 72 | | | | 2,174 | |
| Verisk Analytics, Cl A * | | | 273 | | | | 13,363 | |
| Werner Enterprises | | | 120 | | | | 2,835 | |
The accompanying notes are an integral part of the financial statements.
| Schedule of Investments | April 30, 2012 (Unaudited) |
| Global X NASDAQ 400 Midcap ETF |
| | | Shares | | | Value | |
| COMMON STOCK — continued |
| |
| Industrials — continued | | | | | | | | |
| Woodward | | | 113 | | | $ | 4,700 | |
| Zebra Technologies, Cl A * | | | 93 | | | | 3,607 | |
| | | | | | | | 181,548 | |
| Oil & Gas — 2.4% | | | | | | | | |
| Approach Resources * | | | 38 | | | | 1,364 | |
| ATP Oil & Gas * | | | 86 | | | | 650 | |
| Carrizo Oil & Gas * | | | 64 | | | | 1,795 | |
| Chart Industries * | | | 48 | | | | 3,669 | |
| Crosstex Energy | | | 78 | | | | 1,162 | |
| GeoResources * | | | 41 | | | | 1,546 | |
| GT Advanced Technologies * | | | 207 | | | | 1,348 | |
| Gulfport Energy * | | | 76 | | | | 1,992 | |
| Hercules Offshore * | | | 230 | | | | 1,168 | |
| Lufkin Industries | | | 51 | | | | 3,919 | |
| Patterson-UTI Energy | | | 255 | | | | 4,123 | |
| Petroleum Development * | | | 39 | | | | 1,341 | |
| Rex Energy * | | | 73 | | | | 767 | |
| Rosetta Resources * | | | 88 | | | | 4,424 | |
| SunPower, Cl A * | | | 165 | | | | 926 | |
| Tesco * | | | 62 | | | | 1,013 | |
| TransGlobe Energy * | | | 119 | | | | 1,636 | |
| | | | | | | | 32,843 | |
| Technology — 28.8% | | | | |
| ACI Worldwide * | | | 55 | | | | 2,192 | |
| Acme Packet * | | | 108 | | | | 3,031 | |
| ADTRAN | | | 106 | | | | 3,235 | |
| Advent Software * | | | 88 | | | | 2,375 | |
| Allscripts Healthcare Solutions * | | | 313 | | | | 3,468 | |
| Amkor Technology * | | | 355 | | | | 1,835 | |
| ANSYS * | | | 154 | | | | 10,329 | |
| Ariba * | | | 157 | | | | 5,997 | |
| Arris Group * | | | 198 | | | | 2,560 | |
| Aruba Networks * | | | 166 | | | | 3,506 | |
| Aspen Technology * | | | 155 | | | | 3,066 | |
| athenahealth * | | | 56 | | | | 4,057 | |
| Atmel * | | | 769 | | | | 6,821 | |
| Brightpoint * | | | 112 | | | | 685 | |
| Brocade Communications Systems * | | | 766 | | | | 4,244 | |
| Brooks Automation | | | 107 | | | | 1,258 | |
| Cadence Design Systems * | | | 435 | | | | 5,076 | |
| Cavium * | | | 79 | | | | 2,312 | |
| Ceva * | | | 37 | | | | 817 | |
The accompanying notes are an integral part of the financial statements.
| Schedule of Investments | April 30, 2012 (Unaudited) |
| Global X NASDAQ 400 Midcap ETF |
| | | Shares | | | Value | |
| COMMON STOCK — continued |
| |
| Technology — continued | | | | | | | | |
| Ciena * | | | 152 | | | $ | 2,253 | |
| Cirrus Logic * | | | 110 | | | | 3,012 | |
| Clearwire, Cl A * | | | 406 | | | | 595 | |
| Cogent Communications Group * | | | 77 | | | | 1,442 | |
| CommVault Systems * | | | 75 | | | | 3,905 | |
| Compuware * | | | 359 | | | | 3,131 | |
| Comtech Telecommunications | | | 53 | | | | 1,639 | |
| Comverse Technology * | | | 337 | | | | 2,174 | |
| Concur Technologies * | | | 88 | | | | 4,977 | |
| Cree * | | | 169 | | | | 5,222 | |
| CSG Systems International * | | | 58 | | | | 835 | |
| Cymer * | | | 50 | | | | 2,592 | |
| Cypress Semiconductor | | | 312 | | | | 4,836 | |
| DealerTrack Holdings * | | | 69 | | | | 2,058 | |
| Digital River * | | | 70 | | | | 1,317 | |
| Diodes * | | | 75 | | | | 1,672 | |
| EarthLink | | | 178 | �� | | | 1,445 | |
| Ebix | | | 64 | | | | 1,309 | |
| EchoStar, Cl A * | | | 63 | | | | 1,830 | |
| Electronics for Imaging * | | | 79 | | | | 1,410 | |
| Entegris * | | | 220 | | | | 1,947 | |
| Entropic Communications * | | | 145 | | | | 613 | |
| Equinix * | | | 79 | | | | 12,972 | |
| EZchip Semiconductor * | | | 43 | | | | 1,730 | |
| Finisar * | | | 149 | | | | 2,461 | |
| Fortinet * | | | 257 | | | | 6,713 | |
| Harmonic * | | | 189 | | | | 892 | |
| Hittite Microwave * | | | 51 | | | | 2,730 | |
| IAC | | | 135 | | | | 6,500 | |
| iGATE * | | | 93 | | | | 1,810 | |
| Infinera * | | | 172 | | | | 1,231 | |
| Informatica * | | | 175 | | | | 8,054 | |
| Insight Enterprises * | | | 76 | | | | 1,544 | |
| Integrated Device Technology * | | | 248 | | | | 1,679 | |
| InterDigital | | | 75 | | | | 2,079 | |
| Intersil, Cl A | | | 206 | | | | 2,116 | |
| Ixia * | | | 113 | | | | 1,424 | |
| j2 Global | | | 74 | | | | 1,911 | |
| JDA Software Group * | | | 71 | | | | 2,051 | |
| JDS Uniphase * | | | 379 | | | | 4,605 | |
| Kulicke & Soffa Industries * | | | 120 | | | | 1,572 | |
| Lattice Semiconductor * | | | 195 | | | | 1,065 | |
| LogMein * | | | 40 | | | | 1,440 | |
The accompanying notes are an integral part of the financial statements.
| Schedule of Investments | April 30, 2012 (Unaudited) |
| Global X NASDAQ 400 Midcap ETF |
| | | Shares | | | Value | |
| COMMON STOCK — continued |
| |
| Technology — continued | | | | | | | | |
| MedAssets * | | | 98 | | | $ | 1,236 | |
| Mentor Graphics * | | | 184 | | | | 2,659 | |
| Merge Healthcare * | | | 127 | | | | 546 | |
| Micrel | | | 102 | | | | 1,111 | |
| MICROS Systems * | | | 134 | | | | 7,615 | |
| Microsemi * | | | 142 | | | | 3,056 | |
| MKS Instruments | | | 87 | | | | 2,406 | |
| MModal * | | | 88 | | | | 1,123 | |
| Monotype Imaging Holdings * | | | 58 | | | | 823 | |
| NETGEAR * | | | 62 | | | | 2,387 | |
| Netscout Systems * | | | 73 | | | | 1,510 | |
| NIC | | | 105 | | | | 1,175 | |
| Novellus Systems * | | | 119 | | | | 5,563 | |
| OmniVision Technologies * | | | 92 | | | | 1,695 | |
| ON Semiconductor * | | | 732 | | | | 6,046 | |
| Parametric Technology * | | | 190 | | | | 4,100 | |
| Pegasystems | | | 61 | | | | 2,269 | |
| PMC - Sierra * | | | 389 | | | | 2,750 | |
| Polycom * | | | 290 | | | | 3,848 | |
| Power Integrations | | | 49 | | | | 1,856 | |
| Progress Software * | | | 116 | | | | 2,684 | |
| QLogic * | | | 177 | | | | 3,053 | |
| Quality Systems | | | 95 | | | | 3,553 | |
| Quest Software * | | | 145 | | | | 3,374 | |
| Rambus * | | | 178 | | | | 906 | |
| RF Micro Devices * | | | 448 | | | | 1,940 | |
| Riverbed Technology * | | | 256 | | | | 5,051 | |
| Rovi * | | | 184 | | | | 5,262 | |
| Sapient | | | 228 | | | | 2,729 | |
| Semtech * | | | 105 | | | | 2,862 | |
| Silicon Image * | | | 131 | | | | 786 | |
| Silicon Laboratories * | | | 78 | | | | 2,768 | |
| SINA * | | | 108 | | | | 6,319 | |
| Skyworks Solutions * | | | 302 | | | | 8,196 | |
| Sonus Networks * | | | 454 | | | | 1,285 | |
| Sourcefire * | | | 48 | | | | 2,448 | |
| STEC * | | | 76 | | | | 630 | |
| Stratasys * | | | 35 | | | | 1,793 | |
| Super Micro Computer * | | | 60 | | | | 1,059 | |
| SXC Health Solutions * | | | 103 | | | | 9,330 | |
| Synaptics * | | | 59 | | | | 1,812 | |
| Synchronoss Technologies * | | | 63 | | | | 1,972 | |
| Synopsys * | | | 247 | | | | 7,413 | |
The accompanying notes are an integral part of the financial statements.
| Schedule of Investments | April 30, 2012 (Unaudited) |
| Global X NASDAQ 400 Midcap ETF |
| | | Shares/Face
Amount | | | Value | |
| COMMON STOCK — continued |
| |
| Technology — continued | | | | | | | | |
| Tech Data * | | | 81 | | | $ | 4,357 | |
| Tellabs | | | 592 | | | | 2,232 | |
| Tessera Technologies | | | 84 | | | | 1,314 | |
| Texas Instruments | | | 1,906 | | | | 60,878 | |
| TIBCO Software * | | | 276 | | | | 9,080 | |
| TriQuint Semiconductor * | | | 266 | | | | 1,298 | |
| Ultimate Software Group * | | | 43 | | | | 3,318 | |
| Ultratech * | | | 41 | | | | 1,309 | |
| United Online | | | 144 | | | | 683 | |
| ViaSat * | | | 69 | | | | 3,333 | |
| Volterra Semiconductor * | | | 41 | | | | 1,348 | |
| Websense * | | | 67 | | | | 1,390 | |
| | | | | | | | 405,196 | |
| Telecommunications — 3.0% | | | | | | | | |
| Frontier Communications | | | 1,654 | | | | 6,682 | |
| Leap Wireless International * | | | 129 | | | | 724 | |
| NII Holdings * | | | 285 | | | | 3,988 | |
| SBA Communications, Cl A * | | | 187 | | | | 10,049 | |
| tw telecom inc, Cl A * | | | 250 | | | | 5,445 | |
| Windstream | | | 1,233 | | | | 13,859 | |
| | | | | | | | 40,747 | |
TOTAL UNITED STATES | | | | | | | 1,248,787 | |
| TOTAL COMMON STOCK | | | | | | | | |
| (Cost $1,273,008) | | | | | | | 1,397,290 | |
|
| TIME DEPOSIT — 0.2% | | | | | | | | |
| Brown Brothers Harriman, 0.030% | | | | | | | | |
| (Cost $2,274) | | $ | 2,274 | | | | 2,274 | |
| | | | | | | | | |
| TOTAL INVESTMENTS — 100.0% | | | | | | | | |
| (Cost $1,275,282) | | | | | | $ | 1,399,564 | |
Percentages are based on Net Assets of $1,399,810
* Non-income producing security.
ADR — American Depositary Receipt
Cl — Class
The accompanying notes are an integral part of the financial statements.
| Schedule of Investments | April 30, 2012 (Unaudited) |
| Global X NASDAQ 400 Midcap ETF |
The following is a summary of the inputs used as of April 30, 2012, in valuing the Fund's investments carried at value:
| | | Level 1 | | | Level 2 | | | Level 3 | | | Total | |
| Investments in Securities | | | | | | | | | | | | | | | | |
| Common Stock | | $ | 1,397,290 | | | $ | — | | | $ | — | | | $ | 1,397,290 | |
| Time Deposit | | | — | | | | 2,274 | | | | — | | | | 2,274 | |
| Total Investments in Securities | | $ | 1,397,290 | | | $ | 2,274 | | | $ | — | | | $ | 1,399,564 | |
For the period ended April 30, 2012, there have been no transfers between Level 1 and Level 2 investments.
For the period ended April 30, 2012, there were no Level 3 investments.
The accompanying notes are an integral part of the financial statements.
| Statements of Assets and Liabilities |
| April 30, 2012 (Unaudited) |
| | | Global X
SuperDividend
ETF | | | Global X MLP
ETF | | | Global X Canada
Preferred ETF | | | Global X Social
Media Index ETF | |
| Assets: | | | | | | | | | | | | | | | | |
| Cost of Investments | | $ | 61,862,273 | | | $ | 5,214,399 | | | $ | 12,322,690 | | | $ | 13,860,379 | |
| Cost of Foreign Currency | | | 91,453 | | | | — | | | | 35,559 | | | | 9,851 | |
| Investments at Value | | $ | 60,073,007 | | | $ | 5,374,455 | | | $ | 12,397,714 | | | $ | 14,431,958 | |
| Foreign Currency at Value | | | 91,827 | | | | — | | | | 35,500 | | | | 9,951 | |
| Dividend and Interest Receivable | | | 269,331 | | | | 21,601 | | | | 25,370 | | | | 17,348 | |
| Deferred Tax Asset | | | N/A | | | | 268 | | | | N/A | | | | N/A | |
| Reclaim Receivable | | | 4,929 | | | | — | | | | — | | | | — | |
| Receivable for Investment Securities Sold | | | — | | | | — | | | | 67,998 | | | | 1,825,192 | |
| Total Assets | | | 60,439,094 | | | | 5,396,324 | | | | 12,526,582 | | | | 16,284,449 | |
| | | | | | | | | | | | | | | | | |
| Liabilities: | | | | | | | | | | | | | | | | |
| | | | | | | | | | | | | | | | | |
| Payable for Investment Securities Purchased | | | — | | | | — | | | | — | | | | 1,699,610 | |
| Deferred Tax Liability | | | N/A | | | | 60,037 | | | | N/A | | | | N/A | |
| Payable due to Investment Adviser | | | 27,299 | | | | 716 | | | | 5,910 | | | | 6,752 | |
| | | | | | | | | | | | | | | | | |
| Total Liabilities | | | 27,299 | | | | 60,753 | | | | 5,910 | | | | 1,706,362 | |
| | | | | | | | | | | | | | | | | |
| Net Assets | | $ | 60,411,795 | | | $ | 5,335,571 | | | $ | 12,520,672 | | | $ | 14,578,087 | |
| | | | | | | | | | | | | | | | | |
| Net Assets Consist of: | | | | | | | | | | | | | | | | |
| Paid-in Capital | | $ | 63,356,628 | | | $ | 5,236,000 | | | $ | 12,569,036 | | | $ | 14,227,500 | |
| Undistributed Net Investment Income/(Accumulated Net Investment Loss) | | | 239,082 | | | | (448 | ) | | | 41,826 | | | | 3,307 | |
| Accumulated Net Realized Loss on Investments and Foreign Currency Translations | | | (1,396,471 | ) | | | — | | | | (165,122 | ) | | | (221,389 | ) |
| Net Unrealized Appreciation (Depreciation) on Investments, Net of Deferred Taxes | | | (1,789,266 | ) | | | 100,019 | | | | 75,024 | | | | 571,579 | |
| Net Unrealized Appreciation (Depreciation) on Foreign Currency Translations | | | 1,822 | | | | — | | | | (92 | ) | | | (2,910 | ) |
| | | | | | | | | | | | | | | | | |
| Net Assets | | $ | 60,411,795 | | | $ | 5,335,571 | | | $ | 12,520,672 | | | $ | 14,578,087 | |
| Outstanding Shares of Beneficial Interest | | | | | | | | | | | | | | | | |
| (unlimited authorization — no par value) | | | 2,750,000 | | | | 350,000 | | | | 850,000 | | | | 950,000 | |
| | | | | | | | | | | | | | | | | |
| Net Asset Value, Offering and Redemption Price Per Share | | $ | 21.97 | | | $ | 15.24 | | | $ | 14.73 | | | $ | 15.35 | |
The accompanying notes are an integral part of the financial statements.
| Statements of Assets and Liabilities |
| April 30, 2012 (Unaudited) |
| | | Global X Auto ETF | | | Global X NASDAQ
500 ETF | | | Global X NASDAQ
400 Mid Cap ETF | |
| Assets: | | | | | | | | | | | | |
| Cost of Investments | | $ | 5,127,535 | | | $ | 1,262,304 | | | $ | 1,275,282 | |
| Cost of Foreign Currency | | | 4,398 | | | | — | | | | — | |
| Investments at Value | | $ | 4,928,430 | | | $ | 1,458,897 | | | $ | 1,399,564 | |
| Foreign Currency at Value | | | 4,422 | | | | — | | | | — | |
| Reclaim Receivable | | | 3,129 | | | | 20 | | | | — | |
| Dividend and Interest Receivable | | | 2,923 | | | | 395 | | | | 795 | |
| Total Assets | | | 4,938,904 | | | | 1,459,312 | | | | 1,400,359 | |
| | | | | | | | | | | | | |
| Liabilities: | | | | | | | | | | | | |
| Payable due to Investment Adviser | | | 2,354 | | | | 573 | | | | 549 | |
| Total Liabilities | | | 2,354 | | | | 573 | | | | 549 | |
| | | | | | | | | | | | | |
| Net Assets | | $ | 4,936,550 | | | $ | 1,458,739 | | | $ | 1,399,810 | |
| | | | | | | | | | | | | |
| Net Assets Consist of: | | | | | | | | | | | | |
| Paid-in Capital | | $ | 5,905,000 | | | $ | 1,265,500 | | | $ | 1,128,000 | |
| Undistributed Net Investment Income | | | 22,083 | | | | 1,539 | | | | 938 | |
| Accumulated Net Realized Gain (Loss) on Investments and Foreign Currency Translations | | | (791,529 | ) | | | (4,893 | ) | | | 146,590 | |
| Net Unrealized Appreciation (Depreciation) on Investments | | | (199,105 | ) | | | 196,593 | | | | 124,282 | |
| Net Unrealized Appreciation on Foreign Currency Translations | | | 101 | | | | — | | | | — | |
| | | | | | | | | | | | | |
| Net Assets | | $ | 4,936,550 | | | $ | 1,458,739 | | | $ | 1,399,810 | |
| Outstanding Shares of Beneficial Interest | | | | | | | | | | | | |
| (unlimited authorization — no par value) | | | 350,000 | | | | 50,000 | | | | 50,000 | |
| | | | | | | | | | | | | |
| Net Asset Value, Offering and Redemption Price Per Share | | $ | 14.10 | | | $ | 29.17 | | | $ | 28.00 | |
The accompanying notes are an integral part of the financial statements.
| Statements of Operations |
| For the period ended April 30, 2012 (Unaudited) |
| | | Global X
SuperDividend
ETF | | | Global X
MLP ETF(1) | | | Global X
Canada
Preferred
ETF | | | Global X
Social Media
Index ETF(2) | |
| Investment Income: | | | | | | | | | | | | | | | | |
| | | | | | | | | | | | | | | | | |
| Dividend Income | | $ | 1,591,293 | | | $ | — | | | $ | 286,674 | | | $ | 21,785 | |
| Distributions from Master Limited Partnerships | | | — | | | | 21,601 | | | | — | | | | — | |
| Less Return of Capital Distributions | | | — | | | | (21,601 | ) | | | — | | | | — | |
| Less: Foreign Taxes Withheld | | | (74,031 | ) | | | — | | | | (43,430 | ) | | | (1,305 | ) |
| | | | | | | | | | | | | | | | | |
| Total Investment Income | | | 1,517,262 | | | | — | | | | 243,244 | | | | 20,480 | |
| | | | | | | | | | | | | | | | | |
| Supervision and Administration Fees(3) | | | 112,855 | | | | 716 | | | | 31,523 | | | | 17,173 | |
| | | | | | | | | | | | | | | | | |
| Total Expenses | | | 112,855 | | | | 716 | | | | 31,523 | | | | 17,173 | |
| | | | | | | | | | | | | | | | | |
| Net Expenses | | | 112,855 | | | | 716 | | | | 31,523 | | | | 17,173 | |
| | | | | | | | | | | | | | | | | |
| Net Investment Income/(Loss), Before Deferred Taxes | | | 1,404,407 | | | | (716 | ) | | | 211,721 | | | | 3,307 | |
| Deferred Tax Benefit | | | N/A | | | | 268 | | | | N/A | | | | N/A | |
| | | | | | | | | | | | | | | | | |
| Net Investment Income/(Loss), Net of Deferred Taxes | | | 1,404,407 | | | | (448 | ) | | | 211,721 | | | | 3,307 | |
| | | | | | | | | | | | | | | | | |
| Net Realized Gain (Loss) on: | | | | | | | | | | | | | | | | |
| Investments | | | (544,796 | )(4) | | | — | | | | (164,722 | )(4) | | | (220,470 | )(4) |
| Foreign Currency Transactions | | | 8,154 | | | | — | | | | 3,113 | | | | (919 | ) |
| | | | | | | | | | | | | | | | | |
| Net Realized Loss on Investments, Net of Deferred Taxes | | | (536,642 | ) | | | — | | | | (161,609 | ) | | | (221,389 | ) |
| | | | | | | | | | | | | | | | | |
| Net Change in Unrealized Appreciation (Depreciation) on: | | | | | | | | | | | | | | | | |
| Investments | | | 755,305 | | | | 160,056 | | | | 413,590 | | | | 571,579 | |
| Deferred Tax Benefit/(Expense) | | | N/A | | | | (60,037 | ) | | | N/A | | | | N/A | |
| Foreign Currency Transactions | | | (1,026 | ) | | | — | | | | (190 | ) | | | (2,910 | ) |
| | | | | | | | | | | | | | | | | |
| Net Change in Unrealized Appreciation on Investments, Net of Deferred Taxes | | | 754,279 | | | | 100,019 | | | | 413,400 | | | | 568,669 | |
| | | | | | | | | | | | | | | | | |
| Net Realized and Unrealized Gain on Investments, Net of Deferred Taxes | | | 217,637 | | | | 100,019 | | | | 251,791 | | | | 347,280 | |
| | | | | | | | | | | | | | | | | |
| Net Increase in Net Assets Resulting from Operations | | $ | 1,622,044 | | | $ | 99,571 | | | $ | 463,512 | | | $ | 350,587 | |
| (1) | The Fund commenced operations on April 19, 2012. |
| (2) | The Fund commenced operations on November 14, 2011. |
| (3) | The Supervision and Administration fees reflect the supervisory and administrative fee, which includes fees paid by the Funds for the investment advisory services provided by the Adviser. (See Note 3 in Notes to Financial Statements.) |
| (4) | Includes realized loss as a result of in-kind transactions. (See Note 4 in Notes to Financial Statements.) |
The accompanying notes are an integral part of the financial statements.
| Statements of Operations |
| For the period ended April 30, 2012 (Unaudited) |
| | | Global X
Auto ETF | | | Global X
NASDAQ
500 ETF(1) | | | Global X
NASDAQ
400 Mid Cap
ETF(1) | |
| Investment Income: | | | | | | | | | | | | |
| | | | | | | | | | | | | |
| Dividend Income | | $ | 45,657 | | | $ | 4,658 | | | $ | 4,660 | |
| Interest Income | | | 1 | | | | — | | | | — | |
| Less: Foreign Taxes Withheld | | | (5,353 | ) | | | (15 | ) | | | (44 | ) |
| | | | | | | | | | | | | |
| Total Investment Income | | | 40,305 | | | | 4,643 | | | | 4,616 | |
| | | | | | | | | | | | | |
| Supervision and Administration Fees(2) | | | 10,122 | | | | 3,104 | | | | 3,678 | |
| | | | | | | | | | | | | |
| Total Expenses | | | 10,122 | | | | 3,104 | | | | 3,678 | |
| | | | | | | | | | | | | |
| Net Expenses | | | 10,122 | | | | 3,104 | | | | 3,678 | |
| | | | | | | | | | | | | |
| Net Investment Income | | | 30,183 | | | | 1,539 | | | | 938 | |
| | | | | | | | | | | | | |
| Net Realized Gain (Loss) on: | | | | | | | | | | | | |
| | | | | | | | | | | | | |
| Investments | | | (796,381 | )(3) | | | (4,893 | )(3) | | | 146,590 | (3) |
| Foreign Currency Transactions | | | 6,330 | | | | — | | | | — | |
| | | | | | | | | | | | | |
| Net Realized Gain (Loss) on Investments | | | (790,051 | ) | | | (4,893 | ) | | | 146,590 | |
| | | | | | | | | | | | | |
| Net Change in Unrealized Appreciation on: | | | | | | | | | | | | |
| | | | | | | | | | | | | |
| Investments | | | 756,951 | | | | 196,593 | | | | 124,282 | |
| Foreign Currency Transactions | | | 172 | | | | — | | | | — | |
| | | | | | | | | | | | | |
| Net Change in Unrealized Appreciation on Investments | | | 757,123 | | | | 196,593 | | | | 124,282 | |
| | | | | | | | | | | | | |
| Net Realized and Unrealized Gain (Loss) on Investments | | | (32,928 | ) | | | 191,700 | | | | 270,872 | |
| | | | | | | | | | | | | |
| Net Increase (Decrease) in Net Assets Resulting from Operations | | $ | (2,745 | ) | | $ | 193,239 | | | $ | 271,810 | |
| (1) | The Fund commenced operations on December 5, 2011. |
| (2) | The Supervision and Administration fees reflect the supervisory and administrative fee, which includes fees paid by the Funds for the investment advisory services provided by the Adviser. (See Note 3 in Notes to Financial Statements.) |
| (3) | Includes realized gain/(loss) as a result of in-kind transactions. (See Note 4 in Notes to Financial Statements.) |
The accompanying notes are an integral part of the financial statements.
Statements of Changes in Net Assets
| | | Global X SuperDividend ETF | | | Global X MLP
ETF | |
| | | Period Ended
April 30, 2012
(Unaudited) | | | Period Ended
October 31,
2011(1) (Audited) | | | Period Ended
April 30,2012(2) (Unaudited) | |
| Operations: | | | | | | | | | | | | |
| Net Investment Income/(Loss), Net of Deferred Taxes | | $ | 1,404,407 | | | $ | 904,386 | | | $ | (448 | ) |
| Net Realized Loss on Investments and Foreign Currency Transactions | | | (536,642 | )(3) | | | (2,769,674 | )(3) | | | — | |
| Net Change in Unrealized Appreciation (Depreciation) on Investments and Foreign Currency Transactions, Net of Deferred Taxes | | | 754,279 | | | | (2,541,723 | ) | | | 100,019 | |
| | | | | | | | | | | | | |
| Net Increase (Decrease) in Net Assets Resulting from Operations | | | 1,622,044 | | | | (4,407,011 | ) | | | 99,571 | |
| | | | | | | | | | | | | |
| Dividends and Distributions: | | | | | | | | | | | | |
| Net Investment Income | | | (1,296,910 | ) | | | (831,828 | ) | | | — | |
| | | | | | | | | | | | | |
| Total Dividends and Distributions | | | (1,296,910 | ) | | | (831,828 | ) | | | — | |
| | | | | | | | | | | | | |
| Capital Share Transactions: | | | | | | | | | | | | |
| | | | | | | | | | | | | |
| Issued | | | 30,714,500 | | | | 46,445,500 | | | | 5,236,000 | |
| Redeemed | | | — | | | | (11,834,500 | ) | | | — | |
| | | | | | | | | | | | | |
| Increase in Net Assets from Capital Share Transactions | | | 30,714,500 | | | | 34,611,000 | | | | 5,236,000 | |
| | | | | | | | | | | | | |
| Total Increase in Net Assets | | | 31,039,634 | | | | 29,372,161 | | | | 5,335,571 | |
| | | | | | | | | | | | | |
| Net Assets: | | | | | | | | | | | | |
| Beginning of Period | | | 29,372,161 | | | | — | | | | — | |
| | | | | | | | | | | | | |
| End of Period | | $ | 60,411,795 | | | $ | 29,372,161 | | | $ | 5,335,571 | |
| | | | | | | | | | | | | |
| Undistributed Net Investment Income/Accumulated Net Investment Loss | | $ | 239,082 | | | $ | 131,585 | | | $ | (448 | ) |
| | | | | | | | | | | | | |
| Share Transactions: | | | | | | | | | | | | |
| Issued | | | 1,400,000 | | | | 1,900,000 | | | | 350,000 | |
| Redeemed | | | — | | | | (550,000 | ) | | | — | |
| | | | | | | | | | | | | |
| Net Increase in Shares Outstanding from Share Transactions | | | 1,400,000 | | | | 1,350,000 | | | | 350,000 | |
| (1) | Commenced operations on June 8, 2011. |
| (2) | The Fund commenced operations on April 19, 2012. |
| (3) | Includes realized loss as a result of in-kind transactions. (See Note 4 in Notes to Financial Statements). |
The accompanying notes are an integral part of the financial statements.
Statements of Changes in Net Assets
| | | Global X Canada Preferred ETF | | | Global X Social
Media Index
ETF | |
| | | Period Ended
April 30, 2012
(Unaudited) | | | Period Ended
October 31,
2011(1)(Audited) | | | Period Ended
April 30,2012(2)
(Unaudited) | |
| Operations: | | | | | | | | | | | | |
| Net Investment Income | | $ | 211,721 | | | $ | 125,778 | | | $ | 3,307 | |
| Net Realized Loss on Investments and Foreign Currency Transactions | | | (161,609 | )(3) | | | (93,069 | )(3) | | | (221,389 | )(3) |
| Net Change in Unrealized Appreciation (Depreciation) on Investments and Foreign Currency Transactions | | | 413,400 | | | | (338,468 | ) | | | 568,669 | |
| | | | | | | | | | | | | |
| Net Increase (Decrease) in Net Assets Resulting from Operations | | | 463,512 | | | | (305,759 | ) | | | 350,587 | |
| | | | | | | | | | | | | |
| Dividends and Distributions: | | | | | | | | | | | | |
| Net Investment Income | | | (194,586 | ) | | | (92,495 | ) | | | — | |
| | | | | | | | | | | | | |
| Total Dividends and Distributions | | | (194,586 | ) | | | (92,495 | ) | | | — | |
| | | | | | | | | | | | | |
| Capital Share Transactions: | | | | | | | | | | | | |
| Issued | | | 4,996,500 | | | | 9,047,500 | | | | 14,907,000 | |
| Redeemed | | | (707,000 | ) | | | (687,000 | ) | | | (679,500 | ) |
| | | | | | | | | | | | | |
| Increase in Net Assets from Capital Share Transactions | | | 4,289,500 | | | | 8,360,500 | | | | 14,227,500 | |
| | | | | | | | | | | | | |
| Total Increase in Net Assets | | | 4,558,426 | | | | 7,962,246 | | | | 14,578,087 | |
| | | | | | | | | | | | | |
| Net Assets: | | | | | | | | | | | | |
| Beginning of Period | | | 7,962,246 | | | | — | | | | — | |
| End of Period | | $ | 12,520,672 | | | $ | 7,962,246 | | | $ | 14,578,087 | |
| | | | | | | | | | | | | |
| Undistributed Net Investment Income | | $ | 41,826 | | | $ | 24,691 | | | $ | 3,307 | |
| | | | | | | | | | | | | |
| Share Transactions: | | | | | | | | | | | | |
| Issued | | | 350,000 | | | | 600,000 | | | | 1,000,000 | |
| Redeemed | | | (50,000 | ) | | | (50,000 | ) | | | (50,000 | ) |
| | | | | | | | | | | | | |
| Net Increase in Shares Outstanding from Share Transactions | | | 300,000 | | | | 550,000 | | | | 950,000 | |
| (1) | The Fund commenced operations on May 24, 2011. |
| (2) | The Fund commenced operations on November 14, 2011. |
| (3) | Includes realized loss as a result of in-kind transactions. (See Note 4 in Notes to Financial Statements). |
The accompanying notes are an integral part of the financial statements.
Statements of Changes in Net Assets
| | | Global X Auto ETF | | | Global X
NASDAQ 500
ETF | | | Global X
NASDAQ 400
Mid Cap ETF | |
| | | Period Ended
April 30, 2012
(Unaudited) | | | Period Ended
October 31,
2011(1)(Audited) | | | Period Ended
April 30,
2012(2)
(Unaudited) | | | Period Ended
April 30,
2012(2)
(Unaudited) | |
| Operations: | | | | | | | | | | | | | | | | |
| Net Investment Income | | $ | 30,183 | | | $ | 1,251 | | | $ | 1,539 | | | $ | 938 | |
| Net Realized Gain (Loss) on Investments and Foreign Currency Transactions | | | (790,051 | )(3) | | | 9,771 | | | | (4,893 | )(3) | | | 146,590 | (3) |
| Net Change in Unrealized Appreciation (Depreciation) on Investments and Foreign Currency Transactions | | | 757,123 | | | | (956,127 | ) | | | 196,593 | | | | 124,282 | |
| | | | | | | | | | | | | | | | | |
| Net Increase (Decrease) in Net Assets Resulting from Operations | | | (2,745 | ) | | | (945,105 | ) | | | 193,239 | | | | 271,810 | |
| | | | | | | | | | | | | | | | | |
| Dividends and Distributions: | | | | | | | | | | | | | | | | |
| Net Investment Income | | | (20,600 | ) | | | — | | | | — | | | | — | |
| | | | | | | | | | | | | | | | | |
| Total Dividends and Distributions | | | (20,600 | ) | | | — | | | | — | | | | — | |
| | | | | | | | | | | | | | | | | |
| Capital Share Transactions: | | | | | | | | | | | | | | | | |
| Issued | | | 3,539,500 | | | | 6,115,500 | | | | 2,520,000 | | | | 2,529,000 | |
| Redeemed | | | (3,750,000 | ) | | | — | | | | (1,254,500 | ) | | | (1,401,000 | ) |
| | | | | | | | | | | | | | | | | |
| Increase (Decrease) in Net Assets from Capital Share Transactions | | | (210,500 | ) | | | 6,115,500 | | | | 1,265,500 | | | | 1,128,000 | |
| | | | | | | | | | | | | | | | | |
| Total Increase (Decrease) in Net Assets | | | (233,845 | ) | | | 5,170,395 | | | | 1,458,739 | | | | 1,399,810 | |
| | | | | | | | | | | | | | | | | |
| Net Assets: | | | | | | | | | | | | | | | | |
| Beginning of Period | | | 5,170,395 | | | | — | | | | — | | | | — | |
| End of Period | | $ | 4,936,550 | | | $ | 5,170,395 | | | $ | 1,458,739 | | | $ | 1,399,810 | |
| | | | | | | | | | | | | | | | | |
| Undistributed Net Investment Income | | $ | 22,083 | | | $ | 12,500 | | | $ | 1,539 | | | $ | 938 | |
| | | | | | | | | | | | | | | | | |
| Share Transactions: | | | | | | | | | | | | | | | | |
| Issued | | | 250,000 | | | | 400,000 | | | | 100,000 | | | | 100,000 | |
| Redeemed | | | (300,000 | ) | | | — | | | | (50,000 | ) | | | (50,000 | ) |
| | | | | | | | | | | | | | | | | |
| Net Increase (Decrease) in Shares Outstanding from Share Transactions | | | (50,000 | ) | | | 400,000 | | | | 50,000 | | | | 50,000 | |
| (1) | Commenced operations on May 18, 2011. |
| (2) | Commenced operations on December 5, 2011. |
| (3) | Includes realized gain/(loss) as a result of in-kind transactions. (See Note 4 in Notes to Financial Statements). |
The accompanying notes are an integral part of the financial statements.
Financial Highlights
Selected Per Share Data & Ratios
For a Share Outstanding Throughout the Period
| | | Net Asset
Value,
Beginning
of Period
($) | | | Net
Investment
Income
(Loss) ($)* | | | Net
Realized
and
Unrealized
Gain (Loss)
on
Investments
($) | | | Total from
Operations
($) | | | Distribution
from Net
Investment
Income ($) | | | Distribution
from
Capital
Gains ($) | | | Total from
Distributions
($) | | | Net
Asset
Value,
End of
Period
($) | | | Total
Return
(%)** | | | Net
Assets
End of
Period
($)(000) | | | Ratio of
Expenses
to
Average
Net
Assets
(%) | | | Ratio of
Net
Investment
Income
(Loss) to
Average
Net Assets
(%) | | | Portfolio
Turnover
(%) | |
| Global X SuperDividend ETF | | | | | | | | | | | | | | | | | | | | | | | | | | | | | | | | | | | | | |
| 2012(Unaudited) | | | 21.76 | | | | 0.77 | | | | 0.17 | | | | 0.94 | | | | (0.73 | ) | | | — | | | | (0.73 | ) | | | 21.97 | | | | 4.50 | | | | 60,412 | | | | 0.58 | † | | | 7.22 | † | | | 20.52 | †† |
| 2011(1) | | | 24.70 | | | | 0.64 | | | | (3.02 | ) | | | (2.38 | ) | | | (0.56 | ) | | | — | | | | (0.56 | ) | | | 21.76 | | | | (9.56 | ) | | | 29,372 | | | | 0.58 | † | | | 7.22 | † | | | 4.58 | †† |
| Global X MLP ETF | | | | | | | | | | | | | | | | | | | | | | | | | | | | | | | | | | | | | | | | | | | | | | | | | |
| 2012(2)(Unaudited) | 14.96 | | | | (0.13 | ) | | | 0.41 | | | | 0.28 | | | | — | | | | — | | | | — | | | | 15.24 | | | | 1.87 | | | | 5,336 | | | | 0.45 | †(7) | | | (0.45 | )†(8) | | | — | †† |
| Global X Canada Preferred ETF | | | | | | | | | | | | | | | | | | | | | | | | | | | | | | | | | | | | | | | | | |
| 2012(Unaudited) | | | 14.48 | | | | 0.28 | | | | 0.24 | | | | 0.52 | | | | (0.27 | ) | | | — | | | | (0.27 | ) | | | 14.73 | | | | 3.63 | | | | 12,521 | | | | 0.58 | † | | | 3.90 | † | | | 18.88 | †† |
| 2011(3) | | | 14.97 | | | | 0.27 | | | | (0.56 | ) | | | (0.29 | ) | | | (0.20 | ) | | | — | | | | (0.20 | ) | | | 14.48 | | | | (1.94 | ) | | | 7,962 | | | | 0.58 | † | | | 4.28 | † | | | 3.02 | †† |
| Global X Social Media Index ETF | | | | | | | | | | | | | | | | | | | | | | | | | | | | | | | | | | | | | | | | | |
| 2012(4)(Unaudited) | 14.93 | | | | 0.01 | | | | 0.41 | | | | 0.42 | | | | — | | | | — | | | | — | | | | 15.35 | | | | 2.81 | | | | 14,578 | | | | 0.65 | † | | | 0.13 | † | | | 52.14 | †† |
| Global X Auto ETF | | | | | | | | | | | | | | | | | | | | | | | | | | | | | | | | | | | | | | | | | | | | | | | | | |
| 2012(Unaudited) | | | 12.93 | | | | 0.12 | | | | 1.12 | | | | 1.24 | | | | (0.07 | ) | | | — | | | | (0.07 | ) | | | 14.10 | | | | 9.70 | | | | 4,937 | | | | 0.65 | † | | | 1.94 | † | | | 15.38 | †† |
| 2011(5) | | | 15.20 | | | | — | | | | (2.27 | ) | | | (2.27 | ) | | | — | | | | — | | | | — | | | | 12.93 | | | | (14.93 | ) | | | 5,170 | | | | 0.65 | † | | | 0.07 | † | | | 0.34 | †† |
| Global X NASDAQ 500 ETF | | | | | | | | | | | | | | | | | | | | | | | | | | | | | | | | | | | | | | | | | | | | | | | | | |
| 2012(6)(Unaudited) | | | 25.20 | | | | 0.03 | | | | 3.94 | | | | 3.97 | | | | — | | | | — | | | | — | | | | 29.17 | | | | 15.75 | | | | 1,459 | | | | 0.48 | † | | | 0.24 | † | | | 2.01 | †† |
| Global X NASDAQ 400 Mid Cap ETF | | | | | | | | | | | | | | | | | | | | | | | | | | | | | | | | | | | | | | | | | | | | | |
| 2012(6)(Unaudited) | | | 25.29 | | | | 0.01 | | | | 2.70 | | | | 2.71 | | | | — | | | | — | | | | — | | | | 28.00 | | | | 10.72 | | | | 1,400 | | | | 0.48 | † | | | 0.12 | † | | | 16.45 | †† |
| (1) | The Fund commenced operations on June 8, 2011. |
| (2) | The Fund commenced operations on April 19, 2012. |
| (3) | The Fund commenced operations on May 24, 2011. |
| (4) | The Fund commenced operations on November 14, 2011. |
| (5) | The Fund commenced operations on May 18, 2011. |
| (6) | The Fund commenced operations on December 5, 2011. |
| (7) | During the period ended April 30, 2012 the ratio of expenses to average net assets, net of deferred tax benefit was 0.28%. |
| (8) | During the period ended April 30, 2012 the ratio of net investment loss to average net assets, net of deferred tax benefit was (0.28)%. |
| * | Per share data calculated using average shares method. |
| ** | Total Return is for the period indicated and has not been annualized. The return shown does not reflect the deduction of taxes that a shareholder would pay on Fund distributions or the redemption of Fund shares. |
| †† | Portfolio turnover rate is for the period indicated and has not been annualized. Excludes effect of in-kind transfers. |
Amounts designated as “—” are either $0 or have been rounded to $0.
The accompanying notes are an integral part of the financial statements.
| Notes to Financial Statements |
| April 30, 2012 (unaudited) |
1. ORGANIZATION
The Global X Funds (the "Trust") is a Delaware Statutory Trust formed on March 6, 2008. The Trust is registered under the Investment Company Act of 1940, as amended, as an open-end management investment company with eighty-seven portfolios as of April 30, 2012. The financial statements herein and the related notes pertain to the Global X SuperDividend ETF, Global X MLP ETF, Global X Canada Preferred ETF, Global X Social Media Index ETF, Global X Auto ETF, Global X NASDAQ 500 ETF and Global X NASDAQ 400 Mid Cap ETF (each a “Fund”, collectively, the “Funds”). Each Fund is non-diversified.
2. SIGNIFICANT ACCOUNTING POLICIES
The following is a summary of the Significant Accounting Policies followed by the Funds.
USE OF ESTIMATES — The preparation of financial statements in conformity with U.S. Generally Accepted Accounting Principles ("U.S. GAAP") requires management to make estimates and assumptions that affect the reported amounts of assets and liabilities and disclosure of contingent assets and liabilities at the date of the financial statements and the reported amounts of increases and decreases in net assets from operations during the reporting period. Actual results could differ from those estimates, and could have a material impact to the Funds.
RETURN OF CAPITAL ESTIMATES – Distributions received from the Global X MLP Fund generally are comprised of income and return of capital. The Fund records investment income and return of capital based on estimates made at the time such distributions are received. Such estimates are based on historical information available from the Fund and other industry sources. These estimates may subsequently be revised based on information received from MLPs after their tax reporting periods are concluded. For the period ended April 30, 2012, the Fund estimated that 100% of the MLP distributions received would be treated as return of capital.
SECURITY VALUATION — Securities listed on a securities exchange, market or automated quotation system for which quotations are readily available (except for securities traded on NASDAQ), including securities traded over the counter, are valued at the last quoted sale price on the primary exchange or market (foreign or domestic) on which they are traded (or at approximately 4:00 pm if a security’s primary exchange is normally open at that time), or, if there is no such reported sale, at the most recent mean between the quoted bid and asked prices (absent both bid and asked prices on such exchange, the bid price may be used).
For securities traded on NASDAQ, the NASDAQ Official Closing Price will be used. If available, debt securities are priced based upon valuations provided by independent, third-party pricing agents. Such values generally reflect the last reported sales price if the security is actively traded. The third-party pricing agents may also value debt securities at an evaluated bid price by employing methodologies that utilize actual market transactions, broker-supplied valuations, or other methodologies designed to identify the market value for such securities. Debt obligations with remaining maturities of sixty days or less may be valued at their amortized cost, which approximates market value. The prices for foreign securities are reported in local currency and converted to U.S. dollars using currency exchange rates. Prices for most securities held in the Funds are provided daily by recognized independent pricing agents. If a security price cannot be obtained from an independent, third-party pricing agent, the Funds seek to obtain a bid price from at least one independent broker.
| Notes to Financial Statements (continued) |
| April 30, 2012 (unaudited) |
2. SIGNIFICANT ACCOUNTING POLICIES (continued)
SECURITY VALUATION (continued)
Securities for which market prices are not "readily available" are valued in accordance with Fair Value Procedures established by the Board of Trustees (the “Board”). The Funds’ Fair Value Procedures are implemented through a Fair Value Committee (the “Committee”) designated by the Board. Some of the more common reasons that may necessitate that a security be valued using Fair Value Procedures include: the security's trading has been halted or suspended; the security has been de-listed from a national exchange; the security's primary trading market is temporarily closed at a time when under normal conditions it would be open; the security has not been traded for an extended period of time; the security's primary pricing source is not able or willing to provide a price; or trading of the security is subject to local government-imposed restrictions. When a security is valued in accordance with the Fair Value Procedures, the Committee will determine the value after taking into consideration relevant information reasonably available to the Committee. As of April 30, 2012, there were no securities priced using the Fair Value Procedures.
For securities that principally trade on a foreign market or exchange, a significant gap in time can exist between the time of a particular security's last trade and the time at which the Funds calculated their net asset value. The closing prices of such securities may no longer reflect their market value at the time the Funds calculated net asset value if an event that could materially affect the value of those securities (a “Significant Event”) has occurred between the time of the security's last close and the time that the Funds calculate net asset value. A Significant Event may relate to a single issuer or to an entire market sector. If Global X Management Company LLC (the “Adviser”) becomes aware of a Significant Event that has occurred with respect to a security or group of securities after the closing of the exchange or market on which the security or securities principally trade, but before the time at which the Funds calculate net asset value, it may request that a Committee meeting be called. In addition, the Funds’ Sub-administrator, SEI Investments Global Funds Services (“SEIGFS”), monitors price movements among certain selected indices, securities and/or baskets of securities that may be an indicator that the closing prices received earlier from foreign exchanges or markets may not reflect market value at the time the Funds calculate net asset value. If price movements in a monitored index or security exceed levels established by the Sub-administrator, the Sub-administrator notifies the Adviser that such limits have been exceeded. In such event, the Adviser makes the determination whether a Committee meeting should be called based on the information provided.
In accordance with the authoritative guidance on fair value measurements and disclosure under U.S. GAAP, the Funds disclose the fair value of their investments in a hierarchy that prioritizes the inputs to valuation techniques used to measure the fair value. The objective of a fair value measurement is to determine the price that would be received to sell an asset or paid to transfer a liability in an orderly transaction between market participants at the measurement date (an exit price). Accordingly, the fair value hierarchy gives the highest priority to quoted prices (unadjusted) in active markets for identical assets or liabilities (Level 1) and the lowest priority to unobservable inputs (Level 3). The three levels of the fair value hierarchy are described below:
Level 1 – Unadjusted quoted prices in active markets for identical, unrestricted assets or liabilities that the Funds have the ability to access at the measurement date
| Notes to Financial Statements (continued) |
| April 30, 2012 (unaudited) |
2. SIGNIFICANT ACCOUNTING POLICIES (continued)
SECURITY VALUATION (concluded)
Level 2 – Other significant observable inputs (including quoted prices for similar investments, fair value of investments for which the Funds have the ability to fully redeem tranches at net asset value as of the measurement date or within the near term, and short-term investments valued at amortized cost)
Level 3 – Significant unobservable inputs (including the Funds own assumptions in determining the fair value of investments, fair value of investments for which the Funds do not have the ability to fully redeem tranches at net asset value as of the measurement date or within the near term)
Investments are classified within the level of the lowest significant input considered in determining fair value. Investments classified within Level 3 whose fair value measurement considers several inputs may include Level 1 or Level 2 inputs as components of the overall fair value measurement.
For the period ended April 30, 2012 there have been no significant changes to the Funds’ fair valuation methodologies.
FEDERAL INCOME TAXES – Except for the Global X MLP ETF, it is each Fund’s intention to qualify or continue to qualify as a regulated investment company for Federal income tax purposes by complying with the appropriate provisions of Subchapter M of the Internal Revenue Code of 1986, as amended. Accordingly, no provisions for Federal income taxes have been made in the financial statements.
The Funds evaluate tax positions taken or expected to be taken in the course of preparing the Funds’ tax returns to determine whether it is "more-likely-than-not" (i.e., greater than 50 percent) that each tax position will be sustained upon examination by a taxing authority based on the technical merits of the position. Tax positions not deemed to meet the more-likely-than-not threshold are recorded as a tax benefit or expense in the current year. The Funds did not record any tax provisions in the current period. However, management’s conclusions regarding tax positions may be subject to review and adjustment at a later date based on factors including, but not limited to, examination by tax authorities (i.e., the last three tax year ends, as applicable), on-going analysis of and changes to tax laws, regulations and interpretations thereof.
SECURITY TRANSACTIONS AND INVESTMENT INCOME — Security transactions are accounted for on the trade date for financial reporting purposes. Costs used in determining realized gains and losses on the sale of investment securities are based on specific identification. Dividend income is recorded on the ex-dividend date. Interest income is recognized on the accrual basis from the settlement date.
Notes to Financial Statements (continued)
April 30, 2012 (unaudited)
2. SIGNIFICANT ACCOUNTING POLICIES (concluded)
FOREIGN CURRENCY TRANSLATION — The books and records of the Funds are maintained in U.S. dollars. Investment securities and other assets and liabilities denominated in a foreign currency are translated into U.S. dollars on the date of valuation. Purchases and sales of investment securities, income and expenses are translated into U.S. dollars at the relevant rates of exchange prevailing on the respective dates of such transactions. The Funds do not isolate that portion of realized or unrealized gains and losses resulting from changes in the foreign exchange rate from fluctuations arising from changes in the market prices of the securities. These gains and losses are included in net realized and unrealized gains and losses on investments on the Statement of Operations. Net realized and unrealized gains and losses on foreign currency transactions represent net foreign exchange gains or losses from foreign currency exchange contracts, disposition of foreign currencies, currency gains or losses realized between trade and settlement dates on securities transactions and the difference between the amount of the investment income and foreign withholding taxes recorded on the Funds’ books and the U.S. dollar equivalent amounts actually received or paid.
DIVIDENDS AND DISTRIBUTIONS TO SHAREHOLDERS — The Funds distribute their net investment income on a pro rata basis. Any net realized capital gains are distributed annually. All distributions are recorded on the ex-dividend date.
CREATION UNITS — The Funds issue and redeem shares (“Shares”) at Net Asset Value (“NAV”) and only in large blocks of Shares, (each block of Shares for a Fund is called a “Creation Unit” or multiples thereof). Purchasers of Creation Units (“Authorized Participants”) at NAV must pay a standard creation transaction fee per transaction. The fee is a single charge and will be the same regardless of the number of Creation Units purchased by an investor on the same day. An Authorized Participant who holds Creation Units and wishes to redeem at NAV would also pay a standard Redemption Fee per transaction on the date of such redemption, regardless of the number of Creation Units redeemed that day.
If a Creation Unit is purchased or redeemed for cash, a higher Transaction Fee will be charged. The following table discloses Creation Unit breakdown:
| | | Creation Unit | | | Transaction | | | | | | Redemption | |
| | | Shares | | | Fee | | | Value | | | Fee | |
| Global X SuperDividend ETF | | | 50,000 | | | $ | 3,800 | | | $ | 1,098,500 | | | $ | 3,800 | |
| Global X MLP ETF | | | 50,000 | | | | 500 | | | | 762,000 | | | | 500 | |
| Global X Canada Preferred ETF | | | 50,000 | | | | 1,000 | | | | 736,500 | | | | 1,000 | |
| Global X Social Media Index ETF | | | 50,000 | | | | 1,000 | | | | 767,500 | | | | 1,000 | |
| Global X Auto ETF | | | 50,000 | | | | 1,000 | | | | 705,000 | | | | 1,000 | |
| Global X NASDAQ 500 ETF | | | 50,000 | | | | 3,500 | | | | 1,458,500 | | | | 3,500 | |
| Global X NASDAQ 400 Mid Cap ETF | | | 50,000 | | | | 3,000 | | | | 1,400,000 | | | | 3,000 | |
3. RELATED PARTY TRANSACTIONS
The Adviser serves as the investment adviser and the administrator for the Funds. Subject to the supervision of the Board of Trustees, the Adviser is responsible for managing the investment activities of the Funds and the Funds’ business affairs and other administrative matters and provides or causes to be furnished all supervisory, administrative and other services reasonably necessary for the operation of the Funds, including certain distribution services (provided pursuant to a separate Distribution Agreement), certain shareholder and distribution-related services (provided pursuant to
Notes to Financial Statements (continued)
April 30, 2012 (unaudited)
3. RELATED PARTY TRANSACTIONS (continued)
a separate Rule 12b-1 Plan and related agreements) and investment advisory services (provided pursuant to a separate Investment Advisory Agreement), under what is essentially an "all-in" fee structure. For its service to the Funds, under the Supervision and Administration Agreement, each Fund pays a monthly fee to the Adviser at the annual rate (stated as a percentage of the average daily net assets of the Fund). In addition, the Funds bear other expenses that are not covered by the Supervision and Administration Agreement, which may vary and affect the total expense ratios of the Funds, such as taxes, brokerage fees, commissions, acquired fund fees, and other transaction expenses, interest expenses and extraordinary expenses (such as litigation and indemnification expenses).
| | | Supervision and | |
| | | Administration Fee | |
| Global X SuperDividend ETF | | | 0.58 | % |
| Global X MLP ETF | | | 0.45 | % |
| Global X Canada Preferred ETF | | | 0.58 | % |
| Global X Social Media ETF | | | 0.65 | % |
| Global X Auto ETF | | | 0.65 | % |
| Global X Nasdaq 500 ETF | | | 0.48 | % |
| Global X Nasdaq 400 Midcap ETF | | | 0.48 | % |
SEIGFS serves as Sub-Administrator to the Funds. As Sub-Administrator, SEIGFS provides the Funds with the required general administrative services, including, without limitation: office space, equipment, and personnel; clerical and general back office services; bookkeeping, internal accounting and secretarial services; the calculation of NAV; and assistance with the preparation and filing of reports, registration statements, proxy statements and other materials required to be filed or furnished by the Funds under federal and state securities laws. As compensation for these services, the Sub-Administrator receives certain out-of-pocket costs, transaction fees and asset-based fees which are accrued daily and paid monthly by the Adviser.
SEI Investments Distribution Co. (“SIDCO”) serves as each Funds underwriter and distributor of Shares pursuant to a Distribution Agreement. Under the Distribution Agreement, SIDCO, as agent, receives orders to create and redeem Shares in Creation Unit Aggregations and transmits such orders to the Trust’s custodian and transfer agent. The Distributor has no obligation to sell any specific quantity of Fund Shares. SIDCO bears the following costs and expenses relating to the distribution of Shares: (i) the costs of processing and maintaining records of creations of Creation Units; (ii) all costs of maintaining the records required of a registered broker/dealer; (iii) the expenses of maintaining its registration or qualification as a dealer or broker under Federal or state laws; (iv) filing fees; and (v) all other expenses incurred in connection with the distribution services as contemplated in the Distribution Agreement. SIDCO receives no fee for its distribution services under the Distribution Agreement.
Notes to Financial Statements (continued)
April 30, 2012 (unaudited)
4. INVESTMENT TRANSACTIONS
For the period ended April 30, 2012, the purchases and sales of investments in securities excluding in-kind transactions, long-term U.S. Government and short-term securities were:
| | | | | | Sales and | |
| | | Purchases | | | Maturities | |
| Global X SuperDividend ETF | | $ | 9,454,452 | | | $ | 8,204,209 | |
| Global X MLP ETF | | | - | | | | - | |
| Global X Canada Preferred ETF | | | 1,998,951 | | | | 2,106,097 | |
| Global X Social Media Index ETF | | | 3,364,522 | | | | 3,499,244 | |
| Global X Auto ETF | | | 511,623 | | | | 548,446 | |
| Global X NASDAQ 500 ETF | | | 32,681 | | | | 34,601 | |
| Global X NASDAQ 400 Mid Cap ETF | | | 307,405 | | | | 307,558 | |
For the period ended April 30, 2012, in-kind transactions associated with creations and redemptions were:
| | | | | | Sales and | | | Realized | |
| | | Purchases | | | Maturities | | | Gain/(Loss) | |
| Global X SuperDividend ETF | | $ | 29,386,942 | | | $ | - | | | $ | - | |
| Global X MLP ETF | | | 5,234,023 | | | | - | | | | - | |
| Global X Canada Preferred ETF | | | 4,998,180 | | | | 707,521 | | | | (36,950 | ) |
| Global X Social Media Index ETF | | | 14,779,547 | | | | 668,623 | | | | (71,831 | ) |
| Global X Auto ETF | | | 3,134,336 | | | | 3,299,398 | | | | (672,599 | ) |
| Global X NASDAQ 500 ETF | | | 2,519,404 | | | | 1,252,150 | | | | (5,186 | ) |
| Global X NASDAQ 400 Mid Cap ETF | | | 2,528,242 | | | | 1,401,671 | | | | 137,452 | |
5. TAX INFORMATION
The amount and character of income and capital gain distributions to be paid, if any, are determined in accordance with Federal income tax regulations, which may differ from U.S. GAAP. As a result, net investment income (loss) and net realized gain (loss) on investment transactions for a reporting period may differ significantly from distributions during such period. These book/tax differences may be temporary or permanent. To the extent these differences are permanent in nature, they are charged or credited to undistributed net investment income (loss), accumulated net realized gain (loss) or paid-in capital, as appropriate, in the period that the differences arise.
The tax character of dividends and distributions paid during the last year ended October 31, 2011 were as follows:
Global X
Funds | | Ordinary
Income | | | Long-Term
Capital Gain | | | Totals | |
| | | | | | | | | | |
| Global X SuperDividend ETF 2011 | | $ | 831,828 | | | $ | – | | | $ | 831,828 | |
| Global X Canada Preferred ETF 2011 | | $ | 92,495 | | | $ | – | | | $ | 92,495 | |
Notes to Financial Statements (continued)
April 30, 2012 (unaudited)
As of October 31, 2011, the Components of Tax Basis Distributable Earnings (Accumulated Losses) were as follows:
5. TAX INFORMATION (concluded)
| | | Global X Funds | |
| | | Global X
SuperDividend
ETF | | | Global X Canada
Preferred ETF | | | Global X Auto
ETF | |
| Undistributed Ordinary Income | | $ | 184,525 | | | $ | 24,691 | | | $ | 12,529 | |
| Capital Loss Carryforwards | | | (851,369 | ) | | | (3,513 | ) | | | (18 | ) |
| Unrealized Depreciation on Investments and Foreign Currency | | | (2,603,123 | ) | | | (338,468 | ) | | | (957,616 | ) |
| Total Accumulated Losses | | $ | (3,269,967 | ) | | $ | (317,290 | ) | | $ | (945,105 | ) |
For Federal income tax purposes, capital loss carryforwards represent realized losses of the Funds that may be carried forward for a maximum period of eight years and applied against future gains.
Under the recently enacted Regulated Investment Company Modernization Act of 2010, the Funds will be permitted to carry forward capital losses incurred in taxable years beginning after December 22, 2010 for an unlimited period. However, any losses incurred during those future taxable years will be required to be used prior to the losses incurred in pre-enactment taxable years. As a result of this ordering rule, preenactment capital loss carryforwards may be more likely to expire unused. Additionally, post-enactment capital losses that are carried forward will retain their character as either short-term or long-term capital losses rather than being considered all short-term as under previous law. Losses carried forward under these new provisions are as follows:
| | | Short-Term | | | Long-Term | | | | |
| Global X Funds | | Loss | | | Loss | | | Total | |
| Global X SuperDividend ETF | | $ | 851,369 | | | $ | - | | | $ | 851,369 | |
| Global X Canada Preferred ETF | | | 3,513 | | | | - | | | | 3,513 | |
| Global X Auto ETF | | | 18 | | | | - | | | | 18 | |
The Federal tax cost and aggregate gross unrealized appreciation and depreciation on investments held by the Funds at April 30, 2012 were as follows:
| Global X Funds | | Federal Tax
Cost | | | Aggregated
Gross
Unrealized
Appreciation | | | Aggregated
Gross
Unrealized
Depreciation | | | Net
Unrealized
Appreciation
(Depreciation) | |
| Global X SuperDividend ETF | | $ | 61,862,273 | | | $ | 2,495,134 | | | $ | (4,284,400 | ) | | $ | (1,789,266 | ) |
| Global X MLP ETF | | | 5,214,399 | | | | 172,843 | | | | (12,787 | ) | | | 160,056 | |
| Global X Canada Preferred ETF | | | 12,322,690 | | | | 229,026 | | | | (154,002 | ) | | | 75,024 | |
| Global X Social Media Index ETF | | | 13,860,379 | | | | 1,362,754 | | | | (791,175 | ) | | | 571,579 | |
| Global X Auto ETF | | | 5,127,535 | | | | 121,411 | | | | (320,516 | ) | | | (199,105 | ) |
| Global X NASDAQ 500 ETF | | | 1,262,304 | | | | 223,355 | | | | (26,762 | ) | | | 196,593 | |
| Global X NASDAQ 400 Mid Cap ETF | | | 1,275,282 | | | | 175,826 | | | | (51,544 | ) | | | 124,282 | |
The preceding differences between book and tax cost are primarily due to mark to market treatment of passive foreign investment companies and wash sales.
Notes to Financial Statements (continued)
April 30, 2012 (unaudited)
6. TAX INFORMATION – GLOBAL X MLP FUND
Global X MLP Fund intends to invest primarily in master limited partnerships, which generally are treated as qualified publicly traded partnerships for federal income tax purposes. Accordingly, the Global X MLP ETF does not intend to qualify as a regulated investment company pursuant to Subchapter M of the Internal Revenue Code, but is taxed as a corporation. As a corporation the Fund is obligated to pay federal, state and local income tax on taxable income. Currently the maximum marginal regular federal income tax rate for a corporation is 35 percent. The Fund may be subject to a 20 percent alternative minimum tax on its federal alternative minimum taxable income to the extent that its alternative minimum tax exceeds its regular federal income tax. The Fund currently is using an estimated 37.51% tax rate for federal, state and local tax.
The Global X MLP Fund may rely, to some extent, on information provided by the MLPs, which may not necessarily be timely, to estimate taxable income allocable to MLP units held in its portfolio, and to estimate its associated deferred tax benefit/(liability). Such estimates are made in good faith. From time to time, as new information becomes available, the Fund will modify its estimates or assumptions regarding its tax benefit/(liability).
The tax expense or benefits attributable to certain components of income will be included in the Statement of Operations. Deferred income taxes reflect the net tax effects of temporary differences between the carrying amounts of assets and liabilities for financial reporting purposes and the amounts used for federal income tax purposes. Deferred tax assets and liabilities are calculated utilizing effective tax rates expected to be applied to taxable income in the years the temporary differences are realized or settled. A valuation allowance will be recognized if, based on the available evidence, it is more likely than not that some or all of the deferred tax asset will not be realizable. The Global X MLP Fund may be required to modify the estimates or assumptions it uses regarding the deferred tax asset or liability as new information becomes available.
The Global X MLP Fund’s policy is to classify interest and penalities associated with underpayment of federal and state income taxes, if any, as income tax expense on its Statement of Operations. As of April 30, 2012, the Fund does not have any interest or penalties associated with the underpayment of any income taxes. All tax years since inception remain open and subject to examination by tax jurisdictions. The Fund has reviewed all major jurisdictions and concluded that there is no impact on the Fund’s net assets and no tax liability resulting from unrecognized tax benefits relating to uncertain income tax positions taken or expected to be taken on its tax returns.
Deferred income taxes reflect the net tax expense or benefit of operating income or loss, the tax benefit of capital loss carry forwards, and the tax expense or benefit of unrealized gains or losses on investment securities for financial reporting purposes. Components of the Global X MLP Fund’s deferred tax assets and liabilities as of April 30, 2012 are as follows:
| Deferred tax asset: | | | | |
| Net operating loss carry forwards | | $ | 268 | |
| | | | | |
| Less deferred tax liabilities: | | | | |
| Unrealized gain on investment securities | | | (60,037 | ) |
| Net deferred tax liability | | $ | (59,769 | ) |
Notes to Financial Statements (continued)
April 30, 2012 (unaudited)
6. TAX INFORMATION – GLOBAL X MLP FUND (continued)
The components of income tax benefit/(expense) for deferred federal and state income taxes for the Global X MLP Fund are:
| Deferred tax benefit/(expense) | | | | |
| Federal income taxes | | $ | (55,769 | ) |
| State income taxes (net of federal benefit) | | | (4,000 | ) |
| | | $ | (59,769 | ) |
7. CONCENTRATION OF RISKS
The Funds invest in securities of foreign issuers in several countries. These investments may involve certain considerations and risks not typically associated with investments in the United States as a result of, among other factors, the possibility of future political and economic developments and the level of governmental supervision and regulation of securities markets in the respective countries.
The securities markets of emerging countries are less liquid and subject to greater price volatility, and have a smaller market capitalization, than the U.S. securities markets. In certain countries, there may be fewer publicly traded securities and the market may be dominated by a few issuers or sectors. Issuers and securities markets in such countries are not subject to as extensive and frequent accounting, financial and other reporting requirements or as comprehensive government regulations as are issuers and securities markets in the U.S. In particular, the assets and profits appearing on the financial statements of emerging country issuers may not reflect their financial position or results of operations in the same manner as financial statements for U.S. issuers. Substantially less information may be publicly available about emerging country issuers than is available about issuers in the United States.
The Funds may be subject to taxes imposed by countries in which it invests. Such taxes are generally based on either income or gains earned or repatriated. The Funds accrue and apply such taxes to net investment income, net realized gains and net unrealized gains as income and/or capital gains are earned.
The Funds use a replication strategy. A replication strategy is an indexing strategy that involves investing in the securities of the Underlying Index in approximately the same proportions as in the Underlying Indices. The Funds may utilize a representative sampling strategy with respect to their Underlying Indices when a replication strategy might be detrimental to their shareholders, such as when there are practical difficulties or substantial costs involved in compiling a portfolio of equity securities to follow its Underlying Index, or, in certain instances, when securities in the Underlying Indices become temporarily illiquid, unavailable or less liquid, or due to legal restrictions (such as diversification requirements that apply to the Funds but not the Underlying Indices).
Under normal circumstances, the Global X MLP Fund intends to invest at least 80% of its total assets in securities of MLPs, which are subject to certain risks, such as supply and demand risk, depletion and exploration risk, and the risk associated with the hazards inherent in midstream energy industry activities. A substantial portion of the cash flow received by the Fund is derived from investment in equity securities of MLPs. The amount of cash that an MLP has available for distributions and the tax character of such distributions are dependent upon the amount of cash generated by the MLP’s operations.
Notes to Financial Statements (continued)
April 30, 2012 (unaudited)
8. OTHER
At April 30, 2012, the total Shares outstanding that were held by Authorized Participants were as follows. The Authorized Participants have entered into an agreement with the Funds’ Distributor.
| | | | | | Percentage of | |
| | | Authorized | | | Shares | |
| | | Participants | | | Outstanding | |
| Global X SuperDividend ETF | | | 3 | | | | 100 | % |
| Global X MLP ETF | | | 1 | | | | 100 | % |
| Global X Canada Preferred ETF | | | 3 | | | | 100 | % |
| Global X Social Media Index ETF | | | 3 | | | | 100 | % |
| Global X Auto ETF | | | 2 | | | | 100 | % |
| Global X NASDAQ 500 ETF | | | 1 | | | | 100 | % |
| Global X NASDAQ 400 Mid Cap ETF | | | 1 | | | | 100 | % |
Pursuant to the Trust’s organizational documents, the Trustees of the Trust and the Trust’s officers are indemnified against certain liabilities that may arise out of the performance of their duties.
9. LOANS OF PORTFOLIO SECURITIES
The Funds may lend portfolio securities having a market value up to one-third of the Funds’ total assets. Such loans are secured by collateral equal to no less than the market value of the loaned securities determined daily. Such collateral will be cash or debt securities issued or guaranteed by the U.S. Government or any agencies. Cash collateral received in connection with these loans is invested in short-term money market instruments. It is the Funds’ policy to obtain additional collateral from or return excess collateral to the borrower by the end of the next business day, following the valuation date of the securities loaned. Therefore, the value of the collateral held may be temporarily less than the value of the securities on loan. Lending securities entails a risk of loss to the Funds if and to the extent that the market value of the securities loans were to increase and the borrower did not increase the collateral accordingly, and the borrower fails to return the securities. The Funds could also experience delays and costs in gaining access to the collateral. The Funds bear the risk of any deficiency in the amount of the collateral available for return to the borrower due to any loss on the collateral invested. As of April 30, 2012, there were no securities on loan for any of the Funds.
10. CONTRACTUAL OBLIGATIONS
The Funds enter into contracts in the normal course of business that contain a variety of indemnifications. The Funds maximum exposure under these arrangements is unknown. However the Funds have not had prior gains or losses pursuant to these contracts. Management has reviewed the Funds’ existing contracts and expects the risk of loss to be remote.
Notes to Financial Statements (concluded)
April 30, 2012 (unaudited)
11. NEW ACCOUNTING PROUNCEMENTS
In May 2011, the Financial Accounting Standards Board issued Accounting Standards Updates (“ASU”) No. 2011-04 “Amendments to Achieve Common Fair Value Measurement and Disclosure Requirements in U.S. GAAP and International Financial Reporting Standards (“IFRS”).” ASU 2011-04 includes common requirements for measurement of and disclosure about fair value between U.S. GAAP and IFRS.ASU 2011-04 will require reporting entities to disclose the following information for fair value measurements categorized within Level 3 of the fair value hierarchy: quantitative information about the unobservable inputs used in the fair value measurement, the valuation processes used by the reporting entity, and a narrative description of the sensitivity of the fair value measurement to changes in unobservable inputs and the interrelationships between those unobservable inputs. In addition, ASU 2011-04 will require reporting entities to make disclosures about amounts and reasons for all transfers in and out of Level 1 and Level 2 fair value measurements. The new and revised disclosures are effective for interim and annual reporting periods beginning after December 15, 2011. Adoption of ASU 2011-04 will not materially affect the Funds’ financial condition or results of operations.
12. SUBSEQUENT EVENT
The Funds have evaluated the need for additional disclosures and/or adjustments resulting from subsequent events. Based on this evaluation, no additional disclosures or adjustments were required to the financial statements as of the date the financial statements were issued.
Subsequent to half-year end, on May 25, 2012, the Board of Trustees of the Trust (including the Independent Trustees) initially considered and unanimously approved the Investment Advisory Agreement and the Supervision and Administration Agreement for the Global X Top Guru Holdings Index ETF, Global X Top Value Guru Holdings Index ETF, and Global X Top Activist Investor Holdings Index ETF.
Subsequent to half-year end, on May 25, 2012, the Board of Trustees of the Trust determined that it is in the best interest of the Global X S&P/TSX Venture 30 Canada ETF to modify the Fund’s investment objective and strategies and to change the Fund’s name. The Fund will be renamed the Global X Junior Miners ETF and will pursue the investment objective and strategies outlined below. These changes are scheduled to go into effect on or about September 3, 2012.
The Fund currently seeks to provide investment results that correspond generally to the price and yield performance, before fees and expenses, of the S&P/TSX Venture 30 Index. The S&P/TSX Venture 30 Index is a free-float adjusted, modified capitalization-weighted index designed to provide exposure to the 30 most liquid securities on the TSX Venture Exchange. The TSX Venture exchange is Canada’s junior listings market for emerging companies. Currently the Fund is mostly comprised of small-capitalization companies based in Canada that operate within the mining and energy sectors. Upon implementation of the change, the Fund’s new objective will be to provide investment results that correspond generally to the price and yield performance, before fees and expenses, of the Solactive Junior Miners Index. The Solactive Junior Miners Index is designed to track the market performance of small-capitalization mining companies globally, and therefore the geographic scope of the Fund will expand accordingly. The Fund intends to focus its investments on small-capitalization mining companies including those engaged in mining, producing, smelting, and/or refining materials including but not limited to gold, silver, copper, aluminum, titanium and nickel.
Notes to Financial Statements (concluded)
April 30, 2012 (unaudited)
12. SUBSEQUENT EVENT (continued)
This change is intended to position the Fund to benefit from the growth of commodity consumption around the world by investing in companies that are key elements of the commodity supply chain. This change also allows the Fund to diversify its investments geographically, although the change will increase the Fund’s exposure to emerging markets which may increase the risk of the Fund’s investments. These risks will be described in an updated Summary Prospectus and Statutory Prospectus that will be available at the time the changes described herein become effective.
The Fund also expects to gain certain cost efficiencies associated with the change in investment objective, and upon implementation of the change the total annual expense ratio of the Fund will be reduced from 0.75% to 0.69%.
Subsequent to half-year end, the following investment portfolio of the Trust commenced operations.
| Fund Name | | Commenced Operations |
| Global X Top Guru Holdings Index ETF | | 06/04/2012 |
Disclosure of Fund Expenses (unaudited)
All Exchange Traded Funds (“ETF”) have operating expenses. As a shareholder of an ETF, your investment is affected by these ongoing costs, which include (among others) costs for ETF management, administrative services, brokerage fees, and shareholder reports like this one. It is important for you to understand the impact of these costs on your investment returns. In addition, a shareholder is responsible for brokerage fees as a result of their investment in the Fund.
Operating expenses such as these are deducted from an ETF’s gross income and directly reduce your final investment return. These expenses are expressed as a percentage of the ETF’s average net assets; this percentage is known as the ETF’s expense ratio.
The following examples use the expense ratio and are intended to help you understand the ongoing costs (in dollars) of investing in your Fund and to compare these costs with those of other funds. The examples are based on an investment of $1,000 made at the beginning of the period shown and held for the entire period.
The table on the next page illustrates your Fund’s costs in two ways:
Actual Fund Return. This section helps you to estimate the actual expenses that your Fund incurred over the period. The “Expenses Paid During Period” column shows the actual dollar expense cost incurred by a $1,000 investment in the Fund, and the “Ending Account Value” number is derived from deducting that expense cost from the Fund’s gross investment return.
You can use this information, together with the actual amount you invested in the Funds, to estimate the expenses you paid over that period. Simply divide your actual account value by $1,000 to arrive at a ratio (for example, an $8,600 account value divided by $1,000 = 8.6), then multiply that ratio by the number shown for your Funds under “Expenses Paid During Period.”
Hypothetical 5% Return. This section helps you compare your Fund’s costs with those of other funds. It assumes that the Funds had an annual 5% return before expenses during the year, but that the expense ratio (Column 3) for the period is unchanged. This example is useful in making comparisons because the Securities and Exchange Commission requires all funds to make this 5% calculation. You can assess your Fund’s comparative cost by comparing the hypothetical result for your Fund in the “Expense Paid During Period” column with those that appear in the same charts in the shareholder reports for other funds.
NOTE: Because the return is set at 5% for comparison purposes — NOT your Fund’s actual return — the account values shown may not apply to your specific investment.
Disclosure of Fund Expenses (unaudited) (concluded)
| | | Beginning
Account
Value
11/1/2011 | | | Ending
Account
Value
4/30/2012 | | | Annualized
Expense
Ratios | | | Expenses
Paid
During
Period(1) | |
| Global X SuperDividend ETF | | | | | | | | | | | | | | | | |
| Actual Fund Return | | $ | 1,000.00 | | | $ | 1,045.00 | | | | 0.58 | % | | $ | 2.95 | |
| Hypothetical 5% Return | | | 1,000.00 | | | | 1,021.98 | | | | 0.58 | | | | 2.92 | |
| Global X MLP ETF | | | | | | | | | | | | | | | | |
| Actual Fund Return (2) | | $ | 1,000.00 | | | $ | 1,018.70 | | | | 0.45 | % | | $ | 0.14 | |
| Hypothetical 5% Return | | | 1,000.00 | | | | 1,022.63 | | | | 0.45 | | | | 2.26 | |
| Global X Canada Preferred ETF | | | | | | | | | | | | | | | | |
| Actual Fund Return | | $ | 1,000.00 | | | $ | 1,036.30 | | | | 0.58 | % | | $ | 2.94 | |
| Hypothetical 5% Return | | | 1,000.00 | | | | 1,021.98 | | | | 0.58 | | | | 2.92 | |
| Global X Social Media Index ETF | | | | | | | | | | | | | | | | |
| Actual Fund Return (3) | | $ | 1,000.00 | | | $ | 1,028.10 | | | | 0.65 | % | | $ | 3.04 | |
| Hypothetical 5% Return | | | 1,000.00 | | | | 1,021.63 | | | | 0.65 | | | | 3.27 | |
| Global X Auto ETF | | | | | | | | | | | | | | | | |
| Actual Fund Return | | $ | 1,000.00 | | | $ | 1,097.00 | | | | 0.65 | % | | $ | 3.39 | |
| Hypothetical 5% Return | | | 1,000.00 | | | | 1,021.63 | | | | 0.65 | | | | 3.27 | |
| Global X NASDAQ 400 Mid Cap ETF | | | | | | | | | | | | | | | | |
| Actual Fund Return (4) | | $ | 1,000.00 | | | $ | 1,107.20 | | | | 0.48 | % | | $ | 2.05 | |
| Hypothetical 5% Return | | | 1,000.00 | | | | 1,022.48 | | | | 0.48 | | | | 2.41 | |
| Global X NASDAQ 500 ETF | | | | | | | | | | | | | | | | |
| Actual Fund Return (5) | | $ | 1,000.00 | | | $ | 1,157.50 | | | | 0.48 | % | | $ | 2.09 | |
| Hypothetical 5% Return | | | 1,000.00 | | | | 1,022.48 | | | | 0.48 | | | | 2.41 | |
| (1) | Expenses are equal to the Fund’s annualized expense ratio multiplied by the average account value over the period, multiplied 182/366 (to reflect the one-half year period.) |
| (2) | Expenses are equal to the Fund’s annualized expense ratio multiplied by the average account value over the period, multiplied 178/366 (to reflect the period from inception to date.) |
| (3) | Expenses are equal to the Fund’s annualized expense ratio multiplied by the average account value over the period, multiplied 169/366 (to reflect the period from inception to date.) |
| (4) | Expenses are equal to the Fund’s annualized expense ratio multiplied by the average account value over the period, multiplied 148/366 (to reflect the period from inception to date.) |
| (5) | Expenses are equal to the Fund’s annualized expense ratio multiplied by the average account value over the period, multiplied 148/366 (to reflect the period from inception to date.) |
Approval of Investment Advisory Agreement (unaudited) (concluded)
Section 15(c) of the Investment Company Act of 1940, as amended ("1940 Act"), requires that each mutual fund’s board of trustees, including a majority of those trustees who are not "interested persons" of the mutual fund, as defined in the 1940 Act ("Independent Trustees"), consider on an initial basis and periodically thereafter (as required by the 1940 Act), at an in person meeting called for such purpose, the terms of each fund’s investment advisory agreement and approve each agreement with such changes as the Independent Trustees deem appropriate.
At a quarterly Board meeting held on November 11, 2011, the Board of Trustees (including the Independent Trustees) considered and unanimously approved the continuation of (i) the Investment Advisory Agreement ("Renewal Investment Advisory Agreement") for each Fund covered by this Semi-Annual Report (other than the Global X NASDAQ 500 ETF and Global X NASDAQ 400 Mid Cap ETF) (each a "Renewal Fund") and (ii) the Supervision and Administration Agreement between the Trust ("Renewal Supervision and Administration Agreement"), on behalf of each Renewal Fund, and Global X Management Company ("Global X Management"). The Renewal Investment Advisory Agreement and the Renewal Supervision and Administration Agreement are referred to herein as the "Renewal Agreements." At the same meeting, the Board (including the Independent Trustees) also initially considered and unanimously approved (i) the initial Investment Advisory Agreement for the Global X NASDAQ 500 ETF and Global X NASDAQ 400 Mid Cap ETF (each a “New Fund”) and (ii) the Supervision and Administration Agreement between the Trust, on behalf each of each New Fund, and Global X Management. The Investment Advisory Agreements and Supervision and Administration Agreements for each of the New Funds are referred to herein as the “Agreements.”1
At the February 24, 2012 meeting, the Board (including the Independent Trustees) also considered and unanimously approved a decrease in the unitary fee (including the investment advisory fee) (“Management Fee”) for the Global X MLP ETF (“MLP Fund”).2 Because the MLP Fund had not yet commenced operations, the MLP Fund was considered to be and referred to herein as a New Fund. In considering revisions to the MLP Fund’s Investment Advisory Agreement and Supervision and Administration Agreement, the Board took into account the same factors and considerations as it did with respect to the Agreements the other New Funds considered at the meeting.
In advance of the Board meeting, the Board (including the Independent Trustees) requested (in writing) detailed information from Global X Management in connection with their consideration of the Renewal Agreements and the New Fund Agreements and received and reviewed written responses from Global X Management and supporting materials relating to those requests for information.
1 At the November 11, 2011 meeting, the Board (including the Independent Trustees) also initially considered and unanimously approved (i) the initial Investment Advisory Agreement for the Global X NASDAQ 100 Global Technology ETF and Global X Permanent Portfolio ETF and (ii) the Supervision and Administration Agreement between the Trust, on behalf of each fund, and Global X Management.
2 At the February 24, 2012 board meeting, the Board (including the Independent Trustees) also considered and unanimously approved a decrease in the unitary fee (including the investment advisory fee) (“Management Fee”) for the Global X MLP Natural Gas ETF. Also at the February 24, 2012 board meeting, the Board (including the Independent Trustees) also initially considered and unanimously approved (i) the initial Investment Advisory Agreement for the Global X SuperIncome & MLP Index ETF, Global X SuperIncome Preferred ETF, Global X SuperIncome REIT ETF, and Global X Risk Parity ETF, and (ii) the Supervision and Administration Agreement between the Trust, on behalf of each fund, and Global X Management.
Approval of Investment Advisory Agreement (unaudited) (concluded)
In determining to approve the New Fund Agreements and the continuation of the Renewal Agreements for each New Fund or Renewal Fund (as applicable), the Board concluded that the New Fund Agreements and the Renewal Agreements were fair and reasonable and in the best interests of each New Fund or Renewal Fund (as applicable) and its shareholders, respectively. In approving New Fund Agreements and the continuation of the Renewal Agreements for each New Fund or Renewal Fund (as applicable), the Board considered among other things the following categories of material factors. In addition, the Board based their determinations regarding the continuation of each of the Renewal Fund Agreements on their consideration of all of the materials provided to them by Global X Management and each Renewal Fund’s other service providers throughout the year.
In reaching this decision, the Board did not assign relative weights to the factors discussed below nor did the Board deem any one factor or group of them to be controlling in and of themselves. Certain factors considered by the Board (including the Independent Trustees) with respect to the approval of the New Funds Agreements and the continuation of the Renewal Agreements are discussed separately below.
NEW FUNDS AGREEMENTS
Nature, extent and quality of services
With respect to this factor, the Board considered:
· the terms of the New Funds Agreements and the range of services to be provided to the New Funds in accordance with the New Funds Agreements;
· Global X Management’s key personnel and the portfolio managers who would provide investment advisory services to the New Funds;
· Global X Management’s responsibilities under the New Funds Agreements to, among other things, (i) manage the investment operations of each New Funds and the composition of each New Fund’s assets, including the purchase, retention and disposition of its holdings, (ii) provide quarterly reports to the Trust’s officers and Board and other reports as the Board deems necessary or appropriate, (iii) vote proxies, exercise consents, and exercise all other rights appertaining to securities and assets held by each of the New Funds, (iv) select broker-dealers to execute portfolio transactions for each of the New Funds when necessary, (v) assist in the preparation and filing of reports and proxy statements (if any) to the shareholders of each of the New Funds, the periodic updating of the registration statement, prospectuses, statement of additional information, and other reports and documents for each of the New Funds that are required to be filed by the Trust with the Securities and Exchange Commission ("SEC") and other regulatory or governmental bodies, and (vi) monitor anticipated purchases and redemptions of the shares (including creation units) of each of the New Funds by shareholders and new investors;
· the nature, extent and quality of Global X Management’s services (including advisory, administrative and compliance services) provided by or made available to each of the Renewal Funds and that would be made available to each of the New Funds; and
· the quality of Global X Management’s resources and personnel that would be made available to each of the New Funds, including Global X Management’s experience and the professional qualifications of Global X Management’s key personnel.
Approval of Investment Advisory Agreement (unaudited) (concluded)
Based on these considerations, the Board concluded that it was satisfied with the nature, extent and quality of the services to be provided to each of the New Funds.
Performance
The Board determined that because each of the New Funds had not commenced operations, meaningful data relating to investment performance of each New Fund was not available and, therefore, could not be a factor in approving the New Funds Agreements.
Cost of Services and Profitability
With respect to this factor, the Board considered:
· Global X Management’s expected cost to provide investment management, supervision and administrative and related services to each of the New Funds;
· The unitary fee (including the proposed investment advisory fee) ("Management Fee") that was proposed to be borne by each New Fund under the New Fund Agreements for the investment advisory, supervisory and administrative services that each New Fund requires under a unitary fee structure (including the types of fees and expenses that are not included within the unitary fee and would be borne by each New Fund); and
· the expected profitability to Global X Management, if any, from all services to be provided to each of the New Funds and all aspects of the relationship between Global X Management and each of the New Funds. In connection with these considerations, the Board noted that Global X Management advised the Board that it was uncertain whether it would generate any profits from its services to each of the New Funds during the first 12 months of each New Fund’s operations, but expected to generate profits after that initial period.
Based on these considerations, the Board concluded that the profits anticipated to be realized by Global X Management from its relationship with each of the New Funds would not be excessive.
Comparison of Fees and Services
With respect to this factor, the Board considered:
· comparative information with respect to the proposed Management Fee to be paid to Global X Management by each of the New Funds. In connection with this consideration, Global X Management provided the Board with detailed comparative expense data for each of the New Funds, including fees and expenses paid by unaffiliated comparable specialized and/or focused exchange-traded funds and other registered funds as well as the fees and expenses paid by other Funds that are series of the Trust under the same unified Management Fee structure;
· the structure of the proposed unified Management Fee structure (which includes as one component the proposed investment advisory fee for each New Fund) and the expected total expense ratios for each of the New Funds. In this regard, the Board took into consideration that the purpose of adopting a unitary Management Fee structure for the New Funds was to create a simple, all-inclusive fee that would provide a level of predictability with respect to the overall expense ratio (i.e., the total fees) of each of the New Funds and that the proposed Management Fee for each New Fund was set at a competitive fee to make each New Fund viable in the marketplace; and
Approval of Investment Advisory Agreement (unaudited) (concluded)
· that Global X Management would be responsible for most ordinary expenses of the New Funds, including the costs of various third-party services required by the New Funds, including investment advisory, administrative, audit, certain custody, portfolio accounting, legal, transfer agency and printing costs, but that each New Fund would bear other expenses not covered under the proposed all-inclusive Management Fee, such as such as taxes, brokerage fees, commissions, and other transaction expenses, interest expenses, and extraordinary expenses.
Based on these considerations, the Board concluded that the proposed Management Fee and expected total expense ratio of each New Fund should not preclude approval of the New Funds Agreements.
Economies of Scale
With respect to this factor, the Board considered:
· the extent to which economies of scale would be realized as each of the New Funds grows and whether the proposed unitary Management Fee for each New Fund reflected these economies of scale;
· the significant investment of time, personnel and other resources that Global X Management intends to made in each of the New Funds in order to seek to assure that the New Funds are attractive to investors; and
· that the proposed unitary Management Fee would provide a high level of certainty as to the total level of expenses for each of the New Funds and its shareholders.
Based on these considerations, the Board concluded that approval of the proposed Management Fee for each New Fund was reasonable.
Other Benefits
In considering the New Funds Agreement, in addition to the categories discussed above, the Board considered other benefits that may be realized by Global X Management as a result of its relationships with each of the New Funds.
Renewal Agreements
Nature, extent and quality of services
With respect to this factor, the Board considered:
· the terms of the Renewal Agreements and the range of services that would continue to be provided to each Renewal Fund in accordance with the Renewal Agreements;
· Global X Management’s key personnel and the portfolio managers who would continue to provide investment advisory, supervision and administrative services to each Renewal Fund. In connection with these considerations, the Board noted that Global X Management had significantly increased its support staff and operational resources since the inception of each Renewal Fund;
· Global X Management’s responsibilities under the Renewal Agreements, among other things, to: (i) manage the investment operations of each Renewal Fund and the composition of each Renewal Fund’s assets, including the purchase, retention and disposition of its holdings, (ii) provide quarterly reports to the Trust’s officers and Board and other reports as the Board
Approval of Investment Advisory Agreement (unaudited) (concluded)
deems necessary or appropriate, (iii) vote proxies, exercise consents, and exercise all other rights relating to securities and assets held by each Renewal Fund, (iv) select broker- dealers to execute portfolio transactions for each Renewal Fund when necessary, (v) assist in the preparation and filing of reports and proxy statements (if any) to the shareholders of each Renewal Fund, the periodic updating of the registration statement, prospectuses, statement of additional information, and other reports and documents for each Renewal Fund that are required to be filed by the Trust with the SEC and other regulatory and governmental bodies, and (vi) monitor anticipated purchases and redemptions of the shares (including creation units) of each Renewal Fund by shareholders and new investors;
· the nature, extent and quality of the all of the services (including advisory, administrative and compliance services) that have been provided by Global X Management or made available to each Renewal Fund and the adequacy of Global X Management’s personnel resources that would continue to be made available to each Renewal Fund; and
· Global X Management’s experience and the professional qualifications of Global X Management’s key personnel.
Based on these considerations, the Board concluded that it was satisfied with the nature, extent and quality of the services provided to each Renewal Funds by Global X Management.
Performance
With respect to this fact, the Board considered each Renewal Fund’s total return and investment performance relative to (i) the performance of unaffiliated comparable specialized and/or focused exchange-traded funds and other registered funds in the same classification as each of the Renewal Funds, which performance information is publicly available from such registered funds as well as other third party sources; and (ii) the performance of comparable registered funds, pertinent indexes, and pertinent registered fund performance rankings. The Board noted that some of the Renewal Funds had only been in operations for a few months and that some Renewal Funds had not yet commenced operations. The Board observed that, for the Renewal Funds that had not commenced operations, meaningful data relating to investment performance was not available and, therefore, could not be a factor in approving the Renewal Agreements for the non- operational Renewal Funds.
Based on these considerations and comparisons, the Board concluded that the investment performance of each operational Renewal Fund did not adversely affect the Board approval of the continuance of the Renewal Agreements.
Cost of Services and Profitability
The Board considered Global X Management’s cost to provide investment management and related services to each Renewal Fund. In this regard, the Board considered the Management Fee that has been borne by each Renewal Fund under the Renewal Agreements for the various investment advisory, supervisory and administrative services that each Renewal Fund requires under a unitary fee structure (including the types of fees and expenses that are not included within the unitary fee and would be borne by each New Fund).
Approval of Investment Advisory Agreement (unaudited) (concluded)
In addition, the Board considered the current and expected profitability to Global X Management from all services provided to the Renewal Funds and all aspects of Global X Management’s relationship with each of the Renewal Funds. In connection with these considerations, the Global X Management provided the Board with financial information regarding its operations and services to the Renewal Funds and discussed with the Board its current and expected profitability with respect to the Renewal Funds. Global X Management noted that it was likely that it would not generate profits in the upcoming year from its services to certain of the newer or smaller Renewal Funds because of the small amount of assets under management for those Renewal Funds.
Based on these considerations, the Board concluded that the profits anticipated to be realized by Global X Management from its relationship with each of the Renewal Funds would not be excessive and should not preclude approval of the continuance of each Renewal Agreement.
Comparison of Fees and Services
With respect to this factor, the Board considered:
· comparative information with respect to the Management Fee paid to Global X Management by each of the Renewal Funds. In connection with this consideration, Global X Management provided the Board with detailed comparative expense data for each of the Renewal Funds, including fees and expenses paid by unaffiliated comparable specialized and/or focused exchange-traded funds and other comparable registered funds and fees and expenses paid by other funds that are series of the Trust under the same unified Management Fee structure;
· the structure of the unified Management Fee structure (which includes as one component the investment advisory fee for each Renewal Fund) and the current total expense ratios for each of the Renewal Funds. In this regard, the Board took into consideration that the purpose of adopting a unitary Management Fee structure for the Renewal Funds was to create a simple, all-inclusive fee that would provide a level of predictability with respect to the overall expense ratio (i.e., the total fees) of each of the Renewal Funds and that the proposed Management Fee for each Renewal Fund was set at a competitive fee to make each Renewal Fund viable in the marketplace; and
· that Global X Management is responsible for most ordinary expenses of the New Funds, including the costs of various third-party services required by the Funds, including investment advisory, administrative, audit, certain custody, portfolio accounting, legal, transfer agency and printing costs, but that each New Fund would bear other expenses not covered under the proposed all-inclusive Management Fee, such as asset-based custody fees for certain of the Renewal Funds, taxes, brokerage fees, commissions, and other transaction expenses, interest expenses, and extraordinary expenses.
Based on these considerations, the Board concluded that the proposed Management Fee and total expense ratio of each New Fund should not preclude approval of the Renewal Agreements.
Economies of Scale
With respect to this factor, the Board considered:
· the extent to which economies of scale would be realized as the Renewal Funds grow and whether the unitary Management Fee for each Renewal Fund reflected these economies of scale;
· the significant investment of time, personnel and other resources that Global X Management has made and intends to make in the Renewal Funds in order to seek to assure that the Renewal Funds are attractive to investors; and
Approval of Investment Advisory Agreement (unaudited) (concluded)
· that the proposed unitary Management Fee would provide a high level of certainty as to the total level of expenses for the New Funds and their shareholders.
Based on these considerations, the Board concluded that continuation of the unitary Management Fee for each Renewal Fund was reasonable.
Other Benefits
The Board considered any other benefits realized by Global X Management as a result from its relations relationships with each Renewal Fund and concluded that all information it considered supported approval of the continuation of the Renewal Agreements.
Supplemental Information (unaudited)
Net asset value, or “NAV”, is the price per Share at which the Funds issue and redeem Shares. It is calculated in accordance with the standard formula for valuing mutual fund shares. The “Market Price” of the Funds generally is determined using the midpoint between the highest bid and the lowest offer on the stock exchange on which the Shares of the Funds are listed for trading, as of the time that the Funds’ NAV is calculated. The Funds’ Market Price may be at, above or below their NAV. The NAV of the Funds will fluctuate with changes in the market value of their Funds’ holdings. The Market Price of the Funds will fluctuate in accordance with changes in its NAV, as well as market supply and demand.
Premiums or discounts are the differences (expressed as a percentage) between the NAV and Market Price of the Funds on a given day, generally at the time NAV is calculated. A premium is the amount that the Funds are trading above the reported NAV, expressed as a percentage of the NAV. A discount is the amount that the Funds are trading below the reported NAV, expressed as a percentage of the NAV.
The following information shows the frequency distributions of premiums and discounts for the Funds. The information shown is for the full calendar quarter completed after the inception date through the date of the most recent calendar quarter end.
Each line in the table shows the number of trading days in which the Funds traded within the premium/discount range indicated. The number of trading days in each premium/discount range is also shown as a percentage of the total number of trading days in the period covered by each table. All data presented here represents past performance, which cannot be used to predict future results.
Further information regarding premiums and discounts is available on the Funds’ website at GlobalXFunds.com
notice to shareholders (unaudited)
For shareholders that do not have a February 27, 2012 tax year end, this notice is for informational purposes only. For shareholders with a February 27, 2012 tax year end, please consult your tax advisor as to the pertinence of this notice. For the fiscal year ended February 27, 2012, the liquidated Funds have designated the following items with regard to distributions paid during the year.
| | | Long-Term
Capital Gain
Distributions | | | Ordinary
Income
Distributions | | | Total
Distributions | | | Qualifying
for
Corporate
Dividends
Received
Deduction (1) | | | Qualifying
Dividend
Income (2) | | | Interest
Related
Dividends (3) | | | Short Term
Capital
Gain
Dividends(4) | |
| Global X Farming ETF | | | 0.00 | % | | | 100.00 | % | | | 100.00 | % | | | 2.01 | % | | | 42.76 | % | | | 0.00 | % | | | 100.00 | % |
| Global X Fishing ETF | | | 0.00 | % | | | 100.00 | % | | | 100.00 | % | | | 0.00 | % | | | 59.08 | % | | | 0.00 | % | | | 0.00 | % |
| Global X Food ETF | | | 0.00 | % | | | 100.00 | % | | | 100.00 | % | | | 9.77 | % | | | 30.47 | % | | | 0.00 | % | | | 100.00 | % |
| Global X Waste Management ETF | | | 0.00 | % | | | 100.00 | % | | | 100.00 | % | | | 29.19 | % | | | 81.71 | % | | | 0.00 | % | | | 0.00 | % |
(1) Qualifying dividends represent dividends which qualify for the corporate dividends received deduction and is reflected as a percentage of ordinary income distributions (the total of short term capital gain and net investment income distributions).
(2) The percentage in this column represents the amount of "Qualifying Dividend Income" as created by the Jobs and Growth Relief Reconciliation Act of 2003 and is reflected as a percentage of ordinary income distributions (the total of short term capital gain and net investment income distributions). It is the intention of each of the aforementioned funds to designate the maximum amount permitted by law.
(3) The percentage in this column represents the amount of "Interest Related Dividends" as created by the American Jobs Creation Act of 2004 and is reflected as a percentage of net investment income distributions that is exempt from U.S. withholding tax when paid for foreign investors.
(4) The percentage in this column represents the amount of "Short-Term Capital Gain Dividends" as created by the American Jobs Creation Act of 2004 and is reflected as a percentage of short-term capital gain distributions that is exempt from U.S. withholding tax when paid to foreign investors.
For the short period ended February 27, 2012, the Funds designate all distributions in the short period as ordinary income distributions
On February 27, 2012, the Funds paid per share income distributions to the shareholders of record on February 21, 2012:
| | | Net Investment Income | |
| Global X Waste Management ETF | | | 0.0159 | |
Notes
Notes
399 Park Ave, 32nd floor
New York, NY 10022
1-888-GXFund-1
(1-888-493-8631)
www.globalxfunds.com
Investment Adviser:
Global X Management Company LLC
399 Park Avenue, 32nd floor
New York, NY 10022
Distributor:
SEI Investments Distribution Co.
One Freedom Valley Drive
Oaks, PA 19456
Sub-Administrator:
SEI Investments Global Funds Services
One Freedom Valley Drive
Oaks, PA 19456
Counsel for the Independent Trustees:
Dechert LLP
1175 I Street N.W.
Washington, DC 20007
This information must be preceded or accompanied by a current prospectus for the Funds described.
Item 2. Code of Ethics.
Not applicable for semi-annual report.
Item 3. Audit Committee Financial Expert.
Not applicable for semi-annual report.
Item 4. Principal Accountant Fees and Services.
Not applicable for semi-annual report.
Item 5. Audit Committee of Listed Registrants.
Not applicable to open-end management investment companies.
Item 6. Schedule of Investments.
Not applicable.
Item 7. Disclosure of Proxy Voting Policies and Procedures for Closed-End Management Investment Companies.
Not applicable to open-end management investment companies.
Item 8. Portfolio Managers of Closed-End Management Investment Companies.
Not applicable to open-end management investment companies.
Item 9. Purchases of Equity Securities by Closed-End Management Company and Affiliated Purchasers.
Not applicable to open-end management investment companies.
Item 10. Submission of Matters to a Vote of Security Holders.
There have been no material changes.
Item 11. Controls and Procedures.
(a) The certifying officers, whose certifications are included herewith, have evaluated the registrant’s disclosure controls and procedures within 90 days of the filing date of this report. In their opinion, based on their evaluation, the registrant’s disclosure controls and procedures are adequately designed, and are operating effectively to ensure, that information required to be disclosed by the registrant in the reports it files or submits under the Securities Exchange Act of 1934 is recorded, processed, summarized and reported within the time periods specified in the Securities and Exchange Commission’s rules and forms.
(b) There were no significant changes in the registrant’s internal control over financial reporting that occurred during the registrant’s last fiscal half-year that has materially affected, or is reasonably likely to materially affect, the registrants internal control over financial reporting.
Items 12. Exhibits.
(a)(1) Not applicable for semi-annual report.
(a)(2) A separate certification for the principal executive officer and the principal financial officer of the registrant as required by Rule 30a-2(a) under the Investment Company Act of 1940, as amended (17 CFR 270.30a-2(a)), are filed herewith.
(b) Officer certifications as required by Rule 30a-2(b) under the Investment Company Act of 1940, as amended (17 CFR 270.30a-2(b)) also accompany this filing as an Exhibit.
SIGNATURES
Pursuant to the requirements of the Securities Exchange Act of 1934 and the Investment Company Act of 1940, the registrant has duly caused this report to be signed on its behalf by the undersigned, thereunto duly authorized.
| (Registrant) | The Global X Funds |
| | |
| | |
| By (Signature and Title)* | /s/ Bruno del Ama |
| | Bruno del Ama |
| | President |
Date: July 6, 2012
Pursuant to the requirements of the Securities Exchange Act of 1934 and the Investment Company Act of 1940, this report has been signed below by the following persons on behalf of the registrant and in the capacities and on the dates indicated.
| By (Signature and Title)* | /s/ Bruno del Ama |
| | Bruno del Ama |
| | President |
Date: July 6, 2012
| By (Signature and Title)* | /s/ Jose C. Gonzalez |
| Jose C. Gonzalez |
| CFO |
Date: July 6, 2012
* Print the name and title of each signing officer under his or her signature.