UNITED STATES
SECURITIES AND EXCHANGE COMMISSION
Washington, D.C. 20549
________
FORM N-CSRS
________
CERTIFIED SHAREHOLDER REPORT OF REGISTERED MANAGEMENT
INVESTMENT COMPANIES
Investment Company Act file number 811-22209
Global X Funds
(Exact name of registrant as specified in charter)
________
623 Fifth Avenue, 15th Floor
New York, NY 10022
(Address of principal executive offices) (Zip code)
Bruno del Ama
Global X Management Company LLC
623 Fifth Avenue, 15th Floor
New York, NY 10022
(Name and address of agent for service)
Registrant’s telephone number, including area code: (212) 644-6440
Date of fiscal year end: June 30, 2013
Date of reporting period: December 31, 2012
Item 1. Reports to Stockholders.
Global X Permanent ETF (ticker: PERM)
Global X Top Guru Holdings Index ETF (ticker: GURU)
Global X SuperIncome Preferred ETF (ticker: SPFF)
Semi Annual Report
December 31, 2012
Table of Contents
| |
| Schedules of Investments |
| |
| Global X Permanent ETF | 1 |
| | |
| Global X Top Guru Holdings Index ETF | 6 |
| | |
| Global X SuperIncome Preferred ETF | 9 |
| | |
| Statements of Assets and Liabilities | 12 |
| | |
| Statements of Operations | 13 |
| | |
| Statements of Changes in Net Assets | 14 |
| | |
| Financial Highlights | 16 |
| | |
| Notes to Financial Statements | 17 |
| | |
| Disclosure of Fund Expenses | 26 |
| | |
| Approval of Investment Advisory Agreement | 28 |
| | |
| Supplemental Information | 31 |
The Funds file their complete schedules of Fund holdings with the Securities and Exchange Commission (the “Commission”) for the first and third quarters of each fiscal year on Form N-Q within sixty days after the end of the period. The Funds’ Forms N-Q are available on the Commission’s website at http://www.sec.gov, and may be reviewed and copied at the Commission's Public Reference Room in Washington, DC. Information on the operation of the Public Reference Room may be obtained by calling 1-800-SEC-0330.
A description of the policies and procedures that Global X Funds uses to determine how to vote proxies relating to Fund securities, as well as information relating to how the Funds voted proxies relating to Fund securities during the most recent 12-month period ended June 30, will be available (i) without charge, upon request, by calling 1-888-GXFund-1; and (ii) on the Commission’s website at http://www.sec.gov.
|
| Schedule of Investments | December 31, 2012 (Unaudited) |
| | |
Global X Permanent ETF |
Sector Weightings †:
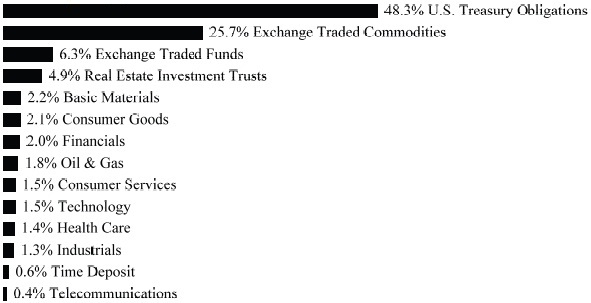
† Percentages based on total investments.
| | | Face Amount/ | | | | |
| | | Shares | | | Value | |
| U.S. TREASURY OBLIGATIONS — 48.3% | | | | | | | | |
| U.S. Treasury Bonds | | | | | | | | |
| 4.625%, 02/15/40 | | $ | 612,000 | | | $ | 826,870 | |
| 4.375%, 05/15/40 | | | 625,000 | | | | 813,574 | |
| 4.375%, 11/15/39 | | | 640,000 | | | | 832,600 | |
| 3.875%, 08/15/40 | | | 694,000 | | | | 834,101 | |
| U.S. Treasury Notes | | | | | | | | |
| 2.625%, 12/31/14 | | | 801,000 | | | | 838,798 | |
| 2.500%, 03/31/15 | | | 804,000 | | | | 843,949 | |
| 2.375%, 02/28/15 | | | 809,000 | | | | 845,405 | |
| 2.125%, 11/30/14 | | | 821,000 | | | | 850,120 | |
| TOTAL U.S. TREASURY OBLIGATIONS | | | | | | | | |
| (Cost $6,554,227) | | | | | | | 6,685,417 | |
| EXCHANGE TRADED COMMODITIES — 25.7% | | | | | | | | |
| ETFS Physical Gold | | | 8,921 | | | | 1,447,254 | |
| ETFS Physical Silver | | | 25,215 | | | | 735,272 | |
| Gold Bullion Securities | | | 8,601 | | | | 1,378,611 | |
| (Cost $3,719,423) | | | | | | | 3,561,137 | |
| COMMON STOCK — 19.1% | | | | | | | | |
| AUSTRALIA—0.4% | | | | | | | | |
| Basic Materials — 0.4% | | | | | | | | |
| BHP Billiton ADR | | | 614 | | | | 48,162 | |
| BRAZIL—0.6% | | | | | | | | |
| Basic Materials — 0.3% | | | | | | | | |
| Vale ADR, Cl B | | | 2,006 | | | | 42,046 | |
The accompanying notes are an integral part of the financial statements.
|
| Schedule of Investments | December 31, 2012 (Unaudited) |
| | |
Global X Permanent ETF |
| | | Shares | | | Value | |
| COMMON STOCK — continued | | | | | | | | |
| | | | | | | | | |
| Oil & Gas — 0.3% | | | | | | | | |
| Petroleo Brasileiro ADR | | | 2,129 | | | $ | 41,452 | |
| TOTAL BRAZIL | | | | | | | 83,498 | |
| CANADA—0.3% | | | | | | | | |
| Basic Materials — 0.3% | | | | | | | | |
| Potash Corp of Saskatchewan | | | 963 | | | | 39,184 | |
| CHINA—0.3% | | | | | | | | |
| Oil & Gas — 0.3% | | | | | | | | |
| PetroChina ADR | | | 316 | | | | 45,435 | |
| NETHERLANDS—0.3% | | | | | | | | |
| Oil & Gas — 0.3% | | | | | | | | |
| Royal Dutch Shell ADR, Cl A | | | 671 | | | | 46,265 | |
| SINGAPORE—0.3% | | | | | | | | |
| Consumer Goods — 0.3% | | | | | | | | |
| Wilmar International | | | 14,013 | | | | 38,319 | |
| SWITZERLAND—0.3% | | | | | | | | |
| Basic Materials — 0.3% | | | | | | | | |
| Xstrata | | | 2,665 | | | | 45,864 | |
| UNITED KINGDOM— 0.6% | | | | | | | | |
| Basic Materials — 0.6% | | | | | | | | |
| Anglo American | | | 1,089 | | | | 33,519 | |
| Rio Tinto ADR | | | 838 | | | | 48,679 | |
| TOTAL UNITED KINGDOM | | | | | | | 82,198 | |
| UNITED STATES— 16.0% | | | | | | | | |
| Basic Materials — 0.3% | | | | | | | | |
| Mosaic | | | 812 | | | | 45,984 | |
| Consumer Goods — 1.8% | | | | | | | | |
| Altria Group | | | 715 | | | | 22,465 | |
| Archer-Daniels-Midland | | | 1,540 | | | | 42,181 | |
| Coca-Cola | | | 733 | | | | 26,571 | |
| Kraft Foods Group | | | 215 | | | | 9,776 | |
| Mondelez International, Cl A | | | 648 | | | | 16,505 | |
| Monsanto | | | 551 | | | | 52,152 | |
| PepsiCo | | | 379 | | | | 25,935 | |
| Philip Morris International | | | 334 | | | | 27,936 | |
| Procter & Gamble | | | 386 | | | | 26,206 | |
| | | | | | | | 249,727 | |
| Consumer Services — 1.5% | | | | | | | | |
| Amazon.com * | | | 106 | | | | 26,621 | |
| Comcast, Cl A | | | 761 | | | | 28,446 | |
The accompanying notes are an integral part of the financial statements.
|
| Schedule of Investments | December 31, 2012 (Unaudited) |
| | |
Global X Permanent ETF |
| | | Shares | | | Value | |
| COMMON STOCK — continued | | | | | | | | |
| | | | | | | | | |
| Consumer Services — continued | | | | | | | | |
| CVS Caremark | | | 600 | | | $ | 29,010 | |
| eBay * | | | 459 | | | | 23,418 | |
| Home Depot | | | 461 | | | | 28,513 | |
| McDonald's | | | 251 | | | | 22,140 | |
| Wal-Mart Stores | | | 412 | | | | 28,111 | |
| Walt Disney | | | 506 | | | | 25,194 | |
| | | | | | | | 211,453 | |
| Financials — 2.0% | | | | | | | | |
| American Express | | | 419 | | | | 24,084 | |
| American International Group * | | | 597 | | | | 21,074 | |
| Bank of America | | | 2,970 | | | | 34,452 | |
| Berkshire Hathaway, Cl B * | | | 312 | | | | 27,987 | |
| Citigroup | | | 801 | | | | 31,687 | |
| JPMorgan Chase | | | 671 | | | | 29,504 | |
| Mastercard, Cl A | | | 45 | | | | 22,108 | |
| US Bancorp | | | 891 | | | | 28,458 | |
| Visa, Cl A | | | 197 | | | | 29,861 | |
| Wells Fargo | | | 855 | | | | 29,224 | |
| | | | | | | | 278,439 | |
| Health Care — 1.4% | | | | | | | | |
| Abbott Laboratories | | | 457 | | | | 29,933 | |
| Amgen | | | 365 | | | | 31,507 | |
| Bristol-Myers Squibb | | | 778 | | | | 25,355 | |
| Johnson & Johnson | | | 375 | | | | 26,288 | |
| Merck | | | 643 | | | | 26,324 | |
| Pfizer | | | 1,163 | | | | 29,168 | |
| UnitedHealth Group | | | 492 | | | | 26,686 | |
| | | | | | | | 195,261 | |
| Industrials — 1.3% | | | | | | | | |
| 3M | | | 287 | | | | 26,648 | |
| Boeing | | | 328 | | | | 24,718 | |
| Caterpillar | | | 212 | | | | 18,991 | |
| General Electric | | | 1,319 | | | | 27,686 | |
| Union Pacific | | | 221 | | | | 27,784 | |
| United Parcel Service, Cl B | | | 321 | | | | 23,667 | |
| United Technologies | | | 318 | | | | 26,079 | |
| | | | | | | | 175,573 | |
| Oil & Gas — 0.9% | | | | | | | | |
| Chevron | | | 439 | | | | 47,473 | |
| Exxon Mobil | | | 538 | | | | 46,564 | |
| Schlumberger | | | 315 | | | | 21,826 | |
| | | | | | | | 115,863 | |
The accompanying notes are an integral part of the financial statements.
|
| Schedule of Investments | December 31, 2012 (Unaudited) |
| | |
Global X Permanent ETF |
| | | Shares/ | | | | |
| | | Face Amount | | | Value | |
| COMMON STOCK — continued | | | | | | |
| | | | | | | | | |
| Real Estate Investment Trusts — 4.9% | | | | | | | | |
| American Tower, Cl A | | | 903 | | | $ | 69,775 | |
| Annaly Capital Management | | | 4,126 | | | | 57,929 | |
| Boston Properties | | | 671 | | | | 70,998 | |
| Equity Residential | | | 1,162 | | | | 65,851 | |
| General Growth Properties | | | 3,486 | | | | 69,197 | |
| HCP | | | 1,550 | | | | 70,029 | |
| Public Storage | | | 498 | | | | 72,190 | |
| Simon Property Group | | | 406 | | | | 64,185 | |
| Ventas | | | 1,082 | | | | 70,027 | |
| Vornado Realty Trust | | | 860 | | | | 68,869 | |
| | | | | | | | 679,050 | |
| | | | | | | | | |
| Technology — 1.5% | | | | | | | | |
| Apple | | | 33 | | | | 17,590 | |
| Cisco Systems | | | 1,244 | | | | 24,445 | |
| EMC * | | | 752 | | | | 19,026 | |
| Google, Cl A * | | | 44 | | | | 31,212 | |
| Intel | | | 922 | | | | 19,021 | |
| International Business Machines | | | 131 | | | | 25,093 | |
| Microsoft | | | 837 | | | | 22,373 | |
| Oracle | | | 858 | | | | 28,588 | |
| QUALCOMM | | | 414 | | | | 25,676 | |
| | | | | | | | 213,024 | |
| | | | | | | | | |
| Telecommunications — 0.4% | | | | | | | | |
| AT&T | | | 692 | | | | 23,328 | |
| Verizon Communications | | | 671 | | | | 29,034 | |
| | | | | | | | 52,362 | |
| TOTAL UNITED STATES | | | | | | | 2,216,736 | |
| TOTAL COMMON STOCK | | | | | | | |
| (Cost $2,576,679) | | | | | | | 2,645,661 | |
| | | | | | | | | |
| EXCHANGE TRADED FUNDS — 6.3% | | | | | | | | |
| Vanguard FTSE All-World ex-US ETF | | | 9,838 | | | | 450,088 | |
| Vanguard Small-Cap ETF | | | 5,295 | | | | 428,366 | |
| TOTAL EXCHANGE TRADED FUNDS | | | | | | | | |
| (Cost $839,344) | | | | | | | 878,454 | |
| TIME DEPOSIT — 0.6% | | | | | | | | |
| Brown Brothers Harriman, 0.031%, 01/02/13 | | | | | | | | |
| (Cost $83,323) | | $ | 83,323 | | | | 83,323 | |
| | | | | | | | | |
| TOTAL INVESTMENTS — 100.0% | | | | | | | | |
| (Cost $13,772,996) | | | | | | $ | 13,853,992 | |
Percentages are based on Net Assets of $13,850,007.
The accompanying notes are an integral part of the financial statements.
|
| Schedule of Investments | December 31, 2012 (Unaudited) |
| | |
Global X Permanent ETF |
| * | Non-income producing security. |
ADR — American Depositary Receipt
Cl — Class
ETF — Exchange Traded Fund
FTSE — Financial Times and London Stock Exchange
The following is a summary of the inputs used as of December 31, 2012, in valuing the Fund's investments carried at value:
| Investments in Securities | | Level 1 | | | Level 2 | | | Level 3 | | | Total | |
| U.S. Treasury Obligations | | $ | — | | | $ | 6,685,417 | | | $ | — | | | $ | 6,685,417 | |
| Exchange Traded Commodities | | | 3,561,137 | | | | — | | | | — | | | | 3,561,137 | |
| Common Stock | | | 2,645,661 | | | | — | | | | — | | | | 2,645,661 | |
| Exchange Traded Funds | | | 878,454 | | | | — | | | | — | | | | 878,454 | |
| Time Deposit | | | — | | | | 83,323 | | | | — | | | | 83,323 | |
| Total Investments in Securities | | $ | 7,085,252 | | | $ | 6,768,740 | | | $ | — | | | $ | 13,853,992 | |
For the period ended December 31, 2012, there have been no transfers between Level 1 & Level 2 investments or Level 2 & Level 3 investments.
For the period ended December 31, 2012, there were no Level 3 investments.
The accompanying notes are an integral part of the financial statements.
|
| Schedule of Investments | December 31, 2012 (Unaudited) |
| | |
Global X Top Guru Holdings Index ETF |
Sector Weightings †:
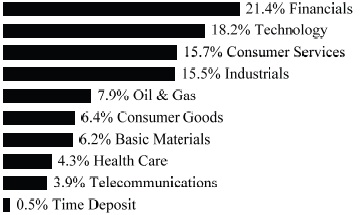
† Percentages based on total investments.
| | | Shares | | | Value | |
| COMMON STOCK — 99.8% | | | | | | | | |
| | | | | | | | | |
| BRAZIL—2.1% | | | | | | | | |
| Consumer Goods — 2.1% | | | | | | | | |
| Cosan, Cl A | | | 2,142 | | | $ | 37,078 | |
| CANADA—4.2% | | | | | | | | |
| Basic Materials — 1.9% | | | | | | | | |
| Agrium | | | 329 | | | | 32,870 | |
| Industrials — 2.3% | | | | | | | | |
| Canadian Pacific Railway | | | 392 | | | | 39,835 | |
| TOTAL CANADA | | | | | | | 72,705 | |
| MEXICO—1.8% | | | | | | | | |
| Telecommunications — 1.8% | | | | | | | | |
| America Movil ADR, Ser L | | | 1,377 | | | | 31,864 | |
| RUSSIA—1.8% | | | | | | | | |
| Technology — 1.8% | | | | | | | | |
| Yandex, Cl A * | | | 1,491 | | | | 32,161 | |
| UNITED KINGDOM— 1.9% | | | | | | | | |
| Oil & Gas — 1.9% | | | | | | | | |
| BP ADR | | | 803 | | | | 33,437 | |
| UNITED STATES— 88.0% | | | | | | | | |
| Basic Materials — 4.3% | | | | | | | | |
| Celanese, Cl A | | | 916 | | | | 40,790 | |
| Cytec Industries | | | 495 | | | | 34,071 | |
| | | | | | | | 74,861 | |
| Consumer Goods — 4.3% | | | | | | | | |
| Delphi Automotive * | | | 1,099 | | | | 42,037 | |
| Kraft Foods Group | | | 726 | | | | 33,011 | |
| | | | | | | | 75,048 | |
The accompanying notes are an integral part of the financial statements.
|
| Schedule of Investments | December 31, 2012 (Unaudited) |
| | |
Global X Top Guru Holdings Index ETF |
| | | Shares | | | Value | |
| COMMON STOCK — continued | | | | | | |
| | | | | | | | | |
| Consumer Services — 15.8% | | | | | | | | |
| Cumulus Media, Cl A * | | | 15,838 | | | $ | 42,287 | |
| Education Management * | | | 11,320 | | | | 49,582 | |
| GameStop, Cl A | | | 1,382 | | | | 34,674 | |
| Liberty Media, Cl A * | | | 312 | | | | 36,195 | |
| News, Cl A | | | 1,381 | | | | 35,271 | |
| News, Cl B | | | 1,355 | | | | 35,555 | |
| Pandora Media * | | | 4,504 | | | | 41,347 | |
| | | | | | | | 274,911 | |
| Financials — 21.5% | | | | | | | | |
| American International Group * | | | 1,012 | | | | 35,724 | |
| CBRE Group, Cl A * | | | 2,018 | | | | 40,158 | |
| CIT Group * | | | 877 | | | | 33,887 | |
| Fidelity National Financial, Cl A | | | 1,573 | | | | 37,044 | |
| Hartford Financial Services Group | | | 1,735 | | | | 38,933 | |
| Hudson Pacific Properties | | | 1,922 | | | | 40,478 | |
| JPMorgan Chase | | | 893 | | | | 39,265 | |
| MBIA * | | | 4,659 | | | | 36,573 | |
| Nationstar Mortgage Holdings * | | | 1,265 | | | | 39,190 | |
| SLM | | | 1,929 | | | | 33,044 | |
| | | | | | | | 374,296 | |
| Health Care — 4.3% | | | | | | | | |
| Life Technologies * | | | 688 | | | | 33,767 | |
| Vivus * | | | 3,138 | | | | 42,112 | |
| | | | | | | | 75,879 | |
| Industrials — 13.2% | | | | | | | | |
| Lockheed Martin | | | 367 | | | | 33,870 | |
| Nortek * | | | 574 | | | | 38,027 | |
| Owens-Illinois | | | 1,714 | | | | 36,457 | |
| Quad | | | 2,299 | | | | 46,877 | |
| Sensata Technologies Holding * | | | 1,139 | | | | 36,995 | |
| Spirit Aerosystems Holdings, Cl A * | | | 2,299 | | | | 39,014 | |
| | | | | | | | 231,240 | |
| Oil & Gas — 6.0% | | | | | | | | |
| Energy Transfer Equity | | | 733 | | | | 33,337 | |
| Pioneer Natural Resources | | | 312 | | | | 33,256 | |
| Targa Resources | | | 726 | | | | 38,362 | |
| | | | | | | | 104,955 | |
| Technology — 16.5% | | | | | | | | |
| Allscripts Healthcare Solutions * | | | 2,599 | | | | 24,483 | |
| Apple | | | 61 | | | | 32,515 | |
| Google, Cl A * | | | 50 | | | | 35,468 | |
The accompanying notes are an integral part of the financial statements.
|
| Schedule of Investments | December 31, 2012 (Unaudited) |
| | |
Global X Top Guru Holdings Index ETF |
| | | Shares/ | | | | |
| | | Face Amount | | | Value | |
| COMMON STOCK — continued | | | | | | |
| | | | | | | | | |
| Technology — continued | | | | | | | | |
| Magnachip Semiconductor * | | | 2,983 | | | $ | 47,489 | |
| Microsoft | | | 1,210 | | | | 32,343 | |
| Motorola Solutions | | | 668 | | | | 37,194 | |
| NXP Semiconductor * | | | 1,420 | | | | 37,446 | |
| Yahoo! * | | | 1,978 | | | | 39,362 | |
| | | | | | | | 286,300 | |
| | | | | | | | | |
| Telecommunications — 2.1% | | | | | | | | |
| Crown Castle International * | | | 494 | | | | 35,647 | |
| TOTAL UNITED STATES | | | | | | | 1,533,137 | |
| TOTAL COMMON STOCK | | | | | | | | |
| (Cost $1,541,150) | | | | | | | 1,740,382 | |
| | | | | | | | | |
| TIME DEPOSIT — 0.5% | | | | | | | | |
| Brown Brothers Harriman, 0.031%, 01/02/13 | | | | | | | | |
| (Cost $7,995) | | $ | 7,995 | | | | 7,995 | |
| TOTAL INVESTMENTS — 100.3% | | | | | | | | |
| (Cost $1,549,145) | | | | | | $ | 1,748,377 | |
Percentages are based on Net Assets of $1,743,389.
| * | Non-income producing security. |
ADR — American Depositary Receipt
Cl — Class
Ser — Series
The following is a summary of the inputs used as of December 31, 2012, in valuing the Fund's investments carried at value:
| Investments in Securities | | Level 1 | | | Level 2 | | | Level 3 | | | Total | |
| Common Stock | | $ | 1,740,382 | | | $ | — | | | $ | — | | | $ | 1,740,382 | |
| Time Deposit | | | — | | | | 7,995 | | | | — | | | | 7,995 | |
| Total Investments in Securities | | $ | 1,740,382 | | | $ | 7,995 | | | $ | — | | | $ | 1,748,377 | |
For the period ended December 31, 2012, there have been no transfers between Level 1 & Level 2 investments or Level 2 & Level 3 investments.
For the period ended December 31, 2012, there were no Level 3 investments.
The accompanying notes are an integral part of the financial statements.
|
| Schedule of Investments | December 31, 2012 (Unaudited) |
| | |
Global X SuperIncome Preferred ETF |
Sector Weightings †:
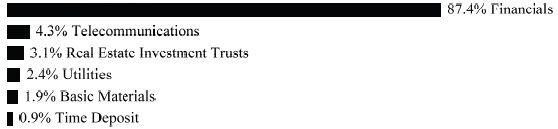
† Percentages based on total investments.
| | | Shares | | | Value | |
| PREFERRED STOCK — 99.8% | | | | | | |
| | | | | | | |
| UNITED STATES— 99.8% | | | | | | |
| Basic Materials — 2.0% | | | | | | |
| AngloGold Ashanti Holdings Finance, 6.000% | | | 3,929 | | | $ | 146,827 | |
| Financials — 88.0% | | | | | | | | |
| Aegon, 8.000% | | | 3,530 | | | | 98,769 | |
| Aegon, 7.250% | | | 7,289 | | | | 182,735 | |
| Aegon, 6.875% | | | 3,791 | | | | 94,775 | |
| Ally Financial, 8.500% | | | 3,176 | | | | 83,434 | |
| Ally Financial, 7.375% | | | 2,927 | | | | 72,824 | |
| American International Group, 7.700% | | | 10,654 | | | | 270,612 | |
| Annaly Capital Management, 7.625% | | | 2,939 | | | | 73,769 | |
| Annaly Capital Management, 7.500% | | | 4,506 | | | | 112,064 | |
| Aviva, 8.250% | | | 3,900 | | | | 108,420 | |
| Bank of America, 8.625% | | | 5,847 | | | | 149,449 | |
| Bank of America, 8.200% | | | 6,551 | | | | 167,706 | |
| Bank of America, 7.250% | | | 2,167 | | | | 54,977 | |
| Barclays Bank, 8.125% | | | 7,394 | | | | 188,029 | |
| Barclays Bank, 7.750% | | | 3,277 | | | | 82,515 | |
| Barclays Bank, 7.100% | | | 3,907 | | | | 97,909 | |
| Citigroup Capital VII, 7.125% | | | 3,001 | | | | 76,165 | |
| Citigroup Capital VIII, 6.950% | | | 3,656 | | | | 92,095 | |
| Citigroup Capital XIII, 7.875% | | | 7,371 | | | | 205,651 | |
| Credit Suisse, 7.900% | | | 14,419 | | | | 365,666 | |
| Deutsche Bank Capital Funding Trust X, 7.350% | | | 2,746 | | | | 68,842 | |
| Deutsche Bank Contingent Capital Trust III, 7.600% | | | 6,666 | | | | 179,582 | |
| Deutsche Bank Contingent Capital Trust V, 8.050% | | | 4,541 | | | | 124,015 | |
| First Niagara Financial Group, 8.625% | | | 3,460 | | | | 98,437 | |
| GMAC Capital Trust I, 8.125% | | | 8,615 | | | | 229,590 | |
| Hartford Financial Services Group, 7.875% | | | 5,735 | | | | 164,652 | |
| Hartford Financial Services Group, 7.250% | | | 5,358 | | | | 110,643 | |
| Hatteras Financial, 7.625% | | | 2,797 | | | | 69,841 | |
| HSBC Holdings, 8.125% | | | 5,059 | | | | 128,347 | |
The accompanying notes are an integral part of the financial statements.
|
| Schedule of Investments | December 31, 2012 (Unaudited) |
| | |
Global X SuperIncome Preferred ETF |
| | | Shares/ | | | | |
| | | Face Amount | | | Value | |
| PREFERRED STOCK — continued | | | | | | |
| | | | | | | |
| Financials — continued | | | | | | | | |
| HSBC Holdings, 8.000% | | | 8,688 | | | $ | 239,441 | |
| ING Groep, 8.500% | | | 6,905 | | | | 176,699 | |
| ING Groep, 7.375% | | | 4,958 | | | | 123,900 | |
| ING Groep, 7.050% | | | 2,729 | | | | 68,252 | |
| JPMorgan Chase Capital X, 7.000% | | | 5,093 | | | | 129,973 | |
| JPMorgan Chase, 8.625% | | | 9,208 | | | | 239,132 | |
| Lloyds Banking Group, 7.750% | | | 8,335 | | | | 228,546 | |
| Prudential Financial, 9.000% | | | 8,967 | | | | 231,528 | |
| Royal Bank of Scotland Group, 7.250% | | | 8,759 | | | | 209,428 | |
| Royal Bank of Scotland Group, 6.750% | | | 3,463 | | | | 79,649 | |
| Royal Bank of Scotland Group, 6.600% | | | 4,447 | | | | 102,281 | |
| Santander Finance Preferred SAU, 10.500% | | | 8,066 | | | | 217,540 | |
| Wachovia Preferred Funding, 7.250% | | | 7,307 | | | | 192,978 | |
| Wells Fargo, 8.000% | | | 7,458 | | | | 218,892 | |
| Wells Fargo Capital XII, 7.875% | | | 5,702 | | | | 144,432 | |
| Zions Bancorporation, 9.500% | | | 7,696 | | | | 199,172 | |
| | | | | | | | 6,553,356 | |
| | | | | | | | | |
| Real Estate Investment Trusts — 3.1% | | | | | | | | |
| CBL & Associates Properties, 7.375% | | | 4,442 | | | | 111,272 | |
| Vornado Realty, 7.875% | | | 4,450 | | | | 120,506 | |
| | | | | | | | 231,778 | |
| | | | | | | | | |
| Telecommunications — 4.3% | | | | | | | | |
| Qwest, 7.500% | | | 5,519 | | | | 148,847 | |
| Qwest, 7.375% | | | 6,360 | | | | 170,512 | |
| | | | | | | | 319,359 | |
| | | | | | | | | |
| Utilities — 2.4% | | | | | | | | |
| Dominion Resources, 8.375% | | | 6,750 | | | | 181,777 | |
| TOTAL UNITED STATES | | | | | | | 7,433,097 | |
| TOTAL PREFERRED STOCK | | | | | | | | |
| (Cost $7,476,477) | | | | | | | 7,433,097 | |
| | | | | | | | | |
| TIME DEPOSIT — 0.9% | | | | | | | | |
| Brown Brothers Harriman, 0.031%, 01/02/13 | | | | | | | | |
| (Cost $65,190) | | $ | 65,190 | | | | 65,190 | |
| | | | | | | | | |
| TOTAL INVESTMENTS — 100.7% | | | | | | | | |
| (Cost $7,541,667) | | | | | | $ | 7,498,287 | |
Percentages are based on Net Assets of $7,444,461.
The accompanying notes are an integral part of the financial statements.
|
| Schedule of Investments | December 31, 2012 (Unaudited) |
| | |
Global X SuperIncome Preferred ETF |
The following is a summary of the inputs used as of December 31, 2012, in valuing the Fund's investments carried at value:
| Investments in Securities | | Level 1 | | | Level 2 | | | Level 3 | | | Total | |
| Preferred Stock | | $ | 7,433,097 | | | $ | — | | | $ | — | | | $ | 7,433,097 | |
| Time Deposit | | | — | | | | 65,190 | | | | — | | | | 65,190 | |
| Total Investments in Securities | | $ | 7,433,097 | | | $ | 65,190 | | | $ | — | | | $ | 7,498,287 | |
For the period ended December 31, 2012, there have been no transfers between Level 1 & Level 2 investments or Level 2 & Level 3 investments.
For the period ended December 31, 2012, there were no Level 3 investments.
The accompanying notes are an integral part of the financial statements.
| |
Statements of Assets and Liabilities December 31, 2012 (Unaudited) |
| | | | | | Global X Top Guru | | | Global X | |
| | | Global X | | | Holdings Index | | | SuperIncome | |
| | | Permanent ETF | | | ETF | | | Preferred ETF | |
| Assets: | | | | | | | | | | | | |
| Cost of Investments | | $ | 13,772,996 | | | $ | 1,549,145 | | | $ | 7,541,667 | |
| Cost of Foreign Currency | | | 415 | | | | — | | | | — | |
| Investments at Value | | $ | 13,853,992 | | | $ | 1,748,377 | | | $ | 7,498,287 | |
| Foreign Currency at Value | | | 426 | | | | — | | | | — | |
| Receivable for Investment Securities Sold | | | 68,746 | | | | 93,155 | | | | 10,491 | |
| Dividend and Interest Receivable | | | 46,992 | | | | 1,019 | | | | 16,666 | |
| Reclaim Receivable | | | 66 | | | | — | | | | — | |
| Total Assets | | | 13,970,222 | | | | 1,842,551 | | | | 7,525,444 | |
| | | | | | | | | | | | | |
| Liabilities: | | | | | | | | | | | | |
| Payable for Income Distributions | | | 114,514 | | | | 20,046 | | | | 71,050 | |
| Payable due to Investment Adviser | | | 5,701 | | | | 1,132 | | | | 3,350 | |
| Payable for Capital Gains Distributions | | | — | | | | 77,984 | | | | 6,583 | |
| Total Liabilities | | | 120,215 | | | | 99,162 | | | | 80,983 | |
| Net Assets | | $ | 13,850,007 | | | $ | 1,743,389 | | | $ | 7,444,461 | |
| | | | | | | | | | | | | |
| Net Assets Consist of: | | | | | | | | | | | | |
| Paid-in Capital | | $ | 13,662,500 | | | $ | 1,074,500 | | | $ | 7,505,000 | |
| Distributions in Excess of Net Investment Income | | | (2,195 | ) | | | (818 | ) | | | (13,948 | ) |
| Accumulated Net Realized Gain (Loss) on Investments and Foreign Currency Transactions | | | 108,694 | | | | 470,475 | | | | (3,211 | ) |
| Net Unrealized Appreciation (Depreciation) on Investments | | | 80,996 | | | | 199,232 | | | | (43,380 | ) |
| Net Unrealized Appreciation on Foreign Currency Transactions | | | 12 | | | | — | | | | — | |
| Net Assets | | $ | 13,850,007 | | | $ | 1,743,389 | | | $ | 7,444,461 | |
| | | | | | | | | | | | |
| Outstanding Shares of Beneficial Interest (unlimited authorization — no par value) | | | 550,000 | | | | 100,000 | | | | 500,000 | |
| | | | | | | | | | | | | |
| Net Asset Value, Offering and Redemption Price Per Share | | $ | 25.18 | | | $ | 17.43 | | | $ | 14.89 | |
The accompanying notes are an integral part of the financial statements.
| |
Statements of Operations For the period ended December 31, 2012 (Unaudited) |
| | | | | | Global X Top | | | Global X | |
| | | Global X | | | Guru | | | SuperIncome | |
| | | Permanent | | | Holdings | | | Preferred | |
| | | ETF | | | Index ETF | | | ETF(1) | |
| Investment Income: | | | | | | | | | | | | |
| Dividend Income | | $ | 52,378 | | | $ | 23,584 | | | $ | 168,381 | |
| Interest Income | | | 50,258 | | | | 2 | | | | 3,032 | |
| Less: Foreign Taxes Withheld | | | (245 | ) | | | (100 | ) | | | (654 | ) |
| Total Investment Income | | | 102,391 | | | | 23,486 | | | | 170,759 | |
| Supervision and Administration Fees(2) | | | 30,922 | | | | 11,271 | | | | 11,629 | |
| Total Expenses | | | 30,922 | | | | 11,271 | | | | 11,629 | |
| | | | | | | | | | | | | |
| Net Investment Income | | | 71,469 | | | | 12,215 | | | | 159,130 | |
| | | | | | | | | | | | | |
| Net Realized Gain on: | | | | | | | | | | | | |
| Investments | | | 123,747 | | | | 544,545 | | | | 3,372 | |
| Foreign Currency Transactions | | | 118 | | | | — | | | | — | |
| | | | | | | | | | | | | |
| Net Realized Gain on Investments and Foreign Currency Transactions | | | 123,865 | | | | 544,545 | | | | 3,372 | |
| | | | | | | | | | | | | |
| Net Change in Unrealized Appreciation (Depreciation) on: | | | | | | | | | | | | |
| Investments | | | 130,108 | | | | (93,125 | ) | | | (43,380 | ) |
| Foreign Currency Transactions | | | 12 | | | | — | | | | — | |
| | | | | | | | | | | | | |
| Net Change in Unrealized Appreciation (Depreciation) on Investments and Foreign Currency Transactions | | | 130,120 | | | | (93,125 | ) | | | (43,380 | ) |
| | | | | | | | | | | | | |
| Net Realized and Unrealized Gain (Loss) on Investments and Foreign Currency Transactions | | | 253,985 | | | | 451,420 | | | | (40,008 | ) |
| | | | | | | | | | | | | |
| Net Increase in Net Assets Resulting from Operations | | $ | 325,454 | | | $ | 463,635 | | | $ | 119,122 | |
| (1) | The Fund commenced operations on July 16, 2012. |
| (2) | The Supervision and Administration fees reflect the supervisory and administrative fee, which includes fees paid by the Funds for the investment advisory services provided by the Adviser. See Note 3 in Notes to Financial Statements. |
The accompanying notes are an integral part of the financial statements.
| |
Statements of Changes in Net Assets |
| | | | | | | | | Global X Top Guru Holdings | |
| | | Global X Permanent ETF | | | Index ETF | |
| | | | Period Ended | | | | | | | | Period Ended | | | | | |
| | | | December 31, | | | | | | | | December 31, | | | | | |
| | | | 2012 | | | | Period Ended | | | | 2012 | | | | Period Ended | |
| | | | (Unaudited) | | | | June 30, 2012(1) | | | | (Unaudited) | | | | June 30, 2012(2) | |
| Operations: | | | | | | | | | | | | | | | | |
| Net Investment Income | | $ | 71,469 | | | $ | 36,536 | | | $ | 12,215 | | | $ | 7,013 | |
| Net Realized Gain (Loss) on Investments and Foreign | | | | | | | | | | | | | | | | |
| Currency Transactions | | | 123,865 | | | | (10,857 | ) | | | 544,545 | | | | 3,914 | |
| Net Change in Unrealized Appreciation | | | | | | | | | | | | | | | | |
| (Depreciation) on Investments and Foreign Currency | | | | | | | | | | | | | | | | |
| Transactions | | | 130,120 | | | | (49,112 | ) | | | (93,125 | ) | | | 292,357 | |
| | | | | | | | | | | | | | | | | |
| Net Increase (Decrease) in Net Assets Resulting | | | | | | | | | | | | | | | | |
| from Operations | | | 325,454 | | | | (23,433 | ) | | | 463,635 | | | | 303,284 | |
| | | | | | | | | | | | | | | | | |
| Dividends and Distributions: | | | | | | | | | | | | | | | | |
| Net Investment Income | | | (114,514 | ) | | | — | | | | (20,046 | ) | | | — | |
| Net Capital Gains | | | — | | | | — | | | | (77,984 | ) | | | — | |
| Total Dividends and Distributions | | | (114,514 | ) | | | — | | | | (98,030 | ) | | | — | |
| | | | | | | | | | | | | | | | | |
| Capital Share Transactions: | | | | | | | | | | | | | | | | |
| Issued | | | 3,830,000 | | | | 14,882,500 | | | | 1,719,500 | | | | 5,236,000 | |
| Redeemed | | | (5,050,000 | ) | | | — | | | | (5,881,000 | ) | | | — | |
| | | | | | | | | | | | | | | | | |
| Increase (Decrease) in Net Assets from Capital | | | | | | | | | | | | | | | | |
| Share Transactions | | | (1,220,000 | ) | | | 14,882,500 | | | | (4,161,500 | ) | | | 5,236,000 | |
| Total Increase (Decrease) in Net Assets | | | (1,009,060 | ) | | | 14,859,067 | | | | (3,795,895 | ) | | | 5,539,284 | |
| Net Assets: | | | | | | | | | | | | | | | | |
| Beginning of Period | | | 14,859,067 | | | | — | | | | 5,539,284 | | | | — | |
| End of Period | | $ | 13,850,007 | | | $ | 14,859,067 | | | $ | 1,743,389 | | | $ | 5,539,284 | |
| | | | | | | | | | | | | | | | | |
| Undistributed (Distributions in Excess of) Net | | | | | | | | | | | | | | | | |
| Investment Income | | $ | (2,195 | ) | | $ | 40,850 | | | $ | (818 | ) | | $ | 7,013 | |
| | | | | | | | | | | | | | | | | |
| Share Transactions: | | | | | | | | | | | | | | | | |
| Issued | | | 150,000 | | | | 600,000 | | | | 100,000 | | | | 350,000 | |
| Redeemed | | | (200,000 | ) | | | — | | | | (350,000 | ) | | | — | |
| | | | | | | | | | | | | | | | | |
| Net Increase (Decrease) in Shares Outstanding from | | | | | | | | | | | | | | | | |
| Share Transactions | | | (50,000 | ) | | | 600,000 | | | | (250,000 | ) | | | 350,000 | |
| (1) | The Fund commenced operations on February 7, 2012. |
| (2) | The Fund commenced operations on June 4, 2012. |
The accompanying notes are an integral part of the financial statements.
| |
Statements of Changes in Net Assets |
| | | | Global X | |
| | | | SuperIncome | |
| | | | Preferred ETF | |
| | | | Period Ended | |
| | | | December 31, | |
| | | | 2012(1) | |
| | | | (Unaudited) | |
| Operations: | | | | |
| Net Investment Income | | $ | 159,130 | |
| Net Realized Gain on Investments | | | 3,372 | |
| Net Change in Unrealized Depreciation on Investments | | | (43,380 | ) |
| | | | | |
| Net Increase in Net Assets Resulting from Operations | | | 119,122 | |
| | | | | |
| Dividends and Distributions: | | | | |
| Net Investment Income | | | (173,078 | ) |
| Net Capital Gains | | | (6,583 | ) |
| Total Dividends and Distributions | | | (179,661 | ) |
| | | | | |
| Capital Share Transactions: | | | | |
| Issued | | | 8,263,500 | |
| Redeemed | | | (758,500 | ) |
| | | | | |
| Increase in Net Assets from Capital Share Transactions | | | 7,505,000 | |
| Total Increase in Net Assets | | | 7,444,461 | |
| Net Assets: | | | | |
| Beginning of Period | | | — | |
| End of Period | | $ | 7,444,461 | |
| Distributions in Excess of Net Investment Income | | $ | (13,948 | ) |
| | | | | |
| Share Transactions: | | | | |
| Issued | | | 550,000 | |
| Redeemed | | | (50,000 | ) |
| | | | | |
| Net Increase in Shares Outstanding from Share Transactions | | | 500,000 | |
| (1) | The Fund commenced operations on July 16, 2012. |
The accompanying notes are an integral part of the financial statements.
| |
Financial Highlights |
Selected Per Share Data & Ratios
For a Share Outstanding Throughout the Period
| | | | | | | Net Realized | | | | | | | | | | | | | | | | | | | | | |
| | | | | | | and | | | | | | | | | | | | | | | | | | | | | |
| | | | | | | Unrealized | | | | | | | | | | | | | | | | | | | | | |
| | | | | | | Gain (Loss) | | | | | | | | | | | | | | | | Ratio of | | Ratio of | | | |
| | | | | | | on | | | | | | | | | | Net | | | | | | Expenses | | Net | | | |
| | | Net Asset | | | | Investments | | | | | | | | | | Asset | | | | Net | | to | | Investment | | | |
| | | Value, | | Net | | and Foreign | | | | Distribution | | Distribution | | | | Value, | | | | Assets | | Average | | Income to | | | |
| | | Beginning | | Investment | | Currency | | Total from | | from Net | | from | | Total from | | End of | | Total | | End of | | Net | | Average | | Portfolio | |
| | | of Period | | Income | | Transactions | | Operations | | Investment | | Capital | | Distributions | | Period | | Return | | Period | | Assets | | Net Assets | | Turnover | |
| | ($) | | ($)* | | ($) | | ($) | | Income ($) | | Gains ($) | | ($) | | ($) | | (%)** | | ($)(000) | | (%) | | (%) | | | (%)†† | |
| Global X Permanent ETF 2012 | | | | | | | | | | | | | | | | | | | | | | | | | | | | | | | | | | |
| (Unaudited) | 24 .77 | | | 0 .14 | | | 0 .48 | | | 0 .62 | | | (0 .21) | | | �� | | | (0 .21) | | | 25 .18 | | | 2 .49 | | | 13,850 | | | 0 .48† | | | 1 .11† | | | 18 .43 | |
| 2012(1) | | | 25 .04 | | | 0 .09 | | | (0 .36) | | | (0 .27) | | | — | | | — | | | — | | | 24 .77 | | | (1 .08) | | | 14,859 | | | 0 .48† | | | 0 .92† | | | 14 .89 | |
| Global X Top Guru Holdings Index ETF 2012 | | | | | | | | | | | | | | | | | | | | | | | | | | | | | | | | |
| (Unaudited) | 15 .83 | | | 0 .07 | | | 2 .51 | | | 2 .58 | | | (0 .20) | | | (0 .78) | | | (0 .98) | | | 17 .43 | | | 16 .38 | | | 1,743 | | | 0 .75† | | | 0 .81† | | | 63 .03 | |
| 2012(2) | | | 14 .96 | | | 0 .02 | | | 0 .85 | | | 0 .87 | | | — | | | — | | | — | | | 15 .83 | | | 5 .82 | | | 5,539 | | | 0 .75† | | | 1 .90† | | | 1 .90 | |
| Global X SuperIncome Preferred ETF 2012(3) | | | | | | | | | | | | | | | | | | | | | | | | | | | | | | | | |
| (Unaudited) | 15 .02 | | | 0 .55 | | | (0 .08) | | | 0 .47 | | | (0 .59) | | | (0 .01) | | | (0 .60) | | | 14 .89 | | | 3 .16 | | | 7,444 | | | 0 .58† | | | 7 .91† | | | 34 .11 | |
| (1) | The Fund commenced operations on February 7, 2012. |
| (2) | The Fund commenced operations on June 4, 2012. |
| (3) | The Fund commenced operations on July 16, 2012. |
| * | Per share data calculated using average shares method. |
| ** | Total return is based on the change in net asset value of a share during the year or period and assumes reinvestment of dividends and distributions at net asset value. Total Return is for the period indicated and has not been annualized. The return shown does not reflect the deduction of taxes that a shareholder would pay on Fund distributions or the redemption of Fund shares. |
| †† | Portfolio turnover rate is for the period indicated and has not been annualized. Excludes effect of in-kind transfers. |
Amounts designated as “—” are either $0 or have been rounded to $0.
The accompanying notes are an integral part of the financial statements.
| |
Notes to Financial Statements December 31, 2012 (Unaudited) |
1. ORGANIZATION
The Global X Funds (the "Trust") is a Delaware Statutory Trust formed on March 6, 2008. The Trust is registered under the Investment Company Act of 1940, as amended, as an open-end management investment company with eighty-nine portfolios (thirty-one of which were operational) as of December 31, 2012. The financial statements herein and the related notes pertain to the Global X Permanent ETF, Global X Top Guru Holdings Index ETF and Global X SuperIncome Preferred ETF (each a “Fund”, collectively, the “Funds”). Each Fund is non-diversified.
2. SIGNIFICANT ACCOUNTING POLICIES
The following is a summary of the significant accounting policies followed by the Funds.
USE OF ESTIMATES -- The preparation of financial statements in conformity with U.S. generally accepted accounting principles ("U.S. GAAP") requires management to make estimates and assumptions that affect the reported amounts of assets and liabilities and disclosure of contingent assets and liabilities at the date of the financial statements and the reported amounts of increases and decreases in net assets from operations during the reporting period. Actual results could differ from those estimates, and could have a material impact to the Funds.
SECURITY VALUATION -- Securities listed on a securities exchange, market or automated quotation system for which quotations are readily available (except for securities traded on NASDAQ), including securities traded over the counter, are valued at the last quoted sale price on the primary exchange or market (foreign or domestic) on which they are traded (or at approximately 4:00 pm if a security’s primary exchange is normally open at that time), or, if there is no such reported sale, at the most recent mean between the quoted bid and asked prices (absent both bid and asked prices on such exchange, the bid price may be used).
For securities traded on NASDAQ, the NASDAQ Official Closing Price will be used. If available, debt securities are priced based upon valuations provided by independent, third-party pricing agents. Such values generally reflect the last reported sales price if the security is actively traded. The third-party pricing agents may also value debt securities at an evaluated bid price by employing methodologies that utilize actual market transactions, broker-supplied valuations, or other methodologies designed to identify the market value for such securities. Debt obligations with remaining maturities of sixty days or less may be valued at their amortized cost, which approximates market value. The prices for foreign securities are reported in local currency and converted to U.S. dollars using currency exchange rates. Prices for most securities held in the Funds are provided daily by recognized independent pricing agents. If a security price cannot be obtained from an independent, third-party pricing agent, the Funds seek to obtain a bid price from at least one independent broker.
| |
Notes to Financial Statements (CONTINUED) December 31, 2012 (Unaudited) |
2. SIGNIFICANT ACCOUNTING POLICIES (continued)
SECURITY VALUATION (continued)
Securities for which market prices are not "readily available" are valued in accordance with Fair Value Procedures established by the Board of Trustees (the “Board”). The Funds’ Fair Value Procedures are implemented through a Fair Value Committee (the “Committee”) designated by the Board. Some of the more common reasons that may necessitate that a security be valued using Fair Value Procedures include: the security's trading has been halted or suspended; the security has been de-listed from its primary trading exchange; the security's primary trading market is temporarily closed at a time when under normal conditions it would be open; the security has not been traded for an extended period of time; the security's primary pricing source is not able or willing to provide a price; or trading of the security is subject to local government-imposed restrictions. In addition, the Funds may fair value their securities if an event that may materially affect the value of the Funds’ securities that traded outside of the United States (a “Significant Event”) has occurred between the time of the security's last close and the time that the Funds calculate their net asset value. A Significant Event may relate to a single issuer or to an entire market sector. Events that may be Significant Events include: government actions, natural disasters, armed conflict, acts of terrorism and significant market fluctuations. If Global X Management Company LLC (“Adviser”) becomes aware of a Significant Event that has occurred with respect to a security or group of securities after the closing of the exchange or market on which the security or securities principally trade, but before the time at which the Funds calculate net asset value, it may request that a Committee meeting be called. When a security is valued in accordance with the Fair Value Procedures, the Committee will determine the value after taking into consideration all relevant information reasonably available to the Committee. As of December 31, 2012, there were no securities priced using the Fair Value Procedures.
In accordance with the authoritative guidance on fair value measurements and disclosure under U.S. GAAP, the Funds disclose the fair value of their investments in a hierarchy that prioritizes the inputs to valuation techniques used to measure the fair value. The objective of a fair value measurement is to determine the price that would be received to sell an asset or paid to transfer a liability in an orderly transaction between market participants at the measurement date (an exit price). Accordingly, the fair value hierarchy gives the highest priority to quoted prices (unadjusted) in active markets for identical assets or liabilities (Level 1) and the lowest priority to unobservable inputs (Level 3). The three levels of the fair value hierarchy are described below:
Level 1 – Unadjusted quoted prices in active markets for identical, unrestricted assets or liabilities that the Funds have the ability to access at the measurement date
Level 2 – Other significant observable inputs (including quoted prices for similar investments, fair value of investments for which the Funds have the ability to fully redeem tranches at net asset value as of the measurement date or within the near-term, and short-term investments valued at amortized cost)
Level 3 – Significant unobservable inputs (including the Funds own assumptions in determining the fair value of investments, fair value of investments for which the Funds do not have the ability to fully redeem tranches at net asset value as of the measurement date or within the near-term)
| |
Notes to Financial Statements (CONTINUED) December 31, 2012 (Unaudited) |
2. SIGNIFICANT ACCOUNTING POLICIES (continued)
SECURITY VALUATION (concluded)
Investments are classified within the level of the lowest significant input considered in determining fair value. Investments classified within Level 3 whose fair value measurement considers several inputs may include Level 1 or Level 2 inputs as components of the overall fair value measurement.
For the period ended December 31, 2012, there have been no significant changes to the Funds’ fair valuation methodologies.
In May 2011, the Financial Accounting Standards Board issued Accounting Standards Updates (“ASU”) No. 2011-04, “Amendments to Achieve Common Fair Value Measurement and Disclosure Requirements in U.S. GAAP and International Financial Reporting Standards” (“IFRS”) (“ASU 2011-04”). ASU 2011-04 includes common requirements for measurement of and disclosure about fair value between U.S. GAAP and IFRS. ASU 2011-04 requires reporting entities to disclose the following information for fair value measurements categorized within Level 3 of the fair value hierarchy: quantitative information about the unobservable inputs used in the fair value measurement, the valuation processes used by the reporting entity, and a narrative description of the sensitivity of the fair value measurement to changes in unobservable inputs and the interrelationships between those unobservable inputs. In addition, ASU 2011-04 requires reporting entities to make disclosures about amounts and reasons for all transfers in and out of Level 1 and Level 2 fair value measurements. Adoption of ASU 2011-04 did not materially affect the Funds’ financial condition or results of operations.
FEDERAL INCOME TAXES -- It is each Fund’s intention to qualify or continue to qualify as a regulated investment company for Federal income tax purposes by complying with the appropriate provisions of Subchapter M of the Internal Revenue Code of 1986, as amended. Accordingly, no provisions for Federal income taxes have been made in the financial statements.
The Funds evaluate tax positions taken or expected to be taken in the course of preparing the Funds’ tax returns to determine whether it is " more-likely-than-not" (i.e., greater than 50 percent) that each tax position will be sustained upon examination by a taxing authority based on the technical merits of the position. Tax positions not deemed to meet the more-likely-than-not threshold are recorded as a tax benefit or expense in the current year. The Funds did not record any tax provisions in the current period. However, management’s conclusions regarding tax positions may be subject to review and adjustment at a later date based on factors including, but not limited to, examination by tax authorities (i.e., the last three tax year ends, as applicable), on-going analysis of and changes to tax laws, regulations and interpretations thereof.
As of and during the period ended December 31, 2012, the Funds did not have a liability for any unrecognized tax benefits. The Funds recognize interest and penalties, if any, related to unrecognized tax benefits as income tax expense in the Statement of Operations. During the period, the Funds did not incur any interest or penalties.
| |
Notes to Financial Statements (CONTINUED) December 31, 2012 (Unaudited) |
2. SIGNIFICANT ACCOUNTING POLICIES (continued)
SECURITY TRANSACTIONS AND INVESTMENT INCOME -- Security transactions are accounted for on the trade date for financial reporting purposes. Costs used in determining realized gains and losses on the sale of investment securities are based on specific identification. Dividend income is recorded on the ex-dividend date. Interest income is recognized on the accrual basis from the settlement date.
FOREIGN CURRENCY TRANSLATION -- The books and records of the Funds are maintained in U.S. dollars. Investment securities and other assets and liabilities denominated in a foreign currency are translated into U.S. dollars on the date of valuation. Purchases and sales of investment securities, income and expenses are translated into U.S. dollars at the relevant rates of exchange prevailing on the respective dates of such transactions. The Funds do not isolate that portion of realized or unrealized gains and losses resulting from changes in the foreign exchange rate from fluctuations arising from changes in the market prices of the securities. These gains and losses are included in net realized and unrealized gains and losses on investments on the Statement of Operations. Net realized and unrealized gains and losses on foreign currency transactions represent net foreign exchange gains or losses from foreign currency exchange contracts, disposition of foreign currencies, currency gains or losses realized between trade and settlement dates on securities transactions and the difference between the amount of the investment income and foreign withholding taxes recorded on the Funds’ books and the U.S. dollar equivalent amounts actually received or paid.
DIVIDENDS AND DISTRIBUTIONS TO SHAREHOLDERS -- The Funds distribute their net investment income on a pro rata basis. Any net realized capital gains are distributed annually. All distributions are recorded on the ex-dividend date.
CREATION UNITS -- The Funds issue and redeem shares (“Shares”) at Net Asset Value (“NAV”), and only in large blocks of Shares (each block of Shares for a Fund is called a “Creation Unit” or multiples thereof). Purchasers of Creation Units (“Authorized Participants”) at NAV must pay a standard creation transaction fee per transaction (“Transaction Fee”). The fee is a single charge and will be the same regardless of the number of Creation Units purchased by an investor on the same day. An Authorized Participant who holds Creation Units and wishes to redeem at NAV would also pay a standard Redemption Fee per transaction on the date of such redemption, regardless of the number of Creation Units redeemed that day.
If a Creation Unit is purchased or redeemed for cash, a higher Transaction Fee will be charged. The following table discloses Creation Unit breakdown:
| | | Creation | | | | | | | | | | |
| | | Unit | | | Transaction | | | | | | Redemption | |
| | | Shares | | | Fee | | | Value | | | Fee | |
| Global X Permanent ETF | | | 50,000 | | | $ | 1,000 | | | $ | 1,259,000 | | | $ | 1,000 | |
| Global X Top Guru Holdings Index ETF | | | 50,000 | | | | 750 | | | | 871,500 | | | | 750 | |
| Global X SuperIncome Preferred ETF | | | 50,000 | | | | 500 | | | | 744,500 | | | | 500 | |
| |
Notes to Financial Statements (CONTINUED) December 31, 2012 (Unaudited) |
3. RELATED PARTY TRANSACTIONS
The Adviser serves as the investment adviser and the administrator for the Funds. Subject to the supervision of the Board of Trustees, the Adviser is responsible for managing the investment activities of the Funds and the Funds’ business affairs and other administrative matters and provides or causes to be furnished all supervisory, administrative and other services reasonably necessary for the operation of the Funds, including certain distribution services (provided pursuant to a separate Distribution Agreement), certain shareholder and distribution-related services (provided pursuant to a separate Rule 12b-1 Plan and related agreements) and investment advisory services (provided pursuant to a separate Investment Advisory Agreement), under what is essentially an "all-in" fee structure. For its service to the Funds, under the Supervision and Administration Agreement, each Fund pays a monthly fee to the Adviser at the annual rate (stated as a percentage of the average daily net assets of the Fund). In addition, the Funds bear other expenses that are not covered by the Supervision and Administration Agreement, which may vary and affect the total expense ratios of the Funds, such as taxes, brokerage fees, commissions, acquired fund fees, and other transaction expenses, interest expenses and extraordinary expenses (such as litigation and indemnification expenses).
| | Supervision and |
| | Administration Fee |
| Global X Permanent ETF | 0.48% |
| Global X Top Guru Holdings Index ETF | 0.75% |
| Global X SuperIncome Preferred ETF | 0.58% |
SEI Investments Global Funds Services (“SEIGFS”) serves as Sub-Administrator to the Funds pursuant to a Sub-Administration Agreement. As Sub-Administrator, SEIGFS provides the Funds with the required general administrative services, including, without limitation: office space, equipment, and personnel; clerical and general back office services; bookkeeping, internal accounting and secretarial services; the calculation of NAV; and assistance with the preparation and filing of reports, registration statements, proxy statements and other materials required to be filed or furnished by the Funds under federal and state securities laws. As compensation for these services, the Sub-Administrator receives certain out-of-pocket costs, transaction fees and asset-based fees which are accrued daily and paid monthly by the Adviser.
SEI Investments Distribution Co. (“SIDCO”) serves as each Fund’s underwriter and distributor of Shares pursuant to a Distribution Agreement. Under the Distribution Agreement, SIDCO, as agent, receives orders to create and redeem Shares in Creation Unit Aggregations and transmits such orders to the Trust’s custodian and transfer agent. The Distributor has no obligation to sell any specific quantity of Fund Shares. SIDCO bears the following costs and expenses relating to the distribution of Shares: (i) the costs of processing and maintaining records of creations of Creation Units; (ii) all costs of maintaining the records required of a registered broker/dealer; (iii) the expenses of maintaining its registration or qualification as a dealer or broker under Federal or state laws; (iv) filing fees; and (v) all other expenses incurred in connection with the distribution services as contemplated in the Distribution Agreement. SIDCO receives no fee for its distribution services under the Distribution Agreement.
| |
Notes to Financial Statements (CONTINUED) December 31, 2012 (Unaudited) |
4. INVESTMENT TRANSACTIONS
For the period ended December 31, 2012, the purchases and sales of investments in securities excluding in-kind transactions, long-term U.S. Government and short-term securities were:
| | | | | | Sales and | |
| | | Purchases | | | Maturities | |
| Global X Permanent ETF | | $ | 9,760,051 | | | $ | 2,140,263 | |
| Global X Top Guru Holdings Index ETF | | | 1,690,701 | | | | 2,786,807 | |
| Global X SuperIncome Preferred ETF | | | 1,489,904 | | | | 1,518,807 | |
For the period ended December 31, 2012, in-kind transactions associated with creations and redemptions were:
| | | | | | Sales and | | | Realized | |
| | | Purchases | | | Maturities | | | Gain/loss | |
| Global X Permanent ETF | | $ | 10,611,076 | | | $ | 4,592,852 | | | $ | 123,591 | |
| Global X Top Guru Holdings Index ETF | | | 6,848,925 | | | | 4,759,266 | | | | 535,141 | |
| Global X SuperIncome Preferred ETF | | | 8,256,619 | | | | 754,389 | | | | 6,163 | |
5. TAX INFORMATION
The amount and character of income and capital gain distributions to be paid, if any, are determined in accordance with Federal income tax regulations, which may differ from U.S. GAAP. As a result investment income (loss) and net realized gain (loss) on investment transactions for a reporting period may differ significantly from distributions during such period. These book/tax differences may be temporary or permanent. To the extent these differences are permanent in nature, they are charged or credited to undistributed net investment income (loss), accumulated net realized gain (loss) or paid-in capital, as appropriate, in the period that the differences arise.
There were no distributiovns from the Funds during the period ended June 30, 2012.
As of June 30, 2012, the components of tax basis distributable earnings (accumulated losses) were as follows:
| | | Global X Funds | |
| | | Global X | | | Global X Top | |
| | | Permanent | | | Guru Holdings | |
| | | ETF | | | Index ETF | |
| Undistributed Ordinary Income | | $ | 50,594 | | | $ | 10,927 | |
| Post October losses | | | (9,941 | ) | | | – | |
| Unrealized Appreciation (Depreciation) on Investments and Foreign Currency | | | (64,086 | ) | | | 292,357 | |
| Total Distributable Earnings (Accumulated Losses) | | $ | (23,433 | ) | | $ | 303,284 | |
| |
Notes to Financial Statements (CONTINUED) December 31, 2012 (Unaudited) |
5. TAX INFORMATION (continued)
Under the recently enacted Regulated Investment Company Modernization Act of 2010, the Funds will be permitted to carry forward capital losses incurred in taxable years beginning after December 22, 2010 for an unlimited period. Post-enactment capital losses that are carried forward will retain their character as either short-term or long-term capital losses rather than being considered all short-term as under previous law. As of December 31, 2012, the Funds had no capital loss carryforwards.
The Federal tax cost and aggregated gross unrealized appreciation and depreciation on investments held by the Funds at December 31, 2012, were as follows:
| | | | | | Aggregated | | | Aggregated | | | Net | |
| | | | | | Gross | | | Gross | | | Unrealized | |
| | | Federal | | | Unrealized | | | Unrealized | | | Appreciation | |
| Global X Funds | | Tax Cost | | | Appreciation | | | Depreciation | | | (Depreciation) | |
| Global X Permanent ETF | | $ | 13,772,996 | | | $ | 323,880 | | | $ | (242,884 | ) | | $ | 80,996 | |
| Global X Top Guru Holdings Index ETF | | | 1,549,145 | | | | 225,346 | | | | (26,114 | ) | | | 199,232 | |
| Global X SuperIncome Preferred ETF | | | 7,541,667 | | | | 41,487 | | | | (84,867 | ) | | | (43,380 | ) |
6. CONCENTRATION OF RISKS
The Funds invest in securities of foreign issuers in several countries. These investments may involve certain considerations and risks not typically associated with investments in the U.S. as a result of, among other factors, the possibility of future political and economic developments and the level of governmental supervision and regulation of securities markets in the respective countries.
The securities markets of emerging countries are less liquid and subject to greater price volatility, and have a smaller market capitalization, than the U.S. securities markets. In certain countries, there may be fewer publicly traded securities and the market may be dominated by a few issuers or sectors. Issuers and securities markets in such countries are not subject to as extensive and frequent accounting, financial and other reporting requirements or as comprehensive government regulations as are issuers and securities markets in the U.S. In particular, the assets and profits appearing on the financial statements of emerging country issuers may not reflect their financial position or results of operations in the same manner as financial statements for U.S. issuers. Substantially less information may be publicly available about emerging country issuers than is available about issuers in the U.S.
The Funds may be subject to taxes imposed by countries in which they invest. Such taxes are generally based on either income or gains earned or repatriated. The Funds accrue and apply such taxes to net investment income, net realized gains and net unrealized gains as income and/or capital gains are earned.
| |
Notes to Financial Statements (CONTINUED) December 31, 2012 (Unaudited) |
6. CONCENTRATION OF RISKS (continued)
The Global X Permanent ETF may hold Exchange Traded Commodities (“ETC”) to gain exposure to gold and silver. As a result, the Fund is subject to the same risks as the underlying ETCs. While the risks of owning shares of an underlying ETC generally reflect the risks of owning the underlying commodities the ETC is designed to track, lack of liquidity in an underlying ETC can result in its value being more volatile than the underlying portfolio securities. The Fund will pay brokerage commissions in connection with the purchase and sale of shares of ETCs. ETCs that invest in commodities may be, or may become, subject to regulatory trading limits that could hurt the value of their securities and could affect the Fund’s ability to pursue its investment program. Additionally, ETCs are not registered under the Investment Company of 1940 Act and, therefore, are not subject to the regulatory scheme and investor protections of the Investment Company Act of 1940.
The Funds use a replication strategy. A replication strategy is an indexing strategy that involves investing in the securities of the Underlying Index in approximately the same proportions as in the Underlying Indices. The Funds may utilize a representative sampling strategy with respect to their Underlying Indices when a replication strategy might be detrimental to their shareholders, such as when there are practical difficulties or substantial costs involved in compiling a portfolio of equity securities to follow its Underlying Index, or, in certain instances, when securities in the Underlying Indices become temporarily illiquid, unavailable or less liquid, or due to legal restrictions (such as diversification requirements that apply to the Funds but not the Underlying Indices).
7. OTHER
At December 31, 2012, the total Shares outstanding that were held by Authorized Participants were as follows. The Authorized Participants have entered into an agreement with the Funds’ Distributor.
| | | | Percentage of |
| | Authorized | | Shares |
| | Participants | | Outstanding |
| Global X Permanent ETF | 3 | | 100% |
| Global X Top Guru Holdings Index ETF | 1 | | 100% |
| Global X SuperIncome Preferred ETF | 2 | | 100% |
Pursuant to the Trust’s organizational documents, the Trustees of the Trust and the Trust’s officers are indemnified against certain liabilities that may arise out of the performance of their duties.
8. CONTRACTUAL OBLIGATIONS
The Funds enter into contracts in the normal course of business that contain a variety of indemnifications. The Funds maximum exposure under these arrangements is unknown. However the Funds have not had prior gains or losses pursuant to these contracts. Management has reviewed the Funds’ existing contracts and expects the risk of loss to be remote.
9. RECENT ACCOUNTING PRONOUNCEMENT
In December 2011, the Financial Accounting Standards Board issued a further update to the guidance “Balance Sheet – Disclosures about Offsetting Assets and Liabilities”. The amendments to this standard require an entity to disclose information about offsetting and related arrangements to enable users of its financial statements to understand the effect of those arrangements on its financial position. The amended guidance is effective for interim and annual reporting periods beginning after January 1, 2013. At this time, management is evaluating the implications of this update and its impact on the financial statements has not been determined.
| |
Notes to Financial Statements (CONCLUDED) December 31, 2012 (Unaudited) |
10. SUBSEQUENT EVENTS
The Funds have evaluated the need for additional disclosures and/or adjustments resulting from subsequent events.
At a meeting of the Board of Trustees held on February 22, 2013, the Board approved that effective July 1, 2013, the fiscal year-end of the Global X Permanent ETF, Global X Top Guru Holdings Index ETF and Global X SuperIncome Preferred ETF be changed from June 30th to October 31st.
| |
Disclosure of Fund Expenses (unaudited) |
All Exchange Traded Funds (“ETF”) have operating expenses. As a shareholder of an ETF, your investment is affected by these ongoing costs, which include (among others) costs for ETF management, administrative services, commissions, and shareholder reports like this one. It is important for you to understand the impact of these costs on your investment returns. In addition, a shareholder is responsible for brokerage fees as a result of their investment in the Fund.
Operating expenses such as these are deducted from an ETF’s gross income and directly reduce its final investment return. These expenses are expressed as a percentage of the ETF’s average net assets; this percentage is known as the ETF’s expense ratio.
The following examples use the expense ratio and are intended to help you understand the ongoing costs (in dollars) of investing in your Fund and to compare these costs with those of other funds. The examples are based on an investment of $1,000 made at the beginning of the period shown and held for the entire period.
The table on the next page illustrates your Fund’s costs in two ways:
Actual Fund Return: This section helps you to estimate the actual expenses that your Fund incurred over the period. The “Expenses Paid During Period” column shows the actual dollar expense cost incurred by a $1,000 investment in the Fund, and the “Ending Account Value” number is derived from deducting that expense cost from the Fund’s gross investment return.
You can use this information, together with the actual amount you invested in the Fund, to estimate the expenses you paid over that period. Simply divide your actual account value by $1,000 to arrive at a ratio (for example, an $8,600 account value divided by $1,000 = 8.6), then multiply that ratio by the number shown for your Fund under “Expenses Paid During Period.”
Hypothetical 5% Return: This section helps you compare your Fund’s costs with those of other funds. It assumes that the Fund had an annual 5% return before expenses during the year, but that the expense ratio (Column 3) for the period is unchanged. This example is useful in making comparisons because the Securities and Exchange Commission requires all funds to make this 5% calculation. You can assess your Fund’s comparative cost by comparing the hypothetical result for your Fund in the “Expenses Paid During Period” column with those that appear in the same charts in the shareholder reports for other funds.
NOTE: Because the return is set at 5% for comparison purposes — NOT your Fund’s actual return — the account values shown may not apply to your specific investment.
| |
Disclosure of Fund Expenses (unaudited) (concluded) |
| | | Beginning | | | Ending | | | | | | Expenses | |
| | | Account | | | Account | | | Annualized | | | Paid | |
| | | Value | | | Value | | | Expense | | | During | |
| | | 7/1/2012 | | | 12/31/2012 | | | Ratios | | | Period(1) | |
| Global X Permanent ETF | | | | | | | | | | | | |
| Actual Fund Return | | $ | 1,000.00 | | | $ | 1,024.90 | | | | 0.48 | % | | $ | 2.44 | |
| Hypothetical 5% Return | | | 1,000.00 | | | | 1,022.79 | | | | 0.48 | | | | 2.44 | |
| Global X Top Guru Holdings Index ETF | | | | | | | | | | | | | | | | |
| Actual Fund Return | | $ | 1,000.00 | | | $ | 1,163.80 | | | | 0.75 | % | | $ | 4.08 | |
| Hypothetical 5% Return | | | 1,000.00 | | | | 1,021.44 | | | | 0.75 | | | | 3.81 | |
| Global X SuperIncome Preferred ETF | | | | | | | | | | | | | | | | |
| Actual Fund Return (2) | | $ | 1,000.00 | | | $ | 1,031.60 | | | | 0.58 | % | | $ | 2.72 | |
| Hypothetical 5% Return | | | 1,000.00 | | | | 1,020.47 | | | | 0.58 | | | | 2.95 | |
| (1) | Unless otherwise indicated, expenses are equal to the Fund’s annualized expense ratio multiplied by the average account value over the period, multiplied 184/365 (to reflect the one-half year period.) |
| (2) | Expenses are equal to the Fund’s annualized expense ratio multiplied by the average account value over the period, multiplied 169/365 (to reflect the period from inception to date.) |
| |
Approval of Investment Advisory Agreement (unaudited) |
Section 15(c) of the Investment Company Act of 1940, as amended ("1940 Act"), requires that each mutual fund’s board of trustees, including a majority of those trustees who are not "interested persons" of the mutual fund, as defined in the 1940 Act ("Independent Trustees"), consider on an initial basis and periodically thereafter (as required by the 1940 Act), at an in person meeting called for such purpose, the terms of each fund’s investment advisory agreement and approve each agreement with such changes as the Independent Trustees deem appropriate.
At a quarterly Board meeting held on November 16, 2012, the Board of Trustees (including the Independent Trustees) considered and unanimously approved the continuation of (i) the Investment Advisory Agreement ("Renewal Investment Advisory Agreement") for the Global X Permanent ETF, Global X Top Guru Holdings Index ETF, and Global X SuperIncome Preferred ETF (each a “Renewal Fund” and the "Renewal Funds") and (ii) the Supervision and Administration Agreement between the Trust ("Renewal Supervision and Administration Agreement"), on behalf of each Renewal Fund, and Global X Management Company ("Global X Management"). The Renewal Investment Advisory Agreement and the Renewal Supervision and Administration Agreement are referred to herein as the "Renewal Agreements."
In advance of the Board meeting, the Board (including the Independent Trustees) requested (in writing) detailed information from Global X Management in connection with their consideration of the Renewal Agreements and received and reviewed written responses from Global X Management and supporting materials relating to those requests for information.
In determining to approve the continuation of the Renewal Agreements for each Renewal Fund, the Board concluded that the Renewal Agreements were fair and reasonable and in the best interests of each Renewal Fund and its shareholders, respectively. In approving the continuation of the Renewal Agreements for each Renewal Fund, the Board considered among other things the following categories of material factors. In addition, the Board based their determinations regarding the continuation of the Renewal Agreements on their consideration of all of the materials provided to them by Global X Management and each Renewal Fund’s other service providers throughout the year.
In reaching this decision, the Board did not assign relative weights to the factors discussed below nor did the Board deem any one factor or group of them to be controlling in and of themselves. Certain factors considered by the Board (including the Independent Trustees) with respect to the approval of the continuation of the Renewal Agreements are discussed separately below.
RENEWAL AGREEMENTS
Nature, extent and quality of services
With respect to this factor, the Board considered:
| • | the terms of the Renewal Agreements and the range of services that would continue to be provided to each Renewal Fund in accordance with the Renewal Agreements; |
| • | Global X Management’s key personnel and the portfolio managers who would continue to provide investment advisory, supervision and administrative services to each Renewal Fund. In connection with these considerations, the Board noted Global X Management’s support staff and operational resources; |
| • | Global X Management’s responsibilities under the Renewal Agreements, among other things, to: (i) manage the investment operations of each Renewal Fund and the composition of each Renewal Fund’s assets, including the purchase, retention and disposition of its holdings, (ii) provide quarterly reports to the Trust’s officers and Board and other reports as the Board deems necessary or appropriate, (iii) vote proxies, exercise consents, and exercise all other |
| |
Approval of Investment Advisory Agreement (unaudited) |
rights relating to securities and assets held by each Renewal Fund, (iv) select broker- dealers to execute portfolio transactions for each Renewal Fund when necessary, (v) assist in the preparation and filing of reports and proxy statements (if any) to the shareholders of each Renewal Fund, the periodic updating of the registration statement, prospectuses, statement of additional information, and other reports and documents for each Renewal Fund that are required to be filed by the Trust with the SEC and other regulatory and governmental bodies, and (vi) monitor anticipated purchases and redemptions of the shares (including creation units) of each Renewal Fund by shareholders and new investors;
| • | the nature, extent and quality of the all of the services (including advisory, administrative and compliance services) that have been provided by Global X Management or made available to each Renewal Fund and the adequacy of Global X Management’s personnel resources that would continue to be made available to each Renewal Fund; and |
| • | Global X Management’s experience and the professional qualifications of Global X Management’s key personnel. |
Based on these considerations, the Board concluded that it was satisfied with the nature, extent and quality of the services provided to the Renewal Fund by Global X Management.
Performance
With respect to this fact, the Board considered each Renewal Fund’s total return and investment performance relative to (i) the performance of unaffiliated comparable specialized and/or focused exchange-traded funds and other registered funds in the same classification as each Renewal Fund, which performance information is publicly available from such registered funds as well as other third party sources; and (ii) the performance of comparable registered funds, pertinent indexes, and pertinent registered fund performance rankings.
Based on these considerations and comparisons, the Board concluded that the investment performance of each Renewal Fund did not adversely affect the Board approval of the continuance of the Renewal Agreements.
Cost of Services and Profitability
The Board considered Global X Management’s cost to provide investment management and related services to each Renewal Fund. In this regard, the Board considered the Management Fee that has been borne by each Renewal Fund under the Renewal Agreements for the various investment advisory, supervisory and administrative services that each Renewal Fund requires under a unitary fee structure (including the types of fees and expenses that are not included within the unitary fee and would be borne by each Renewal Fund).
In addition, the Board considered the current and expected profitability to Global X Management from all services provided to each Renewal Fund and all aspects of Global X Management’s relationship with each Renewal Fund. In connection with these considerations, the Global X Management provided the Board with financial information regarding its operations and services to each Renewal Fund and discussed with the Board its current and expected profitability with respect to each Renewal Fund.
Based on these considerations, the Board concluded that the profits anticipated to be realized by Global X Management from its relationship with each Renewal Fund would not be excessive and should not preclude approval of the continuance of the Renewal Agreement.
| |
Approval of Investment Advisory Agreement (unaudited) |
Comparison of Fees and Services
With respect to this factor, the Board considered:
| • | comparative information with respect to the Management Fee paid to Global X Management by each Renewal Fund. In connection with this consideration, Global X Management provided the Board with detailed comparative expense data for each Renewal Fund, including fees and expenses paid by unaffiliated comparable specialized and/or focused exchange-traded funds and other comparable registered funds and fees and expenses paid by other funds that are series of the Trust under the same unified Management Fee structure; |
| • | the structure of the unified Management Fee structure (which includes as one component the investment advisory fee for each Renewal Fund) and the current total expense ratios for each Renewal Fund. In this regard, the Board took into consideration that the purpose of adopting a unitary Management Fee structure for each Renewal Fund was to create a simple, all-inclusive fee that would provide a level of predictability with respect to the overall expense ratio (i.e., the total fees) of each Renewal Fund and that the proposed Management Fee for each Renewal Fund was set at a competitive fee to make each Renewal Fund viable in the marketplace; and |
| • | that Global X Management is responsible for most ordinary expenses of each Renewal Fund, including the costs of various third-party services required by the Fund, including investment advisory, administrative, audit, certain custody, portfolio accounting, legal, transfer agency and printing costs, but that each Renewal Fund would bear other expenses not covered under the proposed all-inclusive Management Fee, such as taxes, brokerage fees, commissions, and other transaction expenses, interest, and extraordinary expenses. |
Based on these considerations, the Board concluded that the Management Fee and total expense ratio of each Renewal Fund should not preclude approval of the Renewal Agreements.
Economies of Scale
With respect to this factor, the Board considered:
| • | the extent to which economies of scale would be realized as each Renewal Fund grow and whether the unitary Management Fee for each Renewal Fund reflected these economies of scale; |
| • | the significant investment of time, personnel and other resources that Global X Management has made and intends to make in each Renewal Fund in order to seek to assure that each Renewal Fund are attractive to investors; and |
| • | that the proposed unitary Management Fee would provide a high level of certainty as to the total level of expenses for each Renewal Fund and their shareholders. |
Based on these considerations, the Board concluded that continuation of the unitary Management Fee for each Renewal Fund was reasonable.
Other Benefits
The Board considered any other benefits realized by Global X Management as a result from its relations relationships with each Renewal Fund and concluded that all information it considered supported approval of the continuation of the Renewal Agreements.
| |
Supplemental Information (unaudited) |
Net asset value, or “NAV”, is the price per Share at which the Funds issue and redeem Shares. It is calculated in accordance with the standard formula for valuing mutual fund shares. The “Market Price” of the Funds generally is determined using the midpoint between the highest bid and the lowest offer on the stock exchange on which the Shares of the Funds are listed for trading, as of the time that the Funds’ NAV is calculated. The Funds’ Market Price may be at, above or below their NAV. The NAV of the Funds will fluctuate with changes in the market value of their Funds’ holdings. The Market Price of the Funds will fluctuate in accordance with changes in its NAV, as well as market supply and demand.
Premiums or discounts are the differences (expressed as a percentage) between the NAV and Market Price of the Funds on a given day, generally at the time NAV is calculated. A premium is the amount that the Funds are trading above the reported NAV, expressed as a percentage of the NAV. A discount is the amount that the Funds are trading below the reported NAV, expressed as a percentage of the NAV.
Further information regarding premiums and discounts is available on the Funds’ website at GlobalXFunds.com
623 Fifth Ave, 15th floor
New York, NY 10022
1-888-GXFund-1
(1-888-493-8631)
www.globalxfunds.com
Investment Adviser:
Global X Management Company LLC
623 Fifth Avenue, 15th floor
New York, NY 10022
Distributor:
SEI Investments Distribution Co.
One Freedom Valley Drive
Oaks, PA 19456
Sub-Administrator:
SEI Investments Global Funds Services
One Freedom Valley Drive
Oaks, PA 19456
Counsel for the Independent Trustees:
Dechert LLP
1175 I Street N.W.
Washington, DC 20007
This information must be preceded or accompanied by a current prospectus for the Funds described.
GLX-SA-004-0100
Item 2. Code of Ethics.
Not applicable for semi-annual report.
Item 3. Audit Committee Financial Expert.
Not applicable for semi-annual report.
Item 4. Principal Accountant Fees and Services.
Not applicable for semi-annual report.
Item 5. Audit Committee of Listed Registrants.
Not applicable to open-end management investment companies.
Item 6. Schedule of Investments.
Not applicable.
Item 7. Disclosure of Proxy Voting Policies and Procedures for Closed-End Management Investment Companies.
Not applicable to open-end management investment companies.
Item 8. Portfolio Managers of Closed-End Management Investment Companies.
Not applicable to open-end management investment companies.
Item 9. Purchases of Equity Securities by Closed-End Management Company and Affiliated Purchasers.
Not applicable to open-end management investment companies.
Item 10. Submission of Matters to a Vote of Security Holders.
There have been no material changes.
Item 11. Controls and Procedures.
(a) The certifying officers, whose certifications are included herewith, have evaluated the registrant’s disclosure controls and procedures within 90 days of the filing date of this report. In their opinion, based on their evaluation, the registrant’s disclosure controls and procedures are adequately designed, and are operating effectively to ensure, that information required to be disclosed by the registrant in the reports it files or submits under the Securities Exchange Act of 1934 is recorded, processed, summarized and reported within the time periods specified in the Securities and Exchange Commission’s rules and forms.
(b) There were no significant changes in the registrant’s internal control over financial reporting that occurred during the second fiscal quarter of the period covered by this report that has materially affected, or is reasonably likely to materially affect, the registrants internal control over financial reporting.
Items 12. Exhibits.
(a)(1) Not applicable for semi-annual report.
(a)(2) A separate certification for the principal executive officer and the principal financial officer of the registrant as required by Rule 30a-2(a) under the Investment Company Act of 1940, as amended (17 CFR 270.30a-2(a)), are filed herewith.
(b) Officer certifications as required by Rule 30a-2(b) under the Investment Company Act of 1940, as amended (17 CFR 270.30a-2(b)) also accompany this filing as an Exhibit.
SIGNATURES
Pursuant to the requirements of the Securities Exchange Act of 1934 and the Investment Company Act of 1940, the registrant has duly caused this report to be signed on its behalf by the undersigned, thereunto duly authorized.
| (Registrant) | | | The Global X Funds | |
| | | | | |
| By (Signature and Title)* | | | /s/ Bruno del Ama | |
| | | | Bruno del Ama | |
| | | | President | |
| | | | | |
| Date: March 8, 2013 | | | | |
Pursuant to the requirements of the Securities Exchange Act of 1934 and the Investment Company Act of 1940, this report has been signed below by the following persons on behalf of the registrant and in the capacities and on the dates indicated.
| | | | | |
| By (Signature and Title)* | | | /s/ Bruno del Ama | |
| | | | Bruno del Ama | |
| | | | President | |
| | | | | |
| Date: March 8, 2013 | | | | |
| | | | | |
| By (Signature and Title)* | | | /s/ Jose C. Gonzalez | |
| | | | Jose C. Gonzalez | |
| | | | CFO | |
| | | | | |
| Date: March 8, 2013 | | | | |
* Print the name and title of each signing officer under his or her signature.