UNITED STATES
SECURITIES AND EXCHANGE COMMISSION
Washington, D.C. 20549
FORM N-CSRS
CERTIFIED SHAREHOLDER REPORT OF REGISTERED MANAGEMENT
INVESTMENT COMPANIES
Investment Company Act file number 811-22209
Global X Funds
(Exact name of registrant as specified in charter)
399 Park Avenue, Floor 32
New York, NY 10022
(Address of principal executive offices) (Zip code)
SEI Investments Global Funds Services
One Freedom Valley Drive
Oaks, PA 19456
(Name and address of agent for service)
Registrant’s telephone number, including area code: (888) 493-8631
Date of fiscal year end: October 31
Date of reporting period: April 30, 2011
1
| Item 1. | Reports to Stockholders. |
1

Global X Silver Miners ETF
Global X Lithium ETF
Global X Copper Miners ETF
Global X Pure Gold Miners ETF (formerly Global X Gold Miners ETF)
Global X Uranium ETF
Global X Aluminum ETF
Global X Gold Explorers ETF
Global X Brazil Mid Cap ETF
Global X Brazil Financials ETF
Global X Brazil Consumer ETF
Global X FTSE Colombia 20 ETF (formerly Global X/InterBolsa FTSE
Colombia 20 ETF)
Global X FTSE Nordic Region ETF (formerly Global X Nordic 30 ETF)
Global X FTSE Norway 30 ETF
Global X FTSE Argentina 20 ETF
Global X FTSE Andean 40 ETF
Global X FTSE ASEAN 40 ETF
Global X China Consumer ETF
Global X China Energy ETF
Global X China Financials ETF
Global X China Industrials ETF
Global X China Technology ETF
Global X China Materials ETF
Global X Russell Emerging Markets Growth ETF
Global X Russell Emerging Markets Value ETF
Global X S&P/TSX Venture 30 Canada ETF (formerly Global X S&P/TSX
Venture Canada ETF)
Global X Oil Equities ETF
Global X Waste Management ETF
Semi Annual Report
April 30, 2011

TABLE OF CONTENTS
The Funds file their complete schedules of Fund holdings with the Securities and Exchange Commission (the “Commission”) for the first and third quarters of each fiscal year on Form N-Q within sixty days after the end of the period. The Funds’ Forms N-Q are available on the Commission’s website at http://www.sec.gov, and may be reviewed and copied at the Commission’s Public Reference Room in Washington, DC. Information on the operation of the Public Reference Room may be obtained by calling 1-800-SEC-0330.
A description of the policies and procedures that Global X Funds uses to determine how to vote proxies relating to Fund securities, as well as information relating to how the Funds voted proxies relating to Fund securities during the most recent 12-month period ended June 30, will be available (i) without charge, upon request, by calling 1-888-GXFund-1; and (ii) on the Commission’s website at http://www.sec.gov.

| | | | |
| Schedule of Investments | | | | April 30, 2011 (Unaudited) |
| | Global X Silver Miners ETF | | |
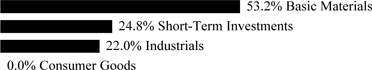
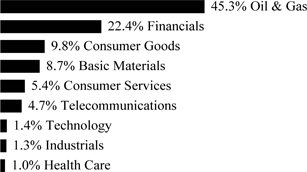
Sector Weightings†:

| † | Percentages based on total investments. |
| | | | | | | | |
| | | Shares | | | Value | |
COMMON STOCK — 101.8% | | | | | | | | |
ARGENTINA — 4.8% | | | | | | | | |
Basic Materials — 4.8% | | | | | | | | |
Silver Standard Resources * | | | 860,014 | | | $ | 29,876,887 | |
| | | | | | | | |
TOTAL ARGENTINA | | | | | | | 29,876,887 | |
| | | | | | | | |
CANADA — 49.2% | | | | | | | | |
Basic Materials — 49.2% | | | | | | | | |
Alexco Resource * | | | 925,073 | | | | 8,871,450 | |
Aurcana * | | | 5,353,543 | | | | 4,980,040 | |
Bear Creek Mining * | | | 1,255,579 | | | | 11,002,907 | |
ECU Silver Mining * | | | 5,130,191 | | | | 4,175,737 | |
Endeavour Silver * | | | 1,340,935 | | | | 15,407,343 | |
Excellon Resources * | | | 4,076,923 | | | | 3,232,233 | |
First Majestic Silver * | | | 1,362,365 | | | | 28,572,222 | |
Fortuna Silver Mines * | | | 2,050,590 | | | | 11,228,389 | |
Great Panther Silver * | | | 1,992,930 | | | | 7,015,282 | |
Impact Silver * | | | 656,541 | | | | 1,561,540 | |
MAG Silver * | | | 747,244 | | | | 9,011,763 | |
Minco Silver * | | | 472,464 | | | | 3,106,476 | |
Minefinders * | | | 1,343,725 | | | | 22,520,831 | |
Orko Silver * | | | 2,109,390 | | | | 6,087,352 | |
Pan American Silver | | | 1,425,589 | | | | 51,435,251 | |
Scorpio Mining * | | | 3,209,685 | | | | 4,207,198 | |
Silver Wheaton | | | 1,839,417 | | | | 74,717,118 | |
Silvercorp Metals | | | 2,189,589 | | | | 29,756,514 | |
Silvermex Resources * | | | 3,528,283 | | | | 3,244,827 | |
US Silver * | | | 4,769,345 | | | | 3,226,618 | |
Wildcat Silver * | | | 1,284,048 | | | | 3,786,992 | |
| | | | | | | | |
TOTAL CANADA | | | | | | | 307,148,083 | |
| | | | | | | | |
MEXICO — 23.5% | | | | | | | | |
Basic Materials — 23.5% | | | | | | | | |
Fresnillo | | | 2,604,681 | | | | 71,380,787 | |
Industrias Penoles | | | 1,937,031 | | | | 75,399,670 | |
| | | | | | | | |
TOTAL MEXICO | | | | | | | 146,780,457 | |
| | | | | | | | |
The accompanying notes are an integral part of the financial statements.
1
| | | | |
| Schedule of Investments | | | | April 30, 2011 (Unaudited) |
| | Global X Silver Miners ETF | | |
| | | | | | | | |
| | | Shares | | | Value | |
COMMON STOCK — continued | | | | | | | | |
PERU — 4.3% | | | | | | | | |
Basic Materials — 4.3% | | | | | | | | |
Hochschild Mining | | | 2,659,003 | | | $ | 27,087,372 | |
| | | | | | | | |
RUSSIA — 4.3% | | | | | | | | |
Basic Materials — 4.3% | | | | | | | | |
Polymetal GDR * | | | 1,414,128 | | | | 27,066,410 | |
| | | | | | | | |
UNITED STATES — 15.7% | | | | | | | | |
Basic Materials — 15.7% | | | | | | | | |
Coeur d’Alene Mines * | | | 943,948 | | | | 29,932,591 | |
Golden Minerals * | | | 195,267 | | | | 3,905,340 | |
Hecla Mining * | | | 3,206,918 | | | | 30,177,098 | |
Mines Management * | | | 401,680 | | | | 1,168,889 | |
Revett Minerals * | | | 363,417 | | | | 2,208,930 | |
Tahoe Resources * | | | 1,333,611 | | | | 30,337,536 | |
| | | | | | | | |
TOTAL UNITED STATES | | | | | | | 97,730,384 | |
| | | | | | | | |
TOTAL COMMON STOCK
(Cost $508,993,282) | | | | | | | 635,689,593 | |
| | | | | | | | |
TOTAL INVESTMENTS — 101.8%
(Cost $508,993,282) | | | | | | $ | 635,689,593 | |
| | | | | | | | |
Percentages are based on Net Assets of $624,402,462.
| * | Non-income producing security. |
GDR — Global Depositary Receipt
The following is a summary of the inputs used as of April 30, 2011 in valuing the Fund’s investments carried at value:
| | | | | | | | | | | | | | | | |
Investments in Securities | | | Level 1 | | | | Level 2 | | | | Level 3 | | | | Total | |
Common Stock | | $ | 635,689,593 | | | $ | — | | | $ | — | | | $ | 635,689,593 | |
| | | | | | | | | | | | | | | | |
Total Investments in Securities | | $ | 635,689,593 | | | $ | — | | | $ | — | | | $ | 635,689,593 | |
| | | | | | | | | | | | | | | | |
There have been no significant transfers between Level 1 and Level 2.
The accompanying notes are an integral part of the financial statements.
2
| | | | |
| Schedule of Investments | | | | April 30, 2011 (Unaudited) |
| | Global X Lithium ETF | | |
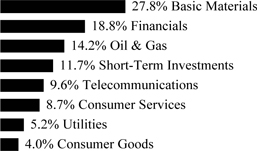
Sector Weightings†:
| † | Percentages based on total investments. |
| | | | | | | | |
| | | Shares | | | Value | |
COMMON STOCK — 100.1% | | | | | | | | |
AUSTRALIA — 5.1% | | | | | | | | |
Basic Materials — 5.1% | | | | | | | | |
Galaxy Resources * | | | 3,682,125 | | | $ | 4,359,646 | |
Orocobre * | | | 1,109,955 | | | | 2,956,927 | |
Talison Lithium * | | | 412,487 | | | | 2,180,164 | |
| | | | | | | | |
TOTAL AUSTRALIA | | | | | | | 9,496,737 | |
| | | | | | | | |
CANADA — 17.0% | | | | | | | | |
Basic Materials — 16.1% | | | | | | | | |
Avalon Rare Metals * | | | 2,341,887 | | | | 21,364,149 | |
Canada Lithium * | | | 3,970,331 | | | | 3,021,816 | |
Lithium Americas * | | | 1,492,407 | | | | 3,234,074 | |
Lithium One * | | | 1,366,014 | | | | 2,599,181 | |
| | | | | | | | |
| | | | | | | 30,219,220 | |
| | | | | | | | |
Industrials — 0.9% | | | | | | | | |
Electrovaya * | | | 795,464 | | | | 1,774,238 | |
| | | | | | | | |
TOTAL CANADA | | | | | | | 31,993,458 | |
| | | | | | | | |
CHILE — 22.1% | | | | | | | | |
Basic Materials — 22.1% | | | | | | | | |
Sociedad Quimica y Minera de Chile ADR | | | 681,477 | | | | 41,590,541 | |
| | | | | | | | |
CHINA — 1.1% | | | | | | | | |
Industrials — 1.1% | | | | | | | | |
China BAK Battery * | | | 1,352,582 | | | | 2,123,554 | |
| | | | | | | | |
FRANCE — 6.3% | | | | | | | | |
Industrials — 6.3% | | | | | | | | |
Saft Groupe | | | 258,372 | | | | 11,862,107 | |
| | | | | | | | |
HONG KONG — 0.9% | | | | | | | | |
Industrials — 0.9% | | | | | | | | |
Coslight Technology International Group | | | 3,426,887 | | | | 1,694,491 | |
| | | | | | | | |
JAPAN — 4.4% | | | | | | | | |
Industrials — 0.0% | | | | | | | | |
Panasonic | | | 39 | | | | 480 | |
| | | | | | | | |
The accompanying notes are an integral part of the financial statements.
3
| | | | |
| Schedule of Investments | | | | April 30, 2011 (Unaudited) |
| | Global X Lithium ETF | | |
| | | | | | | | |
| | | Shares/Face
Amount | | | Value | |
COMMON STOCK — continued | | | | | | | | |
Industrials — 4.4% | | | | | | | | |
GS Yuasa | | | 1,214,051 | | | $ | 8,263,331 | |
| | | | | | | | |
TOTAL JAPAN | | | | | | | 8,263,811 | |
| | | | | | | | |
UNITED STATES — 43.2% | | | | | | | | |
Basic Materials — 27.6% | | | | | | | | |
FMC | | | 397,761 | | | | 35,114,341 | |
Rockwood Holdings * | | | 293,647 | | | | 16,661,531 | |
| | | | | | | | |
| | | | | | | 51,775,872 | |
| | | | | | | | |
Industrials — 15.6% | | | | | | | | |
A123 Systems * | | | 1,060,758 | | | | 6,406,978 | |
Advanced Battery Technologies * | | | 1,878,942 | | | | 3,231,780 | |
Ener1 * | | | 1,877,663 | | | | 4,750,488 | |
Exide Technologies * | | | 998,514 | | | | 10,025,081 | |
Ultralife * | | | 363,761 | | | | 1,600,549 | |
Valence Technology * | | | 2,406,015 | | | | 3,272,180 | |
| | | | | | | | |
| | | | | | | 29,287,056 | |
| | | | | | | | |
TOTAL UNITED STATES | | | | | | | 81,062,928 | |
| | | | | | | | |
TOTAL COMMON STOCK
(Cost $168,868,341) | | | | | | | 188,087,627 | |
| | | | | | | | |
U.S. TREASURY OBLIGATION — 33.0% | | | | | | | | |
United States Treasury Bills (A)
0.010%, 05/19/11
(Cost $61,999,690) | | $ | 62,000,000 | | | | 61,999,504 | |
| | | | | | | | |
TOTAL INVESTMENTS — 133.1%
(Cost $230,868,031) | | | | | | $ | 250,087,131 | |
| | | | | | | | |
Percentages are based on Net Assets of $187,938,325.
| * | Non-income producing security. |
| (A) | The rate reported is the effective yield at time of purchase. |
ADR — American Depositary Receipt
The following is a summary of the inputs used as of April 30, 2011 in valuing the Fund’s investments carried at value:
| | | | | | | | | | | | | | | | |
Investments in Securities | | | Level 1 | | | | Level 2 | | | | Level 3 | | | | Total | |
Common Stock | | $ | 188,087,627 | | | $ | — | | | $ | — | | | $ | 188,087,627 | |
U.S. Treasury Obligation | | | — | | | | 61,999,504 | | | | — | | | | 61,999,504 | |
| | | | | | | | | | | | | | | | |
Total Investments in Securities | | $ | 188,087,627 | | | $ | 61,999,504 | | | $ | — | | | $ | 250,087,131 | |
| | | | | | | | | | | | | | | | |
There have been no significant transfers between Level 1 and Level 2.
The accompanying notes are an integral part of the financial statements.
4
| | | | |
| Schedule of Investments | | | | April 30, 2011 (Unaudited) |
| | Global X Copper Miners ETF | | |
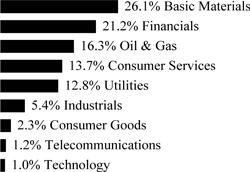
Sector Weightings†:

| † | Percentages based on total investments. |
| | | | | | | | |
| | | Shares | | | Value | |
COMMON STOCK — 99.0% | | | | | | | | |
AUSTRALIA — 11.6% | | | | | | | | |
Basic Materials — 11.6% | | | | | | | | |
Aditya Birla Minerals * | | | 344,375 | | | $ | 679,569 | |
Cudeco * | | | 300,327 | | | | 1,129,321 | |
Equinox Minerals * | | | 584,653 | | | | 5,006,014 | |
OZ Minerals | | | 3,122,057 | | | | 4,928,699 | |
Straits Resources * | | | 561,059 | | | | 544,353 | |
| | | | | | | | |
TOTAL AUSTRALIA | | | | | | | 12,287,956 | |
| | | | | | | | |
BERMUDA — 0.9% | | | | | | | | |
Basic Materials — 0.9% | | | | | | | | |
Katanga Mining * | | | 425,747 | | | | 909,100 | |
| | | | | | | | |
CANADA — 42.4% | | | | | | | | |
Basic Materials — 42.4% | | | | | | | | |
Augusta Resource * | | | 202,903 | | | | 927,267 | |
Capstone Mining * | | | 458,804 | | | | 1,833,276 | |
Continental Minerals | | | 115,421 | | | | 317,225 | |
Copper Mountain Mining * | | | 209,186 | | | | 1,603,170 | |
Copper Mountain Mining * | | | 12,300 | | | | 93,929 | |
Duluth Metals * | | | 248,894 | | | | 644,599 | |
First Quantum Minerals | | | 35,788 | | | | 5,100,736 | |
HudBay Minerals, Cl B | | | 311,275 | | | | 4,968,554 | |
Imperial Metals * | | | 79,124 | | | | 1,835,075 | |
Inmet Mining | | | 69,615 | | | | 4,886,296 | |
Ivanhoe Mines * | | | 190,408 | | | | 5,003,922 | |
Lundin Mining * | | | 555,111 | | | | 5,433,750 | |
Mercator Minerals * | | | 486,462 | | | | 1,804,949 | |
Northern Dynasty Minerals * | | | 170,312 | | | | 2,314,540 | |
Polymet Mining * | | | 302,173 | | | | 610,389 | |
Quadra FNX Mining * | | | 315,008 | | | | 5,171,326 | |
Taseko Mines * | | | 447,008 | | | | 2,355,732 | |
| | | | | | | | |
TOTAL CANADA | | | | | | | 44,904,735 | |
| | | | | | | | |
CHINA — 4.6% | | | | | | | | |
Basic Materials — 4.6% | | | | | | | | |
Jiangxi Copper, Cl H | | | 1,447,534 | | | | 4,911,539 | |
| | | | | | | | |
The accompanying notes are an integral part of the financial statements.
5
| | | | |
| Schedule of Investments | | | | April 30, 2011 (Unaudited) |
| | Global X Copper Miners ETF | | |
| | | | | | | | |
| | | Shares/Face
Amount | | | Value | |
COMMON STOCK — continued | | | | | | | | |
MEXICO — 4.8% | | | | | | | | |
Basic Materials — 4.8% | | | | | | | | |
Grupo Mexico, Cl B | | | 1,458,688 | | | $ | 5,051,898 | |
| | | | | | | | |
POLAND — 4.7% | | | | | | | | |
Basic Materials — 4.7% | | | | | | | | |
KGHM Polska Miedz | | | 67,716 | | | | 4,988,659 | |
| | | | | | | | |
SOUTH AFRICA — 2.5% | | | | | | | | |
Basic Materials — 2.5% | | | | | | | | |
Metorex * | | | 1,836,930 | | | | 2,054,030 | |
Palabora Mining | | | 28,578 | | | | 639,982 | |
| | | | | | | | |
TOTAL SOUTH AFRICA | | | | | | | 2,694,012 | |
| | | | | | | | |
SWITZERLAND — 5.1% | | | | | | | | |
Basic Materials — 5.1% | | | | | | | | |
Xstrata | | | 211,644 | | | | 5,377,694 | |
| | | | | | | | |
UNITED KINGDOM — 12.9% | | | | | | | | |
Basic Materials — 12.9% | | | | | | | | |
Antofagasta | | | 193,266 | | | | 4,412,068 | |
Kazakhmys | | | 193,913 | | | | 4,465,698 | |
Vedanta Resources | | | 123,267 | | | | 4,786,169 | |
| | | | | | | | |
TOTAL UNITED KINGDOM | | | | | | | 13,663,935 | |
| | | | | | | | |
UNITED STATES — 9.5% | | | | | | | | |
Basic Materials — 9.5% | | | | | | | | |
Freeport-McMoRan Copper & Gold | | | 90,558 | | | | 4,983,407 | |
Southern Copper | | | 134,381 | | | | 5,033,912 | |
| | | | | | | | |
TOTAL UNITED STATES | | | | | | | 10,017,319 | |
| | | | | | | | |
TOTAL COMMON STOCK
(Cost $94,173,895) | | | | | | | 104,806,847 | |
| | | | | | | | |
TIME DEPOSIT — 0.1% | | | | | | | | |
Brown Brothers, 0.029% (A)
(Cost $119,342) | | $ | 119,342 | | | | 119,342 | |
| | | | | | | | |
TOTAL INVESTMENTS — 99.1%
(Cost $94,293,237) | | | | | | $ | 104,926,189 | |
| | | | | | | | |
Percentages are based on Net Assets of $105,879,152.
| * | Non-income producing security. |
| (A) | The rate reported is the 7-day simple yield as of April 30, 2011. |
Cl — Class
The accompanying notes are an integral part of the financial statements.
6
| | | | |
| Schedule of Investments | | | | April 30, 2011 (Unaudited) |
| | Global X Copper Miners ETF | | |
The following is a summary of the inputs used as of April 30, 2011 in valuing the Fund’s investments carried at value:
| | | | | | | | | | | | | | | | |
Investments in Securities | | | Level 1 | | | | Level 2 | | | | Level 3 | | | | Total | |
Common Stock | | $ | 104,806,847 | | | $ | — | | | $ | — | | | $ | 104,806,847 | |
Time Deposit | | | — | | | | 119,342 | | | | — | | | | 119,342 | |
| | | | | | | | | | | | | | | | |
Total Investments in Securities | | $ | 104,806,847 | | | $ | 119,342 | | | $ | — | | | $ | 104,926,189 | |
| | | | | | | | | | | | | | | | |
There have been no significant transfers between Level 1 and Level 2.
The accompanying notes are an integral part of the financial statements.
7
| | | | |
| Schedule of Investments | | | | April 30, 2011 (Unaudited) |
| | Global X Pure Gold Miners ETF | | |
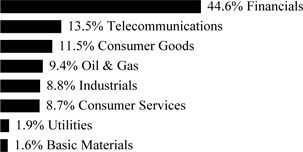
Sector Weightings†:
| † | Percentages based on total investments. |
| | | | | | | | |
| | | Shares | | | Value | |
COMMON STOCK — 100.0% | | | | | | | | |
AUSTRALIA — 9.3% | | | | | | | | |
Basic Materials — 9.3% | | | | | | | | |
Centamin Egypt * | | | 53,200 | | | $ | 115,498 | |
CGA Mining * | | | 14,972 | | | | 47,796 | |
Medusa Mining | | | 8,400 | | | | 73,948 | |
Perseus Mining * | | | 21,200 | | | | 68,098 | |
| | | | | | | | |
TOTAL AUSTRALIA | | | | | | | 305,340 | |
| | | | | | | | |
CANADA — 38.9% | | | | | | | | |
Basic Materials — 38.9% | | | | | | | | |
Alamos Gold | | | 6,128 | | | | 102,867 | |
Aurizon Mines * | | | 8,128 | | | | 55,418 | |
Centerra Gold | | | 8,268 | | | | 153,823 | |
China Gold International Resources * | | | 17,516 | | | | 87,580 | |
Detour Gold * | | | 3,372 | | | | 113,992 | |
Eldorado Gold | | | 9,116 | | | | 169,696 | |
Kinross Gold | | | 9,684 | | | | 153,552 | |
Kirkland Lake Gold * | | | 2,988 | | | | 44,473 | |
Lake Shore Gold * | | | 18,124 | | | | 77,784 | |
Osisko Mining * | | | 10,312 | | | | 150,974 | |
Romarco Minerals * | | | 25,528 | | | | 48,573 | |
SEMAFO * | | | 14,432 | | | | 122,657 | |
| | | | | | | | |
TOTAL CANADA | | | | | | | 1,281,389 | |
| | | | | | | | |
CHINA — 4.0% | | | | | | | | |
Basic Materials — 4.0% | | | | | | | | |
Real Gold Mining | | | 22,800 | | | | 32,412 | |
Zhaojin Mining Industry | | | 21,200 | | | | 98,139 | |
| | | | | | | | |
TOTAL CHINA | | | | | | | 130,551 | |
| | | | | | | | |
JERSEY — 4.9% | | | | | | | | |
Basic Materials — 4.9% | | | | | | | | |
Randgold Resources ADR * | | | 1,876 | | | | 162,405 | |
| | | | | | | | |
RUSSIA — 4.9% | | | | | | | | |
Basic Materials — 4.9% | | | | | | | | |
Polyus Gold ADR | | | 4,444 | | | | 159,984 | |
| | | | | | | | |
SOUTH AFRICA — 16.4% | | | | | | | | |
Basic Materials — 16.4% | | | | | | | | |
AngloGold Ashanti ADR | | | 3,164 | | | | 161,301 | |
The accompanying notes are an integral part of the financial statements.
8
| | | | |
| Schedule of Investments | | | | April 30, 2011 (Unaudited) |
| | Global X Pure Gold Miners ETF | | |
| | | | | | | | |
| | | Shares | | | Value | |
COMMON STOCK — continued | | | | | | | | |
Basic Materials — continued | | | | | | | | |
Gold Fields ADR | | | 8,640 | | | $ | 154,138 | |
Great Basin Gold * | | | 23,028 | | | | 61,100 | |
Harmony Gold Mining ADR | | | 10,460 | | | | 162,862 | |
| | | | | | | | |
TOTAL SOUTH AFRICA | | | | | | | 539,401 | |
| | | | | | | | |
TURKEY — 3.7% | | | | | | | | |
Basic Materials — 3.7% | | | | | | | | |
Koza Altin Isletmeleri * | | | 7,800 | | | | 122,348 | |
| | | | | | | | |
UNITED KINGDOM — 5.4% | | | | | | | | |
Basic Materials — 5.4% | | | | | | | | |
African Barrick Gold | | | 5,600 | | | | 49,285 | |
Petropavlovsk * | | | 8,600 | | | | 128,253 | |
| | | | | | | | |
TOTAL UNITED KINGDOM | | | | | | | 177,538 | |
| | | | | | | | |
UNITED STATES — 12.5% | | | | | | | | |
Basic Materials — 12.5% | | | | | | | | |
Alacer Gold * | | | 14,576 | | | | 152,077 | |
Allied Nevada Gold * | | | 4,328 | | | | 186,364 | |
Gold Resource * | | | 2,480 | | | | 74,772 | |
| | | | | | | | |
TOTAL UNITED STATES | | | | | | | 413,213 | |
| | | | | | | | |
TOTAL COMMON STOCK | | | | | | | | |
(Cost $3,052,144) | | | | | | | 3,292,169 | |
| | | | | | | | |
TOTAL INVESTMENTS — 100.0% | | | | | | | | |
(Cost $3,052,144) | | | | | | $ | 3,292,169 | |
| | | | | | | | |
Percentages are based on Net Assets of $3,292,809.
| * | Non-income producing security. |
ADR — American Depositary Receipt
The following is a summary of the inputs used as of April 30, 2011 in valuing the Fund’s investments carried at value:
| | | | | | | | | | | | | | | | |
Investments in Securities | | | Level 1 | | | | Level 2 | | | | Level 3 | | | | Total | |
Common Stock | | $ | 3,292,169 | | | $ | — | | | $ | — | | | $ | 3,292,169 | |
| | | | | | | | | | | | | | | | |
Total Investments in Securities | | $ | 3,292,169 | | | $ | — | | | $ | — | | | $ | 3,292,169 | |
| | | | | | | | | | | | | | | | |
There have been no significant transfers between Level 1 and Level 2.
The accompanying notes are an integral part of the financial statements.
9
| | | | |
| Schedule of Investments | | | | April 30, 2011 (Unaudited) |
| | Global X Uranium ETF | | |
Sector Weightings†:

| † | Percentages based on total investments. |
| | | | | | | | |
| | | Shares | | | Value | |
COMMON STOCK — 100.1% | | | | | | | | |
AUSTRALIA — 27.5% | | | | | | | | |
Basic Materials — 27.5% | | | | | | | | |
Bannerman Resources * | | | 5,091,136 | | | $ | 1,897,678 | |
Berkeley Resources * | | | 2,370,084 | | | | 2,234,556 | |
Deep Yellow * | | | 10,490,467 | | | | 2,185,131 | |
Energy Resources of Australia | | | 1,821,245 | | | | 10,881,627 | |
Extract Resources * | | | 1,924,648 | | | | 14,094,730 | |
Greenland Minerals & Energy * | | | 5,894,290 | | | | 5,234,142 | |
Mantra Resources * | | | 1,445,708 | | | | 10,682,415 | |
Paladin Energy * | | | 6,831,726 | | | | 24,715,725 | |
Toro Energy * | | | 12,866,881 | | | | 1,551,654 | |
| | | | | | | | |
TOTAL AUSTRALIA | | | | | | | 73,477,658 | |
| | | | | | | | |
CANADA — 46.9% | | | | | | | | |
Basic Materials — 46.9% | | | | | | | | |
Cameco | | | 1,849,536 | | | | 54,606,280 | |
Denison Mines * | | | 4,862,380 | | | | 11,307,861 | |
Forsys Metals * | | | 1,749,934 | | | | 3,274,189 | |
Hathor Exploration * | | | 2,753,548 | | | | 6,345,385 | |
Laramide Resources * | | | 1,428,524 | | | | 1,766,779 | |
Mega Uranium * | | | 7,478,134 | | | | 4,031,552 | |
Uex * | | | 4,103,727 | | | | 4,251,218 | |
Uranium One | | | 9,569,242 | | | | 39,854,983 | |
| | | | | | | | |
TOTAL CANADA | | | | | | | 125,438,247 | |
| | | | | | | | |
SOUTH AFRICA — 3.0% | | | | | | | | |
Basic Materials — 3.0% | | | | | | | | |
First Uranium * | | | 8,672,117 | | | | 7,975,414 | |
| | | | | | | | |
UNITED KINGDOM — 4.5% | | | | | | | | |
Basic Materials — 4.5% | | | | | | | | |
Kalahari Minerals * | | | 3,173,563 | | | | 12,057,208 | |
| | | | | | | | |
UNITED STATES — 18.2% | | | | | | | | |
Basic Materials — 18.2% | | | | | | | | |
Uranerz Energy * | | | 2,535,474 | | | | 7,048,618 | |
Uranium Energy * | | | 2,957,542 | | | | 10,292,246 | |
Uranium Resources * | | | 6,602,475 | | | | 12,016,505 | |
Ur-Energy * | | | 2,592,845 | | | | 4,174,480 | |
The accompanying notes are an integral part of the financial statements.
10
| | | | |
| Schedule of Investments | | | | April 30, 2011 (Unaudited) |
| | Global X Uranium ETF | | |
| | | | | | | | |
| | | Shares | | | Value | |
COMMON STOCK — continued | | | | | | | | |
Basic Materials — continued | | | | | | | | |
USEC * | | | 3,283,266 | | | $ | 15,037,358 | |
| | | | | | | | |
TOTAL UNITED STATES | | | | | | | 48,569,207 | |
| | | | | | | | |
TOTAL COMMON STOCK
(Cost $332,421,702) | | | | | | | 267,517,734 | |
| | | | | | | | |
TOTAL INVESTMENTS — 100.1%
(Cost $332,421,702) | | | | | | $ | 267,517,734 | |
| | | | | | | | |
Percentages are based on Net Assets of $267,168,699.
| * | Non-income producing security. |
The following is a summary of the inputs used as of April 30, 2011 in valuing the Fund’s investments carried at value:
| | | | | | | | | | | | | | | | |
Investments in Securities | | | Level 1 | | | | Level 2 | | | | Level 3 | | | | Total | |
Common Stock | | $ | 267,517,734 | | | $ | — | | | $ | — | | | $ | 267,517,734 | |
| | | | | | | | | | | | | | | | |
Total Investments in Securities | | $ | 267,517,734 | | | $ | — | | | $ | — | | | $ | 267,517,734 | |
| | | | | | | | | | | | | | | | |
There have been no significant transfers between Level 1 and Level 2.
The accompanying notes are an integral part of the financial statements.
11
| | | | |
| Schedule of Investments | | | | April 30, 2011 (Unaudited) |
| | Global X Aluminum ETF | | |
Sector Weightings†:

| † | Percentages based on total investments. |
| | | | | | | | |
| | | Shares | | | Value | |
COMMON STOCK — 99.7% | | | | | | | | |
AUSTRALIA — 7.7% | | | | | | | | |
Basic Materials — 7.7% | | | | | | | | |
Alumina | | | 171,500 | | | $ | 424,914 | |
| | | | | | | | |
CHINA — 10.0% | | | | | | | | |
Basic Materials — 10.0% | | | | | | | | |
Aluminum Corp of China, Cl H | | | 293,300 | | | | 275,326 | |
China Zhongwang Holdings | | | 423,500 | | | | 217,588 | |
XinRen Aluminum Holdings * | | | 156,100 | | | | 58,670 | |
| | | | | | | | |
TOTAL CHINA | | | | | | | 551,584 | |
| | | | | | | | |
GREECE — 5.8% | | | | | | | | |
Basic Materials — 5.8% | | | | | | | | |
Mytilineos Holdings | | | 40,250 | | | | 320,703 | |
| | | | | | | | |
HONG KONG — 3.9% | | | | | | | | |
Basic Materials — 3.9% | | | | | | | | |
Minmetals Resources * | | | 327,600 | | | | 215,141 | |
| | | | | | | | |
JAPAN — 14.1% | | | | | | | | |
Basic Materials — 14.1% | | | | | | | | |
Alconix | | | 2,380 | | | | 70,197 | |
Daiki Aluminum Industry | | | 22,750 | | | | 63,958 | |
Nippon Light Metal | | | 124,600 | | | | 251,965 | |
Sky Aluminum | | | 55,650 | | | | 158,510 | |
Sumitomo Light Metal Industries | | | 203,700 | | | | 231,078 | |
| | | | | | | | |
TOTAL JAPAN | | | | | | | 775,708 | |
| | | | | | | | |
MALAYSIA — 2.7% | | | | | | | | |
Basic Materials — 2.7% | | | | | | | | |
Press Metal | | | 172,200 | | | | 148,879 | |
| | | | | | | | |
NORWAY— 8.9% | | | | | | | | |
Basic Materials — 8.9% | | | | | | | | |
Norsk Hydro | | | 55,300 | | | | 490,379 | |
| | | | | | | | |
RUSSIA — 4.7% | | | | | | | | |
Basic Materials — 4.7% | | | | | | | | |
United RUSAL * | | | 170,100 | | | | 260,213 | |
| | | | | | | | |
SINGAPORE — 3.5% | | | | | | | | |
Basic Materials — 3.5% | | | | | | | | |
Midas Holdings | | | 322,700 | | | | 192,476 | |
| | | | | | | | |
The accompanying notes are an integral part of the financial statements.
12
| | | | |
| Schedule of Investments | | | | April 30, 2011 (Unaudited) |
| | Global X Aluminum ETF | | |
| | | | | | | | |
| | | Shares | | | Value | |
COMMON STOCK — continued | | | | | | | | |
SOUTH KOREA — 1.5% | | | | | | | | |
Basic Materials — 1.5% | | | | | | | | |
Daeho AL | | | 11,340 | | | $ | 36,207 | |
Dayou Smart Aluminum | | | 24,500 | | | | 45,307 | |
| | | | | | | | |
TOTAL SOUTH KOREA | | | | | | | 81,514 | |
| | | | | | | | |
UNITED KINGDOM— 13.9% | | | | | | | | |
Basic Materials — 13.9% | | | | | | | | |
Rio Tinto | | | 10,500 | | | | 764,529 | |
| | | | | | | | |
UNITED STATES — 23.0% | | | | | | | | |
Basic Materials — 23.0% | | | | | | | | |
Alcoa | | | 34,125 | | | | 580,125 | |
Century Aluminum * | | | 15,400 | | | | 307,692 | |
Kaiser Aluminum | | | 4,620 | | | | 231,508 | |
Noranda Aluminum Holding * | | | 8,400 | | | | 142,716 | |
| | | | | | | | |
TOTAL UNITED STATES | | | | | | | 1,262,041 | |
| | | | | | | | |
TOTAL COMMON STOCK
(Cost $5,356,742) | | | | | | | 5,488,081 | |
| | | | | | | | |
TOTAL INVESTMENTS — 99.7%
(Cost $5,356,742) | | | | | | $ | 5,488,081 | |
| | | | | | | | |
Percentages are based on Net Assets of $5,501,647.
| * | Non-income producing security. |
Cl — Class
The following is a summary of the inputs used as of April 30, 2011 in valuing the Fund’s investments carried at value:
| | | | | | | | | | | | | | | | |
Investments in Securities | | | Level 1 | | | | Level 2 | | | | Level 3 | | | | Total | |
Common Stock | | $ | 5,488,081 | | | $ | — | | | $ | — | | | $ | 5,488,081 | |
| | | | | | | | | | | | | | | | |
Total Investments in Securities | | $ | 5,488,081 | | | $ | — | | | $ | — | | | $ | 5,488,081 | |
| | | | | | | | | | | | | | | | |
There have been no significant transfers between Level 1 and Level 2
The accompanying notes are an integral part of the financial statements.
13
| | | | |
| Schedule of Investments | | | | April 30, 2011 (Unaudited) |
| | Global X Gold Explorers ETF | | |
Sector Weightings†:

† Percentages based on total investments.
| | | | | | | | |
| | | Shares | | | Value | |
COMMON STOCK — 100.1% | | | | | | | | |
AUSTRALIA — 11.9% | | | | | | | | |
Basic Materials — 11.9% | | | | | | | | |
Ampella Mining * | | | 286,990 | | | $ | 676,448 | |
Gryphon Minerals * | | | 501,415 | | | | 865,778 | |
Regis Resources * | | | 592,745 | | | | 1,559,582 | |
| | | | | | | | |
TOTAL AUSTRALIA | | | | | | | 3,101,808 | |
| | | | | | | | |
CANADA — 79.5% | | | | | | | | |
Basic Materials — 79.5% | | | | | | | | |
Atac Resources * | | | 123,463 | | | | 912,269 | |
Auryx Gold * | | | 281,721 | | | | 208,462 | |
Canaco Resources * | | | 203,906 | | | | 967,799 | |
Chesapeake Gold * | | | 57,191 | | | | 789,550 | |
Continental Gold * | | | 119,178 | | | | 1,064,539 | |
East Asia Minerals * | | | 126,105 | | | | 747,832 | |
European Goldfields * | | | 82,114 | | | | 1,142,305 | |
Exeter Resource * | | | 145,463 | | | | 759,606 | |
Gabriel Resources * | | | 168,036 | | | | 1,282,473 | |
Greystar Resources * | | | 111,996 | | | | 409,626 | |
Guyana Goldfields * | | | 130,685 | | | | 1,291,654 | |
International Tower Hill Mines * | | | 122,878 | | | | 1,188,513 | |
Kaminak Gold, Cl A * | | | 108,946 | | | | 444,537 | |
Keegan Resources * | | | 83,637 | | | | 778,019 | |
Lydian International * | | | 113,155 | | | | 301,428 | |
Novagold Resources * | | | 92,587 | | | | 1,189,743 | |
Premier Gold Mines * | | | 165,393 | | | | 1,267,547 | |
Rainy River Resources * | | | 106,641 | | | | 1,116,010 | |
Rubicon Minerals * | | | 256,072 | | | | 1,329,084 | |
Sabina Gold & Silver * | | | 204,081 | | | | 1,579,147 | |
Seabridge Gold * | | | 43,696 | | | | 1,488,723 | |
Volta Resources * | | | 208,755 | | | | 372,934 | |
| | | | | | | | |
TOTAL CANADA | | | | | | | 20,631,800 | |
| | | | | | | | |
HONG KONG — 2.7% | | | | | | | | |
Basic Materials — 2.7% | | | | | | | | |
China Precious Metal Resources Holdings * | | | 3,313,902 | | | | 704,096 | |
| | | | | | | | |
The accompanying notes are an integral part of the financial statements.
14
| | | | |
| Schedule of Investments | | | | April 30, 2011 (Unaudited) |
| | Global X Gold Explorers ETF | | |
| | | | | | | | |
| | | Shares | | | Value | |
COMMON STOCK — continued | | | | | | | | |
UNITED STATES — 6.0% | | | | | | | | |
Basic Materials — 6.0% | | | | | | | | |
US Gold * | | | 166,236 | | | $ | 1,562,618 | |
| | | | | | | | |
TOTAL COMMON STOCK
(Cost $24,342,871) | | | | | | | 26,000,322 | |
| | | | | | | | |
TOTAL INVESTMENTS — 100.1%
(Cost $24,342,871) | | | | | | $ | 26,000,322 | |
| | | | | | | | |
Percentages are based on Net Assets of $25,966,684.
| * | Non-income producing security. |
Cl — Class
The following is a summary of the inputs used as of April 30, 2011 in valuing the Fund’s investments carried at value:
| | | | | | | | | | | | | | | | |
Investments in Securities | | | Level 1 | | | | Level 2 | | | | Level 3 | | | | Total | |
Common Stock | | $ | 26,000,322 | | | $ | — | | | $ | — | | | $ | 26,000,322 | |
| | | | | | | | | | | | | | | | |
Total Investments in Securities | | $ | 26,000,322 | | | $ | — | | | $ | — | | | $ | 26,000,322 | |
| | | | | | | | | | | | | | | | |
There have been no significant transfers between Level 1 and Level 2.
The accompanying notes are an integral part of the financial statements.
15
| | | | |
| Schedule of Investments | | | | April 30, 2011 (Unaudited) |
| | Global X Brazil Mid Cap ETF | | |
Sector Weightings†:
| † | Percentages based on total investments. |
| | | | | | | | |
| | | Shares | | | Value | |
COMMON STOCK — 83.0% | | | | | | | | |
BRAZIL — 83.0% | | | | | | | | |
Basic Materials — 2.2% | | | | | | | | |
Fibria Celulose ADR | | | 44,235 | | | $ | 714,395 | |
| | | | | | | | |
Consumer Goods — 10.9% | | | | | | | | |
Cosan, Cl A | | | 28,252 | | | | 351,737 | |
Cosan Industria e Comercio | | | 24,120 | | | | 368,930 | |
Hypermarcas * | | | 58,983 | | | | 790,815 | |
Hypermarcas - Unit (B)(C)* | | | 59 | | | | 76,257 | |
JBS | | | 135,223 | | | | 457,334 | |
Marfrig Alimentos | | | 33,367 | | | | 341,943 | |
Natura Cosmeticos | | | 43,615 | | | | 1,224,159 | |
| | | | | | | | |
| | | | | | | 3,611,175 | |
| | | | | | | | |
Consumer Services — 9.5% | | | | | | | | |
Cia Brasileira de Distribuicao Grupo Pao de Acucar ADR | | | 27,593 | | | | 1,254,378 | |
Gol Linhas Aereas Inteligentes ADR * | | | 23,629 | | | | 336,713 | |
Lojas Renner | | | 31,106 | | | | 1,152,880 | |
TAM ADR | | | 17,865 | | | | 373,021 | |
| | | | | | | | |
| | | | | | | 3,116,992 | |
| | | | | | | | |
Financials — 13.1% | | | | | | | | |
BR Malls Participacoes | | | 81,554 | | | | 861,683 | |
Cyrela Brazil Realty Empreendimentos e Participacoes | | | 71,790 | | | | 760,800 | |
MRV Engenharia e Participacoes | | | 83,325 | | | | 727,306 | |
Multiplan Empreendimentos Imobiliarios | | | 16,800 | | | | 351,166 | |
PDG Realty Empreendimentos e Participacoes | | | 202,688 | | | | 1,193,192 | |
Porto Seguro | | | 25,625 | | | | 425,834 | |
| | | | | | | | |
| | | | | | | 4,319,981 | |
| | | | | | | | |
Industrials — 17.3% | | | | | | | | |
All America Latina Logistica | | | 146,999 | | | | 1,211,130 | |
Cia de Concessoes Rodoviarias | | | 40,268 | | | | 1,250,535 | |
Duratex | | | 60,229 | | | | 633,687 | |
Embraer ADR | | | 40,399 | | | | 1,312,160 | |
LLX Logistica * | | | 116,521 | | | | 336,304 | |
Weg | | | 76,970 | | | | 956,620 | |
| | | | | | | | |
| | | | | | | 5,700,436 | |
| | | | | | | | |
The accompanying notes are an integral part of the financial statements.
16
| | | | |
| Schedule of Investments | | | | April 30, 2011 (Unaudited) |
| | Global X Brazil Mid Cap ETF | | |
| | | | | | | | |
| | | Shares | | | Value | |
COMMON STOCK — continued | | | | | | | | |
Telecommunications — 5.4% | | | | | | | | |
Telegraph Norte Leste Participacoes ADR | | | 60,780 | | | $ | 1,036,299 | |
Tim Participacoes ADR * | | | 15,864 | | | | 748,464 | |
| | | | | | | | |
| | | | | | | 1,784,763 | |
| | | | | | | | |
Utilities — 24.6% | | | | | | | | |
Cia de Saneamento Basico do Estado de Sao Paulo ADR | | | 13,971 | | | | 817,583 | |
Cia Energetica de Minas Gerais ADR | | | 94,371 | | | | 1,969,523 | |
Cia Paranaense de Energia ADR | | | 24,609 | | | | 678,470 | |
CPFL Energia ADR | | | 21,265 | | | | 1,880,677 | |
EDP - Energias do Brasil | | | 13,680 | | | | 340,130 | |
Tractebel Energia | | | 50,280 | | | | 890,208 | |
Ultrapar Participacoes ADR | | | 85,024 | | | | 1,529,582 | |
| | | | | | | | |
| | | | | | | 8,106,173 | |
| | | | | | | | |
TOTAL BRAZIL | | | | | | | 27,353,915 | |
| | | | | | | | |
TOTAL COMMON STOCK
(Cost $23,921,027) | | | | | | | 27,353,915 | |
| | | | | | | | |
PREFERRED STOCK — 16.1% | | | | | | | | |
BRAZIL — 16.1% | | | | | | | | |
Basic Materials — 5.0% | | | | | | | | |
Metalurgica Gerdau, Cl A | | | 71,075 | | | | 1,023,426 | |
Suzano Papel e Celulose | | | 63,430 | | | | 624,219 | |
| | | | | | | | |
| | | | | | | 1,647,645 | |
| | | | | | | | |
Consumer Services — 2.1% | | | | | | | | |
Lojas Americanas | | | 74,950 | | | | 667,069 | |
| | | | | | | | |
Financials — 5.9% | | | | | | | | |
Banco do Estado do Rio Grande do Sul | | | 39,475 | | | | 469,283 | |
Bradespar | | | 57,146 | | | | 1,480,419 | |
| | | | | | | | |
| | | | | | | 1,949,702 | |
| | | | | | | | |
Telecommunications — 1.0% | | | | | | | | |
Telemar Norte Leste | | | 9,675 | | | | 336,073 | |
| | | | | | | | |
Utilities — 2.1% | | | | | | | | |
Cia Energetica de Sao Paulo | | | 35,717 | | | | 688,455 | |
| | | | | | | | |
TOTAL BRAZIL | | | | | | | 5,288,944 | |
| | | | | | | | |
TOTAL PREFERRED STOCK
(Cost $4,806,807) | | | | | | | 5,288,944 | |
| | | | | | | | |
The accompanying notes are an integral part of the financial statements.
17
| | | | |
| Schedule of Investments | | | | April 30, 2011 (Unaudited) |
| | Global X Brazil Mid Cap ETF | | |
| | | | | | | | |
| | | Shares | | | Value | |
CORPORATE OBLIGATION — 0.2% | | | | | | | | |
Marfrig Alimentos, Convertible
1.00%, 07/15/15(A)(B)(C) | | | 12 | | | $ | 77,333 | |
| | | | | | | | |
TOTAL CORPORATE OBLIGATION
(Cost $70,659) | | | | | | | 77,333 | |
| | | | | | | | |
TOTAL INVESTMENTS — 99.3%
(Cost $28,798,493) | | | | | | $ | 32,720,192 | |
| | | | | | | | |
Percentages are based on Net Assets of $32,960,854.
| * | Non-income producing security. |
| (A) | Floating rate security — Rate disclosed is the rate in effect on April 30, 2011. |
| (B) | Security is fair valued using methods determined in good faith by the Fair Value Committee of the Fund. The total value of such security as of April 30, 2011 was $153,590 and represents 0.5% of net assets. |
| (C) | Securities considered illiquid. The total value of such securities as of April 30, 2011 was $153,590 and represented 0.5% of Net Assets. |
ADR — American Depositary Receipt
Cl — Class
The following is a summary of the inputs used as of April 30, 2011 in valuing the Fund’s investments carried at value:
| | | | | | | | | | | | | | | | |
Investments in Securities | | | Level 1 | | | | Level 2 | | | | Level 3 | | | | Total | |
Common Stock | | $ | 27,277,658 | | | $ | — | | | $ | 76,257 | | | $ | 27,353,915 | |
Preferred Stock | | | 5,288,944 | | | | — | | | | — | | | | 5,288,944 | |
Corporate Obligation | | | — | | | | — | | | | 77,333 | | | | 77,333 | |
| | | | | | | | | | | | | | | | |
Total Investments in Securities | | $ | 32,566,602 | | | $ | — | | | $ | 153,590 | | | $ | 32,720,192 | |
| | | | | | | | | | | | | | | | |
| | | | | | | | | | | | |
| | | Investments in
Common Stock | | | Investments in
Corporate
Obligation | | | Total | |
Beginning balance as of October 31, 2010 | | $ | — | | | $ | 71,750 | | | $ | 71,750 | |
Accrued discounts/premiums | | | — | | | | — | | | | — | |
Realized gain/(loss) | | | — | | | | — | | | | — | |
Change in unrealized appreciation/(depreciation) | | | — | | | | 5,583 | | | | 5,583 | |
Net purchases | | | 76,257 | | | | — | | | | 76,257 | |
Net sales | | | — | | | | — | | | | — | |
Transfers into Level 3 | | | — | | | | — | | | | — | |
Transfers out of Level 3 | | | — | | | | — | | | | — | |
| | | | | | | | | | | | |
Ending balance as of April 30, 2011 | | $ | 76,257 | | | $ | 77,333 | | | $ | 153,590 | |
| | | | | | | | | | | | |
There have been no significant transfers between Level 1 and Level 2.
The accompanying notes are an integral part of the financial statements.
18
| | | | |
| Schedule of Investments | | | | April 30, 2011 (Unaudited) |
| | Global Brazil Financials ETF | | |
Sector Weightings†:

| † | Percentages based on total investments. |
| | | | | | | | |
| | | Shares | | | Value | |
COMMON STOCK — 93.2% | | | | | | | | |
BRAZIL — 93.2% | | | | | | | | |
Financials — 93.2% | | | | | | | | |
Banco Bradesco ADR | | | 46,700 | | | $ | 944,741 | |
Banco do Brasil | | | 48,642 | | | | 893,677 | |
Banco Santander Brasil ADR | | | 33,890 | | | | 393,463 | |
BM&F Bovespa | | | 57,650 | | | | 432,833 | |
BR Malls Participacoes | | | 45,116 | | | | 476,687 | |
BR Properties | | | 19,147 | | | | 226,404 | |
Brasil Brokers Participacoes | | | 33,921 | | | | 183,730 | |
Brookfield Incorporacoes | | | 37,400 | | | | 210,657 | |
CETIP - Balcao Organizado de Ativos e Derivativos | | | 37,675 | | | | 619,374 | |
Cielo | | | 51,223 | | | | 479,015 | |
Cyrela Brazil Realty Empreendimentos e Participacoes | | | 35,024 | | | | 371,170 | |
Even Construtora e Incorporadora | | | 17,446 | | | | 97,045 | |
Iguatemi Empresa de Shopping Centers | | | 7,296 | | | | 189,102 | |
Itau Unibanco Holding ADR | | | 39,930 | | | | 948,338 | |
MRV Engenharia e Participacoes | | | 44,237 | | | | 386,125 | |
Multiplan Empreendimentos Imobiliarios | | | 12,870 | | | | 269,018 | |
PDG Realty Empreendimentos e Participacoes | | | 73,587 | | | | 433,195 | |
Porto Seguro | | | 20,006 | | | | 332,458 | |
Redecard | | | 33,991 | | | | 493,982 | |
Rossi Residencial | | | 31,134 | | | | 289,568 | |
Sul America | | | 22,960 | | | | 298,641 | |
TOTAL BRAZIL | | | | | | | 8,969,223 | |
| | | | | | | | |
TOTAL COMMON STOCK
(Cost $8,468,641) | | | | | | | 8,969,223 | |
| | | | | | | | |
PREFERRED STOCK — 6.0% | | | | | | | | |
BRAZIL — 6.0% | | | | | | | | |
Financials — 6.0% | | | | | | | | |
Banco ABC Brasil | | | 9,020 | | | | 77,126 | |
Banco do Estado do Rio Grande do Sul | | | 32,165 | | | | 382,381 | |
Banco Industrial e Comercial | | | 11,440 | | | | 82,545 | |
Banco Panamericano | | | 9,130 | | | | 32,504 | |
| | | | | | | | |
TOTAL BRAZIL | | | | | | | 574,556 | |
| | | | | | | | |
TOTAL PREFERRED STOCK
(Cost $543,864) | | | | | | | 574,556 | |
| | | | | | | | |
TOTAL INVESTMENTS — 99.2%
(Cost $9,012,505) | | | | | | $ | 9,543,779 | |
| | | | | | | | |
The accompanying notes are an integral part of the financial statements.
19
| | | | |
| Schedule of Investments | | | | April 30, 2011 (Unaudited) |
| | Global X Brazil Financials ETF | | |
Percentages are based on Net Assets of $9,626,073.
ADR — American Depositary Receipt
The following is a summary of the inputs used as of April 30, 2011 in valuing the Fund’s investments carried at value:
| | | | | | | | | | | | | | | | |
Investments in Securities | | | Level 1 | | | | Level 2 | | | | Level 3 | | | | Total | |
Common Stock | | $ | 8,969,223 | | | $ | — | | | $ | — | | | $ | 8,969,223 | |
Preferred Stock | | | 574,556 | | | | — | | | | — | | | | 574,556 | |
| | | | | | | | | | | | | | | | |
Total Investments in Securities | | $ | 9,543,779 | | | $ | — | | | $ | — | | | $ | 9,543,779 | |
| | | | | | | | | | | | | | | | |
There have been no significant transfers between Level 1 and Level 2.
The accompanying notes are an integral part of the financial statements.
20
| | | | |
| Schedule of Investments | | | | April 30, 2011 (Unaudited) |
| | Global X Brazil Consumer ETF | | |
Sector Weightings†:

| † | Percentages based on total investments. |
| | | | | | | | |
| | | Shares | | | Value | |
COMMON STOCK — 86.9% | | | | | | | | |
BRAZIL — 86.9% | | | | | | | | |
Consumer Goods — 51.3% | | | | | | | | |
BRF - Brasil Foods ADR | | | 102,760 | | | $ | 2,128,160 | |
Cia Hering | | | 89,335 | | | | 1,933,793 | |
Cosan, Cl A | | | 90,404 | | | | 1,125,530 | |
Cosan Industria e Comercio | | | 70,445 | | | | 1,077,499 | |
Gafisa ADR | | | 108,390 | | | | 1,339,700 | |
Hypermarcas * | | | 98,351 | | | | 1,318,641 | |
Hypermarcas - Unit (B)(C)* | | | 84 | | | | 108,570 | |
JBS | | | 407,446 | | | | 1,378,012 | |
M Dias Branco | | | 14,966 | | | | 386,281 | |
Marfrig Alimentos | | | 105,239 | | | | 1,078,482 | |
Natura Cosmeticos | | | 57,954 | | | | 1,626,618 | |
Sao Martinho | | | 22,078 | | | | 339,661 | |
SLC Agricola | | | 37,128 | | | | 466,873 | |
Souza Cruz | | | 155,125 | | | | 1,765,250 | |
Tereos Internacional * | | | 524,612 | | | | 1,103,920 | |
| | | | | | | | |
| | | | | | | 17,176,990 | |
| | | | | | | | |
Consumer Services — 35.6% | | | | | | | | |
Anhanguera Educacional Participacoes | | | 68,441 | | | | 1,528,501 | |
B2W Cia Global Do Varejo | | | 36,834 | | | | 514,458 | |
Cia Brasileira de Distribuicao Grupo Pao de Acucar ADR | | | 37,006 | | | | 1,682,293 | |
Drogasil | | | 70,071 | | | | 503,371 | |
Gol Linhas Aereas Inteligentes ADR * | | | 75,636 | | | | 1,077,813 | |
Localiza Rent a Car | | | 88,713 | | | | 1,525,548 | |
Lojas Renner | | | 44,901 | | | | 1,664,163 | |
Marisa Lojas | | | 35,924 | | | | 683,310 | |
Multiplus | | | 76,243 | | | | 1,556,365 | |
TAM ADR | | | 57,178 | | | | 1,193,877 | |
| | | | | | | | |
| | | | | | | 11,929,699 | |
| | | | | | | | |
TOTAL BRAZIL | | | | | | | 29,106,689 | |
| | | | | | | | |
TOTAL COMMON STOCK
(Cost $27,065,432) | | | | | | | 29,106,689 | |
| | | | | | | | |
The accompanying notes are an integral part of the financial statements.
21
| | | | |
| Schedule of Investments | | | | April 30, 2011 (Unaudited) |
| | Global X Brazil Consumer ETF | | |
| | | | | | | | |
| | | Shares | | | Value | |
PREFERRED STOCK — 12.3% | | | | | | | | |
BRAZIL — 12.3% | | | | | | | | |
Consumer Goods — 7.1% | | | | | | | | |
Cia de Bebidas das Americas ADR | | | 58,218 | | | $ | 1,896,742 | |
Sao Paulo Alpargatas | | | 68,422 | | | | 495,874 | |
| | | | | | | | |
| | | | | | | 2,392,616 | |
| | | | | | | | |
Consumer Services — 5.2% | | | | | | | | |
Lojas Americanas | | | 161,100 | | | | 1,433,821 | |
Saraiva Livreiros Editores | | | 12,271 | | | | 305,020 | |
| | | | | | | | |
| | | | | | | 1,738,841 | |
| | | | | | | | |
TOTAL BRAZIL | | | | | | | 4,131,457 | |
| | | | | | | | |
TOTAL PREFERRED STOCK
(Cost $3,643,202) | | | | | | | 4,131,457 | |
| | | | | | | | |
CORPORATE OBLIGATION — 0.1% | | | | | | | | |
Marfrig Alimentos
1.00%, 07/15/15(A)(B)(C) | | | 6 | | | | 38,642 | |
| | | | | | | | |
TOTAL CORPORATE OBLIGATION
(Cost $35,153) | | | | | | | 38,642 | |
| | | | | | | | |
TOTAL INVESTMENTS — 99.3%
(Cost $30,743,787) | | | | | | $ | 33,276,788 | |
| | | | | | | | |
Percentages are based on Net Assets of $33,495,152.
| * | Non-income producing security. |
| (A) | Floating rate security — Rate disclosed is the rate in effect on April 30, 2011. |
| (B) | Security is fair valued using methods determined in good faith by the Fair Value Committee of the Fund. The total value of such security as of April 301, 2011 was $147,212 and represents 0.4% of net assets. |
| (C) | Securities considered illiquid. The total value of such securities as of April 30, 2011 was $147,212 and represented 0.4% of Net Assets. |
ADR — American Depositary Receipt
Cl — Class
The accompanying notes are an integral part of the financial statements.
22
| | | | |
| Schedule of Investments | | | | April 30, 2011 (Unaudited) |
| | Global X Brazil Consumer ETF | | |
The following is a summary of the inputs used as of April 30, 2011 in valuing the Fund’s investments carried at value:
| | | | | | | | | | | | | | | | |
Investments in Securities | | | Level 1 | | | | Level 2 | | | | Level 3 | | | | Total | |
Common Stock | | $ | 28,998,119 | | | $ | — | | | $ | 108,570 | | | $ | 29,106,689 | |
Preferred Stock | | | 4,131,457 | | | | — | | | | — | | | | 4,131,457 | |
Corporate Obligation | | | — | | | | — | | | | 38,642 | | | | 38,642 | |
| | | | | | | | | | | | | | | | |
Total Investments in Securities | | $ | 33,129,576 | | | $ | — | | | $ | 147,212 | | | $ | 33,276,788 | |
| | | | | | | | | | | | | | | | |
| | | | | | | | | | | | |
| | | Investments in
Common Stock | | | Investments in
Corporate
Obligations | | | Total | |
Beginning balance as of October 31, 2010 | | $ | — | | | $ | 35,852 | | | $ | 35,852 | |
Accrued discounts/premiums | | | — | | | | — | | | | — | |
Realized gain/(loss) | | | — | | | | — | | | | — | |
Change in unrealized appreciation/(depreciation) | | | — | | | | 2,790 | | | | 2,790 | |
Net purchases | | | 108,570 | | | | — | | | | 108,570 | |
Net sales | | | — | | | | — | | | | — | |
Transfers into Level 3 | | | — | | | | — | | | | — | |
Transfers out of Level 3 | | | — | | | | — | | | | — | |
| | | | | | | | | | | | |
Ending balance as of April 30, 2011 | | $ | 108,570 | | | $ | 38,642 | | | $ | 147,212 | |
| | | | | | | | | | | | |
There have been no significant transfers between Level 1 and Level 2.
The accompanying notes are an integral part of the financial statements.
23
| | | | |
| Schedule of Investments | | | | April 30, 2011 (Unaudited) |
| | Global X FTSE Colombia 20 ETF | | |
Sector Weightings†:
| † | Percentages based on total investments. |
| | | | | | | | |
| | | Shares | | | Value | |
COMMON STOCK — 99.8% | | | | | | | | |
COLOMBIA — 99.8% | | | | | | | | |
Consumer Goods — 5.9% | | | | | | | | |
Grupo Nacional de Chocolates | | | 564,209 | | | $ | 7,296,384 | |
Textiles Fabricato Tejicondor * | | | 75,991,808 | | | | 1,891,520 | |
| | | | | | | | |
| | | | | | | 9,187,904 | |
| | | | | | | | |
Consumer Services — 5.0% | | | | | | | | |
Almacenes Exito | | | 505,606 | | | | 7,779,874 | |
| | | | | | | | |
Financials — 38.6% | | | | | | | | |
BanColombia ADR | | | 244,708 | | | | 16,211,905 | |
Bolsa de Valores de Colombia | | | 224,647,121 | | | | 5,159,627 | |
Cia Colombiana de Inversiones | | | 2,541,213 | | | | 7,116,029 | |
Financiera Colombiana | | | 379,520 | | | | 7,321,173 | |
Grupo Aval Acciones y Valores | | | 14,032,562 | | | | 10,716,727 | |
Grupo de Inversiones Suramericana | | | 476,200 | | | | 9,897,374 | |
Helm Bank | | | 6,644,802 | | | | 1,420,906 | |
Interbolsa | | | 1,196,814 | | | | 1,929,581 | |
| | | | | | | | |
| | | | | | | 59,773,322 | |
| | | | | | | | |
Industrials — 11.2% | | | | | | | | |
Cementos Argos | | | 1,242,291 | | | | 7,519,666 | |
Inversiones Argos | | | 747,488 | | | | 7,805,979 | |
Tableros y Maderas de Caldas | | | 311,736,998 | | | | 2,098,586 | |
| | | | | | | | |
| | | | | | | 17,424,231 | |
| | | | | | | | |
Oil & Gas — 28.3% | | | | | | | | |
Ecopetrol ADR | | | 452,054 | | | | 19,831,609 | |
Pacific Rubiales Energy CAD | | | 524,622 | | | | 15,943,850 | |
Pacific Rubiales Energy USD | | | 15,000 | | | | 456,111 | |
Sociedad de Inversiones en Energia | | | 964,679 | | | | 7,618,328 | |
| | | | | | | | |
| | | | | | | 43,849,898 | |
| | | | | | | | |
Telecommunications — 1.2% | | | | | | | | |
Empresa de Telecomunicaciones de Bogota * | | | 5,228,049 | | | | 1,922,403 | |
| | | | | | | | |
Utilities — 9.6% | | | | | | | | |
Interconexion Electrica | | | 1,056,863 | | | | 7,497,348 | |
The accompanying notes are an integral part of the financial statements.
24
| | | | |
| Schedule of Investments | | | | April 30, 2011 (Unaudited) |
| | Global X FTSE Colombia 20 ETF | | |
| | | | | | | | |
| | | Shares | | | Value | |
COMMON STOCK — continued | | | | | | | | |
Utilities — continued | | | | | | | | |
Isagen | | $ | 5,498,796 | | | $ | 7,310,160 | |
| | | | | | | | |
| | | | | | | 14,807,508 | |
| | | | | | | | |
TOTAL COLOMBIA | | | | | | | 154,745,140 | |
| | | | | | | | |
TOTAL COMMON STOCK
(Cost $148,969,157) | | | | | | | 154,745,140 | |
| | | | | | | | |
TOTAL INVESTMENTS — 99.8%
(Cost $148,969,157) | | | | | | $ | 154,745,140 | |
| | | | | | | | |
Percentages are based on Net Assets of $155,083,105.
| * | Non-income producing security. |
ADR — American Depositary Receipt
CAD — Canadian Dollar
USD — U.S. Dollar
The following is a summary of the inputs used as of April 30, 2011 in valuing the Fund’s investments carried at value:
| | | | | | | | | | | | | | | | |
Investments in Securities | | | Level 1 | | | | Level 2 | | | | Level 3 | | | | Total | |
Common Stock | | $ | 154,745,140 | | | $ | — | | | $ | — | | | $ | 154,745,140 | |
| | | | | | | | | | | | | | | | |
Total Investments in Securities | | $ | 154,745,140 | | | $ | — | | | $ | — | | | $ | 154,745,140 | |
| | | | | | | | | | | | | | | | |
There have been no significant transfers between Level 1 and Level 2.
The accompanying notes are an integral part of the financial statements.
25
| | | | |
| Schedule of Investments | | | | April 30, 2011 (Unaudited) |
| | Global X FTSE Nordic Region ETF | | |
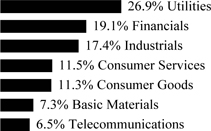
Sector Weightings†:
| † | Percentages based on total investments. |
| | | | | | | | |
| | | Shares | | | Value | |
COMMON STOCK — 99.5% | | | | | | | | |
DENMARK— 18.1% | | | | | | | | |
Consumer Goods — 2.3% | | | | | | | | |
Carlsberg, Cl B | | | 6,741 | | | $ | 800,747 | |
| | | | | | | | |
Financials — 3.7% | | | | | | | | |
Danske Bank | | | 52,845 | | | | 1,270,161 | |
| | | | | | | | |
Health Care — 9.4% | | | | | | | | |
Novo Nordisk ADR | | | 25,549 | | | | 3,254,687 | |
| | | | | | | | |
Industrials — 2.7% | | | | | | | | |
A P Moller - Maersk, Cl B | | | 91 | | | | 921,894 | |
| | | | | | | | |
TOTAL DENMARK | | | | | | | 6,247,489 | |
| | | | | | | | |
FINLAND — 14.6% | | | | | | | | |
Basic Materials — 1.7% | | | | | | | | |
UPM-Kymmene | | | 29,170 | | | | 597,898 | |
| | | | | | | | |
Financials — 3.0% | | | | | | | | |
Sampo, Cl A | | | 31,028 | | | | 1,044,039 | |
| | | | | | | | |
Industrials — 1.7% | | | | | | | | |
Kone, Cl B | | | 9,050 | | | | 566,814 | |
| | | | | | | | |
Technology — 5.7% | | | | | | | | |
Nokia ADR | | | 212,403 | | | | 1,960,480 | |
| | | | | | | | |
Utilities — 2.5% | | | | | | | | |
Fortum | | | 24,580 | | | | 846,733 | |
| | | | | | | | |
TOTAL FINLAND | | | | | | | 5,015,964 | |
| | | | | | | | |
NORWAY — 18.9% | | | | | | | | |
Basic Materials — 3.5% | | | | | | | | |
Norsk Hydro | | | 56,803 | | | | 503,707 | |
Yara International | | | 12,030 | | | | 704,989 | |
| | | | | | | | |
| | | | | | | 1,208,696 | |
| | | | | | | | |
The accompanying notes are an integral part of the financial statements.
26
| | | | |
| Schedule of Investments | | | | April 30, 2011 (Unaudited) |
| | Global X FTSE Nordic Region ETF | | |
| | | | | | | | |
| | | Shares | | | Value | |
COMMON STOCK — continued | | | | | | | | |
Consumer Goods — 1.7% | | | | | | | | |
Orkla | | | 56,550 | | | $ | 573,178 | |
| | | | | | | | |
Financials — 3.2% | | | | | | | | |
DnB | | | 68,999 | | | | 1,122,395 | |
| | | | | | | | |
Oil & Gas — 8.1% | | | | | | | | |
Seadrill | | | 18,422 | | | | 653,086 | |
Statoil ADR | | | 72,341 | | | | 2,120,315 | |
| | | | | | | | |
| | | | | | | 2,773,401 | |
| | | | | | | | |
Telecommunications — 2.4% | | | | | | | | |
Telenor | | | 47,015 | | | | 812,752 | |
| | | | | | | | |
TOTAL NORWAY | | | | | | | 6,490,422 | |
| | | | | | | | |
SWEDEN — 47.9% | | | | | | | | |
Consumer Goods — 1.5% | | | | | | | | |
Svenska Cellulosa, Cl B | | | 33,600 | | | | 515,211 | |
| | | | | | | | |
Consumer Services — 3.3% | | | | | | | | |
Hennes & Mauritz, Cl B | | | 32,412 | | | | 1,145,879 | |
| | | | | | | | |
Financials — 17.2% | | | | | | | | |
Investor, Cl B | | | 25,135 | | | | 626,398 | |
Nordea Bank | | | 169,053 | | | | 1,930,154 | |
Skandinaviska Enskilda Banken, Cl A | | | 120,266 | | | | 1,157,055 | |
Svenska Handelsbanken, Cl A | | | 34,969 | | | | 1,214,274 | |
Swedbank, Cl A | | | 52,762 | | | | 1,001,246 | |
| | | | | | | | |
| | | | | | | 5,929,127 | |
| | | | | | | | |
Industrials — 15.5% | | | | | | | | |
Atlas Copco, Cl A | | | 35,706 | | | | 1,048,890 | |
Sandvik | | | 65,777 | | | | 1,396,359 | |
Scania, Cl B | | | 22,687 | | | | 589,809 | |
SKF, Cl B | | | 22,524 | | | | 711,264 | |
Volvo, Cl B | | | 80,425 | | | | 1,579,468 | |
| | | | | | | | |
| | | | | | | 5,325,790 | |
| | | | | | | | |
Technology — 7.5% | | | | | | | | |
Ericsson ADR | | | 170,809 | | | | 2,596,297 | |
| | | | | | | | |
Telecommunications — 2.9% | | | | | | | | |
TeliaSonera | | | 120,208 | | | | 982,127 | |
| | | | | | | | |
TOTAL SWEDEN | | | | | | | 16,494,431 | |
| | | | | | | | |
TOTAL COMMON STOCK
(Cost $28,370,414) | | | | | | | 34,248,306 | |
| | | | | | | | |
TOTAL INVESTMENTS — 99.5%
(Cost $28,370,414) | | | | | | $ | 34,248,306 | |
| | | | | | | | |
The accompanying notes are an integral part of the financial statements.
27
| | | | |
| Schedule of Investments | | | | April 30, 2011 (Unaudited) |
| | Global X FTSE Nordic Region ETF | | |
Percentages are based on Net Assets of $34,433,038.
ADR — American Depositary Receipt
Cl — Class
The following is a summary of the inputs used as of April 30, 2011 in valuing the Fund’s investments carried at value:
| | | | | | | | | | | | | | | | |
Investments in Securities | | | Level 1 | | | | Level 2 | | | | Level 3 | | | | Total | |
Common Stock | | $ | 34,248,306 | | | $ | — | | | $ | — | | | $ | 34,248,306 | |
| | | | | | | | | | | | | | | | |
Total Investments in Securities | | $ | 34,248,306 | | | $ | — | | | $ | — | | | $ | 34,248,306 | |
| | | | | | | | | | | | | | | | |
There have been no significant transfers between Level 1 and Level 2.
The accompanying notes are an integral part of the financial statements.
28
| | | | |
| Schedule of Investments | | | | April 30, 2011 (Unaudited) |
| | Global X FTSE Norway 30 ETF | | |
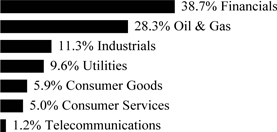
Sector Weightings†:
| † | Percentages based on total investments. |
| | | | | | | | |
| | | Shares | | | Value | |
COMMON STOCK — 99.1% | | | | | | | | |
NORWAY — 99.1% | | | | | | | | |
Basic Materials — 8.6% | | | | | | | | |
Norsk Hydro | | | 243,328 | | | $ | 2,157,739 | |
Yara International | | | 39,136 | | | | 2,293,469 | |
| | | | | | | | |
| | | | | | | 4,451,208 | |
| | | | | | | | |
Consumer Goods — 9.7% | | | | | | | | |
Aker, Cl A | | | 11,662 | | | | 355,834 | |
Austevoll Seafood | | | 34,137 | | | | 262,352 | |
Cermaq | | | 28,713 | | | | 591,366 | |
Marine Harvest | | | 1,090,301 | | | | 1,440,899 | |
Orkla | | | 231,669 | | | | 2,348,146 | |
| | | | | | | | |
| | | | | | | 4,998,597 | |
| | | | | | | | |
Consumer Services — 5.3% | | | | | | | | |
Royal Caribbean Cruises * | | | 43,813 | | | | 1,738,717 | |
Schibsted | | | 33,200 | | | | 998,444 | |
| | | | | | | | |
| | | | | | | 2,737,161 | |
| | | | | | | | |
Financials — 22.2% | | | | | | | | |
DnB | | | 496,135 | | | | 8,070,543 | |
Gjensidige Forsikring | | | 81,242 | | | | 1,058,944 | |
Norwegian Property | | | 202,899 | | | | 410,147 | |
Storebrand | | | 185,266 | | | | 1,925,511 | |
| | | | | | | | |
| | | | | | | 11,465,145 | |
| | | | | | | | |
Health Care — 1.0% | | | | | | | | |
Algeta * | | | 17,032 | | | | 492,076 | |
| | | | | | | | |
Industrials — 1.3% | | | | | | | | |
Golden Ocean Group | | | 139,256 | | | | 170,624 | |
Tomra Systems | | | 58,790 | | | | 504,510 | |
| | | | | | | | |
| | | | | | | 675,134 | |
| | | | | | | | |
Oil & Gas — 44.9% | | | | | | | | |
Aker Solutions | | | 83,968 | | | | 2,027,222 | |
DNO International * | | | 382,130 | | | | 573,508 | |
The accompanying notes are an integral part of the financial statements.
29
| | | | |
| Schedule of Investments | | | | April 30, 2011 (Unaudited) |
| | Global X FTSE Norway 30 ETF | | |
| | | | | | | | |
| | | Shares | | | Value | |
COMMON STOCK — continued | | | | | | | | |
Oil & Gas — continued | | | | | | | | |
Fred Olsen Energy | | | 10,957 | | | $ | 505,663 | |
Frontline | | | 23,336 | | | | 515,334 | |
Petroleum Geo-Services * | | | 88,759 | | | | 1,402,358 | |
ProSafe | | | 93,049 | | | | 755,919 | |
Renewable Energy * | | | 202,866 | | | | 716,480 | |
Seadrill | | | 69,358 | | | | 2,458,837 | |
Statoil | | | 367,669 | | | | 10,762,652 | |
Subsea 7 | | | 88,159 | | | | 2,320,062 | |
TGS Nopec Geophysical | | | 42,104 | | | | 1,108,845 | |
| | | | | | | | |
| | | | | | | 23,146,880 | |
| | | | | | | | |
Technology — 1.4% | | | | | | | | |
Atea | | | 39,963 | | | | 442,018 | |
Nordic Semiconductor | | | 69,240 | | | | 258,802 | |
| | | | | | | | |
| | | | | | | 700,820 | |
| | | | | | | | |
Telecommunications — 4.7% | | | | | | | | |
Telenor | | | 138,973 | | | | 2,402,438 | |
| | | | | | | | |
TOTAL NORWAY | | | | | | | 51,069,459 | |
| | | | | | | | |
TOTAL COMMON STOCK
(Cost $45,924,822) | | | | | | | 51,069,459 | |
| | | | | | | | |
TOTAL INVESTMENTS — 99.1%
(Cost $45,924,822) | | | | | | $ | 51,069,459 | |
| | | | | | | | |
Percentages are based on Net Assets of $51,559,079.
| * | Non-income producing security. |
Cl — Class
The following is a summary of the inputs used as of April 30, 2011 in valuing the Fund’s investments carried at value:
| | | | | | | | | | | | | | | | |
Investments in Securities | | | Level 1 | | | | Level 2 | | | | Level 3 | | | | Total | |
Common Stock | | $ | 51,069,459 | | | $ | — | | | $ | — | | | $ | 51,069,459 | |
| | | | | | | | | | | | | | | | |
Total Investments in Securities | | $ | 51,069,459 | | | $ | — | | | $ | — | | | $ | 51,069,459 | |
| | | | | | | | | | | | | | | | |
There have been no significant transfers between Level 1 and Level 2.
The accompanying notes are an integral part of the financial statements.
30
| | | | |
| Schedule of Investments | | | | April 30, 2011 (Unaudited) |
| | Global X FTSE Argentina 20 ETF | | |
Sector Weightings†:
| † | Percentages based on total investments. |
| | | | | | | | |
| | | Shares | | | Value | |
COMMON STOCK — 98.9% | | | | | | | | |
ARGENTINA — 80.5% | | | | | | | | |
Basic Materials — 21.6% | | | | | | | | |
Tenaris ADR | | | 16,300 | | | $ | 827,877 | |
| | | | | | | | |
Consumer Goods — 4.5% | | | | | | | | |
Cresud SACIF y A ADR | | | 9,900 | | | | 172,359 | |
| | | | | | | | |
Consumer Services — 5.2% | | | | | | | | |
MercadoLibre | | | 2,170 | | | | 198,338 | |
| | | | | | | | |
Financials — 21.0% | | | | | | | | |
Banco Macro ADR | | | 8,799 | | | | 325,475 | |
BBVA Banco Frances ADR | | | 14,750 | | | | 153,547 | |
Grupo Financiero Galicia ADR * | | | 17,569 | | | | 224,532 | |
IRSA Inversiones y Representaciones ADR | | | 7,900 | | | | 100,093 | |
| | | | | | | | |
| | | | | | | 803,647 | |
| | | | | | | | |
Oil & Gas — 11.7% | | | | | | | | |
Petrobras Argentina ADR | | | 7,879 | | | | 179,720 | |
Transportadora de Gas del Sur ADR * | | | 10,600 | | | | 56,180 | |
YPF | | | 4,801 | | | | 211,292 | |
| | | | | | | | |
| | | | | | | 447,192 | |
| | | | | | | | |
Telecommunications — 10.7% | | | | | | | | |
Nortel Inversora | | | 6,350 | | | | 165,862 | |
Telecom Argentina ADR | | | 10,757 | | | | 245,475 | |
| | | | | | | | |
| | | | | | | 411,337 | |
| | | | | | | | |
Utilities — 5.8% | | | | | | | | |
Empresa Distribuidora Y Comericalizadora Norte | | | 3,000 | | | | 31,260 | |
Pampa Energia ADR * | | | 11,959 | | | | 190,465 | |
| | | | | | | | |
| | | | | | | 221,725 | |
| | | | | | | | |
TOTAL ARGENTINA | | | | | | | 3,082,475 | |
| | | | | | | | |
The accompanying notes are an integral part of the financial statements.
31
| | | | |
| Schedule of Investments | | | | April 30, 2011 (Unaudited) |
| | Global X FTSE Argentina 20 ETF | | |
| | | | | | | | |
| | | Shares/Face
Amount | | | Value | |
COMMON STOCK — continued | | | | | | | | |
CANADA — 9.5% | | | | | | | | |
Basic Materials — 9.5% | | | | | | | | |
Goldcorp | | | 3,094 | | | $ | 172,738 | |
Pan American Silver | | | 600 | | | | 21,648 | |
Silver Standard Resources * | | | 650 | | | | 22,581 | |
Yamana Gold | | | 11,543 | | | | 146,711 | |
| | | | | | | | |
TOTAL CANADA | | | | | | | 363,678 | |
| | | | | | | | |
CHILE — 4.6% | | | | | | | | |
Consumer Services — 4.6% | | | | | | | | |
Cencosud | | | 22,428 | | | | 177,183 | |
| | | | | | | | |
TOTAL CHILE | | | | | | | 177,183 | |
| | | | | | | | |
UNITED STATES — 4.3% | | | | | | | | |
Oil & Gas — 4.3% | | | | | | | | |
Apache | | | 1,238 | | | | 165,112 | |
| | | | | | | | |
TOTAL COMMON STOCK
(Cost $3,738,369) | | | | | | | 3,788,448 | |
| | | | | | | | |
U.S. TREASURY OBLIGATION — 13.1% | | | | | | | | |
United States Treasury Bills (A)
0.010%, 05/19/11 (Cost $499,998) | | $ | 500,000 | | | | 499,996 | |
| | | | | | | | |
TOTAL INVESTMENTS — 112.0%
(Cost $4,238,367) | | | | | | $ | 4,288,444 | |
| | | | | | | | |
Percentages are based on Net Assets of $3,830,073.
| * | Non-income producing security. |
| (A) | The rate reported is the effective yield at time of purchase. |
ADR — American Depositary Receipt
The following is a summary of the inputs used as of April 30, 2011 in valuing the Fund’s investments carried at value:
| | | | | | | | | | | | | | | | |
Investments in Securities | | | Level 1 | | | | Level 2 | | | | Level 3 | | | | Total | |
Common Stock | | $ | 3,788,448 | | | $ | — | | | $ | — | | | $ | 3,788,448 | |
U.S. Treasury Obligation | | | — | | | | 499,996 | | | | — | | | | 499,996 | |
| | | | | | | | | | | | | | | | |
Total Investments in Securities | | $ | 3,788,448 | | | $ | 499,996 | | | $ | — | | | $ | 4,288,444 | |
| | | | | | | | | | | | | | | | |
There have been no significant transfers between Level 1 and Level 2.
The accompanying notes are an integral part of the financial statements.
32
| | | | |
| Schedule of Investments | | | | April 30, 2011 (Unaudited) |
| | Global X FTSE Andean 40 ETF | | |
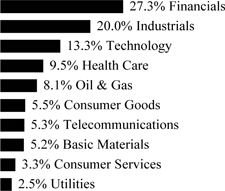
Sector Weightings†:
| † | Percentages based on total investments. |
| | | | | | | | |
| | | Shares | | | Value | |
COMMON STOCK — 99.8% | | | | | | | | |
ARGENTINA — 3.3% | | | | | | | | |
Consumer Services — 3.3% | | | | | | | | |
Cencosud | | | 31,700 | | | $ | 250,432 | |
| | | | | | | | |
CHILE — 49.0% | | | | | | | | |
Basic Materials — 12.3% | | | | | | | | |
CAP | | | 5,468 | | | | 293,987 | |
Empresas CMPC | | | 5,367 | | | | 297,943 | |
Sociedad Quimica y Minera de Chile ADR | | | 5,865 | | | | 357,941 | |
| | | | | | | | |
| | | | | | | 949,871 | |
| | | | | | | | |
Consumer Goods — 2.3% | | | | | | | | |
Cia Cervecerias Unidas ADR | | | 1,241 | | | | 74,460 | |
Cia Pesquera Camanchaca * | | | 143,752 | | | | 25,609 | |
Embotelladora Andina ADR, Cl B | | | 1,206 | | | | 34,781 | |
Viva Concha Y Tora | | | 902 | | | | 45,100 | |
| | | | | | | | |
| | | | | | | 179,950 | |
| | | | | | | | |
Consumer Services — 8.6% | | | | | | | | |
Empresas La Polar | | | 11,500 | | | | 64,538 | |
Lan Airlines ADR | | | 4,951 | | | | 138,331 | |
Ripley * | | | 45,400 | | | | 60,954 | |
SACI Falabella | | | 36,732 | | | | 400,972 | |
| | | | | | | | |
| | | | | | | 664,795 | |
| | | | | | | | |
Financials — 6.6% | | | | | | | | |
Banco de Chile ADR | | | 2,048 | | | | 182,579 | |
Banco de Credito e Inversiones | | | 1,420 | | | | 96,254 | |
Banco Santander Chile ADR | | | 1,768 | | | | 161,931 | |
Corpbanca ADR | | | 2,888 | | | | 66,857 | |
| | | | | | | | |
| | | | | | | 507,621 | |
| | | | | | | | |
Industrials — 1.7% | | | | | | | | |
Cia Sud Americana de Vapores | | | 71,600 | | | | 57,078 | |
Salfacorp | | | 18,500 | | | | 71,512 | |
| | | | | | | | |
| | | | | | | 128,590 | |
| | | | | | | | |
The accompanying notes are an integral part of the financial statements.
33
| | | | |
| Schedule of Investments | | | | April 30, 2011 (Unaudited) |
| | Global X FTSE Andean 40 ETF | | |
| | | | | | | | |
| | | Shares | | | Value | |
COMMON STOCK — continued | | | | | | | | |
Oil & Gas — 5.1% | | | | | | | | |
Empresas COPEC | | | 20,512 | | | $ | 397,976 | |
| | | | | | | | |
Technology — 1.0% | | | | | | | | |
Sonda * | | | 26,700 | | | | 76,834 | |
| | | | | | | | |
Telecommunications — 1.1% | | | | | | | | |
ENTEL Chile | | | 4,350 | | | | 87,926 | |
| | | | | | | | |
Utilities — 10.3% | | | | | | | | |
AES Gener | | | 113,000 | | | | 69,209 | |
Colbun | | | 336,300 | | | | 101,358 | |
Empresa Nacional de Electricidad ADR | | | 6,322 | | | | 356,434 | |
Enersis ADR | | | 12,725 | | | | 271,806 | |
| | | | | | | | |
| | | | | | | 798,807 | |
| | | | | | | | |
TOTAL CHILE | | | | | | | 3,792,370 | |
| | | | | | | | |
COLOMBIA — 29.8% | | | | | | | | |
Consumer Services — 1.8% | | | | | | | | |
Almacenes Exito | | | 8,936 | | | | 137,500 | |
| | | | | | | | |
Financials — 10.6% | | | | | | | | |
BanColombia ADR | | | 6,440 | | | | 426,650 | |
Banco Davivienda | | | 3,207 | | | | 35,960 | |
Financiera Colombiana | | | 5,121 | | | | 98,796 | |
Grupo de Inversiones Suramericana | | | 12,527 | | | | 260,362 | |
| | | | | | | | |
| | | | | | | 821,768 | |
| | | | | | | | |
Industrials — 3.8% | | | | | | | | |
Cementos Argos | | | 18,372 | | | | 111,207 | |
Inversiones Argos | | | 17,197 | | | | 179,587 | |
| | | | | | | | |
| | | | | | | 290,794 | |
| | | | | | | | |
Oil & Gas — 11.1% | | | | | | | | |
Ecopetrol ADR | | | 11,897 | | | | 521,921 | |
Pacific Rubiales Energy CAD | | | 10,985 | | | | 333,847 | |
| | | | | | | | |
| | | | | | | 855,768 | |
| | | | | | | | |
Utilities — 2.5% | | | | | | | | |
Interconexion Electrica | | | 17,808 | | | | 126,329 | |
Isagen | | | 48,500 | | | | 64,477 | |
| | | | | | | | |
| | | | | | | 190,806 | |
| | | | | | | | |
TOTAL COLOMBIA | | | | | | | 2,296,636 | |
| | | | | | | | |
PERU — 11.1% | | | | | | | | |
Basic Materials — 7.1% | | | | | | | | |
Cia de Minas Buenaventura ADR | | | 11,019 | | | | 459,162 | |
Volcan Cia Minera SAA * | | | 76,833 | | | | 84,282 | |
| | | | | | | | |
| | | | | | | 543,444 | |
| | | | | | | | |
Financials — 4.0% | | | | | | | | |
Credicorp | | | 1,285 | | | | 124,182 | |
Credicorp Ltd | | | 1,928 | | | | 186,091 | |
| | | | | | | | |
| | | | | | | 310,273 | |
| | | | | | | | |
The accompanying notes are an integral part of the financial statements.
34
| | | | |
| Schedule of Investments | | | | April 30, 2011 (Unaudited) |
| | Global X FTSE Andean 40 ETF | | |
| | | | | | | | |
| | | Shares | | | Value | |
COMMON STOCK — continued | | | | | | | | |
Financials — continued | | | | | | | | |
TOTAL PERU | | | | | | $ | 853,717 | |
| | | | | | | | |
UNITED STATES — 6.6% | | | | | | | | |
Basic Materials — 6.6% | | | | | | | | |
Southern Copper | | | 13,629 | | | | 510,542 | |
| | | | | | | | |
TOTAL COMMON STOCK
(Cost $7,307,664) | | | | | | | 7,703,697 | |
| | | | | | | | |
TOTAL INVESTMENTS — 99.8%
(Cost $7,307,664) | | | | | | $ | 7,703,697 | |
| | | | | | | | |
Percentages are based on Net Assets of $7,720,097.
| * | Non-income producing security. |
ADR — American Depositary Receipt
CAD — Canadian Dollar
Cl — Class
Ltd. — Limited
The following is a summary of the inputs used as of April 30, 2011 in valuing the Fund’s investments carried at value:
| | | | | | | | | | | | | | | | |
Investments in Securities | | | Level 1 | | | | Level 2 | | | | Level 3 | | | | Total | |
Common Stock | | $ | 7,703,697 | | | $ | — | | | $ | — | | | $ | 7,703,697 | |
| | | | | | | | | | | | | | | | |
Total Investments in Securities | | $ | 7,703,697 | | | $ | — | | | $ | — | | | $ | 7,703,697 | |
| | | | | | | | | | | | | | | | |
There have been no significant transfers between Level 1 and Level 2.
The accompanying notes are an integral part of the financial statements.
35
| | | | |
| Schedule of Investments | | | | April 30, 2011 (Unaudited) |
| | Global X FTSE ASEAN 40 ETF | | |
Sector Weightings†:
| † | Percentages based on total investments. |
| | | | | | | | |
| | | Shares | | | Value | |
COMMON STOCK — 100.0% | | | | | | | | |
INDONESIA — 17.2% | | | | | | | | |
Consumer Goods — 6.1% | | | | | | | | |
Astra International | | | 20,300 | | | $ | 133,113 | |
Unilever Indonesia | | | 10,200 | | | | 18,225 | |
| | | | | | | | |
| | | | | | | 151,338 | |
| | | | | | | | |
Financials — 7.4% | | | | | | | | |
Bank Central Asia | | | 82,200 | | | | 71,036 | |
Bank Mandiri | | | 61,559 | | | | 51,401 | |
Bank Rakyat Indonesia Persero | | | 82,000 | | | | 61,766 | |
| | | | | | | | |
| | | | | | | 184,203 | |
| | | | | | | | |
Telecommunications — 2.5% | | | | | | | | |
Telekomunikasi Indonesia ADR | | | 1,688 | | | | 61,004 | |
| | | | | | | | |
Utilities — 1.2% | | | | | | | | |
Perusahaan Gas Negara | | | 65,000 | | | | 30,363 | |
| | | | | | | | |
TOTAL INDONESIA | | | | | | | 426,908 | |
| | | | | | | | |
MALAYSIA — 29.5% | | | | | | | | |
Basic Materials — 1.6% | | | | | | | | |
Petronas Chemicals Group * | | | 15,966 | | | | 38,985 | |
| | | | | | | | |
Consumer Goods — 2.4% | | | | | | | | |
IOI | | | 33,500 | | | | 59,850 | |
| | | | | | | | |
Consumer Services — 2.9% | | | | | | | | |
Genting | | | 18,600 | | | | 72,867 | |
| | | | | | | | |
Financials — 12.7% | | | | | | | | |
CIMB Group Holdings | | | 37,400 | | | | 103,447 | |
Malayan Banking | | | 36,000 | | | | 106,383 | |
Public Bank | | | 23,700 | | | | 104,853 | |
| | | | | | | | |
| | | | | | | 314,683 | |
| | | | | | | | |
The accompanying notes are an integral part of the financial statements.
36
| | | | |
| Schedule of Investments | | | | April 30, 2011 (Unaudited) |
| | Global X FTSE ASEAN 40 ETF | | |
| | | | | | | | |
| | | Shares | | | Value | |
COMMON STOCK — continued | | | | | | | | |
Industrials — 4.5% | | | | | | | | |
PLUS Expressways | | | 13,400 | | | $ | 20,320 | |
Sime Darby | | | 30,200 | | | | 91,997 | |
| | | | | | | | |
| | | | | | | 112,317 | |
| | | | | | | | |
Oil & Gas — 0.8% | | | | | | | | |
Petronas Gas | | | 5,400 | | | | 20,535 | |
| | | | | | | | |
Telecommunications — 3.9% | | | | | | | | |
Axiata Group * | | | 42,500 | | | | 70,331 | |
Maxis | | | 15,000 | | | | 27,204 | |
| | | | | | | | |
| | | | | | | 97,535 | |
| | | | | | | | |
Utilities — 0.7% | | | | | | | | |
Tenaga Nasional | | | 9,000 | | | | 18,267 | |
| | | | | | | | |
TOTAL MALAYSIA | | | | | | | 735,039 | |
| | | | | | | | |
PHILIPPINES — 0.6% | | | | | | | | |
Telecommunications — 0.6% | | | | | | | | |
Philippine Long Distance Telephone ADR | | | 252 | | | | 14,613 | |
| | | | | | | | |
SINGAPORE — 41.2% | | | | | | | | |
Consumer Goods — 3.0% | | | | | | | | |
Wilmar International | | | 17,100 | | | | 73,631 | |
| | | | | | | | |
Consumer Services — 5.9% | | | | | | | | |
Genting Singapore * | | | 40,700 | | | | 72,162 | |
Jardine Cycle & Carriage | | | 952 | | | | 28,687 | |
Singapore Airlines | | | 3,900 | | | | 44,866 | |
| | | | | | | | |
| | | | | | | 145,715 | |
| | | | | | | | |
Financials — 20.1% | | | | | | | | |
CapitaLand | | | 21,300 | | | | 59,171 | |
City Developments | | | 4,500 | | | | 43,533 | |
DBS Group Holdings | | | 11,600 | | | | 141,979 | |
Oversea-Chinese Banking | | | 16,800 | | | | 131,089 | |
United Overseas Bank | | | 7,800 | | | | 125,040 | |
| | | | | | | | |
| | | | | | | 500,812 | |
| | | | | | | | |
Industrials — 3.2% | | | | | | | | |
Noble Group | | | 30,200 | | | | 55,026 | |
Singapore Technologies Engineering | | | 10,200 | | | | 26,252 | |
| | | | | | | | |
| | | | | | | 81,278 | |
| | | | | | | | |
Oil & Gas — 3.5% | | | | | | | | |
Keppel | | | 8,910 | | | | 86,632 | |
| | | | | | | | |
Telecommunications — 5.5% | | | | | | | | |
Singapore Telecommunications | | | 53,300 | | | | 135,874 | |
| | | | | | | | |
TOTAL SINGAPORE | | | | | | | 1,023,942 | |
| | | | | | | | |
THAILAND — 11.5% | | | | | | | | |
Financials — 4.4% | | | | | | | | |
Bangkok Bank | | | 6,300 | | | | 35,868 | |
The accompanying notes are an integral part of the financial statements.
37
| | | | |
| Schedule of Investments | | | | April 30, 2011 (Unaudited) |
| | Global X FTSE ASEAN 40 ETF | | |
| | | | | | | | |
| | | Shares | | | Value | |
COMMON STOCK — continued | | | | | | | | |
Financials — continued | | | | | | | | |
Kasikornbank | | | 7,800 | | | $ | 33,044 | |
Siam Commercial Bank | | | 10,500 | | | | 40,790 | |
| | | | | | | | |
| | | | | | | 109,702 | |
| | | | | | | | |
Industrials — 1.0% | | | | | | | | |
Siam Cement | | | 2,050 | | | | 25,745 | |
| | | | | | | | |
Oil & Gas — 5.1% | | | | | | | | |
PTT | | | 5,700 | | | | 71,584 | |
PTT Exploration & Production | | | 8,900 | | | | 55,141 | |
| | | | | | | | |
| | | | | | | 126,725 | |
| | | | | | | | |
Telecommunications — 1.0% | | | | | | | | |
Advanced Info Service | | | 8,000 | | | | 24,782 | |
| | | | | | | | |
TOTAL THAILAND | | | | | | | 286,954 | |
| | | | | | | | |
TOTAL COMMON STOCK
(Cost $2,329,467) | | | | | | | 2,487,456 | |
| | | | | | | | |
TOTAL INVESTMENTS — 100.0%
(Cost $2,329,467) | | | | | | $ | 2,487,456 | |
| | | | | | | | |
Percentages are based on Net Assets of $2,486,539.
| * | Non-income producing security. |
ADR — American Depositary Receipt
The following is a summary of the inputs used as of April 30, 2011 in valuing the Fund’s investments carried at value:
| | | | | | | | | | | | | | | | |
Investments in Securities | | | Level 1 | | | | Level 2 | | | | Level 3 | | | | Total | |
Common Stock | | $ | 2,487,456 | | | $ | — | | | $ | — | | | $ | 2,487,456 | |
| | | | | | | | | | | | | | | | |
Total Investments in Securities | | $ | 2,487,456 | | | $ | — | | | $ | — | | | $ | 2,487,456 | |
| | | | | | | | | | | | | | | | |
There have been no significant transfers between Level 1 and Level 2.
The accompanying notes are an integral part of the financial statements.
38
| | | | |
| Schedule of Investments | | | | April 30, 2011 (Unaudited) |
| | Global X China Consumer ETF | | |
Sector Weightings†:
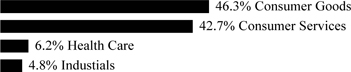
| † | Percentages based on total investments. |
| | | | | | | | |
| | | Shares | | | Value | |
COMMON STOCK — 100.0% | | | | | | | | |
CHINA— 86.1% | | | | | | | | |
Consumer Goods — 39.8% | | | | | | | | |
361 Degrees International | | | 1,713,937 | | | $ | 1,138,814 | |
Anta Sports Products | | | 2,180,688 | | | | 3,526,886 | |
BaWang International Group Holding | | | 2,885,633 | | | | 806,323 | |
China Huiyuan Juice Group | | | 1,177,795 | | | | 773,478 | |
China Yurun Food Group | | | 2,415,129 | | | | 8,847,709 | |
Dongfeng Motor Group, Cl H | | | 5,735,947 | | | | 8,951,915 | |
Great Wall Motor, Cl H | | | 2,960,710 | | | | 5,306,930 | |
Guangzhou Automobile Group, Cl H | | | 6,342,494 | | | | 7,162,553 | |
Hengan International Group | | | 1,155,574 | | | | 9,017,343 | |
Li Ning | | | 1,903,966 | | | | 3,260,761 | |
Shenzhou International Group Holdings | | | 847,122 | | | | 983,922 | |
Tingyi Cayman Islands Holding | | | 3,538,587 | | | | 9,386,535 | |
Tsingtao Brewery, Cl H | | | 817,725 | | | | 4,343,496 | |
Uni-President China Holdings | | | 2,734,827 | | | | 1,570,627 | |
Want Want China Holdings | | | 10,160,796 | | | | 9,119,451 | |
Zhongpin * | | | 86,852 | | | | 1,450,428 | |
| | | | | | | | |
| | | | | | | 75,647,171 | |
| | | | | | | | |
Consumer Services — 40.1% | | | | | | | | |
Air China, Cl H | | | 5,948,184 | | | | 6,020,259 | |
Ajisen China Holdings | | | 1,154,600 | | | | 2,304,472 | |
China Southern Airlines, Cl H * | | | 5,047,136 | | | | 2,638,634 | |
Focus Media Holding ADR * | | | 259,758 | | | | 9,130,494 | |
Golden Eagle Retail Group | | | 1,765,961 | | | | 4,627,578 | |
GOME Electrical Appliances Holdings | | | 25,676,865 | | | | 9,224,746 | |
Home Inns & Hotels Management ADR * | | | 116,742 | | | | 5,046,757 | |
Intime Department Store Group | | | 3,369,231 | | | | 5,258,255 | |
New Oriental Education & Technology Group ADR * | | | 71,414 | | | | 8,901,041 | |
Parkson Retail Group | | | 3,907,527 | | | | 5,997,723 | |
PCD Stores Group | | | 11,978,325 | | | | 3,208,246 | |
Peak Sport Products | | | 1,864,913 | | | | 1,421,636 | |
Wumart Stores, Cl H * | | | 1,465,964 | | | | 3,360,095 | |
Youku.com ADR * | | | 151,258 | | | | 8,942,373 | |
| | | | | | | | |
| | | | | | | 76,082,309 | |
| | | | | | | | |
The accompanying notes are an integral part of the financial statements.
39
| | | | |
| Schedule of Investments | | | | April 30, 2011 (Unaudited) |
| | Global X China Consumer ETF | | |
| | | | | | | | |
| | | Shares | | | Value | |
COMMON STOCK — continued | | | | | | | | |
Health Care — 6.2% | | | | | | | | |
Shandong Weigao Group Medical Polymer, Cl H | | | 1,991,038 | | | $ | 5,460,939 | |
Sinopharm Group, Cl H | | | 1,798,271 | | | | 6,228,961 | |
| | | | | | | | |
| | | | | | | 11,689,900 | |
| | | | | | | | |
TOTAL CHINA | | | | | | | 163,419,380 | |
| | | | | | | | |
HONG KONG — 13.9% | | | | | | | | |
Consumer Goods — 11.1% | | | | | | | | |
AviChina Industry & Technology, Cl H * | | | 5,041,482 | | | | 3,142,040 | |
Bosideng International Holdings | | | 7,313,443 | | | | 2,316,676 | |
China Agri-Industries Holdings | | | 4,472,019 | | | | 5,102,060 | |
China Foods | | | 2,060,677 | | | | 1,440,847 | |
China Resources Enterprise | | | 2,257,953 | | | | 9,100,546 | |
| | | | | | | | |
| | | | | | | 21,102,169 | |
| | | | | | | | |
Consumer Services — 2.8% | | | | | | | | |
China Dongxiang Group | | | 7,628,118 | | | | 2,661,919 | |
China Travel International Investment Hong Kong | | | 7,670,022 | | | | 1,570,370 | |
New World Department Store China | | | 1,332,617 | | | | 1,163,438 | |
| | | | | | | | |
| | | | | | | 5,395,727 | |
| | | | | | | | |
TOTAL HONG KONG | | | | | | | 26,497,896 | |
| | | | | | | | |
TOTAL COMMON STOCK
(Cost $191,687,324) | | | | | | | 189,917,276 | |
| | | | | | | | |
TOTAL INVESTMENTS — 100.0%
(Cost $191,687,324) | | | | | | $ | 189,917,276 | |
| | | | | | | | |
Percentages are based on Net Assets of $189,917,391.
| * | Non-income producing security. |
ADR — American Depositary Receipt
Cl — Class
The following is a summary of the inputs used as of April 30, 2011 in valuing the Fund’s investments carried at value:
| | | | | | | | | | | | | | | | |
Investments in Securities | | | Level 1 | | | | Level 2 | | | | Level 3 | | | | Total | |
Common Stock | | $ | 189,917,276 | | | $ | — | | | $ | — | | | $ | 189,917,276 | |
| | | | | | | | | | | | | | | | |
Total Investments in Securities | | $ | 189,917,276 | | | $ | — | | | $ | — | | | $ | 189,917,276 | |
| | | | | | | | | | | | | | | | |
There have been no significant transfers between Level 1 and Level 2.
The accompanying notes are an integral part of the financial statements.
40
| | | | |
| Schedule of Investments | | | | April 30, 2011 (Unaudited) |
| | Global X China Energy ETF | | |
Sector Weightings†:

| † | Percentages based on total investments. |
| | | | | | | | |
| | | Shares | | | Value | |
COMMON STOCK — 99.8% | | | | | | | | |
CHINA — 68.5% | | | | | | | | |
Energy — 61.2% | | | | | | | | |
China Coal Energy, Cl H | | | 373,971 | | | $ | 521,043 | |
China Longyuan Power Group, Cl H | | | 278,900 | | | | 286,589 | |
China Oilfield Services, Cl H | | | 220,426 | | | | 435,976 | |
China Petroleum & Chemical, Cl H | | | 1,032,470 | | | | 1,039,662 | |
China Shenhua Energy, Cl H | | | 22,552 | | | | 1,038,838 | |
Hanwha SolarOne | | | 10,509 | | | | 71,776 | |
JA Solar Holdings ADR * | | | 24,046 | | | | 165,196 | |
JinkoSolar Holding ADR * | | | 2,877 | | | | 78,111 | |
LDK Solar ADR * | | | 20,751 | | | | 239,674 | |
PetroChina, Cl H | | | 703,147 | | | | 1,010,459 | |
Renesola ADR * | | | 12,364 | | | | 113,502 | |
Suntech Power Holdings ADR * | | | 25,787 | | | | 231,309 | |
Tianneng Power International | | | 79,008 | | | | 41,712 | |
Trina Solar ADR * | | | 11,366 | | | | 323,817 | |
Trony Solar Holdings * | | | 118,526 | | | | 74,480 | |
Yanzhou Coal Mining, Cl H | | | 126,820 | | | | 494,810 | |
Yingli Green Energy Holding ADR * | | | 21,245 | | | | 266,200 | |
| | | | | | | | |
| | | | | | | 6,433,154 | |
| | | | | | | | |
Utilities — 7.3% | | | | | | | | |
Datang International Power Generation, Cl H | | | 407,159 | | | | 153,617 | |
ENN Energy Holdings | | | 97,396 | | | | 333,604 | |
Huadian Power International, Cl H | | | 177,244 | | | | 38,115 | |
Huaneng Power International, Cl H | | | 435,939 | | | | 240,258 | |
| | | | | | | | |
| | | | | | | 765,594 | |
| | | | | | | | |
TOTAL CHINA | | | | | | | 7,198,748 | |
| | | | | | | | |
HONG KONG — 31.3% | | | | | | | | |
Energy — 21.5% | | | | | | | | |
Beijing Enterprises Holdings | | | 66,324 | | | | 352,292 | |
CNOOC | | | 416,149 | | | | 1,026,721 | |
Fushan International Energy Group | | | 552,095 | | | | 387,453 | |
Kunlun Energy | | | 279,703 | | | | 495,592 | |
| | | | | | | | |
| | | | | | | 2,262,058 | |
| | | | | | | | |
Utilities — 9.8% | | | | | | | | |
China Power International Development | | | 207,702 | | | | 47,874 | |
China Resources Power Holdings | | | 242,018 | | | | 445,648 | |
The accompanying notes are an integral part of the financial statements.
41
| | | | |
| Schedule of Investments | | | | April 30, 2011 (Unaudited) |
| | Global X China Energy ETF | | |
| | | | | | | | |
| | | Shares | | | Value | |
COMMON STOCK — continued | | | | | | | | |
Utilities — continued | | | | | | | | |
GCL Poly Energy Holdings | | | 747,942 | | | $ | 534,526 | |
| | | | | | | | |
| | | | | | | 1,028,048 | |
| | | | | | | | |
TOTAL HONG KONG | | | | | | | 3,290,106 | |
| | | | | | | | |
TOTAL COMMON STOCK
(Cost $9,456,385) | | | | | | | 10,488,854 | |
| | | | | | | | |
TOTAL INVESTMENTS — 99.8%
(Cost $9,456,385) | | | | | | $ | 10,488,854 | |
| | | | | | | | |
Percentages are based on Net Assets of $10,518,579.
| * | Non-income producing security. |
ADR — American Depositary Receipt
Cl — Class
The following is a summary of the inputs used as of April 30, 2011 in valuing the Fund’s investments carried at value:
| | | | | | | | | | | | | | | | |
Investments in Securities | | | Level 1 | | | | Level 2 | | | | Level 3 | | | | Total | |
Common Stock | | $ | 10,488,854 | | | $ | — | | | $ | — | | | $ | 10,488,854 | |
| | | | | | | | | | | | | | | | |
Total Investments in Securities | | $ | 10,488,854 | | | $ | — | | | $ | — | | | $ | 10,488,854 | |
| | | | | | | | | | | | | | | | |
There have been no significant transfers between Level 1 and Level 2.
The accompanying notes are an integral part of the financial statements.
42
| | | | |
| Schedule of Investments | | | | April 30, 2011 (Unaudited) |
| | Global X China Financials ETF | | |
Sector Weightings†:

| † | Percentages based on total investments. |
| | | | | | | | |
| | | Shares | | | Value | |
COMMON STOCK — 100.0% | | | | | | | | |
CHINA — 88.3% | | | | | | | | |
Financials — 88.3% | | | | | | | | |
Agile Property Holdings | | | 59,058 | | | $ | 95,972 | |
Agricultural Bank of China, Cl H * | | | 609,691 | | | | 360,355 | |
Bank of China, Cl H | | | 1,383,423 | | | | 764,224 | |
Bank of Communications, Cl H | | | 345,146 | | | | 365,772 | |
China Citic Bank, Cl H | | | 500,984 | | | | 358,680 | |
China Construction Bank, Cl H | | | 813,661 | | | | 769,038 | |
China Life Insurance, Cl H | | | 212,124 | | | | 753,889 | |
China Merchants Bank, Cl H | | | 139,399 | | | | 359,003 | |
China Minsheng Banking, Cl H | | | 194,219 | | | | 186,318 | |
China Pacific Insurance Group, Cl H | | | 69,298 | | | | 299,379 | |
Chongqing Rural Commercial Bank, Cl H * | | | 105,621 | | | | 73,307 | |
CNinsure ADR | | | 2,502 | | | | 36,729 | |
Country Garden Holdings | | | 162,659 | | | | 65,978 | |
E-House China Holdings ADR | | | 3,720 | | | | 44,454 | |
Evergrande Real Estate Group | | | 228,509 | | | | 162,718 | |
Greentown China Holdings | | | 28,256 | | | | 28,307 | |
Guangzhou R&F Properties | | | 46,235 | | | | 62,989 | |
Industrial & Commercial Bank of China, Cl H | | | 909,104 | | | | 769,108 | |
Kaisa Group Holdings * | | | 190,216 | | | | 77,155 | |
Longfor Properties | | | 69,434 | | | | 110,366 | |
PICC Property & Casualty, Cl H * | | | 162,636 | | | | 209,004 | |
Ping An Insurance Group of China, Cl H | | | 33,420 | | | | 363,425 | |
Renhe Commercial Holdings | | | 542,162 | | | | 92,852 | |
Shimao Property Holdings | | | 66,604 | | | | 90,568 | |
Shui On Land | | | 119,984 | | | | 53,148 | |
Sino-Ocean Land Holdings | | | 212,496 | | | | 120,670 | |
Soho China | | | 93,001 | | | | 80,356 | |
| | | | | | | | |
TOTAL CHINA | | | | | | | 6,753,764 | |
| | | | | | | | |
HONG KONG — 11.7% | | | | | | | | |
Financials — 11.7% | | | | | | | | |
China Everbright | | | 40,316 | | | | 88,981 | |
China Overseas Land & Investment | | | 178,650 | | | | 343,686 | |
China Resources Land | | | 86,472 | | | | 149,207 | |
China Taiping Insurance Holdings * | | | 35,404 | | | | 97,332 | |
Franshion Properties China | | | 160,058 | | | | 49,877 | |
Hopson Development Holdings | | | 29,029 | | | | 28,633 | |
KWG Property Holding | | | 55,217 | | | | 39,888 | |
The accompanying notes are an integral part of the financial statements.
43
| | | | |
| Schedule of Investments | | | | April 30, 2011 (Unaudited) |
| | Global X China Financials ETF | | |
| | | | | | | | |
| | | Shares | | | Value | |
COMMON STOCK — continued | | | | | | | | |
Financials — continued | | | | | | | | |
Poly Hong Kong Investments | | | 80,623 | | | $ | 64,470 | |
Shenzhen Investment | | | 104,791 | | | | 32,790 | |
| | | | | | | | |
TOTAL HONG KONG | | | | | | | 894,864 | |
| | | | | | | | |
TOTAL COMMON STOCK
(Cost $8,101,835) | | | | | | | 7,648,628 | |
| | | | | | | | |
TOTAL INVESTMENTS — 100.0%
(Cost $8,101,835) | | | | | | $ | 7,648,628 | |
| | | | | | | | |
Percentages are based on Net Assets of $7,647,564.
| * | Non-income producing security. |
ADR — American Depositary Receipt
Cl — Class
The following is a summary of the inputs used as of April 30, 2011 in valuing the Fund’s investments carried at value:
| | | | | | | | | | | | | | | | |
Investments in Securities | | | Level 1 | | | | Level 2 | | | | Level 3 | | | | Total | |
Common Stock | | $ | 7,648,628 | | | $ | — | | | $ | — | | | $ | 7,648,628 | |
| | | | | | | | | | | | | | | | |
Total Investments in Securities | | $ | 7,648,628 | | | $ | — | | | $ | — | | | $ | 7,648,628 | |
| | | | | | | | | | | | | | | | |
There have been no significant transfers between Level 1 and Level 2.
The accompanying notes are an integral part of the financial statements.
44
| | | | |
| Schedule of Investments | | | | April 30, 2011 (Unaudited) |
| | Global X China Industrials ETF | | |
Sector Weightings†:

| † | Percentages based on total investments. |
| | | | | | | | |
| | | Shares | | | Value | |
COMMON STOCK — 101.6% | | | | | | | | |
CHINA — 85.9% | | | | | | | | |
Industrials — 85.9% | | | | | | | | |
Anhui Conch Cement, Cl H | | | 86,428 | | | $ | 407,882 | |
Asia Cement China Holdings | | | 68,573 | | | | 55,717 | |
BBMG, Cl H | | | 185,421 | | | | 305,139 | |
Byd, Cl H | | | 81,278 | | | | 294,095 | |
China Communications Construction, Cl H | | | 427,657 | | | | 394,841 | |
China COSCO Holdings, Cl H | | | 404,818 | | | | 388,872 | |
China National Building Material, Cl H | | | 266,724 | | | | 561,893 | |
China National Materials | | | 169,646 | | | | 167,114 | |
China Railway Construction, Cl H | | | 299,295 | | | | 264,382 | |
China Railway Group, Cl H | | | 606,490 | | | | 324,882 | |
China Rongsheng Heavy Industry Group | | | 467,562 | | | | 394,356 | |
China Shanshui Cement Group | | | 310,184 | | | | 347,494 | |
China Shipping Container Lines, Cl H * | | | 556,438 | | | | 222,120 | |
China Shipping Development, Cl H | | | 205,498 | | | | 216,191 | |
China South Locomotive and Rolling Stock | | | 291,238 | | | | 321,394 | |
China Zhongwang Holdings | | | 216,563 | | | | 111,267 | |
Dongfang Electric, Cl H | | | 50,695 | | | | 166,788 | |
Duoyuan Global Water ADR (A)(B)* | | | 3,967 | | | | 15,392 | |
First Tractor, Cl H | | | 63,741 | | | | 87,824 | |
Guangshen Railway, Cl H | | | 241,736 | | | | 95,874 | |
Haitian International Holdings | | | 86,800 | | | | 128,536 | |
Harbin Electric * | | | 3,145 | | | | 58,874 | |
Harbin Power Equipment, Cl H | | | 107,746 | | | | 103,918 | |
Metallurgical Corp of China, Cl H * | | | 442,269 | | | | 187,366 | |
Sany Heavy Equipment International Holdings | | | 91,174 | | | | 161,781 | |
Shanghai Electric Group, Cl H | | | 447,826 | | | | 222,590 | |
Sinotrans, Cl H | | | 254,694 | | | | 62,313 | |
Sinotruk Hong Kong | | | 109,567 | | | | 90,860 | |
Weichai Power, Cl H | | | 58,587 | | | | 399,839 | |
Yangzijiang Shipbuilding Holdings | | | 249,121 | | | | 368,420 | |
Zhuzhou CSR Times Electric, Cl H | | | 72,204 | | | | 285,900 | |
| | | | | | | | |
| | | | | | | 7,213,914 | |
| | | | | | | | |
TOTAL CHINA | | | | | | | 7,213,914 | |
| | | | | | | | |
The accompanying notes are an integral part of the financial statements.
45
| | | | |
| Schedule of Investments | | | | April 30, 2011 (Unaudited) |
| | Global X China Industrials ETF | | |
| | | | | | | | |
| | | Shares | | | Value | |
COMMON STOCK — continued | | | | | | | | |
HONG KONG — 15.7% | | | | | | | | |
Industrials — 15.7% | | | | | | | | |
Beijing Capital International Airport, Cl H | | | 235,196 | | | $ | 115,994 | |
China High Speed Transmission Equipment Group | | | 184,504 | | | | 244,235 | |
China Resources Cement Holdings | | | 275,125 | | | | 279,876 | |
Citic Resources Holdings * | | | 338,503 | | | | 83,690 | |
Shanghai Industrial Holdings | | | 94,850 | | | | 374,348 | |
Shenzhen International Holdings | | | 1,062,258 | | | | 98,485 | |
Sinotrans Shipping | | | 214,507 | | | | 66,844 | |
Tianjin Development Holdings | | | 68,712 | | | | 51,672 | |
| | | | | | | | |
TOTAL HONG KONG | | | | | | | 1,315,144 | |
| | | | | | | | |
TOTAL COMMON STOCK
(Cost $8,649,197) | | | | | | | 8,529,058 | |
| | | | | | | | |
TOTAL INVESTMENTS — 101.6%
(Cost $8,649,197) | | | | | | $ | 8,529,058 | |
| | | | | | | | |
Percentages are based on Net Assets of $8,391,729.
| * | Non-income producing security. |
| (A) | Security is fair valued using methods determined in good faith by the Fair Value Committee of the Fund. The total value of such security as of April 30, 2011 was $15,392 and represents 0.2% of net assets. |
| (B) | Security is considered illiquid. The total value of such security as of April 30, 2011 was $15,392 and represented 0.2% of Net Assets. |
ADR — American Depositary Receipt
Cl — Class
The following is a summary of the inputs used as of April 30, 2011 in valuing the Fund’s investments carried at value:
| | | | | | | | | | | | | | | | |
Investments in Securities | | | Level 1 | | | | Level 2 | | | | Level 3 | | | | Total | |
Common Stock | | $ | 8,513,666 | | | $ | — | | | $ | 15,392 | | | $ | 8,529,058 | |
| | | | | | | | | | | | | | | | |
Total Investments in Securities | | $ | 8,513,666 | | | $ | — | | | $ | 15,392 | | | $ | 8,529,058 | |
| | | | | | | | | | | | | | | | |
| | | | |
| | | Investments in
Common Stock | |
Beginning balance as of October 31, 2010 | | $ | — | |
Accrued discounts/premiums | | | — | |
Realized gain/(loss) | | | — | |
Change in unrealized appreciation/(depreciation) | | | — | |
Net purchases | | | — | |
Net sales | | | — | |
Transfers into Level 3 | | | 15,392 | |
Transfers out of Level 3 | | | — | |
| | | | |
Ending balance as of April 30, 2011 | | $ | 15,392 | |
| | | | |
There have been no significant transfers between Level 1 and Level 2.
The accompanying notes are an integral part of the financial statements.
46
| | | | |
| Schedule of Investments | | | | April 30, 2011 (Unaudited) |
| | Global X China Industrials ETF | | |
For the period ended April 30, 2011, transfers between Level 1 and Level 3 assets and liabilities totaled $15,392.
The Level 3 investment presented above was considered a Level 1 investment at the beginning of the reporting period. The reason for the classification change was a temporary trading suspension of the investment’s shares, which necessitated a fair value determination by the Fair Value Committee at the end of the reporting period.
The accompanying notes are an integral part of the financial statements.
47
| | | | |
| Schedule of Investments | | | | April 30, 2011 (Unaudited) |
| | Global X China Technology ETF | | |
Sector Weightings†:
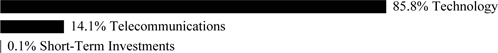
| † | Percentages based on total investments. |
| | | | | | | | |
| | | Shares | | | Value | |
COMMON STOCK — 99.5% | | | | | | | | |
CHINA — 87.2% | | | | | | | | |
Technology — 82.7% | | | | | | | | |
AAC Acoustic Technologies Holdings | | | 83,193 | | | $ | 217,466 | |
Alibaba.com | | | 151,719 | | | | 269,214 | |
AsiaInfo Holdings * | | | 5,944 | | | | 112,341 | |
Baidu ADR * | | | 1,825 | | | | 271,049 | |
BYD Electronic International | | | 109,900 | | | | 58,871 | |
Camelot Information Systems ADR * | | | 5,699 | | | | 109,991 | |
China Communications Services, Cl H | | | 242,625 | | | | 148,089 | |
Ctrip.com International ADR * | | | 5,715 | | | | 278,435 | |
Foxconn International Holdings * | | | 266,309 | | | | 157,058 | |
Giant Interactive Group ADR | | | 28,742 | | | | 254,367 | |
Kingdee International Software Group | | | 202,562 | | | | 129,896 | |
Kingsoft | | | 70,700 | | | | 46,066 | |
Lenovo Group | | | 468,766 | | | | 272,837 | |
Netease.com ADR * | | | 5,578 | | | | 274,884 | |
Perfect World ADR * | | | 5,295 | | | | 144,077 | |
Qihoo 360 Technology | | | 4,574 | | | | 130,359 | |
Semiconductor Manufacturing International * | | | 2,212,416 | | | | 199,422 | |
Shanda Interactive Entertainment ADR * | | | 5,658 | | | | 273,734 | |
Sina * | | | 2,136 | | | | 287,826 | |
Sohu.com * | | | 2,597 | | | | 274,658 | |
Spreadtrum Communications ADR * | | | 6,127 | | | | 131,118 | |
Tencent Holdings | | | 9,800 | | | | 278,886 | |
Travelsky Technology, Cl H | | | 76,249 | | | | 76,977 | |
VanceInfo Technologies ADR * | | | 5,614 | | | | 180,546 | |
ZTE, Cl H | | | 74,905 | | | | 269,587 | |
| | | | | | | | |
| | | | | | | 4,847,754 | |
| | | | | | | | |
Telecommunications — 4.5% | | | | | | | | |
China Telecom, Cl H | | | 456,776 | | | | 263,505 | |
| | | | | | | | |
TOTAL CHINA | | | | | | | 5,111,259 | |
| | | | | | | | |
HONG KONG — 12.3% | | | | | | | | |
Technology — 2.8% | | | | | | | | |
Longtop Financial Technologies ADR * | | | 7,244 | | | | 163,424 | |
| | | | | | | | |
Telecommunications — 9.5% | | | | | | | | |
China Mobile | | | 29,941 | | | | 275,279 | |
China Unicom Hong Kong | | | 139,471 | | | | 283,759 | |
| | | | | | | | |
| | | | | | | 559,038 | |
| | | | | | | | |
The accompanying notes are an integral part of the financial statements.
48
| | | | |
| Schedule of Investments | | | | April 30, 2011 (Unaudited) |
| | Global X China Technology ETF | | |
| | | | | | | | |
| | | Shares/Face
Amount | | | Value | |
COMMON STOCK — continued | | | | | | | | |
Telecommunications — continued | | | | | | | | |
TOTAL HONG KONG | | | | | | $ | 722,462 | |
| | | | | | | | |
TOTAL COMMON STOCK
(Cost $4,995,142) | | | | | | | 5,833,721 | |
| | | | | | | | |
TIME DEPOSIT — 0.1% | | | | | | | | |
Brown Brothers, 0.029%(A)
(Cost $5,376) | | $ | 5,376 | | | | 5,376 | |
| | | | | | | | |
TOTAL INVESTMENTS — 99.6%
(Cost $5,000,518) | | | | | | $ | 5,839,097 | |
| | | | | | | | |
Percentages are based on Net Assets of $5,860,754.
| * | Non-income producing security. |
| (A) | The rate reported is the 7-day simple yield as of April 30, 2011. |
ADR — American Depositary Receipt
Cl — Class
The following is a summary of the inputs used as of April 30, 2011 in valuing the Fund’s investments carried at value:
| | | | | | | | | | | | | | | | |
Investments in Securities | | | Level 1 | | | | Level 2 | | | | Level 3 | | | | Total | |
Common Stock | | $ | 5,833,721 | | | $ | — | | | $ | — | | | $ | 5,833,721 | |
Time Deposit | | | — | | | | 5,376 | | | | — | | | | 5,376 | |
| | | | | | | | | | | | | | | | |
Total Investments in Securities | | $ | 5,833,721 | | | $ | 5,376 | | | $ | — | | | $ | 5,839,097 | |
| | | | | | | | | | | | | | | | |
There have been no significant transfers between Level 1 and Level 2.
The accompanying notes are an integral part of the financial statements.
49
| | | | |
| Schedule of Investments | | | | April 30, 2011 (Unaudited) |
| | Global X China Materials ETF | | |
Sector Weightings†:

† Percentages based on total investments.
| | | | | | | | |
| | | Shares | | | Value | |
COMMON STOCK — 99.9% | | | | | | | | |
CHINA— 78.9% | | | | | | | | |
Basic Materials — 78.9% | | | | | | | | |
Aluminum Corp of China, Cl H | | | 334,560 | | | $ | 314,058 | |
Angang Steel, Cl H | | | 230,725 | | | | 296,209 | |
China Agritech (A)(B)* | | | 4,840 | | | | 24,975 | |
China BlueChemical | | | 359,905 | | | | 292,896 | |
China Green Agriculture * | | | 5,209 | | | | 36,671 | |
China Hongqiao Group * | | | 307,044 | | | | 306,415 | |
China Molybdenum, Cl H | | | 335,777 | | | | 300,932 | |
China Rare Earth Holdings | | | 366,506 | | | | 158,101 | |
China Vanadium Titano — Magnetite Mining | | | 298,620 | | | | 140,352 | |
Chongqing Iron & Steel, Cl H | | | 183,170 | | | | 48,352 | |
Dongyue Group | | | 295,182 | | | | 311,302 | |
General Steel Holdings * | | | 13,028 | | | | 29,443 | |
Gulf Resources * | | | 4,734 | | | | 14,817 | |
Hidili Industry International Development | | | 303,938 | | | | 307,230 | |
Hunan Non-Ferrous Metal, Cl H | | | 555,754 | | | | 241,884 | |
Jiangxi Copper, Cl H | | | 90,552 | | | | 307,247 | |
Lingbao Gold, Cl H | | | 96,598 | | | | 78,986 | |
Maanshan Iron & Steel, Cl H | | | 577,926 | | | | 304,371 | |
Real Gold Mining | | | 146,164 | | | | 207,787 | |
ShengdaTech (A)(B)* | | | 12,544 | | | | 33,367 | |
Sinopec Shanghai Petrochemical, Cl H | | | 626,078 | | | | 303,127 | |
Sinopec Yizheng Chemical Fibre, Cl H * | | | 476,197 | | | | 203,579 | |
Xinjiang Xinxin Mining Industry, Cl H | | | 233,494 | | | | 141,012 | |
Yongye International * | | | 13,259 | | | | 69,477 | |
Zhaojin Mining Industry | | | 63,351 | | | | 293,265 | |
Zijin Mining Group, Cl H | | | 378,607 | | | | 297,878 | |
| | | | | | | | |
TOTAL CHINA | | | | | | | 5,063,733 | |
| | | | | | | | |
HONG KONG — 21.0% | | | | | | | | |
Basic Materials — 21.0% | | | | | | | | |
China Lumena New Materials | | | 272,800 | | | | 141,566 | |
Citic Pacific | | | 103,627 | | | | 309,577 | |
Fufeng Group | | | 246,002 | | | | 181,194 | |
Shougang Concord International Enterprises | | | 1,192,926 | | | | 158,219 | |
Sinofert Holdings | | | 602,260 | | | | 251,268 | |
Yingde Gases * | | | 332,745 | | | | 303,356 | |
| | | | | | | | |
| | | | | | | 1,345,180 | |
| | | | | | | | |
The accompanying notes are an integral part of the financial statements.
50
| | | | |
| Schedule of Investments | | | | April 30, 2011 (Unaudited) |
| | Global X China Materials ETF | | |
| | | | | | |
| | | Shares | | Value | |
COMMON STOCK — continued | | | | | | |
Basic Materials — continued | | | | | | |
TOTAL HONG KONG | | | | $ | 1,345,180 | |
| | | | | | |
TOTAL COMMON STOCK
(Cost $6,598,917) | | | | | 6,408,913 | |
| | | | | | |
TOTAL INVESTMENTS — 99.9%
(Cost $6,598,917) | | | | $ | 6,408,913 | |
| | | | | | |
Percentages are based on Net Assets of $6,414,642.
| * | Non-income producing security. |
| (A) | Securities are fair valued using methods determined in good faith by the Fair Value Committee of the Fund. The total value of such security as of April 30, 2011 was $58,342 and represents 0.9% of net assets. |
| (B) | Securities considered illiquid. The total value of such security as of April 30, 2011 was $58,3422 and represented 0.9% of Net Assets. |
Cl — Class
The following is a summary of the inputs used as of April 30, 2011 in valuing the Fund’s investments carried at value:
| | | | | | | | | | | | | | | | |
Investments in Securities | | | Level 1 | | | | Level 2 | | | | Level 3 | | | | Total | |
Common Stock | | $ | 6,350,571 | | | $ | — | | | $ | 58,342 | | | $ | 6,408,913 | |
| | | | | | | | | | | | | | | | |
Total Investments in Securities | | $ | 6,350,571 | | | $ | — | | | $ | 58,342 | | | $ | 6,408,913 | |
| | | | | | | | | | | | | | | | |
| | | | |
| | | Investments in
Common Stock | |
Beginning balance as of October 31, 2010 | | $ | 1,048,393 | |
Accrued discounts/premiums | | | — | |
Realized gain/(loss) | | | — | |
Change in unrealized appreciation/(depreciation) | | | — | |
Net purchases | | | — | |
Net sales | | | — | |
Transfers into Level 3 | | | 58,342 | |
Transfers out of Level 3 | | | (1,048,393 | ) |
| | | | |
Ending balance as of April 30, 2011 | | $ | 58,342 | |
| | | | |
There have been no significant transfers between Level 1 and Level 2.
For the period ended April 30, 2011, transfers between Level 1 and Level 3 assets and liabilities totaled $990,052.
The Level 3 investments at the end of the reporting period were considered Level 1 investments at the beginning of the reporting period. The reason for the classification change was a temporary suspension of the investments’ shares, which necessitated a fair value determination by the Fair Value Committee at the end of the reporting period.
The accompanying notes are an integral part of the financial statements.
51
| | | | |
| Schedule of Investments | | | | April 30, 2011 (Unaudited) |
| Global X Russell Emerging Markets Growth ETF |
Sector Weightings†:
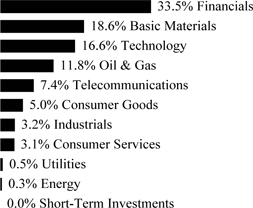
| † | Percentages based on total investments. |
| | | | | | | | |
| | | Shares | | | Value | |
COMMON STOCK — 93.5% | | | | | | | | |
BRAZIL — 14.0% | | | | | | | | |
Basic Materials — 3.8% | | | | | | | | |
Cia Siderurgica Nacional ADR | | | 1,110 | | | $ | 17,682 | |
Gerdau ADR | | | 870 | | | | 10,510 | |
Vale ADR, Cl B | | | 2,158 | | | | 72,077 | |
| | | | | | | | |
| | | | | | | 100,269 | |
| | | | | | | | |
Consumer Goods — 0.2% | | | | | | | | |
Cia de Bebidas das Americas ADR | | | 228 | | | | 5,996 | |
| | | | | | | | |
Financials — 7.5% | | | | | | | | |
Banco Bradesco ADR | | | 4,032 | | | | 81,567 | |
Banco do Brasil | | | 1,020 | | | | 18,740 | |
Cielo | | | 860 | | | | 8,042 | |
Itau Unibanco Holding ADR | | | 3,302 | | | | 78,423 | |
Itausa — Investimentos Itau | | | 1,440 | | | | 11,489 | |
| | | | | | | | |
| | | | | | | 198,261 | |
| | | | | | | | |
Oil & Gas — 2.5% | | | | | | | | |
OGX Petroleo e Gas Participacoes * | | | 1,820 | | | | 19,230 | |
Petroleo Brasileiro ADR | | | 1,206 | | | | 45,020 | |
| | | | | | | | |
| | | | | | | 64,250 | |
| | | | | | | | |
TOTAL BRAZIL | | | | | | | 368,776 | |
| | | | | | | | |
CHILE — 1.2% | | | | | | | | |
Consumer Services — 0.4% | | | | | | | | |
SACI Falabella | | | 900 | | | | 9,824 | |
| | | | | | | | |
Oil & Gas — 0.5% | | | | | | | | |
Empresas COPEC | | | 626 | | | | 12,146 | |
| | | | | | | | |
Utilities — 0.3% | | | | | | | | |
Empresa Nacional de Electricidad ADR | | | 162 | | | | 9,134 | |
| | | | | | | | |
TOTAL CHILE | | | | | | | 31,104 | |
| | | | | | | | |
The accompanying notes are an integral part of the financial statements.
52
| | | | |
| Schedule of Investments | | | | April 30, 2011 (Unaudited) |
| Global X Russell Emerging Markets Growth ETF |
| | | | | | | | |
| | | Shares | | | Value | |
COMMON STOCK — continued | | | | | | | | |
CHINA — 17.8% | | | | | | | | |
Basic Materials — 1.5% | | | | | | | | |
Aluminum Corp of China ADR | | | 30 | | | $ | 706 | |
China Shenhua Energy, Cl H | | | 4,800 | | | | 22,406 | |
Yanzhou Coal Mining ADR | | | 302 | | | | 11,790 | |
Zijin Mining Group, Cl H | | | 6,000 | | | | 4,721 | |
| | | | | | | | |
| | | | | | | 39,623 | |
| | | | | | | | |
Consumer Goods — 0.3% | | | | | | | | |
Tingyi Cayman Islands Holding | | | 2,800 | | | | 7,427 | |
| | | | | | | | |
Consumer Services — 0.1% | | | | | | | | |
Air China, Cl H | | | 3,200 | | | | 3,239 | |
| | | | | | | | |
Energy — 0.3% | | | | | | | | |
China Coal Energy, Cl H | | | 6,000 | | | | 8,360 | |
| | | | | | | | |
Financials — 12.3% | | | | | | | | |
Agricultural Bank of China, Cl H * | | | 24,000 | | | | 14,185 | |
Bank of China, Cl H | | | 89,000 | | | | 49,165 | |
Bank of Communications, Cl H | | | 9,000 | | | | 9,538 | |
China Citic Bank, Cl H | | | 10,000 | | | | 7,159 | |
China Construction Bank, Cl H | | | 94,000 | | | | 88,845 | |
China Life Insurance ADR | | | 738 | | | | 39,623 | |
China Merchants Bank, Cl H | | | 5,800 | | | | 14,937 | |
China Pacific Insurance Group, Cl H | | | 1,460 | | | | 6,307 | |
Industrial & Commercial Bank of China, Cl H | | | 82,000 | | | | 69,373 | |
Ping An Insurance Group of China, Cl H | | | 2,200 | | | | 23,924 | |
| | | | | | | | |
| | | | | | | 323,056 | |
| | | | | | | | |
Industrials — 0.5% | | | | | | | | |
Byd, Cl H | | | 840 | | | | 3,039 | |
China Communications Construction, Cl H | | | 6,000 | | | | 5,540 | |
China Railway Construction, Cl H | | | 3,000 | | | | 2,650 | |
China Railway Group, Cl H | | | 6,000 | | | | 3,214 | |
| | | | | | | | |
| | | | | | | 14,443 | |
| | | | | | | | |
Oil & Gas — 0.2% | | | | | | | | |
China Petroleum & Chemical ADR | | | 38 | | | | 3,829 | |
| | | | | | | | |
Technology — 2.6% | | | | | | | | |
Baidu ADR * | | | 254 | | | | 37,724 | |
Tencent Holdings | | | 1,100 | | | | 31,304 | |
| | | | | | | | |
| | | | | | | 69,028 | |
| | | | | | | | |
TOTAL CHINA | | | | | | | 469,005 | |
| | | | | | | | |
COLOMBIA — 0.5% | | | | | | | | |
Oil & Gas — 0.5% | | | | | | | | |
Ecopetrol ADR | | | 306 | | | | 13,424 | |
| | | | | | | | |
The accompanying notes are an integral part of the financial statements.
53
| | | | |
| Schedule of Investments | | | | April 30, 2011 (Unaudited) |
| Global X Russell Emerging Markets Growth ETF |
| | | | | | | | |
| | | Shares | | | Value | |
COMMON STOCK — continued | | | | | | | | |
CZECH REPUBLIC — 0.2% | | | | | | | | |
Utilities — 0.2% | | | | | | | | |
CEZ | | | 100 | | | $ | 5,741 | |
| | | | | | | | |
HONG KONG — 3.3% | | | | | | | | |
Financials — 0.6% | | | | | | | | |
China Overseas Land & Investment | | | 5,600 | | | | 10,773 | |
China Resources Land | | | 3,000 | | | | 5,177 | |
| | | | | | | | |
| | | | | | | 15,950 | |
| | | | | | | | |
Oil & Gas — 2.1% | | | | | | | | |
CNOOC ADR | | | 222 | | | | 55,378 | |
| | | | | | | | |
Telecommunications — 0.6% | | | | | | | | |
China Mobile ADR | | | 326 | | | | 15,025 | |
| | | | | | | | |
TOTAL HONG KONG | | | | | | | 86,353 | |
| | | | | | | | |
INDIA — 11.6% | | | | | | | | |
Basic Materials — 1.8% | | | | | | | | |
Sterlite Industries India ADR | | | 2,956 | | | | 48,331 | |
| | | | | | | | |
Financials — 3.4% | | | | | | | | |
HDFC Bank ADR | | | 248 | | | | 42,681 | |
ICICI Bank ADR | | | 408 | | | | 20,563 | |
State Bank of India GDR | | | 186 | | | | 25,482 | |
| | | | | | | | |
| | | | | | | 88,726 | |
| | | | | | | | |
Industrials — 0.6% | | | | | | | | |
Larsen & Toubro GDR | | | 410 | | | | 14,795 | |
| | | | | | | | |
Oil & Gas — 2.8% | | | | | | | | |
Reliance Industries GDR (A) | | | 1,694 | | | | 74,519 | |
| | | | | | | | |
Technology — 3.0% | | | | | | | | |
Infosys Technologies ADR | | | 1,110 | | | | 72,350 | |
Wipro ADR | | | 512 | | | | 7,050 | |
| | | | | | | | |
| | | | | | | 79,400 | |
| | | | | | | | |
TOTAL INDIA | | | | | | | 305,771 | |
| | | | | | | | |
INDONESIA — 2.0% | | | | | | | | |
Consumer Goods — 0.9% | | | | | | | | |
Astra International | | | 3,000 | | | | 19,672 | |
Unilever Indonesia | | | 1,720 | | | | 3,073 | |
| | | | | | | | |
| | | | | | | 22,745 | |
| | | | | | | | |
Financials — 0.6% | | | | | | | | |
Bank Central Asia | | | 18,800 | | | | 16,247 | |
| | | | | | | | |
Telecommunications — 0.5% | | | | | | | | |
Telekomunikasi Indonesia ADR | | | 348 | | | | 12,577 | |
| | | | | | | | |
TOTAL INDONESIA | | | | | | | 51,569 | |
| | | | | | | | |
MALAYSIA — 1.9% | | | | | | | | |
Financials — 1.4% | | | | | | | | |
CIMB Group Holdings | | | 5,200 | | | | 14,383 | |
The accompanying notes are an integral part of the financial statements.
54
| | | | |
| Schedule of Investments | | | | April 30, 2011 (Unaudited) |
| Global X Russell Emerging Markets Growth ETF |
| | | | | | | | |
| | | Shares | | | Value | |
COMMON STOCK — continued | | | | | | | | |
Financials — continued | | | | | | | | |
Malayan Banking | | | 3,600 | | | $ | 10,638 | |
Public Bank | | | 2,600 | | | | 11,486 | |
| | | | | | | | |
| | | | | | | 36,507 | |
| | | | | | | | |
Industrials — 0.3% | | | | | | | | |
Sime Darby | | | 2,600 | | | | 7,920 | |
| | | | | | | | |
Telecommunications — 0.2% | | | | | | | | |
Maxis | | | 2,800 | | | | 5,078 | |
| | | | | | | | |
TOTAL MALAYSIA | | | | | | | 49,505 | |
| | | | | | | | |
MEXICO — 5.8% | | | | | | | | |
Basic Materials — 0.7% | | | | | | | | |
Grupo Mexico, Cl B | | | 5,400 | | | | 18,702 | |
| | | | | | | | |
Consumer Goods — 1.0% | | | | | | | | |
Fomento Economico Mexicano ADR | | | 318 | | | | 20,002 | |
Grupo Modelo | | | 920 | | | | 5,754 | |
| | | | | | | | |
| | | | | | | 25,756 | |
| | | | | | | | |
Consumer Services — 1.2% | | | | | | | | |
Grupo Elektra | | | 100 | | | | 4,561 | |
Wal-Mart de Mexico | | | 8,200 | | | | 25,649 | |
| | | | | | | | |
| | | | | | | 30,210 | |
| | | | | | | | |
Telecommunications — 2.9% | | | | | | | | |
America Movil ADR, Ser L | | | 1,250 | | | | 71,500 | |
Telefonos de Mexico ADR | | | 308 | | | | 5,766 | |
| | | | | | | | |
| | | | | | | 77,266 | |
| | | | | | | | |
TOTAL MEXICO | | | | | | | 151,934 | |
| | | | | | | | |
MOROCCO — 0.1% | | | | | | | | |
Telecommunications — 0.1% | | | | | | | | |
Maroc Telecom | | | 204 | | | | 4,045 | |
| | | | | | | | |
POLAND — 0.9% | | | | | | | | |
Financials — 0.9% | | | | | | | | |
Bank Pekao | | | 130 | | | | 8,533 | |
Powszechna Kasa Oszczednosci Bank Polski | | | 898 | | | | 15,480 | |
| | | | | | | | |
TOTAL POLAND | | | | | | | 24,013 | |
| | | | | | | | |
RUSSIA — 4.1% | | | | | | | | |
Basic Materials — 2.0% | | | | | | | | |
MMC Norilsk Nickel ADR | | | 1,668 | | | | 46,037 | |
Novolipetsk Steel GDR | | | 186 | | | | 7,098 | |
| | | | | | | | |
| | | | | | | 53,135 | |
| | | | | | | | |
Financials — 1.6% | | | | | | | | |
VTB Bank GDR | | | 6,532 | | | | 42,262 | |
| | | | | | | | |
The accompanying notes are an integral part of the financial statements.
55
| | | | |
| Schedule of Investments | | | | April 30, 2011 (Unaudited) |
| Global X Russell Emerging Markets Growth ETF |
| | | | | | | | |
| | | Shares | | | Value | |
COMMON STOCK — continued | | | | | | | | |
Telecommunications — 0.5% | | | | | | | | |
Mobile Telesystems ADR | | | 560 | | | $ | 11,844 | |
| | | | | | | | |
TOTAL RUSSIA | | | | | | | 107,241 | |
| | | | | | | | |
SOUTH AFRICA — 10.2% | | | | | | | | |
Basic Materials — 2.6% | | | | | | | | |
Anglo Platinum | | | 102 | | | | 10,364 | |
AngloGold Ashanti ADR | | | 562 | | | | 28,651 | |
Impala Platinum Holdings | | | 672 | | | | 20,990 | |
Kumba Iron Ore | | | 116 | | | | 8,483 | |
| | | | | | | | |
| | | | | | | 68,488 | |
| | | | | | | | |
Consumer Services — 1.4% | | | | | | | | |
Naspers, Cl N | | | 608 | | | | 36,586 | |
| | | | | | | | |
Financials — 1.7% | | | | | | | | |
ABSA Group | | | 472 | | | | 9,775 | |
FirstRand | | | 5,022 | | | | 15,806 | |
Standard Bank Group | | | 1,194 | | | | 18,741 | |
| | | | | | | | |
| | | | | | | 44,322 | |
| | | | | | | | |
Oil & Gas — 2.0% | | | | | | | | |
Sasol ADR | | | 926 | | | | 53,541 | |
| | | | | | | | |
Telecommunications — 2.5% | | | | | | | | |
MTN Group | | | 2,730 | | | | 60,716 | |
Vodacom Group | | | 340 | | | | 4,160 | |
| | | | | | | | |
| | | | | | | 64,876 | |
| | | | | | | | |
TOTAL SOUTH AFRICA | | | | | | | 267,813 | |
| | | | | | | | |
SOUTH KOREA — 7.3% | | | | | | | | |
Basic Materials — 1.3% | | | | | | | | |
LG Chemical | | | 66 | | | | 32,753 | |
POSCO ADR | | | 20 | | | | 2,206 | |
| | | | | | | | |
| | | | | | | 34,959 | |
| | | | | | | | |
Consumer Goods — 1.3% | | | | | | | | |
Hyundai Mobis | | | 60 | | | | 20,168 | |
LG Electronics | | | 138 | | | | 13,309 | |
| | | | | | | | |
| | | | | | | 33,477 | |
| | | | | | | | |
Financials — 0.4% | | | | | | | | |
KB Financial Group ADR | | | 90 | | | | 4,796 | |
Shinhan Financial Group ADR | | | 50 | | | | 4,851 | |
| | | | | | | | |
| | | | | | | 9,647 | |
| | | | | | | | |
Technology — 4.3% | | | | | | | | |
Hynix Semiconductor | | | 720 | | | | 22,787 | |
Samsung Electronics | | | 108 | | | | 90,303 | |
| | | | | | | | |
| | | | | | | 113,090 | |
| | | | | | | | |
TOTAL SOUTH KOREA | | | | | | | 191,173 | |
| | | | | | | | |
The accompanying notes are an integral part of the financial statements.
56
| | | | |
| Schedule of Investments | | | | April 30, 2011 (Unaudited) |
| Global X Russell Emerging Markets Growth ETF |
| | | | | | | | |
| | | Shares | | | Value | |
COMMON STOCK — continued | | | | | | | | |
TAIWAN — 10.3% | | | | | | | | |
Basic Materials — 1.4% | | | | | | | | |
China Steel | | | 15,400 | | | $ | 19,015 | |
Nan Ya Plastics | | | 6,000 | | | | 18,375 | |
| | | | | | | | |
| | | | | | | 37,390 | |
| | | | | | | | |
Financials — 0.6% | | | | | | | | |
Cathay Financial Holding | | | 9,600 | | | | 16,006 | |
| | | | | | | | |
Industrials — 1.8% | | | | | | | | |
Hon Hai Precision Industry | | | 12,200 | | | | 46,170 | |
| | | | | | | | |
Oil & Gas — 0.4% | | | | | | | | |
Formosa Petrochemical | | | 3,000 | | | | 10,516 | |
| | | | | | | | |
Technology — 6.1% | | | | | | | | |
HTC | | | 1,000 | | | | 45,343 | |
MediaTek | | | 1,600 | | | | 17,663 | |
Taiwan Semiconductor Manufacturing ADR | | | 7,122 | | | | 96,147 | |
| | | | | | | | |
| | | | | | | 159,153 | |
| | | | | | | | |
TOTAL TAIWAN | | | | | | | 269,235 | |
| | | | | | | | |
THAILAND — 0.9% | | | | | | | | |
Oil & Gas — 0.9% | | | | | | | | |
PTT | | | 1,080 | | | | 13,563 | |
PTT Exploration & Production | | | 1,720 | | | | 10,657 | |
| | | | | | | | |
TOTAL THAILAND | | | | | | | 24,220 | |
| | | | | | | | |
TURKEY — 1.4% | | | | | | | | |
Financials — 1.3% | | | | | | | | |
Akbank | | | 2,034 | | | | 10,568 | |
Turkiye Garanti Bankasi | | | 3,092 | | | | 16,024 | |
Turkiye Is Bankasi, Cl C | | | 2,078 | | | | 7,353 | |
| | | | | | | | |
| | | | | | | 33,945 | |
| | | | | | | | |
Telecommunications — 0.1% | | | | | | | | |
Turkcell Iletisim Hizmet ADR | | | 114 | | | | 1,687 | |
| | | | | | | | |
TOTAL TURKEY | | | | | | | 35,632 | |
| | | | | | | | |
TOTAL COMMON STOCK
(Cost $2,348,662) | | | | | | | 2,456,554 | |
| | | | | | | | |
PREFERRED STOCK — 6.5% | | | | | | | | |
BRAZIL — 6.5% | | | | | | | | |
Basic Materials — 3.4% | | | | | | | | |
Vale ADR, Cl B | | | 2,978 | | | | 89,042 | |
| | | | | | | | |
Consumer Goods — 1.3% | | | | | | | | |
Cia de Bebidas das Americas ADR | | | 1,078 | | | | 35,121 | |
| | | | | | | | |
Financials — 1.1% | | | | | | | | |
Itausa — Investimentos Itau | | | 3,600 | | | | 27,601 | |
| | | | | | | | |
The accompanying notes are an integral part of the financial statements.
57
| | | | |
| Schedule of Investments | | | | April 30, 2011 (Unaudited) |
| Global X Russell Emerging Markets Growth ETF |
| | | | | | | | |
| | | Shares/Face
Amount | | | Value | |
PREFERRED STOCK — continued | | | | | | | | |
Technology — 0.7% | | | | | | | | |
Samsung Electronics | | | 30 | | | $ | 17,697 | |
| | | | | | | | |
TOTAL BRAZIL | | | | | | | 169,461 | |
| | | | | | | | |
TOTAL PREFERRED STOCK
(Cost $169,277) | | | | | | | 169,461 | |
| | | | | | | | |
TIME DEPOSIT — 0.0% | | | | | | | | |
Brown Brothers, 0.029% (B)
(Cost $440) | | $ | 440 | | | | 440 | |
| | | | | | | | |
TOTAL INVESTMENTS — 100.0%
(Cost $2,518,379) | | | | | | $ | 2,626,455 | |
| | | | | | | | |
Percentages are based on Net Assets of $2,626,346.
| * | Non-income producing security. |
| (A) | Securities sold within terms of a private placement memorandum, exempt from registration under Section 144A of the Securities Act of 1933, as amended, and may be sold only to dealers in that program or other “accredited investors.” These securities have been determined to be liquid under guidelines established by the board of Trustees. |
| (B) | The rate reported is the 7-day simple yield as of April 30, 2011. |
ADR — American Depositary Receipt
Cl — Class
GDR — Global Depositary Receipt
Ser — Series
The following is a summary of the inputs used as of April 30, 2011 in valuing the Fund’s investments carried at value:
| | | | | | | | | | | | | | | | |
Investments in Securities | | | Level 1 | | | | Level 2 | | | | Level 3 | | | | Total | |
Common Stock | | $ | 2,456,554 | | | $ | — | | | $ | — | | | $ | 2,456,554 | |
Preferred Stock | | | 169,461 | | | | — | | | | — | | | | 169,461 | |
Time Deposit | | | — | | | | 440 | | | | — | | | | 440 | |
| | | | | | | | | | | | | | | | |
Total Investments in Securities | | $ | 2,626,015 | | | $ | 440 | | �� | $ | — | | | $ | 2,626,455 | |
| | | | | | | | | | | | | | | | |
There have been no significant transfers between Level 1 and Level 2.
The accompanying notes are an integral part of the financial statements.
58
| | | | |
| Schedule of Investments | | | | April 30, 2011 (Unaudited) |
| Global X Russell Emerging Markets Value ETF |
Sector Weightings†:
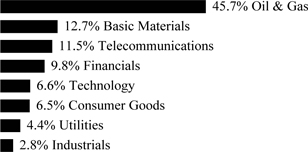
| † | Percentages based on total investments. |
| | | | | | | | |
| | | Shares | | | Value | |
COMMON STOCK — 89.4% | | | | | | | | |
BRAZIL — 8.3% | | | | | | | | |
Basic Materials — 0.5% | | | | | | | | |
Gerdau ADR | | | 514 | | | $ | 6,209 | |
Usinas Siderurgicas de Minas Gerais | | | 520 | | | | 8,446 | |
| | | | | | | | |
| | | | | | | 14,655 | |
| | | | | | | | |
Financials — 2.7% | | | | | | | | |
Banco Santander Brasil ADR | | | 2,400 | | | | 27,864 | |
BM&F Bovespa | | | 5,800 | | | | 43,546 | |
| | | | | | | | |
| | | | | | | 71,410 | |
| | | | | | | | |
Oil & Gas — 3.3% | | | | | | | | |
Petroleo Brasileiro ADR | | | 2,342 | | | | 87,427 | |
| | | | | | | | |
Telecommunications — 0.8% | | | | | | | | |
Vivo Participacoes | | | 40 | | | | 1,567 | |
Vivo Participacoes ADR | | | 484 | | | | 20,236 | |
| | | | | | | | |
| | | | | | | 21,803 | |
| | | | | | | | |
Utilities — 1.0% | | | | | | | | |
Centrais Eletricas Brasileiras ADR | | | 968 | | | | 14,346 | |
Centrais Eletricas Brasileiras ADR, Cl B | | | 718 | | | | 13,455 | |
| | | | | | | | |
| | | | | | | 27,801 | |
| | | | | | | | |
TOTAL BRAZIL | | | | | | | 223,096 | |
| | | | | | | | |
CHILE — 0.7% | | | | | | | | |
Utilities — 0.7% | | | | | | | | |
Enersis ADR | | | 884 | | | | 18,882 | |
| | | | | | | | |
CHINA — 8.8% | | | | | | | | |
Basic Materials — 0.6% | | | | | | | | |
Aluminum Corp of China ADR | | | 480 | | | | 11,304 | |
China Shenhua Energy, Cl H | | | 1,000 | | | | 4,668 | |
| | | | | | | | |
| | | | | | | 15,972 | |
| | | | | | | | |
Financials — 0.6% | | | | | | | | |
Agricultural Bank of China, Cl H * | | | 13,200 | | | | 7,802 | |
The accompanying notes are an integral part of the financial statements.
59
| | | | |
| Schedule of Investments | | | | April 30, 2011 (Unaudited) |
| Global X Russell Emerging Markets Value ETF |
| | | | | | | | |
| | | Shares | | | Value | |
COMMON STOCK — continued | | | | | | | | |
Financials — continued | | | | | | | | |
China Minsheng Banking, Cl H | | | 9,000 | | | $ | 8,634 | |
| | | | | | | | |
| | | | | | | 16,436 | |
| | | | | | | | |
Industrials — 0.5% | | | | | | | | |
China COSCO Holdings, Cl H | | | 9,000 | | | | 8,645 | |
Shanghai Electric Group, Cl H | | | 9,600 | | | | 4,772 | |
| | | | | | | | |
| | | | | | | 13,417 | |
| | | | | | | | |
Oil & Gas — 5.8% | | | | | | | | |
China Petroleum & Chemical ADR | | | 486 | | | | 48,974 | |
PetroChina ADR | | | 736 | | | | 107,147 | |
| | | | | | | | |
| | | | | | | 156,121 | |
| | | | | | | | |
Telecommunications — 1.1% | | | | | | | | |
China Telecom ADR | | | 486 | | | | 28,358 | |
| | | | | | | | |
Utilities — 0.2% | | | | | | | | |
Huaneng Power International ADR | | | 260 | | | | 5,769 | |
| | | | | | | | |
TOTAL CHINA | | | | | | | 236,073 | |
| | | | | | | | |
CZECH REPUBLIC — 0.7% | | | | | | | | |
Utilities — 0.7% | | | | | | | | |
CEZ | | | 340 | | | | 19,520 | |
| | | | | | | | |
HONG KONG — 6.4% | | | | | | | | |
Oil & Gas — 0.4% | | | | | | | | |
CNOOC ADR | | | 42 | | | | 10,477 | |
| | | | | | | | |
Telecommunications — 6.0% | | | | | | | | |
China Mobile ADR | | | 2,794 | | | | 128,776 | |
China Unicom Hong Kong ADR | | | 1,644 | | | | 33,636 | |
| | | | | | | | |
| | | | | | | 162,412 | |
| | | | | | | | |
TOTAL HONG KONG | | | | | | | 172,889 | |
| | | | | | | | |
INDIA — 0.7% | | | | | | | | |
Basic Materials — 0.6% | | | | | | | | |
Tata Steel GDR | | | 1,106 | | | | 15,506 | |
| | | | | | | | |
Telecommunications — 0.1% | | | | | | | | |
Tata Communications ADR | | | 384 | | | | 4,167 | |
| | | | | | | | |
TOTAL INDIA | | | | | | | 19,673 | |
| | | | | | | | |
MEXICO — 0.4% | | | | | | | | |
Telecommunications — 0.4% | | | | | | | | |
America Movil ADR, Ser L | | | 192 | | | | 10,983 | |
Telefonos de Mexico ADR | | | 50 | | | �� | 936 | |
| | | | | | | | |
TOTAL MEXICO | | | | | | | 11,919 | |
| | | | | | | | |
POLAND — 0.3% | | | | | | | | |
Utilities — 0.3% | | | | | | | | |
PGE Polska Grupa Energetyczna | | | 966 | | | | 8,727 | |
| | | | | | | | |
The accompanying notes are an integral part of the financial statements.
60
| | | | |
| Schedule of Investments | | | | April 30, 2011 (Unaudited) |
| Global X Russell Emerging Markets Value ETF |
| | | | | | | | |
| | | Shares | | | Value | |
COMMON STOCK — continued | | | | | | | | |
RUSSIA — 28.1% | | | | | | | | |
Basic Materials — 0.2% | | | | | | | | |
United RUSAL * | | | 2,800 | | | $ | 4,283 | |
| | | | | | | | |
Financials — 0.7% | | | | | | | | |
VTB Bank GDR | | | 3,056 | | | | 19,772 | |
| | | | | | | | |
Oil & Gas — 26.4% | | | | | | | | |
Gazprom Neft JSC ADR | | | 888 | | | | 22,422 | |
Gazprom OAO ADR | | | 19,468 | | | | 328,231 | |
Lukoil OAO ADR | | | 864 | | | | 60,221 | |
NovaTek OAO GDR | | | 508 | | | | 71,374 | |
Rosneft Oil GDR | | | 6,088 | | | | 54,335 | |
Surgutneftegas ADR | | | 13,504 | | | | 142,197 | |
Tatneft ADR | | | 724 | | | | 32,645 | |
| | | | | | | | |
| | | | | | | 711,425 | |
| | | | | | | | |
Telecommunications — 0.1% | | | | | | | | |
Mobile Telesystems ADR | | | 88 | | | | 1,861 | |
| | | | | | | | |
Utilities — 0.7% | | | | | | | | |
Federal Hydrogenerating JSC ADR * | | | 3,936 | | | | 20,448 | |
| | | | | | | | |
TOTAL RUSSIA | | | | | | | 757,789 | |
| | | | | | | | |
SOUTH AFRICA — 1.3% | | | | | | | | |
Basic Materials — 0.3% | | | | | | | | |
Impala Platinum Holdings | | | 242 | | | | 7,559 | |
| | | | | | | | |
Financials — 0.9% | | | | | | | | |
Standard Bank Group | | | 1,506 | | | | 23,638 | |
| | | | | | | | |
Telecommunications — 0.1% | | | | | | | | |
Vodacom Group | | | 282 | | | | 3,449 | |
| | | | | | | | |
TOTAL SOUTH AFRICA | | | | | | | 34,646 | |
| | | | | | | | |
SOUTH KOREA — 24.7% | | | | | | | | |
Basic Materials — 3.6% | | | | | | | | |
POSCO ADR | | | 878 | | | | 96,844 | |
| | | | | | | | |
Consumer Goods — 5.9% | | | | | | | | |
Hyundai Mobis | | | 110 | | | | 36,976 | |
Hyundai Motor | | | 528 | | | | 121,865 | |
| | | | | | | | |
| | | | | | | 158,841 | |
| | | | | | | | |
Financials — 5.0% | | | | | | | | |
KB Financial Group ADR | | | 884 | | | | 47,108 | |
Samsung Life Insurance | | | 314 | | | | 28,548 | |
Shinhan Financial Group ADR | | | 622 | | | | 60,347 | |
| | | | | | | | |
| | | | | | | 136,003 | |
| | | | | | | | |
Industrials — 2.3% | | | | | | | | |
Hyundai Heavy Industries | | | 126 | | | | 63,118 | |
| | | | | | | | |
The accompanying notes are an integral part of the financial statements.
61
| | | | |
| Schedule of Investments | | | | April 30, 2011 (Unaudited) |
| Global X Russell Emerging Markets Value ETF |
| | | | | | | | |
| | | Shares | | | Value | |
COMMON STOCK — continued | | | | | | | | |
Technology — 6.3% | | | | | | | | |
LG Display ADR | | | 1,556 | | | $ | 27,728 | |
Samsung Electronics GDR | | | 340 | | | | 141,270 | |
| | | | | | | | |
| | | | | | | 168,998 | |
| | | | | | | | |
Telecommunications — 0.8% | | | | | | | | |
SK Telecom ADR | | | 1,136 | | | | 21,561 | |
| | | | | | | | |
Utilities — 0.8% | | | | | | | | |
Korea Electric Power ADR | | | 1,742 | | | | 21,078 | |
| | | | | | | | |
TOTAL SOUTH KOREA | | | | | | | 666,443 | |
| | | | | | | | |
TAIWAN — 8.3% | | | | | | | | |
Basic Materials — 6.3% | | | | | | | | |
Formosa Chemicals & Fibre | | | 18,000 | | | | 72,515 | |
Formosa Plastics | | | 17,800 | | | | 72,640 | |
Nan Ya Plastics | | | 7,800 | | | | 23,887 | |
| | | | | | | | |
| | | | | | | 169,042 | |
| | | | | | | | |
Technology — 0.4% | | | | | | | | |
HTC | | | 220 | | | | 9,975 | |
| | | | | | | | |
Telecommunications — 1.6% | | | | | | | | |
Chunghwa Telecom ADR | | | 1,340 | | | | 42,277 | |
| | | | | | | | |
TOTAL TAIWAN | | | | | | | 221,294 | |
| | | | | | | | |
THAILAND — 0.2% | | | | | | | | |
Oil & Gas — 0.2% | | | | | | | | |
PTT | | | 380 | | | | 4,772 | |
| | | | | | | | |
TURKEY — 0.5% | | | | | | | | |
Telecommunications — 0.5% | | | | | | | | |
Turkcell Iletisim Hizmet ADR | | | 832 | | | | 12,314 | |
| | | | | | | | |
TOTAL COMMON STOCK
(Cost $2,216,872) | | | | | | | 2,408,037 | |
| | | | | | | | |
PREFERRED STOCK — 11.0% | | | | | | | | |
BRAZIL — 10.4% | | | | | | | | |
Basic Materials — 0.5% | | | | | | | | |
Usinas Siderurgicas de Minas Gerais | | | 1,320 | | | | 13,510 | |
| | | | | | | | |
Oil & Gas — 9.9% | | | | | | | | |
Petroleo Brasileiro ADR, Cl A | | | 7,956 | | | | 265,492 | |
| | | | | | | | |
TOTAL BRAZIL | | | | | | | 279,002 | |
| | | | | | | | |
SOUTH KOREA — 0.6% | | | | | | | | |
Basic Materials — 0.1% | | | | | | | | |
LG Chemical | | | 22 | | | | 3,791 | |
| | | | | | | | |
Consumer Goods — 0.5% | | | | | | | | |
Hyundai Motor | | | 186 | | | | 14,689 | |
| | | | | | | | |
The accompanying notes are an integral part of the financial statements.
62
| | | | |
| Schedule of Investments | | | | April 30, 2011 (Unaudited) |
| Global X Russell Emerging Markets Value ETF |
| | | | | | |
| | | Shares | | Value | |
PREFERRED STOCK — continued | | | | | | |
Consumer Goods — continued | | | | | | |
TOTAL SOUTH KOREA | | | | $ | 18,480 | |
| | | | | | |
TOTAL PREFERRED STOCK
(Cost $294,367) | | | | | 297,482 | |
| | | | | | |
TOTAL INVESTMENTS — 100.4%
(Cost $2,511,239) | | | | $ | 2,705,519 | |
| | | | | | |
Percentages are based on Net Assets of $2,694,083.
| * | Non-income producing security. |
ADR — American Depositary Receipt
Cl — Class
GDR — Global Depositary Receipt
Ser — Series
The following is a summary of the inputs used as of April 30, 2011 in valuing the Fund’s investments carried at value:
| | | | | | | | | | | | | | | | |
Investments in Securities | | | Level 1 | | | | Level 2 | | | | Level 3 | | | | Total | |
Common Stock | | $ | 2,408,037 | | | $ | — | | | $ | — | | | $ | 2,408,037 | |
Preferred Stock | | | 297,482 | | | | — | | | | — | | | | 297,482 | |
| | | | | | | | | | | | | | | | |
Total Investments in Securities | | $ | 2,705,519 | | | $ | — | | | $ | — | | | $ | 2,705,519 | |
| | | | | | | | | | | | | | | | |
There have been no significant transfers between Level 1 and Level 2.
The accompanying notes are an integral part of the financial statements.
63
| | | | |
| Schedule of Investments | | | | April 30, 2011 (Unaudited) |
| Global X S&P/TSX Venture 30 Canada ETF |
Sector Weightings†:
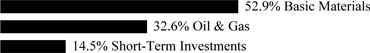
| † | Percentages based on total investments. |
| | | | | | | | |
| | | Shares | | | Value | |
COMMON STOCK — 100.1% | | | | | | | | |
CANADA — 100.1% | | | | | | | | |
Basic Materials — 62.0% | | | | | | | | |
Atac Resources * | | | 50,145 | | | $ | 370,522 | |
Bear Creek Mining * | | | 25,785 | | | | 225,959 | |
Canaco Resources * | | | 51,265 | | | | 243,319 | |
Clifton Star Resources * | | | 15,605 | | | | 65,488 | |
East Asia Minerals * | | | 19,680 | | | | 116,707 | |
Great Western Minerals Group * | | | 70,195 | | | | 59,362 | |
Hathor Exploration * | | | 26,700 | | | | 61,529 | |
Kaminak Gold, Cl A * | | | 30,385 | | | | 123,981 | |
Orko Silver * | | | 27,320 | | | | 78,841 | |
Quest Rare Minerals * | | | 29,350 | | | | 252,857 | |
Rainy River Resources * | | | 26,480 | | | | 277,116 | |
Rare Element Resources * | | | 22,955 | | | | 330,494 | |
Timmins Gold * | | | 48,920 | | | | 124,110 | |
Trelawney Mining and Exploration * | | | 19,195 | | | | 92,120 | |
Victoria Gold * | | | 77,630 | | | | 68,111 | |
Western Potash * | | | 43,315 | | | | 59,524 | |
| | | | | | | | |
| | | | | | | 2,550,040 | |
| | | | | | | | |
Oil & Gas — 38.1% | | | | | | | | |
Africa Oil * | | | 31,460 | | | | 62,188 | |
Alange Energy * | | | 753,100 | | | | 230,866 | |
Arcan Resources * | | | 25,590 | | | | 119,023 | |
Canacol Energy * | | | 214,895 | | | | 290,767 | |
Ithaca Energy * | | | 90,595 | | | | 228,882 | |
Painted Pony Petroleum, Cl A * | | | 12,340 | | | | 129,922 | |
Pan Orient Energy * | | | 14,565 | | | | 93,918 | |
Petrodorado Energy * | | | 95,270 | | | | 39,276 | |
Renegade Petroleum * | | | 15,240 | | | | 61,862 | |
Shamaran Petroleum, Cl Common Subscription Receipt * | | | 3,110 | | | | 2,827 | |
Sterling Resources * | | | 27,480 | | | | 114,161 | |
Surge Energy, Cl Common Subscription Receipt * | | | 6,140 | | | | 56,987 | |
TAG Oil * | | | 11,085 | | | | 68,197 | |
Wild Stream Exploration * | | | 5,585 | | | | 68,189 | |
| | | | | | | | |
| | | | | | | 1,567,065 | |
| | | | | | | | |
TOTAL CANADA | | | | | | | 4,117,105 | |
| | | | | | | | |
TOTAL COMMON STOCK
(Cost $3,990,214) | | | | | | | 4,117,105 | |
| | | | | | | | |
The accompanying notes are an integral part of the financial statements.
64
| | | | |
| Schedule of Investments | | | | April 30, 2011 (Unaudited) |
| Global X S&P/TSX Venture 30 Canada ETF |
| | | | | | | | |
| | | Face Amount | | | Value | |
U.S. TREASURY OBLIGATION — 17.0% | | | | | | | | |
United States Treasury Bills (A)
0.010%, 05/19/11
(Cost $699,997) | | $ | 700,000 | | | $ | 699,994 | |
| | | | | | | | |
TOTAL INVESTMENTS — 117.1%
(Cost $4,690,211) | | | | | | $ | 4,817,099 | |
| | | | | | | | |
Percentages are based on Net Assets of $4,114,111.
| * | Non-income producing security. |
| (A) | The rate reported is the effective yield at time of purchase. |
Cl — Class
The following is a summary of the inputs used as of April 30, 2011 in valuing the Fund’s investments carried at value:
| | | | | | | | | | | | | | | | |
Investments in Securities | | | Level 1 | | | | Level 2 | | | | Level 3 | | | | Total | |
Common Stock | | $ | 4,117,105 | | | $ | — | | | $ | — | | | $ | 4,117,105 | |
U.S. Treasury Obligation | | | — | | | | 699,994 | | | | — | | | | 699,994 | |
| | | | | | | | | | | | | | | | |
Total Investments in Securities | | $ | 4,117,105 | | | $ | 699,994 | | | $ | — | | | $ | 4,817,099 | |
| | | | | | | | | | | | | | | | |
There have been no significant transfers between Level 1 and Level 2.
The accompanying notes are an integral part of the financial statements.
65
| | | | |
| Schedule of Investments | | | | April 30, 2011 (Unaudited) |
| | Global X Oil Equities ETF | | |
Sector Weightings†:

| † | Percentages based on total investments. |
| | | | | | | | |
| | | Shares | | | Value | |
COMMON STOCK — 100.0% | | | | | | | | |
CANADA — 19.2% | | | | | | | | |
Oil & Gas — 19.2% | | | | | | | | |
Canadian Natural Resources | | | 3,125 | | | $ | 147,034 | |
Cenovus Energy | | | 4,040 | | | | 155,365 | |
Crescent Point Energy | | | 3,225 | | | | 146,454 | |
Nexen | | | 5,840 | | | | 154,519 | |
Suncor Energy | | | 3,350 | | | | 154,433 | |
| | | | | | | | |
TOTAL CANADA | | | | | | | 757,805 | |
| | | | | | | | |
UNITED STATES — 80.8% | | | | | | | | |
Oil & Gas — 80.8% | | | | | | | | |
Apache | | | 1,300 | | | | 173,381 | |
Berry Petroleum, Cl A | | | 3,175 | | | | 168,688 | |
Brigham Exploration * | | | 4,455 | | | | 149,376 | |
Clayton Williams Energy * | | | 1,515 | | | | 137,214 | |
Concho Resources * | | | 1,465 | | | | 156,535 | |
ConocoPhillips | | | 1,995 | | | | 157,465 | |
Continental Resources * | | | 2,335 | | | | 160,368 | |
Denbury Resources * | | | 6,620 | | | | 149,413 | |
Devon Energy | | | 1,755 | | | | 159,705 | |
Forest Oil * | | | 4,680 | | | | 168,059 | |
Hess | | | 1,895 | | | | 162,894 | |
Newfield Exploration * | | | 2,215 | | | | 156,822 | |
Noble Energy | | | 1,705 | | | | 164,140 | |
Northern Oil and Gas * | | | 4,885 | | | | 116,068 | |
Petrohawk Energy * | | | 7,425 | | | | 200,549 | |
Pioneer Natural Resources | | | 1,595 | | | | 163,057 | |
Range Resources | | | 3,155 | | | | 178,100 | |
SM Energy | | | 2,185 | | | | 165,754 | |
Swift Energy * | | | 3,745 | | | | 146,766 | |
Whiting Petroleum * | | | 2,325 | | | | 161,588 | |
| | | | | | | | |
TOTAL UNITED STATES | | | | | | | 3,195,942 | |
| | | | | | | | |
TOTAL COMMON STOCK
(Cost $3,853,036) | | | | | | | 3,953,747 | |
| | | | | | | | |
TOTAL INVESTMENTS — 100.0%
(Cost $3,853,036) | | | | | | $ | 3,953,747 | |
| | | | | | | | |
The accompanying notes are an integral part of the financial statements.
66
| | | | |
| Schedule of Investments | | | | April 30, 2011 (Unaudited) |
| | Global X Oil Equities ETF | | |
Percentages are based on Net Assets of $3,954,389.
| * | Non-income producing security. |
Cl — Class
The following is a summary of the inputs used as of April 30, 2011 in valuing the Fund’s investments carried at value:
| | | | | | | | | | | | | | | | |
Investments in Securities | | | Level 1 | | | | Level 2 | | | | Level 3 | | | | Total | |
Common Stock | | $ | 3,953,747 | | | $ | — | | | $ | — | | | $ | 3,953,747 | |
| | | | | | | | | | | | | | | | |
Total Investments in Securities | | $ | 3,953,747 | | | $ | — | | | $ | — | | | $ | 3,953,747 | |
| | | | | | | | | | | | | | | | |
There have been no significant transfers between Level 1 and Level 2.
The accompanying notes are an integral part of the financial statements.
67
| | | | |
| Schedule of Investments | | | | April 30, 2011 (Unaudited) |
| | Global X Waste Management ETF | | |
Sector Weightings†:
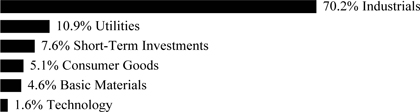
| † | Percentages based on total investments. |
| | | | | | | | |
| | | Shares | | | Value | |
COMMON STOCK — 100.0% | | | | | | | | |
AUSTRALIA — 4.5% | | | | | | | | |
Industrials — 4.5% | | | | | | | | |
Tox Free Solutions | | | 23,600 | | | $ | 55,885 | |
Transpacific Industries Group * | | | 67,600 | | | | 82,262 | |
| | | | | | | | |
TOTAL AUSTRALIA | | | | | | | 138,147 | |
| | | | | | | | |
CANADA — 5.5% | | | | | | | | |
Industrials — 5.5% | | | | | | | | |
IESI-BFC | | | 3,900 | | | | 98,984 | |
Newalta | | | 4,928 | | | | 68,398 | |
| | | | | | | | |
TOTAL CANADA | | | | | | | 167,382 | |
| | | | | | | | |
CHINA — 3.8% | | | | | | | | |
Industrials — 2.0% | | | | | | | | |
Chiho-Tiande Group | | | 79,200 | | | | 60,885 | |
| | | | | | | | |
Technology — 1.8% | | | | | | | | |
Think Environmental * | | | 78,400 | | | | 53,488 | |
| | | | | | | | |
TOTAL CHINA | | | | | | | 114,373 | |
| | | | | | | | |
FRANCE — 12.5% | | | | | | | | |
Industrials — 12.5% | | | | | | | | |
Veolia Environnement | | | 9,240 | | | | 308,652 | |
Seche Environnement | | | 764 | | | | 72,992 | |
| | | | | | | | |
TOTAL FRANCE | | | | | | | 381,644 | |
| | | | | | | | |
HONG KONG — 10.1% | | | | | | | | |
Consumer Goods — 2.1% | | | | | | | | |
Fook Woo Group Holdings * | | | 203,600 | | | | 63,183 | |
| | | | | | | | |
Industrials — 6.3% | | | | | | | | |
China Everbright International | | | 201,600 | | | | 90,340 | |
China Metal Recycling Holdings | | | 73,200 | | | | 101,611 | |
| | | | | | | | |
| | | | | | | 191,951 | |
| | | | | | | | |
Utilities — 1.7% | | | | | | | | |
China Water Affairs Group | | | 136,400 | | | | 51,638 | |
| | | | | | | | |
The accompanying notes are an integral part of the financial statements.
68
| | | | |
| Schedule of Investments | | | | April 30, 2011 (Unaudited) |
| | Global X Waste Management ETF | | |
| | | | | | | | |
| | | Shares/Face
Amount | | | Value | |
COMMON STOCK — continued | | | | | | | | |
Utilities — continued | | | | | | | | |
TOTAL HONG KONG | | | | | | $ | 306,772 | |
| | | | | | | | |
JAPAN — 2.4% | | | | | | | | |
Basic Materials — 2.4% | | | | | | | | |
Asahi Holdings | | | 3,600 | | | | 73,953 | |
| | | | | | | | |
NORWAY — 2.9% | | | | | | | | |
Industrials — 2.9% | | | | | | | | |
Tomra Systems | | | 10,400 | | | | 89,248 | |
| | | | | | | | |
SOUTH KOREA — 1.4% | | | | | | | | |
Industrials — 1.4% | | | | | | | | |
Insun ENT | | | 13,600 | | | | 42,659 | |
| | | | | | | | |
UNITED KINGDOM — 2.0% | | | | | | | | |
Industrials — 2.0% | | | | | | | | |
Shanks Group | | | 29,600 | | | | 59,516 | |
| | | | | | | | |
UNITED STATES — 54.9% | | | | | | | | |
Basic Materials — 2.6% | | | | | | | | |
Calgon Carbon * | | | 4,700 | | | | 80,652 | |
| | | | | | | | |
Consumer Goods — 3.5% | | | | | | | | |
Darling International * | | | 6,612 | | | | 106,916 | |
| | | | | | | | |
Industrials — 48.8% | | | | | | | | |
Casella Waste Systems, Cl A * | | | 6,856 | | | | 46,347 | |
Clean Harbors * | | | 1,348 | | | | 132,778 | |
EnergySolutions | | | 9,032 | | | | 51,031 | |
Metalico * | | | 8,764 | | | | 55,564 | |
Republic Services, Cl A | | | 7,844 | | | | 248,027 | |
Sims Metal Management | | | 9,400 | | | | 179,929 | |
Stericycle * | | | 3,336 | | | | 304,510 | |
US Ecology | | | 3,168 | | | | 58,165 | |
Waste Connections | | | 3,404 | | | | 104,741 | |
Waste Management | | | 7,788 | | | | 307,314 | |
| | | | | | | | |
| | | | | | | 1,488,406 | |
| | | | | | | | |
TOTAL UNITED STATES | | | | | | | 1,675,974 | |
| | | | | | | | |
TOTAL COMMON STOCK
(Cost $2,968,475) | | | | | | | 3,049,668 | |
| | | | | | | | |
U.S. TREASURY OBLIGATION — 8.2% | | | | | | | | |
United States Treasury Bills (A)
0.010%, 05/19/11 (Cost $249,999) | | $ | 250,000 | | | | 249,998 | |
| | | | | | | | |
TOTAL INVESTMENTS — 108.2%
(Cost $3,218,474) | | | | | | $ | 3,299,666 | |
| | | | | | | | |
The accompanying notes are an integral part of the financial statements.
69
| | | | |
| Schedule of Investments | | | | April 30, 2011 (Unaudited) |
| | Global X Waste Management ETF | | |
Percentages are based on Net Assets of $3,049,691.
| * | Non-income producing security. |
(A) The rate reported is the effective yield at time of purchase.
Cl — Class
The following is a summary of the inputs used as of April 30, 2011 in valuing the Fund’s investments carried at value:
| | | | | | | | | | | | | | | | |
Investments in Securities | | | Level 1 | | | | Level 2 | | | | Level 3 | | | | Total | |
Common Stock | | $ | 3,049,668 | | | $ | — | | | $ | — | | | $ | 3,049,668 | |
U.S. Treasury Obligation | | | — | | | | 249,998 | | | | — | | | | 249,998 | |
| | | | | | | | | | | | | | | | |
Total Investments in Securities | | $ | 3,049,668 | | | $ | 249,998 | | | $ | — | | | $ | 3,299,666 | |
| | | | | | | | | | | | | | | | |
There have been no significant transfers between Level 1 and Level 2.
The accompanying notes are an integral part of the financial statements.
70
STATEMENTSOF ASSETSAND LIABILITIES
April 30, 2011 (Unaudited)
| | | | | | | | | | | | | | | | |
| | | Global X Silver
Miners ETF | | | Global X Lithium
ETF | | | Global X Copper
Miners ETF | | | Global X Pure
Gold Miners ETF | |
Assets: | | | | | | | | | | | | | | | | |
Cost of Investments | | $ | 508,993,282 | | | $ | 230,868,031 | | | $ | 94,293,237 | | | $ | 3,052,144 | |
Cost of Foreign Currency | | | — | | | | — | | | | 180,610 | | | | 414 | |
Investments at Value | | $ | 635,689,593 | | | $ | 250,087,131 | | | $ | 104,926,189 | | | $ | 3,292,169 | |
| | | | | | | | | | | | | | | | |
Cash | | | — | | | | — | | | | — | | | | 345 | |
Foreign Currency at Value | | | — | | | | — | | | | 195,617 | | | | 424 | |
Receivable for Investment Securities Sold | | | 42,132,713 | | | | — | | | | 7,083,507 | | | | — | |
Receivable for Capital Shares Sold | | | 35,598,500 | | | | — | | | | 8,135,000 | | | | — | |
Dividend and Interest Receivable | | | 920,656 | | | | 96,530 | | | | 107,749 | | | | 1,443 | |
Reclaim Receivable | | | — | | | | — | | | | 8,660 | | | | — | |
| | | | | | | | | | | | | | | | |
Total Assets | | | 714,341,462 | | | | 250,183,661 | | | | 120,456,722 | | | | 3,294,381 | |
| | | | | | | | | | | | | | | | |
Liabilities: | | | | | | | | | | | | | | | | |
Payable for Investment Securities Purchased | | | 53,631,727 | | | | — | | | | 6,301,652 | | | | — | |
Payable for Capital Shares Redeemed | | | 31,295,000 | | | | — | | | | 8,135,000 | | | | — | |
Overdraft of Foreign Currency* | | | 4,479,226 | | | | 105,151 | | | | — | | | | — | |
Payable due to Investment Adviser | | | 334,781 | | | | 115,337 | | | | 56,491 | | | | 1,572 | |
Due to Custodian | | | 198,266 | | | | 62,024,848 | | | | 84,427 | | | | — | |
| | | | | | | | | | | | | | | | |
Total Liabilities | | | 89,939,000 | | | | 62,245,336 | | | | 14,577,570 | | | | 1,572 | |
| | | | | | | | | | | | | | | | |
Net Assets | | $ | 624,402,462 | | | $ | 187,938,325 | | | $ | 105,879,152 | | | $ | 3,292,809 | |
| | | | | | | | | | | | | | | | |
*Proceeds of Foreign Currency | | $ | 4,488,282 | | | $ | 102,602 | | | $ | — | | | $ | — | |
| | | | | | | | | | | | | | | | |
Net Assets Consist of: | | | | | | | | | | | | | | | | |
Paid-in Capital | | $ | 488,408,866 | | | $ | 166,895,500 | | | $ | 95,127,000 | | | $ | 3,053,000 | |
Distributions in Excess of Net Investment Income/Accumulated Net Investment Loss | | | (2,195,770 | ) | | | (1,822,491 | ) | | | (185,664 | ) | | | (236 | ) |
Accumulated Net Realized Gain on Investments and Foreign Currency Translations | | | 11,561,158 | | | | 3,647,195 | | | | 289,398 | | | | 4 | |
Net Unrealized Appreciation on Investments | | | 126,696,311 | | | | 19,219,100 | | | | 10,632,952 | | | | 240,025 | |
Net Unrealized Appreciation (Depreciation) on Foreign Currency Translations | | | (68,103 | ) | | | (979 | ) | | | 15,466 | | | | 16 | |
| | | | | | | | | | | | | | | | |
Net Assets | | $ | 624,402,462 | | | $ | 187,938,325 | | | $ | 105,879,152 | | | $ | 3,292,809 | |
| | | | | | | | | | | | | | | | |
Outstanding Shares of Beneficial Interest
(unlimited authorization — no par value) | | | 21,950,000 | | | | 8,350,000 | | | | 5,200,000 | | | | 200,000 | |
| | | | | | | | | | | | | | | | |
Net Asset Value, Offering and Redemption Price Per Share | | $ | 28.45 | | | $ | 22.51 | | | $ | 20.36 | | | $ | 16.46 | |
| | | | | | | | | | | | | | | | |
The accompanying notes are an integral part of the financial statements.
71
STATEMENTSOF ASSETSAND LIABILITIES
April 30, 2011 (Unaudited)
| | | | | | | | | | | | | | | | |
| | | Global X
Uranium ETF | | | Global X
Aluminum
ETF | | | Global X Gold
Explorers ETF | | | Global X Brazil
Mid Cap ETF | |
Assets: | | | | | | | | | | | | | | | | |
Cost of Investments | | $ | 332,421,702 | | | $ | 5,356,742 | | | $ | 24,342,871 | | | $ | 28,798,493 | |
Cost of Foreign Currency | | | 75,014 | | | | — | | | | 104,110 | | | | 168,137 | |
| | | | | | | | | | | | | | | | |
Investments at Value | | $ | 267,517,734 | | | $ | 5,488,081 | | | $ | 26,000,322 | | | $ | 32,720,192 | |
Cash | | | — | | | | 42,941 | | | | — | | | | — | |
Foreign Currency at Value | | | 75,345 | | | | — | | | | 104,113 | | | | 173,678 | |
Receivable for Capital Shares Sold | | | 2,164,500 | | | | — | | | | — | | | | — | |
Dividend and Interest Receivable | | | — | | | | 8,407 | | | | — | | | | 204,886 | |
| | | | | | | | | | | | | | | | |
Total Assets | | | 269,757,579 | | | | 5,539,429 | | | | 26,104,435 | | | | 33,098,756 | |
| | | | | | | | | | | | | | | | |
Liabilities: | | | | | | | | | | | | | | | | |
Payable for Investment Securities Purchased | | | 2,166,279 | | | | — | | | | — | | | | — | |
Due to Custodian | | | 277,638 | | | | — | | | | 123,906 | | | | 119,208 | |
Payable due to Investment Adviser | | | 144,963 | | | | 3,137 | | | | 13,845 | | | | 18,694 | |
Overdraft of Foreign Currency* | | | — | | | | 34,645 | | | | — | | | | — | |
| | | | | | | | | | | | | | | | |
Total Liabilities | | | 2,588,880 | | | | 37,782 | | | | 137,751 | | | | 137,902 | |
| | | | | | | | | | | | | | | | |
Net Assets | | $ | 267,168,699 | | | $ | 5,501,647 | | | $ | 25,966,684 | | | $ | 32,960,854 | |
| | | | | | | | | | | | | | | | |
*Proceeds of Foreign Currency | | $ | — | | | $ | 31,848 | | | $ | — | | | $ | — | |
| | | | | | | | | | | | | | | | |
Net Assets Consist of: | | | | | | | | | | | | | | | | |
Paid-in Capital | | $ | 328,419,000 | | | $ | 5,360,000 | | | $ | 23,736,000 | | | $ | 29,372,000 | |
Undistributed (Distributions in Excess of) Net Investment Income/Accumulated Net Investment Loss | | | (339,145 | ) | | | 11,237 | | | | (66,714 | ) | | | 43,997 | |
Accumulated Net Realized Gain (Loss) on Investments and Foreign Currency Translations | | | 3,992,481 | | | | 1,757 | | | | 639,944 | | | | (382,470 | ) |
Net Unrealized Appreciation (Depreciation) on Investments | | | (64,903,968 | ) | | | 131,339 | | | | 1,657,451 | | | | 3,921,699 | |
Net Unrealized Appreciation (Depreciation) on Foreign Currency Translations | | | 331 | | | | (2,686 | ) | | | 3 | | | | 5,628 | |
| | | | | | | | | | | | | | | | |
Net Assets | | $ | 267,168,699 | | | $ | 5,501,647 | | | $ | 25,966,684 | | | $ | 32,960,854 | |
| | | | | | | | | | | | | | | | |
Outstanding Shares of Beneficial Interest (unlimited authorization — no par value) | | | 18,800,000 | | | | 350,000 | | | | 1,400,000 | | | | 1,750,000 | |
| | | | | | | | | | | | | | | | |
Net Asset Value, Offering and Redemption Price Per Share | | $ | 14.21 | | | $ | 15.72 | | | $ | 18.55 | | | $ | 18.83 | |
| | | | | | | | | | | | | | | | |
The accompanying notes are an integral part of the financial statements.
72
STATEMENTSOF ASSETSAND LIABILITIES
April 30, 2011 (Unaudited)
| | | | | | | | | | | | | | | | |
| | | Global X Brazil
Financials ETF | | | Global X Brazil
Consumer ETF | | | Global X FTSE
Colombia 20 ETF | | | Global X FTSE
Nordic Region ETF | |
Assets: | | | | | | | | | | | | | | | | |
Cost of Investments | | $ | 9,012,505 | | | $ | 30,743,787 | | | $ | 148,969,157 | | | $ | 28,370,414 | |
Cost of Foreign Currency | | | 78,982 | | | | 192,037 | | | | 526,349 | | | | 26,073 | |
| | | | | | | | | | | | | | | | |
Investments at Value | | $ | 9,543,779 | | | $ | 33,276,788 | | | $ | 154,745,140 | | | $ | 34,248,306 | |
Cash | | | — | | | | 3,736 | | | | — | | | | — | |
Foreign Currency at Value | | | 82,096 | | | | 196,677 | | | | 526,349 | | | | 26,455 | |
Dividend and Interest Receivable | | | 39,120 | | | | 38,717 | | | | 249,795 | | | | 161,780 | |
Receivable for Capital Shares Sold | | | — | | | | — | | | | 8,483,500 | | | | — | |
Reclaim Receivable | | | — | | | | — | | | | — | | | | 11,532 | |
| | | | | | | | | | | | | | | | |
Total Assets | | | 9,664,995 | | | | 33,515,918 | | | | 164,004,784 | | | | 34,448,073 | |
| | | | | | | | | | | | | | | | |
Liabilities: | | | | | | | | | | | | | | | | |
Payable for Investment Securities Purchased | | | — | | | | — | | | | 8,488,974 | | | | — | |
Due to Custodian | | | 32,838 | | | | — | | | | 361,576 | | | | 1,501 | |
Payable due to Investment Adviser | | | 6,084 | | | | 20,766 | | | | 71,129 | | | | 13,534 | |
| | | | | | | | | | | | | | | | |
Total Liabilities | | | 38,922 | | | | 20,766 | | | | 8,921,679 | | | | 15,035 | |
| | | | | | | | | | | | | | | | |
Net Assets | | $ | 9,626,073 | | | $ | 33,495,152 | | | $ | 155,083,105 | | | $ | 34,433,038 | |
| | | | | | | | | | | | | | | | |
Net Assets Consist of: | | | | | | | | | | | | | | | | |
Paid-in Capital | | $ | 8,996,000 | | | $ | 31,065,000 | | | $ | 150,164,400 | | | $ | 28,037,144 | |
Undistributed (Distributions in Excess of) Net Investment Income | | | 90,897 | | | | 180,816 | | | | (191,140 | ) | | | 526,180 | |
Accumulated Net Realized Gain (Loss) on Investments and Foreign Currency Translations | | | 4,446 | | | | (289,007 | ) | | | (669,485 | ) | | | (8,895 | ) |
Net Unrealized Appreciation on Investments | | | 531,274 | | | | 2,533,001 | | | | 5,775,983 | | | | 5,877,892 | |
Net Unrealized Appreciation on Foreign Currency Translations | | | 3,456 | | | | 5,342 | | | | 3,347 | | | | 717 | |
| | | | | | | | | | | | | | | | |
Net Assets | | $ | 9,626,073 | | | $ | 33,495,152 | | | $ | 155,083,105 | | | $ | 34,433,038 | |
| | | | | | | | | | | | | | | | |
Outstanding Shares of Beneficial Interest (unlimited authorization — no par value) | | | 550,000 | | | | 1,650,000 | | | | 7,280,000 | | | | 1,510,000 | |
| | | | | | | | | | | | | | | | |
Net Asset Value, Offering and Redemption Price Per Share | | $ | 17.50 | | | $ | 20.30 | | | $ | 21.30 | | | $ | 22.80 | |
| | | | | | | | | | | | | | | | |
The accompanying notes are an integral part of the financial statements.
73
STATEMENTSOF ASSETSAND LIABILITIES
April 30, 2011 (Unaudited)
| | | | | | | | | | | | | | | | |
| | | Global X FTSE
Norway 30 ETF | | | Global X FTSE
Argentina 20 ETF | | | Global X FTSE
Andean 40 ETF | | | Global X FTSE
ASEAN 40 ETF | |
Assets: | | | | | | | | | | | | | | | | |
Cost of Investments | | $ | 45,924,822 | | | $ | 4,238,367 | | | $ | 7,307,664 | | | $ | 2,329,467 | |
Cost of Foreign Currency | | | 154,649 | | | | — | | | | 7,687 | | | | — | |
| | | | | | | | | | | | | | | | |
Investments at Value | | $ | 51,069,459 | | | $ | 4,288,444 | | | $ | 7,703,697 | | | $ | 2,487,456 | |
Cash | | | — | | | | 24,050 | | | | — | | | | — | |
Foreign Currency at Value | | | 158,101 | | | | — | | | | 7,747 | | | | — | |
Dividend and Interest Receivable | | | 387,099 | | | | 19,960 | | | | 20,859 | | | | 10,890 | |
| | | | | | | | | | | | | | | | |
Total Assets | | | 51,614,659 | | | | 4,332,454 | | | | 7,732,303 | | | | 2,498,346 | |
| | | | | | | | | | | | | | | | |
Liabilities: | | | | | | | | | | | | | | | | |
Due to Custodian | | | 33,854 | | | | 500,054 | | | | 7,790 | | | | 4,530 | |
Payable due to Investment Adviser | | | 21,726 | | | | 2,327 | | | | 4,416 | | | | 1,184 | |
Overdraft of Foreign Currency* | | | — | | | | — | | | | — | | | | 6,093 | |
| | | | | | | | | | | | | | | | |
Total Liabilities | | | 55,580 | | | | 502,381 | | | | 12,206 | | | | 11,807 | |
| | | | | | | | | | | | | | | | |
Net Assets | | $ | 51,559,079 | | | $ | 3,830,073 | | | $ | 7,720,097 | | | $ | 2,486,539 | |
| | | | | | | | | | | | | | | | |
*Proceeds of Foreign Currency | | $ | — | | | $ | — | | | $ | — | | | $ | 5,744 | |
| | | | | | | | | | | | | | | | |
Net Assets Consist of: | | | | | | | | | | | | | | | | |
Paid-in Capital | | $ | 45,993,000 | | | $ | 3,761,000 | | | $ | 7,298,000 | | | $ | 2,317,500 | |
Undistributed Net Investment Income | | | 477,570 | | | | 28,660 | | | | 31,097 | | | | 12,090 | |
Accumulated Net Realized Loss on Investments and Foreign Currency Translations | | | (60,532 | ) | | | (9,664 | ) | | | (5,095 | ) | | | (849 | ) |
Net Unrealized Appreciation on Investments | | | 5,144,637 | | | | 50,077 | | | | 396,033 | | | | 157,989 | |
Net Unrealized Appreciation (Depreciation) on Foreign Currency Translations | | | 4,404 | | | | — | | | | 62 | | | | (191 | ) |
| | | | | | | | | | | | | | | | |
Net Assets | | $ | 51,559,079 | | | $ | 3,830,073 | | | $ | 7,720,097 | | | $ | 2,486,539 | |
| | | | | | | | | | | | | | | | |
Outstanding Shares of Beneficial Interest (unlimited authorization — no par value) | | | 2,900,000 | | | | 250,000 | | | | 500,000 | | | | 150,000 | |
| | | | | | | | | | | | | | | | |
Net Asset Value, Offering and Redemption Price Per Share | | $ | 17.78 | | | $ | 15.32 | | | $ | 15.44 | | | $ | 16.58 | |
| | | | | | | | | | | | | | | | |
The accompanying notes are an integral part of the financial statements.
74
STATEMENTSOF ASSETSAND LIABILITIES
April 30, 2011 (Unaudited)
| | | | | | | | | | | | | | | | |
| | | Global X China
Consumer ETF | | | Global X China
Energy ETF | | | Global X China
Financials ETF | | | Global X China
Industrials ETF | |
Assets: | | | | | | | | | | | | | | | | |
Cost of Investments | | $ | 191,687,324 | | | $ | 9,456,385 | | | $ | 8,101,835 | | | $ | 8,649,197 | |
Cost of Foreign Currency | | | 97,547 | | | | — | | | | 15,740 | | | | 2,606 | |
| | | | | | | | | | | | | | | | |
Investments at Value | | $ | 189,917,276 | | | $ | 10,488,854 | | | $ | 7,648,628 | | | $ | 8,529,058 | |
Foreign Currency at Value | | | 98,288 | | | | — | | | | 15,761 | | | | 2,613 | |
Receivable for Investment Securities Sold | | | 14,703,161 | | | | 864,275 | | | | 458,024 | | | | 577,093 | |
Receivable for Capital Shares Sold | | | 9,174,000 | | | | 876,500 | | | | 695,000 | | | | 839,000 | |
Dividend and Interest Receivable | | | 502,520 | | | | 60,335 | | | | 30,382 | | | | 50,160 | |
| | | | | | | | | | | | | | | | |
Total Assets | | | 214,395,245 | | | | 12,289,964 | | | | 8,847,795 | | | | 9,997,924 | |
| | | | | | | | | | | | | | | | |
Liabilities: | | | | | | | | | | | | | | | | |
Payable for Investment Securities Purchased | | | 18,709,473 | | | | 866,706 | | | | 473,540 | | | | 744,744 | |
Payable for Capital Shares Redeemed | | | 5,478,000 | | | | 876,500 | | | | 695,000 | | | | 839,000 | |
Due to Custodian | | | 193,537 | | | | 22,551 | | | | 27,494 | | | | 17,963 | |
Payable due to Investment Adviser | | | 96,844 | | | | 5,628 | | | | 4,197 | | | | 4,488 | |
| | | | | | | | | | | | | | | | |
Total Liabilities | | | 24,477,854 | | | | 1,771,385 | | | | 1,200,231 | | | | 1,606,195 | |
| | | | | | | | | | | | | | | | |
Net Assets | | $ | 189,917,391 | | | $ | 10,518,579 | | | $ | 7,647,564 | | | $ | 8,391,729 | |
| | | | | | | | | | | | | | | | |
Net Assets Consist of: | | | | | | | | | | | | | | | | |
Paid-in Capital | | $ | 187,928,500 | | | $ | 9,260,500 | | | $ | 9,944,379 | | | $ | 8,257,721 | |
Undistributed (Distributions in Excess of) Net Investment Income | | | (1,108,113 | ) | | | 29,186 | | | | (58,642 | ) | | | 18,117 | |
Accumulated Net Realized Gain (Loss) on Investments and Foreign Currency Translations | | | 4,865,672 | | | | 196,391 | | | | (1,785,004 | ) | | | 236,000 | |
Net Unrealized Appreciation (Depreciation) on Investments | | | (1,770,048 | ) | | | 1,032,469 | | | | (453,207 | ) | | | (120,139 | ) |
Net Unrealized Appreciation on Foreign Currency Translations | | | 1,380 | | | | 33 | | | | 38 | | | | 30 | |
| | | | | | | | | | | | | | | | |
Net Assets | | $ | 189,917,391 | | | $ | 10,518,579 | | | $ | 7,647,564 | | | $ | 8,391,729 | |
| | | | | | | | | | | | | | | | |
Outstanding Shares of Beneficial Interest
(unlimited authorization — no par value) | | | 10,400,000 | | | | 600,000 | | | | 550,000 | | | | 500,000 | |
| | | | | | | | | | | | | | | | |
Net Asset Value, Offering and Redemption Price Per Share | | $ | 18.26 | | | $ | 17.53 | | | $ | 13.90 | | | $ | 16.78 | |
| | | | | | | | | | | | | | | | |
The accompanying notes are an integral part of the financial statements.
75
STATEMENTSOF ASSETSAND LIABILITIES
April 30, 2011 (Unaudited)
| | | | | | | | | | | | | | | | |
| | | Global X China
Technology ETF | | | Global X China
Materials ETF | | | Global X Russell
Emerging Markets
Growth ETF | | | Global X Russell
Emerging Markets
Value ETF | |
Assets: | | | | | | | | | | | | | | | | |
Cost of Investments | | $ | 5,000,518 | | | $ | 6,598,917 | | | $ | 2,518,379 | | | $ | 2,511,239 | |
Cost of Foreign Currency | | | — | | | | 26,324 | | | | 32,154 | | | | 45,606 | |
| | | | | | | | | | | | | | | | |
Investments at Value | | $ | 5,839,097 | | | $ | 6,408,913 | | | $ | 2,626,455 | | | $ | 2,705,519 | |
Foreign Currency at Value | | | — | | | | 26,343 | | | | 32,884 | | | | 46,677 | |
Receivable for Capital Shares Sold | | | 977,000 | | | | 713,000 | | | | — | | | | — | |
Receivable for Investment Securities Sold | | | 657,939 | | | | 820,141 | | | | — | | | | — | |
Dividend and Interest Receivable | | | 8,551 | | | | 35,677 | | | | 5,622 | | | | 4,459 | |
| | | | | | | | | | | | | | | | |
Total Assets | | | 7,482,587 | | | | 8,004,074 | | | | 2,664,961 | | | | 2,756,655 | |
| | | | | | | | | | | | | | | | |
Liabilities: | | | | | | | | | | | | | | | | |
Payable for Investment Securities Purchased | | | 638,821 | | | | 859,507 | | | | — | | | | — | |
Payable for Capital Shares Redeemed | | | 977,000 | | | | 713,000 | | | | — | | | | — | |
Payable due to Investment Adviser | | | 3,071 | | | | 3,984 | | | | 1,479 | | | | 1,524 | |
Due to Custodian | | | 2,941 | | | | 12,941 | | | | 37,136 | | | | 61,048 | |
| | | | | | | | | | | | | | | | |
Total Liabilities | | | 1,621,833 | | | | 1,589,432 | | | | 38,615 | | | | 62,572 | |
| | | | | | | | | | | | | | | | |
Net Assets | | $ | 5,860,754 | | | $ | 6,414,642 | | | $ | 2,626,346 | | | $ | 2,694,083 | |
| | | | | | | | | | | | | | | | |
Net Assets Consist of: | | | | | | | | | | | | | | | | |
Paid-in Capital | | $ | 4,642,000 | | | $ | (5,186,500 | ) | | $ | 2,511,000 | | | $ | 2,498,000 | |
Undistributed (Distributions in Excess of) Net Investment Income | | | (46 | ) | | | (307,096 | ) | | | 8,952 | | | | 2,318 | |
Accumulated Net Realized Gain (Loss) on Investments and Foreign Currency Translations | | | 380,210 | | | | 12,098,208 | | | | (2,443 | ) | | | (1,596 | ) |
Net Unrealized Appreciation (Depreciation) on Investments | | | 838,579 | | | | (190,004 | ) | | | 108,076 | | | | 194,280 | |
Net Unrealized Appreciation on Foreign Currency Translations | | | 11 | | | | 34 | | | | 761 | | | | 1,081 | |
| | | | | | | | | | | | | | | | |
Net Assets | | $ | 5,860,754 | | | $ | 6,414,642 | | | $ | 2,626,346 | | | $ | 2,694,083 | |
| | | | | | | | | | | | | | | | |
Outstanding Shares of Beneficial Interest (unlimited authorization — no par value) | | | 300,000 | | | | 450,000 | | | | 100,000 | | | | 100,000 | |
| | | | | | | | | | | | | | | | |
Net Asset Value, Offering and Redemption Price Per Share | | $ | 19.54 | | | $ | 14.25 | | | $ | 26.26 | | | $ | 26.94 | |
| | | | | | | | | | | | | | | | |
The accompanying notes are an integral part of the financial statements.
76
STATEMENTSOF ASSETSAND LIABILITIES
April 30, 2011 (Unaudited)
| | | | | | | | | | | | |
| | | Global X S&P/TSX
Venture 30 Canada
ETF | | | Global X Oil
Equities ETF | | | Global X Waste
Management ETF | |
Assets: | | | | | | | | | | | | |
Cost of Investments | | $ | 4,690,211 | | | $ | 3,853,036 | | | $ | 3,218,474 | |
Cost of Foreign Currency | | | — | | | | 756 | | | | — | |
| | | | | | | | | | | | |
Investments at Value | | $ | 4,817,099 | | | $ | 3,953,747 | | | $ | 3,299,666 | |
Cash | | | — | | | | 488 | | | | — | |
Foreign Currency at Value | | | — | | | | 768 | | | | — | |
Dividend and Interest Receivable | | | — | | | | 971 | | | | 892 | |
| | | | | | | | | | | | |
Total Assets | | | 4,817,099 | | | | 3,955,974 | | | | 3,300,558 | |
| | | | | | | | | | | | |
Liabilities: | | | | | | | | | | | | |
Payable due to Investment Adviser | | | 2,577 | | | | 1,585 | | | | 708 | |
Due to Custodian | | | 700,411 | | | | — | | | | 250,159 | |
| | | | | | | | | | | | |
Total Liabilities | | | 702,988 | | | | 1,585 | | | | 250,867 | |
| | | | | | | | | | | | |
Net Assets | | $ | 4,114,111 | | | $ | 3,954,389 | | | $ | 3,049,691 | |
| | | | | | | | | | | | |
Net Assets Consist of: | | | | | | | | | | | | |
Paid-in Capital | | $ | 4,000,000 | | | $ | 3,854,000 | | | $ | 2,968,000 | |
Undistributed Net Investment Income/Accumulated Net Investment Loss | | | (3,387 | ) | | | (349 | ) | | | 469 | |
Accumulated Net Realized Gain (Loss) on Investments and Foreign Currency Translations | | | (9,390 | ) | | | 13 | | | | 30 | |
Net Unrealized Appreciation on Investments | | | 126,888 | | | | 100,711 | | | | 81,192 | |
Net Unrealized Appreciation on Foreign Currency Translations | | | — | | | | 14 | | | | — | |
| | | | | | | | | | | | |
Net Assets | | $ | 4,114,111 | | | $ | 3,954,389 | | | $ | 3,049,691 | |
| | | | | | | | | | | | |
Outstanding Shares of Beneficial Interest
(unlimited authorization — no par value) | | | 250,000 | | | | 250,000 | | | | 200,000 | |
| | | | | | | | | | | | |
Net Asset Value, Offering and Redemption Price Per Share | | $ | 16.46 | | | $ | 15.82 | | | $ | 15.25 | |
| | | | | | | | | | | | |
The accompanying notes are an integral part of the financial statements.
77
STATEMENTSOF OPERATIONS
For the period ended April 30, 2011 (Unaudited)
| | | | | | | | | | | | | | | | | | | | |
| | | Global X Silver
Miners ETF | | | Global X
Lithium ETF | | | Global X
Copper Miners
ETF | | | Global X
Pure Gold
Miners
ETF(1) | | | Global X
Uranium ETF(2) | |
Investment Income: | | | | | | | | | | | | | | | | | | | | |
Dividend Income | | $ | 2,255,927 | | | $ | 373,628 | | | $ | 501,573 | | | $ | 2,246 | | | $ | 2,671,161 | |
Interest Income | | | 208 | | | | 177 | | | | 27 | | | | — | | | | 252 | |
Security Lending Income | | | — | | | | — | | | | — | | | | — | | | | 282,315 | |
Less: Foreign Taxes Withheld | | | (127,998 | ) | | | (41,024 | ) | | | (24,642 | ) | | | (287 | ) | | | (46,600 | ) |
| | | | | | | | | | | | | | | | | | | | |
Total Investment Income | | | 2,128,137 | | | | 332,781 | | | | 476,958 | | | | 1,959 | | | | 2,907,128 | |
| | | | | | | | | | | | | | | | | | | | |
Supervision and Administration Fees(3) | | | 1,336,634 | | | | 571,301 | | | | 278,518 | | | | 2,195 | | | | 564,188 | |
| | | | | | | | | | | | | | | | | | | | |
Total Expenses | | | 1,336,634 | | | | 571,301 | | | | 278,518 | | | | 2,195 | | | | 564,188 | |
| | | | | | | | | | | | | | | | | | | | |
Net Investment Income (Loss) | | | 791,503 | | | | (238,520 | ) | | | 198,440 | | | | (236 | ) | | | 2,342,940 | |
| | | | | | | | | | | | | | | | | | | | |
Net Realized Gain (Loss) on: | | | | | | | | | | | | | | | | | | | | |
Investments | | | 11,569,265 | (4) | | | 3,815,716 | (4) | | | 293,635 | (4) | | | — | | | | 4,102,824 | (4) |
Foreign Currency Transactions | | | (11,112 | ) | | | (168,080 | ) | | | 5,976 | | | | 4 | | | | (110,343 | ) |
| | | | | | | | | | | | | | | | | | | | |
Net Realized Gain on Investments | | | 11,558,153 | | | | 3,647,636 | | | | 299,611 | | | | 4 | | | | 3,992,481 | |
| | | | | | | | | | | | | | | | | | | | |
Net Change in Unrealized Appreciation (Depreciation) on: | | | | | | | | | | | | | | | | | | | | |
Investments | | | 97,399,130 | | | | 12,019,561 | | | | 9,869,060 | | | | 240,025 | | | | (64,903,968 | ) |
Foreign Currency Transactions | | | (68,289 | ) | | | (1,562 | ) | | | 15,317 | | | | 16 | | | | 331 | |
| | | | | | | | | | | | | | | | | | | | |
Net Change in Unrealized Appreciation (Depreciation) on Investments | | | 97,330,841 | | | | 12,017,999 | | | | 9,884,377 | | | | 240,041 | | | | (64,903,637 | ) |
| | | | | | | | | | | | | | | | | | | | |
Net Realized and Unrealized Gain (Loss) on Investments | | | 108,888,994 | | | | 15,665,635 | | | | 10,183,988 | | | | 240,045 | | | | (60,911,156 | ) |
| | | | | | | | | | | | | | | | | | | | |
Net Increase (Decrease) in Net Assets Resulting from Operations | | $ | 109,680,497 | | | $ | 15,427,115 | | | $ | 10,382,428 | | | $ | 239,809 | | | $ | (58,568,216 | ) |
| | | | | | | | | | | | | | | | | | | | |
| (1) | The Fund commenced operations on March 14, 2011. |
| (2) | The Fund commenced operations on November 4, 2010. |
| (3) | The Supervision and Administration fees reflect the supervisory and administrative fee, which includes fees paid by the Funds for the investment advisory services provided by the Adviser (See Note 3 in Notes to Financial Statements.). |
| (4) | Includes realized gains as a result of in-kind transactions (See Note 4 in Notes to Financial Statements). |
The accompanying notes are an integral part of the financial statements.
78
STATEMENTSOF OPERATIONS
For the period ended April 30, 2011 (Unaudited)
| | | | | | | | | | | | | | | | | | | | |
| | | Global X
Aluminum
ETF(1) | | | Global X Gold
Explorers
ETF(2) | | | Global X
Brazil Mid
Cap ETF | | | Global X
Brazil
Financials
ETF | | | Global X
Brazil
Consumer
ETF | |
Investment Income: | | | | | | | | | | | | | | | | | | | | |
Dividend Income | | $ | 22,273 | | | $ | — | | | $ | 568,860 | | | $ | 181,847 | | | $ | 357,765 | |
Interest Income | | | 7 | | | | 58 | | | | 6 | | | | 1 | | | | 8 | |
Less: Foreign Taxes Withheld | | | (1,248 | ) | | | — | | | | (56,405 | ) | | | (21,215 | ) | | | (21,814 | ) |
| | | | | | | | | | | | | | | | | | | | |
Total Investment Income | | | 21,032 | | | | 58 | | | | 512,461 | | | | 160,633 | | | | 335,959 | |
| | | | | | | | | | | | | | | | | | | | |
Supervision and Administration Fees(3) | | | 9,795 | | | | 66,772 | | | | 107,793 | | | | 34,390 | | | | 123,926 | |
| | | | | | | | | | | | | | | | | | | | |
Total Expenses | | | 9,795 | | | | 66,772 | | | | 107,793 | | | | 34,390 | | | | 123,926 | |
| | | | | | | | | | | | | | | | | | | | |
Net Investment Income (Loss) | | | 11,237 | | | | (66,714 | ) | | | 404,668 | | | | 126,243 | | | | 212,033 | |
| | | | | | | | | | | | | | | | | | | | |
Net Realized Gain (Loss) on: | | | | | | | | | | | | | | | | | | | | |
Investments | | | (7 | ) | | | 670,410 | (4) | | | (388,355 | )(4) | | | (3,077 | ) | | | (293,699 | )(4) |
Foreign Currency Transactions | | | 1,764 | | | | (30,466 | ) | | | 5,886 | | | | 7,526 | | | | 4,693 | |
| | | | | | | | | | | | | | | | | | | | |
Net Realized Gain (Loss) on Investments | | | 1,757 | | | | 639,944 | | | | (382,469 | ) | | | 4,449 | | | | (289,006 | ) |
| | | | | | | | | | | | | | | | | | | | |
Net Change in Unrealized Appreciation (Depreciation) on: | | | | | | | | | | | | | | | | | | | | |
Investments | | | 131,339 | | | | 1,657,451 | | | | 1,327,995 | | | | 35,864 | | | | 222,156 | |
Foreign Currency Transactions | | | (2,686 | ) | | | 3 | | | | 5,018 | | | | 3,352 | | | | 5,178 | |
| | | | | | | | | | | | | | | | | | | | |
Net Change in Unrealized Appreciation on Investments | | | 128,653 | | | | 1,657,454 | | | | 1,333,013 | | | | 39,216 | | | | 227,334 | |
| | | | | | | | | | | | | | | | | | | | |
Net Realized and Unrealized Gain (Loss) on Investments | | | 130,410 | | | | 2,297,398 | | | | 950,544 | | | | 43,665 | | | | (61,672 | ) |
| | | | | | | | | | | | | | | | | | | | |
Net Increase in Net Assets Resulting from Operations | | $ | 141,647 | | | $ | 2,230,684 | | | $ | 1,355,212 | | | $ | 169,908 | | | $ | 150,361 | |
| | | | | | | | | | | | | | | | | | | | |
| (1) | The Fund commenced operations on January 4, 2011. |
| (2) | The Fund commenced operations on November 3, 2010. |
| (3) | The Supervision and Administration fees reflect the supervisory and administrative fee, which includes fees paid by the Funds for the investment advisory services provided by the Adviser. (See Note 3 in Notes to Financial Statements.) |
| (4) | Includes realized gains as a result of in-kind transactions (See Note 4 in Notes to Financial Statements). |
The accompanying notes are an integral part of the financial statements.
79
STATEMENTSOF OPERATIONS
For the period ended April 30, 2011 (Unaudited)
| | | | | | | | | | | | | | | | | | | | |
| | | Global X FTSE
Colombia 20
ETF | | | Global X
FTSE Nordic
Region ETF | | | Global X
FTSE
Norway 30
ETF(1) | | | Global X
FTSE
Argentina 20
ETF(2) | | | Global X
FTSE
Andean 40
ETF(3) | |
Investment Income: | | | | | | | | | | | | | | | | | | | | |
Dividend Income | | $ | 1,579,981 | | | $ | 725,897 | | | $ | 705,805 | | | $ | 33,038 | | | $ | 48,021 | |
Interest Income | | | 118 | | | | — | | | | 33 | | | | 2 | | | | 1 | |
Less: Foreign Taxes Withheld | | | (95,028 | ) | | | (120,390 | ) | | | (164,685 | ) | | | (87 | ) | | | (6,914 | ) |
| | | | | | | | | | | | | | | | | | | | |
Total Investment Income | | | 1,485,071 | | | | 605,507 | | | | 541,153 | | | | 32,953 | | | | 41,108 | |
| | | | | | | | | | | | | | | | | | | | |
Supervision and Administration Fees(4) | | | 537,656 | | | | 56,593 | | | | 56,600 | | | | 4,236 | | | | 10,011 | |
Custodian Fees | | | 135,382 | | | | — | | | | — | | | | 57 | | | | — | |
| | | | | | | | | | | | | | | | | | | | |
Total Expenses | | | 673,038 | | | | 56,593 | | | | 56,600 | | | | 4,293 | | | | 10,011 | |
| | | | | | | | | | | | | | | | | | | | |
Waiver of Supervision and Administration Fees | | | (9,986 | ) | | | — | | | | — | | | | — | | | | — | |
| | | | | | | | | | | | | | | | | | | | |
Net Expenses | | | 663,052 | | | | 56,593 | | | | 56,600 | | | | 4,293 | | | | 10,011 | |
| | | | | | | | | | | | | | | | | | | | |
Net Investment Income | | | 822,019 | | | | 548,914 | | | | 484,553 | | | | 28,660 | | | | 31,097 | |
| | | | | | | | | | | | | | | | | | | | |
Net Realized Gain (Loss) on: | | | | | | | | | | | | | | | | | | | | |
Investments | | | (157,228 | )(5) | | | (10,905 | )(5) | | | (57,059 | )(5) | | | (10,221 | ) | | | (15,789 | ) |
Foreign Currency Transactions | | | (33,646 | ) | | | 15,293 | | | | (3,473 | ) | | | 557 | | | | 10,694 | |
| | | | | | | | | | | | | | | | | | | | |
Net Realized Gain (Loss) on Investments | | | (190,874 | ) | | | 4,388 | | | | (60,532 | ) | | | (9,664 | ) | | | (5,095 | ) |
| | | | | | | | | | | | | | | | | | | | |
Net Change in Unrealized Appreciation (Depreciation) on: | | | | | | | | | | | | | | | | | | | | |
Investments | | | (16,156,054 | ) | | | 4,320,025 | | | | 5,144,637 | | | | 50,077 | | | | 396,033 | |
Foreign Currency Transactions | | | 7,411 | | | | 317 | | | | 4,404 | | | | — | | | | 62 | |
| | | | | | | | | | | | | | | | | | | | |
Net Change in Unrealized Appreciation (Depreciation) on Investments | | | (16,148,643 | ) | | | 4,320,342 | | | | 5,149,041 | | | | 50,077 | | | | 396,095 | |
| | | | | | | | | | | | | | | | | | | | |
Net Realized and Unrealized Gain (Loss) on Investments | | | (16,339,517 | ) | | | 4,324,730 | | | | 5,088,509 | | | | 40,413 | | | | 391,000 | |
| | | | | | | | | | | | | | | | | | | | |
Net Increase (Decrease) in Net Assets Resulting from Operations | | $ | (15,517,498 | ) | | $ | 4,873,644 | | | $ | 5,573,062 | | | $ | 69,073 | | | $ | 422,097 | |
| | | | | | | | | | | | | | | | | | | | |
| (1) | The Fund commenced operations on November 9, 2010. |
| (2) | The Fund commenced operations on March 2, 2011. |
| (3) | The Fund commenced operations on February 2, 2011. |
| (4) | The Supervision and Administration fees reflect the supervisory and administrative fee, which includes fees paid by the Funds for the investment advisory services provided by the Adviser. (See Note 3 in Notes to Financial Statements.) |
| (5) | Includes realized gains as a result of in-kind transactions (See Note 4 in Notes to Financial Statements). |
The accompanying notes are an integral part of the financial statements.
80
STATEMENTSOF OPERATIONS
For the period ended April 30, 2011 (Unaudited)
| | | | | | | | | | | | | | | | | | | | |
| | | Global X
FTSE
ASEAN 40
ETF(1) | | | Global X China
Consumer ETF | | | Global X
China Energy
ETF | | | Global X
China
Financials ETF | | | Global X
China
Industrials
ETF | |
Investment Income: | | | | | | | | | | | | | | | | | | | | |
Dividend Income | | $ | 14,952 | | | $ | 675,001 | | | $ | 59,800 | | | $ | 29,606 | | | $ | 52,753 | |
Interest Income | | | 1 | | | | 216 | | | | — | | | | 3 | | | | — | |
Less: Foreign Taxes Withheld | | | (540 | ) | | | (4,418 | ) | | | (683 | ) | | | (459 | ) | | | (1,787 | ) |
| | | | | | | | | | | | | | | | | | | | |
Total Investment Income | | | 14,413 | | | | 670,799 | | | | 59,117 | | | | 29,150 | | | | 50,966 | |
| | | | | | | | | | | | | | | | | | | | |
Supervision and Administration Fees(2) | | | 2,323 | | | | 558,084 | | | | 26,497 | | | | 87,790 | | | | 32,847 | |
| | | | | | | | | | | | | | | | | | | | |
Total Expenses | | | 2,323 | | | | 558,084 | | | | 26,497 | | | | 87,790 | | | | 32,847 | |
| | | | | | | | | | | | | | | | | | | | |
Net Investment Income (Loss) | | | 12,090 | | | | 112,715 | | | | 32,620 | | | | (58,640 | ) | | | 18,119 | |
| | | | | | | | | | | | | | | | | | | | |
Net Realized Gain (Loss) on: | | | | | | | | | | | | | | | | | | | | |
Investments | | | (148 | ) | | | 5,119,246 | (3) | | | 251,315 | (3) | | | (393,207 | )(3) | | | 456,436 | (3) |
Foreign Currency Transactions | | | (701 | ) | | | 11,527 | | | | (49 | ) | | | 955 | | | | (316 | ) |
| | | | | | | | | | | | | | | | | | | | |
Net Realized Gain (Loss) on Investments | | | (849 | ) | | | 5,130,773 | | | | 251,266 | | | | (392,252 | ) | | | 456,120 | |
| | | | | | | | | | | | | | | | | | | | |
Net Change in Unrealized Appreciation (Depreciation) on: | | | | | | | | | | | | | | | | | | | | |
Investments | | | 157,989 | | | | (23,005,438 | ) | | | 818,334 | | | | (3,460,041 | ) | | | (659,769 | ) |
Foreign Currency Transactions | | | (191 | ) | | | 807 | | | | 36 | | | | (99 | ) | | | (680 | ) |
| | | | | | | | | | | | | | | | | | | | |
Net Change in Unrealized Appreciation (Depreciation) on Investments | | | 157,798 | | | | (23,004,631 | ) | | | 818,370 | | | | (3,460,140 | ) | | | (660,449 | ) |
| | | | | | | | | | | | | | | | | | | | |
Net Realized and Unrealized Gain (Loss) on Investments | | | 156,949 | | | | (17,873,858 | ) | | | 1,069,636 | | | | (3,852,392 | ) | | | (204,329 | ) |
| | | | | | | | | | | | | | | | | | | | |
Net Increase (Decrease) in Net Assets Resulting from Operations | | $ | 169,039 | | | $ | (17,761,143 | ) | | $ | 1,102,256 | | | $ | (3,911,032 | ) | | $ | (186,210 | ) |
| | | | | | | | | | | | | | | | | | | | |
| (1) | The Fund commenced operations on February 16, 2011. |
| (2) | The Supervision and Administration fees reflect the supervisory and administrative fee, which includes fees paid by the Funds for the investment advisory services provided by the Adviser. (See Note 3 in Notes to Financial Statements.) |
| (3) | Includes realized gains as a result of in-kind transactions. (See Note 4 in Notes to Financial Statements) |
The accompanying notes are an integral part of the financial statements.
81
STATEMENTSOF OPERATIONS
For the period ended April 30, 2011 (Unaudited)
| | | | | | | | | | | | | | | | | | | | |
| | | Global X
China
Technology
ETF | | | Global X China
Materials ETF | | | Global X
Russell
Emerging
Markets
Growth
ETF(1) | | | Global X
Russell
Emerging
Markets
Value
ETF(1) | | | Global X
S&P/TSX
Venture
30 Canada
ETF(2) | |
Investment Income: | | | | | | | | | | | | | | | | | | | | |
Dividend Income | | $ | 17,540 | | | $ | 64,780 | | | $ | 14,445 | | | $ | 7,888 | | | $ | — | |
Interest Income | | | 2 | | | | — | | | | — | | | | — | | | | — | |
Less: Foreign Taxes Withheld | | | (595 | ) | | | (2,857 | ) | | | (994 | ) | | | (933 | ) | | | — | |
| | | | | | | | | | | | | | | | | | | | |
Total Investment Income | | | 16,947 | | | | 61,923 | | | | 13,451 | | | | 6,955 | | | | — | |
| | | | | | | | | | | | | | | | | | | | |
Supervision and Administration Fees(3) | | | 16,993 | | | | 77,565 | | | | 4,499 | | | | 4,637 | | | | 3,387 | |
| | | | | | | | | | | | | | | | | | | | |
Total Expenses | | | 16,993 | | | | 77,565 | | | | 4,499 | | | | 4,637 | | | | 3,387 | |
| | | | | | | | | | | | | | | | | | | | |
Net Investment Income (Loss) | | | (46 | ) | | | (15,642 | ) | | | 8,952 | | | | 2,318 | | | | (3,387 | ) |
| | | | | | | | | | | | | | | | | | | | |
Net Realized Gain (Loss) on: | | | | | | | | | | | | | | | | | | | | |
Investments | | | 380,058 | (4) | | | 12,117,281 | (4) | | | (1,825 | ) | | | (1,463 | ) | | | (9,390 | )(4) |
Foreign Currency Transactions | | | 153 | | | | (3,456 | ) | | | (618 | ) | | | (133 | ) | | | — | |
| | | | | | | | | | | | | | | | | | | | |
Net Realized Gain (Loss) on Investments | | | 380,211 | | | | 12,113,825 | | | | (2,443 | ) | | | (1,596 | ) | | | (9,390 | ) |
| | | | | | | | | | | | | | | | | | | | |
Net Change in Unrealized Appreciation (Depreciation) on: | | | | | | | | | | | | | | | | | | | | |
Investments | | | 344,715 | | | | (11,101,595 | ) | | | 108,076 | | | | 194,280 | | | | 126,888 | |
Foreign Currency Transactions | | | (26 | ) | | | (40 | ) | | | 761 | | | | 1,081 | | | | — | |
| | | | | | | | | | | | | | | | | | | | |
Net Change in Unrealized Appreciation (Depreciation) on Investments | | | 344,689 | | | | (11,101,635 | ) | | | 108,837 | | | | 195,361 | | | | 126,888 | |
| | | | | | | | | | | | | | | | | | | | |
Net Realized and Unrealized Gain on Investments | | | 724,900 | | | | 1,012,190 | | | | 106,394 | | | | 193,765 | | | | 117,498 | |
| | | | | | | | | | | | | | | | | | | | |
Net Increase in Net Assets Resulting from Operations | | $ | 724,854 | | | $ | 996,548 | | | $ | 115,346 | | | $ | 196,083 | | | $ | 114,111 | |
| | | | | | | | | | | | | | | | | | | | |
| (1) | The Fund commenced operations on January 24, 2011. |
| (2) | The Fund commenced operations on March 16, 2011. |
| (3) | The Supervision and Administration fees reflect the supervisory and administrative fee, which includes fees paid by the Funds for the investment advisory services provided by the Adviser. (See Note 3 in Notes to Financial Statements.) |
| (4) | Includes realized gains as a result of in-kind transactions. (See Note 4 in Notes to Financial Statements) |
The accompanying notes are an integral part of the financial statements.
82
STATEMENTSOF OPERATIONS
For the period ended April 30, 2011 (Unaudited)
| | | | | | | | |
| | | Global X Oil
Equities
ETF(1) | | | Global X
Waste
Management
ETF(2) | |
Investment Income: | | | | | | | | |
Dividend Income | | $ | 2,023 | | | $ | 1,474 | |
Less: Foreign Taxes Withheld | | | (248 | ) | | | (297 | ) |
| | | | | | | | |
Total Investment Income | | | 1,775 | | | | 1,177 | |
| | | | | | | | |
Supervision and Administration Fees(3) | | | 2,124 | | | | 708 | |
| | | | | | | | |
Total Expenses | | | 2,124 | | | | 708 | |
| | | | | | | | |
Net Investment Income (Loss) | | | (349 | ) | | | 469 | |
| | | | | | | | |
Net Realized Gain on: | | | | | | | | |
Foreign Currency Transactions | | | 13 | | | | 30 | |
| | | | | | | | |
Net Realized Gain on Investments | | | 13 | | | | 30 | |
| | | | | | | | |
Net Change in Unrealized Appreciation on: | | | | | | | | |
Investments | | | 100,711 | | | | 81,192 | |
Foreign Currency Transactions | | | 14 | | | | — | |
| | | | | | | | |
Net Change in Unrealized Appreciation on Investments | | | 100,725 | | | | 81,192 | |
| | | | | | | | |
Net Realized and Unrealized Gain on Investments | | | 100,738 | | | | 81,222 | |
| | | | | | | | |
Net Increase in Net Assets Resulting from Operations | | $ | 100,389 | | | $ | 81,691 | |
| | | | | | | | |
| (1) | The Fund commenced operations on March 14, 2011. |
| (2) | The Fund commenced operations on April 12, 2011. |
| (3) | The Supervision and Administration fees reflect the supervisory and administrative fee, which includes fees paid by the Funds for the investment advisory services provided by the Adviser. (See Note 3 in Notes to Financial Statements.) |
The accompanying notes are an integral part of the financial statements.
83
STATEMENTSOF CHANGESIN NET ASSETS
| | | | | | | | | | | | | | | | |
| | | Global X Silver Miners ETF | | | Global X Lithium ETF | |
| | | Period
Ended April 30,
2011
(Unaudited) | | | Period Ended
October 31,
2010 (1)
(Audited) | | | Period
Ended April 30,
2011
(Unaudited) | | | Period Ended
October 31,
2010 (2)
(Audited) | |
Operations: | | | | | | | | | | | | | | | | |
Net Investment Income (Loss) | | $ | 791,503 | | | $ | 229,608 | | | $ | (238,520 | ) | | $ | (60,245 | ) |
Net Realized Gain on Investments and Foreign Currency Transactions | | | 11,558,153 | (3) | | | 276,359 | (3) | | | 3,647,636 | (3) | | | 114,188 | |
Net Change in Unrealized Appreciation on Investments and Foreign Currency Transactions | | | 97,330,841 | | | | 29,297,367 | | | | 12,017,999 | | | | 7,200,122 | |
| | | | | | | | | | | | | | | | |
Net Increase in Net Assets Resulting from Operations | | | 109,680,497 | | | | 29,803,334 | | | | 15,427,115 | | | | 7,254,065 | |
| | | | | | | | | | | | | | | | |
Dividends and Distributions: | | | | | | | | | | | | | | | | |
Net Investment Income | | | (3,208,369 | ) | | | — | | | | (1,533,030 | ) | | | — | |
Net Realized Gains | | | — | | | | — | | | | (105,325 | ) | | | — | |
| | | | | | | | | | | | | | | | |
Total Dividends and Distributions | | | (3,208,369 | ) | | | — | | | | (1,638,355 | ) | | | — | |
| | | | | | | | | | | | | | | | |
Capital Share Transactions: | | | | | | | | | | | | | | | | |
Issued | | | 407,021,000 | | | | 143,459,000 | | | | 116,051,500 | | | | 71,062,500 | |
Redeemed | | | (60,762,500 | ) | | | (1,590,500 | ) | | | (20,218,500 | ) | | | — | |
| | | | | | | | | | | | | | | | |
Increase in Net Assets from Capital Share Transactions | | | 346,258,500 | | | | 141,868,500 | | | | 95,833,000 | | | | 71,062,500 | |
| | | | | | | | | | | | | | | | |
Total Increase in Net Assets | | | 452,730,628 | | | | 171,671,834 | | | | 109,621,760 | | | | 78,316,565 | |
| | | | | | | | | | | | | | | | |
Net Assets: | | | | | | | | | | | | | | | | |
Beginning of Period | | | 171,671,834 | | | | — | | | | 78,316,565 | | | | — | |
| | | | | | | | | | | | | | | | |
End of Period | | $ | 624,402,462 | | | $ | 171,671,834 | | | $ | 187,938,325 | | | $ | 78,316,565 | |
| | | | | | | | | | | | | | | | |
Undistributed (Distributions in Excess of) Net Investment Income/Accumulated Net Investment Loss | | $ | (2,195,770 | ) | | $ | 221,096 | | | $ | (1,822,491 | ) | | $ | (50,941 | ) |
| | | | | | | | | | | | | | | | |
Share Transactions: | | | | | | | | | | | | | | | | |
Issued | | | 15,700,000 | | | | 8,600,000 | | | | 5,350,000 | | | | 3,950,000 | |
Redeemed | | | (2,250,000 | ) | | | (100,000 | ) | | | (950,000 | ) | | | — | |
| | | | | | | | | | | | | | | | |
Net Increase in Shares Outstanding from Share Transactions | | | 13,450,000 | | | | 8,500,000 | | | | 4,400,000 | | | | 3,950,000 | |
| | | | | | | | | | | | | | | | |
| (1) | The Fund commenced operations on April 19, 2010. |
| (2) | The Fund commenced operations on July 22, 2010. |
| (3) | Includes realized gains as a result of in-kind transactions. (See Note 4 in Notes to Financial Statements.) |
The accompanying notes are an integral part of the financial statements.
84
STATEMENTSOF CHANGESIN NET ASSETS
| | | | | | | | | | | | |
| | | Global X Copper Miners ETF | | | Global X Pure
Gold Miners
ETF | |
| | | Period
Ended April 30,
2011
(Unaudited) | | | Period Ended
October 31,
2010 (1)
(Audited) | | | Period Ended
April 30,
2011(2)
(Unaudited) | |
Operations: | | | | | | | | | | | | |
Net Investment Income (Loss) | | $ | 198,440 | | | $ | 1,341 | | | $ | (236 | ) |
Net Realized Gain (Loss) on Investments and Foreign Currency Transactions | | | 299,611 | (3) | | | (6,805 | ) | | | 4 | |
Net Change in Unrealized Appreciation on Investments and Foreign Currency Transactions | | | 9,884,377 | | | | 764,041 | | | | 240,041 | |
| | | | | | | | | | | | |
Net Increase in Net Assets Resulting from Operations | | | 10,382,428 | | | | 758,577 | | | | 239,809 | |
| | | | | | | | | | | | |
Dividends and Distributions: | | | | | | | | | | | | |
Net Investment Income | | | (388,853 | ) | | | — | | | | — | |
| | | | | | | | | | | | |
Total Dividends and Distributions | | | (388,853 | ) | | | — | | | | — | |
| | | | | | | | | | | | |
Capital Share Transactions: | | | | | | | | | | | | |
Issued | | | 103,667,500 | | | | 29,170,000 | | | | 3,053,000 | |
Redeemed | | | (37,710,500 | ) | | | — | | | | — | |
| | | | | | | | | | | | |
Increase in Net Assets from Capital Share Transactions | | | 65,957,000 | | | | 29,170,000 | | | | 3,053,000 | |
| | | | | | | | | | | | |
Total Increase in Net Assets | | | 75,950,575 | | | | 29,928,577 | | | | 3,292,809 | |
| | | | | | | | | | | | |
Net Assets: | | | | | | | | | | | | |
Beginning of Period | | | 29,928,577 | | | | — | | | | — | |
| | | | | | | | | | | | |
End of Period | | $ | 105,879,152 | | | $ | 29,928,577 | | | $ | 3,292,809 | |
| | | | | | | | | | | | |
Undistributed (Distributions in Excess of) Net Investment Income/Accumulated Net Investment Loss | | $ | (185,664 | ) | | $ | 4,749 | | | $ | (236 | ) |
| | | | | | | | | | | | |
Share Transactions: | | | | | | | | | | | | |
Issued | | | 5,400,000 | | | | 1,800,000 | | | | 200,000 | |
Redeemed | | | (2,000,000 | ) | | | — | | | | — | |
| | | | | | | | | | | | |
Net Increase in Shares Outstanding from Share Transactions | | | 3,400,000 | | | | 1,800,000 | | | | 200,000 | |
| | | | | | | | | | | | |
| (1) | The Fund commenced operations on April 19, 2010. |
| (2) | The Fund commenced operations on March 14, 2011. |
| (3) | Includes realized gains as a result of in-kind transactions. (See Note 4 in Notes to Financial Statements.) |
The accompanying notes are an integral part of the financial statements.
85
STATEMENTSOF CHANGESIN NET ASSETS
| | | | | | | | | | | | |
| | | Global X
Uranium ETF
Period
Ended
April 30, 2011(1)
(Unaudited) | | | Global X
Aluminum
ETF
Period Ended
April 30,
2011(2)
(Unaudited) | | | Global X Gold
Explorers ETF
Period Ended
April 30,
2011(3)
(Unaudited) | |
Operations: | | | | | | | | | | | | |
Net Investment Income (Loss) | | $ | 2,342,940 | | | $ | 11,237 | | | $ | (66,714 | ) |
Net Realized Gain on Investments and Foreign Currency Transactions | | | 3,992,481 | (4) | | | 1,757 | | | | 639,944 | (4) |
Net Change in Unrealized Appreciation (Depreciation) on Investments and Foreign Currency Transactions | | | (64,903,637 | ) | | | 128,653 | | | | 1,657,454 | |
| | | | | | | | | | | | |
Net Increase (Decrease) in Net Assets Resulting from Operations | | | (58,568,216 | ) | | | 141,647 | | | | 2,230,684 | |
| | | | | | | | | | | | |
Dividends and Distributions: | | | | | | | | | | | | |
Net Investment Income | | | (2,682,085 | ) | | | — | | | | — | |
| | | | | | | | | | | | |
Total Dividends and Distributions | | | (2,682,085 | ) | | | — | | | | — | |
| | | | | | | | | | | | |
Capital Share Transactions: | | | | | | | | | | | | |
Issued | | | 370,062,000 | | | | 5,360,000 | | | | 27,082,000 | |
Redeemed | | | (41,643,000 | ) | | | — | | | | (3,346,000 | ) |
| | | | | | | | | | | | |
Increase in Net Assets from Capital Share Transactions | | | 328,419,000 | | | | 5,360,000 | | | | 23,736,000 | |
| | | | | | | | | | | | |
Total Increase in Net Assets | | | 267,168,699 | | | | 5,501,647 | | | | 25,966,684 | |
| | | | | | | | | | | | |
Net Assets: | | | | | | | | | | | | |
Beginning of Period | | | — | | | | — | | | | — | |
| | | | | | | | | | | | |
End of Period | | $ | 267,168,699 | | | $ | 5,501,647 | | | $ | 25,966,684 | |
| | | | | | | | | | | | |
Undistributed (Distributions in Excess of) Net Investment Income/Accumulated Net Investment Loss | | $ | (339,145 | ) | | $ | 11,237 | | | $ | (66,714 | ) |
| | | | | | | | | | | | |
Share Transactions: | | | | | | | | | | | | |
Issued | | | 20,950,000 | | | | 350,000 | | | | 1,600,000 | |
Redeemed | | | (2,150,000 | ) | | | — | | | | (200,000 | ) |
| | | | | | | | | | | | |
Net Increase in Shares Outstanding from Share Transactions | | | 18,800,000 | | | | 350,000 | | | | 1,400,000 | |
| | | | | | | | | | | | |
| (1) | The Fund commenced operations on November 4, 2010. |
| (2) | The Fund commenced operations on January 4, 2011. |
| (3) | The Fund commenced operations on November 3, 2010. |
| (4) | Includes realized gains as a result of in-kind transactions. (See Note 4 in Notes to Financial Statements.) |
The accompanying notes are an integral part of the financial statements.
86
STATEMENTSOF CHANGESIN NET ASSETS
| | | | | | | | | | | | | | | | |
| | | Global X Brazil Mid Cap ETF | | | Global X Brazil Financials ETF | |
| | | Period
Ended April
30, 2011
(Unaudited) | | | Period Ended
October 31,
2010(1)
(Audited) | | | Period
Ended April
30, 2011
(Unaudited) | | | Year Ended
October 31,
2010(2)
(Audited) | |
Operations: | | | | | | | | | | | | | | | | |
Net Investment Income | | $ | 404,668 | | | $ | 60,548 | | | $ | 126,243 | | | $ | 12,403 | |
Net Realized Gain (Loss) on Investments and Foreign Currency Transactions | | | (382,469 | )(3) | | | 31,759 | | | | 4,449 | | | | 1,420 | |
Net Change in Unrealized Appreciation on Investments and Foreign Currency Transactions | | | 1,333,013 | | | | 2,594,314 | | | | 39,216 | | | | 495,514 | |
| | | | | | | | | | | | | | | | |
Net Increase in Net Assets Resulting from Operations | | | 1,355,212 | | | | 2,686,621 | | | | 169,908 | | | | 509,337 | |
| | | | | | | | | | | | | | | | |
Dividends and Distributions: | | | | | | | | | | | | | | | | |
Net Investment Income | | | (417,712 | ) | | | — | | | | (49,172 | ) | | | — | |
Net Realized Gains | | | (35,267 | ) | | | — | | | | — | | | | — | |
| | | | | | | | | | | | | | | | |
Total Dividends and Distributions | | | (452,979 | ) | | | — | | | | (49,172 | ) | | | — | |
| | | | | | | | | | | | | | | | |
Capital Share Transactions: | | | | | | | | | | | | | | | | |
Issued | | | 6,216,500 | | | | 26,555,500 | | | | 1,676,000 | | | | 7,320,000 | |
Redeemed | | | (3,400,000 | ) | | | — | | | | — | | | | — | |
| | | | | | | | | | | | | | | | |
Increase in Net Assets from Capital Share Transactions | | | 2,816,500 | | | | 26,555,500 | | | | 1,676,000 | | | | 7,320,000 | |
| | | | | | | | | | | | | | | | |
Total Increase in Net Assets | | | 3,718,733 | | | | 29,242,121 | | | | 1,796,736 | | | | 7,829,337 | |
| | | | | | | | | | | | | | | | |
Net Assets: | | | | | | | | | | | | | | | | |
Beginning of Period | | | 29,242,121 | | | | — | | | | 7,829,337 | | | | — | |
| | | | | | | | | | | | | | | | |
End of Period | | $ | 32,960,854 | | | $ | 29,242,121 | | | $ | 9,626,073 | | | $ | 7,829,337 | |
| | | | | | | | | | | | | | | | |
Undistributed Net Investment Income | | $ | 43,997 | | | $ | 57,041 | | | $ | 90,897 | | | $ | 13,826 | |
| | | | | | | | | | | | | | | | |
Share Transactions: | | | | | | | | | | | | | | | | |
Issued | | | 350,000 | | | | 1,600,000 | | | | 100,000 | | | | 450,000 | |
Redeemed | | | (200,000 | ) | | | — | | | | — | | | | — | |
| | | | | | | | | | | | | | | | |
Net Increase in Shares Outstanding from Share Transactions | | | 150,000 | | | | 1,600,000 | | | | 100,000 | | | | 450,000 | |
| | | | | | | | | | | | | | | | |
| (1) | The Fund commenced operations on June 21, 2010. |
| (2) | The Fund commenced operations on July 28, 2010. |
| (3) | Includes realized gains as a result of in-kind transactions. (See Note 4 in Notes to Financial Statements.) |
The accompanying notes are an integral part of the financial statements.
87
STATEMENTSOF CHANGESIN NET ASSETS
| | | | | | | | | | | | | | | | |
| | | Global X Brazil Consumer ETF | | | Global X FTSE Colombia 20 ETF | |
| | | Period Ended
April 30,
2011
(Unaudited) | | | Period Ended
October 31,
2010(1)
(Audited) | | | Period Ended
April 30,
2011
(Unaudited) | | | Year Ended
October 31,
2010
(Audited) | |
Operations: | | | | | | | | | | | | | | | | |
Net Investment Income | | $ | 212,033 | | | $ | 3,140 | | | $ | 822,019 | | | $ | 248,896 | |
Net Realized Gain (Loss) on Investments and Foreign Currency Transactions | | | (289,006 | ) | | | 23,620 | | | | (190,874 | ) | | | 148,195 | |
Net Change in Unrealized Appreciation (Depreciation) on Investments and Foreign Currency Transactions | | | 227,334 | | | | 2,311,009 | | | | (16,148,643 | ) | | | 20,392,508 | |
| | | | | | | | | | | | | | | | |
Net Increase (Decrease) in Net Assets Resulting from Operations | | | 150,361 | | | | 2,337,769 | | | | (15,517,498 | ) | | | 20,789,599 | |
| | | | | | | | | | | | | | | | |
Dividends and Distributions: | | | | | | | | | | | | | | | | |
Net Investment Income | | | (34,887 | )(2) | | | — | | | | (1,100,700 | )(2) | | | (264,734 | ) |
Net Realized Gains | | | (23,091 | ) | | | — | | | | (643,516 | ) | | | — | |
| | | | | | | | | | | | | | | | |
Total Dividends and Distributions | | | (57,978 | ) | | | — | | | | (1,744,216 | ) | | | (264,734 | ) |
| | | | | | | | | | | | | | | | |
Capital Share Transactions: | | | | | | | | | | | | | | | | |
Issued | | | 11,164,000 | | | | 22,596,500 | | | | 43,150,000 | | | | 168,870,000 | |
Redeemed | | | (2,695,500 | ) | | | — | | | | (67,160,100 | ) | | | — | |
| | | | | | | | | | | | | | | | |
Increase (Decrease) in Net Assets from Capital Share Transactions | | | 8,468,500 | | | | 22,596,500 | | | | (24,010,100 | ) | | | 168,870,000 | |
| | | | | | | | | | | | | | | | |
Total Increase (Decrease) in Net Assets | | | 8,560,883 | | | | 24,934,269 | | | | (41,271,814 | ) | | | 189,394,865 | |
| | | | | | | | | | | | | | | | |
Net Assets: | | | | | | | | | | | | | | | | |
Beginning of Period | | | 24,934,269 | | | | — | | | | 196,354,919 | | | | 6,960,054 | |
| | | | | | | | | | | | | | | | |
End of Period | | $ | 33,495,152 | | | $ | 24,934,269 | | | $ | 155,083,105 | | | $ | 196,354,919 | |
| | | | | | | | | | | | | | | | |
Undistributed Net Investment Income | | $ | 180,816 | | | $ | 3,670 | | | $ | (191,140 | ) | | $ | 87,541 | |
| | | | | | | | | | | | | | | | |
Share Transactions: | | | | | | | | | | | | | | | | |
Issued | | | 550,000 | | | | 1,250,000 | | | | 1,980,000 | (4) | | | 8,040,000 | (3) |
Redeemed | | | (150,000 | ) | | | — | | | | (3,240,000 | )(4) | | | — | |
| | | | | | | | | | | | | | | | |
Net Increase in Shares Outstanding from Share Transactions | | | 400,000 | | | | 1,250,000 | | | | (1,260,000 | ) | | | 8,040,000 | |
| | | | | | | | | | | | | | | | |
| (1) | The Fund commenced operations on July 7, 2010. |
| (2) | Includes realized gains as a result of in-kind transactions. (See Note 4 in Notes to Financial Statements.) |
| (3) | Restated to reflect the effect of a 2 for 1 share split on April 12, 2011. (See Note 8 in Notes to Financial Statements) |
| (4) | Adjusted to reflect the effect of a 2 for 1 share split on April 12, 2011. (See Note 8 in Notes to Financial Statements) |
The accompanying notes are an integral part of the financial statements.
88
STATEMENTSOF CHANGESIN NET ASSETS
| | | | | | | | | | | | | | | | |
| | | | | | | | | Global X FTSE Norway 30 | | | Global X FTSE Argentina 20 | |
| | | Global X FTSE Nordic
Region | | | |
| | | ETF | | | ETF | | | ETF | |
| | | Period Ended
April 30,
2011
(Unaudited) | | | Year Ended
October 31,
2010
(Audited) | | | Period Ended
April 30,
2011(1)
(Unaudited) | | | Period Ended
April 30,
2011(2)
(Audited) | |
Operations: | | | | | | | | | | | | | | | | |
Net Investment Income | | $ | 548,914 | | | $ | 129,926 | | | $ | 484,553 | | | $ | 28,660 | |
Net Realized Gain (Loss) on Investments and Foreign Currency Transactions | | | 4,388 | (3) | | | 412,087 | (3) | | | (60,532 | )(3) | | | (9,664 | ) |
Net Change in Unrealized Appreciation on Investments and Foreign Currency Transactions | | | 4,320,342 | | | | 1,293,175 | | | | 5,149,041 | | | | 50,077 | |
| | | | | | | | | | | | | | | | |
Net Increase in Net Assets Resulting from Operations | | | 4,873,644 | | | | 1,835,188 | | | | 5,573,062 | | | | 69,073 | |
| | | | | | | | | | | | | | | | |
Dividends and Distributions: | | | | | | | | | | | | | | | | |
Net Investment Income | | | (150,580 | ) | | | (2,158 | ) | | | (6,983 | ) | | | — | |
| | | | | | | | | | | | | | | | |
Total Dividends and Distributions | | | (150,580 | ) | | | (2,158 | ) | | | (6,983 | ) | | | — | |
| | | | | | | | | | | | | | | | |
Capital Share Transactions: | | | | | | | | | | | | | | | | |
Issued | | | 18,105,000 | | | | 9,938,400 | | | | 54,156,500 | | | | 3,761,000 | |
Redeemed | | | (1,078,500 | ) | | | (2,462,600 | ) | | | (8,163,500 | ) | | | — | |
| | | | | | | | | | | | | | | | |
Increase in Net Assets from Capital Share Transactions | | | 17,026,500 | | | | 7,475,800 | | | | 45,993,000 | | | | 3,761,000 | |
| | | | | | | | | | | | | | | | |
Total Increase in Net Assets | | | 21,749,564 | | | | 9,308,830 | | | | 51,559,079 | | | | 3,830,073 | |
| | | | | | | | | | | | | | | | |
Net Assets: | | | | | | | | | | | | | | | | |
Beginning of Period | | | 12,683,474 | | | | 3,374,644 | | | | — | | | | — | |
| | | | | | | | | | | | | | | | |
End of Period | | $ | 34,433,038 | | | $ | 12,683,474 | | | $ | 51,559,079 | | | $ | 3,830,073 | |
| | | | | | | | | | | | | | | | |
Undistributed Net Investment Income | | $ | 526,180 | | | $ | 127,846 | | | $ | 477,570 | | | $ | 28,660 | |
| | | | | | | | | | | | | | | | |
Share Transactions: | | | | | | | | | | | | | | | | |
Issued | | | 900,000 | | | | 590,000 | | | | 3,400,000 | | | | 250,000 | |
Redeemed | | | (50,000 | ) | | | (140,000 | ) | | | (500,000 | ) | | | — | |
| | | | | | | | | | | | | | | | |
Net Increase in Shares Outstanding from Share Transactions | | | 850,000 | | | | 450,000 | | | | 2,900,000 | | | | 250,000 | |
| | | | | | | | | | | | | | | | |
| (1) | The Fund commenced operations on November 9, 2010. |
| (2) | The Fund commenced operations on March 2, 2011. |
| (3) | Includes realized gains as a result of in-kind transactions. (See Note 4 in Notes to Financial Statements.) |
The accompanying notes are an integral part of the financial statements.
89
STATEMENTSOF CHANGESIN NET ASSETS
| | | | | | | | | | | | | | | | |
| | | Global X FTSE
Andean 40
ETF
Period Ended
April 30,
2011(1)
(Unaudited) | | | Global X FTSE
ASEAN 40
ETF
Period Ended
April 30,
2011(2)
(Unaudited) | | | Global X China
Period Ended
April 30,
2011
(Unaudited) | | | Consumer ETF
Period Ended
October 31,
2010(3)
(Audited) | |
Operations: | | | | | | | | | | | | | | | | |
Net Investment Income | | $ | 31,097 | | | $ | 12,090 | | | $ | 112,715 | | | $ | 513,308 | |
Net Realized Gain (Loss) on Investments and Foreign Currency Transactions | | | (5,095 | ) | | | (849 | ) | | | 5,130,773 | (4) | | | (264,708 | ) |
Net Change in Unrealized Appreciation (Depreciation) on Investments and Foreign Currency Transactions | | | 396,095 | | | | 157,798 | | | | (23,004,631 | ) | | | 21,235,963 | |
| | | | | | | | | | | | | | | | |
Net Increase (Decrease) in Net Assets Resulting from Operations | | | 422,097 | | | | 169,039 | | | | (17,761,143 | ) | | | 21,484,563 | |
| | | | | | | | | | | | | | | | |
Dividends and Distributions: | | | | | | | | | | | | | | | | |
Net Investment Income | | | — | | | | — | | | | (1,734,529 | ) | | | — | |
| | | | | | | | | | | | | | | | |
Total Dividends and Distributions | | | — | | | | — | | | | (1,734,529 | ) | | | — | |
| | | | | | | | | | | | | | | | |
Capital Share Transactions: | | | | | | | | | | | | | | | | |
Issued | | | 7,298,000 | | | | 2,317,500 | | | | 72,030,500 | | | | 153,390,500 | |
Redeemed | | | — | | | | — | | | | (37,492,500 | ) | | | — | |
| | | | | | | | | | | | | | | | |
Increase in Net Assets from Capital Share Transactions | | | 7,298,000 | | | | 2,317,500 | | | | 34,538,000 | | | | 153,390,500 | |
| | | | | | | | | | | | | | | | |
Total Increase in Net Assets | | | 7,720,097 | | | | 2,486,539 | | | | 15,042,328 | | | | 174,875,063 | |
| | | | | | | | | | | | | | | | |
Net Assets: | | | | | | | | | | | | | | | | |
Beginning of Period | | | — | | | | — | | | | 174,875,063 | | | | — | |
| | | | | | | | | | | | | | | | |
End of Period | | $ | 7,720,097 | | | $ | 2,486,539 | | | $ | 189,917,391 | | | $ | 174,875,063 | |
| | | | | | | | | | | | | | | | |
Undistributed (Distributions in Excess of) Net Investment Income | | $ | 31,097 | | | $ | 12,090 | | | $ | (1,108,113 | ) | | $ | 513,701 | |
| | | | | | | | | | | | | | | | |
Share Transactions: | | | | | | | | | | | | | | | | |
Issued | | | 500,000 | | | | 150,000 | | | | 3,700,000 | | | | 8,600,000 | |
Redeemed | | | — | | | | — | | | | (1,900,000 | ) | | | — | |
| | | | | | | | | | | | | | | | |
Net Increase in Shares Outstanding from Share Transactions | | | 500,000 | | | | 150,000 | | | | 1,800,000 | | | | 8,600,000 | |
| | | | | | | | | | | | | | | | |
| (1) | The Fund commenced operations on February 2, 2011. |
| (2) | The Fund commenced operations on February 16, 2011. |
| (3) | The Fund commenced operations on November 30, 2009. |
| (4) | Includes realized gains as a result of in-kind transactions. (See Note 4 in Notes to Financial Statements.) |
The accompanying notes are an integral part of the financial statements.
90
STATEMENTSOF CHANGESIN NET ASSETS
| | | | | | | | | | | | | | | | |
| | | Global X China Energy ETF | | | Global X China Financials ETF | |
| | | Period Ended
April 30,
2011
(Unaudited) | | | Period Ended
October 31,
2010(1)
(Audited) | | | Period Ended
April 30,
2011
(Unaudited) | | | Period Ended
October 31,
2010(2)
(Audited) | |
Operations: | | | | | | | | | | | | | | | | |
Net Investment Income (Loss) | | $ | 32,620 | | | $ | 57,846 | | | $ | (58,640 | ) | | $ | 1,175,125 | |
Net Realized Gain (Loss) on Investments and Foreign Currency Transactions | | | 251,266 | (3) | | | (54,664 | ) | | | (392,252 | )(3) | | | 1,589,811 | (3) |
Net Change in Unrealized Appreciation (Depreciation) on Investments and Foreign Currency Transactions | | | 818,370 | | | | 214,132 | | | | (3,460,140 | ) | | | 3,006,971 | |
| | | | | | | | | | | | | | | | |
Net Increase (Decrease) in Net Assets Resulting from Operations | | | 1,102,256 | | | | 217,314 | | | | (3,911,032 | ) | | | 5,771,907 | |
| | | | | | | | | | | | | | | | |
Dividends and Distributions: | | | | | | | | | | | | | | | | |
Net Investment Income | | | (61,491 | ) | | | — | | | | (1,177,311 | ) | | | — | |
| | | | | | | | | | | | | | | | |
Total Dividends and Distributions | | | (61,491 | ) | | | — | | | | (1,177,311 | ) | | | — | |
| | | | | | | | | | | | | | | | |
Capital Share Transactions: | | | | | | | | | | | | | | | | |
Issued | | | 5,637,000 | | | | 4,500,000 | | | | 695,000 | | | | 82,874,000 | |
Redeemed | | | (876,500 | ) | | | — | | | | (58,117,500 | ) | | | (18,487,500 | ) |
| | | | | | | | | | | | | | | | |
Increase (Decrease) in Net Assets from Capital Share Transactions | | | 4,760,500 | | | | 4,500,000 | | | | (57,422,500 | ) | | | 64,386,500 | |
| | | | | | | | | | | | | | | | |
Total Increase (Decrease) in Net Assets | | | 5,801,265 | | | | 4,717,314 | | | | (62,510,843 | ) | | | 70,158,407 | |
| | | | | | | | | | | | | | | | |
Net Assets: | | | | | | | | | | | | | | | | |
Beginning of Period | | | 4,717,314 | | | | — | | | | 70,158,407 | | | | — | |
| | | | | | | | | | | | | | | | |
End of Period | | $ | 10,518,579 | | | $ | 4,717,314 | | | $ | 7,647,564 | | | $ | 70,158,407 | |
| | | | | | | | | | | | | | | | |
Undistributed (Distributions in Excess of) Net Investment Income | | $ | 29,186 | | | $ | 58,057 | | | $ | (58,642 | ) | | $ | 1,177,309 | |
| | | | | | | | | | | | | | | | |
Share Transactions: | | | | | | | | | | | | | | | | |
Issued | | | 350,000 | | | | 300,000 | | | | 50,000 | | | | 6,000,000 | |
Redeemed | | | (50,000 | ) | | | — | | | | (4,250,000 | ) | | | (1,250,000 | ) |
| | | | | | | | | | | | | | | | |
Net Increase (Decrease) in Shares Outstanding from Share Transactions | | | 300,000 | | | | 300,000 | | | | (4,200,000 | ) | | | 4,750,000 | |
| | | | | | | | | | | | | | | | |
| (1) | The Fund commenced operations on December 15, 2009. |
| (2) | The Fund commenced operations on December 10, 2009. |
| (3) | Includes realized gains as a result of in-kind transactions. (See Note 4 in Notes to Financial Statements.) |
The accompanying notes are an integral part of the financial statements.
91
STATEMENTSOF CHANGESIN NET ASSETS
| | | | | | | | | | | | | | | | |
| | | Global X China Industrials ETF | | | Global X China Technology ETF | |
| | | Period Ended
April 30,
2011
(Unaudited) | | | Period Ended
October 31,
2010(1)
(Audited) | | | Period Ended
April 30,
2011
(Unaudited) | | | Period Ended
October 31,
2010(2)
(Audited) | |
Operations: | | | | | | | | | | | | | | | | |
Net Investment Income (Loss) | | $ | 18,119 | | | $ | 135,007 | | | $ | (46 | ) | | $ | 7,404 | |
Net Realized Gain on Investments and Foreign Currency Transactions | | | 456,120 | (3) | | | 1,515,803 | (3) | | | 380,211 | (3) | | | 38,475 | |
Net Change in Unrealized Appreciation (Depreciation) on Investments and Foreign Currency Transactions | | | (660,449 | ) | | | 540,340 | | | | 344,689 | | | | 493,901 | |
| | | | | | | | | | | | | | | | |
Net Increase (Decrease) in Net Assets Resulting from Operations | | | (186,210 | ) | | | 2,191,150 | | | | 724,854 | | | | 539,780 | |
| | | | | | | | | | | | | | | | |
Dividends and Distributions: | | | | | | | | | | | | | | | | |
Net Investment Income | | | (149,711 | ) | | | — | | | | (7,571 | ) | | | — | |
Net Realized Gains | | | — | | | | — | | | | (38,309 | ) | | | — | |
| | | | | | | | | | | | | | | | |
Total Dividends and Distributions | | | (149,711 | ) | | | — | | | | (45,880 | ) | | | — | |
| | | | | | | | | | | | | | | | |
Capital Share Transactions: | | | | | | | | | | | | | | | | |
Issued | | | 839,000 | | | | 27,227,000 | | | | 1,857,500 | | | | 3,761,500 | |
Redeemed | | | (4,961,500 | ) | | | (16,568,000 | ) | | | (977,000 | ) | | | — | |
| | | | | | | | | | | | | | | | |
Increase (Decrease) in Net Assets from Capital Share Transactions | | | (4,122,500 | ) | | | 10,659,000 | | | | 880,500 | | | | 3,761,500 | |
| | | | | | | | | | | | | | | | |
Total Increase (Decrease) in Net Assets | | | (4,458,421 | ) | | | 12,850,150 | | | | 1,559,474 | | | | 4,301,280 | |
| | | | | | | | | | | | | | | | |
Net Assets: | | | | | | | | | | | | | | | | |
Beginning of Period | | | 12,850,150 | | | | — | | | | 4,301,280 | | | | — | |
| | | | | | | | | | | | | | | | |
End of Period | | $ | 8,391,729 | | | $ | 12,850,150 | | | $ | 5,860,754 | | | $ | 4,301,280 | |
| | | | | | | | | | | | | | | | |
Undistributed (Distributions in Excess of) Net Investment Income | | $ | 18,117 | | | $ | 149,709 | | | $ | (46 | ) | | $ | 7,571 | |
| | | | | | | | | | | | | | | | |
Share Transactions: | | | | | | | | | | | | | | | | |
Issued | | | 50,000 | | | | 1,700,000 | | | | 100,000 | | | | 250,000 | |
Redeemed | | | (300,000 | ) | | | (950,000 | ) | | | (50,000 | ) | | | — | |
| | | | | | | | | | | | | | | | |
Net Increase (Decrease) in Shares Outstanding from Share Transactions | | | (250,000 | ) | | | 750,000 | | | | 50,000 | | | | 250,000 | |
| | | | | | | | | | | | | | | | |
| (1) | The Fund commenced operations on November 30, 2009. |
| (2) | The Fund commenced operations on December 8, 2009. |
| (3) | Includes realized gains as a result of in-kind transactions. (See Note 4 in Notes to Financial Statements.) |
The accompanying notes are an integral part of the financial statements.
92
STATEMENTSOF CHANGESIN NET ASSETS
| | | | | | | | | | | | | | | | |
| | | | | | | | | Global X
Russell
Emerging
Markets
Growth ETF
Period Ended
April 30,
2011(2)
(Unaudited) | | | Global X
Russell
Emerging
Markets Value
ETF
Period Ended
April 30,
2011(2)
(Unaudited) | |
| | | | | | | | | |
| | | | | | | | | |
| | | | | | | | | |
| | | Global X China Materials ETF | | | |
| | | Period Ended
April 30,
2011
(Unaudited) | | | Period Ended
October 31,
2010(1)
(Audited) | | | |
Operations: | | | | | | | | | | | | | | | | |
Net Investment Income (Loss) | | $ | (15,642 | ) | | $ | 46,418 | | | $ | 8,952 | | | $ | 2,318 | |
Net Realized Gain (Loss) on Investments and Foreign Currency Transactions | | | 12,113,825 | (3) | | | (17,369 | ) | | | (2,443 | ) | | | (1,596 | ) |
Net Change in Unrealized Appreciation (Depreciation) on Investments and Foreign Currency Transactions | | | (11,101,635 | ) | | | 10,911,665 | | | | 108,837 | | | | 195,361 | |
| | | | | | | | | | | | | | | | |
Net Increase in Net Assets Resulting from Operations | | | 996,548 | | | | 10,940,714 | | | | 115,346 | | | | 196,083 | |
| | | | | | | | | | | | | | | | |
Dividends and Distributions: | | | | | | | | | | | | | | | | |
Net Investment Income | | | (336,120 | ) | | | — | | | | — | | | | — | |
| | | | | | | | | | | | | | | | |
Total Dividends and Distributions | | | (336,120 | ) | | | — | | | | — | | | | — | |
| | | | | | | | | | | | | | | | |
Capital Share Transactions: | | | | | | | | | | | | | | | | |
Issued | | | 2,226,000 | | | | 46,701,000 | | | | 2,511,000 | | | | 2,498,000 | |
Redeemed | | | (54,113,500 | ) | | | — | | | | — | | | | — | |
| | | | | | | | | | | | | | | | |
Increase (Decrease) in Net Assets from Capital Share Transactions | | | (51,887,500 | ) | | | 46,701,000 | | | | 2,511,000 | | | | 2,498,000 | |
| | | | | | | | | | | | | | | | |
Total Increase (Decrease) in Net Assets | | | (51,227,072 | ) | | | 57,641,714 | | | | 2,626,346 | | | | 2,694,083 | |
| | | | | | | | | | | | | | | | |
Net Assets: | | | | | | | | | | | | | | | | |
Beginning of Period | | | 57,641,714 | | | | — | | | | — | | | | — | |
| | | | | | | | | | | | | | | | |
End of Period | | $ | 6,414,642 | | | $ | 57,641,714 | | | $ | 2,626,346 | | | $ | 2,694,083 | |
| | | | | | | | | | | | | | | | |
Undistributed (Distributions in Excess of) Net Investment Income | | $ | (307,096 | ) | | $ | 44,666 | | | $ | 8,952 | | | $ | 2,318 | |
| | | | | | | | | | | | | | | | |
Share Transactions: | | | | | | | | | | | | | | | | |
Issued | | | 150,000 | | | | 3,950,000 | | | | 100,000 | | | | 100,000 | |
Redeemed | | | (3,650,000 | ) | | | — | | | | — | | | | — | |
| | | | | | | | | | | | | | | | |
Net Increase (Decrease) in Shares Outstanding from Share Transactions | | | (3,500,000 | ) | | | 3,950,000 | | | | 100,000 | | | | 100,000 | |
| | | | | | | | | | | | | | | | |
| (1) | The Fund commenced operations on January 12, 2010. |
| (2) | The Fund commenced operations on January 24, 2011. |
| (3) | Includes realized gains as a result of in-kind transactions. (See Note 4 in Notes to Financial Statements.) |
The accompanying notes are an integral part of the financial statements.
93
STATEMENTSOF CHANGESIN NET ASSETS
| | | | | | | | | | | | |
| | | Global X
S&P/TSX
Venture 30
Canada ETF
Period Ended
April 30,
2011(1)
(Unaudited) | | | Global X Oil
Equities ETF
Period Ended
April 30,
2011(2)
(Unaudited) | | | Global X
Waste
Management
ETF
Period Ended
April 30,
2011(3)
(Unaudited) | |
Operations: | | | | | | | | | | | | |
Net Investment Income (Loss) | | $ | (3,387 | ) | | $ | (349 | ) | | $ | 469 | |
Net Realized Gain (Loss) on Investments and Foreign Currency Transactions | | | (9,390 | )(4) | | | 13 | | | | 30 | |
Net Change in Unrealized Appreciation on Investments and Foreign Currency Transactions | | | 126,888 | | | | 100,725 | | | | 81,192 | |
| | | | | | | | | | | | |
Net Increase in Net Assets Resulting from Operations | | | 114,111 | | | | 100,389 | | | | 81,691 | |
| | | | | | | | | | | | |
Capital Share Transactions: | | | | | | | | | | | | |
Issued | | | 4,830,000 | | | | 3,854,000 | | | | 2,968,000 | |
Redeemed | | | (830,000 | ) | | | — | | | | — | |
| | | | | | | | | | | | |
Increase in Net Assets from Capital Share Transactions | | | 4,000,000 | | | | 3,854,000 | | | | 2,968,000 | |
| | | | | | | | | | | | |
Total Increase in Net Assets | | | 4,114,111 | | | | 3,954,389 | | | | 3,049,691 | |
| | | | | | | | | | | | |
Net Assets: | | | | | | | | | | | | |
Beginning of Period | | | — | | | | — | | | | — | |
| | | | | | | | | | | | |
End of Period | | $ | 4,114,111 | | | $ | 3,954,389 | | | $ | 3,049,691 | |
| | | | | | | | | | | | |
Accumulated Net Investment Loss/ Undistributed Net Investment Income | | $ | (3,387 | ) | | $ | (349 | ) | | $ | 469 | |
| | | | | | | | | | | | |
Share Transactions: | | | | | | | | | | | | |
Issued | | | 300,000 | | | | 250,000 | | | | 200,000 | |
Redeemed | | | (50,000 | ) | | | — | | | | — | |
| | | | | | | | | | | | |
Net Increase in Shares Outstanding from Share Transactions | | | 250,000 | | | | 250,000 | | | | 200,000 | |
| | | | | | | | | | | | |
| (1) | The Fund commenced operations on March 16, 2011. |
| (2) | The Fund commenced operations on March 14, 2011. |
| (3) | The Fund commenced operations on April 12, 2011. |
| (4) | Includes realized gains as a result of in-kind transactions. (See Note 4 in Notes to Financial Statements.) |
The accompanying notes are an integral part of the financial statements.
94
FINANCIAL HIGHLIGHTS
Selected Per Share Data & Ratios
For a Share Outstanding Throughout the Period
| | | | | | | | | | | | | | | | | | | | | | | | | | | | | | | | | | | | | | | | | | | | | | | | |
| | | Net Asset
Value,
Beginning
of
Period($) | | | Net
Investment
Income
(Loss)($)* | | | Net
Realized and
Unrealized
Gain (Loss) on
Investments($) | | | Total from
Operations($) | | | Distribution
from Net
Investment
Income($) | | | Distribution
from
Capital
Gains($) | | | Net
Asset
Value,
End of
Period($) | | | Total
Return
**(%) | | | Net
Assets
End of
Period
($000) | | | Ratio of
Expenses
to
Average
Net
Assets(%) | | | Ratio of
Net
Investment
Income
(Loss) to
Average
Net
Assets(%) | | | Portfolio
Turnover
(%) | |
Global X Silver Miners ETF | | | | | | | | | | | | | | | | | | | | | | | | | | | | | | | | | | | | | | | | | | | | | | | | |
Institutional Shares | | | | | | | | | | | | | | | | | | | | | | | | | | | | | | | | | | | | | | | | | | | | | | | | |
2011(Unaudited) | | | 20.20 | | | | 0.05 | | | | 8.44 | | | | 8.49 | | | | (0.24 | ) | | | — | | | | 28.45 | | | | 42.13 | | | | 624,402 | | | | 0.65 | † | | | 0.38 | † | | | 8.05 | †† |
2010(1) | | | 14.50 | | | | 0.05 | | | | 5.65 | | | | 5.70 | | | | — | | | | — | | | | 20.20 | | | | 39.31 | | | | 171,672 | | | | 0.65 | † | | | 0.61 | † | | | 0.35 | †† |
Global X Lithium ETF | | | | | | | | | | | | | | | | | | | | | | | | | | | | | | | | | | | | | | | | | | | | | | | | |
Institutional Shares | | | | | | | | | | | | | | | | | | | | | | | | | | | | | | | | | | | | | | | | | | | | | | | | |
2011(Unaudited) | | | 19.83 | | | | (0.03 | ) | | | 2.98 | | | | 2.95 | | | | (0.25 | ) | | | (0.02 | ) | | | 22.51 | | | | 14.87 | | | | 187,938 | | | | 0.75 | † | | | (0.31 | )† | | | 4.81 | †† |
2010(2) | | | 15.51 | | | | (0.03 | ) | | | 4.35 | | | | 4.32 | | | | — | | | | — | | | | 19.83 | | | | 27.85 | | | | 78,317 | | | | 0.75 | † | | | (0.62 | )† | | | 5.55 | †† |
Global X Copper Miners ETF | | | | | | | | | | | | | | | | | | | | | | | | | | | | | | | | | | | | | | | | | | | | | | | | |
Institutional Shares | | | | | | | | | | | | | | | | | | | | | | | | | | | | | | | | | | | | | | | | | | | | | | | | |
2011(Unaudited) | | | 16.63 | | | | 0.04 | | | | 3.78 | | | | 3.82 | | | | (0.09 | ) | | | — | | | | 20.36 | | | | 23.01 | | | | 105,879 | | | | 0.65 | † | | | 0.46 | † | | | 3.74 | †† |
2010(1) | | | 14.40 | | | | — | | | | 2.23 | | | | 2.23 | | | | — | | | | — | | | | 16.63 | | | | 15.49 | | | | 29,929 | | | | 0.65 | † | | | 0.06 | † | | | 1.36 | †† |
Global X Pure Gold Miners ETF | | | | | | | | | | | | | | | | | | | | | | | | | | | | | | | | | | | | | | | | | | | | | | | | |
Institutional Shares | | | | | | | | | | | | | | | | | | | | | | | | | | | | | | | | | | | | | | | | | | | | | | | | |
2011(3) (Unaudited) | | | 15.15 | | | | — | | | | 1.31 | | | | 1.31 | | | | — | | | | — | | | | 16.46 | | | | 8.65 | | | | 3,293 | | | | 0.59 | † | | | (0.06 | )† | | | — | †† |
Global X Uranium ETF | | | | | | | | | | | | | | | | | | | | | | | | | | | | | | | | | | | | | | | | | | | | | | | | |
Institutional Shares | | | | | | | | | | | | | | | | | | | | | | | | | | | | | | | | | | | | | | | | | | | | | | | | |
2011(4) (Unaudited) | | | 16.78 | | | | 0.25 | | | | (2.43 | ) | | | (2.18 | ) | | | (0.39 | ) | | | — | | | | 14.21 | | | | (13.67 | ) | | | 267,169 | | | | 0.69 | † | | | 2.85 | † | | | 0.60 | †† |
Global X Aluminum ETF | | | | | | | | | | | | | | | | | | | | | | | | | | | | | | | | | | | | | | | | | | | | | | | | |
Institutional Shares | | | | | | | | | | | | | | | | | | | | | | | | | | | | | | | | | | | | | | | | | | | | | | | | |
2011(5) (Unaudited) | | | 15.27 | | | | 0.04 | | | | 0.41 | | | | 0.45 | | | | — | | | | — | | | | 15.72 | | | | 2.95 | | | | 5,502 | | | | 0.69 | † | | | 0.79 | † | | | — | †† |
Global X Gold Explorers ETF | | | | | | | | | | | | | | | | | | | | | | | | | | | | | | | | | | | | | | | | | | | | | | | | |
Institutional Shares | | | | | | | | | | | | | | | | | | | | | | | | | | | | | | | | | | | | | | | | | | | | | | | | |
2011(6) (Unaudited) | | | 15.49 | | | | (0.06 | ) | | | 3.12 | | | | 3.06 | | | | — | | | | — | | | | 18.55 | | | | 19.75 | | | | 25,967 | | | | 0.65 | † | | | (0.65 | )† | | | 13.05 | †† |
Global X Brazil Mid Cap ETF | | | | | | | | | | | | | | | | | | | | | | | | | | | | | | | | | | | | | | | | | | | | | | | | |
Institutional Shares | | | | | | | | | | | | | | | | | | | | | | | | | | | | | | | | | | | | | | | | | | | | | | | | |
2011(Unaudited) | | | 18.28 | | | | 0.23 | | | | 0.57 | | | | 0.80 | | | | (0.23 | ) | | | (0.02 | ) | | | 18.83 | | | | 4.53 | | | | 32,961 | | | | 0.69 | † | | | 2.59 | † | | | 5.32 | †† |
2010(7) | | | 15.16 | | | | 0.08 | | | | 3.04 | | | | 3.12 | | | | — | | | | — | | | | 18.28 | | | | 20.58 | | | | 29,242 | | | | 0.69 | † | | | 1.24 | † | | | 2.69 | †† |
Global X Brazil Financials ETF | | | | | | | | | | | | | | | | | | | | | | | | | | | | | | | | | | | | | | | | | | | | | | | | |
Institutional Shares | | | | | | | | | | | | | | | | | | | | | | | | | | | | | | | | | | | | | | | | | | | | | | | | |
2011(Unaudited) | | | 17.40 | | | | 0.23 | | | | (0.04 | ) | | | 0.19 | | | | (0.09 | ) | | | — | | | | 17.50 | | | | 1.11 | | | | 9,626 | | | | 0.77 | † | | | 2.83 | † | | | 7.23 | †† |
2010(8) | | | 15.08 | | | | 0.05 | | | | 2.27 | | | | 2.32 | | | | — | | | | — | | | | 17.40 | | | | 15.38 | | | | 7,829 | | | | 0.77 | † | | | 1.15 | † | | | — | †† |
Global X Brazil Consumer ETF | | | | | | | | | | | | | | | | | | | | | | | | | | | | | | | | | | | | | | | | | | | | | | | | |
Institutional Shares | | | | | | | | | | | | | | | | | | | | | | | | | | | | | | | | | | | | | | | | | | | | | | | | |
2011(Unaudited) | | | 19.95 | | | | 0.13 | | | | 0.25 | | | | 0.38 | | | | (0.02 | ) | | | (0.01 | ) | | | 20.30 | | | | 1.93 | | | | 33,495 | | | | 0.77 | † | | | 1.32 | † | | | 9.87 | †† |
2010(9) | | | 15.48 | | | | — | | | | 4.47 | | | | 4.47 | | | | — | | | | — | | | | 19.95 | | | | 28.88 | | | | 24,934 | | | | 0.77 | † | | | 0.07 | † | | | 4.72 | †† |
Global X FTSE Colombia 20 ETF | | | | | | | | | | | | | | | | | | | | | | | | | | | | | | | | | | | | | | | | | | | | | | | | |
Institutional Shares | | | | | | | | | | | | | | | | | | | | | | | | | | | | | | | | | | | | | | | | | | | | | | | | |
2011(Unaudited)(12) | | | 22.99 | | | | 0.10 | | | | (1.58 | ) | | | (1.48 | ) | | | (0.13 | ) | | | (0.08 | ) | | | 21.30 | | | | (6.42 | ) | | | 155,083 | | | | 0.84 | †@ | | | 1.04 | † | | | 29.18 | †† |
2010(11) | | | 13.92 | | | | 0.16 | | | | 9.44 | | | | 9.60 | | | | (0.53 | ) | | | — | | | | 22.99 | | | | 71.28 | | | | 196,355 | | | | 0.86 | | | | 0.77 | | | | 40.95 | |
2009(10)(11) | | | 7.50 | | | | 0.25 | | | | 6.17 | | | | 6.42 | | | | — | | | | — | | | | 13.92 | | | | 85.60 | | | | 6,960 | | | | 0.86 | | | | 2.93 | | | | 1.94 | †† |
| (1) | The Fund commenced operations on April 19, 2010. |
| (2) | The Fund commenced operations on July 22, 2010. |
| (3) | The Fund commenced operations on March 14, 2011. |
| (4) | The Fund commenced operations on November 4, 2010. |
| (5) | The Fund commenced operations on January 4, 2011. |
| (6) | The Fund commenced operations on November 3, 2010. |
| (7) | The Fund commenced operations on June 21, 2010. |
| (8) | The Fund commenced operations on July 28, 2010. |
| (9) | The Fund commenced operations on July 7, 2010. |
| (10) | The Fund commenced operations on February 5, 2009. |
| (11) | Per share amounts have been restated for a 2 for 1 share split on April 12, 2011. (See Note 8 in Notes to Financial Statements) |
| (12) | Per share amounts have been adjusted for a 2 for 1 share split on April 12, 2011. (See Note 8 in Notes to Financial Statements) |
| * | Per share calculations were performed using average shares. |
| ** | Total Return is for the period indicated and has not been annualized. The return shown does not reflect the deduction of taxes that a shareholder would pay on Fund distributions or the redemption of Fund shares. |
| †† | Portfolio turnover rate is for the period indicated and has not been annualized. Excludes the effects of in-kind transfers. |
| @ | The Ratio of Expenses to Average Net Assets includes the effect of a waiver. If these expense offsets were excluded, the ratio would have been 0.85%, 0.86 and 0.86% for the period ended April 31, 2011 and fiscal years ended 2010, 2009, respectively. |
| Amounts | designated as “—” are either $0 or have been rounded to $0. |
The accompanying notes are an integral part of the financial statements.
95
FINANCIAL HIGHLIGHTS
Selected Per Share Data & Ratios
For a Share Outstanding Throughout the Period
| | | | | | | | | | | | | | | | | | | | | | | | | | | | | | | | | | | | | | | | | | | | | | | | |
| | | Net Asset
Value,
Beginning
of
Period($) | | | Net
Investment
Income
(Loss)($)* | | | Net
Realized and
Unrealized
Gain (Loss) on
Investments($) | | | Total from
Operations($) | | | Distribution
from Net
Investment
Income($) | | | Distribution
from
Capital
Gains($) | | | Net Asset
Value,
End of
Period ($) | | | Total
Return
**(%) | | | Net
Assets
End of
Period
($000) | | | Ratio of
Expenses
to
Average
Net
Assets(%) | | | Ratio of
Net
Investment
Income
(Loss) to
Average
Net
Assets(%) | | | Portfolio
Turnover
(%) | |
Global X FTSE Nordic Region ETF | | | | | | | | | | | | | | | | | | | | | | | | | | | | | | | | | | | | | | | | | | | | | | | | |
Institutional Shares | | | | | | | | | | | | | | | | | | | | | | | | | | | | | | | | | | | | | | | | | | | | | | | | |
2011(Unaudited) | | | 19.22 | | | | 0.49 | | | | 3.26 | | | | 3.75 | | | | (0.17 | ) | | | — | | | | 22.80 | | | | 19.67 | | | | 34,433 | | | | 0.50 | † | | | 4.85 | † | | | 4.18 | †† |
2010 | | | 16.07 | | | | 0.32 | | | | 2.84 | | | | 3.16 | | | | (0.01 | ) | | | — | | | | 19.22 | | | | 19.68 | | | | 12,683 | | | | 0.50 | | | | 1.91 | | | | 4.07 | |
2009(1) | | | 14.50 | | | | (0.02 | ) | | | 1.59 | | | | 1.57 | | | | — | | | | — | | | | 16.07 | | | | 10.83 | | | | 3,375 | | | | 0.50 | † | | | (0.50 | ) | | | 0.70 | †† |
Global X FTSE Norway 30 ETF | | | | | | | | | | | | | | | | | | | | | | | | | | | | | | | | | | | | | | | | | | | | | | | | |
Institutional Shares | | | | | | | | | | | | | | | | | | | | | | | | | | | | | | | | | | | | | | | | | | | | | | | | |
2011(2) (Unaudited) | | | 14.80 | | | | 0.33 | | | | 2.66 | | | | 2.99 | | | | (0.01 | ) | | | — | | | | 17.78 | | | | 20.20 | | | | 51,559 | | | | 0.50 | † | | | 4.26 | † | | | 1.18 | †† |
Global X FTSE Argentina 20 ETF | | | | | | | | | | | | | | | | | | | | | | | | | | | | | | | | | | | | | | | | | | | | | | | | |
Institutional Shares | | | | | | | | | | | | | | | | | | | | | | | | | | | | | | | | | | | | | | | | | | | | | | | | |
2011(3) (Unaudited) | | | 14.93 | | | | 0.12 | | | | 0.27 | | | | 0.39 | | | | — | | | | — | | | | 15.32 | | | | 2.61 | | | | 3,830 | | | | 0.74 | † | | | 5.01 | | | | 7.74 | †† |
Global X FTSE Andean 40 ETF | | | | | | | | | | | | | | | | | | | | | | | | | | | | | | | | | | | | | | | | | | | | | | | | |
Institutional Shares | | | | | | | | | | | | | | | | | | | | | | | | | | | | | | | | | | | | | | | | | | | | | | | | |
2011(4) (Unaudited) | | | 14.88 | | | | 0.08 | | | | 0.48 | | | | 0.56 | | | | — | | | | — | | | | 15.44 | | | | 3.76 | | | | 7,720 | | | | 0.72 | † | | | 2.24 | † | | | 3.44 | †† |
Global X FTSE ASEAN 40 ETF | | | | | | | | | | | | | | | | | | | | | | | | | | | | | | | | | | | | | | | | | | | | | | | | |
Institutional Shares | | | | | | | | | | | | | | | | | | | | | | | | | | | | | | | | | | | | | | | | | | | | | | | | |
2011(5) (Unaudited) | | | 15.08 | | | | 0.11 | | | | 1.39 | | | | 1.50 | | | | — | | | | — | | | | 16.58 | | | | 9.95 | | | | 2,487 | | | | 0.65 | † | | | 3.38 | † | | | 2.36 | †† |
Global X China Consumer ETF | | | | | | | | | | | | | | | | | | | | | | | | | | | | | | | | | | | | | | | | | | | | | | | | |
Institutional Shares | | | | | | | | | | | | | | | | | | | | | | | | | | | | | | | | | | | | | | | | | | | | | | | | |
2011(Unaudited) | | | 20.33 | | | | 0.01 | | | | (1.89 | ) | | | (1.88 | ) | | | (0.19 | ) | | | — | | | | 18.26 | | | | (9.22 | ) | | | 189,917 | | | | 0.65 | † | | | 0.13 | † | | | 6.11 | †† |
2010(6) | | | 15.65 | | | | 0.17 | | | | 4.51 | | | | 4.68 | | | | — | | | | — | | | | 20.33 | | | | 29.90 | | | | 174,875 | | | | 0.65 | † | | | 1.03 | † | | | 3.91 | †† |
Global X China Energy ETF | | | | | | | | | | | | | | | | | | | | | | | | | | | | | | | | | | | | | | | | | | | | | | | | |
Institutional Shares | | | | | | | | | | | | | | | | | | | | | | | | | | | | | | | | | | | | | | | | | | | | | | | | |
2011(Unaudited) | | | 15.72 | | | | 0.06 | | | | 1.89 | | | | 1.95 | | | | (0.14 | ) | | | — | | | | 17.53 | | | | 12.50 | | | | 10,519 | | | | 0.65 | † | | | 0.80 | † | | | 4.29 | †† |
2010(7) | | | 15.02 | | | | 0.23 | | | | 0.47 | | | | 0.70 | | | | — | | | | — | | | | 15.72 | | | | 4.66 | | | | 4,717 | | | | 0.65 | † | | | 1.80 | † | | | 20.55 | †† |
Global X China Financials ETF | | | | | | | | | | | | | | | | | | | | | | | | | | | | | | | | | | | | | | | | | | | | | | | | |
Institutional Shares | | | | | | | | | | | | | | | | | | | | | | | | | | | | | | | | | | | | | | | | | | | | | | | | |
2011(Unaudited) | | | 14.77 | | | | (0.03 | ) | | | (0.52 | ) | | | (0.55 | ) | | | (0.32 | ) | | | — | | | | 13.90 | | | | (3.63 | ) | | | 7,646 | | | | 0.65 | † | | | (0.43 | )† | | | 24.98 | †† |
2010(8) | | | 14.90 | | | | 0.27 | | | | (0.40 | ) | | | (0.13 | ) | | | — | | | | — | | | | 14.77 | | | | (0.87 | ) | | | 70,158 | | | | 0.65 | † | | | 2.26 | † | | | 14.42 | †† |
Global X China Industrials ETF | | | | | | | | | | | | | | | | | | | | | | | | | | | | | | | | | | | | | | | | | | | | | | | | |
Institutional Shares | | | | | | | | | | | | | | | | | | | | | | | | | | | | | | | | | | | | | | | | | | | | | | | | |
2011(Unaudited) | | | 17.13 | | | | 0.03 | | | | (0.15 | ) | | | (0.12 | ) | | | (0.23 | ) | | | — | | | | 16.78 | | | | (0.65 | ) | | | 8,392 | | | | 0.65 | † | | | 0.36 | † | | | 12.75 | †† |
2010(6) | | | 15.50 | | | | 0.08 | | | | 1.55 | | | | 1.63 | | | | — | | | | — | | | | 17.13 | | | | 10.52 | �� | | | 12,850 | | | | 0.65 | † | | | 0.61 | † | | | 12.74 | †† |
Global X China Technology ETF | | | | | | | | | | | | | | | | | | | | | | | | | | | | | | | | | | | | | | | | | | | | | | | | |
Institutional Shares | | | | | | | | | | | | | | | | | | | | | | | | | | | | | | | | | | | | | | | | | | | | | | | | |
2011(Unaudited) | | | 17.21 | | | | — | | | | 2.49 | | | | 2.49 | | | | (0.03 | ) | | | (0.13 | ) | | | 19.54 | | | | 14.59 | | | | 5,861 | | | | 0.65 | † | | | — | † | | | 8.59 | †† |
2010(9) | | | 14.90 | | | | 0.03 | | | | 2.28 | | | | 2.31 | | | | — | | | | — | | | | 17.21 | | | | 15.50 | | | | 4,301 | | | | 0.65 | † | | | 0.24 | † | | | 5.15 | †† |
Global X China Materials ETF | | | | | | | | | | | | | | | | | | | | | | | | | | | | | | | | | | | | | | | | | | | | | | | | |
Institutional Shares | | | | | | | | | | | | | | | | | | | | | | | | | | | | | | | | | | | | | | | | | | | | | | | | |
2011(Unaudited) | | | 14.59 | | | | (0.01 | ) | | | (0.19 | ) | | | (0.20 | ) | | | (0.14 | ) | | | — | | | | 14.25 | | | | (1.30 | ) | | | 6,415 | | | | 0.65 | † | | | (0.13 | )† | | | 20.75 | †† |
2010(10) | | | 14.95 | | | | 0.02 | | | | (0.38 | ) | | | (0.36 | ) | | | — | | | | — | | | | 14.59 | | | | (2.41 | ) | | | 57,642 | | | | 0.65 | † | | | 0.23 | † | | | 6.13 | †† |
| (1) | The Fund commenced operations on August 17, 2009. |
| (2) | The Fund commenced operations on November 9, 2010. |
| (3) | The Fund commenced operations on March 2, 2011. |
| (4) | The Fund commenced operations on February 2, 2011. |
| (5) | The Fund commenced operations on February 16, 2011. |
| (6) | The Fund commenced operations on November 30, 2009. |
| (7) | The Fund commenced operations on December 15, 2009. |
| (8) | The Fund commenced operations on December 10, 2009. |
| (9) | The Fund commenced operations on December 8, 2009. |
| (10) | The Fund commenced operations on January 12, 2010. |
| * | Per share calculations were performed using average shares. |
| ** | Total Return is for the period indicated and has not been annualized. The return shown does not reflect the deduction of taxes that a shareholder would pay on Fund distributions or the redemption of Fund shares. |
| †† | Portfolio turnover rate is for the period indicated and has not been annualized. Excludes the effects of in-kind transfers. |
Amounts designated as “—” are either $0 or have been rounded to $0.
The accompanying notes are an integral part of the financial statements.
96
FINANCIAL HIGHLIGHTS
Selected Per Share Data & Ratios
For a Share Outstanding Throughout the Period
| | | | | | | | | | | | | | | | | | | | | | | | | | | | | | | | | | | | | | | | | | |
| | | Net Asset
Value,
Beginning
of
Period($) | | Net
Investment
Income
(Loss) ($)* | | | Net Realized
and
Unrealized
Gain on
Investments($) | | | Total from
Operations($) | | | Distribution
from Net
Investment
Income ($) | | | Net
Asset
Value
End
of
Period
($) | | | Total
Return
**(%) | | | Net
Assets
End of
Period
($000) | | | Ratio of
Expenses
to
Average
Net
Assets(%) | | | Ratio of
Net
Investment
Income
(Loss) to
Average
Net
Assets(%) | | | Portfolio
Turnover
(%) | |
Global X Russell Emerging Markets Growth ETF | | | | | | | | | | | | | | | | | | | | | | | | | | | | | |
Institutional Shares | | | | | | | | | | | | | | | | | | | | | | | | | | | | | | | | | | | | | | | | | | |
2011(1) (Unaudited) | | 25.11 | | | 0.09 | | | | 1.06 | | | | 1.15 | | | | — | | | | 26.26 | | | | 4.58 | | | | 2,626 | | | | 0.69 | † | | | 1.37 | † | | | — | †† |
Global X Russell Emerging Markets Value ETF | | | | | | | | | | | | | | | | | | | | | | | | | | | | | |
Institutional Shares | | | | | | | | | | | | | | | | | | | | | | | | | | | | | | | | | | | | | | | | | | |
2011(1) (Unaudited) | | 24.98 | | | 0.02 | | | | 1.94 | | | | 1.96 | | | | — | | | | 26.94 | | | | 7.85 | | | | 2,694 | | | | 0.69 | † | | | 0.34 | † | | | — | †† |
Global X S&P/TSX Venture 30 Canada ETF | | | | | | | | | | | | | | | | | | | | | | | | | | | | | |
Institutional Shares | | | | | | | | | | | | | | | | | | | | | | | | | | | | | | | | | | | | | | | | | | |
2011(2) (Unaudited) | | 15.04 | | | (0.02 | ) | | | 1.44 | | | | 1.42 | | | | — | | | | 16.46 | | | | 9.44 | | | | 4,114 | | | | 0.75 | † | | | (0.75 | )† | | | — | †† |
Global X Oil Equities ETF | | | | | | | | | | | | | | | | | | | | | | | | | | | | | |
Institutional Shares | | | | | | | | | | | | | | | | | | | | | | | | | | | | | | | | | | | | | | | | | | |
2011(3) (Unaudited) | | 15.08 | | | — | | | | 0.74 | | | | 0.74 | | | | — | | | | 15.82 | | | | 4.91 | | | | 3,954 | | | | 0.49 | † | | | (0.08 | )† | | | — | †† |
Global X Waste Management ETF | | | | | | | | | | | | | | | | | | | | | | | | | | | | | |
Institutional Shares | | | | | | | | | | | | | | | | | | | | | | | | | | | | | | | | | | | | | | | | | | |
2011(4) (Unaudited) | | 14.87 | | | — | | | | 0.38 | | | | 0.38 | | | | — | | | | 15.25 | | | | 2.56 | | | | 3,050 | | | | 0.65 | † | | | 0.43 | † | | | — | †† |
| (1) | The Fund commenced operations on January 24, 2011. |
| (2) | The Fund commenced operations on March 16, 2011. |
| (3) | The Fund commenced operations on March 14, 2011. |
| (4) | The Fund commenced operations on April 12, 2011. |
| * | Per share calculations were performed using average shares. |
| ** | Total Return is for the period indicated and has not been annualized. The return shown does not reflect the deduction of taxes that a shareholder would pay on Fund distributions or the redemption of Fund shares. |
| †† | Portfolio turnover rate is for the period indicated and has not been annualized. Excludes the effects of in-kind transfers. |
Amounts designated as “—” are either $0 or have been rounded to $0.
The accompanying notes are an integral part of the financial statements.
97
NOTESTO FINANCIAL STATEMENTS
APRIL 30, 2011 (UNAUDITED)
1. ORGANIZATION
The Global X Funds (the “Trust”) is a Delaware Statutory Trust formed on March 6, 2008. The Trust is registered with the Securities and Exchange Commission under the Investment Company Act of 1940, as amended, as an open-end management investment company. As of April 30, 2011, the Trust consisted of the following fifty-five, non-diversified investment portfolios: Global X FTSE Nordic Region ETF1, Global X FTSE Denmark 30 ETF, Global X FTSE Finland 30 ETF, Global X FTSE Norway 30 ETF, Global X FTSE Argentina 20 ETF, Global X FTSE Colombia 20 ETF2, Global X FTSE Philippines PSEi ETF3, Global X FTSE United Arab Emirates 20 ETF, Global X Emerging Africa ETF4, Global X Pakistan KSE30 ETF, Global X China Consumer ETF, Global X China Energy ETF, Global X China Financials ETF, Global X China Industrials ETF, Global X China Materials ETF, Global X China Technology ETF, Global X Copper Miners ETF, Global X Pure Gold Miners ETF5, Global X Platinum Miners ETF, Global X Silver Miners ETF, Global X Brazil Consumer ETF, Global X Brazil Financials ETF, Global X Brazil Industrials ETF, Global X Brazil Materials ETF, Global X Brazil Utilities ETF, Global X Brazil Mid Cap ETF, Global X China Mid Cap, Global X Aluminum ETF, Global X Lithium ETF, Global X Uranium ETF, Global X Fishing Industry ETF6, Global X Food ETF, Global X Shipping ETF, Global X Waste Management ETF, Global X Gold Explorers ETF, Global X Russell Emerging Markets Growth ETF, Global X Russell Emerging Markets Value ETF, Global X Next 11 ETF, Global X FTSE ASEAN 40 ETF, Global X FTSE Andean 40 ETF, Global X S&P/TSX Venture 30 Canada ETF 7, Global X Oil Equities ETF, Global X Auto ETF, Global X UK Mid-Cap ETF, Global X Mexico Small-Cap ETF, Global X Hong Kong Small-Cap ETF, Global X Germany Small-Cap ETF, Global X Singapore Small-Cap ETF, Global X South Korea Small-Cap ETF, Global X Taiwan Small-Cap ETF, Global X Rare Earths ETF, Global X Strategic Metals ETF, Global X Fertilizers/Potash ETF, Global X SuperDividend ETF, and Global X Canada Preferred ETF (each a “Fund”, collectively the “Funds”).8 As of April 30, 2011, the following investment portfolios were operational: Global X FTSE Nordic Region ETF, Global X FTSE Norway 30 ETF, Global X FTSE Argentina 20 ETF, Global X FTSE Colombia 20 ETF, Global X China Consumer ETF, Global X China Energy ETF, Global X China Financials ETF, Global X China Industrials ETF, Global X China Materials ETF, Global X China Technology ETF, Global X Copper Miners ETF, Global X Pure Gold Miners ETF, Global X Silver Miners ETF, Global X Brazil Consumer ETF, Global X Brazil Financials ETF, Global X Brazil Mid Cap ETF, Global X Aluminum ETF, Global X Lithium ETF, Global X Uranium ETF, Global X Waste Management ETF, Global X Gold Explorers ETF, Global X Russell Emerging Markets Growth ETF, Global X Russell Emerging Markets Value ETF, Global X FTSE ASEAN 40 ETF, Global X FTSE Andean 40 ETF, Global X S&P/TSX Venture 30 Canada ETF, and Global X Oil Equities ETF.9
| 1 | Effective March 1, 2011, the name of Global X Nordic 30 ETF was changed to Global X Nordic Region ETF. |
| 2 | Effective March 1, 2011, the name of Global X/Interbolsa FTSE Colombia 20 ETF was changed to Global X FTSE Colombia 20 ETF. |
| 3 | Effective March 1, 2011, the name of Global X Philippines 30 ETF was changed to Global X Philippines PSEi ETF. |
| 4 | Effective March 1, 2011, the name of Global X Emerging Africa NR-40 ETF was changed to Global X Emerging Africa ETF. |
| 5 | Effective March 1, 2011, the name of Global X Gold Miners ETF was changed to Global X Pure Gold Miners ETF. |
| 6 | Effective March 1, 2011, the name of Global X Fishing ETF was changed to Global X Fishing Industry ETF. |
| 7 | Effective March 17, 2011, the name of the Global X S&P/TSX Venture Canada ETF was changed to Global X S&P/TSX Venture 30 Canada ETF. |
| 8 | On May 11, 2011, the Trust added the following investment portfolios: Global X Farming ETF, Global X MLP ETF, and Global X MLP Natural Gas ETF. |
| 9 | Since April 30, 2011, the following funds have become operational (start date in parentheses): Global X Food ETF (May 2, 2011), Global X Fishing Industry ETF (May 3, 2011), Global X Mexico Small-Cap ETF (May 4, 2011), Global X Auto ETF (May 18, 2011), Global X Canada Preferred ETF (May 24, 2011), Global X Fertilizers/Potash ETF (May 25, 2011), Global X Farming ETF (June 1, 2011), Global X SuperDividend ETF (June 8, 2011). |
98
NOTESTO FINANCIAL STATEMENTS (CONTINUED)
APRIL 30, 2011 (UNAUDITED)
2. SIGNIFICANT ACCOUNTING POLICIES
The following is a summary of the Significant Accounting Policies followed by the Funds.
USE OF ESTIMATES — The preparation of financial statements in conformity with U.S. Generally Accepted Accounting Principals (“U.S. GAAP”) requires management to make estimates and assumptions that affect the reported amounts of assets and liabilities and disclosure of contingent assets and liabilities at the date of the financial statements and the reported amounts of increases and decreases in net assets from operations during the reporting period. Actual results could differ from those estimates, and could have a material impact to the Funds.
SECURITY VALUATION — Securities listed on a securities exchange, market or automated quotation system for which quotations are readily available (except for securities traded on NASDAQ), including securities traded over the counter, are valued at the last quoted sale price on the primary exchange or market (foreign or domestic) on which they are traded (or at approximately 4:00 pm if a security’s primary exchange is normally open at that time), or, if there is no such reported sale, at the most recent mean between the quoted bid and asked prices (absent both bid and asked prices on such exchange, the bid price may be used).
For securities traded on NASDAQ, the NASDAQ Official Closing Price will be used. If available, debt securities are priced based upon valuations provided by independent, third-party pricing agents. Such values generally reflect the last reported sales price if the security is actively traded. The third-party pricing agents may also value debt securities at an evaluated bid price by employing methodologies that utilize actual market transactions, broker-supplied valuations, or other methodologies designed to identify the market value for such securities. Debt obligations with remaining maturities of sixty days or less may be valued at their amortized cost, which approximates market value. The prices for foreign securities are reported in local currency and converted to U.S. dollars using currency exchange rates. Prices for most securities held in the Funds are provided daily by recognized independent pricing agents. If a security price cannot be obtained from an independent, third-party pricing agent, the Funds seek to obtain a bid price from at least one independent broker.
Securities for which market prices are not “readily available” are valued in accordance with Fair Value Procedures established by the Board. The Funds’ Fair Value Procedures are implemented through a Fair Value Committee (the “Committee”) designated by the Board. Some of the more common reasons that may necessitate that a security be valued using Fair Value Procedures include: the security’s trading has been halted or suspended; the security has been de-listed from a national exchange; the security’s primary trading market is temporarily closed at a time when under normal conditions it would be open; the security has not been traded for an extended period of time; the security’s primary pricing source is not able or willing to provide a price; or trading of the security is subject to local government-imposed restrictions. When a security is valued in accordance with the Fair Value Procedures, the Committee will determine the value after taking into consideration relevant information reasonably available to the Committee. As of April 30, 2011 there were $153,590, $147,212, $15,392 and $58,342, of fair valued securities in the Global X Brazil Mid Cap ETF, Global X Brazil Consumer ETF, Global X China Industrials ETF and Global X China Materials ETF, respectively. As of April 30, 2011, no other Fund has fair valued securities.
99
NOTESTO FINANCIAL STATEMENTS (CONTINUED)
APRIL 30, 2011 (UNAUDITED)
2. SIGNIFICANT ACCOUNTING POLICIES (continued)
SECURITY VALUATION (concluded)
For securities that principally trade on a foreign market or exchange, a significant gap in time can exist between the time of a particular security’s last trade and the time at which the Fund’s calculated their net asset value. The closing prices of such securities may no longer reflect their market value at the time the Funds calculated net asset value if an event that could materially affect the value of those securities (a “Significant Event”) has occurred between the time of the security’s last close and the time that the Funds calculate net asset value. A Significant Event may relate to a single issuer or to an entire market sector. If the Adviser becomes aware of a Significant Event that has occurred with respect to a security or group of securities after the closing of the exchange or market on which the security or securities principally trade, but before the time at which the Funds calculate net asset value, it may request that a Committee meeting be called. In addition, the Funds’ Sub-administrator, SEI Investments Global Funds Services (“SEIGFS”), monitors price movements among certain selected indices, securities and/or baskets of securities that may be an indicator that the closing prices received earlier from foreign exchanges or markets may not reflect market value at the time the Funds calculate net asset value. If price movements in a monitored index or security exceed levels established by the Sub-administrator, the Sub-administrator notifies the Adviser that such limits have been exceeded. In such event, the Adviser makes the determination whether a Committee meeting should be called based on the information provided.
In accordance with the authoritative guidance on fair value measurements and disclosure under U.S. GAAP, the Funds disclose the fair value of their investments in a hierarchy that prioritizes the inputs to valuation techniques used to measure the fair value. The objective of a fair value measurement is to determine the price that would be received to sell an asset or paid to transfer a liability in an orderly transaction between market participants at the measurement date (an exit price). Accordingly, the fair value hierarchy gives the highest priority to quoted prices (unadjusted) in active markets for identical assets or liabilities (Level 1) and the lowest priority to unobservable inputs (Level 3). The three levels of the fair value hierarchy are described below:
The three levels of the fair value hierarchy are described below:
Level 1 – Unadjusted quoted prices in active markets for identical, unrestricted assets or liabilities that the funds have has the ability to access at the measurement date
Level 2 – Other significant observable inputs (including quoted prices for similar investments, fair value of investments for which the Fund has the ability to fully redeem tranches at net asset value as of the measurement date or within the near term, and short-term investments valued at amortized cost)
Level 3 – Significant unobservable inputs (including the Fund’s own assumptions in determining the fair value of investments, fair value of investments for which the Fund does not have the ability to fully redeem tranches at net asset value as of the measurement date or within the near term) Investments are classified within the level of the lowest significant input considered in determining fair value.
Investments classified within Level 3 whose fair value measurement considers several inputs may include Level 1 or Level 2 inputs as components of the overall fair value measurement.
For the period ended April 30, 2011 there has been no significant changes to the Funds’ fair valuation methodologies.
100
NOTESTO FINANCIAL STATEMENTS (CONTINUED)
APRIL 30, 2011 (UNAUDITED)
2. SIGNIFICANT ACCOUNTING POLICIES (continued)
FEDERAL INCOME TAXES — It is the Funds’ intention to qualify or continue to qualify as a regulated investment company for Federal income tax purposes by complying with the appropriate provisions of Subchapter M of the Internal Revenue Code of 1986, as amended. Accordingly, no provisions for Federal income taxes have been made in the financial statements.
The Funds evaluate tax positions taken or expected to be taken in the course of preparing the Funds’ tax returns to determine whether it is “more-likely-than-not” (i.e., greater than 50 percent) that each tax position will be sustained upon examination by a taxing authority based on the technical merits of the position. Tax positions not deemed to meet the more-likely-than-not threshold are recorded as a tax benefit or expense in the current year. The Funds did not record any tax provision in the current period. However, management’s conclusions regarding tax positions may be subject to review and adjustment at a later date based on factors including, but not limited to, examination by tax authorities (i.e., the last three tax year ends, as applicable), on-going analysis of and changes to tax laws, regulations and interpretations thereof.
SECURITY TRANSACTIONS AND INVESTMENT INCOME — Security transactions are accounted for on trade date. Costs used in determining realized gains and losses on the sale of investment securities are based on specific identification. Dividend income is recorded on the ex-dividend date. Interest income is recognized on the accrual basis from the settlement date.
FOREIGN CURRENCY TRANSLATION — The books and records of the Funds are maintained in U.S. dollars. Investment securities and other assets and liabilities denominated in a foreign currency are translated into U.S. dollars on the date of valuation. Purchases and sales of (i) investment securities, (ii) income and (iii) expenses are translated into U.S. dollars at the relevant rates of exchange prevailing on the respective dates of such transactions. The Funds’ do not isolate that portion of realized or unrealized gains and losses resulting from changes in the foreign exchange rate from fluctuations arising from changes in the market prices of the securities. These gains and losses are included in net realized and unrealized gains and losses on investments on the Statement of Operations. Net realized and unrealized gains and losses on foreign currency transactions represent net foreign exchange gains or losses from foreign currency exchange contracts, disposition of foreign currencies, currency gains or losses realized between trade and settlement dates on securities transactions and the difference between the amount of the investment income and foreign withholding taxes recorded on the Funds’ books and the U.S. dollar equivalent amounts actually received or paid.
DIVIDENDS AND DISTRIBUTIONS TO SHAREHOLDERS — The Funds distribute substantially all of their net investment income annually. Any net realized capital gains are distributed annually. All distributions are recorded on ex-dividend date.
CREATION UNITS — The Funds issue and redeem shares (“Shares”) at NAV and only in large blocks of Shares, (each block of Shares for a Fund is called a “Creation Unit” or multiples thereof). Purchasers of Creation Units (“Authorized Participants”) at NAV must pay a standard creation transaction fee per transaction. The fee is a single charge and will be the same regardless of the number of Creation Units purchased by an investor on the same day. An Authorized Participant who holds Creation Units and wishes to redeem at NAV would also pay a standard Redemption Fee per
101
NOTESTO FINANCIAL STATEMENTS (CONTINUED)
APRIL 30, 2011 (UNAUDITED)
2. SIGNIFICANT ACCOUNTING POLICIES (concluded)
CREATION UNITS (concluded)
transaction on the date of such redemption, regardless of the number of Creation Units redeemed that day.
If a Creation Unit is purchased or redeemed for cash, a higher Transaction Fee will be charged. The following table discloses Creation Unit breakdown:
| | | | | | | | | | | | | | | | |
| | | Creation
Unit Shares | | | Transaction
Fee | | | Value | | | Redemption
Fee | |
Global X Silver Miners ETF | | | 50,000 | | | $ | 1,000 | | | $ | 1,422,500 | | | $ | 1,000 | |
Global X Lithium ETF | | | 50,000 | | | | 1,000 | | | | 1,125,500 | | | | 1,000 | |
Global X Copper Miners ETF | | | 50,000 | | | | 1,000 | | | | 1,018,000 | | | | 1,000 | |
Global X Pure Gold Miners ETF | | | 50,000 | | | | 1,000 | | | | 823,000 | | | | 1,000 | |
Global X Uranium ETF | | | 50,000 | | | | 1,000 | | | | 710,500 | | | | 1,000 | |
Global X Aluminum ETF | | | 50,000 | | | | 1,000 | | | | 786,000 | | | | 1,000 | |
Global X Gold Explorers ETF | | | 50,000 | | | | 1,000 | | | | 927,500 | | | | 1,000 | |
Global X Brazil Mid Cap ETF | | | 50,000 | | | | 1,900 | | | | 941,500 | | | | 1,900 | |
Global X Brazil Financials ETF | | | 50,000 | | | | 1,500 | | | | 875,000 | | | | 1,500 | |
Global X Brazil Consumer ETF | | | 50,000 | | | | 1,500 | | | | 1,015,000 | | | | 1,500 | |
Global X FTSE Colombia 20 ETF | | | 50,000 | | | | 2,500 | | | | 1,065,000 | | | | 2,500 | |
Global X FTSE Nordic Region ETF | | | 50,000 | | | | 1,400 | | | | 1,140,000 | | | | 1,400 | |
Global X FTSE Norway 30 ETF | | | 50,000 | | | | 1,400 | | | | 889,000 | | | | 1,400 | |
Global X FTSE Argentina 20 ETF | | | 50,000 | | | | 1,000 | | | | 766,000 | | | | 1,000 | |
Global X FTSE Andean 40 ETF | | | 50,000 | | | | 2,300 | | | | 772,000 | | | | 2,300 | |
Global X ASEAN 40 ETF | | | 50,000 | | | | 2,300 | | | | 829,000 | | | | 2,300 | |
Global X China Consumer ETF | | | 50,000 | | | | 1,900 | | | | 913,000 | | | | 1,900 | |
Global X China Energy ETF | | | 50,000 | | | | 1,900 | | | | 876,500 | | | | 1,900 | |
Global X China Financials ETF | | | 50,000 | | | | 1,900 | | | | 695,000 | | | | 1,900 | |
Global X China Industrials ETF | | | 50,000 | | | | 1,900 | | | | 839,000 | | | | 1,900 | |
Global X China Technology ETF | | | 50,000 | | | | 1,900 | | | | 977,000 | | | | 1,900 | |
Global X China Materials ETF | | | 50,000 | | | | 1,900 | | | | 712,500 | | | | 1,900 | |
Global X Russell Emerging Markets Growth ETF | | | 50,000 | | | | 4,500 | | | | 1,313,000 | | | | 4,500 | |
Global X Russell Emerging Markets Value ETF | | | 50,000 | | | | 4,500 | | | | 1,347,000 | | | | 4,500 | |
Global X S&P/TSX Venture 30 Canada ETF | | | 50,000 | | | | 1,000 | | | | 823,000 | | | | 1,000 | |
Global X Oil Equities ETF | | | 50,000 | | | | 1,000 | | | | 791,000 | | | | 1,000 | |
Global X Waste Management ETF | | | 50,000 | | | | 1,000 | | | | 762,500 | | | | 1,000 | |
3. RELATED PARTY TRANSACTIONS
The Adviser serves as the investment adviser and the administrator for the Funds. Subject to the supervision of the Board of Trustees, the Adviser is responsible for managing the investment activities of the Funds and the Funds’ business affairs and other administrative matters and provides or causes to be furnished all supervisory, administrative and other services reasonably necessary for the operation of the Funds, including certain distribution services (provided pursuant to a separate Distribution Agreement), certain shareholder and distribution-related services (provided pursuant to a separate Rule 12b-1 Plan and related agreements) and investment advisory services (provided pursuant to a separate Investment Advisory Agreement), under what is essentially an “all-in” fee
102
NOTESTO FINANCIAL STATEMENTS (CONTINUED)
APRIL 30, 2011 (UNAUDITED)
3. RELATED PARTY TRANSACTIONS (continued)
structure. For its service to the Funds, under the Supervision and Administration Agreement, each Fund pays a monthly a fee to the Adviser at the annual rate (stated as a percentage of the average daily net assets of the Fund). In addition, the Funds bear other expenses that are not covered by the Supervision and Administration Agreement, which may vary and affect the total expense ratios of the Funds, such as taxes and governmental fees, brokerage fees, commissions and other transaction expenses, costs of borrowing money, including interest expenses and extraordinary expenses (such as litigation and indemnification expenses). In addition, the Global X FTSE Colombia 20 ETF and Global X FTSE Argentina 20 ETF pays, or would be required to pay, custodial fees that are not covered by the Supervision and Administration Agreement.
| | | | |
| | | Supervision and
Administration Fee | |
Global X Silver Miners ETF | | | 0.65 | % |
Global X Lithium ETF | | | 0.75 | % |
Global X Copper Miners ETF | | | 0.65 | % |
Global X Pure Gold Miners ETF | | | 0.59 | % |
Global X Uranium ETF | | | 0.69 | % |
Global X Aluminum ETF | | | 0.69 | % |
Global X Gold Explorers ETF | | | 0.65 | % |
Global X Brazil Mid Cap ETF | | | 0.69 | % |
Global X Brazil Financials ETF | | | 0.77 | % |
Global X Brazil Consumer ETF | | | 0.77 | % |
Global X FTSE Colombia 20 ETF* | | | 0.68 | % |
Global X FTSE Nordic Region ETF | | | 0.50 | % |
Global X FTSE Norway 30 ETF | | | 0.50 | % |
Global X FTSE Argentina 20 ETF* | | | 0.74 | % |
Global X FTSE Andean 40 ETF | | | 0.72 | % |
Global X ASEAN 40 ETF | | | 0.65 | % |
Global X China Consumer ETF | | | 0.65 | % |
Global X China Energy ETF | | | 0.65 | % |
Global X China Financials ETF | | | 0.65 | % |
Global X China Industrials ETF | | | 0.65 | % |
Global X China Technology ETF | | | 0.65 | % |
Global X China Materials ETF | | | 0.65 | % |
Global X Russell Emerging Markets Growth ETF | | | 0.69 | % |
Global X Russell Emerging Markets Value ETF | | | 0.69 | % |
Global X S&P/TSX Venture 30 Canada ETF | | | 0.75 | % |
Global X Oil Equities ETF | | | 0.49 | % |
Global X Waste Management ETF | | | 0.65 | % |
| * | The Global X FTSE Colombia 20 ETF and the Global X FTSE Argentina 20 ETF paid 0.16% and 0.00%, respectively in Custody Fees (in addition to the Supervision and Administration Fee) during the period ended April 30, 2011. |
103
NOTESTO FINANCIAL STATEMENTS (CONTINUED)
APRIL 30, 2011 (UNAUDITED)
3. RELATED PARTY TRANSACTIONS (concluded)
The Adviser and InterBolsa S.A. (“InterBolsa”), one of the leading broker-dealers located in Colombia, entered into an agreement, pursuant to which InterBolsa has agreed to provide certain marketing, marketing-related and other services and allows the use of InterBolsa’s name and brand with respect to the Global X FTSE Colombia 20 ETF. Under this agreement, InterBolsa agreed to make an initial payment to the Adviser regarding certain start up expenses for the Fund and the Adviser has agreed to share with InterBolsa fifty percent (50%) of the Adviser’s legitimate profits and losses with respect to the Global X FTSE Colombia 20 ETF.
The Adviser and MCCA Lithium ETF, LLC (“MCCA”), a single purpose limited liability firm, have entered into an agreement, pursuant to which MCCA has agreed to assist the Adviser, in its capacity as sponsor of the Global X Lithium ETF, by providing initial capital and additional financial resources to the Adviser in connection with the listing, launch and the continuing operation of the Global X Lithium Fund. In return, the Adviser has agreed to compensate MCCA for its financial assistance to the Adviser with respect to the Global X Lithium ETF by sharing with MCCA fifty percent (50%) of the Adviser’s Net Profits with respect to the Global X Lithium ETF. For this purpose, the term Net Profits means, for any calendar quarter, the total management fees received by the Adviser with respect to the Global X Lithium ETF less direct expenses, marketing expenses and overhead expenses for the Global X Lithium ETF during such quarter. In the event that there are no Net Profits with respect to the Global X Lithium ETF in any calendar quarter, MCCA shall pay fifty percent of the negative shortfall in Net Profits to the Adviser. The agreement between the parties does not contemplate that MCCA or any of its affiliates will be involved directly or indirectly in the distribution of shares of the Global X Lithium ETF.
SEIGFS serves as Sub-Administrator to the Funds. As Sub-Administrator, SEIGFS provides the Funds with the required general administrative services, including, without limitation: office space, equipment, and personnel; clerical and general back office services; bookkeeping, internal accounting and secretarial services; the calculation of NAV; and assistance with the preparation and filing of reports, registration statements, proxy statements and other materials required to be filed or furnished by the Funds under federal and state securities laws. As compensation for these services, the Sub-Administrator receives certain out-of-pocket costs, transaction fees and asset-based fees which are accrued daily and paid monthly by the Adviser.
SEI Investments Distribution Co. (“SIDCO”) serves as each Funds underwriter and distributor of Shares pursuant to a Distribution Agreement. Under the Distribution Agreement, SIDCO, as agent, receives orders to create and redeem Shares in Creation Unit Aggregations and transmits such orders to the Trust’s custodian and transfer agent. The Distributor has no obligation to sell any specific quantity of Fund Shares. SIDCO bears the following costs and expenses relating to the distribution of Shares: (i) the costs of processing and maintaining records of creations of Creation Units; (ii) all costs of maintaining the records required of a registered broker/dealer; (iii) the expenses of maintaining its registration or qualification as a dealer or broker under Federal or state laws; (iv) filing fees; and (v) all other expenses incurred in connection with the distribution services as contemplated in the Distribution Agreement.
104
NOTESTO FINANCIAL STATEMENTS (CONTINUED)
APRIL 30, 2011 (UNAUDITED)
4. INVESTMENT TRANSACTIONS
For the period ended April 30, 2011, the purchases and sales of investments in securities excluding in-kind transactions, long-term U.S. Government and short-term securities were:
| | | | | | | | |
| | | Purchases | | | Sales and
Maturities | |
Global X Silver Miners ETF | | $ | 67,861,826 | | | $ | 32,922,228 | |
Global X Lithium ETF | | | 19,591,480 | | | | 7,209,321 | |
Global X Copper Miners ETF | | | 9,814,496 | | | | 3,128,826 | |
Global X Gold Explorers ETF | | | 6,147,814 | | | | 2,965,521 | |
Global X Uranium ETF | | | 33,926,333 | | | | 1,121,539 | |
Global X Aluminum ETF | | | 211,126 | | | | — | |
Global X Pure Gold Miners ETF | | | — | | | | — | |
Global X Brazil Mid Cap ETF | | | 1,665,052 | | | | 4,032,906 | |
Global X Brazil Financials ETF | | | 693,627 | | | | 649,552 | |
Global X Brazil Consumer ETF | | | 3,117,449 | | | | 4,537,352 | |
Global X FTSE Colombia 20 ETF | | | 51,294,017 | | | | 47,338,696 | |
Global X FTSE Nordic Region ETF | | | 1,817,478 | | | | 950,375 | |
Global X FTSE Norway 30 ETF | | | 2,660,625 | | | | 320,871 | |
Global X FTSE Argentina 20 ETF | | | 418,633 | | | | 292,127 | |
Global X FTSE Andean 40 ETF | | | 3,556,085 | | | | 239,519 | |
Global X FTSE ASEAN 40 ETF | | | 790,853 | | | | 43,857 | |
Global X China Consumer ETF | | | 36,325,853 | | | | 10,550,703 | |
Global X China Energy ETF | | | 1,121,776 | | | | 347,075 | |
Global X China Financials ETF | | | 6,686,013 | | | | 6,633,836 | |
Global X China Industrials ETF | | | 1,850,225 | | | | 1,286,645 | |
Global X China Technology ETF | | | 960,283 | | | | 443,553 | |
Global X China Materials ETF | | | 5,762,615 | | | | 5,434,793 | |
Global X Russell Emerging Markets Growth ETF | | | 426,954 | | | | — | |
Global X Russell Emerging Markets Value ETF | | | 374,687 | | | | — | |
Global X S&P/TSX Venture 30 Canada ETF | | | — | | | | — | |
Global X Oil Equities ETF | | | — | | | | — | |
Global X Waste Management ETF | | | 44,981 | | | | — | |
105
NOTESTO FINANCIAL STATEMENTS (CONTINUED)
APRIL 30, 2011 (UNAUDITED)
4. INVESTMENT TRANSACTIONS (concluded)
For the period ended April 30, 2011, in-kind transactions associated with creations and redemptions were:
| | | | | | | | | | | | |
| | | Purchases | | | Sales and
Maturities | | | Realized
Gain/(Loss) | |
Global X Silver Miners ETF | | $ | 373,879,714 | | | $ | 53,750,708 | | | $ | 15,635,435 | |
Global X Lithium ETF | | | 100,350,670 | | | | 18,824,713 | | | | 4,954,937 | |
Global X Copper Miners ETF | | | 94,412,333 | | | | 36,378,372 | | | | 214,660 | |
Global X Pure Gold Miners ETF | | | 3,052,144 | | | | — | | | | — | |
Global X Uranium ETF | | | 335,521,904 | | | | 40,008,195 | | | | 4,338,070 | |
Global X Aluminum ETF | | | 5,145,616 | | | | — | | | | — | |
Global X Gold Explorers ETF | | | 23,726,433 | | | | 3,236,264 | | | | (97,847 | ) |
Global X Brazil Mid Cap ETF | | | 6,181,675 | | | | 1,340,119 | | | | (61,539 | ) |
Global X Brazil Financials ETF | | | 1,675,018 | | | | — | | | | — | |
Global X Brazil Consumer ETF | | | 11,161,468 | | | | 1,489,065 | | | | 46,095 | |
Global X FTSE Colombia 20 ETF | | | 9,387,610 | | | | 40,624,972 | | | | 5,374,907 | |
Global X FTSE Nordic Region ETF | | | 17,030,340 | | | | 642,932 | | | | (67,310 | ) |
Global X FTSE Norway 30 ETF | | | 51,781,427 | | | | 8,139,326 | | | | (34,570 | ) |
Global X FTSE Argentina 20 ETF | | | 3,622,084 | | | | — | | | | — | |
Global X FTSE Andean 40 ETF | | | 4,006,971 | | | | — | | | | — | |
Global X FTSE ASEAN 40 ETF | | | 1,582,618 | | | | — | | | | — | |
Global X China Consumer ETF | | | 42,173,944 | | | | 34,935,987 | | | | 8,076,487 | |
Global X China Energy ETF | | | 4,758,439 | | | | 834,054 | | | | 260,833 | |
Global X China Financials ETF | | | — | | | | 58,577,667 | | | | (469,371 | ) |
Global X China Industrials ETF | | | — | | | | 4,678,184 | | | | 357,920 | |
Global X China Technology ETF | | | 874,845 | | | | 586,547 | | | | 289,119 | |
Global X China Materials ETF | | | 1,528,181 | | | | 54,150,081 | | | | 11,470,204 | |
Global X Russell Emerging Markets Growth ETF | | | 2,090,985 | | | | — | | | | — | |
Global X Russell Emerging Markets Value ETF | | | 2,136,553 | | | | — | | | | — | |
Global X S&P/TSX Venture 30 Canada ETF | | | 4,829,680 | | | | 830,075 | | | | (9,390 | ) |
Global X Oil Equities ETF | | | 3,853,036 | | | | — | | | | — | |
Global X Waste Management ETF | | | 2,923,494 | | | | — | | | | — | |
During the period ended April 30, 2011, there were no purchases or sales of long-term U.S. Government securities for the Funds.
5. TAX INFORMATION
The amount and character of income and capital gain distributions to be paid, if any, are determined in accordance with Federal income tax regulations, which may differ from U.S. GAAP. As a result, net investment income (loss) and net realized gain (loss) on investment transactions for a reporting period may differ significantly from distributions during such period. These book/tax differences may be temporary or permanent. To the extent these differences are permanent in nature, they are charged or credited to undistributed net investment income (loss), accumulated net realized gain (loss) or paid-in capital, as appropriate, in the period that the differences arise.
106
NOTESTO FINANCIAL STATEMENTS (CONTINUED)
APRIL 30, 2011 (UNAUDITED)
5. TAX INFORMATION (continued)
The tax character of dividends and distributions paid during the last period ended October 31, 2010 and 2009 were as follows:
| | | | | | | | | | | | |
Global X Funds | | Ordinary
Income | | | Long-Term
Capital
Gain | | | Totals | |
Global X FTSE Colombia 20 ETF | | | | | | | | | | | | |
2010 | | $ | 264,734 | | | $ | — | | | $ | 264,734 | |
2009 | | $ | — | | | $ | — | | | $ | — | |
Global X FTSE Nordic Region ETF | | | | | | | | | | | | |
2010 | | $ | 2,158 | | | $ | — | | | $ | 2,158 | |
2009 | | $ | — | | | $ | — | | | $ | — | |
As of October 31, 2010, the components of Distributable Earnings on a tax basis were as follows:
| | | | | | | | | | | | |
| | | Global X Silver
Miners ETF | | | Global X
Lithium ETF | | | Global X Copper
Miners ETF | |
Undistributed Ordinary Income | | $ | 2,989,314 | | | $ | 1,619,934 | | | $ | 367,992 | |
Capital Loss Carryforwards | | | — | | | | — | | | | (10,213 | ) |
Unrealized Appreciation on Investments and Foreign Currency | | | 26,532,154 | | | | 5,620,698 | | | | 400,798 | |
Other Temporary Differences | | | — | | | | 13,433 | | | | — | |
| | | | | | | | | | | | |
Total Distributable Earnings | | $ | 29,521,468 | | | $ | 7,254,065 | | | $ | 758,577 | |
| | | | | | | | | | | | |
| | | |
| | | Global X Brazil
Mid Cap ETF | | | Global X Brazil
Financials ETF | | | Global X Brazil
Consumer ETF | |
Undistributed Ordinary Income | | $ | 318,873 | | | $ | 13,826 | | | $ | 26,760 | |
Capital Loss Carryforwards | | | — | | | | (3 | ) | | | — | |
Unrealized Appreciation on Investments and Foreign Currency | | | 2,367,748 | | | | 495,514 | | | | 2,311,009 | |
| | | | | | | | | | | | |
Total Distributable Earnings | | $ | 2,686,621 | | | $ | 509,337 | | | $ | 2,337,769 | |
| | | | | | | | | | | | |
| | | |
| | | Global X FTSE
Colombia 20
ETF | | | Global X FTSE
Nordic Region
ETF | | | Global X China
Consumer ETF | |
Undistributed Ordinary Income | | $ | 891,803 | | | $ | 150,580 | | | $ | 1,734,523 | |
Undistributed Long-Term Capital Gain | | | 456,069 | | | | — | | | | — | |
Capital Loss Carryforwards | | | — | | | | (7,319 | ) | | | (173,208 | ) |
Unrealized Appreciation on Investments and Foreign Currency | | | 20,832,547 | | | | 1,529,491 | | | | 19,923,248 | |
Other Temporary Differences | | | — | | | | 78 | | | | — | |
| | | | | | | | | | | | |
Total Distributable Earnings | | $ | 22,180,419 | | | $ | 1,672,830 | | | $ | 21,484,563 | |
| | | | | | | | | | | | |
107
NOTESTO FINANCIAL STATEMENTS (CONTINUED)
APRIL 30, 2011 (UNAUDITED)
5. TAX INFORMATION (continued)
| | | | | | | | | | | | |
| | | Global X China
Energy ETF | | | Global X China
Financials ETF | | | Global X China
Industrials ETF | |
Undistributed Ordinary Income | | $ | 61,491 | | | $ | 1,177,309 | | | $ | 149,709 | |
Capital Loss Carryforwards | | | — | | | | (626,459 | ) | | | (220,121 | ) |
Unrealized Appreciation on Investments and Foreign Currency | | | 155,823 | | | | 2,240,678 | | | | 540,341 | |
| | | | | | | | | | | | |
Total Distributable Earnings | | $ | 217,314 | | | $ | 2,791,528 | | | $ | 469,929 | |
| | | | | | | | | | | | |
| | | | | | | | |
| | | Global X China
Technology ETF | | | Global X China
Materials ETF | |
Undistributed Ordinary Income | | $ | 45,879 | | | $ | 336,119 | |
Unrealized Appreciation on Investments and Foreign Currency | | | 493,901 | | | | 10,604,595 | |
| | | | | | | | |
Total Distributable Earnings | | $ | 539,780 | | | $ | 10,940,714 | |
| | | | | | | | |
Under the recently enacted Regulated Investment Company Modernization Act of 2010, Funds will be permitted to carry forward capital losses incurred in taxable years beginning after December 22, 2010 for an unlimited period. However, any losses incurred during those future taxable years will be required to be utilized prior to the losses incurred in pre-enactment taxable years. As a result of this ordering rule, preenactment capital loss carryforwards may be more likely to expire unused. Additionally, post-enactment capital losses that are carried forward will retain their character as either short-term or long-term capital losses rather than being considered all short-term as under previous law.
For Federal income tax purposes, capital loss carryforwards represent realized losses of the Funds that may be carried forward for a maximum period of eight years and applied against future gains. As of October 31, 2010, the Funds that had capital loss carryforwards are listed below.
| | | | | | | | | | | | | | | | | | | | | | | | |
| | | Global X
Copper
Miners
ETF | | | Global X
Brazil
Financials
ETF | | | Global X
FTSE
Nordic
Region
ETF | | | Global X
China
Consumer
ETF | | | Global X
China
Financials
ETF | | | Global X
China
Industrials
ETF | |
Oct. 2018 | | $ | 10,213 | | | $ | 3 | | | $ | 7,319 | | | $ | 173,208 | | | $ | 626,459 | | | $ | 220,121 | |
| | | | | | | | | | | | | | | | | | | | | | | | |
Total | | $ | 10,213 | | | $ | 3 | | | $ | 7,319 | | | $ | 173,208 | | | $ | 626,459 | | | $ | 220,121 | |
| | | | | | | | | | | | | | | | | | | | | | | | |
108
NOTESTO FINANCIAL STATEMENTS (CONTINUED)
APRIL 30, 2011 (UNAUDITED)
5. TAX INFORMATION (concluded)
The Federal tax cost and aggregate gross unrealized appreciation and depreciation on investments held by the Funds at April 30, 2011 were as follows:
| | | | | | | | | | | | | | | | |
Global X Funds | | Federal Tax
Cost | | | Aggregated
Gross
Unrealized
Appreciation | | | Aggregated
Gross
Unrealized
Depreciation | | | Net
Unrealized
Appreciation
(Depreciation) | |
Global X Silver Miners ETF | | $ | 508,993,282 | | | $ | 128,670,867 | | | $ | (1,974,556 | ) | | $ | 126,696,311 | |
Global X Lithium ETF | | | 230,868,031 | | | | 34,301,190 | | | | (15,082,090 | ) | | | 19,219,100 | |
Global X Copper Miners ETF | | | 94,293,237 | | | | 12,098,292 | | | | (1,465,340 | ) | | | 10,632,952 | |
Global X Pure Gold Miners ETF | | | 3,052,144 | | | | 303,650 | | | | (63,625 | ) | | | 240,025 | |
Global X Uranium ETF | | | 332,421,702 | | | | 586,248 | | | | (65,490,216 | ) | | | (64,903,968 | ) |
Global X Aluminum ETF | | | 5,356,742 | | | | 266,072 | | | | (134,733 | ) | | | 131,339 | |
Global X Gold Explorers ETF | | | 24,342,871 | | | | 2,445,686 | | | | (788,235 | ) | | | 1,657,451 | |
Global X Brazil Mid Cap ETF | | | 28,798,493 | | | | 4,464,032 | | | | (542,333 | ) | | | 3,921,699 | |
Global X Brazil Financials ETF | | | 9,012,505 | | | | 767,383 | | | | (236,109 | ) | | | 531,274 | |
Global X Brazil Consumer ETF | | | 30,743,787 | | | | 3,915,271 | | | | (1,382,270 | ) | | | 2,533,001 | |
Global X FTSE Colombia 20 ETF | | | 148,969,157 | | | | 8,128,369 | | | | (2,352,386 | ) | | | 5,775,983 | |
Global X FTSE Nordic Region ETF | | | 28,370,414 | | | | 6,153,815 | | | | (275,923 | ) | | | 5,877,892 | |
Global X FTSE Norway 30 ETF | | | 45,924,822 | | | | 5,453,263 | | | | (308,626 | ) | | | 5,144,637 | |
Global X FTSE Argentina 20 ETF | | | 4,238,367 | | | | 200,323 | | | | (150,246 | ) | | | 50,077 | |
Global X FTSE Andean 40 ETF | | | 7,307,664 | | | | 554,340 | | | | (158,307 | ) | | | 396,033 | |
Global X FTSE ASEAN 40 ETF | | | 2,329,467 | | | | 161,624 | | | | (3,635 | ) | | | 157,989 | |
Global X China Consumer ETF | | | 191,687,324 | | | | 12,557,299 | | | | (14,327,347 | ) | | | (1,770,048 | ) |
Global X China Energy ETF | | | 9,456,385 | | | | 1,253,075 | | | | (220,606 | ) | | | 1,032,469 | |
Global X China Financials ETF | | | 8,101,835 | | | | 390,569 | | | | (843,776 | ) | | | (453,207 | ) |
Global X China Industrials ETF | | | 8,649,197 | | | | 1,571,224 | | | | (1,691,363 | ) | | | (120,139 | ) |
Global X China Technology ETF | | | 5,000,518 | | | | 1,237,905 | | | | (399,326 | ) | | | 838,579 | |
Global X China Materials ETF | | | 6,598,917 | | | | 726,257 | | | | (916,261 | ) | | | (190,004 | ) |
Global X Russell Emerging Markets Growth ETF | | | 2,518,379 | | | | 171,079 | | | | (63,003 | ) | | | 108,076 | |
Global X Russell Emerging Markets Value ETF | | | 2,511,239 | | | | 237,984 | | | | (43,704 | ) | | | 194,280 | |
Global X S&P/TSX Venture 30 Canada ETF | | | 4,690,211 | | | | 288,623 | | | | (161,735 | ) | | | 126,888 | |
Global X Oil Equities ETF | | | 3,853,036 | | | | 150,179 | | | | (49,468 | ) | | | 100,711 | |
Global X Waste Management ETF | | | 3,218,474 | | | | 107,118 | | | | (25,926 | ) | | | 81,192 | |
The preceding differences between book and tax cost are primarily due to mark to market treatment of passive foreign investment companies and wash sales.
6. CONCENTRATION OF RISKS
The Funds invest in securities of foreign issuers in several countries. These investments may involve certain considerations and risks not typically associated with investments in the United States as a result of, among other factors, the possibility of future political and economic developments and the level of governmental supervision and regulation of securities markets in the respective countries.
The securities markets of emerging countries are less liquid and subject to greater price volatility, and have a smaller market capitalization, than the U.S. securities markets. In certain countries, there may be fewer publicly traded securities and the market may be dominated by a few issues or sectors. Issuers and securities markets in such countries are not subject to as extensive and frequent accounting, financial and other reporting requirements or as comprehensive government regulations as are issuers and securities markets in the U.S. In particular, the assets and profits appearing on the financial statements of emerging country issuers may not reflect their financial position or results of operations in the same manner as financial statements for U.S. issuers. Substantially less information
109
NOTESTO FINANCIAL STATEMENTS (CONTINUED)
APRIL 30, 2011 (UNAUDITED)
6. CONCENTRATION OF RISKS (concluded)
may be publicly available about emerging country issuers than is available about issuers in the United States.
The Funds may be subject to taxes imposed by countries in which it invests. Such taxes are generally based on either income or gains earned or repatriated. The Funds accrue and apply such taxes to net investment income, net realized gains and net unrealized gains as income and/or capital gains are earned.
The Funds (other than the Global X Russell Emerging Markets Growth ETF and the Global X Russell Emerging Markets Value ETF) use a replication strategy. A replication strategy is an indexing strategy that involves investing in the securities of the Underlying Index in approximately the same proportions as in the Underlying Index. The Global X Russell Emerging Markets Growth ETF and the Global X Russell Emerging Markets Value ETF use, and the other Funds may utilize, a representative sampling strategy with respect to its Underlying Index when a replication strategy might be detrimental to its shareholders, such as when there are practical difficulties or substantial costs involved in compiling a portfolio of equity securities to follow its Underlying Index, or, in certain instances, when securities in the Underlying Index become temporarily illiquid, unavailable or less liquid, or due to legal restrictions (such as diversification requirements that apply to the Funds but not the Underlying Indexes).
Certain Funds may invest in commodity related securities, which are susceptible to fluctuations in certain commodity markets. Any negative changes in commodity markets could have a great impact on those securities.
110
NOTESTO FINANCIAL STATEMENTS (CONTINUED)
APRIL 30, 2011 (UNAUDITED)
7. OTHER
At April 30, 2011, the total Shares outstanding that were held by Authorized Participants were as follows. The Authorized Participants have entered into an agreement with the Funds’ Distributor.
| | | | | | | | |
| | | Authorized
Participants | | | Percentage
of Shares
Outstanding | |
Global X Silver Miners ETF | | | 6 | | | | 100 | % |
Global X Lithium ETF | | | 4 | | | | 100 | % |
Global X Copper Miners ETF | | | 5 | | | | 100 | % |
Global X Pure Gold Miners ETF | | | 1 | | | | 100 | % |
Global X Uranium ETF | | | 6 | | | | 100 | % |
Global X Aluminum ETF | | | 2 | | | | 100 | % |
Global X Gold Explorers ETF | | | 3 | | | | 100 | % |
Global X Brazil Mid Cap ETF | | | 3 | | | | 100 | % |
Global X Brazil Financials ETF | | | 3 | | | | 100 | % |
Global X Brazil Consumer ETF | | | 3 | | | | 100 | % |
Global X FTSE Colombia 20 ETF | | | 5 | | | | 100 | % |
Global X FTSE Nordic Region ETF | | | 5 | | | | 100 | % |
Global X FTSE Norway 30 ETF | | | 4 | | | | 100 | % |
Global X FTSE Argentina 20 ETF | | | 3 | | | | 100 | % |
Global X FTSE Andean 40 ETF | | | 3 | | | | 100 | % |
Global X FTSE ASEAN 40 ETF | | | 1 | | | | 100 | % |
Global X China Consumer ETF | | | 6 | | | | 100 | % |
Global X China Energy ETF | | | 3 | | | | 100 | % |
Global X China Financials ETF | | | 3 | | | | 100 | % |
Global X China Industrials ETF | | | 1 | | | | 100 | % |
Global X China Technology ETF | | | 3 | | | | 100 | % |
Global X China Materials ETF | | | 2 | | | | 100 | % |
Global X Russell Emerging Markets Growth ETF | | | 1 | | | | 100 | % |
Global X Russell Emerging Markets Value ETF | | | 1 | | | | 100 | % |
Global X S&P/TSX Venture 30 Canada ETF | | | 2 | | | | 100 | % |
Global X Oil Equities ETF | | | 1 | | | | 100 | % |
Global X Waste Management ETF | | | 2 | | | | 100 | % |
Pursuant to the Trust’s organizational documents, the Trustees of the Trust and the Trust’s officers are indemnified against certain liabilities that may arise out of the performance of their duties. Additionally, in the normal course of business, the Funds enter into contracts that provide general indemnifications. The Funds’ maximum exposure under these arrangements is dependent on future claims that may be made against the Funds and, therefore, cannot be established.
111
NOTESTO FINANCIAL STATEMENTS (CONTINUED)
APRIL 30, 2011 (UNAUDITED)
8. SHARE SPLIT
On April 12, 2011, the Global X Colombia 20 ETF Fund declared a 2 for 1 share split.
9. CHANGE OF INDEPENDENT REGISTERED PUBLIC ACCOUNTING FIRM
The Global X Funds have selected Ernst & Young LLP (“E&Y”) to serve as the Funds’ independent registered public accounting firm for the Funds’ fiscal year ended October 31, 2011. The decision to select E&Y was recommended by the Funds’ Audit Committee on December 21, 2010 and was approved by the Funds’ Board of Trustees on January 28, 2011. During the Global X Funds’ fiscal years ended October 31, 2009 and October 31, 2010, neither the Funds, their portfolios, nor anyone on their behalf, consulted with E&Y on items which: (i) concerned the application of accounting principles to a specified transaction, either completed or proposed, or the type of audit opinion that might be rendered on the Global X Funds’ financial statements; or (ii) concerned the subject of a disagreement (as defined in paragraph (a)(1)(iv) of Item 304 of Regulation S-K) or reportable events (as described in paragraph (a)(1)(iv) of said Item 304).
The selection of E&Y does not reflect any disagreements with or dissatisfaction by the Global X Funds or the Funds’ Board of Trustees with the performance of the Global X Funds’ prior independent registered public accounting firm, Sanville & Company (“Sanville”). The decision not to renew the engagement of Sanville, effective upon its completion of its audit for the fiscal year ended October 31, 2010, and to select E&Y was recommended by the Funds’ Audit Committee and approved by the Funds’ Board of Trustees. Sanville’s report on the Global X Funds’ financial statements for the fiscal years ended October 31, 2009 and October 31, 2010 contained no adverse opinion or disclaimer of opinion, nor were they qualified or modified as to uncertainty, audit scope, or accounting principles. During the Global X Funds’ fiscal years ended October 31, 2009 and October 31, 2010 (i) there were no disagreements with Sanville on any matter of accounting principles or practices, financial statement disclosure, or auditing scope or procedure, which disagreements, if not resolved to the satisfaction of Sanville, would have caused them to make reference to the subject matter of the disagreements in connection with their reports on the Global X Funds’ financial statements for such years; and (ii) there were no “reportable events” of the kind described in Item 304(a)(1)(v) of Regulation S-K.
10. LOANS OF PORTFOLIO SECURITIES
The Funds may lend portfolio securities having a market value up to one-third of the Funds’ total assets. Such loans are secured by collateral equal to no less than the market value of the loaned securities determined daily. Such collateral will be cash or debt securities issued or guaranteed by the U.S. Government or any agencies. Cash collateral received in connection with these loans is invested in short-term money market instruments. It is the Funds’ policy to obtain additional collateral from or return excess collateral to the borrower by the end of the next business day, following the valuation date of the securities loaned. Therefore, the value of the collateral held may be temporarily less than the value of the securities on loan. Lending securities entails a risk of loss to the Fund if and to the extent that the market value of the securities loans were to increase and the borrower did not increase the collateral accordingly, and the borrower fails to return the securities. The Fund could also experience delays and costs in gaining access to the collateral. The Fund bears the risk of any deficiency in the amount of the collateral available for return to the borrower due to any loss on the collateral invested. As of April 30, 2011, there were no securities on loan for any of the Funds.
112
NOTESTO FINANCIAL STATEMENTS (CONCLUDED)
APRIL 30, 2011 (UNAUDITED)
11. SUBSEQUENT EVENT
The Funds have evaluated the need for additional disclosures and/or adjustments resulting from subsequent events. Based on this evaluation, no additional disclosures or adjustments were required to the financial statements as of the date the financial statements were issued.
Subsequent to period end, the following investment portfolios of the Trust commenced operations.
| | |
Fund Name | | Commenced Operations |
Global X Food ETF | | May 2, 2011 |
Global X Fishing Industry ETF | | May 3, 2011 |
Global X Mexico Small-Cap ETF | | May 4, 2011 |
Global X Auto ETF | | May 18, 2011 |
Global X Canada Preferred ETF | | May 24, 2011 |
Global X Fertilizers/Potash ETF | | May 25, 2011 |
Global X Farming ETF | | June 1, 2011 |
Global X SuperDividend ETF | | June 8, 2011 |
113
DISCLOSUREOF FUND EXPENSES
APRIL 30, 2011 (UNAUDITED)
All Exchange Traded Funds (“ETF”) have operating expenses. As a shareholder of an ETF, your investment is affected by these ongoing costs, which include (among others) costs for ETF management, administrative services, brokerage fees, and shareholder reports like this one. It is important for you to understand the impact of these costs on your investment returns.
Operating expenses such as these are deducted from an ETF’s gross income and directly reduce your final investment return. These expenses are expressed as a percentage of the ETF’s average net assets; this percentage is known as the ETF’s expense ratio.
The following examples use the expense ratio and are intended to help you understand the ongoing costs (in dollars) of investing in your Fund and to compare these costs with those of other funds. The examples are based on an investment of $1,000 made at the beginning of the period shown and held for the entire period.
The table on the next page illustrates your Fund’s costs in two ways:
Actual Fund Return. This section helps you to estimate the actual expenses that your Fund incurred over the period. The “Expenses Paid During Period” column shows the actual dollar expense cost incurred by a $1,000 investment in the Fund, and the “Ending Account Value” number is derived from deducting that expense cost from the Fund’s gross investment return.
You can use this information, together with the actual amount you invested in the Funds, to estimate the expenses you paid over that period. Simply divide your actual account value by $1,000 to arrive at a ratio (for example, an $8,600 account value divided by $1,000 = 8.6), then multiply that ratio by the number shown for your Funds under “Expenses Paid During Period.”
Hypothetical 5% Return. This section helps you compare your Fund’s costs with those of other funds. It assumes that the Funds had an annual 5% return before expenses during the year, but that the expense ratio (Column 3) for the period is unchanged. This example is useful in making comparisons because the Securities and Exchange Commission requires all funds to make this 5% calculation. You can assess your Fund’s comparative cost by comparing the hypothetical result for your Fund in the “Expense Paid During Period” column with those that appear in the same charts in the shareholder reports for other funds.
NOTE: Because the return is set at 5% for comparison purposes — NOT your Fund’s actual return — the account values shown may not apply to your specific investment.
114
DISCLOSUREOF FUND EXPENSES (CONTINUED)
APRIL 30, 2011 (UNAUDITED)
| | | | | | | | | | | | | | | | |
| | | Beginning
Account
Value
11/1/2010 | | | Ending
Account
Value
4/30/2011 | | | Annualized
Expense
Ratios | | | Expenses
Paid
During
Period | |
Global X Silver Miners ETF(1) | | | | | | | | | | | | | | | | |
Actual Fund Return | | $ | 1,000.00 | | | $ | 1,421.30 | | | | 0.65 | % | | $ | 3.90 | |
Hypothetical 5% Return | | | 1,000.00 | | | | 1,021.57 | | | | 0.65 | | | | 3.26 | |
Global X Lithium ETF(1) | | | | | | | | | | | | | | | | |
Actual Fund Return | | $ | 1,000.00 | | | | 1,148.70 | | | | 0.75 | | | | 4.00 | |
Hypothetical 5% Return | | | 1,000.00 | | | | 1,021.08 | | | | 0.75 | | | | 3.76 | |
Global X Copper Miners ETF(1) | | | | | | | | | | | | | | | | |
Actual Fund Return | | $ | 1,000.00 | | | | 1,230.10 | | | | 0.65 | | | | 3.59 | |
Hypothetical 5% Return | | | 1,000.00 | | | | 1,021.57 | | | | 0.65 | | | | 3.26 | |
Global X Pure Gold Miners ETF | | | | | | | | | | | | | | | | |
Actual Fund Return | | $ | 1,000.00 | | | | 1,086.50 | | | | 0.59 | | | | 0.81 | (2) |
Hypothetical 5% Return | | | 1,000.00 | | | | 1,021.87 | | | | 0.59 | | | | 2.96 | (1) |
Global X Uranium ETF | | | | | | | | | | | | | | | | |
Actual Fund Return | | $ | 1,000.00 | | | | 863.30 | | | | 0.69 | | | | 3.13 | (3) |
Hypothetical 5% Return | | | 1,000.00 | | | | 1,021.37 | | | | 0.69 | | | | 3.46 | (1) |
Global X Aluminum ETF | | | | | | | | | | | | | | | | |
Actual Fund Return | | $ | 1,000.00 | | | | 1,029.50 | | | | 0.69 | | | | 2.29 | (4) |
Hypothetical 5% Return | | | 1,000.00 | | | | 1,021.37 | | | | 0.69 | | | | 2.22 | (1) |
Global X Gold Explorers ETF | | | | | | | | | | | | | | | | |
Actual Fund Return | | $ | 1,000.00 | | | | 1,401.79 | | | | 0.65 | | | | 2.23 | (5) |
Hypothetical 5% Return | | | 1,000.00 | | | | 1,021.62 | | | | 0.65 | | | | 3.46 | (1) |
Global X Brazil Mid Cap ETF(1) | | | | | | | | | | | | | | | | |
Actual Fund Return | | $ | 1,000.00 | | | | 1,045.30 | | | | 0.69 | | | | 3.50 | |
Hypothetical 5% Return | | | 1,000.00 | | | | 1,021.37 | | | | 0.69 | | | | 3.46 | |
Global X Brazil Financials ETF(1) | | | | | | | | | | | | | | | | |
Actual Fund Return | | $ | 1,000.00 | | | | 1,011.10 | | | | 0.77 | | | | 3.84 | |
Hypothetical 5% Return | | | 1,000.00 | | | | 1,020.98 | | | | 0.77 | | | | 3.86 | |
Global X Brazil Consumer ETF(1) | | | | | | | | | | | | | | | | |
Actual Fund Return | | $ | 1,000.00 | | | | 1,019.30 | | | | 0.77 | | | | 3.86 | |
Hypothetical 5% Return | | | 1,000.00 | | | | 1,020.98 | | | | 0.77 | | | | 3.86 | |
| (1) | Expenses are equal to the Fund’s annualized expense ratio multiplied by the average account value over the period, multiplied 181/365 (to reflect the one-half year period.) |
| (2) | Commenced operations on March 14, 2011. Expenses are equal to the Fund’s annualized expense ratio multiplied by the average account value over the period, multiplied by 48/365 (to reflect the period from inception to date.) |
| (3) | Commenced operations on November 4, 2010. Expenses are equal to the Fund’s annualized expense ratio multiplied by the average account value over the period, multiplied by 178/365 (to reflect the period from inception to date.) |
| (4) | Commenced operations on January 4, 2011. Expenses are equal to the Fund’s annualized expense ratio multiplied by the average account value over the period, multiplied by 116/365 (to reflect the period from inception to date.) |
| (5) | Commenced operations on November 3, 2010. Expenses are equal to the Fund’s annualized expense ratio multiplied by the average account value over the period, multiplied by 179/365 (to reflect the period from inception to date.) |
115
DISCLOSUREOF FUND EXPENSES (CONTINUED)
APRIL 30, 2011 (UNAUDITED)
| | | | | | | | | | | | | | | | |
| | | Beginning
Account
Value
11/1/2010 | | | Ending
Account
Value
4/30/2011 | | | Annualized
Expense
Ratios | | | Expenses
Paid
During
Period | |
Global X FTSE Colombia 20 ETF(1) | | | | | | | | | | | | | | | | |
Actual Fund Return | | $ | 1,000.00 | | | $ | 935.80 | | | | 0.84 | % | | $ | 4.03 | |
Hypothetical 5% Return | | | 1,000.00 | | | | 1,020.63 | | | | 0.84 | | | | 4.21 | |
Global X FTSE Nordic Region ETF(1) | | | | | | | | | | | | | | | | |
Actual Fund Return | | $ | 1,000.00 | | | | 1,196.70 | | | | 0.50 | | | | 2.72 | |
Hypothetical 5% Return | | | 1,000.00 | | | | 1,022.32 | | | | 0.50 | | | | 2.51 | |
Global X FTSE Norway 30 ETF | | | | | | | | | | | | | | | | |
Actual Fund Return | | $ | 1,000.00 | | | | 1,202.00 | | | | 0.50 | | | | 2.61 | (2) |
Hypothetical 5% Return | | | 1,000.00 | | | | 1,022.32 | | | | 0.50 | | | | 2.51 | (1) |
Global X FTSE Argentina 20 ETF | | | | | | | | | | | | | | | | |
Actual Fund Return | | $ | 1,000.00 | | | | 1,026.10 | | | | 0.74 | | | | 1.23 | (3) |
Hypothetical 5% Return | | | 1,000.00 | | | | 1,021.12 | | | | 0.74 | | | | 3.71 | (1) |
Global X FTSE Andean 40 ETF | | | | | | | | | | | | | | | | |
Actual Fund Return | | $ | 1,000.00 | | | | 1,037.60 | | | | 0.72 | | | | 1.77 | (4) |
Hypothetical 5% Return | | | 1,000.00 | | | | 1,021.22 | | | | 0.72 | | | | 3.61 | (1) |
Global X FTSE ASEAN 40 ETF | | | | | | | | | | | | | | | | |
Actual Fund Return | | $ | 1,000.00 | | | | 1,099.50 | | | | 0.65 | | | | 1.38 | (5) |
Hypothetical 5% Return | | | 1,000.00 | | | | 1,021.57 | | | | 0.65 | | | | 3.26 | (1) |
Global X China Consumer ETF(1) | | | | | | | | | | | | | | | | |
Actual Fund Return | | $ | 1,000.00 | | | | 907.80 | | | | 0.65 | | | | 3.07 | |
Hypothetical 5% Return | | | 1,000.00 | | | | 1,021.57 | | | | 0.65 | | | | 3.26 | |
Global X China Energy ETF(1) | | | | | | | | | | | | | | | | |
Actual Fund Return | | $ | 1,000.00 | | | | 1,125.00 | | | | 0.65 | | | | 3.42 | |
Hypothetical 5% Return | | | 1,000.00 | | | | 1,021.57 | | | | 0.65 | | | | 3.26 | |
Global X China Financials ETF(1) | | | | | | | | | | | | | | | | |
Actual Fund Return | | $ | 1,000.00 | | | | 963.70 | | | | 0.65 | | | | 3.16 | |
Hypothetical 5% Return | | | 1,000.00 | | | | 1,021.57 | | | | 0.65 | | | | 3.26 | |
Global X China Industrials ETF(1) | | | | | | | | | | | | | | | | |
Actual Fund Return | | $ | 1,000.00 | | | | 993.50 | | | | 0.65 | | | | 3.21 | |
Hypothetical 5% Return | | | 1,000.00 | | | | 1,021.57 | | | | 0.65 | | | | 3.26 | |
| (1) | Expenses are equal to the Fund’s annualized expense ratio multiplied by the average account value over the period, multiplied 181/365 (to reflect the one-half year period.) |
| (2) | Commenced operations on November 9, 2010. Expenses are equal to the Fund’s annualized expense ratio multiplied by the average account value over the period, multiplied by 173/365 (to reflect the period from inception to date.) |
| (3) | Commenced operations on March 2, 2011. Expenses are equal to the Fund’s annualized expense ratio multiplied by the average account value over the period, multiplied by 60/365 (to reflect the period from inception to date.) |
| (4) | Commenced operations on February 2, 2011. Expenses are equal to the Fund’s annualized expense ratio multiplied by the average account value over the period, multiplied by 88/365 (to reflect the period from inception to date.) |
| (5) | Commenced operations on February 16, 2011. Expenses are equal to the Fund’s annualized expense ratio multiplied by the average account value over the period, multiplied by 179/365 (to reflect the period from inception to date.) |
116
DISCLOSUREOF FUND EXPENSES (CONCLUDED)
APRIL 30, 2011 (UNAUDITED)
| | | | | | | | | | | | | | | | |
| | | Beginning
Account
Value
11/1/2010 | | | Ending
Account
Value
4/30/2011 | | | Annualized
Expense
Ratios | | | Expenses
Paid
During
Period | |
Global X China Technology ETF(1) | | | | | | | | | | | | | | | | |
Actual Fund Return | | $ | 1,000.00 | | | $ | 1,134.90 | | | | 0.65 | % | | $ | 3.44 | |
Hypothetical 5% Return | | | 1,000.00 | | | | 1,021.57 | | | | 0.65 | | | | 3.26 | |
Global X China Materials ETF(1) | | | | | | | | | | | | | | | | |
Actual Fund Return | | $ | 1,000.00 | | | | 987.00 | | | | 0.65 | | | | 3.20 | |
Hypothetical 5% Return | | | 1,000.00 | | | | 1,021.57 | | | | 0.65 | | | | 3.26 | |
Global X Russell Emerging Markets Growth ETF | | | | | | | | | | | | | | | | |
Actual Fund Return | | $ | 1,000.00 | | | | 1,045.80 | | | | 0.69 | | | | 1.88 | (2) |
Hypothetical 5% Return | | | 1,000.00 | | | | 1,021.57 | | | | 0.69 | | | | 3.46 | (1) |
Global X Russell Emerging Markets Value ETF | | | | | | | | | | | | | | | | |
Actual Fund Return | | $ | 1,000.00 | | | | 1,078.50 | | | | 0.69 | | | | 1.91 | (2) |
Hypothetical 5% Return | | | 1,000.00 | | | | 1,022.96 | | | | 0.69 | | | | 3.46 | (1) |
Global X S&P/TSX Venture 30 Canada ETF | | | | | | | | | | | | | | | | |
Actual Fund Return | | $ | 1,000.00 | | | | 1,094.40 | | | | 0.75 | | | | 0.99 | (3) |
Hypothetical 5% Return | | | 1,000.00 | | | | 1,021.08 | | | | 0.75 | | | | 3.76 | (1) |
Global X Oil Equities ETF | | | | | | | | | | | | | | | | |
Actual Fund Return | | $ | 1,000.00 | | | | 1,049.10 | | | | 0.49 | | | | 0.66 | (4) |
Hypothetical 5% Return | | | 1,000.00 | | | | 1,022.36 | | | | 0.49 | | | | 2.46 | (1) |
Global X Waste Management ETF | | | | | | | | | | | | | | | | |
Actual Fund Return | | $ | 1,000.00 | | | | 1,025.60 | | | | 0.65 | | | | 0.34 | (5) |
Hypothetical 5% Return | | | 1,000.00 | | | | 1,021.57 | | | | 0.65 | | | | 3.26 | (1) |
| (1) | Expenses are equal to the Fund’s annualized expense ratio multiplied by the average account value over the period, multiplied 181/365 (to reflect the one-half year period.) |
| (2) | Commenced operations on January 24, 2011. Expenses are equal to the Fund’s annualized expense ratio multiplied by the average account value over the period, multiplied by 97/365 (to reflect the period from inception to date.) |
| (3) | Commenced operations on March 16, 2011. Expenses are equal to the Fund’s annualized expense ratio multiplied by the average account value over the period, multiplied by 46/365 (to reflect the period from inception to date.) |
| (4) | Commenced operations on March 14, 2011. Expenses are equal to the Fund’s annualized expense ratio multiplied by the average account value over the period, multiplied by 48/365 (to reflect the period from inception to date.) |
| (5) | Commenced operations on April 12, 2011. Expenses are equal to the Fund’s annualized expense ratio multiplied by the average account value over the period, multiplied by 19/365 (to reflect the period from inception to date.) |
117
SUPPLEMENTAL INFORMATION
APRIL 30, 2011 (UNAUDITED)
Net asset value, or “NAV”, is the price per Share at which the Funds issue and redeems Shares. It is calculated in accordance with the standard formula for valuing mutual fund shares. The “Market Price” of the Funds generally is determined using the midpoint between the highest bid and the lowest offer on the stock exchange on which the Shares of the Funds are listed for trading, as of the time that the Funds’ NAV is calculated. The Funds’ Market Price may be at, above or below their NAV. The NAV of the Funds will fluctuate with changes in the market value of their Funds holdings. The Market Price of the Funds will fluctuate in accordance with changes in its NAV, as well as market supply and demand.
Premiums or discounts are the differences (expressed as a percentage) between the NAV and Market Price of the Funds on a given day, generally at the time NAV is calculated. A premium is the amount that the Funds are trading above the reported NAV, expressed as a percentage of the NAV. A discount is the amount that the Funds are trading below the reported NAV, expressed as a percentage of the NAV.
The following information shows the frequency distributions of premiums and discounts for the Funds. The information shown is for the full calendar quarter completed after the inception date through the date of the most recent calendar quarter end.
Information for the Global X Pure Gold Miners ETF, Global X Aluminum ETF, Global X FTSE Argentina 20 ETF, Global X FTSE Andean 40 ETF, Global X FTSE ASEAN 40 ETF, Global X Russell Emerging Markets Growth ETF, Global X Russell Emerging Markets Value ETF, Global X S&P/TSX Venture 30 Canada ETF, Global X Oil Equities ETF and Global X Waste Management ETF, showing the frequency distributions of premiums and discounts for the Funds are not presented as they did not have a full quarter of information as of April 30, 2011.
Each line in the table shows the number of trading days in which the Funds traded within the premium/discount range indicated. The number of trading days in each premium/discount range is also shown as a percentage of the total number of trading days in the period covered by each table. All data presented here represents past performance, which cannot be used to predict future results.
118
SUPPLEMENTAL INFORMATION (CONTINUED)
APRIL 30, 2011 (UNAUDITED)
| | | | | | | | | | | | | | | | | | | | | | | | |
| | | Percentage of Total Days | |
Premium/Discount Range | | Global X
Silver
Miners
ETF | | | Global X
Lithium
Miners
ETF | | | Global X
Copper
Miners
ETF | | | Global X
Uranium
ETF(1) | | | Global X
Gold
Explorers
ETF(2) | | | Global X
Brazil
Mid Cap
ETF | |
Greater than 3.0% and Less than 3.5% | | | — | | | | 0.82 | % | | | — | | | | 0.85 | % | | | 0.84 | % | | | — | |
Greater than 2.5% and Less than 3.0% | | | 0.82 | % | | | — | | | | 0.82 | % | | | — | | | | — | | | | — | |
Greater than 2.0% and Less than 2.5% | | | 0.82 | % | | | 0.82 | % | | | 0.82 | % | | | 2.54 | % | | | — | | | | 3.28 | % |
Greater than 1.5% and Less than 2.0% | | | — | | | | — | | | | — | | | | 1.69 | % | | | — | | | | 25.41 | % |
Greater than 1.0% and Less than 1.5% | | | 1.64 | % | | | — | | | | 2.46 | % | | | 6.78 | % | | | 2.52 | % | | | 23.77 | % |
Greater than 0.5% and Less than 1.0% | | | 20.49 | % | | | 9.84 | % | | | 28.69 | % | | | 25.42 | % | | | 22.69 | % | | | 7.38 | % |
Between 0.5% and -0.5% | | | 73.77 | % | | | 87.71 | % | | | 59.83 | % | | | 55.08 | % | | | 73.95 | % | | | 35.24 | % |
Less than -0.5% and Greater than -1.0% | | | 1.64 | % | | | — | | | | 6.56 | % | | | 5.08 | % | | | — | | | | 4.10 | % |
Less than -1.0% and Greater than -1.5% | | | 0.82 | % | | | — | | | | — | | | | 0.85 | % | | | — | | | | — | |
Less than -1.5% and Greater than -2.0% | | | — | | | | — | | | | — | | | | 0.85 | % | | | — | | | | — | |
Less than -2.0% and Greater than -2.5% | | | — | | | | — | | | | — | | | | — | | | | — | | | | — | |
Less than -2.5% and Greater than -3.0% | | | — | | | | — | | | | — | | | | — | | | | — | | | | — | |
Less than -3.0% and Greater than -3.5% | | | — | | | | — | | | | — | | | | — | | | | — | | | | — | |
| | | | | | | | | | | | | | | | | | | | | | | | |
Total | | | 100.00 | % | | | 99.19 | % | | | 99.18 | % | | | 99.14 | % | | | 100.00 | % | | | 99.18 | % |
| | | | | | | | | | | | | | | | | | | | | | | | |
| | | | | | | | | | | | | | | | | | | | | | | | |
| | | Number of Days | |
Premium/Discount Range | | Global X
Silver
Miners
ETF | | | Global X
Lithium
Miners
ETF | | | Global X
Copper
Miners
ETF | | | Global X
Uranium
ETF(2) | | | Global X
Gold
Explorers
ETF(4) | | | Global X
Brazil
Mid Cap
ETF | |
Greater than 3.0% and Less than 3.5% | | | — | | | | 1 | | | | — | | | | 1 | | | | 1 | | | | — | |
Greater than 2.5% and Less than 3.0% | | | 1 | | | | — | | | | 1 | | | | — | | | | — | | | | — | |
Greater than 2.0% and Less than 2.5% | | | 1 | | | | 1 | | | | 1 | | | | 3 | | | | — | | | | 4 | |
Greater than 1.5% and Less than 2.0% | | | — | | | | — | | | | — | | | | 2 | | | | — | | | | 31 | |
Greater than 1.0% and Less than 1.5% | | | 2 | | | | — | | | | 3 | | | | 8 | | | | 3 | | | | 29 | |
Greater than 0.5% and Less than 1.0% | | | 25 | | | | 12 | | | | 35 | | | | 30 | | | | 27 | | | | 9 | |
Between 0.5% and -0.5% | | | 90 | | | | 107 | | | | 73 | | | | 65 | | | | 88 | | | | 43 | |
Less than -0.5% and Greater than -1.0% | | | 2 | | | | — | | | | 8 | | | | 6 | | | | — | | | | 5 | |
Less than -1.0% and Greater than -1.5% | | | 1 | | | | — | | | | — | | | | 1 | | | | — | | | | — | |
Less than -1.5% and Greater than -2.0% | | | — | | | | — | | | | — | | | | 1 | | | | — | | | | — | |
Less than -2.0% and Greater than -2.5% | | | — | | | | — | | | | — | | | | — | | | | — | | | | — | |
Less than -2.5% and Greater than -3.0% | | | — | | | | — | | | | — | | | | — | | | | — | | | | — | |
Less than -3.0% and Greater than -3.5% | | | — | | | | — | | | | — | | | | — | | | | — | | | | — | |
| | | | | | | | | | | | | | | | | | | | | | | | |
Total | | | 122 | | | | 121 | | | | 121 | | | | 117 | | | | 119 | | | | 121 | |
| | | | | | | | | | | | | | | | | | | | | | | | |
119
SUPPLEMENTAL INFORMATION (CONTINUED)
APRIL 30, 2011 (UNAUDITED)
| | | | | | | | | | | | | | | | | | | | | | | | |
| | | Percentage of Total Days | |
Premium/Discount Range | | Global X
Brazil
Financials
ETF | | | Global X
Brazil
Consumer
ETF | | | Global X
FTSE
Colombia
20 ETF | | | Global X
FTSE
Nordic
Region
ETF | | | Global X
FTSE
Norway
30
ETF(3) | | | Global X
China
Consumer
ETF | |
Greater than 3.0% and Less than 3.5% | | | — | | | | — | | | | — | | | | — | | | | — | | | | — | |
Greater than 2.5% and Less than 3.0% | | | 0.82 | % | | | 0.82 | % | | | — | | | | — | | | | — | | | | — | |
Greater than 2.0% and Less than 2.5% | | | 2.46 | % | | | 4.92 | % | | | — | | | | — | | | | — | | | | 0.82 | % |
Greater than 1.5% and Less than 2.0% | | | 28.69 | % | | | 21.31 | % | | | — | | | | — | | | | — | | | | 0.82 | % |
Greater than 1.0% and Less than 1.5% | | | 44.26 | % | | | 16.39 | % | | | 0.82 | % | | | — | | | | 6.09 | % | | | 13.93 | % |
Greater than 0.5% and Less than 1.0% | | | 18.85 | % | | | 3.28 | % | | | 9.02 | % | | | 18.85 | % | | | 26.96 | % | | | 27.05 | % |
Between 0.5% and -0.5% | | | 4.10 | % | | | 45.90 | % | | | 60.65 | % | | | 78.68 | % | | | 63.47 | % | | | 43.44 | % |
Less than -0.5% and Greater than -1.0% | | | — | | | | 5.74 | % | | | 26.23 | % | | | 1.64 | % | | | 3.48 | % | | | 9.02 | % |
Less than -1.0% and Greater than -1.5% | | | — | | | | 1.64 | % | | | 1.64 | % | | | — | | | | — | | | | 3.28 | % |
Less than -1.5% and Greater than -2.0% | | | — | | | | — | | | | 0.82 | % | | | — | | | | — | | | | 0.82 | % |
Less than -2.0% and Greater than -2.5% | | | — | | | | — | | | | — | | | | — | | | | — | | | | — | |
Less than -2.5% and Greater than -3.0% | | | — | | | | — | | | | — | | | | — | | | | — | | | | — | |
Less than -3.0% and Greater than -3.5% | | | 0.82 | % | | | — | | | | — | | | | — | | | | — | | | | — | |
| | | | | | | | | | | | | | | | | | | | | | | | |
Total | | | 100.00 | % | | | 100.00 | % | | | 99.18 | % | | | 99.17 | % | | | 100.00 | % | | | 99.18 | % |
| | | | | | | | | | | | | | | | | | | | | | | | |
| | | | | | | | | | | | | | | | | | | | | | | | |
| | | Number of Days | |
Premium/Discount Range | | Global X
Brazil
Financials
ETF | | | Global X
Brazil
Consumer
ETF | | | Global X
FTSE
Colombia
20 ETF | | | Global X
FTSE
Nordic
Region
ETF | | | Global X
FTSE
Norway
30
ETF(5) | | | Global X
China
Consumer
ETF | |
Greater than 3.0% and Less than 3.5% | | | — | | | | — | | | | — | | | | — | | | | — | | | | — | |
Greater than 2.5% and Less than 3.0% | | | 1 | | | | 1 | | | | — | | | | — | | | | — | | | | — | |
Greater than 2.0% and Less than 2.5% | | | 3 | | | | 6 | | | | — | | | | — | | | | — | | | | 1 | |
Greater than 1.5% and Less than 2.0% | | | 35 | | | | 26 | | | | — | | | | — | | | | — | | | | 1 | |
Greater than 1.0% and Less than 1.5% | | | 54 | | | | 20 | | | | 1 | | | | — | | | | 7 | | | | 17 | |
Greater than 0.5% and Less than 1.0% | | | 23 | | | | 4 | | | | 11 | | | | 23 | | | | 31 | | | | 33 | |
Between 0.5% and -0.5% | | | 5 | | | | 56 | | | | 74 | | | | 96 | | | | 73 | | | | 53 | |
Less than -0.5% and Greater than -1.0% | | | — | | | | 7 | | | | 32 | | | | 2 | | | | 4 | | | | 11 | |
Less than -1.0% and Greater than -1.5% | | | — | | | | 2 | | | | 2 | | | | — | | | | — | | | | 4 | |
Less than -1.5% and Greater than -2.0% | | | — | | | | — | | | | 1 | | | | — | | | | — | | | | 1 | |
Less than -2.0% and Greater than -2.5% | | | — | | | | — | | | | — | | | | — | | | | — | | | | — | |
Less than -2.5% and Greater than -3.0% | | | — | | | | — | | | | — | | | | — | | | | — | | | | — | |
Less than -3.0% and Greater than -3.5% | | | 1 | | | | — | | | | — | | | | — | | | | — | | | | — | |
| | | | | | | | | | | | | | | | | | | | | | | | |
Total | | | 122 | | | | 122 | | | | 121 | | | | 121 | | | | 115 | | | | 121 | |
| | | | | | | | | | | | | | | | | | | | | | | | |
120
SUPPLEMENTAL INFORMATION (CONCLUDED)
APRIL 30, 2011 (UNAUDITED)
| | | | | | | | | | | | | | | | | | | | |
| | | Percentage of Total Days | |
Premium/Discount Range | | Global X
China Energy
ETF | | | Global X
China
Financials
ETF | | | Global X
China
Industrials
ETF | | | Global X
China
Technology
ETF | | | Global X
China
Materials ETF | |
Greater than 3.0% and Less than 3.5% | | | — | | | | — | | | | — | | | | — | | | | — | |
Greater than 2.5% and Less than 3.0% | | | — | | | | — | | | | — | | | | — | | | | — | |
Greater than 2.0% and Less than 2.5% | | | — | | | | — | | | | — | | | | 0.82 | % | | | — | |
Greater than 1.5% and Less than 2.0% | | | 2.46 | % | | | 0.82 | % | | | 0.82 | % | | | — | | | | 0.82 | % |
Greater than 1.0% and Less than 1.5% | | | 8.20 | % | | | 2.46 | % | | | 3.28 | % | | | — | | | | 2.46 | % |
Greater than 0.5% and Less than 1.0% | | | 24.59 | % | | | 13.11 | % | | | 8.20 | % | | | 5.74 | % | | | 9.02 | % |
Between 0.5% and -0.5% | | | 47.54 | % | | | 42.62 | % | | | 59.01 | % | | | 81.14 | % | | | 53.28 | % |
Less than -0.5% and Greater than -1.0% | | | 11.48 | % | | | 24.59 | % | | | 18.03 | % | | | 10.66 | % | | | 20.49 | % |
Less than -1.0% and Greater than -1.5% | | | 4.10 | % | | | 12.30 | % | | | 7.38 | % | | | 1.64 | % | | | 9.02 | % |
Less than -1.5% and Greater than -2.0% | | | 0.82 | % | | | 2.46 | % | | | 2.46 | % | | | — | | | | 3.28 | % |
Less than -2.0% and Greater than -2.5% | | | — | | | | — | | | | 0.82 | % | | | — | | | | 0.82 | % |
Less than -2.5% and Greater than -3.0% | | | — | | | | 0.82 | % | | | — | | | | — | | | | — | |
Less than -3.0% and Greater than -3.5% | | | — | | | | — | | | | — | | | | — | | | | — | |
| | | | | | | | | | | | | | | | | | | | |
Total | | | 99.19 | % | | | 99.18 | % | | | 100.00 | % | | | 100.00 | % | | | 99.19 | % |
| | | | | | | | | | | | | | | | | | | | |
| |
| | | Number of Days | |
Premium/Discount Range | | Global X
China Energy
ETF | | | Global X
China
Financials
ETF | | | Global X
China
Industrials
ETF | | | Global X
China
Technology
ETF | | | Global X
China
Materials ETF | |
Greater than 3.0% and Less than 3.5% | | | — | | | | — | | | | — | | | | — | | | | — | |
Greater than 2.5% and Less than 3.0% | | | — | | | | — | | | | — | | | | — | | | | — | |
Greater than 2.0% and Less than 2.5% | | | — | | | | — | | | | — | | | | 1 | | | | — | |
Greater than 1.5% and Less than 2.0% | | | 3 | | | | 1 | | | | 1 | | | | — | | | | 1 | |
Greater than 1.0% and Less than 1.5% | | | 10 | | | | 3 | | | | 4 | | | | — | | | | 3 | |
Greater than 0.5% and Less than 1.0% | | | 30 | | | | 16 | | | | 10 | | | | 7 | | | | 11 | |
Between 0.5% and -0.5% | | | 58 | | | | 52 | | | | 72 | | | | 99 | | | | 65 | |
Less than -0.5% and Greater than -1.0% | | | 14 | | | | 30 | | | | 22 | | | | 13 | | | | 25 | |
Less than -1.0% and Greater than -1.5% | | | 5 | | | | 15 | | | | 9 | | | | 2 | | | | 11 | |
Less than -1.5% and Greater than -2.0% | | | 1 | | | | 3 | | | | 3 | | | | — | | | | 4 | |
Less than -2.0% and Greater than -2.5% | | | — | | | | — | | | | 1 | | | | — | | | | 1 | |
Less than -2.5% and Greater than -3.0% | | | — | | | | 1 | | | | — | | | | — | | | | — | |
Less than -3.0% and Greater than -3.5% | | | — | | | | — | | | | — | | | | — | | | | — | |
| | | | | | | | | | | | | | | | | | | | |
Total | | | 121 | | | | 121 | | | | 122 | | | | 122 | | | | 121 | |
| | | | | | | | | | | | | | | | | | | | |
| (1) | The Fund commenced operations on November 4, 2010. |
| (2) | The Fund commenced operations on November 3, 2010. |
| (3) | The Fund commenced operations on November 9, 2010. |
121
APPROVALOF INVESTMENT ADVISORY AGREEMENT (UNAUDITED)
Section 15(c) of the Investment Company Act of 1940, as amended (“1940 Act”), requires that each mutual fund’s board of trustees, including a majority of those trustees who are not “interested persons” of the mutual fund, as defined in the 1940 Act (“Independent Trustees”), consider on an initial basis and periodically thereafter (as required by the 1940 Act), at an in person meeting called for such purpose, the terms of each fund’s investment advisory agreement and approve each agreement with such changes as the Independent Trustees deem appropriate.
At a quarterly Board meeting held on November 17, 2010, the Board of Trustees (including the Independent Trustees) considered and unanimously approved the continuation of (i) the Investment Advisory Agreement (“Renewal Investment Advisory Agreement”) for each Fund covered by this Semi-Annual Report (other than the Global X FTSE Andean 40 ETF, Global X FTSE ASEAN 40 ETF, Global X Russell Emerging Markets Growth ETF, Global X Russell Emerging Markets Value ETF, Global S&P/TSX Venture 30 Canada ETF and the Global X Oil Equities ETF) (each a “Renewal Fund”) and (ii) the Supervision and Administration Agreement between the Trust (“Renewal Supervision and Administration Agreement”), on behalf of each Renewal Fund, and Global X Management Company (“Global X Management”). The Renewal Investment Advisory Agreement and the Renewal Supervision and Administration Agreement are referred to herein as the “Renewal Agreements.”
At the November 17, 2010 meeting, the Board (including the Independent Trustees) also initially considered and unanimously approved (i) the initial Investment Advisory Agreement (“New Fund Investment Advisory Agreement”) for the Global X FTSE Andean 40 ETF, Global X FTSE ASEAN 40 ETF, Global X Russell Emerging Markets Growth ETF, Global X Russell Emerging Markets Value ETF, Global X S&P/TSX Venture 30 Canada ETF and the Global X Oil Equities ETF (each a “New Fund”) and (ii) the Supervision and Administration Agreement (“New Fund Supervision and Administration Agreement”) between the Trust, on behalf each of each New Fund, and Global X Management. The New Fund Investment Advisory Agreement and New Fund Supervision and Administration Agreement are referred to herein as the “New Fund Agreements.”
In advance of the Board meeting, the Board (including the Independent Trustees) requested (in writing) detailed information from Global X Management in connection with their consideration of the Renewal Agreements and the New Fund Agreements and received and reviewed written responses from Global X Management and supporting materials relating to those requests for information.
In determining to approve the New Fund Agreements and the continuation of the Renewal Agreements for each New Fund or Renewal Fund (as applicable), the Board concluded that the New Fund Agreements and the Renewal Agreements were fair and reasonable and in the best interests of each New Fund or Renewal Fund (as applicable) and its shareholders, respectively. In approving New Fund Agreements and the continuation of the Renewal Agreements for each New Fund or Renewal Fund (as applicable), the Board considered
122
APPROVALOF INVESTMENT ADVISORY AGREEMENT (UNAUDITED)
among other things the following categories of material factors. In addition, the Board based their determinations regarding the continuation of each of the Renewal Fund Agreements on their consideration of all of the materials provided to them by Global X Management and each Renewal Fund’s other service providers throughout the year.
In reaching this decision, the Board did not assign relative weights to the factors discussed below nor did the Board deem any one factor or group of them to be controlling in and of themselves. Certain factors considered by the Board (including the Independent Trustees) with respect to the approval of the New Funds Agreements and the continuation of the Renewal Agreements are discussed separately below.
NEW FUNDS AGREEMENTS
Nature, extent and quality of services
With respect to this factor, the Board considered:
| | • | | the terms of the New Funds Agreements and the range of services to be provided to the New Funds in accordance with the New Funds Agreements; |
| | • | | Global X Management’s key personnel and the portfolio managers who would provide investment advisory services to the New Funds; |
| | • | | Global X Management’s responsibilities under the New Funds Agreements to, among other things, (i) manage the investment operations of each New Funds and the composition of each New Fund’s assets, including the purchase, retention and disposition of its holdings, (ii) provide quarterly reports to the Trust’s officers and Board and other reports as the Board deems necessary or appropriate, (iii) vote proxies, exercise consents, and exercise all other rights appertaining to securities and assets held by each of the New Funds, (iv) select broker-dealers to execute portfolio transactions for each of the New Funds when necessary, (v) assist in the preparation and filing of reports and proxy statements (if any) to the shareholders of each of the New Funds, the periodic updating of the registration statement, prospectuses, statement of additional information, and other reports and documents for each of the New Funds that are required to be filed by the Trust with the Securities and Exchange Commission (“SEC”) and other regulatory or governmental bodies, and (vi) monitor anticipated purchases and redemptions of the shares (including creation units) of each of the New Funds by shareholders and new investors; |
| | • | | the nature, extent and quality of Global X Management’s services (including advisory, administrative and compliance services) provided by or made available to each of the Renewal Funds and that would be made available to each of the New Funds; and |
| | • | | the quality of Global X Management’s resources and personnel that would be made available to each of the New Funds, including Global X Management’s experience and the professional qualifications of Global X Management’s key personnel. |
123
APPROVALOF INVESTMENT ADVISORY AGREEMENT (UNAUDITED)
Based on these considerations, the Board concluded that it was satisfied with the nature, extent and quality of the services to be provided to each of the New Funds.
Performance
The Board determined that because each of the New Funds had not commenced operations, meaningful data relating to investment performance of each New Fund was not available and, therefore, could not be a factor in approving the New Funds Agreements.
Cost of Services and Profitability
With respect to this factor, the Board considered:
| | • | | Global X Management’s expected cost to provide investment management, supervision and administrative and related services to each of the New Funds; |
| | • | | The unitary fee (including the proposed investment advisory fee) (“Management Fee”) that was proposed to be borne by each New Fund under the New Fund Agreements for the investment advisory, supervisory and administrative services that each New Fund requires under a unitary fee structure (including the types of fees and expenses that are not included within the unitary fee and would be borne by each New Fund); and |
| | • | | the expected profitability to Global X Management, if any, from all services to be provided to each of the New Funds and all aspects of the relationship between Global X Management and each of the New Funds. In connection with these considerations, the Board noted that Global X Management advised the Board that it was uncertain whether it would generate any profits from its services to each of the New Funds during the first 12 months of each New Fund’s operations, but expected to generate profits after that initial period. |
Based on these considerations, the Board concluded that the profits anticipated to be realized by Global X Management from its relationship with each of the New Funds would not be excessive.
Comparison of Fees and Services
With respect to this factor, the Board considered:
| | • | | comparative information with respect to the proposed Management Fee to be paid to Global X Management by each of the New Funds. In connection with this consideration, Global X Management provided the Board with detailed comparative expense data for each of the New Funds, including fees and expenses paid by unaffiliated comparable specialized and/or focused exchange-traded funds and other registered funds as well as the fees and expenses paid by other Funds that are series of the Trust under the same unified Management Fee structure; |
124
APPROVALOF INVESTMENT ADVISORY AGREEMENT (UNAUDITED)
| | • | | the structure of the proposed unified Management Fee structure (which includes as one component the proposed investment advisory fee for each New Fund) and the expected total expense ratios for each of the New Funds. In this regard, the Board took into consideration that the purpose of adopting a unitary Management Fee structure for the New Funds was to create a simple, all-inclusive fee that would provide a level of predictability with respect to the overall expense ratio (i.e., the total fees) of each of the New Funds and that the proposed Management Fee for each New Fund was set at a competitive fee to make each New Fund viable in the marketplace; and |
| | • | | that Global X Management would be responsible for most ordinary expenses of the New Funds, including the costs of various third-party services required by the New Funds, including investment advisory, administrative, audit, certain custody, portfolio accounting, legal, transfer agency and printing costs, but that each New Fund would bear other expenses not covered under the proposed all-inclusive Management Fee, such as such as taxes and governmental fees, brokerage fees, commissions, and other transaction expenses, costs of borrowing money, including interest expenses, and extraordinary expenses. |
Based on these considerations, the Board concluded that the proposed Management Fee and expected total expense ratio of each New Fund should not preclude approval of the New Funds Agreements.
Economies of Scale
With respect to this factor, the Board considered:
| | • | | the extent to which economies of scale would be realized as each of the New Funds grows and whether the proposed unitary Management Fee for each New Fund reflected these economies of scale; |
| | • | | the significant investment of time, personnel and other resources that Global X Management intends to made in each of the New Funds in order to seek to assure that the New Funds are attractive to investors; and |
| | • | | that the proposed unitary Management Fee would provide a high level of certainty as to the total level of expenses for each of the New Funds and its shareholders. |
Based on these considerations, the Board concluded that approval of the proposed Management Fee for each New Fund was reasonable.
Other Benefits
In considering the New Funds Agreement, in addition to the categories discussed above, the Board considered other benefits that may be realized by Global X Management as a result of its relationships with each of the New Funds.
125
APPROVALOF INVESTMENT ADVISORY AGREEMENT (UNAUDITED)
RENEWAL AGREEMENTS
Nature, extent and quality of services
With respect to this factor, the Board considered:
| | • | | the terms of the Renewal Agreements and the range of services that would continue to be provided to each Renewal Fund in accordance with the Renewal Agreements; |
| | • | | Global X Management’s key personnel and the portfolio managers who would continue to provide investment advisory, supervision and administrative services to each Renewal Fund. In connection with these considerations, the Board noted that Global X Management had significantly increased its support staff and operational resources since the inception of each Renewal Fund; |
| | • | | Global X Management’s responsibilities under the Renewal Agreements, among other things, to: (i) manage the investment operations of each Renewal Fund and the composition of each Renewal Fund’s assets, including the purchase, retention and disposition of its holdings, (ii) provide quarterly reports to the Trust’s officers and Board and other reports as the Board deems necessary or appropriate, (iii) vote proxies, exercise consents, and exercise all other rights relating to securities and assets held by each Renewal Fund, (iv) select broker-dealers to execute portfolio transactions for each Renewal Fund when necessary, (v) assist in the preparation and filing of reports and proxy statements (if any) to the shareholders of each Renewal Fund, the periodic updating of the registration statement, prospectuses, statement of additional information, and other reports and documents for each Renewal Fund that are required to be filed by the Trust with the SEC and other regulatory and governmental bodies, and (vi) monitor anticipated purchases and redemptions of the shares (including creation units) of each Renewal Fund by shareholders and new investors; |
| | • | | the nature, extent and quality of the all of the services (including advisory, administrative and compliance services) that have been provided by Global X Management or made available to each Renewal Fund and the adequacy of Global X Management’s personnel resources that would continue to be made available to each Renewal Fund; and |
| | • | | Global X Management’s experience and the professional qualifications of Global X Management’s key personnel. |
Based on these considerations, the Board concluded that it was satisfied with the nature, extent and quality of the services provided to each Renewal Funds by Global X Management.
126
APPROVALOF INVESTMENT ADVISORY AGREEMENT (UNAUDITED)
Performance
With respect to this fact, the Board considered each Renewal Fund’s total return and investment performance relative to (i) the performance of unaffiliated comparable specialized and/or focused exchange-traded funds and other registered funds in the same classification as each of the Renewal Funds, which performance information is publicly available from such registered funds as well as other third party sources; and (ii) the performance of comparable registered funds, pertinent indexes, and pertinent registered fund performance rankings. The Board noted that most of the Renewal Funds had only been in operations for a few months and that some Renewal Funds had not yet commenced operations. The Board observed that, for the Renewal Funds that had not commenced operations, meaningful data relating to investment performance was not available and, therefore, could not be a factor in approving the Renewal Agreements for the non-operational Renewal Funds.
Based on these considerations and comparisons, the Board concluded that the investment performance of each operational Renewal Fund did not adversely affect the Board approval of the continuance of the Renewal Agreements.
Cost of Services and Profitability
The Board considered Global X Management’s cost to provide investment management and related services to each Renewal Fund. In this regard, the Board considered the Management Fee that has been borne by each Renewal Fund under the Renewal Agreements for the various investment advisory, supervisory and administrative services that each Renewal Fund requires under a unitary fee structure (including the types of fees and expenses that are not included within the unitary fee and would be borne by each New Fund).
In addition, the Board considered the current and expected profitability to Global X Management from all services provided to the Renewal Funds and all aspects of Global X Management’s relationship with each of the Renewal Funds. In connection with these considerations, the Global X Management provided the Board with financial information regarding its operations and services to the Renewal Funds and discussed with the Board its current and expected profitability with respect to the Renewal Funds. Global X Management noted that it was likely that it would not generate profits in the upcoming year from its services to certain of the newer or smaller Renewal Funds because of the small amount of assets under management for those Renewal Funds.
Based on these considerations, the Board concluded that the profits anticipated to be realized by Global X Management from its relationship with each of the Renewal Funds would not be excessive and should not preclude approval of the continuance of each Renewal Agreement.
127
APPROVALOF INVESTMENT ADVISORY AGREEMENT (UNAUDITED)
Comparison of Fees and Services
With respect to this factor, the Board considered:
| | • | | comparative information with respect to the Management Fee paid to Global X Management by each of the Renewal Funds. In connection with this consideration, Global X Management provided the Board with detailed comparative expense data for each of the Renewal Funds, including fees and expenses paid by unaffiliated comparable specialized and/or focused exchange-traded funds and other comparable registered funds and fees and expenses paid by other funds that are series of the Trust under the same unified Management Fee structure; |
| | • | | the structure of the unified Management Fee structure (which includes as one component the investment advisory fee for each Renewal Fund) and the current total expense ratios for each of the Renewal Funds. In this regard, the Board took into consideration that the purpose of adopting a unitary Management Fee structure for the Renewal Funds was to create a simple, all-inclusive fee that would provide a level of predictability with respect to the overall expense ratio (i.e., the total fees) of each of the Renewal Funds and that the proposed Management Fee for each Renewal Fund was set at a competitive fee to make each Renewal Fund viable in the marketplace; and |
| | • | | that Global X Management is responsible for most ordinary expenses of the New Funds, including the costs of various third-party services required by the Funds, including investment advisory, administrative, audit, certain custody, portfolio accounting, legal, transfer agency and printing costs, but that each New Fund would bear other expenses not covered under the proposed all-inclusive Management Fee, such as asset-based custody fees for certain of the Renewal Funds, taxes and governmental fees, brokerage fees, commissions, and other transaction expenses, costs of borrowing money, including interest expenses, and extraordinary expenses. |
Based on these considerations, the Board concluded that the proposed Management Fee and total expense ratio of each New Fund should not preclude approval of the Renewal Agreements.
Economies of Scale
With respect to this factor, the Board considered:
| | • | | the extent to which economies of scale would be realized as the Renewal Funds grow and whether the unitary Management Fee for each Renewal Fund reflected these economies of scale; |
| | • | | the significant investment of time, personnel and other resources that Global X Management has made and intends to make in the Renewal Funds in order to seek to assure that the Renewal Funds are attractive to investors; and |
128
APPROVALOF INVESTMENT ADVISORY AGREEMENT (UNAUDITED)
| | • | | that the proposed unitary Management Fee would provide a high level of certainty as to the total level of expenses for the New Funds and their shareholders. |
Based on these considerations, the Board concluded that continuation of the unitary Management Fee for each Renewal Fund was reasonable.
Other Benefits
The Board considered any other benefits realized by Global X Management as a result from its relations relationships with each Renewal Fund and concluded that all information it considered supported approval of the continuation of the Renewal Agreements.
129
Notes
Notes
399 Park Avenue, 32nd Floor
New York, NY 10022
1-888-GXFund-1
(1-888-493-8631)
www.globalxfunds.com
Investment Adviser:
Global X Management Company LLC
399 Park Avenue, 32nd Floor
New York, NY 10022
Distributor:
SEI Investments Distribution Co.
One Freedom Valley Drive
Oaks, PA 19456
Sub-Administrator:
SEI Investments Global Funds Services
One Freedom Valley Drive
Oaks, PA 19456
Counsel for the Independent Trustees:
Dechert LLP
1175 I Street N.W.
Washington, DC 20007
This information must be preceded or accompanied by a current prospectus for the Funds described.
GLX-SA-001-0300
Not applicable for semi-annual report.
| Item 3. | Audit Committee Financial Expert. |
Not applicable for semi-annual report.
| Item 4. | Principal Accountant Fees and Services. |
Not applicable for semi-annual report.
| Item 5. | Audit Committee of Listed Registrants. |
Not applicable to open-end management investment companies.
| Item 6. | Schedule of Investments. |
Not applicable.
| Item 7. | Disclosure of Proxy Voting Policies and Procedures for Closed-End Management Investment Companies. |
Not applicable to open-end management investment companies.
| Item 8. | Portfolio Managers of Closed-End Management Investment Companies. |
Not applicable to open-end management investment companies.
| Item 9. | Purchases of Equity Securities by Closed-End Management Company and Affiliated Purchasers. |
Not applicable to open-end management investment companies.
| Item 10. | Submission of Matters to a Vote of Security Holders. |
There have been no material changes.
| Item 11. | Controls and Procedures. |
(a) The registrant’s principal executive and principal financial officers, or persons performing similar functions, have concluded that the registrant’s disclosure controls and procedures (as defined in Rule 30a-3(c) under the Investment Company Act of 1940, as amended (the “1940 Act”) (17 CFR 270.30a-3(c))), are effective as of a date within 90 days of the filing date of the report that includes the disclosure required by this paragraph, based on the evaluation of these controls and procedures required by Rule 30a-3(b) under the 1940 Act (17 CFR 270.30a-3(b)) and Rules 13a-15(b) or 15d-15(b) under the Securities Exchange Act of 1934 (17 CFR 240.13a-15(b) or 240.15d-15(b)).
(b) There has been no change in the registrant’s internal control over financial reporting (as defined in Rule 30a-3(d) under the Act (17 CFR 270.30a-3(d)) that occurred during the second fiscal quarter of the period covered by this report that has materially affected, or is reasonably likely to materially affect, the registrant’s internal control over financial reporting.
(a)(1) Not applicable for semi-annual report.
(a)(2) A separate certification for the principal executive officer and the principal financial officer of the registrant as required by Rule 30a-2(a) under the Investment Company Act of 1940, as amended (17 CFR 270.30a-2(a)), are filed herewith.
(b) Officer certifications as required by Rule 30a-2(b) under the Investment Company Act of 1940, as amended (17 CFR 270.30a-2(b)) also accompany this filing as an Exhibit.
SIGNATURES
Pursuant to the requirements of the Securities Exchange Act of 1934 and the Investment Company Act of 1940, the registrant has duly caused this report to be signed on its behalf by the undersigned, thereunto duly authorized.
| | | | | | | | |
| (Registrant) | | | | | | The Global X Funds |
| | | |
| By (Signature and Title)* | | | | | | /s/ BRUNO DEL AMA |
| | | | | | | | Bruno del Ama |
| | | | | | | | President |
Date: July 6, 2011
Pursuant to the requirements of the Securities Exchange Act of 1934 and the Investment Company Act of 1940, this report has been signed below by the following persons on behalf of the registrant and in the capacities and on the dates indicated.
| | | | |
| By (Signature and Title)* | | | | /s/ BRUNO DEL AMA |
| | | | Bruno del Ama |
| | | | President |
Date: July 6, 2011
| | | | |
| By (Signature and Title)* | | | | /s/ JOSE C. GONZALEZ |
| | | | Jose C. Gonzalez |
| | | | CFO |
Date: July 6, 2011
| * | Print the name and title of each signing officer under his or her signature. |