UNITED STATES
SECURITIES AND EXCHANGE COMMISSION
Washington, D.C. 20549
FORM N-CSR
CERTIFIED SHAREHOLDER REPORT OF REGISTERED MANAGEMENT
INVESTMENT COMPANIES
Investment Company Act file number 811-22209
Global X Funds
(Exact name of registrant as specified in charter)
623 Fifth Avenue, 15th Floor
New York, NY 10022
(Address of principal executive offices) (Zip code)
Bruno del Ama
Global X Management Company LLC
623 Fifth Avenue, 15th Floor
New York, NY 10022
(Name and address of agent for service)
With a copy to:
| Daphne Tippens Chisolm, Esq. | | Eric S. Purple, Esq. |
| Global X Management Company LLC | | K&L Gates LLP |
| 623 Fifth Ave, 15th floor | | 1601 K Street, NW |
| New York, NY 10022 | | Washington, DC 20006 |
Registrant’s telephone number, including area code: (212) 644-6440
Date of fiscal year end: October 31, 2015
Date of reporting period: October 31, 2015
| Item 1. | Reports to Stockholders. |

Global X Silver Miners ETF (ticker: SIL)
Global X Gold Explorers ETF (ticker: GLDX)
Global X Copper Miners ETF (ticker: COPX)
Global X Uranium ETF (ticker: URA)
Global X Lithium ETF (ticker: LIT)
Global X Fertilizers/Potash ETF (ticker: SOIL)
Annual Report
October 31, 2015
Table of Contents
The Funds file their complete schedules of Fund holdings with the Securities and Exchange Commission (the “Commission”) for the first and third quarters of each fiscal year on Form N-Q within sixty days after the end of the period. The Funds’ Forms N-Q are available on the Commission’s website at http://www.sec.gov, and may be reviewed and copied at the Commission's Public Reference Room in Washington, DC. Information on the operation of the Public Reference Room may be obtained by calling 1-800-SEC-0330.
A description of the policies and procedures that Global X Funds uses to determine how to vote proxies relating to Fund securities, as well as information relating to how the Funds voted proxies relating to Fund securities during the most recent 12-month period ended June 30, is available (i) without charge, upon request, by calling 1-888-GXFund-1; and (ii) on the Commission’s website at http://www.sec.gov.
Management Discussion of Fund Performance (unaudited)
Global X Silver Miners ETF
Global X Silver Miners ETF
The Global X Silver Miners ETF (“Fund”) seeks to provide investment results that correspond generally to the price and yield performance, before fees and expenses, of the Solactive Global Silver Miners Total Return Index (“Underlying Index”). The Fund is passively managed, which means the investment adviser does not attempt to take defensive positions in declining markets. The Fund generally seeks to fully replicate the Underlying Index.
The Underlying Index is designed to measure broad-based equity market performance of global companies involved in the silver mining industry, as defined by the index provider.
For the 12-month period ended October 31, 2015 (the “reporting period”), the Fund decreased 20.35%, while the Underlying Index decreased 20.33%. The Fund had a net asset value of $26.16 per share on October 31, 2014 and ended the reporting period with a net asset value of $20.83 on October 31, 2015.
During the reporting period, the highest returns came from Silver Standard Resources, Inc. and AuRico Metals, which returned 69.64% and 45.45%, respectively. The worst performers were Bear Creek Mining and Tahoe Resources, which returned -51.05% and -50.65%, respectively.
Amid concerns of interest rate hikes in the United States, a strengthening US dollar, and lower than expected US economic data, silver prices exhibited a volatile pattern during the reporting period, declining to a six year low. The profitability of silver mining companies tends to be highly leveraged to spot silver prices, and therefore performance of these companies has suffered as prices have declined.
| | | AVERAGE ANNUAL TOTAL RETURN FOR THE YEAR ENDED OCTOBER 31, 2015 | |
| | | One Year Return | | | Three Year Return | | | Five Year Return | | | Annualized Inception to Date* | |
| | | Net Asset Value | | | Market Price | | | Net Asset Value | | | Market Price | | | Net Asset Value | | | Market Price | | | Net Asset Value | | | Market Price | |
| Global X Silver Miners ETF | | | -20.35 | % | | | -20.01 | % | | | -34.39 | % | | | -34.69 | % | | | -18.80 | % | | | -18.89 | % | | | -12.04 | % | | | -12.06 | % |
| Solactive Global Silver Miners Total Return Index | | | -20.33 | % | | | -20.33 | % | | | -34.09 | % | | | -34.09 | % | | | -18.36 | % | | | -18.36 | % | | | -11.52 | % | | | -11.52 | % |
| S&P 500 Index | | | 5.20 | % | | | 5.20 | % | | | 16.20 | % | | | 16.20 | % | | | 14.33 | % | | | 14.33 | % | | | 12.83 | % | | | 12.83 | % |
Growth of a $10,000 Investment
(at Net Asset Value)
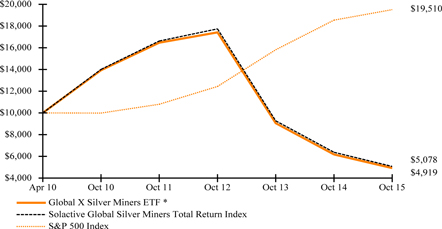
*Fund commenced operations on April 19, 2010.
The S&P 500 Index is a market capitalization-weighted composite index of 500 large capitalization U.S. companies.
The performance data quoted herein represents past performance and the return and value of an investment in the Fund will fluctuate so that, when redeemed, it may be worth less than its original cost. Past performance is no guarantee of future performance and should not be considered as a representation of the future results of the Fund. The Fund's performance assumes the reinvestment of all dividends and all capital gains. Index returns assume reinvestment of dividends and, unlike a Fund's returns, do not reflect any fees or expenses. If such fees and expenses were included in the index returns, the performance would have been lower. Please note that one cannot invest directly in an unmanaged index.
There are no assurances that the Fund will meet its stated objectives.
The Fund’s holdings and allocations are subject to change and should not be considered recommendations to buy individual securities.
The graph and table do not reflect the deduction of taxes that a shareholder would pay on Fund distribution or the redemption or sale of Fund shares.
See definition of comparative indices above.
Management Discussion of Fund Performance (unaudited)
Global X Gold Explorers ETF
Global X Gold Explorers ETF
The Global X Gold Explorers ETF (“Fund”) seeks to provide investment results that correspond generally to the price and yield performance, before fees and expenses, of the Solactive Global Gold Explorers Total Return Index (“Underlying Index”). The Fund is passively managed, which means the investment adviser does not attempt to take defensive positions in declining markets. The Fund generally seeks to fully replicate the Underlying Index.
The Underlying Index is a free float-adjusted, liquidity-tested and market capitalization-weighted index that is designed to measure broad-based equity market performance of global companies involved in gold exploration, as defined by the index provider.
For the 12-month period ended October 31, 2015 (the “reporting period”), the Fund increased 3.36%, while the Underlying Index increased 4.45%. The Fund had a net asset value of $19.28 per share on October 31, 2014 and ended the reporting period with a net asset value of $19.89 on October 31, 2015.
During the reporting period, the highest returns came from Gold Canyon Resources and Paramount Gold & Silver, which returned 91.79% and 91.04%, respectively. The worst performers were Timmins Gold and Lydian International, which returned -55.16% and -54.57%, respectively.
Gold prices have exhibited a volatile pattern during the reporting period owing to an expectation of an interest rate hike by the US Federal Reserve. Gold exploration companies are heavily leveraged to the prices of gold and in a declining price environment, can experience drastic changes in profitability. By the end of October 2015, gold prices reached six year lows.
| | | AVERAGE ANNUAL TOTAL RETURN FOR THE YEAR ENDED OCTOBER 31, 2015 | |
| | | One Year Return | | | Three Year Return | | | Annualized Inception to Date* | |
| | | Net Asset Value | | | Market Price | | | Net Asset Value | | | Market Price | | | Net Asset Value | | | Market Price | |
| Global X Gold Explorers ETF | | | 3.36 | % | | | 6.56 | % | | | -32.92 | % | | | -32.88 | % | | | -29.61 | % | | | -29.36 | % |
| Solactive Global Gold Explorers Total Return Index | | | 4.45 | % | | | 4.45 | % | | | -31.80 | % | | | -31.80 | % | | | -29.00 | % | | | -29.00 | % |
| S&P 500 Index | | | 5.20 | % | | | 5.20 | % | | | 16.20 | % | | | 16.20 | % | | | 14.06 | % | | | 14.06 | % |
Growth of a $10,000 Investment
(at Net Asset Value)
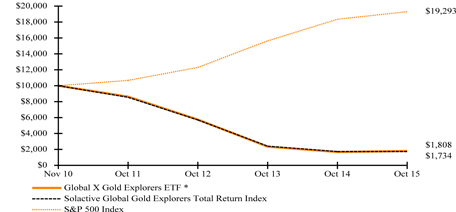
*Fund commenced operations on November 3, 2010.
The S&P 500 Index is a market capitalization-weighted composite index of 500 large capitalization U.S. companies.
The performance data quoted herein represents past performance and the return and value of an investment in the Fund will fluctuate so that, when redeemed, it may be worth less than its original cost. Past performance is no guarantee of future performance and should not be considered as a representation of the future results of the Fund. The Fund's performance assumes the reinvestment of all dividends and all capital gains. Index returns assume reinvestment of dividends and, unlike a Fund's returns, do not reflect any fees or expenses. If such fees and expenses were included in the index returns, the performance would have been lower. Please note that one cannot invest directly in an unmanaged index.
There are no assurances that the Fund will meet its stated objectives.
The Fund’s holdings and allocations are subject to change and should not be considered recommendations to buy individual securities.
The graph and table do not reflect the deduction of taxes that a shareholder would pay on Fund distribution or the redemption or sale of Fund shares.
See definition of comparative indices above.
Management Discussion of Fund Performance (unaudited)
Global X Copper Miners ETF
Global X Copper Miners ETF
The Global X Copper Miners ETF (“Fund”) seeks to provide investment results that correspond generally to the price and yield performance, before fees and expenses, of the Solactive Global Copper Miners Total Return Index (“Underlying Index”). The Fund is passively managed, which means the investment adviser does not attempt to take defensive positions in declining markets. The Fund generally seeks to fully replicate the Underlying Index.
The Underlying Index is designed to measure broad-based equity market performance of global companies involved in the copper mining industry, as defined by the index provider.
For the 12-month period ended October 31, 2015 (the “reporting period”), the Fund decreased 38.64%, while the Underlying Index decreased 38.45%. The Fund had a net asset value of $24.96 per share on October 31, 2014 and ended the reporting period with a net asset value of $14.98 on October 31, 2015.
During the reporting period, the highest returns came from Southern Copper and Sandfire Resources NL, which returned -2.17% and -6.1%, respectively. The worst performers were Imperial Metals and Copper Mountain Mining Corp., which returned -92.9% and -78.56%, respectively.
Copper prices ended the reporting period near six year lows. The metal has suffered from weak economic growth in emerging markets, which had traditionally been major purchasers of the metal for industrial capacities. Copper mining companies, which are held in the Fund, therefore suffered from declining sales numbers.
| | | AVERAGE ANNUAL TOTAL RETURN FOR THE YEAR ENDED OCTOBER 31, 2015 | |
| | | One Year Return | | | Three Year Return | | | Five Year Return | | | Annualized Inception to Date* | |
| | | Net Asset Value | | | Market Price | | | Net Asset Value | | | Market Price | | | Net Asset Value | | | Market Price | | | Net Asset Value | | | Market Price | |
| Global X Copper Miners ETF | | | -38.64 | % | | | -37.36 | % | | | -25.65 | % | | | -25.22 | % | | | -19.21 | % | | | -18.97 | % | | | -15.36 | % | | | -15.08 | % |
| Solactive Global Copper Miners Total Return Index | | | -38.45 | % | | | -38.45 | % | | | -25.68 | % | | | -25.68 | % | | | -19.15 | % | | | -19.15 | % | | | -15.20 | % | | | -15.20 | % |
| S&P 500 Index | | | 5.20 | % | | | 5.20 | % | | | 16.20 | % | | | 16.20 | % | | | 14.33 | % | | | 14.33 | % | | | 12.83 | % | | | 12.83 | % |
Growth of a $10,000 Investment
(at Net Asset Value)
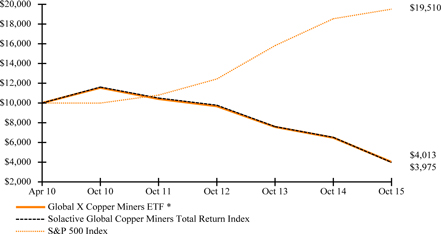
*Fund commenced operations on April 19, 2010.
The S&P 500 Index is a market capitalization-weighted composite index of 500 large capitalization U.S. companies.
The performance data quoted herein represents past performance and the return and value of an investment in the Fund will fluctuate so that, when redeemed, it may be worth less than its original cost. Past performance is no guarantee of future performance and should not be considered as a representation of the future results of the Fund. The Fund's performance assumes the reinvestment of all dividends and all capital gains. Index returns assume reinvestment of dividends and, unlike a Fund's returns, do not reflect any fees or expenses. If such fees and expenses were included in the index returns, the performance would have been lower. Please note that one cannot invest directly in an unmanaged index.
There are no assurances that the Fund will meet its stated objectives.
The Fund’s holdings and allocations are subject to change and should not be considered recommendations to buy individual securities.
The graph and table do not reflect the deduction of taxes that a shareholder would pay on Fund distribution or the redemption or sale of Fund shares.
See definition of comparative indices above.
Management Discussion of Fund Performance (unaudited)
Global X Uranium ETF
Global X Uranium ETF
The Global X Uranium ETF (“Fund”) seeks to provide investment results that correspond generally to the price and yield performance, before fees and expenses, of the Solactive Global Uranium Total Return Index (“Underlying Index”). The Fund is passively managed, which means the investment adviser does not attempt to take defensive positions in declining markets. The Fund generally seeks to fully replicate the Underlying Index.
The Underlying Index is designed to measure broad-based equity market performance of global companies involved in the uranium industry, as defined by the index provider.
For the 12-month period ended October 31, 2015 (the “reporting period”), the Fund decreased 33.01%, while the Underlying Index decreased 30.62%. The Fund had a net asset value of $23.26 per share on October 31, 2014 and ended the reporting period with a net asset value of $14.94 on October 31, 2015.
During the reporting period, the highest returns came from Berkeley Resources and Peninsula Energy, which returned 42.41% and 15.52%, respectively. The worst performers were Energy Resources of Australia and Greenland Minerals & Energy, which returned -78.53% and -69.71%, respectively.
During the reporting period, uranium prices declined as supply outweighed demand. Commodities broadly experienced a heavy selloff during the reporting period due to slowing demand and the looming threat of rising interest rates in the US. Uranium saw a small recovery at the end of September 2015, attributed to Japan restarting its nuclear power plants and increasing nuclear power capacity leading to the construction of more than 60 reactors. Many expect that as coal burning electric plants fall out of favor due to their high levels of pollution, nuclear power will become an increasingly popular choice to meet energy needs around the globe.
| | | AVERAGE ANNUAL TOTAL RETURN FOR THE YEAR ENDED OCTOBER 31, 2015 | |
| | | One Year Return | | | Three Year Return | | | Annualized Inception to Date* | |
| | | Net Asset Value | | | Market Price | | | Net Asset Value | | | Market Price | | | Net Asset Value | | | Market Price | |
| Global X Uranium ETF | | | -33.01 | % | | | -32.72 | % | | | -27.59 | % | | | -28.00 | % | | | -30.60 | % | | | -30.69 | % |
| Solactive Global Uranium Total Return Index | | | -30.62 | % | | | -30.62 | % | | | -26.61 | % | | | -26.61 | % | | | -30.24 | % | | | -30.24 | % |
| S&P 500 Index | | | 5.20 | % | | | 5.20 | % | | | 16.20 | % | | | 16.20 | % | | | 13.63 | % | | | 13.63 | % |
Growth of a $10,000 Investment
(at Net Asset Value)
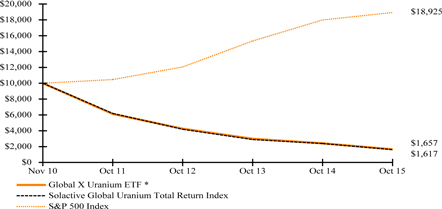
*Fund commenced operations on November 4, 2010.
The S&P 500 Index is a market capitalization-weighted composite index of 500 large capitalization U.S. companies.
The performance data quoted herein represents past performance and the return and value of an investment in the Fund will fluctuate so that, when redeemed, it may be worth less than its original cost. Past performance is no guarantee of future performance and should not be considered as a representation of the future results of the Fund. The Fund's performance assumes the reinvestment of all dividends and all capital gains. Index returns assume reinvestment of dividends and, unlike a Fund's returns, do not reflect any fees or expenses. If such fees and expenses were included in the index returns, the performance would have been lower. Please note that one cannot invest directly in an unmanaged index.
There are no assurances that the Fund will meet its stated objectives.
The Fund’s holdings and allocations are subject to change and should not be considered recommendations to buy individual securities.
The graph and table do not reflect the deduction of taxes that a shareholder would pay on Fund distribution or the redemption or sale of Fund shares.
See definition of comparative indices above.
Management Discussion of Fund Performance (unaudited)
Global X Lithium ETF
Global X Lithium ETF
The Global X Lithium ETF (“Fund”) seeks to provide investment results that correspond generally to the price and yield performance, before fees and expenses, of the Solactive Global Lithium Index (“Underlying Index”). The Fund is passively managed, which means the investment adviser does not attempt to take defensive positions in declining markets. The Fund generally seeks to fully replicate the Underlying Index.
The Underlying Index is designed to measure broad-based equity market performance of global companies involved in the lithium industry, as defined by the index provider.
For the 12-month period ended October 31, 2015 (the “reporting period”), the Fund decreased 13.18%, while the Underlying Index decreased 13.38%. The Fund had a net asset value of $24.00 per share on October 31, 2014 and ended the reporting period with a net asset value of $20.62 on October 31, 2015.
During the reporting period, the highest returns came from Ultralife and Galaxy Resources, which returned 107.08% and 59.69%, respectively. The worst performers were Avalon Rare Metals and Western Lithium USA, which returned -61.64% and -60.69%, respectively.
Commodities as a whole performed poorly during the reporting period, as global markets coped with impending interest rate hikes in the United States as well as slowing growth in major emerging markets like China, Brazil, and Russia. Despite the broad commodity downturn, there is optimism surrounding the lithium sector given expected increases in demand for the metal. Lithium is a key component of lithium-ion battery technology, and demand could increase as fast growing electric car and renewable energy industries are heavily dependent on battery storage.
| | | AVERAGE ANNUAL TOTAL RETURN FOR THE YEAR ENDED OCTOBER 31, 2015 | |
| | | One Year Return | | | Three Year Return | | | Five Year Return | | | Annualized Inception to Date* | |
| | | Net Asset Value | | | Market Price | | | Net Asset Value | | | Market Price | | | Net Asset Value | | | Market Price | | | Net Asset Value | | | Market Price | |
| Global X Lithium ETF | | | -13.18 | % | | | -12.89 | % | | | -9.42 | % | | | -9.01 | % | | | -11.36 | % | | | -11.30 | % | | | -6.55 | % | | | -6.45 | % |
| Solactive Global Lithium Index | | | -13.38 | % | | | -13.38 | % | | | -8.44 | % | | | -8.44 | % | | | -10.61 | % | | | -10.61 | % | | | -5.77 | % | | | -5.77 | % |
| S&P 500 Index | | | 5.20 | % | | | 5.20 | % | | | 16.20 | % | | | 16.20 | % | | | 14.33 | % | | | 14.33 | % | | | 15.35 | % | | | 15.35 | % |
Growth of a $10,000 Investment
(at Net Asset Value)
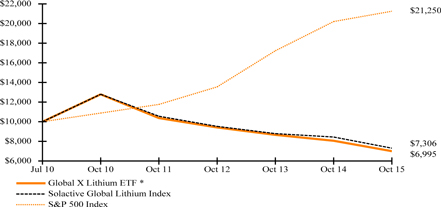
*Fund commenced operations on July 22, 2010.
The S&P 500 Index is a market capitalization-weighted composite index of 500 large capitalization U.S. companies.
The performance data quoted herein represents past performance and the return and value of an investment in the Fund will fluctuate so that, when redeemed, it may be worth less than its original cost. Past performance is no guarantee of future performance and should not be considered as a representation of the future results of the Fund. The Fund's performance assumes the reinvestment of all dividends and all capital gains. Index returns assume reinvestment of dividends and, unlike a Fund's returns, do not reflect any fees or expenses. If such fees and expenses were included in the index returns, the performance would have been lower. Please note that one cannot invest directly in an unmanaged index.
There are no assurances that the Fund will meet its stated objectives.
The Fund’s holdings and allocations are subject to change and should not be considered recommendations to buy individual securities.
The graph and table do not reflect the deduction of taxes that a shareholder would pay on Fund distribution or the redemption or sale of Fund shares.
See definition of comparative indices above.
Management Discussion of Fund Performance (unaudited)
Global X Fertilizers/Potash ETF
Global X Fertilizers/Potash ETF
The Global X Fertilizers/Potash ETF (“Fund”) seeks to provide investment results that correspond generally to the price and yield performance, before fees and expenses, of the Solactive Global Fertilizers/Potash Total Return Index (“Underlying Index”). The Fund is passively managed, which means the investment adviser does not attempt to take defensive positions in declining markets. The Fund generally seeks to fully replicate the Underlying Index.
The Underlying Index is designed to track the performance of the largest listed companies globally that are active in some aspect of the fertilizer/potash industry, as defined by the index provider.
For the 12-month period ended October 31, 2015 (the “reporting period”), the Fund decreased 6.01%, while the Underlying Index decreased 5.47%. The Fund had a net asset value of $10.87 per share on October 31, 2014 and ended the reporting period with a net asset value of $9.98 on October 31, 2015.
During the reporting period, the highest returns came from Nufarm and Gubre Fabrikalari, which returned 37.19% and 21.06%, respectively. The worst performers were Intrepid Potash and Uralkali, which returned -71.5% and -33.67%, respectively.
Prices of fertilizers and potash have been weighed down by lower prices for crops, which is the result of slowing demand from major importing countries. In North America, demand for potash, in first half of 2015 fell by as much as 25 to 30% year over year, while global supply remains high. This fall in demand has weighed significantly on companies in the sector.
| | | AVERAGE ANNUAL TOTAL RETURN FOR THE YEAR ENDED OCTOBER 31, 2015 | |
| | | One Year Return | | | Three Year Return | | | Annualized Inception to Date* | |
| | | Net Asset Value | | | Market Price | | | Net Asset Value | | | Market Price | | | Net Asset Value | | | Market Price | |
| Global X Fertilizers/Potash ETF | | | -6.01 | % | | | -6.22 | % | | | -8.80 | % | | | -8.95 | % | | | -7.60 | % | | | -7.71 | % |
| Solactive Global Fertilizers/Potash Total Return Index | | | -5.47 | % | | | -5.47 | % | | | -8.58 | % | | | -8.58 | % | | | -7.29 | % | | | -7.29 | % |
| S&P 500 Index | | | 5.20 | % | | | 5.20 | % | | | 16.20 | % | | | 16.20 | % | | | 13.16 | % | | | 13.16 | % |
Growth of a $10,000 Investment
(at Net Asset Value)
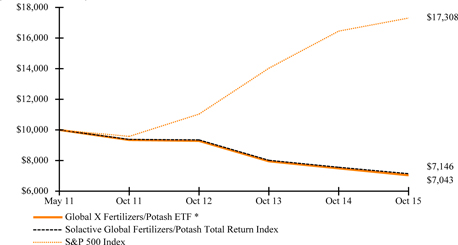
*Fund commenced operations on May 25, 2011.
The S&P 500 Index is a market capitalization-weighted composite index of 500 large capitalization U.S. companies.
The performance data quoted herein represents past performance and the return and value of an investment in the Fund will fluctuate so that, when redeemed, it may be worth less than its original cost. Past performance is no guarantee of future performance and should not be considered as a representation of the future results of the Fund. The Fund's performance assumes the reinvestment of all dividends and all capital gains. Index returns assume reinvestment of dividends and, unlike a Fund's returns, do not reflect any fees or expenses. If such fees and expenses were included in the index returns, the performance would have been lower. Please note that one cannot invest directly in an unmanaged index.
There are no assurances that the Fund will meet its stated objectives.
The Fund’s holdings and allocations are subject to change and should not be considered recommendations to buy individual securities.
The graph and table do not reflect the deduction of taxes that a shareholder would pay on Fund distribution or the redemption or sale of Fund shares.
See definition of comparative indices above.
| Schedule of Investments | October 31, 2015 |
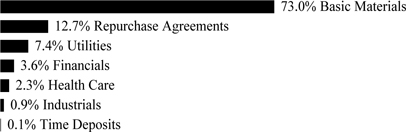
Global X Silver Miners ETF
Sector Weightings (unaudited)†:
† Sector weightings percentages are based on the total market value of investments. Repurchase agreements purchased from cash collateral received for securities lending activity are included in total investments. Please see Note 2 and 7 in Notes to Financial Statements for more detailed information.
| | | Shares | | | Value | |
| COMMON STOCK — 100.4% |
| CANADA— 59.7% | | | | | | | | |
| Basic Materials — 59.7% | | | | | | | | |
| Alamos Gold | | | 1,620,143 | | | $ | 6,221,349 | |
| AuRico Metals *^ | | | 533,199 | | | | 324,185 | |
| AuRico Metals * | | | 121,780 | | | | 73,533 | |
| Bear Creek Mining * (A) | | | 2,520,115 | | | | 1,367,586 | |
| Endeavour Silver * | | | 3,005,449 | | | | 4,958,991 | |
| First Majestic Silver * | | | 1,877,718 | | | | 6,199,979 | |
| Fortuna Silver Mines * | | | 1,981,009 | | | | 5,163,176 | |
| MAG Silver * (A) | | | 1,412,493 | | | | 10,113,450 | |
| Pan American Silver (A) | | | 898,127 | | | | 6,798,821 | |
| Primero Mining * (A) | | | 2,334,539 | | | | 5,370,858 | |
| Silver Standard Resources * | | | 1,020,016 | | | | 7,038,110 | |
| Silver Wheaton | | | 1,164,136 | | | | 15,820,608 | |
| Silvercorp Metals (A) | | | 5,464,655 | | | | 4,043,845 | |
| Silvercrest Metals * | | | 579,500 | | | | 73,083 | |
| Tahoe Resources | | | 1,474,854 | | | | 12,309,707 | |
| TOTAL CANADA | | | | | | | 85,877,281 | |
| MEXICO— 20.1% | | | | | | | | |
| Basic Materials — 20.1% | | | | | | | | |
| Fresnillo | | | 1,087,861 | | | | 12,264,688 | |
| Industrias Penoles | | | 1,254,516 | | | | 16,607,465 | |
| TOTAL MEXICO | | | | | | | 28,872,153 | |
| PERU— 4.1% | | | | | | | | |
| Basic Materials — 4.1% | | | | | | | | |
| Hochschild Mining * | | | 5,196,022 | | | | 5,938,311 | |
| UNITED KINGDOM— 5.2% | | | | | | | | |
| Basic Materials — 5.2% | | | | | | | | |
| Polymetal International | | | 838,850 | | | | 7,442,769 | |
| UNITED STATES— 11.3% | | | | | | | | |
| Basic Materials — 11.3% | | | | | | | | |
| Coeur d'Alene Mines * (A) | | | 1,809,100 | | | | 4,884,570 | |
| Hecla Mining | | | 2,780,678 | | | | 5,756,004 | |
The accompanying notes are an integral part of the financial statements.
| Schedule of Investments | October 31, 2015 |
Global X Silver Miners ETF
| | | Shares/Face
Amount(1) | | | Value | |
| COMMON STOCK — continued | | | | | | | | |
| Basic Materials — continued | | | | | | | | |
| McEwen Mining (A) | | | 6,215,469 | | | $ | 5,595,165 | |
| TOTAL UNITED STATES | | | | | | | 16,235,739 | |
| TOTAL COMMON STOCK | | | | | | | | |
| (Cost $267,934,607) | | | | | | | 144,366,253 | |
| | | | | | | | | |
| REPURCHASE AGREEMENTS (B) — 4.8% | | | | | | | | |
| Barclays Bank | | | | | | | | |
0.070%, dated 10/30/15, to be repurchased on 11/02/15 repurchase price
$5,000,029 (collateralized by U.S. Treasury Obligations, ranging in par
value $11-$2,741,568, 0.000%-2.750%, 11/05/15-02/15/45 with a total
market value of $5,100,000) | | | 5,000,000 | | | | 5,000,000 | |
| Deutsche Bank | | | | | | | | |
0.050%, dated 10/30/15, to be repurchased on 11/02/15 repurchase price
$1,827,726 (collateralized by U.S. Treasury Notes, par value $1,827,726,
3.250%, 07/31/16 with a total market value of $1,877,988) | | | 1,827,718 | | | | 1,827,718 | |
| TOTAL REPURCHASE AGREEMENTS | | | | | | | | |
| (Cost $6,827,718) | | | | | | | 6,827,718 | |
| | | | | | | | | |
| TIME DEPOSIT — 0.0% | | | | | | | | |
| Brown Brothers Harriman, 0.080%, 11/02/15, GBP | | | | | | | | |
| (Cost $11) | | | 7 | | | | 11 | |
| TOTAL INVESTMENTS — 105.2% | | | | | | | | |
| (Cost $274,762,336) | | | | | | $ | 151,193,982 | |
Percentages are based on Net Assets of $143,755,814.
| * | Non-income producing security. |
| ^ | Traded on U.S. stock exchange. |
| (1) | In U.S. Dollars unless otherwise indicated. |
| (A) | This security or a partial position of this security is on loan at October 31, 2015. The total value of securities on loan at October 31, 2015 was $6,097,231. |
| (B) | This security was purchased with cash collateral held from securities on loan. The total value of such securities as of October 31, 2015 was $6,827,718. |
GBP — British Pound Sterling
The following is a summary of the inputs used as of October 31, 2015, in valuing the Fund's investments carried at value:
| Investments in Securities | | Level 1 | | | Level 2 | | | Level 3 | | | Total | |
| Common Stock | | $ | 144,366,253 | | | $ | — | | | $ | — | | | $ | 144,366,253 | |
| Repurchase Agreements | | | — | | | | 6,827,718 | | | | — | | | | 6,827,718 | |
| Time Deposit | | | — | | | | 11 | | | | — | | | | 11 | |
| Total Investments in Securities | | $ | 144,366,253 | | | $ | 6,827,729 | | | $ | — | | | $ | 151,193,982 | |
For the year ended October 31, 2015, there have been no transfers between Level 1, Level 2 and Level 3 investments.
As of October 31, 2015, there were no Level 3 investments.
The accompanying notes are an integral part of the financial statements.
| Schedule of Investments | October 31, 2015 |
Global X Gold Explorers ETF
Sector Weightings (unaudited)†:
† Sector weightings percentages are based on the total market value of investments. Repurchase agreements purchased from cash collateral received for securities lending activity are included in total investments. Please see Note 2 and 7 in Notes to Financial Statements for more detailed information.
| | | Shares/Face
Amount | | | Value | |
| COMMON STOCK — 99.7% | | | | | | | | |
| AUSTRALIA— 8.2% | | | | | | | | |
| Basic Materials — 8.2% | | | | | | | | |
| Gold Road Resources * | | | 4,367,306 | | | $ | 1,293,080 | |
| Gryphon Minerals * (A) | | | 28,310,517 | | | | 1,090,699 | |
| TOTAL AUSTRALIA | | | | | | | 2,383,779 | |
| CANADA— 91.5% | | | | | | | | |
| Basic Materials — 91.5% | | | | | | | | |
| Asanko Gold * | | | 777,370 | | | | 1,324,978 | |
| Atac Resources * | | | 3,979,081 | | | | 1,216,519 | |
| Chesapeake Gold * | | | 814,922 | | | | 1,426,355 | |
| Continental Gold * (B) | | | 563,534 | | | | 702,075 | |
| Exeter Resource * | | | 3,121,416 | | | | 1,136,195 | |
| Gold Canyon Resources * (A) | | | 12,839,169 | | | | 3,385,572 | |
| Guyana Goldfields * | | | 458,500 | | | | 1,142,439 | |
| International Tower Hill Mines * | | | 4,807,994 | | | | 1,242,866 | |
| Kaminak Gold, Cl A * | | | 2,284,736 | | | | 1,414,481 | |
| Lydian International, Cl A * (B) | | | 3,245,419 | | | | 719,358 | |
| Novagold Resources * | | | 477,188 | | | | 1,727,421 | |
| OceanGold | | | 1,105,731 | | | | 2,112,835 | |
| Premier Gold Mines * | | | 858,900 | | | | 1,575,542 | |
| Pretium Resources * (B) | | | 258,381 | | | | 1,546,317 | |
| Rubicon Minerals * ^ (B) | | | 1,333,401 | | | | 601,764 | |
| Rubicon Minerals * (B) | | | 118,412 | | | | 52,493 | |
| Sabina Gold & Silver * (B) | | | 3,355,724 | | | | 1,564,560 | |
| Seabridge Gold * | | | 257,802 | | | | 2,106,242 | |
| Torex Gold Resources * (B) | | | 1,738,868 | | | | 1,648,027 | |
| TOTAL CANADA | | | | | | | 26,646,039 | |
| TOTAL COMMON STOCK | | | | | | | | |
| (Cost $41,461,684) | | | | | | | 29,029,818 | |
| | | | | | | | | |
| REPURCHASE AGREEMENT (C) — 3.6% | | | | | | | | |
| Deutsche Bank | | | | | | | | |
| 0.050%, dated 10/30/15, to be repurchased on 11/02/15 repurchase price $1,037,814 (collateralized by U.S. Treasury Notes, par value $1,037,814, 3.250%, 07/31/16 with a total market value of $1,066,354) | | | | | | | | |
| (Cost $1,037,810) | | $ | 1,037,810 | | | | 1,037,810 | |
The accompanying notes are an integral part of the financial statements.
| Schedule of Investments | October 31, 2015 |
Global X Gold Explorers ETF
| | | Face Amount(1) | | | Value | |
| TIME DEPOSITS — 0.3% | | | | | | | | |
| Brown Brothers Harriman | | | | | | | | |
| 0.030%, 11/02/15 | | | 77,330 | | | $ | 77,330 | |
| 0.050%, 11/02/15, CAD | | | 8 | | | | 6 | |
| TOTAL TIME DEPOSITS | | | | | | | | |
| (Cost $77,336) | | | | | | | 77,336 | |
| TOTAL INVESTMENTS — 103.6% | | | | | | | | |
| (Cost $42,576,830) | | | | | | $ | 30,144,964 | |
Percentages are based on Net Assets of $29,093,081.
| * | Non-income producing security. |
| ^ | Traded on U.S. stock exchange. |
| (1) | In U.S. Dollars unless otherwise indicated. |
| (A) | Affiliated investment (see Note 3). |
| (B) | This security or a partial position of this security is on loan at October 31, 2015. The total value of securities on loan at October 31, 2015 was $546,286. |
| (C) | This security was purchased with cash collateral held from securities on loan. The total value of such securities as of October 31, 2015 was $1,037,810. |
| CAD — Canadian Dollar |
| Cl — Class |
The following is a summary of the inputs used as of October 31, 2015, in valuing the Fund's investments carried at value:
| Investments in Securities | | Level 1 | | | Level 2 | | | Level 3 | | | Total | |
| Common Stock | | $ | 29,029,818 | | | $ | — | | | $ | — | | | $ | 29,029,818 | |
| Repurchase Agreement | | | — | | | | 1,037,810 | | | | — | | | | 1,037,810 | |
| Time Deposits | | | — | | | | 77,336 | | | | — | | | | 77,336 | |
| Total Investments in Securities | | $ | 29,029,818 | | | $ | 1,115,146 | | | $ | — | | | $ | 30,144,964 | |
For the year ended October 31, 2015, there have been no transfers between Level 1, Level 2 or Level 3 investments.
As of October 31, 2015, there were no Level 3 investments.
The accompanying notes are an integral part of the financial statements.
| Schedule of Investments | October 31, 2015 |
Global X Copper Miners ETF
Sector Weightings (unaudited)†:

† Sector weightings percentages are based on the total market value of investments. Repurchase agreements purchased from cash collateral received for securities lending activity are included in total investments. Please see Note 2 and 7 in Notes to Financial Statements for more detailed information.
| | | Shares | | | Value | |
| COMMON STOCK — 99.3% |
| AUSTRALIA— 14.8% | | | | | | | | |
| Basic Materials — 14.8% | | | | | | | | |
| Cudeco *(A) (B) | | | 597,947 | | | $ | 377,503 | |
| OZ Minerals | | | 329,349 | | | | 1,024,487 | |
| Sandfire Resources | | | 309,986 | | | | 1,402,151 | |
| TOTAL AUSTRALIA | | | | | | | 2,804,141 | |
| CANADA— 37.1% | | | | | | | | |
| Basic Materials — 37.1% | | | | | | | | |
| Capstone Mining * | | | 1,923,410 | | | | 984,969 | |
| Copper Mountain Mining * (C) | | | 1,325,702 | | | | 526,896 | |
| Copper Mountain Mining *^ | | | 12,300 | | | | 4,637 | |
| First Quantum Minerals | | | 169,470 | | | | 904,116 | |
| HudBay Minerals, Cl B | | | 190,029 | | | | 986,202 | |
| Imperial Metals * (C) | | | 143,616 | | | | 869,369 | |
| Lundin Mining * | | | 281,703 | | | | 949,524 | |
| Teck Resources, Cl B | | | 152,593 | | | | 893,387 | |
| Turquoise Hill Resources * | | | 337,555 | | | | 918,150 | |
| TOTAL CANADA | | | | | | | 7,037,250 | |
| CHILE— 4.7% | | | | | | | | |
| Basic Materials — 4.7% | | | | | | | | |
| Antofagasta | | | 110,143 | | | | 895,603 | |
| CHINA— 4.8% | | | | | | | | |
| Basic Materials — 4.8% | | | | | | | | |
| Jiangxi Copper, Cl H | | | 693,029 | | | | 917,469 | |
| HONG KONG— 1.7% | | | | | | | | |
| Basic Materials — 1.7% | | | | | | | | |
| CST Mining Group * | | | 29,296,000 | | | | 325,087 | |
| MEXICO—6.2% | | | | | | | | |
| Basic Materials — 6.2% | | | | | | | | |
| Grupo Mexico, Cl B | | | 479,314 | | | | 1,167,492 | |
| PERU— 6.4% | | | | | | | | |
| Basic Materials — 6.4% | | | | | | | | |
| Southern Copper (C) | | | 43,767 | | | | 1,214,972 | |
The accompanying notes are an integral part of the financial statements.
| Schedule of Investments | October 31, 2015 |
Global X Copper Miners ETF
| | | Shares/Face
Amount(1) | | | Value | |
| COMMON STOCK — continued |
| POLAND— 4.8% | | | | | | | | |
| Basic Materials — 4.8% | | | | | | | | |
| KGHM Polska Miedz | | | 39,029 | | | $ | 910,438 | |
| SWITZERLAND— 5.0% | | | | | | | | |
| Basic Materials — 5.0% | | | | | | | | |
| Glencore Xstrata | | | 550,170 | | | | 955,894 | |
| UNITED KINGDOM— 8.9% | | | | | | | | |
| Basic Materials — 8.9% | | | | | | | | |
| KAZ Minerals * | | | 466,687 | | | | 836,793 | |
| Vedanta Resources | | | 110,677 | | | | 845,248 | |
| TOTAL UNITED KINGDOM | | | | | | | 1,682,041 | |
| UNITED STATES— 4.9% | | | | | | | | |
| Basic Materials — 4.9% | | | | | | | | |
| Freeport-McMoRan Copper & Gold | | | 79,242 | | | | 932,678 | |
| TOTAL COMMON STOCK | | | | | | | | |
| (Cost $34,066,809) | | | | | | | 18,843,065 | |
| | | | | | | | | |
| REPURCHASE AGREEMENT (D) — 5.7% | | | | | | | | |
| Deutsche Bank | | | | | | | | |
0.050%, dated 10/30/15, to be repurchased on 11/02/15 repurchase price
$1,082,010 (collateralized by U.S. Treasury Notes, par value $1,082,010,
3.250%, 07/31/16 with a total market value of $1,111,765) | | | | | | | | |
| (Cost $1,082,005) | | | 1,082,005 | | | | 1,082,005 | |
| | | | | | | | | |
| TIME DEPOSITS — 0.9% | | | | | | | | |
| Brown Brothers Harriman | | | | | | | | |
| 0.030%, 11/02/15 | | | 165,822 | | | | 165,822 | |
| 1.104%, 11/02/15, AUD | | | 11 | | | | 8 | |
| 0.050%, 11/02/15, CAD | | | 2 | | | | 1 | |
| 0.080%, 11/02/15, GBP | | | 1 | | | | 2 | |
| TOTAL TIME DEPOSITS | | | | | | | | |
| (Cost $165,833) | | | | | | | 165,833 | |
| TOTAL INVESTMENTS — 105.9% | | | | | | | | |
| (Cost $35,314,647) | | | | | | $ | 20,090,903 | |
Percentages are based on Net Assets of $18,979,404.
| * | Non-income producing security. |
| ^ | Traded on U.S. stock exchange. |
| (1) | In U.S. Dollars unless otherwise indicated. |
| (A) | Security is fair valued using methods determined in good faith by the Fair Value Committee of the Fund. The total value of such security as of October 31, 2015, was $377,503 and represents 2.0% of Net Assets. |
| (B) | Security considered illiquid. The total value of such security as of October 31, 2015 was $377,503 and represented 2.0% of Net Assets. |
| (C) | This security or a partial position of this security is on loan at October 31, 2015. The total value of securities on loan at October 31, 2015 was $1,069,340. |
| (D) | This security was purchased with cash collateral held from securities on loan. The total value of such securities as of October 31, 2015 was $1,082,005. |
The accompanying notes are an integral part of the financial statements.
| Schedule of Investments | October 31, 2015 |
Global X Copper Miners ETF
| AUD — Australian Dollar |
| CAD — Canadian Dollar |
| Cl — Class |
| GBP — British Pound Sterling |
The following is a summary of the inputs used as of October 31, 2015, in valuing the Fund's investments carried at value:
| Investments in Securities | | Level 1 | | | Level 2 | | | Level 3(1) | | | Total | |
| Common Stock | | $ | 18,460,925 | | | $ | 4,637 | | | $ | 377,503 | | | $ | 18,843,065 | |
| Repurchase Agreement | | | — | | | | 1,082,005 | | | | — | | | | 1,082,005 | |
| Time Deposits | | | — | | | | 165,833 | | | | — | | | | 165,833 | |
| Total Investments in Securities | | $ | 18,460,925 | | | $ | 1,252,475 | | | $ | 377,503 | | | $ | 20,090,903 | |
(1)Please see Note 2 for details on the unobservable inputs and the interrelationships and sensitivity between these inputs for those Level 3 securities that are not valued by third party pricing vendors or broker quotes.
The following is a reconciliation of investments in which significant unobservable inputs (Level 3) were used in determining fair value:
| | | Common Stock | |
| Beginning Balance as of October 31, 2014 | | $ | - | |
| Transfers into Level 3 | | | 377,503 | |
| Ending Balance as of October 31, 2015 | | $ | 377,503 | |
For the year ended October 31, 2015, the transfers into Level 3 were due to changes in the availability of observable inputs to determine fair value. Transfers between levels are recognized at period end.
For the year ended October 31, 2015, the transfers between Level 1 and Level 2 in the amount of $4,637 were due to changes in the availability of observable inputs to determine fair value. Transfers between levels are recognized at period end.
The accompanying notes are an integral part of the financial statements.
| Schedule of Investments | October 31, 2015 |
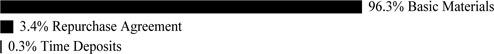
Global X Uranium ETF
Sector Weightings (unaudited)†:
† Sector weightings percentages are based on the total market value of investments. Repurchase agreements purchased from cash collateral received for securities lending activity are included in total investments. Please see Note 2 and 7 in Notes to Financial Statements for more detailed information.
| | | Shares | | | Value | |
| COMMON STOCK — 100.7% |
| AUSTRALIA— 16.5% | | | | | | | | |
| Basic Materials — 16.5% | | | | | | | | |
| Bannerman Resources * | | | 16,821,309 | | | $ | 516,050 | |
| Berkeley Resources * | | | 8,274,187 | | | | 2,538,384 | |
| Energy Resources of Australia * (A) | | | 10,378,854 | | | | 2,517,630 | |
| Greenland Minerals & Energy * (A) | | | 34,830,609 | | | | 695,797 | |
| Paladin Energy * (A) | | | 40,682,341 | | | | 7,111,079 | |
| Peninsula Energy * | | | 7,968,033 | | | | 6,992,295 | |
| Silex Systems * (A) (B) | | | 9,486,202 | | | | 3,011,729 | |
| TOTAL AUSTRALIA | | | | | | | 23,382,964 | |
| CANADA— 60.3% | | | | | | | | |
| Basic Materials — 56.1% | | | | | | | | |
| Cameco | | | 2,786,466 | | | | 39,443,078 | |
| Denison Mines * (A) | | | 18,148,490 | | | | 7,351,779 | |
| Energy Fuels * (A) (B) | | | 1,451,793 | | | | 3,950,306 | |
| Fission 3.0 * (B) | | | 9,579,896 | | | | 475,938 | |
| Fission Uranium * | | | 15,204,190 | | | | 6,972,533 | |
| Laramide Resources * (B) | | | 6,245,849 | | | | 716,075 | |
| Mega Uranium * (B) | | | 24,227,864 | | | | 1,296,251 | |
| Uex * (A) (B) | | | 13,892,565 | | | | 1,274,206 | |
| Uranium Participation * (A) | | | 4,694,232 | | | | 18,226,544 | |
| | | | | | | | 79,706,710 | |
| Financials — 4.2% | | | | | | | | |
| NexGen Energy * (A) | | | 10,680,043 | | | | 5,958,980 | |
| TOTAL CANADA | | | | | | | 85,665,690 | |
| CHINA— 4.4% | | | | | | | | |
| Utilities — 4.4% | | | | | | | | |
| CGN Power, Cl H (C) | | | 15,145,800 | | | | 6,292,755 | |
The accompanying notes are an integral part of the financial statements.
| Schedule of Investments | October 31, 2015 |
Global X Uranium ETF
| | | Shares/Face
Amount(1) | | | Value | |
| COMMON STOCK — continued | | | | | | | | |
| FRANCE— 4.2% | | | | | | | | |
| Utilities — 4.2% | | | | | | | | |
| Areva * | | | 822,434 | | | $ | 5,905,288 | |
| HONG KONG— 3.7% | | | | | | | | |
| Health Care — 2.7% | | | | | | | | |
| CGN Mining * | | | 45,356,700 | | | | 3,862,585 | |
| Industrials — 1.0% | | | | | | | | |
| CNNC International * | | | 3,665,000 | | | | 1,465,981 | |
| TOTAL HONG KONG | | | | | | | 5,328,566 | |
| UNITED STATES— 11.6% | | | | | | | | |
| Basic Materials — 11.6% | | | | | | | | |
| Centrus Energy, Cl A * (B) | | | 447,240 | | | | 1,207,548 | |
| Energy Fuels * (A) (B) | | | 1,079,399 | | | | 2,935,965 | |
| Uranium Energy * (A) (B) | | | 5,301,722 | | | | 5,937,929 | |
| Uranium Resources * (A) (B) | | | 2,099,765 | | | | 1,560,125 | |
| Ur-Energy * (A) (B) | | | 8,975,014 | | | | 4,860,868 | |
| TOTAL UNITED STATES | | | | | | | 16,502,435 | |
| TOTAL COMMON STOCK | | | | | | | | |
| (Cost $271,531,936) | | | | | | | 143,077,698 | |
| | | | | | | | | |
| REPURCHASE AGREEMENTS (D) — 14.7% | | | | | | | | |
| Barclays Bank | | | | | | | | |
0.070%, dated 10/30/15, to be repurchased on 11/02/15 repurchase price
$19,000,111 (collateralized by U.S. Treasury Obligations, ranging in par
value $20-$5,752,259, 0.000%-2.750%, 11/05/15-02/15/45 with a total
market value of $19,380,000) | | | 19,000,000 | | | | 19,000,000 | |
| Deutsche Bank | | | | | | | | |
0.050%, dated 10/30/15, to be repurchased on 11/02/15 repurchase price
$1,830,615 (collateralized by U.S. Treasury Notes, par value $1,830,615,
3.250%, 07/31/16 with a total market value of $1,880,957) | | | 1,830,607 | | | | 1,830,607 | |
| TOTAL REPURCHASE AGREEMENTS | | | | | | | | |
| (Cost $20,830,607) | | | | | | | 20,830,607 | |
| | | | | | | | | |
| TIME DEPOSITS — 0.1% | | | | | | | | |
| Brown Brothers Harriman | | | | | | | | |
| 1.104%, 11/02/15, AUD | | | 3 | | | | 2 | |
| 0.050%, 11/02/15, CAD | | | 127,538 | | | | 97,480 | |
| 0.080%, 11/02/15, GBP | | | 5 | | | | 8 | |
| TOTAL TIME DEPOSITS | | | | | | | | |
| (Cost $97,490) | | | | | | | 97,490 | |
| TOTAL INVESTMENTS — 115.5% | | | | | | | | |
| (Cost $292,460,033) | | | | | | $ | 164,005,795 | |
Percentages are based on Net Assets of $142,056,424.
The accompanying notes are an integral part of the financial statements.
| Schedule of Investments | October 31, 2015 |
Global X Uranium ETF
| * | Non-income producing security. |
| (1) | In U.S. Dollars unless otherwise indicated. |
| (A) | This security or a partial position of this security is on loan at October 31, 2015. The total value of securities on loan at October 31, 2015 was $16,391,367. |
| (B) | Affiliated investment (see Note 3). |
| (C) | Security sold within terms of a private placement memorandum, exempt from registration under Section 144A of the Securities Act of 1933, as amended, and may be sold only to dealers in that program or other "accredited investors." These securities have been determined to be liquid under guidelines established by the board of Trustees. |
| (D) | This security was purchased with cash collateral held from securities on loan. The total value of such securities as of October 31, 2015 was $20,830,607. |
AUD — Australian Dollar
CAD — Canadian Dollar
Cl — Class
GBP — British Pound Sterling
The following is a summary of the inputs used as of October 31, 2015, in valuing the Fund's investments carried at value:
| Investments in Securities | | Level 1 | | | Level 2 | | | Level 3 | | | Total | |
| Common Stock | | $ | 143,077,698 | | | $ | — | | | $ | — | | | $ | 143,077,698 | |
| Repurchase Agreements | | | — | | | | 20,830,607 | | | | — | | | | 20,830,607 | |
| Time Deposits | | | — | | | | 97,490 | | | | — | | | | 97,490 | |
| Total Investments in Securities | | $ | 143,077,698 | | | $ | 20,928,097 | | | $ | — | | | $ | 164,005,795 | |
For the year ended October 31, 2015, there have been no transfers between Level 1, Level 2 or Level 3 investments.
As of October 31, 2015, there were no Level 3 investments.
The accompanying notes are an integral part of the financial statements.
| Schedule of Investments | October 31, 2015 |
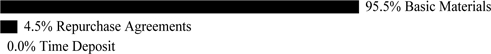
Global X Lithium ETF
Sector Weightings (unaudited)†:
† Sector weightings percentages are based on the total market value of investments. Repurchase agreements purchased from cash collateral received for securities lending activity are included in total investments. Please see Note 2 and 7 in Notes to Financial Statements for more detailed information.
| | | Shares | | | Value | |
| COMMON STOCK — 100.1% | | | | | | | | |
| AUSTRALIA— 2.4% | | | | | | | | |
| Basic Materials — 2.4% | | | | | | | | |
| Galaxy Resources * | | | 6,670,672 | | | $ | 366,458 | |
| Orocobre * | | | 485,701 | | | | 622,009 | |
| TOTAL AUSTRALIA | | | | | | | 988,467 | |
| CANADA— 0.8% | | | | | | | | |
| Basic Materials — 0.8% | | | | | | | | |
| Avalon Rare Metals * (A) | | | 437,807 | | | | 38,482 | |
| Western Lithium USA * (A) | | | 1,003,609 | | | | 287,655 | |
| TOTAL CANADA | | | | | | | 326,137 | |
| CHILE— 9.6% | | | | | | | | |
| Basic Materials — 9.6% | | | | | | | | |
| Sociedad Quimica y Minera de Chile ADR | | | 201,553 | | | | 3,906,097 | |
| CHINA— 4.7% | | | | | | | | |
| Industrials — 4.7% | | | | | | | | |
| BYD, Cl H * | | | 309,200 | | | | 1,930,979 | |
| FRANCE— 4.7% | | | | | | | | |
| Industrials — 4.7% | | | | | | | | |
| Blue Solutions * | | | 19,288 | | | | 465,549 | |
| Saft Groupe | | | 55,582 | | | | 1,442,875 | |
| TOTAL FRANCE | | | | | | | 1,908,424 | |
| HONG KONG— 6.6% | | | | | | | | |
| Consumer Goods — 5.6% | | | | | | | | |
| FDG Electric Vehicles * | | | 32,890,600 | | | | 2,291,703 | |
| Industrials — 1.0% | | | | | | | | |
| Coslight Technology International Group * | | | 1,038,373 | | | | 388,547 | |
| TOTAL HONG KONG | | | | | | | 2,680,250 | |
| JAPAN— 9.3% | | | | | | | | |
| Industrials — 9.3% | | | | | | | | |
| GS Yuasa | | | 447,894 | | | | 1,714,747 | |
| Panasonic | | | 174,500 | | | | 2,075,057 | |
| TOTAL JAPAN | | | | | | | 3,789,804 | |
The accompanying notes are an integral part of the financial statements.
| Schedule of Investments | October 31, 2015 |
Global X Lithium ETF
| | | Shares/Face
Amount | | | Value | |
| COMMON STOCK — continued | | | | | | | | |
| SOUTH KOREA— 11.1% | | | | | | | | |
| Basic Materials — 4.9% | | | | | | | | |
| LG Chemical | | | 7,450 | | | $ | 1,989,847 | |
| Industrials — 6.2% | | | | | | | | |
| Samsung SDI | | | 20,237 | | | | 1,890,479 | |
| Vitzrocell * | | | 49,371 | | | | 619,276 | |
| | | | | | | | 2,509,755 | |
| TOTAL SOUTH KOREA | | | | | | | 4,499,602 | |
| TAIWAN— 11.3% | | | | | | | | |
| Industrials — 11.3% | | | | | | | | |
| Advanced Lithium Electrochemistry Cayman * | | | 805,929 | | | | 913,586 | |
| Changs Ascending Enterprise * | | | 260,017 | | | | 310,769 | |
| Dynapack International Technology | | | 922,300 | | | | 1,517,113 | |
| Simplo Technology | | | 526,500 | | | | 1,873,204 | |
| TOTAL TAIWAN | | | | | | | 4,614,672 | |
| UNITED KINGDOM— 0.2% | | | | | | | | |
| Basic Materials — 0.2% | | | | | | | | |
| Bacanora Minerals * | | | 63,258 | | | | 82,553 | |
| UNITED STATES— 39.4% | | | | | | | | |
| Basic Materials — 28.2% | | | | | | | | |
| Albemarle | | | 58,442 | | | | 3,127,816 | |
| Avalon Rare Metals * | | | 110,956 | | | | 10,419 | |
| FMC | | | 204,618 | | | | 8,329,999 | |
| | | | | | | | 11,468,234 | |
| Consumer Goods — 4.5% | | | | | | | | |
| Tesla Motors * (A) | | | 8,879 | | | | 1,837,331 | |
| Industrials — 6.7% | | | | | | | | |
| China BAK Battery * | | | 21,214 | | | | 64,915 | |
| Johnson Controls | | | 47,535 | | | | 2,147,631 | |
| Ultralife * | | | 76,731 | | | | 520,236 | |
| | | | | | | | 2,732,782 | |
| TOTAL UNITED STATES | | | | | | | 16,038,347 | |
| TOTAL COMMON STOCK | | | | | | | | |
| (Cost $49,714,593) | | | | | | | 40,765,332 | |
| | | | | | | | | |
| REPURCHASE AGREEMENT (B) — 3.0% | | | | | | | | |
| Deutsche Bank | | | | | | | | |
0.050%, dated 10/30/15, to be repurchased on 11/02/15 repurchase price
$1,211,995 (collateralized by U.S. Treasury Notes, par value $1,211,995,
3.250%, 07/31/16 with a total market value of $1,245,325) | | | | | | | | |
| (Cost $1,211,990) | | $ | 1,211,990 | | | | 1,211,990 | |
The accompanying notes are an integral part of the financial statements.
| Schedule of Investments | October 31, 2015 |
Global X Lithium ETF
| | | Face Amount(1) | | | Value | |
| TIME DEPOSIT — 0.0% | | | | | | | | |
| Brown Brothers Harriman, 1.104%, 11/02/15, AUD | | | | | | | | |
| (Cost $2) | | | 3 | | | $ | 2 | |
| TOTAL INVESTMENTS — 103.1% | | | | | | | | |
| (Cost $50,926,585) | | | | | | $ | 41,977,324 | |
Percentages are based on Net Assets of $40,730,959.
| * | Non-income producing security. |
| (1) | In U.S. Dollars unless otherwise indicated. |
| (A) | This security or a partial position of this security is on loan at October 31, 2015. The total value of securities on loan at October 31, 2015 was $1,089,488. |
| (B) | This security was purchased with cash collateral held from securities on loan. The total value of such securities as of October 31, 2015 was $1,211,990. |
ADR — American Depositary Receipt
AUD — Australian Dollar
Cl — Class
The following is a summary of the inputs used as of October 31, 2015, in valuing the Fund's investments carried at value:
| Investments in Securities | | Level 1 | | | Level 2 | | | Level 3 | | | Total | |
| Common Stock | | $ | 40,765,332 | | | $ | — | | | $ | — | | | $ | 40,765,332 | |
| Repurchase Agreement | | | — | | | | 1,211,990 | | | | — | | | | 1,211,990 | |
| Time Deposit | | | — | | | | 2 | | | | — | | | | 2 | |
| Total Investments in Securities | | $ | 40,765,332 | | | $ | 1,211,992 | | | $ | — | | | $ | 41,977,324 | |
The following is a reconciliation of investments in which significant unobservable inputs (Level 3) were used in determining fair value:
| | | Investments in | |
| | | Common Stock | |
| Beginning Balance as of October 31, 2014 | | $ | 2,701,427 | |
| Transfers out of Level 3 | | | (2,291,703 | ) |
| Transfers into Level 3 | | | - | |
| Net purchases | | | 286,808 | |
| Net sales | | | (750,234 | ) |
| Realized gain/(loss) | | | (1,756,221 | ) |
| Change in unrealized appreciation/(depreciation) | | | 1,809,923 | |
| Ending Balance as of October 31, 2015 | | $ | - | |
For the year ended October 31, 2015, the transfers out of Level 3 were due to changes in the availability of observable inputs to determine fair value. Transfers between levels are recognized at period end.
For the year ended October 31, 2015 there have been no transfers between Level 1 and Level 2 investments.
As of October 31, 2015, there were no Level 3 investments.
The accompanying notes are an integral part of the financial statements.
| Schedule of Investments | October 31, 2015 |
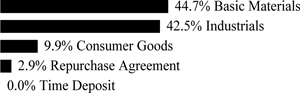
Global X Fertilizers/Potash ETF
Sector Weightings (unaudited)†:

† Sector weightings percentages are based on the total market value of investments.
| | | Shares | | | Value | |
| COMMON STOCK — 99.7% | | | | | | | | |
| AUSTRALIA— 10.4% | | | | | | | | |
| Basic Materials — 10.4% | | | | | | | | |
| Incitec Pivot | | | 219,029 | | | $ | 617,252 | |
| Nufarm | | | 95,692 | | | | 571,432 | |
| TOTAL AUSTRALIA | | | | | | | 1,188,684 | |
| BELGIUM— 4.4% | | | | | | | | |
| Basic Materials — 4.4% | | | | | | | | |
| Tessenderlo Chemie | | | 15,620 | | | | 506,771 | |
| CANADA— 8.5% | | | | | | | | |
| Basic Materials — 8.5% | | | | | | | | |
| Agrium | | | 282 | | | | 26,220 | |
| Agrium ^ | | | 5,868 | | | | 546,135 | |
| Potash Corp of Saskatchewan | | | 20,153 | | | | 407,695 | |
| TOTAL CANADA | | | | | | | 980,050 | |
| CHILE— 5.2% | | | | | | | | |
| Basic Materials — 5.2% | | | | | | | | |
| Sociedad Quimica y Minera de Chile ADR | | | 30,606 | | | | 593,144 | |
| CHINA— 3.9% | | | | | | | | |
| Basic Materials — 3.9% | | | | | | | | |
| China BlueChemical | | | 947,841 | | | | 283,737 | |
| Sinofert Holdings | | | 948,385 | | | | 167,648 | |
| TOTAL CHINA | | | | | | | 451,385 | |
| GERMANY— 4.4% | | | | | | | | |
| Basic Materials — 4.4% | | | | | | | | |
| K+S | | | 20,042 | | | | 508,212 | |
| ISRAEL— 8.7% | | | | | | | | |
| Basic Materials — 8.7% | | | | | | | | |
| Israel Chemicals | | | 94,041 | | | | 521,293 | |
| The Israel Corp | | | 1,835 | | | | 473,627 | |
| TOTAL ISRAEL | | | | | | | 994,920 | |
| NETHERLANDS— 5.4% | | | | | | | | |
| Basic Materials — 5.4% | | | | | | | | |
| OCI * | | | 21,605 | | | | 613,955 | |
| NORWAY— 4.8% | | | | | | | | |
| Basic Materials — 4.8% | | | | | | | | |
| Yara International | | | 12,197 | | | | 555,955 | |
The accompanying notes are an integral part of the financial statements.
| Schedule of Investments | October 31, 2015 |
Global X Fertilizers/Potash ETF
| | | Shares/Face
Amount(1) | | | Value | |
| COMMON STOCK — continued | | | | | | | | |
| POLAND— 5.2% | | | | | | | | |
| Basic Materials — 5.2% | | | | | | | | |
| Grupa Azoty | | | 25,188 | | | $ | 602,148 | |
| RUSSIA— 4.4% | | | | | | | | |
| Basic Materials — 4.4% | | | | | | | | |
| Uralkali GDR | | | 42,024 | | | | 505,128 | |
| SOUTH KOREA— 0.8% | | | | | | | | |
| Basic Materials — 0.8% | | | | | | | | |
| Namhae Chemical | | | 10,708 | | | | 94,395 | |
| SWITZERLAND— 4.4% | | | | | | | | |
| Basic Materials — 4.4% | | | | | | | | |
| Syngenta | | | 1,509 | | | | 509,455 | |
| TAIWAN— 4.3% | | | | | | | | |
| Basic Materials — 4.3% | | | | | | | | |
| Taiwan Fertilizer | | | 383,182 | | | | 490,434 | |
| TURKEY— 1.4% | | | | | | | | |
| Basic Materials — 1.4% | | | | | | | | |
| Bagfas Bandirma Gubre Fabrik | | | 14,255 | | | | 64,871 | |
| Gubre Fabrikalari | | | 39,688 | | | | 89,828 | |
| TOTAL TURKEY | | | | | | | 154,699 | |
| UNITED STATES— 23.5% | | | | | | | | |
| Basic Materials — 23.5% | | | | | | | | |
| CF Industries Holdings | | | 10,787 | | | | 547,656 | |
| Compass Minerals International | | | 7,426 | | | | 603,288 | |
| Intrepid Potash * | | | 30,282 | | | | 116,889 | |
| Mosaic | | | 14,269 | | | | 482,150 | |
| Scotts Miracle-Gro, Cl A | | | 10,238 | | | | 677,346 | |
| Terra Nitrogen | | | 2,535 | | | | 268,152 | |
| TOTAL UNITED STATES | | | | | | | 2,695,481 | |
| TOTAL COMMON STOCK | | | | | | | | |
| (Cost $17,349,056) | | | | | | | 11,444,816 | |
| | | | | | | | | |
| TIME DEPOSITS — 0.0% | | | | | | | | |
| Brown Brothers Harriman | | | | | | | | |
| 0.030%, 11/02/15 | | | 4,171 | | | | 4,171 | |
| 1.104%, 11/02/15, AUD | | | 10 | | | | 7 | |
| 0.121%, 11/02/15, NOK | | | 7 | | | | 1 | |
| TOTAL TIME DEPOSITS | | | | | | | | |
| (Cost $4,179) | | | | | | | 4,179 | |
| TOTAL INVESTMENTS — 99.7% | | | | | | | | |
| (Cost $17,353,235) | | | | | | $ | 11,448,995 | |
Percentages are based on Net Assets of $11,482,617.
The accompanying notes are an integral part of the financial statements.
| Schedule of Investments | October 31, 2015 |
Global X Fertilizers/Potash ETF
| * | Non-income producing security. |
| ^ | Traded on U.S. stock exchange. |
| (1) | In U.S. Dollars unless otherwise indicated. |
ADR — American Depositary Receipt
AUD — Australian Dollar
Cl — Class
GDR — Global Depositary Receipt
NOK — Norwegian Krone
The following is a summary of the inputs used as of October 31, 2015, in valuing the Fund's investments carried at value:
| Investments in Securities | | Level 1 | | | Level 2 | | | Level 3 | | | Total | |
| Common Stock | | $ | 11,444,816 | | | $ | — | | | $ | — | | | $ | 11,444,816 | |
| Time Deposits | | | — | | | | 4,179 | | | | — | | | | 4,179 | |
| Total Investments in Securities | | $ | 11,444,816 | | | $ | 4,179 | | | $ | — | | | $ | 11,448,995 | |
For the year ended October 31, 2015, there have been no transfers between Level 1, Level 2 or Level 3 investments.
As of October 31, 2015, there were no Level 3 investments.
The accompanying notes are an integral part of the financial statements.
| Statements of Assets and Liabilities |
| October 31, 2015 |
| | | Global X Silver
Miners ETF | | | Global X Gold
Explorers ETF | | | Global X Copper
Miners ETF | |
| Assets: | | | | | | | | | | | | |
| Cost of Investments | | $ | 267,934,618 | | | $ | 36,390,188 | | | $ | 34,232,642 | |
| Cost of Repurchase Agreement | | | 6,827,718 | | | | 1,037,810 | | | | 1,082,005 | |
| Cost of Affiliated Investments | | | — | | | | 5,148,832 | | | | — | |
| Cost of Foreign Currency | | | — | | | | — | | | | 3 | |
| Investments, at Value | | $ | 144,366,264 | * | | $ | 24,630,883 | * | | $ | 19,008,898 | * |
| Repurchase Agreement, at Value | | | 6,827,718 | | | | 1,037,810 | | | | 1,082,005 | |
| Affiliated Investments, at Value | | | — | | | | 4,476,271 | | | | — | |
| Foreign Currency, at Value | | | — | | | | — | | | | 3 | |
| Cash | | | 546 | (1) | | | — | | | | — | |
| Receivable for Investment Securities Sold | | | 10,186,302 | | | | — | | | | 1,894,696 | |
| Reclaim Receivable | | | 22,609 | | | | — | | | | 9,643 | |
| Dividend and Interest Receivable | | | 16,032 | | | | 2,258 | | | | 4,777 | |
| Unrealized Appreciation on Spot Contracts | | | 8,618 | | | | — | | | | 1,673 | |
| Receivable for Fund Shares Sold | | | — | | | | — | | | | 70,190 | |
| Total Assets | | | 161,428,089 | | | | 30,147,222 | | | | 22,071,885 | |
| Liabilities: | | | | | | | | | | | | |
| Payable for Investment Securities Purchased | | | 9,172,626 | | | | — | | | | 1,998,832 | |
| Obligation to Return Securities Lending Collateral | | | 6,828,264 | | | | 1,037,810 | | | | 1,082,005 | |
| Cash Overdraft | | | 1,587,335 | | | | — | | | | — | |
| Payable due to Investment Adviser | | | 84,050 | | | | 16,331 | | | | 10,639 | |
| Unrealized Depreciation on Spot Contracts | | | — | | | | — | | | | 1,005 | |
| Total Liabilities | | | 17,672,275 | | | | 1,054,141 | | | | 3,092,481 | |
| Net Assets | | $ | 143,755,814 | | | $ | 29,093,081 | | | $ | 18,979,404 | |
| Net Assets Consist of: | | | | | | | | | | | | |
| Paid-in Capital | | $ | 473,429,574 | | | $ | 90,118,619 | | | $ | 50,666,697 | |
| Undistributed Net Investment Income | | | 225,582 | | | | 162,412 | | | | 26,145 | |
| Accumulated Net Realized Loss on Investments, Affiliated Investments and Foreign Currency Transactions | | | (206,327,997 | ) | | | (48,756,084 | ) | | | (16,500,351 | ) |
| Net Unrealized Depreciation on Investments and Affiliated Investments | | | (123,568,354 | ) | | | (12,431,866 | ) | | | (15,223,744 | ) |
| Net Unrealized Appreciation (Depreciation) on Foreign Currency Translations | | | (2,991 | ) | | | — | | | | 10,657 | |
| Net Assets | | $ | 143,755,814 | | | $ | 29,093,081 | | | $ | 18,979,404 | |
| Outstanding Shares of Beneficial Interest (unlimited authorization — no par value) | | | 6,900,000 | | | | 1,462,379 | | | | 1,266,667 | |
| Net Asset Value, Offering and Redemption Price Per Share | | $ | 20.83 | | | $ | 19.89 | | | $ | 14.98 | |
| *Includes Market Value of Securities on Loan | | $ | 6,097,231 | | | $ | 546,286 | | | $ | 1,069,340 | |
| (1) | Cash is restricted, received from securities on loan. (See Note 7 in Notes to Financial Statements.) |
The accompanying notes are an integral part of the financial statements.
| Statements of Assets and Liabilities |
| October 31, 2015 |
| | | Global X Uranium
ETF | | | Global X Lithium
ETF | | | Global X
Fertilizers/Potash
ETF | |
| Assets: | | | | | | | | | | | | |
| Cost of Investments | | $ | 203,729,430 | | | $ | 49,714,595 | | | $ | 17,353,235 | |
| Cost of Affiliated Investments | | | 67,899,996 | | | | — | | | | — | |
| Cost of Repurchase Agreement | | | 20,830,607 | | | | 1,211,990 | | | | — | |
| Cost of Foreign Currency | | | — | | | | 943,413 | | | | — | |
| Investments, at Value | | $ | 115,948,248 | * | | $ | 40,765,334 | * | | $ | 11,448,995 | |
| Affiliated Investments, at Value | | | 27,226,940 | * | | | — | | | | — | |
| Repurchase Agreement, at Value | | | 20,830,607 | | | | 1,211,990 | | | | — | |
| Foreign Currency, at Value | | | — | | | | 943,875 | | | | — | |
| Cash | | | 160,252 | (1) | | | — | | | | — | |
| Receivable for Investment Securities Sold | | | 1,355,955 | | | | 4,956,767 | | | | — | |
| Dividend and Interest Receivable | | | 113,454 | | | | 25,539 | | | | 9,225 | |
| Unrealized Appreciation on Spot Contracts | | | 3,294 | | | | 1,085 | | | | — | |
| Reclaim Receivable | | | — | | | | — | | | | 31,160 | |
| Total Assets | | | 165,638,750 | | | | 47,904,590 | | | | 11,489,380 | |
| Liabilities: | | | | | | | | | | | | |
| Obligation to Return Securities Lending Collateral | | | 20,990,859 | | | | 1,211,990 | | | | — | |
| Cash Overdraft | | | 1,696,554 | | | | 1,241,168 | | | | — | |
| Payable for Investment Securities Purchased | | | 804,723 | | | | 4,694,538 | | | | — | |
| Payable due to Investment Adviser | | | 85,404 | | | | 25,290 | | | | 6,763 | |
| Unrealized Depreciation on Spot Contracts | | | 4,786 | | | | 645 | | | | — | |
| Total Liabilities | | | 23,582,326 | | | | 7,173,631 | | | | 6,763 | |
| Net Assets | | $ | 142,056,424 | | | $ | 40,730,959 | | | $ | 11,482,617 | |
| Net Assets Consist of: | | | | | | | | | | | | |
| Paid-in Capital | | $ | 540,266,379 | | | $ | 100,900,495 | | | $ | 20,626,540 | |
| Undistributed (Distributions in Excess of) Net Investment Income | | | 1,074,464 | | | | (18,247 | ) | | | 330,845 | |
| Accumulated Net Realized Loss on Investment, Affiliated Investments and Foreign Currency Transactions | | | (270,830,452 | ) | | | (51,200,629 | ) | | | (3,567,361 | ) |
| Net Unrealized Depreciation on Investments and Affiliated Investments | | | (128,454,238 | ) | | | (8,949,261 | ) | | | (5,904,240 | ) |
| Net Unrealized Appreciation (Depreciation) on Foreign Currency Translations | | | 271 | | | | (1,399 | ) | | | (3,167 | ) |
| Net Assets | | $ | 142,056,424 | | | $ | 40,730,959 | | | $ | 11,482,617 | |
| Outstanding Shares of Beneficial Interest (unlimited authorization — no par value) | | | 9,507,536 | | | | 1,975,000 | | | | 1,150,000 | |
| Net Asset Value, Offering and Redemption Price Per Share | | $ | 14.94 | | | $ | 20.62 | | | $ | 9.98 | |
| *Includes Market Value of Securities on Loan | | $ | 16,391,367 | | | $ | 1,089,488 | | | $ | — | |
| (1) | Cash is restricted, received from securities on loan. (See Note 7 in Notes to Financial Statements.) |
The accompanying notes are an integral part of the financial statements.
| Statements of Operations |
| For the year ended October 31, 2015 |
| | | Global X Silver
Miners ETF | | | Global X Gold
Explorers ETF | | | Global X Copper
Miners ETF | |
| Investment Income: | | | | | | | | | | | | |
| Dividend Income | | $ | 1,533,504 | | | $ | 135,885 | | | $ | 383,484 | |
| Interest Income | | | 127 | | | | 14 | | | | 6 | |
| Security Lending Income | | | 83,582 | | | | 266,487 | | | | 24,928 | |
| Less: Foreign Taxes Withheld | | | (126,589 | ) | | | — | | | | (27,129 | ) |
| Total Investment Income | | | 1,490,624 | | | | 402,386 | | | | 381,289 | |
| Supervision and Administration Fees(1) | | | 1,117,498 | | | | 193,765 | | | | 144,171 | |
| Income Tax(3) | | | – | | | | 150 | | | | – | |
| Total Expenses | | | 1,117,498 | | | | 193,915 | | | | 144,171 | |
| Net Investment Income | | | 373,126 | | | | 208,471 | | | | 237,118 | |
| Net Realized Gain (Loss) on: | | | | | | | | | | | | |
| Investments | | | (66,986,628 | )(2) | | | (16,396,433 | ) | | | (5,619,889) | (2) |
| Affiliated Investments | | | — | | | | (1,971,364 | ) | | | — | |
| Foreign Currency Transactions | | | 32,574 | | | | (32,532 | ) | | | 5,013 | |
| Net Realized Loss on Investments, Affiliated Investments and Foreign Currency Transactions | | | (66,954,054 | ) | | | (18,400,329 | ) | | | (5,614,876 | ) |
| Net Change in Unrealized Appreciation (Depreciation) on: | | | | | | | | | | | | |
| Investments | | | 30,509,063 | | | | 16,110,405 | | | | (4,723,123 | ) |
| Affiliated Investments | | | — | | | | 2,988,794 | | | | — | |
| Foreign Currency Translations | | | 4,109 | | | | — | | | | 2,104 | |
| Net Change in Unrealized Appreciation (Depreciation) on Investments, Affiliated Investments and Foreign Currency Translations | | | 30,513,172 | | | | 19,099,199 | | | | (4,721,019 | ) |
| Net Realized and Unrealized Gain (Loss) on Investments, Affiliated Investments and Foreign Currency Transactions and Translations | | | (36,440,882 | ) | | | 698,870 | | | | (10,335,895 | ) |
| Net Increase (Decrease) in Net Assets Resulting from Operations | | $ | (36,067,756 | ) | | $ | 907,341 | | | $ | (10,098,777 | ) |
| (1) | The Supervision and Administration fees includes fees paid by the Funds for the investment advisory services provided by the Adviser. (See Note 3 in Notes to Financial Statements.) |
| (2) | Includes realized gains (losses) as a result of in-kind transactions. (See Note 4 in Notes to Financial Statements.) |
| (3) | See Note 2 in Notes to Financial Statements. |
The accompanying notes are an integral part of the financial statements.
| Statements of Operations |
| For the year ended October 31, 2015 |
| | | Global X Uranium
ETF | | | Global X Lithium
ETF | | | Global X
Fertilizers/Potash
ETF | |
| Investment Income: | | | | | | | | | | | | |
| Dividend Income | | $ | 1,002,308 | | | $ | 566,600 | | | $ | 562,002 | |
| Interest Income | | | 72 | | | | 46 | | | | 5 | |
| Security Lending Income | | | 1,926,672 | | | | 16,866 | | | | — | |
| Less: Foreign Taxes Withheld | | | (150,346 | ) | | | (94,860 | ) | | | (41,262 | ) |
| Total Investment Income | | | 2,778,706 | | | | 488,652 | | | | 520,745 | |
| Supervision and Administration Fees(1) | | | 1,340,857 | | | | 334,037 | | | | 98,108 | |
| Total Expenses | | | 1,340,857 | | | | 334,037 | | | | 98,108 | |
| Net Investment Income | | | 1,437,849 | | | | 154,615 | | | | 422,637 | |
| Net Realized Gain (Loss) on: | | | | | | | | | | | | |
| Investments (2) | | | (34,567,650 | ) | | | 1,314,822 | | | | (1,017,037 | ) |
| Affiliated Investments (2) | | | (22,262,769 | ) | | | — | | | | — | |
| Foreign Currency Transactions | | | (43,181 | ) | | | (22,710 | ) | | | (9,722 | ) |
| Net Realized Gain (Loss) on Investments, Affiliated Investments and Foreign Currency Transactions | | | (56,873,600 | ) | | | 1,292,112 | | | | (1,026,759 | ) |
| Net Change in Unrealized Appreciation (Depreciation) on: | | | | | | | | | | | | |
| Investments | | | (18,412,701 | ) | | | (8,203,592 | ) | | | 84,935 | |
| Affiliated Investments | | | (839,762 | ) | | | — | | | | — | |
| Foreign Currency Translations | | | 270 | | | | (1,318 | ) | | | (1,745 | ) |
| Net Change in Unrealized Appreciation (Depreciation) on Investments, Affiliated Investments and Foreign Currency Translations | | | (19,252,193 | ) | | | (8,204,910 | ) | | | 83,190 | |
| Net Realized and Unrealized Loss on Investments, Affiliated Investments and Foreign Currency Transactions and Translations | | | (76,125,793 | ) | | | (6,912,798 | ) | | | (943,569 | ) |
| Net Decrease in Net Assets Resulting from Operations | | $ | (74,687,944 | ) | | $ | (6,758,183 | ) | | $ | (520,932 | ) |
| (1) | The Supervision and Administration fees includes fees paid by the Funds for the investment advisory services provided by the Adviser. (See Note 3 in Notes to Financial Statements.) |
| (2) | Includes realized gains (losses) as a result of in-kind transactions. (See Note 4 in Notes to Financial Statements.) |
The accompanying notes are an integral part of the financial statements.
| Statements of Changes in Net Assets |
| | | Global X Silver Miners ETF | | | Global X Gold Explorers ETF | |
| | | Year Ended
October 31, 2015 | | | Year Ended
October 31, 2014 | | | Year Ended
October 31, 2015 | | | Year Ended
October 31, 2014 | |
| Operations: | | | | | | | | | | | | | | | | |
| Net Investment Income | | $ | 373,126 | | | $ | 559,003 | | | $ | 208,471 | | | $ | 9,678 | |
| Net Realized Loss on Investments, Affiliated Investments and Foreign Currency Transactions | | | (66,954,054 | )(1) | | | (57,363,296 | )(1) | | | (18,400,329 | ) | | | (6,993,259 | )(1) |
| Net Change in Unrealized Appreciation (Depreciation) on Investments, Affiliated Investments and Foreign Currency Translations | | | 30,513,172 | | | | (23,879,356 | ) | | | 19,099,199 | | | | (6,020,331 | ) |
| Net Increase (Decrease) in Net Assets Resulting from Operations | | | (36,067,756 | ) | | | (80,683,649 | ) | | | 907,341 | | | | (13,003,912 | ) |
| Dividends and Distributions from: | | | | | | | | | | | | | | | | |
| Net Investment Income | | | (129,601 | ) | | | (1,275,569 | ) | | | (40,294 | ) | | | — | |
| Total Dividends and Distributions | | | (129,601 | ) | | | (1,275,569 | ) | | | (40,294 | ) | | | — | |
| Capital Share Transactions: | | | | | | | | | | | | | | | | |
| Issued | | | 29,928,286 | | | | 50,580,032 | | | | 512,019 | | | | 16,427,825 | |
| Redeemed | | | (20,940,116 | ) | | | (15,895,569 | ) | | | — | | | | (7,729,518 | ) |
| Increase in Net Assets from Capital Share Transactions | | | 8,988,170 | | | | 34,684,463 | | | | 512,019 | | | | 8,698,307 | |
| Total Increase (Decrease) in Net Assets | | | (27,209,187 | ) | | | (47,274,755 | ) | | | 1,379,066 | | | | (4,305,605 | ) |
| Net Assets: | | | | | | | | | | | | | | | | |
| Beginning of Year | | | 170,965,001 | | | | 218,239,756 | | | | 27,714,015 | | | | 32,019,620 | |
| End of Year | | $ | 143,755,814 | | | $ | 170,965,001 | | | $ | 29,093,081 | | | $ | 27,714,015 | |
| Undistributed (Distributions in Excess of) Net Investment Income/ (Accumulated Net Investment Loss) | | $ | 225,582 | | | $ | (55,245 | ) | | $ | 162,412 | | | $ | (6,566 | ) |
| Share Transactions: | | | | | | | | | | | | | | | | |
| Issued | | | 1,183,334 | (2) | | | 1,333,333 | (2) | | | 25,000 | (3) | | | 525,000 | (3) |
| Redeemed | | | (816,667 | )(2) | | | (450,000 | )(2) | | | — | | | | (275,000 | )(3) |
| Net Increase in Shares Outstanding from Share Transactions | | | 366,667 | | | | 883,333 | | | | 25,000 | | | | 250,000 | |
| (1) | Includes realized gain (loss) as a result of in-kind transactions. (See Note 4 in Notes to Financial Statements.) |
| (2) | Adjusted to reflect the effect of a 1 for 3 reverse share split on November 18, 2015. (See Note 9 in the Notes to Financial Statements.) |
| (3) | Adjusted to reflect the effect of a 1 for2 reverse share split on November 18, 2015. (See Note 9 in the Notes to Financial Statements.) |
The accompanying notes are an integral part of the financial statements.
| Statements of Changes in Net Assets |
| | | Global X Copper Miners ETF | | | Global X Uranium ETF | |
| | | Year Ended
October 31, 2015 | | | Year Ended
October 31, 2014 | | | Year Ended
October 31, 2015 | | | Year Ended
October 31, 2014 | |
| Operations: | | | | | | | | | | | | | | | | |
| Net Investment Income | | $ | 237,118 | | | $ | 520,075 | | | $ | 1,437,849 | | | $ | 625,871 | |
| Net Realized Loss on Investments, Affiliated Investments and Foreign Currency Transactions(1) | | | (5,614,876 | ) | | | (4,443,768 | ) | | | (56,873,600 | ) | | | (15,576,876 | ) |
| Net Change in Unrealized Depreciation on Investments, Affiliated Investments and Foreign Currency Translations | | | (4,721,019 | ) | | | (631,833 | ) | | | (19,252,193 | ) | | | (53,291,525 | ) |
| Net Decrease in Net Assets Resulting from Operations | | | (10,098,777 | ) | | | (4,555,526 | ) | | | (74,687,944 | ) | | | (68,242,530 | ) |
| Dividends and Distributions from: | | | | | | | | | | | | | | | | |
| Net Investment Income | | | (509,286 | ) | | | (225,417 | ) | | | (9,307,517 | ) | | | (734,117 | ) |
| Total Dividends and Distributions | | | (509,286 | ) | | | (225,417 | ) | | | (9,307,517 | ) | | | (734,117 | ) |
| Capital Share Transactions: | | | | | | | | | | | | | | | | |
| Issued | | | 6,134,592 | | | | 4,282,425 | | | | 31,602,266 | | | | 170,458,752 | |
| Redeemed | | | (3,599,890 | ) | | | (5,276,910 | ) | | | (17,906,993 | ) | | | (7,996,486 | ) |
| Increase (Decrease) in Net Assets from Capital Share Transactions | | | 2,534,702 | | | | (994,485 | ) | | | 13,695,273 | | | | 162,462,266 | |
| Total Increase (Decrease) in Net Assets | | | (8,073,361 | ) | | | (5,775,428 | ) | | | (70,300,188 | ) | | | 93,485,619 | |
| Net Assets: | | | | | | | | | | | | | | | | |
| Beginning of Year | | | 27,052,765 | | | | 32,828,193 | | | | 212,356,612 | | | | 118,870,993 | |
| End of Year | | $ | 18,979,404 | | | $ | 27,052,765 | | | $ | 142,056,424 | | | $ | 212,356,612 | |
| Undistributed Net Investment Income | | $ | 26,145 | | | $ | 263,104 | | | $ | 1,074,464 | | | $ | 8,946,170 | |
| Share Transactions: | | | | | | | | | | | | | | | | |
| Issued | | | 350,000 | (2) | | | 150,000 | (2) | | | 1,350,000 | (3) | | | 5,300,000 | (3) |
| Redeemed | | | (166,666 | )(2) | | | (183,333 | )(2) | | | (975,000 | )(3) | | | (275,000 | )(3) |
| Net Increase (Decrease) in Shares Outstanding from Share Transactions | | | 183,334 | | | | (33,333 | ) | | | 375,000 | | | | 5,025,000 | |
| (1) | Includes realized gain (loss) as a result of in-kind transactions. (See Note 4 in Notes to Financial Statements.) |
| (2) | Adjusted to reflect the effect of a 1 for 3 reverse share split on November 18, 2015. (See Note 9 in the Notes to Financial Statements.) |
| (3) | Adjusted to reflect the effect of a 1 for2 reverse share split on November 18, 2015. (See Note 9 in the Notes to Financial Statements.) |
The accompanying notes are an integral part of the financial statements.
| Statements of Changes in Net Assets |
| | | Global X Lithium ETF | | | Global X Fertilizers/Potash ETF | |
| | | Year Ended
October 31, 2015 | | | Year Ended
October 31, 2014 | | | Year Ended
October 31, 2015 | | | Year Ended
October 31, 2014 | |
| Operations: | | | | | | | | | | | | | | | | |
| Net Investment Income | | $ | 154,615 | | | $ | 414,582 | | | $ | 422,637 | | | $ | 386,118 | |
| Net Realized Gain (Loss) on Investments and Foreign Currency Transactions(1) | | | 1,292,112 | | | | (9,617,499 | ) | | | (1,026,759 | ) | | | (926,245 | ) |
| Net Change in Unrealized Appreciation (Depreciation) on Investments and Foreign Currency Transactions | | | (8,204,910 | ) | | | 4,632,660 | | | | 83,190 | | | | (642,621 | ) |
| Net Decrease in Net Assets Resulting from Operations | | | (6,758,183 | ) | | | (4,570,257 | ) | | | (520,932 | ) | | | (1,182,748 | ) |
| Dividends and Distributions from: | | | | | | | | | | | | | | | | |
| Net Investment Income | | | (471,239 | ) | | | (160,079 | ) | | | (350,078 | ) | | | (366,898 | ) |
| Total Dividends and Distributions | | | (471,239 | ) | | | (160,079 | ) | | | (350,078 | ) | | | (366,898 | ) |
| Capital Share Transactions: | | | | | | | | | | | | | | | | |
| Issued | | | 3,158,262 | | | | 10,505,000 | | | | — | | | | — | |
| Redeemed | | | (5,587,104 | ) | | | (6,490,918 | ) | | | (3,407,437 | ) | | | (5,553,179 | ) |
| Increase (Decrease) in Net Assets from Capital Share Transactions | | | (2,428,842 | ) | | | 4,014,082 | | | | (3,407,437 | ) | | | (5,553,179 | ) |
| Total Decrease in Net Assets | | | (9,658,264 | ) | | | (716,254 | ) | | | (4,278,447 | ) | | | (7,102,825 | ) |
| Net Assets: | | | | | | | | | | | | | | | | |
| Beginning of Year | | | 50,389,223 | | | | 51,105,477 | | | | 15,761,064 | | | | 22,863,889 | |
| End of Year | | $ | 40,730,959 | | | $ | 50,389,223 | | | $ | 11,482,617 | | | $ | 15,761,064 | |
| Undistributed (Distributions in Excess of) Net Investment Income | | $ | (18,247 | ) | | $ | 289,051 | | | $ | 330,845 | | | $ | 305,048 | |
| Share Transactions: | | | | | | | | | | | | | | | | |
| Issued | | | 125,000 | (2) | | | 375,000 | (2) | | | — | | | | — | |
| Redeemed | | | (250,000 | )(2) | | | (250,000 | )(2) | | | (300,000 | ) | | | (500,000 | ) |
| Net Increase (Decrease) in Shares Outstanding from Share Transactions | | | (125,000 | ) | | | 125,000 | | | | (300,000 | ) | | | (500,000 | ) |
| (1) | Includes realized gain (loss) as a result of in-kind transactions. (See Note 4 in Notes to Financial Statements.) |
| (2) | Adjusted to reflect the effect of a 1 for2 reverse share split on November 18, 2015. (See Note 9 in the Notes to Financial Statements.) |
The accompanying notes are an integral part of the financial statements.
Selected Per Share Data & Ratios
For a Share Outstanding Throughout the Period
| | | Net Asset
Value,
Beginning of
Period ($) | | | Net
Investment
Income
(Loss) ($)* | | | Net Realized
and
Unrealized
Gain (Loss)
on
Investments
($) | | | Total from
Operations
($) | | | Distribution
from Net
Investment
Income ($) | | | Distribution
from Capital
Gains ($) | | | Total from
Distributions
($) | | | Net Asset
Value,
End of
Period
($) | | | Total
Return
(%)** | | | Net
Assets
End of
Period
($)(000) | | | Ratio of
Expenses
to
Average
Net
Assets
(%) | | | Ratio of
Net
Investment
Income
(Loss) to
Average
Net Assets
(%) | | | Portfolio
Turnover
(%)†† | |
| Global X Silver Miners ETF | | | | | | | | | | | | | | | | | | | | | | | | | | | | | | | | | | | | | | | | | | | | | | | | | | | | |
| 2015(1) | | | 26.16 | | | | 0.06 | | | | (5.37 | ) | | | (5.31 | ) | | | (0.02 | ) | | | — | | | | (0.02 | ) | | | 20.83 | | | | (20.35 | ) | | | 143,756 | | | | 0.65 | | | | 0.22 | | | | 26.75 | |
| 2014(1) | | | 38.64 | | | | 0.09 | | | | (12.35 | ) | | | (12.26 | ) | | | (0.22 | ) | | | — | | | | (0.22 | ) | | | 26.16 | | | | (31.85 | ) | | | 170,965 | | | | 0.65 | | | | 0.24 | | | | 24.23 | |
| 2013(1) | | | 74.94 | | | | 0.34 | | | | (36.03 | ) | | | (35.69 | ) | | | (0.61 | ) | | | — | | | | (0.61 | ) | | | 38.64 | | | | (47.97 | ) | | | 218,240 | | | | 0.65 | | | | 0.67 | | | | 23.79 | |
| 2012(1) | | | 70.98 | | �� | | 0.40 | | | | 3.67 | | | | 4.07 | | | | (0.11 | ) | | | — | | | | (0.11 | ) | | | 74.94 | | | | 5.76 | | | | 385,967 | | | | 0.65 | | | | 0.62 | | | | 18.13 | |
| 2011(1) | | | 60.60 | | | | 0.12 | | | | 10.99 | | | | 11.11 | | | | (0.73 | ) | | | — | | | | (0.73 | ) | | | 70.98 | | | | 18.20 | | | | 363,106 | | | | 0.65 | | | | 0.16 | | | | 26.50 | |
| Global X Gold Explorers ETF | | | | | | | | | | | | | | | | | | | | | | | | | | | | | | | | | | | | | | | | | | | | | | | | | | | | |
| 2015(2) | | | 19.28 | | | | 0.14 | | | | 0.50 | | | | 0.64 | | | | (0.03 | ) | | | — | | | | (0.03 | ) | | | 19.89 | | | | 3.36 | | | | 29,093 | | | | 0.65 | | | | 0.70 | | | | 57.53 | |
| 2014(2) | | | 26.96 | | | | 0.01 | | | | (7.69 | ) | | | (7.68 | ) | | | — | | | | — | | | | — | | | | 19.28 | | | | (28.49 | ) | | | 27,714 | | | | 0.65 | | | | 0.02 | | | | 29.94 | |
| 2013(2)(3) | | | 69.44 | | | | (0.25 | ) | | | (39.35 | ) | | | (39.60 | ) | | | (2.88 | ) | | | — | | | | (2.88 | ) | | | 26.96 | | | | (59.16 | ) | | | 32,020 | | | | 0.65 | | | | (0.65 | ) | | | 31.73 | |
| 2012(2)(3) | | | 106.88 | | | | (0.49 | ) | | | (34.92 | ) | | | (35.41 | ) | | | (2.03 | ) | | | — | | | | (2.03 | ) | | | 69.44 | | | | (33.42 | ) | | | 41,251 | | | | 0.65 | | | | (0.65 | ) | | | 43.12 | |
| 2011(2)(3)(4) | | | 123.92 | | | | (0.83 | ) | | | (16.21 | ) | | | (17.04 | ) | | | — | | | | — | | | | — | | | | 106.88 | | | | (13.75 | ) | | | 27,392 | | | | 0.65 | † | | | (0.65 | )† | | | 29.96 | |
| Global X Copper Miners ETF | | | | | | | | | | | | | | | | | | | | | | | | | | | | | | | | | | | | | | | | | | | | | | | | | | | | |
| 2015(1) | | | 24.96 | | | | 0.21 | | | | (9.68 | ) | | | (9.47 | ) | | | (0.51 | ) | | | — | | | | (0.51 | ) | | | 14.98 | | | | (38.64 | ) | | | 18,979 | | | | 0.65 | | | | 1.07 | | | | 29.72 | |
| 2014(1) | | | 29.40 | | | | 0.45 | | | | (4.69 | ) | | | (4.24 | ) | | | (0.20 | ) | | | — | | | | (0.20 | ) | | | 24.96 | | | | (14.49 | ) | | | 27,053 | | | | 0.65 | | | | 1.59 | | | | 15.77 | |
| 2013(1) | | | 38.79 | | | | 0.52 | | | | (8.63 | ) | | | (8.11 | ) | | | (1.28 | ) | | | — | | | | (1.28 | ) | | | 29.40 | | | | (21.69 | ) | | | 32,828 | | | | 0.65 | | | | 1.63 | | | | 37.06 | |
| 2012(1) | | | 44.76 | | | | 0.72 | | | | (3.97 | ) | | | (3.25 | ) | | | (1.70 | ) | | | (1.02 | ) | | | (2.72 | ) | | | 38.79 | | | | (7.08 | ) | | | 31,041 | | | | 0.65 | | | | 1.84 | | | | 28.90 | |
| 2011(1) | | | 49.89 | | | | 1.05 | | | | (5.90 | ) | | | (4.85 | ) | | | (0.28 | ) | | | — | | | | (0.28 | ) | | | 44.76 | | | | (9.85 | ) | | | 45,517 | | | | 0.65 | | | | 1.91 | | | | 15.78 | |
| Global X Uranium ETF | | | | | | | | | | | | | | | | | | | | | | | | | | | | | | | | | | | | | | | | | | | | | | | | | | | | |
| 2015(2) | | | 23.26 | | | | 0.15 | | | | (7.50 | ) | | | (7.35 | ) | | | (0.97 | ) | | | — | | | | (0.97 | ) | | | 14.94 | | | | (33.01 | ) | | | 142,056 | | | | 0.69 | | | | 0.74 | | | | 22.37 | |
| 2014(2) | | | 28.94 | | | | 0.09 | | | | (5.60 | ) | | | (5.51 | ) | | | (0.17 | ) | | | — | | | | (0.17 | ) | | | 23.26 | | | | (19.18 | ) | | | 212,357 | | | | 0.69 | | | | 0.30 | | | | 20.90 | |
| 2013(2)(5) | | | 42.06 | | | | 0.18 | | | | (12.56 | ) | | | (12.38 | ) | | | (0.74 | ) | | | — | | | | (0.74 | ) | | | 28.94 | | | | (29.88 | ) | | | 118,871 | | | | 0.69 | | | | 0.51 | | | | 73.16 | |
| 2012(2)(5) | | | 60.54 | | | | 0.15 | | | | (18.63 | ) | | | (18.48 | ) | | | — | | | | — | | | | — | | | | 42.06 | | | | (30.53 | ) | | | 135,668 | | | | 0.69 | | | | 0.30 | | | | 55.90 | |
| 2011(2)(5)(6) | | | 100.68 | | | | 0.87 | | | | (38.68 | ) | | | (37.81 | ) | | | (2.33 | ) | | | — | | | | (2.33 | ) | | | 60.54 | | | | (38.70 | ) | | | 199,349 | | | | 0.69 | † | | | 1.10 | † | | | 24.17 | |
| Global X Lithium ETF | | | | | | | | | | | | | | | | | | | | | | | | | | | | | | | | | | | | | | | | | | | | | | | | | | | | |
| 2015(2) | | | 24.00 | | | | 0.08 | | | | (3.22 | ) | | | (3.14 | ) | | | (0.24 | ) | | | — | | | | (0.24 | ) | | | 20.62 | | | | (13.18 | ) | | | 40,731 | | | | 0.75 | | | | 0.35 | | | | 31.14 | |
| 2014(2) | | | 25.88 | | | | 0.20 | | | | (2.00 | ) | | | (1.80 | ) | | | (0.08 | ) | | | — | | | | (0.08 | ) | | | 24.00 | | | | (6.97 | ) | | | 50,389 | | | | 0.75 | | | | 0.75 | | | | 43.37 | |
| 2013(2) | | | 28.82 | | | | 0.06 | | | | (2.31 | ) | | | (2.25 | ) | | | (0.69 | ) | | | — | | | | (0.69 | ) | | | 25.88 | | | | (8.00 | ) | | | 51,105 | | | | 0.75 | | | | 0.21 | | | | 38.46 | |
| 2012(2) | | | 31.80 | | | | 0.43 | | | | (3.37 | ) | | | (2.94 | ) | | | (0.04 | ) | | | — | | | | (0.04 | ) | | | 28.82 | | | | (9.25 | ) | | | 69,871 | | | | 0.75 | | | | 1.40 | | | | 28.78 | |
| 2011(2) | | | 39.66 | | | | (0.09 | ) | | | (7.24 | ) | | | (7.33 | ) | | | (0.49 | ) | | | (0.04 | ) | | | (0.53 | ) | | | 31.80 | | | | (18.86 | ) | | | 107,301 | | | | 0.75 | | | | (0.22 | ) | | | 24.87 | |
| Global X Fertilizers/Potash ETF | | | | | | | | | | | | | | | | | | | | | | | | | | | | | | | | | | | | | | | | | | | | | | | | | | | | |
| 2015 | | | 10.87 | | | | 0.33 | | | | (0.97 | ) | | | (0.64 | ) | | | (0.25 | ) | | | — | | | | (0.25 | ) | | | 9.98 | | | | (6.01 | ) | | | 11,483 | | | | 0.69 | | | | 2.97 | | | | 30.64 | |
| 2014 | | | 11.73 | | | | 0.23 | | | | (0.90 | ) | | | (0.67 | ) | | | (0.19 | ) | | | — | | | | (0.19 | ) | | | 10.87 | | | | (5.79 | ) | | | 15,761 | | | | 0.69 | | | | 1.98 | | | | 18.79 | |
| 2013 | | | 13.85 | | | | 0.25 | | | | (2.21 | ) | | | (1.96 | ) | | | (0.16 | ) | | | — | | | | (0.16 | ) | | | 11.73 | | | | (14.33 | ) | | | 22,864 | | | | 0.69 | | | | 1.93 | | | | 14.12 | |
| 2012 | | | 14.06 | | | | 0.19 | | | | (0.29 | ) | | | (0.10 | ) | | | (0.09 | ) | | | (0.02 | ) | | | (0.11 | ) | | | 13.85 | | | | (0.61 | ) | | | 28,383 | | | | 0.69 | | | | 1.42 | | | | 24.05 | |
| 2011(7) | | | 15.05 | | | | 0.06 | | | | (1.05 | ) | | | (0.99 | ) | | | — | | | | — | | | | — | | | | 14.06 | | | | (6.58 | ) | | | 35,160 | | | | 0.69 | † | | | 0.90 | † | | | 7.55 | |
| (1) | Per share amounts have been adjusted for a 1 for 3 reverse share split on November 18, 2015. For more information see Note 9 in the Notes to Financial Statements. |
| (2) | Per share amounts have been adjusted for a 1 for 2 reverse share split on November 18, 2015. For more information see Note 9 in the Notes to Financial Statements. |
| (3) | Per share amounts have been adjusted for a 1 for 4 reverse share split on May 16, 2013. For more information see Note 9 in the Notes to Financial Statements |
| (4) | The Fund commenced operations on November 3, 2010. |
| (5) | Per share amounts have been adjusted for a 1 for 3 reverse share split on May 16, 2013. For more information see Note 9 in the Notes to Financial Statements. |
| (6) | The Fund commenced operations on November 4, 2010. |
| (7) | The Fund commenced operations on May 25, 2011. |
| * | Per share data calculated using average shares method. |
| ** | Total return is based on the change in net asset value of a share during the year or period and assumes reinvestment of dividends and distributions at net asset value. Total return is for the period indicated and periods of less than one year have not been annualized. The return shown does not reflect the deduction of taxes that a shareholder would pay on Fund distributions or the redemption of Fund shares. |
| † | Annualized. |
| †† | Portfolio turnover rate is for the period indicated and periods of less than one year have not been annualized. Excludes effect of in-kind transfers. |
Amounts designated as “—” are either $0 or have been rounded to $0.
The accompanying notes are an integral part of the financial statements.
| Notes to Financial Statements |
| October 31, 2015 |
1. ORGANIZATION
The Global X Funds (the “Trust”) is a Delaware statutory trust formed on March 6, 2008. The Trust is registered under the Investment Company Act of 1940, as amended, as an open-end management investment company. As of October 31, 2015, the Trust had ninety-one portfolios, forty-seven of which were operational. The financial statements herein and the related notes pertain to the Global X Silver Miners ETF, Global X Gold Explorers ETF, Global X Copper Miners ETF, Global X Uranium ETF, Global X Lithium ETF and Global X Fertilizers/Potash ETF (the “Funds”). Each Fund has elected non-diversified status.
2. SIGNIFICANT ACCOUNTING POLICIES
The following is a summary of the significant accounting policies followed by the Funds.
USE OF ESTIMATES — The Funds are investment companies that apply the accounting and reporting guidance issued in Topic 946 by the U.S. Financial Accounting Standards Board. The preparation of financial statements in conformity with U.S. generally accepted accounting principles ("U.S. GAAP") requires management to make estimates and assumptions that affect the reported amounts of assets and liabilities and disclosure of contingent assets and liabilities at the date of the financial statements and the reported amounts of increases and decreases in net assets from operations during the reporting period. Actual results could materially differ from those estimates.
SECURITY VALUATION — Securities listed on a securities exchange, market or automated quotation system for which quotations are readily available (except for securities traded on NASDAQ), including securities traded over the counter, are valued at the last quoted sale price on the primary exchange or market (foreign or domestic) on which they are traded (or at approximately 4:00 pm if a security’s primary exchange is normally open at that time), or, if there is no such reported sale, at the most recent mean between the quoted bid and asked prices (absent both bid and asked prices on such exchange, the bid price may be used).
For securities traded on NASDAQ, the NASDAQ official closing price will be used. If available, debt securities are priced based upon valuations provided by independent, third-party pricing agents. Such values generally reflect the last reported sales price if the security is actively traded. The third-party pricing agents may also value debt securities at an evaluated bid price by employing methodologies that utilize actual market transactions, broker-supplied valuations, or other methodologies designed to identify the market value for such securities. Debt obligations with remaining maturities of sixty days or less may be valued at their amortized cost, which approximates market value. The prices for foreign securities are reported in local currency and converted to U.S. dollars using currency exchange rates as of reporting date. The exchange rates used by the Trust for valuation are captured as of the New York or London close each day. Prices for most securities held in the Funds are provided daily by recognized independent pricing agents. If a security price cannot be obtained from an independent, third-party pricing agent, the Funds seek to obtain a bid price from at least one independent broker.
Securities for which market prices are not “readily available” are valued in accordance with Fair Value Procedures established by the Board of Trustees (the “Board”). The Funds’ Fair Value Procedures are implemented through a Fair Value Committee (the “Committee”) designated by the Board. Some of the more common reasons that may necessitate that a security be valued using Fair
| Notes to Financial Statements (continued) |
| October 31, 2015 |
2. SIGNIFICANT ACCOUNTING POLICIES (continued)
SECURITY VALUATION (continued)
Value Procedures include: the security's trading has been halted or suspended; the security has been de-listed from its primary trading exchange; the security's primary trading market is temporarily closed at a time when under normal conditions it would be open; the security has not been traded for an extended period of time; the security's primary pricing source is not able or willing to provide a price; or trading of the security is subject to local government-imposed restrictions. In addition, the Funds may fair value their securities if an event that may materially affect the value of the Funds’ securities that traded outside of the United States (a “Significant Event”) has occurred between the time of the security's last close and the time that the Funds calculate their net asset value. A Significant Event may relate to a single issuer or to an entire market sector. Events that may be Significant Events include: government actions, natural disasters, armed conflict, acts of terrorism and significant market fluctuations. If Global X Management Company LLC (the “Adviser”) becomes aware of a Significant Event that has occurred with respect to a security or group of securities after the closing of the exchange or market on which the security or securities principally trade, but before the time at which the Funds calculate net asset value, it may request that a Committee meeting be called. When a security is valued in accordance with the Fair Value Procedures, the Committee will determine the value after taking into consideration all relevant information reasonably available to the Committee. As of October 31, 2015, there was $377,503 of fair valued securities in the Global X Copper Miners ETF. There were no other securities priced using the Fair Value Procedures.
In accordance with the authoritative guidance on fair value measurements and disclosure under U.S. GAAP, the Funds disclose the fair value of their investments in a hierarchy that prioritizes the inputs to valuation techniques used to measure the fair value. The objective of a fair value measurement is to determine the price that would be received to sell an asset or paid to transfer a liability in an orderly transaction between market participants at the measurement date (an exit price). Accordingly, the fair value hierarchy gives the highest priority to quoted prices (unadjusted) in active markets for identical assets or liabilities (Level 1) and the lowest priority to unobservable inputs (Level 3). The three levels of the fair value hierarchy are described below:
The three levels of the fair value hierarchy are described below:
Level 1 – Unadjusted quoted prices in active markets for identical, unrestricted assets or liabilities that the Funds have the ability to access at the measurement date
Level 2 – Other significant observable inputs (including quoted prices in non-active markets, quoted prices for similar investments, fair value of investments for which the Funds have the ability to fully redeem tranches at net asset value as of the measurement date or within the near term, and short-term investments valued at amortized cost)
Level 3 – Significant unobservable inputs (including the Funds’ own assumptions in determining the fair value of investments and fair value of investments for which the Funds do not have the ability to fully redeem tranches at net asset value as of the measurement date or within the near term)
| Notes to Financial Statements (continued) |
| October 31, 2015 |
2. SIGNIFICANT ACCOUNTING POLICIES (continued)
SECURITY VALUATION (concluded)
Investments are classified within the level of the lowest significant input considered in determining fair value. Investments classified within Level 3 whose fair value measurement considers several inputs may include Level 1 or Level 2 inputs as components of the overall fair value measurement. For the year ended October 31, 2015 there have been no significant changes to the Funds’ fair valuation methodologies.
The following table summarizes the quantitative inputs and assumptions used for items categorized as material Level 3 investments as of October 31, 2015. The disclosures below also include qualitative information on the sensitivity of the fair value measurements to changes in the significant unobservable inputs.
Global X Copper Miners ETF
Quantitative information about Level 3 fair value measurements
| | | | | | | | | | Discount Percentage | |
| Assets | | Fair Value at 10/31/15 | | | Valuation Technique(s) | | Unobservable Input | | Range | |
| Common Stock | | $ | 377,503 | | | Discount from the Last
Traded Price | | Last Traded Price Comparability
Adjustment % | | | 20 | % |
The unobservable input used to determine fair value of the Level 3 asset may have similar or diverging impacts on valuation. Significant increases and decreases in this input could result in significantly higher or lower fair value measurement.
REPURCHASE AGREEMENTS — Securities pledged as collateral for repurchase agreements are held by Citibank N.A. and are designated as being held on each Fund’s behalf by its custodian under a book-entry system. Each Fund monitors the adequacy of the collateral on a daily basis and can require the seller to provide additional collateral in the event the market value of the securities pledged falls below the carrying value of the repurchase agreement, including accrued interest. It is the Funds’ policy to only enter into repurchase agreements with banks and other financial institutions which are deemed by the Adviser to be creditworthy. The Funds bear the risk of loss in the event that the other party to a repurchase agreement defaults on its obligations and the Funds are prevented from exercising their rights to dispose of the underlying securities received as collateral and the risk of a possible decline in the value of the underlying securities during the period. For financial statement purposes, the Funds record the securities lending collateral (included in Repurchase Agreements, at value or restricted cash) as an asset and the obligation to return securities lending collateral as a liability on the Statements of Assets and Liabilities.
Repurchase agreements are entered into by the Funds under Master Repurchase Agreements (“MRA”) which permit the Funds, under certain circumstances, including an event of default (such as bankruptcy or insolvency), to offset payables and/or receivables under the MRA with collateral held and/or posted to the counterparty and create one single net payment due to or from the Funds.
| Notes to Financial Statements (continued) |
| October 31, 2015 |
2. SIGNIFICANT ACCOUNTING POLICIES (continued)
At October 31, 2015, the open repurchase agreements by counterparty which are subject to a MRA on a net payment basis are as follows:
| | | | | | Fair Value of Non-cash | | | Cash Collateral | | | | |
| | Repurchase Agreements | | | Collateral Received | | | Received | | | Net Amount(1) | |
| Global X Silver Miners ETF | | | | | | | | | | | | | | | | |
| Barclays | | $ | 5,000,000 | | | $ | 5,000,000 | | | $ | - | | | $ | - | |
| Deutsche Bank | | | 1,827,718 | | | | 1,827,718 | | | | - | | | | - | |
| Global X Gold Explorers ETF | | | | | | | | | | | | | | | | |
| Deutsche Bank | | | 1,037,810 | | | | 1,037,810 | | | | - | | | | - | |
| Global X Copper Miners ETF | | | | | | | | | | | | | | | | |
| Deutsche Bank | | | 1,082,005 | | | | 1,082,005 | | | | - | | | | - | |
| Global X Uranium ETF | | | | | | | | | | | | | | | | |
| Barclays | | | 19,000,000 | | | | 19,000,000 | | | | - | | | | - | |
| Deutsche Bank | | | 1,830,607 | | | | 1,830,607 | | | | | | | | - | |
| Global X Lithium ETF | | | | | | | | | | | | | | | | |
| Deutsche Bank | | | 1,211,990 | | | | 1,211,990 | | | | - | | | | - | |
(1) Net Amount represents the net amount receivable due from the counterparty in the event of default.
FEDERAL INCOME TAXES — It is each Fund’s intention to qualify or continue to qualify as a regulated investment company for Federal income tax purposes by complying with the appropriate provisions of Subchapter M of the Internal Revenue Code of 1986, as amended. Accordingly, no provisions for Federal income taxes have been made in the financial statements.
During the year ended October 31, 2015, the Global X Gold Explorers ETF incurred federal excise tax in the amount of $150. No other provisions for Federal income taxes have been made in the financial statements.
The Funds evaluate tax positions taken or expected to be taken in the course of preparing the Funds’ tax returns to determine whether it is “more-likely-than-not” (i.e., greater than 50 percent) that each tax position will be sustained upon examination by a taxing authority based on the technical merits of the position. Tax positions not deemed to meet the more-likely-than-not threshold are recorded as a tax benefit or expense in the current year. The Funds did not record any tax provision in the current period. Management’s conclusions regarding tax positions may be subject to review and adjustment at a later date based on factors including, but not limited to, examination by tax authorities (i.e., the last three tax year ends, as applicable), on-going analysis of and changes to tax laws, regulations and interpretations thereof.
As of and during the year ended October 31, 2015, the Funds did not have a liability for any unrecognized tax benefits. The Funds recognize interest and penalties, if any, related to unrecognized tax benefits as income tax expense in the Statement of Operations. During the year, the Funds did not incur any interest or penalties.
| Notes to Financial Statements (continued) |
| October 31, 2015 |
2. SIGNIFICANT ACCOUNTING POLICIES (concluded)
SECURITY TRANSACTIONS AND INVESTMENT INCOME — Security transactions are accounted for on the trade date for financial reporting purposes. Costs used in determining realized gains and losses on the sale of investment securities are based on specific identification. Dividend income is recorded on the ex-dividend date. Interest income is recognized on the accrual basis from the settlement date.
FOREIGN CURRENCY TRANSACTIONS AND TRANSLATION — The books and records of the Funds are maintained in U.S. dollars. Investment securities and other assets and liabilities denominated in a foreign currency are translated into U.S. dollars on the date of valuation. Purchases and sales of investment securities, income and expenses are translated into U.S. dollars at the relevant rates of exchange prevailing on the respective dates of such transactions. The Funds do not isolate that portion of realized or unrealized gains and losses resulting from changes in the foreign exchange rate from fluctuations arising from changes in the market prices of the securities. These gains and losses are included in net realized and unrealized gains and losses on investments on the Statement of Operations. Net realized and unrealized gains and losses on foreign currency transactions and translations represent net foreign exchange gains or losses from foreign currency spot contracts, disposition of foreign currencies, currency gains or losses realized between trade and settlement dates on securities transactions and the difference between the amount of the investment income and foreign withholding taxes recorded on the Funds’ books and the U.S. dollar equivalent amounts actually received or paid.
DIVIDENDS AND DISTRIBUTIONS TO SHAREHOLDERS — The Funds distribute their net investment income on a pro rata basis. Any net realized capital gains are distributed annually. All distributions are recorded on ex-dividend date.
CREATION UNITS — The Funds issue and redeem shares (“Shares”) at Net Asset Value (“NAV”) and only in large blocks of Shares (each block of Shares for a Fund is called a “Creation Unit” or multiples thereof). Purchasers of Creation Units (“Authorized Participants“) at NAV must pay a standard creation transaction fee per transaction. The fee is a single charge and will be the same regardless of the number of Creation Units purchased by an investor on the same day.
An Authorized Participant who holds Creation Units and wishes to redeem at NAV would also pay a standard redemption fee per transaction to Brown Brothers Harriman & Co. (“BBH”), the Funds’ Custodian, on the date of such redemption, regardless of the number of Creation Units redeemed that day.
If a Creation Unit is purchased or redeemed for cash, a higher transaction fee will be charged. The following table discloses Creation Unit breakdown:
| | | | | | Creation | | | Value at October | | | | |
| | | Creation Unit Shares | | | Fee | | | 31, 2015 | | | Redemption Fee | |
| Global X Silver Miners ETF | | | 50,000 | | | $ | 1,000 | | | $ | 1,041,500 | | | $ | 1,000 | |
| Global X Gold Explorers ETF | | | 50,000 | | | | 1,000 | | | | 994,500 | | | | 1,000 | |
| Global X Copper Miners ETF | | | 50,000 | | | | 1,000 | | | | 749,000 | | | | 1,000 | |
| Global X Uranium ETF | | | 50,000 | | | | 1,000 | | | | 747,000 | | | | 1,000 | |
| Global X Lithium ETF | | | 50,000 | | | | 1,000 | | | | 1,031,000 | | | | 1,000 | |
| Global X Fertilizers/Potash ETF | | | 50,000 | | | | 1,000 | | | | 499,000 | | | | 1,000 | |
| Notes to Financial Statements (continued) |
| October 31, 2015 |
3. RELATED PARTY TRANSACTIONS
The Adviser serves as the investment adviser and the administrator for the Funds. Subject to the supervision of the Board of Trustees, the Adviser is responsible for managing the investment activities of the Funds and the Funds’ business affairs and other administrative matters and provides or causes to be furnished all supervisory, administrative and other services reasonably necessary for the operation of the Funds, including certain distribution services (provided pursuant to a separate distribution services agreement), certain shareholder and distribution-related services (provided pursuant to a separate Rule 12b-1 Plan and related agreements) and investment advisory services (provided pursuant to a separate investment advisory agreement), under what is essentially an "all-in" fee structure. For its service to the Funds, under the supervision and administration agreement, each Fund pays a monthly fee to the Adviser at the annual rate (stated as a percentage of the average daily net assets of the Fund). In addition, the Funds bear other expenses, directly and indirectly, that are not covered by the supervision and administration agreement, which may vary and affect the total expense ratios of the Funds, such as taxes, brokerage fees, commissions, acquired fund fees and other transaction expenses, interest expenses, and extraordinary expenses (such as litigation and indemnification expenses).
| | | Supervision and | |
| | | Administration Fee | |
| Global X Silver Miners ETF | | | 0.65 | % |
| Global X Gold Explorers ETF | | | 0.65 | % |
| Global X Copper Miners ETF | | | 0.65 | % |
| Global X Uranium ETF | | | 0.69 | % |
| Global X Lithium ETF | | | 0.75 | % |
| Global X Fertilizers/Potash ETF | | | 0.69 | % |
The Adviser and MCCA Lithium ETF, LLC (“MCCA”), a single purpose limited liability firm, had entered into an agreement, pursuant to which MCCA agreed to assist the Adviser, in its capacity as sponsor of the Global X Lithium ETF, by providing initial capital and additional financial resources to the Adviser in connection with the listing, launch and the continuing operation of the Global X Lithium Fund. In return, the Adviser agreed to compensate MCCA for its financial assistance to the Adviser with respect to the Global X Lithium ETF by sharing with MCCA fifty percent (50%) of the Adviser’s Net Profits with respect to the Global X Lithium ETF. The agreement was terminated on August 7, 2015.
SEI Investments Global Funds Services (“SEIGFS”) serves as Sub-Administrator to the Funds. As Sub-Administrator, SEIGFS provides the Funds with the required general administrative services, including, without limitation: office space, equipment, and personnel; clerical and general back office services; bookkeeping, internal accounting and secretarial services; the calculation of NAV; and assistance with the preparation and filing of reports, registration statements, proxy statement and other materials required to be filed or furnished by the Funds under federal and state securities laws. As compensation for these services, the Sub-Administrator receives certain out-of-pocket costs, transaction fees and asset-based fees which are accrued daily and paid monthly by the Adviser.
| Notes to Financial Statements (continued) |
| October 31, 2015 |
3. RELATED PARTY TRANSACTIONS (continued)
SEI Investments Distribution Co. (“SIDCO”) serves as each Funds’ underwriter and distributor of Shares pursuant to a distribution agreement. Under the distribution agreement, SIDCO, as agent, receives orders to create and redeem Shares in Creation Unit Aggregations and transmits such orders to the Trust’s custodian and transfer agent. SIDCO has no obligation to sell any specific quantity of Fund Shares. SIDCO bears the following costs and expenses relating to the distribution of Shares: (1) the costs of processing and maintaining records of creations of Creation Units; (2) all costs of maintaining the records required of a registered broker/dealer; (3) the expenses of maintaining its registration or qualification as a dealer or broker under Federal or state laws; (4) filing fees; and (5) all other expenses incurred in connection with the distribution services as contemplated in the distribution agreement. SIDCO receives no fee for its distribution services under the distribution agreement.
BBH, located at 50 Post Office Square, Boston, MA 02110, serves as Custodian of the Funds’ assets. As Custodian, BBH has agreed to (1) make receipts and disbursements of money on behalf of the Funds, (2) collect and receive all income and other payments and distributions on account of the Funds’ portfolio investments, (3) respond to correspondence from shareholders, security brokers and others relating to its duties; and (4) make periodic reports to the Funds concerning the Funds’ operations. BBH does not exercise any supervisory function over the purchase and sale of securities. As compensation for these services, the Custodian receives certain out-of-pocket costs, transaction fees and asset-based fees which are accrued daily and paid monthly by the Adviser from its fees. BBH also serves as Transfer Agent. As Transfer Agent, BBH has agreed to (1) issue and redeem shares of each Fund, (2) make dividend and other distributions to shareholders of each Fund, (3) respond to correspondence by shareholders and others relating to its duties; (4) maintain shareholder accounts, and (5) make periodic reports to the Funds. As compensation for these services, the Transfer Agent receives certain out-of-pocket costs, transaction fees and asset-based fees which are accrued daily and paid monthly by the Adviser from its fees.
At October 31, 2015, Global X Gold Explorers ETF and Global X Uranium ETF own greater than 5% of the outstanding shares of the following common stocks. These investments are noted as “Affiliated Investment” in the Schedules of Investments.
| | | | | | | | | | Changes in | | | | | | | | | | |
| | | | | | | | | | Unrealized | | | | | | | | | | |
| Value at | | | Purchases at | | | Proceeds from | | | Appreciation | | | Realized Gain | | | Value at | | | Dividend | |
| 10/31/2014 | | | Cost | | | Sales | | | (Depreciation) | | | (Loss) | | | 10/31/15 | | | Income | |
| Global X Gold Explorers ETF | | | | | | | | | | | | | | | | | | | | | | | | | |
| | Gold Canyon Resources | | | | | | | | | | | | | | | | | | | | | | | | | |
| $ | 1,052,934 | | | $ | 1,343,365 | | | $ | (842,920 | ) | | $ | 3,676,137 | | | $ | (1,843,944 | ) | | $ | 3,385,572 | | | $ | — | |
| | Gryphon Minerals | | | | | | | | | | | | | | | | | | | | | | | | | |
| $ | 1,000,895 | | | $ | 933,911 | | | $ | (29,344 | ) | | $ | (687,343 | ) | | $ | (127,420 | ) | | $ | 1,090,699 | | | $ | — | |
| Totals: | | | | | | | | | | | | | | | | | | | | | | | | | |
| $ | 2,053,829 | | | $ | 2,277,276 | | | $ | (872,264 | ) | | $ | 2,988,794 | | | $ | (1,971,364 | ) | | $ | 4,476,271 | | | $ | — | |
| Notes to Financial Statements (continued) |
| October 31, 2015 |
3. RELATED PARTY TRANSACTIONS (concluded)
| | | | | | | | | | Changes in | | | | | | | | | | |
| | | | | | | | | | Unrealized | | | | | | | | | | |
| Value at | | | Purchases at | | | Proceeds from | | | Appreciation | | | Realized Gain | | | Value at | | | Dividend | |
| 10/31/2014 | | | Cost | | | Sales | | | (Depreciation) | | | (Loss) | | | 10/31/15 | | | Income | |
| Global X Uranium ETF | | | | | | | | | | | | | | | | | | | | | |
| | Centrus Energy | | | | | | | | | | | | | | | | | | | | | | | | | |
| $ | 262,223 | | | $ | 1,393,515 | | | $ | (37,996 | ) | | $ | (408,282 | ) | | $ | (1,912 | ) | | $ | 1,207,548 | | | $ | — | |
| | Energy Fuels | | | | | | | | | | | | | | | | | | | | | | | | | |
| $ | 9,988,789 | | | $ | 11,229,434 | | | $ | (6,014,042 | ) | | $ | (5,753,506 | ) | | $ | (2,564,404 | ) | | $ | 6,886,271 | | | $ | — | |
| | Fission 3.0 | | | | | | | | | | | | | | | | | | | | | | | | | |
| $ | 1,010,852 | | | $ | 186,055 | | | $ | (349,986 | ) | | $ | (5,748 | ) | | $ | (365,235 | ) | | $ | 475,938 | | | $ | — | |
| | Laramide Resources | | | | | | | | | | | | | | | | | | | | | |
| $ | 2,248,253 | | | $ | 302,040 | | | $ | (388,742 | ) | | $ | (49,359 | ) | | $ | (1,396,117 | ) | | $ | 716,075 | | | $ | — | |
| | Mega Uranium | | | | | | | | | | | | | | | | | | | | | | | | | |
| $ | 2,739,735 | | | $ | 401,640 | | | $ | (402,023 | ) | | $ | (397,761 | ) | | $ | (1,045,340 | ) | | $ | 1,296,251 | | | $ | — | |
| | Silex Systems | | | | | | | | | | | | | | | | | | | | | | | | | |
| $ | 5,937,210 | | | $ | 729,027 | | | $ | (1,352,295 | ) | | $ | 3,685,212 | | | $ | (5,987,425 | ) | | $ | 3,011,729 | | | $ | — | |
| | UEX | | | | | | | | | | | | | | | | | | | | | | | | | |
| $ | 4,611,399 | | | $ | 647,938 | | | $ | (1,010,705 | ) | | $ | (273,487 | ) | | $ | (2,700,939 | ) | | $ | 1,274,206 | | | $ | — | |
| | Uranium Energy | | | | | | | | | | | | | | | | | | | | | | | | | |
| $ | 9,171,155 | | | $ | 2,337,799 | | | $ | (4,786,647 | ) | | $ | 3,796,610 | | | $ | (4,580,988 | ) | | $ | 5,937,929 | | | $ | — | |
| | Uranium Resources | | | | | | | | | | | | | | | | | | | | | | | | | |
| $ | 4,030,695 | | | $ | 600,976 | | | $ | (886,435 | ) | | $ | (261,145 | ) | | $ | (1,923,966 | ) | | $ | 1,560,125 | | | $ | — | |
| | Ur-Energy | | | | | | | | | | | | | | | | | | | | | | | | | |
| $ | 8,366,330 | | | $ | 1,420,867 | | | $ | (2,057,590 | ) | | $ | (1,172,296 | ) | | $ | (1,696,443 | ) | | $ | 4,860,868 | | | $ | — | |
| Totals: | | | | | | | | | | | | | | | | | | | | | | | | | |
| $ | 48,366,641 | | | $ | 19,249,291 | | | $ | (17,286,461 | ) | | $ | (839,762 | ) | | $ | (22,262,769 | ) | | $ | 27,226,940 | | | $ | — | |
4. INVESTMENT TRANSACTIONS
For the year ended October 31, 2015, the purchases and sales of investments in securities, excluding in-kind transactions, long-term U.S. Government and short-term securities were:
| | Purchases | | | Sales and Maturities | |
| Global X Silver Miners ETF | | $ | 47,412,008 | | | $ | 45,106,147 | |
| Global X Gold Explorers ETF | | | 17,135,047 | | | | 16,913,970 | |
| Global X Copper Miners ETF | | | 6,540,448 | | | | 6,930,172 | |
| Global X Uranium ETF | | | 42,865,629 | | | | 49,501,721 | |
| Global X Lithium ETF | | | 13,890,690 | | | | 14,414,817 | |
| Global X Fertilizers/Potash ETF | | | 4,308,013 | | | | 4,466,313 | |
| Notes to Financial Statements (continued) |
| October 31, 2015 |
4. INVESTMENT TRANSACTIONS (concluded)
For the years ended October 31, 2015 and October 31, 2014 in-kind transactions associated with creations and redemptions were, respectively:
| | Purchases | | | Sales and Maturities | | | Realized Gain (Loss) | |
| Global X Silver Miners ETF | | $ | 29,988,868 | | | $ | 20,953,183 | | | $ | 1,128,279 | |
| Global X Gold Explorers ETF | | | 511,642 | | | | - | | | | - | |
| Global X Copper Miners ETF | | | 6,123,996 | | | | 3,576,659 | | | | (190,048 | ) |
| Global X Uranium ETF | | | 31,551,324 | | | | 17,897,881 | | | | (3,478,497 | ) |
| Global X Lithium ETF | | | 2,552,262 | | | | 4,456,568 | | | | 564,779 | |
| Global X Fertilizers/Potash ETF | | | - | | | | 3,189,800 | | | | 117,962 | |
| | Purchases | | | Sales and Maturities | | | Realized Gain | |
| Global X Silver Miners ETF | | $ | 50,460,864 | | | $ | 15,836,571 | | | $ | 1,273,352 | |
| Global X Gold Explorers ETF | | | 16,459,659 | | | | 7,748,634 | | | | 874,815 | |
| Global X Copper Miners ETF | | | 4,274,343 | | | | 5,265,265 | | | | 522,868 | |
| Global X Uranium ETF | | | 170,157,507 | | | | 7,973,974 | | | | 1,260,399 | |
| Global X Lithium ETF | | | 8,850,976 | | | | 5,301,237 | | | | 1,530,749 | |
| Global X Fertilizers/Potash ETF | | | - | | | | 5,184,776 | | | | 126,429 | |
| Global X Junior Miners ETF | | | 2,439,784 | | | | 1,615,215 | | | | 225,508 | |
During the year ended October 31, 2015, there were no purchases or sales of long-term U.S. Government securities for the Funds.
5. TAX INFORMATION
The amount and character of income and capital gain distributions to be paid, if any, are determined in accordance with Federal income tax regulations, which may differ from U.S. GAAP. As a result, net investment income (loss) and net realized gain (loss) on investment transactions for a reporting period may differ significantly from distributions during such period. These book/tax differences may be temporary or permanent. To the extent these differences are permanent in nature, they are charged or credited to undistributed net investment income (loss), accumulated net realized gain (loss) or paid-in capital, as appropriate, in the period that the differences arise.
The following differences, primarily attributable to investment in master limited partnership, non-deductible excise tax paid, foreign currency, redemptions in-kind and sales of passive foreign investment companies have been reclassified to/from the following accounts during the fiscal year ended October 31, 2015.
| Global X Funds | | Paid-in Capital | | | Undistributed Net
Investment Income | | | Accumulated Net
Realized Gain (Loss) | |
| Global X Silver Miners ETF | | $ | (122,246 | ) | | $ | 37,302 | | | $ | 84,944 | |
| Global X Gold Explorers ETF | | | (150 | ) | | | 801 | | | | (651 | ) |
| Global X Copper Miners ETF | | | (286,517 | ) | | | 35,209 | | | | 251,308 | |
| Global X Uranium ETF | | | (7,336,678 | ) | | | (2,038 | ) | | | 7,338,716 | |
| Global X Lithium ETF | | | 511,900 | | | | 9,326 | | | | (521,226 | ) |
| Global X Fertilizers/Potash ETF | | | 143,174 | | | | (46,762 | ) | | | (96,412 | ) |
These reclassifications have no impact on net assets or net asset value per share.
| Notes to Financial Statements (continued) |
| October 31, 2015 |
5. TAX INFORMATION (continued)
The tax character of dividends and distributions declared during the years ended October 31, 2015 and 2014 were as follows:
| Global X Funds | | Ordinary Income | | | Long-Term
Capital Gain | | | Return of Capital | | | Totals | |
| | | | | | | | | | | | | |
| Global X Silver Miners ETF | | | | | | | | | | | | | | | | |
| 2015 | | $ | 129,601 | | | $ | – | | | $ | – | | | $ | 129,601 | |
| 2014 | | | 1,275,569 | | | | – | | | | – | | | | 1,275,569 | |
| Global X Gold Explorers ETF | | | | | | | | | | | | | | | | |
| 2015 | | $ | 40,294 | | | $ | – | | | $ | – | | | $ | 40,294 | |
| 2014 | | | – | | | | – | | | | – | | | | – | |
| Global X Copper Miners ETF | | | | | | | | | | | | | | | | |
| 2015 | | $ | 509,286 | | | $ | – | | | $ | – | | | $ | 509,286 | |
| 2014 | | | 225,417 | | | | – | | | | – | | | | 225,417 | |
| Global X Uranium ETF | | | | | | | | | | | | | | | | |
| 2015 | | $ | 9,307,517 | | | $ | – | | | $ | – | | | $ | 9,307,517 | |
| 2014 | | | 734,117 | | | | – | | | | – | | | | 734,117 | |
| Global X Lithium ETF | | | | | | | | | | | | | | | | |
| 2015 | | $ | 471,239 | | | $ | – | | | $ | – | | | $ | 471,239 | |
| 2014 | | | 160,079 | | | | – | | | | – | | | | 160,079 | |
| Global X Fertilizers/Potash ETF | | | | | | | | | | | | | | | | |
| 2015 | | $ | 350,078 | | | $ | – | | | $ | – | | | $ | 350,078 | |
| 2014 | | | 366,898 | | | | – | | | | – | | | | 366,898 | |
As of October 31, 2015, the components of tax basis accumulated losses were as follows:
| | | Global X Funds | |
| | | Global X Silver
Miners ETF | | | Global X Gold
Explorers ETF | | | Global X Copper
Miners ETF | |
| Undistributed Ordinary Income | | $ | 313,290 | | | $ | 2,809,191 | | | $ | 205,680 | |
| Capital Loss Carryforwards | | | (185,016,525 | ) | | | (39,820,135 | ) | | | (13,014,245 | ) |
| Unrealized Depreciation on Investments and Foreign Currency | | | (144,970,525 | ) | | | (24,014,595 | ) | | | (18,878,720 | ) |
| Other Temporary Differences | | | – | | | | 1 | | | | (8 | ) |
| Total Accumulated Losses | | $ | (329,673,760 | ) | | $ | (61,025,538 | ) | | $ | (31,687,293 | ) |
| | | Global X Funds | |
| | | Global X Uranium
ETF | | | Global X Lithium
ETF | | | Global X
Fertilizers/Potash
ETF | |
| Undistributed Ordinary Income | | $ | 2,214,134 | | | $ | – | | | $ | 330,847 | |
| Capital Loss Carryforwards | | | (231,930,607 | ) | | | (50,804,114 | ) | | | (3,330,550 | ) |
| Unrealized Depreciation on Investments and Foreign Currency | | | (168,493,485 | ) | | | (9,365,417 | ) | | | (6,144,214 | ) |
| Other Temporary Differences | | | 3 | | | | (5 | ) | | | (6 | ) |
| Total Accumulated Losses | | $ | (398,209,955 | ) | | $ | (60,169,536 | ) | | $ | (9,143,923 | ) |
| Notes to Financial Statements (continued) |
| October 31, 2015 |
5. TAX INFORMATION (concluded)
For Federal income tax purposes, capital losses incurred in taxable years beginning before December 22, 2010 may be carried forward for a maximum period of eight years and applied against future gains. As of October 31, 2015, the Funds that had capital loss carryforwards are listed below:
| | | Global X Silver | | | Global X Gold | | | Global X | | | Global X | |
| Expiration Date | | Miners ETF | | | Explorers ETF | | | Uranium ETF | | | Lithium ETF | |
| Oct. 2019 | | $ | 8,433,465 | | | $ | 130,976 | | | $ | 12,705,798 | | | $ | 7,329,308 | |
During the fiscal year ended October 31, 2015, the following funds utilized capital loss carryforwards to offset capital gains.
| Global X Funds | | | |
| Global X Lithium ETF | | $ | 1,695,799 | |
For taxable years beginning after December 22, 2010, a RIC is permitted to carry forward net capital losses to offset capital gains realized in later years, and the losses carried forward retain their original character as either long-term or short-term losses. Net capital losses of a RIC realized in taxable years beginning before that date (pre-2011 losses) can be carried forward up to 8 years and are characterized in later years as short-term losses. If a Fund uses pre-2011 loss carryforwards in later years, the carryforwards will not reduce the Fund’s current earnings and profits, while loss carryforwards from later years will reduce the Fund’s current earnings and profits. To the extent that later year capital gains are offset by pre-2011 loss carryforwards, distributions of such gains will be treated as ordinary dividend distributions. Losses carried forward under these new provisions are as follows:
| Global X Funds | | Short-Term Loss | | | Long-Term Loss | | | Total | |
| Global X Silver Miners ETF | | $ | 19,717,142 | | | $ | 156,865,918 | | | $ | 176,583,060 | |
| Global X Gold Explorers ETF | | | 6,155,815 | | | | 33,533,344 | | | | 39,689,159 | |
| Global X Copper M iners ETF | | | 2,294,456 | | | | 10,719,789 | | | | 13,014,245 | |
| Global X Uranium ETF | | | 50,760,288 | | | | 168,464,521 | | | | 219,224,809 | |
| Global X Lithium ETF | | | 10,348,428 | | | | 33,126,378 | | | | 43,474,806 | |
| Global X Fertilizers/Potash ETF | | | 941,537 | | | | 2,389,013 | | | | 3,330,550 | |
The Federal tax cost and aggregate gross unrealized appreciation and depreciation on investments held by the Funds at October 31, 2015 were as follows:
| Global X Funds | | Federal Tax Cost | | | Aggregated
Gross Unrealized
Appreciation | | | Aggregated Gross
Unrealized
Depreciation | | | Net Unrealized
Depreciation | |
| Global X Silver Miners ETF | | $ | 296,161,516 | | | $ | 1,165,387 | | | $ | (146,132,921 | ) | | $ | (144,967,534 | ) |
| Global X Gold Explorers ETF | | | 54,159,559 | | | | 2,607,422 | | | | (26,622,017 | ) | | | (24,014,595 | ) |
| Global X Copper Miners ETF | | | 38,980,280 | | | | – | | | | (18,889,377 | ) | | | (18,889,377 | ) |
| Global X Uranium ETF | | | 332,499,551 | | | | 1,006,781 | | | | (169,500,537 | ) | | | (168,493,756 | ) |
| Global X Lithium ETF | | | 51,341,342 | | | | 1,707,234 | | | | (11,071,252 | ) | | | (9,364,018 | ) |
| Global X Fertilizers/Potash ETF | | | 17,590,042 | | | | 689,652 | | | | (6,830,699 | ) | | | (6,141,047 | ) |
The preceding differences between book and tax cost are primarily due to mark-to-market treatment of passive foreign investment companies and wash sales.
| Notes to Financial Statements (continued) |
| October 31, 2015 |
6. CONCENTRATION OF RISKS
The Funds invest in securities of foreign issuers in various countries. These investments may involve certain considerations and risks not typically associated with investments in the United States as a result of, among other factors, the possibility of future political and economic developments and the level of governmental supervision and regulation of securities markets in the respective countries.
The securities markets of emerging countries are less liquid and subject to greater price volatility, and have a smaller market capitalization, than the U.S. securities markets. In certain countries, there may be fewer publicly traded securities and the market may be dominated by a few issues or sectors. Issuers and securities markets in such countries are not subject to as extensive and frequent accounting, financial and other reporting requirements or as comprehensive government regulations as are issuers and securities markets in the United States. In particular, the assets and profits appearing on the financial statements of emerging country issuers may not reflect their financial position or results of operations in the same manner as financial statements for U.S. issuers. Substantially less information may be publicly available about emerging country issuers than is available about issuers in the United States.
The Funds may be subject to taxes imposed by countries in which they invest. Such taxes are generally based on either income or gains earned or repatriated. The Funds accrue and apply such taxes to net investment income, net realized gains and net unrealized gains as income and/or capital gains are earned.
The Funds use a replication strategy. A replication strategy is an indexing strategy that involves investing in the securities of the underlying index in approximately the same proportions as in the underlying index. The Funds may utilize a representative sampling strategy with respect to their underlying indices when a replication strategy might be detrimental to their shareholders, such as when there are practical difficulties or substantial costs involved in compiling a portfolio of equity securities to follow its underlying index, or, in certain instances, when securities in the underlying index become temporarily illiquid, unavailable or less liquid, or due to legal restrictions (such as diversification requirements that apply to the Funds but not the underlying indexes). Commodity related securities are susceptible to fluctuations in certain commodity markets. Any negative changes in commodity markets could have a great impact on these Funds.
7. LOANS OF PORTFOLIO SECURITIES
The Funds may lend portfolio securities having a market value up to one-third of the Funds’ total assets. Security loans made pursuant to a securities lending agreement are required at all times to be secured by collateral equal to at least 102% for U.S.-based securities and 105% for foreign-based securities. Such collateral will be cash securities issued or guaranteed by the U.S. Government or any agencies. Cash collateral received in connection with these loans can be invested in repurchase agreements or U.S. Treasury obligations and is recognized in the Schedule of Investments and Statement of Assets and Liabilities. The obligation to return securities lending collateral is also recognized as a liability in the Statement of Assets and Liabilities. It is the Funds’ policy to obtain additional collateral from or return excess collateral to the borrower by the end of the next business day, following the valuation date of the securities loaned. Therefore, the value of the collateral held may be temporarily less than the value of the securities on loan. Lending securities entails a risk of loss to the Funds if and to the extent that the market value of the securities loans were to increase and
| Notes to Financial Statements (continued) |
| October 31, 2015 |
7. LOANS OF PORTFOLIO SECURITIES (continued)
the borrower did not increase the collateral accordingly, and the borrower fails to return the securities. The Funds could also experience delays and costs in gaining access to the collateral. The Funds bear the risk of any deficiency in the amount of the collateral available for return to the borrower due to any loss on the collateral invested.
As of October 31, 2015, the value of securities on loan was $6,097,231, $546,286, $1,069,340, $16,391,367 and $1,089,488 for the Global X Silver Miners ETF, Global X Gold Explorers ETF, Global X Copper Miners ETF, Global X Uranium ETF and Global X Lithium ETF, respectively and the value of securities purchased with the cash collateral held from securities on loan was $6,827,718, $1,037,810, $1,082,005, $20,830,607 and $1,211,990 for the Global X Silver Miners ETF, Global X Gold Explorers ETF, Global X Copper Miners ETF, Global X Uranium ETF and Global X Lithium ETF, respectively.
At October 31, 2015, the following Funds had securities on loan, by counterparty:
| | Market Value | | | Cash Collateral | |
| Global X Silver Miners ETF | | | | | | | | |
| Citigroup | | $ | 557,546 | | | $ | 691,900 | |
| Deutsche Bank Securities | | | 2,616,074 | | | | 2,906,100 | |
| JPMorgan | | | 1,939,196 | | | | 2,154,600 | |
| Merrill Lynch Pierce Fenner & Smith | | | 32,663 | | | | 35,026 | |
| Morgan Stanley | | | 744,571 | | | | 815,500 | |
| SG Americas Securities | | | 207,181 | | | | 225,138 | |
| Global X Gold Explorers ETF | | | | | | | | |
| Barclays Capital | | | 81,592 | | | | 87,500 | |
| Deutsche Bank Securities | | | 37,974 | | | | 42,544 | |
| Jefferies & Co. | | | 135,390 | | | | 600,000 | |
| Merrill Lynch Pierce Fenner & Smith | | | 271,817 | | | | 286,800 | |
| Morgan Stanley | | | 15,294 | | | | 16,560 | |
| SG Americas Securities | | | 4,219 | | | | 4,406 | |
| Global X Copper Miners ETF | | | | | | | | |
| Citigroup | | | 199,385 | | | | 199,293 | |
| Credit Suisse | | | 142,643 | | | | 142,562 | |
| UBS Securities | | | 727,312 | | | | 740,150 | |
| Notes to Financial Statements (continued) |
| October 31, 2015 |
7. LOANS OF PORTFOLIO SECURITIES (concluded)
| | Market Value | | | Cash Collateral | |
| Global X Uranium ETF | | | | | | | | |
| Barclays Capital | | | 340,969 | | | | 667,447 | |
| BMO Capital Markets | | | 252,250 | | | | 280,215 | |
| Citigroup | | | 225,840 | | | | 333,050 | |
| Credit Suisse | | | 3,112,683 | | | | 3,522,228 | |
| Deutsche Bank Securities | | | 867,182 | | | | 958,106 | |
| Goldman Sachs & Co. | | | 275,893 | | | | 319,569 | |
| JPMorgan | | | 3,723,138 | | | | 5,124,806 | |
| Macquarie Capital | | | 2,219,775 | | | | 2,534,750 | |
| Merrill Lynch Pierce Fenner & Smith | | | 687,140 | | | | 759,021 | |
| Morgan Stanley | | | 3,913,356 | | | | 5,632,260 | |
| Scotia Capital USA | | | 282,123 | | | | 319,507 | |
| UBS Securities | | | 491,018 | | | | 539,900 | |
| Global X Lithium ETF | | | | | | | | |
| Citigroup | | | 105,104 | | | | 183,350 | |
| Goldman Sachs & Co. | | | 11,813 | | | | 13,440 | |
| Morgan Stanley | | | 972,571 | | | | 1,015,200 | |
8. CONTRACTUAL OBLIGATIONS
The Funds enter into contracts in the normal course of business that contain a variety of indemnifications. The Funds’ maximum exposure under these arrangements is unknown. However, the Funds have not had prior gains or losses pursuant to these contracts. Management has reviewed the Funds’ existing contracts and expects the risk of loss to be remote.
Pursuant to the Trust’s organizational documents, the Trustees of the Trust and the Trust’s officers are indemnified against certain liabilities that may arise out of the performance of their duties.
| Notes to Financial Statements (continued) |
| October 31, 2015 |
9. REVERSE SHARE SPLIT
Effective May 16, 2013, the Global X Gold Explorers ETF, Global X Uranium ETF and the Global X Junior Miners ETF executed a reverse share split for shareholders of record after the close of markets on May 15, 2013. The effect of this transaction was to divide the number of outstanding shares of the Fund by the ratio below, resulting in a corresponding increase in the net asset value per share. The capital share activity presented in the statement of changes in net assets for each of the years in the period then ended, and per share data in the financial highlights for each of the years in the period then ended have been given retroactive effect to reflect these reverse share splits. There were no changes in net assets, results of operations or total return as a result of these transactions. The details of the reverse splits are as follows:
May 16, 2013:
| Fund Name | | | Ratio |
| Global X Gold Explorers ETF | | | 1:4 |
| Global X Uranium ETF | | | 1:3 |
| Global X Junior Miners ETF | | | 1:3 |
Effective November 18, 2015, the Global X Silver Miners ETF, Global X Gold Explorers ETF, Global X Copper Miners ETF, Global X Uranium ETF and the Global X Lithium ETF executed a reverse share split for shareholders of record after the close of markets on November 17, 2015. The effect of this transaction was to divide the number of outstanding shares of the Fund by the ratio below, resulting in a corresponding increase in the net asset value per share. The capital share activity presented in the statement of changes in net assets for each of the years in the period then ended, and per share data in the financial highlights for each of the years in the period then ended have been given retroactive effect to reflect these reverse share splits. There were no changes in net assets, results of operations or total return as a result of these transactions. The details of the reverse splits are as follows:
November 18, 2015:
| Fund Name | | | Ratio |
| Global X Silver Miners ETF | | | 1:3 |
| Global X Gold Explorers ETF | | | 1:2 |
| Global X Copper Miners ETF | | | 1:3 |
| Global X Uranium ETF | | | 1:2 |
| Global X Lithium ETF | | | 1:2 |
10. RECENT ACCOUNTING PRONOUCEMENT
In June 2014, the Financial Accounting Standards Board (FASB) issued Accounting Standards Update (ASU) No. 2014-11, Transfers and Servicing (Topic 860): Repurchase-to-Maturity Transactions, Repurchase Financings, and Disclosures. ASU 2014-11 changes the accounting for repurchase-to-maturity transactions and repurchase financing arrangements and requires enhanced disclosures about repurchase agreements and other similar transactions. This update requires repurchase-to-maturity transactions to be accounted for as secured borrowings. This update also eliminates existing guidance for repurchase financings and requires instead that entities consider the initial transfer and the related repurchase agreement separately when applying the derecognition requirements under U.S. GAAP. The accounting changes in this update are effective for fiscal
| Notes to Financial Statements (concluded) |
| October 31, 2015 |
10. RECENT ACCOUNTING PRONOUCEMENT (concluded)
periods and interim periods beginning after December 15, 2014, and early adoption is prohibited. At this time, management is currently evaluating the implications of ASU No. 2014-11 and its impact on the financial statement disclosures has not yet been determined.
11. SUBSEQUENT EVENTS
The Funds have been evaluated regarding the need for additional disclosures and/or adjustments resulting from subsequent events. Based on this evaluation, no additional disclosure or adjustments were required to the financial statements as of the date the financial statements were issued, except as follows:
Subsequent to October 31, 2015 the following portfolios were added to the Trust; Global X Internet of Things ETF, Global X Healthy Lifestyles ETF, Global X Big Data ETF, Global X FinTech ETF and Global X Conscious Companies ETF.
| Report of Independent Registered Public Accounting Firm |
| October 31, 2015 |
The Board of Trustees and Shareholders of Global X Funds
We have audited the accompanying statements of assets and liabilities, including the schedules of investments, of Global X Silver Miners ETF, Global X Gold Explorers ETF, Global X Copper Miners ETF, Global X Uranium ETF, Global X Lithium ETF and Global X Fertilizers/Potash ETF (six of the series constituting Global X Funds) (the “Funds”) as of October 31, 2015, and the related statements of operations for the year then ended, the statements of changes in net assets for each of the two years in the period then ended, and the financial highlights for each of the five years or periods then ended. These financial statements and financial highlights are the responsibility of the Funds’ management. Our responsibility is to express an opinion on these financial statements and financial highlights based on our audits.
We conducted our audits in accordance with the standards of the Public Company Accounting Oversight Board (United States). Those standards require that we plan and perform the audit to obtain reasonable assurance about whether the financial statements and financial highlights are free of material misstatement. We were not engaged to perform an audit of the Funds’ internal control over financial reporting. Our audits included consideration of internal control over financial reporting as a basis for designing audit procedures that are appropriate in the circumstances, but not for the purpose of expressing an opinion on the effectiveness of the Funds’ internal control over financial reporting. Accordingly, we express no such opinion. An audit also includes examining, on a test basis, evidence supporting the amounts and disclosures in the financial statements and financial highlights, assessing the accounting principles used and significant estimates made by management, and evaluating the overall financial statement presentation. Our procedures included confirmation of securities owned as of October 31, 2015, by correspondence with the custodian and brokers, or by other appropriate auditing procedures where replies from brokers were not received. We believe that our audits provide a reasonable basis for our opinion.
In our opinion, the financial statements and financial highlights referred to above present fairly, in all material respects, the financial position of each of the Funds listed above at October 31, 2015, the results of their operations for the year then ended, the changes in their net assets for each of the two years in the period then ended, and the financial highlights for each of the five years or periods then ended, in conformity with U.S. generally accepted accounting principles.
| |  |
| | |
| Philadelphia, Pennsylvania | |
| December 30, 2015 | |
| Disclosure of Fund Expenses (unaudited) |
All Exchange Traded Funds (“ETF”) have operating expenses. As a shareholder of an ETF, your investment is affected by these ongoing costs, which include (among others) costs for ETF management, administrative services, commissions, and shareholder reports like this one. It is important for you to understand the impact of these costs on your investment returns. In addition, a shareholder is responsible for brokerage fees as a result of their investment in the Fund.
Operating expenses such as these are deducted from an ETF’s gross income and directly reduce its final investment return. These expenses are expressed as a percentage of the ETF’s average net assets; this percentage is known as the ETF’s expense ratio.
The following examples use the expense ratio and are intended to help you understand the ongoing costs (in dollars) of investing in your Fund and to compare these costs with those of other funds. The examples are based on an investment of $1,000 made at the beginning of the period shown and held for the entire period (May 1, 2015 to October 31, 2015).
The table on the next page illustrates your Fund’s costs in two ways:
Actual Fund Return. This section helps you to estimate the actual expenses that your Fund incurred over the period. The “Expenses Paid During Period” column shows the actual dollar expense cost incurred by a $1,000 investment in the Fund, and the “Ending Account Value” number is derived from deducting that expense cost from the Fund’s gross investment return.
You can use this information, together with the actual amount you invested in the Funds, to estimate the expenses you paid over that period. Simply divide your actual account value by $1,000 to arrive at a ratio (for example, an $8,600 account value divided by $1,000 = 8.6), then multiply that ratio by the number shown for your Funds under “Expenses Paid During Period.”
Hypothetical 5% Return. This section helps you compare your Fund’s costs with those of other funds. It assumes that the Funds had an annual 5% return before expenses during the year, but that the expense ratio (Column 3) for the period is unchanged. This example is useful in making comparisons because the Securities and Exchange Commission requires all funds to make this 5% calculation. You can assess your Fund’s comparative cost by comparing the hypothetical result for your Fund in the “Expenses Paid During Period” column with those that appear in the same charts in the shareholder reports for other funds.
NOTE: Because the return is set at 5% for comparison purposes — NOT your Fund’s actual return — the account values shown may not apply to your specific investment.
| Disclosure of Fund Expenses (unaudited) (concluded) |
| | | Beginning
Account
Value
5/1/2015 | | | Ending
Account
Value
10/31/2015 | | | Annualized
Expense
Ratios | | | Expenses
Paid
During
Period(1) | |
| Global X Silver Miners ETF | | | | | | | | | | | | | | | | |
| Actual Fund Return | | $ | 1,000.00 | | | $ | 781.50 | | | | 0.65 | % | | $ | 2.92 | |
| Hypothetical 5% Return | | | 1,000.00 | | | | 1,021.93 | | | | 0.65 | | | | 3.31 | |
| Global X Gold Explorers ETF |
| Actual Fund Return | | $ | 1,000.00 | | | $ | 894.80 | | | | 0.65 | % | | $ | 3.10 | |
| Hypothetical 5% Return | | | 1,000.00 | | | | 1,021.93 | | | | 0.65 | | | | 3.31 | |
| Global X Copper Miners ETF |
| Actual Fund Return | | $ | 1,000.00 | | | $ | 624.50 | | | | 0.65 | % | | $ | 2.66 | |
| Hypothetical 5% Return | | | 1,000.00 | | | | 1,021.93 | | | | 0.65 | | | | 3.32 | |
| Global X Uranium ETF |
| Actual Fund Return | | $ | 1,000.00 | | | $ | 639.00 | | | | 0.69 | % | | $ | 2.85 | |
| Hypothetical 5% Return | | | 1,000.00 | | | | 1,021.72 | | | | 0.69 | | | | 3.52 | |
| Global X Lithium ETF |
| Actual Fund Return | | $ | 1,000.00 | | | $ | 819.60 | | | | 0.75 | % | | $ | 3.44 | |
| Hypothetical 5% Return | | | 1,000.00 | | | | 1,021.42 | | | | 0.75 | | | | 3.82 | |
| Global X Fertilizers/Potash ETF |
| Actual Fund Return | | $ | 1,000.00 | | | $ | 853.00 | | | | 0.69 | % | | $ | 3.22 | |
| Hypothetical 5% Return | | | 1,000.00 | | | | 1,021.72 | | | | 0.69 | | | | 3.52 | |
| (1) | Expenses are equal to the Fund’s annualized expense ratio multiplied by the average account value over the period, multiplied 184/365 (to reflect the one-half year period.) |
| Supplemental Information (unaudited) |
Net asset value, or “NAV”, is the price per Share at which the Funds issue and redeem Shares. It is calculated in accordance with the standard formula for valuing mutual fund shares. The “Market Price” of the Funds generally is determined using the midpoint between the highest bid and the lowest offer on the stock exchange on which the Shares of the Funds are listed for trading, as of the time that the Funds’ NAV is calculated. The Funds’ Market Price may be at, above or below their NAV. The NAV of the Funds will fluctuate with changes in the market value of the Funds’ holdings. The Market Price of the Funds will fluctuate in accordance with changes in its NAV, as well as market supply and demand.
Premiums or discounts are the differences (expressed as a percentage) between the NAV and Market Price of the Funds on a given day, generally at the time NAV is calculated. A premium is the amount that the Funds are trading above the reported NAV, expressed as a percentage of the NAV. A discount is the amount that the Funds are trading below the reported NAV, expressed as a percentage of the NAV.
Further information regarding premiums and discounts is available on the Funds’ website at www.GlobalXFunds.com.
| Trustees and Officers of the Trust (unaudited) |
Set forth below are the names, addresses, year of birth, position with the Trust, Term of Office and Length of Time Served, the principal occupations for the last five years, number of Funds in fund complex overseen by trustee, and other directorships outside the fund complex of each of the persons currently serving as Trustees and Officers of the Trust.
Name,
Address
(Year of
Birth) | Position(s)
Held
with
Funds |
Principal Occupation(s) During
the Past 5 Years | Number of
Funds in
Trust
Overseen
by Trustee |
Other Directorships Held
by Trustees |
| Independent Trustees2 | |
Sanjay Ram Bharwani 623 Fifth Ave, 15th floor New York, NY 10022 (1974) | Trustee (since 2008) | CEO of Risk Advisors Inc. (since 2007) (consulting firm). | 473 | None. |
Scott R. Chichester1 623 Fifth Ave, 15th floor New York, NY 10022 (1970) | Trustee (since 2008) | CFO, AdeptPros Inc. (app development, training and consulting) (since 2012); Founder, Madison Park Advisors LLC (advisory services) (since 2011); CFO, Sterling Seal & Supply Inc. (since 2011), President & Treasurer, Bayview Acquisition Corp (since 2010), CPA, Penda Aiken Inc. (2009-2011) (consultant); Founder and President, DirectPay USA LLC (since 2006) (payroll company); Proprietor, Scott R. Chichester CPA (since 2001) (CPA firm). | 473 | Director of AdeptPros Inc. (since 2015); Director of Sterling Seal & Supply Inc. (since 2011); Director of Bayview Acquisition Corp. (since 2010); Trustee of ARK ETF Trust (since 2014). |
Kartik Kiran Shah 623 Fifth Ave, 15th floor New York, NY 10022 (1977) | Trustee (since 2008) | President and Chief Business Officer, Oxeia Biopharmaceuticals, Inc. (2015-present); Vice President, Business Development, Cynvenio Biosystems (2012-2014); Independent Consultant, Self-Employed (2011-2012) (non-financial services); Director, Wireless Generation (2008-2011) (software). | 473 | Director of Oxeia Biopharmaceuticals, Inc. (2015-present). |
| Trustees and Officers of the Trust (unaudited) |
The Trust’s Statement of Additional Information (“SAI”) includes additional information about the Trustees and Officers. The SAI may be obtained without charge by calling 1-888-493-8631. The following chart lists Trustees and Officers as of October 31, 2015.
Name, Address
(Year of Birth) |
Position(s) Held
with Funds |
Principal Occupation(s)
During
the Past 5 Years | Number of Funds
in Trust
Overseen by
Trustee | Other
Directorships Held
by Trustees |
| Interested Trustee / Officers2 | |
Bruno del Ama 623 Fifth Ave, 15th floor New York, NY 10022 (1976) | Trustee (since 2008), President, Chief Executive Officer (since 2008) | Chief Executive Officer, Global X Management Company (“GXMC”) (since 2008); Chief Compliance Officer, GXMC (2008-2013). | 473 | None. |
Luis Berruga 623 Fifth Ave, 15th floor New York, NY 10022 (1977) | Chief Operating Officer, Treasurer, Principal Accounting Officer and Chief Financial Officer (since 9/2015) | Chief Financial Officer, GXMC (since 9/2015) and Chief Operating Officer (since 2/2014); Investment Banker, Jefferies (2012-2014); Regional Product Specialist, Morgan Stanley (2005-2012). | N/A | N/A |
Daphne Tippens Chisolm 623 Fifth Ave, 15th floor New York, NY 10022 (1969) | Secretary (since 2012) and Chief Compliance Officer (since 2/2015) | General Counsel, GXMC (since 2011); Chief Compliance Officer, GXMC (1/2014 - 5/2014 and 2/2015-present); Founder and President of Law Offices of DT Chisolm, P.C. (since 2009) (law firm). | N/A | N/A |
Dianne M. Descoteaux4 One Freedom Valley Drive Oaks, PA 19456 (1977) | Assistant Secretary (since 2011) | Counsel, SEI Investments (since 2010); Associate, Morgan, Lewis & Bockius LLP (2006-2010). | N/A | N/A |
| Trustees and Officers of the Trust (unaudited) |
Name, Address
(Year of Birth) |
Position(s) Held
with Funds |
Principal Occupation(s) During
the Past 5 Years | Other Directorships
Held
by Trustees |
Lisa Whittaker4 One Freedom Valley Drive Oaks, PA 19456 (1978) | Assistant Secretary (since 2013) | Counsel at SEI Investments (since 2012); Associate Counsel and Compliance Officer at The Glendale Trust Company (2011-2012); Associate of Drinker Biddle & Reath LLP (2006-2011). | N/A |
Peter Rodriguez4 One Freedom Valley Drive Oaks, PA 19456 (1962) | Assistant Treasurer (since 2011) | Fund Accounting Director, SEI Investments Global Funds Services (since 2011); Mutual Fund Trading Director, SEI Global Trust Company (2009-2011); Asset Data Services Director, SEI Global Wealth Services (2006-2009). | N/A |
| 1 | Mr. Chichester is currently married to a sister of Mr. del Ama’s wife. While an “immediate family member” (as defined in Section 2(a)(19) of the 1940 Act) of Mr. del Ama would be considered an Interested Person, Mr. Chichester is not considered an immediate family member for this purpose. Although this fact was taken into consideration in determining whether Mr. Chichester should be considered to be an Independent Trustee for purposes of the Section 2(a)(19) of the 1940 Act, it was determined that this relationship was not one that should disqualify Mr. Chichester from serving as an Independent Trustee of the Trust. |
| 2 | Each Trustee serves until his or her successor is duly elected or appointed and qualified. |
| 3 | As of October 31, 2015, the Trust had ninety-one investment portfolios, forty-seven of which were operational. |
| 4 | These officers of the Trust also serve as officers of one or more mutual funds for which SEI Investments Company or an affiliate acts as investment manager, administrator or distributor. |
| Notice to Shareholders (unaudited) |
For shareholders that do not have an October 31, 2015 tax year end, this notice is for informational purposes only. For shareholders with an October 31, 2015 tax year end, please consult your tax advisor as to the pertinence of this notice. For the fiscal year ended October 31, 2015, the Funds have designated the following items with regard to distributions paid during the year.
| | | Long-Term
Capital Gain
Distributions | | | Ordinary
Income
Distributions | | | Total
Distributions | | | Qualifying
for
Corporate
Dividends
Received
Deduction (1) | | | Qualifying
Dividend
Income (2) | | | U.S.
Government
Interest (3) | | | Interest
Related
Dividends (4) | | | Short Term
Capital Gain
Dividends (5) | | | Foreign
Tax
Credit | |
| Global X Silver Miners ETF | | | 0.00 | % | | | 100.00 | % | | | 100.00 | % | | | 73.75 | % | | | 100.00 | % | | | 0.00 | % | | | 0.00 | % | | | 0.00 | % | | | 48.93 | % |
| Global X Gold Explorers ETF | | | 0.00 | % | | | 100.00 | % | | | 100.00 | % | | | 0.00 | % | | | 0.00 | % | | | 0.00 | % | | | 0.00 | % | | | 0.00 | % | | | 0.00 | % |
| Global X Copper Miners ETF | | | 0.00 | % | | | 100.00 | % | | | 100.00 | % | | | 8.59 | % | | | 100.00 | % | | | 0.00 | % | | | 0.00 | % | | | 0.00 | % | | | 4.28 | % |
| Global X Uranium ETF | | | 0.00 | % | | | 100.00 | % | | | 100.00 | % | | | 0.00 | % | | | 5.06 | % | | | 0.00 | % | | | 0.00 | % | | | 0.00 | % | | | 0.48 | % |
| Global X Lithium ETF | | | 0.00 | % | | | 100.00 | % | | | 100.00 | % | | | 10.61 | % | | | 100.00 | % | | | 0.00 | % | | | 0.00 | % | | | 0.00 | % | | | 0.00 | % |
| Global X Fertilizers/Potash ETF | | | 0.00 | % | | | 100.00 | % | | | 100.00 | % | | | 36.55 | % | | | 97.84 | % | | | 0.00 | % | | | 0.00 | % | | | 0.00 | % | | | 10.53 | % |
(1) Qualifying dividends represent dividends which qualify for the corporate dividends received deduction and is reflected as a percentage of ordinary Income distributions (the total of short term capital gain and net investment income distributions).
(2) The percentage in this column represents the amount of "Qualifying Dividend Income" as created by the Jobs and Growth Relief Reconciliation Act of 2003 and its reflected as a percentage of ordinary income distributions (the total of short term capital gain and net investment income distributions). It is the intention of each of the aforementioned funds to designate the maximum amount permitted by law.
(3) "U.S. Government Interest" represents the amount of interest that was derived from U.S. Government obligations and distributed during the fiscal year. Generally, interest from direct U.S. Government obligations is exempt from state income tax. However, for shareholders who are residents of California, Connecticut and New York, the statutory threshold requirements were not satisfied to permit exemption of these amounts from state income.
(4) The percentage in this column represents the amount of "Qualifying Interest Income" as created by the American Jobs Creation Act of 2004 and is a percentage of net investment income that is exempt from U.S. withholding tax when paid for foreign investors.
(5) The percentage of this column represents the amount of “Short Term Capital Gain Dividend” is reflected as a percentage of short term capital gain distribution that is exempted from U.S. withholding tax when paid to foreign investors.
The Funds intend to pass through a foreign tax credit to shareholders. For the fiscal year ended October 31, 2015, the total amount of foreign source income and foreign tax credit are as follows:
| Fund Name | | Foreign Source Income | | | Foreign Tax Credit Pass Through | |
| Global X Silver Miners ETF | | $ | 1,536,439 | | | $ | 124,154 | |
| Global X Gold Explorers ETF | | | 135,885 | | | | - | |
| Global X Copper Miners ETF | | | 385,970 | | | | 22,775 | |
| Global X Uranium ETF | | | 1,002,380 | | | | 45,138 | |
| Global X Lithium ETF | | | - | | | | - | |
| Global X Fertilizers/Potash ETF | | | 419,523 | | | | 41,181 | |
The information reported herein may differ from the information and distributions taxable to the shareholders for the calendar year ending December 31, 2015. Complete information will be computed and reported in conjunction with your 2015 Form 1099-DIV.
623 Fifth Avenue, 15th floor
New York, NY 10022
1-888-GXFund-1
(1-888-493-8631)
www.globalxfunds.com
Investment Adviser and Administrator:
Global X Management Company LLC
623 Fifth Avenue, 15th floor
New York, NY 10022
Distributor:
SEI Investments Distribution Co.
One Freedom Valley Drive
Oaks, PA 19456
Sub-Administrator:
SEI Investments Global Funds Services
One Freedom Valley Drive
Oaks, PA 19456
Counsel for Global X Funds and the Independent Trustees:
K&L Gates LLP
1601 K Street N.W.
Washington, DC 20006
Custodian and Transfer Agent:
Brown Brothers Harriman & Co.
50Post Office Square
Boston, MA 02110
Independent Registered Public Accounting Firm:
Ernst & Young LLP
2005 Market Street
Suite 700
Philadelphia, PA 19103
This information must be preceded or accompanied by a current prospectus for the Funds described.
GLX-AR-001-0700
Global X China Consumer ETF (ticker: CHIQ)
Global X China Energy ETF (ticker: CHIE)
Global X China Financials ETF (ticker: CHIX)
Global X China Industrials ETF (ticker: CHII)
Global X China Materials ETF (ticker: CHIM)
Global X NASDAQ China Technology ETF (ticker: QQQC)
Global X Southeast Asia ETF (ticker: ASEA)
Global X FTSE Andean 40 ETF (ticker: AND)
Global X MSCI Colombia ETF (ticker: GXG)
Global X Brazil Mid Cap ETF (ticker: BRAZ)
Global X Brazil Consumer ETF (ticker: BRAQ)
Global X MSCI Argentina ETF (ticker: ARGT)
Global X FTSE Greece 20 ETF (ticker: GREK)
Global X MSCI Norway ETF (ticker: NORW)
Global X FTSE Nordic Region ETF (ticker: GXF)
Global X MSCI Nigeria ETF (ticker: NGE)
Global X Next Emerging & Frontier ETF (ticker: EMFM)
Global X FTSE Portugal 20 ETF (ticker: PGAL)
Global X MSCI Pakistan ETF (ticker: PAK)
Annual Report
October 31, 2015
The Funds file their complete schedules of Fund holdings with the Securities and Exchange Commission (the “Commission”) for the first and third quarters of each fiscal year on Form N-Q within sixty days after the end of the period. The Funds’ Forms N-Q are available on the Commission’s website at http://www.sec.gov, and may be reviewed and copied at the Commission's Public Reference Room in Washington, DC. Information on the operation of the Public Reference Room may be obtained by calling 1-800-SEC-0330.
A description of the policies and procedures that Global X Funds uses to determine how to vote proxies relating to Fund securities, as well as information relating to how the Funds voted proxies relating to Fund securities during the most recent 12-month period ended June 30, is available (i) without charge, upon request, by calling 1-888-GXFund-1; and (ii) on the Commission’s website at http://www.sec.gov.
Management Discussion of Fund Performance (unaudited)
Global X China Consumer ETF
Global X China Consumer ETF
The Global X China Consumer ETF (“Fund”) seeks to provide investment results that correspond generally to the price and yield performance, before fees and expenses, of the Solactive China Consumer Total Return Index (“Underlying Index”). The Fund is passively managed, which means the investment adviser does not attempt to take defensive positions in declining markets. The Fund generally seeks to fully replicate the Underlying Index.
The Underlying Index is designed to measure the equity performance of the investable universe of companies in the consumer sector of the Chinese economy, as defined by the index provider. It is made up of securities of companies that have their main business operations in the consumer sector and generally includes companies whose businesses involve: general retail, diversified consumer services, food production and retail, beverages, household goods, leisure goods, personal goods, automobiles, auto components and distributors, tobacco, media, and travel and leisure.
For the 12-month period ended October 31, 2015 (the “reporting period”), the Fund increased 1.34%, while the Underlying Index increased 2.15%. The Fund had a net asset value of $13.82 per share on October 31, 2014 and ended the reporting period with a net asset value of $13.72 on October 31, 2015.
During the reporting period, the highest returns came from China Southern Airlines and Ctrip.com International which returned 119.77% and 61.39%, respectively. The worst performers were China Yurun Food Group and E-Commerce China Dangdang, which returned -50.20% and -47.94%, respectively.
The Chinese government is striving to transform its country from a manufacturing and export based economy to one led by domestic consumption. Despite overall sluggish economic growth in China, retail sales remained strong, rising 11% year over year in October 2015. The consumer sector has benefitted from rising household income and urbanization in China, ultimately leading to positive returns during the reporting period.
| | | AVERAGE ANNUAL TOTAL RETURN FOR THE YEAR ENDED OCTOBER 31, 2015 | |
| | | One Year Return | | | Three Year Return | | | Five Year Return | | | Annualized Inception to Date* | |
| | | Net Asset Value | | | Market Price | | | Net Asset Value | | | Market Price | | | Net Asset Value | | | Market Price | | | Net Asset Value | | | Market Price | |
| Global X China Consumer ETF | | | 1.34 | % | | | 1.20 | % | | | 0.71 | % | | | 0.47 | % | | | -6.52 | % | | | -6.75 | % | | | -1.27 | % | | | -1.31 | % |
| Solactive China Consumer Total Return Index | | | 2.15 | % | | | 2.15 | % | | | 1.36 | % | | | 1.36 | % | | | -5.98 | % | | | -5.98 | % | | | -0.73 | % | | | -0.73 | % |
| S&P 500 Index | | | 5.20 | % | | | 5.20 | % | | | 16.20 | % | | | 16.20 | % | | | 14.33 | % | | | 14.33 | % | | | 13.78 | % | | | 13.78 | % |
Growth of a $10,000 Investment
(At Net Asset Value)
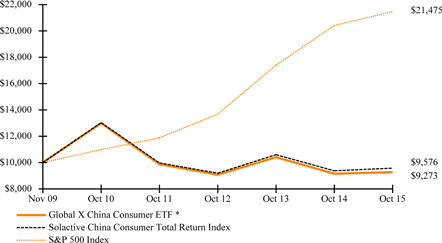
*Fund commenced operations on November 30, 2009.
The S&P 500 Index is a market capitalization-weighted composite index of 500 large capitalization U.S. companies.
Management Discussion of Fund Performance (unaudited)
Global X China Consumer ETF
The performance data quoted herein represents past performance and the return and value of an investment in the Fund will fluctuate so that, when redeemed, it may be worth less than its original cost. Past performance is no guarantee of future performance and should not be considered as a representation of the future results of the Fund. The Fund's performance assumes the reinvestment of all dividends and all capital gains. Index returns assume reinvestment of dividends and, unlike a Fund's returns, do not reflect any fees or expenses. If such fees and expenses were included in the index returns, the performance would have been lower. Please note that one cannot invest directly in an unmanaged index.
There are no assurances that the Fund will meet its stated objectives.
The Fund’s holdings and allocations are subject to change and should not be considered recommendations to buy individual securities.
The graph and table do not reflect the deduction of taxes that a shareholder would pay on Fund distributions or the redemption or sale of Fund shares.
See definition of comparative indices on previous page.
Management Discussion of Fund Performance (unaudited)
Global X China Energy ETF
Global X China Energy ETF
The Global X China Energy ETF (“Fund”) seeks to provide investment results that correspond generally to the price and yield performance, before fees and expenses, of the Solactive China Energy Total Return Index (“Underlying Index”). The Fund is passively managed, which means the investment adviser does not attempt to take defensive positions in declining markets. The Fund generally seeks to fully replicate the Underlying Index.
The Underlying Index is designed to measure the equity performance of the investable universe of companies in the energy sector of the Chinese economy, as defined by the index provider. It is made up of securities of companies that have their main business operations in the energy sector and generally includes companies whose businesses involve: oil, gas, consumable fuels, alternative energy and electricity production and distribution, and energy equipment and services.
For the 12-month period ended October 31, 2015 (the “reporting period”), the Fund decreased 20.89%, while the Underlying Index decreased 20.41%. The Fund had a net asset value of $15.03 per share on October 31, 2014 and ended the reporting period with a net asset value of $11.61 on October 31, 2015.
During the reporting period, the highest returns came from Tianneng Power International and China Power International Development which returned 103.74% and 45.01%, respectively. The worst performers were Yingli Green Energy Holding and Shunfeng International Clean Energy, which returned -75.94% and -61.49%, respectively.
Chinese energy companies were negatively impacted by the global fall in energy prices as well as slowing economic growth in China. Falling energy prices have not only hurt Chinese energy companies domestically, but have also made some overseas investments unviable. The Chinese government is taking measures to bring improvements in the Energy sector, including increasing efficiency and encouraging green energy investments.
| | | AVERAGE ANNUAL TOTAL RETURN FOR THE YEAR ENDED OCTOBER 31, 2015 | |
| | | One Year Return | | | Three Year Return | | | Five Year Return | | | Annualized Inception to Date* | |
| | | Net Asset Value | | | Market Price | | | Net Asset Value | | | Market Price | | | Net Asset Value | | | Market Price | | | Net Asset Value | | | Market Price | |
| Global X China Energy ETF | | | -20.89 | % | | | -20.62 | % | | | -3.60 | % | | | -3.37 | % | | | -4.20 | % | | | -4.34 | % | | | -2.83 | % | | | -2.83 | % |
| Solactive China Energy Total Return Index | | | -20.41 | % | | | -20.41 | % | | | -2.85 | % | | | -2.85 | % | | | -3.50 | % | | | -3.50 | % | | | -2.05 | % | | | -2.05 | % |
| S&P 500 Index | | | 5.20 | % | | | 5.20 | % | | | 16.20 | % | | | 16.20 | % | | | 14.33 | % | | | 14.33 | % | | | 13.65 | % | | | 13.65 | % |
Growth of a $10,000 Investment
(At Net Asset Value)
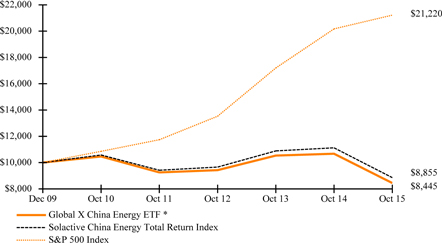
*Fund commenced operations on December 15, 2009.
The S&P 500 Index is a market capitalization-weighted composite index of 500 large capitalization U.S. companies.
The performance data quoted herein represents past performance and the return and value of an investment in the Fund will fluctuate so that, when redeemed, it may be worth less than its original cost. Past performance is no guarantee of future performance and should not be considered as a representation of the future results of the Fund. The Fund's performance assumes the reinvestment of all dividends and all capital gains. Index returns assume reinvestment of dividends and, unlike a Fund's returns, do not reflect any fees or expenses. If such fees and
Management Discussion of Fund Performance (unaudited)
Global X China Energy ETF
expenses were included in the index returns, the performance would have been lower. Please note that one cannot invest directly in an unmanaged index.
There are no assurances that the Fund will meet its stated objectives.
The Fund’s holdings and allocations are subject to change and should not be considered recommendations to buy individual securities.
The graph and table do not reflect the deduction of taxes that a shareholder would pay on Fund distributions or the redemption or sale of Fund shares.
See definition of comparative indices on previous page.
Management Discussion of Fund Performance (unaudited)
Global X China Financials ETF
Global X China Financials ETF
The Global X China Financials ETF (“Fund”) seeks to provide investment results that correspond generally to the price and yield performance, before fees and expenses, of the Solactive China Financials Total Return Index (“Underlying Index”). The Fund is passively managed, which means the investment adviser does not attempt to take defensive positions in declining markets. The Fund generally seeks to fully replicate the Underlying Index.
The Underlying Index is designed to measure the equity performance of the investable universe of companies in the financials sector of the Chinese economy, as defined by index provider. It is made up of securities of companies that have their main business operations in the financials sector and generally includes companies whose businesses involve: banking; insurance, real estate, and financial services.
For the 12-month period ended October 31, 2015 (the “reporting period”), the Fund increased 11.50%, while the Underlying Index increased 11.96%. The Fund had a net asset value of $13.50 per share on October 31, 2014 and ended the reporting period with a net asset value of $14.90 on October 31, 2015.
During the reporting period, the highest returns came from Evergrande Real Estate Group and Hopson Development Holdings, which returned 107.21% and 49.82%, respectively. The worst performers were China Galaxy Securities and Agile Property Holdings, which returned -48.05% and -37.23%, respectively.
In the third quarter of 2015, China's Financial Services sector outpaced the rest of the country's economy, partially reversing the sector's underperformance earlier in the year. In an effort to ease credit within the economy, China's government cut bank reserve requirement levels, leading banks to increase their lending to a record level of over $165 billion. While lending has remained strong, the country's Real Estate sector has experienced declines.
| | | AVERAGE ANNUAL TOTAL RETURN FOR THE YEAR ENDED OCTOBER 31, 2015 | |
| | | One Year Return | | | Three Year Return | | | Five Year Return | | | Annualized Inception to Date* | |
| | | Net Asset Value | | | Market Price | | | Net Asset Value | | | Market Price | | | Net Asset Value | | | Market Price | | | Net Asset Value | | | Market Price | |
| Global X China Financials ETF | | | 11.50 | % | | | 11.53 | % | | | 8.95 | % | | | 9.12 | % | | | 1.55 | % | | | 1.35 | % | | | 1.16 | % | | | 1.10 | % |
| Solactive China Financials Total Return Index | | | 11.96 | % | | | 11.96 | % | | | 9.67 | % | | | 9.67 | % | | | 1.93 | % | | | 1.93 | % | | | 1.60 | % | | | 1.60 | % |
| S&P 500 Index | | | 5.20 | % | | | 5.20 | % | | | 16.20 | % | | | 16.20 | % | | | 14.33 | % | | | 14.33 | % | | | 13.72 | % | | | 13.72 | % |
Growth of a $10,000 Investment
(At Net Asset Value)

*Fund commenced operations on December 10, 2009.
The S&P 500 Index is a market capitalization-weighted composite index of 500 large capitalization U.S. companies.
Management Discussion of Fund Performance (unaudited)
Global X China Financials ETF
The performance data quoted herein represents past performance and the return and value of an investment in the Fund will fluctuate so that, when redeemed, it may be worth less than its original cost. Past performance is no guarantee of future performance and should not be considered as a representation of the future results of the Fund. The Fund's performance assumes the reinvestment of all dividends and all capital gains. Index returns assume reinvestment of dividends and, unlike a Fund's returns, do not reflect any fees or expenses. If such fees and expenses were included in the index returns, the performance would have been lower. Please note that one cannot invest directly in an unmanaged index.
There are no assurances that the Fund will meet its stated objectives.
The Fund’s holdings and allocations are subject to change and should not be considered recommendations to buy individual securities.
The graph and table do not reflect the deduction of taxes that a shareholder would pay on Fund distributions or the redemption or sale of Fund shares.
See definition of comparative indices on previous page.
Management Discussion of Fund Performance (unaudited)
Global X China Industrials ETF
Global X China Industrials ETF
The Global X China Industrials ETF (“Fund”) seeks to provide investment results that correspond generally to the price and yield performance, before fees and expenses, of the Solactive China Industrials Total Return Index (“Underlying Index”). The Fund is passively managed, which means the investment adviser does not attempt to take defensive positions in declining markets. The Fund generally seeks to fully replicate the Underlying Index.
The Underlying Index is designed to measure the equity performance of the investable universe of companies in the industrials sector of the Chinese economy, as defined by the index provider. It is made up of securities of companies that have their main business operations in the industrial sector and generally includes companies whose businesses involve: construction and materials, electronic and electrical equipment, industrial engineering, industrial transportation, and support services, and trading companies, shipbuilding and aerospace.
For the 12-month period ended October 31, 2015 (the “reporting period”), the Fund increased 12.49%, while the Underlying Index increased 17.38%. The Fund had a net asset value of $12.93 per share on October 31, 2014 and ended the reporting period with a net asset value of $14.44 on October 31, 2015.
During the reporting period, the highest returns came from China Shanshui Cement Group and China Communications Construction which returned 120.10% and 67.73%, respectively. The worst performers were China Huarong Energy and Weichai Power which returned -74.72% and -44.20%, respectively.
In the third quarter of 2015, China's GDP expanded by 6.9%, the most sluggish rate since the global financial crisis. Weaker demand for manufactured Chinese goods led to a 6.1% decline in exports. Despite these negative indicators, the Fund delivered positive returns for the 12-month period ended October 31, 2015, as the Chinese government devalued the currency and implemented measures to revive the economy.
| | | AVERAGE ANNUAL TOTAL RETURN FOR THE YEAR ENDED OCTOBER 31, 2015 | |
| | | One Year Return | | | Three Year Return | | | Five Year Return | | | Annualized Inception to Date* | |
| | | Net Asset Value | | | Market Price | | | Net Asset Value | | | Market Price | | | Net Asset Value | | | Market Price | | | Net Asset Value | | | Market Price | |
| Global X China Industrials ETF | | | 12.49 | % | | | 13.13 | % | | | 9.48 | % | | | 9.95 | % | | | -2.36 | % | | | -2.26 | % | | | -0.32 | % | | | -0.15 | % |
| Solactive China Industrials Total Return Index | | | 17.38 | % | | | 17.38 | % | | | 11.62 | % | | | 11.62 | % | | | -1.01 | % | | | -1.01 | % | | | 0.96 | % | | | 0.96 | % |
| S&P 500 Index | | | 5.20 | % | | | 5.20 | % | | | 16.20 | % | | | 16.20 | % | | | 14.33 | % | | | 14.33 | % | | | 13.78 | % | | | 13.78 | % |
Growth of a $10,000 Investment
(At Net Asset Value)
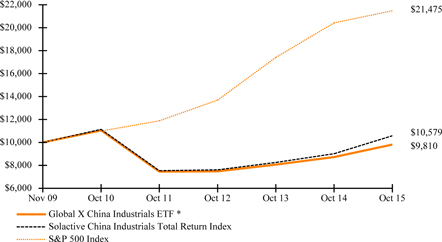
*Fund commenced operations on November 30, 2009.
The S&P 500 Index is a market capitalization-weighted composite index of 500 large capitalization U.S. companies.
The performance data quoted herein represents past performance and the return and value of an investment in the Fund will fluctuate so that, when redeemed, it may be worth less than its original cost. Past performance is no guarantee of future performance and should not be considered as a representation of the future results of the Fund. The Fund's performance assumes the reinvestment of all dividends and all capital gains. Index returns assume reinvestment of dividends and, unlike a Fund's returns, do not reflect any fees or expenses. If such fees and
Management Discussion of Fund Performance (unaudited)
Global X China Industrials ETF
expenses were included in the index returns, the performance would have been lower. Please note that one cannot invest directly in an unmanaged index.
There are no assurances that the Fund will meet its stated objectives.
The Fund’s holdings and allocations are subject to change and should not be considered recommendations to buy individual securities.
The graph and table do not reflect the deduction of taxes that a shareholder would pay on Fund distributions or the redemption or sale of Fund shares.
See definition of comparative indices on previous page.
Management Discussion of Fund Performance (unaudited)
Global X China Materials ETF
Global X China Materials ETF
The Global X China Materials ETF (“Fund”) seeks to provide investment results that correspond generally to the price and yield performance, before fees and expenses, of the Solactive China Materials Total Return Index (“Underlying Index”). The Fund is passively managed, which means the investment adviser does not attempt to take defensive positions in declining markets. The Fund generally seeks to fully replicate the Underlying Index.
The Underlying Index is designed to measure the equity performance of the investable universe of companies in the materials sector of the Chinese economy, as defined by the index provider. It is made up of securities of companies that have their main business operations in the basic materials sector and generally includes companies whose businesses involve: chemicals, metals and mining, and forestry and paper products.
For the 12-month period ended October 31, 2015 (the “reporting period”), the Fund decreased 8.95%, while the Underlying Index decreased 6.63%. The Fund had a net asset value of $14.80 per share on October 31, 2014 and ended the reporting period with a net asset value of $13.29 on October 31, 2015.
During the reporting period, the highest returns came from West China Cement and Hunan Nonferrous Metals, which returned 74.46% and 67.90%, respectively. The worst performers were North Mining Shares and Fosun International which returned -76.65% and -59.85%, respectively.
The materials sector in China has underperformed on account of falling commodity prices and rising costs. This has led to narrowing profits in the mining and raw materials sectors as well as a reduction in investments in fixed assets.
| | | AVERAGE ANNUAL TOTAL RETURN FOR THE YEAR ENDED OCTOBER 31, 2015 | |
| | | One Year Return | | | Three Year Return | | | Five Year Return | | | Annualized Inception to Date* | |
| | | Net Asset Value | | | Market Price | | | Net Asset Value | | | Market Price | | | Net Asset Value | | | Market Price | | | Net Asset Value | | | Market Price | |
| Global X China Materials ETF | | | -8.95 | % | | | -11.32 | % | | | -5.11 | % | | | -5.04 | % | | | -13.60 | % | | | -13.81 | % | | | -12.21 | % | | | -12.31 | % |
| Solactive China Materials Total Return Index | | | -6.63 | % | | | -6.63 | % | | | -2.84 | % | | | -2.84 | % | | | -12.17 | % | | | -12.17 | % | | | -10.87 | % | | | -10.87 | % |
| S&P 500 Index | | | 5.20 | % | | | 5.20 | % | | | 16.20 | % | | | 16.20 | % | | | 14.33 | % | | | 14.33 | % | | | 13.33 | % | | | 13.33 | % |
Growth of a $10,000 Investment
(At Net Asset Value)
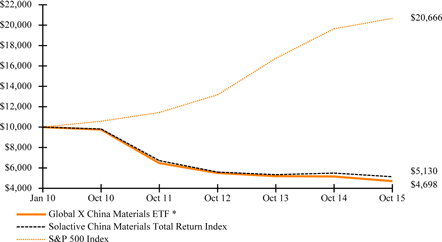
*Fund commenced operations on January 12, 2010.
The S&P 500 Index is a market capitalization-weighted composite index of 500 large capitalization U.S. companies.
Management Discussion of Fund Performance (unaudited)
Global X China Materials ETF
The performance data quoted herein represents past performance and the return and value of an investment in the Fund will fluctuate so that, when redeemed, it may be worth less than its original cost. Past performance is no guarantee of future performance and should not be considered as a representation of the future results of the Fund. The Fund's performance assumes the reinvestment of all dividends and all capital gains. Index returns assume reinvestment of dividends and, unlike a Fund's returns, do not reflect any fees or expenses. If such fees and expenses were included in the index returns, the performance would have been lower. Please note that one cannot invest directly in an unmanaged index.
There are no assurances that the Fund will meet its stated objectives.
The Fund’s holdings and allocations are subject to change and should not be considered recommendations to buy individual securities.
The graph and table do not reflect the deduction of taxes that a shareholder would pay on Fund distributions or the redemption or sale of Fund shares.
See definition of comparative indices on previous page.
Management Discussion of Fund Performance (unaudited)
Global X NASDAQ China Technology ETF
Global X NASDAQ China Technology ETF
The Global X NASDAQ China Technology ETF (“Fund”) seeks to provide investment results that correspond generally to the price and yield performance, before fees and expenses, of the NASDAQ OMX China Technology Index (“Underlying Index”). The Fund is passively managed, which means the investment adviser does not attempt to take defensive positions in declining markets. The Fund generally seeks to fully replicate the Underlying Index.
The Underlying Index is designed to track the performance of the technology sector in China as defined by the index provider. It is made up of securities of companies that have their main business operations in the technology sector and generally includes companies whose businesses involve: computer services, internet, software, computer hardware, electronic office equipment, semiconductors, and telecommunications equipment.
For the 12-month period ended October 31, 2015 (the “reporting period”), the Fund decreased 5.94%, while the Underlying Index decreased 5.48%. The Fund had a net asset value of $23.48 per share on October 31, 2014 and ended the reporting period with a net asset value of $22.01 on October 31, 2015.
During the reporting period, the highest returns came from NetEase and TravelSky Technology, which returned 52.59% and 37.70%, respectively. The worst performers were 500.com and SunCorp Technologies, which returned -62.40% and -62.25%, respectively.
The technology industry in China has witnessed significant growth despite the economy growing by its slowest pace since the global financial crisis. The sector has effectively capitalized on China's nearly 650 million internet users, through areas such as mobile games and e-commerce. As a result, many technology companies in China grew their sales and earnings during the reporting period, but fell short of meeting lofty growth expectations.
| | | AVERAGE ANNUAL TOTAL RETURN FOR THE YEAR ENDED OCTOBER 31, 2015 | |
| | | One Year Return | | | Three Year Return | | | Five Year Return | | | Annualized Inception to Date* | |
| | | Net Asset Value | | | Market Price | | | Net Asset Value | | | Market Price | | | Net Asset Value | | | Market Price | | | Net Asset Value | | | Market Price | |
| Global X NASDAQ China Technology ETF | | | -5.94 | % | | | -6.68 | % | | | 17.29 | % | | | 16.92 | % | | | 5.74 | % | | | 5.34 | % | | | 7.44 | % | | | 7.16 | % |
| Hybrid NASDAQ OMX China Technology Index/Solactive China Technology Index** | | | -5.48 | % | | | -5.48 | % | | | 18.56 | % | | | 18.56 | % | | | 6.49 | % | | | 6.49 | % | | | 8.18 | % | | | 8.18 | % |
| S&P 500 Index | | | 5.20 | % | | | 5.20 | % | | | 16.20 | % | | | 16.20 | % | | | 14.33 | % | | | 14.33 | % | | | 13.89 | % | | | 13.89 | % |
Growth of a $10,000 Investment
(At Net Asset Value)
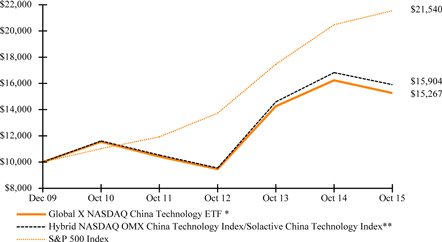
*Fund commenced operations on December 8, 2009.
** Reflects performance of Solactive China Technology Index through December 12, 2011 and NASDAQ OMX China Technology Index thereafter. The inception of the NASDAQ OMX China Technology Index was on November 14, 2011.
The S&P 500 Index is a market capitalization-weighted composite index of 500 large capitalization U.S. companies.
Management Discussion of Fund Performance (unaudited)
Global X NASDAQ China Technology ETF
The performance data quoted herein represents past performance and the return and value of an investment in the Fund will fluctuate so that, when redeemed, it may be worth less than its original cost. Past performance is no guarantee of future performance and should not be considered as a representation of the future results of the Fund. The Fund's performance assumes the reinvestment of all dividends and all capital gains. Index returns assume reinvestment of dividends and, unlike a Fund's returns, do not reflect any fees or expenses. If such fees and expenses were included in the index returns, the performance would have been lower. Please note that one cannot invest directly in an unmanaged index.
There are no assurances that the Fund will meet its stated objectives.
The Fund’s holdings and allocations are subject to change and should not be considered recommendations to buy individual securities.
The graph and table do not reflect the deduction of taxes that a shareholder would pay on Fund distributions or the redemption or sale of Fund shares.
See definition of comparative indices on previous page.
Management Discussion of Fund Performance (unaudited)
Global X Southeast Asia ETF
Global X Southeast Asia ETF
The Global X Southeast Asia ETF (“Fund”) seeks to provide investment results that correspond generally to the price and yield performance, before fees and expenses, of the FTSE/ASEAN 40 Index (“Underlying Index”). The Fund is passively managed, which means the investment adviser does not attempt to take defensive positions in declining markets. The Fund generally seeks to fully replicate the Underlying Index.
The Underlying Index tracks the equity performance of the 40 largest and most liquid companies in the five Association of Southeast Asian Nations ("ASEAN") regions: Singapore, Malaysia, Indonesia, Thailand and the Philippines, as defined by the index provider.
For the 12-month period ended October 31, 2015 (the “reporting period”), the Fund decreased 19.97%, while the Underlying Index decreased 19.65%. The Fund had a net asset value of $16.76 per share on October 31, 2014 and ended the reporting period with a net asset value of $13.07 on October 31, 2015.
During the reporting period, the highest returns came from Unilever Indonesia and The Siam Cement, which returned 9.88% and 9.05%, respectively. The worst performers were Perusahaan Gas Negara and PTT Exploration & Production, which returned -54.03% and -48.02%, respectively.
The Southeast Asia region consisting of Singapore, Malaysia, Indonesia, Thailand, and the Philippines was negatively impacted by falling Chinese demand for their goods and services. Singapore marginally escaped a technical recession in the third quarter of 2015, which could be broadly atrributed to falling exports to China, and a weak manufacturing sector. Malaysia faced economic issues arising from high levels of household debt and the impact of falling energy prices. The region continues to exhibit strong demographics and a growing consumer class, which are expected to be drivers of future growth across this region.
| | | AVERAGE ANNUAL TOTAL RETURN FOR THE YEAR ENDED OCTOBER 31, 2015 | |
| | | One Year Return | | | Three Year Return | | | Annualized Inception to Date* | |
| | | Net Asset Value | | | Market Price | | | Net Asset Value | | | Market Price | | | Net Asset Value | | | Market Price | |
| Global X Southeast Asia ETF | | | -19.97 | % | | | -20.71 | % | | | -5.26 | % | | | -5.52 | % | | | -0.67 | % | | | -0.83 | % |
| FTSE/ASEAN 40 Index | | | -19.65 | % | | | -19.65 | % | | | -4.75 | % | | | -4.75 | % | | | -0.13 | % | | | -0.13 | % |
| S&P 500 Index | | | 5.20 | % | | | 5.20 | % | | | 16.20 | % | | | 16.20 | % | | | 12.20 | % | | | 12.20 | % |
Growth of a $10,000 Investment
(At Net Asset Value)
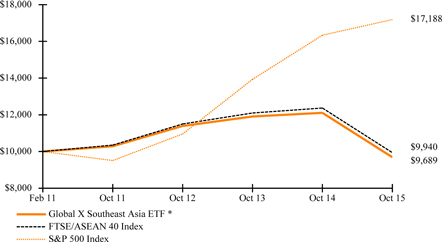
*Fund commenced operations on February 16, 2011.
The S&P 500 Index is a market capitalization-weighted composite index of 500 large capitalization U.S. companies.
Management Discussion of Fund Performance (unaudited)
Global X Southeast Asia ETF
The performance data quoted herein represents past performance and the return and value of an investment in the Fund will fluctuate so that, when redeemed, it may be worth less than its original cost. Past performance is no guarantee of future performance and should not be considered as a representation of the future results of the Fund. The Fund's performance assumes the reinvestment of all dividends and all capital gains. Index returns assume reinvestment of dividends and, unlike a Fund's returns, do not reflect any fees or expenses. If such fees and expenses were included in the index returns, the performance would have been lower. Please note that one cannot invest directly in an unmanaged index.
There are no assurances that the Fund will meet its stated objectives.
The Fund’s holdings and allocations are subject to change and should not be considered recommendations to buy individual securities.
The graph and table do not reflect the deduction of taxes that a shareholder would pay on Fund distributions or the redemption or sale of Fund shares.
See definition of comparative indices on previous page.
Management Discussion of Fund Performance (unaudited)
Global X FTSE Andean 40 ETF
Global X FTSE Andean 40 ETF
The Global X FTSE Andean 40 ETF (“Fund”) seeks to provide investment results that correspond generally to the price and yield performance, before fees and expenses, of the FTSE Andean 40 Index (“Underlying Index”). The Fund is passively managed, which means the investment adviser does not attempt to take defensive positions in declining markets. The Fund generally seeks to fully replicate the Underlying Index.
The Underlying Index is a free-float adjusted, modified capitalization-weighted index designed to measure performance of the 40 largest and most liquid companies in the Chile, Colombia, and Peru markets, as defined by the index provider.
For the 12-month period ended October 31, 2015 (the “reporting period”), the Fund decreased 30.33%, while the Underlying Index decreased 30.10%. The Fund had a net asset value of $10.60 per share on October 31, 2014 and ended the reporting period with a net asset value of $7.23 on October 31, 2015.
During the reporting period, the highest returns came from Cia Cervecerias Unidas and Embotelladora Andina, which returned 15.47% and 12.75%, respectively. The worst performers were Pacific Exploration & Production Corp. and CAP, which returned -86.70% and -70.45%, respectively.
The Andean nations of Colombia, Peru, and Chile were affected negatively by the sell-off in commodity prices, leading to a reduction of trade and a widening of current account deficits. This was coupled with a fall in investments in primary economic sectors leading to a slowdown in these economies and depreciation of their currencies, which negatively impacted returns.
| | | AVERAGE ANNUAL TOTAL RETURN FOR THE YEAR ENDED OCTOBER 31, 2015 | |
| | | One Year Return | | | Three Year Return | | | Annualized Inception to Date* | |
| | | Net Asset Value | | | Market Price | | | Net Asset Value | | | Market Price | | | Net Asset Value | | | Market Price | |
| Global X FTSE Andean 40 ETF | | | -30.33 | % | | | -29.86 | % | | | -19.01 | % | | | -18.88 | % | | | -12.77 | % | | | -12.72 | % |
| FTSE Andean 40 Index | | | -30.10 | % | | | -30.10 | % | | | -18.66 | % | | | -18.66 | % | | | -12.34 | % | | | -12.34 | % |
| S&P 500 Index | | | 5.20 | % | | | 5.20 | % | | | 16.20 | % | | | 16.20 | % | | | 12.70 | % | | | 12.70 | % |
Growth of a $10,000 Investment
(At Net Asset Value)
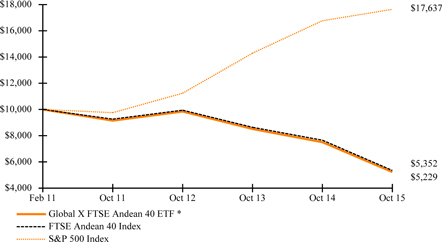
*Fund commenced operations on February 2, 2011.
The S&P 500 Index is a market capitalization-weighted composite index of 500 large capitalization U.S. companies.
The performance data quoted herein represents past performance and the return and value of an investment in the Fund will fluctuate so that, when redeemed, it may be worth less than its original cost. Past performance is no guarantee of future performance and should not be considered as a representation of the future results of the Fund. The Fund's performance assumes the reinvestment of all dividends and all capital gains. Index returns assume reinvestment of dividends and, unlike a Fund's returns, do not reflect any fees or expenses. If such fees and
Management Discussion of Fund Performance (unaudited)
Global X FTSE Andean 40 ETF
expenses were included in the index returns, the performance would have been lower. Please note that one cannot invest directly in an unmanaged index.
There are no assurances that the Fund will meet its stated objectives.
The Fund’s holdings and allocations are subject to change and should not be considered recommendations to buy individual securities.
The graph and table do not reflect the deduction of taxes that a shareholder would pay on Fund distributions or the redemption or sale of Fund shares.
See definition of comparative indices on previous page.
Management Discussion of Fund Performance (unaudited)
Global X MSCI Colombia ETF
Global X MSCI Colombia ETF
The Global X MSCI Colombia ETF (“Fund”) seeks to provide investment results that correspond generally to the price and yield performance, before fees and expenses, of the MSCI All Colombia Capped Index (the “Underlying Index”). The Fund is passively managed, which means the investment adviser does not attempt to take defensive positions in declining markets. The Fund generally seeks to fully replicate the Underlying Index.
The Underlying Index is designed to measure broad-based equity market performance in Colombia, as defined by the index provider.
For the 12-month period ended October 31, 2015 (the “reporting period”), the Fund decreased 47.93%, while the Underlying Index decreased 47.11%. The Fund had a net asset value of $17.42 per share on October 31, 2014 and ended the reporting period with a net asset value of $8.79 on October 31, 2015.
During the reporting period, the highest returns came from Empresa de Energia de Bogotá and ISAGEN, which returned -11.05% and -14.62%, respectively. The worst performers were Pacific Exploration & Production Corp. and Avianca Holdings which returned -86.7% and -69.47%, respectively.
Colombia's economy has been negatively impacted by falling oil prices, given the country's reliance on crude oil exports. The oil price collapse has also pushed the Colombian peso down, which has put further pressure on returns. Despite the economy's struggles, the political environment has been improving, as the government and rebel groups have recommitted to the peace talks.
| | | AVERAGE ANNUAL TOTAL RETURN FOR THE YEAR ENDED OCTOBER 31, 2015 | |
| | | One Year Return | | | Three Year Return | | | Five Year Return | | | Annualized Inception to Date* | |
| | | Net Asset Value | | | Market Price | | | Net Asset Value | | | Market Price | | | Net Asset Value | | | Market Price | | | Net Asset Value | | | Market Price | |
| Global X MSCI Colombia ETF | | | -47.93 | % | | | -48.58 | % | | | -23.92 | % | | | -24.33 | % | | | -15.59 | % | | | -15.74 | % | | | 4.69 | % | | | 4.59 | % |
| Hybrid MSCI All Colombia Capped Index/FTSE Colombia 20 Index** | | | -47.11 | % | | | -47.11 | % | | | -23.18 | % | | | -23.18 | % | | | -14.82 | % | | | -14.82 | % | | | 5.79 | % | | | 5.79 | % |
| S&P 500 Index | | | 5.20 | % | | | 5.20 | % | | | 16.20 | % | | | 16.20 | % | | | 14.33 | % | | | 14.33 | % | | | 16.75 | % | | | 16.75 | % |
Growth of a $10,000 Investment
(At Net Asset Value)
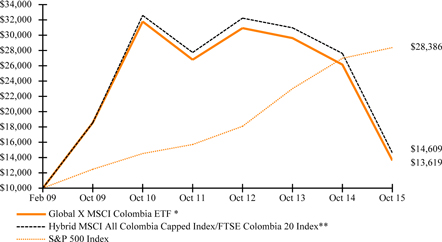
*Fund commenced operations on February 5, 2009.
** Reflects performance of the FTSE Colombia 20 Index through July 14, 2014 and MSCI All Colombia Capped Index thereafter. The inception of the MSCI All Colombia Capped Index was on June 30, 2014.
Effective July 15, 2014, the Fund changed its index from the FTSE Colombia 20 Index to the MSCI All Colombia Capped Index (“New Index”). This change was effected due to the planned migration to the New Index, potentially allowing for broader access to the local market.
The S&P 500 Index is a market capitalization-weighted composite index of 500 large capitalization U.S. companies.
Management Discussion of Fund Performance (unaudited)
Global X MSCI Colombia ETF
The performance data quoted herein represents past performance and the return and value of an investment in the Fund will fluctuate so that, when redeemed, it may be worth less than its original cost. Past performance is no guarantee of future performance and should not be considered as a representation of the future results of the Fund. The Fund's performance assumes the reinvestment of all dividends and all capital gains. The Fund’s performace reflects contractual fee waivers in effect until at least March 1, 2016. Absent these waivers performance would be lower. Index returns assume reinvestment of dividends and, unlike a Fund's returns, do not reflect any fees or expenses. If such fees and expenses were included in the index returns, the performance would have been lower. Please note that one cannot invest directly in an unmanaged index.
There are no assurances that the Fund will meet its stated objectives.
The Fund’s holdings and allocations are subject to change and should not be considered recommendations to buy individual securities.
The graph and table do not reflect the deduction of taxes that a shareholder would pay on Fund distributions or the redemption or sale of Fund shares.
See definition of comparative indices on previous page.
Management Discussion of Fund Performance (unaudited)
Global X Brazil Mid Cap ETF
Global X Brazil Mid Cap ETF
The Global X Brazil Mid Cap ETF (“Fund”) seeks to provide investment results that correspond generally to the price and yield performance, before fees and expenses, of the Solactive Brazil Mid Cap Index (“Underlying Index”). The Fund is passively managed, which means the investment adviser does not attempt to take defensive positions in declining markets. The Fund generally seeks to fully replicate the Underlying Index.
The Underlying Index is designed to measure the equity performance of Brazilian mid-market capitalization companies, as defined by the index provider.
For the 12-month period ended October 31, 2015 (the “reporting period”), the Fund decreased 41.75%, while the Underlying Index decreased 41.43%. The Fund had a net asset value of $12.22 per share on October 31, 2014 and ended the reporting period with a net asset value of $6.87 on October 31, 2015.
During the reporting period, the highest returns came from Klabin and Fibria Celulose, which returned 13.81% and 9.74%, respectively. The worst performers were Via Varejo and Cia Brasileira de Distribuicao Grupo pao de Acucar, which returned -78.85% and -67.37%, respectively.
During the reporting period, Brazil's currency, the real, reached a 12-year low versus the U.S. dollar on account of political uncertainty, a downgrade in credit rating and the government’s failure to meet fiscal targets. The government has indicated that it will attempt to reduce spending and increase taxes to bring the budget deficit under control. Mid-cap companies in Brazil tend to be more sensitive to domestic economic and political trends, which ultimately weighed on returns during the reporting period.
| | | AVERAGE ANNUAL TOTAL RETURN FOR THE YEAR ENDED OCTOBER 31, 2015 | |
| | | One Year Return | | | Three Year Return | | | Five Year Return | | | Annualized Inception to Date* | |
| | | Net Asset Value | | | Market Price | | | Net Asset Value | | | Market Price | | | Net Asset Value | | | Market Price | | | Net Asset Value | | | Market Price | |
| Global X Brazil Mid Cap ETF | | | -41.75 | % | | | -41.91 | % | | | -20.80 | % | | | -20.94 | % | | | -15.18 | % | | | -15.56 | % | | | -11.19 | % | | | -11.33 | % |
| Solactive Brazil Mid Cap Index | | | -41.43 | % | | | -41.43 | % | | | -20.29 | % | | | -20.29 | % | | | -14.49 | % | | | -14.49 | % | | | -10.50 | % | | | -10.50 | % |
| S&P 500 Index | | | 5.20 | % | | | 5.20 | % | | | 16.20 | % | | | 16.20 | % | | | 14.33 | % | | | 14.33 | % | | | 14.74 | % | | | 14.74 | % |
Growth of a $10,000 Investment
(At Net Asset Value)
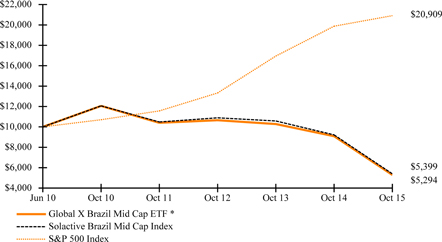
*Fund commenced operations on June 21, 2010.
The S&P 500 Index is a market capitalization-weighted composite index of 500 large capitalization U.S. companies.
The performance data quoted herein represents past performance and the return and value of an investment in the Fund will fluctuate so that, when redeemed, it may be worth less than its original cost. Past performance is no guarantee of future performance and should not be considered as a representation of the future results of the Fund. The Fund's performance assumes the reinvestment of all dividends and all capital gains. Index returns assume reinvestment of dividends and, unlike a Fund's returns, do not reflect any fees or expenses. If such fees and expenses were included in the index returns, the performance would have been lower. Please note that one cannot invest directly in an unmanaged index.
Management Discussion of Fund Performance (unaudited)
Global X Brazil Mid Cap ETF
There are no assurances that the Fund will meet its stated objectives.
The Fund’s holdings and allocations are subject to change and should not be considered recommendations to buy individual securities.
The graph and table do not reflect the deduction of taxes that a shareholder would pay on Fund distributions or the redemption or sale of Fund shares.
See definition of comparative indices on previous page.
Management Discussion of Fund Performance (unaudited)
Global X Brazil Consumer ETF
Global X Brazil Consumer ETF
The Global X Brazil Consumer ETF (“Fund”) seeks to provide investment results that correspond generally to the price and yield performance, before fees and expenses, of the Solactive Brazil Consumer Index (“Underlying Index”). The Fund is passively managed, which means the investment adviser does not attempt to take defensive positions in declining markets. The Fund generally seeks to fully replicate the Underlying Index.
The Underlying Index is designed to measure the equity performance of the consumer sector of the Brazilian economy, as defined by the index provider. It is comprised of securities of companies that have their main business operations in the consumer sector and are domiciled, principally traded in or have their main business operations in Brazil. The stocks are screened for liquidity and weighted according to modified free-float market capitalization. A specific capping methodology is applied at the semi-annual index review to facilitate compliance with the rules governing the listing of financial products on exchanges in the United States.
For the 12-month period ended October 31, 2015 (the “reporting period”), the Fund decreased 47.30%, while the Underlying Index decreased 46.97%. The Fund had a net asset value of $16.57 per share on October 31, 2014 and ended the reporting period with a net asset value of $8.49 on October 31, 2015.
During the reporting period, the highest returns came from Raia Drogasil and Minerva, which returned 11.46% and 2.38%, respectively. The worst performers were Via Varejo and Gol Linhas Aéreas Inteligentes, which returned -88.52% and
-82.68%, respectively.
During the reporting period, Brazil's currency, the real, reached a 12 year low versus the US dollar on account of political uncertainty, a downgrade in credit rating and the government’s failure to meet fiscal targets. The government has indicated that it will attempt to reduce spending and increase taxes to bring the budget deficit under control. The Brazilian consumer sector was further negatively impacted by the country entering a recession in Q2 2015, which weakened Brazil's finances and hurt consumer confidence.
| | | AVERAGE ANNUAL TOTAL RETURN FOR THE YEAR ENDED OCTOBER 31, 2015 | |
| | | One Year Return | | | Three Year Return | | | Five Year Return | | | Annualized Inception to Date* | |
| | | Net Asset Value | | | Market Price | | | Net Asset Value | | | Market Price | | | Net Asset Value | | | Market Price | | | Net Asset Value | | | Market Price | |
| Global X Brazil Consumer ETF | | | -47.30 | % | | | -47.22 | % | | | -22.76 | % | | | -22.83 | % | | | -14.53 | % | | | -14.93 | % | | | -9.51 | % | | | -9.64 | % |
| Solactive Brazil Consumer Index | | | -46.97 | % | | | -46.97 | % | | | -22.01 | % | | | -22.01 | % | | | -13.66 | % | | | -13.66 | % | | | -8.58 | % | | | -8.58 | % |
| S&P 500 Index | | | 5.20 | % | | | 5.20 | % | | | 16.20 | % | | | 16.20 | % | | | 14.33 | % | | | 14.33 | % | | | 15.90 | % | | | 15.90 | % |
Growth of a $10,000 Investment
(At Net Asset Value)
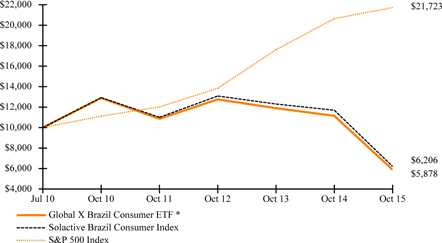
*Fund commenced operations on July 7, 2010.
The S&P 500 Index is a market capitalization-weighted composite index of 500 large capitalization U.S. companies.
Management Discussion of Fund Performance (unaudited)
Global X Brazil Consumer ETF
The performance data quoted herein represents past performance and the return and value of an investment in the Fund will fluctuate so that, when redeemed, it may be worth less than its original cost. Past performance is no guarantee of future performance and should not be considered as a representation of the future results of the Fund. The Fund's performance assumes the reinvestment of all dividends and all capital gains. Index returns assume reinvestment of dividends and, unlike a Fund's returns, do not reflect any fees or expenses. If such fees and expenses were included in the index returns, the performance would have been lower. Please note that one cannot invest directly in an unmanaged index.
There are no assurances that the Fund will meet its stated objectives.
The Fund’s holdings and allocations are subject to change and should not be considered recommendations to buy individual securities.
The graph and table do not reflect the deduction of taxes that a shareholder would pay on Fund distributions or the redemption or sale of Fund shares.
See definition of comparative indices on previous page.
Management Discussion of Fund Performance (unaudited)
Global X MSCI Argentina ETF
Global X MSCI Argentina ETF
The Global X MSCI Argentina ETF (“Fund”) seeks to provide investment results that correspond generally to the price and yield performance, before fees and expenses, of the MSCI All Argentina 25/50 Index (“Underlying Index”). The Fund is passively managed, which means the investment adviser does not attempt to take defensive positions in declining markets. The Fund generally seeks to fully replicate the Underlying Index.
The Underlying Index is designed to represent the performance of the broad Argentina equity universe, while including a minimum number of constituents, as defined by the index provider. The broad Argentina equity universe includes securities that are classified in Argentina according to the MSCI Global Investable Market Index Methodology, together with companies that are headquartered or listed in Argentina and carry out the majority of their operations in Argentina.
For the 12-month period ended October 31, 2015 (the “reporting period”), the Fund decreased 6.04%, while the Underlying Index decreased 5.06%. The Fund had a net asset value of $21.18 per share on October 31, 2014 and ended the reporting period with a net asset value of $19.81 on October 31, 2015.
During the reporting period, the highest returns came from Transportadora de Gas del Sur and Grupo Clarin, which returned 93.65% and 92.63%, respectively. The worst performers were EPI Holdings and Arcos Dorados Holdings, which returned -73.79% and -49.45%, respectively.
During the reporting period, political instability and soaring inflation weighed heavily on the Argentine economy. However, during the presidential elections and the consequent run-off election, markets rallied largely following expectations that the business-friendly presidential candidate could emerge as the new president and would bring about much-needed changes to the existing policies and open up the economy to foreign investment.
| | | AVERAGE ANNUAL TOTAL RETURN FOR THE YEAR ENDED OCTOBER 31, 2015 | |
| | | One Year Return | | | Three Year Return | | | Annualized Inception to Date* | |
| | | Net Asset Value | | | Market Price | | | Net Asset Value | | | Market Price | | | Net Asset Value | | | Market Price | |
| Global X MSCI Argentina ETF | | | -6.04 | % | | | -5.52 | % | | | 6.31 | % | | | 6.64 | % | | | -7.46 | % | | | -7.37 | % |
| Hybrid FTSE Argentina 20/MSCI All Argentina 25/50 Index** | | | -5.06 | % | | | -5.06 | % | | | 7.52 | % | | | 7.52 | % | | | -6.52 | % | | | -6.52 | % |
| S&P 500 Index | | | 5.20 | % | | | 5.20 | % | | | 16.20 | % | | | 16.20 | % | | | 12.79 | % | | | 12.79 | % |
Growth of a $10,000 Investment
(At Net Asset Value)
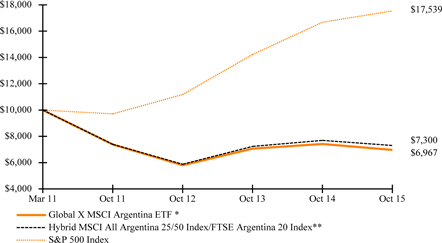
*Fund commenced operations on March 2, 2011.
**Reflects performance of the FTSE Argentina 20 Index through August 14, 2014 and the MSCI All Argentina 25/50 Index (“New Index”) thereafter. This change was effected due to the planned migration to the New Index, potentially allowing for broader access to the local market.
The S&P 500 Index is a market capitalization-weighted composite index of 500 large capitalization U.S. companies.
Management Discussion of Fund Performance (unaudited)
Global X MSCI Argentina ETF
The performance data quoted herein represents past performance and the return and value of an investment in the Fund will fluctuate so that, when redeemed, it may be worth less than its original cost. Past performance is no guarantee of future performance and should not be considered as a representation of the future results of the Fund. The Fund's performance assumes the reinvestment of all dividends and all capital gains. Index returns assume reinvestment of dividends and, unlike a Fund's returns, do not reflect any fees or expenses. If such fees and expenses were included in the index returns, the performance would have been lower. Please note that one cannot invest directly in an unmanaged index.
There are no assurances that the Fund will meet its stated objectives.
The Fund’s holdings and allocations are subject to change and should not be considered recommendations to buy individual securities.
The graph and table do not reflect the deduction of taxes that a shareholder would pay on Fund distributions or the redemption or sale of Fund shares.
See definition of comparative indices on previous page.
Management Discussion of Fund Performance (unaudited)
Global X FTSE Greece 20 ETF
Global X FTSE Greece 20 ETF
The Global X FTSE Greece 20 ETF (“Fund”) seeks to provide investment results that correspond generally to the price and yield performance, before fees and expenses, of the FTSE/ATHEX Custom Capped Index (“Underlying Index”). The Fund is passively managed, which means the investment adviser does not attempt to take defensive positions in declining markets. The Fund generally seeks to fully replicate the Underlying Index.
The Underlying Index is designed to reflect broad-based equity market performance in Greece, as defined by the index provider.
For the 12-month period ended October 31, 2015 (the “reporting period”), the Fund decreased 33.66%, while the Underlying Index decreased 33.05%. The Fund had a net asset value of $15.84 per share on October 31, 2014 and ended the reporting period with a net asset value of $10.41 on October 31, 2015.
During the reporting period, the highest returns came from Motor Oil Hellas Corith Refineries and Bank of Cyprus, which returned 68.85% and 22.21%, respectively. The worst performers were Piraeus Bank and Eurobank Ergasias, which returned -92.93% and -90.14%, respectively.
During the reporting period, Greece was mired in a renewed debt crisis. As a result, its economic and stock market performance has been significantly volatile. After the European Central Bank refused to increase emergency funding to Greek banks, capital controls were imposed and the stock market closed for five weeks. However, in August 2015, Greece received its third Euro zone bail-out worth $95 billion. Political stability following general elections was restored and the Government is implementing reforms focusing primarily on fiscal sustainability.
| | | AVERAGE ANNUAL TOTAL RETURN FOR THE YEAR ENDED OCTOBER 31, 2015 | |
| | | One Year Return | | | Three Year Return | | | Annualized Inception to Date* | |
| | | Net Asset Value | | | Market Price | | | Net Asset Value | | | Market Price | | | Net Asset Value | | | Market Price | |
| Global X FTSE Greece 20 ETF | | | -33.66 | % | | | -32.66 | % | | | -13.27 | % | | | -13.15 | % | | | -8.87 | % | | | -8.72 | % |
| FTSE/ATHEX Custom Capped Index | | | -33.05 | % | | | -33.05 | % | | | -12.81 | % | | | -12.81 | % | | | -7.93 | % | | | -7.93 | % |
| S&P 500 Index | | | 5.20 | % | | | 5.20 | % | | | 16.20 | % | | | 16.20 | % | | | 16.10 | % | | | 16.10 | % |
Growth of a $10,000 Investment
(At Net Asset Value)
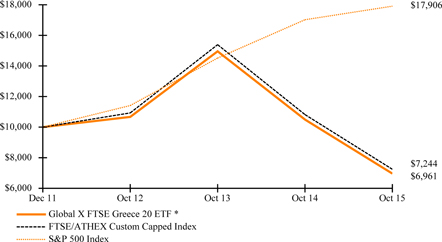
*Fund commenced operations on December 7, 2011.
The S&P 500 Index is a market capitalization-weighted composite index of 500 large capitalization U.S. companies.
The performance data quoted herein represents past performance and the return and value of an investment in the Fund will fluctuate so that, when redeemed, it may be worth less than its original cost. Past performance is no guarantee of future performance and should not be considered as a representation of the future results of the Fund. The Fund's performance assumes the reinvestment of all dividends and all capital gains. Index returns assume reinvestment of dividends and, unlike a Fund's returns, do not reflect any fees or expenses. If such fees and
Management Discussion of Fund Performance (unaudited)
Global X FTSE Greece 20 ETF
expenses were included in the index returns, the performance would have been lower. Please note that one cannot invest directly in an unmanaged index.
There are no assurances that the Fund will meet its stated objectives.
The Fund’s holdings and allocations are subject to change and should not be considered recommendations to buy individual securities.
The graph and table do not reflect the deduction of taxes that a shareholder would pay on Fund distributions or the redemption or sale of Fund shares.
See definition of comparative indices on previous page.
Management Discussion of Fund Performance (unaudited)
Global X MSCI Norway ETF
Global X MSCI Norway ETF
The Global X MSCI Norway ETF (“Fund”) seeks investment results that correspond generally to the price and yield performance, before fees and expenses, of the MSCI Norway IMI 25/50 Index (“Underlying Index”). The Fund is passively managed, which means the investment adviser does not attempt to take defensive positions in declining markets. The Fund generally seeks to fully replicate the Underlying Index.
The Underlying Index is designed to measure broad-based equity market performance in Norway, as defined by the index provider. The Underlying Index consists of stocks traded primarily on the Norwegian stock exchange. The Underlying Index may include large-, mid- or small-capitalization companies.
For the 12-month period ended October 31, 2015 (the “reporting period”), the Fund decreased 22.50%, while the Underlying Index decreased 22.50%. The Fund had a net asset value of $14.82 per share on October 31, 2014 and ended the reporting period with a net asset value of $10.75 on October 31, 2015.
During the reporting period, the highest returns came from Ocean Yield and Bakkafrost P, which returned 43.68% and 36.97%, respectively. The worst performers were Seadrill and Odfjell Drilling, which returned -72.03% and -70.31%, respectively.
Owing to the continuous decline in oil prices, Norway witnessed stock market decline. The country has made attempts to revive the sluggish economy. For instance, the central bank reduced its deposit rate to a record low and signaled the possibility of another cut in the coming year. While declines in the country's currency negatively hurt returns, it could help the country regain global competitiveness in other sectors of its economy.
| | | AVERAGE ANNUAL TOTAL RETURN FOR THE YEAR ENDED OCTOBER 31, 2015 | |
| | | One Year Return | | | Three Year Return | | | Annualized Inception to Date* | |
| | | Net Asset Value | | | Market Price | | | Net Asset Value | | | Market Price | | | Net Asset Value | | | Market Price | |
| Global X MSCI Norway ETF | | | -22.50 | % | | | -22.85 | % | | | -7.11 | % | | | -7.05 | % | | | -3.41 | % | | | -3.41 | % |
Hybrid MSCI Norway IMI 25/50
Index/FTSE Norway 30 Index** | | | -22.50 | % | | | -22.50 | % | | | -6.50 | % | | | -6.50 | % | | | -2.60 | % | | | -2.60 | % |
| S&P 500 Index | | | 5.20 | % | | | 5.20 | % | | | 16.20 | % | | | 16.20 | % | | | 13.80 | % | | | 13.80 | % |
Growth of a $10,000 Investment
(At Net Asset Value)
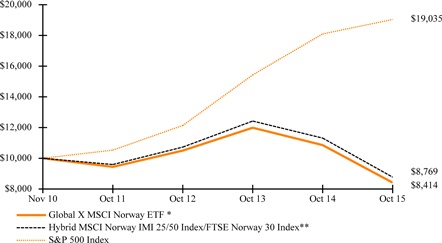
*Fund commenced operations on November 9, 2010.
**Reflects performance of the FTSE Norway 30 Index through July 14, 2014 and the MSCI Norway IMI 25/50 Index (“New Index”) thereafter. This change was effected due to the planned migration to the New Index, potentially allowing for broader access to the local market.
The S&P 500 Index is a market capitalization-weighted composite index of 500 large capitalization U.S. companies.
Management Discussion of Fund Performance (unaudited)
Global X MSCI Norway ETF
The performance data quoted herein represents past performance and the return and value of an investment in the Fund will fluctuate so that, when redeemed, it may be worth less than its original cost. Past performance is no guarantee of future performance and should not be considered as a representation of the future results of the Fund. The Fund's performance assumes the reinvestment of all dividends and all capital gains. Index returns assume reinvestment of dividends and, unlike a Fund's returns, do not reflect any fees or expenses. If such fees and expenses were included in the index returns, the performance would have been lower. Please note that one cannot invest directly in an unmanaged index.
There are no assurances that the Fund will meet its stated objectives.
The Fund’s holdings and allocations are subject to change and should not be considered recommendations to buy individual securities.
The graph and table do not reflect the deduction of taxes that a shareholder would pay on Fund distributions or the redemption or sale of Fund shares.
See definition of comparative indices on previous page.
Management Discussion of Fund Performance (unaudited)
Global X FTSE Nordic Region ETF
Global X FTSE Nordic Region ETF
The Global X FTSE Nordic Region ETF (“Fund”) seeks investment results that correspond generally to the price and yield performance, before fees and expenses, of the FTSE Nordic 30 Index (“Underlying Index”). The Fund is passively managed, which means the investment adviser does not attempt to take defensive positions in declining markets. The Fund generally seeks to fully replicate the Underlying Index.
The Underlying Index is designed to reflect broad-based equity market performance in Sweden, Denmark, Norway and Finland, as defined by the index provider. The Underlying Index tracks the equity performance of the 30 largest and most liquid companies in Sweden, Denmark, Norway and Finland.
For the 12-month period ended October 31, 2015 (the “reporting period”), the Fund decreased 5.05%, while the Underlying Index decreased 5.16%. The Fund had a net asset value of $24.36 per share on October 31, 2014 and ended the reporting period with a net asset value of $22.29 on October 31, 2015.
During the reporting period, the highest returns came from Svenska Cellulosa and Novo Nordisk, which returned 32.96% and 18.73%, respectively. The worst performers were Seadrill and Norsk Hydro, which returned -56.36% and -39.66%, respectively.
Although the Nordic countries (Sweden, Denmark, Finland, and Norway) exhibited healthy public finances and ran current account surplus, the slowdown in exports to China has weighed on their stock market performance. Norway in particular, has been significantly hit by the fall in the oil prices.
| | | AVERAGE ANNUAL TOTAL RETURN FOR THE YEAR ENDED OCTOBER 31, 2015 | |
| | | One Year Return | | | Three Year Return | | | Five Year Return | | | Annualized Inception to Date* | |
| | | Net Asset Value | | | Market Price | | | Net Asset Value | | | Market Price | | | Net Asset Value | | | Market Price | | | Net Asset Value | | | Market Price | |
| Global X FTSE Nordic Region ETF | | | -5.05 | % | | | -5.61 | % | | | 9.28 | % | | | 9.26 | % | | | 5.80 | % | | | 5.62 | % | | | 9.53 | % | | | 9.46 | % |
| FTSE Nordic 30 Index | | | -5.16 | % | | | -5.16 | % | | | 8.99 | % | | | 8.99 | % | | | 5.65 | % | | | 5.65 | % | | | 9.45 | % | | | 9.45 | % |
| S&P 500 Index | | | 5.20 | % | | | 5.20 | % | | | 16.20 | % | | | 16.20 | % | | | 14.33 | % | | | 14.33 | % | | | 15.27 | % | | | 15.27 | % |
Growth of a $10,000 Investment
(At Net Asset Value)
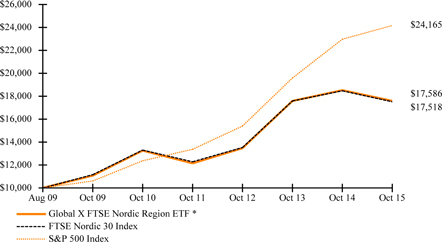
*Fund commenced operations on August 17, 2009.
The S&P 500 Index is a market capitalization-weighted composite index of 500 large capitalization U.S. companies.
The performance data quoted herein represents past performance and the return and value of an investment in the Fund will fluctuate so that, when redeemed, it may be worth less than its original cost. Past performance is no guarantee of future performance and should not be considered as a representation of the future results of the Fund. The Fund's performance assumes the reinvestment of all dividends and all capital gains. Index returns assume reinvestment of dividends and, unlike a Fund's returns, do not reflect any fees or expenses. If such fees and expenses were included in the index returns, the performance would have been lower. Please note that one cannot invest directly in an unmanaged index.
Management Discussion of Fund Performance (unaudited)
Global X FTSE Nordic Region ETF
There are no assurances that the Fund will meet its stated objectives.
The Fund’s holdings and allocations are subject to change and should not be considered recommendations to buy individual securities.
The graph and table do not reflect the deduction of taxes that a shareholder would pay on Fund distributions or the redemption or sale of Fund shares.
See definition of comparative indices on previous page.
Management Discussion of Fund Performance (unaudited)
Global X MSCI Nigeria ETF
Global X MSCI Nigeria ETF
The Global X MSCI Nigeria ETF (“Fund”) seeks to provide investment results that correspond generally to the price and yield performance, before fees and expenses, of the MSCI All Nigeria Select 25/50 Index (“Underlying Index”). The Fund is passively managed, which means the investment adviser does not attempt to take defensive positions in declining markets. The Fund generally seeks to fully replicate the Underlying Index.
The Underlying Index is designed to reflect broad-based equity market performance in Nigeria, as defined by the index provider.
For the 12-month period ended October 31, 2015 (the “reporting period”), the Fund decreased 37.25%, while the Underlying Index decreased 35.76%. The Fund had a net asset value of $13.02 per share on October 31, 2014 and ended the reporting period with a net asset value of $7.94 on October 31, 2015.
During the reporting period, the highest returns came from Forte Oil and Oando, which returned 38.36% and 0.21%, respectively. The worst performers were Access Bank and United Bank for Africa, which returned -99.86% and -94.21%, respectively.
The oil dependent economy has been hurt by falling crude oil prices. Crude makes up about two-thirds of government income and 90 percent of the country's exports. Foreign-exchange reserves dropped 30% since the beginning of 2014 to $30 billion. Despite the economy's struggles, the political enviroment appears to be stabilizing as the markets reacted positively to the election of Muhammadu Buhari.
| | | AVERAGE ANNUAL TOTAL RETURN
FOR THE YEAR ENDED OCTOBER 31, 2015 | |
| | | One Year Return | | | Annualized Inception to Date* | |
| | | Net Asset Value | | | Market Price | | | Net Asset Value | | | Market Price | |
| Global X MSCI Nigeria ETF | | | -37.25 | % | | | -39.10 | % | | | -21.21 | % | | | -20.65 | % |
| Hybrid MSCI All Nigeria Select 25/50 Index/Solactive Nigeria Index** | | | -35.76 | % | | | -35.76 | % | | | -19.83 | % | | | -19.83 | % |
| S&P 500 Index | | | 5.20 | % | | | 5.20 | % | | | 13.82 | % | | | 13.82 | % |
Growth of a $10,000 Investment
(At Net Asset Value)
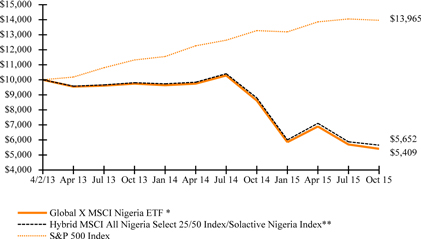
*Fund commenced operations on April 2, 2013.
**Reflects performance of the Solactive Nigeria Index through August 14, 2014 and the MSCI All Nigeria Select 25/50 Index (“New Index”) thereafter. This change was effected due to the planned migration to the New Index, potentially allowing for broader access to the local market.
The S&P 500 Index is a market capitalization-weighted composite index of 500 large capitalization U.S. companies.
Management Discussion of Fund Performance (unaudited)
Global X MSCI Nigeria ETF
The performance data quoted herein represents past performance and the return and value of an investment in the Fund will fluctuate so that, when redeemed, it may be worth less than its original cost. Past performance is no guarantee of future performance and should not be considered as a representation of the future results of the Fund. The Fund's performance assumes the reinvestment of all dividends and all capital gains. The Fund’s performance reflects contractual fee waivers in effect until at least March 1, 2016. Absent these waivers performance would be lower. Index returns assume reinvestment of dividends and, unlike a Fund's returns, do not reflect any fees or expenses. If such fees and expenses were included in the index returns, the performance would have been lower. Please note that one cannot invest directly in an unmanaged index.
There are no assurances that the Fund will meet its stated objectives.
The Fund’s holdings and allocations are subject to change and should not be considered recommendations to buy individual securities.
The graph and table do not reflect the deduction of taxes that a shareholder would pay on Fund distributions or the redemption or sale of Fund shares.
See definition of comparative indices on previous page.
Management Discussion of Fund Performance (unaudited)
Global X Next Emerging & Frontier ETF
Global X Next Emerging & Frontier ETF
The Global X Next Emerging & Frontier ETF (“Fund”) seeks to provide investment results that correspond generally to the price and yield performance, before fees and expenses, of the Solactive Next Emerging & Frontier Index (“Underlying Index”). The Fund is passively managed, which means the investment adviser does not attempt to take defensive positions in declining markets. The Fund generally seeks to fully replicate the Underlying Index.
The Underlying Index is designed to reflect equity performance of next emerging markets and frontier markets companies, as defined by the the index provider. Next Emerging markets are defined as emerging market countries, excluding the BRICs (Brazil, Russia, India and China) and the most developed tier of emerging markets (currently, South Korea and Taiwan). Frontier markets are those emerging market countries that generally have smaller economies or less developed capital markets. The Underlying Index is comprised of common stocks, ADRs and GDRs of selected companies globally that are domiciled, principally traded in or have their main business operations in these markets or that generate at least 50% of their revenues from these markets. The Underlying Index screens the largest stocks according to free-float market capitalization, which may include small- or mid-cap companies, and weights them by modified liquidity.
For the 12-month period ended October 31, 2015 (the “reporting period”), the Fund decreased 23.29%, while the Underlying Index decreased 22.92%. The Fund had a net asset value of $25.55 per share on October 31, 2014 and ended the reporting period with a net asset value of $19.27 on October 31, 2015.
During the reporting period, the highest returns came from Kernel Holding and Cable & Wireless Communications, which returned 76.06% and 53.84%, respectively. The worst performers were Afren and Kumba Iron Ore, which returned
-97.56% and -81.89%, respectively.
Many emerging and frontier markets have experienced declines in their stock markets and currencies as commodity prices fell and expectations of rising interest rates in the United States became more prevalent. Weak global demand for commodity exports and manufactured goods have hampered the performance for many of these economies. Despite this slowdown, many of the next emerging and frontier market countries have attractive demographics and among the highest economic growth rates in the world, fueling optimism for future growth.
| | | AVERAGE ANNUAL TOTAL RETURN
FOR THE YEAR ENDED OCTOBER 31, 2015 | |
| | | One Year Return | | | Annualized Inception to Date* | |
| | | Net Asset Value | | | Market Price | | | Net Asset Value | | | Market Price | |
| Global X Next Emerging & Frontier ETF | | | -23.29 | % | | | -23.66 | % | | | -11.61 | % | | | -12.19 | % |
| Solactive Next Emerging & Frontier Index | | | -22.92 | % | | | -22.92 | % | | | -11.00 | % | | | -11.00 | % |
| S&P 500 Index | | | 5.20 | % | | | 5.20 | % | | | 10.69 | % | | | 10.69 | % |
Growth of a $10,000 Investment
(At Net Asset Value)
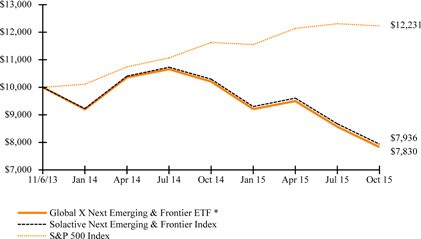
*Fund commenced operations on November 6, 2013.
Management Discussion of Fund Performance (unaudited)
Global X Next Emerging & Frontier ETF
The S&P 500 Index is a market capitalization-weighted composite index of 500 large capitalization U.S. companies.
The performance data quoted herein represents past performance and the return and value of an investment in the Fund will fluctuate so that, when redeemed, it may be worth less than its original cost. Past performance is no guarantee of future performance and should not be considered as a representation of the future results of the Fund. The Fund's performance assumes the reinvestment of all dividends and all capital gains. Index returns assume reinvestment of dividends and, unlike a Fund's returns, do not reflect any fees or expenses. If such fees and expenses were included in the index returns, the performance would have been lower. Please note that one cannot invest directly in an unmanaged index.
There are no assurances that the Fund will meet its stated objectives.
The Fund’s holdings and allocations are subject to change and should not be considered recommendations to buy individual securities.
The graph and table do not reflect the deduction of taxes that a shareholder would pay on Fund distributions or the redemption or sale of Fund shares.
See definition of comparative indices above.
Management Discussion of Fund Performance (unaudited)
Global X FTSE Portugal 20 ETF
Global X FTSE Portugal 20 ETF
The Global X FTSE Portugal 20 ETF (“Fund”) seeks to provide investment results that correspond generally to the price and yield performance, before fees and expenses, of the FTSE Portugal 20 Index (“Underlying Index”). The Fund is passively managed, which means the investment adviser does not attempt to take defensive positions in declining markets. The Fund generally seeks to fully replicate the Underlying Index.
The Underlying Index is designed to reflect broad-based equity market performance in Portugal, as defined the index provider.
For the 12-month period ended October 31, 2015 (the “reporting period”), the Fund decreased 12.39%, while the Underlying Index decreased 12.09%. The Fund had a net asset value of $12.65 per share on October 31, 2014 and ended the reporting period with a net asset value of $10.85 on October 31, 2015.
During the reporting period, the highest returns came from Altri and Jeronimo Martins, which returned 73.54% and 64.54%, respectively. The worst performers were Sonae Industria and Pharol SGPS, which returned -95.54% and -74.10%, respectively.
Political uncertainty prevailed as a key story line in Portugal during the reporting period, which contributed to stock market declines. Although austerity measures implemented following the Euro-zone debt crisis is credited with helping the economy out of recession, Portuguese unemployment still remains at high levels at 12%. The newly formed government has indicated that it hopes to reverse the austerity measures and improve the economic wellbeing of its citizens by raising the minimum wage, lifting a freeze on pensions, and cancelling pay cuts for civil servants.
| | | AVERAGE ANNUAL TOTAL RETURN
FOR THE YEAR ENDED OCTOBER 31, 2015 | |
| | | One Year Return | | | Annualized Inception to Date* | |
| | | Net Asset Value | | | Market Price | | | Net Asset Value | | | Market Price | |
| Global X FTSE Portugal 20 ETF | | | -12.39 | % | | | -13.17 | % | | | -14.38 | % | | | -14.70 | % |
| FTSE Portugal 20 Index | | | -12.09 | % | | | -12.09 | % | | | -13.95 | % | | | -13.95 | % |
| S&P 500 Index | | | 5.20 | % | | | 5.20 | % | | | 10.85 | % | | | 10.85 | % |
Growth of a $10,000 Investment
(At Net Asset Value)
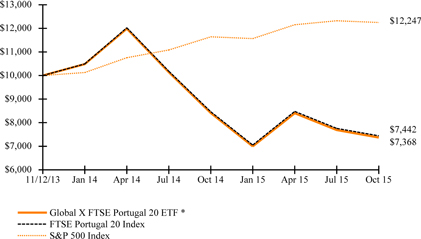
*Fund commenced operations on November 12, 2013.
The S&P 500 Index is a market capitalization-weighted composite index of 500 large capitalization U.S. companies.
The performance data quoted herein represents past performance and the return and value of an investment in the Fund will fluctuate so that, when redeemed, it may be worth less than its original cost. Past performance is no guarantee of future performance and should not be considered as a representation of the future results of the Fund. The Fund's performance assumes the reinvestment of all dividends and all capital gains. Index returns assume reinvestment of dividends and, unlike a Fund's returns, do not reflect any fees or expenses. If such fees and
Management Discussion of Fund Performance (unaudited)
Global X FTSE Portugal 20 ETF
expenses were included in the index returns, the performance would have been lower. Please note that one cannot invest directly in an unmanaged index.
There are no assurances that the Fund will meet its stated objectives.
The Fund’s holdings and allocations are subject to change and should not be considered recommendations to buy individual securities.
The graph and table do not reflect the deduction of taxes that a shareholder would pay on Fund distributions or the redemption or sale of Fund shares.
See definition of comparative indices on previous page.
Management Discussion of Fund Performance (unaudited)
Global X MSCI Pakistan ETF
Global X MSCI Pakistan ETF
The Global X MSCI Pakistan ETF (“Fund”) seeks to provide investment results that correspond generally to the price and yield performance, before fees and expenses, of the MSCI All Pakistan Select 25/50 Index (“Underlying Index”). The Fund is passively managed, which means the investment adviser does not attempt to take defensive positions in declining markets. The Fund generally seeks to fully replicate the Underlying Index.
The Underlying Index is designed to represent the performance of the broad Pakistan equity universe, while including a minimum number of constituents, as defined by the index provider. The broad Pakistan equity universe includes securities that are classified in Pakistan according to the MSCI Global Investable Market Index Methodology, together with companies that are headquartered or listed in Pakistan and carry out the majority of their operations in Pakistan.
For the period from the Fund's commencement date on April 22, 2015 through October 31, 2015 (the “reporting period”), the Fund decreased 7.26%, while the Underlying Index decreased 5.72%. The Fund had a net asset value of $15.28 per share on April 22, 2015 and ended the reporting period with a net asset value of $14.17 on October 31, 2015.
During the reporting period, the highest returns came from Fauji Fertilizer Bin Qasim and Abbott Laboratories Pakistan, which returned 16.87% and 12.93%, respectively. The worst performers were Pakistan Petroleum and Oil & Gas Development, which returned -29.38% and -26.25%, respectively.
Pakistan earned praise from the International Monetary Fund for improving political stability and government efforts to control budget deficits and foreign reserves. Many are optimistc about the country's growth prospects stemming from planned improvements in the domestic energy supply and investment related to the China-Pakistan Economic Corridor.
| | | AVERAGE ANNUAL TOTAL RETURN FOR
THE PERIOD ENDED OCTOBER 31, 2015 | |
| | | Cumulative Inception to Date* | |
| | | Net Asset Value | | | Market Price | |
| Global X MSCI Pakistan ETF* | | | -7.26 | % | | | -6.41 | % |
| MSCI All Pakistan Select 25/50 Index | | | -5.72 | % | | | -5.72 | % |
| S&P 500 Index | | | -0.27 | % | | | -0.27 | % |
Growth of a $10,000 Investment
(At Net Asset Value)
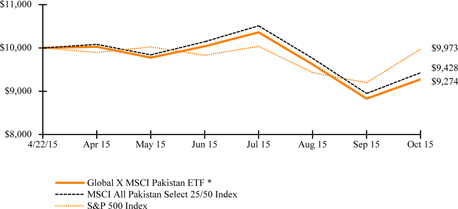
*Fund commenced operations on April 22, 2015. Total return is for the period indicated and has not been annualized.
The S&P 500 Index is a market capitalization-weighted composite index of 500 large capitalization U.S. companies.
The performance data quoted herein represents past performance and the return and value of an investment in the Fund will fluctuate so that, when redeemed, it may be worth less than its original cost. Past performance is no guarantee of future performance and should not be considered as a representation of the future results of the Fund. The Fund's performance assumes the reinvestment of all dividends and all capital gains. Index returns assume reinvestment of dividends and, unlike a Fund's returns, do not reflect any fees or expenses. If such fees and expenses were included in the index returns, the performance would have been lower. Please note that one cannot invest directly in an unmanaged index.
Management Discussion of Fund Performance (unaudited)
Global X MSCI Pakistan ETF
There are no assurances that the Fund will meet its stated objectives.
The Fund’s holdings and allocations are subject to change and should not be considered recommendations to buy individual securities.
The graph and table do not reflect the deduction of taxes that a shareholder would pay on Fund distributions or the redemption or sale of Fund shares.
See definition of comparative indices on previous page.
| Schedule of Investments | October 31, 2015 |
| | |
| Global X China Consumer ETF |
Sector Weightings (unaudited)†:

† Sector weightings percentages are based on the total market value of investments. Repurchase agreements purchased from cash collateral received for securities lending activity are included in total investments. Please see Note 2 and Note 8 in Notes to Financial Statements for more detailed information.
| | | Shares | | | Value | |
| COMMON STOCK — 100.0% | | | | | | | | |
| CHINA— 77.8% | | | | | | | | |
| Consumer Goods — 40.7% | | | | | | | | |
| ANTA Sports Products | | | 1,003,396 | | | $ | 2,815,946 | |
| Belle International Holdings, Cl A | | | 4,634,496 | | | | 4,508,858 | |
| BYD, Cl H * (A) | | | 689,600 | | | | 4,306,608 | |
| China Yurun Food Group * (A) | | | 1,606,688 | | | | 346,211 | |
| Dongfeng Motor Group, Cl H | | | 3,016,046 | | | | 4,374,183 | |
| Great Wall Motor, Cl H | | | 3,547,997 | | | | 4,339,945 | |
| Guangzhou Automobile Group, Cl H | | | 2,459,117 | | | | 2,163,995 | |
| Hengan International Group | | | 403,149 | | | | 4,366,958 | |
| Li Ning * (A) | | | 1,612,669 | | | | 842,739 | |
| Tingyi Cayman Islands Holding | | | 2,248,325 | | | | 3,864,168 | |
| Tsingtao Brewery, Cl H | | | 388,617 | | | | 1,862,830 | |
| Want Want China Holdings (A) | | | 5,304,909 | | | | 4,421,841 | |
| | | | | | | | 38,214,282 | |
| Consumer Services — 34.2% | | | | | | | | |
| Air China, Cl H | | | 2,037,328 | | | | 1,968,953 | |
| Alibaba Group Holding ADR * | | | 59,147 | | | | 4,958,293 | |
| China Southern Airlines, Cl H | | | 1,944,595 | | | | 1,653,512 | |
| Ctrip.com International ADR * | | | 54,637 | | | | 5,079,602 | |
| E-Commerce China Dangdang ADR, Cl A * | | | 48,832 | | | | 330,593 | |
| Golden Eagle Retail Group (A) | | | 533,247 | | | | 685,988 | |
| GOME Electrical Appliances Holding | | | 13,699,605 | | | | 2,527,765 | |
| Homeinns Hotel Group ADR * | | | 26,667 | | | | 799,477 | |
| Intime Retail Group (A) | | | 2,053,084 | | | | 2,272,933 | |
| JD.com ADR * | | | 158,336 | | | | 4,373,240 | |
| New Oriental Education & Technology Group ADR | | | 55,564 | | | | 1,528,566 | |
| Vipshop Holdings ADR * | | | 228,425 | | | | 4,687,281 | |
| Wumart Stores, Cl H * (A) | | | 632,911 | | | | 451,607 | |
| Youku.com ADR * | | | 32,649 | | | | 794,677 | |
| | | | | | | | 32,112,487 | |
| | | | | | | | | |
| Industrials — 2.9% | | | | | | | | |
| China Resources Enterprise | | | 1,459,188 | | | | 2,763,949 | |
The accompanying notes are an integral part of the financial statements.
| Schedule of Investments | October 31, 2015 |
| | |
| Global X China Consumer ETF |
| | | Shares/Face
Amount(1) | | | Value | |
| COMMON STOCK — continued | | | | | | | | |
| TOTAL CHINA | | | | | | $ | 73,090,718 | |
| HONG KONG— 22.2% | | | | | | | | |
| Consumer Goods — 12.9% | | | | | | | | |
| Biostime International Holdings (A) | | | 213,700 | | | | 476,476 | |
| Bosideng International Holdings | | | 3,316,662 | | | | 320,963 | |
| China Agri-Industries Holdings (A) | | | 2,408,856 | | | | 888,934 | |
| China Foods * | | | 862,613 | | | | 395,127 | |
| China Mengniu Dairy | | | 2,266,252 | | | | 4,403,782 | |
| Shenzhou International Group Holdings | | | 578,062 | | | | 2,852,979 | |
| Skyworth Digital Holdings | | | 2,068,787 | | | | 1,537,556 | |
| Uni-President China Holdings | | | 1,522,343 | | | | 1,251,252 | |
| | | | | | | | 12,127,069 | |
| Consumer Services — 9.3% | | | | | | | | |
| Ajisen China Holdings | | | 649,493 | | | | 311,753 | |
| China Dongxiang Group | | | 3,835,488 | | | | 974,944 | |
| Chow Tai Fook Jewellery Group (A) | | | 1,269,679 | | | | 1,086,176 | |
| Melco Crown Entertainment ADR (A) | | | 231,388 | | | | 4,333,897 | |
| Sun Art Retail Group (A) | | | 2,472,225 | | | | 2,028,793 | |
| | | | | | | | 8,735,563 | |
| TOTAL HONG KONG | | | | | | | 20,862,632 | |
| TOTAL COMMON STOCK | | | | | | | | |
| (Cost $108,872,764) | | | | | | | 93,953,350 | |
| | | | | | | | | |
| REPURCHASE AGREEMENTS (B) — 11.2% | | | | | | | | |
| Barclays Bank | | | | | | | | |
0.070%, dated 10/30/15, to be repurchased on 11/02/15 repurchase price
$8,000,047 (collateralized by U.S. Treasury Obligations, ranging in par
value $0.00-$4,512,269, 0.000%-2.750%, 11/05/15-02/15/45 with a total
market value of $8,160,000) | | | 8,000,000 | | | | 8,000,000 | |
| Deutsche Bank | | | | | | | | |
0.050%, dated 10/30/15, to be repurchased on 11/02/15 repurchase price
$2,561,556 (collateralized by U.S. Treasury Obligations, par value
$2,561,556, 3.250%, 07/31/16 with a total market value of $2,631,998) | | | 2,561,545 | | | | 2,561,545 | |
| TOTAL REPURCHASE AGREEMENTS | | | | | | | | |
| (Cost $10,561,545) | | | | | | | 10,561,545 | |
| | | | | | | | | |
| TIME DEPOSITS — 0.2% | | | | | | | | |
| Brown Brothers Harriman | | | | | | | | |
| 0.030%, 11/02/15 | | | 167,289 | | | | 167,289 | |
| 0.005%, 11/02/15, HKD | | | 100,414 | | | | 12,956 | |
| TOTAL TIME DEPOSITS | | | | | | | | |
| (Cost $180,245) | | | | | | | 180,245 | |
| | | | | | | | | |
| TOTAL INVESTMENTS — 111.4% | | | | | | | | |
| (Cost $119,614,554) | | | | | | $ | 104,695,140 | |
The accompanying notes are an integral part of the financial statements.
| Schedule of Investments | October 31, 2015 |
| | |
| Global X China Consumer ETF |
Percentages are based on Net Assets of $93,950,939.
| * | Non-income producing security. |
| (1) | In U.S. Dollars unless otherwise indicated. |
| (A) | This security or a partial position of this security is on loan at October 31, 2015. The total value of securities on loan at October 31, 2015 was $9,955,736. |
| (B) | This security was purchased with cash collateral held from securities on loan. The total value of such securities as of October 31, 2015 was $10,561,545. |
ADR — American Depositary Receipt
Cl — Class
HKD — Hong Kong Dollar
The following is a summary of the inputs used as of October 31, 2015, in valuing the Fund's investments carried at value:
| Investments in Securities | | Level 1 | | | Level 2 | | | Level 3 | | | Total | |
| Common Stock | | $ | 93,953,350 | | | $ | — | | | $ | — | | | $ | 93,953,350 | |
| Repurchase Agreements | | | — | | | | 10,561,545 | | | | — | | | | 10,561,545 | |
| Time Deposits | | | — | | | | 180,245 | | | | — | | | | 180,245 | |
| Total Investments in Securities | | $ | 93,953,350 | | | $ | 10,741,790 | | | $ | — | | | $ | 104,695,140 | |
For the year ended October 31, 2015, there have been no transfers between Level 1, Level 2 or Level 3 investments.
As of October 31, 2015, there were no Level 3 investments.
The accompanying notes are an integral part of the financial statements.
| Schedule of Investments | October 31, 2015 |
| | |
| Global X China Energy ETF |
Sector Weightings (unaudited)†:
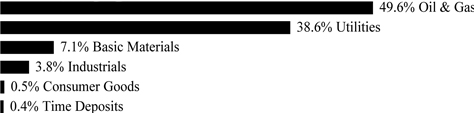
† Sector weightings percentages are based on the total market value of investments.
| | | Shares | | | Value | |
| COMMON STOCK — 99.9% | | | | | | | | |
| CHINA— 56.2% | | | | | | | | |
| Basic Materials — 6.7% | | | | | | | | |
| China Coal Energy, Cl H | | | 44,491 | | | $ | 19,116 | |
| China Shenhua Energy, Cl H | | | 47,230 | | | | 79,955 | |
| Yanzhou Coal Mining, Cl H | | | 36,975 | | | | 17,843 | |
| | | | | | | | 116,914 | |
| Consumer Goods — 0.5% | | | | | | | | |
| Tianneng Power International * | | | 12,615 | | | | 9,181 | |
| Oil & Gas — 32.0% | | | | | | | | |
| Anton Oilfield Services Group * | | | 24,728 | | | | 3,286 | |
| China Longyuan Power Group, Cl H | | | 64,726 | | | | 59,464 | |
| China Oilfield Services, Cl H | | | 37,766 | | | | 42,200 | |
| China Petroleum & Chemical, Cl H | | | 250,627 | | | | 179,479 | |
| Huaneng Renewables, Cl H | | | 71,800 | | | | 22,420 | |
| JA Solar Holdings ADR * | | | 588 | | | | 5,010 | |
| JinkoSolar Holding ADR * | | | 459 | | | | 11,883 | |
| Kunlun Energy | | | 63,905 | | | | 52,278 | |
| PetroChina, Cl H | | | 220,613 | | | | 172,503 | |
| Trina Solar ADR * | | | 768 | | | | 7,826 | |
| | | | | | | | 556,349 | |
| Utilities — 17.0% | | | | | | | | |
| CGN Power, Cl H (A) | | | 173,100 | | | | 71,919 | |
| Datang International Power Generation, Cl H | | | 55,412 | | | | 20,520 | |
| ENN Energy Holdings | | | 14,851 | | | | 85,560 | |
| Huadian Fuxin Energy, Cl H | | | 48,900 | | | | 15,080 | |
| Huadian Power International, Cl H | | | 33,361 | | | | 24,536 | |
| Huaneng Power International, Cl H | | | 71,961 | | | | 78,274 | |
| | | | | | | | 295,889 | |
| TOTAL CHINA | | | | | | | 978,333 | |
| HONG KONG— 43.7% | | | | | | | | |
| Basic Materials — 0.4% | | | | | | | | |
| Shougang Fushan Resources Group | | | 54,815 | | | | 7,426 | |
The accompanying notes are an integral part of the financial statements.
| Schedule of Investments | October 31, 2015 |
| | |
| Global X China Energy ETF |
| | | Shares/Face
Amount(1) | | | Value | |
| COMMON STOCK — continued | | | | | | | | |
| Industrials — 3.9% | | | | | | | | |
| Beijing Enterprises Holdings | | | 10,543 | | | $ | 66,862 | |
| Oil & Gas — 17.6% | | | | | | | | |
| China Gas Holdings | | | 33,037 | | | | 52,688 | |
| China Oil & Gas Group * | | | 89,920 | | | | 6,265 | |
| CNOOC | | | 155,685 | | | | 174,566 | |
| GCL-Poly Energy Holdings | | | 218,111 | | | | 45,310 | |
| Shunfeng International Clean Energy * | | | 34,000 | | | | 10,924 | |
| Xinjiang Goldwind Science & Technology, Cl H | | | 9,120 | | | | 17,204 | |
| | | | | | | | 306,957 | |
| Utilities — 21.8% | | | | | | | | |
| Beijing Jingneng Clean Energy, Cl H | | | 42,800 | | | | 14,911 | |
| China Power International Development | | | 68,284 | | | | 43,173 | |
| China Resources Gas Group | | | 16,690 | | | | 45,978 | |
| China Resources Power Holdings | | | 35,431 | | | | 80,553 | |
| Hong Kong & China Gas | | | 44,233 | | | | 89,835 | |
| Power Assets Holdings | | | 8,980 | | | | 89,625 | |
| Towngas China | | | 20,600 | | | | 14,087 | |
| | | | | | | | 378,162 | |
| TOTAL HONG KONG | | | | | | | 759,407 | |
| TOTAL COMMON STOCK | | | | | | | | |
| (Cost $2,478,209) | | | | | | | 1,737,740 | |
| | | | | | | | | |
| TIME DEPOSITS — 0.4% | | | | | | | | |
| Brown Brothers Harriman | | | | | | | | |
| 0.030%, 11/02/15 | | | 7,688 | | | | 7,688 | |
| 0.005%, 11/02/15, HKD | | | 7 | | | | 1 | |
| TOTAL TIME DEPOSITS | | | | | | | | |
| (Cost $7,689) | | | | | | | 7,689 | |
| TOTAL INVESTMENTS — 100.3% | | | | | | | | |
| (Cost $2,485,898) | | | | | | $ | 1,745,429 | |
Percentages are based on Net Assets of $1,740,803.
| * | Non-income producing security. |
| (1) | In U.S. Dollars unless otherwise indicated. |
| (A) | Securities sold within terms of a private placement memorandum, exempt from registration under Section 144A of the Securities Act of 1933, as amended, and may be sold only to dealers in that program or other "accredited investors." These securities have been determined to be liquid under guidelines established by the board of Trustees. |
ADR — American Depositary Receipt
Cl — Class
HKD — Hong Kong Dollar
The accompanying notes are an integral part of the financial statements.
| Schedule of Investments | October 31, 2015 |
| | |
| Global X China Energy ETF |
The following is a summary of the inputs used as of October 31, 2015, in valuing the Fund's investments carried at value:
| Investments in Securities | | Level 1 | | | Level 2 | | | Level 3 | | | Total | |
| Common Stock | | $ | 1,737,740 | | | $ | — | | | $ | — | | | $ | 1,737,740 | |
| Time Deposits | | | — | | | | 7,689 | | | | — | | | | 7,689 | |
| Total Investments in Securities | | $ | 1,737,740 | | | $ | 7,689 | | | $ | — | | | $ | 1,745,429 | |
|
For the year ended October 31, 2015, there have been no transfers between Level 1, Level 2 or Level 3 investments.
As of October 31, 2015, there were no Level 3 investments.
The accompanying notes are an integral part of the financial statements.
| Schedule of Investments | October 31, 2015 |
| | |
| Global X China Financials ETF |
Sector Weightings (unaudited)†:
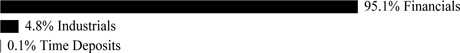
† Sector weightings percentages are based on the total market value of investments.
| | | Shares | | | Value | |
| COMMON STOCK — 100.0% |
| CHINA— 70.5% | | | | | | | | |
| Financials — 70.5% | | | | | | | | |
| Agile Property Holdings | | | 353,112 | | | $ | 192,728 | |
| Agricultural Bank of China, Cl H | | | 6,658,788 | | | | 2,732,216 | |
| Bank of China, Cl H | | | 5,765,934 | | | | 2,730,413 | |
| Bank of Communications, Cl H | | | 1,980,071 | | | | 1,466,511 | |
| China Citic Bank, Cl H * | | | 2,131,122 | | | | 1,383,149 | |
| China Construction Bank, Cl H | | | 7,877,526 | | | | 5,722,568 | |
| China Everbright Bank, Cl H | | | 812,800 | | | | 399,578 | |
| China Galaxy Securities, Cl H | | | 859,500 | | | | 749,696 | |
| China Life Insurance, Cl H | | | 718,040 | | | | 2,598,808 | |
| China Merchants Bank, Cl H | | | 991,134 | | | | 2,602,492 | |
| China Minsheng Banking, Cl H* | | | 1,516,255 | | | | 1,527,974 | |
| China Pacific Insurance Group, Cl H | | | 565,512 | | | | 2,262,019 | |
| Chongqing Rural Commercial Bank, Cl H | | | 629,167 | | | | 396,979 | |
| CITIC Securities, Cl H | | | 510,396 | | | | 1,107,710 | |
| Country Garden Holdings | | | 1,974,997 | | | | 754,312 | |
| Evergrande Real Estate Group | | | 1,091,861 | | | | 839,665 | |
| Guangzhou R&F Properties | | | 230,693 | | | | 229,797 | |
| Industrial & Commercial Bank of China, Cl H | | | 8,987,237 | | | | 5,740,161 | |
| Longfor Properties | | | 297,838 | | | | 400,443 | |
| PICC Property & Casualty, Cl H | | | 1,156,942 | | | | 2,642,272 | |
| Ping An Insurance Group of China, Cl H | | | 497,314 | | | | 2,800,965 | |
| Shui On Land | | | 852,201 | | | | 235,314 | |
| Sino-Ocean Land Holdings | | | 1,108,452 | | | | 647,900 | |
| SOHO China | | | 465,959 | | | | 240,492 | |
| TOTAL CHINA | | | | | | | 40,404,162 | |
| HONG KONG— 29.5% | | | | | | | | |
| Financials — 24.7% | | | | | | | | |
| Cheung Kong Property Holdings | | | 375,650 | | | | 2,641,634 | |
| China Everbright | | | 213,641 | | | | 505,565 | |
| China Jinmao Holdings Group | | | 1,027,658 | | | | 283,762 | |
| China Overseas Land & Investment | | | 830,366 | | | | 2,699,994 | |
| China Resources Land | | | 673,708 | | | | 1,760,311 | |
| China Taiping Insurance Holdings * | | | 364,530 | | | | 1,152,370 | |
| Haitong Securities, Cl H | | | 711,900 | | | | 1,247,416 | |
| KWG Property Holding | | | 292,585 | | | | 212,169 | |
The accompanying notes are an integral part of the financial statements.
| Schedule of Investments | October 31, 2015 |
| | |
| Global X China Financials ETF |
| | | Shares/Face
Amount(1) | | | Value | |
| COMMON STOCK — continued |
| Financials — continued | | | | | | | | |
| New China Life Insurance, Cl H | | | 234,511 | | | $ | 1,034,861 | |
| People's Insurance Group of China, Cl H | | | 2,039,000 | | | | 1,094,469 | |
| Poly Property Group | | | 518,307 | | | | 168,531 | |
| Shenzhen Investment | | | 724,118 | | | | 294,315 | |
| Shimao Property Holdings | | | 295,304 | | | | 521,252 | |
| Sunac China Holdings | | | 448,400 | | | | 276,558 | |
| Yuexiu Property | | | 1,556,745 | | | | 269,163 | |
| | | | | | | | 14,162,370 | |
| Industrials — 4.8% | | | | | | | | |
| CK Hutchison Holdings | | | 200,050 | | | | 2,749,039 | |
| TOTAL HONG KONG | | | | | | | 16,911,409 | |
| TOTAL COMMON STOCK | | | | | | | | |
| (Cost $61,665,900) | | | | | | | 57,315,571 | |
| | | | | | | | | |
| TIME DEPOSITS — 0.1% |
| Brown Brothers Harriman | | | | | | | | |
| 0.030%, 11/02/15 | | | 83,734 | | | | 83,734 | |
| 0.005%, 11/02/15, HKD | | | 38 | | | | 5 | |
| TOTAL TIME DEPOSITS | | | | | | | | |
| (Cost $83,739) | | | | | | | 83,739 | |
| TOTAL INVESTMENTS — 100.1% | | | | | | | | |
| (Cost $61,749,639) | | | | | | $ | 57,399,310 | |
Percentages are based on Net Assets of $57,357,654.
| * | Non-income producing security. |
| (1) | In U.S. Dollars unless otherwise indicated. |
Cl — Class
HKD — Hong Kong Dollar
The following is a summary of the inputs used as of October 31, 2015, in valuing the Fund's investments carried at value:
| Investments in Securities | | Level 1 | | | Level 2 | | | Level 3 | | | Total | |
| Common Stock | | $ | 57,315,571 | | | $ | — | | | $ | — | | | $ | 57,315,571 | |
| Time Deposits | | | — | | | | 83,739 | | | | — | | | | 83,739 | |
| Total Investments in Securities | | $ | 57,315,571 | | | $ | 83,739 | | | $ | — | | | $ | 57,399,310 | |
For the year ended October 31, 2015, there have been no transfers between Level 1, Level 2 or Level 3 investments.
As of October 31, 2015, there were no Level 3 investments.
The accompanying notes are an integral part of the financial statements.
| Schedule of Investments | October 31, 2015 |
| | |
| Global X China Industrials ETF |
Sector Weightings (unaudited)†:
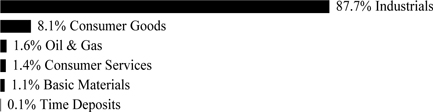
† Sector weightings percentages are based on the total market value of investments.
| | | Shares | | | Value | |
| COMMON STOCK — 100.0% |
| CHINA— 67.8% | | | | | | | | |
| Basic Materials — 1.1% | | | | | | | | |
| China Zhongwang Holdings | | | 186,708 | | | $ | 82,632 | |
| Consumer Goods — 5.0% | | | | | | | | |
| BYD, Cl H * | | | 57,944 | | | | 361,865 | |
| Consumer Services — 1.4% | | | | | | | | |
| Guangshen Railway, Cl H | | | 188,188 | | | | 97,614 | |
| Industrials — 60.3% | | | | | | | | |
| Anhui Conch Cement, Cl H | | | 110,237 | | | | 337,819 | |
| China Communications Construction, Cl H | | | 252,583 | | | | 349,375 | |
| China COSCO Holdings, Cl H *(A) (B) | | | 336,262 | | | | 190,587 | |
| China Lesso Group Holdings | | | 130,345 | | | | 106,125 | |
| China National Building Material, Cl H | | | 379,817 | | | | 237,689 | |
| China National Materials | | | 140,146 | | | | 33,815 | |
| China Railway Construction, Cl H | | | 222,211 | | | | 334,316 | |
| China Railway Group, Cl H | | | 360,168 | | | | 342,968 | |
| China Shanshui Cement Group (A) (B) | | | 243,852 | | | | 105,318 | |
| China Shipping Container Lines, Cl H *(A) (B) | | | 488,452 | | | | 174,290 | |
| China Shipping Development, Cl H (A) (B) | | | 148,244 | | | | 93,375 | |
| China South Locomotive and Rolling Stock | | | 264,063 | | | | 338,337 | |
| Dongfang Electric, Cl H | | | 42,843 | | | | 51,466 | |
| First Tractor, Cl H | | | 52,541 | | | | 35,931 | |
| Haitian International Holdings | | | 83,796 | | | | 147,263 | |
| Harbin Power Equipment, Cl H | | | 83,271 | | | | 49,855 | |
| Hollysys Automation Technologies | | | 5,555 | | | | 118,821 | |
| Jiangsu Expressway, Cl H | | | 161,179 | | | | 218,785 | |
| Metallurgical Corp of China, Cl H (A) (B) | | | 379,941 | | | | 132,027 | |
| Sany Heavy Equipment International Holdings | | | 117,894 | | | | 28,751 | |
| Shanghai Electric Group, Cl H (A) (B) | | | 371,151 | | | | 227,256 | |
| Weichai Power, Cl H | | | 128,918 | | | | 137,732 | |
| Zhejiang Expressway, Cl H | | | 189,200 | | | | 233,872 | |
| Zhuzhou CSR Times Electric, Cl H | | | 50,133 | | | | 326,992 | |
| | | | | | | | 4,352,765 | |
The accompanying notes are an integral part of the financial statements.
| Schedule of Investments | October 31, 2015 |
| | |
| Global X China Industrials ETF |
| | | Shares/Face
Amount(1) | | | Value | |
| COMMON STOCK — continued |
| TOTAL CHINA | | | | | | $ | 4,894,876 | |
| HONG KONG— 28.7% | | | | | | | | |
| Consumer Goods — 3.1% | | | | | | | | |
| AviChina Industry & Technology, Cl H | | | 274,400 | | | | 224,828 | |
| Industrials — 24.0% | | | | | | | | |
| Beijing Capital International Airport, Cl H | | | 182,571 | | | | 196,232 | |
| China Huarong Energy * | | | 724,218 | | | | 29,903 | |
| China International Marine Containers Group, Cl H | | | 58,100 | | | | 103,604 | |
| China Merchants Holdings International | | | 104,411 | | | | 348,257 | |
| China Resources Cement Holdings | | | 228,941 | | | | 92,461 | |
| China State Construction International | | | 225,300 | | | | 343,033 | |
| Shanghai Industrial Holdings | | | 60,899 | | | | 161,086 | |
| Shenzhen International Holdings | | | 125,696 | | | | 191,704 | |
| Sunny Optical Technology Group | | | 88,164 | | | | 206,585 | |
| Zoomlion Heavy Industry Science and Technology | | | 167,900 | | | | 64,343 | |
| | | | | | | | 1,737,208 | |
| Oil & Gas — 1.6% | | | | | | | | |
| China High Speed Transmission Equipment Group | | | 124,950 | | | | 112,534 | |
| TOTAL HONG KONG | | | | | | | 2,074,570 | |
| SINGAPORE— 3.5% | | | | | | | | |
| Industrials — 3.5% | | | | | | | | |
| Yangzijiang Shipbuilding Holdings | | | 280,043 | | | | 249,949 | |
| TOTAL COMMON STOCK | | | | | | | | |
| (Cost $8,703,114) | | | | | | | 7,219,395 | |
| | | | | | | | | |
| TIME DEPOSITS — 0.1% |
| Brown Brothers Harriman | | �� | | | | | | |
| 0.030%, 11/02/15 | | | 4,789 | | | | 4,789 | |
| 0.005%, 11/02/15, HKD | | | 20,542 | | | | 2,651 | |
| TOTAL TIME DEPOSITS | | | | | | | | |
| (Cost $7,440) | | | | | | | 7,440 | |
| TOTAL INVESTMENTS — 100.1% | | | | | | | | |
| (Cost $8,710,554) | | | | | | $ | 7,226,835 | |
Percentages are based on Net Assets of $7,222,274.
| * | Non-income producing security. |
| (1) | In U.S. Dollars unless otherwise indicated. |
| (A) | Security is fair valued using methods determined in good faith by the Fair Value Committee of the Fund. The total value of such securities as of October 31, 2015, was $922,853 and represents 12.8% of Net Assets. |
| (B) | Security considered illiquid. The total value of such securities as of October 31, 2015 was $922,853 and represented 12.8% of Net Assets. |
Cl — Class
HKD — Hong Kong Dollar
The accompanying notes are an integral part of the financial statements.
| Schedule of Investments | October 31, 2015 |
| | |
| Global X China Industrials ETF |
The following is a summary of the inputs used as of October 31, 2015, in valuing the Fund's investments carried at value:
| Investments in Securities | | Level 1 | | | Level 2 | | | Level 3(1) | | | Total | |
| Common Stock | | $ | 6,296,542 | | | $ | — | | | $ | 922,853 | | | $ | 7,219,395 | |
| Time Deposits | | | — | | | | 7,440 | | | | — | | | | 7,440 | |
| Total Investments in Securities | | $ | 6,296,542 | | | $ | 7,440 | | | $ | 922,853 | | | $ | 7,226,835 | |
(1)Please see Note 2 for details on the unobservable inputs and the interrelationships and sensitivity between these inputs for those Level 3 securities that are not valued by third party pricing vendors or broker quotes.
The following is a reconciliation of investments in which significant unobservable inputs (Level 3) were used in determining fair value:
| | | Investments in
Common Stock | |
| | | | |
| Beginning Balance as of October 31, 2014 | | $ | 507,987 | |
| Transfers out of Level 3 | | | (665,329 | ) |
| Transfers into Level 3 | | | 922,853 | |
| Net purchases | | | 661,541 | |
| Net sales | | | (959,582 | ) |
| Realized gain (loss) | | | 181,864 | |
| Net merger receipt | | | 363,140 | |
| Change in unrealized appreciation (depreciation) | | | (89,621 | ) |
| Ending Balance as of October 31, 2015 | | $ | 922,853 | |
For the year ended October 31, 2015, the transfers in and out of Level 3 were due to changes in the availability of
observable inputs to determine fair value. Transfers between levels are recognized at period end.
Net change in unrealized appreciation (depreciation) from investments (Level 3) still held as of October 31, 2015 is $(185,352).
For the year ended October 31, 2015, there have been no transfers between Level 1 and Level 2.
The accompanying notes are an integral part of the financial statements.
| Schedule of Investments | October 31, 2015 |
| | |
| Global X China Materials ETF |
Sector Weightings (unaudited)†:
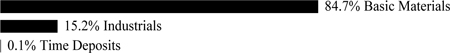
† Sector weightings percentages are based on the total market value of investments.
| | | Shares | | | Value | |
| COMMON STOCK — 98.2% |
| CHINA— 61.6% | | | | | | | | |
| Basic Materials — 57.1% | | | | | | | | |
| Aluminum Corp of China, Cl H * | | | 184,499 | | | $ | 59,753 | |
| Angang Steel, Cl H | | | 113,584 | | | | 47,485 | |
| China BlueChemical | | | 176,329 | | | | 52,784 | |
| China Hongqiao Group | | | 120,582 | | | | 63,013 | |
| China Molybdenum, Cl H | | | 119,788 | | | | 66,926 | |
| Dongyue Group | | | 111,057 | | | | 30,523 | |
| Fosun International | | | 35,600 | | | | 65,135 | |
| Jiangxi Copper, Cl H | | | 47,641 | | | | 63,070 | |
| Maanshan Iron & Steel, Cl H * | | | 180,025 | | | | 38,792 | |
| Real Gold Mining *(A) (B) | | | 97,864 | | | | 1 | |
| Sinofert Holdings | | | 186,630 | | | | 32,991 | |
| Sinopec Shanghai Petrochemical, Cl H | | | 162,810 | | | | 68,064 | |
| Sinopec Yizheng Chemical Fibre, Cl H * | | | 194,014 | | | | 61,583 | |
| Zhaojin Mining Industry | | | 84,844 | | | | 48,169 | |
| Zijin Mining Group, Cl H | | | 224,649 | | | | 60,582 | |
| | | | | | | | 758,871 | |
| Industrials — 4.5% | | | | | | | | |
| BBMG, Cl H | | | 84,900 | | | | 59,922 | |
| TOTAL CHINA | | | | | | | 818,793 | |
| HONG KONG— 34.9% | | | | | | | | |
| Basic Materials — 24.5% | | | | | | | | |
| China Lumena New Materials *(A) (B) | | | 413,450 | | | | 667 | |
| China Precious Metal Resources Holdings * | | | 358,400 | | | | 16,186 | |
| China Silver Group | | | 68,400 | | | | 18,093 | |
| Fufeng Group | | | 110,544 | | | | 58,480 | |
| Kingboard Chemical Holdings | | | 49,400 | | | | 69,988 | |
| Kingboard Laminates Holdings | | | 79,228 | | | | 33,122 | |
| Nine Dragons Paper Holdings | | | 99,200 | | | | 65,919 | |
| North Mining Shares, Cl C * | | | 1,222,056 | | | | 13,245 | |
| Yingde Gases | | | 110,949 | | | | 49,676 | |
| | | | | | | | 325,376 | |
| Industrials — 10.4% | | | | | | | | |
| Citic Pacific | | | 36,400 | | | | 68,102 | |
| TCC International Holdings | | | 148,000 | | | | 29,218 | |
The accompanying notes are an integral part of the financial statements.
| Schedule of Investments | October 31, 2015 |
| | |
| Global X China Materials ETF |
| | | Shares/Face
Amount(1) | | | Value | |
| COMMON STOCK — continued |
| Industrials — continued | | | | | | | | |
| West China Cement | | | 242,100 | | | $ | 41,859 | |
| | | | | | | | 139,179 | |
| TOTAL HONG KONG | | | | | | | 464,555 | |
| SINGAPORE— 1.7% | | | | | | | | |
| Basic Materials — 1.7% | | | | | | | | |
| Midas Holdings* | | | 98,566 | | | | 22,170 | |
| TOTAL COMMON STOCK | | | | | | | | |
| (Cost $2,431,750) | | | | | | | 1,305,518 | |
| | | | | | | | | |
| TIME DEPOSITS — 0.1% | | | | | | | | |
| | | | | | | | | |
| Brown Brothers Harriman | | | | | | | | |
| 0.030%, 11/02/15 | | | 780 | | | | 780 | |
| 0.005%, 11/02/15, HKD | | | 5 | | | | 1 | |
| TOTAL TIME DEPOSITS | | | | | | | | |
| (Cost $781) | | | | | | | 781 | |
| TOTAL INVESTMENTS — 98.3% | | | | | | | | |
| (Cost $2,432,531) | | | | | | $ | 1,306,299 | |
Percentages are based on Net Assets of $1,328,518.
| * | Non-income producing security. |
| (1) | In U.S. Dollars unless otherwise indicated. |
| (A) | Security is fair valued using methods determined in good faith by the Fair Value Committee of the Fund. The total value of such securities as of October 31, 2015, was $668 and represents 0.1% of Net Assets. |
| (B) | Security considered illiquid. The total value of such securities as of October 31, 2015 was $668 and represented 0.1% of Net Assets. |
Cl — Class
HKD — Hong Kong Dollar
The following is a summary of the inputs used as of October 31, 2015, in valuing the Fund's investments carried at value:
| Investments in Securities | | Level 1 | | | Level 2 | | | Level 3 | | | Total | |
| Common Stock | | $ | 1,304,850 | | | $ | — | | | $ | 668 | | | $ | 1,305,518 | |
| Time Deposits | | | — | | | | 781 | | | | — | | | | 781 | |
| Total Investments in Securities | | $ | 1,304,850 | | | $ | 781 | | | $ | 668 | | | $ | 1,306,299 | |
The accompanying notes are an integral part of the financial statements.
| Schedule of Investments | October 31, 2015 |
| | |
| Global X China Materials ETF |
The following is a reconciliation of investments in which significant unobservable inputs (Level 3) were used in determining fair value:
| | | Investments in
Common Stock | |
| | | | |
| Beginning Balance as of October 31, 2014 | | $ | 121,942 | |
| Net purchases | | | 1,341 | |
| Net sales | | | (144,602 | ) |
| Realized gain | | | 14,738 | |
| Change in unrealized appreciation (depreciation) | | | 7,249 | |
| Ending Balance as of October 31, 2015 | | $ | 668 | |
For the year ended October 31, 2015, there have been no transfers between Level 1, Level 2 or Level 3 investments.
Net change in unrealized appreciation (depreciation) from investments (Level 3) still held as of October 31, 2015 is $7,249.
For the year ended October 31, 2015, there have been no transfers between Level 1 and Level 2.
The accompanying notes are an integral part of the financial statements.
| Schedule of Investments | October 31, 2015 |
| | |
| Global X NASDAQ China Technology ETF |
Sector Weightings (unaudited)†:

† Sector weightings percentages are based on the total market value of investments.
| | | Shares | | | Value | |
| COMMON STOCK — 99.9% |
| CHINA— 69.3% | | | | | | | | |
| Technology — 69.3% | | | | | | | | |
| 21Vianet Group ADR * | | | 19,224 | | | $ | 385,249 | |
| Autohome ADR * | | | 12,050 | | | | 435,487 | |
| Baidu ADR * | | | 7,292 | | | | 1,367,031 | |
| China Communications Services, Cl H | | | 332,003 | | | | 133,657 | |
| China Finance Online ADR * | | | 7,361 | | | | 29,959 | |
| ChinaCache International Holdings ADR * | | | 3,668 | | | | 27,547 | |
| Coolpad Group * | | | 980,515 | | | | 172,062 | |
| Kingdee International Software Group | | | 700,349 | | | | 290,076 | |
| Lenovo Group | | | 1,308,703 | | | | 1,222,566 | |
| NetEase ADR | | | 9,662 | | | | 1,396,449 | |
| Qihoo 360 Technology ADR * | | | 20,298 | | | | 1,158,813 | |
| Semiconductor Manufacturing International * | | | 6,116,974 | | | | 568,279 | |
| Shanghai Baosight Software, Cl B | | | 42,947 | | | | 170,414 | |
| Sohu.com * | | | 10,921 | | | | 551,729 | |
| Tencent Holdings | | | 63,125 | | | | 1,194,065 | |
| Travelsky Technology, Cl H | | | 122,555 | | | | 181,537 | |
| V1 Group | | | 1,234,878 | | | | 94,009 | |
| Vimicro International ADR * | | | 7,512 | | | | 96,304 | |
| YY ADR * | | | 9,829 | | | | 559,663 | |
| ZTE, Cl H | | | 266,313 | | | | 643,954 | |
| TOTAL CHINA | | | | | | | 10,678,850 | |
| HONG KONG— 25.2% | | | | | | | | |
| Technology — 25.2% | | | | | | | | |
| Alibaba Health Information Technology * | | | 775,929 | | | | 620,735 | |
| ASM Pacific Technology | | | 69,243 | | | | 494,076 | |
| BYD Electronic International * | | | 296,281 | | | | 194,587 | |
| China Public Procurement * | | | 3,417,200 | | | | 62,170 | |
| Chinasoft International * | | | 583,176 | | | | 254,337 | |
| Comba Telecom Systems Holdings | | | 403,189 | | | | 83,238 | |
| Digital China Holdings* | | | 308,638 | | | | 316,200 | |
| FIH Mobile | | | 891,119 | | | | 426,582 | |
| Hi Sun Technology China * | | | 676,900 | | | | 131,885 | |
| Ju Teng International Holdings | | | 301,744 | | | | 165,470 | |
| PAX Global Technology | | | 242,300 | | | | 318,269 | |
| Suncorp Technologies * | | | 4,566,600 | | | | 126,685 | |
| TCL Communication Technology Holdings | | | 170,032 | | | | 127,029 | |
The accompanying notes are an integral part of the financial statements.
| Schedule of Investments | October 31, 2015 |
| | |
| Global X NASDAQ China Technology ETF |
| | | Shares/Face
Amount(1) | | | Value | |
| COMMON STOCK — continued |
| Technology — continued | | | | | | | | |
| VTech Holdings | | | 46,382 | | | $ | 563,459 | |
| TOTAL HONG KONG | | | | | | | 3,884,722 | |
| UNITED STATES— 5.4% | | | | | | | | |
| Technology — 5.4% | | | | | | | | |
| NQ Mobile ADR * | | | 28,735 | | | | 110,917 | |
| SINA * | | | 13,815 | | | | 658,147 | |
| Weibo ADR * | | | 3,508 | | | | 56,549 | |
| TOTAL UNITED STATES | | | | | | | 825,613 | |
| TOTAL COMMON STOCK | | | | | | | | |
| (Cost $15,242,864) | | | | | | | 15,389,185 | |
| | | | | | | | | |
| TIME DEPOSITS — 0.1% | | | | | | | | |
| | | | | | | | | |
| Brown Brothers Harriman | | | | | | | | |
| 0.030%, 11/02/15 | | | 21,238 | | | | 21,238 | |
| 0.005%, 11/02/15, HKD | | | 6 | | | | 1 | |
| TOTAL TIME DEPOSITS | | | | | | | | |
| (Cost $21,239) | | | | | | | 21,239 | |
| TOTAL INVESTMENTS — 100.0% | | | | | | | | |
| (Cost $15,264,103) | | | | | | $ | 15,410,424 | |
Percentages are based on Net Assets of $15,404,435.
| * | Non-income producing security. |
| (1) | In U.S. Dollars unless otherwise indicated. |
ADR — American Depositary Receipt
Cl — Class
HKD — Hong Kong Dollar
The following is a summary of the inputs used as of October 31, 2015, in valuing the Fund's investments carried at value:
| Investments in Securities | | Level 1 | | | Level 2 | | | Level 3 | | | Total | |
| Common Stock | | $ | 15,389,185 | | | $ | — | | | $ | — | | | $ | 15,389,185 | |
| Time Deposits | | | — | | | | 21,239 | | | | — | | | | 21,239 | |
| Total Investments in Securities | | $ | 15,389,185 | | | $ | 21,239 | | | $ | — | | | $ | 15,410,424 | |
For the year ended October 31, 2015, there have been no transfers between Level 1, Level 2 or Level 3 investments.
As of October 31, 2015, there were no Level 3 investments.
The accompanying notes are an integral part of the financial statements.
| Schedule of Investments | October 31, 2015 |
| | |
| Global X Southeast Asia ETF |
Sector Weightings (unaudited)†:

† Sector weightings percentages are based on the total market value of investments.
| | | Shares | | | Value | |
| COMMON STOCK — 99.7% |
| INDONESIA— 17.2% | | | | | | | | |
| Consumer Goods — 4.0% | | | | | | | | |
| Astra International | | | 997,431 | | | $ | 429,943 | |
| Unilever Indonesia | | | 55,996 | | | | 151,368 | |
| | | | | | | | 581,311 | |
| Financials — 8.9% | | | | | | | | |
| Bank Central Asia | | | 608,856 | | | | 573,826 | |
| Bank Mandiri | | | 459,260 | | | | 291,913 | |
| Bank Rakyat Indonesia Persero | | | 533,860 | | | | 410,512 | |
| | | | | | | | 1,276,251 | |
| Telecommunications — 3.5% | | | | | | | | |
| Telekomunikasi Indonesia ADR | | | 12,517 | | | | 497,676 | |
| Utilities — 0.8% | | | | | | | | |
| Perusahaan Gas Negara | | | 523,539 | | | | 114,748 | |
| TOTAL INDONESIA | | | | | | | 2,469,986 | |
| MALAYSIA— 25.2% | | | | | | | | |
| Basic Materials — 1.4% | | | | | | | | |
| Petronas Chemicals Group | | | 141,424 | | | | 209,041 | |
| Financials — 10.0% | | | | | | | | |
| CIMB Group Holdings | | | 267,605 | | | | 287,164 | |
| Malayan Banking | | | 259,881 | | | | 499,678 | |
| Public Bank | | | 154,429 | | | | 649,925 | |
| | | | | | | | 1,436,767 | |
| Health Care — 1.4% | | | | | | | | |
| IHH Healthcare | | | 137,200 | | | | 201,520 | |
| Industrials — 2.2% | | | | | | | | |
| Sime Darby | | | 160,346 | | | | 312,033 | |
The accompanying notes are an integral part of the financial statements.
| Schedule of Investments | October 31, 2015 |
| | |
| Global X Southeast Asia ETF |
| | | Shares | | | Value | |
| COMMON STOCK — continued |
| Oil & Gas — 1.5% | | | | | | | | |
| Petronas Gas | | | 39,239 | | | $ | 209,896 | |
| Telecommunications — 5.1% | | | | | | | | |
| Axiata Group | | | 219,428 | | | | 315,147 | |
| DiGi.Com | | | 183,500 | | | | 224,677 | |
| Maxis | | | 129,006 | | | | 197,893 | |
| | | | | | | | 737,717 | |
| Utilities — 3.6% | | | | | | | | |
| Tenaga Nasional | | | 175,255 | | | | 516,464 | |
| TOTAL MALAYSIA | | | | | | | 3,623,438 | |
| PHILIPPINES— 4.7% | | | | | | | | |
| Consumer Services — 2.1% | | | | | | | | |
| SM Investments | | | 15,727 | | | | 293,916 | |
| Financials — 1.2% | | | | | | | | |
| SM Prime Holdings | | | 382,400 | | | | 176,417 | |
| Telecommunications — 1.4% | | | | | | | | |
| Philippine Long Distance Telephone ADR | | | 4,256 | | | | 201,819 | |
| TOTAL PHILIPPINES | | | | | | | 672,152 | |
| SINGAPORE— 37.3% | | | | | | | | |
| Consumer Goods — 1.6% | | | | | | | | |
| Wilmar International | | | 103,621 | | | | 231,584 | |
| Consumer Services — 3.4% | | | | | | | | |
| Genting Singapore | | | 298,645 | | | | 173,792 | |
| Jardine Cycle & Carriage | | | 5,418 | | | | 126,195 | |
| Singapore Airlines | | | 24,873 | | | | 191,809 | |
| | | | | | | | 491,796 | |
| Financials — 22.6% | | | | | | | | |
| CapitaLand | | | 124,888 | | | | 276,439 | |
| DBS Group Holdings | | | 88,353 | | | | 1,089,508 | |
| Oversea-Chinese Banking | | | 158,436 | | | | 1,021,548 | |
| United Overseas Bank | | | 59,577 | | | | 864,834 | |
| | | | | | | | 3,252,329 | |
| Oil & Gas — 2.5% | | | | | | | | |
| Keppel | | | 70,807 | | | | 357,953 | |
| Telecommunications — 7.2% | | | | | | | | |
| Singapore Telecommunications | | | 362,434 | | | | 1,029,980 | |
| TOTAL SINGAPORE | | | | | | | 5,363,642 | |
| THAILAND— 15.3% | | | | | | | | |
| Consumer Services — 2.1% | | | | | | | | |
| CP ALL NVDR | | | 218,563 | | | | 307,251 | |
The accompanying notes are an integral part of the financial statements.
| Schedule of Investments | October 31, 2015 |
| | |
| Global X Southeast Asia ETF |
| | | Shares/Face
Amount(1) | | | Value | |
| COMMON STOCK — continued |
| Financials — 4.7% | | | | | | | | |
| Bangkok Bank NVDR | | | 23,201 | | | $ | 109,262 | |
| Kasikornbank NVDR | | | 57,518 | | | | 278,958 | |
| Siam Commercial Bank NVDR | | | 77,171 | | | | 289,656 | |
| | | | | | | | 677,876 | |
| Industrials — 2.5% | | | | | | | | |
| Airports of Thailand NVDR | | | 21,300 | | | | 178,460 | |
| Siam Cement NVDR | | | 14,886 | | | | 190,012 | |
| | | | | | | | 368,472 | |
| Oil & Gas — 3.3% | | | | | | | | |
| PTT Exploration & Production NVDR | | | 68,480 | | | | 140,551 | |
| PTT NVDR | | | 42,114 | | | | 325,616 | |
| | | | | | | | 466,167 | |
| Telecommunications — 2.7% | | | | | | | | |
| Advanced Info Service NVDR | | | 58,611 | | | | 383,956 | |
| TOTAL THAILAND | | | | | | | 2,203,722 | |
| TOTAL COMMON STOCK | | | | | | | | |
| (Cost $18,293,623) | | | | | | | 14,332,940 | |
| TIME DEPOSITS — 0.2% | | | | | | | | |
| Brown Brothers Harriman | | | | | | | | |
| 0.030%, 11/02/15 | | | 29,368 | | | | 29,368 | |
| 0.010%, 11/02/15, SGD | | | 3 | | | | 2 | |
| TOTAL TIME DEPOSITS | | | | | | | | |
| (Cost $29,370) | | | | | | | 29,370 | |
| TOTAL INVESTMENTS — 99.9% | | | | | | | | |
| (Cost $18,322,993) | | | | | | $ | 14,362,310 | |
Percentages are based on Net Assets of $14,375,833.
| (1) | In U.S. Dollars unless otherwise indicated. |
ADR — American Depositary Receipt
NVDR — Non-Voting Depositary Receipt
SGD — Singapore Dollar
The following is a summary of the inputs used as of October 31, 2015, in valuing the Fund's investments carried at value:
| Investments in Securities | | Level 1 | | | Level 2 | | | Level 3 | | | Total | |
| Common Stock | | $ | 14,332,940 | | | $ | — | | | $ | — | | | $ | 14,332,940 | |
| Time Deposits | | | — | | | | 29,370 | | | | — | | | | 29,370 | |
| Total Investments in Securities | | $ | 14,332,940 | | | $ | 29,370 | | | $ | — | | | $ | 14,362,310 | |
For the year ended October 31, 2015, there have been no transfers between Level 1, Level 2 or Level 3 investments.
As of October 31, 2015, there were no Level 3 investments.
The accompanying notes are an integral part of the financial statements.
| Schedule of Investments | October 31, 2015 |
| | |
| Global X FTSE Andean 40 ETF |
Sector Weightings (unaudited)†:
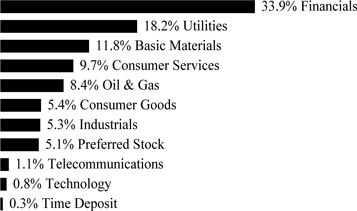
† Sector weightings percentages are based on the total market value of investments.
| | | Shares | | | Value | |
| COMMON STOCK — 94.6% |
| CHILE— 49.1% | | | | | | | | |
| Basic Materials — 5.1% | | | | | | | | |
| CAP | | | 2,551 | | | $ | 6,750 | |
| Empresas CMPC | | | 38,959 | | | | 96,259 | |
| Sociedad Quimica y Minera de Chile ADR | | | 3,188 | | | | 61,784 | |
| | | | | | | | 164,793 | |
| Consumer Goods — 2.9% | | | | | | | | |
| Cia Cervecerias Unidas ADR | | | 2,576 | | | | 61,747 | |
| Vina Concha y Toro | | | 19,500 | | | | 33,201 | |
| | | | | | | | 94,948 | |
| Consumer Services — 8.2% | | | | | | | | |
| Cencosud | | | 40,300 | | | | 88,565 | |
| Latam Airlines Group ADR * | | | 11,735 | | | | 64,660 | |
| SACI Falabella | | | 16,725 | | | | 112,247 | |
| | | | | | | | 265,472 | |
| Financials — 11.7% | | | | | | | | |
| Banco de Chile | | | 3,888 | | | | 412 | |
| Banco de Chile ADR | | | 1,396 | | | | 88,548 | |
| Banco de Credito e Inversiones | | | 1,546 | | | | 63,104 | |
| Banco Santander Chile ADR | | | 5,424 | | | | 103,002 | |
| Corpbanca ADR | | | 3,717 | | | | 50,923 | |
| Parque Arauco | | | 17,964 | | | | 30,045 | |
The accompanying notes are an integral part of the financial statements.
| Schedule of Investments | October 31, 2015 |
| | |
| Global X FTSE Andean 40 ETF |
| | | Shares | | | Value | |
| COMMON STOCK — continued |
| Financials — continued | | | | | | | | |
| Sociedad Matriz Banco de Chile, Cl B | | | 161,020 | | | $ | 45,823 | |
| | | | | | | | 381,857 | |
| Oil & Gas — 3.8% | | | | | | | | |
| Empresas COPEC | | | 13,129 | | | | 123,116 | |
| Technology — 0.8% | | | | | | | | |
| Sonda | | | 16,324 | | | | 26,258 | |
| Telecommunications — 1.1% | | | | | | | | |
| ENTEL Chile | | | 3,765 | | | | 34,862 | |
| Utilities — 15.5% | | | | | | | | |
| AES Gener | | | 87,831 | | | | 42,269 | |
| Aguas Andinas, Cl A | | | 101,242 | | | | 53,294 | |
| Colbun | | | 245,396 | | | | 65,154 | |
| E.CL | | | 18,272 | | | | 26,430 | |
| Empresa Nacional de Electricidad ADR | | | 3,613 | | | | 136,499 | |
| Enersis ADR | | | 13,713 | | | | 181,697 | |
| | | | | | | | 505,343 | |
| TOTAL CHILE | | | | | | | 1,596,649 | |
| COLOMBIA— 29.1% | | | | | | | | |
| Consumer Goods — 2.5% | | | | | | | | |
| Grupo Nutresa | | | 10,775 | | | | 81,311 | |
| Consumer Services — 1.6% | | | | | | | | |
| Almacenes Exito | | | 11,624 | | | | 52,502 | |
| Financials — 12.5% | | | | | | | | |
| BanColombia ADR | | | 4,456 | | | | 154,267 | |
| Financiera Colombiana | | | 5,569 | | | | 73,573 | |
| Grupo Aval Acciones y Valores ADR | | | 3,153 | | | | 25,255 | |
| Grupo de Inversiones Suramericana | | | 12,167 | | | | 154,764 | |
| | | | | | | | 407,859 | |
| Industrials — 5.2% | | | | | | | | |
| Cementos Argos | | | 20,282 | | | | 67,338 | |
| Grupo Argos | | | 16,796 | | | | 103,396 | |
| | | | | | | | 170,734 | |
| Oil & Gas — 4.6% | | | | | | | | |
| Ecopetrol ADR | | | 12,817 | | | | 119,454 | |
| Pacific Exploration and Production* | | | 16,132 | | | | 31,442 | |
| | | | | | | | 150,896 | |
| Utilities — 2.7% | | | | | | | | |
| Interconexion Electrica | | | 17,260 | | | | 41,427 | |
| Isagen | | | 42,430 | | | | 45,049 | |
| | | | | | | | 86,476 | |
| TOTAL COLOMBIA | | | | | | | 949,778 | |
The accompanying notes are an integral part of the financial statements.
| Schedule of Investments | October 31, 2015 |
| | |
| Global X FTSE Andean 40 ETF |
| | | Shares/Face
Amount | | | Value | |
| COMMON STOCK — continued |
| PERU— 16.4% | | | | | | | | |
| Basic Materials — 6.7% | | | | | | | | |
| Cia de Minas Buenaventura ADR * | | | 10,703 | | | $ | 68,606 | |
| Southern Copper | | | 5,390 | | | | 149,627 | |
| | | | | | | | 218,233 | |
| Financials — 9.7% | | | | | | | | |
| Credicorp | | | 1,056 | | | | 119,729 | |
| Credicorp Ltd. | | | 1,722 | | | | 194,896 | |
| | | | | | | | 314,625 | |
| TOTAL PERU | | | | | | | 532,858 | |
| TOTAL COMMON STOCK | | | | | | | | |
| (Cost $5,445,340) | | | | | | | 3,079,285 | |
| PREFERRED STOCK — 5.1% | | | | | | | | |
| CHILE— 0.9% | | | | | | | | |
| Consumer Goods — 0.9% | | | | | | | | |
| Embotelladora Andina | | | 8,230 | | | | 30,210 | |
| COLOMBIA— 4.2% | | | | | | | | |
| Financials — 3.0% | | | | | | | | |
| Banco Davivienda | | | 5,180 | | | | 42,673 | |
| Grupo Aval Acciones y Valores | | | 134,171 | | | | 53,826 | |
| | | | | | | | 96,499 | |
| Industrials — 1.2% | | | | | | | | |
| Grupo Argos | | | 6,530 | | | | 38,798 | |
| TOTAL COLOMBIA | | | | | | | 135,297 | |
| TOTAL PREFERRED STOCK | | | | | | | | |
| (Cost $229,510) | | | | | | | 165,507 | |
| TIME DEPOSIT — 0.3% | | | | | | | | |
| Brown Brothers Harriman, 0.030%, 11/02/15 | | | | | | | | |
| (Cost $9,463) | | $ | 9,463 | | | | 9,463 | |
| TOTAL INVESTMENTS — 100.0% | | | | | | | | |
| (Cost $5,684,313) | | | | | | $ | 3,254,255 | |
Percentages are based on Net Assets of $3,252,788.
| * | Non-income producing security. |
ADR — American Depositary Receipt
Cl — Class
Ltd. — Limited
The accompanying notes are an integral part of the financial statements.
| Schedule of Investments | October 31, 2015 |
| | |
| Global X FTSE Andean 40 ETF |
The following is a summary of the inputs used as of October 31, 2015, in valuing the Fund's investments carried at value:
| Investments in Securities | | Level 1 | | | Level 2 | | | Level 3 | | | Total | |
| Common Stock | | $ | 3,079,285 | | | $ | — | | | $ | — | | | $ | 3,079,285 | |
| Preferred Stock | | | 165,507 | | | | — | | | | — | | | | 165,507 | |
| Time Deposit | | | — | | | | 9,463 | | | | — | | | | 9,463 | |
| Total Investments in Securities | | $ | 3,244,792 | | | $ | 9,463 | | | $ | — | | | $ | 3,254,255 | |
For the year ended October 31, 2015, there have been no transfers between Level 1, Level 2 and Level 3 investments.
As of October 31, 2015, there were no Level 3 investments.
The accompanying notes are an integral part of the financial statements.
| Schedule of Investments | October 31, 2015 |
| | |
| Global X MSCI Colombia ETF |
Sector Weightings (unaudited)†:

† Sector weightings percentages are based on the total market value of investments.
| | | Shares | | | Value | |
| COMMON STOCK — 88.5% |
| COLOMBIA— 88.5% | | | | | | | | |
| Basic Materials — 2.4% | | | | | | | | |
| Mineros | | | 2,435,898 | | | $ | 1,600,625 | |
| Consumer Goods — 4.9% | | | | | | | | |
| Grupo Nutresa | | | 430,178 | | | | 3,246,233 | |
| Consumer Services — 3.2% | | | | | | | | |
| Almacenes Exito | | | 479,193 | | | | 2,164,365 | |
| Financials — 34.3% | | | | | | | | |
| Banco de Bogota | | | 11,617 | | | | 237,040 | |
| BanColombia ADR (A) | | | 323,905 | | | | 11,213,591 | |
| Bolsa de Valores de Colombia | | | 217,229,526 | | | | 1,239,594 | |
| Celsia ESP | | | 1,604,535 | | | | 1,659,194 | |
| Financiera Colombiana | | | 74,548 | | | | 984,863 | |
| Grupo Aval Acciones y Valores | | | 301,311 | | | | 119,837 | |
| Grupo Aval Acciones y Valores ADR | | | 151,369 | | | | 1,212,466 | |
| Grupo de Inversiones Suramericana | | | 486,030 | | | | 6,182,322 | |
| Interbolsa *(B) (C) | | | 1,320,603 | | | | 457 | |
| | | | | | | | 22,849,364 | |
| Industrials — 16.7% | | | | | | | | |
| Cementos Argos | | | 879,720 | | | | 2,920,737 | |
| Cemex Latam Holdings * | | | 673,036 | | | | 2,346,257 | |
| Construcciones El Condor | | | 2,751,553 | | | | 1,027,729 | |
| Constructora Conconcreto | | | 3,657,544 | | | | 1,498,941 | |
| Grupo Argos | | | 538,805 | | | | 3,316,870 | |
| | | | | | | | 11,110,534 | |
| Oil & Gas — 12.8% | | | | | | | | |
| Canacol Energy * | | | 885,464 | | | | 2,050,641 | |
| Ecopetrol ADR (A) | | | 497,406 | | | | 4,635,824 | |
| Pacific Exploration and Production | | | 945,084 | | | | 1,841,987 | |
| | | | | | | | 8,528,452 | |
The accompanying notes are an integral part of the financial statements.
| Schedule of Investments | October 31, 2015 |
| | |
| Global X MSCI Colombia ETF |
| | | Shares/Face
Amount | | | Value | |
| COMMON STOCK — continued | | | | | | |
| Utilities — 14.2% | | | | | | | | |
| Empresa de Energia de Bogota | | | 4,965,996 | | | $ | 3,211,625 | |
| Interconexion Electrica | | | 1,302,933 | | | | 3,127,220 | |
| Isagen | | | 2,949,738 | | | | 3,131,833 | |
| | | | | | | | 9,470,678 | |
| TOTAL COMMON STOCK | | | | | | | | |
| (Cost $89,667,293) | | | | | | | 58,970,251 | |
| | | | | | | | | |
| PREFERRED STOCK — 11.2% | | | | | | | | |
| COLOMBIA—11.2% | | | | | | | | |
| Consumer Services — 1.5% | | | | | | | | |
| Avianca Holdings | | | 1,929,476 | | | | 987,593 | |
| Financials — 8.3% | | | | | | | | |
| Banco Davivienda | | | 368,740 | | | | 3,037,658 | |
| Grupo Aval Acciones y Valores | | | 1,431,941 | | | | 574,460 | |
| Grupo de Inversiones Suramericana | | | 153,703 | | | | 1,932,782 | |
| | | | | | | | 5,544,900 | |
| Industrials — 1.4% | | | | | | | | |
| Grupo Argos | | | 158,438 | | | | 941,368 | |
| TOTAL PREFERRED STOCK | | | | | | | | |
| (Cost $10,803,828) | | | | | | | 7,473,861 | |
| | | | | | | | | |
| TIME DEPOSIT — 0.3% | | | | | | | | |
| Brown Brothers Harriman, 0.030%, 11/02/15 | | | | | | | | |
| (Cost $198,414) | | $ | 198,414 | | | | 198,414 | |
| TOTAL INVESTMENTS — 100.0% | | | | | | | | |
| (Cost $100,669,535) | | | | | | $ | 66,642,526 | |
Percentages are based on Net Assets of $66,615,982.
| * | Non-income producing security. |
| (A) | This security or a partial position of this security is on loan at October 31, 2015. The total value of securities on loan at October 31, 2015 was $1,243,616. |
| (B) | Security is fair valued using methods determined in good faith by the Fair Value Committee of the Fund. The total value of such security as of October 31, 2015, was $457 and represents 0.0% of Net Assets. |
| (C) | Security considered illiquid. The total value of such security as of October 31, 2015 was $457 and represented 0.0% of Net Assets. |
ADR — American Depositary Receipt
The accompanying notes are an integral part of the financial statements.
| Schedule of Investments | October 31, 2015 |
| | |
| Global X MSCI Colombia ETF |
The following is a summary of the inputs used as of October 31, 2015, in valuing the Fund's investments carried at value:
| Investments in Securities | | Level 1 | | | Level 2 | | | Level 3 | | | Total | |
| Common Stock | | $ | 57,942,065 | | | $ | 1,027,729 | | | $ | 457 | | | $ | 58,970,251 | |
| Preferred Stock | | | 7,473,861 | | | | — | | | | — | | | | 7,473,861 | |
| Time Deposit | | | — | | | | 198,414 | | | | — | | | | 198,414 | |
| Total Investments in Securities | | $ | 65,415,926 | | | $ | 1,226,143 | | | $ | 457 | | | $ | 66,642,526 | |
The following is a reconciliation of investments in which significant unobservable inputs (Level 3) were used in determining fair value:
| | | Investments in
Common Stock | |
| | | | |
| Beginning Balance as of October 31, 2014 | | $ | 3,471,731 | |
| Transfers out of Level 3 | | | (1,600,625 | ) |
| Net purchases | | | 1,607,983 | |
| Net sales | | | (1,920,696 | ) |
| Realized gain (loss) | | | (1,642,503 | ) |
| Change in unrealized appreciation (depreciation) | | | 84,567 | |
| Ending Balance as of October 31, 2015 | | $ | 457 | |
For the year ended October 31, 2015, the transfers in and out of Level 3 were due to changes in the availability of observable inputs to determine fair value. Transfers between levels are recognized at period end.
Net change in unrealized appreciation (depreciation) from investments (Level 3) still held as of October 31, 2015 is $(184).
For the year ended October 31, 2015, the transfers between Level 1 and Level 2 in the amount of $1,027,729, were due to changes in the availability of observable inputs to determine fair value. Transfers between levels are recognized at period end.
The accompanying notes are an integral part of the financial statements.
| Schedule of Investments | October 31, 2015 |
| | |
| Global X Brazil Mid Cap ETF |
Sector Weightings (unaudited)†:
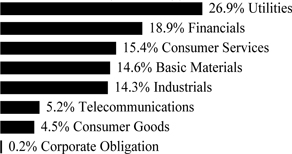
† Sector weightings percentages are based on the total market value of investments.
| | | Shares | | | Value | |
| COMMON STOCK — 92.8% |
| BRAZIL— 92.8% | | | | | | | | |
| Basic Materials — 10.4% | | | | | | | | |
| Cia Siderurgica Nacional ADR | | | 44,605 | | | $ | 54,864 | |
| Fibria Celulose ADR | | | 16,574 | | | | 224,080 | |
| Gerdau ADR | | | 32,718 | | | | 45,478 | |
| | | | | | | | 324,422 | |
| Consumer Goods — 4.5% | | | | | | | | |
| Cosan Industria e Comercio | | | 3,943 | | | | 25,349 | |
| Hypermarcas * | | | 11,887 | | | | 54,121 | |
| M Dias Branco | | | 1,316 | | | | 23,933 | |
| Natura Cosmeticos | | | 6,089 | | | | 36,278 | |
| | | | | | | | 139,681 | |
| Consumer Services — 13.4% | | | | | | | | |
| B2W Cia Digital * | | | 3,050 | | | | 11,569 | |
| Cia Brasileira de Distribuicao Grupo Pao de Acucar ADR | | | 4,531 | | | | 59,492 | |
| Kroton Educacional | | | 49,400 | | | | 126,724 | |
| Localiza Rent a Car | | | 4,772 | | | | 32,280 | |
| Lojas Renner | | | 20,755 | | | | 99,897 | |
| Raia Drogasil | | | 6,480 | | | | 67,419 | |
| Via Varejo | | | 13,690 | | | | 15,137 | |
| | | | | | | | 412,518 | |
| Financials — 18.8% | | | | | | | | |
| BM&F Bovespa | | | 55,806 | | | | 165,517 | |
| BR Malls Participacoes | | | 13,671 | | | | 39,836 | |
| CETIP - Mercados Organizados | | | 7,112 | | | | 63,096 | |
| Grupo BTG Pactual, Cl Miscellaneous | | | 29,917 | | | | 223,386 | |
| Multiplan Empreendimentos Imobiliarios | | | 2,437 | | | | 26,674 | |
| Porto Seguro | | | 2,986 | | | | 25,116 | |
| Qualicorp | | | 9,080 | | | | 38,270 | |
| | | | | | | | 581,895 | |
The accompanying notes are an integral part of the financial statements.
| Schedule of Investments | October 31, 2015 |
| | |
| Global X Brazil Mid Cap ETF |
| | | Shares/Face
Amount | | | Value | |
| COMMON STOCK — continued |
| Industrials — 14.2% | | | | | | | | |
| CCR | | | 29,088 | | | $ | 91,722 | |
| Embraer ADR | | | 3,351 | | | | 98,419 | |
| Klabin | | | 30,984 | | | | 176,780 | |
| WEG | | | 18,770 | | | | 70,321 | |
| | | | | | | | 437,242 | |
| Telecommunications — 5.2% | | | | | | | | |
| Tim Participacoes ADR | | | 14,357 | | | | 159,506 | |
| Utilities — 26.3% | | | | | | | | |
| Centrais Eletricas Brasileiras ADR * | | | 33,346 | | | | 42,016 | |
| Cia de Saneamento Basico do Estado de Sao Paulo ADR | | | 20,919 | | | | 91,834 | |
| Cia Energetica de Minas Gerais ADR | | | 22,047 | | | | 42,991 | |
| Cia Paranaense de Energia ADR | | | 3,275 | | | | 27,051 | |
| CPFL Energia ADR* | | | 15,896 | | | | 127,327 | |
| Equatorial Energia | | | 5,330 | | | | 47,689 | |
| Tractebel Energia | | | 6,697 | | | | 59,013 | |
| Transmissora Alianca de Energia Eletrica | | | 10,840 | | | | 56,123 | |
| Ultrapar Participacoes ADR | | | 18,377 | | | | 318,106 | |
| | | | | | | | 812,150 | |
| TOTAL COMMON STOCK | | | | | | | | |
| (Cost $4,701,162) | | | | | | | 2,867,414 | |
| PREFERRED STOCK — 6.4% | | | | | | | | |
| BRAZIL— 6.4% | | | | | | | | |
| Basic Materials — 3.9% | | | | | | | | |
| Braskem | | | 4,654 | | | | 26,372 | |
| Suzano Papel e Celulose | | | 20,590 | | | | 88,656 | |
| Usinas Siderurgicas de Minas Gerais | | | 11,240 | | | | 8,130 | |
| | | | | | | | 123,158 | |
| Consumer Services — 2.1% | | | | | | | | |
| Lojas Americanas | | | 14,839 | | | | 64,512 | |
| Utilities — 0.4% | | | | | | | | |
| Cia de Transmissao de Energia Eletrica Paulista | | | 990 | | | | 11,436 | |
| TOTAL PREFERRED STOCK | | | | | | | | |
| (Cost $239,908) | | | | | | | 199,106 | |
CORPORATE OBLIGATION — 0.3% | | | | | | | | |
| Hypermarcas | | | | | | | | |
| 11.300%, 10/15/18(A)(B) | | | | | | | | |
(Cost $27,733) | | $ | 59,000 | | | | 7,911 | |
| | | | | | | | | |
| TOTAL INVESTMENTS — 99.5% | | | | | | | | |
| (Cost $4,968,803) | | | | | | $ | 3,074,431 | |
Percentages are based on Net Assets of $3,089,321.
The accompanying notes are an integral part of the financial statements.
| Schedule of Investments | October 31, 2015 |
| | |
| Global X Brazil Mid Cap ETF |
| * | Non-income producing security. |
| (A) | Security considered illiquid. The total value of such securities as of October 31, 2015 was $7,911 and represented 0.3% of Net Assets. |
| (B) | Security is fair valued using methods determined in good faith by the Fair Value Committee of the Fund. The total value of such securities as of October 31, 2015, was $7,911 and represents 0.3% of Net Assets. |
ADR — American Depositary Receipt
Cl — Class
The following is a summary of the inputs used as of October 31, 2015, in valuing the Fund's investments carried at value:
| Investments in Securities | | Level 1 | | | Level 2 | | | Level 3(a) | | | Total | |
| Common Stock | | $ | 2,867,414 | | | $ | — | | | $ | — | | | $ | 2,867,414 | |
| Preferred Stock | | | 199,106 | | | | — | | | | — | | | | 199,106 | |
| Corporate Obligation | | | — | | | | — | | | | 7,911 | | | | 7,911 | |
| Total Investments in Securities | | $ | 3,066,520 | | | $ | — | | | $ | 7,911 | | | $ | 3,074,431 | |
(a) A reconciliation of Level 3 investments and disclosures of significant unobservable inputs are presented when the Fund has over 1% of Level 3 investments at the beginning and/or end of the period in relation to net assets. Management has concluded that Level 3 investments are not material in relation to net assets.
For the year ended October 31, 2015, there have been no transfers between Level 1, Level 2 and Level 3 investments.
The accompanying notes are an integral part of the financial statements.
| Schedule of Investments | October 31, 2015 |
| | |
| Global X Brazil Consumer ETF |
Sector Weightings (unaudited)†:

† Sector weightings percentages are based on the total market value of investments.
| | | Shares | | | Value | |
| COMMON STOCK — 92.3% |
| BRAZIL— 92.3% | | | | | | | | |
| Consumer Goods — 51.2% | | | | | | | | |
| AMBEV ADR | | | 37,072 | | | $ | 180,541 | |
| Arezzo Industria e Comercio | | | 6,082 | | | | 33,229 | |
| BRF ADR | | | 11,057 | | | | 169,504 | |
| Cia Hering | | | 20,173 | | | | 79,513 | |
| Cosan, Cl A | | | 24,232 | | | | 84,812 | |
| Cosan Industria e Comercio | | | 17,937 | | | | 115,313 | |
| Gafisa ADR* | | | 24,202 | | | | 31,221 | |
| Grendene | | | 10,157 | | | | 47,698 | |
| Hypermarcas * | | | 32,950 | | | | 150,020 | |
| JBS | | | 43,206 | | | | 160,182 | |
| M Dias Branco | | | 6,118 | | | | 111,261 | |
| Marfrig Alimentos * | | | 35,286 | | | | 58,479 | |
| Minerva * | | | 14,335 | | | | 47,589 | |
| Natura Cosmeticos | | | 23,986 | | | | 142,906 | |
| Sao Martinho | | | 7,207 | | | | 83,308 | |
| SLC Agricola | | | 5,906 | | | | 26,459 | |
| | | | | | | | 1,522,035 | |
| Consumer Services — 41.1% | | | | | | | | |
| B2W Cia Digital * | | | 14,544 | | | | 55,169 | |
| Cia Brasileira de Distribuicao Grupo Pao de Acucar ADR | | | 7,795 | | | | 102,348 | |
| CVC Brasil Operadora e Agencia de Viagens | | | 10,260 | | | | 38,972 | |
| Estacio Participacoes | | | 39,900 | | | | 160,487 | |
| GAEC Educacao | | | 4,870 | | | | 16,851 | |
| Gol Linhas Aereas Inteligentes ADR | | | 14,496 | | | | 12,878 | |
| Kroton Educacional | | | 57,908 | | | | 148,550 | |
| Localiza Rent a Car | | | 21,001 | | | | 142,059 | |
| Lojas Renner | | | 31,275 | | | | 150,531 | |
| Multiplus | | | 6,462 | | | | 57,733 | |
| Raia Drogasil | | | 18,862 | | | | 196,244 | |
| Restoque Comercio e Confeccoes de Roupas* | | | 43,209 | | | | 34,175 | |
| Smiles | | | 8,101 | | | | 63,440 | |
| Via Varejo | | | 37,574 | | | | 41,546 | |
| | | | | | | | 1,220,983 | |
The accompanying notes are an integral part of the financial statements.
| Schedule of Investments | October 31, 2015 |
| | |
| Global X Brazil Consumer ETF |
| | | Shares/Face
Amount | | | Value | |
| COMMON STOCK — continued |
| TOTAL COMMON STOCK | | | | | | | | |
| (Cost $5,179,003) | | | | | | $ | 2,743,018 | |
| PREFERRED STOCK — 6.9% | | | | | | | | |
| BRAZIL— 6.9% | | | | | | | | |
| Consumer Goods — 1.1% | | | | | | | | |
| Alpargatas | | | 15,758 | | | | 33,823 | |
| Consumer Services — 5.8% | | | | | | | | |
| Lojas Americanas | | | 39,462 | | | | 171,558 | |
| TOTAL PREFERRED STOCK | | | | | | | | |
| (Cost $245,663) | | | | | | | 205,381 | |
| CORPORATE OBLIGATION — 0.4% | | | | | | | | |
| Hypermarcas | | | | | | | | |
11.300%, 10/15/18(A)(B) (Cost $39,485) | | $ | 84,000 | | | | 11,264 | |
| | | | | | | | | |
| TOTAL INVESTMENTS — 99.6% | | | | | | | | |
| (Cost $5,464,151) | | | | | | $ | 2,959,663 | |
Percentages are based on Net Assets of $2,970,632.
| * | Non-income producing security. |
| (A) | Security considered illiquid. The total value of such securities as of October 31, 2015 was $11,264 and represented 0.4% of Net Assets. |
| (B) | Security is fair valued using methods determined in good faith by the Fair Value Committee of the Fund. The total value of such security as of October 31, 2015, was $11,264 and represents 0.4% of Net Assets. |
ADR — American Depositary Receipt
Cl — Class
The accompanying notes are an integral part of the financial statements.
| Schedule of Investments | October 31, 2015 |
| | |
| Global X Brazil Consumer ETF |
The following is a summary of the inputs used as of October 31, 2015, in valuing the Fund's investments carried at value:
| Investments in Securities | | Level 1 | | | Level 2 | | | Level 3(a) | | | Total | |
| Common Stock | | $ | 2,743,018 | | | $ | — | | | $ | — | | | $ | 2,743,018 | |
| Preferred Stock | | | 205,381 | | | | — | | | | — | | | | 205,381 | |
| Corporate Obligation | | | — | | | | — | | | | 11,264 | | | | 11,264 | |
| Total Investments in Securities | | $ | 2,948,399 | | | $ | — | | | $ | 11,264 | | | $ | 2,959,663 | |
(a) A reconciliation of Level 3 investments and disclosures of significant unobservable inputs are presented when the Fund has over 1% of Level 3 investments at the beginning and/or end of the period in relation to net assets. Management has concluded that Level 3 investments are not material in relation to net assets.
For the year ended October 31, 2015, there have been no transfers between Level 1, Level 2 and Level 3 investments.
The accompanying notes are an integral part of the financial statements.
| Schedule of Investments | October 31, 2015 |
| | |
| Global X MSCI Argentina ETF |
Sector Weightings (unaudited)†:
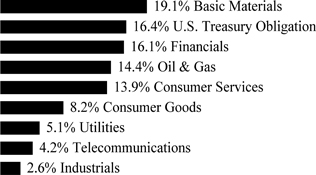
† Sector weightings percentages are based on the total market value of investments.
| | | Shares | | | Value | |
| COMMON STOCK — 99.8% |
| ARGENTINA— 83.3% | | | | | | | | |
| Basic Materials — 18.8% | | | | | | | | |
| Tenaris ADR | | | 114,076 | | | $ | 2,882,701 | |
| Consumer Goods — 2.4% | | | | | | | | |
| Cresud SACIF y A ADR * | | | 28,269 | | | | 361,282 | |
| Consumer Services — 14.7% | | | | | | | | |
| Arcos Dorados Holdings, Cl A | | | 105,290 | | | | 324,293 | |
| Grupo Clarin GDR, Cl B | | | 31,402 | | | | 491,441 | |
| MercadoLibre | | | 14,596 | | | | 1,435,808 | |
| | | | | | | | 2,251,542 | |
| Financials — 19.1% | | | | | | | | |
| Banco Macro ADR * | | | 13,980 | | | | 862,985 | |
| BBVA Banco Frances ADR* | | | 37,271 | | | | 866,551 | |
| Grupo Financiero Galicia ADR | | | 32,443 | | | | 867,850 | |
| IRSA Inversiones y Representaciones ADR * | | | 18,998 | | | | 341,774 | |
| | | | | | | | 2,939,160 | |
| Oil & Gas — 17.2% | | | | | | | | |
| Petrobras Argentina ADR | | | 70,032 | | | | 439,801 | |
| Transportadora de Gas del Sur ADR* | | | 86,574 | | | | 536,759 | |
| YPF ADR | | | 78,233 | | | | 1,671,057 | |
| | | | | | | | 2,647,617 | |
| Telecommunications — 5.0% | | | | | | | | |
| Telecom Argentina ADR | | | 39,508 | | | | 770,801 | |
| Utilities — 6.1% | | | | | | | | |
| Empresa Distribuidora Y Comercializadora Norte ADR * | | | 15,775 | | | | 291,207 | |
| Pampa Energia ADR * | | | 26,582 | | | | 643,816 | |
| | | | | | | | 935,023 | |
| TOTAL ARGENTINA | | | | | | | 12,788,126 | |
The accompanying notes are an integral part of the financial statements.
| Schedule of Investments | October 31, 2015 |
| | |
| Global X MSCI Argentina ETF |
| | | Shares/Face
Amount | | | Value | |
| COMMON STOCK — continued |
| CANADA— 5.7% | | | | | | | | |
| Basic Materials — 4.1% | | | | | | | | |
| Pan American Silver | | | 7,237 | | | $ | 54,871 | |
| Pan American Silver^ | | | 28,761 | | | | 217,721 | |
| Silver Standard Resources * | | | 50,986 | | | | 351,803 | |
| | | | | | | | 624,395 | |
| Industrials — 1.6% | | | | | | | | |
| Finning International | | | 15,628 | | | | 249,647 | |
| TOTAL CANADA | | | | | | | 874,042 | |
| CHILE— 6.7% | | | | | | | | |
| Consumer Goods — 4.8% | | | | | | | | |
| Cia Cervecerias Unidas ADR | | | 15,193 | | | | 364,176 | |
| Embotelladora Andina ADR, Cl B | | | 16,657 | | | | 367,287 | |
| | | | | | | | 731,463 | |
| Consumer Services — 1.9% | | | | | | | | |
| Cencosud | | | 133,538 | | | | 293,470 | |
| TOTAL CHILE | | | | | | | 1,024,933 | |
| HONG KONG— 0.7% | | | | | | | | |
| Consumer Goods — 0.7% | | | | | | | | |
| EPI Holdings * | | | 2,062,690 | | | | 106,460 | |
| MEXICO— 1.9% | | | | | | | | |
| Consumer Goods — 1.9% | | | | | | | | |
| Arca Continental | | | 46,470 | | | | 296,638 | |
| SPAIN— 1.5% | | | | | | | | |
| Industrials — 1.5% | | | | | | | | |
| Prosegur Cia de Seguridad | | | 52,970 | | | | 236,980 | |
| TOTAL COMMON STOCK | | | | | | | | |
| (Cost $18,070,726) | | | | | | | 15,327,179 | |
| U.S. TREASURY OBLIGATION — 19.5% | | | | | | | | |
| United States Treasury Bills | | | | | | | | |
| 0.000%, 11/12/15(A) | | | | | | | | |
| (Cost $3,000,005) | | $ | 3,000,000 | | | | 2,999,991 | |
| TOTAL INVESTMENTS — 119.3% | | | | | | | | |
| (Cost $21,070,731) | | | | | | $ | 18,327,170 | |
Percentages are based on Net Assets of $15,355,058.
| * | Non-income producing security. |
| (A) | The rate reported on the Schedule of Investments is the effective yield at time of purchase. |
| ^ | Traded on the U.S. Stock Exchange. |
ADR — American Depositary Receipt
Cl — Class
GDR — Global Depositary Receipt
The accompanying notes are an integral part of the financial statements.
| Schedule of Investments | October 31, 2015 |
| | |
| Global X MSCI Argentina ETF |
The following is a summary of the inputs used as of October 31, 2015, in valuing the Fund's investments carried at value:
| Investments in Securities | | Level 1 | | | Level 2 | | | Level 3 | | | Total | |
| Common Stock | | $ | 15,327,179 | | | $ | — | | | $ | — | | | $ | 15,327,179 | |
| U.S. Treasury Obligation | | | — | | | | 2,999,991 | | | | — | | | | 2,999,991 | |
| Total Investments in Securities | | $ | 15,327,179 | | | $ | 2,999,991 | | | $ | — | | | $ | 18,327,170 | |
|
For the year ended October 31, 2015, there have been no transfers between Level 1, Level 2 and Level 3 investments.
As of October 31, 2015, there were no Level 3 investments.
The accompanying notes are an integral part of the financial statements.
| Schedule of Investments | October 31, 2015 |
| | |
| Global X FTSE Greece 20 ETF |
Sector Weightings (unaudited)†:
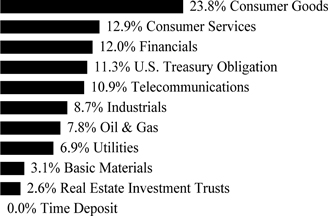
† Sector weightings percentages are based on the total market value of investments.
| | | Shares | | | Value | |
| COMMON STOCK — 99.5% |
| BELGIUM— 0.9% | | | | | | | | |
| Industrials — 0.9% | | | | | | | | |
| Viohalco * | | | 356,415 | | | $ | 901,609 | |
| Viohalco^ * | | | 710,700 | | | | 1,744,444 | |
| TOTAL BELGIUM | | | | | | | 2,646,053 | |
| GREECE— 76.5% | | | | | | | | |
| Basic Materials — 3.5% | | | | | | | | |
| Mytilineos Holdings | | | 1,052,729 | | | | 5,640,077 | |
| Mytilineos Holdings ADR (A) | | | 996,200 | | | | 5,337,241 | |
| | | | | | | | 10,977,318 | |
| Consumer Goods — 4.6% | | | | | | | | |
| JUMBO | | | 1,213,922 | | | | 11,800,492 | |
| JUMBO ADR * | | | 340,000 | | | | 2,805,000 | |
| | | | | | | | 14,605,492 | |
| Consumer Services — 14.5% | | | | | | | | |
| FF Group | | | 385,297 | | | | 7,793,107 | |
| FF Group ADR (A) | | | 286,300 | | | | 5,790,761 | |
| OPAP | | | 1,733,136 | | | | 15,411,865 | |
| OPAP ADR | | | 3,670,900 | | | | 16,592,468 | |
| | | | | | | | 45,588,201 | |
| Financials — 13.5% | | | | | | | | |
| Alpha Bank AE * | | | 83,638,301 | | | | 10,625,019 | |
| Eurobank Ergasias * | | | 195,356,844 | | | | 6,689,860 | |
| National Bank of Greece ADR * | | | 25,711,575 | | | | 19,851,907 | |
| Piraeus Bank * | | | 51,729,847 | | | | 5,314,358 | |
| | | | | | | | 42,481,144 | |
The accompanying notes are an integral part of the financial statements.
| Schedule of Investments | October 31, 2015 |
| | |
| Global X FTSE Greece 20 ETF |
| | | Shares/Face
Amount(1) | | | Value | |
| COMMON STOCK — continued |
| Industrials — 8.7% | | | | | | | | |
| Ellaktor * | | | 3,318,939 | | | $ | 6,525,983 | |
| Metka | | | 536,581 | | | | 5,174,593 | |
| Metka ADR (B) | | | 130,000 | | | | 1,253,668 | |
| Titan Cement | | | 318,208 | | | | 7,012,626 | |
| Titan Cement ADR *(B) | | | 679,800 | | | | 7,490,648 | |
| | | | | | | | 27,457,518 | |
| Oil & Gas — 8.8% | | | | | | | | |
| Hellenic Petroleum | | | 1,810,742 | | | | 10,601,300 | |
| Motor Oil Hellas Corinth Refineries | | | 696,435 | | | | 8,608,695 | |
| Motor Oil Hellas Corinth Refineries ADR * (A) | | | 1,388,300 | | | | 8,580,388 | |
| | | | | | | | 27,790,383 | |
| Real Estate Investment Trusts — 2.9% | | | | | | | | |
| Grivalia Properties | | | 997,852 | | | | 9,115,874 | |
| Telecommunications — 12.2% | | | | | | | | |
| Hellenic Telecommunications Organization | | | 4,119,714 | | | | 38,545,807 | |
| Utilities — 7.8% | | | | | | | | |
| Athens Water Supply & Sewage | | | 1,067,170 | | | | 6,790,203 | |
| Public Power | | | 2,458,685 | | | | 14,231,833 | |
| Terna Energy | | | 863,575 | | | | 2,747,383 | |
| Terna Energy ADR (B) | | | 88,800 | | | | 565,017 | |
| | | | | | | | 24,334,436 | |
| TOTAL GREECE | | | | | | | 240,896,173 | |
| SWITZERLAND— 22.1% | | | | | | | | |
| Consumer Goods — 22.1% | | | | | | | | |
| Coca-Cola HBC | | | 2,909,805 | | | | 69,655,564 | |
| TOTAL COMMON STOCK | | | | | | | | |
| (Cost $389,428,447) | | | | | | | 313,197,790 | |
| U.S. TREASURY OBLIGATION — 12.7% | | | | | | | | |
| United States Treasury Bills | | | | | | | | |
| 0.000%, 11/12/15(C) | | | | | | | | |
| (Cost $40,000,061) | | | 40,000,000 | | | | 39,999,880 | |
| TIME DEPOSIT — 0.0% | | | | | | | | |
| Brown Brothers Harriman, 0.080%, 11/02/15, GBP | | | | | | | | |
| (Cost $1) | | | 1 | | | | 1 | |
| TOTAL INVESTMENTS — 112.2% | | | | | | | | |
| (Cost $429,428,509) | | | | | | $ | 353,197,671 | |
Percentages are based on Net Assets of $314,907,191.
| * | Non-income producing security. |
| ^ | Traded on the Ghana Stock Exchange. |
The accompanying notes are an integral part of the financial statements.
| Schedule of Investments | October 31, 2015 |
| | |
| Global X FTSE Greece 20 ETF |
| (1) | In U.S. Dollars unless otherwise indicated. |
| (A) | Security considered illiquid. The total value of such securities as of October 31, 2015 was $19,708,390 and represented 6.3% of Net Assets. |
| (B) | Security is fair valued using methods determined in good faith by the Fair Value Committee of the Fund. The total value of such securities as of October 31, 2015, was $9,309,333 and represents 3.0% of Net Assets. |
| (C) | The rate reported on the Schedule of Investments is the effective yield at time of purchase. |
ADR — American Depositary Receipt
GBP — British Pound Sterling
The following is a summary of the inputs used as of October 31, 2015, in valuing the Fund's investments carried at value:
| Investments in Securities | | Level 1 | | | Level 2 | | | Level 3 | | | Total | |
| Common Stock | | $ | 284,180,067 | | | $ | 29,017,723 | | | $ | — | | | $ | 313,197,790 | |
| U.S. Treasury Obligation | | | — | | | | 39,999,880 | | | | — | | | | 39,999,880 | |
| Time Deposit | | | — | | | | 1 | | | | — | | | | 1 | |
| Total Investments in Securities | | $ | 284,180,067 | | | $ | 69,017,604 | | | $ | — | | | $ | 353,197,671 | |
|
The following is a reconciliation of investments in which significant unobservable inputs (Level 3) were used in determining fair value:
| | | Investments in
Common Stock | |
| | | | |
| Beginning Balance as of October 31, 2014 | | $ | 534,734 | |
| Net sales | | | (7,793 | ) |
| Realized gain (loss) | | | (1,111,748 | ) |
| Change in unrealized appreciation (depreciation) | | | 584,807 | |
| Ending Balance as of October 31, 2015 | | $ | - | |
For the year ended October 31, 2015, there have been no transfers between Level 1, Level 2 or Level 3 investments.
As of October 31, 2015, there were no Level 3 investments.
The accompanying notes are an integral part of the financial statements.
| Schedule of Investments | October 31, 2015 |
| | |
| Global X MSCI Norway ETF |
Sector Weightings (unaudited)†:
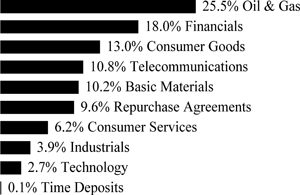
† Sector weightings percentages are based on the total market value of investments. Repurchase agreements purchased from cash collateral received for securities lending activity are included in total investments. Please see Note 2 and Note 8 in Notes to Financial Statements for more detailed information.
| | | Shares | | | Value | |
| COMMON STOCK — 99.7% |
| NORWAY— 97.2% | | | | | | | | |
| Basic Materials — 11.2% | | | | | | | | |
| Borregaard | | | 77,597 | | | $ | 415,413 | |
| Norsk Hydro | | | 857,654 | | | | 3,087,303 | |
| Yara International | | | 84,067 | | | | 3,831,885 | |
| | | | | | | | 7,334,601 | |
| Consumer Goods — 14.3% | | | | | | | | |
| Austevoll Seafood | | | 99,318 | | | | 613,270 | |
| Bakkafrost P | | | 27,785 | | | | 896,417 | |
| Kongsberg Automotive Holding * | | | 361,893 | | | | 209,562 | |
| Leroy Seafood Group | | | 20,800 | | | | 732,516 | |
| Marine Harvest | | | 215,531 | | | | 2,901,153 | |
| Orkla | | | 387,793 | | | | 3,311,121 | |
| Salmar | | | 38,503 | | | | 632,480 | |
| | | | | | | | 9,296,519 | |
| Consumer Services — 6.8% | | | | | | | | |
| Norwegian Air Shuttle * (A) | | | 20,711 | | | | 764,382 | |
| Schibsted, Cl A | | | 45,790 | | | | 1,542,243 | |
| Schibsted, Cl B * | | | 53,936 | | | | 1,689,125 | |
| XXL (B) | | | 39,544 | | | | 424,096 | |
| | | | | | | | 4,419,846 | |
| Financials — 20.0% | | | | | | | | |
| Aker, Cl A | | | 23,200 | | | | 459,240 | |
| DnB | | | 535,148 | | | | 6,842,872 | |
| Entra (B) | | | 56,910 | | | | 485,919 | |
| Gjensidige Forsikring | | | 150,548 | | | | 2,298,660 | |
| Norwegian Property | | | 237,368 | | | | 258,076 | |
The accompanying notes are an integral part of the financial statements.
| Schedule of Investments | October 31, 2015 |
| | |
| Global X MSCI Norway ETF |
| | | Shares | | | Value | |
| COMMON STOCK — continued |
| Financials — continued | | | | | | | | |
| Protector Forsikring | | | 43,209 | | | $ | 312,765 | |
| Selvaag Bolig | | | 50,468 | | | | 143,737 | |
| Sparebank 1 Nord Norge | | | 74,939 | | | | 309,965 | |
| SpareBank 1 SMN | | | 97,700 | | | | 614,825 | |
| Storebrand * | | | 364,588 | | | | 1,280,957 | |
| | | | | | | | 13,007,016 | |
| Industrials — 4.2% | | | | | | | | |
| Avance Gas Holding (A) (B) | | | 20,030 | | | | 276,952 | |
| BW LPG (B) | | | 59,250 | | | | 404,018 | |
| Golden Ocean Group* | | | 96,543 | | | | 188,253 | |
| Hexagon Composites (A) | | | 78,200 | | | | 121,064 | |
| Hoegh LNG Holdings | | | 47,918 | | | | 577,612 | |
| Ocean Yield (A) | | | 40,607 | | | | 328,722 | |
| Stolt-Nielsen | | | 28,890 | | | | 392,629 | |
| Thin Film Electronics * (A) | | | 391,749 | | | | 185,185 | |
| Wilh Wilhelmsen, Cl B | | | 57,827 | | | | 252,171 | |
| | | | | | | | 2,726,606 | |
| Oil & Gas — 25.8% | | | | | | | | |
| Akastor SA | | | 129,986 | | | | 170,513 | |
| Aker Solutions | | | 122,686 | | | | 492,959 | |
| BW Offshore | | | 390,700 | | | | 163,450 | |
| Det Norske Oljeselskap * | | | 89,672 | | | | 552,648 | |
| DNO International * (A) | | | 512,284 | | | | 515,807 | |
| Fred Olsen Energy | | | 31,360 | | | | 145,834 | |
| Petroleum Geo-Services (A) | | | 158,790 | | | | 663,924 | |
| ProSafe | | | 188,770 | | | | 524,250 | |
| Renewable Energy * (A) | | | 1,683,894 | | | | 303,474 | |
| Scatec Solar (A) (B) | | | 35,700 | | | | 178,040 | |
| Statoil | | | 623,117 | | | | 10,029,608 | |
| Subsea 7 | | | 187,324 | | | | 1,466,616 | |
| TGS Nopec Geophysical | | | 75,940 | | | | 1,503,220 | |
| | | | | | | | 16,710,343 | |
| Technology — 3.0% | | | | | | | | |
| Atea | | | 64,383 | | | | 601,085 | |
| Nordic Semiconductor * (A) | | | 134,144 | | | | 647,591 | |
| Opera Software (A) | | | 112,920 | | | | 707,935 | |
| | | | | | | | 1,956,611 | |
| Telecommunications — 11.9% | | | | | | | | |
| Telenor | | | 409,116 | | | | 7,750,277 | |
| TOTAL NORWAY | | | | | | | 63,201,819 | |
The accompanying notes are an integral part of the financial statements.
| Schedule of Investments | October 31, 2015 |
| | |
| Global X MSCI Norway ETF |
| | | Shares/Face
Amount(1) | | | Value | |
| COMMON STOCK — continued |
| UNITED KINGDOM— 2.5% | | | | | | | | |
| Oil & Gas — 2.5% | | | | | | | | |
| Seadrill * | | | 258,038 | | | $ | 1,622,305 | |
| TOTAL COMMON STOCK | | | | | | | | |
| (Cost $101,513,002) | | | | | | | 64,824,124 | |
| REPURCHASE AGREEMENTS (C) — 10.6% | | | | | | | | |
| Barclays Bank | | | | | | | | |
0.070%, dated 10/30/15, to be repurchased on 11/02/15 repurchase price
$5,000,029 (collateralized by U.S. Treasury Obligations, ranging in par
value $11-$2,850,422, 0.000%-2.750%, 11/05/15-02/15/45 with a total
market value of $5,100,000) | | | 5,000,000 | | | | 5,000,000 | |
| Deutsche Bank | | | | | | | | |
0.050%, dated 10/30/15, to be repurchased on 11/02/15 repurchase price
$1,910,374 (collateralized by U.S. Treasury Bills, par value $1,910,374,
3.250%, 07/31/16 with a total market value of $1,962,909) | | | 1,910,366 | | | | 1,910,366 | |
| TOTAL REPURCHASE AGREEMENTS | | | | | | | | |
| (Cost $6,910,366) | | | | | | | 6,910,366 | |
| TIME DEPOSITS — 0.1% | | | | | | | | |
| Brown Brothers Harriman | | | | | | | | |
| 0.030%, 11/02/15 | | | 51,859 | | | | 51,859 | |
| 0.121%, 11/02/15, NOK | | | 608 | | | | 72 | |
| TOTAL TIME DEPOSITS | | | | | | | | |
| (Cost $51,931) | | | | | | | 51,931 | |
| TOTAL INVESTMENTS — 110.4% | | | | | | | | |
| (Cost $108,475,299) | | | | | | $ | 71,786,421 | |
Percentages are based on Net Assets of $65,023,841.
| * | Non-income producing security. |
| (1) | In U.S. Dollars unless otherwise indicated. |
| (A) | This security or a partial position of this security is on loan at October 31, 2015. The total value of securities on loan at October 31, 2015 was $1,870,159. |
| (B) | Security sold within terms of a private placement memorandum, exempt from registration under Section 144A of the Securities Act of 1933, as amended, and may be sold only to dealers in that program or other "accredited investors." These securities have been determined to be liquid under guidelines established by the board of Trustees. |
| (C) | This security was purchased with cash collateral held from securities on loan. The total value of such securities as of October 31, 2015 was $6,910,366. |
Cl — Class
NOK — Norwegian Krone
The accompanying notes are an integral part of the financial statements.
| Schedule of Investments | October 31, 2015 |
| | |
| Global X MSCI Norway ETF |
The following is a summary of the inputs used as of October 31, 2015, in valuing the Fund's investments carried at value:
| Investments in Securities | | Level 1 | | | Level 2 | | | Level 3 | | | Total | |
| Common Stock | | $ | 64,824,124 | | | $ | — | | | $ | — | | | $ | 64,824,124 | |
| Repurchase Agreements | | | — | | | | 6,910,366 | | | | — | | | | 6,910,366 | |
| Time Deposits | | | — | | | | 51,931 | | | | — | | | | 51,931 | |
| Total Investments in Securities | | $ | 64,824,124 | | | $ | 6,962,297 | | | $ | — | | | $ | 71,786,421 | |
For the year ended October 31, 2015, there have been no transfers between Level 1, Level 2 and Level 3 investments.
As of October 31, 2015, there were no Level 3 investments.
The accompanying notes are an integral part of the financial statements.
| Schedule of Investments | October 31, 2015 |
| | |
| Global X FTSE Nordic Region ETF |
Sector Weightings (unaudited)†:
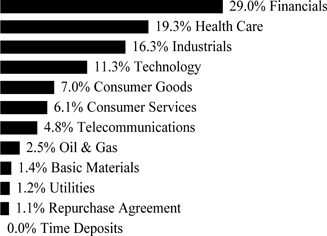
† Sector weightings percentages are based on the total market value of investments. Repurchase agreements purchased from cash collateral received for securities lending activity are included in total investments. Please see Note 2 and Note 8 in Notes to Financial Statements for more detailed information.
| | | Shares | | | Value | |
| COMMON STOCK — 99.1% |
| DENMARK— 28.4% | | | | | | | | |
| Consumer Goods — 3.8% | | | | | | | | |
| Carlsberg, Cl B | | | 9,781 | | | $ | 805,522 | |
| Pandora | | | 10,700 | | | | 1,240,187 | |
| | | | | | | | 2,045,709 | |
| Financials — 3.5% | | | | | | | | |
| Danske Bank | | | 66,573 | | | | 1,839,060 | |
| Health Care — 19.4% | | | | | | | | |
| Coloplast, Cl B | | | 9,265 | | | | 667,785 | |
| Novo Nordisk ADR | | | 160,052 | | | | 8,511,565 | |
| Novozymes, Cl B | | | 21,090 | | | | 982,463 | |
| | | | | | | | 10,161,813 | |
| Industrials — 1.7% | | | | | | | | |
| A P Moller - Maersk, Cl B | | | 609 | | | | 902,062 | |
| TOTAL DENMARK | | | | | | | 14,948,644 | |
| FINLAND— 13.2% | | | | | | | | |
| Financials — 4.1% | | | | | | | | |
| Sampo, Cl A | | | 44,171 | | | | 2,170,344 | |
| Industrials — 2.9% | | | | | | | | |
| Kone, Cl B | | | 35,484 | | | | 1,523,218 | |
| Technology — 5.0% | | | | | | | | |
| Nokia ADR | | | 351,966 | | | | 2,611,588 | |
| Utilities — 1.2% | | | | | | | | |
| Fortum | | | 41,149 | | | | 620,467 | |
| TOTAL FINLAND | | | | | | | 6,925,617 | |
The accompanying notes are an integral part of the financial statements.
| Schedule of Investments | October 31, 2015 |
| | |
| Global X FTSE Nordic Region ETF |
| | | Shares | | | Value | |
| COMMON STOCK — continued |
| NORWAY— 8.7% | | | | | | | | |
| Basic Materials — 1.4% | | | | | | | | |
| Yara International | | | 16,267 | | | $ | 741,471 | |
| Financials — 2.4% | | | | | | | | |
| DnB | | | 100,126 | | | | 1,280,299 | |
| Oil & Gas — 2.5% | | | | | | | | |
| Statoil ADR (A) | | | 82,117 | | | | 1,327,011 | |
| Telecommunications — 2.4% | | | | | | | | |
| Telenor | | | 64,846 | | | | 1,228,440 | |
| TOTAL NORWAY | | | | | | | 4,577,221 | |
| SWEDEN— 48.8% | | | | | | | | |
| Consumer Goods — 3.1% | | | | | | | | |
| Svenska Cellulosa, Cl B | | | 54,323 | | | | 1,612,234 | |
| Consumer Services — 6.1% | | | | | | | | |
| Hennes & Mauritz, Cl B | | | 82,085 | | | | 3,212,461 | |
| Financials — 19.1% | | | | | | | | |
| Investor, Cl B | | | 42,371 | | | | 1,583,869 | |
| Nordea Bank | | | 274,665 | | | | 3,056,883 | |
| Skandinaviska Enskilda Banken, Cl A | | | 136,035 | | | | 1,440,304 | |
| Svenska Handelsbanken, Cl A | | | 124,091 | | | | 1,698,205 | |
| Swedbank, Cl A | | | 98,045 | | | | 2,264,367 | |
| | | | | | | | 10,043,628 | |
| Industrials — 11.7% | | | | | | | | |
| Assa Abloy, Cl B | | | 87,927 | | | | 1,760,414 | |
| Atlas Copco, Cl A | | | 57,933 | | | | 1,521,509 | |
| Sandvik | | | 92,051 | | | | 866,202 | |
| SKF, Cl B | | | 38,479 | | | | 681,578 | |
| Volvo, Cl B | | | 132,663 | | | | 1,386,634 | |
| | | | | | | | 6,216,337 | |
| Technology — 6.4% | | | | | | | | |
| Ericsson ADR | | | 257,517 | | | | 2,508,215 | |
| Hexagon, Cl B | | | 23,730 | | | | 829,479 | |
| | | | | | | | 3,337,694 | |
| Telecommunications — 2.4% | | | | | | | | |
| TeliaSonera | | | 242,561 | | | | 1,249,235 | |
| TOTAL SWEDEN | | | | | | | 25,671,589 | |
| TOTAL COMMON STOCK | | | | | | | | |
| (Cost $51,204,366) | | | | | | | 52,123,071 | |
The accompanying notes are an integral part of the financial statements.
| Schedule of Investments | October 31, 2015 |
| | |
| Global X FTSE Nordic Region ETF |
| | | Shares/Face
Amount(1) | | | Value | |
| |
| REPURCHASE AGREEMENT (B) — 1.1% |
| Deutsche Bank | | | | | | | | |
0.050%, dated 10/30/15, to be repurchased on 11/02/15 repurchase price
$595,002 (collateralized by U.S. Treasury Bills, par value $595,002,
3.250%, 07/31/16 with a total market value of $611,365) | | | | | | | | |
| (Cost $595,000) | | | 595,000 | | | $ | 595,000 | |
| TIME DEPOSITS — 0.0% | | | | | | | | |
| Brown Brothers Harriman | | | | | | | | |
| 0.030%, 11/02/15 | | | 5,117 | | | | 5,117 | |
| 0.121%, 11/02/15, NOK | | | 27 | | | | 3 | |
| TOTAL TIME DEPOSITS | | | | | | | | |
| (Cost $5,120) | | | | | | | 5,120 | |
| TOTAL INVESTMENTS — 100.2% | | | | | | | | |
| (Cost $51,804,486) | | | | | | $ | 52,723,191 | |
Percentages are based on Net Assets of $52,595,789.
| (1) | In U.S. Dollars unless otherwise indicated. |
| (A) | This security or a partial position of this security is on loan at October 31, 2015. The total value of securities on loan at October 31, 2015 was $565,600. |
| (B) | This security was purchased with cash collateral held from securities on loan. The total value of such securities as of October 31, 2015 was $595,000. |
ADR — American Depositary Receipt
Cl — Class
NOK — Norwegian Krone
The following is a summary of the inputs used as of October 31, 2015, in valuing the Fund's investments carried at value:
| Investments in Securities | | Level 1 | | | Level 2 | | | Level 3 | | | Total | |
| Common Stock | | $ | 52,123,071 | | | $ | — | | | $ | — | | | $ | 52,123,071 | |
| Repurchase Agreement | | | — | | | | 595,000 | | | | — | | | | 595,000 | |
| Time Deposits | | | — | | | | 5,120 | | | | — | | | | 5,120 | |
| Total Investments in Securities | | $ | 52,123,071 | | | $ | 600,120 | | | $ | — | | | $ | 52,723,191 | |
For the year ended October 31, 2015, there have been no transfers between Level 1, Level 2 and Level 3 investments.
As of October 31, 2015, there were no Level 3 investments.
The accompanying notes are an integral part of the financial statements.
| Schedule of Investments | October 31, 2015 |
| Global X MSCI Nigeria ETF |
Sector Weightings (unaudited)†:

† Sector weightings percentages are based on the total market value of investments.
| | | Shares | | | Value | |
| COMMON STOCK — 99.9% |
| NIGERIA— 99.9% | | | | | | | | |
| Consumer Goods — 36.2% | | | | | | | | |
| Flour Mills of Nigeria | | | 5,922,489 | | | $ | 629,590 | |
| Guinness Nigeria | | | 1,808,151 | | | | 1,135,488 | |
| Nestle Nigeria | | | 433,807 | | | | 1,798,016 | |
| Nigerian Breweries | | | 6,337,189 | | | | 4,356,917 | |
| Unilever Nigeria | | | 5,081,138 | | | | 987,382 | |
| | | | | | | | 8,907,393 | |
| Financials — 46.8% | | | | | | | | |
| Access Bank | | | 36,732,480 | | | | 848,879 | |
| Diamond Bank | | | 42,125,168 | | | | 554,473 | |
| Ecobank Transnational * | | | 11,886,296 | | | | 1,110,701 | |
| FBN Holdings | | | 36,441,515 | | | | 933,694 | |
| First City Monument Bank | | | 44,673,779 | | | | 439,892 | |
| Guaranty Trust Bank | | | 21,455,950 | | | | 2,488,912 | |
| Stanbic IBTC Holdings | | | 11,517,943 | | | | 1,094,219 | |
| Transnational Corp of Nigeria | | | 66,036,000 | | | | 600,478 | |
| UAC of Nigeria | | | 5,285,024 | | | | 703,077 | |
| United Bank for Africa | | | 50,326,762 | | | | 884,922 | |
| Zenith Bank | | | 20,971,600 | | | | 1,854,309 | |
| | | | | | | | 11,513,556 | |
| Industrials — 9.3% | | | | | | | | |
| Dangote Cement | | | 1,504,100 | | | | 1,231,919 | |
| Lafarge Africa | | | 2,208,933 | | | | 1,065,459 | |
| | | | | | | | 2,297,378 | |
| Oil & Gas — 7.6% | | | | | | | | |
| Forte Oil | | | 1,010,363 | | | | 1,472,018 | |
| Oando * | | | 13,622,165 | | | | 411,300 | |
| | | | | | | | 1,883,318 | |
| TOTAL COMMON STOCK | | | | | | | | |
| (Cost $32,253,655) | | | | | | | 24,601,645 | |
The accompanying notes are an integral part of the financial statements.
| Schedule of Investments | October 31, 2015 |
| Global X MSCI Nigeria ETF |
| | | Shares/Face
Amount(1) | | | Value | |
| TIME DEPOSITS — 0.1% |
| Brown Brothers Harriman | | | | | | | | |
| 0.030%, 11/02/15 | | | 20,411 | | | $ | 20,411 | |
| 0.080%, 11/02/15, GBP | | | 1 | | | | 1 | |
| 0.121%, 11/02/15, NOK | | | 18 | | | | 2 | |
| TOTAL TIME DEPOSITS | | | | | | | | |
| (Cost $20,414) | | | | | | | 20,414 | |
| TOTAL INVESTMENTS — 100.0% | | | | | | | | |
| (Cost $32,274,069) | | | | | | $ | 24,622,059 | |
Percentages are based on Net Assets of $24,623,123.
| * | Non-income producing security. |
| (1) | In U.S. Dollars unless otherwise indicated. |
| GBP — British Pound Sterling |
NOK — Norwegian Krone
The following is a summary of the inputs used as of October 31, 2015, in valuing the Fund's investments carried at value:
| Investments in Securities | | Level 1 | | | Level 2 | | | Level 3 | | | Total | |
| Common Stock | | $ | 23,129,627 | | | $ | 1,472,018 | | | $ | — | | | $ | 24,601,645 | |
| Time Deposits | | | — | | | | 20,414 | | | | — | | | | 20,414 | |
| Total Investments in Securities | | $ | 23,129,627 | | | $ | 1,492,432 | | | $ | — | | | $ | 24,622,059 | |
For the year ended October 31, 2015, the transfers between Level 1 and Level 2, in the amount of $3,494,926, were due to changes in the availability of observable inputs to determine fair value. Transfers between levels are recognized at period end.
As of October 31, 2015, there were no Level 3 investments.
The accompanying notes are an integral part of the financial statements.
| Schedule of Investments | October 31, 2015 |
| | |
| Global X Next Emerging & Frontier ETF |
Sector Weightings (unaudited)†:
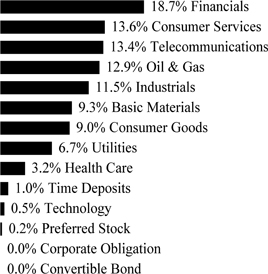
† Sector weightings percentages are based on the total market value of investments.
| | | Shares | | | Value | |
| COMMON STOCK — 99.5% |
| ARGENTINA— 2.5% | | | | | | | | |
| Consumer Services — 1.2% | | | | | | | | |
| MercadoLibre | | | 12,915 | | | $ | 1,270,448 | |
| Oil & Gas — 1.3% | | | | | | | | |
| YPF ADR | | | 67,569 | | | | 1,443,274 | |
| TOTAL ARGENTINA | | | | | | | 2,713,722 | |
| AUSTRALIA— 1.2% | | | | | | | | |
| Oil & Gas — 1.2% | | | | | | | | |
| Oil Search | | | 236,827 | | | | 1,326,369 | |
| BANGLADESH— 1.0% | | | | | | | | |
| Health Care — 0.3% | | | | | | | | |
| Square Pharmaceuticals | | | 120,719 | | | | 376,980 | |
| Telecommunications — 0.7% | | | | | | | | |
| GrameenPhone | | | 222,900 | | | | 712,112 | |
| TOTAL BANGLADESH | | | | | | | 1,089,092 | |
| CANADA— 1.7% | | | | | | | | |
| Basic Materials — 1.7% | | | | | | | | |
| Endeavour Mining * | | | 306,992 | | | | 159,556 | |
| First Quantum Minerals | | | 85,793 | | | | 457,703 | |
| Turquoise Hill Resources * | | | 213,501 | | | | 577,669 | |
| Yamana Gold | | | 291,602 | | | | 638,608 | |
| | | | | | | | 1,833,536 | |
The accompanying notes are an integral part of the financial statements.
| Schedule of Investments | October 31, 2015 |
| | |
| Global X Next Emerging & Frontier ETF |
| | | Shares | | | Value | |
| COMMON STOCK — continued |
| TOTAL CANADA | | | | | | $ | 1,833,536 | |
| CHILE— 4.3% | | | | | | | | |
| Basic Materials — 0.2% | | | | | | | | |
| Empresas CMPC | | | 88,800 | | | | 219,405 | |
| Consumer Services — 1.4% | | | | | | | | |
| Cencosud | | | 66,600 | | | | 146,363 | |
| Latam Airlines Group * | | | 80,080 | | | | 428,129 | |
| SACI Falabella | | | 135,680 | | | | 910,595 | |
| | | | | | | | 1,485,087 | |
| Financials — 0.4% | | | | | | | | |
| Banco de Chile | | | 1,969,299 | | | | 208,595 | |
| Banco Santander Chile | | | 4,344,800 | | | | 206,463 | |
| | | | | | | | 415,058 | |
| Oil & Gas — 0.2% | | | | | | | | |
| Empresas COPEC | | | 18,870 | | | | 176,951 | |
| Utilities — 2.1% | | | | | | | | |
| AES Gener | | | 215,400 | | | | 103,664 | |
| Empresa Nacional de Electricidad | | | 883,449 | | | | 1,107,874 | |
| Enersis | | | 4,005,853 | | | | 1,057,771 | |
| | | | | | | | 2,269,309 | |
| TOTAL CHILE | | | | | | | 4,565,810 | |
| CHINA— 0.2% | | | | | | | | |
| Oil & Gas — 0.2% | | | | | | | | |
| SPT Energy Group | | | 2,439,400 | | | | 239,216 | |
| COLOMBIA— 0.6% | | | | | | | | |
| Consumer Services — 0.1% | | | | | | | | |
| Almacenes Exito | | | 12,210 | | | | 55,149 | |
| Financials — 0.1% | | | | | | | | |
| Grupo de Inversiones Suramericana | | | 10,401 | | | | 132,301 | |
| Industrials — 0.1% | | | | | | | | |
| Cementos Argos | | | 39,846 | | | | 132,292 | |
| Oil & Gas — 0.3% | | | | | | | | |
| Ecopetrol | | | 583,448 | | | | 272,403 | |
| TOTAL COLOMBIA | | | | | | | 592,145 | |
| CZECH REPUBLIC— 1.2% | | | | | | | | |
| Financials — 0.2% | | | | | | | | |
| Komercni Banka | | | 1,221 | | | | 253,881 | |
| Utilities — 1.0% | | | | | | | | |
| CEZ | | | 51,941 | | | | 1,044,002 | |
The accompanying notes are an integral part of the financial statements.
| Schedule of Investments | October 31, 2015 |
| | |
| Global X Next Emerging & Frontier ETF |
| | | Shares | | | Value | |
| COMMON STOCK — continued |
| TOTAL CZECH REPUBLIC | | | | | | $ | 1,297,883 | |
| EGYPT— 0.5% | | | | | | | | |
| Financials — 0.3% | | | | | | | | |
| Commercial International Bank Egypt SAE | | | 54,600 | | | | 359,011 | |
| Telecommunications — 0.2% | | | | | | | | |
| Global Telecom Holding SAE * | | | 282,503 | | | | 65,788 | |
| Telecom Egypt | | | 171,900 | | | | 147,495 | |
| | | | | | | | 213,283 | |
| TOTAL EGYPT | | | | | | | 572,294 | |
| FRANCE— 0.1% | | | | | | | | |
| Oil & Gas — 0.1% | | | | | | | | |
| Etablissements Maurel et Prom | | | 29,941 | | | | 108,451 | |
| HONG KONG— 0.8% | | | | | | | | |
| Consumer Goods — 0.4% | | | | | | | | |
| CP Pokphand * | | | 3,729,700 | | | | 447,558 | |
| Consumer Services — 0.4% | | | | | | | | |
| NagaCorp | | | 645,083 | | | | 457,795 | |
| TOTAL HONG KONG | | | | | | | 905,353 | |
| HUNGARY— 1.0% | | | | | | | | |
| Financials — 0.7% | | | | | | | | |
| OTP Bank | | | 35,910 | | | | 698,571 | |
| Health Care — 0.2% | | | | | | | | |
| Richter Gedeon Nyrt | | | 15,546 | | | | 260,497 | |
| Oil & Gas — 0.1% | | | | | | | | |
| MOL Hungarian Oil & Gas | | | 2,997 | | | | 136,038 | |
| TOTAL HUNGARY | | | | | | | 1,095,106 | |
| INDONESIA— 8.3% | | | | | | | | |
| Consumer Goods — 1.8% | | | | | | | | |
| Astra International | | | 2,335,597 | | | | 1,006,760 | |
| Gudang Garam | | | 85,114 | | | | 267,079 | |
| Indofood CBP Sukses Makmur TBK | | | 222,300 | | | | 214,383 | |
| Indofood Sukses Makmur | | | 444,400 | | | | 179,383 | |
| Unilever Indonesia | | | 103,969 | | | | 281,048 | |
| | | | | | | | 1,948,653 | |
| Financials — 3.2% | | | | | | | | |
| Bank Central Asia | | | 1,461,768 | | | | 1,377,666 | |
| Bank Mandiri | | | 1,936,618 | | | | 1,230,946 | |
| Bank Rakyat Indonesia Persero | | | 1,050,600 | | | | 807,859 | |
| | | | | | | | 3,416,471 | |
The accompanying notes are an integral part of the financial statements.
| Schedule of Investments | October 31, 2015 |
| | |
| Global X Next Emerging & Frontier ETF |
| | | Shares | | | Value | |
| COMMON STOCK — continued |
| Health Care — 0.2% | | | | | | | | |
| Kalbe Farma | | | 2,388,900 | | | $ | 249,580 | |
| Industrials — 1.2% | | | | | | | | |
| Indocement Tunggal Prakarsa | | | 167,200 | | | | 219,880 | |
| Semen Indonesia Persero | | | 1,142,485 | | | | 817,998 | |
| United Tractors | | | 133,200 | | | | 176,140 | |
| | | | | | | | 1,214,018 | |
| Telecommunications — 1.3% | | | | | | | | |
| Telekomunikasi Indonesia Persero | | | 7,208,005 | | | | 1,411,321 | |
| Utilities — 0.6% | | | | | | | | |
| Perusahaan Gas Negara | | | 3,043,939 | | | | 667,165 | |
| TOTAL INDONESIA | | | | | | | 8,907,208 | |
| JAPAN— 0.8% | | | | | | | | |
| Industrials — 0.6% | | | | | | | | |
| Namura Shipbuilding | | | 73,900 | | | | 654,031 | |
| Oil & Gas — 0.2% | | | | | | | | |
| Inpex | | | 20,900 | | | | 200,124 | |
| TOTAL JAPAN | | | | | | | 854,155 | |
| KENYA— 0.3% | | | | | | | | |
| Telecommunications — 0.3% | | | | | | | | |
| Safaricom | | | 2,010,700 | | | | 282,739 | |
| KUWAIT— 0.9% | | | | | | | | |
| Financials — 0.9% | | | | | | | | |
| Kuwait Finance House | | | 349,095 | | | | 645,086 | |
| National Bank of Kuwait SAK | | | 131,219 | | | | 355,055 | |
| TOTAL KUWAIT | | | | | | | 1,000,141 | |
| MALAYSIA— 10.0% | | | | | | | | |
| Basic Materials — 0.2% | | | | | | | | |
| Petronas Chemicals Group | | | 126,990 | | | | 187,706 | |
| Consumer Goods — 0.4% | | | | | | | | |
| British American Tobacco Malaysia | | | 9,985 | | | | 143,685 | |
| IOI | | | 166,000 | | | | 164,609 | |
| Kuala Lumpur Kepong | | | 28,350 | | | | 150,329 | |
| | | | | | | | 458,623 | |
| Consumer Services — 0.3% | | | | | | | | |
| Genting | | | 88,800 | | | | 153,374 | |
| Genting Malaysia | | | 212,000 | | | | 212,197 | |
| | | | | | | | 365,571 | |
The accompanying notes are an integral part of the financial statements.
| Schedule of Investments | October 31, 2015 |
| | |
| Global X Next Emerging & Frontier ETF |
| | | Shares | | | Value | |
| COMMON STOCK — continued |
| Financials — 2.2% | | | | | | | | |
| CIMB Group Holdings | | | 317,370 | | | $ | 340,567 | |
| Malayan Banking | | | 474,026 | | | | 911,419 | |
| Public Bank | | | 250,100 | | | | 1,052,562 | |
| | | | | | | | 2,304,548 | |
| Health Care — 0.3% | | | | | | | | |
| IHH Healthcare | | | 215,252 | | | | 316,164 | |
| Industrials — 1.2% | | | | | | | | |
| MISC | | | 133,200 | | | | 279,981 | |
| Sime Darby | | | 479,699 | | | | 933,493 | |
| | | | | | | | 1,213,474 | |
| Oil & Gas — 0.7% | | | | | | | | |
| Petronas Dagangan | | | 22,200 | | | | 116,271 | |
| Petronas Gas | | | 29,249 | | | | 156,458 | |
| Sapurakencana Petroleum | | | 1,074,967 | | | | 527,975 | |
| | | | | | | | 800,704 | |
| Telecommunications — 3.2% | | | | | | | | |
| Axiata Group | | | 663,667 | | | | 953,172 | |
| DiGi.Com | | | 943,002 | | | | 1,154,607 | |
| Maxis | | | 658,596 | | | | 1,010,276 | |
| Telekom Malaysia | | | 188,085 | | | | 291,584 | |
| | | | | | | | 3,409,639 | |
| Utilities — 1.5% | | | | | | | | |
| Tenaga Nasional | | | 489,873 | | | | 1,443,620 | |
| YTL | | | 420,600 | | | | 147,837 | |
| | | | | | | | 1,591,457 | |
| TOTAL MALAYSIA | | | | | | | 10,647,886 | |
| MEXICO— 10.8% | | | | | | | | |
| Basic Materials — 2.8% | | | | | | | | |
| Fresnillo | | | 82,211 | | | | 926,858 | |
| Grupo Mexico, Cl B | | | 430,668 | | | | 1,049,002 | |
| Industrias Penoles | | | 9,954 | | | | 131,772 | |
| Mexichem | | | 315,317 | | | | 819,734 | |
| | | | | | | | 2,927,366 | |
| Consumer Goods — 1.2% | | | | | | | | |
| Arca Continental | | | 45,938 | | | | 293,242 | |
| Coca-Cola Femsa | | | 22,200 | | | | 170,199 | |
| Gruma, Cl B | | | 26,000 | | | | 398,760 | |
| Grupo Bimbo, Ser A * | | | 88,800 | | | | 250,947 | |
| Grupo Lala, Cl B | | | 84,681 | | | | 216,150 | |
| | | | | | | | 1,329,298 | |
The accompanying notes are an integral part of the financial statements.
| Schedule of Investments | October 31, 2015 |
| | |
| Global X Next Emerging & Frontier ETF |
| | | Shares | | | Value | |
| COMMON STOCK — continued |
| Consumer Services — 2.2% | | | | | | | | |
| Grupo Elektra | | | 8,547 | | | $ | 170,126 | |
| Grupo Televisa | | | 103,421 | | | | 601,551 | |
| Wal-Mart de Mexico | | | 549,680 | | | | 1,454,950 | |
| | | | | | | | 2,226,627 | |
| Financials — 1.1% | | | | | | | | |
| Grupo Financiero Banorte, Cl O | | | 114,984 | | | | 615,173 | |
| Grupo Financiero Inbursa, Cl O | | | 288,600 | | | | 577,942 | |
| | | | | | | | 1,193,115 | |
| Industrials — 2.1% | | | | | | | | |
| Alfa, Cl A | | | 521,870 | | | | 1,081,076 | |
| Cemex, Cl Preference * | | | 574,838 | | | | 363,779 | |
| Grupo Aeroportuario del Sureste, Cl B | | | 13,200 | | | | 204,428 | |
| Promotora y Operadora de Infraestructura * | | | 52,513 | | | | 659,782 | |
| | | | | | | | 2,309,065 | |
| Telecommunications — 1.1% | | | | | | | | |
| America Movil | | | 1,315,367 | | | | 1,169,834 | |
| Utilities — 0.3% | | | | | | | | |
| Infraestructura Energetica Nova | | | 73,240 | | | | 351,782 | |
| TOTAL MEXICO | | | | | | | 11,507,087 | |
| NIGERIA— 0.3% | | | | | | | | |
| Consumer Goods — 0.1% | | | | | | | | |
| Nigerian Breweries | | | 198,400 | | | | 136,403 | |
| Financials — 0.2% | | | | | | | | |
| Guaranty Trust Bank | | | 1,400,900 | | | | 162,506 | |
| TOTAL NIGERIA | | | | | | | 298,909 | |
| OMAN— 0.5% | | | | | | | | |
| Financials — 0.1% | | | | | | | | |
| BankMuscat SAOG | | | 65,410 | | | | 91,064 | |
| Telecommunications — 0.4% | | | | | | | | |
| Oman Telecommunications SAOG | | | 99,510 | | | | 421,302 | |
| TOTAL OMAN | | | | | | | 512,366 | |
| PAKISTAN— 1.0% | | | | | | | | |
| Basic Materials — 0.2% | | | | | | | | |
| Fauji Fertilizer | | | 124,500 | | | | 148,099 | |
| Industrials — 0.4% | | | | | | | | |
| Lucky Cement * | | | 84,000 | | | | 426,202 | |
| Oil & Gas — 0.4% | | | | | | | | |
| Oil & Gas Development | | | 94,300 | | | | 123,294 | |
The accompanying notes are an integral part of the financial statements.
| Schedule of Investments | October 31, 2015 |
| | |
| Global X Next Emerging & Frontier ETF |
| | | Shares | | | Value | |
| COMMON STOCK — continued |
| Oil & Gas — continued | | | | | | | | |
| Pakistan Petroleum | | | 276,600 | | | $ | 333,199 | |
| | | | | | | | 456,493 | |
| TOTAL PAKISTAN | | | | | | | 1,030,794 | |
| PANAMA— 0.7% | | | | | | | | |
| Consumer Services — 0.7% | | | | | | | | |
| Copa Holdings, Cl A | | | 15,679 | | | | 792,103 | |
| PERU— 0.6% | | | | | | | | |
| Financials — 0.6% | | | | | | | | |
| Credicorp Ltd. | | | 5,239 | | | | 592,950 | |
| PHILIPPINES— 5.0% | | | | | | | | |
| Basic Materials — 0.1% | | | | | | | | |
| DMCI Holdings | | | 627,830 | | | | 166,277 | |
| Consumer Goods — 0.7% | | | | | | | | |
| JG Summit Holdings | | | 189,449 | | | | 288,908 | |
| Universal Robina | | | 94,817 | | | | 406,243 | |
| | | | | | | | 695,151 | |
| Consumer Services — 1.4% | | | | | | | | |
| Jollibee Foods | | | 42,100 | | | | 185,233 | |
| SM Investments | | | 67,334 | | | | 1,258,378 | |
| | | | | | | | 1,443,611 | |
| Financials — 0.6% | | | | | | | | |
| Ayala Land | | | 399,900 | | | | 306,203 | |
| SM Prime Holdings | | | 782,297 | | | | 360,906 | |
| | | | | | | | 667,109 | |
| Industrials — 0.6% | | | | | | | | |
| Alliance Global Group | | | 455,400 | | | | 177,413 | |
| Ayala | | | 19,980 | | | | 332,858 | |
| International Container Terminal Services | | | 88,800 | | | | 156,472 | |
| | | | | | | | 666,743 | |
| Telecommunications — 1.1% | | | | | | | | |
| Globe Telecom | | | 3,170 | | | | 154,370 | |
| Philippine Long Distance Telephone | | | 21,564 | | | | 1,013,259 | |
| | | | | | | | 1,167,629 | |
| Utilities — 0.5% | | | | | | | | |
| Aboitiz Power | | | 261,558 | | | | 234,631 | |
| Manila Electric | | | 39,960 | | | | 277,381 | |
| | | | | | | | 512,012 | |
| TOTAL PHILIPPINES | | | | | | | 5,318,532 | |
The accompanying notes are an integral part of the financial statements.
| Schedule of Investments | October 31, 2015 |
| | |
| Global X Next Emerging & Frontier ETF |
| | | Shares | | | Value | |
| COMMON STOCK — continued |
| POLAND— 5.1% | | | | | | | | |
| Basic Materials — 0.8% | | | | | | | | |
| KGHM Polska Miedz | | | 34,946 | | | $ | 815,193 | |
| Consumer Goods — 0.1% | | | | | | | | �� |
| LPP * | | | 77 | | | | 145,805 | |
| Financials — 1.5% | | | | | | | | |
| Bank Pekao | | | 11,824 | | | | 461,185 | |
| Bank Zachodni | | | 2,355 | | | | 190,557 | |
| Powszechna Kasa Oszczednosci Bank Polski | | | 56,891 | | | | 422,974 | |
| Powszechny Zaklad Ubezpieczen | | | 5,514 | | | | 537,852 | |
| | | | | | | | 1,612,568 | |
| Oil & Gas — 1.7% | | | | | | | | |
| Polski Koncern Naftowy Orlen S.A. | | | 93,056 | | | | 1,516,329 | |
| Polskie Gornictwo Naftowe i Gazownictwo | | | 150,800 | | | | 268,548 | |
| | | | | | | | 1,784,877 | |
| Telecommunications — 0.2% | | | | | | | | |
| Orange Polska * | | | 102,300 | | | | 188,286 | |
| Utilities — 0.8% | | | | | | | | |
| PGE | | | 231,750 | | | | 865,720 | |
| TOTAL POLAND | | | | | | | 5,412,449 | |
| QATAR— 1.9% | | | | | | | | |
| Financials — 0.7% | | | | | | | | |
| Qatar National Bank | | | 15,020 | | | | 753,011 | |
| Industrials — 0.9% | | | | | | | | |
| Industries Qatar QSC | | | 30,136 | | | | 1,018,262 | |
| Telecommunications — 0.3% | | | | | | | | |
| Ooredoo QSC | | | 12,790 | | | | 273,350 | |
| TOTAL QATAR | | | | | | | 2,044,623 | |
| RUSSIA— 0.1% | | | | | | | | |
| Oil & Gas — 0.1% | | | | | | | | |
| Bashneft OAO * | | | 5,250 | | | | 157,882 | |
| SINGAPORE— 0.7% | | | | | | | | |
| Consumer Goods — 0.7% | | | | | | | | |
| Thai Beverage | | | 1,656,007 | | | | 798,147 | |
| SOUTH AFRICA— 11.4% | | | | | | | | |
| Basic Materials — 2.0% | | | | | | | | |
| Anglo American Platinum * | | | 16,095 | | | | 282,937 | |
| AngloGold Ashanti * | | | 45,130 | | | | 384,826 | |
The accompanying notes are an integral part of the financial statements.
| Schedule of Investments | October 31, 2015 |
| | |
| Global X Next Emerging & Frontier ETF |
| | | Shares | | | Value | |
| COMMON STOCK — continued |
| Basic Materials — continued | | | | | | | | |
| Gold Fields ADR | | | 302,068 | | | $ | 764,232 | |
| Impala Platinum Holdings | | | 56,620 | | | | 155,097 | |
| Kumba Iron Ore | | | 18,336 | | | | 79,577 | |
| Sasol | | | 14,943 | | | | 479,656 | |
| | | | | | | | 2,146,325 | |
| Consumer Goods — 1.6% | | | | | | | | |
| Steinhoff International Holdings | | | 187,911 | | | | 1,152,918 | |
| Tiger Brands | | | 23,483 | | | | 538,556 | |
| | | | | | | | 1,691,474 | |
| Consumer Services — 3.2% | | | | | | | | |
| Mr Price Group | | | 17,400 | | | | 267,806 | |
| Naspers, Cl N | | | 13,703 | | | | 2,011,783 | |
| Shoprite Holdings | | | 40,204 | | | | 419,318 | |
| Woolworths Holdings | | | 99,318 | | | | 737,477 | |
| | | | | | | | 3,436,384 | |
| Financials — 1.3% | | | | | | | | |
| FirstRand | | | 208,480 | | | | 766,927 | |
| Standard Bank Group | | | 59,965 | | | | 625,116 | |
| | | | | | | | 1,392,043 | |
| Health Care — 1.6% | | | | | | | | |
| Aspen Pharmacare Holdings | | | 26,441 | | | | 595,230 | |
| Mediclinic International | | | 93,156 | | | | 820,323 | |
| Netcare | | | 117,400 | | | | 335,109 | |
| | | | | | | | 1,750,662 | |
| Industrials — 0.7% | | | | | | | | |
| Bidvest Group | | | 27,910 | | | | 715,607 | |
| Telecommunications — 1.0% | | | | | | | | |
| MTN Group | | | 36,143 | | | | 413,088 | |
| Vodacom Group | | | 64,310 | | | | 697,707 | |
| | | | | | | | 1,110,795 | |
| TOTAL SOUTH AFRICA | | | | | | | 12,243,290 | |
| SOUTH KOREA— 0.5% | | | | | | | | |
| Consumer Goods — 0.5% | | | | | | | | |
| Youngone * | | | 11,700 | | | | 491,584 | |
| THAILAND— 9.5% | | | | | | | | |
| Consumer Goods — 0.5% | | | | | | | | |
| Charoen Pokphand Foods NVDR | | | 924,757 | | | | 538,201 | |
| Consumer Services — 0.8% | | | | | | | | |
| CP ALL NVDR | | | 602,222 | | | | 846,590 | |
The accompanying notes are an integral part of the financial statements.
| Schedule of Investments | October 31, 2015 |
| | |
| Global X Next Emerging & Frontier ETF |
| | | Shares | | | Value | |
| COMMON STOCK — continued |
| Financials — 0.5% | | | | | | | | |
| Siam Commercial Bank NVDR | | | 145,860 | | | $ | 547,475 | |
| Health Care — 0.5% | | | | | | | | |
| Bangkok Dusit Medical Services NVDR | | | 600,600 | | | | 320,838 | |
| Bumrungrad Hospital NVDR | | | 34,400 | | | | 208,910 | |
| | | | | | | | 529,748 | |
| Industrials — 2.9% | | | | | | | | |
| Airports of Thailand NVDR | | | 109,494 | | | | 917,388 | |
| CH Karnchang NVDR | | | 1,156,800 | | | | 918,805 | |
| Siam Cement NVDR | | | 103,100 | | | | 1,316,016 | |
| | | | | | | | 3,152,209 | |
| Oil & Gas — 2.0% | | | | | | | | |
| PTT Exploration & Production NVDR | | | 257,960 | | | | 529,446 | |
| PTT Global Chemical NVDR | | | 313,231 | | | | 490,972 | |
| PTT NVDR | | | 140,991 | | | | 1,090,111 | |
| | | | | | | | 2,110,529 | |
| Technology — 0.6% | | | | | | | | |
| Intouch Holdings NVDR | | | 292,730 | | | | 617,270 | |
| Telecommunications — 1.7% | | | | | | | | |
| Advanced Info Service NVDR | | | 177,454 | | | | 1,162,488 | |
| Total Access Communication NVDR | | | 210,821 | | | | 403,060 | |
| True NVDR * | | | 1,011,500 | | | | 287,232 | |
| | | | | | | | 1,852,780 | |
| TOTAL THAILAND | | | | | | | 10,194,802 | |
| TURKEY— 9.3% | | | | | | | | |
| Basic Materials — 1.6% | | | | | | | | |
| Eregli Demir ve Celik Fabrikalari | | | 1,177,873 | | | | 1,674,816 | |
| Consumer Goods — 0.4% | | | | | | | | |
| Anadolu Efes Biracilik Ve Malt Sanayii | | | 16,650 | | | | 131,526 | |
| Coca-Cola Icecek | | | 9,990 | | | | 126,779 | |
| Ford Otomotiv Sanayi | | | 14,430 | | | | 169,992 | |
| | | | | | | | 428,297 | |
| Consumer Services — 2.1% | | | | | | | | |
| BIM Birlesik Magazalar | | | 64,489 | | | | 1,313,435 | |
| Turk Hava Yollari * | | | 317,175 | | | | 937,930 | |
| | | | | | | | 2,251,365 | |
| Financials — 1.2% | | | | | | | | |
| Akbank | | | 170,000 | | | | 437,320 | |
| Turkiye Garanti Bankasi | | | 170,925 | | | | 444,396 | |
| Turkiye Is Bankasi, Cl C | | | 262,644 | | | | 449,226 | |
| | | | | | | | 1,330,942 | |
The accompanying notes are an integral part of the financial statements.
| Schedule of Investments | October 31, 2015 |
| | |
| Global X Next Emerging & Frontier ETF |
| | | Shares | | | Value | |
| COMMON STOCK — continued |
| Industrials — 0.2% | | | | | | | | |
| Enka Insaat ve Sanayi | | | 120,315 | | | $ | 213,638 | |
| Oil & Gas — 2.7% | | | | | | | | |
| KOC Holding | | | 276,136 | | | | 1,251,887 | |
| Tupras Turkiye Petrol Rafinerileri | | | 62,043 | | | | 1,640,785 | |
| | | | | | | | 2,892,672 | |
| Telecommunications — 1.1% | | | | | | | | |
| Turk Telekomunikasyon | | | 83,936 | | | | 181,329 | |
| Turkcell Iletisim Hizmetleri | | | 234,840 | | | | 935,618 | |
| | | | | | | | 1,116,947 | |
| TOTAL TURKEY | | | | | | | 9,908,677 | |
| UKRAINE— 0.6% | | | | | | | | |
| Consumer Goods — 0.6% | | | | | | | | |
| Kernel Holding | | | 46,531 | | | | 630,536 | |
| UNITED ARAB EMIRATES— 3.1% | | | | | | | | |
| Financials — 2.4% | | | | | | | | |
| Emaar Properties PJSC | | | 847,171 | | | | 1,487,721 | |
| First Gulf Bank PJSC | | | 229,961 | | | | 773,236 | |
| National Bank of Abu Dhabi PJSC | | | 128,874 | | | | 305,264 | |
| | | | | | | | 2,566,221 | |
| Industrials — 0.7% | | | | | | | | |
| DP World | | | 35,080 | | | | 708,967 | |
| TOTAL UNITED ARAB EMIRATES | | | | | | | 3,275,188 | |
| UNITED KINGDOM— 1.9% | | | | | | | | |
| Financials — 0.5% | | | | | | | | |
| Bank of Georgia Holdings | | | 15,654 | | | | 483,521 | |
| Oil & Gas — 0.6% | | | | | | | | |
| Premier Oil | | | 174,473 | | | | 184,578 | |
| Tullow Oil | | | 163,600 | | | | 512,655 | |
| | | | | | | | 697,233 | |
| Telecommunications — 0.8% | | | | | | | | |
| Cable & Wireless Communications | | | 739,662 | | | | 840,759 | |
| TOTAL UNITED KINGDOM | | | | | | | 2,021,513 | |
| UNITED STATES— 0.5% | | | | | | | | |
| Oil & Gas — 0.5% | | | | | | | | |
| Kosmos Energy * | | | 68,624 | | | | 468,016 | |
| Pacific Drilling * | | | 50,606 | | | | 80,969 | |
| TOTAL UNITED STATES | | | | | | | 548,985 | |
The accompanying notes are an integral part of the financial statements.
| Schedule of Investments | October 31, 2015 |
| | |
| Global X Next Emerging & Frontier ETF |
| | | Shares/Face Amount(1) | | | Value | |
| COMMON STOCK — continued |
| VIETNAM— 0.6% | | | | | | | | |
| Financials — 0.1% | | | | | | | | |
| Bank for Foreign Trade of Vietnam JSC | | | 60,800 | | | $ | 129,845 | |
| Oil & Gas — 0.5% | | | | | | | | |
| PetroVietnam Gas JSC | | | 69,970 | | | | 146,610 | |
| PetroVietnam Technical Service | | | 336,200 | | | | 325,129 | |
| | | | | | | | 471,739 | |
| TOTAL VIETNAM | | | | | | | 601,584 | |
| TOTAL COMMON STOCK | | | | | | | | |
| (Cost $135,579,420) | | | | | | | 106,413,107 | |
| |
| PREFERRED STOCK — 0.3% |
| CHILE— 0.2% | | | | | | | | |
| Basic Materials — 0.2% | | | | | | | | |
| Sociedad Quimica y Minera de Chile | | | 7,090 | | | | 136,592 | |
| COLOMBIA— 0.1% | | | | | | | | |
| Financials — 0.1% | | | | | | | | |
| Banco Davivienda | | | 13,800 | | | | 113,683 | |
| TOTAL PREFERRED STOCK | | | | | | | | |
| (Cost $410,124) | | | | | | | 250,275 | |
| |
| CORPORATE OBLIGATION — 0.0% |
| BankMuscat SAOG | | | | | | | | |
| 0.035%, 03/19/18 | | | | | | | | |
| (Cost $–) | | | 22,009 | | | | 5,374 | |
| |
| CONVERTIBLE BOND — 0.0% |
| BankMuscat SAOG | | | | | | | | |
| 4.500%, 03/20/17 | | | | | | | | |
| (Cost $–) | | | 2,702 | | | | 702 | |
| |
| TIME DEPOSITS — 1.0% |
| Brown Brothers Harriman | | | | | | | | |
| 0.030%, 11/02/15 | | | 1,059,428 | | | | 1,059,428 | |
| 1.032%, 11/02/15, AUD | | | 7 | | | | 5 | |
| 0.050%, 11/02/15, CAD | | | 25 | | | | 19 | |
| 0.005%, 11/02/15, HKD | | | 65,683 | | | | 8,475 | |
| 4.900%, 05/01/15, ZAR | | | 10,288 | | | | 745 | |
| TOTAL TIME DEPOSITS | | | | | | | | |
| (Cost $1,068,672) | | | | | | | 1,068,672 | |
| TOTAL INVESTMENTS — 100.8% | | | | | | | | |
| (Cost $137,058,216) | | | | | | $ | 107,738,130 | |
Percentages are based on Net Assets of $106,925,030.
The accompanying notes are an integral part of the financial statements.
| Schedule of Investments | October 31, 2015 |
| | |
| Global X Next Emerging & Frontier ETF |
| * | Non-income producing security. |
| (1) | In U.S. Dollars unless otherwise indicated. |
ADR — American Depositary Receipt
AUD — Australian Dollar
CAD — Canadian Dollar
Cl — Class
HKD — Hong Kong Dollar
Ltd. — Limited
NVDR — Non-Voting Depositary Receipt
Ser — Series
ZAR — South African Rand
The following is a summary of the inputs used as of October 31, 2015, in valuing the Fund's investments carried at value:
| Investments in Securities | | Level 1 | | | Level 2 | | | Level 3 | | | Total | |
| Common Stock | | $ | 106,413,107 | | | $ | — | | | $ | — | | | $ | 106,413,107 | |
| Preferred Stock | | | 250,275 | | | | — | | | | — | | | | 250,275 | |
| Corporate Obligation | | | — | | | | 5,374 | | | | — | | | | 5,374 | |
| Convertible Bond | | | — | | | | 702 | | | | — | | | | 702 | |
| Time Deposits | | | — | | | | 1,068,672 | | | | — | | | | 1,068,672 | |
| Total Investments in Securities | | $ | 106,663,382 | | | $ | 1,074,748 | | | $ | — | | | $ | 107,738,130 | |
The following is a reconciliation of investments in which significant unobservable inputs (Level 3) were used in determining fair value:
| | | Investments in Common Stock | |
| | | | |
| Beginning Balance as of October 31, 2014 | | $ | 1,024,905 | |
| Transfers out of Level 3 | | | (798,147 | ) |
| Net purchases | | | 68,036 | |
| Net sales | | | (123,043 | ) |
| Realized gain (loss) | | | 14,392 | |
| Change in unrealized appreciation (depreciation) | | | (186,143 | ) |
| Ending Balance as of October 31, 2015 | | $ | - | |
For the year ended October 31, 2015, the transfers out of Level 3 were due to changes in the availability of observable inputs to determine fair value. Transfers between levels are recognized at period end.
The accompanying notes are an integral part of the financial statements.
| Schedule of Investments | October 31, 2015 |
| |
| Global X FTSE Portugal 20 ETF |
Sector Weightings (unaudited)†:
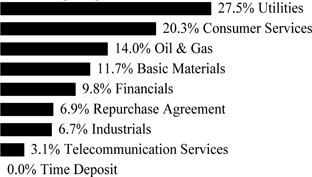
† Sector weightings percentages are based on the total market value of investments. Repurchase agreements purchased from cash collateral received for securities lending activity are included in total investments. Please see Note 2 and Note 8 in Notes to Financial Statements for more detailed information.
| | | Shares | | | Value | |
| COMMON STOCK — 99.6% |
| PORTUGAL— 99.6% | | | | | | | | |
| Basic Materials — 12.5% | | | | | | | | |
| Altri | | | 294,009 | | | $ | 1,396,872 | |
| Portucel | | | 465,209 | | | | 1,903,983 | |
| Semapa-Sociedade de Investimento e Gestao | | | 97,017 | | | | 1,379,282 | |
| | | | | | | | 4,680,137 | |
| Consumer Services — 21.6% | | | | | | | | |
| Jeronimo Martins | | | 335,335 | | | | 4,735,941 | |
| NOS SGPS (A) | | | 203,876 | | | | 1,702,382 | |
| Sonae | | | 1,380,381 | | | | 1,659,031 | |
| | | | | | | | 8,097,354 | |
| Financials — 10.5% | | | | | | | | |
| Banco BPI, Cl G * | | | 1,434,747 | | | | 1,752,900 | |
| Banco Comercial Portugues, Cl R * (A) | | | 28,071,017 | | | | 1,621,759 | |
| Banco Espirito Santo *(B) (C) | | | 2,085,614 | | | | — | |
| BANIF - Banco Internacional do Funchal * (A) | | | 127,414,646 | | | | 408,173 | |
| Sonae Capital * | | | 355,869 | | | | 165,894 | |
| | | | | | | | 3,948,726 | |
| Industrials — 7.2% | | | | | | | | |
| Cimpor Cimentos de Portugal * | | | 151,699 | | | | 98,702 | |
| CTT-Correios de Portugal | | | 153,850 | | | | 1,756,445 | |
| Mota-Engil | | | 273,832 | | | | 691,190 | |
| Sonae Industria * | | | 13,352,321 | | | | 134,222 | |
| | | | | | | | 2,680,559 | |
| Oil & Gas — 15.0% | | | | | | | | |
| Galp Energia | | | 516,274 | | | | 5,610,087 | |
The accompanying notes are an integral part of the financial statements.
| Schedule of Investments | October 31, 2015 |
| |
| Global X FTSE Portugal 20 ETF |
| | | Shares/Face Amount | | | Value | |
| COMMON STOCK — continued |
| Telecommunication Services — 3.4% | | | | | | | | |
| Pharol SGPS * | | | 2,205,735 | | | $ | 935,645 | |
| Sonaecom | | | 134,145 | | | | 317,114 | |
| | | | | | | | 1,252,759 | |
| Utilities — 29.4% | | | | | | | | |
| EDP Renovaveis | | | 244,735 | | | | 1,787,810 | |
| Energias de Portugal | | | 2,018,836 | | | | 7,511,035 | |
| REN - Redes Energeticas Nacionais | | | 552,038 | | | | 1,693,447 | |
| | | | | | | | 10,992,292 | |
| TOTAL COMMON STOCK | | | | | | | | |
| (Cost $47,071,288) | | | | | | | 37,261,914 | |
| |
| REPURCHASE AGREEMENT (D) — 7.4% |
| Deutsche Bank | | | | | | | | |
0.050%, dated 10/30/15, to be repurchased on 11/02/15 repurchase price
$2,773,674 (collateralized by U.S. Treasury Bills, par value $2,773,674,
3.250%, 07/31/16 with a total market value of $2,849,950)
(Cost $2,773,662) | | $ | 2,773,662 | | | | 2,773,662 | |
| |
| TIME DEPOSIT — 0.0% |
| Brown Brothers Harriman, 0.030%, 11/02/15 | | | | | | | | |
| (Cost $16,783) | | | 16,783 | | | | 16,783 | |
| |
| TOTAL INVESTMENTS — 107.0% | | | | | | | | |
| (Cost $49,861,733) | | | | | | $ | 40,052,359 | |
Percentages are based on Net Assets of $37,448,523.
| * | Non-income producing security. |
| (A) | This security or a partial position of this security is on loan at October 31, 2015. The total value of securities on loan at October 31, 2015 was $1,960,486. |
| (B) | Security is fair valued using methods determined in good faith by the Fair Value Committee of the Fund. The total value of such security as of October 31, 2015, was $0 and represents 0.0% of Net Assets. |
| (C) | Security considered illiquid. The total value of such security as of October 31, 2015 was $0 and represented 0.0% of Net Assets. |
| (D) | This security was purchased with cash collateral held from securities on loan. The total value of such securities as of October 31, 2015 was $2,773,662. |
Cl — Class
Amounts designated as “—“ are either $0 or have been rounded to $0.
The accompanying notes are an integral part of the financial statements.
| Schedule of Investments | October 31, 2015 |
| |
| Global X FTSE Portugal 20 ETF |
The following is a summary of the inputs used as of October 31, 2015, in valuing the Fund's investments carried at value:
| Investments in Securities | | Level 1 | | | Level 2 | | | Level 3 | | | Total | |
| Common Stock | | $ | 37,261,914 | | | $ | — | | | $ | — | | | $ | 37,261,914 | |
| Repurchase Agreement | | | — | | | | 2,773,662 | | | | — | | | | 2,773,662 | |
| Time Deposit | | | — | | | | 16,783 | | | | — | | | | 16,783 | |
| Total Investments in Securities | | $ | 37,261,914 | | | $ | 2,790,445 | | | $ | — | | | $ | 40,052,359 | |
For the period ended October 31, 2015, there have been no transfers between Level 1, Level 2 or Level 3 investments.
As of October 31, 2015, there were no Level 3 investments.
The accompanying notes are an integral part of the financial statements.
| Schedule of Investments | October 31, 2015 |
| |
| Global X MSCI Pakistan ETF |
Sector Weightings (unaudited)†:
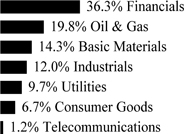
† Sector weightings percentages are based on the total market value of investments.
| | | Shares | | | Value | |
| COMMON STOCK — 100.4% |
| PAKISTAN— 100.4% | | | | | | | | |
| Basic Materials — 14.4% | | | | | | | | |
| Engro | | | 99,200 | | | $ | 287,314 | |
| Fatima Fertilizer | | | 299,400 | | | | 132,319 | |
| Fauji Fertilizer | | | 249,900 | | | | 297,271 | |
| Fauji Fertilizer Bin Qasim | | | 179,300 | | | | 98,869 | |
| | | | | | | | 815,773 | |
| Consumer Goods — 6.8% | | | | | | | | |
| Indus Motor | | | 11,300 | | | | 127,925 | |
| Nishat Mills | | | 96,100 | | | | 93,750 | |
| Pak Elektron | | | 111,600 | | | | 81,455 | |
| PAK Suzuki Motor | | | 18,250 | | | | 80,564 | |
| | | | | | | | 383,694 | |
| Financials — 36.3% | | | | | | | | |
| Askari Bank | | | 315,500 | | | | 66,951 | |
| Bank Al Habib | | | 540,600 | | | | 220,318 | |
| Bank Alfalah | | | 468,300 | | | | 127,472 | |
| Habib Bank | | | 284,800 | | | | 566,010 | |
| MCB Bank | | | 276,100 | | | | 640,780 | |
| National Bank of Pakistan | | | 353,600 | | | | 186,938 | |
| United Bank | | | 162,600 | | | | 252,923 | |
| | | | | | | | 2,061,392 | |
| Industrials — 12.1% | | | | | | | | |
| DG Khan Cement | | | 55,200 | | | | 73,626 | |
| Fauji Cement | | | 423,500 | | | | 143,655 | |
| Lucky Cement | | | 72,800 | | | | 369,376 | |
| Maple Leaf Cement Factory | | | 145,300 | | | | 97,844 | |
| | | | | | | | 684,501 | |
| Oil & Gas — 19.9% | | | | | | | | |
| Attock Petroleum | | | 14,800 | | | | 72,660 | |
The accompanying notes are an integral part of the financial statements.
| Schedule of Investments | October 31, 2015 |
| |
| Global X MSCI Pakistan ETF |
| | | Shares | | | Value | |
| COMMON STOCK — continued |
| Oil & Gas — continued | | | | | | | | |
| National Refinery | | | 24,600 | | | $ | 53,774 | |
| Oil & Gas Development | | | 295,440 | | | | 386,277 | |
| Pakistan Oilfields | | | 48,770 | | | | 147,438 | |
| Pakistan Petroleum | | | 131,500 | | | | 158,408 | |
| Pakistan State Oil | | | 79,820 | | | | 255,301 | |
| Shell Pakistan | | | 24,700 | | | | 51,404 | |
| | | | | | | | 1,125,262 | |
| Telecommunications — 1.2% | | | | | | | | |
| Pakistan Telecommunication | | | 407,080 | | | | 67,943 | |
| Utilities — 9.7% | | | | | | | | |
| Hub Power | | | 259,842 | | | | 256,764 | |
| K-Electric * | | | 1,162,900 | | | | 83,434 | |
| Kot Addu Power | | | 181,700 | | | | 145,811 | |
| SUI Southern Gas * | | | 179,300 | | | | 64,763 | |
| | | | | | | | 550,772 | |
| TOTAL COMMON STOCK | | | | | | | | |
| (Cost $6,149,851) | | | | | | | 5,689,337 | |
| TOTAL INVESTMENTS — 100.4% | | | | | | | | |
| (Cost $6,149,851) | | | | | | $ | 5,689,337 | |
Percentages are based on Net Assets of $5,666,859.
| * | Non-income producing security. |
As of October 31, 2015, all of the Fund's investments were considered Level 1, in accordance with the authorative guidance on fair value measuremnts and disclosure under U.S. GAAP.
For the period ended October 31, 2015, there have been no transfers between Level 1, Level 2 or Level 3 investments.
As of October 31, 2015, there were no Level 3 investments.
The accompanying notes are an integral part of the financial statements.
| Statements of Assets and Liabilities |
| October 31, 2015 |
| | | Global X China
Consumer ETF | | | Global X China
Energy ETF | | | Global X China
Financials ETF | | | Global X China
Industrials ETF | |
| Assets: | | | | | | | | | | | | | | | | |
| Cost of Investments | | $ | 109,053,009 | | | $ | 2,485,898 | | | $ | 61,749,639 | | | $ | 8,710,554 | |
| Cost of Repurchase Agreement | | | 10,561,545 | | | | — | | | | — | | | | — | |
| Investments, at Value | | $ | 94,133,595 | * | | $ | 1,745,429 | | | $ | 57,399,310 | | | $ | 7,226,835 | |
| Repurchase Agreement, at Value | | | 10,561,545 | | | | — | | | | — | | | | — | |
| Receivable for Investment Securities Sold | | | 5,957,870 | | | | 94,110 | | | | 4,839,982 | | | | 478,703 | |
| Receivable for Capital Shares Sold | | | — | | | | — | | | | — | �� | | | 174,480 | |
| Dividend and Interest Receivable | | | 50,924 | | | | 468 | | | | 21,966 | | | | 6,326 | |
| Total Assets | | | 110,703,934 | | | | 1,840,007 | | | | 62,261,258 | | | | 7,886,344 | |
| Liabilities: | | | | | | | | | | | | | | | | |
| Obligation to Return Securities Lending Collateral | | | 10,561,545 | | | | — | | | | — | | | | — | |
| Payable for Investment Securities Purchased | | | 6,142,546 | | | | 98,219 | | | | 4,872,026 | | | | 618,313 | |
| Payable for Capital Shares Redeemed | | | — | | | | — | | | | — | | | | 41,751 | |
| Payable due to Investment Adviser | | | 48,904 | | | | 985 | | | | 31,578 | | | | 4,006 | |
| Total Liabilities | | | 16,752,995 | | | | 99,204 | | | | 4,903,604 | | | | 664,070 | |
| Net Assets | | $ | 93,950,939 | | | $ | 1,740,803 | | | $ | 57,357,654 | | | $ | 7,222,274 | |
| Net Assets Consist of: | | | | | | | | | | | | | | | | |
| Paid-in Capital | | $ | 133,581,768 | | | $ | 3,191,064 | | | $ | 60,788,725 | | | $ | 10,226,457 | |
| Undistributed Net Investment Income | | | 3,540,439 | | | | 48,201 | | | | 2,726,593 | | | | 95,160 | |
| Accumulated Net Realized Loss on Investments and Foreign Currency Translations | | | (28,251,856 | ) | | | (757,993 | ) | | | (1,807,334 | ) | | | (1,615,624 | ) |
| Net Unrealized Depreciation on Investments | | | (14,919,414 | ) | | | (740,469 | ) | | | (4,350,329 | ) | | | (1,483,719 | ) |
| Net Unrealized Appreciation (Depreciation) on Foreign Currency Translations | | | 2 | | | | — | | | | (1 | ) | | | — | |
| Net Assets | | $ | 93,950,939 | | | $ | 1,740,803 | | | $ | 57,357,654 | | | $ | 7,222,274 | |
| Outstanding Shares of Beneficial Interest (unlimited authorization — no par value) | | | 6,850,000 | | | | 150,000 | | | | 3,850,000 | | | | 500,000 | |
| Net Asset Value, Offering and Redemption Price Per Share | | $ | 13.72 | | | $ | 11.61 | | | $ | 14.90 | | | $ | 14.44 | |
| *Includes Market Value of Securities on Loan | | $ | 9,955,736 | | | $ | — | | | $ | — | | | $ | — | |
The accompanying notes are an integral part of the financial statements.
| Statements of Assets and Liabilities |
| October 31, 2015 |
| | | Global X China
Materials ETF | | | Global X NASDAQ
China Technology
ETF | | | Global X Southeast
Asia ETF | | | Global X FTSE
Andean 40 ETF | |
| Assets: | | | | | | | | | | | | | | | | |
| Cost of Investments | | $ | 2,432,531 | | | $ | 15,264,103 | | | $ | 18,322,993 | | | $ | 5,684,313 | |
| Cost of Foreign Currency | | | — | | | | — | | | | 4,086 | | | | 165 | |
| Investments, at Value | | $ | 1,306,299 | | | $ | 15,410,424 | | | $ | 14,362,310 | | | $ | 3,254,255 | |
| Foreign Currency, at Value | | | — | | | | — | | | | 4,088 | | | | 164 | |
| Receivable for Investment Securities Sold | | | 114,499 | | | | — | | | | — | | | | — | |
| Receivable for Capital Shares Sold | | | 1,341 | | | | — | | | | — | | | | — | |
| Dividend and Interest Receivable | | | — | | | | 2,112 | | | | 14,518 | | | | 378 | |
| Reclaim Receivable | | | — | | | | — | | | | 2,908 | | | | — | |
| Total Assets | | | 1,422,139 | | | | 15,412,536 | | | | 14,383,824 | | | | 3,254,797 | |
| Liabilities: | | | | | | | | | | | | | | | | |
| Payable for Investment Securities Purchased | | | 91,815 | | | | — | | | | — | | | | — | |
| Payable for Capital Shares Redeemed | | | 1,071 | | | | — | | | | — | | | | — | |
| Payable due to Investment Adviser | | | 735 | | | | 8,101 | | | | 7,968 | | | | 2,009 | |
| Unrealized Depreciation on Forward Foreign Currency Contracts | | | — | | | | — | | | | 23 | | | | — | |
| Total Liabilities | | | 93,621 | | | | 8,101 | | | | 7,991 | | | | 2,009 | |
| Net Assets | | $ | 1,328,518 | | | $ | 15,404,435 | | | $ | 14,375,833 | | | $ | 3,252,788 | |
| Net Assets Consist of: | | | | | | | | | | | | | | | | |
| Paid-in Capital | | $ | 3,382,230 | | | $ | 17,135,090 | | | $ | 21,833,153 | | | $ | 8,315,005 | |
| Undistributed Net Investment Income | | | 70,631 | | | | 91,745 | | | | 447,921 | | | | 80,784 | |
| Accumulated Net Realized Loss on Investments and Foreign Currency Translations | | | (998,110 | ) | | | (1,968,721 | ) | | | (3,944,740 | ) | | | (2,712,945 | ) |
| Net Unrealized Appreciation (Depreciation) on Investments | | | (1,126,232 | ) | | | 146,321 | | | | (3,960,683 | ) | | | (2,430,058 | ) |
| Net Unrealized Appreciation (Depreciation) on Foreign Currency Translations | | | (1 | ) | | | — | | | | 182 | | | | 2 | |
| Net Assets | | $ | 1,328,518 | | | $ | 15,404,435 | | | $ | 14,375,833 | | | $ | 3,252,788 | |
| Outstanding Shares of Beneficial Interest (unlimited authorization — no par value) | | | 99,971 | | | | 700,000 | | | | 1,100,000 | | | | 450,000 | |
| Net Asset Value, Offering and Redemption Price Per Share | | $ | 13.29 | | | $ | 22.01 | | | $ | 13.07 | | | $ | 7.23 | |
The accompanying notes are an integral part of the financial statements.
| Statements of Assets and Liabilities |
| October 31, 2015 |
| | | Global X MSCI
Colombia ETF | | | Global X Brazil
Mid Cap ETF | | | Global X Brazil
Consumer ETF | | | Global X MSCI
Argentina ETF | |
| Assets: | | | | | | | | | | | | | | | | |
| Cost of Investments | | $ | 100,669,535 | | | $ | 4,968,803 | | | $ | 5,464,151 | | | $ | 21,070,731 | |
| Cost of Foreign Currency | | | — | | | | 23,116 | | | | 23,449 | | | | — | |
| Investments, at Value | | $ | 66,642,526 | * | | $ | 3,074,431 | | | $ | 2,959,663 | | | $ | 18,327,170 | |
| Cash | | | 1,298,800 | (1) | | | — | | | | — | | | | — | |
| Foreign Currency, at Value | | | — | | | | 23,330 | | | | 23,730 | | | | — | |
| Dividend and Interest Receivable | | | 8,263 | | | | 8,883 | | | | 6,127 | | | | 31,816 | |
| Reclaim Receivable | | | — | | | | — | | | | — | | | | 536 | |
| Total Assets | | | 67,949,589 | | | | 3,106,644 | | | | 2,989,520 | | | | 18,359,522 | |
| Liabilities: | | | | | | | | | | | | | | | | |
| Obligation to Return Securities Lending Collateral | | | 1,298,800 | | | | — | | | | — | | | | — | |
| Payable due to Investment Adviser | | | 34,807 | | | | 1,818 | | | | 2,111 | | | | 8,602 | |
| Cash Overdraft | | | — | | | | 15,175 | | | | 15,829 | | | | 2,995,769 | |
| Unrealized Depreciation on Forward Foreign Currency Contracts | | | — | | | | 35 | | | | — | | | | — | |
| Payable due to Custodian | | | — | | | | 295 | | | | 948 | | | | 93 | |
| Total Liabilities | | | 1,333,607 | | | | 17,323 | | | | 18,888 | | | | 3,004,464 | |
| Net Assets | | $ | 66,615,982 | | | $ | 3,089,321 | | | $ | 2,970,632 | | | $ | 15,355,058 | |
| Net Assets Consist of: | | | | | | | | | | | | | | | | |
| Paid-in Capital | | $ | 158,784,678 | | | $ | 11,877,345 | | | $ | 9,664,211 | | | $ | 21,299,554 | |
| Undistributed Net Investment Income | | | 491,296 | | | | 55,329 | | | | 36,221 | | | | 44,367 | |
| Accumulated Net Realized Loss on Investments and Foreign Currency Translations | | | (58,633,037 | ) | | | (6,948,322 | ) | | | (4,224,885 | ) | | | (3,245,285 | ) |
| Net Unrealized Depreciation on Investments | | | (34,027,009 | ) | | | (1,894,372 | ) | | | (2,504,488 | ) | | | (2,743,561 | ) |
| Net Unrealized Appreciation (Depreciation) on Foreign Currency Translations | | | 54 | | | | (659 | ) | | | (427 | ) | | | (17 | ) |
| Net Assets | | $ | 66,615,982 | | | $ | 3,089,321 | | | $ | 2,970,632 | | | $ | 15,355,058 | |
| Outstanding Shares of Beneficial Interest (unlimited authorization — no par value) | | | 7,580,000 | | | | 450,000 | | | | 350,000 | | | | 774,975 | |
| Net Asset Value, Offering and Redemption Price Per Share | | $ | 8.79 | | | $ | 6.87 | | | $ | 8.49 | | | $ | 19.81 | |
| *Includes Market Value of Securities on Loan | | $ | 1,243,616 | | | $ | — | | | $ | — | | | $ | — | |
(1) Cash is restricted, received from securities on loan. (See Note 8 in Notes to Financial Statements).
The accompanying notes are an integral part of the financial statements.
| Statements of Assets and Liabilities |
| October 31, 2015 |
| | | Global X FTSE
Greece 20 ETF | | | Global X MSCI
Norway ETF | | | Global X FTSE
Nordic Region
ETF | | | Global X MSCI
Nigeria ETF | |
| Assets: | | | | | | | | | | | | | | | | |
| Cost of Investments | | $ | 429,428,509 | | | $ | 101,564,933 | | | $ | 51,209,486 | | | $ | 32,274,069 | |
| Cost of Repurchase Agreement | | | — | | | | 6,910,366 | | | | 595,000 | | | | — | |
| Investments, at Value | | $ | 353,197,671 | | | $ | 64,876,055 | * | | $ | 52,128,191 | * | | $ | 24,622,059 | |
| Repurchase Agreement, at Value | | | — | | | | 6,910,366 | | | | 595,000 | | | | — | |
| Receivable for Investment Securities Sold | | | 2,599,542 | | | | — | | | | — | | | | 383,481 | |
| Receivable for Capital Shares Sold | | | 137,558 | | | | — | | | | — | | | | — | |
| Dividend and Interest Receivable | | | 97,147 | | | | 5,674 | | | | 17,710 | | | | 26,890 | |
| Reclaim Receivable | | | — | | | | 170,522 | | | | 472,406 | | | | 3,583 | |
| Due from Broker | | | — | | | | — | | | | — | | | | 5,766 | |
| Total Assets | | | 356,031,918 | | | | 71,962,617 | | | | 53,213,307 | | | | 25,041,779 | |
| Liabilities: | | | | | | | | | | | | | | | | |
| Cash Overdraft | | | 38,189,750 | | | | — | | | | 3 | | | | — | |
| Payable for Capital Shares Redeemed | | | 2,602,111 | | | | — | | | | — | | | | 403,311 | |
| Payable for Investment Securities Purchased | | | 137,558 | | | | — | | | | — | | | | — | |
| Payable due to Investment Adviser | | | 146,527 | | | | 28,410 | | | | 22,515 | | | | 15,345 | |
| Obligation to Return Securities Lending Collateral | | | — | | | | 6,910,366 | | | | 595,000 | | | | — | |
| Payable due to Custodian | | | 35,553 | | | | — | | | | — | | | | — | |
| Payable for Foreign Capital Gains Tax | | | 12,924 | | | | — | | | | — | | | | — | |
| Due to Broker | | | 304 | | | | — | | | | — | | | | — | |
| Total Liabilities | | | 41,124,727 | | | | 6,938,776 | | | | 617,518 | | | | 418,656 | |
| Net Assets | | $ | 314,907,191 | | | $ | 65,023,841 | | | $ | 52,595,789 | | | $ | 24,623,123 | |
| Net Assets Consist of: | | | | | | | | | | | | | | | | |
| Paid-in Capital | | $ | 464,217,944 | | | $ | 111,358,023 | | | $ | 53,205,019 | | | $ | 36,977,531 | |
| Undistributed Net Investment Income | | | 3,523,899 | | | | 1,890,655 | | | | 1,135,677 | | | | 820,220 | |
| Accumulated Net Realized Loss on Investments and Foreign Currency Translations | | | (76,603,828 | ) | | | (11,485,775 | ) | | | (2,582,537 | ) | | | (5,521,045 | ) |
| Net Unrealized Appreciation (Depreciation) on Investments | | | (76,230,838 | ) | | | (36,688,878 | ) | | | 918,705 | | | | (7,652,010 | ) |
| Net Unrealized Appreciation (Depreciation) on Foreign Currency Translations | | | 14 | | | | (50,184 | ) | | | (81,075 | ) | | | (1,573 | ) |
| Net Assets | | $ | 314,907,191 | | | $ | 65,023,841 | | | $ | 52,595,789 | | | $ | 24,623,123 | |
| Outstanding Shares of Beneficial Interest (unlimited authorization — no par value) | | | 30,250,000 | | | | 6,050,000 | | | | 2,360,000 | | | | 3,100,000 | |
| Net Asset Value, Offering and Redemption Price Per Share | | $ | 10.41 | | | $ | 10.75 | | | $ | 22.29 | | | $ | 7.94 | |
| *Includes Market Value of Securities on Loan | | $ | — | | | $ | 1,870,159 | | | $ | 565,600 | | | $ | — | |
The accompanying notes are an integral part of the financial statements.
| Statements of Assets and Liabilities |
| October 31, 2015 |
| | | Global X Next
Emerging &
Frontier ETF | | | Global X FTSE
Portugal 20 ETF | | | Global X MSCI
Pakistan ETF | |
| Assets: | | | | | | | | | | | | |
| Cost of Investments | | $ | 137,058,216 | | | $ | 47,088,071 | | | $ | 6,149,851 | |
| Cost of Repurchase Agreement | | | — | | | | 2,773,662 | | | | — | |
| Cost of Foreign Currency | | | 124,422 | | | | — | | | | — | |
| Investments, at Value | | $ | 107,738,130 | | | $ | 37,278,697 | * | | $ | 5,689,337 | |
| Foreign Currency, at Value | | | 124,432 | | | | — | | | | — | |
| Repurchase Agreement, at Value | | | — | | | | 2,773,662 | | | | — | |
| Dividend and Interest Receivable | | | 73,802 | | | | 1,430 | | | | 78,269 | |
| Receivable for Investment Securities Sold | | | 472,449 | | | | — | | | | — | |
| Reclaim Receivable | | | 15,977 | | | | 191,493 | | | | — | |
| Unrealized Appreciation on Forward Foreign Currency Contracts | | | 110 | | | | — | | | | — | |
| Due from Broker | | | 8,226 | | | | — | | | | — | |
| Total Assets | | | 108,433,126 | | | | 40,245,282 | | | | 5,767,606 | |
| Liabilities: | | | | | | | | | | | | |
| Payable for Capital Shares Redeemed | | | 1,443,951 | | | | — | | | | — | |
| Payable due to Investment Adviser | | | 46,463 | | | | 17,475 | | | | 3,257 | |
| Unrealized Depreciation on Forward Foreign Currency Contracts | | | 73 | | | | — | | | | — | |
| Obligation to Return Securities Lending Collateral | | | — | | | | 2,773,662 | | | | — | |
| Cash Overdraft | | | — | | | | — | | | | 73,640 | |
| Payable due to Custodian | | | 17,479 | | | | 4,282 | | | | 1,910 | |
| Payable for Foreign Capital Gains Tax | | | 130 | | | | — | | | | — | |
| Accrued Foreign Capital Gains Tax on Appreciated Securities | | | — | | | | — | | | | 21,940 | |
| Due to Broker | | | — | | | | 1,340 | | | | — | |
| Total Liabilities | | | 1,508,096 | | | | 2,796,759 | | | | 100,747 | |
| Net Assets | | $ | 106,925,030 | | | $ | 37,448,523 | | | $ | 5,666,859 | |
| Net Assets Consist of: | | | | | | | | | | | | |
| Paid-in Capital | | $ | 144,153,390 | | | $ | 51,598,705 | | | $ | 6,047,981 | |
| Undistributed Net Investment Income | | | 2,242,259 | | | | 1,003,581 | | | | 110,195 | |
| Accumulated Net Realized Loss on Investments and Foreign Currency Translations | | | (10,161,190 | ) | | | (5,326,902 | ) | | | (8,372 | ) |
| Net Unrealized Depreciation on Investments | | | (29,320,086 | ) | | | (9,809,374 | ) | | | (460,514 | ) |
| Net Unrealized Appreciation (Depreciation) on Foreign Currency Translations | | | 10,657 | | | | (17,487 | ) | | | (22,431 | ) |
| Net Assets | | $ | 106,925,030 | | | $ | 37,448,523 | | | $ | 5,666,859 | |
| Outstanding Shares of Beneficial Interest (unlimited authorization — no par value) | | | 5,550,000 | | | | 3,450,000 | | | | 400,000 | |
| Net Asset Value, Offering and Redemption Price Per Share | | $ | 19.27 | | | $ | 10.85 | | | $ | 14.17 | |
| *Includes Market Value of Securities on Loan | | $ | — | | | $ | 1,960,486 | | | $ | — | |
The accompanying notes are an integral part of the financial statements.
| Statements of Operations |
| For the year ended October 31, 2015 |
| | | Global X China
Consumer ETF | | | Global X China
Energy ETF | | | Global X China
Financials ETF | | | Global X China
Industrials ETF | |
| Investment Income: | | | | | | | | | | | | | | | | |
| Dividend Income | | $ | 4,689,255 | | | $ | 72,629 | | | $ | 3,536,205 | | | $ | 156,816 | |
| Interest Income | | | 52 | | | | 1 | | | | 25 | | | | 11 | |
| Security Lending Income | | | 130,292 | | | | — | | | | — | | | | — | |
| Less: Foreign Taxes Withheld | | | (54,330 | ) | | | (5,532 | ) | | | (279,138 | ) | | | (10,484 | ) |
| Total Investment Income | | | 4,765,269 | | | | 67,098 | | | | 3,257,092 | | | | 146,343 | |
| Supervision and Administration Fees(1) | | | 686,886 | | | | 18,887 | | | | 530,409 | | | | 46,914 | |
| Total Expenses | | | 686,886 | | | | 18,887 | | | | 530,409 | | | | 46,914 | |
| Net Investment Income | | | 4,078,383 | | | | 48,211 | | | | 2,726,683 | | | | 99,429 | |
| Net Realized Gain (Loss) on: | | | | | | | | | | | | | | | | |
| Investments (2) | | | (12,632,137 | ) | | | 79,381 | | | | 3,005,060 | | | | 861,936 | |
| Foreign Currency Transactions | | | (1,446 | ) | | | (10 | ) | | | (176 | ) | | | (409 | ) |
| Net Realized Gain (Loss) on Investments and Foreign Currency Transactions | | | (12,633,583 | ) | | | 79,371 | | | | 3,004,884 | | | | 861,527 | |
| Net Change in Unrealized Appreciation (Depreciation) on: | | | | | | | | | | | | | | | | |
| Investments | | | 7,370,040 | | | | (693,919 | ) | | | (2,867,617 | ) | | | (1,121,417 | ) |
| Foreign Currency Translation | | | (62 | ) | | | — | | | | (3 | ) | | | — | |
| Net Change in Unrealized Appreciation (Depreciation) on Investments and Foreign Currency Translations | | | 7,369,978 | | | | (693,919 | ) | | | (2,867,620 | ) | | | (1,121,417 | ) |
| Net Realized and Unrealized Gain (Loss) on Investments and Foreign Currency Transactions and Translations | | | (5,263,605 | ) | | | (614,548 | ) | | | 137,264 | | | | (259,890 | ) |
| Net Increase (Decrease) in Net Assets Resulting from Operations | | $ | (1,185,222 | ) | | $ | (566,337 | ) | | $ | 2,863,947 | | | $ | (160,461 | ) |
| (1) | The Supervision and Administration fees includes fees paid by the Funds for the investment advisory services provided by the Adviser. (See Note 3 in Notes to Financial Statements.) |
| (2) | Includes realized gains/(losses) as a result of in-kind transactions. (See Note 4 in Notes to Financial Statements). |
The accompanying notes are an integral part of the financial statements.
| Statements of Operations |
| For the year ended October 31, 2015 |
| | | Global X China
Materials ETF | | | Global X
NASDAQ China
Technology ETF | | | Global X Southeast
Asia ETF | | | Global X FTSE
Andean 40 ETF | |
| Investment Income: | | | | | | | | | | | | | | | | |
| Dividend Income | | $ | 93,853 | | | $ | 228,228 | | | $ | 673,713 | | | $ | 180,344 | |
| Interest Income | | | 1 | | | | 12 | | | | 10 | | | | — | |
| Less: Foreign Taxes Withheld | | | (4,017 | ) | | | (5,106 | ) | | | (29,989 | ) | | | (22,423 | ) |
| Total Investment Income | | | 89,837 | | | | 223,134 | | | | 643,734 | | | | 157,921 | |
| Supervision and Administration Fees(1) | | | 19,188 | | | | 123,615 | | | | 144,236 | | | | 41,546 | |
| Total Expenses | | | 19,188 | | | | 123,615 | | | | 144,236 | | | | 41,546 | |
| Net Investment Income | | | 70,649 | | | | 99,519 | | | | 499,498 | | | | 116,375 | |
| Net Realized Gain (Loss) on: | | | | | | | | | | | | | | | | |
| Investments (2) | | | (389,789 | ) | | | 426,009 | | | | (3,070,663 | ) | | | (1,885,525 | ) |
| Foreign Currency Transactions | | | (18 | ) | | | 918 | | | | (3,087 | ) | | | (8,477 | ) |
| Net Realized Gain (Loss) on Investments and Foreign Currency Transactions | | | (389,807 | ) | | | 426,927 | | | | (3,073,750 | ) | | | (1,894,002 | ) |
| Net Change in Unrealized Appreciation (Depreciation) on: | | | | | | | | | | | | | | | | |
| Investments | | | (339,996 | ) | | | (2,620,410 | ) | | | (2,491,295 | ) | | | (313,548 | ) |
| Foreign Currency Translation | | | 3 | | | | — | | | | (577 | ) | | | 4 | |
| Net Change in Unrealized Depreciation on Investments and Foreign Currency Translations | | | (339,993 | ) | | | (2,620,410 | ) | | | (2,491,872 | ) | | | (313,544 | ) |
| Net Realized and Unrealized Loss on Investments and Foreign Currency Transactions and Translations | | | (729,800 | ) | | | (2,193,483 | ) | | | (5,565,622 | ) | | | (2,207,546 | ) |
| Net Decrease in Net Assets Resulting from Operations | | $ | (659,151 | ) | | $ | (2,093,964 | ) | | $ | (5,066,124 | ) | | $ | (2,091,171 | ) |
| (1) | The Supervision and Administration fees includes fees paid by the Funds for the investment advisory services provided by the Adviser. (See Note 3 in Notes to Financial Statements). |
| (2) | Includes realized gains/(losses) as a result of in-kind transactions. (See Note 4 in Notes to Financial Statements). |
The accompanying notes are an integral part of the financial statements.
| Statements of Operations |
| For the year ended October 31, 2015 |
| | | Global X MSCI
Colombia ETF | | | Global X Brazil
Mid Cap ETF | | | Global X Brazil
Consumer ETF | | | Global X MSCI
Argentina ETF | |
| Investment Income: | | | | | | | | | | | | | | | | |
| Dividend Income | | $ | 2,479,537 | | | $ | 136,359 | | | $ | 117,128 | | | $ | 254,680 | |
| Interest Income | | | 129 | | | | 11,010 | | | | 15,673 | | | | 11,253 | |
| Security Lending Income | | | 23,303 | | | | — | | | | — | | | | — | |
| Less: Foreign Taxes Withheld | | | (11,875 | ) | | | (3,455 | ) | | | (3,108 | ) | | | (32,722 | ) |
| Total Investment Income | | | 2,491,094 | | | | 143,914 | | | | 129,693 | | | | 233,211 | |
| Supervision and Administration Fees(1) | | | 496,154 | | | | 33,680 | | | | 49,093 | | | | 130,732 | |
| Custodian Fees | | | 82,051 | | | | – | | | | – | | | | 658 | |
| Total Expenses | | | 578,205 | | | | 33,680 | | | | 49,093 | | | | 131,390 | |
| Waiver of Supervision and Administration Fees | | | (51,075 | ) | | | – | | | | – | | | | – | |
| Waiver of Custodian Fees | | | (82,051 | ) | | | – | | | | – | | | | – | |
| Net Expenses | | | 445,079 | | | | 33,680 | | | | 49,093 | | | | 131,390 | |
| Net Investment Income | | | 2,046,015 | | | | 110,234 | | | | 80,600 | | | | 101,821 | |
| Net Realized Gain (Loss) on: | | | | | | | | | | | | | | | | |
| Investments (2) | | | (32,824,227 | ) | | | (2,031,038 | ) | | | (1,698,344 | ) | | | (418,091 | ) |
| Foreign Currency Transactions | | | (624,950 | ) | | | (3,274 | ) | | | (14,205 | ) | | | 1,618 | |
| Net Realized Loss on Investments and Foreign Currency Transactions | | | (33,449,177 | ) | | | (2,034,312 | ) | | | (1,712,549 | ) | | | (416,473 | ) |
| Net Change in Unrealized Appreciation (Depreciation) on: | | | | | | | | | | | | | | | | |
| Investments | | | (18,878,800 | ) | | | (863,107 | ) | | | (2,485,783 | ) | | | (1,540,975 | ) |
| Foreign Currency Translations | | | (9,306 | ) | | | 67 | | | | 13 | | | | (14 | ) |
| Net Change in Unrealized Depreciation on Investments and Foreign Currency Translations | | | (18,888,106 | ) | | | (863,040 | ) | | | (2,485,770 | ) | | | (1,540,989 | ) |
| Net Realized and Unrealized Loss on Investments and Foreign Currency Transactions | | | (52,337,283 | ) | | | (2,897,352 | ) | | | (4,198,319 | ) | | | (1,957,462 | ) |
| Net Decrease in Net Assets Resulting from Operations | | $ | (50,291,268 | ) | | $ | (2,787,118 | ) | | $ | (4,117,719 | ) | | $ | (1,855,641 | ) |
| (1) | The Supervision and Administration fees includes fees paid by the Funds for the investment advisory services provided by the Adviser. (See Note 3 in Notes to Financial Statements). |
| (2) | Includes realized gains/(losses) as a result of in-kind transactions. (See Note 4 in Notes to Financial Statements). |
The accompanying notes are an integral part of the financial statements.
| Statements of Operations |
| For the year ended October 31, 2015 |
| | | Global X FTSE
Greece 20 ETF | | | Global X MSCI
Norway ETF | | | Global X FTSE
Nordic Region
ETF | | | Global X MSCI
Nigeria ETF | |
| Investment Income: | | | | | | | | | | | | | | | | |
| Dividend Income | | $ | 5,625,414 | | | $ | 3,141,012 | | | $ | 1,829,732 | | | $ | 1,171,987 | |
| Interest Income | | | 122 | | | | 151 | | | | 5 | | | | 204 | |
| Security Lending Income | | | 7,412 | | | | 381,972 | | | | 6,542 | | | | — | |
| Less: Foreign Taxes Withheld | | | (351,200 | ) | | | (580,022 | ) | | | (146,864 | ) | | | (97,626 | ) |
| Total Investment Income | | | 5,281,748 | | | | 2,943,113 | | | | 1,689,415 | | | | 1,074,565 | |
| Supervision and Administration Fees(1) | | | 1,303,599 | | | | 451,912 | | | | 279,063 | | | | 166,192 | |
| Custodian Fees | | | 156,613 | | | | – | | | | – | | | | 58,656 | |
| Total Expenses | | | 1,460,212 | | | | 451,912 | | | | 279,063 | | | | 224,848 | |
| Waiver of Custodian Fees | | | – | | | | – | | | | – | | | | (58,656 | ) |
| Net Expenses | | | 1,460,212 | | | | 451,912 | | | | 279,063 | | | | 166,192 | |
| Net Investment Income | | | 3,821,536 | | | | 2,491,201 | | | | 1,410,352 | | | | 908,373 | |
| Net Realized Gain (Loss) on: | | | | | | | | | | | | | | | | |
| Investments | | | (76,175,038 | )(2) | | | (26,663,663 | )(2) | | | (334,205 | )(2) | | | (4,464,364 | ) |
| Foreign Currency Transactions | | | (50,393 | ) | | | (161,375 | ) | | | 8,655 | | | | 33,138 | |
| Net Realized Loss on Investments and Foreign Currency Transactions | | | (76,225,431 | ) | | | (26,825,038 | ) | | | (325,550 | ) | | | (4,431,226 | ) |
| Net Change in Unrealized Depreciation on: | | | | | | | | | | | | | | | | |
| Investments | | | (8,460,313 | ) | | | (7,350,161 | ) | | | (3,970,539 | ) | | | (5,676,912 | ) |
| Foreign Currency Translation | | | (425 | ) | | | (37,681 | ) | | | (41,875 | ) | | | (971 | ) |
| Net Change in Unrealized Depreciation on Investments and Foreign Currency Translations | | | (8,460,738 | ) | | | (7,387,842 | ) | | | (4,012,414 | ) | | | (5,677,883 | ) |
| Net Realized and Unrealized Loss on Investments and Foreign Currency Transactions and Translations | | | (84,686,169 | ) | | | (34,212,880 | ) | | | (4,337,964 | ) | | | (10,109,109 | ) |
| Net Decrease in Net Assets Resulting from Operations | | $ | (80,864,633 | ) | | $ | (31,721,679 | ) | | $ | (2,927,612 | ) | | $ | (9,200,736 | ) |
| (1) | The Supervision and Administration fees includes fees paid by the Funds for the investment advisory services provided by the Adviser. (See Note 3 in Notes to Financial Statements). |
| (2) | Includes realized gains/(losses) as a result of in-kind transactions. (See Note 4 in Notes to Financial Statements). |
The accompanying notes are an integral part of the financial statements.
| Statements of Operations |
| For the year or period ended October 31, 2015 |
| | | Global X Next
Emerging &
Frontier ETF | | | Global X FTSE
Portugal 20 ETF | | | Global X MSCI
Pakistan ETF(3) | |
| Investment Income: | | | | | | | | | | | | |
| Dividend Income | | $ | 3,964,729 | | | $ | 1,412,262 | | | $ | 148,315 | |
| Interest Income | | | — | | | | 7 | | | | — | |
| Security Lending Income | | | — | | | | 33,018 | | | | — | |
| Less: Foreign Taxes Withheld | | | (344,979 | ) | | | (214,273 | ) | | | (15,405 | ) |
| Total Investment Income | | | 3,619,750 | | | | 1,231,014 | | | | 132,910 | |
| Supervision and Administration Fees(1) | | | 633,469 | | | | 205,875 | | | | 16,940 | |
| Custodian Fees | | | 111,494 | | | | 23,497 | | | | 5,421 | |
| Total Expenses | | | 744,963 | | | | 229,372 | | | | 22,361 | |
| Net Investment Income | | | 2,874,787 | | | | 1,001,642 | | | | 110,549 | |
| Net Realized Gain (Loss) on: | | | | | | | | | | | | |
| Investments | | | (10,586,106 | )(2) | | | (4,826,440 | )(2) | | | (7,787 | ) |
| Foreign Currency Transactions | | | (93,235 | ) | | | 1,939 | | | | (939 | ) |
| Net Realized Loss on Investments and Foreign Currency Transactions | | | (10,679,341 | ) | | | (4,824,501 | ) | | | (8,726 | ) |
| Net Change in Unrealized Appreciation (Depreciation) on: | | | | | | | | | | | | |
| Investments | | | (27,228,926 | ) | | | (1,686,810 | ) | | | (460,514 | ) |
| Foreign Capital Gains Tax on Appreciated Securities | | | — | | | | — | | | | (21,940 | ) |
| Foreign Currency Translation | | | 2,084 | | | | (11,320 | ) | | | (491 | ) |
| Net Change in Unrealized Depreciation on Investments and Foreign Currency Translations | | | (27,226,842 | ) | | | (1,698,130 | ) | | | (482,945 | ) |
| Net Realized and Unrealized Loss on Investments and Foreign Currency Transactions and Translations | | | (37,906,183 | ) | | | (6,522,631 | ) | | | (491,671 | ) |
| Net Decrease in Net Assets Resulting from Operations | | $ | (35,031,396 | ) | | $ | (5,520,989 | ) | | $ | (381,122 | ) |
| (1) | The Supervision and Administration fees includes fees paid by the Funds for the investment advisory services provided by the Adviser. (See Note 3 in Notes to Financial Statements). |
| (2) | Includes realized gains (losses) as a result of in-kind redemptions. (See Note 4 in Notes to Financial Statements). |
| (3) | The Fund commenced operations on April 22, 2015. |
The accompanying notes are an integral part of the financial statements.
| Statements of Changes in Net Assets |
| |
| | | Global X China Consumer ETF | | | Global X China Energy ETF | |
| | | Year Ended
October 31, 2015 | | | Year Ended
October 31, 2014 | | | Year Ended
October 31, 2015 | | | Year Ended
October 31, 2014 | |
| Operations: | | | | | | | | | | | | | | | | |
| Net Investment Income | | $ | 4,078,383 | | | $ | 1,913,938 | | | $ | 48,211 | | | $ | 81,755 | |
| Net Realized Gain (Loss) on Investments and Foreign Currency Transactions(1) | | | (12,633,583 | ) | | | (2,704,977 | ) | | | 79,371 | | | | 134,132 | |
| Net Change in Unrealized Appreciation (Depreciation) on Investments and Foreign Currency Translations | | | 7,369,978 | | | | (22,387,593 | ) | | | (693,919 | ) | | | (382,964 | ) |
| Net Decrease in Net Assets Resulting from Operations | | | (1,185,222 | ) | | | (23,178,632 | ) | | | (566,337 | ) | | | (167,077 | ) |
| Dividends and Distributions from: | | | | | | | | | | | | | | | | |
| Net Investment Income | | | (2,353,761 | ) | | | (1,981,753 | ) | | | (81,629 | ) | | | (85,026 | ) |
| Total Dividends and Distributions | | | (2,353,761 | ) | | | (1,981,753 | ) | | | (81,629 | ) | | | (85,026 | ) |
| Capital Share Transactions: | | | | | | | | | | | | | | | | |
| Issued | | | 4,518,462 | | | | 48,155,014 | | | | — | | | | 1,700,115 | |
| Redeemed | | | (41,042,576 | ) | | | (59,534,481 | ) | | | (2,120,068 | ) | | | (1,473,525 | ) |
| Increase (Decrease) in Net Assets from Capital Share Transactions | | | (36,524,114 | ) | | | (11,379,467 | ) | | | (2,120,068 | ) | | | 226,590 | |
| Total Decrease in Net Assets | | | (40,063,097 | ) | | | (36,539,852 | ) | | | (2,768,034 | ) | | | (25,513 | ) |
| Net Assets: | | | | | | | | | | | | | | | | |
| Beginning of Year | | | 134,014,036 | | | | 170,553,888 | | | | 4,508,837 | | | | 4,534,350 | |
| End of Year | | $ | 93,950,939 | | | $ | 134,014,036 | | | $ | 1,740,803 | | | $ | 4,508,837 | |
| Undistributed Net Investment Income | | $ | 3,540,439 | | | $ | 1,730,708 | | | $ | 48,201 | | | $ | 81,629 | |
| Share Transactions: | | | | | | | | | | | | | | | | |
| Issued | | | 350,000 | | | | 3,050,000 | | | | — | | | | 100,000 | |
| Redeemed | | | (3,200,000 | ) | | | (4,100,000 | ) | | | (150,000 | ) | | | (100,000 | ) |
| Net Decrease in Shares Outstanding from Share Transactions | | | (2,850,000 | ) | | | (1,050,000 | ) | | | (150,000 | ) | | | — | |
| (1) | Includes realized gains/(losses) as a result of in-kind transactions. (See Note 4 in Notes to Financial Statements). |
The accompanying notes are an integral part of the financial statements.
| Statements of Changes in Net Assets |
| |
| | | Global X China Financials ETF | | | Global X China Industrials ETF | |
| | | Year Ended
October 31, 2015 | | | Year Ended
October 31, 2014 | | | Year Ended
October 31, 2015 | | | Year Ended
October 31, 2014 | |
| Operations: | | | | | | | | | | | | | | | | |
| Net Investment Income | | $ | 2,726,683 | | | $ | 581,521 | | | $ | 99,429 | | | $ | 45,160 | |
| Net Realized Gain (Loss) on Investments and Foreign Currency Transactions(1) | | | 3,004,884 | | | | (2,274,890 | ) | | | 861,527 | | | | (488,702 | ) |
| Net Change in Unrealized Appreciation (Depreciation) on Investments and Foreign Currency Translations | | | (2,867,620 | ) | | | (2,627,366 | ) | | | (1,121,417 | ) | | | 713,362 | |
| Net Increase (Decrease) in Net Assets Resulting from Operations | | | 2,863,947 | | | | (4,320,735 | ) | | | (160,461 | ) | | | 269,820 | |
| Dividends and Distributions from: | | | | | | | | | | | | | | | | |
| Net Investment Income | | | (617,666 | ) | | | (243,282 | ) | | | (44,362 | ) | | | (65,300 | ) |
| Total Dividends and Distributions | | | (617,666 | ) | | | (243,282 | ) | | | (44,362 | ) | | | (65,300 | ) |
| Capital Share Transactions: | | | | | | | | | | | | | | | | |
| Issued | | | 45,839,534 | | | | 43,844,234 | | | | 6,125,108 | | | | 2,505,369 | |
| Redeemed | | | (39,313,495 | ) | | | (33,212,829 | ) | | | (4,518,645 | ) | | | (1,137,500 | ) |
| Increase in Net Assets from Capital Share Transactions | | | 6,526,039 | | | | 10,631,405 | | | | 1,606,463 | | | | 1,367,869 | |
| Total Increase in Net Assets | | | 8,772,320 | | | | 6,067,388 | | | | 1,401,640 | | | | 1,572,389 | |
| Net Assets: | | | | | | | | | | | | | | | | |
| Beginning of Year | | | 48,585,334 | | | | 42,517,946 | | | | 5,820,634 | | | | 4,248,245 | |
| End of Year | | $ | 57,357,654 | | | $ | 48,585,334 | | | $ | 7,222,274 | | | $ | 5,820,634 | |
| Undistributed Net Investment Income | | $ | 2,726,593 | | | $ | 580,994 | | | $ | 95,160 | | | $ | 39,452 | |
| Share Transactions: | | | | | | | | | | | | | | | | |
| Issued | | | 2,850,000 | | | | 3,200,000 | | | | 350,000 | | | | 200,000 | |
| Redeemed | | | (2,600,000 | ) | | | (2,800,000 | ) | | | (300,000 | ) | | | (100,000 | ) |
| Net Increase in Shares Outstanding from Share Transactions | | | 250,000 | | | | 400,000 | | | | 50,000 | | | | 100,000 | |
| (1) | Includes realized gains/(losses) as a result of in-kind transactions. (See Note 4 in Notes to Financial Statements). |
The accompanying notes are an integral part of the financial statements.
| Statements of Changes in Net Assets |
| |
| | | Global X China Materials ETF | | | Global X NASDAQ China Technology
ETF | |
| | | Year Ended
October 31, 2015 | | | Year Ended
October 31, 2014 | | | Year Ended
October 31, 2015 | | | Year Ended
October 31, 2014 | |
| Operations: | | | | | | | | | | | | | | | | |
| Net Investment Income | | $ | 70,649 | | | $ | 30,707 | | | $ | 99,519 | | | $ | 54,398 | |
| Net Realized Gain (Loss) on Investments and Foreign Currency Transactions(1) | | | (389,807 | ) | | | 116,946 | | | | 426,927 | | | | 222,294 | |
| Net Change in Unrealized Appreciation (Depreciation) on Investments and Foreign Currency Translations | | | (339,993 | ) | | | (240,082 | ) | | | (2,620,410 | ) | | | 1,408,514 | |
| Net Increase (Decrease) in Net Assets Resulting from Operations | | | (659,151 | ) | | | (92,429 | ) | | | (2,093,964 | ) | | | 1,685,206 | |
| Dividends and Distributions from: | | | | | | | | | | | | | | | | |
| Net Investment Income | | | (30,768 | ) | | | (36,867 | ) | | | (64,823 | ) | | | (3,666 | ) |
| Total Dividends and Distributions | | | (30,768 | ) | | | (36,867 | ) | | | (64,823 | ) | | | (3,666 | ) |
| Capital Share Transactions: | | | | | | | | | | | | | | | | |
| Issued | | | 4,880,764 | | | | 3,210,002 | | | | 2,507,379 | | | | 11,389,496 | |
| Redeemed | | | (5,821,646 | ) | | | (2,390,367 | ) | | | (7,251,028 | ) | | | (1,081,619 | ) |
| Increase (Decrease) in Net Assets from Capital Share Transactions | | | (940,882 | ) | | | 819,635 | | | | (4,743,649 | ) | | | 10,307,877 | |
| Total Increase (Decrease) in Net Assets | | | (1,630,801 | ) | | | 690,339 | | | | (6,902,436 | ) | | | 11,989,417 | |
| Net Assets: | | | | | | | | | | | | | | | | |
| Beginning of Year | | | 2,959,319 | | | | 2,268,980 | | | | 22,306,871 | | | | 10,317,454 | |
| End of Year | | $ | 1,328,518 | | | $ | 2,959,319 | | | $ | 15,404,435 | | | $ | 22,306,871 | |
| Undistributed Net Investment Income | | $ | 70,631 | | | $ | 30,768 | | | $ | 91,745 | | | $ | 54,302 | |
| Share Transactions: | | | | | | | | | | | | | | | | |
| Issued | | | 250,000 | | | | 200,000 | | | | 100,000 | | | | 500,000 | |
| Redeemed | | | (350,000 | ) | | | (150,000 | ) | | | (350,000 | ) | | | (50,000 | ) |
| Net Increase (Decrease) in Shares Outstanding from Share Transactions | | | (100,000 | ) | | | 50,000 | | | | (250,000 | ) | | | 450,000 | |
| (1) | Includes realized gains/(losses) as a result of in-kind transactions. (See Note 4 in Notes to Financial Statements). |
The accompanying notes are an integral part of the financial statements.
| Statements of Changes in Net Assets |
| |
| | | Global X Southeast Asia ETF | | | Global X FTSE Andean 40 ETF | |
| | | Year Ended
October 31, 2015 | | | Year Ended
October 31, 2014 | | | Year Ended
October 31, 2015 | | | Year Ended
October 31, 2014 | |
| Operations: | | | | | | | | | | | | | | | | |
| Net Investment Income | | $ | 499,498 | | | $ | 782,192 | | | $ | 116,375 | | | $ | 162,703 | |
| Net Realized Loss on Investments and Foreign Currency Transactions(1) | | | (3,073,750 | ) | | | (1,187,065 | ) | | | (1,894,002 | ) | | | (783,510 | ) |
| Net Change in Unrealized Depreciation on Investments and Foreign Currency Translations | | | (2,491,872 | ) | | | (370,487 | ) | | | (313,544 | ) | | | (785,045 | ) |
| Net Decrease in Net Assets Resulting from Operations | | | (5,066,124 | ) | | | (775,360 | ) | | | (2,091,171 | ) | | | (1,405,852 | ) |
| Dividends and Distributions from: | | | | | | | | | | | | | | | | |
| Net Investment Income | | | (689,799 | ) | | | (1,423,135 | ) | | | (168,007 | ) | | | (153,480 | ) |
| Total Dividends and Distributions | | | (689,799 | ) | | | (1,423,135 | ) | | | (168,007 | ) | | | (153,480 | ) |
| Capital Share Transactions: | | | | | | | | | | | | | | | | |
| Issued | | | 1,664,730 | | | | 871,105 | | | | 432,014 | | | | 1,612,500 | |
| Redeemed | | | (10,868,937 | ) | | | (18,970,966 | ) | | | (3,930,506 | ) | | | (1,425,000 | ) |
| Increase (Decrease) in Net Assets from Capital Share Transactions | | | (9,204,207 | ) | | | (18,099,861 | ) | | | (3,498,492 | ) | | | 187,500 | |
| Total Decrease in Net Assets | | | (14,960,130 | ) | | | (20,298,356 | ) | | | (5,757,670 | ) | | | (1,371,832 | ) |
| Net Assets: | | | | | | | | | | | | | | | | |
| Beginning of Year | | | 29,335,963 | | | | 49,634,319 | | | | 9,010,458 | | | | 10,382,290 | |
| End of Year | | $ | 14,375,833 | | | $ | 29,335,963 | | | $ | 3,252,788 | | | $ | 9,010,458 | |
| Undistributed Net Investment Income | | $ | 447,921 | | | $ | 641,309 | | | $ | 80,784 | | | $ | 140,219 | |
| Share Transactions: | | | | | | | | | | | | | | | | |
| Issued | | | 100,000 | | | | 50,000 | | | | 50,000 | | | | 150,000 | |
| Redeemed | | | (750,000 | ) | | | (1,200,000 | ) | | | (450,000 | ) | | | (150,000 | ) |
| Net Decrease in Shares Outstanding from Share Transactions | | | (650,000 | ) | | | (1,150,000 | ) | | | (400,000 | ) | | | — | |
| (1) | Includes realized gains/(losses) as a result of in-kind transactions. (See Note 4 in Notes to Financial Statements). |
The accompanying notes are an integral part of the financial statements.
| Statements of Changes in Net Assets |
| |
| | | Global X MSCI Colombia ETF | | | Global X Brazil Mid Cap ETF | |
| | | Year Ended
October 31, 2015 | | | Year Ended
October 31, 2014 | | | Year Ended
October 31, 2015 | | | Year Ended
October 31, 2014 | |
| Operations: | | | | | | | | | | | | | | | | |
| Net Investment Income | | $ | 2,046,015 | | | $ | 2,347,157 | | | $ | 110,234 | | | $ | 272,879 | |
| Net Realized Loss on Investments and Foreign Currency Transactions(1) | | | (33,449,177 | ) | | | (1,311,327 | ) | | | (2,034,312 | ) | | | (484,122 | ) |
| Net Change in Unrealized Depreciation on Investments and Foreign Currency Translations | | | (18,888,106 | ) | | | (19,271,052 | ) | | | (863,040 | ) | | | (902,819 | ) |
| Net Decrease in Net Assets Resulting from Operations | | | (50,291,268 | ) | | | (18,235,222 | ) | | | (2,787,118 | ) | | | (1,114,062 | ) |
| Dividends and Distributions from: | | | | | | | | | | | | | | | | |
| Net Investment Income | | | (2,318,237 | ) | | | (4,567,150 | ) | | | (242,176 | ) | | | (531,843 | ) |
| Total Dividends and Distributions | | | (2,318,237 | ) | | | (4,567,150 | ) | | | (242,176 | ) | | | (531,843 | ) |
| Capital Share Transactions: | | | | | | | | | | | | | | | | |
| Issued | | | 45,234,599 | | | | 29,655,286 | | | | — | | | | — | |
| Redeemed | | | (26,696,623 | ) | | | (55,789,957 | ) | | | (1,823,648 | ) | | | (2,802,000 | ) |
| Increase (Decrease) in Net Assets from Capital Share Transactions | | | 18,537,976 | | | | (26,134,671 | ) | | | (1,823,648 | ) | | | (2,802,000 | ) |
| Total Decrease in Net Assets | | | (34,071,529 | ) | | | (48,937,043 | ) | | | (4,852,942 | ) | | | (4,447,905 | ) |
| Net Assets: | | | | | | | | | | | | | | | | |
| Beginning of Year | | | 100,687,511 | | | | 149,624,554 | | | | 7,942,263 | | | | 12,390,168 | |
| End of Year | | $ | 66,615,982 | | | $ | 100,687,511 | | | $ | 3,089,321 | | | $ | 7,942,263 | |
| Undistributed Net Investment Income | | $ | 491,296 | | | $ | 1,165,141 | | | $ | 55,329 | | | $ | 209,391 | |
| Share Transactions: | | | | | | | | | | | | | | | | |
| Issued | | | 4,150,000 | | | | 1,550,000 | | | | — | | | | — | |
| Redeemed | | | (2,350,000 | ) | | | (3,050,000 | ) | | | (200,000 | ) | | | (200,000 | ) |
| Net Increase (Decrease) in Shares Outstanding from Share Transactions | | | 1,800,000 | | | | (1,500,000 | ) | | | (200,000 | ) | | | (200,000 | ) |
| (1) | Includes realized gains(losses) as a result of in-kind transactions. (See Note 4 in Notes to Financial Statements). |
The accompanying notes are an integral part of the financial statements.
| Statements of Changes in Net Assets |
| |
| | | Global X Brazil Consumer ETF | | | Global X MSCI Argentina ETF | |
| | | Year Ended
October 31, 2015 | | | Year Ended
October 31, 2014 | | | Year Ended
October 31, 2015 | | | Year Ended
October 31, 2014 | |
| Operations: | | | | | | | | | | | | | | | | |
| Net Investment Income | | $ | 80,600 | | | $ | 269,976 | | | $ | 101,821 | | | $ | 69,027 | |
| Net Realized Gain (Loss) on Investments and Foreign Currency Transactions(1) | | | (1,712,549 | ) | | | 146,889 | | | | (416,473 | ) | | | 216,289 | |
| Net Change in Unrealized Depreciation on Investments and Foreign Currency Transactions | | | (2,485,770 | ) | | | (1,193,505 | ) | | | (1,540,989 | ) | | | (1,390,959 | ) |
| Net Decrease in Net Assets Resulting from Operations | | | (4,117,719 | ) | | | (776,640 | ) | | | (1,855,641 | ) | | | (1,105,643 | ) |
| Dividends and Distributions from: | | | | | | | | | | | | | | | | |
| Net Investment Income | | | (240,598 | ) | | | (185,072 | ) | | | (90,100 | ) | | | (45,738 | ) |
| Total Dividends and Distributions | | | (240,598 | ) | | | (185,072 | ) | | | (90,100 | ) | | | (45,738 | ) |
| Capital Share Transactions: | | | | | | | | | | | | | | | | |
| Issued | | | — | | | | — | | | | 4,191,155 | | | | 33,130,182 | |
| Redeemed | | | (2,613,701 | ) | | | (7,882,187 | ) | | | (7,542,603 | ) | | | (17,921,744 | ) |
| Increase (Decrease) in Net Assets from Capital Share Transactions | | | (2,613,701 | ) | | | (7,882,187 | ) | | | (3,351,448 | ) | | | 15,208,438 | |
| Total Increase (Decrease) in Net Assets | | | (6,972,018 | ) | | | (8,843,899 | ) | | | (5,297,189 | ) | | | 14,057,057 | |
| Net Assets: | | | | | | | | | | | | | | | | |
| Beginning of Year | | | 9,942,650 | | | | 18,786,549 | | | | 20,652,247 | | | | 6,595,190 | |
| End of Year | | $ | 2,970,632 | | | $ | 9,942,650 | | | $ | 15,355,058 | | | $ | 20,652,247 | |
| Undistributed Net Investment Income | | $ | 36,221 | | | $ | 238,743 | | | $ | 44,367 | | | $ | 31,028 | |
| Share Transactions: | | | | | | | | | | | | | | | | |
| Issued | | | — | | | | — | | | | 200,000 | | | | 1,500,000 | |
| Redeemed | | | (250,000 | ) | | | (450,000 | ) | | | (400,000 | ) | | | (850,000 | ) |
| Net Increase (Decrease) in Shares Outstanding from Share Transactions | | | (250,000 | ) | | | (450,000 | ) | | | (200,000 | ) | | | 650,000 | |
| (1) | Includes realized gains/(losses) as a result of in-kind transactions. (See Note 4 in Notes to Financial Statements). |
The accompanying notes are an integral part of the financial statements.
| Statements of Changes in Net Assets |
| |
| | | Global X FTSE Greece 20 ETF | | | Global X MSCI Norway ETF | |
| | | Year Ended
October 31, 2015 | | | Year Ended
October 31, 2014 | | | Year Ended
October 31, 2015 | | | Year Ended
October 31, 2014 | |
| Operations: | | | | | | | | | | | | | | | | |
| Net Investment Income | | $ | 3,821,536 | | | $ | 747,129 | | | $ | 2,491,201 | | | $ | 4,715,125 | |
| Net Realized Gain (Loss) on Investments and Foreign Currency Transactions(1) | | | (76,225,431 | ) | | | 3,451,956 | | | | (26,825,038 | ) | | | 1,465,465 | |
| Net Change in Unrealized Depreciation on Investments and Foreign Currency Translations | | | (8,460,738 | ) | | | (88,239,623 | ) | | | (7,387,842 | ) | | | (35,374,857 | ) |
| Net Decrease in Net Assets Resulting from Operations | | | (80,864,633 | ) | | | (84,040,538 | ) | | | (31,721,679 | ) | | | (29,194,267 | ) |
| Dividends and Distributions from: | | | | | | | | | | | | | | | | |
| Net Investment Income | | | (956,353 | ) | | | (53,067 | ) | | | (4,921,308 | ) | | | (2,012,342 | ) |
| Net Realized Gains | | | — | | | | (99,419 | ) | | | — | | | | — | |
| Total Dividends and Distributions | | | (956,353 | ) | | | (152,486 | ) | | | (4,921,308 | ) | | | (2,012,342 | ) |
| Capital Share Transactions: | | | | | | | | | | | | | | | | |
| Issued | | | 336,524,730 | | | | 365,866,512 | | | | 41,588,211 | | | | 157,097,512 | |
| Redeemed | | | (79,997,814 | ) | | | (236,410,164 | ) | | | (122,958,997 | ) | | | (23,318,063 | ) |
| Increase (Decrease) in Net Assets from Capital Share Transactions | | | 256,526,916 | | | | 129,456,348 | | | | (81,370,786 | ) | | | 133,779,449 | |
| Total Increase (Decrease) in Net Assets | | | 174,705,930 | | | | 45,263,324 | | | | (118,013,773 | ) | | | 102,572,840 | |
| Net Assets: | | | | | | | | | | | | | | | | |
| Beginning of Year | | | 140,201,261 | | | | 94,937,937 | | | | 183,037,614 | | | | 80,464,774 | |
| End of Year | | $ | 314,907,191 | | | $ | 140,201,261 | | | $ | 65,023,841 | | | $ | 183,037,614 | |
| Undistributed Net Investment Income | | $ | 3,523,899 | | | $ | 707,125 | | | $ | 1,890,655 | | | $ | 4,442,674 | |
| Share Transactions: | | | | | | | | | | | | | | | | |
| Issued | | | 28,000,000 | | | | 16,150,000 | | | | 3,200,000 | | | | 9,000,000 | |
| Redeemed | | | (6,600,000 | ) | | | (11,500,000 | ) | | | (9,500,000 | ) | | | (1,450,000 | ) |
| Net Increase (Decrease) in Shares Outstanding from Share Transactions | | | 21,400,000 | | | | 4,650,000 | | | | (6,300,000 | ) | | | 7,550,000 | |
| (1) | Includes realized gains/(losses) as a result of in-kind transactions. (See Note 4 in Notes to Financial Statements). |
The accompanying notes are an integral part of the financial statements.
| Statements of Changes in Net Assets |
| |
| | | Global X FTSE Nordic Region ETF | | | Global X MSCI Nigeria ETF | |
| | | Year Ended
October 31, 2015 | | | Year Ended
October 31, 2014 | | | Year Ended
October 31, 2015 | | | Year Ended
October 31, 2014 | |
| Operations: | | | | | | | | | | | | | | | | |
| Net Investment Income | | $ | 1,410,352 | | | $ | 1,941,897 | | | $ | 908,373 | | | $ | 443,264 | |
| Net Realized Gain (Loss) on Investments and Foreign Currency Transactions | | | (325,550 | )(1) | | | 3,135,947 | (1) | | | (4,431,226 | ) | | | (1,146,397 | ) |
| Net Change in Unrealized Depreciation on Investments and Foreign Currency Translations | | | (4,012,414 | ) | | | (2,958,708 | ) | | | (5,677,883 | ) | | | (1,689,895 | ) |
| Net Increase (Decrease) in Net Assets Resulting from Operations | | | (2,927,612 | ) | | | 2,119,136 | | | | (9,200,736 | ) | | | (2,393,028 | ) |
| Dividends and Distributions from: | | | | | | | | | | | | | | | | |
| Net Investment Income | | | (2,045,741 | ) | | | (1,480,041 | ) | | | (505,208 | ) | | | (76,054 | ) |
| Net Realized Gains | | | — | | | | — | | | | — | | | | (16,784 | ) |
| Total Dividends and Distributions | | | (2,045,741 | ) | | | (1,480,041 | ) | | | (505,208 | ) | | | (92,838 | ) |
| Capital Share Transactions: | | | | | | | | | | | | | | | | |
| Issued | | | 2,475,978 | | | | 13,753,500 | | | | 19,080,421 | | | | 14,117,633 | |
| Redeemed | | | (4,833,389 | ) | | | (10,480,721 | ) | | | (1,675,335 | ) | | | (677,320 | ) |
| Increase (Decrease) in Net Assets from Capital Share Transactions | | | (2,357,411 | ) | | | 3,272,779 | | | | 17,405,086 | | | | 13,440,313 | |
| Total Increase (Decrease) in Net Assets | | | (7,330,764 | ) | | | 3,911,874 | | | | 7,699,142 | | | | 10,954,447 | |
| Net Assets: | | | | | | | | | | | | | | | | |
| Beginning of Year | | | 59,926,553 | | | | 56,014,679 | | | | 16,923,981 | | | | 5,969,534 | |
| End of Year | | $ | 52,595,789 | | | $ | 59,926,553 | | | $ | 24,623,123 | | | $ | 16,923,981 | |
| Undistributed Net Investment Income | | $ | 1,135,677 | | | $ | 1,695,771 | | | $ | 820,220 | | | $ | 383,917 | |
| Share Transactions: | | | | | | | | | | | | | | | | |
| Issued | | | 100,000 | | | | 550,000 | | | | 2,000,000 | | | | 950,000 | |
| Redeemed | | | (200,000 | ) | | | (450,000 | ) | | | (200,000 | ) | | | (50,000 | ) |
| Net Increase (Decrease) in Shares Outstanding from Share Transactions | | | (100,000 | ) | | | 100,000 | | | | 1,800,000 | | | | 900,000 | |
| (1) | Includes realized gains/(losses) as a result of in-kind transactions. (See Note 4 in Notes to Financial Statements). |
The accompanying notes are an integral part of the financial statements.
| Statements of Changes in Net Assets |
| |
| | | Global X Next Emerging & Frontier
ETF | | | Global X FTSE Portugal 20 ETF | |
| | | Year Ended
October 31, 2015 | | | Period Ended
October 31, 2014(1) | | | Year Ended
October 31, 2015 | | | Period Ended
October 31, 2014(2) | |
| Operations: | | | | | | | | | | | | | | | | |
| Net Investment Income | | $ | 2,874,787 | | | $ | 1,853,596 | | | $ | 1,001,642 | | | $ | 574,014 | |
| Net Realized Loss on Investments and Foreign Currency Transactions(3) | | | (10,679,341 | ) | | | (238,800 | ) | | | (4,824,501 | ) | | | (1,289,384 | ) |
| Net Change in Unrealized Depreciation on Investments and Foreign Currency Translations | | | (27,226,842 | ) | | | (2,082,587 | ) | | | (1,698,130 | ) | | | (8,128,731 | ) |
| Net Decrease in Net Assets Resulting from Operations | | | (35,031,396 | ) | | | (467,791 | ) | | | (5,520,989 | ) | | | (8,844,101 | ) |
| Dividends and Distributions from: | | | | | | | | | | | | | | | | |
| Net Investment Income | | | (2,316,518 | ) | | | (28,312 | ) | | | (575,663 | ) | | | — | |
| Total Dividends and Distributions | | | (2,316,518 | ) | | | (28,312 | ) | | | (575,663 | ) | | | — | |
| Capital Share Transactions: | | | | | | | | | | | | | | | | |
| Issued | | | 8,809,775 | | | | 156,318,000 | | | | 25,089,819 | | | | 53,026,360 | |
| Redeemed | | | (16,563,940 | ) | | | (3,794,788 | ) | | | (18,236,165 | ) | | | (7,490,738 | ) |
| Increase (Decrease) in Net Assets from Capital Share Transactions | | | (7,754,165 | ) | | | 152,523,212 | | | | 6,853,654 | | | | 45,535,622 | |
| Total Increase (Decrease) in Net Assets | | | (45,102,079 | ) | | | 152,027,109 | | | | 757,002 | | | | 36,691,521 | |
| Net Assets: | | | | | | | | | | | | | | | | |
| Beginning of Year/Period | | | 152,027,109 | | | | — | | | | 36,691,521 | | | | — | |
| End of Year/Period | | $ | 106,925,030 | | | $ | 152,027,109 | | | $ | 37,448,523 | | | $ | 36,691,521 | |
| Undistributed Net Investment Income | | $ | 2,242,259 | | | $ | 1,775,431 | | | $ | 1,003,581 | | | $ | 575,664 | |
| Share Transactions: | | | | | | | | | | | | | | | | |
| Issued | | | 400,000 | | | | 6,100,000 | | | | 2,200,000 | | | | 3,450,000 | |
| Redeemed | | | (800,000 | ) | | | (150,000 | ) | | | (1,650,000 | ) | | | (550,000 | ) |
| Net Increase (Decrease) in Shares Outstanding from Share Transactions | | | (400,000 | ) | | | 5,950,000 | | | | 550,000 | | | | 2,900,000 | |
| (1) | Commenced operations on November 6, 2013. |
| (2) | Commenced operations on November 12, 2013. |
| (3) | Includes realized gains(losses) as a result of in-kind transactions. (See Note 4 in Notes to Financial Statements). |
The accompanying notes are an integral part of the financial statements.
| Statements of Changes in Net Assets |
| |
| | | Global X MSCI
Pakistan ETF | |
| | | Period Ended
October 31, 2015(1) | |
| Operations: | | | | |
| Net Investment Income | | $ | 110,549 | |
| Net Realized Loss on Investments and Foreign Currency Transactions | | | (8,726 | ) |
| Net Change in Unrealized Depreciation on Investments and Foreign Currency Translations | | | (482,945 | ) |
| Net Decrease in Net Assets Resulting from Operations | | | (381,122 | ) |
| Capital Share Transactions: | | | | |
| Issued | | | 6,047,981 | |
| Increase in Net Assets from Capital Share Transactions | | | 6,047,981 | |
| Total Increase in Net Assets | | | 5,666,859 | |
| Net Assets: | | | | |
| Beginning of Period | | | — | |
| End of Period | | $ | 5,666,859 | |
| Undistributed Net Investment Income | | $ | 110,195 | |
| Share Transactions: | | | | |
| Issued | | | 400,000 | |
| Net Increase in Shares Outstanding from Share Transactions | | | 400,000 | |
| (1) | Commenced operations on April 22, 2015. |
The accompanying notes are an integral part of the financial statements.
Selected Per Share Data & Ratios
For a Share Outstanding Throughout the Period
| | | Net Asset
Value,
Beginning of
Period ($) | | | Net
Investment
Income ($)* | | | Net Realized
and
Unrealized
Gain (Loss)
on
Investments
($) | | | Total from
Operations
($) | | | Distribution
from Net
Investment
Income ($) | | | Distribution
from
Capital
Gains ($) | | | Total from
Distributions
($) | | | Net Asset
Value, End
of Period
($) | | | Total
Return
(%)** | | | Net
Assets
End of
Period
($)(000) | | | Ratio of
Expenses
to Average
Net Assets
(%) | | | Ratio of
Net
Investment
Income to
Average
Net Assets
(%) | | | Portfolio
Turnover
(%) | |
| Global X China Consumer ETF | | | | | | | | | | | | | | | | | | | | | | | | | | | | | | | | |
| 2015 | | | 13.82 | | | | 0.53 | | | | (0.37 | ) | | | 0.16 | | | | (0.26 | ) | | | — | | | | (0.26 | ) | | | 13.72 | | | | 1.34 | | | | 93,951 | | | | 0.65 | | | | 3.86 | | | | 24.57 | |
| 2014 | | | 15.87 | | | | 0.17 | | | | (2.07 | ) | | | (1.90 | ) | | | (0.15 | ) | | | — | | | | (0.15 | ) | | | 13.82 | | | | (12.09 | ) | | | 134,014 | | | | 0.65 | | | | 1.18 | | | | 18.89 | |
| 2013 | | | 14.00 | | | | 0.16 | | | | 1.88 | | | | 2.04 | | | | (0.17 | ) | | | — | | | | (0.17 | ) | | | 15.87 | | | | 14.66 | | | | 170,554 | | | | 0.65 | | | | 1.11 | | | | 27.76 | |
| 2012 | | | 15.29 | | | | 0.24 | | | | (1.47 | ) | | | (1.23 | ) | | | (0.06 | ) | | | — | | | | (0.06 | ) | | | 14.00 | | | | (8.06 | ) | | | 126,715 | | | | 0.65 | | | | 1.73 | | | | 17.32 | |
| 2011 | | | 20.33 | | | | 0.17 | | | | (5.02 | ) | | | (4.85 | ) | | | (0.19 | ) | | | — | | | | (0.19 | ) | | | 15.29 | | | | (23.99 | ) | | | 136,858 | | | | 0.65 | | | | 0.98 | | | | 12.37 | |
| Global X China Energy ETF | | | | | | | | | | | | | | | | | | | | | | | | | | | | | | | | |
| 2015 | | | 15.03 | | | | 0.22 | | | | (3.31 | ) | | | (3.09 | ) | | | (0.33 | ) | | | — | | | | (0.33 | ) | | | 11.61 | | | | (20.89 | ) | | | 1,741 | | | | 0.65 | | | | 1.66 | | | | 15.62 | |
| 2014 | | | 15.11 | | | | 0.29 | | | | (0.09 | ) | | | 0.20 | | | | (0.28 | ) | | | — | | | | (0.28 | ) | | | 15.03 | | | | 1.34 | | | | 4,509 | | | | 0.65 | | | | 1.90 | | | | 12.65 | |
| 2013 | | | 13.76 | | | | 0.26 | | | | 1.34 | | | | 1.60 | | | | (0.25 | ) | | | — | | | | (0.25 | ) | | | 15.11 | | | | 11.72 | | | | 4,534 | | | | 0.65 | | | | 1.82 | | | | 24.41 | |
| 2012 | | | 13.78 | | | | 0.25 | | | | (0.01 | ) | | | 0.24 | | | | (0.26 | ) | | | — | | | | (0.26 | ) | | | 13.76 | | | | 1.87 | | | | 4,816 | | | | 0.65 | | | | 1.85 | | | | 17.22 | |
| 2011 | | | 15.72 | | | | 0.27 | | | | (2.07 | ) | | | (1.80 | ) | | | (0.14 | ) | | | — | | | | (0.14 | ) | | | 13.78 | | | | (11.57 | ) | | | 4,822 | | | | 0.65 | | | | 1.70 | | | | 11.39 | |
| Global X China Financials ETF | | | | | | | | | | | | | | | | | | | | | | | | | | | | | | | | |
| 2015 | | | 13.50 | | | | 0.54 | | | | 1.02 | | | | 1.56 | | | | (0.16 | ) | | | — | | | | (0.16 | ) | | | 14.90 | | | | 11.50 | | | | 57,358 | | | | 0.65 | | | | 3.34 | | | | 15.88 | |
| 2014 | | | 13.29 | | | | 0.23 | | | | 0.05 | ^ | | | 0.28 | | | | (0.07 | ) | | | — | | | | (0.07 | ) | | | 13.50 | | | | 2.08 | | | | 48,585 | | | | 0.65 | | | | 1.76 | | | | 6.90 | |
| 2013 | | | 12.03 | | | | 0.27 | | | | 1.36 | | | | 1.63 | | | | (0.37 | ) | | | — | | | | (0.37 | ) | | | 13.29 | | | | 13.61 | | | | 42,518 | | | | 0.65 | | | | 2.09 | | | | 33.49 | |
| 2012 | | | 10.92 | | | | 0.20 | | | | 0.92 | | | | 1.12 | | | | (0.01 | ) | | | — | | | | (0.01 | ) | | | 12.03 | | | | 10.28 | | | | 6,013 | | | | 0.65 | | | | 1.76 | | | | 14.02 | |
| 2011 | | | 14.77 | | | | 0.03 | | | | (3.56 | ) | | | (3.53 | ) | | | (0.32 | ) | | | — | | | | (0.32 | ) | | | 10.92 | | | | (24.29 | ) | | | 10,924 | | | | 0.65 | | | | 0.25 | | | | 41.54 | |
| Global X China Industrials ETF | | | | | | | | | | | | | | | | | | | | | | | | | | | | | | | | |
| 2015 | | | 12.93 | | | | 0.21 | | | | 1.40 | | | | 1.61 | | | | (0.10 | ) | | | — | | | | (0.10 | ) | | | 14.44 | | | | 12.49 | | | | 7,222 | | | | 0.65 | | | | 1.38 | | | | 23.87 | |
| 2014 | | | 12.14 | | | | 0.15 | | | | 0.83 | | | | 0.98 | | | | (0.19 | ) | | | — | | | | (0.19 | ) | | | 12.93 | | | | 8.13 | | | | 5,821 | | | | 0.65 | | | | 1.24 | | | | 10.61 | |
| 2013 | | | 11.40 | | | | 0.15 | | | | 0.75 | | | | 0.90 | | | | (0.16 | ) | | | — | | | | (0.16 | ) | | | 12.14 | | | | 7.89 | | | | 4,248 | | | | 0.65 | | | | 1.28 | | | | 19.01 | |
| 2012 | | | 11.39 | | | | 0.16 | | | | (0.13 | ) | | | 0.03 | | | | (0.02 | ) | | | — | | | | (0.02 | ) | | | 11.40 | | | | 0.30 | | | | 4,561 | | | | 0.65 | | | | 1.48 | | | | 23.00 | |
| 2011 | | | 17.13 | | | | 0.13 | | | | (5.64 | ) | | | (5.51 | ) | | | (0.23 | ) | | | — | | | | (0.23 | ) | | | 11.39 | | | | (32.56 | ) | | | 4,558 | | | | 0.65 | | | | 0.88 | | | | 20.13 | |
| Global X China Materials ETF | | | | | | | | | | | | | | | | | | | | | | | | | | | | | | | | |
| 2015 | | | 14.80 | | | | 0.40 | | | | (1.70 | ) | | | (1.30 | ) | | | (0.21 | ) | | | — | | | | (0.21 | ) | | | 13.29 | | | | (8.95 | ) | | | 1,329 | | | | 0.65 | | | | 2.39 | | | | 28.59 | |
| 2014 | | | 15.13 | | | | 0.19 | | | | (0.27 | ) | | | (0.08 | ) | | | (0.25 | ) | | | — | | | | (0.25 | ) | | | 14.80 | | | | (0.57 | ) | | | 2,959 | | | | 0.65 | | | | 1.26 | | | | 13.51 | |
| 2013(1) | | | 16.28 | | | | 0.17 | | | | (1.05 | ) | | | (0.88 | ) | | | (0.27 | ) | | | — | | | | (0.27 | ) | | | 15.13 | | | | (5.63 | ) | | | 2,269 | | | | 0.65 | | | | 1.65 | | | | 31.07 | |
| 2012(1) | | | 19.16 | | | | 0.25 | | | | (3.13 | ) | | | (2.88 | ) | | | — | | | | — | | | | — | | | | 16.28 | | | | (15.03 | ) | | | 2,441 | | | | 0.65 | | | | 1.50 | | | | 50.30 | |
| 2011(1) | | | 29.18 | | | | 0.01 | | | | (9.74 | ) | | | (9.73 | ) | | | (0.29 | ) | | | — | | | | (0.29 | ) | | | 19.16 | | | | (33.69 | ) | | | 2,875 | | | | 0.65 | | | | 0.05 | | | | 36.82 | |
| Global X NASDAQ China Technology ETF | | | | | | | | | | | | | | | | | | | | | | | | | | | | | | | | |
| 2015 | | | 23.48 | | | | 0.12 | | | | (1.52 | ) | | | (1.40 | ) | | | (0.07 | ) | | | — | | | | (0.07 | ) | | | 22.01 | | | | (5.94 | ) | | | 15,404 | | | | 0.65 | | | | 0.52 | | | | 44.95 | |
| 2014 | | | 20.63 | | | | 0.06 | | | | 2.80 | | | | 2.86 | | | | (0.01 | ) | | | — | | | | (0.01 | ) | | | 23.48 | | | | 13.85 | | | | 22,307 | | | | 0.65 | | | | 0.29 | | | | 64.79 | |
| 2013 | | | 13.77 | | | | 0.02 | | | | 6.92 | | | | 6.94 | | | | (0.08 | ) | | | — | | | | (0.08 | ) | | | 20.63 | | | | 50.68 | | | | 10,317 | | | | 0.65 | | | | 0.14 | | | | 57.24 | |
| 2012 | | | 15.38 | | | | 0.05 | | | | (1.47 | ) | | | (1.42 | ) | | | (0.19 | ) | | | — | | | | (0.19 | ) | | | 13.77 | | | | (9.17 | ) | | | 2,754 | | | | 0.65 | | | | 0.35 | | | | 53.45 | |
| 2011 | | | 17.21 | | | | 0.38 | | | | (2.05 | ) | | | (1.67 | ) | | | (0.03 | ) | | | (0.13 | ) | | | (0.16 | ) | | | 15.38 | | | | (9.81 | ) | | | 4,614 | | | | 0.65 | | | | 2.26 | | | | 16.79 | |
| (1) | Per share amounts have been restated for a 1 for 2 reverse share split on May 16, 2013. See Note 7 in the Notes to Financial Statements. |
| ^ | The amount shown for a share outstanding throughout the period does not accord with the aggregate net gains on investments for the period because of the sales and repurchases of fund shares in relation to fluctuating market value of the investments of the Fund. |
| * | Per share data calculated using average shares method. |
| ** | Total Return is for the period indicated and has not been annualized. The return shown does not reflect the deduction of taxes that a shareholder would pay on Fund distributions or the redemption of Fund shares. |
Amounts designated as “—” are either $0 or have been rounded to $0.
The accompanying notes are an integral part of the financial statements.
Selected Per Share Data & Ratios
For a Share Outstanding Throughout the Period
| | | Net Asset
Value,
Beginning of
Period ($) | | | Net
Investment
Income ($)* | | | Net Realized
and
Unrealized
Gain (Loss)
on
Investments
($) | | | Total from
Operations
($) | | | Distribution
from Net
Investment
Income ($) | | | Distribution
from
Capital
Gains ($) | | | Total from
Distributions
($) | | | Net Asset
Value, End
of Period
($) | | | Total
Return
(%)** | | | Net
Assets
End of
Period
($)(000) | | | Ratio of
Expenses
to Average
Net Assets
(%) | | | Ratio of
Net
Investment
Income to
Average
Net Assets
(%) | | | Portfolio
Turnover
(%) | |
| Global X Southeast Asia ETF | | | | | | | | | | | | | | | | | | | | | | | | | | | | | | | | |
| 2015 | | | 16.76 | | | | 0.34 | | | | (3.61 | ) | | | (3.27 | ) | | | (0.42 | ) | | | — | | | | (0.42 | ) | | | 13.07 | | | | (19.97 | ) | | | 14,376 | | | | 0.65 | | | | 2.26 | | | | 24.06 | |
| 2014 | | | 17.12 | | | | 0.39 | | | | (0.16 | ) | | | 0.23 | | | | (0.59 | ) | | | — | | | | (0.59 | ) | | | 16.76 | | | | 1.68 | | | | 29,336 | | | | 0.65 | | | | 2.36 | | | | 8.36 | |
| 2013 | | | 16.75 | | | | 0.47 | | | | 0.28 | ^ | | | 0.75 | | | | (0.38 | ) | | | — | | | | (0.38 | ) | | | 17.12 | | | | 4.50 | | | | 49,634 | | | | 0.65 | | | | 2.73 | | | | 24.07 | |
| 2012 | | | 15.51 | | | | 0.51 | | | | 1.10 | | | | 1.61 | | | | (0.37 | ) | | | — | | | | (0.37 | ) | | | 16.75 | | | | 10.77 | | | | 32,656 | | | | 0.65 | | | | 3.23 | | | | 9.69 | |
| 2011(1) | | | 15.08 | | | | 0.38 | | | | 0.05 | | | | 0.43 | | | | — | | | | — | | | | — | | | | 15.51 | | | | 2.85 | | | | 23,262 | | | | 0.62 | † | | | 3.46 | † | | | 2.68 | †† |
| Global X FTSE Andean 40 ETF | | | | | | | | | | | | | | | | | | | | | | | | | | | | | | | | |
| 2015 | | | 10.60 | | | | 0.17 | | | | (3.34 | ) | | | (3.17 | ) | | | (0.20 | ) | | | — | | | | (0.20 | ) | | | 7.23 | | | | (30.33 | ) | | | 3,253 | | | | 0.72 | | | | 2.02 | | | | 21.91 | |
| 2014 | | | 12.21 | | | | 0.19 | | | | (1.63 | ) | | | (1.44 | ) | | | (0.17 | ) | | | — | | | | (0.17 | ) | | | 10.60 | | | | (11.84 | ) | | | 9,010 | | | | 0.72 | | | | 1.71 | | | | 19.94 | |
| 2013 | | | 14.37 | | | | 0.23 | | | | (2.13 | ) | | | (1.90 | ) | | | (0.26 | ) | | | — | | | | (0.26 | ) | | | 12.21 | | | | (13.52 | ) | | | 10,382 | | | | 0.72 | | | | 1.71 | | | | 22.05 | |
| 2012 | | | 13.61 | | | | 0.23 | | | | 0.77 | | | | 1.00 | | | | (0.24 | ) | | | — | | | | (0.24 | ) | | | 14.37 | | | | 7.63 | | | | 8,620 | | | | 0.72 | | | | 1.65 | | | | 25.80 | |
| 2011(2) | | | 14.88 | | | | 0.19 | | | | (1.46 | ) | | | (1.27 | ) | | | — | | | | — | | | | — | | | | 13.61 | | | | (8.53 | ) | | | 6,806 | | | | 0.72 | † | | | 1.81 | † | | | 15.83 | †† |
| Global X MSCI Colombia ETF | | | | | | | | | | | | | | | | | | | | | | | | | | | | | | | | |
| 2015 | | | 17.42 | | | | 0.31 | | | | (8.53 | ) | | | (8.22 | ) | | | (0.41 | ) | | | — | | | | (0.41 | ) | | | 8.79 | | | | (47.93 | ) | | | 66,616 | | | | 0.61 | @ | | | 2.80 | | | | 66.93 | |
| 2014 | | | 20.55 | | | | 0.40 | | | | (2.78 | ) | | | (2.38 | ) | | | (0.75 | ) | | | — | | | | (0.75 | ) | | | 17.42 | | | | (11.73 | ) | | | 100,688 | | | | 0.66 | @ | | | 2.12 | | | | 47.57 | |
| 2013 | | | 21.89 | | | | 0.42 | | | | (1.31 | ) | | | (0.89 | ) | | | (0.45 | ) | | | — | | | | (0.45 | ) | | | 20.55 | | | | (4.21 | ) | | | 149,625 | | | | 0.75 | @ | | | 2.05 | | | | 52.06 | |
| 2012 | | | 19.19 | | | | 0.39 | | | | 2.52 | | | | 2.91 | | | | (0.21 | ) | | | — | | | | (0.21 | ) | | | 21.89 | | | | 15.41 | | | | 182,379 | | | | 0.78 | @ | | | 1.92 | | | | 61.70 | |
| 2011 | | | 22.99 | | | | 0.29 | | | | (3.88 | ) | | | (3.59 | ) | | | (0.13 | ) | | | (0.08 | ) | | | (0.21 | ) | | | 19.19 | | | | (15.69 | ) | | | 141,613 | | | | 0.81 | @ | | | 1.39 | | | | 63.11 | |
| Global X Brazil Mid Cap ETF | | | | | | | | | | | | | | | | | | | | | | | | | | | | | | | | |
| 2015 | | | 12.22 | | | | 0.21 | | | | (5.19 | ) | | | (4.98 | ) | | | (0.37 | ) | | | — | | | | (0.37 | ) | | | 6.87 | | | | (41.75 | ) | | | 3,089 | | | | 0.69 | | | | 2.26 | | | | 31.63 | |
| 2014 | | | 14.58 | | | | 0.39 | | | | (2.04 | ) | | | (1.65 | ) | | | (0.71 | ) | | | — | | | | (0.71 | ) | | | 12.22 | | | | (11.59 | ) | | | 7,942 | | | | 0.69 | | | | 2.99 | | | | 17.72 | |
| 2013 | | | 15.55 | | | | 0.50 | | | | (1.02 | ) | | | (0.52 | ) | | | (0.45 | ) | | | — | | | | (0.45 | ) | | | 14.58 | | | | (3.52 | ) | | | 12,390 | | | | 0.69 | | | | 3.32 | | | | 16.38 | |
| 2012 | | | 15.55 | | | | 0.47 | | | | (0.13 | ) | | | 0.34 | | | | (0.34 | ) | | | — | | | | (0.34 | ) | | | 15.55 | | | | 2.42 | | | | 20,994 | | | | 0.69 | | | | 2.98 | | | | 34.81 | |
| 2011 | | | 18.28 | | | | 0.46 | | | | (2.94 | ) | | | (2.48 | ) | | | (0.23 | ) | | | (0.02 | ) | | | (0.25 | ) | | | 15.55 | | | | (13.73 | ) | | | 23,329 | | | | 0.69 | | | | 2.68 | | | | 16.90 | |
| Global X Brazil Consumer ETF | | | | | | | | | | | | | | | | | | | | | | | | | | | | | | | | |
| 2015 | | | 16.57 | | | | 0.15 | | | | (7.83 | ) | | | (7.68 | ) | | | (0.40 | ) | | | — | | | | (0.40 | ) | | | 8.49 | | | | (47.30 | ) | | | 2,971 | | | | 0.77 | | | | 1.26 | | | | 29.16 | |
| 2014 | | | 17.89 | | | | 0.33 | | | | (1.44 | ) | | | (1.11 | ) | | | (0.21 | ) | | | — | | | | (0.21 | ) | | | 16.57 | | | | (6.20 | ) | | | 9,943 | | | | 0.78 | ‡ | | | 1.98 | | | | 18.59 | |
| 2013 | | | 19.43 | | | | 0.15 | | | | (1.45 | ) | | | (1.30 | ) | | | (0.24 | ) | | | — | | | | (0.24 | ) | | | 17.89 | | | | (6.80 | ) | | | 18,787 | | | | 0.77 | | | | 0.80 | | | | 15.01 | |
| 2012 | | | 16.78 | | | | 0.14 | | | | 2.73 | | | | 2.87 | | | | (0.22 | ) | | | — | | | | (0.22 | ) | | | 19.43 | | | | 17.49 | | | | 25,257 | | | | 0.77 | | | | 0.83 | | | | 49.88 | |
| 2011 | | | 19.95 | | | | 0.28 | | | | (3.42 | ) | | | (3.14 | ) | | | (0.02 | ) | | | (0.01 | ) | | | (0.03 | ) | | | 16.78 | | | | (15.74 | ) | | | 29,361 | | | | 0.77 | | | | 1.53 | | | | 37.28 | |
| Global X MSCI Argentina ETF | | | | | | | | | | | | | | | | | | | | | | | | | | | | | | | | |
| 2015 | | | 21.18 | | | | 0.11 | | | | (1.39 | ) | | | (1.28 | ) | | | (0.09 | ) | | | — | | | | (0.09 | ) | | | 19.81 | | | | (6.04 | ) | | | 15,355 | | | | 0.74 | | | | 0.58 | | | | 26.88 | |
| 2014 | | | 20.29 | | | | 0.10 | | | | 0.91 | ^ | | | 1.01 | | | | (0.12 | ) | | | — | | | | (0.12 | ) | | | 21.18 | | | | 5.03 | | | | 20,652 | | | | 0.74 | | | | 0.49 | | | | 95.29 | |
| 2013(3) | | | 16.84 | | | | 0.10 | | | | 3.53 | | | | 3.63 | | | | (0.18 | ) | | | — | | | | (0.18 | ) | | | 20.29 | | | | 21.73 | | | | 6,595 | | | | 0.74 | | | | 0.57 | | | | 26.52 | |
| 2012(3) | | | 22.04 | | | | 0.24 | | | | (4.85 | ) | | | (4.61 | ) | | | (0.59 | ) | | | — | | | | (0.59 | ) | | | 16.84 | | | | (21.44 | ) | | | 2,946 | | | | 0.74 | | | | 1.25 | | | | 29.51 | |
| 2011(3)(4) | | | 29.86 | | | | 0.45 | | | | (8.27 | ) | | | (7.82 | ) | | | — | | | | — | | | | — | | | | 22.04 | | | | (26.19 | ) | | | 3,857 | | | | 0.75 | † | | | 2.53 | † | | | 40.86 | †† |
| (1) | The Fund commenced operations on February 16, 2011. |
| (2) | The Fund commenced operations on February 2, 2011. |
| (3) | Per share amounts have been restated for a 1 for 2 reverse share split on May 16, 2013. See Note 7 in the Notes to Financial Statements. |
| (4) | The Fund commenced operations on March 2, 2011. |
| ^ | The amount shown for a share outstanding throughout the period does not accord with the aggregate net gains on investments for the period because of the sales and repurchases of fund shares in relation to fluctuating market value of the investments of the Fund. |
| * | Per share data calculated using average shares method. |
| ** | Total Return is for the period indicated and has not been annualized. The return shown does not reflect the deduction of taxes that a shareholder would pay on Fund distributions or the redemption of Fund shares. |
| † | Annualized. |
| †† | Portfolio turnover rate is for the period indicated and has not been annualized. Excludes effect of in-kind transfers. |
| @ | The ratio of Expenses to Average Net Assets includes the effect of a waiver. If these offsets were excluded, the ratio would have been 0.79%, 0.78%, 0.80%, 0.83%, and 0.83% for the years ended October 31, 2015, 2014, 2013, 2012, and 2011, respectively. |
| ‡ | The ratio of Expenses to Average Net Assets includes the effect of income taxes. If these expenses were excluded, the ratio would have been 0.77% for the Global X Brazil Consumer ETF. |
Amounts designated as “—” are either $0 or have been rounded to $0.
The accompanying notes are an integral part of the financial statements.
Selected Per Share Data & Ratios
For a Share Outstanding Throughout the Period
| | | Net Asset
Value,
Beginning of
Period ($) | | | Net
Investment
Income ($)* | | | Net Realized
and
Unrealized
Gain (Loss)
on
Investments
($) | | | Total from
Operations
($) | | | Distribution
from Net
Investment
Income ($) | | | Distribution
from
Capital
Gains ($) | | | Total from
Distributions
($) | | | Net Asset
Value, End
of Period
($) | | | Total
Return
(%)** | | | Net
Assets
End of
Period
($)(000) | | | Ratio of
Expenses
to Average
Net Assets
(%) | | | Ratio of
Net
Investment
Income to
Average
Net Assets
(%) | | | Portfolio
Turnover
(%) | |
| Global X FTSE Greece 20 ETF | | | | | | | | | | | | | | | | | | | | | | | | | | | | | | | | |
| 2015 | | | 15.84 | | | | 0.18 | | | | (5.48 | ) | | | (5.30 | ) | | | (0.13 | ) | | | — | | | | (0.13 | ) | | | 10.41 | | | | (33.66 | ) | | | 314,907 | | | | 0.62 | | | | 1.61 | | | | 29.35 | |
| 2014 | | | 22.60 | | | | 0.08 | | | | (6.83 | ) | | | (6.75 | ) | | | (0.01 | ) | | | — | | | | (0.01 | ) | | | 15.84 | | | | (29.83 | ) | | | 140,201 | | | | 0.62 | | | | 0.38 | | | | 64.19 | |
| 2013 | | | 16.16 | | | | 0.15 | | | | 6.32 | | | | 6.47 | | | | (0.02 | ) | | | (0.01 | ) | | | (0.03 | ) | | | 22.60 | | | | 40.14 | | | | 94,938 | | | | 0.61 | | | | 0.84 | | | | 77.29 | |
| 2012(1) | | | 15.18 | | | | 0.25 | | | | 0.76 | | | | 1.01 | | | | (0.03 | ) | | | — | | | | (0.03 | ) | | | 16.16 | | | | 6.70 | | | | 25,863 | | | | 0.62 | † | | | 1.93 | † | | | 23.99 | †† |
| Global X MSCI Norway ETF | | | | | | | | | | | | | | | | | | | | | | | | | | | | | | | | |
| 2015 | | | 14.82 | | | | 0.34 | | | | (3.58 | ) | | | (3.24 | ) | | | (0.83 | ) | | | — | | | | (0.83 | ) | | | 10.75 | | | | (22.50 | ) | | | 65,024 | | | | 0.50 | | | | 2.76 | | | | 16.05 | |
| 2014 | | | 16.76 | | | | 0.63 | | | | (2.18 | ) | | | (1.55 | ) | | | (0.39 | ) | | | — | | | | (0.39 | ) | | | 14.82 | | | | (9.46 | ) | | | 183,038 | | | | 0.50 | | | | 3.76 | | | | 26.50 | |
| 2013 | | | 15.09 | | | | 0.50 | | | | 1.60 | | | | 2.10 | | | | (0.43 | ) | | | — | | | | (0.43 | ) | | | 16.76 | | | | 14.21 | | | | 80,465 | | | | 0.50 | | | | 3.23 | | | | 11.01 | |
| 2012 | | | 13.96 | | | | 0.49 | | | | 1.00 | | | | 1.49 | | | | (0.36 | ) | | | — | | | | (0.36 | ) | | | 15.09 | | | | 11.24 | | | | 61,129 | | | | 0.50 | | | | 3.52 | | | | 23.39 | |
| 2011(2) | | | 14.80 | | | | 0.44 | | | | (1.27 | ) | | | (0.83 | ) | | | (0.01 | ) | | | — | | | | (0.01 | ) | | | 13.96 | | | | (5.62 | ) | | | 74,707 | | | | 0.50 | † | | | 3.03 | † | | | 24.26 | †† |
| Global X FTSE Nordic Region ETF | | | | | | | | | | | | | | | | | | | | | | | | | | | | | | | | |
| 2015 | | | 24.36 | | | | 0.59 | | | | (1.81 | ) | | | (1.22 | ) | | | (0.85 | ) | | | — | | | | (0.85 | ) | | | 22.29 | | | | (5.05 | ) | | | 52,596 | | | | 0.50 | | | | 2.53 | | | | 7.76 | |
| 2014 | | | 23.74 | | | | 0.79 | | | | 0.46 | | | | 1.25 | | | | (0.63 | ) | | | — | | | | (0.63 | ) | | | 24.36 | | | | 5.30 | | | | 59,927 | | | | 0.50 | | | | 3.16 | | | | 6.05 | |
| 2013 | | | 18.65 | | | | 0.62 | | | | 4.97 | | | | 5.59 | | | | (0.50 | ) | | | — | | | | (0.50 | ) | | | 23.74 | | | | 30.54 | | | | 56,015 | | | | 0.50 | | | | 2.92 | | | | 8.95 | |
| 2012 | | | 17.47 | | | | 0.50 | | | | 1.27 | | | | 1.77 | | | | (0.53 | ) | | | (0.06 | ) | | | (0.59 | ) | | | 18.65 | | | | 10.84 | | | | 26,293 | | | | 0.50 | | | | 2.88 | | | | 10.15 | |
| 2011 | | | 19.22 | | | | 0.53 | | | | (2.11 | ) | | | (1.58 | ) | | | (0.17 | ) | | | — | | | | (0.17 | ) | | | 17.47 | | | | (8.34 | ) | | | 29,005 | | | | 0.50 | | | | 2.74 | | | | 3.59 | |
| Global X MSCI Nigeria ETF | | | | | | | | | | | | | | | | | | | | | | | | | | | | | | | | |
| 2015 | | | 13.02 | | | | 0.34 | | | | (5.11 | ) | | | (4.77 | ) | | | (0.31 | ) | | | — | | | | (0.31 | ) | | | 7.94 | | | | (37.25 | ) | | | 24,623 | | | | 0.68 | @ | | | 3.72 | | | | 34.00 | |
| 2014 | | | 14.92 | | | | 0.47 | | | | (2.16 | ) | | | (1.69 | ) | | | (0.17 | ) | | | (0.04 | ) | | | (0.21 | ) | | | 13.02 | | | | (11.55 | ) | | | 16,924 | | | | 0.68 | @ | | | 3.14 | | | | 54.75 | |
| 2013(3) | | | 15.31 | | | | 0.30 | | | | (0.69 | ) | | | (0.39 | ) | | | — | | | | — | | | | — | | | | 14.92 | | | | (2.55 | ) | | | 5,970 | | | | 0.68 | †@ | | | 3.54 | † | | | 5.44 | †† |
| Global X Next Emerging & Frontier ETF | | | | | | | | | | | | | | | | | | | | | | | | | | | | | | | | |
| 2015 | | | 25.55 | | | | 0.49 | | | | (6.37 | ) | | | (5.88 | ) | | | (0.40 | ) | | | — | | | | (0.40 | ) | | | 19.27 | | | | (23.29 | ) | | | 106,925 | | | | 0.58 | | | | 2.22 | | | | 19.72 | |
| 2014(4) | | | 25.08 | | | | 0.51 | | | | 0.01 | ^ | | | 0.52 | | | | (0.05 | ) | | | — | | | | (0.05 | ) | | | 25.55 | | | | 2.07 | | | | 152,027 | | | | 0.58 | †‡ | | | 2.00 | † | | | 24.14 | †† |
| Global X FTSE Portugal 20 ETF | | | | | | | | | | | | | | | | | | | | | | | | | | | | | | | | |
| 2015 | | | 12.65 | | | | 0.30 | | | | (1.87 | ) | | | (1.57 | ) | | | (0.23 | ) | | | — | | | | (0.23 | ) | | | 10.85 | | | | (12.39 | ) | | | 37,449 | | | | 0.61 | | | | 2.68 | | | | 35.26 | |
| 2014(5) | | | 15.04 | | | | 0.38 | | | | (2.77 | ) | | | (2.39 | ) | | | — | | | | — | | | | — | | | | 12.65 | | | | (15.89 | ) | | | 36,692 | | | | 0.61 | † | | | 2.58 | † | | | 53.58 | †† |
| Global X MSCI Pakistan ETF | | | | | | | | | | | | | | | | | | | | | | | | | | | | | | | | |
| 2015(6) | | | 15.28 | | | | 0.35 | | | | (1.46 | ) | | | (1.11 | ) | | | — | | | | — | | | | — | | | | 14.17 | | | | (7.26 | ) | | | 5,667 | | | | 0.90 | † | | | 4.43 | † | | | 19.31 | †† |
| (1) | The Fund commenced operations on December 7, 2011. |
| (2) | The Fund commenced operations on November 9, 2010. |
| (3) | The Fund commenced operations on April 2, 2013. |
| (4) | The Fund commenced operations on November 6, 2013. |
| (5) | The Fund commenced operations on November 12, 2013. |
| (6) | The Fund commenced operations on April 22, 2015. |
| ^ | The amount shown for a share outstanding throughout the period does not accord with the aggregate net gains on investments for the period because of the sales and repurchases of fund shares in relation to fluctuating market value of the investments of the Fund. |
| * | Per share data calculated using average shares method. |
| ** | Total Return is for the period indicated and has not been annualized. The return shown does not reflect the deduction of taxes that a shareholder would pay on Fund distributions or the redemption of Fund shares. |
| † | Annualized. |
| †† | Portfolio turnover rate is for the period indicated and has not been annualized. Excludes effect of in-kind transfers. |
| @ | The ratio of Expenses to Average Net Assets includes the effect of a waiver. If these offsets were excluded, the ratio would have been 0.92%, 0.92% and 0.92% for the years and or period ended October 31, 2015, 2014, and 2013, respectively. |
| ‡ | The ratio of Expenses to Average Net Assets includes the effect of income taxes. If these expenses were excluded, the ratio would have been 0.58% for the Global X Next Emerging & Frontier ETF. |
Amounts designated as “—” are either $0 or have been rounded to $0.
The accompanying notes are an integral part of the financial statements.
| Notes to Financial Statements |
| October 31, 2015 |
1. ORGANIZATION
The Global X Funds (the "Trust") is a Delaware statutory trust formed on March 6, 2008. The Trust is registered under the Investment Company Act of 1940, as amended, as an open-end management investment company. As of October 31, 2015, the Trust had ninety-one portfolios, forty-seven of which were operational. The financial statements herein and the related notes pertain to the Global X China Consumer ETF, Global X China Energy ETF, Global X China Financials ETF, Global X China Industrials ETF, Global X China Materials ETF, Global X NASDAQ China Technology ETF, Global X Southeast Asia ETF, Global X FTSE Andean 40 ETF, Global X MSCI Colombia ETF, Global X Brazil Mid Cap ETF, Global X Brazil Consumer ETF, Global X MSCI Argentina ETF, Global X FTSE Greece 20 ETF, Global X MSCI Norway ETF, Global X FTSE Nordic Region ETF, Global X MSCI Nigeria ETF, Global X Next Emerging & Frontier ETF, Global X FTSE Portugal 20 ETF and Global X MSCI Pakistan ETF (each a “Fund”, and collectively, the “Funds”). Each Fund has elected non-diversification status.
The Global X MSCI Pakistan ETF commenced operations on April 22, 2015.
2. SIGNIFICANT ACCOUNTING POLICIES
The following is a summary of the Significant Accounting Policies followed by the Funds.
USE OF ESTIMATES — The Funds are investment companies that apply the accounting and reporting guidance issued in Topic 946 by the U.S. Financial Accounting Standards Board. The preparation of financial statements in conformity with U.S. generally accepted accounting principles ("U.S. GAAP") requires management to make estimates and assumptions that affect the reported amounts of assets and liabilities and disclosure of contingent assets and liabilities at the date of the financial statements and the reported amounts of increases and decreases in net assets from operations during the reporting period. Actual results could differ from those estimates.
SECURITY VALUATION — Securities listed on a securities exchange, market or automated quotation system for which quotations are readily available (except for securities traded on NASDAQ and the Nigerian Stock Exchange), including securities traded over the counter, are valued at the last quoted sale price on the primary exchange or market (foreign or domestic) on which they are traded (or at approximately 4:00 pm if a security’s primary exchange is normally open at that time), or, if there is no such reported sale, at the most recent mean between the quoted bid and asked prices (absent both bid and asked prices on such exchange, the bid price may be used).
For securities traded on NASDAQ and the Nigerian Stock Exchange, the Official Closing Price will be used. If available, debt securities are priced based upon valuations provided by independent, third-party pricing agents. Such values generally reflect the last reported sales price if the security is actively traded. The third-party pricing agents may also value debt securities at an evaluated bid price by employing methodologies that utilize actual market transactions, broker-supplied valuations, or other methodologies designed to identify the market value for such securities. Debt obligations with remaining maturities of sixty days or less may be valued at their amortized cost, which approximates market value. The prices for foreign securities are reported in local currency and converted to U.S. dollars using currency exchange rates. Prices for most securities held in the Funds are provided daily by recognized independent pricing agents. If a security price cannot be obtained from an independent, third-party pricing agent, the Funds seek to obtain a bid price from at least one independent broker.
| Notes to Financial Statements |
| October 31, 2015 (continued) |
2. SIGNIFICANT ACCOUNTING POLICIES (continued)
Securities for which market prices are not "readily available" are valued in accordance with Fair Value Procedures established by the Board of Trustees (the “Board”). The Funds’ Fair Value Procedures are implemented through a Fair Value Committee (the "Committee") designated by the Board. Some of the more common reasons that may necessitate that a security be valued using Fair Value Procedures include: the security's trading has been halted or suspended; the security has been de-listed from its primary trading exchange; the security's primary trading market is temporarily closed at a time when under normal conditions it would be open; the security has not been traded for an extended period of time; the security's primary pricing source is not able or willing to provide a price; or trading of the security is subject to local government-imposed restrictions. In addition, the Funds may fair value their securities if an event that may materially affect the value of the Funds’ securities that traded outside of the United States (a “Significant Event”) has occurred between the time of the security's last close and the time that the Funds calculate net asset value. A Significant Event may relate to a single issuer or to an entire market sector. Events that may be Significant Events include: government actions, natural disaster, armed conflict, acts of terrorism and significant market fluctuations. If Global X Management Company LLC (the “Adviser”) becomes aware of a Significant Event that has occurred with respect to a security or group of securities after the closing of the exchange or market on which the security or securities principally trade, but before the time at which the Funds calculate net asset value, it may request that a Committee meeting be called. When a security is valued in accordance with the Fair Value Procedures, the Committee will determine the value after taking into consideration relevant information reasonably available to the Committee. As of October 31, 2015, there were securities valued using Fair Value Procedures of $922,853, $668, $457, $7,911, $11,264 and $9,309,333 in Global X China Industrials ETF, Global X China Materials ETF, Global X MSCI Colombia ETF, Global X Brazil Mid Cap ETF, Global X Brazil Consumer ETF and Global X FTSE Greece 20 ETF, respectively. There were no other securities priced using the Fair Value Procedures.
In accordance with the authoritative guidance on fair value measurements and disclosure under U.S. GAAP, the Funds disclose the fair value of their investments in a hierarchy that prioritizes the inputs to valuation techniques used to measure the fair value. The objective of a fair value measurement is to determine the price that would be received to sell an asset or paid to transfer a liability in an orderly transaction between market participants at the measurement date (an exit price). Accordingly, the fair value hierarchy gives the highest priority to quoted prices (unadjusted) in active markets for identical assets or liabilities (Level 1) and the lowest priority to unobservable inputs (Level 3). The three levels of the fair value hierarchy are described below:
Level 1 – Unadjusted quoted prices in active markets for identical, unrestricted assets or liabilities that the Funds have the ability to access at the measurement date
Level 2 – Other significant observable inputs (including quoted prices in non-active markets, quoted prices for similar investments, fair value of investments for which the Funds have the ability to fully redeem tranches at net asset value as of the measurement date or within the near term, and short-term investments valued at amortized cost)
Level 3 – Significant unobservable inputs (including the Funds’ own assumptions in determining the fair value of investments, fair value of investments for which the Funds do not have the ability to fully redeem tranches at net asset value as of the measurement date or within the near term)
| Notes to Financial Statements |
| October 31, 2015 (continued) |
2. SIGNIFICANT ACCOUNTING POLICIES (continued)
Investments are classified within the level of the lowest significant input considered in determining fair value. Investments classified within Level 3 whose fair value measurement considers several inputs may include Level 1 or Level 2 inputs as components of the overall fair value measurement.
For the year ended October 31, 2015, there have been no significant changes to the Funds’ fair valuation methodologies.
The following table summarizes the quantitative inputs and assumptions used for items categorized as material Level 3 investments as of October 31, 2015. The disclosures below also include qualitative information on the sensitivity of the fair value measurements to changes in the significant unobservable inputs.
Global X China Industrials ETF
Quantitative information about Level 3 fair value measurements
| | | Fair Value at | | | | | | | | |
| Assets | | 10/31/2015 | | | Valuation Technique(s) | | Unobservable Input | | Discount Percentage | |
| Common Stock | | $ | 922,853 | | | Discount from the Last
Traded Price | | Last Traded Price
Comparability Adjustment % | | | 1-33% | |
The unobservable input used to determine fair value of the Level 3 asset may have similar or diverging impacts on valuation. Significant increases and decreases in this input could result in significantly higher or lower fair value measurement.
DUE TO/FROM BROKERS — Due to/from brokers includes cash and collateral balances with the Funds’ clearing brokers or counterparties at October 31, 2015. The Funds continuously monitor the credit standing of each broker or counterparty with whom they conduct business. In the event a broker or counterparty is unable to fulfill its obligations, the Funds would be subject to counterparty credit risk.
| Notes to Financial Statements |
| October 31, 2015 (continued) |
2. SIGNIFICANT ACCOUNTING POLICIES (continued)
REPURCHASE AGREEMENTS — Securities pledged as collateral for repurchase agreements are held by Citibank, N.A. and are designated as being held on each Fund’s behalf by its custodian under a book-entry system. Each Fund monitors the adequacy of the collateral on a daily basis and can require the seller to provide additional collateral in the event the market value of the securities pledged falls below the carrying value of the repurchase agreement, including accrued interest. It is the Funds’ policy to only enter into repurchase agreements with banks and other financial institutions which are deemed by the Adviser to be creditworthy. The Fund bears the risk of loss in the event that the other party to a repurchase agreement defaults on its obligations and the Fund is prevented from exercising its rights to dispose of the underlying securities received as collateral and the risk of a possible decline in the value of the underlying securities during the period. For financial statement purposes, the Funds record the securities lending collateral (included in Repurchase Agreements, at value or restricted cash) as an asset and the obligation to return securities lending collateral as a liability on the Statements of Assets and Liabilities.
Repurchase agreements are entered into by the Funds under Master Repurchase Agreements (“MRA”) which permit the Funds, under certain circumstances including an event of default (such as bankruptcy or insolvency), to offset payables and/or receivables under the MRA with collateral held and/or posted to the counterparty and create one single net payment due to or from the Funds.
At October 31, 2015, the open repurchase agreements by counterparty which are subject to a MRA on a net payment basis are as follows:
| | | | | | Fair Value of Non-cash | | | Cash Collateral | | | | |
| | Repurchase Agreements | | | Collateral Received | | | Received | | | Net Amount(1) | |
| Global X China Consumer ETF | | | | | | | | | | | | | | | | |
| Barclays | | $ | 8,000,000 | | | $ | 8,000,000 | | | $ | - | | | $ | - | |
| Deutsche Bank | | | 2,561,545 | | | | 2,561,545 | | | | - | | | | - | |
| Global X MSCI Norway ETF | | | | | | | | | | | | | | | | |
| Barclays | | | 5,000,000 | | | | 5,000,000 | | | | - | | | | - | |
| Deutsche Bank | | | 1,910,366 | | | | 1,910,366 | | | | - | | | | - | |
| Global X FTSE Nordic Region ETF | | | | | | | | | | | | | | | | |
| Deutsche Bank | | | 595,000 | | | | 595,000 | | | | - | | | | - | |
| Global X FTSE Portugal 20 ETF | | | | | | | | | | | | | | | | |
| Deutsche Bank | | | 2,773,662 | | | | 2,773,662 | | | | - | | | | - | |
(1)Net Amount represents the net amount receivable due from the counterparty in the event of default.
FEDERAL INCOME TAXES — It is each Fund’s intention to qualify or continue to qualify as a regulated investment company for Federal income tax purposes by complying with the appropriate provisions of Subchapter M of the Internal Revenue Code of 1986, as amended. Accordingly, no provisions for Federal income taxes have been made in the financial statements.
The Funds evaluate tax positions taken or expected to be taken in the course of preparing the Funds’ tax returns to determine whether it is "more-likely-than-not" (i.e., greater than 50 percent) that each tax position will be sustained upon examination by a taxing authority based on the technical merits of the position. Tax positions not deemed to meet the more-likely-than-not threshold are recorded as a tax benefit or expense in the current year.
| Notes to Financial Statements |
| October 31, 2015 (continued) |
2. SIGNIFICANT ACCOUNTING POLICIES (continued)
The Funds did not record any tax provision in the current period. However, management’s conclusions regarding tax positions may be subject to review and adjustment at a later date based on factors including, but not limited to, examination by tax authorities (i.e., the last three tax year ends, as applicable), on-going analysis of and changes to tax laws, regulations and interpretations thereof.
As of and during the year ended October 31, 2015, the Funds did not have a liability for any unrecognized tax benefits. The Funds recognize interest and penalties, if any, related to unrecognized tax benefits as income tax expense in the Statement of Operations. During the year, the Funds did not incur any interest or penalties.
SECURITY TRANSACTIONS AND INVESTMENT INCOME — Security transactions are accounted for on the trade date for financial reporting purposes. Costs used in determining realized gains and losses on the sale of investment securities are based on specific identification. Dividend income is recorded on the ex-dividend date. Interest income is recognized on the accrual basis from the settlement date.
FOREIGN CURRENCY TRANSACTIONS AND TRANSLATION — The books and records of the Funds are maintained in U.S. dollars. Investment securities and other assets and liabilities denominated in a foreign currency are translated into U.S. dollars on the date of valuation. Purchases and sales of investment securities, income and expenses are translated into U.S. dollars at the relevant rates of exchange prevailing on the respective dates of such transactions. The Funds do not isolate that portion of realized or unrealized gains and losses resulting from changes in the foreign exchange rate from fluctuations arising from changes in the market prices of the securities. These gains and losses are included in net realized and unrealized gains and losses on investments on the Statement of Operations. Net realized and unrealized gains and losses on foreign currency transactions and translations represent net foreign exchange gains or losses from foreign currency spot contracts, disposition of foreign currencies, currency gains or losses realized between trade and settlement dates on securities transactions and the difference between the amount of the investment income and foreign withholding taxes recorded on the Funds’ books and the U.S. dollar equivalent amounts actually received or paid.
DIVIDENDS AND DISTRIBUTIONS TO SHAREHOLDERS — The Funds distribute their net investment income on a pro rata basis. Any net realized capital gains are distributed annually. All distributions are recorded on ex-dividend date.
CREATION UNITS — The Funds issue and redeem shares ("Shares") at Net Asset Value (“NAV”) and only in large blocks of Shares, (each block of Shares for a Fund is called a "Creation Unit" or multiples thereof). Purchasers of Creation Units ("Authorized Participants") at NAV must pay a standard creation transaction fee per transaction. The fee is a single charge and will be the same regardless of the number of Creation Units purchased by an investor on the same day. An Authorized Participant who holds Creation Units and wishes to redeem at NAV would also pay a standard redemption fee per transaction payable to Brown Brothers Harriman & Co. (“BBH”), the Fund’s custodian (“Custodian”), on the date of such redemption, regardless of the number of Creation Units redeemed that day.
| Notes to Financial Statements |
| October 31, 2015 (continued) |
2. SIGNIFICANT ACCOUNTING POLICIES (continued)
If a Creation Unit is purchased or redeemed for cash, a higher Transaction Fee will be charged. The following table discloses Creation Unit breakdown:
| | | | | | | | | Value at | | | | |
| | | Creation Unit | | | Creation | | | October 31, | | | Redemption | |
| | | Shares | | | Fee | | | 2015 | | | Fee | |
| Global X China Consumer ETF | | | 50,000 | | | $ | 1,900 | | | $ | 686,000 | | | $ | 1,900 | |
| Global X China Energy ETF | | | 50,000 | | | | 1,900 | | | | 580,500 | | | | 1,900 | |
| Global X China Financials ETF | | | 50,000 | | | | 1,900 | | | | 745,000 | | | | 1,900 | |
| Global X China Industrials ETF | | | 50,000 | | | | 1,900 | | | | 722,000 | | | | 1,900 | |
| Global X China Materials ETF | | | 50,000 | | | | 1,900 | | | | 664,500 | | | | 1,900 | |
| Global X NASDAQ China Technology ETF | | | 50,000 | | | | 1,900 | | | | 1,100,500 | | | | 1,900 | |
| Global X Southeast Asia ETF | | | 50,000 | | | | 2,300 | | | | 653,500 | | | | 2,300 | |
| Global X FTSE Andean 40 ETF | | | 50,000 | | | | 2,300 | | | | 361,500 | | | | 2,300 | |
| Global X MSCI Colombia ETF | | | 50,000 | | | | 2,500 | | | | 439,500 | | | | 2,500 | |
| Global X Brazil Mid Cap ETF | | | 50,000 | | | | 1,900 | | | | 343,500 | | | | 1,900 | |
| Global X Brazil Consumer ETF | | | 50,000 | | | | 1,500 | | | | 424,500 | | | | 1,500 | |
| Global X MSCI Argentina ETF | | | 50,000 | | | | 1,000 | | | | 990,500 | | | | 1,000 | |
| Global X FTSE Greece 20 ETF | | | 50,000 | | | | 1,000 | | | | 520,500 | | | | 1,000 | |
| Global X MSCI Norway ETF | | | 50,000 | | | | 1,400 | | | | 537,500 | | | | 1,400 | |
| Global X FTSE Nordic Region ETF | | | 50,000 | | | | 1,400 | | | | 1,114,500 | | | | 1,400 | |
| Global X MSCI Nigeria ETF | | | 50,000 | | | | 2,300 | | | | 397,000 | | | | 2,300 | |
| Global X Next Emerging & Frontier ETF | | | 50,000 | | | | 9,500 | | | | 963,500 | | | | 9,500 | |
| Global X FTSE Portugal 20 ETF | | | 50,000 | | | | 1,000 | | | | 542,500 | | | | 1,000 | |
| Global X MSCI Pakistan ETF | | | 50,000 | | | | 3,800 | | | | 708,500 | | | | 3,800 | |
3. RELATED PARTY TRANSACTIONS
The Adviser serves as the investment adviser and the administrator for the Funds. Subject to the supervision of the Board of Trustees, the Adviser is responsible for managing the investment activities of the Funds and the Funds’ business affairs and other administrative matters and provides or causes to be furnished all supervisory, administrative and other services reasonably necessary for the operation of the Funds, including certain distribution services (provided pursuant to a separate distribution services agreement), certain shareholder and distribution-related services (provided pursuant to a separate Rule 12b-1 Plan and related agreements) and investment advisory services (provided pursuant to a separate Investment Advisory Agreement), under what is essentially an "all-in" fee structure. For its service to the Funds, under the Supervision and Administration Agreement, each Fund pays a monthly fee to the Adviser at the annual rate (stated as a percentage of the average daily net assets of the Fund). In addition, the Funds bear other expenses, directly and indirectly that are not covered by the Supervision and Administration Agreement, which may vary and affect the total expense ratios of the Funds, such as taxes, brokerage fees, commissions and other transaction expenses, interest expenses, acquired fund fees and extraordinary expenses (such as litigation and indemnification expenses). In addition, the Global X MSCI Colombia ETF, Global X MSCI Argentina ETF, Global X FTSE Greece 20 ETF, Global X MSCI Nigeria ETF, Global X Next Emerging & Frontier ETF, Global X FTSE Portugal 20 ETF and Global X MSCI Pakistan ETF pay custodial fees that are not covered by the Supervision and Administration Agreement. Pursuant to an agreement with the Custodian, the Global X MSCI Colombia ETF, Global X MSCI Argentina ETF,
| Notes to Financial Statements |
| October 31, 2015 (continued) |
3. RELATED PARTY TRANSACTIONS (continued)
Global X FTSE Greece 20 ETF, Global X MSCI Nigeria ETF, Global X Next Emerging & Frontier ETF, Global X FTSE Portugal 20 ETF and Global X MSCI Pakistan ETF may pay up to 0.11%, 0.01%, 0.06%, 0.24%, 0.09%, 0.06% and 0.20%, respectively, in Custody Fees (in addition to the
Supervision and Administration Fee).
| | | Supervision | |
| | | and | |
| | | Administration | |
| | Fee | |
| Global X China Consumer ETF | | | 0.65 | % |
| Global X China Energy ETF | | | 0.65 | % |
| Global X China Financials ETF | | | 0.65 | % |
| Global X China Industrials ETF | | | 0.65 | % |
| Global X China Materials ETF | | | 0.65 | % |
| Global X NASDAQ China Technology ETF | | | 0.65 | % |
| Global X Southeast Asia ETF | | | 0.65 | % |
| Global X FTSE Andean 40 ETF | | | 0.72 | % |
| Global X MSCI Colombia ETF* | | | 0.61 | % |
| Global X Brazil Mid Cap ETF | | | 0.69 | % |
| Global X Brazil Consumer ETF | | | 0.77 | % |
| Global X MSCI Argentina ETF | | | 0.74 | % |
| Global X FTSE Greece 20 ETF | | | 0.55 | % |
| Global X MSCI Norway ETF | | | 0.50 | % |
| Global X FTSE Nordic Region ETF | | | 0.50 | % |
| Global X MSCI Nigeria ETF** | | | 0.68 | % |
| Global X Next Emerging & Frontier ETF | | | 0.49 | % |
| Global X FTSE Portugal 20 ETF | | | 0.55 | % |
| Global X MSCI Pakistan ETF | | | 0.68 | % |
*Pursuant to an expense limitation agreement, the Adviser has agreed to waive or reimburse fees and/or limit fund expenses to the extent necessary to assure that the operating expenses of the Global X MSCI Colombia Fund (the “Fund”) (exclusive of taxes, brokerage fees, commissions, and other transaction expenses, interest and extraordinary expenses (such as litigation and indemnification expenses)) will not exceed 0.61% of the Fund’s average daily net assets per year until at least March 1, 2016. The Fund (at a later date) may reimburse the Adviser for the fees and expenses it waived or reimbursed and/or limited pursuant to the expense limitation agreement during any of the prior three fiscal years, provided that, among other things, any reimbursement made to the Adviser does not cause Total Annual Fund Operating Expenses to exceed the maximum permitted rate during the period in which it is paid and the Board of Trustees has approved such reimbursement to the Adviser. At October 31, 2015, the amounts of waivers/reimbursements subject to recoupment for Global X MSCI Colombia ETF were $133,126 expiring in 2018, $132,223 expiring in 2017, $84,928 expiring in 2016 and $77,243 expiring in 2015. As of October 31, 2015, there had been no recoupment of previously waived and reimbursed fees.
**Pursuant to an expense limitation agreement, the Adviser has agreed to waive or reimburse fees and/or limit fund expenses to the extent necessary to assure that the operating expenses of the Global X MSCI Nigeria Fund (the “Fund”) (exclusive of taxes, brokerage fees, commissions, and other transaction expenses, interest and extraordinary expenses (such as litigation and indemnification expenses)) will not exceed 0.68% of the Fund’s average daily net assets per year until at least March 1, 2016. The Fund (at a later date) may reimburse the Adviser for the fees and expenses it waived or reimbursed and/or limited pursuant to the expense limitation agreement during any of the prior three fiscal years, provided that, among other things, any reimbursement made to the Adviser does not cause Total Annual Fund Operating Expenses of the Fund to exceed the maximum permitted rate during the period in which it is paid and the Board of Trustees has approved such reimbursement to the Adviser. At October 31, 2015, the amounts of waivers/reimbursements subject to recoupment for Global X MSCI Nigeria ETF were $58,656 expiring in 2018, $33,893 expiring in 2017 and $5,469 expiring in 2016. As of October 31, 2015, there had been no recoupment of previously waived and reimbursed fees.
| Notes to Financial Statements |
| October 31, 2015 (continued) |
3. RELATED PARTY TRANSACTIONS (continued)
SEI Investments Global Funds Services (“SEIGFS”) serves as Sub-Administrator to the Funds. As Sub-Administrator, SEIGFS provides the Funds with the required general administrative services, including, without limitation: office space, equipment, and personnel; clerical and general back office services; bookkeeping, internal accounting and secretarial services; the calculation of NAV; and assistance with the preparation and filing of reports, registration statements, proxy statements and other materials required to be filed or furnished by the Funds under federal and state securities laws. As compensation for these services, the Sub-Administrator receives certain out-of-pocket costs, transaction fees and asset-based fees which are accrued daily and paid monthly by the Adviser.
SEI Investments Distribution Co. (“SIDCO”) serves as each Fund’s underwriter and distributor of Shares pursuant to a Distribution Agreement. Under the Distribution Agreement, SIDCO, as agent, receives orders to create and redeem Shares in Creation Unit Aggregations and transmits such orders to the Trust’s custodian and transfer agent. The Distributor has no obligation to sell any specific quantity of Fund Shares. SIDCO bears the following costs and expenses relating to the distribution of Shares: (i) the costs of processing and maintaining records of creations of Creation Units; (ii) all costs of maintaining the records required of a registered broker/dealer; (iii) the expenses of maintaining its registration or qualification as a dealer or broker under Federal or state laws; (iv) filing fees; and (v) all other expenses incurred in connection with the distribution services as contemplated in the Distribution Agreement. SIDCO receives no fee for its distribution services under the Distribution Agreement.
BBH, located at 50 Post Office Square, Boston, MA 02110, serves as Custodian of the Funds’ assets. As Custodian, BBH has agreed to (1) make receipts and disbursements of money on behalf of the Fund, (2) collect and receive all income and other payments and distributions on account of the Funds’ portfolio investments, (3) respond to correspondence from shareholders, security brokers and others relating to its duties; and (4) make periodic reports to the Funds concerning the Funds’ operations. BBH does not exercise any supervisory function over the purchase and sale of securities. As compensation for these services, the Custodian receives certain out-of-pocket costs, transaction fees and asset-based fees which are accrued daily and paid monthly by the Adviser from its fees. BBH also serves as Transfer Agent. As Transfer Agent, BBH has agreed to (1) issue and redeem shares of each Fund, (2) make dividend and other distributions to shareholders of each Fund, (3) respond to correspondence by shareholders and others relating to its duties; (4) maintain shareholder accounts, and (5) make periodic reports to the Funds. As compensation for these services, the Transfer Agent receives certain out of-pocket costs, transaction fees and asset-based fees which are accrued daily and paid monthly by the Adviser from its fees.
| Notes to Financial Statements |
| October 31, 2015 (continued) |
4. INVESTMENT TRANSACTIONS
For the year or period ended October 31, 2015, the purchases and sales of investments in securities, excluding in-kind transactions, long-term U.S. Government and short-term securities were:
| | Purchases | | | Sales and Maturities | |
| Global X China Consumer ETF | | $ | 30,751,542 | | | $ | 25,971,341 | |
| Global X China Energy ETF | | | 455,467 | | | | 486,280 | |
| Global X China Financials ETF | | | 14,503,566 | | | | 12,523,990 | |
| Global X China Industrials ETF | | | 1,932,432 | | | | 1,702,740 | |
| Global X China Materials ETF | | | 840,759 | | | | 835,957 | |
| Global X NASDAQ China Technology ETF | | | 9,336,099 | | | | 8,508,746 | |
| Global X Southeast Asia ETF | | | 5,307,091 | | | | 7,879,757 | |
| Global X FTSE Andean 40 ETF | | | 1,242,394 | | | | 2,927,625 | |
| Global X MSCI Colombia ETF | | | 61,866,261 | | | | 49,605,675 | |
| Global X Brazil Mid Cap ETF | | | 1,562,630 | | | | 2,596,914 | |
| Global X Brazil Consumer ETF | | | 1,870,841 | | | | 4,097,089 | |
| Global X MSCI Argentina ETF | | | 4,740,155 | | | | 4,876,287 | |
| Global X FTSE Greece 20 ETF | | | 72,684,808 | | | | 68,861,352 | |
| Global X MSCI Norway ETF | | | 15,119,515 | | | | 16,399,266 | |
| Global X FTSE Nordic Region ETF | | | 4,280,707 | | | | 5,049,826 | |
| Global X MSCI Nigeria ETF | | | 25,991,844 | | | | 8,134,895 | |
| Global X Next Emerging & Frontier ETF | | | 25,443,507 | | | | 27,112,857 | |
| Global X FTSE Portugal 20 ETF | | | 13,331,652 | | | | 13,060,614 | |
| Global X MSCI Pakistan ETF | | | 7,073,642 | | | | 911,490 | |
During the year or period ended October 31, 2015, there were no purchases or sales of long-term U.S. Government securities for the Funds.
| Notes to Financial Statements |
| October 31, 2015 (continued) |
4. INVESTMENT TRANSACTIONS (continued)
For the year or period ended October 31, 2015 and October 31, 2014, in-kind transactions associated with creations and redemptions were, respectively:
| | | | | | Sales and | | | Realized Gain | |
| | Purchases | | | Maturities | | | (Loss) | |
| Global X China Consumer ETF | | $ | 1,135,345 | | | $ | 41,029,893 | | | $ | (3,147,297 | ) |
| Global X China Energy ETF | | | - | | | | 2,122,033 | | | | 219,731 | |
| Global X China Financials ETF | | | 45,882,818 | | | | 39,106,611 | | | | 3,401,732 | |
| Global X China Industrials ETF | | | 6,131,493 | | | | 4,518,457 | | | | 1,036,289 | |
| Global X China Materials ETF | | | 4,885,323 | | | | 5,808,257 | | | | (332,946 | ) |
| Global X NASDAQ China Technology ETF | | | 1,415,138 | | | | 6,938,264 | | | | 1,274,116 | |
| Global X Southeast Asia ETF | | | 1,207,349 | | | | 8,031,728 | | | | (919,877 | ) |
| Global X FTSE Andean 40 ETF | | | 234,771 | | | | 2,109,859 | | | | (480,205 | ) |
| Global X MSCI Colombia ETF | | | 15,101,015 | | | | 9,743,616 | | | | (280,459 | ) |
| Global X Brazil Mid Cap ETF | | | - | | | | 892,420 | | | | (229,856 | ) |
| Global X Brazil Consumer ETF | | | - | | | | 513,276 | | | | (471,937 | ) |
| Global X MSCI Argentina ETF | | | 4,124,088 | | | | 7,272,609 | | | | 164,299 | |
| Global X FTSE Greece 20 ETF | | | 334,382,731 | | | | 79,994,697 | | | | (11,482,974 | ) |
| Global X MSCI Norway ETF | | | 41,440,084 | | | | 122,868,376 | | | | (20,092,704 | ) |
| Global X FTSE Nordic Region ETF | | | 2,472,391 | | | | 4,832,278 | | | | 1,294,820 | |
| Global X MSCI Nigeria ETF | | | - | | | | - | | | | - | |
| Global X Next Emerging & Frontier ETF | | | 6,537,161 | | | | 12,195,780 | | | | (829,169 | ) |
| Global X FTSE Portugal 20 ETF | | | 25,105,756 | | | | 18,233,849 | | | | (1,050,630 | ) |
| Global X MSCI Pakistan ETF | | | - | | | | - | | | | - | |
| | | | | | Sales and | | | Realized Gain | |
| | | Purchases | | | Maturities | | | (Loss) | |
| Global X China Consumer ETF | | $ | 47,940,122 | | | $ | 59,438,708 | | | $ | 8,591,703 | |
| Global X China Energy ETF | | | 1,699,167 | | | | 1,473,707 | | | | 285,984 | |
| Global X China Financials ETF | | | 43,833,368 | | | | 33,262,860 | | | | (1,909,351 | ) |
| Global X China Industrials ETF | | | 2,505,310 | | | | 1,137,325 | | | | (192,086 | ) |
| Global X China Materials ETF | | | 3,140,144 | | | | 2,325,727 | | | | 242,887 | |
| Global X NASDAQ China Technology ETF | | | 11,399,519 | | | | 1,083,174 | | | | 427,255 | |
| Global X Southeast Asia ETF | | | 618,059 | | | | 13,850,456 | | | | (775,180 | ) |
| Global X FTSE Andean 40 ETF | | | 861,619 | | | | 778,248 | | | | (48,376 | ) |
| Global X MSCI Colombia ETF | | | 10,416,753 | | | | 19,375,791 | | | | (1,830,863 | ) |
| Global X Brazil Mid Cap ETF | | | - | | | | 1,446,513 | | | | 210,770 | |
| Global X Brazil Consumer ETF | | | - | | | | 1,757,766 | | | | (6,808 | ) |
| Global X MSCI Argentina ETF | | | 31,901,934 | | | | 17,604,834 | | | | 1,741,787 | |
| Global X FTSE Greece 20 ETF | | | 362,238,361 | | | | 236,278,267 | | | | 16,402,582 | |
| Global X MSCI Norway ETF | | | 156,687,697 | | | | 23,285,532 | | | | 3,808,749 | |
| Global X FTSE Nordic Region ETF | | | 13,746,411 | | | | 10,481,543 | | | | 3,016,773 | |
| Global X MSCI Nigeria ETF | | | 3,562,309 | | | | - | | | | - | |
| Global X Next Emerging & Frontier ETF | | | 107,644,116 | | | | 2,778,201 | | | | 215,323 | |
| Global X FTSE Portugal 20 ETF | | | 53,044,408 | | | | 7,499,502 | | | | 396,498 | |
| Notes to Financial Statements |
| October 31, 2015 (continued) |
5. TAX INFORMATION
The amount and character of income and capital gain distributions to be paid, if any, are determined in accordance with Federal income tax regulations, which may differ from U.S. GAAP. As a result, net investment income (loss) and net realized gain (loss) on investment transactions for a reporting period may differ significantly from distributions during such period. These book/tax differences may be temporary or permanent. To the extent these differences are permanent in nature, they are charged or credited to undistributed net investment income (loss), accumulated net realized gain (loss) or paid-in capital, as appropriate, in the period that the differences arise.
The following differences, primarily attributable to foreign currency, redemptions in-kind and sales of passive foreign investment companies, have been reclassified to/from the following accounts during the fiscal period ended October 31, 2015.
| Global X Funds | | Paid-in
Capital | | | Undistributed
Net Investment
Income/(Loss) | | | Accumulated
Net Realized
Gain/(Loss) | |
| Global X China Consumer ETF | | $ | (5,132,406 | ) | | $ | 85,109 | | | $ | 5,047,297 | |
| Global X China Energy ETF | | | 214,899 | | | | (10 | ) | | | (214,889 | ) |
| Global X China Financials ETF | | | 3,340,376 | | | | 36,582 | | | | (3,376,958 | ) |
| Global X China Industrials ETF | | | 939,021 | | | | 641 | | | | (939,662 | ) |
| Global X China Materials ETF | | | (333,360 | ) | | | (18 | ) | | | 333,378 | |
| Global X NASDAQ China Technology ETF | | | 1,209,798 | | | | 2,747 | | | | (1,212,545 | ) |
| Global X Southeast Asia ETF | | | (946,998 | ) | | | (3,087 | ) | | | 950,085 | |
| Global X FTSE Andean 40 ETF | | | (572,037 | ) | | | (7,803 | ) | | | 579,840 | |
| Global X MSCI Colombia ETF | | | (325,167 | ) | | | (401,623 | ) | | | 726,790 | |
| Global X Brazil Mid Cap ETF | | | (229,958 | ) | | | (22,120 | ) | | | 252,078 | |
| Global X Brazil Consumer ETF | | | (480,057 | ) | | | (42,524 | ) | | | 522,581 | |
| Global X MSCI Argentina ETF | | | (53,088 | ) | | | 1,618 | | | | 51,470 | |
| Global X FTSE Greece 20 ETF | | | (17,050,388 | ) | | | (48,409 | ) | | | 17,098,797 | |
| Global X MSCI Norway ETF | | | (22,212,881 | ) | | | (121,912 | ) | | | 22,334,793 | |
| Global X FTSE Nordic Region ETF | | | 1,173,086 | | | | 75,295 | | | | (1,248,381 | ) |
| Global X MSCI Nigeria ETF | | | (30,368 | ) | | | 33,138 | | | | (2,770 | ) |
| Global X Next Emerging & Frontier ETF | | | (830,963 | ) | | | (91,441 | ) | | | 922,404 | |
| Global X FTSE Portugal 20 ETF | | | (1,187,069 | ) | | | 1,938 | | | | 1,185,131 | |
| Global X MSCI Pakistan ETF(1) | | | — | | | | (354 | ) | | | 354 | |
(1) Commenced operations on April 22, 2015.
| Notes to Financial Statements |
| October 31, 2015 (continued) |
5. TAX INFORMATION (continued)
The tax character of dividends and distributions declared during the periods ended October 31, 2015 and 2014 were as follows:
| Global X Funds | | Ordinary Income | | | Long-Term
Capital Gain | | | Totals | |
| | | | | | | | | | |
| Global X China Consumer ETF | | | | | | | | | | | | |
| 2015 | | $ | 2,353,761 | | | $ | – | | | $ | 2,353,761 | |
| 2014 | | | 1,981,753 | | | | – | | | | 1,981,753 | |
| Global X China Energy ETF | | | | | | | | | | | | |
| 2015 | | $ | 81,629 | | | $ | – | | | $ | 81,629 | |
| 2014 | | | 85,026 | | | | – | | | | 85,026 | |
| Global X China Financials ETF | | | | | | | | | | | | |
| 2015 | | $ | 617,666 | | | $ | – | | | $ | 617,666 | |
| 2014 | | | 243,282 | | | | – | | | | 243,282 | |
| Global X China Industrials ETF | | | | | | | | | | | | |
| 2015 | | $ | 44,362 | | | $ | – | | | $ | 44,362 | |
| 2014 | | | 65,300 | | | | – | | | | 65,300 | |
| Global X China Materials ETF | | | | | | | | | | | | |
| 2015 | | $ | 30,768 | | | $ | – | | | $ | 30,768 | |
| 2014 | | | 36,867 | | | | – | | | | 36,867 | |
| Global X NASDAQ China Technology ETF | | | | | | | | | | | | |
| 2015 | | $ | 64,823 | | | $ | – | | | $ | 64,823 | |
| 2014 | | | 3,666 | | | | – | | | | 3,666 | |
| Global X Southeast Asia ETF | | | | | | | | | | | | |
| 2015 | | $ | 689,799 | | | $ | – | | | $ | 689,799 | |
| 2014 | | | 1,423,135 | | | | – | | | | 1,423,135 | |
| Global X FTSE Andean 40 ETF | | | | | | | | | | | | |
| 2015 | | $ | 168,007 | | | $ | – | | | $ | 168,007 | |
| 2014 | | | 153,480 | | | | – | | | | 153,480 | |
| Global X MSCI Colombia ETF | | | | | | | | | | | | |
| 2015 | | $ | 2,318,237 | | | $ | – | | | $ | 2,318,237 | |
| 2014 | | | 4,567,150 | | | | – | | | | 4,567,150 | |
| Global X Brazil Mid Cap ETF | | | | | | | | | | | | |
| 2015 | | $ | 242,176 | | | $ | – | | | $ | 242,176 | |
| 2014 | | | 531,843 | | | | – | | | | 531,843 | |
| Global X Brazil Consumer ETF | | | | | | | | | | | | |
| 2015 | | $ | 240,598 | | | $ | – | | | $ | 240,598 | |
| 2014 | | | 185,072 | | | | – | | | | 185,072 | |
| Global X MSCI Argentina ETF | | | | | | | | | | | | |
| 2015 | | $ | 90,100 | | | $ | – | | | $ | 90,100 | |
| 2014 | | | 45,738 | | | | – | | | | 45,738 | |
| Global X FTSE Greece 20 ETF | | | | | | | | | | | | |
| 2015 | | $ | 956,353 | | | $ | – | | | $ | 956,353 | |
| 2014 | | | 118,994 | | | | 33,492 | | | | 152,486 | |
| Global X MSCI Norway ETF | | | | | | | | | | | | |
| 2015 | | $ | 4,921,308 | | | $ | – | | | $ | 4,921,308 | |
| 2014 | | | 2,012,342 | | | | – | | | | 2,012,342 | |
| Global X FTSE Nordic Region ETF | | | | | | | | | | | | |
| 2015 | | $ | 2,045,741 | | | $ | – | | | $ | 2,045,741 | |
| 2014 | | | 1,480,041 | | | | – | | | | 1,480,041 | |
| Global X MSCI Nigeria ETF | | | | | | | | | | | | |
| 2015 | | $ | 505,208 | | | $ | – | | | $ | 505,208 | |
| 2014 | | | 92,838 | | | | – | | | | 92,838 | |
| Global X Next Emerging & Frontier ETF | | | | | | | | | | | | |
| 2015 | | $ | 2,316,518 | | | $ | – | | | $ | 2,316,518 | |
| 2014 | | | 28,312 | | | | – | | | | 28,312 | |
| Global X FTSE Portugal 20 ETF | | | | | | | | | | | | |
| 2015 | | $ | 575,663 | | | $ | – | | | $ | 575,663 | |
| 2014 | | | – | | | | – | | | | – | |
| Global X MSCI Pakistan ETF(1) | | | | | | | | | | | | |
| 2015 | | $ | – | | | $ | – | | | $ | – | |
(1)Commenced operations on April 22, 2015.
| Notes to Financial Statements |
| October 31, 2015 (continued) |
5. TAX INFORMATION (continued)
As of October 31, 2015, the components of tax basis accumulated losses were as follows:
| | | Global X China
Consumer ETF | | | Global X China
Energy ETF | | | Global X China
Financials ETF | |
| Undistributed Ordinary Income | | $ | 3,897,491 | | | $ | 48,200 | | | $ | 2,771,631 | |
| Capital Loss Carryforwards | | | (27,019,305 | ) | | | (754,956 | ) | | | (1,667,972 | ) |
| Unrealized Depreciation on Investments and Foreign Currency | | | (16,509,018 | ) | | | (743,505 | ) | | | (4,534,728 | ) |
| Other Temporary Differences | | | 3 | | | | - | | | | (2 | ) |
| Total Accumulated Losses | | $ | (39,630,829 | ) | | $ | (1,450,261 | ) | | $ | (3,431,071 | ) |
| | | Global X China
Industrials ETF | | | Global X China
Materials ETF | | | Global X
NASDAQ China
Technology ETF | |
| Undistributed Ordinary Income | | $ | 95,164 | | | $ | 70,632 | | | $ | 94,445 | |
| Capital Loss Carryforwards | | | (1,586,527 | ) | | | (963,423 | ) | | | (1,635,512 | ) |
| Unrealized Depreciation on Investments and Foreign Currency | | | (1,512,818 | ) | | | (1,160,921 | ) | | | (189,589 | ) |
| Other Temporary Differences | | | (2 | ) | | | - | | | | 1 | |
| Total Accumulated Losses | | $ | (3,004,183 | ) | | $ | (2,053,712 | ) | | $ | (1,730,655 | ) |
| | | Global X
Southeast Asia
ETF | | | Global X FTSE
Andean 40 ETF | | | Global X MSCI
Colombia ETF | |
| Undistributed Ordinary Income | | $ | 447,920 | | | $ | 81,274 | | | $ | 808,120 | |
| Capital Loss Carryforwards | | | (3,827,248 | ) | | | (2,451,855 | ) | | | (49,177,815 | ) |
| Unrealized Depreciation on Investments and Foreign Currency | | | (4,077,989 | ) | | | (2,691,638 | ) | | | (43,798,998 | ) |
| Other Temporary Differences | | | (3 | ) | | | 2 | | | | (3 | ) |
| Total Accumulated Losses | | $ | (7,457,320 | ) | | $ | (5,062,217 | ) | | $ | (92,168,696 | ) |
| | | Global X Brazil
Mid Cap ETF | | | Global X Brazil
Consumer ETF | | | Global X MSCI
Argentina ETF | |
| Undistributed Ordinary Income | | $ | 55,360 | | | $ | 36,222 | | | $ | 44,367 | |
| Capital Loss Carryforwards | | | (6,915,882 | ) | | | (3,765,955 | ) | | | (2,436,274 | ) |
| Unrealized Depreciation on Investments and Foreign Currency | | | (1,927,501 | ) | | | (2,963,846 | ) | | | (3,552,587 | ) |
| Other Temporary Differences | | | (1 | ) | | | — | | | | (2 | ) |
| Total Accumulated Losses | | $ | (8,788,024 | ) | | $ | (6,693,579 | ) | | $ | (5,944,496 | ) |
| | | Global X FTSE
Greece 20 ETF | | | Global X MSCI
Norway ETF | | | Global X FTSE
Nordic Region
ETF | |
| Undistributed Ordinary Income | | $ | 3,839,733 | | | $ | 1,890,658 | | | $ | 1,487,702 | |
| Capital Loss Carryforwards | | | (16,532,722 | ) | | | (10,016,662 | ) | | | (1,999,710 | ) |
| Unrealized Depreciation on Investments and Foreign Currency | | | (136,617,759 | ) | | | (38,208,171 | ) | | | (97,219 | ) |
| Other Temporary Differences | | | (5 | ) | | | (7 | ) | | | (3 | ) |
| Total Accumulated Losses | | $ | (149,310,753 | ) | | $ | (46,334,182 | ) | | $ | (609,230 | ) |
| Notes to Financial Statements |
| October 31, 2015 (continued) |
5. TAX INFORMATION (continued)
| | | Global X MSCI
Nigeria ETF | | | Global X Next
Emerging &
Frontier ETF | | | Global X FTSE
Portugal 20 ETF | |
| Undistributed Ordinary Income | | $ | 820,219 | | | $ | 2,268,026 | | | $ | 1,003,582 | |
| Capital Loss Carryforwards | | | (4,348,029 | ) | | | (10,016,854 | ) | | | (2,579,572 | ) |
| Unrealized Depreciation on Investments and Foreign Currency | | | (8,826,598 | ) | | | (29,479,531 | ) | | | (12,574,191 | ) |
| Other Temporary Differences | | | — | | | | (1 | ) | | | (1 | ) |
| Total Accumulated Losses | | $ | (12,354,408 | ) | | $ | (37,228,360 | ) | | $ | (14,150,182 | ) |
| | | Global X MSCI
Pakistan ETF | |
| Undistributed Ordinary Income | | $ | 131,535 | |
| Capital Loss Carryforwards | | | - | |
| Unrealized Depreciation on Investments and Foreign Currency | | | (512,657 | ) |
| Other Temporary Differences | | | - | |
| Total Accumulated Losses | | $ | (381,122 | ) |
For Federal income tax purposes, capital loss carryforwards represent realized losses of the Funds that may be carried forward for a maximum period of eight years and applied against future gains. As of October 31, 2015, the Funds that had capital loss carryforwards are listed below:
| | | | | | | | | Global X | | | Global X | | | Global X | |
| | | | | | Global X | | | China | | | China | | | China | |
| | | Global X China | | | China | | | Financials | | | Industrials | | | Materials | |
| Expiration date | | Consumer ETF | | | Energy ETF | | | ETF | | | ETF | | | ETF | |
| October 2019 | | $ | 1,341,121 | | | $ | 33,912 | | | $ | - | | | $ | - | | | $ | - | |
| October 2018 | | | 173,208 | | | | - | | | | 551,954 | | | | 94,810 | | | | - | |
| | | $ | 1,514,329 | | | $ | 33,912 | | | $ | 551,954 | | | $ | 94,810 | | | $ | - | |
| | | Global X | | | | | | Global X | | | Global X | | | | |
| | | NASDAQ | | | Global X | | | FTSE | | | MSCI | | | Global X | |
| | | China | | | Southeast | | | Andean 40 | | | Colombia | | | Brazil Mid | |
| Expiration date | | Technology | | | Asia ETF | | | ETF | | | ETF | | | Cap ETF | |
| October 2019 | | $ | 236,466 | | | $ | - | | | $ | 120,886 | | | $ | 8,249,654 | | | $ | 918,379 | |
| October 2018 | | | - | | | | - | | | | - | | | | - | | | | - | |
| | | $ | 236,466 | | | $ | - | | | $ | 120,886 | | | $ | 8,249,654 | | | $ | 918,379 | |
| | | | | | Global X | | | | | | | | | | |
| | | | | | MSCI | | | Global X | | | Global X | | | Glob al X | |
| | | Glob al X Brazil | | | Argentina | | | FTSE Greece | | | MSCI | | | FTSE Nordic | |
| Expiration date | | Consumer ETF | | | ETF | | | 20 ETF | | | Norway ETF | | | Region ETF | |
| October 2019 | | $ | 563,593 | | | $ | 414,683 | | | $ | - | | | $ | 1,802,290 | | | $ | - | |
| October 2018 | | | - | | | | - | | | | - | | | | - | | | | - | |
| | | $ | 563,593 | | | $ | 414,683 | | | $ | - | | | $ | 1,802,290 | | | $ | - | |
| Notes to Financial Statements |
| October 31, 2015 (continued) |
5. TAX INFORMATION (continued)
| | | | | | Global X | | | Global X | | | | |
| | | | | | Next | | | FTSE | | | Global X | |
| | | Glob al X MS CI | | | Emerging & | | | Portugal 20 | | | MSCI | |
| Expiration date | | Nigeria ETF | | | Frontier ETF | | | ETF | | | Pakistan ETF | |
| October 2019 | | $ | - | | | $ | - | | | $ | - | | | $ | - | |
| October 2018 | | | - | | | | - | | | | - | | | | - | |
| | | $ | - | | | $ | - | | | $ | - | | | $ | - | |
For taxable years beginning after December 22, 2010, a RIC is permitted to carry forward net capital losses to offset capital gains realized in later years, and the losses carried forward retain their original character as either long-term or short-term losses. Net capital losses of a RIC realized in taxable years beginning before that date (pre-2011 losses) can be carried forward up to 8 years and are characterized in later years as short-term losses. If a Fund uses pre-2011 loss carryforwards in later years, the carryforwards will not reduce the Fund’s current earnings and profits, while loss carryforwards from later years will reduce the Fund’s current earnings and profits. To the extent that later year capital gains are offset by pre-2011 loss carryforwards, distributions of such gains will be treated as ordinary dividend distributions. Losses carried forward under these new provisions are as follows:
| Global X Funds | | Short-Term Loss | | | Long-Term Loss | | | Total | |
| Global X China Consumer ETF | | $ | 2,811,294 | | | $ | 22,693,682 | | | $ | 25,504,976 | |
| Global X China Energy ETF | | | 98,914 | | | | 622,130 | | | | 721,044 | |
| Global X China Financials ETF | | | 934,694 | | | | 181,324 | | | | 1,116,018 | |
| Global X China Industrials ETF | | | 141,546 | | | | 1,350,171 | | | | 1,491,717 | |
| Global X China Materials ETF | | | 14,977 | | | | 948,446 | | | | 963,423 | |
| Global X NASDAQ China Technology ETF | | | 1,399,046 | | | | — | | | | 1,399,046 | |
| Global X Southeast Asia ETF | | | 1,694,186 | | | | 2,133,062 | | | | 3,827,248 | |
| Global X FTSE Andean 40 ETF | | | 420,645 | | | | 1,910,324 | | | | 2,330,969 | |
| Global X MSCI Colombia ETF | | | 17,015,026 | | | | 23,913,135 | | | | 40,928,161 | |
| Global X Brazil Mid Cap ETF | | | 968,019 | | | | 5,029,484 | | | | 5,997,503 | |
| Global X Brazil Consumer ETF | | | 1,095,948 | | | | 2,106,414 | | | | 3,202,362 | |
| Global X MSCI Argentina ETF | | | 707,481 | | | | 1,314,110 | | | | 2,021,591 | |
| Global X FTSE Greece 20 ETF | | | 9,838,003 | | | | 6,694,719 | | | | 16,532,722 | |
| Global X MSCI Norway ETF | | | 5,176,585 | | | | 3,037,787 | | | | 8,214,372 | |
| Global X FTSE Nordic Region ETF | | | 751,648 | | | | 1,248,062 | | | | 1,999,710 | |
| Global X MSCI Nigeria ETF | | | 2,607,050 | | | | 1,740,979 | | | | 4,348,029 | |
| Global X Next Emerging & Frontier ETF | | | 4,117,627 | | | | 5,899,227 | | | | 10,016,854 | |
| Global X FTSE Portugal 20 ETF | | | 2,579,572 | | | | — | | | | 2,579,572 | |
| Global X MSCI Pakistan ETF(1) | | | — | | | | — | | | | — | |
(1) Commenced operations on April 22, 2015.
During the year ended October 31, 2015 the following funds utilized capital loss carryforwards to offset capital gains amounting to:
| Global X Funds | | | |
| Global X China Consumer ETF | | $ | 35,678 | |
| Global X China Financials ETF | | | 325,234 | |
| Global X China Materials ETF | | | 14,406 | |
| Global X NASDAQ China Technology ETF | | | 436,300 | |
| Global X FTSE Portugal 20 ETF | | | 32,893 | |
| Notes to Financial Statements |
| October 31, 2015 (continued) |
5. TAX INFORMATION (continued)
The Federal tax cost and aggregate gross unrealized appreciation and depreciation on investments held by the Funds at October 31, 2015 were as follows:
| Global X Funds | | Federal Tax
Cost | | | Aggregated
Gross
Unrealized
Appreciation | | | Aggregated
Gross
Unrealized
Depreciation | | | Net Unrealized
Appreciation
(Depreciation) | |
| Global X China Consumer ETF | | $ | 121,204,160 | | | $ | 8,004,646 | | | $ | (24,513,666 | ) | | $ | (16,509,020 | ) |
| Global X China Energy ETF | | | 2,488,934 | | | | 58,515 | | | | (802,020 | ) | | | (743,505 | ) |
| Global X China Financials ETF | | | 61,934,038 | | | | 2,331,577 | | | | (6,866,305 | ) | | | (4,534,728 | ) |
| Global X China Industrials ETF | | | 8,739,653 | | | | 249,550 | | | | (1,762,368 | ) | | | (1,512,818 | ) |
| Global X China Materials ETF | | | 2,467,219 | | | | 637 | | | | (1,161,557 | ) | | | (1,160,920 | ) |
| Global X NASDAQ China Technology ETF | | | 15,600,012 | | | | 1,691,487 | | | | (1,881,075 | ) | | | (189,588 | ) |
| Global X Southeast Asia ETF | | | 18,440,481 | | | | 66,900 | | | | (4,145,071 | ) | | | (4,078,171 | ) |
| Global X FTSE Andean 40 ETF | | | 5,945,895 | | | | 20,796 | | | | (2,712,436 | ) | | | (2,691,640 | ) |
| Global X MSCI Colombia ETF | | | 110,441,578 | | | | 298,944 | | | | (44,097,996 | ) | | | (43,799,052 | ) |
| Global X Brazil Mid Cap ETF | | | 5,001,274 | | | | 62,891 | | | | (1,989,734 | ) | | | (1,926,843 | ) |
| Global X Brazil Consumer ETF | | | 5,923,083 | | | | 148,662 | | | | (3,112,082 | ) | | | (2,963,420 | ) |
| Global X MSCI Argentina ETF | | | 21,879,740 | | | | 1,932,624 | | | | (5,485,194 | ) | | | (3,552,570 | ) |
| Global X FTSE Greece 20 ETF | | | 489,815,444 | | | | 20,222,332 | | | | (156,840,105 | ) | | | (136,617,773 | ) |
| Global X MSCI Norway ETF | | | 109,944,408 | | | | 717,541 | | | | (38,875,528 | ) | | | (38,157,987 | ) |
| Global X FTSE Nordic Region ETF | | | 52,739,336 | | | | 5,928,185 | | | | (5,944,330 | ) | | | (16,145 | ) |
| Global X MSCI Nigeria ETF | | | 33,447,084 | | | | 623,878 | | | | (9,448,903 | ) | | | (8,825,025 | ) |
| Global X Next Emerging & Frontier ETF | | | 137,228,319 | | | | 2,917,974 | | | | (32,408,163 | ) | | | (29,490,189 | ) |
| Global X FTSE Portugal 20 ETF | | | 52,609,063 | | | | 1,441,035 | | | | (13,997,739 | ) | | | (12,556,704 | ) |
| Global X MSCI Pakistan ETF(1) | | | 6,179,563 | | | | 50,061 | | | | (540,287 | ) | | | (490,226 | ) |
(1) Commenced operations on April 22, 2015.
The preceding differences between book and tax cost are primarily due to mark to market treatment of passive foreign investment companies and wash sales.
6. CONCENTRATION OF RISKS
The Funds invest in securities of foreign issuers in several countries. These investments may involve certain considerations and risks not typically associated with investments in the United States as a result of, among other factors, the possibility of future political and economic developments and the level of governmental supervision and regulation of securities markets in the respective countries.
The securities markets of emerging countries are less liquid and subject to greater price volatility, and have a smaller market capitalization, than the U.S. securities markets. In certain countries, there may be fewer publicly traded securities and the market may be dominated by a few issues or sectors.
Issuers and securities markets in such countries are not subject to as extensive and frequent accounting, financial and other reporting requirements or as comprehensive government regulations are issuers and securities markets in the U.S. In particular, the assets and profits appearing on the financial statements of emerging country issuers may not reflect their financial position or results of operations in the same manner as financial statements for U.S. issuers. Substantially less information may be publicly available about emerging country issuers than is available about issuers in the United States.
The Funds may be subject to taxes imposed by countries in which it invests. Such taxes are generally based on either income or gains earned or repatriated. The Funds accrue and apply such taxes to net
| Notes to Financial Statements |
| October 31, 2015 (continued) |
6. CONCENTRATION OF RISKS (continued)
investment income, net realized gains and net unrealized gains as income and/or capital gains are earned.
The Funds use a replication strategy. A replication strategy is an indexing strategy that involves investing in the securities of the underlying index in approximately the same proportions as in the underlying index. The Funds may utilize a representative sampling strategy with respect to their underlying index when a replication strategy might be detrimental to its shareholders, such as when there are practical difficulties or substantial costs involved in compiling a portfolio of equity securities to follow its underlying index, or, in certain instances, when securities in the underlying index become temporarily illiquid, unavailable or less liquid, or due to legal restrictions (such as diversification requirements that apply to the Funds but not the underlying indexes).
Certain Funds may invest in commodity related securities, which are susceptible to fluctuations in certain commodity markets. Any negative changes in commodity markets could have a great impact on those securities.
7. REVERSE SHARE SPLIT
Effective May 16, 2013, the Global X China Materials ETF and the Global X MSCI Argentina ETF executed a 1-for-2 reverse share split for shareholders of record after the close of markets on May 15, 2013. The effect of this transaction was to divide the number of outstanding shares of the Funds by two, resulting in a corresponding increase in the net asset value per share. The per share data in the financial highlights for each of the years in the period then ended have been given retroactive effect to reflect these reverse share splits. There were no changes in net assets, results of operations or total return as a result of these transactions.
8. LOANS OF PORTFOLIO SECURITIES
The Funds may lend portfolio securities having a market value up to one-third of the Funds’ total assets. Security loans made pursuant to a securities lending agreement are required at all times to be secured by collateral equal to at least 102% for U.S. based securities and 105% for foreign based securities. Such collateral received in connection with these loans will be cash and can be invested in repurchase agreements or U.S. Treasury obligations and is recognized in the Schedule of Investments and Statement of Assets and Liabilities. The obligation to return securities lending collateral is also recognized as a liability in the Statement of Assets and Liabilities. It is the Funds’ policy to obtain additional collateral from or return excess collateral to the borrower by the end of the next business day, following the valuation date of the securities loaned. Therefore, the value of the collateral held may be temporarily less than the value of the securities on loan. Lending securities entails a risk of loss to the Funds if and to the extent that the market value of the securities loans were to increase and the borrower did not increase the collateral accordingly, and the borrower fails to return the securities. The Funds could also experience delays and costs in gaining access to the collateral. The Funds bear the risk of any deficiency in the amount of the collateral available for return to the borrower due to any loss on the collateral invested.
| Notes to Financial Statements |
| October 31, 2015 (continued) |
8. LOANS OF PORTFOLIO SECURITIES (continued)
As of October 31, 2015, the value of the securities on loan was $9,955,736, $1,243,616, $1,870,159, $565,600 and $1,960,486 for the Global X China Consumer ETF, Global X MSCI Colombia ETF, Global X MSCI Norway ETF, Global X FTSE Nordic Region ETF and Global X FTSE Portugal 20 ETF, respectively. The value of securities purchased with the cash collateral held from securities on loan was $10,561,545, $6,910,366, $595,000 and $2,773,662 for the Global X China Consumer ETF, Global X MSCI Norway ETF, Global X FTSE Nordic Region ETF and Global X FTSE Portugal 20 ETF, respectively. The value of the cash collateral held from securities on loan was $1,298,800 for the Global X MSCI Columbia ETF.
At October 31, 2015, the following Funds had securities on loan, by counterparty:
| | | Market Value | | | Cash Collateral | |
| Global X China Consumer ETF | | | | | | | | |
| BMO Capital Markets Corp | | $ | 7,216 | | | $ | 7,702 | |
| BNP Paribas Prime Brokerage | | | 13,088 | | | | 15,185 | |
| Credit Suisse | | | 267,196 | | | | 280,849 | |
| Deutsche Bank | | | 274,329 | | | | 290,527 | |
| Goldman Sachs | | | 4,725,705 | | | | 5,027,751 | |
| JPMorgan | | | 79,404 | | | | 83,830 | |
| Macquarie Capital | | | 16,053 | | | | 16,920 | |
| ML Pierce, Fenner & Smith | | | 850,822 | | | | 897,786 | |
| Morgan Stanley | | | 3,273,211 | | | | 3,462,025 | |
| Nomura Securities | | | 187,425 | | | | 203,970 | |
| Scotia Capital | | | 261,287 | | | | 275,000 | |
| Global X MSCI Colombia ETF | | | | | | | | |
| BMO Capital Markets Corp | | | 495,824 | | | | 532,000 | |
| JPMorgan | | | 747,792 | | | | 766,800 | |
| Global X MSCI Norway ETF | | | | | | | | |
| Citigroup | | | 447,625 | | | | 462,540 | |
| Credit Suisse | | | 354,308 | | | | 362,880 | |
| Goldman Sachs | | | 79,997 | | | | 82,302 | |
| JPMorgan | | | 25,308 | | | | 26,326 | |
| Morgan Stanley | | | 504,371 | | | | 526,027 | |
| Nomura Securities | | | 41,812 | | | | 43,500 | |
| Scotia Capital | | | 210,601 | | | | 232,920 | |
| UBS Securities | | | 206,137 | | | | 210,171 | |
| Global X FTSE Nordic Region ETF | | | | | | | | |
| Deutsche Bank | | | 565,600 | | | | 595,000 | |
| Global X FTSE Portugal 20 ETF | | | | | | | | |
| Credit Suisse | | | 1,914,007 | | | | 2,628,574 | |
| ML Pierce, Fenner & Smith | | | 14,560 | | | | 45,449 | |
| Morgan Stanley | | | 31,919 | | | | 99,639 | |
| Notes to Financial Statements |
| October 31, 2015 (concluded) |
9. CONTRACTUAL OBLIGATIONS
The Funds enter into contracts in the normal course of business that contain a variety of indemnifications. The Funds’ maximum exposure under these arrangements is unknown. However the Funds have not had prior gains or losses pursuant to these contracts. Management has reviewed the Funds’ existing contracts and expects the risk of loss to be remote.
Pursuant to the Trust’s organizational documents, the Trustees of the Trust and the Trust’s officers are indemnified against certain liabilities that may arise out of the performance of their duties.
10. NEW ACCOUNTING PRONOUNCMENT
In June 2014, the Financial Accounting Standards Board (FASB) issued Accounting Standards Update (ASU) No. 2014-11, Transfers and Servicing (Topic 860): Repurchase-to-Maturity Transactions, Repurchase Financings, and Disclosures. ASU 2014-11 changes the accounting for repurchase-to-maturity transactions and repurchase financing arrangements and requires enhanced disclosures about repurchase agreements and other similar transactions. This update requires repurchase-to-maturity transactions to be accounted for as secured borrowings. This update also eliminates existing guidance for repurchase financings and requires instead that entities consider the initial transfer and the related repurchase agreement separately when applying the derecognition requirements under U.S. GAAP. The accounting changes in this update are effective for fiscal periods and interim periods beginning after December 15, 2014, and early adoption is prohibited. At this time, management is currently evaluating the implications of ASU No. 2014-11 and its impact on the Funds’ financial statement disclosures has not yet been determined.
11. SUBSEQUENT EVENTS
The Funds have been evaluated regarding the need for additional disclosures and/or adjustments resulting from subsequent events. Based on this evaluation, no additional disclosure or adjustments were required to the financial statements as of the date the financial statements were issued, except as follows:
Subsequent to October 31, 2015 the following portfolios were added to the Trust: Global X Internet of Things ETF, Global X Healthy Lifestyles ETF, Global X Big Data ETF, Global X FinTech ETF and Global X Conscious Companies ETF.
| Report of Independent Registered Public Accounting Firm |
| October 31, 2015 |
The Board of Trustees and Shareholders of Global X Funds
We have audited the accompanying statements of assets and liabilities, including the schedule of investments, of Global X China Consumer ETF, Global X China Energy ETF, Global X China Financials ETF, Global X China Industrials ETF, Global X China Materials ETF, Global X NASDAQ China Technology ETF, Global X Southeast Asia ETF, Global X FTSE Andean 40 ETF, Global X MSCI Colombia ETF, Global X Brazil Mid Cap ETF, Global X Brazil Consumer ETF, Global X MSCI Argentina ETF, Global X FTSE Greece 20 ETF, Global X MSCI Norway ETF, Global X FTSE Nordic Region ETF, Global X MSCI Nigeria ETF, Global X Next Emerging & Frontier ETF, Global X FTSE Portugal 20 ETF, and Global X MSCI Pakistan ETF (nineteen of the series constituting the Global X Funds) (the “Funds”) as of October 31, 2015, and the related statements of operations for the year or period then ended, the statements of changes in net assets for each of the two years or periods then ended, and the financial highlights for each of the five years or periods then ended. These financial statements and financial highlights are the responsibility of the Funds’ management. Our responsibility is to express an opinion on these financial statements and financial highlights based on our audits.
We conducted our audits in accordance with the standards of the Public Company Accounting Oversight Board (United States). Those standards require that we plan and perform the audit to obtain reasonable assurance about whether the financial statements and financial highlights are free of material misstatement. We were not engaged to perform an audit of the Funds’ internal control over financial reporting. Our audits included consideration of internal control over financial reporting as a basis for designing audit procedures that are appropriate in the circumstances, but not for the purpose of expressing an opinion on the effectiveness of the Funds’ internal control over financial reporting. Accordingly, we express no such opinion. An audit also includes examining, on a test basis, evidence supporting the amounts and disclosures in the financial statements and financial highlights, assessing the accounting principles used and significant estimates made by management, and evaluating the overall financial statement presentation. Our procedures included confirmation of securities owned as of October 31, 2015, by correspondence with the custodian and brokers, or by other appropriate auditing procedures where replies from brokers were not received. We believe that our audits provide a reasonable basis for our opinion.
In our opinion, the financial statements and financial highlights referred to above present fairly, in all material respects, the financial position of each of the Funds listed above at October 31, 2015, the results of their operations for the year or period then ended, the changes in their net assets for each of the two years or periods then ended, and their financial highlights for each of the five years or periods then ended, in conformity with U.S. generally accepted accounting principles.

Philadelphia, Pennsylvania
December 30, 2015
| Disclosure of Fund Expenses (unaudited) |
| |
ETFs have operating expenses. As a shareholder of an ETF, your investment is affected by these ongoing costs, which include (among others) costs for ETF management, administrative services, brokerage fees, and shareholder reports like this one. It is important for you to understand the impact of these costs on your investment returns. In addition, a shareholder is responsible for brokerage fees as a result of their investment in a Fund.
Operating expenses such as these are deducted from an ETF’s gross income and directly reduce your final investment return. These expenses are expressed as a percentage of the ETF’s average net assets; this percentage is known as the ETF’s expense ratio.
The following examples use the expense ratio and are intended to help you understand the ongoing costs (in dollars) of investing in your Fund and to compare these costs with those of other funds. The examples are based on an investment of $1,000 made at the beginning of the period shown and held for the entire period from May 1, 2015 through October 31, 2015.
The table on the next page illustrates your Fund’s costs in two ways:
Actual Fund Return. This section helps you to estimate the actual expenses that your Fund incurred over the period. The “Expenses Paid During Period” column shows the actual dollar expense cost incurred by a $1,000 investment in the Fund, and the “Ending Account Value” number is derived from deducting that expense cost from the Fund’s gross investment return.
You can use this information, together with the actual amount you invested in the Funds, to estimate the expenses you paid over that period. Simply divide your actual account value by $1,000 to arrive at a ratio (for example, an $8,600 account value divided by $1,000 = 8.6), then multiply that ratio by the number shown for your Funds under “Expenses Paid During Period.”
Hypothetical 5% Return. This section helps you compare your Fund’s costs with those of other funds. It assumes that the Funds had an annual 5% return before expenses during the year, but that the expense ratio (Column 3) for the period is unchanged. This example is useful in making comparisons because the Securities and Exchange Commission requires all funds to make this 5% calculation. You can assess your Fund’s comparative cost by comparing the hypothetical result for your Fund in the “Expenses Paid During Period” column with those that appear in the same charts in the shareholder reports for other funds.
NOTE: Because the return is set at 5% for comparison purposes — NOT your Fund’s actual return — the account values shown may not apply to your specific investment.
| Disclosure of Fund Expenses (unaudited) (continued) |
| |
| | | Beginning
Account
Value
5/1/2015 | | | Ending
Account
Value
10/31/2015 | | | Annualized
Expense
Ratios | | | Expenses
Paid
During
Period(1) | |
| Global X China Consumer ETF |
| Actual Fund Return | | $ | 1,000.00 | | | $ | 885.70 | | | | 0.65 | % | | $ | 3.09 | |
| Hypothetical 5% Return | | | 1,000.00 | | | | 1,021.93 | | | | 0.65 | | | | 3.31 | |
| Global X China Energy ETF |
| Actual Fund Return | | $ | 1,000.00 | | | $ | 746.10 | | | | 0.65 | % | | $ | 2.86 | |
| Hypothetical 5% Return | | | 1,000.00 | | | | 1,021.93 | | | | 0.65 | | | | 3.31 | |
| Global X China Financials ETF |
| Actual Fund Return | | $ | 1,000.00 | | | $ | 772.80 | | | | 0.65 | % | | $ | 2.90 | |
| Hypothetical 5% Return | | | 1,000.00 | | | | 1,021.93 | | | | 0.65 | | | | 3.31 | |
| Global X China Industrials ETF |
| Actual Fund Return | | $ | 1,000.00 | | | $ | 739.40 | | | | 0.65 | % | | $ | 2.85 | |
| Hypothetical 5% Return | | | 1,000.00 | | | | 1,021.93 | | | | 0.65 | | | | 3.31 | |
| Global X China Materials ETF |
| Actual Fund Return | | $ | 1,000.00 | | | $ | 657.30 | | | | 0.65 | % | | $ | 2.72 | |
| Hypothetical 5% Return | | | 1,000.00 | | | | 1,021.93 | | | | 0.65 | | | | 3.31 | |
| Global X NASDAQ China Technology ETF |
| Actual Fund Return | | $ | 1,000.00 | | | $ | 783.80 | | | | 0.65 | % | | $ | 2.92 | |
| Hypothetical 5% Return | | | 1,000.00 | | | | 1,021.93 | | | | 0.65 | | | | 3.31 | |
| Global X Southeast Asia ETF |
| Actual Fund Return | | $ | 1,000.00 | | | $ | 814.80 | | | | 0.65 | % | | $ | 2.97 | |
| Hypothetical 5% Return | | | 1,000.00 | | | | 1,021.93 | | | | 0.65 | | | | 3.31 | |
| Global X FTSE Andean 40 ETF |
| Actual Fund Return | | $ | 1,000.00 | | | $ | 781.60 | | | | 0.72 | % | | $ | 3.23 | |
| Hypothetical 5% Return | | | 1,000.00 | | | | 1,021.58 | | | | 0.72 | | | | 3.67 | |
| Global X MSCI Colombia ETF |
| Actual Fund Return | | $ | 1,000.00 | | | $ | 711.20 | | | | 0.61 | % | | $ | 2.63 | |
| Hypothetical 5% Return | | | 1,000.00 | | | | 1,022.13 | | | | 0.61 | | | | 3.11 | |
| Global X Brazil Mid Cap ETF | | | | | | | | | | | | | | | | |
| Actual Fund Return | | $ | 1,000.00 | | | $ | 697.80 | | | | 0.69 | % | | $ | 2.95 | |
| Hypothetical 5% Return | | | 1,000.00 | | | | 1,021.73 | | | | 0.69 | | | | 3.52 | |
| Global X Brazil Consumer ETF |
| Actual Fund Return | | $ | 1,000.00 | | | $ | 648.90 | | | | 0.77 | % | | $ | 3.20 | |
| Hypothetical 5% Return | | | 1,000.00 | | | | 1,021.32 | | | | 0.77 | | | | 3.92 | |
| Global X MSCI Argentina ETF |
| Actual Fund Return | | $ | 1,000.00 | | | $ | 880.70 | | | | 0.74 | % | | $ | 3.52 | |
| Hypothetical 5% Return | | | 1,000.00 | | | | 1,021.46 | | | | 0.74 | | | | 3.79 | |
| Global X FTSE Greece 20 ETF |
| Actual Fund Return | | $ | 1,000.00 | | | $ | 858.90 | | | | 0.62 | % | | $ | 2.92 | |
| Hypothetical 5% Return | | | 1,000.00 | | | | 1,022.06 | | | | 0.62 | | | | 3.18 | |
| Global X MSCI Norway ETF |
| Actual Fund Return | | $ | 1,000.00 | | | $ | 816.90 | | | | 0.50 | % | | $ | 2.29 | |
| Hypothetical 5% Return | | | 1,000.00 | | | | 1,022.68 | | | | 0.50 | | | | 2.55 | |
| Global X FTSE Nordic Region ETF |
| Actual Fund Return | | $ | 1,000.00 | | | $ | 913.20 | | | | 0.50 | % | | $ | 2.41 | |
| Hypothetical 5% Return | | | 1,000.00 | | | | 1,022.68 | | | | 0.50 | | | | 2.55 | |
| Global X MSCI Nigeria ETF |
| Actual Fund Return | | $ | 1,000.00 | | | $ | 784.60 | | | | 0.68 | % | | $ | 3.06 | |
| Hypothetical 5% Return | | | 1,000.00 | | | | 1,021.78 | | | | 0.68 | | | | 3.46 | |
| Disclosure of Fund Expenses (unaudited) (concluded) |
| |
| | | Beginning
Account
Value
5/1/2015 | | | Ending
Account
Value
10/31/2015 | | | Annualized
Expense
Ratios | | | Expenses
Paid
During
Period(1) | |
| Global X Next Emerging & Frontier ETF |
| Actual Fund Return | | $ | 1,000.00 | | | $ | 824.20 | | | | 0.57 | % | | $ | 2.63 | |
| Hypothetical 5% Return | | | 1,000.00 | | | | 1,022.32 | | | | 0.57 | | | | 2.91 | |
| Global X FTSE Portugal 20 ETF |
| Actual Fund Return | | $ | 1,000.00 | | | $ | 877.10 | | | | 0.61 | % | | $ | 2.90 | |
| Hypothetical 5% Return | | | 1,000.00 | | | | 1,022.11 | | | | 0.61 | | | | 3.13 | |
| Global X MSCI Pakistan ETF |
| Actual Fund Return | | $ | 1,000.00 | | | $ | 924.90 | | | | 0.90 | % | | $ | 4.36 | |
| Hypothetical 5% Return | | | 1,000.00 | | | | 1,020.68 | | | | 0.90 | | | | 4.57 | |
| (1) | Expenses are equal to the Fund’s annualized expense ratio multiplied by the average account value over the period, multiplied by 184/365 (to reflect the one-half year period.). |
| Supplemental Information (unaudited) |
| |
Net asset value, or “NAV”, is the price per Share at which the Funds issue and redeem Shares. It is calculated in accordance with the standard formula for valuing mutual fund shares. The “Market Price” of the Funds generally is determined using the midpoint between the highest bid and the lowest offer on the stock exchange on which the Shares of the Funds are listed for trading, as of the time that the Funds’ NAV is calculated. The Funds’ Market Price may be at, above or below their NAV. The NAV of the Funds will fluctuate with changes in the market value of the Funds’ holdings. The Market Price of the Funds will fluctuate in accordance with changes in their NAV, as well as market supply and demand.
Premiums or discounts are the differences (expressed as a percentage) between the NAV and Market Price of the Funds on a given day, generally at the time NAV is calculated. A premium is the amount that the Funds are trading above the reported NAV, expressed as a percentage of the NAV. A discount is the amount that the Funds are trading below the reported NAV, expressed as a percentage of the NAV.
Further information regarding premiums and discounts is available on the Funds’ website at www.GlobalXFunds.com.
| Trustees and Officers of the Trust (unaudited) |
| |
Set forth below are the names, addresses, year of birth, position with the Trust, Term of Office and Length of Time Served, the principal occupations for the last five years, number of Funds in fund complex overseen by the Trustees, and other directorships outside the fund complex of each of the persons currently serving as Trustees and Officers of the Trust.
Name,
Address
(Year of
Birth) | Position(s)
Held
with
Funds | Principal Occupation(s) During
the Past 5 Years | Number of
Funds in
Trust
Overseen
by Trustee | Other Directorships Held
by Trustees |
| Independent Trustees2 | |
Sanjay Ram Bharwani 623 Fifth Ave, 15th floor New York, NY 10022 (1974) | Trustee (since 2008) | CEO of Risk Advisors Inc. (since 2007) (consulting firm). | 473 | None. |
Scott R. Chichester1 623 Fifth Ave, 15th floor New York, NY 10022 (1970) | Trustee (since 2008) | CFO, AdeptPros Inc. (app development, training and consulting) (since 2012); Founder, Madison Park Advisors LLC (advisory services) (since 2011); CFO, Sterling Seal & Supply Inc. (since 2011), President & Treasurer, Bayview Acquisition Corp (since 2010), CPA, Penda Aiken Inc. (2009-2011) (consultant); Founder and President, DirectPay USA LLC (since 2006) (payroll company); Proprietor, Scott R. Chichester CPA (since 2001) (CPA firm). | 473 | Director of AdeptPros Inc. (since 2015); Director of Sterling Seal & Supply Inc. (since 2011); Director of Bayview Acquisition Corp. (since 2010); Trustee of ARK ETF Trust (since 2014). |
Kartik Kiran Shah 623 Fifth Ave, 15th floor New York, NY 10022 (1977) | Trustee (since 2008) | President and Chief Business Officer, Oxeia Biopharmaceuticals, Inc. (2015-present); Vice President, Business Development, Cynvenio Biosystems (2012-2014); Independent Consultant, Self-Employed (2011-2012) (non-financial services); Director, Wireless Generation (2008-2011) (software). | 473 | Director of Oxeia Biopharmaceuticals, Inc. (2015-present). |
| Trustees and Officers of the Trust (unaudited)(continued) |
| |
The Trust’s Statement of Additional Information (“SAI”) includes additional information about the Trustees and Officers. The SAI may be obtained without charge by calling 1-888-493-8631. The following chart lists Trustees and Officers as of October 31, 2015.
Name, Address
(Year of Birth) | Position(s) Held
with Funds | Principal Occupation(s)
During
the Past 5 Years | Number of Funds
in Trust
Overseen by
Trustee | Other
Directorships Held
by Trustees |
| Interested Trustee / Officers2 | |
Bruno del Ama 623 Fifth Ave, 15th floor New York, NY 10022 (1976) | Trustee (since 2008), President, Chief Executive Officer (since 2008). | Chief Executive Officer, Global X Management Company ("GXMC")(since 2008); Chief Compliance Officer, GXMC (2008-2013). | 473 | None. |
Luis Berruga 623 Fifth Ave, 15th floor New York, NY 10022 (1977) | Chief Operating Officer, Treasurer, Principal Accounting Officer and Chief Financial Officer (from 9/2015). | Chief Financial Officer, GXMC (since 9/2015) and Chief Operating Officer (since 2/2014); Investment Banker, Jefferies (2012-2014); Regional Product Specialist, Morgan Stanley (2005-2012). | N/A | N/A |
Daphne Tippens Chisolm 623 Fifth Ave, 15th floor New York, NY 10022 (1969) | Secretary (since 2012) and Chief Compliance Officer (since 2/2015). | General Counsel, GXMC (since 2011); Chief Compliance Officer, GXMC (1/2014 - 5/2014 and 2/2015 - present); Founder and President of Law Offices of DT Chisolm, P.C. (since 2009) (law firm). | N/A | N/A |
Dianne M. Descoteaux4 One Freedom Valley Drive Oaks, PA 19456 (1977) | Assistant Secretary (since 2011). | Counsel, SEI Investments (since 2010); Associate, Morgan, Lewis & Bockius LLP (2006-2010). | N/A | N/A |
| Trustees and Officers of the Trust (unaudited)(concluded) |
| |
Name, Address
(Year of Birth) | Position(s) Held
with Funds | Principal Occupation(s) During
the Past 5 Years | Other Directorships
Held
by Trustees |
Lisa Whittaker4 One Freedom Valley Drive Oaks, PA 19456 (1978) | Assistant Secretary (since 2013). | Counsel at SEI Investments (since 2012); Associate Counsel and Compliance Officer at The Glendale Trust Company (2011-2012); Associate of Drinker Biddle & Reath LLP (2006-2011). | N/A |
Peter Rodriguez4 One Freedom Valley Drive Oaks, PA 19456 (1962) | Assistant Treasurer (since 2011). | Fund Accounting Director, SEI Investments Global Fund Services (since 2011); Mutual Fund Trading Director, SEI Global Trust Company (2009-2011); Asset Data Services Director, SEI Global Wealth Services (2006-2009). | N/A |
| 1 | Mr. Chichester is currently married to a sister of Mr. del Ama’s wife. While an “immediate family member” (as defined in Section 2(a)(19) of the 1940 Act) of Mr. del Ama would be considered an Interested Person, Mr. Chichester is not considered an immediate family member for this purpose. Although this fact was taken into consideration in determining whether Mr. Chichester should be considered to be an Independent Trustee for purposes of the Section 2(a)(19) of the 1940 Act, it was determined that this relationship was not one that should disqualify Mr. Chichester from serving as an Independent Trustee of the Trust. |
| 2 | Each Trustee serves until his or her successor is duly elected or appointed and qualified. |
| 3 | As of October 31, 2015, the Trust had ninety one investment portfolios, forty seven of which were operational. |
| 4 | These officers of the Trust also serve as officers of one or more mutual funds for which SEI Investments Company or an affiliate acts as investment manager, administrator or distributor. |
| Notice to Shareholders (unaudited) |
| |
For shareholders that do not have an October 31, 2015 tax year end, this notice is for informational purposes only. For shareholders with an October 31, 2015 tax year end, please consult your tax advisor as to the pertinence of this notice. For the fiscal year ended October 31, 2015, the Funds have designated the following items with regard to distributions paid during the year.
| | | Long-Term
Capital Gain
Distributions | | | Ordinary
Income
Distributions | | | Total
Distributions | | | Qualifying
for
Corporate
Dividends
Received
Deduction
(1) | | | Qualifying
Dividend
Income (2) | | | U.S.
Government
Interest (3) | | | Interest
Related
Dividends
(4) | | | Short Term
Capital
Gain
Dividends(5) | | | Foreign
Tax Credit | |
| Global X China Consumer ETF | | | 0.00 | % | | | 100.00 | % | | | 100.00 | % | | | 0.00 | % | | | 53.65 | % | | | 0.00 | % | | | 0.00 | % | | | 0.00 | % | | | 1.81 | % |
| Global X China Energy ETF | | | 0.00 | % | | | 100.00 | % | | | 100.00 | % | | | 0.00 | % | | | 97.68 | % | | | 0.00 | % | | | 0.00 | % | | | 0.00 | % | | | 6.35 | % |
| Global X China Financials ETF | | | 0.00 | % | | | 100.00 | % | | | 100.00 | % | | | 0.00 | % | | | 100.00 | % | | | 0.00 | % | | | 0.00 | % | | | 0.00 | % | | | 31.08 | % |
| Global X China Industrials ETF | | | 0.00 | % | | | 100.00 | % | | | 100.00 | % | | | 0.00 | % | | | 99.96 | % | | | 0.00 | % | | | 0.00 | % | | | 0.00 | % | | | 19.11 | % |
| Global X China Materials ETF | | | 0.00 | % | | | 100.00 | % | | | 100.00 | % | | | 0.00 | % | | | 95.54 | % | | | 0.00 | % | | | 0.00 | % | | | 0.00 | % | | | 11.34 | % |
| Global X NASDAQ China Technology ETF | | | 0.00 | % | | | 100.00 | % | | | 100.00 | % | | | 0.00 | % | | | 100.00 | % | | | 0.00 | % | | | 0.00 | % | | | 0.00 | % | | | 6.93 | % |
| Global X Southeast Asia ETF | | | 0.00 | % | | | 100.00 | % | | | 100.00 | % | | | 0.00 | % | | | 42.68 | % | | | 0.00 | % | | | 0.00 | % | | | 0.00 | % | | | 4.16 | % |
| Global X FTSE Andean 40 ETF | | | 0.00 | % | | | 100.00 | % | | | 100.00 | % | | | 0.00 | % | | | 97.47 | % | | | 0.00 | % | | | 0.00 | % | | | 0.00 | % | | | 11.74 | % |
| Global X MSCI Colombia ETF | | | 0.00 | % | | | 100.00 | % | | | 100.00 | % | | | 0.00 | % | | | 100.00 | % | | | 0.00 | % | | | 0.00 | % | | | 0.00 | % | | | 0.49 | % |
| Global X Brazil Mid Cap ETF | | | 0.00 | % | | | 100.00 | % | | | 100.00 | % | | | 0.00 | % | | | 63.53 | % | | | 0.00 | % | | | 0.34 | % | | | 0.00 | % | | | 0.00 | % |
| Global X Brazil Consumer ETF | | | 0.00 | % | | | 100.00 | % | | | 100.00 | % | | | 0.00 | % | | | 32.82 | % | | | 0.00 | % | | | 0.13 | % | | | 0.00 | % | | | 0.00 | % |
| Global X MSCI Argentina ETF | | | 0.00 | % | | | 100.00 | % | | | 100.00 | % | | | 32.85 | % | | | 100.00 | % | | | 0.00 | % | | | 0.00 | % | | | 0.00 | % | | | 26.63 | % |
| Global X FTSE Greece 20 ETF | | | 0.00 | % | | | 100.00 | % | | | 100.00 | % | | | 0.00 | % | | | 100.00 | % | | | 0.00 | % | | | 0.00 | % | | | 0.00 | % | | | 26.78 | % |
| Global X MSCI Norway ETF | | | 0.00 | % | | | 100.00 | % | | | 100.00 | % | | | 0.00 | % | | | 35.61 | % | | | 0.00 | % | | | 0.00 | % | | | 0.00 | % | | | 1.44 | % |
| Global X FTSE Nordic Region ETF | | | 0.00 | % | | | 100.00 | % | | | 100.00 | % | | | 17.68 | % | | | 98.80 | % | | | 0.00 | % | | | 0.00 | % | | | 0.00 | % | | | 5.44 | % |
| Global X MSCI Nigeria ETF | | | 0.00 | % | | | 100.00 | % | | | 100.00 | % | | | 0.00 | % | | | 0.00 | % | | | 0.00 | % | | | 0.00 | % | | | 0.00 | % | | | 16.19 | % |
| Global X Next Emerging & Frontier ETF | | | 0.00 | % | | | 100.00 | % | | | 100.00 | % | | | 0.00 | % | | | 100.00 | % | | | 0.00 | % | | | 0.00 | % | | | 0.00 | % | | | 12.94 | % |
| Global X FTSE Portugal 20 ETF | | | 0.00 | % | | | 100.00 | % | | | 100.00 | % | | | 0.00 | % | | | 99.64 | % | | | 0.00 | % | | | 0.00 | % | | | 0.00 | % | | | 27.09 | % |
| Global X MSCI Pakistan ETF | | | 0.00 | % | | | 100.00 | % | | | 100.00 | % | | | 0.00 | % | | | 100.00 | % | | | 0.00 | % | | | 0.00 | % | | | 0.00 | % | | | 100.00 | % |
(1) Qualifying dividends represent dividends which qualify for the corporate dividends received deduction and is reflected as a percentage of ordinary Income distributions (the total of short term capital gain and net investment income distributions).
(2) The percentage in this column represents the amount of "Qualifying Dividend Income" as created by the Jobs and Growth Relief Reconciliation Act of 2003 and is reflected as a percentage of ordinary income distributions (the total of short term capital gain and net investment income distributions). It is the intention of each of the aforementioned funds to designate the maximum amount permitted by law.
(3) “U.S. Government Interest” represents the amount of interest that was derived from U.S. Government obligations and distributed during the fiscal year. Generally, interest from direct U.S. Government obligations is exempt from state income tax. However, for shareholders who are residents of California, Connecticut and New York, the statutory threshold requirements were not satisfied to permit exemption of these amounts from state income.
(4) The percentage in this column represents the amount of "Interest Related Dividends" is reflected as a percentage of ordinary income distribution. Interest related dividends is exempt from U.S. withholding tax when paid to foreign investors.
(5) The percentage of this column represents the amount of “Short Term Capital Gain Dividend” is reflected as a percentage of short term capital gain distribution that is exempted from U.S. withholding tax when paid to foreign investors.
| Notice to Shareholders (unaudited) |
| |
The Funds intend to pass through a foreign tax credit to shareholders. For the fiscal year ended October 31, 2015, the total amount of foreign source income and foreign tax credit are as follows:
| Fund Name | | Foreign Source Income | | | Foreign Tax Credit Pass Through | |
| Global X China Consumer ETF | | $ | 4,689,255 | | | $ | 43,358 | |
| Global X China Energy ETF | | | 72,629 | | | | 5,532 | |
| Global X China Financials ETF | | | 3,536,230 | | | | 278,588 | |
| Global X China Industrials ETF | | | 156,850 | | | | 10,479 | |
| Global X China Materials ETF | | | 93,854 | | | | 3,935 | |
| Global X NASDAQ China Technology ETF | | | 228,239 | | | | 4,828 | |
| Global X Southeast Asia ETF | | | 673,723 | | | | 29,952 | |
| Global X FTSE Andean 40 ETF | | | 180,344 | | | | 22,348 | |
| Global X MSCI Colombia ETF | | | 2,479,537 | | | | 11,521 | |
| Global X Brazil Mid Cap ETF | | | 154,524 | | | | - | |
| Global X Brazil Consumer ETF | | | 138,250 | | | | - | |
| Global X MSCI Argentina ETF | | | 265,933 | | | | 32,707 | |
| Global X FTSE Greece 20 ETF | | | 5,625,413 | | | | 349,713 | |
| Global X MSCI Norway ETF | | | 3,141,012 | | | | 72,123 | |
| Global X FTSE Nordic Region ETF | | | 1,829,732 | | | | 117,707 | |
| Global X MSCI Nigeria ETF | | | - | | | | 97,626 | |
| Global X Next Emerging & Frontier ETF | | | 3,971,685 | | | | 344,384 | |
| Global X FTSE Portugal 20 ETF | | | 1,412,262 | | | | 213,925 | |
| Global X MSCI Pakistan ETF | | | 148,315 | | | | 15,419 | |
The information reported herein may differ from the information and distributions taxable to the shareholders for the calendar year ending December 31, 2015. Complete information will be computed and reported in conjunction with your 2015 Form 1099-DIV.

623 Fifth Avenue, 15th floor
New York, NY 10022
1-888-GXFund-1
(1-888-493-8631)
www.globalxfunds.com
Investment Adviser and Administrator:
Global X Management Company LLC
623 Fifth Avenue, 15th floor
New York, NY 10022
Distributor:
SEI Investments Distribution Co.
One Freedom Valley Drive
Oaks, PA 19456
Sub-Administrator:
SEI Investments Global Funds Services
One Freedom Valley Drive
Oaks, PA 19456
Counsel for Global X Funds and the Independent Trustees:
K&L Gates LLP
1601 K Street N.W.
Washington, DC 20006
Custodian and Transfer Agent:
Brown Brothers Harriman & Co.
50 Post Office Square
Boston, MA 02110
Independent Registered Public Accounting Firm:
Ernst & Young LLP
2005 Market Street
Suite 700
Philadelphia, PA 19103
This information must be preceded or accompanied by a prospectus for the funds described.
GLX-AR-002-0500
Global X SuperDividend® ETF (ticker: SDIV)
Global X SuperDividend® U.S. ETF (ticker: DIV)
Global X SuperDividend® Emerging Markets ETF (ticker: SDEM)
Global X SuperDividend® REIT ETF (ticker: SRET)
Global X SuperIncome™ Preferred ETF (ticker: SPFF)
Global X Social Media Index ETF (ticker: SOCL)
Global X | JPMorgan Efficiente Index ETF (ticker: EFFE)
Global X | JPMorgan US Sector Rotator Index ETF (ticker: SCTO)
Global X Permanent ETF (ticker: PERM)
Global X Guru™ Index ETF (ticker: GURU)
Global X Guru™ Activist Index ETF (ticker: ACTX)
Global X Guru™ International Index ETF (ticker: GURI)
Global X GF China Bond ETF (ticker: CHNB)
Global X Scientific Beta US ETF (ticker: SCIU)
Global X Scientific Beta Europe ETF (ticker: SCID)
Global X Scientific Beta Japan ETF (ticker: SCIJ)
Global X Scientific Beta Asia ex-Japan ETF (ticker: SCIX)
Global X YieldCo Index ETF (ticker: YLCO)
Annual Report
October 31, 2015
The Funds file their complete schedules of Fund holdings with the Securities and Exchange Commission (the “Commission”) for the first and third quarters of each fiscal year on Form N-Q within sixty days after the end of the period. The Funds’ Forms N-Q are available on the Commission’s website at http://www.sec.gov, and may be reviewed and copied at the Commission's Public Reference Room in Washington, DC. Information on the operation of the Public Reference Room may be obtained by calling 1-800-SEC-0330.
A description of the policies and procedures that Global X Funds use to determine how to vote proxies relating to Fund securities, as well as information relating to how the Funds voted proxies relating to Fund securities during the most recent 12-month period ended June 30, is available (i) without charge, upon request, by calling 1-888-GXFund-1; and (ii) on the Commission’s website at http://www.sec.gov.
Management Discussion of Fund Performance (unaudited)
Global X SuperDividend® ETF
Global X SuperDividend® ETF
The Global X SuperDividend® ETF (“Fund”) seeks investment results that correspond generally to the price and yield performance, before fees and expenses, of the Solactive Global SuperDividend® Index (“Underlying Index”). The Fund is passively managed, which means the investment adviser does not attempt to take defensive positions in declining markets. The Fund generally seeks to fully replicate the Underlying Index.
The Underlying Index tracks the performance of 100 equally-weighted companies that rank among the highest dividend yielding equity securities in the world, as defined by the index provider.
For the 12-month period ended October 31, 2015 (the “reporting period”), the Fund decreased 9.01%, while the Underlying Index decreased 8.96%. The Fund had a net asset value of $24.24 per share on October 31, 2014 and ended the reporting period with a net asset value of $20.65 on October 31, 2015.
During the reporting period, the highest returns came from Evergrande Real Estate Group and Provident Financial, which returned 96.43% and 62.89%, respectively. The worst performers were Commonwealth Bank of Australia and CTC Media, which returned -75.25% and -67.89%, respectively.
Stocks held by the Fund have among the highest dividend yields in the world. High dividend investing is a value-oriented strategy that was negatively impacted by the underperformance of value stocks versus their growth counterparts over the course of the reporting period. The Fund has had an average approximate exposure of 29.8% to stocks in the United States, 17.4% to stocks in Australia, and 7.6% to stocks in the United Kingdom. Over the reporting period, stocks in the Fund from these regions had total returns of approximately -11.5%, -11.7% and 19.6%, respectively.
| | | AVERAGE TOTAL RETURN FOR THE YEAR ENDED OCTOBER 31, 2015 | |
| | | One Year Return | | | Three Year Return | | | Annualized Inception to Date* | |
| | | Net Asset Value | | | Market Price | | | Net Asset Value | | | Market Price | | | Net Asset Value | | | Market Price | |
| Global X SuperDividend® ETF | | | -9.01 | % | | | -9.53 | % | | | 5.00 | % | | | 4.82 | % | | | 2.91 | % | | | 2.84 | % |
| Solactive Global SuperDividend® Index | | | -8.96 | % | | | -8.96 | % | | | 4.87 | % | | | 4.87 | % | | | 2.49 | % | | | 2.49 | % |
| S&P 500 Index | | | 5.20 | % | | | 5.20 | % | | | 16.20 | % | | | 16.20 | % | | | 14.07 | % | | | 14.07 | % |
Growth of a $10,000 Investment
(at Net Asset Value)
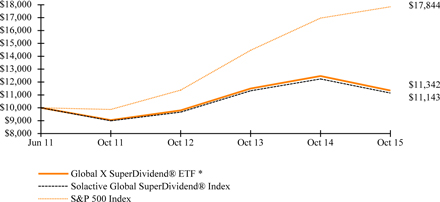
* The Fund commenced operations on June 8, 2011.
The S&P 500 Index is a market capitalization weighted composite index of 500 large capitalization U.S. companies.
The performance data quoted herein represents past performance and the return and value of an investment in the Fund will fluctuate so that, when redeemed, it may be worth less than its original cost. Past performance is no guarantee of future performance and should not be considered as a representation of the future results of the Fund. The Fund's performance assumes the reinvestment of all dividends and all capital gains. Index returns assume reinvestment of dividends and, unlike a Fund's returns, do not reflect any fees or expenses. If such fees and expenses were included in the index returns, the performance would have been lower. Please note that one cannot invest directly in an unmanaged index.
Management Discussion of Fund Performance (unaudited)
Global X SuperDividend® ETF
There are no assurances that the Fund will meet its stated objectives.
The Fund’s holdings and allocations are subject to change and should not be considered recommendations to buy individual securities.
The graph and table do not reflect the deduction of taxes that a shareholder would pay on Fund distributions or the redemption or sale of Fund shares.
See definition of comparative indices on previous page.
Management Discussion of Fund Performance (unaudited)
Global X SuperDividend® U.S. ETF
Global X SuperDividend® U.S. ETF
The Global X SuperDividend® U.S. ETF ("Fund") seeks to provide investment results that correspond generally to the price and yield performance, before fees and expenses, of the INDXX SuperDividend® U.S. Low Volatility Index ("Underlying Index").The Fund is passively managed, which means the investment adviser does not attempt to take defensive positions in declining markets. The Fund generally seeks to fully replicate the Underlying Index.
The Underlying Index tracks the performance of 50 equally-weighted common stocks including master limited partnerships ("MLPs") and real estate investment trust ("REITs") that rank among the highest dividend yielding equity securities in the United States, as defined by the index provider. The components of the Underlying Index have paid dividends consistently over the last two years. The Underlying Index is comprised of securities that the index provider determines to have lower relative volatility, as measured by the beta of each security relative to the market benchmark.
For the 12-month period ended October 31, 2015 (the “reporting period”), the Fund decreased 8.67%, while the Underlying Index decreased 8.34%. The Fund had a net asset value of $29.60 per share on October 31, 2014 and ended the reporting period with a net asset value of $25.23 on October 31, 2015.
During the reporting period, the highest returns came from Reynolds American and TECO Energy, which returned 59.48% and 43.96%, respectively. The worst performers were Memorial Production Partners and Windstream Holdings, which returned -58.9% and -55.92%, respectively.
The Fund invests in many of the highest yielding stocks in the United States. High dividend investing is a value-oriented strategy that was negatively impacted by the underperformance of value stocks versus their growth counterparts over the course of the reporting period. In addition, the Fund's exposure to high yielding MLPs weighed on returns as MLPs experienced declines related to falling oil prices.
| | | AVERAGE TOTAL RETURN FOR THE YEAR ENDED OCTOBER 31, 2015 | |
| | | One Year Return | | | Annualized Inception to Date* | |
| | | Net Asset Value | | | Market Price | | | Net Asset Value | | | Market Price | |
| Global X SuperDividend® U.S. ETF | | | -8.67 | % | | | -8.85 | % | | | 6.61 | % | | | 6.85 | % |
| INDXX SuperDividend® U.S. Low Volatility Index | | | -8.34 | % | | | -8.34 | % | | | 6.95 | % | | | 6.95 | % |
| S&P 500 Index | | | 5.20 | % | | | 5.20 | % | | | 13.91 | % | | | 13.91 | % |
Growth of a $10,000 Investment
(at Net Asset Value)
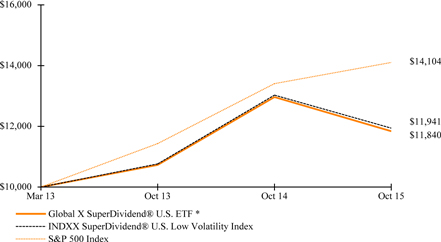
* The Fund commenced operations on March 11, 2013.
The S&P 500 Index is a market capitalization weighted composite index of 500 large capitalization U.S. companies.
Management Discussion of Fund Performance (unaudited)
Global X SuperDividend® U.S. ETF
The performance data quoted herein represents past performance and the return and value of an investment in the Fund will fluctuate so that, when redeemed, it may be worth less than its original cost. Past performance is no guarantee of future performance and should not be considered as a representation of the future results of the Fund. The Fund's performance assumes the reinvestment of all dividends and all capital gains. Index returns assume reinvestment of dividends and, unlike a Fund's returns, do not reflect any fees or expenses. If such fees and expenses were included in the index returns, the performance would have been lower. Please note that one cannot invest directly in an unmanaged index.
There are no assurances that the Fund will meet its stated objectives.
The Fund’s holdings and allocations are subject to change and should not be considered recommendations to buy individual securities.
The graph and table do not reflect the deduction of taxes that a shareholder would pay on Fund distributions or the redemption or sale of Fund shares.
See definition of comparative indices on previous page.
Management Discussion of Fund Performance (unaudited)
Global X SuperDividend® Emerging Markets ETF
Global X SuperDividend® Emerging Markets ETF
The Global X SuperDividend® Emerging Markets ETF (“Fund”) seeks investment results that correspond generally to the price and yield performance, before fees and expenses, of the INDXX SuperDividend® Emerging Markets Index (“Underlying Index”).The Fund is passively managed, which means the investment adviser does not attempt to take defensive positions in declining markets. The Fund generally seeks to fully replicate the Underlying Index.
The Underlying Index tracks the performance of 50 equally weighted companies that rank among the highest dividend yielding equity securities in emerging markets, as defined by the index provider. The Underlying Index may include components from the following countries: Brazil, Chile, Colombia, Mexico, Peru, Czech Republic, Egypt, Greece, Hungary, Poland, Qatar, Russia, South Africa, Turkey, United Arab Emirates, China, India, Indonesia, Malaysia, Philippines, and Thailand. The Underlying Index selects the publicly-listed securities in these markets with the highest dividend yield, subject to minimum market capitalization and liquidity requirements, and subject to maximum allocations to individual countries and sectors. The components of the Underlying Index must also have paid dividends consistently over the last 2 years.
For the period from the Fund's commencement date on March 16, 2015 through October, 31 2015 (the “reporting period”), the Fund decreased 4.89%, while the Underlying Index decreased 4.35%. The Fund had a net asset value of $14.90 per share on March 16, 2015 and ended the reporting period with a net asset value of $13.73 on October 31, 2015.
During the reporting period, the highest returns came from Evergrande Real Estate Group and Intime Retail Group, which returned 95.48% and 90.91%, respectively. The worst performers were Kumba Iron Ore and Exxaro Resources, which returned -68.01% and -45.31%, respectively.
Stocks held by the Fund have among the highest dividend yields in emerging markets. High dividend investing is a value-oriented strategy that was negatively impacted by the underperformance of value stocks versus their growth counterparts over the course of the reporting period. During the reporting period, emerging markets suffered from expectations of rising rates in the United States as well as slowing economic figures from China.
Management Discussion of Fund Performance (unaudited)
Global X SuperDividend® Emerging Markets ETF
| | | AVERAGE TOTAL RETURN FOR THE
PERIOD ENDED OCTOBER 31, 2015 | |
| | | Cumulative Inception to Date* | |
| | | Net Asset Value | | | Market Price | |
| Global X SuperDividend® Emerging Markets ETF | | | -4.89 | % | | | -5.03 | % |
| INDXX SuperDividend® Emerging Markets Index | | | -4.35 | % | | | -4.35 | % |
| S&P 500 | | | 1.14 | % | | | 1.14 | % |
Growth of a $10,000 Investment
(at Net Asset Value)

* The Fund commenced operations on March 16, 2015. Total return is for the period indicated and has not been annualized.
The S&P 500 Index is a market capitalization weighted composite index of 500 large capitalization U.S. companies.
The performance data quoted herein represents past performance and the return and value of an investment in the Fund will fluctuate so that, when redeemed, it may be worth less than its original cost. Past performance is no guarantee of future performance and should not be considered as a representation of the future results of the Fund. The Fund's performance assumes the reinvestment of all dividends and all capital gains. Index returns assume reinvestment of dividends and, unlike a Fund's returns, do not reflect any fees or expenses. If such fees and expenses were included in the index returns, the performance would have been lower. Please note that one cannot invest directly in an unmanaged index.
There are no assurances that the Fund will meet its stated objectives.
The Fund’s holdings and allocations are subject to change and should not be considered recommendations to buy individual securities.
The graph and table do not reflect the deduction of taxes that a shareholder would pay on Fund distributions or the redemption or sale of Fund shares.
See definition of comparative indices on previous page.
Management Discussion of Fund Performance (unaudited)
Global X SuperDividend® REIT ETF
Global X SuperDividend® REIT Markets ETF
The Global X SuperDividend® REIT ETF (“Fund”) seeks investment results that correspond generally to the price and yield performance, before fees and expenses, of the Solactive Global SuperDividend® REIT Index (“Underlying Index”). The Fund generally seeks to fully replicate the Underlying Index.
The Underlying Index tracks the performance of real estate investment trusts (“REITs”) that rank among the highest dividend-yielding REITs globally, as determined by the index provider. The index provider screens the highest dividend-yielding REITs to exclude REITs that have historically exhibited the highest volatility, as determined by the index provider.
For the period from the Fund's commencement date on March 16, 2015 through October, 31 2015 (the “reporting period”), the Fund decreased 8.86%, while the Underlying Index decreased 10.10%. The Fund had a net asset value of $15.12 per share on March 16, 2015 and ended the reporting period with a net asset value of $13.18 on October 31, 2015.
During the reporting period, the highest returns came from Vicinity Centres and Blackstone Mortgage Trust, which returned 10.31% and 3.37%, respectively. The worst performers were Corrections Corp. of America and PennyMac Mortgage Investment Trust, which returned -25.39% and -23.11%, respectively.
The Fund invests in among the highest dividend-yielding REITs around the world. REITs struggled over the course of the reporting period as the market priced in expectations of rising interest rates in the United States. The Fund is unique in its exposure to REITs globally, which included holdings in the United States, Canada, South Africa, and Australia, which may help diversify across interest rate regimes.
| | | AVERAGE ANNUAL TOTAL RETURN FOR
THE PERIOD ENDED OCTOBER 31, 2015 | |
| | | Cumulative Inception to Date* | |
| | | Net Asset Value | | | Market Price | |
| Global X SuperDividend® REIT ETF | | | -8.86 | % | | | -8.59 | % |
| Solactive Global SuperDividend® REIT Index | | | -10.10 | % | | | -10.10 | % |
| S&P 500 | | | 1.14 | % | | | 1.14 | % |
Growth of a $10,000 Investment
(at Net Asset Value)
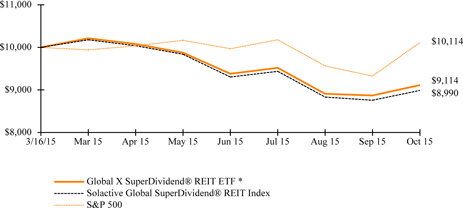
* The Fund commenced operations on March 16, 2015. Total return is for the period indicated and has not been annualized.
The S&P 500 Index is a market capitalization weighted composite index of 500 large capitalization U.S. companies.
Management Discussion of Fund Performance (unaudited)
Global X SuperDividend® REIT ETF
The performance data quoted herein represents past performance and the return and value of an investment in the Fund will fluctuate so that, when redeemed, it may be worth less than its original cost. Past performance is no guarantee of future performance and should not be considered as a representation of the future results of the Fund. The Fund's performance assumes the reinvestment of all dividends and all capital gains. Index returns assume reinvestment of dividends and, unlike a Fund's returns, do not reflect any fees or expenses. If such fees and expenses were included in the index returns, the performance would have been lower. Please note that one cannot invest directly in an unmanaged index.
There are no assurances that the Fund will meet its stated objectives.
The Fund’s holdings and allocations are subject to change and should not be considered recommendations to buy individual securities.
The graph and table do not reflect the deduction of taxes that a shareholder would pay on Fund distributions or the redemption or sale of Fund shares.
See definition of comparative indices on previous page.
Management Discussion of Fund Performance (unaudited)
Global X SuperIncome™ Preferred ETF
Global X SuperIncome™ Preferred ETF
The Global X SuperIncome™ Preferred ETF (“Fund”) seeks investment results that correspond generally to the price and yield performance, before fees and expenses, of the S&P Enhanced Yield North American Preferred Stock Index (“Underlying Index”).The Fund is passively managed, which means the investment adviser does not attempt to take defensive positions in declining markets. The Fund generally seeks to fully replicate the Underlying Index.
The Underlying Index tracks the performance of the highest dividend-yielding preferred securities in the United States and Canada, as determined by the index provider. The Underlying Index is comprised of preferred stocks that meet certain criteria relating to size, liquidity, issuer concentration and rating, maturity and other requirements, as determined by the index provider. The Underlying Index does not seek to directly reflect the performance of the companies issuing the preferred stock.
For the 12-month period ended October 31, 2015 (the “reporting period”), the Fund decreased 1.95%, while the Underlying Index decreased 0.60%. The Fund had a net asset value of $14.74 per share on October 31, 2014 and ended the reporting period with a net asset value of $13.49 on October 31, 2015.
During the reporting period, the highest returns came from Annaly Capital Management and Digital Realty Trust, which returned 60.08% and 58.94%, respectively. The worst performers were Southwestern Energy and ArcelorMittal, which returned -53.41% and -51.91%, respectively.
The Fund invests in certain of the highest dividend-yielding preferred shares in the United States and Canada. Preferred shares held by the Fund issued by companies in the Financials, Consumer Goods, Consumer Services, and Telecommunications sectors had positive total returns. Preferred shares held by the Fund issued by companies in the Energy and Materials sectors suffered from falling commodity prices, which led to declining credit quality and widening credit spreads.
| | | AVERAGE TOTAL RETURN FOR THE YEAR ENDED OCTOBER 31, 2015 | |
| | | One Year Return | | | Three Year Return | | | Annualized Inception to Date* | |
| | | Net Asset Value | | | Market Price | | | Net Asset Value | | | Market Price | | | Net Asset Value | | | Market Price | |
| Global X SuperIncome™ Preferred ETF | | | -1.95 | % | | | -2.35 | % | | | 3.27 | % | | | 3.23 | % | | | 3.83 | % | | | 4.35 | % |
| S&P Enhanced Yield North American Preferred Stock Index | | | -0.60 | % | | | -0.60 | % | | | 3.99 | % | | | 3.99 | % | | | 4.56 | % | | | 4.56 | % |
| S&P 500 Index | | | 5.20 | % | | | 5.20 | % | | | 16.20 | % | | | 16.20 | % | | | 16.35 | % | | | 16.35 | % |
Growth of a $10,000 Investment
(at Net Asset Value)
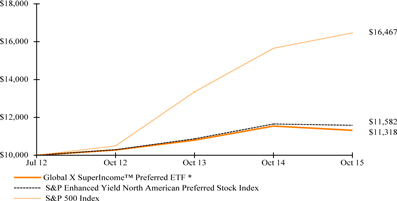
* Fund commenced operations on July 16, 2012.
The S&P 500 Index is a market capitalization weighted composite index of 500 large capitalization U.S. companies.
Management Discussion of Fund Performance (unaudited)
Global X SuperIncome™ Preferred ETF
The performance data quoted herein represents past performance and the return and value of an investment in the Fund will fluctuate so that, when redeemed, it may be worth less than its original cost. Past performance is no guarantee of future performance and should not be considered as a representation of the future results of the Fund. The Fund's performance assumes the reinvestment of all dividends and all capital gains. Index returns assume reinvestment of dividends and, unlike a Fund's returns, do not reflect any fees or expenses. If such fees and expenses were included in the index returns, the performance would have been lower. Please note that one cannot invest directly in an unmanaged index.
There are no assurances that the Fund will meet its stated objectives.
The Fund’s holdings and allocations are subject to change and should not be considered recommendations to buy individual securities.
The graph and table do not reflect the deduction of taxes that a shareholder would pay on Fund distributions or the redemption or sale of Fund shares.
See definition of comparative indices on previous page.
Management Discussion of Fund Performance (unaudited)
Global X Social Media Index ETF
Global X Social Media Index ETF
The Global X Social Media Index ETF (“Fund”) seeks to provide investment results that correspond generally to the price and yield performance, before fees and expenses, of the Solactive Social Media Total Return Index (“Underlying Index”). The Fund is passively managed, which means the investment adviser does not attempt to take defensive positions in declining markets. The Fund generally seeks to fully replicate the Underlying Index.
The Underlying Index tracks the equity performance of the largest and most liquid companies involved in the social media industry, including companies that provide social networking, file sharing, and other web-based media applications, as defined by the index provider.
For the 12-month period ended October 31, 2015 (the “reporting period”), the Fund increased 0.00%, while the Index increased 0.28%. The Fund had a net asset value of $19.30 per share on October 31, 2014 and ended the reporting period with a net asset value of $19.29 on October 31, 2015.
During the reporting period, the highest returns came from XING and NEXON, which returned 88.12% and 63.58%, respectively. The worst performers were Yelp, Cl A and Groupon, Cl A, which returned -62.92% and -49.25%, respectively.
The social media industry faced high growth expectations, but largely delivered with meaningful revenue expansion during the reporting period. Future growth expectations remain high as investors expect social media platforms to continue to attract new users and monetize their networks. In November 2014, the number of global internet users crossed 3 billion, which is nearly half the world's population, but social media has a global penetration of only 30%. As more people in emerging markets gain internet access, social networks will need to continue to attract these users and convert them into additional revenue.
| | | AVERAGE TOTAL RETURN FOR THE YEAR ENDED OCTOBER 31, 2015 | |
| | | One Year Return | | | Three Year Return | | | Annualized Inception to Date* | |
| | | Net Asset Value | | | Market Price | | | Net Asset Value | | | Market Price | | | Net Asset Value | | | Market Price | |
| Global X Social Media Index ETF | | | 0.00 | % | | | 0.00 | % | | | 14.91 | % | | | 15.03 | % | | | 6.93 | % | | | 6.74 | % |
| Solactive Social Media Total Return Index | | | 0.28 | % | | | 0.28 | % | | | 15.28 | % | | | 15.28 | % | | | 7.42 | % | | | 7.42 | % |
| S&P 500 Index | | | 5.20 | % | | | 5.20 | % | | | 16.20 | % | | | 16.20 | % | | | 16.10 | % | | | 16.10 | % |
Growth of a $10,000 Investment
(at Net Asset Value)
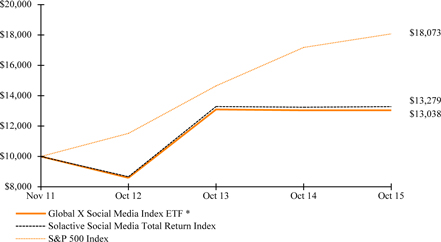
* The Fund commenced operations on November 14, 2011.
The S&P 500 Index is a market capitalization weighted composite index of 500 large capitalization U.S. companies.
Management Discussion of Fund Performance (unaudited)
Global X Social Media Index ETF
The performance data quoted herein represents past performance and the return and value of an investment in the Fund will fluctuate so that, when redeemed, it may be worth less than its original cost. Past performance is no guarantee of future performance and should not be considered as a representation of the future results of the Fund. The Fund's performance assumes the reinvestment of all dividends and all capital gains. Index returns assume reinvestment of dividends and, unlike a Fund's returns, do not reflect any fees or expenses. If such fees and expenses were included in the index returns, the performance would have been lower. Please note that one cannot invest directly in an unmanaged index.
There are no assurances that the Fund will meet its stated objectives.
The Fund’s holdings and allocations are subject to change and should not be considered recommendations to buy individual securities.
The graph and table do not reflect the deduction of taxes that a shareholder would pay on Fund distributions or the redemption or sale of Fund shares.
See definition of comparative indices on previous page.
Management Discussion of Fund Performance (unaudited)
Global X | JPMorgan Efficiente Index ETF
Global X | JPMorgan Efficiente Index ETF
The Global X | JPMorgan Efficiente Index ETF (“Fund”) seeks investment results that correspond generally to the price and yield performance, before fees and expenses, of the JPMorgan ETF Efficiente 10 TR Series X Index (“Underlying Index”). The Fund is passively managed, which means the investment adviser does not attempt to take defensive positions in declining markets. The Fund generally seeks to fully replicate the Underlying Index.
The Underlying Index tracks the total return performance of a portfolio of eleven exchange-traded funds (each, an "ETF") and two exchange-traded products (each an "ETP") (each ETP and ETF, a "Constituent" and together the "Constituents"), as defined by the index provider. The share prices of the ETFs and ETPs are expected to track the performance of equities or bonds in developed or emerging markets, real estate investments, U.S. Treasury bonds, U.S. Treasury Inflation Protected Securities, a single commodity or a portfolio of commodity futures contracts. The Underlying Index allocates index weights among the Constituents based on a proprietary methodology created by the index provider. On a monthly basis and subject to certain weighting constraints, the Underlying Index is rebalanced to reallocate index weights among the Constituents so that the resulting portfolio would have had the highest return during the previous six months and an annualized volatility level of 10% or less over the same period (subject to upward adjustment under limited circumstances). This methodology is informed by the “modern portfolio theory” approach to asset allocation, which suggests that an investor allocate assets in a manner that maximizes return for a given risk appetite. Since the index weights assigned to the Constituents at each monthly rebalancing are determined based on past performance, there is no guarantee that any monthly rebalancing will result in the Underlying Index achieving the highest possible returns for the relevant month.
For the 12-month period ended October 31, 2015 (the “reporting period”), the Fund decreased 6.37%, while the Underlying Index decreased 5.72%. The Fund had a net asset value of $25.49 per share on October 31, 2014 and ended the reporting period with a net asset value of $23.72 on October 31, 2015.
During the reporting period, the highest returns came from Vanguard REIT Index Fund and iShares iBoxx USD Investment Grade Corporate Bond ETF, which returned 3.23% and 1.51%, respectively. The worst performers were Vanguard FTSE Emerging Markets ETF and Vanguard Developed Markets Index Fund ETF, which returned -19.73% and -8.87%, respectively.
Over the reporting period, the Fund had an approximate average weighting of 37.1% in ETFs with exposure to developed market equities, 27.1% in ETFs with exposure to Bonds, 12.5% in ETFs with exposure to Emerging Markets, 10.8% in ETFs with exposure to Alternatives, and 12.5% in ETFs with exposure to Short Term US Treasuries or Inflation Protected Securities. The Fund allocated 50% of its exposure to an ETF accessing short term US Treasuries from August 2015 to October 2015.
Management Discussion of Fund Performance (unaudited)
Global X | JPMorgan Efficiente Index ETF
| | | AVERAGE TOTAL RETURN FOR THE YEAR ENDED OCTOBER 31, 2015 | |
| | | One Year Return | | | Annualized Inception to Date* | |
| | | Net Asset Value | | | Market Price | | | Net Asset Value | | | Market Price | |
| Global X | JPMorgan Efficiente Index ETF | | | -6.37 | % | | | -7.02 | % | | | -4.25 | % | | | -4.89 | % |
| JPMorgan ETF Efficiente 10 TR Series X Index | | | -5.72 | % | | | -5.72 | % | | | -3.56 | % | | | -3.56 | % |
| S&P 500 Index | | | 5.20 | % | | | 5.20 | % | | | 9.93 | % | | | 9.93 | % |
Growth of a $10,000 Investment
(at Net Asset Value)
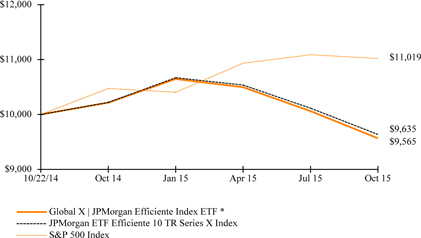
* The Fund commenced operations on October 22, 2014.
The S&P 500 Index is a market capitalization weighted composite index of 500 large capitalization U.S. companies.
The performance data quoted herein represents past performance and the return and value of an investment in the Fund will fluctuate so that, when redeemed, it may be worth less than its original cost. Past performance is no guarantee of future performance and should not be considered as a representation of the future results of the Fund. The Fund's performance assumes the reinvestment of all dividends and all capital gains. Index returns assume reinvestment of dividends and, unlike a Fund's returns, do not reflect any fees or expenses. If such fees and expenses were included in the index returns, the performance would have been lower. Please note that one cannot invest directly in an unmanaged index.
There are no assurances that the Fund will meet its stated objectives.
The Fund’s holdings and allocations are subject to change and should not be considered recommendations to buy individual securities.
The graph and table do not reflect the deduction of taxes that a shareholder would pay on Fund distributions or the redemption or sale of Fund shares.
See definition of comparative indices on previous page.
Management Discussion of Fund Performance (unaudited)
Global X | JPMorgan US Sector Rotator Index ETF
Global X | JPMorgan US Sector Rotator Index ETF
The Global X | JPMorgan US Sector Rotator Index ETF (“Fund”) seeks investment results that correspond generally to the price and yield performance, before fees and expenses, of the JPMorgan US Sector Rotator TR Series X Index (“Underlying Index”), which is composed of underlying equity exchange-traded funds ("ETFs") and a fixed income ETF. The Fund is passively managed, which means the investment adviser does not attempt to take defensive positions in declining markets. The Fund generally seeks to fully replicate the Underlying Index.
The Underlying Index aims to participate in the best-performing U.S. sectors of the market while limiting its exposure to the market during periods of high volatility or market declines, as defined by the index provider. The Underlying Index rebalances monthly to reflect changing market conditions by tracking the performance of a portfolio that may include a U.S. Treasury Bond ETF and zero to five ETFs selected out of a pool of ten U.S. sector ETFs. The sectors represented by the U.S. sector ETFs are: consumer discretionary, consumer staples, energy, financials, healthcare, industrial, utilities, materials, technology and real estate. On each monthly rebalancing date, the Underlying Index seeks to select up to five U.S. sector ETFs with the highest positive performance during the prior month. The Underlying Index will include an allocation to the U.S. Treasury Bond ETF if fewer than five U.S. sector ETFs have positive performance during the prior month. The U.S. sector ETFs selected for inclusion in the Underlying Index each month are equal-volatility weighted, based on each U.S. sector ETF’s realized volatility during the prior month, meaning that each U.S. sector ETF has the same amount of volatility contribution to the Underlying Index as of such monthly rebalancing date. If the overall realized volatility of the portfolio of selected U.S. sector ETFs exceeds 20%, based on each U.S. sector ETF’s realized volatility during the prior month, the weight assigned on a monthly rebalancing date to each U.S. sector ETF is adjusted down proportionally and the exposure is re-allocated to the U.S. Treasury Bond ETF in order to reduce the overall volatility of the Underlying Index to 20% as of such monthly rebalancing date. Since the index weights assigned to the U.S. Sector ETF and the U.S. Treasury Bond ETF are determined on past performance, there is no guarantee that any monthly rebalancing will result in the Underlying Index achieving the highest possible returns for the relevant month.
For the 12-month period ended October 31, 2015 (the “reporting period”), the Fund decreased 6.90%, while the Underlying Index decreased 6.07%. The Fund had a net asset value of $25.41 per share on October 31, 2014 and ended the reporting period with a net asset value of $23.55 on October 31, 2015.
During the reporting period, the highest returns came from Health Care Select Sector SPDR Fund and Consumer Staples Select Sector SPDR Fund, which returned 6.32% and 0.52%, respectively. The worst performers were Financial Select Sector SPDR Fund and Technology Select Sector SPDR Fund, which returned -12.71% and -7.74%, respectively.
Over the reporting period, the Fund had an approximate average weighting of 25% to ETFs with exposure to short term US Treasuries, 11.9% to ETFs with exposure to Consumer Discretionary stocks, and 10.9% exposure to ETFs with exposure to real estate investment trusts. From July 2015 to Octobter 2015, the Fund became very defensive, with an approximate average exposure of 60% to ETFs accessing short term US Treasuries, as US market volatility increased and many individual sector ETFs produced negative returns.
Management Discussion of Fund Performance (unaudited)
Global X | JPMorgan US Sector Rotator Index ETF
| | | AVERAGE TOTAL RETURN FOR THE YEAR ENDED OCTOBER 31, 2015 | |
| | | One Year Return | | | Annualized Inception to Date* | |
| | | Net Asset Value | | | Market Price | | | Net Asset Value | | | Market Price | |
| Global X | JPMorgan US Sector Rotator Index ETF | | | -6.90 | % | | | -6.86 | % | | | -5.36 | % | | | -5.74 | % |
| JPMorgan US Sector Rotator TR Series X Index | | | -6.07 | % | | | -6.07 | % | | | -4.47 | % | | | -4.47 | % |
| S&P 500 Index | | | 5.20 | % | | | 5.20 | % | | | 9.93 | % | | | 9.93 | % |
Growth of a $10,000 Investment
(at Net Asset Value)
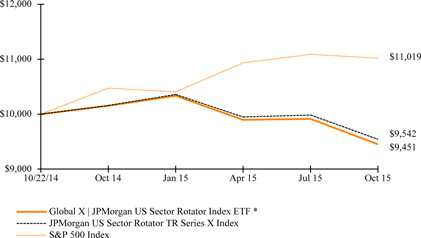
* The Fund commenced operations on October 22, 2014.
The S&P 500 Index is a market capitalization weighted composite index of 500 large capitalization U.S. companies.
The performance data quoted herein represents past performance and the return and value of an investment in the Fund will fluctuate so that, when redeemed, it may be worth less than its original cost. Past performance is no guarantee of future performance and should not be considered as a representation of the future results of the Fund. The Fund's performance assumes the reinvestment of all dividends and all capital gains. Index returns assume reinvestment of dividends and, unlike a Fund's returns, do not reflect any fees or expenses. If such fees and expenses were included in the index returns, the performance would have been lower. Please note that one cannot invest directly in an unmanaged index.
There are no assurances that the Fund will meet its stated objectives.
The Fund’s holdings and allocations are subject to change and should not be considered recommendations to buy individual securities.
The graph and table do not reflect the deduction of taxes that a shareholder would pay on Fund distributions or the redemption or sale of Fund shares.
See definition of comparative indices on previous page.
Management Discussion of Fund Performance (unaudited)
Global X Permanent ETF
Global X Permanent ETF
The Global X Permanent ETF (“Fund”) seeks to provide investment results that correspond generally to the price and yield performance, before fees and expenses, of the Solactive Permanent Index (“Underlying Index”). The Fund is passively managed, which means the investment adviser does not attempt to take defensive positions in declining markets. The Fund utilizes a "sampling" methodology to seek to achieve its investment objective.
The Underlying Index tracks the performance of four asset class categories that are designed to perform differently across different economic environments, as defined by the index provider. On each rebalance, the Underlying Index allocates 25% each to four asset class categories, as follows: stocks, U.S. Treasury Bonds (long- term), U.S. Treasury Bills and Bonds (short-term), and gold and silver.
For the 12-month period ended October 31, 2015 (the “reporting period”), the Fund increased 0.25%, while the Underlying Index increased 0.11%. The Fund had a net asset value of $24.11 per share on October 31, 2014 and ended the reporting period with a net asset value of $23.94 on October 31, 2015.
During the reporting period, the highest returns came from Amazon.com and Facebook, Cl A, which returned 104.90% and 35.98%, respectively. The worst performers were Glencore Xstrata and Potash Corp of Saskatchewan, which returned -63.96% and -40.80%, respectively.
The Fund seeks to provide generally equal exposure to equities, short term treasuries, long term treasuries, and precious metals. Over the reporting period, the Fund's exposures across asset classes with low correlations to each other resulted in an annualized volatility of approximately 8.8%.
| | | AVERAGE TOTAL RETURN FOR THE YEAR ENDED OCTOBER 31, 2015 | |
| | | One Year Return | | | Three Year Return | | | Annualized Inception to Date* | |
| | | Net Asset Value | | | Market Price | | | Net Asset Value | | | Market Price | | | Net Asset Value | | | Market Price | |
| Global X Permanent Index ETF | | | 0.25 | % | | | 0.66 | % | | | -0.94 | % | | | -0.88 | % | | | -0.22 | % | | | -0.07 | % |
| Solactive Permanent Index | | | 0.11 | % | | | 0.11 | % | | | -0.82 | % | | | -0.82 | % | | | -0.04 | % | | | -0.04 | % |
| S&P 500 Index | | | 5.20 | % | | | 5.20 | % | | | 16.20 | % | | | 16.20 | % | | | 14.76 | % | | | 14.76 | % |
Growth of a $10,000 Investment
(at Net Asset Value)
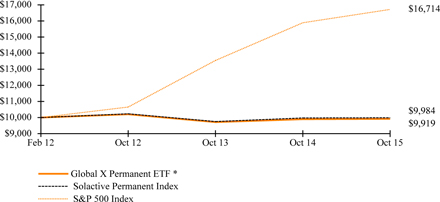
* The Fund commenced operations on February 7, 2012.
The S&P 500 Index is a market capitalization weighted composite index of 500 large capitalization U.S. companies.
The performance data quoted herein represents past performance and the return and value of an investment in the Fund will fluctuate so that, when redeemed, it may be worth less than its original cost. Past performance is no guarantee of future performance and should not be considered as a representation of the future results of the Fund. The Fund's performance assumes the reinvestment of all dividends and all capital gains. Index returns assume reinvestment of dividends and, unlike a Fund's returns, do not reflect any fees or expenses. If such fees and expenses were included in the index returns, the performance would have been lower. Please note that one cannot invest directly in an unmanaged index.
There are no assurances that the Fund will meet its stated objectives.
Management Discussion of Fund Performance (unaudited)
Global X Permanent ETF
The Fund’s holdings and allocations are subject to change and should not be considered recommendations to buy individual securities.
The graph and table do not reflect the deduction of taxes that a shareholder would pay on Fund distributions or the redemption or sale of Fund shares.
See definition of comparative indices on previous page.
Management Discussion of Fund Performance (unaudited)
Global X Guru™ Index ETF
Global X Guru™ Index ETF
The Global X Guru™ Index ETF (“Fund”) seeks investment results that correspond generally to the price and yield performance, before fees and expenses, of the Solactive Guru Index (“Underlying Index”).The Fund is passively managed, which means the investment adviser does not attempt to take defensive positions in declining markets. The Fund generally seeks to fully replicate the Underlying Index.
The Underlying Index is comprised of the top U.S. listed equity positions reported on Form 13F by a select group of entities characterized as hedge funds, as defined by the index provider. Hedge funds are selected from a pool of thousands of privately offered pooled investment vehicles based on the size of their reported equity holdings and the efficacy of replicating their publicly disclosed positions. Hedge funds must have minimum reported holdings of $500 million in their Form 13F to be considered for the Underlying Index. Additional filters are applied to eliminate hedge funds that have high turnover rates for equity holdings. Only hedge funds with a concentrated top holding are included in the selection process. Once the hedge fund pool has been determined, the Index Provider utilizes Form 13F filings to compile the top stock holding from each of these hedge funds. The stocks are screened for liquidity, equal weighted, and rebalanced quarterly following the Form 13F filing timeline.
For the 12-month period ended October 31, 2015 (the “reporting period”), the Fund decreased 7.94%, while the Underlying Index decreased 7.60%. The Fund had a net asset value of $26.30 per share on October 31, 2014 and ended the reporting period with a net asset value of $23.96 on October 31, 2015.
During the reporting period, the highest returns came from CDW and NIKE, Cl B, which returned 45.98% and 42.5%, respectively. The worst performers were Arbutus Biopharma and Horizon Pharma, which returned -51.24% and -50.75%, respectively.
The Fund invests in many of the top U.S. listed equity positions reported on Form 13F by major hedge funds. Over the course of the reporting period, the underperformance of hedge fund picks in the Health Care industry (more specifically the Pharamceuticals industry) weighed heavily on the Fund's performance. Stocks held by the Fund in the Pharamceuticals industry were down approximately 25%, with the majority of losses occurring during October 2015. Pharmaceuticals had an average weight of 8.2% over the course of the reporting period. The Energy sector also contributed negatively to the fund's returns, as stocks held from that sector fell nearly 27.3% and had an average weight of 5.5% in the fund.
| | | AVERAGE TOTAL RETURN FOR THE YEAR ENDED OCTOBER 31, 2015 | |
| | | One Year Return | | | Three Year Return | | | Annualized Inception to Date* | |
| | | Net Asset Value | | | Market Price | | | Net Asset Value | | | Market Price | | | Net Asset Value | | | Market Price | |
| Global X Guru™ Index ETF | | | -7.94 | % | | | -7.95 | % | | | 14.20 | % | | | 14.21 | % | | | 17.11 | % | | | 17.10 | % |
| Solactive Guru Index | | | -7.60 | % | | | -7.60 | % | | | 14.86 | % | | | 14.86 | % | | | 17.76 | % | | | 17.76 | % |
| S&P 500 Index | | | 5.20 | % | | | 5.20 | % | | | 16.20 | % | | | 16.20 | % | | | 17.81 | % | | | 17.81 | % |
Growth of a $10,000 Investment
(at Net Asset Value)

* The Fund commenced operations on June 4, 2012.
The S&P 500 Index is a market capitalization weighted composite index of 500 large capitalization U.S. companies.
Management Discussion of Fund Performance (unaudited)
Global X Guru™ Index ETF
The performance data quoted herein represents past performance and the return and value of an investment in the Fund will fluctuate so that, when redeemed, it may be worth less than its original cost. Past performance is no guarantee of future performance and should not be considered as a representation of the future results of the Fund. The Fund's performance assumes the reinvestment of all dividends and all capital gains. Index returns assume reinvestment of dividends and, unlike a Fund's returns, do not reflect any fees or expenses. If such fees and expenses were included in the index returns, the performance would have been lower. Please note that one cannot invest directly in an unmanaged index.
There are no assurances that the Fund will meet its stated objectives.
The Fund’s holdings and allocations are subject to change and should not be considered recommendations to buy individual securities.
The graph and table do not reflect the deduction of taxes that a shareholder would pay on Fund distributions or the redemption or sale of Fund shares.
See definition of comparative Indices on the previous page.
Management Discussion of Fund Performance (unaudited)
Global X Guru™ Activist Index ETF
Global X Guru™ Activist Index ETF
The Global X Guru™ Activist Index ETF ("Fund") seeks investment results that correspond generally to the price and yield performance, before fees and expenses, of the Solactive Guru Activist Index ("Underlying Index'').The Fund is passively managed, which means the investment adviser does not attempt to take defensive positions in declining markets. The Fund generally seeks to fully replicate the Underlying Index.
The Underlying Index is comprised of US listed equity positions reported on Form 13F and Schedule 13D by a select group of entities characterized as premier activist investors, as defined by the index provider. Activist investors are defined by the index provider as investors that aim to buy securities to put public pressure on management to increase shareholder value. Once the pool of activist investors has been determined, the index provider utilizes Form13F filings and Schedule 13D filings to compile the top 50 aggregate stock holdings held by the pool of activist investors, after screening for certain liquidity and market capitalization requirements. The stocks are equal weighted and rebalanced quarterly following the Form 13F filing timeline. On a monthly basis, securities may be added to or removed from the Underlying Index as a result of Schedule 13D filings.
For the period from the Fund's commencement date on April 28, 2015 through October 31, 2015 (the “reporting period”), the Fund decreased 10.83%, while the Underlying Index decreased 10.70%. The Fund had a net asset value of $15.05 per share on April 28, 2015 and ended the reporting period with a net asset value of $13.42 on October 31, 2015.
During the reporting period, the highest returns came from Mondelez International, Cl A and Time Warner, which returned 20.20% and 19.53%, respectively. The worst performers were SunEdison, Inc. and Platform Specialty Products Corp. which, returned -67.47% and -60.30%, respectively.
The Fund invests in certain U.S. listed equity positions held by activist investors. Activist investors seek to unlock unrealized value for shareholders by effecting major changes in target companies. Traditionally, an activist investor will purchase a large number of shares in a company with the objective of accumulating enough voting power to swing company proxy votes. Through these proxy votes, an activist investor will seek to obtain seats on a company’s board of directors, allowing for considerable influence over the company’s strategy, governance, and policies. More recently, activist investors have incorporated highly public campaigns into their strategies via appearances on TV news outlets and social media to galvanize other investors to their cause and to increase pressure on the company’s senior management and board. The Fund's exposures to energy and materials stocks weighed negatively on returns while its exposure to consumer staples was a positive.
Management Discussion of Fund Performance (unaudited)
Global X Guru™ Activist Index ETF
| | | AVERAGE TOTAL RETURN FOR THE
PERIOD ENDED OCTOBER 31, 2015 | |
| | | Cumulative Inception to Date* | |
| | | Net Asset Value | | | Market Price | |
| Global X Guru™ Activist Index ETF | | | -10.83 | % | | | -10.90 | % |
| Solactive Guru Activist Index | | | -10.70 | % | | | -10.70 | % |
| S&P 500 | | | -0.61 | % | | | -0.61 | % |
Growth of a $10,000 Investment
(at Net Asset Value)
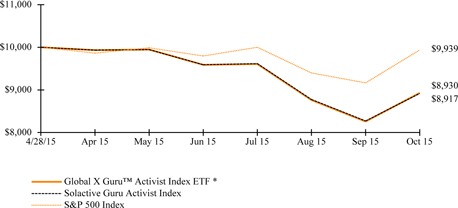
* The Fund commenced operations on April 28, 2015. Total return is for the period indicated and has not been annualized.
The S&P 500 Index is a market capitalization weighted composite index of 500 large capitalization U.S. companies.
The performance data quoted herein represents past performance and the return and value of an investment in the Fund will fluctuate so that, when redeemed, it may be worth less than its original cost. Past performance is no guarantee of future performance and should not be considered as a representation of the future results of the Fund. The Fund's performance assumes the reinvestment of all dividends and all capital gains. Index returns assume reinvestment of dividends and, unlike a Fund's returns, do not reflect any fees or expenses. If such fees and expenses were included in the index returns, the performance would have been lower. Please note that one cannot invest directly in an unmanaged index.
There are no assurances that the Fund will meet its stated objectives.
The Fund’s holdings and allocations are subject to change and should not be considered recommendations to buy individual securities.
The graph and table do not reflect the deduction of taxes that a shareholder would pay on Fund distributions or the redemption or sale of Fund shares.
See definition of comparative Indices on the previous page.
Management Discussion of Fund Performance (unaudited)
Global X Guru™ International Index ETF
Global X Guru™ International Index ETF
The Global X Guru™ International Index ETF (“Fund”) seeks investment results that correspond generally to the price and yield performance, before fees and expenses, of the Solactive Guru International Index (“Underlying Index”).The Fund is passively managed, which means the investment adviser does not attempt to take defensive positions in declining markets. The Fund generally seeks to fully replicate the Underlying Index.
The Underlying Index is comprised of international companies reported on Form 13F by hedge funds and other institutional investors, as defined by the index provider. Hedge funds are selected from a pool of thousands of privately offered pooled investment vehicles based on the size of their reported equity holdings and the efficacy of replicating their publicly disclosed positions. Institutional investors are selected based on the qualitative factor of whether they have a strong management team with a track record of creating shareholder value. Additional filters are applied to exclude the holdings of hedge funds and institutional investors that report less than $500 million in holdings on their Form 13F or that have high turnover rates for equity holdings, as defined by the index provider. Once the pool of investors has been determined, the index provider utilizes Form 13F filings to compile 50 stocks that represent the top international positions from these investors. The stocks must meet minimum size and liquidity thresholds to be included in the Underlying Index. Stocks in the Underlying Index are equal weighted and rebalanced quarterly following the Form 13F filing timeline.
For the 12-month period ended October 31, 2015 (the “reporting period”), the Fund decreased 15.31%, while the Underlying Index decreased 14.69%. The Fund had a net asset value of $15.62 per share on October 31, 2014 and ended the reporting period with a net asset value of $13.13 on October 31, 2015.
During the reporting period, the highest returns came from Ctrip.com International ADR and Talisman Energy, Inc. which returned 126.37% and 70.08%, respectively. The worst performers were Altisource Portfolio Solutions SA and Arbutus Biopharma, which returned -64.08% and -59.66%, respectively.
The Fund invests in international stocks reported on Form 13F by hedge funds and other institutional investors. During the reporting period, the Fund had a 10% average weighting to China, which contributed positively to the Fund's performance, while a 10% average weighting to Brazil weighed on the Fund's performance.
Management Discussion of Fund Performance (unaudited)
Global X Guru™ International Index ETF
| | | AVERAGE TOTAL RETURN FOR THE YEAR ENDED OCTOBER 31, 2015 | |
| | | One Year Return | | | Annualized Inception to Date* | |
| | | Net Asset Value | | | Market Price | | | Net Asset Value | | | Market Price | |
| Global X Guru™ International Index ETF | | | -15.31 | % | | | -15.31 | % | | | -6.73 | % | | | -6.73 | % |
| Solactive Guru International Index | | | -14.69 | % | | | -14.69 | % | | | -6.00 | % | | | -6.00 | % |
| S&P 500 Index | | | 5.20 | % | | | 5.20 | % | | | 8.58 | % | | | 8.58 | % |
Growth of a $10,000 Investment
(at Net Asset Value)

* The Fund commenced operations on March 10, 2014.
The S&P 500 Index is a market capitalization weighted composite index of 500 large capitalization U.S. companies.
The performance data quoted herein represents past performance and the return and value of an investment in the Fund will fluctuate so that, when redeemed, it may be worth less than its original cost. Past performance is no guarantee of future performance and should not be considered as a representation of the future results of the Fund. The Fund's performance assumes the reinvestment of all dividends and all capital gains. Index returns assume reinvestment of dividends and, unlike a Fund's returns, do not reflect any fees or expenses. If such fees and expenses were included in the index returns, the performance would have been lower. Please note that one cannot invest directly in an unmanaged index.
There are no assurances that the Fund will meet its stated objectives.
The Fund’s holdings and allocations are subject to change and should not be considered recommendations to buy individual securities.
The graph and table do not reflect the deduction of taxes that a shareholder would pay on Fund distributions or the redemption or sale of Fund shares.
See definition of comparative indices on previous page.
Management Discussion of Fund Performance (unaudited)
Global X GF China Bond ETF
Global X GF China Bond ETF
The Global X GF China Bond ETF (“Fund”) seeks to provide investment results that correspond generally to the price and yield performance, before fees and expenses, of the S&P China Composite Select Bond Index (“Underlying Index”). The Fund is passively managed, which means the investment adviser does not attempt to take defensive positions in declining markets. The Fund utilizes a "sampling" methodology to seek to acheive its investment objective.
The Underlying Index is designed to provide exposure to RMB-denominated bonds that are issued or distributed within mainland China. The Underlying Index, strictly in accordance with its guidelines and mandated procedures, includes securities with a minimum maturity of one year and with an outstanding principal amount of RMB 1 billion. The Underlying Index is composed of RMB denominated bonds issued by governments, agencies, and Central State-Owned Enterprises (CSOEs). The Fund seeks to achieve its investment objective by primarily investing directly in Chinese bonds issued or distributed in the PRC. Because the Fund does not satisfy the criteria to qualify as a Renminbi Qualified Foreign Institutional Investor ("RQFII") or Qualified Foreign Institutional Investor ("QFII") itself, the Fund invests directly in RMB-denominated bonds via the RQFII quota of the Fund’s sub-adviser, GF International Investment Management Limited ("GFIIM" or “Sub-Adviser”). The Sub-Adviser has obtained RQFII status and has been granted an RQFII quota of at least 500 Million RMB (“RQFII quota”), which the Sub-Adviser will use all or a portion of to invest the portion of the Fund’s assets allocated to it by the Adviser in RMB-denominated bonds. At such time that the Sub-Adviser has utilized its entire RQFII quota, the Sub-Adviser may, subject to applicable regulations, apply for an increase of the RQFII quota. Assets not allocated to the Sub-Adviser for investment directly in RMB-denominated bonds are managed by the adviser.
For the period from the Fund's commencement date on November 18, 2014 through October 31, 2015 (the “reporting period”), the Fund increased 1.67%, while the Underlying Index increased 2.64%. The Fund had a net asset value of $38.00 per share on November 18, 2014 and ended the reporting period with a net asset value of $37.56 on October 31, 2015.
During the reporting period, the highest returns came from Export Import Bank China and China North Industries Group, which returned 8.65% and 4.78%, respectively. The worst performers were China Development Bank and China Government Bond, which returned -30.42% and -8.34%, respectively.
In the third quarter of 2015, China's gross domestic product grew by 6.9%, its slowest rate since the global economic crisis. The Chinese government has implemented a series of economic stimulus measures to maintain high economic growth rates, such as devaluing the currency, lowering interest rates, and easing bank reserve requirements. These measures have had a mixed impact on the Fund. Devaluation of the yuan versus the dollar resulted in negative price returns for investors, but interest rate cuts have boosted price returns of the underlying bonds. The International Monetary Fund announced that it will be adding the yuan to its special drawing rights (SDR) basket, effectively making the yuan a global reserve currency, which could result in more purchasing of yuan-denominated assets such as Chinese onshore bonds.
Management Discussion of Fund Performance (unaudited)
Global X GF China Bond ETF
| | | AVERAGE TOTAL RETURN FOR THE
PERIOD ENDED OCTOBER 31, 2015 | |
| | | Cumulative Inception to Date* | |
| | | Net Asset Value | | | Market Price | |
| Global X GF China Bond ETF | | | 1.67 | % | | | 1.37 | % |
| S&P China Composite Select Bond Index | | | 2.64 | % | | | 2.64 | % |
| S&P 500 Index | | | 3.30 | % | | | 3.30 | % |
Growth of a $10,000 Investment
(at Net Asset Value)
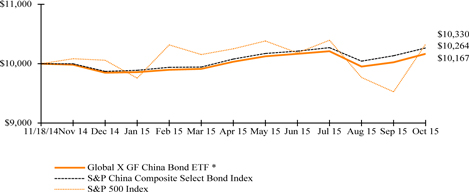
* Fund commenced operations on November 18, 2014. Total return is for the period indicated and has not been annualized.
The S&P 500 Index is a market capitalization weighted composite index of 500 large capitalization U.S. companies.
The performance data quoted herein represents past performance and the return and value of an investment in the Fund will fluctuate so that, when redeemed, it may be worth less than its original cost. Past performance is no guarantee of future performance and should not be considered as a representation of the future results of the Fund. The Fund's performance assumes the reinvestment of all dividends and all capital gains. The Fund’s performance reflects contractual fee waivers in effect until at least March 1, 2016. Absent these waivers performance would be lower. Index returns assume reinvestment of dividends and, unlike a Fund's returns, do not reflect any fees or expenses. If such fees and expenses were included in the index returns, the performance would have been lower. Please note that one cannot invest directly in an unmanaged index.
There are no assurances that the Fund will meet its stated objectives.
The Fund’s holdings and allocations are subject to change and should not be considered recommendations to buy individual securities.
The graph and table do not reflect the deduction of taxes that a shareholder would pay on Fund distributions or the redemption or sale of Fund shares.
See definition of comparative indices on previous page.
Management Discussion of Fund Performance (unaudited)
Global X Scientific Beta US ETF
Global X Scientific Beta US ETF
The Global X Scientific Beta US ETF (“Fund”) seeks investment results that correspond generally to the price and yield performance, before fees and expenses, of the Scientific Beta United States Multi-Beta Multi-Strategy Equal Risk Contribution Index (“Underlying Index”). The Fund is passively managed, which means the investment adviser does not attempt to take defensive positions in declining markets. The Fund generally seeks to fully replicate the Underlying Index.
The Underlying Index generally comprises approximately 500 or less U.S. listed common stocks selected based on a proprietary methodology developed by the index provider. The objective of the Underlying Index is to outperform traditional market capitalization-weighted indexes, with lower volatility. The Underlying Index’s components are selected by applying four factors that have been widely recognized by academic literature to outperform market capitalization weighted-indexes over the long run: Value, Size, Low-Volatility and Momentum. Each of these factors is applied by using the following metrics: price-to-book ratio for Value; free-float market capitalization for Size; historical volatility over the trailing 104 week period for Low-Volatility; and one-year-minus-one-month total returns for Momentum. Finally, components are weighted by employing a proprietary, multi-step process that combines multiple weighting methodologies to diversify the risks associated with any one weighting scheme.
For the period from the Fund's commencement date on May 12, 2015 through October, 31 2015 (the “reporting period”), the Fund decreased 0.92%, while the Underlying Index decreased 0.79%. The Fund had a net asset value of $24.90 per share on May 12, 2015 and ended the reporting period with a net asset value of $24.67 on October 31, 2015.
During the reporting period, the highest returns came from Amazon.com and Activision Blizzard, which returned 40.34% and 38.1%, respectively. The worst performers were Keurig Green Mountain and Southwestern Energy, which returned -50.33% and -49.57%, respectively.
Over the reporting period, the Fund had a 20.4% weighting to stocks in the Financials sector, with other large exposures of 14.6% to the Technology sector, 13.6% to the Consumer Services sector, and 13.1% to the Consumer Goods sector and 13.1% to the Health Care sector. The Fund had an approximate average exposure of 20% to Low Volatility stocks, 24% to Mid Cap stocks, 29% to Value stocks, and 27% to Momentum stocks, as defined by the index provider.
Management Discussion of Fund Performance (unaudited)
Global X Scientific Beta US ETF
| | | AVERAGE TOTAL RETURN FOR THE
PERIOD ENDED OCTOBER 31, 2015 | |
| | | Cumulative Inception to Date* | |
| | | Net Asset Value | | | Market Price | |
| Global X Scientific Beta US ETF | | | -0.92 | % | | | -0.88 | % |
| Scientific Beta US Multi-Beta Multi-Strategy Equal Risk Contribution Index | | | -0.79 | % | | | -0.79 | % |
| S&P 500 Index | | | 0.02 | % | | | 0.02 | % |
Growth of a $10,000 Investment
(at Net Asset Value)
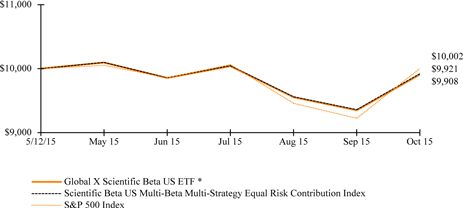
* Fund commenced operations on May 12, 2015. Total return is for the period indicated and has not been annualized.
The S&P 500 Index is a market capitalization weighted composite index of 500 large capitalization U.S. companies.
The performance data quoted herein represents past performance and the return and value of an investment in the Fund will fluctuate so that, when redeemed, it may be worth less than its original cost. Past performance is no guarantee of future performance and should not be considered as a representation of the future results of the Fund. The Fund's performance assumes the reinvestment of all dividends and all capital gains. Index returns assume reinvestment of dividends and, unlike a Fund's returns, do not reflect any fees or expenses. If such fees and expenses were included in the index returns, the performance would have been lower. Please note that one cannot invest directly in an unmanaged index.
There are no assurances that the Fund will meet its stated objectives.
The Fund’s holdings and allocations are subject to change and should not be considered recommendations to buy individual securities.
The graph and table do not reflect the deduction of taxes that a shareholder would pay on Fund distributions or the redemption or sale of Fund shares.
See definition of comparative indices on previous page.
Management Discussion of Fund Performance (unaudited)
Global X Scientific Beta Europe ETF
Global X Scientific Beta Europe ETF
The Global X Scientific Beta Europe ETF (“Fund”) seeks investment results that correspond generally to the price and yield performance, before fees and expenses, of the Scientific Beta Extended Developed Europe Multi-Beta Multi-Strategy Equal Risk Contribution Index (“Underlying Index”). The Fund is passively managed, which means the investment adviser does not attempt to take defensive positions in declining markets. The Fund generally seeks to fully replicate the Underlying Index.
The Underlying Index generally comprises approximately 600 or less European-listed common stocks selected based on a proprietary methodology developed by the index provider. The objective of the Underlying Index is to outperform traditional market capitalization-weighted indexes, with lower volatility. The components of the Underlying Index are selected from a universe of the 600 largest, as measured by free float market capitalization, and most liquid stocks that are ordinarily traded principally on a stock exchange in one of the following 16 developed European countries: Austria, Belgium, Denmark, Finland, France, Germany, Greece, Ireland, Italy, Netherlands, Norway, Portugal, Spain, Sweden, Switzerland and the United Kingdom. The Underlying Index’s components are selected by applying four factors that have been widely recognized by academic literature to outperform market capitalization weighted-indexes over the long run: Value, Size, Low-Volatility and Momentum. Each of these factors is applied by using the following metrics: price-to-book ratio for Value; free-float market capitalization for Size; historical volatility over the trailing 104 week period for Low-Volatility; and one-year-minus-one-month total returns for Momentum. Finally, components are weighted by employing a proprietary, multi-step process that combines multiple weighting methodologies to diversify the risks associated with any one weighting scheme.
For the period from the Fund's commencement date on May 12, 2015 through October, 31 2015 (the “reporting period”), the Fund decreased 1.93%, while the Underlying Index decreased 1.75%. The Fund had a net asset value of $24.89 per share on May 12, 2015 and ended the reporting period with a net asset value of $24.41 on October 31, 2015.
During the reporting period, the highest returns came from Vonovia and Galenica, which returned 66.01% and 65.86%, respectively. The worst performers were AdStar, Inc. and Deutsche Wohnen, which returned -93.75% and -78.34%, respectively.
Over the reporting period, the Fund had a 27% weighting to stocks in the Financials sector, with other large exposures of 17.9% to the Industrials sector, 12.3% to the Consumer Services sector and 12.1% to the Consumer Goods sector. The Fund had an approximate average exposure of 34% to Low Volatility stocks, 18% to Mid Cap stocks, 28% to Value stocks, and 20% to Momentum stocks, as defined by the index provider.
Management Discussion of Fund Performance (unaudited)
Global X Scientific Beta Europe ETF
| | | AVERAGE TOTAL RETURN FOR THE
PERIOD ENDED OCTOBER 31, 2015 | |
| | | Cumulative Inception to Date* | |
| | | Net Asset Value | | | Market Price | |
| Global X Scientific Beta Europe ETF | | | -1.93 | % | | | -2.13 | % |
| Scientific Beta Extended Developed Europe Multi-Beta Multi-Strategy Equal Risk Contribution Index | | | -1.75 | % | | | -1.75 | % |
| S&P 500 Index | | | 0.02 | % | | | 0.02 | % |
Growth of a $10,000 Investment
(at Net Asset Value)
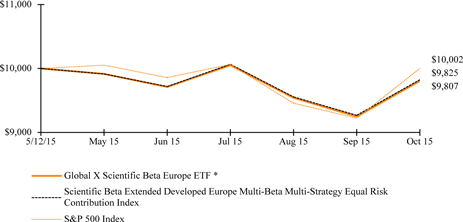
* Fund commenced operations on May 12, 2015. Total return is for the period indicated and has not been annualized.
The S&P 500 Index is a market capitalization weighted composite index of 500 large capitalization U.S. companies.
The performance data quoted herein represents past performance and the return and value of an investment in the Fund will fluctuate so that, when redeemed, it may be worth less than its original cost. Past performance is no guarantee of future performance and should not be considered as a representation of the future results of the Fund. The Fund's performance assumes the reinvestment of all dividends and all capital gains. Index returns assume reinvestment of dividends and, unlike a Fund's returns, do not reflect any fees or expenses. If such fees and expenses were included in the index returns, the performance would have been lower. Please note that one cannot invest directly in an unmanaged index.
There are no assurances that the Fund will meet its stated objectives.
The Fund’s holdings and allocations are subject to change and should not be considered recommendations to buy individual securities.
The graph and table do not reflect the deduction of taxes that a shareholder would pay on Fund distributions or the redemption or sale of Fund shares.
See definition of comparative Indices on previous page.
Management Discussion of Fund Performance (unaudited)
Global X Scientific Beta Japan ETF
Global X Scientific Beta Japan ETF
The Global X Scientific Beta Japan ETF (“Fund”) seeks investment results that correspond generally to the price and yield performance, before fees and expenses, of the Scientific Beta Japan Multi-Beta Multi-Strategy Equal Risk Contribution Index (“Underlying Index”). The Fund is passively managed, which means the investment adviser does not attempt to take defensive positions in declining markets. The Fund generally seeks to fully replicate the Underlying Index.
The Underlying Index generally comprises approximately 500 or less Japanese-listed common stocks selected based on a proprietary methodology developed by the index provider. The objective of the Underlying Index is to outperform traditional market capitalization-weighted indexes, with lower volatility The components of the Underlying Index are selected from a universe of the 500 largest, as measured by free float market capitalization, and most liquid stocks traded principally on a stock exchange in and incorporated or domiciled (i.e., maintain a principal place of business) in Japan. The Underlying Index’s components are selected by applying four factors that have been widely recognized by academic literature to outperform market capitalization weighted-indexes over the long run: Value, Size, Low-Volatility and Momentum. Each of these factors is applied by using the following metrics: price-to-book ratio for Value; free-float market capitalization for Size; historical volatility over the trailing 104 week period for Low-Volatility; and one-year-minus-one-month total returns for Momentum. Finally, components are weighted by employing a proprietary, multi-step process that combines multiple weighting methodologies to diversify the risks associated with any one weighting scheme.
For the period from the Fund's commencement date on May 12, 2015 through October, 31 2015 (the “reporting period”), the Fund increased 0.48%, while the Underlying Index increased 0.65%. The Fund had a net asset value of $25.07 per share on May 12, 2015 and ended the reporting period with a net asset value of $25.19 on October 31, 2015.
During the reporting period, the highest returns came from ACOM and KOSÉ, which returned 69.53% and 60.09%, respectively. The worst performers were IHI and Topcon, which returned -38.31% and -36.97%, respectively.
Over the reporting period, the Fund had a 19.8% weighting to stocks in the Industrials sector, with other large exposures of 16.5% to the Financials sector, 18.1% to the Consumer Goods sector and 16.5% to the Consumer Services sector. The Fund had an approximate average exposure of 19% to Low Volatility stocks, 22% to Mid Cap stocks, 34% to Value stocks, and 25% to Momentum stocks, as defined by the index provider.
Management Discussion of Fund Performance (unaudited)
Global X Scientific Beta Japan ETF
| | | AVERAGE TOTAL RETURN FOR THE
PERIOD ENDED OCTOBER 31, 2015 | |
| | | Cumulative Inception to Date* | |
| | | Net Asset Value | | | Market Price | |
| Global X Scientific Beta Japan ETF | | | 0.48 | % | | | -0.28 | % |
| Scientific Beta Japan Multi-Beta Multi-Strategy Equal Risk Contribution Index | | | 0.65 | % | | | 0.65 | % |
| S&P 500 Index | | | 0.02 | % | | | 0.02 | % |
Growth of a $10,000 Investment
(at Net Asset Value)
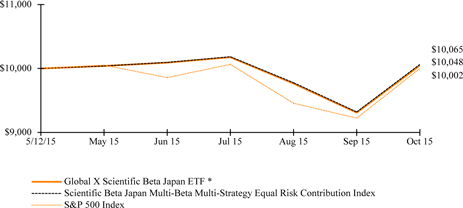
* Fund commenced operations on May 12, 2015. Total return is for the period indicated and has not been annualized.
The S&P 500 Index is a market capitalization weighted composite index of 500 large capitalization U.S. companies.
The performance data quoted herein represents past performance and the return and value of an investment in the Fund will fluctuate so that, when redeemed, it may be worth less than its original cost. Past performance is no guarantee of future performance and should not be considered as a representation of the future results of the Fund. The Fund's performance assumes the reinvestment of all dividends and all capital gains. Index returns assume reinvestment of dividends and, unlike a Fund's returns, do not reflect any fees or expenses. If such fees and expenses were included in the index returns, the performance would have been lower. Please note that one cannot invest directly in an unmanaged index.
There are no assurances that the Fund will meet its stated objectives.
The Fund’s holdings and allocations are subject to change and should not be considered recommendations to buy individual securities.
The graph and table do not reflect the deduction of taxes that a shareholder would pay on Fund distributions or the redemption or sale of Fund shares.
See definition of comparative Indices on previous page.
Management Discussion of Fund Performance (unaudited)
Global X Scientific Beta Asia ex-Japan ETF
Global X Scientific Beta Asia ex-Japan ETF
The Global X Scientific Beta Asia ex-Japan ETF (“Fund”) seeks investment results that correspond generally to the price and yield performance, before fees and expenses, of the Scientific Beta Developed Asia-Pacific ex-Japan Multi-Beta Multi-Strategy Equal Risk Contribution Index (“Underlying Index”). The Fund is passively managed, which means the investment adviser does not attempt to take defensive positions in declining markets. The Fund generally seeks to fully replicate the Underlying Index.
The Underlying Index generally comprises approximately 400 or less Asian-listed common stocks selected based on a proprietary methodology developed by the index provider. The objective of the Underlying Index is to outperform traditional market capitalization-weighted indexes, with lower volatility. The components of the Underlying Index are selected from a universe of the 400 largest, as measured by free float market capitalization, and most liquid stocks traded principally on a stock exchange in and incorporated or domiciled (i.e., maintain a principal place of business) in developed markets in Asia, excluding Japan, but may include Hong Kong, New Zealand, Singapore, South Korea and Australia. The Underlying Index’s components are selected by applying four factors that have been widely recognized by academic literature to outperform market capitalization weighted-indexes over the long run: Value, Size, Low-Volatility and Momentum. Each of these factors is applied by using the following metrics: price-to-book ratio for Value; free-float market capitalization for Size; historical volatility over the trailing 104 week period for Low-Volatility; and one-year-minus-one-month total returns for Momentum. Finally, components are weighted by employing a proprietary, multi-step process that combines multiple weighting methodologies to diversify the risks associated with any one weighting scheme.
For the period from the Fund's commencement date on May 12, 2015 through October, 31 2015 (the “reporting period”), the Fund decreased 13.10%, while the Underlying Index decreased 14.09%. The Fund had a net asset value of $24.89 per share on May 12, 2015 and ended the reporting period with a net asset value of $21.63 on October 31, 2015.
During the reporting period, the highest returns came from Blackmores and Medy-Tox, which returned 97.54% and 42.04%, respectively. The worst performers were Commonwealth Bank of Australia and Liquefied Natural Gas, which returned -75.25% and -70.94%, respectively.
Over the reporting period, the Fund had a 32.7% weighting to stocks in the Financials sector, with other large exposures of 16.4% to the Industrials sector, 15.2% to the Consumer Services sector and 7.0% to the Health Care sector. The Fund had an approximate average exposure of 27% to Low Volatility stocks, 20% to Mid Cap stocks, 28% to Value stocks, and 26% to Momentum stocks, as defined by the index provider.
Management Discussion of Fund Performance (unaudited)
Global X Scientific Beta Asia ex-Japan ETF
| | | AVERAGE TOTAL RETURN FOR THE
PERIOD ENDED OCTOBER 31, 2015 | |
| | | Cumulative Inception to Date* | |
| | | Net Asset Value | | | Market Price | |
| Global X Scientific Beta Asia ex-Japan ETF | | | -13.10 | % | | | -12.90 | % |
| Scientific Beta Developed Asia-Pacific ex-Japan Multi-Beta Multi-Strategy Equal Risk Contribution Index | | | -14.09 | % | | | -14.09 | % |
| S&P 500 Index | | | 0.02 | % | | | 0.02 | % |
Growth of a $10,000 Investment
(at Net Asset Value)
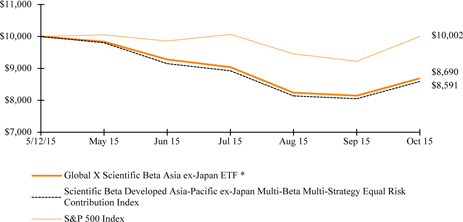
* Fund commenced operations on May 12, 2015. Total return is for the period indicated and has not been annualized.
The S&P 500 Index is a market capitalization weighted composite index of 500 large capitalization U.S. companies.
The performance data quoted herein represents past performance and the return and value of an investment in the Fund will fluctuate so that, when redeemed, it may be worth less than its original cost. Past performance is no guarantee of future performance and should not be considered as a representation of the future results of the Fund. The Fund's performance assumes the reinvestment of all dividends and all capital gains. Index returns assume reinvestment of dividends and, unlike a Fund's returns, do not reflect any fees or expenses. If such fees and expenses were included in the index returns, the performance would have been lower. Please note that one cannot invest directly in an unmanaged index.
There are no assurances that the Fund will meet its stated objectives.
The Fund’s holdings and allocations are subject to change and should not be considered recommendations to buy individual securities.
The graph and table do not reflect the deduction of taxes that a shareholder would pay on Fund distributions or the redemption or sale of Fund shares.
See definition of comparative Indices on previous page.
Management Discussion of Fund Performance (unaudited)
Global X YieldCo Index ETF
Global X YieldCo Index ETF
The Global X YieldCo Index ETF (“Fund”) seeks to track, before fees and expenses, the price and yield performance of the INDXX Global Yieldco Index (“Underlying Index”). The Fund is passively managed, which means the investment adviser does not attempt to take defensive positions in declining markets. The Fund generally seeks to fully replicate the Underlying Index.
The Underlying Index comprises publicly traded companies that are formed to own operating assets that produce defined cash flows (“Yieldcos”), as well as companies that have publicly announced plans to spin-off a YieldCo in an initial public offering, as determined by the index provider. The components of the Underlying Index are YieldCos selected from the universe of global publicly listed equities, which have a minimum market capitalization of $500 million and an Average Daily Value Traded (“ADVT”) over the last three months greater than $1 million. If less than 20 securities satisfy this criteria, the market capitalization and ADVT requirements are lowered. If there are still fewer than 20 securities, the parent companies of proposed YieldCos with the nearest anticipated listing dates will be included in the Underlying Index until there are 20 Underlying Index constituents. If a parent company is a part of the Underlying Index, and its corresponding YieldCo becomes publicly listed, the listed YieldCo will replace the parent entity in the Underlying Index during the subsequent index rebalance. Underlying Index constituents are ranked by market capitalization. The remaining securities are weighted based on their market capitalization, with a cap of 4.75% on any of the securities falling outside of the top five by market capitalization. If any parent companies of YieldCos are Underlying Index constituents, they are each capped at a 4.75% weighting. Companies that are structured as partnerships are capped at a 25% weighting in the aggregate.
For the period from the Fund's commencement date on May 27, 2015 through October, 31 2015 (the “reporting period”), the Fund decreased 26.39%, while the Underlying Index decreased 26.23%. The Fund had a net asset value of $15.19 per share on May 27, 2015 and ended the reporting period with a net asset value of $11.06 on October 31, 2015.
During the reporting period, the highest returns came from 8point3 Energy Partners and Greencoat UK Wind, which returned 6.49% and 2.82%, respectively. The worst performers were SunEdison and TerraForm Power, Cl A, which returned -65.4% and -53.86%, respectively.
Soon after the Fund launched, the Energy sector experienced a heavy selloff as falling energy prices cut into profitability. Despite the long term contracted nature of the solar and wind projects held by YieldCos, many market participants became worried that renewable energy sources would fall out of favor with cheap fossil fuel prices. In addition, some have commented that the plethora of initial public offerings of YieldCos resulted in too much supply of YieldCo shares in the market, which hurt prices.
Management Discussion of Fund Performance (unaudited)
Global X YieldCo Index ETF
| | | AVERAGE TOTAL RETURN FOR THE
PERIOD ENDED OCTOBER 31, 2015 | |
| | | Cumulative Inception to Date* | |
| | | Net Asset Value | | | Market Price | |
| Global X YieldCo Index ETF | | | -26.39 | % | | | -26.13 | % |
| Indxx Global YieldCo Index | | | -26.23 | % | | | -26.23 | % |
| S&P 500 Index | | | -1.24 | % | | | -1.24 | % |
Growth of a $10,000 Investment
(at Net Asset Value)
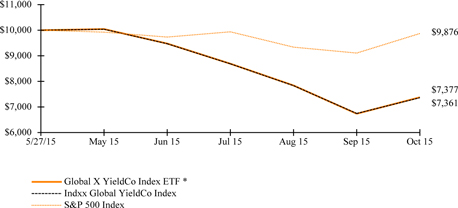
* Fund commenced operations on May 27, 2015. Total return is for the period indicated and has not been annualized.
The S&P 500 Index is a market capitalization weighted composite index of 500 large capitalization U.S. companies.
The performance data quoted herein represents past performance and the return and value of an investment in the Fund will fluctuate so that, when redeemed, it may be worth less than its original cost. Past performance is no guarantee of future performance and should not be considered as a representation of the future results of the Fund. The Fund's performance assumes the reinvestment of all dividends and all capital gains. Index returns assume reinvestment of dividends and, unlike a Fund's returns, do not reflect any fees or expenses. If such fees and expenses were included in the index returns, the performance would have been lower. Please note that one cannot invest directly in an unmanaged index.
There are no assurances that the Fund will meet its stated objectives.
The Fund’s holdings and allocations are subject to change and should not be considered recommendations to buy individual securities.
The graph and table do not reflect the deduction of taxes that a shareholder would pay on Fund distributions or the redemption or sale of Fund shares.
See definition of comparative Indices on previous page.
| Schedule of Investments | October 31, 2015 |
Global X SuperDividend® ETF
Sector Weightings (unaudited)†:
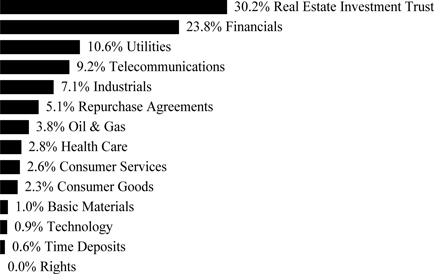
† Sector weightings percentages are based on the total market value of investments. Repurchase agreements purchased from cash collateral received for securities lending activity are included in total investments. Please see Note 2 and 7 in Notes to Financial Statements for more detailed information.
| | | Shares | | | Value | |
| COMMON STOCK — 98.5% |
| AUSTRALIA— 17.1% | | | | | | | | |
| Consumer Services — 1.7% | | | | | | | | |
| Myer Holdings | | | 7,301,843 | | | $ | 5,001,120 | |
| Southern Cross Media Group | | | 14,158,446 | | | | 9,899,316 | |
| | | | | | | | 14,900,436 | |
| Financials — 6.3% | | | | | | | | |
| ASX | | | 303,142 | | | | 8,914,923 | |
| Bank of Queensland | | | 910,317 | | | | 8,488,516 | |
| Bendigo and Adelaide Bank | | | 955,489 | | | | 7,294,121 | |
| Commonwealth Bank of Australia | | | 141,400 | | | | 7,740,662 | |
| IOOF Holdings (A) | | | 1,233,316 | | | | 8,218,352 | |
| National Australia Bank | | | 339,069 | | | | 7,293,549 | |
| Westpac Banking | | | 338,254 | | | | 7,572,851 | |
| | | | | | | | 55,522,974 | |
| Industrials — 1.3% | | | | | | | | |
| Sydney Airport | | | 2,486,693 | | | | 11,443,145 | |
| Oil & Gas — 1.1% | | | | | | | | |
| APA Group | | | 1,460,291 | | | | 9,584,970 | |
| Real Estate Investment Trust — 3.9% | | | | | | | | |
| Abacus Property Group | | | 4,175,098 | | | | 9,740,426 | |
| Charter Hall Retail | | | 2,981,288 | | | | 9,018,479 | |
| Cromwell Property Group | | | 11,118,754 | | | | 7,972,338 | |
The accompanying notes are an integral part of the financial statements.
| Schedule of Investments | October 31, 2015 |
Global X SuperDividend® ETF
| | | Shares | | | Value | |
| COMMON STOCK — continued | | | | | | | | |
| Real Estate Investment Trust — continued | | | | | | | | |
| Stockland | | | 2,725,836 | | | $ | 7,876,228 | |
| | | | | | | | 34,607,471 | |
| Telecommunications — 0.8% | | | | | | | | |
| Telstra | | | 1,929,652 | | | | 7,434,235 | |
| Utilities — 2.0% | | | | | | | | |
| DUET Group | | | 5,007,371 | | | | 8,431,120 | |
| Spark Infrastructure Group | | | 5,869,085 | | | | 8,709,581 | |
| | | | | | | | 17,140,701 | |
| TOTAL AUSTRALIA | | | | | | | 150,633,932 | |
| BRAZIL— 3.0% | | | | | | | | |
| Financials — 0.6% | | | | | | | | |
| Banco do Brasil | | | 1,194,800 | | | | 4,964,281 | |
| Telecommunications — 0.8% | | | | | | | | |
| Telefonica Brasil ADR | | | 719,095 | | | | 7,449,824 | |
| Utilities — 1.6% | | | | | | | | |
| Light | | | 2,000,100 | | | | 6,676,280 | |
| Transmissora Alianca de Energia Eletrica | | | 1,429,800 | | | | 7,402,604 | |
| | | | | | | | 14,078,884 | |
| TOTAL BRAZIL | | | | | | | 26,492,989 | |
| CANADA— 3.9% | | | | | | | | |
| Consumer Services — 1.1% | | | | | | | | |
| Parkland Fuel (A) | | | 543,465 | | | | 9,449,940 | |
| Oil & Gas — 1.8% | | | | | | | | |
| Surge Energy (A) | | | 3,970,950 | | | | 8,923,142 | |
| Veresen (A) | | | 797,676 | | | | 6,938,168 | |
| | | | | | | | 15,861,310 | |
| Real Estate Investment Trust — 1.0% | | | | | | | | |
| Dream Global | | | 1,354,399 | | | | 9,409,934 | |
| TOTAL CANADA | | | | | | | 34,721,184 | |
| CHINA— 3.4% | | | | | | | | |
| Consumer Goods — 1.1% | | | | | | | | |
| Pacific Textiles Holdings | | | 7,081,500 | | | | 10,124,130 | |
| Financials — 2.3% | | | | | | | | |
| Evergrande Real Estate Group | | | 26,079,200 | | | | 20,055,487 | |
| TOTAL CHINA | | | | | | | 30,179,617 | |
| FINLAND— 4.8% | | | | | | | | |
| Basic Materials — 1.1% | | | | | | | | |
| UPM-Kymmene | | | 521,820 | | | | 9,828,150 | |
| Health Care — 1.3% | | | | | | | | |
| Orion, Cl B | | | 307,778 | | | | 11,056,426 | |
The accompanying notes are an integral part of the financial statements.
| Schedule of Investments | October 31, 2015 |
Global X SuperDividend® ETF
| | | Shares | | | Value | |
| COMMON STOCK — continued | | | | | | |
| Telecommunications — 1.6% | | | | | | | | |
| Elisa | | | 370,059 | | | $ | 14,013,237 | |
| Utilities — 0.8% | | | | | | | | |
| Fortum | | | 469,174 | | | | 7,074,459 | |
| TOTAL FINLAND | | | | | | | 41,972,272 | |
| FRANCE— 7.6% | | | | | | | | |
| Financials — 1.0% | | | | | | | | |
| Euler Hermes | | | 97,705 | | | | 9,201,060 | |
| Industrials — 1.1% | | | | | | | | |
| Bouygues | | | 247,489 | | | | 9,422,385 | |
| Oil & Gas — 1.1% | | | | | | | | |
| Total | | | 190,680 | | | | 9,298,509 | |
| Real Estate Investment Trust — 1.0% | | | | | | | | |
| Fonciere Des Regions | | | 96,044 | | | | 9,097,688 | |
| Utilities — 3.4% | | | | | | | | |
| Electricite de France | | | 369,667 | | | | 6,915,484 | |
| Suez Environnement | | | 538,880 | | | | 10,304,236 | |
| Veolia Environnement * | | | 528,269 | | | | 12,356,777 | |
| | | | | | | | 29,576,497 | |
| TOTAL FRANCE | | | | | | | 66,596,139 | |
| GERMANY— 1.2% | | | | | | | | |
| Telecommunications — 1.2% | | | | | | | | |
| Freenet | | | 325,249 | | | | 11,022,954 | |
| GREECE— 0.8% | | | | | | | | |
| Industrials — 0.8% | | | | | | | | |
| Costamare | | | 522,887 | | | | 7,357,020 | |
| HONG KONG— 1.0% | | | | | | | | |
| Technology — 1.0% | | | | | | | | |
| VTech Holdings | | | 697,324 | | | | 8,471,252 | |
| ISRAEL— 1.4% | | | | | | | | |
| Telecommunications — 1.4% | | | | | | | | |
| Bezeq The Israeli Telecommunication | | | 5,749,539 | | | | 12,383,760 | |
| ITALY— 1.2% | | | | | | | | |
| Utilities — 1.2% | | | | | | | | |
| Hera | | | 4,005,919 | | | | 10,576,129 | |
| NIGERIA— 0.9% | | | | | | | | |
| Financials — 0.9% | | | | | | | | |
| FBN Holdings | | | 292,875,730 | | | | 7,503,975 | |
| NORWAY— 1.3% | | | | | | | | |
| Industrials — 1.3% | | | | | | | | |
| Ship Finance International (A) | | | 664,091 | | | | 11,349,315 | |
The accompanying notes are an integral part of the financial statements.
| Schedule of Investments | October 31, 2015 |
Global X SuperDividend® ETF
| | | Shares | | | Value | |
| COMMON STOCK — continued | | | | | | | | |
| PORTUGAL— 1.1% | | | | | | | | |
| Utilities — 1.1% | | | | | | | | |
| Energias de Portugal | | | 2,631,151 | | | $ | 9,789,140 | |
| SINGAPORE— 6.9% | | | | | | | | |
| Industrials — 2.0% | | | | | | | | |
| Hutchison Port Holdings Trust | | | 14,333,675 | | | | 7,955,190 | |
| Venture | | | 1,630,161 | | | | 9,626,156 | |
| | | | | | | | 17,581,346 | |
| Real Estate Investment Trust — 4.0% | | | | | | | | |
| Ascendas | | | 5,507,149 | | | | 9,398,133 | |
| Mapletree Industrial Trust | | | 8,599,000 | | | | 9,363,424 | |
| Mapletree Logistics Trust | | | 11,100,463 | | | | 8,084,593 | |
| Suntec | | | 7,017,685 | | | | 8,267,890 | |
| | | | | | | | 35,114,040 | |
| Telecommunications — 0.9% | | | | | | | | |
| StarHub | | | 3,128,806 | | | | 8,042,629 | |
| TOTAL SINGAPORE | | | | | | | 60,738,015 | |
| SOUTH AFRICA— 1.0% | | | | | | | | |
| Real Estate Investment Trust — 1.0% | | | | | | | | |
| Redefine Properties | | | 10,187,950 | | | | 8,530,143 | |
| SPAIN— 0.9% | | | | | | | | |
| Financials — 0.9% | | | | | | | | |
| Banco Santander | | | 1,368,566 | | | | 7,710,146 | |
| SWEDEN— 0.9% | | | | | | | | |
| Telecommunications — 0.9% | | | | | | | | |
| TeliaSonera | | | 1,606,117 | | | | 8,271,807 | |
| UNITED KINGDOM— 9.0% | | | | | | | | |
| Financials — 7.9% | | | | | | | | |
| Admiral Group | | | 442,797 | | | | 11,030,603 | |
| Amlin | | | 1,327,978 | | | | 13,515,637 | |
| Intermediate Capital Group | | | 1,299,296 | | | | 11,357,553 | |
| Phoenix Group Holdings | | | 786,627 | | | | 10,393,196 | |
| Provident Financial | | | 240,470 | | | | 12,886,964 | |
| Standard Life | | | 1,501,793 | | | | 9,762,234 | |
| | | | | | | | 68,946,187 | |
| Utilities — 1.1% | | | | | | | | |
| SSE | | | 424,283 | | | | 9,927,239 | |
| TOTAL UNITED KINGDOM | | | | | | | 78,873,426 | |
The accompanying notes are an integral part of the financial statements.
| Schedule of Investments | October 31, 2015 |
Global X SuperDividend® ETF
| | | Shares | | | Value | |
| COMMON STOCK — continued | | | | | | | | |
| UNITED STATES— 31.1% | | | | | | | | |
| Consumer Goods — 1.2% | | | | | | | | |
| Vector Group (A) | | | 451,068 | | | $ | 10,938,399 | |
| Financials — 4.5% | | | | | | | | |
| Arlington Asset Investment, Cl A | | | 400,635 | | | | 5,548,795 | |
| Armour Residential | | | 400,042 | | | | 8,208,862 | |
| BGC Partners, Cl A | | | 1,056,665 | | | | 9,140,152 | |
| New York Community Bancorp (A) | | | 603,875 | | | | 9,976,015 | |
| Resource Capital (A) | | | 509,722 | | | | 6,544,830 | |
| | | | | | | | 39,418,654 | |
| Health Care — 1.8% | | | | | | | | |
| AstraZeneca | | | 146,985 | | | | 9,421,795 | |
| PDL BioPharma (A) | | | 1,368,387 | | | | 6,267,213 | |
| | | | | | | | 15,689,008 | |
| Industrials — 1.0% | | | | | | | | |
| RR Donnelley & Sons | | | 552,135 | | | | 9,314,518 | |
| Real Estate Investment Trust — 20.7% | | | | | | | | |
| Altisource Residential | | | 524,817 | | | | 7,552,117 | |
| American Capital Mortgage Investment | | | 544,993 | | | | 7,907,848 | |
| Annaly Capital Management | | | 928,746 | | | | 9,241,023 | |
| Apollo Commercial Real Estate Finance | | | 595,409 | | | | 9,889,743 | |
| Apollo Residential Mortgage | | | 590,918 | | | | 7,605,115 | |
| Capstead Mortgage | | | 833,443 | | | | 8,042,725 | |
| Chimera Investment | | | 620,219 | | | | 8,732,684 | |
| CYS Investments | | | 1,118,277 | | | | 8,633,098 | |
| Franklin Street Properties | | | 786,360 | | | | 8,193,871 | |
| Hatteras Financial | | | 535,944 | | | | 7,669,359 | |
| Hospitality Properties Trust | | | 314,206 | | | | 8,433,289 | |
| Invesco Mortgage Capital | | | 646,570 | | | | 7,791,168 | |
| Investors Real Estate Trust | | | 1,306,255 | | | | 10,606,791 | |
| Medical Properties Trust | | | 660,186 | | | | 7,460,102 | |
| New Residential Investment | | | 564,849 | | | | 6,851,618 | |
| New York Mortgage Trust (A) | | | 1,277,411 | | | | 7,255,694 | |
| NorthStar Realty Finance | | | 530,273 | | | | 6,368,579 | |
| Omega Healthcare Investors | | | 247,188 | | | | 8,532,930 | |
| PennyMac Mortgage Investment Trust | | | 463,766 | | | | 6,780,259 | |
| RAIT Financial Trust | | | 1,352,834 | | | | 6,561,245 | |
| Sabra Health Care | | | 306,770 | | | | 6,957,544 | |
| Senior Housing Properties Trust | | | 441,206 | | | | 6,701,919 | |
| Starwood Property Trust | | | 408,260 | | | | 8,201,943 | |
| | | | | | | | 181,970,664 | |
| Telecommunications — 1.9% | | | | | | | | |
| Consolidated Communications Holdings | | | 416,374 | | | | 9,201,865 | |
The accompanying notes are an integral part of the financial statements.
| Schedule of Investments | October 31, 2015 |
Global X SuperDividend® ETF
| | | Shares/Face
Amount(1)/
Number of
Rights | | | Value | |
| COMMON STOCK — continued | | | | | | | | |
| Telecommunications — continued | | | | | | | | |
| Frontier Communications (A) | | | 1,200,794 | | | $ | 6,172,081 | |
| Windstream Holdings (A) | | | 191,727 | | | | 1,248,143 | |
| | | | | | | | 16,622,089 | |
| TOTAL UNITED STATES | | | | | | | 273,953,332 | |
| TOTAL COMMON STOCK | | | | | | | | |
| (Cost $949,487,372) | | | | | | | 867,126,547 | |
| | | | | | | | | |
| PREFERRED STOCK — 0.6% | | | | | | | | |
| BRAZIL— 0.6% | | | | | | | | |
| Financials — 0.6% | | | | | | | | |
| Bradespar | | | | | | | | |
| (Cost $6,429,830) | | | 2,507,000 | | | | 5,381,018 | |
| | | | | | | | | |
| RIGHTS — 0.0% | | | | | | | | |
| Australia — 0.0% | | | | | | | | |
| Westpac Banking* | | | 14,811 | | | | 51,777 | |
| | | | | | | | | |
| Spain — 0.0% | | | | | | | | |
| Banco Santander* | | | 1,378,166 | | | | 76,120 | |
| | | | | | | | | |
| TOTAL RIGHTS | | | | | | | | |
| (Cost $–) | | | | | | | 127,897 | |
| | | | | | | | | |
| REPURCHASE AGREEMENTS — 5.3% | | | | | | | | |
| Barclays Bank | | | | | | | | |
0.070%, dated 10/30/15, to be repurchased on 11/02/15 repurchase price
$44,000,257 (collateralized by U.S. Treasury Obligations, ranging in par
value $33-$16,689,451, 0.000%-2.750%, 11/05/15-02/15/45 with a total
market value of $44,880,000) (B) | | $ | 44,000,000 | | | | 44,000,000 | |
| Deutsche Bank | | | | | | | | |
0.050%, dated 10/30/15, to be repurchased on 11/02/15 repurchase price
$2,835,313 (collateralized by U.S. Treasury Obligations, par value
$2,835,313, 3.250%, 07/31/16 with a total market value of $2,913,284) (B) | | | 2,835,301 | | | | 2,835,301 | |
| TOTAL REPURCHASE AGREEMENTS | | | | | | | | |
| (Cost $46,835,301) | | | | | | | 46,835,301 | |
| | | | | | | | | |
| TIME DEPOSITS — 0.6% | | | | | | | | |
| Brown Brothers Harriman | | | | | | | | |
| 0.030%, 11/02/15 | | | 5,086,508 | | | | 5,086,508 | |
| 1.032%, 11/02/15, AUD | | | 209,771 | | | | 149,661 | |
| 0.050%, 11/02/15, CAD | | | 50,472 | | | | 38,577 | |
| 0.080%, 11/02/15, GBP | | | 53 | | | | 82 | |
| 0.005%, 11/02/15, HKD | | | 29 | | | | 4 | |
The accompanying notes are an integral part of the financial statements.
| Schedule of Investments | October 31, 2015 |
Global X SuperDividend® ETF
| | | Face Amount(1) | | | Value | |
| TIME DEPOSITS — continued | | | | | | | | |
| 2.800%, 11/02/15, NZD | | | 11 | | | $ | 7 | |
| 0.004%, 11/02/15, SGD | | | 30 | | | | 21 | |
| 4.900%, 11/02/15, ZAR | | | 3,317 | | | | 241 | |
| TOTAL TIME DEPOSITS | | | | | | | | |
| (Cost $5,275,101) | | | | | | | 5,275,101 | |
| TOTAL INVESTMENTS — 105.0% | | | | | | | | |
| (Cost $1,008,027,604) | | | | | | $ | 924,745,864 | |
Percentages are based on Net Assets of $880,666,002.
| * | Non-income producing security. |
| (1) | In U.S. Dollars unless otherwise indicated. |
| (A) | This security or a partial position of this security is on loan at October 31, 2015. The total value of securities on loan at October 31, 2015 was $44,921,955. |
| (B) | These securities were purchased with cash collateral held from securities on loan. The total value of such securities as of October 31, 2015 was $46,835,301. |
| ADR — American Depositary Receipt |
| AUD — Australian Dollar |
| CAD — Canadian Dollar |
| Cl — Class |
| EUR — Euro |
| GBP — British Pound Sterling |
| HKD — Hong Kong Dollar |
| NZD — New Zealand Dollar |
| SGD — Singapore Dollar |
| ZAR — South African Rand |
The following is a summary of the inputs used as of October 31, 2015, in valuing the Fund's investments carried at value:
| Investments in Securities | | Level 1 | | | Level 2 | | | Level 3 | | | Total | |
| Common Stock | | $ | 867,126,547 | | | $ | — | | | $ | — | | | $ | 867,126,547 | |
| Preferred Stock | | | 5,381,018 | | | | — | | | | — | | | | 5,381,018 | |
| Rights | | | 127,897 | | | | — | | | | — | | | | 127,897 | |
| Repurchase Agreements | | | — | | | | 46,835,301 | | | | — | | | | 46,835,301 | |
| Time Deposits | | | — | | | | 5,275,101 | | | | — | | | | 5,275,101 | |
| Total Investments in Securities | | $ | 872,635,462 | | | $ | 52,110,402 | | | $ | — | | | $ | 924,745,864 | |
For the year ended October 31, 2015, there have been no transfers between Level 1, Level 2 or Level 3 investments.
As of October 31, 2015, there were no Level 3 investments.
The accompanying notes are an integral part of the financial statements.
| Schedule of Investments | October 31, 2015 |
Global X SuperDividend® U.S. ETF
Sector Weightings (unaudited)†:
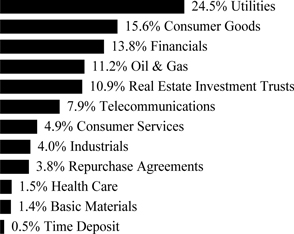
† Sector weightings percentages are based on the total market value of investments. Repurchase agreements purchased from cash collateral received for securities lending activity are included in total investments. Please see Note 2 and 7 in Notes to Financial Statements for more detailed information.
| | | Shares | | | Value | |
| COMMON STOCK — 83.2% | | | | | | | | |
| Basic Materials — 1.5% | | | | | | | | |
| Kronos Worldwide | | | 522,071 | | | $ | 4,124,361 | |
| Consumer Goods — 16.1% | | | | | | | | |
| Altria Group | | | 116,701 | | | | 7,056,910 | |
| B&G Foods | | | 230,136 | | | | 8,351,635 | |
| Mattel (A) | | | 251,152 | | | | 6,173,316 | |
| Philip Morris International | | | 78,630 | | | | 6,950,892 | |
| Reynolds American | | | 174,960 | | | | 8,454,067 | |
| Universal (A) | | | 136,605 | | | | 7,378,036 | |
| | | | | | | | 44,364,856 | |
| Consumer Services — 2.6% | | | | | | | | |
| Six Flags Entertainment | | | 136,432 | | | | 7,099,921 | |
| Financials — 14.4% | | | | | | | | |
| Apollo Commercial Real Estate Finance | | | 406,391 | | | | 6,750,155 | |
| Apollo Residential Mortgage | | | 439,712 | | | | 5,659,093 | |
| Arlington Asset Investment, Cl A (A) | | | 284,941 | | | | 3,946,433 | |
| Chimera Investment | | | 431,886 | | | | 6,080,955 | |
| New York Community Bancorp (A) | | | 390,359 | | | | 6,448,730 | |
| New York Mortgage Trust (A) | | | 896,716 | | | | 5,093,347 | |
| Starwood Property Trust | | | 274,622 | | | | 5,517,156 | |
| | | | | | | | 39,495,869 | |
| Health Care — 1.5% | | | | | | | | |
| PDL BioPharma (A) | | | 928,157 | | | | 4,250,959 | |
The accompanying notes are an integral part of the financial statements.
| Schedule of Investments | October 31, 2015 |
Global X SuperDividend® U.S. ETF
| | | Shares | | | Value | |
| COMMON STOCK — continued | | | | | | | | |
| Industrials — 4.2% | | | | | | | | |
| Covanta Holding | | | 306,090 | | | $ | 5,130,069 | |
| Macquarie Infrastructure | | | 80,517 | | | | 6,405,127 | |
| | | | | | | | 11,535,196 | |
| Real Estate Investment Trusts — 11.3% | | | | | | | | |
| AG Mortgage Investment Trust | | | 373,317 | | | | 5,678,151 | |
| Capstead Mortgage | | | 568,615 | | | | 5,487,135 | |
| Colony Capital | | | 262,703 | | | | 5,343,379 | |
| Communications Sales & Leasing | | | 157,307 | | | | 3,160,298 | |
| CYS Investments | | | 781,023 | | | | 6,029,497 | |
| Western Asset Mortgage Capital (A) | | | 480,185 | | | | 5,483,713 | |
| | | | | | | | 31,182,173 | |
| Telecommunications — 8.2% | | | | | | | | |
| AT&T | | | 189,140 | | | | 6,338,081 | |
| CenturyLink | | | 178,561 | | | | 5,037,206 | |
| Frontier Communications | | | 798,549 | | | | 4,104,542 | |
| Verizon Communications | | | 130,578 | | | | 6,121,497 | |
| Windstream Holdings (A) | | | 124,131 | | | | 808,093 | |
| | | | | | | | 22,409,419 | |
| Utilities — 23.4% | | | | | | | | |
| Ameren | | | 151,057 | | | | 6,598,170 | |
| Avista | | | 187,700 | | | | 6,353,645 | |
| Consolidated Edison | | | 100,267 | | | | 6,592,555 | |
| Duke Energy | | | 81,191 | | | | 5,802,721 | |
| Empire District Electric | | | 252,511 | | | | 5,694,123 | |
| Entergy | | | 80,592 | | | | 5,493,150 | |
| Northwest Natural Gas | | | 133,168 | | | | 6,361,435 | |
| PPL | | | 186,405 | | | | 6,412,332 | |
| Southern | | | 138,798 | | | | 6,259,790 | |
| Talen Energy * | | | 20,998 | | | | 182,263 | |
| TECO Energy | | | 320,177 | | | | 8,644,779 | |
| | | | | | | | 64,394,963 | |
| TOTAL COMMON STOCK | | | | | | | | |
| (Cost $245,018,026) | | | | | | | 228,857,717 | |
| | | | | | | | | |
| MASTER LIMITED PARTNERSHIPS — 16.1% | | | | | | | | |
| Consumer Services — 2.5% | | | | | | | | |
| Stonemor Partners | | | 226,766 | | | | 6,982,125 | |
| Oil & Gas — 11.6% | | | | | | | | |
| CSI Compressco | | | 398,319 | | | | 5,660,113 | |
| Enbridge Energy Partners | | | 163,774 | | | | 4,575,846 | |
| Energy Transfer Partners | | | 108,210 | | | | 4,778,554 | |
The accompanying notes are an integral part of the financial statements.
| Schedule of Investments | October 31, 2015 |
Global X SuperDividend® U.S. ETF
| | | Shares/Face
Amount | | | Value | |
| MASTER LIMITED PARTNERSHIPS — continued | | | | | | | | |
| Oil & Gas — continued | | | | | | | | |
| Exterran Partners | | | 131,000 | | | $ | 2,616,070 | |
| Martin Midstream Partners | | | 217,237 | | | | 6,289,011 | |
| Midcoast Energy Partners | | | 255,905 | | | | 3,224,403 | |
| TC PipeLines | | | 90,597 | | | | 4,680,241 | |
| | | | | | | | 31,824,238 | |
| Utilities — 2.0% | | | | | | | | |
| Ferrellgas Partners | | | 266,158 | | | | 5,429,623 | |
| TOTAL MASTER LIMITED PARTNERSHIPS | | | | | | | | |
| (Cost $49,034,319) | | | | | | | 44,235,986 | |
| | | | | | | | | |
| REPURCHASE AGREEMENTS — 3.9% | | | | | | | | |
| Barclays Bank | | | | | | | | |
0.070%, dated 10/30/15, to be repurchased on 11/02/15 repurchase price
$9,000,053 (collateralized by U.S. Treasury Obligations, ranging in par
value $20.00-$5,130,760, 0.000%-2.750%, 11/05/15-02/15/45 with a total
market value of $9,180,000) (B) | | $ | 9,000,000 | | | | 9,000,000 | |
| Deutsche Bank | | | | | | | | |
0.050%, dated 10/30/15, to be repurchased on 11/02/15 repurchase price
$1,708,562 (collateralized by U.S. Treasury Obligations, par value
$1,708,562, 3.250%, 07/31/16 with a total market value of $1,755,548) (B) | | | 1,708,555 | | | | 1,708,555 | |
| TOTAL REPURCHASE AGREEMENTS | | | | | | | | |
| (Cost $10,708,555) | | | | | | | 10,708,555 | |
| TIME DEPOSIT — 0.5% | | | | | | | | |
| Brown Brothers Harriman, 0.030%, 11/02/15 | | | | | | | | |
| (Cost $1,407,051) | | | 1,407,051 | | | | 1,407,051 | |
| TOTAL INVESTMENTS — 103.7% | | | | | | | | |
| (Cost $306,167,951) | | | | | | $ | 285,209,309 | |
Percentages are based on Net Assets of $274,998,625.
| * | Non-income producing security. |
| (A) | This security or a partial position of this security is on loan at October 31, 2015. The total value of securities on loan at October 31, 2015 was $10,251,104. |
| (B) | These securities were purchased with cash collateral held from securities on loan. The total value of such securities as of October 31, 2015 was $10,708,555. |
Cl — Class
The accompanying notes are an integral part of the financial statements.
| Schedule of Investments | October 31, 2015 |
Global X SuperDividend® U.S. ETF
The following is a summary of the inputs used as of October 31, 2015, in valuing the Fund's investments carried at value:
| Investments in Securities | | Level 1 | | | Level 2 | | | Level 3 | | | Total | |
| Common Stock | | $ | 228,857,717 | | | $ | — | | | $ | — | | | $ | 228,857,717 | |
| Master Limited Partnerships | | | 44,235,986 | | | | — | | | | — | | | | 44,235,986 | |
| Repurchase Agreements | | | — | | | | 10,708,555 | | | | — | | | | 10,708,555 | |
| Time Deposit | | | — | | | | 1,407,051 | | | | — | | | | 1,407,051 | |
| Total Investments in Securities | | $ | 273,093,703 | | | $ | 12,115,606 | | | $ | — | | | $ | 285,209,309 | |
For the year ended October 31, 2015, there have been no transfers between Level 1, Level 2 or Level 3 investments.
As of October 31, 2015, there were no Level 3 investments.
The accompanying notes are an integral part of the financial statements.
| Schedule of Investments | October 31, 2015 |
Global X SuperDividend® Emerging Markets ETF‡
Sector Weightings (unaudited)†:
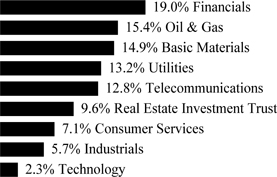
† Sector weightings percentages are based on the total market value of investments.
| | | Shares | | | Value | |
| COMMON STOCK — 92.4% | | | | | | | | |
| BRAZIL— 10.6% | | | | | | | | |
| Consumer Services — 1.6% | | | | | | | | |
| Multiplus | | | 6,140 | | | $ | 54,856 | |
| Industrials — 2.2% | | | | | | | | |
| CCR | | | 13,510 | | | | 42,600 | |
| EcoRodovias Infraestrutura e Logistica | | | 20,600 | | | | 31,889 | |
| | | | | | | | 74,489 | |
| Oil & Gas — 1.8% | | | | | | | | |
| Petroleo Brasileiro ADR * | | | 12,664 | | | | 61,800 | |
| Utilities — 5.0% | | | | | | | | |
| CPFL Energia * | | | 12,509 | | | | 50,412 | |
| EDP - Energias do Brasil | | | 23,880 | | | | 70,081 | |
| Light | | | 15,200 | | | | 50,737 | |
| | | | | | | | 171,230 | |
| TOTAL BRAZIL | | | | | | | 362,375 | |
| CHINA— 19.2% | | | | | | | | |
| Basic Materials — 1.9% | | | | | | | | |
| China Hongqiao Group | | | 124,433 | | | | 65,025 | |
| Consumer Services — 4.0% | | | | | | | | |
| Intime Retail Group | | | 125,100 | | | | 138,496 | |
| Financials — 10.5% | | | | | | | | |
| Agile Property Holdings | | | 130,200 | | | | 71,063 | |
| Country Garden Holdings | | | 199,600 | | | | 76,233 | |
| Evergrande Real Estate Group | | | 204,488 | | | | 157,256 | |
| SOHO China | | | 113,200 | | | | 58,425 | |
| | | | | | | | 362,977 | |
The accompanying notes are an integral part of the financial statements.
| Schedule of Investments | October 31, 2015 |
Global X SuperDividend® Emerging Markets ETF‡
| | | Shares | | | Value | |
| COMMON STOCK — continued | | | | | | | | |
| Oil & Gas — 2.8% | | | | | | | | |
| Sinopec Engineering Group, Cl H | | | 109,800 | | | $ | 94,923 | |
| TOTAL CHINA | | | | | | | 661,421 | |
| CZECH REPUBLIC— 2.0% | | | | | | | | |
| Utilities — 2.0% | | | | | | | | |
| CEZ | | | 3,440 | | | | 69,143 | |
| GREECE— 1.9% | | | | | | | | |
| Industrials — 1.9% | | | | | | | | |
| Costamare | | | 4,592 | | | | 64,609 | |
| HONG KONG— 2.6% | | | | | | | | |
| Financials — 2.6% | | | | | | | | |
| KWG Property Holding | | | 125,450 | | | | 90,970 | |
| INDIA— 6.5% | | | | | | | | |
| Basic Materials — 1.5% | | | | | | | | |
| NMDC | | | 34,470 | | | | 52,883 | |
| Financials — 2.7% | | | | | | | | |
| Indiabulls Housing Finance | | | 8,250 | | | | 90,971 | |
| Technology — 2.3% | | | | | | | | |
| Hexaware Technologies | | | 21,440 | | | | 78,729 | |
| TOTAL INDIA | | | | | | | 222,583 | |
| MALAYSIA— 7.9% | | | | | | | | |
| Basic Materials — 2.7% | | | | | | | | |
| HAP Seng Consolidated | | | 63,870 | | | | 89,948 | |
| Financials — 1.8% | | | | | | | | |
| Malayan Banking | | | 32,800 | | | | 63,065 | |
| Telecommunications — 1.8% | | | | | | | | |
| Maxis | | | 40,500 | | | | 62,126 | |
| Utilities — 1.6% | | | | | | | | |
| YTL | | | 156,840 | | | | 55,128 | |
| TOTAL MALAYSIA | | | | | | | 270,267 | |
| MEXICO— 3.9% | | | | | | | | |
| Real Estate Investment Trust — 3.9% | | | | | | | | |
| Mexico Real Estate Management | | | 48,400 | | | | 66,939 | |
| PLA Administradora Industrial S de RL | | | 37,000 | | | | 68,074 | |
| TOTAL MEXICO | | | | | | | 135,013 | |
| POLAND— 3.4% | | | | | | | | |
| Telecommunications — 1.8% | | | | | | | | |
| Orange Polska | | | 33,050 | | | | 60,830 | |
| Utilities — 1.6% | | | | | | | | |
| PGE | | | 14,600 | | | | 54,539 | |
The accompanying notes are an integral part of the financial statements.
| Schedule of Investments | October 31, 2015 |
Global X SuperDividend® Emerging Markets ETF‡
| | | Shares | | | Value | |
| COMMON STOCK — continued | | | | | | | | |
| TOTAL POLAND | | | | | | $ | 115,369 | |
| RUSSIA— 10.9% | | | | | | | | |
| Oil & Gas — 5.2% | | | | | | | | |
| Gazprom OAO ADR | | | 19,681 | | | | 82,857 | |
| Rosneft OAO GDR | | | 24,185 | | | | 96,740 | |
| | | | | | | | 179,597 | |
| Telecommunications — 5.7% | | | | | | | | |
| Mobile TeleSystems ADR | | | 10,286 | | | | 72,311 | |
| Sistema GDR | | | 17,411 | | | | 121,006 | |
| | | | | | | | 193,317 | |
| TOTAL RUSSIA | | | | | | | 372,914 | |
| SOUTH AFRICA— 11.7% | | | | | | | | |
| Basic Materials — 3.4% | | | | | | | | |
| Assore | | | 5,590 | | | | 32,391 | |
| Kumba Iron Ore | | | 4,105 | | | | 17,815 | |
| Sasol | | | 2,130 | | | | 68,371 | |
| | | | | | | | 118,577 | |
| Oil & Gas — 1.1% | | | | | | | | |
| Exxaro Resources | | | 8,690 | | | | 36,172 | |
| Real Estate Investment Trust — 5.7% | | | | | | | | |
| Capital Property Fund | | | 62,300 | | | | 72,828 | |
| Growthpoint Properties | | | 31,400 | | | | 57,698 | |
| Redefine Properties | | | 80,200 | | | | 67,150 | |
| | | | | | | | 197,676 | |
| Telecommunications — 1.5% | | | | | | | | |
| MTN Group | | | 4,530 | | | | 51,775 | |
| TOTAL SOUTH AFRICA | | | | | | | 404,200 | |
| THAILAND— 3.4% | | | | | | | | |
| Oil & Gas — 1.4% | | | | | | | | |
| PTT Exploration & Production | | | 23,350 | | | | 47,924 | |
| Telecommunications — 2.0% | | | | | | | | |
| Intouch Holdings | | | 32,000 | | | | 67,478 | |
| TOTAL THAILAND | | | | | | | 115,402 | |
| TURKEY— 3.1% | | | | | | | | |
| Consumer Services — 1.5% | | | | | | | | |
| Dogus Otomotiv Servis ve Ticaret | | | 13,830 | | | | 50,350 | |
| Industrials — 1.6% | | | | | | | | |
| Turk Traktor ve Ziraat Makineleri | | | 2,380 | | | | 56,729 | |
| TOTAL TURKEY | | | | | | | 107,079 | |
The accompanying notes are an integral part of the financial statements.
| Schedule of Investments | October 31, 2015 |
Global X SuperDividend® Emerging Markets ETF‡
| | | Shares | | | Value | |
| COMMON STOCK — continued | | | | | | | | |
| UNITED KINGDOM— 5.3% | | | | | | | | |
| Basic Materials — 5.3% | | | | | | | | |
| MMC Norilsk Nickel ADR | | | 4,868 | | | $ | 72,290 | |
| Vedanta Resources | | | 14,380 | | | | 109,821 | |
| TOTAL UNITED KINGDOM | | | | | | | 182,111 | |
| TOTAL COMMON STOCK | | | | | | | | |
| (Cost $3,580,854) | | | | | | | 3,173,456 | |
| | | | | | | | | |
| PREFERRED STOCK — 7.3% | | | | | | | | |
| BRAZIL— 4.2% | | | | | | | | |
| Financials — 1.2% | | | | | | | | |
| Bradespar | | | 18,540 | | | | 39,794 | |
| Utilities — 3.0% | | | | | | | | |
| Cia Energetica de Sao Paulo | | | 10,850 | | | | 45,730 | |
| Cia Paranaense de Energia | | | 6,750 | | | | 57,075 | |
| | | | | | | | 102,805 | |
| TOTAL BRAZIL | | | | | | | 142,599 | |
| RUSSIA— 3.1% | | | | | | | | |
| Oil & Gas — 3.1% | | | | | | | | |
| Surgutneftegas OAO | | | 157,100 | | | | 107,013 | |
| TOTAL PREFERRED STOCK | | | | | | | | |
| (Cost $311,706) | | | | | | | 249,612 | |
| TOTAL INVESTMENTS — 99.7% | | | | | | | | |
| (Cost $3,892,560) | | | | | | $ | 3,423,068 | |
Percentages are based on Net Assets of $3,433,051.
| * | Non-income producing security. |
| ‡ | Fund commenced operations on March 16, 2015. |
ADR — American Depositary Receipt
Cl — Class
GDR — Global Depositary Receipt
As of October 31, 2015, all of the Fund’s investments were considered Level 1, in accordance with authoritative guidance on fair value measurements and disclosure under U.S. GAAP.
For the period ended October 31, 2015, there have been no transfers between Level 1, Level 2 or Level 3 investments.
As of October 31, 2015, there were no Level 3 investments.
The accompanying notes are an integral part of the financial statements.
| Schedule of Investments | October 31, 2015 |
Global X SuperDividend® REIT ETF‡
Sector Weightings (unaudited)†:

† Sector weightings percentages are based on the total market value of investments.
| | | Shares | | | Value | |
| COMMON STOCK — 99.4% | | | | | | | | |
| AUSTRALIA— 10.7% | | | | | | | | |
| Real Estate Investment Trusts — 10.7% | | | | | | | | |
| Federation Centres (A) | | | 69,665 | | | $ | 144,634 | |
| GPT Group | | | 43,334 | | | | 147,473 | |
| Stockland | | | 44,922 | | | | 129,801 | |
| TOTAL AUSTRALIA | | | | | | | 421,908 | |
| CANADA— 9.5% | | | | | | | | |
| Real Estate Investment Trusts — 9.5% | | | | | | | | |
| Cominar Real Estate Investment Trust | | | 10,198 | | | | 119,880 | |
| H&R Real Estate Investment Trust | | | 8,005 | | | | 128,364 | |
| RioCan Real Estate Investment Trust | | | 6,616 | | | | 128,947 | |
| TOTAL CANADA | | | | | | | 377,191 | |
| SOUTH AFRICA— 3.3% | | | | | | | | |
| Real Estate Investment Trusts — 3.3% | | | | | | | | |
| Redefine Properties | | | 158,100 | | | | 132,374 | |
| UNITED STATES— 75.9% | | | | | | | | |
| Real Estate Investment Trusts — 75.9% | | | | | | | | |
| American Capital Agency | | | 7,260 | | | | 129,446 | |
| American Capital Mortgage Investment | | | 8,474 | | | | 122,958 | |
| Annaly Capital Management | | | 15,012 | | | | 149,368 | |
| Anworth Mortgage Asset | | | 30,535 | | | | 145,651 | |
| Armour Residential | | | 6,061 | | | | 124,372 | |
| Blackstone Mortgage Trust, Cl A | | | 5,271 | | | | 145,058 | |
| Capstead Mortgage | | | 13,086 | | | | 126,280 | |
| Chambers Street Properties | | | 18,285 | | | | 129,458 | |
| Chimera Investment | | | 10,158 | | | | 143,025 | |
| Columbia Property Trust | | | 6,274 | | | | 155,845 | |
| Corrections Corp of America | | | 3,891 | | | | 110,894 | |
| CYS Investments | | | 18,030 | | | | 139,192 | |
| EPR Properties | | | 2,361 | | | | 134,128 | |
| Government Properties Income Trust | | | 6,787 | | | | 110,492 | |
| Hatteras Financial | | | 8,668 | | | | 124,039 | |
| Liberty Property Trust | | | 3,791 | | | | 128,970 | |
| MFA Financial | | | 20,076 | | | | 138,926 | |
| PennyMac Mortgage Investment Trust | | | 6,911 | | | | 101,039 | |
The accompanying notes are an integral part of the financial statements.
| Schedule of Investments | October 31, 2015 |
Global X SuperDividend® REIT ETF‡
| | | Shares | | | Value | |
| COMMON STOCK — continued | | | | | | | | |
| Real Estate Investment Trusts — continued | | | | | | | | |
| Select Income | | | 6,195 | | | $ | 125,139 | |
| Spirit Realty Capital | | | 11,918 | | | | 121,325 | |
| Starwood Property Trust | | | 6,452 | | | | 129,621 | |
| Two Harbors Investment | | | 15,243 | | | | 128,956 | |
| WP Carey | | | 2,132 | | | | 135,105 | |
| TOTAL UNITED STATES | | | | | | | 2,999,287 | |
| TOTAL COMMON STOCK | | | | | | | | |
| (Cost $4,293,419) | | | | | | | 3,930,760 | |
| TOTAL INVESTMENTS — 99.4% | | | | | | | | |
| (Cost $4,293,419) | | | | | | $ | 3,930,760 | |
Percentages are based on Net Assets of $3,953,805.
| ‡ | The Fund commenced operations on March 16, 2015. |
| (A) | Security is fair valued using methods determined in good faith by the Fair Value Committee of the Fund. The total value of such security as of October 31, 2015 was $144,634 and represents 3.7% of Net Assets. |
Cl — Class
The following is a summary of the inputs used as of October 31, 2015, in valuing the Fund's investments carried at value:
| Investments in Securities | | Level 1 | | | Level 2 | | | Level 3 | | | Total | |
| Common Stock | | $ | 3,786,126 | | | $ | 144,634 | | | $ | — | | | $ | 3,930,760 | |
| Total Investments in Securities | | $ | 3,786,126 | | | $ | 144,634 | | | $ | — | | | $ | 3,930,760 | |
For the period ended October 31, 2015, there have been no transfers between Level 1, Level 2 or Level 3 investments.
As of October 31, 2015, there were no Level 3 investments.
The accompanying notes are an integral part of the financial statements.
| Schedule of Investments | October 31, 2015 |
Global X SuperIncome™ Preferred ETF
Sector Weightings (unaudited)†:
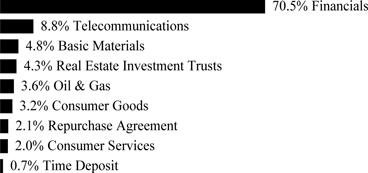
† Sector weightings percentages are based on the total market value of investments. Repurchase agreements purchased from cash collateral received for securities lending activity are included in total investments. Please see Note 2 and 7 in Notes to Financial Statements for more detailed information.
| | | Shares | | | Value | |
| PREFERRED STOCK — 99.7% | | | | | | | | |
| BERMUDA— 1.3% | | | | | | | | |
| Financials — 1.3% | | | | | | | | |
| PartnerRe, 0.000% | | | 104,986 | | | $ | 3,000,500 | |
| LUXEMBOURG— 2.6% | | | | | | | | |
| Basic Materials — 2.6% | | | | | | | | |
| ArcelorMittal, 6.000% | | | 675,322 | | | | 6,104,911 | |
| NETHERLANDS— 6.2% | | | | | | | | |
| Financials — 6.2% | | | | | | | | |
| Aegon, 6.375% | | | 280,579 | | | | 7,182,822 | |
| ING Groep, 7.050% | | | 123,022 | | | | 3,237,939 | |
| ING Groep, 6.375% | | | 161,198 | | | | 4,128,281 | |
| | | | | | | | 14,549,042 | |
| TOTAL NETHERLANDS | | | | | | | 14,549,042 | |
| UNITED STATES— 89.6% | | | | | | | | |
| Basic Materials — 2.3% | | | | | | | | |
| Alcoa, 5.375% (A) | | | 172,416 | | | | 5,453,518 | |
| Consumer Goods — 3.3% | | | | | | | | |
| CHS, 7.500% | | | 145,416 | | | | 4,038,202 | |
| CHS, 6.750%(A) (B) | | | 137,808 | | | | 3,715,304 | |
| | | | | | | | 7,753,506 | |
| Consumer Services — 2.1% | | | | | | | | |
| Weyerhaeuser, 0.000% | | | 97,340 | | | | 4,885,495 | |
| Financials — 64.8% | | | | | | | | |
| Aegon, 8.000% | | | 149,090 | | | | 4,126,811 | |
| Ally Financial, 8.500%(B) | | | 93,807 | | | | 2,410,840 | |
| Barclays Bank, 8.125% | | | 230,625 | | | | 6,060,825 | |
The accompanying notes are an integral part of the financial statements.
| Schedule of Investments | October 31, 2015 |
Global X SuperIncome™ Preferred ETF
| | | Shares | | | Value | |
| PREFERRED STOCK — continued | | | | | | | | |
| Financials — continued | | | | | | | | |
| Barclays Bank, 7.750% | | | 99,780 | | | $ | 2,619,225 | |
| Barclays Bank, 7.100% | | | 119,039 | | | | 3,087,872 | |
| Capital One Financial, 6.700%(A) | | | 141,614 | | | | 3,853,317 | |
| Capital One Financial, 6.250% | | | 141,431 | | | | 3,663,063 | |
| Citigroup, 7.125%(B) | | | 114,770 | | | | 3,164,209 | |
| Citigroup, 6.875% | | | 58,195 | | | | 1,559,044 | |
| Citigroup Capital XIII, 7.875%(B) | | | 270,968 | | | | 6,882,587 | |
| Colony Capital, 0.000% | | | 86,557 | | | | 1,960,516 | |
| Countrywide Capital IV, 6.750% | | | 80,658 | | | | 2,076,943 | |
| Countrywide Capital V, 7.000% | | | 238,041 | | | | 6,112,893 | |
| Deutsche Bank Contingent Capital Trust III, 7.600% | | | 249,939 | | | | 6,683,369 | |
| Deutsche Bank Contingent Capital Trust V, 8.050% | | | 174,221 | | | | 4,763,202 | |
| Discover Financial Services, 6.500% | | | 163,075 | | | | 4,352,472 | |
| First Niagara Financial Group, 8.625%(B) | | | 98,026 | | | | 2,699,636 | |
| GMAC Capital Trust I, 8.125%(B) | | | 359,679 | | | | 9,290,508 | |
| Hartford Financial Services Group, 7.875%(B) | | | 174,805 | | | | 5,383,994 | |
| HSBC Holdings, 8.125%(A) | | | 168,153 | | | | 4,447,647 | |
| HSBC Holdings, 8.000% | | | 284,098 | | | | 7,386,548 | |
| ING Groep, 7.200% | | | 169,628 | | | | 4,451,039 | |
| JPMorgan Chase, 6.700% | | | 259,870 | | | | 7,016,490 | |
| Ladenburg Thalmann Financial Services, 8.000%(A) | | | 102,151 | | | | 2,430,172 | |
| Merrill Lynch Preferred Capital Trust V, 7.280% | | | 134,848 | | | | 3,515,487 | |
| Morgan Stanley, 7.125%(A) (B) | | | 168,203 | | | | 4,684,454 | |
| Morgan Stanley, 6.875%(B) | | | 167,537 | | | | 4,531,876 | |
| Morgan Stanley, 6.625%(A) | | | 97,970 | | | | 2,621,677 | |
| RBS Capital Fund Trust, 0.000% | | | 224,778 | | | | 5,596,972 | |
| Regions Financial, 6.375%(B) | | | 142,166 | | | | 3,764,556 | |
| Regions Financial, 6.375% | | | 140,286 | | | | 3,647,436 | |
| Royal Bank of Scotland Group, 7.250% | | | 159,364 | | | | 4,060,595 | |
| Royal Bank of Scotland Group, 6.600%(A) | | | 82,534 | | | | 2,095,538 | |
| Wells Fargo, 8.000% | | | 420,171 | | | | 11,785,797 | |
| | | | | | | | 152,787,610 | |
| Oil & Gas — 3.7% | | | | | | | | |
| Southwestern Energy, 6.250% | | | 250,779 | | | | 7,029,636 | |
| WPX Energy, 0.000% | | | 45,776 | | | | 1,693,254 | |
| | | | | | | | 8,722,890 | |
| Real Estate Investment Trusts — 4.4% | | | | | | | | |
| Digital Realty Trust, 7.375% | | | 102,926 | | | | 2,825,319 | |
| Vereit, 6.700% (A) | | | 304,489 | | | | 7,554,372 | |
| | | | | | | | 10,379,691 | |
| Telecommunications — 9.0% | | | | | | | | |
| Frontier Communications, 0.000% | | | 121,750 | | | | 12,069,078 | |
| Qwest, 7.500% | | | 161,852 | | | | 4,240,522 | |
The accompanying notes are an integral part of the financial statements.
| Schedule of Investments | October 31, 2015 |
Global X SuperIncome™ Preferred ETF
| | | Shares/Face
Amount | | | Value | |
| PREFERRED STOCK — continued | | | | | | | | |
| Telecommunications — continued | | | | | | | | |
| Qwest, 7.375% | | | 186,270 | | | $ | 4,807,629 | |
| | | | | | | | 21,117,229 | |
| TOTAL UNITED STATES | | | | | | | 211,099,939 | |
| TOTAL PREFERRED STOCK | | | | | | | | |
| (Cost $251,559,409) | | | | | | | 234,754,392 | |
| | | | | | | | | |
| REPURCHASE AGREEMENT — 2.1% | | | | | | | | |
| Deutsche Bank | | | | | | | | |
0.050%, dated 10/30/15, to be repurchased on 11/02/15 repurchase price
$5,029,221 (collateralized by U.S. Treasury Obligations, par value
$5,029,221, 3.250%, 07/31/16 with a total market value of $5,167,525) (C) | | | | | | | | |
| (Cost $5,029,200) | | $ | 5,029,200 | | | | 5,029,200 | |
| TIME DEPOSIT — 0.8% |
| Brown Brothers Harriman, 0.030%, 11/02/15 | | | | | | | | |
| (Cost $1,828,540) | | | 1,828,540 | | | | 1,828,540 | |
| TOTAL INVESTMENTS — 102.6% | | | | | | | | |
| (Cost $258,417,149) | | | | | | $ | 241,612,132 | |
Percentages are based on Net Assets of $235,426,807.
| (A) | This security or a partial position of this security is on loan at October 31, 2015. The total value of securities on loan at October 31, 2015 was $4,907,868. |
| (B) | Floating rate security - Rate disclosed is the rate in effect on October 31, 2015. |
| (C) | These securities were purchased with cash collateral held from securities on loan. The total value of such securities as of October 31, 2015 was $5,029,200. |
Ser — Series
The following is a summary of the inputs used as of October 31, 2015, in valuing the Fund's investments carried at value:
| Investments in Securities | | Level 1 | | | Level 2 | | | Level 3 | | | Total | |
| Preferred Stock | | $ | 234,754,392 | | | $ | — | | | $ | — | | | $ | 234,754,392 | |
| Time Deposit | | | — | | | | 1,828,540 | | | | — | | | | 1,828,540 | |
| Repurchase Agreement | | | — | | | | 5,029,200 | | | | — | | | | 5,029,200 | |
| Total Investments in Securities | | $ | 234,754,392 | | | $ | 6,857,740 | | | $ | — | | | $ | 241,612,132 | |
For the year ended October 31, 2015, there have been no transfers between Level 1, Level 2 or Level 3 investments.
As of October 31, 2015, there were no Level 3 investments.
The accompanying notes are an integral part of the financial statements.
| Schedule of Investments | | October 31, 2015 |
Global X Social Media Index ETF
Sector Weightings (unaudited)†:
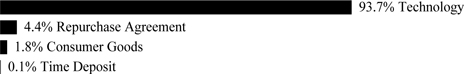
† Sector weightings percentages are based on the total market value of investments. Repurchase agreements purchased from cash collateral received for securities lending activity are included in total investments. Please see Note 2 and 7 in Notes to Financial Statements for more detailed information.
| | | Shares | | | Value | |
| COMMON STOCK — 100.3% | | | | | | | | |
| CHINA— 22.2% | | | | | | | | |
| Technology — 22.2% | | | | | | | | |
| Changyou.com ADR * | | | 7,384 | | | $ | 147,385 | |
| NetEase ADR | | | 25,863 | | | | 3,737,979 | |
| Renren ADR * | | | 159,664 | | | | 577,984 | |
| Tencent Holdings | | | 402,905 | | | | 7,621,305 | |
| Youku.com ADR * | | | 145,259 | | | | 3,535,604 | |
| YY ADR * (A) | | | 26,158 | | | | 1,489,436 | |
| TOTAL CHINA | | | | | | | 17,109,693 | |
| GERMANY— 0.8% | | | | | | | | |
| Technology — 0.8% | | | | | | | | |
| XING | | | 3,342 | | | | 663,039 | |
| IRELAND— 1.9% | | | | | | | | |
| Consumer Goods — 1.9% | | | | | | | | |
| King Digital Entertainment * (A) | | | 96,725 | | | | 1,447,006 | |
| JAPAN— 10.7% | | | | | | | | |
| Technology — 10.7% | | | | | | | | |
| Dena * (A) | | | 125,731 | | | | 2,033,784 | |
| Gree * (A) | | | 123,835 | | | | 630,078 | |
| Mixi * | | | 49,130 | | | | 1,889,068 | |
| Nexon | | | 265,572 | | | | 3,714,817 | |
| TOTAL JAPAN | | | | | | | 8,267,747 | |
| RUSSIA— 9.4% | | | | | | | | |
| Technology — 9.4% | | | | | | | | |
| Mail.ru Group GDR * | | | 152,938 | | | | 2,982,291 | |
| Yandex, Cl A * | | | 266,110 | | | | 4,284,371 | |
| TOTAL RUSSIA | | | | | | | 7,266,662 | |
The accompanying notes are an integral part of the financial statements.
| Schedule of Investments | | October 31, 2015 |
Global X Social Media Index ETF
| | | Shares/Face
Amount(1) | | | Value | |
| COMMON STOCK — continued | | | | | | | | |
| | | | | | | | | |
| TAIWAN— 1.2% | | | | | | | | |
| Technology — 1.2% | | | | | | | | |
| PChome Online | | | 81,833 | | | $ | 920,081 | |
| UNITED STATES— 54.1% | | | | | | | | |
| Technology — 54.1% | | | | | | | | |
| Alphabet * | | | 5,202 | | | | 3,835,903 | |
| Angie's List * (A) | | | 52,225 | | | | 403,699 | |
| Demand Media * | | | 154 | | | | 670 | |
| Facebook, Cl A * | | | 78,103 | | | | 7,964,163 | |
| Groupon, Cl A * | | | 563,962 | | | | 2,092,299 | |
| Jive Software * | | | 56,101 | | | | 273,212 | |
| LinkedIn, Cl A * | | | 38,560 | | | | 9,287,947 | |
| Nutrisystem | | | 33,927 | | | | 784,731 | |
| Pandora Media * | | | 181,591 | | | | 2,090,112 | |
| SINA * | | | 68,405 | | | | 3,258,814 | |
| Twitter * | | | 116,127 | | | | 3,304,974 | |
| United Online * | | | 16,683 | | | | 194,858 | |
| Weibo ADR * (A) | | | 30,939 | | | | 498,737 | |
| Yahoo! * | | | 108,420 | | | | 3,861,920 | |
| Yelp, Cl A * | | | 78,530 | | | | 1,747,293 | |
| Zynga, Cl A * | | | 909,840 | | | | 2,156,321 | |
| TOTAL UNITED STATES | | | | | | | 41,755,653 | |
| TOTAL COMMON STOCK | | | | | | | | |
| (Cost $92,191,167) | | | | | | | 77,429,881 | |
| | | | | | | | | |
| REPURCHASE AGREEMENT — 4.6% | | | | | | | | |
| Deutsche Bank | | | | | | | | |
0.050%, dated 10/30/15, to be repurchased on 11/02/15 repurchase price
$3,529,766 (collateralized by U.S. Treasury Obligations, par value
$3,529,766, 3.250%, 07/31/16 with a total market value of $3,626,834) (B) | | | | | | | | |
| (Cost $3,529,751) | | $ | 3,529,751 | | | | 3,529,751 | |
| TIME DEPOSIT — 0.1% | | | | | | | | |
| Brown Brothers Harriman, 0.030%, 11/02/15 | | | | | | | | |
| (Cost $71,538) | | | 71,538 | | | | 71,538 | |
| TOTAL INVESTMENTS — 105.0% | | | | | | | | |
| (Cost $95,792,456) | | | | | | $ | 81,031,170 | |
Percentages are based on Net Assets of $77,144,752.
| * | Non-income producing security. |
| (1) | In U.S. Dollars unless otherwise indicated. |
| (A) | This security or a partial position of this security is on loan at October 31, 2015. The total value of securities on loan at October 31, 2015 was $3,423,061. |
The accompanying notes are an integral part of the financial statements.
| Schedule of Investments | | October 31, 2015 |
Global X Social Media Index ETF
| (B) | These securities were purchased with cash collateral held from securities on loan. The total value of such securities as of October 31, 2015 was $3,529,751. |
ADR — American Depositary Receipt
Cl — Class
GDR — Global Depositary Receipt
The following is a summary of the inputs used as of October 31, 2015, in valuing the Fund's investments carried at value:
| Investments in Securities | | Level 1 | | | Level 2 | | | Level 3 | | | Total | |
| Common Stock | | $ | 77,429,881 | | | $ | — | | | $ | — | | | $ | 77,429,881 | |
| Time Deposit | | | — | | | | 71,538 | | | | — | | | | 71,538 | |
| Repurchase Agreement | | | — | | | | 3,529,751 | | | | — | | | | 3,529,751 | |
| Total Investments in Securities | | $ | 77,429,881 | | | $ | 3,601,289 | | | $ | — | | | $ | 81,031,170 | |
For the year ended October 31, 2015, there have been no transfers between Level 1, Level 2 or Level 3 investments.
As of October 31, 2015, there were no Level 3 investments.
The accompanying notes are an integral part of the financial statements.
| Schedule of Investments | October 31, 2015 |
| | |
| Global X | JPMorgan Efficiente Index ETF |
Sector Weightings (unaudited)†:

† Sector weightings percentages are based on the total market value of investments.
| | | Shares/Face
Amount | | | Value | |
| EXCHANGE TRADED FUNDS — 99.9% | | | | | | |
| iShares 1-3 Year Treasury Bond ETF, Cl 3 | | | 48,788 | | | $ | 4,138,686 | |
| iShares 20+ Year Treasury Bond ETF | | | 13,377 | | | | 1,642,428 | |
| iShares iBoxx $ Investment Grade Corporate Bond ETF | | | 14,300 | | | | 1,664,806 | |
| iShares JP Morgan USD Emerging Markets Bond ETF | | | 7,827 | | | | 849,230 | |
| TOTAL EXCHANGE TRADED FUNDS | | | | | | | | |
| (Cost $8,268,821) | | | | | | | 8,295,150 | |
| | | | | | | | | |
| TIME DEPOSIT — 0.2% |
| Brown Brothers Harriman, 0.030%, 11/02/15 | | | | | | | | |
| (Cost $12,732) | | $ | 12,732 | | | | 12,732 | |
| | | | | | | | | |
| TOTAL INVESTMENTS — 100.1% | | | | | | | | |
| (Cost $8,281,553) | | | | | | $ | 8,307,882 | |
Percentages are based on Net Assets of $8,302,420.
Cl — Class
ETF — Exchange Traded Fund
USD — U.S. Dollar
The following is a summary of the inputs used as of October 31, 2015, in valuing the Fund's investments carried at value:
| Investments in Securities | | Level 1 | | | Level 2 | | | Level 3 | | | Total | |
| Exchange Traded Funds | | $ | 8,295,150 | | | $ | — | | | $ | — | | | $ | 8,295,150 | |
| Time Deposit | | | — | | | | 12,732 | | | | — | | | | 12,732 | |
| Total Investments in Securities | | $ | 8,295,150 | | | $ | 12,732 | | | $ | — | | | $ | 8,307,882 | |
For the year ended October 31, 2015, there have been no transfers between Level 1, Level 2 or Level 3 investments.
As of October 31, 2015, there were no Level 3 investments.
The accompanying notes are an integral part of the financial statements.
| Schedule of Investments | October 31, 2015 |
| | |
| Global X | JPMorgan US Sector Rotator Index ETF |
Sector Weightings (unaudited)†:

† Sector weightings percentages are based on the total market value of investments.
| | | Shares/Face
Amount | | | Value | |
| EXCHANGE TRADED FUNDS — 100.0% |
| iShares 1-3 Year Treasury Bond ETF, Cl 3 | | | 98,554 | | | $ | 8,360,336 | |
| SPDR Dow Jones REIT ETF | | | 30,116 | | | | 2,745,375 | |
| Utilities Select Sector SPDR Fund | | | 68,880 | | | | 3,013,500 | |
| TOTAL EXCHANGE TRADED FUNDS | | | | | | | | |
| (Cost $13,934,295) | | | | | | | 14,119,211 | |
| | | | | | | | | |
| TIME DEPOSIT — 0.1% |
| Brown Brothers Harriman, 0.030%, 11/02/15 | | | | | | | | |
| (Cost $16,371) | | $ | 16,371 | | | | 16,371 | |
| | | | | | | | | |
| TOTAL INVESTMENTS — 100.1% | | | | | | | | |
| (Cost $13,950,666) | | | | | | $ | 14,135,582 | |
Percentages are based on Net Assets of $14,127,289.
Cl — Class
ETF — Exchange Traded Fund
REIT — Real Estate Investment Trust
SPDR — Standard & Poor’s Depositary Receipts
The following is a summary of the inputs used as of October 31, 2015, in valuing the Fund's investments carried at value:
| Investments in Securities | | Level 1 | | | Level 2 | | | Level 3 | | | Total | |
| Exchange Traded Funds | | $ | 14,119,211 | | | $ | — | | | $ | — | | | $ | 14,119,211 | |
| Time Deposit | | | — | | | | 16,371 | | | | — | | | | 16,371 | |
| Total Investments in Securities | | $ | 14,119,211 | | | $ | 16,371 | | | $ | — | | | $ | 14,135,582 | |
For the year ended October 31, 2015, there have been no transfers between Level 1, Level 2 or Level 3 investments.
As of October 31, 2015, there were no Level 3 investments.
The accompanying notes are an integral part of the financial statements.
| Schedule of Investments | October 31, 2015 |
| | |
| Global X Permanent ETF |
Sector Weightings (unaudited)†:
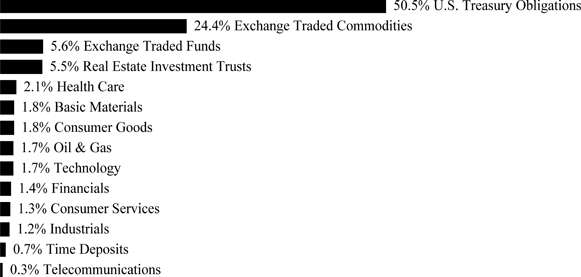
† Sector weightings percentages are based on the total market value of investments. Repurchase agreements purchased from cash collateral received for securities lending activity are included in total investments. Please see Note 2 and 7 in Notes to Financial Statements for more detailed information.
| | | Face Amount(1)/
Shares | | | Value | |
| U.S. TREASURY OBLIGATIONS — 50.3% |
| U.S. Treasury Bonds | | | | | | | | |
| 4.625%, 02/15/40 | | $ | 518,200 | | | $ | 684,301 | |
| 4.375%, 05/15/40 | | | 541,700 | | | | 690,512 | |
| 4.375%, 11/15/39 | | | 541,800 | | | | 690,837 | |
| 3.875%, 08/15/40 | | | 579,318 | | | | 685,285 | |
| | | | | | | | | |
| U.S. Treasury Notes | | | | | | | | |
| 1.500%, 07/31/16 | | | 660,000 | | | | 665,414 | |
| 1.500%, 06/30/16 | | | 664,000 | | | | 669,006 | |
| 1.000%, 08/31/16 | | | 665,000 | | | | 668,126 | |
| 0.875%, 11/30/16 | | | 668,000 | | | | 670,836 | |
| | | | | | | | | |
| TOTAL U.S. TREASURY OBLIGATIONS | | | | | | | | |
| (Cost $5,329,514) | | | | | | | 5,424,317 | |
| | | | | | | | | |
| EXCHANGE TRADED COMMODITIES — 24.3% |
| ETFS Physical Gold * | | | 9,440 | | | | 1,042,507 | |
| ETFS Physical Silver * | | | 31,662 | | | | 472,234 | |
| ETFS Physical Silver (GBP shares) * | | | 3,802 | | | | 56,698 | |
| Gold Bullion Securities * | | | 9,569 | | | | 1,042,830 | |
| TOTAL EXCHANGE TRADED COMMODITIES | | | | | | | | |
| (Cost $3,731,980) | | | | | | | 2,614,269 | |
| | | | | | | | | |
| COMMON STOCK — 18.7% |
| AUSTRALIA— 0.3% | | | | | | | | |
| Basic Materials — 0.3% | | | | | | | | |
| BHP Billiton ADR | | | 878 | | | | 28,878 | |
The accompanying notes are an integral part of the financial statements.
| Schedule of Investments | October 31, 2015 |
| | |
| Global X Permanent ETF |
| | | Shares | | | Value | |
| COMMON STOCK — continued |
| CANADA— 0.2% | | | | | | | | |
| Basic Materials — 0.2% | | | | | | | | |
| Potash Corp of Saskatchewan | | | 1,149 | | | $ | 23,244 | |
| FRANCE— 0.3% | | | | | | | | |
| Oil & Gas — 0.3% | | | | | | | | |
| Total | | | 712 | | | | 34,721 | |
| NETHERLANDS— 0.3% | | | | | | | | |
| Oil & Gas — 0.3% | | | | | | | | |
| Royal Dutch Shell ADR, Cl A | | | 625 | | | | 32,787 | |
| PERU— 0.3% | | | | | | | | |
| Basic Materials — 0.3% | | | | | | | | |
| Southern Copper | | | 1,205 | | | | 33,451 | |
| SWITZERLAND— 0.4% | | | | | | | | |
| Basic Materials — 0.4% | | | | | | | | |
| Glencore | | | 8,630 | | | | 14,994 | |
| Syngenta ADR | | | 447 | | | | 30,079 | |
| TOTAL SWITZERLAND | | | | | | | 45,073 | |
| UNITED KINGDOM— 0.9% | | | | | | | | |
| Basic Materials — 0.6% | | | | | | | | |
| MMC Norilsk Nickel ADR | | | 2,000 | | | | 29,700 | |
| Rio Tinto ADR | | | 867 | | | | 31,654 | |
| | | | | | | | 61,354 | |
| Oil & Gas — 0.3% | | | | | | | | |
| BP | | | 5,300 | | | | 31,628 | |
| TOTAL UNITED KINGDOM | | | | | | | 92,982 | |
| UNITED STATES— 16.0% | | | | | | | | |
| Consumer Goods — 1.7% | | | | | | | | |
| Altria Group | | | 391 | | | | 23,644 | |
| Archer-Daniels-Midland | | | 737 | | | | 33,652 | |
| Coca-Cola | | | 464 | | | | 19,650 | |
| Monsanto | | | 334 | | | | 31,136 | |
| PepsiCo | | | 205 | | | | 20,949 | |
| Philip Morris International | | | 238 | | | | 21,039 | |
| Procter & Gamble | | | 245 | | | | 18,713 | |
| Walgreens Boots Alliance | | | 227 | | | | 19,222 | |
| | | | | | | | 188,005 | |
| Consumer Services — 1.3% | | | | | | | | |
| Amazon.com * | | | 44 | | | | 27,540 | |
| Comcast, Cl A | | | 318 | | | | 19,913 | |
The accompanying notes are an integral part of the financial statements.
| Schedule of Investments | October 31, 2015 |
| | |
| Global X Permanent ETF |
| | | Shares | | | Value | |
| COMMON STOCK — continued |
| Consumer Services — continued | | | | | | | | |
| CVS Health | | | 183 | | | $ | 18,077 | |
| Home Depot | | | 173 | | | | 21,390 | |
| McDonald's | | | 202 | | | | 22,674 | |
| Wal-Mart Stores | | | 270 | | | | 15,455 | |
| Walt Disney | | | 168 | | | | 19,108 | |
| | | | | | | | 144,157 | |
| Financials — 1.4% | | | | | | | | |
| Bank of America | | | 1,127 | | | | 18,911 | |
| Berkshire Hathaway, Cl B * | | | 140 | | | | 19,043 | |
| Citigroup | | | 347 | | | | 18,450 | |
| Goldman Sachs Group | | | 92 | | | | 17,250 | |
| JPMorgan Chase | | | 283 | | | | 18,183 | |
| Mastercard, Cl A | | | 205 | | | | 20,293 | |
| Visa, Cl A | | | 285 | | | | 22,110 | |
| Wells Fargo | | | 340 | | | | 18,407 | |
| | | | | | | | 152,647 | |
| Health Care — 2.1% | | | | | | | | |
| AbbVie | | | 285 | | | | 16,972 | |
| Allergan * | | | 63 | | | | 19,434 | |
| Amgen | | | 125 | | | | 19,773 | |
| Biogen Idec * | | | 48 | | | | 13,944 | |
| Bristol-Myers Squibb | | | 289 | | | | 19,059 | |
| Celgene * | | | 166 | | | | 20,370 | |
| Eli Lilly | | | 229 | | | | 18,679 | |
| Gilead Sciences | | | 163 | | | | 17,625 | |
| Johnson & Johnson | | | 196 | | | | 19,802 | |
| Merck | | | 336 | | | | 18,366 | |
| Pfizer | | | 573 | | | | 19,379 | |
| UnitedHealth Group | | | 157 | | | | 18,491 | |
| | | | | | | | 221,894 | |
| Industrials — 1.2% | | | | | | | | |
| 3M | | | 130 | | | | 20,437 | |
| Boeing | | | 138 | | | | 20,433 | |
| Deere | | | 366 | | | | 28,548 | |
| General Electric | | | 718 | | | | 20,765 | |
| Union Pacific | | | 197 | | | | 17,602 | |
| United Technologies | | | 173 | | | | 17,025 | |
| | | | | | | | 124,810 | |
| Oil & Gas — 0.8% | | | | | | | | |
| Chevron | | | 369 | | | | 33,535 | |
| Exxon Mobil | | | 428 | | | | 35,413 | |
| Schlumberger | | | 223 | | | | 17,429 | |
| | | | | | | | 86,377 | |
The accompanying notes are an integral part of the financial statements.
| Schedule of Investments | October 31, 2015 |
| | |
| Global X Permanent ETF |
| | | Shares/Face
Amount(1) | | | Value | |
| COMMON STOCK — continued |
| Real Estate Investment Trusts — 5.5% | | | | | | | | |
| American Tower, Cl A | | | 572 | | | $ | 58,476 | |
| AvalonBay Communities | | | 335 | | | | 58,568 | |
| Care Capital Properties | | | 209 | | | | 6,887 | |
| Crown Castle International | | | 665 | | | | 56,831 | |
| Equity Residential | | | 760 | | | | 58,763 | |
| General Growth Properties | | | 2,082 | | | | 60,274 | |
| ProLogis | | | 1,439 | | | | 61,489 | |
| Public Storage | | | 290 | | | | 66,543 | |
| Simon Property Group | | | 309 | | | | 62,251 | |
| Ventas | | | 838 | | | | 45,017 | |
| Welltower | | | 813 | | | | 52,739 | |
| | | | | | | | 587,838 | |
| Technology — 1.7% | | | | | | | | |
| Alphabet * | | | 33 | | | | 24,334 | |
| Apple | | | 152 | | | | 18,164 | |
| Cisco Systems | | | 697 | | | | 20,108 | |
| Facebook, Cl A * | | | 222 | | | | 22,637 | |
| Intel | | | 629 | | | | 21,298 | |
| International Business Machines | | | 118 | | | | 16,530 | |
| Microsoft | | | 434 | | | | 22,846 | |
| Oracle | | | 453 | | | | 17,594 | |
| QUALCOMM | | | 306 | | | | 18,183 | |
| | | | | | | | 181,694 | |
| Telecommunications — 0.3% | | | | | | | | |
| AT&T | | | 537 | | | | 17,995 | |
| Verizon Communications | | | 410 | | | | 19,221 | |
| | | | | | | | 37,216 | |
| TOTAL UNITED STATES | | | | | | | 1,724,638 | |
| TOTAL COMMON STOCK | | | | | | | | |
| (Cost $1,886,428) | | | | | | | 2,015,774 | |
| | | | | | | | | |
| EXCHANGE TRADED FUNDS — 5.6% |
| Vanguard FTSE All-World ex-US ETF, Cl U | | | 6,631 | | | | 301,578 | |
| Vanguard Small-Cap ETF | | | 2,649 | | | | 302,198 | |
| TOTAL EXCHANGE TRADED FUNDS | | | | | | | | |
| (Cost $567,483) | | | | | | | 603,776 | |
| | | | | | | | | |
| TIME DEPOSITS — 0.7% |
| Brown Brothers Harriman | | | | | | | | |
| 0.030%, 11/02/15 | | $ | 77,059 | | | | 77,059 | |
| 0.080%, 11/02/15, GBP | | | 2 | | | | 3 | |
| TOTAL TIME DEPOSITS | | | | | | | | |
| (Cost $77,062) | | | | | | | 77,062 | |
The accompanying notes are an integral part of the financial statements.
| Schedule of Investments | October 31, 2015 |
| | |
| Global X Permanent ETF |
| | | Value | |
| | | | |
| TOTAL INVESTMENTS — 99.6% | | | | |
| (Cost $11,592,467) | | $ | 10,735,198 | |
Percentages are based on Net Assets of $10,773,714.
| (1) | In U.S. Dollars unless otherwise indicated. |
| * | Non-income producing security. |
| ADR — American Depositary Receipt |
| Cl — Class |
| ETF — Exchange Traded Fund |
| FTSE — Financial Times and Stock Exchange |
| GBP — British Pound Sterling |
The following is a summary of the inputs used as of October 31, 2015, in valuing the Fund's investments carried at value:
| Investments in Securities | | Level 1 | | | Level 2 | | | Level 3 | | | Total | |
| U.S. Treasury Obligations | | $ | — | | | $ | 5,424,317 | | | $ | — | | | $ | 5,424,317 | |
| Exchange Traded Commodities | | | 2,614,269 | | | | — | | | | — | | | | 2,614,269 | |
| Common Stock | | | 2,015,774 | | | | — | | | | — | | | | 2,015,774 | |
| Exchange Traded Funds | | | 603,776 | | | | — | | | | — | | | | 603,776 | |
| Time Deposits | | | — | | | | 77,062 | | | | — | | | | 77,062 | |
| Total Investments in Securities | | $ | 5,233,819 | | | $ | 5,501,379 | | | $ | — | | | $ | 10,735,198 | |
|
For the year ended October 31, 2015, there have been no transfers between Level 1, Level 2 or Level 3 investments.
As of October 31, 2015, there were no Level 3 investments.
The accompanying notes are an integral part of the financial statements.
| Schedule of Investments | October 31, 2015 |
| | |
| Global X Guru™ Index ETF |
Sector Weightings (unaudited)†:
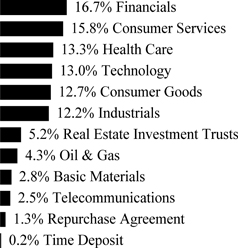
† Sector weightings percentages are based on the total market value of investments. Repurchase agreements purchased from cash collateral received for securities lending activity are included in total investments. Please see Note 2 and 7 in Notes to Financial Statements for more detailed information.
| | | Shares | | | Value | |
| COMMON STOCK — 97.4% |
| CANADA— 3.3% | | | | | | | | |
| Health Care — 1.0% | | | | | | | | |
| Valeant Pharmaceuticals International * | | | 19,341 | | | $ | 1,813,606 | |
| Industrials — 2.3% | | | | | | | | |
| Canadian Pacific Railway | | | 30,739 | | | | 4,318,830 | |
| TOTAL CANADA | | | | | | | 6,132,436 | |
| IRELAND— 3.7% | | | | | | | | |
| Health Care — 3.7% | | | | | | | | |
| Horizon Pharma * (A) | | | 151,764 | | | | 2,385,730 | |
| Shire ADR | | | 19,650 | | | | 4,461,533 | |
| TOTAL IRELAND | | | | | | | 6,847,263 | |
| MEXICO— 2.5% | | | | | | | | |
| Telecommunications — 2.5% | | | | | | | | |
| America Movil ADR, Ser L | | | 257,318 | | | | 4,582,834 | |
| UNITED KINGDOM— 2.3% | | | | | | | | |
| Consumer Services — 2.3% | | | | | | | | |
| Liberty Global * | | | 99,235 | | | | 4,231,380 | |
| UNITED STATES— 85.6% | | | | | | | | |
| Basic Materials — 2.9% | | | | | | | | |
| Celanese, Cl A | | | 74,670 | | | | 5,305,304 | |
The accompanying notes are an integral part of the financial statements.
| Schedule of Investments | October 31, 2015 |
| | |
| Global X Guru™ Index ETF |
| | | Shares | | | Value | |
| COMMON STOCK — continued |
| Consumer Goods — 12.9% | | | | | | | | |
| Darling Ingredients * | | | 347,773 | | | $ | 3,519,463 | |
| DR Horton | | | 154,795 | | | | 4,557,165 | |
| General Motors | | | 152,802 | | | | 5,334,318 | |
| Mondelez International, Cl A | | | 104,560 | | | | 4,826,489 | |
| NIKE, Cl B | | | 42,011 | | | | 5,504,701 | |
| | | | | | | | 23,742,136 | |
| Consumer Services — 13.8% | | | | | | | | |
| CBS, Cl B | | | 96,546 | | | | 4,491,320 | |
| Houghton Mifflin Harcourt * | | | 204,190 | | | | 4,000,082 | |
| Michaels * | | | 190,201 | | | | 4,446,900 | |
| Netflix * | | | 38,524 | | | | 4,175,231 | |
| Pandora Media * | | | 251,830 | | | | 2,898,563 | |
| priceline.com * | | | 3,699 | | | | 5,379,234 | |
| | | | | | | | 25,391,330 | |
| Financials — 16.9% | | | | | | | | |
| Ally Financial * | | | 221,627 | | | | 4,414,810 | |
| American International Group | | | 75,128 | | | | 4,737,571 | |
| Bank of New York Mellon | | | 109,635 | | | | 4,566,298 | |
| Citigroup | | | 83,612 | | | | 4,445,650 | |
| JPMorgan Chase | | | 70,966 | | | | 4,559,565 | |
| Moody's | | | 43,407 | | | | 4,174,017 | |
| Voya Financial | | | 107,350 | | | | 4,355,190 | |
| | | | | | | | 31,253,101 | |
| Health Care — 8.8% | | | | | | | | |
| Allergan * | | | 15,037 | | | | 4,638,463 | |
| Cigna | | | 32,952 | | | | 4,416,886 | |
| Depomed * | | | 153,743 | | | | 2,690,502 | |
| Humana | | | 25,458 | | | | 4,547,563 | |
| | | | | | | | 16,293,414 | |
| Industrials — 10.1% | | | | | | | | |
| FleetCor Technologies * | | | 29,479 | | | | 4,270,328 | |
| Owens-Illinois * | | | 217,400 | | | | 4,684,970 | |
| RR Donnelley & Sons (A) | | | 300,453 | | | | 5,068,642 | |
| Spirit Aerosystems Holdings, Cl A * | | | 85,611 | | | | 4,515,124 | |
| | | | | | | | 18,539,064 | |
| Oil & Gas — 1.9% | | | | | | | | |
| Cheniere Energy * | | | 70,864 | | | | 3,509,185 | |
| Real Estate Investment Trusts — 5.2% | | | | | | | | |
| American Tower, Cl A | | | 47,617 | | | | 4,867,886 | |
| Crown Castle International | | | 55,953 | | | | 4,781,743 | |
| | | | | | | | 9,649,629 | |
| Technology — 13.1% | | | | | | | | |
| Akamai Technologies * | | | 65,660 | | | | 3,993,442 | |
The accompanying notes are an integral part of the financial statements.
| Schedule of Investments | October 31, 2015 |
| | |
| Global X Guru™ Index ETF |
| | Shares/Face
Amount | | Value |
| COMMON STOCK — continued |
| Technology — continued | | | | | | |
| Apple | | 41,238 | | | $ | 4,927,941 |
| CDK Global | | 93,081 | | | | 4,634,503 |
| CDW | | 121,602 | | | | 5,434,393 |
| Facebook, Cl A * | | 51,427 | | | | 5,244,011 |
| | | | | | | 24,234,290 |
| TOTAL UNITED STATES | | | | | | 157,917,453 |
| TOTAL COMMON STOCK | | | | | | |
| (Cost $188,969,327) | | | | | | 179,711,366 |
| | | | | | | |
| MASTER LIMITED PARTNERSHIPS — 2.4% |
| UNITED STATES— 2.4% | | | | | | |
| Oil & Gas — 2.4% | | | | | | |
| Enterprise Products Partners | | | | | | |
| (Cost $5,205,006) | | 163,151 | | | | 4,507,862 |
| | | | | | | |
| | | | | | | |
| REPURCHASE AGREEMENT — 1.4% |
| Deutsche Bank | | | | | | |
0.050%, dated 10/30/15, to be repurchased on 11/02/15 repurchase price
$2,487,610 (collateralized by U.S. Treasury Obligations, par value
$2,487,610, 3.250%, 07/31/16 with a total market value of $2,556,020) (B) | | | | | | |
| (Cost $2,487,600) | $ | 2,487,600 | | | | 2,487,600 |
| TIME DEPOSIT — 0.1% |
| Brown Brothers Harriman, 0.030%, 11/02/15 | | | | | | |
| (Cost $264,466) | | 264,466 | | | | 264,466 |
| TOTAL INVESTMENTS — 101.3% | | | | | | |
| (Cost $196,926,399) | | | | | $ | 186,971,294 |
Percentages are based on Net Assets of $184,504,854.
| * | Non-income producing security. |
| (A) | This security or a partial position of this security is on loan at October 31, 2015. The total value of securities on loan at October 31, 2015 was $2,248,289. |
| (B) | These securities were purchased with cash collateral held from securities on loan. The total value of such securities as of October 31, 2015 was $2,487,600. |
| ADR — American Depositary Receipt |
| Cl — Class |
| Ser — Series |
The accompanying notes are an integral part of the financial statements.
| Schedule of Investments | October 31, 2015 |
| |
| Global X Guru™ Index ETF |
The following is a summary of the inputs used as of October 31, 2015, in valuing the Fund's investments carried at value:
| Investments in Securities | | Level 1 | | | Level 2 | | | Level 3 | | | Total | |
| Common Stock | | $ | 179,711,366 | | | $ | — | | | $ | — | | | $ | 179,711,366 | |
| Master Limited Partnership | | | 4,507,862 | | | | — | | | | — | | | | 4,507,862 | |
| Time Deposit | | | — | | | | 264,466 | | | | — | | | | 264,466 | |
| Repurchase Agreement | | | — | | | | 2,487,600 | | | | — | | | | 2,487,600 | |
| Total Investments in Securities | | $ | 184,219,228 | | | $ | 2,752,066 | | | $ | — | | | $ | 186,971,294 | |
|
For the year ended October 31, 2015, there have been no transfers between Level 1, Level 2 or Level 3 investments.
As of October 31, 2015, there were no Level 3 investments.
The accompanying notes are an integral part of the financial statements.
| Schedule of Investments | October 31, 2015 |
| |
| Global X Guru™ Activist Index ETF‡ |
Sector Weightings (unaudited)†:
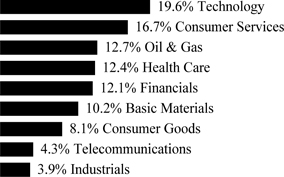
† Sector weightings percentages are based on the total market value of investments.
| | | Shares | | | Value | |
| COMMON STOCK — 99.8% |
| CANADA— 6.6% | | | | | | | | |
| Basic Materials — 1.9% | | | | | | | | |
| Agrium | | | 535 | | | $ | 49,792 | |
| Consumer Services — 2.0% | | | | | | | | |
| Restaurant Brands International | | | 1,312 | | | | 52,690 | |
| Health Care — 0.8% | | | | | | | | |
| Valeant Pharmaceuticals International * | | | 227 | | | | 21,286 | |
| Industrials — 1.9% | | | | | | | | |
| Canadian Pacific Railway | | | 361 | | | | 50,721 | |
| TOTAL CANADA | | | | | | | 174,489 | |
| UNITED STATES— 93.2% | | | | | | | | |
| Basic Materials — 8.3% | | | | | | | | |
| Air Products & Chemicals | | | 386 | | | | 53,646 | |
| Dow Chemical | | | 1,240 | | | | 64,071 | |
| EI du Pont de Nemours | | | 1,045 | | | | 66,254 | |
| Freeport-McMoRan Copper & Gold | | | 3,386 | | | | 39,853 | |
| | | | | | | | 223,824 | |
| Consumer Goods — 8.1% | | | | | | | | |
| ConAgra Foods | | | 1,256 | | | | 50,931 | |
| Mondelez International, Cl A | | | 1,227 | | | | 56,638 | |
| PepsiCo | | | 568 | | | | 58,044 | |
| Walgreens Boots Alliance | | | 612 | | | | 51,824 | |
| | | | | | | | 217,437 | |
| Consumer Services — 14.7% | | | | | | | | |
| eBay * | | | 2,004 | | | | 55,912 | |
| Hertz Global Holdings * | | | 3,033 | | | | 59,144 | |
| McDonald's | | | 563 | | | | 63,196 | |
The accompanying notes are an integral part of the financial statements.
| Schedule of Investments | October 31, 2015 |
| |
| Global X Guru™ Activist Index ETF‡ |
| | | Shares | | | Value | |
| COMMON STOCK — continued |
| Consumer Services — continued | | | | | | | | |
| Sysco | | | 1,378 | | | $ | 56,843 | |
| Time Warner | | | 714 | | | | 53,792 | |
| Twenty-First Century Fox, Cl B | | | 1,878 | | | | 57,992 | |
| Yum! Brands | | | 667 | | | | 47,297 | |
| | | | | | | | 394,176 | |
| Financials — 12.1% | | | | | | | | |
| American Express | | | 700 | | | | 51,282 | |
| Aon | | | 553 | | | | 51,600 | |
| Bank of New York Mellon | | | 1,287 | | | | 53,604 | |
| CBRE Group, Cl A * | | | 1,496 | | | | 55,771 | |
| Intercontinental Exchange | | | 235 | | | | 59,314 | |
| Loews | | | 1,461 | | | | 53,268 | |
| | | | | | | | 324,839 | |
| Health Care — 11.6% | | | | | | | | |
| Allergan * | | | 177 | | | | 54,598 | |
| Amgen | | | 334 | | | | 52,832 | |
| Baxter International | | | 1,391 | | | | 52,010 | |
| Hologic * | | | 1,321 | | | | 51,334 | |
| Progenics Pharmaceuticals * | | | 6,831 | | | | 50,140 | |
| Zoetis, Cl A | | | 1,165 | | | | 50,107 | |
| | | | | | | | 311,021 | |
| Industrials — 2.0% | | | | | | | | |
| FedEx | | | 344 | | | | 53,681 | |
| Oil & Gas — 12.7% | | | | | | | | |
| Baker Hughes | | | 999 | | | | 52,627 | |
| Cheniere Energy * | | | 885 | | | | 43,825 | |
| Chesapeake Energy * | | | 5,200 | | | | 37,076 | |
| CVR Energy | | | 1,323 | | | | 58,820 | |
| Halliburton | | | 1,373 | | | | 52,696 | |
| Hess | | | 965 | | | | 54,243 | |
| Williams | | | 1,033 | | | | 40,742 | |
| | | | | | | | 340,029 | |
| Technology — 19.5% | | | | | | | | |
| Adobe Systems * | | | 653 | | | | 57,895 | |
| Alphabet * | | | 86 | | | | 61,130 | |
| Apple | | | 483 | | | | 57,718 | |
| EMC | | | 2,104 | | | | 55,167 | |
| Juniper Networks | | | 2,002 | | | | 62,842 | |
| Microsoft | | | 1,198 | | | | 63,063 | |
| Motorola Solutions | | | 869 | | | | 60,804 | |
| Nuance Communications * | | | 3,092 | | | | 52,471 | |
| QUALCOMM | | | 914 | | | | 54,310 | |
| | | | | | | | 525,400 | |
The accompanying notes are an integral part of the financial statements.
| Schedule of Investments | October 31, 2015 |
| |
| Global X Guru™ Activist Index ETF‡ |
| | | Shares | | | Value | |
| COMMON STOCK — continued |
| Telecommunications — 4.2% | | | | | | | | |
| AT&T | | | 1,657 | | | $ | 55,526 | |
| Level 3 Communications * | | | 1,146 | | | | 58,389 | |
| | | | | | | | 113,915 | |
| TOTAL UNITED STATES | | | | | | | 2,504,322 | |
| TOTAL COMMON STOCK | | | | | | | | |
| (Cost $2,736,334) | | | | | | | 2,678,811 | |
| TOTAL INVESTMENTS — 99.8% | | | | | | | | |
| (Cost $2,736,334) | | | | | | $ | 2,678,811 | |
Percentages are based on Net Assets of $2,683,146.
| * | Non-income producing security. |
| ‡ | Fund commenced operations on April 28, 2015. |
As of October 31, 2015, all of the Fund’s investments were considered Level 1, in accordance with authoritative guidance on fair value measurements and disclosure under U.S. GAAP.
For the period ended October 31, 2015, there have been no transfers between Level 1, Level 2 or Level 3 investments.
As of October 31, 2015, there were no Level 3 investments.
The accompanying notes are an integral part of the financial statements.
| Schedule of Investments | October 31, 2015 |
| |
| Global X Guru™ International Index ETF |
Sector Weightings (unaudited)†:
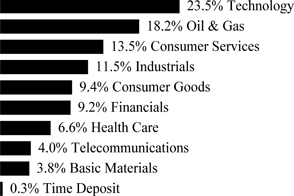
† Sector weightings percentages are based on the total market value of investments.
| | | Shares | | | Value | |
| COMMON STOCK — 99.6% |
| ARGENTINA— 1.9% | | | | | | | | |
| Oil & Gas — 1.9% | | | | | | | | |
| YPF ADR | | | 1,138 | | | $ | 24,308 | |
| BELGIUM— 2.1% | | | | | | | | |
| Consumer Goods — 2.1% | | | | | | | | |
| Anheuser-Busch InBev ADR | | | 233 | | | | 27,804 | |
| BRAZIL— 9.6% | | | | | | | | |
| Consumer Goods — 1.9% | | | | | | | | |
| AMBEV ADR | | | 5,226 | | | | 25,451 | |
| Financials — 5.4% | | | | | | | | |
| Banco Bradesco ADR | | | 3,949 | | | | 21,483 | |
| Banco Santander Brasil ADR | | | 6,906 | | | | 24,654 | |
| Itau Unibanco Holding ADR | | | 3,563 | | | | 24,406 | |
| | | | | | | | 70,543 | |
| Industrials — 2.3% | | | | | | | | |
| Embraer ADR | | | 1,009 | | | | 29,634 | |
| TOTAL BRAZIL | | | | | | | 125,628 | |
| CANADA— 13.7% | | | | | | | | |
| Basic Materials — 3.8% | | | | | | | | |
| Agrium | | | 254 | | | | 23,640 | |
| Barrick Gold | | | 3,373 | | | | 25,938 | |
| | | | | | | | 49,578 | |
| Consumer Goods — 1.8% | | | | | | | | |
| Gildan Activewear, Cl A | | | 839 | | | | 24,105 | |
| Consumer Services — 1.9% | | | | | | | | |
| Restaurant Brands International | | | 625 | | | | 25,100 | |
The accompanying notes are an integral part of the financial statements.
| Schedule of Investments | October 31, 2015 |
| |
| Global X Guru™ International Index ETF |
| | | Shares | | | Value | |
| COMMON STOCK — continued |
| Industrials — 1.9% | | | | | | | | |
| Canadian Pacific Railway | | | 176 | | | $ | 24,728 | |
| Oil & Gas — 2.3% | | | | | | | | |
| Cenovus Energy | | | 2,056 | | | | 30,655 | |
| Technology — 2.0% | | | | | | | | |
| BlackBerry * | | | 3,553 | | | | 25,901 | |
| TOTAL CANADA | | | | | | | 180,067 | |
| CHINA— 12.0% | | | | | | | | |
| Consumer Services — 7.2% | | | | | | | | |
| Alibaba Group Holding ADR * | | | 364 | | | | 30,514 | |
| Ctrip.com International ADR * | | | 391 | | | | 36,351 | |
| Vipshop Holdings ADR * | | | 1,403 | | | | 28,790 | |
| | | | | | | | 95,655 | |
| Technology — 4.8% | | | | | | | | |
| Baidu ADR * | | | 164 | | | | 30,745 | |
| NetEase ADR | | | 218 | | | | 31,508 | |
| | | | | | | | 62,253 | |
| TOTAL CHINA | | | | | | | 157,908 | |
| CYPRUS— 1.4% | | | | | | | | |
| Oil & Gas — 1.4% | | | | | | | | |
| Ocean Rig * | | | 8,352 | | | | 17,873 | |
| FINLAND— 2.3% | | | | | | | | |
| Technology — 2.3% | | | | | | | | |
| Nokia ADR | | | 4,126 | | | | 30,615 | |
| FRANCE— 1.5% | | | | | | | | |
| Health Care — 1.5% | | | | | | | | |
| Flamel Technologies ADR * | | | 1,204 | | | | 19,721 | |
| GERMANY— 1.8% | | | | | | | | |
| Financials — 1.8% | | | | | | | | |
| Deutsche Bank | | | 847 | | | | 23,674 | |
| HONG KONG— 1.8% | | | | | | | | |
| Consumer Services — 1.8% | | | | | | | | |
| Melco Crown Entertainment ADR | | | 1,292 | | | | 24,199 | |
| INDIA— 2.0% | | | | | | | | |
| Technology — 2.0% | | | | | | | | |
| Infosys ADR | | | 1,467 | | | | 26,641 | |
| IRELAND— 1.9% | | | | | | | | |
| Health Care — 1.9% | | | | | | | | |
| Shire ADR | | | 110 | | | | 24,975 | |
The accompanying notes are an integral part of the financial statements.
| Schedule of Investments | October 31, 2015 |
| |
| Global X Guru™ International Index ETF |
| | | Shares | | | Value | |
| COMMON STOCK — continued |
| ISRAEL— 7.5% | | | | | | | | |
| Health Care — 1.7% | | | | | | | | |
| Teva Pharmaceutical Industries ADR | | | 383 | | | $ | 22,670 | |
| Technology — 5.8% | | | | | | | | |
| Mellanox Technologies * | | | 635 | | | | 29,915 | |
| RADWARE * | | | 1,344 | | | | 20,039 | |
| Tower Semiconductor * | | | 1,936 | | | | 25,865 | |
| | | | | | | | 75,819 | |
| TOTAL ISRAEL | | | | | | | 98,489 | |
| MEXICO— 3.6% | | | | | | | | |
| Industrials — 1.6% | | | | | | | | |
| Cemex ADR * | | | 3,399 | | | | 21,448 | |
| Telecommunications — 2.0% | | | | | | | | |
| America Movil ADR, Ser L | | | 1,464 | | | | 26,074 | |
| TOTAL MEXICO | | | | | | | 47,522 | |
| NETHERLANDS— 5.8% | | | | | | | | |
| Industrials — 3.8% | | | | | | | | |
| AerCap Holdings * | | | 570 | | | | 23,655 | |
| Koninklijke Philips | | | 987 | | | | 26,590 | |
| | | | | | | | 50,245 | |
| Oil & Gas — 2.0% | | | | | | | | |
| Royal Dutch Shell ADR, Cl A | | | 488 | | | | 25,600 | |
| TOTAL NETHERLANDS | | | | | | | 75,845 | |
| PERU— 2.0% | | | | | | | | |
| Financials — 2.0% | | | | | | | | |
| Credicorp Ltd. | | | 231 | | | | 26,145 | |
| SINGAPORE— 4.1% | | | | | | | | |
| Oil & Gas — 2.1% | | | | | | | | |
| Interoil * | | | 712 | | | | 27,241 | |
| Technology — 2.0% | | | | | | | | |
| Avago Technologies, Cl A | | | 219 | | | | 26,966 | |
| TOTAL SINGAPORE | | | | | | | 54,207 | |
| SOUTH KOREA— 2.0% | | | | | | | | |
| Telecommunications — 2.0% | | | | | | | | |
| SK Telecom ADR | | | 1,108 | | | | 26,104 | |
| TAIWAN— 2.2% | | | | | | | | |
| Technology — 2.2% | | | | | | | | |
| Taiwan Semiconductor Manufacturing ADR | | | 1,339 | | | | 29,404 | |
The accompanying notes are an integral part of the financial statements.
| Schedule of Investments | October 31, 2015 |
| |
| Global X Guru™ International Index ETF |
| | | Shares/Face Amount | | | Value | |
| COMMON STOCK — continued |
| UNITED KINGDOM— 6.2% | | | | | | | | |
| Consumer Goods — 2.0% | | | | | | | | |
| Fiat Chrysler Automobiles * | | | 1,766 | | | $ | 25,854 | |
| Oil & Gas — 4.2% | | | | | | | | |
| BP ADR | | | 769 | | | | 27,453 | |
| Ensco, Cl A | | | 1,680 | | | | 27,939 | |
| | | | | | | | 55,392 | |
| TOTAL UNITED KINGDOM | | | | | | | 81,246 | |
| UNITED STATES— 14.2% | | | | | | | | |
| Consumer Goods — 1.6% | | | | | | | | |
| Caesarstone * | | | 597 | | | | 21,199 | |
| Consumer Services — 2.5% | | | | | | | | |
| TAL Education Group ADR * | | | 857 | | | | 32,952 | |
| Health Care — 1.5% | | | | | | | | |
| Arbutus Biopharma * | | | 3,488 | | | | 19,184 | |
| Industrials — 1.9% | | | | | | | | |
| Chicago Bridge & Iron | | | 545 | | | | 24,454 | |
| Oil & Gas — 4.3% | | | | | | | | |
| Euronav | | | 2,069 | | | | 30,952 | |
| TransCanada | | | 755 | | | | 25,361 | |
| | | | | | | | 56,313 | |
| Technology — 2.4% | | | | | | | | |
| SINA * | | | 674 | | | | 32,109 | |
| TOTAL UNITED STATES | | | | | | | 186,211 | |
| TOTAL COMMON STOCK | | | | | | | | |
| (Cost $1,457,400) | | | | | | | 1,308,586 | |
| |
| TIME DEPOSIT — 0.3% |
| Brown Brothers Harriman, 0.030%, 11/02/15 | | | | | | | | |
| (Cost $3,477) | | $ | 3,477 | | | | 3,477 | |
| TOTAL INVESTMENTS — 99.9% | | | | | | | | |
| (Cost $1,460,877) | | | | | | $ | 1,312,063 | |
Percentages are based on Net Assets of $1,312,967.
| * | Non-income producing security. |
ADR — American Depositary Receipt
Cl — Class
Ltd. — Limited
Ser — Series
The accompanying notes are an integral part of the financial statements.
| Schedule of Investments | October 31, 2015 |
| |
| Global X Guru™ International Index ETF |
The following is a summary of the inputs used as of October 31, 2015, in valuing the Fund's investments carried at value:
| Investments in Securities | | Level 1 | | | Level 2 | | | Level 3 | | | Total | |
| Common Stock | | $ | 1,308,586 | | | $ | — | | | $ | — | | | $ | 1,308,586 | |
| Time Deposit | | | — | | | | 3,477 | | | | — | | | | 3,477 | |
| Total Investments in Securities | | $ | 1,308,586 | | | $ | 3,477 | | | $ | — | | | $ | 1,312,063 | |
|
For the year ended October 31, 2015, there have been no transfers between Level 1, Level 2 or Level 3 investments.
As of October 31, 2015, there were no Level 3 investments.
The accompanying notes are an integral part of the financial statements.
| Schedule of Investments | October 31, 2015 |
| |
| Global X GF China Bond ETF‡ |
Sector Weightings (unaudited)†:
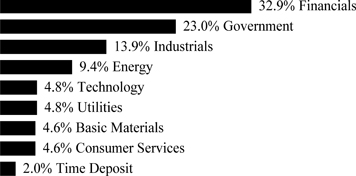
† Sector weightings percentages are based on the total market value of investments.
| | | Face Amount(1) | | | Value | |
| CORPORATE OBLIGATIONS — 96.5% |
| Basic Materials — 4.5% | | | | | | | | |
| Wuhan Iron & Steel Group MTN | | | | | | | | |
| 4.990%, 08/08/16 | | | 10,000,000 | | | $ | 1,603,147 | |
| Consumer Services — 4.6% | | | | | | | | |
| Overseas Chinese Town Enterprises MTN | | | | | | | | |
| 5.400%, 08/08/17 | | | 10,000,000 | | | | 1,628,863 | |
| Energy — 9.2% | | | | | | | | |
| China Three Gorges MTN | | | | | | | | |
| 4.440%, 04/17/18 | | | 10,000,000 | | | | 1,618,656 | |
| Shenhua Group MTN | | | | | | | | |
| 5.150%, 06/13/19 | | | 10,000,000 | | | | 1,672,237 | |
| | | | | | | | 3,290,893 | |
| Financials — 32.4% | | | | | | | | |
| Agricultural Development Bank of China | | | | | | | | |
| 4.950%, 07/16/19 | | | 10,000,000 | | | | 1,677,213 | |
| China Development Bank | | | | | | | | |
| 4.830%, 09/19/19 | | | 30,000,000 | | | | 5,002,238 | |
| 3.750%, 07/09/17 | | | 20,000,000 | | | | 3,210,533 | |
| China Merchants Group MTN | | | | | | | | |
| 5.400%, 08/18/21 | | | 10,000,000 | | | | 1,685,678 | |
| | | | | | | | 11,575,662 | |
| Government — 22.7% | | | | | | | | |
| China Government Bond | | | | | | | | |
| 4.000%, 09/11/17 | | | 20,000,000 | | | | 3,249,960 | |
| 3.530%, 10/30/19 | | | 30,000,000 | | | | 4,860,432 | |
| | | | | | | | 8,110,392 | |
| Industrials — 13.6% | | | | | | | | |
| China North Industries Group | | | | | | | | |
| 4.480%, 05/24/17 | | | 10,000,000 | | | | 1,612,483 | |
| China Shipbuilding Industry MTN | | | | | | | | |
| 5.350%, 05/12/17 | | | 10,000,000 | | | | 1,623,854 | |
The accompanying notes are an integral part of the financial statements.
| Schedule of Investments | October 31, 2015 |
| |
| Global X GF China Bond ETF‡ |
| | | Face Amount(1) | | | Value | |
| CORPORATE OBLIGATIONS — continued |
| Industrials — continued | | | | | | | | |
| China State Shipbuilding MTN | | | | | | | | |
| 4.800%, 07/18/19 | | | 10,000,000 | | | $ | 1,638,990 | |
| | | | | | | | 4,875,327 | |
| Technology — 4.7% | | | | | | | | |
| China Electronics MTN | | | | | | | | |
| 5.400%, 06/13/19 | | | 10,000,000 | | | | 1,672,253 | |
| Utilities — 4.8% | | | | | | | | |
| China Huaneng Group MTN | | | | | | | | |
| 5.750%, 03/14/19 | | | 10,000,000 | | | | 1,695,598 | |
| TOTAL CORPORATE OBLIGATIONS | | | | | | | | |
| (Cost $34,326,659) | | | | | | | 34,452,135 | |
| |
| TIME DEPOSIT — 2.0% |
| Brown Brothers Harriman, 0.030%, 11/02/15 | | | | | | | | |
| (Cost $707,915) | | $ | 707,915 | | | | 707,915 | |
| TOTAL INVESTMENTS — 98.5% | | | | | | | | |
| (Cost $35,034,574) | | | | | | $ | 35,160,050 | |
Percentages are based on Net Assets of $35,679,527.
| ‡ | Fund commenced operations on November 18, 2014. |
| (1) | In local currency (CNY) unless otherwise indicated. |
CNY — Chinese Yuan Renminbi
MTN — Medium Term Note
As of October 31, 2015, all of the Fund’s investments were considered Level 2, in accordance with authoritative guidance on fair value measurements and disclosure under U.S. GAAP.
For the period ended October 31, 2015, there have been no transfers between Level 1, Level 2 or Level 3 investments.
As of October 31, 2015, there were no Level 3 investments.
The accompanying notes are an integral part of the financial statements.
| Schedule of Investments | October 31, 2015 |
| |
| Global X Scientific Beta US ETF‡ |
Sector Weightings (unaudited)†:
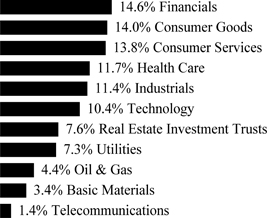
† Sector weightings percentages are based on the total market value of investments.
| | | Shares | | | Value | |
| COMMON STOCK — 99.7% |
| IRELAND— 0.3% | | | | | | | | |
| Financials — 0.2% | | | | | | | | |
| XL Group, Cl A | | | 157 | | | $ | 5,979 | |
| Health Care — 0.1% | | | | | | | | |
| Alkermes * | | | 30 | | | | 2,158 | |
| Technology — 0.0% | | | | | | | | |
| Seagate Technology | | | 24 | | | | 913 | |
| TOTAL IRELAND | | | | | | | 9,050 | |
| ISRAEL— 0.4% | | | | | | | | |
| Technology — 0.4% | | | | | | | | |
| Check Point Software Technologies * | | | 127 | | | | 10,787 | |
| SINGAPORE— 0.1% | | | | | | | | |
| Technology — 0.1% | | | | | | | | |
| Avago Technologies, Cl A | | | 16 | | | | 1,970 | |
| SWEDEN— 0.2% | | | | | | | | |
| Consumer Goods — 0.2% | | | | | | | | |
| Autoliv | | | 46 | | | | 5,577 | |
| SWITZERLAND— 0.4% | | | | | | | | |
| Industrials — 0.4% | | | | | | | | |
| Mettler-Toledo International * | | | 6 | | | | 1,866 | |
| TE Connectivity | | | 100 | | | | 6,444 | |
| TOTAL SWITZERLAND | | | | | | | 8,310 | |
The accompanying notes are an integral part of the financial statements.
| Schedule of Investments | October 31, 2015 |
| |
| Global X Scientific Beta US ETF‡ |
| | | Shares | | | Value | |
| COMMON STOCK — continued |
| UNITED KINGDOM— 0.2% | | | | | | | | |
| Consumer Goods — 0.2% | | | | | | | | |
| Delphi Automotive | | | 44 | | | $ | 3,660 | |
| UNITED STATES— 98.1% | | | | | | | | |
| Basic Materials — 3.4% | | | | | | | | |
| Air Products & Chemicals | | | 18 | | | | 2,501 | |
| Airgas | | | 43 | | | | 4,135 | |
| Alcoa | | | 522 | | | | 4,661 | |
| Ashland | | | 65 | | | | 7,132 | |
| Celanese, Cl A | | | 32 | | | | 2,273 | |
| CF Industries Holdings | | | 223 | | | | 11,322 | |
| Dow Chemical | | | 46 | | | | 2,377 | |
| Eastman Chemical | | | 18 | | | | 1,299 | |
| Ecolab | | | 12 | | | | 1,444 | |
| EI du Pont de Nemours | | | 90 | | | | 5,706 | |
| Freeport-McMoRan Copper & Gold | | | 122 | | | | 1,436 | |
| International Flavors & Fragrances | | | 28 | | | | 3,250 | |
| International Paper | | | 37 | | | | 1,580 | |
| Mosaic | | | 111 | | | | 3,751 | |
| Newmont Mining | | | 647 | | | | 12,591 | |
| Nucor | | | 47 | | | | 1,988 | |
| PPG Industries | | | 24 | | | | 2,502 | |
| Praxair | | | 16 | | | | 1,777 | |
| Sigma-Aldrich | | | 83 | | | | 11,597 | |
| | | | | | | | 83,322 | |
| Consumer Goods — 13.5% | | | | | | | | |
| Activision Blizzard | | | 459 | | | | 15,955 | |
| Altria Group | | | 119 | | | | 7,196 | |
| Archer-Daniels-Midland | | | 141 | | | | 6,438 | |
| BorgWarner | | | 24 | | | | 1,028 | |
| Brown-Forman, Cl B | | | 33 | | | | 3,504 | |
| Bunge | | | 203 | | | | 14,811 | |
| Campbell Soup | | | 101 | | | | 5,130 | |
| Church & Dwight | | | 107 | | | | 9,212 | |
| Clorox | | | 137 | | | | 16,706 | |
| Coach | | | 126 | | | | 3,931 | |
| Coca-Cola | | | 49 | | | | 2,075 | |
| Coca-Cola Enterprises | | | 62 | | | | 3,183 | |
| Colgate-Palmolive | | | 31 | | | | 2,057 | |
| ConAgra Foods | | | 481 | | | | 19,505 | |
| Constellation Brands, Cl A | | | 72 | | | | 9,705 | |
| DR Horton | | | 66 | | | | 1,943 | |
| Dr Pepper Snapple Group | | | 91 | | | | 8,133 | |
The accompanying notes are an integral part of the financial statements.
| Schedule of Investments | October 31, 2015 |
| |
| Global X Scientific Beta US ETF‡ |
| | | Shares | | | Value | |
| COMMON STOCK — continued |
| Consumer Goods — continued | | | | | | | | |
| Electronic Arts * | | | 128 | | | $ | 9,225 | |
| Estee Lauder, Cl A | | | 68 | | | | 5,471 | |
| Ford Motor | | | 271 | | | | 4,014 | |
| General Mills | | | 29 | | | | 1,685 | |
| General Motors | | | 52 | | | | 1,815 | |
| Genuine Parts | | | 55 | | | | 4,992 | |
| Goodyear Tire & Rubber | | | 69 | | | | 2,266 | |
| Hanesbrands | | | 167 | | | | 5,334 | |
| Harley-Davidson | | | 28 | | | | 1,385 | |
| Harman International Industries | | | 20 | | | | 2,199 | |
| Hasbro | | | 17 | | | | 1,306 | |
| Hershey | | | 21 | | | | 1,862 | |
| Hormel Foods | | | 29 | | | | 1,959 | |
| Jarden * | | | 55 | | | | 2,464 | |
| JM Smucker | | | 93 | | | | 10,917 | |
| Kellogg | | | 62 | | | | 4,372 | |
| Keurig Green Mountain | | | 20 | | | | 1,015 | |
| Kimberly-Clark | | | 23 | | | | 2,753 | |
| Lennar | | | 40 | | | | 2,003 | |
| Leucadia National | | | 205 | | | | 4,102 | |
| LKQ * | | | 62 | | | | 1,836 | |
| Mattel | | | 224 | | | | 5,506 | |
| McCormick | | | 88 | | | | 7,390 | |
| Michael Kors Holdings * | | | 53 | | | | 2,048 | |
| Mohawk Industries * | | | 27 | | | | 5,279 | |
| Molson Coors Brewing, Cl B | | | 96 | | | | 8,458 | |
| Mondelez International, Cl A | | | 92 | | | | 4,247 | |
| Monsanto | | | 20 | | | | 1,864 | |
| Monster Beverage * | | | 39 | | | | 5,316 | |
| Newell Rubbermaid | | | 145 | | | | 6,152 | |
| NIKE, Cl B | | | 52 | | | | 6,814 | |
| PepsiCo | | | 21 | | | | 2,146 | |
| Philip Morris International | | | 26 | | | | 2,299 | |
| Polaris Industries | | | 11 | | | | 1,236 | |
| Procter & Gamble | | | 35 | | | | 2,673 | |
| PVH | | | 69 | | | | 6,276 | |
| Ralph Lauren, Cl A | | | 26 | | | | 2,880 | |
| Reynolds American | | | 151 | | | | 7,296 | |
| Snap-On | | | 11 | | | | 1,825 | |
| Stanley Black & Decker | | | 105 | | | | 11,128 | |
| Tesla Motors * | | | 24 | | | | 4,966 | |
| Tyson Foods, Cl A | | | 210 | | | | 9,316 | |
| Under Armour, Cl A * | | | 86 | | | | 8,177 | |
| VF | | | 76 | | | | 5,131 | |
The accompanying notes are an integral part of the financial statements.
| Schedule of Investments | October 31, 2015 |
| |
| Global X Scientific Beta US ETF‡ |
| | | Shares | | | Value | |
| COMMON STOCK — continued |
| Consumer Goods — continued | | | | | | | | |
| Walgreens Boots Alliance | | | 80 | | | $ | 6,774 | |
| Whirlpool | | | 32 | | | | 5,124 | |
| | | | | | | | 333,808 | |
| Consumer Services — 13.7% | | | | | | | | |
| Advance Auto Parts | | | 39 | | | | 7,739 | |
| Alaska Air Group | | | 16 | | | | 1,220 | |
| Amazon.com * | | | 7 | | | | 4,381 | |
| American Airlines Group | | | 25 | | | | 1,156 | |
| AmerisourceBergen, Cl A | | | 60 | | | | 5,790 | |
| AutoZone * | | | 12 | | | | 9,413 | |
| Bed Bath & Beyond * | | | 46 | | | | 2,743 | |
| Best Buy | | | 222 | | | | 7,777 | |
| Cardinal Health | | | 68 | | | | 5,590 | |
| CarMax * | | | 45 | | | | 2,655 | |
| Carnival | | | 97 | | | | 5,246 | |
| Charter Communications, Cl A * | | | 48 | | | | 9,165 | |
| Chipotle Mexican Grill, Cl A * | | | 14 | | | | 8,963 | |
| Comcast, Cl A | | | 90 | | | | 5,636 | |
| Costco Wholesale | | | 35 | | | | 5,534 | |
| CVS Health | | | 71 | | | | 7,013 | |
| Darden Restaurants | | | 25 | | | | 1,547 | |
| Delta Air Lines | | | 91 | | | | 4,626 | |
| DISH Network, Cl A * | | | 111 | | | | 6,990 | |
| Dollar General | | | 85 | | | | 5,760 | |
| Dollar Tree * | | | 101 | | | | 6,615 | |
| eBay * | | | 478 | | | | 13,336 | |
| Expedia | | | 63 | | | | 8,587 | |
| Foot Locker | | | 25 | | | | 1,694 | |
| Gap | | | 66 | | | | 1,796 | |
| H&R Block | | | 40 | | | | 1,490 | |
| Hertz Global Holdings * | | | 65 | | | | 1,268 | |
| Hilton Worldwide Holdings | | | 68 | | | | 1,699 | |
| Home Depot | | | 28 | | | | 3,462 | |
| IHS, Cl A * | | | 12 | | | | 1,435 | |
| Interpublic Group of | | | 88 | | | | 2,018 | |
| Kohl's | | | 266 | | | | 12,268 | |
| Kroger | | | 122 | | | | 4,612 | |
| L Brands | | | 106 | | | | 10,174 | |
| Liberty Global, Cl A * | | | 141 | | | | 6,277 | |
| Lowe's | | | 21 | | | | 1,550 | |
| Marriott International, Cl A | | | 54 | | | | 4,146 | |
| McDonald's | | | 44 | | | | 4,939 | |
| McKesson | | | 21 | | | | 3,755 | |
| MGM Resorts International * | | | 181 | | | | 4,198 | |
The accompanying notes are an integral part of the financial statements.
| Schedule of Investments | October 31, 2015 |
| |
| Global X Scientific Beta US ETF‡ |
| | | Shares | | | Value | |
| COMMON STOCK — continued |
| Consumer Services — continued | | | | | | | | |
| Netflix * | | | 44 | | | $ | 4,769 | |
| Nielsen Holdings | | | 271 | | | | 12,875 | |
| Nordstrom | | | 116 | | | | 7,564 | |
| Norwegian Cruise Line Holdings * | | | 22 | | | | 1,400 | |
| Omnicom Group | | | 16 | | | | 1,199 | |
| O'Reilly Automotive * | | | 14 | | | | 3,868 | |
| Rite Aid * | | | 156 | | | | 1,229 | |
| Ross Stores | | | 111 | | | | 5,614 | |
| Royal Caribbean Cruises | | | 55 | | | | 5,409 | |
| Signet Jewelers | | | 36 | | | | 5,434 | |
| Sirius XM Holdings * | | | 462 | | | | 1,885 | |
| Southwest Airlines | | | 154 | | | | 7,129 | |
| Staples | | | 887 | | | | 11,522 | |
| Starbucks | | | 90 | | | | 5,631 | |
| Starwood Hotels & Resorts Worldwide | | | 21 | | | | 1,677 | |
| Sysco | | | 53 | | | | 2,186 | |
| Target | | | 132 | | | | 10,188 | |
| Tiffany | | | 14 | | | | 1,154 | |
| Time Warner | | | 76 | | | | 5,726 | |
| Time Warner Cable | | | 16 | | | | 3,030 | |
| TJX | | | 61 | | | | 4,465 | |
| Tractor Supply | | | 38 | | | | 3,511 | |
| TripAdvisor * | | | 22 | | | | 1,843 | |
| Twenty-First Century Fox, Cl A | | | 34 | | | | 1,044 | |
| Ulta Salon Cosmetics & Fragrance * | | | 18 | | | | 3,131 | |
| United Continental Holdings * | | | 66 | | | | 3,980 | |
| Viacom, Cl B | | | 17 | | | | 838 | |
| Wal-Mart Stores | | | 61 | | | | 3,492 | |
| Walt Disney | | | 45 | | | | 5,118 | |
| Whole Foods Market | | | 16 | | | | 479 | |
| Wyndham Worldwide | | | 47 | | | | 3,824 | |
| Yum! Brands | | | 40 | | | | 2,837 | |
| | | | | | | | 338,314 | |
| Financials — 14.4% | | | | | | | | |
| ACE | | | 40 | | | | 4,542 | |
| Affiliated Managers Group * | | | 6 | | | | 1,082 | |
| Aflac | | | 70 | | | | 4,463 | |
| Allstate | | | 110 | | | | 6,807 | |
| Ally Financial * | | | 80 | | | | 1,594 | |
| American Express | | | 14 | | | | 1,026 | |
| American International Group | | | 54 | | | | 3,405 | |
| Ameriprise Financial | | | 13 | | | | 1,500 | |
| Aon | | | 11 | | | | 1,026 | |
| Arch Capital Group * | | | 160 | | | | 11,982 | |
The accompanying notes are an integral part of the financial statements.
| Schedule of Investments | October 31, 2015 |
| |
| Global X Scientific Beta US ETF‡ |
| | | Shares | | | Value | |
| COMMON STOCK — continued |
| Financials — continued | | | | | | | | |
| Bank of America | | | 198 | | | $ | 3,322 | |
| Bank of New York Mellon | | | 218 | | | | 9,080 | |
| BB&T | | | 157 | | | | 5,833 | |
| Berkshire Hathaway, Cl B * | | | 68 | | | | 9,249 | |
| BlackRock, Cl A | | | 9 | | | | 3,168 | |
| Capital One Financial | | | 51 | | | | 4,024 | |
| CBRE Group, Cl A * | | | 75 | | | | 2,796 | |
| Charles Schwab | | | 250 | | | | 7,630 | |
| Chubb | | | 43 | | | | 5,562 | |
| Cincinnati Financial | | | 115 | | | | 6,927 | |
| CIT Group | | | 235 | | | | 10,105 | |
| Citigroup | | | 34 | | | | 1,808 | |
| Citizens Financial Group | | | 103 | | | | 2,503 | |
| CME Group, Cl A | | | 180 | | | | 17,005 | |
| Comerica | | | 125 | | | | 5,425 | |
| Discover Financial Services | | | 65 | | | | 3,654 | |
| Equifax | | | 66 | | | | 7,034 | |
| Extra Space Storage | | | 24 | | | | 1,902 | |
| Fifth Third Bancorp | | | 284 | | | | 5,410 | |
| First Republic Bank | | | 41 | | | | 2,677 | |
| FNF Group | | | 166 | | | | 5,857 | |
| Franklin Resources | | | 24 | | | | 978 | |
| Goldman Sachs Group | | | 21 | | | | 3,937 | |
| Hartford Financial Services Group | | | 133 | | | | 6,153 | |
| Huntington Bancshares | | | 1,165 | | | | 12,780 | |
| Intercontinental Exchange | | | 39 | | | | 9,844 | |
| Invesco | | | 105 | | | | 3,483 | |
| JPMorgan Chase | | | 106 | | | | 6,810 | |
| KeyCorp | | | 297 | | | | 3,689 | |
| Lincoln National | | | 89 | | | | 4,762 | |
| Loews | | | 167 | | | | 6,089 | |
| M&T Bank | | | 91 | | | | 10,906 | |
| Markel * | | | 19 | | | | 16,492 | |
| Marsh & McLennan | | | 54 | | | | 3,010 | |
| Mastercard, Cl A | | | 28 | | | | 2,772 | |
| McGraw Hill Financial | | | 17 | | | | 1,575 | |
| MetLife | | | 30 | | | | 1,511 | |
| Moody's | | | 32 | | | | 3,077 | |
| Morgan Stanley | | | 88 | | | | 2,901 | |
| New York Community Bancorp | | | 514 | | | | 8,491 | |
| Northern Trust | | | 129 | | | | 9,080 | |
| PNC Financial Services Group | | | 86 | | | | 7,762 | |
| Principal Financial Group | | | 59 | | | | 2,959 | |
| Progressive | | | 285 | | | | 9,442 | |
The accompanying notes are an integral part of the financial statements.
| Schedule of Investments | October 31, 2015 |
| |
| Global X Scientific Beta US ETF‡ |
| | | Shares | | | Value | |
| COMMON STOCK — continued |
| Financials — continued | | | | | | | | |
| Prudential Financial | | | 18 | | | $ | 1,485 | |
| Regions Financial | | | 424 | | | | 3,965 | |
| State Street | | | 39 | | | | 2,691 | |
| SunTrust Banks | | | 64 | | | | 2,657 | |
| T Rowe Price Group | | | 14 | | | | 1,059 | |
| TD Ameritrade Holding | | | 143 | | | | 4,929 | |
| Travelers | | | 39 | | | | 4,403 | |
| Unum Group | | | 122 | | | | 4,227 | |
| US Bancorp | | | 96 | | | | 4,049 | |
| Visa, Cl A | | | 39 | | | | 3,025 | |
| Voya Financial | | | 106 | | | | 4,300 | |
| Wells Fargo | | | 126 | | | | 6,822 | |
| Western Union | | | 275 | | | | 5,294 | |
| Willis Group Holdings | | | 166 | | | | 7,405 | |
| | | | | | | | 353,212 | |
| Health Care — 11.6% | | | | | | | | |
| Abbott Laboratories | | | 97 | | | | 4,346 | |
| AbbVie | | | 19 | | | | 1,131 | |
| Aetna | | | 77 | | | | 8,838 | |
| Allergan * | | | 15 | | | | 4,627 | |
| Amgen | | | 9 | | | | 1,424 | |
| Anthem | | | 67 | | | | 9,323 | |
| Baxter International | | | 62 | | | | 2,318 | |
| Becton Dickinson and | | | 37 | | | | 5,273 | |
| Biogen Idec * | | | 4 | | | | 1,162 | |
| BioMarin Pharmaceutical * | | | 32 | | | | 3,745 | |
| Boston Scientific * | | | 310 | | | | 5,667 | |
| Bristol-Myers Squibb | | | 37 | | | | 2,440 | |
| Celgene * | | | 12 | | | | 1,473 | |
| Cigna | | | 95 | | | | 12,734 | |
| CR Bard | | | 36 | | | | 6,709 | |
| DaVita HealthCare Partners * | | | 160 | | | | 12,402 | |
| DENTSPLY International | | | 148 | | | | 9,006 | |
| Edwards Lifesciences * | | | 36 | | | | 5,658 | |
| Eli Lilly | | | 57 | | | | 4,650 | |
| Endo International * | | | 74 | | | | 4,439 | |
| Express Scripts Holding * | | | 141 | | | | 12,180 | |
| Gilead Sciences | | | 17 | | | | 1,838 | |
| HCA Holdings * | | | 51 | | | | 3,508 | |
| Henry Schein * | | | 71 | | | | 10,771 | |
| Hologic * | | | 33 | | | | 1,282 | |
| Humana | | | 53 | | | | 9,467 | |
| Illumina * | | | 17 | | | | 2,436 | |
| Incyte * | | | 40 | | | | 4,701 | |
The accompanying notes are an integral part of the financial statements.
| Schedule of Investments | October 31, 2015 |
| |
| Global X Scientific Beta US ETF‡ |
| | | Shares | | | Value | |
| COMMON STOCK — continued |
| Health Care — continued | | | | | | | | |
| Intuitive Surgical * | | | 10 | | | $ | 4,966 | |
| Jazz Pharmaceuticals * | | | 32 | | | | 4,393 | |
| Johnson & Johnson | | | 14 | | | | 1,414 | |
| Laboratory Corp of America Holdings * | | | 98 | | | | 12,029 | |
| Mallinckrodt * | | | 52 | | | | 3,415 | |
| Medivation * | | | 89 | | | | 3,743 | |
| Medtronic | | | 62 | | | | 4,583 | |
| Merck | | | 173 | | | | 9,456 | |
| Mylan * | | | 23 | | | | 1,014 | |
| Perrigo | | | 44 | | | | 6,941 | |
| Pfizer | | | 249 | | | | 8,421 | |
| Quest Diagnostics | | | 235 | | | | 15,968 | |
| Regeneron Pharmaceuticals * | | | 3 | | | | 1,672 | |
| ResMed | | | 41 | | | | 2,362 | |
| Stryker | | | 28 | | | | 2,677 | |
| Thermo Fisher Scientific | | | 25 | | | | 3,269 | |
| UnitedHealth Group | | | 120 | | | | 14,134 | |
| Universal Health Services, Cl B | | | 68 | | | | 8,302 | |
| Varian Medical Systems * | | | 72 | | | | 5,654 | |
| Vertex Pharmaceuticals * | | | 18 | | | | 2,245 | |
| Waters * | | | 67 | | | | 8,563 | |
| Zimmer Biomet Holdings | | | 33 | | | | 3,451 | |
| Zoetis, Cl A | | | 84 | | | | 3,613 | |
| | | | | | | | 285,833 | |
| Industrials — 11.0% | | | | | | | | |
| 3M | | | 18 | | | | 2,830 | |
| Accenture, Cl A | | | 38 | | | | 4,074 | |
| Acuity Brands | | | 7 | | | | 1,530 | |
| Agilent Technologies | | | 16 | | | | 604 | |
| Alliance Data Systems * | | | 18 | | | | 5,352 | |
| AMETEK | | | 50 | | | | 2,741 | |
| Amphenol, Cl A | | | 83 | | | | 4,500 | |
| Automatic Data Processing | | | 38 | | | | 3,306 | |
| Ball | | | 101 | | | | 6,918 | |
| Boeing | | | 11 | | | | 1,629 | |
| Caterpillar | | | 16 | | | | 1,168 | |
| CH Robinson Worldwide | | | 99 | | | | 6,869 | |
| CSX | | | 95 | | | | 2,564 | |
| Cummins | | | 10 | | | | 1,035 | |
| Danaher | | | 41 | | | | 3,826 | |
| Deere | | | 88 | | | | 6,864 | |
| Dover | | | 80 | | | | 5,154 | |
| Eaton | | | 25 | | | | 1,398 | |
| Emerson Electric | | | 20 | | | | 944 | |
The accompanying notes are an integral part of the financial statements.
| Schedule of Investments | October 31, 2015 |
| |
| Global X Scientific Beta US ETF‡ |
| | | Shares | | | Value | |
| COMMON STOCK — continued |
| Industrials — continued | | | | | | | | |
| Expeditors International of Washington | | | 89 | | | $ | 4,431 | |
| Fastenal | | | 41 | | | | 1,606 | |
| FedEx | | | 30 | | | | 4,682 | |
| Fidelity National Information Services | | | 150 | | | | 10,938 | |
| Fiserv * | | | 77 | | | | 7,431 | |
| FleetCor Technologies * | | | 34 | | | | 4,925 | |
| Fluor | | | 43 | | | | 2,056 | |
| General Dynamics | | | 34 | | | | 5,052 | |
| General Electric | | | 145 | | | | 4,193 | |
| Honeywell International | | | 12 | | | | 1,239 | |
| Illinois Tool Works | | | 39 | | | | 3,586 | |
| Ingersoll-Rand | | | 65 | | | | 3,852 | |
| JB Hunt Transport Services | | | 46 | | | | 3,513 | |
| Johnson Controls | | | 36 | | | | 1,627 | |
| Kansas City Southern | | | 24 | | | | 1,986 | |
| L-3 Communications Holdings | | | 68 | | | | 8,595 | |
| LinkedIn, Cl A * | | | 12 | | | | 2,890 | |
| Lockheed Martin | | | 16 | | | | 3,517 | |
| Martin Marietta Materials | | | 37 | | | | 5,741 | |
| Masco | | | 145 | | | | 4,205 | |
| Norfolk Southern | | | 17 | | | | 1,361 | |
| Northrop Grumman | | | 16 | | | | 3,004 | |
| Parker-Hannifin | | | 26 | | | | 2,722 | |
| Paychex | | | 114 | | | | 5,880 | |
| Precision Castparts | | | 7 | | | | 1,616 | |
| Raytheon | | | 67 | | | | 7,866 | |
| Republic Services, Cl A | | | 229 | | | | 10,016 | |
| Rockwell Automation | | | 17 | | | | 1,856 | |
| Rockwell Collins | | | 59 | | | | 5,116 | |
| Roper Technologies | | | 64 | | | | 11,926 | |
| Sealed Air | | | 39 | | | | 1,916 | |
| Sherwin-Williams | | | 14 | | | | 3,736 | |
| Stericycle * | | | 41 | | | | 4,976 | |
| Textron | | | 98 | | | | 4,133 | |
| Towers Watson, Cl A | | | 69 | | | | 8,525 | |
| TransDigm Group * | | | 51 | | | | 11,212 | |
| Tyco International | | | 27 | | | | 984 | |
| Union Pacific | | | 11 | | | | 983 | |
| United Parcel Service, Cl B | | | 19 | | | | 1,957 | |
| United Rentals * | | | 12 | | | | 898 | |
| United Technologies | | | 10 | | | | 984 | |
| Verisk Analytics, Cl A * | | | 93 | | | | 6,660 | |
| Vulcan Materials | | | 102 | | | | 9,851 | |
| Wabtec | | | 31 | | | | 2,569 | |
The accompanying notes are an integral part of the financial statements.
| Schedule of Investments | October 31, 2015 |
| |
| Global X Scientific Beta US ETF‡ |
| | | Shares | | | Value | |
| COMMON STOCK — continued |
| Industrials — continued | | | | | | | | |
| Waste Management | | | 31 | | | $ | 1,667 | |
| Westrock | | | 22 | | | | 1,183 | |
| WW Grainger | | | 15 | | | | 3,150 | |
| Xerox | | | 621 | | | | 5,831 | |
| | | | | | | | 271,949 | |
| Oil & Gas — 4.4% | | | | | | | | |
| Anadarko Petroleum | | | 26 | | | | 1,739 | |
| Apache | | | 62 | | | | 2,922 | |
| Baker Hughes | | | 46 | | | | 2,423 | |
| Cabot Oil & Gas | | | 136 | | | | 2,953 | |
| Cameron International * | | | 113 | | | | 7,685 | |
| Cheniere Energy * | | | 24 | | | | 1,188 | |
| Chevron | | | 28 | | | | 2,545 | |
| Cimarex Energy | | | 44 | | | | 5,195 | |
| Concho Resources * | | | 68 | | | | 7,882 | |
| ConocoPhillips | | | 37 | | | | 1,974 | |
| Devon Energy | | | 30 | | | | 1,258 | |
| EOG Resources | | | 24 | | | | 2,060 | |
| EQT | | | 68 | | | | 4,493 | |
| Exxon Mobil | | | 44 | | | | 3,641 | |
| FMC Technologies * | | | 54 | | | | 1,827 | |
| Halliburton | | | 35 | | | | 1,343 | |
| Hess | | | 22 | | | | 1,237 | |
| HollyFrontier | | | 179 | | | | 8,766 | |
| Kinder Morgan | | | 127 | | | | 3,473 | |
| Marathon Oil | | | 90 | | | | 1,654 | |
| Marathon Petroleum | | | 102 | | | | 5,284 | |
| National Oilwell Varco | | | 42 | | | | 1,581 | |
| Noble Energy | | | 37 | | | | 1,326 | |
| Occidental Petroleum | | | 76 | | | | 5,665 | |
| ONEOK | | | 59 | | | | 2,001 | |
| Phillips 66 | | | 28 | | | | 2,493 | |
| Pioneer Natural Resources | | | 10 | | | | 1,371 | |
| Schlumberger | | | 26 | | | | 2,032 | |
| Spectra Energy | | | 109 | | | | 3,114 | |
| Tesoro | | | 81 | | | | 8,661 | |
| Valero Energy | | | 45 | | | | 2,966 | |
| Weatherford International * | | | 385 | | | | 3,943 | |
| Williams | | | 37 | | | | 1,459 | |
| | | | | | | | 108,154 | |
| Real Estate Investment Trusts — 7.5% | | | | | | | | |
| American Tower, Cl A | | | 17 | | | | 1,738 | |
| Annaly Capital Management | | | 1,516 | | | | 15,084 | |
| AvalonBay Communities | | | 104 | | | | 18,182 | |
The accompanying notes are an integral part of the financial statements.
| Schedule of Investments | October 31, 2015 |
| |
| Global X Scientific Beta US ETF‡ |
| | | Shares | | | Value | |
| COMMON STOCK — continued |
| Real Estate Investment Trusts — continued | | | | | | | | |
| Boston Properties | | | 27 | | | $ | 3,398 | |
| Crown Castle International | | | 27 | | | | 2,307 | |
| Digital Realty Trust | | | 185 | | | | 13,683 | |
| Equinix | | | 17 | | | | 5,043 | |
| Equity Residential | | | 144 | | | | 11,134 | |
| Essex Property Trust | | | 38 | | | | 8,377 | |
| Federal Realty Investment Trust | | | 47 | | | | 6,744 | |
| General Growth Properties | | | 316 | | | | 9,148 | |
| HCP | | | 163 | | | | 6,064 | |
| Host Hotels & Resorts | | | 126 | | | | 2,184 | |
| Kimco Realty | | | 175 | | | | 4,685 | |
| Macerich | | | 118 | | | | 9,999 | |
| Plum Creek Timber | | | 65 | | | | 2,648 | |
| ProLogis | | | 75 | | | | 3,205 | |
| Public Storage | | | 20 | | | | 4,589 | |
| Realty Income | | | 267 | | | | 13,206 | |
| Simon Property Group | | | 21 | | | | 4,231 | |
| SL Green Realty | | | 61 | | | | 7,236 | |
| Ventas | | | 135 | | | | 7,252 | |
| VEREIT | | | 819 | | | | 6,765 | |
| Vornado Realty Trust | | | 30 | | | | 3,016 | |
| Welltower | | | 201 | | | | 13,039 | |
| Weyerhaeuser | | | 110 | | | | 3,226 | |
| | | | | | | | 186,183 | |
| Technology — 9.9% | | | | | | | | |
| Adobe Systems * | | | 32 | | | | 2,837 | |
| Akamai Technologies * | | | 67 | | | | 4,075 | |
| Altera | | | 187 | | | | 9,827 | |
| Amdocs | | | 322 | | | | 19,182 | |
| Analog Devices | | | 65 | | | | 3,908 | |
| ANSYS * | | | 24 | | | | 2,287 | |
| Apple | | | 43 | | | | 5,139 | |
| Applied Materials | | | 85 | | | | 1,425 | |
| Autodesk * | | | 38 | | | | 2,097 | |
| Broadcom, Cl A | | | 112 | | | | 5,757 | |
| CA | | | 152 | | | | 4,212 | |
| Cerner * | | | 54 | | | | 3,580 | |
| Cisco Systems | | | 228 | | | | 6,578 | |
| Citrix Systems * | | | 56 | | | | 4,598 | |
| Cognizant Technology Solutions, Cl A * | | | 22 | | | | 1,498 | |
| Computer Sciences | | | 105 | | | | 6,992 | |
| Corning | | | 79 | | | | 1,469 | |
| EMC | | | 173 | | | | 4,536 | |
| F5 Networks * | | | 41 | | | | 4,518 | |
The accompanying notes are an integral part of the financial statements.
| Schedule of Investments | October 31, 2015 |
| |
| Global X Scientific Beta US ETF‡ |
| | | Shares | | | Value | |
| COMMON STOCK — continued |
| Technology — continued | | | | | | | | |
| Facebook, Cl A * | | | 52 | | | $ | 5,302 | |
| Harris | | | 67 | | | | 5,302 | |
| Hewlett-Packard | | | 131 | | | | 3,532 | |
| Intel | | | 305 | | | | 10,327 | |
| International Business Machines | | | 24 | | | | 3,362 | |
| Intuit | | | 40 | | | | 3,897 | |
| Juniper Networks | | | 295 | | | | 9,260 | |
| KLA-Tencor | | | 52 | | | | 3,490 | |
| Lam Research | | | 77 | | | | 5,897 | |
| Linear Technology | | | 61 | | | | 2,710 | |
| Maxim Integrated Products | | | 81 | | | | 3,319 | |
| Microchip Technology | | | 80 | | | | 3,863 | |
| Micron Technology * | | | 128 | | | | 2,120 | |
| Microsoft | | | 51 | | | | 2,685 | |
| Motorola Solutions | | | 58 | | | | 4,058 | |
| NetApp | | | 190 | | | | 6,460 | |
| NVIDIA | | | 355 | | | | 10,071 | |
| Oracle | | | 26 | | | | 1,010 | |
| Palo Alto Networks * | | | 28 | | | | 4,508 | |
| QUALCOMM | | | 59 | | | | 3,506 | |
| Red Hat * | | | 51 | | | | 4,035 | |
| salesforce.com inc * | | | 24 | | | | 1,865 | |
| SanDisk * | | | 30 | | | | 2,310 | |
| ServiceNow * | | | 48 | | | | 3,919 | |
| Skyworks Solutions | | | 77 | | | | 5,948 | |
| Symantec | | | 438 | | | | 9,023 | |
| Texas Instruments | | | 62 | | | | 3,517 | |
| VeriSign * | | | 81 | | | | 6,529 | |
| VMware, Cl A * | | | 41 | | | | 2,466 | |
| Western Digital | | | 27 | | | | 1,804 | |
| Workday, Cl A * | | | 46 | | | | 3,633 | |
| Xilinx | | | 79 | | | | 3,762 | |
| Yahoo! * | | | 141 | | | | 5,022 | |
| | | | | | | | 243,027 | |
| Telecommunications — 1.4% | | | | | | | | |
| AT&T | | | 233 | | | | 7,808 | |
| CenturyLink | | | 136 | | | | 3,836 | |
| Level 3 Communications * | | | 96 | | | | 4,891 | |
| SBA Communications, Cl A * | | | 113 | | | | 13,449 | |
| T-Mobile US * | | | 92 | | | | 3,486 | |
| Verizon Communications | | | 37 | | | | 1,735 | |
| | | | | | | | 35,205 | |
| Utilities — 7.3% | | | | | | | | |
| AES | | | 196 | | | | 2,146 | |
The accompanying notes are an integral part of the financial statements.
| Schedule of Investments | October 31, 2015 |
| |
| Global X Scientific Beta US ETF‡ |
| | | Shares | | | Value | |
| COMMON STOCK — continued |
| Utilities — continued | | | | | | | | |
| Ameren | | | 167 | | | $ | 7,295 | |
| American Electric Power | | | 67 | | | | 3,796 | |
| American Water Works | | | 336 | | | | 19,273 | |
| CenterPoint Energy | | | 373 | | | | 6,919 | |
| CMS Energy | | | 274 | | | | 9,883 | |
| Consolidated Edison | | | 119 | | | | 7,824 | |
| Dominion Resources | | | 18 | | | | 1,286 | |
| DTE Energy | | | 88 | | | | 7,180 | |
| Duke Energy | | | 186 | | | | 13,293 | |
| Edison International | | | 195 | | | | 11,801 | |
| Entergy | | | 98 | | | | 6,680 | |
| Eversource Energy | | | 141 | | | | 7,183 | |
| Exelon | | | 256 | | | | 7,147 | |
| FirstEnergy | | | 203 | | | | 6,334 | |
| NextEra Energy | | | 33 | | | | 3,388 | |
| PG&E | | | 213 | | | | 11,374 | |
| PPL | | | 180 | | | | 6,192 | |
| Public Service Enterprise Group | | | 251 | | | | 10,364 | |
| Sempra Energy | | | 44 | | | | 4,506 | |
| Southern | | | 202 | | | | 9,110 | |
| WEC Energy Group | | | 165 | | | | 8,507 | |
| Xcel Energy | | | 246 | | | | 8,765 | |
| | | | | | | | 180,246 | |
| TOTAL UNITED STATES | | | | | | | 2,419,253 | |
| TOTAL COMMON STOCK | | | | | | | | |
| (Cost $2,483,238) | | | | | | | 2,458,607 | |
| TOTAL INVESTMENTS — 99.7% | | | | | | | | |
| (Cost $2,483,238) | | | | | | $ | 2,458,607 | |
Percentages are based on Net Assets of $2,466,512.
| * | Non-income producing security. |
| ‡ | Fund commenced operations on May 12, 2015. |
As of October 31, 2015, all of the Fund’s investments were considered Level 1, in accordance with authoritative guidance on fair value measurements and disclosure under U.S. GAAP.
For the period ended October 31, 2015, there have been no transfers between Level 1, Level 2 or Level 3 investments.
As of October 31, 2015, there were no Level 3 investments.
The accompanying notes are an integral part of the financial statements.
| Schedule of Investments | October 31, 2015 |
| |
| Global X Scientific Beta Europe ETF‡ |
Sector Weightings (unaudited)†:

† Sector weightings percentages are based on the total market value of investments.
| | | Shares | | | Value | |
| COMMON STOCK — 99.4% |
| AUSTRIA— 0.7% | | | | | | | | |
| Basic Materials — 0.0% | | | | | | | | |
| voestalpine | | | 27 | | | $ | 982 | |
| Financials — 0.3% | | | | | | | | |
| Erste Group Bank * | | | 91 | | | | 2,681 | |
| IMMOFINANZ * | | | 1,777 | | | | 4,578 | |
| | | | | | | | 7,259 | |
| Industrials — 0.2% | | | | | | | | |
| ANDRITZ | | | 61 | | | | 3,086 | |
| Wienerberger | | | 120 | | | | 2,222 | |
| | | | | | | | 5,308 | |
| Oil & Gas — 0.2% | | | | | | | | |
| OMV | | | 172 | | | | 4,598 | |
| TOTAL AUSTRIA | | | | | | | 18,147 | |
| BELGIUM— 3.5% | | | | | | | | |
| Basic Materials — 0.1% | | | | | | | | |
| Solvay | | | 20 | | | | 2,271 | |
| Umicore | | | 30 | | | | 1,281 | |
| | | | | | | | 3,552 | |
| Consumer Goods — 0.1% | | | | | | | | |
| Anheuser-Busch InBev | | | 25 | | | | 3,002 | |
| Consumer Services — 1.0% | | | | | | | | |
| Colruyt | | | 140 | | | | 6,965 | |
| Delhaize Group | | | 62 | | | | 5,781 | |
The accompanying notes are an integral part of the financial statements.
| Schedule of Investments | October 31, 2015 |
| |
| Global X Scientific Beta Europe ETF‡ |
| | | Shares | | | Value | |
| COMMON STOCK — continued |
| Consumer Services — continued | | | | | | | | |
| Telenet Group Holding * | | | 153 | | | $ | 8,944 | |
| | | | | | | | 21,690 | |
| Financials — 1.1% | | | | | | | | |
| Ackermans & van Haaren | | | 60 | | | | 9,180 | |
| Ageas | | | 82 | | | | 3,640 | |
| Groupe Bruxelles Lambert | | | 52 | | | | 4,246 | |
| KBC Groep | | | 32 | | | | 1,958 | |
| Sofina | | | 57 | | | | 6,438 | |
| | | | | | | | 25,462 | |
| Health Care — 0.4% | | | | | | | | |
| UCB | | | 125 | | | | 10,870 | |
| Industrials — 0.1% | | | | | | | | |
| bpost | | | 130 | | | | 3,270 | |
| Real Estate Investment Trusts — 0.3% | | | | | | | | |
| Cofinimmo | | | 72 | | | | 8,073 | |
| Telecommunications — 0.4% | | | | | | | | |
| Proximus | | | 308 | | | | 10,722 | |
| TOTAL BELGIUM | | | | | | | 86,641 | |
| CHILE— 0.1% | | | | | | | | |
| Basic Materials — 0.1% | | | | | | | | |
| Antofagasta | | | 160 | | | | 1,301 | |
| DENMARK— 4.4% | | | | | | | | |
| Consumer Goods — 0.3% | | | | | | | | |
| Carlsberg, Cl B | | | 48 | | | | 3,953 | |
| Pandora | | | 20 | | | | 2,318 | |
| | | | | | | | 6,271 | |
| Financials — 1.3% | | | | | | | | |
| Danske Bank | | | 144 | | | | 3,978 | |
| Jyske Bank * | | | 124 | | | | 6,082 | |
| Sydbank | | | 250 | | | | 8,262 | |
| Topdanmark * | | | 249 | | | | 6,661 | |
| Tryg | | | 330 | | | | 5,963 | |
| | | | | | �� | | 30,946 | |
| Health Care — 1.9% | | | | | | | | |
| Christian Hansen Holding | | | 238 | | | | 14,370 | |
| Coloplast, Cl B | | | 100 | | | | 7,207 | |
| Genmab * | | | 35 | | | | 3,468 | |
| GN Store Nord | | | 98 | | | | 1,796 | |
| Novo Nordisk, Cl B | | | 129 | | | | 6,885 | |
| Novozymes, Cl B | | | 139 | | | | 6,475 | |
| William Demant Holding * | | | 65 | | | | 5,671 | |
| | | | | | | | 45,872 | |
The accompanying notes are an integral part of the financial statements.
| Schedule of Investments | October 31, 2015 |
| |
| Global X Scientific Beta Europe ETF‡ |
| | | Shares | | | Value | |
| COMMON STOCK — continued |
| Industrials — 0.6% | | | | | | | | |
| A P Moller - Maersk, Cl B | | | 2 | | | $ | 2,962 | |
| DSV | | | 179 | | | | 7,291 | |
| FLSmidth | | | 57 | | | | 2,168 | |
| ISS | | | 74 | | | | 2,616 | |
| | | | | | | | 15,037 | |
| Telecommunications — 0.3% | | | | | | | | |
| TDC | | | 1,582 | | | | 8,330 | |
| TOTAL DENMARK | | | | | | | 106,456 | |
| FINLAND— 2.3% | | | | | | | | |
| Basic Materials — 0.2% | | | | | | | | |
| Stora Enso, Cl R | | | 170 | | | | 1,586 | |
| UPM-Kymmene | | | 118 | | | | 2,222 | |
| | | | | | | | 3,808 | |
| Consumer Goods — 0.1% | | | | | | | | |
| Amer Sports | | | 103 | | | | 2,904 | |
| Nokian Renkaat | | | 31 | | | | 1,176 | |
| | | | | | | | 4,080 | |
| Consumer Services — 0.1% | | | | | | | | |
| Kesko, Cl B | | | 89 | | | | 2,855 | |
| Financials — 0.2% | | | | | | | | |
| Sampo, Cl A | | | 115 | | | | 5,651 | |
| Health Care — 0.2% | | | | | | | | |
| Orion, Cl B | | | 145 | | | | 5,209 | |
| Industrials — 0.6% | | | | | | | | |
| Huhtamaki | | | 231 | | | | 8,190 | |
| Kone, Cl B | | | 88 | | | | 3,777 | |
| Metso | | | 41 | | | | 1,009 | |
| | | | | | | | 12,976 | |
| Oil & Gas — 0.2% | | | | | | | | |
| Neste | | | 245 | | | | 6,006 | |
| Technology — 0.1% | | | | | | | | |
| Nokia | | | 240 | | | | 1,795 | |
| Telecommunications — 0.2% | | | | | | | | |
| Elisa | | | 155 | | | | 5,869 | |
| Utilities — 0.4% | | | | | | | | |
| Fortum | | | 459 | | | | 6,921 | |
| TOTAL FINLAND | | | | | | | 55,170 | |
| FRANCE— 13.6% | | | | | | | | |
| Basic Materials — 0.4% | | | | | | | | |
| Air Liquide | | | 12 | | | | 1,563 | |
| Arkema | | | 30 | | | | 2,207 | |
The accompanying notes are an integral part of the financial statements.
| Schedule of Investments | October 31, 2015 |
| |
| Global X Scientific Beta Europe ETF‡ |
| | | Shares | | | Value | |
| COMMON STOCK — continued |
| Basic Materials — continued | | | | | | | | |
| Imerys | | | 60 | | | $ | 4,129 | |
| | | | | | | | 7,899 | |
| Consumer Goods — 2.3% | | | | | | | | |
| Christian Dior | | | 12 | | | | 2,374 | |
| Cie Generale des Etablissements Michelin, Cl B | | | 14 | | | | 1,401 | |
| Danone | | | 42 | | | | 2,942 | |
| Faurecia | | | 60 | | | | 2,388 | |
| Hermes International | | | 19 | | | | 7,353 | |
| L'Oreal | | | 36 | | | | 6,603 | |
| LVMH Moet Hennessy Louis Vuitton | | | 19 | | | | 3,560 | |
| Pernod Ricard | | | 59 | | | | 6,987 | |
| Peugeot * | | | 233 | | | | 4,124 | |
| Renault | | | 18 | | | | 1,705 | |
| SEB | | | 60 | | | | 6,130 | |
| Societe BIC | | | 66 | | | | 10,575 | |
| Valeo | | | 6 | | | | 933 | |
| | | | | | | | 57,075 | |
| Consumer Services — 2.1% | | | | | | | | |
| Accor | | | 52 | | | | 2,599 | |
| Air France-KLM * | | | 80 | | | | 590 | |
| Carrefour | | | 60 | | | | 1,967 | |
| Casino Guichard Perrachon | | | 40 | | | | 2,313 | |
| Eutelsat Communications | | | 346 | | | | 11,469 | |
| JCDecaux | | | 52 | | | | 2,128 | |
| Kering | | | 43 | | | | 8,007 | |
| Lagardere SCA | | | 219 | | | | 6,413 | |
| Numericable-SFR SAS * | | | 16 | | | | 728 | |
| Publicis Groupe | | | 48 | | | | 3,132 | |
| Societe Television Francaise 1 | | | 172 | | | | 2,226 | |
| Sodexo | | | 21 | | | | 1,878 | |
| Technicolor | | | 105 | | | | 715 | |
| Vivendi | | | 351 | | | | 8,497 | |
| | | | | | | | 52,662 | |
| Financials — 1.2% | | | | | | | | |
| AXA | | | 60 | | | | 1,612 | |
| BNP Paribas | | | 24 | | | | 1,465 | |
| CNP Assurances | | | 116 | | | | 1,665 | |
| Credit Agricole | | | 160 | | | | 2,036 | |
| Fonciere Des Regions | | | 60 | | | | 5,683 | |
| Natixis | | | 497 | | | | 3,064 | |
| SCOR | | | 220 | | | | 8,231 | |
| Societe Generale | | | 27 | | | | 1,262 | |
| Wendel | | | 36 | | | | 4,341 | |
| | | | | | | | 29,359 | |
The accompanying notes are an integral part of the financial statements.
| Schedule of Investments | October 31, 2015 |
| |
| Global X Scientific Beta Europe ETF‡ |
| | | Shares | | | Value | |
| COMMON STOCK — continued |
| Health Care — 1.2% | | | | | | | | |
| Essilor International | | | 31 | | | $ | 4,096 | |
| Ipsen | | | 33 | | | | 2,094 | |
| Orpea | | | 153 | | | | 12,338 | |
| Sanofi | | | 88 | | | | 8,929 | |
| | | | | | | | 27,457 | |
| Industrials — 3.2% | | | | | | | | |
| Aeroports de Paris | | | 104 | | | | 13,137 | |
| Alstom * | | | 71 | | | | 2,326 | |
| Bollore | | | 1,108 | | | | 5,510 | |
| Bouygues | | | 46 | | | | 1,751 | |
| Bureau Veritas | | | 188 | | | | 4,272 | |
| Cie de Saint-Gobain | | | 28 | | | | 1,181 | |
| Edenred | | | 111 | | | | 2,051 | |
| Eiffage | | | 40 | | | | 2,508 | |
| Eurazeo | | | 40 | | | | 2,831 | |
| Groupe Eurotunnel | | | 77 | | | | 1,084 | |
| Legrand | | | 27 | | | | 1,489 | |
| Rexel | | | 359 | | | | 4,929 | |
| Safran | | | 64 | | | | 4,886 | |
| Schneider Electric | | | 16 | | | | 974 | |
| Teleperformance | | | 183 | | | | 14,450 | |
| Thales | | | 107 | | | | 7,792 | |
| Vinci | | | 49 | | | | 3,322 | |
| Zodiac Aerospace | | | 171 | | | | 4,345 | |
| | | | | | | | 78,838 | |
| Oil & Gas — 0.2% | | | | | | | | |
| Technip | | | 47 | | | | 2,466 | |
| Total | | | 69 | | | | 3,365 | |
| | | | | | | | 5,831 | |
| Real Estate Investment Trusts — 0.6% | | | | | | | | |
| Gecina | | | 51 | | | | 6,558 | |
| ICADE | | | 83 | | | | 6,176 | |
| Klepierre | | | 41 | | | | 1,955 | |
| | | | | | | | 14,689 | |
| Technology — 1.3% | | | | | | | | |
| Atos | | | 99 | | | | 7,934 | |
| Cap Gemini | | | 52 | | | | 4,655 | |
| Dassault Systemes | | | 125 | | | | 9,920 | |
| Iliad | | | 13 | | | | 2,748 | |
| Ingenico Group | | | 36 | | | | 4,271 | |
| STMicroelectronics | | | 402 | | | | 2,796 | |
| | | | | | | | 32,324 | |
The accompanying notes are an integral part of the financial statements.
| Schedule of Investments | October 31, 2015 |
| |
| Global X Scientific Beta Europe ETF‡ |
| | | Shares | | | Value | |
| COMMON STOCK — continued |
| Telecommunications — 0.2% | | | | | | | | |
| Orange | | | 229 | | | $ | 4,056 | |
| Utilities — 0.9% | | | | | | | | |
| Electricite de France | | | 115 | | | | 2,151 | |
| Engie | | | 177 | | | | 3,120 | |
| Rubis SCA | | | 105 | | | | 8,466 | |
| Suez Environnement | | | 309 | | | | 5,908 | |
| Veolia Environnement * | | | 113 | | | | 2,643 | |
| | | | | | | | 22,288 | |
| TOTAL FRANCE | | | | | | | 332,478 | |
| GERMANY— 9.8% | | | | | | | | |
| Basic Materials — 1.3% | | | | | | | | |
| Aurubis | | | 106 | | | | 7,119 | |
| BASF | | | 14 | | | | 1,153 | |
| Bayer | | | 16 | | | | 2,145 | |
| Brenntag | | | 30 | | | | 1,821 | |
| Evonik Industries | | | 56 | | | | 2,045 | |
| K+S | | | 109 | | | | 2,764 | |
| LANXESS | | | 38 | | | | 2,051 | |
| Linde | | | 23 | | | | 4,008 | |
| Symrise | | | 126 | | | | 8,336 | |
| | | | | | | | 31,442 | |
| Consumer Goods — 0.8% | | | | | | | | |
| adidas | | | 20 | | | | 1,802 | |
| Bayerische Motoren Werke | | | 12 | | | | 1,238 | |
| Beiersdorf | | | 30 | | | | 2,864 | |
| Daimler | | | 24 | | | | 2,093 | |
| HUGO BOSS | | | 51 | | | | 5,272 | |
| OSRAM Licht | | | 74 | | | | 4,374 | |
| Rheinmetall | | | 40 | | | | 2,530 | |
| | | | | | | | 20,173 | |
| Consumer Services — 0.7% | | | | | | | | |
| Axel Springer | | | 74 | | | | 4,180 | |
| Deutsche Lufthansa * | | | 151 | | | | 2,240 | |
| Kabel Deutschland Holding | | | 38 | | | | 4,859 | |
| METRO | | | 75 | | | | 2,322 | |
| ProSiebenSat.1 Media | | | 23 | | | | 1,250 | |
| Zalando * (A) | | | 24 | | | | 845 | |
| | | | | | | | 15,696 | |
| Financials — 2.3% | | | | | | | | |
| Aareal Bank | | | 40 | | | | 1,531 | |
| Allianz | | | 24 | | | | 4,224 | |
| Commerzbank * | | | 200 | | | | 2,212 | |
| Deutsche Bank | | | 40 | | | | 1,125 | |
The accompanying notes are an integral part of the financial statements.
| Schedule of Investments | October 31, 2015 |
| |
| Global X Scientific Beta Europe ETF‡ |
| | | Shares | | | Value | |
| COMMON STOCK — continued |
| Financials — continued | | | | | | | | |
| Deutsche Boerse | | | 33 | | | $ | 3,053 | |
| Deutsche EuroShop | | | 120 | | | | 5,815 | |
| Deutsche Wohnen | | | 313 | | | | 8,871 | |
| Hannover Rueck | | | 71 | | | | 8,251 | |
| LEG Immobilien | | | 95 | | | | 7,614 | |
| Muenchener Rueckversicherungs-Gesellschaft in Muenchen | | | 21 | | | | 4,210 | |
| Vonovia | | | 280 | | | | 9,385 | |
| | | | | | | | 56,291 | |
| Health Care — 1.4% | | | | | | | | |
| Fresenius & KGaA | | | 158 | | | | 11,650 | |
| Fresenius Medical Care & KGaA | | | 107 | | | | 9,679 | |
| Gerresheimer | | | 28 | | | | 2,195 | |
| Merck KGaA | | | 56 | | | | 5,495 | |
| MorphoSys * | | | 19 | | | | 1,181 | |
| STADA Arzneimittel | | | 95 | | | | 3,633 | |
| | | | | | | | 33,833 | |
| Industrials — 1.9% | | | | | | | | |
| Bilfinger | | | 55 | | | | 2,479 | |
| Deutsche Post | | | 51 | | | | 1,525 | |
| Duerr | | | 21 | | | | 1,758 | |
| Fraport Frankfurt Airport Services Worldwide | | | 88 | | | | 5,609 | |
| GEA Group | | | 105 | | | | 4,230 | |
| HeidelbergCement | | | 18 | | | | 1,348 | |
| KION Group * | | | 47 | | | | 2,129 | |
| Leoni | | | 40 | | | | 1,641 | |
| MAN | | | 48 | | | | 5,028 | |
| MTU Aero Engines | | | 62 | | | | 5,765 | |
| Siemens | | | 17 | | | | 1,718 | |
| Wirecard | | | 249 | | | | 12,929 | |
| | | | | | | | 46,159 | |
| Technology — 0.3% | | | | | | | | |
| Infineon Technologies | | | 67 | | | | 829 | |
| SAP | | | 33 | | | | 2,620 | |
| United Internet | | | 76 | | | | 3,967 | |
| | | | | | | | 7,416 | |
| Telecommunications — 1.0% | | | | | | | | |
| Deutsche Telekom | | | 321 | | | | 6,030 | |
| Drillisch | | | 25 | | | | 1,295 | |
| Freenet | | | 354 | | | | 11,998 | |
| Telefonica Deutschland Holding | | | 874 | | | | 5,654 | |
| | | | | | | | 24,977 | |
| Utilities — 0.1% | | | | | | | | |
| E.ON | | | 160 | | | | 1,696 | |
The accompanying notes are an integral part of the financial statements.
| Schedule of Investments | October 31, 2015 |
| |
| Global X Scientific Beta Europe ETF‡ |
| | | Shares | | | Value | |
| COMMON STOCK — continued |
| Utilities — continued | | | | | | | | |
| RWE | | | 119 | | | $ | 1,664 | |
| | | | | | | | 3,360 | |
| TOTAL GERMANY | | | | | | | 239,347 | |
| IRELAND— 1.7% | | | | | | | | |
| Consumer Goods — 0.8% | | | | | | | | |
| Glanbia | | | 509 | | | | 9,919 | |
| Kerry Group, Cl A | | | 119 | | | | 9,721 | |
| | | | | | | | 19,640 | |
| Consumer Services — 0.4% | | | | | | | | |
| Paddy Power | | | 64 | | | | 7,437 | |
| Ryanair Holdings * | | | 202 | | | | 3,012 | |
| | | | | | | | 10,449 | |
| Financials — 0.2% | | | | | | | | |
| Bank of Ireland * | | | 12,383 | | | | 4,637 | |
| Industrials — 0.3% | | | | | | | | |
| CRH | | | 73 | | | | 2,005 | |
| Smurfit Kappa Group | | | 178 | | | | 5,099 | |
| | | | | | | | 7,104 | |
| TOTAL IRELAND | | | | | | | 41,830 | |
| ITALY— 5.0% | | | | | | | | |
| Basic Materials — 0.2% | | | | | | | | |
| Tenaris | | | 325 | | | | 4,100 | |
| Consumer Goods — 0.7% | | | | | | | | |
| Davide Campari-Milano | | | 663 | | | | 5,705 | |
| Fiat Chrysler Automobiles * | | | 249 | | | | 3,691 | |
| Luxottica Group | | | 102 | | | | 7,183 | |
| Moncler | | | 55 | | | | 890 | |
| | | | | | | | 17,469 | |
| Consumer Services — 0.2% | | | | | | | | |
| Mediaset | | | 920 | | | | 4,695 | |
| Financials — 2.1% | | | | | | | | |
| Assicurazioni Generali | | | 201 | | | | 3,828 | |
| Azimut Holding | | | 58 | | | | 1,402 | |
| Banca Monte dei Paschi di Siena * | | | 1,948 | | | | 3,598 | |
| Banca Popolare dell'Emilia Romagna SC | | | 525 | | | | 4,260 | |
| Banca Popolare di Milano Scarl | | | 4,543 | | | | 4,291 | |
| Banca Popolare di Sondrio SCARL | | | 1,000 | | | | 4,589 | |
| Banco Popolare SC * | | | 289 | | | | 4,345 | |
| EXOR | | | 118 | | | | 5,885 | |
| Intesa Sanpaolo | | | 570 | | | | 1,995 | |
| Mediobanca | | | 506 | | | | 5,114 | |
| UniCredit | | | 348 | | | | 2,260 | |
The accompanying notes are an integral part of the financial statements.
| Schedule of Investments | October 31, 2015 |
| |
| Global X Scientific Beta Europe ETF‡ |
| | | Shares | | | Value | |
| COMMON STOCK — continued |
| Financials — continued | | | | | | | | |
| Unione di Banche Italiane SCpA | | | 501 | | | $ | 3,769 | |
| Unipol Gruppo Finanziario | | | 209 | | | | 979 | |
| UnipolSai | | | 1,244 | | | | 3,018 | |
| | | | | | | | 49,333 | |
| Health Care — 0.0% | | | | | | | | |
| Recordati | | | 33 | | | | 824 | |
| Industrials — 0.7% | | | | | | | | |
| Atlantia | | | 100 | | | | 2,784 | |
| CNH Industrial | | | 233 | | | | 1,583 | |
| Finmeccanica * | | | 720 | | | | 9,465 | |
| Italcementi | | | 124 | | | | 1,384 | |
| Prysmian | | | 40 | | | | 868 | |
| | | | | | | | 16,084 | |
| Oil & Gas — 0.2% | | | | | | | | |
| Eni | | | 177 | | | | 2,905 | |
| Saipem * | | | 254 | | | | 2,398 | |
| | | | | | | | 5,303 | |
| Telecommunications — 0.2% | | | | | | | | |
| Telecom Italia * | | | 2,686 | | | | 3,765 | |
| Utilities — 0.7% | | | | | | | | |
| Enel | | | 461 | | | | 2,137 | |
| Enel Green Power | | | 3,998 | | | | 8,502 | |
| Snam | | | 1,087 | | | | 5,656 | |
| Terna Rete Elettrica Nazionale | | | 618 | | | | 3,159 | |
| | | | | | | | 19,454 | |
| TOTAL ITALY | | | | | | | 121,027 | |
| LUXEMBOURG— 0.1% | | | | | | | | |
| Consumer Services — 0.0% | | | | | | | | |
| B&M European Value Retail | | | 311 | | | | 1,601 | |
| Health Care — 0.1% | | | | | | | | |
| Eurofins Scientific | | | 4 | | | | 1,455 | |
| TOTAL LUXEMBOURG | | | | | | | 3,056 | |
| MEXICO— 0.1% | | | | | | | | |
| Basic Materials — 0.1% | | | | | | | | |
| Fresnillo | | | 180 | | | | 2,029 | |
| NETHERLANDS— 4.2% | | | | | | | | |
| Basic Materials — 0.5% | | | | | | | | |
| Akzo Nobel | | | 28 | | | | 1,993 | |
| ArcelorMittal | | | 100 | | | | 560 | |
| Koninklijke DSM | | | 119 | | | | 6,384 | |
| OCI * | | | 152 | | | | 4,319 | |
| | | | | | | | 13,256 | |
The accompanying notes are an integral part of the financial statements.
| Schedule of Investments | October 31, 2015 |
| |
| Global X Scientific Beta Europe ETF‡ |
| | | Shares | | | Value | |
| COMMON STOCK — continued |
| Consumer Goods — 0.7% | | | | | | | | |
| Heineken | | | 73 | | | $ | 6,702 | |
| Heineken Holding | | | 64 | | | | 5,156 | |
| Unilever | | | 88 | | | | 3,997 | |
| | | | | | | | 15,855 | |
| Consumer Services — 0.4% | | | | | | | | |
| Koninklijke Ahold | | | 176 | | | | 3,601 | |
| RELX | | | 224 | | | | 3,848 | |
| Wolters Kluwer | | | 92 | | | | 3,130 | |
| | | | | | | | 10,579 | |
| Financials — 0.7% | | | | | | | | |
| Aegon | | | 699 | | | | 4,327 | |
| Delta Lloyd | | | 434 | | | | 3,442 | |
| Euronext (A) | | | 56 | | | | 2,473 | |
| ING Groep | | | 127 | | | | 1,857 | |
| NN Group | | | 113 | | | | 3,567 | |
| | | | | | | | 15,666 | |
| Industrials — 0.8% | | | | | | | | |
| Aalberts Industries | | | 53 | | | | 1,731 | |
| Arcadis | | | 32 | | | | 811 | |
| Boskalis Westminster | | | 110 | | | | 5,376 | |
| Koninklijke Philips | | | 149 | | | | 4,047 | |
| Koninklijke Vopak | | | 60 | | | | 2,424 | |
| PostNL * | | | 358 | | | | 1,485 | |
| TNT Express * | | | 530 | | | | 4,479 | |
| | | | | | | | 20,353 | |
| Oil & Gas — 0.1% | | | | | | | | |
| SBM Offshore * | | | 166 | | | | 2,286 | |
| Real Estate Investment Trusts — 0.5% | | | | | | | | |
| Unibail-Rodamco | | | 18 | | | | 5,052 | |
| Wereldhave | | | 113 | | | | 7,087 | |
| | | | | | | | 12,139 | |
| Technology — 0.4% | | | | | | | | |
| ASM International | | | 160 | | | | 6,152 | |
| ASML Holding | | | 27 | | | | 2,524 | |
| | | | | | | | 8,676 | |
| Telecommunications — 0.1% | | | | | | | | |
| Koninklijke KPN | | | 800 | | | | 2,952 | |
| TOTAL NETHERLANDS | | | | | | | 101,762 | |
| NORWAY— 1.8% | | | | | | | | |
| Basic Materials — 0.3% | | | | | | | | |
| Norsk Hydro | | | 400 | | | | 1,440 | |
The accompanying notes are an integral part of the financial statements.
| Schedule of Investments | October 31, 2015 |
| |
| Global X Scientific Beta Europe ETF‡ |
| | | Shares | | | Value | |
| COMMON STOCK — continued |
| Basic Materials — continued | | | | | | | | |
| Yara International | | | 150 | | | $ | 6,837 | |
| | | | | | | | 8,277 | |
| Consumer Goods — 0.6% | | | | | | | | |
| Marine Harvest | | | 656 | | | | 8,830 | |
| Orkla | | | 858 | | | | 7,326 | |
| | | | | | | | 16,156 | |
| Consumer Services — 0.1% | | | | | | | | |
| Schibsted, Cl A | | | 62 | | | | 2,088 | |
| Financials — 0.4% | | | | | | | | |
| DnB | | | 140 | | | | 1,790 | |
| Gjensidige Forsikring * | | | 412 | | | | 6,291 | |
| | | | | | | | 8,081 | |
| Oil & Gas — 0.3% | | | | | | | | |
| Statoil | | | 169 | | | | 2,720 | |
| Subsea 7 * | | | 331 | | | | 2,592 | |
| TGS Nopec Geophysical | | | 160 | | | | 3,167 | |
| | | | | | | | 8,479 | |
| Telecommunications — 0.1% | | | | | | | | |
| Telenor | | | 89 | | | | 1,686 | |
| TOTAL NORWAY | | | | | | | 44,767 | |
| PORTUGAL— 0.4% | | | | | | | | |
| Consumer Services — 0.1% | | | | | | | | |
| Jeronimo Martins | | | 159 | | | | 2,246 | |
| Financials — 0.1% | | | | | | | | |
| Banco Comercial Portugues, Cl R * | | | 57,800 | | | | 3,339 | |
| Oil & Gas — 0.1% | | | | | | | | |
| Galp Energia | | | 200 | | | | 2,173 | |
| Utilities — 0.1% | | | | | | | | |
| Energias de Portugal | | | 599 | | | | 2,229 | |
| TOTAL PORTUGAL | | | | | | | 9,987 | |
| SPAIN— 3.8% | | | | | | | | |
| Basic Materials — 0.1% | | | | | | | | |
| Acerinox | | | 179 | | | | 1,946 | |
| Consumer Goods — 0.3% | | | | | | | | |
| Viscofan | | | 132 | | | | 7,749 | |
| Consumer Services — 0.2% | | | | | | | | |
| Distribuidora Internacional de Alimentacion * | | | 48 | | | | 307 | |
| Industria de Diseno Textil | | | 80 | | | | 3,014 | |
| Mediaset Espana Comunicacion | | | 176 | | | | 2,149 | |
| | | | | | | | 5,470 | |
The accompanying notes are an integral part of the financial statements.
| Schedule of Investments | October 31, 2015 |
| |
| Global X Scientific Beta Europe ETF‡ |
| | | Shares | | | Value | |
| COMMON STOCK — continued |
| Financials — 0.8% | | | | | | | | |
| Banco Bilbao Vizcaya Argentaria | | | 120 | | | $ | 1,039 | |
| Banco de Sabadell | | | 1,131 | | | | 2,198 | |
| Banco Popular Espanol | | | 484 | | | | 1,853 | |
| Banco Santander | | | 200 | | | | 1,127 | |
| Bankia | | | 1,555 | | | | 2,013 | |
| Bankinter | | | 693 | | | | 5,051 | |
| Bolsas y Mercados Espanoles SHMSF | | | 33 | | | | 1,191 | |
| CaixaBank | | | 709 | | | | 2,735 | |
| Mapfre | | | 659 | | | | 1,969 | |
| | | | | | | | 19,176 | |
| Industrials — 0.8% | | | | | | | | |
| Abertis Infraestructuras | | | 89 | | | | 1,486 | |
| Acciona | | | 24 | | | | 2,028 | |
| ACS Actividades de Construccion y Servicios | | | 33 | | | | 1,128 | |
| Aena SA * (A) | | | 10 | | | | 1,121 | |
| Amadeus IT Holding, Cl A | | | 61 | | | | 2,612 | |
| Ferrovial | | | 200 | | | | 5,073 | |
| Zardoya Otis | | | 302 | | | | 3,736 | |
| | | | | | | | 17,184 | |
| Oil & Gas — 0.2% | | | | | | | | |
| Gamesa Tecnologica | | | 180 | | | | 2,860 | |
| Repsol | | | 169 | | | | 2,142 | |
| | | | | | | | 5,002 | |
| Real Estate Investment Trusts — 0.2% | | | | | | | | |
| Merlin Properties Socimi | | | 291 | | | | 3,748 | |
| Telecommunications — 0.1% | | | | | | | | |
| Telefonica | | | 120 | | | | 1,595 | |
| Utilities — 1.1% | | | | | | | | |
| Enagas | | | 216 | | | | 6,574 | |
| Endesa | | | 425 | | | | 9,508 | |
| Gas Natural SDG | | | 160 | | | | 3,484 | |
| Iberdrola | | | 787 | | | | 5,648 | |
| Red Electrica | | | 67 | | | | 5,936 | |
| | | | | | | | 31,150 | |
| TOTAL SPAIN | | | | | | | 93,020 | |
| SWEDEN— 5.4% | | | | | | | | |
| Basic Materials — 0.5% | | | | | | | | |
| BillerudKorsnas | | | 348 | | | | 6,349 | |
| Boliden | | | 180 | | | | 3,468 | |
| Hexpol | | | 169 | | | | 1,656 | |
| | | | | | | | 11,473 | |
The accompanying notes are an integral part of the financial statements.
| Schedule of Investments | October 31, 2015 |
| |
| Global X Scientific Beta Europe ETF‡ |
| | | Shares | | | Value | |
| COMMON STOCK — continued |
| Consumer Goods — 0.7% | | | | | | | | |
| Electrolux | | | 40 | | | $ | 1,187 | |
| Husqvarna, Cl B | | | 248 | | | | 1,646 | |
| Svenska Cellulosa, Cl B | | | 226 | | | | 6,707 | |
| Swedish Match | | | 123 | | | | 3,892 | |
| | | | | | | | 13,432 | |
| Consumer Services — 0.5% | | | | | | | | |
| Hennes & Mauritz, Cl B | | | 63 | | | | 2,466 | |
| ICA Gruppen | | | 255 | | | | 9,136 | |
| | | | | | | | 11,602 | |
| Financials — 1.5% | | | | | | | | |
| Castellum | | | 421 | | | | 6,346 | |
| Fabege | | | 318 | | | | 5,090 | |
| Industrivarden, Cl C | | | 295 | | | | 5,404 | |
| Intrum Justitia | | | 102 | | | | 3,688 | |
| Investment Kinnevik, Cl B | | | 75 | | | | 2,411 | |
| Investor, Cl B | | | 100 | | | | 3,738 | |
| JM | | | 31 | | | | 883 | |
| Nordea Bank | | | 225 | | | | 2,504 | |
| Skandinaviska Enskilda Banken, Cl A | | | 251 | | | | 2,658 | |
| Svenska Handelsbanken, Cl A | | | 371 | | | | 5,077 | |
| Swedbank, Cl A | | | 153 | | | | 3,534 | |
| | | | | | | | 41,333 | |
| Health Care — 0.6% | | | | | | | | |
| Elekta, Cl B | | | 177 | | | | 1,377 | |
| Getinge, Cl B | | | 36 | | | | 907 | |
| Meda, Cl A | | | 635 | | | | 9,401 | |
| Swedish Orphan Biovitrum * | | | 155 | | | | 2,373 | |
| | | | | | | | 14,058 | |
| Industrials — 0.8% | | | | | | | | |
| Assa Abloy, Cl B | | | 180 | | | | 3,603 | |
| Atlas Copco, Cl A | | | 95 | | | | 2,495 | |
| NCC, Cl B | | | 124 | | | | 3,853 | |
| Nibe Industrier, Cl B | | | 24 | | | | 778 | |
| Securitas, Cl B | | | 456 | | | | 5,993 | |
| Skanska, Cl B | | | 78 | | | | 1,530 | |
| Trelleborg, Cl B | | | 192 | | | | 3,265 | |
| | | | | | | | 21,517 | |
| Oil & Gas — 0.1% | | | | | | | | |
| Lundin Petroleum * | | | 100 | | | | 1,454 | |
| Technology — 0.3% | | | | | | | | |
| Hexagon, Cl B | | | 20 | | | | 699 | |
| Telefonaktiebolaget LM Ericsson, Cl B | | | 711 | | | | 6,979 | |
| | | | | | | | 7,678 | |
The accompanying notes are an integral part of the financial statements.
| Schedule of Investments | October 31, 2015 |
| |
| Global X Scientific Beta Europe ETF‡ |
| | | Shares | | | Value | |
| COMMON STOCK — continued |
| Telecommunications — 0.4% | | | | | | | | |
| Tele2, Cl B | | | 701 | | | $ | 7,059 | |
| TeliaSonera | | | 600 | | | | 3,090 | |
| | | | | | | | 10,149 | |
| TOTAL SWEDEN | | | | | | | 132,696 | |
| SWITZERLAND— 11.0% | | | | | | | | |
| Basic Materials — 1.0% | | | | | | | | |
| Clariant | | | 265 | | | | 4,893 | |
| EMS-Chemie Holding | | | 17 | | | | 7,218 | |
| Givaudan | | | 4 | | | | 7,182 | |
| Glencore Xstrata | | | 271 | | | | 471 | |
| Syngenta | | | 12 | | | | 4,051 | |
| | | | | | | | 23,815 | |
| Consumer Goods — 1.3% | | | | | | | | |
| Aryzta | | | 88 | | | | 3,982 | |
| Barry Callebaut | | | 8 | | | | 9,633 | |
| Cie Financiere Richemont | | | 25 | | | | 2,151 | |
| Coca-Cola HBC | | | 147 | | | | 3,519 | |
| Nestle | | | 106 | | | | 8,129 | |
| Swatch Group | | | 11 | | | | 4,317 | |
| | | | | | | | 31,731 | |
| Consumer Services — 0.6% | | | | | | | | |
| Dufry * | | | 46 | | | | 5,399 | |
| Galenica | | | 6 | | | | 8,826 | |
| | | | | | | | 14,225 | |
| Financials — 3.7% | | | | | | | | |
| Baloise Holding | | | 43 | | | | 5,178 | |
| Credit Suisse Group | | | 60 | | | | 1,502 | |
| GAM Holding | | | 174 | | | | 3,195 | |
| Helvetia Holding | | | 13 | | | | 6,825 | |
| Julius Baer Group | | | 123 | | | | 6,129 | |
| Pargesa Holding | | | 85 | | | | 5,415 | |
| Partners Group Holding | | | 35 | | | | 12,711 | |
| PSP Swiss Property | | | 137 | | | | 11,959 | |
| Swiss Life Holding | | | 29 | | | | 6,946 | |
| Swiss Prime Site | | | 216 | | | | 16,566 | |
| Swiss Re | | | 97 | | | | 9,044 | |
| UBS Group | | | 101 | | | | 2,027 | |
| Zurich Insurance Group | | | 27 | | | | 7,157 | |
| | | | | | | | 94,654 | |
| Health Care — 1.3% | | | | | | | | |
| Actelion | | | 9 | | | | 1,254 | |
| Lonza Group | | | 67 | | | | 9,869 | |
| Novartis | | | 53 | | | | 4,831 | |
The accompanying notes are an integral part of the financial statements.
| Schedule of Investments | October 31, 2015 |
| |
| Global X Scientific Beta Europe ETF‡ |
| | | Shares | | | Value | |
| COMMON STOCK — continued |
| Health Care — continued | | | | | | | | |
| Roche Holding | | | 22 | | | $ | 5,988 | |
| Sonova Holding | | | 45 | | | | 6,162 | |
| Straumann Holding | | | 12 | | | | 3,409 | |
| | | | | | | | 31,513 | |
| Industrials — 2.4% | | | | | | | | |
| ABB | | | 80 | | | | 1,514 | |
| DKSH Holding | | | 59 | | | | 3,606 | |
| Flughafen Zuerich | | | 15 | | | | 11,397 | |
| Geberit | | | 15 | | | | 4,859 | |
| Georg Fischer | | | 5 | | | | 3,084 | |
| Kaba Holding | | | 6 | | | | 3,756 | |
| Kuehne + Nagel International | | | 50 | | | | 6,954 | |
| LafargeHolcim | | | 45 | | | | 2,545 | |
| OC Oerlikon * | | | 468 | | | | 4,506 | |
| Schindler Holding | | | 29 | | | | 4,724 | |
| SGS | | | 2 | | | | 3,823 | |
| Sulzer | | | 34 | | | | 3,446 | |
| Wolseley | | | 41 | | | | 2,417 | |
| | | | | | | | 56,631 | |
| Technology — 0.4% | | | | | | | | |
| AMS | | | 76 | | | | 2,444 | |
| Logitech International | | | 221 | | | | 3,262 | |
| Temenos Group * | | | 81 | | | | 3,800 | |
| | | | | | | | 9,506 | |
| Telecommunications — 0.3% | | | | | | | | |
| Swisscom | | | 14 | | | | 7,243 | |
| TOTAL SWITZERLAND | | | | | | | 269,318 | |
| UNITED KINGDOM— 31.3% | | | | | | | | |
| Basic Materials — 0.6% | | | | | | | | |
| Anglo American | | | 104 | | | | 878 | |
| BHP Billiton | | | 57 | | | | 916 | |
| Croda International | | | 116 | | | | 5,192 | |
| Johnson Matthey | | | 40 | | | | 1,597 | |
| Mondi | | | 85 | | | | 1,974 | |
| Randgold Resources | | | 54 | | | | 3,643 | |
| Rio Tinto | | | 34 | | | | 1,238 | |
| Victrex | | | 60 | | | | 1,714 | |
| | | | | | | | 17,152 | |
| Consumer Goods — 3.2% | | | | | | | | |
| Barratt Developments | | | 487 | | | | 4,607 | |
| Bellway | | | 175 | | | | 7,016 | |
| Berkeley Group Holdings | | | 154 | | | | 7,891 | |
| Bovis Homes Group | | | 150 | | | | 2,375 | |
The accompanying notes are an integral part of the financial statements.
| Schedule of Investments | October 31, 2015 |
| |
| Global X Scientific Beta Europe ETF‡ |
| | | Shares | | | Value | |
| COMMON STOCK — continued |
| Consumer Goods — continued | | | | | | | | |
| British American Tobacco | | | 59 | | | $ | 3,517 | |
| Britvic | | | 213 | | | | 2,299 | |
| Burberry Group | | | 110 | | | | 2,256 | |
| Diageo | | | 59 | | | | 1,712 | |
| Galliford Try | | | 150 | | | | 3,468 | |
| Greencore Group | | | 358 | | | | 1,670 | |
| Imperial Tobacco Group | | | 148 | | | | 7,997 | |
| Persimmon | | | 244 | | | | 7,514 | |
| Reckitt Benckiser Group | | | 77 | | | | 7,544 | |
| SABMiller | | | 50 | | | | 3,085 | |
| Tate & Lyle | | | 136 | | | | 1,255 | |
| Taylor Wimpey | | | 1,652 | | | | 5,052 | |
| Unilever | | | 100 | | | | 4,468 | |
| | | | | | | | 73,726 | |
| Consumer Services — 6.2% | | | | | | | | |
| AA | | | 369 | | | | 1,578 | |
| ASOS * | | | 40 | | | | 2,015 | |
| Betfair Group | | | 83 | | | | 4,137 | |
| Booker Group | | | 827 | | | | 2,377 | |
| Carnival | | | 111 | | | | 6,201 | |
| Compass Group | | | 197 | | | | 3,405 | |
| Daily Mail & General Trust, Cl A | | | 128 | | | | 1,481 | |
| Dixons Carphone | | | 498 | | | | 3,548 | |
| easyJet | | | 161 | | | | 4,351 | |
| Firstgroup * | | | 2,029 | | | | 3,032 | |
| Greene King | | | 635 | | | | 7,880 | |
| Home Retail Group | | | 1,770 | | | | 3,069 | |
| Inchcape | | | 324 | | | | 4,001 | |
| Informa | | | 736 | | | | 6,456 | |
| InterContinental Hotels Group | | | 64 | | | | 2,571 | |
| International Consolidated Airlines Group | | | 137 | | | | 1,232 | |
| ITV | | | 400 | | | | 1,559 | |
| J Sainsbury | | | 1,179 | | | | 4,851 | |
| Just Eat * | | | 165 | | | | 1,086 | |
| Kingfisher | | | 1,000 | | | | 5,453 | |
| Marks & Spencer Group | | | 115 | | | | 911 | |
| Merlin Entertainments (A) | | | 301 | | | | 1,928 | |
| MoneySuperMarket.com | | | 151 | | | | 779 | |
| Next | | | 101 | | | | 12,479 | |
| Ocado Group * | | | 200 | | | | 1,164 | |
| Pearson | | | 333 | | | | 4,431 | |
| Playtech | | | 204 | | | | 2,697 | |
| RELX | | | 216 | | | | 3,876 | |
| Restaurant Group | | | 384 | | | | 4,252 | |
The accompanying notes are an integral part of the financial statements.
| Schedule of Investments | October 31, 2015 |
| |
| Global X Scientific Beta Europe ETF‡ |
| | | Shares | | | Value | |
| COMMON STOCK — continued |
| Consumer Services — continued | | | | | | | | |
| Rightmove | | | 42 | | | $ | 2,490 | |
| Sky | | | 523 | | | | 8,853 | |
| Sports Direct International * | | | 143 | | | | 1,539 | |
| Stagecoach Group | | | 1,318 | | | | 7,043 | |
| Tesco * | | | 859 | | | | 2,432 | |
| Thomas Cook Group * | | | 800 | | | | 1,518 | |
| UBM | | | 483 | | | | 3,819 | |
| WH Smith | | | 157 | | | | 4,134 | |
| Whitbread | | | 45 | | | | 3,451 | |
| William Hill | | | 476 | | | | 2,331 | |
| WM Morrison Supermarkets | | | 1,734 | | | | 4,512 | |
| WPP | | | 108 | | | | 2,432 | |
| | | | | | | | 147,354 | |
| Financials — 7.5% | | | | | | | | |
| 3i Group | | | 347 | | | | 2,685 | |
| Admiral Group | | | 441 | | | | 10,986 | |
| Amlin | | | 1,685 | | | | 17,149 | |
| Aviva | | | 400 | | | | 3,002 | |
| Barclays | | | 600 | | | | 2,150 | |
| Beazley | | | 1,130 | | | | 6,345 | |
| Capital & Counties Properties | | | 1,234 | | | | 8,471 | |
| Close Brothers Group | | | 400 | | | | 9,044 | |
| Direct Line Insurance Group | | | 1,996 | | | | 12,158 | |
| Hargreaves Lansdown | | | 58 | | | | 1,293 | |
| Henderson Group | | | 400 | | | | 1,774 | |
| Hiscox | | | 772 | | | | 11,535 | |
| HSBC Holdings | | | 770 | | | | 6,037 | |
| ICAP | | | 524 | | | | 3,561 | |
| IG Group Holdings | | | 754 | | | | 8,797 | |
| Intermediate Capital Group | | | 466 | | | | 4,073 | |
| Investec | | | 407 | | | | 3,407 | |
| Jardine Lloyd Thompson Group | | | 300 | | | | 4,390 | |
| Jupiter Fund Management | | | 245 | | | | 1,706 | |
| Legal & General Group | | | 1,095 | | | | 4,424 | |
| Lloyds Banking Group | | | 2,965 | | | | 3,376 | |
| London Stock Exchange Group | | | 29 | | | | 1,140 | |
| Man Group | | | 1,400 | | | | 3,613 | |
| Old Mutual | | | 1,177 | | | | 3,859 | |
| Paragon Group of | | | 670 | | | | 4,346 | |
| Phoenix Group Holdings | | | 838 | | | | 11,072 | |
| Provident Financial | | | 235 | | | | 12,594 | |
| Prudential | | | 100 | | | | 2,346 | |
| Royal Bank of Scotland Group * | | | 400 | | | | 1,962 | |
| RSA Insurance Group | | | 541 | | | | 3,517 | |
The accompanying notes are an integral part of the financial statements.
| Schedule of Investments | October 31, 2015 |
| |
| Global X Scientific Beta Europe ETF‡ |
| | | Shares | | | Value | |
| COMMON STOCK — continued |
| Financials — continued | | | | | | | | |
| Schroders | | | 40 | | | $ | 1,843 | |
| St. James's Place | | | 140 | | | | 2,085 | |
| Standard Chartered | | | 171 | | | | 1,905 | |
| Standard Life | | | 297 | | | | 1,931 | |
| Unite Group | | | 255 | | | | 2,619 | |
| | | | | | | | 181,195 | |
| Health Care — 0.7% | | | | | | | | |
| BTG * | | | 458 | | | | 3,904 | |
| GlaxoSmithKline | | | 162 | | | | 3,515 | |
| Hikma Pharmaceuticals | | | 169 | | | | 5,649 | |
| Shire | | | 33 | | | | 2,510 | |
| Smith & Nephew | | | 204 | | | | 3,497 | |
| | | | | | | | 19,075 | |
| Industrials — 5.9% | | | | | | | | |
| Ashtead Group | | | 95 | | | | 1,467 | |
| Babcock International Group | | | 201 | | | | 2,992 | |
| BAE Systems | | | 690 | | | | 4,692 | |
| Balfour Beatty * | | | 1,173 | | | | 4,515 | |
| BBA Aviation | | | 2,580 | | | | 7,599 | |
| Berendsen | | | 433 | | | | 6,854 | |
| Bodycote | | | 295 | | | | 2,346 | |
| Bunzl | | | 244 | | | | 7,005 | |
| Capita | | | 355 | | | | 6,990 | |
| Carillion | | | 858 | | | | 4,048 | |
| Cobham | | | 1,067 | | | | 4,573 | |
| DCC | | | 79 | | | | 6,351 | |
| DS Smith | | | 800 | | | | 4,782 | |
| Essentra | | | 172 | | | | 2,237 | |
| Experian | | | 132 | | | | 2,259 | |
| G4S | | | 1,521 | | | | 5,701 | |
| Halma | | | 400 | | | | 4,717 | |
| Hays | | | 800 | | | | 1,741 | |
| Howden Joinery Group | | | 929 | | | | 6,652 | |
| Intertek Group | | | 132 | | | | 5,351 | |
| Kingspan Group | | | 150 | | | | 3,650 | |
| Meggitt | | | 731 | | | | 3,992 | |
| Melrose Industries | | | 1,200 | | | | 4,933 | |
| Michael Page International | | | 220 | | | | 1,681 | |
| QinetiQ Group | | | 1,600 | | | | 5,535 | |
| Regus | | | 308 | | | | 1,592 | |
| Rentokil Initial | | | 3,266 | | | | 7,793 | |
| Rotork | | | 400 | | | | 1,158 | |
| Royal Mail | | | 200 | | | | 1,375 | |
| RPC Group | | | 60 | | | | 603 | |
The accompanying notes are an integral part of the financial statements.
| Schedule of Investments | October 31, 2015 |
| |
| Global X Scientific Beta Europe ETF‡ |
| | | Shares | | | Value | |
| COMMON STOCK — continued |
| Industrials — continued | | | | | | | | |
| Senior | | | 400 | | | $ | 1,401 | |
| Serco Group * | | | 561 | | | | 812 | |
| Smiths Group | | | 154 | | | | 2,288 | |
| Spectris | | | 20 | | | | 515 | |
| Spirax-Sarco Engineering | | | 96 | | | | 4,509 | |
| Travis Perkins | | | 94 | | | | 2,782 | |
| Ultra Electronics Holdings | | | 180 | | | | 4,679 | |
| WS Atkins | | | 197 | | | | 4,193 | |
| | | | | | | | 146,363 | |
| Oil & Gas — 0.6% | | | | | | | | |
| Amec Foster Wheeler | | | 89 | | | | 977 | |
| BG Group | | | 144 | | | | 2,280 | |
| BP | | | 713 | | | | 4,254 | |
| John Wood Group | | | 278 | | | | 2,563 | |
| Petrofac | | | 71 | | | | 924 | |
| Royal Dutch Shell, Cl A | | | 146 | | | | 3,811 | |
| Tullow Oil * | | | 373 | | | | 1,169 | |
| | | | | | | | 15,978 | |
| Real Estate Investment Trusts — 2.7% | | | | | | | | |
| British Land | | | 412 | | | | 5,539 | |
| Derwent London | | | 181 | | | | 10,846 | |
| Great Portland Estates | | | 892 | | | | 12,253 | |
| Hammerson | | | 547 | | | | 5,378 | |
| Intu Properties | | | 1,501 | | | | 8,023 | |
| Land Securities Group | | | 334 | | | | 6,907 | |
| Segro | | | 1,100 | | | | 7,641 | |
| Shaftesbury | | | 714 | | | | 10,371 | |
| | | | | | | | 66,958 | |
| Technology — 0.8% | | | | | | | | |
| ARM Holdings | | | 55 | | | | 871 | |
| Dialog Semiconductor * | | | 40 | | | | 1,487 | |
| Micro Focus International | | | 260 | | | | 5,043 | |
| Sage Group | | | 618 | | | | 5,202 | |
| Telecity Group | | | 352 | | | | 6,387 | |
| | | | | | | | 18,990 | |
| Telecommunications — 1.0% | | | | | | | | |
| BT Group, Cl A | | | 508 | | | | 3,648 | |
| Cable & Wireless Communications | | | 2,581 | | | | 2,934 | |
| Inmarsat | | | 496 | | | | 7,545 | |
| TalkTalk Telecom Group | | | 1,002 | | | | 3,915 | |
| Vodafone Group | | | 2,184 | | | | 7,227 | |
| | | | | | | | 25,269 | |
The accompanying notes are an integral part of the financial statements.
| Schedule of Investments | October 31, 2015 |
| |
| Global X Scientific Beta Europe ETF‡ |
| | | Shares/Number
of Rights | | | Value | |
| COMMON STOCK — continued | | | | | | | | |
| Utilities — 2.1% | | | | | | | | |
| Centrica | | | 871 | | | $ | 3,041 | |
| Drax Group | | | 1,085 | | | | 4,367 | |
| National Grid | | | 411 | | | | 5,871 | |
| Pennon Group | | | 900 | | | | 11,272 | |
| Severn Trent | | | 245 | | | | 8,487 | |
| SSE | | | 323 | | | | 7,557 | |
| United Utilities Group | | | 547 | | | | 8,351 | |
| | | | | | | | 48,946 | |
| TOTAL UNITED KINGDOM | | | | | | | 761,006 | |
| UNITED STATES— 0.2% | | | | | | | | |
| Health Care — 0.2% | | | | | | | | |
| AstraZeneca | | | 87 | | | | 5,577 | |
| TOTAL COMMON STOCK | | | | | | | | |
| (Cost $2,489,063) | | | | | | | 2,425,615 | |
| | | | | | | | | |
| PREFERRED STOCK — 0.3% | | | | | | | | |
| GERMANY— 0.3% | | | | | | | | |
| Basic Materials — 0.2% | | | | | | | | |
| FUCHS PETROLUB, 0.000% | | | 39 | | | | 1,879 | |
| Henkel & KGaA, 0.000% | | | 34 | | | | 3,707 | |
| | | | | | | | 5,586 | |
| Consumer Goods — 0.1% | | | | | | | | |
| Porsche Automobil Holding, 0.000% | | | 14 | | | | 659 | |
| Volkswagen, 0.000% | | | 6 | | | | 724 | |
| | | | | | | | 1,383 | |
| TOTAL GERMANY | | | | | | | 6,969 | |
| TOTAL PREFERRED STOCK | | | | | | | | |
| (Cost $8,313) | | | | | | | 6,969 | |
| | | | | | | | | |
| RIGHTS — 0.0% | | | | | | | | |
| France — 0.0% | | | | | | | | |
| Technicolor* | | | 105 | | | | 26 | |
| | | | | | | | | |
| Spain — 0.0% | | | | | | | | |
| Banco Santander* | | | 200 | | | | 11 | |
| | | | | | | | | |
| TOTAL RIGHTS | | | | | | | | |
| (Cost $–) | | | | | | | 37 | |
| TOTAL INVESTMENTS — 99.7% | | | | | | | | |
| (Cost $2,497,376) | | | | | | $ | 2,432,621 | |
Percentages are based on Net Assets of $2,440,790.
The accompanying notes are an integral part of the financial statements.
| Schedule of Investments | October 31, 2015 |
| |
| Global X Scientific Beta Europe ETF‡ |
| * | Non-income producing security. |
| ‡ | Fund commenced operations on May 12, 2015. |
| (A) | Securities sold within terms of a private placement memorandum, exempt from registration under Section 144A of the Securities Act of 1933, as amended, and may be sold only to dealers in that program or other "accredited investors." These securities have been determined to be liquid under guidelines established by the Board of Trustees. |
As of October 31, 2015, all of the Fund’s investments were considered Level 1, in accordance with authoritative guidance on fair value measurements and disclosure under U.S. GAAP.
For the period ended October 31, 2015, there have been no transfers between Level 1, Level 2 or Level 3 investments.
As of October 31, 2015, there were no Level 3 investments.
The accompanying notes are an integral part of the financial statements.
| Schedule of Investments | October 31, 2015 |
| |
| Global X Scientific Beta Japan ETF‡ |
Sector Weightings (unaudited)†:
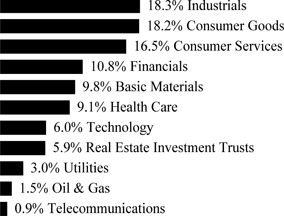
† Sector weightings percentages are based on the total market value of investments.
| | | Shares | | | Value | |
| COMMON STOCK — 99.9% |
| Basic Materials — 9.8% | | | | | | | | |
| ADEKA | | | 600 | | | $ | 8,890 | |
| Air Water | | | 314 | | | | 5,181 | |
| Asahi Kasei | | | 1,010 | | | | 6,248 | |
| Daicel | | | 593 | | | | 7,902 | |
| Daido Steel | | | 1,177 | | | | 4,535 | |
| Denki Kagaku Kogyo | | | 1,389 | | | | 6,503 | |
| DIC | | | 2,247 | | | | 6,145 | |
| Dowa Holdings | | | 160 | | | | 1,405 | |
| Hitachi Chemical | | | 579 | | | | 9,270 | |
| Hitachi Metals | | | 300 | | | | 3,428 | |
| JFE Holdings | | | 140 | | | | 2,223 | |
| JSR | | | 293 | | | | 4,664 | |
| Kaneka | | | 1,387 | | | | 12,389 | |
| Kansai Paint | | | 156 | | | | 2,395 | |
| Kobe Steel * | | | 1,800 | | | | 2,297 | |
| Kuraray | | | 420 | | | | 5,221 | |
| Maruichi Steel Tube | | | 431 | | | | 11,109 | |
| Mitsubishi Chemical Holdings | | | 1,117 | | | | 7,038 | |
| Mitsubishi Gas Chemical | | | 1,345 | | | | 7,557 | |
| Mitsui Chemicals | | | 2,517 | | | | 9,615 | |
| Mitsui Mining & Smelting | | | 2,516 | | | | 4,879 | |
| Nagase | | | 534 | | | | 6,691 | |
| Nihon Parkerizing | | | 153 | | | | 1,376 | |
| Nippon Kayaku | | | 282 | | | | 2,961 | |
| Nippon Paint Holdings | | | 131 | | | | 2,797 | |
The accompanying notes are an integral part of the financial statements.
| Schedule of Investments | October 31, 2015 |
| |
| Global X Scientific Beta Japan ETF‡ |
| | | Shares | | | Value | |
| COMMON STOCK — continued |
| Basic Materials — continued | | | | | | | | |
| Nippon Paper Industries | | | 325 | | | $ | 6,057 | |
| Nippon Shokubai | | | 169 | | | | 13,331 | |
| Nippon Steel & Sumitomo Metal | | | 74 | | | | 1,515 | |
| Nissan Chemical Industries | | | 227 | | | | 5,681 | |
| Nitto Denko | | | 40 | | | | 2,593 | |
| NOF | | | 1,139 | | | | 8,193 | |
| Oji Holdings | | | 450 | | | | 2,346 | |
| Shin-Etsu Chemical | | | 19 | | | | 1,139 | |
| Showa Denko | | | 4,029 | | | | 5,108 | |
| Sumitomo Chemical | | | 657 | | | | 3,806 | |
| Sumitomo Metal Mining | | | 335 | | | | 4,193 | |
| Taiyo Nippon Sanso | | | 339 | | | | 3,531 | |
| Teijin | | | 2,702 | | | | 9,628 | |
| Toagosei | | | 640 | | | | 5,410 | |
| Toray Industries | | | 630 | | | | 5,547 | |
| Tosoh | | | 862 | | | | 4,422 | |
| Ube Industries | | | 3,886 | | | | 8,212 | |
| Yamato Kogyo | | | 296 | | | | 7,947 | |
| Zeon | | | 607 | | | | 4,995 | |
| | | | | | | | 246,373 | |
| Consumer Goods — 18.1% | | | | | | | | |
| ABC-Mart | | | 183 | | | | 10,267 | |
| Aisin Seiki | | | 136 | | | | 5,449 | |
| Ajinomoto | | | 290 | | | | 6,505 | |
| Asahi Group Holdings | | | 186 | | | | 5,775 | |
| Asics | | | 198 | | | | 5,521 | |
| Bridgestone | | | 89 | | | | 3,301 | |
| Calbee | | | 292 | | | | 10,671 | |
| Casio Computer | | | 195 | | | | 3,704 | |
| Citizen Holdings | | | 600 | | | | 4,584 | |
| Coca-Cola East Japan | | | 482 | | | | 6,807 | |
| Coca-Cola West | | | 478 | | | | 9,725 | |
| Daihatsu Motor | | | 629 | | | | 7,767 | |
| Daiichikosho | | | 246 | | | | 8,235 | |
| Daiwa House Industry | | | 132 | | | | 3,496 | |
| Denso | | | 71 | | | | 3,331 | |
| Ezaki Glico | | | 160 | | | | 7,690 | |
| Fuji Heavy Industries * | | | 40 | | | | 1,567 | |
| GungHo Online Entertainment * | | | 564 | | | | 1,846 | |
| Honda Motor | | | 160 | | | | 5,362 | |
| House Foods Group | | | 752 | | | | 13,061 | |
| Ito En | | | 220 | | | | 4,623 | |
| Japan Tobacco | | | 58 | | | | 2,024 | |
| JTEKT | | | 93 | | | | 1,620 | |
The accompanying notes are an integral part of the financial statements.
| Schedule of Investments | October 31, 2015 |
| |
| Global X Scientific Beta Japan ETF‡ |
| | | Shares | | | Value | |
| COMMON STOCK — continued |
| Consumer Goods — continued | | | | | | | | |
| Kagome | | | 400 | | | $ | 6,825 | |
| Kao | | | 80 | | | | 4,136 | |
| Kewpie | | | 349 | | | | 8,023 | |
| Kikkoman | | | 45 | | | | 1,423 | |
| Kirin Holdings | | | 100 | | | | 1,426 | |
| Koito Manufacturing | | | 47 | | | | 1,801 | |
| Konami | | | 411 | | | | 9,393 | |
| Kose | | | 75 | | | | 7,389 | |
| Lion | | | 600 | | | | 5,822 | |
| MEIJI Holdings | | | 100 | | | | 7,947 | |
| Morinaga | | | 276 | | | | 1,416 | |
| Nexon | | | 427 | | | | 5,973 | |
| NH Foods | | | 647 | | | | 13,570 | |
| NHK Spring | | | 613 | | | | 6,304 | |
| Nichi-iko Pharmaceutical | | | 57 | | | | 1,597 | |
| Nichirei | | | 1,253 | | | | 8,213 | |
| Nifco | | | 167 | | | | 6,497 | |
| Nikon | | | 375 | | | | 4,885 | |
| Nintendo | | | 14 | | | | 2,260 | |
| Nissan Motor * | | | 736 | | | | 7,724 | |
| Nisshin Seifun Group | | | 939 | | | | 14,458 | |
| Nisshinbo Holdings | | | 266 | | | | 3,635 | |
| Nissin Foods Holdings | | | 58 | | | | 2,696 | |
| NOK | | | 155 | | | | 3,689 | |
| NSK | | | 100 | | | | 1,195 | |
| Onward Holdings | | | 1,492 | | | | 9,421 | |
| Pigeon | | | 300 | | | | 8,490 | |
| Pola Orbis Holdings | | | 28 | | | | 1,794 | |
| Rinnai | | | 25 | | | | 1,995 | |
| Sangetsu | | | 504 | | | | 8,094 | |
| Sanrio | | | 76 | | | | 2,031 | |
| Sapporo Holdings | | | 1,159 | | | | 4,802 | |
| Sega Sammy Holdings | | | 194 | | | | 2,056 | |
| Sekisui Chemical | | | 433 | | | | 5,153 | |
| Sekisui House | | | 374 | | | | 6,274 | |
| Sharp * | | | 1,627 | | | | 1,793 | |
| Shimano | | | 17 | | | | 2,702 | |
| Shiseido | | | 124 | | | | 2,971 | |
| Sony | | | 75 | | | | 2,163 | |
| Sumitomo Electric Industries | | | 234 | | | | 3,228 | |
| Sumitomo Forestry | | | 451 | | | | 5,438 | |
| Sumitomo Rubber Industries | | | 320 | | | | 4,805 | |
| Suntory Beverage & Food | | | 124 | | | | 5,045 | |
| Suzuki Motor | | | 42 | | | | 1,389 | |
The accompanying notes are an integral part of the financial statements.
| Schedule of Investments | October 31, 2015 |
| |
| Global X Scientific Beta Japan ETF‡ |
| | | Shares | | | Value | |
| COMMON STOCK — continued |
| Consumer Goods — continued | | | | | | | | |
| Takara Holdings | | | 140 | | | $ | 1,013 | |
| Tokai Rika | | | 348 | | | | 7,643 | |
| Toyo Suisan Kaisha | | | 164 | | | | 6,088 | |
| Toyo Tire & Rubber | | | 221 | | | | 4,701 | |
| Toyobo | | | 5,355 | | | | 7,899 | |
| Toyoda Gosei | | | 326 | | | | 7,559 | |
| Toyota Industries | | | 80 | | | | 4,249 | |
| Toyota Motor * | | | 45 | | | | 2,785 | |
| TS Tech | | | 190 | | | | 5,259 | |
| Unicharm | | | 248 | | | | 5,333 | |
| Wacoal Holdings | | | 995 | | | | 12,566 | |
| Yakult Honsha | | | 20 | | | | 1,067 | |
| Yamaha | | | 219 | | | | 5,490 | |
| Yamaha Motor | | | 114 | | | | 2,590 | |
| Yamazaki Baking | | | 1,278 | | | | 24,814 | |
| Yokohama Rubber | | | 256 | | | | 4,964 | |
| | | | | | | | 454,892 | |
| Consumer Services — 16.4% | | | | | | | | |
| Aeon | | | 288 | | | | 4,293 | |
| ANA Holdings | | | 4,918 | | | | 14,765 | |
| Aoyama Trading | | | 236 | | | | 8,664 | |
| Arcs | | | 458 | | | | 9,291 | |
| Autobacs Seven | | | 459 | | | | 8,083 | |
| Benesse Holdings | | | 169 | | | | 4,558 | |
| Central Japan Railway | | | 14 | | | | 2,576 | |
| Cosmos Pharmaceutical | | | 43 | | | | 5,391 | |
| Dai Nippon Printing | | | 377 | | | | 3,930 | |
| Dena * | | | 213 | | | | 3,445 | |
| Don Quijote Holdings | | | 197 | | | | 7,305 | |
| Duskin | | | 511 | | | | 8,813 | |
| East Japan Railway | | | 40 | | | | 3,835 | |
| FamilyMart | | | 93 | | | | 3,826 | |
| Fast Retailing | | | 3 | | | | 1,103 | |
| Fuji Media Holdings | | | 326 | | | | 3,901 | |
| H2O Retailing | | | 546 | | | | 10,709 | |
| Hakuhodo DY Holdings | | | 370 | | | | 3,925 | |
| Hankyu Hanshin Holdings | | | 1,129 | | | | 7,400 | |
| HIS | | | 60 | | | | 2,034 | |
| Isetan Mitsukoshi Holdings | | | 178 | | | | 2,884 | |
| Izumi | | | 236 | | | | 8,840 | |
| J Front Retailing | | | 205 | | | | 3,401 | |
| Japan Airlines * | | | 188 | | | | 7,135 | |
| Kakaku.com * | | | 236 | | | | 4,447 | |
| Keihan Electric Railway | | | 1,623 | | | | 11,580 | |
The accompanying notes are an integral part of the financial statements.
| Schedule of Investments | October 31, 2015 |
| |
| Global X Scientific Beta Japan ETF‡ |
| | | Shares | | | Value | |
| COMMON STOCK — continued |
| Consumer Services — continued | | | | | | | | |
| Keikyu | | | 133 | | | $ | 1,101 | |
| Keio | | | 152 | | | | 1,246 | |
| Keisei Electric Railway | | | 230 | | | | 2,857 | |
| Kintetsu Group Holdings | | | 400 | | | | 1,555 | |
| K's Holdings | | | 369 | | | | 13,102 | |
| Lawson | | | 51 | | | | 3,799 | |
| M3 * | | | 421 | | | | 8,223 | |
| Marui Group | | | 312 | | | | 4,067 | |
| Matsumotokiyoshi Holdings | | | 328 | | | | 14,162 | |
| McDonald's Holdings Japan * | | | 375 | | | | 8,883 | |
| Nagoya Railroad | | | 3,023 | | | | 12,574 | |
| Nankai Electric Railway | | | 2,114 | | | | 10,861 | |
| Nippon Television Holdings | | | 280 | | | | 4,887 | |
| Nishimatsu | | | 442 | | | | 1,769 | |
| Nishi-Nippon Railroad | | | 1,948 | | | | 10,138 | |
| Nitori Holdings | | | 161 | | | | 12,661 | |
| Odakyu Electric Railway | | | 109 | | | | 1,073 | |
| Oriental Land | | | 84 | | | | 5,139 | |
| Park24 | | | 324 | | | | 6,830 | |
| Pilot | | | 37 | | | | 1,579 | |
| Rakuten * | | | 126 | | | | 1,762 | |
| Resorttrust | | | 140 | | | | 3,620 | |
| Ryohin Keikaku | | | 36 | | | | 7,288 | |
| Sankyo | | | 304 | | | | 11,790 | |
| Seibu Holdings | | | 77 | | | | 1,570 | |
| Seven & i Holdings | | | 26 | | | | 1,187 | |
| Shimachu | | | 354 | | | | 7,791 | |
| Shimamura | | | 46 | | | | 5,211 | |
| Shochiku | | | 483 | | | | 4,283 | |
| Sotetsu Holdings | | | 981 | | | | 5,617 | |
| Start Today | | | 56 | | | | 1,891 | |
| Sugi Holdings | | | 89 | | | | 4,359 | |
| Sundrug | | | 153 | | | | 8,140 | |
| Takashimaya | | | 372 | | | | 3,351 | |
| Tobu Railway | | | 302 | | | | 1,469 | |
| Toho | | | 124 | | | | 3,247 | |
| Tokyo Broadcasting System Holdings | | | 337 | | | | 5,051 | |
| Tokyu | | | 140 | | | | 1,143 | |
| Tsuruha Holdings | | | 152 | | | | 12,117 | |
| TV Asahi Holdings | | | 222 | | | | 3,731 | |
| UNY Group Holdings | | | 1,756 | | | | 9,779 | |
| USS | | | 319 | | | | 5,686 | |
| Valor | | | 67 | | | | 1,576 | |
| Welcia Holdings | | | 36 | | | | 1,787 | |
The accompanying notes are an integral part of the financial statements.
| Schedule of Investments | October 31, 2015 |
| |
| Global X Scientific Beta Japan ETF‡ |
| | | Shares | | | Value | |
| COMMON STOCK — continued |
| Consumer Services — continued | | | | | | | | |
| West Japan Railway | | | 65 | | | $ | 4,595 | |
| Yamada Denki | | | 1,495 | | | | 6,777 | |
| | | | | | | | 407,458 | |
| Financials — 10.8% | | | | | | | | |
| 77 Bank | | | 949 | | | | 5,285 | |
| Acom * | | | 475 | | | | 2,622 | |
| AEON Financial Service | | | 128 | | | | 3,230 | |
| Aeon Mall | | | 100 | | | | 1,685 | |
| Aozora Bank | | | 3,693 | | | | 13,558 | |
| Awa Bank | | | 1,200 | | | | 6,692 | |
| Bank of Kyoto | | | 287 | | | | 2,928 | |
| Bank of Yokohama | | | 1,032 | | | | 6,493 | |
| Chiba Bank | | | 600 | | | | 4,415 | |
| Chugoku Bank | | | 456 | | | | 6,518 | |
| Credit Saison | | | 121 | | | | 2,508 | |
| Dai-ichi Life Insurance | | | 191 | | | | 3,348 | |
| Daishi Bank | | | 1,400 | | | | 6,369 | |
| Daito Trust Construction | | | 20 | | | | 2,178 | |
| Daiwa Securities Group | | | 239 | | | | 1,648 | |
| Fukuoka Financial Group | | | 1,111 | | | | 5,901 | |
| Gunma Bank | | | 466 | | | | 2,954 | |
| Hachijuni Bank | | | 430 | | | | 2,958 | |
| Hiroshima Bank | | | 548 | | | | 3,074 | |
| Hitachi Capital | | | 240 | | | | 6,950 | |
| Hokuhoku Financial Group | | | 1,830 | | | | 4,094 | |
| Hyakugo Bank | | | 942 | | | | 4,855 | |
| Hyakujushi Bank | | | 1,146 | | | | 4,340 | |
| Iida Group Holdings | | | 158 | | | | 2,988 | |
| Invincible Investment | | | 3 | | | | 1,787 | |
| Iyo Bank | | | 362 | | | | 3,927 | |
| Jafco * | | | 100 | | | | 3,857 | |
| Japan Exchange Group | | | 80 | | | | 1,302 | |
| Joyo Bank | | | 800 | | | | 4,190 | |
| Juroku Bank | | | 1,216 | | | | 5,462 | |
| Keiyo Bank | | | 1,067 | | | | 5,402 | |
| Leopalace21 * | | | 1,314 | | | | 7,055 | |
| Matsui Securities * | | | 129 | | | | 1,147 | |
| Mitsubishi UFJ Financial Group | | | 618 | | | | 4,049 | |
| Mitsubishi UFJ Lease & Finance | | | 715 | | | | 3,785 | |
| Mizuho Financial Group | | | 2,436 | | | | 5,053 | |
| MS&AD Insurance Group Holdings | | | 105 | | | | 3,125 | |
| Musashino Bank | | | 100 | | | | 3,837 | |
| Nishi-Nippon City Bank | | | 2,136 | | | | 6,301 | |
| Nomura Holdings | | | 279 | | | | 1,770 | |
The accompanying notes are an integral part of the financial statements.
| Schedule of Investments | October 31, 2015 |
| |
| Global X Scientific Beta Japan ETF‡ |
| | | Shares | | | Value | |
| COMMON STOCK — continued |
| Financials — continued | | | | | | | | |
| Nomura Real Estate Holdings | | | 315 | | | $ | 6,784 | |
| North Pacific Bank | | | 958 | | | | 3,707 | |
| NTT Urban Development | | | 244 | | | | 2,441 | |
| Ogaki Kyoritsu Bank | | | 2,014 | | | | 7,894 | |
| Okasan Securities Group * | | | 427 | | | | 2,534 | |
| Orient * | | | 1,730 | | | | 3,484 | |
| ORIX | | | 123 | | | | 1,816 | |
| Resona Holdings | | | 1,200 | | | | 6,400 | |
| San-In Godo Bank | | | 848 | | | | 7,891 | |
| SBI Holdings | | | 432 | | | | 4,944 | |
| Senshu Ikeda Holdings | | | 1,504 | | | | 6,518 | |
| Seven Bank | | | 1,657 | | | | 7,607 | |
| Shiga Bank | | | 1,000 | | | | 5,378 | |
| Shinsei Bank | | | 1,721 | | | | 3,637 | |
| Shizuoka Bank | | | 408 | | | | 4,132 | |
| Sompo Japan Nipponkoa Holdings | | | 88 | | | | 2,792 | |
| Sony Financial Holdings | | | 93 | | | | 1,683 | |
| Sumitomo Mitsui Financial Group | | | 47 | | | | 1,893 | |
| Sumitomo Mitsui Trust Holdings | | | 460 | | | | 1,783 | |
| Suruga Bank | | | 180 | | | | 3,577 | |
| T&D Holdings | | | 206 | | | | 2,735 | |
| Tokai Tokyo Financial Holdings | | | 163 | | | | 1,001 | |
| Tokio Marine Holdings | | | 109 | | | | 4,237 | |
| Tokyo Tatemono | | | 165 | | | | 2,063 | |
| Tokyu Fudosan Holdings | | | 200 | | | | 1,417 | |
| Yamaguchi Financial Group | | | 351 | | | | 4,348 | |
| | | | | | | | 272,336 | |
| Health Care — 9.1% | | | | | | | | |
| Alfresa Holdings | | | 479 | | | | 9,261 | |
| Asahi Intecc | | | 90 | | | | 3,505 | |
| Astellas Pharma | | | 328 | | | | 4,797 | |
| Chugai Pharmaceutical | | | 115 | | | | 3,726 | |
| Daiichi Sankyo | | | 372 | | | | 7,351 | |
| Eisai | | | 95 | | | | 5,989 | |
| Hisamitsu Pharmaceutical | | | 33 | | | | 1,288 | |
| Kaken Pharmaceutical | | | 187 | | | | 13,017 | |
| Kissei Pharmaceutical | | | 369 | | | | 9,556 | |
| Kobayashi Pharmaceutical | | | 75 | | | | 5,855 | |
| KYORIN Holdings | | | 607 | | | | 10,276 | |
| Kyowa Hakko Kirin | | | 720 | | | | 11,945 | |
| Medipal Holdings | | | 280 | | | | 4,928 | |
| Miraca Holdings | | | 103 | | | | 4,618 | |
| Mitsubishi Tanabe Pharma | | | 930 | | | | 15,844 | |
| Nihon Kohden | | | 360 | | | | 7,062 | |
The accompanying notes are an integral part of the financial statements.
| Schedule of Investments | October 31, 2015 |
| |
| Global X Scientific Beta Japan ETF‡ |
| | | Shares | | | Value | |
| COMMON STOCK — continued |
| Health Care — continued | | | | | | | | |
| Nihon M&A Center | | | 43 | | | $ | 1,785 | |
| Nippon Shinyaku | | | 179 | | | | 7,046 | |
| Nipro | | | 596 | | | | 6,727 | |
| Olympus | | | 50 | | | | 1,701 | |
| Ono Pharmaceutical | | | 32 | | | | 4,423 | |
| Otsuka Holdings | | | 492 | | | | 16,487 | |
| Rohto Pharmaceutical | | | 331 | | | | 5,497 | |
| Santen Pharmaceutical | | | 535 | | | | 7,320 | |
| Sawai Pharmaceutical | | | 135 | | | | 8,692 | |
| Shionogi | | | 72 | | | | 2,978 | |
| Sumitomo Dainippon Pharma | | | 481 | | | | 5,353 | |
| Suzuken | | | 170 | | | | 6,558 | |
| Sysmex | | | 27 | | | | 1,559 | |
| Taisho Pharmaceutical Holdings | | | 99 | | | | 6,219 | |
| Takeda Pharmaceutical | | | 105 | | | | 5,160 | |
| Terumo | | | 113 | | | | 3,380 | |
| Toho Holdings | | | 362 | | | | 8,078 | |
| Topcon | | | 152 | | | | 2,217 | |
| Tsumura | | | 313 | | | | 7,589 | |
| | | | | | | | 227,787 | |
| Industrials — 18.4% | | | | | | | | |
| Aica Kogyo | | | 226 | | | | 4,515 | |
| Alps Electric | | | 103 | | | | 3,235 | |
| Amada Holdings | | | 204 | | | | 1,831 | |
| Asahi Glass | | | 1,316 | | | | 7,602 | |
| Azbil | | | 160 | | | | 4,070 | |
| Century Tokyo Leasing | | | 100 | | | | 3,427 | |
| Chiyoda | | | 782 | | | | 5,981 | |
| COMSYS Holdings | | | 372 | | | | 4,892 | |
| Daifuku | | | 157 | | | | 2,346 | |
| Daikin Industries | | | 20 | | | | 1,299 | |
| Disco | | | 86 | | | | 7,918 | |
| DMG Mori | | | 180 | | | | 2,595 | |
| Ebara | | | 1,241 | | | | 5,420 | |
| FANUC | | | 12 | | | | 2,143 | |
| Fuji Electric | | | 400 | | | | 1,800 | |
| Fujikura | | | 1,126 | | | | 5,832 | |
| Furukawa Electric | | | 4,631 | | | | 8,519 | |
| Glory | | | 178 | | | | 4,536 | |
| GS Yuasa | | | 2,300 | | | | 8,805 | |
| Hamamatsu Photonics | | | 48 | | | | 1,233 | |
| Haseko | | | 279 | | | | 2,869 | |
| Hazama Ando | | | 154 | | | | 915 | |
| Hirose Electric | | | 16 | | | | 1,957 | |
The accompanying notes are an integral part of the financial statements.
| Schedule of Investments | October 31, 2015 |
| |
| Global X Scientific Beta Japan ETF‡ |
| | | Shares | | | Value | |
| COMMON STOCK — continued |
| Industrials — continued | | | | | | | | |
| Hitachi | | | 353 | | | $ | 2,056 | |
| Hitachi Construction Machinery | | | 195 | | | | 3,041 | |
| Horiba | | | 100 | | | | 3,969 | |
| Hoshizaki Electric | | | 80 | | | | 5,840 | |
| Hoya | | | 62 | | | | 2,584 | |
| Ibiden | | | 344 | | | | 4,783 | |
| IHI | | | 280 | | | | 798 | |
| Isuzu Motors | | | 152 | | | | 1,791 | |
| ITOCHU | | | 488 | | | | 6,163 | |
| Japan Airport Terminal | | | 40 | | | | 2,188 | |
| Japan Aviation Electronics Industry | | | 183 | | | | 3,286 | |
| Japan Display * | | | 588 | | | | 1,861 | |
| Japan Steel Works | | | 1,193 | | | | 4,469 | |
| Kajima | | | 1,872 | | | | 10,813 | |
| Kamigumi | | | 800 | | | | 6,934 | |
| Kanamoto | | | 62 | | | | 1,260 | |
| Kawasaki Heavy Industries | | | 328 | | | | 1,329 | |
| Kawasaki Kisen Kaisha | | | 3,209 | | | | 7,260 | |
| Keyence | | | 2 | | | | 1,054 | |
| Kinden | | | 796 | | | | 10,402 | |
| Komatsu | | | 104 | | | | 1,725 | |
| Kubota * | | | 128 | | | | 2,006 | |
| Kumagai Gumi | | | 300 | | | | 905 | |
| Kurita Water Industries | | | 131 | | | | 2,978 | |
| Kyocera | | | 80 | | | | 3,648 | |
| Lintec | | | 487 | | | | 11,506 | |
| LIXIL Group | | | 198 | | | | 4,268 | |
| Mabuchi Motor | | | 75 | | | | 3,754 | |
| Maeda Road Construction | | | 382 | | | | 7,012 | |
| Marubeni | | | 1,557 | | | | 9,063 | |
| Minebea | | | 254 | | | | 2,833 | |
| MISUMI Group | | | 300 | | | | 3,950 | |
| Mitsubishi | | | 472 | | | | 8,654 | |
| Mitsubishi Electric | | | 127 | | | | 1,337 | |
| Mitsubishi Logistics | | | 240 | | | | 3,472 | |
| Mitsubishi Materials | | | 1,481 | | | | 5,204 | |
| Mitsui | | | 740 | | | | 9,447 | |
| Mitsui Engineering & Shipbuilding | | | 2,904 | | | | 4,500 | |
| Mitsui OSK Lines | | | 658 | | | | 1,772 | |
| Miura | | | 761 | | | | 9,151 | |
| Monotaro | | | 70 | | | | 1,818 | |
| Murata Manufacturing | | | 12 | | | | 1,726 | |
| Nabtesco | | | 237 | | | | 4,796 | |
| Nachi-Fujikoshi | | | 327 | | | | 1,480 | |
The accompanying notes are an integral part of the financial statements.
| Schedule of Investments | October 31, 2015 |
| |
| Global X Scientific Beta Japan ETF‡ |
| | | Shares | | | Value | |
| COMMON STOCK — continued |
| Industrials — continued | | | | | | | | |
| Nidec | | | 91 | | | $ | 6,917 | |
| Nippon Electric Glass | | | 1,576 | | | | 7,797 | |
| Nippon Express | | | 1,195 | | | | 6,209 | |
| Nippon Konpo Unyu Soko | | | 286 | | | | 5,567 | |
| Nippon Yusen | | | 1,400 | | | | 3,689 | |
| NTN | | | 800 | | | | 4,024 | |
| Obayashi | | | 1,051 | | | | 9,267 | |
| OKUMA | | | 200 | | | | 1,619 | |
| Omron | | | 28 | | | | 936 | |
| OSG | | | 168 | | | | 3,189 | |
| Panasonic | | | 99 | | | | 1,177 | |
| Penta-Ocean Construction | | | 355 | | | | 1,624 | |
| Recruit Holdings | | | 25 | | | | 808 | |
| Rengo | | | 1,359 | | | | 6,498 | |
| Sankyu | | | 1,839 | | | | 10,439 | |
| Sanwa Holdings | | | 702 | | | | 5,701 | |
| Secom | | | 46 | | | | 3,094 | |
| Seino Holdings | | | 268 | | | | 3,207 | |
| Shimadzu | | | 163 | | | | 2,560 | |
| Shimizu | | | 722 | | | | 6,360 | |
| SHO-BOND Holdings | | | 73 | | | | 2,913 | |
| SMC | | | 9 | | | | 2,337 | |
| Sohgo Security Services | | | 146 | | | | 7,102 | |
| Sojitz | | | 4,563 | | | | 10,134 | |
| Sumitomo | | | 500 | | | | 5,513 | |
| Sumitomo Heavy Industries | | | 1,364 | | | | 6,217 | |
| Sumitomo Osaka Cement | | | 3,547 | | | | 13,756 | |
| Tadano | | | 152 | | | | 1,831 | |
| Taiheiyo Cement | | | 827 | | | | 2,741 | |
| Taisei | | | 451 | | | | 2,952 | |
| Taiyo Yuden | | | 339 | | | | 4,818 | |
| TDK | | | 83 | | | | 5,344 | |
| Temp Holdings | | | 141 | | | | 2,121 | |
| Toppan Printing | | | 432 | | | | 3,902 | |
| Toshiba * | | | 1,614 | | | | 4,589 | |
| TOTO | | | 69 | | | | 2,361 | |
| Toyo Seikan Group Holdings | | | 185 | | | | 3,606 | |
| Toyota Tsusho | | | 120 | | | | 2,768 | |
| Tsubakimoto Chain | | | 629 | | | | 4,644 | |
| Ushio | | | 346 | | | | 4,797 | |
| Yamato Holdings | | | 74 | | | | 1,466 | |
| | | | | | | | 469,220 | |
| Oil & Gas — 1.5% | | | | | | | | |
| Idemitsu Kosan | | | 620 | | | | 10,219 | |
The accompanying notes are an integral part of the financial statements.
| Schedule of Investments | October 31, 2015 |
| |
| Global X Scientific Beta Japan ETF‡ |
| | | Shares | | | Value | |
| COMMON STOCK — continued |
| Oil & Gas — continued | | | | | | | | |
| Inpex | | | 825 | | | $ | 7,900 | |
| Japan Petroleum Exploration | | | 307 | | | | 9,260 | |
| JX Holdings | | | 2,057 | | | | 8,114 | |
| TonenGeneral Sekiyu | | | 303 | | | | 3,161 | |
| | | | | | | | 38,654 | |
| Real Estate Investment Trusts — 5.9% | | | | | | | | |
| Activia Properties | | | 2 | | | | 8,519 | |
| Advance Residence Investment | | | 3 | | | | 6,426 | |
| Daiwa House Residential Investment | | | 4 | | | | 8,128 | |
| Daiwa Office Investment | | | 2 | | | | 10,259 | |
| Frontier Real Estate Investment | | | 1 | | | | 4,060 | |
| GLP J-Reit | | | 4 | | | | 3,991 | |
| Industrial & Infrastructure Fund Investment | | | 1 | | | | 4,541 | |
| Japan Excellent | | | 13 | | | | 14,295 | |
| Japan Hotel Investment | | | 19 | | | | 13,241 | |
| Japan Logistics Fund | | | 4 | | | | 7,504 | |
| Japan Prime Realty Investment | | | 1 | | | | 3,269 | |
| Japan Real Estate Investment | | | 1 | | | | 4,641 | |
| Japan Retail Fund Investment | | | 1 | | | | 1,944 | |
| Kenedix Office Investment, Cl A | | | 1 | | | | 4,599 | |
| Mori Hills Investment, Cl A | | | 10 | | | | 12,430 | |
| Mori Trust Sogo | | | 3 | | | | 5,330 | |
| Nippon Accommodations Fund | | | 6 | | | | 20,759 | |
| Nippon Building Fund | | | 1 | | | | 4,765 | |
| Nippon Prologis | | | 2 | | | | 3,535 | |
| Orix | | | 4 | | | | 5,403 | |
| United Urban Investment | | | 1 | | | | 1,393 | |
| | | | | | | | 149,032 | |
| Technology — 6.0% | | | | | | | | |
| Advantest | | | 161 | | | | 1,295 | |
| Canon | | | 54 | | | | 1,629 | |
| FUJIFILM Holdings | | | 132 | | | | 5,307 | |
| Hitachi High-Technologies | | | 415 | | | | 11,264 | |
| IT Holdings | | | 781 | | | | 19,449 | |
| Itochu Techno-Solutions | | | 368 | | | | 8,112 | |
| Konica Minolta | | | 309 | | | | 3,203 | |
| Mixi * | | | 73 | | | | 2,807 | |
| NEC | | | 2,966 | | | | 9,217 | |
| Nomura Research Institute | | | 132 | | | | 5,436 | |
| NTT Data | | | 101 | | | | 5,064 | |
| Obic | | | 200 | | | | 10,640 | |
| Oki Electric Industry | | | 779 | | | | 1,323 | |
| Oracle Japan * | | | 129 | | | | 5,901 | |
| Otsuka | | | 134 | | | | 6,518 | |
The accompanying notes are an integral part of the financial statements.
| Schedule of Investments | October 31, 2015 |
| |
| Global X Scientific Beta Japan ETF‡ |
| | | Shares | | | Value | |
| COMMON STOCK — continued |
| Technology — continued | | | | | | | | |
| Renesas Electronics * | | | 265 | | | $ | 1,717 | |
| Ricoh | | | 288 | | | | 3,124 | |
| Rohm | | | 73 | | | | 3,648 | |
| SCREEN Holdings | | | 800 | | | | 4,773 | |
| SCSK | | | 272 | | | | 10,492 | |
| Square Enix Holdings | | | 259 | | | | 7,040 | |
| Sumco | | | 461 | | | | 4,691 | |
| Tokyo Ohka Kogyo | | | 423 | | | | 13,635 | |
| Trend Micro * | | | 60 | | | | 2,354 | |
| | | | | | | | 148,639 | |
| Telecommunications — 0.9% | | | | | | | | |
| Hikari Tsushin | | | 48 | | | | 3,679 | |
| KDDI | | | 80 | | | | 1,953 | |
| Nippon Telegraph & Telephone | | | 339 | | | | 12,602 | |
| NTT DOCOMO | | | 242 | | | | 4,728 | |
| | | | | | | | 22,962 | |
| Utilities — 3.0% | | | | | | | | |
| Chubu Electric Power | | | 197 | | | | 3,052 | |
| Chugoku Electric Power * | | | 200 | | | | 3,040 | |
| Electric Power Development | | | 393 | | | | 13,043 | |
| Hokkaido Electric Power * | | | 516 | | | | 5,546 | |
| Hokuriku Electric Power | | | 438 | | | | 6,576 | |
| Iwatani | | | 850 | | | | 4,740 | |
| Kansai Electric Power * | | | 464 | | | | 5,991 | |
| Kyushu Electric Power * | | | 491 | | | | 5,973 | |
| Osaka Gas | | | 1,267 | | | | 5,021 | |
| Shikoku Electric Power * | | | 193 | | | | 3,301 | |
| Toho Gas | | | 1,584 | | | | 9,766 | |
| Tohoku Electric Power | | | 438 | | | | 6,199 | |
| Tokyo Electric Power * | | | 590 | | | | 4,053 | |
| Tokyo Gas | | | 264 | | | | 1,316 | |
| | | | | | | | 77,617 | |
| TOTAL COMMON STOCK | | | | | | | | |
| (Cost $2,516,728) | | | | | | | 2,514,970 | |
| TOTAL INVESTMENTS — 99.9% | | | | | | | | |
| (Cost $2,516,728) | | | | | | $ | 2,514,970 | |
Percentages are based on Net Assets of $2,518,541.
| * | Non-income producing security. |
| ‡ | Fund commenced operations on May 12, 2015. |
The accompanying notes are an integral part of the financial statements.
| Schedule of Investments | October 31, 2015 |
| |
| Global X Scientific Beta Japan ETF‡ |
As of October 31, 2015, all of the Fund’s investments were considered Level 1, in accordance with authoritative guidance on fair value measurements and disclosure under U.S. GAAP.
For the period ended October 31, 2015, there have been no transfers between Level 1, Level 2 or Level 3 investments.
As of October 31, 2015, there were no Level 2 or 3 investments.
The accompanying notes are an integral part of the financial statements.
| Schedule of Investments | October 31, 2015 |
| |
| Global X Scientific Beta Asia ex-Japan ETF‡ |
Sector Weightings (unaudited)†:
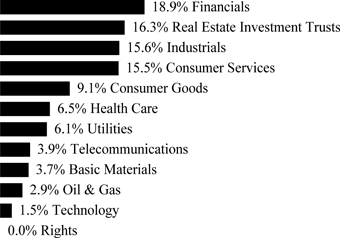
† Sector weightings percentages are based on the total market value of investments.
| | | Shares | | | Value | |
| COMMON STOCK — 99.7% |
| AUSTRALIA— 29.8% | | | | | | | | |
| Basic Materials — 3.0% | | | | | | | | |
| Alumina | | | 5,750 | | | $ | 4,451 | |
| BHP Billiton | | | 80 | | | | 1,314 | |
| BlueScope Steel | | | 1,108 | | | | 3,526 | |
| Evolution Mining | | | 7,540 | | | | 7,558 | |
| Fortescue Metals Group | | | 1,640 | | | | 2,445 | |
| Incitec Pivot | | | 2,670 | | | | 7,524 | |
| Independence Group | | | 930 | | | | 1,838 | |
| Mineral Resources | | | 600 | | | | 1,832 | |
| Newcrest Mining * | | | 500 | | | | 4,391 | |
| Northern Star Resources | | | 3,283 | | | | 6,465 | |
| Nufarm | | | 1,170 | | | | 6,987 | |
| OZ Minerals | | | 550 | | | | 1,711 | |
| Regis Resources | | | 490 | | | | 727 | |
| Rio Tinto | | | 50 | | | | 1,807 | |
| Sandfire Resources | | | 250 | | | | 1,131 | |
| Syrah Resources * | | | 270 | | | | 607 | |
| Washington H Soul Pattinson | | | 616 | | | | 7,076 | |
| Western Areas | | | 580 | | | | 989 | |
| Whitehaven Coal * | | | 7,530 | | | | 5,479 | |
| | | | | | | | 67,858 | |
| Consumer Goods — 2.0% | | | | | | | | |
| Asaleo Care | | | 1,560 | | | | 1,959 | |
| Bega Cheese | | | 430 | | | | 1,779 | |
The accompanying notes are an integral part of the financial statements.
| Schedule of Investments | October 31, 2015 |
| |
| Global X Scientific Beta Asia ex-Japan ETF‡ |
| | | Shares | | | Value | |
| COMMON STOCK — continued |
| Consumer Goods — continued | | | | | | | | |
| Blackmores | | | 84 | | | $ | 10,048 | |
| Breville Group | | | 630 | | | | 2,953 | |
| Burson Group | | | 820 | | | | 2,094 | |
| Coca-Cola Amatil | | | 470 | | | | 3,055 | |
| GrainCorp, Cl A | | | 940 | | | | 6,070 | |
| GUD Holdings | | | 650 | | | | 3,728 | |
| Pacific Brands * | | | 1,140 | | | | 586 | |
| Select Harvests | | | 651 | | | | 4,719 | |
| Tassal Group | | | 190 | | | | 573 | |
| Treasury Wine Estates | | | 944 | | | | 4,768 | |
| | | | | | | | 42,332 | |
| Consumer Services — 5.4% | | | | | | | | |
| Amalgamated Holdings | | | 840 | | | | 8,390 | |
| AP Eagers | | | 850 | | | | 6,471 | |
| APN News & Media * | | | 7,950 | | | | 2,921 | |
| ARB | | | 120 | | | | 1,266 | |
| Aristocrat Leisure | | | 678 | | | | 4,508 | |
| Australian Pharmaceutical Industries | | | 6,910 | | | | 9,762 | |
| Automotive Holdings Group | | | 380 | | | | 1,152 | |
| Corporate Travel Management | | | 360 | | | | 2,895 | |
| Domino's Pizza Enterprises | | | 100 | | | | 3,335 | |
| Echo Entertainment Group | | | 2,030 | | | | 7,401 | |
| Fairfax Media | | | 4,900 | | | | 3,304 | |
| G8 Education | | | 457 | | | | 978 | |
| Greencross | | | 200 | | | | 893 | |
| Harvey Norman Holdings | | | 1,310 | | | | 3,720 | |
| InvoCare | | | 620 | | | | 4,915 | |
| Mantra Group | | | 790 | | | | 2,328 | |
| Metcash | | | 3,430 | | | | 2,912 | |
| Myer Holdings | | | 2,964 | | | | 2,030 | |
| Navitas | | | 1,057 | | | | 3,167 | |
| Nine Entertainment Holdings | | | 2,653 | | | | 2,934 | |
| Qantas Airways * | | | 657 | | | | 1,852 | |
| Retail Food Group | | | 1,230 | | | | 4,063 | |
| Seven Group Holdings | | | 720 | | | | 2,594 | |
| Seven West Media | | | 4,692 | | | | 2,260 | |
| Sigma Pharmaceuticals | | | 5,310 | | | | 3,182 | |
| Southern Cross Media Group | | | 6,944 | | | | 4,855 | |
| Super Retail Group | | | 190 | | | | 1,309 | |
| TABCORP Holdings | | | 2,046 | | | | 6,890 | |
| Tatts Group | | | 2,921 | | | | 8,253 | |
| Village Roadshow | | | 100 | | | | 537 | |
| Wesfarmers | | | 126 | | | | 3,543 | |
The accompanying notes are an integral part of the financial statements.
| Schedule of Investments | October 31, 2015 |
| |
| Global X Scientific Beta Asia ex-Japan ETF‡ |
| | | Shares | | | Value | |
| COMMON STOCK — continued |
| Consumer Services — continued | | | | | | | | |
| Woolworths | | | 100 | | | $ | 1,720 | |
| | | | | | | | 116,340 | |
| Financials — 5.3% | | | | | | | | |
| Abacus Property Group | | | 4,398 | | | | 10,261 | |
| AMP | | | 370 | | | | 1,513 | |
| Ardent Leisure Group | | | 5,470 | | | | 10,889 | |
| ASX | | | 60 | | | | 1,765 | |
| Australia & New Zealand Banking Group | | | 70 | | | | 1,359 | |
| Aveo Group | | | 2,665 | | | | 5,856 | |
| Bank of Queensland | | | 350 | | | | 3,264 | |
| Bendigo and Adelaide Bank | | | 380 | | | | 2,901 | |
| BT Investment Management | | | 530 | | | | 4,313 | |
| Challenger | | | 460 | | | | 2,700 | |
| Charter Hall Retail | | | 3,058 | | | | 9,252 | |
| Commonwealth Bank of Australia | | | 30 | | | | 1,642 | |
| Cover-More Group | | | 500 | | | | 813 | |
| Cromwell Property Group | | | 8,378 | | | | 6,007 | |
| FlexiGroup | | | 450 | | | | 982 | |
| Genworth Mortgage Insurance Australia | | | 1,020 | | | | 1,965 | |
| Insurance Australia Group | | | 429 | | | | 1,717 | |
| IOOF Holdings | | | 547 | | | | 3,645 | |
| Lend Lease Group | | | 430 | | | | 3,988 | |
| Macquarie Group | | | 60 | | | | 3,669 | |
| Magellan Financial Group | | | 160 | | | | 2,572 | |
| McMillan Shakespeare | | | 740 | | | | 6,637 | |
| National Australia Bank | | | 145 | | | | 3,119 | |
| Perpetual | | | 50 | | | | 1,602 | |
| Platinum Asset Management | | | 671 | | | | 3,543 | |
| Premier Investments | | | 440 | | | | 4,298 | |
| QBE Insurance Group | | | 592 | | | | 5,595 | |
| Steadfast Group | | | 980 | | | | 1,049 | |
| Stockland | | | 1,100 | | | | 3,178 | |
| Suncorp Group | | | 350 | | | | 3,274 | |
| Veda Group | | | 1,170 | | | | 2,187 | |
| Westpac Banking | | | 70 | | | | 1,567 | |
| | | | | | | | 117,122 | |
| Health Care — 3.5% | | | | | | | | |
| Ansell | | | 560 | | | | 8,038 | |
| Cochlear | | | 180 | | | | 11,423 | |
| CSL | | | 112 | | | | 7,495 | |
| Estia Health | | | 430 | | | | 2,282 | |
| Healthscope | | | 1,380 | | | | 2,658 | |
| Japara Healthcare | | | 1,080 | | | | 2,389 | |
| Mayne Pharma Group * | | | 5,160 | | | | 3,773 | |
The accompanying notes are an integral part of the financial statements.
| Schedule of Investments | October 31, 2015 |
| |
| Global X Scientific Beta Asia ex-Japan ETF‡ |
| | | Shares | | | Value | |
| COMMON STOCK — continued |
| Health Care — continued | | | | | | | | |
| Mesoblast (B)(C) * | | | 410 | | | $ | 997 | |
| nib holdings | | | 1,975 | | | | 5,087 | |
| Primary Health Care | | | 2,527 | | | | 6,689 | |
| Ramsay Health Care | | | 156 | | | | 6,902 | |
| Regis Healthcare | | | 550 | | | | 2,296 | |
| Sirtex Medical | | | 250 | | | | 6,787 | |
| Sonic Healthcare | | | 680 | | | | 9,354 | |
| | | | | | | | 76,170 | |
| Industrials — 4.5% | | | | | | | | |
| Adelaide Brighton | | | 500 | | | | 1,495 | |
| Amcor | | | 1,040 | | | | 10,128 | |
| Asciano | | | 1,230 | | | | 7,196 | |
| Aurizon Holdings | | | 1,380 | | | | 5,090 | |
| Boral | | | 737 | | | | 2,834 | |
| Brambles | | | 660 | | | | 4,888 | |
| Brickworks | | | 726 | | | | 7,526 | |
| Computershare | | | 580 | | | | 4,473 | |
| CSR | | | 2,438 | | | | 4,818 | |
| Downer EDI | | | 500 | | | | 1,266 | |
| DuluxGroup | | | 1,300 | | | | 5,472 | |
| GWA Group * | | | 1,330 | | | | 2,353 | |
| IPH | | | 510 | | | | 2,674 | |
| Macquarie Atlas Roads Group | | | 480 | | | | 1,397 | |
| Monadelphous Group | | | 240 | | | | 1,185 | |
| Orora | | | 2,450 | | | | 4,090 | |
| Pact Group Holdings | | | 1,010 | | | | 3,697 | |
| Qube Holdings | | | 1,460 | | | | 2,385 | |
| SAI Global | | | 350 | | | | 1,096 | |
| Slater & Gordon | | | 503 | | | | 994 | |
| Spotless Group Holdings | | | 1,680 | | | | 2,577 | |
| Sydney Airport | | | 1,000 | | | | 4,602 | |
| Transfield Services * | | | 6,136 | | | | 4,400 | |
| Transpacific Industries Group | | | 10,850 | | | | 5,263 | |
| Transurban Group | | | 640 | | | | 4,767 | |
| | | | | | | | 96,666 | |
| Oil & Gas — 1.1% | | | | | | | | |
| APA Group | | | 610 | | | | 4,004 | |
| Beach Energy | | | 6,330 | | | | 2,890 | |
| Caltex Australia | | | 190 | | | | 4,284 | |
| Liquefied Natural Gas * | | | 1,020 | | | | 1,088 | |
| Oil Search | | | 670 | | | | 3,752 | |
| Santos | | | 400 | | | | 1,667 | |
| Woodside Petroleum | | | 140 | | | | 2,958 | |
The accompanying notes are an integral part of the financial statements.
| Schedule of Investments | October 31, 2015 |
| |
| Global X Scientific Beta Asia ex-Japan ETF‡ |
| | | Shares | | | Value | |
| COMMON STOCK — continued |
| Oil & Gas — continued | | | | | | | | |
| WorleyParsons | | | 330 | | | $ | 1,535 | |
| | | | | | | | 22,178 | |
| Real Estate Investment Trusts — 2.8% | | | | | | | | |
| ALE Property Group | | | 3,958 | | | | 11,014 | |
| BWP Trust | | | 2,730 | | | | 6,272 | |
| Dexus Property Group | | | 290 | | | | 1,601 | |
| Federation Centres (B) | | | 2,960 | | | | 6,145 | |
| Goodman Group | | | 1,120 | | | | 4,850 | |
| GPT Group | | | 1,150 | | | | 3,914 | |
| Growthpoint Properties Australia | | | 3,390 | | | | 7,449 | |
| Investa Office Fund | | | 2,004 | | | | 5,776 | |
| Mirvac Group | | | 1,160 | | | | 1,494 | |
| Scentre Group | | | 920 | | | | 2,717 | |
| Shopping Centres Australasia Property Group | | | 2,130 | | | | 3,130 | |
| Westfield * | | | 400 | | | | 2,925 | |
| | | | | | | | 57,287 | |
| Technology — 0.5% | | | | | | | | |
| IRESS | | | 570 | | | | 3,819 | |
| iSentia Group | | | 760 | | | | 2,239 | |
| Recall Holdings | | | 470 | | | | 2,569 | |
| Technology One | | | 1,160 | | | | 3,186 | |
| | | | | | | | 11,813 | |
| Telecommunications — 0.5% | | | | | | | | |
| M2 Group | | | 620 | | | | 4,379 | |
| Telstra | | | 923 | | | | 3,556 | |
| TPG Telecom | | | 330 | | | | 2,604 | |
| Vocus Communications | | | 130 | | | | 604 | |
| | | | | | | | 11,143 | |
| Utilities — 1.2% | | | | | | | | |
| AGL Energy | | | 520 | | | | 6,207 | |
| AusNet Services | | | 6,260 | | | | 6,454 | |
| DUET Group | | | 1,419 | | | | 2,389 | |
| Origin Energy | | | 217 | | | | 851 | |
| Spark Infrastructure Group | | | 6,630 | | | | 9,838 | |
| | | | | | | | 25,739 | |
| TOTAL AUSTRALIA | | | | | | | 644,648 | |
| CHINA— 0.6% | | | | | | | | |
| Consumer Goods — 0.6% | | | | | | | | |
| Pacific Textiles Holdings | | | 8,510 | | | | 12,166 | |
| HONG KONG— 29.9% | | | | | | | | |
| Basic Materials — 0.3% | | | | | | | | |
| G-Resources Group | | | 283,264 | | | | 6,360 | |
The accompanying notes are an integral part of the financial statements.
| Schedule of Investments | October 31, 2015 |
| |
| Global X Scientific Beta Asia ex-Japan ETF‡ |
| | | Shares | | | Value | |
| COMMON STOCK — continued |
| Consumer Goods — 4.8% | | | | | | | | |
| China Smarter Energy Group Holdings * | | | 27,540 | | | $ | 2,345 | |
| China Strategic Holdings * | | | 98,419 | | | | 3,098 | |
| First Pacific | | | 4,440 | | | | 3,042 | |
| Global Brands Group Holding * | | | 5,750 | | | | 1,195 | |
| Man Wah Holdings | | | 6,480 | | | | 7,425 | |
| Samsonite International | | | 1,686 | | | | 4,993 | |
| Shenzhou International Group Holdings | | | 1,150 | | | | 5,676 | |
| Sincere Watch Hong Kong * | | | 15,770 | | | | 1,669 | |
| Stella International Holdings | | | 5,640 | | | | 13,957 | |
| Techtronic Industries | | | 1,349 | | | | 4,952 | |
| Texwinca Holdings | | | 8,340 | | | | 8,125 | |
| Uni-President China Holdings | | | 8,710 | | | | 7,159 | |
| Vitasoy International Holdings | | | 10,170 | | | | 16,954 | |
| Yue Yuen Industrial Holdings | | | 7,110 | | | | 26,008 | |
| | | | | | | | 106,598 | |
| Consumer Services — 6.0% | | | | | | | | |
| Cafe de Coral Holdings | | | 4,210 | | | | 14,259 | |
| Cathay Pacific Airways | | | 5,250 | | | | 10,459 | |
| Chow Sang Sang Holdings International | | | 2,251 | | | | 4,392 | |
| Esprit Holdings | | | 6,374 | | | | 7,179 | |
| Giordano International | | | 2,160 | | | | 1,165 | |
| Great Eagle Holdings | | | 1,736 | | | | 5,723 | |
| Hongkong & Shanghai Hotels | | | 9,213 | | | | 10,485 | |
| Lifestyle International Holdings | | | 3,890 | | | | 5,632 | |
| L'Occitane International | | | 1,720 | | | | 3,471 | |
| Luk Fook Holdings International | | | 1,310 | | | | 3,389 | |
| Melco International Development | | | 777 | | | | 1,209 | |
| Miramar Hotel & Investment | | | 6,856 | | | | 11,536 | |
| MTR | | | 2,770 | | | | 12,581 | |
| NagaCorp | | | 3,120 | | | | 2,214 | |
| Sa Sa International Holdings | | | 2,580 | | | | 829 | |
| Shangri-La Asia | | | 5,830 | | | | 5,356 | |
| Shun Tak Holdings * | | | 18,670 | | | | 7,468 | |
| Television Broadcasts | | | 1,082 | | | | 3,951 | |
| Transport International Holdings | | | 6,701 | | | | 18,114 | |
| | | | | | | | 129,412 | |
| Financials — 7.1% | | | | | | | | |
| AIA Group | | | 590 | | | | 3,471 | |
| Bank of East Asia | | | 1,730 | | | | 6,486 | |
| China Innovative Finance Group * | | | 22,700 | | | | 2,226 | |
| Chinese Estates Holdings | | | 2,744 | | | | 6,394 | |
| CK Hutchison Holdings | | | 110 | | | | 1,512 | |
| Dah Sing Banking Group | | | 2,231 | | | | 4,243 | |
| Dah Sing Financial Holdings | | | 750 | | | | 4,214 | |
The accompanying notes are an integral part of the financial statements.
| Schedule of Investments | October 31, 2015 |
| |
| Global X Scientific Beta Asia ex-Japan ETF‡ |
| | | Shares | | | Value | |
| COMMON STOCK — continued |
| Financials — continued | | | | | | | | |
| Far East Consortium International | | | 21,030 | | | $ | 7,679 | |
| Goldin Properties * | | | 680 | | | | 586 | |
| Good Fellow Resources Holdings * | | | 7,210 | | | | 1,768 | |
| Guoco Group | | | 1,500 | | | | 17,225 | |
| Haitong International Securities Group | | | 2,430 | | | | 1,351 | |
| Hang Lung Group | | | 970 | | | | 3,523 | |
| Hang Lung Properties | | | 1,600 | | | | 3,927 | |
| Hang Seng Bank | | | 331 | | | | 6,090 | |
| Henderson Land Development | | | 803 | | | | 5,144 | |
| HKR International | | | 22,018 | | | | 9,830 | |
| Hong Kong Exchanges and Clearing | | | 50 | | | | 1,315 | |
| Hopewell Holdings | | | 3,160 | | | | 11,437 | |
| Hysan Development | | | 971 | | | | 4,316 | |
| Kerry Properties | | | 1,474 | | | | 4,374 | |
| Kowloon Development | | | 9,920 | | | | 11,239 | |
| New World Development | | | 2,560 | | | | 2,745 | |
| Sino Land | | | 2,070 | | | | 3,210 | |
| Sun Hung Kai | | | 14,680 | | | | 9,907 | |
| Sun Hung Kai Properties | | | 480 | | | | 6,435 | |
| Swire Properties | | | 1,860 | | | | 5,604 | |
| Value Partners Group | | | 1,070 | | | | 1,142 | |
| Wharf Holdings | | | 520 | | | | 3,110 | |
| Wheelock | | | 650 | | | | 3,040 | |
| | | | | | | | 153,543 | |
| Health Care — 0.0% | | | | | | | | |
| China Traditional Chinese Medicine * | | | 1,000 | | | | 759 | |
| Industrials — 3.8% | | | | | | | | |
| Hanison Construction | | | 5,245 | | | | 968 | |
| Hopewell Highway Infrastructure | | | 23,500 | | | | 10,825 | |
| Johnson Electric Holdings | | | 5,689 | | | | 20,884 | |
| Kerry Logistics Network | | | 1,370 | | | | 2,043 | |
| NWS Holdings | | | 10,501 | | | | 15,853 | |
| Orient Overseas International | | | 1,891 | | | | 9,040 | |
| Pacific Basin Shipping | | | 10,520 | | | | 3,122 | |
| SITC International Holdings | | | 13,000 | | | | 6,693 | |
| Summit Ascent Holdings * | | | 2,630 | | | | 1,317 | |
| Swire Pacific, Cl A | | | 758 | | | | 8,802 | |
| | | | | | | | 79,547 | |
| Oil & Gas — 0.8% | | | | | | | | |
| Brightoil Petroleum Holdings * | | | 7,700 | | | | 2,752 | |
| China LNG Group * | | | 118,450 | | | | 4,967 | |
| Hanergy Thin Film Power Group (B) (C) * | | | 29,000 | | | | 3,658 | |
| United Energy Group * | | | 29,170 | | | | 3,952 | |
| | | | | | | | 15,329 | |
The accompanying notes are an integral part of the financial statements.
| Schedule of Investments | October 31, 2015 |
| |
| Global X Scientific Beta Asia ex-Japan ETF‡ |
| | | Shares | | | Value | |
| COMMON STOCK — continued |
| Real Estate Investment Trusts — 2.6% | | | | | | | | |
| Champion�� | | | 21,450 | | | $ | 11,237 | |
| Link | | | 2,070 | | | | 12,406 | |
| Prosperity | | | 35,210 | | | | 12,948 | |
| Sunlight | | | 20,290 | | | | 10,289 | |
| Yuexiu | | | 22,000 | | | | 11,639 | |
| | | | | | | | 58,519 | |
| Technology — 0.7% | | | | | | | | |
| BYD Electronic International * | | | 3,550 | | | | 2,332 | |
| FIH Mobile | | | 9,410 | | | | 4,505 | |
| Suncorp Technologies * | | | 51,699 | | | | 1,434 | |
| VTech Holdings | | | 594 | | | | 7,216 | |
| | | | | | | | 15,487 | |
| Telecommunications — 1.8% | | | | | | | | |
| Huanxi Media Group * | | | 3,320 | | | | 1,371 | |
| Hutchison Telecommunications Hong Kong Holdings | | | 31,132 | | | | 11,529 | |
| PCCW | | | 30,600 | | | | 16,583 | |
| SmarTone Telecommunications Holdings | | | 4,821 | | | | 8,584 | |
| | | | | | | | 38,067 | |
| Utilities — 2.0% | | | | | | | | |
| Cheung Kong Infrastructure Holdings | | | 1,950 | | | | 18,154 | |
| CLP Holdings | | | 784 | | | | 6,828 | |
| HK Electric Investments & HK Electric Investments (A) | | | 3,995 | | | | 3,067 | |
| Hong Kong & China Gas | | | 2,350 | | | | 4,773 | |
| Power Assets Holdings | | | 1,100 | | | | 10,979 | |
| | | | | | | | 43,801 | |
| TOTAL HONG KONG | | | | | | | 647,422 | |
| NEW ZEALAND— 12.4% | | | | | | | | |
| Basic Materials — 0.3% | | | | | | | | |
| Nuplex Industries | | | 2,620 | | | | 7,552 | |
| Consumer Services — 0.8% | | | | | | | | |
| Air New Zealand | | | 3,170 | | | | 6,241 | |
| SKY Network Television | | | 1,030 | | | | 3,164 | |
| SKYCITY Entertainment Group | | | 1,176 | | | | 3,191 | |
| Summerset Group Holdings | | | 760 | | | | 2,021 | |
| Trade Me Group | | | 1,342 | | | | 3,323 | |
| | | | | | | | 17,940 | |
| Health Care — 1.9% | | | | | | | | |
| Ebos Group | | | 1,298 | | | | 11,988 | |
| Fisher & Paykel Healthcare | | | 3,000 | | | | 15,792 | |
| Metlifecare | | | 2,550 | | | | 7,695 | |
| Ryman Healthcare | | | 1,000 | | | | 5,338 | |
| | | | | | | | 40,813 | |
The accompanying notes are an integral part of the financial statements.
| Schedule of Investments | October 31, 2015 |
| |
| Global X Scientific Beta Asia ex-Japan ETF‡ |
| | | Shares | | | Value | |
| COMMON STOCK — continued |
| Industrials — 3.1% | | | | | | | | |
| Auckland International Airport | | | 6,403 | | | $ | 22,788 | |
| Fletcher Building | | | 1,083 | | | | 5,466 | |
| Freightways | | | 1,240 | | | | 4,942 | |
| Infratil | | | 8,669 | | | | 18,212 | |
| Mainfreight | | | 470 | | | | 4,929 | |
| Port of Tauranga | | | 740 | | | | 9,012 | |
| | | | | | | | 65,349 | |
| Oil & Gas — 0.1% | | | | | | | | |
| Z Energy | | | 680 | | | | 3,083 | |
| Real Estate Investment Trusts — 3.0% | | | | | | | | |
| Argosy Property | | | 23,130 | | | | 17,605 | |
| Goodman Property Trust | | | 11,810 | | | | 9,629 | |
| Kiwi Property Group | | | 11,110 | | | | 10,223 | |
| Precinct Properties New Zealand | | | 17,259 | | | | 14,246 | |
| Property for Industry | | | 12,580 | | | | 13,108 | |
| | | | | | | | 64,811 | |
| Technology — 0.1% | | | | | | | | |
| Xero * | | | 210 | | | | 2,272 | |
| Telecommunications — 0.9% | | | | | | | | |
| Chorus * | | | 5,766 | | | | 11,099 | |
| Spark New Zealand | | | 3,749 | | | | 8,523 | |
| | | | | | | | 19,622 | |
| Utilities — 2.2% | | | | | | | | |
| Contact Energy | | | 3,530 | | | | 12,396 | |
| Genesis Energy | | | 2,800 | | | | 3,533 | |
| Meridian Energy | | | 1,830 | | | | 2,749 | |
| Mighty River Power | | | 6,616 | | | | 12,534 | |
| Vector | | | 7,050 | | | | 15,741 | |
| | | | | | | | 46,953 | |
| TOTAL NEW ZEALAND | | | | | | | 268,395 | |
| SINGAPORE— 26.8% | | | | | | | | |
| Consumer Goods — 1.7% | | | | | | | | |
| First Resources | | | 1,310 | | | | 1,759 | |
| Golden Agri-Resources | | | 27,200 | | | | 7,574 | |
| Olam International | | | 3,890 | | | | 5,555 | |
| Sinarmas Land | | | 16,590 | | | | 5,686 | |
| Thai Beverage | | | 6,834 | | | | 3,294 | |
| Wilmar International | | | 4,690 | | | | 10,482 | |
| | | | | | | | 34,350 | |
| Consumer Services — 3.1% | | | | | | | | |
| Accordia Golf Trust | | | 6,420 | | | | 2,934 | |
| Asian Pay Television Trust | | | 29,990 | | | | 16,917 | |
The accompanying notes are an integral part of the financial statements.
| Schedule of Investments | October 31, 2015 |
| |
| Global X Scientific Beta Asia ex-Japan ETF‡ |
| | | Shares | | | Value | |
| COMMON STOCK — continued |
| Consumer Services — continued | | | | | | | | |
| ComfortDelGro | | | 3,700 | | | $ | 8,031 | |
| Dairy Farm International Holdings | | | 850 | | | | 5,602 | |
| Genting Singapore | | | 5,520 | | | | 3,212 | |
| Mandarin Oriental International | | | 5,978 | | | | 9,147 | |
| OUE | | | 5,279 | | | | 6,747 | |
| Singapore Airlines | | | 1,000 | | | | 7,712 | |
| Singapore Press Holdings | | | 1,150 | | | | 3,276 | |
| SMRT | | | 4,070 | | | | 4,243 | |
| | | | | | | | 67,821 | |
| Financials — 6.2% | | | | | | | | |
| ARA Asset Management | | | 4,670 | | | | 4,702 | |
| Ascendas India Trust | | | 18,092 | | | | 11,302 | |
| CapitaLand | | | 1,400 | | | | 3,099 | |
| City Developments | | | 670 | | | | 3,799 | |
| DBS Group Holdings | | | 550 | | | | 6,782 | |
| Frasers Centrepoint Trust | | | 2,550 | | | | 2,968 | |
| Global Logistic Properties | | | 2,010 | | | | 3,215 | |
| Great Eastern Holdings | | | 600 | | | | 9,147 | |
| GuocoLand | | | 5,850 | | | | 7,769 | |
| Hong Leong Finance | | | 6,353 | | | | 10,796 | |
| Hongkong Land Holdings | | | 1,259 | | | | 9,455 | |
| Keppel | | | 3,900 | | | | 2,910 | |
| Mapletree Industrial Trust | | | 12,762 | | | | 13,897 | |
| Mapletree Logistics Trust | | | 15,520 | | | | 11,303 | |
| Oversea-Chinese Banking | | | 673 | | | | 4,339 | |
| Religare Health Trust | | | 10,970 | | | | 7,794 | |
| Singapore Exchange | | | 820 | | | | 4,321 | |
| United Overseas Bank | | | 420 | | | | 6,097 | |
| UOL Group | | | 910 | | | | 4,262 | |
| Wing Tai Holdings | | | 2,666 | | | | 3,322 | |
| Yanlord Land Group | | | 3,400 | | | | 2,537 | |
| | | | | | | | 133,816 | |
| Health Care — 1.3% | | | | | | | | |
| Biosensors International Group (B) * | | | 13,125 | | | | 6,373 | |
| Haw Par | | | 2,560 | | | | 15,336 | |
| Raffles Medical Group | | | 2,250 | | | | 6,908 | |
| | | | | | | | 28,617 | |
| Industrials — 3.7% | | | | | | | | |
| Jardine Matheson Holdings | | | 144 | | | | 7,861 | |
| Jardine Strategic Holdings | | | 130 | | | | 3,922 | |
| Neptune Orient Lines * | | | 12,270 | | | | 8,717 | |
| Noble Group | | | 4,153 | | | | 1,498 | |
| SATS | | | 1,930 | | | | 5,223 | |
The accompanying notes are an integral part of the financial statements.
| Schedule of Investments | October 31, 2015 |
| |
| Global X Scientific Beta Asia ex-Japan ETF‡ |
| | | Shares | | | Value | |
| COMMON STOCK — continued |
| Industrials — continued | | | | | | | | |
| SIA Engineering | | | 2,410 | | | $ | 6,866 | |
| Singapore Post | | | 9,130 | | | | 12,354 | |
| Singapore Technologies Engineering | | | 980 | | | | 2,316 | |
| United Engineers | | | 4,920 | | | | 6,991 | |
| Venture | | | 2,236 | | | | 13,204 | |
| Yangzijiang Shipbuilding Holdings | | | 8,790 | | | | 7,846 | |
| | | | | | | | 76,798 | |
| Oil & Gas — 0.9% | | | | | | | | |
| Ezion Holdings | | | 6,090 | | | | 3,044 | |
| Keppel | | | 570 | | | | 2,882 | |
| Sembcorp Industries | | | 5,400 | | | | 13,803 | |
| Sembcorp Marine | | | 1,390 | | | | 2,322 | |
| | | | | | | | 22,051 | |
| Real Estate Investment Trusts — 8.3% | | | | | | | | |
| AIMS AMP Capital Industrial | | | 7,210 | | | | 7,207 | |
| Ascendas | | | 3,600 | | | | 6,144 | |
| Ascott Residence Trust | | | 8,533 | | | | 7,372 | |
| Cache Logistics Trust | | | 9,973 | | | | 7,157 | |
| Cambridge Industrial Trust | | | 17,232 | | | | 7,506 | |
| CapitaLand Commercial Trust | | | 4,270 | | | | 4,299 | |
| CapitaLand Mall Trust | | | 3,160 | | | | 4,468 | |
| CapitaLand Retail China Trust | | | 6,476 | | | | 7,029 | |
| First | | | 7,120 | | | | 6,304 | |
| Fortune | | | 16,000 | | | | 16,556 | |
| Frasers Centrepoint Trust | | | 6,580 | | | | 9,185 | |
| Frasers Commercial Trust | | | 9,850 | | | | 9,635 | |
| Keppel | | | 6,000 | | | | 4,134 | |
| Lippo Malls Indonesia Retail Trust | | | 33,129 | | | | 7,570 | |
| Mapletree Commercial Trust | | | 7,830 | | | | 7,659 | |
| Mapletree Greater China Commercial Trust | | | 9,660 | | | | 6,863 | |
| OUE Hospitality Trust | | | 23,104 | | | | 13,445 | |
| Parkway Life | | | 5,060 | | | | 8,346 | |
| Sabana Shari'ah Compliant Industrial | | | 15,810 | | | | 8,580 | |
| Soilbuild Business Space | | | 20,740 | | | | 11,847 | |
| SPH | | | 17,690 | | | | 11,873 | |
| Starhill Global | | | 13,080 | | | | 7,565 | |
| Suntec | | | 3,170 | | | | 3,735 | |
| | | | | | | | 184,479 | |
| Technology — 0.2% | | | | | | | | |
| Silverlake Axis | | | 7,903 | | | | 3,245 | |
| Telecommunications — 0.7% | | | | | | | | |
| M1 | | | 3,490 | | | | 7,077 | |
| Singapore Telecommunications | | | 1,450 | | | | 4,121 | |
The accompanying notes are an integral part of the financial statements.
| Schedule of Investments | October 31, 2015 |
| |
| Global X Scientific Beta Asia ex-Japan ETF‡ |
| | | Shares/Number
of Rights | | | Value | |
| COMMON STOCK — continued |
| Telecommunications — continued | | | | | | | | |
| StarHub | | | 1,690 | | | $ | 4,344 | |
| | | | | | | | 15,542 | |
| Utilities — 0.7% | | | | | | | | |
| Keppel Infrastructure Trust | | | 24,199 | | | | 8,985 | |
| SIIC Environment Holdings * | | | 6,564 | | | | 3,984 | |
| | | | | | | | 12,969 | |
| TOTAL SINGAPORE | | | | | | | 579,688 | |
| UNITED STATES— 0.2% | | | | | | | | |
| Industrials — 0.2% | | | | | | | | |
| Sims Metal Management | | | 650 | | | | 4,563 | |
| TOTAL COMMON STOCK | | | | | | | | |
| (Cost $2,439,633) | | | | | | | 2,156,882 | |
| | | | | | | | | |
| RIGHTS — 0.0% |
| Australia — 0.0% | | | | | | | | |
| Flexigroup* (B) (C) | | | 101 | | | | 62 | |
| Westpac Banking* | | | 3 | | | | 10 | |
| TOTAL RIGHTS | | | | | | | | |
| (Cost $–) | | | | | | | 72 | |
| TOTAL INVESTMENTS — 99.7% | | | | | | | | |
| (Cost $2,439,633) | | | | | | $ | 2,156,954 | |
Percentages are based on Net Assets of $2,162,791.
| * | Non-income producing security. |
| ‡ | Fund commenced operations on May 12, 2015. |
| (A) | Securities sold within terms of a private placement memorandum, exempt from registration under Section 144A of the Securities Act of 1933, as amended, and may be sold only to dealers in that program or other "accredited investors." These securities have been determined to be liquid under guidelines established by the Board of Trustees. |
| (B) | Security is fair valued using methods determined in good faith by the Fair Value Committee of the Fund. The total value of such securities as of October 31, 2015, was $17,235 and represents 0.8% of Net Assets. |
| (C) | Securities considered illiquid. The total value of such securities as of October 31, 2015, was $4,717 and represented 0.2% of Net Assets. |
Cl — Class
The accompanying notes are an integral part of the financial statements.
| Schedule of Investments | October 31, 2015 |
| |
| Global X Scientific Beta Asia ex-Japan ETF‡ |
| The following is a summary of the inputs used as of October 31, 2015, in valuing the Fund's investments carried at value: |
| |
| Investments in Securities | | Level 1 | | | Level 2 | | | Level 3(a) | | | Total | |
| Common Stock | | | | | | | | | | | | | | | | |
| Australia | | $ | 637,506 | | | $ | 6,145 | | | $ | 997 | | | $ | 644,648 | |
| China | | | 12,166 | | | | — | | | | — | | | | 12,166 | |
| Hong Kong | | | 643,764 | | | | — | | | | 3,658 | | | | 647,422 | |
| New Zealand | | | 268,395 | | | | — | | | | — | | | | 268,395 | |
| Singapore | | | 573,315 | | | | 6,373 | | | | — | | | | 579,688 | |
| United States | | | 4,563 | | | | — | | | | — | | | | 4,563 | |
| Rights | | | 10 | | | | 62 | | | | — | | | | 72 | |
| Total Investments in Securities | | $ | 2,139,719 | | | $ | 12,580 | | | $ | 4,655 | | | $ | 2,156,954 | |
|
(a) A reconciliation of Level 3 investments and disclosures of significant unobservable inputs are presented when the Fund has a significant amount of Level 3 investments at the beginning and/or end of the period in relation to net assets. Management has concluded that Level 3 investments are not material in relation to net assets.
For the period ended October 31, 2015, there have been no transfers between Level 1, Level 2 or Level 3 investments.
The accompanying notes are an integral part of the financial statements.
| Schedule of Investments | October 31, 2015 |
| |
| Global X YieldCo Index ETF‡ |
Sector Weightings (unaudited)†:
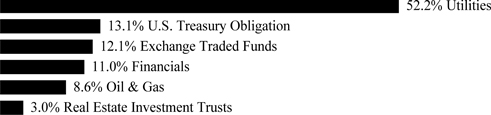
† Sector weightings percentages are based on the total market value of investments.
| | | Shares | | | Value | |
| COMMON STOCK — 86.0% |
| CANADA— 28.1% | | | | | | | | |
| Utilities — 28.1% | | | | | | | | |
| Brookfield Renewable Energy Partners | | | 14,432 | | | $ | 380,715 | |
| Capstone Infrastructure | | | 19,141 | | | | 46,816 | |
| Innergex Renewable Energy | | | 20,173 | | | | 163,129 | |
| Northland Power | | | 14,070 | | | | 181,743 | |
| TransAlta Renewables | | | 20,603 | | | | 159,048 | |
| | | | | | | | 931,451 | |
| TOTAL CANADA | | | | | | | 931,451 | |
| GUERNSEY— 5.1% | | | | | | | | |
| Financials — 5.1% | | | | | | | | |
| Renewables Infrastructure Group | | | 109,170 | | | | 169,024 | |
| SPAIN— 4.9% | | | | | | | | |
| Utilities — 4.9% | | | | | | | | |
| Saeta Yield | | | 16,231 | | | | 161,546 | |
| UNITED STATES— 47.9% | | | | | | | | |
| Financials — 7.5% | | | | | | | | |
| NRG Yield, Cl A | | | 18,243 | | | | 250,476 | |
| Oil & Gas — 9.9% | | | | | | | | |
| 8Point3 Energy Partners | | | 11,200 | | | | 150,752 | |
| Pattern Energy Group, Cl A | | | 7,548 | | | | 176,548 | |
| | | | | | | | 327,300 | |
| Real Estate Investment Trusts — 3.5% | | | | | | | | |
| Hannon Armstrong Sustainable Infrastructure Capital | | | 6,421 | | | | 115,642 | |
| Utilities — 27.0% | | | | | | | | |
| Abengoa Yield | | | 11,335 | | | | 210,038 | |
| NextEra Energy Partners | | | 10,518 | | | | 276,203 | |
| Terraform Global * | | | 16,700 | | | | 127,421 | |
| TerraForm Power, Cl A | | | 15,668 | | | | 285,941 | |
| | | | | | | | 899,603 | |
The accompanying notes are an integral part of the financial statements.
| Schedule of Investments | October 31, 2015 |
| |
| Global X YieldCo Index ETF‡ |
| | | Face Amount/ Shares | | | Value | |
| COMMON STOCK — continued |
| TOTAL UNITED STATES | | | | | | $ | 1,593,021 | |
| TOTAL COMMON STOCK | | | | | | | | |
| (Cost $3,737,631) | | | | | | | 2,855,042 | |
| | | | | | | | | |
| U.S. TREASURY OBLIGATIONS — 15.1% |
| U.S. Treasury Bills | | | | | | | | |
| 0.000%, 11/12/15(A) | | $ | 500,000 | | | | 499,999 | |
| | | | | | | | | |
| TOTAL U.S. TREASURY OBLIGATIONS | | | | | | | | |
| (Cost $500,001) | | | | | | | 499,999 | |
| | | | | | | | | |
| EXCHANGE TRADED FUNDS — 13.9% |
| Bluefield Solar Income Fund | | | 55,200 | | | | 89,514 | |
| Foresight Solar Fund | | | 55,920 | | | | 86,795 | |
| Greencoat UK Wind | | | 91,730 | | | | 158,313 | |
| John Laing Environmental Assets Group | | | 31,600 | | | | 52,219 | |
| NextEnergy Solar Fund | | | 47,700 | | | | 75,510 | |
| TOTAL EXCHANGE TRADED FUNDS | | | | | | | | |
| (Cost $467,203) | | | | | | | 462,351 | |
| | | | | | | | | |
| TOTAL INVESTMENTS — 115.0% | | | | | | | | |
| (Cost $4,704,835) | | | | | | $ | 3,817,392 | |
Percentages are based on Net Assets of $3,319,309.
| * | Non-income producing security. |
| ‡ | Fund commenced operations on May 27, 2015. |
| (A) | The rate reported on the Schedule of Investments is the effective yield at time of purchase. |
| The following is a summary of the inputs used as of October 31, 2015, in valuing the Fund's investments carried at value: |
| |
| Investments in Securities | | Level 1 | | | Level 2 | | | Level 3 | | | Total | |
| Common Stock | | $ | 2,855,042 | | | $ | — | | | $ | — | | | $ | 2,855,042 | |
| U.S. Treasury Obligations | | | — | | | | 499,999 | | | | — | | | | 499,999 | |
| Exchange Traded Funds | | | 462,351 | | | | — | | | | — | | | | 462,351 | |
| Total Investments in Securities | | $ | 3,317,393 | | | $ | 499,999 | | | $ | — | | | $ | 3,817,392 | |
For the period ended October 31, 2015, there have been no transfers between Level 1, Level 2 or Level 3 investments.
As of October 31, 2015, there were no Level 3 investments.
The accompanying notes are an integral part of the financial statements.
| Statements of Assets and Liabilities |
| October 31, 2015 |
| | | Global X
SuperDividend®
ETF | | | Global X
SuperDividend®
U.S. ETF | | | Global X
SuperDividend®
Emerging Markets
ETF | | | Global X
SuperDividend®
REIT ETF | |
| Assets: | | | | | | | | | | | | | | | | |
| Cost of Investments | | $ | 961,192,303 | | | $ | 295,459,396 | | | $ | 3,892,560 | | | $ | 4,293,419 | |
| Cost of Repurchase Agreement | | | 46,835,301 | | | | 10,708,555 | | | | — | | | | — | |
| Cost of Foreign Currency | | | — | | | | — | | | | 1,928 | | | | 995 | |
| Investments, at Value | | $ | 877,910,563 | * | | $ | 274,500,754 | * | | $ | 3,423,068 | | | $ | 3,930,760 | |
| Repurchase Agreement, at Value | | | 46,835,301 | | | | 10,708,555 | | | | — | | | | — | |
| Foreign Currency, at Value | | | — | | | | — | | | | 1,918 | | | | 503 | |
| Cash | | | — | | | | — | | | | — | | | | 13,134 | |
| Dividend and Interest Receivable | | | 2,851,872 | | | | 586,790 | | | | 14,180 | | | | 10,612 | |
| Receivable for Fund Shares Sold | | | — | | | | — | | | | — | | | | 22,845 | |
| Due from Broker | | | — | | | | 750 | | | | — | | | | — | |
| Reclaim Receivable | | | 338,238 | | | | 14,812 | | | | — | | | | 326 | |
| Total Assets | | | 927,935,974 | | | | 285,811,661 | | | | 3,439,166 | | | | 3,978,180 | |
| Liabilities: | | | | | | | | | | | | | | | | |
| Obligation to Return Securities Lending Collateral | | | 46,835,301 | | | | 10,708,555 | | | | — | | | | — | |
| Payable due to Investment Adviser | | | 433,042 | | | | 104,481 | | | | 1,914 | | | | 1,527 | |
| Unrealized Depreciation on Spot Contracts | | | 1,621 | | | | — | | | | — | | | | 3 | |
| Payable for Investment Securities Purchased | | | — | | | | — | | | | — | | | | 22,845 | |
| Cash Overdraft | | | 8 | | | | — | | | | 4,201 | | | | — | |
| Total Liabilities | | | 47,269,972 | | | | 10,813,036 | | | | 6,115 | | | | 24,375 | |
| Net Assets | | $ | 880,666,002 | | | $ | 274,998,625 | | | $ | 3,433,051 | | | $ | 3,953,805 | |
| Net Assets Consist of: | | | | | | | | | | | | | | | | |
| Paid-in Capital | | $ | 1,020,171,190 | | | $ | 310,874,721 | | | $ | 3,884,738 | | | $ | 4,303,098 | |
| Undistributed (Distributions in Excess of) Net Investment Income | | | (5,638,231 | ) | | | — | | | | 26,374 | | | | 18,276 | |
| Accumulated Net Realized Gain (Loss) on Investments and Foreign Currency Transactions | | | (50,555,231 | ) | | | (14,917,454 | ) | | | (7,921 | ) | | | (4,923 | ) |
| Net Unrealized Appreciation (Depreciation) on Investments | | | (83,281,740 | ) | | | (20,958,642 | ) | | | (469,492 | ) | | | (362,659 | ) |
| Net Unrealized Appreciation (Depreciation) on Foreign Currency Translations | | | (29,986 | ) | | | — | | | | (648 | ) | | | 13 | |
| Net Assets | | $ | 880,666,002 | | | $ | 274,998,625 | | | $ | 3,433,051 | | | $ | 3,953,805 | |
| Outstanding Shares of Beneficial Interest (unlimited authorization — no par value) | | | 42,650,000 | | | | 10,900,000 | | | | 250,000 | | | | 300,000 | |
| Net Asset Value, Offering and Redemption Price Per Share | | $ | 20.65 | | | $ | 25.23 | | | $ | 13.73 | | | $ | 13.18 | |
| *Includes Market Value of Securities on Loan | | $ | 44,921,955 | | | $ | 10,251,104 | | | $ | — | | | $ | — | |
The accompanying notes are an integral part of the financial statements.
| Statements of Assets and Liabilities |
| October 31, 2015 |
| | | Global X
SuperIncome™
Preferred ETF | | | Global X Social
Media Index ETF | | | Global X |
JPMorgan
Efficiente Index
ETF | | | Global X |
JPMorgan US
Sector Rotator
Index ETF | |
| Assets: | | | | | | | | | | | | | | | | |
| Cost of Investments | | $ | 253,387,949 | | | $ | 92,262,705 | | | $ | 8,281,553 | | | $ | 13,950,666 | |
| Cost of Repurchase Agreement | | | 5,029,200 | | | | 3,529,751 | | | | — | | | | — | |
| Investments, at Value | | $ | 236,582,932 | * | | $ | 77,501,419 | * | | $ | 8,307,882 | | | $ | 14,135,582 | |
| Repurchase Agreement, at Value | | | 5,029,200 | | | | 3,529,751 | | | | — | | | | — | |
| Receivable for Investment Securities Sold | | | 1,192,723 | | | | 7,365,651 | | | | — | | | | — | |
| Dividend and Interest Receivable | | | 445,079 | | | | 12,269 | | | | — | | | | — | |
| Due from Broker | | | 11,586 | | | | — | | | | — | | | | — | |
| Reclaim Receivable | | | — | | | | 449 | | | | — | | | | — | |
| Total Assets | | | 243,261,520 | | | | 88,409,539 | | | | 8,307,882 | | | | 14,135,582 | |
| Liabilities: | | | | | | | | | | | | | | | | |
| Obligation to Return Securities Lending Collateral | | | 5,029,200 | | | | 3,529,751 | | | | — | | | | — | |
| Payable for Investment Securities Purchased | | | 2,687,090 | | | | 7,694,382 | | | | — | | | | — | |
| Payable due to Investment Adviser | | | 118,423 | | | | 40,654 | | | | 5,462 | | | | 8,293 | |
| Total Liabilities | | | 7,834,713 | | | | 11,264,787 | | | | 5,462 | | | | 8,293 | |
| Net Assets | | $ | 235,426,807 | | | $ | 77,144,752 | | | $ | 8,302,420 | | | $ | 14,127,289 | |
| Net Assets Consist of: | | | | | | | | | | | | | | | | |
| Paid-in Capital | | $ | 260,885,893 | | | $ | 102,929,417 | | | $ | 10,147,132 | | | $ | 16,596,533 | |
| Undistributed (Distributions in Excess of) Net Investment Income | | | 267,725 | | | | (32,203 | ) | | | 256,863 | | | | 131,976 | |
| Accumulated Net Realized Loss on Investments and Foreign Currency Transactions | | | (8,921,794 | ) | | | (10,991,121 | ) | | | (2,127,904 | ) | | | (2,786,136 | ) |
| Net Unrealized Appreciation (Depreciation) on Investments | | | (16,805,017 | ) | | | (14,761,286 | ) | | | 26,329 | | | | 184,916 | |
| Net Unrealized Appreciation (Depreciation) on Foreign Currency Translations | | | — | | | | (55 | ) | | | — | | | | — | |
| Net Assets | | $ | 235,426,807 | | | $ | 77,144,752 | | | $ | 8,302,420 | | | $ | 14,127,289 | |
| Outstanding Shares of Beneficial Interest (unlimited authorization — no par value) | | | 17,450,000 | | | | 4,000,000 | | | | 350,000 | | | | 600,000 | |
| Net Asset Value, Offering and Redemption Price Per Share | | $ | 13.49 | | | $ | 19.29 | | | $ | 23.72 | | | $ | 23.55 | |
| *Includes Market Value of Securities on Loan | | $ | 4,907,868 | | | $ | 3,423,061 | | | $ | — | | | $ | — | |
The accompanying notes are an integral part of the financial statements.
| Statements of Assets and Liabilities |
| October 31, 2015 |
| | | Global X
Permanent ETF | | | Global X Guru™
Index ETF | | | Global X Guru™
Activist Index
ETF | | | Global X Guru™
International
Index ETF | |
| Assets: | | | | | | | | | | | | | | | | |
| Cost of Investments | | $ | 11,592,467 | | | $ | 194,438,799 | | | $ | 2,736,334 | | | $ | 1,460,877 | |
| Cost of Repurchase Agreement | | | — | | | | 2,487,600 | | | | — | | | | — | |
| Investments, at Value | | $ | 10,735,198 | | | $ | 184,483,694 | * | | $ | 2,678,811 | | | $ | 1,312,063 | |
| Repurchase Agreement, at Value | | | — | | | | 2,487,600 | | | | — | | | | — | |
| Cash | | | — | | | | — | | | | 3,640 | | | | — | |
| Dividend and Interest Receivable | | | 42,871 | | | | 139,908 | | | | 2,283 | | | | 28 | |
| Reclaim Receivable | | | 44 | | | | — | | | | 82 | | | | 1,691 | |
| Total Assets | | | 10,778,113 | | | | 187,111,202 | | | | 2,684,816 | | | | 1,313,782 | |
| Liabilities: | | | | | | | | | | | | | | | | |
| Payable due to Investment Adviser | | | 4,399 | | | | 118,748 | | | | 1,670 | | | | 815 | |
| Obligation to Return Securities Lending Collateral | | | — | | | | 2,487,600 | | | | — | | | | — | |
| Total Liabilities | | | 4,399 | | | | 2,606,348 | | | | 1,670 | | | | 815 | |
| Net Assets | | $ | 10,773,714 | | | $ | 184,504,854 | | | $ | 2,683,146 | | | $ | 1,312,967 | |
| Net Assets Consist of: | | | | | | | | | | | | | | | | |
| Paid-in Capital | | $ | 12,000,053 | | | $ | 208,456,185 | | | $ | 2,997,667 | | | $ | 1,608,860 | |
| Undistributed Net Investment Income | | | 91,967 | | | | 578,659 | | | | 11,721 | | | | 9,574 | |
| Accumulated Net Realized Gain (Loss) on Investments and Foreign Currency Transactions | | | (461,037 | ) | | | (14,574,885 | ) | | | (268,719 | ) | | | (156,653 | ) |
| Net Unrealized Appreciation (Depreciation) on Investments | | | (857,269 | ) | | | (9,955,105 | ) | | | (57,523 | ) | | | (148,814 | ) |
| Net Assets | | $ | 10,773,714 | | | $ | 184,504,854 | | | $ | 2,683,146 | | | $ | 1,312,967 | |
| Outstanding Shares of Beneficial Interest (unlimited authorization — no par value) | | | 450,000 | | | | 7,700,000 | | | | 200,000 | | | | 100,000 | |
| Net Asset Value, Offering and Redemption Price Per Share | | $ | 23.94 | | | $ | 23.96 | | | $ | 13.42 | | | $ | 13.13 | |
| *Includes Market Value of Securities on Loan | | $ | — | | | $ | 2,248,289 | | | $ | — | | | $ | — | |
The accompanying notes are an integral part of the financial statements.
| Statements of Assets and Liabilities |
| October 31, 2015 |
| | | Global X GF
China Bond ETF | | | Global X
Scientific Beta US
ETF | | | Global X
Scientific Beta
Europe ETF | | | Global X
Scientific Beta
Japan ETF | |
| Assets: | | | | | | | | | | | | | | | | |
| Cost of Investments | | $ | 35,034,574 | | | $ | 2,483,238 | | | $ | 2,497,376 | | | $ | 2,516,728 | |
| Cost of Foreign Currency | | | 10,598 | | | | — | | | | 659 | | | | 90 | |
| Investments, at Value | | $ | 35,160,050 | | | $ | 2,458,607 | | | $ | 2,432,621 | | | $ | 2,514,970 | |
| Cash | | | — | | | | 6,862 | | | | 4,416 | | | | — | |
| Foreign Currency, at Value | | | 12,190 | | | | — | | | | 547 | | | | 90 | |
| Dividend and Interest Receivable | | | 582,551 | | | | 1,754 | | | | 2,320 | | | | 13,505 | |
| Reclaim Receivable | | | — | | | | 9 | | | | 1,664 | | | | — | |
| Total Assets | | | 35,754,791 | | | | 2,467,232 | | | | 2,441,568 | | | | 2,528,565 | |
| Liabilities: | | | | | | | | | | | | | | | | |
| Payable due to Investment Adviser | | | 17,752 | | | | 720 | | | | 774 | | | | 789 | |
| Cash Overdraft | | | — | | | | — | | | | — | | | | 9,235 | |
| Unrealized Depreciation on Spot Contracts | | | — | | | | — | | | | 4 | | | | — | |
| Accrued Foreign Capital Gains Tax on Appreciated Securities | | | 57,512 | | | | — | | | | — | | | | — | |
| Total Liabilities | | | 75,264 | | | | 720 | | | | 778 | | | | 10,024 | |
| Net Assets | | $ | 35,679,527 | | | $ | 2,466,512 | | | $ | 2,440,790 | | | $ | 2,518,541 | |
| Net Assets Consist of: | | | | | | | | | | | | | | | | |
| Paid-in Capital | | $ | 36,102,990 | | | $ | 2,490,000 | | | $ | 2,489,000 | | | $ | 2,507,000 | |
| Undistributed (Distributions in Excess of) Net Investment Income | | | (487,379 | ) | | | 18,288 | | | | 26,121 | | | | 12,102 | |
| Accumulated Net Realized Gain (Loss) on Investments and Foreign Currency Transactions | | | (4,970 | ) | | | (17,145 | ) | | | (9,570 | ) | | | 1,275 | |
| Net Unrealized Appreciation (Depreciation) on Investments | | | 125,476 | | | | (24,631 | ) | | | (64,755 | ) | | | (1,758 | ) |
| Foreign Capital Gains Tax on Appreciated Securities | | | (57,512 | ) | | | — | | | | — | | | | — | |
| Net Unrealized Appreciation (Depreciation) on Foreign Currency Translations | | | 922 | | | | — | | | | (6 | ) | | | (78 | ) |
| Net Assets | | $ | 35,679,527 | | | $ | 2,466,512 | | | $ | 2,440,790 | | | $ | 2,518,541 | |
| Outstanding Shares of Beneficial Interest (unlimited authorization — no par value) | | | 950,000 | | | | 100,000 | | | | 100,000 | | | | 100,000 | |
| Net Asset Value, Offering and Redemption Price Per Share | | $ | 37.56 | | | $ | 24.67 | | | $ | 24.41 | | | $ | 25.19 | |
The accompanying notes are an integral part of the financial statements.
| Statements of Assets and Liabilities |
| October 31, 2015 |
| | | Global X Scientific
Beta Asia ex-Japan
ETF | | | Global X YieldCo
Index ETF | |
| Assets: | | | | | | | | |
| Cost of Investments | | $ | 2,439,633 | | | $ | 4,704,835 | |
| Cost of Foreign Currency | | | 280 | | | | 1,871 | |
| Investments, at Value | | $ | 2,156,954 | | | $ | 3,817,392 | |
| Cash | | | 6,514 | | | | — | |
| Foreign Currency, at Value | | | 281 | | | | 1,871 | |
| Dividend and Interest Receivable | | | 5,308 | | | | 5,652 | |
| Unrealized Appreciation on Spot Contracts | | | 7 | | | | — | |
| Reclaim Receivable | | | — | | | | 207 | |
| Total Assets | | | 2,169,064 | | | | 3,825,122 | |
| Liabilities: | | | | | | | | |
| Payable for Investment Securities Purchased | | | 5,581 | | | | — | |
| Payable due to Investment Adviser | | | 688 | | | | 1,826 | |
| Unrealized Depreciation on Spot Contracts | | | 4 | | | | 12 | |
| Cash Overdraft | | | — | | | | 503,975 | |
| Total Liabilities | | | 6,273 | | | | 505,813 | |
| Net Assets | | $ | 2,162,791 | | | $ | 3,319,309 | |
| Net Assets Consist of: | | | | | | | | |
| Paid-in Capital | | $ | 2,499,952 | | | $ | 4,351,749 | |
| Undistributed Net Investment Income | | | 46,987 | | | | 10,723 | |
| Accumulated Net Realized Loss on Investments and Foreign Currency Transactions | | | (101,438 | ) | | | (155,720 | ) |
| Net Unrealized Appreciation (Depreciation) on Investments | | | (282,679 | ) | | | (887,443 | ) |
| Net Unrealized Appreciation (Depreciation) on Foreign Currency Translations | | | (31 | ) | | | — | |
| Net Assets | | $ | 2,162,791 | | | $ | 3,319,309 | |
| Outstanding Shares of Beneficial Interest (unlimited authorization — no par value) | | | 100,000 | | | | 300,000 | |
| Net Asset Value, Offering and Redemption Price Per Share | | $ | 21.63 | | | $ | 11.06 | |
The accompanying notes are an integral part of the financial statements.
| Statements of Operations |
| For the year or period ended October 31, 2015 |
| | | Global X
SuperDividend®
ETF | | | Global X
SuperDividend®
U.S. ETF | | | Global X
SuperDividend®
Emerging Markets
ETF(2) | | | Global X
SuperDividend®
REIT ETF(2) | |
| Investment Income: | | | | | | | | | | | | | | | | |
| Dividend Income | | $ | 64,233,340 | | | $ | 19,476,257 | | | $ | 166,834 | | | $ | 126,868 | |
| Interest Income | | | 939 | | | | 320 | | | | — | | | | — | |
| Security Lending Income | | | 518,197 | | | | 255,237 | | | | — | | | | — | |
| Less: Foreign Taxes Withheld | | | (3,187,533 | ) | | | (15,429 | ) | | | (11,240 | ) | | | (2,801 | ) |
| Total Investment Income | | | 61,564,943 | | | | 19,716,385 | | | | 155,594 | | | | 124,067 | |
| Supervision and Administration Fees(1) | | | 5,800,309 | | | | 1,325,426 | | | | 13,670 | | | | 8,652 | |
| Total Expenses | | | 5,800,309 | | | | 1,325,426 | | | | 13,670 | | | | 8,652 | |
| Net Investment Income | | | 55,764,634 | | | | 18,390,959 | | | | 141,924 | | | | 115,415 | |
| Net Realized Gain (Loss) on: | | | | | | | | | | | | | | | | |
| Investments | | | (37,203,933 | )(3) | | | (14,851,179 | )(3) | | | (7,906 | ) | | | 12,329 | |
| Foreign Currency Transactions | | | (948,136 | ) | | | — | | | | (4,990 | ) | | | (541 | ) |
| Net Realized Gain (Loss) on Investments and Foreign Currency Transactions | | | (38,152,069 | ) | | | (14,851,179 | ) | | | (12,896 | ) | | | 11,788 | |
| Net Change in Unrealized Appreciation (Depreciation) on: | | | | | | | | | | | | | | | | |
| Investments | | | (115,523,009 | ) | | | (32,039,760 | ) | | | (469,492 | ) | | | (362,659 | ) |
| Foreign Currency Translations | | | (3,596 | ) | | | — | | | | (648 | ) | | | 13 | |
| Net Change in Unrealized Depreciation on Investments and Foreign Currency Translations | | | (115,526,605 | ) | | | (32,039,760 | ) | | | (470,140 | ) | | | (362,646 | ) |
| Net Realized and Unrealized Loss on Investments and Foreign Currency Transactions and Translations | | | (153,678,674 | ) | | | (46,890,939 | ) | | | (483,036 | ) | | | (350,858 | ) |
| Net Decrease in Net Assets Resulting from Operations | | $ | (97,914,040 | ) | | $ | (28,499,980 | ) | | $ | (341,112 | ) | | $ | (235,443 | ) |
| (1) | The Supervision and Administration fees include fees paid by the Funds for the investment advisory services provided by the Adviser. (See Note 3 in Notes to Financial Statements.) |
| (2) | The Fund commenced operations March 16, 2015. |
| (3) | Includes realized gains (losses) as a result of in-kind redemptions. (See Note 4 in Notes to Financial Statements.) |
The accompanying notes are an integral part of the financial statements.
| Statements of Operations |
| For the year or period ended October 31, 2015 |
| | | Global X
SuperIncome™
Preferred ETF | | | Global X Social
Media Index ETF | | | Global X |
JPMorgan
Efficiente Index
ETF | | | Global X |
JPMorgan US
Sector Rotator
Index ETF | |
| Investment Income: | | | | | | | | | | | | | | | | |
| Dividend Income | | $ | 17,503,410 | | | $ | 353,721 | | | $ | 329,939 | | | $ | 302,316 | |
| Interest Income | | | 169,128 | | | | 22 | | | | 28 | | | | 51 | |
| Security Lending Income | | | 150,772 | | | | 353,748 | | | | — | | | | — | |
| Less: Foreign Taxes Withheld | | | — | | | | (29,308 | ) | | | — | | | | — | |
| Total Investment Income | | | 17,823,310 | | | | 678,183 | | | | 329,967 | | | | 302,367 | |
| Supervision and Administration Fees(1) | | | 1,424,288 | | | | 634,501 | | | | 95,445 | | | | 137,886 | |
| Tax Expense | | | 3,118 | | | | – | | | | – | | | | – | |
| Total Expenses | | | 1,427,406 | | | | 634,501 | | | | 95,445 | | | | 137,886 | |
| Net Investment Income | | | 16,395,904 | | | | 43,682 | | | | 234,522 | | | | 164,481 | |
| Net Realized Gain (Loss) on: | | | | | | | | | | | | | | | | |
| Investments (2) | | | (6,016,791 | ) | | | 3,429,958 | | | | (1,998,124 | ) | | | (2,764,955 | ) |
| Foreign Currency Transactions | | | — | | | | (27,251 | ) | | | — | | | | — | |
| Net Realized Gain (Loss) on Investments and Foreign Currency Transactions | | | (6,016,791 | ) | | | 3,402,707 | | | | (1,998,124 | ) | | | (2,764,955 | ) |
| Net Change in Unrealized Appreciation (Depreciation) on: | | | | | | | | | | | | | | | | |
| Investments | | | (16,410,848 | ) | | | (3,954,928 | ) | | | (28,134 | ) | | | 149,664 | |
| Foreign Currency Translations | | | — | | | | 826 | | | | — | | | | — | |
| Net Change in Unrealized Appreciation (Depreciation) on Investments and Foreign Currency Translations | | | (16,410,848 | ) | | | (3,954,102 | ) | | | (28,134 | ) | | | 149,664 | |
| Net Realized and Unrealized Loss on Investments and Foreign Currency Transactions and Translations | | | (22,427,639 | ) | | | (551,395 | ) | | | (2,026,258 | ) | | | (2,615,291 | ) |
| Net Decrease in Net Assets Resulting from Operations | | $ | (6,031,735 | ) | | $ | (507,713 | ) | | $ | (1,791,736 | ) | | $ | (2,450,810 | ) |
| (1) | The Supervision and Administration fees include fees paid by the Funds for the investment advisory services provided by the Adviser. (See Note 3 in Notes to Financial Statements.) |
| (2) | Includes realized gains (losses) as a result of in-kind redemptions. (See Note 4 in Notes to Financial Statements.) |
The accompanying notes are an integral part of the financial statements.
| Statements of Operations |
| For the year or period ended October 31, 2015 |
| | | Global X
Permanent ETF | | | Global X Guru™
Index ETF | | | Global X Guru™
Activist Index
ETF(1) | | | Global X Guru™
International
Index ETF | |
| Investment Income: | | | | | | | | | | | | | | | | |
| Dividend Income | | $ | 68,283 | | | $ | 3,433,980 | | | $ | 22,579 | | | $ | 32,913 | |
| Interest Income | | | 86,340 | | | | 160 | | | | — | | | | — | |
| Security Lending Income | | | — | | | | 50,742 | | | | — | | | | — | |
| Less: Foreign Taxes Withheld | | | (1,163 | ) | | | (5,975 | ) | | | (405 | ) | | | (3,826 | ) |
| Total Investment Income | | | 153,460 | | | | 3,478,907 | | | | 22,174 | | | | 29,087 | |
| Supervision and Administration Fees(2) | | | 48,720 | | | | 2,285,259 | | | | 10,453 | | | | 13,619 | |
| Total Expenses | | | 48,720 | | | | 2,285,259 | | | | 10,453 | | | | 13,619 | |
| Net Investment Income | | | 104,740 | | | | 1,193,648 | | | | 11,721 | | | | 15,468 | |
| Net Realized Gain (Loss) on: | | | | | | | | | | | | | | | | |
| Investments | | | 36,193 | (3) | | | 10,809,860 | (3) | | | (268,719 | ) | | | (92,603 | )(3) |
| Foreign Currency Transactions | | | 261 | | | | — | | | | — | | | | — | |
| Net Realized Gain (Loss) on Investments and Foreign Currency Transactions | | | 36,454 | | | | 10,809,860 | | | | (268,719 | ) | | | (92,603 | ) |
| Net Change in Unrealized Appreciation (Depreciation) on: | | | | | | | | | | | | | | | | |
| Investments | | | (97,856 | ) | | | (28,388,415 | ) | | | (57,523 | ) | | | (177,481 | ) |
| Net Change in Unrealized Appreciation (Depreciation) on Investments | | | (97,856 | ) | | | (28,388,415 | ) | | | (57,523 | ) | | | (177,481 | ) |
| Net Realized and Unrealized Loss on Investments and Foreign Currency Transactions | | | (61,402 | ) | | | (17,578,555 | ) | | | (326,242 | ) | | | (270,084 | ) |
| Net Increase (Decrease) in Net Assets Resulting from Operations | | $ | 43,338 | | | $ | (16,384,907 | ) | | $ | (314,521 | ) | | $ | (254,616 | ) |
| (1) | The Fund commenced operations on April 28, 2015. |
| (2) | The Supervision and Administration fees include fees paid by the Funds for the investment advisory services provided by the Adviser. (See Note 3 in Notes to Financial Statements.) |
| (3) | Includes realized gains (losses) as a result of in-kind redemptions. (See Note 4 in Notes to Financial Statements.) |
The accompanying notes are an integral part of the financial statements.
| Statements of Operations |
| For the year or period ended October 31, 2015 |
| | | Global X GF China
Bond ETF(1) | | | Global X Scientific
Beta US ETF(3) | | | Global X Scientific
Beta Europe
ETF(3) | | | Global X Scientific
Beta Japan ETF(3) | |
| Investment Income: | | | | | | | | | | | | | | | | |
| Dividend Income | | $ | — | | | $ | 21,879 | | | $ | 33,008 | | | $ | 19,278 | |
| Interest Income | | | 1,640,198 | | | | — | | | | — | | | | — | |
| Less: Foreign Taxes Withheld | | | — | | | | (9 | ) | | | (3,360 | ) | | | (2,959 | ) |
| Total Investment Income | | | 1,640,198 | | | | 21,870 | | | | 29,648 | | | | 16,319 | |
| Supervision and Administration Fees(2) | | | 203,315 | | | | 4,020 | | | | 4,335 | | | | 4,414 | |
| Custodian Fees | | | 41,318 | | | | – | | | | – | | | | – | |
| Total Expenses | | | 244,633 | | | | 4,020 | | | | 4,335 | | | | 4,414 | |
| Waiver of Supervision and Administration Fees | | | (33,886 | ) | | | – | | | | – | | | | – | |
| Net Expenses | | | 210,747 | | | | 4,020 | | | | 4,335 | | | | 4,414 | |
| Net Investment Income | | | 1,429,451 | | | | 17,850 | | | | 25,313 | | | | 11,905 | |
| Net Realized Gain (loss) on: | | | | | | | | | | | | | | | | |
| Investments | | | (541,008 | ) | | | (16,707 | ) | | | (8,949 | ) | | | 1,331 | |
| Foreign Currency Transactions | | | (190,853 | ) | | | — | | | | 187 | | | | 141 | |
| Net Realized Gain (Loss) on Investments and Foreign Currency Transactions | | | (731,861 | ) | | | (16,707 | ) | | | (8,762 | ) | | | 1,472 | |
| Net Change in Unrealized Appreciation (Depreciation) on: | | | | | | | | | | | | | | | | |
| Investments | | | 125,476 | | | | (24,631 | ) | | | (64,755 | ) | | | (1,758 | ) |
| Foreign Capital Gains Tax on Appreciated Securities | | | (57,512 | ) | | | — | | | | — | | | | — | |
| Foreign Currency Translations | | | 922 | | | | — | | | | (6 | ) | | | (78 | ) |
| Net Change in Unrealized Appreciation (Depreciation) on Investments and Foreign Currency Translations | | | 68,886 | | | | (24,631 | ) | | | (64,761 | ) | | | (1,836 | ) |
| Net Realized and Unrealized Loss on Investments and Foreign Currency Transactions and Translations | | | (662,975 | ) | | | (41,338 | ) | | | (73,523 | ) | | | (364 | ) |
| Net Increase (Decrease) in Net Assets Resulting from Operations | | $ | 766,476 | | | $ | (23,488 | ) | | $ | (48,210 | ) | | $ | 11,541 | |
| (1) | The Fund commenced operations on November 18, 2014. |
(2) | The Supervision and Administration fees include fees paid by the Funds for the investment advisory services provided by the Adviser. (See Note 3 in Notes to Financial Statements.) |
| (3) | The Fund commenced operations on May 12, 2015. |
The accompanying notes are an integral part of the financial statements.
| Statements of Operations |
| For the year or period ended October 31, 2015 |
| | | Global X Scientific
Beta Asia ex-Japan
ETF(1) | | | Global X YieldCo
Index ETF(2) | |
| Investment Income: | | | | | | | | |
| Dividend Income | | $ | 49,621 | | | $ | 62,717 | |
| Interest Income | | | — | | | | 1 | |
| Less: Foreign Taxes Withheld | | | (2,211 | ) | | | (3,396 | ) |
| Total Investment Income | | | 47,410 | | | | 59,322 | |
| Supervision and Administration Fees(3) | | | 3,962 | | | | 8,768 | |
| Total Expenses | | | 3,962 | | | | 8,768 | |
| Net Investment Income | | | 43,448 | | | | 50,554 | |
| Net Realized Gain (loss) on: | | | | | | | | |
| Investments | | | (100,540 | ) | | | (159,320 | ) |
| Foreign Currency Transactions | | | 2,641 | | | | (2,481 | ) |
| Net Realized (Loss) on Investments and Foreign Currency Transactions | | | (97,899 | ) | | | (161,801 | ) |
| Net Change in Unrealized Appreciation (Depreciation) on: | | | | | | | | |
| Investments | | | (282,679 | ) | | | (887,443 | ) |
| Foreign Currency Translations | | | (31 | ) | | | — | |
| Net Change in Unrealized Appreciation (Depreciation) on Investments and Foreign Currency Translations | | | (282,710 | ) | | | (887,443 | ) |
| Net Realized and Unrealized Loss on Investments and Foreign Currency Transactions and Translations | | | (380,609 | ) | | | (1,049,244 | ) |
| Net Decrease in Net Assets Resulting from Operations | | $ | (337,161 | ) | | $ | (998,690 | ) |
| (1) | The Fund commenced operations on May 12, 2015. |
(2) (3) | The Fund commenced operations on May 27, 2015. The Supervision and Administration fees include fees paid by the Funds for the investment advisory services provided by the Adviser. (See Note 3 in Notes to Financial Statements.) |
The accompanying notes are an integral part of the financial statements.
| Statements of Changes in Net Assets |
| |
| | | Global X SuperDividend® ETF | | | Global X SuperDividend® U.S. ETF | |
| | | Year Ended
October 31, 2015 | | | Year Ended
October 31, 2014 | | | Year Ended
October 31, 2015 | | | Year Ended
October 31, 2014 | |
| Operations: | | | | | | | | | | | | | | | | |
| Net Investment Income | | $ | 55,764,634 | | | $ | 53,950,753 | | | $ | 18,390,959 | | | $ | 6,886,974 | |
| Net Realized Gain (Loss) on Investments and Foreign Currency Transactions | | | (38,152,069 | )(1) | | | 28,755,720 | (1) | | | (14,851,179 | )(1) | | | 2,818,231 | (1) |
| Net Change in Unrealized Appreciation (Depreciation) on Investments and Foreign Currency Translations | | | (115,526,605 | ) | | | (20,389,996 | ) | | | (32,039,760 | ) | | | 9,558,716 | |
| Net Increase (Decrease) in Net Assets Resulting from Operations | | | (97,914,040 | ) | | | 62,316,477 | | | | (28,499,980 | ) | | | 19,263,921 | |
| Dividends and Distributions from: | | | | | | | | | | | | | | | | |
| Net Investment Income | | | (63,792,372 | ) | | | (55,528,000 | ) | | | (13,048,101 | ) | | | (5,177,061 | ) |
| Net Realized Gains | | | (1,980,385 | ) | | | — | | | | — | | | | — | |
| Return of Capital | | | — | | | | — | | | | (7,048,014 | ) | | | (617,714 | ) |
| Total Dividends and Distributions | | | (65,772,757 | ) | | | (55,528,000 | ) | | | (20,096,115 | ) | | | (5,794,775 | ) |
| Capital Share Transactions: | | | | | | | | | | | | | | | | |
| Issued | | | 105,826,823 | | | | 304,468,290 | | | | 113,535,136 | | | | 227,401,148 | |
| Redeemed | | | (99,050,071 | ) | | | (48,918,715 | ) | | | (66,655,050 | ) | | | (16,035,000 | ) |
| Increase in Net Assets from Capital Share Transactions | | | 6,776,752 | | | | 255,549,575 | | | | 46,880,086 | | | | 211,366,148 | |
| Total Increase (Decrease) in Net Assets | | | (156,910,045 | ) | | | 262,338,052 | | | | (1,716,009 | ) | | | 224,835,294 | |
| Net Assets: | | | | | | | | | | | | | | | | |
| Beginning of Year | | | 1,037,576,047 | | | | 775,237,995 | | | | 276,714,634 | | | | 51,879,340 | |
| End of Year | | $ | 880,666,002 | | | $ | 1,037,576,047 | | | $ | 274,998,625 | | | $ | 276,714,634 | |
| Undistributed (Distributions in Excess of) Net Investment Income | | $ | (5,638,231 | ) | | $ | (2,625,792 | ) | | $ | — | | | $ | — | |
| Share Transactions: | | | | | | | | | | | | | | | | |
| Issued | | | 4,550,000 | | | | 12,250,000 | | | | 3,950,000 | | | | 7,950,000 | |
| Redeemed | | | (4,700,000 | ) | | | (2,100,000 | ) | | | (2,400,000 | ) | | | (600,000 | ) |
| Net Increase (Decrease) in Shares Outstanding from Share Transactions | | | (150,000 | ) | | | 10,150,000 | | | | 1,550,000 | | | | 7,350,000 | |
| (1) | Includes realized gains (losses) as a result of in-kind redemptions. (See Note 4 in Notes to Financial Statements.) |
The accompanying notes are an integral part of the financial statements.
| Statements of Changes in Net Assets |
| |
| | | Global X
SuperDividend®
Emerging Markets
ETF | | | Global X
SuperDividend®
REIT ETF | |
| | | Period Ended
October 31,
2015(1) | | | Period Ended
October 31,
2015(1) | |
| Operations: | | | | | | | | |
| Net Investment Income | | $ | 141,924 | | | $ | 115,415 | |
| Net Realized Gain (Loss) on Investments and Foreign Currency Transactions | | | (12,896 | ) | | | 11,788 | |
| Net Change in Unrealized Appreciation (Depreciation) on Investments and Foreign Currency Translations | | | (470,140 | ) | | | (362,646 | ) |
| Net Decrease in Net Assets Resulting from Operations | | | (341,112 | ) | | | (235,443 | ) |
| Dividends and Distributions from: | | | | | | | | |
| Net Investment Income | | | (110,575 | ) | | | (113,850 | ) |
| Total Dividends and Distributions | | | (110,575 | ) | | | (113,850 | ) |
| Capital Share Transactions: | | | | | | | | |
| Issued | | | 3,884,738 | | | | 4,303,098 | |
| Increase in Net Assets from Capital Share Transactions | | | 3,884,738 | | | | 4,303,098 | |
| Total Increase in Net Assets | | | 3,433,051 | | | | 3,953,805 | |
| Net Assets: | | | | | | | | |
| Beginning of Period | | | — | | | | — | |
| End of Period | | $ | 3,433,051 | | | $ | 3,953,805 | |
| Undistributed Net Investment Income | | $ | 26,374 | | | $ | 18,276 | |
| Share Transactions: | | | | | | | | |
| Issued | | | 250,000 | | | | 300,000 | |
| Increase in Shares Outstanding from Share Transactions | | | 250,000 | | | | 300,000 | |
| (1) | The Fund commenced operations on March 16, 2015. |
The accompanying notes are an integral part of the financial statements.
| Statements of Changes in Net Assets |
| |
| | | Global X SuperIncome™ Preferred
ETF | | | Global X Social Media Index ETF | |
| | | Year Ended
October 31, 2015 | | | Year Ended
October 31, 2014 | | | Year Ended
October 31, 2015 | | | Year Ended
October 31, 2014 | |
| Operations: | | | | | | | | | | | | | | | | |
| Net Investment Income (Loss) | | $ | 16,395,904 | | | $ | 6,891,089 | | | $ | 43,682 | | | $ | (12,711 | ) |
| Net Realized Gain (Loss) on Investments and Foreign Currency Transactions | | | (6,016,791 | )(1) | | | (483,511 | )(1) | | | 3,402,707 | (1) | | | 8,231,848 | (1) |
| Net Change in Unrealized Appreciation (Depreciation) on Investments and Foreign Currency Translations | | | (16,410,848 | ) | | | (826,411 | ) | | | (3,954,102 | ) | | | (13,398,596 | ) |
| Net Increase (Decrease) in Net Assets Resulting from Operations | | | (6,031,735 | ) | | | 5,581,167 | | | | (507,713 | ) | | | (5,179,459 | ) |
| Dividends and Distributions from: | | | | | | | | | | | | | | | | |
| Net Investment Income | | | (16,693,614 | ) | | | (6,808,392 | ) | | | (57,330 | ) | | | (1,764 | ) |
| Total Dividends and Distributions | | | (16,693,614 | ) | | | (6,808,392 | ) | | | (57,330 | ) | | | (1,764 | ) |
| Capital Share Transactions: | | | | | | | | | | | | | | | | |
| Issued | | | 143,668,838 | | | | 117,538,007 | | | | 47,160,234 | | | | 104,020,692 | |
| Redeemed | | | (48,391,387 | ) | | | (13,401,000 | ) | | | (95,868,254 | ) | | | (68,369,208 | ) |
| Net Increase (Decrease) in Net Assets from Capital Share Transactions | | | 95,277,451 | | | | 104,137,007 | | | | (48,708,020 | ) | | | 35,651,484 | |
| Total Increase (Decrease) in Net Assets | | | 72,552,102 | | | | 102,909,782 | | | | (49,273,063 | ) | | | 30,470,261 | |
| Net Assets: | | | | | | | | | | | | | | | | |
| Beginning of Year | | | 162,874,705 | | | | 59,964,923 | | | | 126,417,815 | | | | 95,947,554 | |
| End of Year | | $ | 235,426,807 | | | $ | 162,874,705 | | | $ | 77,144,752 | | | $ | 126,417,815 | |
| Undistributed (Distributions in Excess of) Net Investment Income | | $ | 267,725 | | | $ | 314,426 | | | $ | (32,203 | ) | | $ | (3,828 | ) |
| Share Transactions: | | | | | | | | | | | | | | | | |
| Issued | | | 9,850,000 | | | | 7,900,000 | | | | 2,500,000 | | | | 5,100,000 | |
| Redeemed | | | (3,450,000 | ) | | | (900,000 | ) | | | (5,050,000 | ) | | | (3,500,000 | ) |
| Net Increase (Decrease) in Shares Outstanding from Share Transactions | | | 6,400,000 | | | | 7,000,000 | | | | (2,550,000 | ) | | | 1,600,000 | |
| (1) | Includes realized gains (losses) as a result of in-kind redemptions. (See Note 4 in Notes to Financial Statements.) |
The accompanying notes are an integral part of the financial statements.
| Statements of Changes in Net Assets |
| |
| | | Global X | JPMorgan Efficiente Index
ETF | | | Global X | JPMorgan US Sector
Rotator Index ETF | |
| | | Year Ended
October 31, 2015 | | | Period Ended
October 31, 2014(1) | | | Year Ended
October 31, 2015 | | | Period Ended
October 31, 2014(1) | |
| Operations: | | | | | | | | | | | | | | | | |
| Net Investment Income (Loss) | | $ | 234,522 | | | $ | (380 | ) | | $ | 164,481 | | | $ | (381 | ) |
| Net Realized Gain (Loss) on Investments and Foreign Currency Transactions | | | (1,998,124 | )(2) | | | — | | | | (2,764,955 | )(2) | | | 3,446 | |
| Net Change in Unrealized Appreciation (Depreciation) on Investments and Foreign Currency Translations | | | (28,134 | ) | | | 54,463 | | | | 149,664 | | | | 35,252 | |
| Net Increase (Decrease) in Net Assets Resulting from Operations | | | (1,791,736 | ) | | | 54,083 | | | | (2,450,810 | ) | | | 38,317 | |
| Dividends and Distributions from: | | | | | | | | | | | | | | | | |
| Net Investment Income | | | (15,956 | ) | | | — | | | | (32,505 | ) | | | — | |
| Net Realized Gains | | | — | | | | — | | | | (3,065 | ) | | | — | |
| Total Dividends and Distributions | | | (15,956 | ) | | | — | | | | (35,570 | ) | | | — | |
| Capital Share Transactions: | | | | | | | | | | | | | | | | |
| Issued | | | 23,733,266 | | | | 2,495,000 | | | | 28,365,035 | | | | 2,503,000 | |
| Redeemed | | | (16,172,237 | ) | | | — | | | | (14,292,683 | ) | | | — | |
| Net Increase in Net Assets from Capital Share Transactions | | | 7,561,029 | | | | 2,495,000 | | | | 14,072,352 | | | | 2,503,000 | |
| Total Increase in Net Assets | | | 5,753,337 | | | | 2,549,083 | | | | 11,585,972 | | | | 2,541,317 | |
| Net Assets: | | | | | | | | | | | | | | | | |
| Beginning of Year or Period | | | 2,549,083 | | | | — | | | | 2,541,317 | | | | — | |
| End of Year or Period | | $ | 8,302,420 | | | $ | 2,549,083 | | | $ | 14,127,289 | | | $ | 2,541,317 | |
| Undistributed Net Investment Income/Accumulated Net Investment Loss | | $ | 256,863 | | | $ | (380 | ) | | $ | 131,976 | | | $ | — | |
| Share Transactions: | | | | | | | | | | | | | | | | |
| Issued | | | 900,000 | | | | 100,000 | | | | 1,100,000 | | | | 100,000 | |
| Redeemed | | | (650,000 | ) | | | — | | | | (600,000 | ) | | | — | |
| Net Increase in Shares Outstanding from Share Transactions | | | 250,000 | | | | 100,000 | | | | 500,000 | | | | 100,000 | |
| (1) | The Fund commenced operations on October 22, 2014. |
| (2) | Includes realized gains (losses) as a result of in-kind redemptions. (See Note 4 in Notes to Financial Statements.) |
The accompanying notes are an integral part of the financial statements.
| Statements of Changes in Net Assets |
| |
| | | Global X Permanent ETF | | | Global X Guru™ Index ETF | |
| | | Year Ended
October 31, 2015 | | | Year Ended
October 31, 2014 | | | Year Ended
October 31, 2015 | | | Year Ended
October 31, 2014 | |
| Operations: | | | | | | | | | | | | | | | | |
| Net Investment Income | | $ | 104,740 | | | $ | 121,011 | | | $ | 1,193,648 | | | $ | 4,142,275 | |
| Net Realized Gain (Loss) on Investments and Foreign Currency Transactions | | | 36,454 | (1) | | | (70,010 | )(1) | | | 10,809,860 | (1) | | | 30,193,967 | (1) |
| Net Change in Unrealized Appreciation (Depreciation) on Investments and Foreign Currency Translations | | | (97,856 | ) | | | 196,407 | | | | (28,388,415 | ) | | | (2,560,775 | ) |
| Net Increase (Decrease) in Net Assets Resulting from Operations | | | 43,338 | | | | 247,408 | | | | (16,384,907 | ) | | | 31,775,467 | |
| Dividends and Distributions from: | | | | | | | | | | | | | | | | |
| Net Investment Income | | | (105,609 | ) | | | (217,743 | ) | | | (4,215,674 | ) | | | (424,262 | ) |
| Net Realized Gains | | | — | | | | (47,656 | ) | | | — | | | | (50,655 | ) |
| Total Dividends and Distributions | | | (105,609 | ) | | | (265,399 | ) | | | (4,215,674 | ) | | | (474,917 | ) |
| Capital Share Transactions: | | | | | | | | | | | | | | | | |
| Issued | | | 3,655,316 | | | | 1,157,000 | | | | 11,909,461 | | | | 568,526,986 | |
| Redeemed | | | (1,258,291 | ) | | | (7,176,640 | ) | | | (243,390,062 | ) | | | (404,301,007 | ) |
| Net Increase (Decrease) in Net Assets from Capital Share Transactions | | | 2,397,025 | | | | (6,019,640 | ) | | | (231,480,601 | ) | | | 164,225,979 | |
| Total Increase (Decrease) in Net Assets | | | 2,334,754 | | | | (6,037,631 | ) | | | (252,081,182 | ) | | | 195,526,529 | |
| Net Assets: | | | | | | | | | | | | | | | | |
| Beginning of Year | | | 8,438,960 | | | | 14,476,591 | | | | 436,586,036 | | | | 241,059,507 | |
| End of Year | | $ | 10,773,714 | | | $ | 8,438,960 | | | $ | 184,504,854 | | | $ | 436,586,036 | |
| Undistributed Net Investment Income | | $ | 91,967 | | | $ | 90,545 | | | $ | 578,659 | | | $ | 3,815,497 | |
| Share Transactions: | | | | | | | | | | | | | | | | |
| Issued | | | 150,000 | | | | 50,000 | | | | 450,000 | | | | 22,750,000 | |
| Redeemed | | | (50,000 | ) | | | (300,000 | ) | | | (9,350,000 | ) | | | (16,200,000 | ) |
| Net Increase (Decrease) in Shares Outstanding from Share Transactions | | | 100,000 | | | | (250,000 | ) | | | (8,900,000 | ) | | | 6,550,000 | |
| (1) | Includes realized gains (losses) as a result of in-kind redemptions. (See Note 4 in Notes to Financial Statements.) |
The accompanying notes are an integral part of the financial statements.
| Statements of Changes in Net Assets |
| |
| | | Global X Guru™
Activist Index
ETF | | | Global X Guru™ International Index
ETF | |
| | | Period Ended
October 31, 2015(1) | | | Year Ended
October 31, 2015 | | | Period Ended
October 31, 2014(2) | |
| Operations: | | | | | | | | | | | | |
| Net Investment Income | | $ | 11,721 | | | $ | 15,468 | | | $ | 10,465 | |
| Net Realized Gain (Loss) on Investments and Foreign Currency Transactions | | | (268,719 | ) | | | (92,603 | )(3) | | | 36,258 | (3) |
| Net Change in Unrealized Appreciation (Depreciation) on Investments and Foreign Currency Translations | | | (57,523 | ) | | | (177,481 | ) | | | 28,667 | |
| Net Increase (Decrease) in Net Assets Resulting from Operations | | | (314,521 | ) | | | (254,616 | ) | | | 75,390 | |
| Dividends and Distributions from: | | | | | | | | | | | | |
| Net Investment Income | | | — | | | | (16,359 | ) | | | — | |
| Total Dividends and Distributions | | | — | | | | (16,359 | ) | | | — | |
| Capital Share Transactions: | | | | | | | | | | | | |
| Issued | | | 2,997,667 | | | | — | | | | 3,080,523 | |
| Redeemed | | | — | | | | (759,471 | ) | | | (812,500 | ) |
| Net Increase (Decrease) in Net Assets from Capital Share Transactions | | | 2,997,667 | | | | (759,471 | ) | | | 2,268,023 | |
| Total Increase (Decrease) in Net Assets | | | 2,683,146 | | | | (1,030,446 | ) | | | 2,343,413 | |
| Net Assets: | | | | | | | | | | | | |
| Beginning of Year or Period | | | — | | | | 2,343,413 | | | | — | |
| End of Year or Period | | $ | 2,683,146 | | | $ | 1,312,967 | | | $ | 2,343,413 | |
| Undistributed Net Investment Income | | $ | 11,721 | | | $ | 9,574 | | | $ | 10,465 | |
| Share Transactions: | | | | | | | | | | | | |
| Issued | | | 200,000 | | | | — | | | | 200,000 | |
| Redeemed | | | — | | | | (50,000 | ) | | | (50,000 | ) |
| Net Increase (Decrease) in Shares Outstanding from Share Transactions | | | 200,000 | | | | (50,000 | ) | | | 150,000 | |
| (1) | The Fund commenced operations on April 28, 2015. |
| (2) | The Fund commenced operations on March 10, 2014. |
| (3) | Includes realized gains (losses) as a result of in-kind redemptions. (See Note 4 in Notes to Financial Statements.) |
The accompanying notes are an integral part of the financial statements.
| Statements of Changes in Net Assets |
| |
| | | Global X GF
China Bond ETF | | | Global X Scientific
Beta US ETF | |
| | | Period Ended
October 31, 2015(1) | | | Period Ended
October 31, 2015(2) | |
| Operations: | | | | | | | | |
| Net Investment Income | | $ | 1,429,451 | | | $ | 17,850 | |
| Net Realized Loss on Investments and Foreign Currency Transactions | | | (731,861 | ) | | | (16,707 | ) |
| Net Change in Unrealized Appreciation (Depreciation) on Investments and Foreign Currency Translations | | | 68,886 | | | | (24,631 | ) |
| Net Increase (Decrease) in Net Assets Resulting from Operations | | | 766,476 | | | | (23,488 | ) |
| Dividends and Distributions from: | | | | | | | | |
| Net Investment Income | | | (1,077,663 | ) | | | — | |
| Return of Capital | | | (206,554 | ) | | | — | |
| Total Dividends and Distributions | | | (1,284,217 | ) | | | — | |
| Capital Share Transactions: | | | | | | | | |
| Issued | | | 49,389,420 | | | | 2,490,000 | |
| Redeemed | | | (13,192,152 | ) | | | — | |
| Net Increase in Net Assets from Capital Share Transactions | | | 36,197,268 | | | | 2,490,000 | |
| Total Increase in Net Assets | | | 35,679,527 | | | | 2,466,512 | |
| Net Assets: | | | | | | | | |
| Beginning of Period | | | — | | | | — | |
| End of Period | | $ | 35,679,527 | | | $ | 2,466,512 | |
| Undistributed Net Investment Income | | $ | (487,379 | ) | | $ | 18,288 | |
| Share Transactions: | | | | | | | | |
| Issued | | | 1,300,000 | (3) | | | 100,000 | |
| Redeemed | | | (350,000 | )(3) | | | — | |
| Net Increase in Shares Outstanding from Share Transactions | | | 950,000 | | | | 100,000 | |
| (1) | The Fund commenced operations on November 18, 2014. |
| (2) | The Fund commenced operations on May 12, 2015. |
| (3) | Adjusted to reflect the effect of a 2 for 1 share split on March 11, 2015. (See note 9 in the Notes to Financial Statements.) |
The accompanying notes are an integral part of the financial statements.
| Statements of Changes in Net Assets |
| |
| | | Global X Scientific
Beta Europe ETF | | | Global X Scientific
Beta Japan ETF | |
| | | Period Ended
October 31, 2015(1) | | | Period Ended
October 31, 2015(1) | |
| Operations: | | | | | | | | |
| Net Investment Income | | $ | 25,313 | | | $ | 11,905 | |
| Net Realized Gain (Loss) on Investments and Foreign Currency Transactions | | | (8,762 | ) | | | 1,472 | |
| Net Change in Unrealized Appreciation (Depreciation) on Investments and Foreign Currency Translations | | | (64,761 | ) | | | (1,836 | ) |
| Net Increase (Decrease) in Net Assets Resulting from Operations | | | (48,210 | ) | | | 11,541 | |
| Capital Share Transactions: | | | | | | | | |
| Issued | | | 2,489,000 | | | | 2,507,000 | |
| Increase in Net Assets from Capital Share Transactions | | | 2,489,000 | | | | 2,507,000 | |
| Total Increase in Net Assets | | | 2,440,790 | | | | 2,518,541 | |
| Net Assets: | | | | | | | | |
| Beginning of Period | | | — | | | | — | |
| End of Period | | $ | 2,440,790 | | | $ | 2,518,541 | |
| Undistributed Net Investment Income | | $ | 26,121 | | | $ | 12,102 | |
| Share Transactions: | | | | | | | | |
| Issued | | | 100,000 | | | | 100,000 | |
| Increase in Shares Outstanding from Share Transactions | | | 100,000 | | | | 100,000 | |
| (1) | The Fund commenced operations on May 12, 2015. |
The accompanying notes are an integral part of the financial statements.
| Statements of Changes in Net Assets |
| |
| | | Global X Scientific
Beta Asia ex-
Japan ETF | | | Global X YieldCo
Index ETF | |
| | | Period Ended
October 31, 2015(1) | | | Period Ended
October 31, 2015(2) | |
| Operations: | | | | | | | | |
| Net Investment Income | | $ | 43,448 | | | $ | 50,554 | |
| Net Realized Loss on Investments and Foreign Currency Transactions | | | (97,899 | ) | | | (161,801 | ) |
| Net Change in Unrealized Appreciation (Depreciation) on Investments and Foreign Currency Translations | | | (282,710 | ) | | | (887,443 | ) |
| Net Decrease in Net Assets Resulting from Operations | | | (337,161 | ) | | | (998,690 | ) |
| Dividends and Distributions from: | | | | | | | | |
| Net Investment Income | | | — | | | | (33,750 | ) |
| Total Dividends and Distributions | | | — | | | | (33,750 | ) |
| Capital Share Transactions: | | | | | | | | |
| Issued | | | 2,499,952 | | | | 4,351,749 | |
| Increase in Net Assets from Capital Share Transactions | | | 2,499,952 | | | | 4,351,749 | |
| Total Increase in Net Assets | | | 2,162,791 | | | | 3,319,309 | |
| Net Assets: | | | | | | | | |
| Beginning of Period | | | — | | | | — | |
| End of Period | | $ | 2,162,791 | | | $ | 3,319,309 | |
| Undistributed Net Investment Income | | $ | 46,987 | | | $ | 10,723 | |
| Share Transactions: | | | | | | | | |
| Issued | | | 100,000 | | | | 300,000 | |
| Increase in Shares Outstanding from Share Transactions | | | 100,000 | | | | 300,000 | |
| (1) | The Fund commenced operations on May 12, 2015. |
| (2) | The Fund commenced operations on May 27, 2015. |
The accompanying notes are an integral part of the financial statements.
Selected Per Share Data & Ratios
For a Share Outstanding Throughout the Period
| | | Net Asset
Value,
Beginning of
Period ($) | | | Net
Investment
Income
(Loss) ($)* | | | Net Realized
and
Unrealized
Gain (Loss)
on
Investments
($) | | | Total from
Operations
($) | | | Distribution
from Net
Investment
Income ($) | | | Distribution
from
Capital
Gains ($) | | | Return of Capital ($) | | | Total from
Distributions
($) | | | Net Asset
Value, End
of Period
($) | | | Total
Return
(%)** | | | Net Assets
End of
Period
($)(000) | | | Ratio of
Expenses
to Average
Net Assets
(%) | | | Ratio of
Net
Investment
Income
(Loss) to
Average
Net Assets
(%) | | | Portfolio
Turnover
(%)†† | |
| Global X SuperDividend® ETF | | | | | | | | | | | | | | | | |
| 2015 | | | 24.24 | | | | 1.26 | | | | (3.36 | ) | | | (2.10 | ) | | | (1.44 | ) | | | (0.05 | ) | | | — | | | | (1.49 | ) | | | 20.65 | | | | (9.01 | ) | | | 880,666 | | | | 0.58 | | | | 5.58 | | | | 26.12 | |
| 2014 | | | 23.74 | | | | 1.40 | | | | 0.56 | | | | 1.96 | | | | (1.46 | ) | | | — | | | | — | | | | (1.46 | ) | | | 24.24 | | | | 8.41 | | | | 1,037,576 | | | | 0.58 | | | | 5.71 | | | | 33.63 | |
| 2013 | | | 21.86 | | | | 1.34 | | | | 2.27 | | | | 3.61 | | | | (1.73 | ) | | | — | | | | — | | | | (1.73 | ) | | | 23.74 | | | | 17.34 | | | | 775,238 | | | | 0.58 | | | | 5.93 | | | | 43.64 | |
| 2012 | | | 21.76 | | | | 1.62 | | | | 0.09 | | | | 1.71 | | | | (1.61 | ) | | | — | | | | — | | | | (1.61 | ) | | | 21.86 | | | | 8.34 | | | | 162,828 | | | | 0.58 | | | | 7.53 | | | | 34.03 | |
| 2011(1) | | | 24.70 | | | | 0.64 | | | | (3.02 | ) | | | (2.38 | ) | | | (0.56 | ) | | | — | | | | — | | | | (0.56 | ) | | | 21.76 | | | | (9.56 | ) | | | 29,372 | | | | 0.58 | † | | | 7.22 | † | | | 4.58 | |
| Global X SuperDividend® U.S. ETF | | | | | | | | | | | | | | | | |
| 2015 | | | 29.60 | | | | 1.71 | | | | (4.19 | ) | | | (2.48 | ) | | | (1.23 | ) | | | — | | | | (0.66 | ) | | | (1.89 | ) | | | 25.23 | | | | (8.67 | ) | | | 274,999 | | | | 0.45 | | | | 6.25 | | | | 42.51 | |
| 2014 | | | 25.94 | | | | 1.78 | | | | 3.45 | | | | 5.23 | | | | (1.41 | ) | | | — | | | | (0.16 | ) | | | (1.57 | ) | | | 29.60 | | | | 20.80 | | | | 276,715 | | | | 0.45 | | | | 6.32 | | | | 40.04 | |
| 2013(2) | | | 25.15 | | | | 0.98 | | | | 0.82 | | | | 1.80 | | | | (0.91 | ) | | | — | | | | (0.10 | ) | | | (1.01 | ) | | | 25.94 | | | | 7.32 | | | | 51,879 | | | | 0.45 | † | | | 6.02 | † | | | 20.36 | |
| Global X SuperDividend® Emerging Markets ETF | | | | | | | | | | | | | | | | |
| 2015(3) | | | 14.90 | | | | 0.66 | | | | (1.34 | ) | | | (0.68 | ) | | | (0.49 | ) | | | — | | | | — | | | | (0.49 | ) | | | 13.73 | | | | (4.89 | ) | | | 3,433 | | | | 0.65 | † | | | 6.72 | † | | | 1.25 | |
| Global X SuperDividend® REIT ETF | | | | | | | | | | | | | | | | |
| 2015(3) | | | 15.12 | | | | 0.63 | | | | (1.95 | ) | | | (1.32 | ) | | | (0.62 | ) | | | — | | | | — | | | | (0.62 | ) | | | 13.18 | | | | (8.86 | ) | | | 3,954 | | | | 0.54 | † | | | 7.20 | † | | | 1.45 | |
| Global X SuperIncome™ Preferred ETF | | | | | | | | | | | | | | | | |
| 2015 | | | 14.74 | | | | 0.95 | | | | (1.21 | ) | | | (0.26 | ) | | | (0.99 | ) | | | — | | | | — | | | | (0.99 | ) | | | 13.49 | | | | (1.95 | ) | | | 235,427 | | | | 0.58 | | | | 6.68 | | | | 76.54 | |
| 2014 | | | 14.81 | | | | 1.01 | | | | (0.02 | ) | | | 0.99 | | | | (1.06 | ) | | | — | | | | — | | | | (1.06 | ) | | | 14.74 | | | | 6.89 | | | | 162,875 | | | | 0.58 | | | | 6.78 | | | | 85.07 | |
| 2013^ | | | 14.65 | | | | 0.31 | | | | 0.18 | | | | 0.49 | | | | (0.33 | ) | | | — | | | | — | | | | (0.33 | ) | | | 14.81 | | | | 3.38 | | | | 59,965 | | | | 0.58 | † | | | 6.34 | † | | | 61.86 | |
| 2013(4) | | | 15.02 | | | | 1.13 | | | | (0.47 | ) | | | 0.66 | | | | (1.02 | ) | | | (0.01 | ) | | | — | | | | (1.03 | ) | | | 14.65 | | | | 4.46 | | | | 35,169 | | | | 0.58 | † | | | 7.84 | † | | | 91.98 | |
| Global X Social Media Index ETF | | | | | | | | | | | | | | | | |
| 2015 | | | 19.30 | | | | 0.01 | | | | (0.01 | ) | | | — | | | | (0.01 | ) | | | — | | | | — | | | | (0.01 | ) | | | 19.29 | | | | 0.00 | | | | 77,145 | | | | 0.65 | | | | 0.04 | | | | 26.51 | |
| 2014 | | | 19.38 | | | | — | | | | (0.08 | ) | | | (0.08 | ) | | | — | | | | — | | | | — | | | | — | | | | 19.30 | | | | (0.41 | ) | | | 126,418 | | | | 0.65 | | | | (0.01 | ) | | | 26.52 | |
| 2013 | | | 12.83 | | | | — | | | | 6.66 | | | | 6.66 | | | | (0.11 | ) | | | — | | | | — | | | | (0.11 | ) | | | 19.38 | | | | 52.34 | | | | 95,948 | | | | 0.65 | | | | (0.01 | ) | | | 55.96 | |
| 2012(5) | | | 14.93 | | | | 0.12 | | | | (2.22 | ) | | | (2.10 | ) | | | — | | | | — | | | | — | | | | — | | | | 12.83 | | | | (14.07 | ) | | | 13,471 | | | | 0.65 | † | | | 0.88 | † | | | 91.78 | |
| Global X | JPMorgan Efficiente Index ETF | | | | | | | | | | | | | | | | |
| 2015 | | | 25.49 | | | | 0.43 | | | | (2.04 | ) | | | (1.61 | ) | | | (0.16 | ) | | | — | | | | — | | | | (0.16 | ) | | | 23.72 | | | | (6.37 | ) | | | 8,302 | | | | 0.69 | | | | 1.70 | | | | 311.58 | |
| 2014(6) | | | 24.95 | | | | — | | | | 0.54 | | | | 0.54 | | | | — | | | | — | | | | — | | | | — | | | | 25.49 | | | | 2.16 | | | | 2,549 | | | | 0.69 | † | | | (0.69 | )† | | | — | |
| Global X | JPMorgan US Sector Rotator Index ETF | | | | | | | | | | | | | | | | |
| 2015 | | | 25.41 | | | | 0.20 | | | | (1.94 | ) | | | (1.74 | ) | | | (0.11 | ) | | | (0.01 | ) | | | — | | | | (0.12 | ) | | | 23.55 | | | | (6.90 | ) | | | 14,127 | | | | 0.69 | | | | 0.82 | | | | 907.92 | |
| 2014(6) | | | 25.03 | | | | — | | | | 0.38 | | | | 0.38 | | | | — | | | | — | | | | — | | | | — | | | | 25.41 | | | | 1.52 | | | | 2,541 | | | | 0.69 | † | | | (0.69 | )† | | | 63.35 | |
| Global X Permanent ETF | | | | | | | | | | | | | | | | |
| 2015 | | | 24.11 | | | | 0.25 | | | | (0.19 | ) | | | 0.06 | | | | (0.23 | ) | | | — | | | | — | | | | (0.23 | ) | | | 23.94 | | | | 0.25 | | | | 10,774 | | | | 0.48 | | | | 1.03 | | | | 31.10 | |
| 2014 | | | 24.13 | | | | 0.24 | | | | 0.18 | | | | 0.42 | | | | (0.36 | ) | | | (0.08 | ) | | | — | | | | (0.44 | ) | | | 24.11 | | | | 1.84 | | | | 8,439 | | | | 0.48 | | | | 1.02 | | | | 24.63 | |
| 2013^ | | | 23.15 | | | | 0.07 | | | | 0.91 | | | | 0.98 | | | | — | | | | — | | | | — | | | | — | | | | 24.13 | | | | 4.23 | | | | 14,477 | | | | 0.48 | † | | | 0.90 | † | | | 3.08 | |
| 2013 | | | 24.77 | | | | 0.25 | | | | (1.66 | ) | | | (1.41 | ) | | | (0.21 | ) | | | — | | | | — | | | | (0.21 | ) | | | 23.15 | | | | (5.77 | ) | | | 15,048 | | | | 0.48 | | | | 0.98 | | | | 44.44 | |
| 2012(7) | | | 25.04 | | | | 0.09 | | | | (0.36 | ) | | | (0.27 | ) | | | — | | | | — | | | | — | | | | — | | | | 24.77 | | | | (1.08 | ) | | | 14,859 | | | | 0.48 | † | | | 0.92 | † | | | 14.89 | |
| * | Per share data calculated using average shares method. |
| ** | Total return is based on the change in net asset value of a share during the year or period and assumes reinvestment of dividends and distributions at net asset value. Total return is for the period indicated and periods of less than one year have not been annualized. The return shown does not reflect the deduction of taxes that a shareholder would pay on Fund distributions or the redemption of Fund shares. |
| † | Annualized. |
†† ^ | Portfolio turnover rate is for the period indicated and periods of less than one year have not been annualized. Excludes effect of in-kind transfers. For the period July 1, 2013 to October 31, 2013. Effective July 1, 2013 the Global X Permanent ETF, Global X Guru™ Index ETF (formerly Global X Top Guru Holdings Index ETF) and Global X SuperIncome™ Preferred ETF each changed their fiscal year end to October 31. |
| (1) | The Fund commenced operations on June 8, 2011. |
| (2) | The Fund commenced operations on March 11, 2013. |
| (3) | The Fund commenced operations on March 16, 2015. |
| (4) | The Fund commenced operations on July 16, 2012. |
| (5) | The Fund commenced operations on November 14, 2011. |
| (6) | The Fund commenced operations on October 22, 2014. |
| (7) | The Fund commenced operations on February 7, 2012. |
Amounts designated as “—” are $0 or have been rounded to $0.
The accompanying notes are an integral part of the financial statements.
Selected Per Share Data & Ratios
For a Share Outstanding Throughout the Period
| | | Net Asset
Value,
Beginning
of Period
($) | | | Net
Investment
Income
($)* | | | Net
Realized
and
Unrealized
Gain (Loss)
on
Investments
($) | | | Total from
Operations
($) | | | Distribution
from Net
Investment
Income ($) | | | Distribution
from
Capital
Gains ($) | | | Return of
Capital ($) | | | Total from
Distributions
($) | | | Net
Asset
Value,
End of
Period
($) | | | Total
Return
(%)** | | | Net
Assets
End of
Period
($)(000) | | | Ratio of
Expenses
to
Average
Net
Assets
(%) | | | Ratio of
Net
Investment
Income to
Average
Net Assets
(%) | | | Portfolio
Turnover
(%)†† | |
| Global X Guru™ Index ETF | | | | | | | | | | | | | | | | |
| 2015 | | | 26.30 | | | | 0.10 | | | | (2.16 | ) | | | (2.06 | ) | | | (0.28 | ) | | | — | | | | — | | | | (0.28 | ) | | | 23.96 | | | | (7.94 | ) | | | 184,505 | | | | 0.75 | | | | 0.39 | | | | 129.71 | |
| 2014 | | | 23.99 | | | | 0.22 | | | | 2.12 | | | | 2.34 | | | | (0.03 | ) | | | — | | | | — | | | | (0.03 | ) | | | 26.30 | | | | 9.76 | | | | 436,586 | | | | 0.75 | | | | 0.88 | | | | 128.37 | |
| 2013^ | | | 20.68 | | | | 0.01 | | | | 3.30 | | | | 3.31 | | | | — | | | | — | | | | — | | | | — | | | | 23.99 | | | | 16.01 | | | | 241,060 | | | | 0.75 | † | | | 0.10 | † | | | 24.89 | |
| 2013 | | | 15.83 | | | | 0.17 | | | | 5.66 | | | | 5.83 | | | | (0.20 | ) | | | (0.78 | ) | | | — | | | | (0.98 | ) | | | 20.68 | | | | 38.08 | | | | 52,740 | | | | 0.75 | | | | 0.85 | | | | 77.25 | |
| 2012(1) | | | 14.96 | | | | 0.02 | | | | 0.85 | | | | 0.87 | | | | — | | | | — | | | | — | | | | — | | | | 15.83 | | | | 5.82 | | | | 5,539 | | | | 0.75 | † | | | 1.90 | † | | | 1.90 | |
| Global X Guru™ Activist Index ETF | | | | | | | | | | | | | | | | |
| 2015(2) | | | 15.05 | | | | 0.06 | | | | (1.69 | ) | | | (1.63 | ) | | | — | | | | — | | | | — | | | | — | | | | 13.42 | | | | (10.83 | ) | | | 2,683 | | | | 0.75 | † | | | 0.84 | † | | | 50.29 | |
| Global X Guru™ International Index ETF | | | | | | | | | | | | | | | | |
| 2015 | | | 15.62 | | | | 0.12 | | | | (2.50 | ) | | | (2.38 | ) | | | (0.11 | ) | | | — | | | | — | | | | (0.11 | ) | | | 13.13 | | | | (15.31 | ) | | | 1,313 | | | | 0.75 | | | | 0.85 | | | | 118.14 | |
| 2014(3) | | | 14.83 | | | | 0.09 | | | | 0.70 | | | | 0.79 | | | | — | | | | — | | | | — | | | | — | | | | 15.62 | | | | 5.33 | | | | 2,343 | | | | 0.75 | † | | | 0.89 | † | | | 62.71 | |
| Global X GF China Bond ETF | | | | | | | | | | | | | | | | |
| 2015(4)(7) | | | 38.00 | | | | 1.20 | | | | (0.58 | ) | | | 0.62 | | | | (0.89 | ) | | | — | | | | (0.17 | ) | | | (1.06 | ) | | | 37.56 | | | | 1.67 | | | | 35,680 | | | | 0.50 | †@ | | | 3.37 | † | | | 102.51 | |
| Global X Scientific Beta US ETF | | | | | | | | | | | | | | | | |
| 2015(5) | | | 24.90 | | | | 0.18 | | | | (0.41 | ) | | | (0.23 | ) | | | — | | | | — | | | | — | | | | — | | | | 24.67 | | | | (0.92 | ) | | | 2,467 | | | | 0.35 | † | | | 1.55 | † | | | 20.90 | |
| Global X Scientific Beta Europe ETF | | | | | | | | | | | | | | | | |
| 2015(5) | | | 24.89 | | | | 0.25 | | | | (0.73 | ) | | | (0.48 | ) | | | — | | | | — | | | | — | | | | — | | | | 24.41 | | | | (1.93 | ) | | | 2,441 | | | | 0.38 | † | | | 2.22 | † | | | 17.53 | |
| Global X Scientific Beta Japan ETF | | | | | | | | | | | | | | | | |
| 2015(5) | | | 25.07 | | | | 0.12 | | | | — | | | | 0.12 | | | | — | | | | — | | | | — | | | | — | | | | 25.19 | | | | 0.48 | | | | 2,519 | | | | 0.38 | † | | | 1.02 | † | | | 20.31 | |
| Global X Scientific Beta Asia ex-Japan ETF | | | | | | | | | | | | | | | | |
| 2015(5) | | | 24.89 | | | | 0.44 | | | | (3.70 | ) | | | (3.26 | ) | | | — | | | | — | | | | — | | | | — | | | | 21.63 | | | | (13.10 | ) | | | 2,163 | | | | 0.38 | † | | | 4.17 | † | | | 59.21 | |
| Global X YieldCo Index ETF | | | | | | | | | | | | | | | | |
| 2015(6) | | | 15.19 | | | | 0.20 | | | | (4.19 | ) | | | (3.99 | ) | | | (0.14 | ) | | | — | | | | — | | | | (0.14 | ) | | | 11.06 | | | | (26.39 | ) | | | 3,319 | | | | 0.65 | † | | | 3.72 | † | | | 22.97 | |
| * | Per share data calculated using average shares method. |
| ** | Total return is based on the change in net asset value of a share during the year or period and assumes reinvestment of dividends and distributions at net asset value. Total return is for the period indicated and periods of less than one year have not been annualized. The return shown does not reflect the deduction of taxes that a shareholder would pay on Fund distributions or the redemption of Fund shares. |
| † | Annualized. |
| †† | Portfolio turnover rate is for the period indicated and periods of less than one year have not been annualized. Excludes effect of in-kind transfers. |
| @ | The ratio of expenses to Average Net Assets includes the effect of a waiver. If these offsets were excluded, the ratio would have been 0.58%. |
| ^ | For the period July 1, 2013 to October 31, 2013. Effective July 1, 2013 the Global X Permanent ETF, Global X Guru™ Index ETF (formerly Global X Top Guru Holdings Index ETF) and Global X SuperIncome™ Preferred ETF each changed their fiscal year end to October 31. |
| (1) | The Fund commenced operations on June 4, 2012. |
| (2) | The Fund commenced operations on April 28, 2015. |
| (3) | The Fund commenced operations on March 10, 2014. |
| (4) | The Fund commenced operations on November 18, 2014. |
| (5) | The Fund commenced operations on May 12, 2015. |
| (6) | The Fund commenced operations on May 27, 2015. |
| (7) | Per share amounts have been adjusted for a 2 for 1 share split on March 11, 2015. For more information see Note 9 in the Notes to Financial Statements. |
Amounts designated as “—” are $0 or have been rounded to $0.
The accompanying notes are an integral part of the financial statements.
| Notes to Financial Statements |
| October 31, 2015 |
1. ORGANIZATION
The Global X Funds (the "Trust") is a Delaware statutory trust formed on March 6, 2008. The Trust is registered under the Investment Company Act of 1940, as amended, as an open-end management investment company. As of October 31, 2015, the Trust had ninety-one portfolios, forty-seven of which were operational. The financial statements herein and the related notes pertain to the Global X SuperDividend® ETF, Global X SuperDividend® U.S. ETF, Global X SuperDividend® Emerging Markets ETF, Global X SuperDividend® REIT ETF, Global X SuperIncome™ Preferred ETF, Global X Social Media Index ETF, Global X | JPMorgan Efficiente Index ETF, Global X | JPMorgan US Sector Rotator Index ETF, Global X Permanent ETF, Global X Guru™ Index ETF, Global X Guru™ Activist Index ETF, Global X Guru™ International Index ETF, Global X GF China Bond ETF, Global X Scientific Beta US ETF, Global X Scientific Beta Europe ETF, Global X Scientific Beta Japan ETF, Global X Scientific Beta Asia ex-Japan ETF, and Global X YieldCo Index ETF (each a “Fund” collectively, the “Funds”). Each Fund has elected non-diversification status.
The Global X GF China Bond ETF commenced operations on November 18, 2014. The Global X SuperDividend® Emerging Markets ETF and Global X SuperDividend® REIT ETF commenced operations on March 16, 2015. The Global X Guru™ Activist Index ETF commenced operations on April 28, 2015. The Global X Scientific Beta US ETF, Global X Scientific Beta Europe ETF, Global X Scientific Beta Japan ETF and the Global X Scientific Beta Asia ex-Japan ETF commenced operations on May 12, 2015. The Global X YieldCo Index ETF commenced operations on May 27, 2015.
2. SIGNIFICANT ACCOUNTING POLICIES
The following is a summary of the significant accounting policies followed by the Funds.
USE OF ESTIMATES – The Funds are investment companies that apply the accounting and reporting guidance issued in Topic 946 by the U.S. Financial Accounting Standards Board. The preparation of financial statements in conformity with U.S. generally accepted accounting principles ("U.S. GAAP") requires management to make estimates and assumptions that affect the reported amounts of assets and liabilities and disclosure of contingent assets and liabilities at the date of the financial statements and the reported amounts of increases and decreases in net assets from operations during the reporting period. Actual results could materially differ from those estimates.
MASTER LIMITED PARTNERSHIPS (“MLPs”) – Certain funds may invest in MLPs. MLPs are publicly traded partnerships engaged in the transportation, storage and processing of minerals and natural resources. By confining their operations to these specific activities, their interests, or units, are able to trade on public securities exchanges exactly like the shares of a corporation, without entity level taxation. To qualify as a MLP and to not be taxed as a corporation, a partnership must receive at least 90% of its income from qualifying sources as set forth in Section 7704(d) of the Internal Revenue Code of 1986, as amended (the “Code”). These qualifying sources include natural resource-based activities such as the processing, transportation and storage of mineral or natural resources. MLPs generally have two classes of owners: the general partner and limited partners. The general partner of an MLP is typically owned by a major energy company, an investment fund, the direct management of the MLP, or is an entity owned by one or more of such parties. The general partner may be structured as a private or publicly traded corporation or other entity. The general partner typically controls the operations and management of the MLP through an up to 2% equity interest in the MLP plus, in many cases, ownership of common units and subordinated units.
| Notes to Financial Statements (continued) |
| October 31, 2015 |
2. SIGNIFICANT ACCOUNTING POLICIES (continued)
MASTER LIMITED PARTNERSHIPS (“MLPs”) (concluded)
Limited partners typically own the remainder of the partnership, through ownership of common units, and have a limited role in the partnership’s operations and management. MLPs are typically structured such that common units and general partner interests have first priority to receive quarterly cash distributions up to an established minimum amount (“minimum quarterly distributions” or “MQD”). Common and general partner interests also accrue arrearages in distributions to the extent the MQD is not paid. Once common and general partner interests have been paid, subordinated units receive distributions of up to the MQD; however, subordinated units do not accrue arrearages. Distributable cash in excess of the MQD is paid to both common and subordinated units and is distributed to both common and subordinated units generally on a pro rata basis. The general partner is also eligible to receive incentive distributions if the general partner operates the business in a manner which results in distributions paid per common unit surpassing specified target levels. As the general partner increases cash distributions to the limited partners, the general partner receives an increasingly higher percentage of the incremental cash distributions.
SECURITY VALUATION - Securities listed on a securities exchange, market or automated quotation system for which quotations are readily available (except for securities traded on NASDAQ), including securities traded over the counter, are valued at the last quoted sale price on the primary exchange or market (foreign or domestic) on which they are traded (or at approximately 4:00 pm EST if a security’s primary exchange is normally open at that time), or, if there is no such reported sale, at the most recent mean between the quoted bid and asked prices (absent both bid and asked prices on such exchange, the bid price may be used).
For securities traded on NASDAQ, the NASDAQ official closing price will be used. If available, debt securities are priced based upon valuations provided by independent, third-party pricing agents. Such values generally reflect the last reported sales price if the security is actively traded. The third-party pricing agents may also value debt securities at an evaluated bid price by employing methodologies that utilize actual market transactions, broker-supplied valuations, or other methodologies designed to identify the market value for such securities. Debt obligations with remaining maturities of sixty days or less may be valued at their amortized cost, which approximates market value. The prices for foreign securities are reported in local currency and converted to U.S. dollars using currency exchange rates as of the reporting date. The exchange rates used by the Trust for valuation are captured as of the New York or London close each day. Prices for most securities held in the Funds are provided daily by recognized independent pricing agents. If a security price cannot be obtained from an independent, third-party pricing agent, the Funds seek to obtain a bid price from at least one independent broker.
Securities for which market prices are not "readily available" are valued in accordance with fair value procedures established by the Board of Trustees (the “Board”). The Funds’ fair value procedures are implemented through a fair value committee (the “Committee”) designated by the Board. Some of the more common reasons that may necessitate that a security be valued using fair value procedures include: the security's trading has been halted or suspended; the security has been de-listed from its primary trading exchange; the security's primary trading market is temporarily closed at a time when under normal conditions it would be open; the security has not been traded for an extended period of time; the security's primary pricing source is not able or willing to provide a price; or, trading of the security is subject to local government-imposed restrictions. In addition, the
| Notes to Financial Statements (continued) |
| October 31, 2015 |
2. SIGNIFICANT ACCOUNTING POLICIES (continued)
SECURITY VALUATION (concluded)
Funds may fair value their securities if an event that may materially affect the value of the Funds’ securities that traded outside of the United States (a “Significant Event”) has occurred between the time of the security's last close and the time that the Funds calculate their net asset value. A Significant Event may relate to a single issuer or to an entire market sector. Events that may be Significant Events include: government actions, natural disasters, armed conflict, acts of terrorism and significant market fluctuations. If Global X Management Company LLC (the “Adviser”) becomes aware of a Significant Event that has occurred with respect to a security or group of securities after the closing of the exchange or market on which the security or securities principally trade, but before the time at which the Funds calculate net asset value, it may request that a Committee meeting be called. When a security is valued in accordance with the Fair Value Procedures, the Committee will determine the value after taking into consideration all relevant information reasonably available to the Committee. As of October 31, 2015, there were $144,634 and $17,231 of fair valued securities in the Global X SuperDividend® REIT ETF and Global X Scientific Beta Asia ex-Japan ETF, respectively. There were no other securities priced using the Fair Value Procedures.
In accordance with the authoritative guidance on fair value measurements and disclosure under U.S. GAAP, the Funds disclose the fair value of their investments in a hierarchy that prioritizes the inputs to valuation techniques used to measure the fair value. The objective of a fair value measurement is to determine the price that would be received to sell an asset or paid to transfer a liability in an orderly transaction between market participants at the measurement date (an exit price). Accordingly, the fair value hierarchy gives the highest priority to quoted prices (unadjusted) in active markets for identical assets or liabilities (Level 1) and the lowest priority to unobservable inputs (Level 3). The three levels of the fair value hierarchy are described below:
Level 1 – Unadjusted quoted prices in active markets for identical, unrestricted assets or liabilities that the Funds have the ability to access at the measurement date
Level 2 – Other significant observable inputs (including quoted prices in non-active markets, quoted prices for similar investments, fair value of investments for which the Funds have the ability to fully redeem tranches at net asset value as of the measurement date or within the near term, and short-term investments valued at amortized cost)
Level 3 – Significant unobservable inputs (including the Funds’ own assumptions in determining the fair value of investments, and fair value of investments for which the Funds do not have the ability to fully redeem tranches at net asset value as of the measurement date or within the near term)
Investments are classified within the level of the lowest significant input considered in determining fair value. Investments classified within Level 3 whose fair value measurement considers several inputs may include Level 1 or Level 2 inputs as components of the overall fair value measurement.
For the year or period ended October 31, 2015, there have been no significant changes to the Funds’ fair valuation methodologies.
| Notes to Financial Statements (continued) |
| October 31, 2015 |
2. SIGNIFICANT ACCOUNTING POLICIES (continued)
The unobservable inputs used to determine fair value of Level 3 assets may have similar or diverging impacts on valuation. Significant increases and decreases in these inputs in isolation and interrelationships between those inputs could result in significantly higher or lower fair value measurement.
REPURCHASE AGREEMENTS - Securities pledged as collateral for repurchase agreements are held by Citibank, N.A. and are designated as being held on each Fund’s behalf by its custodian under a book-entry system. Each Fund monitors the adequacy of the collateral on a daily basis and can require the seller to provide additional collateral in the event the market value of the securities pledged falls below the carrying value of the repurchase agreement, including accrued interest.
It is the Funds’ policy to only enter into repurchase agreements with banks and other financial institutions which are deemed by the Adviser to be creditworthy. The Funds bear the risk of loss in the event that the other party to a repurchase agreement defaults on its obligations, and the Funds are prevented from exercising their rights to dispose of the underlying securities received as collateral and the risk of a possible decline in the value of the underlying securities during the period. For financial statement purposes, the Funds record the securities lending collateral (included in Repurchase Agreements, at value or restricted cash) as an asset and the obligation to return securities lending collateral as a liability on the Statements of Assets and Liabilities.
Repurchase agreements are entered into by the Funds under Master Repurchase Agreements (“MRA”) which permit the Funds, under certain circumstances, including an event of default (such as bankruptcy or insolvency), to offset payables and/or receivables under the MRA with collateral held and/or posted to the counterparty and create one single net payment due to or from the Funds.
At October 31, 2015, the open repurchase agreements by counterparty which are subject to a MRA on a net payment basis are as follows:
| | | | | | Fair Value of Non-cash | | | Cash Collateral | | | | |
| | | Repurchase Agreements | | | Collateral Received | | | Received | | | Net Amount(1) | |
| Global X SuperDividend® ETF | | | | | | | | | | | | | | | | |
| Barclays | | $ | 44,000,000 | | | $ | 44,000,000 | | | $ | - | | | $ | - | �� |
| Deutsche Bank | | | 2,835,301 | | | | 2,835,301 | | | | - | | | | - | |
| Global X SuperDividend® U.S. ETF | | | | | | | | | | | | | | | | |
| Barclays | | | 9,000,000 | | | | 9,000,000 | | | | - | | | | - | |
| Deutsche Bank | | | 1,708,555 | | | | 1,708,555 | | | | - | | | | - | |
| Global X SuperIncome™ Preferred ETF | | | | | | | | | | | | | | | | |
| Deutsche Bank | | | 5,029,200 | | | | 5,029,200 | | | | - | | | | - | |
| Global X Social Media Index ETF | | | | | | | | | | | | | | | | |
| Deutsche Bank | | | 3,529,751 | | | | 3,529,751 | | | | - | | | | - | |
| Global X Guru™ Index ETF | | | | | | | | | | | | | | | | |
| Deutsche Bank | | | 2,487,600 | | | | 2,487,600 | | | | - | | | | - | |
(1)Net Amount represents the net amount receivable due from the counterparty in the event of default.
| Notes to Financial Statements (continued) |
| October 31, 2015 |
2. SIGNIFICANT ACCOUNTING POLICIES (continued)
FEDERAL INCOME TAXES – It is each Fund’s intention to qualify, or continue to qualify, as a regulated investment company for Federal income tax purposes by complying with the appropriate provisions of Subchapter M of the Internal Revenue Code of 1986, as amended. Accordingly, no provisions for Federal income taxes have been made in the financial statements except as described below.
During the year ended October 31, 2015, the Global X SuperIncomeTM Preferred ETF incurred federal excise tax in the amount of $3,118. No other provisions for Federal income taxes have been made in the financial statements.
The Funds evaluate tax positions taken or expected to be taken in the course of preparing the Funds’ tax returns to determine whether it is "more-likely-than-not" (i.e., greater than 50 percent) that each tax position will be sustained upon examination by a taxing authority based on the technical merits of the position. Tax positions not deemed to meet the more-likely-than-not threshold are recorded as a tax benefit or expense in the current year. The Funds did not record any tax provisions in the current period; however, management’s conclusions regarding tax positions may be subject to review and adjustment at a later date based on factors including, but not limited to, examination by tax authorities (i.e., the last three tax year ends, as applicable), on-going analysis of and changes to tax laws, regulations and interpretations thereof.
As of and during the year or period ended October 31, 2015, the Funds did not have a liability for any unrecognized tax benefits. The Funds recognize interest and penalties, if any, related to unrecognized tax benefits as income tax expense in the Statement of Operations. During the period, the Funds did not incur any interest or penalties.
SECURITY TRANSACTIONS AND INVESTMENT INCOME — Security transactions are accounted for on the trade date for financial reporting purposes. Costs used in determining realized gains and losses on the sale of investment securities are based on specific identification. Dividend income is recorded on the ex-dividend date. Interest income is recognized on the accrual basis from the settlement date.
FOREIGN CURRENCY TRANSACTIONS AND TRANSLATION — The books and records of the Funds are maintained in U.S. dollars. Investment securities and other assets and liabilities denominated in a foreign currency are translated into U.S. dollars on the date of valuation. Purchases and sales of investment securities, income and expenses are translated into U.S. dollars at the relevant rates of exchange prevailing on the respective dates of such transactions. The Funds do not isolate that portion of realized or unrealized gains and losses resulting from changes in the foreign exchange rate from fluctuations arising from changes in the market prices of the securities. These gains and losses are included in net realized and unrealized gains and losses on investments on the Statement of Operations. Net realized and unrealized gains and losses on foreign currency transactions and translations represent net foreign exchange gains or losses from foreign currency spot contracts, disposition of foreign currencies, currency gains or losses realized between trade and settlement dates on securities transactions and the difference between the amount of the investment income and foreign withholding taxes recorded on the Funds’ books and the U.S. dollar equivalent amounts actually received or paid.
| Notes to Financial Statements (continued) |
| October 31, 2015 |
2. SIGNIFICANT ACCOUNTING POLICIES (concluded)
DIVIDENDS AND DISTRIBUTIONS TO SHAREHOLDERS — The Funds distribute their net investment income on a pro rata basis. Any net realized capital gains are distributed annually. All distributions are recorded on the ex-dividend date.
INVESTMENTS IN REITs — With respect to the Funds, dividend income is recorded based on the income included in distributions received from real estate investment trust (“REIT”) investments using published REIT reclassifications, including some management estimates when actual amounts are not available. Distributions received in excess of these estimated amounts are recorded as a reduction of the cost of investments or reclassified to capital gains. The actual amounts of income, return of capital, and capital gains are only determined by each REIT after its fiscal year end, and may differ from the estimated amounts.
CREATION UNITS — The Funds issue and redeem shares (“Shares”) at Net Asset Value (“NAV”) and only in large blocks of Shares, (each block of Shares for a Fund is called a “Creation Unit” or multiples thereof). Purchasers of Creation Units (“Authorized Participants”) at NAV must pay a standard creation transaction fee per transaction. The fee is a single charge and will be the same regardless of the number of Creation Units purchased by an investor on the same day. An Authorized Participant who holds Creation Units and wishes to redeem at NAV would also pay a standard Redemption Fee per transaction to Brown Brothers Harriman & Co. (“BBH”), the Funds’ custodian (“Custodian”), on the date of such redemption, regardless of the number of Creation Units redeemed that day.
If a Creation Unit is purchased or redeemed for cash, a higher transaction fee will be charged. The following table discloses Creation Unit breakdown:
| | | | | | | | | Value at | | | | |
| | | | | | | | | October 31, | | | | |
| | | Creation Unit Shares | | | Creation Fee | | | 2015 | | | Redemption Fee | |
| Global X SuperDividend® ETF | | | 50,000 | | | $ | 3,800 | | | $ | 1,032,500 | | | $ | 3,800 | |
| Global X SuperDividend® U.S. ETF | | | 50,000 | | | | 750 | | | | 1,261,500 | | | | 750 | |
| Global X SuperDividend® Emerging Markets ETF | | | 50,000 | | | | 3,000 | | | | 686,500 | | | | 3,000 | |
| Global X SuperDividend® REIT ETF | | | 50,000 | | | | 750 | | | | 659,000 | | | | 750 | |
| Global X SuperIncome™ Preferred ETF | | | 50,000 | | | | 500 | | | | 674,500 | | | | 500 | |
| Global X Social Media Index ETF | | | 50,000 | | | | 1,000 | | | | 964,500 | | | | 1,000 | |
| Global X | JPMorgan Efficiente Index ETF | | | 50,000 | | | | 500 | | | | 1,186,000 | | | | 500 | |
| Global X | JPMorgan US Sector Rotator Index ETF | | | 50,000 | | | | 500 | | | | 1,177,500 | | | | 500 | |
| Global X Permanent ETF | | | 50,000 | | | | 1,000 | | | | 1,197,000 | | | | 1,000 | |
| Global X Guru™ Index ETF | | | 50,000 | | | | 750 | | | | 1,198,000 | | | | 750 | |
| Global X Guru™ Activist Index ETF | | | 50,000 | | | | 750 | | | | 671,000 | | | | 750 | |
| Global X Guru™ International Index ETF | | | 50,000 | | | | 750 | | | | 656,500 | | | | 750 | |
| Global X GF China Bond ETF | | | 50,000 | | | | 1,000 | | | | 1,878,000 | | | | 1,000 | |
| Global X Scientific Beta US ETF | | | 50,000 | | | | 2,500 | | | | 1,233,500 | | | | 2,500 | |
| Global X Scientific Beta Europe ETF | | | 50,000 | | | | 10,500 | | | | 1,220,500 | | | | 10,500 | |
| Global X Scientific Beta Japan ETF | | | 50,000 | | | | 5,500 | | | | 1,259,500 | | | | 5,500 | |
| Global X Scientific Beta Asia ex-Japan ETF | | | 50,000 | | | | 11,000 | | | | 1,081,500 | | | | 11,000 | |
| Global X YieldCo Index ETF | | | 50,000 | | | | 500 | | | | 553,000 | | | | 500 | |
| Notes to Financial Statements (continued) |
| October 31, 2015 |
3. RELATED PARTY TRANSACTIONS
The Adviser serves as the investment adviser and the administrator for the Funds. Subject to the supervision of the Board of Trustees, the Adviser is responsible for managing the investment activities of the Funds and the Funds’ business affairs and other administrative matters and provides or causes to be furnished all supervisory, administrative and other services reasonably necessary for the operation of the Funds, including certain distribution services (provided pursuant to a separate Distribution Agreement), certain shareholder and distribution-related services (provided pursuant to a separate Rule 12b-1 Plan and related agreements) and investment advisory services (provided pursuant to a separate Investment Advisory Agreement), under what is essentially an "all-in" fee structure. For its service to the Funds, under the Supervision and Administration Agreement, each Fund pays a monthly fee to the Adviser at the annual rate (stated as a percentage of the average daily net assets of the Fund). In addition, the Funds bear other expenses, directly and indirectly, that are not covered by the Supervision and Administration Agreement, which may vary and affect the total expense ratios of the Funds, such as taxes, brokerage fees, commissions, acquired fund fees, and other transaction expenses, interest expenses and extraordinary expenses (such as litigation and indemnification expenses). In addition, the Global X GF China Bond ETF pays custodial fees that are not covered by the Supervision and Administration Agreement. Pursuant to an agreement with the Custodian, the Global X GF China Bond ETF may pay up to 0.10% in Custody Fees (in addition to the Supervision and Administration Fee).
The following table discloses supervision and administration fees pursuant to the agreement:
| | | Supervision and | |
| | | Administration Fee | |
| Global X SuperDividend® ETF | | | 0.58 | % |
| Global X SuperDividend® U.S. ETF | | | 0.45 | % |
| Global X SuperDividend® Emerging Markets ETF | | | 0.65 | % |
| Global X SuperDividend® REIT ETF | | | 0.58 | % |
| Global X SuperIncomeTM Preferred ETF | | | 0.58 | % |
| Global X Social Media Index ETF | | | 0.65 | % |
| Global X | JPMorgan Efficiente Index ETF | | | 0.69 | % |
| Global X | JPMorgan US Sector Rotator Index ETF | | | 0.69 | % |
| Global X Permanent ETF | | | 0.48 | % |
| Global X GuruTM Index ETF | | | 0.75 | % |
| Global X GuruTM Activist Index ETF | | | 0.75 | % |
| Global X GuruTM International Index ETF | | | 0.75 | % |
| Global X GF China Bond ETF * | | | 0.48 | % |
| Global X Scientific Beta US ETF | | | 0.35 | % |
| Global X Scientific Beta Europe ETF | | | 0.38 | % |
| Global X Scientific Beta Japan ETF | | | 0.38 | % |
| Global X Scientific Beta Asia ex-Japan ETF | | | 0.38 | % |
| Global X YieldCo Index ETF | | | 0.65 | % |
| Notes to Financial Statements (continued) |
| October 31, 2015 |
3. RELATED PARTY TRANSACTIONS (continued)
*Pursuant to an Expense Limitation Agreement, the Adviser has agreed to waive or reimburse fees and/or limit Fund expenses to the extent necessary to assure that the operating expenses of the Fund (exclusive of taxes, brokerage fees, commissions, and other transaction expenses, interest and extraordinary expenses (such as litigation and indemnification expenses)) will not exceed 0.50% of the Fund’s average daily net assets per year until at least March 1, 2016. Pursuant to the Expense Limitation Agreement, the Fund (at a later date) may reimburse the Adviser for the fees and expenses it waived or reimbursed and/or limited pursuant to the Expense Limitation Agreement during any of the prior three fiscal years, provided that, among other things, any reimbursement made to the Adviser does not cause Total Annual Fund Operating Expenses of the Fund to exceed 0.50% during the period in which it is paid and the Board of Trustees has approved in advance such reimbursement to the Adviser. At October 31, 2015, the amount of waivers/reimbursements subject to recoupment for Global X GF China Bond ETF are $33,886 expiring in 2018. As of October 31, 2015, there had been no recoupment of previously waived and reimbursed fees.
GF International Investment Management Limited (“Sub-Adviser”), located at Suites 3503-3505, 35/F, Two International Finance Centre, 8 Finance Street, Central, Hong Kong serves as sub-adviser to the Global X GF China Bond ETF. The Sub-Adviser is responsible for the day-to-day investment management of the Global X GF China Bond ETF, subject to the oversight of the Adviser. For the services it provides to the Global X GF China Bond ETF, the Adviser pays the Sub-Adviser a fee equal to 50% of the net profit the Adviser derives from its relationship with the Global X GF China Bond ETF. In addition, the investment sub-advisory agreement requires the Sub-Adviser to pay the Adviser a payment equal to 50% of any amount by which certain administrative and other operating expenses of the Fund exceed the unitary fee paid by the Fund to the Adviser, calculated quarterly.
SEI Investments Global Funds Services (“SEIGFS”) serves as sub-administrator to the Funds. As Sub-Administrator, SEIGFS provides the Funds with the required general administrative services, including, without limitation: office space, equipment, and personnel; clerical and general back office services; bookkeeping, internal accounting and secretarial services; the calculation of NAV; and assistance with the preparation and filing of reports, registration statements, proxy statements, and other materials required to be filed or furnished by the Funds under federal and state securities laws. As compensation for these services, the sub-administrator receives certain out-of-pocket costs, transaction fees, and asset-based fees which are accrued daily and paid monthly by the Adviser.
SEI Investments Distribution Co. (“SIDCO”) serves as each Fund’s underwriter and distributor of Shares pursuant to a distribution agreement. Under the distribution agreement, SIDCO, as agent, receives orders to create and redeem Shares in Creation Unit Aggregations and transmits such orders to the Trust’s custodian and transfer agent. SIDCO has no obligation to sell any specific quantity of Fund Shares. SIDCO bears the following costs and expenses relating to the distribution of Shares: (1) the costs of processing and maintaining records of creations of Creation Units; (2) all costs of maintaining the records required of a registered broker/dealer; (3) the expenses of maintaining its registration or qualification as a dealer or broker under Federal or state laws; (4) filing fees; and (5) all other expenses incurred in connection with the distribution services as contemplated in the distribution agreement. SIDCO receives no fee for its distribution services under the distribution agreement.
BBH, located at 50 Post Office Square, Boston, MA 02110, serves as Custodian of the Funds’ assets. As Custodian, BBH has agreed to (1) make receipts and disbursements of money on behalf of the Funds, (2) collect and receive all income and other payments and distributions on account of the Funds’ portfolio investments, (3) respond to correspondence from shareholders, security brokers and others relating to its duties; and (4) make periodic reports to the Funds concerning the Funds’ operations. BBH does not exercise any supervisory function over the purchase and sale of securities. BBH also serves as the Fund’s transfer agent. As Transfer Agent, BBH has agreed to (1) issue and redeem shares of each Fund, (2) make dividend and other distributions to shareholders of each Fund, (3) respond to
| Notes to Financial Statements (continued) |
| October 31, 2015 |
3. RELATED PARTY TRANSACTIONS (concluded)
correspondence by shareholders and others relating to its duties; (4) maintain shareholder accounts, and (5) make periodic reports to the Funds. As compensation for these services, BBH receives certain out-of-pocket costs, transaction fees and asset-based fees which are accrued daily and paid monthly by the Adviser from its fees.
4. INVESTMENT TRANSACTIONS
For the year or period ended October 31, 2015, the purchases and sales of investments in securities excluding in-kind transactions, long-term U.S. Government and short-term securities were:
| | | | | | Sales and | |
| | | Purchases | | | Maturities | |
| Global X SuperDividend® ETF | | $ | 258,090,718 | | | $ | 263,012,784 | |
| Global X SuperDividend® U.S. ETF | | | 123,014,934 | | | | 138,466,382 | |
| Global X SuperDividend® Emerging Markets ETF | | | 1,214,967 | | | | 41,983 | |
| Global X SuperDividend® REIT ETF | | | 38,909 | | | | 38,878 | |
| Global X SuperIncome™ Preferred ETF | | | 183,319,834 | | | | 183,753,876 | |
| Global X Social Media Index ETF | | | 26,581,658 | | | | 26,084,317 | |
| Global X | JPMorgan Efficiente Index ETF | | | 41,058,174 | | | | 40,834,753 | |
| Global X | JPMorgan US Sector Rotator Index ETF | | | 174,941,766 | | | | 174,710,368 | |
| Global X Permanent ETF | | | 703,180 | | | | 491,095 | |
| Global X Guru™ Index ETF | | | 391,941,017 | | | | 394,407,177 | |
| Global X Guru™ Activist Index ETF | | | 1,305,452 | | | | 1,297,441 | |
| Global X Guru™ International Index ETF | | | 2,158,781 | | | | 2,165,741 | |
| Global X GF China Bond ETF | | | 77,653,616 | | | | 44,099,554 | |
| Global X Scientific Beta US ETF | | | 519,013 | | | | 508,217 | |
| Global X Scientific Beta Europe ETF | | | 447,613 | | | | 422,546 | |
| Global X Scientific Beta Japan ETF | | | 521,790 | | | | 503,219 | |
| Global X Scientific Beta Asia ex-Japan ETF | | | 1,941,175 | | | | 1,304,666 | |
| Global X YieldCo Index ETF | | | 691,091 | | | | 671,448 | |
For the year ended October 31, 2015, the purchases and sales of long-term U.S. Government securities were:
| | | | | | Sales and | |
| | | Purchases | | | Maturities | |
| Global X Permanent ETF | | $ | 3,297,523 | | | $ | 2,417,392 | |
| Notes to Financial Statements (continued) |
| October 31, 2015 |
4. INVESTMENT TRANSACTIONS (concluded)
For the year or periods ended October 31, 2015 in-kind transactions associated with creations and redemptions were:
| | | | | | Sales and | | | Realized | |
| | | Purchases | | | Maturities | | | Gain | |
| Global X SuperDividend® ETF | | $ | 101,430,555 | | | $ | 95,779,030 | | | $ | 7,033,898 | |
| Global X SuperDividend® U.S. ETF | | | 113,364,881 | | | | 51,541,836 | | | | 5,510,557 | |
| Global X SuperDividend® Emerging Markets ETF | | | 2,727,482 | | | | - | | | | - | |
| Global X SuperDividend® REIT ETF | | | 4,298,312 | | | | - | | | | - | |
| Global X SuperIncome™ Preferred ETF | | | 143,517,095 | | | | 48,396,514 | | | | 598,502 | |
| Global X Social Media Index ETF | | | 45,438,519 | | | | 94,218,207 | | | | 7,918,432 | |
| Global X | JPMorgan Efficiente Index ETF | | | 23,753,014 | | | | 16,203,931 | | | | 95,084 | |
| Global X | JPMorgan US Sector Rotator Index ETF | | | 28,317,222 | | | | 14,354,708 | | | | 21,181 | |
| Global X Permanent ETF | | | 1,731,998 | | | | 597,499 | | | | 80,850 | |
| Global X Guru™ Index ETF | | | 11,925,032 | | | | 243,540,847 | | | | 17,920,882 | |
| Global X Guru™ Activist Index ETF | | | 2,997,065 | | | | - | | | | - | |
| Global X Guru™ International Index ETF | | | - | | | | 758,840 | | | | 34,757 | |
| Global X GF China Bond ETF | | | - | | | | - | | | | - | |
| Global X Scientific Beta US ETF | | | 2,489,675 | | | | - | | | | - | |
| Global X Scientific Beta Europe ETF | | | 2,481,275 | | | | - | | | | - | |
| Global X Scientific Beta Japan ETF | | | 2,496,883 | | | | - | | | | - | |
| Global X Scientific Beta Asia ex-Japan ETF | | | 1,903,496 | | | | - | | | | - | |
| Global X YieldCo Index ETF | | | 4,344,899 | | | | - | | | | - | |
For the year or periods ended October 31, 2014, in-kind transactions associated with creations and redemptions were:
| | | | | | Sales and | | | | |
| | | Purchases | | | Maturities | | | Realized Gain | |
| Global X SuperDividend® ETF | | $ | 291,318,883 | | | $ | 46,485,624 | | | $ | 6,877,254 | |
| Global X SuperDividend® U.S. ETF | | | 226,952,335 | | | | 15,011,076 | | | | 3,725,106 | |
| Global X SuperIncomeTM Preferred ETF | | | 117,436,325 | | | | 13,616,202 | | | | 873,051 | |
| Global X Social Media Index ETF | | | 102,815,373 | | | | 67,464,717 | | | | 13,728,822 | |
| Global X | JPMorgan Efficiente Index ETF | | | 2,494,440 | | | | - | | | | - | |
| Global X | JPMorgan US Sector Rotator Index ETF | | | 2,502,135 | | | | - | | | | - | |
| Global X Permanent ETF | | | 602,819 | | | | 4,899,378 | | | | 47,979 | |
| Global X GuruTM Index ETF | | | 568,383,721 | | | | 403,551,463 | | | | 37,571,401 | |
| Global X GuruTM International Index ETF | | | 3,080,436 | | | | 734,683 | | | | 66,415 | |
| | | | | | | | | | | | | |
| Notes to Financial Statements (continued) |
| October 31, 2015 |
5. TAX INFORMATION
The amount and character of income and capital gain distributions to be paid, if any, are determined in accordance with Federal income tax regulations, which may differ from U.S. GAAP. As a result, net investment income (loss) and net realized gain (loss) on investment transactions for a reporting period may differ significantly from distributions during such period. These book/tax differences may be temporary or permanent. To the extent these differences are permanent in nature, they are charged or credited to undistributed net investment income (loss), accumulated net realized gain (loss) or paid-in capital, as appropriate, in the period that the differences arise.
The following differences, primarily attributable to foreign currency, redemptions in-kind, REIT adjustments, MLP dividends, return of capital distribution and sales of passive foreign investment companies have been reclassified to/from the following accounts during the fiscal year ended October 31, 2015:
| Global X Funds | | Paid-in Capital | | | Undistributed Net
Investment Income | | | Accumulated Net
Realized Gain (Loss) | |
| Global X SuperDividend® ETF | | $ | 5,606,903 | | | $ | 5,015,299 | | | $ | (10,622,202 | ) |
| Global X SuperDividend® U.S. ETF | | | (1,565,208 | ) | | | 1,705,156 | | | | (139,948 | ) |
| Global X SuperDividend® Emerging Markets ETF | | | – | | | | (4,975 | ) | | | 4,975 | |
| Global X SuperDividend® REIT ETF | | | – | | | | 16,711 | | | | (16,711 | ) |
| Global X SuperIncome™ Preferred ETF | | | 287,080 | | | | 251,009 | | | | (538,089 | ) |
| Global X Social Media Index ETF | | | 6,875,705 | | | | (14,727 | ) | | | (6,860,978 | ) |
| Global X | JPMorgan Efficiente Index ETF | | | 91,103 | | | | 38,677 | | | | (129,780 | ) |
| Global X | JPMorgan US Sector Rotator Index ETF | | | 21,181 | | | | – | | | | (21,181 | ) |
| Global X Permanent ETF | | | 80,850 | | | | 2,291 | | | | (83,141 | ) |
| Global X Guru™ Index ETF | | | 18,007,483 | | | | (214,812 | ) | | | (17,792,671 | ) |
| Global X Guru™ International Index ETF | | | 33,893 | | | | – | | | | (33,893 | ) |
| Global X GF China Bond ETF | | | (94,278 | ) | | | (632,613 | ) | | | 726,891 | |
| Global X Scientific Beta US ETF | | | – | | | | 438 | | | | (438 | ) |
| Global X Scientific Beta Europe ETF | | | – | | | | 808 | | | | (808 | ) |
| Global X Scientific Beta Japan ETF | | | – | | | | 197 | | | | (197 | ) |
| Global X Scientific Beta Asia ex-Japan ETF | | | – | | | | 3,539 | | | | (3,539 | ) |
| Global X YieldCo Index ETF | | | – | | | | (6,081 | ) | | | 6,081 | |
These reclassifications have no impact on net assets or net asset value per share.
| Notes to Financial Statements (continued) |
| October 31, 2015 |
5. TAX INFORMATION (continued)
The tax character of dividends and distributions declared during the years or periods ended October 31, 2015 and October 31, 2014 were as follows:
| Global X Funds | | Ordinary Income | | | Long-Term
Capital Gain | | | Return of Capital | | | Totals | |
| | | | | | | | | | | | | | | | | |
| Global X SuperDividend® ETF | | | | | | | | | | | | | | | | |
| 2015 | | $ | 63,792,396 | | | $ | 1,980,361 | | | $ | – | | | $ | 65,772,757 | |
| 2014 | | | 55,528,000 | | | | – | | | | – | | | | 55,528,000 | |
| Global X SuperDividend® U.S. ETF | | | | | | | | | | | | | | | | |
| 2015 | | $ | 13,048,101 | | | $ | – | | | $ | 7,048,014 | | | $ | 20,096,115 | |
| 2014 | | | 5,177,061 | | | | – | | | | 617,714 | | | | 5,794,775 | |
| Global X SuperDividend® Emerging Markets ETF | | | | | | | | | | | | | | | | |
| 2015 | | $ | 110,575 | | | $ | – | | | $ | – | | | $ | 110,575 | |
| Global X SuperDividend® REIT ETF | | | | | | | | | | | | | | | | |
| 2015 | | $ | 113,850 | | | $ | – | | | $ | – | | | $ | 113,850 | |
| Global X SuperIncome™ Preferred ETF | | | | | | | | | | | | | | | | |
| 2015 | | $ | 16,693,614 | | | $ | – | | | $ | – | | | $ | 16,693,614 | |
| 2014 | | | 6,808,392 | | | | – | | | | – | | | | 6,808,392 | |
| Global X Social Media Index ETF | | | | | | | | | | | | | | | | |
| 2015 | | $ | 57,330 | | | $ | – | | | $ | – | | | $ | 57,330 | |
| 2014 | | | 1,764 | | | | – | | | | – | | | | 1,764 | |
| Global X | JPMorgan Efficiente Index ETF | | | | | | | | | | | | | | | | |
| 2015 | | $ | 15,956 | | | $ | – | | | $ | – | | | $ | 15,956 | |
| 2014 | | | – | | | | – | | | | – | | | | – | |
| Global X | JPMorgan US Sector Rotator Index ETF | | | | | | | | | | | | | | | | |
| 2015 | | $ | 35,570 | | | $ | – | | | $ | – | | | $ | 35,570 | |
| 2014 | | | – | | | | – | | | | – | | | | – | |
| Global X Permanent ETF | | | | | | | | | | | | | | | | |
| 2015 | | $ | 105,609 | | | $ | – | | | $ | – | | | $ | 105,609 | |
| 2014 | | | 217,578 | | | | 47,821 | | | | – | | | | 265,399 | |
| Global X Guru™ Index ETF | | | | | | | | | | | | | | | | |
| 2015 | | $ | 4,215,674 | | | $ | – | | | $ | – | | | $ | 4,215,674 | |
| 2014 | | | 424,270 | | | | 50,647 | | | | – | | | | 474,917 | |
| Global X Guru™ International Index ETF | | | | | | | | | | | | | | | | |
| 2015 | | $ | 16,359 | | | $ | – | | | $ | – | | | $ | 16,359 | |
| 2014 | | | – | | | | – | | | | – | | | | – | |
| Global X GF China Bond ETF | | | | | | | | | | | | | | | | |
| 2015 | | $ | 1,077,663 | | | $ | – | | | $ | 206,554 | | | $ | 1,284,217 | |
| Global X YieldCo Index ETF | | | | | | | | | | | | | | | | |
| 2015 | | $ | 33,750 | | | $ | – | | | $ | – | | | $ | 33,750 | |
| | | | | | | | | | | | | | | | | |
| Notes to Financial Statements (continued) |
| October 31, 2015 |
5. TAX INFORMATION (continued)
As of October 31, 2015, the components of tax basis distributable earnings (accumulated losses) were as follows:
| | | Global X Funds | |
| | | Global X
SuperDividend®
ETF | | | Global X
SuperDividend®
U.S. ETF | | | Global X
SuperDividend®
Emerging
Markets ETF | | | Global X
SuperDividend®
REIT ETF | | | Global X
SuperIncome™
Preferred ETF | |
| Undistributed Ordinary Income | | $ | 3,773,985 | | | $ | — | | | $ | 48,776 | | | $ | 24,015 | | | $ | 542,070 | |
| Capital Loss Carryforwards | | | (43,826,894 | ) | | | (17,160,697 | ) | | | (6,022 | ) | | | (321 | ) | | | (7,792,207 | ) |
| Unrealized Appreciation (Depreciation) on Investments and Foreign Currency | | | (99,452,280 | ) | | | (18,715,399 | ) | | | (494,439 | ) | | | (372,987 | ) | | | (17,744,104 | ) |
| Other Temporary Differences | | | 1 | | | | — | | | | (2 | ) | | | — | | | | (464,845 | ) |
| Total Distributable Earnings | | $ | (139,505,188 | ) | | $ | (35,876,096 | ) | | $ | (451,687 | ) | | $ | (349,293 | ) | | $ | (25,459,086 | ) |
| | | Global X Funds | |
| | | Global X Social
Media Index
ETF | | | Global X |
JPMorgan
Efficiente Index
ETF | | | Global X |
JPMorgan US
Sector Rotator
Index ETF | | | Global X
Permanent ETF | | | Global X Guru™
Index ETF | |
| Undistributed Ordinary Income | | $ | 6,657 | | | $ | 256,863 | | | $ | 131,977 | | | $ | 91,966 | | | $ | 578,657 | |
| Capital Loss Carryforwards | | | (8,366,075 | ) | | | (2,118,785 | ) | | | (2,519,657 | ) | | | (427,671 | ) | | | (14,096,223 | ) |
| Unrealized Appreciation (Depreciation) on Investments and Foreign Currency | | | (17,425,251 | ) | | | 17,210 | | | | (81,564 | ) | | | (890,634 | ) | | | (10,433,765 | ) |
| Other Temporary Differences | | | 4 | | | | — | | | | — | | | | — | | | | — | |
| Total Distributable Earnings | | $ | (25,784,665 | ) | | $ | (1,844,712 | ) | | $ | (2,469,244 | ) | | $ | (1,226,339 | ) | | $ | (23,951,331 | ) |
| | | Global X Funds | |
| | | Global X
Guru™ Activist
Index ETF | | | Global X
Guru™
International
Index ETF | | | Global X GF
China Bond
ETF | | | Global X Scientific
Beta US ETF | | | Global X Scientific
Beta Europe ETF | |
| Undistributed Ordinary Income | | $ | 11,721 | | | $ | 18,012 | | | $ | — | | | $ | 18,289 | | | $ | 31,100 | |
| Capital Loss Carryforwards | | | (214,336 | ) | | | (150,303 | ) | | | — | | | | (16,868 | ) | | | (9,104 | ) |
| Unrealized Appreciation (Depreciation) on Investments and Foreign Currency | | | (111,906 | ) | | | (163,602 | ) | | | (423,463 | ) | | | (24,908 | ) | | | (70,206 | ) |
| Other Temporary Differences | | | — | | | | — | | | | — | | | | (1 | ) | | | — | |
| Total Distributable Earnings | | $ | (314,521 | ) | | $ | (295,893 | ) | | $ | (423,463 | ) | | $ | (23,488 | ) | | $ | (48,210 | ) |
| Notes to Financial Statements (continued) |
| October 31, 2015 |
5. TAX INFORMATION (continued)
| | | Global X Funds | |
| | | Global X
Scientific Beta
Japan ETF | | | Global X
Scientific Beta
Asia ex-Japan
ETF | | | Global X YieldCo
Index ETF | |
| Undistributed Ordinary Income | | $ | 18,478 | | | $ | 51,090 | | | $ | 12,245 | |
| Capital Loss Carryforwards | | | — | | | | (100,432 | ) | | | (151,516 | ) |
| Unrealized Appreciation (Depreciation) on Investments and Foreign Currency | | | (6,938 | ) | | | (287,820 | ) | | | (893,169 | ) |
| Other Temporary Differences | | | 1 | | | | 1 | | | | — | |
| Total Distributable Earnings | | $ | 11,541 | | | $ | (337,161 | ) | | $ | (1,032,440 | ) |
For taxable years beginning after December 22, 2010, a RIC is permitted to carry forward net capital losses to offset capital gains realized in later years, and the losses carried forward retain their original character as either long-term or short-term losses. Net capital losses of a RIC realized in taxable years beginning before that date (pre-2011 losses) can be carried forward up to 8 years and are characterized in later years as short-term losses. If a Fund uses pre-2011 loss carryforwards in later years, the carryforwards will not reduce the Fund’s current earnings and profits, while loss carryforwards from later years will reduce the Fund’s current earnings and profits. To the extent that later year capital gains are offset by pre-2011 loss carryforwards, distributions of such gains will be treated as ordinary dividend distributions. Losses carried forward under these new provisions are as follows:
| | | Short-Term | | | Long-Term | | | | |
| Global X Funds | | Loss | | | Loss | | | Total | |
| Global X SuperDividend® ETF | | $ | 20,935,291 | | | $ | 22,891,603 | | | $ | 43,826,894 | |
| Global X SuperDividend® U.S. ETF | | | 17,160,697 | | | | - | | | | 17,160,697 | |
| Global X SuperDividend® Emerging Markets ETF | | | 6,022 | | | | - | | | | 6,022 | |
| Global X SuperDividend® REIT ETF | | | 321 | | | | - | | | | 321 | |
| Global X SuperIncomeTM Preferred ETF | | | 5,202,365 | | | | 2,589,842 | | | | 7,792,207 | |
| Global X Social Media Index ETF | | | 4,255,564 | | | | 4,110,511 | | | | 8,366,075 | |
| Global X JPMorgan Efficiente Index ETF | | | 2,118,785 | | | | - | | | | 2,118,785 | |
| Global X JPMorgan US Sector Rotator Index ETF | | | 2,519,657 | | | | - | | | | 2,519,657 | |
| Global X Permanent ETF | | | 392,694 | | | | 34,977 | | | | 427,671 | |
| Global X GuruTM Index ETF | | | 14,096,223 | | | | - | | | | 14,096,223 | |
| Global X GuruTM Activist Index ETF | | | 214,336 | | | | - | | | | 214,336 | |
| Global X GuruTM International Index ETF | | | 148,934 | | | | 1,369 | | | | 150,303 | |
| Global X Scientific Beta US ETF | | | 16,868 | | | | - | | | | 16,868 | |
| Global X Scientific Beta Europe ETF | | | 9,104 | | | | - | | | | 9,104 | |
| Global X Scientific Beta Asia ex-Japan ETF | | | 100,432 | | | | - | | | | 100,432 | |
| Global X YieldCo Index ETF | | | 151,516 | | | | - | | | | 151,516 | |
During the year ended October 31, 2015 the following funds utilized capital loss carryforwards to offset capital gains amounting to:
| Global X Funds | | | |
| Global X SuperDividend® U.S. ETF | | $ | 428,615 | |
| Global X Social Media Index ETF | | | 188,749 | |
| Global X GuruTM Index ETF | | | 3,586,223 | |
| Notes to Financial Statements (continued) |
| October 31, 2015 |
5. TAX INFORMATION (concluded)
The Federal tax cost and aggregate gross unrealized appreciation and depreciation on investments held by the Funds at October 31, 2015 were as follows:
| Global X Funds | | Federal Tax Cost | | | Aggregated
Gross
Unrealized
Appreciation | | | Aggregated Gross
Unrealized
Depreciation | | | Net Unrealized
Appreciation
(Depreciation) | |
| Global X SuperDividend® ETF | | $ | 1,024,168,158 | | | $ | 69,962,834 | | | $ | (169,385,128 | ) | | $ | (99,422,294 | ) |
| Global X SuperDividend® U.S. ETF | | | 303,924,708 | | | | 15,805,899 | | | | (34,521,298 | ) | | | (18,715,399 | ) |
| Global X SuperDividend® Emerging Markets ETF | | | 3,916,859 | | | | 150,369 | | | | (644,160 | ) | | | (493,791 | ) |
| Global X SuperDividend® REIT ETF | | | 4,303,760 | | | | 525 | | | | (373,525 | ) | | | (373,000 | ) |
| Global X SuperIncome™ Preferred ETF | | | 259,356,236 | | | | 2,378,808 | | | | (20,122,912 | ) | | | (17,744,104 | ) |
| Global X Social Media Index ETF | | | 98,456,366 | | | | 7,348,736 | | | | (24,773,932 | ) | | | (17,425,196 | ) |
| Global X | JPMorgan Efficiente Index ETF | | | 8,290,672 | | | | 27,812 | | | | (10,602 | ) | | | 17,210 | |
| Global X | JPMorgan US Sector Rotator Index ETF | | | 14,217,146 | | | | 184,916 | | | | (266,480 | ) | | | (81,564 | ) |
| Global X Permanent ETF | | | 11,625,832 | | | | 441,399 | | | | (1,332,033 | ) | | | (890,634 | ) |
| Global X Guru™ Index ETF | | | 197,405,059 | | | | 13,442,848 | | | | (23,876,613 | ) | | | (10,433,765 | ) |
| Global X Guru™ Activist Index ETF | | | 2,790,717 | | | | 113,658 | | | | (225,564 | ) | | | (111,906 | ) |
| Global X Guru™ International Index ETF | | | 1,475,665 | | | | 84,797 | | | | (248,399 | ) | | | (163,602 | ) |
| Global X GF China Bond ETF | | | 35,526,923 | | | | 303,075 | | | | (669,948 | ) | | | (366,873 | ) |
| Global X Scientific Beta US ETF | | | 2,483,515 | | | | 35,763 | | | | (60,671 | ) | | | (24,908 | ) |
| Global X Scientific Beta Europe ETF | | | 2,502,821 | | | | 94,850 | | | | (165,050 | ) | | | (70,200 | ) |
| Global X Scientific Beta Japan ETF | | | 2,521,830 | | | | 129,985 | | | | (136,845 | ) | | | (6,860 | ) |
| Global X Scientific Beta Asia ex-Japan ETF | | | 2,444,743 | | | | 114,826 | | | | (402,615 | ) | | | (287,789 | ) |
| Global X YieldCo Index ETF | | | 4,710,561 | | | | 4,956 | | | | (898,125 | ) | | | (893,169 | ) |
The preceding differences between book and tax cost are primarily due to mark-to-market treatment of passive foreign investment companies, MLP adjustments and wash sales.
6. CONCENTRATION OF RISKS
The Funds invest in securities of foreign issuers in various countries. These investments may involve certain considerations and risks not typically associated with investments in the United States as a result of, among other factors, the possibility of future political and economic developments and the level of governmental supervision and regulation of securities markets in the respective countries.
The securities markets of emerging countries are less liquid, subject to greater price volatility, and have a smaller market capitalization than those of U.S. securities markets. In certain countries, there may be fewer publicly traded securities and the market may be dominated by a few issuers or sectors. Issuers and securities markets in such countries are not subject to as extensive and frequent accounting, financial and other reporting requirements or as comprehensive government regulations as are issuers and securities markets in the U.S. In particular, the assets and profits appearing on the financial statements of emerging country issuers may not reflect their financial position or results of operations in the same manner as financial statements for U.S. issuers. Substantially less information may be publicly available about emerging country issuers than is available about issuers in the United States.
The Funds may be subject to taxes imposed by countries in which they invest. Such taxes are generally based on either income or gains earned or repatriated. The Funds accrue and apply such taxes to net
| Notes to Financial Statements (continued) |
| October 31, 2015 |
6. CONCENTRATION OF RISKS (concluded)
investment income, net realized gains and net unrealized gains as income and/or capital gains are earned.
The Funds (other than the Global X GF China Bond ETF and the Global X Permanent ETF) use a replication strategy. A replication strategy is an indexing strategy that involves investing in the securities of an underlying index in approximately the same proportions as in the underlying index. The Funds (other than the Global X GF China Bond ETF and the Global X Permanent ETF) may utilize a representative sampling strategy with respect to their underlying indices when a replication strategy might be detrimental to their shareholders, such as when there are practical difficulties or substantial costs involved in compiling a portfolio of equity securities to follow their underlying indices, or, in certain instances, when securities in the underlying indices become temporarily illiquid, unavailable or less liquid, or due to legal restrictions (such as diversification requirements that apply to the Funds but not the underlying indices).
Because of the practical difficulties and expense of purchasing all of the securities in their respective underlying indexes, the Global X GF China Bond ETF and the Global X Permanent ETF do not expect to purchase all of the securities in their underlying indexes. Instead, the Adviser will utilize a “sampling” methodology in seeking to achieve the Funds’ objective. As such, the Funds may purchase a subset of the securities in their respective underlying index in an effort to hold a portfolio of securities with generally the same risk and return characteristics of the underlying index.
7. LOANS OF PORTFOLIO SECURITIES
The Funds may lend portfolio securities having a market value up to one-third of the Funds’ total assets. Security loans made pursuant to a securities lending agreement are required at all times to be secured by collateral equal to at least 102% for U.S.-based securities and 105% for foreign-based securities. Such collateral received in connection with these loans will be cash and can be invested in repurchase agreements or U.S. Treasury obligations and is recognized in the Schedule of Investments and Statement of Assets and Liabilities. The obligation to return securities lending collateral is also recognized as a liability in the Statement of Assets and Liabilities. It is the Funds’ policy to obtain additional collateral from or return excess collateral to the borrower by the end of the next business day, following the valuation date of the securities loaned. Therefore, the value of the collateral held may be temporarily less than the value of the securities on loan. Lending securities entails a risk of loss to the Funds if and to the extent that the market value of the securities loans were to increase and the borrower did not increase the collateral accordingly, and the borrower fails to return the securities. The Funds could also experience delays and costs in gaining access to the collateral. The Funds bear the risk of any deficiency in the amount of the collateral available for return to the borrower due to any loss on the collateral invested.
As of October 31, 2015 the value of securities on loan was $44,921,955, $10,251,104, $4,907,868, $3,423,061 and $2,248,289 for the Global X SuperDividend® ETF, Global X SuperDividend® U.S. ETF, Global X SuperIncome™ Preferred ETF, Global X Social Media Index ETF and Global X Guru™ Index ETF, respectively and the value of securities purchased with the cash collateral held from securities on loan was $46,835,301, $10,708,555, $5,029,200, $3,529,751 and $2,487,600 for the Global X SuperDividend® ETF, Global X SuperDividend® U.S. ETF, Global X SuperIncome™ Preferred ETF, Global X Social Media Index ETF and Global X Guru™ Index ETF, respectively.
| Notes to Financial Statements (continued) |
| October 31, 2015 |
7. LOANS OF PORTFOLIO SECURITIES (concluded)
At October 31, 2015, the following Funds had securities on loan, by counterparty:
| | | Market Value | | | Cash Collateral | |
| Global X SuperDividend® ETF | | | | | | | | |
| Barclays | | $ | 4,718,012 | | | $ | 4,922,675 | |
| BNP Prime Brokerage | | | 5,010,295 | | | | 5,226,565 | |
| Citigroup | | | 1,599,108 | | | | 1,635,350 | |
| Credit Suisse | | | 208,538 | | | | 217,500 | |
| Goldman Sachs & Co. | | | 9,637,618 | | | | 10,108,143 | |
| JPMorgan | | | 5,923,502 | | | | 6,130,502 | |
| Merrill Lynch Pierce Fenner & Smith | | | 215,334 | | | | 220,500 | |
| Morgan Stanley | | | 705,496 | | | | 748,200 | |
| National Financial Services | | | 6,517,220 | | | | 6,778,750 | |
| Nomura Securities | | | 10,386,832 | | | | 10,847,116 | |
| Global X SuperDividend® U.S. ETF | | | | | | | | |
| Barclays | | | 2,755,500 | | | | 2,901,600 | |
| BMO Capital Markets | | | 4,401,815 | | | | 4,564,000 | |
| Deutsche Bank | | | 1,072,040 | | | | 1,124,250 | |
| Goldman Sachs & Co. | | | 90,489 | | | | 97,300 | |
| Jefferies & Co. | | | 177,614 | | | | 182,400 | |
| JPMorgan | | | 65,380 | | | | 70,301 | |
| Merrill Lynch Pierce Fenner & Smith | | | 272,938 | | | | 286,800 | |
| Morgan Stanley | | | 1,415,328 | | | | 1,481,904 | |
| Global X SuperIncome™ Preferred ETF | | | | | | | | |
| Citigroup | | | 10,156 | | | | 10,400 | |
| Deutsche Bank | | | 1,334,614 | | | | 1,372,400 | |
| JPMorgan | | | 27,210 | | | | 28,000 | |
| Merrill Lynch Pierce Fenner & Smith | | | 1,677,736 | | | | 1,719,900 | |
| Morgan Stanley | | | 4,758 | | | | 5,000 | |
| National Financial Services | | | 1,003,969 | | | | 1,024,250 | |
| Wells Fargo Securities | | | 849,425 | | | | 869,250 | |
| Global X Social Media Index ETF | | | | | | | | |
| Barclays | | | 418,880 | | | | 434,000 | |
| Citigroup | | | 115,950 | | | | 112,500 | |
| Credit Suisse | | | 1,023,897 | | | | 1,060,702 | |
| Merrill Lynch Pierce Fenner & Smith | | | 140,134 | | | | 137,199 | |
| Morgan Stanley | | | 767,312 | | | | 785,400 | |
| National Financial Services | | | 148,104 | | | | 153,450 | |
| UBS Securities | | | 808,784 | | | | 846,500 | |
| Global X Guru™ Index ETF | | | | | | | | |
| JPMorgan | | | 1,136,556 | | | | 1,301,400 | |
| Pershing | | | 1,111,733 | | | | 1,186,200 | |
| Notes to Financial Statements (concluded) |
| October 31, 2015 |
8. CONTRACTUAL OBLIGATIONS
The Funds enter into contracts in the normal course of business that contain a variety of indemnifications. The Funds’ maximum exposure under these arrangements is unknown; however the Funds have not had prior gains or losses pursuant to these contracts. Management has reviewed the Funds’ existing contracts and expects the risk of loss to be remote.
Pursuant to the Trust’s organizational documents, the Trustees of the Trust and the Trust’s officers are indemnified against certain liabilities that may arise out of the performance of their duties.
9. SHARE SPLIT
Effective March 11, 2015, the Global X GF China Bond ETF executed a share split after the close of markets on March 10, 2015. The effect of this transaction was to multiply the number of outstanding shares of the Fund by two, resulting in a corresponding proportionate decrease in the net asset value per share. The capital share activity presented in the statement of changes in net assets and per share data in the financial highlights has been given retroactive effect to reflect these share splits. There were no changes in net assets, results of operations or total return as a result of these transactions.
10. NEW ACCOUNTING PRONOUNCEMENT
In June 2014, the Financial Accounting Standards Board (FASB) issued Accounting Standards Update (ASU) No. 2014-11, Transfers and Servicing (Topic 860): Repurchase-to-Maturity Transactions, Repurchase Financings, and Disclosures. ASU 2014-11 changes the accounting for repurchase-to-maturity transactions and repurchase financing arrangements and requires enhanced disclosures about repurchase agreements and other similar transactions. This update requires repurchase-to-maturity transactions to be accounted for as secured borrowings. This update also eliminates existing guidance for repurchase financings and requires instead that entities consider the initial transfer and the related repurchase agreement separately when applying the derecognition requirements under U.S. GAAP. The accounting changes in this update are effective for fiscal periods and interim periods beginning after December 15, 2014, and early adoption is prohibited. At this time, management is currently evaluating the implications of ASU No. 2014-11 and its impact on the Funds’ financial statement disclosures has not yet been determined.
11. SUBSEQUENT EVENTS
The Funds have been evaluated regarding the need for additional disclosures and/or adjustments resulting from subsequent events. Based on this evaluation, no additional disclosure or adjustments were required to the financial statements as of the date the financial statements were issued, except as follows:
Subsequent to October 31, 2015, the following investment portfolios were added to the Trust: Global X Internet of Things ETF, Global X Healthy Lifestyle ETF, Global X Big Data ETF, Global X FinTech ETF, and Global X Conscious Companies ETF.
| Report of Independent Registered Public Accounting Firm |
| October 31, 2015 |
The Board of Trustees and Shareholders of Global X Funds
We have audited the accompanying statements of assets and liabilities, including the schedules of investments, of Global X SuperDividend® ETF, Global X SuperDividend® U.S. ETF, Global X SuperDividend® Emerging Markets ETF, Global X SuperDividend® REIT ETF, Global X SuperIncomeTM Preferred ETF, Global X Social Media Index ETF, Global X | JPMorgan Efficiente Index ETF, Global X | JPMorgan US Sector Rotator Index ETF, Global X Permanent ETF, Global X GuruTM Index ETF, Global X GuruTM Activist Index ETF, Global X GuruTM International Index ETF, Global X GF China Bond ETF, Global X Scientific Beta US ETF, Global X Scientific Beta Europe ETF, Global X Scientific Beta Japan ETF, Global X Scientific Beta Asia ex-Japan ETF, and Global X YieldCo Index ETF (eighteen of the series constituting the Global X Funds) (the “Funds”) as of October 31, 2015, and the related statements of operations for the year or period then ended, the statements of changes in net assets for each of the two years or periods then ended, and the financial highlights for each of the periods indicated therein. These financial statements and financial highlights are the responsibility of the Funds’ management. Our responsibility is to express an opinion on these financial statements and financial highlights based on our audits.
We conducted our audits in accordance with the standards of the Public Company Accounting Oversight Board (United States). Those standards require that we plan and perform the audit to obtain reasonable assurance about whether the financial statements and financial highlights are free of material misstatement. We were not engaged to perform an audit of the Funds’ internal control over financial reporting. Our audits included consideration of internal control over financial reporting as a basis for designing audit procedures that are appropriate in the circumstances, but not for the purpose of expressing an opinion on the effectiveness of the Funds’ internal control over financial reporting. Accordingly, we express no such opinion. An audit also includes examining, on a test basis, evidence supporting the amounts and disclosures in the financial statements and financial highlights, assessing the accounting principles used and significant estimates made by management, and evaluating the overall financial statement presentation. Our procedures included confirmation of securities owned as of October 31, 2015, by correspondence with the custodian and brokers, or by other appropriate auditing procedures where replies from brokers were not received. We believe that our audits provide a reasonable basis for our opinion.
In our opinion, the financial statements and financial highlights referred to above present fairly, in all material respects, the financial position of each of the Funds listed above at October 31, 2015, the results of their operations for the year or period then ended, the changes in their net assets for each of the two years or periods then ended, and their financial highlights for each of the periods indicated therein, in conformity with U.S. generally accepted accounting principles.
Philadelphia, Pennsylvania
December 30, 2015
| Disclosure of Fund Expenses (unaudited) |
| |
All ETFs have operating expenses. As a shareholder of an ETF, your investment is affected by these ongoing costs, which include (among others) costs for ETF management, administrative services, commissions, and shareholder reports like this one. It is important for you to understand the impact of these costs on your investment returns. In addition, a shareholder is responsible for brokerage fees as a result of their investment in a Fund.
Operating expenses such as these are deducted from an ETF’s gross income and directly reduce its final investment return. These expenses are expressed as a percentage of the ETF’s average net assets; this percentage is known as the ETF’s expense ratio.
The following examples use the expense ratio and are intended to help you understand the ongoing costs (in dollars) of investing in your Fund and to compare these costs with those of other funds. The examples are based on an investment of $1,000 made at the beginning of the period shown and held for the entire period (May 1, 2015 through October 31, 2015).
The table on the next page illustrates your Fund’s costs in two ways:
Actual Fund Return. This section helps you to estimate the actual expenses that your Fund incurred over the period. The “Expenses Paid During Period” column shows the actual dollar expense cost incurred by a $1,000 investment in the Fund, and the “Ending Account Value” number is derived from deducting that expense cost from the Fund’s gross investment return.
You can use this information, together with the actual amount you invested in the Fund, to estimate the expenses you paid over that period. Simply divide your actual account value by $1,000 to arrive at a ratio (for example, an $8,600 account value divided by $1,000 = 8.6), then multiply that ratio by the number shown for your Fund under “Expenses Paid During Period.”
Hypothetical 5% Return. This section helps you compare your Fund’s costs with those of other funds. It assumes that the Fund had an annual 5% return before expenses during the year, but that the expense ratio (Column 3) for the period is unchanged. This example is useful in making comparisons because the Securities and Exchange Commission requires all funds to make this 5% calculation. You can assess your Fund’s comparative cost by comparing the hypothetical result for your Fund in the “Expenses Paid During Period” column with those that appear in the same charts in the shareholder reports for other funds.
NOTE: Because the return is set at 5% for comparison purposes — NOT your Fund’s actual return — the account values shown may not apply to your specific investment.
| Disclosure of Fund Expenses (unaudited) (continued) |
| |
| | | Beginning
Account
Value
5/1/2015 | | | Ending
Account
Value
10/31/2015 | | | Annualized
Expense
Ratios | | | Expenses
Paid
During
Period(1) | |
| Global X SuperDividend® ETF |
| Actual Fund Return | | $ | 1,000.00 | | | $ | 891.80 | | | | 0.58 | % | | $ | 2.77 | |
| Hypothetical 5% Return | | | 1,000.00 | | | | 1,022.28 | | | | 0.58 | | | | 2.96 | |
| Global X SuperDividend® U.S.ETF |
| Actual Fund Return | | $ | 1,000.00 | | | $ | 920.10 | | | | 0.45 | % | | $ | 2.18 | |
| Hypothetical 5% Return | | | 1,000.00 | | | | 1,022.94 | | | | 0.45 | | | | 2.29 | |
| Global X SuperDividend® Emerging Markets ETF |
| Actual Fund Return | | $ | 1,000.00 | | | $ | 773.50 | | | | 0.65 | % | | $ | 2.91 | |
| Hypothetical 5% Return | | | 1,000.00 | | | | 1,021.93 | | | | 0.65 | | | | 3.31 | |
| Global X SuperDividend® REIT ETF |
| Actual Fund Return | | $ | 1,000.00 | | | $ | 904.20 | | | | 0.53 | % | | $ | 2.54 | |
| Hypothetical 5% Return | | | 1,000.00 | | | | 1,022.53 | | | | 0.53 | | | | 2.70 | |
| Global X SuperIncome™ Preferred ETF |
| Actual Fund Return | | $ | 1,000.00 | | | $ | 955.90 | | | | 0.58 | % | | $ | 2.86 | |
| Hypothetical 5% Return | | | 1,000.00 | | | | 1,022.28 | | | | 0.58 | | | | 2.96 | |
| Global X Social Media Index ETF |
| Actual Fund Return | | $ | 1,000.00 | | | $ | 948.80 | | | | 0.65 | % | | $ | 3.19 | |
| Hypothetical 5% Return | | | 1,000.00 | | | | 1,021.93 | | | | 0.65 | | | | 3.31 | |
| Global X | JPMorgan Efficiente Index ETF |
| Actual Fund Return | | $ | 1,000.00 | | | $ | 911.30 | | | | 0.69 | % | | $ | 3.32 | |
| Hypothetical 5% Return | | | 1,000.00 | | | | 1,021.73 | | | | 0.69 | | | | 3.52 | |
| Global X | JPMorgan US Sector Rotator Index ETF |
| Actual Fund Return | | $ | 1,000.00 | | | $ | 955.00 | | | | 0.69 | % | | $ | 3.40 | |
| Hypothetical 5% Return | | | 1,000.00 | | | | 1,021.73 | | | | 0.69 | | | | 3.52 | |
| Global X Permanent ETF |
| Actual Fund Return | | $ | 1,000.00 | | | $ | 980.30 | | | | 0.48 | % | | $ | 2.40 | |
| Hypothetical 5% Return | | | 1,000.00 | | | | 1,022.79 | | | | 0.48 | | | | 2.45 | |
| Global X Guru™ Index ETF |
| Actual Fund Return | | $ | 1,000.00 | | | $ | 899.40 | | | | 0.75 | % | | $ | 3.59 | |
| Hypothetical 5% Return | | | 1,000.00 | | | | 1,021.42 | | | | 0.75 | | | | 3.82 | |
| Global X Guru™ Activist Index ETF |
| Actual Fund Return | | $ | 1,000.00 | | | $ | 897.70 | | | | 0.75 | % | | $ | 3.59 | |
| Hypothetical 5% Return | | | 1,000.00 | | | | 1,021.42 | | | | 0.75 | | | | 3.82 | |
| Global X Guru™ International Index ETF |
| Actual Fund Return | | $ | 1,000.00 | | | $ | 867.20 | | | | 0.75 | % | | $ | 3.53 | |
| Hypothetical 5% Return | | | 1,000.00 | | | | 1,021.42 | | | | 0.75 | | | | 3.82 | |
| Global X GF China Bond ETF |
| Actual Fund Return | | $ | 1,000.00 | | | $ | 1,013.40 | | | | 0.50 | % | | $ | 2.54 | |
| Hypothetical 5% Return | | | 1,000.00 | | | | 1,022.68 | | | | 0.50 | | | | 2.55 | |
| Global X Scientific Beta US ETF |
| Actual Fund Return(2) | | $ | 1,000.00 | | | $ | 990.80 | | | | 0.35 | % | | $ | 1.64 | |
| Hypothetical 5% Return | | | 1,000.00 | | | | 1,023.45 | | | | 0.35 | | | | 1.77 | |
| Global X Scientific Beta Europe ETF |
| Actual Fund Return(2) | | $ | 1,000.00 | | | $ | 980.70 | | | | 0.38 | % | | $ | 1.77 | |
| Hypothetical 5% Return | | | 1,000.00 | | | | 1,023.30 | | | | 0.38 | | | | 1.93 | |
| Global X Scientific Beta Japan ETF |
| Actual Fund Return(2) | | $ | 1,000.00 | | | $ | 1,004.80 | | | | 0.38 | % | | $ | 1.79 | |
| Hypothetical 5% Return | | | 1,000.00 | | | | 1,023.30 | | | | 0.38 | | | | 1.93 | |
| Disclosure of Fund Expenses (unaudited) (concluded) |
| |
| | | Beginning
Account
Value
5/1/2015 | | | Ending
Account
Value
10/31/2015 | | | Annualized
Expense
Ratios | | | Expenses
Paid
During
Period(1) | |
| Global X Scientific Beta Asia ex-Japan ETF | | | | | | | | | | | | | | | | |
| Actual Fund Return(2) | | $ | 1,000.00 | | | $ | 869.00 | | | | 0.38 | % | | $ | 1.67 | |
| Hypothetical 5% Return | | | 1,000.00 | | | | 1,023.30 | | | | 0.38 | | | | 1.93 | |
| Global X YieldCo Index ETF | | | | | | | | | | | | | | | | |
| Actual Fund Return(3) | | $ | 1,000.00 | | | $ | 736.10 | | | | 0.65 | % | | $ | 2.43 | |
| Hypothetical 5% Return | | | 1,000.00 | | | | 1,021.95 | | | | 0.65 | | | | 3.29 | |
| (1) | Expenses are equal to the Fund’s annualized expense ratio multiplied by the average account value over the period, multiplied 184/365 (to reflect the one-half year period), unless otherwise noted. |
| (2) | Expenses are equal to the Fund’s annualized expense ratio multiplied by the average account value over the period, multiplied 173/365 (to reflect the period from inception to date.) |
| (3) | Expenses are equal to the Fund’s annualized expense ratio multiplied by the average account value over the period, multiplied 158/365 (to reflect the period from inception to date.) |
| APPROVAL OF INVESTMENT ADVISORY AGREEMENT(unaudited) |
| |
Section 15(c) of the Investment Company Act of 1940, as amended ("1940 Act"), requires the board of trustees of an exchange-traded fund (“ETF”), including a majority of those trustees who are not "interested persons" of the ETF, as defined in the 1940 Act ("Independent Trustees"), consider on an initial basis and periodically thereafter (as required by the 1940 Act), at an in person meeting called for such purpose, the terms of each fund’s investment advisory agreement and whether to approve entering into, or renewing, each agreement.
At a Board meeting held on April 21, 2015, the Board of Trustees (including the Trust’s Independent Trustees voting separately) initially considered and unanimously approved (i) the initial Investment Advisory Agreement for the Global X YieldCo Index ETF and (ii) the Supervision and Administration Agreement between the Trust, on behalf of the Global X YieldCo Index ETF, and Global X Management Company (“Global X Management”). At a quarterly Board meeting held on March 10, 2015, the Board of Trustees (including the Trust’s Independent Trustees voting separately) initially considered and unanimously approved (i) the initial Investment Advisory Agreement for the Global X Scientific Beta US ETF, Global X Scientific Beta Europe ETF, Global X Scientific Beta Asia ex-Japan ETF, and Global X Scientific Beta Japan ETF and (ii) the Supervision and Administration Agreement between the Trust, on behalf of these funds, and Global X Management.
The Global X YieldCo Index ETF, Global X Scientific Beta US ETF, Global X Scientific Beta Europe ETF, Global X Scientific Beta Asia ex-Japan ETF, and Global X Scientific Beta Japan ETF are referred to herein as the “New Funds.” The Investment Advisory Agreements and Supervision and Administration Agreements for each New Fund are referred to herein as the “New Fund Agreements.”
In advance of the Board meeting, the Board (including the Trust’s Independent Trustees) and the Independent Trustees’ independent legal counsel requested (in writing) detailed information from Global X Management in connection with their consideration of the New Fund Agreements and received and reviewed written responses from Global X Management and supporting materials relating to those requests for information. In the course of their consideration of the New Fund Agreements, the Trust’s Independent Trustees were advised by their counsel and, in addition to meeting with management of Global X Management, they met separately in executive session with their counsel.
In determining to approve the New Fund Agreements for each New Fund, the Board considered a variety of factors, including the factors discussed at greater detail below. After full consideration of the factors below, as well as other factors that were instructive in their consideration, the Board, including all of the Trust’s Independent Trustees voting separately, concluded, in the exercise of their business judgement, that the New Fund Agreements were fair and reasonable and in the best interest of each New Fund. In reaching this decision, the Board did not assign relative weights to the factors discussed below nor did the Board deem any one factor or group of them to be controlling in and of themselves. Each member of the Board may have afforded different weight to the various factors.
Nature, Extent and Quality of Services
With respect to this factor, the Board considered:
| | • | the terms of the New Fund Agreements and the range of services to be provided to each New Fund in accordance with the New Fund Agreements; |
| | • | Global X Management’s key personnel and the portfolio managers who would provide investment advisory services to each New Fund; |
| | • | Global X Management’s responsibilities under the New Fund Agreements to, among other things, (i) manage the investment operations of each New Fund and the composition of each New Fund’s assets, including the purchase, retention and disposition of its holdings, (ii) provide quarterly reports to the Trust’s officers and the Board and other reports as the Board deems necessary or appropriate, (iii) vote proxies, exercise consents, and exercise all other rights |
| APPROVAL OF INVESTMENT ADVISORY AGREEMENT(unaudited) |
| |
| | | appertaining to securities and assets held by each New Fund, (iv) select broker-dealers to execute portfolio transactions for each New Fund when necessary, (v) assist in the preparation and filing of reports and proxy statements (if any) to the shareholders of each New Fund, the periodic updating of the registration statement, prospectuses, statement of additional information, and other reports and documents for each New Fund that are required to be filed by the Trust with the Securities and Exchange Commission ("SEC") and other regulatory or governmental bodies, and (vi) monitor anticipated purchases and redemptions of the shares (including creation units) of each New Fund by shareholders and new investors; |
| | • | the nature, extent and quality of Global X Management’s services (including advisory, administrative and compliance services) that would be made available to each New Fund; and |
| | • | the quality of Global X Management’s resources and personnel that would be made available to each New Fund, including Global X Management’s experience and the professional qualifications of Global X Management’s key personnel. |
Based on these considerations, the Board concluded that it was satisfied with the nature, extent and quality of the services to be provided to each New Fund.
Performance
The Board determined that because each New Fund had not commenced operations, meaningful data relating to investment performance of each New Fund was not available and, therefore, could not be a factor in approving the New Fund Agreements.
Cost of Services and Profitability
With respect to this factor, the Board considered:
| | • | Global X Management’s expected costs to provide investment management, supervision and administrative and related services to each New Fund; |
| | • | The unitary fee (including the proposed investment advisory fee) ("Management Fee") that was proposed to be borne by each New Fund under the New Fund Agreements for the investment advisory, supervisory and administrative services that each New Fund requires under a unitary fee structure (including the types of fees and expenses that are not included within the unitary fee and would be borne by each New Fund); and |
| | • | the expected profitability to Global X Management, if any, from all services to be provided to each New Fund and all aspects of the relationship between Global X Management and each New Fund. |
Based on these considerations, the Board concluded that the proposed Management Fee rate paid by each Fund to Global X Management, in light of the nature, extent and quality of the services provided, was reasonable and in the best interests of Fund shareholders.
Comparison of Fees and Services
With respect to this factor, the Board considered:
| | • | comparative information with respect to the proposed Management Fee to be paid to Global X Management by each New Fund. In connection with this consideration, Global X Management provided the Board with comparative expense data for each New Fund, including fees paid by unaffiliated comparable specialized and/or focused exchange-traded funds and/or other registered funds |
| | • | the structure of the proposed unitary Management Fee (which includes as one component the proposed investment advisory fee for each New Fund) and the expected total expense ratios for each New Fund. In this regard, the Board took into consideration that the purpose of adopting a |
| APPROVAL OF INVESTMENT ADVISORY AGREEMENT(unaudited) |
| |
| | | unitary Management Fee structure for each New Fund was to create a simple, all-inclusive fee that would provide a level of predictability with respect to the overall expense ratio (i.e., the total fees) of each New Fund and that the proposed Management Fee for each New Fund was set at a competitive fee to make each New Fund viable in the marketplace. The Board also took into consideration that each New Fund, unlike other series of the Trust, would invest substantially in other exchange traded funds, and that the unitary fee for each New Fund is based on services provided that will be in addition to, rather than duplicative of, the services provided under the advisory contract(s) of any exchange traded fund in which a New Fund may invest ; and |
| | • | that Global X Management would be responsible for most ordinary expenses of each New Fund, including the costs of various third-party services required by each New Fund, including investment advisory, administrative, audit, certain custody, portfolio accounting, legal, transfer agency and printing costs, but that each New Fund would bear other expenses not covered under the proposed all-inclusive Management Fee, such as taxes, brokerage fees, commissions, and other transaction expenses, interest expenses, and extraordinary expenses. |
Based on these considerations, the Board concluded that it would be in the best interest of the New Funds and their shareholders to approve the New Fund Agreements.
Economies of Scale
With respect to this factor, the Board considered:
| | • | the extent to which economies of scale would be realized as each New Fund grows and whether the proposed unitary Management Fee for each New Fund reflected these economies of scale; |
| | • | the significant investment of time, personnel and other resources that Global X Management intends to made in each New Fund in order to seek to assure that each New Fund is attractive to investors; and |
| | • | that the proposed unitary Management Fee would provide a high level of certainty as to the total level of expenses for each New Fund and its shareholders. |
Based on these considerations, the Board concluded that approval of the proposed Management Fee for each New Fund was reasonable.
Other Benefits
In considering the New Fund Agreements, in addition to the categories discussed above, the Board considered other benefits that may be realized by Global X Management as a result of its relationships with each New Fund. As a result, the Board concluded that, in the exercise of its business judgement, all information it considered supported approval of the New Fund Agreements.
| Supplemental Information (unaudited) |
| |
Net asset value, or “NAV”, is the price per Share at which the Funds issue and redeem Shares. It is calculated in accordance with the standard formula for valuing mutual fund shares. The “Market Price” of the Funds generally is determined using the midpoint between the highest bid and the lowest offer on the stock exchange on which the Shares of the Funds are listed for trading, as of the time that the Funds’ NAV is calculated. The Funds’ Market Price may be at, above or below their NAV. The NAV of the Funds will fluctuate with changes in the market value of the Funds’ holdings. The Market Price of the Funds will fluctuate in accordance with changes in its NAV, as well as market supply and demand.
Premiums or discounts are the differences (expressed as a percentage) between the NAV and Market Price of the Funds on a given day, generally at the time NAV is calculated. A premium is the amount that the Funds are trading above the reported NAV, expressed as a percentage of the NAV. A discount is the amount that the Funds are trading below the reported NAV, expressed as a percentage of the NAV.
Further information regarding premiums and discounts is available on the Funds’ website at www.GlobalXFunds.com
| Trustees and Officers of the Trust (unaudited) |
| |
Set forth below are the names, addresses, year of birth, position with the Trust, Term of Office and Length of Time Served, the principal occupations for the last five years, number of Funds in fund complex overseen by Trustee, and other directorships outside the fund complex of each of the persons currently serving as Trustees and Officers of the Trust.
Name,
Address (Year of
Birth) | Position(s)
Held with
Funds | Principal Occupation(s) During the Past 5 Years | Number of
Funds in
Trust
Overseen
by Trustee | Other Directorships Held by Trustees |
| Independent Trustees2 | |
Sanjay Ram Bharwani 623 Fifth Ave, 15th floor New York, NY 10022 (1974) | Trustee (since 2008) | CEO of Risk Advisors Inc. (since 2007) (consulting firm). | 473 | None. |
Scott R. Chichester1 623 Fifth Ave, 15th floor New York, NY 10022 (1970) | Trustee (since 2008) | CFO, AdeptPros Inc. (app development, training and consulting) (since 2012); Founder, Madison Park Advisors LLC (advisory services) (since 2011); CFO, Sterling Seal & Supply Inc. (since 2011), President & Treasurer, Bayview Acquisition Corp (since 2010), CPA, Penda Aiken Inc. (2009-2011) (consultant); Founder and President, DirectPay USA LLC (since 2006) (payroll company); Proprietor, Scott R. Chichester CPA (since 2001) (CPA firm). | 473 | Director of AdeptPros Inc. (since 2015); Director of Sterling Seal & Supply Inc. (since 2011);Director of Bayview Acquisition Corp. (since 2010); Trustee of ARK ETF Trust (since 2014). |
Kartik Kiran Shah 623 Fifth Ave, 15th floor New York, NY 10022 (1977) | Trustee (since 2008) | President and Chief Business Officer, Oxeia Biopharmaceuticals, Inc. (2015-Present); Vice President, Business Development, Cynvenio Biosystems (2012-2014); Independent Consultant, Self-Employed (2011-2012) (non-financial services); Director, Wireless Generation (2008-2011) (software). | 473 | Director of Oxeia Biopharmaceuticals, Inc. (2015-Present). |
| Trustees and Officers of the Trust (unaudited)(continued) |
| |
The Trust’s Statement of Additional Information (“SAI”) includes additional information about the Trustees and Officers. The SAI may be obtained without charge by calling 1-888-493-8631. The following chart lists Trustees and Officers as of October 31, 2015.
Name, Address (Year of Birth) | Position(s) Held with Funds | Principal Occupation(s)
During the Past 5 Years | Number of Funds
in Trust
Overseen by
Trustee | Other
Directorships Held by Trustees |
| Interested Trustee / Officers2 | |
Bruno del Ama 623 Fifth Ave, 15th floor New York, NY 10022 (1976) | Trustee (since 2008), President, Chief Executive Officer (since 2008) | Chief Executive Officer, Global X Management Company (“GXMC”) (since 2008); Chief Compliance Officer, GXMC (2008-2013). | 473 | None. |
Luis Berruga 623 Fifth Ave, 15th floor New York, NY 10022 (1977) | Chief Operating Officer, Treasurer, Principal Accounting Officer and Chief Financial Officer (since 9/2015). | Chief Financial Officer, GXMC (since 9/2015) and Chief Operating Officer (since 2/2014); Investment Banker, Jefferies (2012-2014); Regional Product Specialist, Morgan Stanley (2005 - 2012). | N/A | N/A |
Daphne Tippens Chisolm 623 Fifth Ave, 15th floor New York, NY 10022 (1969) | Secretary (since 2012) and Chief Compliance Officer (since 2/2015) | General Counsel, GXMC (since 2011); Chief Compliance Officer, GXMC (1/2014 - 5/2014 and 2/2015-present); Founder and President of Law Offices of DT Chisolm, P.C. (since 2009) (law firm). | N/A | N/A |
Dianne M. Descoteaux4 One Freedom Valley Drive Oaks, PA 19456 (1977) | Assistant Secretary (since 2011) | Counsel, SEI Investments (since 2010); Associate, Morgan, Lewis & Bockius LLP (2006-2010). | N/A | N/A |
| Trustees and Officers of the Trust (unaudited)(concluded) |
| |
Name, Address (Year of Birth) | Position(s) Held with Funds | Principal Occupation(s) During the Past 5 Years | Other Directorships
Held by Trustees |
Lisa Whittaker4 One Freedom Valley Drive Oaks, PA 19456 (1978) | Assistant Secretary (since 2013) | Counsel at SEI Investments (since 2012); Associate Counsel and Compliance Officer at The Glendale Trust Company (2011-2012); Associate of Drinker Biddle & Reath LLP (2006-2011). | N/A |
Peter Rodriguez4 One Freedom Valley Drive Oaks, PA 19456 (1962) | Assistant Treasurer (since 2011) | Fund Accounting Director, SEI Investments Global Funds Services (since 2011); Mutual Fund Trading Director, SEI Global Trust Company (2009-2011); Asset Data Services Director, SEI Global Wealth Services (2006-2009). | N/A |
| 1 | Mr. Chichester is currently married to a sister of Mr. del Ama’s wife. While an “immediate family member” (as defined in Section 2(a)(19) of the 1940 Act) of Mr. del Ama would be considered an Interested Person, Mr. Chichester is not considered an immediate family member for this purpose. Although this fact was taken into consideration in determining whether Mr. Chichester should be considered to be an Independent Trustee for purposes of the Section 2(a)(19) of the 1940 Act, it was determined that this relationship was not one that should disqualify Mr. Chichester from serving as an Independent Trustee of the Trust. |
| 2 | Each Trustee serves until his or her successor is duly elected or appointed and qualified. |
| 3 | As of October 31, 2015, the Trust had ninety-one investment portfolios, forty-seven of which were operational. |
| 4 | These officers of the Trust also serve as officers of one or more mutual funds for which SEI Investments Company or an affiliate acts as investment manager, administrator or distributor. |
| NOTICE TO SHAREHOLDERS (unaudited) |
| |
For shareholders that do not have an October 31, 2015 tax year end, this notice is for informational purposes only. For shareholders with an October 31, 2015 tax year end, please consult your tax advisor as to the pertinence of this notice. For the fiscal year ended October 31, 2015, the Funds are designating the following items with regard to distributions paid during the year.
| | | Return of
Capital | | | Long-Term
Capital Gain
Distributions | | | Ordinary
Income
Distributions | | | Total
Distributions | | | Qualifying
for
Corporate
Dividends
Received
Deduction
(1) | | | Qualifying
Dividend
Income (2) | | | U.S.
Government
Interest (3) | | | Interest
Related
Dividends (4) | | | Short Term
Capital
Gain
Dividends(5) | | | Foreign Tax
Credit | |
| Global X SuperDividend® ETF | | | 0.00 | % | | | 2.98 | % | | | 97.02 | % | | | 100.00 | % | | | 0.00 | % | | | 50.75 | % | | | 0.00 | % | | | 0.00 | % | | | 0.00 | % | | | 0.89 | % |
| Global X SuperDividend® U.S. ETF | | | 35.07 | % | | | 0.00 | % | | | 64.93 | % | | | 100.00 | % | | | 75.63 | % | | | 73.56 | % | | | 0.00 | % | | | 0.00 | % | | | 0.00 | % | | | 0.00 | % |
| Global X SuperDividend® Emerging Markets ETF | | | 0.00 | % | | | 0.00 | % | | | 100.00 | % | | | 100.00 | % | | | 0.00 | % | | | 63.34 | % | | | 0.00 | % | | | 0.00 | % | | | 0.00 | % | | | 7.42 | % |
| Global X SuperDividend® REIT ETF | | | 0.00 | % | | | 0.00 | % | | | 100.00 | % | | | 100.00 | % | | | 0.00 | % | | | 2.63 | % | | | 0.00 | % | | | 0.00 | % | | | 0.00 | % | | | 0.00 | % |
| Global X SuperIncome™ Preferred ETF | | | 0.00 | % | | | 0.00 | % | | | 100.00 | % | | | 100.00 | % | | | 73.78 | % | | | 73.67 | % | | | 0.00 | % | | | 14.51 | % | | | 0.00 | % | | | 0.00 | % |
| Global X Social Media Index ETF | | | 0.00 | % | | | 0.00 | % | | | 100.00 | % | | | 100.00 | % | | | 100.00 | % | | | 100.00 | % | | | 0.00 | % | | | 0.00 | % | | | 0.00 | % | | | 0.00 | % |
| Global X | JPMorgan Efficiente Index ETF | | | 0.00 | % | | | 0.00 | % | | | 100.00 | % | | | 100.00 | % | | | 3.95 | % | | | 1.98 | % | | | 0.00 | % | | | 0.01 | % | | | 0.00 | % | | | 0.00 | % |
| Global X | JPMorgan US Sector Rotator Index ETF | | | 0.00 | % | | | 0.00 | % | | | 100.00 | % | | | 100.00 | % | | | 19.68 | % | | | 7.70 | % | | | 0.00 | % | | | 0.02 | % | | | 100.00 | % | | | 0.00 | % |
| Global X Permanent ETF | | | 0.00 | % | | | 0.00 | % | | | 100.00 | % | | | 100.00 | % | | | 42.90 | % | | | 51.05 | % | | | 55.71 | % | | | 9.13 | % | | | 0.00 | % | | | 0.00 | % |
| Global X Guru™ Index ETF | | | 0.00 | % | | | 0.00 | % | | | 100.00 | % | | | 100.00 | % | | | 99.98 | % | | | 98.16 | % | | | 0.00 | % | | | 0.00 | % | | | 0.00 | % | | | 0.00 | % |
| Global X Guru™ Activist Index ETF | | | 0.00 | % | | | 0.00 | % | | | 0.00 | % | | | 0.00 | % | | | 0.00 | % | | | 0.00 | % | | | 0.00 | % | | | 0.00 | % | | | 0.00 | % | | | 0.00 | % |
| Global X Guru™ International Index ETF | | | 0.00 | % | | | 0.00 | % | | | 100.00 | % | | | 100.00 | % | | | 34.99 | % | | | 100.00 | % | | | 0.00 | % | | | 0.00 | % | | | 0.00 | % | | | 16.68 | % |
| Global X GF China Bond ETF | | | 16.08 | % | | | 0.00 | % | | | 83.92 | % | | | 100.00 | % | | | 0.00 | % | | | 0.00 | % | | | 0.00 | % | | | 0.00 | % | | | 100.00 | % | | | 0.00 | % |
| Global X Scientific Beta US ETF | | | 0.00 | % | | | 0.00 | % | | | 0.00 | % | | | 0.00 | % | | | 0.00 | % | | | 0.00 | % | | | 0.00 | % | | | 0.00 | % | | | 0.00 | % | | | 0.00 | % |
| Global X Scientific Beta Europe ETF | | | 0.00 | % | | | 0.00 | % | | | 100.00 | % | | | 100.00 | % | | | 0.00 | % | | | 93.79 | % | | | 0.00 | % | | | 0.00 | % | | | 0.00 | % | | | 100.00 | % |
| Global X Scientific Beta Japan ETF | | | 0.00 | % | | | 0.00 | % | | | 100.00 | % | | | 100.00 | % | | | 0.00 | % | | | 77.36 | % | | | 0.00 | % | | | 0.00 | % | | | 0.00 | % | | | 100.00 | % |
| Global X Scientific Beta Asia ex-Japan ETF | | | 0.00 | % | | | 0.00 | % | | | 100.00 | % | | | 100.00 | % | | | 0.00 | % | | | 39.43 | % | | | 0.00 | % | | | 0.00 | % | | | 0.00 | % | | | 100.00 | % |
| Global X YieldCo Index ETF | | | 0.00 | % | | | 0.00 | % | | | 100.00 | % | | | 100.00 | % | | | 24.15 | % | | | 97.94 | % | | | 0.00 | % | | | 0.00 | % | | | 0.00 | % | | | 0.00 | % |
(1) Qualifying dividends represent dividends which qualify for the corporate dividends received deduction and is reflected as a percentage of ordinary Income distributions (the total of short term capital gain and net investment income distributions).
(2) The percentage in this column represents the amount of "Qualifying Dividend Income" as created by the Jobs and Growth Relief Reconciliation Act of 2003 and its reflected as a percentage of ordinary income distributions (the total of short term capital gain and net investment income distributions). It is the intention of each of the aforementioned funds to designate the maximum amount permitted by law.
(3) U.S. Government Interest represents the amount of interest that was derived from U.S. Government obligations and distributed during the fiscal year. Generally, interest from direct U.S. Government obligations is exempt from state income tax.
(4) The percentage in this column represents the amount of "Qualifying Interest Income" as created by the American Jobs Creation Act of 2004 and is a percentage of net investment income that is exempt from U.S. withholding tax when paid for foreign investors.
(5) The percentage of this column represents the amount of “Short Term Capital Gain Dividend” is reflected as a percentage of short term capital gain distribution that is exempted from U.S. withholding tax when paid to foreign investors.
| NOTICE TO SHAREHOLDERS (unaudited) |
| |
The Funds intend to pass through a foreign tax credit to shareholders. For the fiscal year ended October 31, 2015, the total amount of foreign source income and foreign tax credit are as follows:
| | | Foreign | | | Foreign Tax | |
| | | Source | | | Credit Pass | |
| Global X Funds | | Income | | | through | |
| Global X SuperDividend® ETF | | $ | 31,198,172 | | | $ | 593,759 | |
| Global X SuperDividend® Emerging Markets ETF | | | 167,970 | | | | 8,864 | |
| Global X GuruTM International Index ETF | | | 32,913 | | | | 3,276 | |
| Global X Scientific Beta Europe ETF | | | 32,519 | | | | 1,185 | |
| Global X Scientific Beta Japan ETF | | | 19,279 | | | | 2,959 | |
| Global X Scientific Beta Asia ex-Japan ETF | | | 24,506 | | | | 1,965 | |
The information reported herein may differ from the information and distributions taxable to the shareholders for the calendar year ending December 31, 2015. Complete information will be computed and reported in conjunction with your 2015 Form 1099-DIV.
623 Fifth Avenue, 15th floor
New York, NY 10022
1-888-GXFund-1
(1-888-493-8631)
www.globalxfunds.com
Investment Adviser and Administrator:
Global X Management Company LLC
623 Fifth Avenue, 15th floor
New York, NY 10022
Distributor:
SEI Investments Distribution Co.
One Freedom Valley Drive
Oaks, PA 19456
Sub-Administrator:
SEI Investments Global Funds Services
One Freedom Valley Drive
Oaks, PA 19456
Counsel for Global X Funds and the Independent Trustees:
K&L Gates LLP
1601 K Street N.W.
Washington, DC 20007
Custodian and Transfer Agent:
Brown Brothers Harriman & Co.
50 Post Office Square
Boston, MA 02110
Independent Registered Public Accounting Firm:
Ernst & Young LLP
2005 Market Street
Suite 700
Philadelphia, PA 19103
This information must be preceded or accompanied by a current prospectus for the Funds described.
GLX-AR-003-0500
The registrant has adopted a code of ethics that applies to the registrant’s principal executive officer, principal financial officer, comptroller or principal accounting officer, and any person who performs a similar function.
| Item 3. | Audit Committee Financial Expert. |
(a)(1) The registrant’s board of trustees has determined that the registrant has at least one audit committee financial expert serving on the audit committee.
(a)(2) The audit committee financial expert is Scott Chichester and is independent as defined in Form N-CSR Item 3(a)(2).
| Item 4. | Principal Accountant Fees and Services. |
Fees billed by Ernst & Young LLP in 2015 and 2014 related to the registrant.
In 2015 and 2014, Ernst & Young, LLP billed the registrant aggregate fees for services rendered to the registrant for the last two fiscal years as follows:
| | | | 2015 | | | 2014 | |
| | | | | | | | All fees and
services to
the Trust
that were
pre-
approved | | | | All fees and
services to
service
affiliates that
were pre-
approved | | | | All other
fees and
services to
service
affiliates that
did not
require pre-
approval | | | | All fees and
services to
the Trust
that were
pre-
approved | | | | All fees and
services to
service
affiliates that
were pre-
approved | | | | All other
fees and
services to
service
affiliates that
did not
require pre-
approval | |
| | (a) | | | Audit Fees
| | $ | 575,582 | | | $ | 0 | | | $ | 0 | | | $ | 483,530 | | | $ | 0 | | | $ | 0 | |
| | (b) | | | Audit-Related Fees
| | $ | 0 | | | $ | 0 | | | $ | 0 | | | $ | 0 | | | $ | 0 | | | $ | 0 | |
| | (c) | | | Tax Fees
| | $ | 192,855 | | | $ | 0 | | | $ | 0 | | | $ | 127,725 | | | $ | 0 | | | $ | 0 | |
| | (d) | | | All Other Fees
| | $ | 0 | | | $ | 0 | | | $ | 0 | | | $ | 0 | | | $ | 0 | | | $ | 0 | |
| (e)(2) | Percentage of fees billed applicable to non-audit services pursuant to waiver of pre-approval requirement were as follows for Ernst & Young LLP in 2015 and 2014: |
| | | 2015 | | | 2014 | |
Audit-Related Fees
| | | 0 | % | | | 0 | % |
| Tax Fees | | | 0 | % | | | 0 | % |
All Other Fees
| | | 0 | % | | | 0 | % |
(f) Not applicable.
(g The aggregate non-audit fees and services billed by Ernst & Young, LLP in 2015 and 2014 for the last two fiscal years were $192,855 and $127,725, respectively.
(h) During the past fiscal year, all non-audit services provided by registrant’s principal accountant to either registrant’s investment adviser or to any entity controlling, controlled by, or under common control with registrant’s investment adviser that provides ongoing services to registrant were pre-approved by the audit committee of registrant’s Board of Trustees. Included in the audit committee’s pre-approval was the review and consideration as to whether the provision of these non-audit services is compatible with maintaining the principal accountant’s independence.
Item 5. Audit Committee of Listed Registrants.
Not applicable to open-end management investment companies.
Item 6. Schedule of Investments.
Not applicable.
Item 7. Disclosure of Proxy Voting Policies and Procedures for Closed-End Management Investment Companies.
Not applicable to open-end management investment companies.
Item 8. Portfolio Managers of Closed-End Management Investment Companies.
Not applicable to open-end management investment companies. Effective for closed-end management investment companies for fiscal years ending on or after December 31, 2005.
Item 9. Purchases of Equity Securities by Closed-End Management Company and Affiliated Purchasers.
Not applicable to open-end management investment companies.
Item 10. Submission of Matters to a Vote of Security Holders.
There have been no material changes.
Item 11. Controls and Procedures.
(a) The certifying officers, whose certifications are included herewith, have evaluated the registrant’s disclosure controls and procedures within 90 days of the filing date of this report. In their opinion, based on their evaluation, the registrant’s disclosure controls and procedures are adequately designed, and are operating effectively to ensure, that information required to be disclosed by the registrant in the reports it files or submits under the Securities Exchange Act of 1934 is recorded, processed, summarized and reported within the time periods specified in the Securities and Exchange Commission’s rules and forms.
(b) There were no significant changes in the registrant’s internal control over financial reporting that occurred during the second fiscal quarter of the period covered by this report that has materially affected, or is reasonably likely to materially affect, the registrants internal control over financial reporting.
Items 12. Exhibits.
(a)(1) Code of Ethics attached hereto.
(a)(2) A separate certification for the principal executive officer and the principal financial officer of the registrant as required by Rule 30a-2(a) under the Investment Company Act of 1940, as amended (17 CFR 270.30a-2(a)), are filed herewith.
(b) Officer certifications as required by Rule 30a-2(b) under the Investment Company Act of 1940, as amended (17 CFR 270.30a-2(b)) also accompany this filing as an Exhibit.
SIGNATURES
Pursuant to the requirements of the Securities Exchange Act of 1934 and the Investment Company Act of 1940, the registrant has duly caused this report to be signed on its behalf by the undersigned, thereunto duly authorized.
| (Registrant) | Global X Funds |
| | |
| By (Signature and Title)* | /s/ Bruno del Ama |
| | Bruno del Ama |
| | President |
Date: January 8, 2016
Pursuant to the requirements of the Securities Exchange Act of 1934 and the Investment Company Act of 1940, this report has been signed below by the following persons on behalf of the registrant and in the capacities and on the dates indicated.
| By (Signature and Title)* | /s/ Bruno del Ama |
| | Bruno del Ama |
| | President |
| | |
| Date: January 8, 2016 | |
| | |
| By (Signature and Title)* | /s/ Luis Berruga |
| | Luis Berruga |
| | Chief Financial Officer |
Date: January 8, 2016
| * | Print the name and title of each signing officer under his or her signature. |