UNITED STATES
SECURITIES AND EXCHANGE COMMISSION
Washington, D.C. 20549
FORM N-CSR
CERTIFIED SHAREHOLDER REPORT OF REGISTERED MANAGEMENT
INVESTMENT COMPANIES
Investment Company Act file number 811-22209
Global X Funds
(Exact name of registrant as specified in charter)
623 Fifth Avenue, 15th Floor
New York, NY 10022
(Address of principal executive offices) (Zip code)
Bruno del Ama
Global X Management Company LLC
600 Lexington Ave, 20th Floor
New York, NY 10022
(Name and address of agent for service)
With a copy to:
| Daphne Tippens Chisolm, Esq. | Eric S. Purple, Esq. |
| Global X Management Company LLC | Stradley Ronon Stevens & Young, LLP |
| 600 Lexington Ave, 20th Floor | 1250 Connecticut Avenue, N.W. |
| New York, NY 10022 | Suite 500 |
| | Washington, DC 20036 |
Registrant’s telephone number, including area code: (212) 644-6440
Date of fiscal year end: October 31, 2016
Date of reporting period: October 31, 2016
| Item 1. | Reports to Stockholders. |

Global X Silver Miners ETF (ticker: SIL)
Global X Gold Explorers ETF (ticker: GOEX)
Global X Copper Miners ETF (ticker: COPX)
Global X Uranium ETF (ticker: URA)
Global X Lithium ETF (ticker: LIT)
Global X Fertilizers/Potash ETF (ticker: SOIL)
Annual Report
October 31, 2016
Shares are bought and sold at market price (not NAV) and are not individually redeemed from the Fund. Shares may only be redeemed directly from a fund by Authorized Participants, in very large creation/redemption units. Brokerage commissions will reduce returns.
The Funds file their complete schedules of Fund holdings with the Securities and Exchange Commission (the “Commission”) for the first and third quarters of each fiscal year on Form N-Q within sixty days after the end of the period. The Funds’ Forms N-Q are available on the Commission’s website at http://www.sec.gov, and may be reviewed and copied at the Commission's Public Reference Room in Washington, DC. Information on the operation of the Public Reference Room may be obtained by calling 1-800-SEC-0330.
A description of the policies and procedures that Global X Funds uses to determine how to vote proxies relating to Fund securities, as well as information relating to how the Funds voted proxies relating to Fund securities during the most recent 12-month period ended June 30, is available (i) without charge, upon request, by calling 1-888-GXFund-1; and (ii) on the Commission’s website at http://www.sec.gov.
| Management Discussion of Fund Performance (unaudited) |
| Global X Silver Miners ETF |
Global X Silver Miners ETF
The Global X Silver Miners ETF (“Fund”) seeks to provide investment results that correspond generally to the price and yield performance, before fees and expenses, of the Solactive Global Silver Miners Total Return Index (“Underlying Index”). The Fund is passively managed, which means the investment adviser does not attempt to take defensive positions in declining markets. The Fund generally seeks to fully replicate the Underlying Index.
The Underlying Index is designed to measure broad-based equity market performance of global companies involved in the silver mining industry, as defined by the index provider.
For the 12-month period ended October 31, 2016 (the “reporting period”), the Fund increased 95.69%, while the Underlying Index increased 97.09%. The Fund had a net asset value of $20.83 per share on October 31, 2015 and ended the reporting period with a net asset value of $40.61 on October 31, 2016.
During the reporting period, the highest returns came from Coeur d’Alene Mines and Bear Creek Mining which returned 314.07% and 271.23%, respectively. The worst performers were Primero Mining and Great Panther Silver which returned
-41.3% and -15.08%, respectively.
After falling to a near six year low at the end of 2015, silver prices rebounded sharply in the first half of 2016. The uptrend in prices was driven by dovish central bank policies around the world, which continued the trend of keeping interest rates low. With low rates, the opportunity cost for holding non-yield bearing asset classes, like precious metals remained low. In addition, heighted geopolitical risks around the world drove additional investor assets towards precious metals as a store of value. The profitability and therefore the performance of silver mining companies tends to be leveraged to changes in spot silver prices. Therefore, as the underlying commodity benefited from the macro environment, silver mining stocks benefited disproportionately.
| | | AVERAGE ANNUAL TOTAL RETURN FOR THE YEAR ENDED OCTOBER 31, 2016 | |
| | | One Year Return | | | Three Year Return | | | Five Year Return | | | Annualized Inception to Date* | |
| | | Net Asset Value | | | Market Price | | | Net Asset Value | | | Market Price | | | Net Asset Value | | | Market Price | | | Net Asset Value | | | Market Price | |
| Global X Silver Miners ETF | | | 95.69 | % | | | 96.00 | % | | | 2.05 | % | | | 2.01 | % | | | -10.18 | % | | | -10.35 | % | | | -0.58 | % | | | -0.58 | % |
| Solactive Global Silver Miners Total Return Index | | | 97.09 | % | | | 97.09 | % | | | 2.56 | % | | | 2.56 | % | | | -9.64 | % | | | -9.64 | % | | | 0.01 | % | | | 0.01 | % |
| S&P 500 Index | | | 4.51 | % | | | 4.51 | % | | | 8.84 | % | | | 8.84 | % | | | 13.57 | % | | | 13.57 | % | | | 11.51 | % | | | 11.51 | % |
Growth of a $10,000 Investment
(at Net Asset Value)
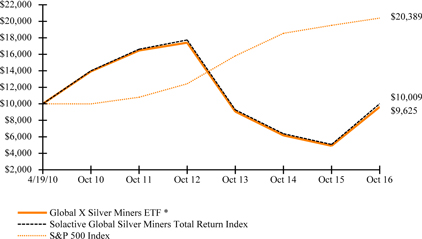
*Fund commenced operations on April 19, 2010.
The S&P 500 Index is a market capitalization-weighted composite index of 500 large capitalization U.S. companies.
The performance data quoted herein represents past performance and the return and value of an investment in the Fund will fluctuate so that, when redeemed, it may be worth less than its original cost. Past performance is no guarantee of future performance and should not be considered as a representation of the future results of the Fund. The Fund's performance assumes the reinvestment of all dividends and all capital gains. Index returns assume reinvestment of dividends and, unlike a Fund's returns, do not reflect any fees or expenses. If such fees and expenses were included in the index returns, the performance would have been lower. Please note that one cannot invest directly in an unmanaged index.
There are no assurances that the Fund will meet its stated objectives.
| Management Discussion of Fund Performance (unaudited) |
| Global X Silver Miners ETF |
The Fund’s holdings and allocations are subject to change and should not be considered recommendations to buy individual securities.
The graph and table do not reflect the deduction of taxes that a shareholder would pay on Fund distribution or the redemption or sale of Fund shares.
See definition of comparative indices above and on previous page.
| Management Discussion of Fund Performance (unaudited) |
| Global X Gold Explorers ETF |
Global X Gold Explorers ETF
The Global X Gold Explorers ETF (“Fund”) seeks to provide investment results that correspond generally to the price and yield performance, before fees and expenses, of the Solactive Global Gold Explorers Total Return Index (“Underlying Index”). The Fund is passively managed, which means the investment adviser does not attempt to take defensive positions in declining markets. The Fund generally seeks to fully replicate the Underlying Index.
The Underlying Index is a free float-adjusted, liquidity-tested and market capitalization-weighted index that is designed to measure broad-based equity market performance of global companies involved in gold exploration, as defined by the index provider.
For the 12-month period ended October 31, 2016 (the “reporting period”), the Fund increased 95.95%, while the Underlying Index increased 97.26%. The Fund had a net asset value of $19.89 per share on October 31, 2015 and ended the reporting period with a net asset value of $34.95 on October 31, 2016.
During the reporting period, the highest returns came from International Tower Hill Mines and Gryphon Minerals which returned 360.35% and 301.79%, respectively. The worst performers were the two Rubicon Minerals stocks, which returned -98.58% and -90.6%.
By the end of 2015, gold prices had reached nearly a 6-year low, which put significant pressure on the gold exploration industry, which tends to benefit from higher gold prices. In early 2016, however, gold prices began to rebound sharply as geopolitical and economic uncertainties came to the forefront, such as the Brexit vote, central bank stimulus packages, and the U.S. presidential elections. Furthermore, increasing demand for physical gold and a weaker U.S. Dollar also supported gold prices during the reporting period. Gold exploration companies are highly sensitive to gold prices, and the increasing value of the yellow metal during the reporting period was a strong contributor of the positive performance of the Fund.
| | | AVERAGE ANNUAL TOTAL RETURN FOR THE YEAR ENDED OCTOBER 31, 2016 | |
| | | One Year Return | | | Three Year Return | | | Five Year Return | | | Annualized Inception to
Date* | |
| | | Net Asset
Value | | | Market Price | | | Net Asset
Value | | | Market Price | | | Net Asset
Value | | | Market Price | | | Net Asset
Value | | | Market Price | |
| Global X Gold Explorers ETF | | | 95.95 | % | | | 90.60 | % | | | 13.12 | % | | | 12.06 | % | | | -17.01 | % | | | -17.22 | % | | | -16.50 | % | | | -16.63 | % |
| Solactive Global Gold Explorers Total Return Index | | | 97.26 | % | | | 97.26 | % | | | 13.86 | % | | | 13.86 | % | | | -16.03 | % | | | -16.03 | % | | | -15.81 | % | | | -15.81 | % |
| S&P 500 Index | | | 4.51 | % | | | 4.51 | % | | | 8.84 | % | | | 8.84 | % | | | 13.57 | % | | | 13.57 | % | | | 12.40 | % | | | 12.40 | % |
Growth of a $10,000 Investment
(at Net Asset Value)
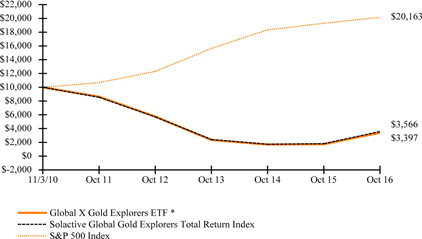
*Fund commenced operations on November 3, 2010.
The S&P 500 Index is a market capitalization-weighted composite index of 500 large capitalization U.S. companies.
The performance data quoted herein represents past performance and the return and value of an investment in the Fund will fluctuate so that, when redeemed, it may be worth less than its original cost. Past performance is no guarantee of future performance and should not be considered as a representation of the future results of the Fund. The Fund's performance assumes the reinvestment of all dividends and all capital gains. Index returns assume reinvestment of dividends and, unlike a Fund's returns, do not reflect any fees or expenses. If such fees and expenses were included in the index returns, the performance would have been lower. Please note that one cannot invest directly in an unmanaged index.
| Management Discussion of Fund Performance (unaudited) |
| Global X Gold Explorers ETF |
There are no assurances that the Fund will meet its stated objectives.
The Fund’s holdings and allocations are subject to change and should not be considered recommendations to buy individual securities.
The graph and table do not reflect the deduction of taxes that a shareholder would pay on Fund distribution or the redemption or sale of Fund shares.
See definition of comparative indices above and on previous page.
| Management Discussion of Fund Performance (unaudited) |
| Global X Copper Miners ETF |
Global X Copper Miners ETF
The Global X Copper Miners ETF (“Fund”) seeks to provide investment results that correspond generally to the price and yield performance, before fees and expenses, of the Solactive Global Copper Miners Total Return Index (“Underlying Index”). The Fund is passively managed, which means the investment adviser does not attempt to take defensive positions in declining markets. The Fund generally seeks to fully replicate the Underlying Index.
The Underlying Index is designed to measure broad-based equity market performance of global companies involved in the copper mining industry, as defined by the index provider.
For the 12-month period ended October 31, 2016 (the “reporting period”), the Fund increased 18.88%, while the Underlying Index increased 20.21%. The Fund had a net asset value of $14.98 per share on October 31, 2015 and ended the reporting period with a net asset value of $17.60 on October 31, 2016.
During the reporting period, the highest returns came from Teck Resources and KAZ Minerals, which returned 273.91% and 94.74%, respectively. The worst performers were Imperial Metals and KGHM Polska Miedz, which returned -36.52% and -21.01%, respectively.
The performance of copper mining companies tends to be highly correlated to changes in copper prices. In Q1 2016, spot copper prices reached multi-years lows given concerns around global growth, particularly in China, which is a major consumer of raw copper. Copper is used extensively in wiring for vehicles, heavy machinery, and telecommunication networks. Later in the reporting period, broad commodity prices recovered as fears over a hard landing in Chinese economic growth abated, which provided support for a recovery in copper prices. Subsequently, copper mining companies rallied on expectations of higher future profitability.
| | | AVERAGE ANNUAL TOTAL RETURN FOR THE YEAR ENDED OCTOBER 31, 2016 | |
| | | One Year Return | | | Three Year Return | | | Five Year Return | | | Annualized Inception to Date* | |
| | | Net Asset Value | | | Market Price | | | Net Asset Value | | | Market Price | | | Net Asset Value | | | Market Price | | | Net Asset Value | | | Market Price | |
| Global X Copper Miners ETF | | | 18.88 | % | | | 16.77 | % | | | -14.54 | % | | | -14.37 | % | | | -14.60 | % | | | -14.47 | % | | | -10.84 | % | | | -10.84 | % |
| Solactive Global Copper Miners Total Return Index | | | 20.21 | % | | | 20.21 | % | | | -14.10 | % | | | -14.10 | % | | | -14.41 | % | | | -14.41 | % | | | -10.56 | % | | | -10.56 | % |
| S&P 500 Index | | | 4.51 | % | | | 4.51 | % | | | 8.84 | % | | | 8.84 | % | | | 13.57 | % | | | 13.57 | % | | | 11.51 | % | | | 11.51 | % |
Growth of a $10,000 Investment
(at Net Asset Value)
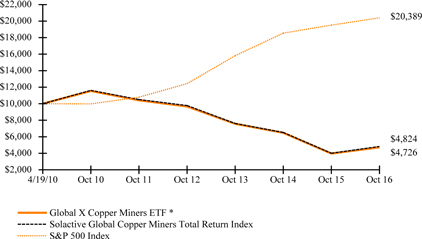
*Fund commenced operations on April 19, 2010.
The S&P 500 Index is a market capitalization-weighted composite index of 500 large capitalization U.S. companies.
The performance data quoted herein represents past performance and the return and value of an investment in the Fund will fluctuate so that, when redeemed, it may be worth less than its original cost. Past performance is no guarantee of future performance and should not be considered as a representation of the future results of the Fund. The Fund's performance assumes the reinvestment of all dividends and all capital gains. Index returns assume reinvestment of dividends and, unlike a Fund's returns, do not reflect any fees or expenses. If such fees and expenses were included in the index returns, the performance would have been lower. Please note that one cannot invest directly in an unmanaged index.
There are no assurances that the Fund will meet its stated objectives.
The Fund’s holdings and allocations are subject to change and should not be considered recommendations to buy individual securities.
| Management Discussion of Fund Performance (unaudited) |
| Global X Copper Miners ETF |
The graph and table do not reflect the deduction of taxes that a shareholder would pay on Fund distribution or the redemption or sale of Fund shares.
See definition of comparative indices above and on previous page.
| Management Discussion of Fund Performance (unaudited) |
| Global X Uranium ETF |
Global X Uranium ETF
The Global X Uranium ETF (“Fund”) seeks to provide investment results that correspond generally to the price and yield performance, before fees and expenses, of the Solactive Global Uranium Total Return Index (“Underlying Index”). The Fund is passively managed, which means the investment adviser does not attempt to take defensive positions in declining markets. The Fund generally seeks to fully replicate the Underlying Index.
The Underlying Index is designed to measure broad-based equity market performance of global companies involved in the uranium industry, as defined by the index provider.
For the 12-month period ended October 31, 2016 (the “reporting period”), the Fund decreased 17.53%, while the Underlying Index decreased 16.42%. The Fund had a net asset value of $14.94 per share on October 31, 2015 and ended the reporting period with a net asset value of $12.08 on October 31, 2016.
During the reporting period, the highest returns came from Greenland Minerals and Energy and NexGen Energy, which returned 219.97% and 115.3%, respectively. The worst performers were Uranium Resources and Peninsula Energy, which returned -83.96% and -48.84%, respectively.
Uranium prices came under pressure during the reporting period, given high levels of supply of the commodity in the market. Some of this is due to high stocks of uranium from decommissions weapons, but demand has also suffered as Japan’s uranium consumption remains stifled after the Fukushima disaster, and other countries like Germany are phasing out nuclear power generation. The longer term outlook for the uranium market appears stronger given Japan’s return to nuclear power generation and greater focus on nuclear power from emerging markets like China and India, which have massive power demands but are concerned about air quality.
| | | AVERAGE ANNUAL TOTAL RETURN FOR THE YEAR ENDED OCTOBER 31, 2016 | |
| | | One Year Return | | | Three Year Return | | | Five Year Return | | | Annualized Inception to
Date* | |
| | | Net Asset
Value | | | Market Price | | | Net Asset
Value | | | Market Price | | | Net Asset
Value | | | Market Price | | | Net Asset
Value | | | Market Price | |
| Global X Uranium ETF | | | -17.53 | % | | | -16.64 | % | | | -23.57 | % | | | -23.78 | % | | | -26.29 | % | | | -26.22 | % | | | -28.57 | % | | | -28.52 | % |
| Solactive Global Uranium Total Return Index | | | -16.42 | % | | | -16.42 | % | | | -21.77 | % | | | -21.77 | % | | | -25.88 | % | | | -25.88 | % | | | -28.12 | % | | | -28.12 | % |
| S&P 500 Index | | | 4.51 | % | | | 4.51 | % | | | 8.84 | % | | | 8.84 | % | | | 13.57 | % | | | 13.57 | % | | | 12.05 | % | | | 12.05 | % |
Growth of a $10,000 Investment
(at Net Asset Value)
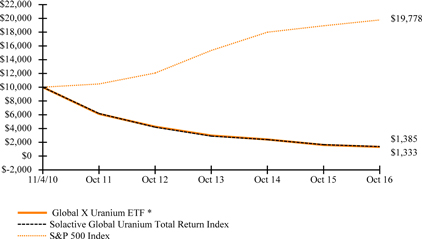
*Fund commenced operations on November 4, 2010.
The S&P 500 Index is a market capitalization-weighted composite index of 500 large capitalization U.S. companies.
The performance data quoted herein represents past performance and the return and value of an investment in the Fund will fluctuate so that, when redeemed, it may be worth less than its original cost. Past performance is no guarantee of future performance and should not be considered as a representation of the future results of the Fund. The Fund's performance assumes the reinvestment of all dividends and all capital gains. Index returns assume reinvestment of dividends and, unlike a Fund's returns, do not reflect any fees or expenses. If such fees and expenses were included in the index returns, the performance would have been lower. Please note that one cannot invest directly in an unmanaged index.
There are no assurances that the Fund will meet its stated objectives.
| Management Discussion of Fund Performance (unaudited) |
| Global X Uranium ETF |
The Fund’s holdings and allocations are subject to change and should not be considered recommendations to buy individual securities.
The graph and table do not reflect the deduction of taxes that a shareholder would pay on Fund distribution or the redemption or sale of Fund shares.
See definition of comparative indices above and on previous page.
| Management Discussion of Fund Performance (unaudited) |
| Global X Lithium ETF |
Global X Lithium ETF
The Global X Lithium ETF (“Fund”) seeks to provide investment results that correspond generally to the price and yield performance, before fees and expenses, of the Solactive Global Lithium Index (“Underlying Index”). The Fund is passively managed, which means the investment adviser does not attempt to take defensive positions in declining markets. The Fund generally seeks to fully replicate the Underlying Index.
The Underlying Index is designed to measure broad-based equity market performance of global companies involved in the lithium industry, as defined by the index provider.
For the 12-month period ended October 31, 2016 (the “reporting period”), the Fund increased 16.76%, while the Underlying Index increased 17.57%. The Fund had a net asset value of $20.62 per share on October 31, 2015 and ended the reporting period with a net asset value of $24.02 on October 31, 2016.
During the reporting period, the highest returns came from Galaxy Resources and Orocobre, which returned 384.81% and 127.58%, respectively. The worst performers were Blue Solutions and China BAK Battery, which returned -46.32% and -42.81%, respectively.
Demand for lithium has continued to grow as its use in state of the art batteries for electric vehicles, mobile electronics and renewable energy have made it an increasingly important commodity for transportation, telecommunications, and energy storage. While lithium broadly benefited from the general rebound in commodity prices during the reporting period, there has been additional optimism around the adoption of electric vehicles by mainstream consumers. Demand for electric vehicles has grown rapidly, not just among affluent consumers in the US, but among emerging markets like China and India, where simplicity, efficiency, and low emissions are increasingly becoming important features.
| | | AVERAGE ANNUAL TOTAL RETURN FOR THE YEAR ENDED OCTOBER 31, 2016 | |
| | | One Year Return | | | Three Year Return | | | Five Year Return | | | Annualized Inception to Date* | |
| | | Net Asset Value | | | Market Price | | | Net Asset Value | | | Market Price | | | Net Asset Value | | | Market Price | | | Net Asset Value | | | Market Price | |
| Global X Lithium ETF | | | 16.76 | % | | | 16.47 | % | | | -1.93 | % | | | -1.97 | % | | | -4.67 | % | | | -4.41 | % | | | -3.17 | % | | | -3.12 | % |
| Solactive Global Lithium Index | | | 17.57 | % | | | 17.57 | % | | | -0.74 | % | | | -0.74 | % | | | -4.04 | % | | | -4.04 | % | | | -2.39 | % | | | -2.39 | % |
| S&P 500 Index | | | 4.51 | % | | | 4.51 | % | | | 8.84 | % | | | 8.84 | % | | | 13.57 | % | | | 13.57 | % | | | 13.54 | % | | | 13.54 | % |
Growth of a $10,000 Investment
(at Net Asset Value)
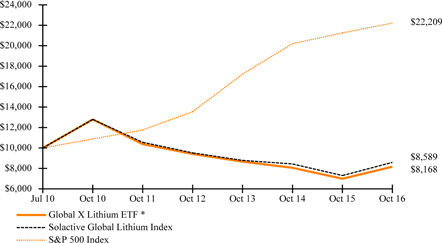
*Fund commenced operations on July 22, 2010.
The S&P 500 Index is a market capitalization-weighted composite index of 500 large capitalization U.S. companies.
The performance data quoted herein represents past performance and the return and value of an investment in the Fund will fluctuate so that, when redeemed, it may be worth less than its original cost. Past performance is no guarantee of future performance and should not be considered as a representation of the future results of the Fund. The Fund's performance assumes the reinvestment of all dividends and all capital gains. Index returns assume reinvestment of dividends and, unlike a Fund's returns, do not reflect any fees or expenses. If such fees and expenses were included in the index returns, the performance would have been lower. Please note that one cannot invest directly in an unmanaged index.
There are no assurances that the Fund will meet its stated objectives.
The Fund’s holdings and allocations are subject to change and should not be considered recommendations to buy individual securities.
| Management Discussion of Fund Performance (unaudited) |
| Global X Lithium ETF |
The graph and table do not reflect the deduction of taxes that a shareholder would pay on Fund distribution or the redemption or sale of Fund shares.
See definition of comparative indices above and on previous page.
| Management Discussion of Fund Performance (unaudited) |
| Global X Fertilizers/Potash ETF |
Global X Fertilizers/Potash ETF
The Global X Fertilizers/Potash ETF (“Fund”) seeks to provide investment results that correspond generally to the price and yield performance, before fees and expenses, of the Solactive Global Fertilizers/Potash Total Return Index (“Underlying Index”). The Fund is passively managed, which means the investment adviser does not attempt to take defensive positions in declining markets. The Fund generally seeks to fully replicate the Underlying Index.
The Underlying Index is designed to track the performance of the largest listed companies globally that are active in some aspect of the fertilizer/potash industry, as defined by the index provider.
For the 12-month period ended October 31, 2016 (the “reporting period”), the Fund decreased 11.15%, while the Underlying Index decreased 11.13%. The Fund had a net asset value of $9.98 per share on October 31, 2015 and ended the reporting period with a net asset value of $8.56 on October 31, 2016.
During the reporting period, the highest returns came from Sirius Minerals and Sociedad Quimica Y Minera De Chile, which returned 66.54% and 57.13%, respectively. The worst performers were Intrepid Potash and OCI, which returned -67.1% and -51.2%, respectively.
The fertilizers and potash market experienced significant price declines during the period, due in part to delays by China in signing key supply contracts and a flooding of the market with too much supply. North America and Europe are the two major regions for potash and fertilizer production, while China, India and Brazil are the key importers. This dynamic can make the industry sensitive to fluctuations in exchange rates, trade policies, and emerging market growth rates. The expansion of fertilizer production projects, the delay in buyer purchases and falling incomes from farms all contributed to the pressure on fertilizer prices during the period.
| | | AVERAGE ANNUAL TOTAL RETURN FOR THE YEAR ENDED OCTOBER 31, 2016 | |
| | | One Year Return | | | Three Year Return | | | Five Year Return | | | Annualized Inception to Date* | |
| | | Net Asset Value | | | Market Price | | | Net Asset Value | | | Market Price | | | Net Asset Value | | | Market Price | | | Net Asset Value | | | Market Price | |
| Global X Fertilizers/Potash ETF | | | -11.15 | % | | | -10.18 | % | | | -7.69 | % | | | -7.45 | % | | | -7.70 | % | | | -7.56 | % | | | -8.27 | % | | | -8.17 | % |
| Solactive Global Fertilizers/Potash Total Return Index | | | -11.13 | % | | | -11.13 | % | | | -7.48 | % | | | -7.48 | % | | | -7.51 | % | | | -7.51 | % | | | -8.02 | % | | | -8.02 | % |
| S&P 500 Index | | | 4.51 | % | | | 4.51 | % | | | 8.84 | % | | | 8.84 | % | | | 13.57 | % | | | 13.57 | % | | | 11.51 | % | | | 11.51 | % |
Growth of a $10,000 Investment
(at Net Asset Value)
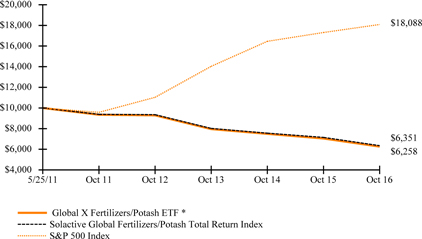
*Fund commenced operations on May 25, 2011.
The S&P 500 Index is a market capitalization-weighted composite index of 500 large capitalization U.S. companies.
The performance data quoted herein represents past performance and the return and value of an investment in the Fund will fluctuate so that, when redeemed, it may be worth less than its original cost. Past performance is no guarantee of future performance and should not be considered as a representation of the future results of the Fund. The Fund's performance assumes the reinvestment of all dividends and all capital gains. Index returns assume reinvestment of dividends and, unlike a Fund's returns, do not reflect any fees or expenses. If such fees and expenses were included in the index returns, the performance would have been lower. Please note that one cannot invest directly in an unmanaged index.
There are no assurances that the Fund will meet its stated objectives.
The Fund’s holdings and allocations are subject to change and should not be considered recommendations to buy individual securities.
| Management Discussion of Fund Performance (unaudited) |
| Global X Fertilizers/Potash ETF |
The graph and table do not reflect the deduction of taxes that a shareholder would pay on Fund distribution or the redemption or sale of Fund shares.
See definition of comparative indices above and on previous page.
| Schedule of Investments | October 31, 2016 |
| Global X Silver Miners ETF |
Sector Weightings (unaudited)†:

† Sector weightings percentages are based on the total market value of investments. Repurchase agreements purchased from cash collateral received for securities lending activity are included in total investments. Please see Notes 2 and 7 in Notes to Financial Statements for more detailed information.
| | | Shares | | | Value | |
| COMMON STOCK — 99.7% |
| CANADA— 24.4% | | | | | | | | |
| Basic Materials — 24.4% | | | | | | | | |
| Alexco Resource * | | | 238,300 | | | $ | 414,280 | |
| AuRico Metals * | | | 1,169,231 | | | | 1,073,049 | |
| AuRico Metals^ * (A) | | | 533,199 | | | | 495,875 | |
| Bear Creek Mining * (A) | | | 1,112,438 | | | | 2,241,062 | |
| Excellon Resources * | | | 94,300 | | | | 119,612 | |
| First Majestic Silver * (A) | | | 1,878,556 | | | | 15,095,727 | |
| Fortuna Silver Mines * | | | 1,759,550 | | | | 12,038,854 | |
| Great Panther Silver * | | | 1,892,560 | | | | 2,584,133 | |
| Klondex Mines, Cl Common Subscription Receipt * | | | 741,800 | | | | 4,090,209 | |
| Primero Mining * (A) | | | 2,226,588 | | | | 3,006,994 | |
| Silvercorp Metals * (A) | | | 2,376,139 | | | | 6,177,961 | |
| Tahoe Resources | | | 3,761,260 | | | | 45,126,701 | |
| TOTAL CANADA | | | | | | | 92,464,457 | |
| MEXICO— 8.1% | | | | | | | | |
| Basic Materials — 8.1% | | | | | | | | |
| Industrias Penoles | | | 1,266,913 | | | | 30,801,327 | |
| UNITED KINGDOM— 19.3% | | | | | | | | |
| Basic Materials — 19.3% | | | | | | | | |
| Fresnillo | | | 2,295,758 | | | | 45,967,294 | |
| Hochschild Mining | | | 2,802,871 | | | | 9,119,674 | |
| Polymetal International | | | 1,677,921 | | | | 18,252,745 | |
| TOTAL UNITED KINGDOM | | | | | | | 73,339,713 | |
| UNITED STATES— 47.9% | | | | | | | | |
| Basic Materials — 47.9% | | | | | | | | |
| Alamos Gold, Cl A | | | 2,263,432 | | | | 17,767,941 | |
| Coeur d'Alene Mines * | | | 1,907,479 | | | | 21,325,615 | |
| Endeavour Silver * (A) | | | 1,611,453 | | | | 7,090,393 | |
| Hecla Mining | | | 3,864,158 | | | | 23,146,306 | |
| MAG Silver * | | | 1,073,245 | | | | 15,701,574 | |
| McEwen Mining (A) | | | 2,914,750 | | | | 9,472,938 | |
| Pan American Silver | | | 1,537,726 | | | | 24,649,748 | |
| Silver Standard Resources * | | | 1,415,409 | | | | 15,512,883 | |
The accompanying notes are an integral part of the financial statements.
| Schedule of Investments | October 31, 2016 |
| Global X Silver Miners ETF |
| | | Shares/Face
Amount | | | Value | |
| COMMON STOCK — continued |
| Basic Materials — continued | | | | | | | | |
| Silver Wheaton | | | 1,961,432 | | | $ | 47,290,126 | |
| TOTAL UNITED STATES | | | | | | | 181,957,524 | |
| TOTAL COMMON STOCK | | | | | | | | |
| (Cost $334,080,408) | | | | | | | 378,563,021 | |
| | | | | | | | | |
| REPURCHASE AGREEMENTS — 3.0% |
| Barclays Bank | | | | | | | | |
| 0.320%, dated 10/31/16, to be repurchased on 11/01/16 repurchase price $10,000,089 (collateralized by U.S Treasury Obligations, ranging in par value $1-$3,479,661, 0.000%-4.750%, 11/15/16-05/15/46, with a total market value of $10,200,000)(B) | | $ | 10,000,000 | | | | 10,000,000 | |
| Deutsche Bank | | | | | | | | |
| 0.350%, dated 10/31/16, to be repurchased on 11/01/16 repurchase price $1,205,567 (collateralized by U.S. Treasury Obligations, par value $1,121,100, 3.000%, 05/15/45 with a total market value of $1,234,992)(B) | | | 1,205,555 | | | | 1,205,555 | |
| TOTAL REPURCHASE AGREEMENTS | | | | | | | | |
| (Cost $11,205,555) | | | | | | | 11,205,555 | |
| TOTAL INVESTMENTS — 102.7% | | | | | | | | |
| (Cost $345,285,963) | | | | | | $ | 389,768,576 | |
Percentages are based on Net Assets of $379,617,292.
| * | Non-income producing security. |
| ^ | Traded on U.S. stock exchange |
| (A) | This security or a partial position of this security is on loan as of October 31, 2016. The total value of securities on loan as of October 31, 2016 was $10,710,032. |
| (B) | Security was purchased with cash collateral held from securities on loan. The total value of such securities as of October 31, 2016 was $11,205,555. |
Cl — Class
The following is a summary of the inputs used as of October 31, 2016, in valuing the Fund's investments carried at value:
| Investments in Securities | | Level 1 | | | Level 2 | | | Level 3 | | | Total | |
| Common Stock | | $ | 378,563,021 | | | $ | — | | | $ | — | | | $ | 378,563,021 | |
| Repurchase Agreements | | | — | | | | 11,205,555 | | | | — | | | | 11,205,555 | |
| Total Investments in Securities | | $ | 378,563,021 | | | $ | 11,205,555 | | | $ | — | | | $ | 389,768,576 | |
For the year ended October 31, 2016, there have been no transfers between Level 1, Level 2 and Level 3 investments.
As of October 31, 2016, there were no Level 3 investments.
The accompanying notes are an integral part of the financial statements.
| Schedule of Investments | October 31, 2016 |
| Global X Gold Explorers ETF |
Sector Weightings (unaudited)†:
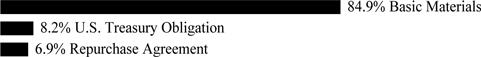
† Sector weightings percentages are based on the total market value of investments. Repurchase agreements purchased from cash collateral received for securities lending activity are included in total investments. Please see Notes 2 and 7 in Notes to Financial Statements for more detailed information.
| | | Shares/Face
Amount | | | Value | |
| COMMON STOCK — 99.9% |
| AUSTRALIA— 10.3% | | | | | | | | |
| Basic Materials — 10.3% | | | | | | | | |
| Gold Road Resources * | | | 5,542,806 | | | $ | 2,383,050 | |
| Teranga Gold * | | | 6,056,776 | | | | 5,023,693 | |
| TOTAL AUSTRALIA | | | | | | | 7,406,743 | |
| CANADA— 80.5% | | | | | | | | |
| Basic Materials — 80.5% | | | | | | | | |
| Asanko Gold * | | | 979,624 | | | | 3,618,085 | |
| Atac Resources * | | | 5,010,501 | | | | 2,056,165 | |
| Chesapeake Gold * | | | 1,027,032 | | | | 3,448,345 | |
| Continental Gold * | | | 711,209 | | | | 1,958,113 | |
| Exeter Resource * (A) | | | 3,971,463 | | | | 4,592,999 | |
| First Mining Finance * (A) | | | 16,146,208 | | | | 9,878,672 | |
| Guyana Goldfields * | | | 577,532 | | | | 3,399,909 | |
| International Tower Hill Mines * (A) (B) | | | 6,042,874 | | | | 4,553,854 | |
| Lydian International, Cl Common Subscription Receipt * | | | 4,087,460 | | | | 1,219,910 | |
| OceanaGold | | | 1,414,244 | | | | 4,326,357 | |
| Premier Gold Mines * | | | 1,084,033 | | | | 2,280,898 | |
| Pretium Resources * | | | 325,478 | | | | 3,183,747 | |
| Roxgold * | | | 4,563,960 | | | | 5,107,957 | |
| Rubicon Minerals * (A) (C) (D) | | | 1,759,902 | | | | 11,083 | |
| Sabina Gold & Silver * (A) | | | 4,241,595 | | | | 4,367,395 | |
| Torex Gold Resources * | | | 217,745 | | | | 4,053,526 | |
| TOTAL CANADA | | | | | | | 58,057,015 | |
| UNITED STATES— 9.1% | | | | | | | | |
| Basic Materials — 9.1% | | | | | | | | |
| Novagold Resources * (A) | | | 600,852 | | | | 3,004,260 | |
| Seabridge Gold * (A) | | | 322,984 | | | | 3,536,675 | |
| TOTAL UNITED STATES | | | | | | | 6,540,935 | |
| TOTAL COMMON STOCK | | | | | | | | |
| (Cost $59,874,635) | | | | | | | 72,004,693 | |
| | | | | | | | | |
| U.S. TREASURY OBLIGATION — 9.7% |
| United States Treasury Bill | | | | | | | | |
| 0.130%, 11/10/16(E) | | | | | | | | |
| (Cost $6,999,773) | | $ | 7,000,000 | | | | 6,999,783 | |
The accompanying notes are an integral part of the financial statements.
| Schedule of Investments | October 31, 2016 |
| Global X Gold Explorers ETF |
| | | Face Amount | | | Value | |
| |
| REPURCHASE AGREEMENT — 8.1% |
| Deutsche Bank | | | | | | | | |
| 0.350%, dated 10/31/16, to be repurchased on 11/01/16 repurchase price $5,814,568 (collateralized by U.S. Treasury Obligations, par value $5,407,175, 3.000%, 05/15/45 with a total market value of $5,956,489)(F) (Cost $5,814,511) | | $ | 5,814,511 | | | $ | 5,814,511 | |
| TOTAL INVESTMENTS — 117.7% | | | | | | | | |
| (Cost $72,688,919) | | | | | | $ | 84,818,987 | |
Percentages are based on Net Assets of $72,074,094.
| * | Non-income producing security. |
| (A) | This security or a partial position of this security is on loan as of October 31, 2016. The total value of securities on loan as of October 31, 2016 was $5,595,578. |
| (B) | Affiliated investment (See Note 3 in Notes to Financial Statements). |
| (C) | Security considered illiquid. The total value of such securities as of October 31, 2016 was $11,083 and represented 0.0% of Net Assets. |
| (D) | Security is fair valued using methods determined in good faith by the Fair Value Committee of the Fund. The total value of such securities as of October 31, 2016, was $11,083 and represents 0.0% of Net Assets. |
| (E) | The rate reported on the Schedule of Investments is the effective yield at time of purchase. |
| (F) | Security was purchased with cash collateral held from securities on loan. The total value of such securities as of October 31, 2016 was $5,814,511. |
Cl — Class
The following is a summary of the level of inputs used as of October 31, 2016, in valuing the Fund's investments carried at value:
| Investments in Securities | | Level 1 | | | Level 2 | | | Level 3(1) | | | Total | |
| Common Stock | | $ | 71,993,610 | | | $ | — | | | $ | 11,083 | | | $ | 72,004,693 | |
| U.S. Treasury Obligation | | | — | | | | 6,999,783 | | | | — | | | | 6,999,783 | |
| Repurchase Agreement | | | — | | | | 5,814,511 | | | | — | | | | 5,814,511 | |
| Total Investments in Securities | | $ | 71,993,610 | | | $ | 12,814,294 | | | $ | 11,083 | | | $ | 84,818,987 | |
(1) A reconciliation of Level 3 investments and disclosures of significant unobservable inputs are presented when the Fund has a significant amount of Level 3 investments at the beginning and/or end of the period in relation to Net Assets. Management has concluded that Level 3 investments are not material in relation to Net Assets.
For the year ended October 31, 2016, the transfers into Level 3 were due to changes in the availability of observable inputs to determine fair value. Transfers between levels are recognized at period end.
The accompanying notes are an integral part of the financial statements.
| Schedule of Investments | October 31, 2016 |
| Global X Copper Miners ETF |
Sector Weightings (unaudited)†:

† Sector weightings percentages are based on the total market value of investments. Repurchase agreements purchased from cash collateral received for securities lending activity are included in total investments. Please see Notes 2 and 7 in Notes to Financial Statements for more detailed information.
| | | Shares | | | Value | |
| COMMON STOCK — 99.9% |
| AUSTRALIA— 10.5% | | | | | | | | |
| Basic Materials — 10.5% | | | | | | | | |
| Cudeco * (A) (B) (C) | | | 670,647 | | | $ | 199,385 | |
| OZ Minerals | | | 254,449 | | | | 1,297,271 | |
| Sandfire Resources | | | 296,786 | | | | 1,174,361 | |
| TOTAL AUSTRALIA | | | | | | | 2,671,017 | |
| CANADA— 37.9% | | | | | | | | |
| Basic Materials — 37.9% | | | | | | | | |
| Altius Minerals | | | 125,845 | | | | 1,044,131 | |
| Capstone Mining * | | | 1,702,252 | | | | 1,028,781 | |
| First Quantum Minerals | | | 159,233 | | | | 1,513,620 | |
| HudBay Minerals, Cl B | | | 301,156 | | | | 1,269,563 | |
| Imperial Metals * (C) | | | 169,600 | | | | 651,699 | |
| Lundin Mining, Cl Common Subscription Receipt * | | | 297,315 | | | | 1,164,636 | |
| Nevsun Resources | | | 386,592 | | | | 1,122,062 | |
| Teck Resources, Cl B | | | 86,002 | | | | 1,858,323 | |
| TOTAL CANADA | | | | | | | 9,652,815 | |
| HONG KONG— 6.1% | | | | | | | | |
| Basic Materials — 6.1% | | | | | | | | |
| Jiangxi Copper, Cl H | | | 991,829 | | | | 1,171,545 | |
| NetMind Financial Holdings * | | | 42,368,000 | | | | 382,439 | |
| TOTAL HONG KONG | | | | | | | 1,553,984 | |
| JAPAN— 1.2% | | | | | | | | |
| Basic Materials — 1.2% | | | | | | | | |
| Nittetsu Mining | | | 7,500 | | | | 313,318 | |
| MEXICO— 4.3% | | | | | | | | |
| Basic Materials — 4.3% | | | | | | | | |
| Grupo Mexico, Cl B | | | 447,114 | | | | 1,103,075 | |
| PERU— 4.7% | | | | | | | | |
| Basic Materials — 4.7% | | | | | | | | |
| Southern Copper (C) | | | 42,609 | | | | 1,209,669 | |
| POLAND— 4.6% | | | | | | | | |
| Basic Materials — 4.6% | | | | | | | | |
| KGHM Polska Miedz | | | 65,219 | | | | 1,177,831 | |
The accompanying notes are an integral part of the financial statements.
| Schedule of Investments | October 31, 2016 |
| Global X Copper Miners ETF |
| | | Shares/Face
Amount | | | Value | |
| COMMON STOCK — continued |
| UNITED KINGDOM— 19.3% | | | | | | | | |
| Basic Materials — 19.3% | | | | | | | | |
| Antofagasta (C) | | | 179,243 | | | $ | 1,188,286 | |
| Glencore | | | 403,070 | | | | 1,230,267 | |
| KAZ Minerals * | | | 353,687 | | | | 1,234,992 | |
| Vedanta Resources (C) | | | 145,477 | | | | 1,267,265 | |
| TOTAL UNITED KINGDOM | | | | | | | 4,920,810 | |
| UNITED STATES— 11.3% | | | | | | | | |
| Basic Materials — 11.3% | | | | | | | | |
| Freeport-McMoRan Copper & Gold | | | 118,313 | | | | 1,322,739 | |
| Turquoise Hill Resources * | | | 379,176 | | | | 1,175,446 | |
| Vedanta ADR | | | 32,064 | | | | 386,692 | |
| TOTAL UNITED STATES | | | | | | | 2,884,877 | |
| TOTAL COMMON STOCK | | | | | | | | |
| (Cost $30,139,432) | | | | | | | 25,487,396 | |
| | | | | | | | | |
| REPURCHASE AGREEMENT — 8.7% |
| Deutsche Bank | | | | | | | | |
| 0.350%, dated 10/31/16, to be repurchased on 11/01/16 repurchase price $2,210,717 (collateralized by U.S. Treasury Obligations, par value $2,055,826, 3.000%, 05/15/45 with a total market value of $2,264,676)(D) (Cost $2,210,696) | | $ | 2,210,696 | | | | 2,210,696 | |
| TOTAL INVESTMENTS — 108.6% | | | | | | | | |
| (Cost $32,350,128) | | | | | | $ | 27,698,092 | |
Percentages are based on Net Assets of $25,503,853.
| * | Non-income producing security. |
| (A) | Security considered illiquid. The total value of such securities as of October 31, 2016 was $199,385 and represented 0.8% of Net Assets. |
| (B) | Security is fair valued using methods determined in good faith by the Fair Value Committee of the Fund. The total value of such securities as of October 31, 2016, was $199,385 and represents 0.8% of Net Assets. |
| (C) | This security or a partial position of this security is on loan as of October 31, 2016. The total value of securities on loan as of October 31, 2016 was $2,130,405. |
| (D) | Security was purchased with cash collateral held from securities on loan. The total value of such securities as of October 31, 2016 was $2,210,696. |
ADR — American Depositary Receipt
Cl — Class
The following is a summary of the level of inputs used as of October 31, 2016, in valuing the Fund's investments carried at value:
| Investments in Securities | | Level 1 | | | Level 2 | | | Level 3 | | | Total | |
| Common Stock | | $ | 25,288,011 | | | $ | — | | | $ | 199,385 | | | $ | 25,487,396 | |
| Repurchase Agreement | | | — | | | | 2,210,696 | | | | — | | | | 2,210,696 | |
| Total Investments in Securities | | $ | 25,288,011 | | | $ | 2,210,696 | | | $ | 199,385 | | | $ | 27,698,092 | |
The accompanying notes are an integral part of the financial statements.
| Schedule of Investments | October 31, 2016 |
| Global X Copper Miners ETF |
The following is a reconciliation of investments in which significant unobservable inputs (Level 3) were used in determining fair value:
| | | Common Stock | |
| | | | |
| Beginning Balance as of October 31, 2015 | | $ | 377,503 | |
| Realized gain/(loss) | | | (30,277 | ) |
| Net purchases | | | 67,216 | |
| Net sales | | | (72,311 | ) |
| Change in unrealized appreciation/(depreciation) | | | (142,746 | ) |
| Ending Balance as of October 31, 2016 | | $ | 199,385 | |
For the year ended October 31, 2016, there have been no transfers between Level 1, Level 2 and Level 3 investments.
The accompanying notes are an integral part of the financial statements.
| Schedule of Investments | October 31, 2016 |
Sector Weightings (unaudited)†:
† Sector weightings percentages are based on the total market value of investments. Repurchase agreements purchased from cash collateral received for securities lending activity are included in total investments. Please see Notes 2 and 7 in Notes to Financial Statements for more detailed information.
| | | Shares | | | Value | |
| COMMON STOCK — 100.0% |
| AUSTRALIA— 18.1% | | | | | | | | |
| Basic Materials — 16.6% | | | | | | | | |
| Berkeley Energia * | | | 7,477,441 | | | $ | 4,210,559 | |
| Energy Resources of Australia * (A) | | | 8,851,984 | | | | 2,290,206 | |
| Greenland Minerals & Energy * | | | 42,900,270 | | | | 2,742,170 | |
| Paladin Energy * (A) | | | 36,853,017 | | | | 3,926,053 | |
| Peninsula Energy * | | | 8,371,868 | | | | 3,758,629 | |
| | | | | | | | 16,927,617 | |
| Industrials — 1.5% | | | | | | | | |
| Silex Systems * | | | 6,054,724 | | | | 1,566,493 | |
| TOTAL AUSTRALIA | | | | | | | 18,494,110 | |
| CANADA— 52.0% | | | | | | | | |
| Basic Materials — 52.0% | | | | | | | | |
| Cameco | | | 2,590,107 | | | | 19,963,295 | |
| Denison Mines * (A) | | | 11,937,419 | | | | 4,809,704 | |
| Energy Fuels * (A) | | | 2,369,019 | | | | 3,429,134 | |
| Fission 3.0 * | | | 7,037,000 | | | | 367,536 | |
| Fission Uranium * | | | 9,498,795 | | | | 3,898,032 | |
| Laramide Resources * | | | 4,397,821 | | | | 754,709 | |
| Mega Uranium * (A) (B) | | | 14,714,670 | | | | 1,427,276 | |
| NexGen Energy * (A) | | | 7,175,401 | | | | 8,619,583 | |
| Uex * (A) | | | 11,899,156 | | | | 1,775,662 | |
| Uranium Participation * | | | 2,960,444 | | | | 8,217,013 | |
| TOTAL CANADA | | | | | | | 53,261,944 | |
| CHINA— 5.3% | | | | | | | | |
| Utilities — 5.3% | | | | | | | | |
| CGN Power, Cl H (C) | | | 18,630,600 | | | | 5,453,550 | |
| FRANCE— 5.5% | | | | | | | | |
| Utilities — 5.5% | | | | | | | | |
| Areva * | | | 1,066,072 | | | | 5,589,562 | |
The accompanying notes are an integral part of the financial statements.
| Schedule of Investments | October 31, 2016 |
| | | Shares/Face
Amount | | | Value | |
| COMMON STOCK — continued |
| HONG KONG— 9.2% | | | | | | | | |
| Industrials — 9.2% | | | | | | | | |
| CGN Mining * | | | 76,124,300 | | | $ | 6,576,953 | |
| CNNC International * | | | 8,994,600 | | | | 2,864,873 | |
| TOTAL HONG KONG | | | | | | | 9,441,826 | |
| UNITED STATES— 9.9% | | | | | | | | |
| Basic Materials — 9.9% | | | | | | | | |
| Centrus Energy, Cl A * (A) | | | 305,590 | | | | 1,194,857 | |
| Uranium Energy * (A) | | | 5,716,947 | | | | 5,133,246 | |
| Ur-Energy * (A) (B) | | | 7,603,407 | | | | 3,809,307 | |
| TOTAL UNITED STATES | | | | | | | 10,137,410 | |
| TOTAL COMMON STOCK | | | | | | | | |
| (Cost $215,988,904) | | | | | | | 102,378,402 | |
| | | | | | | | | |
| REPURCHASE AGREEMENTS — 7.5% |
| Barclays Bank | | | | | | | | |
| 0.320%, dated 10/31/16, to be repurchased on 11/01/16 repurchase price $5,000,044 (collateralized by U.S Treasury Obligations, ranging in par value $1-$1,456,630, 0.000%-4.750%, 11/15/16-05/15/46, with a total market value of $5,100,000)(D) | | $ | 5,000,000 | | | | 5,000,000 | |
| Deutsche Bank | | | | | | | | |
| 0.350%, dated 10/31/16, to be repurchased on 11/01/16 repurchase price $2,694,229 (collateralized by U.S. Treasury Obligations, par value $2,505,461, 3.000%, 05/15/45 with a total market value of $2,759,990)(D) | | | 2,694,203 | | | | 2,694,203 | |
| TOTAL REPURCHASE AGREEMENT | | | | | | | | |
| (Cost $7,694,203) | | | | | | | 7,694,203 | |
| TOTAL INVESTMENTS — 107.5% | | | | | | | | |
| (Cost $223,683,107) | | | | | | $ | 110,072,605 | |
Percentages are based on Net Assets of $102,436,689.
| * | Non-income producing security. |
| (A) | This security or a partial position of this security is on loan at October 31, 2016. The total value of securities on loan as of October 31, 2016 was $6,448,642. |
| (B) | Affiliated investment (See Note 3 in Notes to Financial Statements). |
| (C) | Security sold within terms of a private placement memorandum, exempt from registration under Section 144A of the Securities Act of 1933, as amended, and may be sold only to dealers in that program or other "accredited investors." The total value of such securities as of October 31, 2016 was $5,453,550 and represents 5.3% of Net Assets. |
| (D) | Security was purchased with cash collateral held from securities on loan. The total value of such securities as of October 31, 2016 was $7,694,203. |
Cl — Class
The following is a summary of the level of inputs used as of October 31, 2016, in valuing the Fund's investments carried at value:
| Investments in Securities | | Level 1 | | | Level 2 | | | Level 3 | | | Total | |
| Common Stock | | $ | 102,378,402 | | | $ | — | | | $ | — | | | $ | 102,378,402 | |
| Repurchase Agreements | | | — | | | | 7,694,203 | | | | — | | | | 7,694,203 | |
| Total Investments in Securities | | $ | 102,378,402 | | | $ | 7,694,203 | | | $ | — | | | $ | 110,072,605 | |
The accompanying notes are an integral part of the financial statements.
| Schedule of Investments | October 31, 2016 |
For the year ended October 31, 2016, there have been no transfers between Level 1, Level 2 or Level 3 investments.
As of October 31, 2016, there were no Level 3 investments.
The accompanying notes are an integral part of the financial statements.
| Schedule of Investments | October 31, 2016 |
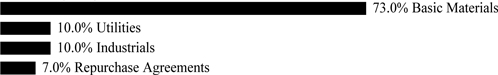
Sector Weightings (unaudited)†:

† Sector weightings percentages are based on the total market value of investments. Repurchase agreements purchased from cash collateral received for securities lending activity are included in total investments. Please see Notes 2 and 7 in Notes to Financial Statements for more detailed information.
| | | Shares | | | Value | |
| COMMON STOCK — 99.8% |
| AUSTRALIA— 8.4% | | | | | | | | |
| Basic Materials — 8.4% | | | | | | | | |
| Galaxy Resources * (A) | | | 12,225,589 | | | $ | 3,256,064 | |
| Orocobre * | | | 1,418,299 | | | | 4,133,535 | |
| Pilbara Minerals * | | | 5,162,072 | | | | 2,042,596 | |
| TOTAL AUSTRALIA | | | | | | | 9,432,195 | |
| CANADA— 2.3% | | | | | | | | |
| Basic Materials — 2.3% | | | | | | | | |
| Lithium Americas * | | | 3,563,296 | | | | 2,020,597 | |
| Nemaska Lithium * | | | 591,677 | | | | 618,054 | |
| TOTAL CANADA | | | | | | | 2,638,651 | |
| CHINA— 4.7% | | | | | | | | |
| Consumer Goods — 4.7% | | | | | | | | |
| BYD, Cl H * | | | 802,638 | | | | 5,278,572 | |
| FRANCE— 0.6% | | | | | | | | |
| Industrials — 0.6% | | | | | | | | |
| Blue Solutions * | | | 56,255 | | | | 728,903 | |
| HONG KONG— 5.5% | | | | | | | | |
| Consumer Goods — 4.3% | | | | | | | | |
| FDG Electric Vehicles * | | | 93,020,900 | | | | 4,858,052 | |
| Industrials — 1.2% | | | | | | | | |
| Coslight Technology International Group * | | | 1,773,373 | | | | 1,310,332 | |
| TOTAL HONG KONG | | | | | | | 6,168,384 | |
| JAPAN— 9.4% | | | | | | | | |
| Consumer Goods — 4.6% | | | | | | | | |
| Panasonic | | | 500,920 | | | | 5,229,188 | |
| Industrials — 4.8% | | | | | | | | |
| GS Yuasa | | | 1,243,094 | | | | 5,370,554 | |
| TOTAL JAPAN | | | | | | | 10,599,742 | |
| SOUTH KOREA— 11.7% | | | | | | | | |
| Basic Materials — 4.7% | | | | | | | | |
| LG Chemical | | | 24,444 | | | | 5,265,847 | |
The accompanying notes are an integral part of the financial statements.
| Schedule of Investments | October 31, 2016 |
| | | Shares/Face
Amount | | | Value | |
| COMMON STOCK — continued |
| Industrials — 7.0% | | | | | | | | |
| L&F | | | 65,405 | | | $ | 940,277 | |
| Samsung SDI | | | 63,603 | | | | 5,241,655 | |
| Vitzrocell | | | 176,616 | | | | 1,674,707 | |
| | | | | | | | 7,856,639 | |
| TOTAL SOUTH KOREA | | | | | | | 13,122,486 | |
| TAIWAN— 9.1% | | | | | | | | |
| Industrials — 9.1% | | | | | | | | |
| Advanced Lithium Electrochemistry Cayman * | | | 1,286,229 | | | | 1,294,075 | |
| Changs Ascending Enterprise * | | | 423,551 | | | | 574,443 | |
| Dynapack International Technology | | | 2,631,300 | | | | 3,443,641 | |
| Simplo Technology | | | 1,572,200 | | | | 4,857,466 | |
| TOTAL TAIWAN | | | | | | | 10,169,625 | |
| UNITED KINGDOM— 0.7% | | | | | | | | |
| Basic Materials — 0.7% | | | | | | | | |
| Bacanora Minerals * | | | 788,557 | | | | 765,384 | |
| UNITED STATES— 47.4% | | | | | | | | |
| Basic Materials — 38.8% | | | | | | | | |
| Albemarle | | | 63,526 | | | | 5,307,597 | |
| FMC | | | 468,748 | | | | 21,979,594 | |
| Sociedad Quimica y Minera de Chile ADR | | | 556,731 | | | | 16,289,949 | |
| | | | | | | | 43,577,140 | |
| Consumer Goods — 4.5% | | | | | | | | |
| Tesla Motors * | | | 25,806 | | | | 5,102,621 | |
| Industrials — 4.1% | | | | | | | | |
| China BAK Battery * (A) | | | 148,887 | | | | 260,552 | |
| EnerSys | | | 54,669 | | | | 3,560,592 | |
| Ultralife * | | | 183,190 | | | | 751,079 | |
| | | | | | | | 4,572,223 | |
| TOTAL UNITED STATES | | | | | | | 53,251,984 | |
| TOTAL COMMON STOCK | | | | | | | | |
| (Cost $112,826,196) | | | | | | | 112,155,926 | |
| | | | | | | | | |
| REPURCHASE AGREEMENT — 1.6% |
| Deutsche Bank | | | | | | | | |
| 0.350%, dated 10/31/16, to be repurchased on 11/01/16 repurchase price $1,768,469 (collateralized by U.S. Treasury Obligations, par value $1,644,563, 3.000%, 05/15/45 with a total market value of $1,811,634)(B) (Cost $1,768,452) | | $ | 1,768,452 | | | | 1,768,452 | |
| TOTAL INVESTMENTS — 101.4% | | | | | | | | |
| (Cost $114,594,648) | | | | | | $ | 113,924,378 | |
Percentages are based on Net Assets of $112,304,244.
| * | Non-income producing security. |
The accompanying notes are an integral part of the financial statements.
| Schedule of Investments | October 31, 2016 |
| (A) | This security or a partial position of this security is on loan as of October 31, 2016. The total value of securities on loan as of October 31, 2016 was $1,707,966. |
| (B) | Security was purchased with cash collateral held from securities on loan. The total value of such securities as of October 31, 2016 was $1,768,452. |
ADR — American Depositary Receipt
Cl — Class
The following is a summary of the level of inputs used as of October 31, 2016, in valuing the Fund's investments carried at value:
| Investments in Securities | | Level 1 | | | Level 2 | | | Level 3 | | | Total | |
| Common Stock | | $ | 112,155,926 | | | $ | — | | | $ | — | | | $ | 112,155,926 | |
| Repurchase Agreement | | | — | | | | 1,768,452 | | | | — | | | | 1,768,452 | |
| Total Investments in Securities | | $ | 112,155,926 | | | $ | 1,768,452 | | | $ | — | | | $ | 113,924,378 | |
For the year ended October 31, 2016, there have been no transfers between Level 1, Level 2 or Level 3 investments.
As of October 31, 2016, there were no Level 3 investments
The accompanying notes are an integral part of the financial statements.
| Schedule of Investments | October 31, 2016 |
| Global X Fertilizers/Potash ETF |
Sector Weightings (unaudited)†:

† Sector weightings percentages are based on the total market value of investments.
| | | Shares | | | Value | |
| COMMON STOCK — 99.8% |
| AUSTRALIA— 10.3% | | | | | | | | |
| Basic Materials — 10.3% | | | | | | | | |
| Incitec Pivot | | | 213,391 | | | $ | 479,019 | |
| Nufarm | | | 99,473 | | | | 670,647 | |
| TOTAL AUSTRALIA | | | | | | | 1,149,666 | |
| BELGIUM— 4.6% | | | | | | | | |
| Basic Materials — 4.6% | | | | | | | | |
| Tessenderlo Chemie | | | 15,293 | | | | 509,297 | |
| CANADA— 9.8% | | | | | | | | |
| Basic Materials — 9.8% | | | | | | | | |
| Agrium | | | 6,018 | | | | 552,879 | |
| Potash Corp of Saskatchewan | | | 32,793 | | | | 533,643 | |
| TOTAL CANADA | | | | | | | 1,086,522 | |
| GERMANY— 4.0% | | | | | | | | |
| Basic Materials — 4.0% | | | | | | | | |
| K+S | | | 22,082 | | | | 446,123 | |
| HONG KONG— 2.8% | | | | | | | | |
| Basic Materials — 2.8% | | | | | | | | |
| China BlueChemical | | | 983,501 | | | | 190,236 | |
| Sinofert Holdings | | | 937,865 | | | | 123,358 | |
| TOTAL HONG KONG | | | | | | | 313,594 | |
| ISRAEL—6.6% | | | | | | | | |
| Basic Materials — 6.6% | | | | | | | | |
| Israel Chemicals | | | 127,309 | | | | 452,793 | |
| The Israel Corp * | | | 1,916 | | | | 285,352 | |
| TOTAL ISRAEL | | | | | | | 738,145 | |
| NETHERLANDS— 4.2% | | | | | | | | |
| Basic Materials — 4.2% | | | | | | | | |
| OCI * | | | 33,789 | | | | 468,551 | |
| NORWAY— 4.8% | | | | | | | | |
| Basic Materials — 4.8% | | | | | | | | |
| Yara International | | | 14,902 | | | | 527,348 | |
| POLAND— 3.5% | | | | | | | | |
| Basic Materials — 3.5% | | | | | | | | |
| Grupa Azoty | | | 24,748 | | | | 392,990 | |
The accompanying notes are an integral part of the financial statements.
| Schedule of Investments | October 31, 2016 |
| Global X Fertilizers/Potash ETF |
| | | Shares | | | Value | |
| COMMON STOCK — continued |
| SOUTH KOREA— 0.6% | | | | | | | | |
| Basic Materials — 0.6% | | | | | | | | |
| Namhae Chemical | | | 8,649 | | | $ | 61,603 | |
| SWITZERLAND— 4.8% | | | | | | | | |
| Basic Materials — 4.8% | | | | | | | | |
| Syngenta * | | | 1,328 | | | | 531,254 | |
| TAIWAN— 4.7% | | | | | | | | |
| Basic Materials — 4.7% | | | | | | | | |
| Taiwan Fertilizer | | | 389,697 | | | | 522,354 | |
| TURKEY— 1.1% | | | | | | | | |
| Basic Materials — 1.1% | | | | | | | | |
| Bagfas Bandirma Gubre Fabrik | | | 13,565 | | | | 47,311 | |
| Gubre Fabrikalari | | | 43,188 | | | | 71,131 | |
| TOTAL TURKEY | | | | | | | 118,442 | |
| UNITED KINGDOM— 8.5% | | | | | | | | |
| Basic Materials — 8.5% | | | | | | | | |
| PhosAgro PJSC GDR | | | 36,463 | | | | 452,141 | |
| Sirius Minerals * | | | 1,055,900 | | | | 496,321 | |
| TOTAL UNITED KINGDOM | | | | | | | 948,462 | |
| UNITED STATES— 29.5% | | | | | | | | |
| Basic Materials — 29.5% | | | | | | | | |
| CF Industries Holdings | | | 18,510 | | | | 444,425 | |
| Compass Minerals International | | | 6,896 | | | | 495,478 | |
| CVR Partners (A) | | | 35,876 | | | | 163,594 | |
| Mosaic | | | 20,513 | | | | 482,671 | |
| Rentech Escrow Shares * (B) (C) | | | 7,168 | | | | — | |
| Scotts Miracle-Gro, Cl A | | | 7,966 | | | | 701,725 | |
| Sociedad Quimica y Minera de Chile ADR | | | 25,280 | | | | 739,693 | |
| Terra Nitrogen (A) | | | 2,469 | | | | 256,134 | |
| TOTAL UNITED STATES | | | | | | | 3,283,720 | |
| TOTAL COMMON STOCK | | | | | | | | |
| (Cost $15,675,144) | | | | | | | 11,098,071 | |
| TOTAL INVESTMENTS — 99.8% | | | | | | | | |
| (Cost $15,675,144) | | | | | | $ | 11,098,071 | |
Percentages are based on Net Assets of $11,124,672.
| * | Non-income producing security. |
| (A) | Security considered Master Limited Partnership. As of October 31, 2016, these securities amounted to $419,728 or 3.8% of net assets. |
| (B) | Security considered illiquid. The total value of such securities as of October 31, 2016 was $– and represented 0.0% of Net Assets. |
| (C) | Security is fair valued using methods determined in good faith by the Fair Value Committee of the Fund. The total value of such securities as of October 31, 2016, was $– and represents 0.0% of Net Assets. |
Amounts designated as “—“ are $0 or have been rounded to $0.
The accompanying notes are an integral part of the financial statements.
| Schedule of Investments | October 31, 2016 |
| Global X Fertilizers/Potash ETF |
ADR — American Depositary Receipt
Cl — Class
GDR — Global Depositary Receipt
The following is a summary of the level of inputs used as of October 31, 2016, in valuing the Fund's investments carried at value:
| Investments in Securities | | Level 1 | | | Level 2 | | | Level 3(1) | | | Total | |
| Common Stock | | $ | 11,098,071 | | | $ | — | | | $ | — | (2) | | $ | 11,098,071 | |
| Total Investments in Securities | | $ | 11,098,071 | | | $ | — | | | $ | — | | | $ | 11,098,071 | |
(1) A reconciliation of Level 3 investments and disclosures of significant unobservable inputs are presented when the Fund has a significant amount of Level 3 investments at the beginning and/or end of the period in relation to Net Assets. Management has concluded that Level 3 investments are not material in relation to Net Assets.
(2) Amounts designated as “—“ are $0 or have been rounded to $0.
For the year ended October 31, 2016, there have been no transfers between Level 1, Level 2 and Level 3 investments.
The accompanying notes are an integral part of the financial statements.
| Statements of Assets and Liabilities |
| October 31, 2016 |
| | | Global X Silver
Miners ETF | | | Global X Gold
Explorers ETF | | | Global X Copper
Miners ETF | |
| Assets: | | | | | | | | | | | | |
| Cost of Investments | | $ | 334,080,408 | | | $ | 63,283,695 | | | $ | 30,139,432 | |
| Cost of Repurchase Agreement | | | 11,205,555 | | | | 5,814,511 | | | | 2,210,696 | |
| Cost of Affiliated Investments | | | — | | | | 3,590,713 | | | | — | |
| Cost of Foreign Currency | | | 122,303 | | | | — | | | | 24 | |
| Investments, at Value | | $ | 378,563,021 | * | | $ | 74,450,622 | * | | $ | 25,487,396 | * |
| Repurchase Agreement, at Value | | | 11,205,555 | | | | 5,814,511 | | | | 2,210,696 | |
| Foreign Currency, at Value | | | 122,303 | | | | — | | | | 23 | |
| Affiliated Investments, at Value | | | — | | | | 4,553,854 | | | | — | |
| Cash | | | — | | | | — | | | | 98,009 | |
| Receivable for Investment Securities Sold | | | 32,526,037 | | | | — | | | | 2,598,677 | |
| Reclaim Receivable | | | 22,735 | | | | — | | | | 9,438 | |
| Dividend and Interest Receivable | | | 16,768 | | | | 19,865 | | | | 13,671 | |
| Unrealized Appreciation on Spot Contracts | | | 10,253 | | | | — | | | | 69 | |
| Total Assets | | | 422,466,672 | | | | 84,838,852 | | | | 30,417,979 | |
| Liabilities: | | | | | | | | | | | | |
| Payable for Investment Securities Purchased | | | 28,416,320 | | | | — | | | | 2,689,959 | |
| Obligation to Return Securities Lending Collateral | | | 11,205,555 | | | | 5,814,511 | | | | 2,210,696 | |
| Cash Overdraft | | | 3,001,632 | | | | 6,910,306 | | | | — | |
| Payable due to Investment Adviser | | | 213,934 | | | | 39,941 | | | | 13,416 | |
| Unrealized Depreciation on Spot Contracts | | | 11,939 | | | | — | | | | 55 | |
| Total Liabilities | | | 42,849,380 | | | | 12,764,758 | | | | 4,914,126 | |
| Net Assets | | $ | 379,617,292 | | | $ | 72,074,094 | | | $ | 25,503,853 | |
| Net Assets Consist of: | | | | | | | | | | | | |
| Paid-in Capital | | $ | 592,164,043 | | | $ | 111,755,578 | | | $ | 53,160,865 | |
| Undistributed (Distributions in Excess of) Net Investment Income | | | 269,857 | | | | (938,905 | ) | | | 76,960 | |
| Accumulated Net Realized Loss on Investments and Foreign Currency Transactions | | | (257,310,689 | ) | | | (50,872,651 | ) | | | (23,081,142 | ) |
| Net Unrealized Appreciation (Depreciation) on Investments | | | 44,482,613 | | | | 12,130,068 | | | | (4,652,036 | ) |
| Net Unrealized Appreciation (Depreciation) on Foreign Currency Translations | | | 11,468 | | | | 4 | | | | (794 | ) |
| Net Assets | | $ | 379,617,292 | | | $ | 72,074,094 | | | $ | 25,503,853 | |
| Outstanding Shares of Beneficial Interest | | | | | | | | | | | | |
| (unlimited authorization — no par value) | | | 9,347,318 | | | | 2,062,054 | | | | 1,449,374 | |
| Net Asset Value, Offering and Redemption Price Per Share | | $ | 40.61 | | | $ | 34.95 | | | $ | 17.60 | |
| *Includes Market Value of Securities on Loan | | $ | 10,710,032 | | | $ | 5,595,578 | | | $ | 2,130,405 | |
The accompanying notes are an integral part of the financial statements.
| Statements of Assets and Liabilities |
| October 31, 2016 |
| | | Global X Uranium
ETF | | | Global X Lithium
ETF | | | Global X
Fertilizers/Potash
ETF | |
| Assets: | | | | | | | | | | | | |
| Cost of Investments | | $ | 205,411,773 | | | $ | 112,826,196 | | | $ | 15,675,144 | |
| Cost of Repurchase Agreement | | | 7,694,203 | | | | 1,768,452 | | | | — | |
| Cost of Affiliated Investments | | | 10,577,131 | | | | — | | | | — | |
| Cost of Foreign Currency | | | 2,389 | | | | 894,823 | | | | 22,028 | |
| Investments, at Value | | $ | 97,141,819 | * | | $ | 112,155,926 | * | | $ | 11,098,071 | |
| Repurchase Agreement, at Value | | | 7,694,203 | | | | 1,768,452 | | | | — | |
| Affiliated Investments, at Value | | | 5,236,583 | | | | — | | | | — | |
| Cash | | | 62,491 | | | | — | | | | — | |
| Foreign Currency, at Value | | | 2,388 | | | | 894,805 | | | | 22,028 | |
| Dividend and Interest Receivable | | | 62,198 | | | | 82,267 | | | | 10,941 | |
| Receivable for Investment Securities Sold | | | 1,360 | | | | 11,378,586 | | | | — | |
| Unrealized Appreciation on Spot Contracts | | | — | | | | 28 | | | | — | |
| Reclaim Receivable | | | — | | | | — | | | | 22,544 | |
| Due from Broker | | | — | | | | — | | | | 44,266 | |
| Total Assets | | | 110,201,042 | | | | 126,280,064 | | | | 11,197,850 | |
| Liabilities: | | | | | | | | | | | | |
| Obligation to Return Securities Lending Collateral | | | 7,694,203 | | | | 1,768,452 | | | | — | |
| Payable due to Investment Adviser | | | 62,260 | | | | 68,933 | | | | 5,841 | |
| Payable for Investment Securities Purchased | | | 7,886 | | | | 12,062,214 | | | | 44,319 | |
| Unrealized Depreciation on Spot Contracts | | | 4 | | | | — | | | | — | |
| Cash Overdraft | | | — | | | | 73,629 | | | | 23,018 | |
| Due to Broker | | | — | | | | 2,592 | | | | — | |
| Total Liabilities | | | 7,764,353 | | | | 13,975,820 | | | | 73,178 | |
| Net Assets | | $ | 102,436,689 | | | $ | 112,304,244 | | | $ | 11,124,672 | |
| Net Assets Consist of: | | | | | | | | | | | | |
| Paid-in Capital | | $ | 512,931,803 | | | $ | 168,653,266 | | | $ | 21,804,205 | |
| Undistributed Net Investment Income | | | 2,129,397 | | | | 710,566 | | | | 195,160 | |
| Accumulated Net Realized Loss on Investments and Foreign Currency Transactions | | | (299,014,008 | ) | | | (56,389,305 | ) | | | (6,296,154 | ) |
| Net Unrealized Appreciation (Depreciation) on Investments | | | (113,610,502 | ) | | | (670,270 | ) | | | (4,577,073 | ) |
| Net Unrealized Appreciation (Depreciation) on Foreign Currency Translations | | | (1 | ) | | | (13 | ) | | | (1,466 | ) |
| Net Assets | | $ | 102,436,689 | | | $ | 112,304,244 | | | $ | 11,124,672 | |
| Outstanding Shares of Beneficial Interest | | | | | | | | | | | | |
| (unlimited authorization — no par value) | | | 8,481,666 | | | | 4,674,628 | | | | 1,300,000 | |
| Net Asset Value, Offering and Redemption Price Per Share | | $ | 12.08 | | | $ | 24.02 | | | $ | 8.56 | |
| *Includes Market Value of Securities on Loan | | $ | 6,448,642 | | | $ | 1,707,966 | | | $ | — | |
The accompanying notes are an integral part of the financial statements.
| Statements of Operations |
| For the year ended October 31, 2016 |
| | | Global X Silver
Miners ETF | | | Global X Gold
Explorers ETF | | | Global X Copper
Miners ETF | |
| Investment Income: | | | | | | | | | | | | |
| Dividend Income | | $ | 2,151,656 | | | $ | 44,469 | | | $ | 232,202 | |
| Interest Income | | | 1,604 | | | | 210 | | | | 25 | |
| Security Lending Income | | | 291,173 | | | | 195,584 | | | | 31,582 | |
| Less: Foreign Taxes Withheld | | | (153,700 | ) | | | (6,670 | ) | | | (10,817 | ) |
| Total Investment Income | | | 2,290,733 | | | | 233,593 | | | | 252,992 | |
| Supervision and Administration Fees(1) | | | 1,809,280 | | | | 349,438 | | | | 135,171 | |
| Custodian Fees | | | 10,354 | | | | 3,119 | | | | 261 | |
| Total Expenses | | | 1,819,634 | | | | 352,557 | | | | 135,432 | |
| Net Investment Income(Loss) | | | 471,099 | | | | (118,964 | ) | | | 117,560 | |
| Net Realized Gain (Loss) on: | | | | | | | | | | | | |
| Investments (2) | | | (32,546,896 | ) | | | 1,650,072 | | | | (5,345,402 | ) |
| Affiliated Investments | | | — | | | | (442,176 | ) | | | — | |
| Foreign Currency Transactions | | | (64,340 | ) | | | (3,554 | ) | | | 13,266 | |
| Net Realized Gain (Loss) on Investments and Foreign Currency Transactions | | | (32,611,236 | ) | | | 1,204,342 | | | | (5,332,136 | ) |
| Net Change in Unrealized Appreciation (Depreciation) on: | | | | | | | | | | | | |
| Investments | | | 168,050,967 | | | | 22,006,653 | | | | 10,571,708 | |
| Affiliated Investments | | | — | | | | 2,555,281 | | | | — | |
| Foreign Currency Translations | | | 14,459 | | | | 4 | | | | (11,451 | ) |
| Net Change in Unrealized Appreciation on Investments, Affiliated Investments and Foreign Currency Translations | | | 168,065,426 | | | | 24,561,938 | | | | 10,560,257 | |
| Net Realized and Unrealized Gain on Investments, Affiliated Investments and Foreign Currency Transactions and Translations | | | 135,454,190 | | | | 25,766,280 | | | | 5,228,121 | |
| Net Increase in Net Assets Resulting from Operations | | $ | 135,925,289 | | | $ | 25,647,316 | | | $ | 5,345,681 | |
| (1) | The Supervision and Administration fees includes fees paid by the Funds for the investment advisory services provided by the Adviser. (See Note 3 in Notes to Financial Statements.) |
| (2) | Includes realized gains (losses) as a result of in-kind transactions. (See Note 4 in Notes to Financial Statements.) |
The accompanying notes are an integral part of the financial statements.
| Statements of Operations |
| For the year ended October 31, 2016 |
| | | Global X Uranium
ETF | | | Global X Lithium
ETF | | | Global X
Fertilizers/Potash
ETF | |
| Investment Income: | | | | | | | | | | | | |
| Dividend Income | | $ | 823,303 | | | $ | 1,352,434 | | | $ | 293,736 | |
| Interest Income | | | 779 | | | | 146 | | | | 35 | |
| Security Lending Income | | | 960,622 | | | | 205,451 | | | | — | |
| Less: Foreign Taxes Withheld | | | (119,542 | ) | | | (180,136 | ) | | | (38,506 | ) |
| Total Investment Income | | | 1,665,162 | | | | 1,377,895 | | | | 255,265 | |
| Supervision and Administration Fees(1) | | | 818,754 | | | | 524,846 | | | | 65,512 | |
| Custodian Fees | | | 5,635 | | | | 7,653 | | | | 31 | |
| Total Expenses | | | 824,389 | | | | 532,499 | | | | 65,543 | |
| Net Investment Income | | | 840,773 | | | | 845,396 | | | | 189,722 | |
| Net Realized Gain (Loss) on: | | | | | | | | | | | | |
| Investments (2) | | | (36,121,419 | ) | | | (2,487,651 | ) | | | (2,763,715 | ) |
| Affiliated Investments | | | (2,975,892 | ) | | | — | | | | — | |
| Foreign Currency Transactions | | | (1,934 | ) | | | (23,305 | ) | | | (1,608 | ) |
| Net Realized Loss on Investments and Foreign Currency Transactions | | | (39,099,245 | ) | | | (2,510,956 | ) | | | (2,765,323 | ) |
| Net Change in Unrealized Appreciation (Depreciation) on: | | | | | | | | | | | | |
| Investments | | | 11,667,862 | | | | 8,278,991 | | | | 1,327,167 | |
| Affiliated Investments | | | 3,175,874 | | | | — | | | | — | |
| Foreign Currency Translations | | | (272 | ) | | | 1,386 | | | | 1,701 | |
| Net Change in Unrealized Appreciation on Investments, Affiliated Investments and Foreign Currency Translations | | | 14,843,464 | | | | 8,280,377 | | | | 1,328,868 | |
| Net Realized and Unrealized Gain (Loss) on Investments, Affiliated Investments and Foreign Currency Transactions and Translations | | | (24,255,781 | ) | | | 5,769,421 | | | | (1,436,455 | ) |
| Net Increase (Decrease) in Net Assets Resulting from Operations | | $ | (23,415,008 | ) | | $ | 6,614,817 | | | $ | (1,246,733 | ) |
| (1) | The Supervision and Administration fees includes fees paid by the Funds for the investment advisory services provided by the Adviser. (See Note 3 in Notes to Financial Statements.) |
| (2) | Includes realized gains (losses) as a result of in-kind transactions. (See Note 4 in Notes to Financial Statements.) |
The accompanying notes are an integral part of the financial statements.
| Statements of Changes in Net Assets |
| | | Global X Silver Miners ETF | | | Global X Gold Explorers ETF | |
| | | Year Ended
October 31, 2016 | | | Year Ended
October 31, 2015 | | | Year Ended
October 31, 2016 | | | Year Ended
October 31, 2015 | |
| Operations: | | | | | | | | | | | | | | | | |
| Net Investment Income (Loss) | | $ | 471,099 | | | $ | 373,126 | | | $ | (118,964 | ) | | $ | 208,471 | |
| Net Realized Gain (Loss) on Investments and Foreign Currency Transactions | | | (32,611,236 | )(1) | | | (66,954,054 | )(1) | | | 1,204,342 | (1) | | | (18,400,329 | ) |
| Net Change in Unrealized Appreciation (Depreciation) on Investments and Foreign Currency Translations | | | 168,065,426 | | | | 30,513,172 | | | | 24,561,938 | | | | 19,099,199 | |
| Net Increase (Decrease) in Net Assets Resulting from Operations | | | 135,925,289 | | | | (36,067,756 | ) | | | 25,647,316 | | | | 907,341 | |
| Dividends and Distributions from: | | | | | | | | | | | | | | | | |
| Net Investment Income | | | (492,527 | ) | | | (129,601 | ) | | | (2,809,410 | ) | | | (40,294 | ) |
| Total Dividends and Distributions | | | (492,527 | ) | | | (129,601 | ) | | | (2,809,410 | ) | | | (40,294 | ) |
| Capital Share Transactions: | | | | | | | | | | | | | | | | |
| Issued | | | 145,373,948 | | | | 29,928,286 | | | | 23,235,210 | | | | 512,019 | |
| Redeemed | | | (44,945,232 | ) | | | (20,940,116 | ) | | | (3,092,103 | ) | | | — | |
| Increase in Net Assets from Capital Share Transactions | | | 100,428,716 | | | | 8,988,170 | | | | 20,143,107 | | | | 512,019 | |
| Total Increase (Decrease) in Net Assets | | | 235,861,478 | | | | (27,209,187 | ) | | | 42,981,013 | | | | 1,379,066 | |
| Net Assets: | | | | | | | | | | | | | | | | |
| Beginning of Year | | | 143,755,814 | | | | 170,965,001 | | | | 29,093,081 | | | | 27,714,015 | |
| End of Year | | $ | 379,617,292 | | | $ | 143,755,814 | | | $ | 72,074,094 | | | $ | 29,093,081 | |
| Undistributed Net Investment Income | | $ | 269,857 | | | $ | 225,582 | | | $ | (938,905 | ) | | $ | 162,412 | |
| Share Transactions: | | | | | | | | | | | | | | | | |
| Issued | | | 3,550,000 | | | | 1,183,334 | (2) | | | 700,000 | | | | 25,000 | (3) |
| Redeemed | | | (1,102,682 | ) | | | (816,667 | )(2) | | | (100,325 | ) | | | — | |
| Net Increase in Shares Outstanding from Share Transactions | | | 2,447,318 | | | | 366,667 | | | | 599,675 | | | | 25,000 | |
| (1) | Includes realized gain (loss) as a result of in-kind transactions. (See Note 4 in Notes to Financial Statements.) |
| (2) | Adjusted to reflect the effect of a 1 for 3 reverse share split on November 18, 2015. (See Note 10 in the Notes to Financial Statements.) |
| (3) | Adjusted to reflect the effect of a 1 for2 reverse share split on November 18, 2015. (See Note 10 in the Notes to Financial Statements.) |
The accompanying notes are an integral part of the financial statements.
| Statements of Changes in Net Assets |
| | | Global X Copper Miners ETF | | | Global X Uranium ETF | |
| | | Year Ended
October 31, 2016 | | | Year Ended
October 31, 2015 | | | Year Ended
October 31, 2016 | | | Year Ended
October 31, 2015 | |
| Operations: | | | | | | | | | | | | | | | | |
| Net Investment Income | | $ | 117,560 | | | $ | 237,118 | | | $ | 840,773 | | | $ | 1,437,849 | |
| Net Realized Loss on Investments, Affiliated Investments and Foreign Currency Transactions(1) | | | (5,332,136 | ) | | | (5,614,876 | ) | | | (39,099,245 | ) | | | (56,873,600 | ) |
| Net Change in Unrealized Appreciation (Depreciation) on Investments and Foreign Currency Translations | | | 10,560,257 | | | | (4,721,019 | ) | | | 14,843,464 | | | | (19,252,193 | ) |
| Net Increase (Decrease) in Net Assets Resulting from Operations | | | 5,345,681 | | | | (10,098,777 | ) | | | (23,415,008 | ) | | | (74,687,944 | ) |
| Dividends and Distributions from: | | | | | | | | | | | | | | | | |
| Net Investment Income | | | (205,898 | ) | | | (509,286 | ) | | | (2,421,696 | ) | | | (9,307,517 | ) |
| Total Dividends and Distributions | | | (205,898 | ) | | | (509,286 | ) | | | (2,421,696 | ) | | | (9,307,517 | ) |
| Capital Share Transactions: | | | | | | | | | | | | | | | | |
| Issued | | | 4,973,174 | | | | 6,134,592 | | | | 4,984,570 | | | | 31,602,266 | |
| Redeemed | | | (3,588,508 | ) | | | (3,599,890 | ) | | | (18,767,601 | ) | | | (17,906,993 | ) |
| Increase (Decrease) in Net Assets from Capital Share Transactions | | | 1,384,666 | | | | 2,534,702 | | | | (13,783,031 | ) | | | 13,695,273 | |
| Total Increase (Decrease) in Net Assets | | | 6,524,449 | | | | (8,073,361 | ) | | | (39,619,735 | ) | | | (70,300,188 | ) |
| Net Assets: | | | | | | | | | | | | | | | | |
| Beginning of Year | | | 18,979,404 | | | | 27,052,765 | | | | 142,056,424 | | | | 212,356,612 | |
| End of Year | | $ | 25,503,853 | | | $ | 18,979,404 | | | $ | 102,436,689 | | | $ | 142,056,424 | |
| Undistributed Net Investment Income | | $ | 76,960 | | | $ | 26,145 | | | $ | 2,129,397 | | | $ | 1,074,464 | |
| Share Transactions: | | | | | | | | | | | | | | | | |
| Issued | | | 433,333 | | | | 350,000 | (2) | | | 350,000 | | | | 1,350,000 | (3) |
| Redeemed | | | (250,626 | ) | | | (166,666 | )(2) | | | (1,375,870 | ) | | | (975,000 | )(3) |
| Net Increase (Decrease) in Shares Outstanding from Share Transactions | | | 182,707 | | | | 183,334 | | | | (1,025,870 | ) | | | 375,000 | |
| (1) | Includes realized gain (loss) as a result of in-kind transactions. (See Note 4 in Notes to Financial Statements.) |
| (2) | Adjusted to reflect the effect of a 1 for 3 reverse share split on November 18, 2015. (See Note 10 in the Notes to Financial Statements.) |
| (3) | Adjusted to reflect the effect of a 1 for2 reverse share split on November 18, 2015. (See Note 10 in the Notes to Financial Statements.) |
The accompanying notes are an integral part of the financial statements.
| Statements of Changes in Net Assets |
| | | Global X Lithium ETF | | | Global X Fertilizers/Potash ETF | |
| | | Year Ended
October 31, 2016 | | | Year Ended
October 31, 2015 | | | Year Ended
October 31, 2016 | | | Year Ended
October 31, 2015 | |
| Operations: | | | | | | | | | | | | | | | | |
| Net Investment Income | | $ | 845,396 | | | $ | 154,615 | | | $ | 189,722 | | | $ | 422,637 | |
| Net Realized Gain (Loss) on Investments and Foreign Currency Transactions(1) | | | (2,510,956 | ) | | | 1,292,112 | | | | (2,765,323 | ) | | | (1,026,759 | ) |
| Net Change in Unrealized Appreciation (Depreciation) on Investments and Foreign Currency Translations | | | 8,280,377 | | | | (8,204,910 | ) | | | 1,328,868 | | | | 83,190 | |
| Net Increase (Decrease) in Net Assets Resulting from Operations | | | 6,614,817 | | | | (6,758,183 | ) | | | (1,246,733 | ) | | | (520,932 | ) |
| Dividends and Distributions from: | | | | | | | | | | | | | | | | |
| Net Investment Income | | | (97,361 | ) | | | (471,239 | ) | | | (363,096 | ) | | | (350,078 | ) |
| Total Dividends and Distributions | | | (97,361 | ) | | | (471,239 | ) | | | (363,096 | ) | | | (350,078 | ) |
| Capital Share Transactions: | | | | | | | | | | | | | | | | |
| Issued | | | 77,405,685 | | | | 3,158,262 | | | | 2,166,918 | | | | — | |
| Redeemed | | | (12,349,856 | ) | | | (5,587,104 | ) | | | (915,034 | ) | | | (3,407,437 | ) |
| Increase (Decrease) in Net Assets from Capital Share Transactions | | | 65,055,829 | | | | (2,428,842 | ) | | | 1,251,884 | | | | (3,407,437 | ) |
| Total Increase (Decrease) in Net Assets | | | 71,573,285 | | | | (9,658,264 | ) | | | (357,945 | ) | | | (4,278,447 | ) |
| Net Assets: | | | | | | | | | | | | | | | | |
| Beginning of Year | | | 40,730,959 | | | | 50,389,223 | | | | 11,482,617 | | | | 15,761,064 | |
| End of Year | | $ | 112,304,244 | | | $ | 40,730,959 | | | $ | 11,124,672 | | | $ | 11,482,617 | |
| Undistributed (Distributions in Excess of) Net Investment Income | | $ | 710,566 | | | $ | (18,247 | ) | | $ | 195,160 | | | $ | 330,845 | |
| Share Transactions: | | | | | | | | | | | | | | | | |
| Issued | | | 3,200,000 | | | | 125,000 | (2) | | | 250,000 | | | | — | |
| Redeemed | | | (500,372 | ) | | | (250,000 | )(2) | | | (100,000 | ) | | | (300,000 | ) |
| Net Increase (Decrease) in Shares Outstanding from Share Transactions | | | 2,699,628 | | | | (125,000 | ) | | | 150,000 | | | | (300,000 | ) |
| (1) | Includes realized gain (loss) as a result of in-kind transactions. (See Note 4 in Notes to Financial Statements.) |
| (2) | Adjusted to reflect the effect of a 1 for2 reverse share split on November 18, 2015. (See Note 10 in the Notes to Financial Statements.) |
The accompanying notes are an integral part of the financial statements.
Selected Per Share Data & Ratios
For a Share Outstanding Throughout the Period
| | | Net Asset
Value,
Beginning of
Period ($) | | | Net
Investment
Income
(Loss) ($)* | | | Net Realized
and
Unrealized
Gain (Loss)
on
Investments
($) | | | Total from
Operations
($) | | | Distribution
from Net
Investment
Income ($) | | | Distribution
from Capital
Gains ($) | | | Total from
Distributions
($) | | | Net Asset
Value,
End of
Period
($) | | | Total
Return
(%)** | | | Net
Assets
End of
Period
($)(000) | | | Ratio of
Expenses
to
Average
Net
Assets
(%) | | | Ratio of
Net
Investment
Income
(Loss) to
Average
Net Assets
(%) | | | Portfolio
Turnover
(%)†† | |
| Global X Silver Miners ETF |
| 2016 | | | 20.83 | | | | 0.05 | | | | 19.80 | | | | 19.85 | | | | (0.07 | ) | | | — | | | | (0.07 | ) | | | 40.61 | | | | 95.69 | | | | 379,617 | | | | 0.65 | | | | 0.17 | | | | 27.45 | |
| 2015(1) | | | 26.16 | | | | 0.06 | | | | (5.37 | ) | | | (5.31 | ) | | | (0.02 | ) | | | — | | | | (0.02 | ) | | | 20.83 | | | | (20.35 | ) | | | 143,756 | | | | 0.65 | | | | 0.22 | | | | 26.75 | |
| 2014(1) | | | 38.64 | | | | 0.09 | | | | (12.35 | ) | | | (12.26 | ) | | | (0.22 | ) | | | — | | | | (0.22 | ) | | | 26.16 | | | | (31.85 | ) | | | 170,965 | | | | 0.65 | | | | 0.24 | | | | 24.23 | |
| 2013(1) | | | 74.94 | | | | 0.34 | | | | (36.03 | ) | | | (35.69 | ) | | | (0.61 | ) | | | — | | | | (0.61 | ) | | | 38.64 | | | | (47.97 | ) | | | 218,240 | | | | 0.65 | | | | 0.67 | | | | 23.79 | |
| 2012(1) | | | 70.98 | | | | 0.40 | | | | 3.67 | | | | 4.07 | | | | (0.11 | ) | | | — | | | | (0.11 | ) | | | 74.94 | | | | 5.76 | | | | 385,967 | | | | 0.65 | | | | 0.62 | | | | 18.13 | |
| Global X Gold Explorers ETF |
| 2016 | | | 19.89 | | | | (0.06 | ) | | | 17.04 | | | | 16.98 | | | | (1.92 | ) | | | — | | | | (1.92 | ) | | | 34.95 | | | | 95.95 | | | | 72,074 | | | | 0.66 | | | | (0.22 | ) | | | 17.06 | |
| 2015(2) | | | 19.28 | | | | 0.14 | | | | 0.50 | | | | 0.64 | | | | (0.03 | ) | | | — | | | | (0.03 | ) | | | 19.89 | | | | 3.36 | | | | 29,093 | | | | 0.65 | | | | 0.70 | | | | 57.53 | |
| 2014(2) | | | 26.96 | | | | 0.01 | | | | (7.69 | ) | | | (7.68 | ) | | | — | | | | — | | | | — | | | | 19.28 | | | | (28.49 | ) | | | 27,714 | | | | 0.65 | | | | 0.02 | | | | 29.94 | |
| 2013(2)(3) | | | 69.44 | | | | (0.25 | ) | | | (39.35 | ) | | | (39.60 | ) | | | (2.88 | ) | | | — | | | | (2.88 | ) | | | 26.96 | | | | (59.16 | ) | | | 32,020 | | | | 0.65 | | | | (0.65 | ) | | | 31.73 | |
| 2012(2)(3) | | | 106.88 | | | | (0.49 | ) | | | (34.92 | ) | | | (35.41 | ) | | | (2.03 | ) | | | — | | | | (2.03 | ) | | | 69.44 | | | | (33.42 | ) | | | 41,251 | | | | 0.65 | | | | (0.65 | ) | | | 43.12 | |
| Global X Copper Miners ETF |
| 2016 | | | 14.98 | | | | 0.07 | | | | 2.69 | | | | 2.76 | | | | (0.14 | ) | | | — | | | | (0.14 | ) | | | 17.60 | | | | 18.88 | | | | 25,504 | | | | 0.65 | | | | 0.57 | | | | 34.73 | |
| 2015(1) | | | 24.96 | | | | 0.21 | | | | (9.68 | ) | | | (9.47 | ) | | | (0.51 | ) | | | — | | | | (0.51 | ) | | | 14.98 | | | | (38.64 | ) | | | 18,979 | | | | 0.65 | | | | 1.07 | | | | 29.72 | |
| 2014(1) | | | 29.40 | | | | 0.45 | | | | (4.69 | ) | | | (4.24 | ) | | | (0.20 | ) | | | — | | | | (0.20 | ) | | | 24.96 | | | | (14.49 | ) | | | 27,053 | | | | 0.65 | | | | 1.59 | | | | 15.77 | |
| 2013(1) | | | 38.79 | | | | 0.52 | | | | (8.63 | ) | | | (8.11 | ) | | | (1.28 | ) | | | — | | | | (1.28 | ) | | | 29.40 | | | | (21.69 | ) | | | 32,828 | | | | 0.65 | | | | 1.63 | | | | 37.06 | |
| 2012(1) | | | 44.76 | | | | 0.72 | | | | (3.97 | ) | | | (3.25 | ) | | | (1.70 | ) | | | (1.02 | ) | | | (2.72 | ) | | | 38.79 | | | | (7.08 | ) | | | 31,041 | | | | 0.65 | | | | 1.84 | | | | 28.90 | |
| Global X Uranium ETF |
| 2016 | | | 14.94 | | | | 0.09 | | | | (2.68 | ) | | | (2.59 | ) | | | (0.27 | ) | | | — | | | | (0.27 | ) | | | 12.08 | | | | (17.53 | ) | | | 102,437 | | | | 0.70 | | | | 0.71 | | | | 14.48 | |
| 2015(2) | | | 23.26 | | | | 0.15 | | | | (7.50 | ) | | | (7.35 | ) | | | (0.97 | ) | | | — | | | | (0.97 | ) | | | 14.94 | | | | (33.01 | ) | | | 142,056 | | | | 0.69 | | | | 0.74 | | | | 22.37 | |
| 2014(2) | | | 28.94 | | | | 0.09 | | | | (5.60 | ) | | | (5.51 | ) | | | (0.17 | ) | | | — | | | | (0.17 | ) | | | 23.26 | | | | (19.18 | ) | | | 212,357 | | | | 0.69 | | | | 0.30 | | | | 20.90 | |
| 2013(2)(4) | | | 42.06 | | | | 0.18 | | | | (12.56 | ) | | | (12.38 | ) | | | (0.74 | ) | | | — | | | | (0.74 | ) | | | 28.94 | | | | (29.88 | ) | | | 118,871 | | | | 0.69 | | | | 0.51 | | | | 73.16 | |
| 2012(2)(4) | | | 60.54 | | | | 0.15 | | | | (18.63 | ) | | | (18.48 | ) | | | — | | | | — | | | | — | | | | 42.06 | | | | (30.53 | ) | | | 135,668 | | | | 0.69 | | | | 0.30 | | | | 55.90 | |
| Global X Lithium ETF |
| 2016 | | | 20.62 | | | | 0.27 | | | | 3.18 | | | | 3.45 | | | | (0.05 | ) | | | — | | | | (0.05 | ) | | | 24.02 | | | | 16.76 | | | | 112,304 | | | | 0.76 | | | | 1.21 | | | | 44.90 | |
| 2015(2) | | | 24.00 | | | | 0.08 | | | | (3.22 | ) | | | (3.14 | ) | | | (0.24 | ) | | | — | | | | (0.24 | ) | | | 20.62 | | | | (13.18 | ) | | | 40,731 | | | | 0.75 | | | | 0.35 | | | | 31.14 | |
| 2014(2) | | | 25.88 | | | | 0.20 | | | | (2.00 | ) | | | (1.80 | ) | | | (0.08 | ) | | | — | | | | (0.08 | ) | | | 24.00 | | | | (6.97 | ) | | | 50,389 | | | | 0.75 | | | | 0.75 | | | | 43.37 | |
| 2013(2) | | | 28.82 | | | | 0.06 | | | | (2.31 | ) | | | (2.25 | ) | | | (0.69 | ) | | | — | | | | (0.69 | ) | | | 25.88 | | | | (8.00 | ) | | | 51,105 | | | | 0.75 | | | | 0.21 | | | | 38.46 | |
| 2012(2) | | | 31.80 | | | | 0.43 | | | | (3.37 | ) | | | (2.94 | ) | | | (0.04 | ) | | | — | | | | (0.04 | ) | | | 28.82 | | | | (9.25 | ) | | | 69,871 | | | | 0.75 | | | | 1.40 | | | | 28.78 | |
| Global X Fertilizers/Potash ETF |
| 2016 | | | 9.98 | | | | 0.18 | ‡‡ | | | (1.27 | ) | | | (1.09 | ) | | | (0.33 | ) | | | — | | | | (0.33 | ) | | | 8.56 | | | | (11.15 | ) | | | 11,125 | | | | 0.69 | | | | 2.00 | ‡‡ | | | 25.38 | |
| 2015 | | | 10.87 | | | | 0.33 | | | | (0.97 | ) | | | (0.64 | ) | | | (0.25 | ) | | | — | | | | (0.25 | ) | | | 9.98 | | | | (6.01 | ) | | | 11,483 | | | | 0.69 | | | | 2.97 | | | | 30.64 | |
| 2014 | | | 11.73 | | | | 0.23 | | | | (0.90 | ) | | | (0.67 | ) | | | (0.19 | ) | | | — | | | | (0.19 | ) | | | 10.87 | | | | (5.79 | ) | | | 15,761 | | | | 0.69 | | | | 1.98 | | | | 18.79 | |
| 2013 | | | 13.85 | | | | 0.25 | | | | (2.21 | ) | | | (1.96 | ) | | | (0.16 | ) | | | — | | | | (0.16 | ) | | | 11.73 | | | | (14.33 | ) | | | 22,864 | | | | 0.69 | | | | 1.93 | | | | 14.12 | |
| 2012 | | | 14.06 | | | | 0.19 | | | | (0.29 | ) | | | (0.10 | ) | | | (0.09 | ) | | | (0.02 | ) | | | (0.11 | ) | | | 13.85 | | | | (0.61 | ) | | | 28,383 | | | | 0.69 | | | | 1.42 | | | | 24.05 | |
| (1) | Per share amounts have been adjusted for a 1 for 3 reverse share split on November 18, 2015. For more information see Note 10 in the Notes to Financial Statements. |
| (2) | Per share amounts have been adjusted for a 1 for 2 reverse share split on November 18, 2015. For more information see Note 10 in the Notes to Financial Statements. |
| (3) | Per share amounts have been adjusted for a 1 for 4 reverse share split on May 16, 2013. For more information see Note 10 in the Notes to Financial Statements. |
| (4) | Per share amounts have been adjusted for a 1 for 3 reverse share split on May 16, 2013. For more information see Note 10 in the Notes to Financial Statements. |
| * | Per share data calculated using average shares method. |
| ** | Total return is based on the change in net asset value of a share during the year or period and assumes reinvestment of dividends and distributions at net asset value. Total return is for the period indicated and periods of less than one year have not been annualized. The return shown does not reflect the deduction of taxes that a shareholder would pay on Fund distributions or the redemption of Fund shares. |
| †† | Portfolio turnover rate is for the period indicated and has not been annualized. Excludes effect of in-kind transfers. |
| ‡‡ | See Note 8 in the Notes to Financial Statements. |
Amounts designated as “—” are either $0 or have been rounded to $0.
The accompanying notes are an integral part of the financial statements.
| Notes to Financial Statements |
| October 31, 2016 |
1. ORGANIZATION
The Global X Funds (the “Trust”) is a Delaware statutory trust formed on March 6, 2008. The Trust is registered under the Investment Company Act of 1940, as amended, as an open-end management investment company. As of October 31, 2016, the Trust had one hundred portfolios, fifty-four of which were operational. The financial statements herein and the related notes pertain to the Global X Silver Miners ETF, Global X Gold Explorers ETF, Global X Copper Miners ETF, Global X Uranium ETF, Global X Lithium ETF and Global X Fertilizers/Potash ETF (the “Funds”). Each Fund has elected non-diversified status.
2. SIGNIFICANT ACCOUNTING POLICIES
The following is a summary of the significant accounting policies followed by the Funds.
USE OF ESTIMATES — The Funds are investment companies that apply the accounting and reporting guidance issued in Topic 946 by the U.S. Financial Accounting Standards Board. The preparation of financial statements in conformity with U.S. generally accepted accounting principles ("U.S. GAAP") requires management to make estimates and assumptions that affect the reported amounts of assets and liabilities and disclosure of contingent assets and liabilities at the date of the financial statements and the reported amounts of increases and decreases in net assets from operations during the reporting period. Actual results could materially differ from those estimates.
RETURN OF CAPITAL ESTIMATES — Distributions received by the Funds from underlying master limited partnership (“MLP”) investments generally are comprised of income and return of capital. The Funds record investment income and return of capital based on estimates made at the time such distributions are received. Such estimates are based on historical information available from the MLPs and other industry sources. These estimates may subsequently be revised based on information received from the MLPs after their tax reporting periods are concluded.
SECURITY VALUATION — Securities listed on a securities exchange, market or automated quotation system for which quotations are readily available (except for securities traded on NASDAQ), including securities traded over the counter, are valued at the last quoted sale price on the primary exchange or market (foreign or domestic) on which they are traded (or at approximately 4:00 pm if a security’s primary exchange is normally open at that time), or, if there is no such reported sale, at the most recent mean between the quoted bid and asked prices (absent both bid and asked prices on such exchange, the bid price may be used).
For securities traded on NASDAQ, the NASDAQ official closing price will be used. If available, debt securities are priced based upon valuations provided by independent, third-party pricing agents. Such values generally reflect the last reported sales price if the security is actively traded. The third-party pricing agents may also value debt securities at an evaluated bid price by employing methodologies that utilize actual market transactions, broker-supplied valuations, or other methodologies designed to identify the market value for such securities. Debt obligations with remaining maturities of sixty days or less may be valued at their amortized cost, which approximates market value. The prices for foreign securities are reported in local currency and converted to U.S. dollars using currency exchange rates as of reporting date. The exchange rates used by the Trust for valuation are captured as of the New York or London close each day. Prices for most securities held in the Funds are provided daily by recognized independent pricing agents. If a security price cannot
| Notes to Financial Statements (continued) |
| October 31, 2016 |
2. SIGNIFICANT ACCOUNTING POLICIES (continued)
SECURITY VALUATION (continued)
be obtained from an independent, third-party pricing agent, the Funds seek to obtain a bid price from at least one independent broker.
Securities for which market prices are not “readily available” are valued in accordance with Fair Value Procedures established by the Board of Trustees (the “Board”). The Funds’ Fair Value Procedures are implemented through a Fair Value Committee (the “Committee”) designated by the Board. Some of the more common reasons that may necessitate that a security be valued using Fair Value Procedures include: the security's trading has been halted or suspended; the security has been de-listed from its primary trading exchange; the security's primary trading market is temporarily closed at a time when under normal conditions it would be open; the security has not been traded for an extended period of time; the security's primary pricing source is not able or willing to provide a price; or trading of the security is subject to local government-imposed restrictions. In addition, the Funds may fair value their securities if an event that may materially affect the value of the Funds’ securities that traded outside of the United States (a “Significant Event”) has occurred between the time of the security's last close and the time that the Funds calculate their net asset value. A Significant Event may relate to a single issuer or to an entire market sector. Events that may be Significant Events include: government actions, natural disasters, armed conflict, acts of terrorism and significant market fluctuations. If Global X Management Company LLC (the “Adviser”) becomes aware of a Significant Event that has occurred with respect to a security or group of securities after the closing of the exchange or market on which the security or securities principally trade, but before the time at which the Funds calculate net asset value, it may request that a Committee meeting be called. When a security is valued in accordance with the Fair Value Procedures, the Committee will determine the value after taking into consideration all relevant information reasonably available to the Committee. As of October 31, 2016, there was $11,083 of fair valued securities in Global X Gold Explorers ETF, $199,385 of fair valued securities in the Global X Copper Miners ETF and $0 of fair valued securities in the Global X Fertilizers/Potash ETF. There were no other securities priced using the Fair Value Procedures.
In accordance with the authoritative guidance on fair value measurements and disclosure under U.S. GAAP, the Funds disclose the fair value of their investments in a hierarchy that prioritizes the inputs to valuation techniques used to measure the fair value. The objective of a fair value measurement is to determine the price that would be received to sell an asset or paid to transfer a liability in an orderly transaction between market participants at the measurement date (an exit price). Accordingly, the fair value hierarchy gives the highest priority to quoted prices (unadjusted) in active markets for identical assets or liabilities (Level 1) and the lowest priority to unobservable inputs (Level 3). The three levels of the fair value hierarchy are described below:
The three levels of the fair value hierarchy are described below:
Level 1 – Unadjusted quoted prices in active markets for identical, unrestricted assets or liabilities that the Funds have the ability to access at the measurement date
| Notes to Financial Statements (continued) |
| October 31, 2016 |
2. SIGNIFICANT ACCOUNTING POLICIES (continued)
SECURITY VALUATION (concluded)
Level 2 – Other significant observable inputs (including quoted prices in non-active markets, quoted prices for similar investments, fair value of investments for which the Funds have the
ability to fully redeem tranches at net asset value as of the measurement date or within the near term, and short-term investments valued at amortized cost)
Level 3 – Significant unobservable inputs (including the Funds’ own assumptions in determining the fair value of investments and fair value of investments for which the Funds do not have the ability to fully redeem tranches at net asset value as of the measurement date or within the near term)
Investments are classified within the level of the lowest significant input considered in determining fair value. Investments classified within Level 3 whose fair value measurement considers several inputs may include Level 1 or Level 2 inputs as components of the overall fair value measurement. For the year ended October 31, 2016 there have been no significant changes to the Funds’ fair valuation methodologies.
REPURCHASE AGREEMENTS — Securities pledged as collateral for repurchase agreements are held by Citibank N.A. and are designated as being held on each Fund’s behalf by its custodian under a book-entry system. Each Fund monitors the adequacy of the collateral on a daily basis and can require the seller to provide additional collateral in the event the market value of the securities pledged falls below the carrying value of the repurchase agreement, including accrued interest. It is the Funds’ policy to only enter into repurchase agreements with banks and other financial institutions which are deemed by the Adviser to be creditworthy. The Funds bear the risk of loss in the event that the other party to a repurchase agreement defaults on its obligations and the Funds are prevented from exercising their rights to dispose of the underlying securities received as collateral and the risk of a possible decline in the value of the underlying securities during the period. For financial statement purposes, the Funds record the securities lending collateral (included in Repurchase Agreements, at value or restricted cash) as an asset and the obligation to return securities lending collateral as a liability on the Statements of Assets and Liabilities.
Repurchase agreements are entered into by the Funds under Master Repurchase Agreements (“MRA”) which permit the Funds, under certain circumstances, including an event of default (such as bankruptcy or insolvency), to offset payables and/or receivables under the MRA with collateral held and/or posted to the counterparty and create one single net payment due to or from the Funds.
| Notes to Financial Statements (continued) |
| October 31, 2016 |
2. SIGNIFICANT ACCOUNTING POLICIES (continued)
REPURCHASE AGREEMENTS (concluded)
At October 31, 2016, the open repurchase agreements by counterparty which are subject to a MRA on a net payment basis are as follows:
| | | | | | Fair Value of Non-cash | | | Cash Collateral | | | | |
| | | Repurchase Agreements | | | Collateral Received(1) | | | Received | | | Net Amount(2) | |
| Global X Silver Miners ETF | | | | | | | | | | | | | | | | |
| Barclays | | $ | 10,000,000 | | | $ | 10,000,000 | | | $ | - | | | $ | - | |
| Deutsche Bank | | | 1,205,555 | | | | 1,205,555 | | | | - | | | | - | |
| Global X Gold Explorers ETF | | | | | | | | | | | | | | | | |
| Deutsche Bank | | | 5,814,511 | | | | 5,814,511 | | | | - | | | | - | |
| Global X Copper Miners ETF | | | | | | | | | | | | | | | | |
| Deutsche Bank | | | 2,210,696 | | | | 2,210,696 | | | | - | | | | - | |
| Global X Uranium ETF | | | | | | | | | | | | | | | | |
| Barclays | | | 5,000,000 | | | | 5,000,000 | | | | - | | | | - | |
| Deutsche Bank | | | 2,694,203 | | | | 2,694,203 | | | | | | | | - | |
| Global X Lithium ETF | | | | | | | | | | | | | | | | |
| Deutsche Bank | | | 1,768,452 | | | | 1,768,452 | | | | - | | | | - | |
(1) Excess collateral received is not presented in the table above. Please refer to the Schedule of Investments for the market value of the collateral received for each Fund.
(2) Net Amount represents the net amount receivable due from the counterparty in the event of default.
FEDERAL INCOME TAXES — It is each Fund’s intention to qualify or continue to qualify as a regulated investment company for Federal income tax purposes by complying with the appropriate provisions of Subchapter M of the Internal Revenue Code of 1986, as amended. Accordingly, no provisions for Federal income taxes have been made in the financial statements.
The Funds evaluate tax positions taken or expected to be taken in the course of preparing the Funds’ tax returns to determine whether it is “more-likely-than-not” (i.e., greater than 50 percent) that each tax position will be sustained upon examination by a taxing authority based on the technical merits of the position. Tax positions not deemed to meet the more-likely-than-not threshold are recorded as a tax benefit or expense in the current year. The Funds did not record any tax provision in the current period. Management’s conclusions regarding tax positions may be subject to review and adjustment at a later date based on factors including, but not limited to, examination by tax authorities (i.e., the last three tax year ends, as applicable), on-going analysis of and changes to tax laws, regulations and interpretations thereof.
If the Funds have foreign tax filings that have not been made, the tax years that remain subject to examination may date back to the inception of the Fund.
As of and during the year ended October 31, 2016, the Funds did not have a liability for any unrecognized tax benefits. The Funds recognize interest and penalties, if any, related to unrecognized tax benefits as income tax expense in the Statement of Operations. During the year, the Funds did not incur any interest or penalties.
| Notes to Financial Statements (continued) |
| October 31, 2016 |
2. SIGNIFICANT ACCOUNTING POLICIES (continued)
SECURITY TRANSACTIONS AND INVESTMENT INCOME — Security transactions are accounted for on the trade date for financial reporting purposes. Costs used in determining realized gains and losses on the sale of investment securities are based on specific identification. Dividend income is recorded on the ex-dividend date. Interest income is recognized on the accrual basis from the settlement date.
FOREIGN CURRENCY TRANSACTIONS AND TRANSLATION — The books and records of the Funds are maintained in U.S. dollars. Investment securities and other assets and liabilities denominated in a foreign currency are translated into U.S. dollars on the date of valuation. Purchases and sales of investment securities, income and expenses are translated into U.S. dollars at the relevant rates of exchange prevailing on the respective dates of such transactions. The Funds do not isolate that portion of realized or unrealized gains and losses resulting from changes in the foreign exchange rate from fluctuations arising from changes in the market prices of the securities. These gains and losses are included in net realized and unrealized gains and losses on investments on the Statement of Operations. Net realized and unrealized gains and losses on foreign currency transactions and translations represent net foreign exchange gains or losses from foreign currency spot contracts, disposition of foreign currencies, currency gains or losses realized between trade and settlement dates on securities transactions and the difference between the amount of the investment income and foreign withholding taxes recorded on the Funds’ books and the U.S. dollar equivalent amounts actually received or paid.
DIVIDENDS AND DISTRIBUTIONS TO SHAREHOLDERS — The Funds distribute their net investment income on a pro rata basis. Any net investment income and net realized capital gains are distributed at least annually. All distributions are recorded on ex-dividend date
CREATION UNITS — The Funds issue and redeem shares (“Shares”) at Net Asset Value (“NAV”) and only in large blocks of Shares (each block of Shares for a Fund is called a “Creation Unit” or multiples thereof). Purchasers of Creation Units (“Authorized Participants“) at NAV must pay a standard creation transaction fee per transaction. The fee is a single charge and will be the same regardless of the number of Creation Units purchased by an investor on the same day.
An Authorized Participant who holds Creation Units and wishes to redeem at NAV would also pay a standard redemption fee per transaction to Brown Brothers Harriman & Co. (“BBH”), the Funds’ Custodian, on the date of such redemption, regardless of the number of Creation Units redeemed that day.
If a Creation Unit is purchased or redeemed for cash, a higher transaction fee will be charged. The following table discloses Creation Unit breakdown:
| | | | | | Creation | | | Value as of | | | | |
| | | Creation Unit Shares | | | Fee | | | October 31, 2016 | | | Redemption Fee | |
| Global X Silver Miners ETF | | | 50,000 | | | $ | 1,000 | | | $ | 2,030,500 | | | $ | 1,000 | |
| Global X Gold Explorers ETF | | | 50,000 | | | | 1,000 | | | | 1,747,500 | | | | 1,000 | |
| Global X Copper Miners ETF | | | 50,000 | | | | 1,000 | | | | 880,000 | | | | 1,000 | |
| Global X Uranium ETF | | | 50,000 | | | | 1,000 | | | | 604,000 | | | | 1,000 | |
| Global X Lithium ETF | | | 50,000 | | | | 1,000 | | | | 1,201,000 | | | | 1,000 | |
| Global X Fertilizers/Potash ETF | | | 50,000 | | | | 1,000 | | | | 428,000 | | | | 1,000 | |
| Notes to Financial Statements (continued) |
| October 31, 2016 |
2. SIGNIFICANT ACCOUNTING POLICIES (concluded)
CASH OVERDRAFT CHARGES — Per the terms of an agreement with BBH, if a Fund has a cash overdraft on a given day, it will be assessed an overdraft charge of LIBOR plus 2.00%. Cash overdraft charges are included in custodian fees on the Statements of Operations.
3. RELATED PARTIES AND SERVICE PROVIDER TRANSACTIONS
The Adviser serves as the investment adviser and the administrator for the Funds. Subject to the supervision of the Board of Trustees, the Adviser is responsible for managing the investment activities of the Funds and the Funds’ business affairs and other administrative matters and provides or causes to be furnished all supervisory, administrative and other services reasonably necessary for the operation of the Funds, including certain distribution services (provided pursuant to a separate distribution services agreement), certain shareholder and distribution-related services (provided pursuant to a separate Rule 12b-1 Plan and related agreements) and investment advisory services (provided pursuant to a separate investment advisory agreement), under what is essentially an "all-in" fee structure. For its service to the Funds, under the supervision and administration agreement, each Fund pays a monthly fee to the Adviser at the annual rate (stated as a percentage of the average daily net assets of the Fund). In addition, the Funds bear other expenses, directly and indirectly, that are not covered by the supervision and administration agreement, which may vary and affect the total expense ratios of the Funds, such as taxes, brokerage fees, commissions, acquired fund fees and other transaction expenses, interest expenses, and extraordinary expenses (such as litigation and indemnification expenses).
| | | Supervision and | |
| | | Administration Fee | |
| Global X Silver Miners ETF | | | 0.65% | |
| Global X Gold Explorers ETF | | | 0.65% | |
| Global X Copper Miners ETF | | | 0.65% | |
| Global X Uranium ETF | | | 0.69% | |
| Global X Lithium ETF | | | 0.75% | |
| Global X Fertilizers/Potash ETF | | | 0.69% | |
SEI Investments Global Funds Services (“SEIGFS”) serves as Sub-Administrator to the Funds. As Sub-Administrator, SEIGFS provides the Funds with the required general administrative services, including, without limitation: office space, equipment, and personnel; clerical and general back office services; bookkeeping, internal accounting and secretarial services; the calculation of NAV; and assistance with the preparation and filing of reports, registration statements, proxy statement and other materials required to be filed or furnished by the Funds under federal and state securities laws. As compensation for these services, the Sub-Administrator receives certain out-of-pocket costs, transaction fees and asset-based fees which are accrued daily and paid monthly by the Adviser.
SEI Investments Distribution Co. (“SIDCO”) serves as each Funds’ underwriter and distributor of Creation Units pursuant to a distribution agreement. SIDCO has no obligation to sell any specific quantity of Fund Shares. SIDCO bears the following costs and expenses relating to the distribution of Shares: (1) the costs of processing and maintaining records of creations of Creation Units; (2) all costs of maintaining the records required of a registered broker/dealer; (3) the expenses of maintaining its registration or qualification as a dealer or broker under Federal or state laws; (4) filing fees; and (5) all other expenses incurred in connection with the distribution services as
| Notes to Financial Statements (continued) |
| October 31, 2016 |
3. RELATED PARTIES AND SERVICE PROVIDER TRANSACTIONS (concluded)
contemplated in the distribution agreement. SIDCO receives no fee for its distribution services under the distribution agreement, rather the Adviser compensates SIDCO for certain expenses, out-of-pocket costs, and transaction fees.
BBH, located at 50 Post Office Square, Boston, MA 02110, serves as Custodian of the Funds’ assets. As Custodian, BBH has agreed to (1) make receipts and disbursements of money on behalf of the Funds, (2) collect and receive all income and other payments and distributions on account of the Funds’ portfolio investments, (3) respond to correspondence from shareholders, security brokers and others relating to its duties; and (4) make periodic reports to the Funds concerning the Funds’ operations. BBH does not exercise any supervisory function over the purchase and sale of securities. As compensation for these services, the Custodian receives certain out-of-pocket costs, transaction fees and asset-based fees which are accrued daily and paid monthly by the Adviser from its fees. BBH also serves as Transfer Agent. As Transfer Agent, BBH has agreed to (1) issue and redeem shares of each Fund, (2) make dividend and other distributions to shareholders of each Fund, (3) respond to correspondence by shareholders and others relating to its duties; (4) maintain shareholder accounts, and (5) make periodic reports to the Funds. As compensation for these services, the Transfer Agent receives certain out-of-pocket costs, transaction fees and asset-based fees which are accrued daily and paid monthly by the Adviser from its fees.
As of October 31, 2016, Global X Gold Explorers ETF and Global X Uranium ETF own greater than 5% of the outstanding shares of the following common stocks. These investments are noted as “Affiliated investment” in the Schedules of Investments.
| | | | | | | | | | Changes in | | | | | | | | | | |
| | | | | | | | | | Unrealized | | | | | | | | | | |
| Value at | | | Purchases at | | | Proceeds from | | | Appreciation | | | Realized Gain | | | Value at | | | Dividend | |
| 10/31/2015 | | | Cost | | | Sales | | | (Depreciation) | | | (Loss) | | | 10/31/16 | | | Income | |
| Global X Gold Exp lorers ETF |
| International Tower Hill Mines |
| $ | 1,242,866 | | | $ | 1,462,494 | | | $ | (264,611 | ) | | $ | 2,555,281 | | | $ | (442,176 | ) | | $ | 4,553,854 | | | $ | — | |
| Totals: |
| $ | 1,242,866 | | | $ | 1,462,494 | | | $ | (264,611 | ) | | $ | 2,555,281 | | | $ | (442,176 | ) | | $ | 4,553,854 | | | $ | — | |
| | | | | | | | | | Changes in | | | | | | | | | | |
| | | | | | | | | | Unrealized | | | | | | | | | | |
| Value At | | | Purchases at | | | Proceeds from | | | Appreciation | | | Realized Gain | | | Value at | | | Dividend | |
| 10/31/2015 | | | Cost | | | Sales | | | (Depreciation) | | | (Loss) | | | 10/31/2016 | | | Income | |
| Global X Uranium ETF |
| Mega Uranium |
| $ | 1,296,251 | | | $ | 88,106 | | | $ | (490,004 | ) | | $ | 2,227,052 | | | $ | (1,694,129 | ) | | $ | 1,427,276 | | | $ | — | |
| UR-Energy |
| | 4,860,868 | | | | 496,736 | | | | (1,215,356 | ) | | | 948,822 | | | | (1,281,763 | ) | | | 3,809,307 | | | | — | |
| Totals: |
| $ | 6,157,119 | | | $ | 584,842 | | | $ | (1,705,360 | ) | | $ | 3,175,874 | | | $ | (2,975,892 | ) | | $ | 5,236,583 | | | $ | — | |
| Notes to Financial Statements (continued) |
| October 31, 2016 |
4. INVESTMENT TRANSACTIONS
For the year ended October 31, 2016, the purchases and sales of investments in securities, excluding in-kind transactions, long-term U.S. Government and short-term securities were:
| | | Purchases | | | Sales and Maturities | |
| Global X Silver Miners ETF | | $ | 74,903,709 | | | $ | 76,743,842 | |
| Global X Gold Explorers ETF | | | 9,069,900 | | | | 12,027,411 | |
| Global X Copper Miners ETF | | | 7,498,659 | | | | 7,328,791 | |
| Global X Uranium ETF | | | 17,275,393 | | | | 19,931,148 | |
| Global X Lithium ETF | | | 45,410,233 | | | | 31,661,330 | |
| Global X Fertilizers/Potash ETF | | | 2,445,158 | | | | 2,495,535 | |
For the year ended October 31, 2016, in-kind transactions associated with creations and redemptions were:
| | | Purchases | | | Sales and Maturities | | | Realized Gain (Loss) | |
| Global X Silver Miners ETF | | $ | 145,433,344 | | | $ | 44,897,775 | | | $ | 22,538,544 | |
| Global X Gold Explorers ETF | | | 23,251,227 | | | | 3,088,731 | | | | 1,676,631 | |
| Global X Copper Miners ETF | | | 4,830,327 | | | | 3,582,170 | | | | 1,112,237 | |
| Global X Uranium ETF | | | 4,988,210 | | | | 18,778,301 | | | | (9,356,756 | ) |
| Global X Lithium ETF | | | 61,343,177 | | | | 9,484,973 | | | | 2,721,848 | |
| Global X Fertilizers/Potash ETF | | | 2,044,841 | | | | 864,976 | | | | (66,175 | ) |
For the year ended October 31, 2015, in-kind transactions associated with creations and redemptions were:
| | | Purchases | | | Sales and Maturities | | | Realized Gain (Loss) | |
| Global X Silver Miners ETF | | $ | 29,988,868 | | | $ | 20,953,183 | | | $ | 1,128,279 | |
| Global X Gold Explorers ETF | | | 511,642 | | | | - | | | | - | |
| Global X Copper Miners ETF | | | 6,123,996 | | | | 3,576,659 | | | | (190,048 | ) |
| Global X Uranium ETF | | | 31,551,324 | | | | 17,897,881 | | | | (3,478,497 | ) |
| Global X Lithium ETF | | | 2,552,262 | | | | 4,456,568 | | | | 564,779 | |
| Global X Fertilizers/Potash ETF | | | - | | | | 3,189,800 | | | | 117,962 | |
During the year ended October 31, 2016, there were no purchases or sales of long-term U.S. Government securities for the Funds.
5. TAX INFORMATION
The amount and character of income and capital gain distributions to be paid, if any, are determined in accordance with Federal income tax regulations, which may differ from U.S. GAAP. As a result, net investment income (loss) and net realized gain (loss) on investment transactions for a reporting period may differ significantly from distributions during such period. These book/tax differences may be temporary or permanent. To the extent these differences are permanent in nature, they are charged or credited to undistributed net investment income (loss), accumulated net realized gain (loss) or paid-in capital, as appropriate, in the period that the differences arise.
| Notes to Financial Statements (continued) |
| October 31, 2016 |
5. TAX INFORMATION (continued)
The following differences, primarily attributable to investment in master limited partnership, foreign currency, redemptions in-kind and sales of passive foreign investment companies have been reclassified to/from the following accounts during the fiscal year ended October 31, 2016.
| Global X Funds | | Paid-in
Capital | | | Undistributed
Net
Investment
Income
(Loss) | | | Accumulated
Net Realized
Gain (Loss) | |
| Global X Silver Miners ETF | | $ | 18,305,753 | | | $ | 65,703 | | | $ | (18,371,456 | ) |
| Global X Gold Explorers ETF | | | 1,493,852 | | | | 1,827,057 | | | | (3,320,909 | ) |
| Global X Copper Miners ETF | | | 1,109,502 | | | | 139,153 | | | | (1,248,655 | ) |
| Global X Uranium ETF | | | (13,551,545 | ) | | | 2,635,856 | | | | 10,915,689 | |
| Global X Lithium ETF | | | 2,696,942 | | | | (19,222 | ) | | | (2,677,720 | ) |
| Global X Fertilizers/Potash ETF | | | (74,219 | ) | | | 37,689 | | | | 36,530 | |
These reclassifications have no impact on net assets or net asset value per share.
The tax character of dividends and distributions declared during the years ended October 31, 2016 and 2015 were as follows:
| Global X Funds | | Ordinary Income | | | Long-Term
Capital Gain | | | Return of Capital | | | Totals | |
| | | | | | | | | | | | | | | | | |
| Global X Silver Miners ETF |
| 2016 | | $ | 492,527 | | | $ | – | | | $ | – | | | $ | 492,527 | |
| 2015 | | | 129,601 | | | | – | | | | – | | | | 129,601 | |
| Global X Gold Explorers ETF |
| 2016 | | $ | 2,809,410 | | | $ | – | | | $ | – | | | $ | 2,809,410 | |
| 2015 | | | 40,294 | | | | – | | | | – | | | | 40,294 | |
| Global X Copper Miners ETF |
| 2016 | | $ | 205,898 | | | $ | – | | | $ | – | | | $ | 205,898 | |
| 2015 | | | 509,286 | | | | – | | | | – | | | | 509,286 | |
| Global X Uranium ETF |
| 2016 | | $ | 2,421,696 | | | $ | – | | | $ | – | | | $ | 2,421,696 | |
| 2015 | | | 9,307,517 | | | | – | | | | – | | | | 9,307,517 | |
| Global X Lithium ETF |
| 2016 | | $ | 97,361 | | | $ | – | | | $ | – | | | $ | 97,361 | |
| 2015 | | | 471,239 | | | | – | | | | – | | | | 471,239 | |
| Global X Fertilizers/Potash ETF |
| 2016 | | $ | 363,096 | | | $ | – | | | $ | – | | | $ | 363,096 | |
| 2015 | | | 350,078 | | | | – | | | | – | | | | 350,078 | |
| Notes to Financial Statements (continued) |
| October 31, 2016 |
5. TAX INFORMATION (continued)
As of October 31, 2016, the components of tax basis accumulated losses were as follows:
| | | Global X Funds | |
| | | Global X Silver
Miners ETF | | | Global X Gold
Explorers ETF | | | Global X Copper
Miners ETF | |
| Undistributed Ordinary Income | | $ | 9,132,632 | | | $ | 15,400,104 | | | $ | 201,567 | |
| Capital Loss Carryforwards | | | (235,451,271 | ) | | | (44,339,503 | ) | | | (18,693,787 | ) |
| Unrealized Appreciation (Depreciation) on Investments and Foreign Currency | | | 13,771,888 | | | | (10,742,086 | ) | | | (9,164,784 | ) |
| Other Temporary Differences | | | – | | | | 1 | | | | (8 | ) |
| Total Accumulated Losses | | $ | (212,546,751 | ) | | $ | (39,681,484 | ) | | $ | (27,657,012 | ) |
| | | Global X Funds | |
| | | | | | | | | Global X | |
| | | Global X Uranium | | | Global X Lithium | | | Fertilizers/Potash | |
| | | ETF | | | ETF | | | ETF | |
| Undistributed Ordinary Income | | $ | 9,058,721 | | | $ | 1,955,639 | | | $ | 362,744 | |
| Capital Loss Carryforwards | | | (268,462,994 | ) | | | (53,642,151 | ) | | | (5,803,623 | ) |
| Unrealized Depreciation on Investments and Foreign Currency | | | (151,090,845 | ) | | | (4,662,508 | ) | | | (5,238,648 | ) |
| Other Temporary Differences | | | 4 | | | | (2 | ) | | | (6 | ) |
| Total Accumulated Losses | | $ | (410,495,114 | ) | | $ | (56,349,022 | ) | | $ | (10,679,533 | ) |
For Federal income tax purposes, capital losses incurred in taxable years beginning before December 22, 2010 may be carried forward for a maximum period of eight years and applied against future gains. As of October 31, 2016, the Funds that had capital loss carryforwards are listed below:
| | | Global X Silver | | | Global X Gold | | | Global X | | | Global X | |
| Expiration Date | | Miners ETF | | | Explorers ETF | | | Uranium ETF | | | Lithium ETF | |
| Oct. 2019 | | $ | 8,433,465 | | | $ | 130,976 | | | $ | 12,705,798 | | | $ | 7,329,308 | |
During the fiscal year ended October 31, 2016, the following fund utilized capital loss carryforwards to offset capital gains.
| Global X Funds | | | |
| Global X Gold Explorers ETF | | $ | 278,233 | |
For taxable years beginning after December 22, 2010, a RIC is permitted to carry forward net capital losses to offset capital gains realized in later years, and the losses carried forward retain their original character as either long-term or short-term losses. Net capital losses of a RIC realized in taxable years beginning before that date (pre-2011 losses) can be carried forward up to 8 years and are characterized in later years as short-term losses. If a Fund uses pre-2011 loss carryforwards in later years, the carryforwards will not reduce the Fund’s current earnings and profits, while loss carryforwards from later years will reduce the Fund’s current earnings and profits. To the extent that later year capital gains are offset by pre-2011 loss carryforwards, distributions of such gains will be treated as ordinary dividend distributions. Losses carried forward under these new provisions are as follows:
| Notes to Financial Statements (continued) |
| October 31, 2016 |
5. TAX INFORMATION (concluded)
| Global X Funds | | Short-Term Loss | | | Long-Term Loss | | | Total | |
| Global X Silver Miners ETF | | $ | 25,224,302 | | | $ | 201,793,504 | | | $ | 227,017,806 | |
| Global X Gold Explorers ETF | | | 5,877,582 | | | | 38,330,945 | | | | 44,208,527 | |
| Global X Copper Miners ETF | | | 2,962,226 | | | | 15,731,561 | | | | 18,693,787 | |
| Global X Uranium ETF | | | 53,896,086 | | | | 201,861,110 | | | | 255,757,196 | |
| Global X Lithium ETF | | | 12,232,765 | | | | 34,080,078 | | | | 46,312,843 | |
| Global X Fertilizers/Potash ETF | | | 836,397 | | | | 4,967,226 | | | | 5,803,623 | |
The Federal tax cost and aggregate gross unrealized appreciation and depreciation on investments held by the Funds at October 31, 2016 were as follows:
| Global X Funds | | Federal Tax
Cost | | | Aggregated
Gross
Unrealized
Appreciation | | | Aggregated
Gross
Unrealized
Depreciation | | | Net Unrealized
Appreciation
(Depreciation) | |
| Global X Silver Miners ETF | | $ | 376,008,156 | | | $ | 60,172,758 | | | $ | (46,412,338 | ) | | $ | 13,760,420 | |
| Global X Gold Explorers ETF | | | 95,561,077 | | | | 17,318,446 | | | | (28,060,536 | ) | | | (10,742,090 | ) |
| Global X Copper Miners ETF | | | 36,862,081 | | | | 2,575,769 | | | | (11,739,758 | ) | | | (9,163,989 | ) |
| Global X Uranium ETF | | | 261,163,449 | | | | 7,479,325 | | | | (158,570,169 | ) | | | (151,090,844 | ) |
| Global X Lithium ETF | | | 118,586,873 | | | | 5,860,943 | | | | (10,523,438 | ) | | | (4,662,495 | ) |
| Global X Fertilizers/Potash ETF | | | 16,335,253 | | | | 708,386 | | | | (5,945,568 | ) | | | (5,237,182 | ) |
The preceding differences between book and tax cost are primarily due to mark-to-market treatment of passive foreign investment companies and wash sales.
6. CONCENTRATION OF RISKS
The Funds invest in securities of foreign issuers in various countries. These investments may involve certain considerations and risks not typically associated with investments in the United States as a result of, among other factors, the possibility of future political and economic developments and the level of governmental supervision and regulation of securities markets in the respective countries.
The securities markets of emerging countries are less liquid and subject to greater price volatility, and have a smaller market capitalization, than the U.S. securities markets. In certain countries, there may be fewer publicly traded securities and the market may be dominated by a few issues or sectors.
Issuers and securities markets in such countries are not subject to as extensive and frequent accounting, financial and other reporting requirements or as comprehensive government regulations as are issuers and securities markets in the United States. In particular, the assets and profits appearing on the financial statements of emerging country issuers may not reflect their financial position or results of operations in the same manner as financial statements for U.S. issuers. Substantially less information may be publicly available about emerging country issuers than is available about issuers in the United States.
The Funds may be subject to taxes imposed by countries in which they invest. Such taxes are generally based on either income or gains earned or repatriated. The Funds accrue and apply such
| Notes to Financial Statements (continued) |
| October 31, 2016 |
6. CONCENTRATION OF RISKS (concluded)
taxes to net investment income, net realized gains and net unrealized gains as income and/or capital gains are earned.
The Funds use a replication strategy. A replication strategy is an indexing strategy that involves investing in the securities of the underlying index in approximately the same proportions as in the underlying index. The Funds may utilize a representative sampling strategy with respect to their underlying indices when a replication strategy might be detrimental to their shareholders, such as when there are practical difficulties or substantial costs involved in compiling a portfolio of equity securities to follow its underlying index, or, in certain instances, when securities in the underlying index become temporarily illiquid, unavailable or less liquid, or due to legal restrictions (such as diversification requirements that apply to the Funds but not the underlying indexes). Commodity related securities are susceptible to fluctuations in certain commodity markets. Any negative changes in commodity markets could have a great impact on these Funds.
A more complete description of risks is included is each Fund’s prospectus and SAI.
7. LOANS OF PORTFOLIO SECURITIES
The Funds may lend portfolio securities having a market value up to one-third of the Funds’ total assets. Security loans made pursuant to a securities lending agreement are required at all times to be secured by collateral equal to at least 102% of the value of domestic equity securities and ADRs and 105% of the value of foreign equity securities (other than ADRs). Such collateral will be cash securities issued or guaranteed by the U.S. Government or any agencies. Cash collateral received in connection with these loans can be invested in repurchase agreements or U.S. Treasury obligations and is recognized in the Schedule of Investments and Statement of Assets and Liabilities. The obligation to return securities lending collateral is also recognized as a liability in the Statement of Assets and Liabilities. It is the Funds’ policy to obtain additional collateral from or return excess collateral to the borrower by the end of the next business day, following the valuation date of the securities loaned. Therefore, the value of the collateral held may be temporarily less than the value of the securities on loan. Lending securities entails a risk of loss to the Funds if and to the extent that the market value of the securities loans were to increase and the borrower did not increase the collateral accordingly, and the borrower fails to return the securities. The Funds could also experience delays and costs in gaining access to the collateral. The Funds bear the risk of any deficiency in the amount of the collateral available for return to the borrower due to any loss on the collateral invested.
As of October 31, 2016, the value of securities on loan was $10,710,032, $5,595,578, $2,130,405, $6,448,642 and $1,707,966 for the Global X Silver Miners ETF, Global X Gold Explorers ETF, Global X Copper Miners ETF, Global X Uranium ETF and Global X Lithium ETF, respectively and the value of securities purchased with the cash collateral held from securities on loan was $11,205,555, $5,814,511, $2,210,696, $7,694,203 and $1,768,452 for the Global X Silver Miners ETF, Global X Gold Explorers ETF, Global X Copper Miners ETF, Global X Uranium ETF and Global X Lithium ETF, respectively.
| Notes to Financial Statements (continued) |
| October 31, 2016 |
7. LOANS OF PORTFOLIO SECURITIES (concluded)
At October 31, 2016, the following Funds had securities on loan, by counterparty:
| | | Market Value | | | Cash Collateral | |
| Global X Silver Miners ETF | | | | | | | | |
| Credit Suisse | | $ | 329,260 | | | $ | 356,510 | |
| Deutsche Bank Securities | | | 2,109,286 | | | | 2,161,705 | |
| Goldman Sachs & Co. | | | 4,836 | | | | 5,200 | |
| JPMorgan | | | 4,674,150 | | | | 5,033,700 | |
| Morgan Stanley | | | 3,567,717 | | | | 3,622,852 | |
| UBS Securities | | | 24,783 | | | | 25,588 | |
| Global X Gold Explorers ETF | | | | | | | | |
| Barclays Capital | | | 1,638,705 | | | | 1,716,885 | |
| BNP Paribas Prime Brokerage | | | 174,000 | | | | 191,400 | |
| Citigroup | | | 1,679,455 | | | | 1,783,311 | |
| Credit Suisse | | | 7,957 | | | | 9,882 | |
| Deutsche Bank Securities | | | 118,986 | | | | 127,533 | |
| JPMorgan | | | 158,775 | | | | 159,500 | |
| Morgan Stanley | | | 1,817,700 | | | | 1,826,000 | |
| Global X Copper Miners ETF | | | | | | | | |
| Credit Suisse | | | 275,485 | | | | 300,750 | |
| Goldman Sachs & Co. | | | 871,110 | | | | 910,000 | |
| JPMorgan | | | 295,256 | | | | 296,400 | |
| Merrill Lynch Pierce Fenner & Smith | | | 70,776 | | | | 71,051 | |
| Morgan Stanley | | | 617,778 | | | | 632,495 | |
| Global X Uranium ETF | | | | | | | | |
| Barclays Capital | | | 50,100 | | | | 200,000 | |
| Credit Suisse | | | 896,135 | | | | 1,011,886 | |
| Deutsche Bank Securities | | | 1,617,586 | | | | 1,893,044 | |
| Goldman Sachs & Co. | | | 111,203 | | | | 124,200 | |
| JPMorgan | | | 597,854 | | | | 775,608 | |
| Morgan Stanley | | | 2,945,846 | | | | 3,414,216 | |
| SG Americas Securities | | | 23,998 | | | | 47,900 | |
| UBS Securities | | | 205,920 | | | | 227,349 | |
| Global X Lithium ETF | | | | | | | | |
| Credit Suisse | | | 96,684 | | | | 102,300 | |
| Deutsche Bank Securities | | | 523,961 | | | | 554,400 | |
| JPMorgan | | | 11,550 | | | | 13,200 | |
| Merrill Lynch Pierce Fenner & Smith | | | 372,865 | | | | 392,000 | |
| Morgan Stanley | | | 702,906 | | | | 706,552 | |
| Notes to Financial Statements (continued) |
| October 31, 2016 |
8. CHANGE IN ACCOUNTING ESTIMATE
Effective November 1, 2015, the Funds changed their method for estimating the characterization of amounts distributed by master limited partnerships, which correspondingly impacted the net investment income, cost of investments and appreciation (depreciation) on investments and the associated financial highlight ratios and per share disclosures to the extent that the fund recorded investment income that differed from amounts previously estimated. There is no impact to net assets, total return or the expense ratio in the current period or future periods as a result of management’s change in methodology.
9. CONTRACTUAL OBLIGATIONS
The Funds enter into contracts in the normal course of business that contain a variety of indemnifications. The Funds’ maximum exposure under these arrangements is unknown. However, the Funds have not had prior gains or losses pursuant to these contracts. Management has reviewed the Funds’ existing contracts and expects the risk of loss to be remote.
Pursuant to the Trust’s organizational documents, the Trustees of the Trust and the Trust’s officers are indemnified against certain liabilities that may arise out of the performance of their duties.
| Notes to Financial Statements (continued) |
| October 31, 2016 |
10. REVERSE SHARE SPLIT
Effective May 16, 2013, the Global X Gold Explorers ETF and Global X Uranium ETF executed a reverse share split for shareholders of record after the close of markets on May 15, 2013. The effect of this transaction was to divide the number of outstanding shares of the Fund by the ratio below, resulting in a corresponding increase in the net asset value per share. The capital share activity presented in the statement of changes in net assets for each of the years in the period then ended, and per share data in the financial highlights for each of the years in the period then ended have been given retroactive effect to reflect these reverse share splits. There were no changes in net assets, results of operations or total return as a result of these transactions. The details of the reverse splits are as follows:
May 16, 2013:
| Fund Name | | Ratio |
| Global X Gold Explorers ETF | | 1:4 |
| Global X Uranium ETF | | 1:3 |
Effective November 18, 2015, the Global X Silver Miners ETF, Global X Gold Explorers ETF, Global X Copper Miners ETF, Global X Uranium ETF and the Global X Lithium ETF executed a reverse share split for shareholders of record after the close of markets on November 17, 2015. The effect of this transaction was to divide the number of outstanding shares of the Fund by the ratio below, resulting in a corresponding increase in the net asset value per share. The capital share activity presented in the statement of changes in net assets for each of the years in the period then ended, and per share data in the financial highlights for each of the years in the period then ended have been given retroactive effect to reflect these reverse share splits. There were no changes in net assets, results of operations or total return as a result of these transactions. The details of the reverse splits are as follows:
November 18, 2015:
| Fund Name | | Ratio |
| Global X Silver Miners ETF | | 1:3 |
| Global X Gold Explorers ETF | | 1:2 |
| Global X Copper Miners ETF | | 1:3 |
| Global X Uranium ETF | | 1:2 |
| Global X Lithium ETF | | 1:2 |
11. REGULATORY MATTERS
In October 2016, the Securities and Exchange Commission (the “SEC”) released its Final Rule on Investment Company Reporting Modernization (the “Rule”). The Rule which introduces two new regulatory reporting forms for investment companies – Form N-PORT and Form N-CEN – also contains amendments to Regulation S-X which impact financial statement presentation, particularly the presentation of derivative investments. Although still evaluating the impact of the Rule, management believes that many of the Regulation S-X amendments are consistent with the Portfolios’ current financial statement presentation and expects that the Funds will be able to comply with the Rule’s Regulation S-X amendments by the August 1, 2017 compliance date.
| Notes to Financial Statements (continued) |
| October 31, 2016 |
12. SUBSEQUENT EVENTS
The Funds have been evaluated regarding the need for additional disclosures and/or adjustments resulting from subsequent events. Based on this evaluation, no additional disclosure or adjustments were required to the financial statements as of the date the financial statements were issued, except as follows:
New Series
Subsequent to October 31, 2016, the following investment series of the Trust was launched: Global X MSCI SuperDividend® EAFE ETF.
Index Change for the Global X Gold Explorers ETF
The Board of Trustees of the Trust approved the adoption of a new index as outlined in the table below. The new index will increase the diversification and improve the liquidity characteristics of the Fund.
| | Old Index | New Index |
| Index | Solactive Global Gold Explorers Total Return Index | Solactive Global Gold Explorers & Developers Total Return Index |
| Index Components | 21 | 43* |
| Index Description | The Solactive Global Gold Explorers Total Return Index is designed to measure broad based equity market performance of global companies involved in gold exploration. The stocks are screened for liquidity and weighted according to modified free-float market capitalization. A specific capping methodology is used at the time of the semi-annual index review to seek to assure compliance with the rules governing the listing of financial products on exchanges in the United States. | The Solactive Global Gold Explorers & Developers Total Return Index is designed to measure broad based equity market performance of global companies involved in gold exploration, including companies that are engaged in both gold exploration and limited levels of gold production (“Developers”). The stocks are screened for liquidity and weighted according to modified free-float market capitalization. A specific capping methodology is used at the time of the semi-annual index review to seek to assure compliance with the rules governing the listing of financial products on exchanges in the United States. |
*Index constituents for the Solactive Global Gold Explorers & Developers Total Return Index are as of September 28, 2016. The number of index constituents may change by the effective date.
The Fund began implementation of the change on or about November 30, 2016, with the change occurring in two phases.
The phase approach is intended to enable the Global X Gold Explorers ETF’s advisor, Global X Management Co. LLC, to make the necessary adjustments to portfolio holdings in a manner that minimizes impact to Fund shareholders. In the first phase, expected to commence in the fourth quarter of 2016, the Fund will track the Solactive Global Gold Explorers & Developers Total Return Transition Index, an interim index that will gradually reduce exposure to small-capitalization stocks
| Notes to Financial Statements (continued) |
| October 31, 2016 |
12. SUBSEQUENT EVENTS (concluded)
while proportionately increasing exposure to other stocks based on their weightings in the new index. This first phase is expected to be implemented over the course of approximately six months.
In the second phase, the Fund will begin tracking the Solactive Global Gold Explorers & Developers Total Return Index, which is expected to occur upon completion of the first phase.
To protect the Fund from the potential for harmful “front running” by traders, the exact timing of the index changes will not be disclosed to investors. In the meantime, the Fund will continue seeking to track its current index.
The adjustments to the Fund’s portfolio holdings are expected to result in modest, temporary increases in the Fund’s transaction costs and turnover rate. It is important to note that the actual transaction costs, turnover rate, and any other costs will be highly dependent upon a number of factors, including the market environment at the time of the portfolio adjustments. These changes are not expected to increase the expense ratio of the Fund.
| Report of Independent Registered Public Accounting Firm |
| October 31, 2016 |
To the Board of Trustees and Shareholders of Global X Funds:
In our opinion, the accompanying statements of assets and liabilities, including the schedules of investments, and the related statements of operations and of changes in net assets and the financial highlights present fairly, in all material respects, the financial position of Global X Silver Miners ETF, Global X Gold Explorers ETF, Global X Copper Miners ETF, Global X Uranium ETF, Global X Lithium ETF and Global X Fertilizers/Potash ETF (six of the series constituting Global X Funds, hereafter referred to as the "Funds") as of October 31, 2016, the results of each of their operations, the changes in each of their net assets and each of their financial highlights for the year then ended, in conformity with accounting principles generally accepted in the United States of America. These financial statements and financial highlights (hereafter referred to as "financial statements") are the responsibility of the Funds’ management. Our responsibility is to express an opinion on these financial statements based on our audits. We conducted our audits of these financial statements in accordance with the standards of the Public Company Accounting Oversight Board (United States). Those standards require that we plan and perform the audit to obtain reasonable assurance about whether the financial statements are free of material misstatement. An audit includes examining, on a test basis, evidence supporting the amounts and disclosures in the financial statements, assessing the accounting principles used and significant estimates made by management, and evaluating the overall financial statement presentation. We believe that our audits, which included confirmation of securities as of October 31, 2016 by correspondence with the custodian and brokers, provide a reasonable basis for our opinion. The statements of changes in net assets for the year ended October 31, 2015 and the financial highlights for each of the years or periods ended on or prior to October 31, 2015 were audited by other auditors whose report dated December 30, 2015 expressed an unqualified opinion on those financial statements and financial highlights.
PricewaterhouseCoopers LLP
Philadelphia, Pennsylvania
December 22, 2016
| Disclosure of Fund Expenses (unaudited) |
ETFs have operating expenses. As a shareholder of an ETF, your investment is affected by these ongoing costs, which include (among others) costs for ETF management, administrative services, brokerage fees, and shareholder reports like this one. It is important for you to understand the impact of these costs on your investment returns. In addition, a shareholder is responsible for brokerage fees as a result of their investment in a Fund.
Operating expenses such as these are deducted from an ETF’s gross income and directly reduce your final investment return. These expenses are expressed as a percentage of the ETF’s average net assets; this percentage is known as the ETF’s expense ratio.
The following examples use the expense ratio and are intended to help you understand the ongoing costs (in dollars) of investing in your Fund and to compare these costs with those of other funds. The examples are based on an investment of $1,000 made at the beginning of the period shown and held for the entire period from May 1, 2016 through October 31, 2016.
The table on the next page illustrates your Fund’s costs in two ways:
Actual Fund Return. This section helps you to estimate the actual expenses that your Fund incurred over the period. The “Expenses Paid During Period” column shows the actual dollar expense cost incurred by a $1,000 investment in the Fund, and the “Ending Account Value” number is derived from deducting that expense cost from the Fund’s gross investment return.
You can use this information, together with the actual amount you invested in the Funds, to estimate the expenses you paid over that period. Simply divide your actual account value by $1,000 to arrive at a ratio (for example, an $8,600 account value divided by $1,000 = 8.6), then multiply that ratio by the number shown for your Funds under “Expenses Paid During Period.”
Hypothetical 5% Return. This section helps you compare your Fund’s costs with those of other funds. It assumes that the Funds had an annual 5% return before expenses during the year, but that the expense ratio (Column 3) for the period is unchanged. This example is useful in making comparisons because the Securities and Exchange Commission requires all funds to make this 5% calculation. You can assess your Fund’s comparative cost by comparing the hypothetical result for your Fund in the “Expenses Paid During Period” column with those that appear in the same charts in the shareholder reports for other funds.
NOTE: Because the return is set at 5% for comparison purposes — NOT your Fund’s actual return — the account values shown may not apply to your specific investment.
| Disclosure of Fund Expenses (unaudited) (concluded) |
| | | Beginning
Account
Value
5/1/2016 | | | Ending
Account
Value
10/31/2016 | | | Annualized
Expense
Ratios | | | Expenses
Paid
During
Period(1) | |
| Global X Silver Miners ETF |
| Actual Fund Return | | $ | 1,000.00 | | | $ | 1,109.30 | | | | 0.66 | % | | | $3.48 | |
| Hypothetical 5% Return | | | 1,000.00 | | | | 1,021.84 | | | | 0.66 | | | | 3.33 | |
| Global X Gold Explorers ETF |
| Actual Fund Return | | $ | 1,000.00 | | | $ | 967.60 | | | | 0.66 | % | | | $3.26 | |
| Hypothetical 5% Return | | | 1,000.00 | | | | 1,021.83 | | | | 0.66 | | | | 3.35 | |
| Global X Copper Miners ETF |
| Actual Fund Return | | $ | 1,000.00 | | | $ | 1,019.10 | | | | 0.65 | % | | | $3.31 | |
| Hypothetical 5% Return | | | 1,000.00 | | | | 1,021.86 | | | | 0.65 | | | | 3.31 | |
| Global X Uranium ETF |
| Actual Fund Return | | $ | 1,000.00 | | | $ | 784.40 | | | | 0.70 | % | | | $3.14 | |
| Hypothetical 5% Return | | | 1,000.00 | | | | 1,021.62 | | | | 0.70 | | | | 3.56 | |
| Global X Lithium ETF |
| Actual Fund Return | | $ | 1,000.00 | | | $ | 1,058.60 | | | | 0.76 | % | | | $3.96 | |
| Hypothetical 5% Return | | | 1,000.00 | | | | 1,021.29 | | | | 0.76 | | | | 3.89 | |
| Global X Fertilizers/Potash ETF |
| Actual Fund Return | | $ | 1,000.00 | | | $ | 946.90 | | | | 0.69 | % | | | $3.38 | |
| Hypothetical 5% Return | | | 1,000.00 | | | | 1,021.67 | | | | 0.69 | | | | 3.51 | |
| (1) | Expenses are equal to the Fund’s annualized expense ratio multiplied by the average account value over the period, multiplied 184/366 (to reflect the one-half year period.) |
| Supplemental Information (unaudited) |
Net asset value, or “NAV”, is the price per Share at which the Funds issue and redeem Shares. It is calculated in accordance with the standard formula for valuing mutual fund shares. The “Market Price” of the Funds generally is determined using the midpoint between the highest bid and the lowest offer on the stock exchange on which the Shares of the Funds are listed for trading, as of the time that the Funds’ NAV is calculated. The Funds’ Market Price may be at, above or below their NAV. The NAV of the Funds will fluctuate with changes in the market value of the Funds’ holdings. The Market Price of the Funds will fluctuate in accordance with changes in its NAV, as well as market supply and demand.
Premiums or discounts are the differences (expressed as a percentage) between the NAV and Market Price of the Funds on a given day, generally at the time NAV is calculated. A premium is the amount that the Funds are trading above the reported NAV, expressed as a percentage of the NAV. A discount is the amount that the Funds are trading below the reported NAV, expressed as a percentage of the NAV.
Further information regarding premiums and discounts is available on the Funds’ website at www.GlobalXFunds.com.
| Trustees and Officers of the Trust (unaudited) |
Set forth below are the names, addresses, year of birth, position with the Trust, Term of Office and Length of Time Served, the principal occupations for the last five years, number of Funds in fund complex overseen by trustee, and other directorships outside the fund complex of each of the persons currently serving as Trustees and Officers of the Trust.
Name,
Address
(Year of
Birth) | Position(s)
Held
with
Funds | Principal Occupation(s) During
the Past 5 Years | Number of
Funds in
Trust
Overseen
by Trustee | Other Directorships Held
by Trustees |
| Independent Trustees2 | |
Sanjay Ram Bharwani 600 Lexington Ave, 20th floor New York, NY 10022 (1974) | Trustee
(since 2008) | CEO of Risk Advisors Inc. (since 2007) (consulting firm). | 543 | None. |
Scott R. Chichester1 600 Lexington Ave, 20th floor New York, NY 10022 (1970) | Trustee
(since 2008) | CFO, AdeptPros Inc. (app development, training and consulting) (since 2012); Founder, Madison Park Advisors LLC (advisory services) (since 2011); CFO, Sterling Seal & Supply Inc. (since 2011), President & Treasurer, Bayview Acquisition Corp (since 2010), CPA, Penda Aiken Inc. (2009-2011) (consultant); Founder and President, DirectPay USA LLC (since 2006) (payroll company); Proprietor, Scott R. Chichester CPA (since 2001) (CPA firm). | 543 | Director of AdeptPros Inc. (since 2015); Director of Sterling Seal & Supply Inc. (since 2011); Director of Bayview Acquisition Corp. (since 2010); Trustee of ARK ETF Trust (since 2014). |
Kartik Kiran Shah 600 Lexington Ave, 20th floor New York, NY 10022 (1977) | Trustee
(since 2008) | President and Chief Business Officer, Oxeia Biopharmaceuticals, Inc. (2015-present); Vice President, Business Development, Cynvenio Biosystems (2012-2014); Independent Consultant, Self-Employed (2011-2012) (non-financial services); Director, Wireless Generation (2008-2011) (software). | 543 | Director of Oxeia Biopharmaceuticals, Inc. (2015-present). |
| Trustees and Officers of the Trust (unaudited) |
The Trust’s Statement of Additional Information (“SAI”) includes additional information about the Trustees and Officers. The SAI may be obtained without charge by calling 1-888-493-8631. The following chart lists Trustees and Officers as of October 31, 2016.
Name, Address (Year of Birth) | Position(s) Held with Funds | Principal Occupation(s) During the Past 5 Years | Other
Directorships Held by Trustees
During the Past 5 Years |
| Interested Trustees/Officers2 |
Bruno del Ama 600 Lexington Avenue, 20th Floor New York, NY 10022 (1976) | Trustee (since 2008); President, Chief Executive Officer (since 2008). | Chief Executive Officer, Global X Management Company ("GXMC") (since 2008); Chief Compliance Officer, GXMC (2008-2013). | None. |
Luis Berruga 600 Lexington Avenue, 20th Floor New York, NY 10022 (1977) | Chief Operating Officer, Treasurer, Principal Accounting Officer and Chief Financial Officer (since 9/2015). | Chief Financial Officer, GXMC (since 2015) and Chief Operating Officer (since 2014); Investment Banker, Jefferies (2012-2014); Regional Product Specialist, Morgan Stanley (2005-2012). | None. |
Daphne Tippens Chisolm 600 Lexington Avenue, 20th Floor New York, NY 10022 (1969) | Secretary (since 2012). | General Counsel, GXMC (since 2011); Chief Compliance Officer, GXMC (1/2014 - 5/2014 and 2/2015 - 9/2016). | None. |
Joe Costello 600 Lexington Avenue, 20th Floor New York, NY 10022 (1974) | Chief Compliance Officer (since 9/2016). | Chief Compliance Officer, FlexShares Funds (2011-2015); Vice President, Northern Trust Investments (2003 - 2015). | None. |
Lisa K. Whittaker One Freedom Valley Drive Oaks, PA 19456 (1978) | Assistant Secretary (since 2013). | Counsel at SEI Investments (since 2012); Associate Counsel and Compliance Officer at The Glendale Trust Company (2011-2012); Associate of Drinker Biddle & Reath LLP (2006-2011). | None. |
Eric Kleinschmidt One Freedom Valley Drive Oaks, PA 19456 (1968) | Assistant Treasurer (since 2016). | Director, Fund Accounting, SEI Investments Global Funds Services (2004 to present), Manager, Fund Accounting 1999 to 2004. | None. |
| 1 | Mr. Chichester is currently married to a sister of Mr. del Ama’s wife. While an “immediate family member” (as defined in Section 2(a)(19) of the 1940 Act) of Mr. del Ama would be considered an Interested Person, Mr. Chichester is not considered an immediate family member for this purpose. Although this fact was taken into consideration in determining whether Mr. Chichester should be considered to be an Independent Trustee for purposes of the Section 2(a)(19) of the 1940 Act, it was determined that this relationship was not one that should disqualify Mr. Chichester from serving as an Independent Trustee of the Trust. |
| 2 | Each Trustee serves until his or her successor is duly elected or appointed and qualified. |
| 3 | As of October 31, 2016, the Trust had one hundred investment portfolios, fifty-four of which were operational. |
| 4 | These officers of the Trust also serve as officers of one or more mutual funds for which SEI Investments Company or an affiliate acts as investment manager, administrator or distributor. |
| Notice to Shareholders (unaudited) |
For shareholders that do not have an October 31, 2016 tax year end, this notice is for informational purposes only. For shareholders with an October 31, 2016 tax year end, please consult your tax advisor as to the pertinence of this notice. For the fiscal year ended October 31, 2016, the Funds have designated the following items with regard to distributions paid during the year.
| | | Long-Term Capital Gain Distributions | | | Ordinary
Income
Distributions | | | Total
Distributions | | | Qualifying
for
Corporate
Dividends
Received
Deduction (1) | | | Qualifying
Dividend
Income (2) | | | U.S.
Government
Interest (3) | | | Interest
Related
Dividends (4) | | | Short Term
Capital Gain
Dividends (5) | | | Foreign
Tax
Credit | |
| Global X Silver Miners ETF | | | 0.00 | % | | | 100.00 | % | | | 100.00 | % | | | 39.32 | % | | | 59.93 | % | | | 0.20 | % | | | 0.01 | % | | | 0.00 | % | | | 23.61 | % |
| Global X Gold Explorers ETF | | | 0.00 | % | | | 100.00 | % | | | 100.00 | % | | | 0.00 | % | | | 0.00 | % | | | 0.01 | % | | | 0.00 | % | | | 0.00 | % | | | 0.24 | % |
| Global X Copper Miners ETF | | | 0.00 | % | | | 100.00 | % | | | 100.00 | % | | | 5.68 | % | | | 100.00 | % | | | 0.00 | % | | | 0.00 | % | | | 0.00 | % | | | 4.51 | % |
| Global X Uranium ETF | | | 0.00 | % | | | 100.00 | % | | | 100.00 | % | | | 0.00 | % | | | 10.39 | % | | | 0.02 | % | | | 0.00 | % | | | 0.00 | % | | | 3.69 | % |
| Global X Lithium ETF | | | 0.00 | % | | | 100.00 | % | | | 100.00 | % | | | 16.41 | % | | | 42.45 | % | | | 0.00 | % | | | 0.01 | % | | | 0.00 | % | | | 64.85 | % |
| Global X Fertilizers/Potash ETF | | | 0.00 | % | | | 100.00 | % | | | 100.00 | % | | | 24.49 | % | | | 85.25 | % | | | 0.00 | % | | | 0.00 | % | | | 0.00 | % | | | 9.59 | % |
(1) Qualifying dividends represent dividends which qualify for the corporate dividends received deduction and is reflected as a percentage of ordinary Income distributions (the total of short term capital gain and net investment income distributions).
(2) The percentage in this column represents the amount of "Qualifying Dividend Income" as created by the Jobs and Growth Relief Reconciliation Act of 2003 and is reflected as a percentage of ordinary income distributions (the total of short term capital gain and net investment income distributions). It is the intention of each of the aforementioned funds to designate the maximum amount permitted by law.
(3) "U.S. Government Interest" represents the amount of interest that was derived from U.S. Government obligations and distributed during the fiscal year. Generally, interest from direct U.S. Government obligations is exempt from state income tax. However, for shareholders who are residents of California, Connecticut and New York, the statutory threshold requirements were not satisfied to permit exemption of these amounts from state income.
(4) The percentage in this column represents the amount of "Interest Related Dividends" is reflected as a percentage of ordinary income distribution. Interest related dividends is exempt from U.S. withholding tax when paid to foreign investors.
(5) The percentage of this column represents the amount of “Short Term Capital Gain Dividend” is reflected as a percentage of short term capital gain distribution that is exempted from U.S. withholding tax when paid to foreign investors.
The Funds intend to pass through a foreign tax credit to shareholders. For the fiscal year ended October 31, 2016, the total amount of foreign source income and foreign tax credit are as follows:
| Fund Name | | Foreign Source Income | | | Foreign Tax Credit Pass Through | |
| Global X Silver Miners ETF | | $ | 1,704,638 | | | $ | 152,200 | |
| Global X Gold Explorers ETF | | | 44,469 | | | | 6,670 | |
| Global X Copper Miners ETF | | | 225,678 | | | | 9,718 | |
| Global X Uranium ETF | | | 823,303 | | | | 92,833 | |
| Global X Lithium ETF | | | 980,552 | | | | 179,594 | |
| Global X Fertilizers/Potash ETF | | | 115,829 | | | | 38,506 | |
The information reported herein may differ from the information and distributions taxable to the shareholders for the calendar year ending December 31, 2016. Complete information will be computed and reported in conjunction with your 2016 Form 1099-DIV.
600 Lexington Avenue, 20th floor
New York, NY 10022
1-888-GXFund-1
(1-888-493-8631)
www.globalxfunds.com
Investment Adviser and Administrator:
Global X Management Company LLC
600 Lexington Avenue, 20th floor
New York, NY 10022
Distributor:
SEI Investments Distribution Co.
One Freedom Valley Drive
Oaks, PA 19456
Sub-Administrator:
SEI Investments Global Funds Services
One Freedom Valley Drive
Oaks, PA 19456
Counsel for Global X Funds and the Independent Trustees:
Stradley Ronon Stevens & Young, LLP
1250 Connecticut Avenue, N.W.
Suite 500
Washington, DC 20036
Custodian and Transfer Agent:
Brown Brothers Harriman & Co.
50 Post Office Square
Boston, MA 02110
Independent Registered Public Accounting Firm:
PricewaterhouseCoopers LLP
Two Commerce Square
Suite 1800
2001 Market Street
Philadelphia, PA 19103
This information must be preceded or accompanied by a current prospectus for the Funds described.
GLX-AR-001-0800
| Global X China Consumer ETF (ticker: CHIQ) | |
| Global X China Energy ETF (ticker: CHIE) |
| Global X China Financials ETF (ticker: CHIX) |
| Global X China Industrials ETF (ticker: CHII) |
| Global X China Materials ETF (ticker: CHIM) |
| Global X NASDAQ China Technology ETF (ticker: QQQC) |
| Global X Southeast Asia ETF (ticker: ASEA) |
| Global X FTSE Andean 40 ETF (ticker: AND) |
| Global X MSCI Colombia ETF (ticker: GXG) |
| Global X Brazil Mid Cap ETF (ticker: BRAZ) |
| Global X Brazil Consumer ETF (ticker: BRAQ) |
| Global X MSCI Argentina ETF (ticker: ARGT) |
| Global X MSCI Greece ETF (ticker: GREK) |
| Global X MSCI Norway ETF (ticker: NORW) |
| Global X FTSE Nordic Region ETF (ticker: GXF) |
| Global X MSCI Nigeria ETF (ticker: NGE) |
| Global X Next Emerging & Frontier ETF (ticker: EMFM) |
| Global X MSCI Portugal ETF (formerly, Global X FTSE Portugal 20 ETF) (ticker: PGAL) |
| Global X MSCI Pakistan ETF (ticker: PAK) |
Annual Report
October 31, 2016
Shares are bought and sold at market price (not NAV) and are not individually redeemed from the Fund. Shares may only be redeemed directly from a fund by Authorized Participants, in very large creation/redemption units. Brokerage commissions will reduce returns.
The Funds file their complete schedules of Fund holdings with the Securities and Exchange Commission (the “Commission”) for the first and third quarters of each fiscal year on Form N-Q within sixty days after the end of the period. The Funds’ Forms N-Q are available on the Commission’s website at http://www.sec.gov, and may be reviewed and copied at the Commission's Public Reference Room in Washington, DC. Information on the operation of the Public Reference Room may be obtained by calling 1-800-SEC-0330.
A description of the policies and procedures that Global X Funds uses to determine how to vote proxies relating to Fund securities, as well as information relating to how the Funds voted proxies relating to Fund securities during the most recent 12-month period ended June 30, is available (i) without charge, upon request, by calling 1-888-GXFund-1; and (ii) on the Commission’s website at http://www.sec.gov.
| Management Discussion of Fund Performance (unaudited) |
| Global X China Consumer ETF |
Global X China Consumer ETF
The Global X China Consumer ETF (“Fund”) seeks to provide investment results that correspond generally to the price and yield performance, before fees and expenses, of the Solactive China Consumer Total Return Index (“Underlying Index”). The Fund is passively managed, which means the investment adviser does not attempt to take defensive positions in declining markets. The Fund generally seeks to fully replicate the Underlying Index.
The Underlying Index is designed to measure the equity performance of the investable universe of companies in the consumer sector of the Chinese economy, as defined by the index provider. It is comprised of securities of companies that have their main business operations in the consumer sector and generally includes companies whose businesses involve: general retail, diversified consumer services, food production and retail, beverages, household goods, leisure goods, personal goods, automobiles, auto components and distributors, tobacco, media, and travel and leisure.
For the 12-month period ended October 31, 2016 (the “reporting period”), the Fund decreased 8.57%, while the Underlying Index decreased 7.82%. The Fund had a net asset value of $13.72 per share on October 31, 2015 and ended the reporting period with a net asset value of $11.97 on October 31, 2016.
During the reporting period, the highest returns came from New Oriental Education & Technology Group and Guangzhou Automobile Group, which returned 82.22% and 40.81%, respectively. The worst performers were Tingyi Cayman Islands Holding and Belle International Holdings, which returned -35.59% and -35.22%, respectively.
China’s most recent five-year development plan was announced shortly before the reporting period and commenced at the beginning of 2016. The plan outlined initiatives to transition China from a manufacturing and export led economy to one that is driven more by China’s ‘new sectors’ such as consumption, technology, and services. In Q1 2016, over 80% of China’s GDP growth came from consumption, demonstrating the importance of this segment to the country’s economic growth. China’s consumer sector continues to benefit from the trend of increasing urbanization and rising wages, both of which are supportive of greater consumption. The sector faces challenges such as high savings rates and a weakening currency.
| | | AVERAGE ANNUAL TOTAL RETURN FOR THE YEAR ENDED OCTOBER 31, 2016 | |
| | | One Year Return | | | Three Year Return | | | Five Year Return | | | Annualized Inception to Date* | |
| | | Net Asset Value | | | Market Price | | | Net Asset Value | | | Market Price | | | Net Asset Value | | | Market Price | | | Net Asset Value | | | Market Price | |
| Global X China Consumer ETF | | | -8.57 | % | | | -8.61 | % | | | -6.61 | % | | | -6.49 | % | | | -3.00 | % | | | -2.51 | % | | | -2.36 | % | | | -2.40 | % |
| Solactive China Consumer Total Return Index | | | -7.82 | % | | | -7.82 | % | | | -5.92 | % | | | -5.92 | % | | | -2.41 | % | | | -2.41 | % | | | -1.79 | % | | | -1.79 | % |
| S&P 500 Index | | | 4.51 | % | | | 4.51 | % | | | 8.84 | % | | | 8.84 | % | | | 13.57 | % | | | 13.57 | % | | | 12.39 | % | | | 12.39 | % |
Growth of a $10,000 Investment
(At Net Asset Value)
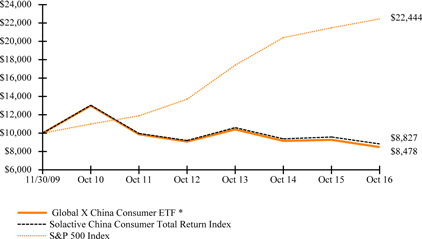
*Fund commenced operations on November 30, 2009.
The S&P 500 Index is a market capitalization-weighted composite index of 500 large capitalization U.S. companies.
| Management Discussion of Fund Performance (unaudited) |
| Global X China Consumer ETF |
The performance data quoted herein represents past performance and the return and value of an investment in the Fund will fluctuate so that, when redeemed, it may be worth less than its original cost. Past performance is no guarantee of future performance and should not be considered as a representation of the future results of the Fund. The Fund's performance assumes the reinvestment of all dividends and all capital gains. Index returns assume reinvestment of dividends and, unlike a Fund's returns, do not reflect any fees or expenses. If such fees and expenses were included in the index returns, the performance would have been lower. Please note that one cannot invest directly in an unmanaged index.
There are no assurances that the Fund will meet its stated objectives.
The Fund’s holdings and allocations are subject to change and should not be considered recommendations to buy individual securities.
The graph and table do not reflect the deduction of taxes that a shareholder would pay on Fund distributions or the redemption or sale of Fund shares.
See definition of comparative indices on previous page.
| Management Discussion of Fund Performance (unaudited) |
| Global X China Energy ETF |
Global X China Energy ETF
The Global X China Energy ETF (“Fund”) seeks to provide investment results that correspond generally to the price and yield performance, before fees and expenses, of the Solactive China Energy Total Return Index (“Underlying Index”). The Fund is passively managed, which means the investment adviser does not attempt to take defensive positions in declining markets. The Fund generally seeks to fully replicate the Underlying Index.
The Underlying Index is designed to measure the equity performance of the investable universe of companies in the energy sector of the Chinese economy, as defined by the index provider. It is comprised of securities of companies that have their main business operations in the energy sector and generally includes companies whose businesses involve: oil, gas, consumable fuels, alternative energy and electricity production and distribution, and energy equipment and services.
For the 12-month period ended October 31, 2016 (the “reporting period”), the Fund decreased 6.11%, while the Underlying Index decreased 5.34%. The Fund had a net asset value of $11.61 per share on October 31, 2015 and ended the reporting period with a net asset value of $10.56 on October 31, 2016.
During the reporting period, the highest returns came from Shougang Fushan Resources Group and Yanzhou Coal Mining, which returned 83.42% and 54.02%, respectively. The worst performers were Shunfeng International Clean Energy and JinkoSolar Holding, which returned -73.51% and -40.48%, respectively.
During the reporting period, the Chinese energy industry experienced slower growth, which is primarily attributed to a general slowdown in China’s economic development. China’s domestic energy demand growth continues to slow as the government implements a series of policies designed to increase energy efficiency and mitigate the negative environmental effects of energy consumption. In addition, global energy prices across a range of energy commodities such as oil and natural gas remained low throughout the reporting period due to excess supply and weak demand. This low price environment put additional pressure on China’s energy companies which may profit off of higher energy prices. While the oil market did recover in the second half of the reporting period, there is still uncertainty as to what impact China’s energy policy will have on traditional as well as renewable energy companies in China.
| | | AVERAGE ANNUAL TOTAL RETURN FOR THE YEAR ENDED OCTOBER 31, 2016 | |
| | | One Year Return | | | Three Year Return | | | Five Year Return | | | Annualized Inception to Date* | |
| | | Net Asset Value | | | Market Price | | | Net Asset Value | | | Market Price | | | Net Asset Value | | | Market Price | | | Net Asset Value | | | Market Price | |
| Global X China Energy ETF | | | -6.11 | % | | | -6.93 | % | | | -9.03 | % | | | -9.18 | % | | | -3.04 | % | | | -2.65 | % | | | -3.32 | % | | | -3.44 | % |
| Solactive China Energy Total Return Index | | | -5.34 | % | | | -5.34 | % | | | -8.35 | % | | | -8.35 | % | | | -2.31 | % | | | -2.31 | % | | | -2.53 | % | | | -2.53 | % |
| S&P 500 Index | | | 4.51 | % | | | 4.51 | % | | | 8.84 | % | | | 8.84 | % | | | 13.57 | % | | | 13.57 | % | | | 12.27 | % | | | 12.27 | % |
Growth of a $10,000 Investment
(At Net Asset Value)
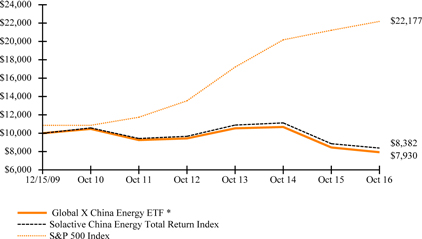
*Fund commenced operations on December 15, 2009.
The S&P 500 Index is a market capitalization-weighted composite index of 500 large capitalization U.S. companies.
| Management Discussion of Fund Performance (unaudited) |
| Global X China Energy ETF |
The performance data quoted herein represents past performance and the return and value of an investment in the Fund will fluctuate so that, when redeemed, it may be worth less than its original cost. Past performance is no guarantee of future performance and should not be considered as a representation of the future results of the Fund. The Fund's performance assumes the reinvestment of all dividends and all capital gains. Index returns assume reinvestment of dividends and, unlike a Fund's returns, do not reflect any fees or expenses. If such fees and expenses were included in the index returns, the performance would have been lower. Please note that one cannot invest directly in an unmanaged index.
There are no assurances that the Fund will meet its stated objectives.
The Fund’s holdings and allocations are subject to change and should not be considered recommendations to buy individual securities.
The graph and table do not reflect the deduction of taxes that a shareholder would pay on Fund distributions or the redemption or sale of Fund shares.
See definition of comparative indices on previous page.
| Management Discussion of Fund Performance (unaudited) |
| Global X China Financials ETF |
Global X China Financials ETF
The Global X China Financials ETF (“Fund”) seeks to provide investment results that correspond generally to the price and yield performance, before fees and expenses, of the Solactive China Financials Total Return Index (“Underlying Index”). The Fund is passively managed, which means the investment adviser does not attempt to take defensive positions in declining markets. The Fund generally seeks to fully replicate the Underlying Index.
The Underlying Index is designed to measure the equity performance of the investable universe of companies in the financials sector of the Chinese economy, as defined by the index provider. It is comprised of securities of companies that have their main business operations in the financials sector and generally includes companies whose businesses involve: banking; insurance, real estate, and financial services.
For the 12-month period ended October 31, 2016 (the “reporting period”), the Fund decreased 2.56%, while the Underlying Index decreased 1.74%. The Fund had a net asset value of $14.90 per share on October 31, 2015 and ended the reporting period with a net asset value of $13.80 on October 31, 2016.
During the reporting period, the highest returns came from Guangzhou R&F Properties and Country Garden Holdings, which returned 61.83% and 42.69%, respectively. The worst performers were China Taiping Insurance Holdings, and China Life Insurance, which returned -38.89% and -29.41%, respectively.
Over the course of the reporting period, China’s financial stocks sported low valuations as investors have generally shied away from the sector, which has been criticized for liberal lending policies. During the period, the percentage of non-performing loans (NPLs) increased as the slowing economy impacted China’s weaker borrowers. To the sector’s benefit, the People’s Bank of China (PBOC) has been cutting the required reserve ratio, most recently in February 2016, which makes more money available for lending, which can potentially increase bank profits.
| | | AVERAGE ANNUAL TOTAL RETURN FOR THE YEAR ENDED OCTOBER 31, 2016 | |
| | | One Year Return | | | Three Year Return | | | Five Year Return | | | Annualized Inception to Date* | |
| | | Net Asset Value | | | Market Price | | | Net Asset Value | | | Market Price | | | Net Asset Value | | | Market Price | | | Net Asset Value | | | Market Price | |
| Global X China Financials ETF | | | -2.56 | % | | | -2.36 | % | | | 3.51 | % | | | 3.67 | % | | | 6.80 | % | | | 7.16 | % | | | 0.61 | % | | | 0.59 | % |
| Solactive China Financials Total Return Index | | | -1.74 | % | | | -1.74 | % | | | 4.26 | % | | | 4.26 | % | | | 7.48 | % | | | 7.48 | % | | | 1.10 | % | | | 1.10 | % |
| S&P 500 Index | | | 4.51 | % | | | 4.51 | % | | | 8.84 | % | | | 8.84 | % | | | 13.57 | % | | | 13.57 | % | | | 12.33 | % | | | 12.33 | % |
Growth of a $10,000 Investment
(At Net Asset Value)
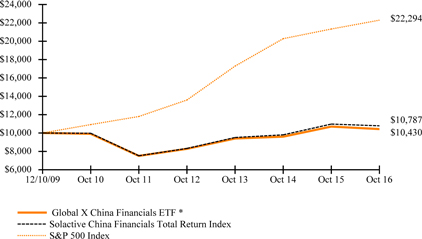
*Fund commenced operations on December 10, 2009.
The S&P 500 Index is a market capitalization-weighted composite index of 500 large capitalization U.S. companies.
The performance data quoted herein represents past performance and the return and value of an investment in the Fund will fluctuate so that, when redeemed, it may be worth less than its original cost. Past performance is no guarantee of future performance and should not be considered as a representation of the future results of the Fund. The Fund's performance assumes the reinvestment of all dividends and all
| Management Discussion of Fund Performance (unaudited) |
| Global X China Financials ETF |
capital gains. Index returns assume reinvestment of dividends and, unlike a Fund's returns, do not reflect any fees or expenses. If such fees and expenses were included in the index returns, the performance would have been lower. Please note that one cannot invest directly in an unmanaged index.
There are no assurances that the Fund will meet its stated objectives.
The Fund’s holdings and allocations are subject to change and should not be considered recommendations to buy individual securities.
The graph and table do not reflect the deduction of taxes that a shareholder would pay on Fund distributions or the redemption or sale of Fund shares.
See definition of comparative indices on previous page.
| Management Discussion of Fund Performance (unaudited) |
| Global X China Industrials ETF |
Global X China Industrials ETF
The Global X China Industrials ETF (“Fund”) seeks to provide investment results that correspond generally to the price and yield performance, before fees and expenses, of the Solactive China Industrials Total Return Index (“Underlying Index”). The Fund is passively managed, which means the investment adviser does not attempt to take defensive positions in declining markets. The Fund generally seeks to fully replicate the Underlying Index.
The Underlying Index is designed to measure the equity performance of the investable universe of companies in the industrials sector of the Chinese economy, as defined by the index provider. It is comprised of securities of companies that have their main business operations in the industrial sector and generally includes companies whose businesses involve: construction and materials, electronic and electrical equipment, industrial engineering, industrial transportation, and support services, and trading companies, shipbuilding and aerospace.
For the 12-month period ended October 31, 2016 (the “reporting period”), the Fund decreased 10.60%, while the Underlying Index decreased 8.82%. The Fund had a net asset value of $14.44 per share on October 31, 2015 and ended the reporting period with a net asset value of $12.57 on October 31, 2016.
During the reporting period, the highest returns came from Sunny Optical Technology Group and Weichai Power, which returned 110.67% and 45.09%, respectively. The worst performers were China Huarong Energy and China Shipping Container Lines, which returned -52.42% and -41.09%, respectively.
During the reporting period, China’s industrial production growth fell to its lowest levels in over five years, despite the metric still reading nearly 6% in year over year growth. Slowing GDP growth in China during the reporting period indicates general weakness in the economy. In addition, the economy continues to transition from a manufacturing and export-led economy, to one driven by services and consumption.
| | | AVERAGE ANNUAL TOTAL RETURN FOR THE YEAR ENDED OCTOBER 31, 2016 | |
| | | One Year Return | | | Three Year Return | | | Five Year Return | | | Annualized Inception to Date* | |
| | | Net Asset Value | | | Market Price | | | Net Asset Value | | | Market Price | | | Net Asset Value | | | Market Price | | | Net Asset Value | | | Market Price | |
| Global X China Industrials ETF | | | -10.60 | % | | | -12.66 | % | | | 2.83 | % | | | 2.67 | % | | | 3.31 | % | | | 3.50 | % | | | -1.88 | % | | | -2.06 | % |
| Solactive China Industrials Total Return Index | | | -8.82 | % | | | -8.82 | % | | | 5.34 | % | | | 5.34 | % | | | 5.06 | % | | | 5.06 | % | | | -0.52 | % | | | -0.52 | % |
| S&P 500 Index | | | 4.51 | % | | | 4.51 | % | | | 8.84 | % | | | 8.84 | % | | | 13.57 | % | | | 13.57 | % | | | 12.39 | % | | | 12.39 | % |
Growth of a $10,000 Investment
(At Net Asset Value)
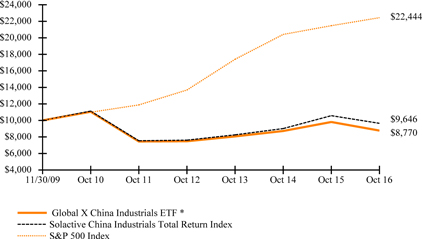
*Fund commenced operations on November 30, 2009.
The S&P 500 Index is a market capitalization-weighted composite index of 500 large capitalization U.S. companies.
The performance data quoted herein represents past performance and the return and value of an investment in the Fund will fluctuate so that, when redeemed, it may be worth less than its original cost. Past performance is no guarantee of future performance and should not be considered as a representation of the future results of the Fund. The Fund's performance assumes the reinvestment of all dividends and all
| Management Discussion of Fund Performance (unaudited) |
| Global X China Industrials ETF |
capital gains. Index returns assume reinvestment of dividends and, unlike a Fund's returns, do not reflect any fees or expenses. If such fees and expenses were included in the index returns, the performance would have been lower. Please note that one cannot invest directly in an unmanaged index.
There are no assurances that the Fund will meet its stated objectives.
The Fund’s holdings and allocations are subject to change and should not be considered recommendations to buy individual securities.
The graph and table do not reflect the deduction of taxes that a shareholder would pay on Fund distributions or the redemption or sale of Fund shares.
See definition of comparative indices on previous page.
| Management Discussion of Fund Performance (unaudited) |
| Global X China Materials ETF |
Global X China Materials ETF
The Global X China Materials ETF (“Fund”) seeks to provide investment results that correspond generally to the price and yield performance, before fees and expenses, of the Solactive China Materials Total Return Index (“Underlying Index”). The Fund is passively managed, which means the investment adviser does not attempt to take defensive positions in declining markets. The Fund generally seeks to fully replicate the Underlying Index.
The Underlying Index is designed to measure the equity performance of the investable universe of companies in the materials sector of the Chinese economy, as defined by the index provider. It is comprised of securities of companies that have their main business operations in the basic materials sector and generally includes companies whose businesses involve: chemicals, metals and mining, and forestry and paper products.
For the 12-month period ended October 31, 2016 (the “reporting period”), the Fund increased 6.84%, while the Underlying Index increased 8.19%. The Fund had a net asset value of $13.29 per share on October 31, 2015 and ended the reporting period with a net asset value of $13.42 on October 31, 2016.
During the reporting period, the highest returns came from Kingboard Chemical Holdings and Zhaojin Mining Industry, which returned 115.88% and 79.21%, respectively. The worst performers were China Molybdenum and West China Cement, which returned -60.3% and -41.08%, respectively.
During the reporting period, China’s materials sector benefited as the country’s housing market gained momentum, resulting in more construction and demand for basic materials. The housing market, along with other areas of China’s economy, was boosted by accommodative central bank policies, such as interest rate cuts and lower deposit requirements. The materials segment also benefited from the broad rebound in commodity prices as many materials firms profited from higher commodity prices.
| | | AVERAGE ANNUAL TOTAL RETURN FOR THE YEAR ENDED OCTOBER 31, 2016 | |
| | | One Year Return | | | Three Year Return | | | Five Year Return | | | Annualized Inception to Date* | |
| | | Net Asset Value | | | Market Price | | | Net Asset Value | | | Market Price | | | Net Asset Value | | | Market Price | | | Net Asset Value | | | Market Price | |
| Global X China Materials ETF | | | 6.84 | % | | | 8.14 | % | | | -1.10 | % | | | -0.81 | % | | | -4.96 | % | | | -4.52 | % | | | -9.64 | % | | | -9.56 | % |
| Solactive China Materials Total Return Index | | | 8.19 | % | | | 8.19 | % | | | 1.30 | % | | | 1.30 | % | | | -3.73 | % | | | -3.73 | % | | | -8.29 | % | | | -8.29 | % |
| S&P 500 Index | | | 4.51 | % | | | 4.51 | % | | | 8.84 | % | | | 8.84 | % | | | 13.57 | % | | | 13.57 | % | | | 11.98 | % | | | 11.98 | % |
Growth of a $10,000 Investment
(At Net Asset Value)
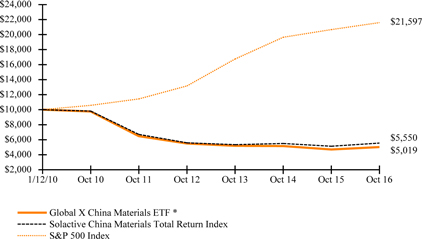
*Fund commenced operations on January 12, 2010.
The S&P 500 Index is a market capitalization-weighted composite index of 500 large capitalization U.S. companies.
| Management Discussion of Fund Performance (unaudited) |
| Global X China Materials ETF |
The performance data quoted herein represents past performance and the return and value of an investment in the Fund will fluctuate so that, when redeemed, it may be worth less than its original cost. Past performance is no guarantee of future performance and should not be considered as a representation of the future results of the Fund. The Fund's performance assumes the reinvestment of all dividends and all capital gains. Index returns assume reinvestment of dividends and, unlike a Fund's returns, do not reflect any fees or expenses. If such fees and expenses were included in the index returns, the performance would have been lower. Please note that one cannot invest directly in an unmanaged index.
There are no assurances that the Fund will meet its stated objectives.
The Fund’s holdings and allocations are subject to change and should not be considered recommendations to buy individual securities.
The graph and table do not reflect the deduction of taxes that a shareholder would pay on Fund distributions or the redemption or sale of Fund shares.
See definition of comparative indices on previous page.
| Management Discussion of Fund Performance (unaudited) |
| Global X NASDAQ China Technology ETF |
Global X NASDAQ China Technology ETF
The Global X NASDAQ China Technology ETF (“Fund”) seeks to provide investment results that correspond generally to the price and yield performance, before fees and expenses, of the NASDAQ OMX China Technology Index (“Underlying Index”). The Fund is passively managed, which means the investment adviser does not attempt to take defensive positions in declining markets. The Fund generally seeks to fully replicate the Underlying Index.
The Underlying Index is designed to track the performance of the technology sector in China as defined by the index provider. It is comprised of securities of companies that have their main business operations in the technology sector and generally includes companies whose businesses involve: computer services, internet, software, computer hardware, electronic office equipment, semiconductors, and telecommunications equipment.
For the 12-month period ended October 31, 2016 (the “reporting period”), the Fund increased 6.20%, while the Underlying Index increased 7.12%. The Fund had a net asset value of $22.01 per share on October 31, 2015 and ended the reporting period with a net asset value of $23.23 on October 31, 2016.
During the reporting period, the highest returns came from Weibo and Baozun, which returned 185.42% and 126.32%, respectively. The worst performers were Suncorp Technologies and 21Vianet Group, which returned -64.67% and -63.52%, respectively.
The technology sector in China continues to grow, as e-commerce and hardware companies continue to benefit from higher internet and mobile penetration. China has implemented policies to encourage foreign direct investment (FDI) into its high-tech industries, including software, electronics and information technology. Joint ventures between foreign companies and Chinese firms has also contributed positively to China’s technology development. China’s most recent five-year development plan was announced shortly before the reporting period and commenced at the beginning of 2016. The plan outlined initiatives to grow the cyber economy and improve internet connectivity to continue to modernize the country. In addition, China’s Single’s Day in November 2015 became one of the largest e-commerce days, surpassing the U.S.’s Cyber Monday.
| | | AVERAGE ANNUAL TOTAL RETURN FOR THE YEAR ENDED OCTOBER 31, 2016 | |
| | | One Year Return | | | Three Year Return | | | Five Year Return | | | Annualized Inception to Date* | |
| | | Net Asset Value | | | Market Price | | | Net Asset Value | | | Market Price | | | Net Asset Value | | | Market Price | | | Net Asset Value | | | Market Price | |
| Global X NASDAQ China Technology ETF | | | 6.20 | % | | | 6.54 | % | | | 4.38 | % | | | 4.12 | % | | | 9.25 | % | | | 9.37 | % | | | 7.26 | % | | | 7.16 | % |
| Hybrid NASDAQ OMX China Technology Index/Solactive China Technology Index** | | | 7.12 | % | | | 7.12 | % | | | 5.29 | % | | | 5.29 | % | | | 10.09 | % | | | 10.09 | % | | | 8.02 | % | | | 8.02 | % |
| S&P 500 Index | | | 4.51 | % | | | 4.51 | % | | | 8.84 | % | | | 8.84 | % | | | 13.57 | % | | | 13.57 | % | | | 12.48 | % | | | 12.48 | % |
Growth of a $10,000 Investment
(At Net Asset Value)
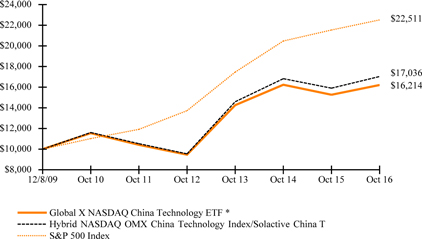
| Management Discussion of Fund Performance (unaudited) |
| Global X NASDAQ China Technology ETF |
*Fund commenced operations on December 8, 2009.
** Reflects performance of Solactive China Technology Index through December 12, 2011 and NASDAQ OMX China Technology Index thereafter.
The S&P 500 Index is a market capitalization-weighted composite index of 500 large capitalization U.S. companies.
The performance data quoted herein represents past performance and the return and value of an investment in the Fund will fluctuate so that, when redeemed, it may be worth less than its original cost. Past performance is no guarantee of future performance and should not be considered as a representation of the future results of the Fund. The Fund's performance assumes the reinvestment of all dividends and all capital gains. Index returns assume reinvestment of dividends and, unlike a Fund's returns, do not reflect any fees or expenses. If such fees and expenses were included in the index returns, the performance would have been lower. Please note that one cannot invest directly in an unmanaged index.
There are no assurances that the Fund will meet its stated objectives.
The Fund’s holdings and allocations are subject to change and should not be considered recommendations to buy individual securities.
The graph and table do not reflect the deduction of taxes that a shareholder would pay on Fund distributions or the redemption or sale of Fund shares.
See definition of comparative indices above and on previous page.
| Management Discussion of Fund Performance (unaudited) |
| Global X Southeast Asia ETF |
Global X Southeast Asia ETF
The Global X Southeast Asia ETF (“Fund”) seeks to provide investment results that correspond generally to the price and yield performance, before fees and expenses, of the FTSE/ASEAN 40 Index (“Underlying Index”). The Fund is passively managed, which means the investment adviser does not attempt to take defensive positions in declining markets. The Fund generally seeks to fully replicate the Underlying Index.
The Underlying Index tracks the equity performance of the 40 largest and most liquid companies in the five Association of Southeast Asian Nations ("ASEAN") regions: Singapore, Malaysia, Indonesia, Thailand and the Philippines, as defined by the index provider.
For the 12-month period ended October 31, 2016 (the “reporting period”), the Fund increased 8.75%, while the Underlying Index increased 9.57%. The Fund had a net asset value of $13.07 per share on October 31, 2015 and ended the reporting period with a net asset value of $13.72 on October 31, 2016.
During the reporting period, the highest returns came from Telekomunikasi Indonesia and Astra International, which returned 66.98% and 49.76%, respectively. The worst performers were PLDT and Advanced Info Service, which returned -29.94% and -28.42%, respectively.
The Association of South East Asian Nations (ASEAN) – which includes Singapore, Malaysia, Indonesia, the Philippines and Thailand, among other countries — remains one of the more dynamic regions in the global economy. Collectively the ASEAN region has delivered impressive productivity growth despite facing headwinds from a weak global recovery and the slowdown in China’s economic growth, a key trading partner for the region. Indonesia has been a particular bright spot, with the rupiah outperforming most other Asian currencies. The Philippine economy also experienced positive developments during the period, with consumption and investment remaining robust and an acceleration in GDP growth. In contrast, Malaysia generally underperformed during the period, with low oil prices and weak external demand causing economic growth in Malaysia to falter. While the ASEAN region could benefit from further economic integration and increased trade with regional partners, the uncertain status of agreements such as the Trans-Pacific Partnership has made the outlook somewhat less clear. In addition, the region could face political turmoil with relatively recent political changes in Indonesia, the Philippines, and Thailand.
| | | AVERAGE ANNUAL TOTAL RETURN FOR THE YEAR ENDED OCTOBER 31, 2016 | |
| | | One Year Return | | | Three Year Return | | | Five Year Return | | | Annualized Inception to Date* | |
| | | Net Asset Value | | | Market Price | | | Net Asset Value | | | Market Price | | | Net Asset Value | | | Market Price | | | Net Asset Value | | | Market Price | |
| Global X Southeast Asia ETF | | | 8.75 | % | | | 8.87 | % | | | -3.99 | % | | | -4.07 | % | | | 0.48 | % | | | 0.50 | % | | | 0.92 | % | | | 0.81 | % |
| FTSE/ASEAN 40 Index | | | 9.57 | % | | | 9.57 | % | | | -3.44 | % | | | -3.44 | % | | | 1.02 | % | | | 1.02 | % | | | 1.51 | % | | | 1.51 | % |
| S&P 500 Index | | | 4.51 | % | | | 4.51 | % | | | 8.84 | % | | | 8.84 | % | | | 13.57 | % | | | 13.57 | % | | | 10.80 | % | | | 10.80 | % |
Growth of a $10,000 Investment
(At Net Asset Value)
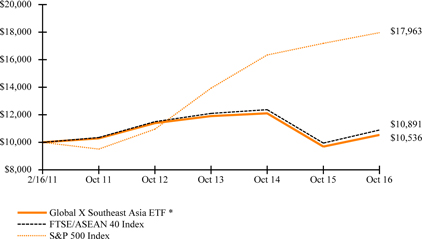
*Fund commenced operations on February 16, 2011.
The S&P 500 Index is a market capitalization-weighted composite index of 500 large capitalization U.S. companies.
| Management Discussion of Fund Performance (unaudited) |
| Global X Southeast Asia ETF |
The performance data quoted herein represents past performance and the return and value of an investment in the Fund will fluctuate so that, when redeemed, it may be worth less than its original cost. Past performance is no guarantee of future performance and should not be considered as a representation of the future results of the Fund. The Fund's performance assumes the reinvestment of all dividends and all capital gains. Index returns assume reinvestment of dividends and, unlike a Fund's returns, do not reflect any fees or expenses. If such fees and expenses were included in the index returns, the performance would have been lower. Please note that one cannot invest directly in an unmanaged index.
There are no assurances that the Fund will meet its stated objectives.
The Fund’s holdings and allocations are subject to change and should not be considered recommendations to buy individual securities.
The graph and table do not reflect the deduction of taxes that a shareholder would pay on Fund distributions or the redemption or sale of Fund shares.
See definition of comparative indices on previous page.
| Management Discussion of Fund Performance (unaudited) |
| Global X FTSE Andean 40 ETF |
Global X FTSE Andean 40 ETF
The Global X FTSE Andean 40 ETF (“Fund”) seeks to provide investment results that correspond generally to the price and yield performance, before fees and expenses, of the FTSE Andean 40 Index (“Underlying Index”). The Fund is passively managed, which means the investment adviser does not attempt to take defensive positions in declining markets. The Fund generally seeks to fully replicate the Underlying Index.
The Underlying Index is a free-float adjusted, modified capitalization-weighted index designed to measure performance of the 40 largest and most liquid companies in the Chile, Colombia, and Peru markets, as defined by the index provider.
For the 12-month period ended October 31, 2016 (the “reporting period”), the Fund increased 15.64%, while the Underlying Index increased 16.65%. The Fund had a net asset value of $7.23 per share on October 31, 2015 and ended the reporting period with a net asset value of $8.14 on October 31, 2016.
During the reporting period, the highest returns came from Cia de Minas Buenaventura and Empresa Nacional de Electricidad, which returned 107.33% and 91.67%, respectively. The worst performers were the two Pacific Exploration and Production stocks, which returned -90.23% and -73.68%.
The Andean region includes the countries of Chile, Colombia, and Peru. These countries tend to be heavily dependent on commodity exports like oil and precious metals. While commodity prices bottomed in Q1 2016, the recovery in oil and precious metals provided boosts to each of these economies. In addition, these developing countries have benefited from generally business-friendly and fiscally prudent policies, which has helped attract foreign investment. In addition, the Andean region maintains a favorable free trade and investment environment, which has a positive effect on the economic growth in the region. Furthermore, the countries of the Andean region have also managed to keep inflation in check, which lends credibility to their monetary policy and makes it easier for companies to do business in the region.
| | | AVERAGE ANNUAL TOTAL RETURN FOR THE YEAR ENDED OCTOBER 31, 2016 | |
| | | One Year Return | | | Three Year Return | | | Five Year Return | | | Annualized Inception to Date* | |
| | | Net Asset Value | | | Market Price | | | Net Asset Value | | | Market Price | | | Net Asset Value | | | Market Price | | | Net Asset Value | | | Market Price | |
| Global X FTSE Andean 40 ETF | | | 15.64 | % | | | 13.99 | % | | | -10.78 | % | | | -11.19 | % | | | -7.94 | % | | | -8.06 | % | | | -8.38 | % | | | -8.57 | % |
| FTSE Andean 40 Index | | | 16.65 | % | | | 16.65 | % | | | -10.26 | % | | | -10.26 | % | | | -7.58 | % | | | -7.58 | % | | | -7.87 | % | | | -7.87 | % |
| S&P 500 Index | | | 4.51 | % | | | 4.51 | % | | | 8.84 | % | | | 8.84 | % | | | 13.57 | % | | | 13.57 | % | | | 11.23 | % | | | 11.23 | % |
Growth of a $10,000 Investment
(At Net Asset Value)
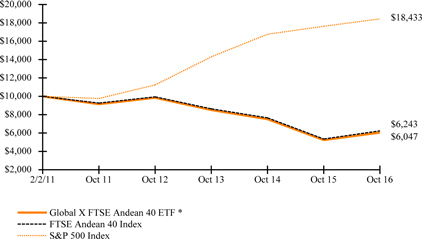
*Fund commenced operations on February 2, 2011.
The S&P 500 Index is a market capitalization-weighted composite index of 500 large capitalization U.S. companies.
The performance data quoted herein represents past performance and the return and value of an investment in the Fund will fluctuate so that, when redeemed, it may be worth less than its original cost. Past performance is no guarantee of future performance and should not be considered as a representation of the future results of the Fund. The Fund's performance assumes the reinvestment of all dividends and all capital gains. Index returns assume reinvestment of dividends and, unlike a Fund's returns, do not reflect any fees or expenses. If such fees and
| Management Discussion of Fund Performance (unaudited) |
| Global X FTSE Andean 40 ETF |
expenses were included in the index returns, the performance would have been lower. Please note that one cannot invest directly in an unmanaged index.
There are no assurances that the Fund will meet its stated objectives.
The Fund’s holdings and allocations are subject to change and should not be considered recommendations to buy individual securities.
The graph and table do not reflect the deduction of taxes that a shareholder would pay on Fund distributions or the redemption or sale of Fund shares.
See definition of comparative indices on previous page.
| Management Discussion of Fund Performance (unaudited) |
| Global X MSCI Colombia ETF |
Global X MSCI Colombia ETF
The Global X MSCI Colombia ETF (“Fund”) seeks to provide investment results that correspond generally to the price and yield performance, before fees and expenses, of the MSCI All Colombia Select 25/50 Index (the “Underlying Index”). The Fund is passively managed, which means the investment adviser does not attempt to take defensive positions in declining markets. The Fund generally seeks to fully replicate the Underlying Index.
The Underlying Index is designed to measure broad-based equity market performance in Colombia, as defined by the index provider.
For the 12-month period ended October 31, 2016 (the “reporting period”), the Fund increased 6.55%, while the Underlying Index increased 6.96%. The Fund had a net asset value of $8.79 per share on October 31, 2015 and ended the reporting period with a net asset value of $9.22 on October 31, 2016.
During the reporting period, the highest returns came from Avianca Holding and Interconexion Electrica, which returned 59.25% and 42.49%, respectively. The worst performers were the two Pacific Exploration and Production stocks, which returned -90.23% and -69.47%.
With oil representing a significant percentage of the country’s exports, Colombia’s economy and currency are closely tied to oil prices. Colombian equities suffered when oil prices declined in the beginning of the reporting period but began to recover as oil rebounded after Q1 2016. While the low oil price environment has negatively impacted government revenues, Colombia has managed to reduce its current account deficit during the reporting period through fiscal reform measures and continues to work to improve its current account through widening of the personal income tax base, simplification of the corporate tax code, and a value-added tax hike. The Colombian government has also prioritized finalizing a peace deal in the long-standing conflict with FARC rebels in the country, which could result in greater optimism for the country’s future growth.
| | | AVERAGE ANNUAL TOTAL RETURN FOR THE YEAR ENDED OCTOBER 31, 2016 | |
| | | One Year Return | | | Three Year Return | | | Five Year Return | | | Annualized Inception to Date* | |
| | | Net Asset Value | | | Market Price | | | Net Asset Value | | | Market Price | | | Net Asset Value | | | Market Price | | | Net Asset Value | | | Market Price | |
| Global X MSCI Colombia ETF | | | 6.55 | % | | | 7.05 | % | | | -21.18 | % | | | -21.22 | % | | | -11.55 | % | | | -11.70 | % | | | 4.93 | % | | | 4.91 | % |
| Hybrid MSCI All Colombia Select 25/50/MSCI All Colombia Capped Index/FTSE Colombia 20 Index** | | | 6.96 | % | | | 6.96 | % | | | -20.39 | % | | | -20.39 | % | | | -10.84 | % | | | -10.84 | % | | | 5.94 | % | | | 5.94 | % |
| S&P 500 Index | | | 4.51 | % | | | 4.51 | % | | | 8.84 | % | | | 8.84 | % | | | 13.57 | % | | | 13.57 | % | | | 15.08 | % | | | 15.08 | % |
Growth of a $10,000 Investment
(At Net Asset Value)
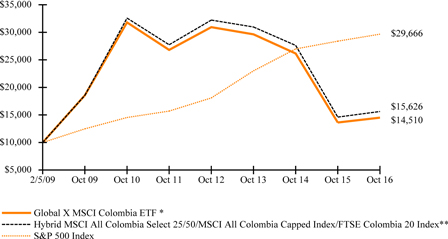
*Fund commenced operations on February 5, 2009.
| Management Discussion of Fund Performance (unaudited) |
| Global X MSCI Colombia ETF |
**Reflects performance of the FTSE Colombia 20 Index through July 14, 2014, the MSCI All Colombia Capped Index through August 30, 2016 and the MSCI All Colombia Select 25/50 Index, thereafter. The inception of the MSCI All Colombia Select 25/50 Index (“New Index”) was on July 15, 2016. Effective on or around August 31, 2016, the Fund began to track the New Index. This change was due to the planned migration to the New Index, potentially improving the trading characteristics of the Fund.
The S&P 500 Index is a market capitalization-weighted composite index of 500 large capitalization U.S. companies.
The performance data quoted herein represents past performance and the return and value of an investment in the Fund will fluctuate so that, when redeemed, it may be worth less than its original cost. Past performance is no guarantee of future performance and should not be considered as a representation of the future results of the Fund. The Fund's performance assumes the reinvestment of all dividends and all capital gains. The Fund’s performace reflects contractual fee waivers in effect until at least March 1, 2017. Absent these waivers performance would be lower. Index returns assume reinvestment of dividends and, unlike a Fund's returns, do not reflect any fees or expenses. If such fees and expenses were included in the index returns, the performance would have been lower. Please note that one cannot invest directly in an unmanaged index.
There are no assurances that the Fund will meet its stated objectives.
The Fund’s holdings and allocations are subject to change and should not be considered recommendations to buy individual securities.
The graph and table do not reflect the deduction of taxes that a shareholder would pay on Fund distributions or the redemption or sale of Fund shares.
See definition of comparative indices above and on previous page.
| Management Discussion of Fund Performance (unaudited) |
| Global X Brazil Mid Cap ETF |
Global X Brazil Mid Cap ETF
The Global X Brazil Mid Cap ETF (“Fund”) seeks to provide investment results that correspond generally to the price and yield performance, before fees and expenses, of the Solactive Brazil Mid Cap Index (“Underlying Index”). The Fund is passively managed, which means the investment adviser does not attempt to take defensive positions in declining markets. The Fund generally seeks to fully replicate the Underlying Index.
The Underlying Index is designed to measure the equity performance of Brazilian mid-market capitalization companies, as defined by the index provider.
For the 12-month period ended October 31, 2016 (the “reporting period”), the Fund increased 49.36%, while the Underlying Index increased 50.64%. The Fund had a net asset value of $6.87 per share on October 31, 2015 and ended the reporting period with a net asset value of $9.98 on October 31, 2016.
During the reporting period, the highest returns came from Cia Siderurgica Nacional and Gerdau, which returned 173.98% and 148.74%, respectively. The worst performers were EDP-Energias do Brasil and Fibria Celulose, which returned -56.97% and -35.75%, respectively.
Over the reporting period, Brazil has had standout equity performance among emerging markets. Much of this positive performance has been driven by the recovery in commodity prices, particularly oil, which is a major export of Brazil. The country’s equity performance has also benefited from political changes, which have been perceived as positives by the markets. Brazilian President Dilma Rousseff was impeached for corruption charges in August 2016 and replaced with Michel Temer, who many consider a more pro-business politician. During the reporting period, however, the Brazilian economy continued to struggle to emerge from its deepest recession on record, with Brazil’s central bank facing the dual challenges of high inflation and a shrinking economy. Midcap Brazilian stocks tend to be more domestically focused than the large cap segment, which consists of more multi-national conglomerates. As such, these midcaps tend to be more sensitive to changes in the strength of the Brazilian economy. Therefore, the Fund’s performance could benefit from positive economic developments such as falling inflation, lower interest rates, and a return to economic growth, should these events occur.
| | | AVERAGE ANNUAL TOTAL RETURN FOR THE YEAR ENDED OCTOBER 31, 2016 | |
| | | One Year Return | | | Three Year Return | | | Five Year Return | | | Annualized Inception to Date* | |
| | | Net Asset Value | | | Market Price | | | Net Asset Value | | | Market Price | | | Net Asset Value | | | Market Price | | | Net Asset Value | | | Market Price | |
| Global X Brazil Mid Cap ETF | | | 49.36 | % | | | 49.77 | % | | | -8.38 | % | | | -8.46 | % | | | -5.34 | % | | | -5.31 | % | | | -3.63 | % | | | -3.71 | % |
| Solactive Brazil Mid Cap Index | | | 50.64 | % | | | 50.64 | % | | | -7.78 | % | | | -7.78 | % | | | -4.56 | % | | | -4.56 | % | | | -2.89 | % | | | -2.89 | % |
| S&P 500 Index | | | 4.51 | % | | | 4.51 | % | | | 8.84 | % | | | 8.84 | % | | | 13.57 | % | | | 13.57 | % | | | 13.06 | % | | | 13.06 | % |
Growth of a $10,000 Investment
(At Net Asset Value)
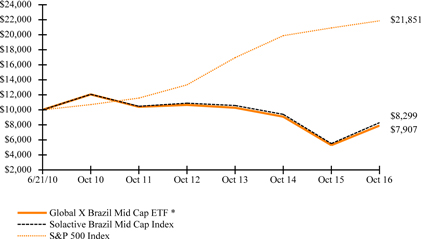
*Fund commenced operations on June 21, 2010.
The S&P 500 Index is a market capitalization-weighted composite index of 500 large capitalization U.S. companies.
| Management Discussion of Fund Performance (unaudited) |
| Global X Brazil Mid Cap ETF |
The performance data quoted herein represents past performance and the return and value of an investment in the Fund will fluctuate so that, when redeemed, it may be worth less than its original cost. Past performance is no guarantee of future performance and should not be considered as a representation of the future results of the Fund. The Fund's performance assumes the reinvestment of all dividends and all capital gains. Index returns assume reinvestment of dividends and, unlike a Fund's returns, do not reflect any fees or expenses. If such fees and expenses were included in the index returns, the performance would have been lower. Please note that one cannot invest directly in an unmanaged index.
There are no assurances that the Fund will meet its stated objectives.
The Fund’s holdings and allocations are subject to change and should not be considered recommendations to buy individual securities.
The graph and table do not reflect the deduction of taxes that a shareholder would pay on Fund distributions or the redemption or sale of Fund shares.
See definition of comparative indices on previous page.
| Management Discussion of Fund Performance (unaudited) |
| Global X Brazil Consumer ETF |
Global X Brazil Consumer ETF
The Global X Brazil Consumer ETF (“Fund”) seeks to provide investment results that correspond generally to the price and yield performance, before fees and expenses, of the Solactive Brazil Consumer Index (“Underlying Index”). The Fund is passively managed, which means the investment adviser does not attempt to take defensive positions in declining markets. The Fund generally seeks to fully replicate the Underlying Index.
The Underlying Index is designed to measure the equity performance of the consumer sector of the Brazilian economy, as defined by the index provider. Consumer companies include producers of food, beverages, apparel, household and leisure goods, cars and related items, media content, operators of retail stores, and companies offering services to private consumers.
For the 12-month period ended October 31, 2016 (the “reporting period”), the Fund increased 71.59%, while the Underlying Index increased 73.18%. The Fund had a net asset value of $8.49 per share on October 31, 2015 and ended the reporting period with a net asset value of $14.36 on October 31, 2016.
During the reporting period, the highest returns came from Via Varejo and Cosan, which returned 161.71% and 158.4%, respectively. The worst performers were B2W Cia Digital and Restoque Comercio e Confeccoes de Roupas, which returned -89.59% and -33.55%, respectively.
Over the reporting period, Brazil has had standout equity performance among emerging markets. Much of this positive performance has been driven by the recovery in commodity prices, particularly oil, which is a major export of Brazil. The country’s equity performance has also benefited from political changes, which have been perceived as positives by the markets. Brazilian President Dilma Rousseff was impeached for corruption charges in August 2016 and replaced with Michel Temer, who many consider a more pro-business politician. During the reporting period, however, the Brazilian economy continued to struggle to emerge from its deepest recession on record, with Brazil’s central bank facing the dual challenges of high inflation and a shrinking economy. The general state of the economy has continued to put pressure on the Brazilian consumer as consumer confidence remains below longer term averages and unemployment remains well above 10%.
| | | AVERAGE ANNUAL TOTAL RETURN FOR THE YEAR ENDED OCTOBER 31, 2016 | |
| | | One Year Return | | | Three Year Return | | | Five Year Return | | | Annualized Inception to Date* | |
| | | Net Asset Value | | | Market Price | | | Net Asset Value | | | Market Price | | | Net Asset Value | | | Market Price | | | Net Asset Value | | | Market Price | |
| Global X Brazil Consumer ETF | | | 71.59 | % | | | 72.35 | % | | | -5.34 | % | | | -5.35 | % | | | -1.46 | % | | | -1.85 | % | | | 0.14 | % | | | 0.09 | % |
| Solactive Brazil Consumer Index | | | 73.18 | % | | | 73.18 | % | | | -4.39 | % | | | -4.39 | % | | | -0.48 | % | | | -0.48 | % | | | 1.15 | % | | | 1.15 | % |
| S&P 500 Index | | | 4.51 | % | | | 4.51 | % | | | 8.84 | % | | | 8.84 | % | | | 13.57 | % | | | 13.57 | % | | | 14.01 | % | | | 14.01 | % |
Growth of a $10,000 Investment
(At Net Asset Value)
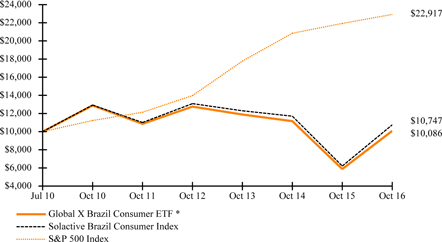
*Fund commenced operations on July 7, 2010.
| Management Discussion of Fund Performance (unaudited) |
| Global X Brazil Consumer ETF |
The S&P 500 Index is a market capitalization-weighted composite index of 500 large capitalization U.S. companies.
The performance data quoted herein represents past performance and the return and value of an investment in the Fund will fluctuate so that, when redeemed, it may be worth less than its original cost. Past performance is no guarantee of future performance and should not be considered as a representation of the future results of the Fund. The Fund's performance assumes the reinvestment of all dividends and all capital gains. Index returns assume reinvestment of dividends and, unlike a Fund's returns, do not reflect any fees or expenses. If such fees and expenses were included in the index returns, the performance would have been lower. Please note that one cannot invest directly in an unmanaged index.
There are no assurances that the Fund will meet its stated objectives.
The Fund’s holdings and allocations are subject to change and should not be considered recommendations to buy individual securities.
The graph and table do not reflect the deduction of taxes that a shareholder would pay on Fund distributions or the redemption or sale of Fund shares.
See definition of comparative indices above and on previous page.
| Management Discussion of Fund Performance (unaudited) |
| Global X MSCI Argentina ETF |
Global X MSCI Argentina ETF
The Global X MSCI Argentina ETF (“Fund”) seeks to provide investment results that correspond generally to the price and yield performance, before fees and expenses, of the MSCI All Argentina 25/50 Index (“Underlying Index”). The Fund is passively managed, which means the investment adviser does not attempt to take defensive positions in declining markets. The Fund generally seeks to fully replicate the Underlying Index.
The Underlying Index is designed to represent the performance of the broad Argentina equity universe, while including a minimum number of constituents, as defined by the index provider. The broad Argentina equity universe includes securities that are classified in Argentina according to the MSCI Global Investable Market Index Methodology, together with companies that are headquartered or listed in Argentina and carry out the majority of their operations in Argentina.
For the 12-month period ended October 31, 2016 (the “reporting period”), the Fund increased 20.65%, while the Underlying Index increased 22.81%. The Fund had a net asset value of $19.81 per share on October 31, 2015 and ended the reporting period with a net asset value of $23.69 on October 31, 2016.
During the reporting period, the highest returns came from the two Pan American Silver stocks, which returned 132.15% and 112.89%. The worst performers were EPI Holdings and YPF, which returned -50.5% and -16.38%, respectively.
Elected in November 2015, President Mauricio Macri has implemented a series of new economic policies with the goal of spurring the Argentinian economy after a decade of erratic economic growth. One such policy was unpegging the Argentinian peso from the dollar, which allowed the currency to devalue about 30%. This coincided with a significant increase in interest rates and a reduction of the government payroll, which overall has had a positive impact on the Argentine economy. After a long hiatus, Argentina has also been able to return to the global debt markets with the announcement to settle the previously defaulted debt to U.S. bondholders. Macri’s aggressive economic policies have renewed foreign investors’ confidence in Argentina. Nevertheless, challenges and pressure remain as the potential for high inflation remains prevalent and the country also remains highly dependent on commodity exports.
| | | AVERAGE ANNUAL TOTAL RETURN FOR THE YEAR ENDED OCTOBER 31, 2016 | |
| | | One Year Return | | | Three Year Return | | | Five Year Return | | | Annualized Inception to Date* | |
| | | Net Asset Value | | | Market Price | | | Net Asset Value | | | Market Price | | | Net Asset Value | | | Market Price | | | Net Asset Value | | | Market Price | |
| Global X MSCI Argentina ETF | | | 20.65 | % | | | 20.51 | % | | | 5.99 | % | | | 5.99 | % | | | 2.63 | % | | | 2.83 | % | | | -3.02 | % | | | -2.96 | % |
| Hybrid FTSE Argentina 20/MSCI All Argentina 25/50 Index** | | | 22.81 | % | | | 22.81 | % | | | 7.42 | % | | | 7.42 | % | | | 3.93 | % | | | 3.93 | % | | | -1.91 | % | | | -1.91 | % |
| S&P 500 Index | | | 4.51 | % | | | 4.51 | % | | | 8.84 | % | | | 8.84 | % | | | 13.57 | % | | | 13.57 | % | | | 11.28 | % | | | 11.28 | % |
Growth of a $10,000 Investment
(At Net Asset Value)
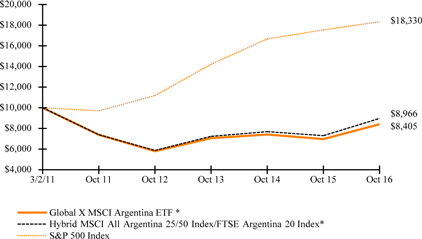
*Fund commenced operations on March 2, 2011.
**Reflects performance of the FTSE Argentina 20 Index through August 14, 2014 and the MSCI All Argentina 25/50 Index (“New Index”) thereafter.
The S&P 500 Index is a market capitalization-weighted composite index of 500 large capitalization U.S. companies.
| Management Discussion of Fund Performance (unaudited) |
| Global X MSCI Argentina ETF |
The performance data quoted herein represents past performance and the return and value of an investment in the Fund will fluctuate so that, when redeemed, it may be worth less than its original cost. Past performance is no guarantee of future performance and should not be considered as a representation of the future results of the Fund. The Fund's performance assumes the reinvestment of all dividends and all capital gains. Index returns assume reinvestment of dividends and, unlike a Fund's returns, do not reflect any fees or expenses. If such fees and expenses were included in the index returns, the performance would have been lower. Please note that one cannot invest directly in an unmanaged index.
There are no assurances that the Fund will meet its stated objectives.
The Fund’s holdings and allocations are subject to change and should not be considered recommendations to buy individual securities.
The graph and table do not reflect the deduction of taxes that a shareholder would pay on Fund distributions or the redemption or sale of Fund shares.
See definition of comparative indices on previous page.
| Management Discussion of Fund Performance (unaudited) |
| Global X MSCI Greece ETF |
Global X MSCI Greece ETF
The Global X MSCI Greece ETF (“Fund”) seeks to provide investment results that correspond generally to the price and yield performance, before fees and expenses, of the MSCI All Greece Select 25/50 Index (“Underlying Index”). The Fund is passively managed, which means the investment adviser does not attempt to take defensive positions in declining markets. The Fund generally seeks to fully replicate the Underlying Index.
The Underlying Index is designed to reflect broad-based equity market performance in Greece, as defined by the index provider.
For the 12-month period ended October 31, 2016 (the “reporting period”), the Fund decreased 28.33%, while the Underlying Index decreased 27.47%. The Fund had a net asset value of $10.41 per share on October 31, 2015 and ended the reporting period with a net asset value of $7.35 on October 31, 2016.
During the reporting period, the highest returns came from Jumbo and GasLog, which returned 75.52% and 72.9%, respectively. The worst performers were Piraeus Bank and National Bank of Greece, which returned -98.39% and -96.95%, respectively.
At a macro level, many developments and indicators in 2016 point towards a gradual improvement in Greece’s economy. The Bank of Greece continues seeking to restore confidence and boost liquidity in Greece’s capital markets, which would improve the investment climate after the completion of the first Greek bailout review by the European Central Bank (ECB). In addition, the Greek economy appears to be gradually strengthening, while inflation continued to abate in the second quarter of 2016. The European Commission expects Greece's current account to turn to a surplus in 2016 for the first time in more than 20 years. Due to gradual improvement in the economy and subdued wage growth, the unemployment rate has continued its downward trend during the reporting period. Despite these positive trends, however, significant challenges still lie ahead for Greece as its economy continues to adjust to austerity policies and subdued levels of economic growth. In addition, the Fund’s performance was negatively impacted by large stock dilutions from Greek banks which in November 2015 raised capital through equity issuances at steep discounts.
| | | AVERAGE ANNUAL TOTAL RETURN FOR THE YEAR ENDED OCTOBER 31, 2016 | |
| | | One Year Return | | | Three Year Return | | | Annualized Inception to Date* | |
| | | Net Asset Value | | | Market Price | | | Net Asset Value | | | Market Price | | | Net Asset Value | | | Market Price | |
| Global X MSCI Greece ETF | | | -28.33 | % | | | -29.40 | % | | | -30.64 | % | | | -30.99 | % | | | -13.24 | % | | | -13.39 | % |
| Hybrid MSCI All Greece Select25/50/ FTSE/ATHEX Custom Capped Index** | | | -27.47 | % | | | -27.47 | % | | | -30.11 | % | | | -30.11 | % | | | -12.31 | % | | | -12.31 | % |
| S&P 500 Index | | | 4.51 | % | | | 4.51 | % | | | 8.84 | % | | | 8.84 | % | | | 13.64 | % | | | 13.64 | % |
Growth of a $10,000 Investment
(At Net Asset Value)
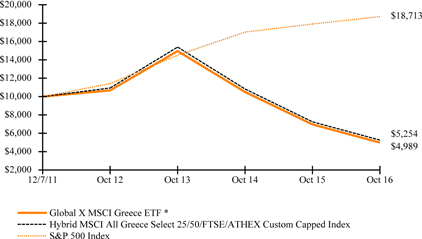
*Fund commenced operations on December 7, 2011.
| Management Discussion of Fund Performance (unaudited) |
| Global X MSCI Greece ETF |
** Reflects performance of the FTSE/ATEHX Custom Capped Index through March 1, 2016 and MSCI All Greece Select 25/50 Index, thereafter. The inception of the MSCI All Greece Select 25/50 Index (“New Index”) was on December 23, 2015. Effective on or around March 1, 2016, the Fund began to track the New Index. The change was due to the planned migration to the New Index, potentially allowing for broader exposure to the local market.
The S&P 500 Index is a market capitalization-weighted composite index of 500 large capitalization U.S. companies.
The performance data quoted herein represents past performance and the return and value of an investment in the Fund will fluctuate so that, when redeemed, it may be worth less than its original cost. Past performance is no guarantee of future performance and should not be considered as a representation of the future results of the Fund. The Fund's performance assumes the reinvestment of all dividends and all capital gains. Index returns assume reinvestment of dividends and, unlike a Fund's returns, do not reflect any fees or expenses. If such fees and expenses were included in the index returns, the performance would have been lower. Please note that one cannot invest directly in an unmanaged index.
There are no assurances that the Fund will meet its stated objectives.
The Fund’s holdings and allocations are subject to change and should not be considered recommendations to buy individual securities.
The graph and table do not reflect the deduction of taxes that a shareholder would pay on Fund distributions or the redemption or sale of Fund shares.
See definition of comparative indices above and on previous page.
| Management Discussion of Fund Performance (unaudited) |
| Global X MSCI Norway ETF |
Global X MSCI Norway ETF
The Global X MSCI Norway ETF (“Fund”) seeks investment results that correspond generally to the price and yield performance, before fees and expenses, of the MSCI Norway IMI 25/50 Index (“Underlying Index”). The Fund is passively managed, which means the investment adviser does not attempt to take defensive positions in declining markets. The Fund generally seeks to fully replicate the Underlying Index.
The Underlying Index is designed to measure broad-based equity market performance in Norway, as defined by the index provider. The Underlying Index consists of stocks traded primarily on the Norwegian stock exchange. The Underlying Index may include large-, mid- or small-capitalization companies.
For the 12-month period ended October 31, 2016 (the “reporting period”), the Fund increased 6.86%, while the Underlying Index increased 7.27%. The Fund had a net asset value of $10.75 per share on October 31, 2015 and ended the reporting period with a net asset value of $11.07 on October 31, 2016.
During the reporting period, the highest returns came from Aker and Hexagon Composites, which returned 160.75% and 127.02%, respectively. The worst performers were ProSafe and Avance Gas Holding, which returned -98.05% and -76.69%, respectively.
Norwegian equity prices and the Norwegian currency have suffered from the fall in oil prices that began in late 2014; oil prices continued to demonstrate weakness during the reporting period. To stimulate growth, the Norwegian Central Bank slashed benchmark interest rates by 25 basis points and the government implemented fiscal stimulus policies by tapping into its massive sovereign wealth fund. Despite negative GDP growth in Q4 2015, the economy returned to positive growth in both Q1 and Q2 of 2016 and further benefited from the improvement in oil prices since Q1 2016.
| | | AVERAGE ANNUAL TOTAL RETURN FOR THE YEAR ENDED OCTOBER 31, 2016 | |
| | | One Year Return | | | Three Year Return | | | Five Year Return | | | Annualized Inception to Date* | |
| | | Net Asset Value | | | Market Price | | | Net Asset Value | | | Market Price | | | Net Asset Value | | | Market Price | | | Net Asset Value | | | Market Price | |
| Global X MSCI Norway ETF | | | 6.86 | % | | | 6.65 | % | | | -9.15 | % | | | -9.23 | % | | | -0.97 | % | | | -0.90 | % | | | -1.77 | % | | | -1.79 | % |
| Hybrid MSCI Norway IMI 25/50 Index/FTSE Norway 30 Index** | | | 7.27 | % | | | 7.27 | % | | | -8.85 | % | | | -8.85 | % | | | -0.38 | % | | | -0.38 | % | | | -1.02 | % | | | -1.02 | % |
| S&P 500 Index | | | 4.51 | % | | | 4.51 | % | | | 8.84 | % | | | 8.84 | % | | | 13.57 | % | | | 13.57 | % | | | 12.19 | % | | | 12.19 | % |
Growth of a $10,000 Investment
(At Net Asset Value)
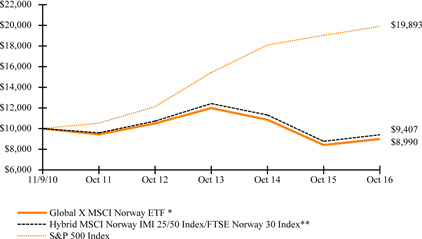
*Fund commenced operations on November 9, 2010.
**Reflects performance of the FTSE Norway 30 Index through July 14, 2014 and the MSCI Norway IMI 25/50 Index thereafter.
The S&P 500 Index is a market capitalization-weighted composite index of 500 large capitalization U.S. companies.
Management Discussion of Fund Performance (unaudited)
Global X MSCI Norway ETF
The performance data quoted herein represents past performance and the return and value of an investment in the Fund will fluctuate so that, when redeemed, it may be worth less than its original cost. Past performance is no guarantee of future performance and should not be considered as a representation of the future results of the Fund. The Fund's performance assumes the reinvestment of all dividends and all capital gains. Index returns assume reinvestment of dividends and, unlike a Fund's returns, do not reflect any fees or expenses. If such fees and expenses were included in the index returns, the performance would have been lower. Please note that one cannot invest directly in an unmanaged index.
There are no assurances that the Fund will meet its stated objectives.
The Fund’s holdings and allocations are subject to change and should not be considered recommendations to buy individual securities.
The graph and table do not reflect the deduction of taxes that a shareholder would pay on Fund distributions or the redemption or sale of Fund shares.
See definition of comparative indices on previous page.
Management Discussion of Fund Performance (unaudited)
Global X FTSE Nordic Region ETF
Global X FTSE Nordic Region ETF
The Global X FTSE Nordic Region ETF (“Fund”) seeks investment results that correspond generally to the price and yield performance, before fees and expenses, of the FTSE Nordic 30 Index (“Underlying Index”). The Fund is passively managed, which means the investment adviser does not attempt to take defensive positions in declining markets. The Fund generally seeks to fully replicate the Underlying Index.
The Underlying Index is designed to reflect broad-based equity market performance in Sweden, Denmark, Norway and Finland, as defined by the index provider. The Underlying Index tracks the equity performance of the 30 largest and most liquid companies in Sweden, Denmark, Norway and Finland.
For the 12-month period ended October 31, 2016 (the “reporting period”), the Fund decreased 10.54%, while the Underlying Index decreased 10.53%. The Fund had a net asset value of $22.29 per share on October 31, 2015 and ended the reporting period with a net asset value of $19.38 on October 31, 2016.
During the reporting period, the highest returns came from Sandvik and Fortum, which returned 24.65% and 21.27%, respectively. The worst performers were Ericsson and Nokia, which returned -48.46% and -37.39%, respectively.
The Nordic region has experienced subdued growth due to economic headwinds in Europe and low oil prices. The region consists of Sweden, Norway, Denmark and Finland, which overall have experienced declining competitiveness relative to peer group countries competing in similar export markets, given high wages. Several of the Nordic countries have exposure to oil prices, most notably Norway, which is a significant oil exporter. Low oil prices during the reporting period created headwinds for Norway, with a steep decline in oil-related activities contributing to stagnant private consumption. Despite a focus on oil, the region is among the world leaders in the green-energy movement, which could position these countries to successfully transition to a less oil-dependent economy.
| | | AVERAGE ANNUAL TOTAL RETURN FOR THE YEAR ENDED OCTOBER 31, 2016 | |
| | | One Year Return | | | Three Year Return | | | Five Year Return | | | Annualized Inception to Date* | |
| | | Net Asset Value | | | Market Price | | | Net Asset Value | | | Market Price | | | Net Asset Value | | | Market Price | | | Net Asset Value | | | Market Price | |
| Global X FTSE Nordic Region ETF | | | -10.54 | % | | | -10.36 | % | | | -3.65 | % | | | -3.77 | % | | | 5.29 | % | | | 5.45 | % | | | 6.49 | % | | | 6.46 | % |
| FTSE Nordic 30 Index | | | -10.53 | % | | | -10.53 | % | | | -3.77 | % | | | -3.77 | % | | | 5.00 | % | | | 5.00 | % | | | 6.43 | % | | | 6.43 | % |
| S&P 500 Index | | | 4.51 | % | | | 4.51 | % | | | 8.84 | % | | | 8.84 | % | | | 13.57 | % | | | 13.57 | % | | | 13.71 | % | | | 13.71 | % |
Growth of a $10,000 Investment
(At Net Asset Value)
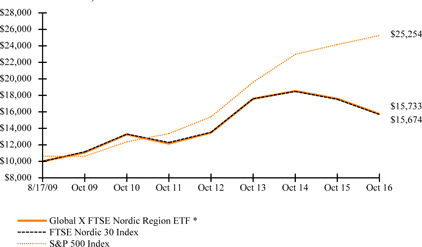
*Fund commenced operations on August 17, 2009.
The S&P 500 Index is a market capitalization-weighted composite index of 500 large capitalization U.S. companies.
The performance data quoted herein represents past performance and the return and value of an investment in the Fund will fluctuate so that, when redeemed, it may be worth less than its original cost. Past performance is no guarantee of future performance and should not be
Management Discussion of Fund Performance (unaudited)
Global X FTSE Nordic Region ETF
considered as a representation of the future results of the Fund. The Fund's performance assumes the reinvestment of all dividends and all capital gains. Index returns assume reinvestment of dividends and, unlike a Fund's returns, do not reflect any fees or expenses. If such fees and expenses were included in the index returns, the performance would have been lower. Please note that one cannot invest directly in an unmanaged index.
There are no assurances that the Fund will meet its stated objectives.
The Fund’s holdings and allocations are subject to change and should not be considered recommendations to buy individual securities.
The graph and table do not reflect the deduction of taxes that a shareholder would pay on Fund distributions or the redemption or sale of Fund shares.
See definition of comparative indices on previous page.
Management Discussion of Fund Performance (unaudited)
Global X MSCI Nigeria ETF
Global X MSCI Nigeria ETF
The Global X MSCI Nigeria ETF (“Fund”) seeks to provide investment results that correspond generally to the price and yield performance, before fees and expenses, of the MSCI All Nigeria Select 25/50 Index (“Underlying Index”). The Fund is passively managed, which means the investment adviser does not attempt to take defensive positions in declining markets. The Fund generally seeks to fully replicate the Underlying Index.
The Underlying Index is designed to represent the performance of the broad Nigeria equity universe, while including a minimum number of constituents, as defined by the index provider.
For the 12-month period ended October 31, 2016 (the “reporting period”), the Fund decreased 43.30%, while the Underlying Index decreased 41.79%. The Fund had a net asset value of $7.94 per share on October 31, 2015 and ended the reporting period with a net asset value of $4.31 on October 31, 2016.
During the reporting period, the highest returns came from United Bank for Africa and Access Bank, which returned -9.81% and -12.3%, respectively. The worst performers were Diamond Bank and Forte Oil, which returned -74.94% and -73.55%, respectively.
The Nigerian economy, currency and government revenues are highly dependent on oil prices. The prolonged slump in oil prices during the reporting period has put significant strain on Nigeria, particularly on its government finances and on the country’s ability to maintain a long-standing currency peg to the US dollar. As low oil prices persisted, the Nigerian central bank decided to abandon its currency peg and implement a “managed float” of the local currency. While generally viewed as a positive decision for the long-term, the short-term impact was a swift devaluation in the local currency, which negatively impacted Nigerian equities in US dollar terms. Nigeria still maintains a degree of capital controls in the currency market, making it more challenging to repatriate the local currency. Furthermore, Nigeria’s economic growth has slowed significantly since the fall in oil prices, with the country officially entering a recession and experiencing negative GDP growth from Q1 2016 to Q3 2016.
| | | AVERAGE ANNUAL TOTAL RETURN FOR THE YEAR ENDED OCTOBER 31, 2016 | |
| | | One Year Return | | | Three Year Return | | | Annualized Inception to Date* | |
| | | Net Asset Value | | | Market Price | | | Net Asset Value | | | Market Price | | | Net Asset Value | | | Market Price | |
| Global X MSCI Nigeria ETF | | | -43.30 | % | | | -39.90 | % | | | -31.98 | % | | | -31.02 | % | | | -28.13 | % | | | -26.58 | % |
| Hybrid MSCI All Nigeria Select 25/50 Index/Solactive Nigeria Index** | | | -41.79 | % | | | -41.79 | % | | | -30.52 | % | | | -30.52 | % | | | -26.67 | % | | | -26.67 | % |
| S&P 500 Index | | | 4.51 | % | | | 4.51 | % | | | 8.84 | % | | | 8.84 | % | | | 11.13 | % | | | 11.13 | % |
Growth of a $10,000 Investment
(At Net Asset Value)
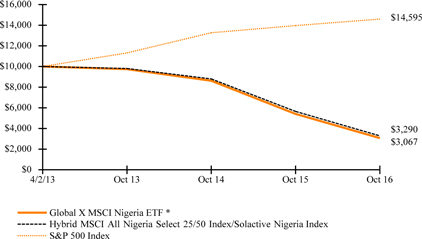
*Fund commenced operations on April 2, 2013.
Management Discussion of Fund Performance (unaudited)
Global X MSCI Nigeria ETF
**Reflects performance of the Solactive Nigeria Index through August 14, 2014 and the MSCI All Nigeria Select 25/50 Index thereafter.
The S&P 500 Index is a market capitalization-weighted composite index of 500 large capitalization U.S. companies.
The performance data quoted herein represents past performance and the return and value of an investment in the Fund will fluctuate so that, when redeemed, it may be worth less than its original cost. Past performance is no guarantee of future performance and should not be considered as a representation of the future results of the Fund. The Fund's performance assumes the reinvestment of all dividends and all capital gains. The Fund’s performance reflects contractual fee waivers in effect until at least March 1, 2016. Absent these waivers performance would be lower. Index returns assume reinvestment of dividends and, unlike a Fund's returns, do not reflect any fees or expenses. If such fees and expenses were included in the index returns, the performance would have been lower. Please note that one cannot invest directly in an unmanaged index.
There are no assurances that the Fund will meet its stated objectives.
The Fund’s holdings and allocations are subject to change and should not be considered recommendations to buy individual securities.
The graph and table do not reflect the deduction of taxes that a shareholder would pay on Fund distributions or the redemption or sale of Fund shares.
See definition of comparative indices above.
Management Discussion of Fund Performance (unaudited)
Global X Next Emerging & Frontier ETF
Global X Next Emerging & Frontier ETF
The Global X Next Emerging & Frontier ETF (“Fund”) seeks to provide investment results that correspond generally to the price and yield performance, before fees and expenses, of the Solactive Next Emerging & Frontier Index (“Underlying Index”). The Fund is passively managed, which means the investment adviser does not attempt to take defensive positions in declining markets. The Fund generally seeks to fully replicate the Underlying Index.
The Underlying Index is designed to reflect equity performance of next emerging markets and frontier markets companies, as defined by the index provider. Next Emerging markets are defined as emerging market countries, excluding the BRICs (Brazil, Russia, India and China) and excluding the most developed tier of emerging markets (South Korea and Taiwan). Frontier markets are those emerging market countries that generally have smaller economies or less developed capital markets.
For the 12-month period ended October 31, 2016 (the “reporting period”), the Fund increased 7.33%, while the Underlying Index increased 8.28%. The Fund had a net asset value of $19.27 per share on October 31, 2015 and ended the reporting period with a net asset value of $20.15 on October 31, 2016.
During the reporting period, the highest returns came from Endeavour Mining and Yamana Gold, which returned 282.25% and 139.94%, respectively. The worst performers were Pacific Drilling and Total Access Communication Public, which returned -78% and -51.19%, respectively.
Emerging and frontier market equities tend to have elevated sensitivities to commodities prices as well as the US dollar. Over the course of the reporting period, commodities reversed their multi-year slump and the dollar began to weaken versus international currencies. Both of these developments had a positive impact on emerging and frontier markets. In addition, the low growth environment among developed markets increased investor interest in gaining exposure to the higher growth potential economies in the emerging and frontier markets. Due in part to their attractive demographics, many emerging and frontier countries exhibit higher GDP growth rates than developed market averages. The Fund had an average approximate exposure of 17.7% in the financials sector, 14.9% in the materials sector, and 12.6% in telecommunication services stocks.
| | | AVERAGE ANNUAL TOTAL RETURN
FOR THE YEAR ENDED OCTOBER 31, 2016 | |
| | | One Year Return | | | Annualized Inception to Date* | |
| | | Net Asset Value | | | Market Price | | | Net Asset Value | | | Market Price | |
| Global X Next Emerging & Frontier ETF | | | 7.33 | % | | | 10.48 | % | | | -5.66 | % | | | -5.16 | % |
| Solactive Next Emerging & Frontier Index | | | 8.28 | % | | | 8.28 | % | | | -4.97 | % | | | -4.97 | % |
| S&P 500 Index | | | 4.51 | % | | | 4.51 | % | | | 8.57 | % | | | 8.57 | % |
Growth of a $10,000 Investment
(At Net Asset Value)

*Fund commenced operations on November 6, 2013.
Management Discussion of Fund Performance (unaudited)
Global X Next Emerging & Frontier ETF
The S&P 500 Index is a market capitalization-weighted composite index of 500 large capitalization U.S. companies.
The performance data quoted herein represents past performance and the return and value of an investment in the Fund will fluctuate so that, when redeemed, it may be worth less than its original cost. Past performance is no guarantee of future performance and should not be considered as a representation of the future results of the Fund. The Fund's performance assumes the reinvestment of all dividends and all capital gains. Index returns assume reinvestment of dividends and, unlike a Fund's returns, do not reflect any fees or expenses. If such fees and expenses were included in the index returns, the performance would have been lower. Please note that one cannot invest directly in an unmanaged index.
There are no assurances that the Fund will meet its stated objectives.
The Fund’s holdings and allocations are subject to change and should not be considered recommendations to buy individual securities.
The graph and table do not reflect the deduction of taxes that a shareholder would pay on Fund distributions or the redemption or sale of Fund shares.
See definition of comparative indices above and on previous page.
Management Discussion of Fund Performance (unaudited)
Global X FTSE Portugal 20 ETF
Global X FTSE Portugal 20 ETF
The Global X FTSE Portugal 20 ETF (“Fund”) seeks to provide investment results that correspond generally to the price and yield performance, before fees and expenses, of the FTSE Portugal 20 Index (“Underlying Index”). The Fund is passively managed, which means the investment adviser does not attempt to take defensive positions in declining markets. The Fund generally seeks to fully replicate the Underlying Index.
The Underlying Index is designed to reflect broad-based equity market performance in Portugal, as defined by the index provider.
For the 12-month period ended October 31, 2016 (the “reporting period”), the Fund decreased 4.86%, while the Underlying Index decreased 5.13%. The Fund had a net asset value of $10.85 per share on October 31, 2015 and ended the reporting period with a net asset value of $9.88 on October 31, 2016.
During the reporting period, the highest returns came from Sonae Capital and Corticeira Amorim, which returned 79.75% and 60.36%, respectively. The worst performers were Banco Comercial Portugues and Cimpor Cimentos de Portugal, which returned -69.31% and -47.6%, respectively.
During the reporting period, Portugal’s GDP growth continued its downward trend primarily due to falling exports and softening domestic demand. The fiscal situation in Portugal remains challenging, and even though government spending to GDP ratio has declined since 2014, Portugal’s government debt burden remains significant. To the positive, consumer confidence has remained relatively stable and the unemployment rate has declined since the height of the European debt crisis. Concerns remain however with regard to corporate leverage and bank balance sheet quality, which may negatively affect corporate investment.
| | | AVERAGE ANNUAL TOTAL RETURN
FOR THE YEAR ENDED OCTOBER 31, 2016 | |
| | | One Year Return | | | Annualized Inception to Date* | |
| | | Net Asset Value | | | Market Price | | | Net Asset Value | | | Market Price | |
| Global X FTSE Portugal 20 ETF | | | -4.86 | % | | | -4.16 | % | | | -11.28 | % | | | -11.28 | % |
| FTSE Portugal 20 Index | | | -5.13 | % | | | -5.13 | % | | | -11.06 | % | | | -11.06 | % |
| S&P 500 Index | | | 4.51 | % | | | 4.51 | % | | | 8.66 | % | | | 8.66 | % |
Growth of a $10,000 Investment
(At Net Asset Value)
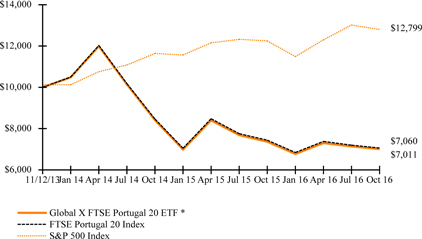
*Fund commenced operations on November 12, 2013.
The S&P 500 Index is a market capitalization-weighted composite index of 500 large capitalization U.S. companies.
The performance data quoted herein represents past performance and the return and value of an investment in the Fund will fluctuate so that, when redeemed, it may be worth less than its original cost. Past performance is no guarantee of future performance and should not be considered as a representation of the future results of the Fund. The Fund's performance assumes the reinvestment of all dividends and all capital gains. Index returns assume reinvestment of dividends and, unlike a Fund's returns, do not reflect any fees or expenses. If such fees and
Management Discussion of Fund Performance (unaudited)
Global X FTSE Portugal 20 ETF
expenses were included in the index returns, the performance would have been lower. Please note that one cannot invest directly in an unmanaged index.
There are no assurances that the Fund will meet its stated objectives.
The Fund’s holdings and allocations are subject to change and should not be considered recommendations to buy individual securities.
The graph and table do not reflect the deduction of taxes that a shareholder would pay on Fund distributions or the redemption or sale of Fund shares.
See definition of comparative indices on previous page.
Management Discussion of Fund Performance (unaudited)
Global X MSCI Pakistan ETF
Global X MSCI Pakistan ETF
The Global X MSCI Pakistan ETF (“Fund”) seeks to provide investment results that correspond generally to the price and yield performance, before fees and expenses, of the MSCI All Pakistan Select 25/50 Index (“Underlying Index”). The Fund is passively managed, which means the investment adviser does not attempt to take defensive positions in declining markets. The Fund generally seeks to fully replicate the Underlying Index.
The Underlying Index is designed to represent the performance of the broad Pakistan equity universe, while including a minimum number of constituents, as defined by the index provider. The broad Pakistan equity universe includes securities that are classified in Pakistan according to the MSCI Global Investable Market Index Methodology, together with companies that are headquartered or listed in Pakistan and carry out the majority of their operations in Pakistan.
For the 12-month period ended October 31, 2016 (the “reporting period”), the Fund increased 10.95%, while the Underlying Index increased 13.84%. The Fund had a net asset value of $14.17 per share on October 31, 2015 and ended the reporting period with a net asset value of $15.23 on October 31, 2016.
During the reporting period, the highest returns came from National Refinery and Honda Atlas Cars Pakistan, which returned 151.7% and 88.11%, respectively. The worst performers were Fatima Fertilizer and Pak Elektron, which returned -26.1% and -15.53%, respectively.
The government of Pakistan has continued its efforts to attract foreign direct investment and implement policy reform, which has improved the country’s economic growth. Furthermore, inflation has abated, the government’s budget deficit has been reduced, and the country continues to move forward with a privatization program. Chinese investment in the China-Pakistan Economic Corridor and government campaigns to boost trade may also contribute to economic growth in the coming years. During the reporting period, index provider, MSCI, announced that Pakistan will be reclassified from Frontier Markets to Emerging Markets, a signal that economic and political reforms are progressing. Nevertheless, the country faces headwinds from domestic security concerns, energy shortages/outages, and high levels of corruption.
| | | AVERAGE ANNUAL TOTAL RETURN
FOR THE YEAR ENDED OCTOBER 31, 2016 | |
| | | One Year Return | | | Annualized Inception to Date* | |
| | | Net Asset Value | | | Market Price | | | Net Asset Value | | | Market Price | |
| Global X MSCI Pakistan ETF* | | | 10.87 | % | | | 9.94 | % | | | 1.84 | % | | | 1.89 | % |
| MSCI All Pakistan Select 25/50 Index | | | 13.84 | % | | | 13.84 | % | | | 4.73 | % | | | 4.73 | % |
| S&P 500 Index | | | 4.51 | % | | | 4.51 | % | | | 2.74 | % | | | 2.74 | % |
Growth of a $10,000 Investment
(At Net Asset Value)
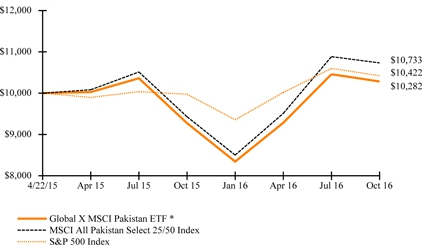
*Fund commenced operations on April 22, 2015.
The S&P 500 Index is a market capitalization-weighted composite index of 500 large capitalization U.S. companies.
Management Discussion of Fund Performance (unaudited)
Global X MSCI Pakistan ETF
The performance data quoted herein represents past performance and the return and value of an investment in the Fund will fluctuate so that, when redeemed, it may be worth less than its original cost. Past performance is no guarantee of future performance and should not be considered as a representation of the future results of the Fund. The Fund's performance assumes the reinvestment of all dividends and all capital gains. Index returns assume reinvestment of dividends and, unlike a Fund's returns, do not reflect any fees or expenses. If such fees and expenses were included in the index returns, the performance would have been lower. Please note that one cannot invest directly in an unmanaged index.
There are no assurances that the Fund will meet its stated objectives.
The Fund’s holdings and allocations are subject to change and should not be considered recommendations to buy individual securities.
The graph and table do not reflect the deduction of taxes that a shareholder would pay on Fund distributions or the redemption or sale of Fund shares.
See definition of comparative indices on previous page.
| Schedule of Investments | October 31, 2016 |
Global X China Consumer ETF
Sector Weightings (unaudited)†:

† Sector weightings percentages are based on the total market value of investments. Repurchase agreements purchased from cash collateral received for securities lending activity are included in total investments. Please see Note 2 and Note 8 in Notes to Financial Statements for more detailed information.
| | | Shares | | | Value | |
| COMMON STOCK — 100.0% |
| CHINA— 56.0% | | | | | | | | |
| Consumer Goods — 31.4% | | | | | | | | |
| ANTA Sports Products | | | 547,596 | | | $ | 1,581,739 | |
| Belle International Holdings, Cl A | | | 3,295,496 | | | | 1,997,309 | |
| China Resources Beer Holdings | | | 1,017,088 | | | | 2,164,059 | |
| BYD, Cl H * (A) | | | 450,000 | | | | 2,959,438 | |
| China Yurun Food Group * (A) | | | 859,788 | | | | 137,480 | |
| Dongfeng Motor Group, Cl H | | | 1,853,046 | | | | 1,928,352 | |
| Great Wall Motor, Cl H | | | 2,022,897 | | | | 1,974,678 | |
| Guangzhou Automobile Group, Cl H | | | 1,303,317 | | | | 1,576,448 | |
| Hengan International Group | | | 435,349 | | | | 3,466,579 | |
| Li Ning * | | | 979,969 | | | | 700,082 | |
| Tingyi Cayman Islands Holding (A) | | | 1,186,425 | | | | 1,280,537 | |
| Tsingtao Brewery, Cl H (A) | | | 219,617 | | | | 877,918 | |
| Want Want China Holdings (A) | | | 3,698,909 | | | | 2,256,116 | |
| | | | | | | | 22,900,735 | |
| Consumer Services — 24.6% | | | | | | | | |
| Air China, Cl H | | | 1,103,328 | | | | 725,607 | |
| Alibaba Group Holding ADR * | | | 41,051 | | | | 4,174,476 | |
| China Southern Airlines, Cl H | | | 1,148,995 | | | | 645,998 | |
| Ctrip.com International ADR * | | | 75,962 | | | | 3,353,723 | |
| Golden Eagle Retail Group | | | 271,000 | | | | 376,717 | |
| GOME Electrical Appliances Holding (A) | | | 6,991,205 | | | | 883,496 | |
| Intime Retail Group | | | 977,384 | | | | 767,554 | |
| JD.com ADR * | | | 133,717 | | | | 3,469,956 | |
| New Oriental Education & Technology Group ADR * | | | 24,078 | | | | 1,207,030 | |
| Vipshop Holdings ADR * | | | 173,512 | | | | 2,371,909 | |
| | | | | | | | 17,976,466 | |
| TOTAL CHINA | | | | | | | 40,877,201 | |
| HONG KONG— 44.0% | | | | | | | | |
| Consumer Goods — 27.5% | | | | | | | | |
| Biostime International Holdings (A) | | | 115,800 | | | | 284,914 | |
| Brilliance China Automotive Holdings | | | 1,298,700 | | | | 1,542,393 | |
| China Agri-Industries Holdings * | | | 1,315,056 | | | | 515,519 | |
| China Foods | | | 464,813 | | | | 206,188 | |
| China Mengniu Dairy | | | 1,740,752 | | | | 3,299,749 | |
The accompanying notes are an integral part of the financial statements.
| Schedule of Investments | October 31, 2016 |
Global X China Consumer ETF
| | | Shares/Face
Amount | | | Value | |
| COMMON STOCK — continued |
| Consumer Goods — continued | | | | | | | | |
| Geely Automobile Holdings | | | 3,250,000 | | | $ | 3,352,741 | |
| Li & Fung | | | 3,628,700 | | | | 1,787,479 | |
| Shenzhou International Group Holdings (A) | | | 366,862 | | | | 2,433,967 | |
| Skyworth Digital Holdings | | | 1,176,087 | | | | 761,324 | |
| Techtronic Industries | | | 545,300 | | | | 2,053,265 | |
| Uni-President China Holdings | | | 824,143 | | | | 557,941 | |
| WH Group (B) | | | 3,996,400 | | | | 3,241,501 | |
| | | | | | | | 20,036,981 | |
| Consumer Services — 16.5% | | | | | | | | |
| China Dongxiang Group | | | 2,045,188 | | | | 398,233 | |
| Chow Tai Fook Jewellery Group | | | 689,779 | | | | 489,214 | |
| Galaxy Entertainment Group | | | 931,700 | | | | 3,826,592 | |
| Melco Crown Entertainment ADR (A) | | | 195,997 | | | | 3,280,990 | |
| MTR | | | 563,800 | | | | 3,122,589 | |
| Sun Art Retail Group (A) | | | 1,350,025 | | | | 952,260 | |
| | | | | | | | 12,069,878 | |
| TOTAL HONG KONG | | | | | | | 32,106,859 | |
| TOTAL COMMON STOCK | | | | | | | | |
| (Cost $85,084,566) | | | | | | | 72,984,060 | |
|
| REPURCHASE AGREEMENTS (C) — 10.2% |
| Barclays Bank | | | | | | | | |
| 0.320%, dated 10/31/16, to be repurchased on 11/01/16 repurchase price $6,000,053 (collateralized by U.S Treasury Obligations, ranging in par value $0-$3,006,448, 0.000%-4.750%, 11/15/16-05/15/46, with a total market value of $6,120,000) | | $ | 6,000,000 | | | | 6,000,000 | |
| Deutsche Bank | | | | | | | | |
| 0.350%, dated 10/31/16, to be repurchased on 11/01/16 repurchase price $1,484,683 (collateralized by U.S. Treasury Obligations, par value $1,380,661, 3.000%, 05/15/45 with a total market value of $1,520,921) | | | 1,484,669 | | | | 1,484,669 | |
| TOTAL REPURCHASE AGREEMENTS | | | | | | | | |
| (Cost $7,484,669) | | | | | | | 7,484,669 | |
| TOTAL INVESTMENTS — 110.2% | | | | | | | | |
| (Cost $92,569,235) | | | | | | $ | 80,468,729 | |
Percentages are based on Net Assets of $73,022,636.
| * | Non-income producing security. |
| (A) | This security or a partial position of this security is on loan as of October 31, 2016. The total value of securities on loan as of October 31, 2016 was $7,072,381. |
| (B) | Security sold within terms of a private placement memorandum, exempt from registration under Section 144A of the Securities Act of 1933, as amended, and may be sold only to dealers in that program or other "accredited investors." The total value of such securities as of October 31, 2016 was $3,241,501 and represents 4.4% of Net Assets. |
| | |
| (C) | This security was purchased with cash collateral held from securities on loan. The total value of such securities as of October 31, 2016 was $7,484,669. |
The accompanying notes are an integral part of the financial statements.
| Schedule of Investments | October 31, 2016 |
Global X China Consumer ETF
| ADR — American Depositary Receipt |
| Cl — Class |
The following is a summary of the level of inputs used as of October 31, 2016, in valuing the Fund's investments carried at value:
| Investments in Securities | | Level 1 | | | Level 2 | | | Level 3 | | | Total | |
| Common Stock | | $ | 72,984,060 | | | $ | — | | | $ | — | | | $ | 72,984,060 | |
| Repurchase Agreements | | | — | | | | 7,484,669 | | | | — | | | | 7,484,669 | |
| Total Investments in Securities | | $ | 72,984,060 | | | $ | 7,484,669 | | | $ | — | | | $ | 80,468,729 | |
For the year ended October 31, 2016, there have been no transfers between Level 1, Level 2 or Level 3 investments.
As of October 31, 2016, there were no Level 3 investments.
The accompanying notes are an integral part of the financial statements.
| Schedule of Investments | October 31, 2016 |
Global X China Energy ETF
Sector Weightings (unaudited)†:
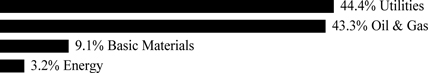
† Sector weightings percentages are based on the total market value of investments.
| | | Shares | | | Value | |
| COMMON STOCK — 100.0% |
| CHINA— 48.4% | | | | | | | | |
| Basic Materials — 8.5% | | | | | | | | |
| China Coal Energy, Cl H | | | 62,491 | | | $ | 35,457 | |
| China Shenhua Energy, Cl H | | | 37,830 | | | | 78,735 | |
| Yanzhou Coal Mining, Cl H | | | 27,075 | | | | 20,075 | |
| | | | | | | | 134,267 | |
| Energy — 0.6% | | | | | | | | |
| Tianneng Power International | | | 10,115 | | | | 9,130 | |
| Oil & Gas — 28.6% | | | | | | | | |
| China Longyuan Power Group, Cl H | | | 47,226 | | | | 36,113 | |
| China Oilfield Services, Cl H | | | 27,566 | | | | 26,660 | |
| China Petroleum & Chemical, Cl H | | | 217,027 | | | | 158,121 | |
| Huaneng Renewables, Cl H | | | 60,600 | | | | 20,396 | |
| JA Solar Holdings ADR * | | | 503 | | | | 2,928 | |
| JinkoSolar Holding ADR * | | | 418 | | | | 6,441 | |
| Kunlun Energy | | | 47,105 | | | | 35,656 | |
| PetroChina, Cl H | | | 232,913 | | | | 160,384 | |
| Trina Solar ADR * | | | 525 | | | | 5,450 | |
| | | | | | | | 452,149 | |
| Utilities — 10.7% | | | | | | | | |
| CGN Power, Cl H (A) | | | 155,400 | | | | 45,489 | |
| Datang International Power Generation, Cl H | | | 42,412 | | | | 11,430 | |
| ENN Energy Holdings | | | 11,541 | | | | 54,320 | |
| Huadian Fuxin Energy, Cl H | | | 40,100 | | | | 9,308 | |
| Huadian Power International, Cl H | | | 24,961 | | | | 10,718 | |
| Huaneng Power International, Cl H | | | 64,861 | | | | 39,896 | |
| | | | | | | | 171,161 | |
| TOTAL CHINA | | | | | | | 766,707 | |
| HONG KONG— 51.6% | | | | | | | | |
| Basic Materials — 0.6% | | | | | | | | |
| Shougang Fushan Resources Group | | | 43,815 | | | | 9,492 | |
| Energy — 2.6% | | | | | | | | |
| Beijing Enterprises Holdings | | | 7,323 | | | | 36,639 | |
| Canvest Environmental Protection Group | | | 8,900 | | | | 4,017 | |
| | | | | | | | 40,656 | |
The accompanying notes are an integral part of the financial statements.
| Schedule of Investments | October 31, 2016 |
Global X China Energy ETF
| | | Shares | | | Value | |
| COMMON STOCK — continued |
| Oil & Gas — 14.8% | | | | | | | | |
| China Gas Holdings | | | 23,737 | | | $ | 36,180 | |
| CNOOC | | | 120,785 | | | | 153,729 | |
| GCL-Poly Energy Holdings | | | 187,611 | | | | 25,403 | |
| Shunfeng International Clean Energy * | | | 42,700 | | | | 3,634 | |
| United Photovoltaics Group * | | | 50,200 | | | | 4,402 | |
| Xinjiang Goldwind Science & Technology, Cl H | | | 7,140 | | | | 9,870 | |
| | | | | | | | 233,218 | |
| Utilities — 33.6% | | | | | | | | |
| Beijing Jingneng Clean Energy, Cl H | | | 31,300 | | | | 9,525 | |
| China Power International Development | | | 49,584 | | | | 18,095 | |
| China Power New Energy Development | | | 6,620 | | | | 4,021 | |
| China Resources Gas Group | | | 12,250 | | | | 38,465 | |
| China Resources Power Holdings | | | 27,231 | | | | 46,281 | |
| CLP Holdings | | | 15,990 | | | | 162,687 | |
| Concord New Energy Group | | | 78,700 | | | | 3,958 | |
| Hong Kong & China Gas | | | 83,886 | | | | 164,422 | |
| Power Assets Holdings | | | 8,170 | | | | 76,855 | |
| Towngas China | | | 14,680 | | | | 8,272 | |
| | | | | | | | 532,581 | |
| TOTAL HONG KONG | | | | | | | 815,947 | |
| TOTAL INVESTMENTS — 100.0% | | | | | | | | |
| (Cost $2,209,804) | | | | | | $ | 1,582,654 | |
Percentages are based on Net Assets of $1,583,275.
| * | Non-income producing security. |
| (A) | Security sold within terms of a private placement memorandum, exempt from registration under Section 144A of the Securities Act of 1933, as amended, and may be sold only to dealers in that program or other "accredited investors." The total value of such securities as of October 31, 2016 was $45,489 and represents 2.9% of Net Assets. |
| ADR — American Depositary Receipt |
| Cl — Class |
| As of October 31, 2016, all of the Fund's investments were considered Level 1, in accordance with authoritative guidance on fair value measurements and disclosure under U.S. GAAP. |
For the year ended October 31, 2016, there have been no transfers between Level 1, Level 2 or Level 3 investments.
The accompanying notes are an integral part of the financial statements.
| Schedule of Investments | October 31, 2016 |
Global X China Financials ETF
Sector Weightings (unaudited)†:

† Sector weightings percentages are based on the total market value of investments.
| | | Shares | | | Value | |
| COMMON STOCK — 99.3% |
| CHINA— 60.1% | | | | | | | | |
| Financials — 60.1% | | | | | | | | |
| Agile Group Holdings | | | 127,312 | | | $ | 70,758 | |
| Agricultural Bank of China, Cl H | | | 2,413,188 | | | | 1,017,573 | |
| Bank of China, Cl H | | | 3,038,534 | | | | 1,363,547 | |
| Bank of Communications, Cl H | | | 693,871 | | | | 528,802 | |
| China Citic Bank, Cl H | | | 1,126,622 | | | | 727,851 | |
| China Construction Bank, Cl H | | | 3,881,126 | | | | 2,842,711 | |
| China Everbright Bank, Cl H | | | 251,100 | | | | 114,624 | |
| China Galaxy Securities, Cl H | | | 322,500 | | | | 306,911 | |
| China Life Insurance, Cl H | | | 509,340 | | | | 1,265,000 | |
| China Merchants Bank, Cl H | | | 378,934 | | | | 924,509 | |
| China Minsheng Banking, Cl H | | | 556,155 | | | | 634,696 | |
| China Pacific Insurance Group, Cl H | | | 255,212 | | | | 923,125 | |
| Chongqing Rural Commercial Bank, Cl H | | | 228,967 | | | | 137,294 | |
| CITIC Securities, Cl H | | | 204,796 | | | | 454,231 | |
| Country Garden Holdings | | | 675,997 | | | | 352,170 | |
| Guangzhou R&F Properties | | | 86,693 | | | | 122,524 | |
| Industrial & Commercial Bank of China, Cl H | | | 4,677,237 | | | | 2,816,650 | |
| Longfor Properties | | | 123,338 | | | | 163,818 | |
| PICC Property & Casualty, Cl H | | | 422,342 | | | | 684,039 | |
| Ping An Insurance Group of China, Cl H | | | 258,414 | | | | 1,364,572 | |
| Sino-Ocean Group Holding | | | 262,152 | | | | 109,190 | |
| SOHO China | | | 168,459 | | | | 87,109 | |
| | | | | | | | 17,011,704 | |
| TOTAL CHINA | | | | | | | 17,011,704 | |
| HONG KONG— 39.2% | | | | | | | | |
| Financials — 39.2% | | | | | | | | |
| AIA Group | | | 424,200 | | | | 2,677,626 | |
| Cheung Kong Property Holdings | | | 191,350 | | | | 1,417,572 | |
| China Everbright | | | 77,741 | | | | 152,377 | |
| China Evergrande Group | | | 320,661 | | | | 212,124 | |
| China Overseas Land & Investment | | | 439,366 | | | | 1,356,934 | |
| China Resources Land | | | 246,208 | | | | 614,024 | |
| China Taiping Insurance Holdings * | | | 132,830 | | | | 256,587 | |
| CK Hutchison Holdings | | | 107,750 | | | | 1,333,180 | |
| Haitong Securities, Cl H | | | 268,400 | | | | 476,242 | |
| Hong Kong Exchanges & Clearing | | | 51,100 | | | | 1,353,468 | |
| KWG Property Holding | | | 106,285 | | | | 61,675 | |
The accompanying notes are an integral part of the financial statements.
| Schedule of Investments | October 31, 2016 |
Global X China Financials ETF
| | | Shares | | | Value | |
| COMMON STOCK — continued |
| Financials — continued | | | | | | | | |
| New China Life Insurance, Cl H | | | 85,811 | | | $ | 371,800 | |
| People's Insurance Group of China, Cl H | | | 740,800 | | | | 295,179 | |
| Poly Property Group | | | 180,407 | | | | 57,229 | |
| Shenzhen Investment | | | 267,518 | | | | 116,944 | |
| Shimao Property Holdings | | | 103,004 | | | | 137,873 | |
| Sunac China Holdings | | | 165,000 | | | | 112,981 | |
| Yuexiu Property | | | 571,345 | | | | 83,990 | |
| TOTAL HONG KONG | | | | | | | 11,087,805 | |
| TOTAL INVESTMENTS — 99.3% | | | | | | | | |
| (Cost $31,181,647) | | | | | | $ | 28,099,509 | |
Percentages are based on Net Assets of $28,288,609.
| * | Non-income producing security. |
| As of October 31, 2016, all of the Fund's investments were considered Level 1, in accordance with authoritative guidance on fair value measurements and disclosure under U.S. GAAP. |
For the year ended October 31, 2016, there have been no transfers between Level 1, Level 2 or Level 3 investments.
The accompanying notes are an integral part of the financial statements.
| Schedule of Investments | October 31, 2016 |
Global X China Industrials ETF
Sector Weightings (unaudited)†:

† Sector weightings percentages are based on the total market value of investments.
| | | Shares | | | Value | |
| COMMON STOCK — 99.9% |
| CHINA— 64.2% | | | | | | | | |
| Consumer Goods — 5.0% | | | | | | | | |
| BYD, Cl H * | | | 28,494 | | | $ | 187,392 | |
| Industrials — 59.2% | | | | | | | | |
| Anhui Conch Cement, Cl H | | | 69,287 | | | | 192,095 | |
| China Communications Construction, Cl H | | | 171,833 | | | | 189,230 | |
| China COSCO Holdings, Cl H * | | | 164,232 | | | | 56,757 | |
| China Lesso Group Holdings | | | 62,755 | | | | 46,046 | |
| China National Building Material, Cl H | | | 185,947 | | | | 85,123 | |
| China Railway Construction, Cl H | | | 122,441 | | | | 153,469 | |
| China Railway Group, Cl H | | | 246,458 | | | | 190,687 | |
| China Shanshui Cement Group (A) (B) | | | 195,552 | | | | 7,931 | |
| China Shipping Container Lines, Cl H * | | | 232,082 | | | | 48,782 | |
| China Shipping Development, Cl H | | | 83,784 | | | | 46,349 | |
| China Zhongwang Holdings | | | 90,188 | | | | 41,751 | |
| CRRC | | | 201,913 | | | | 183,300 | |
| Dongfang Electric, Cl H | | | 21,693 | | | | 16,812 | |
| First Tractor, Cl H | | | 25,341 | | | | 14,182 | |
| Guangshen Railway, Cl H | | | 92,348 | | | | 51,087 | |
| Haitian International Holdings | | | 40,846 | | | | 84,275 | |
| Harbin Power Equipment, Cl H | | | 39,711 | | | | 19,408 | |
| Hollysys Automation Technologies | | | 3,160 | | | | 62,916 | |
| Jiangsu Expressway, Cl H | | | 78,799 | | | | 107,303 | |
| Metallurgical Corp of China, Cl H | | | 182,901 | | | | 59,671 | |
| Shanghai Electric Group, Cl H | | | 169,971 | | | | 78,685 | |
| Sinotrans, Cl H | | | 129,600 | | | | 61,166 | |
| Weichai Power, Cl H | | | 62,688 | | | | 94,741 | |
| Yangzijiang Shipbuilding Holdings | | | 137,303 | | | | 73,490 | |
| Zhejiang Expressway, Cl H | | | 92,710 | | | | 97,195 | |
| Zhuzhou CRRC Times Electric, Cl H | | | 35,313 | | | | 171,218 | |
| | | | | | | | 2,233,669 | |
| TOTAL CHINA | | | | | | | 2,421,061 | |
| HONG KONG— 35.7% | | | | | | | | |
| Industrials — 35.7% | | | | | | | | |
| AviChina Industry & Technology, Cl H | | | 135,080 | | | | 91,797 | |
| Beijing Capital International Airport, Cl H | | | 92,641 | | | | 97,123 | |
| Beijing Enterprises Water Group | | | 261,900 | | | | 190,139 | |
The accompanying notes are an integral part of the financial statements.
| Schedule of Investments | October 31, 2016 |
Global X China Industrials ETF
| | | Shares | | | Value | |
| COMMON STOCK — continued |
| Industrials — continued | | | | | | | | |
| China High Speed Transmission Equipment Group | | | 66,120 | | | $ | 68,636 | |
| China International Marine Containers Group, Cl H | | | 25,180 | | | | 30,002 | |
| China Merchants Holdings International | | | 67,761 | | | | 175,631 | |
| China Resources Cement Holdings | | | 111,321 | | | | 45,075 | |
| China State Construction International Holdings | | | 108,650 | | | | 158,880 | |
| COSCO Pacific | | | 103,500 | | | | 102,768 | |
| Shanghai Industrial Holdings | | | 29,299 | | | | 89,731 | |
| Shenzhen International Holdings | | | 52,506 | | | | 81,249 | |
| Sunny Optical Technology Group | | | 36,874 | | | | 180,213 | |
| Zoomlion Heavy Industry Science and Technology | | | 89,000 | | | | 32,479 | |
| | | | | | | | 1,343,723 | |
| TOTAL HONG KONG | | | | | | | 1,343,723 | |
| TOTAL INVESTMENTS — 99.9% | | | | | | | | |
| (Cost $5,249,854) | | | | | | $ | 3,764,784 | |
Percentages are based on Net Assets of $3,770,292.
| * | Non-income producing security. |
| (A) | Security considered illiquid. The total value of such securities as of October 31, 2016 was $7,931 and represented 0.2% of Net Assets. |
| (B) | Security is fair valued using methods determined in good faith by the Fair Value Committee of the Fund. The total value of such securities as of October 31, 2016, was $7,931 and represents 0.2% of Net Assets. |
The following is a summary of the level of inputs used as of October 31, 2016, in valuing the Fund's investments carried at value:
| Investments in Securities | | Level 1 | | | Level 2 | | | Level 3 | | | Total | |
| Common Stock | | $ | 3,756,853 | | | $ | — | | | $ | 7,931 | | | $ | 3,764,784 | |
| Total Investments in Securities | | $ | 3,756,853 | | | $ | — | | | $ | 7,931 | | | $ | 3,764,784 | |
The following is a reconciliation of investments in which significant unobservable inputs (Level 3) were used in determining fair value:
| | | Investments in
Common Stock | |
| | | | |
| Beginning Balance as of October 31, 2015 | | $ | 922,853 | |
| Transfers out of Level 3 | | | (290,245 | ) |
| Net purchases | | | 2,926 | |
| Net sales | | | (344,077 | ) |
| Realized gain (loss) | | | (249,192 | ) |
| Change in unrealized appreciation (depreciation) | | | (34,334 | ) |
| Ending Balance as of October 31, 2016 | | $ | 7,931 | |
For the year ended October 31, 2016, the transfers in and out of Level 3 were due to changes in the availability of observable inputs to determine fair value. Transfers between levels are recognized at period end.
The accompanying notes are an integral part of the financial statements.
| Schedule of Investments | October 31, 2016 |
Global X China Industrials ETF
Net change in unrealized appreciation (depreciation) from investments (Level 3) still held as of October 31, 2016 is $(46,495).
For the year ended October 31, 2016, there have been no transfers between Level 1 and Level 2.
The accompanying notes are an integral part of the financial statements.
| Schedule of Investments | October 31, 2016 |
Global X China Materials ETF
Sector Weightings (unaudited)†:

† Sector weightings percentages are based on the total market value of investments.
| | | Shares | | | Value | |
| COMMON STOCK — 99.9% |
| CHINA— 64.4% | | | | | | | | |
| Basic Materials — 64.4% | | | | | | | | |
| Aluminum Corp of China, Cl H * | | | 177,339 | | | $ | 65,860 | |
| Angang Steel, Cl H | | | 132,824 | | | | 68,169 | |
| BBMG, Cl H | | | 184,940 | | | | 67,729 | |
| China BlueChemical | | | 228,109 | | | | 44,122 | |
| China Hongqiao Group | | | 74,742 | | | | 66,889 | |
| China Molybdenum, Cl H | | | 313,554 | | | | 69,545 | |
| Dongyue Group * (A) (B) | | | 104,857 | | | | 5,444 | |
| Fosun International | | | 45,340 | | | | 65,834 | |
| Jiangxi Copper, Cl H | | | 58,391 | | | | 68,971 | |
| Maanshan Iron & Steel, Cl H * | | | 223,225 | | | | 50,950 | |
| Real Gold Mining * (A) (B) | | | 97,864 | | | | 1 | |
| Sinofert Holdings | | | 216,930 | | | | 28,533 | |
| Sinopec Shanghai Petrochemical, Cl H | | | 130,850 | | | | 66,818 | |
| Sinopec Yizheng Chemical Fibre, Cl H * | | | 270,214 | | | | 56,100 | |
| Zhaojin Mining Industry | | | 69,884 | | | | 70,651 | |
| Zijin Mining Group, Cl H | | | 217,859 | | | | 68,548 | |
| | | | | | | | 864,164 | |
| TOTAL CHINA | | | | | | | 864,164 | |
| HONG KONG— 35.5% | | | | | | | | |
| Basic Materials — 35.5% | | | | | | | | |
| China Lumena New Materials * (A) (B) | | | 1,950 | | | | 3 | |
| China Metal Resources Utilization * (C) | | | 71,900 | | | | 28,835 | |
| China Silver Group | | | 97,000 | | | | 19,138 | |
| Citic Pacific | | | 46,440 | | | | 66,712 | |
| Fufeng Group | | | 131,454 | | | | 55,600 | |
| Kingboard Chemical Holdings | | | 21,400 | | | | 63,332 | |
| Munsun Capital Group * | | | 961,300 | | | | 30,990 | |
| Nine Dragons Paper Holdings | | | 73,070 | | | | 59,550 | |
| TCC International Holdings | | | 267,540 | | | | 67,964 | |
| West China Cement | | | 267,560 | | | | 27,257 | |
| Yingde Gases | | | 140,579 | | | | 56,740 | |
| | | | | | | | 476,121 | |
| TOTAL HONG KONG | | | | | | | 476,121 | |
| TOTAL INVESTMENTS — 99.9% | | | | | | | | |
| (Cost $2,157,342) | | | | | | $ | 1,340,285 | |
Percentages are based on Net Assets of $1,341,570.
| * | Non-income producing security. |
The accompanying notes are an integral part of the financial statements.
| Schedule of Investments | October 31, 2016 |
Global X China Materials ETF
| (A) | Security considered illiquid. The total value of such securities as of October 31, 2016 was $5,448 and represented 0.4% of Net Assets. |
| (B) | Security is fair valued using methods determined in good faith by the Fair Value Committee of the Fund. The total value of such securities as of October 31, 2016, was $5,448 and represents 0.4% of Net Assets. |
| (C) | Security sold within terms of a private placement memorandum, exempt from registration under Section 144A of the Securities Act of 1933, as amended, and may be sold only to dealers in that program or other "accredited investors." The total value of such securities as of October 31, 2016 was $28,835 and represents 2.2% of Net Assets. |
The following is a summary of the level of inputs used as of October 31, 2016, in valuing the Fund's investments carried at value:
| Investments in Securities | | Level 1 | | | Level 2 | | | Level 3(1) | | | Total | |
| Common Stock | | $ | 1,334,837 | | | $ | — | | | $ | 5,448 | | | $ | 1,340,285 | |
| Total Investments in Securities | | $ | 1,334,837 | | | $ | — | | | $ | 5,448 | | | $ | 1,340,285 | |
(1) A reconciliation of Level 3 investments and disclosures of significant unobservable inputs are presented when the Fund
has a significant amount of Level 3 investments at the beginning and/or end of the period in relation to Net Assets. Management has concluded that Level 3 investments are not material in relation to Net Assets.
For the year ended October 31, 2016, there have been no transfers between Level 1, Level 2 or Level 3 investments.
The accompanying notes are an integral part of the financial statements.
| Schedule of Investments | October 31, 2016 |
Global X NASDAQ China Technology ETF
Sector Weightings (unaudited)†:

† Sector weightings percentages are based on the total market value of investments.
| | | Shares | | | Value | |
| COMMON STOCK — 99.9% |
| CHINA— 66.3% | | | | | | | | |
| Technology — 66.3% | | | | | | | | |
| 21Vianet Group ADR * | | | 16,585 | | | $ | 121,236 | |
| 500.com ADR, Cl A * | | | 7,195 | | | | 121,883 | |
| Autohome ADR * | | | 13,786 | | | | 323,282 | |
| Baidu ADR * | | | 6,503 | | | | 1,150,121 | |
| Baozun ADR * | | | 7,295 | | | | 96,586 | |
| China Communications Services, Cl H | | | 812,453 | | | | 482,976 | |
| China Finance Online ADR * | | | 7,503 | | | | 29,487 | |
| Coolpad Group | | | 1,124,635 | | | | 195,782 | |
| Eastern Communications, Cl B | | | 107,695 | | | | 79,156 | |
| Kingdee International Software Group | | | 605,089 | | | | 245,785 | |
| Lenovo Group | | | 1,651,073 | | | | 1,060,284 | |
| NetEase ADR | | | 5,248 | | | | 1,348,683 | |
| NQ Mobile ADR, Cl A * | | | 30,171 | | | | 104,392 | |
| Semiconductor Manufacturing International * | | | 5,077,214 | | | | 615,432 | |
| Shanghai Baosight Software, Cl B | | | 82,390 | | | | 142,947 | |
| Shanghai Potevio, Cl B * | | | 44,755 | | | | 63,955 | |
| SINA * | | | 14,541 | | | | 1,048,988 | |
| Sohu.com * | | | 10,065 | | | | 376,733 | |
| Travelsky Technology, Cl H | | | 255,695 | | | | 546,680 | |
| Weibo ADR * | | | 11,635 | | | | 535,326 | |
| YY ADR * | | | 5,185 | | | | 249,243 | |
| ZTE, Cl H | | | 226,483 | | | | 311,913 | |
| | | | | | | | 9,250,870 | |
| TOTAL CHINA | | | | | | | 9,250,870 | |
| HONG KONG— 33.6% | | | | | | | | |
| Technology — 33.6% | | | | | | | | |
| Alibaba Health Information Technology * | | | 893,509 | | | | 467,791 | |
| ASM Pacific Technology | | | 63,133 | | | | 609,361 | |
| BYD Electronic International | | | 227,581 | | | | 179,603 | |
| China Electronics Holdings | | | 299,000 | | | | 72,101 | |
| China Public Procurement * | | | 2,952,900 | | | | 27,797 | |
| Chinasoft International * | | | 686,756 | | | | 323,237 | |
| Digital China Holdings | | | 318,648 | | | | 267,086 | |
| FIH Mobile | | | 1,026,609 | | | | 338,900 | |
| Heng Xin China Holdings * | | | 1,763,800 | | | | 22,744 | |
| HKBN | | | 221,470 | | | | 261,314 | |
| Hua Hong Semiconductor (A) | | | 111,700 | | | | 132,228 | |
| National Agricultural Holdings * | | | 289,400 | | | | 42,543 | |
The accompanying notes are an integral part of the financial statements.
| Schedule of Investments | October 31, 2016 |
Global X NASDAQ China Technology ETF
| | | Shares | | | Value | |
| COMMON STOCK — continued |
| Technology — continued | | | | | | | | |
| New Sports Group * | | | 4,523,400 | | | $ | 58,330 | |
| PAX Global Technology | | | 237,880 | | | | 148,774 | |
| Suncorp Technologies * | | | 4,780,100 | | | | 46,846 | |
| Tencent Holdings | | | 42,775 | | | | 1,135,173 | |
| VTech Holdings | | | 44,472 | | | | 545,947 | |
| | | | | | | | 4,679,775 | |
| TOTAL HONG KONG | | | | | | | 4,679,775 | |
| TOTAL INVESTMENTS — 99.9% | | | | | | | | |
| (Cost $13,452,705) | | | | | | $ | 13,930,645 | |
Percentages are based on Net Assets of $13,940,244.
| * | Non-income producing security. |
| (A) | Security sold within terms of a private placement memorandum, exempt from registration under Section 144A of the Securities Act of 1933, as amended, and may be sold only to dealers in that program or other "accredited investors." The total value of such securities as of October 31, 2016 was $132,228 and represents 0.9% of Net Assets. |
| ADR — American Depositary Receipt |
| Cl — Class |
| As of October 31, 2016, all of the Fund's investments were considered Level 1, in accordance with authoritative guidance on fair value measurements and disclosure under U.S. GAAP. |
For the year ended October 31, 2016, there have been no transfers between Level 1, Level 2 or Level 3 investments.
The accompanying notes are an integral part of the financial statements.
| Schedule of Investments | October 31, 2016 |
Global X Southeast Asia ETF
Sector Weightings (unaudited)†:
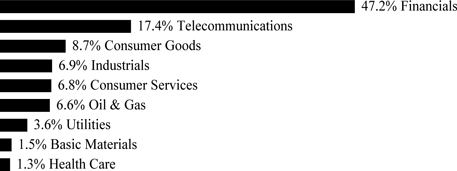
† Sector weightings percentages are based on the total market value of investments.
| | | Shares | | | Value | |
| COMMON STOCK — 99.8% |
| INDONESIA— 20.6% | | | | | | | | |
| Consumer Goods — 5.7% | | | | | | | | |
| Astra International | | | 750,181 | | | $ | 472,888 | |
| Gudang Garam | | | 17,090 | | | | 88,934 | |
| Unilever Indonesia | | | 42,576 | | | | 145,123 | |
| | | | | | | | 706,945 | |
| Financials — 9.9% | | | | | | | | |
| Bank Central Asia | | | 457,736 | | | | 544,632 | |
| Bank Mandiri | | | 348,180 | | | | 306,205 | |
| Bank Rakyat Indonesia Persero | | | 401,240 | | | | 375,163 | |
| | | | | | | | 1,226,000 | |
| Telecommunications — 5.0% | | | | | | | | |
| Telekomunikasi Indonesia ADR | | | 18,814 | | | | 611,267 | |
| TOTAL INDONESIA | | | | | | | 2,544,212 | |
| MALAYSIA— 23.3% | | | | | | | | |
| Basic Materials — 1.5% | | | | | | | | |
| Petronas Chemicals Group | | | 107,324 | | | | 179,087 | |
| Financials — 9.6% | | | | | | | | |
| CIMB Group Holdings | | | 208,375 | | | | 249,851 | |
| Malayan Banking | | | 205,431 | | | | 386,867 | |
| Public Bank | | | 116,049 | | | | 549,400 | |
| | | | | | | | 1,186,118 | |
| Health Care — 1.3% | | | | | | | | |
| IHH Healthcare | | | 104,080 | | | | 158,787 | |
| Industrials — 1.9% | | | | | | | | |
| Sime Darby | | | 122,696 | | | | 239,542 | |
| Oil & Gas — 1.3% | | | | | | | | |
| Petronas Gas | | | 29,479 | | | | 154,598 | |
The accompanying notes are an integral part of the financial statements.
| Schedule of Investments | October 31, 2016 |
Global X Southeast Asia ETF
| | | Shares | | | Value | |
| COMMON STOCK — continued |
| Telecommunications — 4.1% | | | | | | | | |
| Axiata Group | | | 169,788 | | | $ | 199,132 | |
| DiGi.Com | | | 139,100 | | | | 166,787 | |
| Maxis | | | 97,806 | | | | 138,957 | |
| | | | | | | | 504,876 | |
| Utilities — 3.6% | | | | | | | | |
| Tenaga Nasional | | | 131,575 | | | | 449,770 | |
| TOTAL MALAYSIA | | | | | | | 2,872,778 | |
| PHILIPPINES— 6.4% | | | | | | | | |
| Consumer Goods — 1.5% | | | | | | | | |
| JG Summit Holdings | | | 114,720 | | | | 180,055 | |
| Consumer Services — 2.0% | | | | | | | | |
| SM Investments | | | 17,840 | | | | 247,581 | |
| Financials — 2.4% | | | | | | | | |
| Ayala Land | | | 141,770 | | | | 106,131 | |
| SM Prime Holdings | | | 344,300 | | | | 191,268 | |
| | | | | | | | 297,399 | |
| Telecommunications — 0.5% | | | | | | | | |
| PLDT ADR | | | 2,036 | | | | 64,745 | |
| TOTAL PHILIPPINES | | | | | | | 789,780 | |
| SINGAPORE— 28.3% | | | | | | | | |
| Consumer Goods — 1.5% | | | | | | | | |
| Wilmar International | | | 78,351 | | | | 186,322 | |
| Consumer Services — 2.1% | | | | | | | | |
| Jardine Cycle & Carriage | | | 4,118 | | | | 124,910 | |
| Singapore Airlines | | | 18,913 | | | | 137,645 | |
| | | | | | | | 262,555 | |
| Financials — 18.5% | | | | | | | | |
| CapitaLand | | | 94,518 | | | | 209,829 | |
| DBS Group Holdings | | | 66,503 | | | | 716,679 | |
| Oversea-Chinese Banking | | | 123,466 | | | | 752,203 | |
| United Overseas Bank | | | 44,897 | | | | 605,766 | |
| | | | | | | | 2,284,477 | |
| Telecommunications — 6.2% | | | | | | | | |
| Singapore Telecommunications | | | 273,324 | | | | 761,906 | |
| TOTAL SINGAPORE | | | | | | | 3,495,260 | |
| THAILAND— 21.2% | | | | | | | | |
| Consumer Services — 2.7% | | | | | | | | |
| CP ALL NVDR | | | 194,473 | | | | 337,574 | |
| Financials — 6.6% | | | | | | | | |
| Bangkok Bank NVDR | | | 17,721 | | | | 80,763 | |
| Kasikornbank NVDR | | | 74,628 | | | | 366,770 | |
The accompanying notes are an integral part of the financial statements.
| Schedule of Investments | October 31, 2016 |
Global X Southeast Asia ETF
| | | Shares | | | Value | |
| COMMON STOCK — continued |
| Financials — continued | | | | | | | | |
| Siam Commercial Bank NVDR | | | 89,871 | | | $ | 368,497 | |
| | | | | | | | 816,030 | |
| Industrials — 5.0% | | | | | | | | |
| Airports of Thailand NVDR | | | 15,950 | | | | 173,639 | |
| Siam Cement NVDR | | | 31,376 | | | | 448,260 | |
| | | | | | | | 621,899 | |
| Oil & Gas — 5.3% | | | | | | | | |
| PTT NVDR | | | 53,074 | | | | 524,712 | |
| PTT Exploration & Production NVDR | | | 51,610 | | | | 122,767 | |
| | | | | | | | 647,479 | |
| Telecommunications — 1.6% | | | | | | | | |
| Advanced Info Service NVDR | | | 44,201 | | | | 193,867 | |
| TOTAL THAILAND | | | | | | | 2,616,849 | |
| TOTAL INVESTMENTS — 99.8% | | | | | | | | |
| (Cost $13,893,495) | | | | | | $ | 12,318,879 | |
Percentages are based on Net Assets of $12,349,367.
| ADR — American Depositary Receipt |
NVDR — Non-Voting Depositary Receipt
| As of October 31, 2016, all of the Fund's investments were considered Level 1, in accordance with authoritative guidance on fair value measurements and disclosure under U.S. GAAP. |
For the year ended October 31, 2016, there have been no transfers between Level 1, Level 2 or Level 3 investments.
The accompanying notes are an integral part of the financial statements.
| Schedule of Investments | October 31, 2016 |
Global X FTSE Andean 40 ETF
Sector Weightings (unaudited)†:
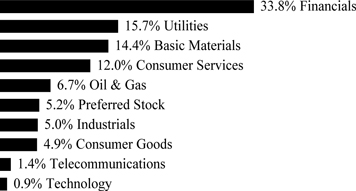
† Sector weightings percentages are based on the total market value of investments.
| | | Shares | | | Value | |
| COMMON STOCK — 94.8% |
| CHILE— 46.7% | | | | | | | | |
| Basic Materials — 5.4% | | | | | | | | |
| CAP | | | 2,923 | | | $ | 20,400 | |
| Empresas CMPC | | | 43,983 | | | | 95,261 | |
| Sociedad Quimica y Minera de Chile ADR | | | 3,609 | | | | 105,599 | |
| | | | | | | | 221,260 | |
| Consumer Goods — 2.5% | | | | | | | | |
| Cia Cervecerias Unidas ADR | | | 2,912 | | | | 62,608 | |
| Vina Concha y Toro | | | 21,950 | | | | 38,301 | |
| | | | | | | | 100,909 | |
| Consumer Services — 10.4% | | | | | | | | |
| Cencosud | | | 44,651 | | | | 145,540 | |
| Latam Airlines Group ADR * | | | 13,128 | | | | 125,898 | |
| SACI Falabella | | | 19,215 | | | | 150,856 | |
| | | | | | | | 422,294 | |
| Financials — 11.6% | | | | | | | | |
| Banco de Chile ADR | | | 1,602 | | | | 116,113 | |
| Banco de Chile | | | 8,024 | | | | 955 | |
| Banco de Credito e Inversiones | | | 1,939 | | | | 99,645 | |
| Banco Santander Chile ADR | | | 6,135 | | | | 140,185 | |
| Parque Arauco | | | 21,944 | | | | 54,410 | |
| Sociedad Matriz Banco de Chile, Cl B | | | 181,300 | | | | 60,940 | |
| | | | | | | | 472,248 | |
| Oil & Gas — 3.7% | | | | | | | | |
| Empresas COPEC | | | 14,876 | | | | 149,457 | |
| Technology — 0.9% | | | | | | | | |
| Sonda | | | 18,424 | | | | 38,071 | |
The accompanying notes are an integral part of the financial statements.
| Schedule of Investments | October 31, 2016 |
Global X FTSE Andean 40 ETF
| | | Shares | | | Value | |
| COMMON STOCK — continued |
| Telecommunications — 1.4% | | | | | | | | |
| ENTEL Chile * | | | 5,461 | | | $ | 58,554 | |
| Utilities — 10.8% | | | | | | | | |
| AES Gener | | | 98,911 | | | | 33,695 | |
| Aguas Andinas, Cl A | | | 120,634 | | | | 79,526 | |
| Colbun | | | 277,295 | | | | 60,402 | |
| Empresa Nacional de Electricidad ADR | | | 4,421 | | | | 91,780 | |
| Enersis ADR | | | 15,502 | | | | 134,402 | |
| Engie Energia Chile | | | 20,632 | | | | 36,602 | |
| | | | | | | | 436,407 | |
| TOTAL CHILE | | | | | | | 1,899,200 | |
| COLOMBIA— 24.7% | | | | | | | | |
| Consumer Goods — 2.4% | | | | | | | | |
| Grupo Nutresa | | | 11,660 | | | | 97,993 | |
| Consumer Services — 1.6% | | | | | | | | |
| Almacenes Exito | | | 12,592 | | | | 63,042 | |
| Financials — 11.2% | | | | | | | | |
| BanColombia ADR | | | 4,608 | | | | 176,394 | |
| Financiera Colombiana | | | 6,110 | | | | 76,026 | |
| Grupo Aval Acciones y Valores ADR | | | 4,155 | | | | 34,029 | |
| Grupo de Inversiones Suramericana | | | 13,214 | | | | 171,035 | |
| | | | | | | | 457,484 | |
| Industrials — 5.0% | | | | | | | | |
| Cementos Argos | | | 22,045 | | | | 87,559 | |
| Grupo Argos | | | 18,069 | | | | 117,601 | |
| | | | | | | | 205,160 | |
| Oil & Gas — 3.0% | | | | | | | | |
| Ecopetrol ADR * | | | 13,895 | | | | 120,748 | |
| Utilities — 1.5% | | | | | | | | |
| Interconexion Electrica | | | 18,697 | | | | 62,342 | |
| TOTAL COLOMBIA | | | | | | | 1,006,769 | |
| PERU— 18.4% | | | | | | | | |
| Basic Materials — 9.0% | | | | | | | | |
| Cia de Minas Buenaventura ADR | | | 11,616 | | | | 154,377 | |
| Southern Copper | | | 7,483 | | | | 212,442 | |
| | | | | | | | 366,819 | |
| Financials — 9.4% | | | | | | | | |
| Credicorp | | | 1,056 | | | | 156,921 | |
| Credicorp Ltd. | | | 1,520 | | | | 225,994 | |
| | | | | | | | 382,915 | |
| TOTAL PERU | | | | | | | 749,734 | |
The accompanying notes are an integral part of the financial statements.
| Schedule of Investments | October 31, 2016 |
| Global X FTSE Andean 40 ETF |
| | | Shares | | | Value | |
| COMMON STOCK — continued | | | | | | | | |
| UNITED STATES— 5.0% | | | | | | | | |
| Financials — 1.5% | | | | | | | | |
| Itau CorpBanca ADR | | | 4,577 | | | $ | 61,790 | |
| Utilities — 3.5% | | | | | | | | |
| Endesa Americas ADR | | | 4,400 | | | | 63,228 | |
| Enersis Chile ADR | | | 15,491 | | | | 76,990 | |
| | | | | | | | 140,218 | |
| TOTAL UNITED STATES | | | | | | | 202,008 | |
| TOTAL COMMON STOCK | | | | | | | | |
| (Cost $4,982,808) | | | | | | | 3,857,711 | |
| | | | | | | | | |
| PREFERRED STOCK — 5.2% | | | | | | | | |
| CHILE — 0.9% | | | | | | | | |
| Consumer Goods — 0.9% | | | | | | | | |
| Embotelladora Andina | | | 9,270 | | | | 37,168 | |
| COLOMBIA — 4.3% | | | | | | | | |
| Financials — 2.8% | | | | | | | | |
| Banco Davivienda | | | 5,655 | | | | 57,756 | |
| Grupo Aval Acciones y Valores | | | 134,171 | | | | 55,529 | |
| | | | | | | | 113,285 | |
| Industrials — 1.5% | | | | | | | | |
| Grupo Argos | | | 9,700 | | | | 59,571 | |
| TOTAL COLOMBIA | | | | | | | 172,856 | |
| TOTAL PREFERRED STOCK | | | | | | | | |
| (Cost $252,421) | | | | | | | 210,024 | |
| TOTAL INVESTMENTS — 100.0% | | | | | | | | |
| (Cost $5,235,229) | | | | | | $ | 4,067,735 | |
Percentages are based on Net Assets of $4,067,842.
| * | Non-income producing security. |
ADR — American Depositary Receipt
Cl — Class
Ltd. — Limited
As of October 31, 2016, all of the Fund's investments were considered Level 1, in accordance with authoritative guidance on fair value measurements and disclosure under U.S. GAAP.
For the year ended October 31, 2016, there have been no transfers between Level 1, Level 2 and Level 3 investments.
The accompanying notes are an integral part of the financial statements.
| Schedule of Investments | October 31, 2016 |
| Global X MSCI Colombia ETF |
Sector Weightings (unaudited)†:
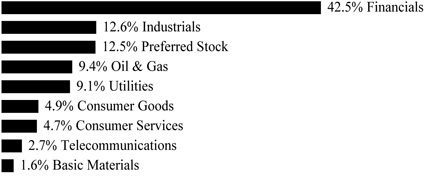
† Sector weightings percentages are based on the total market value of investments.
| | | Shares | | | Value | |
| COMMON STOCK — 88.8% | | | | | | | | |
| COLOMBIA— 88.8% | | | | | | | | |
| Basic Materials — 1.6% | | | | | | | | |
| Mineros | | | 2,044,718 | | | $ | 1,433,163 | |
| Consumer Goods — 5.0% | | | | | | | | |
| Grupo Nutresa | | | 522,478 | | | | 4,391,033 | |
| Consumer Services — 4.8% | | | | | | | | |
| Almacenes Exito | | | 851,193 | | | | 4,261,498 | |
| Financials — 43.1% | | | | | | | | |
| Banco de Bogota | | | 200,437 | | | | 4,153,102 | |
| BanColombia ADR | | | 410,198 | | | | 15,702,380 | |
| Celsia ESP | | | 2,685,535 | | | | 3,634,667 | |
| Financiera Colombiana | | | 318,430 | | | | 3,962,167 | |
| Grupo Aval Acciones y Valores ADR | | | 380,065 | | | | 3,112,732 | |
| Grupo de Inversiones Suramericana | | | 594,450 | | | | 7,694,247 | |
| | | | | | | | 38,259,295 | |
| Industrials — 12.8% | | | | | | | | |
| Cementos Argos | | | 1,020,011 | | | | 4,015,255 | |
| Cemex Latam Holdings * | | | 920,036 | | | | 3,433,125 | |
| Grupo Argos | | | 602,205 | | | | 3,919,421 | |
| | | | | | | | 11,367,801 | |
| Oil & Gas — 9.5% | | | | | | | | |
| Canacol Energy * | | | 1,121,919 | | | | 3,465,581 | |
| Ecopetrol ADR * | | | 575,489 | | | | 5,000,999 | |
| | | | | | | | 8,466,580 | |
| Telecommunications — 2.8% | | | | | | | | |
| Empresa de Telecomunicaciones de Bogota | | | 12,552,200 | | | | 2,467,619 | |
| Utilities — 9.2% | | | | | | | | |
| Empresa de Energia de Bogota | | | 6,369,126 | | | | 4,039,024 | |
| Interconexion Electrica | | | 1,233,033 | | | | 4,111,338 | |
| | | | | | | | 8,150,362 | |
The accompanying notes are an integral part of the financial statements.
| Schedule of Investments | October 31, 2016 |
| Global X MSCI Colombia ETF |
| | | Shares | | | Value | |
| COMMON STOCK — continued | | | | | | | | |
| TOTAL COLOMBIA | | | | | | $ | 78,797,351 | |
| TOTAL COMMON STOCK | | | | | | | | |
| (Cost $89,913,129) | | | | | | | 78,797,351 | |
| | | | | | | | | |
| PREFERRED STOCK — 12.7% | | | | | | | | |
| COLOMBIA — 12.7% | | | | | | | | |
| Consumer Services — 3.4% | | | | | | | | |
| Avianca Holdings | | | 3,760,031 | | | | 3,011,935 | |
| Financials — 8.2% | | | | | | | | |
| Banco Davivienda | | | 421,690 | | | | 4,306,830 | |
| Grupo Aval Acciones y Valores | | | 1,431,941 | | | | 592,638 | |
| Grupo de Inversiones Suramericana | | | 187,943 | | | | 2,383,706 | |
| | | | | | | | 7,283,174 | |
| Industrials — 1.1% | | | | | | | | |
| Grupo Argos | | | 161,788 | | | | 993,590 | |
| TOTAL COLOMBIA | | | | | | | 11,288,699 | |
| TOTAL PREFERRED STOCK | | | | | | | | |
| (Cost $11,018,093) | | | | | | | 11,288,699 | |
| TOTAL INVESTMENTS — 101.5% | | | | | | | | |
| (Cost $100,931,222) | | | | | | $ | 90,086,050 | |
Percentages are based on Net Assets of $88,760,495.
| * | Non-income producing security. |
ADR — American Depositary Receipt
As of October 31, 2016, all of the Fund's investments were considered Level 1, in accordance with authoritative guidance on fair value measurements and disclosure under U.S. GAAP.
For the year ended October 31, 2016, there have been no transfers between Level 1, Level 2, and Level 3 investments.
The accompanying notes are an integral part of the financial statements.
| Schedule of Investments | October 31, 2016 |
| Global X Brazil Mid Cap ETF |
Sector Weightings (unaudited)†:
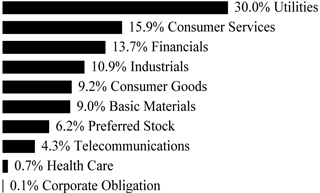
† Sector weightings percentages are based on the total market value of investments.
| | | Shares | | | Value | |
| COMMON STOCK — 93.7% | | | | | | | | |
| BRAZIL— 93.7% | | | | | | | | |
| Basic Materials — 9.0% | | | | | | | | |
| Cia Siderurgica Nacional ADR * | | | 49,899 | | | $ | 168,159 | |
| Fibria Celulose ADR | | | 18,588 | | | | 148,332 | |
| Gerdau ADR | | | 37,697 | | | | 129,301 | |
| | | | | | | | 445,792 | |
| Consumer Goods — 9.2% | | | | | | | | |
| Cosan Industria e Comercio | | | 5,453 | | | | 73,566 | |
| Hypermarcas | | | 13,497 | | | | 113,958 | |
| JBS | | | 34,700 | | | | 106,538 | |
| M Dias Branco | | | 1,486 | | | | 63,921 | |
| Natura Cosmeticos | | | 6,679 | | | | 65,232 | |
| Sao Martinho | | | 1,734 | | | | 34,950 | |
| | | | | | | | 458,165 | |
| Consumer Services — 15.9% | | | | | | | | |
| Cia Brasileira de Distribuicao Grupo Pao de Acucar ADR | | | 4,381 | | | | 83,458 | |
| Kroton Educacional | | | 54,670 | | | | 274,399 | |
| Localiza Rent a Car | | | 5,332 | | | | 67,015 | |
| Lojas Renner | | | 23,025 | | | | 196,296 | |
| Raia Drogasil | | | 7,740 | | | | 173,706 | |
| | | | | | | | 794,874 | |
| Financials — 13.7% | | | | | | | | |
| BM&F Bovespa | | | 61,366 | | | | 363,445 | |
| BR Malls Participacoes * | | | 20,941 | | | | 84,403 | |
| CETIP - Mercados Organizados | | | 8,282 | | | | 117,382 | |
| Grupo BTG Pactual | | | 5,309 | | | | 27,368 | |
| Multiplan Empreendimentos Imobiliarios | | | 2,847 | | | | 57,743 | |
| Porto Seguro | | | 3,316 | | | | 31,884 | |
| | | | | | | | 682,225 | |
The accompanying notes are an integral part of the financial statements.
| Schedule of Investments | October 31, 2016 |
| Global X Brazil Mid Cap ETF |
| | | Shares/Face
Amount | | | Value | |
| COMMON STOCK — continued | | | | | | | | |
| Health Care — 0.7% | | | | | | | | |
| Odontoprev | | | 9,280 | | | $ | 35,175 | |
| Industrials — 10.9% | | | | | | | | |
| CCR | | | 31,007 | | | | 170,223 | |
| Embraer ADR | | | 3,726 | | | | 79,699 | |
| Klabin | | | 34,094 | | | | 177,047 | |
| WEG | | | 20,780 | | | | 115,786 | |
| | | | | | | | 542,755 | |
| Telecommunications — 4.3% | | | | | | | | |
| Tim Participacoes ADR | | | 15,295 | | | | 211,836 | |
| Utilities — 30.0% | | | | | | | | |
| AES Tiete Energia | | | 6,500 | | | | 34,062 | |
| Cia de Saneamento Basico do Estado de Sao Paulo ADR | | | 22,907 | | | | 240,982 | |
| Cia Energetica de Minas Gerais ADR | | | 26,564 | | | | 80,223 | |
| Cia Paranaense de Energia ADR | | | 3,939 | | | | 44,944 | |
| CPFL Energia ADR | | | 18,803 | | | | 285,806 | |
| EDP - Energias do Brasil | | | 12,984 | | | | 62,709 | |
| Engie Brasil Energia | | | 7,567 | | | | 97,735 | |
| Equatorial Energia | | | 6,430 | | | | 115,262 | |
| Transmissora Alianca de Energia Eletrica | | | 12,720 | | | | 82,768 | |
| Ultrapar Participacoes ADR | | | 20,207 | | | | 456,678 | |
| | | | | | | | 1,501,169 | |
| TOTAL BRAZIL | | | | | | | 4,671,991 | |
| TOTAL COMMON STOCK | | | | | | | | |
| (Cost $4,816,369) | | | | | | | 4,671,991 | |
| | | | | | | | | |
| PREFERRED STOCK — 6.2% | | | | | | | | |
| BRAZIL— 6.2% | | | | | | | | |
| Basic Materials — 2.8% | | | | | | | | |
| Braskem | | | 6,410 | | | | 57,381 | |
| Suzano Papel e Celulose | | | 22,860 | | | | 81,234 | |
| | | | | | | | 138,615 | |
| Consumer Services — 2.7% | | | | | | | | |
| Lojas Americanas | | | 20,330 | | | | 133,827 | |
| Utilities — 0.7% | | | | | | | | |
| Cia de Transmissao de Energia Eletrica Paulista | | | 1,630 | | | | 35,676 | |
| TOTAL BRAZIL | | | | | | | 308,118 | |
| TOTAL PREFERRED STOCK | | | | | | | | |
| (Cost $259,876) | | | | | | | 308,118 | |
| | | | | | | | | |
| CORPORATE OBLIGATION — 0.1% | | | | | | | | |
| Hypermarcas | | | | | | | | |
| 11.300%, 10/15/18 (A) (B) | | | | | | | | |
| (Cost $11,802) | | $ | 19,655 | | | | 6,311 | |
The accompanying notes are an integral part of the financial statements.
| Schedule of Investments | October 31, 2016 |
| Global X Brazil Mid Cap ETF |
| | | Value | |
| TOTAL INVESTMENTS — 100.0% | | | | |
| (Cost $5,088,047) | | $ | 4,986,420 | |
Percentages are based on Net Assets of $4,988,355.
| * | Non-income producing security. | |
| (A) | Security considered illiquid. The total value of such securities as of October 31, 2016 was $6,311 and represented 0.1% of Net Assets. |
| (B) | Security is fair valued using methods determined in good faith by the Fair Value Committee of the Fund. The total value of such securities as of October 31, 2016, was $6,311 and represents 0.1% of Net Assets. |
ADR — American Depositary Receipt
The following is a summary of the level of inputs used as of October 31, 2016, in valuing the Fund's investments carried at value:
| Investments in Securities | | Level 1 | | | Level 2 | | | Level 3(1) | | | Total | |
| Common Stock | | $ | 4,671,991 | | | $ | — | | | $ | — | | | $ | 4,671,991 | |
| Preferred Stock | | | 308,118 | | | | — | | | | — | | | | 308,118 | |
| Corporate Obligation | | | — | | | | — | | | | 6,311 | | | | 6,311 | |
| Total Investments in Securities | | $ | 4,980,109 | | | $ | — | | | $ | 6,311 | | | $ | 4,986,420 | |
(1) A reconciliation of Level 3 investments and disclosures of significant unobservable inputs are presented when the Fund has a significant amount of Level 3 investments at the beginning and/or end of the period in relation to Net Assets. Management has concluded that Level 3 investments are not material in relation to Net Assets.
For the year ended October 31, 2016, there have been no transfers between Level 1, Level 2 and Level 3 investments.
The accompanying notes are an integral part of the financial statements.
| Schedule of Investments | October 31, 2016 |
| Global X Brazil Consumer ETF |
Sector Weightings (unaudited)†:
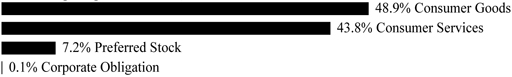
† Sector weightings percentages are based on the total market value of investments.
| | | Shares | | | Value | |
| COMMON STOCK — 92.4% | | | | | | | | |
| BRAZIL— 92.4% | | | | | | | | |
| Consumer Goods — 48.8% | | | | | | | | |
| AMBEV ADR | | | 47,245 | | | $ | 278,745 | |
| Arezzo Industria e Comercio | | | 10,582 | | | | 99,741 | |
| BRF ADR | | | 18,798 | | | | 314,302 | |
| Cia Hering | | | 34,453 | | | | 212,213 | |
| Cosan, Cl A | | | 40,712 | | | | 362,337 | |
| Cosan Industria e Comercio | | | 24,647 | | | | 332,509 | |
| Grendene | | | 20,577 | | | | 127,654 | |
| Hypermarcas | | | 28,200 | | | | 238,099 | |
| JBS | | | 74,056 | | | | 227,372 | |
| M Dias Branco | | | 9,308 | | | | 400,386 | |
| Marfrig Alimentos * | | | 63,716 | | | | 114,115 | |
| Minerva * | | | 36,405 | | | | 117,638 | |
| Natura Cosmeticos | | | 38,806 | | | | 379,008 | |
| Sao Martinho | | | 12,017 | | | | 242,211 | |
| SLC Agricola | | | 11,506 | | | | 56,733 | |
| | | | | | | | 3,503,063 | |
| Consumer Services — 43.6% | | | | | | | | |
| B2W Cia Digital * | | | 27,984 | | | | 137,805 | |
| Cia Brasileira de Distribuicao Grupo Pao de Acucar ADR | | | 20,246 | | | | 385,686 | |
| CVC Brasil Operadora e Agencia de Viagens | | | 18,110 | | | | 140,436 | |
| Estacio Participacoes | | | 66,260 | | | | 389,709 | |
| Kroton Educacional | | | 77,868 | | | | 390,834 | |
| Localiza Rent a Car | | | 26,031 | | | | 327,171 | |
| Lojas Renner | | | 39,805 | | | | 339,352 | |
| Multiplus | | | 10,852 | | | | 148,905 | |
| Raia Drogasil | | | 15,102 | | | | 338,929 | |
| Smiles | | | 12,861 | | | | 237,245 | |
| Via Varejo | | | 106,334 | | | | 304,306 | |
| | | | | | | | 3,140,378 | |
| TOTAL BRAZIL | | | | | | | 6,643,441 | |
| TOTAL COMMON STOCK | | | | | | | | |
| (Cost $6,245,903) | | | | | | | 6,643,441 | |
The accompanying notes are an integral part of the financial statements.
| Schedule of Investments | October 31, 2016 |
| Global X Brazil Consumer ETF |
| | | Shares/Face
Amount | | | Value | |
| PREFERRED STOCK — 7.2% | | | | | | | | |
| Consumer Goods — 2.2% | | | | | | | | |
| Alpargatas | | | 46,537 | | | $ | 158,316 | |
| Consumer Services — 5.0% | | | | | | | | |
| Lojas Americanas | | | 54,042 | | | | 355,745 | |
| TOTAL PREFERRED STOCK | | | | | | | | |
| (Cost $384,857) | | | | | | | 514,061 | |
| | | | | | | | | |
| CORPORATE OBLIGATION — 0.1% | | | | | | | | |
| Hypermarcas | | | | | | | | |
| 11.300%, 10/15/18 (A) (B) | | | | | | | | |
| (Cost $16,803) | | $ | 27,984 | | | | 8,986 | |
| TOTAL INVESTMENTS — 99.7% | | | | | | | | |
| (Cost $6,647,563) | | | | | | $ | 7,166,488 | |
Percentages are based on Net Assets of $7,181,777.
| * | Non-income producing security. |
| (A) | Security considered illiquid. The total value of such securities as of October 31, 2016, was $8,986 and represented 0.1% of Net Assets. |
| (B) | Security is fair valued using methods determined in good faith by the Fair Value Committee of the Fund. The total value of such securities as of October 31, 2016, was $8,986 and represents 0.1% of Net Assets. |
ADR — American Depositary Receipt
Cl — Class
The following is a summary of the level of inputs used as of October 31, 2016, in valuing the Fund's investments carried at value:
| Investments in Securities | | Level 1 | | | Level 2 | | | Level 3(1) | | | Total | |
| Common Stock | | $ | 6,643,441 | | | $ | — | | | $ | — | | | $ | 6,643,441 | |
| Preferred Stock | | | 514,061 | | | | — | | | | — | | | | 514,061 | |
| Corporate Obligation | | | — | | | | — | | | | 8,986 | | | | 8,986 | |
| Total Investments in Securities | | $ | 7,157,502 | | | $ | — | | | $ | 8,986 | | | $ | 7,166,488 | |
(1) A reconciliation of Level 3 investments and disclosures of significant unobservable inputs are presented when the Fund
has a significant amount of Level 3 investments at the beginning and/or end of the period in relation to Net Assets. Management has concluded that Level 3 investments are not material in relation to Net Assets.
For the year ended October 31, 2016, there have been no transfers between Level 1, Level 2 and Level 3 investments.
The accompanying notes are an integral part of the financial statements.
| Schedule of Investments | October 31, 2016 |
Global X MSCI Argentina ETF |
Sector Weightings (unaudited)†:
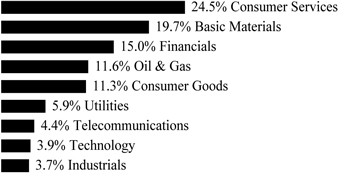
† Sector weightings percentages are based on the total market value of investments.
| | | Shares | | | Value | |
| COMMON STOCK — 99.9% | | | | | | | | |
| ARGENTINA— 78.2% | | | | | | | | |
| Basic Materials — 16.4% | | | | | | | | |
| Tenaris ADR | | | 525,704 | | | $ | 14,824,853 | |
| Consumer Goods — 2.5% | | | | | | | | |
| Cresud SACIF y A ADR * | | | 129,620 | | | | 2,268,350 | |
| Consumer Services — 22.4% | | | | | | | | |
| Arcos Dorados Holdings, Cl A * | | | 491,421 | | | | 3,022,239 | |
| Grupo Clarin GDR, Cl B | | | 117,748 | | | | 2,943,700 | |
| MercadoLibre | | | 84,985 | | | | 14,278,330 | |
| | | | | | | | 20,244,269 | |
| Financials — 15.0% | | | | | | | | |
| Banco Macro ADR | | | 64,397 | | | | 4,908,983 | |
| BBVA Banco Frances ADR | | | 143,710 | | | | 2,821,027 | |
| Grupo Financiero Galicia ADR | | | 131,692 | | | | 4,100,889 | |
| IRSA Inversiones y Representaciones ADR * | | | 95,064 | | | | 1,781,499 | |
| | | | | | | | 13,612,398 | |
| Oil & Gas — 11.6% | | | | | | | | |
| Petrobras Argentina ADR * | | | 290,923 | | | | 1,931,729 | |
| Transportadora de Gas del Sur ADR | | | 312,470 | | | | 2,265,408 | |
| YPF ADR | | | 352,727 | | | | 6,264,431 | |
| | | | | | | | 10,461,568 | |
| Telecommunications — 4.4% | | | | | | | | |
| Telecom Argentina ADR | | | 213,172 | | | | 4,011,897 | |
| Utilities — 5.9% | | | | | | | | |
| Empresa Distribuidora Y Comercializadora Norte ADR * | | | 52,336 | | | | 1,343,465 | |
| Pampa Energia ADR * | | | 118,670 | | | | 4,043,087 | |
| | | | | | | | 5,386,552 | |
| TOTAL ARGENTINA | | | | | | | 70,809,887 | |
The accompanying notes are an integral part of the financial statements.
| Schedule of Investments | October 31, 2016 |
| Global X MSCI Argentina ETF |
| | | Shares | | | Value | |
| COMMON STOCK — continued | | | | | | | | |
| CANADA— 5.2% | | | | | | | | |
| Basic Materials — 3.3% | | | | | | | | |
| Pan American Silver ^ | | | 95,397 | | | $ | 1,524,644 | |
| Silver Standard Resources * | | | 134,373 | | | | 1,475,822 | |
| | | | | | | | 3,000,466 | |
| Industrials — 1.9% | | | | | | | | |
| Finning International | | | 89,923 | | | | 1,674,671 | |
| TOTAL CANADA | | | | | | | 4,675,137 | |
| CHILE— 5.6% | | | | | | | | |
| Consumer Goods — 3.5% | | | | | | | | |
| Cia Cervecerias Unidas ADR | | | 68,904 | | | | 1,481,436 | |
| Embotelladora Andina ADR, Cl B | | | 72,189 | | | | 1,738,311 | |
| | | | | | | | 3,219,747 | |
| Consumer Services — 2.1% | | | | | | | | |
| Cencosud | | | 579,950 | | | | 1,890,350 | |
| TOTAL CHILE | | | | | | | 5,110,097 | |
| LUXEMBOURG— 3.7% | | | | | | | | |
| Consumer Goods — 3.7% | | | | | | | | |
| Adecoagro * | | | 307,798 | | | | 3,385,778 | |
| MEXICO— 1.5% | | | | | | | | |
| Consumer Goods — 1.5% | | | | | | | | |
| Arca Continental | | | 222,437 | | | | 1,389,204 | |
| SPAIN— 1.8% | | | | | | | | |
| Industrials — 1.8% | | | | | | | | |
| Prosegur Cia de Seguridad | | | 226,920 | | | | 1,646,727 | |
| UNITED STATES— 3.9% | | | | | | | | |
| Technology — 3.9% | | | | | | | | |
| Globant * | | | 80,205 | | | | 3,488,918 | |
| TOTAL INVESTMENTS — 99.9% | | | | | | | | |
| (Cost $81,046,590) | | | | | | $ | 90,505,748 | |
Percentages are based on Net Assets of $90,601,600.
| * | Non-income producing security. |
| ^ | Traded on the U.S. Stock Exchange. |
ADR — American Depositary Receipt
Cl — Class
GDR — Global Depositary Receipt
As of October 31, 2016, all of the Fund's investments were considered Level 1, in accordance with authoritative guidance on fair value measurements and disclosure under U.S. GAAP.
For the year ended October 31, 2016, there have been no transfers between Level 1, Level 2 and Level 3 investments.
As of October 31, 2016, there were no Level 3 investments.
The accompanying notes are an integral part of the financial statements.
| Schedule of Investments | October 31, 2016 |
Sector Weightings (unaudited)†:
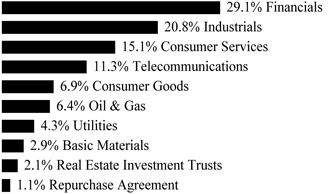
† Sector weightings percentages are based on the total market value of investments. Repurchase agreements purchased from cash collateral received for securities lending activity are included in total investments. Please see Note 2 and Note 8 in Notes to Financial Statements for more detailed information.
| | | Shares | | | Value | |
| COMMON STOCK — 99.8% | | | | | | | | |
| GREECE— 89.8% | | | | | | | | |
| Basic Materials — 3.0% | | | | | | | | |
| Mytilineos Holdings ADR * | | | 626,200 | | | $ | 3,576,354 | |
| Mytilineos Holdings * | | | 638,426 | | | | 3,646,189 | |
| | | | | | | | 7,222,543 | |
| Consumer Goods — 6.9% | | | | | | | | |
| JUMBO | | | 845,897 | | | | 12,008,206 | |
| JUMBO ADR | | | 340,000 | | | | 4,826,572 | |
| | | | | | | | 16,834,778 | |
| Consumer Services — 15.2% | | | | | | | | |
| Aegean Airlines | | | 565,326 | | | | 3,637,709 | |
| FF Group * | | | 249,592 | | | | 5,970,027 | |
| FF Group ADR * | | | 200,300 | | | | 4,790,996 | |
| OPAP | | | 2,021,058 | | | | 17,214,352 | |
| OPAP ADR | | | 1,404,900 | | | | 5,901,985 | |
| | | | | | | | 37,515,069 | |
| Financials — 29.4% | | | | | | | | |
| Alpha Bank AE * | | | 17,247,034 | | | | 29,493,744 | |
| Eurobank Ergasias * | | | 20,775,766 | | | | 12,207,106 | |
| Hellenic Exchanges - Athens Stock Exchange | | | 1,008,651 | | | | 4,975,587 | |
| National Bank of Greece * | | | 63,169,991 | | | | 12,949,211 | |
| Piraeus Bank * | | | 75,635,992 | | | | 12,519,770 | |
| | | | | | | | 72,145,418 | |
| Industrials — 11.0% | | | | | | | | |
| Aegean Marine Petroleum Network (A) | | | 568,436 | | | | 4,888,550 | |
| Ellaktor * | | | 2,286,431 | | | | 3,107,926 | |
| Metka Industrial - Construction ADR | | | 130,000 | | | | 1,091,597 | |
| Metka Industrial - Construction | | | 344,111 | | | | 2,889,470 | |
The accompanying notes are an integral part of the financial statements.
| Schedule of Investments | October 31, 2016 |
| | | Shares/Face
Amount | | | Value | |
| COMMON STOCK — continued | | | | | | | | |
| Industrials — continued | | | | | | | | |
| Titan Cement | | | 236,750 | | | $ | 5,494,166 | |
| Titan Cement ADR | | | 439,800 | | | | 5,103,131 | |
| Tsakos Energy Navigation | | | 1,017,584 | | | | 4,579,128 | |
| | | | | | | | 27,153,968 | |
| Oil & Gas — 6.4% | | | | | | | | |
| Hellenic Petroleum | | | 1,070,588 | | | | 4,893,835 | |
| Motor Oil Hellas Corinth Refineries | | | 523,415 | | | | 6,259,819 | |
| Motor Oil Hellas Corinth Refineries ADR | | | 768,300 | | | | 4,594,280 | |
| | | | | | | | 15,747,934 | |
| Real Estate Investment Trusts — 2.1% | | | | | | | | |
| Grivalia Properties | | | 678,380 | | | | 5,220,367 | |
| Telecommunications — 11.4% | | | | | | | | |
| Hellenic Telecommunications Organization | | | 3,056,282 | | | | 27,975,045 | |
| Utilities — 4.4% | | | | | | | | |
| Athens Water Supply & Sewage | | | 732,929 | | | | 4,338,569 | |
| Public Power | | | 1,913,305 | | | | 6,250,163 | |
| | | | | | | | 10,588,732 | |
| TOTAL GREECE | | | | | | | 220,403,854 | |
| MONACO— 6.8% | | | | | | | | |
| Industrials — 6.8% | | | | | | | | |
| GasLog | | | 665,944 | | | | 10,222,240 | |
| GasLog Partners (B) | | | 316,062 | | | | 6,479,271 | |
| | | | | | | | 16,701,511 | |
| TOTAL MONACO | | | | | | | 16,701,511 | |
| UNITED STATES— 3.2% | | | | | | | | |
| Industrials — 3.2% | | | | | | | | |
| Capital Product Partners | | | 1,657,057 | | | | 5,054,024 | |
| Dorian LPG * | | | 503,149 | | | | 2,832,729 | |
| | | | | | | | 7,886,753 | |
| TOTAL UNITED STATES | | | | | | | 7,886,753 | |
| TOTAL COMMON STOCK | | | | | | | | |
| (Cost $281,640,692) | | | | | | | 244,992,118 | |
| | | | | | | | | |
| REPURCHASE AGREEMENT (C) — 1.1% | | | | | | | | |
| Deutsche Bank | | | | | | | | |
| 0.350%, dated 10/31/16, to be repurchased on 11/01/16 repurchase price $2,806,677 (collateralized by U.S. Treasury Obligations, par value $2,610,030, 3.000%, 05/15/45 with a total market value of $2,875,182) | | $ | 2,806,650 | | | | 2,806,650 | |
| TOTAL REPURCHASE AGREEMENT | | | | | | | | |
| (Cost $2,806,650) | | | | | | | 2,806,650 | |
| TOTAL INVESTMENTS — 100.9% | | | | | | | | |
| (Cost $284,447,342) | | | | | | $ | 247,798,768 | |
Percentages are based on Net Assets of $245,561,296.
The accompanying notes are an integral part of the financial statements.
| Schedule of Investments | October 31, 2016 |
| * | Non-income producing security. |
| (A) | This security or a partial position of this security is on loan as of October 31, 2016. The total value of securities on loan as of October 31, 2016 was $2,586,020. |
| (B) | Security considered Master Limited Partnership. As of October 31, 2016, these securities amounted to $6,479,271 or 2.6% of Net Assets. |
| (C) | This security was purchased with cash collateral held from securities on loan. The total value of such securities as of October 31, 2016 was $2,806,650. |
ADR — American Depositary Receipt
The following is a summary of the level of inputs used as of October 31, 2016, in valuing the Fund's investments carried at value:
| Investments in Securities | | Level 1 | | | Level 2 | | | Level 3 | | | Total | |
| Common Stock | | $ | 244,992,118 | | | $ | — | | | $ | — | | | $ | 244,992,118 | |
| Repurchase Agreement | | | — | | | | 2,806,650 | | | | — | | | | 2,806,650 | |
| Total Investments in Securities | | $ | 244,992,118 | | | $ | 2,806,650 | | | $ | — | | | $ | 247,798,768 | |
For the year ended October 31, 2016, there have been no transfers between Level 1, Level 2 or Level 3 investments.
As of October 31, 2016, there were no Level 3 investments.
The accompanying notes are an integral part of the financial statements.
| Schedule of Investments | October 31, 2016 |
Sector Weightings (unaudited)†:
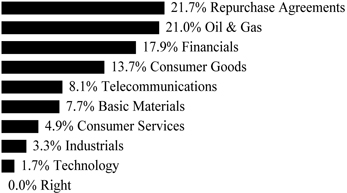
† Sector weightings percentages are based on the total market value of investments. Repurchase agreements purchased from cash collateral received for securities lending activity are included in total investments. Please see Note 2 and Note 8 in Notes to Financial Statements for more detailed information.
| | | Shares | | | Value | |
| COMMON STOCK — 99.7% | | | | | | | | |
| NORWAY— 99.7% | | | | | | | | |
| Basic Materials — 9.8% | | | | | | | | |
| Borregaard | | | 122,697 | | | $ | 1,204,450 | |
| Norsk Hydro | | | 1,124,190 | | | | 5,034,124 | |
| Yara International | | | 138,743 | | | | 4,909,798 | |
| | | | | | | | 11,148,372 | |
| Consumer Goods — 17.5% | | | | | | | | |
| Austevoll Seafood | | | 110,918 | | | | 1,001,447 | |
| Bakkafrost P | | | 44,115 | | | | 1,853,039 | |
| Kongsberg Automotive Holding * | | | 623,293 | | | | 515,920 | |
| Leroy Seafood Group | | | 34,260 | | | | 1,814,008 | |
| Marine Harvest | | | 305,117 | | | | 5,542,909 | |
| Orkla | | | 772,393 | | | | 7,306,022 | |
| Salmar | | | 57,693 | | | | 1,875,217 | |
| | | | | | | | 19,908,562 | |
| Consumer Services — 6.1% | | | | | | | | |
| Europris (A) | | | 138,239 | | | | 705,314 | |
| Norwegian Air Shuttle * (B) | | | 32,981 | | | | 1,113,563 | |
| Schibsted, Cl B | | | 87,506 | | | | 1,972,516 | |
| Schibsted, Cl A | | | 74,020 | | | | 1,777,065 | |
| XXL (A) | | | 111,744 | | | | 1,401,633 | |
| | | | | | | | 6,970,091 | |
| Financials — 22.9% | | | | | | | | |
| Aker, Cl A | | | 32,990 | | | | 1,219,416 | |
| DnB | | | 950,104 | | | | 13,759,694 | |
| Entra (A) | | | 100,510 | | | | 1,078,009 | |
| Gjensidige Forsikring | | | 213,208 | | | | 3,826,734 | |
The accompanying notes are an integral part of the financial statements.
| Schedule of Investments | October 31, 2016 |
| | | Shares | | | Value | |
| COMMON STOCK — continued | | | | | | | | |
| Financials — continued | | | | | | | | |
| Norwegian Property | | | 365,968 | | | $ | 479,001 | |
| Protector Forsikring | | | 78,309 | | | | 671,441 | |
| Selvaag Bolig | | | 80,958 | | | | 395,398 | |
| Skandiabanken * (A) | | | 14,100 | | | | 105,091 | |
| Sparebank 1 Nord Norge | | | 131,739 | | | | 761,557 | |
| SpareBank 1 SMN | | | 152,900 | | | | 1,125,702 | |
| Storebrand * | | | 496,488 | | | | 2,558,419 | |
| Treasure * | | | 98,427 | | | | 218,291 | |
| | | | | | | | 26,198,753 | |
| Industrials — 4.4% | | | | | | | | |
| Avance Gas Holding (A) (B) | | | 53,010 | | | | 129,771 | |
| BW LPG (A) | | | 107,650 | | | | 347,812 | |
| Frontline | | | 91,764 | | | | 673,930 | |
| Golden Ocean Group * (B) | | | 91,950 | | | | 335,419 | |
| Hexagon Composites (B) | | | 134,200 | | | | 471,650 | |
| Hoegh LNG Holdings | | | 61,218 | | | | 641,749 | |
| IDEX * (B) | | | 523,007 | | | | 429,741 | |
| Ocean Yield | | | 85,207 | | | | 712,515 | |
| Stolt-Nielsen | | | 37,040 | | | | 455,624 | |
| Thin Film Electronics * (B) | | | 845,969 | | | | 426,499 | |
| Wilh Wilhelmsen, Cl B | | | 98,827 | | | | 312,598 | |
| | | | | | | | 4,937,308 | |
| Oil & Gas — 26.5% | | | | | | | | |
| Akastor | | | 284,895 | | | | 393,604 | |
| Aker Solutions | | | 194,886 | | | | 898,207 | |
| Det Norske Oljeselskap * | | | 117,572 | | | | 1,889,371 | |
| DNO International * | | | 804,684 | | | | 690,444 | |
| Fred Olsen Energy * (B) | | | 72,860 | | | | 125,827 | |
| Petroleum Geo-Services (B) | | | 272,390 | | | | 733,838 | |
| ProSafe, Cl A | | | 377,970 | | | | 12,826 | |
| REC Silicon * (B) | | | 2,742,494 | | | | 343,998 | |
| Scatec Solar (A) (B) | | | 95,210 | | | | 384,235 | |
| Seadrill * | | | 397,238 | | | | 853,550 | |
| Statoil (B) | | | 1,103,239 | | | | 18,103,310 | |
| Subsea 7 | | | 284,824 | | | | 3,199,824 | |
| Tanker Investments * | | | 52,929 | | | | 288,011 | |
| TGS Nopec Geophysical | | | 114,180 | | | | 2,317,793 | |
| | | | | | | | 30,234,838 | |
| Technology — 2.2% | | | | | | | | |
| Atea | | | 97,583 | | | | 875,136 | |
| Nordic Semiconductor * (B) | | | 155,144 | | | | 620,467 | |
| Opera Software * (B) | | | 138,820 | | | | 979,981 | |
| | | | | | | | 2,475,584 | |
The accompanying notes are an integral part of the financial statements.
| Schedule of Investments | October 31, 2016 |
| | | Shares/
Number of
Rights/
Face Amount | | | Value | |
| COMMON STOCK — continued | | | | | | | | |
| Telecommunications — 10.3% | | | | | | | | |
| Telenor (B) | | | 734,356 | | | $ | 11,703,133 | |
| TOTAL NORWAY | | | | | | | 113,576,641 | |
| TOTAL COMMON STOCK | | | | | | | | |
| (Cost $131,123,889) | | | | | | | 113,576,641 | |
| | | | | | | | | |
| RIGHT — 0.0% | | | | | | | | |
| Norway — 0.0% | | | | | | | | |
| Avance Gas Holding(C) (D) | | | 12,643 | | | | 4,903 | |
| | | | | | | | | |
| TOTAL RIGHT (Cost $–)** | | | | | | | 4,903 | |
| | | | | | | | | |
| REPURCHASE AGREEMENTS (E) — 27.6% | | | | | | | | |
| Barclays Bank | | | | | | | | |
| 0.320%, dated 10/31/16, to be repurchased on 11/01/16 repurchase price $29,000,258 (collateralized by U.S Treasury Obligations, ranging in par value $2-$15,653,126, 0.000%-4.750%, 11/15/16-05/15/46, with a total market value of $29,580,000) | | $ | 29,000,000 | | | | 29,000,000 | |
| Deutsche Bank | | | | | | | | |
| 0.350%, dated 10/31/16, to be repurchased on 11/01/16 repurchase price $2,508,928 (collateralized by U.S. Treasury Obligations, par value $2,333,143, 3.000%, 05/15/45 with a total market value of $2,570,166) | | | 2,508,904 | | | | 2,508,904 | |
| TOTAL REPURCHASE AGREEMENTS | | | | | | | | |
| (Cost $31,508,904) | | | | | | | 31,508,904 | |
| TOTAL INVESTMENTS — 127.3% | | | | | | | | |
| (Cost $162,632,793) | | | | | | $ | 145,090,448 | |
Percentages are based on Net Assets of $113,997,105.
| * | Non-income producing security. |
| ** | Amounts designated as “–“ are $0 or have been rounded to $0. |
| (A) | Security sold within terms of a private placement memorandum, exempt from registration under Section 144A of the Securities Act of 1933, as amended, and may be sold only to dealers in that program or other "accredited investors." The total value of such securities as of October 31, 2016 was $4,151,865 and represents 3.5% of Net Assets. |
| (B) | This security or a partial position of this security is on loan as of October 31, 2016. The total value of securities on loan as of October 31, 2016 was $24,195,714. |
| (C) | Security considered illiquid. The total value of such securities as of October 31, 2016 was $4,903 and represented 0.0% of Net Assets. |
| (D) | Security is fair valued using methods determined in good faith by the Fair Value Committee of the Fund. The total value of such securities as of October 31, 2016, was $4,903 and represents 0.0% of Net Assets. |
| (E) | This security was purchased with cash collateral held from securities on loan. The total value of such securities as of October 31, 2016 was $31,508,904. |
Cl — Class
The accompanying notes are an integral part of the financial statements.
| Schedule of Investments | October 31, 2016 |
The following is a summary of the level of inputs used as of October 31, 2016, in valuing the Fund's investments carried at value:
| Investments in Securities | | Level 1 | | | Level 2 | | | Level 3(1) | | | Total | |
| Common Stock | | $ | 113,576,641 | | | $ | — | | | $ | — | | | $ | 113,576,641 | |
| Repurchase Agreements | | | — | | | | 31,508,904 | | | | — | | | | 31,508,904 | |
| Right | | | — | | | | — | | | | 4,903 | | | | 4,903 | |
| Total Investments in Securities | | $ | 113,576,641 | | | $ | 31,508,904 | | | $ | 4,903 | | | $ | 145,090,448 | |
(1) A reconciliation of Level 3 investments and disclosures of significant unobservable inputs are presented when the Fund has a significant amount of Level 3 investments at the beginning and/or end of the period in relation to Net Assets. Management has concluded that Level 3 investments are not material in relation to Net Assets.
For the year ended October 31, 2016, there have been no transfers between Level 1, Level 2 and Level 3 investments.
The accompanying notes are an integral part of the financial statements.
| Schedule of Investments | October 31, 2016 |
| Global X FTSE Nordic Region ETF |
Sector Weightings (unaudited)†:
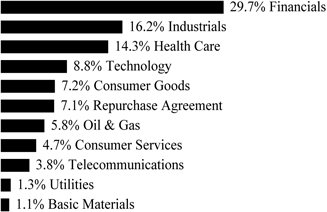
† Sector weightings percentages are based on the total market value of investments. Repurchase agreements purchased from cash collateral received for securities lending activity are included in total investments. Please see Note 2 and Note 8 in Notes to Financial Statements for more detailed information.
| | | Shares | | | Value | |
| COMMON STOCK — 99.9% | | | | | | | | |
| DENMARK— 29.5% | | | | | | | | |
| Consumer Goods — 4.5% | | | | | | | | |
| Carlsberg, Cl B | | | 8,231 | | | $ | 741,089 | |
| Pandora | | | 8,623 | | | | 1,120,736 | |
| | | | | | | | 1,861,825 | |
| Financials — 4.4% | | | | | | | | |
| Danske Bank | | | 58,243 | | | | 1,795,486 | |
| Health Care — 15.4% | | | | | | | | |
| Coloplast, Cl B | | | 7,761 | | | | 540,719 | |
| Novo Nordisk ADR | | | 143,907 | | | | 5,114,455 | |
| Novozymes, Cl B | | | 17,240 | | | | 639,436 | |
| | | | | | | | 6,294,610 | |
| Industrials — 1.8% | | | | | | | | |
| A P Moller - Maersk, Cl B | | | 481 | | | | 737,148 | |
| Oil & Gas — 3.4% | | | | | | | | |
| Vestas Wind Systems | | | 17,100 | | | | 1,369,532 | |
| TOTAL DENMARK | | | | | | | 12,058,601 | |
| FINLAND— 13.7% | | | | | | | | |
| Financials — 4.1% | | | | | | | | |
| Sampo, Cl A | | | 36,641 | | | | 1,677,732 | |
| Industrials — 3.3% | | | | | | | | |
| Kone, Cl B | | | 29,604 | | | | 1,360,712 | |
| Technology — 4.9% | | | | | | | | |
| Nokia ADR (A) | | | 445,621 | | | | 1,996,382 | |
| Utilities — 1.4% | | | | | | | | |
| Fortum | | | 34,569 | | | | 575,620 | |
The accompanying notes are an integral part of the financial statements.
| Schedule of Investments | October 31, 2016 |
| Global X FTSE Nordic Region ETF |
| | | Shares | | | Value | |
| COMMON STOCK — continued | | | | | | | | |
| TOTAL FINLAND | | | | | | $ | 5,610,446 | |
| NORWAY— 8.9% | | | | | | | | |
| Basic Materials — 1.2% | | | | | | | | |
| Yara International | | | 13,657 | | | | 483,290 | |
| Financials — 2.6% | | | | | | | | |
| DnB | | | 75,046 | | | | 1,086,839 | |
| Oil & Gas — 3.0% | | | | | | | | |
| Statoil ADR | | | 74,549 | | | | 1,210,676 | |
| Telecommunications — 2.1% | | | | | | | | |
| Telenor (A) | | | 54,076 | | | | 861,787 | |
| TOTAL NORWAY | | | | | | | 3,642,592 | |
| SWEDEN— 47.8% | | | | | | | | |
| Consumer Goods — 3.2% | | | | | | | | |
| Svenska Cellulosa, Cl B | | | 46,483 | | | | 1,318,517 | |
| Consumer Services — 5.1% | | | | | | | | |
| Hennes & Mauritz, Cl B | | | 74,035 | | | | 2,085,273 | |
| Financials — 20.8% | | | | | | | | |
| Investor, Cl B | | | 35,191 | | | | 1,252,544 | |
| Nordea Bank | | | 247,605 | | | | 2,606,007 | |
| Skandinaviska Enskilda Banken, Cl A | | | 111,795 | | | | 1,129,537 | |
| Svenska Handelsbanken, Cl A | | | 114,681 | | | | 1,566,114 | |
| Swedbank, Cl A | | | 82,255 | | | | 1,929,298 | |
| | | | | | | | 8,483,500 | |
| Industrials — 12.2% | | | | | | | | |
| Assa Abloy, Cl B | | | 73,207 | | | | 1,333,249 | |
| Atlas Copco, Cl A | | | 48,243 | | | | 1,417,103 | |
| Sandvik | | | 83,951 | | | | 955,691 | |
| Volvo, Cl B | | | 120,313 | | | | 1,293,617 | |
| | | | | | | | 4,999,660 | |
| Technology — 4.5% | | | | | | | | |
| Ericsson ADR | | | 232,301 | | | | 1,131,306 | |
| Hexagon, Cl B | | | 19,970 | | | | 699,941 | |
| | | | | | | | 1,831,247 | |
| Telecommunications — 2.0% | | | | | | | | |
| Telia (A) | | | 202,241 | | | | 809,278 | |
| TOTAL SWEDEN | | | | | | | 19,527,475 | |
| TOTAL COMMON STOCK | | | | | | | | |
| (Cost $45,949,804) | | | | | | | 40,839,114 | |
The accompanying notes are an integral part of the financial statements.
| Schedule of Investments | October 31, 2016 |
| Global X FTSE Nordic Region ETF |
| | | Face Amount | | | Value | |
| REPURCHASE AGREEMENT (B) — 7.6% | | | | | | | | |
| Deutsche Bank | | | | | | | | |
| 0.350%, dated 10/31/16, to be repurchased on 11/01/16 repurchase price $3,124,617 (collateralized by U.S. Treasury Obligations, par value $2,905,694, 3.000%, 05/15/45 with a total market value of $3,200,883) | | | | | | | | |
| (Cost $3,124,587) | | $ | 3,124,587 | | | $ | 3,124,587 | |
| TOTAL INVESTMENTS — 107.5% | | | | | | | | |
| (Cost $49,074,391) | | | | | | $ | 43,963,701 | |
Percentages are based on Net Assets of $40,898,647.
| (A) | This security or a partial position of this security is on loan as of October 31, 2016. The total value of securities on loan as of October 31, 2016 was $2,140,756. |
| (B) | This security was purchased with cash collateral held from securities on loan. The total value of such securities as of October 31, 2016 was $3,124,587. |
ADR — American Depositary Receipt
Cl — Class
The following is a summary of the level of inputs used as of October 31, 2016, in valuing the Fund's investments carried at value:
| Investments in Securities | | Level 1 | | | Level 2 | | | Level 3 | | | Total | |
| Common Stock | | $ | 40,839,114 | | | $ | — | | | $ | — | | | $ | 40,839,114 | |
| Repurchase Agreement | | | — | | | | 3,124,587 | | | | — | | | | 3,124,587 | |
| Total Investments in Securities | | $ | 40,839,114 | | | $ | 3,124,587 | | | $ | — | | | $ | 43,963,701 | |
For the year ended October 31, 2016, there have been no transfers between Level 1, Level 2 and Level 3 investments.
As of October 31, 2016, there were no Level 3 investments.
The accompanying notes are an integral part of the financial statements.
| Schedule of Investments | October 31, 2016 |
| Global X MSCI Nigeria ETF |
Sector Weightings (unaudited)†:
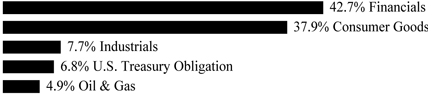
† Sector weightings percentages are based on the total market value of investments.
| | | Shares | | | Value | |
| COMMON STOCK — 97.8% | | | | | | | | |
| NIGERIA— 97.8% | | | | | | | | |
| Consumer Goods — 39.8% | | | | | | | | |
| Flour Mills of Nigeria | | | 13,018,067 | | | $ | 787,897 | |
| Guinness Nigeria | | | 3,304,209 | | | | 838,499 | |
| Nestle Nigeria | | | 803,521 | | | | 2,026,326 | |
| Nigerian Breweries | | | 11,843,124 | | | | 5,489,724 | |
| PZ Cussons Nigeria | | | 9,138,503 | | | | 507,292 | |
| Unilever Nigeria | | | 9,460,113 | | | | 1,500,414 | |
| | | | | | | | 11,150,152 | |
| Financials — 44.7% | | | | | | | | |
| Access Bank | | | 72,215,307 | | | | 1,294,263 | |
| Diamond Bank * | | | 113,210,695 | | | | 373,479 | |
| Ecobank Transnational | | | 33,038,705 | | | | 1,122,425 | |
| FBN Holdings | | | 94,539,115 | | | | 899,659 | |
| Guaranty Trust Bank | | | 42,192,798 | | | | 3,145,220 | |
| Stanbic IBTC Holdings * | | | 23,272,118 | | | | 1,254,960 | |
| Transnational Corp of Nigeria * | | | 192,665,948 | | | | 556,149 | |
| UAC of Nigeria | | | 13,240,301 | | | | 821,088 | |
| United Bank for Africa | | | 92,751,662 | | | | 1,250,419 | |
| Zenith Bank | | | 38,777,500 | | | | 1,808,182 | |
| | | | | | | | 12,525,844 | |
| Industrials — 8.1% | | | | | | | | |
| Dangote Cement | | | 2,210,581 | | | | 1,227,127 | |
| Lafarge Africa | | | 6,858,474 | | | | 1,033,394 | |
| | | | | | | | 2,260,521 | |
| Oil & Gas — 5.2% | | | | | | | | |
| Forte Oil | | | 1,907,251 | | | | 725,996 | |
| Oando | | | 46,539,870 | | | | 729,284 | |
| | | | | | | | 1,455,280 | |
| TOTAL NIGERIA | | | | | | | 27,391,797 | |
| TOTAL COMMON STOCK | | | | | | | | |
| (Cost $42,980,484) | | | | | | | 27,391,797 | |
The accompanying notes are an integral part of the financial statements.
| Schedule of Investments | October 31, 2016 |
| Global X MSCI Nigeria ETF |
| | | Face Amount | | | Value | |
| U.S. TREASURY OBLIGATION — 7.1% | | | | | | | | |
| United States Treasury Bill | | | | | | | | |
| 0.130%, 11/10/16(A) | | | | | | | | |
| (Cost $1,999,935) | | $ | 2,000,000 | | | $ | 1,999,938 | |
| TOTAL INVESTMENTS — 104.9% | | | | | | | | |
| (Cost $44,980,419) | | | | | | $ | 29,391,735 | |
Percentages are based on Net Assets of $28,008,542.
| * | Non-income producing security. |
| (A) | The rate reported is the effective yield at time of purchase. |
The following is a summary of the level of inputs used as of October 31, 2016, in valuing the Fund's investments carried at value:
| Investments in Securities | | Level 1 | | | Level 2 | | | Level 3 | | | Total | |
| Common Stock | | $ | 27,391,797 | | | $ | — | | | $ | — | | | $ | 27,391,797 | |
| U.S. Treasury Obligation | | | — | | | | 1,999,938 | | | | — | | | | 1,999,938 | |
| Total Investments in Securities | | $ | 27,391,797 | | | $ | 1,999,938 | | | $ | — | | | $ | 29,391,735 | |
For the year ended October 31, 2016, there have been no transfers between Level 1, Level 2 and Level 3 investments.
As of October 31, 2016, there were no Level 3 investments.
The accompanying notes are an integral part of the financial statements.
| Schedule of Investments | October 31, 2016 |
| Global X Next Emerging & Frontier ETF |
Sector Weightings (unaudited)†:
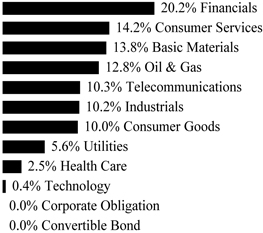
† Sector weightings percentages are based on the total market value of investments.
| | | Shares | | | Value | |
| COMMON STOCK — 99.7% | | | | | | | | |
| ARGENTINA— 3.4% | | | | | | | | |
| Consumer Services — 1.7% | | | | | | | | |
| MercadoLibre | | | 1,563 | | | $ | 262,600 | |
| Financials — 0.6% | | | | | | | | |
| Banco Macro ADR | | | 1,123 | | | | 85,606 | |
| Oil & Gas — 1.1% | | | | | | | | |
| YPF ADR | | | 8,972 | | | | 159,343 | |
| TOTAL ARGENTINA | | | | | | | 507,549 | |
| AUSTRALIA— 2.0% | | | | | | | | |
| Basic Materials — 0.5% | | | | | | | | |
| St. Barbara * | | | 34,600 | | | | 69,245 | |
| Oil & Gas — 1.5% | | | | | | | | |
| Oil Search | | | 31,827 | | | | 161,296 | |
| Santos | | | 26,600 | | | | 72,261 | |
| | | | | | | | 233,557 | |
| TOTAL AUSTRALIA | | | | | | | 302,802 | |
| CANADA— 3.2% | | | | | | | | |
| Basic Materials — 3.2% | | | | | | | | |
| B2Gold * | | | 38,070 | | | | 110,212 | |
| Barrick Gold | | | 4,147 | | | | 72,946 | |
| Endeavour Mining * | | | 4,029 | | | | 78,761 | |
| First Quantum Minerals | | | 11,432 | | | | 108,669 | |
| Lucara Diamond | | | 7,087 | | | | 20,041 | |
| Turquoise Hill Resources * | | | 27,917 | | | | 86,651 | |
| | | | | | | | 477,280 | |
| TOTAL CANADA | | | | | | | 477,280 | |
The accompanying notes are an integral part of the financial statements.
| Schedule of Investments | October 31, 2016 |
| Global X Next Emerging & Frontier ETF |
| | | Shares | | | Value | |
| COMMON STOCK — continued | | | | | | | | |
| CHILE— 4.1% | | | | | | | | |
| Basic Materials — 0.2% | | | | | | | | |
| Empresas CMPC | | | 12,000 | | | $ | 25,990 | |
| Consumer Goods — 0.3% | | | | | | | | |
| Cia Cervecerias Unidas ADR | | | 2,214 | | | | 47,601 | |
| Consumer Services — 1.8% | | | | | | | | |
| Cencosud | | | 8,600 | | | | 28,032 | |
| Latam Airlines Group * | | | 10,560 | | | | 101,129 | |
| SACI Falabella | | | 18,400 | | | | 144,458 | |
| | | | | | | | 273,619 | |
| Financials — 0.4% | | | | | | | | |
| Banco de Chile | | | 284,406 | | | | 33,847 | |
| Banco Santander Chile | | | 624,440 | | | | 34,934 | |
| | | | | | | | 68,781 | |
| Oil & Gas — 0.2% | | | | | | | | |
| Empresas COPEC | | | 2,550 | | | | 25,619 | |
| Utilities — 1.2% | | | | | | | | |
| AES Gener | | | 29,500 | | | | 10,050 | |
| Empresa Nacional de Electricidad | | | 117,549 | | | | 81,076 | |
| Enersis | | | 546,453 | | | | 92,542 | |
| | | | | | | | 183,668 | |
| TOTAL CHILE | | | | | | | 625,278 | |
| COLOMBIA— 0.5% | | | | | | | | |
| Consumer Services — 0.1% | | | | | | | | |
| Almacenes Exito | | | 1,650 | | | | 8,261 | |
| Financials — 0.1% | | | | | | | | |
| Grupo de Inversiones Suramericana | | | 1,351 | | | | 17,487 | |
| Industrials — 0.1% | | | | | | | | |
| Cementos Argos | | | 5,446 | | | | 21,630 | |
| Oil & Gas — 0.2% | | | | | | | | |
| Ecopetrol | | | 80,048 | | | | 35,000 | |
| TOTAL COLOMBIA | | | | | | | 82,378 | |
| CZECH REPUBLIC— 1.1% | | | | | | | | |
| Financials — 0.2% | | | | | | | | |
| Komercni Banka | | | 875 | | | | 32,007 | |
| Utilities — 0.9% | | | | | | | | |
| CEZ | | | 7,391 | | | | 139,106 | |
| TOTAL CZECH REPUBLIC | | | | | | | 171,113 | |
The accompanying notes are an integral part of the financial statements.
| Schedule of Investments | October 31, 2016 |
| Global X Next Emerging & Frontier ETF |
| | | Shares | | | Value | |
| COMMON STOCK — continued | | | | | | | | |
| EGYPT— 0.6% | | | | | | | | |
| Financials — 0.5% | | | | | | | | |
| Commercial International Bank Egypt SAE | | | 9,175 | | | $ | 53,407 | |
| Talaat Moustafa Group | | | 32,100 | | | | 20,496 | |
| | | | | | | | 73,903 | |
| Telecommunications — 0.1% | | | | | | | | |
| Global Telecom Holding SAE * | | | 42,503 | | | | 23,023 | |
| TOTAL EGYPT | | | | | | | 96,926 | |
| FRANCE— 0.1% | | | | | | | | |
| Oil & Gas — 0.1% | | | | | | | | |
| Etablissements Maurel et Prom | | | 3,861 | | | | 16,972 | |
| HONG KONG— 0.4% | | | | | | | | |
| Consumer Services — 0.4% | | | | | | | | |
| NagaCorp | | | 88,483 | | | | 54,654 | |
| HUNGARY— 1.4% | | | | | | | | |
| Financials — 0.9% | | | | | | | | |
| OTP Bank | | | 4,930 | | | | 138,580 | |
| Health Care — 0.3% | | | | | | | | |
| Richter Gedeon Nyrt | | | 2,056 | | | | 44,223 | |
| Oil & Gas — 0.2% | | | | | | | | |
| MOL Hungarian Oil & Gas | | | 416 | | | | 26,784 | |
| TOTAL HUNGARY | | | | | | | 209,587 | |
| INDONESIA— 11.0% | | | | | | | | |
| Consumer Goods — 2.7% | | | | | | | | |
| Astra International | | | 316,197 | | | | 199,319 | |
| Gudang Garam | | | 11,444 | | | | 59,553 | |
| Hanjaya Mandala Sampoerna | | | 100,800 | | | | 30,515 | |
| Indofood CBP Sukses Makmur TBK | | | 58,900 | | | | 42,433 | |
| Indofood Sukses Makmur | | | 59,900 | | | | 39,021 | |
| Unilever Indonesia | | | 13,869 | | | | 47,273 | |
| | | | | | | | 418,114 | |
| Consumer Services — 0.2% | | | | | | | | |
| Matahari Department Store | | | 19,800 | | | | 27,352 | |
| Financials — 4.0% | | | | | | | | |
| Bank Central Asia | | | 197,058 | | | | 234,467 | |
| Bank CIMB Niaga * | | | 6,633 | | | | 486 | |
| Bank Mandiri | | | 263,418 | | | | 231,662 | |
| Bank Rakyat Indonesia Persero | | | 143,100 | | | | 133,800 | |
| | | | | | | | 600,415 | |
| Health Care — 0.3% | | | | | | | | |
| Kalbe Farma | | | 310,700 | | | | 41,433 | |
The accompanying notes are an integral part of the financial statements.
| Schedule of Investments | October 31, 2016 |
| Global X Next Emerging & Frontier ETF |
| | | Shares | | | Value | |
| COMMON STOCK — continued | | | | | | | | |
| Industrials — 1.2% | | | | | | | | |
| Indocement Tunggal Prakarsa | | | 23,200 | | | $ | 29,249 | |
| Semen Indonesia Persero | | | 156,705 | | | | 118,297 | |
| United Tractors | | | 17,800 | | | | 29,501 | |
| | | | | | | | 177,047 | |
| Telecommunications — 2.1% | | | | | | | | |
| Telekomunikasi Indonesia Persero | | | 980,005 | | | | 316,954 | |
| Utilities — 0.5% | | | | | | | | |
| Perusahaan Gas Negara | | | 417,039 | | | | 81,823 | |
| TOTAL INDONESIA | | | | | | | 1,663,138 | |
| ITALY— 0.6% | | | | | | | | |
| Oil & Gas — 0.6% | | | | | | | | |
| Saipem | | | 211,400 | | | | 86,901 | |
| JAPAN— 0.8% | | | | | | | | |
| Basic Materials — 0.4% | | | | | | | | |
| Kyoei Steel | | | 3,500 | | | | 66,746 | |
| Industrials — 0.4% | | | | | | | | |
| Namura Shipbuilding | | | 10,040 | | | | 61,242 | |
| TOTAL JAPAN | | | | | | | 127,988 | |
| KUWAIT— 0.8% | | | | | | | | |
| Financials — 0.8% | | | | | | | | |
| Kuwait Finance House | | | 52,114 | | | | 81,643 | |
| National Bank of Kuwait SAK | | | 18,864 | | | | 36,708 | |
| | | | | | | | 118,351 | |
| TOTAL KUWAIT | | | | | | | 118,351 | |
| MALAYSIA— 9.5% | | | | | | | | |
| Basic Materials — 0.3% | | | | | | | | |
| HAP Seng Consolidated | | | 11,500 | | | | 21,355 | |
| Petronas Chemicals Group | | | 17,590 | | | | 29,352 | |
| | | | | | | | 50,707 | |
| Consumer Goods — 0.3% | | | | | | | | |
| IOI | | | 23,200 | | | | 24,887 | |
| Kuala Lumpur Kepong | | | 3,980 | | | | 22,732 | |
| | | | | | | | 47,619 | |
| Consumer Services — 0.4% | | | | | | | | |
| Genting | | | 12,000 | | | | 22,427 | |
| Genting Malaysia | | | 28,800 | | | | 32,679 | |
| | | | | | | | 55,106 | |
| Financials — 2.2% | | | | | | | | |
| CIMB Group Holdings | | | 42,600 | | | | 51,079 | |
| Malayan Banking | | | 64,926 | | | | 122,268 | |
The accompanying notes are an integral part of the financial statements.
| Schedule of Investments | October 31, 2016 |
| Global X Next Emerging & Frontier ETF |
| | | Shares | | | Value | |
| COMMON STOCK — continued | | | | | | | | |
| Financials — continued | | | | | | | | |
| Public Bank | | | 34,400 | | | $ | 162,857 | |
| | | | | | | | 336,204 | |
| Health Care — 0.3% | | | | | | | | |
| IHH Healthcare | | | 28,172 | | | | 42,980 | |
| Industrials — 1.2% | | | | | | | | |
| MISC | | | 17,800 | | | | 31,908 | |
| Sime Darby | | | 66,389 | | | | 129,613 | |
| Westports Holdings | | | 20,700 | | | | 21,761 | |
| | | | | | | | 183,282 | |
| Oil & Gas — 0.2% | | | | | | | | |
| Petronas Dagangan | | | 3,000 | | | | 16,706 | |
| Petronas Gas | | | 4,089 | | | | 21,444 | |
| | | | | | | | 38,150 | |
| Telecommunications — 2.9% | | | | | | | | |
| Axiata Group | | | 90,467 | | | | 106,102 | |
| DiGi.Com | | | 130,402 | | | | 156,358 | |
| Maxis | | | 90,096 | | | | 128,003 | |
| Telekom Malaysia | | | 25,885 | | | | 40,355 | |
| | | | | | | | 430,818 | |
| Utilities — 1.7% | | | | | | | | |
| Tenaga Nasional | | | 66,473 | | | | 227,228 | |
| YTL | | | 61,000 | | | | 23,120 | |
| | | | | | | | 250,348 | |
| TOTAL MALAYSIA | | | | | | | 1,435,214 | |
| MEXICO— 8.8% | | | | | | | | |
| Basic Materials — 1.9% | | | | | | | | |
| Grupo Mexico, Cl B | | | 57,768 | | | | 142,520 | |
| Industrias Penoles | | | 1,314 | | | | 31,946 | |
| Mexichem | | | 42,617 | | | | 102,353 | |
| | | | | | | | 276,819 | |
| Consumer Goods — 1.3% | | | | | | | | |
| Arca Continental | | | 6,038 | | | | 37,710 | |
| Coca-Cola Femsa | | | 3,000 | | | | 22,638 | |
| Fomento Economico Mexicano | | | 3,500 | | | | 33,726 | |
| Gruma, Cl B | | | 3,380 | | | | 47,218 | |
| Grupo Bimbo, Ser A | | | 11,360 | | | | 30,781 | |
| Grupo Lala, Cl B | | | 11,381 | | | | 21,270 | |
| | | | | | | | 193,343 | |
| Consumer Services — 1.5% | | | | | | | | |
| Grupo Televisa | | | 13,721 | | | | 67,746 | |
| Wal-Mart de Mexico | | | 76,180 | | | | 161,939 | |
| | | | | | | | 229,685 | |
The accompanying notes are an integral part of the financial statements.
| Schedule of Investments | October 31, 2016 |
| Global X Next Emerging & Frontier ETF |
| | | Shares | | | Value | |
| COMMON STOCK — continued | | | | | | | | |
| Financials — 1.0% | | | | | | | | |
| Grupo Financiero Banorte, Cl O | | | 15,124 | | | $ | 89,663 | |
| Grupo Financiero Inbursa, Cl O | | | 38,100 | | | | 62,394 | |
| | | | | | | | 152,057 | |
| Industrials — 2.0% | | | | | | | | |
| Alfa, Cl A | | | 70,770 | | | | 107,919 | |
| Cemex, Cl Preference * | | | 77,984 | | | | 67,794 | |
| Grupo Aeroportuario del Pacifico, Cl B | | | 3,200 | | | | 31,069 | |
| Grupo Aeroportuario del Sureste, Cl B | | | 1,670 | | | | 26,718 | |
| Promotora y Operadora de Infraestructura | | | 7,103 | | | | 79,631 | |
| | | | | | | | 313,131 | |
| Telecommunications — 0.8% | | | | | | | | |
| America Movil | | | 177,967 | | | | 118,471 | |
| Utilities — 0.3% | | | | | | | | |
| Infraestructura Energetica Nova | | | 10,140 | | | | 45,019 | |
| TOTAL MEXICO | | | | | | | 1,328,525 | |
| NETHERLANDS— 0.3% | | | | | | | | |
| Telecommunications — 0.3% | | | | | | | | |
| VimpelCom ADR | | | 13,566 | | | | 45,310 | |
| OMAN— 0.4% | | | | | | | | |
| Financials — 0.1% | | | | | | | | |
| BankMuscat SAOG | | | 9,540 | | | | 10,257 | |
| Telecommunications — 0.3% | | | | | | | | |
| Oman Telecommunications SAOG | | | 14,010 | | | | 53,850 | |
| TOTAL OMAN | | | | | | | 64,107 | |
| PAKISTAN— 0.7% | | | | | | | | |
| Financials — 0.1% | | | | | | | | |
| United Bank | | | 12,000 | | | | 23,070 | |
| Oil & Gas — 0.5% | | | | | | | | |
| Oil & Gas Development | | | 13,200 | | | | 17,712 | |
| Pakistan Petroleum | | | 38,900 | | | | 55,147 | |
| | | | | | | | 72,859 | |
| Utilities — 0.1% | | | | | | | | |
| K-Electric * | | | 183,000 | | | | 16,292 | |
| TOTAL PAKISTAN | | | | | | | 112,221 | |
| PANAMA— 1.3% | | | | | | | | |
| Consumer Services — 1.3% | | | | | | | | |
| Copa Holdings, Cl A | | | 2,169 | | | | 200,047 | |
| PERU— 1.1% | | | | | | | | |
| Basic Materials — 0.4% | | | | | | | | |
| Hochschild Mining | | | 9,000 | | | | 29,283 | |
The accompanying notes are an integral part of the financial statements.
| Schedule of Investments | October 31, 2016 |
| Global X Next Emerging & Frontier ETF |
| | | Shares | | | Value | |
| COMMON STOCK — continued | | | | | | | | |
| Basic Materials — continued | | | | | | | | |
| Southern Copper | | | 1,218 | | | $ | 34,579 | |
| | | | | | | | 63,862 | |
| Financials — 0.7% | | | | | | | | |
| Credicorp Ltd. | | | 709 | | | | 105,414 | |
| TOTAL PERU | | | | | | | 169,276 | |
| PHILIPPINES— 4.2% | | | | | | | | |
| Consumer Goods — 0.6% | | | | | | | | |
| JG Summit Holdings | | | 24,849 | | | | 39,001 | |
| Universal Robina | | | 12,537 | | | | 47,121 | |
| | | | | | | | 86,122 | |
| Consumer Services — 1.4% | | | | | | | | |
| Jollibee Foods | | | 5,600 | | | | 27,524 | |
| SM Investments | | | 13,536 | | | | 187,851 | |
| | | | | | | | 215,375 | |
| Financials — 0.6% | | | | | | | | |
| Ayala Land | | | 51,500 | | | | 38,554 | |
| SM Prime Holdings | | | 104,097 | | | | 57,829 | |
| | | | | | | | 96,383 | |
| Industrials — 0.5% | | | | | | | | |
| Aboitiz Equity Ventures | | | 13,500 | | | | 21,746 | |
| Ayala | | | 2,610 | | | | 45,007 | |
| | | | | | | | 66,753 | |
| Telecommunications — 0.7% | | | | | | | | |
| Globe Telecom | | | 430 | | | | 15,807 | |
| PLDT | | | 2,914 | | | | 92,073 | |
| | | | | | | | 107,880 | |
| Utilities — 0.4% | | | | | | | | |
| Aboitiz Power | | | 35,858 | | | | 34,027 | |
| Manila Electric | | | 5,620 | | | | 32,033 | |
| | | | | | | | 66,060 | |
| TOTAL PHILIPPINES | | | | | | | 638,573 | |
| POLAND— 4.3% | | | | | | | | |
| Basic Materials — 0.6% | | | | | | | | |
| KGHM Polska Miedz | | | 4,626 | | | | 83,544 | |
| Consumer Goods — 0.1% | | | | | | | | |
| LPP * | | | 10 | | | | 14,939 | |
| Financials — 1.2% | | | | | | | | |
| Bank Pekao | | | 1,524 | | | | 46,872 | |
| Bank Zachodni | | | 338 | | | | 27,223 | |
| Powszechna Kasa Oszczednosci Bank Polski | | | 7,551 | | | | 52,721 | |
| Powszechny Zaklad Ubezpieczen | | | 7,330 | | | | 50,731 | |
| | | | | | | | 177,547 | |
The accompanying notes are an integral part of the financial statements.
| Schedule of Investments | October 31, 2016 |
| Global X Next Emerging & Frontier ETF |
| | | Shares | | | Value | |
| COMMON STOCK — continued | | | | | | | | |
| Oil & Gas — 1.8% | | | | | | | | |
| Polski Koncern Naftowy Orlen S.A. | | | 12,596 | | | $ | 248,985 | |
| Polskie Gornictwo Naftowe i Gazownictwo | | | 20,100 | | | | 25,637 | |
| | | | | | | | 274,622 | |
| Telecommunications — 0.1% | | | | | | | | |
| Orange Polska | | | 13,400 | | | | 19,066 | |
| Utilities — 0.5% | | | | | | | | |
| PGE | | | 30,490 | | | | 79,559 | |
| TOTAL POLAND | | | | | | | 649,277 | |
| QATAR— 1.8% | | | | | | | | |
| Financials — 0.7% | | | | | | | | |
| Qatar National Bank | | | 2,404 | | | | 105,625 | |
| Industrials — 0.8% | | | | | | | | |
| Industries Qatar QSC | | | 4,176 | | | | 116,970 | |
| Telecommunications — 0.3% | | | | | | | | |
| Ooredoo QSC | | | 1,770 | | | | 47,148 | |
| TOTAL QATAR | | | | | | | 269,743 | |
| SINGAPORE— 1.1% | | | | | | | | |
| Consumer Goods — 1.1% | | | | | | | | |
| Thai Beverage | | | 229,407 | | | | 159,047 | |
| SOUTH AFRICA— 9.3% | | | | | | | | |
| Basic Materials — 2.4% | | | | | | | | |
| Anglo American Platinum * | | | 2,095 | | | | 49,363 | |
| AngloGold Ashanti * | | | 5,840 | | | | 78,249 | |
| Gold Fields ADR | | | 40,224 | | | | 166,930 | |
| Sasol | | | 1,963 | | | | 54,514 | |
| | | | | | | | 349,056 | |
| Consumer Goods — 0.6% | | | | | | | | |
| Tiger Brands | | | 3,313 | | | | 94,354 | |
| Consumer Services — 3.0% | | | | | | | | |
| Naspers, Cl N | | | 1,831 | | | | 306,907 | |
| Shoprite Holdings | | | 5,424 | | | | 80,058 | |
| Woolworths Holdings | | | 13,518 | | | | 78,316 | |
| | | | | | | | 465,281 | |
| Financials — 1.3% | | | | | | | | |
| FirstRand | | | 28,680 | | | | 102,787 | |
| Standard Bank Group | | | 8,085 | | | | 85,788 | |
| | | | | | | | 188,575 | |
| Health Care — 1.1% | | | | | | | | |
| Aspen Pharmacare Holdings | | | 3,541 | | | | 77,144 | |
| Mediclinic International | | | 7,598 | | | | 83,884 | |
| | | | | | | | 161,028 | |
The accompanying notes are an integral part of the financial statements.
| Schedule of Investments | October 31, 2016 |
| Global X Next Emerging & Frontier ETF |
| | | Shares | | | Value | |
| COMMON STOCK — continued | | | | | | | | |
| Telecommunications — 0.9% | | | | | | | | |
| MTN Group | | | 5,123 | | | $ | 44,217 | |
| Vodacom Group | | | 8,810 | | | | 95,043 | |
| | | | | | | | 139,260 | |
| TOTAL SOUTH AFRICA | | | | | | | 1,397,554 | |
| SOUTH KOREA— 0.3% | | | | | | | | |
| Consumer Goods — 0.3% | | | | | | | | |
| Youngone | | | 1,530 | | | | 42,988 | |
| TAIWAN— 0.7% | | | | | | | | |
| Consumer Goods — 0.7% | | | | | | | | |
| Taiwan Paiho | | | 32,300 | | | | 110,029 | |
| THAILAND— 10.5% | | | | | | | | |
| Basic Materials — 0.2% | | | | | | | | |
| Indorama Ventures NVDR | | | 35,800 | | | | 29,921 | |
| Consumer Goods — 1.0% | | | | | | | | |
| Carabao Group NVDR | | | 14,700 | | | | 28,982 | |
| Charoen Pokphand Foods NVDR | | | 127,957 | | | | 115,170 | |
| | | | | | | | 144,152 | |
| Consumer Services — 1.1% | | | | | | | | |
| CP ALL NVDR | | | 82,022 | | | | 142,377 | |
| Minor International NVDR | | | 26,400 | | | | 29,042 | |
| | | | | | | | 171,419 | |
| Financials — 0.8% | | | | | | | | |
| Kasikornbank NVDR | | | 7,000 | | | | 34,402 | |
| Siam Commercial Bank NVDR | | | 20,400 | | | | 83,646 | |
| | | | | | | | 118,048 | |
| Health Care — 0.5% | | | | | | | | |
| Bangkok Dusit Medical Services NVDR | | | 80,700 | | | | 52,574 | |
| Bumrungrad Hospital NVDR | | | 4,500 | | | | 23,530 | |
| | | | | | | | 76,104 | |
| Industrials — 3.1% | | | | | | | | |
| Airports of Thailand NVDR | | | 14,694 | | | | 159,966 | |
| CH Karnchang NVDR | | | 127,800 | | | | 107,725 | |
| Siam Cement NVDR | | | 13,910 | | | | 198,729 | |
| | | | | | | | 466,420 | |
| Oil & Gas — 2.5% | | | | | | | | |
| PTT NVDR | | | 18,941 | | | | 187,259 | |
| PTT Exploration & Production NVDR | | | 35,460 | | | | 84,350 | |
| PTT Global Chemical NVDR | | | 42,231 | | | | 72,401 | |
| Thai Oil NVDR | | | 18,000 | | | | 36,002 | |
| | | | | | | | 380,012 | |
| Technology — 0.4% | | | | | | | | |
| Intouch Holdings PCL NVDR | | | 40,270 | | | | 60,985 | |
The accompanying notes are an integral part of the financial statements.
| Schedule of Investments | October 31, 2016 |
| Global X Next Emerging & Frontier ETF |
| | | Shares | | | Value | |
| COMMON STOCK — continued | | | | | | | | |
| Telecommunications — 0.9% | | | | | | | | |
| Advanced Info Service NVDR | | | 24,454 | | | $ | 107,256 | |
| True NVDR | | | 134,620 | | | | 25,964 | |
| | | | | | | | 133,220 | |
| TOTAL THAILAND | | | | | | | 1,580,281 | |
| TURKEY— 7.4% | | | | | | | | |
| Basic Materials — 1.5% | | | | | | | | |
| Eregli Demir ve Celik Fabrikalari | | | 166,473 | | | | 225,795 | |
| Consumer Goods — 0.3% | | | | | | | | |
| Ford Otomotiv Sanayi | | | 1,950 | | | | 19,925 | |
| Tofas Turk Otomobil Fabrikasi | | | 3,600 | | | | 27,088 | |
| | | | | | | | 47,013 | |
| Consumer Services — 1.1% | | | | | | | | |
| Arcelik | | | 4,800 | | | | 31,684 | |
| BIM Birlesik Magazalar | | | 8,719 | | | | 141,912 | |
| | | | | | | | 173,596 | |
| Financials — 1.2% | | | | | | | | |
| Akbank | | | 23,680 | | | | 63,243 | |
| Turkiye Garanti Bankasi | | | 23,125 | | | | 62,806 | |
| Turkiye Is Bankasi, Cl C | | | 36,144 | | | | 58,595 | |
| | | | | | | | 184,644 | |
| Industrials — 0.2% | | | | | | | | |
| Enka Insaat ve Sanayi | | | 17,445 | | | | 26,591 | |
| Oil & Gas — 2.2% | | | | | | | | |
| KOC Holding | | | 37,436 | | | | 155,956 | |
| Tupras Turkiye Petrol Rafinerileri | | | 8,853 | | | | 180,259 | |
| | | | | | | | 336,215 | |
| Telecommunications — 0.9% | | | | | | | | |
| Turk Telekomunikasyon | | | 12,036 | | | | 22,233 | |
| Turkcell Iletisim Hizmetleri | | | 31,140 | | | | 100,262 | |
| | | | | | | | 122,495 | |
| TOTAL TURKEY | | | | | | | 1,116,349 | |
| UKRAINE— 0.7% | | | | | | | | |
| Consumer Goods — 0.7% | | | | | | | | |
| Kernel Holding | | | 6,251 | | | | 99,836 | |
| UNITED ARAB EMIRATES— 2.9% | | | | | | | | |
| Financials — 2.3% | | | | | | | | |
| Emaar Properties PJSC | | | 114,171 | | | | 216,649 | |
| First Gulf Bank PJSC | | | 30,961 | | | | 96,935 | |
| National Bank of Abu Dhabi PJSC | | | 17,424 | | | | 41,981 | |
| | | | | | | | 355,565 | |
| Industrials — 0.6% | | | | | | | | |
| DP World * | | | 4,651 | | | | 83,485 | |
The accompanying notes are an integral part of the financial statements.
| Schedule of Investments | October 31, 2016 |
| Global X Next Emerging & Frontier ETF |
| | | Shares/Face
Amount | | | Value | |
| COMMON STOCK — continued | | | | | | | | |
| TOTAL UNITED ARAB EMIRATES | | | | | | $ | 439,050 | |
| UNITED KINGDOM— 3.3% | | | | | | | | |
| Basic Materials — 2.2% | | | | | | | | |
| Antofagasta | | | 5,600 | | | | 37,125 | |
| Fresnillo | | | 11,091 | | | | 222,072 | |
| KAZ Minerals * | | | 11,700 | | | | 40,853 | |
| Mondi | | | 1,720 | | | | 33,515 | |
| | | | | | | | 333,565 | |
| Financials — 0.5% | | | | | | | | |
| Bank of Georgia Holdings | | | 2,114 | | | | 76,294 | |
| Oil & Gas — 0.6% | | | | | | | | |
| Premier Oil * | | | 22,173 | | | | 17,867 | |
| Tullow Oil | | | 21,500 | | | | 69,482 | |
| | | | | | | | 87,349 | |
| TOTAL UNITED KINGDOM | | | | | | | 497,208 | |
| UNITED STATES— 1.1% | | | | | | | | |
| Oil & Gas — 1.1% | | | | | | | | |
| Kosmos Energy * | | | 8,943 | | | | 46,593 | |
| Occidental Petroleum | | | 977 | | | | 71,233 | |
| Pacific Drilling * | | | 772 | | | | 2,718 | |
| Seadrill Partners (A) | | | 15,444 | | | | 50,347 | |
| | | | | | | | 170,891 | |
| TOTAL UNITED STATES | | | | | | | 170,891 | |
| TOTAL COMMON STOCK | | | | | | | | |
| (Cost $17,015,297) | | | | | | | 15,066,443 | |
| | | | | | | | | |
| CORPORATE OBLIGATION — 0.0% | | | | | | | | |
| Bank Muscat SAOG | | | | | | | | |
| 0.035%, 03/19/18 | | | 22,009 | | | | 5,487 | |
| (Cost $–) | | | 22,009 | | | | 5,487 | |
| | | | | | | | | |
| CONVERTIBLE BOND — 0.0% | | | | | | | | |
| BankMuscat SAOG | | | | | | | | |
| 4.500%, 03/20/17 | | | 2,702 | | | | 772 | |
| (Cost $–) | | | 2,702 | | | | 772 | |
| TOTAL INVESTMENTS — 99.7% | | | | | | | | |
| (Cost $17,015,297) | | | | | | $ | 15,072,702 | |
Percentages are based on Net Assets of $15,111,796.
| * | Non-income producing security. |
| (A) | Security considered Master Limited Partnership. As of October 31, 2016, these securities amounted to $50,347 or 0.3% of Net Assets. |
| ADR — American Depositary Receipt |
| Cl — Class |
The accompanying notes are an integral part of the financial statements.
| Schedule of Investments | October 31, 2016 |
| Global X Next Emerging & Frontier ETF |
| Ltd. — Limited |
| NVDR — Non-Voting Depositary Receipt |
| Ser — Series |
| The following is a summary of the level of inputs used as of October 31, 2016, in valuing the Fund's investments carried at value: |
| Investments in Securities | | Level 1 | | | Level 2 | | | Level 3 | | | Total | |
| Common Stock | | $ | 15,066,443 | | | $ | — | | | $ | — | | | $ | 15,066,443 | |
| Corporate Obligation | | | — | | | | 5,487 | | | | — | | | | 5,487 | |
| Convertible Bond | | | — | | | | 772 | | | | — | | | | 772 | |
| Total Investments in Securities | | $ | 15,066,443 | | | $ | 6,259 | | | $ | — | | | $ | 15,072,702 | |
For the year ended October 31, 2016, there have been no transfers between Level 1, Level 2 and Level 3 investments.
For the year ended October 31, 2016, there were no Level 3 investments.
The accompanying notes are an integral part of the financial statements.
| Schedule of Investments | October 31, 2016 |
| Global X FTSE Portugal 20 ETF |
| Sector Weightings (unaudited)†: |
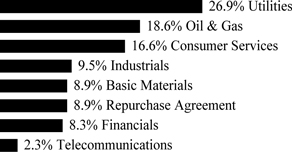 |
| |
| † Sector weightings percentages are based on the total market value of investments. Repurchase agreements purchased from cash collateral received for securities lending activity are included in total investments. Please see Note 2 and Note 8 in Notes to Financial Statements for more detailed information. |
| | | Shares | | | Value | |
| COMMON STOCK — 99.8% |
| PORTUGAL— 99.8% | | | | | | | | |
| Basic Materials — 9.8% | | | | | | | | |
| Altri | | | 182,131 | | | $ | 634,296 | |
| Navigator | | | 373,309 | | | | 1,092,624 | |
| Semapa-Sociedade de Investimento e Gestao | | | 60,017 | | | | 771,068 | |
| | | | | | | | 2,497,988 | |
| Consumer Services — 18.2% | | | | | | | | |
| Jeronimo Martins | | | 129,785 | | | | 2,229,381 | |
| NOS SGPS | | | 182,178 | | | | 1,208,609 | |
| Sonae | | | 1,547,034 | | | | 1,229,501 | |
| | | | | | | | 4,667,491 | |
| Financials — 9.1% | | | | | | | | |
| Banco BPI, Cl G * | | | 888,690 | | | | 1,100,829 | |
| Banco Comercial Portugues, Cl R * (A) | | | 785,010 | | | | 1,043,822 | |
| Banco Espirito Santo * (B) (C) | | | 2,085,614 | | | | — | |
| BANIF - Banco Internacional do Funchal * (A) (B) (C) | | | 95,112,146 | | | | 2,085 | |
| Sonae Capital | | | 235,369 | | | | 181,125 | |
| | | | | | | | 2,327,861 | |
| Industrials — 10.4% | | | | | | | | |
| Cimpor Cimentos de Portugal * | | | 106,908 | | | | 36,447 | |
| Corticeira Amorim SGPS | | | 104,796 | | | | 1,050,556 | |
| CTT-Correios de Portugal | | | 167,409 | | | | 1,106,407 | |
| Mota-Engil | | | 226,732 | | | | 442,409 | |
| Sonae Industria * | | | 8,693,443 | | | | 61,944 | |
| | | | | | | | 2,697,763 | |
| Oil & Gas — 20.4% | | | | | | | | |
| Galp Energia | | | 387,216 | | | | 5,242,170 | |
| Telecommunications — 2.4% | | | | | | | | |
| Pharol SGPS | | | 1,372,135 | | | | 379,043 | |
The accompanying notes are an integral part of the financial statements.
| Schedule of Investments | October 31, 2016 |
| Global X FTSE Portugal 20 ETF |
| | | Shares/Face
Amount | | | Value | |
| COMMON STOCK — continued |
| Telecommunications — continued | | | | | | | | |
| Sonaecom | | | 85,737 | | | $ | 239,662 | |
| | | | | | | | 618,705 | |
| Utilities — 29.5% | | | | | | | | |
| EDP Renovaveis | | | 153,435 | | | | 1,157,860 | |
| Energias de Portugal | | | 1,570,747 | | | | 5,184,512 | |
| REN - Redes Energeticas Nacionais | | | 421,938 | | | | 1,231,254 | |
| | | | | | | | 7,573,626 | |
| TOTAL PORTUGAL | | | | | | | 25,625,604 | |
| TOTAL COMMON STOCK | | | | | | | | |
| (Cost $35,359,044) | | | | | | | 25,625,604 | |
| | | | | | | | | |
| REPURCHASE AGREEMENT (D) — 9.7% | | | | | | | | |
| Deutsche Bank | | | | | | | | |
| 0.350%, dated 10/31/16, to be repurchased on 11/01/16 repurchase price $2,503,117 (collateralized by U.S. Treasury Obligations, par value $2,327,739, 3.000%, 05/15/45 with a total market value of $2,564,213) | | | | | | | | |
| (Cost $2,503,093) | | $ | 2,503,093 | | | | 2,503,093 | |
| TOTAL INVESTMENTS — 109.5% | | | | | | | | |
| (Cost $37,862,137) | | | | | | $ | 28,128,697 | |
Percentages are based on Net Assets of $25,693,565.
| * | Non-income producing security. |
| (A) | This security or a partial position of this security is on loan as of October 31, 2016. The total value of securities on loan as of October 31, 2016 was $255,976 |
| (B) | Security considered illiquid. The total value of such securities as of October 31, 2016 was $2,085 and represented 0.0% of Net Assets. |
| (C) | Security is fair valued using methods determined in good faith by the Fair Value Committee of the Fund. The total value of such securities as of October 31, 2016, was $2,085 and represents 0.0% of Net Assets. |
| (D) | This security was purchased with cash collateral held from securities on loan. The total value of such securities as of October 31, 2016 was $2,503,093. |
Cl — Class
| The following is a summary of the level of inputs used as of October 31, 2016, in valuing the Fund's investments carried at value: |
| Investments in Securities | | Level 1 | | | Level 2 | | | Level 3(1) | | | Total | |
| Common Stock | | $ | 25,623,519 | | | $ | — | | | $ | 2,085 | | | $ | 25,625,604 | |
| Repurchase Agreement | | | — | | | | 2,503,093 | | | | — | | | | 2,503,093 | |
| Total Investments in Securities | | $ | 25,623,519 | | | $ | 2,503,093 | | | $ | 2,085 | | | $ | 28,128,697 | |
(1) A reconciliation of Level 3 investments and disclosures of significant unobservable inputs are presented when the Fund has a significant amount of Level 3 investments at the beginning and/or end of the period in relation to Net Assets. Management has concluded that Level 3 investments are not material in relation to Net Assets.
The accompanying notes are an integral part of the financial statements.
| Schedule of Investments | October 31, 2016 |
| Global X FTSE Portugal 20 ETF |
For the period ended October 31, 2016, the transfers between Level 1 and Level 3 in the amount of $2,085, were due to changes in the availability of oberservable inputs to determine fair value. Transfers between levels are recognized at period end.
The accompanying notes are an integral part of the financial statements.
| Schedule of Investments | October 31, 2016 |
| Global X MSCI Pakistan ETF |
| Sector Weightings (unaudited)†: |
 |
| |
| † Sector weightings percentages are based on the total market value of investments. |
| | | Shares | | | Value | |
| COMMON STOCK — 101.0% |
| PAKISTAN— 101.0% | | | | | | | | |
| Basic Materials — 12.0% | | | | | | | | |
| Dawood Hercules | | | 26,800 | | | $ | 33,720 | |
| Engro | | | 205,990 | | | | 548,664 | |
| Fatima Fertilizer | | | 353,700 | | | | 111,308 | |
| Fauji Fertilizer | | | 458,900 | | | | 454,389 | |
| Fauji Fertilizer Bin Qasim | | | 299,000 | | | | 133,723 | |
| | | | | | | | 1,281,804 | |
| Consumer Goods — 8.3% | | | | | | | | |
| Honda Atlas Cars Pakistan | | | 19,400 | | | | 100,043 | |
| Indus Motor | | | 19,390 | | | | 279,701 | |
| Nishat Mills | | | 162,500 | | | | 214,212 | |
| Pak Elektron | | | 231,800 | | | | 146,689 | |
| PAK Suzuki Motor | | | 29,150 | | | | 142,190 | |
| | | | | | | | 882,835 | |
| Financials — 31.9% | | | | | | | | |
| Bank Al Habib | | | 764,000 | | | | 335,198 | |
| Habib Bank | | | 489,950 | | | | 1,045,725 | |
| MCB Bank | | | 460,440 | | | | 937,707 | |
| National Bank of Pakistan | | | 586,600 | | | | 402,056 | |
| United Bank | | | 357,990 | | | | 688,243 | |
| | | | | | | | 3,408,929 | |
| Health Care — 3.5% | | | | | | | | |
| Ferozsons Laboratories | | | 13,830 | | | | 101,680 | |
| Searle | | | 57,295 | | | | 269,374 | |
| | | | | | | | 371,054 | |
| Industrials — 17.5% | | | | | | | | |
| DG Khan Cement | | | 82,360 | | | | 134,904 | |
| Fauji Cement | | | 693,500 | | | | 227,505 | |
| Kohat Cement | | | 27,700 | | | | 62,145 | |
| Lucky Cement | | | 148,260 | | | | 949,981 | |
| Maple Leaf Cement Factory | | | 231,700 | | | | 201,522 | |
The accompanying notes are an integral part of the financial statements.
| Schedule of Investments | October 31, 2016 |
| Global X MSCI Pakistan ETF |
| | | Shares | | | Value | |
| COMMON STOCK — continued |
| Industrials — continued | | | | | | | | |
| Packages | | | 32,330 | | | $ | 211,666 | |
| Pakistan International Bulk Terminal * | | | 285,600 | | | | 77,940 | |
| | | | | | | | 1,865,663 | |
| Oil & Gas — 18.2% | | | | | | | | |
| Byco Petroleum Pakistan * | | | 189,800 | | | | 35,461 | |
| National Refinery | | | 31,300 | | | | 166,523 | |
| Oil & Gas Development | | | 517,240 | | | | 694,029 | |
| Pakistan Oilfields | | | 79,920 | | | | 302,377 | |
| Pakistan Petroleum | | | 178,800 | | | | 253,476 | |
| Pakistan State Oil | | | 126,430 | | | | 488,469 | |
| | | | | | | | 1,940,335 | |
| Telecommunications — 1.0% | | | | | | | | |
| Pakistan Telecommunication | | | 701,080 | | | | 109,845 | |
| Utilities — 8.6% | | | | | | | | |
| Hub Power | | | 420,742 | | | | 428,490 | |
| K-Electric * | | | 1,863,200 | | | | 165,875 | |
| Kot Addu Power | | | 302,800 | | | | 213,289 | |
| SUI Southern Gas * | | | 282,200 | | | | 104,236 | |
| | | | | | | | 911,890 | |
| TOTAL INVESTMENTS — 101.0% | | | | | | | | |
| (Cost $10,565,522) | | | | | | $ | 10,772,355 | |
Percentages are based on Net Assets of $10,663,533.
| * | Non-income producing security. |
| As of October 31, 2016, all of the Fund's investments were considered Level 1, in accordance with authoritative guidance on fair value measurements and disclosure under U.S. GAAP. |
For the period ended October 31, 2016, there have been no transfers between Level 1, Level 2 or Level 3 investments.
The accompanying notes are an integral part of the financial statements.
| Statements of Assets and Liabilities |
| October 31, 2016 |
| | | Global X China
Consumer ETF | | | Global X China
Energy ETF | | | Global X China
Financials ETF | | | Global X China
Industrials ETF | |
| Assets: | | | | | | | | | | | | | | | | |
| Cost of Investments | | $ | 85,084,566 | | | $ | 2,209,804 | | | $ | 31,181,647 | | | $ | 5,249,854 | |
| Cost of Repurchase Agreement | | | 7,484,669 | | | | — | | | | — | | | | — | |
| Cost of Foreign Currency | | | 21,197 | | | | 998 | | | | 180 | | | | 1,292 | |
| Investments, at Value | | $ | 72,984,060 | * | | $ | 1,582,654 | | | $ | 28,099,509 | | | $ | 3,764,784 | |
| Repurchase Agreement, at Value | | | 7,484,669 | | | | — | | | | — | | | | — | |
| Cash | | | 141,723 | | | | 3,476 | | | | 37,571 | | | | 6,013 | |
| Foreign Currency, at Value | | | 21,197 | | | | 999 | | | | 6 | | | | 1,435 | |
| Receivable for Investment Securities Sold | | | 11,324,823 | | | | 113,681 | | | | 4,460,551 | | | | 356,137 | |
| Dividend and Interest Receivable | | | 28,548 | | | | — | | | | 11,080 | | | | 3,181 | |
| Total Assets | | | 91,985,020 | | | | 1,700,810 | | | | 32,608,717 | | | | 4,131,550 | |
| Liabilities: | | | | | | | | | | | | | | | | |
| Payable for Investment Securities Purchased | | | 11,436,396 | | | | 116,647 | | | | 4,304,488 | | | | 357,205 | |
| Obligation to Return Securities Lending Collateral | | | 7,484,669 | | | | — | | | | — | | | | — | |
| Payable due to Investment Adviser | | | 41,317 | | | | 888 | | | | 15,620 | | | | 2,098 | |
| Payable for Capital Shares Redeemed | | | — | | | | — | | | | — | | | | 1,955 | |
| Unrealized Depreciation on Spot Contracts | | | 2 | | | | — | | | | — | | | | — | |
| Total Liabilities | | | 18,962,384 | | | | 117,535 | | | | 4,320,108 | | | | 361,258 | |
| Net Assets | | $ | 73,022,636 | | | $ | 1,583,275 | | | $ | 28,288,609 | | | $ | 3,770,292 | |
| Net Assets Consist of: | | | | | | | | | | | | | | | | |
| Paid-in Capital | | $ | 124,682,292 | | | $ | 3,191,064 | | | $ | 34,887,423 | | | $ | 7,365,710 | |
| Undistributed Net Investment Income | | | 922,520 | | | | 32,231 | | | | 528,232 | | | | 51,038 | |
| Accumulated Net Realized Loss on Investments and Foreign Currency Transactions | | | (40,481,675 | ) | | | (1,012,871 | ) | | | (4,044,912 | ) | | | (2,161,387 | ) |
| Net Unrealized Depreciation on Investments | | | (12,100,506 | ) | | | (627,150 | ) | | | (3,082,138 | ) | | | (1,485,070 | ) |
| Net Unrealized Appreciation on Foreign Currency Translations | | | 5 | | | | 1 | | | | 4 | | | | 1 | |
| Net Assets | | $ | 73,022,636 | | | $ | 1,583,275 | | | $ | 28,288,609 | | | $ | 3,770,292 | |
| Outstanding Shares of Beneficial Interest (unlimited authorization — no par value) | | | 6,100,000 | | | | 150,000 | | | | 2,050,000 | | | | 300,000 | |
| Net Asset Value, Offering and Redemption Price Per Share | | $ | 11.97 | | | $ | 10.56 | | | $ | 13.80 | | | $ | 12.57 | |
| *Includes Market Value of Securities on Loan | | $ | 7,072,381 | | | $ | — | | | $ | — | | | $ | — | |
The accompanying notes are an integral part of the financial statements.
| Statements of Assets and Liabilities |
| October 31, 2016 |
| | | Global X China
Materials ETF | | | Global X NASDAQ
China Technology
ETF | | | Global X Southeast
Asia ETF | | | Global X FTSE
Andean 40 ETF | |
| Assets: | | | | | | | | | | | | | | | | |
| Cost of Investments | | $ | 2,157,342 | | | $ | 13,452,705 | | | $ | 13,893,495 | | | $ | 5,235,229 | |
| Cost of Foreign Currency | | | 180 | | | | 10 | | | | 4,009 | | | | 204 | |
| Investments, at Value | | $ | 1,340,285 | | | $ | 13,930,645 | | | $ | 12,318,879 | | | $ | 4,067,735 | |
| Cash | | | 4,212 | | | | 17,540 | | | | 31,328 | | | | 8,947 | |
| Foreign Currency, at Value | | | 200 | | | | 10 | | | | 4,012 | | | | 187 | |
| Receivable for Investment Securities Sold | | | 143,305 | | | | — | | | | 3,959 | | | | — | |
| Unrealized Appreciation on Forward Foreign Currency Contracts | | | — | | | | — | | | | — | | | | 1 | |
| Dividend and Interest Receivable | | | — | | | | — | | | | 2,024 | | | | 257 | |
| Total Assets | | | 1,488,002 | | | | 13,948,195 | | | | 12,360,202 | | | | 4,077,127 | |
| Liabilities: | | | | | | | | | | | | | | | | |
| Payable for Investment Securities Purchased | | | 145,679 | | | | — | | | | 3,974 | | | | — | |
| Payable due to Investment Adviser | | | 753 | | | | 7,951 | | | | 6,861 | | | | 2,423 | |
| Payable for Foreign Capital Gains Tax on Appreciated Securities | | | — | | | | — | | | | — | | | | 6,862 | |
| Total Liabilities | | | 146,432 | | | | 7,951 | | | | 10,835 | | | | 9,285 | |
| Net Assets | | $ | 1,341,570 | | | $ | 13,940,244 | | | $ | 12,349,367 | | | $ | 4,067,842 | |
| Net Assets Consist of: | | | | | | | | | | | | | | | | |
| Paid-in Capital | | $ | 3,284,550 | | | $ | 15,258,644 | | | $ | 18,893,551 | | | $ | 8,633,638 | |
| Undistributed Net Investment Income | | | 16,196 | | | | 277,404 | | | | 260,146 | | | | 40,586 | |
| Accumulated Net Realized Loss on Investments and Foreign Currency Transactions | | | (1,142,118 | ) | | | (2,073,744 | ) | | | (5,229,676 | ) | | | (3,432,024 | ) |
| Net Unrealized Appreciation (Depreciation) on Investments | | | (817,057 | ) | | | 477,940 | | | | (1,574,616 | ) | | | (1,167,494 | ) |
| Net Unrealized Depreciation on Foreign Currency Translations | | | (1 | ) | | | — | | | | (38 | ) | | | (6,864 | ) |
| Net Assets | | $ | 1,341,570 | | | $ | 13,940,244 | | | $ | 12,349,367 | | | $ | 4,067,842 | |
| Outstanding Shares of Beneficial Interest (unlimited authorization — no par value) | | | 99,971 | | | | 600,000 | | | | 900,000 | | | | 500,000 | |
| Net Asset Value, Offering and Redemption Price Per Share | | $ | 13.42 | | | $ | 23.23 | | | $ | 13.72 | | | $ | 8.14 | |
The accompanying notes are an integral part of the financial statements.
| Statements of Assets and Liabilities |
| October 31, 2016 |
| | | Global X MSCI
Colombia ETF | | | Global X Brazil
Mid Cap ETF | | | Global X Brazil
Consumer ETF | | | Global X MSCI
Argentina ETF | |
| Assets: | | | | | | | | | | | | | | | | |
| Cost of Investments | | $ | 100,931,222 | | | $ | 5,088,047 | | | $ | 6,647,563 | | | $ | 81,046,590 | |
| Cost of Foreign Currency | | | 56,269 | | | | 3,056 | | | | 4,367 | | | | 35,724 | |
| Investments, at Value | | $ | 90,086,050 | | | $ | 4,986,420 | | | $ | 7,166,488 | | | $ | 90,505,748 | |
| Foreign Currency, at Value | | | 56,269 | | | | 3,113 | | | | 4,432 | | | | 36,491 | |
| Cash | | | — | | | | — | | | | 8,794 | | | | 153,861 | |
| Dividend and Interest Receivable | | | 21,243 | | | | 8,530 | | | | 6,675 | | | | 7,065 | |
| Receivable for Investment Securities Sold | | | 13,997 | | | | — | | | | — | | | | — | |
| Receivable for Capital Shares Sold | | | — | | | | 495,912 | | | | — | | | | 8,316,769 | |
| Reclaim Receivable | | | — | | | | — | | | | — | | | | 1,183 | |
| Total Assets | | | 90,177,559 | | | | 5,493,975 | | | | 7,186,389 | | | | 99,021,117 | |
| Liabilities: | | | | | | | | | | | | | | | | |
| Cash Overdraft | | | 1,298,382 | | | | 7,408 | | | | — | | | | — | |
| Payable for Investment Securities Purchased | | | 64,198 | | | | 494,512 | | | | — | | | | 8,368,634 | |
| Payable due to Investment Adviser | | | 37,008 | | | | 2,792 | | | | 4,612 | | | | 50,248 | |
| Unrealized Depreciation on Spot Contracts | | | — | | | | 908 | | | | — | | | | — | |
| Payable due to Custodian | | | 17,476 | | | | — | | | | — | | | | 635 | |
| Total Liabilities | | | 1,417,064 | | | | 505,620 | | | | 4,612 | | | | 8,419,517 | |
| Net Assets | | $ | 88,760,495 | | | $ | 4,988,355 | | | $ | 7,181,777 | | | $ | 90,601,600 | |
| Net Assets Consist of: | | | | | | | | | | | | | | | | |
| Paid-in Capital | | $ | 175,862,847 | | | $ | 12,410,185 | | | $ | 11,585,920 | | | $ | 86,285,890 | |
| Undistributed Net Investment Income | | | 724,010 | | | | 34,327 | | | | 31,230 | | | | 209,519 | |
| Accumulated Net Realized Loss on Investments and Foreign Currency Transactions | | | (76,980,677 | ) | | | (7,354,830 | ) | | | (4,954,642 | ) | | | (5,354,693 | ) |
| Net Unrealized Appreciation (Depreciation) on Investments | | | (10,845,172 | ) | | | (101,627 | ) | | | 518,925 | | | | 9,459,158 | |
| Net Unrealized Appreciation (Depreciation) on Foreign Currency Translations | | | (513 | ) | | | 300 | | | | 344 | | | | 1,726 | |
| Net Assets | | $ | 88,760,495 | | | $ | 4,988,355 | | | $ | 7,181,777 | | | $ | 90,601,600 | |
| Outstanding Shares of Beneficial Interest (unlimited authorization — no par value) | | | 9,630,000 | | | | 500,000 | | | | 500,000 | | | | 3,824,975 | |
| Net Asset Value, Offering and Redemption Price Per Share | | $ | 9.22 | | | $ | 9.98 | | | $ | 14.36 | | | $ | 23.69 | |
The accompanying notes are an integral part of the financial statements.
| Statements of Assets and Liabilities |
| October 31, 2016 |
| | | Global X MSCI
Greece ETF | | | Global X MSCI
Norway ETF | | | Global X FTSE
Nordic Region
ETF | | | Global X MSCI
Nigeria ETF | |
| Assets: | | | | | | | | | | | | | | | | |
| Cost of Investments | | $ | 281,640,692 | | | $ | 131,123,889 | | | $ | 45,949,804 | | | $ | 44,980,419 | |
| Cost of Repurchase Agreement | | | 2,806,650 | | | | 31,508,904 | | | | 3,124,587 | | | | — | |
| Cost of Foreign Currency | | | 12,055 | | | | 102 | | | | 28,469 | | | | 1,316,619 | |
| Investments, at Value | | $ | 244,992,118 | * | | $ | 113,581,544 | * | | $ | 40,839,114 | * | | $ | 29,391,735 | |
| Repurchase Agreement, at Value | | | 2,806,650 | | | | 31,508,904 | | | | 3,124,587 | | | | — | |
| Cash | | | 671,391 | | | | 188,655 | | | | — | | | | — | |
| Foreign Currency, at Value | | | 12,006 | | | | 104 | | | | 11,577 | | | | 1,317,283 | |
| Dividend and Interest Receivable | | | 92,985 | | | | 275,372 | | | | 50,230 | | | | 4,435 | |
| Receivable for Capital Shares Sold | | | — | | | | — | | | | — | | | | 648,428 | |
| Reclaim Receivable | | | — | | | | — | | | | 578,041 | | | | 406 | |
| Due from Broker | | | — | | | | — | | | | — | | | | 35,578 | |
| Total Assets | | | 248,575,150 | | | | 145,554,579 | | | | 44,603,549 | | | | 31,397,865 | |
| Liabilities: | | | | | | | | | | | | | | | | |
| Obligation to Return Securities Lending Collateral | | | 2,806,650 | | | | 31,508,904 | | | | 3,124,587 | | | | — | |
| Payable due to Investment Adviser | | | 114,529 | | | | 48,570 | | | | 18,030 | | | | 14,445 | |
| Payable for Investment Securities Purchased | | | — | | | | — | | | | — | | | | 2,108,562 | |
| Cash Overdraft | | | — | | | | — | | | | 562,266 | | | | 936,456 | |
| Unrealized Depreciation on Spot Contracts | | | — | | | | — | | | | 19 | | | | 1,547 | |
| Payable due to Custodian | | | 30,619 | | | | — | | | | — | | | | 18,853 | |
| Payable for Foreign Capital Gains Tax on Appreciated Securities | | | 33,561 | | | | — | | | | — | | | | — | |
| Due to Broker | | | 28,495 | | | | — | | | | — | | | | 309,460 | |
| Total Liabilities | | | 3,013,854 | | | | 31,557,474 | | | | 3,704,902 | | | | 3,389,323 | |
| Net Assets | | $ | 245,561,296 | | | $ | 113,997,105 | | | $ | 40,898,647 | | | $ | 28,008,542 | |
| Net Assets Consist of: | | | | | | | | | | | | | | | | |
| Paid-in Capital | | $ | 481,119,636 | | | $ | 153,538,927 | | | $ | 48,724,966 | | | $ | 53,196,122 | |
| Undistributed Net Investment Income | | | 4,017,796 | | | | 2,694,337 | | | | 1,107,674 | | | | 706,368 | |
| Accumulated Net Realized Loss on Investments and Foreign Currency Transactions | | | (202,927,516 | ) | | | (24,694,375 | ) | | | (3,718,706 | ) | | | (10,305,278 | ) |
| Net Unrealized Depreciation on Investments | | | (36,648,574 | ) | | | (17,542,345 | ) | | | (5,110,690 | ) | | | (15,588,684 | ) |
| Net Unrealized Appreciation (Depreciation) on Foreign Currency Translations | | | (46 | ) | | | 561 | | | | (104,597 | ) | | | 14 | |
| Net Assets | | $ | 245,561,296 | | | $ | 113,997,105 | | | $ | 40,898,647 | | | $ | 28,008,542 | |
| Outstanding Shares of Beneficial Interest (unlimited authorization — no par value) | | | 33,400,000 | | | | 10,300,000 | | | | 2,110,000 | | | | 6,500,000 | |
| Net Asset Value, Offering and Redemption Price Per Share | | $ | 7.35 | | | $ | 11.07 | | | $ | 19.38 | | | $ | 4.31 | |
| *Includes Market Value of Securities on Loan | | $ | 2,586,020 | | | $ | 24,195,714 | | | $ | 2,140,756 | | | $ | — | |
The accompanying notes are an integral part of the financial statements.
| Statements of Assets and Liabilities |
| October 31, 2016 |
| | | Global X Next
Emerging &
Frontier ETF | | | Global X FTSE
Portugal 20 ETF | | | Global X MSCI
Pakistan ETF | |
| Assets: | | | | | | | | | | | | |
| Cost of Investments | | $ | 17,015,297 | | | $ | 35,359,044 | | | $ | 10,565,522 | |
| Cost of Repurchase Agreement | | | — | | | | 2,503,093 | | | | — | |
| Cost of Foreign Currency | | | 1,189 | | | | 10,437 | | | | 20,783 | |
| Investments, at Value | | $ | 15,072,702 | | | $ | 25,625,604 | * | | $ | 10,772,355 | |
| Cash | | | 36,344 | | | | — | | | | — | |
| Foreign Currency, at Value | | | 1,941 | | | | 10,462 | | | | 21,758 | |
| Repurchase Agreement, at Value | | | — | | | | 2,503,093 | | | | — | |
| Dividend and Interest Receivable | | | 6,423 | | | | 21,043 | | | | 134,998 | |
| Reclaim Receivable | | | 3,698 | | | | 190,376 | | | | — | |
| Receivable from Broker | | | — | | | | 2 | | | | — | |
| Total Assets | | | 15,121,108 | | | | 28,350,580 | | | | 10,929,111 | |
| Liabilities: | | | | | | | | | | | | |
| Payable due to Investment Adviser | | | 6,276 | | | | 12,033 | | | | 6,306 | |
| Obligation to Return Securities Lending Collateral | | | — | | | | 2,503,093 | | | | — | |
| Cash Overdraft | | | — | | | | 139,194 | | | | 114,713 | |
| Payable due to Custodian | | | 1,592 | | | | 2,695 | | | | 9,535 | |
| Payable for Foreign Capital Gains Tax on Appreciated Securities | | | 1,444 | | | | — | | | | 135,024 | |
| Total Liabilities | | | 9,312 | | | | 2,657,015 | | | | 265,578 | |
| Net Assets | | $ | 15,111,796 | | | $ | 25,693,565 | | | $ | 10,663,533 | |
| Net Assets Consist of: | | | | | | | | | | | | |
| Paid-in Capital | | $ | 38,091,327 | | | $ | 41,946,943 | | | $ | 10,494,604 | |
| Undistributed Net Investment Income | | | 322,196 | | | | 868,860 | | | | 258,559 | |
| Accumulated Net Realized Loss on Investments and Foreign Currency Transactions | | | (21,356,576 | ) | | | (7,369,859 | ) | | | (161,270 | ) |
| Net Unrealized Appreciation (Depreciation) on Investments | | | (1,942,595 | ) | | | (9,733,440 | ) | | | 206,833 | |
| Net Unrealized Depreciation on Foreign Currency Translations | | | (2,556 | ) | | | (18,939 | ) | | | (135,193 | ) |
| Net Assets | | $ | 15,111,796 | | | $ | 25,693,565 | | | $ | 10,663,533 | |
| Outstanding Shares of Beneficial Interest (unlimited authorization — no par value) | | | 750,000 | | | | 2,600,000 | | | | 700,000 | |
| Net Asset Value, Offering and Redemption Price Per Share | | $ | 20.15 | | | $ | 9.88 | | | $ | 15.23 | |
| *Includes Market Value of Securities on Loan | | $ | — | | | $ | 255,976 | | | $ | — | |
The accompanying notes are an integral part of the financial statements.
| Statements of Operations |
| For the year ended October 31, 2016 |
| | | Global X China
Consumer ETF | | | Global X China
Energy ETF | | | Global X China
Financials ETF | | | Global X China
Industrials ETF | |
| Investment Income: | | | | | | | | | | | | | | | | |
| Dividend Income | | $ | 1,749,235 | | | $ | 46,018 | | | $ | 769,855 | | | $ | 90,436 | |
| Interest Income | | | 169 | | | | 1 | | | | 74 | | | | 5 | |
| Security Lending Income | | | 120,256 | | | | — | | | | — | | | | — | |
| Less: Foreign Taxes Withheld | | | (35,776 | ) | | | (2,763 | ) | | | (55,479 | ) | | | (5,047 | ) |
| Total Investment Income | | | 1,833,884 | | | | 43,256 | | | | 714,450 | | | | 85,394 | |
| Supervision and Administration Fees(1) | | | 506,253 | | | | 9,883 | | | | 180,450 | | | | 26,095 | |
| Custodian Fees | | | 201 | | | | 19 | | | | 902 | | | | 129 | |
| Total Expenses | | | 506,454 | | | | 9,902 | | | | 181,352 | | | | 26,224 | |
| Net Investment Income | | | 1,327,430 | | | | 33,354 | | | | 533,098 | | | | 59,170 | |
| Net Realized Gain (Loss) on: | | | | | | | | | | | | | | | | |
| Investments | | | (13,183,652 | )(2) | | | (254,878 | ) | | | (10,834,075 | ) (2) | | | (790,007 | )(2) |
| Foreign Currency Transactions | | | (1,940 | ) | | | 14 | | | | (79 | ) | | | (43 | ) |
| Net Realized Loss on Investments and Foreign Currency Transactions | | | (13,185,592 | ) | | | (254,864 | ) | | | (10,834,154 | ) | | | (790,050 | ) |
| Net Change in Unrealized Appreciation (Depreciation) on: | | | | | | | | | | | | | | | | |
| Investments | | | 2,818,908 | | | | 113,319 | | | | 1,268,191 | | | | (1,351 | ) |
| Foreign Currency Translations | | | 3 | | | | 1 | | | | 5 | | | | 1 | |
| Net Change in Unrealized Appreciation (Depreciation) on Investments and Foreign Currency Translations | | | 2,818,911 | | | | 113,320 | | | | 1,268,196 | | | | (1,350 | ) |
| Net Realized and Unrealized Loss on Investments and Foreign Currency Transactions and Translations | | | (10,366,681 | ) | | | (141,544 | ) | | | (9,565,958 | ) | | | (791,400 | ) |
| Net Decrease in Net Assets Resulting from Operations | | $ | (9,039,251 | ) | | $ | (108,190 | ) | | $ | (9,032,860 | ) | | $ | (732,230 | ) |
| (1) | The Supervision and Administration fees includes fees paid by the Funds for the investment advisory services provided by the Adviser. (See Note 3 in Notes to Financial Statements.) |
| (2) | Includes realized gains/(losses) as a result of in-kind transactions. (See Note 4 in Notes to Financial Statements). |
The accompanying notes are an integral part of the financial statements.
| Statements of Operations |
| For the year ended October 31, 2016 |
| | | Global X China
Materials ETF | | | Global X
NASDAQ China
Technology ETF | | | Global X Southeast
Asia ETF | | | Global X FTSE
Andean 40 ETF | |
| Investment Income: | | | | | | | | | | | | | | | | |
| Dividend Income | | $ | 25,460 | | | $ | 380,411 | | | $ | 407,339 | | | $ | 86,853 | |
| Interest Income | | | 3 | | | | 22 | | | | 25 | | | | 14 | |
| Less: Foreign Taxes Withheld | | | (913 | ) | | | (4,697 | ) | | | (22,127 | ) | | | (12,752 | ) |
| Total Investment Income | | | 24,550 | | | | 375,736 | | | | 385,237 | | | | 74,115 | |
| Supervision and Administration Fees(1) | | | 8,135 | | | | 89,156 | | | | 82,254 | | | | 25,902 | |
| Custodian Fees | | | 12 | | | | 149 | | | | 19 | | | | 158 | |
| Total Expenses | | | 8,147 | | | | 89,305 | | | | 82,273 | | | | 26,060 | |
| Net Investment Income | | | 16,403 | | | | 286,431 | | | | 302,964 | | | | 48,055 | |
| Net Realized Gain (Loss) on: | | | | | | | | | | | | | | | | |
| Investments (2) | | | (241,688 | ) | | | 118,560 | | | | (1,805,790 | ) | | | (718,624 | ) |
| Foreign Currency Transactions | | | (6 | ) | | | (21 | ) | | | (4,588 | ) | | | (3,004 | ) |
| Net Realized Gain (Loss) on Investments and Foreign Currency Transactions | | | (241,694 | ) | | | 118,539 | | | | (1,810,378 | ) | | | (721,628 | ) |
| Net Change in Unrealized Appreciation (Depreciation) on: | | | | | | | | | | | | | | | | |
| Investments | | | 309,175 | | | | 331,619 | | | | 2,386,067 | | | | 1,262,564 | |
| Foreign Capital Gains Tax on Appreciated Securities | | | — | | | | — | | | | — | | | | (6,862 | ) |
| Foreign Currency Translations | | | — | | | | — | | | | (220 | ) | | | (4 | ) |
| Net Change in Unrealized Appreciation on Investments and Foreign Currency Translations | | | 309,175 | | | | 331,619 | | | | 2,385,847 | | | | 1,255,698 | |
| Net Realized and Unrealized Gain on Investments and Foreign Currency Transactions and Translations | | | 67,481 | | | | 450,158 | | | | 575,469 | | | | 534,070 | |
| Net Increase in Net Assets Resulting from Operations | | $ | 83,884 | | | $ | 736,589 | | | $ | 878,433 | | | $ | 582,125 | |
| (1) | The Supervision and Administration fees includes fees paid by the Funds for the investment advisory services provided by the Adviser. (See Note 3 in Notes to Financial Statements). |
| (2) | Includes realized gains/(losses) as a result of in-kind transactions. (See Note 4 in Notes to Financial Statements). |
The accompanying notes are an integral part of the financial statements.
| Statements of Operations |
| For the year ended October 31, 2016 |
| | | Global X MSCI
Colombia ETF | | | Global X Brazil
Mid Cap ETF | | | Global X Brazil
Consumer ETF | | | Global X MSCI
Argentina ETF | |
| Investment Income: | | | | | | | | | | | | | | | | |
| Dividend Income | | $ | 1,869,534 | | | $ | 85,712 | | | $ | 69,636 | | | $ | 874,579 | |
| Interest Income | | | 288 | | | | — | | | | — | | | | 104 | |
| Security Lending Income | | | 27,092 | | | | — | | | | — | | | | — | |
| Less: Foreign Taxes Withheld | | | (33,231 | ) | | | (802 | ) | | | (1,348 | ) | | | (98,250 | ) |
| Total Investment Income | | | 1,863,683 | | | | 84,910 | | | | 68,288 | | | | 776,433 | |
| Supervision and Administration Fees(1) | | | 514,058 | | | | 25,114 | | | | 32,344 | | | | 399,785 | |
| Tax Expense | | | – | | | | 89 | | | | 23 | | | | – | |
| Custodian Fees | | | 123,104 | | | | 40 | | | | 8 | | | | 2,466 | |
| Total Expenses | | | 637,162 | | | | 25,243 | | | | 32,375 | | | | 402,251 | |
| Waiver of Supervision and Administration Fees | | | (124,250 | ) | | | – | | | | – | | | | – | |
| Reimbursement from Adviser | | | (21,507 | ) | | | – | | | | – | | | | – | |
| Net Expenses | | | 491,405 | | | | 25,243 | | | | 32,375 | | | | 402,251 | |
| Net Investment Income | | | 1,372,278 | | | | 59,667 | | | | 35,913 | | | | 374,182 | |
| Net Realized Gain (Loss) on: | | | | | | | | | | | | | | | | |
| Investments (2) | | | (17,925,316 | ) | | | (324,455 | ) | | | (729,520 | ) | | | 3,125,005 | |
| Foreign Currency Transactions | | | (190,771 | ) | | | (557 | ) | | | 341 | | | | 4,724 | |
| Net Realized Gain (Loss) on Investments and Foreign Currency Transactions | | | (18,116,087 | ) | | | (325,012 | ) | | | (729,179 | ) | | | 3,129,729 | |
| Net Change in Unrealized Appreciation (Depreciation) on: | | | | | | | | | | | | | | | | |
| Investments | | | 23,181,837 | | | | 1,792,745 | | | | 3,023,413 | | | | 12,202,719 | |
| Foreign Currency Translations | | | (567 | ) | | | 959 | | | | 771 | | | | 1,743 | |
| Net Change in Unrealized Appreciation on Investments and Foreign Currency Translations | | | 23,181,270 | | | | 1,793,704 | | | | 3,024,184 | | | | 12,204,462 | |
| Net Realized and Unrealized Gain on Investments and Foreign Currency Transactions and Translations | | | 5,065,183 | | | | 1,468,692 | | | | 2,295,005 | | | | 15,334,191 | |
| Net Increase in Net Assets Resulting from Operations | | $ | 6,437,461 | | | $ | 1,528,359 | | | $ | 2,330,918 | | | $ | 15,708,373 | |
| (1) | The Supervision and Administration fees includes fees paid by the Funds for the investment advisory services provided by the Adviser. (See Note 3 in Notes to Financial Statements). |
| (2) | Includes realized gains/(losses) as a result of in-kind transactions. (See Note 4 in Notes to Financial Statements). |
The accompanying notes are an integral part of the financial statements.
| Statements of Operations |
| For the year ended October 31, 2016 |
| | | Global X MSCI
Greece ETF | | | Global X MSCI
Norway ETF | | | Global X FTSE Nordic
Region ETF | | | Global X MSCI
Nigeria ETF | |
| Investment Income: | | | | | | | | | | | | | | | | |
| Dividend Income | | $ | 6,120,598 | | | $ | 4,117,633 | | | $ | 1,852,136 | | | $ | 1,135,758 | |
| Interest Income | | | 1,503 | | | | 157 | | | | 5 | | | | 324 | |
| Security Lending Income | | | 30,253 | | | | 495,042 | | | | 13,448 | | | | — | |
| Less: Foreign Taxes Withheld | | | (451,827 | ) | | | (1,097,895 | ) | | | (213,811 | ) | | | (98,653 | ) |
| Total Investment Income | | | 5,700,527 | | | | 3,514,937 | | | | 1,651,778 | | | | 1,037,429 | |
| Supervision and Administration Fees(1) | | | 1,342,450 | | | | 451,973 | | | | 234,767 | | | | 146,235 | |
| Custodian Fees | | | 179,744 | | | | 162 | | | | 4,414 | | | | 89,780 | |
| Total Expenses | | | 1,522,194 | | | | 452,135 | | | | 239,181 | | | | 236,015 | |
| Reimbursement from Adviser | | | – | | | | – | | | | – | | | | (15,742 | ) |
| Net Expenses | | | 1,522,194 | | | | 452,135 | | | | 239,181 | | | | 220,273 | |
| Net Investment Income | | | 4,178,333 | | | | 3,062,802 | | | | 1,412,597 | | | | 817,156 | |
| Net Realized Gain (Loss) on: | | | | | | | | | | | | | | | | |
| Investment | | | (134,843,912 | )(2) | | | (13,079,604 | )(2) | | | (466,015 | )(2) | | | (4,784,233 | ) |
| Foreign Currency Transactions | | | 28,412 | | | | (46,647 | ) | | | (14,264 | ) | | | (80,430 | ) |
| Net Realized Loss on Investments and Foreign Currency Transactions | | | (134,815,500 | ) | | | (13,126,251 | ) | | | (480,279 | ) | | | (4,864,663 | ) |
| Net Change in Unrealized Appreciation (Depreciation) on: | | | | | | | | | | | | | | | | |
| Investments | | | 39,582,264 | | | | 19,146,533 | | | | (6,029,395 | ) | | | (7,936,674 | ) |
| Foreign Currency Translations | | | (60 | ) | | | 50,745 | | | | (23,522 | ) | | | 1,587 | |
| Net Change in Unrealized Appreciation (Depreciation) on Investments and Foreign Currency Translations | | | 39,582,204 | | | | 19,197,278 | | | | (6,052,917 | ) | | | (7,935,087 | ) |
| Net Realized and Unrealized Gain (Loss) on Investments and Foreign Currency Transactions and Translations | | | (95,233,296 | ) | | | 6,071,027 | | | | (6,533,196 | ) | | | (12,799,750 | ) |
| Net Increase (Decrease) in Net Assets Resulting from Operations | | $ | (91,054,963 | ) | | $ | 9,133,829 | | | $ | (5,120,599 | ) | | $ | (11,982,594 | ) |
| (1) | The Supervision and Administration fees includes fees paid by the Funds for the investment advisory services provided by the Adviser. (See Note 3 in Notes to Financial Statements). |
| (2) | Includes realized gains/(losses) as a result of in-kind transactions. (See Note 4 in Notes to Financial Statements). |
The accompanying notes are an integral part of the financial statements.
| Statements of Operations |
| For the year or period ended October 31, 2016 |
| | | Global X Next Emerging
& Frontier ETF | | | Global X FTSE
Portugal 20 ETF | | | Global X MSCI
Pakistan ETF | |
| Investment Income: | | | | | | | | | | | | |
| Dividend Income | | $ | 764,463 | | | $ | 1,313,310 | | | $ | 417,109 | |
| Interest Income | | | 1,031 | | | | 1,383 | | | | 39 | |
| Security Lending Income | | | — | | | | 184,325 | | | | — | |
| Less: Foreign Taxes Withheld | | | (74,984 | ) | | | (204,603 | ) | | | (51,904 | ) |
| Total Investment Income | | | 690,510 | | | | 1,294,415 | | | | 365,244 | |
| Supervision and Administration Fees(1) | | | 199,987 | | | | 146,308 | | | | 50,578 | |
| Custodian Fees | | | 28,933 | | | | 16,161 | | | | 16,742 | |
| Total Expenses | | | 228,920 | | | | 162,469 | | | | 67,320 | |
| Net Investment Income | | | 461,590 | | | | 1,131,946 | | | | 297,924 | |
| Net Realized Gain (Loss) on: | | | | | | | | | | | | |
| Investments | | | (30,853,109 | )(2) | | | 3,357,471 | )(2) | | | (133,976 | ) |
| Foreign Currency Transactions | | | 9,491 | | | | (6,147 | ) | | | (3,634 | ) |
| Net Realized Loss on Investments and Foreign Currency Transactions | | | (30,843,618 | ) | | | (3,363,618 | ) | | | (137,610 | ) |
| Net Change in Unrealized Appreciation (Depreciation) on: | | | | | | | | | | | | |
| Investments | | | 27,377,491 | | | | 75,934 | | | | 667,347 | |
| Foreign Capital Gains Tax on Appreciated Securities | | | (1,444 | ) | | | — | | | | (113,084 | ) |
| Foreign Currency Translations | | | (11,769 | ) | | | (1,452 | ) | | | 322 | |
| Net Change in Unrealized Appreciation on Investments and Foreign Currency Translations | | | 27,364,278 | | | | 74,482 | | | | 554,585 | |
| Net Realized and Unrealized Gain (Loss) on Investments and Foreign Currency Transactions and Translations | | | (3,479,340 | ) | | | (3,289,136 | ) | | | 416,975 | |
| Net Increase (Decrease) in Net Assets Resulting from Operations | | $ | (3,017,750 | ) | | $ | (2,157,190 | ) | | $ | 714,899 | |
| (1) | The Supervision and Administration fees includes fees paid by the Funds for the investment advisory services provided by the Adviser. (See Note 3 in Notes to Financial Statements). |
| (2) | Includes realized gains/(losses) as a result of in-kind transactions. (See Note 4 in Notes to Financial Statements). |
The accompanying notes are an integral part of the financial statements.
| Statements of Changes in Net Assets |
| | | Global X China Consumer ETF | | | Global X China Energy ETF | |
| | | Year Ended October 31,
2016 | | | Year Ended October 31,
2015 | | | Year Ended
October 31, 2016 | | | Year Ended
October 31, 2015 | |
| Operations: | | | | | | | | | | | | | | | | |
| Net Investment Income | | $ | 1,327,430 | | | $ | 4,078,383 | | | $ | 33,354 | | | $ | 48,211 | |
| Net Realized Gain (Loss) on Investments and Foreign Currency Transactions | | | (13,185,592 | )(1) | | | (12,633,583 | )(1) | | | (254,864 | ) | | | 79,371 | (1) |
| Net Change in Unrealized Appreciation (Depreciation) on Investments and Foreign Currency Translations | | | 2,818,911 | | | | 7,369,978 | | | | 113,320 | | | | (693,919 | ) |
| Net Decrease in Net Assets Resulting from Operations | | | (9,039,251 | ) | | | (1,185,222 | ) | | | (108,190 | ) | | | (566,337 | ) |
| Dividends and Distributions from: | | | | | | | | | | | | | | | | |
| Net Investment Income | | | (4,048,651 | ) | | | (2,353,761 | ) | | | (49,338 | ) | | | (81,629 | ) |
| Total Dividends and Distributions | | | (4,048,651 | ) | | | (2,353,761 | ) | | | (49,338 | ) | | | (81,629 | ) |
| Capital Share Transactions: | | | | | | | | | | | | | | | | |
| Issued | | | 12,709,523 | | | | 4,518,462 | | | | — | | | | — | |
| Redeemed | | | (20,549,924 | ) | | | (41,042,576 | ) | | | — | | | | (2,120,068 | ) |
| Decrease in Net Assets from Capital Share Transactions | | | (7,840,401 | ) | | | (36,524,114 | ) | | | — | | | | (2,120,068 | ) |
| Total Decrease in Net Assets | | | (20,928,303 | ) | | | (40,063,097 | ) | | | (157,528 | ) | | | (2,768,034 | ) |
| Net Assets: | | | | | | | | | | | | | | | | |
| Beginning of Year | | | 93,950,939 | | | | 134,014,036 | | | | 1,740,803 | | | | 4,508,837 | |
| End of Year | | $ | 73,022,636 | | | $ | 93,950,939 | | | $ | 1,583,275 | | | $ | 1,740,803 | |
| Undistributed Net Investment Income | | $ | 922,520 | | | $ | 3,540,439 | | | $ | 32,231 | | | $ | 48,201 | |
| Share Transactions: | | | | | | | | | | | | | | | | |
| Issued | | | 1,200,000 | | | | 350,000 | | | | — | | | | — | |
| Redeemed | | | (1,950,000 | ) | | | (3,200,000 | ) | | | — | | | | (150,000 | ) |
| Net Decrease in Shares Outstanding from Share Transactions | | | (750,000 | ) | | | (2,850,000 | ) | | | — | | | | (150,000 | ) |
(1) Includes realized gains/(losses) as a result of in-kind transactions. (See Note 4 in Notes to Financial Statements).
The accompanying notes are an integral part of the financial statements.
| Statements of Changes in Net Assets |
| | | Global X China Financials ETF | | | Global X China Industrials ETF | |
| | | Year Ended October 31, 2016 | | | Year Ended October 31, 2015 | | | Year Ended October 31, 2016 | | | Year Ended October 31, 2015 | |
| Operations: | | | | | | | | | | | | | | | | |
| Net Investment Income | | $ | 533,098 | | | $ | 2,726,683 | | | $ | 59,170 | | | $ | 99,429 | |
| Net Realized Gain (Loss) on Investments and Foreign Currency Transactions(1) | | | (10,834,154 | ) | | | 3,004,884 | | | | (790,050 | ) | | | 861,527 | |
| Net Change in Unrealized Appreciation (Depreciation) on Investments and Foreign Currency Translations | | | 1,268,196 | | | | (2,867,620 | ) | | | (1,350 | ) | | | (1,121,417 | ) |
| Net Increase (Decrease) in Net Assets Resulting from Operations | | | (9,032,860 | ) | | | 2,863,947 | | | | (732,230 | ) | | | (160,461 | ) |
| Dividends and Distributions from: | | | | | | | | | | | | | | | | |
| Net Investment Income | | | (2,772,013 | ) | | | (617,666 | ) | | | (103,249 | ) | | | (44,362 | ) |
| Total Dividends and Distributions | | | (2,772,013 | ) | | | (617,666 | ) | | | (103,249 | ) | | | (44,362 | ) |
| Capital Share Transactions: | | | | | | | | | | | | | | | | |
| Issued | | | 11,582,475 | | | | 45,839,534 | | | | — | | | | 6,125,108 | |
| Redeemed | | | (28,846,647 | ) | | | (39,313,495 | ) | | | (2,616,503 | ) | | | (4,518,645 | ) |
| Increase (Decrease) in Net Assets from Capital Share Transactions | | | (17,264,172 | ) | | | 6,526,039 | | | | (2,616,503 | ) | | | 1,606,463 | |
| Total Increase (Decrease) in Net Assets | | | (29,069,045 | ) | | | 8,772,320 | | | | (3,451,982 | ) | | | 1,401,640 | |
| Net Assets: | | | | | | | | | | | | | | | | |
| Beginning of Year | | | 57,357,654 | | | | 48,585,334 | | | | 7,222,274 | | | | 5,820,634 | |
| End of Year | | $ | 28,288,609 | | | $ | 57,357,654 | | | $ | 3,770,292 | | | $ | 7,222,274 | |
| Undistributed Net Investment Income | | $ | 528,232 | | | $ | 2,726,593 | | | $ | 51,038 | | | $ | 95,160 | |
| Share Transactions: | | | | | | | | | | | | | | | | |
| Issued | | | 800,000 | | | | 2,850,000 | | | | — | | | | 350,000 | |
| Redeemed | | | (2,600,000 | ) | | | (2,600,000 | ) | | | (200,000 | ) | | | (300,000 | ) |
| Net Increase (Decrease) in Shares Outstanding from Share Transactions | | | (1,800,000 | ) | | | 250,000 | | | | (200,000 | ) | | | 50,000 | |
(1) Includes realized gains/(losses) as a result of in-kind transactions. (See Note 4 in Notes to Financial Statements).
The accompanying notes are an integral part of the financial statements.
| Statements of Changes in Net Assets |
| | | Global X China Materials ETF | | | Global X NASDAQ China Technology
ETF | |
| | | Year Ended October 31, 2016 | | | Year Ended October 31, 2015 | | | Year Ended October 31, 2016 | | | Year Ended October 31, 2015 | |
| Operations: | | | | | | | | | | | | | | | | |
| Net Investment Income | | $ | 16,403 | | | $ | 70,649 | | | $ | 286,431 | | | $ | 99,519 | |
| Net Realized Gain (Loss) on Investments and Foreign Currency Transactions(1) | | | (241,694 | ) | | | (389,807 | ) | | | 118,539 | | | | 426,927 | |
| Net Change in Unrealized Appreciation (Depreciation) on Investments and Foreign Currency Translations | | | 309,175 | | | | (339,993 | ) | | | 331,619 | | | | (2,620,410 | ) |
| Net Increase (Decrease) in Net Assets Resulting from Operations | | | 83,884 | | | | (659,151 | ) | | | 736,589 | | | | (2,093,964 | ) |
| Dividends and Distributions from: | | | | | | | | | | | | | | | | |
| Net Investment Income | | | (70,832 | ) | | | (30,768 | ) | | | (100,894 | ) | | | (64,823 | ) |
| Total Dividends and Distributions | | | (70,832 | ) | | | (30,768 | ) | | | (100,894 | ) | | | (64,823 | ) |
| Capital Share Transactions: | | | | | | | | | | | | | | | | |
| Issued | | | — | | | | 4,880,764 | | | | — | | | | 2,507,379 | |
| Redeemed | | | — | | | | (5,821,646 | ) | | | (2,099,886 | ) | | | (7,251,028 | ) |
| Decrease in Net Assets from Capital Share Transactions | | | — | | | | (940,882 | ) | | | (2,099,886 | ) | | | (4,743,649 | ) |
| Total Increase (Decrease) in Net Assets | | | 13,052 | | | | (1,630,801 | ) | | | (1,464,191 | ) | | | (6,902,436 | ) |
| Net Assets: | | | | | | | | | | | | | | | | |
| Beginning of Year | | | 1,328,518 | | | | 2,959,319 | | | | 15,404,435 | | | | 22,306,871 | |
| End of Year | | $ | 1,341,570 | | | $ | 1,328,518 | | | $ | 13,940,244 | | | $ | 15,404,435 | |
| Undistributed Net Investment Income | | $ | 16,196 | | | $ | 70,631 | | | $ | 277,404 | | | $ | 91,745 | |
| Share Transactions: | | | | | | | | | | | | | | | | |
| Issued | | | — | | | | 250,000 | | | | — | | | | 100,000 | |
| Redeemed | | | — | | | | (350,000 | ) | | | (100,000 | ) | | | (350,000 | ) |
| Net Decrease in Shares Outstanding from Share Transactions | | | — | | | | (100,000 | ) | | | (100,000 | ) | | | (250,000 | ) |
(1) Includes realized gains/(losses) as a result of in-kind transactions. (See Note 4 in Notes to Financial Statements.)
The accompanying notes are an integral part of the financial statements.
| Statements of Changes in Net Assets |
| | | Global X Southeast Asia ETF | | | Global X FTSE Andean 40 ETF | |
| | | Year Ended
October 31, 2016 | | | Year Ended
October 31, 2015 | | | Year Ended
October 31, 2016 | | | Year Ended
October 31, 2015 | |
| Operations: | | | | | | | | | | | | | | | | |
| Net Investment Income | | $ | 302,964 | | | $ | 499,498 | | | $ | 48,055 | | | $ | 116,375 | |
| Net Realized Loss on Investments and Foreign Currency Transactions(1) | | | (1,810,378 | ) | | | (3,073,750 | ) | | | (721,628 | ) | | | (1,894,002 | ) |
| Net Change in Unrealized Appreciation (Depreciation) on Investments and Foreign Currency Translations | | | 2,385,847 | | | | (2,491,872 | ) | | | 1,255,698 | | | | (313,544 | ) |
| Net Increase (Decrease) in Net Assets Resulting from Operations | | | 878,433 | | | | (5,066,124 | ) | | | 582,125 | | | | (2,091,171 | ) |
| Dividends and Distributions from: | | | | | | | | | | | | | | | | |
| Net Investment Income | | | (486,151 | ) | | | (689,799 | ) | | | (85,704 | ) | | | (168,007 | ) |
| Total Dividends and Distributions | | | (486,151 | ) | | | (689,799 | ) | | | (85,704 | ) | | | (168,007 | ) |
| Capital Share Transactions: | | | | | | | | | | | | | | | | |
| Issued | | | — | | | | 1,664,730 | | | | 318,633 | | | | 432,014 | |
| Redeemed | | | (2,418,748 | ) | | | (10,868,937 | ) | | | — | | | | (3,930,506 | ) |
| Increase (Decrease) in Net Assets from Capital Share Transactions | | | (2,418,748 | ) | | | (9,204,207 | ) | | | 318,633 | | | | (3,498,492 | ) |
| Total Increase (Decrease) in Net Assets | | | (2,026,466 | ) | | | (14,960,130 | ) | | | 815,054 | | | | (5,757,670 | ) |
| Net Assets: | | | | | | | | | | | | | | | | |
| Beginning of Year | | | 14,375,833 | | | | 29,335,963 | | | | 3,252,788 | | | | 9,010,458 | |
| End of Year | | $ | 12,349,367 | | | $ | 14,375,833 | | | $ | 4,067,842 | | | $ | 3,252,788 | |
| Undistributed Net Investment Income | | $ | 260,146 | | | $ | 447,921 | | | $ | 40,586 | | | $ | 80,784 | |
| Share Transactions: | | | | | | | | | | | | | | | | |
| Issued | | | — | | | | 100,000 | | | | 50,000 | | | | 50,000 | |
| Redeemed | | | (200,000 | ) | | | (750,000 | ) | | | — | | | | (450,000 | ) |
| Net Increase (Decrease) in Shares Outstanding from Share Transactions | | | (200,000 | ) | | | (650,000 | ) | | | 50,000 | | | | (400,000 | ) |
| (1) | Includes realized gains/(losses) as a result of in-kind transactions. (See Note 4 in Notes to Financial Statements). |
The accompanying notes are an integral part of the financial statements.
| Statements of Changes in Net Assets |
| | | Global X MSCI Colombia ETF | | | Global X Brazil Mid Cap ETF | |
| | | Year Ended
October 31, 2016 | | | Year Ended
October 31, 2015 | | | Year Ended
October 31, 2016 | | | Year Ended
October 31, 2015 | |
| Operations: | | | | | | | | | | | | | | | | |
| Net Investment Income | | $ | 1,372,278 | | | $ | 2,046,015 | | | $ | 59,667 | | | $ | 110,234 | |
| Net Realized Loss on Investments and Foreign Currency Transactions(1) | | | (18,116,087 | ) | | | (33,449,177 | ) | | | (325,012 | ) | | | (2,034,312 | ) |
| Net Change in Unrealized Appreciation (Depreciation) on Investments and Foreign Currency Translations | | | 23,181,270 | | | | (18,888,106 | ) | | | 1,793,704 | | | | (863,040 | ) |
| Net Increase (Decrease) in Net Assets Resulting from Operations | | | 6,437,461 | | | | (50,291,268 | ) | | | 1,528,359 | | | | (2,787,118 | ) |
| Dividends and Distributions from: | | | | | | | | | | | | | | | | |
| Net Investment Income | | | (948,793 | ) | | | (2,318,237 | ) | | | (80,368 | ) | | | (242,176 | ) |
| Total Dividends and Distributions | | | (948,793 | ) | | | (2,318,237 | ) | | | (80,368 | ) | | | (242,176 | ) |
| Capital Share Transactions: | | | | | | | | | | | | | | | | |
| Issued | | | 22,093,246 | | | | 45,234,599 | | | | 1,877,362 | | | | — | |
| Redeemed | | | (5,437,401 | ) | | | (26,696,623 | ) | | | (1,426,319 | ) | | | (1,823,648 | ) |
| Increase (Decrease) in Net Assets from Capital Share Transactions | | | 16,655,845 | | | | 18,537,976 | | | | 451,043 | | | | (1,823,648 | ) |
| Total Increase (Decrease) in Net Assets | | | 22,144,513 | | | | (34,071,529 | ) | | | 1,899,034 | | | | (4,852,942 | ) |
| Net Assets: | | | | | | | | | | | | | | | | |
| Beginning of Year | | | 66,615,982 | | | | 100,687,511 | | | | 3,089,321 | | | | 7,942,263 | |
| End of Year | | $ | 88,760,495 | | | $ | 66,615,982 | | | $ | 4,988,355 | | | $ | 3,089,321 | |
| Undistributed Net Investment Income | | $ | 724,010 | | | $ | 491,296 | | | $ | 34,327 | | | $ | 55,329 | |
| Share Transactions: | | | | | | | | | | | | | | | | |
| Issued | | | 2,650,000 | | | | 4,150,000 | | | | 200,000 | | | | — | |
| Redeemed | | | (600,000 | ) | | | (2,350,000 | ) | | | (150,000 | ) | | | (200,000 | ) |
| Net Increase (Decrease) in Shares Outstanding from Share Transactions | | | 2,050,000 | | | | 1,800,000 | | | | 50,000 | | | | (200,000 | ) |
(1) Includes realized gains(losses) as a result of in-kind transactions. (See Note 4 in Notes to Financial Statements).
The accompanying notes are an integral part of the financial statements.
| Statements of Changes in Net Assets |
| | | Global X Brazil Consumer ETF | | | Global X MSCI Argentina ETF | |
| | | Year Ended
October 31, 2016 | | | Year Ended
October 31, 2015 | | | Year Ended
October 31, 2016 | | | Year Ended
October 31, 2015 | |
| Operations: | | | | | | | | | | | | | | | | |
| Net Investment Income | | $ | 35,913 | | | $ | 80,600 | | | $ | 374,182 | | | $ | 101,821 | |
| Net Realized Gain (Loss) on Investments and Foreign Currency Transactions(1) | | | (729,179 | ) | | | (1,712,549 | ) | | | 3,129,729 | | | | (416,473 | ) |
| Net Change in Unrealized Appreciation (Depreciation) on Investments and Foreign Currency Translations | | | 3,024,184 | | | | (2,485,770 | ) | | | 12,204,462 | | | | (1,540,989 | ) |
| Net Increase (Decrease) in Net Assets Resulting from Operations | | | 2,330,918 | | | | (4,117,719 | ) | | | 15,708,373 | | | | (1,855,641 | ) |
| Dividends and Distributions from: | | | | | | | | | | | | | | | | |
| Net Investment Income | | | (41,505 | ) | | | (240,598 | ) | | | (213,754 | ) | | | (90,100 | ) |
| Total Dividends and Distributions | | | (41,505 | ) | | | (240,598 | ) | | | (213,754 | ) | | | (90,100 | ) |
| Capital Share Transactions: | | | | | | | | | | | | | | | | |
| Issued | | | 1,921,732 | | | | — | | | | 78,356,541 | | | | 4,191,155 | |
| Redeemed | | | — | | | | (2,613,701 | ) | | | (18,604,618 | ) | | | (7,542,603 | ) |
| Increase (Decrease) in Net Assets from Capital Share Transactions | | | 1,921,732 | | | | (2,613,701 | ) | | | 59,751,923 | | | | (3,351,448 | ) |
| Total Increase (Decrease) in Net Assets | | | 4,211,145 | | | | (6,972,018 | ) | | | 75,246,542 | | | | (5,297,189 | ) |
| Net Assets: | | | | | | | | | | | | | | | | |
| Beginning of Year | | | 2,970,632 | | | | 9,942,650 | | | | 15,355,058 | | | | 20,652,247 | |
| End of Year | | $ | 7,181,777 | | | $ | 2,970,632 | | | $ | 90,601,600 | | | $ | 15,355,058 | |
| Undistributed Net Investment Income | | $ | 31,230 | | | $ | 36,221 | | | $ | 209,519 | | | $ | 44,367 | |
| Share Transactions: | | | | | | | | | | | | | | | | |
| Issued | | | 150,000 | | | | — | | | | 3,900,000 | | | | 200,000 | |
| Redeemed | | | — | | | | (250,000 | ) | | | (850,000 | ) | | | (400,000 | ) |
| Net Increase (Decrease) in Shares Outstanding from Share Transactions | | | 150,000 | | | | (250,000 | ) | | | 3,050,000 | | | | (200,000 | ) |
(1) Includes realized gains/(losses) as a result of in-kind transactions. (See Note 4 in Notes to Financial Statements).
The accompanying notes are an integral part of the financial statements.
| Statements of Changes in Net Assets |
| | | Global X MSCI Greece ETF | | | Global X MSCI Norway ETF | |
| | | Year Ended
October 31, 2016 | | | Year Ended
October 31, 2015 | | | Year Ended
October 31, 2016 | | | Year Ended
October 31, 2015 | |
| Operations: | | | | | | | | | | | | | | | | |
| Net Investment Income | | $ | 4,178,333 | | | $ | 3,821,536 | | | $ | 3,062,802 | | | $ | 2,491,201 | |
| Net Realized Loss on Investments and Foreign Currency Transactions(1) | | | (134,815,500 | ) | | | (76,225,431 | ) | | | (13,126,251 | ) | | | (26,825,038 | ) |
| Net Change in Unrealized Appreciation (Depreciation) on Investments and Foreign Currency Translations | | | 39,582,204 | | | | (8,460,738 | ) | | | 19,197,278 | | | | (7,387,842 | ) |
| Net Increase (Decrease) in Net Assets Resulting from Operations | | | (91,054,963 | ) | | | (80,864,633 | ) | | | 9,133,829 | | | | (31,721,679 | ) |
| Dividends and Distributions from: | | | | | | | | | | | | | | | | |
| Net Investment Income | | | (3,840,043 | ) | | | (956,353 | ) | | | (2,212,531 | ) | | | (4,921,308 | ) |
| Total Dividends and Distributions | | | (3,840,043 | ) | | | (956,353 | ) | | | (2,212,531 | ) | | | (4,921,308 | ) |
| Capital Share Transactions: | | | | | | | | | | | | | | | | |
| Issued | | | 71,752,872 | | | | 336,524,730 | | | | 54,452,738 | | | | 41,588,211 | |
| Redeemed | | | (46,203,761 | ) | | | (79,997,814 | ) | | | (12,400,772 | ) | | | (122,958,997 | ) |
| Increase (Decrease) in Net Assets from Capital Share Transactions | | | 25,549,111 | | | | 256,526,916 | | | | 42,051,966 | | | | (81,370,786 | ) |
| Total Increase (Decrease) in Net Assets | | | (69,345,895 | ) | | | 174,705,930 | | | | 48,973,264 | | | | (118,013,773 | ) |
| Net Assets: | | | | | | | | | | | | | | | | |
| Beginning of Year | | | 314,907,191 | | | | 140,201,261 | | | | 65,023,841 | | | | 183,037,614 | |
| End of Year | | $ | 245,561,296 | | | $ | 314,907,191 | | | $ | 113,997,105 | | | $ | 65,023,841 | |
| Undistributed Net Investment Income | | $ | 4,017,796 | | | $ | 3,523,899 | | | $ | 2,694,337 | | | $ | 1,890,655 | |
| Share Transactions: | | | | | | | | | | | | | | | | |
| Issued | | | 8,850,000 | | | | 28,000,000 | | | | 5,450,000 | | | | 3,200,000 | |
| Redeemed | | | (5,700,000 | ) | | | (6,600,000 | ) | | | (1,200,000 | ) | | | (9,500,000 | ) |
| Net Increase (Decrease) in Shares Outstanding from Share Transactions | | | 3,150,000 | | | | 21,400,000 | | | | 4,250,000 | | | | (6,300,000 | ) |
| (1) | Includes realized gains/(losses) as a result of in-kind transactions. (See Note 4 in Notes to Financial Statements). |
The accompanying notes are an integral part of the financial statements.
| Statements of Changes in Net Assets |
| | | Global X FTSE Nordic Region ETF | | | Global X MSCI Nigeria ETF | |
| | | Year Ended October 31,
2016 | | | Year Ended October 31,
2015 | | | Year Ended
October 31, 2016 | | | Year Ended
October 31, 2015 | |
| Operations: | | | | | | | | | | | | | | | | |
| Net Investment Income | | $ | 1,412,597 | | | $ | 1,410,352 | | | $ | 817,156 | | | $ | 908,373 | |
| Net Realized Loss on Investments and Foreign Currency Transactions | | | (480,279 | )(1) | | | (325,550 | )(1) | | | (4,864,663 | ) | | | (4,431,226 | ) |
| Net Change in Unrealized Depreciation on Investments and Foreign Currency Translations | | | (6,052,917 | ) | | | (4,012,414 | ) | | | (7,935,087 | ) | | | (5,677,883 | ) |
| Net Decrease in Net Assets Resulting from Operations | | | (5,120,599 | ) | | | (2,927,612 | ) | | | (11,982,594 | ) | | | (9,200,736 | ) |
| Dividends and Distributions from: | | | | | | | | | | | | | | | | |
| Net Investment Income | | | (1,490,826 | ) | | | (2,045,741 | ) | | | (850,578 | ) | | | (505,208 | ) |
| Total Dividends and Distributions | | | (1,490,826 | ) | | | (2,045,741 | ) | | | (850,578 | ) | | | (505,208 | ) |
| Capital Share Transactions: | | | | | | | | | | | | | | | | |
| Issued | | | — | | | | 2,475,978 | | | | 18,433,905 | | | | 19,080,421 | |
| Redeemed | | | (5,085,717 | ) | | | (4,833,389 | ) | | | (2,215,314 | ) | | | (1,675,335 | ) |
| Increase (Decrease) in Net Assets from Capital Share Transactions | | | (5,085,717 | ) | | | (2,357,411 | ) | | | 16,218,591 | | | | 17,405,086 | |
| Total Increase (Decrease) in Net Assets | | | (11,697,142 | ) | | | (7,330,764 | ) | | | 3,385,419 | | | | 7,699,142 | |
| Net Assets: | | | | | | | | | | | | | | | | |
| Beginning of Year | | | 52,595,789 | | | | 59,926,553 | | | | 24,623,123 | | | | 16,923,981 | |
| End of Year | | $ | 40,898,647 | | | $ | 52,595,789 | | | $ | 28,008,542 | | | $ | 24,623,123 | |
| Undistributed Net Investment Income | | $ | 1,107,674 | | | $ | 1,135,677 | | | $ | 706,368 | | | $ | 820,220 | |
| Share Transactions: | | | | | | | | | | | | | | | | |
| Issued | | | — | | | | 100,000 | | | | 3,700,000 | | | | 2,000,000 | |
| Redeemed | | | (250,000 | ) | | | (200,000 | ) | | | (300,000 | ) | | | (200,000 | ) |
| Net Increase (Decrease) in Shares Outstanding from Share Transactions | | | (250,000 | ) | | | (100,000 | ) | | | 3,400,000 | | | | 1,800,000 | |
(1) Includes realized gains/(losses) as a result of in-kind transactions. (See Note 4 in Notes to Financial Statements).
The accompanying notes are an integral part of the financial statements.
| Statements of Changes in Net Assets |
| | | Global X Next Emerging & Frontier
ETF | | | Global X FTSE Portugal 20 ETF | |
| | | Year Ended
October 31, 2016 | | | Year Ended
October 31, 2015 | | | Year Ended
October 31, 2016 | | | Year Ended
October 31, 2015 | |
| Operations: | | | | | | | | | | | | | | | | |
| Net Investment Income | | $ | 461,590 | | | $ | 2,874,787 | | | $ | 1,131,946 | | | $ | 1,001,642 | |
| Net Realized Loss on Investments and Foreign Currency Transactions(1) | | | (30,843,618 | ) | | | (10,679,341 | ) | | | (3,363,618 | ) | | | (4,824,501 | ) |
| Net Change in Unrealized Appreciation (Depreciation) on Investments and Foreign Currency Translations | | | 27,364,278 | | | | (27,226,842 | ) | | | 74,482 | | | | (1,698,130 | ) |
| Net Decrease in Net Assets Resulting from Operations | | | (3,017,750 | ) | | | (35,031,396 | ) | | | (2,157,190 | ) | | | (5,520,989 | ) |
| Dividends and Distributions from: | | | | | | | | | | | | | | | | |
| Net Investment Income | | | (2,414,376 | ) | | | (2,316,518 | ) | | | (1,260,520 | ) | | | (575,663 | ) |
| Total Dividends and Distributions | | | (2,414,376 | ) | | | (2,316,518 | ) | | | (1,260,520 | ) | | | (575,663 | ) |
| Capital Share Transactions: | | | | | | | | | | | | | | | | |
| Issued | | | 2,018,082 | | | | 8,809,775 | | | | 5,179,446 | | | | 25,089,819 | |
| Redeemed | | | (88,399,190 | ) | | | (16,563,940 | ) | | | (13,516,694 | ) | | | (18,236,165 | ) |
| Increase (Decrease) in Net Assets from Capital Share Transactions | | | (86,381,108 | ) | | | (7,754,165 | ) | | | (8,337,248 | ) | | | 6,853,654 | |
| Total Increase (Decrease) in Net Assets | | | (91,813,234 | ) | | | (45,102,079 | ) | | | (11,754,958 | ) | | | 757,002 | |
| Net Assets: | | | | | | | | | | | | | | | | |
| Beginning of Year | | | 106,925,030 | | | | 152,027,109 | | | | 37,448,523 | | | | 36,691,521 | |
| End of Year | | $ | 15,111,796 | | | $ | 106,925,030 | | | $ | 25,693,565 | | | $ | 37,448,523 | |
| Undistributed Net Investment Income | | $ | 322,196 | | | $ | 2,242,259 | | | $ | 868,860 | | | $ | 1,003,581 | |
| Share Transactions: | | | | | | | | | | | | | | | | |
| Issued | | | 100,000 | | | | 400,000 | | | | 500,000 | | | | 2,200,000 | |
| Redeemed | | | (4,900,000 | ) | | | (800,000 | ) | | | (1,350,000 | ) | | | (1,650,000 | ) |
| Net Increase (Decrease) in Shares Outstanding from Share Transactions | | | (4,800,000 | ) | | | (400,000 | ) | | | (850,000 | ) | | | 550,000 | |
(1) Includes realized gains(losses) as a result of in-kind transactions. (See Note 4 in Notes to Financial Statements).
The accompanying notes are an integral part of the financial statements.
| Statements of Changes in Net Assets |
| | | Global X MSCI Pakistan ETF | |
| | | Year Ended
October 31, 2016 | | | Period Ended
October 31, 2015(1) | |
| Operations: | | | | | | | | |
| Net Investment Income | | $ | 297,924 | | | $ | 110,549 | |
| Net Realized Loss on Investments and Foreign Currency Transactions | | | (137,610 | ) | | | (8,726 | ) |
| Net Change in Unrealized Appreciation (Depreciation) on Investments and Foreign Currency Translations | | | 554,585 | | | | (482,945 | ) |
| Net Increase (Decrease) in Net Assets Resulting from Operations | | | 714,899 | | | | (381,122 | ) |
| Dividends and Distributions from: | | | | | | | | |
| Net Investment Income | | | (146,008 | ) | | | — | |
| Net Realized Gains | | | (18,840 | ) | | | — | |
| Total Dividends and Distributions | | | (164,848 | ) | | | — | |
| Capital Share Transactions: | | | | | | | | |
| Issued | | | 4,446,623 | | | | 6,047,981 | |
| Total Increase in Net Assets | | | 4,996,674 | | | | 5,666,859 | |
| Net Assets: | | | | | | | | |
| Beginning of Year/Period | | | 5,666,859 | | | | — | |
| End of Year/Period | | $ | 10,663,533 | | | $ | 5,666,859 | |
| Undistributed Net Investment Income | | $ | 258,559 | | | $ | 110,195 | |
| Share Transactions: | | | | | | | | |
| Issued | | | 300,000 | | | | 400,000 | |
| Net Increase in Shares Outstanding from Share Transactions | | | 300,000 | | | | 400,000 | |
(1) Commenced operations on April 22, 2015.
The accompanying notes are an integral part of the financial statements.
Selected Per Share Data & Ratios
For a Share Outstanding Throughout the Period
| | | Net Asset
Value,
Beginning
of Period
($) | | | Net
Investment
Income ($)* | | | Net Realized
and
Unrealized
Gain (Loss)
on
Investments
($) | | | Total from
Operations
($) | | | Distribution
from Net
Investment
Income ($) | | | Distribution
from
Capital
Gains ($) | | | Total from
Distributions
($) | | | Net Asset
Value, End
of Period ($) | | | Total
Return
(%)** | | | Net Assets
End of
Period
($)(000) | | | Ratio of
Expenses
to Average
Net Assets
(%) | | | Ratio of Net
Investment
Income to
Average
Net Assets
(%) | | | Portfolio
Turnover
(%) †† | |
| Global X China Consumer ETF | | | | | | | | | | | | | | | | | | | | | | | | | | | | | | | | | | | | | |
| 2016 | | | 13.72 | | | | 0 .20 | | | | (1 .36) | | | | (1 .16) | | | | (0 .59) | | | | — | | | | (0 .59) | | | | 11.97 | | | | (8 .57) | | | | 73,023 | | | | 0 .65 | | | | 1 .71 | | | | 38 .13 | |
| 2015 | | | 13.82 | | | | 0 .53 | | | | (0 .37) | | | | 0 .16 | | | | (0 .26) | | | | — | | | | (0 .26) | | | | 13.72 | | | | 1 .34 | | | | 93,951 | | | | 0 .65 | | | | 3 .86 | | | | 24 .57 | |
| 2014 | | | 15.87 | | | | 0 .17 | | | | (2 .07) | | | | (1 .90) | | | | (0 .15) | | | | — | | | | (0 .15) | | | | 13.82 | | | | (12 .09) | | | | 134,014 | | | | 0 .65 | | | | 1 .18 | | | | 18 .89 | |
| 2013 | | | 14.00 | | | | 0 .16 | | | | 1 .88 | | | | 2 .04 | | | | (0 .17) | | | | — | | | | (0 .17) | | | | 15.87 | | | | 14 .66 | | | | 170,554 | | | | 0 .65 | | | | 1 .11 | | | | 27 .76 | |
| 2012 | | | 15.29 | | | | 0 .24 | | | | (1 .47) | | | | (1 .23) | | | | (0 .06) | | | | — | | | | (0 .06) | | | | 14.00 | | | | (8 .06) | | | | 126,715 | | | | 0 .65 | | | | 1 .73 | | | | 17 .32 | |
| Global X China Energy ETF | | | | | | | | | | | | | | | | | | | | | | | | | | | | | | | | | | | | | |
| 2016 | | | 11.61 | | | | 0 .22 | | | | (0 .94) | | | | (0 .72) | | | | (0 .33) | | | | — | | | | (0 .33) | | | | 10.56 | | | | (6 .11) | | | | 1,583 | | | | 0 .65 | | | | 2 .19 | | | | 22 .19 | |
| 2015 | | | 15.03 | | | | 0 .22 | | | | (3 .31) | | | | (3 .09) | | | | (0 .33) | | | | — | | | | (0 .33) | | | | 11.61 | | | | (20 .89) | | | | 1,741 | | | | 0 .65 | | | | 1 .66 | | | | 15 .62 | |
| 2014 | | | 15.11 | | | | 0 .29 | | | | (0 .09) | | | | 0 .20 | | | | (0 .28) | | | | — | | | | (0 .28) | | | | 15.03 | | | | 1 .34 | | | | 4,509 | | | | 0 .65 | | | | 1 .90 | | | | 12 .65 | |
| 2013 | | | 13.76 | | | | 0 .26 | | | | 1 .34 | | | | 1 .60 | | | | (0 .25) | | | | — | | | | (0 .25) | | | | 15.11 | | | | 11 .72 | | | | 4,534 | | | | 0 .65 | | | | 1 .82 | | | | 24 .41 | |
| 2012 | | | 13.78 | | | | 0 .25 | | | | (0 .01) | | | | 0 .24 | | | | (0 .26) | | | | — | | | | (0 .26) | | | | 13.76 | | | | 1 .87 | | | | 4,816 | | | | 0 .65 | | | | 1 .85 | | | | 17 .22 | |
| Global X China Financials ETF | | | | | | | | | | | | | | | | | | | | | | | | | | | | | | | | | | | | | |
| 2016 | | | 14.90 | | | | 0 .25 | | | | (0 .62) | | | | (0 .37) | | | | (0 .73) | | | | — | | | | (0 .73) | | | | 13.80 | | | | (2 .56) | | | | 28,289 | | | | 0 .65 | | | | 1 .92 | | | | 18 .43 | |
| 2015 | | | 13.50 | | | | 0 .54 | | | | 1 .02 | | | | 1 .56 | | | | (0 .16) | | | | — | | | | (0 .16) | | | | 14.90 | | | | 11 .50 | | | | 57,358 | | | | 0 .65 | | | | 3 .34 | | | | 15 .88 | |
| 2014 | | | 13.29 | | | | 0 .23 | | | | 0 .05^ | | | | 0 .28 | | | | (0 .07) | | | | — | | | | (0 .07) | | | | 13.50 | | | | 2 .08 | | | | 48,585 | | | | 0 .65 | | | | 1 .76 | | | | 6 .90 | |
| 2013 | | | 12.03 | | | | 0 .27 | | | | 1 .36 | | | | 1 .63 | | | | (0 .37) | | | | — | | | | (0 .37) | | | | 13.29 | | | | 13 .61 | | | | 42,518 | | | | 0 .65 | | | | 2 .09 | | | | 33 .49 | |
| 2012 | | | 10.92 | | | | 0 .20 | | | | 0 .92 | | | | 1 .12 | | | | (0 .01) | | | | — | | | | (0 .01) | | | | 12.03 | | | | 10 .28 | | | | 6,013 | | | | 0 .65 | | | | 1 .76 | | | | 14 .02 | |
| Global X China Industrials ETF | | | | | | | | | | | | | | | | | | | | | | | | | | | | | | | | | | | | | |
| 2016 | | | 14.44 | | | | 0 .18 | | | | (1 .71) | | | | (1 .53) | | | | (0 .34) | | | | — | | | | (0 .34) | | | | 12.57 | | | | (10 .60) | | | | 3,770 | | | | 0 .65 | | | | 1 .47 | | | | 14 .08 | |
| 2015 | | | 12.93 | | | | 0 .21 | | | | 1 .40 | | | | 1 .61 | | | | (0 .10) | | | | — | | | | (0 .10) | | | | 14.44 | | | | 12 .49 | | | | 7,222 | | | | 0 .65 | | | | 1 .38 | | | | 23 .87 | |
| 2014 | | | 12.14 | | | | 0 .15 | | | | 0 .83 | | | | 0 .98 | | | | (0 .19) | | | | — | | | | (0 .19) | | | | 12.93 | | | | 8 .13 | | | | 5,821 | | | | 0 .65 | | | | 1 .24 | | | | 10 .61 | |
| 2013 | | | 11.40 | | | | 0 .15 | | | | 0 .75 | | | | 0 .90 | | | | (0 .16) | | | | — | | | | (0 .16) | | | | 12.14 | | | | 7 .89 | | | | 4,248 | | | | 0 .65 | | | | 1 .28 | | | | 19 .01 | |
| 2012 | | | 11.39 | | | | 0 .16 | | | | (0 .13) | | | | 0 .03 | | | | (0 .02) | | | | — | | | | (0 .02) | | | | 11.40 | | | | 0 .30 | | | | 4,561 | | | | 0 .65 | | | | 1 .48 | | | | 23 .00 | |
| Global X China Materials ETF | | | | | | | | | | | | | | | | | | | | | | | | | | | | | | | | | | | | | |
| 2016 | | | 13.29 | | | | 0 .16 | | | | 0 .68 | | | | 0 .84 | | | | (0 .71) | | | | — | | | | (0 .71) | | | | 13.42 | | | | 6 .84 | | | | 1,342 | | | | 0 .65 | | | | 1 .31 | | | | 26 .33 | |
| 2015 | | | 14.80 | | | | 0 .40 | | | | (1 .70) | | | | (1 .30) | | | | (0 .21) | | | | — | | | | (0 .21) | | | | 13.29 | | | | (8 .95) | | | | 1,329 | | | | 0 .65 | | | | 2 .39 | | | | 28 .59 | |
| 2014 | | | 15.13 | | | | 0 .19 | | | | (0 .27) | | | | (0 .08) | | | | (0 .25) | | | | — | | | | (0 .25) | | | | 14.80 | | | | (0 .57) | | | | 2,959 | | | | 0 .65 | | | | 1 .26 | | | | 13 .51 | |
| 2013(1) | | | 16.28 | | | | 0 .17 | | | | (1 .05) | | | | (0 .88) | | | | (0 .27) | | | | — | | | | (0 .27) | | | | 15.13 | | | | (5 .63) | | | | 2,269 | | | | 0 .65 | | | | 1 .65 | | | | 31 .07 | |
| 2012(1) | | | 19.16 | | | | 0 .25 | | | | (3 .13) | | | | (2 .88) | | | | — | | | | — | | | | — | | | | 16.28 | | | | (15 .03) | | | | 2,441 | | | | 0 .65 | | | | 1 .50 | | | | 50 .30 | |
| Global X NASDAQ China Technology ETF | | | | | | | | | | | | | | | | | | | | | | | | | | | | | | | | | | | | | |
| 2016 | | | 22.01 | | | | 0 .45 | | | | 0 .91 | | | | 1 .36 | | | | (0 .14) | | | | — | | | | (0 .14) | | | | 23.23 | | | | 6 .20 | | | | 13,940 | | | | 0 .65 | | | | 2 .09 | | | | 42 .02 | |
| 2015 | | | 23.48 | | | | 0 .12 | | | | (1 .52) | | | | (1 .40) | | | | (0 .07) | | | | — | | | | (0 .07) | | | | 22.01 | | | | (5 .94) | | | | 15,404 | | | | 0 .65 | | | | 0 .52 | | | | 44 .95 | |
| 2014 | | | 20.63 | | | | 0 .06 | | | | 2 .80 | | | | 2 .86 | | | | (0 .01) | | | | — | | | | (0 .01) | | | | 23.48 | | | | 13 .85 | | | | 22,307 | | | | 0 .65 | | | | 0 .29 | | | | 64 .79 | |
| 2013 | | | 13.77 | | | | 0 .02 | | | | 6 .92 | | | | 6 .94 | | | | (0 .08) | | | | — | | | | (0 .08) | | | | 20.63 | | | | 50 .68 | | | | 10,317 | | | | 0 .65 | | | | 0 .14 | | | | 57 .24 | |
| 2012 | | | 15.38 | | | | 0 .05 | | | | (1 .47) | | | | (1 .42) | | | | (0 .19) | | | | — | | | | (0 .19) | | | | 13.77 | | | | (9 .17) | | | | 2,754 | | | | 0 .65 | | | | 0 .35 | | | | 53 .45 | |
| (1) | Per share amounts have been restated for a 1 for 2 reverse share split on May 16, 2013. See Note 7 in the Notes to Financial Statements. |
| ^ | The amount shown for a share outstanding throughout the period does not accord with the aggregate net gains on investments for the period because of the sales and repurchases of fund shares in relation to fluctuating market value of the investments of the Fund. |
| * | Per share data calculated using average shares method. |
| ** | Total Return is for the period indicated and has not been annualized. The return shown does not reflect the deduction of taxes that a shareholder would pay on Fund distributions or the redemption of Fund shares. |
| †† | Portfolio turnover rate is for the period indicated and periods of less than one year have not been annualized. Excludes effect of in-kind transfers. |
Amounts designated as “—” are either $0 or have been rounded to $0.
The accompanying notes are an integral part of the financial statements.
Selected Per Share Data & Ratios
For a Share Outstanding Throughout the Period
| | | Net Asset
Value,
Beginning of
Period ($) | | | Net
Investment
Income ($)* | | | Net Realized
and
Unrealized
Gain (Loss)
on
Investments
($) | | | Total from
Operations
($) | | | Distribution
from Net
Investment
Income ($) | | | Distribution
from
Capital
Gains ($) | | | Total from
Distributions
($) | | | Net Asset
Value, End
of Period
($) | | | Total
Return
(%)** | | | Net Assets
End of
Period
($)(000) | | | Ratio of
Expenses
to Average
Net Assets
(%) | | | Ratio of Net
Investment
Income to
Average
Net Assets
(%) | | | Portfolio
Turnover
(%) †† | |
| Global X Southeast Asia ETF |
| 2016 | | | 13.07 | | | | 0.31 | | | | 0.78 | | | | 1.09 | | | | (0.44 | ) | | | — | | | | (0.44 | ) | | | 13.72 | | | | 8.75 | | | | 12,349 | | | | 0.65 | | | | 2.40 | | | | 12.94 | |
| 2015 | | | 16.76 | | | | 0.34 | | | | (3.61 | ) | | | (3.27 | ) | | | (0.42 | ) | | | — | | | | (0.42 | ) | | | 13.07 | | | | (19.97 | ) | | | 14,376 | | | | 0.65 | | | | 2.26 | | | | 24.06 | |
| 2014 | | | 17.12 | | | | 0.39 | | | | (0.16 | ) | | | 0.23 | | | | (0.59 | ) | | | — | | | | (0.59 | ) | | | 16.76 | | | | 1.68 | | | | 29,336 | | | | 0.65 | | | | 2.36 | | | | 8.36 | |
| 2013 | | | 16.75 | | | | 0.47 | | | | 0.28^ | | | | 0.75 | | | | (0.38 | ) | | | — | | | | (0.38 | ) | | | 17.12 | | | | 4.50 | | | | 49,634 | | | | 0.65 | | | | 2.73 | | | | 24.07 | |
| 2012 | | | 15.51 | | | | 0.51 | | | | 1.10 | | | | 1.61 | | | | (0.37 | ) | | | — | | | | (0.37 | ) | | | 16.75 | | | | 10.77 | | | | 32,656 | | | | 0.65 | | | | 3.23 | | | | 9.69 | |
| Global X FTSE Andean 40 ETF |
| 2016 | | | 7.23 | | | | 0.10 | | | | 0.98 | | | | 1.08 | | | | (0.17 | ) | | | — | | | | (0.17 | ) | | | 8.14 | | | | 15.64 | | | | 4,068 | | | | 0.72 | | | | 1.34 | | | | 14.07 | |
| 2015 | | | 10.60 | | | | 0.17 | | | | (3.34 | ) | | | (3.17 | ) | | | (0.20 | ) | | | — | | | | (0.20 | ) | | | 7.23 | | | | (30.33 | ) | | | 3,253 | | | | 0.72 | | | | 2.02 | | | | 21.91 | |
| 2014 | | | 12.21 | | | | 0.19 | | | | (1.63 | ) | | | (1.44 | ) | | | (0.17 | ) | | | — | | | | (0.17 | ) | | | 10.60 | | | | (11.84 | ) | | | 9,010 | | | | 0.72 | | | | 1.71 | | | | 19.94 | |
| 2013 | | | 14.37 | | | | 0.23 | | | | (2.13 | ) | | | (1.90 | ) | | | (0.26 | ) | | | — | | | | (0.26 | ) | | | 12.21 | | | | (13.52 | ) | | | 10,382 | | | | 0.72 | | | | 1.71 | | | | 22.05 | |
| 2012 | | | 13.61 | | | | 0.23 | | | | 0.77 | | | | 1.00 | | | | (0.24 | ) | | | — | | | | (0.24 | ) | | | 14.37 | | | | 7.63 | | | | 8,620 | | | | 0.72 | | | | 1.65 | | | | 25.80 | |
| Global X MSCI Colombia ETF |
| 2016 | | | 8.79 | | | | 0.16 | | | | 0.39 | | | | 0.55 | | | | (0.12 | ) | | | — | | | | (0.12 | ) | | | 9.22 | | | | 6.55 | | | | 88,760 | | | | 0.65 | @ | | | 1.82 | | | | 37.60 | |
| 2015 | | | 17.42 | | | | 0.31 | | | | (8.53 | ) | | | (8.22 | ) | | | (0.41 | ) | | | — | | | | (0.41 | ) | | | 8.79 | | | | (47.93 | ) | | | 66,616 | | | | 0.61 | @ | | | 2.80 | | | | 66.93 | |
| 2014 | | | 20.55 | | | | 0.40 | | | | (2.78 | ) | | | (2.38 | ) | | | (0.75 | ) | | | — | | | | (0.75 | ) | | | 17.42 | | | | (11.73 | ) | | | 100,688 | | | | 0.66 | @ | | | 2.12 | | | | 47.57 | |
| 2013 | | | 21.89 | | | | 0.42 | | | | (1.31 | ) | | | (0.89 | ) | | | (0.45 | ) | | | — | | | | (0.45 | ) | | | 20.55 | | | | (4.21 | ) | | | 149,625 | | | | 0.75 | @ | | | 2.05 | | | | 52.06 | |
| 2012 | | | 19.19 | | | | 0.39 | | | | 2.52 | | | | 2.91 | | | | (0.21 | ) | | | — | | | | (0.21 | ) | | | 21.89 | | | | 15.41 | | | | 182,379 | | | | 0.78 | @ | | | 1.92 | | | | 61.70 | |
| Global X Brazil Mid Cap ETF |
| 2016 | | | 6.87 | | | | 0.13 | | | | 3.16 | | | | 3.29 | | | | (0.18 | ) | | | — | | | | (0.18 | ) | | | 9.98 | | | | 49.36 | | | | 4,988 | | | | 0.69 | | | | 1.64 | | | | 39.09 | |
| 2015 | | | 12.22 | | | | 0.21 | | | | (5.19 | ) | | | (4.98 | ) | | | (0.37 | ) | | | — | | | | (0.37 | ) | | | 6.87 | | | | (41.75 | ) | | | 3,089 | | | | 0.69 | | | | 2.26 | | | | 31.63 | |
| 2014 | | | 14.58 | | | | 0.39 | | | | (2.04 | ) | | | (1.65 | ) | | | (0.71 | ) | | | — | | | | (0.71 | ) | | | 12.22 | | | | (11.59 | ) | | | 7,942 | | | | 0.69 | | | | 2.99 | | | | 17.72 | |
| 2013 | | | 15.55 | | | | 0.50 | | | | (1.02 | ) | | | (0.52 | ) | | | (0.45 | ) | | | — | | | | (0.45 | ) | | | 14.58 | | | | (3.52 | ) | | | 12,390 | | | | 0.69 | | | | 3.32 | | | | 16.38 | |
| 2012 | | | 15.55 | | | | 0.47 | | | | (0.13 | ) | | | 0.34 | | | | (0.34 | ) | | | — | | | | (0.34 | ) | | | 15.55 | | | | 2.42 | | | | 20,994 | | | | 0.69 | | | | 2.98 | | | | 34.81 | |
| Global X Brazil Consumer ETF |
| 2016 | | | 8.49 | | | | 0.09 | | | | 5.90 | | | | 5.99 | | | | (0.12 | ) | | | — | | | | (0.12 | ) | | | 14.36 | | | | 71.59 | | | | 7,182 | | | | 0.77 | | | | 0.86 | | | | 14.64 | |
| 2015 | | | 16.57 | | | | 0.15 | | | | (7.83 | ) | | | (7.68 | ) | | | (0.40 | ) | | | — | | | | (0.40 | ) | | | 8.49 | | | | (47.30 | ) | | | 2,971 | | | | 0.77 | | | | 1.26 | | | | 29.16 | |
| 2014 | | | 17.89 | | | | 0.33 | | | | (1.44 | ) | | | (1.11 | ) | | | (0.21 | ) | | | — | | | | (0.21 | ) | | | 16.57 | | | | (6.20 | ) | | | 9,943 | | | | 0.78 | ‡ | | | 1.98 | | | | 18.59 | |
| 2013 | | | 19.43 | | | | 0.15 | | | | (1.45 | ) | | | (1.30 | ) | | | (0.24 | ) | | | — | | | | (0.24 | ) | | | 17.89 | | | | (6.80 | ) | | | 18,787 | | | | 0.77 | | | | 0.80 | | | | 15.01 | |
| 2012 | | | 16.78 | | | | 0.14 | | | | 2.73 | | | | 2.87 | | | | (0.22 | ) | | | — | | | | (0.22 | ) | | | 19.43 | | | | 17.49 | | | | 25,257 | | | | 0.77 | | | | 0.83 | | | | 49.88 | |
| Global X MSCI Argentina ETF |
| 2016 | | | 19.81 | | | | 0.15 | | | | 3.89 | | | | 4.04 | | | | (0.16 | ) | | | — | | | | (0.16 | ) | | | 23.69 | | | | 20.65 | | | | 90,602 | | | | 0.74 | | | | 0.69 | | | | 20.88 | |
| 2015 | | | 21.18 | | | | 0.11 | | | | (1.39 | ) | | | (1.28 | ) | | | (0.09 | ) | | | — | | | | (0.09 | ) | | | 19.81 | | | | (6.04 | ) | | | 15,355 | | | | 0.74 | | | | 0.58 | | | | 26.88 | |
| 2014 | | | 20.29 | | | | 0.10 | | | | 0.91^ | | | | 1.01 | | | | (0.12 | ) | | | — | | | | (0.12 | ) | | | 21.18 | | | | 5.03 | | | | 20,652 | | | | 0.74 | | | | 0.49 | | | | 95.29 | |
| 2013(1) | | | 16.84 | | | | 0.10 | | | | 3.53 | | | | 3.63 | | | | (0.18 | ) | | | — | | | | (0.18 | ) | | | 20.29 | | | | 21.73 | | | | 6,595 | | | | 0.74 | | | | 0.57 | | | | 26.52 | |
| 2012(1) | | | 22.04 | | | | 0.24 | | | | (4.85 | ) | | | (4.61 | ) | | | (0.59 | ) | | | — | | | | (0.59 | ) | | | 16.84 | | | | (21.44 | ) | | | 2,946 | | | | 0.74 | | | | 1.25 | | | | 29.51 | |
| (1) | Per share amounts have been restated for a 1 for 2 reverse share split on May 16, 2013. See Note 7 in the Notes to Financial Statements. |
| ^ | The amount shown for a share outstanding throughout the period does not accord with the aggregate net gains on investments for the period because of the sales and repurchases of fund shares in relation to fluctuating market value of the investments of the Fund. |
| * | Per share data calculated using average shares method. |
| ** | Total Return is for the period indicated and has not been annualized. The return shown does not reflect the deduction of taxes that a shareholder would pay on Fund distributions or the redemption of Fund shares. |
| †† | Portfolio turnover rate is for the period indicated and periods of less than one year have not been annualized. Excludes effect of in-kind transfers. |
| @ | The ratio of Expenses to Average Net Assets includes the effect of a waiver. If these offsets were excluded, the ratio would have been 0.84%, 0.79%, 0.78%, 0.80%, and 0.83% for the years ended October 31, 2016, 2015, 2014, 2013, and 2012, respectively. |
| ‡ | The ratio of Expenses to Average Net Assets includes the effect of income taxes. If these expenses were excluded, the ratio would have been 0.77% for the Global X Brazil Consumer ETF. |
Amounts designated as “—” are either $0 or have been rounded to $0.
The accompanying notes are an integral part of the financial statements.
Selected Per Share Data & Ratios
For a Share Outstanding Throughout the Period
| | | Net Asset
Value,
Beginning of
Period ($) | | | Net
Investment
Income ($)* | | | Net Realized
and
Unrealized
Gain (Loss)
on
Investments
($) | | | Total from
Operations
($) | | | Distribution
from Net
Investment
Income ($) | | | Distribution
from
Capital
Gains ($) | | | Total from
Distributions
($) | | | Net Asset
Value, End
of Period
($) | | | Total
Return
(%)** | | | Net Assets
End of
Period
($)(000) | | | Ratio of
Expenses
to Average
Net Assets
(%) | | | Ratio of Net
Investment
Income to
Average
Net Assets
(%) | | | Portfolio
Turnover
(%) †† | |
| Global X MSCI Greece ETF |
| 2016 | | | 10.41 | | | | 0.13 | | | | (3.07 | ) | | | (2.94 | ) | | | (0.12 | ) | | | — | | | | (0.12 | ) | | | 7.35 | | | | (28.33 | ) | | | 245,561 | | | | 0.62 | | | | 1.71 | | | | 76.19 | |
| 2015 | | | 15.84 | | | | 0.18 | | | | (5.48 | ) | | | (5.30 | ) | | | (0.13 | ) | | | — | | | | (0.13 | ) | | | 10.41 | | | | (33.66 | ) | | | 314,907 | | | | 0.62 | | | | 1.61 | | | | 29.35 | |
| 2014 | | | 22.60 | | | | 0.08 | | | | (6.83 | ) | | | (6.75 | ) | | | (0.01 | ) | | | — | | | | (0.01 | ) | | | 15.84 | | | | (29.83 | ) | | | 140,201 | | | | 0.62 | | | | 0.38 | | | | 64.19 | |
| 2013 | | | 16.16 | | | | 0.15 | | | | 6.32 | | | | 6.47 | | | | (0.02 | ) | | | (0.01 | ) | | | (0.03 | ) | | | 22.60 | | | | 40.14 | | | | 94,938 | | | | 0.61 | | | | 0.84 | | | | 77.29 | |
| 2012(1) | | | 15.18 | | | | 0.25 | | | | 0.76 | | | | 1.01 | | | | (0.03 | ) | | | — | | | | (0.03 | ) | | | 16.16 | | | | 6.70 | | | | 25,863 | | | | 0.62 | † | | | 1.93 | † | | | 23.99 | |
| Global X MSCI Norway ETF |
| 2016 | | | 10.75 | | | | 0.35 | | | | 0.34 | | | | 0.69 | | | | (0.37 | ) | | | — | | | | (0.37 | ) | | | 11.07 | | | | 6.86 | | | | 113,997 | | | | 0.50 | | | | 3.39 | | | | 16.62 | |
| 2015 | | | 14.82 | | | | 0.34 | | | | (3.58 | ) | | | (3.24 | ) | | | (0.83 | ) | | | — | | | | (0.83 | ) | | | 10.75 | | | | (22.50 | ) | | | 65,024 | | | | 0.50 | | | | 2.76 | | | | 16.05 | |
| 2014 | | | 16.76 | | | | 0.63 | | | | (2.18 | ) | | | (1.55 | ) | | | (0.39 | ) | | | — | | | | (0.39 | ) | | | 14.82 | | | | (9.46 | ) | | | 183,038 | | | | 0.50 | | | | 3.76 | | | | 26.50 | |
| 2013 | | | 15.09 | | | | 0.50 | | | | 1.60 | | | | 2.10 | | | | (0.43 | ) | | | — | | | | (0.43 | ) | | | 16.76 | | | | 14.21 | | | | 80,465 | | | | 0.50 | | | | 3.23 | | | | 11.01 | |
| 2012 | | | 13.96 | | | | 0.49 | | | | 1.00 | | | | 1.49 | | | | (0.36 | ) | | | — | | | | (0.36 | ) | | | 15.09 | | | | 11.24 | | | | 61,129 | | | | 0.50 | | | | 3.52 | | | | 23.39 | |
| Global X FTSE Nordic Region ETF |
| 2016 | | | 22.29 | | | | 0.63 | | | | (2.91 | ) | | | (2.28 | ) | | | (0.63 | ) | | | — | | | | (0.63 | ) | | | 19.38 | | | | (10.54 | ) | | | 40,899 | | | | 0.51 | | | | 3.01 | | | | 10.90 | |
| 2015 | | | 24.36 | | | | 0.59 | | | | (1.81 | ) | | | (1.22 | ) | | | (0.85 | ) | | | — | | | | (0.85 | ) | | | 22.29 | | | | (5.05 | ) | | | 52,596 | | | | 0.50 | | | | 2.53 | | | | 7.76 | |
| 2014 | | | 23.74 | | | | 0.79 | | | | 0.46 | | | | 1.25 | | | | (0.63 | ) | | | — | | | | (0.63 | ) | | | 24.36 | | | | 5.30 | | | | 59,927 | | | | 0.50 | | | | 3.16 | | | | 6.05 | |
| 2013 | | | 18.65 | | | | 0.62 | | | | 4.97 | | | | 5.59 | | | | (0.50 | ) | | | — | | | | (0.50 | ) | | | 23.74 | | | | 30.54 | | | | 56,015 | | | | 0.50 | | | | 2.92 | | | | 8.95 | |
| 2012 | | | 17.47 | | | | 0.50 | | | | 1.27 | | | | 1.77 | | | | (0.53 | ) | | | (0.06 | ) | | | (0.59 | ) | | | 18.65 | | | | 10.84 | | | | 26,293 | | | | 0.50 | | | | 2.88 | | | | 10.15 | |
| Global X MSCI Nigeria ETF |
| 2016 | | | 7.94 | | | | 0.21 | | | | (3.54 | ) | | | (3.33 | ) | | | (0.30 | ) | | | — | | | | (0.30 | ) | | | 4.31 | | | | (43.30 | ) | | | 28,009 | | | | 1.02 | @ | | | 3.80 | | | | 29.61 | |
| 2015 | | | 13.02 | | | | 0.34 | | | | (5.11 | ) | | | (4.77 | ) | | | (0.31 | ) | | | — | | | | (0.31 | ) | | | 7.94 | | | | (37.25 | ) | | | 24,623 | | | | 0.68 | @ | | | 3.72 | | | | 34.00 | |
| 2014 | | | 14.92 | | | | 0.47 | | | | (2.16 | ) | | | (1.69 | ) | | | (0.17 | ) | | | (0.04 | ) | | | (0.21 | ) | | | 13.02 | | | | (11.55 | ) | | | 16,924 | | | | 0.68 | @ | | | 3.14 | | | | 54.75 | |
| 2013(2) | | | 15.31 | | | | 0.30 | | | | (0.69 | ) | | | (0.39 | ) | | | — | | | | — | | | | — | | | | 14.92 | | | | (2.55 | ) | | | 5,970 | | | | 0.68 | †@ | | | 3.54 | † | | | 5.44 | |
| Global X Next Emerging & Frontier ETF |
| 2016 | | | 19.27 | | | | 0.20 | | | | 1.14^ | | | | 1.34 | | | | (0.46 | ) | | | — | | | | (0.46 | ) | | | 20.15 | | | | 7.33 | | | | 15,112 | | | | 0.56 | | | | 1.13 | | | | 9.35 | |
| 2015 | | | 25.55 | | | | 0.49 | | | | (6.37 | ) | | | (5.88 | ) | | | (0.40 | ) | | | — | | | | (0.40 | ) | | | 19.27 | | | | (23.29 | ) | | | 106,925 | | | | 0.58 | | | | 2.22 | | | | 19.72 | |
| 2014(3) | | | 25.08 | | | | 0.51 | | | | 0.01^ | | | | 0.52 | | | | (0.05 | ) | | | — | | | | (0.05 | ) | | | 25.55 | | | | 2.07 | | | | 152,027 | | | | 0.58 | †‡ | | | 2.00 | † | | | 24.14 | |
| Global X FTSE Portugal 20 ETF |
| 2016 | | | 10.85 | | | | 0.42 | | | | (0.93 | ) | | | (0.51 | ) | | | (0.46 | ) | | | — | | | | (0.46 | ) | | | 9.88 | | | | (4.86 | ) | | | 25,694 | | | | 0.61 | | | | 4.26 | | | | 27.20 | |
| 2015 | | | 12.65 | | | | 0.30 | | | | (1.87 | ) | | | (1.57 | ) | | | (0.23 | ) | | | — | | | | (0.23 | ) | | | 10.85 | | | | (12.39 | ) | | | 37,449 | | | | 0.61 | | | | 2.68 | | | | 35.26 | |
| 2014(4) | | | 15.04 | | | | 0.38 | | | | (2.77 | ) | | | (2.39 | ) | | | — | | | | — | | | | — | | | | 12.65 | | | | (15.89 | ) | | | 36,692 | | | | 0.61 | † | | | 2.58 | † | | | 53.58 | |
| Global X MSCI Pakistan ETF |
| 2016 | | | 14.17 | | | | 0.58 | | | | 0.90 | | | | 1.48 | | | | (0.37 | ) | | | (0.05 | ) | | | (0.42 | ) | | | 15.23 | | | | 10.87 | | | | 10,664 | | | | 0.91 | | | | 4.01 | | | | 21.22 | |
| 2015(5) | | | 15.28 | | | | 0.35 | | | | (1.46 | ) | | | (1.11 | ) | | | — | | | | — | | | | — | | | | 14.17 | | | | (7.26 | ) | | | 5,667 | | | | 0.90 | † | | | 4.43 | † | | | 19.31 | |
| (1) | The Fund commenced operations on December 7, 2011. |
| (2) | The Fund commenced operations on April 2, 2013. |
| (3) | The Fund commenced operations on November 6, 2013. |
| (4) | The Fund commenced operations on November 12, 2013. |
| (5) | The Fund commenced operations on April 22, 2015. |
| ^ | The amount shown for a share outstanding throughout the period does not accord with the aggregate net gains on investments for the period because of the sales and repurchases of fund shares in relation to fluctuating market value of the investments of the Fund. |
| * | Per share data calculated using average shares method. |
| ** | Total Return is for the period indicated and has not been annualized. The return shown does not reflect the deduction of taxes that a shareholder would pay on Fund distributions or the redemption of Fund shares. |
| †† | Portfolio turnover rate is for the period indicated and periods of less than one year have not been annualized. Excludes effect of in-kind transfers. |
| @ | The ratio of Expenses to Average Net Assets includes the effect of a waiver. If these offsets were excluded, the ratio would have been 1.10%, 0.92%, 0.92% and 0.92% for the years and or period ended October 31, 2016, 2015 ,2014, and 2013, respectively. |
| ‡ | The ratio of Expenses to Average Net Assets includes the effect of income taxes. If these expenses were excluded, the ratio would have been 0.58% for the Global X Next Emerging & Frontier ETF. |
Amounts designated as “—” are either $0 or have been rounded to $0.
The accompanying notes are an integral part of the financial statements.
Notes to Financial Statements
1. ORGANIZATION
The Global X Funds (the "Trust") is a Delaware statutory trust formed on March 6, 2008. The Trust is registered under the Investment Company Act of 1940, as amended, as an open-end management investment company. As of October 31, 2016, the Trust had 100 portfolios, fifty-four of which were operational. The financial statements herein and the related notes pertain to the Global X China Consumer ETF, Global X China Energy ETF, Global X China Financials ETF, Global X China Industrials ETF, Global X China Materials ETF, Global X NASDAQ China Technology ETF, Global X Southeast Asia ETF, Global X FTSE Andean 40 ETF, Global X MSCI Colombia ETF, Global X Brazil Mid Cap ETF, Global X Brazil Consumer ETF, Global X MSCI Argentina ETF, Global X MSCI Greece ETF, Global X MSCI Norway ETF, Global X FTSE Nordic Region ETF, Global X MSCI Nigeria ETF, Global X Next Emerging & Frontier ETF, Global X FTSE Portugal 20 ETF and Global X MSCI Pakistan ETF (each a “Fund”, and collectively, the “Funds”). Each Fund had elected non-diversification status.
2. SIGNIFICANT ACCOUNTING POLICIES
The following is a summary of the Significant Accounting Policies followed by the Funds.
USE OF ESTIMATES — The Funds are investment companies that apply the accounting and reporting guidance issued in Topic 946 by the U.S. Financial Accounting Standards Board. The preparation of financial statements in conformity with U.S. generally accepted accounting principles ("U.S. GAAP") requires management to make estimates and assumptions that affect the reported amounts of assets and liabilities and disclosure of contingent assets and liabilities at the date of the financial statements and the reported amounts of increases and decreases in net assets from operations during the reporting period. Actual results could differ from those estimates.
RETURN OF CAPITAL ESTIMATES — Distributions received by the Funds from underlying master limited partnership (“MLP”) investments generally are comprised of income and return of capital. The Funds record investment income and return of capital based on estimates made at the time such distributions are received. Such estimates are based on historical information available from the MLPs and other industry sources. These estimates may subsequently be revised based on information received from the MLPs after their tax reporting periods are concluded.
SECURITY VALUATION — Securities listed on a securities exchange, market or automated quotation system for which quotations are readily available (except for securities traded on NASDAQ and the Nigerian Stock Exchange), including securities traded over the counter, are valued at the last quoted sale price on the primary exchange or market (foreign or domestic) on which they are traded (or at approximately 4:00 pm if a security’s primary exchange is normally open at that time), or, if there is no such reported sale, at the most recent mean between the quoted bid and asked prices (absent both bid and asked prices on such exchange, the bid price may be used).
For securities traded on NASDAQ and the Nigerian Stock Exchange, the Official Closing Price will be used. If available, debt securities are priced based upon valuations provided by independent, third-party pricing agents. Such values generally reflect the last reported sales price if the security is actively traded. The third-party pricing agents may also value debt securities at an evaluated bid price by employing methodologies that utilize actual market transactions, broker-supplied valuations, or other methodologies designed to identify the market value for such securities. Debt obligations with remaining maturities of sixty days or less may be valued at their amortized cost, which
Notes to Financial Statements (continued)
2. SIGNIFICANT ACCOUNTING POLICIES (continued)
approximates market value. The prices for foreign securities are reported in local currency and converted to U.S. dollars using currency exchange rates. Prices for most securities held in the Funds are provided daily by recognized independent pricing agents. If a security price cannot be obtained from an independent, third-party pricing agent, the Funds seek to obtain a bid price from at least one independent broker.
Securities for which market prices are not "readily available" are valued in accordance with Fair Value Procedures established by the Board of Trustees (the “Board”). The Funds’ Fair Value Procedures are implemented through a Fair Value Committee (the "Committee") designated by the Board. Some of the more common reasons that may necessitate that a security be valued using Fair Value Procedures include: the security's trading has been halted or suspended; the security has been de-listed from its primary trading exchange; the security's primary trading market is temporarily closed at a time when under normal conditions it would be open; the security has not been traded for an extended period of time; the security's primary pricing source is not able or willing to provide a price; or trading of the security is subject to local government-imposed restrictions. In addition, the Funds may fair value their securities if an event that may materially affect the value of the Funds’ securities that traded outside of the United States (a “Significant Event”) has occurred between the time of the security's last close and the time that the Funds calculate net asset value. A Significant Event may relate to a single issuer or to an entire market sector. Events that may be Significant Events include: government actions, natural disaster, armed conflict, acts of terrorism and significant market fluctuations. If Global X Management Company LLC (the “Adviser”) becomes aware of a Significant Event that has occurred with respect to a security or group of securities after the closing of the exchange or market on which the security or securities principally trade, but before the time at which the Funds calculate net asset value, it may request that a Committee meeting be called. When a security is valued in accordance with the Fair Value Procedures, the Committee will determine the value after taking into consideration relevant information reasonably available to the Committee. As of October 31, 2016, there were securities valued using Fair Value Procedures of $7,931, $5,448, $6,311, $8,986, $4,903 and $2,085 in Global X China Industrials ETF, Global X China Materials ETF, Global X Brazil Mid Cap ETF, Global X Brazil Consumer ETF, Global X MSCI Norway ETF and Global X FTSE Portugal 20 ETF, respectively. There were no other securities priced using the Fair Value Procedures.
In accordance with the authoritative guidance on fair value measurements and disclosure under U.S. GAAP, the Funds disclose the fair value of their investments in a hierarchy that prioritizes the inputs to valuation techniques used to measure the fair value. The objective of a fair value measurement is to determine the price that would be received to sell an asset or paid to transfer a liability in an orderly transaction between market participants at the measurement date (an exit price). Accordingly, the fair value hierarchy gives the highest priority to quoted prices (unadjusted) in active markets for identical assets or liabilities (Level 1) and the lowest priority to unobservable inputs (Level 3). The three levels of the fair value hierarchy are described below:
Level 1 – Unadjusted quoted prices in active markets for identical, unrestricted assets or liabilities that the Funds have the ability to access at the measurement date
Level 2 – Other significant observable inputs (including quoted prices in non-active markets, quoted prices for similar investments, fair value of investments for which the Funds have the ability to fully redeem tranches at net asset value as of the measurement date or within the near term, and short-term investments valued at amortized cost)
Notes to Financial Statements (continued)
2. SIGNIFICANT ACCOUNTING POLICIES (continued)
Level 3 – Significant unobservable inputs (including the Funds’ own assumptions in determining the fair value of investments, fair value of investments for which the Funds do not have the ability to fully redeem tranches at net asset value as of the measurement date or within the near term)
Investments are classified within the level of the lowest significant input considered in determining fair value. Investments classified within Level 3 whose fair value measurement considers several inputs may include Level 1 or Level 2 inputs as components of the overall fair value measurement. For the year ended October 31, 2016, there have been no significant changes to the Funds’ fair valuation methodologies.
DUE TO/FROM BROKERS — Due to/from brokers includes cash and collateral balances with the Funds’ clearing brokers or counterparties at October 31, 2016. The Funds continuously monitor the credit standing of each broker or counterparty with whom they conduct business. In the event a broker or counterparty is unable to fulfill its obligations, the Funds would be subject to counterparty credit risk.
REPURCHASE AGREEMENTS — Securities pledged as collateral for repurchase agreements are held by Citibank, N.A. and are designated as being held on each Fund’s behalf by its custodian under a book-entry system. Each Fund monitors the adequacy of the collateral on a daily basis and can require the seller to provide additional collateral in the event the market value of the securities pledged falls below the carrying value of the repurchase agreement, including accrued interest. It is the Funds’ policy to only enter into repurchase agreements with banks and other financial institutions which are deemed by the Adviser to be creditworthy. The Fund bears the risk of loss in the event that the other party to a repurchase agreement defaults on its obligations and the Fund is prevented from exercising its rights to dispose of the underlying securities received as collateral and the risk of a possible decline in the value of the underlying securities during the period. For financial statement purposes, the Funds record the securities lending collateral (included in Repurchase Agreements, at value or restricted cash) as an asset and the obligation to return securities lending collateral as a liability on the Statements of Assets and Liabilities.
Repurchase agreements are entered into by the Funds under Master Repurchase Agreements (“MRA”) which permit the Funds, under certain circumstances including an event of default (such as bankruptcy or insolvency), to offset payables and/or receivables under the MRA with collateral held and/or posted to the counterparty and create one single net payment due to or from the Funds.
Notes to Financial Statements (continued)
2. SIGNIFICANT ACCOUNTING POLICIES (continued)
At October 31, 2016, the open repurchase agreements by counterparty which are subject to a MRA on a net payment basis are as follows:
| | | | | | Fair Value of Non-cash | | | Cash Collateral | | | | |
| | | Repurchase Agreements | | | Collateral Received(1) | | | Received | | | Net Amount (2) | |
| Global X China Consumer ETF | | | | | | | | | | | | | | | | |
| Barclays Bank | | $ | 6,000,000 | | | $ | 6,000,000 | | | $ | - | | | $ | - | |
| Deutsche Bank | | | 1,484,669 | | | | 1,484,669 | | | | - | | | | - | |
| Global X MSCI Greece ETF | | | | | | | | | | | | | | | | |
| Deutsche Bank | | | 2,806,650 | | | | 2,806,650 | | | | - | | | | - | |
| Global X MSCI Norway ETF | | | | | | | | | | | | | | | | |
| Barclays Bank | | | 29,000,000 | | | | 29,000,000 | | | | - | | | | - | |
| Deutsche Bank | | | 2,508,904 | | | | 2,508,904 | | | | - | | | | - | |
| Global X FTSE Nordic Region ETF | | | | | | | | | | | | | | | | |
| Deutsche Bank | | | 3,124,587 | | | | 3,124,587 | | | | - | | | | - | |
| Global X FTSE Portugal 20 ETF | | | | | | | | | | | | | | | | |
| Deutsche Bank | | | 2,503,093 | | | | 2,503,093 | | | | - | | | | - | |
(1)As of October 31, 2016, the value of the collateral received exceeded the market value of the Funds' holding in the repurchase agreement. Please refer to the Schedule of Investments for the market value of each Fund's collateral.
(2)Net Amount represents the net amount receivable due from the counterparty in the event of default.
FEDERAL INCOME TAXES — It is each Fund’s intention to qualify or continue to qualify as a regulated investment company for Federal income tax purposes by complying with the appropriate provisions of Subchapter M of the Internal Revenue Code of 1986, as amended. Accordingly, no provisions for Federal income taxes have been made in the financial statements.
During the year ended October 31, 2016, the Global X Brazil Mid Cap ETF and Global X Brazil Consumer ETF incurred federal excise taxes in the amount of $89 and $23, respectively. No other provisions for Federal income taxes have been made in the financial statements.
The Funds evaluate tax positions taken or expected to be taken in the course of preparing the Funds’ tax returns to determine whether it is "more-likely-than-not" (i.e., greater than 50 percent) that each tax position will be sustained upon examination by a taxing authority based on the technical merits of the position. Tax positions not deemed to meet the more-likely-than-not threshold are recorded as a tax benefit or expense in the current year.
If the Funds have foreign tax filings that have not been made, the tax years that remain subject to examination may date back to the inception of the Fund.
The Funds did not record any tax provision in the current period. However, management’s conclusions regarding tax positions may be subject to review and adjustment at a later date based on factors including, but not limited to, examination by tax authorities (i.e., the last three tax year ends, as applicable), on-going analysis of and changes to tax laws, regulations and interpretations thereof.
As of and during the year ended October 31, 2016, the Funds did not have a liability for any unrecognized tax benefits. The Funds recognize interest and penalties, if any, related to unrecognized tax benefits as income tax expense in the Statement of Operations. During the year, the Funds did not incur any interest or penalties.
Notes to Financial Statements (continued)
2. SIGNIFICANT ACCOUNTING POLICIES (continued)
SECURITY TRANSACTIONS AND INVESTMENT INCOME — Security transactions are accounted for on the trade date for financial reporting purposes. Costs used in determining realized gains and losses on the sale of investment securities are based on specific identification. Dividend income is recorded on the ex-dividend date. Interest income is recognized on the accrual basis from the settlement date.
FOREIGN CURRENCY TRANSACTIONS AND TRANSLATION — The books and records of the Funds are maintained in U.S. dollars. Investment securities and other assets and liabilities denominated in a foreign currency are translated into U.S. dollars on the date of valuation. Purchases and sales of investment securities, income and expenses are translated into U.S. dollars at the relevant rates of exchange prevailing on the respective dates of such transactions. The Funds do not isolate that portion of realized or unrealized gains and losses resulting from changes in the foreign exchange rate from fluctuations arising from changes in the market prices of the securities. These gains and losses are included in net realized and unrealized gains and losses on investments on the Statement of Operations. Net realized and unrealized gains and losses on foreign currency transactions and translations represent net foreign exchange gains or losses from foreign currency spot contracts, disposition of foreign currencies, currency gains or losses realized between trade and settlement dates on securities transactions and the difference between the amount of the investment income and foreign withholding taxes recorded on the Funds’ books and the U.S. dollar equivalent amounts actually received or paid.
DIVIDENDS AND DISTRIBUTIONS TO SHAREHOLDERS — The Funds distribute their net investment income on a pro rata basis. Any net investment income and net realized capital gains are distributed at least annually. All distributions are recorded on ex-dividend date.
CREATION UNITS — The Funds issue and redeem shares ("Shares") at Net Asset Value (“NAV”) and only in large blocks of Shares, (each block of Shares for a Fund is called a "Creation Unit" or multiples thereof). Purchasers of Creation Units ("Authorized Participants") at NAV must pay a standard creation transaction fee per transaction. The fee is a single charge and will be the same regardless of the number of Creation Units purchased by an investor on the same day. An Authorized Participant who holds Creation Units and wishes to redeem at NAV would also pay a standard redemption fee per transaction payable to Brown Brothers Harriman & Co. (“BBH”), the Fund’s custodian (“Custodian”), on the date of such redemption, regardless of the number of Creation Units redeemed that day.
CASH OVERDRAFT CHARGES — Per the terms of an agreement with BBH, if a Fund has a cash overdraft on a given day, it will be assessed an overdraft charge of LIBOR plus 2.00%. Cash overdraft charges are included in custodian fees on the Statements of Operations.
Notes to Financial Statements (continued)
2. SIGNIFICANT ACCOUNTING POLICIES (continued)
If a Creation Unit is purchased or redeemed for cash, a higher Transaction Fee will be charged. The following table discloses Creation Unit breakdown:
| | | Creation Unit | | | Creation | | | Value at | | | Redemption | |
| | | Shares | | | Fee | | | October 31, 2016 | | | Fee | |
| Global X China Consumer ETF | | | 50,000 | | | $ | 1,900 | | | $ | 598,500 | | | $ | 1,900 | |
| Global X China Energy ETF | | | 50,000 | | | | 1,900 | | | | 528,000 | | | | 1,900 | |
| Global X China Financials ETF | | | 50,000 | | | | 1,900 | | | | 690,000 | | | | 1,900 | |
| Global X China Industrials ETF | | | 50,000 | | | | 1,900 | | | | 628,500 | | | | 1,900 | |
| Global X China Materials ETF | | | 50,000 | | | | 1,900 | | | | 671,000 | | | | 1,900 | |
| Global X NASDAQ China Technology ETF | | | 50,000 | | | | 1,900 | | | | 1,161,500 | | | | 1,900 | |
| Global X Southeast Asia ETF | | | 50,000 | | | | 2,300 | | | | 686,000 | | | | 2,300 | |
| Global X FTSE Andean 40 ETF | | | 50,000 | | | | 2,300 | | | | 407,000 | | | | 2,300 | |
| Global X MSCI Colombia ETF | | | 50,000 | | | | 2,500 | | | | 461,000 | | | | 2,500 | |
| Global X Brazil Mid Cap ETF | | | 50,000 | | | | 1,900 | | | | 499,000 | | | | 1,900 | |
| Global X Brazil Consumer ETF | | | 50,000 | | | | 1,500 | | | | 718,000 | | | | 1,500 | |
| Global X MSCI Argentina ETF | | | 50,000 | | | | 1,000 | | | | 1,184,500 | | | | 1,000 | |
| Global X MSCI Greece ETF | | | 50,000 | | | | 1,000 | | | | 367,500 | | | | 1,000 | |
| Global X MSCI Norway ETF | | | 50,000 | | | | 1,400 | | | | 553,500 | | | | 1,400 | |
| Global X FTSE Nordic Region ETF | | | 50,000 | | | | 1,400 | | | | 969,000 | | | | 1,400 | |
| Global X MSCI Nigeria ETF | | | 50,000 | | | | 2,300 | | | | 215,500 | | | | 2,300 | |
| Global X Next Emerging & Frontier ETF | | | 50,000 | | | | 9,500 | | | | 1,007,500 | | | | 9,500 | |
| Global X FTSE Portugal 20 ETF | | | 50,000 | | | | 1,000 | | | | 494,000 | | | | 1,000 | |
| Global X MSCI Pakistan ETF | | | 50,000 | | | | 3,800 | | | | 762,000 | | | | 3,800 | |
3. RELATED PARTIES AND SERVICE PROVIDER TRANSACTIONS
The Adviser serves as the investment adviser and the administrator for the Funds. Subject to the supervision of the Board of Trustees, the Adviser is responsible for managing the investment activities of the Funds and the Funds’ business affairs and other administrative matters and provides or causes to be furnished all supervisory, administrative and other services reasonably necessary for the operation of the Funds, including certain distribution services (provided pursuant to a separate distribution services agreement), certain shareholder and distribution-related services (provided pursuant to a separate Rule 12b-1 Plan and related agreements) and investment advisory services (provided pursuant to a separate Investment Advisory Agreement), under what is essentially an "all-in" fee structure. For its service to the Funds, under the Supervision and Administration Agreement, each Fund pays a monthly fee to the Adviser at the annual rate below (stated as a percentage of the average daily net assets of the Fund). In addition, the Funds bear other expenses, directly and indirectly that are not covered by the Supervision and Administration Agreement, which may vary and affect the total expense ratios of the Funds, such as taxes, brokerage fees, commissions and other transaction expenses, interest expenses, acquired fund fees and extraordinary expenses (such as litigation and indemnification expenses). In addition, the Global X MSCI Colombia ETF, Global X MSCI Argentina ETF, Global X MSCI Greece ETF, Global X MSCI Nigeria ETF, Global X Next Emerging & Frontier ETF, Global X FTSE Portugal 20 ETF and Global X MSCI Pakistan ETF pay
Notes to Financial Statements (continued)
3. RELATED PARTIES AND SERVICE PROVIDER TRANSACTIONS (continued)
custodial fees that are not covered by the Supervision and Administration Agreement. Pursuant to an agreement with the Custodian, the Global X MSCI Colombia ETF, Global X MSCI Argentina ETF, Global X MSCI Greece ETF, Global X MSCI Nigeria ETF, Global X Next Emerging & Frontier ETF, Global X FTSE Portugal 20 ETF and Global X MSCI Pakistan ETF may pay up to 0.16%, 0.01%, 0.07%, 0.42%, 0.07%, 0.06% and 0.23%, respectively, in Custody Fees (in addition to the Supervision and Administration Fee). The Adviser reimbursed custody fees paid by the Global X MSCI Colombia ETF and the Global X MSCI Nigeria ETF in the amounts of $21,507 and 15,742, respectively.
| | | Supervision | |
| | | and | |
| | | Administration | |
| | | Fee | |
| Global X China Consumer ETF | | | 0.65% | |
| Global X China Energy ETF | | | 0.65% | |
| Global X China Financials ETF | | | 0.65% | |
| Global X China Industrials ETF | | | 0.65% | |
| Global X China Materials ETF | | | 0.65% | |
| Global X NASDAQ China Technology ETF | | | 0.65% | |
| Global X Southeast Asia ETF | | | 0.65% | |
| Global X FTSE Andean 40 ETF | | | 0.72% | |
| Global X MSCI Colombia ETF* | | | 0.61% | |
| Global X Brazil Mid Cap ETF | | | 0.69% | |
| Global X Brazil Consumer ETF | | | 0.77% | |
| Global X MSCI Argentina ETF | | | 0.74% | |
| Global X MSCI Greece ETF | | | 0.55% | |
| Global X MSCI Norway ETF | | | 0.50% | |
| Global X FTSE Nordic Region ETF | | | 0.50% | |
| Global X MSCI Nigeria ETF** | | | 0.68% | |
| Global X Next Emerging & Frontier ETF | | | 0.49% | |
| Global X FTSE Portugal 20 ETF | | | 0.55% | |
| Global X MSCI Pakistan ETF | | | 0.68% | |
*Pursuant to an expense limitation agreement, the Adviser has agreed to waive or reimburse fees and/or limit fund expenses to the extent necessary to assure that the operating expenses of the Global X MSCI Colombia ETF (the “Fund”) (exclusive of taxes, brokerage fees, commissions, and other transaction expenses, interest and extraordinary expenses (such as litigation and indemnification expenses)) will not exceed 0.61% of the Fund’s average daily net assets per year until at least March 1, 2017. The Fund (at a later date) may reimburse the Adviser for the fees and expenses it waived or reimbursed and/or limited pursuant to the expense limitation agreement during any of the prior three fiscal years, provided that, among other things, any reimbursement made to the Adviser does not cause Total Annual Fund Operating Expenses to exceed the maximum permitted rate during the period in which it is paid and the Board of Trustees has approved such reimbursement to the Adviser. As of October 31, 2016, the amounts of waivers/reimbursements subject to recoupment for Global X MSCI Colombia ETF were $145,757 expiring 2019, $133,126 expiring in 2018, and $132,223 expiring in 2017. As of October 31, 2016, there had been no recoupment of previously waived and reimbursed fees.
**Efffective March 2, 2016, the Adviser discontinued an expense limitation agreements that had been in place with respect to the Global X MSCI Nigeria ETF. As of October 31, 2016, the amounts of waivers/reimbursements subject to recoupment for Global X MSCI Nigeria ETF were $15,742 expiring in 2019, $58,656 expiring in 2018, and $33,893 expiring in 2017. As of October 31, 2016, there had been no recoupment of previously waived and reimbursed fees.
Notes to Financial Statements (continued)
3. RELATED PARTIES AND SERVICE PROVIDER TRANSACTIONS (continued)
SEI Investments Global Funds Services (“SEIGFS”) serves as Sub-Administrator to the Funds. As Sub-Administrator, SEIGFS provides the Funds with the required general administrative services, including, without limitation: office space, equipment, and personnel; clerical and general back office services; bookkeeping, internal accounting and secretarial services; the calculation of NAV; and assistance with the preparation and filing of reports, registration statements, proxy statements and other materials required to be filed or furnished by the Funds under federal and state securities laws. As compensation for these services, the Sub-Administrator receives certain out-of-pocket costs, transaction fees and asset-based fees which are accrued daily and paid monthly by the Adviser.
SEI Investments Distribution Co. (“SIDCO”) serves as each Fund’s underwriter and distributor of Creation Units pursuant to a Distribution Agreement. The Distributor has no obligation to sell any specific quantity of Fund Shares. SIDCO bears the following costs and expenses relating to the distribution of Shares: (i) the costs of processing and maintaining records of creations of Creation Units; (ii) all costs of maintaining the records required of a registered broker/dealer; (iii) the expenses of maintaining its registration or qualification as a dealer or broker under Federal or state laws; (iv) filing fees; and (v) all other expenses incurred in connection with the distribution services as contemplated in the Distribution Agreement. SIDCO receives no fee for its distribution services under the Distribution Agreement, rather the Adviser compensates SIDCO for certain expenses, out-of-pocket costs, and transaction fees.
BBH, located at 50 Post Office Square, Boston, MA 02110, serves as Custodian of certain Funds’ assets. As Custodian, BBH has agreed to (1) make receipts and disbursements of money on behalf of the Fund, (2) collect and receive all income and other payments and distributions on account of the Funds’ portfolio investments, (3) respond to correspondence from shareholders, security brokers and others relating to its duties; and (4) make periodic reports to the Funds concerning the Funds’ operations. BBH does not exercise any supervisory function over the purchase and sale of securities. As compensation for these services, the Custodian receives certain out-of-pocket costs, transaction fees and asset-based fees which are accrued daily and paid monthly by the Adviser from its fees. BBH also serves as Transfer Agent. As Transfer Agent, BBH has agreed to (1) issue and redeem shares of each Fund, (2) make dividend and other distributions to shareholders of each Fund, (3) respond to correspondence by shareholders and others relating to its duties; (4) maintain shareholder accounts, and (5) make periodic reports to the Funds. As compensation for these services, the Transfer Agent receives certain out of-pocket costs, transaction fees and asset-based fees which are accrued daily and paid monthly by the Adviser from its fees.
Notes to Financial Statements (continued)
4. INVESTMENT TRANSACTIONS
For the year ended October 31, 2016, the purchases and sales of investments in securities, excluding in-kind transactions, long-term U.S. Government and short-term securities were:
| | | | | | Sales and | |
| | | Purchases | | | Maturities | |
| Global X China Consumer ETF | | $ | 31,222,893 | | | $ | 29,621,176 | |
| Global X China Energy ETF | | | 338,660 | | | | 352,186 | |
| Global X China Financials ETF | | | 5,331,360 | | | | 7,691,392 | |
| Global X China Industrials ETF | | | 595,877 | | | | 665,498 | |
| Global X China Materials ETF | | | 327,567 | | | | 342,250 | |
| Global X NASDAQ China Technology ETF | | | 5,936,458 | | | | 5,783,152 | |
| Global X Southeast Asia ETF | | | 1,638,172 | | | | 2,459,174 | |
| Global X FTSE Andean 40 ETF | | | 620,047 | | | | 506,311 | |
| Global X MSCI Colombia ETF | | | 42,641,140 | | | | 29,100,760 | |
| Global X Brazil Mid Cap ETF | | | 1,686,927 | | | | 1,412,569 | |
| Global X Brazil Consumer ETF | | | 2,187,027 | | | | 616,702 | |
| Global X MSCI Argentina ETF | | | 12,879,490 | | | | 11,359,417 | |
| Global X MSCI Greece ETF | | | 190,343,039 | | | | 189,309,174 | |
| Global X MSCI Norway ETF | | | 15,859,387 | | | | 15,238,215 | |
| Global X FTSE Nordic Region ETF | | | 5,403,366 | | | | 5,108,455 | |
| Global X MSCI Nigeria ETF | | | 22,046,118 | | | | 6,508,392 | |
| Global X Next Emerging & Frontier ETF | | | 3,969,087 | | | | 28,525,826 | |
| Global X FTSE Portugal 20 ETF | | | 7,312,865 | | | | 7,356,593 | |
| Global X MSCI Pakistan ETF | | | 6,134,699 | | | | 1,588,219 | |
During the year ended October 31, 2016, there were no purchases or sales of long-term U.S. Government securities for the Funds.
Notes to Financial Statements (continued)
4. INVESTMENT TRANSACTIONS (continued)
For the year ended October 31, 2016, in-kind transactions associated with creations and redemptions were:
| | | | | | Sales and | | | Realized | |
| | | Purchases | | | Maturities | | | Gain/(Loss) | |
| Global X China Consumer ETF | | | 8,335,368 | | | | 20,544,683 | | | | (565,301 | ) |
| Global X China Energy ETF | | | - | | | | - | | | | - | |
| Global X China Financials ETF | | | 11,578,774 | | | | 28,868,519 | | | | (8,507,920 | ) |
| Global X China Industrials ETF | | | - | | | | 2,574,819 | | | | (228,240 | ) |
| Global X China Materials ETF | | | - | | | | - | | | | - | |
| Global X NASDAQ China Technology ETF | | | - | | | | 2,061,309 | | | | 293,542 | |
| Global X Southeast Asia ETF | | | - | | | | 1,770,489 | | | | (504,981 | ) |
| Global X FTSE Andean 40 ETF | | | 165,267 | | | | - | | | | - | |
| Global X MSCI Colombia ETF | | | 6,492,950 | | | | 1,635,821 | | | | 422,324 | |
| Global X Brazil Mid Cap ETF | | | 715,684 | | | | 537,121 | | | | 81,886 | |
| Global X Brazil Consumer ETF | | | 350,985 | | | | - | | | | - | |
| Global X MSCI Argentina ETF | | | 76,581,806 | | | | 18,250,743 | | | | 5,345,023 | |
| Global X MSCI Greece ETF | | | 71,815,387 | | | | 46,240,196 | | | | (977,470 | ) |
| Global X MSCI Norway ETF | | | 54,480,759 | | | | 12,411,440 | | | | 264,023 | |
| Global X FTSE Nordic Region ETF | | | - | | | | 5,083,458 | | | | 793,419 | |
| Global X MSCI Nigeria ETF | | | - | | | | - | | | | - | |
| Global X Next Emerging & Frontier ETF | | | 1,568,756 | | | | 65,046,354 | | | | (19,651,937 | ) |
| Global X FTSE Portugal 20 ETF | | | 5,189,524 | | | | 13,500,567 | | | | (549,784 | ) |
| Global X MSCI Pakistan ETF | | | - | | | | - | | | | - | |
For the year ended October 31, 2015, in-kind transactions associated with creations and redemptions were:
| | | | | | Sales and | | | Realized Gain | |
| | | Purchases | | | Maturities | | | (Loss) | |
| Global X China Consumer ETF | | $ | 1,135,345 | | | $ | 41,029,893 | | | $ | (3,147,297 | ) |
| Global X China Energy ETF | | | - | | | | 2,122,033 | | | | 219,731 | |
| Global X China Financials ETF | | | 45,882,818 | | | | 39,106,611 | | | | 3,401,732 | |
| Global X China Industrials ETF | | | 6,131,493 | | | | 4,518,457 | | | | 1,036,289 | |
| Global X China Materials ETF | | | 4,885,323 | | | | 5,808,257 | | | | (332,946 | ) |
| Global X NASDAQ China Technology ETF | | | 1,415,138 | | | | 6,938,264 | | | | 1,274,116 | |
| Global X Southeast Asia ETF | | | 1,207,349 | | | | 8,031,728 | | | | (919,877 | ) |
| Global X FTSE Andean 40 ETF | | | 234,771 | | | | 2,109,859 | | | | (480,205 | ) |
| Global X MSCI Colombia ETF | | | 15,101,015 | | | | 9,743,616 | | | | (280,459 | ) |
| Global X Brazil Mid Cap ETF | | | - | | | | 892,420 | | | | (229,856 | ) |
| Global X Brazil Consumer ETF | | | - | | | | 513,276 | | | | (471,937 | ) |
| Global X MSCI Argentina ETF | | | 4,124,088 | | | | 7,272,609 | | | | 164,299 | |
| Global X MSCI Greece ETF | | | 334,382,731 | | | | 79,994,697 | | | | (11,482,974 | ) |
| Global X MSCI Norway ETF | | | 41,440,084 | | | | 122,868,376 | | | | (20,092,704 | ) |
| Global X FTSE Nordic Region ETF | | | 2,472,391 | | | | 4,832,278 | | | | 1,294,820 | |
| Global X MSCI Nigeria ETF | | | - | | | | - | | | | - | |
| Global X Next Emerging & Frontier ETF | | | 6,537,161 | | | | 12,195,780 | | | | (829,169 | ) |
| Global X FTSE Portugal 20 ETF | | | 25,105,756 | | | | 18,233,849 | | | | (1,050,630 | ) |
| Global X MSCI Pakistan ETF | | | - | | | | - | | | | - | |
Notes to Financial Statements (continued)
5. TAX INFORMATION
The amount and character of income and capital gain distributions to be paid, if any, are determined in accordance with Federal income tax regulations, which may differ from U.S. GAAP. As a result, net investment income (loss) and net realized gain (loss) on investment transactions for a reporting period may differ significantly from distributions during such period. These book/tax differences may be temporary or permanent. To the extent these differences are permanent in nature, they are charged or credited to undistributed net investment income (loss), accumulated net realized gain (loss) or paid-in capital, as appropriate, in the period that the differences arise.
The following differences, primarily attributable to redemptions in-kind, sales of passive foreign investment companies, and excise tax, have been reclassified to/from the following accounts during the fiscal period ended October 31, 2016.
| Global X Funds | | Paid-in
Capital | | | Undistributed
Net
Investment
Income
(Loss) | | | Accumulated
Net Realized
Gain (Loss) | |
| Global X China Consumer ETF | | $ | (1,059,075 | ) | | $ | 103,302 | | | $ | 955,773 | |
| Global X China Energy ETF | | | – | | | | 14 | | | | (14 | ) |
| Global X China Financials ETF | | | (8,637,130 | ) | | | 40,554 | | | | 8,596,576 | |
| Global X China Industrials ETF | | | (244,244 | ) | | | (43 | ) | | | 244,287 | |
| Global X China Materials ETF | | | (97,680 | ) | | | (6 | ) | | | 97,686 | |
| Global X NASDAQ China Technology ETF | | | 223,440 | | | | 122 | | | | (223,562 | ) |
| Global X Southeast Asia ETF | | | (520,854 | ) | | | (4,588 | ) | | | 525,442 | |
| Global X FTSE Andean 40 ETF | | | – | | | | (2,549 | ) | | | 2,549 | |
| Global X MSCI Colombia ETF | | | 422,324 | | | | (190,771 | ) | | | (231,553 | ) |
| Global X Brazil Mid Cap ETF | | | 81,797 | | | | (301 | ) | | | (81,496 | ) |
| Global X Brazil Consumer ETF | | | (23 | ) | | | 601 | | | | (578 | ) |
| Global X MSCI Argentina ETF | | | 5,234,413 | | | | 4,724 | | | | (5,239,137 | ) |
| Global X MSCI Greece ETF | | | (8,647,419 | ) | | | 155,607 | | | | 8,491,812 | |
| Global X MSCI Norway ETF | | | 128,938 | | | | (46,589 | ) | | | (82,349 | ) |
| Global X FTSE Nordic Region ETF | | | 605,664 | | | | 50,226 | | | | (655,890 | ) |
| Global X MSCI Nigeria ETF | | | – | | | | (80,430 | ) | | | 80,430 | |
| Global X Next Emerging & Frontier ETF | | | (19,680,955 | ) | | | 32,723 | | | | 19,648,232 | |
| Global X FTSE Portugal 20 ETF | | | (1,314,514 | ) | | | (6,147 | ) | | | 1,320,661 | |
| Global X MSCI Pakistan ETF | | | – | | | | (3,552 | ) | | | 3,552 | |
Notes to Financial Statements (continued)
5. TAX INFORMATION (continued)
The tax character of dividends and distributions declared during the periods ended October 31, 2016 and 2015 were as follows:
| Global X Funds | | Ordinary Income | | | Long-Term Capital Gain | | | Return of Capital | | | Totals | |
| Global X China Consumer ETF |
| 2016 | | $ | 4,048,651 | | | $ | – | | | $ | – | | | $ | 4,048,651 | |
| 2015 | | | 2,353,761 | | | | – | | | | – | | | | 2,353,761 | |
| Global X China Energy ETF |
| 2016 | | $ | 49,338 | | | $ | – | | | $ | – | | | $ | 49,338 | |
| 2015 | | | 81,629 | | | | – | | | | – | | | | 81,629 | |
| Global X China Financials ETF |
| 2016 | | $ | 2,772,013 | | | $ | – | | | $ | – | | | $ | 2,772,013 | |
| 2015 | | | 617,666 | | | | – | | | | – | | | | 617,666 | |
| Global X China Industrials ETF |
| 2016 | | $ | 103,249 | | | $ | – | | | $ | – | | | $ | 103,249 | |
| 2015 | | | 44,362 | | | | – | | | | – | | | | 44,362 | |
| Global X China Materials ETF |
| 2016 | | $ | 70,832 | | | $ | – | | | $ | – | | | $ | 70,832 | |
| 2015 | | | 30,768 | | | | – | | | | – | | | | 30,768 | |
| Global X NASDAQ China Technology ETF |
| 2016 | | $ | 100,894 | | | $ | – | | | $ | – | | | $ | 100,894 | |
| 2015 | | | 64,823 | | | | – | | | | – | | | | 64,823 | |
| Global X Southeast Asia ETF |
| 2016 | | $ | 486,151 | | | $ | – | | | $ | – | | | $ | 486,151 | |
| 2015 | | | 689,799 | | | | – | | | | – | | | | 689,799 | |
| Global X FTSE Andean 40 ETF |
| 2016 | | $ | 85,704 | | | $ | – | | | $ | – | | | $ | 85,704 | |
| 2015 | | | 168,007 | | | | – | | | | – | | | | 168,007 | |
| Global X MSCI Colombia ETF |
| 2016 | | $ | 948,793 | | | $ | – | | | $ | – | | | $ | 948,793 | |
| 2015 | | | 2,318,237 | | | | – | | | | – | | | | 2,318,237 | |
| Global X Brazil Mid Cap ETF |
| 2016 | | $ | 80,368 | | | $ | – | | | $ | – | | | $ | 80,368 | |
| 2015 | | | 242,176 | | | | – | | | | – | | | | 242,176 | |
| Global X Brazil Consumer ETF |
| 2016 | | $ | 41,505 | | | $ | – | | | $ | – | | | $ | 41,505 | |
| 2015 | | | 240,598 | | | | – | | | | – | | | | 240,598 | |
| Global X MSCI Argentina ETF |
| 2016 | | $ | 213,754 | | | $ | – | | | $ | – | | | $ | 213,754 | |
| 2015 | | | 90,100 | | | | – | | | | – | | | | 90,100 | |
| Global X MSCI Greece ETF |
| 2016 | | $ | 3,840,043 | | | $ | – | | | $ | – | | | $ | 3,840,043 | |
| 2015 | | | 956,353 | | | | – | | | | – | | | | 956,353 | |
| Global X MSCI Norway ETF |
| 2016 | | $ | 2,212,531 | | | $ | – | | | $ | – | | | $ | 2,212,531 | |
| 2015 | | | 4,921,308 | | | | – | | | | – | | | | 4,921,308 | |
| Global X FTSE Nordic Region ETF |
| 2016 | | $ | 1,490,826 | | | $ | – | | | $ | – | | | $ | 1,490,826 | |
| 2015 | | | 2,045,741 | | | | – | | | | – | | | | 2,045,741 | |
| Global X MSCI Nigeria ETF |
| 2016 | | $ | 850,578 | | | $ | – | | | $ | – | | | $ | 850,578 | |
| 2015 | | | 505,208 | | | | – | | | | – | | | | 505,208 | |
| Global X Next Emerging & Frontier ETF |
| 2016 | | $ | 2,414,376 | | | $ | – | | | $ | – | | | $ | 2,414,376 | |
| 2015 | | | 2,316,518 | | | | – | | | | – | | | | 2,316,518 | |
| Global X FTSE Portugal 20 ETF |
| 2016 | | $ | 1,260,520 | | | $ | – | | | $ | – | | | $ | 1,260,520 | |
| 2015 | | | 575,663 | | | | – | | | | – | | | | 575,663 | |
| Global X MSCI Pakistan ETF |
| 2016 | | $ | 164,848 | | | $ | – | | | $ | – | | | $ | 164,848 | |
| 2015 | | | – | | | | – | | | | – | | | | – | |
| Notes to Financial Statements (continued) |
| October 31, 2016 |
5. TAX INFORMATION (continued)
As of October 31, 2016, the components of tax basis distributable earnings (accumulated losses) were as follows:
| | | Global X Funds | |
| | | Global X China
Consumer ETF | | | Global X China
Energy ETF | | | Global X China
Financials ETF | |
| Undistributed Ordinary Income | | $ | 943,798 | | | $ | 32,232 | | | $ | 528,235 | |
| Capital Loss Carryforwards | | | (39,596,948 | ) | | | (1,008,864 | ) | | | (3,406,332 | ) |
| Unrealized Depreciation on Investments and Foreign Currency | | | (13,006,502 | ) | | | (631,155 | ) | | | (3,720,715 | ) |
| Other Temporary Differences | | | (4 | ) | | | (2 | ) | | | (2 | ) |
| Total Accumulated Losses | | $ | (51,659,656 | ) | | $ | (1,607,789 | ) | | $ | (6,598,814 | ) |
| | | Global X Funds | |
| | | Global X China
Industrials ETF | | | Global X China
Materials ETF | | | Global X
NASDAQ China
Technology ETF | |
| Undistributed Ordinary Income | | $ | 51,042 | | | $ | 16,196 | | | $ | 512,966 | |
| Capital Loss Carryforwards | | | (2,139,294 | ) | | | (1,109,924 | ) | | | (1,831,567 | ) |
| Unrealized Appreciation (Depreciation) on Investments and Foreign Currency | | | (1,507,164 | ) | | | (849,252 | ) | | | 201 | |
| Other Temporary Differences | | | (2 | ) | | | – | | | | – | |
| Total Accumulated Losses | | $ | (3,595,418 | ) | | $ | (1,942,980 | ) | | $ | (1,318,400 | ) |
| | | Global X Funds | |
| | | Global X
Southeast Asia
ETF | | | Global X FTSE
Andean 40 ETF | | | Global X MSCI
Colombia ETF | |
| Undistributed Ordinary Income | | $ | 260,145 | | | $ | 40,619 | | | $ | 1,040,833 | |
| Capital Loss Carryforwards | | | (5,106,632 | ) | | | (3,031,751 | ) | | | (63,528,411 | ) |
| Unrealized Depreciation on Investments and Foreign Currency | | | (1,697,695 | ) | | | (1,574,667 | ) | | | (24,614,771 | ) |
| Other Temporary Differences | | | (2 | ) | | | 3 | | | | (3 | ) |
| Total Accumulated Losses | | $ | (6,544,184 | ) | | $ | (4,565,796 | ) | | $ | (87,102,352 | ) |
| | | Global X Funds | |
| | | Global X Brazil
Mid Cap ETF | | | Global X Brazil
Consumer ETF | | | Global X MSCI
Argentina ETF | |
| Undistributed Ordinary Income | | $ | 38,894 | | | $ | 31,229 | | | $ | 209,518 | |
| Capital Loss Carryforwards | | | (7,281,355 | ) | | | (4,510,237 | ) | | | (2,740,135 | ) |
| Unrealized Appreciation (Depreciation) on Investments and Foreign Currency | | | (179,369 | ) | | | 74,864 | | | | 6,846,329 | |
| Other Temporary Differences | | | – | | | | 1 | | | | (2 | ) |
| Total Distributable Earnings (Accumulated Losses) | | $ | (7,421,830 | ) | | $ | (4,404,143 | ) | | $ | 4,315,710 | |
| Notes to Financial Statements (continued) |
| October 31, 2016 |
5. TAX INFORMATION (continued)
| | | Global X Funds | |
| | | Global X MSCI
Greece ETF | | | Global X MSCI
Norway ETF | | | Global X FTSE
Nordic Region
ETF | |
| Undistributed Ordinary Income | | $ | 4,017,794 | | | $ | 2,752,961 | | | $ | 1,335,960 | |
| Capital Loss Carryforwards | | | (115,436,458 | ) | | | (17,425,477 | ) | | | (3,148,918 | ) |
| Unrealized Depreciation on Investments and Foreign Currency | | | (124,139,672 | ) | | | (24,869,300 | ) | | | (6,013,359 | ) |
| Other Temporary Differences | | | (4 | ) | | | (6 | ) | | | (2 | ) |
| Total Accumulated Losses | | $ | (235,558,340 | ) | | $ | (39,541,822 | ) | | $ | (7,826,319 | ) |
| | | Global X Funds | |
| | | Global X MSCI
Nigeria ETF | | | Global X Next
Emerging &
Frontier ETF | | | Global X FTSE
Portugal 20 ETF | |
| Undistributed Ordinary Income | | $ | 706,367 | | | $ | 322,606 | | | $ | 878,662 | |
| Capital Loss Carryforwards | | | (6,839,590 | ) | | | (21,101,218 | ) | | | (5,612,626 | ) |
| Unrealized Depreciation on Investments and Foreign Currency | | | (19,054,357 | ) | | | (2,200,917 | ) | | | (11,519,414 | ) |
| Other Temporary Differences | | | – | | | | (2 | ) | | | – | |
| Total Accumulated Losses | | $ | (25,187,580 | ) | | $ | (22,979,531 | ) | | $ | (16,253,378 | ) |
| | | | | | | | | | | | | |
| | | Global X Funds | | | | | | | |
| | | Global X MSCI
Pakistan ETF | | | | | | | |
| Undistributed Ordinary Income | | $ | 292,242 | | | | | | | | | |
| Capital Loss Carryforwards | | | (96,696 | ) | | | | | | | | |
| Unrealized Depreciation on Investments and Foreign Currency | | | (26,618 | ) | | | | | | | | |
| Other Temporary Differences | | | 1 | | | | | | | | | |
| Total Distributable Earnings | | $ | 168,929 | | | | | | | | | |
| Notes to Financial Statements (continued) |
| October 31, 2016 |
5. TAX INFORMATION (continued)
For Federal income tax purposes, capital losses incurred in taxable years beginning before December 22, 2010 may be carried forward for a maximum period of eight years and applied against future gains. As of October 31, 2016, the Funds that had capital loss carryforwards are listed below:
| | | | | | | | | Global X | | | Global X | | | Global X | |
| | | | | | Global X | | | China | | | China | | | China | |
| | | Global X China | | | China | | | Financials | | | Industrials | | | Materials | |
| Expiration date | | Consumer ETF | | | Energy ETF | | | ETF | | | ETF | | | ETF | |
| October 2019 | | $ | 1,341,121 | | | $ | 33,912 | | | $ | - | | | $ | - | | | $ | - | |
| October 2018 | | | 173,208 | | | | - | | | | 551,954 | | | | 94,810 | | | | - | |
| | | $ | 1,514,329 | | | $ | 33,912 | | | $ | 551,954 | | | $ | 94,810 | | | $ | - | |
| | | | | | | | | | | | | | | | |
| | | Global X | | | | | | Global X | | | Global X | | | | |
| | | NASDAQ | | | Global X | | | FTSE | | | MSCI | | | Global X | |
| | | China | | | Southeast | | | Andean 40 | | | Colombia | | | Brazil Mid | |
| Expiration date | | Technology | | | Asia ETF | | | ETF | | | ETF | | | Cap ETF | |
| October 2019 | | $ | 236,466 | | | $ | - | | | $ | 120,886 | | | $ | 8,249,654 | | | $ | 918,379 | |
| October 2018 | | | - | | | | - | | | | - | | | | - | | | | - | |
| | | $ | 236,466 | | | $ | - | | | $ | 120,886 | | | $ | 8,249,654 | | | $ | 918,379 | |
| | | | | | | | | | | | | | | | |
| | | | | | Global X | | | | | | | | | | |
| | | | | | MSCI | | | Global X | | | Global X | | | Global X | |
| | | Global X Brazil | | | Argentina | | | MSCI Greece | | | MSCI | | | FTSE Nordic | |
| Expiration date | | Consumer ETF | | | ETF | | | ETF | | | Norway ETF | | | Region ETF | |
| October 2019 | | $ | 563,593 | | | $ | 414,683 | | | $ | - | | | $ | 1,802,290 | | | $ | - | |
| October 2018 | | | - | | | | - | | | | - | | | | - | | | | - | |
| | | $ | 563,593 | | | $ | 414,683 | | | $ | - | | | $ | 1,802,290 | | | $ | - | |
| | | | | | | | | | | | | | | | |
| | | | | | Global X | | | Global X | | | | | | | |
| | | | | | Next | | | FTSE | | | Global X | | | | |
| | | Global X MSCI | | | Emerging & | | | Portugal 20 | | | MSCI | | | | |
| Expiration date | | Nigeria ETF | | | Frontier ETF | | | ETF | | | Pakistan ETF | | | | |
| October 2019 | | $ | - | | | $ | - | | | $ | - | | | $ | - | | | | | |
| October 2018 | | | - | | | | - | | | | - | | | | - | | | | | |
| | | $ | - | | | $ | - | | | $ | - | | | $ | - | | | | | |
| Notes to Financial Statements (continued) |
| October 31, 2016 |
5. TAX INFORMATION (continued)
For taxable years beginning after December 22, 2010, a RIC is permitted to carry forward net capital losses to offset capital gains realized in later years, and the losses carried forward retain their original character as either long-term or short-term losses. Net capital losses of a RIC realized in taxable years beginning before that date (pre-2011 losses) can be carried forward up to 8 years and are characterized in later years as short-term losses. If a Fund uses pre-2011 loss carryforwards in later years, the carryforwards will not reduce the Fund’s current earnings and profits, while loss carryforwards from later years will reduce the Fund’s current earnings and profits. To the extent that later year capital gains are offset by pre-2011 loss carryforwards, distributions of such gains will be treated as ordinary dividend distributions. Losses carried forward under these new provisions are as follows:
| | | Short-Term
Loss | | | Long-Term
Loss | | | Total | |
| Global X China Consumer ETF | | $ | 3,567,366 | | | $ | 34,515,253 | | | $ | 38,082,619 | |
| Global X China Energy ETF | | | 116,783 | | | | 858,169 | | | | 974,952 | |
| Global X China Financials ETF | | | 1,802,696 | | | | 1,051,682 | | | | 2,854,378 | |
| Global X China Industrials ETF | | | 274,601 | | | | 1,769,883 | | | | 2,044,484 | |
| Global X China Materials ETF | | | 65,324 | | | | 1,044,600 | | | | 1,109,924 | |
| Global X NASDAQ China Technology ETF | | | 1,595,101 | | | | – | | | | 1,595,101 | |
| Global X Southeast Asia ETF | | | 1,759,826 | | | | 3,346,806 | | | | 5,106,632 | |
| Global X FTSE Andean 40 ETF | | | 422,513 | | | | 2,488,352 | | | | 2,910,865 | |
| Global X MSCI Colombia ETF | | | 20,421,461 | | | | 34,857,296 | | | | 55,278,757 | |
| Global X Brazil Mid Cap ETF | | | 1,070,992 | | | | 5,291,984 | | | | 6,362,976 | |
| Global X Brazil Consumer ETF | | | 1,227,376 | | | | 2,719,268 | | | | 3,946,644 | |
| Global X MSCI Argentina ETF | | | 646,683 | | | | 1,678,769 | | | | 2,325,452 | |
| Global X MSCI Greece ETF | | | 54,197,276 | | | | 61,239,182 | | | | 115,436,458 | |
| Global X MSCI Norway ETF | | | 5,485,730 | | | | 10,137,457 | | | | 15,623,187 | |
| Global X FTSE Nordic Region ETF | | | 1,085,662 | | | | 2,063,256 | | | | 3,148,918 | |
| Global X MSCI Nigeria ETF | | | 3,869,879 | | | | 2,969,711 | | | | 6,839,590 | |
| Global X Next Emerging & Frontier ETF | | | 4,889,604 | | | | 16,211,614 | | | | 21,101,218 | |
| Global X FTSE Portugal 20 ETF | | | 3,150,668 | | | | 2,461,958 | | | | 5,612,626 | |
| Global X MSCI Pakistan ETF | | | 39,866 | | | | 56,830 | | | | 96,696 | |
During the year ended October 31, 2016 the Funds did not utilize capital loss carryforwards to offset capital gains.
| Notes to Financial Statements (continued) |
| October 31, 2016 |
5. TAX INFORMATION (continued)
The Federal tax cost and aggregate gross unrealized appreciation and depreciation on investments held by the Funds at October 31, 2016 were as follows:
| Global X Funds | | Federal Tax
Cost | | | Aggregated
Gross
Unrealized
Appreciation | | | Aggregated
Gross
Unrealized
Depreciation | | | Net Unrealized
Appreciation
(Depreciation) | |
| Global X China Consumer ETF | | $ | 93,475,236 | | | $ | 7,066,584 | | | $ | (20,073,091 | ) | | $ | (13,006,507 | ) |
| Global X China Energy ETF | | | 2,213,810 | | | | 51,795 | | | | (682,951 | ) | | | (631,156 | ) |
| Global X China Financials ETF | | | 31,820,228 | | | | 78,980 | | | | (3,799,699 | ) | | | (3,720,719 | ) |
| Global X China Industrials ETF | | | 5,271,948 | | | | 117,905 | | | | (1,625,069 | ) | | | (1,507,164 | ) |
| Global X China Materials ETF | | | 2,189,536 | | | | 27,716 | | | | (876,967 | ) | | | (849,251 | ) |
| Global X NASDAQ China Technology ETF | | | 13,930,444 | | | | 2,608,382 | | | | (2,608,181 | ) | | | 201 | |
| Global X Southeast Asia ETF | | | 14,016,536 | | | | 580,787 | | | | (2,278,444 | ) | | | (1,697,657 | ) |
| Global X FTSE Andean 40 ETF | | | 5,635,538 | | | | 161,061 | | | | (1,728,864 | ) | | | (1,567,803 | ) |
| Global X MSCI Colombia ETF | | | 114,700,308 | | | | 2,047,801 | | | | (26,662,059 | ) | | | (24,614,258 | ) |
| Global X Brazil Mid Cap ETF | | | 5,166,089 | | | | 608,336 | | | | (788,005 | ) | | | (179,669 | ) |
| Global X Brazil Consumer ETF | | | 7,091,968 | | | | 1,094,243 | | | | (1,019,723 | ) | | | 74,520 | |
| Global X MSCI Argentina ETF | | | 83,661,146 | | | | 11,269,463 | | | | (4,424,861 | ) | | | 6,844,602 | |
| Global X MSCI Greece ETF | | | 371,938,395 | | | | 15,159,437 | | | | (139,299,064 | ) | | | (124,139,627 | ) |
| Global X MSCI Norway ETF | | | 169,960,308 | | | | 6,257,797 | | | | (31,127,657 | ) | | | (24,869,860 | ) |
| Global X FTSE Nordic Region ETF | | | 49,872,464 | | | | 2,165,764 | | | | (8,074,527 | ) | | | (5,908,763 | ) |
| Global X MSCI Nigeria ETF | | | 48,446,106 | | | | 123,304 | | | | (19,177,675 | ) | | | (19,054,371 | ) |
| Global X Next Emerging & Frontier ETF | | | 17,271,064 | | | | 971,487 | | | | (3,169,849 | ) | | | (2,198,362 | ) |
| Global X FTSE Portugal 20 ETF | | | 39,629,171 | | | | 941,027 | | | | (12,441,501 | ) | | | (11,500,474 | ) |
| Global X MSCI Pakistan ETF | | | 10,663,780 | | | | 851,695 | | | | (743,120 | ) | | | 108,575 | |
The preceding differences between book and tax cost are primarily due to mark to market treatment of passive foreign investment companies and wash sales.
6. CONCENTRATION OF RISKS
The Funds invest in securities of foreign issuers in several countries. These investments may involve certain considerations and risks not typically associated with investments in the United States as a result of, among other factors, the possibility of future political and economic developments and the level of governmental supervision and regulation of securities markets in the respective countries.
The securities markets of emerging countries are less liquid and subject to greater price volatility, and have a smaller market capitalization, than the U.S. securities markets. In certain countries, there may be fewer publicly traded securities and the market may be dominated by a few issues or sectors.
Issuers and securities markets in such countries are not subject to as extensive and frequent accounting, financial and other reporting requirements or as comprehensive government regulations are issuers and securities markets in the U.S. In particular, the assets and profits appearing on the financial statements of emerging country issuers may not reflect their financial position or results of operations in the same manner as financial statements for U.S. issuers. Substantially less information may be publicly available about emerging country issuers than is available about issuers in the United States.
| Notes to Financial Statements (continued) |
| October 31, 2016 |
6. CONCENTRATION OF RISKS (continued)
The Funds may be subject to taxes imposed by countries in which it invests. Such taxes are generally based on either income or gains earned or repatriated. The Funds accrue and apply such taxes to net investment income, net realized gains and net unrealized gains as income and/or capital gains are earned.
The Funds (other than the Global X Next Emerging & Frontier ETF) use a replication strategy. A replication strategy is an indexing strategy that involves investing in the securities of the underlying index in approximately the same proportions as in the underlying index. The Funds (other than the Global X Next Emerging & Frontier ETF) may utilize a representative sampling strategy with respect to their underlying index when a replication strategy might be detrimental to its shareholders, such as when there are practical difficulties or substantial costs involved in compiling a portfolio of equity securities to follow its underlying index, or, in certain instances, when securities in the underlying index become temporarily illiquid, unavailable or less liquid, or due to legal restrictions (such as diversification requirements that apply to the Funds but not the underlying indexes).
Because of the practical difficulties and expense of purchasing all of the securities in its respective underlying indices, the Global X Next Emerging & Frontier ETF does not expect to purchase all of the securities in its underlying indices. Instead, the Adviser will utilize a “sampling” methodology in seeking to achieve the Fund’s objective. As such, the Fund may purchase a subset of the securities in its respective underlying index in an effort to hold a portfolio of securities with generally the same risk and return characteristics of the underlying index.
Certain Funds may invest in commodity related securities, which are susceptible to fluctuations in certain commodity markets. Any negative changes in commodity markets could have a great impact on those securities.
A more complete description of risks is included in each Fund’s prospectus and SAI.
7. LOANS OF PORTFOLIO SECURITIES
The Funds may lend portfolio securities having a market value up to one-third of the Funds’ total assets. Security loans made pursuant to a securities lending agreement are required at all times to be secured by collateral equal to at least 102% of the value of domestic equity securities and ADRs and 105% of the value of foreign equity securities (other than ADRS). Such collateral received in connection with these loans will be cash and can be invested in repurchase agreements or U.S. Treasury obligations and is recognized in the Schedule of Investments and Statement of Assets and Liabilities. The obligation to return securities lending collateral is also recognized as a liability in the Statement of Assets and Liabilities. It is the Funds’ policy to obtain additional collateral from or return excess collateral to the borrower by the end of the next business day, following the valuation date of the securities loaned. Therefore, the value of the collateral held may be temporarily less than the value of the securities on loan. Lending securities entails a risk of loss to the Funds if and to the extent that the market value of the securities loans were to increase and the borrower did not increase the collateral accordingly, and the borrower fails to return the securities. The Funds could also experience delays and costs in gaining access to the collateral. The Funds bear the risk of any deficiency in the amount of the collateral available for return to the borrower due to any loss on the collateral invested.
Notes to Financial Statements (continued) |
| October 31, 2016 |
7. LOANS OF PORTFOLIO SECURITIES (continued)
As of October 31, 2016, the value of the securities on loan was $7,072,381, $2,586,020, $24,195,714, $2,140,756 and $255,976 for the Global X China Consumer ETF, Global X MSCI Greece ETF, Global X MSCI Norway ETF, Global X FTSE Nordic Region ETF and Global X FTSE Portugal 20 ETF, respectively. The value of securities purchased with the cash collateral held from securities on loan was $7,484,669, $2,806,650, $31,508,904 , $3,124,587 and $2,503,093 for the Global X China Consumer ETF, Global X MSCI Greece ETF, Global X MSCI Norway ETF, Global X FTSE Nordic Region ETF and Global X FTSE Portugal 20 ETF, respectively.
At October 31, 2016, the following Funds had securities on loan, by counterparty:
| | | Market Value | | | Cash Collateral | |
| Global X China Consumer ETF | | | | | | | | |
| Credit Suisse | | $ | 228,817 | | | $ | 241,800 | |
| Deutsche Bank | | | 1,847,526 | | | | 1,936,475 | |
| Goldman Sachs | | | 1,469,958 | | | | 1,566,500 | |
| Jefferies | | | 408,183 | | | | 452,200 | |
| Morgan Stanley | | | 3,117,897 | | | | 3,287,694 | |
| Global X MSCI Greece ETF | | | | | | | | |
| Credit Suisse | | | 1,720,000 | | | | 1,850,000 | |
| ML Pierce, Fenner & Smith | | | 866,020 | | | | 956,650 | |
| Global X MSCI Norway ETF | | | | | | | | |
| BMO Capital Markets | | | 24,481 | | | | 27,800 | |
| Citigroup | | | 625,195 | | | | 683,475 | |
| Credit Suisse | | | 963,444 | | | | 1,045,550 | |
| Deutsche Bank | | | 82,602 | | | | 92,507 | |
| Goldman Sachs | | | 11,060,076 | | | | 17,627,743 | |
| Jefferies | | | 103,733 | | | | 107,510 | |
| JPMorgan | | | 638,605 | | | | 682,403 | |
| ML Pierce, Fenner & Smith | | | 109,717 | | | | 112,213 | |
| SG Americas | | | 11,928 | | | | 13,080 | |
| UBS Securities | | | 10,575,933 | | | | 11,116,623 | |
| Global X FTSE Nordic Region ETF | | | | | | | | |
| Credit Suisse | | | 1,313,466 | | | | 1,393,500 | |
| Deutsche Bank | | | 142,016 | | | | 1,012,557 | |
| UBS Securities | | | 685,274 | | | | 718,530 | |
| Global X FTSE Portugal 20 ETF | | | | | | | | |
| Citigroup | | | 869 | | | | 1,981,637 | |
| Credit Suisse | | | 170,041 | | | | 185,426 | |
| JPMorgan | | | 84,740 | | | | 143,390 | |
| ML Pierce, Fenner & Smith | | | 115 | | | | 96,500 | |
| Morgan Stanley | | | 211 | | | | 96,140 | |
| Notes to Financial Statements (continued) |
| October 31, 2016 |
8. CHANGE IN ACCOUNTING ESTIMATE
Effective November 1, 2015, the Funds changed their method for estimating the characterization of amounts distributed by master limited partnerships, which correspondingly impacted the net investment income, cost of investments and appreciation (depreciation) on investments and the associated financial highlight ratios and per share disclosures to the extent that the fund recorded investment income that differed from amounts previously estimated. There is no impact to net assets, total return, or the expense ratio as a result of management’s change in methodology.
9. CONTRACTUAL OBLIGATIONS
The Funds enter into contracts in the normal course of business that contain a variety of indemnifications. The Funds’ maximum exposure under these arrangements is unknown. However the Funds have not had prior gains or losses pursuant to these contracts. Management has reviewed the Funds’ existing contracts and expects the risk of loss to be remote.
Pursuant to the Trust’s organizational documents, the Trustees of the Trust and the Trust’s officers are indemnified against certain liabilities that may arise out of the performance of their duties.
10. REVERSE SHARE SPLIT
Effective May 16, 2013, the Global X China Materials ETF and the Global X MSCI Argentina ETF executed a 1-for-2 reverse share split for shareholders of record after the close of markets on May 15, 2013. The effect of this transaction was to divide the number of outstanding shares of the Funds by two, resulting in a corresponding increase in the net asset value per share. The per share data in the financial highlights for each of the years in the period then ended have been given retroactive effect to reflect these reverse share splits. There were no changes in net assets, results of operations or total return as a result of these transactions.
11. REGULATORY MATTERS
In October 2016, the Securities and Exchange Commission (the “SEC”) released its Final Rule on Investment Company Reporting Modernization (the “Rule”). The Rule which introduces two new regulatory reporting forms for investment companies – Form N-PORT and Form N-CEN – also contains amendments to Regulation S-X which impact financial statement presentation, particularly the presentation of derivative investments. Although still evaluating the impact of the Rule, management believes that many of the Regulation S-X amendments are consistent with the Portfolios’ current financial statement presentation and expects that the Funds will be able to comply with the Rule’s Regulation S-X amendments by the August 1, 2017 compliance date.
12. SUBSEQUENT EVENTS
The Funds have been evaluated regarding the need for additional disclosures and/or adjustments resulting from subsequent events. Based on this evaluation, no additional disclosure or adjustments were required to the financial statements as of the date the financial statements were issued, except as follows:
Notes to Financial Statements (concluded) |
| October 31, 2016 |
12. SUBSEQUENT EVENTS (continued)
New Series
Subsequent to October 31, 2016, the following investment series of the Trust was launched: Global X MSCI SuperDividend® EAFE ETF.
Name and Index Change for Global X FTSE Portugal 20 ETF
On or around December 6, 2016, the following changes took effect for the Global X FTSE Portugal 20 ETF.
| | | Old Fund Name and Underlying
Index | | New Fund Name and Underlying
Index |
| Name | | Global X FTSE Portugal 20 ETF | | Global X MSCI Portugal ETF |
| Index | | FTSE Portugal 20 Index | | MSCI All Portugal Plus 25/50 Index |
| Index Components | | 20 | | 20* |
| Index Description | | The FTSE Portugal 20 Index is designed to reflect broad-based equity market performance in Portugal. The stocks are screened for liquidity and weighted according to modified free-float market capitalization. The index is comprised of the top 20 companies that are domiciled in, principally traded in or whose revenues are primarily from Portugal. A specific capping methodology is applied to facilitate compliance with the rules governing the listing of financial products on exchanges in the United States. | | The MSCI All Portugal Plus 25/50 Index is designed to represent the performance of the Broad Portugal Equity Universe, while including constituents with minimum levels of liquidity. The Broad Portugal Equity Universe includes securities that are classified in Portugal according to the MSCI Global Investable Market Index Methodology, together with companies that are headquartered or listed in Portugal and carry out the majority of their operations in Portugal. A specific capping methodology is applied to facilitate compliance with the rules governing the listing of financial products on exchanges in the United States. |
The prior index is the FTSE Portugal 20 Index (the “Prior Index”). The Prior Index is designed to reflect broad-based equity market performance in Portugal. The stocks are screened for liquidity and weighted according to modified free-float market capitalization. The new index is the MSCI All Portugal Plus 25/50 Index (the “New Index”). The New Index is designed to represent the performance of the Broad Portugal Equity Universe, while including constituents with minimum levels of liquidity and applying a specific capping methodology to facilitate compliance with the rules governing the listing of financial products on exchanges in the United States.
On or around March 1, 2017, the Global X Next Emerging & Frontier ETF anticipates changing its diversification status from “non-diversified” to “diversified.”
| Report of Independent Registered Public Accounting Firm |
| October 31, 2016 |
To the Board of Trustees and Shareholders of Global X Funds:
In our opinion, the accompanying statements of assets and liabilities, including the schedules of investments, and the related statements of operations and of changes in net assets and the financial highlights present fairly, in all material respects, the financial position of Global X China Consumer ETF, Global X China Energy ETF, Global X China Financials ETF, Global X China Industrials ETF, Global X China Materials ETF, Global X NASDAQ China Technology ETF, Global X Southeast Asia ETF, Global X FTSE Andean 40 ETF, Global X MSCI Colombia ETF, Global X Brazil Mid Cap ETF, Global X Brazil Consumer ETF, Global X MSCI Argentina ETF, Global X MSCI Greece ETF, Global X MSCI Norway ETF, Global X FTSE Nordic Region ETF, Global X MSCI Nigeria ETF, Global X Next Emerging & Frontier ETF, Global X MSCI Portugal ETF and Global X MSCI Pakistan ETF (nineteen of the series constituting Global X Funds, hereafter referred to as the "Funds") as of October 31, 2016, the results of each of their operations, the changes in each of their net assets and each of their financial highlights for the year then ended, in conformity with accounting principles generally accepted in the United States of America. These financial statements and financial highlights (hereafter referred to as "financial statements") are the responsibility of the Funds’ management. Our responsibility is to express an opinion on these financial statements based on our audits. We conducted our audits of these financial statements in accordance with the standards of the Public Company Accounting Oversight Board (United States). Those standards require that we plan and perform the audit to obtain reasonable assurance about whether the financial statements are free of material misstatement. An audit includes examining, on a test basis, evidence supporting the amounts and disclosures in the financial statements, assessing the accounting principles used and significant estimates made by management, and evaluating the overall financial statement presentation. We believe that our audits, which included confirmation of securities as of October 31, 2016 by correspondence with the custodian and brokers, provide a reasonable basis for our opinion. The statements of changes in net assets for the year or period ended October 31, 2015 and the financial highlights for each of the years or periods ended on or prior to October 31, 2015 were audited by other auditors whose report dated December 30, 2015 expressed an unqualified opinion on those financial statements and financial highlights.
PricewaterhouseCoopers LLP
Philadelphia, Pennsylvania
December 22, 2016
| Disclosure of Fund Expenses (unaudited) |
ETFs have operating expenses. As a shareholder of an ETF, your investment is affected by these ongoing costs, which include (among others) costs for ETF management, administrative services, brokerage fees, and shareholder reports like this one. It is important for you to understand the impact of these costs on your investment returns. In addition, a shareholder is responsible for brokerage fees as a result of their investment in a Fund.
Operating expenses such as these are deducted from an ETF’s gross income and directly reduce your final investment return. These expenses are expressed as a percentage of the ETF’s average net assets; this percentage is known as the ETF’s expense ratio.
The following examples use the expense ratio and are intended to help you understand the ongoing costs (in dollars) of investing in your Fund and to compare these costs with those of other funds. The examples are based on an investment of $1,000 made at the beginning of the period shown and held for the entire period from May 1, 2016 through October 31, 2016.
The table on the next page illustrates your Fund’s costs in two ways:
Actual Fund Return. This section helps you to estimate the actual expenses that your Fund incurred over the period. The “Expenses Paid During Period” column shows the actual dollar expense cost incurred by a $1,000 investment in the Fund, and the “Ending Account Value” number is derived from deducting that expense cost from the Fund’s gross investment return.
You can use this information, together with the actual amount you invested in the Funds, to estimate the expenses you paid over that period. Simply divide your actual account value by $1,000 to arrive at a ratio (for example, an $8,600 account value divided by $1,000 = 8.6), then multiply that ratio by the number shown for your Funds under “Expenses Paid During Period.”
Hypothetical 5% Return. This section helps you compare your Fund’s costs with those of other funds. It assumes that the Funds had an annual 5% return before expenses during the year, but that the expense ratio (Column 3) for the period is unchanged. This example is useful in making comparisons because the Securities and Exchange Commission requires all funds to make this 5% calculation. You can assess your Fund’s comparative cost by comparing the hypothetical result for your Fund in the “Expenses Paid During Period” column with those that appear in the same charts in the shareholder reports for other funds.
NOTE: Because the return is set at 5% for comparison purposes — NOT your Fund’s actual return — the account values shown may not apply to your specific investment.
| Disclosure of Fund Expenses (unaudited) (continued) |
| | | Beginning
Account
Value
5/1/2016 | | | Ending
Account
Value
10/31/2016 | | | Annualized
Expense
Ratios | | | Expenses
Paid
During
Period(1) | |
| Global X China Consumer ETF |
| Actual Fund Return | | $ | 1,000.00 | | | $ | 1,052.80 | | | | 0.65 | % | | $ | 3.36 | |
| Hypothetical 5% Return | | | 1,000.00 | | | | 1,021.87 | | | | 0.65 | | | | 3.31 | |
| Global X China Energy ETF |
| Actual Fund Return | | $ | 1,000.00 | | | $ | 1,041.40 | | | | 0.65 | % | | $ | 3.35 | |
| Hypothetical 5% Return | | | 1,000.00 | | | | 1,021.86 | | | | 0.65 | | | | 3.32 | |
| Global X China Financials ETF |
| Actual Fund Return | | $ | 1,000.00 | | | $ | 1,115.60 | | | | 0.66 | % | | $ | 3.50 | |
| Hypothetical 5% Return | | | 1,000.00 | | | | 1,021.83 | | | | 0.66 | | | | 3.34 | |
| Global X China Industrials ETF |
| Actual Fund Return | | $ | 1,000.00 | | | $ | 1,017.80 | | | | 0.66 | % | | $ | 3.33 | |
| Hypothetical 5% Return | | | 1,000.00 | | | | 1,021.83 | | | | 0.66 | | | | 3.34 | |
| Global X China Materials ETF |
| Actual Fund Return | | $ | 1,000.00 | | | $ | 1,057.50 | | | | 0.65 | % | | $ | 3.37 | |
| Hypothetical 5% Return | | | 1,000.00 | | | | 1,021.86 | | | | 0.65 | | | | 3.31 | |
| Global X NASDAQ China Technology ETF |
| Actual Fund Return | | $ | 1,000.00 | | | $ | 1,095.80 | | | | 0.65 | % | | $ | 3.43 | |
| Hypothetical 5% Return | | | 1,000.00 | | | | 1,021.86 | | | | 0.65 | | | | 3.31 | |
| Global X Southeast Asia ETF |
| Actual Fund Return | | $ | 1,000.00 | | | $ | 1,026.20 | | | | 0.65 | % | | $ | 3.31 | |
| Hypothetical 5% Return | | | 1,000.00 | | | | 1,021.87 | | | | 0.65 | | | | 3.31 | |
| Global X FTSE Andean 40 ETF |
| Actual Fund Return | | $ | 1,000.00 | | | $ | 1,031.70 | | | | 0.73 | % | | $ | 3.71 | |
| Hypothetical 5% Return | | | 1,000.00 | | | | 1,021.48 | | | | 0.73 | | | | 3.70 | |
| Global X MSCI Colombia ETF |
| Actual Fund Return | | $ | 1,000.00 | | | $ | 967.50 | | | | 0.68 | % | | $ | 3.36 | |
| Hypothetical 5% Return | | | 1,000.00 | | | | 1,021.72 | | | | 0.68 | | | | 3.46 | |
| Global X Brazil Mid Cap ETF |
| Actual Fund Return | | $ | 1,000.00 | | | $ | 1,209.70 | | | | 0.69 | % | | $ | 3.84 | |
| Hypothetical 5% Return | | | 1,000.00 | | | | 1,021.66 | | | | 0.69 | | | | 3.51 | |
| Global X Brazil Consumer ETF |
| Actual Fund Return | | $ | 1,000.00 | | | $ | 1,376.80 | | | | 0.77 | % | | $ | 4.59 | |
| Hypothetical 5% Return | | | 1,000.00 | | | | 1,021.27 | | | | 0.77 | | | | 3.91 | |
| Global X MSCI Argentina ETF |
| Actual Fund Return | | $ | 1,000.00 | | | $ | 1,150.60 | | | | 0.74 | % | | $ | 4.02 | |
| Hypothetical 5% Return | | | 1,000.00 | | | | 1,021.40 | | | | 0.74 | | | | 3.78 | |
| Global X MSCI Greece ETF |
| Actual Fund Return | | $ | 1,000.00 | | | $ | 936.30 | | | | 0.64 | % | | $ | 3.10 | |
| Hypothetical 5% Return | | | 1,000.00 | | | | 1,021.94 | | | | 0.64 | | | | 3.24 | |
| Global X MSCI Norway ETF |
| Actual Fund Return | | $ | 1,000.00 | | | $ | 1,017.50 | | | | 0.50 | % | | $ | 2.54 | |
| Hypothetical 5% Return | | | 1,000.00 | | | | 1,022.62 | | | | 0.50 | | | | 2.54 | |
| Global X FTSE Nordic Region ETF |
| Actual Fund Return | | $ | 1,000.00 | | | $ | 895.60 | | | | 0.52 | % | | $ | 2.47 | |
| Hypothetical 5% Return | | | 1,000.00 | | | | 1,022.53 | | | | 0.52 | | | | 2.64 | |
| Global X MSCI Nigeria ETF |
| Actual Fund Return | | $ | 1,000.00 | | | $ | 706.60 | | | | 1.25 | % | | $ | 5.35 | |
| Hypothetical 5% Return | | | 1,000.00 | | | | 1,018.87 | | | | 1.25 | | | | 6.33 | |
| Disclosure of Fund Expenses (unaudited) (concluded) |
| | | Beginning
Account
Value
5/1/2016 | | | Ending
Account
Value
10/31/2016 | | | Annualized
Expense
Ratios | | | Expenses
Paid
During
Period(1) | |
| Global X Next Emerging & Frontier ETF |
| Actual Fund Return | | $ | 1,000.00 | | | $ | 1,005.00 | | | | 0.47 | % | | $ | 2.38 | |
| Hypothetical 5% Return | | | 1,000.00 | | | | 1,022.76 | | | | 0.47 | | | | 2.40 | |
| Global X FTSE Portugal 20 ETF |
| Actual Fund Return | | $ | 1,000.00 | | | $ | 960.20 | | | | 0.60 | % | | $ | 2.98 | |
| Hypothetical 5% Return | | | 1,000.00 | | | | 1,022.10 | | | | 0.60 | | | | 3.07 | |
| Global X MSCI Pakistan ETF |
| Actual Fund Return | | $ | 1,000.00 | | | $ | 1,108.40 | | | | 0.91 | % | | $ | 4.84 | |
| Hypothetical 5% Return | | | 1,000.00 | | | | 1,020.55 | | | | 0.91 | | | | 4.64 | |
| (1) | Expenses are equal to the Fund’s annualized expense ratio multiplied by the average account value over the period, multiplied by 184/366 (to reflect the one-half year period.). |
| Supplemental Information (unaudited) |
Net asset value, or “NAV”, is the price per Share at which the Funds issue and redeem Shares. It is calculated in accordance with the standard formula for valuing mutual fund shares. The “Market Price” of the Funds generally is determined using the midpoint between the highest bid and the lowest offer on the stock exchange on which the Shares of the Funds are listed for trading, as of the time that the Funds’ NAV is calculated. The Funds’ Market Price may be at, above or below their NAV. The NAV of the Funds will fluctuate with changes in the market value of the Funds’ holdings. The Market Price of the Funds will fluctuate in accordance with changes in their NAV, as well as market supply and demand.
Premiums or discounts are the differences (expressed as a percentage) between the NAV and Market Price of the Funds on a given day, generally at the time NAV is calculated. A premium is the amount that the Funds are trading above the reported NAV, expressed as a percentage of the NAV. A discount is the amount that the Funds are trading below the reported NAV, expressed as a percentage of the NAV.
Further information regarding premiums and discounts is available on the Funds’ website at www.GlobalXFunds.com.
| Trustees and Officers of the Trust (unaudited) |
Set forth below are the names, addresses, year of birth, position with the Trust, Term of Office and Length of Time Served, the principal occupations for the last five years, number of Funds in fund complex overseen by the Trustees, and other directorships outside the fund complex of each of the persons currently serving as Trustees and Officers of the Trust.
Name,
Address
(Year of
Birth) | Position(s)
Held
with
Funds | Principal Occupation(s) During
the Past 5 Years | Number of
Funds in
Trust
Overseen
by Trustee | Other Directorships Held
by Trustees |
| Independent Trustees2 |
Sanjay Ram Bharwani 600 Lexington Ave, 20th floor New York, NY 10022 (1974) | Trustee (since 2008) | CEO of Risk Advisors Inc. (since 2007) (consulting firm). | 543 | None. |
Scott R. Chichester1 600 Lexington Ave, 20th floor New York, NY 10022
(1970) | Trustee (since 2008) | CFO, AdeptPros Inc. (app development, training and consulting) (since 2012); Founder, Madison Park Advisors LLC (advisory services) (since 2011); CFO, Sterling Seal & Supply Inc. (since 2011), President & Treasurer, Bayview Acquisition Corp (since 2010), CPA, Penda Aiken Inc. (2009-2011) (consultant); Founder and President, DirectPay USA LLC (since 2006) (payroll company); Proprietor, Scott R. Chichester CPA (since 2001) (CPA firm). | 543 | Director of AdeptPros Inc. (since 2015); Director of Sterling Seal & Supply Inc. (since 2011); Director of Bayview Acquisition Corp. (since 2010); Trustee of ARK ETF Trust (since 2014). |
Kartik Kiran Shah 600 Lexington Ave, 20th floor New York, NY 10022
(1977) | Trustee (since 2008) | President and Chief Business Officer, Oxeia Biopharmaceuticals, Inc. (2015-present); Vice President, Business Development, Cynvenio Biosystems (2012-2014); Independent Consultant, Self-Employed (2011-2012) (non-financial services); Director, Wireless Generation (2008-2011) (software). | 543 | Director of Oxeia Biopharmaceuticals, Inc. (2015-present). |
Trustees and Officers of the Trust (unaudited)(continued) |
The Trust’s Statement of Additional Information (“SAI”) includes additional information about the Trustees and Officers. The SAI may be obtained without charge by calling 1-888-493-8631. The following chart lists Trustees and Officers as of October 31, 2016.
Name, Address
(Year of Birth) | Position(s) Held
with Funds | Principal Occupation(s)
During
the Past 5 Years | Other
Directorships Held
by Trustees |
| Interested Trustee / Officers2 |
Bruno del Ama 600 Lexington Avenue, 20th Floor New York, NY 10022 (1976) | Trustee (since 2008); President, Chief Executive Officer (since 2008). | Chief Executive Officer, Global X Management Company ("GXMC") (since 2008); Chief Compliance Officer, GXMC (2008-2013). | None. |
Luis Berruga 600 Lexington Avenue, 20th Floor New York, NY 10022 (1977) | Chief Operating Officer, Treasurer, Principal Accounting Officer and Chief Financial Officer (since 9/2015). | Chief Financial Officer, GXMC (since 9/2015) and Chief Operating Officer (since 2/2014); Investment Banker, Jefferies (2012-2014); Regional Product Specialist, Morgan Stanley (2005-2012). | None. |
Daphne Tippens Chisolm 600 Lexington Avenue, 20th Floor New York, NY 10022 (1969) | Secretary (since 2012). | General Counsel, GXMC (since 2011); Chief Compliance Officer, GXMC (1/2014 - 5/2014 and 2/2015 - 9/2016). | None. |
Joe Costello 600 Lexington Avenue, 20th Floor New York, NY 10022 (1974) | Chief Compliance Officer (since 9/2016). | Chief Compliance Officer, FlexShares Funds (2011-2015); Vice President, Northern Trust Investments (2003 - 2015). | None. |
Trustees and Officers of the Trust (unaudited)(concluded) |
Name, Address
(Year of Birth) | Position(s) Held
with Funds | Principal Occupation(s) During
the Past 5 Years | Other Directorships
Held
by Trustees |
Lisa Whittaker4 One Freedom Valley Drive Oaks, PA 19456 (1978) | Assistant Secretary (since 2013). | Counsel at SEI Investments (since 2012); Associate Counsel and Compliance Officer at The Glendale Trust Company (2011-2012); Associate of Drinker Biddle & Reath LLP (2006-2011). | None. |
Eric Kleinschmidt4 One Freedom Valley Drive Oaks, PA 19456 (1962) | Assistant Treasurer (since 2016). | Director, Fund Accounting, SEI Investments Global Funds Services (2004 to present. | None. |
| 1 | Mr. Chichester is currently married to a sister of Mr. del Ama’s wife. While an “immediate family member” (as defined in Section 2(a)(19) of the 1940 Act) of Mr. del Ama would be considered an Interested Person, Mr. Chichester is not considered an immediate family member for this purpose. Although this fact was taken into consideration in determining whether Mr. Chichester should be considered to be an Independent Trustee for purposes of the Section 2(a)(19) of the 1940 Act, it was determined that this relationship was not one that should disqualify Mr. Chichester from serving as an Independent Trustee of the Trust. |
| 2 | Each Trustee serves until his or her successor is duly elected or appointed and qualified. |
| 3 | As of October 31, 2016, the Trust had one hundred investment portfolios, fifty-four of which were operational. |
| 4 | These officers of the Trust also serve as officers of one or more mutual funds for which SEI Investments Company or an affiliate acts as investment manager, administrator or distributor. |
| Notice to Shareholders (unaudited) |
For shareholders that do not have an October 31, 2016 tax year end, this notice is for informational purposes only. For shareholders with an October 31, 2016 tax year end, please consult your tax advisor as to the pertinence of this notice. For the fiscal year ended October 31, 2016, the Funds have designated the following items with regard to distributions paid during the year.
| | | Long-Term
Capital Gain
Distributions | | | Ordinary
Income
Distributions | | | Total
Distributions | | | Qualifying
for
Corporate
Dividends
Received
Deduction (1) | | | Qualifying
Dividend
Income (2) | | | U.S.
Government
Interest (3) | | | Interest
Related
Dividends
(4) | | | Short Term
Capital
Gain
Dividends(5) | | | Foreign
Tax Credit | |
| Global X China Consumer ETF | | | 0.00 | % | | | 100.00 | % | | | 100.00 | % | | | 0.00 | % | | | 27.06 | % | | | 0.00 | % | | | 0.00 | % | | | 0.00 | % | | | 0.86 | % |
| Global X China Energy ETF | | | 0.00 | % | | | 100.00 | % | | | 100.00 | % | | | 0.00 | % | | | 94.96 | % | | | 0.00 | % | | | 0.00 | % | | | 0.00 | % | | | 5.30 | % |
| Global X China Financials ETF | | | 0.00 | % | | | 100.00 | % | | | 100.00 | % | | | 0.00 | % | | | 100.00 | % | | | 0.00 | % | | | 0.00 | % | | | 0.00 | % | | | 1.96 | % |
| Global X China Industrials ETF | | | 0.00 | % | | | 100.00 | % | | | 100.00 | % | | | 0.00 | % | | | 99.58 | % | | | 0.00 | % | | | 0.01 | % | | | 0.00 | % | | | 4.66 | % |
| Global X China Materials ETF | | | 0.00 | % | | | 100.00 | % | | | 100.00 | % | | | 0.00 | % | | | 82.26 | % | | | 0.00 | % | | | 0.00 | % | | | 0.00 | % | | | 1.27 | % |
| Global X NASDAQ China Technology ETF | | | 0.00 | % | | | 100.00 | % | | | 100.00 | % | | | 0.00 | % | | | 91.28 | % | | | 0.00 | % | | | 0.01 | % | | | 0.00 | % | | | 4.45 | % |
| Global X Southeast Asia ETF | | | 0.00 | % | | | 100.00 | % | | | 100.00 | % | | | 0.00 | % | | | 39.99 | % | | | 0.00 | % | | | 0.00 | % | | | 0.00 | % | | | 4.35 | % |
| Global X FTSE Andean 40 ETF | | | 0.00 | % | | | 100.00 | % | | | 100.00 | % | | | 0.36 | % | | | 91.51 | % | | | 0.00 | % | | | 0.00 | % | | | 0.00 | % | | | 12.95 | % |
| Global X MSCI Colombia ETF | | | 0.00 | % | | | 100.00 | % | | | 100.00 | % | | | 0.00 | % | | | 92.60 | % | | | 0.01 | % | | | 0.01 | % | | | 0.00 | % | | | 3.38 | % |
| Global X Brazil Mid Cap ETF | | | 0.00 | % | | | 100.00 | % | | | 100.00 | % | | | 0.00 | % | | | 66.23 | % | | | 0.00 | % | | | 2.16 | % | | | 0.00 | % | | | 0.00 | % |
| Global X Brazil Consumer ETF | | | 0.00 | % | | | 100.00 | % | | | 100.00 | % | | | 0.00 | % | | | 66.13 | % | | | 0.00 | % | | | 14.61 | % | | | 0.00 | % | | | 0.00 | % |
| Global X MSCI Argentina ETF | | | 0.00 | % | | | 100.00 | % | | | 100.00 | % | | | 3.28 | % | | | 100.00 | % | | | 0.00 | % | | | 0.01 | % | | | 0.00 | % | | | 31.49 | % |
| Global X MSCI Greece ETF | | | 0.00 | % | | | 100.00 | % | | | 100.00 | % | | | 0.64 | % | | | 100.00 | % | | | 0.02 | % | | | 0.00 | % | | | 0.00 | % | | | 10.50 | % |
| Global X MSCI Norway ETF | | | 0.00 | % | | | 100.00 | % | | | 100.00 | % | | | 0.00 | % | | | 40.53 | % | | | 0.00 | % | | | 0.00 | % | | | 0.00 | % | | | 20.03 | % |
| Global X FTSE Nordic Region ETF | | | 0.00 | % | | | 100.00 | % | | | 100.00 | % | | | 0.00 | % | | | 100.00 | % | | | 0.00 | % | | | 0.00 | % | | | 0.00 | % | | | 10.93 | % |
| Global X MSCI Nigeria ETF | | | 0.00 | % | | | 100.00 | % | | | 100.00 | % | | | 0.00 | % | | | 0.00 | % | | | 0.00 | % | | | 0.02 | % | | | 0.00 | % | | | 10.39 | % |
| Global X Next Emerging & Frontier ETF | | | 0.00 | % | | | 100.00 | % | | | 100.00 | % | | | 0.01 | % | | | 98.51 | % | | | 0.00 | % | | | 0.01 | % | | | 0.00 | % | | | 3.01 | % |
| Global X FTSE Portugal 20 ETF | | | 0.00 | % | | | 100.00 | % | | | 100.00 | % | | | 0.00 | % | | | 99.33 | % | | | 0.01 | % | | | 0.03 | % | | | 0.00 | % | | | 13.96 | % |
| Global X MSCI Pakistan ETF | | | 0.00 | % | | | 100.00 | % | | | 100.00 | % | | | 0.00 | % | | | 100.00 | % | | | 0.02 | % | | | 0.00 | % | | | 0.00 | % | | | 23.95 | % |
(1) Qualifying dividends represent dividends which qualify for the corporate dividends received deduction and is reflected as a percentage of ordinary Income distributions (the total of short term capital gain and net investment income distributions).
(2) The percentage in this column represents the amount of "Qualifying Dividend Income" as created by the Jobs and Growth Relief Reconciliation Act of 2003 and is reflected as a percentage of ordinary income distributions (the total of short term capital gain and net investment income distributions). It is the intention of each of the aforementioned funds to designate the maximum amount permitted by law.
(3) “U.S. Government Interest” represents the amount of interest that was derived from U.S. Government obligations and distributed during the fiscal year. Generally, interest from direct U.S. Government obligations is exempt from state income tax. However, for shareholders who are residents of California, Connecticut and New York, the statutory threshold requirements were not satisfied to permit exemption of these amounts from state income.
(4) The percentage in this column represents the amount of "Interest Related Dividends" is reflected as a percentage of ordinary income distribution. Interest related dividends is exempt from U.S. withholding tax when paid to foreign investors.
(5) The percentage of this column represents the amount of “Short Term Capital Gain Dividend” is reflected as a percentage of short term capital gain distribution that is exempted from U.S. withholding tax when paid to foreign investors.
| Notice to Shareholders (unaudited) |
The Funds intend to pass through a foreign tax credit to shareholders. For the fiscal year ended October 31, 2016, the total amount of foreign source income and foreign tax credit are as follows:
| Fund Name | | Foreign Source Income | | | Foreign Tax Credit Pass Through | |
| Global X China Consumer ETF | | $ | 1,610,709 | | | $ | 35,321 | |
| Global X China Energy ETF | | | 46,019 | | | | 2,763 | |
| Global X China Financials ETF | | | 769,856 | | | | 55,479 | |
| Global X China Industrials ETF | | | 90,436 | | | | 5,046 | |
| Global X China Materials ETF | | | 25,460 | | | | 913 | |
| Global X NASDAQ China Technology ETF | | | 290,141 | | | | 4,697 | |
| Global X Southeast Asia ETF | | | 391,111 | | | | 22,127 | |
| Global X FTSE Andean 40 ETF | | | 81,808 | | | | 12,752 | |
| Global X MSCI Colombia ETF | | | 1,488,275 | | | | 33,209 | |
| Global X Brazil Mid Cap ETF | | | - | | | | - | |
| Global X Brazil Consumer ETF | | | - | | | | - | |
| Global X MSCI Argentina ETF | | | 213,930 | | | | 98,233 | |
| Global X MSCI Greece ETF | | | 5,116,045 | | | | 450,738 | |
| Global X MSCI Norway ETF | | | 4,117,633 | | | | 554,317 | |
| Global X FTSE Nordic Region ETF | | | 1,465,371 | | | | 183,035 | |
| Global X MSCI Nigeria ETF | | | 1,135,758 | | | | 98,653 | |
| Global X Next Emerging & Frontier ETF | | | 734,508 | | | | 74,901 | |
| Global X FTSE Portugal 20 ETF | | | 1,313,311 | | | | 204,603 | |
| Global X MSCI Pakistan ETF | | | 417,109 | | | | 51,904 | |
The information reported herein may differ from the information and distributions taxable to the shareholders for the calendar year ending December 31, 2016. Complete information will be computed and reported in conjunction with your 2016 Form 1099-DIV.

600 Lexington Avenue, 20th floor
New York, NY 10022
1-888-GXFund-1
(1-888-493-8631)
www.globalxfunds.com
Investment Adviser and Administrator:
Global X Management Company LLC
600 Lexington Avenue, 20th floor
New York, NY 10022
Distributor:
SEI Investments Distribution Co.
One Freedom Valley Drive
Oaks, PA 19456
Sub-Administrator:
SEI Investments Global Funds Services
One Freedom Valley Drive
Oaks, PA 19456
Counsel for Global X Funds and the Independent Trustees:
Stradley Ronon Stevens & Young, LLP
1250 Connecticut Avenue, N.W.
Suite 500
Washington, DC 20036
Custodian and Transfer Agent:
Brown Brothers Harriman & Co.
50 Post Office Square
Boston, MA 02110
Independent Registered Public Accounting Firm:
PricewaterhouseCoopers LLP
Two Commerce Square
Suite 1800
2001 Market Street
Philadelphia, PA 19103
This information must be preceded or accompanied by a prospectus for the funds described.
GLX-AR-002-0600
| Global X SuperDividend® ETF (ticker: SDIV) | |
| Global X SuperDividend® U.S. ETF (ticker: DIV) |
Global X MSCI SuperDividend® Emerging Markets ETF (formerly, Global X SuperDividend® Emerging Markets ETF) (ticker: SDEM) |
| Global X SuperDividend® REIT ETF (ticker: SRET) |
| Global X SuperIncome™ Preferred ETF (ticker: SPFF) |
| Global X Social Media Index ETF (ticker: SOCL) |
| Global X | JPMorgan Efficiente Index ETF (ticker: EFFE) |
| Global X | JPMorgan US Sector Rotator Index ETF (ticker: SCTO) |
| Global X Permanent ETF (ticker: PERM) |
| Global X Guru® Index ETF (ticker: GURU) |
| Global X Guru® Activist Index ETF (ticker: ACTX) |
| Global X Guru® International Index ETF (ticker: GURI) |
| Global X Scientific Beta US ETF (ticker: SCIU) |
| Global X Scientific Beta Europe ETF (ticker: SCID) |
| Global X Scientific Beta Japan ETF (ticker: SCIJ) |
| Global X Scientific Beta Asia ex-Japan ETF (ticker: SCIX) |
| Global X YieldCo Index ETF (ticker: YLCO) |
| Global X S&P 500® Catholic Values ETF (ticker: CATH) |
Annual Report
October 31, 2016
The Funds file their complete schedules of Fund holdings with the Securities and Exchange Commission (the “Commission”) for the first and third quarters of each fiscal year on Form N-Q within sixty days after the end of the period. The Funds’ Forms N-Q are available on the Commission’s website at http://www.sec.gov, and may be reviewed and copied at the Commission's Public Reference Room in Washington, DC. Information on the operation of the Public Reference Room may be obtained by calling 1-800-SEC-0330.
A description of the policies and procedures that Global X Funds use to determine how to vote proxies relating to Fund securities, as well as information relating to how the Funds voted proxies relating to Fund securities during the most recent 12-month period ended June 30, is available (i) without charge, upon request, by calling 1-888-GXFund-1; and (ii) on the Commission’s website at http://www.sec.gov.
| Management Discussion of Fund Performance (unaudited) |
| Global X SuperDividend® ETF |
Global X SuperDividend® ETF
The Global X SuperDividend® ETF (“Fund”) seeks investment results that correspond generally to the price and yield performance, before fees and expenses, of the Solactive Global SuperDividend® Index (“Underlying Index”). The Fund is passively managed, which means the investment adviser does not attempt to take defensive positions in declining markets. The Fund generally seeks to fully replicate the Underlying Index.
The Underlying Index tracks the performance of 100 equally-weighted companies that rank among the highest dividend yielding equity securities in the world including emerging market countries, as defined by the index provider.
For the 12-month period ended October 31, 2016 (the “reporting period”), the Fund increased 6.23%, while the Underlying Index increased 5.00%. The Fund had a net asset value of $20.65 per share on October 31, 2015 and ended the reporting period with a net asset value of $20.43 on October 31, 2016.
During the reporting period, the highest returns came from ONEOK and Williams Companies, which returned 136.66% and 103.92%, respectively. The worst performers were United Development Funding IV and Costamare, which returned-90.64% and -48.21%, respectively.
Stocks held by the Fund have among the highest dividend yields in the world. High dividend investing is a value-oriented strategy that was positively impacted by the performance of value stocks versus their growth counterparts. Over the reporting period, the Fund had an average approximate exposure of 40.1% to stocks in the U.S., 18.5% to stocks in Australia, and 6.8% to stocks in Singapore. Over the reporting period, stocks in the Fund from these regions had total returns of approximately 15.4%, 15.6% and 8.2%, respectively.
| | | AVERAGE TOTAL RETURN FOR THE YEAR ENDED OCTOBER 31, 2016 | |
| | | One Year Return | | | Three Year Return | | | Annualized Inception to Date* | |
| | | Net Asset Value | | | Market Price | | | Net Asset Value | | | Market Price | | | Net Asset Value | | | Market Price | |
| Global X SuperDividend® ETF | | | 6.23 | % | | | 6.58 | % | | | 1.57 | % | | | 1.53 | % | | | 3.52 | % | | | 3.52 | % |
| Solactive Global SuperDividend® Index | | | 5.00 | % | | | 5.00 | % | | | 1.10 | % | | | 1.10 | % | | | 2.95 | % | | | 2.95 | % |
| S&P 500 Index | | | 4.51 | % | | | 4.51 | % | | | 8.84 | % | | | 8.84 | % | | | 12.23 | % | | | 12.23 | % |
Growth of a $10,000 Investment
(at Net Asset Value)
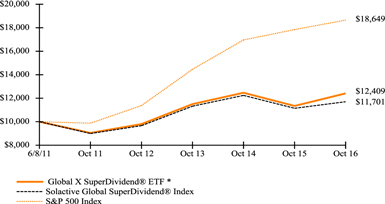
* The Fund commenced operations on June 8, 2011.
The S&P 500 Index is a market capitalization weighted composite index of 500 large capitalization U.S. companies.
The performance data quoted herein represents past performance and the return and value of an investment in the Fund will fluctuate so that, when redeemed, it may be worth less than its original cost. Past performance is no guarantee of future performance and should not be considered as a representation of the future results of the Fund. The Fund's performance assumes the reinvestment of all dividends and all capital gains. Index returns assume reinvestment of dividends and, unlike a Fund's returns, do not reflect any fees or expenses. If such fees and expenses were included in the index returns, the performance would have been lower. Please note that one cannot invest directly in an unmanaged index.
There are no assurances that the Fund will meet its stated objectives.
The Fund’s holdings and allocations are subject to change and should not be considered recommendations to buy individual securities.
The graph and table do not reflect the deduction of taxes that a shareholder would pay on Fund distributions or the redemption or sale of Fund shares.
See definition of comparative indices above.
| Management Discussion of Fund Performance (unaudited) |
| Global X SuperDividend® U.S. ETF |
Global X SuperDividend® U.S. ETF
The Global X SuperDividend® U.S. ETF ("Fund") seeks to provide investment results that correspond generally to the price and yield performance, before fees and expenses, of the INDXX SuperDividend® U.S. Low Volatility Index ("Underlying Index").The Fund is passively managed, which means the investment adviser does not attempt to take defensive positions in declining markets. The Fund generally seeks to fully replicate the Underlying Index.
The Underlying Index tracks the performance of 50 equally-weighted common stocks including master limited partnerships ("MLPs") and real estate investment trust ("REITs") that rank among the highest dividend yielding equity securities in the United States, as defined by the index provider. The Underlying Index is comprised of securities that the index provider determines to have lower relative volatility, as measured by the beta, a measure of a security's sensitivity to the movements of the broader market, of each security relative to the market benchmark.
For the 12-month period ended October 31, 2016 (the “reporting period”), the Fund increased 2.13%, while the Underlying Index increased 3.35%. The Fund had a net asset value of $25.23 per share on October 31, 2015 and ended the reporting period with a net asset value of $24.00 on October 31, 2016.
During the reporting period, the highest returns came from CONE Midstream Partners and Summit Midstream Partners, which returned 108.89% and 89.46%, respectively. The worst performers were Midcoast Energy Partners and Archrock Partners, which returned -65.27% and -61.31%, respectively.
The Fund invests in many of the highest yielding stocks in the US. High dividend investing is a value-oriented strategy that was positively impacted by the performance of value stocks versus their growth counterparts. Over the course of the reporting period, the high dividend strategy maintained significant exposures to the financials sector at an approximate average weight of 24.7%, utilities at 24.7%, and consumer discretionary at 15.1%.
| | | AVERAGE TOTAL RETURN FOR THE YEAR ENDED OCTOBER 31, 2016 | |
| | | One Year Return | | | Three Year Return | | | Annualized Inception to Date* | |
| | | Net Asset Value | | | Market Price | | | Net Asset Value | | | Market Price | | | Net Asset Value | | | Market Price | |
| Global X SuperDividend® U.S. ETF | | | 2.13 | % | | | 2.12 | % | | | 4.06 | % | | | 4.01 | % | | | 5.36 | % | | | 5.53 | % |
| INDXX SuperDividend® U.S. Low Volatility Index | | | 3.35 | % | | | 3.35 | % | | | 4.66 | % | | | 4.66 | % | | | 5.94 | % | | | 5.94 | % |
| S&P 500 Index | | | 4.51 | % | | | 4.51 | % | | | 8.84 | % | | | 8.84 | % | | | 11.24 | % | | | 11.24 | % |
Growth of a $10,000 Investment
(at Net Asset Value)
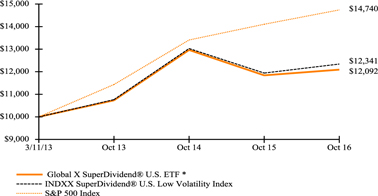
* The Fund commenced operations on March 11, 2013.
The S&P 500 Index is a market capitalization weighted composite index of 500 large capitalization U.S. companies.
The performance data quoted herein represents past performance and the return and value of an investment in the Fund will fluctuate so that, when redeemed, it may be worth less than its original cost. Past performance is no guarantee of future performance and should not be considered as a representation of the future results of the Fund. The Fund's performance assumes the reinvestment of all dividends and all capital gains. Index returns assume reinvestment of dividends and, unlike a Fund's returns, do not reflect any fees or expenses. If such fees and expenses were included in the index returns, the performance would have been lower. Please note that one cannot invest directly in an unmanaged index.
There are no assurances that the Fund will meet its stated objectives.
The Fund’s holdings and allocations are subject to change and should not be considered recommendations to buy individual securities.
The graph and table do not reflect the deduction of taxes that a shareholder would pay on Fund distributions or the redemption or sale of Fund shares.
See definition of comparative indices above.
| Management Discussion of Fund Performance (unaudited) |
| Global X SuperDividend® Emerging Markets ETF |
Global X SuperDividend® Emerging Markets ETF
The Global X SuperDividend® Emerging Markets ETF (“Fund”) seeks investment results that correspond generally to the price and yield performance, before fees and expenses, of the INDXX SuperDividend® Emerging Markets Index (“Underlying Index”).The Fund is passively managed, which means the investment adviser does not attempt to take defensive positions in declining markets. The Fund generally seeks to fully replicate the Underlying Index.
The Underlying Index tracks the performance of 50 equally weighted companies that rank among the highest dividend yielding equity securities in emerging markets, as defined by the index provider. The Underlying Index may include components from the following countries: Brazil, Chile, Colombia, Mexico, Peru, Czech Republic, Egypt, Greece, Hungary, Poland, Qatar, Russia, South Africa, Turkey, United Arab Emirates, China, India, Indonesia, Malaysia, Philippines, and Thailand. The Underlying Index selects the publicly-listed securities in these markets with the highest dividend yield, subject to minimum market capitalization and liquidity requirements, and subject to maximum allocations to individual countries and sectors.
For the 12-month period ended October 31, 2016 (the “reporting period”), the Fund increased 15.58%, while the Underlying Index increased 16.91%. The Fund had a net asset value of $13.73 per share on October 31, 2015 and ended the reporting period with a net asset value of $14.96 on October 31, 2016.
During the reporting period, the highest returns came from Vedanta Limited and Banco do Brasil, which returned 186.97% and 179.08%, respectively. The worst performers were Bradespar and Vedanta Resources, which returned -59.62% and -54.66%, respectively.
During the reporting period, emerging markets experienced bouts of volatility given uncertainties around U.S. Federal Reserve rate hikes, Chinese economic growth, and rapidly changing oil prices. Stocks held by the Fund have among the highest dividend yields in the emerging markets. Over the reporting period, the Fund had an average approximate exposure of 20.1% to stocks in the China, 13.7% to stocks in Brazil, 13.3% to stocks in Russia. Materials, real estate, and telecommunication services stocks received the highest average allocation in the Fund at 19.2%, 14.4% and 12.7% respectively.
| | | AVERAGE TOTAL RETURN FOR THE YEAR ENDED OCTOBER 31, 2016 | |
| | | One Year Return | | | Annualized Inception to Date* | |
| | | Net Asset Value | | | Market Price | | | Net Asset Value | | | Market Price | |
| Global X SuperDividend® Emerging Markets ETF | | | 15.58 | % | | | 15.84 | % | | | 6.00 | % | | | 6.06 | % |
| Indxx SuperDividend® Emerging Markets Index | | | 16.91 | % | | | 16.91 | % | | | 7.10 | % | | | 7.10 | % |
| S&P 500 | | | 4.51 | % | | | 4.51 | % | | | 3.46 | % | | | 3.46 | % |
| Management Discussion of Fund Performance (unaudited) |
| Global X SuperDividend® Emerging Markets ETF |
Growth of a $10,000 Investment
(at Net Asset Value)
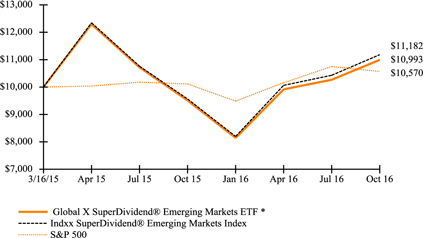
* The Fund commenced operations on March 16, 2015.
The S&P 500 Index is a market capitalization weighted composite index of 500 large capitalization U.S. companies.
The performance data quoted herein represents past performance and the return and value of an investment in the Fund will fluctuate so that, when redeemed, it may be worth less than its original cost. Past performance is no guarantee of future performance and should not be considered as a representation of the future results of the Fund. The Fund's performance assumes the reinvestment of all dividends and all capital gains. Index returns assume reinvestment of dividends and, unlike a Fund's returns, do not reflect any fees or expenses. If such fees and expenses were included in the index returns, the performance would have been lower. Please note that one cannot invest directly in an unmanaged index.
There are no assurances that the Fund will meet its stated objectives.
The Fund’s holdings and allocations are subject to change and should not be considered recommendations to buy individual securities.
The graph and table do not reflect the deduction of taxes that a shareholder would pay on Fund distributions or the redemption or sale of Fund shares.
See definition of comparative indices above and on previous page.
| Management Discussion of Fund Performance (unaudited) |
| Global X SuperDividend® REIT ETF |
Global X SuperDividend® REIT ETF
The Global X SuperDividend® REIT ETF (“Fund”) seeks investment results that correspond generally to the price and yield performance, before fees and expenses, of the Solactive Global SuperDividend® REIT Index (“Underlying Index”). The Fund generally seeks to fully replicate the Underlying Index.
The Underlying Index tracks the performance of real estate investment trusts (“REITs”) that rank among the highest-yielding REITs globally, as determined by the index provider. The index provider screens the highest yielding REITs to exclude REITs that have historically exhibited the highest volatility, as determined by the index provider.
For the 12-month period ended October 31, 2016 (the “reporting period”), the Fund increased 21.01%, while the Underlying Index increased 18.96%. The Fund had a net asset value of $13.18 per share on October 31, 2015 and ended the reporting period with a net asset value of $14.60 on October 31, 2016.
During the reporting period, the highest returns came from RMR Group and Senior Housing Properties Trust, which returned 75.36% and 55.64%, respectively. The worst performers were Redefine Properties and Government Properties Income Trust, which returned -25.91% and -12.13%, respectively.
The Fund invests in among the highest dividend yielding REITs around the world. REITs performed well over the course of the reporting period as government yields fell in many places around the world and investors continued to seek income from alternative sources. During the reporting period, the Fund had an average approximate exposure of 83.4% to U.S. REITs, 10.8% to Canadian REITs and 2.8% to Australian REITs.
| | | AVERAGE ANNUAL TOTAL RETURN FOR THE YEAR ENDED OCTOBER 31, 2016 | |
| | | One Year Return | | | Annualized Inception to Date* | |
| | | Net Asset Value | | | Market Price | | | Net Asset Value | | | Market Price | |
| Global X SuperDividend® REIT ETF | | | 21.01 | % | | | 20.84 | % | | | 6.22 | % | | | 6.32 | % |
| Solactive Global SuperDividend® REIT Index | | | 18.96 | % | | | 18.96 | % | | | 4.22 | % | | | 4.22 | % |
| S&P 500 | | | 4.51 | % | | | 4.51 | % | | | 3.46 | % | | | 3.46 | % |
Growth of a $10,000 Investment
(at Net Asset Value)
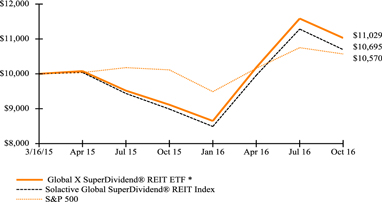
* The Fund commenced operations on March 16, 2015.
The S&P 500 Index is a market capitalization weighted composite index of 500 large capitalization U.S. companies.
The performance data quoted herein represents past performance and the return and value of an investment in the Fund will fluctuate so that, when redeemed, it may be worth less than its original cost. Past performance is no guarantee of future performance and should not be considered as a representation of the future results of the Fund. The Fund's performance assumes the reinvestment of all dividends and all capital gains. Index returns assume reinvestment of dividends and, unlike a Fund's returns, do not reflect any fees or expenses. If such fees and expenses were included in the index returns, the performance would have been lower. Please note that one cannot invest directly in an unmanaged index.
There are no assurances that the Fund will meet its stated objectives.
The Fund’s holdings and allocations are subject to change and should not be considered recommendations to buy individual securities.
The graph and table do not reflect the deduction of taxes that a shareholder would pay on Fund distributions or the redemption or sale of Fund shares.
See definition of comparative indices above.
| Management Discussion of Fund Performance (unaudited) |
| Global X SuperIncome™ Preferred ETF |
Global X SuperIncome™ Preferred ETF
The Global X SuperIncome™ Preferred ETF (“Fund”) seeks investment results that correspond generally to the price and yield performance, before fees and expenses, of the S&P Enhanced Yield North American Preferred Stock Index (“Underlying Index”).The Fund is passively managed, which means the investment adviser does not attempt to take defensive positions in declining markets. The Fund generally seeks to fully replicate the Underlying Index.
The Underlying Index tracks the performance of the highest-yielding preferred securities in the United States and Canada, as determined by the index provider. The Underlying Index is comprised of preferred stocks that meet certain criteria relating to size, liquidity, issuer concentration and rating, maturity and other requirements, as determined by the index provider. The Underlying Index does not seek to directly reflect the performance of the companies issuing the preferred stock.
For the 12-month period ended October 31, 2016 (the “reporting period”), the Fund increased 4.44%, while the Underlying Index increased 4.89%. The Fund had a net asset value of $13.49 per share on October 31, 2015 and ended the reporting period with a net asset value of $13.16 on October 31, 2016.
During the reporting period, the highest returns came from Northstar Realty Finance and Vereit, which returned 17.48% and 15.35%, respectively. The worst performers were ArcelorMittal and PartnerRe, which returned -38.57% and -13.69%, respectively
The Fund invests in among the highest dividend yielding preferred shares in the U.S. and Canada. Over the course of the reporting period, 10 year U.S. Treasury yields declined as inflation and growth expectations remained low. As a result, preferred shares benefitted as investors continued to seek income from asset classes that historically paid higher income than government and corporate bonds. During the reporting period, the Fund had an average approximate exposure of 78.4% in the financials sector, 8.3% in telecommunication services sector, and 6.3% in the energy sector.
| | | AVERAGE TOTAL RETURN FOR THE YEAR ENDED OCTOBER 31, 2016 | |
| | | One Year Return | | | Three Year Return | | | Annualized Inception to Date* | |
| | | Net Asset Value | | | Market Price | | | Net Asset Value | | | Market Price | | | Net Asset Value | | | Market Price | |
| Global X SuperIncome™ Preferred ETF | | | 4.44 | % | | | 4.59 | % | | | 3.06 | % | | | 2.87 | % | | | 3.98 | % | | | 4.41 | % |
| S&P Enhanced Yield North American Preferred Stock Index | | | 4.89 | % | | | 4.89 | % | | | 3.83 | % | | | 3.83 | % | | | 4.68 | % | | | 4.68 | % |
| S&P 500 Index | | | 4.51 | % | | | 4.51 | % | | | 8.84 | % | | | 8.84 | % | | | 13.47 | % | | | 13.47 | % |
Growth of a $10,000 Investment
(at Net Asset Value)
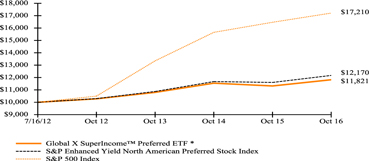
* Fund commenced operations on July 16, 2012.
The S&P 500 Index is a market capitalization weighted composite index of 500 large capitalization U.S. companies.
The performance data quoted herein represents past performance and the return and value of an investment in the Fund will fluctuate so that, when redeemed, it may be worth less than its original cost. Past performance is no guarantee of future performance and should not be considered as a representation of the future results of the Fund. The Fund's performance assumes the reinvestment of all dividends and all capital gains. Index returns assume reinvestment of dividends and, unlike a Fund's returns, do not reflect any fees or expenses. If such fees and expenses were included in the index returns, the performance would have been lower. Please note that one cannot invest directly in an unmanaged index.
There are no assurances that the Fund will meet its stated objectives.
The Fund’s holdings and allocations are subject to change and should not be considered recommendations to buy individual securities.
The graph and table do not reflect the deduction of taxes that a shareholder would pay on Fund distributions or the redemption or sale of Fund shares.
See definition of comparative indices above.
| Management Discussion of Fund Performance (unaudited) |
| Global X Social Media Index ETF |
Global X Social Media Index ETF
The Global X Social Media Index ETF (“Fund”) seeks to provide investment results that correspond generally to the price and yield performance, before fees and expenses, of the Solactive Social Media Total Return Index (“Underlying Index”). The Fund is passively managed, which means the investment adviser does not attempt to take defensive positions in declining markets. The Fund generally seeks to fully replicate the Underlying Index.
The Underlying Index tracks the equity performance of the largest and most liquid companies involved in the social media industry, including companies that provide social networking, file sharing, and other web-based media applications, as defined by the index provider.
For the 12-month period ended October 31, 2016 (the “reporting period”), the Fund increased 21.99%, while the Underlying Index increased 22.93%. The Fund had a net asset value of $19.29 per share on October 31, 2015 and ended the reporting period with a net asset value of $23.53 on October 31, 2016.
During the reporting period, the highest returns came from Weibo and DeNA, which returned 185.42% and 100.88%, respectively. The worst performers were Renren and Twitter, which returned -45.86% and -36.93%, respectively.
The social media industry experienced strong growth during the reporting period, and has been one of the faster growing industries within the technology sector. With the natural slowing of user growth due to high rates of social media penetration in developed markets, social media firms have begun to focus on monetizing users through advertising and data licensing. Social media companies have also focused on user growth in developing economies by sponsoring programs that connect more people to the internet. In addition, the social media industry has benefited from increasing attention from marketers, as young consumers have demonstrated a propensity to be more swayed by social media advertisements than more traditional channels.
| | | AVERAGE TOTAL RETURN FOR THE YEAR ENDED OCTOBER 31, 2016 | |
| | | One Year Return | | | Three Year Return | | | Annualized Inception to Date* | |
| | | Net Asset Value | | | Market Price | | | Net Asset Value | | | Market Price | | | Net Asset Value | | | Market Price | |
| Global X Social Media Index ETF | | | 21.99 | % | | | 21.75 | % | | | 6.70 | % | | | 6.58 | % | | | 9.80 | % | | | 9.79 | % |
| Solactive Social Media Total Return Index | | | 22.93 | % | | | 22.93 | % | | | 7.11 | % | | | 7.11 | % | | | 10.38 | % | | | 10.38 | % |
| S&P 500 Index | | | 4.51 | % | | | 4.51 | % | | | 8.84 | % | | | 8.84 | % | | | 13.66 | % | | | 13.66 | % |
Growth of a $10,000 Investment
(at Net Asset Value)
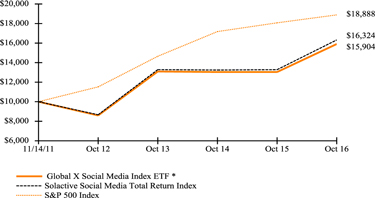
* The Fund commenced operations on November 14, 2011.
The S&P 500 Index is a market capitalization weighted composite index of 500 large capitalization U.S. companies.
The performance data quoted herein represents past performance and the return and value of an investment in the Fund will fluctuate so that, when redeemed, it may be worth less than its original cost. Past performance is no guarantee of future performance and should not be considered as a representation of the future results of the Fund. The Fund's performance assumes the reinvestment of all dividends and all capital gains. Index returns assume reinvestment of dividends and, unlike a Fund's returns, do not reflect any fees or expenses. If such fees and expenses were included in the index returns, the performance would have been lower. Please note that one cannot invest directly in an unmanaged index.
There are no assurances that the Fund will meet its stated objectives.
The Fund’s holdings and allocations are subject to change and should not be considered recommendations to buy individual securities.
The graph and table do not reflect the deduction of taxes that a shareholder would pay on Fund distributions or the redemption or sale of Fund shares.
See definition of comparative indices above.
| Management Discussion of Fund Performance (unaudited) |
| Global X | JPMorgan Efficiente Index ETF |
Global X | JPMorgan Efficiente Index ETF
The Global X | JPMorgan Efficiente Index ETF (“Fund”) seeks investment results that correspond generally to the price and yield performance, before fees and expenses, of the JPMorgan ETF Efficiente 10 TR Series X Index (“Underlying Index”). The Fund is passively managed, which means the investment adviser does not attempt to take defensive positions in declining markets. The Fund generally seeks to fully replicate the Underlying Index.
The Underlying Index tracks the total return performance of a portfolio of eleven exchange-traded funds (each, an "ETF") and two exchange-traded products (each an "ETP") (each ETP and ETF, a "Constituent" and together the "Constituents"), as defined by the index provider. The share prices of the ETFs and ETPs are expected to track the performance of equities or bonds in developed or emerging markets, real estate investments, U.S. Treasury bonds, U.S. Treasury Inflation Protected Securities, a single commodity or a portfolio of commodity futures contracts. The Underlying Index allocates index weights among the Constituents based on a proprietary methodology created by the index provider. On a monthly basis and subject to certain weighting constraints, the Underlying Index is rebalanced to reallocate index weights among the Constituents so that the resulting portfolio would have had the highest return during the previous six months and an annualized volatility level of 10% or less over the same period (subject to upward adjustment under limited circumstances). This methodology is informed by the “modern portfolio theory” approach to asset allocation, which suggests that an investor allocate assets in a manner that maximizes return for a given risk appetite. Since the index weights assigned to the Constituents at each monthly rebalancing are determined based on past performance, there is no guarantee that any monthly rebalancing will result in the Underlying Index achieving the highest possible returns for the relevant month.
For the 12-month period ended October 31, 2016 (the “reporting period”), the Fund increased 6.12%, while the Underlying Index increased 6.97%. The Fund had a net asset value of $23.72 per share on October 31, 2015 and ended the reporting period with a net asset value of $24.05 on October 31, 2016.
During the reporting period, the highest returns came from iShares 20+ Year Treasury Bond ETF and Vanguard FTSE Emerging Markets ETF, which returned 14.09% and 7.69%, respectively. The worst performers were iShares S&P GSCI Commodity Indexed Trust and Vanguard S&P 500 Index Fund, which returned -15.08% and -2.82%, respectively.
During the reporting period, the Fund’s highest average exposures includes an approximate average weighting of 17.0% in ETFs with exposure to REITs, 16.9% in ETFs with exposure to long term U.S. treasuries, 13.0% in ETFs with exposure to Emerging Market Bonds, and 10.7% in ETFs with exposure to short term U.S. treasuries.
| | | AVERAGE TOTAL RETURN FOR THE YEAR ENDED OCTOBER 31, 2016 | |
| | | One Year Return | | | Annualized Inception to Date* | |
| | | Net Asset Value | | | Market Price | | | Net Asset Value | | | Market Price | |
| Global X | JPMorgan Efficiente Index ETF | | | 6.12 | % | | | 6.17 | % | | | 0.74 | % | | | 0.72 | % |
| JPMorgan ETF Efficiente 10 TR Series X Index | | | 6.97 | % | | | 6.97 | % | | | 1.50 | % | | | 1.50 | % |
| S&P 500 Index | | | 4.51 | % | | | 4.51 | % | | | 7.21 | % | | | 7.21 | % |
| Management Discussion of Fund Performance (unaudited) |
| Global X | JPMorgan Efficiente Index ETF |
Growth of a $10,000 Investment
(at Net Asset Value)
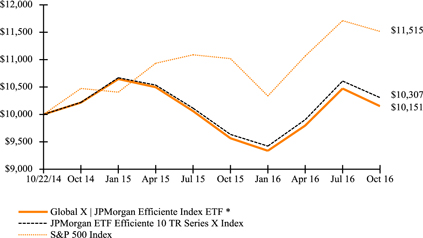
* The Fund commenced operations on October 22, 2014.
The S&P 500 Index is a market capitalization weighted composite index of 500 large capitalization U.S. companies.
The performance data quoted herein represents past performance and the return and value of an investment in the Fund will fluctuate so that, when redeemed, it may be worth less than its original cost. Past performance is no guarantee of future performance and should not be considered as a representation of the future results of the Fund. The Fund's performance assumes the reinvestment of all dividends and all capital gains. Index returns assume reinvestment of dividends and, unlike a Fund's returns, do not reflect any fees or expenses. If such fees and expenses were included in the index returns, the performance would have been lower. Please note that one cannot invest directly in an unmanaged index.
There are no assurances that the Fund will meet its stated objectives.
The Fund’s holdings and allocations are subject to change and should not be considered recommendations to buy individual securities.
The graph and table do not reflect the deduction of taxes that a shareholder would pay on Fund distributions or the redemption or sale of Fund shares.
See definition of comparative indices above and on previous page.
| Management Discussion of Fund Performance (unaudited) |
| Global X | JPMorgan US Sector Rotator Index ETF |
Global X | JPMorgan US Sector Rotator Index ETF
The Global X | JPMorgan US Sector Rotator Index ETF (“Fund”) seeks investment results that correspond generally to the price and yield performance, before fees and expenses, of the JPMorgan US Sector Rotator TR Series X Index (“Underlying Index”), which is composed of underlying equity exchange-traded funds ("ETFs") and a fixed income ETF. The Fund is passively managed, which means the investment adviser does not attempt to take defensive positions in declining markets. The Fund generally seeks to fully replicate the Underlying Index.
The Underlying Index aims to participate in the best-performing U.S. sectors of the market while limiting its exposure to the market during periods of high volatility or market declines, as defined by the index provider. The Underlying Index rebalances monthly to reflect changing market conditions by tracking the performance of a portfolio that may include one U.S. Treasury Bond ETF and zero to five ETFs selected out of a pool of ten U.S. sector ETFs. The sectors represented by all the U.S. sector ETFs are: consumer discretionary, consumer staples, energy, financials, healthcare, industrial, utilities, materials, technology and real estate. On each monthly rebalancing date, the Underlying Index seeks to select up to five U.S. sector ETFs with the highest positive performance during the prior month. The Underlying Index will include an allocation to the U.S. Treasury Bond ETF if fewer than five U.S. sector ETFs have positive performance during the prior month. The U.S. sector ETFs selected for inclusion in the Underlying Index each month are equal-volatility weighted, based on each U.S. sector ETF’s realized volatility during the prior month, meaning that each U.S. sector ETF has the same amount of volatility contribution to the Underlying Index as of such monthly rebalancing date. If the overall realized volatility of the portfolio of selected U.S. sector ETFs exceeds 20%, based on each U.S. sector ETF’s realized volatility during the prior month, the weight assigned on a monthly rebalancing date to each U.S. sector ETF is adjusted down proportionally and the exposure is re-allocated to the U.S. Treasury Bond ETF in order to reduce the overall volatility of the Underlying Index to 20% as of such monthly rebalancing date. Since the index weights assigned to the U.S. Sector ETF and the U.S. Treasury Bond ETF are determined on past performance, there is no guarantee that any monthly rebalancing will result in the Underlying Index achieving the highest possible returns for the relevant month.
For the 12-month period ended October 31, 2016 (the “reporting period”), the Fund increased 2.60%, while the Underlying Index increased 3.64%. The Fund had a net asset value of $23.55 per share on October 31, 2015 and ended the reporting period with a net asset value of $23.79 on October 31, 2016.
During the reporting period, the highest returns came from Utilities Select Sector SPDR Fund and SPDR Dow Jones REIT ETF, which returned 18.31% and 7.38%, respectively. The worst performers were Financial Select Sector SPDR Fund and Health Care Select Sector SPDR Fund, which returned -7.4% and -6.4%, respectively.
The Fund seeks to participate in flat or rising markets through a sector rotation strategy while allocating exposure to a short term treasury ETF in periods of high volatility or declining markets. During the reporting period, the Fund had an approximate average weighting of 13.4% to short term treasury ETF as bouts of broad market volatility throughout the reporting period produced signals to reduce the Fund’s equity exposures. Among equity sectors, ETFs with exposure to the industrials sector had the highest average weighting with 12.0%, followed by ETFs with exposure to the information technology sector at 11.6% and ETFs with exposure to the materials sector at 11.0%.
| | | AVERAGE TOTAL RETURN FOR THE YEAR ENDED OCTOBER 31, 2016 | |
| | | One Year Return | | | Annualized Inception to Date* | |
| | | Net Asset Value | | | Market Price | | | Net Asset Value | | | Market Price | |
| Global X | JPMorgan US Sector Rotator Index ETF | | | 2.60 | % | | | 2.47 | % | | | -1.51 | % | | | -1.55 | % |
| JPMorgan US Sector Rotator TR Series X Index | | | 3.64 | % | | | 3.64 | % | | | -0.55 | % | | | -0.55 | % |
| S&P 500 Index | | | 4.51 | % | | | 4.51 | % | | | 7.21 | % | | | 7.21 | % |
| Management Discussion of Fund Performance (unaudited) |
| Global X | JPMorgan US Sector Rotator Index ETF |
Growth of a $10,000 Investment
(at Net Asset Value)
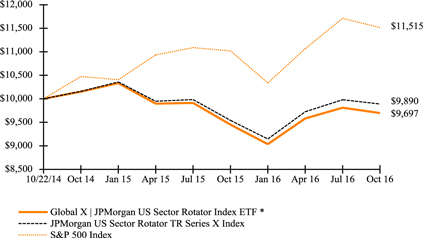
* The Fund commenced operations on October 22, 2014.
The S&P 500 Index is a market capitalization weighted composite index of 500 large capitalization U.S. companies.
The performance data quoted herein represents past performance and the return and value of an investment in the Fund will fluctuate so that, when redeemed, it may be worth less than its original cost. Past performance is no guarantee of future performance and should not be considered as a representation of the future results of the Fund. The Fund's performance assumes the reinvestment of all dividends and all capital gains. Index returns assume reinvestment of dividends and, unlike a Fund's returns, do not reflect any fees or expenses. If such fees and expenses were included in the index returns, the performance would have been lower. Please note that one cannot invest directly in an unmanaged index.
There are no assurances that the Fund will meet its stated objectives.
The Fund’s holdings and allocations are subject to change and should not be considered recommendations to buy individual securities.
The graph and table do not reflect the deduction of taxes that a shareholder would pay on Fund distributions or the redemption or sale of Fund shares.
See definition of comparative indices above and on previous page.
| Management Discussion of Fund Performance (unaudited) |
| Global X Permanent ETF |
Global X Permanent ETF
The Global X Permanent ETF (“Fund”) seeks to provide investment results that correspond generally to the price and yield performance, before fees and expenses, of the Solactive Permanent Index (“Underlying Index”). The Fund is passively managed, which means the investment adviser does not attempt to take defensive positions in declining markets. The Fund utilizes a "sampling" methodology to seek to achieve its investment objective.
The Underlying Index tracks the performance of four asset class categories that are designed to perform differently across different economic environments, as defined by the index provider. On each rebalance, the Underlying Index allocates 25% each to four asset class categories, as follows: stocks, U.S. Treasury Bonds (long-term), U.S. Treasury Bills and Bonds (short-term), and gold and silver.
For the 12-month period ended October 31, 2016 (the “reporting period”), the Fund increased 6.13%, while the Underlying Index increased 6.93%. The Fund had a net asset value of $23.94 per share on October 31, 2015 and ended the reporting period with a net asset value of $25.13 on October 31, 2016.
During the reporting period, the highest returns came from Glencore and Ventas, which returned 75.67% and 40.67%, respectively. The worst performers were Allergan and Gilead Sciences, which returned -32.27% and -30.48%, respectively.
The Fund seeks to provide generally equal exposure to equities, short term treasuries, long term treasuries, and precious metals. Over the reporting period, the Fund's exposures across asset classes with low correlations to each other resulted in an annualized volatility of approximately 6.2%, as measured by the annualized standard deviation of daily returns. Furthermore, due to the Fund’s allocation of approximately 25% of assets to gold and silver, the Fund benefited from the rebound of gold and silver prices during the reporting period.
| | | AVERAGE TOTAL RETURN FOR THE YEAR ENDED OCTOBER 31, 2016 | |
| | | One Year Return | | | Three Year Return | | | Annualized Inception to Date* | |
| | | Net Asset Value | | | Market Price | | | Net Asset Value | | | Market Price | | | Net Asset Value | | | Market Price | |
| Global X Permanent ETF | | | 6.13 | % | | | 4.87 | % | | | 2.71 | % | | | 2.23 | % | | | 1.09 | % | | | 0.96 | % |
| Solactive Permanent Index | | | 6.93 | % | | | 6.93 | % | | | 3.07 | % | | | 3.07 | % | | | 1.38 | % | | | 1.38 | % |
| S&P 500 Index | | | 4.51 | % | | | 4.51 | % | | | 8.84 | % | | | 8.84 | % | | | 12.50 | % | | | 12.50 | % |
Growth of a $10,000 Investment
(at Net Asset Value)
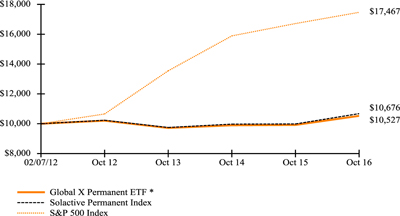
* The Fund commenced operations on February 7, 2012.
The S&P 500 Index is a market capitalization weighted composite index of 500 large capitalization U.S. companies.
The performance data quoted herein represents past performance and the return and value of an investment in the Fund will fluctuate so that, when redeemed, it may be worth less than its original cost. Past performance is no guarantee of future performance and should not be considered as a representation of the future results of the Fund. The Fund's performance assumes the reinvestment of all dividends and all capital gains. Index returns assume reinvestment of dividends and, unlike a Fund's returns, do not reflect any fees or expenses. If such fees and expenses were included in the index returns, the performance would have been lower. Please note that one cannot invest directly in an unmanaged index.
There are no assurances that the Fund will meet its stated objectives.
The Fund’s holdings and allocations are subject to change and should not be considered recommendations to buy individual securities.
The graph and table do not reflect the deduction of taxes that a shareholder would pay on Fund distributions or the redemption or sale of Fund shares.
See definition of comparative indices above and on previous page.
| Management Discussion of Fund Performance (unaudited) |
| Global X Guru® Index ETF |
Global X Guru® Index ETF
The Global X Guru® Index ETF (“Fund”) seeks investment results that correspond generally to the price and yield performance, before fees and expenses, of the Solactive Guru Index (“Underlying Index”).The Fund is passively managed, which means the investment adviser does not attempt to take defensive positions in declining markets. The Fund generally seeks to fully replicate the Underlying Index.
The Underlying Index is comprised of the top U.S. listed equity positions reported on Form 13F by a select group of entities characterized as hedge funds, as defined by the index provider. Hedge funds are selected by the index provider from a pool of thousands of privately offered pooled investment vehicles based on the size of their reported equity holdings and the efficacy of replicating their publicly disclosed positions. Hedge funds must have minimum reported holdings of $500 million in their Form 13F to be considered for the Underlying Index. Additional filters are applied to eliminate hedge funds that have high turnover rates for equity holdings. Only hedge funds with a concentrated top holding are included in the selection process. Once the hedge fund pool has been determined, the index provider utilizes Form 13F filings to compile the top stock holding from each of these hedge funds. The stocks are screened for liquidity, equal weighted, and rebalanced quarterly following the Form 13F filing timeline.
For the 12-month period ended October 31, 2016 (the “reporting period”), the Fund decreased 2.97%, while the Underlying Index decreased 2.81%. The Fund had a net asset value of $23.96 per share on October 31, 2015 and ended the reporting period with a net asset value of $23.14 on October 31, 2016.
During the reporting period, the highest returns came from Macquarie Infrastructure and Darling Ingredients, which returned 42.44% and 34.39%, respectively. The worst performers were Valeant Pharmaceuticals International and Houghton Mifflin Harcourt; which returned -71.08% and -35.43%, respectively.
The Fund invests in many of the top U.S. listed equity positions reported on Form 13F by major hedge funds. Over the course of the reporting period, the underperformance of hedge fund picks within the consumer discretionary sector weighed on the Fund's performance. These stocks generated returns of -17.8%, whereas the consumer discretionary stocks in the S&P 500 were only down approximately -1.8%. In addition, the Fund maintained a weight of 22.4% to consumer discretionary versus a 12.5% weighting for the sector in the S&P 500. The Fund’s exposures to the real estate sector contributed positive returns, as the Fund was overweight the sector 5.5% versus 2.9% in the S&P 500. real estate holdings in the Fund returned 14.8% versus returns of 3.6% for real estate holdings in the S&P 500.
| | | AVERAGE TOTAL RETURN FOR THE YEAR ENDED OCTOBER 31, 2016 | |
| | | One Year Return | | | Three Year Return | | | Annualized Inception to Date* | |
| | | Net Asset Value | | | Market Price | | | Net Asset Value | | | Market Price | | | Net Asset Value | | | Market Price | |
| Global X Guru® Index ETF | | | -2.97 | % | | | -2.93 | % | | | -0.66 | % | | | -0.70 | % | | | 12.22 | % | | | 12.22 | % |
| Solactive Guru Index | | | -2.81 | % | | | -2.81 | % | | | -0.32 | % | | | -0.32 | % | | | 12.74 | % | | | 12.74 | % |
| S&P 500 Index | | | 4.51 | % | | | 4.51 | % | | | 8.84 | % | | | 8.84 | % | | | 14.64 | % | | | 14.64 | % |
| Management Discussion of Fund Performance (unaudited) |
| Global X Guru® Index ETF |
Growth of a $10,000 Investment
(at Net Asset Value)
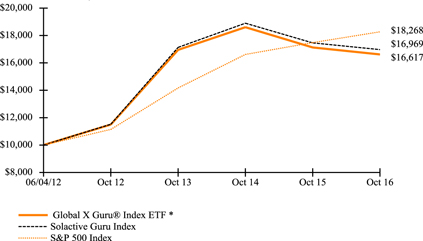
* The Fund commenced operations on June 4, 2012.
The S&P 500 Index is a market capitalization weighted composite index of 500 large capitalization U.S. companies.
The performance data quoted herein represents past performance and the return and value of an investment in the Fund will fluctuate so that, when redeemed, it may be worth less than its original cost. Past performance is no guarantee of future performance and should not be considered as a representation of the future results of the Fund. The Fund's performance assumes the reinvestment of all dividends and all capital gains. Index returns assume reinvestment of dividends and, unlike a Fund's returns, do not reflect any fees or expenses. If such fees and expenses were included in the index returns, the performance would have been lower. Please note that one cannot invest directly in an unmanaged index.
There are no assurances that the Fund will meet its stated objectives.
The Fund’s holdings and allocations are subject to change and should not be considered recommendations to buy individual securities.
The graph and table do not reflect the deduction of taxes that a shareholder would pay on Fund distributions or the redemption or sale of Fund shares.
See definition of comparative indices above and on previous page.
| Management Discussion of Fund Performance (unaudited) |
| Global X Guru®Activist Index ETF |
Global X Guru® Activist Index ETF
The Global X Guru® Activist Index ETF ("Fund") seeks investment results that correspond generally to the price and yield performance, before fees and expenses, of the Solactive Guru Activist Index ("Underlying Index'').The Fund is passively managed, which means the investment adviser does not attempt to take defensive positions in declining markets. The Fund generally seeks to fully replicate the Underlying Index.
The Underlying Index is comprised of US listed equity positions reported on Form 13F and Schedule 13D by a select group of entities characterized as premier activist investors, as defined by the index provider. Activist investors are defined by the index provider as investors that aim to buy securities to put public pressure on management to increase shareholder value. Once the pool of activist investors has been determined, the index provider utilizes Form13F filings and Schedule 13D filings to compile the top 50 aggregate stock holdings held by the pool of activist investors, after screening for certain liquidity and market capitalization requirements. The stocks are equal weighted and rebalanced quarterly following the Form 13F filing timeline. On a monthly basis, securities may be added to or removed from the Underlying Index as a result of Schedule 13D filings.
For the 12-month period ended October 31, 2016 (the “reporting period”), the Fund increased 0.37%, while the Underlying Index increased 0.69%. The Fund had a net asset value of $13.42 per share on October 31, 2015 and ended the reporting period with a net asset value of $13.35 on October 31, 2016.
During the reporting period, the highest returns came from CONSOL Energy and Baxter International, which returned 121.57% and 28.78%, respectively. The worst performers were Valeant Pharmaceuticals International and CVR Energy, which returned -80.97% and -67.29%, respectively.
The Fund invests in certain U.S. listed equity positions held by activist investors. Activist investors seek to unlock unrealized value for shareholders by effecting major changes in target companies. Traditionally, an activist investor will purchase a large number of shares in a company with the objective of accumulating enough voting power to swing company proxy votes. Through these proxy votes, an activist investor will seek to obtain seats on a company’s board of directors, allowing for considerable influence over the company’s strategy, governance, and policies. More recently, activist investors have incorporated highly public campaigns into their strategies via appearances on TV news outlets and social media to galvanize other investors to their cause and to increase pressure on the company’s senior management and board. During the reporting period, the Fund's exposures to information technology and consumer discretionary stocks contributed positive returns to the Fund, while its exposures within the health care and industrials sectors weighed negatively on Fund performance.
| | | AVERAGE TOTAL RETURN FOR THE YEAR ENDED OCTOBER 31, 2016 | |
| | | One Year Return | | | Annualized Inception to Date* | |
| | | Net Asset Value | | | Market Price | | | Net Asset Value | | | Market Price | |
| Global X Guru® Activist Index ETF | | | 0.37 | % | | | 0.44 | % | | | -7.10 | % | | | -7.10 | % |
| Solactive Guru Activist Index | | | 0.69 | % | | | 0.69 | % | | | -6.82 | % | | | -6.82 | % |
| S&P 500 Index | | | 4.51 | % | | | 4.51 | % | | | 5.86 | % | | | 5.86 | % |
| Management Discussion of Fund Performance (unaudited) |
| Global X Guru®Activist Index ETF |
Growth of a $10,000 Investment
(at Net Asset Value)
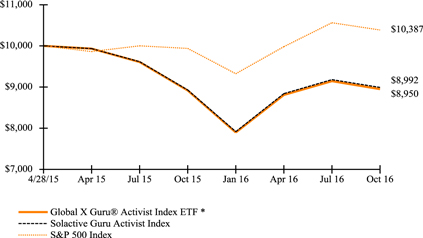
* The Fund commenced operations on April 28, 2015.
The S&P 500 Index is a market capitalization weighted composite index of 500 large capitalization U.S. companies.
The performance data quoted herein represents past performance and the return and value of an investment in the Fund will fluctuate so that, when redeemed, it may be worth less than its original cost. Past performance is no guarantee of future performance and should not be considered as a representation of the future results of the Fund. The Fund's performance assumes the reinvestment of all dividends and all capital gains. Index returns assume reinvestment of dividends and, unlike a Fund's returns, do not reflect any fees or expenses. If such fees and expenses were included in the index returns, the performance would have been lower. Please note that one cannot invest directly in an unmanaged index.
There are no assurances that the Fund will meet its stated objectives.
The Fund’s holdings and allocations are subject to change and should not be considered recommendations to buy individual securities.
The graph and table do not reflect the deduction of taxes that a shareholder would pay on Fund distributions or the redemption or sale of Fund shares.
See definition of comparative indices above and on previous page.
| Management Discussion of Fund Performance (unaudited) |
| Global X Guru® International Index ETF |
Global X Guru® International Index ETF
The Global X Guru® International Index ETF (“Fund”) seeks investment results that correspond generally to the price and yield performance, before fees and expenses, of the Solactive Guru International Index (“Underlying Index”).The Fund is passively managed, which means the investment adviser does not attempt to take defensive positions in declining markets. The Fund generally seeks to fully replicate the Underlying Index.
The Underlying Index is comprised of international companies reported on Form 13F by hedge funds and other institutional investors, as defined by the index provider. Hedge funds are selected from a pool of thousands of privately offered pooled investment vehicles based on the size of their reported equity holdings and the efficacy of replicating their publicly disclosed positions. Institutional investors are selected by the index provider based on the qualitative factor of whether they have a strong management team with a track record of creating shareholder value. Additional filters are applied to exclude the holdings of hedge funds and institutional investors that report less than $500 million in holdings on their Form 13F or that have high turnover rates for equity holdings, as defined by the index provider. Once the pool of investors has been determined, the index provider utilizes Form 13F filings to compile 50 stocks that represent the top international positions from these investors. The stocks must meet minimum size and liquidity thresholds to be included in the Underlying Index. Stocks in the Underlying Index are equal weighted and rebalanced quarterly following the Form 13F filing timeline.
For the 12-month period ended October 31, 2016 (the “reporting period”), the Fund increased 7.51%, while the Underlying Index increased 8.62%. The Fund had a net asset value of $13.13 per share on October 31, 2015 and ended the reporting period with a net asset value of $13.88 on October 31, 2016.
During the reporting period, the highest returns came from Petroleo Brasileiro and Barrick Gold, which returned 233.43% and 130.21%, respectively. The worst performers were Ensco and Vipshop Holdings, which returned -52.19% and
-45.81%, respectively.
The Fund invests in international stocks reported on Form 13F by hedge funds and other institutional investors. During the reporting period, the Fund had a 21.7% average weighting to Canada and a 10.6% average weighting to Brazil, which contributed positively to the Fund's performance. These two countries both broadly benefited from the rebound in commodity prices, which helped contribute to their positive returns.
| | | AVERAGE TOTAL RETURN FOR THE YEAR ENDED OCTOBER 31, 2016 | |
| | | One Year Return | | | Annualized Inception to Date* | |
| | | Net Asset Value | | | Market Price | | | Net Asset Value | | | Market Price | |
| Global X Guru® International Index ETF | | | 7.51 | % | | | 7.51 | % | | | -1.57 | % | | | -1.57 | % |
| Solactive Guru International Index | | | 8.62 | % | | | 8.62 | % | | | -0.72 | % | | | -0.72 | % |
| S&P 500 Index | | | 4.51 | % | | | 4.51 | % | | | 7.02 | % | | | 7.02 | % |
| Management Discussion of Fund Performance (unaudited) |
| Global X Guru® International Index ETF |
Growth of a $10,000 Investment
(at Net Asset Value)
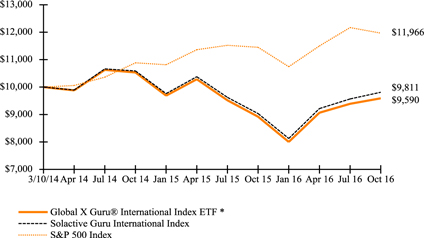
* The Fund commenced operations on March 10, 2014.
The S&P 500 Index is a market capitalization weighted composite index of 500 large capitalization U.S. companies.
The performance data quoted herein represents past performance and the return and value of an investment in the Fund will fluctuate so that, when redeemed, it may be worth less than its original cost. Past performance is no guarantee of future performance and should not be considered as a representation of the future results of the Fund. The Fund's performance assumes the reinvestment of all dividends and all capital gains. Index returns assume reinvestment of dividends and, unlike a Fund's returns, do not reflect any fees or expenses. If such fees and expenses were included in the index returns, the performance would have been lower. Please note that one cannot invest directly in an unmanaged index.
There are no assurances that the Fund will meet its stated objectives.
The Fund’s holdings and allocations are subject to change and should not be considered recommendations to buy individual securities.
The graph and table do not reflect the deduction of taxes that a shareholder would pay on Fund distributions or the redemption or sale of Fund shares.
See definition of comparative indices above and on previous page.
| Management Discussion of Fund Performance (unaudited) |
| Global X Scientific Beta US ETF |
Global X Scientific Beta US ETF
The Global X Scientific Beta US ETF (“Fund”) seeks investment results that correspond generally to the price and yield performance, before fees and expenses, of the Scientific Beta United States Multi-Beta Multi-Strategy Equal Risk Contribution Index (“Underlying Index”). The Fund is passively managed, which means the investment adviser does not attempt to take defensive positions in declining markets. The Fund generally seeks to fully replicate the Underlying Index.
The Underlying Index generally comprises approximately 500 or less U.S. listed common stocks selected based on a proprietary methodology developed by the index provider. The objective of the Underlying Index is to outperform traditional market capitalization-weighted indexes, with lower volatility. The Underlying Index’s components are selected by applying four factors that have been widely recognized by academic literature to outperform market capitalization weighted-indexes over the long run: Value, Size, Low-Volatility and Momentum. Each of these factors is applied by using the following metrics: price-to-book ratio for Value; free-float market capitalization for Size; historical volatility over the trailing 104 week period for Low-Volatility; and one-year-minus-one-month total returns for Momentum. Finally, components are weighted by employing a proprietary, multi-step process that combines multiple weighting methodologies to diversify the risks associated with any one weighting scheme.
For the 12-month period ended October 31, 2016 (the “reporting period”), the Fund increased 4.43%, while the Underlying Index increased 4.77%. The Fund had a net asset value of $24.67 per share on October 31, 2015 and ended the reporting period with a net asset value of $25.46 on October 31, 2016.
During the reporting period, the highest returns came from California Resources and NVIDIA, which returned 250% and 153.78%, respectively. The worst performers were Endo International and Alkermes, which returned -72.6% and -58.01%, respectively.
During the period, the Fund had an average of about 15.1% weighting to stocks in the financials sector, with other average large exposures of about 13.5% to consumer discretionary, and 12.5% to information technology stocks. The Fund had an average approximate exposure of 18% to low volatility stocks, 26% to mid cap stocks, 28% to value stocks, and 28% to momentum stocks, as defined by the index provider. Over the course of the reporting period, the value factor became one of the better performing factors in the US after years of underperformance versus its growth counterpart. In addition, the low volatility and momentum factors began to converge as low volatility had exhibited consistent outperformance. This led to the momentum selection methodology increasingly identifying low volatility stocks as recent high performers.
| | | AVERAGE TOTAL RETURN FOR THE YEAR ENDED OCTOBER 31, 2016 | |
| | | One Year Return | | | Annualized Inception to Date* | |
| | | Net Asset Value | | | Market Price | | | Net Asset Value | | | Market Price | |
| Global X Scientific Beta US ETF | | | 4.43 | % | | | 4.43 | % | | | 2.35 | % | | | 2.37 | % |
| Scientific Beta US Multi-Beta Multi-Strategy Equal Risk Contribution Index | | | 4.77 | % | | | 4.77 | % | | | 2.66 | % | | | 2.66 | % |
| S&P 500 Index | | | 4.51 | % | | | 4.51 | % | | | 3.05 | % | | | 3.05 | % |
| Management Discussion of Fund Performance (unaudited) |
| Global X Scientific Beta US ETF |
Growth of a $10,000 Investment
(at Net Asset Value)
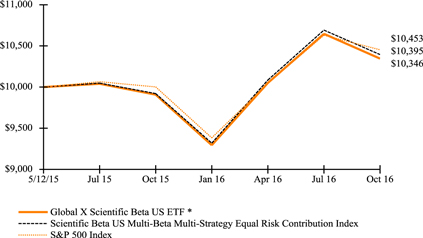
* Fund commenced operations on May 12, 2015.
The S&P 500 Index is a market capitalization weighted composite index of 500 large capitalization U.S. companies.
The performance data quoted herein represents past performance and the return and value of an investment in the Fund will fluctuate so that, when redeemed, it may be worth less than its original cost. Past performance is no guarantee of future performance and should not be considered as a representation of the future results of the Fund. The Fund's performance assumes the reinvestment of all dividends and all capital gains. Index returns assume reinvestment of dividends and, unlike a Fund's returns, do not reflect any fees or expenses. If such fees and expenses were included in the index returns, the performance would have been lower. Please note that one cannot invest directly in an unmanaged index.
There are no assurances that the Fund will meet its stated objectives.
The Fund’s holdings and allocations are subject to change and should not be considered recommendations to buy individual securities.
The graph and table do not reflect the deduction of taxes that a shareholder would pay on Fund distributions or the redemption or sale of Fund shares.
See definition of comparative indices above and on previous page.
| Management Discussion of Fund Performance (unaudited) |
| Global X Scientific Beta Europe ETF |
Global X Scientific Beta Europe ETF
The Global X Scientific Beta Europe ETF (“Fund”) seeks investment results that correspond generally to the price and yield performance, before fees and expenses, of the Scientific Beta Extended Developed Europe Multi-Beta Multi-Strategy Equal Risk Contribution Index (“Underlying Index”). The Fund is passively managed, which means the investment adviser does not attempt to take defensive positions in declining markets. The Fund generally seeks to fully replicate the Underlying Index.
The Underlying Index generally comprises approximately 600 or less European-listed common stocks selected based on a proprietary methodology developed by the index provider. The objective of the Underlying Index is to outperform traditional market capitalization-weighted indexes, with lower volatility. The components of the Underlying Index are selected from a universe of the 600 largest, as measured by free float market capitalization, and most liquid stocks that are ordinarily traded principally on a stock exchange in one of the following 16 developed European countries: Austria, Belgium, Denmark, Finland, France, Germany, Greece, Ireland, Italy, Netherlands, Norway, Portugal, Spain, Sweden, Switzerland and the United Kingdom. The Underlying Index’s components are selected by applying four factors that have been widely recognized by academic literature to outperform market capitalization weighted-indexes over the long run: Value, Size, Low-Volatility and Momentum. Each of these factors is applied by using the following metrics: price-to-book ratio for Value; free-float market capitalization for Size; historical volatility over the trailing 104 week period for Low-Volatility; and one-year-minus-one-month total returns for Momentum. Finally, components are weighted by employing a proprietary, multi-step process that combines multiple weighting methodologies to diversify the risks associated with any one weighting scheme.
For the 12-month period ended October 31, 2016 (the “reporting period”), the Fund decreased 5.96%, while the Underlying Index decreased 5.62%. The Fund had a net asset value of $24.41 per share on October 31, 2015 and ended the reporting period with a net asset value of $22.63 on October 31, 2016.
During the reporting period, the highest returns came from adidas and Neste, which returned 84.45% and 81.97%, respectively. The worst performers were Saipem and Banca Monte dei Paschi di Siena, which returned -91.95% and -87.79%, respectively.
During the reporting period, the Fund had an average weighting of approximately 19.1% to the financials sector, with other notable sector exposures of approximately 18.7% to industrials and 11.4% to consumer discretionary stocks. The Fund had an average approximate exposure of 26% to low volatility stocks, 18% to mid cap stocks, 37% to value stocks, and 19% to momentum stocks, as defined by the index provider. The Fund benefited from its exposure to mid cap and value stocks, which performed well relative to the broader market over the reporting period.
| | | AVERAGE TOTAL RETURN FOR THE YEAR ENDED OCTOBER 31, 2016 | |
| | | One Year Return | | | Annualized Inception to Date* | |
| | | Net Asset Value | | | Market Price | | | Net Asset Value | | | Market Price | |
| Global X Scientific Beta Europe ETF | | | -5.96 | % | | | -5.19 | % | | | -5.36 | % | | | -4.97 | % |
| Scientific Beta Extended Developed Europe Multi-Beta Multi-Strategy Equal Risk Contribution Index | | | -5.62 | % | | | -5.62 | % | | | -5.00 | % | | | -5.00 | % |
| S&P 500 Index | | | 4.51 | % | | | 4.51 | % | | | 3.05 | % | | | 3.05 | % |
| Management Discussion of Fund Performance (unaudited) |
| Global X Scientific Beta Europe ETF |
Growth of a $10,000 Investment
(at Net Asset Value)
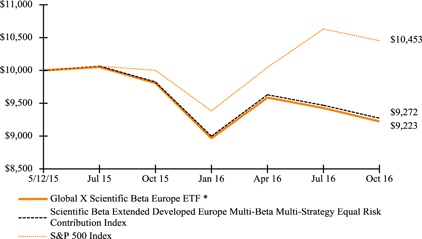
* Fund commenced operations on May 12, 2015.
The S&P 500 Index is a market capitalization weighted composite index of 500 large capitalization U.S. companies.
The performance data quoted herein represents past performance and the return and value of an investment in the Fund will fluctuate so that, when redeemed, it may be worth less than its original cost. Past performance is no guarantee of future performance and should not be considered as a representation of the future results of the Fund. The Fund's performance assumes the reinvestment of all dividends and all capital gains. Index returns assume reinvestment of dividends and, unlike a Fund's returns, do not reflect any fees or expenses. If such fees and expenses were included in the index returns, the performance would have been lower. Please note that one cannot invest directly in an unmanaged index.
There are no assurances that the Fund will meet its stated objectives.
The Fund’s holdings and allocations are subject to change and should not be considered recommendations to buy individual securities.
The graph and table do not reflect the deduction of taxes that a shareholder would pay on Fund distributions or the redemption or sale of Fund shares.
See definition of comparative indices above and on previous page.
| Management Discussion of Fund Performance (unaudited) |
| Global X Scientific Beta Japan ETF |
Global X Scientific Beta Japan ETF
The Global X Scientific Beta Japan ETF (“Fund”) seeks investment results that correspond generally to the price and yield performance, before fees and expenses, of the Scientific Beta Japan Multi-Beta Multi-Strategy Equal Risk Contribution Index (“Underlying Index”). The Fund is passively managed, which means the investment adviser does not attempt to take defensive positions in declining markets. The Fund generally seeks to fully replicate the Underlying Index.
The Underlying Index generally comprises approximately 500 or less Japanese-listed common stocks selected based on a proprietary methodology developed by the index provider. The objective of the Underlying Index is to outperform traditional market capitalization-weighted indexes, with lower volatility The components of the Underlying Index are selected from a universe of the 500 largest, as measured by free float market capitalization, and most liquid stocks traded principally on a stock exchange in and incorporated or domiciled (i.e., maintain a principal place of business) in Japan. The Underlying Index’s components are selected by applying four factors that have been widely recognized by academic literature to outperform market capitalization weighted-indexes over the long run: Value, Size, Low-Volatility and Momentum. Each of these factors is applied by using the following metrics: price-to-book ratio for Value; free-float market capitalization for Size; historical volatility over the trailing 104 week period for Low-Volatility; and one-year-minus-one-month total returns for Momentum. Finally, components are weighted by employing a proprietary, multi-step process that combines multiple weighting methodologies to diversify the risks associated with any one weighting scheme.
For the 12-month period ended October 31, 2016 (the “reporting period”), the Fund increased 9.63%, while the Underlying Index increased 9.88%. The Fund had a net asset value of $25.19 per share on October 31, 2015 and ended the reporting period with a net asset value of $27.38 on October 31, 2016.
During the reporting period, the highest returns came from Miura and Konami Holdings, which returned 78.14% and 74.01%, respectively. The worst performers were Hokuhoku Financial Group and Toyo Tire & Rubber, which returned -48.49% and -47.34%, respectively.
During the reporting period, the Fund had an average weighting of approximately 21.1% to the industrials sector, with other notable sector exposures of approximately 15.6% to consumer discretionary, and 12.1% to consumer staples stocks. The Fund had an average approximate exposure of 18% to low volatility stocks, 19% to mid cap stocks, 44% to value stocks, and 19% to momentum stocks, as defined by the index provider. The Fund benefited from higher exposure to mid cap stocks which tend to be more domestically focused and less sensitive to an appreciating yen.
| | | AVERAGE TOTAL RETURN FOR THE YEAR ENDED OCTOBER 31, 2016 | |
| | | One Year Return | | | Annualized Inception to Date* | |
| | | Net Asset Value | | | Market Price | | | Net Asset Value | | | Market Price | |
| Global X Scientific Beta Japan ETF | | | 9.63 | % | | | 10.90 | % | | | 6.81 | % | | | 7.10 | % |
| Scientific Beta Japan Multi-Beta Multi-Strategy Equal Risk Contribution Index | | | 9.88 | % | | | 9.88 | % | | | 7.07 | % | | | 7.07 | % |
| S&P 500 Index | | | 4.51 | % | | | 4.51 | % | | | 3.05 | % | | | 3.05 | % |
| Management Discussion of Fund Performance (unaudited) |
| Global X Scientific Beta Japan ETF |
Growth of a $10,000 Investment
(at Net Asset Value)
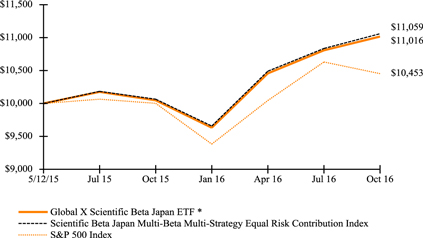
* Fund commenced operations on May 12, 2015.
The S&P 500 Index is a market capitalization weighted composite index of 500 large capitalization U.S. companies.
The performance data quoted herein represents past performance and the return and value of an investment in the Fund will fluctuate so that, when redeemed, it may be worth less than its original cost. Past performance is no guarantee of future performance and should not be considered as a representation of the future results of the Fund. The Fund's performance assumes the reinvestment of all dividends and all capital gains. Index returns assume reinvestment of dividends and, unlike a Fund's returns, do not reflect any fees or expenses. If such fees and expenses were included in the index returns, the performance would have been lower. Please note that one cannot invest directly in an unmanaged index.
There are no assurances that the Fund will meet its stated objectives.
The Fund’s holdings and allocations are subject to change and should not be considered recommendations to buy individual securities.
The graph and table do not reflect the deduction of taxes that a shareholder would pay on Fund distributions or the redemption or sale of Fund shares.
See definition of comparative indices above and on previous page.
| Management Discussion of Fund Performance (unaudited) |
| Global X Scientific Beta Asia ex-Japan ETF |
Global X Scientific Beta Asia ex-Japan ETF
The Global X Scientific Beta Asia ex-Japan ETF (“Fund”) seeks investment results that correspond generally to the price and yield performance, before fees and expenses, of the Scientific Beta Developed Asia-Pacific ex-Japan Multi-Beta Multi-Strategy Equal Risk Contribution Index (“Underlying Index”). The Fund is passively managed, which means the investment adviser does not attempt to take defensive positions in declining markets. The Fund generally seeks to fully replicate the Underlying Index.
The Underlying Index generally comprises approximately 400 or less Asian-listed common stocks selected based on a proprietary methodology developed by the index provider. The objective of the Underlying Index is to outperform traditional market capitalization-weighted indexes, with lower volatility. The components of the Underlying Index are selected from a universe of the 400 largest, as measured by free float market capitalization, and most liquid stocks traded principally on a stock exchange in and incorporated or domiciled (i.e., maintain a principal place of business) in developed markets in Asia, excluding Japan, but may include Hong Kong, New Zealand, Singapore, South Korea and Australia. The Underlying Index’s components are selected by applying four factors that have been widely recognized by academic literature to outperform market capitalization weighted-indexes over the long run: Value, Size, Low-Volatility and Momentum. Each of these factors is applied by using the following metrics: price-to-book ratio for Value; free-float market capitalization for Size; historical volatility over the trailing 104 week period for Low-Volatility; and one-year-minus-one-month total returns for Momentum. Finally, components are weighted by employing a proprietary, multi-step process that combines multiple weighting methodologies to diversify the risks associated with any one weighting scheme.
For the 12-month period ended October 31, 2016 (the “reporting period”), the Fund increased 9.29%, while the Underlying Index increased 9.39%. The Fund had a net asset value of $21.63 per share on October 31, 2015 and ended the reporting period with a net asset value of $22.96 on October 31, 2016.
During the reporting period, the highest returns came from Fortescue Metals Group and South32, which returned 191.47% and 162.2%, respectively. The worst performers were Santos and United Energy Group, which returned -86.23% and
-67.16%, respectively.
During the period, the Fund had an average of approximately 26.4% weighting to stocks in the real estate sector, with other large average exposures of 15.3% to industrials, and 14.6% to consumer discretionary stocks. The Fund had an average approximate exposure of 25% to low volatility stocks, 22% to mid cap stocks, 27% to value stocks, and 25% to momentum stocks, as defined by the index provider.
| | | AVERAGE TOTAL RETURN FOR THE YEAR ENDED OCTOBER 31, 2016 | |
| | | One Year Return | | | Annualized Inception to Date* | |
| | | Net Asset Value | | | Market Price | | | Net Asset Value | | | Market Price | |
| Global X Scientific Beta Asia ex-Japan ETF | | | 9.29 | % | | | 9.43 | % | | | -3.45 | % | | | -3.21 | % |
| Scientific Beta Developed Asia-Pacific ex-Japan Multi-Beta Multi-Strategy Equal Risk Contribution Index | | | 9.39 | % | | | 9.39 | % | | | -4.13 | % | | | -4.13 | % |
| S&P 500 Index | | | 4.51 | % | | | 4.51 | % | | | 3.05 | % | | | 3.05 | % |
| Management Discussion of Fund Performance (unaudited) |
| Global X Scientific Beta Asia ex-Japan ETF |
Growth of a $10,000 Investment
(at Net Asset Value)
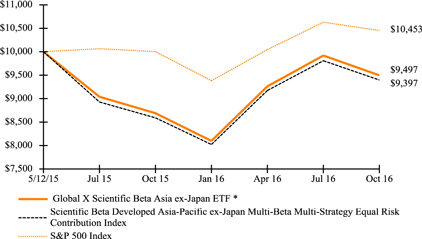
* Fund commenced operations on May 12, 2015.
The S&P 500 Index is a market capitalization weighted composite index of 500 large capitalization U.S. companies.
The performance data quoted herein represents past performance and the return and value of an investment in the Fund will fluctuate so that, when redeemed, it may be worth less than its original cost. Past performance is no guarantee of future performance and should not be considered as a representation of the future results of the Fund. The Fund's performance assumes the reinvestment of all dividends and all capital gains. Index returns assume reinvestment of dividends and, unlike a Fund's returns, do not reflect any fees or expenses. If such fees and expenses were included in the index returns, the performance would have been lower. Please note that one cannot invest directly in an unmanaged index.
There are no assurances that the Fund will meet its stated objectives.
The Fund’s holdings and allocations are subject to change and should not be considered recommendations to buy individual securities.
The graph and table do not reflect the deduction of taxes that a shareholder would pay on Fund distributions or the redemption or sale of Fund shares.
See definition of comparative indices above and on previous page.
| Management Discussion of Fund Performance (unaudited) |
| Global X YieldCo Index ETF |
Global X YieldCo Index ETF
The Global X YieldCo Index ETF (“Fund”) seeks to track, before fees and expenses, the price and yield performance of the INDXX Global Yieldco Index (“Underlying Index”). The Fund is passively managed, which means the investment adviser does not attempt to take defensive positions in declining markets. The Fund generally seeks to fully replicate the Underlying Index.
The Underlying Index comprises publicly traded companies that are formed to own operating assets that produce defined cash flows (“Yieldcos”), as well as companies that have publicly announced plans to spin-off a YieldCo in an initial public offering, as determined by the index provider. The components of the Underlying Index are YieldCos selected from the universe of global publicly listed equities, which have a minimum market capitalization of $500 million and an Average Daily Value Traded (“ADVT”) over the last three months greater than $1 million. If less than 20 securities satisfy this criteria, the market capitalization and ADVT requirements are lowered. If there are still fewer than 20 securities, the parent companies of proposed YieldCos with the nearest anticipated listing dates will be included in the Underlying Index until there are 20 Underlying Index constituents. If a parent company is a part of the Underlying Index, and its corresponding YieldCo becomes publicly listed, the listed YieldCo will replace the parent entity in the index during the subsequent index rebalance. Underlying Index constituents are ranked by market capitalization. The remaining securities are weighted based on their market capitalization, with a cap of 4.75% on any of the securities falling outside of the top five by market capitalization. If any parent companies of YieldCos are Underlying Index constituents, they are each capped at a 4.75% weighting. Companies that are structured as partnerships are capped at a 25% weighting in the aggregate.
For the 12-month period ended October 31, 2016 (the “reporting period”), the Fund increased 7.25% and the Underlying Index increased 7.25%. The Fund had a net asset value of $11.06 per share on October 31, 2015 and ended the reporting period with a net asset value of $11.16 on October 31, 2016.
During the reporting period, the highest returns came from Capstone Infrastructure and TransAlta Renewables, which returned 55.48% and 53.63%, respectively. The worst performers were TerraForm Global and TerraForm Power, which returned -44.99% and -28.66%, respectively.
YieldCos are typically holding companies that own a portfolio of solar, wind, and hydro projects, which deliver electricity to customers. During the beginning of the reporting period, YieldCos suffered from the broader sell off in energy prices. Despite the fact that many of the solar, wind, and hydro projects held by many YieldCos have long term contracts to deliver power to customers, many market participants became worried that renewable energy sources would fall out of favor with the abundance of cheap fossil fuels.
| | | AVERAGE TOTAL RETURN FOR THE YEAR ENDED OCTOBER 31, 2016 | |
| | | One Year Return | | | Annualized Inception to Date* | |
| | | Net Asset Value | | | Market Price | | | Net Asset Value | | | Market Price | |
| Global X YieldCo Index ETF | | | 7.25 | % | | | 7.78 | % | | | -15.26 | % | | | -14.76 | % |
| Indxx Global YieldCo Index | | | 7.25 | % | | | 7.25 | % | | | -15.08 | % | | | -15.08 | % |
| S&P 500 Index | | | 4.51 | % | | | 4.51 | % | | | 2.23 | % | | | 2.23 | % |
| Management Discussion of Fund Performance (unaudited) |
| Global X YieldCo Index ETF |
Growth of a $10,000 Investment
(at Net Asset Value)
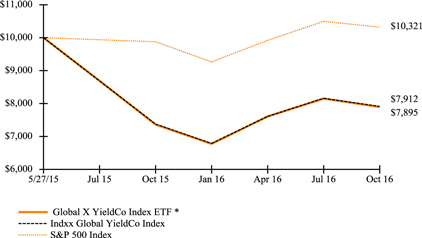
* Fund commenced operations on May 27, 2015.
The S&P 500 Index is a market capitalization weighted composite index of 500 large capitalization U.S. companies.
The performance data quoted herein represents past performance and the return and value of an investment in the Fund will fluctuate so that, when redeemed, it may be worth less than its original cost. Past performance is no guarantee of future performance and should not be considered as a representation of the future results of the Fund. The Fund's performance assumes the reinvestment of all dividends and all capital gains. Index returns assume reinvestment of dividends and, unlike a Fund's returns, do not reflect any fees or expenses. If such fees and expenses were included in the index returns, the performance would have been lower. Please note that one cannot invest directly in an unmanaged index.
There are no assurances that the Fund will meet its stated objectives.
The Fund’s holdings and allocations are subject to change and should not be considered recommendations to buy individual securities.
The graph and table do not reflect the deduction of taxes that a shareholder would pay on Fund distributions or the redemption or sale of Fund shares.
See definition of comparative indices above and on previous page.
| Management Discussion of Fund Performance (unaudited) |
| Global X S&P 500® Catholic Values ETF |
Global X S&P 500® Catholic Values ETF
The Global X S&P 500® Catholic Values ETF (“Fund”) seeks investment results that correspond generally to the price and yield performance, before fees and expenses, of the S&P 500® Catholic Values Index (“Underlying Index”). The Fund is passively managed, which means the investment adviser does not attempt to take defensive positions in declining markets. The Fund generally seeks to fully replicate the Underlying Index.
The S&P 500® Catholic Values Index is designed to provide exposure to U.S. equity securities included in the S&P 500® Index while maintaining alignment with the moral and social teachings of the Catholic Church. The Underlying Index is based on the S&P 500® Index, and generally comprises approximately 500 or less U.S. listed common stocks. All index constituents are members of the S&P 500® Index and follow the eligibility criteria for that index. From this starting universe, constituents are screened to exclude companies involved in activities which are perceived to be inconsistent with Catholic values as outlined in the Socially Responsible Investment Guidelines of the United States Conference of Catholic Bishops (“USCCB”). The Underlying Index then reweights the remaining constituents so that the Underlying Index’s sector exposures matches the sector exposures of the S&P 500® Index.
For the period from the Fund's commencement date on April 18, 2016 through October 31, 2016 (the “reporting period”), the Fund increased 2.39%, while the Underlying Index increased 2.56%. The Fund had a net asset value of $25.14 per share on April 18, 2016 and ended the reporting period with a net asset value of $25.74 on October 31, 2016.
During the reporting period, the highest returns came from NVIDIA and Newmont Mining, which returned 153.78% and 91.02%, respectively. The worst performers were CF Industries Holdings and Signet Jewelers, which returned -50.75% and -45.6%, respectively.
The Global X S&P 500® Catholic Values ETF provides exposure to the companies within the S&P 500® whose business practices align with the core values of the Catholic faith as determined by the U.S. Conference of Catholic Bishops. The Underlying Index also seeks to have a low tracking difference relative to the S&P 500 by equalizing the sector allocations to that of the S&P 500 Index. Over the reporting period, the Fund had a tracking difference of approximately 0.25% versus the S&P 500.
| | | AVERAGE TOTAL RETURN FOR THE
PERIOD ENDED OCTOBER 31, 2016 | |
| | | Cumulative Inception to Date* | |
| | | Net Asset Value | | | Market Price | |
| Global X S&P 500® Catholic Values ETF | | | 2.39 | % | | | 2.70 | % |
| S&P 500 Catholic Values Index | | | 2.56 | % | | | 2.56 | % |
| S&P 500 Index | | | 2.64 | % | | | 2.64 | % |
| Management Discussion of Fund Performance (unaudited) |
| Global X S&P 500® Catholic Values ETF |
Growth of a $10,000 Investment
(at Net Asset Value)
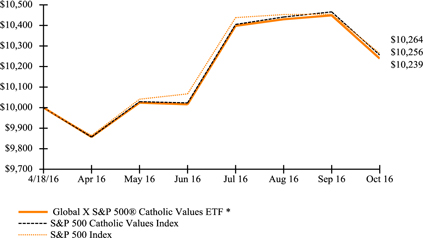
* Fund commenced operations on April 18, 2016. Total return is for the period indicated and has not been annualized.
The S&P 500 Index is a market capitalization weighted composite index of 500 large capitalization U.S. companies.
The performance data quoted herein represents past performance and the return and value of an investment in the Fund will fluctuate so that, when redeemed, it may be worth less than its original cost. Past performance is no guarantee of future performance and should not be considered as a representation of the future results of the Fund. The Fund's performance assumes the reinvestment of all dividends and all capital gains. Index returns assume reinvestment of dividends and, unlike a Fund's returns, do not reflect any fees or expenses. If such fees and expenses were included in the index returns, the performance would have been lower. Please note that one cannot invest directly in an unmanaged index.
There are no assurances that the Fund will meet its stated objectives.
The Fund’s holdings and allocations are subject to change and should not be considered recommendations to buy individual securities.
The graph and table do not reflect the deduction of taxes that a shareholder would pay on Fund distributions or the redemption or sale of Fund shares.
See definition of comparative indices above and on previous page.
| Schedule of Investments | October 31, 2016 |
| Global X SuperDividend® ETF |
Sector Weightings (unaudited)†:
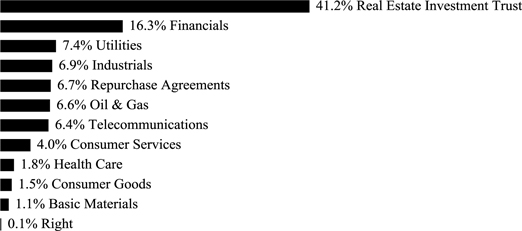
† Sector weightings percentages are based on the total market value of investments. Repurchase agreements purchased from cash collateral received for securities lending activity are included in total investments. Please see Notes 2 and 7 in Notes to Financial Statements for more detailed information.
| | | Shares | | | Value | |
| COMMON STOCK — 98.9% |
| AUSTRALIA— 17.2% | | | | | | | | |
| Consumer Services — 2.0% | | | | | | | | |
| Seven West Media | | | 11,269,993 | | | $ | 5,831,598 | |
| Southern Cross Media Group | | | 9,065,848 | | | | 9,934,042 | |
| | | | | | | | 15,765,640 | |
| Financials — 6.9% | | | | | | | | |
| ASX | | | 232,672 | | | | 8,344,429 | |
| Bank of Queensland | | | 877,317 | | | | 6,983,020 | |
| Bendigo and Adelaide Bank | | | 1,163,889 | | | | 9,857,386 | |
| Commonwealth Bank of Australia | | | 129,710 | | | | 7,243,783 | |
| IOOF Holdings | | | 1,314,716 | | | | 8,203,532 | |
| National Australia Bank | | | 383,929 | | | | 8,180,202 | |
| Westpac Banking | | | 325,954 | | | | 7,557,599 | |
| | | | | | | | 56,369,951 | |
| Industrials — 0.9% | | | | | | | | |
| Sydney Airport | | | 1,481,793 | | | | 7,058,573 | |
| Oil & Gas — 0.8% | | | | | | | | |
| APA Group | | | 1,094,191 | | | | 6,627,676 | |
| Real Estate Investment Trust — 3.6% | | | | | | | | |
| Abacus Property Group | | | 3,275,817 | | | | 6,979,635 | |
| Charter Hall Retail | | | 2,301,288 | | | | 7,267,317 | |
| Cromwell Property Group | | | 9,959,254 | | | | 6,896,413 | |
| Stockland | | | 2,212,336 | | | | 7,440,951 | |
| | | | | | | | 28,584,316 | |
The accompanying notes are an integral part of the financial statements.
| Schedule of Investments | October 31, 2016 |
| Global X SuperDividend® ETF |
| | | Shares | | | Value | |
| COMMON STOCK — continued |
| Telecommunications — 0.9% | | | | | | | | |
| Telstra | | | 1,910,252 | | | $ | 7,238,942 | |
| Utilities — 2.1% | | | | | | | | |
| DUET Group | | | 4,299,271 | | | | 7,786,223 | |
| Spark Infrastructure Group | | | 5,191,635 | | | | 8,770,254 | |
| | | | | | | | 16,556,477 | |
| TOTAL AUSTRALIA | | | | | | | 138,201,575 | |
| CANADA— 4.7% | | | | | | | | |
| Consumer Services — 2.2% | | | | | | | | |
| Corus Entertainment (A) | | | 877,961 | | | | 7,251,653 | |
| Parkland Fuel (A) | | | 457,329 | | | | 10,690,630 | |
| | | | | | | | 17,942,283 | |
| Oil & Gas — 1.5% | | | | | | | | |
| Veresen (A) | | | 1,273,134 | | | | 11,541,562 | |
| Real Estate Investment Trust — 1.0% | | | | | | | | |
| Dream Global | | | 1,167,836 | | | | 7,946,775 | |
| TOTAL CANADA | | | | | | | 37,430,620 | |
| FINLAND— 4.2% | | | | | | | | |
| Basic Materials — 1.2% | | | | | | | | |
| UPM-Kymmene | | | 404,520 | | | | 9,400,842 | |
| Health Care — 1.1% | | | | | | | | |
| Orion, Cl B | | | 207,368 | | | | 8,817,641 | |
| Telecommunications — 0.8% | | | | | | | | |
| Elisa | | | 192,899 | | | | 6,491,712 | |
| Utilities — 1.1% | | | | | | | | |
| Fortum | | | 540,124 | | | | 8,993,777 | |
| TOTAL FINLAND | | | | | | | 33,703,972 | |
| FRANCE— 4.4% | | | | | | | | |
| Financials — 0.9% | | | | | | | | |
| Euler Hermes | | | 82,930 | | | | 7,186,285 | |
| Industrials — 0.8% | | | | | | | | |
| Bouygues | | | 184,909 | | | | 6,021,137 | |
| Oil & Gas — 0.9% | | | | | | | | |
| Total | | | 155,940 | | | | 7,473,578 | |
| Real Estate Investment Trust — 0.9% | | | | | | | | |
| Fonciere Des Regions | | | 86,558 | | | | 7,555,702 | |
| Utilities — 0.9% | | | | | | | | |
| Electricite de France (A) | | | 627,157 | | | | 7,019,285 | |
| TOTAL FRANCE | | | | | | | 35,255,987 | |
The accompanying notes are an integral part of the financial statements.
| Schedule of Investments | October 31, 2016 |
| Global X SuperDividend® ETF |
| | | Shares | | | Value | |
| COMMON STOCK — continued |
| GERMANY— 0.9% | | | | | | | | |
| Telecommunications — 0.9% | | | | | | | | |
| Freenet | | | 239,919 | | | $ | 6,865,612 | |
| GREECE— 0.8% | | | | | | | | |
| Industrials — 0.8% | | | | | | | | |
| Costamare | | | 1,039,845 | | | | 6,758,993 | |
| HONG KONG— 2.6% | | | | | | | | |
| Consumer Goods — 0.8% | | | | | | | | |
| Pacific Textiles Holdings | | | 4,882,600 | | | | 6,157,673 | |
| Industrials — 0.9% | | | | | | | | |
| Seaspan, Cl A (A) | | | 584,569 | | | | 7,231,118 | |
| Real Estate Investment Trust — 0.9% | | | | | | | | |
| China Evergrande Group | | | 11,138,100 | | | | 7,368,093 | |
| TOTAL HONG KONG | | | | | | | 20,756,884 | |
| ISRAEL— 0.7% | | | | | | | | |
| Telecommunications — 0.7% | | | | | | | | |
| Bezeq The Israeli Telecommunication | | | 3,252,576 | | | | 5,902,688 | |
| PORTUGAL— 0.9% | | | | | | | | |
| Utilities — 0.9% | | | | | | | | |
| Energias de Portugal | | | 2,217,551 | | | | 7,319,396 | |
| SINGAPORE— 6.6% | | | | | | | | |
| Industrials — 2.0% | | | | | | | | |
| Hutchison Port Holdings Trust | | | 15,760,373 | | | | 7,013,366 | |
| Venture | | | 1,262,261 | | | | 8,615,187 | |
| | | | | | | | 15,628,553 | |
| Real Estate Investment Trust — 3.7% | | | | | | | | |
| Ascendas | | | 4,157,149 | | | | 7,078,413 | |
| Mapletree Industrial Trust | | | 6,349,500 | | | | 7,846,210 | |
| Mapletree Logistics Trust | | | 10,189,163 | | | | 7,576,539 | |
| Suntec Real Estate Investment Trust | | | 6,112,185 | | | | 7,377,305 | |
| | | | | | | | 29,878,467 | |
| Telecommunications — 0.9% | | | | | | | | |
| StarHub | | | 2,915,506 | | | | 7,079,826 | |
| TOTAL SINGAPORE | | | | | | | 52,586,847 | |
| SOUTH AFRICA— 1.1% | | | | | | | | |
| Real Estate Investment Trust — 1.1% | | | | | | | | |
| Redefine Properties | | | 10,382,650 | | | | 8,917,566 | |
| SWEDEN— 0.7% | | | | | | | | |
| Telecommunications — 0.7% | | | | | | | | |
| Telia | | | 1,506,817 | | | | 6,029,606 | |
The accompanying notes are an integral part of the financial statements.
| Schedule of Investments | October 31, 2016 |
| Global X SuperDividend® ETF |
| | | Shares | | | Value | |
| COMMON STOCK — continued |
| UNITED KINGDOM— 4.0% | | | | | | | | |
| Financials — 2.3% | | | | | | | | |
| Intermediate Capital Group | | | 891,296 | | | $ | 6,588,933 | |
| Phoenix Group Holdings | | | 618,527 | | | | 5,516,427 | |
| Standard Life | | | 1,519,893 | | | | 6,268,327 | |
| | | | | | | | 18,373,687 | |
| Health Care — 0.8% | | | | | | | | |
| AstraZeneca | | | 119,045 | | | | 6,668,276 | |
| Utilities — 0.9% | | | | | | | | |
| SSE | | | 353,353 | | | | 6,863,694 | |
| TOTAL UNITED KINGDOM | | | | | | | 31,905,657 | |
| UNITED STATES— 50.1% | | | | | | | | |
| Consumer Goods — 0.9% | | | | | | | | |
| Vector Group (A) | | | 330,976 | | | | 6,930,637 | |
| Financials — 6.9% | | | | | | | | |
| AGNC Investment | | | 392,226 | | | | 7,868,054 | |
| Artisan Partners Asset Management, Cl A | | | 256,900 | | | | 6,679,400 | |
| Ashford Hospitality Trust | | | 1,283,438 | | | | 7,456,775 | |
| BGC Partners, Cl A | | | 802,431 | | | | 6,892,882 | |
| MTGE Investment | | | 533,745 | | | | 9,100,352 | |
| TPG Specialty Lending | | | 459,519 | | | | 8,234,580 | |
| Washington Prime Group | | | 920,401 | | | | 9,655,006 | |
| | | | | | | | 55,887,049 | |
| Industrials — 2.3% | | | | | | | | |
| Donnelley Financial Solutions * | | | 64,810 | | | | 1,390,175 | |
| LSC Communications | | | 64,810 | | | | 1,570,995 | |
| Nordic American Tankers (A) | | | 531,350 | | | | 4,341,130 | |
| RR Donnelley & Sons | | | 173,487 | | | | 3,079,394 | |
| Ship Finance International (A) | | | 601,682 | | | | 7,611,277 | |
| | | | | | | | 17,992,971 | |
| Oil & Gas — 3.8% | | | | | | | | |
| Pattern Energy Group, Cl A | | | 379,497 | | | | 8,481,758 | |
| SemGroup, Cl A | | | 263,236 | | | | 8,489,361 | |
| Targa Resources | | | 314,972 | | | | 13,827,271 | |
| | | | | | | | 30,798,390 | |
| Real Estate Investment Trust — 32.4% | | | | | | | | |
| Altisource Residential | | | 751,011 | | | | 7,562,681 | |
| Annaly Capital Management | | | 1,281,562 | | | | 13,276,982 | |
| Apollo Commercial Real Estate Finance | | | 434,917 | | | | 7,358,796 | |
| Blackstone Mortgage Trust, Cl A | | | 300,196 | | | | 9,065,919 | |
| Capstead Mortgage | | | 746,362 | | | | 7,097,903 | |
| CBL & Associates Properties | | | 676,025 | | | | 7,233,467 | |
The accompanying notes are an integral part of the financial statements.
| Schedule of Investments | October 31, 2016 |
| Global X SuperDividend® ETF |
| | | Shares | | | Value | |
| COMMON STOCK — continued |
| Real Estate Investment Trust — continued | | | | | | | | |
| Chimera Investment | | | 575,373 | | | $ | 9,016,095 | |
| Colony Capital | | | 461,155 | | | | 8,766,556 | |
| CYS Investments | | | 942,203 | | | | 8,121,790 | |
| Franklin Street Properties | | | 764,319 | | | | 8,843,171 | |
| Gaming and Leisure Properties | | | 254,283 | | | | 8,348,111 | |
| GEO Group | | | 249,803 | | | | 5,985,280 | |
| Government Properties Income Trust (A) | | | 524,533 | | | | 10,039,562 | |
| Hospitality Properties Trust | | | 295,353 | | | | 8,080,858 | |
| Invesco Mortgage Capital | | | 687,276 | | | | 10,261,031 | |
| Investors Real Estate Trust (A) | | | 1,113,576 | | | | 6,759,406 | |
| Lexington Realty Trust | | | 891,486 | | | | 9,039,668 | |
| Medical Properties Trust | | | 639,036 | | | | 8,908,162 | |
| MFA Financial | | | 1,076,488 | | | | 7,869,127 | |
| New Residential Investment | | | 667,403 | | | | 9,316,946 | |
| New York Mortgage Trust (A) | | | 1,512,981 | | | | 8,941,718 | |
| Omega Healthcare Investors (A) | | | 230,076 | | | | 7,323,319 | |
| PennyMac Mortgage Investment Trust | | | 609,587 | | | | 9,277,914 | |
| Redwood Trust | | | 695,874 | | | | 9,783,988 | |
| Sabra Health Care | | | 388,743 | | | | 9,057,712 | |
| Select Income | | | 352,146 | | | | 8,712,092 | |
| Senior Housing Properties Trust | | | 480,963 | | | | 10,230,083 | |
| Starwood Property Trust | | | 398,108 | | | | 8,853,922 | |
| Two Harbors Investment | | | 944,674 | | | | 7,869,135 | |
| VEREIT | | | 902,633 | | | | 8,484,750 | |
| | | | | | | | 259,486,144 | |
| Telecommunications — 1.8% | | | | | | | | |
| Consolidated Communications Holdings | | | 334,089 | | | | 7,994,750 | |
| Frontier Communications (A) | | | 1,573,236 | | | | 6,324,409 | |
| | | | | | | | 14,319,159 | |
| Utilities — 2.0% | | | | | | | | |
| ONEOK | | | 329,673 | | | | 15,966,063 | |
| TOTAL UNITED STATES | | | | | | | 401,380,413 | |
| TOTAL COMMON STOCK | | | | | | | | |
| (Cost $834,523,055) | | | | | | | 793,015,815 | |
| | | | | | | | | |
| RIGHTS — 0.1% |
| United Kingdom — 0.1% | | | | | | | | |
| Phoenix Group Holdings, 11/11/16* | | | | | | | | |
| (Cost $-) | | | 360,807 | | | | 977,928 | |
The accompanying notes are an integral part of the financial statements.
| Schedule of Investments | October 31, 2016 |
| Global X SuperDividend® ETF |
| | | Face Amount | | | Value | |
| REPURCHASE AGREEMENTS — 7.2% |
| Barclays Bank | | | | | | | | |
| 0.320%, dated 10/31/16, to be repurchased on 11/01/16 repurchase price $56,000,498 (collateralized by U.S Treasury Obligations, ranging in par value $1-$17,286,279, 0.000%-4.750%, 11/15/16-05/15/46, with a total market value of $57,120,000)(B) | | $ | 56,000,000 | | | $ | 56,000,000 | |
| Deutsche Bank | | | | | | | | |
| 0.350%, dated 10/31/16, to be repurchased on 11/01/16 repurchase price $1,413,253 (collateralized by U.S. Treasury Obligations, par value $1,314,235, 3.000%, 05/15/45 with a total market value of $1,447,747)(B) | | | 1,413,239 | | | | 1,413,239 | |
| TOTAL REPURCHASE AGREEMENTS | | | | | | | | |
| (Cost $57,413,239) | | | | | | | 57,413,239 | |
| TOTAL INVESTMENTS — 106.2% | | | | | | | | |
| (Cost $891,936,294) | | | | | | $ | 851,406,982 | |
Percentages are based on Net Assets of $801,816,025.
| * | Non-income producing security. |
| (A) | This security or a partial position of this security is on loan as of October 31, 2016. The total value of securities on loan as of October 31, 2016 was $54,773,970. |
| (B) | Security was purchased with cash collateral held from securities on loan. The total value of such securities as of October 31, 2016 was $57,413,239. |
Cl — Class
The following is a summary of the level of inputs used as of October 31, 2016, in valuing the Fund's investments carried at value:
| Investments in Securities | | Level 1 | | | Level 2 | | | Level 3 | | | Total | |
| Common Stock | | $ | 793,015,815 | | | $ | — | | | $ | — | | | $ | 793,015,815 | |
| Rights | | | 977,928 | | | | — | | | | — | | | | 977,928 | |
| Repurchase Agreements | | | — | | | | 57,413,239 | | | | — | | | | 57,413,239 | |
| Total Investments in Securities | | $ | 793,993,743 | | | $ | 57,413,239 | | | $ | — | | | $ | 851,406,982 | |
For the year ended October 31, 2016, there have been no transfers between Level 1, Level 2 or Level 3 investments.
As of October 31, 2016, there were no Level 3 investments.
The accompanying notes are an integral part of the financial statements.
| Schedule of Investments | October 31, 2016 |
| Global X SuperDividend® U.S. ETF |
Sector Weightings (unaudited)†:
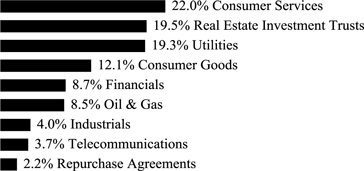
† Sector weightings percentages are based on the total market value of investments. Repurchase agreements purchased from cash collateral received for securities lending activity are included in total investments. Please see Notes 2 and 7 in Notes to Financial Statements for more detailed information.
| | | Shares | | | Value | |
| COMMON STOCK — 78.2% |
| UNITED STATES— 78.2% | | | | | | | | |
| Consumer Goods — 12.3% | | | | | | | | |
| Altria Group | | | 109,974 | | | $ | 7,271,481 | |
| B&G Foods | | | 178,292 | | | | 7,559,581 | |
| Mattel | | | 206,624 | | | | 6,514,855 | |
| Philip Morris International | | | 72,132 | | | | 6,956,410 | |
| Universal | | | 121,344 | | | | 6,576,844 | |
| Vector Group | | | 319,934 | | | | 6,699,418 | |
| | | | | | | | 41,578,589 | |
| Consumer Services — 14.5% | | | | | | | | |
| ClubCorp Holdings | | | 619,462 | | | | 7,154,786 | |
| DineEquity | | | 78,954 | | | | 6,245,261 | |
| Guess? | | | 341,592 | | | | 4,611,492 | |
| National CineMedia | | | 454,149 | | | | 6,299,047 | |
| Regal Entertainment Group, Cl A (A) | | | 344,545 | | | | 7,411,163 | |
| SeaWorld Entertainment (A) | | | 350,621 | | | | 4,912,200 | |
| Six Flags Entertainment | | | 127,904 | | | | 7,117,858 | |
| Staples | | | 715,107 | | | | 5,291,792 | |
| | | | | | | | 49,043,599 | |
| Financials — 5.0% | | | | | | | | |
| AGNC Investment | | | 381,991 | | | | 7,662,740 | |
| MTGE Investment | | | 180,528 | | | | 3,078,002 | |
| New York Community Bancorp | | | 428,798 | | | | 6,157,539 | |
| | | | | | | | 16,898,281 | |
| Industrials — 4.1% | | | | | | | | |
| Covanta Holding | | | 504,793 | | | | 7,571,895 | |
| McGrath RentCorp | | | 205,367 | | | | 6,181,547 | |
| | | | | | | | 13,753,442 | |
The accompanying notes are an integral part of the financial statements.
| Schedule of Investments | October 31, 2016 |
| Global X SuperDividend® U.S. ETF |
| | | Shares | | | Value | |
| COMMON STOCK — continued |
| Real Estate Investment Trusts — 19.8% | | | | | | | | |
| Annaly Capital Management | | | 705,653 | | | $ | 7,310,565 | |
| Apollo Commercial Real Estate Finance | | | 426,447 | | | | 7,215,483 | |
| Chimera Investment | | | 573,779 | | | | 8,991,117 | |
| Colony Capital | | | 420,778 | | | | 7,998,990 | |
| CYS Investments | | | 927,132 | | | | 7,991,878 | |
| Invesco Mortgage Capital | | | 674,260 | | | | 10,066,702 | |
| PennyMac Mortgage Investment Trust | | | 591,053 | | | | 8,995,826 | |
| Starwood Property Trust | | | 382,974 | | | | 8,517,342 | |
| | | | | | | | 67,087,903 | |
| Telecommunications — 3.8% | | | | | | | | |
| AT&T | | | 181,614 | | | | 6,681,579 | |
| Verizon Communications | | | 130,663 | | | | 6,284,890 | |
| | | | | | | | 12,966,469 | |
| Utilities — 18.7% | | | | | | | | |
| Ameren | | | 145,611 | | | | 7,273,270 | |
| Avista | | | 176,428 | | | | 7,304,119 | |
| Consolidated Edison | | | 93,235 | | | | 7,043,904 | |
| Duke Energy | | | 89,324 | | | | 7,147,707 | |
| Empire District Electric | | | 198,876 | | | | 6,807,525 | |
| Entergy | | | 90,380 | | | | 6,659,198 | |
| Northwest Natural Gas | | | 127,335 | | | | 7,487,298 | |
| PPL | | | 187,468 | | | | 6,437,651 | |
| Southern | | | 136,215 | | | | 7,024,608 | |
| | | | | | | | 63,185,280 | |
| TOTAL COMMON STOCK | | | | | | | | |
| (Cost $258,084,372) | | | | | | | 264,513,563 | |
| | | | | | | | | |
| MASTER LIMITED PARTNERSHIPS — 21.5% |
| UNITED STATES— 21.5% | | | | | | | | |
| Consumer Services — 7.9% | | | | | | | | |
| CrossAmerica Partners | | | 332,498 | | | | 8,495,324 | |
| Stonemor Partners | | | 248,189 | | | | 3,266,167 | |
| Suburban Propane Partners | | | 271,303 | | | | 8,733,244 | |
| Sunoco | | | 222,057 | | | | 6,326,404 | |
| | | | | | | | 26,821,139 | |
| Financials — 3.9% | | | | | | | | |
| Ellington Financial | | | 405,326 | | | | 6,428,470 | |
| Icahn Enterprises | | | 141,177 | | | | 6,759,555 | |
| | | | | | | | 13,188,025 | |
| Oil & Gas — 8.7% | | | | | | | | |
| Cone Midstream Partners | | | 653,789 | | | | 13,801,486 | |
| Delek Logistics Partners | | | 252,853 | | | | 6,270,754 | |
| Summit Midstream Partners | | | 415,358 | | | | 9,220,948 | |
| | | | | | | | 29,293,188 | |
The accompanying notes are an integral part of the financial statements.
| Schedule of Investments | October 31, 2016 |
| Global X SuperDividend® U.S. ETF |
| | | Shares/Face
Amount | | | Value | |
| MASTER LIMITED PARTNERSHIPS — continued |
| Utilities — 1.0% | | | | | | | | |
| Ferrellgas Partners | | | 376,270 | | | $ | 3,284,837 | |
| TOTAL MASTER LIMITED PARTNERSHIP | | | | | | | | |
(Cost $70,139,515)
| | | | | | | 72,587,189 | |
| | | | | | | | | |
| REPURCHASE AGREEMENT — 2.2% |
| Deutsche Bank | | | | | | | | |
| 0.350%, dated 10/31/16, to be repurchased on 11/01/16 repurchase price $7,571,299 (collateralized by U.S. Treasury Obligations, par value $7,040,823, 3.000%, 05/15/45 with a total market value of $7,759,098)(B) | | | | | | | | |
| (Cost $7,571,225) | | $ | 7,571,225 | | | | 7,571,225 | |
| TOTAL INVESTMENTS — 101.9% | | | | | | | | |
| (Cost $335,795,112) | | | | | | $ | 344,671,977 | |
Percentages are based on Net Assets of $338,396,614.
| (A) | This security or a partial position of this security is on loan as of October 31, 2016. The total value of securities on loan as of October 31, 2016 was $7,287,261. |
| (B) | Security was purchased with cash collateral held from securities on loan. The total value of such securities as of October 31, 2016 was $7,571,225. |
Cl — Class
The following is a summary of the level of inputs used as of October 31, 2016, in valuing the Fund's investments carried at value:
| Investments in Securities | | Level 1 | | | Level 2 | | | Level 3 | | | Total | |
| Common Stock | | $ | 264,513,563 | | | $ | — | | | $ | — | | | $ | 264,513,563 | |
| Master Limited Partnerships | | | 72,587,189 | | | | — | | | | — | | | | 72,587,189 | |
| Repurchase Agreement | | | — | | | | 7,571,225 | | | | — | | | | 7,571,225 | |
| Total Investments in Securities | | $ | 337,100,752 | | | $ | 7,571,225 | | | $ | — | | | $ | 344,671,977 | |
|
For the year ended October 31, 2016, there have been no transfers between Level 1, Level 2 or Level 3 investments.
As of October 31, 2016, there were no Level 3 investments.
The accompanying notes are an integral part of the financial statements.
| Schedule of Investments | October 31, 2016 |
| Global X SuperDividend® Emerging Markets ETF |
Sector Weightings (unaudited)†:
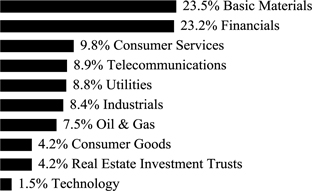
† Sector weightings percentages are based on the total market value of investments.
| | | Shares | | | Value | |
| COMMON STOCK — 95.5% |
| BRAZIL— 13.9% | | | | | | | | |
| Consumer Services — 2.7% | | | | | | | | |
| Multiplus | | | 7,340 | | | $ | 100,715 | |
| Financials — 11.2% | | | | | | | | |
| Banco do Brasil | | | 16,910 | | | | 156,716 | |
| Banco Santander Brasil ADR | | | 16,954 | | | | 138,684 | |
| Itau Unibanco Holding | | | 10,233 | | | | 122,080 | |
| | | | | | | | 417,480 | |
| TOTAL BRAZIL | | | | | | | 518,195 | |
| CHINA— 10.4% | | | | | | | | |
| Consumer Goods — 1.3% | | | | | | | | |
| Belle International Holdings, Cl A | | | 83,100 | | | | 50,365 | |
| Consumer Services — 1.5% | | | | | | | | |
| Intime Retail Group | | | 71,570 | | | | 56,205 | |
| Financials — 3.8% | | | | | | | | |
| Agricultural Bank of China, Cl H | | | 158,500 | | | | 66,835 | |
| Country Garden Holdings | | | 143,300 | | | | 74,654 | |
| | | | | | | | 141,489 | |
| Oil & Gas — 2.2% | | | | | | | | |
| China Oilfield Services, Cl H | | | 84,000 | | | | 81,239 | |
| Utilities — 1.6% | | | | | | | | |
| Datang International Power Generation, Cl H | | | 221,500 | | | | 59,696 | |
| TOTAL CHINA | | | | | | | 388,994 | |
| CZECH REPUBLIC— 1.8% | | | | | | | | |
| Utilities — 1.8% | | | | | | | | |
| CEZ | | | 3,520 | | | | 66,250 | |
The accompanying notes are an integral part of the financial statements.
| Schedule of Investments | October 31, 2016 |
| Global X SuperDividend® Emerging Markets ETF |
| | | Shares | | | Value | |
| COMMON STOCK — continued |
| GREECE— 1.8% | | | | | | | | |
| Consumer Services — 1.8% | | | | | | | | |
| OPAP | | | 7,860 | | | $ | 66,948 | |
| HONG KONG— 11.7% | | | | | | | | |
| Basic Materials — 2.5% | | | | | | | | |
| China Hongqiao Group | | | 104,433 | | | | 93,460 | |
| Financials — 3.0% | | | | | | | | |
| China Evergrande Group | | | 88,488 | | | | 58,537 | |
| KWG Property Holding | | | 96,728 | | | | 56,130 | |
| | | | | | | | 114,667 | |
| Industrials — 4.1% | | | | | | | | |
| China Resources Cement Holdings | | | 223,300 | | | | 90,416 | |
| China South City Holdings | | | 295,300 | | | | 65,496 | |
| | | | | | | | 155,912 | |
| Oil & Gas — 2.1% | | | | | | | | |
| CNOOC | | | 61,280 | | | | 77,994 | |
| TOTAL HONG KONG | | | | | | | 442,033 | |
| INDIA— 9.3% | | | | | | | | |
| Basic Materials — 7.1% | | | | | | | | |
| NMDC | | | 49,670 | | | | 98,877 | |
| Vedanta | | | 54,600 | | | | 165,590 | |
| | | | | | | | 264,467 | |
| Financials — 2.2% | | | | | | | | |
| Power Finance | | | 45,000 | | | | 83,887 | |
| TOTAL INDIA | | | | | | | 348,354 | |
| INDONESIA— 3.3% | | | | | | | | |
| Industrials — 3.3% | | | | | | | | |
| Indocement Tunggal Prakarsa | | | 38,200 | | | | 48,160 | |
| United Tractors | | | 44,650 | | | | 74,000 | |
| TOTAL INDONESIA | | | | | | | 122,160 | |
| MALAYSIA— 4.3% | | | | | | | | |
| Consumer Goods — 1.3% | | | | | | | | |
| British American Tobacco Malaysia | | | 4,100 | | | | 48,399 | |
| Consumer Services — 1.6% | | | | | | | | |
| Astro Malaysia Holdings | | | 88,500 | | | | 60,124 | |
| Financials — 1.4% | | | | | | | | |
| Malayan Banking | | | 27,520 | | | | 51,826 | |
| TOTAL MALAYSIA | | | | | | | 160,349 | |
The accompanying notes are an integral part of the financial statements.
| Schedule of Investments | October 31, 2016 |
| Global X SuperDividend® Emerging Markets ETF |
| | | Shares | | | Value | |
| COMMON STOCK — continued |
| PHILIPPINES— 1.5% | | | | | | | | |
| Telecommunications — 1.5% | | | | | | | | |
| Globe Telecom | | | 1,480 | | | $ | 54,404 | |
| POLAND— 2.3% | | | | | | | | |
| Telecommunications — 1.4% | | | | | | | | |
| Orange Polska | | | 36,050 | | | | 51,292 | |
| Utilities — 0.9% | | | | | | | | |
| Energa | | | 16,500 | | | | 33,706 | |
| TOTAL POLAND | | | | | | | 84,998 | |
| RUSSIA— 10.6% | | | | | | | | |
| Basic Materials — 8.7% | | | | | | | | |
| MMC Norilsk Nickel PJSC ADR | | | 4,698 | | | | 70,846 | |
| Novolipetsk Steel PJSC GDR | | | 6,560 | | | | 106,272 | |
| PhosAgro PJSC GDR | | | 4,700 | | | | 58,280 | |
| Severstal PJSC | | | 6,580 | | | | 92,156 | |
| | | | | | | | 327,554 | |
| Oil & Gas — 1.9% | | | | | | | | |
| Gazprom PJSC ADR | | | 16,331 | | | | 70,550 | |
| TOTAL RUSSIA | | | | | | | 398,104 | |
| SOUTH AFRICA— 8.1% | | | | | | | | |
| Consumer Services — 2.2% | | | | | | | | |
| Foschini Group | | | 7,870 | | | | 81,020 | |
| Real Estate Investment Trusts — 4.2% | | | | | | | | |
| Growthpoint Properties | | | 40,030 | | | | 74,642 | |
| Redefine Properties | | | 97,400 | | | | 83,656 | |
| | | | | | | | 158,298 | |
| Telecommunications — 1.7% | | | | | | | | |
| MTN Group | | | 7,160 | | | | 61,799 | |
| TOTAL SOUTH AFRICA | | | | | | | 301,117 | |
| THAILAND— 10.4% | | | | | | | | |
| Basic Materials — 3.1% | | | | | | | | |
| Banpu PCL NVDR | | | 223,250 | | | | 116,736 | |
| Financials — 1.5% | | | | | | | | |
| BTS Group Holdings PCL NVDR | | | 231,200 | | | | 56,483 | |
| Technology — 1.5% | | | | | | | | |
| Intouch Holdings PCL NVDR | | | 36,280 | | | | 54,942 | |
| Telecommunications — 2.8% | | | | | | | | |
| Advanced Info Service NVDR | | | 12,050 | | | | 52,852 | |
The accompanying notes are an integral part of the financial statements.
| Schedule of Investments | October 31, 2016 |
| Global X SuperDividend® Emerging Markets ETF |
| | | Shares | | | Value | |
| COMMON STOCK — continued |
| Telecommunications — continued | | | | | | | | |
| Total Access Communication NVDR | | | 59,600 | | | $ | 53,218 | |
| | | | | | | | 106,070 | |
| Utilities — 1.5% | | | | | | | | |
| Glow Energy PCL NVDR | | | 25,050 | | | | 55,114 | |
| TOTAL THAILAND | | | | | | | 389,345 | |
| TURKEY— 6.1% | | | | | | | | |
| Basic Materials — 2.0% | | | | | | | | |
| Eregli Demir ve Celik Fabrikalari | | | 54,300 | | | | 73,650 | |
| Consumer Goods — 1.6% | | | | | | | | |
| Tofas Turk Otomobil Fabrikasi | | | 7,990 | | | | 60,121 | |
| Industrials — 1.0% | | | | | | | | |
| TAV Havalimanlari Holding | | | 9,400 | | | | 38,613 | |
| Telecommunications — 1.5% | | | | | | | | |
| Turk Telekomunikasyon | | | 30,900 | | | | 57,079 | |
| TOTAL TURKEY | | | | | | | 229,463 | |
| TOTAL COMMON STOCK | | | | | | | | |
| (Cost $2,987,815) | | | | | | | 3,570,714 | |
| | | | | | | | | |
| PREFERRED STOCK — 4.3% |
| BRAZIL— 3.0% | | | | | | | | |
| Utilities — 3.0% | | | | | | | | |
| Cia de Transmissao de Energia Eletrica Paulista (A) | | | 5,200 | | | | 113,811 | |
| RUSSIA— 1.3% | | | | | | | | |
| Oil & Gas — 1.3% | | | | | | | | |
| Surgutneftegas PJSC (A) | | | 109,800 | | | | 49,843 | |
| TOTAL PREFERRED STOCK | | | | | | | | |
| (Cost $126,025) | | | | | | | 163,654 | |
| TOTAL INVESTMENTS — 99.8% | | | | | | | | |
| (Cost $3,113,840) | | | | | | $ | 3,734,368 | |
Percentages are based on Net Assets of $3,740,433.
| (A) | Interest rate unavailable |
ADR — American Depositary Receipt
Cl — Class
GDR — Global Depositary Receipt
NVDR — Non-Voting Depositary Receipt
As of October 31, 2016, all of the Fund's investments were considered Level 1, in accordance with authoritative guidance on fair value measurements and disclosure under U.S. GAAP.
For the year ended October 31, 2016, there have been no transfers between Level 1, Level 2 or Level 3 investments.
The accompanying notes are an integral part of the financial statements.
| Schedule of Investments | October 31, 2016 |
| Global X SuperDividend® REIT ETF |
Sector Weightings (unaudited)†:

† Sector weightings percentages are based on the total market value of investments.
| | | Shares | | | Value | |
| COMMON STOCK — 99.5% |
| CANADA— 9.2% | | | | | | | | |
| Real Estate Investment Trusts — 9.2% | | | | | | | | |
| Artis Real Estate Investment Trust | | | 112,032 | | | $ | 979,679 | |
| Cominar Real Estate Investment Trust | | | 88,709 | | | | 983,560 | |
| H&R Real Estate Investment Trust | | | 69,734 | | | | 1,186,818 | |
| TOTAL CANADA | | | | | | | 3,150,057 | |
| SINGAPORE— 3.0% | | | | | | | | |
| Real Estate Investment Trusts — 3.0% | | | | | | | | |
| Ascendas Real Estate Investment Trust | | | 610,104 | | | | 1,038,829 | |
| UNITED STATES— 87.3% | | | | | | | | |
| Real Estate Investment Trusts — 87.3% | | | | | | | | |
| AGNC Investment | | | 56,387 | | | | 1,131,123 | |
| Annaly Capital Management | | | 183,910 | | | | 1,905,307 | |
| Apollo Commercial Real Estate Finance | | | 60,268 | | | | 1,019,735 | |
| Blackstone Mortgage Trust, Cl A | | | 38,285 | | | | 1,156,207 | |
| Capstead Mortgage | | | 114,619 | | | | 1,090,027 | |
| Chimera Investment | | | 102,056 | | | | 1,599,218 | |
| CYS Investments | | | 145,249 | | | | 1,252,046 | |
| EPR Properties | | | 16,082 | | | | 1,169,483 | |
| Gaming and Leisure Properties | | | 36,191 | | | | 1,188,151 | |
| Gramercy Property Trust | | | 128,351 | | | | 1,183,396 | |
| HCP | | | 24,964 | | | | 855,017 | |
| Invesco Mortgage Capital | | | 83,997 | | | | 1,254,075 | |
| Iron Mountain | | | 35,942 | | | | 1,212,324 | |
| Lexington Realty Trust | | | 129,491 | | | | 1,313,039 | |
| Liberty Property Trust | | | 32,038 | | | | 1,295,296 | |
| MFA Financial | | | 157,220 | | | | 1,149,278 | |
| MTGE Investment | | | 73,695 | | | | 1,256,500 | |
| Omega Healthcare Investors | | | 26,583 | | | | 846,137 | |
| Select Income | | | 49,481 | | | | 1,224,160 | |
| Senior Housing Properties Trust | | | 61,528 | | | | 1,308,701 | |
| Spirit Realty Capital | | | 93,728 | | | | 1,116,300 | |
| STAG Industrial | | | 54,105 | | | | 1,248,202 | |
| Starwood Property Trust | | | 51,701 | | | | 1,149,830 | |
| Two Harbors Investment | | | 125,872 | | | | 1,048,514 | |
| WP Carey | | | 16,096 | | | | 977,671 | |
| | | | | | | | 29,949,737 | |
The accompanying notes are an integral part of the financial statements.
| Schedule of Investments | October 31, 2016 |
| Global X SuperDividend® REIT ETF |
| | | | | | Value | |
| COMMON STOCK — continued |
| TOTAL COMMON STOCK | | | | | | | | |
| (Cost $34,636,504) | | | | | | $ | 34,138,623 | |
| TOTAL INVESTMENTS — 99.5% | | | | | | | | |
| (Cost $34,636,504) | | | | | | $ | 34,138,623 | |
Percentages are based on Net Assets of $34,302,323.
Cl — Class
As of October 31, 2016, all of the Fund's investments were considered Level 1, in accordance with authoritative guidance on fair value measurements and disclosure under U.S. GAAP.
For the period ended October 31, 2016, there have been no transfers between Level 1, Level 2 or Level 3 investments.
The accompanying notes are an integral part of the financial statements.
| Schedule of Investments | October 31, 2016 |
| Global X SuperIncome™ Preferred ETF |
Sector Weightings (unaudited)†:
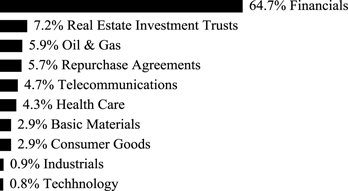
† Sector weightings percentages are based on the total market value of investments. Repurchase agreements purchased from cash collateral received for securities lending activity are included in total investments. Please see Notes 2 and 7 in Notes to Financial Statements for more detailed information.
| | | Shares | | | Value | |
| PREFERRED STOCK — 99.7% |
| BERMUDA— 0.6% | | | | | | | | |
| Financials — 0.6% | | | | | | | | |
| PartnerRe, Ser E, 7.250% | | | 58,560 | | | $ | 1,480,983 | |
| GERMANY— 5.0% | | | | | | | | |
| Financials — 5.0% | | | | | | | | |
| Deutsche Bank Contingent Capital Trust II, 6.550% | | | 95,124 | | | | 2,193,560 | |
| Deutsche Bank Contingent Capital Trust III, 7.600% | | | 228,510 | | | | 5,550,508 | |
| Deutsche Bank Contingent Capital Trust V, 8.050%(A) | | | 160,063 | | | | 3,958,358 | |
| TOTAL GERMANY | | | | | | | 11,702,426 | |
| NETHERLANDS— 9.3% | | | | | | | | |
| Financials — 9.3% | | | | | | | | |
| Aegon, 8.000% | | | 127,945 | | | | 3,400,778 | |
| Aegon, 6.375% | | | 249,281 | | | | 6,346,694 | |
| ING Groep, 7.200% | | | 233,159 | | | | 6,031,823 | |
| ING Groep, 6.375% | | | 222,996 | | | | 5,753,297 | |
| TOTAL NETHERLANDS | | | | | | | 21,532,592 | |
| UNITED KINGDOM— 12.0% | | | | | | | | |
| Financials — 12.0% | | | | | | | | |
| Barclays Bank, Ser 3, 7.100%(A) | | | 154,518 | | | | 3,985,019 | |
| Barclays Bank, Ser 5, 8.125% | | | 299,519 | | | | 7,799,475 | |
| HSBC Holdings, 8.125%(A) | | | 162,849 | | | | 4,369,239 | |
| HSBC Holdings, Ser 2, 8.000% | | | 283,360 | | | | 7,384,362 | |
| Royal Bank of Scotland Group, Ser S, 6.600% | | | 161,578 | | | | 4,108,928 | |
| TOTAL UNITED KINGDOM | | | | | | | 27,647,023 | |
The accompanying notes are an integral part of the financial statements.
| Schedule of Investments | October 31, 2016 |
| Global X SuperIncome™ Preferred ETF |
| | | Shares | | | Value | |
| PREFERRED STOCK — continued |
| Basic Materials — 3.1% | | | | | | | | |
| Alcoa, Ser 1, 5.375% | | | 148,932 | | | $ | 4,601,999 | |
| NuStar Logistics, 7.625%(B) | | | 98,424 | | | | 2,520,638 | |
| | | | | | | | 7,122,637 | |
| Consumer Goods — 3.1% | | | | | | | | |
| CHS, Ser 3, 6.750%(A) (B) | | | 120,702 | | | | 3,391,726 | |
| CHS, Ser 4, 7.500% | | | 129,606 | | | | 3,790,976 | |
| | | | | | | | 7,182,702 | |
| Financials — 41.4% | | | | | | | | |
| AmTrust Financial Services, 6.950% | | | 69,877 | | | | 1,764,394 | |
| Annaly Capital Management, 7.625% | | | 69,249 | | | | 1,748,537 | |
| Ares Management, 7.000% | | | 62,626 | | | | 1,623,892 | |
| Aviva, 8.250% | | | 94,462 | | | | 2,421,061 | |
| Axis Capital Holdings, 6.875% | | | 97,368 | | | | 2,497,489 | |
| Capital One Financial, Ser C, 6.250% | | | 122,311 | | | | 3,248,580 | |
| Capital One Financial, Ser D, 6.700%(A) | | | 121,353 | | | | 3,408,806 | |
| Citigroup, Ser J, 7.125%(B) | | | 111,300 | | | | 3,174,276 | |
| Citigroup, Ser L, 6.875% | | | 56,202 | | | | 1,519,702 | |
| Citigroup Capital XIII, 7.875%(B) | | | 264,854 | | | | 6,888,852 | |
| Colony Capital, 7.125% | | | 66,863 | | | | 1,703,669 | |
| Countrywide Capital V, 7.000% | | | 367,163 | | | | 9,458,119 | |
| Discover Financial Services, Ser B, 6.500% | | | 142,895 | | | | 3,742,420 | |
| GMAC Capital Trust I, Ser 2, 6.411%(B) | | | 463,180 | | | | 11,824,986 | |
| Hartford Financial Services Group, 7.875%(B) | | | 145,685 | | | | 4,557,027 | |
| JPMorgan Chase, Ser T, 6.700%(A) | | | 227,898 | | | | 6,248,963 | |
| KeyCorp, 8.625%(B) | | | 84,886 | | | | 2,215,525 | |
| Morgan Stanley, Ser E, 7.125%(B) | | | 157,523 | | | | 4,596,521 | |
| Morgan Stanley, Ser F, 6.875%(A) (B) | | | 154,953 | | | | 4,502,934 | |
| Morgan Stanley, Ser G, 6.625%(A) | | | 92,068 | | | | 2,518,060 | |
| Navient, 6.000% | | | 65,937 | | | | 1,507,979 | |
| Regions Financial, Ser A, 6.375% | | | 127,877 | | | | 3,322,244 | |
| Wells Fargo, Ser J, 8.000% | | | 436,900 | | | | 11,857,466 | |
| | | | | | | | 96,351,502 | |
| Health Care — 4.6% | | | | | | | | |
| Allergan, 5.500%* | | | 13,878 | | | | 10,672,182 | |
| Industrials — 1.0% | | | | | | | | |
| Stericycle, 5.250%* | | | 33,159 | | | | 2,237,238 | |
| Oil & Gas — 6.3% | | | | | | | | |
| Kinder Morgan, Ser A, 9.750% (A) | | | 200,196 | | | | 9,219,026 | |
| Southwestern Energy, Ser B, 6.250% | | | 211,088 | | | | 5,291,976 | |
| | | | | | | | 14,511,002 | |
| Real Estate Investment Trusts — 7.6% | | | | | | | | |
| Annaly Capital Management, Ser D, 7.500% | | | 45,077 | | | | 1,131,433 | |
| CBL & Associates Properties, Ser D, 7.375% | | | 88,762 | | | | 2,241,241 | |
The accompanying notes are an integral part of the financial statements.
| Schedule of Investments | October 31, 2016 |
| Global X SuperIncome™ Preferred ETF |
| | | Shares/Face
Amount | | | Value | |
| PREFERRED STOCK — continued |
| Real Estate Investment Trusts — continued | | | | | | | | |
| CHS, Ser B, 7.875%(A) | | | 127,185 | | | $ | 3,988,521 | |
| Digital Realty Trust, Ser H, 7.375% | | | 88,929 | | | | 2,466,001 | |
| NorthStar Realty Finance, Ser B, 8.250% | | | 28,363 | | | | 715,315 | |
| Vereit, Ser F, 6.700%(A) | | | 264,349 | | | | 7,089,840 | |
| | | | | | | | 17,632,351 | |
| Techhnology — 0.8% | | | | | | | | |
| Belden, 6.750%* | | | 20,367 | | | | 1,966,434 | |
| Telecommunications — 4.9% | | | | | | | | |
| Frontier Communications, Ser A, 11.125% | | | 115,154 | | | | 9,616,511 | |
| Qwest, 7.500%(A) | | | 70,748 | | | | 1,798,414 | |
| | | | | | | | 11,414,925 | |
| TOTAL UNITED STATES | | | | | | | 169,090,973 | |
| TOTAL PREFERRED STOCK | | | | | | | | |
| (Cost $240,199,021) | | | | | | | 231,453,997 | |
| | | | | | | | | |
| REPURCHASE AGREEMENTS — 6.0% |
| Barclays Bank | | | | | | | | |
| 0.320%, dated 10/31/16, to be repurchased on 11/01/16, repurchase price $13,000,116 (collateralized by U.S Treasury Obligations, ranging in par value $1-$7,016,919, 0.000%-4.750%, 11/15/16-05/15/46, with a total market value of $13,260,000)(C) | | $ | 13,000,000 | | | | 13,000,000 | |
| Deutsche Bank | | | | | | | | |
| 0.350%, dated 10/31/16, to be repurchased on 11/01/16, repurchase price $991,010 (collateralized by U.S. Treasury Obligations, par value $921,576, 3.000%, 05/15/45 with a total market value of $1,015,198)(C) | | | 991,000 | | | | 991,000 | |
| TOTAL REPURCHASE AGREEMENTS | | | | | | | | |
| (Cost $13,991,000) | | | | | | | 13,991,000 | |
| TOTAL INVESTMENTS — 105.7% | | | | | | | | |
| (Cost $254,190,021) | | | | | | $ | 245,444,997 | |
Percentages are based on Net Assets of $232,206,248
| * | Non-income producing security. |
| (A) | This security or a partial position of this security is on loan as of October 31, 2016. The total value of securities on loan as of October 31, 2016 was $13,600,406. |
| (B) | Floating rate security - Rate disclosed is the rate in effect on October 31, 2016. |
| (C) | Security was purchased with cash collateral held from securities on loan. The total value of such securities as of October 31, 2016 was $13,991,000. |
Ser — Series
The accompanying notes are an integral part of the financial statements.
| Schedule of Investments | October 31, 2016 |
| Global X SuperIncome™ Preferred ETF |
The following is a summary of the level of inputs used as of October 31, 2016, in valuing the Fund's investments carried at value:
| Investments in Securities | | Level 1 | | | Level 2 | | | Level 3 | | | Total | |
| Preferred Stock | | $ | 231,453,997 | | | $ | — | | | $ | — | | | $ | 231,453,997 | |
| Repurchase Agreements | | | — | | | | 13,991,000 | | | | — | | | | 13,991,000 | |
| Total Investments in Securities | | $ | 231,453,997 | | | $ | 13,991,000 | | | $ | — | | | $ | 245,444,997 | |
|
For the year ended October 31, 2016, there have been no transfers between Level 1, Level 2 or Level 3 investments.
As of October 31, 2016, there were no Level 3 investments.
The accompanying notes are an integral part of the financial statements.
| Schedule of Investments | October 31, 2016 |
| Global X Social Media Index ETF |
Sector Weightings (unaudited)†:
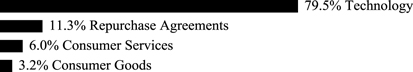
† Sector weightings percentages are based on the total market value of investments. Repurchase agreements purchased from cash collateral received for securities lending activity are included in total investments. Please see Notes 2 and 7 in Notes to Financial Statements for more detailed information.
| | | Shares | | | Value | |
| COMMON STOCK — 99.9% |
| CHINA— 12.8% | | | | | | | | |
| Technology — 12.8% | | | | | | | | |
| Changyou.com ADR * | | | 8,101 | | | $ | 214,272 | |
| NetEase ADR | | | 24,553 | | | | 6,309,875 | |
| Renren ADR * | | | 251,537 | | | | 493,013 | |
| SINA * | | | 70,259 | | | | 5,068,484 | |
| Weibo ADR * (A) | | | 94,967 | | | | 4,369,432 | |
| YY ADR * | | | 16,332 | | | | 785,079 | |
| | | | | | | | 17,240,155 | |
| TOTAL CHINA | | | | | | | 17,240,155 | |
| GERMANY— 5.1% | | | | | | | | |
| Technology — 5.1% | | | | | | | | |
| United Internet | | | 150,620 | | | | 6,173,465 | |
| XING | | | 3,205 | | | | 651,547 | |
| | | | | | | | 6,825,012 | |
| TOTAL GERMANY | | | | | | | 6,825,012 | |
| HONG KONG— 9.9% | | | | | | | | |
| Technology — 9.9% | | | | | | | | |
| Tencent Holdings | | | 501,745 | | | | 13,315,425 | |
| JAPAN— 9.3% | | | | | | | | |
| Consumer Goods — 2.7% | | | | | | | | |
| Nexon (A) | | | 209,472 | | | | 3,568,110 | |
| Technology — 6.6% | | | | | | | | |
| Dena | | | 131,681 | | | | 4,235,445 | |
| Gree | | | 125,735 | | | | 697,564 | |
| LINE * (A) | | | 50,070 | | | | 2,051,210 | |
| Mixi | | | 50,670 | | | | 1,863,630 | |
| | | | | | | | 8,847,849 | |
| TOTAL JAPAN | | | | | | | 12,415,959 | |
| RUSSIA— 5.8% | | | | | | | | |
| Technology — 5.8% | | | | | | | | |
| Mail.ru Group GDR * | | | 94,921 | | | | 1,553,857 | |
The accompanying notes are an integral part of the financial statements.
| Schedule of Investments | October 31, 2016 |
| Global X Social Media Index ETF |
| | | Shares/Face
Amount | | | Value | |
| COMMON STOCK — continued |
| Technology — continued | | | | | | | | |
| Yandex, Cl A * | | | 318,099 | | | $ | 6,263,369 | |
| | | | | | | | 7,817,226 | |
| TOTAL RUSSIA | | | | | | | 7,817,226 | |
| TAIWAN— 0.8% | | | | | | | | |
| Consumer Services — 0.8% | | | | | | | | |
| PChome Online | | | 98,346 | | | | 1,068,927 | |
| UNITED STATES— 56.2% | | | | | | | | |
| Consumer Goods — 0.9% | | | | | | | | |
| Nutrisystem | | | 35,094 | | | | 1,112,480 | |
| Consumer Services — 6.1% | | | | | | | | |
| Angie's List * | | | 46,586 | | | | 358,712 | |
| Groupon, Cl A * (A) | | | 506,035 | | | | 2,019,080 | |
| Pandora Media * (A) | | | 262,965 | | | | 2,979,394 | |
| Yelp, Cl A * | | | 84,862 | | | | 2,771,593 | |
| | | | | | | | 8,128,779 | |
| Technology — 49.2% | | | | | | | | |
| Alphabet, Cl A * | | | 7,946 | | | | 6,435,465 | |
| Facebook, Cl A * | | | 105,875 | | | | 13,868,566 | |
| IAC | | | 88,685 | | | | 5,714,861 | |
| Jive Software * | | | 74,936 | | | | 295,997 | |
| LinkedIn, Cl A * | | | 70,900 | | | | 13,442,640 | |
| Match Group * (A) | | | 49,072 | | | | 886,240 | |
| MeetMe * | | | 59,333 | | | | 290,138 | |
| Momo ADR * | | | 149,506 | | | | 3,600,105 | |
| Twitter * (A) | | | 703,279 | | | | 12,623,858 | |
| Yahoo! * | | | 153,403 | | | | 6,373,895 | |
| Zynga, Cl A * | | | 904,600 | | | | 2,541,926 | |
| | | | | | | | 66,073,691 | |
| TOTAL UNITED STATES | | | | | | | 75,314,950 | |
| TOTAL COMMON STOCK | | | | | | | | |
| (Cost $133,295,620) | | | | | | | 133,997,654 | |
| | | | | | | | | |
| REPURCHASE AGREEMENTS — 12.8% |
| Barclays Bank | | | | | | | | |
| 0.320%, dated 10/31/16, to be repurchased on 11/01/16 repurchase price $16,000,142 (collateralized by U.S Treasury Obligations, ranging in par value $1-$7,877,993, 0.000%-4.750%, 11/15/16-05/15/46, with a total market value of $16,320,000)(B) | | $ | 16,000,000 | | | | 16,000,000 | |
The accompanying notes are an integral part of the financial statements.
| Schedule of Investments | October 31, 2016 |
| Global X Social Media Index ETF |
| | | Face Amount | | | Value | |
| REPURCHASE AGREEMENTS — continued | | | | | | | | |
| | | | | | | | | |
| Deutsche Bank | | | | | | | | |
| 0.350%, dated 10/31/16, to be repurchased on 11/01/16 repurchase price $1,121,608 (collateralized by U.S. Treasury Obligations, par value $1,043,024, 3.000%, 05/15/45 with a total market value of $1,148,984)(B) | | $ | 1,121,597 | | | $ | 1,121,597 | |
| TOTAL REPURCHASE AGREEMENTS | | | | | | | | |
| (Cost $17,121,597) | | | | | | | 17,121,597 | |
| TOTAL INVESTMENTS — 112.7% | | | | | | | | |
| (Cost $150,417,217) | | | | | | $ | 151,119,251 | |
Percentages are based on Net Assets of $134,110,738.
| * | Non-income producing security. |
| (A) | This security or a partial position of this security is on loan as of October 31, 2016. The total value of securities on loan as of October 31, 2016 was $16,161,795. |
| (B) | Security was purchased with cash collateral held from securities on loan. The total value of such securities as of October 31, 2016 was $17,121,597. |
ADR — American Depositary Receipt
Cl — Class
GDR — Global Depositary Receipt
The following is a summary of the level of inputs used as of October 31, 2016, in valuing the Fund's investments carried at value:
| Investments in Securities | | Level 1 | | | Level 2 | | | Level 3 | | | Total | |
| Common Stock | | $ | 133,997,654 | | | $ | — | | | $ | — | | | $ | 133,997,654 | |
| Repurchase Agreements | | | — | | | | 17,121,597 | | | | — | | | | 17,121,597 | |
| Total Investments in Securities | | $ | 133,997,654 | | | $ | 17,121,597 | | | $ | — | | | $ | 151,119,251 | |
|
For the year ended October 31, 2016, there have been no transfers between Level 1, Level 2 or Level 3 investments.
As of October 31, 2016, there were no Level 3 investments.
The accompanying notes are an integral part of the financial statements.
| Schedule of Investments | October 31, 2016 |
| Global X | JPMorgan Efficiente Index ETF |
Sector Weightings (unaudited)†:

† Sector weightings percentages are based on the total market value of investments.
| | | Shares | | | Value | |
| EXCHANGE TRADED FUNDS — 90.1% |
| iShares Core S&P Small-Capital ETF | | | 11,915 | | | $ | 1,413,953 | |
| iShares JP Morgan USD Emerging Markets Bond ETF | | | 12,579 | | | | 1,442,686 | |
| iShares S&P GSCI Commodity Indexed Trust | | | 24,580 | | | | 357,885 | |
| SPDR Bloomberg Barclays High Yield Bond ETF | | | 40,341 | | | | 1,462,765 | |
| Vanguard FTSE Emerging Markets ETF | | | 38,933 | | | | 1,469,720 | |
| Vanguard REIT ETF | | | 4,298 | | | | 351,404 | |
| TOTAL EXCHANGE TRADED FUNDS | | | | | | | | |
| (Cost $6,472,711) | | | | | | | 6,498,413 | |
| | | | | | | | | |
| EXCHANGE TRADED COMMODITY — 9.9% |
| ETFS Physical Gold | | | | | | | | |
| (Cost $735,184) | | | 5,811 | | | | 712,923 | |
| | | | | | | | | |
| TOTAL INVESTMENTS — 100.0% | | | | | | | | |
| (Cost $7,207,895) | | | | | | $ | 7,211,336 | |
Percentages are based on Net Assets of $7,214,656.
ETF — Exchange Traded Fund
FTSE — Financial Times and Stock Exchange
REIT — Real Estate Investment Trust
SPDR — Standard & Poor’s Depositary Receipts
S&P — Standard & Poor's
USD — U.S. Dollar
As of October 31, 2016, all of the Fund's investments were considered Level 1, in accordance with authoritative guidance on fair value measurements and disclosure under U.S. GAAP.
For the year ended October 31, 2016, there have been no transfers between Level 1, Level 2 or Level 3 investments.
The accompanying notes are an integral part of the financial statements.
| Schedule of Investments | October 31, 2016 |
| Global X | JPMorgan US Sector Rotator Index ETF |
Sector Weightings (unaudited)†:

† Sector weightings percentages are based on the total market value of investments.
| | | Shares | | | Value | |
| EXCHANGE TRADED FUNDS — 99.9% |
| Energy Select Sector SPDR Fund | | | 22,567 | | | $ | 1,548,548 | |
| iShares 1-3 Year Treasury Bond ETF, Cl 3 | | | 50,413 | | | | 4,282,584 | |
| Technology Select Sector SPDR Fund | | | 59,173 | | | | 2,805,984 | |
| Utilities Select Sector SPDR Fund | | | 41,680 | | | | 2,060,242 | |
| | | | | | | | | |
| TOTAL INVESTMENTS — 99.9% | | | | | | | | |
| (Cost $10,618,473) | | | | | | $ | 10,697,358 | |
Percentages are based on Net Assets of $10,706,274.
Cl — Class
ETF — Exchange Traded Fund
SPDR — Standard & Poor’s Depositary Receipts
As of October 31, 2016, all of the Fund's investments were considered Level 1, in accordance with authoritative guidance on fair value measurements and disclosure under U.S. GAAP.
For the year ended October 31, 2016, there have been no transfers between Level 1, Level 2 or Level 3 investments.
The accompanying notes are an integral part of the financial statements.
| Schedule of Investments | October 31, 2016 |
Sector Weightings (unaudited)†:
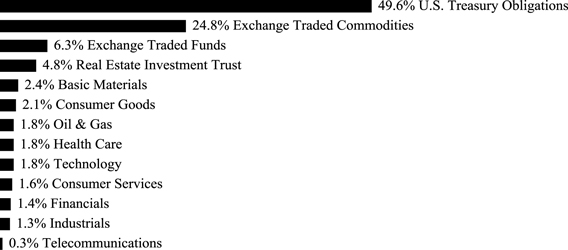
† Sector weightings percentages are based on the total market value of investments.
| | | Face
Amount/Shares | | | Value | |
| U.S. TREASURY OBLIGATIONS — 49.1% |
| U.S. Treasury Bonds | | | | | | | | |
| 4.625%, 02/15/40 | | $ | 376,000 | | | $ | 521,230 | |
| 4.375%, 11/15/39 | | | 391,800 | | | | 525,211 | |
| 3.875%, 08/15/40 | | | 18 | | | | 23 | |
| 3.125%, 02/15/42 | | | 468,400 | | | | 521,369 | |
| 3.125%, 11/15/41 | | | 471,700 | | | | 524,563 | |
| U.S. Treasury Notes | | | | | | | | |
| 3.125%, 05/15/19 | | | 525,300 | | | | 553,904 | |
| 1.500%, 08/31/18 | | | 551,100 | | | | 557,429 | |
| 1.375%, 09/30/18 | | | 552,400 | | | | 557,493 | |
| 0.750%, 02/28/18 | | | 559,900 | | | | 559,747 | |
| | | | | | | | | |
| TOTAL U.S. TREASURY OBLIGATIONS | | | | | | | | |
| (Cost $4,287,327) | | | | | | | 4,320,969 | |
| | | | | | | | | |
| EXCHANGE TRADED COMMODITIES — 24.6% |
| ETFS Physical Gold | | | 7,056 | | | | 865,665 | |
| ETFS Physical Silver | | | 21,514 | | | | 366,383 | |
| ETFS Physical Silver (GBP shares) | | | 3,802 | | | | 64,638 | |
| Gold Bullion Securities | | | 7,147 | | | | 864,644 | |
| TOTAL EXCHANGE TRADED COMMODITIES | | | | | | | | |
| (Cost $2,958,687) | | | | | | | 2,161,330 | |
| | | | | | | | | |
| COMMON STOCK — 19.1% |
| AUSTRALIA— 0.4% | | | | | | | | |
| Basic Materials — 0.4% | | | | | | | | |
| BHP Billiton ADR | | | 1,048 | | | | 36,701 | |
| FRANCE— 0.3% | | | | | | | | |
| Oil & Gas — 0.3% | | | | | | | | |
| Total | | | 592 | | | | 28,372 | |
The accompanying notes are an integral part of the financial statements.
| Schedule of Investments | October 31, 2016 |
| | | Shares | | | Value | |
| COMMON STOCK — continued |
| NETHERLANDS — 0.3% | | | | | | | | |
| Oil & Gas — 0.3% | | | | | | | | |
| Royal Dutch Shell ADR, Cl A | | | 529 | | | $ | 26,349 | |
| PERU — 0.4% | | | | | | | | |
| Basic Materials — 0.4% | | | | | | | | |
| Southern Copper | | | 1,109 | | | | 31,485 | |
| RUSSIA— 0.4% | | | | | | | | |
| Basic Materials — 0.4% | | | | | | | | |
| MMC Norilsk Nickel PJSC ADR | | | 2,250 | | | | 33,930 | |
| SWITZERLAND— 0.4% | | | | | | | | |
| Basic Materials — 0.4% | | | | | | | | |
| Syngenta ADR | | | 390 | | | | 31,364 | |
| UNITED KINGDOM— 1.2% | | | | | | | | |
| Basic Materials — 0.9% | | | | | | | | |
| Glencore | | | 14,680 | | | | 44,807 | |
| Rio Tinto ADR | | | 938 | | | | 32,689 | |
| | | | | | | | 77,496 | |
| Oil & Gas — 0.3% | | | | | | | | |
| BP | | | 5,090 | | | | 30,059 | |
| TOTAL UNITED KINGDOM | | | | | | | 107,555 | |
| UNITED STATES— 15.7% | | | | | | | | |
| Basic Materials — 0.0% | | | | | | | | |
| AdvanSix * | | | 5 | | | | 79 | |
| Consumer Goods — 2.1% | | | | | | | | |
| Altria Group | | | 237 | | | | 15,670 | |
| Archer-Daniels-Midland | | | 683 | | | | 29,758 | |
| Coca-Cola | | | 354 | | | | 15,010 | |
| Kraft Heinz | | | 182 | | | | 16,189 | |
| Monsanto | | | 291 | | | | 29,324 | |
| PepsiCo | | | 159 | | | | 17,045 | |
| Philip Morris International | | | 154 | | | | 14,852 | |
| Procter & Gamble | | | 189 | | | | 16,405 | |
| Tyson Foods, Cl A | | | 461 | | | | 32,662 | |
| | | | | | | | 186,915 | |
| Consumer Services — 1.6% | | | | | | | | |
| Amazon.com * | | | 22 | | | | 17,376 | |
| Comcast, Cl A | | | 246 | | | | 15,208 | |
| CVS Health | | | 167 | | | | 14,045 | |
| Home Depot | | | 122 | | | | 14,885 | |
| McDonald's | | | 129 | | | | 14,521 | |
| Starbucks | | | 280 | | | | 14,860 | |
| Walgreens Boots Alliance | | | 194 | | | | 16,050 | |
The accompanying notes are an integral part of the financial statements.
| Schedule of Investments | October 31, 2016 |
| | | Shares | | | Value | |
| COMMON STOCK — continued |
| Consumer Services — continued | | | | | | | | |
| Wal-Mart Stores | | | 210 | | | $ | 14,704 | |
| Walt Disney | | | 158 | | | | 14,645 | |
| | | | | | | | 136,294 | |
| Financials — 1.4% | | | | | | | | |
| Bank of America | | | 1,117 | | | | 18,431 | |
| Berkshire Hathaway, Cl B * | | | 108 | | | | 15,584 | |
| Citigroup | | | 353 | | | | 17,350 | |
| JPMorgan Chase | | | 245 | | | | 16,969 | |
| Mastercard, Cl A | | | 184 | | | | 19,692 | |
| Visa, Cl A | | | 201 | | | | 16,584 | |
| Wells Fargo | | | 327 | | | | 15,045 | |
| | | | | | | | 119,655 | |
| Health Care — 1.8% | | | | | | | | |
| AbbVie | | | 256 | | | | 14,280 | |
| Allergan * | | | 67 | | | | 13,999 | |
| Amgen | | | 106 | | | | 14,963 | |
| Bristol-Myers Squibb | | | 225 | | | | 11,455 | |
| Eli Lilly | | | 212 | | | | 15,654 | |
| Gilead Sciences | | | 188 | | | | 13,842 | |
| Johnson & Johnson | | | 134 | | | | 15,543 | |
| Medtronic | | | 183 | | | | 15,010 | |
| Merck | | | 260 | | | | 15,267 | |
| Pfizer | | | 445 | | | | 14,111 | |
| UnitedHealth Group | | | 113 | | | | 15,970 | |
| | | | | | | | 160,094 | |
| Industrials — 1.2% | | | | | | | | |
| 3M | | | 90 | | | | 14,877 | |
| Boeing | | | 117 | | | | 16,664 | |
| Deere | | | 369 | | | | 32,583 | |
| General Electric | | | 503 | | | | 14,637 | |
| Honeywell International | | | 134 | | | | 14,697 | |
| United Technologies | | | 153 | | | | 15,637 | |
| | | | | | | | 109,095 | |
| Oil & Gas — 0.8% | | | | | | | | |
| Chevron | | | 285 | | | | 29,854 | |
| Exxon Mobil | | | 318 | | | | 26,496 | |
| Schlumberger | | | 197 | | | | 15,411 | |
| | | | | | | | 71,761 | |
| Real Estate Investment Trust — 4.7% | | | | | | | | |
| American Tower, Cl A | | | 393 | | | | 46,056 | |
| AvalonBay Communities | | | 251 | | | | 42,966 | |
| Crown Castle International | | | 456 | | | | 41,492 | |
| Equinix | | | 114 | | | | 40,730 | |
The accompanying notes are an integral part of the financial statements.
| Schedule of Investments | October 31, 2016 |
| | | Shares | | | Value | |
| COMMON STOCK — continued |
| Real Estate Investment Trust — continued | | | | | | | | |
| Equity Residential | | | 664 | | | $ | 41,002 | |
| General Growth Properties | | | 1,512 | | | | 37,724 | |
| ProLogis | | | 915 | | | | 47,726 | |
| Public Storage | | | 182 | | | | 38,897 | |
| Simon Property Group | | | 210 | | | | 39,052 | |
| Welltower | | | 600 | | | | 41,118 | |
| | | | | | | | 416,763 | |
| Technology — 1.8% | | | | | | | | |
| Alphabet, Cl A * | | | 22 | | | | 17,818 | |
| Apple | | | 163 | | | | 18,507 | |
| Cisco Systems | | | 541 | | | | 16,598 | |
| Facebook, Cl A * | | | 136 | | | | 17,814 | |
| Intel | | | 487 | | | | 16,982 | |
| International Business Machines | | | 101 | | | | 15,523 | |
| Microsoft | | | 302 | | | | 18,096 | |
| Oracle | | | 384 | | | | 14,753 | |
| QUALCOMM | | | 282 | | | | 19,379 | |
| | | | | | | | 155,470 | |
| Telecommunications — 0.3% | | | | | | | | |
| AT&T | | | 375 | | | | 13,796 | |
| Verizon Communications | | | 287 | | | | 13,805 | |
| | | | | | | | 27,601 | |
| TOTAL UNITED STATES | | | | | | | 1,383,727 | |
| TOTAL COMMON STOCK | | | | | | | | |
| (Cost $1,562,871) | | | | | | | 1,679,483 | |
| | | | | | | | | |
| EXCHANGE TRADED FUNDS — 6.3% |
| Vanguard FTSE All-World ex-US ETF, Cl U | | | 6,287 | | | | 280,777 | |
| Vanguard Small-Cap ETF | | | 2,330 | | | | 273,123 | |
| TOTAL EXCHANGE TRADED FUNDS | | | | | | | | |
| (Cost $528,152) | | | | | | | 553,900 | |
| | | | | | | | | |
| TOTAL INVESTMENTS — 99.1% | | | | | | | | |
| (Cost $9,337,037) | | | | | | $ | 8,715,682 | |
Percentages are based on Net Assets of $8,795,921.
| * | Non-income producing security. |
ADR — American Depositary Receipt
Cl — Class
ETF — Exchange Traded Fund
FTSE — Financial Times and Stock Exchange
GBP — British Pound Sterling
The accompanying notes are an integral part of the financial statements.
| Schedule of Investments | October 31, 2016 |
The following is a summary of the level of inputs used as of October 31, 2016, in valuing the Fund's investments carried at value:
| Investments in Securities | | Level 1 | | | Level 2 | | | Level 3 | | | Total | |
| U.S. Treasury Obligations | | $ | — | | | $ | 4,320,969 | | | $ | — | | | $ | 4,320,969 | |
| Exchange Traded Commodities | | | 2,161,330 | | | | — | | | | — | | | | 2,161,330 | |
| Common Stock | | | 1,679,483 | | | | — | | | | — | | | | 1,679,483 | |
| Exchange Traded Funds | | | 553,900 | | | | — | | | | — | | | | 553,900 | |
| Total Investments in Securities | | $ | 4,394,713 | | | $ | 4,320,969 | | | $ | — | | | $ | 8,715,682 | |
For the year ended October 31, 2016, there have been no transfers between Level 1, Level 2 or Level 3 investments.
As of October 31, 2016, there were no Level 3 investments.
The accompanying notes are an integral part of the financial statements.
| Schedule of Investments | October 31, 2016 |
Sector Weightings (unaudited)†:
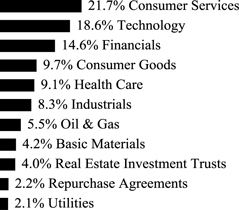
† Sector weightings percentages are based on the total market value of investments. Repurchase agreements purchased from cash collateral received for securities lending activity are included in total investments. Please see Notes 2 and 7 in Notes to Financial Statements for more detailed information.
| | | Shares | | | Value | |
| COMMON STOCK — 97.9% |
| CHINA— 2.1% | | | | | | | | |
| Technology — 2.1% | | | | | | | | |
| Baidu ADR * | | | 7,001 | | | $ | 1,238,197 | |
| IRELAND— 1.5% | | | | | | | | |
| Health Care — 1.5% | | | | | | | | |
| Horizon Pharma * | | | 53,087 | | | | 887,614 | |
| UNITED STATES— 94.3% | | | | | | | | |
| Basic Materials — 4.3% | | | | | | | | |
| Celanese, Cl A | | | 18,366 | | | | 1,339,249 | |
| Ferro * | | | 91,447 | | | | 1,185,153 | |
| | | | | | | | 2,524,402 | |
| Consumer Goods — 9.9% | | | | | | | | |
| Constellation Brands, Cl A | | | 7,371 | | | | 1,231,842 | |
| Darling Ingredients * | | | 85,332 | | | | 1,160,515 | |
| Mondelez International, Cl A | | | 28,397 | | | | 1,276,161 | |
| NIKE, Cl B | | | 21,356 | | | | 1,071,644 | |
| NVR * | | | 713 | | | | 1,085,899 | |
| | | | | | | | 5,826,061 | |
| Consumer Services — 22.1% | | | | | | | | |
| Amazon.com * | | | 1,589 | | | | 1,255,024 | |
| CBS, Cl B | | | 23,501 | | | | 1,330,627 | |
| Charter Communications, Cl A * | | | 4,713 | | | | 1,177,732 | |
| GrubHub * | | | 32,667 | | | | 1,244,939 | |
| Houghton Mifflin Harcourt * | | | 80,311 | | | | 1,015,934 | |
| Netflix * | | | 12,752 | | | | 1,592,342 | |
| Pandora Media * (A) | | | 92,502 | | | | 1,048,048 | |
The accompanying notes are an integral part of the financial statements.
| Schedule of Investments | October 31, 2016 |
| | | Shares | | | Value | |
| COMMON STOCK — continued |
| Consumer Services — continued | | | | | | | | |
| Restaurant Brands International | | | 25,634 | | | $ | 1,139,944 | |
| Signet Jewelers (A) | | | 13,112 | | | | 1,065,481 | |
| Tribune Media, Cl A | | | 31,269 | | | | 1,019,369 | |
| Yum! Brands | | | 13,505 | | | | 1,165,211 | |
| | | | | | | | 13,054,651 | |
| Financials — 14.8% | | | | | | | | |
| American International Group | | | 20,440 | | | | 1,261,148 | |
| Aon | | | 11,109 | | | | 1,231,210 | |
| Bank of New York Mellon | | | 30,319 | | | | 1,311,903 | |
| Berkshire Hathaway, Cl B * | | | 8,233 | | | | 1,188,022 | |
| Investors Bancorp | | | 107,409 | | | | 1,316,835 | |
| JPMorgan Chase | | | 18,458 | | | | 1,278,401 | |
| Western Union | | | 58,218 | | | | 1,168,435 | |
| | | | | | | | 8,755,954 | |
| Health Care — 7.8% | | | | | | | | |
| Allergan * | | | 4,789 | | | | 1,000,614 | |
| Cigna | | | 9,194 | | | | 1,092,523 | |
| Humana | | | 6,746 | | | | 1,157,141 | |
| Incyte * | | | 15,575 | | | | 1,354,558 | |
| | | | | | | | 4,604,836 | |
| Industrials — 8.4% | | | | | | | | |
| Dycom Industries * | | | 14,226 | | | | 1,094,406 | |
| FleetCor Technologies * | | | 7,216 | | | | 1,264,965 | |
| Macquarie Infrastructure | | | 15,132 | | | | 1,237,949 | |
| Spirit Aerosystems Holdings, Cl A | | | 27,078 | | | | 1,363,648 | |
| | | | | | | | 4,960,968 | |
| Oil & Gas — 3.8% | | | | | | | | |
| Cheniere Energy * | | | 27,424 | | | | 1,033,885 | |
| Pioneer Natural Resources | | | 6,785 | | | | 1,214,651 | |
| | | | | | | | 2,248,536 | |
| Real Estate Investment Trusts — 4.1% | | | | | | | | |
| American Tower, Cl A | | | 10,623 | | | | 1,244,909 | |
| Crown Castle International | | | 12,793 | | | | 1,164,035 | |
| | | | | | | | 2,408,944 | |
| Technology — 16.9% | | | | | | | | |
| Alphabet, Cl A * | | | 1,511 | | | | 1,223,759 | |
| Apple | | | 11,083 | | | | 1,258,364 | |
| Autodesk * | | | 19,358 | | | | 1,399,196 | |
| Broadcom | | | 7,034 | | | | 1,197,749 | |
| CDK Global | | | 20,787 | | | | 1,135,178 | |
| Facebook, Cl A * | | | 9,836 | | | | 1,288,418 | |
| Microsoft | | | 21,107 | | | | 1,264,732 | |
The accompanying notes are an integral part of the financial statements.
| Schedule of Investments | October 31, 2016 |
| | | Shares | | | Value | |
| COMMON STOCK — continued |
| Technology — continued | | | | | | | | |
| Yahoo! * | | | 28,533 | | | $ | 1,185,546 | |
| | | | | | | | 9,952,942 | |
| Utilities — 2.2% | | | | | | | | |
| FirstEnergy | | | 37,399 | | | | 1,282,412 | |
| TOTAL UNITED STATES | | | | | | | 55,619,706 | |
| TOTAL COMMON STOCK | | | | | | | | |
| (Cost $59,328,977) | | | | | | | 57,745,517 | |
| | | | | | | | | |
| MASTER LIMITED PARTNERSHIP — 1.7% |
| UNITED STATES— 1.7% | | | | | | | | |
| Oil & Gas — 1.7% | | | | | | | | |
| Energy Transfer Partners | | | | | | | | |
| (Cost $1,056,644) | | | 29,423 | | | | 1,029,217 | |
| | | | | | | | | |
| REPURCHASE AGREEMENT — 2.3% |
| Deutsche Bank | | | | | | | | |
0.350%, dated 10/31/16, to be repurchased on 11/01/16 repurchase price $1,336,013 (collateralized by U.S. Treasury Obligations, par value $1,242,407, 3.000%, 05/15/45 with a total market value of $1,368,662)(B) (Cost $1,336,000) | | $ | 1,336,000 | | | | 1,336,000 | |
| TOTAL INVESTMENTS — 101.9% | | | | | | | | |
| (Cost $61,721,621) | | | | | | $ | 60,110,734 | |
Percentages are based on Net Assets of $59,013,432.
| * | Non-income producing security. |
| (A) | This security or a partial position of this security is on loan as of October 31, 2016. The total value of securities on loan as of October 31, 2016 was $1,290,225. |
| (B) | Security was purchased with cash collateral held from securities on loan. The total value of such securities as of October 31, 2016 was $1,336,000. |
ADR — American Depositary Receipt
Cl — Class
The following is a summary of the level of inputs used as of October 31, 2016, in valuing the Fund's investments carried at value:
| Investments in Securities | | Level 1 | | | Level 2 | | | Level 3 | | | Total | |
| Common Stock | | $ | 57,745,517 | | | $ | — | | | $ | — | | | $ | 57,745,517 | |
| Master Limited Partnership | | | 1,029,217 | | | | — | | | | — | | | | 1,029,217 | |
| Repurchase Agreement | | | — | | | | 1,336,000 | | | | — | | | | 1,336,000 | |
| Total Investments in Securities | | $ | 58,774,734 | | | $ | 1,336,000 | | | $ | — | | | $ | 60,110,734 | |
For the year ended October 31, 2016, there have been no transfers between Level 1, Level 2 or Level 3 investments.
As of October 31, 2016, there were no Level 3 investments.
The accompanying notes are an integral part of the financial statements.
| Schedule of Investments | October 31, 2016 |
| Global X Guru® Activist Index ETF |
Sector Weightings (unaudited)†:
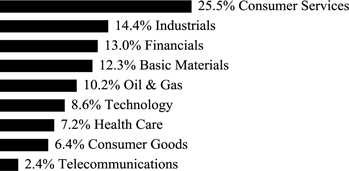
† Sector weightings percentages are based on the total market value of investments.
| | | Shares | | | Value | |
| COMMON STOCK — 99.7% |
| CANADA— 1.4% | | | | | | | | |
| Health Care — 1.4% | | | | | | | | |
| Valeant Pharmaceuticals International * | | | 1,061 | | | $ | 18,928 | |
| UNITED STATES— 98.3% | | | | | | | | |
| Basic Materials — 12.2% | | | | | | | | |
| Air Products & Chemicals | | | 185 | | | | 24,683 | |
| Alcoa | | | 914 | | | | 26,250 | |
| CONSOL Energy | | | 1,580 | | | | 26,781 | |
| Dow Chemical | | | 539 | | | | 29,004 | |
| EI du Pont de Nemours | | | 415 | | | | 28,548 | |
| Freeport-McMoRan Copper & Gold | | | 2,335 | | | | 26,105 | |
| Versum Materials * | | | 92 | | | | 2,088 | |
| | | | | | | | 163,459 | |
| Consumer Goods — 6.4% | | | | | | | | |
| ConAgra Foods | | | 616 | | | | 29,679 | |
| Herbalife * | | | 434 | | | | 26,335 | |
| Mondelez International, Cl A | | | 661 | | | | 29,705 | |
| | | | | | | | 85,719 | |
| Consumer Services — 25.4% | | | | | | | | |
| Charter Communications, Cl A * | | | 110 | | | | 27,488 | |
| Chipotle Mexican Grill, Cl A * | | | 56 | | | | 20,203 | |
| Comcast, Cl A | | | 419 | | | | 25,903 | |
| Cracker Barrel Old Country Store | | | 176 | | | | 24,288 | |
| Hertz Global Holdings * | | | 565 | | | | 18,730 | |
| Restaurant Brands International | | | 596 | | | | 26,504 | |
| Scripps Networks Interactive, Cl A | | | 444 | | | | 28,575 | |
| Sysco | | | 542 | | | | 26,081 | |
| Time Warner | | | 349 | | | | 31,057 | |
| Twenty-First Century Fox, Cl B | | | 1,080 | | | | 28,501 | |
| Walgreens Boots Alliance | | | 341 | | | | 28,211 | |
The accompanying notes are an integral part of the financial statements.
| Schedule of Investments | October 31, 2016 |
| Global X Guru® Activist Index ETF |
| | | Shares | | | Value | |
| COMMON STOCK — continued |
| Consumer Services — continued | | | | | | | | |
| Wynn Resorts | | | 278 | | | $ | 26,285 | |
| Yum! Brands | | | 314 | | | | 27,092 | |
| | | | | | | | 338,918 | |
| Financials — 12.9% | | | | | | | | |
| American International Group | | | 476 | | | | 29,369 | |
| Bank of New York Mellon | | | 706 | | | | 30,549 | |
| CBRE Group, Cl A * | | | 960 | | | | 24,730 | |
| Liberty Broadband, Cl C * | | | 414 | | | | 27,593 | |
| Morgan Stanley | | | 933 | | | | 31,320 | |
| Willis Towers Watson | | | 232 | | | | 29,209 | |
| | | | | | | | 172,770 | |
| Health Care — 5.8% | | | | | | | | |
| Allergan * | | | 111 | | | | 23,192 | |
| Baxter International | | | 586 | | | | 27,888 | |
| Zoetis, Cl A | | | 542 | | | | 25,908 | |
| | | | | | | | 76,988 | |
| Industrials — 14.4% | | | | | | | | |
| Alliance Data Systems | | | 133 | | | | 27,195 | |
| FedEx | | | 169 | | | | 29,460 | |
| General Electric | | | 905 | | | | 26,336 | |
| PayPal Holdings * | | | 735 | | | | 30,619 | |
| Pentair | | | 425 | | | | 23,430 | |
| United Technologies | | | 258 | | | | 26,368 | |
| Xerox | | | 2,882 | | | | 28,157 | |
| | | | | | | | 191,565 | |
| Oil & Gas — 10.2% | | | | | | | | |
| Baker Hughes | | | 551 | | | | 30,525 | |
| Cheniere Energy * | | | 638 | | | | 24,053 | |
| CVR Energy | | | 1,956 | | | | 25,937 | |
| Hess | | | 498 | | | | 23,889 | |
| Williams | | | 1,073 | | | | 31,331 | |
| | | | | | | | 135,735 | |
| Technology — 8.6% | | | | | | | | |
| Alphabet, Cl C * | | | 36 | | | | 28,244 | |
| Apple | | | 258 | | | | 29,293 | |
| Microsoft | | | 491 | | | | 29,421 | |
| Yahoo! * | | | 664 | | | | 27,589 | |
| | | | | | | | 114,547 | |
| Telecommunications — 2.4% | | | | | | | | |
| Level 3 Communications * | | | 579 | | | | 32,511 | |
The accompanying notes are an integral part of the financial statements.
| Schedule of Investments | October 31, 2016 |
| Global X Guru® Activist Index ETF |
| | | | | | Value | |
| COMMON STOCK — continued |
| TOTAL UNITED STATES | | | | | | $ | 1,312,212 | |
| TOTAL COMMON STOCK | | | | | | | | |
| (Cost $1,360,719) | | | | | | | 1,331,140 | |
| TOTAL INVESTMENTS — 99.7% | | | | | | | | |
| (Cost $1,360,719) | | | | | | $ | 1,331,140 | |
Percentages are based on Net Assets of $1,334,780.
| * | Non-income producing security. |
Cl — Class
As of October 31, 2016, all of the Fund's investments were considered Level 1, in accordance with authoritative guidance on fair value measurements and disclosure under U.S. GAAP.
For the year ended October 31, 2016, there have been no transfers between Level 1, Level 2 or Level 3 investments.
The accompanying notes are an integral part of the financial statements.
| Schedule of Investments | October 31, 2016 |
| Global X Guru® International Index ETF |
Sector Weightings (unaudited)†:
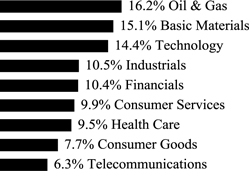
† Sector weightings percentages are based on the total market value of investments.
| | | Shares | | | Value | |
| COMMON STOCK — 99.8% |
| ARGENTINA— 2.0% | | | | | | | | |
| Oil & Gas — 2.0% | | | | | | | | |
| YPF ADR | | | 779 | | | $ | 13,835 | |
| BRAZIL— 13.7% | | | | | | | | |
| Consumer Goods — 2.0% | | | | | | | | |
| AMBEV ADR | | | 2,290 | | | | 13,511 | |
| Financials — 4.7% | | | | | | | | |
| Banco Bradesco ADR | | | 1,559 | | | | 16,229 | |
| Itau Unibanco Holding ADR | | | 1,366 | | | | 16,296 | |
| | | | | | | | 32,525 | |
| Industrials — 2.4% | | | | | | | | |
| Embraer ADR | | | 779 | | | | 16,663 | |
| Oil & Gas — 2.5% | | | | | | | | |
| Petroleo Brasileiro ADR * | | | 1,492 | | | | 17,412 | |
| Telecommunications — 2.1% | | | | | | | | |
| Tim Participacoes ADR | | | 1,074 | | | | 14,875 | |
| TOTAL BRAZIL | | | | | | | 94,986 | |
| CANADA— 23.0% | | | | | | | | |
| Basic Materials — 7.6% | | | | | | | | |
| Barrick Gold | | | 677 | | | | 11,909 | |
| Franco-Nevada | | | 179 | | | | 11,717 | |
| Kinross Gold * | | | 2,788 | | | | 10,762 | |
| Teck Resources, Cl B | | | 854 | | | | 18,429 | |
| | | | | | | | 52,817 | |
| Consumer Goods — 3.9% | | | | | | | | |
| Gildan Activewear, Cl A | | | 475 | | | | 12,193 | |
| Magna International | | | 349 | | | | 14,327 | |
| | | | | | | | 26,520 | |
The accompanying notes are an integral part of the financial statements.
| Schedule of Investments | October 31, 2016 |
| Global X Guru® International Index ETF |
| | | Shares | | | Value | |
| COMMON STOCK — continued |
| Consumer Services — 1.9% | | | | | | | | |
| Restaurant Brands International | | | 295 | | | $ | 13,119 | |
| Industrials — 1.9% | | | | | | | | |
| Canadian Pacific Railway | | | 93 | | | | 13,295 | |
| Oil & Gas — 6.0% | | | | | | | | |
| Canadian Natural Resources | | | 430 | | | | 13,635 | |
| Suncor Energy | | | 494 | | | | 14,830 | |
| TransCanada | | | 296 | | | | 13,403 | |
| | | | | | | | 41,868 | |
| Technology — 1.7% | | | | | | | | |
| BlackBerry * | | | 1,726 | | | | 12,168 | |
| TOTAL CANADA | | | | | | | 159,787 | |
| CHINA— 11.6% | | | | | | | | |
| Consumer Services — 5.7% | | | | | | | | |
| Alibaba Group Holding ADR * | | | 146 | | | | 14,847 | |
| China Lodging Group ADR | | | 331 | | | | 14,236 | |
| Fang Holdings ADR * | | | 3,299 | | | | 10,986 | |
| | | | | | | | 40,069 | |
| Oil & Gas — 1.6% | | | | | | | | |
| JinkoSolar Holding ADR * | | | 711 | | | | 10,957 | |
| Technology — 4.3% | | | | | | | | |
| Baidu ADR * | | | 81 | | | | 14,325 | |
| SINA * | | | 198 | | | | 14,284 | |
| Weibo ADR * | | | 19 | | | | 874 | |
| | | | | | | | 29,483 | |
| TOTAL CHINA | | | | | | | 80,509 | |
| DENMARK— 1.5% | | | | | | | | |
| Health Care — 1.5% | | | | | | | | |
| Novo Nordisk ADR | | | 302 | | | | 10,733 | |
| HONG KONG— 2.3% | | | | | | | | |
| Consumer Services — 2.3% | | | | | | | | |
| Melco Crown Entertainment ADR | | | 962 | | | | 16,104 | |
| INDIA— 1.9% | | | | | | | | |
| Technology — 1.9% | | | | | | | | |
| Infosys ADR | | | 887 | | | | 13,536 | |
| IRELAND— 3.9% | | | | | | | | |
| Health Care — 1.7% | | | | | | | | |
| Shire ADR | | | 71 | | | | 11,973 | |
| Industrials — 2.2% | | | | | | | | |
| AerCap Holdings * | | | 364 | | | | 14,964 | |
| TOTAL IRELAND | | | | | | | 26,937 | |
The accompanying notes are an integral part of the financial statements.
| Schedule of Investments | October 31, 2016 |
| Global X Guru® International Index ETF |
| | | Shares | | | Value | |
| COMMON STOCK — continued |
| ISRAEL— 7.8% | | | | | | | | |
| Health Care — 1.7% | | | | | | | | |
| Teva Pharmaceutical Industries ADR | | | 267 | | | $ | 11,411 | |
| Industrials — 1.9% | | | | | | | | |
| Orbotech * | | | 490 | | | | 13,426 | |
| Technology — 4.2% | | | | | | | | |
| Mellanox Technologies * | | | 335 | | | | 14,539 | |
| Tower Semiconductor * | | | 932 | | | | 14,493 | |
| | | | | | | | 29,032 | |
| TOTAL ISRAEL | | | | | | | 53,869 | |
| LUXEMBOURG— 1.7% | | | | | | | | |
| Financials — 1.7% | | | | | | | | |
| Altisource Portfolio Solutions * | | | 449 | | | | 11,562 | |
| MEXICO— 4.1% | | | | | | | | |
| Consumer Goods — 1.9% | | | | | | | | |
| Coca-Cola Femsa ADR | | | 173 | | | | 12,977 | |
| Telecommunications — 2.2% | | | | | | | | |
| America Movil ADR, Ser L, Cl L | | | 1,155 | | | | 15,176 | |
| TOTAL MEXICO | | | | | | | 28,153 | |
| NETHERLANDS— 6.2% | | | | | | | | |
| Basic Materials — 2.1% | | | | | | | | |
| ArcelorMittal | | | 2,150 | | | | 14,469 | |
| Industrials — 2.1% | | | | | | | | |
| Koninklijke Philips | | | 491 | | | | 14,745 | |
| Oil & Gas — 2.0% | | | | | | | | |
| Royal Dutch Shell ADR, Cl A | | | 276 | | | | 13,748 | |
| TOTAL NETHERLANDS | | | | | | | 42,962 | |
| PERU— 3.6% | | | | | | | | |
| Basic Materials — 1.7% | | | | | | | | |
| Cia de Minas Buenaventura ADR | | | 864 | | | | 11,483 | |
| Financials — 1.9% | | | | | | | | |
| Credicorp Ltd. | | | 90 | | | | 13,381 | |
| TOTAL PERU | | | | | | | 24,864 | |
| SOUTH AFRICA— 1.4% | | | | | | | | |
| Basic Materials — 1.4% | | | | | | | | |
| AngloGold Ashanti ADR * | | | 712 | | | | 9,783 | |
| SOUTH KOREA— 1.9% | | | | | | | | |
| Telecommunications — 1.9% | | | | | | | | |
| SK Telecom ADR | | | 613 | | | | 13,394 | |
The accompanying notes are an integral part of the financial statements.
| Schedule of Investments | October 31, 2016 |
| Global X Guru® International Index ETF |
| | | Shares | | | Value | |
| COMMON STOCK — continued |
| SPAIN— 1.8% | | | | | | | | |
| Health Care — 1.8% | | | | | | | | |
| Grifols ADR | | | 859 | | | $ | 12,275 | |
| SWITZERLAND— 2.1% | | | | | | | | |
| Financials — 2.1% | | | | | | | | |
| UBS Group | | | 1,038 | | | | 14,605 | |
| TAIWAN— 2.2% | | | | | | | | |
| Technology — 2.2% | | | | | | | | |
| Taiwan Semiconductor Manufacturing ADR | | | 483 | | | | 15,021 | |
| UNITED KINGDOM— 7.1% | | | | | | | | |
| Basic Materials — 2.2% | | | | | | | | |
| Rio Tinto ADR | | | 432 | | | | 15,055 | |
| Health Care — 2.8% | | | | | | | | |
| GW Pharmaceuticals ADR * | | | 169 | | | | 19,839 | |
| Oil & Gas — 2.1% | | | | | | | | |
| BP ADR | | | 409 | | | | 14,540 | |
| TOTAL UNITED KINGDOM | | | | | | | 49,434 | |
| TOTAL COMMON STOCK | | | | | | | | |
| (Cost $716,398) | | | | | | | 692,349 | |
| TOTAL INVESTMENTS — 99.8% | | | | | | | | |
| (Cost $716,398) | | | | | | $ | 692,349 | |
Percentages are based on Net Assets of $693,777.
| * | Non-income producing security. |
ADR — American Depositary Receipt
Cl — Class
Ltd. — Limited
As of October 31, 2016, all of the Fund's investments were considered Level 1, in accordance with authoritative guidance on fair value measurements and disclosure under U.S. GAAP.
For the year ended October 31, 2016, there have been no transfers between Level 1, Level 2 or Level 3 investments.
The accompanying notes are an integral part of the financial statements.
| Schedule of Investments | October 31, 2016 |
| Global X Scientific Beta US ETF |
Sector Weightings (unaudited)†:
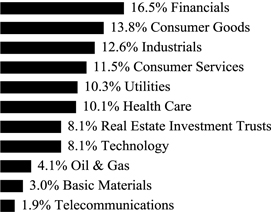
† Sector weightings percentages are based on the total market value of investments.
| | | Shares | | | Value | |
| COMMON STOCK — 99.7% |
| UNITED STATES— 99.7% | | | | | | |
| Basic Materials — 3.0% | | | | | | | | |
| Albemarle | | | 1,071 | | | $ | 89,482 | |
| Alcoa | | | 4,379 | | | | 125,765 | |
| Ashland Global Holdings | | | 1,508 | | | | 168,489 | |
| Celanese, Cl A | | | 2,338 | | | | 170,487 | |
| Dow Chemical | | | 1,365 | | | | 73,451 | |
| Eastman Chemical | | | 1,237 | | | | 88,953 | |
| Ecolab | | | 720 | | | | 82,202 | |
| International Flavors & Fragrances | | | 1,354 | | | | 177,076 | |
| International Paper | | | 965 | | | | 43,454 | |
| Mosaic | | | 4,617 | | | | 108,638 | |
| Newmont Mining | | | 20,601 | | | | 763,061 | |
| Nucor | | | 1,152 | | | | 56,275 | |
| Praxair | | | 443 | | | | 51,857 | |
| | | | | | | | 1,999,190 | |
| Consumer Goods — 13.8% | | | | | | | | |
| Activision Blizzard | | | 4,420 | | | | 190,811 | |
| Altria Group | | | 2,062 | | | | 136,339 | |
| Archer-Daniels-Midland | | | 1,191 | | | | 51,892 | |
| Autoliv | | | 2,004 | | | | 193,947 | |
| BorgWarner | | | 1,769 | | | | 63,401 | |
| Brown-Forman, Cl B | | | 2,634 | | | | 121,612 | |
| Bunge | | | 4,746 | | | | 294,300 | |
| Campbell Soup | | | 4,651 | | | | 252,735 | |
| Church & Dwight | | | 5,170 | | | | 249,504 | |
| Clorox | | | 3,459 | | | | 415,149 | |
| Coach | | | 5,944 | | | | 213,330 | |
The accompanying notes are an integral part of the financial statements.
| Schedule of Investments | October 31, 2016 |
| Global X Scientific Beta US ETF |
| | | Shares | | | Value | |
| COMMON STOCK — continued |
| Consumer Goods — continued | | | | | | | | |
| Coca-Cola | | | 3,586 | | | $ | 152,046 | |
| Colgate-Palmolive | | | 1,684 | | | | 120,170 | |
| ConAgra Foods | | | 7,549 | | | | 363,711 | |
| Constellation Brands, Cl A | | | 735 | | | | 122,833 | |
| DR Horton | | | 4,451 | | | | 128,322 | |
| Dr Pepper Snapple Group | | | 2,260 | | | | 198,405 | |
| Electronic Arts * | | | 957 | | | | 75,144 | |
| Estee Lauder, Cl A | | | 2,260 | | | | 196,914 | |
| Ford Motor | | | 6,471 | | | | 75,969 | |
| General Mills | | | 1,684 | | | | 104,374 | |
| General Motors | | | 1,285 | | | | 40,606 | |
| Genuine Parts | | | 1,140 | | | | 103,273 | |
| Goodyear Tire & Rubber | | | 2,154 | | | | 62,531 | |
| Hanesbrands | | | 3,248 | | | | 83,474 | |
| Harley-Davidson | | | 713 | | | | 40,655 | |
| Hasbro | | | 1,638 | | | | 136,626 | |
| Hershey | | | 1,251 | | | | 128,177 | |
| Hormel Foods | | | 4,897 | | | | 188,535 | |
| Ingredion | | | 771 | | | | 101,132 | |
| JM Smucker | | | 2,017 | | | | 264,852 | |
| Kellogg | | | 2,689 | | | | 202,025 | |
| Kimberly-Clark | | | 777 | | | | 88,897 | |
| Kraft Heinz | | | 971 | | | | 86,370 | |
| Lear | | | 934 | | | | 114,676 | |
| Lennar, Cl A | | | 1,460 | | | | 60,868 | |
| LKQ * | | | 3,648 | | | | 117,757 | |
| Mattel | | | 7,250 | | | | 228,592 | |
| McCormick | | | 3,165 | | | | 303,429 | |
| Michael Kors Holdings * | | | 4,031 | | | | 204,694 | |
| Mohawk Industries * | | | 798 | | | | 147,072 | |
| Molson Coors Brewing, Cl B | | | 2,154 | | | | 223,607 | |
| Mondelez International, Cl A | | | 3,076 | | | | 138,235 | |
| Monsanto | | | 835 | | | | 84,143 | |
| Monster Beverage * | | | 475 | | | | 68,562 | |
| Newell Brands | | | 1,660 | | | | 79,713 | |
| NIKE, Cl B | | | 2,383 | | | | 119,579 | |
| PepsiCo | | | 1,136 | | | | 121,779 | |
| Philip Morris International | | | 1,367 | | | | 131,834 | |
| Procter & Gamble | | | 1,485 | | | | 128,898 | |
| PVH | | | 2,366 | | | | 253,115 | |
| Reynolds American | | | 2,986 | | | | 164,469 | |
| Snap-On | | | 772 | | | | 118,965 | |
| Stanley Black & Decker | | | 2,832 | | | | 322,395 | |
| Tesla Motors * | | | 316 | | | | 62,483 | |
The accompanying notes are an integral part of the financial statements.
| Schedule of Investments | October 31, 2016 |
| Global X Scientific Beta US ETF |
| | | Shares | | | Value | |
| COMMON STOCK — continued |
| Consumer Goods — continued | | | | | | | | |
| Tyson Foods, Cl A | | | 7,029 | | | $ | 498,005 | |
| VF | | | 872 | | | | 47,271 | |
| Whirlpool | | | 510 | | | | 76,408 | |
| WhiteWave Foods, Cl A * | | | 671 | | | | 36,563 | |
| | | | | | | | 9,101,173 | |
| Consumer Services — 11.5% | | | | | | | | |
| Advance Auto Parts | | | 1,023 | | | | 143,302 | |
| Alaska Air Group | | | 1,175 | | | | 84,859 | |
| Amazon.com * | | | 124 | | | | 97,938 | |
| AmerisourceBergen, Cl A | | | 877 | | | | 61,671 | |
| AutoZone * | | | 256 | | | | 189,993 | |
| Bed Bath & Beyond | | | 3,689 | | | | 149,109 | |
| Best Buy | | | 8,961 | | | | 348,672 | |
| Cardinal Health | | | 879 | | | | 60,379 | |
| CarMax * | | | 723 | | | | 36,107 | |
| Carnival | | | 2,535 | | | | 124,468 | |
| Charter Communications, Cl A * | | | 167 | | | | 41,732 | |
| Chipotle Mexican Grill, Cl A * | | | 319 | | | | 115,082 | |
| Comcast, Cl A | | | 3,208 | | | | 198,319 | |
| Costco Wholesale | | | 723 | | | | 106,910 | |
| CVS Health | | | 1,736 | | | | 145,998 | |
| Darden Restaurants | | | 2,277 | | | | 147,527 | |
| Delta Air Lines | | | 2,918 | | | | 121,885 | |
| DISH Network, Cl A * | | | 1,562 | | | | 91,471 | |
| Dollar General | | | 1,143 | | | | 78,970 | |
| Dollar Tree * | | | 2,038 | | | | 153,971 | |
| Expedia | | | 1,436 | | | | 185,574 | |
| Foot Locker | | | 2,032 | | | | 135,677 | |
| Hilton Worldwide Holdings | | | 2,121 | | | | 47,935 | |
| Home Depot | | | 561 | | | | 68,448 | |
| Interpublic Group | | | 4,883 | | | | 109,330 | |
| Kohl's | | | 5,829 | | | | 255,019 | |
| Kroger | | | 4,044 | | | | 125,283 | |
| L Brands | | | 1,810 | | | | 130,664 | |
| Liberty Global, Cl A * | | | 5,732 | | | | 186,863 | |
| Liberty Interactive, Cl A * | | | 2,915 | | | | 53,898 | |
| Lowe's | | | 826 | | | | 55,053 | |
| Macy's | | | 2,538 | | | | 92,611 | |
| Marriott International, Cl A | | | 1,074 | | | | 73,784 | |
| McDonald's | | | 1,980 | | | | 222,889 | |
| McKesson | | | 326 | | | | 41,457 | |
| MGM Resorts International * | | | 6,709 | | | | 175,575 | |
| Netflix * | | | 627 | | | | 78,294 | |
| Nielsen Holdings | | | 4,558 | | | | 205,201 | |
The accompanying notes are an integral part of the financial statements.
| Schedule of Investments | October 31, 2016 |
| Global X Scientific Beta US ETF |
| | | Shares | | | Value | |
| COMMON STOCK — continued |
| Consumer Services — continued | | | | | | | | |
| Omnicom Group | | | 868 | | | $ | 69,284 | |
| O'Reilly Automotive * | | | 162 | | | | 42,839 | |
| priceline.com * | | | 52 | | | | 76,660 | |
| Rite Aid * | | | 12,629 | | | | 84,741 | |
| Ross Stores | | | 857 | | | | 53,597 | |
| Royal Caribbean Cruises | | | 1,644 | | | | 126,374 | |
| Sirius XM Holdings | | | 42,131 | | | | 175,686 | |
| Southwest Airlines | | | 3,349 | | | | 134,127 | |
| Starbucks | | | 2,281 | | | | 121,053 | |
| Sysco | | | 2,963 | | | | 142,579 | |
| Target | | | 4,419 | | | | 303,718 | |
| Tiffany | | | 1,290 | | | | 94,712 | |
| Time Warner | | | 1,589 | | | | 141,405 | |
| TJX | | | 2,066 | | | | 152,367 | |
| Tractor Supply | | | 883 | | | | 55,302 | |
| TripAdvisor * | | | 834 | | | | 53,776 | |
| Ulta Salon Cosmetics & Fragrance * | | | 810 | | | | 197,105 | |
| United Continental Holdings * | | | 1,656 | | | | 93,117 | |
| Walgreens Boots Alliance | | | 2,587 | | | | 214,022 | |
| Wal-Mart Stores | | | 2,417 | | | | 169,238 | |
| Walt Disney | | | 1,902 | | | | 176,296 | |
| Whole Foods Market | | | 1,623 | | | | 45,915 | |
| Wyndham Worldwide | | | 1,200 | | | | 79,008 | |
| Yum! Brands | | | 809 | | | | 69,800 | |
| | | | | | | | 7,614,639 | |
| Financials — 16.4% | | | | | | | | |
| Aflac | | | 2,283 | | | | 157,230 | |
| Alexandria Real Estate Equities | | | 730 | | | | 78,701 | |
| Alleghany * | | | 369 | | | | 190,482 | |
| Allstate | | | 1,881 | | | | 127,720 | |
| Ally Financial | | | 5,121 | | | | 92,537 | |
| American Express | | | 667 | | | | 44,302 | |
| American International Group | | | 2,208 | | | | 136,234 | |
| Ameriprise Financial | | | 443 | | | | 39,157 | |
| Aon | | | 1,322 | | | | 146,517 | |
| Arch Capital Group * | | | 6,705 | | | | 522,789 | |
| Arthur J Gallagher | | | 4,180 | | | | 201,601 | |
| Bank of America | | | 6,095 | | | | 100,567 | |
| Bank of New York Mellon | | | 3,742 | | | | 161,916 | |
| BB&T | | | 4,569 | | | | 179,105 | |
| Berkshire Hathaway, Cl B * | | | 894 | | | | 129,004 | |
| BlackRock, Cl A | | | 129 | | | | 44,020 | |
| Brixmor Property Group | | | 2,941 | | | | 74,760 | |
| Capital One Financial | | | 929 | | | | 68,783 | |
The accompanying notes are an integral part of the financial statements.
| Schedule of Investments | October 31, 2016 |
| Global X Scientific Beta US ETF |
| | | Shares | | | Value | |
| COMMON STOCK — continued |
| Financials — continued | | | | | | | | |
| CBRE Group, Cl A * | | | 1,255 | | | $ | 32,329 | |
| Charles Schwab | | | 2,546 | | | | 80,708 | |
| Chubb | | | 1,485 | | | | 188,595 | |
| Cincinnati Financial | | | 3,545 | | | | 250,915 | |
| CIT Group | | | 6,030 | | | | 219,070 | |
| Citigroup | | | 1,027 | | | | 50,477 | |
| Citizens Financial Group | | | 3,615 | | | | 95,219 | |
| CME Group, Cl A | | | 4,580 | | | | 458,458 | |
| Comerica | | | 4,577 | | | | 238,416 | |
| Discover Financial Services | | | 2,071 | | | | 116,659 | |
| Duke Realty | | | 2,776 | | | | 72,593 | |
| E*TRADE Financial * | | | 2,399 | | | | 67,556 | |
| Equifax | | | 1,408 | | | | 174,550 | |
| Everest Re Group | | | 1,090 | | | | 221,837 | |
| Fifth Third Bancorp | | | 10,088 | | | | 219,515 | |
| First Republic Bank | | | 3,337 | | | | 248,373 | |
| FNF Group | | | 4,712 | | | | 169,208 | |
| Franklin Resources | | | 1,964 | | | | 66,108 | |
| Goldman Sachs Group | | | 647 | | | | 115,321 | |
| Hartford Financial Services Group | | | 4,306 | | | | 189,938 | |
| Huntington Bancshares | | | 29,783 | | | | 315,700 | |
| IHS Markit * | | | 1,011 | | | | 37,194 | |
| Intercontinental Exchange | | | 1,061 | | | | 286,884 | |
| Invesco | | | 2,735 | | | | 76,826 | |
| JPMorgan Chase | | | 2,452 | | | | 169,826 | |
| KeyCorp | | | 11,938 | | | | 168,565 | |
| Lincoln National | | | 1,826 | | | | 89,638 | |
| Loews | | | 4,470 | | | | 192,344 | |
| M&T Bank | | | 2,577 | | | | 316,275 | |
| Markel * | | | 492 | | | | 431,696 | |
| Marsh & McLennan | | | 1,359 | | | | 86,147 | |
| Mastercard, Cl A | | | 701 | | | | 75,021 | |
| MetLife | | | 1,015 | | | | 47,664 | |
| Moody's | | | 612 | | | | 61,518 | |
| Morgan Stanley | | | 1,650 | | | | 55,391 | |
| Nasdaq | | | 2,687 | | | | 171,888 | |
| New York Community Bancorp | | | 17,843 | | | | 256,225 | |
| Northern Trust | | | 2,519 | | | | 182,426 | |
| PNC Financial Services Group | | | 1,567 | | | | 149,805 | |
| Principal Financial Group | | | 1,908 | | | | 104,177 | |
| Progressive | | | 8,048 | | | | 253,592 | |
| Prudential Financial | | | 596 | | | | 50,535 | |
| Regions Financial | | | 17,972 | | | | 192,480 | |
| S&P Global | | | 446 | | | | 54,345 | |
The accompanying notes are an integral part of the financial statements.
| Schedule of Investments | October 31, 2016 |
| Global X Scientific Beta US ETF |
| | | Shares | | | Value | |
| COMMON STOCK — continued |
| Financials — continued | | | | | | | | |
| State Street | | | 719 | | | $ | 50,481 | |
| SunTrust Banks | | | 1,737 | | | | 78,564 | |
| TD Ameritrade Holding | | | 2,254 | | | | 77,110 | |
| Travelers | | | 1,441 | | | | 155,887 | |
| Unum Group | | | 4,048 | | | | 143,299 | |
| US Bancorp | | | 2,529 | | | | 113,198 | |
| Visa, Cl A | | | 1,004 | | | | 82,840 | |
| Wells Fargo | | | 2,251 | | | | 103,569 | |
| Western Union | | | 2,964 | | | | 59,488 | |
| Willis Towers Watson | | | 1,816 | | | | 228,634 | |
| XL Group | | | 5,348 | | | | 185,576 | |
| | | | | | | | 10,876,078 | |
| Health Care — 10.1% | | | | | | | | |
| Abbott Laboratories | | | 2,300 | | | | 90,252 | |
| Aetna | | | 2,658 | | | | 285,336 | |
| Allergan * | | | 304 | | | | 63,518 | |
| Anthem | | | 1,518 | | | | 184,983 | |
| Baxter International | | | 4,708 | | | | 224,054 | |
| Becton Dickinson | | | 1,071 | | | | 179,832 | |
| BioMarin Pharmaceutical * | | | 609 | | | | 49,036 | |
| Boston Scientific * | | | 3,227 | | | | 70,994 | |
| Bristol-Myers Squibb | | | 1,618 | | | | 82,372 | |
| Centene * | | | 890 | | | | 55,607 | |
| Cigna | | | 1,697 | | | | 201,655 | |
| Cooper | | | 583 | | | | 102,631 | |
| CR Bard | | | 947 | | | | 205,196 | |
| DaVita * | | | 2,869 | | | | 168,181 | |
| DENTSPLY SIRONA | | | 3,423 | | | | 197,062 | |
| Edwards Lifesciences * | | | 772 | | | | 73,510 | |
| Eli Lilly | | | 2,374 | | | | 175,296 | |
| Express Scripts Holding * | | | 3,028 | | | | 204,087 | |
| Henry Schein * | | | 852 | | | | 127,118 | |
| Hologic * | | | 2,737 | | | | 98,559 | |
| Humana | | | 877 | | | | 150,432 | |
| IDEXX Laboratories * | | | 332 | | | | 35,571 | |
| Incyte * | | | 772 | | | | 67,141 | |
| Intuitive Surgical * | | | 252 | | | | 169,364 | |
| Johnson & Johnson | | | 885 | | | | 102,651 | |
| Laboratory Corp of America Holdings * | | | 2,887 | | | | 361,857 | |
| Mallinckrodt * | | | 1,554 | | | | 92,090 | |
| Medtronic | | | 1,660 | | | | 136,153 | |
| Merck | | | 3,911 | | | | 229,654 | |
| Perrigo | | | 925 | | | | 76,951 | |
| Pfizer | | | 8,541 | | | | 270,835 | |
The accompanying notes are an integral part of the financial statements.
| Schedule of Investments | October 31, 2016 |
| Global X Scientific Beta US ETF |
| | | Shares | | | Value | |
| COMMON STOCK — continued |
| Health Care — continued | | | | | | | | |
| Quest Diagnostics | | | 5,772 | | | $ | 470,072 | |
| ResMed | | | 2,393 | | | | 143,030 | |
| Stryker | | | 763 | | | | 88,012 | |
| Thermo Fisher Scientific | | | 1,105 | | | | 162,468 | |
| UnitedHealth Group | | | 1,888 | | | | 266,831 | |
| Universal Health Services, Cl B | | | 2,659 | | | | 320,968 | |
| Varian Medical Systems * | | | 2,217 | | | | 201,148 | |
| Waters * | | | 1,710 | | | | 237,929 | |
| Zimmer Biomet Holdings | | | 1,050 | | | | 110,670 | |
| Zoetis, Cl A | | | 3,513 | | | | 167,922 | |
| | | | | | | | 6,701,028 | |
| Industrials — 12.5% | | | | | | | | |
| 3M | | | 456 | | | | 75,377 | |
| Accenture, Cl A | | | 562 | | | | 65,327 | |
| Acuity Brands | | | 311 | | | | 69,530 | |
| Agilent Technologies | | | 1,444 | | | | 62,915 | |
| Alliance Data Systems | | | 207 | | | | 42,325 | |
| AMETEK | | | 1,535 | | | | 67,693 | |
| Amphenol, Cl A | | | 2,151 | | | | 141,816 | |
| Automatic Data Processing | | | 787 | | | | 68,516 | |
| Ball | | | 1,752 | | | | 135,027 | |
| Boeing | | | 821 | | | | 116,935 | |
| Broadridge Financial Solutions | | | 723 | | | | 46,749 | |
| Caterpillar | | | 540 | | | | 45,068 | |
| CH Robinson Worldwide | | | 4,862 | | | | 331,199 | |
| Cintas | | | 431 | | | | 45,975 | |
| CSX | | | 1,398 | | | | 42,653 | |
| Cummins | | | 442 | | | | 56,497 | |
| Danaher | | | 2,275 | | | | 178,701 | |
| Deere | | | 2,897 | | | | 255,805 | |
| Dover | | | 1,272 | | | | 85,084 | |
| Eaton | | | 675 | | | | 43,045 | |
| Expeditors International of Washington | | | 4,819 | | | | 248,034 | |
| Fastenal | | | 2,802 | | | | 109,222 | |
| FedEx | | | 503 | | | | 87,683 | |
| Fidelity National Information Services | | | 1,763 | | | | 130,321 | |
| Fiserv * | | | 645 | | | | 63,520 | |
| FleetCor Technologies * | | | 726 | | | | 127,268 | |
| Fluor | | | 1,502 | | | | 78,089 | |
| Fortune Brands Home & Security | | | 1,544 | | | | 84,349 | |
| General Dynamics | | | 498 | | | | 75,068 | |
| General Electric | | | 5,297 | | | | 154,143 | |
| Global Payments | | | 1,614 | | | | 117,047 | |
| Honeywell International | | | 574 | | | | 62,956 | |
The accompanying notes are an integral part of the financial statements.
| Schedule of Investments | October 31, 2016 |
| Global X Scientific Beta US ETF |
| | | Shares | | | Value | |
| COMMON STOCK — continued |
| Industrials — continued | | | | | | | | |
| Illinois Tool Works | | | 681 | | | $ | 77,341 | |
| Ingersoll-Rand | | | 1,238 | | | | 83,305 | |
| JB Hunt Transport Services | | | 1,090 | | | | 88,955 | |
| Kansas City Southern | | | 977 | | | | 85,741 | |
| L-3 Communications Holdings, Cl 3 | | | 1,690 | | | | 231,429 | |
| Lockheed Martin | | | 402 | | | | 99,045 | |
| Martin Marietta Materials | | | 1,240 | | | | 229,871 | |
| Masco | | | 3,970 | | | | 122,593 | |
| Mettler-Toledo International * | | | 354 | | | | 143,044 | |
| Norfolk Southern | | | 597 | | | | 55,521 | |
| Northrop Grumman | | | 317 | | | | 72,593 | |
| Parker-Hannifin | | | 769 | | | | 94,395 | |
| Paychex | | | 2,537 | | | | 140,042 | |
| PayPal Holdings * | | | 1,284 | | | | 53,492 | |
| Pentair | | | 939 | | | | 51,767 | |
| Raytheon | | | 662 | | | | 90,436 | |
| Republic Services, Cl A | | | 7,947 | | | | 418,251 | |
| Rockwell Automation | | | 404 | | | | 48,367 | |
| Rockwell Collins | | | 1,408 | | | | 118,722 | |
| Roper Technologies | | | 1,338 | | | | 231,889 | |
| Sealed Air | | | 2,149 | | | | 98,059 | |
| Sherwin-Williams | | | 348 | | | | 85,211 | |
| Stericycle * | | | 726 | | | | 58,145 | |
| TE Connectivity | | | 1,346 | | | | 84,623 | |
| Textron | | | 2,061 | | | | 82,605 | |
| Total System Services | | | 2,908 | | | | 145,051 | |
| TransDigm Group | | | 1,172 | | | | 319,323 | |
| United Parcel Service, Cl B | | | 454 | | | | 48,923 | |
| Valspar | | | 1,214 | | | | 120,915 | |
| Vantiv, Cl A * | | | 3,456 | | | | 201,692 | |
| Verisk Analytics, Cl A * | | | 3,121 | | | | 254,518 | |
| Vulcan Materials | | | 2,828 | | | | 320,130 | |
| Waste Management | | | 1,858 | | | | 121,996 | |
| Westrock | | | 1,389 | | | | 64,158 | |
| WW Grainger | | | 552 | | | | 114,882 | |
| Xerox | | | 17,967 | | | | 175,538 | |
| Xylem | | | 2,913 | | | | 140,785 | |
| | | | | | | | 8,287,290 | |
| Oil & Gas — 4.2% | | | | | | | | |
| Anadarko Petroleum | | | 836 | | | | 49,692 | |
| Baker Hughes | | | 1,397 | | | | 77,394 | |
| Cabot Oil & Gas | | | 3,667 | | | | 76,567 | |
| Chevron | | | 934 | | | | 97,836 | |
| Cimarex Energy | | | 854 | | | | 110,277 | |
The accompanying notes are an integral part of the financial statements.
| Schedule of Investments | October 31, 2016 |
| Global X Scientific Beta US ETF |
| | | Shares | | | Value | |
| COMMON STOCK — continued |
| Oil & Gas — continued | | | | | | | | |
| Concho Resources * | | | 3,217 | | | $ | 408,366 | |
| ConocoPhillips | | | 1,134 | | | | 49,272 | |
| Devon Energy | | | 1,139 | | | | 43,157 | |
| EOG Resources | | | 813 | | | | 73,511 | |
| EQT | | | 1,900 | | | | 125,400 | |
| Exxon Mobil | | | 2,766 | | | | 230,463 | |
| Halliburton | | | 1,356 | | | | 62,376 | |
| Kinder Morgan | | | 2,686 | | | | 54,875 | |
| Marathon Oil | | | 4,903 | | | | 64,621 | |
| Marathon Petroleum | | | 2,152 | | | | 93,806 | |
| National Oilwell Varco | | | 2,592 | | | | 83,203 | |
| Newfield Exploration * | | | 844 | | | | 34,258 | |
| Occidental Petroleum | | | 2,727 | | | | 198,826 | |
| Phillips 66 | | | 1,610 | | | | 130,651 | |
| Pioneer Natural Resources | | | 1,087 | | | | 194,595 | |
| Schlumberger | | | 877 | | | | 68,608 | |
| Spectra Energy | | | 1,870 | | | | 78,185 | |
| Tesoro | | | 1,924 | | | | 163,482 | |
| Valero Energy | | | 2,819 | | | | 166,998 | |
| | | | | | | | 2,736,419 | |
| Real Estate Investment Trusts — 8.1% | | | | | | | | |
| American Tower, Cl A | | | 821 | | | | 96,213 | |
| Annaly Capital Management | | | 60,004 | | | | 621,641 | |
| AvalonBay Communities | | | 1,624 | | | | 277,996 | |
| Boston Properties | | | 615 | | | | 74,095 | |
| Crown Castle International | | | 1,779 | | | | 161,871 | |
| Digital Realty Trust | | | 3,428 | | | | 320,278 | |
| Equinix | | | 256 | | | | 91,464 | |
| Equity Residential | | | 3,417 | | | | 211,000 | |
| Essex Property Trust | | | 1,108 | | | | 237,212 | |
| Extra Space Storage | | | 1,668 | | | | 122,014 | |
| Federal Realty Investment Trust | | | 1,084 | | | | 157,429 | |
| General Growth Properties | | | 6,060 | | | | 151,197 | |
| HCP | | | 3,214 | | | | 110,080 | |
| Host Hotels & Resorts | | | 4,572 | | | | 70,775 | |
| Kimco Realty | | | 5,452 | | | | 145,078 | |
| Macerich | | | 3,579 | | | | 253,322 | |
| ProLogis | | | 2,358 | | | | 122,993 | |
| Public Storage | | | 393 | | | | 83,992 | |
| Realty Income | | | 7,350 | | | | 435,414 | |
| Simon Property Group | | | 403 | | | | 74,942 | |
| SL Green Realty | | | 1,238 | | | | 121,596 | |
| UDR | | | 6,158 | | | | 215,345 | |
| Ventas | | | 4,748 | | | | 321,677 | |
The accompanying notes are an integral part of the financial statements.
| Schedule of Investments | October 31, 2016 |
| Global X Scientific Beta US ETF |
| | | Shares | | | Value | |
| COMMON STOCK — continued |
| Real Estate Investment Trusts — continued | | | | | | | | |
| VEREIT | | | 42,886 | | | $ | 403,128 | |
| Vornado Realty Trust | | | 778 | | | | 72,183 | |
| Welltower | | | 4,650 | | | | 318,665 | |
| Weyerhaeuser | | | 3,152 | | | | 94,339 | |
| | | | | | | | 5,365,939 | |
| Technology — 8.0% | | | | | | | | |
| Adobe Systems * | | | 467 | | | | 50,207 | |
| Akamai Technologies * | | | 1,355 | | | | 94,132 | |
| Alphabet, Cl A * | | | 69 | | | | 55,883 | |
| Amdocs | | | 7,668 | | | | 448,194 | |
| ANSYS * | | | 986 | | | | 90,071 | |
| Autodesk * | | | 1,862 | | | | 134,585 | |
| Broadcom | | | 370 | | | | 63,004 | |
| CA | | | 3,520 | | | | 108,205 | |
| Cerner * | | | 875 | | | | 51,258 | |
| Check Point Software Technologies * | | | 2,875 | | | | 243,110 | |
| Cisco Systems | | | 4,043 | | | | 124,039 | |
| Citrix Systems * | | | 2,421 | | | | 205,301 | |
| Corning | | | 2,525 | | | | 57,343 | |
| F5 Networks * | | | 818 | | | | 113,056 | |
| Facebook, Cl A * | | | 661 | | | | 86,584 | |
| Gartner * | | | 1,091 | | | | 93,870 | |
| Harris | | | 1,948 | | | | 173,781 | |
| Hewlett Packard Enterprise | | | 1,821 | | | | 40,918 | |
| Intel | | | 2,336 | | | | 81,456 | |
| International Business Machines | | | 597 | | | | 91,753 | |
| Intuit | | | 825 | | | | 89,710 | |
| Juniper Networks | | | 8,495 | | | | 223,758 | |
| KLA-Tencor | | | 1,197 | | | | 89,907 | |
| Lam Research | | | 1,014 | | | | 98,216 | |
| Linear Technology | | | 1,746 | | | | 104,865 | |
| Maxim Integrated Products | | | 4,406 | | | | 174,610 | |
| Microchip Technology | | | 957 | | | | 57,946 | |
| Micron Technology * | | | 6,794 | | | | 116,585 | |
| Microsoft | | | 806 | | | | 48,295 | |
| Motorola Solutions | | | 3,284 | | | | 238,353 | |
| NetApp | | | 6,460 | | | | 219,252 | |
| NVIDIA | | | 937 | | | | 66,677 | |
| Palo Alto Networks * | | | 599 | | | | 92,144 | |
| Qorvo * | | | 898 | | | | 49,974 | |
| QUALCOMM | | | 769 | | | | 52,846 | |
| Red Hat * | | | 775 | | | | 60,024 | |
| salesforce.com * | | | 710 | | | | 53,364 | |
| ServiceNow * | | | 927 | | | | 81,493 | |
The accompanying notes are an integral part of the financial statements.
| Schedule of Investments | October 31, 2016 |
| Global X Scientific Beta US ETF |
| | | Shares | | | Value | |
| COMMON STOCK — continued |
| Technology — continued | | | | | | | | |
| Skyworks Solutions | | | 1,178 | | | $ | 90,635 | |
| Symantec | | | 8,050 | | | | 201,491 | |
| Synopsys * | | | 1,534 | | | | 90,982 | |
| Texas Instruments | | | 1,051 | | | | 74,463 | |
| Twitter * | | | 4,033 | | | | 72,392 | |
| VeriSign * | | | 1,550 | | | | 130,231 | |
| Western Digital | | | 891 | | | | 52,070 | |
| Workday, Cl A * | | | 889 | | | | 77,059 | |
| Xilinx | | | 2,019 | | | | 102,706 | |
| Yahoo! * | | | 2,399 | | | | 99,679 | |
| | | | | | | | 5,316,477 | |
| Telecommunications — 1.9% | | | | | | | | |
| AT&T | | | 10,231 | | | | 376,398 | |
| CenturyLink | | | 3,627 | | | | 96,406 | |
| Level 3 Communications * | | | 2,170 | | | | 121,846 | |
| SBA Communications, Cl A * | | | 1,958 | | | | 221,802 | |
| T-Mobile US * | | | 6,400 | | | | 318,272 | |
| Verizon Communications | | | 2,418 | | | | 116,306 | |
| | | | | | | | 1,251,030 | |
| Utilities — 10.2% | | | | | | | | |
| Alliant Energy | | | 4,221 | | | | 160,609 | |
| Ameren | | | 4,696 | | | | 234,565 | |
| American Electric Power | | | 2,787 | | | | 180,709 | |
| American Water Works | | | 7,566 | | | | 560,187 | |
| CenterPoint Energy | | | 12,301 | | | | 280,463 | |
| CMS Energy | | | 6,904 | | | | 291,004 | |
| Consolidated Edison | | | 5,068 | | | | 382,887 | |
| Dominion Resources | | | 1,258 | | | | 94,602 | |
| DTE Energy | | | 2,749 | | | | 263,931 | |
| Duke Energy | | | 4,929 | | | | 394,419 | |
| Edison International | | | 3,970 | | | | 291,716 | |
| Entergy | | | 3,564 | | | | 262,595 | |
| Eversource Energy | | | 4,667 | | | | 256,965 | |
| Exelon | | | 9,786 | | | | 333,409 | |
| FirstEnergy | | | 5,785 | | | | 198,368 | |
| NextEra Energy | | | 1,222 | | | | 156,416 | |
| NiSource | | | 5,562 | | | | 129,372 | |
| ONEOK | | | 1,689 | | | | 81,798 | |
| PG&E | | | 3,758 | | | | 233,447 | |
| Pinnacle West Capital | | | 2,151 | | | | 163,756 | |
| PPL | | | 4,022 | | | | 138,115 | |
| Public Service Enterprise Group | | | 4,046 | | | | 170,256 | |
| SCANA | | | 2,668 | | | | 195,724 | |
| Sempra Energy | | | 885 | | | | 94,784 | |
The accompanying notes are an integral part of the financial statements.
| Schedule of Investments | October 31, 2016 |
| Global X Scientific Beta US ETF |
| | | Shares | | | Value | |
| COMMON STOCK — continued |
| Utilities — continued | | | | | | | | |
| Southern | | | 7,835 | | | $ | 404,051 | |
| WEC Energy Group | | | 5,783 | | | | 345,361 | |
| Westar Energy, Cl A | | | 3,189 | | | | 182,793 | |
| Xcel Energy | | | 6,970 | | | | 289,603 | |
| | | | | | | | 6,771,905 | |
| TOTAL COMMON STOCK | | | | | | | | |
| (Cost $64,718,233) | | | | | | | 66,021,168 | |
| TOTAL INVESTMENTS — 99.7% | | | | | | | | |
| (Cost $64,718,233) | | | | | | $ | 66,021,168 | |
Percentages are based on Net Assets of $66,201,777.
| * | Non-income producing security. |
Cl — Class
S&P — Standard & Poor's
As of October 31, 2016, all of the Fund's investments were considered Level 1, in accordance with authoritative guidance on fair value measurements and disclosure under U.S. GAAP.
For the year ended October 31, 2016, there have been no transfers between Level 1, Level 2 or Level 3 investments.
The accompanying notes are an integral part of the financial statements.
| Schedule of Investments | October 31, 2016 |
| Global X Scientific Beta Europe ETF |
Sector Weightings (unaudited)†:
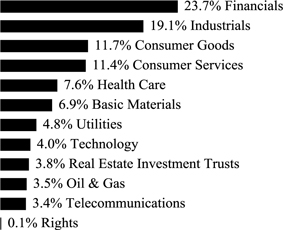
† Sector weightings percentages are based on the total market value of investments.
| | | Shares | | | Value | |
| COMMON STOCK — 99.1% |
| AUSTRIA— 1.1% | | | | | | | | |
| Basic Materials — 0.1% | | | | | | | | |
| voestalpine | | | 260 | | | $ | 9,186 | |
| Financials — 0.5% | | | | | | | | |
| Erste Group Bank | | | 1,000 | | | | 31,362 | |
| IMMOFINANZ | | | 8,719 | | | | 18,762 | |
| | | | | | | | 50,124 | |
| Industrials — 0.3% | | | | | | | | |
| ANDRITZ | | | 333 | | | | 17,394 | |
| Wienerberger | | | 1,750 | | | | 27,941 | |
| | | | | | | | 45,335 | |
| Oil & Gas — 0.2% | | | | | | | | |
| OMV | | | 1,115 | | | | 34,804 | |
| TOTAL AUSTRIA | | | | | | | 139,449 | |
| BELGIUM— 4.6% | | | | | | | | |
| Basic Materials — 0.3% | | | | | | | | |
| Solvay | | | 151 | | | | 17,306 | |
| Umicore | | | 320 | | | | 19,430 | |
| | | | | | | | 36,736 | |
| Consumer Goods — 0.2% | | | | | | | | |
| Anheuser-Busch InBev | | | 119 | | | | 13,638 | |
| Ontex Group | | | 465 | | | | 14,041 | |
| | | | | | | | 27,679 | |
| Consumer Services — 0.6% | | | | | | | | |
| Colruyt | | | 839 | | | | 45,034 | |
The accompanying notes are an integral part of the financial statements.
| Schedule of Investments | October 31, 2016 |
| Global X Scientific Beta Europe ETF |
| | | Shares | | | Value | |
| COMMON STOCK — continued |
| Consumer Services — continued | | | | | | | | |
| Telenet Group Holding * | | | 356 | | | $ | 19,030 | |
| | | | | | | | 64,064 | |
| Financials — 1.6% | | | | | | | | |
| Ackermans & van Haaren | | | 408 | | | | 56,600 | |
| Ageas | | | 644 | | | | 23,491 | |
| Groupe Bruxelles Lambert | | | 346 | | | | 29,721 | |
| KBC Groep | | | 266 | | | | 16,186 | |
| Sofina | | | 548 | | | | 76,471 | |
| | | | | | | | 202,469 | |
| Health Care — 0.6% | | | | | | | | |
| UCB | | | 1,124 | | | | 76,010 | |
| Industrials — 0.5% | | | | | | | | |
| bpost | | | 2,223 | | | | 59,057 | |
| Real Estate Investment Trusts — 0.6% | | | | | | | | |
| Cofinimmo | | | 661 | | | | 77,350 | |
| Telecommunications — 0.2% | | | | | | | | |
| Proximus | | | 884 | | | | 25,273 | |
| TOTAL BELGIUM | | | | | | | 568,638 | |
| DENMARK— 4.3% | | | | | | | | |
| Consumer Goods — 0.4% | | | | | | | | |
| Carlsberg, Cl B | | | 340 | | | | 30,612 | |
| Pandora | | | 55 | | | | 7,148 | |
| Royal Unibrew | | | 151 | | | | 7,054 | |
| | | | | | | | 44,814 | |
| Financials — 0.9% | | | | | | | | |
| Danske Bank | | | 722 | | | | 22,257 | |
| Jyske Bank | | | 810 | | | | 36,704 | |
| Sydbank | | | 929 | | | | 29,008 | |
| Tryg | | | 1,522 | | | | 29,695 | |
| | | | | | | | 117,664 | |
| Health Care — 1.8% | | | | | | | | |
| Christian Hansen Holding | | | 932 | | | | 55,732 | |
| Coloplast, Cl B | | | 511 | | | | 35,602 | |
| Genmab * | | | 96 | | | | 15,816 | |
| GN Store Nord | | | 716 | | | | 14,497 | |
| H Lundbeck | | | 382 | | | | 12,300 | |
| Novo Nordisk, Cl B | | | 608 | | | | 21,717 | |
| Novozymes, Cl B | | | 288 | | | | 10,682 | |
The accompanying notes are an integral part of the financial statements.
| Schedule of Investments | October 31, 2016 |
| Global X Scientific Beta Europe ETF |
| | | Shares | | | Value | |
| COMMON STOCK — continued |
| Health Care — continued | | | | | | | | |
| William Demant Holding * | | | 3,492 | | | $ | 64,941 | |
| | | | | | | | 231,287 | |
| Industrials — 0.5% | | | | | | | | |
| A P Moller - Maersk, Cl B | | | 10 | | | | 15,325 | |
| Industrials — continued | | | | | | | | |
| DSV | | | 494 | | | | 23,906 | |
| ISS | | | 497 | | | | 19,510 | |
| | | | | | | | 58,741 | |
| Oil & Gas — 0.1% | | | | | | | | |
| Vestas Wind Systems | | | 83 | | | | 6,647 | |
| Technology — 0.2% | | | | | | | | |
| SimCorp | | | 424 | | | | 23,399 | |
| Telecommunications — 0.4% | | | | | | | | |
| TDC | | | 9,007 | | | | 49,626 | |
| TOTAL DENMARK | | | | | | | 532,178 | |
| FINLAND— 3.1% | | | | | | | | |
| Basic Materials — 0.3% | | | | | | | | |
| Stora Enso, Cl R | | | 1,573 | | | | 14,855 | |
| UPM-Kymmene | | | 816 | | | | 18,964 | |
| | | | | | | | 33,819 | |
| Consumer Goods — 0.3% | | | | | | | | |
| Amer Sports | | | 745 | | | | 20,253 | |
| Nokian Renkaat | | | 314 | | | | 10,522 | |
| | | | | | | | 30,775 | |
| Consumer Services — 0.3% | | | | | | | | |
| Kesko, Cl B | | | 684 | | | | 33,951 | |
| Financials — 0.3% | | | | | | | | |
| Sampo, Cl A | | | 695 | | | | 31,823 | |
| Health Care — 0.3% | | | | | | | | |
| Orion, Cl B | | | 845 | | | | 35,931 | |
| Industrials — 0.4% | | | | | | | | |
| Huhtamaki | | | 898 | | | | 36,206 | |
| Kone, Cl B | | | 303 | | | | 13,927 | |
| Metso | | | 413 | | | | 10,820 | |
| | | | | | | | 60,953 | |
| Oil & Gas — 0.5% | | | | | | | | |
| Neste | | | 1,627 | | | | 70,145 | |
| Technology — 0.2% | | | | | | | | |
| Nokia | | | 1,587 | | | | 7,077 | |
The accompanying notes are an integral part of the financial statements.
| Schedule of Investments | October 31, 2016 |
| Global X Scientific Beta Europe ETF |
| | | Shares | | | Value | |
| COMMON STOCK — continued |
| Technology — continued | | | | | | | | |
| Tieto | | | 245 | | | $ | 6,712 | |
| | | | | | | | 13,789 | |
| Telecommunications — 0.2% | | | | | | | | |
| Elisa | | | 688 | | | | 23,154 | |
| Utilities — 0.3% | | | | | | | | |
| Fortum | | | 2,878 | | | | 47,923 | |
| TOTAL FINLAND | | | | | | | 382,263 | |
| FRANCE— 16.1% | | | | | | | | |
| Basic Materials — 0.5% | | | | | | | | |
| Air Liquide | | | 57 | | | | 5,791 | |
| Arkema | | | 352 | | | | 33,331 | |
| Imerys | | | 362 | | | | 25,143 | |
| | | | | | | | 64,265 | |
| Consumer Goods — 2.5% | | | | | | | | |
| Christian Dior | | | 43 | | | | 8,284 | |
| Cie Generale des Etablissements Michelin, Cl B | | | 255 | | | | 27,570 | |
| Danone | | | 292 | | | | 20,191 | |
| Faurecia | | | 323 | | | | 11,865 | |
| Hermes International | | | 82 | | | | 33,178 | |
| L'Oreal | | | 198 | | | | 35,390 | |
| LVMH Moet Hennessy Louis Vuitton | | | 110 | | | | 19,962 | |
| Pernod Ricard | | | 320 | | | | 38,008 | |
| Peugeot * | | | 991 | | | | 14,823 | |
| Plastic Omnium | | | 215 | | | | 6,995 | |
| Renault | | | 96 | | | | 8,325 | |
| SEB | | | 382 | | | | 56,133 | |
| Societe BIC | | | 199 | | | | 27,552 | |
| UBISOFT Entertainment * | | | 260 | | | | 8,835 | |
| | | | | | | | 317,111 | |
| Consumer Services — 2.3% | | | | | | | | |
| Carrefour | | | 469 | | | | 12,285 | |
| Casino Guichard Perrachon | | | 254 | | | | 12,621 | |
| Elior Group (A) | | | 1,404 | | | | 31,481 | |
| Eutelsat Communications | | | 1,705 | | | | 35,698 | |
| JCDecaux | | | 414 | | | | 12,641 | |
| Kering | | | 256 | | | | 56,700 | |
| Lagardere SCA | | | 1,400 | | | | 35,605 | |
| Publicis Groupe | | | 317 | | | | 21,719 | |
| Sodexo | | | 148 | | | | 17,165 | |
| Technicolor | | | 2,045 | | | | 11,939 | |
The accompanying notes are an integral part of the financial statements.
| Schedule of Investments | October 31, 2016 |
| Global X Scientific Beta Europe ETF |
| | | Shares | | | Value | |
| COMMON STOCK — continued |
| Consumer Services — continued | | | | | | | | |
| Vivendi | | | 1,802 | | | $ | 36,386 | |
| | | | | | | | 284,240 | |
| Financials — 1.9% | | | | | | | | |
| Amundi (A) | | | 190 | | | | 9,299 | |
| AXA | | | 856 | | | | 19,269 | |
| BNP Paribas | | | 211 | | | | 12,221 | |
| CNP Assurances | | | 1,135 | | | | 19,640 | |
| Credit Agricole | | | 1,089 | | | | 11,737 | |
| Fonciere Des Regions | | | 399 | | | | 34,829 | |
| Natixis | | | 3,312 | | | | 16,719 | |
| Nexity | | | 558 | | | | 27,981 | |
| SCOR | | | 1,508 | | | | 48,749 | |
| Societe Generale | | | 236 | | | | 9,200 | |
| Wendel | | | 230 | | | | 26,423 | |
| | | | | | | | 236,067 | |
| Health Care — 1.3% | | | | | | | | |
| BioMerieux | | | 49 | | | | 7,133 | |
| Essilor International | | | 129 | | | | 14,481 | |
| Ipsen | | | 444 | | | | 30,644 | |
| Orpea | | | 680 | | | | 56,533 | |
| Sanofi | | | 597 | | | | 46,438 | |
| | | | | | | | 155,229 | |
| Industrials — 3.4% | | | | | | | | |
| Aeroports de Paris | | | 593 | | | | 59,811 | |
| Airbus Group | | | 189 | | | | 11,219 | |
| Alstom | | | 1,219 | | | | 32,699 | |
| Bollore | | | 6,471 | | | | 21,281 | |
| Bouygues | | | 463 | | | | 15,077 | |
| Bureau Veritas | | | 986 | | | | 18,602 | |
| Cie de Saint-Gobain | | | 208 | | | | 9,222 | |
| Eiffage | | | 354 | | | | 26,170 | |
| Eurazeo | | | 372 | | | | 21,380 | |
| Legrand | | | 183 | | | | 10,329 | |
| Rexel | | | 1,812 | | | | 25,097 | |
| Safran | | | 246 | | | | 16,889 | |
| Schneider Electric | | | 158 | | | | 10,590 | |
| Teleperformance | | | 715 | | | | 75,455 | |
| Thales | | | 389 | | | | 36,574 | |
| Vinci | | | 320 | | | | 23,145 | |
The accompanying notes are an integral part of the financial statements.
| Schedule of Investments | October 31, 2016 |
| Global X Scientific Beta Europe ETF |
| | | Shares | | | Value | |
| COMMON STOCK — continued |
| Industrials — continued | | | | | | | | |
| Zodiac Aerospace | | | 330 | | | $ | 8,020 | |
| | | | | | | | 421,560 | |
| Oil & Gas — 0.4% | | | | | | | | |
| Technip | | | 408 | | | | 27,023 | |
| Total | | | 573 | | | | 27,462 | |
| | | | | | | | 54,485 | |
| Real Estate Investment Trusts — 1.0% | | | | | | | | |
| Gecina | | | 419 | | | | 60,995 | |
| ICADE | | | 624 | | | | 44,790 | |
| Klepierre | | | 463 | | | | 18,914 | |
| | | | | | | | 124,699 | |
| Technology — 1.5% | | | | | | | | |
| Atos | | | 496 | | | | 51,447 | |
| Capgemini | | | 255 | | | | 21,099 | |
| Dassault Systemes | | | 387 | | | | 30,604 | |
| Iliad | | | 64 | | | | 13,407 | |
| Ingenico Group | | | 176 | | | | 13,910 | |
| STMicroelectronics | | | 5,949 | | | | 56,651 | |
| | | | | | | | 187,118 | |
| Telecommunications — 0.2% | | | | | | | | |
| Orange | | | 1,677 | | | | 26,380 | |
| Utilities — 1.1% | | | | | | | | |
| Electricite de France | | | 1,493 | | | | 16,710 | |
| Engie | | | 1,138 | | | | 16,386 | |
| Rubis SCA | | | 574 | | | | 52,276 | |
| Suez | | | 1,616 | | | | 25,553 | |
| Veolia Environnement | | | 971 | | | | 21,161 | |
| | | | | | | | 132,086 | |
| TOTAL FRANCE | | | | | | | 2,003,240 | |
| GERMANY— 10.8% | | | | | | | | |
| Basic Materials — 1.7% | | | | | | | | |
| Aurubis | | | 627 | | | | 32,572 | |
| BASF | | | 191 | | | | 16,813 | |
| Brenntag | | | 186 | | | | 9,929 | |
| Covestro (A) | | | 152 | | | | 8,971 | |
| Evonik Industries | | | 719 | | | | 22,431 | |
| K+S | | | 1,079 | | | | 21,799 | |
| LANXESS | | | 455 | | | | 29,093 | |
| Linde | | | 165 | | | | 27,185 | |
| Symrise | | | 534 | | | | 36,593 | |
| | | | | | | | 205,386 | |
The accompanying notes are an integral part of the financial statements.
| Schedule of Investments | October 31, 2016 |
| Global X Scientific Beta Europe ETF |
| | | Shares | | | Value | |
| COMMON STOCK — continued |
| Consumer Goods — 0.9% | | | | | | | | |
| adidas | | | 44 | | | $ | 7,206 | |
| Bayerische Motoren Werke | | | 109 | | | | 9,483 | |
| Beiersdorf | | | 264 | | | | 23,210 | |
| Continental | | | 28 | | | | 5,358 | |
| Daimler | | | 133 | | | | 9,464 | |
| HUGO BOSS | | | 172 | | | | 10,787 | |
| OSRAM Licht | | | 635 | | | | 35,953 | |
| Rheinmetall | | | 345 | | | | 23,867 | |
| | | | | | | | 125,328 | |
| Consumer Services — 0.8% | | | | | | | | |
| Axel Springer | | | 528 | | | | 26,402 | |
| Deutsche Lufthansa | | | 1,854 | | | | 23,667 | |
| Fielmann | | | 94 | | | | 6,510 | |
| METRO | | | 318 | | | | 9,513 | |
| ProSiebenSat.1 Media | | | 232 | | | | 9,985 | |
| Zalando * (A) | | | 219 | | | | 9,600 | |
| | | | | | | | 85,677 | |
| Financials — 2.3% | | | | | | | | |
| Aareal Bank | | | 386 | | | | 13,906 | |
| Allianz | | | 148 | | | | 23,037 | |
| Commerzbank | | | 1,937 | | | | 13,137 | |
| Deutsche Annington Immobilien | | | 1,725 | | | | 60,672 | |
| Deutsche Bank | | | 479 | | | | 6,907 | |
| Deutsche EuroShop | | | 803 | | | | 34,638 | |
| Deutsche Wohnen | | | 867 | | | | 28,246 | |
| Hannover Rueck | | | 357 | | | | 39,741 | |
| LEG Immobilien | | | 469 | | | | 39,505 | |
| Muenchener Rueckversicherungs-Gesellschaft in Muenchen | | | 165 | | | | 31,942 | |
| | | | | | | | 291,731 | |
| Health Care — 1.2% | | | | | | | | |
| Fresenius & KGaA | | | 595 | | | | 43,857 | |
| Fresenius Medical Care & KGaA | | | 481 | | | | 39,129 | |
| Gerresheimer | | | 372 | | | | 28,019 | |
| Merck KGaA | | | 203 | | | | 20,842 | |
| STADA Arzneimittel | | | 229 | | | | 11,448 | |
| | | | | | | | 143,295 | |
| Industrials — 2.3% | | | | | | | | |
| Deutsche Post | | | 197 | | | | 6,096 | |
| Fraport Frankfurt Airport Services Worldwide | | | 486 | | | | 28,806 | |
| GEA Group | | | 449 | | | | 17,338 | |
The accompanying notes are an integral part of the financial statements.
| Schedule of Investments | October 31, 2016 |
| Global X Scientific Beta Europe ETF |
| | | Shares | | | Value | |
| COMMON STOCK — continued |
| Industrials — continued | | | | | | | | |
| HeidelbergCement | | | 168 | | | $ | 15,867 | |
| HOCHTIEF | | | 109 | | | | 14,858 | |
| KION Group | | | 774 | | | | 46,682 | |
| Krones | | | 121 | | | | 12,316 | |
| MAN | | | 588 | | | | 60,047 | |
| MTU Aero Engines | | | 544 | | | | 56,699 | |
| Siemens | | | 114 | | | | 12,928 | |
| Wirecard | | | 531 | | | | 25,155 | |
| | | | | | | | 296,792 | |
| Oil & Gas — 0.1% | | | | | | | | |
| Nordex * | | | 245 | | | | 6,434 | |
| Technology — 0.4% | | | | | | | | |
| SAP | | | 248 | | | | 21,814 | |
| Software | | | 183 | | | | 6,640 | |
| United Internet | | | 577 | | | | 23,650 | |
| | | | | | | | 52,104 | |
| Telecommunications — 0.9% | | | | | | | | |
| Deutsche Telekom | | | 2,083 | | | | 33,897 | |
| Drillisch | | | 137 | | | | 6,247 | |
| Freenet | | | 1,035 | | | | 29,618 | |
| Telefonica Deutschland Holding | | | 10,215 | | | | 39,539 | |
| | | | | | | | 109,301 | |
| Utilities — 0.2% | | | | | | | | |
| E.ON | | | 1,412 | | | | 10,327 | |
| RWE | | | 1,211 | | | | 19,196 | |
| | | | | | | | 29,523 | |
| TOTAL GERMANY | | | | | | | 1,345,571 | |
| IRELAND— 1.4% | | | | | | | | |
| Consumer Goods — 0.7% | | | | | | | | |
| Glanbia | | | 3,117 | | | | 50,706 | |
| Kerry Group, Cl A | | | 317 | | | | 22,983 | |
| | | | | | | | 73,689 | |
| Consumer Services — 0.2% | | | | | | | | |
| Paddy Power Betfair | | | 161 | | | | 16,643 | |
| Ryanair Holdings ADR * | | | 218 | | | | 16,370 | |
| | | | | | | | 33,013 | |
| Financials — 0.1% | | | | | | | | |
| Bank of Ireland * | | | 55,502 | | | | 11,864 | |
| Industrials — 0.4% | | | | | | | | |
| CRH | | | 501 | | | | 16,292 | |
The accompanying notes are an integral part of the financial statements.
| Schedule of Investments | October 31, 2016 |
| Global X Scientific Beta Europe ETF |
| | | Shares | | | Value | |
| COMMON STOCK — continued |
| Industrials — continued | | | | | | | | |
| Smurfit Kappa Group | | | 1,620 | | | $ | 35,446 | |
| | | | | | | | 51,738 | |
| TOTAL IRELAND | | | | | | | 170,304 | |
| ITALY— 4.5% | | | | | | | | |
| Basic Materials — 0.1% | | | | | | | | |
| Tenaris | | | 1,071 | | | | 15,122 | |
| Consumer Goods — 0.6% | | | | | | | | |
| Davide Campari-Milano | | | 3,153 | | | | 31,712 | |
| Fiat Chrysler Automobiles | | | 2,151 | | | | 15,727 | |
| Luxottica Group | | | 419 | | | | 20,830 | |
| Moncler | | | 429 | | | | 7,134 | |
| | | | | | | | 75,403 | |
| Consumer Services — 0.3% | | | | | | | | |
| Mediaset | | | 8,086 | | | | 23,082 | |
| Yoox Net-A-Porter Group, Cl A * | | | 500 | | | | 14,360 | |
| | | | | | | | 37,442 | |
| Financials — 1.3% | | | | | | | | |
| Assicurazioni Generali | | | 1,323 | | | | 17,070 | |
| Banca Popolare dell'Emilia Romagna SC | | | 3,731 | | | | 17,480 | |
| Banca Popolare di Milano Scarl | | | 35,979 | | | | 16,470 | |
| Banco Popolare SC | | | 3,573 | | | | 10,278 | |
| EXOR | | | 629 | | | | 26,691 | |
| Intesa Sanpaolo | | | 4,091 | | | | 9,462 | |
| Mediobanca | | | 2,347 | | | | 17,173 | |
| Poste Italiane (A) | | | 1,690 | | | | 11,236 | |
| UniCredit | | | 4,193 | | | | 10,388 | |
| Unione di Banche Italiane SCpA | | | 5,037 | | | | 13,870 | |
| UnipolSai | | | 11,416 | | | | 21,775 | |
| | | | | | | | 171,893 | |
| Health Care — 0.2% | | | | | | | | |
| Recordati | | | 735 | | | | 20,771 | |
| Industrials — 0.6% | | | | | | | | |
| Atlantia | | | 424 | | | | 10,369 | |
| CNH Industrial | | | 1,383 | | | | 10,734 | |
| Finmeccanica * | | | 2,808 | | | | 34,167 | |
| Prysmian | | | 441 | | | | 10,959 | |
| | | | | | | | 66,229 | |
| Oil & Gas — 0.2% | | | | | | | | |
| Eni | | | 1,146 | | | | 16,595 | |
The accompanying notes are an integral part of the financial statements.
| Schedule of Investments | October 31, 2016 |
| Global X Scientific Beta Europe ETF |
| | | Shares | | | Value | |
| COMMON STOCK — continued |
| Oil & Gas — continued | | | | | | | | |
| Saipem | | | 35,306 | | | $ | 14,513 | |
| | | | | | | | 31,108 | |
| Telecommunications — 0.2% | | | | | | | | |
| Telecom Italia | | | 25,700 | | | | 22,270 | |
| Utilities — 1.0% | | | | | | | | |
| A2A | | | 15,291 | | | | 20,802 | |
| Enel | | | 5,180 | | | | 22,260 | |
| Hera | | | 11,661 | | | | 29,784 | |
| Snam | | | 7,092 | | | | 37,332 | |
| Terna Rete Elettrica Nazionale | | | 2,874 | | | | 14,057 | |
| | | | | | | | 124,235 | |
| TOTAL ITALY | | | | | | | 564,473 | |
| LUXEMBOURG— 0.2% | | | | | | | | |
| Consumer Services — 0.0% | | | | | | | | |
| B&M European Value Retail | | | 1,850 | | | | 5,299 | |
| Health Care — 0.2% | | | | | | | | |
| Eurofins Scientific | | | 36 | | | | 16,334 | |
| TOTAL LUXEMBOURG | | | | | | | 21,633 | |
| NETHERLANDS— 4.3% | | | | | | | | |
| Basic Materials — 0.6% | | | | | | | | |
| Akzo Nobel | | | 229 | | | | 14,780 | |
| ArcelorMittal | | | 1,444 | | | | 9,716 | |
| Koninklijke DSM | | | 889 | | | | 57,087 | |
| | | | | | | | 81,583 | |
| Consumer Goods — 0.5% | | | | | | | | |
| Heineken | | | 248 | | | | 20,403 | |
| Heineken Holding | | | 181 | | | | 13,911 | |
| Unilever | | | 619 | | | | 25,907 | |
| | | | | | | | 60,221 | |
| Consumer Services — 0.4% | | | | | | | | |
| Koninklijke Ahold Delhaize | | | 1,080 | | | | 24,619 | |
| RELX | | | 941 | | | | 15,860 | |
| Wolters Kluwer | | | 436 | | | | 16,850 | |
| | | | | | | | 57,329 | |
| Financials — 0.8% | | | | | | | | |
| ABN AMRO Group (A) | | | 452 | | | | 10,418 | |
| Aegon | | | 3,020 | | | | 13,004 | |
| Delta Lloyd | | | 2,393 | | | | 14,454 | |
| Euronext (A) | | | 258 | | | | 10,310 | |
| ING Groep | | | 753 | | | | 9,901 | |
The accompanying notes are an integral part of the financial statements.
| Schedule of Investments | October 31, 2016 |
| Global X Scientific Beta Europe ETF |
| | | Shares | | | Value | |
| COMMON STOCK — continued |
| Financials — continued | | | | | | | | |
| NN Group | | | 1,038 | | | $ | 31,234 | |
| | | | | | | | 89,321 | |
| Industrials — 0.8% | | | | | | | | |
| Aalberts Industries | | | 535 | | | | 16,876 | |
| Boskalis Westminster | | | 586 | | | | 18,883 | |
| Koninklijke Philips | | | 1,000 | | | | 30,102 | |
| Koninklijke Vopak | | | 669 | | | | 33,738 | |
| | | | | | | | 99,599 | |
| Oil & Gas — 0.2% | | | | | | | | |
| SBM Offshore | | | 1,819 | | | | 26,091 | |
| Real Estate Investment Trusts — 0.6% | | | | | | | | |
| Unibail-Rodamco | | | 93 | | | | 22,122 | |
| Wereldhave | | | 1,066 | | | | 47,672 | |
| | | | | | | | 69,794 | |
| Technology — 0.4% | | | | | | | | |
| ASM International | | | 702 | | | | 29,904 | |
| Gemalto | | | 140 | | | | 7,602 | |
| NXP Semiconductors * | | | 92 | | | | 9,200 | |
| | | | | | | | 46,706 | |
| Telecommunications — 0.1% | | | | | | | | |
| Koninklijke KPN | | | 3,553 | | | | 11,571 | |
| TOTAL NETHERLANDS | | | | | | | 542,215 | |
| NORWAY— 2.2% | | | | | | | | |
| Basic Materials — 0.3% | | | | | | | | |
| Norsk Hydro | | | 2,475 | | | | 11,083 | |
| Yara International | | | 879 | | | | 31,106 | |
| | | | | | | | 42,189 | |
| Consumer Goods — 0.7% | | | | | | | | |
| Marine Harvest | | | 1,174 | | | | 21,327 | |
| Orkla | | | 6,820 | | | | 64,511 | |
| | | | | | | | 85,838 | |
| Consumer Services — 0.1% | | | | | | | | |
| Schibsted, Cl A | | | 264 | | | | 6,338 | |
| Financials — 0.6% | | | | | | | | |
| DnB | | | 735 | | | | 10,644 | |
| Gjensidige Forsikring | | | 3,610 | | | | 64,794 | |
| | | | | | | | 75,438 | |
| Oil & Gas — 0.5% | | | | | | | | |
| Statoil | | | 1,422 | | | | 23,334 | |
The accompanying notes are an integral part of the financial statements.
| Schedule of Investments | October 31, 2016 |
| Global X Scientific Beta Europe ETF |
| | | Shares | | | Value | |
| COMMON STOCK — continued |
| Oil & Gas — continued | | | | | | | | |
| Subsea 7 | | | 3,867 | | | $ | 43,443 | |
| | | | | | | | 66,777 | |
| TOTAL NORWAY | | | | | | | 276,580 | |
| PORTUGAL— 0.5% | | | | | | | | |
| Consumer Services — 0.2% | | | | | | | | |
| Jeronimo Martins | | | 1,405 | | | | 24,134 | |
| Oil & Gas — 0.2% | | | | | | | | |
| Galp Energia | | | 1,878 | | | | 25,425 | |
| Utilities — 0.1% | | | | | | | | |
| Energias de Portugal | | | 4,996 | | | | 16,490 | |
| TOTAL PORTUGAL | | | | | | | 66,049 | |
| SPAIN— 4.5% | | | | | | | | |
| Basic Materials — 0.1% | | | | | | | | |
| Acerinox | | | 705 | | | | 8,671 | |
| Consumer Goods — 0.1% | | | | | | | | |
| Viscofan | | | 326 | | | | 15,343 | |
| Consumer Services — 0.2% | | | | | | | | |
| Industria de Diseno Textil | | | 334 | | | | 11,659 | |
| Mediaset Espana Comunicacion | | | 1,102 | | | | 12,292 | |
| | | | | | | | 23,951 | |
| Financials — 1.1% | | | | | | | | |
| Banco Bilbao Vizcaya Argentaria | | | 1,377 | | | | 9,929 | |
| Banco de Sabadell | | | 6,609 | | | | 8,831 | |
| Banco Popular Espanol | | | 8,831 | | | | 9,671 | |
| Banco Santander | | | 2,146 | | | | 10,532 | |
| Bankia | | | 23,009 | | | | 20,228 | |
| Bankinter | | | 5,791 | | | | 44,273 | |
| Bolsas y Mercados Espanoles SHMSF | | | 190 | | | | 5,742 | |
| CaixaBank | | | 7,123 | | | | 21,528 | |
| Mapfre | | | 5,238 | | | | 15,543 | |
| | | | | | | | 146,277 | |
| Health Care — 0.1% | | | | | | | | |
| Grifols | | | 360 | | | | 7,107 | |
| Industrials — 0.9% | | | | | | | | |
| Abertis Infraestructuras | | | 1,285 | | | | 19,051 | |
| Acciona | | | 260 | | | | 19,763 | |
| ACS Actividades de Construccion y Servicios | | | 265 | | | | 8,113 | |
| Aena SA (A) | | | 64 | | | | 9,384 | |
The accompanying notes are an integral part of the financial statements.
| Schedule of Investments | October 31, 2016 |
| Global X Scientific Beta Europe ETF |
| | | Shares | | | Value | |
| COMMON STOCK — continued |
| Industrials — continued | | | | | | | | |
| Amadeus IT Group, Cl A | | | 280 | | | $ | 13,198 | |
| Ferrovial | | | 1,190 | | | | 23,122 | |
| Zardoya Otis | | | 1,604 | | | | 13,521 | |
| | | | | | | | 106,152 | |
| Oil & Gas — 0.2% | | | | | | | | |
| Gamesa Tecnologica | | | 685 | | | | 15,825 | |
| Repsol | | | 854 | | | | 11,950 | |
| | | | | | | | 27,775 | |
| Real Estate Investment Trusts — 0.2% | | | | | | | | |
| Merlin Properties Socimi | | | 2,410 | | | | 27,053 | |
| Telecommunications — 0.1% | | | | | | | | |
| Cellnex Telecom SAU (A) | | | 405 | | | | 6,642 | |
| Telefonica | | | 546 | | | | 5,542 | |
| | | | | | | | 12,184 | |
| Utilities — 1.5% | | | | | | | | |
| Enagas | | | 757 | | | | 21,701 | |
| Endesa | | | 4,336 | | | | 92,045 | |
| Gas Natural SDG | | | 1,025 | | | | 20,197 | |
| Iberdrola | | | 4,450 | | | | 30,288 | |
| Red Electrica | | | 852 | | | | 17,750 | |
| | | | | | | | 181,981 | |
| TOTAL SPAIN | | | | | | | 556,494 | |
| SWEDEN— 6.0% | | | | | | | | |
| Basic Materials — 0.4% | | | | | | | | |
| BillerudKorsnas | | | 1,182 | | | | 19,443 | |
| Boliden | | | 776 | | | | 18,003 | |
| Hexpol | | | 1,363 | | | | 11,218 | |
| | | | | | | | 48,664 | |
| Consumer Goods — 0.7% | | | | | | | | |
| Husqvarna, Cl B | | | 1,095 | | | | 8,248 | |
| Svenska Cellulosa, Cl B | | | 1,689 | | | | 47,909 | |
| Swedish Match | | | 768 | | | | 26,756 | |
| | | | | | | | 82,913 | |
| Consumer Services — 0.7% | | | | | | | | |
| Hennes & Mauritz, Cl B | | | 284 | | | | 7,999 | |
| ICA Gruppen | | | 2,388 | | | | 74,249 | |
| | | | | | | | 82,248 | |
| Financials — 2.0% | | | | | | | | |
| Castellum | | | 2,738 | | | | 37,149 | |
| Fabege | | | 1,986 | | | | 33,593 | |
The accompanying notes are an integral part of the financial statements.
| Schedule of Investments | October 31, 2016 |
| Global X Scientific Beta Europe ETF |
| | | Shares | | | Value | |
| COMMON STOCK — continued |
| Financials — continued | | | | | | | | |
| Fastighets Balder, Cl B * | | | 608 | | | $ | 13,829 | |
| Hufvudstaden, Cl A | | | 673 | | | | 10,429 | |
| Industrivarden, Cl C | | | 1,652 | | | | 29,519 | |
| Intrum Justitia | | | 496 | | | | 15,312 | |
| Investor, Cl B | | | 461 | | | | 16,408 | |
| Kinnevik | | | 702 | | | | 17,773 | |
| Nordea Bank | | | 1,573 | | | | 16,556 | |
| Skandinaviska Enskilda Banken, Cl A | | | 1,780 | | | | 17,984 | |
| Svenska Handelsbanken, Cl A | | | 2,358 | | | | 32,201 | |
| Swedbank, Cl A | | | 919 | | | | 21,555 | |
| | | | | | | | 262,308 | |
| Health Care — 0.3% | | | | | | | | |
| Elekta, Cl B | | | 3,734 | | | | 32,429 | |
| Getinge, Cl B | | | 436 | | | | 7,153 | |
| Swedish Orphan Biovitrum * | | | 587 | | | | 6,022 | |
| | | | | | | | 45,604 | |
| Industrials — 1.1% | | | | | | | | |
| Assa Abloy, Cl B | | | 632 | | | | 11,510 | |
| Fingerprint Cards, Cl B * | | | 1,088 | | | | 10,553 | |
| Nibe Industrier, Cl B | | | 1,303 | | | | 9,706 | |
| Saab, Cl B | | | 407 | | | | 14,437 | |
| Securitas, Cl B | | | 2,033 | | | | 31,459 | |
| Skanska, Cl B | | | 610 | | | | 13,266 | |
| Trelleborg, Cl B | | | 1,446 | | | | 25,276 | |
| Volvo, Cl B | | | 772 | | | | 8,301 | |
| | | | | | | | 124,508 | |
| Oil & Gas — 0.2% | | | | | | | | |
| Lundin Petroleum * | | | 1,267 | | | | 22,822 | |
| Technology — 0.2% | | | | | | | | |
| Hexagon, Cl B | | | 147 | | | | 5,152 | |
| Telefonaktiebolaget LM Ericsson, Cl B | | | 4,850 | | | | 23,504 | |
| | | | | | | | 28,656 | |
| Telecommunications — 0.4% | | | | | | | | |
| Tele2, Cl B | | | 4,076 | | | | 33,728 | |
| Telia | | | 4,035 | | | | 16,146 | |
| | | | | | | | 49,874 | |
| TOTAL SWEDEN | | | | | | | 747,597 | |
| SWITZERLAND— 11.6% | | | | | | | | |
| Basic Materials — 0.7% | | | | | | | | |
| Clariant | | | 1,200 | | | | 19,889 | |
| EMS-Chemie Holding | | | 66 | | | | 33,153 | |
The accompanying notes are an integral part of the financial statements.
| Schedule of Investments | October 31, 2016 |
| Global X Scientific Beta Europe ETF |
| | | Shares | | | Value | |
| COMMON STOCK — continued |
| Basic Materials — continued | | | | | | | | |
| Givaudan | | | 14 | | | $ | 27,111 | |
| Syngenta * | | | 39 | | | | 15,602 | |
| | | | | | | | 95,755 | |
| Consumer Goods — 1.7% | | | | | | | | |
| Aryzta | | | 940 | | | | 41,330 | |
| Barry Callebaut | | | 41 | | | | 51,079 | |
| Chocoladefabriken Lindt & Spruengli | | | 4 | | | | 20,791 | |
| Cie Financiere Richemont | | | 265 | | | | 17,057 | |
| Coca-Cola HBC | | | 1,092 | | | | 23,545 | |
| Nestle | | | 424 | | | | 30,763 | |
| Swatch Group | | | 76 | | | | 22,879 | |
| | | | | | | | 207,444 | |
| Consumer Services — 0.2% | | | | | | | | |
| Dufry * | | | 144 | | | | 17,532 | |
| Galenica | | | 15 | | | | 15,047 | |
| | | | | | | | 32,579 | |
| Financials — 4.4% | | | | | | | | |
| Baloise Holding | | | 218 | | | | 26,850 | |
| Cembra Money Bank | | | 103 | | | | 7,879 | |
| Credit Suisse Group | | | 645 | | | | 9,014 | |
| GAM Holding | | | 1,387 | | | | 13,451 | |
| Helvetia Holding | | | 87 | | | | 45,308 | |
| Julius Baer Group | | | 691 | | | | 28,027 | |
| Pargesa Holding | | | 529 | | | | 35,547 | |
| Partners Group Holding | | | 92 | | | | 46,610 | |
| PSP Swiss Property | | | 892 | | | | 79,828 | |
| Swiss Life Holding | | | 154 | | | | 40,801 | |
| Swiss Prime Site | | | 1,167 | | | | 96,827 | |
| Swiss Re | | | 653 | | | | 60,684 | |
| UBS Group | | | 633 | | | | 8,961 | |
| Zurich Insurance Group | | | 150 | | | | 39,271 | |
| | | | | | | | 539,058 | |
| Health Care — 1.0% | | | | | | | | |
| Actelion | | | 54 | | | | 7,809 | |
| Lonza Group | | | 102 | | | | 19,267 | |
| Novartis | | | 136 | | | | 9,682 | |
| Roche Holding | | | 64 | | | | 14,723 | |
| Sonova Holding | | | 180 | | | | 24,154 | |
| Straumann Holding | | | 115 | | | | 43,202 | |
| | | | | | | | 118,837 | |
The accompanying notes are an integral part of the financial statements.
| Schedule of Investments | October 31, 2016 |
| Global X Scientific Beta Europe ETF |
| | | Shares | | | Value | |
| COMMON STOCK — continued |
| Industrials — 2.8% | | | | | | | | |
| ABB | | | 346 | | | $ | 7,138 | |
| DKSH Holding | | | 439 | | | | 30,454 | |
| Flughafen Zuerich | | | 448 | | | | 82,451 | |
| Geberit | | | 77 | | | | 32,602 | |
| Georg Fischer | | | 25 | | | | 22,184 | |
| Kaba Holding | | | 50 | | | | 34,761 | |
| Kuehne + Nagel International | | | 200 | | | | 27,141 | |
| LafargeHolcim | | | 230 | | | | 12,292 | |
| OC Oerlikon | | | 2,996 | | | | 28,206 | |
| Schindler Holding | | | 127 | | | | 23,617 | |
| SGS | | | 10 | | | | 20,285 | |
| Sika | | | 2 | | | | 9,619 | |
| Wolseley | | | 236 | | | | 12,248 | |
| | | | | | | | 342,998 | |
| Technology — 0.6% | | | | | | | | |
| AMS | | | 356 | | | | 9,990 | |
| Logitech International | | | 1,694 | | | | 41,027 | |
| Temenos Group | | | 452 | | | | 29,184 | |
| | | | | | | | 80,201 | |
| Telecommunications — 0.2% | | | | | | | | |
| Sunrise Communications Group (A) | | | 179 | | | | 12,236 | |
| Swisscom | | | 37 | | | | 16,938 | |
| | | | | | | | 29,174 | |
| TOTAL SWITZERLAND | | | | | | | 1,446,046 | |
| UNITED KINGDOM— 23.8% | | | | | | | | |
| Basic Materials — 1.6% | | | | | | | | |
| Anglo American | | | 1,212 | | | | 16,736 | |
| Antofagasta | | | 1,882 | | | | 12,477 | |
| BHP Billiton | | | 637 | | | | 9,601 | |
| Centamin | | | 4,361 | | | | 8,402 | |
| Croda International | | | 484 | | | | 20,670 | |
| Fresnillo | | | 1,944 | | | | 38,924 | |
| Glencore | | | 3,496 | | | | 10,671 | |
| Polymetal International | | | 1,162 | | | | 12,640 | |
| Randgold Resources | | | 590 | | | | 52,151 | |
| Rio Tinto | | | 387 | | | | 13,416 | |
| | | | | | | | 195,688 | |
| Consumer Goods — 2.1% | | | | | | | | |
| Barratt Developments | | | 2,554 | | | | 14,147 | |
| Bellway | | | 688 | | | | 19,874 | |
| Berkeley Group Holdings | | | 908 | | | | 26,152 | |
The accompanying notes are an integral part of the financial statements.
| Schedule of Investments | October 31, 2016 |
| Global X Scientific Beta Europe ETF |
| | | Shares | | | Value | |
| COMMON STOCK — continued | | | | | | | | |
| Consumer Goods — continued | | | | | | | | |
| British American Tobacco | | | 171 | | | $ | 9,795 | |
| Britvic | | | 1,291 | | | | 8,748 | |
| Crest Nicholson Holdings | | | 1,497 | | | | 7,437 | |
| Diageo | | | 511 | | | | 13,597 | |
| Glanbia | | | 54 | | | | 880 | |
| Greencore Group | | | 3,294 | | | | 13,271 | |
| Imperial Tobacco Group | | | 433 | | | | 20,911 | |
| Kerry Group, Cl A | | | 31 | | | | 2,263 | |
| Persimmon | | | 999 | | | | 20,661 | |
| Reckitt Benckiser Group | | | 221 | | | | 19,732 | |
| Tate & Lyle | | | 3,681 | | | | 35,054 | |
| Taylor Wimpey | | | 8,558 | | | | 14,805 | |
| Unilever | | | 556 | | | | 23,202 | |
| | | | | | | | 250,529 | |
| Consumer Services — 5.2% | | | | | | | | |
| ASOS * | | | 179 | | | | 11,489 | |
| Auto Trader Group (A) | | | 1,787 | | | | 8,175 | |
| Booker Group | | | 4,944 | | | | 10,829 | |
| Carnival | | | 811 | | | | 38,972 | |
| Compass Group | | | 668 | | | | 12,078 | |
| Daily Mail & General Trust, Cl A | | | 966 | | | | 8,845 | |
| Dixons Carphone | | | 3,145 | | | | 12,084 | |
| Domino's Pizza Group | | | 3,773 | | | | 15,667 | |
| easyJet | | | 504 | | | | 5,766 | |
| Firstgroup * | | | 24,349 | | | | 32,581 | |
| Greene King | | | 3,429 | | | | 30,624 | |
| GVC Holdings * | | | 2,723 | | | | 23,155 | |
| Inchcape | | | 1,573 | | | | 12,493 | |
| Informa | | | 2,455 | | | | 20,158 | |
| J Sainsbury | | | 14,167 | | | | 43,397 | |
| Just Eat * | | | 1,043 | | | | 7,156 | |
| Kingfisher | | | 6,856 | | | | 30,243 | |
| Marks & Spencer Group | | | 1,753 | | | | 7,288 | |
| Merlin Entertainments (A) | | | 3,442 | | | | 19,364 | |
| MoneySuperMarket.com | | | 3,529 | | | | 11,285 | |
| National Express Group | | | 5,031 | | | | 22,592 | |
| Next | | | 237 | | | | 13,935 | |
| Ocado Group * | | | 2,353 | | | | 7,900 | |
| Pearson | | | 1,412 | | | | 13,059 | |
| Playtech | | | 1,104 | | | | 12,508 | |
| RELX | | | 884 | | | | 15,768 | |
The accompanying notes are an integral part of the financial statements.
| Schedule of Investments | October 31, 2016 |
| Global X Scientific Beta Europe ETF |
| | | Shares | | | Value | |
| COMMON STOCK — continued | | | | | | | | |
| Consumer Services — continued | | | | | | | | |
| Rightmove | | | 150 | | | $ | 6,840 | |
| Saga | | | 8,648 | | | | 20,948 | |
| Sky | | | 1,134 | | | | 11,325 | |
| SSP Group | | | 1,656 | | | | 6,868 | |
| Tesco | | | 9,167 | | | | 23,587 | |
| UBM | | | 2,115 | | | | 18,553 | |
| WH Smith | | | 1,463 | | | | 26,310 | |
| William Hill | | | 4,231 | | | | 15,280 | |
| WM Morrison Supermarkets | | | 21,573 | | | | 59,656 | |
| WPP | | | 467 | | | | 10,137 | |
| | | | | | | | 646,915 | |
| Financials — 5.9% | | | | | | | | |
| 3i Group | | | 1,889 | | | | 15,475 | |
| Aberdeen Asset Management | | | 3,142 | | | | 12,283 | |
| Admiral Group | | | 2,541 | | | | 59,471 | |
| Aviva | | | 2,316 | | | | 12,521 | |
| Barclays | | | 5,989 | | | | 13,915 | |
| Beazley | | | 10,756 | | | | 47,800 | |
| Capital & Counties Properties | | | 6,303 | | | | 22,186 | |
| Close Brothers Group | | | 2,290 | | | | 37,100 | |
| Direct Line Insurance Group | | | 17,483 | | | | 73,874 | |
| Hargreaves Lansdown | | | 512 | | | | 7,251 | |
| Hiscox | | | 6,558 | | | | 81,747 | |
| HSBC Holdings | | | 5,294 | | | | 39,827 | |
| ICAP | | | 1,133 | | | | 6,702 | |
| IG Group Holdings | | | 4,619 | | | | 46,552 | |
| Intermediate Capital Group | | | 2,736 | | | | 20,226 | |
| Investec | | | 1,982 | | | | 12,293 | |
| Jardine Lloyd Thompson Group | | | 2,084 | | | | 26,156 | |
| Legal & General Group | | | 5,526 | | | | 14,128 | |
| Lloyds Banking Group | | | 21,997 | | | | 15,378 | |
| Man Group | | | 8,794 | | | | 13,389 | |
| Old Mutual | | | 3,381 | | | | 8,318 | |
| Phoenix Group Holdings | | | 4,952 | | | | 44,165 | |
| Provident Financial | | | 784 | | | | 28,237 | |
| Royal Bank of Scotland Group * | | | 2,639 | | | | 6,093 | |
| RSA Insurance Group | | | 5,330 | | | | 35,953 | |
| St. James's Place | | | 770 | | | | 8,884 | |
| Standard Chartered | | | 1,766 | | | | 15,349 | |
| Standard Life | | | 1,895 | | | | 7,815 | |
The accompanying notes are an integral part of the financial statements.
| Schedule of Investments | October 31, 2016 |
| Global X Scientific Beta Europe ETF |
| | | Shares | | | Value | |
| COMMON STOCK — continued | | | | | | | | |
| Financials — continued | | | | | | | | |
| Unite Group | | | 2,667 | | | $ | 18,023 | |
| | | | | | | | 751,111 | |
| Health Care — 0.6% | | | | | | | | |
| AstraZeneca | | | 249 | | | | 13,948 | |
| BTG * | | | 1,546 | | | | 12,420 | |
| GlaxoSmithKline | | | 1,126 | | | | 22,250 | |
| Hikma Pharmaceuticals | | | 705 | | | | 15,097 | |
| Smith & Nephew | | | 357 | | | | 5,156 | |
| UDG Healthcare | | | 877 | | | | 6,997 | |
| | | | | | | | 75,868 | |
| Industrials — 4.6% | | | | | | | | |
| Babcock International Group | | | 369 | | | | 4,456 | |
| BAE Systems | | | 1,378 | | | | 9,127 | |
| Balfour Beatty | | | 7,458 | | | | 24,676 | |
| BBA Aviation | | | 15,941 | | | | 50,330 | |
| Berendsen | | | 1,548 | | | | 18,257 | |
| Bunzl | | | 520 | | | | 13,961 | |
| Capita | | | 688 | | | | 4,922 | |
| Cobham | | | 7,416 | | | | 12,938 | |
| DCC | | | 154 | | | | 12,531 | |
| DS Smith | | | 3,408 | | | | 16,594 | |
| Experian | | | 460 | | | | 8,834 | |
| G4S | | | 8,495 | | | | 22,817 | |
| Halma | | | 1,672 | | | | 21,393 | |
| Hays | | | 3,989 | | | | 6,653 | |
| HomeServe | | | 975 | | | | 7,255 | |
| Howden Joinery Group | | | 3,131 | | | | 14,331 | |
| Intertek Group | | | 653 | | | | 27,250 | |
| Kingspan Group | | | 675 | | | | 16,501 | |
| Meggitt | | | 4,268 | | | | 22,683 | |
| Paysafe Group * | | | 3,864 | | | | 20,427 | |
| QinetiQ Group | | | 12,879 | | | | 36,196 | |
| Regus | | | 2,061 | | | | 6,263 | |
| Rentokil Initial | | | 13,659 | | | | 38,072 | |
| Rotork | | | 3,031 | | | | 7,549 | |
| Royal Mail | | | 4,130 | | | | 24,758 | |
| RPC Group | | | 1,002 | | | | 11,597 | |
| Serco Group | | | 6,353 | | | | 10,642 | |
| Smiths Group | | | 762 | | | | 13,192 | |
| Spectris | | | 546 | | | | 13,659 | |
The accompanying notes are an integral part of the financial statements.
| Schedule of Investments | October 31, 2016 |
| Global X Scientific Beta Europe ETF |
| | | Shares | | | Value | |
| COMMON STOCK — continued | | | | | | | | |
| Industrials — continued | | | | | | | | |
| Spirax-Sarco Engineering | | | 404 | | | $ | 21,762 | |
| Travis Perkins | | | 820 | | | | 13,345 | |
| Weir Group | | | 614 | | | | 12,744 | |
| WS Atkins | | | 1,303 | | | | 24,053 | |
| | | | | | | | 569,768 | |
| Oil & Gas — 0.7% | | | | | | | | |
| Amec Foster Wheeler | | | 1,685 | | | | 9,200 | |
| BP | | | 3,619 | | | | 21,372 | |
| John Wood Group | | | 2,490 | | | | 23,378 | |
| Petrofac | | | 735 | | | | 7,237 | |
| Royal Dutch Shell, Cl A | | | 739 | | | | 18,392 | |
| Tullow Oil | | | 5,211 | | | | 16,840 | |
| | | | | | | | 96,419 | |
| Real Estate Investment Trusts — 1.4% | | | | | | | | |
| British Land | | | 1,880 | | | | 13,439 | |
| Derwent London | | | 699 | | | | 20,644 | |
| Great Portland Estates | | | 3,553 | | | | 25,767 | |
| Hammerson | | | 2,497 | | | | 16,798 | |
| Intu Properties | | | 6,763 | | | | 22,748 | |
| Land Securities Group | | | 1,382 | | | | 16,856 | |
| Segro | | | 4,487 | | | | 23,951 | |
| Shaftesbury | | | 3,185 | | | | 35,657 | |
| | | | | | | | 175,860 | |
| Technology — 0.5% | | | | | | | | |
| Dialog Semiconductor * | | | 473 | | | | 18,537 | |
| Micro Focus International | | | 1,141 | | | | 29,825 | |
| Sage Group | | | 1,981 | | | | 17,450 | |
| | | | | | | | 65,812 | |
| Telecommunications — 0.5% | | | | | | | | |
| BT Group, Cl A | | | 2,002 | | | | 9,189 | |
| Inmarsat | | | 1,391 | | | | 11,913 | |
| Vodafone Group | | | 13,100 | | | | 35,954 | |
| | | | | | | | 57,056 | |
| Utilities — 0.7% | | | | | | | | |
| National Grid | | | 1,432 | | | | 18,620 | |
| Pennon Group | | | 2,617 | | | | 26,663 | |
| Severn Trent | | | 651 | | | | 18,503 | |
| SSE | | | 649 | | | | 12,606 | |
| United Utilities Group | | | 999 | | | | 11,465 | |
| | | | | | | | 87,857 | |
| TOTAL UNITED KINGDOM | | | | | | | 2,972,883 | |
| TOTAL COMMON STOCK | | | | | | | | |
| (Cost $12,570,028) | | | | | | | 12,335,613 | |
The accompanying notes are an integral part of the financial statements.
| Schedule of Investments | October 31, 2016 |
| Global X Scientific Beta Europe ETF |
| | | Shares/Number | | | | |
| | | of Rights | | | Value | |
| PREFERRED STOCK — 0.6% | | | | | | | | |
| GERMANY— 0.6% | | | | | | | | |
| Basic Materials — 0.1% | | | | | | | | |
| FUCHS PETROLUB (D) | | | 364 | | | $ | 16,250 | |
| Consumer Goods — 0.2% | | | | | | | | |
| Henkel & KGaA (D) | | | 108 | | | | 13,840 | |
| Porsche Automobil Holding (D) | | | 150 | | | | 8,078 | |
| Volkswagen (D) | | | 67 | | | | 9,195 | |
| | | | | | | | 31,113 | |
| Industrials — 0.3% | | | | | | | | |
| Sartorius (D) | | | 316 | | | | 24,792 | |
| TOTAL GERMANY | | | | | | | 72,155 | |
| TOTAL PREFERRED STOCK | | | | | | | | |
| (Cost $65,587) | | | | | | | 72,155 | |
| | | | | | | | | |
| RIGHTS — 0.1% | | | | | | | | |
| Italy — 0.0% | | | | | | | | |
| EXOR, 11/11/16* (A) (B) | | | 629 | | | | — | |
| | | | | | | | | |
| Spain — 0.0% | | | | | | | | |
| Ferrovial*# | | | 1,190 | | | | 509 | |
| | | | | | | | | |
| Sweden — 0.0% | | | | | | | | |
| Tele2, 11/20/16* (A) (B) | | | 4,076 | | | | 1,223 | |
| | | | | | | | | |
| United Kingdom — 0.1% | | | | | | | | |
| Phoenix Group Holdings, 11/11/16* | | | 2,888 | | | | 7,827 | |
| | | | | | | | | |
| TOTAL RIGHTS | | | | | | | | |
| (Cost $–) | | | | | | | 9,559 | |
| TOTAL INVESTMENTS — 99.8% | | | | | | | | |
| (Cost $12,635,615) | | | | | | $ | 12,417,327 | |
| Percentages are based on Net Assets of $12,447,365. |
| * | Non-income producing security. |
| # | Expiration date is unavailable. |
| (A) | Security sold within terms of a private placement memorandum, exempt from registration under Section 144A of the Securities Act of 1933, as amended, and may be sold only to dealers in that program or other "accredited investors." The total value of such securities as of October 31, 2016 was $147,116 and represents 1.2% of Net Assets. |
| (B) | Security is fair valued using methods determined in good faith by the Fair Value Committee of the Fund. The total value of such securities as of October 31, 2016, was $1,223 and represents 0.0% of Net Assets. |
| (C) | Security considered illiquid. The total value of such securities as of October 31, 2016 was $1,223 and represented 0.0% of Net Assets. |
| (D) | Interest rate unavailable |
| ADR — American Depositary Receipt |
| Cl — Class |
The accompanying notes are an integral part of the financial statements.
| Schedule of Investments | October 31, 2016 |
| Global X Scientific Beta Europe ETF |
| The following is a summary of the level of inputs used as of October 31, 2016, in valuing the Fund's investments carried at value: |
| Investments in Securities | | Level 1 | | | Level 2 | | | Level 3(1) | | | Total | |
| Common Stock | | $ | 12,335,613 | | | $ | — | | | $ | — | | | $ | 12,335,613 | |
| Preferred Stock | | | 72,155 | | | | — | | | | — | | | | 72,155 | |
| Rights | | | 8,336 | | | | — | | | | 1,223 | | | | 9,559 | |
| Total Investments in Securities | | $ | 12,416,104 | | | $ | — | | | $ | 1,223 | | | $ | 12,417,327 | |
(1) A reconciliation of Level 3 investments and disclosures of significant unobservable inputs are presented when the Fund has a significant amount of Level 3 investments at the beginning and/or end of the period in relation to Net Assets. Management has concluded that Level 3 investments are not material in relation to Net Assets.
For the year ended October 31, 2016, there have been no transfers between Level 1, Level 2 or Level 3 investments.
The accompanying notes are an integral part of the financial statements.
| Schedule of Investments | October 31, 2016 |
| Global X Scientific Beta Japan ETF |
| Sector Weightings (unaudited)†: |
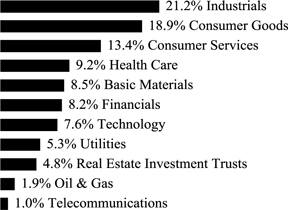
† Sector weightings percentages are based on the total market value of investments. |
| | | Shares | | | Value | |
| COMMON STOCK — 99.8% | | | | | | | | |
| JAPAN— 99.8% | | | | | | | | |
| Basic Materials — 8.5% | | | | | | | | |
| Air Water | | | 2,702 | | | $ | 50,577 | |
| Asahi Kasei | | | 13,536 | | | | 122,086 | |
| Daicel | | | 6,063 | | | | 79,851 | |
| JFE Holdings | | | 2,799 | | | | 40,127 | |
| JSR | | | 3,302 | | | | 50,213 | |
| Kaneka | | | 10,279 | | | | 85,100 | |
| Kansai Paint | | | 394 | | | | 8,474 | |
| Kobe Steel | | | 4,538 | | | | 37,484 | |
| Kuraray | | | 5,929 | | | | 89,935 | |
| Mitsubishi Chemical Holdings | | | 8,132 | | | | 53,473 | |
| Mitsui Chemicals | | | 18,091 | | | | 89,177 | |
| Nippon Steel & Sumitomo Metal | | | 1,242 | | | | 24,566 | |
| Nissan Chemical Industries | | | 1,134 | | | | 38,471 | |
| Oji Holdings | | | 12,049 | | | | 51,024 | |
| Shin-Etsu Chemical | | | 862 | | | | 65,385 | |
| Sumitomo Chemical | | | 6,306 | | | | 29,884 | |
| Sumitomo Metal Mining | | | 3,994 | | | | 51,670 | |
| Teijin | | | 5,160 | | | | 99,827 | |
| Toray Industries | | | 3,610 | | | | 33,625 | |
| Tosoh | | | 7,999 | | | | 52,294 | |
| | | | | | | | 1,153,243 | |
| Consumer Goods — 18.9% | | | | | | | | |
| Aisin Seiki | | | 1,899 | | | | 83,398 | |
| Ajinomoto | | | 1,011 | | | | 22,479 | |
| Asahi Group Holdings | | | 355 | | | | 12,672 | |
| Bandai Namco Holdings | | | 833 | | | | 24,970 | |
The accompanying notes are an integral part of the financial statements.
| Schedule of Investments | October 31, 2016 |
| Global X Scientific Beta Japan ETF |
| | | Shares | | | Value | |
| COMMON STOCK — continued | | | | | | | | |
| Consumer Goods — continued | | | | | | | | |
| Bridgestone | | | 2,792 | | | $ | 104,017 | |
| Calbee | | | 1,280 | | | | 46,408 | |
| Casio Computer | | | 3,429 | | | | 47,837 | |
| Daiwa House Industry | | | 500 | | | | 13,732 | |
| Denso | | | 1,720 | | | | 74,719 | |
| Ezaki Glico | | | 558 | | | | 31,701 | |
| Honda Motor | | | 1,842 | | | | 55,110 | |
| Japan Tobacco | | | 553 | | | | 21,018 | |
| JTEKT | | | 4,115 | | | | 60,892 | |
| Kao | | | 294 | | | | 15,122 | |
| Kewpie | | | 872 | | | | 24,770 | |
| Kirin Holdings | | | 2,073 | | | | 35,656 | |
| Konami Holdings | | | 2,076 | | | | 81,886 | |
| Kose | | | 179 | | | | 16,335 | |
| Lion | | | 2,066 | | | | 33,796 | |
| Makita | | | 525 | | | | 36,321 | |
| Mazda Motor | | | 1,446 | | | | 23,771 | |
| MEIJI Holdings | | | 95 | | | | 9,474 | |
| Mitsubishi Motors | | | 22,747 | | | | 126,630 | |
| Nexon | | | 1,140 | | | | 19,419 | |
| NGK Spark Plug | | | 4,092 | | | | 80,839 | |
| NH Foods | | | 7,938 | | | | 189,905 | |
| Nichirei | | | 6,223 | | | | 136,144 | |
| Nikon | | | 8,936 | | | | 134,951 | |
| Nissan Motor | | | 5,034 | | | | 51,186 | |
| Nisshin Seifun Group | | | 6,733 | | | | 99,183 | |
| Nissin Foods Holdings | | | 975 | | | | 56,411 | |
| NSK | | | 4,639 | | | | 51,473 | |
| Panasonic | | | 2,743 | | | | 28,635 | |
| Pigeon | | | 323 | | | | 9,098 | |
| Rinnai | | | 644 | | | | 61,897 | |
| Sekisui Chemical | | | 4,327 | | | | 68,147 | |
| Sekisui House | | | 2,585 | | | | 42,716 | |
| Stanley Electric | | | 3,441 | | | | 94,731 | |
| Sumitomo Electric Industries | | | 2,491 | | | | 36,849 | |
| Sumitomo Rubber Industries | | | 3,569 | | | | 59,707 | |
| Suntory Beverage & Food | | | 977 | | | | 42,721 | |
| Suzuki Motor | | | 1,147 | | | | 40,713 | |
| Toyo Suisan Kaisha | | | 1,096 | | | | 44,378 | |
| Toyota Industries | | | 917 | | | | 42,017 | |
| Toyota Motor | | | 986 | | | | 57,039 | |
| Yamaha | | | 515 | | | | 18,402 | |
| Yamaha Motor | | | 2,672 | | | | 59,372 | |
| Yamazaki Baking | | | 2,681 | | | | 60,108 | |
| | | | | | | | 2,588,755 | |
The accompanying notes are an integral part of the financial statements.
| Schedule of Investments | October 31, 2016 |
| Global X Scientific Beta Japan ETF |
| | | Shares | | | Value | |
| COMMON STOCK — continued | | | | | | | | |
| Consumer Services — 13.3% | | | | | | | | |
| Aeon | | | 7,608 | | | $ | 105,195 | |
| ANA Holdings | | | 30,850 | | | | 86,662 | |
| Central Japan Railway | | | 83 | | | | 14,110 | |
| Dai Nippon Printing | | | 4,424 | | | | 44,373 | |
| Dentsu | | | 694 | | | | 34,606 | |
| East Japan Railway | | | 179 | | | | 15,768 | |
| FamilyMart UNY Holdings | | | 1,411 | | | | 88,351 | |
| Hakuhodo DY Holdings | | | 1,884 | | | | 22,644 | |
| Hankyu Hanshin Holdings | | | 2,067 | | | | 68,451 | |
| Isetan Mitsukoshi Holdings | | | 3,790 | | | | 38,302 | |
| J Front Retailing | | | 3,822 | | | | 52,628 | |
| Japan Airlines | | | 1,271 | | | | 37,446 | |
| Kakaku.com | | | 2,771 | | | | 46,541 | |
| Keihan Holdings | | | 4,726 | | | | 31,886 | |
| Keikyu | | | 4,233 | | | | 42,658 | |
| Keio | | | 2,107 | | | | 17,444 | |
| Keisei Electric Railway | | | 1,087 | | | | 26,243 | |
| Kintetsu Group Holdings | | | 6,031 | | | | 24,334 | |
| Lawson | | | 635 | | | | 48,221 | |
| M3 | | | 625 | | | | 19,032 | |
| Marui Group | | | 4,121 | | | | 57,844 | |
| Nagoya Railroad | | | 22,820 | | | | 120,305 | |
| Nankai Electric Railway | | | 10,396 | | | | 47,189 | |
| Nitori Holdings | | | 325 | | | | 38,876 | |
| Odakyu Electric Railway | | | 749 | | | | 15,289 | |
| Oriental Land | | | 488 | | | | 28,499 | |
| Park24 | | | 2,252 | | | | 69,541 | |
| Ryohin Keikaku | | | 57 | | | | 12,172 | |
| Seibu Holdings | | | 1,889 | | | | 32,644 | |
| Seven & i Holdings | | | 377 | | | | 15,724 | |
| Shimamura | | | 271 | | | | 34,686 | |
| Sotetsu Holdings | | | 7,318 | | | | 35,725 | |
| Start Today | | | 1,479 | | | | 25,953 | |
| Sundrug | | | 381 | | | | 29,984 | |
| Tobu Railway | | | 13,794 | | | | 67,733 | |
| Toho | | | 950 | | | | 28,522 | |
| Tokyu | | | 1,958 | | | | 14,664 | |
| Tsuruha Holdings | | | 441 | | | | 50,863 | |
| USS | | | 878 | | | | 14,855 | |
| West Japan Railway | | | 1,182 | | | | 72,797 | |
| Yamada Denki | | | 28,577 | | | | 147,664 | |
| | | | | | | | 1,826,424 | |
| Financials — 8.2% | | | | | | | | |
| Acom * | | | 4,475 | | | | 20,611 | |
The accompanying notes are an integral part of the financial statements.
| Schedule of Investments | October 31, 2016 |
| Global X Scientific Beta Japan ETF |
| | | Shares | | | Value | |
| COMMON STOCK — continued | | | | | | | | |
| Financials — continued | | | | | | | | |
| Aozora Bank | | | 25,944 | | | $ | 85,669 | |
| Bank of Kyoto | | | 4,911 | | | | 36,032 | |
| Chiba Bank | | | 7,383 | | | | 45,667 | |
| Credit Saison | | | 2,073 | | | | 35,824 | |
| Dai-ichi Life Holdings | | | 2,800 | | | | 41,060 | |
| Daito Trust Construction | | | 226 | | | | 37,797 | |
| Daiwa Securities Group | | | 4,304 | | | | 25,709 | |
| Fukuoka Financial Group | | | 12,374 | | | | 53,577 | |
| Iida Group Holdings | | | 2,327 | | | | 44,930 | |
| Japan Exchange Group | | | 561 | | | | 8,344 | |
| Japan Post Bank | | | 1,900 | | | | 22,384 | |
| Japan Post Holdings | | | 1,400 | | | | 17,826 | |
| Mitsubishi UFJ Financial Group | | | 4,946 | | | | 25,633 | |
| Mitsubishi UFJ Lease & Finance | | | 7,982 | | | | 38,662 | |
| Mitsui Fudosan | | | 1,035 | | | | 23,544 | |
| Mizuho Financial Group | | | 31,652 | | | | 53,343 | |
| MS&AD Insurance Group Holdings | | | 877 | | | | 26,055 | |
| Nomura Holdings | | | 5,965 | | | | 29,886 | |
| Nomura Real Estate Master Fund | | | 14 | | | | 22,648 | |
| Orient * | | | 8,229 | | | | 15,348 | |
| ORIX | | | 1,751 | | | | 27,752 | |
| Resona Holdings | | | 14,757 | | | | 65,440 | |
| Shinsei Bank | | | 40,217 | | | | 65,061 | |
| Shizuoka Bank | | | 4,420 | | | | 37,308 | |
| Sompo Holdings | | | 851 | | | | 27,566 | |
| Sumitomo Mitsui Financial Group | | | 781 | | | | 27,149 | |
| Sumitomo Mitsui Trust Holdings | | | 695 | | | | 23,479 | |
| Suruga Bank | | | 995 | | | | 24,287 | |
| T&D Holdings | | | 2,545 | | | | 30,782 | |
| Tokio Marine Holdings | | | 910 | | | | 35,929 | |
| Tokyo Tatemono | | | 2,668 | | | | 33,920 | |
| Tokyu Fudosan Holdings | | | 5,001 | | | | 28,221 | |
| | | | | | | | 1,137,443 | |
| Health Care — 9.2% | | | | | | | | |
| Alfresa Holdings | | | 3,135 | | | | 66,289 | |
| Asahi Intecc | | | 403 | | | | 17,449 | |
| Astellas Pharma | | | 610 | | | | 9,053 | |
| Chugai Pharmaceutical | | | 487 | | | | 16,591 | |
| Daiichi Sankyo | | | 3,919 | | | | 94,204 | |
| Eisai | | | 366 | | | | 23,328 | |
| Hisamitsu Pharmaceutical | | | 672 | | | | 35,875 | |
| Kobayashi Pharmaceutical | | | 787 | | | | 41,116 | |
| Kyowa Hakko Kirin | | | 7,582 | | | | 115,803 | |
| Medipal Holdings | | | 3,161 | | | | 53,994 | |
The accompanying notes are an integral part of the financial statements.
| Schedule of Investments | October 31, 2016 |
| Global X Scientific Beta Japan ETF |
| | | Shares | | | Value | |
| COMMON STOCK — continued | | | | | | | | |
| Health Care — continued | | | | | | | | |
| Miraca Holdings | | | 473 | | | $ | 22,866 | |
| Mitsubishi Tanabe Pharma | | | 9,008 | | | | 175,384 | |
| Nippon Shinyaku | | | 925 | | | | 46,917 | |
| Olympus | | | 433 | | | | 15,452 | |
| Otsuka Holdings | | | 2,324 | | | | 101,665 | |
| Santen Pharmaceutical | | | 1,431 | | | | 20,889 | |
| Sawai Pharmaceutical | | | 613 | | | | 39,609 | |
| Sosei Group * | | | 132 | | | | 19,822 | |
| Sumitomo Dainippon Pharma | | | 6,358 | | | | 110,177 | |
| Suzuken | | | 2,725 | | | | 87,518 | |
| Taisho Pharmaceutical Holdings | | | 910 | | | | 88,761 | |
| Takeda Pharmaceutical | | | 563 | | | | 25,181 | |
| Terumo | | | 505 | | | | 19,535 | |
| | | | | | | | 1,247,478 | |
| Industrials — 21.1% | | | | | | | | |
| Alps Electric | | | 573 | | | | 13,741 | |
| Amada Holdings | | | 5,117 | | | | 58,335 | |
| Asahi Glass | | | 7,412 | | | | 51,842 | |
| Daikin Industries | | | 135 | | | | 12,950 | |
| Disco | | | 313 | | | | 37,827 | |
| Fuji Electric | | | 17,776 | | | | 88,808 | |
| Hamamatsu Photonics | | | 439 | | | | 13,285 | |
| Haseko | | | 1,245 | | | | 12,120 | |
| Hino Motors | | | 5,293 | | | | 57,672 | |
| Hirose Electric | | | 218 | | | | 28,794 | |
| Hitachi | | | 8,069 | | | | 42,938 | |
| Hoshizaki | | | 601 | | | | 54,218 | |
| Hoya | | | 387 | | | | 16,149 | |
| IHI | | | 26,055 | | | | 68,680 | |
| Isuzu Motors | | | 1,911 | | | | 23,632 | |
| ITOCHU | | | 2,045 | | | | 25,853 | |
| JGC | | | 4,547 | | | | 80,438 | |
| Kajima | | | 22,807 | | | | 153,877 | |
| Kawasaki Heavy Industries | | | 11,850 | | | | 34,619 | |
| Komatsu | | | 4,682 | | | | 104,391 | |
| Kurita Water Industries | | | 4,096 | | | | 96,938 | |
| Kyocera | | | 1,835 | | | | 89,231 | |
| LIXIL Group | | | 6,520 | | | | 149,714 | |
| Mabuchi Motor | | | 225 | | | | 13,082 | |
| Marubeni | | | 10,843 | | | | 57,029 | |
| Minebea | | | 8,667 | | | | 88,579 | |
| MISUMI Group | | | 1,132 | | | | 20,650 | |
| Mitsubishi | | | 1,377 | | | | 30,021 | |
| Mitsubishi Electric | | | 2,109 | | | | 28,549 | |
The accompanying notes are an integral part of the financial statements.
| Schedule of Investments | October 31, 2016 |
| Global X Scientific Beta Japan ETF |
| | | Shares | | | Value | |
| COMMON STOCK — continued | | | | | | | | |
| Industrials — continued | | | | | | | | |
| Mitsubishi Heavy Industries | | | 6,020 | | | $ | 25,745 | |
| Mitsubishi Materials | | | 1,409 | | | | 40,426 | |
| Mitsui | | | 4,793 | | | | 66,501 | |
| Mitsui OSK Lines | | | 16,808 | | | | 42,066 | |
| Nabtesco | | | 679 | | | | 20,289 | |
| Nidec | | | 375 | | | | 36,292 | |
| Nippon Express | | | 13,550 | | | | 66,922 | |
| Nippon Yusen | | | 25,317 | | | | 51,798 | |
| Obayashi | | | 14,462 | | | | 139,411 | |
| Secom | | | 283 | | | | 20,421 | |
| Shimadzu | | | 1,303 | | | | 18,959 | |
| Shimizu | | | 12,793 | | | | 113,705 | |
| SMC | | | 56 | | | | 16,248 | |
| Sohgo Security Services | | | 381 | | | | 17,367 | |
| Sojitz | | | 21,263 | | | | 55,846 | |
| Sumitomo | | | 3,839 | | | | 44,186 | |
| Sumitomo Heavy Industries | | | 11,465 | | | | 60,443 | |
| Taiheiyo Cement | | | 42,837 | | | | 122,700 | |
| Taisei | | | 5,160 | | | | 38,693 | |
| TDK | | | 920 | | | | 63,560 | |
| Temp Holdings | | | 1,315 | | | | 22,299 | |
| Toppan Printing | | | 7,167 | | | | 67,384 | |
| Toyo Seikan Group Holdings | | | 2,549 | | | | 47,058 | |
| Toyota Tsusho | | | 1,416 | | | | 33,458 | |
| Yaskawa Electric | | | 710 | | | | 11,331 | |
| Yokogawa Electric | | | 7,380 | | | | 103,728 | |
| | | | | | | | 2,900,798 | |
| Oil & Gas — 1.9% | | | | | | | | |
| Inpex | | | 8,508 | | | | 79,797 | |
| JX Holdings | | | 25,671 | | | | 101,600 | |
| TonenGeneral Sekiyu | | | 7,802 | | | | 76,917 | |
| | | | | | | | 258,314 | |
| Real Estate Investment Trusts — 4.8% | | | | | | | | |
| Activia Properties | | | 14 | | | | 67,945 | |
| Advance Residence Investment | | | 32 | | | | 89,346 | |
| Daiwa House Investment | | | 6 | | | | 16,187 | |
| GLP J-Reit | | | 65 | | | | 81,339 | |
| Japan Hotel Investment | | | 74 | | | | 49,927 | |
| Japan Prime Realty Investment | | | 11 | | | | 47,366 | |
| Japan Real Estate Investment | | | 7 | | | | 40,434 | |
| Japan Retail Fund Investment | | | 16 | | | | 36,222 | |
| Nippon Building Fund | | | 4 | | | | 23,714 | |
| Nippon Prologis | | | 37 | | | | 83,552 | |
| Orix | | | 40 | | | | 68,402 | |
The accompanying notes are an integral part of the financial statements.
| Schedule of Investments | October 31, 2016 |
| Global X Scientific Beta Japan ETF |
| | | Shares | | | Value | |
| COMMON STOCK — continued | | | | | | | | |
| Real Estate Investment Trusts — continued | | | | | | | | |
| United Urban Investment | | | 33 | | | $ | 55,552 | |
| | | | | | | | 659,986 | |
| Technology — 7.6% | | | | | | | | |
| Brother Industries | | | 3,145 | | | | 57,761 | |
| Canon | | | 3,033 | | | | 87,078 | |
| FUJIFILM Holdings | | | 1,671 | | | | 63,208 | |
| Fujitsu | | | 24,130 | | | | 143,078 | |
| Konica Minolta | | | 7,700 | | | | 68,951 | |
| NEC | | | 36,556 | | | | 97,752 | |
| Nomura Research Institute | | | 905 | | | | 31,391 | |
| NTT Data | | | 492 | | | | 25,376 | |
| Obic | | | 696 | | | | 36,163 | |
| Otsuka | | | 1,516 | | | | 72,132 | |
| Ricoh | | | 7,696 | | | | 62,690 | |
| Rohm | | | 1,499 | | | | 78,884 | |
| Seiko Epson | | | 5,018 | | | | 101,854 | |
| Square Enix Holdings | | | 1,104 | | | | 36,560 | |
| Tokyo Electron | | | 202 | | | | 18,238 | |
| Trend Micro | | | 1,024 | | | | 36,055 | |
| Yahoo Japan | | | 3,406 | | | | 13,062 | |
| | | | | | | | 1,030,233 | |
| Telecommunications — 1.0% | | | | | | | | |
| KDDI | | | 600 | | | | 18,225 | |
| Nippon Telegraph & Telephone | | | 2,247 | | | | 99,643 | |
| NTT DOCOMO | | | 987 | | | | 24,801 | |
| | | | | | | | 142,669 | |
| Utilities — 5.3% | | | | | | | | |
| Chubu Electric Power | | | 4,655 | | | | 68,417 | |
| Chugoku Electric Power | | | 6,052 | | | | 70,722 | |
| Electric Power Development | | | 4,472 | | | | 104,135 | |
| Kansai Electric Power * | | | 7,280 | | | | 69,589 | |
| Kyushu Electric Power | | | 7,462 | | | | 67,672 | |
| Osaka Gas | | | 15,936 | | | | 66,225 | |
| Toho Gas | | | 11,894 | | | | 110,128 | |
| Tohoku Electric Power | | | 4,477 | | | | 54,746 | |
| Tokyo Electric Power Holdings * | | | 8,777 | | | | 34,077 | |
| Tokyo Gas | | | 15,467 | | | | 70,090 | |
| | | | | | | | 715,801 | |
| TOTAL COMMON STOCK | | | | | | | | |
| (Cost $12,516,651) | | | | | | | 13,661,144 | |
| TOTAL INVESTMENTS — 99.8% | | | | | | | | |
| (Cost $12,516,651) | | | | | | $ | 13,661,144 | |
| Percentages are based on Net Assets of $13,688,439. |
The accompanying notes are an integral part of the financial statements.
| Schedule of Investments | October 31, 2016 |
| Global X Scientific Beta Japan ETF |
| * | Non-income producing security. |
As of October 31, 2016, all of the Fund's investments were considered Level 1, in accordance with authoritative guidance on fair value measurements and disclosure under U.S. GAAP.
For the year ended October 31, 2016, there have been no transfers between Level 1, Level 2 or Level 3 investments.
The accompanying notes are an integral part of the financial statements.
| Schedule of Investments | October 31, 2016 |
| Global X Scientific Beta Asia ex-Japan ETF |
| Sector Weightings (unaudited)†: | |
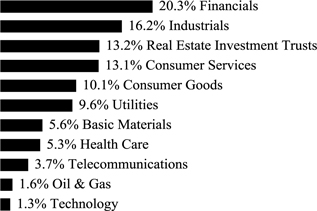
| † Sector weightings percentages are based on the total market value of investments. | |
| | | Shares | | | Value | |
| COMMON STOCK — 99.7% | | | | | | | | |
| AUSTRALIA— 36.4% | | | | | | | | |
| Basic Materials — 5.6% | | | | | | | | |
| Alumina | | | 9,344 | | | $ | 11,234 | |
| BHP Billiton | | | 268 | | | | 4,705 | |
| BlueScope Steel | | | 3,047 | | | | 18,085 | |
| Evolution Mining | | | 7,247 | | | | 12,463 | |
| Fortescue Metals Group | | | 4,127 | | | | 17,272 | |
| Incitec Pivot | | | 2,109 | | | | 4,734 | |
| Independence Group | | | 1,710 | | | | 5,530 | |
| Newcrest Mining | | | 832 | | | | 14,283 | |
| Northern Star Resources | | | 3,105 | | | | 9,829 | |
| South32 | | | 2,233 | | | | 4,367 | |
| Washington H Soul Pattinson | | | 2,090 | | | | 25,287 | |
| | | | | | | | 127,789 | |
| Consumer Goods — 1.1% | | | | | | | | |
| Blackmores | | | 140 | | | | 11,940 | |
| Coca-Cola Amatil | | | 1,119 | | | | 8,123 | |
| Treasury Wine Estates | | | 696 | | | | 5,688 | |
| | | | | | | | 25,751 | |
| Consumer Services — 5.7% | | | | | | | | |
| Aristocrat Leisure | | | 460 | | | | 5,370 | |
| carsales.com | | | 822 | | | | 6,668 | |
| Domino's Pizza Enterprises | | | 226 | | | | 11,049 | |
| Fairfax Media | | | 15,714 | | | | 9,865 | |
| Harvey Norman Holdings | | | 2,839 | | | | 10,910 | |
| JB Hi-Fi | | | 1,022 | | | | 22,079 | |
| Metcash | | | 8,440 | | | | 12,781 | |
| Qantas Airways | | | 3,316 | | | | 7,721 | |
The accompanying notes are an integral part of the financial statements.
| Schedule of Investments | October 31, 2016 |
| Global X Scientific Beta Asia ex-Japan ETF |
| | | Shares | | | Value | |
| COMMON STOCK — continued | | | | | | | | |
| Consumer Services — continued | | | | | | | | |
| Star Entertainment Grp | | | 4,646 | | | $ | 17,641 | |
| TABCORP Holdings | | | 1,336 | | | | 4,920 | |
| Tatts Group | | | 2,656 | | | | 8,206 | |
| Wesfarmers | | | 379 | | | | 11,827 | |
| | | | | | | | 129,037 | |
| Financials — 4.9% | | | | | | | | |
| AMP | | | 732 | | | | 2,546 | |
| ASX | | | 192 | | | | 6,885 | |
| Australia & New Zealand Banking Group | | | 203 | | | | 4,302 | |
| Bank of Queensland | | | 752 | | | | 5,986 | |
| Bendigo and Adelaide Bank | | | 912 | | | | 7,724 | |
| Charter Hall Group | | | 3,000 | | | | 10,729 | |
| Charter Hall Retail | | | 4,540 | | | | 14,337 | |
| Lend Lease Group | | | 399 | | | | 4,105 | |
| Macquarie Group | | | 68 | | | | 4,129 | |
| Magellan Financial Group | | | 436 | | | | 7,064 | |
| National Australia Bank | | | 194 | | | | 4,133 | |
| Perpetual | | | 90 | | | | 3,098 | |
| QBE Insurance Group | | | 538 | | | | 4,090 | |
| REA Group | | | 250 | | | | 9,729 | |
| Stockland | | | 3,632 | | | | 12,216 | |
| Suncorp Group | | | 477 | | | | 4,345 | |
| Vicinity Centres | | | 3,043 | | | | 6,646 | |
| | | | | | | | 112,064 | |
| Health Care — 3.7% | | | | | | | | |
| Ansell | | | 469 | | | | 7,741 | |
| Cochlear | | | 172 | | | | 16,748 | |
| CSL | | | 157 | | | | 12,008 | |
| Healthscope | | | 4,705 | | | | 7,912 | |
| Mayne Pharma Group * | | | 2,000 | | | | 2,496 | |
| nib holdings | | | 2,088 | | | | 7,658 | |
| Primary Health Care | | | 4,275 | | | | 12,492 | |
| Ramsay Health Care | | | 117 | | | | 6,531 | |
| Sonic Healthcare | | | 802 | | | | 12,505 | |
| | | | | | | | 86,091 | |
| Industrials — 5.7% | | | | | | | | |
| Adelaide Brighton | | | 1,646 | | | | 6,701 | |
| ALS | | | 886 | | | | 4,200 | |
| Amcor | | | 901 | | | | 10,078 | |
| Aurizon Holdings | | | 2,356 | | | | 8,749 | |
| Boral | | | 2,738 | | | | 13,126 | |
| Brambles | | | 857 | | | | 7,519 | |
| CIMIC Group | | | 259 | | | | 5,832 | |
| CSR | | | 2,335 | | | | 6,503 | |
The accompanying notes are an integral part of the financial statements.
| Schedule of Investments | October 31, 2016 |
| Global X Scientific Beta Asia ex-Japan ETF |
| | | Shares | | | Value | |
| COMMON STOCK — continued | | | | | | | | |
| Industrials — continued | | | | | | | | |
| Downer EDI | | | 1,320 | | | $ | 5,856 | |
| DuluxGroup | | | 3,128 | | | | 15,329 | |
| Macquarie Atlas Roads Group | | | 2,636 | | | | 9,468 | |
| Orora | | | 4,154 | | | | 9,167 | |
| SEEK | | | 318 | | | | 3,543 | |
| Sydney Airport | | | 2,608 | | | | 12,423 | |
| Transurban Group | | | 1,188 | | | | 9,393 | |
| | | | | | | | 127,887 | |
| Oil & Gas — 0.8% | | | | | | | | |
| APA Group | | | 922 | | | | 5,585 | |
| Caltex Australia | | | 249 | | | | 5,823 | |
| Santos | | | 1,022 | | | | 2,776 | |
| Woodside Petroleum | | | 213 | | | | 4,598 | |
| | | | | | | | 18,782 | |
| Real Estate Investment Trusts — 5.2% | | | | | | | | |
| BWP Trust | | | 6,195 | | | | 14,001 | |
| Dexus Property Group | | | 1,711 | | | | 11,640 | |
| Goodman Group | | | 2,778 | | | | 14,353 | |
| GPT Group | | | 3,559 | | | | 12,620 | |
| Investa Office Fund | | | 6,813 | | | | 21,981 | |
| Mirvac Group | | | 7,994 | | | | 12,714 | |
| Scentre Group | | | 4,190 | | | | 13,423 | |
| Shopping Centres Australasia Property Group | | | 8,091 | | | | 13,483 | |
| Westfield | | | 1,233 | | | | 8,350 | |
| | | | | | | | 122,565 | |
| Telecommunications — 0.8% | | | | | | | | |
| Telstra | | | 1,231 | | | | 4,665 | |
| TPG Telecom | | | 1,438 | | | | 8,272 | |
| Vocus Communications | | | 1,208 | | | | 5,249 | |
| | | | | | | | 18,186 | |
| Utilities — 2.9% | | | | | | | | |
| AGL Energy | | | 1,769 | | | | 25,818 | |
| AusNet Services | | | 14,908 | | | | 17,016 | |
| DUET Group | | | 2,594 | | | | 4,698 | |
| Spark Infrastructure Group | | | 11,920 | | | | 20,137 | |
| | | | | | | | 67,669 | |
| TOTAL AUSTRALIA | | | | | | | 835,821 | |
| HONG KONG— 30.1% | | | | | | | | |
| Consumer Goods — 7.5% | | | | | | | | |
| First Pacific | | | 22,483 | | | | 17,047 | |
| Li & Fung | | | 12,909 | | | | 6,359 | |
| PRADA | | | 1,579 | | | | 5,538 | |
| Shenzhou International Group Holdings | | | 4,574 | | | | 30,346 | |
The accompanying notes are an integral part of the financial statements.
| Schedule of Investments | October 31, 2016 |
| Global X Scientific Beta Asia ex-Japan ETF |
| | | Shares | | | Value | |
| COMMON STOCK — continued | | | | | | | | |
| Consumer Goods — continued | | | | | | | | |
| Techtronic Industries | | | 6,014 | | | $ | 22,645 | |
| Vitasoy International Holdings | | | 16,664 | | | | 34,854 | |
| Yue Yuen Industrial Holdings | | | 14,669 | | | | 55,897 | |
| | | | | | | | 172,686 | |
| Consumer Services — 3.3% | | | | | | | | |
| Cathay Pacific Airways | | | 8,864 | | | | 11,682 | |
| Esprit Holdings | | | 18,095 | | | | 14,934 | |
| Kingston Financial Group | | | 9,461 | | | | 3,941 | |
| MTR | | | 7,382 | | | | 40,885 | |
| Wynn Macau | | | 2,182 | | | | 3,348 | |
| | | | | | | | 74,790 | |
| Financials — 9.0% | | | | | | | | |
| AIA Group | | | 580 | | | | 3,661 | |
| Bank of East Asia | | | 1,781 | | | | 7,177 | |
| Cheung Kong Property Holdings | | | 812 | | | | 6,016 | |
| Dah Sing Financial Holdings | | | 2,462 | | | | 16,731 | |
| Haitong International Securities Group | | | 20,946 | | | | 13,451 | |
| Hang Lung Group | | | 4,837 | | | | 18,556 | |
| Hang Lung Properties | | | 1,933 | | | | 4,267 | |
| Hang Seng Bank | | | 585 | | | | 10,569 | |
| Henderson Land Development | | | 699 | | | | 4,142 | |
| Hopewell Holdings | | | 7,462 | | | | 26,173 | |
| Hysan Development | | | 4,955 | | | | 22,875 | |
| Kerry Properties | | | 4,079 | | | | 12,913 | |
| New World Development | | | 3,853 | | | | 4,805 | |
| Sino Land | | | 4,608 | | | | 7,844 | |
| Sun Hung Kai Properties | | | 677 | | | | 10,109 | |
| Swire Properties | | | 5,375 | | | | 15,456 | |
| Wharf Holdings | | | 1,208 | | | | 9,082 | |
| Wheelock | | | 2,170 | | | | 13,404 | |
| | | | | | | | 207,231 | |
| Industrials — 2.8% | | | | | | | | |
| AAC Technologies Holdings | | | 1,201 | | | | 11,460 | |
| CK Hutchison Holdings | | | 783 | | | | 9,688 | |
| NWS Holdings | | | 18,623 | | | | 32,996 | |
| Swire Pacific, Cl A | | | 776 | | | | 8,070 | |
| | | | | | | | 62,214 | |
| Oil & Gas — 0.0% | | | | | | | | |
| Hanergy Thin Film Power Group *(A) (B) | | | 29,000 | | | | 37 | |
| Real Estate Investment Trusts — 1.1% | | | | | | | | |
| Link | | | 3,618 | | | | 25,800 | |
| Technology — 1.3% | | | | | | | | |
| ASM Pacific Technology | | | 1,006 | | | | 9,710 | |
The accompanying notes are an integral part of the financial statements.
| Schedule of Investments | October 31, 2016 |
| Global X Scientific Beta Asia ex-Japan ETF |
| | | Shares | | | Value | |
| COMMON STOCK — continued | | | | | | | | |
| Technology — continued | | | | | | | | |
| VTech Holdings | | | 1,743 | | | $ | 21,397 | |
| | | | | | | | 31,107 | |
| Telecommunications — 1.6% | | | | | | | | |
| PCCW | | | 59,801 | | | | 35,627 | |
| Utilities — 3.5% | | | | | | | | |
| Cheung Kong Infrastructure Holdings | | | 2,913 | | | | 23,872 | |
| CLP Holdings | | | 2,196 | | | | 22,343 | |
| Hong Kong & China Gas | | | 3,541 | | | | 6,941 | |
| Power Assets Holdings | | | 2,954 | | | | 27,788 | |
| | | | | | | | 80,944 | |
| TOTAL HONG KONG | | | | | | | 690,436 | |
| NEW ZEALAND— 10.8% | | | | | | | | |
| Consumer Services — 1.1% | | | | | | | | |
| SKY Network Television | | | 2,317 | | | | 7,658 | |
| SKYCITY Entertainment Group | | | 2,319 | | | | 6,470 | |
| Trade Me Group | | | 3,569 | | | | 12,409 | |
| | | | | | | | 26,537 | |
| Health Care — 1.5% | | | | | | | | |
| Fisher & Paykel Healthcare | | | 2,227 | | | | 14,116 | |
| Ryman Healthcare | | | 3,433 | | | | 21,809 | |
| | | | | | | | 35,925 | |
| Industrials — 3.0% | | | | | | | | |
| Auckland International Airport | | | 4,108 | | | | 19,367 | |
| Fletcher Building | | | 1,906 | | | | 14,140 | |
| Infratil | | | 16,661 | | | | 35,520 | |
| | | | | | | | 69,027 | |
| Oil & Gas — 0.5% | | | | | | | | |
| Z Energy | | | 1,942 | | | | 10,864 | |
| Real Estate Investment Trusts — 1.2% | | | | | | | | |
| Kiwi Property Group | | | 25,249 | | | | 26,462 | |
| Telecommunications — 0.3% | | | | | | | | |
| Spark New Zealand | | | 2,500 | | | | 6,546 | |
| Utilities — 3.2% | | | | | | | | |
| Contact Energy | | | 8,688 | | | | 29,523 | |
| Mercury NZ | | | 15,735 | | | | 34,334 | |
| Meridian Energy | | | 4,924 | | | | 9,053 | |
| | | | | | | | 72,910 | |
| TOTAL NEW ZEALAND | | | | | | | 248,271 | |
| SINGAPORE— 22.4% | | | | | | | | |
| Consumer Goods — 1.5% | | | | | | | | |
| Golden Agri-Resources | | | 46,011 | | | | 12,727 | |
| Thai Beverage | | | 12,465 | | | | 8,642 | |
The accompanying notes are an integral part of the financial statements.
| Schedule of Investments | October 31, 2016 |
| Global X Scientific Beta Asia ex-Japan ETF |
| | | Shares | | | Value | |
| COMMON STOCK — continued | | | | | | | | |
| Consumer Goods — continued | | | | | | | | |
| Wilmar International | | | 4,923 | | | $ | 11,707 | |
| | | | | | | | 33,076 | |
| Consumer Services — 3.0% | | | | | | | | |
| ComfortDelGro | | | 3,470 | | | | 6,332 | |
| Dairy Farm International Holdings | | | 2,362 | | | | 16,699 | |
| Genting Singapore | | | 22,515 | | | | 12,051 | |
| Jardine Cycle & Carriage | | | 110 | | | | 3,337 | |
| Singapore Airlines | | | 3,632 | | | | 26,433 | |
| Singapore Press Holdings | | | 2,003 | | | | 5,353 | |
| | | | | | | | 70,205 | |
| Financials — 6.2% | | | | | | | | |
| Ascendas Real Estate Investment Trust | | | 11,038 | | | | 18,795 | |
| CapitaLand | | | 3,118 | | | | 6,922 | |
| City Developments | | | 1,361 | | | | 8,301 | |
| DBS Group Holdings | | | 637 | | | | 6,865 | |
| Global Logistic Properties | | | 4,888 | | | | 6,233 | |
| Hongkong Land Holdings | | | 2,315 | | | | 15,510 | |
| Mapletree Industrial Trust | | | 26,128 | | | | 32,287 | |
| Oversea-Chinese Banking | | | 1,263 | | | | 7,695 | |
| Singapore Exchange | | | 1,183 | | | | 6,026 | |
| Suntec Real Estate Investment Trust | | | 14,221 | | | | 17,165 | |
| United Overseas Bank | | | 599 | | | | 8,082 | |
| UOL Group | | | 2,674 | | | | 10,893 | |
| | | | | | | | 144,774 | |
| Industrials — 4.8% | | | | | | | | |
| Jardine Matheson Holdings | | | 165 | | | | 10,050 | |
| Jardine Strategic Holdings | | | 243 | | | | 8,527 | |
| SATS | | | 8,748 | | | | 30,419 | |
| Singapore Post | | | 10,182 | | | | 11,704 | |
| Singapore Technologies Engineering | | | 3,245 | | | | 7,297 | |
| Venture | | | 6,133 | | | | 41,859 | |
| | | | | | | | 109,856 | |
| Oil & Gas — 0.3% | | | | | | | | |
| Keppel | | | 822 | | | | 3,118 | |
| Sembcorp Industries | | | 2,865 | | | | 5,208 | |
| | | | | | | | 8,326 | |
| Real Estate Investment Trusts — 5.6% | | | | | | | | |
| CapitaLand Commercial Trust | | | 14,075 | | | | 15,927 | |
| CapitaLand Mall Trust | | | 15,453 | | | | 22,981 | |
| Fortune | | | 28,994 | | | | 35,369 | |
| Keppel | | | 20,848 | | | | 16,326 | |
| Mapletree Commercial Trust | | | 17,953 | | | | 19,734 | |
| Mapletree Greater China Commercial Trust | | | 22,052 | | | | 16,477 | |
| | | | | | | | 126,814 | |
The accompanying notes are an integral part of the financial statements.
| Schedule of Investments | October 31, 2016 |
| Global X Scientific Beta Asia ex-Japan ETF |
| | | Shares | | | Value | |
| COMMON STOCK — continued | | | | | | | | |
| Telecommunications — 1.0% | | | | | | | | |
| Singapore Telecommunications | | | 3,015 | | | $ | 8,404 | |
| StarHub | | | 5,637 | | | | 13,689 | |
| | | | | | | | 22,093 | |
| TOTAL SINGAPORE | | | | | | | 515,144 | |
| TOTAL COMMON STOCK | | | | | | | | |
| (Cost $2,249,622) | | | | | | | 2,289,672 | |
| TOTAL INVESTMENTS — 99.7% | | | | | | | | |
| (Cost $2,249,622) | | | | | | $ | 2,289,672 | |
Percentages are based on Net Assets of $2,295,886.
| * | Non-income producing security. |
| (A) | Security is fair valued using methods determined in good faith by the Fair Value Committee of the Fund. The total value of such securities as of October 31, 2016, was $37 and represents 0.0% of Net Assets. |
| (B) | Security considered illiquid. The total value of such securities as of October 31, 2016 was $37 and represented 0.0% of Net Assets. |
Cl — Class
The following is a summary of the level of inputs used as of October 31, 2016, in valuing the Fund's investments carried at value:
| Investments in Securities | | Level 1 | | | Level 2 | | | Level 3(1) | | | Total | |
| Common Stock | | | | | | | | | | | | | | | | |
| Australia | | $ | 835,821 | | | $ | – | | | $ | – | | | $ | 835,821 | |
| Hong Kong | | | 690,399 | | | | – | | | | 37 | | | | 690,436 | |
| New Zealand | | | 248,271 | | | | – | | | | – | | | | 248,271 | |
| Singapore | | | 515,144 | | | | – | | | | – | | | | 515,144 | |
| Total Investments in Securities | | $ | 2,289,635 | | | $ | – | | | $ | 37 | | | $ | 2,289,672 | |
(1) A reconciliation of Level 3 investments and disclosures of significant unobservable inputs are presented when the Fund has a significant amount of Level 3 investments at the beginning and/or end of the period in relation to Net Assets. Management has concluded that Level 3 investments are not material in relation to Net Assets.
For the year ended October 31, 2016, there have been no transfers between Level 1, Level 2 or Level 3 investments.
The accompanying notes are an integral part of the financial statements.
| Schedule of Investments | October 31, 2016 |
| Global X YieldCo Index ETF |
Sector Weightings (unaudited)†:
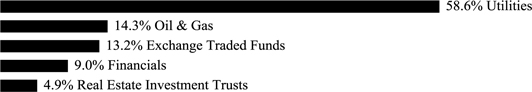
† Sector weightings percentages are based on the total market value of investments.
| | | Shares | | | Value | |
| COMMON STOCK — 86.5% |
| CANADA— 40.3% | | | | | | | | |
| Oil & Gas — 4.7% | | | | | | | | |
| Canadian Solar * | | | 21,831 | | | $ | 315,240 | |
| Utilities — 35.6% | | | | | | | | |
| Brookfield Renewable Partners | | | 24,673 | | | | 754,008 | |
| Innergex Renewable Energy | | | 29,556 | | | | 328,804 | |
| Northland Power | | | 38,279 | | | | 685,467 | |
| TransAlta Renewables | | | 55,764 | | | | 616,202 | |
| | | | | | | | 2,384,481 | |
| TOTAL CANADA | | | | | | | 2,699,721 | |
| GUERNSEY— 4.5% | | | | | | | | |
| Financials — 4.5% | | | | | | | | |
| Renewables Infrastructure Group | | | 233,791 | | | | 306,557 | |
| SPAIN— 4.4% | | | | | | | | |
| Utilities — 4.4% | | | | | | | | |
| Saeta Yield | | | 30,711 | | | | 296,593 | |
| UNITED STATES— 37.3% | | | | | | | | |
| Financials — 4.4% | | | | | | | | |
| NRG Yield, Cl A | | | 19,773 | | | | 291,256 | |
| Oil & Gas — 9.5% | | | | | | | | |
| 8Point3 Energy Partners, Cl A | | | 7,611 | | | | 116,448 | |
| Pattern Energy Group, Cl A | | | 23,315 | | | | 521,090 | |
| | | | | | | | 637,538 | |
| Real Estate Investment Trusts — 4.9% | | | | | | | | |
| Hannon Armstrong Sustainable Infrastructure Capital | | | 14,383 | | | | 328,795 | |
| Utilities — 18.5% | | | | | | | | |
| Atlantica Yield | | | 25,201 | | | | 453,114 | |
| NextEra Energy Partners | | | 11,261 | | | | 307,988 | |
| TerraForm Global, Cl A | | | 44,092 | | | | 165,345 | |
| TerraForm Power, Cl A | | | 24,730 | | | | 306,899 | |
| | | | | | | | 1,233,346 | |
| TOTAL UNITED STATES | | | | | | | 2,490,935 | |
The accompanying notes are an integral part of the financial statements.
| Schedule of Investments | October 31, 2016 |
| Global X YieldCo Index ETF |
| | | Shares | | | Value | |
| COMMON STOCK — continued |
| TOTAL COMMON STOCK | | | | | | | | |
| (Cost $5,328,662) | | | | | | $ | 5,793,806 | |
| | | | | | | | | |
| EXCHANGE TRADED FUNDS — 13.2% |
| Bluefield Solar Income Fund | | | 120,590 | | | | 150,173 | |
| Foresight Solar Fund | | | 105,660 | | | | 134,482 | |
| Greencoat UK Wind | | | 217,380 | | | | 303,881 | |
| John Laing Environmental Assets Group | | | 101,010 | | | | 130,722 | |
| NextEnergy Solar Fund | | | 124,990 | | | | 164,808 | |
| TOTAL EXCHANGE TRADED FUNDS | | | | | | | | |
| (Cost $997,684) | | | | | | | 884,066 | |
| | | | | | | | | |
| TOTAL INVESTMENTS — 99.7% | | | | | | | | |
| (Cost $6,326,346) | | | | | | $ | 6,677,872 | |
Percentages are based on Net Assets of $6,695,442.
| * | Non-income producing security. |
Cl — Class
As of October 31, 2016, all of the Fund's investments were considered Level 1, in accordance with authoritative guidance on fair value measurements and disclosure under U.S. GAAP.
For the period ended October 31, 2016, there have been no transfers between Level 1, Level 2 or Level 3 investments.
The accompanying notes are an integral part of the financial statements.
| Schedule of Investments | October 31, 2016 |
| Global X S&P 500® Catholic Values ETF‡ |
Sector Weightings (unaudited)†:
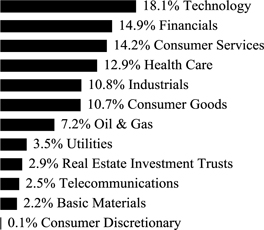
† Sector weightings percentages are based on the total market value of investments.
| | | Shares | | | Value | |
| COMMON STOCK — 99.8% |
| UNITED STATES— 99.8% | | | | | | | | |
| Basic Materials — 2.2% | | | | | | | | |
| Air Products & Chemicals | | | 470 | | | $ | 62,707 | |
| Albemarle | | | 243 | | | | 20,303 | |
| Alcoa | | | 959 | | | | 27,542 | |
| Avery Dennison | | | 186 | | | | 12,981 | |
| CF Industries Holdings | | | 509 | | | | 12,221 | |
| Dow Chemical | | | 2,462 | | | | 132,480 | |
| Eastman Chemical | | | 312 | | | | 22,436 | |
| Ecolab | | | 589 | | | | 67,246 | |
| EI du Pont de Nemours | | | 1,921 | | | | 132,146 | |
| FMC | | | 292 | | | | 13,692 | |
| Freeport-McMoRan Copper & Gold | | | 2,699 | | | | 30,175 | |
| International Flavors & Fragrances | | | 185 | | | | 24,194 | |
| International Paper | | | 897 | | | | 40,392 | |
| LyondellBasell Industries, Cl A | | | 744 | | | | 59,185 | |
| Mosaic | | | 773 | | | | 18,189 | |
| Newmont Mining | | | 1,159 | | | | 42,929 | |
| Nucor | | | 695 | | | | 33,951 | |
| PPG Industries | | | 589 | | | | 54,854 | |
| Praxair | | | 620 | | | | 72,577 | |
| | | | | | | | 880,200 | |
| Consumer Discretionary — 0.1% | | | | | | | | |
| PulteGroup | | | 682 | | | | 12,685 | |
| Under Armour, Cl C * | | | 406 | | | | 10,499 | |
| | | | | | | | 23,184 | |
The accompanying notes are an integral part of the financial statements.
| Schedule of Investments | October 31, 2016 |
| Global X S&P 500® Catholic Values ETF‡ |
| | | Shares | | | Value | |
| COMMON STOCK — continued |
| Consumer Goods — 10.7% | | | | | | | | |
| Activision Blizzard | | | 1,477 | | | $ | 63,762 | |
| Altria Group | | | 4,252 | | | | 281,142 | |
| Archer-Daniels-Midland | | | 1,271 | | | | 55,377 | |
| BorgWarner | | | 452 | | | | 16,200 | |
| Brown-Forman, Cl B | | | 421 | | | | 19,438 | |
| Campbell Soup | | | 427 | | | | 23,203 | |
| Clorox | | | 279 | | | | 33,486 | |
| Coach | | | 589 | | | | 21,139 | |
| Coca-Cola | | | 8,462 | | | | 358,788 | |
| Colgate-Palmolive | | | 1,936 | | | | 138,153 | |
| ConAgra Foods | | | 918 | | | | 44,229 | |
| Constellation Brands, Cl A | | | 380 | | | | 63,506 | |
| Delphi Automotive | | | 589 | | | | 38,326 | |
| DR Horton | | | 726 | | | | 20,931 | |
| Dr Pepper Snapple Group | | | 403 | | | | 35,379 | |
| Electronic Arts * | | | 651 | | | | 51,117 | |
| Estee Lauder, Cl A | | | 494 | | | | 43,042 | |
| Ford Motor | | | 8,406 | | | | 98,686 | |
| Garmin | | | 248 | | | | 11,993 | |
| General Mills | | | 1,302 | | | | 80,698 | |
| General Motors | | | 3,071 | | | | 97,044 | |
| Genuine Parts | | | 310 | | | | 28,083 | |
| Goodyear Tire & Rubber | | | 558 | | | | 16,199 | |
| Hanesbrands | | | 808 | | | | 20,766 | |
| Harley-Davidson | | | 390 | | | | 22,238 | |
| Harman International Industries | | | 155 | | | | 12,355 | |
| Hasbro | | | 248 | | | | 20,686 | |
| Hershey | | | 310 | | | | 31,763 | |
| Hormel Foods | | | 589 | | | | 22,677 | |
| JM Smucker | | | 248 | | | | 32,565 | |
| Kellogg | | | 556 | | | | 41,772 | |
| Kimberly-Clark | | | 775 | | | | 88,668 | |
| Kraft Heinz | | | 1,303 | | | | 115,902 | |
| Leggett & Platt | | | 279 | | | | 12,801 | |
| Lennar, Cl A | | | 401 | | | | 16,718 | |
| LKQ * | | | 651 | | | | 21,014 | |
| Mattel | | | 742 | | | | 23,395 | |
| McCormick | | | 248 | | | | 23,776 | |
| Mead Johnson Nutrition, Cl A | | | 403 | | | | 30,132 | |
| Michael Kors Holdings * | | | 372 | | | | 18,890 | |
| Mohawk Industries * | | | 132 | | | | 24,328 | |
| Molson Coors Brewing, Cl B | | | 403 | | | | 41,835 | |
| Mondelez International, Cl A | | | 3,364 | | | | 151,178 | |
| Monsanto | | | 960 | | | | 96,739 | |
The accompanying notes are an integral part of the financial statements.
| Schedule of Investments | October 31, 2016 |
| Global X S&P 500® Catholic Values ETF‡ |
| | | Shares | | | Value | |
| COMMON STOCK — continued |
| Consumer Goods — continued | | | | | | | | |
| Monster Beverage * | | | 309 | | | $ | 44,601 | |
| Newell Brands | | | 1,051 | | | | 50,468 | |
| NIKE, Cl B | | | 2,916 | | | | 146,325 | |
| PepsiCo | | | 3,131 | | | | 335,643 | |
| Philip Morris International | | | 3,381 | | | | 326,064 | |
| Procter & Gamble | | | 5,821 | | | | 505,262 | |
| PVH | | | 186 | | | | 19,898 | |
| Ralph Lauren, Cl A | | | 124 | | | | 12,164 | |
| Reynolds American | | | 1,796 | | | | 98,924 | |
| Snap-On | | | 217 | | | | 33,440 | |
| Stanley Black & Decker | | | 543 | | | | 61,815 | |
| Tyson Foods, Cl A | | | 653 | | | | 46,265 | |
| Under Armour, Cl A * | | | 401 | | | | 12,471 | |
| VF | | | 713 | | | | 38,652 | |
| Whirlpool | | | 156 | | | | 23,372 | |
| | | | | | | | 4,265,483 | |
| Consumer Services — 14.2% | | | | | | | | |
| Adient * | | | 205 | | | | 9,334 | |
| Advance Auto Parts | | | 155 | | | | 21,712 | |
| Alaska Air Group | | | 434 | | | | 31,343 | |
| Amazon.com * | | | 854 | | | | 674,506 | |
| American Airlines Group | | | 1,795 | | | | 72,877 | |
| AmerisourceBergen, Cl A | | | 774 | | | | 54,428 | |
| AutoNation * | | | 155 | | | | 6,800 | |
| AutoZone * | | | 62 | | | | 46,014 | |
| Bed Bath & Beyond | | | 341 | | | | 13,783 | |
| Best Buy | | | 605 | | | | 23,541 | |
| Cardinal Health | | | 1,364 | | | | 93,693 | |
| CarMax * | | | 403 | | | | 20,126 | |
| Carnival | | | 932 | | | | 45,761 | |
| CBS, Cl B | | | 886 | | | | 50,165 | |
| Charter Communications, Cl A * | | | 471 | | | | 117,698 | |
| Chipotle Mexican Grill, Cl A * | | | 62 | | | | 22,367 | |
| Comcast, Cl A | | | 5,194 | | | | 321,094 | |
| Costco Wholesale | | | 961 | | | | 142,103 | |
| CVS Health | | | 2,324 | | | | 195,448 | |
| Darden Restaurants | | | 261 | | | | 16,910 | |
| Delta Air Lines | | | 2,539 | | | | 106,055 | |
| Discovery Communications, Cl C * | | | 511 | | | | 12,831 | |
| Discovery Communications, Cl A * | | | 323 | | | | 8,434 | |
| Dollar General | | | 561 | | | | 38,759 | |
| Dollar Tree * | | | 496 | | | | 37,473 | |
| Dun & Bradstreet | | | 124 | | | | 15,481 | |
| eBay * | | | 2,296 | | | | 65,459 | |
The accompanying notes are an integral part of the financial statements.
| Schedule of Investments | October 31, 2016 |
| Global X S&P 500® Catholic Values ETF‡ |
| | | Shares | | | Value | |
| COMMON STOCK — continued |
| Consumer Services — continued | | | | | | | | |
| Expedia | | | 248 | | | $ | 32,049 | |
| Foot Locker | | | 279 | | | | 18,629 | |
| Gap | | | 483 | | | | 13,326 | |
| H&R Block | | | 483 | | | | 11,095 | |
| Home Depot | | | 2,677 | | | | 326,620 | |
| Interpublic Group | | | 868 | | | | 19,435 | |
| Kohl's | | | 403 | | | | 17,631 | |
| Kroger | | | 2,064 | | | | 63,943 | |
| L Brands | | | 524 | | | | 37,828 | |
| Lowe's | | | 1,892 | | | | 126,101 | |
| Macy's | | | 664 | | | | 24,229 | |
| Marriott International, Cl A | | | 692 | | | | 47,540 | |
| McDonald's | | | 1,854 | | | | 208,706 | |
| McKesson | | | 960 | | | | 122,083 | |
| Netflix * | | | 930 | | | | 116,129 | |
| News, Cl A | | | 819 | | | | 9,926 | |
| News | | | 230 | | | | 2,852 | |
| Nielsen Holdings | | | 1,219 | | | | 54,880 | |
| Nordstrom | | | 266 | | | | 13,832 | |
| Omnicom Group | | | 510 | | | | 40,708 | |
| O'Reilly Automotive * | | | 211 | | | | 55,797 | |
| priceline.com * | | | 108 | | | | 159,217 | |
| Robert Half International | | | 465 | | | | 17,400 | |
| Ross Stores | | | 868 | | | | 54,285 | |
| Royal Caribbean Cruises | | | 372 | | | | 28,596 | |
| Scripps Networks Interactive, Cl A | | | 217 | | | | 13,966 | |
| Signet Jewelers | | | 157 | | | | 12,758 | |
| Southwest Airlines | | | 2,102 | | | | 84,185 | |
| Staples | | | 1,393 | | | | 10,308 | |
| Starbucks | | | 3,170 | | | | 168,232 | |
| Sysco | | | 1,132 | | | | 54,472 | |
| Target | | | 1,258 | | | | 86,463 | |
| TEGNA | | | 465 | | | | 9,123 | |
| Tiffany | | | 248 | | | | 18,208 | |
| Time Warner | | | 1,676 | | | | 149,147 | |
| TJX | | | 1,426 | | | | 105,167 | |
| Tractor Supply | | | 279 | | | | 17,474 | |
| TripAdvisor * | | | 248 | | | | 15,991 | |
| Twenty-First Century Fox, Cl A | | | 2,332 | | | | 61,262 | |
| Twenty-First Century Fox, Cl B | | | 1,049 | | | | 27,683 | |
| Ulta Salon Cosmetics & Fragrance * | | | 126 | | | | 30,661 | |
| United Continental Holdings * | | | 1,066 | | | | 59,941 | |
| Urban Outfitters * | | | 186 | | | | 6,222 | |
| Viacom, Cl B | | | 744 | | | | 27,945 | |
The accompanying notes are an integral part of the financial statements.
| Schedule of Investments | October 31, 2016 |
| Global X S&P 500® Catholic Values ETF‡ |
| | | Shares | | | Value | |
| COMMON STOCK — continued |
| Consumer Services — continued | | | | | | | | |
| Walgreens Boots Alliance | | | 1,861 | | | $ | 153,961 | |
| Wal-Mart Stores | | | 3,301 | | | | 231,135 | |
| Walt Disney | | | 3,196 | | | | 296,237 | |
| Whole Foods Market | | | 682 | | | | 19,294 | |
| Wyndham Worldwide | | | 248 | | | | 16,328 | |
| Wynn Resorts | | | 186 | | | | 17,586 | |
| Yum! Brands | | | 806 | | | | 69,542 | |
| | | | | | | | 5,650,323 | |
| Financials — 14.9% | | | | | | | | |
| Affiliated Managers Group * | | | 124 | | | | 16,450 | |
| Aflac | | | 899 | | | | 61,914 | |
| Allstate | | | 806 | | | | 54,727 | |
| American Express | | | 1,679 | | | | 111,518 | |
| American International Group | | | 2,208 | | | | 136,234 | |
| Ameriprise Financial | | | 344 | | | | 30,406 | |
| Aon | | | 573 | | | | 63,506 | |
| Arthur J Gallagher | | | 372 | | | | 17,942 | |
| Assurant | | | 124 | | | | 9,984 | |
| Bank of America | | | 22,082 | | | | 364,354 | |
| Bank of New York Mellon | | | 2,323 | | | | 100,516 | |
| BB&T | | | 1,765 | | | | 69,188 | |
| Berkshire Hathaway, Cl B * | | | 4,114 | | | | 593,649 | |
| BlackRock, Cl A | | | 271 | | | | 92,476 | |
| Capital One Financial | | | 1,088 | | | | 80,556 | |
| CBRE Group, Cl A * | | | 633 | | | | 16,306 | |
| Charles Schwab | | | 2,587 | | | | 82,008 | |
| Chubb | | | 993 | | | | 126,111 | |
| Cincinnati Financial | | | 310 | | | | 21,942 | |
| Citigroup | | | 6,294 | | | | 309,350 | |
| Citizens Financial Group | | | 1,132 | | | | 29,817 | |
| CME Group, Cl A | | | 729 | | | | 72,973 | |
| Comerica | | | 372 | | | | 19,377 | |
| Discover Financial Services | | | 886 | | | | 49,908 | |
| E*TRADE Financial * | | | 589 | | | | 16,586 | |
| Equifax | | | 434 | | | | 53,803 | |
| Fifth Third Bancorp | | | 1,658 | | | | 36,078 | |
| Franklin Resources | | | 793 | | | | 26,692 | |
| Goldman Sachs Group | | | 813 | | | | 144,910 | |
| Hartford Financial Services Group | | | 837 | | | | 36,920 | |
| Huntington Bancshares | | | 2,370 | | | | 25,122 | |
| Intercontinental Exchange | | | 254 | | | | 68,679 | |
| Invesco | | | 899 | | | | 25,253 | |
| JPMorgan Chase | | | 7,819 | | | | 541,545 | |
| KeyCorp | | | 2,362 | | | | 33,351 | |
The accompanying notes are an integral part of the financial statements.
| Schedule of Investments | October 31, 2016 |
| Global X S&P 500® Catholic Values ETF‡ |
| | | Shares | | | Value | |
| COMMON STOCK — continued |
| Financials — continued | | | | | | | | |
| Legg Mason | | | 204 | | | $ | 5,859 | |
| Leucadia National | | | 713 | | | | 13,312 | |
| Lincoln National | | | 514 | | | | 25,232 | |
| Loews | | | 587 | | | | 25,259 | |
| M&T Bank | | | 341 | | | | 41,851 | |
| Marsh & McLennan | | | 1,116 | | | | 70,743 | |
| Mastercard, Cl A | | | 2,107 | | | | 225,491 | |
| MetLife | | | 2,372 | | | | 111,389 | |
| Moody's | | | 372 | | | | 37,393 | |
| Morgan Stanley | | | 3,191 | | | | 107,122 | |
| Nasdaq | | | 248 | | | | 15,865 | |
| Navient | | | 702 | | | | 8,972 | |
| Northern Trust | | | 465 | | | | 33,675 | |
| People's United Financial | | | 680 | | | | 11,043 | |
| PNC Financial Services Group | | | 1,072 | | | | 102,483 | |
| Principal Financial Group | | | 589 | | | | 32,159 | |
| Progressive | | | 1,254 | | | | 39,514 | |
| Prudential Financial | | | 961 | | | | 81,483 | |
| Regions Financial | | | 2,730 | | | | 29,238 | |
| S&P Global | | | 558 | | | | 67,992 | |
| State Street | | | 801 | | | | 56,238 | |
| SunTrust Banks | | | 1,085 | | | | 49,075 | |
| Synchrony Financial | | | 1,713 | | | | 48,975 | |
| T Rowe Price Group | | | 527 | | | | 33,733 | |
| Torchmark | | | 248 | | | | 15,726 | |
| Travelers | | | 620 | | | | 67,072 | |
| Unum Group | | | 497 | | | | 17,594 | |
| US Bancorp | | | 3,473 | | | | 155,451 | |
| Visa, Cl A | | | 4,124 | | | | 340,271 | |
| Wells Fargo | | | 9,834 | | | | 452,463 | |
| Western Union | | | 1,056 | | | | 21,194 | |
| Willis Towers Watson | | | 281 | | | | 35,378 | |
| XL Group | | | 607 | | | | 21,063 | |
| Zions Bancorporation | | | 434 | | | | 13,979 | |
| | | | | | | | 5,954,438 | |
| Health Care — 12.8% | | | | | | | | |
| AbbVie | | | 6,912 | | | | 385,551 | |
| Aetna | | | 1,488 | | | | 159,737 | |
| Alexion Pharmaceuticals * | | | 956 | | | | 124,758 | |
| Anthem | | | 1,115 | | | | 135,874 | |
| Baxter International | | | 2,085 | | | | 99,225 | |
| Biogen Idec * | | | 929 | | | | 260,287 | |
| Boston Scientific * | | | 5,737 | | | | 126,214 | |
| Celgene * | | | 3,282 | | | | 335,355 | |
The accompanying notes are an integral part of the financial statements.
| Schedule of Investments | October 31, 2016 |
| Global X S&P 500® Catholic Values ETF‡ |
| | | Shares | | | Value | |
| COMMON STOCK — continued |
| Health Care — continued | | | | | | | | |
| Centene * | | | 713 | | | $ | 44,548 | |
| CR Bard | | | 310 | | | | 67,171 | |
| DaVita * | | | 695 | | | | 40,741 | |
| DENTSPLY SIRONA | | | 992 | | | | 57,109 | |
| Edwards Lifesciences * | | | 899 | | | | 85,603 | |
| Eli Lilly | | | 4,123 | | | | 304,443 | |
| Express Scripts Holding * | | | 2,665 | | | | 179,621 | |
| Gilead Sciences | | | 5,611 | | | | 413,138 | |
| Henry Schein * | | | 341 | | | | 50,877 | |
| Hologic * | | | 1,172 | | | | 42,204 | |
| Humana | | | 627 | | | | 107,549 | |
| Illumina * | | | 620 | | | | 84,407 | |
| Intuitive Surgical * | | | 164 | | | | 110,221 | |
| Laboratory Corp of America Holdings * | | | 434 | | | | 54,398 | |
| Mallinckrodt * | | | 465 | | | | 27,556 | |
| Medtronic | | | 5,867 | | | | 481,212 | |
| Patterson | | | 341 | | | | 14,564 | |
| Quest Diagnostics | | | 589 | | | | 47,968 | |
| Regeneron Pharmaceuticals * | | | 317 | | | | 109,371 | |
| St. Jude Medical | | | 1,207 | | | | 93,953 | |
| Stryker | | | 1,332 | | | | 153,646 | |
| UnitedHealth Group | | | 4,039 | | | | 570,832 | |
| Varian Medical Systems * | | | 403 | | | | 36,564 | |
| Vertex Pharmaceuticals * | | | 1,055 | | | | 80,032 | |
| Waters * | | | 341 | | | | 47,447 | |
| Zimmer Biomet Holdings | | | 838 | | | | 88,325 | |
| Zoetis, Cl A | | | 2,098 | | | | 100,284 | |
| | | | | | | | 5,120,785 | |
| Industrials — 10.8% | | | | | | | | |
| 3M | | | 2,051 | | | | 339,031 | |
| Accenture, Cl A | | | 1,364 | | | | 158,550 | |
| Acuity Brands | | | 155 | | | | 34,653 | |
| Allegion | | | 341 | | | | 21,769 | |
| Alliance Data Systems | | | 124 | | | | 25,354 | |
| AMETEK | | | 837 | | | | 36,912 | |
| Amphenol, Cl A | | | 680 | | | | 44,832 | |
| Automatic Data Processing | | | 992 | | | | 86,364 | |
| Ball | | | 373 | | | | 28,747 | |
| Caterpillar | | | 1,981 | | | | 165,333 | |
| CH Robinson Worldwide | | | 525 | | | | 35,763 | |
| Cintas | | | 310 | | | | 33,068 | |
| CSRA | | | 308 | | | | 7,728 | |
| CSX | | | 3,207 | | | | 97,846 | |
| Cummins | | | 561 | | | | 71,707 | |
The accompanying notes are an integral part of the financial statements.
| Schedule of Investments | October 31, 2016 |
| Global X S&P 500® Catholic Values ETF‡ |
| | | Shares | | | Value | |
| COMMON STOCK — continued |
| Industrials — continued | | | | | | | | |
| Deere | | | 980 | | | $ | 86,534 | |
| Dover | | | 558 | | | | 37,325 | |
| Eaton | | | 1,541 | | | | 98,270 | |
| Emerson Electric | | | 2,182 | | | | 110,583 | |
| Expeditors International of Washington | | | 651 | | | | 33,507 | |
| Fastenal | | | 1,052 | | | | 41,007 | |
| FedEx | | | 828 | | | | 144,337 | |
| Fidelity National Information Services | | | 711 | | | | 52,557 | |
| Fiserv * | | | 484 | | | | 47,664 | |
| FLIR Systems | | | 310 | | | | 10,205 | |
| Flowserve | | | 465 | | | | 19,693 | |
| Fortive | | | 1,018 | | | | 51,969 | |
| Fortune Brands Home & Security | | | 520 | | | | 28,408 | |
| Global Payments | | | 340 | | | | 24,657 | |
| Illinois Tool Works | | | 1,083 | | | | 122,996 | |
| Ingersoll-Rand | | | 928 | | | | 62,445 | |
| Jacobs Engineering Group * | | | 434 | | | | 22,385 | |
| JB Hunt Transport Services | | | 310 | | | | 25,299 | |
| Johnson Controls International | | | 2,051 | | | | 82,697 | |
| Kansas City Southern | | | 401 | | | | 35,192 | |
| Martin Marietta Materials | | | 147 | | | | 27,251 | |
| Masco | | | 1,207 | | | | 37,272 | |
| Mettler-Toledo International * | | | 113 | | | | 45,661 | |
| Norfolk Southern | | | 995 | | | | 92,535 | |
| Owens-Illinois * | | | 354 | | | | 6,832 | |
| PACCAR | | | 1,269 | | | | 69,693 | |
| Parker-Hannifin | | | 453 | | | | 55,606 | |
| Paychex | | | 695 | | | | 38,364 | |
| PayPal Holdings * | | | 2,448 | | | | 101,984 | |
| Pentair | | | 613 | | | | 33,795 | |
| Quanta Services * | | | 558 | | | | 16,043 | |
| Republic Services, Cl A | | | 853 | | | | 44,893 | |
| Rockwell Automation | | | 465 | | | | 55,670 | |
| Roper Technologies | | | 343 | | | | 59,445 | |
| Ryder System | | | 186 | | | | 12,907 | |
| Sealed Air | | | 432 | | | | 19,712 | |
| Sherwin-Williams | | | 179 | | | | 43,830 | |
| Stericycle * | | | 310 | | | | 24,828 | |
| TE Connectivity | | | 777 | | | | 48,851 | |
| Teradata * | | | 279 | | | | 7,522 | |
| Total System Services | | | 372 | | | | 18,555 | |
| TransDigm Group | | | 186 | | | | 50,678 | |
| Union Pacific | | | 2,826 | | | | 249,196 | |
| United Parcel Service, Cl B | | | 2,345 | | | | 252,697 | |
The accompanying notes are an integral part of the financial statements.
| Schedule of Investments | October 31, 2016 |
| Global X S&P 500® Catholic Values ETF‡ |
| | | Shares | | | Value | |
| COMMON STOCK — continued |
| Industrials — continued | | | | | | | | |
| United Rentals * | | | 310 | | | $ | 23,455 | |
| United Technologies | | | 2,640 | | | | 269,808 | |
| Verisk Analytics, Cl A * | | | 558 | | | | 45,505 | |
| Vulcan Materials | | | 279 | | | | 31,583 | |
| Waste Management | | | 1,379 | | | | 90,545 | |
| Westrock | | | 556 | | | | 25,682 | |
| WW Grainger | | | 209 | | | | 43,497 | |
| Xerox | | | 1,865 | | | | 18,221 | |
| Xylem | | | 649 | | | | 31,366 | |
| | | | | | | | 4,318,869 | |
| Oil & Gas — 7.2% | | | | | | | | |
| Anadarko Petroleum | | | 1,199 | | | | 71,269 | |
| Apache | | | 820 | | | | 48,774 | |
| Baker Hughes | | | 946 | | | | 52,408 | |
| Cabot Oil & Gas | | | 1,006 | | | | 21,005 | |
| Chesapeake Energy * | | | 1,326 | | | | 7,306 | |
| Chevron | | | 4,109 | | | | 430,418 | |
| Cimarex Energy | | | 217 | | | | 28,021 | |
| Concho Resources * | | | 308 | | | | 39,098 | |
| ConocoPhillips | | | 2,678 | | | | 116,359 | |
| Devon Energy | | | 1,143 | | | | 43,308 | |
| EOG Resources | | | 1,205 | | | | 108,956 | |
| EQT | | | 373 | | | | 24,618 | |
| Exxon Mobil | | | 9,049 | | | | 753,962 | |
| First Solar * | | | 155 | | | | 6,276 | |
| FMC Technologies * | | | 496 | | | | 16,006 | |
| Halliburton | | | 1,871 | | | | 86,066 | |
| Helmerich & Payne | | | 246 | | | | 15,525 | |
| Hess | | | 571 | | | | 27,391 | |
| Kinder Morgan | | | 4,179 | | | | 85,377 | |
| Marathon Oil | | | 1,840 | | | | 24,251 | |
| Marathon Petroleum | | | 1,145 | | | | 49,911 | |
| Murphy Oil | | | 341 | | | | 8,822 | |
| National Oilwell Varco | | | 819 | | | | 26,290 | |
| Newfield Exploration * | | | 434 | | | | 17,616 | |
| Noble Energy | | | 930 | | | | 32,057 | |
| Occidental Petroleum | | | 1,657 | | | | 120,812 | |
| Phillips 66 | | | 967 | | | | 78,472 | |
| Pioneer Natural Resources | | | 370 | | | | 66,237 | |
| Range Resources | | | 385 | | | | 13,009 | |
| Schlumberger | | | 3,021 | | | | 236,333 | |
| Southwestern Energy * | | | 1,037 | | | | 10,774 | |
| Spectra Energy | | | 1,523 | | | | 63,677 | |
| Tesoro | | | 248 | | | | 21,073 | |
The accompanying notes are an integral part of the financial statements.
| Schedule of Investments | October 31, 2016 |
| Global X S&P 500® Catholic Values ETF‡ |
| | | Shares | | | Value | |
| COMMON STOCK — continued |
| Oil & Gas — continued | | | | | | | | |
| Transocean | | | 744 | | | $ | 7,150 | |
| Valero Energy | | | 1,008 | | | | 59,714 | |
| Williams | | | 1,486 | | | | 43,391 | |
| | | | | | | | 2,861,732 | |
| Real Estate Investment Trusts — 2.9% | | | | | | | | |
| American Tower, Cl A | | | 925 | | | | 108,401 | |
| Apartment Investment & Management, Cl A | | | 341 | | | | 15,028 | |
| AvalonBay Communities | | | 304 | | | | 52,039 | |
| Boston Properties | | | 341 | | | | 41,084 | |
| Crown Castle International | | | 726 | | | | 66,059 | |
| Digital Realty Trust | | | 310 | | | | 28,963 | |
| Equinix | | | 155 | | | | 55,378 | |
| Equity Residential | | | 788 | | | | 48,659 | |
| Essex Property Trust | | | 148 | | | | 31,685 | |
| Extra Space Storage | | | 279 | | | | 20,409 | |
| Federal Realty Investment Trust | | | 155 | | | | 22,511 | |
| General Growth Properties | | | 1,254 | | | | 31,287 | |
| HCP | | | 1,005 | | | | 34,421 | |
| Host Hotels & Resorts | | | 1,612 | | | | 24,954 | |
| Iron Mountain | | | 528 | | | | 17,809 | |
| Kimco Realty | | | 897 | | | | 23,869 | |
| Macerich | | | 266 | | | | 18,827 | |
| ProLogis | | | 1,130 | | | | 58,941 | |
| Public Storage | | | 317 | | | | 67,749 | |
| Realty Income | | | 559 | | | | 33,115 | |
| Simon Property Group | | | 681 | | | | 126,639 | |
| SL Green Realty | | | 217 | | | | 21,314 | |
| UDR | | | 572 | | | | 20,003 | |
| Ventas | | | 766 | | | | 51,897 | |
| Vornado Realty Trust | | | 372 | | | | 34,514 | |
| Welltower | | | 776 | | | | 53,179 | |
| Weyerhaeuser | | | 1,616 | | | | 48,367 | |
| | | | | | | | 1,157,101 | |
| Technology — 18.0% | | | | | | | | |
| Adobe Systems * | | | 1,085 | | | | 116,648 | |
| Akamai Technologies * | | | 372 | | | | 25,843 | |
| Alphabet, Cl C * | | | 648 | | | | 508,382 | |
| Alphabet, Cl A * | | | 647 | | | | 524,005 | |
| Analog Devices | | | 667 | | | | 42,755 | |
| Apple | | | 11,781 | | | | 1,337,614 | |
| Applied Materials | | | 2,360 | | | | 68,629 | |
| Autodesk * | | | 432 | | | | 31,225 | |
| Broadcom | | | 864 | | | | 147,122 | |
| CA | | | 664 | | | | 20,411 | |
The accompanying notes are an integral part of the financial statements.
| Schedule of Investments | October 31, 2016 |
| Global X S&P 500® Catholic Values ETF‡ |
| | | Shares | | | Value | |
| COMMON STOCK — continued |
| Technology — continued | | | | | | | | |
| Cerner * | | | 1,271 | | | $ | 74,455 | |
| Cisco Systems | | | 10,995 | | | | 337,326 | |
| Citrix Systems * | | | 341 | | | | 28,917 | |
| Cognizant Technology Solutions, Cl A * | | | 1,316 | | | | 67,577 | |
| F5 Networks * | | | 155 | | | | 21,423 | |
| Facebook, Cl A * | | | 5,078 | | | | 665,168 | |
| Hewlett Packard Enterprise | | | 3,616 | | | | 81,252 | |
| HP | | | 3,733 | | | | 54,091 | |
| Intel | | | 10,342 | | | | 360,625 | |
| International Business Machines | | | 1,897 | | | | 291,550 | |
| Intuit | | | 532 | | | | 57,850 | |
| Juniper Networks | | | 799 | | | | 21,046 | |
| KLA-Tencor | | | 341 | | | | 25,613 | |
| Lam Research | | | 341 | | | | 33,029 | |
| Linear Technology | | | 527 | | | | 31,652 | |
| Microchip Technology | | | 465 | | | | 28,156 | |
| Micron Technology * | | | 2,246 | | | | 38,541 | |
| Microsoft | | | 17,028 | | | | 1,020,318 | |
| Motorola Solutions | | | 354 | | | | 25,693 | |
| NetApp | | | 620 | | | | 21,043 | |
| NVIDIA | | | 1,171 | | | | 83,328 | |
| Oracle | | | 6,580 | | | | 252,804 | |
| Pitney Bowes | | | 682 | | | | 12,167 | |
| Qorvo * | | | 279 | | | | 15,526 | |
| QUALCOMM | | | 3,208 | | | | 220,454 | |
| Red Hat * | | | 403 | | | | 31,212 | |
| salesforce.com * | | | 1,401 | | | | 105,299 | |
| Seagate Technology | | | 651 | | | | 22,336 | |
| Skyworks Solutions | | | 403 | | | | 31,007 | |
| Symantec | | | 1,331 | | | | 33,315 | |
| Texas Instruments | | | 2,183 | | | | 154,666 | |
| VeriSign * | | | 217 | | | | 18,232 | |
| Western Digital | | | 618 | | | | 36,116 | |
| Xilinx | | | 558 | | | | 28,385 | |
| Yahoo! * | | | 1,902 | | | | 79,028 | |
| | | | | | | | 7,231,834 | |
| Telecommunications — 2.5% | | | | | | | | |
| AT&T | | | 13,302 | | | | 489,381 | |
| CenturyLink | | | 1,176 | | | | 31,258 | |
| Frontier Communications | | | 2,523 | | | | 10,142 | |
| Level 3 Communications * | | | 620 | | | | 34,813 | |
| Verizon Communications | | | 8,812 | | | | 423,857 | |
| | | | | | | | 989,451 | |
The accompanying notes are an integral part of the financial statements.
| Schedule of Investments | October 31, 2016 |
| Global X S&P 500® Catholic Values ETF‡ |
| | | Shares | | | Value | |
| COMMON STOCK — continued |
| Utilities — 3.5% | | | | | | | | |
| AES | | | 1,437 | | | $ | 16,913 | |
| Alliant Energy | | | 491 | | | | 18,683 | |
| Ameren | | | 527 | | | | 26,324 | |
| American Electric Power | | | 1,068 | | | | 69,249 | |
| American Water Works | | | 386 | | | | 28,579 | |
| CenterPoint Energy | | | 943 | | | | 21,500 | |
| CMS Energy | | | 618 | | | | 26,049 | |
| Consolidated Edison | | | 665 | | | | 50,241 | |
| Dominion Resources | | | 1,368 | | | | 102,873 | |
| DTE Energy | | | 401 | | | | 38,500 | |
| Duke Energy | | | 1,504 | | | | 120,350 | |
| Edison International | | | 711 | | | | 52,244 | |
| Entergy | | | 401 | | | | 29,546 | |
| Eversource Energy | | | 682 | | | | 37,551 | |
| Exelon | | | 2,011 | | | | 68,515 | |
| FirstEnergy | | | 928 | | | | 31,821 | |
| NextEra Energy | | | 1,017 | | | | 130,176 | |
| NiSource | | | 711 | | | | 16,538 | |
| NRG Energy | | | 682 | | | | 7,250 | |
| ONEOK | | | 463 | | | | 22,423 | |
| PG&E | | | 1,083 | | | | 67,276 | |
| Pinnacle West Capital | | | 248 | | | | 18,880 | |
| PPL | | | 1,484 | | | | 50,961 | |
| Public Service Enterprise Group | | | 1,114 | | | | 46,877 | |
| SCANA | | | 310 | | | | 22,742 | |
| Sempra Energy | | | 552 | | | | 59,119 | |
| Southern | | | 2,141 | | | | 110,411 | |
| WEC Energy Group | | | 682 | | | | 40,729 | |
| Xcel Energy | | | 1,114 | | | | 46,287 | |
| | | | | | | | 1,378,607 | |
| TOTAL UNITED STATES | | | | | | | 39,832,007 | |
| TOTAL COMMON STOCK | | | | | | | | |
| (Cost $40,377,383) | | | | | | | 39,832,007 | |
| TOTAL INVESTMENTS — 99.8% | | | | | | | | |
| (Cost $40,377,383) | | | | | | $ | 39,832,007 | |
Percentages are based on Net Assets of $39,898,957.
| * | Non-income producing security. |
| ‡ | Fund commenced operations on April 18, 2016. |
| Cl — Class |
| S&P — Standard & Poor's |
The accompanying notes are an integral part of the financial statements.
| Schedule of Investments | October 31, 2016 |
| Global X S&P 500® Catholic Values ETF‡ |
As of October 31, 2016, all of the Fund's investments were considered Level 1, in accordance with authoritative guidance on fair value measurements and disclosure under U.S. GAAP.
For the period ended October 31, 2016, there have been no transfers between Level 1, Level 2 or Level 3 investments.
The accompanying notes are an integral part of the financial statements.
| Statements of Assets and Liabilities |
| October 31, 2016 |
| | | Global X
SuperDividend®
ETF | | | Global X
SuperDividend®
U.S. ETF | | | Global X
SuperDividend®
Emerging Markets
ETF | | | Global X
SuperDividend®
REIT ETF | |
| Assets: | | | | | | | | | | | | | | | | |
| Cost of Investments | | $ | 834,523,055 | | | $ | 328,223,887 | | | $ | 3,113,840 | | | $ | 34,636,504 | |
| Cost of Repurchase Agreement | | | 57,413,239 | | | | 7,571,225 | | | | — | | | | — | |
| Cost of Foreign Currency | | | 312,324 | | | | — | | | | 234 | | | | 4,942 | |
| Investments, at Value | | $ | 793,993,743 | * | | $ | 337,100,752 | * | | $ | 3,734,368 | | | $ | 34,138,623 | |
| Repurchase Agreement, at Value | | | 57,413,239 | | | | 7,571,225 | | | | — | | | | — | |
| Cash | | | 3,637,015 | | | | 821,899 | | | | 3,854 | | | | 66,459 | |
| Foreign Currency, at Value | | | 312,968 | | | | — | | | | 242 | | | | 4,912 | |
| Dividend and Interest Receivable | | | 3,789,603 | | | | 592,014 | | | | 3,988 | | | | 107,480 | |
| Reclaim Receivable | | | 523,847 | | | | 14,812 | | | | — | | | | 1,564 | |
| Receivable for Investment Securities Sold | | | 53,733 | | | | — | | | | — | | | | 4,760 | |
| Receivable for Capital Shares Sold | | | — | | | | 4,829,804 | | | | — | | | | — | |
| Total Assets | | | 859,724,148 | | | | 350,930,506 | | | | 3,742,452 | | | | 34,323,798 | |
| Liabilities: | | | | | | | | | | | | | | | | |
| Obligation to Return Securities Lending Collateral | | | 57,413,239 | | | | 7,571,225 | | | | — | | | | — | |
| Payable due to Investment Adviser | | | 399,570 | | | | 127,899 | | | | 2,019 | | | | 16,377 | |
| Payable for Investment Securities Purchased | | | 53,826 | | | | 4,828,619 | | | | — | | | | 4,764 | |
| Due to Broker | | | 41,135 | | | | 6,149 | | | | — | | | | 334 | |
| Unrealized Depreciation on Spot Contracts | | | 353 | | | | — | | | | — | | | | — | |
| Total Liabilities | | | 57,908,123 | | | | 12,533,892 | | | | 2,019 | | | | 21,475 | |
| Net Assets | | $ | 801,816,025 | | | $ | 338,396,614 | | | $ | 3,740,433 | | | $ | 34,302,323 | |
| Net Assets Consist of: | | | | | | | | | | | | | | | | |
| Paid-in Capital | | $ | 948,151,507 | | | $ | 384,562,501 | | | $ | 3,884,738 | | | $ | 35,022,853 | |
| Undistributed (Distributions in Excess of) Net Investment Income | | | (1,599,748 | ) | | | (1 | ) | | | 1,635 | | | | (80,141 | ) |
| Accumulated Net Realized Loss on Investments and Foreign Currency Transactions | | | (104,148,973 | ) | | | (55,042,751 | ) | | | (766,476 | ) | | | (142,440 | ) |
| Net Unrealized Appreciation (Depreciation) on Investments | | | (40,529,312 | ) | | | 8,876,865 | | | | 620,528 | | | | (497,881 | ) |
| Net Unrealized Appreciation (Depreciation) on Foreign Currency Translations | | | (57,449 | ) | | | — | | | | 8 | | | | (68 | ) |
| Net Assets | | $ | 801,816,025 | | | $ | 338,396,614 | | | $ | 3,740,433 | | | $ | 34,302,323 | |
| Outstanding Shares of Beneficial Interest | | | | | | | | | | | | | | | | |
| (unlimited authorization — no par value) | | | 39,250,000 | | | | 14,100,000 | | | | 250,000 | | | | 2,350,000 | |
| Net Asset Value, Offering and Redemption Price Per Share | | $ | 20.43 | | | $ | 24.00 | | | $ | 14.96 | | | $ | 14.60 | |
| *Includes Market Value of Securities on Loan | | $ | 54,773,970 | | | $ | 7,287,261 | | | $ | — | | | $ | — | |
The accompanying notes are an integral part of the financial statements.
| Statements of Assets and Liabilities |
| October 31, 2016 |
| | | Global X
SuperIncome™
Preferred ETF | | | Global X Social
Media Index ETF | | | Global X |
JPMorgan
Efficiente Index
ETF | | | Global X |
JPMorgan US
Sector Rotator
Index ETF | |
| Assets: | | | | | | | | | | | | | | | | |
| Cost of Investments | | $ | 240,199,021 | | | $ | 133,295,620 | | | $ | 7,207,895 | | | $ | 10,618,473 | |
| Cost of Repurchase Agreement | | | 13,991,000 | | | | 17,121,597 | | | | — | | | | — | |
| Investments, at Value | | $ | 231,453,997 | * | | $ | 133,997,654 | * | | $ | 7,211,336 | | | $ | 10,697,358 | |
| Repurchase Agreement, at Value | | | 13,991,000 | | | | 17,121,597 | | | | — | | | | — | |
| Cash | | | 2,104,422 | | | | 60,297 | | | | 7,587 | | | | 15,163 | |
| Receivable for Investment Securities Sold | | | 1,417,755 | | | | 13,560,862 | | | | — | | | | — | |
| Dividend and Interest Receivable | | | 428,545 | | | | 40,410 | | | | — | | | | — | |
| Reclaim Receivable | | | — | | | | 5,794 | | | | — | | | | — | |
| Total Assets | | | 249,395,719 | | | | 164,786,614 | | | | 7,218,923 | | | | 10,712,521 | |
| Liabilities: | | | | | | | | | | | | | | | | |
| Obligation to Return Securities Lending Collateral | | | 13,991,000 | | | | 17,121,597 | | | | — | | | | — | |
| Payable for Investment Securities Purchased | | | 3,083,024 | | | | 13,478,120 | | | | — | | | | — | |
| Payable due to Investment Adviser | | | 114,947 | | | | 76,159 | | | | 4,267 | | | | 6,247 | |
| Due to Broker | | | 500 | | | | — | | | | — | | | | — | |
| Total Liabilities | | | 17,189,471 | | | | 30,675,876 | | | | 4,267 | | | | 6,247 | |
| Net Assets | | $ | 232,206,248 | | | $ | 134,110,738 | | | $ | 7,214,656 | | | $ | 10,706,274 | |
| Net Assets Consist of: | | | | | | | | | | | | | | | | |
| Paid-in Capital | | $ | 262,707,243 | | | $ | 153,131,160 | | | $ | 8,981,592 | | | $ | 12,860,351 | |
| Undistributed Net Investment Income | | | 513,583 | | | | 60,572 | | | | 95,278 | | | | 143,599 | |
| Accumulated Net Realized Loss on Investments and Foreign Currency Transactions | | | (22,269,554 | ) | | | (19,781,544 | ) | | | (1,865,655 | ) | | | (2,376,561 | ) |
| Net Unrealized Appreciation (Depreciation) on Investments | | | (8,745,024 | ) | | | 702,034 | | | | 3,441 | | | | 78,885 | |
| Net Unrealized Depreciation on Foreign Currency Translations | | | — | | | | (1,484 | ) | | | — | | | | — | |
| Net Assets | | $ | 232,206,248 | | | $ | 134,110,738 | | | $ | 7,214,656 | | | $ | 10,706,274 | |
| Outstanding Shares of Beneficial Interest | | | | | | | | | | | | | | | | |
| (unlimited authorization — no par value) | | | 17,650,000 | | | | 5,700,000 | | | | 300,000 | | | | 450,000 | |
| Net Asset Value, Offering and Redemption Price Per Share | | $ | 13.16 | | | $ | 23.53 | | | $ | 24.05 | | | $ | 23.79 | |
| *Includes Market Value of Securities on Loan | | $ | 13,600,406 | | | $ | 16,161,795 | | | $ | — | | | $ | — | |
The accompanying notes are an integral part of the financial statements.
| Statements of Assets and Liabilities |
| October 31, 2016 |
| | | Global X
Permanent ETF | | | Global X Guru®
Index ETF | | | Global X Guru®
Activist Index ETF | | | Global X Guru®
International Index
ETF | |
| Assets: | | | | | | | | | | | | | | | | |
| Cost of Investments | | $ | 9,337,037 | | | $ | 60,385,621 | | | $ | 1,360,719 | | | $ | 716,398 | |
| Cost of Repurchase Agreement | | | — | | | | 1,336,000 | | | | — | | | | — | |
| Cost of Foreign Currency | | | 2 | | | | — | | | | — | | | | 12 | |
| Investments, at Value | | $ | 8,715,682 | | | $ | 58,774,734 | * | | $ | 1,331,140 | | | $ | 692,349 | |
| Cash | | | 50,895 | | | | 253,782 | | | | 3,368 | | | | 650 | |
| Foreign Currency, at Value | | | 2 | | | | — | | | | — | | | | 12 | |
| Repurchase Agreement, at Value | | | — | | | | 1,336,000 | | | | — | | | | — | |
| Dividend and Interest Receivable | | | 32,934 | | | | 28,278 | | | | 1,127 | | | | 603 | |
| Receivable for Investment Securities Sold | | | — | | | | 1,157,236 | | | | — | | | | — | |
| Reclaim Receivable | | | — | | | | 480 | | | | — | | | | 606 | |
| Total Assets | | | 8,799,513 | | | | 61,550,510 | | | | 1,335,635 | | | | 694,220 | |
| Liabilities: | | | | | | | | | | | | | | | | |
| Payable due to Investment Adviser | | | 3,592 | | | | 41,375 | | | | 855 | | | | 443 | |
| Obligation to Return Securities Lending Collateral | | | — | | | | 1,336,000 | | | | — | | | | — | |
| Payable for Capital Shares Redeemed | | | — | | | | 1,159,637 | | | | — | | | | — | |
| Due to Broker | | | — | | | | 66 | | | | — | | | | — | |
| Total Liabilities | | | 3,592 | | | | 2,537,078 | | | | 855 | | | | 443 | |
| Net Assets | | $ | 8,795,921 | | | $ | 59,013,432 | | | $ | 1,334,780 | | | $ | 693,777 | |
| Net Assets Consist of: | | | | | | | | | | | | | | | | |
| Paid-in Capital | | $ | 9,654,662 | | | $ | 93,565,365 | | | $ | 1,649,538 | | | $ | 973,328 | |
| Undistributed Net Investment Income | | | 70,936 | | | | 3 | | | | 9,333 | | | | 15,783 | |
| Accumulated Net Realized Loss on Investments and Foreign Currency Transactions | | | (308,322 | ) | | | (32,941,049 | ) | | | (294,512 | ) | | | (271,285 | ) |
| Net Unrealized Depreciation on Investments | | | (621,355 | ) | | | (1,610,887 | ) | | | (29,579 | ) | | | (24,049 | ) |
| Net Assets | | $ | 8,795,921 | | | $ | 59,013,432 | | | $ | 1,334,780 | | | $ | 693,777 | |
| Outstanding Shares of Beneficial Interest | | | | | | | | | | | | | | | | |
| (unlimited authorization — no par value) | | | 350,000 | | | | 2,550,000 | | | | 100,000 | | | | 50,000 | |
| Net Asset Value, Offering and Redemption Price Per Share | | $ | 25.13 | | | $ | 23.14 | | | $ | 13.35 | | | $ | 13.88 | |
| *Includes Market Value of Securities on Loan | | $ | — | | | $ | 1,290,225 | | | $ | — | | | $ | — | |
The accompanying notes are an integral part of the financial statements.
| Statements of Assets and Liabilities |
| October 31, 2016 |
| | | Global X Scientific
Beta US ETF | | | Global X Scientific
Beta Europe ETF | | | Global X Scientific
Beta Japan ETF | | | Global X Scientific
Beta Asia ex-Japan
ETF | |
| Assets: | | | | | | | | | | | | | | | | |
| Cost of Investments | | $ | 64,718,233 | | | $ | 12,635,615 | | | $ | 12,516,651 | | | $ | 2,249,622 | |
| Cost of Foreign Currency | | | — | | | | 2,703 | | | | 268 | | | | — | |
| Investments, at Value | | $ | 66,021,168 | | | $ | 12,417,327 | | | $ | 13,661,144 | | | $ | 2,289,672 | |
| Cash | | | 121,741 | | | | 9,386 | | | | — | | | | 3,721 | |
| Foreign Currency, at Value | | | — | | | | 2,721 | | | | 268 | | | | — | |
| Dividend and Interest Receivable | | | 69,420 | | | | 9,820 | | | | 89,578 | | | | 3,244 | |
| Reclaim Receivable | | | 136 | | | | 15,509 | | | | — | | | | — | |
| Receivable for Investment Securities Sold | | | — | | | | 133 | | | | 274 | | | | — | |
| Total Assets | | | 66,212,465 | | | | 12,454,896 | | | | 13,751,264 | | | | 2,296,637 | |
| Liabilities: | | | | | | | | | | | | | | | | |
| Payable due to Investment Adviser | | | 10,688 | | | | 4,063 | | | | 4,355 | | | | 751 | |
| Payable for Investment Securities Purchased | | | — | | | | 134 | | | | 273 | | | | — | |
| Cash Overdraft | | | — | | | | — | | | | 58,197 | | | | — | |
| Due to Broker | | | — | | | | 3,328 | | | | — | | | | — | |
| Unrealized Depreciation on Spot Contracts | | | — | | | | 6 | | | | — | | | | — | |
| Total Liabilities | | | 10,688 | | | | 7,531 | | | | 62,825 | | | | 751 | |
| Net Assets | | $ | 66,201,777 | | | $ | 12,447,365 | | | $ | 13,688,439 | | | $ | 2,295,886 | |
| Net Assets Consist of: | | | | | | | | | | | | | | | | |
| Paid-in Capital | | $ | 64,780,080 | | | $ | 12,657,892 | | | $ | 12,466,734 | | | $ | 2,499,952 | |
| Undistributed Net Investment Income | | | 622,202 | | | | 296,809 | | | | 281,015 | | | | 76,164 | |
| Accumulated Net Realized Loss on Investments and Foreign Currency Transactions | | | (503,440 | ) | | | (288,222 | ) | | | (200,074 | ) | | | (320,280 | ) |
| Net Unrealized Appreciation (Depreciation) on Investments | | | 1,302,935 | | | | (218,288 | ) | | | 1,144,493 | | | | 40,050 | |
| Net Unrealized Depreciation on Foreign Currency Translations | | | — | | | | (826 | ) | | | (3,729 | ) | | | — | |
| Net Assets | | $ | 66,201,777 | | | $ | 12,447,365 | | | $ | 13,688,439 | | | $ | 2,295,886 | |
| Outstanding Shares of Beneficial Interest | | | | | | | | | | | | | | | | |
| (unlimited authorization — no par value) | | | 2,600,000 | | | | 550,000 | | | | 500,000 | | | | 100,000 | |
| Net Asset Value, Offering and Redemption Price Per Share | | $ | 25.46 | | | $ | 22.63 | | | $ | 27.38 | | | $ | 22.96 | |
The accompanying notes are an integral part of the financial statements.
| Statements of Assets and Liabilities |
| October 31, 2016 |
| | | Global X YieldCo
Index ETF | | | Global X S&P 500®
Catholic Values
ETF | |
| Assets: | | | | | | | | |
| Cost of Investments | | $ | 6,326,346 | | | $ | 40,377,383 | |
| Cost of Foreign Currency | | | 2,588 | | | | — | |
| Investments, at Value | | $ | 6,677,872 | | | $ | 39,832,007 | |
| Cash | | | 4,361 | | | | 35,304 | |
| Foreign Currency, at Value | | | 2,588 | | | | — | |
| Dividend and Interest Receivable | | | 13,775 | | | | 41,219 | |
| Receivable for Investment Securities Sold | | | 2,581 | | | | — | |
| Reclaim Receivable | | | 562 | | | | 330 | |
| Total Assets | | | 6,701,739 | | | | 39,908,860 | |
| Liabilities: | | | | | | | | |
| Payable due to Investment Adviser | | | 3,714 | | | | 9,851 | |
| Payable for Investment Securities Purchased | | | 2,583 | | | | 52 | |
| Total Liabilities | | | 6,297 | | | | 9,903 | |
| Net Assets | | $ | 6,695,442 | | | $ | 39,898,957 | |
| Net Assets Consist of: | | | | | | | | |
| Paid-in Capital | | $ | 7,411,901 | | | $ | 40,314,242 | |
| Undistributed (Distributions in Excess of) Net Investment Income | | | (16 | ) | | | 146,462 | |
| Accumulated Net Realized Loss on Investments and Foreign Currency Transactions | | | (1,067,942 | ) | | | (16,371 | ) |
| Net Unrealized Appreciation (Depreciation) on Investments | | | 351,526 | | | | (545,376 | ) |
| Net Unrealized Depreciation on Foreign Currency Translations | | | (27 | ) | | | — | |
| Net Assets | | $ | 6,695,442 | | | $ | 39,898,957 | |
| Outstanding Shares of Beneficial Interest | | | | | | | | |
| (unlimited authorization — no par value) | | | 600,000 | | | | 1,550,000 | |
| Net Asset Value, Offering and Redemption Price Per Share | | $ | 11.16 | | | $ | 25.74 | |
The accompanying notes are an integral part of the financial statements.
| Statements of Operations |
| For the year ended October 31, 2016 |
| | | Global X
SuperDividend®
ETF | | | Global X
SuperDividend® U.S.
ETF | | | Global X
SuperDividend®
Emerging
Markets ETF | | | Global X
SuperDividend®
REIT ETF | |
| Investment Income: | | | | | | | | | | | | | | | | |
| Dividend Income | | $ | 48,885,116 | | | $ | 12,205,935 | | | $ | 181,222 | | | $ | 852,155 | |
| Interest Income | | | 2,040 | | | | 979 | | | | — | | | | — | |
| Security Lending Income | | | 1,819,134 | | | | 333,596 | | | | — | | | | — | |
| Less: Foreign Taxes Withheld | | | (1,537,048 | ) | | | — | | | | (12,472 | ) | | | (19,174 | ) |
| Total Investment Income | | | 49,169,242 | | | | 12,540,510 | | | | 168,750 | | | | 832,981 | |
| Supervision and Administration Fees(1) | | | 4,565,595 | | | | 1,338,851 | | | | 21,355 | | | | 69,127 | |
| Custodian Fees | | | 7,009 | | | | 3,610 | | | | 56 | | | | 76 | |
| Total Expenses | | | 4,572,604 | | | | 1,342,461 | | | | 21,411 | | | | 69,203 | |
| Net Investment Income | | | 44,596,638 | | | | 11,198,049 | | | | 147,339 | | | | 763,778 | |
| Net Realized Loss on: | | | | | | | | | | | | | | | | |
| Investments | | | (47,081,347 | )(2) | | | (35,817,624 | )(2) | | | (734,085 | ) | | | (104,970 | ) |
| Foreign Currency Transactions | | | (115,835 | ) | | | — | | | | (5,254 | ) | | | (2,242 | ) |
| Net Realized Loss on Investments and Foreign Currency Transactions | | | (47,197,182 | ) | | | (35,817,624 | ) | | | (739,339 | ) | | | (107,212 | ) |
| Net Change in Unrealized Appreciation (Depreciation) on: | | | | | | | | | | | | | | | | |
| Investments | | | 42,752,428 | | | | 29,835,507 | | | | 1,090,020 | | | | (135,222 | ) |
| Foreign Currency Translations | | | (27,463 | ) | | | — | | | | 656 | | | | (81 | ) |
| Net Change in Unrealized Appreciation (Depreciation) on Investments and Foreign Currency Translations | | | 42,724,965 | | | | 29,835,507 | | | | 1,090,676 | | | | (135,303 | ) |
| Net Realized and Unrealized Gain (Loss) on Investments and Foreign Currency Transactions and Translations | | | (4,472,217 | ) | | | (5,982,117 | ) | | | 351,337 | | | | (242,515 | ) |
| Net Increase in Net Assets Resulting from Operations | | $ | 40,124,421 | | | $ | 5,215,932 | | | $ | 498,676 | | | $ | 521,263 | |
| (1) | The Supervision and Administration fees reflect the supervisory and administrative fee, which includes fees paid by the Funds for the investment advisory services provided by the Adviser. (See Note 3 in Notes to Financial Statements.) |
| (2) | Includes realized gains (losses) as a result of in-kind redemptions. (See Note 4 in Notes to Financial Statements.) |
The accompanying notes are an integral part of the financial statements.
| Statements of Operations |
| For the year ended October 31, 2016 |
| | | Global X
SuperIncome™
Preferred ETF | | | Global X Social
Media Index ETF | | | Global X |
JPMorgan
Efficiente Index
ETF | | | Global X |
JPMorgan US
Sector Rotator
Index ETF | |
| Investment Income: | | | | | | | | | | | | | | | | |
| Dividend Income | | $ | 15,618,881 | | | $ | 632,869 | | | $ | 208,133 | | | $ | 304,684 | |
| Interest Income | | | 1,310 | | | | 129 | | | | 36 | | | | 148 | |
| Security Lending Income | | | 331,801 | | | | 35,567 | | | | — | | | | — | |
| Less: Foreign Taxes Withheld | | | — | | | | (25,135 | ) | | | — | | | | — | |
| Total Investment Income | | | 15,951,992 | | | | 643,430 | | | | 208,169 | | | | 304,832 | |
| Supervision and Administration Fees(1) | | | 1,251,903 | | | | 544,333 | | | | 50,587 | | | | 95,945 | |
| Custodian Fees | | | 1,711 | | | | 360 | | | | 6 | | | | 81 | |
| Total Expenses | | | 1,253,614 | | | | 544,693 | | | | 50,593 | | | | 96,026 | |
| Net Investment Income | | | 14,698,378 | | | | 98,737 | | | | 157,576 | | | | 208,806 | |
| Net Realized Gain (Loss) on: | | | | | | | | | | | | | | | | |
| Investments (2) | | | (15,342,553 | ) | | | (9,516,754 | ) | | | 264,481 | | | | 397,550 | |
| Foreign Currency Transactions | | | — | | | | (33,775 | ) | | | — | | | | — | |
| Net Realized Gain (Loss) on Investments and Foreign Currency Transactions | | | (15,342,553 | ) | | | (9,550,529 | ) | | | 264,481 | | | | 397,550 | |
| Net Change in Unrealized Appreciation (Depreciation) on: | | | | | | | | | | | | | | | | |
| Investments | | | 8,059,993 | | | | 15,463,320 | | | | (22,888 | ) | | | (106,031 | ) |
| Foreign Currency Translations | | | — | | | | (1,429 | ) | | | — | | | | — | |
| Net Change in Unrealized Appreciation (Depreciation) on Investments and Foreign Currency Translations | | | 8,059,993 | | | | 15,461,891 | | | | (22,888 | ) | | | (106,031 | ) |
| Net Realized and Unrealized Gain (Loss) on Investments and Foreign Currency Transactions and Translations | | | (7,282,560 | ) | | | 5,911,362 | | | | 241,593 | | | | 291,519 | |
| Net Increase in Net Assets Resulting from Operations | | $ | 7,415,818 | | | $ | 6,010,099 | | | $ | 399,169 | | | $ | 500,325 | |
| (1) | The Supervision and Administration fees reflect the supervisory and administrative fee, which includes fees paid by the Funds for the investment advisory services provided by the Adviser. (See Note 3 in Notes to Financial Statements.) |
| (2) | Includes realized gains (losses) as a result of in-kind redemptions. (See Note 4 in Notes to Financial Statements.) |
The accompanying notes are an integral part of the financial statements.
| Statements of Operations |
| For the year ended October 31, 2016 |
| | | Global X
Permanent ETF | | | Global X Guru®
Index ETF | | | Global X Guru®
Activist Index ETF | | | Global X Guru®
International
Index ETF | |
| Investment Income: | | | | | | | | | | | | | | | | |
| Dividend Income | | $ | 61,079 | | | $ | 1,263,781 | | | $ | 26,728 | | | $ | 24,006 | |
| Interest Income | | | 75,507 | | | | 279 | | | | — | | | | 6 | |
| Security Lending Income | | | — | | | | 137,852 | | | | — | | | | — | |
| Less: Foreign Taxes Withheld | | | (765 | ) | | | (2,037 | ) | | | (269 | ) | | | (3,602 | ) |
| Total Investment Income | | | 135,821 | | | | 1,399,875 | | | | 26,459 | | | | 20,410 | |
| Supervision and Administration Fees(1) | | | 44,325 | | | | 824,972 | | | | 11,452 | | | | 8,124 | |
| Custodian Fees | | | – | | | | 33 | | | | – | | | | 8 | |
| Total Expenses | | | 44,325 | | | | 825,005 | | | | 11,452 | | | | 8,132 | |
| Net Investment Income | | | 91,496 | | | | 574,870 | | | | 15,007 | | | | 12,278 | |
| Net Realized Gain (Loss) on: | | | | | | | | | | | | | | | | |
| Investments (2) | | | 153,489 | | | | (18,740,544 | ) | | | (129,919 | ) | | | (55,716 | ) |
| Foreign Currency Transactions | | | 76 | | | | — | | | | — | | | | — | |
| Net Realized Gain (Loss) on Investments and Foreign Currency Transactions | | | 153,565 | | | | (18,740,544 | ) | | | (129,919 | ) | | | (55,716 | ) |
| Net Change in Unrealized Appreciation on: | | | | | | | | | | | | | | | | |
| Investments | | | 235,914 | | | | 8,344,218 | | | | 27,944 | | | | 124,765 | |
| Net Change in Unrealized Appreciation on Investments and Foreign Currency Translations | | | 235,914 | | | | 8,344,218 | | | | 27,944 | | | | 124,765 | |
| Net Realized and Unrealized Gain (Loss) on Investments and Foreign Currency Transactions and Translations | | | 389,479 | | | | (10,396,326 | ) | | | (101,975 | ) | | | 69,049 | |
| Net Increase (Decrease) in Net Assets Resulting from Operations | | $ | 480,975 | | | $ | (9,821,456 | ) | | $ | (86,968 | ) | | $ | 81,327 | |
| (1) | The Supervision and Administration fees reflect the supervisory and administrative fee, which includes fees paid by the Funds for the investment advisory services provided by the Adviser. (See Note 3 in Notes to Financial Statements.) |
| (2) | Includes realized gains (losses) as a result of in-kind redemptions. (See Note 4 in Notes to Financial Statements.) |
The accompanying notes are an integral part of the financial statements.
| Statements of Operations |
| For the year ended October 31, 2016 |
| | | Global X Scientific
Beta US ETF | | | Global X Scientific
Beta Europe ETF | | | Global X Scientific
Beta Japan ETF | | | Global X Scientific
Beta Asia ex-Japan
ETF | |
| Investment Income: | | | | | | | | | | | | | | | | |
| Dividend Income | | $ | 685,769 | | | $ | 379,480 | | | $ | 261,316 | | | $ | 91,164 | |
| Interest Income | | | 2 | | | | — | | | | — | | | | — | |
| Less: Foreign Taxes Withheld | | | (75 | ) | | | (31,977 | ) | | | (30,585 | ) | | | (3,239 | ) |
| Total Investment Income | | | 685,696 | | | | 347,503 | | | | 230,731 | | | | 87,925 | |
| Supervision and Administration Fees(1) | | | 118,569 | | | | 40,414 | | | | 41,185 | | | | 8,370 | |
| Tax Expense | | | 2 | | | | – | | | | – | | | | – | |
| Custodian Fees | | | 1 | | | | 29 | | | | 358 | | | | 22 | |
| Total Expenses | | | 118,572 | | | | 40,443 | | | | 41,543 | | | | 8,392 | |
| Waiver of Supervision and Administration Fees | | | (50,604 | ) | | | – | | | | – | | | | – | |
| Net Expenses | | | 67,968 | | | | 40,443 | | | | 41,543 | | | | 8,392 | |
| Net Investment Income | | | 617,728 | | | | 307,060 | | | | 189,188 | | | | 79,533 | |
| Net Realized Gains (Loss) on: | | | | | | | | | | | | | | | | |
| Investments (2) | | | (471,109 | ) | | | (275,437 | ) | | | (108,584 | ) | | | (206,898 | ) |
| Foreign Currency Transactions | | | — | | | | (5,291 | ) | | | 8,793 | | | | 117 | |
| Net Realized Loss on Investments and Foreign Currency Transactions | | | (471,109 | ) | | | (280,728 | ) | | | (99,791 | ) | | | (206,781 | ) |
| Net Change in Unrealized Appreciation (Depreciation) on: | | | | | | | | | | | | | | | | |
| Investments | | | 1,327,566 | | | | (153,533 | ) | | | 1,146,251 | | | | 322,729 | |
| Foreign Currency Translations | | | — | | | | (820 | ) | | | (3,651 | ) | | | 31 | |
| Net Change in Unrealized Appreciation (Depreciation) on Investments and Foreign Currency Translations | | | 1,327,566 | | | | (154,353 | ) | | | 1,142,600 | | | | 322,760 | |
| Net Realized and Unrealized Gain (Loss) on Investments and Foreign Currency Transactions and Translations | | | 856,457 | | | | (435,081 | ) | | | 1,042,809 | | | | 115,979 | |
| Net Increase (Decrease) in Net Assets Resulting from Operations | | $ | 1,474,185 | | | $ | (128,021 | ) | | $ | 1,231,997 | | | $ | 195,512 | |
| (1) | The Supervision and Administration fees reflect the supervisory and administrative fee, which includes fees paid by the Funds for the investment advisory services provided by the Adviser. (See Note 3 in Notes to Financial Statements.) |
The accompanying notes are an integral part of the financial statements.
| Statements of Operations |
| For the year or period ended October 31, 2016 |
| | | Global X YieldCo
Index ETF | | | Global X S&P
500® Catholic
Values ETF(3) | |
| Investment Income: | | | | | | | | |
| Dividend Income | | $ | 232,633 | | | $ | 169,651 | |
| Interest Income | | | 10 | | | | 1 | |
| Less: Foreign Taxes Withheld | | | (12,791 | ) | | | (41 | ) |
| Total Investment Income | | | 219,852 | | | | 169,611 | |
| Supervision and Administration Fees(1) | | | 32,239 | | �� | | 32,365 | |
| Custodian Fees | | | 390 | | | | 2 | |
| Total Expenses | | | 32,629 | | | | 32,367 | |
| Waiver of Supervision and Administration Fees | | | – | | | | (8,298 | ) |
| Net Expenses | | | 32,629 | | | | 24,069 | |
| Net Investment Income | | | 187,223 | | | | 145,542 | |
| Net Realized Gain (Loss) on: | | | | | | | | |
| Investments | | | (878,444 | )(2) | | | (15,451 | ) |
| Foreign Currency Transactions | | | 316 | | | | — | |
| Net Realized Loss on Investments and Foreign Currency Transactions | | | (878,128 | ) | | | (15,451 | ) |
| Net Change in Unrealized Appreciation (Depreciation) on: | | | | | | | | |
| Investments | | | 1,238,969 | | | | (545,376 | ) |
| Foreign Currency Translations | | | (27 | ) | | | — | |
| Net Change in Unrealized Appreciation (Depreciation) on Investments and Foreign Currency Translations | | | 1,238,942 | | | | (545,376 | ) |
| Net Realized and Unrealized Gain (Loss) on Investments and Foreign Currency Transactions and Translations | | | 360,814 | | | | (560,827 | ) |
| Net Increase (Decrease) in Net Assets Resulting from Operations | | $ | 548,037 | | | $ | (415,285 | ) |
| (1) | The Supervision and Administration fees reflect the supervisory and administrative fee, which includes fees paid by the Funds for the investment advisory services provided by the Adviser. (See Note 3 in Notes to Financial Statements.) |
| (2) | Includes realized gains (losses) as a result of in-kind redemptions. (See Note 4 in Notes to Financial Statements.) |
| (3) | Fund commenced operations on April 18, 2016. |
The accompanying notes are an integral part of the financial statements.
| Statements of Changes in Net Assets |
| |
| | | Global X SuperDividend® ETF | | | Global X SuperDividend® U.S. ETF | |
| | | Year Ended
October 31, 2016 | | | Year Ended
October 31, 2015 | | | Year Ended
October 31, 2016 | | | Year Ended
October 31, 2015 | |
| Operations: | | | | | | | | | | | | | | | | |
| Net Investment Income | | $ | 44,596,638 | | | $ | 55,764,634 | | | $ | 11,198,049 | | | $ | 18,390,959 | |
| Net Realized Loss on Investments and Foreign Currency Transactions(1) | | | (47,197,182 | ) | | | (38,152,069 | ) | | | (35,817,624 | ) | | | (14,851,179 | ) |
| Net Change in Unrealized Appreciation (Depreciation) on Investments and Foreign Currency Translations | | | 42,724,965 | | | | (115,526,605 | ) | | | 29,835,507 | | | | (32,039,760 | ) |
| Net Increase (Decrease) in Net Assets Resulting from Operations | | | 40,124,421 | | | | (97,914,040 | ) | | | 5,215,932 | | | | (28,499,980 | ) |
| Dividends and Distributions from: | | | | | | | | | | | | | | | | |
| Net Investment Income | | | (50,746,230 | ) | | | (63,792,372 | ) | | | (12,821,203 | ) | | | (13,048,101 | ) |
| Net Realized Gains | | | — | | | | (1,980,385 | ) | | | — | | | | — | |
| Return of Capital | | | (5,683,920 | ) | | | — | | | | (8,107,347 | ) | | | (7,048,014 | ) |
| Total Dividends and Distributions | | | (56,430,150 | ) | | | (65,772,757 | ) | | | (20,928,550 | ) | | | (20,096,115 | ) |
| Capital Share Transactions: | | | | | | | | | | | | | | | | |
| Issued | | | 49,804,205 | | | | 105,826,823 | | | | 127,291,547 | | | | 113,535,136 | |
| Redeemed | | | (112,348,453 | ) | | | (99,050,071 | ) | | | (48,180,940 | ) | | | (66,655,050 | ) |
| Increase (Decrease) in Net Assets from Capital Share Transactions | | | (62,544,248 | ) | | | 6,776,752 | | | | 79,110,607 | | | | 46,880,086 | |
| Total Increase (Decrease) in Net Assets | | | (78,849,977 | ) | | | (156,910,045 | ) | | | 63,397,989 | | | | (1,716,009 | ) |
| Net Assets: | | | | | | | | | | | | | | | | |
| Beginning of Year | | | 880,666,002 | | | | 1,037,576,047 | | | | 274,998,625 | | | | 276,714,634 | |
| End of Year | | $ | 801,816,025 | | | $ | 880,666,002 | | | $ | 338,396,614 | | | $ | 274,998,625 | |
| Distributions in Excess of Net Investment Income | | $ | (1,599,748 | ) | | $ | (5,638,231 | ) | | $ | (1 | ) | | $ | — | |
| Share Transactions: | | | | | | | | | | | | | | | | |
| Issued | | | 2,400,000 | | | | 4,550,000 | | | | 5,200,000 | | | | 3,950,000 | |
| Redeemed | | | (5,800,000 | ) | | | (4,700,000 | ) | | | (2,000,000 | ) | | | (2,400,000 | ) |
| Net Increase (Decrease) in Shares Outstanding from Share Transactions | | | (3,400,000 | ) | | | (150,000 | ) | | | 3,200,000 | | | | 1,550,000 | |
| (1) | Includes realized gains (losses) as a result of in-kind redemptions. (See Note 4 in Notes to Financial Statements.) |
The accompanying notes are an integral part of the financial statements.
| Statements of Changes in Net Assets |
| |
| | | Global X SuperDividend® Emerging
Markets ETF | | | Global X SuperDividend® REIT ETF | |
| | | Year Ended
October 31, 2016 | | | Period Ended
October 31, 2015(1) | | | Year Ended
October 31, 2016 | | | Period Ended
October 31, 2015(1) | |
| Operations: | | | | | | | | | | | | | | | | |
| Net Investment Income | | $ | 147,339 | | | $ | 141,924 | | | $ | 763,778 | | | $ | 115,415 | |
| Net Realized Gain (Loss) on Investments and Foreign Currency Transactions | | | (739,339 | ) | | | (12,896 | ) | | | (107,212 | ) | | | 11,788 | |
| Net Change in Unrealized Appreciation (Depreciation) on Investments and Foreign Currency Translations | | | 1,090,676 | | | | (470,140 | ) | | | (135,303 | ) | | | (362,646 | ) |
| Net Increase (Decrease) in Net Assets Resulting from Operations | | | 498,676 | | | | (341,112 | ) | | | 521,263 | | | | (235,443 | ) |
| Dividends and Distributions from: | | | | | | | | | | | | | | | | |
| Net Investment Income | | | (191,294 | ) | | | (110,575 | ) | | | (892,500 | ) | | | (113,850 | ) |
| Total Dividends and Distributions | | | (191,294 | ) | | | (110,575 | ) | | | (892,500 | ) | | | (113,850 | ) |
| Capital Share Transactions: | | | | | | | | | | | | | | | | |
| Issued | | | — | | | | 3,884,738 | | | | 30,719,755 | | | | 4,303,098 | |
| Increase in Net Assets from Capital Share Transactions | | | — | | | | 3,884,738 | | | | 30,719,755 | | | | 4,303,098 | |
| Total Increase in Net Assets | | | 307,382 | | | | 3,433,051 | | | | 30,348,518 | | | | 3,953,805 | |
| Net Assets: | | | | | | | | | | | | | | | | |
| Beginning of Year/Period | | | 3,433,051 | | | | — | | | | 3,953,805 | | | | — | |
| End of Year/Period | | $ | 3,740,433 | | | $ | 3,433,051 | | | $ | 34,302,323 | | | $ | 3,953,805 | |
Undistributed (Distributions in Excess of) Net Investment Income | | $ | 1,635 | | | $ | 26,374 | | | $ | (80,141 | ) | | $ | 18,276 | |
| Share Transactions: | | | | | | | | | | | | | | | | |
| Issued | | | — | | | | 250,000 | | | | 2,050,000 | | | | 300,000 | |
| Net Increase in Shares Outstanding from Share Transactions | | | — | | | | 250,000 | | | | 2,050,000 | | | | 300,000 | |
| (1) | The Fund commenced operations on March 16, 2015. |
The accompanying notes are an integral part of the financial statements.
| Statements of Changes in Net Assets |
| |
| | | Global X SuperIncome™ Preferred
ETF | | | Global X Social Media Index ETF | |
| | | Year Ended
October 31, 2016 | | | Year Ended
October 31, 2015 | | | Year Ended
October 31, 2016 | | | Year Ended
October 31, 2015 | |
| Operations: | | | | | | | | | | | | | | | | |
| Net Investment Income | | $ | 14,698,378 | | | $ | 16,395,904 | | | $ | 98,737 | | | $ | 43,682 | |
| Net Realized Gain (Loss) on Investments and Foreign Currency Transactions(1) | | | (15,342,553 | ) | | | (6,016,791 | ) | | | (9,550,529 | ) | | | 3,402,707 | |
| Net Change in Unrealized Appreciation (Depreciation) on Investments and Foreign Currency Translations | | | 8,059,993 | | | | (16,410,848 | ) | | | 15,461,891 | | | | (3,954,102 | ) |
| Net Increase (Decrease) in Net Assets Resulting from Operations | | | 7,415,818 | | | | (6,031,735 | ) | | | 6,010,099 | | | | (507,713 | ) |
| Dividends and Distributions from: | | | | | | | | | | | | | | | | |
| Net Investment Income | | | (14,776,181 | ) | | | (16,693,614 | ) | | | (6,875 | ) | | | (57,330 | ) |
| Total Dividends and Distributions | | | (14,776,181 | ) | | | (16,693,614 | ) | | | (6,875 | ) | | | (57,330 | ) |
| Capital Share Transactions: | | | | | | | | | | | | | | | | |
| Issued | | | 37,190,345 | | | | 143,668,838 | | | | 94,491,559 | | | | 47,160,234 | |
| Redeemed | | | (33,050,541 | ) | | | (48,391,387 | ) | | | (43,528,797 | ) | | | (95,868,254 | ) |
| Increase (Decrease) in Net Assets from Capital Share Transactions | | | 4,139,804 | | | | 95,277,451 | | | | 50,962,762 | | | | (48,708,020 | ) |
| Total Increase (Decrease) in Net Assets | | | (3,220,559 | ) | | | 72,552,102 | | | | 56,965,986 | | | | (49,273,063 | ) |
| Net Assets: | | | | | | | | | | | | | | | | |
| Beginning of Year | | | 235,426,807 | | | | 162,874,705 | | | | 77,144,752 | | | | 126,417,815 | |
| End of Year | | $ | 232,206,248 | | | $ | 235,426,807 | | | $ | 134,110,738 | | | $ | 77,144,752 | |
| Undistributed (Distributions in Excess of) Net Investment Income | | $ | 513,583 | | | $ | 267,725 | | | $ | 60,572 | | | $ | (32,203 | ) |
| Share Transactions: | | | | | | | | | | | | | | | | |
| Issued | | | 2,750,000 | | | | 9,850,000 | | | | 4,150,000 | | | | 2,500,000 | |
| Redeemed | | | (2,550,000 | ) | | | (3,450,000 | ) | | | (2,450,000 | ) | | | (5,050,000 | ) |
| Net Increase (Decrease) in Shares Outstanding from Share Transactions | | | 200,000 | | | | 6,400,000 | | | | 1,700,000 | | | | (2,550,000 | ) |
| (1) | Includes realized gains (losses) as a result of in-kind redemptions. (See Note 4 in Notes to Financial Statements.) |
The accompanying notes are an integral part of the financial statements.
| Statements of Changes in Net Assets |
| |
| | | Global X | JPMorgan Efficiente Index
ETF | | | Global X | JPMorgan US Sector
Rotator Index ETF | |
| | | Year Ended
October 31, 2016 | | | Year Ended
October 31, 2015 | | | Year Ended
October 31, 2016 | | | Year Ended
October 31, 2015 | |
| Operations: | | | | | | | | | | | | | | | | |
| Net Investment Income | | $ | 157,576 | | | $ | 234,522 | | | $ | 208,806 | | | $ | 164,481 | |
| Net Realized Gain (Loss) on Investments and Foreign Currency Transactions(1) | | | 264,481 | | | | (1,998,124 | ) | | | 397,550 | | | | (2,764,955 | ) |
| Net Change in Unrealized Appreciation (Depreciation) on Investments and Foreign Currency Translations | | | (22,888 | ) | | | (28,134 | ) | | | (106,031 | ) | | | 149,664 | |
| Net Increase (Decrease) in Net Assets Resulting from Operations | | | 399,169 | | | | (1,791,736 | ) | | | 500,325 | | | | (2,450,810 | ) |
| Dividends and Distributions from: | | | | | | | | | | | | | | | | |
| Net Investment Income | | | (312,783 | ) | | | (15,956 | ) | | | (197,183 | ) | | | (32,505 | ) |
| Net Realized Gains | | | — | | | | — | | | | — | | | | (3,065 | ) |
| Total Dividends and Distributions | | | (312,783 | ) | | | (15,956 | ) | | | (197,183 | ) | | | (35,570 | ) |
| Capital Share Transactions: | | | | | | | | | | | | | | | | |
| Issued | | | 1,121,897 | | | | 23,733,266 | | | | 3,404,929 | | | | 28,365,035 | |
| Redeemed | | | (2,296,047 | ) | | | (16,172,237 | ) | | | (7,129,086 | ) | | | (14,292,683 | ) |
| Increase (Decrease) in Net Assets from Capital Share Transactions | | | (1,174,150 | ) | | | 7,561,029 | | | | (3,724,157 | ) | | | 14,072,352 | |
| Total Increase (Decrease) in Net Assets | | | (1,087,764 | ) | | | 5,753,337 | | | | (3,421,015 | ) | | | 11,585,972 | |
| Net Assets: | | | | | | | | | | | | | | | | |
| Beginning of Year | | | 8,302,420 | | | | 2,549,083 | | | | 14,127,289 | | | | 2,541,317 | |
| End of Year | | $ | 7,214,656 | | | $ | 8,302,420 | | | $ | 10,706,274 | | | $ | 14,127,289 | |
| Undistributed Net Investment Income | | $ | 95,278 | | | $ | 256,863 | | | $ | 143,599 | | | $ | 131,976 | |
| Share Transactions: | | | | | | | | | | | | | | | | |
| Issued | | | 50,000 | | | | 900,000 | | | | 150,000 | | | | 1,100,000 | |
| Redeemed | | | (100,000 | ) | | | (650,000 | ) | | | (300,000 | ) | | | (600,000 | ) |
| Net Increase (Decrease) in Shares Outstanding from Share Transactions | | | (50,000 | ) | | | 250,000 | | | | (150,000 | ) | | | 500,000 | |
| (1) | Includes realized gains (losses) as a result of in-kind redemptions. (See Note 4 in Notes to Financial Statements.) |
The accompanying notes are an integral part of the financial statements.
| Statements of Changes in Net Assets |
| |
| | | Global X Permanent ETF | | | Global X Guru® Index ETF | |
| | | Year Ended
October 31, 2016 | | | Year Ended
October 31, 2015 | | | Year Ended
October 31, 2016 | | | Year Ended
October 31, 2015 | |
| Operations: | | | | | | | | | | | | | | | | |
| Net Investment Income | | $ | 91,496 | | | $ | 104,740 | | | $ | 574,870 | | | $ | 1,193,648 | |
| Net Realized Gain (Loss) on Investments and Foreign Currency Transactions(1) | | | 153,565 | | | | 36,454 | | | | (18,740,544 | ) | | | 10,809,860 | |
| Net Change in Unrealized Appreciation (Depreciation) on Investments and Foreign Currency Translations | | | 235,914 | | | | (97,856 | ) | | | 8,344,218 | | | | (28,388,415 | ) |
| Net Increase (Decrease) in Net Assets Resulting from Operations | | | 480,975 | | | | 43,338 | | | | (9,821,456 | ) | | | (16,384,907 | ) |
| Dividends and Distributions from: | | | | | | | | | | | | | | | | |
| Net Investment Income | | | (114,717 | ) | | | (105,609 | ) | | | (635,053 | ) | | | (4,215,674 | ) |
| Return of Capital | | | — | | | | — | | | | (125,403 | ) | | | — | |
| Total Dividends and Distributions | | | (114,717 | ) | | | (105,609 | ) | | | (760,456 | ) | | | (4,215,674 | ) |
| Capital Share Transactions: | | | | | | | | | | | | | | | | |
| Issued | | | — | | | | 3,655,316 | | | | 10,209,709 | | | | 11,909,461 | |
| Redeemed | | | (2,344,051 | ) | | | (1,258,291 | ) | | | (125,119,219 | ) | | | (243,390,062 | ) |
| Increase (Decrease) in Net Assets from Capital Share Transactions | | | (2,344,051 | ) | | | 2,397,025 | | | | (114,909,510 | ) | | | (231,480,601 | ) |
| Total Increase (Decrease) in Net Assets | | | (1,977,793 | ) | | | 2,334,754 | | | | (125,491,422 | ) | | | (252,081,182 | ) |
| Net Assets: | | | | | | | | | | | | | | | | |
| Beginning of Year | | | 10,773,714 | | | | 8,438,960 | | | | 184,504,854 | | | | 436,586,036 | |
| End of Year | | $ | 8,795,921 | | | $ | 10,773,714 | | | $ | 59,013,432 | | | $ | 184,504,854 | |
| Undistributed Net Investment Income | | $ | 70,936 | | | $ | 91,967 | | | $ | 3 | | | $ | 578,659 | |
| Share Transactions: | | | | | | | | | | | | | | | | |
| Issued | | | — | | | | 150,000 | | | | 450,000 | | | | 450,000 | |
| Redeemed | | | (100,000 | ) | | | (50,000 | ) | | | (5,600,000 | ) | | | (9,350,000 | ) |
| Net Increase (Decrease) in Shares Outstanding from Share Transactions | | | (100,000 | ) | | | 100,000 | | | | (5,150,000 | ) | | | (8,900,000 | ) |
| (1) | Includes realized gains (losses) as a result of in-kind redemptions. (See Note 4 in Notes to Financial Statements.) |
The accompanying notes are an integral part of the financial statements.
| Statements of Changes in Net Assets |
| |
| | | Global X Guru® Activist Index ETF | | | Global X Guru® International Index
ETF | |
| | | Year Ended
October 31, 2016 | | | Period Ended
October 31, 2015(1) | | | Year Ended
October 31, 2016 | | | Year Ended
October 31, 2015 | |
| Operations: | | | | | | | | | | | | | | | | |
| Net Investment Income | | $ | 15,007 | | | $ | 11,721 | | | $ | 12,278 | | | $ | 15,468 | |
| Net Realized Loss on Investments and Foreign Currency Transactions | | | (129,919 | )(2) | | | (268,719 | ) | | | (55,716 | )(2) | | | (92,603 | )(2) |
| Net Change in Unrealized Appreciation (Depreciation) on Investments and Foreign Currency Translations | | | 27,944 | | | | (57,523 | ) | | | 124,765 | | | | (177,481 | ) |
| Net Increase (Decrease) in Net Assets Resulting from Operations | | | (86,968 | ) | | | (314,521 | ) | | | 81,327 | | | | (254,616 | ) |
| Dividends and Distributions from: | | | | | | | | | | | | | | | | |
| Net Investment Income | | | (17,395 | ) | | | — | | | | (21,629 | ) | | | (16,359 | ) |
| Total Dividends and Distributions | | | (17,395 | ) | | | — | | | | (21,629 | ) | | | (16,359 | ) |
| Capital Share Transactions: | | | | | | | | | | | | | | | | |
| Issued | | | — | | | | 2,997,667 | | | | — | | | | — | |
| Redeemed | | | (1,244,003 | ) | | | — | | | | (678,888 | ) | | | (759,471 | ) |
| Increase (Decrease) in Net Assets from Capital Share Transactions | | | (1,244,003 | ) | | | 2,997,667 | | | | (678,888 | ) | | | (759,471 | ) |
| Total Increase (Decrease) in Net Assets | | | (1,348,366 | ) | | | 2,683,146 | | | | (619,190 | ) | | | (1,030,446 | ) |
| Net Assets: | | | | | | | | | | | | | | | | |
| Beginning of Year/Period | | | 2,683,146 | | | | — | | | | 1,312,967 | | | | 2,343,413 | |
| End of Year/Period | | $ | 1,334,780 | | | $ | 2,683,146 | | | $ | 693,777 | | | $ | 1,312,967 | |
| Undistributed Net Investment Income | | $ | 9,333 | | | $ | 11,721 | | | $ | 15,783 | | | $ | 9,574 | |
| Share Transactions: | | | | | | | | | | | | | | | | |
| Issued | | | — | | | | 200,000 | | | | — | | | | — | |
| Redeemed | | | (100,000 | ) | | | — | | | | (50,000 | ) | | | (50,000 | ) |
| Net Increase (Decrease) in Shares Outstanding from Share Transactions | | | (100,000 | ) | | | 200,000 | | | | (50,000 | ) | | | (50,000 | ) |
| (1) | The Fund commenced operations on April 28, 2015. |
| (2) | Includes realized gains (losses) as a result of in-kind redemptions. (See Note 4 in Notes to Financial Statements.) |
The accompanying notes are an integral part of the financial statements.
| Statements of Changes in Net Assets |
| |
| | | Global X Scientific Beta US ETF | | | Global X Scientific Beta Europe ETF | |
| | | Year Ended
October 31, 2016 | | | Period Ended
October 31, 2015(1) | | | Year Ended
October 31, 2016 | | | Period Ended
October 31, 2015(1) | |
| Operations: | | | | | | | | | | | | | | | | |
| Net Investment Income | | $ | 617,728 | | | $ | 17,850 | | | $ | 307,060 | | | $ | 25,313 | |
| Net Realized Loss on Investments and Foreign Currency Transactions | | | (471,109 | ) | | | (16,707 | ) | | | (280,728 | ) | | | (8,762 | ) |
| Net Change in Unrealized Appreciation (Depreciation) on Investments and Foreign Currency Translations | | | 1,327,566 | | | | (24,631 | ) | | | (154,353 | ) | | | (64,761 | ) |
| Net Increase (Decrease) in Net Assets Resulting from Operations | | | 1,474,185 | | | | (23,488 | ) | | | (128,021 | ) | | | (48,210 | ) |
| Dividends and Distributions from: | | | | | | | | | | | | | | | | |
| Net Investment Income | | | (29,000 | ) | | | — | | | | (34,296 | ) | | | — | |
| Total Dividends and Distributions | | | (29,000 | ) | | | — | | | | (34,296 | ) | | | — | |
| Capital Share Transactions: | | | | | | | | | | | | | | | | |
| Issued | | | 62,290,080 | | | | 2,490,000 | | | | 10,168,892 | | | | 2,489,000 | |
| Increase in Net Assets from Capital Share Transactions | | | 62,290,080 | | | | 2,490,000 | | | | 10,168,892 | | | | 2,489,000 | |
| Total Increase in Net Assets | | | 63,735,265 | | | | 2,466,512 | | | | 10,006,575 | | | | 2,440,790 | |
| Net Assets: | | | | | | | | | | | | | | | | |
| Beginning of Year/Period | | | 2,466,512 | | | | — | | | | 2,440,790 | | | | — | |
| End of Year/Period | | $ | 66,201,777 | | | $ | 2,466,512 | | | $ | 12,447,365 | | | $ | 2,440,790 | |
| Undistributed Net Investment Income | | $ | 622,202 | | | $ | 18,288 | | | $ | 296,809 | | | $ | 26,121 | |
| Share Transactions: | | | | | | | | | | | | | | | | |
| Issued | | | 2,500,000 | | | | 100,000 | | | | 450,000 | | | | 100,000 | |
| Net Increase in Shares Outstanding from Share Transactions | | | 2,500,000 | | | | 100,000 | | | | 450,000 | | | | 100,000 | |
| (1) | The Fund commenced operations on May 12, 2015. |
The accompanying notes are an integral part of the financial statements.
| Statements of Changes in Net Assets |
| |
| | | Global X Scientific Beta Japan ETF | | | Global X Scientific Beta Asia ex-Japan
ETF | |
| | | Year Ended
October 31, 2016 | | | Period Ended
October 31, 2015(1) | | | Year Ended
October 31, 2016 | | | Period Ended
October 31, 2015(1) | |
| Operations: | | | | | | | | | | | | | | | | |
| Net Investment Income | | $ | 189,188 | | | $ | 11,905 | | | $ | 79,533 | | | $ | 43,448 | |
| Net Realized Gain (Loss) on Investments and Foreign Currency Transactions | | | (99,791 | ) | | | 1,472 | | | | (206,781 | ) | | | (97,899 | ) |
| Net Change in Unrealized Appreciation (Depreciation) on Investments and Foreign Currency Translations | | | 1,142,600 | | | | (1,836 | ) | | | 322,760 | | | | (282,710 | ) |
| Net Increase (Decrease) in Net Assets Resulting from Operations | | | 1,231,997 | | | | 11,541 | | | | 195,512 | | | | (337,161 | ) |
| Dividends and Distributions from: | | | | | | | | | | | | | | | | |
| Net Investment Income | | | (20,668 | ) | | | — | | | | (62,417 | ) | | | — | |
| Net Realized Gains | | | (1,165 | ) | | | — | | | | — | | | | — | |
| Total Dividends and Distributions | | | (21,833 | ) | | | — | | | | (62,417 | ) | | | — | |
| Capital Share Transactions: | | | | | | | | | | | | | | | | |
| Issued | | | 9,959,734 | | | | 2,507,000 | | | | — | | | | 2,499,952 | |
| Increase in Net Assets from Capital Share Transactions | | | 9,959,734 | | | | 2,507,000 | | | | — | | | | 2,499,952 | |
| Total Increase in Net Assets | | | 11,169,898 | | | | 2,518,541 | | | | 133,095 | | | | 2,162,791 | |
| Net Assets: | | | | | | | | | | | | | | | | |
| Beginning of Year/Period | | | 2,518,541 | | | | — | | | | 2,162,791 | | | | — | |
| End of Year/Period | | $ | 13,688,439 | | | $ | 2,518,541 | | | $ | 2,295,886 | | | $ | 2,162,791 | |
| Undistributed Net Investment Income | | $ | 281,015 | | | $ | 12,102 | | | $ | 76,164 | | | $ | 46,987 | |
| Share Transactions: | | | | | | | | | | | | | | | | |
| Issued | | | 400,000 | | | | 100,000 | | | | — | | | | 100,000 | |
| Net Increase in Shares Outstanding from Share Transactions | | | 400,000 | | | | 100,000 | | | | — | | | | 100,000 | |
| (1) | The Fund commenced operations on May 12, 2015. |
The accompanying notes are an integral part of the financial statements.
| Statements of Changes in Net Assets |
| |
| | | Global X YieldCo Index ETF | | | Global X S&P
500® Catholic
Values ETF | |
| | | Year Ended
October 31, 2016 | | | Period Ended
October 31, 2015(1) | | | Period Ended
October 31, 2016(2) | |
| Operations: | | | | | | | | | | | | |
| Net Investment Income | | $ | 187,223 | | | $ | 50,554 | | | $ | 145,542 | |
| Net Realized Loss on Investments and Foreign Currency Transactions | | | (878,128 | )(3) | | | (161,801 | ) | | | (15,451 | ) |
| Net Change in Unrealized Appreciation (Depreciation) on Investments and Foreign Currency Translations | | | 1,238,942 | | | | (887,443 | ) | | | (545,376 | ) |
| Net Increase (Decrease) in Net Assets Resulting from Operations | | | 548,037 | | | | (998,690 | ) | | | (415,285 | ) |
| Dividends and Distributions from: | | | | | | | | | | | | |
| Net Investment Income | | | (199,159 | ) | | | (33,750 | ) | | | — | |
| Return of Capital | | | (76,200 | ) | | | — | | | | — | |
| Total Dividends and Distributions | | | (275,359 | ) | | | (33,750 | ) | | | — | |
| Capital Share Transactions: | | | | | | | | | | | | |
| Issued | | | 4,187,034 | | | | 4,351,749 | | | | 40,314,242 | |
| Redeemed | | | (1,083,579 | ) | | | — | | | | — | |
| Increase in Net Assets from Capital Share Transactions | | | 3,103,455 | | | | 4,351,749 | | | | 40,314,242 | |
| Total Increase in Net Assets | | | 3,376,133 | | | | 3,319,309 | | | | 39,898,957 | |
| Net Assets: | | | | | | | | | | | | |
| Beginning of Year/Period | | | 3,319,309 | | | | — | | | | — | |
| End of Year/Period | | $ | 6,695,442 | | | $ | 3,319,309 | | | $ | 39,898,957 | |
| Undistributed (Distributions in Excess of) Net Investment Income | | $ | (16 | ) | | $ | 10,723 | | | $ | 146,462 | |
| Share Transactions: | | | | | | | | | | | | |
| Issued | | | 400,000 | | | | 300,000 | | | | 1,550,000 | |
| Redeemed | | | (100,000 | ) | | | — | | | | — | |
| Net Increase in Shares Outstanding from Share Transactions | | | 300,000 | | | | 300,000 | | | | 1,550,000 | |
| (1) | The Fund commenced operations on May 27, 2015. |
| (2) | The Fund commenced operations on April 18, 2016. |
| (3) | Includes realized gains (losses) as a result of in-kind redemptions. (See Note 4 in Notes to Financial Statements.) |
The accompanying notes are an integral part of the financial statements.
| | Selected Per Share Data & Ratios |
| | For a Share Outstanding Throughout the Period |
| | | Net Asset
Value,
Beginning of
Period ($) | | | Net
Investment
Income ($)* | | | Net Realized
and
Unrealized
Gain (Loss)
on
Investments
($) | | | Total from
Operations
($) | | | Distribution
from Net
Investment
Income ($) | | | Distribution
from
Capital
Gains ($) | | | Return of
Capital ($) | | | Total from
Distributions
($) | | | Net Asset
Value, End
of Period ($) | | | Total
Return
(%)** | | | Net Assets
End of
Period
($)(000) | | | Ratio of
Expenses
to Average
Net Assets
(%) | | | Ratio of Net
Investment
Income
(Loss) to
Average
Net Assets
(%) | | | Portfolio
Turnover
(%)†† | |
| Global X SuperDividend® ETF | | | | | | | | | | | | | | | | | | | | | | | | | | | | | | | | | | | | | | | | | | | | | | | | | |
| 2016 | | | 20.65 | | | | 1.15 | | | | 0.08 | | | | 1.23 | | | | (1.30 | ) | | | — | | | | (0.15 | ) | | | (1.45 | ) | | | 20.43 | | | | 6.23 | | | | 801,816 | | | | 0.58 | | | | 5.67 | | | | 39.06 | |
| 2015 | | | 24.24 | | | | 1.26 | | | | (3.36 | ) | | | (2.10 | ) | | | (1.44 | ) | | | (0.05 | ) | | | — | | | | (1.49 | ) | | | 20.65 | | | | (9.01 | ) | | | 880,666 | | | | 0.58 | | | | 5.58 | | | | 26.12 | |
| 2014 | | | 23.74 | | | | 1.40 | | | | 0.56 | | | | 1.96 | | | | (1.46 | ) | | | — | | | | — | | | | (1.46 | ) | | | 24.24 | | | | 8.41 | | | | 1,037,576 | | | | 0.58 | | | | 5.71 | | | | 33.63 | |
| 2013 | | | 21.86 | | | | 1.34 | | | | 2.27 | | | | 3.61 | | | | (1.73 | ) | | | — | | | | — | | | | (1.73 | ) | | | 23.74 | | | | 17.34 | | | | 775,238 | | | | 0.58 | | | | 5.93 | | | | 43.64 | |
| 2012 | | | 21.76 | | | | 1.62 | | | | 0.09 | | | | 1.71 | | | | (1.61 | ) | | | — | | | | — | | | | (1.61 | ) | | | 21.86 | | | | 8.34 | | | | 162,828 | | | | 0.58 | | | | 7.53 | | | | 34.03 | |
| Global X SuperDividend® U.S. ETF | | | | | | | | | | | | | | | | | | | | | | | | | | | | | | | | | | | | | | | | | | | | | | | | | |
| 2016 | | | 25.23 | | | | 0.92# | | | | (0.40 | ) | | | 0.52 | | | | (1.07 | ) | | | — | | | | (0.68 | ) | | | (1.75 | ) | | | 24.00 | | | | 2.13 | | | | 338,397 | | | | 0.45 | | | | 3.77 | # | | | 53.45 | |
| 2015 | | | 29.60 | | | | 1.71 | | | | (4.19 | ) | | | (2.48 | ) | | | (1.23 | ) | | | — | | | | (0.66 | ) | | | (1.89 | ) | | | 25.23 | | | | (8.67 | ) | | | 274,999 | | | | 0.45 | | | | 6.25 | | | | 42.51 | |
| 2014 | | | 25.94 | | | | 1.78 | | | | 3.45 | | | | 5.23 | | | | (1.41 | ) | | | — | | | | (0.16 | ) | | | (1.57 | ) | | | 29.60 | | | | 20.80 | | | | 276,715 | | | | 0.45 | | | | 6.32 | | | | 40.04 | |
| 2013(1) | | | 25.15 | | | | 0.98 | | | | 0.82 | | | | 1.80 | | | | (0.91 | ) | | | — | | | | (0.10 | ) | | | (1.01 | ) | | | 25.94 | | | | 7.32 | | | | 51,879 | | | | 0.45 | † | | | 6.02 | † | | | 20.36 | |
| Global X SuperDividend® Emerging Markets ETF | | | | | | | | | | | | | | | | | | | | | | | | | | | | | | | | | | | | | | | | | | | | | |
| 2016 | | | 13.73 | | | | 0.59 | | | | 1.41 | | | | 2.00 | | | | (0.77 | ) | | | — | | | | — | | | | (0.77 | ) | | | 14.96 | | | | 15.58 | | | | 3,740 | | | | 0.65 | | | | 4.49 | | | | 64.83 | |
| 2015(2) | | | 14.90 | | | | 0.66 | | | | (1.34 | ) | | | (0.68 | ) | | | (0.49 | ) | | | — | | | | — | | | | (0.49 | ) | | | 13.73 | | | | (4.89 | ) | | | 3,433 | | | | 0.65 | † | | | 6.72 | † | | | 1.25 | |
| Global X SuperDividend® REIT ETF | | | | | | | | | | | | | | | | | | | | | | | | | | | | | | | | | | | | | | | | | | | | | | | | | |
| 2016 | | | 13.18 | | | | 0.91 | | | | 1.72 | | | | 2.63 | | | | (1.21 | ) | | | — | | | | — | | | | (1.21 | ) | | | 14.60 | | | | 21.01 | | | | 34,302 | | | | 0.56 | | | | 6.23 | | | | 16.87 | |
| 2015(2) | | | 15.12 | | | | 0.63 | | | | (1.95 | ) | | | (1.32 | ) | | | (0.62 | ) | | | — | | | | — | | | | (0.62 | ) | | | 13.18 | | | | (8.86 | ) | | | 3,954 | | | | 0.54 | † | | | 7.20 | † | | | 1.45 | |
| Global X SuperIncome™ Preferred ETF | | | | | | | | | | | | | | | | | | | | | | | | | | | | | | | | | | | | | | | | | | | | | |
| 2016 | | | 13.49 | | | | 0.91 | | | | (0.33 | ) | | | 0.58 | | | | (0.91 | ) | | | — | | | | — | | | | (0.91 | ) | | | 13.16 | | | | 4.44 | | | | 232,206 | | | | 0.58 | | | | 6.81 | | | | 47.62 | |
| 2015 | | | 14.74 | | | | 0.95 | | | | (1.21 | ) | | | (0.26 | ) | | | (0.99 | ) | | | — | | | | — | | | | (0.99 | ) | | | 13.49 | | | | (1.95 | ) | | | 235,427 | | | | 0.58 | | | | 6.68 | | | | 76.54 | |
| 2014 | | | 14.81 | | | | 1.01 | | | | (0.02 | ) | | | 0.99 | | | | (1.06 | ) | | | — | | | | — | | | | (1.06 | ) | | | 14.74 | | | | 6.89 | | | | 162,875 | | | | 0.58 | | | | 6.78 | | | | 85.07 | |
| 2013^ | | | 14.65 | | | | 0.31 | | | | 0.18 | | | | 0.49 | | | | (0.33 | ) | | | — | | | | — | | | | (0.33 | ) | | | 14.81 | | | | 3.38 | | | | 59,965 | | | | 0.58 | | | | 6.34 | | | | 61.86 | |
| 2013(3) | | | 15.02 | | | | 1.13 | | | | (0.47 | ) | | | 0.66 | | | | (1.02 | ) | | | (0.01 | ) | | | — | | | | (1.03 | ) | | | 14.65 | | | | 4.46 | | | | 35,169 | | | | 0.58 | † | | | 7.84 | † | | | 91.98 | |
| Global X Social Media Index ETF | | | | | | | | | | | | | | | | | | | | | | | | | | | | | | | | | | | | | | | | | | | | | | | | | |
| 2016 | | | 19.29 | | | | 0.02 | | | | 4.22 | | | | 4.24 | | | | — | | | | — | | | | — | | | | *** | | | | 23.53 | | | | 21.99 | | | | 134,111 | | | | 0.65 | | | | 0.12 | | | | 39.89 | |
| 2015 | | | 19.30 | | | | 0.01 | | | | (0.01 | ) | | | — | | | | (0.01 | ) | | | — | | | | — | | | | (0.01 | ) | | | 19.29 | | | | — | | | | 77,145 | | | | 0.65 | | | | 0.04 | | | | 26.51 | |
| 2014 | | | 19.38 | | | | — | | | | (0.08 | ) | | | (0.08 | ) | | | — | | | | — | | | | — | | | | — | | | | 19.30 | | | | (0.41 | ) | | | 126,418 | | | | 0.65 | | | | (0.01 | ) | | | 26.52 | |
| 2013 | | | 12.83 | | | | — | | | | 6.66 | | | | 6.66 | | | | (0.11 | ) | | | — | | | | — | | | | (0.11 | ) | | | 19.38 | | | | 52.34 | | | | 95,948 | | | | 0.65 | | | | (0.01 | ) | | | 55.96 | |
| 2012(4) | | | 14.93 | | | | 0.12 | | | | (2.22 | ) | | | (2.10 | ) | | | — | | | | — | | | | — | | | | — | | | | 12.83 | | | | (14.07 | ) | | | 13,471 | | | | 0.65 | † | | | 0.88 | † | | | 91.78 | |
| Global X | JPMorgan Efficiente Index ETF | | | | | | | | | | | | | | | | | | | | | | | | | | | | | | | | | | | | | | | | | | | | | |
| 2016 | | | 23.72 | | | | 0.51 | | | | 0.86 | | | | 1.37 | | | | (1.04 | ) | | | — | | | | — | | | | (1.04 | ) | | | 24.05 | | | | 6.12 | | | | 7,215 | | | | 0.69 | | | | 2.15 | | | | 387.39 | |
| 2015 | | | 25.49 | | | | 0.43 | | | | (2.04 | ) | | | (1.61 | ) | | | (0.16 | ) | | | — | | | | — | | | | (0.16 | ) | | | 23.72 | | | | (6.37 | ) | | | 8,302 | | | | 0.69 | | | | 1.70 | | | | 311.58 | |
| 2014(5) | | | 24.95 | | | | — | | | | 0.54 | | | | 0.54 | | | | — | | | | — | | | | — | | | | — | | | | 25.49 | | | | 2.16 | | | | 2,549 | | | | 0.69 | † | | | (0.69 | )† | | | — | |
| Global X | JPMorgan US Sector Rotator Index ETF | | | | | | | | | | | | | | | | | | | | | | | | | | | | | | | | | | | | | | | | | | | | | |
| 2016 | | | 23.55 | | | | 0.35 | | | | 0.25 | | | | 0.60 | | | | (0.36 | ) | | | — | | | | — | | | | (0.36 | ) | | | 23.79 | | | | 2.60 | | | | 10,706 | | | | 0.69 | | | | 1.50 | | | | 839.83 | |
| 2015 | | | 25.41 | | | | 0.20 | | | | (1.94 | ) | | | (1.74 | ) | | | (0.11 | ) | | | (0.01 | ) | | | — | | | | (0.12 | ) | | | 23.55 | | | | (6.90 | ) | | | 14,127 | | | | 0.69 | | | | 0.82 | | | | 907.92 | |
| 2014(5) | | | 25.03 | | | | — | | | | 0.38 | | | | 0.38 | | | | — | | | | — | | | | — | | | | — | | | | 25.41 | | | | 1.52 | | | | 2,541 | | | | 0.69 | † | | | (0.69 | )† | | | 63.35 | |
| Global X Permanent ETF | | | | | | | | | | | | | | | | | | | | | | | | | | | | | | | | | | | | | | | | | | | | | | | | | |
| 2016 | | | 23.94 | | | | 0.24 | | | | 1.20 | | | | 1.44 | | | | (0.25 | ) | | | — | | | | — | | | | (0.25 | ) | | | 25.13 | | | | 6.13 | | | | 8,796 | | | | 0.48 | | | | 0.99 | | | | 42.12 | |
| 2015 | | | 24.11 | | | | 0.25 | | | | (0.19 | ) | | | 0.06 | | | | (0.23 | ) | | | — | | | | — | | | | (0.23 | ) | | | 23.94 | | | | 0.25 | | | | 10,774 | | | | 0.48 | | | | 1.03 | | | | 31.10 | |
| 2014 | | | 24.13 | | | | 0.24 | | | | 0.18 | | | | 0.42 | | | | (0.36 | ) | | | (0.08 | ) | | | — | | | | (0.44 | ) | | | 24.11 | | | | 1.84 | | | | 8,439 | | | | 0.48 | | | | 1.02 | | | | 24.63 | |
| 2013^ | | | 23.15 | | | | 0.07 | | | | 0.91 | | | | 0.98 | | | | — | | | | — | | | | — | | | | — | | | | 24.13 | | | | 4.23 | | | | 14,477 | | | | 0.48 | † | | | 0.90 | † | | | 3.08 | |
| 2013 | | | 24.77 | | | | 0.25 | | | | (1.66 | ) | | | (1.41 | ) | | | (0.21 | ) | | | — | | | | — | | | | (0.21 | ) | | | 23.15 | | | | (5.77 | ) | | | 15,048 | | | | 0.48 | | | | 0.98 | | | | 44.44 | |
| 2012(6) | | | 25.04 | | | | 0.09 | | | | (0.36 | ) | | | (0.27 | ) | | | — | | | | — | | | | — | | | | — | | | | 24.77 | | | | (1.08 | ) | | | 14,859 | | | | 0.48 | † | | | 0.92 | † | | | 14.89 | |
| * | Per share data calculated using average shares method. |
| ** | Total return is based on the change in net asset value of a share during the year or period and assumes reinvestment of dividends and distributions at net asset value. Total return is for the period indicated and periods of less than one year have not been annualized. The return shown does not reflect the deduction of taxes that a shareholder would pay on Fund distributions or the redemption of Fund shares. |
| *** | Amount rounds to less than $0.00. |
| † | Annualized. |
| †† | Portfolio turnover rate is for the period indicated and periods of less than one year have not been annualized. Excludes effect of in-kind transfers. |
| ^ | For the period July 1, 2013 to October 31, 2013. Effective July 1, 2013 the Global X Permanent ETF, Global X Guru® Index ETF (formerly Global X Top Guru Holdings Index ETF) and Global X SuperIncome™ Preferred ETF each changed their fiscal year end to October 31. |
| # | See Note 8 in the Notes to Financial Statements. |
| (1) | The Fund commenced operations on March 11, 2013. |
| (2) | The Fund commenced operations on March 16, 2015. |
| (3) | The Fund commenced operations on July 16, 2012. |
| (4) | The Fund commenced operations on November 14, 2011. |
| (5) | The Fund commenced operations on October 22, 2014. |
| (6) | The Fund commenced operations on February 7, 2012. |
Amounts designated as “—” are $0 or have been rounded to $0.
The accompanying notes are an integral part of the financial statements.
| | Selected Per Share Data & Ratios |
| | For a Share Outstanding Throughout the Period |
| | | Net Asset
Value,
Beginning of
Period ($) | | | Net
Investment
Income ($)* | | | Net Realized
and
Unrealized
Gain (Loss)
on
Investments
($) | | | Total from
Operations
($) | | | Distribution
from Net
Investment
Income ($) | | | Distribution
from
Capital
Gains ($) | | | Return
of
Capital
($) | | | Total from
Distributions
($) | | | Net Asset
Value, End
of Period ($) | | | Total
Return
(%)** | | | Net Assets
End of
Period
($)(000) | | | Ratio of
Expenses
to Average
Net Assets
(%) | | | Ratio of Net
Investment
Income to
Average
Net Assets
(%) | | | Portfolio
Turnover
(%)†† | |
| Global X Guru® Index ETF | | | | | | | | | | | | | | | | | | | | | | | | | | | | | | | | | | | | | | | | | | | | | | | | | |
| 2016 | | | 23.96 | | | | 0.12# | | | | (0.83 | ) | | | (0.71 | ) | | | (0.09 | ) | | | — | | | | (0.02 | ) | | | (0.11 | ) | | | 23.14 | | | | (2.97 | ) | | | 59,013 | | | | 0.75 | | | | 0.52# | | | | 102.07 | |
| 2015 | | | 26.30 | | | | 0.10 | | | | (2.16 | ) | | | (2.06 | ) | | | (0.28 | ) | | | — | | | | — | | | | (0.28 | ) | | | 23.96 | | | | (7.94 | ) | | | 184,505 | | | | 0.75 | | | | 0.39 | | | | 129.71 | |
| 2014 | | | 23.99 | | | | 0.22 | | | | 2.12 | | | | 2.34 | | | | (0.03 | ) | | | — | | | | — | | | | (0.03 | ) | | | 26.30 | | | | 9.76 | | | | 436,586 | | | | 0.75 | | | | 0.88 | | | | 128.37 | |
| 2013^ | | | 20.68 | | | | 0.01 | | | | 3.30 | | | | 3.31 | | | | — | | | | — | | | | — | | | | — | | | | 23.99 | | | | 16.01 | | | | 241,060 | | | | 0.75 | † | | | 0.10 | † | | | 24.89 | |
| 2013 | | | 15.83 | | | | 0.17 | | | | 5.66 | | | | 5.83 | | | | (0.20 | ) | | | (0.78 | ) | | | — | | | | (0.98 | ) | | | 20.68 | | | | 38.08 | | | | 52,740 | | | | 0.75 | | | | 0.85 | | | | 77.25 | |
| 2012(1) | | | 14.96 | | | | 0.02 | | | | 0.85 | | | | 0.87 | | | | — | | | | — | | | | — | | | | — | | | | 15.83 | | | | 5.82 | | | | 5,539 | | | | 0.75 | † | | | 1.90 | † | | | 1.90 | |
| Global X Guru® Activist Index ETF | | | | | | | | | | | | | | | | | | | | | | | | | | | | | | | | | | | | | | | | | | | | | | | | | |
| 2016 | | | 13.42 | | | | 0.13 | | | | (0.08 | ) | | | 0.05 | | | | (0.12 | ) | | | — | | | | — | | | | (0.12 | ) | | | 13.35 | | | | 0.37 | | | | 1,335 | | | | 0.75 | | | | 0.98 | | | | 82.02 | |
| 2015(2) | | | 15.05 | | | | 0.06 | | | | (1.69 | ) | | | (1.63 | ) | | | — | | | | — | | | | — | | | | — | | | | 13.42 | | | | (10.83 | ) | | | 2,683 | | | | 0.75 | † | | | 0.84 | † | | | 50.29 | |
| Global X Guru® International Index ETF | | | | | | | | | | | | | | | | | | | | | | | | | | | | | | | | | | | | | | | | | | | | | |
| 2016 | | | 13.13 | | | | 0.14 | | | | 0.83 | | | | 0.97 | | | | (0.22 | ) | | | — | | | | — | | | | (0.22 | ) | | | 13.88 | | | | 7.51 | | | | 694 | | | | 0.75 | | | | 1.13 | | | | 116.22 | |
| 2015 | | | 15.62 | | | | 0.12 | | | | (2.50 | ) | | | (2.38 | ) | | | (0.11 | ) | | | — | | | | — | | | | (0.11 | ) | | | 13.13 | | | | (15.31 | ) | | | 1,313 | | | | 0.75 | | | | 0.85 | | | | 118.14 | |
| 2014(3) | | | 14.83 | | | | 0.09 | | | | 0.70 | | | | 0.79 | | | | — | | | | — | | | | — | | | | — | | | | 15.62 | | | | 5.33 | | | | 2,343 | | | | 0.75 | † | | | 0.89 | † | | | 62.71 | |
| Global X Scientific Beta US ETF | | | | | | | | | | | | | | | | | | | | | | | | | | | | | | | | | | | | | | | | | | | | | | | | | |
| 2016 | | | 24.67 | | | | 0.46 | | | | 0.62 | | | | 1.08 | | | | (0.29 | ) | | | — | | | | — | | | | (0.29 | ) | | | 25.46 | | | | 4.43 | | | | 66,202 | | | | 0.20 | @ | | | 1.82 | | | | 32.54 | |
| 2015(4) | | | 24.90 | | | | 0.18 | | | | (0.41 | ) | | | (0.23 | ) | | | — | | | | — | | | | — | | | | — | | | | 24.67 | | | | (0.92 | ) | | | 2,467 | | | | 0.35 | † | | | 1.55 | † | | | 20.90 | |
| Global X Scientific Beta Europe ETF | | | | | | | | | | | | | | | | | | | | | | | | | | | | | | | | | | | | | | | | | | | | | | | | | |
| 2016 | | | 24.41 | | | | 0.66 | | | | (2.10 | ) | | | (1.44 | ) | | | (0.34 | ) | | | — | | | | — | | | | (0.34 | ) | | | 22.63 | | | | (5.96 | ) | | | 12,447 | | | | 0.38 | | | | 2.89 | | | | 35.72 | |
| 2015(4) | | | 24.89 | | | | 0.25 | | | | (0.73 | ) | | | (0.48 | ) | | | — | | | | — | | | | — | | | | — | | | | 24.41 | | | | (1.93 | ) | | | 2,441 | | | | 0.38 | † | | | 2.22 | † | | | 17.53 | |
| Global X Scientific Beta Japan ETF | | | | | | | | | | | | | | | | | | | | | | | | | | | | | | | | | | | | | | | | | | | | | | | | | |
| 2016 | | | 25.19 | | | | 0.44 | | | | 1.97 | | | | 2.41 | | | | (0.21 | ) | | | (0.01 | ) | | | — | | | | (0.22 | ) | | | 27.38 | | | | 9.63 | | | | 13,688 | | | | 0.38 | | | | 1.75 | | | | 82.57 | |
| 2015(4) | | | 25.07 | | | | 0.12 | | | | — | | | | 0.12 | | | | — | | | | — | | | | — | | | | — | | | | 25.19 | | | | 0.48 | | | | 2,519 | | | | 0.38 | † | | | 1.02 | † | | | 20.31 | |
| Global X Scientific Beta Asia ex-Japan ETF | | | | | | | | | | | | | | | | | | | | | | | | | | | | | | | | | | | | | | | | | | | | | |
| 2016 | | | 21.63 | | | | 0.80 | | | | 1.15 | | | | 1.95 | | | | (0.62 | ) | | | — | | | | — | | | | (0.62 | ) | | | 22.96 | | | | 9.29 | | | | 2,296 | | | | 0.38 | | | | 3.61 | | | | 74.44 | |
| 2015(4) | | | 24.89 | | | | 0.44 | | | | (3.70 | ) | | | (3.26 | ) | | | — | | | | — | | | | — | | | | — | | | | 21.63 | | | | (13.10 | ) | | | 2,163 | | | | 0.38 | † | | | 4.17 | † | | | 59.21 | |
| Global X YieldCo Index ETF | | | | | | | | | | | | | | | | | | | | | | | | | | | | | | | | | | | | | | | | | | | | | | | | | |
| 2016 | | | 11.06 | | | | 0.41# | | | | 0.35 | | | | 0.76 | | | | (0.48 | ) | | | — | | | | (0.18 | ) | | | (0.66 | ) | | | 11.16 | | | | 7.25 | | | | 6,695 | | | | 0.66 | | | | 3.78# | | | | 40.25 | |
| 2015(5) | | | 15.19 | | | | 0.20 | | | | (4.19 | ) | | | (3.99 | ) | | | (0.14 | ) | | | — | | | | — | | | | (0.14 | ) | | | 11.06 | | | | (26.39 | ) | | | 3,319 | | | | 0.65 | † | | | 3.72 | † | | | 22.97 | |
| Global X S&P 500® Catholic Values ETF | | | | | | | | | | | | | | | | | | | | | | | | | | | | | | | | | | | | | | | | | | | | | |
| 2016(6) | | | 25.14 | | | | 0.24 | | | | 0.36 | | | | 0.60 | | | | — | | | | — | | | | — | | | | — | | | | 25.74 | | | | 2.39 | | | | 39,899 | | | | 0.29 | †@ | | | 1.75 | † | | | 2.80 | |
| * | Per share data calculated using average shares method. |
| ** | Total return is based on the change in net asset value of a share during the year or period and assumes reinvestment of dividends and distributions at net asset value. Total return is for the period indicated and periods of less than one year have not been annualized. The return shown does not reflect the deduction of taxes that a shareholder would pay on Fund distributions or the redemption of Fund shares. |
| † | Annualized. |
| †† | Portfolio turnover rate is for the period indicated and periods of less than one year have not been annualized. Excludes effect of in-kind transfers. |
| @ | The ratio of expenses to Average Net Assets includes the effect of a waiver. If these offsets were excluded, the ratio would have been 0.35% and 0.39%, for the Global X Scientific Beta US ETF and the Global X S&P 500® Catholic Values ETF, respectively. |
| ^ | For the period July 1, 2013 to October 31, 2013. Effective July 1, 2013 the Global X Permanent ETF, Global X Guru® Index ETF (formerly Global X Top Guru Holdings Index ETF) and Global X SuperIncome™ Preferred ETF each changed their fiscal year end to October 31. |
| # | See Note 8 in the Notes to Financial Statements. |
| (1) | The Fund commenced operations on June 4, 2012. |
| (2) | The Fund commenced operations on April 28, 2015. |
| (3) | The Fund commenced operations on March 10, 2014. |
| (4) | The Fund commenced operations on May 12, 2015. |
| (5) | The Fund commenced operations on May 27, 2015. |
| (6) | The Fund commenced operations on April 18, 2016. |
Amounts designated as “—” are $0 or have been rounded to $0.
The accompanying notes are an integral part of the financial statements.
| Notes to Financial Statements |
| October 31, 2016 |
1. ORGANIZATION
The Global X Funds (the "Trust") is a Delaware statutory trust formed on March 6, 2008. The Trust is registered under the Investment Company Act of 1940, as amended, as an open-end management investment company. As of October 31, 2016, the Trust had one hundred portfolios, fifty-four of which were operational. The financial statements herein and the related notes pertain to the Global X SuperDividend® ETF, Global X SuperDividend® U.S. ETF, Global X MSCI SuperDividend® Emerging Markets ETF, Global X SuperDividend® REIT ETF, Global X SuperIncome™ Preferred ETF, Global X Social Media Index ETF, Global X| JPMorgan Efficiente Index ETF, Global X | JPMorgan US Sector Rotator Index ETF, | Global X Permanent ETF, Global X Guru® Index ETF, Global X Guru® Activist Index ETF, Global X Guru® International Index ETF, Global X Scientific Beta US ETF, Global X Scientific Beta Europe ETF, Global X Scientific Beta Japan ETF, Global X Scientific Beta Asia ex-Japan ETF, Global X YieldCo Index ETF and Global X S&P 500® Catholic Values ETF (each a “Fund” collectively, the “Funds”). Each Fund had elected non-diversification status.
2. SIGNIFICANT ACCOUNTING POLICIES
The following is a summary of the significant accounting policies followed by the Funds.
USE OF ESTIMATES – The Funds are investment companies that apply the accounting and reporting guidance issued in Topic 946 by the U.S. Financial Accounting Standards Board. The preparation of financial statements in conformity with U.S. generally accepted accounting principles ("U.S. GAAP") requires management to make estimates and assumptions that affect the reported amounts of assets and liabilities and disclosure of contingent assets and liabilities at the date of the financial statements and the reported amounts of increases and decreases in net assets from operations during the reporting period. Actual results could materially differ from those estimates.
RETURN OF CAPITAL ESTIMATES – Distributions received by the Funds from underlying master limited partnership (“MLP”) investments generally are comprised of income and return of capital. The Funds record investment income and return of capital based on estimates made at the time such distributions are received. Such estimates are based on historical information available from the MLPs and other industry sources. These estimates may subsequently be revised based on information received from the MLPs after their tax reporting periods are concluded.
MASTER LIMITED PARTNERSHIPS (“MLPs”) – Certain funds may invest in MLPs. MLPs are publicly traded partnerships engaged in the transportation, storage and processing of minerals and natural resources. By confining their operations to these specific activities, their interests, or units, are able to trade on public securities exchanges exactly like the shares of a corporation, without entity level taxation. To qualify as an MLP and to not be taxed as a corporation, a partnership must receive at least 90% of its income from qualifying sources as set forth in Section 7704(d) of the Internal Revenue Code of 1986, as amended (the “Code”). These qualifying sources include natural resource-based activities such as the processing, transportation and storage of mineral or natural resources. MLPs generally have two classes of owners: the general partner and limited partners. The general partner of an MLP is typically owned by a major energy company, an investment fund, the direct management of the MLP, or is an entity owned by one or more of such parties. The general partner may be structured as a private or publicly traded corporation or other entity. The general partner typically controls the operations and management of the MLP through an up to 2% equity interest in the MLP plus, in many cases, ownership of common units and subordinated units.
| Notes to Financial Statements (continued) |
| October 31, 2016 |
2. SIGNIFICANT ACCOUNTING POLICIES (continued)
MASTER LIMITED PARTNERSHIPS (“MLPs”) (concluded)
Limited partners typically own the remainder of the partnership, through ownership of common units, and have a limited role in the partnership’s operations and management. MLPs are typically structured such that common units and general partner interests have first priority to receive quarterly cash distributions up to an established minimum amount (“minimum quarterly distributions” or “MQD”). Common and general partner interests also accrue arrearages in distributions to the extent the MQD is not paid. Once common and general partner interests have been paid, subordinated units receive distributions of up to the MQD; however, subordinated units do not accrue arrearages. Distributable cash in excess of the MQD is paid to both common and subordinated units and is distributed to both common and subordinated units generally on a pro rata basis. The general partner is also eligible to receive incentive distributions if the general partner operates the business in a manner which results in distributions paid per common unit surpassing specified target levels. As the general partner increases cash distributions to the limited partners, the general partner receives an increasingly higher percentage of the incremental cash distributions.
SECURITY VALUATION - Securities listed on a securities exchange, market or automated quotation system for which quotations are readily available (except for securities traded on NASDAQ), including securities traded over the counter, are valued at the last quoted sale price on the primary exchange or market (foreign or domestic) on which they are traded (or at approximately 4:00 pm EST if a security’s primary exchange is normally open at that time), or, if there is no such reported sale, at the most recent mean between the quoted bid and asked prices (absent both bid and asked prices on such exchange, the bid price may be used).
For securities traded on NASDAQ, the NASDAQ official closing price will be used. If available, debt securities are priced based upon valuations provided by independent, third-party pricing agents. Such values generally reflect the last reported sales price if the security is actively traded. The third-party pricing agents may also value debt securities at an evaluated bid price by employing methodologies that utilize actual market transactions, broker-supplied valuations, or other methodologies designed to identify the market value for such securities. Debt obligations with remaining maturities of sixty days or less may be valued at their amortized cost, which approximates market value. The prices for foreign securities are reported in local currency and converted to U.S. dollars using currency exchange rates as of the reporting date. The exchange rates used by the Trust for valuation are captured as of the New York or London close each day. Prices for most securities held in the Funds are provided daily by recognized independent pricing agents. If a security price cannot be obtained from an independent, third-party pricing agent, the Funds seek to obtain a bid price from at least one independent broker.
Securities for which market prices are not "readily available" are valued in accordance with fair value procedures established by the Board of Trustees (the “Board”). The Funds’ fair value procedures are implemented through a fair value committee (the “Committee”) designated by the Board. Some of the more common reasons that may necessitate that a security be valued using fair value procedures include: the security's trading has been halted or suspended; the security has been de-listed from its primary trading exchange; the security's primary trading market is temporarily closed at a time when under normal conditions it would be open; the security has not been traded for an extended period of time; the security's primary pricing source is not able or willing to provide a price; or, trading of the security is subject to local government-imposed restrictions. In addition, the Funds may fair value their securities if an event that may materially affect the value of the Funds’ securities that traded outside of
| Notes to Financial Statements (continued) |
| October 31, 2016 |
2. SIGNIFICANT ACCOUNTING POLICIES (continued)
SECURITY VALUATION (concluded)
the United States (a “Significant Event”) has occurred between the time of the security's last close and the time that the Funds calculate their net asset value. A Significant Event may relate to a single issuer or to an entire market sector. Events that may be Significant Events include: government actions, natural disasters, armed conflict, acts of terrorism and significant market fluctuations. If Global X Management Company LLC (the “Adviser”) becomes aware of a Significant Event that has occurred with respect to a security or group of securities after the closing of the exchange or market on which the security or securities principally trade, but before the time at which the Funds calculate net asset value, it may request that a Committee meeting be called. When a security is valued in accordance with the Fair Value Procedures, the Committee will determine the value after taking into consideration all relevant information reasonably available to the Committee. As of October 31, 2016, there were $1,223 and $37 of fair valued securities in the Global X Scientific Beta Europe ETF and Global X Scientific Beta Asia ex-Japan ETF, respectively. There were no other securities priced using the Fair Value Procedures.
In accordance with the authoritative guidance on fair value measurements and disclosure under U.S. GAAP, the Funds disclose the fair value of their investments in a hierarchy that prioritizes the inputs to valuation techniques used to measure the fair value. The objective of a fair value measurement is to determine the price that would be received to sell an asset or paid to transfer a liability in an orderly transaction between market participants at the measurement date (an exit price). Accordingly, the fair value hierarchy gives the highest priority to quoted prices (unadjusted) in active markets for identical assets or liabilities (Level 1) and the lowest priority to unobservable inputs (Level 3). The three levels of the fair value hierarchy are described below:
Level 1 – Unadjusted quoted prices in active markets for identical, unrestricted assets or liabilities that the Funds have the ability to access at the measurement date
Level 2 – Other significant observable inputs (including quoted prices in non-active markets, quoted prices for similar investments, fair value of investments for which the Funds have the ability to fully redeem tranches at net asset value as of the measurement date or within the near term, and short-term investments valued at amortized cost)
Level 3 – Significant unobservable inputs (including the Funds’ own assumptions in determining the fair value of investments, and fair value of investments for which the Funds do not have the ability to fully redeem tranches at net asset value as of the measurement date or within the near term)
Investments are classified within the level of the lowest significant input considered in determining fair value. Investments classified within Level 3 whose fair value measurement considers several inputs may include Level 1 or Level 2 inputs as components of the overall fair value measurement.
For the year or period ended October 31, 2016, there have been no significant changes to the Funds’ fair valuation methodologies.
The unobservable inputs used to determine fair value of Level 3 assets may have similar or diverging impacts on valuation. Significant increases and decreases in these inputs in isolation and interrelationships between those inputs could result in significantly higher or lower fair value measurement.
| Notes to Financial Statements (continued) |
| October 31, 2016 |
2. SIGNIFICANT ACCOUNTING POLICIES (continued)
DUE TO/FROM BROKERS – Due to/from brokers includes cash and collateral balances with the Funds’ clearing brokers or counterparties at October 31, 2016. The Funds continuously monitor the credit standing of each broker or counterparty with whom they conduct business. In the event a broker or counterparty is unable to fulfill its obligations, the Funds would be subject to counterparty credit risk.
REPURCHASE AGREEMENTS - Securities pledged as collateral for repurchase agreements are held by Citibank, N.A. and are designated as being held on each Fund’s behalf by its custodian under a book-entry system. Each Fund monitors the adequacy of the collateral on a daily basis and can require the seller to provide additional collateral in the event the market value of the securities pledged falls below the carrying value of the repurchase agreement, including accrued interest.
It is the Funds’ policy to only enter into repurchase agreements with banks and other financial institutions which are deemed by the Adviser to be creditworthy. The Funds bear the risk of loss in the event that the other party to a repurchase agreement defaults on its obligations, and the Funds are prevented from exercising their rights to dispose of the underlying securities received as collateral and the risk of a possible decline in the value of the underlying securities during the period. For financial statement purposes, the Funds record the securities lending collateral (included in Repurchase Agreements, at value or restricted cash) as an asset and the obligation to return securities lending collateral as a liability on the Statements of Assets and Liabilities.
Repurchase agreements are entered into by the Funds under Master Repurchase Agreements (“MRA”) which permit the Funds, under certain circumstances, including an event of default (such as bankruptcy or insolvency), to offset payables and/or receivables under the MRA with collateral held and/or posted to the counterparty and create one single net payment due to or from the Funds.
At October 31, 2016, the open repurchase agreements by counterparty which are subject to a MRA on a net payment basis are as follows:
| | | | | | Fair Value of Non-cash | | | Cash Collateral | | | | |
| | | Repurchase Agreements | | | Collateral Received(1) | | | Received | | | Net Amount(2) | |
| Global X SuperDividend® ETF | | | | | | | | | | | | | | | | |
| Barclays Bank | | $ | 56,000,000 | | | $ | 56,000,000 | | | $ | - | | | $ | - | |
| Deutsche Bank | | | 1,413,239 | | | | 1,413,239 | | | | - | | | | - | |
| Global X SuperDividend® U.S. ETF | | | | | | | | | | | | | | | | |
| Deutsche Bank | | | 7,571,225 | | | | 7,571,225 | | | | - | | | | - | |
| Global X SuperIncomeTM Preferred ETF | | | | | | | | | | | | | | | | |
| Barclays Bank | | | 13,000,000 | | | | 13,000,000 | | | | - | | | | - | |
| Deutsche Bank | | | 991,000 | | | | 991,000 | | | | - | | | | - | |
| Global X Social Media Index ETF | | | | | | | | | | | | | | | | |
| Barclays Bank | | | 16,000,000 | | | | 16,000,000 | | | | - | | | | - | |
| Deutsche Bank | | | 1,121,597 | | | | 1,121,597 | | | | - | | | | - | |
| Global X Guru® Index ETF | | | | | | | | | | | | | | | | |
| Deutsche Bank | | | 1,336,000 | | | | 1,336,000 | | | | - | | | | - | |
(1)Excess collateral received is not presented in the table above. Please refer to the Schedule of Investments for the market value of the collateral received for each Fund.
(2)Net Amount represents the net amount receivable due from the counterparty in the event of default.
| Notes to Financial Statements (continued) |
| October 31, 2016 |
2. SIGNIFICANT ACCOUNTING POLICIES (continued)
FEDERAL INCOME TAXES – It is each Fund’s intention to qualify, or continue to qualify, as a regulated investment company for Federal income tax purposes by complying with the appropriate provisions of Subchapter M of the Internal Revenue Code of 1986, as amended. Accordingly, no provisions for Federal income taxes have been made in the financial statements except as described below.
During the year ended October 31, 2016, the Global X Scientific Beta US ETF incurred federal excise tax in the amount of $2. No other provisions for Federal income taxes have been made in the financial statements.
The Funds evaluate tax positions taken or expected to be taken in the course of preparing the Funds’ tax returns to determine whether it is "more-likely-than-not" (i.e., greater than 50 percent) that each tax position will be sustained upon examination by a taxing authority based on the technical merits of the position. Tax positions not deemed to meet the more-likely-than-not threshold are recorded as a tax benefit or expense in the current year. The Funds did not record any tax provisions in the current period; however, management’s conclusions regarding tax positions may be subject to review and adjustment at a later date based on factors including, but not limited to, examination by tax authorities (i.e., the last three tax year ends, as applicable), on-going analysis of and changes to tax laws, regulations and interpretations thereof.
If the Funds have foreign tax filings that have not been made, the tax years that remain subject to examination may date back to the inception of the Fund.
As of and during the year or period ended October 31, 2016, the Funds did not have a liability for any unrecognized tax benefits. The Funds recognize interest and penalties, if any, related to unrecognized tax benefits as income tax expense in the Statement of Operations. During the period, the Funds did not incur any interest or penalties.
SECURITY TRANSACTIONS AND INVESTMENT INCOME – Security transactions are accounted for on the trade date for financial reporting purposes. Costs used in determining realized gains and losses on the sale of investment securities are based on specific identification. Dividend income is recorded on the ex-dividend date. Interest income is recognized on the accrual basis from the settlement date.
FOREIGN CURRENCY TRANSACTIONS AND TRANSLATION – The books and records of the Funds are maintained in U.S. dollars. Investment securities and other assets and liabilities denominated in a foreign currency are translated into U.S. dollars on the date of valuation. Purchases and sales of investment securities, income and expenses are translated into U.S. dollars at the relevant rates of exchange prevailing on the respective dates of such transactions. The Funds do not isolate that portion of realized or unrealized gains and losses resulting from changes in the foreign exchange rate from fluctuations arising from changes in the market prices of the securities. These gains and losses are included in net realized and unrealized gains and losses on investments on the Statement of Operations. Net realized and unrealized gains and losses on foreign currency transactions and translations represent net foreign exchange gains or losses from foreign currency spot contracts, disposition of foreign currencies, currency gains or losses realized between trade and settlement dates on securities transactions and the difference between the amount of the investment income and foreign withholding taxes recorded on the Funds’ books and the U.S. dollar equivalent amounts actually received or paid.
| Notes to Financial Statements (continued) |
| October 31, 2016 |
2. SIGNIFICANT ACCOUNTING POLICIES (concluded)
DIVIDENDS AND DISTRIBUTIONS TO SHAREHOLDERS – The Funds distribute their net investment income on a pro rata basis. Any net investment income and net realized capital gains are distributed at least annually. All distributions are recorded on ex-dividend date.
INVESTMENTS IN REITs – With respect to the Funds, dividend income is recorded based on the income included in distributions received from real estate investment trust (“REIT”) investments using published REIT reclassifications, including some management estimates when actual amounts are not available. Distributions received in excess of these estimated amounts are recorded as a reduction of the cost of investments or reclassified to capital gains. The actual amounts of income, return of capital, and capital gains are only determined by each REIT after its fiscal year end, and may differ from the estimated amounts.
CREATION UNITS – The Funds issue and redeem shares (“Shares”) at Net Asset Value (“NAV”) and only in large blocks of Shares, (each block of Shares for a Fund is called a “Creation Unit” or multiples thereof). Purchasers of Creation Units (“Authorized Participants”) at NAV must pay a standard creation transaction fee per transaction. The fee is a single charge and will be the same regardless of the number of Creation Units purchased by an investor on the same day. An Authorized Participant who holds Creation Units and wishes to redeem at NAV would also pay a standard Redemption Fee per transaction to Brown Brothers Harriman & Co. (“BBH”), the Funds’ custodian (“Custodian”), on the date of such redemption, regardless of the number of Creation Units redeemed that day.
If a Creation Unit is purchased or redeemed for cash, a higher transaction fee will be charged. The following table discloses Creation Unit breakdown:
| | | | | | Creation | | | Value at October | | | | |
| | | Creation Unit Shares | | | Fee | | | 31, 2016 | | | Redemption Fee | |
| Global X SuperDividend® ETF | | | 50,000 | | | $ | 3,800 | | | $ | 1,021,500 | | | $ | 3,800 | |
| Global X SuperDividend® U.S. ETF | | | 50,000 | | | | 750 | | | | 1,200,000 | | | | 750 | |
| Global X SuperDividend® Emerging Markets ETF | | | 50,000 | | | | 3,000 | | | | 748,000 | | | | 3,000 | |
| Global X SuperDividend® REIT ETF | | | 50,000 | | | | 750 | | | | 730,000 | | | | 750 | |
| Global X SuperIncomeTM Preferred ETF | | | 50,000 | | | | 500 | | | | 658,000 | | | | 500 | |
| Global X Social Media Index ETF | | | 50,000 | | | | 1,000 | | | | 1,176,500 | | | | 1,000 | |
| Global X | JPMorgan Efficiente Index ETF | | | 50,000 | | | | 500 | | | | 1,202,500 | | | | 500 | |
| Global X | JPMorgan US Sector Rotator Index ETF | | | 50,000 | | | | 500 | | | | 1,189,500 | | | | 500 | |
| Global X Permanent ETF | | | 50,000 | | | | 1,000 | | | | 1,256,500 | | | | 1,000 | |
| Global X Guru® Index ETF | | | 50,000 | | | | 750 | | | | 1,157,000 | | | | 750 | |
| Global X Guru® Activist Index ETF | | | 50,000 | | | | 750 | | | | 667,500 | | | | 750 | |
| Global X Guru® International Index ETF | | | 50,000 | | | | 750 | | | | 694,000 | | | | 750 | |
| Global X Scientific Beta US ETF | | | 50,000 | | | | 2,500 | | | | 1,273,000 | | | | 2,500 | |
| Global X Scientific Beta Europe ETF | | | 50,000 | | | | 10,500 | | | | 1,131,500 | | | | 10,500 | |
| Global X Scientific Beta Japan ETF | | | 50,000 | | | | 5,500 | | | | 1,369,000 | | | | 5,500 | |
| Global X Scientific Beta Asia ex-Japan ETF | | | 50,000 | | | | 11,000 | | | | 1,148,000 | | | | 11,000 | |
| Global X YieldCo Index ETF | | | 50,000 | | | | 500 | | | | 558,000 | | | | 500 | |
| Global X S&P 500® Catholic Values ETF | | | 50,000 | | | | 2,300 | | | | 1,287,000 | | | | 2,300 | |
CASH OVERDRAFT CHARGES – Per the terms of an agreement with BBH, if a Fund has a cash overdraft on a given day, it will be assessed an overdraft charge of LIBOR plus 2.00%. Cash overdraft charges are included in custodian fees on the Statement of Operations.
| Notes to Financial Statements (continued) |
| October 31, 2016 |
3. RELATED PARTY TRANSACTIONS AND SERVICE PROVIDER TRANSACTIONS
The Adviser serves as the investment adviser and the administrator for the Funds. Subject to the supervision of the Board of Trustees, the Adviser is responsible for managing the investment activities of the Funds and the Funds’ business affairs and other administrative matters and provides or causes to be furnished all supervisory, administrative and other services reasonably necessary for the operation of the Funds, including certain distribution services (provided pursuant to a separate Distribution Agreement), certain shareholder and distribution-related services (provided pursuant to a separate Rule 12b-1 Plan and related agreements) and investment advisory services (provided pursuant to a separate Investment Advisory Agreement), under what is essentially an "all-in" fee structure. For its service to the Funds, under the Supervision and Administration Agreement, each Fund pays a monthly fee to the Adviser at the annual rate below (stated as a percentage of the average daily net assets of the Fund). In addition, the Funds bear other expenses, directly and indirectly, that are not covered by the Supervision and Administration Agreement, which may vary and affect the total expense ratios of the Funds, such as taxes, brokerage fees, commissions, acquired fund fees, and other transaction expenses, interest expenses and extraordinary expenses (such as litigation and indemnification expenses).
The following table discloses supervision and administration fees pursuant to the agreement:
| | | Supervision and | |
| | | Administration Fee | |
| Global X SuperDividend® ETF | | | 0.58 | % |
| Global X SuperDividend® U.S. ETF | | | 0.45 | % |
| Global X SuperDividend® Emerging Markets ETF | | | 0.65 | % |
| Global X SuperDividend® REIT ETF | | | 0.58 | % |
| Global X SuperIncomeTM Preferred ETF | | | 0.58 | % |
| Global X Social Media Index ETF | | | 0.65 | % |
| Global X | JPMorgan Efficiente Index ETF | | | 0.69 | % |
| Global X | JPMorgan US Sector Rotator Index ETF | | | 0.69 | % |
| Global X Permanent ETF | | | 0.48 | % |
| Global X Guru® Index ETF | | | 0.75 | % |
| Global X Guru® Activist Index ETF | | | 0.75 | % |
| Global X Guru® International Index ETF | | | 0.75 | % |
| Global X Scientific Beta US ETF* | | | 0.19 | % |
| Global X Scientific Beta Europe ETF | | | 0.38 | % |
| Global X Scientific Beta Japan ETF | | | 0.38 | % |
| Global X Scientific Beta Asia ex-Japan ETF | | | 0.38 | % |
| Global X YieldCo Index ETF | | | 0.65 | % |
| Global X S&P 500® Catholic Values ETF** | | | 0.29 | % |
| Notes to Financial Statements (continued) |
| October 31, 2016 |
3. RELATED PARTY TRANSACTIONS (concluded)
*Effective March 1, 2016, pursuant to an expense limitation agreement, the Adviser has contractually agreed to reimburse or waive fees and/or limit fund expenses to the extent necessary to assure that the operating expenses of the Global X Scientific Beta US ETF (the “Fund) (exclusive of taxes, brokerage fees, commissions, and other transaction expenses, interest, and extraordinary expenses (such as litigation and indemnification expenses)) will not exceed 0.19% of the Fund’s average daily net assets per year until at least March 1, 2017. The Fund (at a later date) may reimburse the Adviser for the fees it reimbursed or waived and/or limited pursuant to the expense limitation agreement during any of the prior three fiscal years, provided that, among other things, reimbursement to be made to the Adviser does not cause Total Annual Fund Operating Expenses of the Fund to exceed 0.19% during the year in which it is paid and the Board of Trustees has approved such reimbursement to the Adviser.
**Pursuant to an expense limitation agreement, the Adviser has contractually agreed to waive or reimburse fees and/or limit fund expenses to the extent necessary to assure that the operating expenses of the Global X S&P 500® Catholic Values ETF (the “Fund) (exclusive of taxes, brokerage fees, commissions, and other transaction expenses, interest and extraordinary expenses (such as litigation and indemnification expenses)) will not exceed 0.29% of the Fund’s average daily net assets per year until at least March 1, 2017. The Fund (at a later date) may reimburse the Adviser for the fees and expenses it waived or reimbursed and/or limited pursuant to the expense limitation agreement during any of the prior three fiscal years, provided that, among other things, any reimbursement made to the Adviser does not cause Total Annual Fund Operating Expenses of the Fund to exceed 0.29% during the period in which it is paid and the Board of Trustees has approved such reimbursement to the Adviser.
SEI Investments Global Funds Services (“SEIGFS”) serves as sub-administrator to the Funds. As Sub-Administrator, SEIGFS provides the Funds with the required general administrative services, including, without limitation: office space, equipment, and personnel; clerical and general back office services; bookkeeping, internal accounting and secretarial services; the calculation of NAV; and assistance with the preparation and filing of reports, registration statements, proxy statements, and other materials required to be filed or furnished by the Funds under federal and state securities laws. As compensation for these services, the sub-administrator receives certain out-of-pocket costs, transaction fees, and asset-based fees which are accrued daily and paid monthly by the Adviser.
SEI Investments Distribution Co. (“SIDCO”) serves as each Fund’s underwriter and distributor of Creation Units pursuant to a distribution agreement. SIDCO has no obligation to sell any specific quantity of Fund Shares. SIDCO bears the following costs and expenses relating to the distribution of Shares: (1) the costs of processing and maintaining records of creations of Creation Units; (2) all costs of maintaining the records required of a registered broker/dealer; (3) the expenses of maintaining its registration or qualification as a dealer or broker under Federal or state laws; (4) filing fees; and (5) all other expenses incurred in connection with the distribution services as contemplated in the distribution agreement. SIDCO receives no fee from the Funds for its distribution services under the distribution agreement, rather the Adviser compensates SIDCO for certain expenses, out-of-pocket costs, and transaction fees.
BBH, located at 50 Post Office Square, Boston, MA 02110, serves as Custodian of the Funds’ assets. As Custodian, BBH has agreed to (1) make receipts and disbursements of money on behalf of the Funds, (2) collect and receive all income and other payments and distributions on account of the Funds’ portfolio investments, (3) respond to correspondence from shareholders, security brokers and others relating to its duties; and (4) make periodic reports to the Funds concerning the Funds’ operations. BBH does not exercise any supervisory function over the purchase and sale of securities. BBH also serves as the Fund’s transfer agent. As Transfer Agent, BBH has agreed to (1) issue and redeem shares of each Fund, (2) make dividend and other distributions to shareholders of each Fund, (3) respond to correspondence by shareholders and others relating to its duties; (4) maintain shareholder accounts, and (5) make periodic reports to the Funds. As compensation for these services, BBH receives certain out-of-pocket costs, transaction fees and asset-based fees which are accrued daily and paid monthly by the Adviser from its fees.
| Notes to Financial Statements (continued) |
| October 31, 2016 |
4. INVESTMENT TRANSACTIONS
For the year or period ended October 31, 2016, the purchases and sales of investments in securities excluding in-kind transactions, long-term U.S. Government and short-term securities were:
| | | | | | Sales and | |
| | | Purchases | | | Maturities | |
| Global X SuperDividend® ETF | | $ | 308,276,906 | | | $ | 314,608,353 | |
| Global X SuperDividend® U.S. ETF | | | 159,479,427 | | | | 168,833,933 | |
| Global X SuperDividend® Emerging Markets ETF | | | 2,142,847 | | | | 2,187,481 | |
| Global X SuperDividend® REIT ETF | | | 2,198,909 | | | | 2,294,995 | |
| Global X SuperIncomeTM Preferred ETF | | | 103,388,055 | | | | 103,248,077 | |
| Global X Social Media Index ETF | | | 34,728,015 | | | | 34,547,874 | |
| Global X | JPMorgan Efficiente Index ETF | | | 28,382,156 | | | | 28,525,661 | |
| Global X | JPMorgan US Sector Rotator Index ETF | | | 116,272,196 | | | | 116,249,992 | |
| Global X Permanent ETF | | | 353,649 | | | | 319,781 | |
| Global X Guru® Index ETF | | | 112,932,779 | | | | 112,693,777 | |
| Global X Guru® Activist Index ETF | | | 1,277,273 | | | | 1,280,593 | |
| Global X Guru® International Index ETF | | | 1,258,879 | | | | 1,279,960 | |
| Global X Scientific Beta US ETF | | | 11,634,883 | | | | 11,172,143 | |
| Global X Scientific Beta Europe ETF | | | 3,787,098 | | | | 3,643,451 | |
| Global X Scientific Beta Japan ETF | | | 8,759,879 | | | | 8,620,385 | |
| Global X Scientific Beta Asia ex-Japan ETF | | | 1,657,900 | | | | 1,639,935 | |
| Global X YieldCo Index ETF | | | 1,996,057 | | | | 2,231,043 | |
| Global X S&P 500® Catholic Values ETF | | | 602,324 | | | | 513,376 | |
For the year ended October 31, 2016, the purchases and sales of long-term U.S. Government securities were:
| | | | | | Sales and | |
| | | Purchases | | | Maturities | |
| Global X Permanent ETF | | $ | 3,377,574 | | | $ | 3,932,473 | |
For the year or periods ended October 31, 2016 in-kind transactions associated with creations and redemptions were:
| | | | | | Sales and | | | | |
| | | Purchases | | | Maturities | | | Realized Gain | |
| Global X SuperDividend® ETF | | $ | 49,567,614 | | | $ | 110,361,789 | | | $ | 1,670,902 | |
| Global X SuperDividend® U.S. ETF | | | 127,157,535 | | | | 38,867,485 | | | | 4,168,310 | |
| Global X SuperDividend® Emerging Markets ETF | | | - | | | | - | | | | - | |
| Global X SuperDividend® REIT ETF | | | 30,674,729 | | | | - | | | | - | |
| Global X SuperIncomeTM Preferred ETF | | | 37,158,930 | | | | 33,003,074 | | | | (2,067,492 | ) |
| Global X Social Media Index ETF | | | 93,518,723 | | | | 43,082,274 | | | | 700,608 | |
| Global X | JPMorgan Efficiente Index ETF | | | 1,122,106 | | | | 2,290,750 | | | | 7,626 | |
| Global X | JPMorgan US Sector Rotator Index ETF | | | 3,399,243 | | | | 7,134,820 | | | | (12,025 | ) |
| Global X Permanent ETF | | | - | | | | 1,107,409 | | | | 9,615 | |
| Global X Guru® Index ETF | | | 10,236,109 | | | | 125,096,107 | | | | 891,469 | |
| Global X Guru® Activist Index ETF | | | - | | | | 1,242,332 | | | | (95,155 | ) |
| Global X Guru® International Index ETF | | | - | | | | 664,197 | | | | 44,537 | |
| Global X Scientific Beta US ETF | | | 62,260,200 | | | | - | | | | - | |
| Global X Scientific Beta Europe ETF | | | 10,270,697 | | | | - | | | | - | |
| Global X Scientific Beta Japan ETF | | | 9,969,557 | | | | - | | | | - | |
| Global X Scientific Beta Asia ex-Japan ETF | | | - | | | | - | | | | - | |
| Global X YieldCo Index ETF | | | 4,183,988 | | | | 911,080 | | | | 29,597 | |
| Global X S&P 500® Catholic Values ETF | | | 40,304,954 | | | | - | | | | - | |
| Notes to Financial Statements (continued) |
| October 31, 2016 |
4. INVESTMENT TRANSACTIONS (concluded)
For the year or periods ended October 31, 2015, in-kind transactions associated with creations and redemptions were:
| | | | | | Sales and | | | | |
| | | Purchases | | | Maturities | | | Realized Gain | |
| Global X SuperDividend® ETF | | $ | 101,430,555 | | | $ | 95,779,030 | | | $ | 7,033,898 | |
| Global X SuperDividend® U.S. ETF | | | 113,364,881 | | | | 51,541,836 | | | | 5,510,557 | |
| Global X SuperDividend® Emerging Markets ETF | | | 2,727,482 | | | | - | | | | - | |
| Global X SuperDividend® REIT ETF | | | 4,298,312 | | | | - | | | | - | |
| Global X SuperIncomeTM Preferred ETF | | | 143,517,095 | | | | 48,396,514 | | | | 598,502 | |
| Global X Social Media Index ETF | | | 45,438,519 | | | | 94,218,207 | | | | 7,918,432 | |
| Global X | JPMorgan Efficiente Index ETF | | | 23,753,014 | | | | 16,203,931 | | | | 95,084 | |
| Global X | JPMorgan US Sector Rotator Index ETF | | | 28,317,222 | | | | 14,354,708 | | | | 21,181 | |
| Global X Permanent ETF | | | 1,731,998 | | | | 597,499 | | | | 80,850 | |
| Global X Guru® Index ETF | | | 11,925,032 | | | | 243,540,847 | | | | 17,920,882 | |
| Global X Guru® Activist Index ETF | | | 2,997,065 | | | | - | | | | - | |
| Global X Guru® International Index ETF | | | - | | | | 758,840 | | | | 34,757 | |
| Global X Scientific Beta US ETF | | | 2,489,675 | | | | - | | | | - | |
| Global X Scientific Beta Europe ETF | | | 2,481,275 | | | | - | | | | - | |
| Global X Scientific Beta Japan ETF | | | 2,496,883 | | | | - | | | | - | |
| Global X Scientific Beta Asia ex-Japan ETF | | | 1,903,496 | | | | - | | | | - | |
| Global X YieldCo Index ETF | | | 4,344,899 | | | | - | | | | - | |
5. TAX INFORMATION
The Global X SuperDividend® REIT ETF has a tax year that ends on December 31. The following tax disclosures are representative as of October 31, 2016. Accordingly, the disclosures are for informational use by shareholders and are subject to change attributable to activity through the end of the tax year ending December 31, 2016.
The amount and character of income and capital gain distributions to be paid, if any, are determined in accordance with Federal income tax regulations, which may differ from U.S. GAAP. As a result, net investment income (loss) and net realized gain (loss) on investment transactions for a reporting period may differ significantly from distributions during such period. These book/tax differences may be temporary or permanent. To the extent these differences are permanent in nature, they are charged or credited to undistributed net investment income (loss), accumulated net realized gain (loss) or paid-in capital, as appropriate, in the period that the differences arise.
The following differences, primarily attributable to preferred stock interest, foreign currency, redemptions in-kind, REIT adjustments, MLP dividends, return of capital distribution and sales of passive foreign investment companies have been reclassified to/from the following accounts during the fiscal year ended October 31, 2016:
| Global X Funds | | Paid-in
Capital | | | Undistributed
Net
Investment
Income | | | Accumulated
Net Realized
Loss | |
| Global X SuperDividend® ETF | | $ | (3,791,515 | ) | | $ | 10,188,075 | | | $ | (6,396,560 | ) |
| Global X SuperDividend® U.S. ETF | | | 2,684,520 | | | | 1,623,153 | | | | (4,307,673 | ) |
| Global X SuperDividend® Emerging Markets ETF | | | – | | | | 19,216 | | | | (19,216 | ) |
| Global X SuperDividend® REIT ETF | | | – | | | | 30,305 | | | | (30,305 | ) |
| Global X SuperIncome™ Preferred ETF | | | (2,318,454 | ) | | | 323,661 | | | | 1,994,793 | |
| Global X Social Media Index ETF | | | (761,019 | ) | | | 913 | | | | 760,106 | |
| Notes to Financial Statements (continued) |
| October 31, 2016 |
5. TAX INFORMATION (continued)
| Global X Funds | | Paid-in
Capital | | | Undistributed
Net Investment
Income | | | Accumulated
Net Realized
Loss | |
| Global X | JPMorgan Efficiente Index ETF | | $ | 8,610 | | | $ | (6,378 | ) | | $ | (2,232 | ) |
| Global X | JPMorgan US Sector Rotator Index ETF | | | (12,025 | ) | | | – | | | | 12,025 | |
| Global X Permanent ETF | | | (1,340 | ) | | | 2,190 | | | | (850 | ) |
| Global X Guru® Index ETF | | | 144,093 | | | | (518,473 | ) | | | 374,380 | |
| Global X Guru® Activist Index ETF | | | (104,126 | ) | | | – | | | | 104,126 | |
| Global X Guru® International Index ETF | | | 43,356 | | | | 15,560 | | | | (58,916 | ) |
| Global X Scientific Beta US ETF | | | – | | | | 15,186 | | | | (15,186 | ) |
| Global X Scientific Beta Europe ETF | | | – | | | | (2,076 | ) | | | 2,076 | |
| Global X Scientific Beta Japan ETF | | | – | | | | 100,393 | | | | (100,393 | ) |
| Global X Scientific Beta Asia ex-Japan ETF | | | – | | | | 12,061 | | | | (12,061 | ) |
| Global X YieldCo Index ETF | | | 32,897 | | | | 1,197 | | | | (34,094 | ) |
| Global X S&P 500® Catholic Values ETF | | | – | | | | 920 | | | | (920 | ) |
These reclassifications have no impact on net assets or net asset value per share.
The tax character of dividends and distributions declared during the years or periods ended October 31, 2016 and October 31, 2015 were as follows:
| Global X Funds | | Ordinary Income | | | Long-Term
Capital Gain | | | Return of Capital | | | Totals | |
| | | | | | | | | | | | | | | | | |
| Global X SuperDividend® ETF | | | | | | | | | | | | | | | | |
| 2016 | | $ | 50,746,230 | | | $ | – | | | $ | 5,683,920 | | | $ | 56,430,150 | |
| 2015 | | | 63,792,396 | | | | 1,980,361 | | | | – | | | | 65,772,757 | |
| Global X SuperDividend® U.S. ETF | | | | | | | | | | | | | | | | |
| 2016 | | $ | 12,821,203 | | | $ | – | | | $ | 8,107,347 | | | $ | 20,928,550 | |
| 2015 | | | 13,048,101 | | | | – | | | | 7,048,014 | | | | 20,096,115 | |
| Global X SuperDividend® Emerging Markets ETF | | | | | | | | | | | | | | | | |
| 2016 | | $ | 191,294 | | | $ | – | | | $ | – | | | $ | 191,294 | |
| 2015 | | | 110,575 | | | | – | | | | – | | | | 110,575 | |
| Global X SuperDividend® REIT ETF(1) | | | | | | | | | | | | | | | | |
| 2016 | | $ | 210,363 | | | $ | 10,512 | | | $ | – | | | $ | 220,875 | |
| Global X SuperIncome™ Preferred ETF | | | | | | | | | | | | | | | | |
| 2016 | | $ | 14,776,181 | | | $ | – | | | $ | – | | | $ | 14,776,181 | |
| 2015 | | | 16,693,614 | | | | – | | | | – | | | | 16,693,614 | |
| Global X Social Media Index ETF | | | | | | | | | | | | | | | | |
| 2016 | | $ | 6,875 | | | $ | – | | | $ | – | | | $ | 6,875 | |
| 2015 | | | 57,330 | | | | – | | | | – | | | | 57,330 | |
| Global X | JPMorgan Efficiente Index ETF | | | | | | | | | | | | | | | | |
| 2016 | | $ | 312,783 | | | $ | – | | | $ | – | | | $ | 312,783 | |
| 2015 | | | 15,956 | | | | – | | | | – | | | | 15,956 | |
| Global X | JPMorgan US Sector Rotator Index ETF | | | | | | | | | | | | | | | | |
| 2016 | | $ | 197,183 | | | $ | – | | | $ | – | | | $ | 197,183 | |
| 2015 | | | 35,570 | | | | – | | | | – | | | | 35,570 | |
| Global X Permanent ETF | | | | | | | | | | | | | | | | |
| 2016 | | $ | 114,717 | | | $ | – | | | $ | – | | | $ | 114,717 | |
| 2015 | | | 105,609 | | | | – | | | | – | | | | 105,609 | |
| Global X Guru® Index ETF | | | | | | | | | | | | | | | | |
| 2016 | | $ | 635,053 | | | $ | – | | | $ | 125,403 | | | $ | 760,456 | |
| 2015 | | | 4,215,674 | | | | – | | | | – | | | | 4,215,674 | |
| Global X Guru® Activist Index ETF | | | | | | | | | | | | | | | | |
| 2016 | | $ | 17,395 | | | $ | – | | | $ | – | | | $ | 17,395 | |
| 2015 | | | – | | | | – | | | | – | | | | – | |
| (1) | The Global X SuperDividend® REIT ETF has a tax year that ends on December 31. |
| Notes to Financial Statements (continued) |
| October 31, 2016 |
5. TAX INFORMATION (continued)
| Global X Funds | | Ordinary Income | | | Long-Term
Capital Gain | | | Return of Capital | | | Totals | |
| | | | |
| Global X Guru® International Index ETF | | | | | | | | | | | | | | | | |
| 2016 | | $ | 21,629 | | | $ | – | | | $ | – | | | $ | 21,629 | |
| 2015 | | | 16,359 | | | | – | | | | – | | | | 16,359 | |
| Global X Scientific Beta US ETF | | | | | | | | | | | | | | | | |
| 2016 | | $ | 29,000 | | | $ | – | | | $ | – | | | $ | 29,000 | |
| 2015 | | | – | | | | – | | | | – | | | | – | |
| Global X Scientific Beta Europe ETF | | | | | | | | | | | | | | | | |
| 2016 | | $ | 34,296 | | | $ | – | | | $ | – | | | $ | 34,296 | |
| 2015 | | | – | | | | – | | | | – | | | | – | |
| Global X Scientific Beta Japan ETF | | | | | | | | | | | | | | | | |
| 2016 | | $ | 21,833 | | | $ | – | | | $ | – | | | $ | 21,833 | |
| 2015 | | | – | | | | – | | | | – | | | | – | |
| Global X Scientific Beta Asia ex-Japan ETF | | | | | | | | | | | | | | | | |
| 2016 | | $ | 62,417 | | | $ | – | | | $ | – | | | $ | 62,417 | |
| 2015 | | | – | | | | – | | | | – | | | | – | |
| Global X YieldCo Index ETF | | | | | | | | | | | | | | | | |
| 2016 | | $ | 199,159 | | | $ | – | | | $ | 76,200 | | | $ | 275,359 | |
| 2015 | | | 33,750 | | | | – | | | | – | | | | 33,750 | |
| Global X S&P 500® Catholic Values ETF | | | | | | | | | | | | | | | | |
| 2016 | | $ | – | | | $ | – | | | $ | – | | | $ | – | |
As of October 31, 2016, the components of tax basis distributable earnings (accumulated losses) were as follows:
| | | Global X Funds | |
| | | Global X
SuperDividend®
ETF | | | Global X
SuperDividend®
U.S. ETF | | | Global X
SuperDividend®
Emerging Markets
ETF | |
| Undistributed Ordinary Income | | $ | – | | | $ | – | | | $ | 35,389 | |
| Capital Loss Carryforwards | | | (101,362,848 | ) | | | (52,964,186 | ) | | | (760,140 | ) |
| Unrealized Appreciation (Depreciation) on Investments and Foreign Currency | | | (44,972,636 | ) | | | 6,916,391 | | | | 580,447 | |
| Other Temporary Differences | | | | | | | (118,092 | ) | | | (1 | ) |
| Total Accumulated Losses | | $ | (146,335,484 | ) | | $ | (46,165,887 | ) | | $ | (144,305 | ) |
| | | Global X Funds | |
| | | Global X
SuperDividend®
REIT ETF(1) | | | Global X
SuperIncome™
Preferred ETF | | | Global X Social
Media Index ETF | |
| Undistributed Ordinary Income | | $ | – | | | $ | 533,528 | | | $ | 126,357 | |
| Undistributed Long-Term Capital Gain | | | – | | | | – | | | | – | |
| Capital Loss Carryforwards | | | – | | | | (20,699,377 | ) | | | (17,330,355 | ) |
| Unrealized Depreciation on Investments and Foreign Currency | | | (520,829 | ) | | | (9,939,632 | ) | | | (1,816,427 | ) |
| Other Temporary Differences | | | (16,808 | ) | | | (395,514 | ) | | | 3 | |
| Total Accumulated Losses | | $ | (537,637 | ) | | $ | (30,500,995 | ) | | $ | (19,020,422 | ) |
(1) The Global X SuperDividend® REIT ETF has a tax year that ends on December 31.
| Notes to Financial Statements (continued) |
| October 31, 2016 |
5. TAX INFORMATION (continued)
| | | Global X Funds | |
| | | Global X |
JPMorgan
Efficiente Index
ETF | | | Global X |
JPMorgan US
Sector Rotator
Index ETF | | | Global X
Permanent ETF | |
| Undistributed Ordinary Income | | $ | 95,278 | | | $ | 143,598 | | | $ | 94,485 | |
| Capital Loss Carryforwards | | | (1,847,731 | ) | | | (2,319,937 | ) | | | (294,088 | ) |
| Unrealized Appreciation (Depreciation) on Investments and Foreign Currency | | | (14,484 | ) | | | 22,261 | | | | (659,138 | ) |
| Other Temporary Differences | | | 1 | | | | 1 | | | | – | |
| Total Accumulated Losses | | $ | (1,766,936 | ) | | $ | (2,154,077 | ) | | $ | (858,741 | ) |
| | | Global X Funds | |
| | | Global X Guru®
Index ETF | | | Global X Guru®
Activist Index
ETF | | | Global X Guru®
International
Index ETF | |
| Undistributed Ordinary Income | | $ | – | | | $ | 9,333 | | | $ | 21,599 | |
| Capital Loss Carryforwards | | | (32,723,455 | ) | | | (289,935 | ) | | | (267,687 | ) |
| Unrealized Depreciation on Investments and Foreign Currency | | | (1,828,478 | ) | | | (34,156 | ) | | | (33,460 | ) |
| Other Temporary Differences | | | – | | | | – | | | | (3 | ) |
| Total Accumulated Losses | | $ | (34,551,933 | ) | | $ | (314,758 | ) | | $ | (279,551 | ) |
| | | Global X Funds | |
| | | Global X Scientific
Beta US ETF | | | Global X Scientific
Beta Europe ETF | | | Global X Scientific
Beta Japan ETF | |
| Undistributed Ordinary Income | | $ | 622,201 | | | $ | 352,082 | | | $ | 356,381 | |
| Capital Loss Carryforwards | | | (294,899 | ) | | | (252,277 | ) | | | (185,460 | ) |
| Unrealized Appreciation (Depreciation) on Investments and Foreign Currency | | | 1,094,393 | | | | (310,331 | ) | | | 1,050,786 | |
| Other Temporary Differences | | | 2 | | | | (1 | ) | | | (2 | ) |
| Total Distributable Earnings (Accumulated Losses) | | $ | 1,421,697 | | | $ | (210,527 | ) | | $ | 1,221,705 | |
| | | Global X Funds | |
| | | Global X Scientific
Beta Asia ex-
Japan ETF | | | Global X YieldCo
Index ETF | | | Global X S&P
500® Catholic
Values ETF | |
| Undistributed Ordinary Income | | $ | 90,845 | | | $ | – | | | $ | 150,770 | |
| Capital Loss Carryforwards | | | (318,379 | ) | | | (918,246 | ) | | | – | |
| Unrealized Appreciation (Depreciation) on Investments and Foreign Currency | | | 23,467 | | | | 201,788 | | | | (566,056 | ) |
| Other Temporary Differences | | | 1 | | | | (1 | ) | | | 1 | |
| Total Accumulated Losses | | $ | (204,066 | ) | | $ | (716,459 | ) | | $ | (415,285 | ) |
| Notes to Financial Statements (continued) |
| October 31, 2016 |
5. TAX INFORMATION (continued)
For taxable years beginning after December 22, 2010, a RIC is permitted to carry forward net capital losses to offset capital gains realized in later years, and the losses carried forward retain their original character as either long-term or short-term losses. Net capital losses of a RIC realized in taxable years beginning before that date (pre-2011 losses) can be carried forward up to 8 years and are characterized in later years as short-term losses. If a Fund uses pre-2011 loss carryforwards in later years, the carryforwards will not reduce the Fund’s current earnings and profits, while loss carryforwards from later years will reduce the Fund’s current earnings and profits. To the extent that later year capital gains are offset by pre-2011 loss carryforwards, distributions of such gains will be treated as ordinary dividend distributions. Losses carried forward under these new provisions are as follows:
| | | Short-Term | | | Long-Term | | | | |
| Global X Funds | | Loss | | | Loss | | | Total | |
| Global X SuperDividend® ETF | | $ | 37,746,451 | | | $ | 63,616,397 | | | $ | 101,362,848 | |
| Global X SuperDividend® U.S. ETF | | | 40,787,399 | | | | 12,176,787 | | | | 52,964,186 | |
| Global X SuperDividend® Emerging Markets ETF | | | 760,140 | | | | - | | | | 760,140 | |
| Global X SuperIncomeTM Preferred ETF | | | 8,632,180 | | | | 12,067,197 | | | | 20,699,377 | |
| Global X Social Media Index ETF | | | 4,551,994 | | | | 12,778,361 | | | | 17,330,355 | |
| Global X | JPMorgan Efficiente Index ETF | | | 1,847,731 | | | | - | | | | 1,847,731 | |
| Global X | JPMorgan US Sector Rotator Index ETF | | | 2,319,937 | | | | - | | | | 2,319,937 | |
| Global X Permanent ETF | | | 294,088 | | | | - | | | | 294,088 | |
| Global X Guru® Index ETF | | | 28,756,602 | | | | 3,966,853 | | | | 32,723,455 | |
| Global X Guru® Activist Index ETF | | | 278,556 | | | | 11,379 | | | | 289,935 | |
| Global X Guru® International Index ETF | | | 247,601 | | | | 20,086 | | | | 267,687 | |
| Global X Scientific Beta US ETF | | | 281,709 | | | | 13,190 | | | | 294,899 | |
| Global X Scientific Beta Europe ETF | | | 206,933 | | | | 45,344 | | | | 252,277 | |
| Global X Scientific Beta Japan ETF | | | 180,515 | | | | 4,945 | | | | 185,460 | |
| Global X Scientific Beta Asia ex-Japan ETF | | | 262,554 | | | | 55,825 | | | | 318,379 | |
| Global X YieldCo Index ETF | | | 550,784 | | | | 367,462 | | | | 918,246 | |
| Global X S&P 500® Catholic Values ETF | | | - | | | | - | | | | - | |
During the year ended October 31, 2016 the following funds utilized capital loss carryforwards to offset capital gains amounting to:
| | | | |
| Global X Funds | | | |
| Global X JPMorgan Efficiente Index ETF | | $ | 264,676 | |
| Global X JPMorgan US Sector Rotator Index ETF | | | 199,720 | |
| Global X Permanent ETF | | | 133,583 | |
| Notes to Financial Statements (continued) |
| October 31, 2016 |
5. TAX INFORMATION (continued)
The Federal tax cost and aggregate gross unrealized appreciation and depreciation on investments held by the Funds at October 31, 2016 were as follows:
| Global X Funds | | Federal Tax
Cost | | | Aggregated
Gross
Unrealized
Appreciation | | | Aggregated
Gross
Unrealized
Depreciation | | | Net Unrealized
Appreciation
(Depreciation) | |
| Global X SuperDividend® ETF | | $ | 896,322,169 | | | $ | 54,987,295 | | | $ | (99,902,482 | ) | | $ | (44,915,187 | ) |
| Global X SuperDividend® U.S. ETF | | | 337,755,586 | | | | 32,278,645 | | | | (25,362,254 | ) | | | 6,916,391 | |
| Global X SuperDividend® Emerging Markets ETF | | | 3,153,930 | | | | 868,506 | | | | (288,068 | ) | | | 580,438 | |
| Global X SuperDividend® REIT ETF | | | 34,671,160 | | | | 519,964 | | | | (1,052,501 | ) | | | (532,537 | ) |
| Global X SuperIncome™ Preferred ETF | | | 255,384,628 | | | | 4,235,979 | | | | (14,175,611 | ) | | | (9,939,632 | ) |
| Global X Social Media Index ETF | | | 152,934,194 | | | | 12,262,050 | | | | (14,076,993 | ) | | | (1,814,943 | ) |
| Global X | JPMorgan Efficiente Index ETF | | | 7,225,820 | | | | 100,620 | | | | (115,104 | ) | | | (14,484 | ) |
| Global X | JPMorgan US Sector Rotator Index ETF | | | 10,675,097 | | | | 90,453 | | | | (68,192 | ) | | | 22,261 | |
| Global X Permanent ETF | | | 9,374,820 | | | | 352,119 | | | | (1,011,257 | ) | | | (659,138 | ) |
| Global X Guru® Index ETF | | | 61,939,212 | | | | 4,156,330 | | | | (5,984,808 | ) | | | (1,828,478 | ) |
| Global X Guru® Activist Index ETF | | | 1,365,296 | | | | 94,831 | | | | (128,987 | ) | | | (34,156 | ) |
| Global X Guru® International Index ETF | | | 725,809 | | | | 74,858 | | | | (108,318 | ) | | | (33,460 | ) |
| Global X Scientific Beta US ETF | | | 64,926,775 | | | | 2,979,761 | | | | (1,885,368 | ) | | | 1,094,393 | |
| Global X Scientific Beta Europe ETF | | | 12,726,832 | | | | 830,498 | | | | (1,140,003 | ) | | | (309,505 | ) |
| Global X Scientific Beta Japan ETF | | | 12,606,629 | | | | 1,330,269 | | | | (275,754 | ) | | | 1,054,515 | |
| Global X Scientific Beta Asia ex-Japan ETF | | | 2,266,205 | | | | 149,764 | | | | (126,297 | ) | | | 23,467 | |
| Global X YieldCo Index ETF | | | 6,476,057 | | | | 534,562 | | | | (332,747 | ) | | | 201,815 | |
| Global X S&P 500® Catholic Values ETF | | | 40,398,063 | | | | 915,271 | | | | (1,481,327 | ) | | | (566,056 | ) |
The preceding differences between book and tax cost are primarily due to mark-to-market treatment of passive foreign investment companies, MLP adjustments and wash sales.
6. CONCENTRATION OF RISKS
The Funds invest in securities of foreign issuers in various countries. These investments may involve certain considerations and risks not typically associated with investments in the United States as a result of, among other factors, the possibility of future political and economic developments and the level of governmental supervision and regulation of securities markets in the respective countries.
The securities markets of emerging countries are less liquid, subject to greater price volatility, and have a smaller market capitalization than those of U.S. securities markets. In certain countries, there may be fewer publicly traded securities and the market may be dominated by a few issuers or sectors. Issuers and securities markets in such countries are not subject to as extensive and frequent accounting, financial and other reporting requirements or as comprehensive government regulations as are issuers and securities markets in the U.S. In particular, the assets and profits appearing on the financial statements of emerging country issuers may not reflect their financial position or results of operations in the same manner as financial statements for U.S. issuers. Substantially less information may be publicly available about emerging country issuers than is available about issuers in the United States.
The Funds may be subject to taxes imposed by countries in which they invest. Such taxes are generally based on either income or gains earned or repatriated. The Funds accrue and apply such taxes to net investment income, net realized gains and net unrealized gains as income and/or capital gains are earned.
| Notes to Financial Statements (continued) |
| October 31, 2016 |
6. CONCENTRATION OF RISKS (concluded)
The Funds (other than the Global X Permanent ETF, Global X SuperIncome Preferred ETF and Global X|JP Morgan Efficient Index ETF) use a replication strategy. A replication strategy is an indexing strategy that involves investing in the securities of an underlying index in approximately the same proportions as in the underlying index. The Funds (other than the Global X Permanent ETF, Global X SuperIncome Preferred ETF and Global X|JP Morgan Efficient Index ETF) may utilize a representative sampling strategy with respect to their underlying indices when a replication strategy might be detrimental to their shareholders, such as when there are practical difficulties or substantial costs involved in compiling a portfolio of equity securities to follow their underlying indices, or, in certain instances, when securities in the underlying indices become temporarily illiquid, unavailable or less liquid, or due to legal restrictions (such as diversification requirements that apply to the Funds but not the underlying indices).
Because of the practical difficulties and expense of purchasing all of the securities in its respective underlying indices, the Global X Permanent ETF, Global X SuperIncome Preferred ETF and Global X|JP Morgan Efficient Index ETF does not expect to purchase all of the securities in its underlying indices. Instead, the Adviser will utilize a “sampling” methodology in seeking to achieve the Funds’ objective. As such, the Funds may purchase a subset of the securities in its respective underlying index in an effort to hold a portfolio of securities with generally the same risk and return characteristics of the underlying index.
7. LOANS OF PORTFOLIO SECURITIES
The Funds may lend portfolio securities having a market value up to one-third of the Funds’ total assets. Security loans made pursuant to a securities lending agreement are required at all times to be secured by collateral equal to at least 102% of the value of domestic equity securities and ADRs and 105% of the value of foreign equity securities (other than ADRs). Such collateral received in connection with these loans will be cash and can be invested in repurchase agreements or U.S. Treasury obligations and is recognized in the Schedule of Investments and Statement of Assets and Liabilities. The obligation to return securities lending collateral is also recognized as a liability in the Statement of Assets and Liabilities. It is the Funds’ policy to obtain additional collateral from or return excess collateral to the borrower by the end of the next business day, following the valuation date of the securities loaned. Therefore, the value of the collateral held may be temporarily less than the value of the securities on loan. Lending securities entails a risk of loss to the Funds if and to the extent that the market value of the securities loans were to increase and the borrower did not increase the collateral accordingly, and the borrower fails to return the securities. The Funds could also experience delays and costs in gaining access to the collateral. The Funds bear the risk of any deficiency in the amount of the collateral available for return to the borrower due to any loss on the collateral invested.
As of October 31, 2016 the value of securities on loan was $54,773,970, $7,287,261, $13,600,406, $16,161,795 and $1,290,225 for the Global X SuperDividend® ETF, Global X SuperDividend® U.S. ETF, Global X SuperIncome™ Preferred ETF, Global X Social Media Index ETF and Global X Guru® Index ETF, respectively and the value of securities purchased with the cash collateral held from securities on loan was $57,413,239, $7,571,225, $13,991,000, $17,121,597 and $1,336,000 for the Global X SuperDividend® ETF, Global X SuperDividend® U.S. ETF, Global X SuperIncome™ Preferred ETF, Global X Social Media Index ETF and Global X Guru® Index ETF, respectively.
| Notes to Financial Statements (continued) |
| October 31, 2016 |
7. LOANS OF PORTFOLIO SECURITIES (concluded)
As of October 31, 2016, the following Funds had securities on loan, by counterparty:
| | | Market Value | | | Cash Collateral | |
| Global X SuperDividend® ETF | | | | | | | | |
| Barclays Bank | | $ | 5,987,843 | | | $ | 6,393,250 | |
| BNP Prime Brokerage | | | 18,336,829 | | | | 19,214,276 | |
| Credit Suisse | | | 436,098 | | | | 441,015 | |
| Deutsche Bank | | | 3,641,142 | | | | 3,829,332 | |
| Goldman Sachs & Co. | | | 16,513,264 | | | | 16,989,550 | |
| ING Financial Markets | | | 462,300 | | | | 575,000 | |
| JPMorgan | | | 1,062,100 | | | | 1,170,000 | |
| Morgan Stanley | | | 6,103,354 | | | | 6,439,740 | |
| National Financial Services | | | 2,231,040 | | | | 2,361,076 | |
| Global X SuperDividend® U.S. ETF | | | | | | | | |
| Barclays Bank | | | 486,147 | | | | 511,825 | |
| BM O Capital Markets Corp. | | | 3,306,087 | | | | 3,381,400 | |
| Goldman Sachs & Co. | | | 1,075,500 | | | | 1,087,500 | |
| JPMorgan | | | 65,847 | | | | 70,500 | |
| Morgan Stanley | | | 2,353,680 | | | | 2,520,000 | |
| Global X SuperIncomeTM Preferred ETF | | | | | | | | |
| Goldman Sachs & Co. | | | 442,899 | | | | 454,075 | |
| JPMorgan | | | 4,201,562 | | | | 4,312,000 | |
| Morgan Stanley | | | 1,271,086 | | | | 1,305,900 | |
| National Financial Services | | | 414,580 | | | | 424,375 | |
| Wells Fargo Bank NA | | | 7,270,279 | | | | 7,494,650 | |
| Global X Social Media Index ETF | | | | | | | | |
| Citigroup | | | 1,373,167 | | | | 1,439,641 | |
| Deutsche Bank | | | 7,269,750 | | | | 7,391,250 | |
| JPM organ | | | 5,650,615 | | | | 6,081,496 | |
| M errill Lynch Pierce Fenner & Smith | | | 395,514 | | | | 416,100 | |
| Morgan Stanley | | | 242,004 | | | | 254,600 | |
| National Financial Services | | | 18,782 | | | | 19,760 | |
| Pershing | | | 1,211,963 | | | | 1,518,750 | |
| Global X Guru® Index ETF | | | | | | | | |
| Deutsche Bank | | | 650,080 | | | | 658,000 | |
| Morgan Stanley | | | 640,145 | | | | 678,000 | |
| Notes to Financial Statements (continued) |
| October 31, 2016 |
8. CHANGE IN ACCOUNTING ESTIMATE
Effective November 1, 2015, the Funds changed their method for estimating the characterization of amounts distributed by master limited partnerships, which correspondingly impacted the net investment income, cost of investments and appreciation (depreciation) on investments and the associated financial highlight ratios and per share disclosures to the extent that the fund recorded investment income that differed from amounts previously estimated. There is no impact to net assets, total return or the expense ratio as a result of management’s change in methodology.
9. CONTRACTUAL OBLIGATIONS
The Funds enter into contracts in the normal course of business that contain a variety of indemnifications. The Funds’ maximum exposure under these arrangements is unknown; however the Funds have not had prior gains or losses pursuant to these contracts. Management has reviewed the Funds’ existing contracts and expects the risk of loss to be remote.
Pursuant to the Trust’s organizational documents, the Trustees of the Trust and the Trust’s officers are indemnified against certain liabilities that may arise out of the performance of their duties.
10. REGULATORY MATTERS
In October 2016, the Securities and Exchange Commission (the “SEC”) released its Final Rule on Investment Company Reporting Modernization (the “Rule”). The Rule which introduces two new regulatory reporting forms for investment companies – Form N-PORT and Form N-CEN – also contains amendments to Regulation S-X which impact financial statement presentation, particularly the presentation of derivative investments. Although still evaluating the impact of the Rule, management believes that many of the Regulation S-X amendments are consistent with the Portfolios’ current financial statement presentation and expects that the Funds will be able to comply with the Rule’s Regulation S-X amendments by the August 1, 2017 compliance date.
| Notes to Financial Statements (continued) |
| October 31, 2016 |
11. SUBSEQUENT EVENTS
The Funds have been evaluated regarding the need for additional disclosures and/or adjustments resulting from subsequent events. Based on this evaluation, no additional disclosure or adjustments were required to the financial statements as of the date the financial statements were issued, except as follows:
New Series
Subsequent to October 31, 2016, the following investment series of the Trust was launched: Global X MSCI SuperDividend® EAFE ETF.
Name and Index Change for Global X SuperDividend® Emerging Markets ETF
On or around November 16, 2016, the following changes took effect for Global X SuperDividend® Emerging Markets ETF.
| | Prior Fund Name and Underlying Index | New Fund Name and Underlying Index |
| Fund Name | Global X SuperDividend® Emerging Markets ETF | Global X MSCI SuperDividend® Emerging Markets ETF |
| Index Name | INDXX SuperDividend® Emerging Markets Index | MSCI Emerging Markets Top 50 Dividend Index |
| Index Components | 50 | 50* |
| Index Description | The INDXX SuperDividend® Emerging Markets Index tracks the performance of 50 equally weighted companies that rank among the highest dividend yielding equity securities in emerging markets, as defined by INDXX, LLC. The Underlying Index may include components from the following countries: Brazil, Chile, Colombia, Mexico, Peru, Czech Republic, Egypt, Greece, Hungary, Poland, Qatar, Russia, South Africa, Turkey, United Arab Emirates, China, India, Indonesia, Malaysia, Philippines, Thailand. The index selects the publicly-listed securities in these markets with the highest dividend yield, subject to minimum market capitalization and liquidity requirements, and subject to maximum allocations to individual countries and sectors. The components of the Underlying Index must also have paid dividends consistently over the last 2 years. | The MSCI Emerging Markets Top 50 Dividend Index tracks the performance of 50 equally-weighted companies that rank among the highest dividend yielding equity securities in Emerging Markets, as defined by MSCI. The Underlying Index may include components from the following countries: Brazil, Chile, Colombia, Mexico, Peru, Czech Republic, Egypt, Greece, Hungary, Poland, Qatar, Russia, South Africa, Turkey, United Arab Emirates, China, India, Indonesia, Malaysia, Philippines, Thailand, Korea and Taiwan. The MSCI Emerging Markets Top 50 Dividend Index begins with the MSCI Emerging Markets Index, which is a capitalization-weighted index, as its starting universe, and then follows a rules-based methodology that is designed to select among the highest dividend yielding equity securities of the MSCI Emerging Markets Index. The MSCI Emerging Markets Top 50 Dividend Index is equal weighted and rebalanced annually. |
| Notes to Financial Statements (concluded) |
| October 31, 2016 |
11. SUBSEQUENT EVENTS (concluded)
*Index constituents for the MSCI Emerging Markets Top 50 Dividend Index are as of August 24, 2016. The number of index constituents may change by the effective date (on or around November 16, 2016).
The prior index is the INDXX SuperDividend® Emerging Markets Index (the “Prior Index”). The Prior Index is designed to reflect performance of 50 equally weighted companies that rank among the highest dividend yielding equity securities in emerging markets. The new index is the MSCI Emerging Markets Top 50 Dividend Index (the “New Index”). The New Index tracks the performance of 50 equally-weighted companies that rank among the highest dividend yielding equity securities in emerging markets, using the MSCI Emerging Markets Index as its starting universe. The New Index follows a rules-based methodology that is designed to select among the highest dividend yielding equity securities of the MSCI Emerging Markets Index, while screening for dividend stability and applying sector and country capping to limit concentration.
On or around March 1, 2017, the following Funds anticipate changing their diversification status from “non-diversified” to “diversified”:
Global X SuperDividend® ETF
Global X SuperDividend® U.S. ETF
Global X Guru® Index ETF
Global X Scientific Beta US ETF
Global X Scientific Beta Europe ETF
Global X Scientific Beta Japan ETF
Global X Scientific Beta Asia ex-Japan ETF
Global X S&P 500® Catholic Values ETF
| REPORT OF INDEPENDENT REGISTERED PUBLIC ACCOUNTING FIRM |
| October 31, 2016 |
To the Board of Trustees and Shareholders of Global X Funds:
In our opinion, the accompanying statements of assets and liabilities, including the schedules of investments, and the related statements of operations and of changes in net assets and the financial highlights present fairly, in all material respects, the financial position of Global X SuperDividend ETF, Global X SuperDividend U.S. ETF, Global X MSCI SuperDividend Emerging Markets ETF, Global X SuperDividend REIT ETF, Global X SuperIncome Preferred ETF, Global X Social Media Index ETF, Global X JPMorgan Efficiente Index ETF, Global X JPMorgan US Sector Rotator Index ETF, Global X Permanent ETF, Global X Guru Index ETF, Global X Guru Activist Index ETF, Global X Guru International Index ETF, Global X Scientific Beta US ETF, Global X Scientific Beta Europe ETF, Global X Scientific Beta Japan ETF, Global X Scientific Beta Asia ex-Japan ETF, Global X YieldCo Index ETF and Global X S&P 500 Catholic Values ETF (eighteen of the series constituting Global X Funds, hereafter referred to as the "Funds") as of October 31, 2016, the results of each of their operations, the changes in each of their net assets and each of their financial highlights for the period then ended, in conformity with accounting principles generally accepted in the United States of America. These financial statements and financial highlights (hereafter referred to as "financial statements") are the responsibility of the Funds’ management. Our responsibility is to express an opinion on these financial statements based on our audits. We conducted our audits of these financial statements in accordance with the standards of the Public Company Accounting Oversight Board (United States). Those standards require that we plan and perform the audit to obtain reasonable assurance about whether the financial statements are free of material misstatement. An audit includes examining, on a test basis, evidence supporting the amounts and disclosures in the financial statements, assessing the accounting principles used and significant estimates made by management, and evaluating the overall financial statement presentation. We believe that our audits, which included confirmation of securities as of October 31, 2016 by correspondence with the custodian and brokers, provide a reasonable basis for our opinion. The statements of changes in net assets for the year ended October 31, 2015 and the financial highlights for each of the years or periods ended on or prior to October 31, 2015 were audited by other auditors whose report dated December 30, 2015 expressed an unqualified opinion on those financial statements and financial highlights.
PricewaterhouseCoopers LLP
Philadelphia, Pennsylvania
December 22, 2016
| Disclosure of Fund Expenses (Unaudited) |
All ETFs have operating expenses. As a shareholder of an ETF, your investment is affected by these ongoing costs, which include (among others) costs for ETF management, administrative services, commissions, and shareholder reports like this one. It is important for you to understand the impact of these costs on your investment returns. In addition, a shareholder is responsible for brokerage fees as a result of their investment in a Fund.
Operating expenses such as these are deducted from an ETF’s gross income and directly reduce its final investment return. These expenses are expressed as a percentage of the ETF’s average net assets; this percentage is known as the ETF’s expense ratio.
The following examples use the expense ratio and are intended to help you understand the ongoing costs (in dollars) of investing in your Fund and to compare these costs with those of other funds. The examples are based on an investment of $1,000 made at the beginning of the period shown and held for the entire period (May 1, 2016 through October 31, 2016).
The table on the next page illustrates your Fund’s costs in two ways:
Actual Fund Return. This section helps you to estimate the actual expenses that your Fund incurred over the period. The “Expenses Paid During Period” column shows the actual dollar expense cost incurred by a $1,000 investment in the Fund, and the “Ending Account Value” number is derived from deducting that expense cost from the Fund’s gross investment return.
You can use this information, together with the actual amount you invested in the Fund, to estimate the expenses you paid over that period. Simply divide your actual account value by $1,000 to arrive at a ratio (for example, an $8,600 account value divided by $1,000 = 8.6), then multiply that ratio by the number shown for your Fund under “Expenses Paid During Period.”
Hypothetical 5% Return. This section helps you compare your Fund’s costs with those of other funds. It assumes that the Fund had an annual 5% return before expenses during the year, but that the expense ratio (Column 3) for the period is unchanged. This example is useful in making comparisons because the Securities and Exchange Commission requires all funds to make this 5% calculation. You can assess your Fund’s comparative cost by comparing the hypothetical result for your Fund in the “Expenses Paid During Period” column with those that appear in the same charts in the shareholder reports for other funds.
NOTE: Because the return is set at 5% for comparison purposes — NOT your Fund’s actual return — the account values shown may not apply to your specific investment.
| Disclosure of Fund Expenses (Unaudited) (Continued) |
| | | Beginning
Account
Value
5/1/2016 | | | Ending
Account
Value
10/31/2016 | | | Annualized
Expense
Ratios | | | Expenses
Paid
During
Period(1) | |
| Global X SuperDividend® ETF |
| Actual Fund Return | | $ | 1,000.00 | | | $ | 1,021.50 | | | | 0.58 | % | | $ | 2.95 | |
| Hypothetical 5% Return | | | 1,000.00 | | | | 1,022.21 | | | | 0.58 | | | | 2.96 | |
| Global X SuperDividend® U.S. ETF |
| Actual Fund Return | | $ | 1,000.00 | | | $ | 997.60 | | | | 0.45 | % | | $ | 2.27 | |
| Hypothetical 5% Return | | | 1,000.00 | | | | 1,022.86 | | | | 0.45 | | | | 2.30 | |
| Global X SuperDividend® Emerging Markets ETF |
| Actual Fund Return | | $ | 1,000.00 | | | $ | 1,108.50 | | | | 0.65 | % | | $ | 3.46 | |
| Hypothetical 5% Return | | | 1,000.00 | | | | 1,021.86 | | | | 0.65 | | | | 3.32 | |
| Global X SuperDividend® REIT ETF |
| Actual Fund Return | | $ | 1,000.00 | | | $ | 1,083.00 | | | | 0.57 | % | | $ | 2.98 | |
| Hypothetical 5% Return | | | 1,000.00 | | | | 1,022.28 | | | | 0.57 | | | | 2.89 | |
| Global X SuperIncome™ Preferred ETF |
| Actual Fund Return | | $ | 1,000.00 | | | $ | 1,005.90 | | | | 0.58 | % | | $ | 2.93 | |
| Hypothetical 5% Return | | | 1,000.00 | | | | 1,022.21 | | | | 0.58 | | | | 2.95 | |
| Global X Social Media Index ETF |
| Actual Fund Return | | $ | 1,000.00 | | | $ | 1,251.60 | | | | 0.65 | % | | $ | 3.67 | |
| Hypothetical 5% Return | | | 1,000.00 | | | | 1,021.87 | | | | 0.65 | | | | 3.30 | |
| Global X | JPMorgan Efficiente Index ETF |
| Actual Fund Return | | $ | 1,000.00 | | | $ | 1,036.20 | | | | 0.69 | % | | $ | 3.53 | |
| Hypothetical 5% Return | | | 1,000.00 | | | | 1,021.67 | | | | 0.69 | | | | 3.51 | |
| Global X | JPMorgan US Sector Rotator Index ETF |
| Actual Fund Return | | $ | 1,000.00 | | | $ | 1,011.90 | | | | 0.69 | % | | $ | 3.50 | |
| Hypothetical 5% Return | | | 1,000.00 | | | | 1,021.66 | | | | 0.69 | | | | 3.52 | |
| Global X Permanent ETF |
| Actual Fund Return | | $ | 1,000.00 | | | $ | 1,008.40 | | | | 0.48 | % | | $ | 2.42 | |
| Hypothetical 5% Return | | | 1,000.00 | | | | 1,022.72 | | | | 0.48 | | | | 2.44 | |
| Global X Guru® Index ETF |
| Actual Fund Return | | $ | 1,000.00 | | | $ | 1,043.80 | | | | 0.75 | % | | $ | 3.86 | |
| Hypothetical 5% Return | | | 1,000.00 | | | | 1,021.36 | | | | 0.75 | | | | 3.82 | |
| Global X Guru® Activist Index ETF |
| Actual Fund Return | | $ | 1,000.00 | | | $ | 1,016.00 | | | | 0.75 | % | | $ | 3.80 | |
| Hypothetical 5% Return | | | 1,000.00 | | | | 1,021.37 | | | | 0.75 | | | | 3.81 | |
| Global X Guru® International Index ETF |
| Actual Fund Return | | $ | 1,000.00 | | | $ | 1,057.90 | | | | 0.75 | % | | $ | 3.89 | |
| Hypothetical 5% Return | | | 1,000.00 | | | | 1,021.36 | | | | 0.75 | | | | 3.82 | |
| Global X Scientific Beta US ETF |
| Actual Fund Return | | $ | 1,000.00 | | | $ | 1,029.50 | | | | 0.19 | % | | $ | 0.97 | |
| Hypothetical 5% Return | | | 1,000.00 | | | | 1,024.18 | | | | 0.19 | | | | 0.97 | |
| Global X Scientific Beta Europe ETF |
| Actual Fund Return | | $ | 1,000.00 | | | $ | 962.20 | | | | 0.38 | % | | $ | 1.88 | |
| Hypothetical 5% Return | | | 1,000.00 | | | | 1,023.22 | | | | 0.38 | | | | 1.93 | |
| Global X Scientific Beta Japan ETF |
| Actual Fund Return | | $ | 1,000.00 | | | $ | 1,053.50 | | | | 0.39 | % | | $ | 1.99 | |
| Hypothetical 5% Return | | | 1,000.00 | | | | 1,023.20 | | | | 0.39 | | | | 1.96 | |
| Global X Scientific Beta Asia ex-Japan ETF |
| Actual Fund Return | | $ | 1,000.00 | | | $ | 1,025.50 | | | | 0.38 | % | | $ | 1.94 | |
| Hypothetical 5% Return | | | 1,000.00 | | | | 1,023.22 | | | | 0.38 | | | | 1.94 | |
| Disclosure of Fund Expenses (Unaudited) (Concluded) |
| | | Beginning
Account
Value
5/1/2016 | | | Ending
Account
Value
10/31/2016 | | | Annualized
Expense
Ratios | | | Expenses
Paid
During
Period(1) | |
| Global X YieldCo Index ETF |
| Actual Fund Return | | $ | 1,000.00 | | | $ | 1,038.10 | | | | 0.66 | % | | $ | 3.39 | |
| Hypothetical 5% Return | | | 1,000.00 | | | | 1,021.81 | | | | 0.66 | | | | 3.36 | |
| Global X S&P 500® Catholic Values ETF |
| Actual Fund Return | | $ | 1,000.00 | | | $ | 1,038.70 | | | | 0.29 | % | | $ | 1.48 | |
| Hypothetical 5% Return | | | 1,000.00 | | | | 1,023.69 | | | | 0.29 | | | | 1.46 | |
| (1) | Expenses are equal to the Fund’s annualized expense ratio multiplied by the average account value over the period, multiplied 184/366 (to reflect the one-half year period), unless otherwise noted. |
| Supplemental Information (Unaudited) |
Net asset value, or “NAV”, is the price per Share at which the Funds issue and redeem Shares. It is calculated in accordance with the standard formula for valuing mutual fund shares. The “Market Price” of the Funds generally is determined using the midpoint between the highest bid and the lowest offer on the stock exchange on which the Shares of the Funds are listed for trading, as of the time that the Funds’ NAV is calculated. The Funds’ Market Price may be at, above or below their NAV. The NAV of the Funds will fluctuate with changes in the market value of the Funds’ holdings. The Market Price of the Funds will fluctuate in accordance with changes in its NAV, as well as market supply and demand.
Premiums or discounts are the differences (expressed as a percentage) between the NAV and Market Price of the Funds on a given day, generally at the time NAV is calculated. A premium is the amount that the Funds are trading above the reported NAV, expressed as a percentage of the NAV. A discount is the amount that the Funds are trading below the reported NAV, expressed as a percentage of the NAV.
Further information regarding premiums and discounts is available on the Funds’ website at www.GlobalXFunds.com
| Trustees and Officers of the Trust (Unaudited) |
Set forth below are the names, addresses, year of birth, position with the Trust, Term of Office and Length of Time Served, the principal occupations for the last five years, number of Funds in fund complex overseen by Trustee, and other directorships outside the fund complex of each of the persons currently serving as Trustees and Officers of the Trust.
Name,
Address (Year of
Birth) | Position(s)
Held with
Funds | Principal Occupation(s) During the Past 5 Years | Number of
Funds in
Trust
Overseen
by Trustee | Other Directorships Held by Trustees |
| Independent Trustees2 | |
Sanjay Ram Bharwani 600 Lexington Avenue, 20th Floor New York, NY 10022 (1974) | Trustee (since 2008) | CEO of Risk Advisors Inc. (since 2007) (consulting firm). | 543 | None. |
Scott R. Chichester1 600 Lexington Avenue, 20th Floor New York, NY 10022 (1970) | Trustee (since 2008) | CFO, AdeptPros Inc. (app development, training and consulting) (since 2012); Founder, Madison Park Advisors LLC (advisory services) (since 2011); CFO, Sterling Seal & Supply Inc. (since 2011), President & Treasurer, Bayview Acquisition Corp (since 2010), CPA, Penda Aiken Inc. (2009-2011) (consultant); Founder and President, DirectPay USA LLC (since 2006) (payroll company); Proprietor, Scott R. Chichester CPA (since 2001) (CPA firm). | 543 | Director of AdeptPros Inc. (since 2015); Director of Sterling Seal & Supply Inc. (since 2011);Director of Bayview Acquisition Corp. (since 2010); Trustee of ARK ETF Trust (since 2014). |
Kartik Kiran Shah 600 Lexington Avenue, 20th Floor New York, NY 10022 (1977) | Trustee (since 2008) | President and Chief Business Officer, Oxeia Biopharmaceuticals, Inc. (2015-Present); Vice President, Business Development, Cynvenio Biosystems (2012-2014); Independent Consultant, Self-Employed (2011-2012) (non-financial services); Director, Wireless Generation (2008-2011) (software). | 543 | Director of Oxeia Biopharmaceuticals, Inc. (2015-Present). |
| Trustees and Officers of the Trust (unaudited) (Concluded) |
The Trust’s Statement of Additional Information (“SAI”) includes additional information about the Trustees and Officers. The SAI may be obtained without charge by calling 1-888-493-8631. The following chart lists Trustees and Officers as of October 31, 2016.
Name, Address (Year of Birth) | Position(s) Held with Funds | Principal Occupation(s) During the Past 5 Years | Other
Directorships Held by Trustees
During the Past 5 Years |
| Interested Trustee / Officers2 |
Bruno del Ama 600 Lexington Avenue, 20th floor New York, NY 10022 (1976) | Trustee (since 2008); President, Chief Executive Officer (since 2008). | Chief Executive Officer, Global X Management Company ("GXMC") (since 2008); Chief Compliance Officer, GXMC (2008-2013). | None. |
Luis Berruga 600 Lexington Avenue, 20th Floor New York, NY 10022 (1977) | Chief Operating Officer, Treasurer, Principal Accounting Officer and Chief Financial Officer (since 9/2015). | Chief Financial Officer, GXMC (since 9/2015) and Chief Operating Officer (since 2/2014); Investment Banker, Jefferies (2012-2014); Regional Product Specialist, Morgan Stanley (2005-2012). | None. |
Daphne Tippens Chisolm 600 Lexington Avenue, 20th Floor New York, NY 10022 (1969) | Secretary (since 2012). | General Counsel, GXMC (since 2011); Chief Compliance Officer, GXMC (1/2014 - 5/2014 and 2/2015 - 9/2016). | None. |
Joe Costello 600 Lexington Avenue, 20th Floor New York, NY 10022 (1974) | Chief Compliance Officer (since 9/2016). | Chief Compliance Officer, FlexShares Funds (2011-2015); Vice President, Northern Trust Investments (2003 - 2015). | None. |
Lisa K. Whittaker4 One Freedom Valley Drive Oaks, PA 19456 (1978) | Assistant Secretary (since 2013). | Counsel at SEI Investments (since 2012); Associate Counsel and Compliance Officer at The Glendale Trust Company (2011-2012); Associate of Drinker Biddle & Reath LLP (2006-2011). | None. |
Eric Kleinschmidt4 One Freedom Valley Drive Oaks, PA 19456 (1968) | Assistant Treasurer (since 2016). | Director, Fund Accounting, SEI Investments Global Funds Services (2004 to present). | None. |
| 1 | Mr. Chichester is currently married to a sister of Mr. del Ama’s wife. While an “immediate family member” (as defined in Section 2(a)(19) of the 1940 Act) of Mr. del Ama would be considered an Interested Person, Mr. Chichester is not considered an immediate family member for this purpose. Although this fact was taken into consideration in determining whether Mr. Chichester should be considered to be an Independent Trustee for purposes of the Section 2(a)(19) of the 1940 Act, it was determined that this relationship was not one that should disqualify Mr. Chichester from serving as an Independent Trustee of the Trust. |
| 2 | Each Trustee serves until his or her successor is duly elected or appointed and qualified. |
| 3 | As of October 31, 2016, the Trust had one hundred investment portfolios, fifty-four of which were operational. |
| 4 | These officers of the Trust also serve as officers of one or more mutual funds for which SEI Investments Company or an affiliate acts as investment manager, administrator or distributor. |
| Notice to Shareholders (Unaudited) |
For shareholders that do not have an October 31, 2016 tax year end, this notice is for informational purposes only. For shareholders with an October 31, 2016 tax year end, please consult your tax advisor as to the pertinence of this notice. For the fiscal year ended October 31, 2016, the Funds are designating the following items with regard to distributions paid during the year.
| | | Return of
Capital | | | Long-Term
Capital Gain
Distributions | | | Ordinary
Income
Distributions | | | Total
Distributions | | | Qualifying
for
Corporate
Dividends
Received
Deduction
(1) | | | Qualifying
Dividend
Income (2) | | | U.S.
Government
Interest (3) | | | Interest
Related
Dividends
(4) | | | Short
Term
Capital
Gain
Dividends
(5) | | | Foreign
Tax
Credit | |
| Global X SuperDividend® ETF | | | 0.00 | % | | | 0.00 | % | | | 100.00 | % | | | 100.00 | % | | | 8.15 | % | | | 45.10 | % | | | 0.00 | % | | | 0.00 | % | | | 0.00 | % | | | 0.00 | % |
| Global X SuperDividend® U.S. ETF | | | 38.74 | % | | | 0.00 | % | | | 61.26 | % | | | 100.00 | % | | | 67.87 | % | | | 67.67 | % | | | 0.00 | % | | | 1.58 | % | | | 0.00 | % | | | 0.00 | % |
| Global X SuperDividend® Emerging Markets ETF | | | 0.00 | % | | | 0.00 | % | | | 100.00 | % | | | 100.00 | % | | | 0.55 | % | | | 69.02 | % | | | 0.00 | % | | | 0.00 | % | | | 0.00 | % | | | 6.12 | % |
| Global X SuperDividend® REIT ETF | | | 0.00 | % | | | 5.97 | % | | | 94.03 | % | | | 100.00 | % | | | 0.00 | % | | | 0.00 | % | | | 0.00 | % | | | 0.00 | % | | | 0.00 | % | | | 0.00 | % |
| Global X SuperIncome™ Preferred ETF | | | 0.00 | % | | | 0.00 | % | | | 100.00 | % | | | 100.00 | % | | | 52.17 | % | | | 68.08 | % | | | 0.00 | % | | | 26.64 | % | | | 0.00 | % | | | 0.00 | % |
| Global X Social Media Index ETF | | | 0.00 | % | | | 0.00 | % | | | 100.00 | % | | | 100.00 | % | | | 97.34 | % | | | 96.83 | % | | | 0.00 | % | | | 0.00 | % | | | 0.00 | % | | | 0.00 | % |
| Global X | JPMorgan Efficiente Index ETF | | | 0.00 | % | | | 0.00 | % | | | 100.00 | % | | | 100.00 | % | | | 4.43 | % | | | 4.95 | % | | | 8.06 | % | | | 0.01 | % | | | 0.00 | % | | | 0.00 | % |
| Global X | JPMorgan US Sector Rotator Index ETF | | | 0.00 | % | | | 0.00 | % | | | 100.00 | % | | | 100.00 | % | | | 35.48 | % | | | 23.84 | % | | | 4.91 | % | | | 0.03 | % | | | 0.00 | % | | | 0.00 | % |
| Global X Permanent ETF | | | 0.00 | % | | | 0.00 | % | | | 100.00 | % | | | 100.00 | % | | | 29.27 | % | | | 39.20 | % | | | 47.43 | % | | | 60.53 | % | | | 0.00 | % | | | 0.00 | % |
| Global X Guru® Index ETF | | | 16.49 | % | | | 0.00 | % | | | 83.51 | % | | | 100.00 | % | | | 100.00 | % | | | 100.00 | % | | | 0.00 | % | | | 0.00 | % | | | 0.00 | % | | | 0.00 | % |
| Global X Guru® Activist Index ETF | | | 0.00 | % | | | 0.00 | % | | | 100.00 | % | | | 100.00 | % | | | 100.00 | % | | | 100.00 | % | | | 0.00 | % | | | 0.00 | % | | | 0.00 | % | | | 0.00 | % |
| Global X Guru® International Index ETF | | | 0.00 | % | | | 0.00 | % | | | 100.00 | % | | | 100.00 | % | | | 0.10 | % | | | 90.42 | % | | | 0.00 | % | | | 0.00 | % | | | 0.00 | % | | | 14.28 | % |
| Global X Scientific Beta US ETF | | | 0.00 | % | | | 0.00 | % | | | 100.00 | % | | | 100.00 | % | | | 93.31 | % | | | 92.73 | % | | | 0.00 | % | | | 0.00 | % | | | 0.00 | % | | | 0.00 | % |
| Global X Scientific Beta Europe ETF | | | 0.00 | % | | | 0.00 | % | | | 100.00 | % | | | 100.00 | % | | | 0.10 | % | | | 93.14 | % | | | 0.00 | % | | | 0.00 | % | | | 0.00 | % | | | 38.60 | % |
| Global X Scientific Beta Japan ETF | | | 0.00 | % | | | 0.00 | % | | | 100.00 | % | | | 100.00 | % | | | 0.00 | % | | | 64.56 | % | | | 0.00 | % | | | 0.00 | % | | | 0.00 | % | | | 58.33 | % |
| Global X Scientific Beta Asia ex-Japan ETF | | | 0.00 | % | | | 0.00 | % | | | 100.00 | % | | | 100.00 | % | | | 0.04 | % | | | 38.06 | % | | | 0.00 | % | | | 0.00 | % | | | 0.00 | % | | | 4.89 | % |
| Global X YieldCo Index ETF | | | 27.67 | % | | | 0.00 | % | | | 72.33 | % | | | 100.00 | % | | | 45.97 | % | | | 99.87 | % | | | 0.00 | % | | | 0.00 | % | | | 0.00 | % | | | 0.00 | % |
| Global X S&P 500® Catholic Values ETF | | | 0.00 | % | | | 0.00 | % | | | 0.00 | % | | | 0.00 | % | | | 0.00 | % | | | 0.00 | % | | | 0.00 | % | | | 0.00 | % | | | 0.00 | % | | | 0.00 | % |
(1) Qualifying dividends represent dividends which qualify for the corporate dividends received deduction and is reflected as a percentage of ordinary Income distributions (the total of short term capital gain and net investment income distributions).
(2) The percentage in this column represents the amount of "Qualifying Dividend Income" as created by the Jobs and Growth Relief Reconciliation Act of 2003 and its reflected as a percentage of ordinary income distributions (the total of short term capital gain and net investment income distributions). It is the intention of each of the aforementioned funds to designate the maximum amount permitted by law.
(3) "U.S. Government Interest" represents the amount of interest that was derived from U.S. Government obligations and distributed during the fiscal year. Generally, interest from direct U.S. Government obligations is exempt from state income tax. However, for shareholders who are residents of California, Connecticut and New York, the statutory threshold requirements were not satisfied to permit exemption of these amounts from state income.
(4) The percentage in this column represents the amount of "Qualifying Interest Income" as created by the American Jobs Creation Act of 2004 and is a percentage of net investment income that is exempt from U.S. withholding tax when paid for foreign investors.
(5) The percentage of this column represents the amount of “Short Term Capital Gain Dividend” is reflected as a percentage of short term capital gain distribution that is exempted from U.S. withholding tax when paid to foreign investors.
| Notice to Shareholders (Unaudited) |
The Funds intend to pass through a foreign tax credit to shareholders. For the fiscal year ended October 31, 2016, the total amount of foreign source income and foreign tax credit are as follows:
| | | Foreign | | | Foreign Tax | |
| | | Source | | | Credit Pass | |
| Global X Funds | | Income | | | through | |
| Global X SuperDividend® Emerging Markets ETF | | $ | 183,605 | | | $ | 12,472 | |
| Global X Guru® International Index ETF | | | 3,625 | | | | 3,602 | |
| Global X Scientific Beta Europe ETF | | | 382,983 | | | | 21,561 | |
| Global X Scientific Beta Japan ETF | | | 261,201 | | | | 30,565 | |
| Global X Scientific Beta Asia ex-Japan ETF | | | 93,237 | | | | 3,209 | |
The information reported herein may differ from the information and distributions taxable to the shareholders for the calendar year ending December 31, 2016. Complete information will be computed and reported in conjunction with your 2016 Form 1099-DIV.
600 Lexington Avenue, 20th Floor
New York, NY 10022
1-888-GXFund-1
(1-888-493-8631)
www.globalxfunds.com
Investment Adviser and Administrator:
Global X Management Company LLC
600 Lexington Avenue, 20th Floor
New York, NY 10022
Distributor:
SEI Investments Distribution Co.
One Freedom Valley Drive
Oaks, PA 19456
Sub-Administrator:
SEI Investments Global Funds Services
One Freedom Valley Drive
Oaks, PA 19456
Counsel for Global X Funds and the Independent Trustees:
Stradley Ronon Stevens & Young, LLP
1250 Connecticut Avenue, N.W.
Suite 500
Washington, DC 2006
Custodian and Transfer Agent:
Brown Brothers Harriman & Co.
50 Post Office Square
Boston, MA 02110
Independent Registered Public Accounting Firm:
PricewaterhouseCoopers LLP
Two Commerce Square
Suite 1800
Philadelphia, PA 19103
This information must be preceded or accompanied by a current prospectus for the Funds described.
GLX-AR-003-0600
The registrant has adopted a code of ethics that applies to the registrant’s principal executive officer, principal financial officer, comptroller or principal accounting officer, and any person who performs a similar function.
| Item 3. | Audit Committee Financial Expert. |
(a)(1) The registrant’s board of trustees has determined that the registrant has at least one audit committee financial expert serving on the audit committee.
(a)(2) The audit committee financial expert is Scott Chichester and is independent as defined in Form N-CSR Item 3(a)(2).
| Item 4. | Principal Accountant Fees and Services. |
Fees billed by Pricewaterhouse Coopers LLP in 2016 and Ernst & Young, LLP in 2015 related to the registrant.
In 2016 and 2015, Pricewaterhouse Coopers LLP and Ernst & Young, LLP, respectively, billed the registrant aggregate fees for services rendered to the registrant for the last two fiscal years as follows:
| | | 2016 | | | 2015 | |
| | | | | All fees and
services to
the Trust
that were
pre-
approved | | | All fees and
services to
service
affiliates that
were pre-
approved | | | All other
fees and
services to
service
affiliates that
did not
require pre-
approval | | | All fees and
services to
the Trust
that were
pre-
approved | | | All fees and
services to
service
affiliates that
were pre-
approved | | | All other
fees and
services to
service
affiliates that
did not
require pre-
approval | |
| (a) | | Audit Fees | | $ | 532,690 | | | $ | 0 | | | $ | 0 | | | $ | 575,582 | | | $ | 0 | | | $ | 0 | |
| (b) | | Audit-Related Fees | | $ | 0 | | | $ | 0 | | | $ | 0 | | | $ | 0 | | | $ | 0 | | | $ | 0 | |
| (c) | | Tax Fees | | $ | 201,260 | | | $ | 0 | | | $ | 0 | | | $ | 192,855 | | | $ | 0 | | | $ | 0 | |
| (d) | | All Other Fees | | $ | 0 | | | $ | 0 | | | $ | 0 | | | $ | 0 | | | $ | 0 | | | $ | 0 | |
(e)(1) Not applicable.
(e)(2) Percentage of fees billed applicable to non-audit services pursuant to waiver of pre-approval requirement were as follows for Pricewaterhouse Coopers LLP in 2016 and Ernst & Young, LLP 2015:
| | | 2016 | | | 2015 | |
Audit-Related Fees
| | | 0 | % | | | 0 | % |
| Tax Fees | | | 0 | % | | | 0 | % |
All Other Fees
| | | 0 | % | | | 0 | % |
(f) Not applicable.
(g) The aggregate non-audit fees and services billed by Pricewaterhouse Coopers LLP in 2016 and Ernst & Young, LLP in 2015 for the last two fiscal years were $201,260 and $192,855, respectively.
(h) During the past fiscal year, all non-audit services provided by registrant’s principal accountant to either registrant’s investment adviser or to any entity controlling, controlled by, or under common control with registrant’s investment adviser that provides ongoing services to registrant were pre-approved by the audit committee of registrant’s Board of Trustees. Included in the audit committee’s pre-approval was the review and consideration as to whether the provision of these non-audit services is compatible with maintaining the principal accountant’s independence.
| Item 5. | Audit Committee of Listed Registrants. |
Not applicable to open-end management investment companies.
| Item 6. | Schedule of Investments. |
Not applicable.
| Item 7. | Disclosure of Proxy Voting Policies and Procedures for Closed-End Management Investment Companies. |
Not applicable to open-end management investment companies.
| Item 8. | Portfolio Managers of Closed-End Management Investment Companies. |
Not applicable to open-end management investment companies. Effective for closed-end management investment companies for fiscal years ending on or after December 31, 2005.
| Item 9. | Purchases of Equity Securities by Closed-End Management Company and Affiliated Purchasers. |
Not applicable to open-end management investment companies.
| Item 10. | Submission of Matters to a Vote of Security Holders. |
There have been no material changes.
| Item 11. | Controls and Procedures. |
(a) The certifying officers, whose certifications are included herewith, have evaluated the registrant’s disclosure controls and procedures within 90 days of the filing date of this report. In their opinion, based on their evaluation, the registrant’s disclosure controls and procedures are adequately designed, and are operating effectively to ensure, that information required to be disclosed by the registrant in the reports it files or submits under the Securities Exchange Act of 1934 is recorded, processed, summarized and reported within the time periods specified in the Securities and Exchange Commission’s rules and forms.
(b) There were no significant changes in the registrant’s internal control over financial reporting that occurred during the second fiscal quarter of the period covered by this report that has materially affected, or is reasonably likely to materially affect, the registrants internal control over financial reporting.
(a)(1) Code of Ethics attached hereto.
(a)(2) A separate certification for the principal executive officer and the principal financial officer of the registrant as required by Rule 30a-2(a) under the Investment Company Act of 1940, as amended (17 CFR 270.30a-2(a)), are filed herewith.
(b) Officer certifications as required by Rule 30a-2(b) under the Investment Company Act of 1940, as amended (17 CFR 270.30a-2(b)) also accompany this filing as an Exhibit.
SIGNATURES
Pursuant to the requirements of the Securities Exchange Act of 1934 and the Investment Company Act of 1940, the registrant has duly caused this report to be signed on its behalf by the undersigned, thereunto duly authorized.
| (Registrant) | Global X Funds |
| | |
| By (Signature and Title)* | /s/ Bruno del Ama |
| | Bruno del Ama |
| | President |
Date: December 30, 2016
Pursuant to the requirements of the Securities Exchange Act of 1934 and the Investment Company Act of 1940, this report has been signed below by the following persons on behalf of the registrant and in the capacities and on the dates indicated.
| By (Signature and Title)* | /s/ Bruno del Ama |
| | Bruno del Ama |
| | President |
| | |
| Date: December 30, 2016 | |
| | |
| By (Signature and Title)* | /s/ Luis Berruga |
| | Luis Berruga |
| | Chief Financial Officer |
Date: December 30, 2016
* Print the name and title of each signing officer under his or her signature.