UNITED STATES
SECURITIES AND EXCHANGE COMMISSION
Washington, D.C. 20549
________
FORM N-CSR
________
CERTIFIED SHAREHOLDER REPORT OF REGISTERED MANAGEMENT
INVESTMENT COMPANIES
Investment Company Act file number 811-22209
Global X Funds
(Exact name of registrant as specified in charter)
________
600 Lexington Avenue, 20th Floor
New York, NY 10022
(Address of principal executive offices) (Zip code)
Bruno del Ama
Global X Management Company LLC
600 Lexington Ave, 20th Floor
New York, NY 10022
(Name and address of agent for service)
With a copy to:
| Daphne Tippens Chisolm, Esq. | Eric S. Purple, Esq. |
| Global X Management Company LLC | Stradley Ronon Stevens & Young, LLP |
| 600 Lexington Ave, 20th Floor | 1250 Connecticut Avenue, N.W. |
| New York, NY 10022 | Suite 500 |
| | Washington, DC 20036 |
Registrant’s telephone number, including area code: (212) 644-6440
Date of fiscal year end: October 31, 2017
Date of reporting period: October 31, 2017
| Item 1. | Reports to Stockholders. |

Global X Silver Miners ETF (ticker: SIL)
Global X Gold Explorers ETF (ticker: GOEX)
Global X Copper Miners ETF (ticker: COPX)
Global X Uranium ETF (ticker: URA)
Global X Lithium & Battery Tech ETF
(formerly Global X Lithium ETF) (ticker: LIT)
Global X Fertilizers/Potash ETF (ticker: SOIL)
Annual Report
October 31, 2017
Shares are bought and sold at market price (not NAV) and are not individually redeemed from a Fund. Shares may only be redeemed directly from a Fund by Authorized Participants, in very large creation/redemption units. Brokerage commissions will reduce returns.
The Funds file their complete schedules of Fund holdings with the Securities and Exchange Commission (the “Commission”) for the first and third quarters of each fiscal year on Form N-Q within sixty days after the end of the period. The Funds’ Forms N-Q are available on the Commission’s website at http://www.sec.gov, and may be reviewed and copied at the Commission's Public Reference Room in Washington, DC. Information on the operation of the Public Reference Room may be obtained by calling 1-800-SEC-0330.
A description of the policies and procedures that Global X Funds uses to determine how to vote proxies relating to Fund securities, as well as information relating to how the Funds voted proxies relating to Fund securities during the most recent 12-month period ended June 30, is available (i) without charge, upon request, by calling 1-888-GXFund-1; and (ii) on the Commission’s website at http://www.sec.gov.
| Management Discussion of Fund Performance (unaudited) |
| Global X Silver Miners ETF |
Global X Silver Miners ETF
The Global X Silver Miners ETF (“Fund”) seeks to provide investment results that correspond generally to the price and yield performance, before fees and expenses, of the Solactive Global Silver Miners Total Return Index (“Underlying Index”). The Fund is passively managed, which means the investment adviser does not attempt to take defensive positions in declining markets. The Fund generally seeks to fully replicate the Underlying Index.
The Underlying Index is designed to measure broad-based equity market performance of global companies involved in the silver mining industry, as defined by the index provider.
For the 12-month period ended October 31, 2017 (the “reporting period”), the Fund decreased 18.61%, while the Underlying Index decreased 18.17%. The Fund had a net asset value of $40.61 per share on October 31, 2016 and ended the reporting period with a net asset value of $31.96 on October 31, 2017.
During the reporting period, the highest returns came from Volcan Compania Minera SAA and Americas Silver, which returned 87.64% and 36.52%, respectively. The worst performers were Primero Mining and Tahoe Resources, which returned -95.12% and -59.98%, respectively.
Silver mining firms derive revenue from the price of silver and the amount that they produce. Given the high fixed costs associated with mining the precious metal, these firms can have earnings that are significantly leveraged to the price movements of silver. The reporting period has been volatile for the silver market, translating into volatility within the mining segment as well. Some miners reduced their output during the period while industrial demand increased. These events initially sparked a rally in the metal at the start of 2017. Later in the period, however, silver lost its gains, resulting in a selloff in the miners.
| | | AVERAGE ANNUAL TOTAL RETURN FOR THE YEAR ENDED OCTOBER 31, 2017 | |
| | | One Year Return | | | Three Year Return | | | Five Year Return | | | Annualized Inception to Date* | |
| | | Net Asset Value | | | Market Price | | | Net Asset Value | | | Market Price | | | Net Asset Value | | | Market Price | | | Net Asset Value | | | Market Price | |
| Global X Silver Miners ETF | | | -18.61 | % | | | -18.50 | % | | | 8.25 | % | | | 8.51 | % | | | -14.76 | % | | | -14.95 | % | | | -3.19 | % | | | -3.17 | % |
| Solactive Global Silver Miners Total Return Index | | | -18.17 | % | | | -18.17 | % | | | 8.72 | % | | | 8.72 | % | | | -14.32 | % | | | -14.32 | % | | | -2.62 | % | | | -2.62 | % |
| MSCI ACWI Index | | | 23.20 | % | | | 23.20 | % | | | 7.92 | % | | | 7.92 | % | | | 10.80 | % | | | 10.80 | % | | | 8.66 | % | | | 8.66 | % |
| S&P 500 Index | | | 23.63 | % | | | 23.63 | % | | | 10.77 | % | | | 10.77 | % | | | 15.18 | % | | | 15.18 | % | | | 13.05 | % | | | 13.05 | % |
Growth of a $10,000 Investment
(at Net Asset Value)
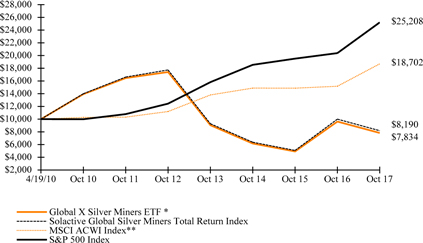
*Fund commenced operations on April 19, 2010.
**As of March 1, 2017, the Fund changed its broad based benchmark from the S&P 500 Index to the MSCI ACWI Index. The new benchmark is a more appropriate comparison for the Fund.
The MSCI ACWI (All Country World Index) Index is a free float-adjusted market capitalization weighted index that is designed to measure the equity market performance of developed and emerging markets.
The S&P 500 Index is a market capitalization-weighted composite index of 500 large capitalization U.S. companies.
| Management Discussion of Fund Performance (unaudited) |
| Global X Silver Miners ETF |
The performance data quoted herein represents past performance and the return and value of an investment in the Fund will fluctuate so that, when redeemed, it may be worth less than its original cost. Past performance is no guarantee of future performance and should not be considered as a representation of the future results of the Fund. The Fund's performance assumes the reinvestment of all dividends and all capital gains. Index returns assume reinvestment of dividends and, unlike the Fund's returns, do not reflect any fees or expenses. If such fees and expenses were included in the index returns, the performance would have been lower. Please note that one cannot invest directly in an unmanaged index.
There are no assurances that the Fund will meet its stated objectives.
The Fund’s holdings and allocations are subject to change and should not be considered recommendations to buy individual securities.
The graph and table do not reflect the deduction of taxes that a shareholder would pay on Fund distributions or the redemption or sale of Fund shares.
See definition of comparative indices on previous page.
| Management Discussion of Fund Performance (unaudited) |
| Global X Gold Explorers ETF |
Global X Gold Explorers ETF
The Global X Gold Explorers ETF (“Fund”) seeks to provide investment results that correspond generally to the price and yield performance, before fees and expenses, of the Solactive Global Gold Explorers & Developers Total Return Index (“Underlying Index”). The Fund is passively managed, which means the investment adviser does not attempt to take defensive positions in declining markets. The Fund generally seeks to fully replicate the Underlying Index.
The Underlying Index is a free float-adjusted, liquidity-tested and market capitalization-weighted index that is designed to measure broad-based equity market performance of global companies involved in gold exploration, as defined by the index provider.
For the 12-month period ended October 31, 2017 (the “reporting period”), the Fund decreased 13.61%, while the Underlying Index decreased 13.15%. The Fund had a net asset value of $34.95 per share on October 31, 2016 and ended the reporting period with a net asset value of $21.46 on October 31, 2017.
During the reporting period, the highest returns came from Teranga Gold Resources and Kirkland Lake Gold, which returned 230.54% and 90.92%, respectively. The worst performers were Primero Mining and Asanko Gold, which returned -92.87% and -74.80%, respectively.
Gold explorers are firms with minimal amounts of gold production, that instead seek to profit on finding and securing mining rights to new gold deposits. These companies’ stock prices tend to be driven by both the price of gold as well as the firms’ ability to successfully find such deposits. During the reporting period, gold prices were essentially flat. Although the US dollar weakened, inflation remained low, and geopolitical tensions intensified around the world, demand for gold fell overall as investors preferred risk-on assets like equities.
| | | AVERAGE ANNUAL TOTAL RETURN FOR THE YEAR ENDED OCTOBER 31, 2017 | |
| | | One Year Return | | | Three Year Return | | | Five Year Return | | | Annualized Inception to Date* | |
| | | Net Asset Value | | | Market Price | | | Net Asset Value | | | Market Price | | | Net Asset Value | | | Market Price | | | Net Asset Value | | | Market Price | |
| Global X Gold Explorers ETF | | | -13.61 | % | | | -12.29 | % | | | 20.48 | % | | | 21.22 | % | | | -12.58 | % | | | -12.75 | % | | | -16.09 | % | | | -16.02 | % |
| Hybrid Solactive Global Gold Explorers Total Return Index/Solactive Global Gold Explorers & Developers Total Return Transition Index/Solactive Global Gold Explorers & Developers Total Return Index | | | -13.15 | % | | | -13.15 | % | | | 21.40 | % | | | 21.40 | % | | | -11.48 | % | | | -11.48 | % | | | -15.43 | % | | | -15.43 | % |
| MSCI EAFE Index | | | 23.44 | % | | | 23.44 | % | | | 6.08 | % | | | 6.08 | % | | | 8.53 | % | | | 8.53 | % | | | 5.96 | % | | | 5.96 | % |
| S&P 500 Index | | | 23.63 | % | | | 23.63 | % | | | 10.77 | % | | | 10.77 | % | | | 15.18 | % | | | 15.18 | % | | | 13.94 | % | | | 13.94 | % |
Growth of a $10,000 Investment
(at Net Asset Value)
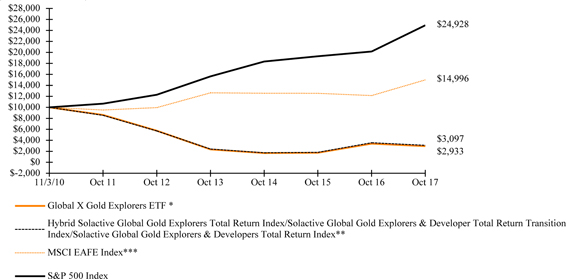
*Fund commenced operations on November 3, 2010.
**Hybrid index performance reflects the performance of the Solactive Global Gold Explorers Total Return Index through November 30, 2016, the Solactive Global Gold Explorers & Developers Total Return Transition Index through April 30, 2017, and the Solactive Global Gold Explorers &
| Management Discussion of Fund Performance (unaudited) |
| Global X Gold Explorers ETF |
Developers Total Return Index thereafter. This change was due to planned migration to the new Underlying Index, in an effort to provide broader exposure to the local market.
***As of March 1, 2017, the Fund changed its broad based benchmark from the S&P 500 Index to the MSCI EAFE Index. The new benchmark is a more appropriate comparison for the Fund.
The MSCI EAFE Index (Europe, Australasia, Far East) is a free float-adjusted market capitalization index that is designed to measure the equity market performance of developed markets, excluding the US & Canada.
The S&P 500 Index is a market capitalization-weighted composite index of 500 large capitalization U.S. companies.
The performance data quoted herein represents past performance and the return and value of an investment in the Fund will fluctuate so that, when redeemed, it may be worth less than its original cost. Past performance is no guarantee of future performance and should not be considered as a representation of the future results of the Fund. The Fund's performance assumes the reinvestment of all dividends and all capital gains. Index returns assume reinvestment of dividends and, unlike the Fund's returns, do not reflect any fees or expenses. If such fees and expenses were included in the index returns, the performance would have been lower. Please note that one cannot invest directly in an unmanaged index.
There are no assurances that the Fund will meet its stated objectives.
The Fund’s holdings and allocations are subject to change and should not be considered recommendations to buy individual securities.
The graph and table do not reflect the deduction of taxes that a shareholder would pay on Fund distributions or the redemption or sale of Fund shares.
See definition of comparative indices above.
| Management Discussion of Fund Performance (unaudited) |
| Global X Copper Miners ETF |
Global X Copper Miners ETF
The Global X Copper Miners ETF (“Fund”) seeks to provide investment results that correspond generally to the price and yield performance, before fees and expenses, of the Solactive Global Copper Miners Total Return Index (“Underlying Index”). The Fund is passively managed, which means the investment adviser does not attempt to take defensive positions in declining markets. The Fund generally seeks to fully replicate the Underlying Index.
The Underlying Index is designed to measure broad-based equity market performance of global companies involved in the copper mining industry, as defined by the index provider.
For the 12-month period ended October 31, 2017 (the “reporting period”), the Fund increased 46.38%, while the Underlying Index increased 47.79%. The Fund had a net asset value of $17.60 per share on October 31, 2016 and ended the reporting period with a net asset value of $25.61 on October 31, 2017.
During the reporting period, the highest returns came from KAZ Minerals and Lundin Mining, which returned 209.19% and 97.06%, respectively. The worst performers were CuDeco and SolGold, which returned -44.62% and -23.06%, respectively.
Copper mining firms derive revenue from the price of copper and the amount that they produce. Given the high fixed costs associated with mining the metal, these firms can have earnings that are significantly leveraged to the price movements of copper. In addition, many copper miners sell other metals and minerals that are a by-product of copper mining, and therefore can have exposure to the price movements of these materials as well. Copper is primarily used in an industrial capacity such as in electrical wiring and pipes. Demand for the metal is therefore closely tied to economic activity, particularly real estate and infrastructure development. During the reporting period, the metal benefitted from better than expected economic data out of China, which is the world’s largest consumer of copper. In addition, in the first half of 2017 there were disruptions and supply stoppages by major miners that reduced the total output. This supported higher prices for the metal during the period.
| | | AVERAGE ANNUAL TOTAL RETURN FOR THE YEAR ENDED OCTOBER 31, 2017 | |
| | | One Year Return | | | Three Year Return | | | Five Year Return | | | Annualized Inception to Date* | |
| | | Net Asset Value | | | Market Price | | | Net Asset Value | | | Market Price | | | Net Asset Value | | | Market Price | | | Net Asset Value | | | Market Price | |
| Global X Copper Miners ETF | | | 46.38 | % | | | 46.23 | % | | | 2.21 | % | | | 2.27 | % | | | -6.48 | % | | | -6.51 | % | | | -4.77 | % | | | -4.78 | % |
| Solactive Global Copper Miners Total Return Index | | | 47.79 | % | | | 47.79 | % | | | 3.03 | % | | | 3.03 | % | | | -6.12 | % | | | -6.12 | % | | | -4.39 | % | | | -4.39 | % |
| MSCI EAFE Index | | | 23.44 | % | | | 23.44 | % | | | 6.08 | % | | | 6.08 | % | | | 8.53 | % | | | 8.53 | % | | | 6.06 | % | | | 6.06 | % |
| S&P 500 Index | | | 23.63 | % | | | 23.63 | % | | | 10.77 | % | | | 10.77 | % | | | 15.18 | % | | | 15.18 | % | | | 13.05 | % | | | 13.05 | % |
Growth of a $10,000 Investment
(at Net Asset Value)
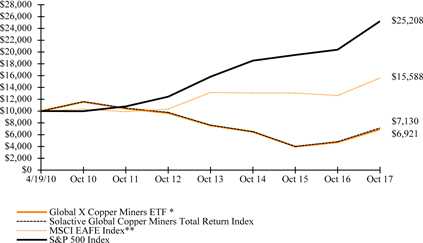
*Fund commenced operations on April 19, 2010.
**As of March 1, 2017, the Fund changed its broad based benchmark from the S&P 500 Index to the MSCI EAFE Index. The new benchmark is a more appropriate comparison for the Fund.
The MSCI EAFE Index (Europe, Australasia, Far East) is a free float-adjusted market capitalization index that is designed to measure the equity market performance of developed markets, excluding the US & Canada.
| Management Discussion of Fund Performance (unaudited) |
| Global X Copper Miners ETF |
The S&P 500 Index is a market capitalization-weighted composite index of 500 large capitalization U.S. companies.
The performance data quoted herein represents past performance and the return and value of an investment in the Fund will fluctuate so that, when redeemed, it may be worth less than its original cost. Past performance is no guarantee of future performance and should not be considered as a representation of the future results of the Fund. The Fund's performance assumes the reinvestment of all dividends and all capital gains. Index returns assume reinvestment of dividends and, unlike the Fund's returns, do not reflect any fees or expenses. If such fees and expenses were included in the index returns, the performance would have been lower. Please note that one cannot invest directly in an unmanaged index.
There are no assurances that the Fund will meet its stated objectives.
The Fund’s holdings and allocations are subject to change and should not be considered recommendations to buy individual securities.
The graph and table do not reflect the deduction of taxes that a shareholder would pay on Fund distributions or the redemption or sale of Fund shares.
See definition of comparative indices above and on previous page.
| Management Discussion of Fund Performance (unaudited) |
| Global X Uranium ETF |
Global X Uranium ETF
The Global X Uranium ETF (“Fund”) seeks to provide investment results that correspond generally to the price and yield performance, before fees and expenses, of the Solactive Global Uranium Total Return Index (“Underlying Index”). The Fund is passively managed, which means the investment adviser does not attempt to take defensive positions in declining markets. The Fund generally seeks to fully replicate the Underlying Index.
The Underlying Index is designed to measure broad-based equity market performance of global companies involved in the uranium industry, as defined by the index provider.
For the 12-month period ended October 31, 2017 (the “reporting period”), the Fund increased 5.75%, while the Underlying Index increased 4.48%. The Fund had a net asset value of $12.08 per share on October 31, 2016 and ended the reporting period with a net asset value of $11.88 on October 31, 2017.
During the reporting period, the highest returns came from Energy Resources of Australia and Nexgen Energy, which returned 67.44% and 56.27%, respectively. The worst performers were Peninsula Energy and UEX, which returned -50.47% and -19.42%, respectively.
The uranium industry continued to face the challenges of an oversupplied market during the reporting period. These issues largely stemmed from the slow implementation of planned output cuts by major producers and contributions of secondary supply sources like decommissioned weapons. Despite supply-side challenges, nuclear energy generation continues to be a favored source for electricity in emerging markets like China, India, Saudi Arabia, and the UAE. Another positive during the period was Japan’s reactivation of five nuclear reactors, six years after the 2011 Fukushima episode.
| | | AVERAGE ANNUAL TOTAL RETURN FOR THE YEAR ENDED OCTOBER 31, 2017 | |
| | | One Year Return | | | Three Year Return | | | Five Year Return | | | Annualized Inception to Date* | |
| | | Net Asset Value | | | Market Price | | | Net Asset Value | | | Market Price | | | Net Asset Value | | | Market Price | | | Net Asset Value | | | Market Price | |
| Global X Uranium ETF | | | 5.75 | % | | | 5.62 | % | | | -16.40 | % | | | -16.02 | % | | | -19.83 | % | | | -19.95 | % | | | -24.44 | % | | | -24.42 | % |
| Solactive Global Uranium Total Return Index | | | 4.48 | % | | | 4.48 | % | | | -15.39 | % | | | -15.39 | % | | | -19.17 | % | | | -19.17 | % | | | -24.17 | % | | | -24.17 | % |
| MSCI EAFE Index | | | 23.44 | % | | | 23.44 | % | | | 6.08 | % | | | 6.08 | % | | | 8.53 | % | | | 8.53 | % | | | 5.53 | % | | | 5.53 | % |
| S&P 500 Index | | | 23.63 | % | | | 23.63 | % | | | 10.77 | % | | | 10.77 | % | | | 15.18 | % | | | 15.18 | % | | | 13.64 | % | | | 13.64 | % |
Growth of a $10,000 Investment
(at Net Asset Value)
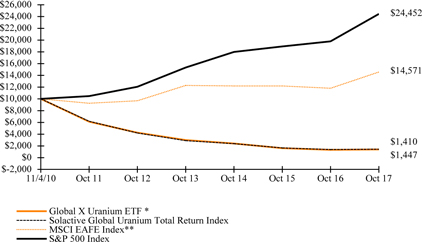
*Fund commenced operations on November 4, 2010.
**As of March 1, 2017, the Fund changed its broad based benchmark from the S&P 500 Index to the MSCI EAFE Index. The new benchmark is a more appropriate comparison for the Fund.
The MSCI EAFE Index (Europe, Australasia, Far East) is a free float-adjusted market capitalization index that is designed to measure the equity market performance of developed markets, excluding the US & Canada.
The S&P 500 Index is a market capitalization-weighted composite index of 500 large capitalization U.S. companies.
The performance data quoted herein represents past performance and the return and value of an investment in the Fund will fluctuate so that, when redeemed, it may be worth less than its original cost. Past performance is no guarantee of future performance and should not be considered as a representation of the future results of the Fund. The Fund's performance assumes the reinvestment of all dividends and all
| Management Discussion of Fund Performance (unaudited) |
| Global X Uranium ETF |
capital gains. Index returns assume reinvestment of dividends and, unlike the Fund's returns, do not reflect any fees or expenses. If such fees and expenses were included in the index returns, the performance would have been lower. Please note that one cannot invest directly in an unmanaged index.
There are no assurances that the Fund will meet its stated objectives.
The Fund’s holdings and allocations are subject to change and should not be considered recommendations to buy individual securities.
The graph and table do not reflect the deduction of taxes that a shareholder would pay on Fund distributions or the redemption or sale of Fund shares.
See definition of comparative indices on previous page.
| Management Discussion of Fund Performance (unaudited) |
| Global X Lithium & Battery Tech ETF |
Global X Lithium & Battery Tech ETF
The Global X Lithium & Battery Tech ETF (“Fund”) seeks to provide investment results that correspond generally to the price and yield performance, before fees and expenses, of the Solactive Global Lithium Index (“Underlying Index”). The Fund is passively managed, which means the investment adviser does not attempt to take defensive positions in declining markets. The Fund generally seeks to fully replicate the Underlying Index.
The Underlying Index is designed to measure broad-based equity market performance of global companies involved in the lithium industry, as defined by the index provider.
For the 12-month period ended October 31, 2017 (the “reporting period”), the Fund increased 66.46%, while the Underlying Index increased 66.25%. The Fund had a net asset value of $24.02 per share on October 31, 2016 and ended the reporting period with a net asset value of $39.14 on October 31, 2017.
During the reporting period, the highest returns came from Lithium Americas and Samsung SDI, which returned 187.28% and 125.19%, respectively. The worst performers were Coslight Technology International Group and FDG Electric Vehicles, which returned -40.33% and -16.55%, respectively.
Lithium experienced a resurgence during the period due to the increased expectations for the adoption of electric vehicles (EVs). The vast majority of EVs run on lithium-ion batteries, which depend on the white metal for their battery chemistry. While EVs remain largely a niche product in the current automobile landscape, expectations for their adoption reached higher levels during the reporting period, forcing battery suppliers to aggressively lock up future supply. Excitement around EVs was driven by a combination of falling battery prices along with government regulations around the world that seek to eventually phase out internal combustion engines. Various governments including the United Kingdom, France, Norway, the Netherlands, China, and India have all laid out plans to promote EVs for their lower pollution output. In response to these new regulations, virtually all major automobile manufacturers have announced plans to electrify their vehicle fleets over the next few years with their fully electric vehicles or hybrid models.
| | | AVERAGE ANNUAL TOTAL RETURN FOR THE YEAR ENDED OCTOBER 31, 2017 | |
| | | One Year Return | | | Three Year Return | | | Five Year Return | | | Annualized Inception to Date* | |
| | | Net Asset Value | | | Market Price | | | Net Asset Value | | | Market Price | | | Net Asset Value | | | Market Price | | | Net Asset Value | | | Market Price | |
| Global X Lithium & Battery Tech ETF | | | 66.46 | % | | | 66.16 | % | | | 19.05 | % | | | 19.02 | % | | | 7.63 | % | | | 7.83 | % | | | 4.31 | % | | | 4.34 | % |
| Solactive Global Lithium Index | | | 66.25 | % | | | 66.25 | % | | | 19.19 | % | | | 19.19 | % | | | 8.45 | % | | | 8.45 | % | | | 5.02 | % | | | 5.02 | % |
| MSCI ACWI Index | | | 23.20 | % | | | 23.20 | % | | | 7.92 | % | | | 7.92 | % | | | 10.80 | % | | | 10.80 | % | | | 10.16 | % | | | 10.16 | % |
| S&P 500 Index | | | 23.63 | % | | | 23.63 | % | | | 10.77 | % | | | 10.77 | % | | | 15.18 | % | | | 15.18 | % | | | 14.88 | % | | | 14.88 | % |
Growth of a $10,000 Investment
(at Net Asset Value)

*Fund commenced operations on July 22, 2010.
**As of March 1, 2017, the Fund changed its broad based benchmark from the S&P 500 Index to the MSCI ACWI Index. The new benchmark is a more appropriate comparison for the Fund.
The MSCI ACWI (All Country World Index) Index is a free float-adjusted market capitalization weighted index that is designed to measure the equity market performance of developed and emerging markets.
The S&P 500 Index is a market capitalization-weighted composite index of 500 large capitalization U.S. companies.
| Management Discussion of Fund Performance (unaudited) |
| Global X Lithium & Battery Tech ETF |
The performance data quoted herein represents past performance and the return and value of an investment in the Fund will fluctuate so that, when redeemed, it may be worth less than its original cost. Past performance is no guarantee of future performance and should not be considered as a representation of the future results of the Fund. The Fund's performance assumes the reinvestment of all dividends and all capital gains. Index returns assume reinvestment of dividends and, unlike the Fund's returns, do not reflect any fees or expenses. If such fees and expenses were included in the index returns, the performance would have been lower. Please note that one cannot invest directly in an unmanaged index.
There are no assurances that the Fund will meet its stated objectives.
The Fund’s holdings and allocations are subject to change and should not be considered recommendations to buy individual securities.
The graph and table do not reflect the deduction of taxes that a shareholder would pay on Fund distributions or the redemption or sale of Fund shares.
See definition of comparative indices on previous page.
| Management Discussion of Fund Performance (unaudited) |
| Global X Fertilizers/Potash ETF |
Global X Fertilizers/Potash ETF
The Global X Fertilizers/Potash ETF (“Fund”) seeks to provide investment results that correspond generally to the price and yield performance, before fees and expenses, of the Solactive Global Fertilizers/Potash Total Return Index (“Underlying Index”). The Fund is passively managed, which means the investment adviser does not attempt to take defensive positions in declining markets. The Fund generally seeks to fully replicate the Underlying Index.
The Underlying Index is designed to track the performance of the largest listed companies globally that are active in some aspect of the fertilizer/potash industry, as defined by the index provider.
For the 12-month period ended October 31, 2017 (the “reporting period”), the Fund increased 23.99%, while the Underlying Index increased 24.42%. The Fund had a net asset value of $8.56 per share on October 31, 2016 and ended the reporting period with a net asset value of $10.28 on October 31, 2017.
During the reporting period, the highest returns came from Sociedad Quimica Y Minera De Chile ADR and OCI, which returned 112.97% and 71.08%, respectively. The worst performers were Sirius Minerals and Gubre Fabrikalari, which returned -68.32% and -24.52%, respectively.
The global fertilizer market struggled with low agricultural prices and feeble demand in a well-supplied market. Despite these headwinds, prices picked up toward the end of the reporting period on higher import demand from recovering economies like Brazil, supply outages, and limited exports from China. North America and Europe are the two major regions for potash and fertilizer production, while China, India, and Brazil are key importers. This dynamic makes the industry sensitive to exchange rate fluctuations, trade policies, and emerging market growth rates. Fortunately, the uptick in global growth and a strengthening emerging market economy drove additional demand.
| | | AVERAGE ANNUAL TOTAL RETURN FOR THE YEAR ENDED OCTOBER 31, 2017 | |
| | | One Year Return | | | Three Year Return | | | Five Year Return | | | Annualized Inception to Date* | |
| | | Net Asset Value | | | Market Price | | | Net Asset Value | | | Market Price | | | Net Asset Value | | | Market Price | | | Net Asset Value | | | Market Price | |
| Global X Fertilizers/Potash ETF | | | 23.99 | % | | | 23.51 | % | | | 1.17 | % | | | 1.33 | % | | | -3.53 | % | | | -3.49 | % | | | -3.87 | % | | | -3.84 | % |
Solactive Global Fertilizers/Potash
Total Return Index | | | 24.42 | % | | | 24.42 | % | | | 1.49 | % | | | 1.49 | % | | | -3.31 | % | | | -3.31 | % | | | -3.59 | % | | | -3.59 | % |
| MSCI ACWI Index | | | 23.20 | % | | | 23.20 | % | | | 7.92 | % | | | 7.92 | % | | | 10.80 | % | | | 10.80 | % | | | 8.37 | % | | | 8.37 | % |
| S&P 500 Index | | | 23.63 | % | | | 23.63 | % | | | 10.77 | % | | | 10.77 | % | | | 15.18 | % | | | 15.18 | % | | | 13.31 | % | | | 13.31 | % |
Growth of a $10,000 Investment
(at Net Asset Value)
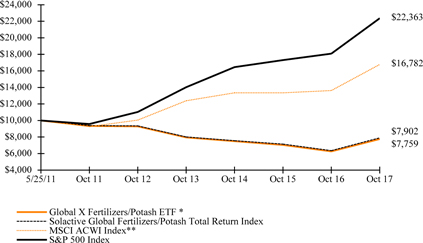
*Fund commenced operations on May 25, 2011.
**As of March 1, 2017, the Fund changed its broad based benchmark from the S&P 500 Index to the MSCI ACWI Index. The new benchmark is a more appropriate comparison for the Fund.
The MSCI ACWI (All Country World Index) Index is a free float-adjusted market capitalization weighted index that is designed to measure the equity market performance of developed and emerging markets.
The S&P 500 Index is a market capitalization-weighted composite index of 500 large capitalization U.S. companies.
The performance data quoted herein represents past performance and the return and value of an investment in the Fund will fluctuate so that, when redeemed, it may be worth less than its original cost. Past performance is no guarantee of future performance and should not be considered as a representation of the future results of the Fund. The Fund's performance assumes the reinvestment of all dividends and all
| Management Discussion of Fund Performance (unaudited) |
| Global X Fertilizers/Potash ETF |
capital gains. Index returns assume reinvestment of dividends and, unlike the Fund's returns, do not reflect any fees or expenses. If such fees and expenses were included in the index returns, the performance would have been lower. Please note that one cannot invest directly in an unmanaged index.
There are no assurances that the Fund will meet its stated objectives.
The Fund’s holdings and allocations are subject to change and should not be considered recommendations to buy individual securities.
The graph and table do not reflect the deduction of taxes that a shareholder would pay on Fund distributions or the redemption or sale of Fund shares.
See definition of comparative indices on previous page.
| Schedule of Investments | October 31, 2017 |
| Global X Silver Miners ETF |
Sector Weightings (unaudited)†:

† Sector weightings percentages are based on the total market value of investments. Repurchase agreements purchased from cash collateral received for securities lending activity are included in total investments. Please see Notes 2 and 7 in Notes to Financial Statements for more detailed information.
| | | Shares | | | Value | |
| COMMON STOCK — 99.8% |
| CANADA— 21.4% | | | | | | | | |
| Basic Materials — 21.4% | | | | | | | | |
| Alamos Gold, Cl A | | | 1,129,379 | | | $ | 7,157,727 | |
| Alexco Resource * (A) | | | 695,842 | | | | 863,662 | |
| Americas Silver * | | | 515,652 | | | | 2,096,049 | |
| AuRico Metals * | | | 1,896,501 | | | | 1,912,537 | |
| Bear Creek Mining * (A) | | | 1,131,672 | | | | 1,711,861 | |
| Excellon Resources * (A) | | | 759,990 | | | | 990,445 | |
| First Majestic Silver * (A) | | | 2,152,123 | | | | 14,507,756 | |
| Fortuna Silver Mines * | | | 2,072,986 | | | | 8,731,917 | |
| Great Panther Silver * (A) | | | 2,155,778 | | | | 2,642,254 | |
| Klondex Mines * | | | 2,117,047 | | | | 6,125,658 | |
| MAG Silver * | | | 916,538 | | | | 9,776,121 | |
| Mandalay Resources | | | 5,568,828 | | | | 1,274,381 | |
| Primero Mining * (A) | | | 1,796,559 | | | | 118,461 | |
| Silvercorp Metals (A) | | | 2,162,929 | | | | 5,493,840 | |
| Tahoe Resources (A) | | | 3,650,163 | | | | 17,527,352 | |
| TOTAL CANADA | | | | | | | 80,930,021 | |
| MEXICO— 11.2% | | | | | | | | |
| Basic Materials — 11.2% | | | | | | | | |
| Industrias Penoles | | | 1,644,909 | | | | 38,322,525 | |
| Minera Frisco * | | | 6,791,140 | | | | 4,000,792 | |
| TOTAL MEXICO | | | | | | | 42,323,317 | |
| PERU— 4.1% | | | | | | | | |
| Basic Materials — 4.1% | | | | | | | | |
| Volcan Cia Minera SAA | | | 31,868,700 | | | | 15,700,317 | |
| SOUTH KOREA— 3.3% | | | | | | | | |
| Basic Materials — 3.3% | | | | | | | | |
| Korea Zinc | | | 27,743 | | | | 12,678,552 | |
| UNITED KINGDOM— 26.4% | | | | | | | | |
| Basic Materials — 26.4% | | | | | | | | |
| Fresnillo | | | 2,567,335 | | | | 44,389,012 | |
| Hochschild Mining | | | 3,153,835 | | | | 9,230,655 | |
| Polymetal International | | | 4,003,277 | | | | 46,489,772 | |
| TOTAL UNITED KINGDOM | | | | | | | 100,109,439 | |
The accompanying notes are an integral part of the financial statements.
| Schedule of Investments | October 31, 2017 |
| Global X Silver Miners ETF |
| | | Shares/Face
Amount | | | Value | |
| COMMON STOCK — continued |
| UNITED STATES— 33.4% | | | | | | | | |
| Basic Materials — 33.4% | | | | | | | | |
| Coeur d'Alene Mines * | | | 2,162,578 | | | $ | 16,413,967 | |
| Endeavour Silver * (A) | | | 1,590,018 | | | | 3,307,237 | |
| Hecla Mining | | | 3,734,605 | | | | 17,627,335 | |
| McEwen Mining (A) | | | 3,195,182 | | | | 6,198,653 | |
| Pan American Silver | | | 1,119,011 | | | | 18,273,450 | |
| SSR Mining * | | | 1,545,443 | | | | 14,836,253 | |
| Wheaton Precious Metals (A) | | | 2,394,686 | | | | 49,665,788 | |
| TOTAL UNITED STATES | | | | | | | 126,322,683 | |
| TOTAL COMMON STOCK | | | | | | | | |
| (Cost $396,258,834) | | | | | | | 378,064,329 | |
| | | | | | | | | |
| REPURCHASE AGREEMENTS (B) — 5.0% |
| Barclays Bank | | | | | | | | |
| 1.050%, dated 10/31/17, to be repurchased on 11/01/17 repurchase price $11,175,145 (collateralized by U.S Treasury Obligations, ranging in par value $0-$2,586,399, 0.000%-9.000%, 11/15/17-08/15/47, with a total market value of $11,398,315) | | $ | 11,174,819 | | | | 11,174,819 | |
| Deutsche Bank | | | | | | | | |
| 1.040%, dated 10/31/17, to be repurchased on 11/01/17 repurchase price $7,637,631 (collateralized by U.S. Treasury Obligations, par value $7,403,706, 3.625%, 02/15/20 with a total market value of $7,784,353) | | | 7,637,410 | | | | 7,637,410 | |
| TOTAL REPURCHASE AGREEMENTS | | | | | | | | |
| (Cost $18,812,229) | | | | | | | 18,812,229 | |
| TOTAL INVESTMENTS — 104.8% | | | | | | | | |
| (Cost $415,071,063) | | | | | | $ | 396,876,558 | |
Percentages are based on Net Assets of $378,656,412.
| * | Non-income producing security. |
| (A) | This security or a partial position of this security is on loan at October 31, 2017. The total value of securities on loan at October 31, 2017 was $17,545,584. |
| (B) | Security was purchased with cash collateral held from securities on loan. The total value of such securities as of October 31, 2017 was $18,812,229. |
Cl — Class
The following is a summary of the level of inputs used as of October 31, 2017, in valuing the Fund's investments carried at value:
| Investments in Securities | | Level 1 | | | Level 2 | | | Level 3 | | | Total | |
| Common Stock | | $ | 378,064,329 | | | $ | — | | | $ | — | | | $ | 378,064,329 | |
| Repurchase Agreements | | | — | | | | 18,812,229 | | | | — | | | | 18,812,229 | |
| Total Investments in Securities | | $ | 378,064,329 | | | $ | 18,812,229 | | | $ | — | | | $ | 396,876,558 | |
For the year ended October 31, 2017, there have been no transfers between Level 1, Level 2 and Level 3 investments.
As of October 31, 2017, there were no Level 3 investments.
The accompanying notes are an integral part of the financial statements.
| Schedule of Investments | October 31, 2017 |
| Global X Gold Explorers ETF |
Sector Weightings (unaudited)†:

† Sector weightings percentages are based on the total market value of investments. Repurchase agreements purchased from cash collateral received for securities lending activity are included in total investments. Please see Notes 2 and 7 in Notes to Financial Statements for more detailed information.
| | | Shares | | | Value | |
| COMMON STOCK — 99.8% |
| AUSTRALIA— 20.0% | | | | | | | | |
| Basic Materials — 20.0% | | | | | | | | |
| Beadell Resources * | | | 1,489,849 | | | $ | 205,621 | |
| Gold Road Resources * | | | 965,531 | | | | 510,820 | |
| Independence Group | | | 581,200 | | | | 1,786,991 | |
| Metals X | | | 533,256 | | | | 408,873 | |
| Perseus Mining * | | | 1,221,816 | | | | 299,784 | |
| Regis Resources | | | 589,239 | | | | 1,757,493 | |
| Resolute Mining | | | 791,403 | | | | 625,011 | |
| Saracen Mineral Holdings * | | | 1,023,542 | | | | 1,141,882 | |
| Silver Lake Resources * | | | 606,867 | | | | 169,839 | |
| St. Barbara | | | 648,485 | | | | 1,441,951 | |
| Westgold Resources * | | | 344,302 | | | | 494,986 | |
| TOTAL AUSTRALIA | | | | | | | 8,843,251 | |
| CANADA— 57.5% | | | | | | | | |
| Basic Materials — 57.5% | | | | | | | | |
| Alacer Gold * | | | 367,851 | | | | 573,563 | |
| Alamos Gold, Cl A | | | 268,808 | | | | 1,703,639 | |
| Argonaut Gold * | | | 211,344 | | | | 381,996 | |
| Asanko Gold * (A) | | | 250,757 | | | | 233,425 | |
| B2Gold * | | | 722,211 | | | | 1,837,601 | |
| China Gold International Resources * | | | 304,650 | | | | 472,655 | |
| Continental Gold * | | | 175,207 | | | | 421,334 | |
| Dalradian Resources * (A) | | | 318,354 | | | | 301,289 | |
| Dundee Precious Metals * | | | 179,032 | | | | 358,314 | |
| Eldorado Gold | | | 871,588 | | | | 1,095,317 | |
| Guyana Goldfields * | | | 211,102 | | | | 753,292 | |
| Kirkland Lake Gold | | | 233,759 | | | | 2,743,599 | |
| Klondex Mines * | | | 206,467 | | | | 597,411 | |
| Lundin Gold * (A) | | | 79,068 | | | | 302,999 | |
| Mandalay Resources | | | 357,178 | | | | 81,737 | |
| New Gold * | | | 520,096 | | | | 1,722,760 | |
| OceanaGold | | | 651,555 | | | | 1,748,802 | |
| Osisko Mining * | | | 206,608 | | | | 631,476 | |
| Premier Gold Mines * | | | 249,347 | | | | 663,455 | |
| Pretium Resources * (A) | | | 182,101 | | | | 2,051,126 | |
| Primero Mining * (A) | | | 221,300 | | | | 14,592 | |
| Richmont Mines * | | | 79,159 | | | | 689,594 | |
The accompanying notes are an integral part of the financial statements.
| Schedule of Investments | October 31, 2017 |
| Global X Gold Explorers ETF |
| | | Shares/Face
Amount | | | Value | |
| COMMON STOCK — continued |
| Basic Materials — continued | | | | | | | | |
| Roxgold * (A) | | | 424,302 | | | $ | 362,061 | |
| Sabina Gold & Silver * | | | 227,467 | | | | 375,847 | |
| SEMAFO * | | | 411,635 | | | | 1,034,596 | |
| SSR Mining * | | | 151,178 | | | | 1,453,026 | |
| Tahoe Resources | | | 210,000 | | | | 1,008,378 | |
| Teranga Gold * | | | 107,851 | | | | 219,199 | |
| Torex Gold Resources * | | | 100,661 | | | | 1,389,155 | |
| Wesdome Gold Mines * | | | 165,634 | | | | 229,994 | |
| TOTAL CANADA | | | | | | | 25,452,232 | |
| INDONESIA— 1.2% | | | | | | | | |
| Basic Materials — 1.2% | | | | | | | | |
| Aneka Tambang Persero * | | | 10,647,300 | | | | 506,360 | |
| PERU— 2.1% | | | | | | | | |
| Basic Materials — 2.1% | | | | | | | | |
| Hochschild Mining | | | 314,900 | | | | 921,650 | |
| TURKEY— 1.1% | | | | | | | | |
| Basic Materials — 1.1% | | | | | | | | |
| Koza Altin Isletmeleri * | | | 57,974 | | | | 502,083 | |
| UNITED KINGDOM— 5.1% | | | | | | | | |
| Basic Materials — 5.1% | | | | | | | | |
| Centamin | | | 1,022,648 | | | | 1,891,731 | |
| Highland Gold Mining | | | 198,952 | | | | 377,143 | |
| TOTAL UNITED KINGDOM | | | | | | | 2,268,874 | |
| UNITED STATES— 12.8% | | | | | | | | |
| Basic Materials — 12.8% | | | | | | | | |
| Coeur d'Alene Mines * | | | 267,666 | | | | 2,031,585 | |
| Gold Resource | | | 81,757 | | | | 296,778 | |
| Golden Star Resources * (A) | | | 518,099 | | | | 404,117 | |
| McEwen Mining (A) | | | 340,374 | | | | 660,326 | |
| Novagold Resources * | | | 345,386 | | | | 1,405,721 | |
| Seabridge Gold * (A) | | | 64,270 | | | | 874,072 | |
| TOTAL UNITED STATES | | | | | | | 5,672,599 | |
| TOTAL COMMON STOCK | | | | | | | | |
| (Cost $42,345,043) | | | | | | | 44,167,049 | |
| | | | | | | | | |
| REPURCHASE AGREEMENTS (B) — 6.2% |
| Barclays Bank | | | | | | | | |
| 1.050%, dated 10/31/17, to be repurchased on 11/01/17 repurchase price $1,637,226 (collateralized by U.S Treasury Obligations, ranging in par value $0-$366,136, 0.000%-9.000%, 11/15/17-08/15/47, with a total market value of $1,669,922) | | $ | 1,637,178 | | | | 1,637,178 | |
The accompanying notes are an integral part of the financial statements.
| Schedule of Investments | October 31, 2017 |
| Global X Gold Explorers ETF |
| | | Face Amount | | | Value | |
| REPURCHASE AGREEMENTS — continued |
| Deutsche Bank | | | | | | | | |
| 1.040%, dated 10/31/17, to be repurchased on 11/01/17 repurchase price $1,118,958 (collateralized by U.S. Treasury Obligations, par value $1,084,687, 3.625%, 02/15/20 with a total market value of $1,140,454) | | $ | 1,118,926 | | | $ | 1,118,926 | |
| TOTAL REPURCHASE AGREEMENTS | | | | | | | | |
| (Cost $2,756,104) | | | | | | | 2,756,104 | |
| TOTAL INVESTMENTS — 106.0% | | | | | | | | |
| (Cost $45,101,147) | | | | | | $ | 46,923,153 | |
Percentages are based on Net Assets of $44,255,790.
| * | Non-income producing security. |
| (A) | This security or a partial position of this security is on loan at October 31, 2017. The total value of securities on loan at October 31, 2017 was $2,577,054. |
| (B) | Security was purchased with cash collateral held from securities on loan. The total value of such securities as of October 31, 2017 was $2,756,104. |
Cl — Class
The following is a summary of the level of inputs used as of October 31, 2017, in valuing the Fund's investments carried at value:
| Investments in Securities | | Level 1 | | | Level 2 | | | Level 3 | | | Total | |
| Common Stock | | $ | 44,167,049 | | | $ | — | | | $ | — | | | $ | 44,167,049 | |
| Repurchase Agreements | | | — | | | | 2,756,104 | | | | — | | | | 2,756,104 | |
| Total Investments in Securities | | $ | 44,167,049 | | | $ | 2,756,104 | | | $ | — | | | $ | 46,923,153 | |
For the year ended October 31, 2017, there have been no transfers between Level 1, Level 2 and Level 3 investments.
As of October 31, 2017, there were no Level 3 investments.
The accompanying notes are an integral part of the financial statements.
| Schedule of Investments | October 31, 2017 |
Global X Copper Miners ETF
Sector Weightings (unaudited)†:

† Sector weightings percentages are based on the total market value of investments. Repurchase agreements purchased from cash collateral received for securities lending activity are included in total investments. Please see Notes 2 and 7 in Notes to Financial Statements for more detailed information.
| | | Shares | | | Value | |
| COMMON STOCK — 100.0% |
| AUSTRALIA— 6.0% | | | | | | | | |
| Basic Materials — 6.0% | | | | | | | | |
| OZ Minerals | | | 474,349 | | | $ | 2,927,833 | |
| Sandfire Resources | | | 241,186 | | | | 1,061,492 | |
| TOTAL AUSTRALIA | | | | | | | 3,989,325 | |
| CANADA— 28.8% | | | | | | | | |
| Basic Materials — 28.8% | | | | | | | | |
| Altius Minerals | | | 71,585 | | | | 662,485 | |
| Capstone Mining * | | | 552,444 | | | | 629,969 | |
| First Quantum Minerals | | | 262,835 | | | | 2,942,137 | |
| HudBay Minerals, Cl B | | | 411,238 | | | | 3,059,322 | |
| Ivanhoe Mines, Cl A * | | | 851,278 | | | | 3,083,910 | |
| Lundin Mining | | | 424,357 | | | | 3,239,216 | |
| Nevsun Resources | | | 473,543 | | | | 1,116,725 | |
| Northern Dynasty Minerals * | | | 467,204 | | | | 931,436 | |
| Taseko Mines * | | | 335,448 | | | | 736,419 | |
| Teck Resources, Cl B | | | 134,281 | | | | 2,745,828 | |
| TOTAL CANADA | | | | | | | 19,147,447 | |
| HONG KONG— 12.1% | | | | | | | | |
| Basic Materials — 12.1% | | | | | | | | |
| Jiangxi Copper, Cl H | | | 1,898,529 | | | | 3,027,212 | |
| Jinchuan Group International Resources * | | | 2,946,700 | | | | 419,241 | |
| MMG * | | | 3,361,900 | | | | 1,521,124 | |
| Zijin Mining Group, Cl H | | | 8,996,160 | | | | 3,113,337 | |
| TOTAL HONG KONG | | | | | | | 8,080,914 | |
| JAPAN— 1.0% | | | | | | | | |
| Basic Materials — 1.0% | | | | | | | | |
| Nittetsu Mining | | | 9,000 | | | | 664,525 | |
| MEXICO— 4.8% | | | | | | | | |
| Basic Materials — 4.8% | | | | | | | | |
| Grupo Mexico, Cl B | | | 973,978 | | | | 3,173,915 | |
| PHILIPPINES— 0.8% | | | | | | | | |
| Basic Materials — 0.8% | | | | | | | | |
| Philex Mining | | | 3,667,700 | | | | 540,653 | |
The accompanying notes are an integral part of the financial statements.
| Schedule of Investments | October 31, 2017 |
Global X Copper Miners ETF
| | | Shares/Face
Amount | | | Value | |
| COMMON STOCK — continued |
| POLAND— 4.7% | | | | | | | | |
| Basic Materials — 4.7% | | | | | | | | |
| KGHM Polska Miedz | | | 93,719 | | | $ | 3,166,591 | |
| SWEDEN— 4.8% | | | | | | | | |
| Basic Materials — 4.8% | | | | | | | | |
| Boliden | | | 91,100 | | | | 3,188,359 | |
| UNITED KINGDOM— 23.0% | | | | | | | | |
| Basic Materials — 23.0% | | | | | | | | |
| Antofagasta | | | 246,397 | | | | 3,123,153 | |
| Central Asia Metals | | | 212,078 | | | | 682,951 | |
| Glencore | | | 663,470 | | | | 3,198,231 | |
| KAZ Minerals * | | | 291,497 | | | | 3,147,071 | |
| SolGold * (A) | | | 1,005,956 | | | | 444,174 | |
| Vedanta ADR | | | 160,977 | | | | 3,316,126 | |
| Vedanta Resources | | | 118,177 | | | | 1,393,567 | |
| TOTAL UNITED KINGDOM | | | | | | | 15,305,273 | |
| UNITED STATES— 14.0% | | | | | | | | |
| Basic Materials — 14.0% | | | | | | | | |
| Freeport-McMoRan Copper & Gold * | | | 219,933 | | | | 3,074,663 | |
| Southern Copper | | | 75,524 | | | | 3,243,756 | |
| Turquoise Hill Resources * | | | 980,152 | | | | 3,009,067 | |
| TOTAL UNITED STATES | | | | | | | 9,327,486 | |
| TOTAL COMMON STOCK | | | | | | | | |
| (Cost $62,888,525) | | | | | | | 66,584,488 | |
| | | | | | | | | |
| REPURCHASE AGREEMENTS (B) — 0.6% | | | | | | | | |
| Barclays Bank | | | | | | | | |
| 1.050%, dated 10/31/17, to be repurchased on 11/01/17 repurchase price $221,609 (collateralized by U.S Treasury Obligations, ranging in par value $0-$73,904, 0.000%-9.000%, 11/15/17-08/15/47, with a total market value of $226,034) | | $ | 221,602 | | | | 221,602 | |
| Deutsche Bank | | | | | | | | |
| 1.040%, dated 10/31/17, to be repurchased on 11/01/17 repurchase price $151,458 (collateralized by U.S. Treasury Obligations, par value $146,819, 3.625%, 02/15/20 with a total market value of $154,368) | | | 151,454 | | | | 151,454 | |
| TOTAL REPURCHASE AGREEMENTS | | | | | | | | |
| (Cost $373,056) | | | | | | | 373,056 | |
| TOTAL INVESTMENTS — 100.6% | | | | | | | | |
| (Cost $63,261,581) | | | | | | $ | 66,957,544 | |
Percentages are based on Net Assets of $66,567,442.
| * | Non-income producing security. |
| (A) | This security or a partial position of this security is on loan at October 31, 2017. The total value of securities on loan at October 31, 2017 was $313,496. |
| (B) | Security was purchased with cash collateral held from securities on loan. The total value of such securities as of October 31, 2017 was $373,056. |
The accompanying notes are an integral part of the financial statements.
| Schedule of Investments | October 31, 2017 |
Global X Copper Miners ETF
| ADR — American Depositary Receipt |
| Cl — Class |
The following is a summary of the level of inputs used as of October 31, 2017, in valuing the Fund's investments carried at value:
| Investments in Securities | | Level 1 | | | Level 2 | | | Level 3 | | | Total | |
| Common Stock | | $ | 66,584,488 | | | $ | — | | | $ | — | | | $ | 66,584,488 | |
| Repurchase Agreements | | | — | | | | 373,056 | | | | — | | | | 373,056 | |
| Total Investments in Securities | | $ | 66,584,488 | | | $ | 373,056 | | | $ | — | | | $ | 66,957,544 | |
The following is a reconciliation of investments in which significant unobservable inputs (Level 3) were used in determining fair value:
| | | Investments in | |
| | | Common Stock | |
| Beginning Balance as of October 31, 2016 | | $ | 199,385 | |
| Net purchases | | | 128,512 | |
| Net sales | | | (225,369 | ) |
| Realized gain/(loss) | | | (1,312,844 | ) |
| Change in unrealized appreciation/(depreciation) | | | 1,210,316 | |
| Ending Balance as of October 31, 2017 | | $ | - | |
As of October 31, 2017, there were no Level 3 investments.
The accompanying notes are an integral part of the financial statements.
| Schedule of Investments | October 31, 2017 |
Global X Uranium ETF
Sector Weightings (unaudited)†:
† Sector weightings percentages are based on the total market value of investments. Repurchase agreements purchased from cash collateral received for securities lending activity are included in total investments. Please see Notes 2 and 7 in Notes to Financial Statements for more detailed information.
| | | Shares | | | Value | |
| COMMON STOCK — 98.3% |
| AUSTRALIA— 14.5% | | | | | | | | |
| Basic Materials — 13.2% | | | | | | | | |
| Berkeley Energia * (G) | | | 18,795,849 | | | $ | 11,385,222 | |
| Energy Resources of Australia * (A) | | | 18,692,785 | | | | 8,097,947 | |
| Greenland Minerals & Energy * (G) | | | 88,149,393 | | | | 6,758,834 | |
| Paladin Energy *(B) (C) (F) | | | 29,982,387 | | | | 533,687 | |
| Peninsula Energy * (A) (G) | | | 20,264,750 | | | | 4,506,006 | |
| | | | | | | | 31,281,696 | |
| Industrials — 1.3% | | | | | | | | |
| Silex Systems * (G) | | | 13,127,049 | | | | 3,019,540 | |
| TOTAL AUSTRALIA | | | | | | | 34,301,236 | |
| CANADA— 61.2% | | | | | | | | |
| Basic Materials — 48.6% | | | | | | | | |
| Cameco (A) | | | 6,772,733 | | | | 55,060,307 | |
| Denison Mines * (A) | | | 27,282,392 | | | | 11,216,871 | |
| Energy Fuels * (A) (G) | | | 7,373,981 | | | | 10,182,054 | |
| Fission Uranium * (A) (G) | | | 24,991,178 | | | | 10,856,458 | |
| Laramide Resources * (G) | | | 11,820,655 | | | | 2,246,576 | |
| Mega Uranium * (A) (G) | | | 32,758,903 | | | | 3,684,773 | |
| Uex * (A) (G) | | | 29,487,476 | | | | 3,545,542 | |
| Uranium Participation * (G) | | | 6,624,571 | | | | 18,037,580 | |
| | | | | | | | 114,830,161 | |
| Energy — 12.6% | | | | | | | | |
| NexGen Energy * (A) | | | 15,870,393 | | | | 29,793,151 | |
| TOTAL CANADA | | | | | | | 144,623,312 | |
| CHINA— 5.7% | | | | | | | | |
| Utilities — 5.7% | | | | | | | | |
| CGN Power, Cl H (D) | | | 45,679,200 | | | | 13,407,851 | |
| HONG KONG— 8.7% | | | | | | | | |
| Industrials — 8.7% | | | | | | | | |
| CGN Mining | | | 161,388,900 | | | | 11,791,083 | |
| CNNC International * | | | 19,246,200 | | | | 8,634,123 | |
| TOTAL HONG KONG | | | | | | | 20,425,206 | |
The accompanying notes are an integral part of the financial statements.
| Schedule of Investments | October 31, 2017 |
Global X Uranium ETF
| | | Shares/Face
Amount | | | Value | |
| COMMON STOCK — continued | | | | | | | | |
| UNITED STATES— 8.2% | | | | | | | | |
| Basic Materials — 8.2% | | | | | | | | |
| Centrus Energy, Cl A * (A) (G) | | | 663,497 | | | $ | 2,647,353 | |
| Uranium Energy * (A) | | | 7,560,720 | | | | 8,014,363 | |
| Ur-Energy * (A) (G) | | | 16,567,711 | | | | 8,780,887 | |
| TOTAL UNITED STATES | | | | | | | 19,442,603 | |
| TOTAL COMMON STOCK | | | | | | | | |
| (Cost $356,135,608) | | | | | | | 232,200,208 | |
| | | | | | | | | |
| REPURCHASE AGREEMENTS (E) — 16.2% | | | | | | | | |
| Barclays Bank | | | | | | | | |
| 1.050%, dated 10/31/17, to be repurchased on 11/01/17 repurchase price $22,754,845 (collateralized by U.S Treasury Obligations, ranging in par value $0-$6,232,063, 0.000%-9.000%, 11/15/17-08/15/47, with a total market value of $23,209,265) | | $ | 22,754,182 | | | | 22,754,182 | |
| Deutsche Bank | | | | | | | | |
| 1.040%, dated 10/31/17, to be repurchased on 11/01/17 repurchase price $15,551,755 (collateralized by U.S. Treasury Obligations, par value $15,075,436, 3.625%, 02/15/20 with a total market value of $15,850,510) | | | 15,551,306 | | | | 15,551,306 | |
| TOTAL REPURCHASE AGREEMENTS | | | | | | | | |
| (Cost $38,305,488) | | | | | | | 38,305,488 | |
| TOTAL INVESTMENTS — 114.5% | | | | | | | | |
| (Cost $394,441,096) | | | | | | $ | 270,505,696 | |
Percentages are based on Net Assets of $236,218,206.
| * | Non-income producing security. |
| (A) | This security or a partial position of this security is on loan at October 31, 2017. The total value of securities on loan at October 31, 2017 was $34,989,365. |
| (B) | Security is fair valued using methods determined in good faith by the Fair Value Committee of the Fund. The total value of such securities as of October 31, 2017, was $533,687 and represents 0.2% of Net Assets. |
| (C) | Security considered illiquid. The total value of such securities as of October 31, 2017 was $533,687 and represented 0.2% of Net Assets. |
| (D) | Security sold within terms of a private placement memorandum, exempt from registration under Section 144A of the Securities Act of 1933, as amended, and may be sold only to dealers in that program or other "accredited investors." The total value of such securities as of October 31, 2017 was $13,407,851 and represents 5.7% of Net Assets. |
| (E) | Security was purchased with cash collateral held from securities on loan. The total value of such securities as of October 31, 2017 was $38,305,488. |
| (F) | Level 3 security in accordance with fair value hierarchy. |
| (G) | Affiliated investment. |
Cl — Class
The accompanying notes are an integral part of the financial statements.
| Schedule of Investments | October 31, 2017 |
Global X Uranium ETF
The following is a summary of the level of inputs used as of October 31, 2017, in valuing the Fund's investments carried at value:
| Investments in Securities | | Level 1 | | | Level 2 | | | Level 3(1) | | | Total | |
| Common Stock | | $ | 231,666,521 | | | $ | — | | | $ | 533,687 | | | $ | 232,200,208 | |
| Repurchase Agreements | | | — | | | | 38,305,488 | | | | — | | | | 38,305,488 | |
| Total Investments in Securities | | $ | 231,666,521 | | | $ | 38,305,488 | | | $ | 533,687 | | | $ | 270,505,696 | |
(1) A reconciliation of Level 3 investments and disclosures of significant unobservable inputs are presented when the Fund has a significant amount of Level 3 investments at the beginning and/or end of the period in relation to Net Assets. Management has concluded that Level 3 investments are not material in relation to Net Assets.
For the year ended October 31, 2017, the transfers into Level 3 were due to change in the availability of observable inputs to determine to fair value.
The following is a summary of the transactions with affiliates for the year ended October 31, 2017:
| | | | | | | | | | Changes in | | | | | | | | | | |
| | | | | | | | | | Unrealized | | | | | | | | | | |
| Value At | | | Purchases at | | | Proceeds from | | | Appreciation | | | Realized Gain | | | Value at | | | Dividend | |
| 10/31/2016 | | | Cost | | | Sales | | | (Depreciation) | | | (Loss) | | | 10/31/2017 | | | Income | |
| Global X Uranium ETF | | | | | | | | | | | | | | | | | | | | | | |
| Berkeley Energia | | | | | | | | | | | | | | | | | | | | | | | | | |
| $ | 4,210,559 | | | $ | 10,005,040 | | | ($ | 1,533,658 | ) | | ($ | 1,919,834 | ) | | $ | 623,115 | | | $ | 11,385,222 | | | $ | — | |
| Centrus Energy | | | | | | | | | | | | | | | | | | | | | | | | | |
| | 1,194,857 | | | | 2,837,249 | | | | (403,328 | ) | | | (1,054,123 | ) | | | 72,698 | | | | 2,647,353 | | | | — | |
| Energy Fuels | | | | | | | | | | | | | | | | | | | | | | | | | |
| | 3,429,134 | | | | 11,509,007 | | | | (1,341,196 | ) | | | (1,976,881 | ) | | | (1,438,010 | ) | | | 10,182,054 | | | | — | |
| Fission Uranium | | | | | | | | | | | | | | | | | | | | | | | | | |
| | 3,898,032 | | | | 11,022,385 | | | | (1,541,097 | ) | | | (1,954,444 | ) | | | (568,418 | ) | | | 10,856,458 | | | | — | |
| Greenland Minerals & Energy | | | | | | | | | | | | | | | | | | | | | |
| | 2,742,170 | | | | 5,900,412 | | | | (1,684,343 | ) | | | 62,046 | | | | (261,451 | ) | | | 6,758,834 | | | | — | |
| Laramide Resources | | | | | | | | | | | | | | | | | | | | | |
| | 754,709 | | | | 3,181,251 | | | | (428,122 | ) | | | (1,222,153 | ) | | | (39,109 | ) | | | 2,246,576 | | | | — | |
| Mega Uranium | | | | | | | | | | | | | | | | | | | | | | | | | |
| | 1,427,276 | | | | 4,049,328 | | | | (661,899 | ) | | | (1,080,585 | ) | | | (49,347 | ) | | | 3,684,773 | | | | — | |
| Peninsula Energy | | | | | | | | | | | | | | | | | | | | | | | | | |
| | 3,758,629 | | | | 6,960,917 | | | | (937,462 | ) | | | (4,626,614 | ) | | | (649,464 | ) | | | 4,506,006 | | | | — | |
| Silex Systems | | | | | | | | | | | | | | | | | | | | | | | | | |
| | 1,566,493 | | | | 3,983,781 | | | | (730,586 | ) | | | (1,580,817 | ) | | | (219,331 | ) | | | 3,019,540 | | | | — | |
| Uex | | | | | | | | | | | | | | | | | | | | | | | | | |
| | 1,775,662 | | | | 4,693,049 | | | | (722,185 | ) | | | (1,979,029 | ) | | | (221,955 | ) | | | 3,545,542 | | | | — | |
| Uranium Participation | | | | | | | | | | | | | | | | | | | | | |
| | 8,217,013 | | | | 15,769,919 | | | | (3,607,590 | ) | | | (1,717,265 | ) | | | (624,497 | ) | | | 18,037,580 | | | | — | |
| Ur-Energy | | | | | | | | | | | | | | | | | | | | | | | | | |
| | 3,809,307 | | | | 8,702,449 | | | | (1,662,175 | ) | | | (1,313,508 | ) | | | (755,186 | ) | | | 8,780,887 | | | | — | |
| Totals: | | | | | | | | | | | | | | | | | | | | | | | | | |
| $ | 36,783,841 | | | $ | 88,614,787 | | | ($ | 15,253,641 | ) | | ($ | 20,363,207 | ) | | ($ | 4,130,955 | ) | | $ | 85,650,825 | | | $ | — | |
The accompanying notes are an integral part of the financial statements.
| Schedule of Investments | October 31, 2017 |
Global X Lithium & Battery Tech ETF
Sector Weightings (unaudited)†:
† Sector weightings percentages are based on the total market value of investments. Repurchase agreements purchased from cash collateral received for securities lending activity are included in total investments. Please see Notes 2 and 7 in Notes to Financial Statements for more detailed information.
| | | Shares | | | Value | |
| COMMON STOCK — 99.9% |
| AUSTRALIA— 9.2% | | | | | | | | |
| Basic Materials — 9.2% | | | | | | | | |
| Altura Mining * | | | 16,092,538 | | | $ | 4,380,315 | |
| Galaxy Resources * (A) | | | 11,812,816 | | | | 31,248,200 | |
| Lithium Australia NL * | | | 4,788,020 | | | | 770,953 | |
| Neometals * | | | 5,027,665 | | | | 1,657,629 | |
| Orocobre * | | | 6,113,200 | | | | 22,686,445 | |
| Pilbara Minerals * (A) | | | 43,319,149 | | | | 26,904,034 | |
| TOTAL AUSTRALIA | | | | | | | 87,647,576 | |
| CANADA— 3.4% | | | | | | | | |
| Basic Materials — 3.3% | | | | | | | | |
| Lithium Americas * (A) | | | 8,889,327 | | | | 14,481,101 | |
| Millennial Lithium * | | | 337,387 | | | | 641,221 | |
| Nemaska Lithium * (A) | | | 11,075,187 | | | | 15,894,109 | |
| | | | | | | | 31,016,431 | |
| Financials — 0.1% | | | | | | | | |
| Lithium X Energy * | | | 579,792 | | | | 908,525 | |
| TOTAL CANADA | | | | | | | 31,924,956 | |
| CHILE— 9.1% | | | | | | | | |
| Basic Materials — 9.1% | | | | | | | | |
| Sociedad Quimica y Minera de Chile ADR | | | 1,443,553 | | | | 86,237,856 | |
| CHINA— 4.2% | | | | | | | | |
| Consumer Goods — 4.2% | | | | | | | | |
| BYD, Cl H | | | 4,527,938 | | | | 39,668,354 | |
| FRANCE— 0.4% | | | | | | | | |
| Industrials — 0.4% | | | | | | | | |
| Blue Solutions * | | | 119,516 | | | | 3,344,293 | |
| HONG KONG— 2.1% | | | | | | | | |
| Consumer Goods — 1.9% | | | | | | | | |
| FDG Electric Vehicles * | | | 404,556,100 | | | | 17,630,428 | |
The accompanying notes are an integral part of the financial statements.
| Schedule of Investments | October 31, 2017 |
Global X Lithium & Battery Tech ETF
| | | Shares | | | Value | |
| COMMON STOCK — continued |
| Industrials — 0.2% | | | | | | | | |
| Coslight Technology International Group * | | | 4,307,973 | | | $ | 1,899,488 | |
| TOTAL HONG KONG | | | | | | | 19,529,916 | |
| JAPAN— 9.3% | | | | | | | | |
| Consumer Goods — 4.9% | | | | | | | | |
| Panasonic | | | 3,140,220 | | | | 46,994,140 | |
| Industrials — 4.4% | | | | | | | | |
| GS Yuasa | | | 8,418,294 | | | | 42,006,272 | |
| TOTAL JAPAN | | | | | | | 89,000,412 | |
| SOUTH KOREA— 11.8% | | | | | | | | |
| Basic Materials — 5.2% | | | | | | | | |
| LG Chemical | | | 136,898 | | | | 49,304,541 | |
| Industrials — 6.6% | | | | | | | | |
| L&F | | | 466,806 | | | | 13,478,979 | |
| Samsung SDI | | | 262,263 | | | | 48,222,589 | |
| Vitzrocell *(B) (C) (E) | | | 123,568 | | | | 1,005,393 | |
| | | | | | | | 62,706,961 | |
| TOTAL SOUTH KOREA | | | | | | | 112,011,502 | |
| SWITZERLAND— 0.0% | | | | | | | | |
| Consumer Goods — 0.0% | | | | | | | | |
| Leclanche * | | | 112,853 | | | | 263,792 | |
| TAIWAN— 4.4% | | | | | | | | |
| Consumer Goods — 0.0% | | | | | | | | |
| SYNergy ScienTech | | | 82,300 | | | | 96,300 | |
| Industrials — 4.4% | | | | | | | | |
| Advanced Lithium Electrochemistry Cayman * | | | 4,161,729 | | | | 3,753,346 | |
| Changs Ascending Enterprise * | | | 1,294,651 | | | | 2,008,974 | |
| Dynapack International Technology | | | 4,778,800 | | | | 8,112,686 | |
| Simplo Technology | | | 4,829,680 | | | | 27,783,932 | |
| | | | | | | | 41,658,938 | |
| TOTAL TAIWAN | | | | | | | 41,755,238 | |
| UNITED KINGDOM— 0.3% | | | | | | | | |
| Basic Materials — 0.3% | | | | | | | | |
| Bacanora Minerals * | | | 2,374,977 | | | | 2,586,159 | |
| UNITED STATES— 45.7% | | | | | | | | |
| Basic Materials — 36.3% | | | | | | | | |
| Albemarle | | | 1,290,772 | | | | 181,856,867 | |
| FMC | | | 1,756,619 | | | | 163,119,641 | |
| | | | | | | | 344,976,508 | |
| Consumer Goods — 4.4% | | | | | | | | |
| Tesla * (A) | | | 126,684 | | | | 41,999,546 | |
The accompanying notes are an integral part of the financial statements.
| Schedule of Investments | October 31, 2017 |
Global X Lithium & Battery Tech ETF
| | | Shares/Face
Amount | | | Value | |
| COMMON STOCK — continued |
| Industrials — 5.0% | | | | | | | | |
| CBAK Energy Technology * (A) | | | 604,678 | | | $ | 1,088,420 | |
| EnerSys | | | 619,656 | | | | 42,985,537 | |
| Highpower International * | | | 222,219 | | | | 1,255,537 | |
| Ultralife * | | | 343,487 | | | | 2,576,153 | |
| | | | | | | | 47,905,647 | |
| TOTAL UNITED STATES | | | | | | | 434,881,701 | |
| TOTAL COMMON STOCK | | | | | | | | |
| (Cost $807,001,075) | | | | | | | 948,851,755 | |
| | | | | | | | | |
| REPURCHASE AGREEMENTS (D) — 4.5% | | | | | | | | |
| Barclays Bank | | | | | | | | |
| 1.050%, dated 10/31/17, to be repurchased on 11/01/17 repurchase price $25,502,427 (collateralized by U.S Treasury Obligations, ranging in par value $1-$4,457,772, 0.000%-9.000%, 11/15/17-08/15/47, with a total market value of $26,011,716) | | $ | 25,501,683 | | | | 25,501,683 | |
| Deutsche Bank | | | | | | | | |
| 1.040%, dated 10/31/17, to be repurchased on 11/01/17 repurchase price $17,429,584 (collateralized by U.S. Treasury Obligations, par value $16,895,751, 3.625%, 02/15/20 with a total market value of $17,764,412) | | | 17,429,080 | | | | 17,429,080 | |
| TOTAL REPURCHASE AGREEMENTS | | | | | | | | |
| (Cost $42,930,763) | | | | | | | 42,930,763 | |
| TOTAL INVESTMENTS — 104.4% | | | | | | | | |
| (Cost $849,931,838) | | | | | | $ | 991,782,518 | |
Percentages are based on Net Assets of $950,070,825.
| * | Non-income producing security. |
| (A) | This security or a partial position of this security is on loan at October 31, 2017. The total value of securities on loan at October 31, 2017 was $42,168,968. |
| (B) | Security is fair valued using methods determined in good faith by the Fair Value Committee of the Fund. The total value of such securities as of October 31, 2017, was $1,005,393 and represents 0.1% of Net Assets. |
| (C) | Security considered illiquid. The total value of such securities as of October 31, 2017 was $1,005,393 and represented 0.1% of Net Assets. |
| (D) | Security was purchased with cash collateral held from securities on loan. The total value of such securities as of October 31, 2017 was $42,930,763. |
| (E) | Level 3 security in accordance with fair value hierarchy. |
ADR — American Depositary Receipt
Cl — Class
The following is a summary of the level of inputs used as of October 31, 2017, in valuing the Fund's investments carried at value:
| Investments in Securities | | Level 1 | | | Level 2 | | | Level 3(1) | | | Total | |
| Common Stock | | $ | 947,846,362 | | | $ | — | | | $ | 1,005,393 | | | $ | 948,851,755 | |
| Repurchase Agreements | | | — | | | | 42,930,763 | | | | — | | | | 42,930,763 | |
| Total Investments in Securities | | $ | 947,846,362 | | | $ | 42,930,763 | | | $ | 1,005,393 | | | $ | 991,782,518 | |
(1) A reconciliation of Level 3 investments and disclosures of significant unobservable inputs are presented when the Fund has a significant amount of Level 3 investments at the beginning and/or end of the period in relation to Net Assets. Management has concluded that Level 3 investments are not material in relation to Net Assets.
For the year ended October 31, 2017, the transfers into Level 3 were due to change in the availability of observable inputs to determine to fair value.
The accompanying notes are an integral part of the financial statements.
| Schedule of Investments | October 31, 2017 |
Global X Fertilizers/Potash ETF
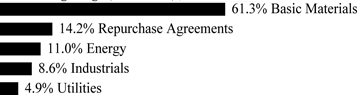
Sector Weightings (unaudited)†:

† Sector weightings percentages are based on the total market value of investments.
| | | Shares | | | Value | |
| COMMON STOCK — 99.6% |
| AUSTRALIA— 9.0% | | | | | | | | |
| Basic Materials — 9.0% | | | | | | | | |
| Incitec Pivot | | | 253,301 | | | $ | 741,912 | |
| Nufarm | | | 93,463 | | | | 650,696 | |
| TOTAL AUSTRALIA | | | | | | | 1,392,608 | |
| BELGIUM— 4.4% | | | | | | | | |
| Basic Materials — 4.4% | | | | | | | | |
| Tessenderlo Group * | | | 14,203 | | | | 681,683 | |
| CANADA— 11.0% | | | | | | | | |
| Basic Materials — 11.0% | | | | | | | | |
| Agrium | | | 7,826 | | | | 852,658 | |
| Potash Corp of Saskatchewan | | | 43,355 | | | | 844,499 | |
| TOTAL CANADA | | | | | | | 1,697,157 | |
| CHILE— 7.9% | | | | | | | | |
| Basic Materials — 7.9% | | | | | | | | |
| Sociedad Quimica y Minera de Chile ADR | | | 20,468 | | | | 1,222,758 | |
| GERMANY— 4.2% | | | | | | | | |
| Basic Materials — 4.2% | | | | | | | | |
| K+S | | | 26,972 | | | | 654,183 | |
| HONG KONG— 3.0% | | | | | | | | |
| Basic Materials — 3.0% | | | | | | | | |
| China BlueChemical | | | 997,201 | | | | 297,813 | |
| Sinofert Holdings | | | 971,365 | | | | 171,817 | |
| TOTAL HONG KONG | | | | | | | 469,630 | |
| ISRAEL— 6.9% | | | | | | | | |
| Basic Materials — 6.9% | | | | | | | | |
| Israel Chemicals | | | 164,609 | | | | 686,397 | |
| The Israel Corp * | | | 1,982 | | | | 369,827 | |
| TOTAL ISRAEL | | | | | | | 1,056,224 | |
| MALAYSIA— 4.7% | | | | | | | | |
| Basic Materials — 4.7% | | | | | | | | |
| Petronas Chemicals Group | | | 411,800 | | | | 716,893 | |
| NETHERLANDS— 4.5% | | | | | | | | |
| Basic Materials — 4.5% | | | | | | | | |
| OCI * | | | 29,359 | | | | 696,516 | |
The accompanying notes are an integral part of the financial statements.
| Schedule of Investments | October 31, 2017 |
Global X Fertilizers/Potash ETF
| | | Shares | | | Value | |
| COMMON STOCK — continued |
| NORWAY— 5.5% | | | | | | | | |
| Basic Materials — 5.5% | | | | | | | | |
| Yara International | | | 17,812 | | | $ | 844,241 | |
| POLAND— 3.4% | | | | | | | | |
| Basic Materials — 3.4% | | | | | | | | |
| Grupa Azoty | | | 25,798 | | | | 517,541 | |
| RUSSIA— 3.9% | | | | | | | | |
| Basic Materials — 3.9% | | | | | | | | |
| PhosAgro PJSC GDR | | | 43,956 | | | | 604,395 | |
| SOUTH KOREA— 0.5% | | | | | | | | |
| Basic Materials — 0.5% | | | | | | | | |
| Namhae Chemical | | | 8,949 | | | | 72,528 | |
| TAIWAN— 3.4% | | | | | | | | |
| Basic Materials — 3.4% | | | | | | | | |
| Taiwan Fertilizer | | | 398,197 | | | | 520,200 | |
| TURKEY— 0.6% | | | | | | | | |
| Basic Materials — 0.6% | | | | | | | | |
| Bagfas Bandirma Gubre Fabrik | | | 15,045 | | | | 41,530 | |
| Gubre Fabrikalari | | | 43,055 | | | | 53,528 | |
| TOTAL TURKEY | | | | | | | 95,058 | |
| UNITED KINGDOM— 4.7% | | | | | | | | |
| Basic Materials — 4.7% | | | | | | | | |
| Sirius Minerals * | | | 2,036,200 | | | | 724,665 | |
| UNITED STATES— 22.0% | | | | | | | | |
| Basic Materials — 22.0% | | | | | | | | |
| CF Industries Holdings | | | 25,178 | | | | 956,261 | |
| Compass Minerals International | | | 10,223 | | | | 670,629 | |
| CVR Partners (A) | | | 31,684 | | | | 112,795 | |
| Mosaic | | | 30,257 | | | | 675,941 | |
| Rentech Escrow Shares *(B) (C) (D) | | | 7,168 | | | | — | |
| Scotts Miracle-Gro, Cl A | | | 7,884 | | | | 785,404 | |
| Terra Nitrogen | | | 2,554 | | | | 195,892 | |
| TOTAL UNITED STATES | | | | | | | 3,396,922 | |
| TOTAL COMMON STOCK | | | | | | | | |
| (Cost $16,370,255) | | | | | | | 15,363,202 | |
The accompanying notes are an integral part of the financial statements.
| Schedule of Investments | October 31, 2017 |
Global X Fertilizers/Potash ETF
| | | Number Of
Rights | | | Value | |
| RIGHTS — 0.2% |
| Australia — 0.2% | | | | | | | | |
| Nufarm * | | | | | | | | |
| (Cost $–) | | | 20,081 | | | $ | 26,175 | |
| TOTAL INVESTMENTS — 99.8% | | | | | | | | |
| (Cost $16,370,255) | | | | | | $ | 15,389,377 | |
Percentages are based on Net Assets of $15,417,575.
| * | Non-income producing security. |
| (A) | Security considered Master Limited Partnership. At October 31, 2017, these securities amounted to $308,687 or 2.0% of net assets. |
| (B) | Security is fair valued using methods determined in good faith by the Fair Value Committee of the Fund. The total value of such securities as of October 31, 2017, was $0 and represents –% of Net Assets. |
| (C) | Security considered illiquid. The total value of such securities as of October 31, 2017 was $0 and represented –% of Net Assets. |
| (D) | Level 3 security in accordance with fair value hierarchy. |
Amounts designated as “—“ are $0 or have been rounded to $0.
| ADR — American Depositary Receipt |
| Cl — Class |
| GDR — Global Depositary Receipt |
| PJSC — Public Joint Stock Company |
The following is a summary of the level of inputs used as of October 31, 2017, in valuing the Fund's investments carried at value:
| Investments in Securities | | Level 1 | | | Level 2 | | | Level 3(1) | | | Total | |
| Common Stock | | $ | 15,363,202 | | | $ | — | | | $ | — | (2) | | $ | 15,363,202 | |
| Right | | | 26,175 | | | | — | | | | — | | | | 26,175 | |
| Total Investments in Securities | | $ | 15,389,377 | | | $ | — | | | $ | — | | | $ | 15,389,377 | |
(1) A reconciliation of Level 3 investments and disclosures of significant unobservable inputs are presented when the Fund has a significant amount of Level 3 investments at the beginning and/or end of the period in relation to Net Assets. Management has concluded that Level 3 investments are not material in relation to Net Assets.
(2) Amounts designated as “—“ are $0 or have been rounded to $0.
For the year ended October 31, 2017, there have been no transfers between Level 1, Level 2 and Level 3 investments.
The accompanying notes are an integral part of the financial statements.
| Statements of Assets and Liabilities |
| October 31, 2017 |
| | | Global X Silver
Miners ETF | | | Global X Gold
Explorers ETF | | | Global X Copper
Miners ETF | |
| Assets: | | | | | | | | | | | | |
| Cost of Investments | | $ | 396,258,834 | | | $ | 42,345,043 | | | $ | 62,888,525 | |
| Cost of Repurchase Agreements | | | 18,812,229 | | | | 2,756,104 | | | | 373,056 | |
| Cost of Foreign Currency | | | 125,919 | | | | 1 | | | | 75 | |
| Investments, at Value | | $ | 378,064,329 | * | | $ | 44,167,049 | * | | $ | 66,584,488 | * |
| Repurchase Agreements, at Value | | | 18,812,229 | | | | 2,756,104 | | | | 373,056 | |
| Cash | | | 524,079 | | | | 84,019 | | | | — | |
| Foreign Currency, at Value | | | 125,919 | | | | 1 | | | | 11 | |
| Receivable for Investment Securities Sold | | | 10,641,523 | | | | 4,781,215 | | | | 12,131,305 | |
| Dividend and Interest Receivable | | | 272,392 | | | | 4,742 | | | | 14,786 | |
| Reclaim Receivable | | | 19,070 | | | | — | | | | — | |
| Unrealized Appreciation on Spot Contracts | | | 5,250 | | | | 541 | | | | 216 | |
| Receivable for Capital Shares Sold | | | — | | | | 1,088,853 | | | | — | |
| Total Assets | | | 408,464,791 | | | | 52,882,524 | | | | 79,103,862 | |
| Liabilities: | | | | | | | | | | | | |
| Obligation to Return Securities Lending Collateral | | | 18,812,229 | | | | 2,756,104 | | | | 373,056 | |
| Payable for Investment Securities Purchased | | | 10,780,673 | | | | 5,845,192 | | | | 8,268,485 | |
| Payable due to Investment Adviser | | | 211,723 | | | | 25,438 | | | | 34,649 | |
| Payable for Capital Shares Redeemed | | | — | | | | — | | | | 3,847,906 | |
| Cash Overdraft | | | — | | | | — | | | | 11,569 | |
| Unrealized Depreciation on Spot Contracts | | | 3,754 | | | | — | | | | 755 | |
| Total Liabilities | | | 29,808,379 | | | | 8,626,734 | | | | 12,536,420 | |
| Net Assets | | $ | 378,656,412 | | | $ | 44,255,790 | | | $ | 66,567,442 | |
| Net Assets Consist of: | | | | | | | | | | | | |
| Paid-in Capital | | $ | 688,768,977 | | | $ | 109,954,852 | | | $ | 88,721,340 | |
| Undistributed (Distributions in Excess of) Net Investment Income | | | (3,389,457 | ) | | | (3,848,873 | ) | | | 510,601 | |
| Accumulated Net Realized Loss on Investments and Foreign Currency Transactions | | | (288,520,139 | ) | | | (63,669,525 | ) | | | (26,370,561 | ) |
| Net Unrealized Appreciation (Depreciation) on Investments | | | (18,194,505 | ) | | | 1,822,006 | | | | 3,695,963 | |
| Net Unrealized Appreciation (Depreciation) on Foreign Currency Translations | | | (8,464 | ) | | | (2,670 | ) | | | 10,099 | |
| Net Assets | | $ | 378,656,412 | | | $ | 44,255,790 | | | $ | 66,567,442 | |
| Outstanding Shares of Beneficial Interest | | | | | | | | | | | | |
| (unlimited authorization — no par value) | | | 11,847,318 | | | | 2,062,054 | | | | 2,599,374 | |
| Net Asset Value, Offering and Redemption Price Per Share | | $ | 31.96 | | | $ | 21.46 | | | $ | 25.61 | |
| *Includes Market Value of Securities on Loan | | $ | 17,545,584 | | | $ | 2,577,054 | | | $ | 313,496 | |
The accompanying notes are an integral part of the financial statements.
| Statements of Assets and Liabilities |
| October 31, 2017 |
| | | Global X Uranium
ETF | | | Global X Lithium
& Battery Tech
ETF | | | Global X
Fertilizers/Potash
ETF | |
| Assets: | | | | | | | | | | | | |
| Cost of Investments | | $ | 214,157,385 | | | $ | 807,001,075 | | | $ | 16,370,255 | |
| Cost of Repurchase Agreements | | | 38,305,488 | | | | 42,930,763 | | | | — | |
| Cost of Affiliated Investments | | | 141,978,223 | | | | — | | | | — | |
| Cost of Foreign Currency | | | 5 | | | | 327,593 | | | | — | |
| Investments, at Value | | $ | 146,549,383 | * | | $ | 948,851,755 | * | | $ | 15,389,377 | |
| Repurchase Agreements, at Value | | | 38,305,488 | | | | 42,930,763 | | | | — | |
| Affiliated Investments, at Value | | | 85,650,825 | | | | — | | | | — | |
| Cash | | | 3,597,733 | | | | 2,869,155 | | | | 8,018 | |
| Foreign Currency, at Value | | | 6 | | | | 327,599 | | | | — | |
| Receivable for Investment Securities Sold | | | 440,664 | | | | 103,722,487 | | | | — | |
| Dividend and Interest Receivable | | | 152,205 | | | | 456,122 | | | | 12,878 | |
| Unrealized Appreciation on Spot Contracts | | | 13 | | | | 634 | | | | — | |
| Receivable for Capital Shares Sold | | | — | | | | 11,710,509 | | | | — | |
| Reclaim Receivable | | | — | | | | — | | | | 16,288 | |
| Total Assets | | | 274,696,317 | | | | 1,110,869,024 | | | | 15,426,561 | |
| Liabilities: | | | | | | | | | | | | |
| Obligation to Return Securities Lending Collateral | | | 38,305,488 | | | | 42,930,763 | | | | — | |
| Payable due to Investment Adviser | | | 147,648 | | | | 548,037 | | | | 8,699 | |
| Payable for Investment Securities Purchased | | | 24,975 | | | | 117,316,100 | | | | — | |
| Unrealized Depreciation on Spot Contracts | | | — | | | | 3,299 | | | | — | |
| Due to Broker | | | — | | | | — | | | | 287 | |
| Total Liabilities | | | 38,478,111 | | | | 160,798,199 | | | | 8,986 | |
| Net Assets | | $ | 236,218,206 | | | $ | 950,070,825 | | | $ | 15,417,575 | |
| Net Assets Consist of: | | | | | | | | | | | | |
| Paid-in Capital | | $ | 704,113,886 | | | $ | 866,682,616 | | | $ | 23,846,007 | |
| Undistributed (Distributions in Excess of) Net Investment Income | | | (2,023,138 | ) | | | 1,268,358 | | | | (6,886 | ) |
| Accumulated Net Realized Loss on Investments and Foreign Currency Transactions | | | (341,937,166 | ) | | | (59,728,570 | ) | | | (7,439,540 | ) |
| Net Unrealized Appreciation (Depreciation) on Investments | | | (123,935,400 | ) | | | 141,850,680 | | | | (980,878 | ) |
| Net Unrealized Appreciation (Depreciation) on Foreign Currency Translations | | | 24 | | | | (2,259 | ) | | | (1,128 | ) |
| Net Assets | | $ | 236,218,206 | | | $ | 950,070,825 | | | $ | 15,417,575 | |
| Outstanding Shares of Beneficial Interest | | | | | | | | | | | | |
| (unlimited authorization — no par value) | | | 19,881,666 | | | | 24,274,628 | | | | 1,500,000 | |
| Net Asset Value, Offering and Redemption Price Per Share | | $ | 11.88 | | | $ | 39.14 | | | $ | 10.28 | |
| *Includes Market Value of Securities on Loan | | $ | 34,989,365 | | | $ | 42,168,968 | | | $ | — | |
The accompanying notes are an integral part of the financial statements.
| Statements of Operations |
| For the year ended October 31, 2017 |
| | | Global X Silver
Miners ETF | | | Global X Gold
Explorers ETF | | | Global X Copper
Miners ETF | |
| Investment Income: | | | | | | | | | | | | |
| Dividend Income | | $ | 4,186,228 | | | $ | 277,566 | | | $ | 705,446 | |
| Interest Income | | | 4,532 | | | | 675 | | | | 147 | |
| Security Lending Income | | | 312,086 | | | | 181,991 | | | | 6,341 | |
| Less: Foreign Taxes Withheld | | | (219,200 | ) | | | (4,272 | ) | | | (35,646 | ) |
| Total Investment Income | | | 4,283,646 | | | | 455,960 | | | | 676,288 | |
| Supervision and Administration Fees(1) | | | 2,294,867 | | | | 306,855 | | | | 285,663 | |
| Custodian Fees | | | 7,268 | | | | 4,245 | | | | 342 | |
| Total Expenses | | | 2,302,135 | | | | 311,100 | | | | 286,005 | |
| Net Investment Income | | | 1,981,511 | | | | 144,860 | | | | 390,283 | |
| Net Realized Gain (Loss) on: | | | | | | | | | | | | |
| Investments (2) | | | (21,799,629 | ) | | | (998,644 | ) | | | 962,047 | |
| Foreign Currency Transactions | | | 199,656 | | | | 8,728 | | | | 3,414 | |
| Net Realized Gain (Loss) on Investments and Foreign Currency Transactions | | | (21,599,973 | ) | | | (989,916 | ) | | | 965,461 | |
| Net Change in Unrealized Appreciation (Depreciation) on: | | | | | | | | | | | | |
| Investments | | | (62,677,118 | ) | | | (10,308,062 | ) | | | 8,347,999 | |
| Foreign Currency Translations | | | (19,932 | ) | | | (2,674 | ) | | | 10,893 | |
| Net Change in Unrealized Appreciation (Depreciation) on Investments and Foreign Currency Translations | | | (62,697,050 | ) | | | (10,310,736 | ) | | | 8,358,892 | |
| Net Realized and Unrealized Gain (Loss) on Investments and Foreign Currency Transactions and Translations | | | (84,297,023 | ) | | | (11,300,652 | ) | | | 9,324,353 | |
| Net Increase (Decrease) in Net Assets Resulting from Operations | | $ | (82,315,512 | ) | | $ | (11,155,792 | ) | | $ | 9,714,636 | |
| (1) | The Supervision and Administration fees reflect the supervisory and administrative fee, which includes fees paid by the Funds for the investment advisory services provided by the Adviser. (See Note 3 in Notes to Financial Statements.) |
| (2) | Includes realized gains (losses) as a result of in-kind redemptions. (See Note 4 in Notes to Financial Statements.) |
The accompanying notes are an integral part of the financial statements.
| Statements of Operations |
| For the year ended October 31, 2017 |
| | | Global X Uranium
ETF | | | Global X Lithium
& Battery Tech
ETF | | | Global X
Fertilizers/Potash
ETF | |
| Investment Income: | | | | | | | | | | | | |
| Dividend Income | | $ | 2,330,536 | | | $ | 4,497,277 | | | $ | 332,127 | |
| Interest Income | | | 6,008 | | | | 2,254 | | | | — | |
| Security Lending Income | | | 2,456,925 | | | | 839,826 | | | | — | |
| Less: Foreign Taxes Withheld | | | (273,197 | ) | | | (532,609 | ) | | | (34,612 | ) |
| Total Investment Income | | | 4,520,272 | | | | 4,806,748 | | | | 297,515 | |
| Supervision and Administration Fees(1) | | | 1,683,748 | | | | 2,031,441 | | | | 95,455 | |
| Custodian Fees | | | 9,820 | | | | 4,695 | | | | 212 | |
| Total Expenses | | | 1,693,568 | | | | 2,036,136 | | | | 95,667 | |
| Net Investment Income | | | 2,826,704 | | | | 2,770,612 | | | | 201,848 | |
| Net Realized Gain (Loss) on: | | | | | | | | | | | | |
| Investments (2) | | | (34,027,603 | ) | | | 6,429,877 | | | | (961,950 | ) |
| Affiliated Investments (2) | | | (4,130,955 | ) | | | — | | | | — | |
| Foreign Currency Transactions | | | 181,491 | | | | (105,919 | ) | | | (5,756 | ) |
| Net Realized Gain (Loss) on Investments and Foreign Currency Transactions | | | (37,977,067 | ) | | | 6,323,958 | | | | (967,706 | ) |
| Net Change in Unrealized Appreciation (Depreciation) on: | | | | | | | | | | | | |
| Investments | | | 10,038,309 | | | | 142,520,950 | | | | 3,596,195 | |
| Affiliated Investments | | | (20,363,207 | ) | | | — | | | | — | |
| Foreign Currency Translations | | | 25 | | | | (2,246 | ) | | | 338 | |
| Net Change in Unrealized Appreciation (Depreciation) on Investments and Foreign Currency Translations | | | (10,324,873 | ) | | | 142,518,704 | | | | 3,596,533 | |
| Net Realized and Unrealized Gain (Loss) on Investments and Foreign Currency Transactions and Translations | | | (48,301,940 | ) | | | 148,842,662 | | | | 2,628,827 | |
| Net Increase (Decrease) in Net Assets Resulting from Operations | | $ | (45,475,236 | ) | | $ | 151,613,274 | | | $ | 2,830,675 | |
| (1) | The Supervision and Administration fees reflect the supervisory and administrative fee, which includes fees paid by the Funds for the investment advisory services provided by the Adviser. (See Note 3 in Notes to Financial Statements.) |
| (2) | Includes realized gains (losses) as a result of in-kind redemptions. (See Note 4 in Notes to Financial Statements.) |
The accompanying notes are an integral part of the financial statements.
| Statements of Changes in Net Assets |
| | | Global X Silver Miners ETF | | | Global X Gold Explorers ETF | |
| | | Year Ended
October 31, 2017 | | | Year Ended
October 31, 2016 | | | Year Ended
October 31, 2017 | | | Year Ended
October 31, 2016 | |
| Operations: | | | | | | | | | | | | | | | | |
| Net Investment Income (Loss) | | $ | 1,981,511 | | | $ | 471,099 | | | $ | 144,860 | | | $ | (118,964 | ) |
| Net Realized Gain (Loss) on Investments and Foreign Currency Transactions(1) | | | (21,599,973 | ) | | | (32,611,236 | ) | | | (989,916 | ) | | | 1,204,342 | |
| Net Change in Unrealized Appreciation (Depreciation) on Investments and Foreign Currency Translations | | | (62,697,050 | ) | | | 168,065,426 | | | | (10,310,736 | ) | | | 24,561,938 | |
| Net Increase (Decrease) in Net Assets Resulting from Operations | | | (82,315,512 | ) | | | 135,925,289 | | | | (11,155,792 | ) | | | 25,647,316 | |
| Dividends and Distributions from: | | | | | | | | | | | | | | | | |
| Net Investment Income | | | (9,132,632 | ) | | | (492,527 | ) | | | (15,400,105 | ) | | | (2,809,410 | ) |
| Return of Capital | | | (91,018 | ) | | | — | | | | — | | | | — | |
| Total Dividends and Distributions | | | (9,223,650 | ) | | | (492,527 | ) | | | (15,400,105 | ) | | | (2,809,410 | ) |
| Capital Share Transactions: | | | | | | | | | | | | | | | | |
| Issued | | | 137,114,616 | | | | 145,373,948 | | | | 4,463,722 | | | | 23,235,210 | |
| Redeemed | | | (46,536,334 | ) | | | (44,945,232 | ) | | | (5,726,129 | ) | | | (3,092,103 | ) |
| Increase (Decrease) in Net Assets from Capital Share Transactions | | | 90,578,282 | | | | 100,428,716 | | | | (1,262,407 | ) | | | 20,143,107 | |
| Total Increase (Decrease) in Net Assets | | | (960,880 | ) | | | 235,861,478 | | | | (27,818,304 | ) | | | 42,981,013 | |
| Net Assets: | | | | | | | | | | | | | | | | |
| Beginning of Year | | | 379,617,292 | | | | 143,755,814 | | | | 72,074,094 | | | | 29,093,081 | |
| End of Year | | $ | 378,656,412 | | | $ | 379,617,292 | | | $ | 44,255,790 | | | $ | 72,074,094 | |
| Undistributed (Distributions in Excess of) Net Investment Income | | $ | (3,389,457 | ) | | $ | 269,857 | | | $ | (3,848,873 | ) | | $ | (938,905 | ) |
| Share Transactions: | | | | | | | | | | | | | | | | |
| Issued | | | 3,850,000 | | | | 3,550,000 | | | | 200,000 | | | | 700,000 | |
| Redeemed | | | (1,350,000 | ) | | | (1,102,682 | ) | | | (200,000 | ) | | | (100,325 | ) |
| Net Increase in Shares Outstanding from Share Transactions | | | 2,500,000 | | | | 2,447,318 | | | | — | | | | 599,675 | |
| (1) | Includes realized gain (loss) as a result of in-kind transactions. (See Note 4 in Notes to Financial Statements.) |
The accompanying notes are an integral part of the financial statements.
| Statements of Changes in Net Assets |
| | | Global X Copper Miners ETF | | | Global X Uranium ETF | |
| | | Year Ended
October 31, 2017 | | | Year Ended
October 31, 2016 | | | Year Ended
October 31, 2017 | | | Year Ended
October 31, 2016 | |
| Operations: | | | | | | | | | | | | | | | | |
| Net Investment Income | | $ | 390,283 | | | $ | 117,560 | | | $ | 2,826,704 | | | $ | 840,773 | |
| Net Realized Gain (Loss) on Investments and Foreign Currency Transactions(1) | | | 965,461 | | | | (5,332,136 | ) | | | (37,977,067 | ) | | | (39,099,245 | ) |
| Net Change in Unrealized Appreciation (Depreciation) on Investments and Foreign Currency Translations | | | 8,358,892 | | | | 10,560,257 | | | | (10,324,873 | ) | | | 14,843,464 | |
| Net Increase (Decrease) in Net Assets Resulting from Operations | | | 9,714,636 | | | | 5,345,681 | | | | (45,475,236 | ) | | | (23,415,008 | ) |
| Dividends and Distributions from: | | | | | | | | | | | | | | | | |
| Net Investment Income | | | (232,862 | ) | | | (205,898 | ) | | | (9,254,190 | ) | | | (2,421,696 | ) |
| Total Dividends and Distributions | | | (232,862 | ) | | | (205,898 | ) | | | (9,254,190 | ) | | | (2,421,696 | ) |
| Capital Share Transactions: | | | | | | | | | | | | | | | | |
| Issued | | | 52,074,785 | | | | 4,973,174 | | | | 220,075,566 | | | | 4,984,570 | |
| Redeemed | | | (20,492,970 | ) | | | (3,588,508 | ) | | | (31,564,623 | ) | | | (18,767,601 | ) |
| Increase (Decrease) in Net Assets from Capital Share Transactions | | | 31,581,815 | | | | 1,384,666 | | | | 188,510,943 | | | | (13,783,031 | ) |
| Total Increase (Decrease) in Net Assets | | | 41,063,589 | | | | 6,524,449 | | | | 133,781,517 | | | | (39,619,735 | ) |
| Net Assets: | | | | | | | | | | | | | | | | |
| Beginning of Year | | | 25,503,853 | | | | 18,979,404 | | | | 102,436,689 | | | | 142,056,424 | |
| End of Year | | $ | 66,567,442 | | | $ | 25,503,853 | | | $ | 236,218,206 | | | $ | 102,436,689 | |
| Undistributed (Distributions in Excess of) Net Investment Income | | $ | 510,601 | | | $ | 76,960 | | | $ | (2,023,138 | ) | | $ | 2,129,397 | |
| Share Transactions: | | | | | | | | | | | | | | | | |
| Issued | | | 2,100,000 | | | | 433,333 | | | | 13,800,000 | | | | 350,000 | |
| Redeemed | | | (950,000 | ) | | | (250,626 | ) | | | (2,400,000 | ) | | | (1,375,870 | ) |
| Net Increase (Decrease) in Shares Outstanding from Share Transactions | | | 1,150,000 | | | | 182,707 | | | | 11,400,000 | | | | (1,025,870 | ) |
(1) Includes realized gain (loss) as a result of in-kind transactions. (See Note 4 in Notes to Financial Statements.)
The accompanying notes are an integral part of the financial statements.
| Statements of Changes in Net Assets |
| | | Global X Lithium & Battery Tech ETF | | | Global X Fertilizers/Potash ETF | |
| | | Year Ended
October 31, 2017 | | | Year Ended
October 31, 2016 | | | Year Ended
October 31, 2017 | | | Year Ended
October 31, 2016 | |
| Operations: | | | | | | | | | | | | | | | | |
| Net Investment Income | | $ | 2,770,612 | | | $ | 845,396 | | | $ | 201,848 | | | $ | 189,722 | |
| Net Realized Gain (Loss) on Investments and Foreign Currency Transactions(1) | | | 6,323,958 | | | | (2,510,956 | ) | | | (967,706 | ) | | | (2,765,323 | ) |
| Net Change in Unrealized Appreciation (Depreciation) on Investments and Foreign Currency Translations | | | 142,518,704 | | | | 8,280,377 | | | | 3,596,533 | | | | 1,328,868 | |
| Net Increase (Decrease) in Net Assets Resulting from Operations | | | 151,613,274 | | | | 6,614,817 | | | | 2,830,675 | | | | (1,246,733 | ) |
| Dividends and Distributions from: | | | | | | | | | | | | | | | | |
| Net Investment Income | | | (2,450,314 | ) | | | (97,361 | ) | | | (403,740 | ) | | | (363,096 | ) |
| Total Dividends and Distributions | | | (2,450,314 | ) | | | (97,361 | ) | | | (403,740 | ) | | | (363,096 | ) |
| Capital Share Transactions: | | | | | | | | | | | | | | | | |
| Issued | | | 717,180,556 | | | | 77,405,685 | | | | 2,812,869 | | | | 2,166,918 | |
| Redeemed | | | (28,576,935 | ) | | | (12,349,856 | ) | | | (946,901 | ) | | | (915,034 | ) |
| Increase in Net Assets from Capital Share Transactions | | | 688,603,621 | | | | 65,055,829 | | | | 1,865,968 | | | | 1,251,884 | |
| Total Increase (Decrease) in Net Assets | | | 837,766,581 | | | | 71,573,285 | | | | 4,292,903 | | | | (357,945 | ) |
| Net Assets: | | | | | | | | | | | | | | | | |
| Beginning of Year | | | 112,304,244 | | | | 40,730,959 | | | | 11,124,672 | | | | 11,482,617 | |
| End of Year | | $ | 950,070,825 | | | $ | 112,304,244 | | | $ | 15,417,575 | | | $ | 11,124,672 | |
| Undistributed (Distributions in Excess of) Net Investment Income | | $ | 1,268,358 | | | $ | 710,566 | | | $ | (6,886 | ) | | $ | 195,160 | |
| Share Transactions: | | | | | | | | | | | | | | | | |
| Issued | | | 20,500,000 | | | | 3,200,000 | | | | 300,000 | | | | 250,000 | |
| Redeemed | | | (900,000 | ) | | | (500,372 | ) | | | (100,000 | ) | | | (100,000 | ) |
| Net Increase in Shares Outstanding from Share Transactions | | | 19,600,000 | | | | 2,699,628 | | | | 200,000 | | | | 150,000 | |
(1) Includes realized gain (loss) as a result of in-kind transactions. (See Note 4 in Notes to Financial Statements.)
The accompanying notes are an integral part of the financial statements.
Selected Per Share Data & Ratios
For a Share Outstanding Throughout the Period
| | | | | | | | | | | | | | | | | | | | | | | | | | | | | | | | | | | | Ratio of | | | | |
| | | | | | | | | Net Realized | | | | | | | | | | | | | | | | | | | | | | | | | | | Net | | | | |
| | | Net | | | | | | and | | | | | | | | | | | | | | | Net | | | | | | | | | Ratio of | | | Investment | | | | |
| | | Asset | | | | | | Unrealized | | | | | | | | | | | | | | | Asset | | | | | | | | | Expenses | | | Income | | | | |
| | | Value, | | | Net | | | Gain (Loss) | | | | | | Distribution | | | | | | | | | Value, | | | | | | Net Assets | | | to | | | (Loss) to | | | | |
| | | Beginning | | | Investment | | | on | | | Total from | | | from Net | | | | | | Total from | | | End of | | | Total | | | End of | | | Average | | | Average | | | Portfolio | |
| | | of Period | | | Income | | | Investments | | | Operations | | | Investment | | | Return of | | | Distributions | | | Period | | | Return | | | Period | | | Net Assets | | | Net Assets | | | Turnover | |
| | | ($) | | | (Loss) ($)* | | | ($) | | | ($) | | | Income ($) | | | Capital | | | ($) | | | ($) | | | (%)** | | | ($)(000) | | | (%) | | | (%) | | | (%)†† | |
| Global X Silver Miners ETF | | | | | | | | | | | | | | | | | | | | | | | | | | | | | | | | | | | | | | | | | | | | | | | | | | | | |
| 2017 | | | 40.61 | | | | 0.20 | | | | (7.78 | ) | | | (7.58 | ) | | | (1.06 | ) | | | (0.01 | ) | | | (1.07 | ) | | | 31.96 | | | | (18.61 | ) | | | 378,656 | | | | 0.65 | | | | 0.56 | | | | 24.46 | |
| 2016 | | | 20.83 | | | | 0.05 | | | | 19.80 | | | | 19.85 | | | | (0.07 | ) | | | — | | | | (0.07 | ) | | | 40.61 | | | | 95.69 | | | | 379,617 | | | | 0.65 | | | | 0.17 | | | | 27.45 | |
| 2015(1) | | | 26.16 | | | | 0.06 | | | | (5.37 | ) | | | (5.31 | ) | | | (0.02 | ) | | | — | | | | (0.02 | ) | | | 20.83 | | | | (20.35 | ) | | | 143,756 | | | | 0.65 | | | | 0.22 | | | | 26.75 | |
| 2014(1) | | | 38.64 | | | | 0.09 | | | | (12.35 | ) | | | (12.26 | ) | | | (0.22 | ) | | | — | | | | (0.22 | ) | | | 26.16 | | | | (31.85 | ) | | | 170,965 | | | | 0.65 | | | | 0.24 | | | | 24.23 | |
| 2013(1) | | | 74.94 | | | | 0.34 | | | | (36.03 | ) | | | (35.69 | ) | | | (0.61 | ) | | | — | | | | (0.61 | ) | | | 38.64 | | | | (47.97 | ) | | | 218,240 | | | | 0.65 | | | | 0.67 | | | | 23.79 | |
| Global X Gold Explorers ETF | | | | | | | | | | | | | | | | | | | | | | | | | | | | | | | | | | | | | | | | | | | | | | | | | | | | |
| 2017 | | | 34.95 | | | | 0.07 | | | | (5.51 | ) | | | (5.44 | ) | | | (8.05 | ) | | | — | | | | (8.05 | ) | | | 21.46 | | | | (13.61 | ) | | | 44,256 | | | | 0.66 | | | | 0.31 | | | | 84.00 | |
| 2016 | | | 19.89 | | | | (0.06 | ) | | | 17.04 | | | | 16.98 | | | | (1.92 | ) | | | — | | | | (1.92 | ) | | | 34.95 | | | | 95.95 | | | | 72,074 | | | | 0.66 | | | | (0.22 | ) | | | 17.06 | |
| 2015(2) | | | 19.28 | | | | 0.14 | | | | 0.50 | | | | 0.64 | | | | (0.03 | ) | | | — | | | | (0.03 | ) | | | 19.89 | | | | 3.36 | | | | 29,093 | | | | 0.65 | | | | 0.70 | | | | 57.53 | |
| 2014(2) | | | 26.96 | | | | 0.01 | | | | (7.69 | ) | | | (7.68 | ) | | | — | | | | — | | | | — | | | | 19.28 | | | | 28.49 | | | | 27,714 | | | | 0.65 | | | | 0.02 | | | | 29.94 | |
| 2013(2)(3) | | | 69.44 | | | | (0.25 | ) | | | (39.35 | ) | | | (39.60 | ) | | | (2.88 | ) | | | — | | | | (2.88 | ) | | | 26.96 | | | | (59.16 | ) | | | 32,020 | | | | 0.65 | | | | (0.65 | ) | | | 31.73 | |
| Global X Copper Miners ETF | | | | | | | | | | | | | | | | | | | | | | | | | | | | | | | | | | | | | | | | | | | | | | | | | | | | |
| 2017 | | | 17.60 | | | | 0.20 | | | | 7.93 | | | | 8.13 | | | | (0.12 | ) | | | — | | | | (0.12 | ) | | | 25.61 | | | | 46.38 | | | | 66,567 | | | | 0.65 | | | | 0.89 | | | | 43.58 | |
| 2016 | | | 14.98 | | | | 0.07 | | | | 2.69 | | | | 2.76 | | | | (0.14 | ) | | | — | | | | (0.14 | ) | | | 17.60 | | | | 18.88 | | | | 25,504 | | | | 0.65 | | | | 0.57 | | | | 34.73 | |
| 2015(1) | | | 24.96 | | | | 0.21 | | | | (9.68 | ) | | | (9.47 | ) | | | (0.51 | ) | | | — | | | | (0.51 | ) | | | 14.98 | | | | (38.64 | ) | | | 18,979 | | | | 0.65 | | | | 1.07 | | | | 29.72 | |
| 2014(1) | | | 29.40 | | | | 0.45 | | | | (4.69 | ) | | | (4.24 | ) | | | (0.20 | ) | | | — | | | | (0.20 | ) | | | 24.96 | | | | (14.49 | ) | | | 27,053 | | | | 0.65 | | | | 1.59 | | | | 15.77 | |
| 2013(1) | | | 38.79 | | | | 0.52 | | | | (8.63 | ) | | | (8.11 | ) | | | (1.28 | ) | | | — | | | | (1.28 | ) | | | 29.40 | | | | (21.69 | ) | | | 32,828 | | | | 0.65 | | | | 1.63 | | | | 37.06 | |
| Global X Uranium ETF | | | | | | | | | | | | | | | | | | | | | | | | | | | | | | | | | | | | | | | | | | | | | | | | | | | | |
| 2017 | | | 12.08 | | | | 0.16 | | | | 0.58 | | | | 0.74 | | | | (0.94 | ) | | | — | | | | (0.94 | ) | | | 11.88 | | | | 5.75 | | | | 236,218 | | | | 0.69 | | | | 1.16 | | | | 11.95 | |
| 2016 | | | 14.94 | | | | 0.09 | | | | (2.68 | ) | | | (2.59 | ) | | | (0.27 | ) | | | — | | | | (0.27 | ) | | | 12.08 | | | | (17.53 | ) | | | 102,437 | | | | 0.70 | | | | 0.71 | | | | 14.48 | |
| 2015(2) | | | 23.26 | | | | 0.15 | | | | (7.50 | ) | | | (7.35 | ) | | | (0.97 | ) | | | — | | | | (0.97 | ) | | | 14.94 | | | | (33.01 | ) | | | 142,056 | | | | 0.69 | | | | 0.74 | | | | 22.37 | |
| 2014(2) | | | 28.94 | | | | 0.09 | | | | (5.60 | ) | | | (5.51 | ) | | | (0.17 | ) | | | — | | | | (0.17 | ) | | | 23.26 | | | | (19.18 | ) | | | 212,357 | | | | 0.69 | | | | 0.30 | | | | 20.90 | |
| 2013(2)(4) | | | 42.06 | | | | 0.18 | | | | (12.56 | ) | | | (12.38 | ) | | | (0.74 | ) | | | — | | | | (0.74 | ) | | | 28.94 | | | | (29.88 | ) | | | 118,871 | | | | 0.69 | | | | 0.51 | | | | 73.16 | |
| Global X Lithium & Battery Tech ETF | | | | | | | | | | | | | | | | | | | | | | | | | | | | | | | | | | | | | | | | | | | | | | | | | | | | |
| 2017 | | | 24.02 | | | | 0.33 | | | | 15.31 | | | | 15.64 | | | | (0.52 | ) | | | — | | | | (0.52 | ) | | | 39.14 | | | | 66.46 | | | | 950,071 | | | | 0.75 | | | | 1.02 | | | | 68.13 | |
| 2016 | | | 20.62 | | | | 0.27 | | | | 3.18 | | | | 3.45 | | | | (0.05 | ) | | | — | | | | (0.05 | ) | | | 24.02 | | | | 16.76 | | | | 112,304 | | | | 0.76 | | | | 1.21 | | | | 44.90 | |
| 2015(2) | | | 24.00 | | | | 0.08 | | | | (3.22 | ) | | | (3.14 | ) | | | (0.24 | ) | | | — | | | | (0.24 | ) | | | 20.62 | | | | (13.18 | ) | | | 40,731 | | | | 0.75 | | | | 0.35 | | | | 31.14 | |
| 2014(2) | | | 25.88 | | | | 0.20 | | | | (2.00 | ) | | | (1.80 | ) | | | (0.08 | ) | | | — | | | | (0.08 | ) | | | 24.00 | | | | (6.97 | ) | | | 50,389 | | | | 0.75 | | | | 0.75 | | | | 43.37 | |
| 2013(2) | | | 28.82 | | | | 0.06 | | | | (2.31 | ) | | | (2.25 | ) | | | (0.69 | ) | | | — | | | | (0.69 | ) | | | 25.88 | | | | (8.00 | ) | | | 51,105 | | | | 0.75 | | | | 0.21 | | | | 38.46 | |
| Global X Fertilizers/Potash ETF | | | | | | | | | | | | | | | | | | | | | | | | | | | | | | | | | | | | | | | | | | | | | | | | | | | | |
| 2017 | | | 8.56 | | | | 0.14 | | | | 1.87 | | | | 2.01 | | | | (0.29 | ) | | | — | | | | (0.29 | ) | | | 10.28 | | | | 23.99 | | | | 15,418 | | | | 0.69 | | | | 1.46 | | | | 23.56 | |
| 2016 | | | 9.98 | | | | 0.18 | ‡‡ | | | (1.27 | ) | | | (1.09 | ) | | | (0.33 | ) | | | — | | | | (0.33 | ) | | | 8.56 | | | | (11.15 | ) | | | 11,125 | | | | 0.69 | | | | 2.00 | ‡‡ | | | 25.38 | |
| 2015 | | | 10.87 | | | | 0.33 | | | | (0.97 | ) | | | (0.64 | ) | | | (0.25 | ) | | | — | | | | (0.25 | ) | | | 9.98 | | | | (6.01 | ) | | | 11,483 | | | | 0.69 | | | | 2.97 | | | | 30.64 | |
| 2014 | | | 11.73 | | | | 0.23 | | | | (0.90 | ) | | | (0.67 | ) | | | (0.19 | ) | | | — | | | | (0.19 | ) | | | 10.87 | | | | (5.79 | ) | | | 15,761 | | | | 0.69 | | | | 1.98 | | | | 18.79 | |
| 2013 | | | 13.85 | | | | 0.25 | | | | (2.21 | ) | | | (1.96 | ) | | | (0.16 | ) | | | — | | | | (0.16 | ) | | | 11.73 | | | | 14.33 | | | | 22,864 | | | | 0.69 | | | | 1.93 | | | | 14.12 | |
| (1) | Per share amounts have been adjusted for a 1 for 3 reverse share split on November 18, 2015. For more information see Note 9 in the Notes to Financial Statements. |
| (2) | Per share amounts have been adjusted for a 1 for 2 reverse share split on November 18, 2015. For more information see Note 9 in the Notes to Financial Statements |
| (3) | Per share amounts have been adjusted for a 1 for 4 reverse share split on May 16, 2013. For more information see Note 9 in the Notes to Financial Statements |
| (4) | Per share amounts have been adjusted for a 1 for 3 reverse share split on May 16, 2013. For more information see Note 9 in the Notes to Financial Statements. |
| * | Per share data calculated using average shares method. |
| ** | Total return is based on the change in net asset value of a share during the year or period and assumes reinvestment of dividends and distributions at net asset value. Total return is for the period indicated and periods of less than one year have not been annualized. The return shown does not reflect the deduction of taxes that a shareholder would pay on Fund distributions or the redemption of Fund shares. |
| †† | Portfolio turnover rate is for the period indicated and has not been annualized. Excludes effect of in-kind transfers. |
| ‡‡ | Effective November 1, 2015, the Fund changed its method for estimating the characterization of amounts distributed by master limited partnerships, which correspondingly impacted the financial highlight ratios and per share disclosures to the extent that the fund recorded investment income that differed from amounts previously estimated. |
Amounts designated as “—” are either $0 or have been rounded to $0.
The accompanying notes are an integral part of the financial statements.
| Notes to Financial Statements |
| October 31, 2017 |
1. ORGANIZATION
The Global X Funds (the “Trust”) is a Delaware statutory trust formed on March 6, 2008. The Trust is registered under the Investment Company Act of 1940, as amended, as an open-end management investment company. As of October 31, 2017, the Trust had ninety-six portfolios, fifty-two of which were operational. The financial statements herein and the related notes pertain to the Global X Silver Miners ETF, Global X Gold Explorers ETF, Global X Copper Miners ETF, Global X Uranium ETF, Global X Lithium & Battery Tech ETF and Global X Fertilizers/Potash ETF (the “Funds”). Each Fund has elected non-diversified status.
2. SIGNIFICANT ACCOUNTING POLICIES
The following is a summary of the significant accounting policies followed by the Funds.
USE OF ESTIMATES — The Funds are investment companies that apply the accounting and reporting guidance issued in Topic 946 by the U.S. Financial Accounting Standards Board. The preparation of financial statements in conformity with U.S. generally accepted accounting principles ("U.S. GAAP") requires management to make estimates and assumptions that affect the reported amounts of assets and liabilities and disclosure of contingent assets and liabilities at the date of the financial statements and the reported amounts of increases and decreases in net assets from operations during the reporting period. Actual results could materially differ from those estimates.
RETURN OF CAPITAL ESTIMATES — Distributions received by the Funds from underlying master limited partnership (“MLP”) investments generally are comprised of income and return of capital. The Funds record investment income and return of capital based on estimates made at the time such distributions are received. Such estimates are based on historical information available from the MLPs and other industry sources. These estimates may subsequently be revised based on information received from the MLPs after their tax reporting periods are concluded.
SECURITY VALUATION — Securities listed on a securities exchange, market or automated quotation system for which quotations are readily available (except for securities traded on NASDAQ), including securities traded over the counter, are valued at the last quoted sale price on the primary exchange or market (foreign or domestic) on which they are traded (or at approximately 4:00 pm if a security’s primary exchange is normally open at that time), or, if there is no such reported sale, at the most recent mean between the quoted bid and asked prices, which approximate fair value (absent both bid and asked prices on such exchange, the bid price may be used).
For securities traded on NASDAQ, the NASDAQ official closing price will be used. If available, debt securities are priced based upon valuations provided by independent, third-party pricing agents. Such values generally reflect the last reported sales price if the security is actively traded. The third-party pricing agents may also value debt securities at an evaluated bid price by employing methodologies that utilize actual market transactions, broker-supplied valuations, or other methodologies designed to identify the market value for such securities. Debt obligations with remaining maturities of sixty days or less may be valued at their amortized cost, which approximates market value. The prices for foreign securities are reported in local currency and converted to U.S. dollars using currency exchange rates as of reporting date. The exchange rates used by the Trust for valuation are captured as of the New York or London close each day. Prices for most securities held by the Funds are provided daily by recognized independent pricing agents. If a security price cannot
| Notes to Financial Statements (continued) |
| October 31, 2017 |
2. SIGNIFICANT ACCOUNTING POLICIES (continued)
SECURITY VALUATION (continued)
be obtained from an independent, third-party pricing agent, the Funds seek to obtain a bid price from at least one independent broker.
Securities for which market prices are not “readily available” are valued in accordance with Fair Value Procedures established by the Board of Trustees (the “Board”). The Funds’ Fair Value Procedures are implemented through a Fair Value Committee (the “Committee”) designated by the Board. Some of the more common reasons that may necessitate that a security be valued using the Fair Value Procedures include: the security's trading has been halted or suspended; the security has been de-listed from its primary trading exchange; the security's primary trading market is temporarily closed at a time, when under normal conditions it would be open; the security has not been traded for an extended period of time; the security's primary pricing source is not able or willing to provide a price; or trading of the security is subject to local government-imposed restrictions. In addition, the Funds may fair value a security if an event that may materially affect the value of the Funds’ security that traded outside of the United States (a “Significant Event”) has occurred between the time of the security's last close and the time that the Funds calculate their net asset values. A Significant Event may relate to a single issuer or to an entire market sector. Events that may be Significant Events include: government actions, natural disasters, armed conflict, acts of terrorism and significant market fluctuations. If Global X Management Company LLC, the Funds’ investment adviser (the “Adviser”), becomes aware of a Significant Event that has occurred with respect to a security or group of securities after the closing of the exchange or market on which the security or securities principally trade, but before the time at which the Funds calculate net asset value, it may request that a Committee meeting be called. When a security is valued in accordance with the Fair Value Procedures, the Committee will determine the value after taking into consideration all relevant information reasonably available to the Committee. As of October 31, 2017, there was $533,687, $1,005,393 and $0 of fair valued securities in Global X Uranium ETF, Global X Lithium & Battery Tech ETF and Global X Fertilizers/Potash ETF, respectively. There were no other securities priced using the Fair Value Procedures.
In accordance with the authoritative guidance on fair value measurements and disclosure under U.S. GAAP, the Funds disclose the fair value of their investments in a hierarchy that prioritizes the inputs to valuation techniques used to measure the fair value. The objective of a fair value measurement is to determine the price that would be received to sell an asset or paid to transfer a liability in an orderly transaction between market participants at the measurement date (an exit price). Accordingly, the fair value hierarchy gives the highest priority to quoted prices (unadjusted) in active markets for identical assets or liabilities (Level 1) and the lowest priority to unobservable inputs (Level 3). The three levels of the fair value hierarchy are described below:
Level 1 – Unadjusted quoted prices in active markets for identical, unrestricted assets or liabilities that the Funds have the ability to access at the measurement date
Level 2 – Other significant observable inputs (including quoted prices in non-active markets, quoted prices for similar investments, fair value of investments for which the Funds have the ability to fully redeem tranches at net asset value as of the measurement date or within the near term, and short-term investments valued at amortized cost)
| Notes to Financial Statements (continued) |
| October 31, 2017 |
2. SIGNIFICANT ACCOUNTING POLICIES (continued)
SECURITY VALUATION (concluded)
Level 3 – Significant unobservable inputs (including the Funds’ own assumptions in determining the fair value of investments and fair value of investments for which the Funds do not have the ability to fully redeem tranches at net asset value as of the measurement date or within the near term)
Investments are classified within the level of the lowest significant input considered in determining fair value. Investments classified within Level 3 whose fair value measurement considers several inputs may include Level 1 or Level 2 inputs as components of the overall fair value measurement. For the year ended October 31, 2017 there have been no significant changes to the Funds’ fair valuation methodologies.
DUE TO/FROM BROKERS — Due to/from brokers includes cash and collateral balances with the Funds’ clearing brokers or counterparties at October 31, 2017. The Funds continuously monitor the credit standing of each broker or counterparty with whom they conduct business. In the event a broker or counterparty is unable to fulfill its obligations, the Funds would be subject to counterparty credit risk.
REPURCHASE AGREEMENTS — Securities pledged as collateral for repurchase agreements by Deutsche Bank are held by Citibank N.A. whereas the collateral for repurchase agreements by Barclays Bank are held by BNY Mellon and are designated as being held on each Fund’s behalf by its custodian under a book-entry system. Each Fund monitors the adequacy of the collateral on a daily basis and can require the seller to provide additional collateral in the event the market value of the securities pledged falls below the carrying value of the repurchase agreement, including accrued interest. It is the Funds’ policy to only enter into repurchase agreements with banks and other financial institutions which are deemed by the Adviser to be creditworthy. The Funds bear the risk of loss in the event that the other party to a repurchase agreement defaults on its obligations and the Funds are prevented from exercising their rights to dispose of the underlying securities received as collateral and the risk of a possible decline in the value of the underlying securities during the period. For financial statement purposes, the Funds record the securities lending collateral (included in repurchase agreements, at value or restricted cash) as an asset and the obligation to return securities lending collateral as a liability on the Statements of Assets and Liabilities.
Repurchase agreements are entered into by the Funds under Master Repurchase Agreements (“MRA”) which permit the Funds, under certain circumstances, including an event of default (such as bankruptcy or insolvency), to offset payables and/or receivables under a MRA with collateral held and/or posted to the counterparty and create one single net payment due to or from the Funds.
| Notes to Financial Statements (continued) |
| October 31, 2017 |
2. SIGNIFICANT ACCOUNTING POLICIES (continued)
REPURCHASE AGREEMENTS (concluded)
At October 31, 2017, the open repurchase agreements by counterparty which are subject to a MRA on a net payment basis are as follows:
| | | | | | Fair Value of Non-cash | | | Cash Collateral | | | | |
| | | Repurchase Agreements | | | Collateral Received(1) | | | Received | | | Net Amount (2) | |
| Global X Silver Miners ETF | | | | | | | | | | | | | | | | |
| Barclays | | $ | 11,174,819 | | | $ | 11,174,819 | | | $ | - | | | $ | - | |
| Deutsche Bank | | | 7,637,410 | | | | 7,637,410 | | | | - | | | | - | |
| Global X Gold Explorers ETF | | | | | | | | | | | | | | | | |
| Barclays | | | 1,637,178 | | | | 1,637,178 | | | | - | | | | - | |
| Deutsche Bank | | | 1,118,926 | | | | 1,118,926 | | | | - | | | | - | |
| Global X Copper Miners ETF | | | | | | | | | | | | | | | | |
| Barclays | | | 221,602 | | | | 221,602 | | | | - | | | | - | |
| Deutsche Bank | | | 151,454 | | | | 151,454 | | | | - | | | | - | |
| Global X Uranium ETF | | | | | | | | | | | | | | | | |
| Barclays | | | 22,754,182 | | | | 22,754,182 | | | | - | | | | - | |
| Deutsche Bank | | | 15,551,306 | | | | 15,551,306 | | | | | | | | - | |
| Global X Lithium & Battery Tech ETF | | | | | | | | | | | | | | | | |
| Barclays | | | 25,501,683 | | | | 25,501,683 | | | | - | | | | - | |
| Deutsche Bank | | | 17,429,080 | | | | 17,429,080 | | | | - | | | | - | |
(1) Excess collateral received is not presented in the table above. Please refer to the Schedule of Investments for the market value of the collateral received for each Fund.
(2) Net Amount represents the net amount receivable due from the counterparty in the event of default.
FEDERAL INCOME TAXES — It is each Fund’s intention to qualify or continue to qualify as a regulated investment company for Federal income tax purposes by complying with the appropriate provisions of Subchapter M of the Internal Revenue Code of 1986, as amended. Accordingly, no provisions for Federal income taxes have been made in the financial statements.
The Funds evaluate tax positions taken or expected to be taken in the course of preparing the Funds’ tax returns to determine whether it is “more-likely-than-not” (i.e., greater than 50 percent) that each tax position will be sustained upon examination by a taxing authority based on the technical merits of the position. Tax positions not deemed to meet the more-likely-than-not threshold are recorded as a tax benefit or expense in the current year. The Funds did not record any tax provision in the current period. Management’s conclusions regarding tax positions may be subject to review and adjustment at a later date based on factors including, but not limited to, examination by tax authorities (i.e., the last three tax year ends, as applicable) and on-going analysis of and changes to tax laws, regulations and interpretations thereof.
If the Funds have foreign tax filings that have not been made, the tax years that remain subject to examination may date back to the inception of the Funds.
As of and during the year ended October 31, 2017, the Funds did not have a liability for any unrecognized tax benefits. The Funds recognize interest and penalties, if any, related to unrecognized tax benefits as income tax expense in the Statement of Operations. During the year, the Funds did not incur any interest or penalties.
| Notes to Financial Statements (continued) |
| October 31, 2017 |
2. SIGNIFICANT ACCOUNTING POLICIES (continued)
SECURITY TRANSACTIONS AND INVESTMENT INCOME — Security transactions are accounted for on the trade date for financial reporting purposes. Costs used in determining realized gains and losses on the sale of investment securities are based on specific identification. Dividend income is recorded on the ex-dividend date. Interest income is recognized on the accrual basis from the settlement date.
FOREIGN CURRENCY TRANSACTIONS AND TRANSLATION — The books and records of the Funds are maintained in U.S. dollars. Investment securities and other assets and liabilities denominated in a foreign currency are translated into U.S. dollars on the date of valuation. Purchases and sales of investment securities, income and expenses are translated into U.S. dollars at the relevant rates of exchange prevailing on the respective dates of such transactions. The Funds do not isolate that portion of realized or unrealized gains and losses resulting from changes in the foreign exchange rate from fluctuations arising from changes in the market prices of the securities. These gains and losses are included in net realized and unrealized gains and losses on investments on the Statement of Operations. Net realized and unrealized gains and losses on foreign currency transactions and translations represent net foreign exchange gains or losses from foreign currency spot contracts, disposition of foreign currencies, currency gains or losses realized between trade and settlement dates on securities transactions and the difference between the amount of the investment income and foreign withholding taxes recorded on the Funds’ books and the U.S. dollar equivalent amounts actually received or paid.
DIVIDENDS AND DISTRIBUTIONS TO SHAREHOLDERS — The Funds distribute their net investment income on a pro rata basis. Any net investment income and net realized capital gains are distributed at least annually. All distributions are recorded on ex-dividend date
CREATION UNITS — The Funds issue and redeem their shares (“Shares”) on a continuous basis at Net Asset Value (“NAV”) and only in large blocks of 50,000 Shares, referred to as “Creation Units”. Purchasers of Creation Units (“Authorized Participants”) at NAV must pay a standard creation transaction fee per transaction. The fee is a single charge and will be the same regardless of the number of Creation Units purchased by an Authorized Participant on the same day.
An Authorized Participant who holds Creation Units and wishes to redeem at NAV would also pay a standard redemption fee per transaction to Brown Brothers Harriman & Co. (“BBH”), the Funds’ custodian (“Custodian”), on the date of such redemption, regardless of the number of Creation Units redeemed that day. If a Creation Unit is purchased or redeemed for cash, an additional variable fee may be charged. The following table discloses Creation Unit breakdown:
| | | Creation Unit Shares | | | Creation Fee | | | Value as of
October 31, 2017 | | | Redemption Fee | |
| Global X Silver Miners ETF | | | 50,000 | | | $ | 500 | | | $ | 1,598,000 | | | $ | 500 | |
| Global X Gold Explorers ETF | | | 50,000 | | | | 1,000 | | | | 1,073,000 | | | | 1,000 | |
| Global X Copper Miners ETF | | | 50,000 | | | | 1,000 | | | | 1,280,500 | | | | 1,000 | |
| Global X Uranium ETF | | | 50,000 | | | | 1,000 | | | | 594,000 | | | | 1,000 | |
| Global X Lithium & Battery Tech ETF | | | 50,000 | | | | 1,000 | | | | 1,957,000 | | | | 1,000 | |
| Global X Fertilizers/Potash ETF | | | 50,000 | | | | 1,000 | | | | 514,000 | | | | 1,000 | |
| Notes to Financial Statements (continued) |
| October 31, 2017 |
2. SIGNIFICANT ACCOUNTING POLICIES (concluded)
CASH OVERDRAFT CHARGES — Per the terms of an agreement with BBH, if a Fund has a cash overdraft on a given day, it will be assessed an overdraft charge of LIBOR plus 2.00%. Cash overdraft charges are included in custodian fees on the Statements of Operations.
3. RELATED PARTIES AND SERVICE PROVIDER TRANSACTIONS
The Adviser serves as the investment adviser and the administrator for the Funds. Subject to the supervision of the Board, the Adviser is responsible for managing the investment activities of the Funds and the Funds’ business affairs and other administrative matters and provides or causes to be furnished all supervisory, administrative and other services reasonably necessary for the operation of the Funds, including certain distribution services (provided pursuant to a separate distribution services agreement), certain shareholder and distribution-related services (provided pursuant to a separate Rule 12b-1 Plan and related agreements) and investment advisory services (provided pursuant to a separate investment advisory agreement), under what is essentially an "all-in" fee structure. For the Adviser’s service to the Funds, under the supervision and administration agreement, each Fund pays a monthly fee to the Adviser at the annual rate (stated as a percentage of the average daily net assets of the Fund). In addition, the Funds bear other expenses, directly and indirectly, that are not covered by the supervision and administration agreement, which may vary and affect the total expense ratios of the Funds, such as taxes, brokerage fees, commissions, acquired fund fees and other transaction expenses, interest expenses, and extraordinary expenses (such as litigation and indemnification expenses).
| | | Supervision and | |
| | | Administration Fee | |
| Global X Silver Miners ETF | | | 0.65 | % |
| Global X Gold Explorers ETF | | | 0.65 | % |
| Global X Copper Miners ETF | | | 0.65 | % |
| Global X Uranium ETF | | | 0.69 | % |
| Global X Lithium & Battery Tech ETF | | | 0.75 | % |
| Global X Fertilizers/Potash ETF | | | 0.69 | % |
SEI Investments Global Funds Services (“SEIGFS”) serves as sub-administrator to the Funds. As sub-administrator, SEIGFS provides the Funds with the required general administrative services, including, without limitation: office space, equipment, and personnel; clerical and general back office services; bookkeeping, internal accounting and secretarial services; the calculation of NAV; and assistance with the preparation and filing of reports, registration statements, proxy statement and other materials required to be filed or furnished by the Funds under federal and state securities laws. As compensation for these services, SEIGFS receives certain out-of-pocket costs, transaction fees and asset-based fees which are accrued daily and paid monthly by the Adviser.
SEI Investments Distribution Co. (“SIDCO”) serves as each Funds’ underwriter and distributor of Creation Units pursuant to a distribution agreement. SIDCO has no obligation to sell any specific quantity of Fund Shares. SIDCO bears the following costs and expenses relating to the distribution of Shares: (1) the costs of processing and maintaining records of creations of Creation Units; (2) all costs of maintaining the records required of a registered broker/dealer; (3) the expenses of maintaining its registration or qualification as a dealer or broker under Federal or state laws; (4) filing fees; and (5) all other expenses incurred in connection with the distribution services as
| Notes to Financial Statements (continued) |
| October 31, 2017 |
3. RELATED PARTIES AND SERVICE PROVIDER TRANSACTIONS (concluded)
contemplated in the distribution agreement. SIDCO receives no fee for its distribution services under the distribution agreement, rather the Adviser compensates SIDCO for certain expenses, out-of-pocket costs, and transaction fees.
BBH serves as custodian of the Funds’ assets. As custodian, BBH has agreed to (1) make receipts and disbursements of money on behalf of the Funds, (2) collect and receive all income and other payments and distributions on account of the Funds’ portfolio investments, (3) respond to correspondence from shareholders, security brokers and others relating to its duties; and (4) make periodic reports to the Funds concerning the Funds’ operations. BBH does not exercise any supervisory function over the purchase and sale of securities. As compensation for these services, BBH receives certain out-of-pocket costs, transaction fees and asset-based fees which are accrued daily and paid monthly by the Adviser from its fees. BBH also serves as transfer agent. As transfer agent, BBH has agreed to (1) issue and redeem Shares of each Fund, (2) make dividend and other distributions to shareholders of each Fund, (3) respond to correspondence by shareholders and others relating to its duties; (4) maintain shareholder accounts, and (5) make periodic reports to the Funds. As compensation for these services, BBH receives certain out-of-pocket costs, transaction fees and asset-based fees which are accrued daily and paid monthly by the Adviser from its fees.
4. INVESTMENT TRANSACTIONS
For the year ended October 31, 2017, the purchases and sales of investments in securities, excluding in-kind transactions, long-term U.S. Government and short-term securities were:
| | | Purchases | | | Sales and Maturities | |
| Global X Silver Miners ETF | | $ | 86,392,141 | | | $ | 90,979,376 | |
| Global X Gold Explorers ETF | | | 40,309,331 | | | | 55,579,988 | |
| Global X Copper Miners ETF | | | 19,552,338 | | | | 19,304,805 | |
| Global X Uranium ETF | | | 28,157,062 | | | | 38,037,793 | |
| Global X Lithium & Battery Tech ETF | | | 324,884,812 | | | | 196,061,962 | |
| Global X Fertilizers/Potash ETF | | | 3,239,781 | | | | 3,274,435 | |
For the year ended October 31, 2017, in-kind transactions associated with creations and redemptions were:
| | | Purchases | | | Sales and Maturities | | | Realized Gain (Loss) | |
| Global X Silver Miners ETF | | $ | 134,999,650 | | | $ | 46,423,991 | | | $ | 14,135,966 | |
| Global X Gold Explorers ETF | | | 4,464,710 | | | | 5,725,045 | | | | 2,195,637 | |
| Global X Copper Miners ETF | | | 51,988,692 | | | | 20,442,081 | | | | 5,518,062 | |
| Global X Uranium ETF | | | 219,684,517 | | | | 31,497,992 | | | | 5,860,803 | |
| Global X Lithium & Battery Tech ETF | | | 582,212,989 | | | | 23,140,393 | | | | 9,800,107 | |
| Global X Fertilizers/Potash ETF | | | 2,566,977 | | | | 860,231 | | | | 181,966 | |
| Notes to Financial Statements (continued) |
| October 31, 2017 |
4. INVESTMENT TRANSACTIONS (concluded)
For the year ended October 31, 2016, in-kind transactions associated with creations and redemptions were:
| | | Purchases | | | Sales and Maturities | | | Realized Gain (Loss) | |
| Global X Silver Miners ETF | | $ | 145,433,344 | | | $ | 44,897,775 | | | $ | 22,538,544 | |
| Global X Gold Explorers ETF | | | 23,251,227 | | | | 3,088,731 | | | | 1,676,631 | |
| Global X Copper Miners ETF | | | 4,830,327 | | | | 3,582,170 | | | | 1,112,237 | |
| Global X Uranium ETF | | | 4,988,210 | | | | 18,778,301 | | | | (9,356,756 | ) |
| Global X Lithium & Battery Tech ETF | | | 61,343,177 | | | | 9,484,973 | | | | 2,721,848 | |
| Global X Fertilizers/Potash ETF | | | 2,044,841 | | | | 864,976 | | | | (66,175 | ) |
During the year ended October 31, 2017, there were no purchases or sales of long-term U.S. Government securities for the Funds.
5. TAX INFORMATION
The amount and character of income and capital gain distributions to be paid, if any, are determined in accordance with Federal income tax regulations, which may differ from U.S. GAAP. As a result, net investment income (loss) and net realized gain (loss) on investment transactions for a reporting period may differ significantly from distributions during such period. These book/tax differences may be temporary or permanent. To the extent these differences are permanent in nature, they are charged or credited to undistributed net investment income (loss), accumulated net realized gain (loss) or paid-in capital, as appropriate, in the period that the differences arise.
The following differences, primarily attributable to net operating losses, investment in MLPs, foreign currency, redemptions in-kind and sales of passive foreign investment companies have been reclassified to/from the following accounts during the fiscal year ended October 31, 2017.
| Global X Funds | | Paid-in
Capital | | | Undistributed
Net
Investment
Income | | | Accumulated
Net Realized
Loss | |
| Global X Silver Miners ETF | | $ | 6,117,670 | | | $ | 3,491,807 | | | $ | (9,609,477 | ) |
| Global X Gold Explorers ETF | | | (538,319 | ) | | | 12,345,277 | | | | (11,806,958 | ) |
| Global X Copper Miners ETF | | | 3,978,660 | | | | 276,220 | | | | (4,254,880 | ) |
| Global X Uranium ETF | | | 2,671,140 | | | | 2,274,951 | | | | (4,946,091 | ) |
| Global X Lithium & Battery Tech ETF | | | 9,425,729 | | | | 237,494 | | | | (9,663,223 | ) |
| Global X Fertilizers/Potash ETF | | | 175,834 | | | | (154 | ) | | | (175,680 | ) |
These reclassifications have no impact on net assets or NAV per share.
| Notes to Financial Statements (continued) |
| October 31, 2017 |
5. TAX INFORMATION (continued)
The tax character of dividends and distributions declared during the years ended October 31, 2017 and 2016 were as follows:
| Global X Funds | | Ordinary Income | | | Long-Term
Capital Gain | | | Return of Capital | | | Totals | |
| | | | | | | | | | | | | |
| Global X Silver Miners ETF | | | | | | | | | | | | | | | | |
| 2017 | | $ | 9,132,632 | | | $ | – | | | $ | 91,018 | | | $ | 9,223,650 | |
| 2016 | | | 492,527 | | | | – | | | | – | | | | 492,527 | |
| Global X Gold Explorers ETF | | | | | | | | | | | | | | | | |
| 2017 | | $ | 15,400,105 | | | $ | – | | | $ | – | | | $ | 15,400,105 | |
| 2016 | | | 2,809,410 | | | | – | | | | – | | | | 2,809,410 | |
| Global X Copper Miners ETF | | | | | | | | | | | | | | | | |
| 2017 | | $ | 232,862 | | | $ | – | | | $ | – | | | $ | 232,862 | |
| 2016 | | | 205,898 | | | | – | | | | – | | | | 205,898 | |
| Global X Uranium ETF | | | | | | | | | | | | | | | | |
| 2017 | | $ | 9,254,190 | | | $ | – | | | $ | – | | | $ | 9,254,190 | |
| 2016 | | | 2,421,696 | | | | – | | | | – | | | | 2,421,696 | |
| Global X Lithium & Battery Tech ETF | | | | | | | | | | | | | | | | |
| 2017 | | $ | 2,450,314 | | | $ | – | | | $ | – | | | $ | 2,450,314 | |
| 2016 | | | 97,361 | | | | – | | | | – | | | | 97,361 | |
| Global X Fertilizers/Potash ETF | | | | | | | | | | | | | | | | |
| 2017 | | $ | 403,740 | | | $ | – | | | $ | – | | | $ | 403,740 | |
| 2016 | | | 363,096 | | | | – | | | | – | | | | 363,096 | |
As of October 31, 2017, the components of tax basis accumulated losses were as follows:
| | | Global X Funds | |
| | | Global X Silver
Miners ETF | | | Global X Gold
Explorers ETF | | | Global X Copper
Miners ETF | |
| Undistributed Ordinary Income | | $ | – | | | $ | – | | | $ | 1,006,229 | |
| Capital Loss Carryforwards | | | (259,457,602 | ) | | | (61,985,019 | ) | | | (22,917,036 | ) |
| Unrealized Depreciation on Investments and Foreign Currency | | | (50,654,961 | ) | | | (3,714,043 | ) | | | (243,082 | ) |
| Other Temporary Differences | | | (2 | ) | | | – | | | | (9 | ) |
| Total Accumulated Losses | | $ | (310,112,565 | ) | | $ | (65,699,062 | ) | | $ | (22,153,898 | ) |
| | | Global X Funds | |
| | | Global X Uranium
ETF | | | Global X Lithium
& Battery Tech
ETF | | | Global X
Fertilizers/Potash
ETF | |
| Undistributed Ordinary Income | | $ | 7,113,909 | | | $ | 33,347,115 | | | $ | 74,722 | |
| Capital Loss Carryforwards | | | (308,444,586 | ) | | | (51,501,238 | ) | | | (6,150,269 | ) |
| Unrealized Appreciation (Depreciation) on Investments and Foreign Currency | | | (166,565,006 | ) | | | 101,542,335 | | | | (2,352,879 | ) |
| Other Temporary Differences | | | 3 | | | | (3 | ) | | | (6 | ) |
| Total Distributable Earnings (Accumulated Losses) | | $ | (467,895,680 | ) | | $ | 83,388,209 | | | $ | (8,428,432 | ) |
For Federal income tax purposes, capital losses incurred in taxable years beginning before December 22, 2010 may be carried forward for a maximum period of eight years and applied against future gains. As of October 31, 2017, the Funds that had capital loss carryforwards are listed below:
| | | Global X Silver | | | Global X Gold | | | Global X | | | Global X Lithium & | |
| Expiration Date | | Miners ETF | | | Explorers ETF | | | Uranium ETF | | | Battery Tech ETF | |
| Oct. 2019 | | $ | 8,433,465 | | | $ | 130,976 | | | $ | 12,705,798 | | | $ | 7,329,308 | |
| Notes to Financial Statements (continued) |
| October 31, 2017 |
5. TAX INFORMATION (concluded)
For taxable years beginning after December 22, 2010, a registered investment company (“RIC”) is permitted to carry forward net capital losses to offset capital gains realized in later years, and the losses carried forward retain their original character as either long-term or short-term losses. Net capital losses of a RIC realized in taxable years beginning before that date (pre-2011 losses) can be carried forward up to 8 years and are characterized in later years as short-term losses. If a Fund uses pre-2011 loss carryforwards in later years, the carryforwards will not reduce the Fund’s current earnings and profits, while loss carryforwards from later years will reduce the Fund’s current earnings and profits. To the extent that later year capital gains are offset by pre-2011 loss carryforwards, distributions of such gains will be treated as ordinary dividend distributions. Losses carried forward under these new provisions are as follows:
| Global X Funds | | Short-Term Loss | | | Long-Term Loss | | | Total | |
| Global X Silver Miners ETF | | $ | 39,119,969 | | | $ | 211,904,168 | | | $ | 251,024,137 | |
| Global X Gold Explorers ETF | | | 12,391,860 | | | | 49,462,183 | | | | 61,854,043 | |
| Global X Copper Miners ETF | | | 4,424,798 | | | | 18,492,238 | | | | 22,917,036 | |
| Global X Uranium ETF | | | 57,023,884 | | | | 238,714,904 | | | | 295,738,788 | |
| Global X Lithium & Battery Tech ETF | | | 10,233,343 | | | | 33,938,587 | | | | 44,171,930 | |
| Global X Fertilizers/Potash ETF | | | 814,337 | | | | 5,335,932 | | | | 6,150,269 | |
The Federal tax cost and aggregate gross unrealized appreciation and depreciation on investments held by the Funds at October 31, 2017 were as follows:
| Global X Funds | | Federal Tax
Cost | | | Aggregated
Gross
Unrealized
Appreciation | | | Aggregated
Gross
Unrealized
Depreciation | | | Net Unrealized
Appreciation
(Depreciation) | |
| Global X Silver Miners ETF | | $ | 447,523,055 | | | $ | 21,659,406 | | | $ | (72,305,903 | ) | | $ | (50,646,497 | ) |
| Global X Gold Explorers ETF | | | 50,634,526 | | | | 6,403,881 | | | | (10,115,254 | ) | | | (3,711,373 | ) |
| Global X Copper Miners ETF | | | 67,210,725 | | | | 6,493,179 | | | | (6,746,360 | ) | | | (253,181 | ) |
| Global X Uranium ETF | | | 437,070,726 | | | | 1,503,935 | | | | (168,068,965 | ) | | | (166,565,030 | ) |
| Global X Lithium & Battery Tech ETF | | | 890,237,924 | | | | 143,055,477 | | | | (41,510,883 | ) | | | 101,544,594 | |
| Global X Fertilizers/Potash ETF | | | 17,741,128 | | | | 2,058,671 | | | | (4,410,422 | ) | | | (2,351,751 | ) |
The preceding differences between book and tax cost are primarily due to mark-to-market treatment of passive foreign investment companies and wash sales.
6. CONCENTRATION OF RISKS
The Funds invest in securities of foreign issuers in various countries. These investments may involve certain considerations and risks not typically associated with investments in the United States as a result of, among other factors, the possibility of future political and economic developments and the level of governmental supervision and regulation of securities markets in the respective countries.
The securities markets of emerging countries are less liquid and subject to greater price volatility, and have a smaller market capitalization, than the U.S. securities markets. In certain countries, there may be fewer publicly traded securities and the market may be dominated by a few issuers or sectors.
Issuers and securities markets in such countries are not subject to as extensive and frequent accounting, financial and other reporting requirements or as comprehensive government regulations
| Notes to Financial Statements (continued) |
| October 31, 2017 |
6. CONCENTRATION OF RISKS (concluded)
as are issuers and securities markets in the United States. In particular, the assets and profits appearing on the financial statements of emerging country issuers may not reflect their financial position or results of operations in the same manner as financial statements for U.S. issuers. Substantially less information may be publicly available about emerging country issuers than is available about issuers in the United States.
The Funds may be subject to taxes imposed by countries in which they invest. Such taxes are generally based on either income or gains earned or repatriated. The Funds accrue and apply such taxes to net investment income, net realized gains and net unrealized gains as income and/or capital gains are earned.
The Funds use a replication strategy. A replication strategy is an indexing strategy that involves investing in the securities of the underlying index in approximately the same proportions as in the underlying index. Each Fund may utilize a representative sampling strategy with respect to its underlying index when a replication strategy might be detrimental to their shareholders, such as when there are practical difficulties or substantial costs involved in compiling a portfolio of equity securities to follow its underlying index, or, in certain instances, when securities in the underlying index become temporarily illiquid, unavailable or less liquid, or due to legal restrictions (such as diversification requirements that apply to the Funds but not the underlying indexes). Commodity related securities are susceptible to fluctuations in certain commodity markets. Any negative changes in commodity markets could have a great impact on these Funds.
A more complete description of risks is included is each Fund’s prospectus and statement of additional information (“SAI”).
7. LOANS OF PORTFOLIO SECURITIES
The Funds may lend portfolio securities having a market value up to one-third of the Funds’ total assets. Security loans made pursuant to a securities lending agreement are initially required to be secured by collateral equal to at least 102% of the value of domestic equity securities and ADRs and 105% of the value of foreign equity securities (other than ADRs). Such collateral received in connection with these loans will be cash and can be invested in repurchase agreements or U.S. Treasury obligations and is recognized in the Schedule of Investments and Statement of Assets and Liabilities. The obligation to return securities lending collateral is also recognized as a liability in the Statement of Assets and Liabilities. It is the Funds’ policy to obtain additional collateral from or return excess collateral to the borrower by the end of the next business day, following the valuation date of the securities loaned. Therefore, the value of the collateral held may be temporarily less than the value of the securities on loan. Lending securities entails a risk of loss to the Funds if and to the extent that the market value of the securities loans were to increase and the borrower did not increase the collateral accordingly, and the borrower fails to return the securities. In the event the borrower may not provide additional collateral when required or may not return the securities when due, the agency agreement requires the lending agent to indemnify the Funds by replacing either the security or the security’s current market value to the fund. The Funds could suffer a loss if the value of an investment purchased with cash collateral falls below the market value of loaned securities or if the value of an investment purchased with cash collateral falls below the value of the original cash collateral received. The Funds could also experience delays and costs in gaining access to the
| Notes to Financial Statements (continued) |
| October 31, 2017 |
7. LOANS OF PORTFOLIO SECURITIES (continued)
collateral. The Funds bear the risk of any deficiency in the amount of the collateral available for return to the borrower due to any loss on the collateral invested.
As of October 31, 2017, the value of securities on loan was $17,545,584, $2,577,054, $313,496, $34,989,365 and $42,168,968 for the Global X Silver Miners ETF, Global X Gold Explorers ETF, Global X Copper Miners ETF, Global X Uranium ETF and Global X Lithium & Battery Tech ETF, respectively and the value of securities purchased with the cash collateral held from securities on loan was $18,812,229, $2,756,104, $373,056, $38,305,488 and $42,930,763 for the Global X Silver Miners ETF, Global X Gold Explorers ETF, Global X Copper Miners ETF, Global X Uranium ETF and Global X Lithium & Battery Tech ETF, respectively.
At October 31, 2017, the following Funds had securities on loan, by counterparty:
| | | Market Value | | | Cash Collateral | |
| Global X Silver Miners ETF | | | | | | | | |
| BMO Capital Markets | | $ | 160,168 | | | $ | 174,518 | |
| Citigroup | | | 399,152 | | | | 441,370 | |
| Credit Suisse | | | 336,010 | | | | 358,627 | |
| Deutsche Bank Securities | | | 8,776,617 | | | | 9,323,327 | |
| Goldman Sachs & Co. | | | - | | | | 44,578 | |
| JPMorgan | | | 3,113,567 | | | | 3,246,861 | |
| Merrill Lynch Pierce Fenner & Smith | | | 1,985,054 | | | | 2,251,186 | |
| Morgan Stanley | | | 2,744,695 | | | | 2,927,452 | |
| Scotia Capital | | | 30,321 | | | | 44,310 | |
| Global X Gold Explorers ETF | | | | | | | | |
| Barclays Capital | | | 129,627 | | | | 133,550 | |
| Credit Suisse | | | 1,358,801 | | | | 1,440,811 | |
| Deutsche Bank Securities | | | 176,312 | | | | 194,188 | |
| JPMorgan | | | 564,136 | | | | 611,205 | |
| Morgan Stanley | | | 258,400 | | | | 261,250 | |
| UBS Securities | | | 89,778 | | | | 115,100 | |
| Global X Copper Miners ETF | | | | | | | | |
| Goldman Sachs & Co. | | | - | | | | 103,256 | |
| JPMorgan | | | 176,617 | | | | 152,000 | (1) |
| UBS Securities | | | 136,879 | | | | 117,800 | (1) |
| Notes to Financial Statements (continued) |
| October 31, 2017 |
7. LOANS OF PORTFOLIO SECURITIES (concluded)
| | | Market Value | | | Cash Collateral | |
| Global X Uranium ETF | | | | | | | | |
| Barclays Capital | | $ | 94,914 | | | $ | 104,400 | |
| BNP Paribal | | | 5,985 | | | | 6,000 | |
| Credit Suisse | | | 2,935,581 | | | | 3,224,182 | |
| Deutsche Bank Securities | | | 16,352,358 | | | | 17,606,979 | |
| Goldman Sachs & Co. | | | 668,204 | | | | 678,041 | |
| JPMorgan | | | 4,289,325 | | | | 4,797,781 | |
| Merrill Lynch Pierce Fenner & Smith | | | 183,484 | | | | 234,092 | |
| Morgan Stanley | | | 3,907,190 | | | | 4,764,077 | |
| SG Americas Securities | | | 5,546,880 | | | | 5,811,126 | |
| UBS Securities | | | 1,005,444 | | | | 1,078,810 | |
| Global X Lithium & Battery Tech ETF | | | | | | | | |
| BMO Capital Markets | | | 751,259 | | | | 792,360 | |
| Citigroup | | | 654,440 | | | | 644,511 | (1) |
| Credit Suisse | | | 5,804,077 | | | | 6,143,390 | |
| Deutsche Bank Securities | | | 3,483,666 | | | | 3,763,350 | |
| JPMorgan | | | 22,958,450 | | | | 22,672,537 | (1) |
| Merrill Lynch Pierce Fenner & Smith | | | 1,517,883 | | | | 1,600,365 | |
| Morgan Stanley | | | 6,450,221 | | | | 6,735,294 | |
| UBS Securities | | | 548,972 | | | | 578,956 | |
(1) It is the Funds' policy to obtain additional collateral from or return excess collateral to the borrower by the end of the next business day, following the valuation date of the securities loaned. Therefore, the value of the collateral held may be temporarily less than the value of the securities on loan.
8. CONTRACTUAL OBLIGATIONS
The Funds enter into contracts in the normal course of business that contain a variety of indemnifications. The Funds’ maximum exposure under these arrangements is unknown. However, the Funds have not had prior gains or losses pursuant to these contracts. Management has reviewed the Funds’ existing contracts and expects the risk of loss to be remote.
Pursuant to the Trust’s organizational documents, the Trustees of the Trust and the Trust’s officers are indemnified against certain liabilities that may arise out of the performance of their duties.
9. REVERSE SHARE SPLIT
Effective May 16, 2013, each of the Global X Gold Explorers ETF and Global X Uranium ETF executed a reverse share split for shareholders of record after the close of markets on May 15, 2013. The effect of this transaction for each Fund was to divide the number of outstanding shares of the Fund by the applicable ratio below, resulting in a corresponding increase in the net asset value per share. The capital share activity presented in the statement of changes in net assets for each of the years in the period then ended, and per share data in the financial highlights for each of the years in the period then ended, have been given retroactive effect to reflect these reverse share splits. There
| Notes to Financial Statements (concluded) |
| October 31, 2017 |
9. REVERSE SHARE SPLIT (concluded)
were no changes in net assets, results of operations or total return as a result of these transactions. The details of the reverse splits are as follows:
May 16, 2013:
| Fund Name | | Ratio |
| Global X Gold Explorers ETF | | 1:4 |
| Global X Uranium ETF | | 1:3 |
Effective November 18, 2015, each of the Global X Silver Miners ETF, Global X Gold Explorers ETF, Global X Copper Miners ETF, Global X Uranium ETF and the Global X Lithium & Battery Tech ETF executed a reverse share split for shareholders of record after the close of markets on November 17, 2015. The effect of this transaction for each Fund was to divide the number of outstanding shares of the Fund by the applicable ratio below, resulting in a corresponding increase in the net asset value per share. The capital share activity presented in the statement of changes in net assets for each of the years in the period then ended, and per share data in the financial highlights for each of the years in the period then ended, have been given retroactive effect to reflect these reverse share splits. There were no changes in net assets, results of operations or total return as a result of these transactions. The details of the reverse splits are as follows:
November 18, 2015:
| Fund Name | | Ratio |
| Global X Silver Miners ETF | | 1:3 |
| Global X Gold Explorers ETF | | 1:2 |
| Global X Copper Miners ETF | | 1:3 |
| Global X Uranium ETF | | 1:2 |
| Global X Lithium & Battery Tech ETF | | 1:2 |
10. REGULATORY MATTERS
In October 2016, the U.S. Securities and Exchange Commission adopted new rules and amended existing rules (together, final rules) intended to modernize the reporting and disclosure of information by RICs. In part, the final rules amended Regulation S-X and require standardized, enhanced disclosures about derivatives in investment company financial statements, as well as other amendments. As of August 1, 2017, management has implemented the amendments to Regulation S-X, which did not have a material impact on the Funds’ financial statements and related disclosures or impact the Funds’ net assets or results of operations.
11. SUBSEQUENT EVENTS
The Funds have been evaluated regarding the need for additional disclosures and/or adjustments resulting from subsequent events. Based on this evaluation, please note the additional disclosure:
On November 1, 2017, the Trust entered into an agreement with BBH in which BBH will serve as the new securities lending agent for the Trust and each of its series.
| Report of Independent Registered Public Accounting Firm |
To the Board of Trustees and Shareholders of Global X Silver Miners ETF, Global X Gold Explorers ETF, Global X Copper Miners ETF, Global X Uranium ETF, Global X Lithium & Battery Tech ETF and Global X Fertilizers/Potash ETF
In our opinion, the accompanying statements of assets and liabilities, including the schedules of investments, and the related statements of operations and of changes in net assets and the financial highlights present fairly, in all material respects, the financial position of Global X Silver Miners ETF, Global X Gold Explorers ETF, Global X Copper Miners ETF, Global X Uranium ETF, Global X Lithium & Battery Tech ETF and Global X Fertilizers/Potash ETF (six series of Global X Funds, hereafter referred to as the "Funds") as of October 31, 2017, the results of each of their operations for the year then ended, and the changes in each of their net assets and the financial highlights for each of the two years in the period then ended, in conformity with accounting principles generally accepted in the United States of America. These financial statements and financial highlights (hereafter referred to as "financial statements") are the responsibility of the Funds’ management. Our responsibility is to express an opinion on these financial statements based on our audits. We conducted our audits of these financial statements in accordance with the standards of the Public Company Accounting Oversight Board (United States). Those standards require that we plan and perform the audit to obtain reasonable assurance about whether the financial statements are free of material misstatement. An audit includes examining, on a test basis, evidence supporting the amounts and disclosures in the financial statements, assessing the accounting principles used and significant estimates made by management, and evaluating the overall financial statement presentation. We believe that our audits, which included confirmation of securities as of October 31, 2017 by correspondence with the custodian and brokers and the application of alternative auditing procedures where confirmations of securities purchased had not been received, provide a reasonable basis for the opinions expressed above.
The financial statements, as of and for the year ended October 31, 2015 and the financial highlights for each of the years ended on or prior to October 31, 2015 (not presented herein, other than the financial highlights) were audited by other auditors whose report dated December 30, 2015 expressed an unqualified opinion on those financial statements and financial highlights.
| PricewaterhouseCoopers LLP | |
| Philadelphia, Pennsylvania | |
| December 21, 2017 | |
| Disclosure of Fund Expenses (unaudited) |
ETFs (such as the Funds) have operating expenses. As a shareholder of an ETF, your investment is affected by these ongoing costs, which include (among others) costs for ETF management, administrative services, brokerage fees, and shareholder reports like this one. It is important for you to understand the impact of these costs on your investment returns. In addition, a shareholder is responsible for brokerage fees as a result of the shareholder’s investment in a Fund.
Operating expenses such as these are deducted from Funds’ gross income and directly reduce your final investment return. These expenses are expressed as a percentage of the Funds’ average net assets; this percentage is known as the Funds’ expense ratio.
The following examples use the expense ratio and are intended to help you understand the ongoing costs (in dollars) of investing in a Fund and to compare these costs with those of other funds. The examples are based on an investment of $1,000 made at the beginning of the period shown and held for the entire period from May 1, 2017 through October 31, 2017.
The table on the next page illustrates your Fund’s costs in two ways:
Actual Fund Return. This section helps you to estimate the actual expenses that your Fund incurred over the period. The “Expenses Paid During Period” column shows the actual dollar expense cost incurred by a $1,000 investment in the Fund, and the “Ending Account Value” number is derived from deducting that expense cost from the Fund’s gross investment return.
You can use this information, together with the actual amount you invested in the Funds, to estimate the expenses you paid over that period. Simply divide your actual account value by $1,000 to arrive at a ratio (for example, an $8,600 account value divided by $1,000 = 8.6), then multiply that ratio by the number shown for your Funds under “Expenses Paid During Period.”
Hypothetical 5% Return. This section helps you compare your Fund’s costs with those of other funds. It assumes that the Funds had an annual 5% return before expenses during the year, but that the expense ratio (Column 3) for the period is unchanged. This example is useful in making comparisons because the Securities and Exchange Commission requires all funds to make this 5% calculation. You can assess your Fund’s comparative cost by comparing the hypothetical result for your Fund in the “Expenses Paid During Period” column with those that appear in the same charts in the shareholder reports for other funds.
NOTE: Because the return is set at 5% for comparison purposes — NOT your Fund’s actual return — the account values shown may not apply to your specific investment.
| Disclosure of Fund Expenses (unaudited) (concluded) |
| | | Beginning
Account
Value
5/1/2017 | | | Ending
Account
Value
10/31/2017 | | | Annualized
Expense
Ratios | | | Expenses
Paid
During
Period(1) | |
| Global X Silver Miners ETF |
| Actual Fund Return | | $ | 1,000.00 | | | $ | 916.90 | | | | 0.65 | % | | $ | 3.14 | |
| Hypothetical 5% Return | | | 1,000.00 | | | | 1,021.92 | | | | 0.65 | | | | 3.32 | |
| Global X Gold Explorers ETF |
| Actual Fund Return | | $ | 1,000.00 | | | $ | 969.70 | | | | 0.65 | % | | $ | 3.23 | |
| Hypothetical 5% Return | | | 1,000.00 | | | | 1,021.92 | | | | 0.65 | | | | 3.32 | |
| Global X Copper Miners ETF |
| Actual Fund Return | | $ | 1,000.00 | | | $ | 1,196.20 | | | | 0.65 | % | | $ | 3.61 | |
| Hypothetical 5% Return | | | 1,000.00 | | | | 1,021.92 | | | | 0.65 | | | | 3.32 | |
| Global X Uranium ETF |
| Actual Fund Return | | $ | 1,000.00 | | | $ | 895.30 | | | | 0.70 | % | | $ | 3.33 | |
| Hypothetical 5% Return | | | 1,000.00 | | | | 1,021.69 | | | | 0.70 | | | | 3.55 | |
| Global X Lithium & Battery Tech ETF |
| Actual Fund Return | | $ | 1,000.00 | | | $ | 1,370.40 | | | | 0.75 | % | | $ | 4.49 | |
| Hypothetical 5% Return | | | 1,000.00 | | | | 1,021.42 | | | | 0.75 | | | | 3.83 | |
| Global X Fertilizers/Potash ETF |
| Actual Fund Return | | $ | 1,000.00 | | | $ | 1,107.80 | | | | 0.69 | % | | $ | 3.67 | |
| Hypothetical 5% Return | | | 1,000.00 | | | | 1,021.72 | | | | 0.69 | | | | 3.52 | |
| (1) | Expenses are equal to the Fund’s annualized expense ratio multiplied by the average account value over the period, multiplied 184/365 (to reflect the one-half year period.) |
| Supplemental Information (unaudited) |
NAV, is the price per Share at which the Funds issue and redeem Shares. It is calculated in accordance with the standard formula for valuing mutual fund shares. The “Market Price” of the Funds generally is determined using the midpoint between the highest bid and the lowest offer on the stock exchange on which the Shares of the Funds are listed for trading, as of the time that the Funds’ NAV is calculated. The Funds’ Market Price may be at, above or below their NAV. The NAV of the Funds will fluctuate with changes in the market value of the Funds’ holdings. The Market Price of the Funds will fluctuate in accordance with changes in its NAV, as well as market supply and demand.
Premiums or discounts are the differences (expressed as a percentage) between the NAV and Market Price of the Funds on a given day, generally at the time NAV is calculated. A premium is the amount that the Funds are trading above the reported NAV, expressed as a percentage of the NAV. A discount is the amount that the Funds are trading below the reported NAV, expressed as a percentage of the NAV.
Further information regarding premiums and discounts is available on the Funds’ website at www.GlobalXFunds.com.
| Trustees and Officers of the Trust (unaudited) |
Set forth below are the names, addresses, years of birth, positions with the Trust, Term of Office and Length of Time Served, the principal occupations for the last five years, number of Funds in fund complex overseen by Trustee, and other directorships outside the fund complex of each of the persons currently serving as Trustees and Officers of the Trust.
Name,
Address
(Year of
Birth) | Position(s)
Held
with Trust | Principal Occupation(s) During
the Past 5 Years | Number of
Funds in
Trust
Overseen
by Trustee | Other Directorships Held
by Trustees |
| Independent Trustees2 | |
Sanjay Ram Bharwani
600 Lexington Ave,
20th floor
New York, NY 10022
(1974) | Trustee (since 2008) | CEO of Risk Advisors Inc. (consulting firm) (since 2007). | 523 | None. |
Scott R. Chichester1
600 Lexington Ave,
20th floor
New York, NY 10022
(1970) | Trustee (since 2008) | CFO, AdeptPros Inc. (app development, training and consulting) (since 2012); Founder, Madison Park Advisors LLC (advisory services) (since 2011); CFO, Sterling Seal & Supply Inc. (since 2011); President & Treasurer, Bayview Acquisition Corp (2010-2012); Founder and President, DirectPay USA LLC (payroll company) (since 2006); Proprietor, Scott R. Chichester CPA (CPA firm) (since 2001). | 523 | Director of AdeptPros Inc. (since 2015); Director of Sterling Seal & Supply Inc. (since 2011); Director of Bayview Acquisition Corp. (2010-2012); Trustee of ARK ETF Trust (since 2014). |
Kartik Kiran Shah
600 Lexington Ave,
20th floor
New York, NY 10022
(1977) | Trustee (since 2008) | Chief Business Officer, Oxeia Biopharmaceuticals, Inc. (since 2014); Vice President, Business Development, Cynvenio Biosystems (2012-2014); Independent Consultant, Self-Employed (non-financial services) (2011-2012). | 523 | Director of Oxeia Biopharmaceuticals, Inc. (since 2014). |
| Trustees and Officers of the Trust (unaudited) |
The Trust’s Statement of Additional Information (“SAI”) includes additional information about the Trustees and Officers. The SAI may be obtained without charge by calling 1-888-493-8631. The following chart lists Trustees and Officers as of October 31, 2017.
Name, Address
(Year of Birth) | Position(s) Held
with Funds | Principal Occupation(s)
During the Past 5 Years | Other
Directorships
Held by Trustees
During the Past
5 Years |
| Interested Trustees/Officers2 |
Bruno del Ama
600 Lexington Avenue,
20th Floor
New York, NY 10022
(1976) | Trustee (since 2008); President, Chief Executive Officer (since 2008). | Chief Executive Officer, Global X Management Company ("GXMC") (since 2008); Chief Compliance Officer, GXMC (2008-2013). | None. |
Luis Berruga
600 Lexington Avenue,
20th Floor
New York, NY 10022
(1977) | Chief Operating Officer, Treasurer, Principal Accounting Officer and Chief Financial Officer (since 9/2015). | Chief Financial Officer, GXMC (since 2015) and Chief Operating Officer (since 2014); Investment Banker, Jefferies (2012-2014); Regional Product Specialist, Morgan Stanley (2005-2012). | None. |
Daphne Tippens Chisolm
600 Lexington Avenue,
20th Floor
New York, NY 10022
(1969) | Secretary (since 2012). | General Counsel, GXMC (since 2011); Chief Compliance Officer, GXMC (1/2014 - 5/2014 and 2/2015 - 9/2016). | None. |
Joe Costello
600 Lexington Avenue,
20th Floor
New York, NY 10022
(1974) | Chief Compliance Officer (since 9/2016). | Chief Compliance Officer, FlexShares Funds (2011-2015); Vice President, Northern Trust Investments (2003 - 2015). | None. |
Lisa K. Whittaker4
One Freedom Valley Drive
Oaks, PA 19456
(1978) | Assistant Secretary (since 2013). | Counsel at SEI Investments (since 2012); Associate Counsel and Compliance Officer at The Glendale Trust Company (2011-2012); Associate of Drinker Biddle & Reath LLP (2006-2011). | None. |
Eric Kleinschmidt4
One Freedom Valley Drive
Oaks, PA 19456
(1968) | Assistant Treasurer (since 2016). | Director, Fund Accounting, SEI Investments Global Funds Services (2004 to present), Manager, Fund Accounting (1999 to 2004). | None. |
| 1 | Mr. Chichester is currently married to a sister of Mr. del Ama’s wife. While an “immediate family member” (as defined in Section 2(a)(19) of the 1940 Act) of Mr. del Ama would be considered an Interested Person, Mr. Chichester is not considered an immediate family member for this purpose. Although this fact was taken into consideration in determining whether Mr. Chichester should be considered to be an Independent Trustee for purposes of the Section 2(a)(19) of the 1940 Act, it was determined that this relationship was not one that should disqualify Mr. Chichester from serving as an Independent Trustee of the Trust. |
| 2 | Each Trustee serves until his or her successor is duly elected or appointed and qualified. |
| 3 | As of October 31, 2017, the Trust had ninety-six investment portfolios, fifty-two of which were operational. |
| 4 | These officers of the Trust also serve as officers of one or more mutual funds for which SEI Investments Company or an affiliate acts as investment manager, administrator or distributor. |
| Notice to Shareholders (unaudited) |
For shareholders that do not have an October 31, 2017 tax year end, this notice is for informational purposes only. For shareholders with an October 31, 2017 tax year end, please consult your tax advisor as to the pertinence of this notice. For the fiscal year ended October 31, 2017, the Funds have designated the following items with regard to distributions paid during the year.
| | | Return of
Capital | | | Ordinary
Income
Distributions | | | Total
Distributions | | | Qualifying
for
Corporate
Dividends
Received
Deduction
(1) | | | Qualifying
Dividend
Income (2) | | | U.S.
Government
Interest (3) | | | Interest
Related
Dividends
(4) | | | Short
Term
Capital
Gain
Dividends
(5) | | | Foreign
Tax
Credit | |
| Global X Silver Miners ETF | | | 0.99 | % | | | 99.01 | % | | | 100.00 | % | | | 6.78 | % | | | 22.06 | % | | | 0.00 | % | | | 0.01 | % | | | 0.00 | % | | | 0.00 | % |
| Global X Gold Explorers ETF | | | 0.00 | % | | | 100.00 | % | | | 100.00 | % | | | 0.00 | % | | | 0.29 | % | | | 0.00 | % | | | 0.00 | % | | | 0.00 | % | | | 0.00 | % |
| Global X Copper Miners ETF | | | 0.00 | % | | | 100.00 | % | | | 100.00 | % | | | 1.09 | % | | | 88.50 | % | | | 0.00 | % | | | 0.01 | % | | | 0.00 | % | | | 13.28 | % |
| Global X Uranium ETF | | | 0.00 | % | | | 100.00 | % | | | 100.00 | % | | | 0.00 | % | | | 7.08 | % | | | 0.02 | % | | | 0.01 | % | | | 0.00 | % | | | 1.36 | % |
| Global X Lithium & Battery Tech ETF | | | 0.00 | % | | | 100.00 | % | | | 100.00 | % | | | 11.52 | % | | | 30.61 | % | | | 0.00 | % | | | 0.01 | % | | | 0.00 | % | | | 17.86 | % |
| Global X Fertilizers/Potash ETF | | | 0.00 | % | | | 100.00 | % | | | 100.00 | % | | | 22.16 | % | | | 72.30 | % | | | 0.00 | % | | | 0.01 | % | | | 0.00 | % | | | 7.13 | % |
(1) Qualifying dividends represent dividends which qualify for the corporate dividends received deduction and is reflected as a percentage of ordinary Income distributions (the total of short term capital gain and net investment income distributions).
(2) The percentage in this column represents the amount of "Qualifying Dividend Income" as created by the Jobs and Growth Relief Reconciliation Act of 2003 and is reflected as a percentage of ordinary income distributions (the total of short term capital gain and net investment income distributions). It is the intention of each of the aforementioned funds to designate the maximum amount permitted by law.
(3) "U.S. Government Interest" represents the amount of interest that was derived from U.S. Government obligations and distributed during the fiscal
year. Generally, interest from direct U.S. Government obligations is exempt from state income tax. However, for shareholders who are residents of
California, Connecticut and New York, the statutory threshold requirements were not satisfied to permit exemption of these amounts from state income.
(4) The percentage in this column represents the amount of "Interest Related Dividends" is reflected as a percentage of ordinary income distribution. Interest related dividends is exempt from U.S. withholding tax when paid to foreign investors.
(5) The percentage of this column represents the amount of “Short Term Capital Gain Dividend” is reflected as a percentage of short term capital gain
distribution that is exempted from U.S. withholding tax when paid to foreign investors.
The Funds intend to pass through a foreign tax credit to shareholders. For the fiscal year ended October 31, 2017, the total amount of foreign source income and foreign tax credit are as follows:
| Fund Name | | Foreign Source Income | | | Foreign Tax Credit Pass Through | |
| Global X Copper Miners ETF | | $ | 705,484 | | | $ | 35,646 | |
| Global X Uranium ETF | | | 2,330,135 | | | | 127,640 | |
| Global X Lithium & Battery Tech ETF | | | 4,497,272 | | | | 532,609 | |
| Global X Fertilizers/Potash ETF | | | 201,826 | | | | 31,015 | |
The information reported herein may differ from the information and distributions taxable to the shareholders for the calendar year ending December 31, 2017. Complete information will be computed and reported in conjunction with your 2017 Form 1099-DIV.
600 Lexington Avenue, 20th floor
New York, NY 10022
1-888-GXFund-1
(1-888-493-8631)
www.globalxfunds.com
Investment Adviser and Administrator:
Global X Management Company LLC
600 Lexington Avenue, 20th floor
New York, NY 10022
Distributor:
SEI Investments Distribution Co.
One Freedom Valley Drive
Oaks, PA 19456
Sub-Administrator:
SEI Investments Global Funds Services
One Freedom Valley Drive
Oaks, PA 19456
Counsel for Global X Funds and the Independent Trustees:
Stradley Ronon Stevens & Young, LLP
1250 Connecticut Avenue, N.W.
Suite 500
Washington, DC 20036
Custodian and Transfer Agent:
Brown Brothers Harriman & Co.
50 Post Office Square
Boston, MA 02110
Independent Registered Public Accounting Firm:
PricewaterhouseCoopers LLP
Two Commerce Square
Suite 1800
2001 Market Street
Philadelphia, PA 19103
This information must be preceded or accompanied by a current prospectus for the Funds described.
GLX-AR-001-0900
Global X China Consumer ETF (ticker: CHIQ)
Global X China Energy ETF (ticker: CHIE)
Global X China Financials ETF (ticker: CHIX)
Global X China Industrials ETF (ticker: CHII)
Global X China Materials ETF (ticker: CHIM)
Global X NASDAQ China Technology ETF (ticker: QQQC)
Global X FTSE Southeast Asia ETF (ticker: ASEA)
(formerly Global X Southeast Asia ETF)
Global X MSCI Colombia ETF (ticker: GXG)
Global X MSCI Argentina ETF (ticker: ARGT)
Global X MSCI Greece ETF (ticker: GREK)
Global X MSCI Norway ETF (ticker: NORW)
Global X FTSE Nordic Region ETF (ticker: GXF)
Global X MSCI Nigeria ETF (ticker: NGE)
Global X Next Emerging & Frontier ETF (ticker: EMFM)
Global X MSCI Portugal ETF (ticker: PGAL)
Global X MSCI Pakistan ETF (ticker: PAK)
Annual Report
October 31, 2017
Shares are bought and sold at market price (not NAV) and are not individually redeemed from a Fund. Shares may only be redeemed directly from a Fund by Authorized Participants, in very large creation/redemption units. Brokerage commissions will reduce returns.
The Funds file their complete schedules of Fund holdings with the Securities and Exchange Commission (the “Commission”) for the first and third quarters of each fiscal year on Form N-Q within sixty days after the end of the period. The Funds’ Forms N-Q are available on the Commission’s website at http://www.sec.gov, and may be reviewed and copied at the Commission's Public Reference Room in Washington, DC. Information on the operation of the Public Reference Room may be obtained by calling 1-800-SEC-0330.
A description of the policies and procedures that Global X Funds uses to determine how to vote proxies relating to Fund securities, as well as information relating to how the Funds voted proxies relating to Fund securities during the most recent 12-month period ended June 30, is available (i) without charge, upon request, by calling 1-888-GXFund-1; and (ii) on the Commission’s website at http://www.sec.gov.
| Management Discussion of Fund Performance (unaudited) |
| Global X China Consumer ETF |
Global X China Consumer ETF
The Global X China Consumer ETF (“Fund”) seeks to provide investment results that correspond generally to the price and yield performance, before fees and expenses, of the Solactive China Consumer Total Return Index (“Underlying Index”). The Fund is passively managed, which means the investment adviser does not attempt to take defensive positions in declining markets. The Fund generally seeks to fully replicate the Underlying Index.
The Underlying Index is designed to measure the equity performance of the investable universe of companies in the consumer sector of the Chinese economy, as defined by the index provider. It is comprised of securities of companies that have their main business operations in the consumer sector and generally includes companies whose businesses involve: general retail, diversified consumer services, food production and retail, beverages, household goods, leisure goods, personal goods, automobiles, auto components and distributors, tobacco, media, and travel and leisure.
For the 12-month period ended October 31, 2017 (the “reporting period”), the Fund increased 47.90%, while the Underlying Index increased 48.80%. The Fund had a net asset value of $11.97 per share on October 31, 2016 and ended the reporting period with a net asset value of $17.44 on October 31, 2017.
During the reporting period, the highest returns came from Geely Automobile Holdings and Brilliance China Automotive Holdings, which returned 202.44% and 113.89%, respectively. The worst performers were Vipshop Holdings and Skyworth Digital Holdings, which returned -42.21% and -26.52%, respectively.
China’s policy to transform the country from a manufacturing and exports-led economy to one driven more by consumption and services is supporting growth of the country’s consumer sector. During the first half of 2017, the economy grew 6.9% year-over-year, with consumption driving over 60% of that growth. A tight labor market and shrinking workforce are forcing wages upwards, leading to increasing disposable income. This, combined with high consumer confidence and urbanization, is helping to stimulate additional spending. In addition, the Chinese government’s increased spending on health, education, retirement benefits, and public transfer is increasing public consumption directly and private consumption indirectly, as people find it less necessary to engage in excessive precautionary savings.
| | | AVERAGE ANNUAL TOTAL RETURN FOR THE YEAR ENDED OCTOBER 31, 2017 | |
| | | One Year Return | | | Three Year Return | | | Five Year Return | | | Annualized Inception to Date* | |
| | | Net Asset Value | | | Market Price | | | Net Asset Value | | | Market Price | | | Net Asset Value | | | Market Price | | | Net Asset Value | | | Market Price | |
| Global X China Consumer ETF | | | 47.90 | % | | | 48.42 | % | | | 11.07 | % | | | 11.14 | % | | | 6.67 | % | | | 6.59 | % | | | 2.90 | % | | | 2.90 | % |
| Solactive China Consumer Total Return Index | | | 48.80 | % | | | 48.80 | % | | | 11.90 | % | | | 11.90 | % | | | 7.39 | % | | | 7.39 | % | | | 3.50 | % | | | 3.50 | % |
| MSCI Emerging Markets Index | | | 26.45 | % | | | 26.45 | % | | | 5.70 | % | | | 5.70 | % | | | 4.83 | % | | | 4.83 | % | | | 4.53 | % | | | 4.53 | % |
| S&P 500 Index | | | 23.63 | % | | | 23.63 | % | | | 10.77 | % | | | 10.77 | % | | | 15.18 | % | | | 15.18 | % | | | 13.75 | % | | | 13.75 | % |
Growth of a $10,000 Investment
(At Net Asset Value)
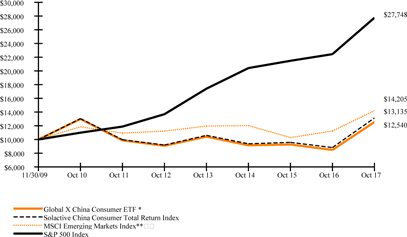
*Fund commenced operations on November 30, 2009.
| Management Discussion of Fund Performance (unaudited) |
| Global X China Consumer ETF |
**As of March 1, 2017, the Fund changed its broad based benchmark from the S&P 500 Index to the MSCI Emerging Markets Index. The new benchmark is a more appropriate comparison for the Fund.
The MSCI Emerging Markets Index is a free float-adjusted market capitalization index that is designed to measure equity market performance
of emerging markets.
The S&P 500 Index is a market capitalization-weighted composite index of 500 large capitalization U.S. companies.
The performance data quoted herein represents past performance and the return and value of an investment in the Fund will fluctuate so that, when redeemed, it may be worth less than its original cost. Past performance is no guarantee of future performance and should not be considered as a representation of the future results of the Fund. The Fund's performance assumes the reinvestment of all dividends and all capital gains. Index returns assume reinvestment of dividends and, unlike the Fund's returns, do not reflect any fees or expenses. If such fees and expenses were included in the index returns, the performance would have been lower. Please note that one cannot invest directly in an unmanaged index.
There are no assurances that the Fund will meet its stated objectives.
The Fund’s holdings and allocations are subject to change and should not be considered recommendations to buy individual securities.
The graph and table do not reflect the deduction of taxes that a shareholder would pay on Fund distributions or the redemption or sale of Fund shares.
See definition of comparative indices on above.
| Management Discussion of Fund Performance (unaudited) |
| Global X China Energy ETF |
Global X China Energy ETF
The Global X China Energy ETF (“Fund”) seeks to provide investment results that correspond generally to the price and yield performance, before fees and expenses, of the Solactive China Energy Total Return Index (“Underlying Index”). The Fund is passively managed, which means the investment adviser does not attempt to take defensive positions in declining markets. The Fund generally seeks to fully replicate the Underlying Index.
The Underlying Index is designed to measure the equity performance of the investable universe of companies in the energy sector of the Chinese economy, as defined by the index provider. It is comprised of securities of companies that have their main business operations in the energy sector and generally includes companies whose businesses involve: oil, gas, consumable fuels, alternative energy and electricity production and distribution, and energy equipment and services.
For the 12-month period ended October 31, 2017 (the “reporting period”), the Fund increased 13.13%, while the Underlying Index increased 14.10%. The Fund had a net asset value of $10.56 per share on October 31, 2016 and ended the reporting period with a net asset value of $11.69 on October 31, 2017.
During the reporting period, the highest returns came from China Gas Holdings and JinkoSolar Holding, which returned 102.28% and 72.81%, respectively. The worst performers were Shunfeng International Clean Energy and China Coal Energy, which returned -21.69% and -18.39%, respectively.
China’s recent movement to focus on more environmentally friendly growth has begun to impact the country’s energy sector, resulting in some underperformance versus other sectors of China’s market. China’s slowing long term economic growth, coupled with falling energy intensity (a measure of energy used per unit of GDP), and more environmentally friendly government policies can be attributed to slowing energy demand. Energy intensity slid 3.8% year-over-year in Q1 2017, faster than the government’s target. However, a near term pick-up in GDP growth during the period under review marginally improved the prospects for the energy sector, as GDP growth touched 6.9% year-over-year in the first half of 2017.
| | | AVERAGE ANNUAL TOTAL RETURN FOR THE YEAR ENDED OCTOBER 31, 2017 | |
| | | One Year Return | | | Three Year Return | | | Five Year Return | | | Annualized Inception to Date* | |
| | | Net Asset Value | | | Market Price | | | Net Asset Value | | | Market Price | | | Net Asset Value | | | Market Price | | | Net Asset Value | | | Market Price | |
| Global X China Energy ETF | | | 13.13 | % | | | 13.45 | % | | | -5.63 | % | | | -5.71 | % | | | -0.99 | % | | | -0.96 | % | | | -1.37 | % | | | -1.44 | % |
| Solactive China Energy Total Return Index | | | 14.10 | % | | | 14.10 | % | | | -4.92 | % | | | -4.92 | % | | | -0.20 | % | | | -0.20 | % | | | -0.56 | % | | | -0.56 | % |
| MSCI Emerging Markets Index | | | 26.45 | % | | | 26.45 | % | | | 5.70 | % | | | 5.70 | % | | | 4.83 | % | | | 4.83 | % | | | 4.24 | % | | | 4.24 | % |
| S&P 500 Index | | | 23.63 | % | | | 23.63 | % | | | 10.77 | % | | | 10.77 | % | | | 15.18 | % | | | 15.18 | % | | | 13.75 | % | | | 13.75 | % |
Growth of a $10,000 Investment
(At Net Asset Value)
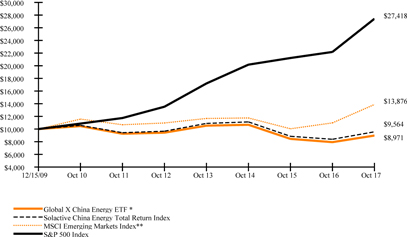
*Fund commenced operations on December 15, 2009.
**As of March 1, 2017, the Fund changed its broad based benchmark from the S&P 500 Index to the MSCI Emerging Markets Index. The new benchmark is a more appropriate comparison for the Fund.
| Management Discussion of Fund Performance (unaudited) |
| Global X China Energy ETF |
The MSCI Emerging Markets Index is a free float-adjusted market capitalization index that is designed to measure equity market performance of emerging markets.
The S&P 500 Index is a market capitalization-weighted composite index of 500 large capitalization U.S. companies.
The performance data quoted herein represents past performance and the return and value of an investment in the Fund will fluctuate so that, when redeemed, it may be worth less than its original cost. Past performance is no guarantee of future performance and should not be considered as a representation of the future results of the Fund. The Fund's performance assumes the reinvestment of all dividends and all capital gains. Index returns assume reinvestment of dividends and, unlike the Fund's returns, do not reflect any fees or expenses. If such fees and expenses were included in the index returns, the performance would have been lower. Please note that one cannot invest directly in an unmanaged index.
There are no assurances that the Fund will meet its stated objectives.
The Fund’s holdings and allocations are subject to change and should not be considered recommendations to buy individual securities.
The graph and table do not reflect the deduction of taxes that a shareholder would pay on Fund distributions or the redemption or sale of Fund shares.
See definition of comparative indices above.
| Management Discussion of Fund Performance (unaudited) |
| Global X China Financials ETF |
Global X China Financials ETF
The Global X China Financials ETF (“Fund”) seeks to provide investment results that correspond generally to the price and yield performance, before fees and expenses, of the Solactive China Financials Total Return Index (“Underlying Index”). The Fund is passively managed, which means the investment adviser does not attempt to take defensive positions in declining markets. The Fund generally seeks to fully replicate the Underlying Index.
The Underlying Index is designed to measure the equity performance of the investable universe of companies in the financials sector of the Chinese economy, as defined by the index provider. It is comprised of securities of companies that have their main business operations in the financials sector and generally includes companies whose businesses involve: banking; insurance, real estate, and financial services.
For the 12-month period ended October 31, 2017 (the “reporting period”), the Fund increased 30.32%, while the Underlying Index increased 31.51%. The Fund had a net asset value of $13.80 per share on October 31, 2016 and ended the reporting period with a net asset value of $17.63 on October 31, 2017.
During the reporting period, the highest returns came from Sunac China Holdings and China Evergrande Group, which returned 661.08% and 482.24%, respectively. The worst performers were I-Cable Communications and China Minsheng Banking Corporation, which returned -18.41% and -11.38%, respectively.
The Financials and Real Estate sectors in China experienced diminishing growth as the country’s broad economic growth slowed and the government continued to clamp down on an overheated property sector and reduce financial speculation. In Q2 2017, for example, GDP growth clocked in at 6.9%, but the Financials sector grew at just 3.2% during the quarter, while Real Estate grew 6.2%. However, the sector was able to shed some of its earlier vulnerabilities during the period due to better than expected economic growth in the first half (“HI”) of 2017, tight monetary conditions, and stricter regulations. Credit demand recovered with a pick-up in GDP growth, and higher interest rates helped reverse contracting net interest margin (NIM) of banks. Consequently, China’s big four banks reported faster profit growth and stronger NIM during H1 2017.
| | | AVERAGE ANNUAL TOTAL RETURN FOR THE YEAR ENDED OCTOBER 31, 2017 | |
| | | One Year Return | | | Three Year Return | | | Five Year Return | | | Annualized Inception to Date* | |
| | | Net Asset Value | | | Market Price | | | Net Asset Value | | | Market Price | | | Net Asset Value | | | Market Price | | | Net Asset Value | | | Market Price | |
| Global X China Financials ETF | | | 30.32 | % | | | 30.61 | % | | | 12.29 | % | | | 12.46 | % | | | 10.43 | % | | | 10.63 | % | | | 3.97 | % | | | 3.97 | % |
| Solactive China Financials Total Return Index | | | 31.51 | % | | | 31.51 | % | | | 13.10 | % | | | 13.10 | % | | | 11.26 | % | | | 11.26 | % | | | 4.53 | % | | | 4.53 | % |
| MSCI Emerging Markets Index | | | 26.45 | % | | | 26.45 | % | | | 5.70 | % | | | 5.70 | % | | | 4.83 | % | | | 4.83 | % | | | 4.37 | % | | | 4.37 | % |
| S&P 500 Index | | | 23.63 | % | | | 23.63 | % | | | 10.77 | % | | | 10.77 | % | | | 15.18 | % | | | 15.18 | % | | | 13.70 | % | | | 13.70 | % |
Growth of a $10,000 Investment
(At Net Asset Value)
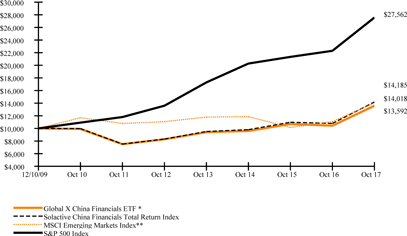
*Fund commenced operations on December 10, 2009.
**As of March 1, 2017, the Fund changed its broad based benchmark from the S&P 500 Index to the MSCI Emerging Markets Index. The new benchmark is a more appropriate comparison for the Fund.
| Management Discussion of Fund Performance (unaudited) |
| Global X China Financials ETF |
The MSCI Emerging Markets Index is a free float-adjusted market capitalization index that is designed to measure equity market performance
of emerging markets.
The S&P 500 Index is a market capitalization-weighted composite index of 500 large capitalization U.S. companies.
The performance data quoted herein represents past performance and the return and value of an investment in the Fund will fluctuate so that, when redeemed, it may be worth less than its original cost. Past performance is no guarantee of future performance and should not be considered as a representation of the future results of the Fund. The Fund's performance assumes the reinvestment of all dividends and all capital gains. Index returns assume reinvestment of dividends and, unlike the Fund's returns, do not reflect any fees or expenses. If such fees and expenses were included in the index returns, the performance would have been lower. Please note that one cannot invest directly in an unmanaged index.
There are no assurances that the Fund will meet its stated objectives.
The Fund’s holdings and allocations are subject to change and should not be considered recommendations to buy individual securities.
The graph and table do not reflect the deduction of taxes that a shareholder would pay on Fund distributions or the redemption or sale of Fund shares.
See definition of comparative indices above.
| Management Discussion of Fund Performance (unaudited) |
| Global X China Industrials ETF |
Global X China Industrials ETF
The Global X China Industrials ETF (“Fund”) seeks to provide investment results that correspond generally to the price and yield performance, before fees and expenses, of the Solactive China Industrials Total Return Index (“Underlying Index”). The Fund is passively managed, which means the investment adviser does not attempt to take defensive positions in declining markets. The Fund generally seeks to fully replicate the Underlying Index.
The Underlying Index is designed to measure the equity performance of the investable universe of companies in the industrials sector of the Chinese economy, as defined by the index provider. It is comprised of securities of companies that have their main business operations in the industrials sector and generally includes companies whose businesses involve: construction and materials, electronic and electrical equipment, industrial engineering, industrial transportation, and support services, and trading companies, shipbuilding and aerospace.
For the 12-month period ended October 31, 2017 (the “reporting period”), the Fund increased 29.88%, while the Underlying Index increased 26.69%. The Fund had a net asset value of $12.57 per share on October 31, 2016 and ended the reporting period with a net asset value of $16.06 on October 31, 2017.
During the reporting period, the highest returns came from Sunny Optical Technology Group and Yangzijiang Shipbuilding Holdings, which returned 201.10% and 123.13%, respectively. The worst performers were Noble Group and AviChina Industry & Technology, which returned -79.19% and -14.56%, respectively.
China’s industrial sector, which accounts for approximately one-third of the country’s gross domestic product (GDP), saw a resurgence during the period under review. Backed by solid infrastructure spending, resilience of the property market, and strong exports growth, value-added industrial output increased 6.7% year-over-year from January-October 2017, versus growth of just 6.1% and 6.0% in 2015 and 2016, respectively. High tech and equipment manufacturing contributed around 12% and 32%, respectively to the overall industrial output increase during the first three quarters of 2017. The sector broadly benefitted from an increase in global growth, which increased demand for Chinese exports from the Industrials sector.
| | | AVERAGE ANNUAL TOTAL RETURN FOR THE YEAR ENDED OCTOBER 31, 2017 | |
| | | One Year Return | | | Three Year Return | | | Five Year Return | | | Annualized Inception to Date* | |
| | | Net Asset Value | | | Market Price | | | Net Asset Value | | | Market Price | | | Net Asset Value | | | Market Price | | | Net Asset Value | | | Market Price | |
| Global X China Industrials ETF | | | 29.88 | % | | | 30.28 | % | | | 9.31 | % | | | 8.78 | % | | | 8.79 | % | | | 8.63 | % | | | 1.66 | % | | | 1.53 | % |
| Solactive China Industrials Total Return Index | | | 26.69 | % | | | 26.69 | % | | | 10.68 | % | | | 10.68 | % | | | 9.94 | % | | | 9.94 | % | | | 2.57 | % | | | 2.57 | % |
| MSCI Emerging Markets Index | | | 26.45 | % | | | 26.45 | % | | | 5.70 | % | | | 5.70 | % | | | 4.83 | % | | | 4.83 | % | | | 4.53 | % | | | 4.53 | % |
| S&P 500 Index | | | 23.63 | % | | | 23.63 | % | | | 10.77 | % | | | 10.77 | % | | | 15.18 | % | | | 15.18 | % | | | 13.75 | % | | | 13.75 | % |
Growth of a $10,000 Investment
(At Net Asset Value)

*Fund commenced operations on November 30, 2009.
**As of March 1, 2017, the Fund changed its broad based benchmark from the S&P 500 Index to the MSCI Emerging Markets Index. The new benchmark is a more appropriate comparison for the Fund.
| Management Discussion of Fund Performance (unaudited) |
| Global X China Industrials ETF |
The MSCI Emerging Markets Index is a free float-adjusted market capitalization index that is designed to measure equity market performance
of emerging markets.
The S&P 500 Index is a market capitalization-weighted composite index of 500 large capitalization U.S. companies.
The performance data quoted herein represents past performance and the return and value of an investment in the Fund will fluctuate so that, when redeemed, it may be worth less than its original cost. Past performance is no guarantee of future performance and should not be considered as a representation of the future results of the Fund. The Fund's performance assumes the reinvestment of all dividends and all capital gains. Index returns assume reinvestment of dividends and, unlike the Fund's returns, do not reflect any fees or expenses. If such fees and expenses were included in the index returns, the performance would have been lower. Please note that one cannot invest directly in an unmanaged index.
There are no assurances that the Fund will meet its stated objectives.
The Fund’s holdings and allocations are subject to change and should not be considered recommendations to buy individual securities.
The graph and table do not reflect the deduction of taxes that a shareholder would pay on Fund distributions or the redemption or sale of Fund shares.
See definition of comparative indices above.
| Management Discussion of Fund Performance (unaudited) |
| Global X China Materials ETF |
Global X China Materials ETF
The Global X China Materials ETF (“Fund”) seeks to provide investment results that correspond generally to the price and yield performance, before fees and expenses, of the Solactive China Materials Total Return Index (“Underlying Index”). The Fund is passively managed, which means the investment adviser does not attempt to take defensive positions in declining markets. The Fund generally seeks to fully replicate the Underlying Index.
The Underlying Index is designed to measure the equity performance of the investable universe of companies in the materials sector of the Chinese economy, as defined by the index provider. It is comprised of securities of companies that have their main business operations in the basic materials sector and generally includes companies whose businesses involve: chemicals, metals and mining, and forestry and paper products.
For the 12-month period ended October 31, 2017 (the “reporting period”), the Fund increased 62.79%, while the Underlying Index increased 49.50%. The Fund had a net asset value of $13.42 per share on October 31, 2016 and ended the reporting period with a net asset value of $21.59 on October 31, 2017.
During the reporting period, the highest returns came from China Molybdenum and China Oriental Group, which returned 192.99% and 142.61%, respectively. The worst performers were Munsun Capital Group and Zhaojin Mining Industry, which returned -71.37 % and -18.16%, respectively.
During the period under review, China’s materials sector benefited from an increase in global commodity prices, which drove higher profitability for the firms in the sector. Higher commodity prices were supported by supply constraints following China’s policy to curb pollution and reduce dumping of excess materials. In addition, as a provider of raw materials for the Industrials sector, materials firms enjoyed a rebound in industrial output, which grew 6.7% year-over-year from January-October 2017.
| | | AVERAGE ANNUAL TOTAL RETURN FOR THE YEAR ENDED OCTOBER 31, 2017 | |
| | | One Year Return | | | Three Year Return | | | Five Year Return | | | Annualized Inception to Date* | |
| | | Net Asset Value | | | Market Price | | | Net Asset Value | | | Market Price | | | Net Asset Value | | | Market Price | | | Net Asset Value | | | Market Price | |
| Global X China Materials ETF | | | 62.79 | % | | | 61.85 | % | | | 16.56 | % | | | 15.78 | % | | | 8.24 | % | | | 8.43 | % | | | -2.56 | % | | | -2.56 | % |
| Solactive China Materials Total Return Index | | | 49.50 | % | | | 49.50 | % | | | 14.73 | % | | | 14.73 | % | | | 8.21 | % | | | 8.21 | % | | | -2.36 | % | | | -2.36 | % |
| MSCI Emerging Markets Index | | | 26.45 | % | | | 26.45 | % | | | 5.70 | % | | | 5.70 | % | | | 4.83 | % | | | 4.83 | % | | | 3.66 | % | | | 3.66 | % |
| S&P 500 Index | | | 23.63 | % | | | 23.63 | % | | | 10.77 | % | | | 10.77 | % | | | 15.18 | % | | | 15.18 | % | | | 13.41 | % | | | 13.41 | % |
Growth of a $10,000 Investment
(At Net Asset Value)
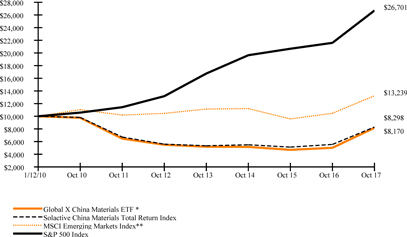
*Fund commenced operations on January 12, 2010.
**As of March 1, 2017, the Fund changed its broad based benchmark from the S&P 500 Index to the MSCI Emerging Markets Index. The new benchmark is a more appropriate comparison for the Fund.
| Management Discussion of Fund Performance (unaudited) |
| Global X China Materials ETF |
The MSCI Emerging Markets Index is a free float-adjusted market capitalization index that is designed to measure equity market performance
of emerging markets.
The S&P 500 Index is a market capitalization-weighted composite index of 500 large capitalization U.S. companies.
The performance data quoted herein represents past performance and the return and value of an investment in the Fund will fluctuate so that, when redeemed, it may be worth less than its original cost. Past performance is no guarantee of future performance and should not be considered as a representation of the future results of the Fund. The Fund's performance assumes the reinvestment of all dividends and all capital gains. Index returns assume reinvestment of dividends and, unlike the Fund's returns, do not reflect any fees or expenses. If such fees and expenses were included in the index returns, the performance would have been lower. Please note that one cannot invest directly in an unmanaged index.
There are no assurances that the Fund will meet its stated objectives.
The Fund’s holdings and allocations are subject to change and should not be considered recommendations to buy individual securities.
The graph and table do not reflect the deduction of taxes that a shareholder would pay on Fund distributions or the redemption or sale of Fund shares.
See definition of comparative indices above.
| Management Discussion of Fund Performance (unaudited) |
| Global X NASDAQ China Technology ETF |
Global X NASDAQ China Technology ETF
The Global X NASDAQ China Technology ETF (“Fund”) seeks to provide investment results that correspond generally to the price and yield performance, before fees and expenses, of the NASDAQ OMX China Technology Index (“Underlying Index”). The Fund is passively managed, which means the investment adviser does not attempt to take defensive positions in declining markets. The Fund generally seeks to fully replicate the Underlying Index.
The Underlying Index is designed to track the performance of the technology sector in China as defined by the index provider. It is comprised of securities of companies that have their main business operations in the technology sector and generally includes companies whose businesses involve: computer services, internet, software, computer hardware, electronic office equipment, semiconductors, and telecommunications equipment.
For the 12-month period ended October 31, 2017 (the “reporting period”), the Fund increased 31.56%, while the Underlying Index increased 33.86%. The Fund had a net asset value of $23.23 per share on October 31, 2016 and ended the reporting period with a net asset value of $29.24 on October 31, 2017.
During the reporting period, the highest returns came from BYD Electronic (International) and ZTE Corporation, which returned 244.22% and 151.75%, respectively. The worst performers were 500.com and Shanghai Potevio, which returned -44.45% and -30.30%, respectively.
China’s government has long supported the development of its domestic technology industry as a means for modernization and progress. For example, in 2006 the country set out on a 15 year National Medium- and Long-Term Program for Science and Technology Development to transform the economy into a major global innovation center by 2020. As this program comes to conclusion, the country has embarked on another broad plan, ‘Made in China 2025’ that seeks to upgrade the economy and its infrastructure to one that is technologically enabled. With support from the central government, as well as organic entrepreneurship, China’s technology companies have become among the fastest growing segments of its economy. While historically, growth in the sector was primarily driven by manufacturing electronics hardware components for export, China’s Technology sector is now becoming increasingly domestic focused. The country now has more than 730 million online users, of which over 90% have mobile internet. Increasingly, these internet users are buying items online, using social media, and playing interactive mobile games, helping to drive the sales growth of the country’s technology companies.
| | | AVERAGE ANNUAL TOTAL RETURN FOR THE YEAR ENDED OCTOBER 31, 2017 | |
| | | One Year Return | | | Three Year Return | | | Five Year Return | | | Annualized Inception to Date* | |
| | | Net Asset Value | | | Market Price | | | Net Asset Value | | | Market Price | | | Net Asset Value | | | Market Price | | | Net Asset Value | | | Market Price | |
| Global X NASDAQ China Technology ETF | | | 31.56 | % | | | 33.52 | % | | | 9.53 | % | | | 9.90 | % | | | 17.65 | % | | | 17.99 | % | | | 10.07 | % | | | 10.19 | % |
| Hybrid NASDAQ OMX China Technology Index/Solactive China Technology Index** | | | 33.86 | % | | | 33.86 | % | | | 10.66 | % | | | 10.66 | % | | | 19.03 | % | | | 19.03 | % | | | 11.01 | % | | | 11.01 | % |
| MSCI Emerging Markets Index | | | 26.45 | % | | | 26.45 | % | | | 5.70 | % | | | 5.70 | % | | | 4.83 | % | | | 4.83 | % | | | 4.31 | % | | | 4.31 | % |
| S&P 500 Index | | | 23.63 | % | | | 23.63 | % | | | 10.77 | % | | | 10.77 | % | | | 15.18 | % | | | 15.18 | % | | | 13.83 | % | | | 13.83 | % |
Growth of a $10,000 Investment
(At Net Asset Value)
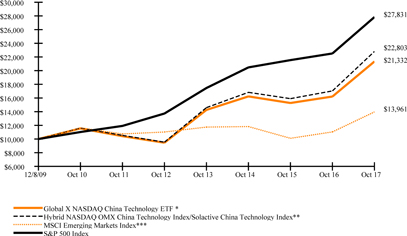
| Management Discussion of Fund Performance (unaudited) |
| Global X NASDAQ China Technology ETF |
*Fund commenced operations on December 8, 2009.
** Reflects performance of Solactive China Technology Index through December 13, 2011 and NASDAQ OMX China Technology Index thereafter.
*** As of March 1, 2017, the Fund changed its broad based benchmark from the S&P 500 Index to the MSCI Emerging Markets Index. The new benchmark is a more appropriate comparison for the Fund.
The MSCI Emerging Markets Index is a free float-adjusted market capitalization index that is designed to measure equity market performance
of emerging markets.
The S&P 500 Index is a market capitalization-weighted composite index of 500 large capitalization U.S. companies.
The performance data quoted herein represents past performance and the return and value of an investment in the Fund will fluctuate so that, when redeemed, it may be worth less than its original cost. Past performance is no guarantee of future performance and should not be considered as a representation of the future results of the Fund. The Fund's performance assumes the reinvestment of all dividends and all capital gains. Index returns assume reinvestment of dividends and, unlike the Fund's returns, do not reflect any fees or expenses. If such fees and expenses were included in the index returns, the performance would have been lower. Please note that one cannot invest directly in an unmanaged index.
There are no assurances that the Fund will meet its stated objectives.
The Fund’s holdings and allocations are subject to change and should not be considered recommendations to buy individual securities.
The graph and table do not reflect the deduction of taxes that a shareholder would pay on Fund distributions or the redemption or sale of Fund shares.
See definition of comparative indices above.
| Management Discussion of Fund Performance (unaudited) |
| Global X FTSE Southeast Asia ETF |
Global X FTSE Southeast Asia ETF
The Global X FTSE Southeast Asia ETF (“Fund”) seeks to provide investment results that correspond generally to the price and yield performance, before fees and expenses, of the FTSE/ASEAN 40 Index (“Underlying Index”). The Fund is passively managed, which means the investment adviser does not attempt to take defensive positions in declining markets. The Fund generally seeks to fully replicate the Underlying Index.
The Underlying Index tracks the equity performance of the 40 largest and most liquid companies in the five Association of Southeast Asian Nations ("ASEAN") regions: Singapore, Malaysia, Indonesia, Thailand and the Philippines, as defined by the index provider.
For the 12-month period ended October 31, 2017 (the “reporting period”), the Fund increased 19.19%, while the Underlying Index increased 19.87%. The Fund had a net asset value of $13.72 per share on October 31, 2016 and ended the reporting period with a net asset value of $15.91 on October 31, 2017.
During the reporting period, the highest returns came from Airports of Thailand Public Company and DBS Group Holdings, which returned 67.36% and 59.93%, respectively. The worst performers were PT Telekomunikasi Indonesia and Petronas Gas, which returned -16.55% and -16.01%, respectively.
The Southeast Asia region includes many high growth and dynamic economies such as Singapore, Malaysia, Indonesia, the Philippines, and Thailand. During the period, Southeast Asia largely enjoyed robust economic growth, driven by strong domestic consumption and investment. Another positive driver was stronger than expected economic data out of China, which is a key trading partner for the region. Indonesia, the region’s largest economy, continued to expand, growing 5.0% year-over-year in the first half (“HI”) of 2017, backed by strong investments and exports. Malaysia’s economy grew at the fastest pace in two years, clocking 5.7% year-over-year over the same period. Although growth moderated in the Philippines, the country remained one of the fastest growing economies in the region, reporting 6.4% year-over-year growth in H1 2017. In Singapore, the 2.7% year-over-year growth in H1 was supported by an increase in global electronics trade, while a higher agriculture output facilitated 3.5% year-over-year growth in Thailand.
| | | AVERAGE ANNUAL TOTAL RETURN FOR THE YEAR ENDED OCTOBER 31, 2017 | |
| | | One Year Return | | | Three Year Return | | | Five Year Return | | | Annualized Inception to Date* | |
| | | Net Asset Value | | | Market Price | | | Net Asset Value | | | Market Price | | | Net Asset Value | | | Market Price | | | Net Asset Value | | | Market Price | |
| Global X FTSE Southeast Asia ETF | | | 19.19 | % | | | 19.85 | % | | | 1.23 | % | | | 1.14 | % | | | 1.97 | % | | | 1.94 | % | | | 3.46 | % | | | 3.45 | % |
| FTSE/ASEAN 40 Index | | | 19.87 | % | | | 19.87 | % | | | 1.75 | % | | | 1.75 | % | | | 2.52 | % | | | 2.52 | % | | | 4.03 | % | | | 4.03 | % |
| MSCI Emeerging Markets Index | | | 26.45 | % | | | 26.45 | % | | | 5.70 | % | | | 5.70 | % | | | 4.83 | % | | | 4.83 | % | | | 2.65 | % | | | 2.65 | % |
| S&P 500 Index | | | 23.63 | % | | | 23.63 | % | | | 10.77 | % | | | 10.77 | % | | | 15.18 | % | | | 15.18 | % | | | 12.63 | % | | | 12.63 | % |
Growth of a $10,000 Investment
(At Net Asset Value)
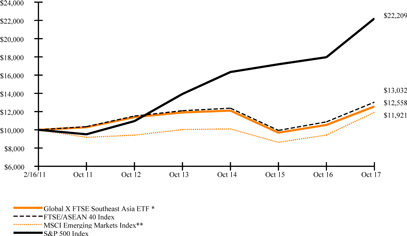
*Fund commenced operations on February 16, 2011.
**As of March 1, 2017, the Fund changed its broad based benchmark from the S&P 500 Index to the FTSE/ASEAN 40 Index. The new benchmark is a more appropriate comparison for the Fund.
| Management Discussion of Fund Performance (unaudited) |
| Global X FTSE Southeast Asia ETF |
The FTSE/ASEAN 40 Index is designed to represent the performance of the largest companies in the ASEAN region's markets.
The MSCI Emerging Markets Index is a free float-adjusted market capitalization index that is designed to measure equity market performance
of emerging markets.
The S&P 500 Index is a market capitalization-weighted composite index of 500 large capitalization U.S. companies.
The performance data quoted herein represents past performance and the return and value of an investment in the Fund will fluctuate so that, when redeemed, it may be worth less than its original cost. Past performance is no guarantee of future performance and should not be considered as a representation of the future results of the Fund. The Fund's performance assumes the reinvestment of all dividends and all capital gains. Index returns assume reinvestment of dividends and, unlike the Fund's returns, do not reflect any fees or expenses. If such fees and expenses were included in the index returns, the performance would have been lower. Please note that one cannot invest directly in an unmanaged index.
There are no assurances that the Fund will meet its stated objectives.
The Fund’s holdings and allocations are subject to change and should not be considered recommendations to buy individual securities.
The graph and table do not reflect the deduction of taxes that a shareholder would pay on Fund distributions or the redemption or sale of Fund shares.
See definition of comparative indices above.
| Management Discussion of Fund Performance (unaudited) |
| Global X MSCI Colombia ETF |
Global X MSCI Colombia ETF
The Global X MSCI Colombia ETF (“Fund”) seeks to provide investment results that correspond generally to the price and yield performance, before fees and expenses, of the MSCI All Colombia Select 25/50 Index (the “Underlying Index”). The Fund is passively managed, which means the investment adviser does not attempt to take defensive positions in declining markets. The Fund generally seeks to fully replicate the Underlying Index.
The Underlying Index is designed to represent the performance of the broad Colombia equity universe, as defined by the index provider.
For the 12-month period ended October 31, 2017 (the “reporting period”), the Fund increased 5.24%, while the Underlying Index increased 5.99%. The Fund had a net asset value of $9.22 per share on October 31, 2016 and ended the reporting period with a net asset value of $9.56 on October 31, 2017.
During the reporting period, the highest returns came from Empresas Copec and Enel Americas, which returned 60.63% and 38.19%, respectively. The worst performers were Corporacion Financiera Colombiana and Empresa de Telecomunicaciones de Bogota, which returned -22.86% and -17.25%, respectively.
Colombia’s economy, which relies heavily on oil exports, faced some challenges adjusting to an extended low oil price environment. As a consequence, economic growth was slow during the period under review, coming in at a 1.3% increase year-over-year in Q2 2017 following a 1.2% year-over-year increase in Q1. Private consumption increased moderately, but exports growth was weak. Investments experienced a revival during the period. Ambitious infrastructure projects and improved confidence following the peace deal with FARC rebels provided an improving business climate for attracting additional investment. Further, the mining sector experienced a recovery in Q2 2017 with improving commodity prices. Inflation also fell, which gave room for the central bank to ease monetary policy allowing for more economic stimulus.
| | | AVERAGE ANNUAL TOTAL RETURN FOR THE YEAR ENDED OCTOBER 31, 2017 | |
| | | One Year Return | | | Three Year Return | | | Five Year Return | | | Annualized Inception to Date* | |
| | | Net Asset Value | | | Market Price | | | Net Asset Value | | | Market Price | | | Net Asset Value | | | Market Price | | | Net Asset Value | | | Market Price | |
| Global X MSCI Colombia ETF | | | 5.24 | % | | | 5.36 | % | | | -16.42 | % | | | -16.61 | % | | | -13.16 | % | | | -13.34 | % | | | 4.97 | % | | | 4.96 | % |
| Hybrid MSCI All Colombia Select 25/50 Index/MSCI All Colombia Capped Index/FTSE Colombia 20 Index** | | | 5.99 | % | | | 5.99 | % | | | -15.67 | % | | | -15.67 | % | | | -12.47 | % | | | -12.47 | % | | | 5.95 | % | | | 5.95 | % |
| MSCI Emerging Markets Index | | | 26.45 | % | | | 26.45 | % | | | 5.70 | % | | | 5.70 | % | | | 4.83 | % | | | 4.83 | % | | | 11.42 | % | | | 11.42 | % |
| S&P 500 Index | | | 23.63 | % | | | 23.63 | % | | | 10.77 | % | | | 10.77 | % | | | 15.18 | % | | | 15.18 | % | | | 16.03 | % | | | 16.03 | % |
Growth of a $10,000 Investment
(At Net Asset Value)
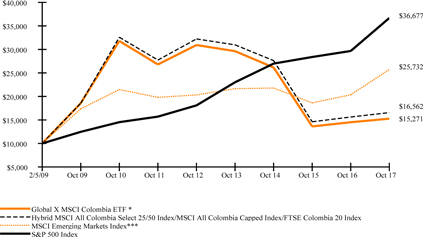
*Fund commenced operations on February 5, 2009.
| Management Discussion of Fund Performance (unaudited) |
| Global X MSCI Colombia ETF |
**Reflects performance of the FTSE Colombia 20 Index through July 14, 2014, the MSCI All Colombia Capped Index through August 30, 2016 and the MSCI All Colombia Select 25/50 Index, thereafter. The inception of the MSCI All Colombia Select 25/50 Index (“New Index”) was on July 15, 2016. Effective on or around August 31, 2016, the Fund began to track the New Index. This change was due to the planned migration to the New Index, potentially improving the trading characteristics of the Fund.
***As of March 1, 2017, the Fund changed its broad based benchmark from the S&P 500 Index to the MSCI Emerging Markets Index. The new benchmark is a more appropriate comparison for the Fund.
The MSCI Emerging Markets Index is a free float-adjusted market capitalization index that is designed to measure equity market performance
of emerging markets.
The S&P 500 Index is a market capitalization-weighted composite index of 500 large capitalization U.S. companies.
The performance data quoted herein represents past performance and the return and value of an investment in the Fund will fluctuate so that, when redeemed, it may be worth less than its original cost. Past performance is no guarantee of future performance and should not be considered as a representation of the future results of the Fund. The Fund's performance assumes the reinvestment of all dividends and all capital gains. The Fund’s performace reflects contractual fee waivers in effect until at least March 1, 2018. Absent these waivers performance would be lower. Index returns assume reinvestment of dividends and, unlike the Fund's returns, do not reflect any fees or expenses. If such fees and expenses were included in the index returns, the performance would have been lower. Please note that one cannot invest directly in an unmanaged index.
There are no assurances that the Fund will meet its stated objectives.
The Fund’s holdings and allocations are subject to change and should not be considered recommendations to buy individual securities.
The graph and table do not reflect the deduction of taxes that a shareholder would pay on Fund distributions or the redemption or sale of Fund shares.
See definition of comparative indices above.
| Management Discussion of Fund Performance (unaudited) |
| Global X MSCI Argentina ETF |
Global X MSCI Argentina ETF
The Global X MSCI Argentina ETF (“Fund”) seeks to provide investment results that correspond generally to the price and yield performance, before fees and expenses, of the MSCI All Argentina 25/50 Index (“Underlying Index”). The Fund is passively managed, which means the investment adviser does not attempt to take defensive positions in declining markets. The Fund generally seeks to fully replicate the Underlying Index.
The Underlying Index is designed to represent the performance of the broad Argentina equity universe, while including a minimum number of constituents, as defined by the index provider. The broad Argentina equity universe includes securities that are classified in Argentina according to the MSCI Global Investable Market Index Methodology, together with companies that are headquartered or listed in Argentina and carry out the majority of their operations in Argentina.
For the 12-month period ended October 31, 2017 (the “reporting period”), the Fund increased 35.79%, while the Underlying Index increased 36.08%. The Fund had a net asset value of $23.69 per share on October 31, 2016 and ended the reporting period with a net asset value of $32.05 on October 31, 2017.
During the reporting period, the highest returns came from Transportadora de Gas del Sur and Pampa Energia, which returned 192.69% and 99.09%, respectively. The worst performers were Grupo Clarin and Petrobras Argentina, which returned -75.52% and -26.05%, respectively.
Argentina’s economy is in the midst of a major transition under the relatively new government led by Mauricio Macri, who came to power in 2015. Macri has implemented a series of ambitious reforms, including removing foreign exchange controls, floating the country’s currency, reestablishing access to the international capital markets, and eliminating export taxes and trade barriers. The economy has started to enjoy the benefits of these reforms, as it grew 2.7% year-over-year in the first half of 2017. Exports are strengthening and investments are ramping up with an improving business climate and greater access for foreign capital. While many believe the country is on the right path towards more sustainable long term growth, double-digit inflation remains an issue that needs to be tamed, as well as the nation’s large fiscal deficit. Changes required to tackle these issues, such as implementing austerity measures and reducing energy subsidies, are unpopular among the electorate and therefore politically difficult to put in place.
| | | AVERAGE ANNUAL TOTAL RETURN FOR THE YEAR ENDED OCTOBER 31, 2017 | |
| | | One Year Return | | | Three Year Return | | | Five Year Return | | | Annualized Inception to Date* | |
| | | Net Asset Value | | | Market Price | | | Net Asset Value | | | Market Price | | | Net Asset Value | | | Market Price | | | Net Asset Value | | | Market Price | |
| Global X MSCI Argentina ETF | | | 35.79 | % | | | 35.16 | % | | | 15.46 | % | | | 15.45 | % | | | 14.50 | % | | | 14.58 | % | | | 2.00 | % | | | 1.99 | % |
| Hybrid FTSE Argentina 20 Index/MSCI All Argentina 25/50 Index** | | | 36.08 | % | | | 36.08 | % | | | 16.64 | % | | | 16.64 | % | | | 15.74 | % | | | 15.74 | % | | | 3.03 | % | | | 3.03 | % |
| MSCI Emerging Markets Index | | | 26.45 | % | | | 26.45 | % | | | 5.70 | % | | | 5.70 | % | | | 4.83 | % | | | 4.83 | % | | | 2.60 | % | | | 2.60 | % |
| S&P 500 Index | | | 23.63 | % | | | 23.63 | % | | | 10.77 | % | | | 10.77 | % | | | 15.18 | % | | | 15.18 | % | | | 13.05 | % | | | 13.05 | % |
Growth of a $10,000 Investment
(At Net Asset Value)
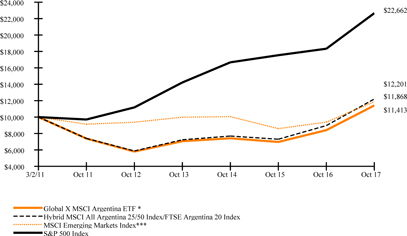
*Fund commenced operations on March 2, 2011.
| Management Discussion of Fund Performance (unaudited) |
| Global X MSCI Argentina ETF |
**Reflects performance of the FTSE Argentina 20 Index through August 14, 2014 and the MSCI All Argentina 25/50 Index (“New Index”) thereafter.
***As of March 1, 2017, the Fund changed its broad based benchmark from the S&P 500 Index to the MSCI Emerging Markets Index. The new benchmark is a more appropriate comparison for the Fund.
The MSCI Emerging Markets Index is a free float-adjusted market capitalization index that is designed to measure equity market performance of emerging markets.
The S&P 500 Index is a market capitalization-weighted composite index of 500 large capitalization U.S. companies.
The performance data quoted herein represents past performance and the return and value of an investment in the Fund will fluctuate so that, when redeemed, it may be worth less than its original cost. Past performance is no guarantee of future performance and should not be considered as a representation of the future results of the Fund. The Fund's performance assumes the reinvestment of all dividends and all capital gains. Index returns assume reinvestment of dividends and, unlike the Fund's returns, do not reflect any fees or expenses. If such fees and expenses were included in the index returns, the performance would have been lower. Please note that one cannot invest directly in an unmanaged index.
There are no assurances that the Fund will meet its stated objectives.
The Fund’s holdings and allocations are subject to change and should not be considered recommendations to buy individual securities.
The graph and table do not reflect the deduction of taxes that a shareholder would pay on Fund distributions or the redemption or sale of Fund shares.
See definition of comparative indices above.
| Management Discussion of Fund Performance (unaudited) |
| Global X MSCI Greece ETF |
Global X MSCI Greece ETF
The Global X MSCI Greece ETF (“Fund”) seeks to provide investment results that correspond generally to the price and yield performance, before fees and expenses, of the MSCI All Greece Select 25/50 Index (“Underlying Index”). The Fund is passively managed, which means the investment adviser does not attempt to take defensive positions in declining markets. The Fund generally seeks to fully replicate the Underlying Index.
The Underlying Index is designed to represent the performance of the broad Greece equity universe, as defined by the index provider.
For the 12-month period ended October 31, 2017 (the “reporting period”), the Fund increased 29.04%, while the Underlying Index increased 30.81%. The Fund had a net asset value of $7.35 per share on October 31, 2016 and ended the reporting period with a net asset value of $9.30 on October 31, 2017.
During the reporting period, the highest returns came from Motor Oil (Hellas) Corinth Refineries and Motor Oil (Hellas) Corinth Refineries Unsponsored ADR, which returned 111.09% and 108.18%, respectively. The worst performers were Aegean Marine Petroleum Network and Piraeus Bank, which returned -47.09% and -13.08%, respectively.
Greece continues to work its way through a crippling debt load that became exposed during the financial crisis and continues to hold back the country today. Despite achieving a 3.9% primary account surplus in 2016, the country’s debt to GDP level was 179% at year end. This high indebtedness continues to be a point of conflict for creditors. At the beginning of 2017, tensions flared again as the International Monetary Fund (IMF) warned Greece of its unsustainable debt and demanded a restructuring. Instead of a restructuring, the European Union (EU) granted an additional aid payment and set new economic targets for Greece. The country took a significant step forward, however, by successfully selling five-year bonds to raise capital outside of their bailout program. The country is targeting an exit of the program by the second half of 2018. After negligible growth in 2016, Greece’s economy has shown positive signs. In the first half of 2017, the economy expanded 0.8% due primarily to increasing exports and consumption.
| | | AVERAGE ANNUAL TOTAL RETURN FOR THE YEAR ENDED OCTOBER 31, 2017 | |
| | | One Year Return | | | Three Year Return | | | Five Year Return | | | Annualized Inception to Date* | |
| | | Net Asset Value | | | Market Price | | | Net Asset Value | | | Market Price | | | Net Asset Value | | | Market Price | | | Net Asset Value | | | Market Price | |
| Global X MSCI Greece ETF | | | 29.04 | % | | | 30.09 | % | | | -15.03 | % | | | -14.80 | % | | | -9.61 | % | | | -9.66 | % | | | -7.20 | % | | | -7.20 | % |
| Hybrid MSCI All Greece Select 25/50 Index/ FTSE/ATHEX Custom Capped Index** | | | 30.81 | % | | | 30.81 | % | | | -14.04 | % | | | -14.04 | % | | | -8.86 | % | | | -8.86 | % | | | -6.16 | % | | | -6.16 | % |
| MSCI Emerging Markets Index | | | 26.45 | % | | | 26.45 | % | | | 5.70 | % | | | 5.70 | % | | | 4.83 | % | | | 4.83 | % | | | 5.18 | % | | | 5.18 | % |
| S&P 500 Index | | | 23.63 | % | | | 23.63 | % | | | 10.77 | % | | | 10.77 | % | | | 15.18 | % | | | 15.18 | % | | | 15.28 | % | | | 15.28 | % |
Growth of a $10,000 Investment
(At Net Asset Value)
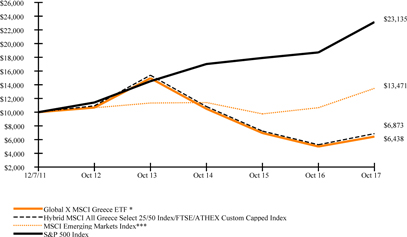
*Fund commenced operations on December 7, 2011.
| Management Discussion of Fund Performance (unaudited) |
| Global X MSCI Greece ETF |
** Reflects performance of the FTSE/ATHEX Custom Capped Index through February 29, 2016 and MSCI All Greece Select 25/50 Index, thereafter. The inception of the MSCI All Greece Select 25/50 Index (“New Index”) was on December 23, 2015. Effective on or around March 1, 2016, the Fund began to track the New Index. The change was due to the planned migration to the New Index, potentially allowing for broader exposure to the local market.
***As of March 1, 2017, the Fund changed its broad based benchmark from the S&P 500 Index to the MSCI Emerging Markets Index. The new benchmark is a more appropriate comparison for the Fund.
The MSCI Emerging Markets Index is a free float-adjusted market capitalization index that is designed to measure equity market performance of emerging markets.
The S&P 500 Index is a market capitalization-weighted composite index of 500 large capitalization U.S. companies.
The performance data quoted herein represents past performance and the return and value of an investment in the Fund will fluctuate so that, when redeemed, it may be worth less than its original cost. Past performance is no guarantee of future performance and should not be considered as a representation of the future results of the Fund. The Fund's performance assumes the reinvestment of all dividends and all capital gains. Index returns assume reinvestment of dividends and, unlike the Fund's returns, do not reflect any fees or expenses. If such fees and expenses were included in the index returns, the performance would have been lower. Please note that one cannot invest directly in an unmanaged index.
There are no assurances that the Fund will meet its stated objectives.
The Fund’s holdings and allocations are subject to change and should not be considered recommendations to buy individual securities.
The graph and table do not reflect the deduction of taxes that a shareholder would pay on Fund distributions or the redemption or sale of Fund shares.
See definition of comparative indices above.
| Management Discussion of Fund Performance (unaudited) |
| Global X MSCI Norway ETF |
Global X MSCI Norway ETF
The Global X MSCI Norway ETF (“Fund”) seeks investment results that correspond generally to the price and yield performance, before fees and expenses, of the MSCI Norway IMI 25/50 Index (“Underlying Index”). The Fund is passively managed, which means the investment adviser does not attempt to take defensive positions in declining markets. The Fund generally seeks to fully replicate the Underlying Index.
The Underlying Index is designed to represent the performance of the broad Norway equity universe, as defined by the index provider. The Underlying Index may include large-, mid- or small-capitalization companies.
For the 12-month period ended October 31, 2017 (the “reporting period”), the Fund increased 25.53%, while the Underlying Index increased 25.69%. The Fund had a net asset value of $11.07 per share on October 31, 2016 and ended the reporting period with a net asset value of $13.50 on October 31, 2017.
During the reporting period, the highest returns came from Golden Ocean Group and Wallenius Wilhelmsen Logistics, which returned 121.13% and 81.22%, respectively. The worst performers were Seadrill and Avance Gas Holding, which returned -88.15% and -63.65%, respectively.
Norway’s economic growth gained momentum after a period of adjustment to lower oil incomes following the fall in crude prices which began in 2014. To facilitate this adjustment, the government adopted lower interest rates and expansionary fiscal policies to help stimulate the economy. In addition, various reform measures have been implemented such as reducing corporate tax rates, simplifying business regulations, improving education and skill development programs, restraining wages, and increasing labor force participation. These initiatives were aimed at improving the country’s competitiveness and productivity, as well as supporting economic growth in non-oil-related sectors.
| | | AVERAGE ANNUAL TOTAL RETURN FOR THE YEAR ENDED OCTOBER 31, 2017 | |
| | | One Year Return | | | Three Year Return | | | Five Year Return | | | Annualized Inception to Date* | |
| | | Net Asset Value | | | Market Price | | | Net Asset Value | | | Market Price | | | Net Asset Value | | | Market Price | | | Net Asset Value | | | Market Price | |
| Global X MSCI Norway ETF | | | 25.53 | % | | | 26.23 | % | | | 1.30 | % | | | 1.27 | % | | | 1.46 | % | | | 1.57 | % | | | 1.75 | % | | | 1.81 | % |
| Hybrid MSCI Norway IMI 25/50 Index/FTSE Norway 30 Index** | | | 25.69 | % | | | 25.69 | % | | | 1.47 | % | | | 1.47 | % | | | 1.96 | % | | | 1.96 | % | | | 2.43 | % | | | 2.43 | % |
| MSCI EAFE Index | | | 23.44 | % | | | 23.44 | % | | | 6.08 | % | | | 6.08 | % | | | 8.53 | % | | | 8.53 | % | | | 5.57 | % | | | 5.57 | % |
| S&P 500 Index | | | 23.63 | % | | | 23.63 | % | | | 10.77 | % | | | 10.77 | % | | | 15.18 | % | | | 15.18 | % | | | 13.76 | % | | | 13.76 | % |
Growth of a $10,000 Investment
(At Net Asset Value)
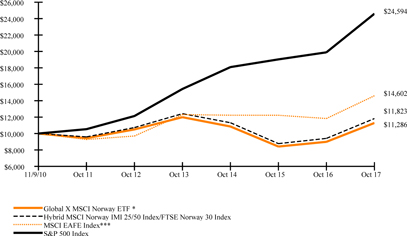
*Fund commenced operations on November 9, 2010.
**Reflects performance of the FTSE Norway 30 Index through July 14, 2014 and the MSCI Norway IMI 25/50 Index thereafter.
***As of March 1, 2017, the Fund changed its broad based benchmark from the S&P 500 Index to the MSCI EAFE Index. The new benchmark is a more appropriate comparison for the Fund.
| Management Discussion of Fund Performance (unaudited) |
| Global X MSCI Norway ETF |
The MSCI EAFE Index (Europe, Australasia, Far East) is a free float-adjusted market capitalization index that is designed to measure the equity market performance of developed markets, excluding the US & Canada.
The S&P 500 Index is a market capitalization-weighted composite index of 500 large capitalization U.S. companies.
The performance data quoted herein represents past performance and the return and value of an investment in the Fund will fluctuate so that, when redeemed, it may be worth less than its original cost. Past performance is no guarantee of future performance and should not be considered as a representation of the future results of the Fund. The Fund's performance assumes the reinvestment of all dividends and all capital gains. Index returns assume reinvestment of dividends and, unlike the Fund's returns, do not reflect any fees or expenses. If such fees and expenses were included in the index returns, the performance would have been lower. Please note that one cannot invest directly in an unmanaged index.
There are no assurances that the Fund will meet its stated objectives.
The Fund’s holdings and allocations are subject to change and should not be considered recommendations to buy individual securities.
The graph and table do not reflect the deduction of taxes that a shareholder would pay on Fund distributions or the redemption or sale of Fund shares.
See definition of comparative indices above.
| Management Discussion of Fund Performance (unaudited) |
| Global X FTSE Nordic Region ETF |
Global X FTSE Nordic Region ETF
The Global X FTSE Nordic Region ETF (“Fund”) seeks investment results that correspond generally to the price and yield performance, before fees and expenses, of the FTSE Nordic 30 Index (“Underlying Index”). The Fund is passively managed, which means the investment adviser does not attempt to take defensive positions in declining markets. The Fund generally seeks to fully replicate the Underlying Index.
The Underlying Index is designed to reflect the equity market performance of companies in Sweden, Denmark, Norway and Finland, as defined by the index provider. The Underlying Index tracks the equity performance of the 30 largest and most liquid companies in Sweden, Denmark, Norway and Finland.
For the 12-month period ended October 31, 2017 (the “reporting period”), the Fund increased 27.97%, while the Underlying Index increased 26.75%. The Fund had a net asset value of $19.38 per share on October 31, 2016 and ended the reporting period with a net asset value of $23.89 on October 31, 2017.
During the reporting period, the highest returns came from Volvo and Sandvik, which returned 89.12% and 63.54%, respectively. The worst performers were Pandora and Nokia, which returned -18.35% and -17.09%, respectively.
Nordic economies witnessed robust economic growth during the period, supported broadly by improving domestic demand. Strong household consumption, backed by employment growth, and rising property investments facilitated growth in Sweden. Denmark also experienced consumption growth stemming from an improving labor market. Finland’s economy expanded during the period under review, assisted by a revival in exports due to increased foreign demand and improved competitiveness. In Norway, the uptick in global oil prices and a relatively weak currency supported growth and exports.
| | | AVERAGE ANNUAL TOTAL RETURN FOR THE YEAR ENDED OCTOBER 31, 2017 | |
| | | One Year Return | | | Three Year Return | | | Five Year Return | | | Annualized Inception to Date* | |
| | | Net Asset Value | | | Market Price | | | Net Asset Value | | | Market Price | | | Net Asset Value | | | Market Price | | | Net Asset Value | | | Market Price | |
| Global X FTSE Nordic Region ETF | | | 27.97 | % | | | 28.25 | % | | | 2.82 | % | | | 2.76 | % | | | 8.36 | % | | | 8.44 | % | | | 8.90 | % | | | 8.91 | % |
| FTSE Nordic 30 Index | | | 26.75 | % | | | 26.75 | % | | | 1.99 | % | | | 1.99 | % | | | 7.70 | % | | | 7.70 | % | | | 8.54 | % | | | 8.54 | % |
| MSCI EAFE Index | | | 23.44 | % | | | 23.44 | % | | | 6.08 | % | | | 6.08 | % | | | 8.53 | % | | | 8.53 | % | | | 7.28 | % | | | 7.28 | % |
| S&P 500 Index | | | 23.63 | % | | | 23.63 | % | | | 10.77 | % | | | 10.77 | % | | | 15.18 | % | | | 15.18 | % | | | 14.87 | % | | | 14.87 | % |
Growth of a $10,000 Investment
(At Net Asset Value)
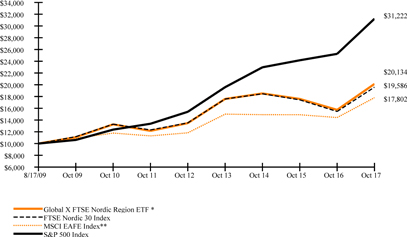
*Fund commenced operations on August 17, 2009.
**As of March 1, 2017, the Fund changed its broad based benchmark from the S&P 500 Index to the MSCI EAFE Index. The new benchmark is a more appropriate comparison for the Fund.
The MSCI EAFE Index (Europe, Australasia, Far East) is a free float-adjusted market capitalization index that is designed to measure the equity market performance of developed markets, excluding the US & Canada.
The S&P 500 Index is a market capitalization-weighted composite index of 500 large capitalization U.S. companies.
| Management Discussion of Fund Performance (unaudited) |
| Global X FTSE Nordic Region ETF |
The performance data quoted herein represents past performance and the return and value of an investment in the Fund will fluctuate so that, when redeemed, it may be worth less than its original cost. Past performance is no guarantee of future performance and should not be considered as a representation of the future results of the Fund. The Fund's performance assumes the reinvestment of all dividends and all capital gains. Index returns assume reinvestment of dividends and, unlike the Fund's returns, do not reflect any fees or expenses. If such fees and expenses were included in the index returns, the performance would have been lower. Please note that one cannot invest directly in an unmanaged index.
There are no assurances that the Fund will meet its stated objectives.
The Fund’s holdings and allocations are subject to change and should not be considered recommendations to buy individual securities.
The graph and table do not reflect the deduction of taxes that a shareholder would pay on Fund distributions or the redemption or sale of Fund shares.
See definition of comparative indices on the previous page.
| Management Discussion of Fund Performance (unaudited) |
| Global X MSCI Nigeria ETF |
Global X MSCI Nigeria ETF
The Global X MSCI Nigeria ETF (“Fund”) seeks to provide investment results that correspond generally to the price and yield performance, before fees and expenses, of the MSCI All Nigeria Select 25/50 Index (“Underlying Index”). The Fund is passively managed, which means the investment adviser does not attempt to take defensive positions in declining markets. The Fund generally seeks to fully replicate the Underlying Index.
The Underlying Index is designed to represent the performance of the broad Nigeria equity universe, while including a minimum number of constituents, as defined by the index provider.
For the 12-month period ended October 31, 2017 (the “reporting period”), the Fund increased 27.52%, while the Underlying Index increased 30.15%. The Fund had a net asset value of $4.31 per share on October 31, 2016 and ended the reporting period with a net asset value of $21.43 on October 31, 2017.
During the reporting period, the highest returns came from Stanbic IBTC Holdings and United Bank for Africa, which returned 129.54% and 123.13%, respectively. The worst performers were Forte Oil and Unilever Nigeria, which returned -70.81% and -33.35%, respectively.
After five consecutive quarters of contraction, Nigeria’s economy recovered in Q2 2017. During the quarter, GDP grew approximately 3.2% quarter-over-quarter and 0.6% year-over-year. Higher oil production and prices, as well as progress in the farming sector enabled the economy to overcome its recession. Nigeria’s Purchasing Managers’ Index indicated robust growth in new export orders and output, as well as job additions. While encouraging signs are emerging throughout the economy, the country’s recovery remains fragile. Nigeria is exposed to the threat of military unrest in the oil-rich Delta region and remains heavily dependent on oil and gas revenues. In an attempt to diversify the economy the government has placed a renewed focus on implementing public and social investment projects, promoting growth in the private sector, encouraging job creation, and diversifying the economy.
| | | AVERAGE ANNUAL TOTAL RETURN FOR THE YEAR ENDED OCTOBER 31, 2017 | |
| | | One Year Return | | | Three Year Return | | | Annualized Inception to Date* | |
| | | Net Asset Value | | | Market Price | | | Net Asset Value | | | Market Price | | | Net Asset Value | | | Market Price | |
| Global X MSCI Nigeria ETF | | | 27.52 | % | | | 17.92 | % | | | -23.16 | % | | | -24.43 | % | | | -18.54 | % | | | -18.57 | % |
| Hybrid MSCI All Nigeria Select 25/50 Index/Solactive Nigeria Index** | | | 30.15 | % | | | 30.15 | % | | | -21.34 | % | | | -21.34 | % | | | -16.90 | % | | | -16.90 | % |
| MSCI Emerging Markets Index | | | 26.45 | % | | | 26.45 | % | | | 5.70 | % | | | 5.70 | % | | | 4.40 | % | | | 4.40 | % |
| S&P 500 Index | | | 23.63 | % | | | 23.63 | % | | | 10.77 | % | | | 10.77 | % | | | 13.74 | % | | | 13.74 | % |
Growth of a $10,000 Investment
(At Net Asset Value)
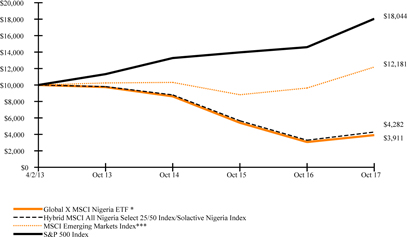
*Fund commenced operations on April 2, 2013.
| Management Discussion of Fund Performance (unaudited) |
| Global X MSCI Nigeria ETF |
**Reflects performance of the Solactive Nigeria Index through August 14, 2014 and the MSCI All Nigeria Select 25/50 Index thereafter.
***As of March 1, 2017, the Fund changed its broad based benchmark from the S&P 500 Index to the MSCI Emerging Markets Index. The new benchmark is a more appropriate comparison for the Fund.
The MSCI Emerging Markets Index is a free float-adjusted market capitalization index that is designed to measure equity market performance of emerging markets.
The S&P 500 Index is a market capitalization-weighted composite index of 500 large capitalization U.S. companies.
The performance data quoted herein represents past performance and the return and value of an investment in the Fund will fluctuate so that, when redeemed, it may be worth less than its original cost. Past performance is no guarantee of future performance and should not be considered as a representation of the future results of the Fund. The Fund's performance assumes the reinvestment of all dividends and all capital gains. The Fund’s performance reflects contractual fee waivers in effect from its inception through February 29, 2016. Absent these waivers performance would be lower. Index returns assume reinvestment of dividends and, unlike the Fund's returns, do not reflect any fees or expenses. If such fees and expenses were included in the index returns, the performance would have been lower. Please note that one cannot invest directly in an unmanaged index.
There are no assurances that the Fund will meet its stated objectives.
The Fund’s holdings and allocations are subject to change and should not be considered recommendations to buy individual securities.
The graph and table do not reflect the deduction of taxes that a shareholder would pay on Fund distributions or the redemption or sale of Fund shares.
See definition of comparative indices above.
| Management Discussion of Fund Performance (unaudited) |
| Global X Next Emerging & Frontier ETF |
Global X Next Emerging & Frontier ETF
The Global X Next Emerging & Frontier ETF (“Fund”) seeks to provide investment results that correspond generally to the price and yield performance, before fees and expenses, of the Solactive Next Emerging & Frontier Index (“Underlying Index”). The Fund is passively managed, which means the investment adviser does not attempt to take defensive positions in declining markets. The Fund generally seeks to fully replicate the Underlying Index.
The Underlying Index is designed to reflect equity performance of next emerging markets and frontier markets companies, as defined by the index provider. Next Emerging markets are defined as emerging market countries, excluding the BRICs (Brazil, Russia, India and China) and excluding the most developed tier of emerging markets (South Korea and Taiwan). Frontier markets are those emerging market countries that generally have smaller economies or less developed capital markets.
For the 12-month period ended October 31, 2017 (the “reporting period”), the Fund increased 18.53%, while the Underlying Index increased 19.20%. The Fund had a net asset value of $20.15 per share on October 31, 2016 and ended the reporting period with a net asset value of $23.28 on October 31, 2017.
During the reporting period, the highest returns came from KAZ Minerals and Antofagasta, which returned 209.19% and 95.42%, respectively. The worst performers were Pacific Drilling and Lucara Diamond, which returned -51.42% and -36.34%, respectively.
Emerging and frontier market equities tend to have elevated sensitivities to commodities prices as well as the US dollar. Over the course of the reporting period, commodities generally strengthened and the dollar weakened versus international currencies. Both of these developments had a positive impact on emerging and frontier markets. In addition, the pickup in global demand driven by continued growth in the US and China as well as recoveries in Japan and Europe, helped contribute to greater export demand from these markets. Due in part to their attractive demographics, many emerging and frontier countries exhibit higher GDP growth rates than developed market averages. They also tend to exhibit greater risks, given less diversified economies and less stable government institutions.
| | | AVERAGE ANNUAL TOTAL RETURN FOR THE YEAR ENDED OCTOBER 31, 2017 | |
| | | One Year Return | | | Three Year Return | | | Annualized Inception to Date* | |
| | | Net Asset Value | | | Market Price | | | Net Asset Value | | | Market Price | | | Net Asset Value | | | Market Price | |
| Global X Next Emerging & Frontier ETF | | | 18.53 | % | | | 16.47 | % | | | -0.81 | % | | | -0.60 | % | | | -0.10 | % | | | -0.14 | % |
| Solactive Next Emerging & Frontier Index | | | 19.20 | % | | | 19.20 | % | | | -0.17 | % | | | -0.17 | % | | | 0.59 | % | | | 0.59 | % |
| MSCI Emerging Markets Index | | | 26.45 | % | | | 26.45 | % | | | 5.70 | % | | | 5.70 | % | | | 4.89 | % | | | 4.89 | % |
| S&P 500 Index | | | 23.63 | % | | | 23.63 | % | | | 10.77 | % | | | 10.77 | % | | | 12.17 | % | | | 12.17 | % |
Growth of a $10,000 Investment
(At Net Asset Value)
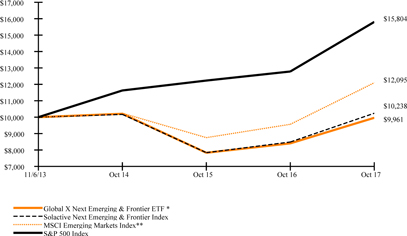
*Fund commenced operations on November 6, 2013.
**As of March 1, 2017, the Fund changed its broad based benchmark from the S&P 500 Index to the MSCI Emerging Markets Index. The new benchmark is a more appropriate comparison for the Fund.
| Management Discussion of Fund Performance (unaudited) |
| Global X Next Emerging & Frontier ETF |
The MSCI Emerging Markets Index is a free float-adjusted market capitalization index that is designed to measure equity market performance of emerging markets.
The S&P 500 Index is a market capitalization-weighted composite index of 500 large capitalization U.S. companies.
The performance data quoted herein represents past performance and the return and value of an investment in the Fund will fluctuate so that, when redeemed, it may be worth less than its original cost. Past performance is no guarantee of future performance and should not be considered as a representation of the future results of the Fund. The Fund's performance assumes the reinvestment of all dividends and all capital gains. Index returns assume reinvestment of dividends and, unlike the Fund's returns, do not reflect any fees or expenses. If such fees and expenses were included in the index returns, the performance would have been lower. Please note that one cannot invest directly in an unmanaged index.
There are no assurances that the Fund will meet its stated objectives.
The Fund’s holdings and allocations are subject to change and should not be considered recommendations to buy individual securities.
The graph and table do not reflect the deduction of taxes that a shareholder would pay on Fund distributions or the redemption or sale of Fund shares.
See definition of comparative indices above.
| Management Discussion of Fund Performance (unaudited) |
| Global X MSCI Portugal ETF |
Global X MSCI Portugal ETF
The Global X MSCI Portugal ETF (“Fund”) seeks to provide investment results that correspond generally to the price and yield performance, before fees and expenses, of the MSCI All Portugal Plus 25/50 Index (“Underlying Index”). The Fund is passively managed, which means the investment adviser does not attempt to take defensive positions in declining markets. The Fund generally seeks to fully replicate the Underlying Index.
The Underlying Index is designed to represent the performance of the broad Portugal equity universe, while including a minimum number of constituents, as defined by the index provider.
For the 12-month period ended October 31, 2017 (the “reporting period”), the Fund increased 31.88%, while the Hybrid Underlying Index increased 31.85%. The Fund had a net asset value of $9.88 per share on October 31, 2016 and ended the reporting period with a net asset value of $12.49 on October 31, 2017.
During the reporting period, the highest returns came from Caixa Economica Montepio Geral and Mota-Engil, which returned 160.36% and 115.80%, respectively. The worst performers were Cimpor-Cimentos de Portugal and Banco BPI, which returned -31.10% and -18.83%, respectively.
During the reporting period, Portugal’s economic recovery gained momentum. According to Portugal-based National Statistics Institute (INE), in Q1 2017, quarter-over-quarter GDP expanded 1%, improving the year-over-year growth to 2.8%. This was the fastest pace for the country since 2007. Although Portugal’s debt to GDP ratio remained above 125%, increased exports and structural reforms that cut public investment and spending, narrowed the deficit to 2% of GDP. In addition, the country benefitted from the unemployment rate falling below 10% and an upgrade of the country’s credit rating from junk to investment grade are indicators of a strong near-term outlook.
| | | AVERAGE ANNUAL TOTAL RETURN FOR THE YEAR ENDED OCTOBER 31, 2017 | |
| | | One Year Return | | | Three Year Return | | | Annualized Inception to Date* | |
| | | Net Asset Value | | | Market Price | | | Net Asset Value | | | Market Price | | | Net Asset Value | | | Market Price | |
| Global X MSCI Portugal ETF | | | 31.88 | % | | | 32.01 | % | | | 3.20 | % | | | 3.18 | % | | | -1.96 | % | | | -1.93 | % |
| Hybrid FTSE Portugal 20 Index/MSCI All Portugal Plus 25/50 Index** | | | 31.85 | % | | | 31.85 | % | | | 3.22 | % | | | 3.22 | % | | | -1.79 | % | | | -1.79 | % |
| MSCI EAFE Index | | | 23.44 | % | | | 23.44 | % | | | 6.08 | % | | | 6.08 | % | | | 4.70 | % | | | 4.70 | % |
| S&P 500 Index | | | 23.63 | % | | | 23.63 | % | | | 10.77 | % | | | 10.77 | % | | | 12.25 | % | | | 12.25 | % |
Growth of a $10,000 Investment
(At Net Asset Value)
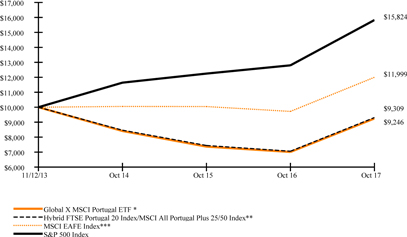
*Fund commenced operations on November 12, 2013.
** Hybrid index performance reflects the performance of the FTSE Portugal 20 Index through December 5, 2016, and the MSCI All Portugal Plus 25/50 Index thereafter.
***As of March 1, 2017, the Fund changed its broad based benchmark from the S&P 500 Index to the MSCI EAFE Index. The new benchmark is a more appropriate comparison for the Fund.
| Management Discussion of Fund Performance (unaudited) |
| Global X MSCI Portugal ETF |
The MSCI EAFE Index (Europe, Australasia, Far East) is a free float-adjusted market capitalization index that is designed to measure the equity market performance of developed markets, excluding the US & Canada.
The S&P 500 Index is a market capitalization-weighted composite index of 500 large capitalization U.S. companies.
The performance data quoted herein represents past performance and the return and value of an investment in the Fund will fluctuate so that, when redeemed, it may be worth less than its original cost. Past performance is no guarantee of future performance and should not be considered as a representation of the future results of the Fund. The Fund's performance assumes the reinvestment of all dividends and all capital gains. Index returns assume reinvestment of dividends and, unlike the Fund's returns, do not reflect any fees or expenses. If such fees and expenses were included in the index returns, the performance would have been lower. Please note that one cannot invest directly in an unmanaged index.
There are no assurances that the Fund will meet its stated objectives.
The Fund’s holdings and allocations are subject to change and should not be considered recommendations to buy individual securities.
The graph and table do not reflect the deduction of taxes that a shareholder would pay on Fund distributions or the redemption or sale of Fund shares.
See definition of comparative indices above and on previous page.
| Management Discussion of Fund Performance (unaudited) |
| Global X MSCI Pakistan ETF |
Global X MSCI Pakistan ETF
The Global X MSCI Pakistan ETF (“Fund”) seeks to provide investment results that correspond generally to the price and yield performance, before fees and expenses, of the MSCI All Pakistan Select 25/50 Index (“Underlying Index”). The Fund is passively managed, which means the investment adviser does not attempt to take defensive positions in declining markets. The Fund generally seeks to fully replicate the Underlying Index.
The Underlying Index is designed to represent the performance of the broad Pakistan equity universe, while including a minimum number of constituents, as defined by the index provider. The broad Pakistan equity universe includes securities that are classified in Pakistan according to the MSCI Global Investable Market Index Methodology, together with companies that are headquartered or listed in Pakistan and carry out the majority of their operations in Pakistan.
For the 12-month period ended October 31, 2017 (the “reporting period”), the Fund decreased 8.25%, while the Underlying Index decreased 6.23%. The Fund had a net asset value of $15.23 per share on October 31, 2016 and ended the reporting period with a net asset value of $13.56 on October 31, 2017.
During the reporting period, the highest returns came from Pakistan Oilfields and Millat Tractors, which returned 59.99% and 39.40%, respectively. The worst performers were Ferozsons Laboratories and K-Electric, which returned -64.29% and -40.92%, respectively.
One of the largest drivers of Pakistan’s stock market performance during the period had little to do with the domestic economy. In June 2017, index provider MSCI added Pakistani equities to the MSCI Emerging Markets Index. Leading up to this addition, stocks hailing from Pakistan experienced periods of significant volume and volatility as the market adjusted to this change. Index changes aside, Pakistan’s economic outlook improved over the period as the country implemented significant economic reforms and the business climate improved. Economic growth was driven mainly by domestic consumption, which constitutes 80% of the GDP. Consumption increased by 8.6% in the country’s financial year ending June 2017.
| | | AVERAGE ANNUAL TOTAL RETURN
FOR THE YEAR ENDED OCTOBER 31, 2017 | |
| | | One Year Return | | | Annualized Inception to Date* | |
| | | Net Asset Value | | | Market Price | | | Net Asset Value | | | Market Price | |
| Global X MSCI Pakistan ETF* | | | -8.25 | % | | | -8.83 | % | | | -2.29 | % | | | -2.51 | % |
| MSCI All Pakistan Select 25/50 Index | | | -6.23 | % | | | -6.23 | % | | | 0.25 | % | | | 0.25 | % |
| MSCI Emerging Markets Index | | | 26.45 | % | | | 26.45 | % | | | 5.22 | % | | | 5.22 | % |
| S&P 500 Index | | | 23.63 | % | | | 23.63 | % | | | 10.54 | % | | | 10.54 | % |
Growth of a $10,000 Investment
(At Net Asset Value)
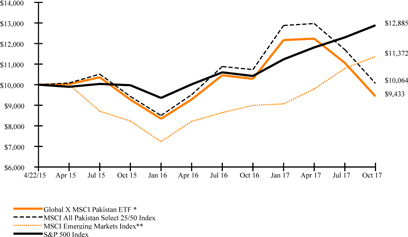
*Fund commenced operations on April 22, 2015.
**As of March 1, 2017, the Fund changed its broad based benchmark from the S&P 500 Index to the MSCI Emerging Markets Index. The new benchmark is a more appropriate comparison for the Fund.
| Management Discussion of Fund Performance (unaudited) |
| Global X MSCI Pakistan ETF |
The MSCI Emerging Markets Index is a free float-adjusted market capitalization index that is designed to measure equity market performance of emerging markets.
The S&P 500 Index is a market capitalization-weighted composite index of 500 large capitalization U.S. companies.
The performance data quoted herein represents past performance and the return and value of an investment in the Fund will fluctuate so that, when redeemed, it may be worth less than its original cost. Past performance is no guarantee of future performance and should not be considered as a representation of the future results of the Fund. The Fund's performance assumes the reinvestment of all dividends and all capital gains. Index returns assume reinvestment of dividends and, unlike the Fund's returns, do not reflect any fees or expenses. If such fees and expenses were included in the index returns, the performance would have been lower. Please note that one cannot invest directly in an unmanaged index.
There are no assurances that the Fund will meet its stated objectives.
The Fund’s holdings and allocations are subject to change and should not be considered recommendations to buy individual securities.
The graph and table do not reflect the deduction of taxes that a shareholder would pay on Fund distributions or the redemption or sale of Fund shares.
See definition of comparative indices above.
| Schedule of Investments | October 31, 2017 |
| Global X China Consumer ETF |
Sector Weightings (unaudited)†:
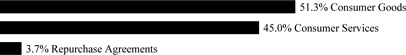
† Sector weightings percentages are based on the total market value of investments. Repurchase agreements purchased from cash collateral received for securities lending activity are included in total investments. Please see Note 2 and Note 8 in Notes to Financial Statements for more detailed information.
| | | Shares | | | Value | |
| COMMON STOCK — 100.0% |
| CHINA— 52.3% | | | | | | | | |
| Consumer Goods — 23.8% | | | | | | | | |
| ANTA Sports Products | | | 885,996 | | | $ | 3,963,350 | |
| BYD, Cl H * (A) | | | 597,800 | | | | 5,237,206 | |
| China Resources Beer Holdings | | | 1,203,888 | | | | 3,471,953 | |
| Dongfeng Motor Group, Cl H | | | 2,473,046 | | | | 3,391,729 | |
| Great Wall Motor, Cl H | | | 2,684,697 | | | | 3,382,626 | |
| Guangzhou Automobile Group, Cl H | | | 1,737,117 | | | | 4,319,525 | |
| Hengan International Group | | | 581,149 | | | | 5,728,211 | |
| Li Ning * | | | 1,498,969 | | | | 1,308,413 | |
| Tingyi Cayman Islands Holding | | | 1,579,925 | | | | 2,490,845 | |
| Tsingtao Brewery, Cl H | | | 60,717 | | | | 254,096 | |
| Want Want China Holdings | | | 4,239,109 | | | | 3,466,574 | |
| | | | | | | | 37,014,528 | |
| Consumer Services — 28.5% | | | | | | | | |
| Air China, Cl H | | | 1,472,428 | | | | 1,402,258 | |
| Alibaba Group Holding ADR * | | | 43,385 | | | | 8,021,453 | |
| China Dongxiang Group | | | 296,388 | | | | 55,085 | |
| China Lodging Group ADR * | | | 27,900 | | | | 3,735,531 | |
| China Southern Airlines, Cl H | | | 1,754,891 | | | | 1,295,621 | |
| Ctrip.com International ADR * | | | 139,269 | | | | 6,669,593 | |
| GOME Electrical Appliances Holding (A) | | | 9,114,305 | | | | 1,168,231 | |
| JD.com ADR * | | | 192,150 | | | | 7,209,468 | |
| New Oriental Education & Technology Group ADR | | | 83,656 | | | | 6,963,525 | |
| TAL Education Group ADR * | | | 216,900 | | | | 5,964,750 | |
| Vipshop Holdings ADR * | | | 263,868 | | | | 2,084,557 | |
| | | | | | | | 44,570,072 | |
| TOTAL CHINA | | | | | | | 81,584,600 | |
| HONG KONG— 47.7% | | | | | | | | |
| Consumer Goods — 29.4% | | | | | | | | |
| BAIC Motor, Cl H (B) | | | 911,400 | | | | 1,066,559 | |
| Brilliance China Automotive Holdings | | | 2,513,800 | | | | 6,353,936 | |
| China Agri-Industries Holdings | | | 1,740,056 | | | | 849,754 | |
| China Foods | | | 618,813 | | | | 391,031 | |
| China Mengniu Dairy * | | | 2,061,252 | | | | 5,706,766 | |
| Geely Automobile Holdings | | | 2,216,300 | | | | 6,860,423 | |
The accompanying notes are an integral part of the financial statements.
| Schedule of Investments | October 31, 2017 |
| Global X China Consumer ETF |
| | | Shares/Face
Amount | | | Value | |
| COMMON STOCK — continued |
| Consumer Goods — continued | | | | | | | | |
| Health and Happiness H&H International Holdings * | | | 157,700 | | | $ | 823,691 | |
| Li & Fung | | | 4,885,800 | | | | 2,461,123 | |
| Shenzhou International Group Holdings | | | 626,162 | | | | 5,345,227 | |
| Skyworth Digital Holdings | | | 1,594,787 | | | | 733,842 | |
| Techtronic Industries | | | 1,189,000 | | | | 6,972,333 | |
| Uni-President China Holdings | | | 1,097,543 | | | | 917,222 | |
| WH Group (B) | | | 7,416,600 | | | | 7,509,952 | |
| | | | | | | | 45,991,859 | |
| Consumer Services — 18.3% | | | | | | | | |
| China ZhengTong Auto Services Holdings | | | 715,500 | | | | 752,936 | |
| Chow Tai Fook Jewellery Group | | | 919,379 | | | | 960,411 | |
| Galaxy Entertainment Group * | | | 1,124,800 | | | | 7,655,526 | |
| Melco Crown Entertainment ADR | | | 326,731 | | | | 8,259,760 | |
| Melco International Development | | | 543,000 | | | | 1,485,945 | |
| MTR | | | 1,311,000 | | | | 7,595,324 | |
| Sun Art Retail Group | | | 1,789,625 | | | | 1,807,563 | |
| | | | | | | | 28,517,465 | |
| TOTAL HONG KONG | | | | | | | 74,509,324 | |
| TOTAL COMMON STOCK | | | | | | | | |
| (Cost $130,740,254) | | | | | | | 156,093,924 | |
|
| REPURCHASE AGREEMENTS (C) — 3.9% |
| Barclays Bank | | | | | | | | |
| 1.050%, dated 10/31/17, to be repurchased on 11/01/17 repurchase price $3,552,644 (collateralized by U.S Treasury Obligations, ranging in par value $0-$1,184,763, 0.000%-9.000%, 11/15/17-08/15/47, with a total market value of $3,623,591) | | $ | 3,552,540 | | | | 3,552,540 | |
| Deutsche Bank | | | | | | | | |
| 1.040%, dated 10/31/17, to be repurchased on 11/01/17 repurchase price $2,428,047 (collateralized by U.S. Treasury Obligations, par value $2,353,681, 3.625%, 02/15/20 with a total market value of $2,474,691) | | | 2,427,977 | | | | 2,427,977 | |
| TOTAL REPURCHASE AGREEMENTS | | | | | | | | |
| (Cost $5,980,517) | | | | | | | 5,980,517 | |
| TOTAL INVESTMENTS — 103.9% | | | | | | | | |
| (Cost $136,720,771) | | | | | | $ | 162,074,441 | |
Percentages are based on Net Assets of $156,049,577.
| * | Non-income producing security. |
| (A) | This security or a partial position of this security is on loan at October 31, 2017. The total value of securities on loan at October 31, 2017 was $5,626,645. |
| (B) | Security sold within terms of a private placement memorandum, exempt from registration under Section 144A of the Securities Act of 1933, as amended, and may be sold only to dealers in that program or other "accredited investors." The total value of such securities as of October 31, 2017 was $8,576,511 and represents 5.5% of Net Assets. |
| (C) | Security was purchased with cash collateral held from securities on loan. The total value of such securities as of October 31, 2017 was $5,980,517. |
The accompanying notes are an integral part of the financial statements.
| Schedule of Investments | October 31, 2017 |
| Global X China Consumer ETF |
ADR — American Depositary Receipt
Cl — Class
The following is a summary of the level of inputs used as of October 31, 2017, in valuing the Fund's investments carried at value:
| Investments in Securities | | Level 1 | | | Level 2 | | | Level 3 | | | Total | |
| Common Stock | | $ | 156,093,924 | | | $ | — | | | $ | — | | | $ | 156,093,924 | |
| Repurchase Agreements | | | — | | | | 5,980,517 | | | | — | | | | 5,980,517 | |
| Total Investments in Securities | | $ | 156,093,924 | | | $ | 5,980,517 | | | $ | — | | | $ | 162,074,441 | |
|
For the year ended October 31, 2017, there have been no transfers between Level 1, Level 2 or Level 3 investments.
As of October 31, 2017, there were no Level 3 investments.
The accompanying notes are an integral part of the financial statements.
| Schedule of Investments | October 31, 2017 |
| Global X China Energy ETF |
Sector Weightings (unaudited)†:
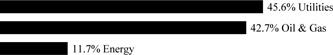
† Sector weightings percentages are based on the total market value of investments.
| | | Shares | | | Value | |
| COMMON STOCK — 99.9% |
| CHINA— 43.5% | | | | | | | | |
| Energy — 8.0% | | | | | | | | |
| China Coal Energy, Cl H | | | 34,341 | | | $ | 15,714 | |
| China Shenhua Energy, Cl H | | | 33,930 | | | | 81,065 | |
| Honghua Group * | | | 36,000 | | | | 3,461 | |
| Tianneng Power International | | | 10,815 | | | | 10,424 | |
| Yanzhou Coal Mining, Cl H | | | 29,125 | | | | 29,043 | |
| | | | | | | | 139,707 | |
| Oil & Gas — 23.3% | | | | | | | | |
| China Longyuan Power Group, Cl H | | | 50,966 | | | | 37,758 | |
| China Oilfield Services, Cl H | | | 29,686 | | | | 26,292 | |
| China Petroleum & Chemical, Cl H | | | 235,297 | | | | 172,813 | |
| Huaneng Renewables, Cl H | | | 78,340 | | | | 26,911 | |
| JA Solar Holdings ADR * | | | 700 | | | | 5,215 | |
| JinkoSolar Holding ADR * | | | 322 | | | | 8,575 | |
| Kunlun Energy | | | 50,325 | | | | 46,637 | |
| PetroChina, Cl H | | | 128,763 | | | | 84,007 | |
| | | | | | | | 408,208 | |
| Utilities — 12.2% | | | | | | | | |
| CGN Power, Cl H (A) | | | 166,360 | | | | 48,830 | |
| Datang International Power Generation, Cl H * | | | 46,512 | | | | 15,679 | |
| ENN Energy Holdings | | | 11,231 | | | | 82,342 | |
| Huadian Fuxin Energy, Cl H | | | 42,060 | | | | 10,944 | |
| Huadian Power International, Cl H | | | 26,701 | | | | 11,089 | |
| Huaneng Power International, Cl H | | | 69,451 | | | | 46,468 | |
| | | | | | | | 215,352 | |
| TOTAL CHINA | | | | | | | 763,267 | |
The accompanying notes are an integral part of the financial statements.
| Schedule of Investments | October 31, 2017 |
| Global X China Energy ETF |
| | | Shares | | | Value | |
| COMMON STOCK — continued |
| HONG KONG— 56.4% | | | | | | | | |
| Energy — 3.8% | | | | | | | | |
| Beijing Enterprises Holdings | | | 7,863 | | | $ | 46,714 | |
| Canvest Environmental Protection Group | | | 16,000 | | | | 8,921 | |
| Shougang Fushan Resources Group | | | 47,715 | | | | 10,275 | |
| | | | | | | | 65,910 | |
| Oil & Gas — 19.2% | | | | | | | | |
| Beijing Gas Blue Sky Holdings * | | | 80,000 | | | | 5,435 | |
| China Gas Holdings | | | 26,617 | | | | 80,856 | |
| CNOOC | | | 134,285 | | | | 182,792 | |
| GCL-Poly Energy Holdings * | | | 200,321 | | | | 34,406 | |
| Panda Green Energy Group * | | | 72,800 | | | | 11,011 | |
| Shunfeng International Clean Energy * | | | 42,700 | | | | 2,846 | |
| Sinopec Kantons Holdings | | | 14,100 | | | | 9,127 | |
| Xinjiang Goldwind Science & Technology, Cl H | | | 9,978 | | | | 12,636 | |
| | | | | | | | 339,109 | |
| Utilities — 33.4% | | | | | | | | |
| Beijing Jingneng Clean Energy, Cl H | | | 30,300 | | | | 8,466 | |
| China Power International Development | | | 53,574 | | | | 17,030 | |
| China Resources Gas Group | | | 13,170 | | | | 48,194 | |
| China Resources Power Holdings | | | 29,201 | | | | 56,143 | |
| China Suntien Green Energy, Cl H | | | 26,500 | | | | 7,506 | |
| CLP Holdings | | | 17,070 | | | | 173,614 | |
| Concord New Energy Group | | | 74,590 | | | | 3,633 | |
| Hong Kong & China Gas | | | 92,163 | | | | 174,597 | |
| Power Assets Holdings | | | 9,480 | | | | 82,141 | |
| Towngas China * | | | 14,800 | | | | 12,141 | |
| | | | | | | | 583,465 | |
| TOTAL HONG KONG | | | | | | | 988,484 | |
| TOTAL INVESTMENTS — 99.9% | | | | | | | | |
| (Cost $2,082,662) | | | | | | $ | 1,751,751 | |
Percentages are based on Net Assets of $1,753,491.
| * | Non-income producing security. |
| (A) | Security sold within terms of a private placement memorandum, exempt from registration under Section 144A of the Securities Act of 1933, as amended, and may be sold only to dealers in that program or other "accredited investors." The total value of such securities as of October 31, 2017 was $48,830 and represents 2.8% of Net Assets. |
ADR — American Depositary Receipt
Cl — Class
As of October 31, 2017, all of the Fund's investments were considered Level 1, in accordance with authoritative guidance on fair value measurements and disclosure under U.S. GAAP.
For the year ended October 31, 2017, there have been no transfers between Level 1, Level 2 or Level 3 investments.
The accompanying notes are an integral part of the financial statements.
| Schedule of Investments | October 31, 2017 |
| Global X China Financials ETF |
Sector Weightings (unaudited)†:

† Sector weightings percentages are based on the total market value of investments.
| | | Shares | | | Value | |
| COMMON STOCK — 99.9% |
| CHINA— 52.1% | | | | | | | | |
| Financials — 52.1% | | | | | | | | |
| Agile Group Holdings | | | 129,212 | | | $ | 188,142 | |
| Agricultural Bank of China, Cl H | | | 2,610,288 | | | | 1,227,891 | |
| Bank of China, Cl H | | | 4,612,334 | | | | 2,299,723 | |
| Bank of Communications, Cl H | | | 667,271 | | | | 502,904 | |
| China Citic Bank, Cl H | | | 857,922 | | | | 552,022 | |
| China Construction Bank, Cl H | | | 5,652,926 | | | | 5,042,985 | |
| China Galaxy Securities, Cl H | | | 338,700 | | | | 295,209 | |
| China Life Insurance, Cl H | | | 687,440 | | | | 2,273,315 | |
| China Merchants Bank, Cl H | | | 379,634 | | | | 1,447,629 | |
| China Minsheng Banking, Cl H | | | 551,055 | | | | 533,270 | |
| China Pacific Insurance Group, Cl H | | | 256,012 | | | | 1,261,717 | |
| CITIC Securities, Cl H | | | 204,996 | | | | 455,091 | |
| Country Garden Holdings | | | 687,197 | | | | 1,088,692 | |
| Guangzhou R&F Properties | | | 86,193 | | | | 183,615 | |
| Industrial & Commercial Bank of China, Cl H | | | 6,257,737 | | | | 4,964,930 | |
| Longfor Properties | | | 130,438 | | | | 304,620 | |
| PICC Property & Casualty, Cl H | | | 424,242 | | | | 840,676 | |
| Ping An Insurance Group of China, Cl H | | | 290,514 | | | | 2,550,720 | |
| Sino-Ocean Group Holding | | | 259,152 | | | | 169,074 | |
| TOTAL CHINA | | | | | | | 26,182,225 | |
| HONG KONG— 47.8% | | | | | | | | |
| Financials — 47.8% | | | | | | | | |
| AIA Group | | | 644,800 | | | | 4,851,414 | |
| BOC Hong Kong Holdings | | | 331,200 | | | | 1,577,082 | |
| China Cinda Asset Management, Cl H | | | 980,000 | | | | 380,604 | |
| China Everbright | | | 79,641 | | | | 188,849 | |
| China Evergrande Group * | | | 201,161 | | | | 774,807 | |
| China Overseas Land & Investment | | | 452,566 | | | | 1,467,600 | |
| China Resources Land | | | 246,308 | | | | 734,018 | |
| China Taiping Insurance Holdings | | | 136,330 | | | | 449,086 | |
| China Vanke, Cl H | | | 120,900 | | | | 430,026 | |
| CK Asset Holdings | | | 233,650 | | | | 1,921,178 | |
| CK Hutchison Holdings | | | 186,950 | | | | 2,373,478 | |
| Haitong Securities, Cl H | | | 284,100 | | | | 449,357 | |
| Hong Kong Exchanges & Clearing | | | 84,930 | | | | 2,364,428 | |
| KWG Property Holding | | | 120,185 | | | | 119,233 | |
| New China Life Insurance, Cl H | | | 86,211 | | | | 538,694 | |
The accompanying notes are an integral part of the financial statements.
| Schedule of Investments | October 31, 2017 |
| Global X China Financials ETF |
| | | Shares | | | Value | |
| COMMON STOCK — continued |
| Financials — continued | | | | | | | | |
| New World Development | | | 504,000 | | | $ | 750,658 | |
| People's Insurance Group of China, Cl H | | | 642,800 | | | | 305,672 | |
| Shimao Property Holdings | | | 98,804 | | | | 206,934 | |
| Sun Hung Kai Properties | | | 134,550 | | | | 2,200,592 | |
| Sunac China Holdings | | | 182,800 | | | | 930,190 | |
| Wharf Holdings | | | 108,450 | | | | 986,250 | |
| TOTAL HONG KONG | | | | | | | 24,000,150 | |
| TOTAL INVESTMENTS — 99.9% | | | | | | | | |
| (Cost $43,815,344) | | | | | | $ | 50,182,375 | |
Percentages are based on Net Assets of $50,251,319.
| * | Non-income producing security. |
Cl — Class
| As of October 31, 2017, all of the Fund's investments were considered Level 1, in accordance with authoritative guidance on fair value measurements and disclosure under U.S. GAAP. |
For the year ended October 31, 2017, there have been no transfers between Level 1, Level 2 or Level 3 investments.
The accompanying notes are an integral part of the financial statements.
| Schedule of Investments | October 31, 2017 |
| Global X China Industrials ETF |
Sector Weightings (unaudited)†:
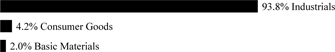
† Sector weightings percentages are based on the total market value of investments.
| | | Shares | | | Value | |
| COMMON STOCK — 99.8% |
| CHINA— 55.6% | | | | | | | | |
| Industrials — 55.6% | | | | | | | | |
| Anhui Conch Cement, Cl H | | | 47,877 | | | $ | 204,658 | |
| BYD, Cl H * | | | 19,214 | | | | 168,330 | |
| China Communications Construction, Cl H | | | 150,143 | | | | 182,247 | |
| China COSCO Holdings, Cl H * | | | 124,432 | | | | 68,262 | |
| China Lesso Group Holdings | | | 45,855 | | | | 30,622 | |
| China National Building Material, Cl H | | | 139,037 | | | | 117,263 | |
| China Railway Construction, Cl H | | | 90,801 | | | | 113,940 | |
| China Railway Group, Cl H | | | 187,198 | | | | 150,444 | |
| China Shanshui Cement Group *(A) (B) (C) | | | 243,752 | | | | 312 | |
| China Shipping Container Lines, Cl H * | | | 175,482 | | | | 39,362 | |
| China Shipping Development, Cl H (C) | | | 64,184 | | | | 37,221 | |
| CRRC | | | 201,553 | | | | 198,665 | |
| Guangshen Railway, Cl H | | | 68,848 | | | | 40,064 | |
| Haitian International Holdings | | | 31,226 | | | | 93,456 | |
| Hollysys Automation Technologies | | | 2,598 | | | | 58,325 | |
| Jiangsu Expressway, Cl H | | | 58,919 | | | | 90,321 | |
| Metallurgical Corp of China, Cl H | | | 138,201 | | | | 45,702 | |
| Shanghai Electric Group, Cl H * | | | 132,771 | | | | 60,244 | |
| Sinotrans, Cl H | | | 98,200 | | | | 47,201 | |
| Weichai Power, Cl H | | | 93,796 | | | | 116,617 | |
| Yangzijiang Shipbuilding Holdings | | | 109,273 | | | | 126,325 | |
| Zhejiang Expressway, Cl H | | | 70,140 | | | | 86,756 | |
| Zhuzhou CRRC Times Electric, Cl H | | | 26,423 | | | | 154,606 | |
| TOTAL CHINA | | | | | | | 2,230,943 | |
| HONG KONG— 44.2% | | | | | | | | |
| Industrials — 44.2% | | | | | | | | |
| AviChina Industry & Technology, Cl H | | | 100,190 | | | | 58,174 | |
| Beijing Capital International Airport, Cl H | | | 68,731 | | | | 112,763 | |
| Beijing Enterprises Water Group | | | 224,330 | | | | 188,336 | |
| China Everbright International | | | 115,250 | | | | 162,495 | |
| China High Speed Transmission Equipment Group | | | 19,050 | | | | 20,755 | |
The accompanying notes are an integral part of the financial statements.
| Schedule of Investments | October 31, 2017 |
| Global X China Industrials ETF |
| | | Shares | | | Value | |
| COMMON STOCK — continued |
| Industrials — continued | | | | | | | | |
| China International Marine Containers Group, Cl H | | | 18,380 | | | $ | 36,610 | |
| China Merchants Holdings International | | | 58,431 | | | | 182,742 | |
| China Resources Cement Holdings | | | 83,821 | | | | 56,620 | |
| China State Construction International Holdings | | | 85,610 | | | | 120,265 | |
| COSCO Pacific | | | 80,330 | | | | 93,079 | |
| Guangdong Investment | | | 133,660 | | | | 193,591 | |
| Lee & Man Paper Manufacturing | | | 66,800 | | | | 81,512 | |
| Noble Group * | | | 49,680 | | | | 10,575 | |
| Orient Overseas International | | | 9,400 | | | | 90,484 | |
| Shanghai Industrial Holdings | | | 21,939 | | | | 67,348 | |
| Shenzhen International Holdings | | | 41,706 | | | | 79,651 | |
| Sunny Optical Technology Group | | | 12,804 | | | | 187,420 | |
| Zoomlion Heavy Industry Science and Technology | | | 68,500 | | | | 33,189 | |
| TOTAL HONG KONG | | | | | | | 1,775,609 | |
| TOTAL INVESTMENTS — 99.8% | | | | | | | | |
| (Cost $4,557,042) | | | | | | $ | 4,006,552 | |
Percentages are based on Net Assets of $4,015,019.
| * | Non-income producing security. |
| (A) | Level 3 security in accordance with fair value hierarchy. |
| (B) | Security considered illiquid. The total value of such securities as of October 31, 2017 was $312 and represented 0.0% of Net Assets. |
| (C) | Security is fair valued using methods determined in good faith by the Fair Value Committee of the Fund. The total value of such securities as of October 31, 2017, was $37,533 and represents 0.9% of Net Assets. |
Cl — Class
The following is a summary of the level of inputs used as of October 31, 2017, in valuing the Fund's investments carried at value:
| Investments in Securities | | Level 1 | | | Level 2 | | | Level 3 | | | Total | |
| Common Stock | | $ | 3,969,019 | | | $ | — | | | $ | 37,533 | | | $ | 4,006,552 | |
| Total Investments in Securities | | $ | 3,969,019 | | | $ | — | | | $ | 37,533 | | | $ | 4,006,552 | |
The following is a reconciliation of investments in which significant unobservable inputs (Level 3) were used in determining fair value:
| | | Investments in
Common Stock | |
| | | | |
| Beginning Balance as of October 31, 2016 | | $ | 7,931 | |
| Transfers into Level 3 | | | 37,221 | |
| Net sales | | | (20,846 | ) |
| Realized gain (loss) | | | 68,397 | |
| Change in unrealized appreciation (depreciation) | | | (55,170 | ) |
| Ending Balance as of October 31, 2017 | | $ | 37,533 | |
For the year ended October 31, 2017, the transfers in and out of Level 3 were due to changes in the availability of observable inputs to determine fair value. Transfers between levels are recognized at period end.
The accompanying notes are an integral part of the financial statements.
| Schedule of Investments | October 31, 2017 |
| Global X China Materials ETF |
Sector Weightings (unaudited)†:

† Sector weightings percentages are based on the total market value of investments.
| | | Shares | | | Value | |
| COMMON STOCK — 99.0% |
| CHINA— 54.6% | | | | | | | | |
| Basic Materials — 54.6% | | | | | | | | |
| Aluminum Corp of China, Cl H * | | | 281,339 | | | $ | 226,462 | |
| Angang Steel, Cl H | | | 256,424 | | | | 224,484 | |
| BBMG, Cl H | | | 499,740 | | | | 249,172 | |
| China BlueChemical * | | | 417,809 | | | | 124,778 | |
| China Hongqiao Group | | | 110,642 | | | | 132,740 | |
| China Molybdenum, Cl H | | | 426,154 | | | | 276,936 | |
| Dongyue Group | | | 250,000 | | | | 181,689 | |
| Fosun International | | | 106,340 | | | | 263,608 | |
| Jiangxi Copper, Cl H | | | 149,491 | | | | 238,364 | |
| Maanshan Iron & Steel, Cl H * | | | 408,425 | | | | 191,601 | |
| Real Gold Mining *(A) (B) (C) | | | 97,864 | | | | — | |
| Sinofert Holdings * | | | 414,230 | | | | 73,270 | |
| Sinopec Shanghai Petrochemical, Cl H | | | 409,450 | | | | 244,039 | |
| Sinopec Yizheng Chemical Fibre, Cl H * | | | 493,214 | | | | 84,712 | |
| Zhaojin Mining Industry | | | 236,884 | | | | 194,625 | |
| Zijin Mining Group, Cl H | | | 694,159 | | | | 240,230 | |
| TOTAL CHINA | | | | | | | 2,946,710 | |
| HONG KONG— 44.4% | | | | | | | | |
| Basic Materials — 44.4% | | | | | | | | |
| China Lumena New Materials *(A) (B) (C) | | | 1,950 | | | | — | |
| China Metal Resources Utilization * (D) | | | 214,100 | | | | 83,974 | |
| China Oriental Group | | | 209,900 | | | | 137,211 | |
| China Sanjiang Fine Chemicals | | | 115,600 | | | | 49,341 | |
| China Silver Group | | | 258,900 | | | | 89,267 | |
| Citic Pacific | | | 169,340 | | | | 247,874 | |
| CPMC Holdings | | | 84,000 | | | | 70,415 | |
| E-Commodities Holdings | | | 719,800 | | | | 70,118 | |
| Fufeng Group * | | | 359,254 | | | | 258,787 | |
| Hengxing Gold Holding | | | 54,000 | | | | 44,020 | |
| IRC * | | | 828,100 | | | | 27,066 | |
| Kingboard Chemical Holdings | | | 45,000 | | | | 266,765 | |
| Kingboard Laminates Holdings | | | 153,300 | | | | 257,406 | |
| MMG * | | | 497,000 | | | | 224,872 | |
| Mobile Internet China Holding * | | | 105,000 | | | | 30,147 | |
| Munsun Capital Group * | | | 2,196,400 | | | | 20,270 | |
| Nine Dragons Paper Holdings | | | 119,670 | | | | 219,651 | |
| TCC International Holdings (A) (B) (C) | | | 421,540 | | | | 194,512 | |
The accompanying notes are an integral part of the financial statements.
| Schedule of Investments | October 31, 2017 |
| Global X China Materials ETF |
| | | Shares | | | Value | |
| COMMON STOCK — continued |
| Basic Materials — continued | | | | | | | | |
| West China Cement * | | | 482,860 | | | $ | 76,745 | |
| Xiwang Special Steel * | | | 141,000 | | | | 26,748 | |
| TOTAL HONG KONG | | | | | | | 2,395,189 | |
| TOTAL INVESTMENTS — 99.0% | | | | | | | | |
| (Cost $4,961,881) | | | | | | $ | 5,341,899 | |
Percentages are based on Net Assets of $5,397,099.
| * | Non-income producing security. |
| (A) | Level 3 security in accordance with fair value hierarchy. |
| (B) | Security considered illiquid. The total value of such securities as of October 31, 2017 was $194,512 and represented 3.6% of Net Assets. |
| (C) | Security is fair valued using methods determined in good faith by the Fair Value Committee of the Fund. The total value of such securities as of October 31, 2017, was $194,512 and represents 3.6% of Net Assets. |
| (D) | Security sold within terms of a private placement memorandum, exempt from registration under Section 144A of the Securities Act of 1933, as amended, and may be sold only to dealers in that program or other "accredited investors." The total value of such securities as of October 31, 2017 was $83,974 and represents 1.6% of Net Assets. |
Cl — Class
The following is a summary of the level of inputs used as of October 31, 2017, in valuing the Fund's investments carried at value:
| Investments in Securities | | Level 1 | | | Level 2 | | | Level 3 | | | Total | |
| Common Stock | | $ | 5,147,387 | | | $ | — | | | $ | 194,512 | | | $ | 5,341,899 | |
| Total Investments in Securities | | $ | 5,147,387 | | | $ | — | | | $ | 194,512 | | | $ | 5,341,899 | |
The following is a reconciliation of investments in which significant unobservable inputs (Level 3) were used in determining fair value:
| | | Investments in
Common Stock | |
| | | | |
| Beginning Balance as of October 31, 2016 | | $ | 5,448 | |
| Transfers out of Level 3 | | | (181,689 | ) |
| Transfers into Level 3 | | | 194,512 | |
| Net purchases | | | 182,701 | |
| Net sales | | | (38,415 | ) |
| Realized gain (loss) | | | (22,787 | ) |
| Change in unrealized appreciation (depreciation) | | | 54,742 | |
| Ending Balance as of October 31, 2017 | | $ | 194,512 | |
For the year ended October 31, 2017, the transfers in and out of Level 3 were due to changes in the availability of observable inputs to determine fair value. Transfers between levels are recognized at period end.
The accompanying notes are an integral part of the financial statements.
| Schedule of Investments | October 31, 2017 |
| Global X NASDAQ China Technology ETF |
Sector Weightings (unaudited)†:

† Sector weightings percentages are based on the total market value of investments.
| | | Shares | | | Value | |
| COMMON STOCK — 100.9% |
| CHINA— 62.9% | | | | | | | | |
| Technology — 62.9% | | | | | | | | |
| 21Vianet Group ADR * | | | 12,670 | | | $ | 95,152 | |
| 500.com ADR, Cl A * | | | 5,372 | | | | 50,551 | |
| Autohome ADR * | | | 10,768 | | | | 619,268 | |
| Baidu ADR * | | | 6,075 | | | | 1,481,936 | |
| Baozun ADR * | | | 10,298 | | | | 323,254 | |
| China Communications Services, Cl H | | | 635,953 | | | | 385,559 | |
| Coolpad Group * (A) (B) (C) | | | 777,435 | | | | 35,873 | |
| Kingdee International Software Group * | | | 518,989 | | | | 278,061 | |
| Kingsoft | | | 260,300 | | | | 657,272 | |
| Lenovo Group | | | 1,289,273 | | | | 746,945 | |
| NetEase ADR | | | 5,023 | | | | 1,416,084 | |
| NQ Mobile ADR, Cl A * | | | 24,038 | | | | 88,460 | |
| O-Net Technologies Group * | | | 112,600 | | | | 81,400 | |
| SINA * | | | 13,606 | | | | 1,464,686 | |
| Sohu.com * | | | 6,910 | | | | 395,459 | |
| Tian Ge Interactive Holdings (D) | | | 171,200 | | | | 125,079 | |
| Travelsky Technology, Cl H | | | 227,595 | | | | 589,277 | |
| Weibo ADR * | | | 15,142 | | | | 1,402,906 | |
| YY ADR * | | | 11,201 | | | | 1,012,458 | |
| ZTE, Cl H * | | | 203,383 | | | | 705,159 | |
| TOTAL CHINA | | | | | | | 11,954,839 | |
| HONG KONG— 38.0% | | | | | | | | |
| Technology — 38.0% | | | | | | | | |
| Alibaba Health Information Technology * | | | 850,009 | | | | 455,413 | |
| ASM Pacific Technology | | | 57,033 | | | | 829,712 | |
| BYD Electronic International | | | 178,781 | | | | 483,514 | |
| China Goldjoy Group | | | 2,003,500 | | | | 154,080 | |
| Chinasoft International * | | | 564,256 | | | | 329,073 | |
| Digital China Holdings * | | | 208,448 | | | | 126,109 | |
| FIH Mobile | | | 812,909 | | | | 255,278 | |
| HKBN | | | 153,470 | | | | 155,795 | |
| Legend Holdings, Cl H (D) | | | 100,900 | | | | 265,125 | |
| Meitu * (D) | | | 457,600 | | | | 674,511 | |
| Nanfang Communication Holdings | | | 80,200 | | | | 41,941 | |
| National Agricultural Holdings *(A) (B) (C) | | | 204,200 | | | | 14,016 | |
| PAX Global Technology | | | 165,780 | | | | 83,933 | |
| Semiconductor Manufacturing International * | | | 750,121 | | | | 1,149,920 | |
The accompanying notes are an integral part of the financial statements.
| Schedule of Investments | October 31, 2017 |
| Global X NASDAQ China Technology ETF |
| | | Shares | | | Value | |
| COMMON STOCK — continued |
| Technology — continued | | | | | | | | |
| Sinosoft Technology Group | | | 108,300 | | | $ | 33,176 | |
| Tencent Holdings | | | 33,525 | | | | 1,503,120 | |
| VTech Holdings | | | 34,180 | | | | 485,857 | |
| Yangtze Optical Fibre and Cable Joint Stock, Cl H (D) | | | 48,700 | | | | 181,335 | |
| TOTAL HONG KONG | | | | | | | 7,221,908 | |
| TOTAL COMMON STOCK | | | | | | | | |
| (Cost $14,687,525) | | | | | | | 19,176,747 | |
| | | Number Of
Rights | | | | |
| RIGHTS — 0.0% | | | | | | | | |
| | | | | | | | | |
HONG KONG— 0.00% Tencent Holdings * (A) (B) (C) (Cost $–) | | | 24 | | | | — | |
| TOTAL INVESTMENTS — 100.9% | | | | | | | | |
| (Cost $14,687,525) | | | | | | $ | 19,176,747 | |
Percentages are based on Net Assets of $19,007,019.
| * | Non-income producing security. |
| (A) | Level 3 security in accordance with fair value hierarchy. |
| (B) | Security considered illiquid. The total value of such securities as of October 31, 2017 was $49,889 and represented 0.3% of Net Assets. |
| (C) | Security is fair valued using methods determined in good faith by the Fair Value Committee of the Fund. The total value of such securities as of October 31, 2017, was $49,889 and represents 0.3% of Net Assets. |
| (D) | Security sold within terms of a private placement memorandum, exempt from registration under Section 144A of the Securities Act of 1933, as amended, and may be sold only to dealers in that program or other "accredited investors." The total value of such securities as of October 31, 2017 was $1,246,050 and represents 6.6% of Net Assets. |
ADR — American Depositary Receipt
Cl — Class
Amounts designated as “—” are either $0 or have been rounded to $0.
The following is a summary of the level of inputs used as of October 31, 2017, in valuing the Fund's investments carried at value:
| Investments in Securities | | Level 1 | | | Level 2 | | | Level 3(1) | | | Total | |
| Common Stock | | $ | 19,126,858 | | | $ | — | | | $ | 49,889 | | | $ | 19,176,747 | |
| Rights | | | — | | | | — | | | | — | (2) | | | — | |
| Total Investments in Securities | | $ | 19,126,858 | | | $ | — | | | $ | 49,889 | | | $ | 19,176,747 | |
(1) A reconciliation of Level 3 investments and disclosures of significant unobservable inputs are presented when the Fund
has a significant amount of Level 3 investments at the beginning and/or end of the period in relation to Net Assets. Management has concluded that Level 3 investments are not material in relation to Net Assets.
(2) Amounts designated as “—“ are $0 or have been rounded to $0.
For the year ended October 31, 2017, the transfers into Level 3 were due to changes in the availability of observable inputs to determine fair value. Transfers between levels are recognized at period end.
The accompanying notes are an integral part of the financial statements.
| Schedule of Investments | October 31, 2017 |
| Global X FTSE Southeast Asia ETF |
Sector Weightings (unaudited)†:
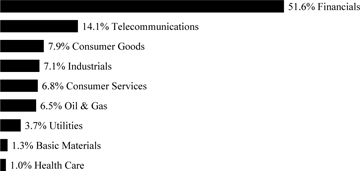
† Sector weightings percentages are based on the total market value of investments.
| | | Shares | | | Value | |
| COMMON STOCK — 99.8% |
| INDONESIA— 18.4% | | | | | | | | |
| Consumer Goods — 5.4% | | | | | | | | |
| Astra International | | | 744,981 | | | $ | 439,436 | |
| Gudang Garam | | | 16,900 | | | | 87,226 | |
| Hanjaya Mandala Sampoerna | | | 317,800 | | | | 93,260 | |
| Unilever Indonesia | | | 42,176 | | | | 154,244 | |
| | | | | | | | 774,166 | |
| Financials — 9.4% | | | | | | | | |
| Bank Central Asia | | | 355,296 | | | | 547,516 | |
| Bank Mandiri | | | 681,380 | | | | 354,192 | |
| Bank Rakyat Indonesia Persero | | | 389,640 | | | | 448,176 | |
| | | | | | | | 1,349,884 | |
| Telecommunications — 3.6% | | | | | | | | |
| Telekomunikasi Indonesia Persero | | | 1,732,400 | | | | 514,770 | |
| TOTAL INDONESIA | | | | | | | 2,638,820 | |
| MALAYSIA— 21.7% | | | | | | | | |
| Basic Materials — 1.3% | | | | | | | | |
| Petronas Chemicals Group | | | 104,724 | | | | 182,312 | |
| Financials — 9.4% | | | | | | | | |
| CIMB Group Holdings | | | 234,675 | | | | 340,358 | |
| Malayan Banking | | | 211,431 | | | | 461,967 | |
| Public Bank | | | 113,559 | | | | 548,817 | |
| | | | | | | | 1,351,142 | |
| Health Care — 0.9% | | | | | | | | |
| IHH Healthcare | | | 101,680 | | | | 135,461 | |
| Industrials — 2.0% | | | | | | | | |
| Sime Darby | | | 129,796 | | | | 282,065 | |
| Oil & Gas — 0.9% | | | | | | | | |
| Petronas Gas | | | 28,779 | | | | 122,635 | |
The accompanying notes are an integral part of the financial statements.
| Schedule of Investments | October 31, 2017 |
| Global X FTSE Southeast Asia ETF |
| | | Shares | | | Value | |
| COMMON STOCK — continued |
| Telecommunications — 3.5% | | | | | | | | |
| Axiata Group | | | 160,888 | | | $ | 204,839 | |
| DiGi.com | | | 135,600 | | | | 160,151 | |
| Maxis | | | 100,006 | | | | 140,554 | |
| | | | | | | | 505,544 | |
| Utilities — 3.7% | | | | | | | | |
| Tenaga Nasional | | | 150,145 | | | | 531,989 | |
| TOTAL MALAYSIA | | | | | | | 3,111,148 | |
| PHILIPPINES— 6.6% | | | | | | | | |
| Consumer Goods — 1.2% | | | | | | | | |
| JG Summit Holdings | | | 112,020 | | | | 166,864 | |
| Consumer Services — 2.3% | | | | | | | | |
| SM Investments | | | 17,740 | | | | 328,168 | |
| Financials — 3.1% | | | | | | | | |
| Ayala Land | | | 253,060 | | | | 211,761 | |
| SM Prime Holdings | | | 329,600 | | | | 236,227 | |
| | | | | | | | 447,988 | |
| TOTAL PHILIPPINES | | | | | | | 943,020 | |
| SINGAPORE— 31.0% | | | | | | | | |
| Consumer Goods — 1.2% | | | | | | | | |
| Wilmar International | | | 71,051 | | | | 176,793 | |
| Consumer Services — 1.7% | | | | | | | | |
| Jardine Cycle & Carriage | | | 3,618 | | | | 104,604 | |
| Singapore Airlines | | | 18,643 | | | | 140,534 | |
| | | | | | | | 245,138 | |
| Financials — 22.8% | | | | | | | | |
| CapitaLand | | | 92,318 | | | | 248,684 | |
| DBS Group Holdings | | | 65,963 | | | | 1,102,934 | |
| Oversea-Chinese Banking | | | 120,666 | | | | 1,053,968 | |
| United Overseas Bank | | | 46,997 | | | | 849,285 | |
| | | | | | | | 3,254,871 | |
| Telecommunications — 5.3% | | | | | | | | |
| Singapore Telecommunications | | | 274,404 | | | | 755,296 | |
| TOTAL SINGAPORE | | | | | | | 4,432,098 | |
| THAILAND— 22.1% | | | | | | | | |
| Consumer Services — 2.8% | | | | | | | | |
| CP ALL NVDR | | | 192,173 | | | | 404,940 | |
| Financials — 6.8% | | | | | | | | |
| Bangkok Bank NVDR | | | 17,611 | | | | 102,316 | |
| Kasikornbank NVDR | | | 74,108 | | | | 490,781 | |
| Siam Commercial Bank NVDR | | | 88,341 | | | | 389,583 | |
| | | | | | | | 982,680 | |
The accompanying notes are an integral part of the financial statements.
| Schedule of Investments | October 31, 2017 |
| Global X FTSE Southeast Asia ETF |
| | | Shares | | | Value | |
| COMMON STOCK — continued |
| Industrials — 5.2% | | | | | | | | |
| Airports of Thailand NVDR | | | 157,300 | | | $ | 281,739 | |
| Siam Cement NVDR | | | 31,006 | | | | 457,343 | |
| | | | | | | | 739,082 | |
| Oil & Gas — 5.6% | | | | | | | | |
| PTT NVDR | | | 52,744 | | | | 666,842 | |
| PTT Exploration & Production NVDR | | | 50,510 | | | | 131,140 | |
| | | | | | | | 797,982 | |
| Telecommunications — 1.7% | | | | | | | | |
| Advanced Info Service NVDR | | | 40,851 | | | | 239,179 | |
| TOTAL THAILAND | | | | | | | 3,163,863 | |
| TOTAL INVESTMENTS — 99.8% | | | | | | | | |
| (Cost $13,727,666) | | | | | | $ | 14,288,949 | |
Percentages are based on Net Assets of $14,319,818.
NVDR — Non-Voting Depositary Receipt
As of October 31, 2017, all of the Fund's investments were considered Level 1, in accordance with authoritative guidance on fair value measurements and disclosure under U.S. GAAP.
For the year ended October 31, 2017, there have been no transfers between Level 1, Level 2 or Level 3 investments.
The accompanying notes are an integral part of the financial statements.
| Schedule of Investments | October 31, 2017 |
| Global X MSCI Colombia ETF |
Sector Weightings (unaudited)†:
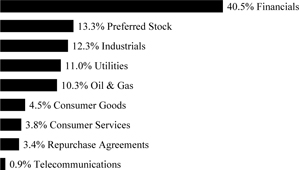
† Sector weightings percentages are based on the total market value of investments. Repurchase agreements purchased from cash collateral received for securities lending activity are included in total investments. Please see Note 2 and Note 8 in Notes to Financial Statements for more detailed information.
| | | Shares | | | Value | |
| COMMON STOCK — 86.0% |
| CHILE— 4.8% | | | | | | | | |
| Oil & Gas — 2.6% | | | | | | | | |
| Empresas COPEC | | | 157,500 | | | $ | 2,429,447 | |
| Utilities — 2.2% | | | | | | | | |
| Enersis | | | 9,228,499 | | | | 1,987,192 | |
| TOTAL CHILE | | | | | | | 4,416,639 | |
| COLOMBIA— 81.2% | | | | | | | | |
| Consumer Goods — 4.6% | | | | | | | | |
| Grupo Nutresa | | | 484,758 | | | | 4,304,351 | |
| Consumer Services — 3.9% | | | | | | | | |
| Almacenes Exito | | | 673,916 | | | | 3,618,721 | |
| Financials — 41.9% | | | | | | | | |
| Banco de Bogota | | | 133,277 | | | | 2,811,820 | |
| BanColombia | | | 655,770 | | | | 6,077,123 | |
| BanColombia ADR | | | 328,629 | | | | 12,405,745 | |
| Celsia ESP | | | 1,573,349 | | | | 2,321,500 | |
| Financiera Colombiana | | | 333,942 | | | | 3,138,589 | |
| Grupo Aval Acciones y Valores ADR | | | 431,464 | | | | 3,589,781 | |
| Grupo de Inversiones Suramericana | | | 676,300 | | | | 8,583,195 | |
| | | | | | | | 38,927,753 | |
| Industrials — 12.7% | | | | | | | | |
| Cementos Argos | | | 953,981 | | | | 3,479,846 | |
| Cementos Argos GDR | | | 167,420 | | | | 536,425 | |
| Cemex Latam Holdings * | | | 687,696 | | | | 2,436,198 | |
| Grupo Argos | | | 826,518 | | | | 5,388,791 | |
| | | | | | | | 11,841,260 | |
| Oil & Gas — 8.0% | | | | | | | | |
| Canacol Energy * | | | 668,040 | | | | 2,124,710 | |
The accompanying notes are an integral part of the financial statements.
| Schedule of Investments | October 31, 2017 |
| Global X MSCI Colombia ETF |
| | | Shares/Face
Amount | | | Value | |
| COMMON STOCK — continued |
| Oil & Gas — continued | | | | | | | | |
| Ecopetrol ADR (A) | | | 479,680 | | | $ | 5,319,651 | |
| | | | | | | | 7,444,361 | |
| Telecommunications — 0.9% | | | | | | | | |
| Empresa de Telecomunicaciones de Bogota * | | | 5,256,280 | | | | 855,029 | |
| Utilities — 9.2% | | | | | | | | |
| Empresa de Energia de Bogota | | | 6,505,426 | | | | 4,264,970 | |
| Interconexion Electrica | | | 977,703 | | | | 4,279,653 | |
| | | | | | | | 8,544,623 | |
| TOTAL COLOMBIA | | | | | | | 75,536,098 | |
| TOTAL COMMON STOCK | | | | | | | | |
| (Cost $79,522,851) | | | | | | | 79,952,737 | |
|
| PREFERRED STOCK — 13.7% |
| COLOMBIA— 13.7% | | | | | | | | |
| Consumer Services — 1.7% | | | | | | | | |
| Avianca Holdings | | | 1,836,131 | | | | 1,611,062 | |
| Financials — 8.8% | | | | | | | | |
| Banco Davivienda | | | 370,590 | | | | 3,651,091 | |
| Grupo Aval Acciones y Valores | | | 1,431,941 | | | | 595,269 | |
| Grupo de Inversiones Suramericana | | | 317,023 | | | | 3,913,034 | |
| | | | | | | | 8,159,394 | |
| Industrials — 3.2% | | | | | | | | |
| Grupo Argos | | | 492,729 | | | | 2,979,362 | |
| TOTAL PREFERRED STOCK | | | | | | | | |
| (Cost $12,750,660) | | | | | | | 12,749,818 | |
|
| REPURCHASE AGREEMENTS (B) — 3.5% |
| Barclays Bank | | | | | | | | |
| 1.050%, dated 10/31/17, to be repurchased on 11/01/17 repurchase price $1,931,316 (collateralized by U.S Treasury Obligations, ranging in par value $0-$644,070, 0.000%-9.000%, 11/15/17-08/15/47, with a total market value of $1,969,884) | | $ | 1,931,259 | | | | 1,931,259 | |
| Deutsche Bank | | | | | | | | |
| 1.040%, dated 10/31/17, to be repurchased on 11/01/17 repurchase price $1,319,954 (collateralized by U.S. Treasury Obligations, par value $1,279,526, 3.625%, 02/15/20 with a total market value of $1,345,311) | | | 1,319,916 | | | | 1,319,916 | |
| TOTAL REPURCHASE AGREEMENTS | | | | | | | | |
| (Cost $3,251,175) | | | | | | | 3,251,175 | |
| TOTAL INVESTMENTS — 103.2% | | | | | | | | |
| (Cost $95,524,686) | | | | | | $ | 95,953,730 | |
Percentages are based on Net Assets of $92,984,369.
The accompanying notes are an integral part of the financial statements.
| Schedule of Investments | October 31, 2017 |
| Global X MSCI Colombia ETF |
| * | Non-income producing security. |
| (A) | This security or a partial position of this security is on loan at October 31, 2017. The total value of securities on loan at October 31, 2017 was $3,173,958. |
| (B) | Security was purchased with cash collateral held from securities on loan. The total value of such securities as of October 31, 2017 was $3,251,175. |
ADR — American Depositary Receipt
Cl — Class
The following is a summary of the level of inputs used as of October 31, 2017, in valuing the Fund's investments carried at value:
| Investments in Securities | | Level 1 | | | Level 2 | | | Level 3 | | | Total | |
| Common Stock | | $ | 79,952,737 | | | $ | — | | | $ | — | | | $ | 79,952,737 | |
| Preferred Stock | | | 12,749,818 | | | | — | | | | — | | | | 12,749,818 | |
| Repurchase Agreements | | | — | | | | 3,251,175 | | | | — | | | | 3,251,175 | |
| Total Investments in Securities | | $ | 92,702,555 | | | $ | 3,251,175 | | | $ | — | | | $ | 95,953,730 | |
For the year ended October 31, 2017, there have been no transfers between Level 1, Level 2, and Level 3 investments.
The accompanying notes are an integral part of the financial statements.
| Schedule of Investments | October 31, 2017 |
| Global X MSCI Argentina ETF |
Sector Weightings (unaudited)†:
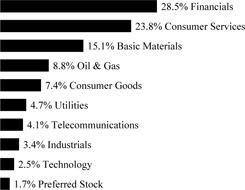
† Sector weightings percentages are based on the total market value of investments.
| | | Shares | | | Value | |
| COMMON STOCK — 98.1% |
| ARGENTINA— 87.6% | | | | | | | | |
| Basic Materials — 12.3% | | | | | | | | |
| Tenaris | | | 1,644,876 | | | $ | 22,515,224 | |
| Consumer Goods — 4.5% | | | | | | | | |
| Adecoagro * | | | 436,289 | | | | 4,432,696 | |
| Cresud SACIF y A ADR * | | | 179,036 | | | | 3,881,500 | |
| | | | | | | | 8,314,196 | |
| Consumer Services — 22.2% | | | | | | | | |
| Arcos Dorados Holdings, Cl A * | | | 561,889 | | | | 5,618,890 | |
| MercadoLibre | | | 146,014 | | | | 35,088,624 | |
| | | | | | | | 40,707,514 | |
| Financials — 28.5% | | | | | | | | |
| Banco Macro ADR | | | 157,930 | | | | 19,886,546 | |
| BBVA Banco Frances ADR | | | 313,782 | | | | 6,915,755 | |
| Cablevision Holding GDR * | | | 145,330 | | | | 3,487,920 | |
| Grupo Financiero Galicia ADR | | | 193,761 | | | | 10,637,479 | |
| Grupo Supervielle ADR | | | 283,847 | | | | 7,609,938 | |
| IRSA Inversiones y Representaciones ADR * | | | 125,005 | | | | 3,640,146 | |
| | | | | | | | 52,177,784 | |
| Oil & Gas — 8.8% | | | | | | | | |
| Transportadora de Gas del Sur ADR * | | | 332,878 | | | | 7,063,671 | |
| YPF ADR | | | 364,930 | | | | 8,962,681 | |
| | | | | | | | 16,026,352 | |
| Technology — 2.5% | | | | | | | | |
| Globant * | | | 121,735 | | | | 4,591,844 | |
| Telecommunications — 4.1% | | | | | | | | |
| Telecom Argentina ADR * | | | 233,436 | | | | 7,612,348 | |
| Utilities — 4.7% | | | | | | | | |
| Empresa Distribuidora Y Comercializadora Norte ADR * | | | 47,694 | | | | 2,055,612 | |
The accompanying notes are an integral part of the financial statements.
| Schedule of Investments | October 31, 2017 |
| Global X MSCI Argentina ETF |
| | | Shares | | | Value | |
| COMMON STOCK — continued |
| Utilities — continued | | | | | | | | |
| Pampa Energia ADR * | | | 98,147 | | | $ | 6,657,311 | |
| | | | | | | | 8,712,923 | |
| TOTAL ARGENTINA | | | | | | | 160,658,185 | |
| CANADA— 4.5% | | | | | | | | |
| Basic Materials — 2.8% | | | | | | | | |
| Pan American Silver | | | 154,973 | | | | 2,534,195 | |
| SSR Mining * | | | 265,449 | | | | 2,551,325 | |
| | | | | | | | 5,085,520 | |
| Industrials — 1.7% | | | | | | | | |
| Finning International | | | 131,150 | | | | 3,200,666 | |
| TOTAL CANADA | | | | | | | 8,286,186 | |
| CHILE— 3.1% | | | | | | | | |
| Consumer Goods — 1.6% | | | | | | | | |
| Cia Cervecerias Unidas | | | 198,398 | | | | 2,865,695 | |
| Consumer Services — 1.5% | | | | | | | | |
| Cencosud | | | 924,750 | | | | 2,770,665 | |
| TOTAL CHILE | | | | | | | 5,636,360 | |
| MEXICO— 1.2% | | | | | | | | |
| Consumer Goods — 1.2% | | | | | | | | |
| Arca Continental | | | 358,137 | | | | 2,284,147 | |
| SPAIN— 1.7% | | | | | | | | |
| Industrials — 1.7% | | | | | | | | |
| Prosegur Cia de Seguridad | | | 413,720 | | | | 3,156,843 | |
| TOTAL COMMON STOCK | | | | | | | | |
| (Cost $149,100,289) | | | | | | | 180,021,721 | |
|
| PREFERRED STOCK — 1.7% |
| CHILE— 1.7% | | | | | | | | |
| Consumer Goods — 1.7% | | | | | | | | |
| Embotelladora Andina | | | 604,004 | | | | 3,099,456 | |
| (Cost $2,846,396) | | | | | | | | |
| TOTAL INVESTMENTS — 99.8% | | | | | | | | |
| (Cost $151,946,685) | | | | | | $ | 183,121,177 | |
Percentages are based on Net Assets of $183,467,707.
| * | Non-income producing security. |
ADR — American Depositary Receipt
Cl — Class
GDR — Global Depositary Receipt
As of October 31, 2017, all of the Fund's investments were considered Level 1, in accordance with authoritative guidance on fair value measurements and disclosure under U.S. GAAP.
The accompanying notes are an integral part of the financial statements.
| Schedule of Investments | October 31, 2017 |
| Global X MSCI Argentina ETF |
For the year ended October 31, 2017, there have been no transfers between Level 1, Level 2 and Level 3 investments.
As of October 31, 2017, there were no Level 3 investments.
The accompanying notes are an integral part of the financial statements.
| Schedule of Investments | October 31, 2017 |
Sector Weightings (unaudited)†:
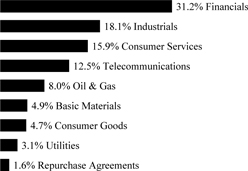
† Sector weightings percentages are based on the total market value of investments. Repurchase agreements purchased from cash collateral received for securities lending activity are included in total investments. Please see Note 2 and Note 8 in Notes to Financial Statements for more detailed information.
| | | Shares | | | Value | |
| COMMON STOCK — 99.9% |
| GREECE— 99.9% | | | | | | | | |
| Basic Materials — 5.0% | | | | | | | | |
| Mytilineos Holdings * | | | 1,029,195 | | | $ | 10,778,606 | |
| Mytilineos Holdings ADR * | | | 626,200 | | | | 6,558,130 | |
| | | | | | | | 17,336,736 | |
| Consumer Goods — 4.8% | | | | | | | | |
| JUMBO | | | 696,493 | | | | 11,196,985 | |
| JUMBO ADR | | | 340,000 | | | | 5,465,908 | |
| | | | | | | | 16,662,893 | |
| Consumer Services — 16.2% | | | | | | | | |
| Aegean Airlines | | | 664,410 | | | | 6,044,946 | |
| FF Group * | | | 371,502 | | | | 7,781,370 | |
| FF Group ADR * | | | 200,300 | | | | 4,310,857 | |
| OPAP | | | 2,732,008 | | | | 30,616,974 | |
| OPAP ADR (A) | | | 1,404,900 | | | | 7,822,483 | |
| | | | | | | | 56,576,630 | |
| Financials — 31.6% | | | | | | | | |
| Alpha Bank AE * | | | 21,100,839 | | | | 42,034,034 | |
| Eurobank Ergasias * | | | 16,341,913 | | | | 13,345,232 | |
| Grivalia Properties | | | 777,752 | | | | 8,109,039 | |
| Hellenic Exchanges - Athens Stock Exchange | | | 1,170,951 | | | | 6,547,646 | |
| LAMDA Development * | | | 497,989 | | | | 3,741,835 | |
| National Bank of Greece * | | | 84,800,513 | | | | 28,055,761 | |
| Piraeus Bank * | | | 3,031,461 | | | | 8,722,765 | |
| | | | | | | | 110,556,312 | |
| Industrials — 18.4% | | | | | | | | |
| Aegean Marine Petroleum Network (A) | | | 644,880 | | | | 2,901,960 | |
| Capital Product Partners | | | 2,034,083 | | | | 6,956,564 | |
| Dorian LPG * | | | 552,981 | | | | 3,953,814 | |
The accompanying notes are an integral part of the financial statements.
| Schedule of Investments | October 31, 2017 |
| | | Shares/Face
Amount | | | Value | |
| COMMON STOCK — continued |
| Industrials — continued | | | | | | | | |
| Ellaktor * | | | 2,652,629 | | | $ | 5,036,970 | |
| GasLog (A) | | | 768,975 | | | | 13,264,819 | |
| GasLog Partners | | | 492,439 | | | | 11,695,427 | |
| Titan Cement | | | 413,209 | | | | 9,973,894 | |
| Titan Cement ADR | | | 439,800 | | | | 5,307,858 | |
| Tsakos Energy Navigation (A) | | | 1,221,064 | | | | 5,482,577 | |
| | | | | | | | 64,573,883 | |
| Oil & Gas — 8.1% | | | | | | | | |
| Hellenic Petroleum | | | 1,105,897 | | | | 9,765,379 | |
| Motor Oil Hellas Corinth Refineries | | | 384,600 | | | | 9,207,174 | |
| Motor Oil Hellas Corinth Refineries ADR | | | 768,300 | | | | 9,196,397 | |
| | | | | | | | 28,168,950 | |
| Telecommunications — 12.7% | | | | | | | | |
| Hellenic Telecommunications Organization | | | 3,735,771 | | | | 44,390,051 | |
| Utilities — 3.1% | | | | | | | | |
| Athens Water Supply & Sewage | | | 531,595 | | | | 3,808,564 | |
| Public Power * | | | 2,176,030 | | | | 4,715,015 | |
| Terna Energy | | | 496,978 | | | | 2,414,229 | |
| | | | | | | | 10,937,808 | |
| TOTAL COMMON STOCK | | | | | | | | |
| (Cost $332,617,845) | | | | | | | 349,203,263 | |
|
| REPURCHASE AGREEMENTS (B) — 1.6% |
| Barclays Bank | | | | | | | | |
| 1.050%, dated 10/31/17, to be repurchased on 11/01/17 repurchase price $3,368,463 (collateralized by U.S Treasury Obligations, ranging in par value $0-$1,123,441, 0.000%-9.000%, 11/15/17-08/15/47, with a total market value of $3,435,732) | | $ | 3,368,365 | | | | 3,368,365 | |
| Deutsche Bank | | | | | | | | |
| 1.040%, dated 10/31/17, to be repurchased on 11/01/17 repurchase price $2,302,170 (collateralized by U.S. Treasury Obligations, par value $2,231,659, 3.625%, 02/15/20 with a total market value of $2,346,395) | | | 2,302,103 | | | | 2,302,103 | |
| TOTAL REPURCHASE AGREEMENTS | | | | | | | | |
| (Cost $5,670,468) | | | | | | | 5,670,468 | |
| TOTAL INVESTMENTS — 101.5% | | | | | | | | |
| (Cost $338,288,313) | | | | | | $ | 354,873,731 | |
Percentages are based on Net Assets of $349,788,473.
The accompanying notes are an integral part of the financial statements.
| Schedule of Investments | October 31, 2017 |
| * | Non-income producing security. |
| (A) | This security or a partial position of this security is on loan at October 31, 2017. The total value of securities on loan at October 31, 2017 was $5,402,172. |
| (B) | Security was purchased with cash collateral held from securities on loan. The total value of such securities as of October 31, 2017 was $5,670,468. |
ADR — American Depositary Receipt
The following is a summary of the level of inputs used as of October 31, 2017, in valuing the Fund's investments carried at value:
| Investments in Securities | | Level 1 | | | Level 2 | | | Level 3 | | | Total | |
| Common Stock | | $ | 349,203,263 | | | $ | — | | | $ | — | | | $ | 349,203,263 | |
| Repurchase Agreements | | | — | | | | 5,670,468 | | | | — | | | | 5,670,468 | |
| Total Investments in Securities | | $ | 349,203,263 | | | $ | 5,670,468 | | | $ | — | | | $ | 354,873,731 | |
For the year ended October 31, 2017, there have been no transfers between Level 1, Level 2 or Level 3 investments.
As of October 31, 2017, there were no Level 3 investments.
The accompanying notes are an integral part of the financial statements.
| Schedule of Investments | October 31, 2017 |
Global X MSCI Norway ETF
Sector Weightings (unaudited)†:
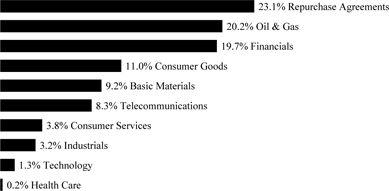
† Sector weightings percentages are based on the total market value of investments. Repurchase agreements purchased from cash collateral received for securities lending activity are included in total investments. Please see Note 2 and Note 8 in Notes to Financial Statements for more detailed information.
| | | Shares | | | Value | |
| COMMON STOCK — 99.7% |
| NORWAY— 99.7% | | | | | | | | |
| Basic Materials — 12.0% | | | | | | | | |
| Borregaard | | | 145,417 | | | $ | 1,399,625 | |
| Norsk Hydro | | | 1,307,790 | | | | 10,093,858 | |
| Yara International | | | 175,043 | | | | 8,296,566 | |
| | | | | | | | 19,790,049 | |
| Consumer Goods — 14.3% | | | | | | | | |
| Austevoll Seafood | | | 130,818 | | | | 1,307,077 | |
| Bakkafrost P | | | 51,905 | | | | 2,314,882 | |
| Grieg Seafood | | | 54,600 | | | | 517,512 | |
| Kongsberg Automotive Holding * | | | 738,193 | | | | 867,040 | |
| Leroy Seafood Group | | | 406,100 | | | | 2,435,042 | |
| Marine Harvest * | | | 363,457 | | | | 7,085,321 | |
| Norway Royal Salmon | | | 14,437 | | | | 279,674 | |
| Orkla (A) | | | 692,724 | | | | 6,769,000 | |
| Salmar | | | 68,293 | | | | 2,034,125 | |
| | | | | | | | 23,609,673 | |
| Consumer Services — 4.9% | | | | | | | | |
| Europris (B) | | | 177,400 | | | | 806,571 | |
| Norwegian Air Shuttle * (A) | | | 38,761 | | | | 1,094,341 | |
| Schibsted, Cl A | | | 89,720 | | | | 2,309,370 | |
| Schibsted, Cl B | | | 105,336 | | | | 2,465,423 | |
| XXL (B) | | | 131,604 | | | | 1,415,460 | |
| | | | | | | | 8,091,165 | |
| Financials — 25.5% | | | | | | | | |
| Aker, Cl A | | | 36,170 | | | | 1,635,671 | |
| B2Holding | | | 212,615 | | | | 478,143 | |
The accompanying notes are an integral part of the financial statements.
| Schedule of Investments | October 31, 2017 |
Global X MSCI Norway ETF
| | | Shares | | | Value | |
| COMMON STOCK — continued |
| Financials — continued | | | | | | | | |
| DnB | | | 1,095,182 | | | $ | 21,082,043 | |
| Entra (B) | | | 129,242 | | | | 1,777,060 | |
| Gjensidige Forsikring | | | 252,808 | | | | 4,749,091 | |
| Norwegian Finance Holding * | | | 126,600 | | | | 1,578,264 | |
| Norwegian Property | | | 317,400 | | | | 389,869 | |
| Protector Forsikring | | | 93,209 | | | | 1,013,897 | |
| Selvaag Bolig | | | 94,358 | | | | 343,669 | |
| Skandiabanken (B) | | | 82,605 | | | | 835,450 | |
| Sparebank 1 Nord Norge | | | 155,839 | | | | 1,228,518 | |
| SpareBank 1 SMN | | | 179,300 | | | | 1,857,231 | |
| Storebrand | | | 587,988 | | | | 5,026,920 | |
| | | | | | | | 41,995,826 | |
| Health Care — 0.3% | | | | | | | | |
| Nordic Nanovector * | | | 44,100 | | | | 450,599 | |
| Industrials — 4.1% | | | | | | | | |
| BW LPG * (B) | | | 118,150 | | | | 442,888 | |
| Frontline | | | 117,864 | | | | 720,273 | |
| Gaming Innovation Group * (A) | | | 347,300 | | | | 217,330 | |
| Golden Ocean Group * (A) | | | 158,960 | | | | 1,282,265 | |
| Hexagon Composites * | | | 162,400 | | | | 545,839 | |
| Hoegh LNG Holdings | | | 72,488 | | | | 573,656 | |
| IDEX * | | | 623,607 | | | | 366,608 | |
| Ocean Yield | | | 94,107 | | | | 836,760 | |
| Stolt-Nielsen | | | 44,740 | | | | 628,839 | |
| Thin Film Electronics * (A) | | | 1,340,469 | | | | 398,115 | |
| Wallenius Wilhelmsen Logistics, Cl B * | | | 118,027 | | | | 676,550 | |
| | | | | | | | 6,689,123 | |
| Oil & Gas — 26.1% | | | | | | | | |
| Akastor * | | | 320,785 | | | | 737,085 | |
| Aker BP | | | 133,312 | | | | 3,059,924 | |
| Aker Solutions * | | | 217,666 | | | | 1,192,362 | |
| BW Offshore * | | | 99,798 | | | | 326,891 | |
| DNO International * | | | 949,424 | | | | 1,148,792 | |
| Petroleum Geo-Services * (A) | | | 453,890 | | | | 741,699 | |
| REC Silicon * (A) | | | 3,185,694 | | | | 416,614 | |
| Scatec Solar (B) | | | 124,310 | | | | 714,085 | |
| Statoil (A) | | | 1,286,696 | | | | 26,011,014 | |
| Subsea 7 * | | | 336,524 | | | | 5,647,190 | |
| TGS Nopec Geophysical | | | 136,030 | | | | 3,117,323 | |
| | | | | | | | 43,112,979 | |
| Technology — 1.8% | | | | | | | | |
| Atea | | | 116,911 | | | | 1,471,765 | |
| Nordic Semiconductor * (A) | | | 185,904 | | | | 929,304 | |
The accompanying notes are an integral part of the financial statements.
| Schedule of Investments | October 31, 2017 |
Global X MSCI Norway ETF
| | | Shares/Face
Amount | | | Value | |
| COMMON STOCK — continued |
| Technology — continued | | | | | | | | |
| Opera Software * | | | 164,420 | | | $ | 470,237 | |
| | | | | | | | 2,871,306 | |
| Telecommunications — 10.7% | | | | | | | | |
| Telenor (A) | | | 834,466 | | | | 17,695,138 | |
| TOTAL COMMON STOCK | | | | | | | | |
| (Cost $158,477,571) | | | | | | | 164,305,858 | |
|
| REPURCHASE AGREEMENTS (C) — 29.9% |
| Barclays Bank | | | | | | | | |
| 1.050%, dated 10/31/17, to be repurchased on 11/01/17 repurchase price $29,262,915 (collateralized by U.S Treasury Obligations, ranging in par value $1-$9,758,819, 0.000%-9.000%, 11/15/17-08/15/47, with a total market value of $29,847,303) | | $ | 29,262,061 | | | | 29,262,061 | |
| Deutsche Bank | | | | | | | | |
| 1.040%, dated 10/31/17, to be repurchased on 11/01/17 repurchase price $19,999,683 (collateralized by U.S. Treasury Obligations, par value $19,387,132, 3.625%, 02/15/20 with a total market value of $20,383,883) | | | 19,999,105 | | | | 19,999,105 | |
| TOTAL REPURCHASE AGREEMENTS | | | | | | | | |
| (Cost $49,261,166) | | | | | | | 49,261,166 | |
| TOTAL INVESTMENTS — 129.6% | | | | | | | | |
| (Cost $207,738,737) | | | | | | $ | 213,567,024 | |
Percentages are based on Net Assets of $164,736,114.
| * | Non-income producing security. |
| (A) | This security or a partial position of this security is on loan at October 31, 2017. The total value of securities on loan at October 31, 2017 was $46,316,939. |
| (B) | Security sold within terms of a private placement memorandum, exempt from registration under Section 144A of the Securities Act of 1933, as amended, and may be sold only to dealers in that program or other "accredited investors." The total value of such securities as of October 31, 2017 was $5,991,514 and represents 3.6% of Net Assets. |
| (C) | Security was purchased with cash collateral held from securities on loan. The total value of such securities as of October 31, 2017 was $49,261,166. |
Cl — Class
The following is a summary of the level of inputs used as of October 31, 2017, in valuing the Fund's investments carried at value:
| Investments in Securities | | Level 1 | | | Level 2 | | | Level 3 | | | Total | |
| Common Stock | | $ | 164,305,858 | | | $ | — | | | $ | — | | | $ | 164,305,858 | |
| Repurchase Agreements | | | — | | | | 49,261,166 | | | | — | | | | 49,261,166 | |
| Total Investments in Securities | | $ | 164,305,858 | | | $ | 49,261,166 | | | $ | — | | | $ | 213,567,024 | |
For the year ended October 31, 2017, there have been no transfers between Level 1, Level 2 and Level 3 investments.
The accompanying notes are an integral part of the financial statements.
| Schedule of Investments | October 31, 2017 |
Global X FTSE Nordic Region ETF
Sector Weightings (unaudited)†:
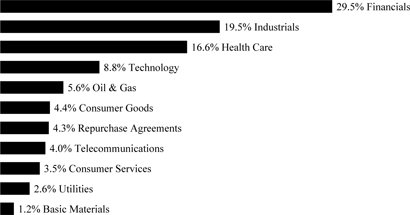
† Sector weightings percentages are based on the total market value of investments. Repurchase agreements purchased from cash collateral received for securities lending activity are included in total investments. Please see Note 2 and Note 8 in Notes to Financial Statements for more detailed information.
| | | Shares | | | Value | |
| COMMON STOCK — 100.0% |
| DENMARK— 29.5% | | | | | | | | |
| Consumer Goods — 1.9% | | | | | | | | |
| Carlsberg, Cl B | | | 6,295 | | | $ | 718,924 | |
| Financials — 4.2% | | | | | | | | |
| Danske Bank | | | 42,197 | | | | 1,609,902 | |
| Health Care — 17.3% | | | | | | | | |
| Coloplast, Cl B | | | 7,870 | | | | 692,426 | |
| Novo Nordisk, Cl B | | | 105,425 | | | | 5,245,173 | |
| Novozymes, Cl B | | | 13,000 | | | | 718,016 | |
| | | | | | | | 6,655,615 | |
| Industrials — 1.9% | | | | | | | | |
| A P Moller - Maersk, Cl B | | | 388 | | | | 745,313 | |
| Oil & Gas — 2.8% | | | | | | | | |
| Vestas Wind Systems | | | 12,437 | | | | 1,097,165 | |
| Utilities — 1.4% | | | | | | | | |
| Orsted (A) | | | 9,592 | | | | 537,594 | |
| TOTAL DENMARK | | | | | | | 11,364,513 | |
| FINLAND— 12.8% | | | | | | | | |
| Financials — 3.8% | | | | | | | | |
| Sampo, Cl A | | | 28,042 | | | | 1,469,378 | |
| Industrials — 3.2% | | | | | | | | |
| Kone, Cl B | | | 22,790 | | | | 1,233,736 | |
| Technology — 4.4% | | | | | | | | |
| Nokia | | | 338,832 | | | | 1,664,142 | |
| Utilities — 1.4% | | | | | | | | |
| Fortum | | | 25,671 | | | | 545,173 | |
The accompanying notes are an integral part of the financial statements.
| Schedule of Investments | October 31, 2017 |
Global X FTSE Nordic Region ETF
| | | Shares | | | Value | |
| COMMON STOCK — continued |
| TOTAL FINLAND | | | | | | $ | 4,912,429 | |
| NORWAY— 9.8% | | | | | | | | |
| Basic Materials — 1.3% | | | | | | | | |
| Yara International | | | 10,426 | | | | 494,164 | |
| Financials — 3.2% | | | | | | | | |
| DnB | | | 64,328 | | | | 1,238,302 | |
| Oil & Gas — 3.0% | | | | | | | | |
| Statoil (B) | | | 57,655 | | | | 1,165,516 | |
| Telecommunications — 2.3% | | | | | | | | |
| Telenor | | | 40,565 | | | | 860,195 | |
| TOTAL NORWAY | | | | | | | 3,758,177 | |
| SWEDEN— 47.9% | | | | | | | | |
| Consumer Goods — 2.7% | | | | | | | | |
| Essity, Cl B * | | | 35,286 | | | | 1,054,981 | |
| Consumer Services — 3.7% | | | | | | | | |
| Hennes & Mauritz, Cl B | | | 56,431 | | | | 1,416,875 | |
| Financials — 19.5% | | | | | | | | |
| Investor, Cl B | | | 27,143 | | | | 1,345,186 | |
| Nordea Bank | | | 190,131 | | | | 2,298,342 | |
| Skandinaviska Enskilda Banken, Cl A | | | 85,299 | | | | 1,051,489 | |
| Svenska Handelsbanken, Cl A | | | 87,274 | | | | 1,250,971 | |
| Swedbank, Cl A | | | 62,700 | | | | 1,556,303 | |
| | | | | | | | 7,502,291 | |
| Industrials — 15.2% | | | | | | | | |
| Assa Abloy, Cl B | | | 55,861 | | | | 1,179,034 | |
| Atlas Copco, Cl A | | | 37,652 | | | | 1,651,475 | |
| Sandvik | | | 64,152 | | | | 1,171,653 | |
| Volvo, Cl B | | | 93,321 | | | | 1,849,298 | |
| | | | | | | | 5,851,460 | |
| Technology — 4.9% | | | | | | | | |
| Hexagon, Cl B | | | 14,929 | | | | 765,549 | |
| Telefonaktiebolaget LM Ericsson, Cl B | | | 176,780 | | | | 1,112,820 | |
| | | | | | | | 1,878,369 | |
| Telecommunications — 1.9% | | | | | | | | |
| Telia (B) | | | 153,750 | | | | 711,652 | |
| TOTAL SWEDEN | | | | | | | 18,415,628 | |
| TOTAL COMMON STOCK | | | | | | | | |
| (Cost $36,517,157) | | | | | | | 38,450,747 | |
The accompanying notes are an integral part of the financial statements.
| Schedule of Investments | October 31, 2017 |
Global X FTSE Nordic Region ETF
| | | Face Amount | | | Value | |
| REPURCHASE AGREEMENTS (C) — 4.4% |
| Barclays Bank | | | | | | | | |
| 1.050%, dated 10/31/17, to be repurchased on 11/01/17 repurchase price $1,017,965 (collateralized by U.S Treasury Obligations, ranging in par value $0-$339,479, 0.000%-9.000%, 11/15/17-08/15/47, with a total market value of $1,038,294) | | $ | 1,017,935 | | | $ | 1,017,935 | |
| Deutsche Bank | | | | | | | | |
| 1.040%, dated 10/31/17, to be repurchased on 11/01/17 repurchase price $695,726 (collateralized by U.S. Treasury Obligations, par value $674,417, 3.625%, 02/15/20 with a total market value of $709,091) | | | 695,706 | | | | 695,706 | |
| TOTAL REPURCHASE AGREEMENTS | | | | | | | | |
| (Cost $1,713,641) | | | | | | | 1,713,641 | |
| TOTAL INVESTMENTS — 104.4% | | | | | | | | |
| (Cost $38,230,798) | | | | | | $ | 40,164,388 | |
Percentages are based on Net Assets of $38,463,568.
| * | Non-income producing security. |
| (A) | Security sold within terms of a private placement memorandum, exempt from registration under Section 144A of the Securities Act of 1933, as amended, and may be sold only to dealers in that program or other "accredited investors." The total value of such securities as of October 31, 2017 was $537,594 and represents 1.4% of Net Assets. |
| (B) | This security or a partial position of this security is on loan at October 31, 2017. The total value of securities on loan at October 31, 2017 was $1,620,128. |
| (C) | Security was purchased with cash collateral held from securities on loan. The total value of such securities as of October 31, 2017 was $1,713,641. |
Cl — Class
The following is a summary of the level of inputs used as of October 31, 2017, in valuing the Fund's investments carried at value:
| Investments in Securities | | Level 1 | | | Level 2 | | | Level 3 | | | Total | |
| Common Stock | | $ | 38,450,747 | | | $ | — | | | $ | — | | | $ | 38,450,747 | |
| Repurchase Agreements | | | — | | | | 1,713,641 | | | | — | | | | 1,713,641 | |
| Total Investments in Securities | | $ | 38,450,747 | | | $ | 1,713,641 | | | $ | — | | | $ | 40,164,388 | |
For the year ended October 31, 2017, there have been no transfers between Level 1, Level 2 and Level 3 investments.
As of October 31, 2017, there were no Level 3 investments.
The accompanying notes are an integral part of the financial statements.
| Schedule of Investments | October 31, 2017 |
Global X MSCI Nigeria ETF
Sector Weightings (unaudited)†:
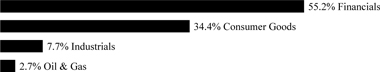
† Sector weightings percentages are based on the total market value of investments.
| | | Shares | | | Value | |
| COMMON STOCK — 99.9% |
| NIGERIA— 99.9% | | | | | | | | |
| Consumer Goods — 34.4% | | | | | | | | |
| Flour Mills of Nigeria | | | 22,350,667 | | | $ | 1,955,683 | |
| Guinness Nigeria | | | 9,617,514 | | | | 2,671,532 | |
| Nestle Nigeria | | | 909,130 | | | | 3,161,752 | |
| Nigerian Breweries | | | 24,699,683 | | | | 10,291,534 | |
| PZ Cussons Nigeria | | | 18,123,020 | | | | 1,157,860 | |
| Unilever Nigeria | | | 25,663,442 | | | | 2,936,325 | |
| | | | | | | | 22,174,686 | |
| Financials — 55.1% | | | | | | | | |
| Access Bank | | | 110,166,014 | | | | 2,998,964 | |
| Diamond Bank * | | | 252,862,595 | | | | 709,420 | |
| Ecobank Transnational | | | 61,616,232 | | | | 2,909,655 | |
| FBN Holdings | | | 171,685,815 | | | | 2,956,811 | |
| Guaranty Trust Bank | | | 90,313,203 | | | | 10,536,540 | |
| Stanbic IBTC Holdings | | | 27,727,112 | | | | 3,361,142 | |
| Transnational Corp of Nigeria * | | | 358,563,448 | | | | 1,434,254 | |
| UAC of Nigeria | | | 23,420,209 | | | | 1,222,405 | |
| United Bank for Africa | | | 111,089,162 | | | | 2,962,378 | |
| Zenith Bank | | | 92,049,012 | | | | 6,517,582 | |
| | | | | | | | 35,609,151 | |
| Industrials — 7.7% | | | | | | | | |
| Dangote Cement | | | 4,969,830 | | | | 3,092,339 | |
| Lafarge Africa | | | 13,256,563 | | | | 1,839,348 | |
| | | | | | | | 4,931,687 | |
| Oil & Gas — 2.7% | | | | | | | | |
| Forte Oil * | | | 5,914,493 | | | | 657,166 | |
| Oando * | | | 66,355,205 | | | | 1,104,077 | |
| | | | | | | | 1,761,243 | |
| TOTAL INVESTMENTS — 99.9% | | | | | | | | |
| (Cost $59,019,542) | | | | | | $ | 64,476,767 | |
Percentages are based on Net Assets of $64,559,308.
| * | Non-income producing security. |
The accompanying notes are an integral part of the financial statements.
| Schedule of Investments | October 31, 2017 |
Global X MSCI Nigeria ETF
As of October 31, 2017, all of the Fund's investments were considered Level 1, in accordance with authoritative guidance on fair value measurements and disclosure under U.S. GAAP.
For the year ended October 31, 2017, there have been no transfers between Level 1, Level 2 and Level 3 investments.
As of October 31, 2017, there were no Level 3 investments.
The accompanying notes are an integral part of the financial statements.
| Schedule of Investments | October 31, 2017 |
Global X Next Emerging & Frontier ETF
Sector Weightings (unaudited)†:
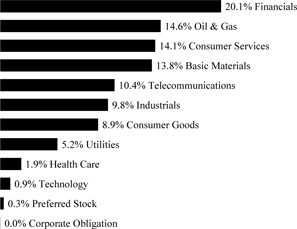
† Sector weightings percentages are based on the total market value of investments.
| | | Shares | | | Value | |
| COMMON STOCK — 99.3% |
| ARGENTINA— 3.6% | | | | | | | | |
| Basic Materials — 0.3% | | | | | | | | |
| Tenaris ADR | | | 1,867 | | | $ | 50,876 | |
| Consumer Services — 1.3% | | | | | | | | |
| MercadoLibre | | | 862 | | | | 207,147 | |
| Financials — 0.8% | | | | | | | | |
| Banco Macro ADR | | | 986 | | | | 124,157 | |
| Oil & Gas — 1.2% | | | | | | | | |
| YPF ADR | | | 8,189 | | | | 201,122 | |
| TOTAL ARGENTINA | | | | | | | 583,302 | |
| AUSTRALIA— 1.9% | | | | | | | | |
| Basic Materials — 0.4% | | | | | | | | |
| St. Barbara | | | 30,900 | | | | 68,708 | |
| Oil & Gas — 1.5% | | | | | | | | |
| Oil Search | | | 28,947 | | | | 163,800 | |
| Santos * | | | 23,850 | | | | 82,291 | |
| | | | | | | | 246,091 | |
| TOTAL AUSTRALIA | | | | | | | 314,799 | |
| CANADA— 2.5% | | | | | | | | |
| Basic Materials — 2.5% | | | | | | | | |
| B2Gold * | | | 34,239 | | | | 87,118 | |
| Barrick Gold | | | 3,690 | | | | 53,320 | |
| Endeavour Mining * | | | 3,611 | | | | 64,231 | |
| First Quantum Minerals | | | 10,406 | | | | 116,483 | |
The accompanying notes are an integral part of the financial statements.
| Schedule of Investments | October 31, 2017 |
Global X Next Emerging & Frontier ETF
| | | Shares | | | Value | |
| COMMON STOCK — continued | | | | | | | | |
| Basic Materials —continued | | | | | | | | |
| Lucara Diamond | | | 6,573 | | | $ | 11,473 | |
| Turquoise Hill Resources * | | | 25,477 | | | | 77,868 | |
| TOTAL CANADA | | | | | | | 410,493 | |
| CHILE— 4.6% | | | | | | | | |
| Basic Materials — 0.2% | | | | | | | | |
| Empresas CMPC | | | 11,200 | | | | 35,741 | |
| Consumer Goods — 0.3% | | | | | | | | |
| Cia Cervecerias Unidas ADR | | | 1,977 | | | | 56,305 | |
| Consumer Services — 2.0% | | | | | | | | |
| Cencosud | | | 8,000 | | | | 23,969 | |
| Latam Airlines Group | | | 9,580 | | | | 132,204 | |
| SACI Falabella | | | 16,660 | | | | 159,283 | |
| | | | | | | | 315,456 | |
| Financials — 0.5% | | | | | | | | |
| Banco de Chile | | | 253,161 | | | | 38,871 | |
| Banco Santander Chile | | | 551,340 | | | | 43,389 | |
| | | | | | | | 82,260 | |
| Oil & Gas — 0.2% | | | | | | | | |
| Empresas COPEC | | | 2,380 | | | | 36,711 | |
| Utilities — 1.4% | | | | | | | | |
| Empresa Nacional de Electricidad | | | 111,649 | | | | 97,431 | |
| Enersis | | | 501,953 | | | | 108,086 | |
| Enersis Chile | | | 203,800 | | | | 23,779 | |
| | | | | | | | 229,296 | |
| TOTAL CHILE | | | | | | | 755,769 | |
| COLOMBIA— 0.5% | | | | | | | | |
| Consumer Services — 0.0% | | | | | | | | |
| Almacenes Exito | | | 1,540 | | | | 8,269 | |
| Financials — 0.1% | | | | | | | | |
| Grupo de Inversiones Suramericana | | | 1,261 | | | | 16,004 | |
| Industrials — 0.1% | | | | | | | | |
| Cementos Argos | | | 5,046 | | | | 18,406 | |
| Oil & Gas — 0.3% | | | | | | | | |
| Ecopetrol | | | 74,748 | | | | 40,899 | |
| TOTAL COLOMBIA | | | | | | | 83,578 | |
| CZECH REPUBLIC— 1.1% | | | | | | | | |
| Financials — 0.2% | | | | | | | | |
| Komercni Banka | | | 705 | | | | 30,309 | |
| Utilities — 0.9% | | | | | | | | |
| CEZ | | | 6,621 | | | | 145,182 | |
| TOTAL CZECH REPUBLIC | | | | | | | 175,491 | |
The accompanying notes are an integral part of the financial statements.
| Schedule of Investments | October 31, 2017 |
Global X Next Emerging & Frontier ETF
| | | Shares | | | Value | |
| COMMON STOCK — continued | | | | | | | | |
| EGYPT— 0.4% | | | | | | | | |
| Financials — 0.3% | | | | | | | | |
| Commercial International Bank Egypt SAE | | | 7,475 | | | $ | 33,411 | |
| Talaat Moustafa Group | | | 20,000 | | | | 10,886 | |
| | | | | | | | 44,297 | |
| Telecommunications — 0.1% | | | | | | | | |
| Global Telecom Holding SAE * | | | 32,103 | | | | 12,341 | |
| TOTAL EGYPT | | | | | | | 56,638 | |
| GEORGIA— 0.6% | | | | | | | | |
| Financials — 0.6% | | | | | | | | |
| Bank of Georgia Holdings | | | 1,884 | | | | 89,066 | |
| GHANA— 0.3% | | | | | | | | |
| Oil & Gas — 0.3% | | | | | | | | |
| Tullow Oil * | | | 23,040 | | | | 55,685 | |
| HONG KONG— 0.4% | | | | | | | | |
| Consumer Services — 0.4% | | | | | | | | |
| NagaCorp | | | 82,383 | | | | 66,525 | |
| HUNGARY— 1.6% | | | | | | | | |
| Financials — 1.1% | | | | | | | | |
| OTP Bank | | | 4,420 | | | | 178,213 | |
| Health Care — 0.3% | | | | | | | | |
| Richter Gedeon Nyrt | | | 1,916 | | | | 47,655 | |
| Oil & Gas — 0.2% | | | | | | | | |
| MOL Hungarian Oil & Gas | | | 3,088 | | | | 36,971 | |
| TOTAL HUNGARY | | | | | | | 262,839 | |
| INDONESIA— 9.9% | | | | | | | | |
| Basic Materials — 0.2% | | | | | | | | |
| Chandra Asri Petrochemical | | | 12,000 | | | | 25,128 | |
| Consumer Goods — 2.3% | | | | | | | | |
| Astra International | | | 291,697 | | | | 172,061 | |
| Gudang Garam | | | 10,254 | | | | 52,924 | |
| Hanjaya Mandala Sampoerna | | | 94,100 | | | | 27,614 | |
| Indofood CBP Sukses Makmur TBK | | | 55,000 | | | | 35,687 | |
| Indofood Sukses Makmur | | | 55,800 | | | | 33,737 | |
| Unilever Indonesia | | | 12,969 | | | | 47,429 | |
| | | | | | | | 369,452 | |
| Financials — 4.1% | | | | | | | | |
| Bank Central Asia | | | 179,458 | | | | 276,547 | |
| Bank Mandiri | | | 476,236 | | | | 247,555 | |
| Bank Rakyat Indonesia Persero | | | 129,200 | | | | 148,610 | |
| | | | | | | | 672,712 | |
The accompanying notes are an integral part of the financial statements.
| Schedule of Investments | October 31, 2017 |
Global X Next Emerging & Frontier ETF
| | | Shares | | | Value | |
| COMMON STOCK — continued | | | | | | | | |
| Health Care — 0.2% | | | | | | | | |
| Kalbe Farma | | | 289,600 | | | $ | 34,165 | |
| Industrials — 1.2% | | | | | | | | |
| Indocement Tunggal Prakarsa | | | 20,100 | | | | 33,272 | |
| Semen Indonesia Persero | | | 145,505 | | | | 116,940 | |
| United Tractors | | | 16,500 | | | | 42,185 | |
| | | | | | | | 192,397 | |
| Telecommunications — 1.6% | | | | | | | | |
| Telekomunikasi Indonesia Persero | | | 902,405 | | | | 268,143 | |
| Utilities — 0.3% | | | | | | | | |
| Perusahaan Gas Negara | | | 385,839 | | | | 52,346 | |
| TOTAL INDONESIA | | | | | | | 1,614,343 | |
| ITALY— 0.5% | | | | | | | | |
| Oil & Gas — 0.5% | | | | | | | | |
| Saipem * | | | 19,060 | | | | 80,111 | |
| JAPAN— 0.8% | | | | | | | | |
| Industrials — 0.3% | | | | | | | | |
| Namura Shipbuilding | | | 9,340 | | | | 57,538 | |
| Oil & Gas — 0.5% | | | | | | | | |
| Inpex | | | 7,200 | | | | 76,321 | |
| TOTAL JAPAN | | | | | | | 133,859 | |
| KENYA— 0.4% | | | | | | | | |
| Telecommunications — 0.4% | | | | | | | | |
| Safaricom | | | 233,000 | | | | 57,240 | |
| KUWAIT— 1.2% | | | | | | | | |
| Financials — 0.9% | | | | | | | | |
| Kuwait Finance House | | | 50,465 | | | | 98,562 | |
| National Bank of Kuwait SAK | | | 16,842 | | | | 42,689 | |
| | | | | | | | 141,251 | |
| Telecommunications — 0.3% | | | | | | | | |
| Mobile Telecommunications KSC | | | 38,800 | | | | 59,752 | |
| TOTAL KUWAIT | | | | | | | 201,003 | |
| MALAYSIA— 8.2% | | | | | | | | |
| Basic Materials — 0.2% | | | | | | | | |
| Petronas Chemicals Group | | | 16,390 | | | | 28,533 | |
| Consumer Goods — 0.4% | | | | | | | | |
| IOI | | | 21,600 | | | | 22,756 | |
| Kuala Lumpur Kepong | | | 3,730 | | | | 21,674 | |
| PPB Group | | | 5,600 | | | | 22,196 | |
| | | | | | | | 66,626 | |
The accompanying notes are an integral part of the financial statements.
| Schedule of Investments | October 31, 2017 |
Global X Next Emerging & Frontier ETF
| | | Shares | | | Value | |
| COMMON STOCK — continued | | | | | | | | |
| Consumer Services — 0.3% | | | | | | | | |
| Genting | | | 11,200 | | | $ | 23,942 | |
| Genting Malaysia | | | 24,500 | | | | 29,110 | |
| | | | | | | | 53,052 | |
| Financials — 2.1% | | | | | | | | |
| CIMB Group Holdings | | | 39,700 | | | | 57,578 | |
| Malayan Banking | | | 61,026 | | | | 133,339 | |
| Public Bank | | | 31,130 | | | | 150,448 | |
| | | | | | | | 341,365 | |
| Health Care — 0.2% | | | | | | | | |
| IHH Healthcare | | | 26,272 | | | | 35,000 | |
| Industrials — 1.0% | | | | | | | | |
| MISC | | | 16,600 | | | | 27,252 | |
| Sime Darby | | | 61,989 | | | | 134,711 | |
| | | | | | | | 161,963 | |
| Oil & Gas — 0.2% | | | | | | | | |
| Petronas Dagangan | | | 2,800 | | | | 15,847 | |
| Petronas Gas | | | 3,789 | | | | 16,146 | |
| | | | | | | | 31,993 | |
| Telecommunications — 2.5% | | | | | | | | |
| Axiata Group | | | 82,067 | | | | 104,486 | |
| DiGi.com | | | 124,802 | | | | 147,398 | |
| Maxis | | | 83,996 | | | | 118,053 | |
| Telekom Malaysia | | | 24,185 | | | | 36,276 | |
| | | | | | | | 406,213 | |
| Utilities — 1.3% | | | | | | | | |
| Tenaga Nasional | | | 61,753 | | | | 218,801 | |
| TOTAL MALAYSIA | | | | | | | 1,343,546 | |
| MEXICO— 8.6% | | | | | | | | |
| Basic Materials — 2.9% | | | | | | | | |
| Fresnillo | | | 10,151 | | | | 175,510 | |
| Grupo Mexico, Cl B | | | 52,788 | | | | 172,021 | |
| Industrias Penoles | | | 1,224 | | | | 28,516 | |
| Mexichem | | | 39,760 | | | | 102,589 | |
| | | | | | | | 478,636 | |
| Consumer Goods — 1.0% | | | | | | | | |
| Arca Continental | | | 5,638 | | | | 35,958 | |
| Becle * | | | 17,100 | | | | 27,451 | |
| Fomento Economico Mexicano | | | 3,300 | | | | 28,872 | |
| Gruma, Cl B | | | 3,160 | | | | 41,482 | |
| Grupo Bimbo, Ser A | | | 10,560 | | | | 24,465 | |
| | | | | | | | 158,228 | |
The accompanying notes are an integral part of the financial statements.
| Schedule of Investments | October 31, 2017 |
Global X Next Emerging & Frontier ETF
| | | Shares | | | Value | |
| COMMON STOCK — continued | | | | | | | | |
| Consumer Services — 1.5% | | | | | | | | |
| Grupo Elektra | | | 710 | | | $ | 28,537 | |
| Grupo Televisa | | | 12,821 | | | | 56,249 | |
| Wal-Mart de Mexico | | | 72,680 | | | | 162,759 | |
| | | | | | | | 247,545 | |
| Financials — 0.8% | | | | | | | | |
| Grupo Financiero Banorte, Cl O | | | 13,524 | | | | 80,436 | |
| Grupo Financiero Inbursa, Cl O | | | 33,200 | | | | 57,184 | |
| | | | | | | | 137,620 | |
| Industrials — 1.2% | | | | | | | | |
| Alfa, Cl A | | | 65,170 | | | | 68,235 | |
| Cemex * | | | 72,679 | | | | 59,191 | |
| Grupo Aeroportuario del Pacifico, Cl B | | | 3,000 | | | | 28,515 | |
| Grupo Aeroportuario del Sureste, Cl B | | | 1,570 | | | | 28,061 | |
| | | | | | | | 184,002 | |
| Telecommunications — 0.9% | | | | | | | | |
| America Movil | | | 162,367 | | | | 140,382 | |
| Utilities — 0.3% | | | | | | | | |
| Infraestructura Energetica Nova | | | 9,440 | | | | 48,305 | |
| TOTAL MEXICO | | | | | | | 1,394,718 | |
| OMAN— 0.3% | | | | | | | | |
| Financials — 0.0% | | | | | | | | |
| BankMuscat SAOG | | | 4,433 | | | | 4,537 | |
| Telecommunications — 0.3% | | | | | | | | |
| Oman Telecommunications SAOG | | | 13,110 | | | | 40,187 | |
| TOTAL OMAN | | | | | | | 44,724 | |
| PAKISTAN— 0.6% | | | | | | | | |
| Financials — 0.1% | | | | | | | | |
| United Bank | | | 9,500 | | | | 16,152 | |
| Oil & Gas — 0.5% | | | | | | | | |
| Oil & Gas Development | | | 12,300 | | | | 16,773 | |
| Pakistan Petroleum | | | 36,000 | | | | 61,429 | |
| | | | | | | | 78,202 | |
| TOTAL PAKISTAN | | | | | | | 94,354 | |
| PANAMA— 1.5% | | | | | | | | |
| Consumer Services — 1.5% | | | | | | | | |
| Copa Holdings, Cl A | | | 2,010 | | | | 247,612 | |
| PERU— 1.0% | | | | | | | | |
| Basic Materials — 0.2% | | | | | | | | |
| Hochschild Mining | | | 8,400 | | | | 24,585 | |
| Financials — 0.8% | | | | | | | | |
| Credicorp | | | 635 | | | | 132,994 | |
The accompanying notes are an integral part of the financial statements.
| Schedule of Investments | October 31, 2017 |
Global X Next Emerging & Frontier ETF
| | | Shares | | | Value | |
| COMMON STOCK — continued | | | | | | | | |
| TOTAL PERU | | | | | | $ | 157,579 | |
| PHILIPPINES— 4.3% | | | | | | | | |
| Consumer Goods — 0.4% | | | | | | | | |
| JG Summit Holdings | | | 23,149 | | | | 34,483 | |
| Universal Robina | | | 11,737 | | | | 32,511 | |
| | | | | | | | 66,994 | |
| Consumer Services — 1.6% | | | | | | | | |
| Jollibee Foods | | | 5,200 | | | | 25,081 | |
| SM Investments | | | 12,226 | | | | 226,166 | |
| | | | | | | | 251,247 | |
| Financials — 0.8% | | | | | | | | |
| Ayala Land | | | 43,500 | | | | 36,401 | |
| GT Capital Holdings | | | 1,300 | | | | 29,714 | |
| SM Prime Holdings | | | 93,197 | | | | 66,795 | |
| | | | | | | | 132,910 | |
| Industrials — 0.4% | | | | | | | | |
| Aboitiz Equity Ventures | | | 9,600 | | | | 13,928 | |
| Ayala | | | 2,150 | | | | 42,938 | |
| International Container Terminal Services | | | 11,000 | | | | 22,565 | |
| | | | | | | | 79,431 | |
| Telecommunications — 0.7% | | | | | | | | |
| Globe Telecom | | | 400 | | | | 15,822 | |
| PLDT | | | 2,814 | | | | 93,209 | |
| | | | | | | | 109,031 | |
| Utilities — 0.4% | | | | | | | | |
| Aboitiz Power | | | 33,458 | | | | 27,544 | |
| Manila Electric | | | 5,220 | | | | 29,505 | |
| | | | | | | | 57,049 | |
| TOTAL PHILIPPINES | | | | | | | 696,662 | |
| POLAND— 5.4% | | | | | | | | |
| Basic Materials — 0.9% | | | | | | | | |
| KGHM Polska Miedz | | | 4,316 | | | | 145,830 | |
| Consumer Goods — 0.1% | | | | | | | | |
| LPP * | | | 9 | | | | 21,206 | |
| Financials — 1.4% | | | | | | | | |
| Bank Pekao | | | 1,274 | | | | 41,628 | |
| Bank Zachodni | | | 247 | | | | 24,796 | |
| Powszechna Kasa Oszczednosci Bank Polski * | | | 6,581 | | | | 70,081 | |
| Powszechny Zaklad Ubezpieczen | | | 6,760 | | | | 87,276 | |
| | | | | | | | 223,781 | |
The accompanying notes are an integral part of the financial statements.
| Schedule of Investments | October 31, 2017 |
Global X Next Emerging & Frontier ETF
| | | Shares | | | Value | |
| COMMON STOCK — continued | | | | | | | | |
| Oil & Gas — 2.4% | | | | | | | | |
| Polski Koncern Naftowy Orlen S.A. | | | 10,136 | | | $ | 358,493 | |
| Polskie Gornictwo Naftowe i Gazownictwo | | | 18,700 | | | | 34,380 | |
| | | | | | | | 392,873 | |
| Utilities — 0.6% | | | | | | | | |
| PGE * | | | 28,390 | | | | 101,815 | |
| TOTAL POLAND | | | | | | | 885,505 | |
| QATAR— 1.3% | | | | | | | | |
| Financials — 0.5% | | | | | | | | |
| Qatar National Bank | | | 2,330 | | | | 77,757 | |
| Industrials — 0.6% | | | | | | | | |
| Industries Qatar QSC | | | 3,866 | | | | 101,409 | |
| Telecommunications — 0.2% | | | | | | | | |
| Ooredoo QPSC | | | 1,510 | | | | 35,627 | |
| TOTAL QATAR | | | | | | | 214,793 | |
| SOUTH AFRICA— 8.4% | | | | | | | | |
| Basic Materials — 2.0% | | | | | | | | |
| Anglo American Platinum * | | | 1,955 | | | | 54,400 | |
| AngloGold Ashanti | | | 5,260 | | | | 48,478 | |
| Gold Fields ADR | | | 36,933 | | | | 146,624 | |
| Mondi | | | 1,600 | | | | 38,691 | |
| Sasol | | | 1,823 | | | | 53,328 | |
| | | | | | | | 341,521 | |
| Consumer Goods — 0.8% | | | | | | | | |
| Remgro | | | 3,700 | | | | 55,992 | |
| Tiger Brands | | | 2,913 | | | | 79,513 | |
| | | | | | | | 135,505 | |
| Consumer Services — 3.1% | | | | | | | | |
| Naspers, Cl N | | | 1,559 | | | | 379,794 | |
| Shoprite Holdings | | | 5,074 | | | | 72,609 | |
| Woolworths Holdings | | | 12,618 | | | | 50,280 | |
| | | | | | | | 502,683 | |
| Financials — 1.2% | | | | | | | | |
| FirstRand | | | 26,180 | | | | 94,881 | |
| Standard Bank Group | | | 7,555 | | | | 87,617 | |
| | | | | | | | 182,498 | |
| Health Care — 0.5% | | | | | | | | |
| Aspen Pharmacare Holdings | | | 3,301 | | | | 74,569 | |
| Industrials — 0.0% | | | | | | | | |
| Novus Holdings | | | 539 | | | | 267 | |
The accompanying notes are an integral part of the financial statements.
| Schedule of Investments | October 31, 2017 |
Global X Next Emerging & Frontier ETF
| | | Shares | | | Value | |
| COMMON STOCK — continued | | | | | | | | |
| Telecommunications — 0.8% | | | | | | | | |
| MTN Group | | | 4,803 | | | $ | 41,698 | |
| Vodacom Group | | | 8,210 | | | | 89,176 | |
| | | | | | | | 130,874 | |
| TOTAL SOUTH AFRICA | | | | | | | 1,367,917 | |
| SOUTH KOREA— 0.3% | | | | | | | | |
| Consumer Goods — 0.3% | | | | | | | | |
| Youngone | | | 1,430 | | | | 43,908 | |
| THAILAND— 12.5% | | | | | | | | |
| Basic Materials — 0.3% | | | | | | | | |
| Indorama Ventures NVDR | | | 33,400 | | | | 46,249 | |
| Consumer Goods — 2.2% | | | | | | | | |
| Carabao Group NVDR | | | 31,800 | | | | 100,990 | |
| Charoen Pokphand Foods NVDR | | | 121,457 | | | | 95,060 | |
| Thai Beverage | | | 211,907 | | | | 152,429 | |
| | | | | | | | 348,479 | |
| Consumer Services — 1.2% | | | | | | | | |
| CP ALL NVDR | | | 74,822 | | | | 157,662 | |
| Minor International NVDR | | | 24,600 | | | | 32,027 | |
| | | | | | | | 189,689 | |
| Financials — 0.7% | | | | | | | | |
| Kasikornbank NVDR | | | 6,130 | | | | 40,596 | |
| Siam Commercial Bank NVDR | | | 18,070 | | | | 79,689 | |
| | | | | | | | 120,285 | |
| Health Care — 0.3% | | | | | | | | |
| Bangkok Dusit Medical Services NVDR | | | 72,300 | | | | 46,140 | |
| Industrials — 3.7% | | | | | | | | |
| Airports of Thailand NVDR | | | 134,940 | | | | 241,690 | |
| Berli Jucker NVDR | | | 43,300 | | | | 69,734 | |
| CH Karnchang NVDR | | | 116,000 | | | | 95,153 | |
| Siam Cement NVDR | | | 13,220 | | | | 194,997 | |
| | | | | | | | 601,574 | |
| Oil & Gas — 2.8% | | | | | | | | |
| PTT NVDR | | | 18,091 | | | | 228,724 | |
| PTT Exploration & Production NVDR | | | 33,060 | | | | 85,835 | |
| PTT Global Chemical NVDR | | | 40,931 | | | | 98,570 | |
| Thai Oil NVDR | | | 16,800 | | | | 51,583 | |
| | | | | | | | 464,712 | |
| Technology — 0.4% | | | | | | | | |
| Intouch Holdings PCL NVDR | | | 38,670 | | | | 67,515 | |
The accompanying notes are an integral part of the financial statements.
| Schedule of Investments | October 31, 2017 |
Global X Next Emerging & Frontier ETF
| | | Shares | | | Value | |
| COMMON STOCK — continued | | | | | | | | |
| Telecommunications — 0.9% | | | | | | | | |
| Advanced Info Service NVDR | | | 23,154 | | | $ | 135,565 | |
| True NVDR * | | | 125,520 | | | | 23,237 | |
| | | | | | | | 158,802 | |
| TOTAL THAILAND | | | | | | | 2,043,445 | |
| TURKEY— 8.8% | | | | | | | | |
| Basic Materials — 2.3% | | | | | | | | |
| Eregli Demir ve Celik Fabrikalari | | | 159,573 | | | | 374,076 | |
| Consumer Services — 1.1% | | | | | | | | |
| Arcelik | | | 4,500 | | | | 24,559 | |
| BIM Birlesik Magazalar | | | 7,919 | | | | 161,340 | |
| | | | | | | | 185,899 | |
| Financials — 1.1% | | | | | | | | |
| Akbank Turk | | | 21,050 | | | | 55,500 | |
| Turkiye Garanti Bankasi | | | 21,525 | | | | 59,134 | |
| Turkiye Is Bankasi, Cl C | | | 31,844 | | | | 59,888 | |
| | | | | | | | 174,522 | |
| Industrials — 0.2% | | | | | | | | |
| Enka Insaat ve Sanayi | | | 17,841 | | | | 27,021 | |
| Oil & Gas — 2.8% | | | | | | | | |
| KOC Holding | | | 34,446 | | | | 153,878 | |
| Tupras Turkiye Petrol Rafinerileri | | | 8,533 | | | | 306,793 | |
| | | | | | | | 460,671 | |
| Technology — 0.5% | | | | | | | | |
| Aselsan Elektronik Sanayi Ve Ticaret | | | 9,500 | | | | 84,927 | |
| Telecommunications — 0.8% | | | | | | | | |
| Turk Telekomunikasyon * | | | 11,236 | | | | 19,089 | |
| Turkcell Iletisim Hizmetleri | | | 29,200 | | | | 108,984 | |
| | | | | | | | 128,073 | |
| TOTAL TURKEY | | | | | | | 1,435,189 | |
| UKRAINE— 0.5% | | | | | | | | |
| Consumer Goods — 0.5% | | | | | | | | |
| Kernel Holding | | | 5,651 | | | | 75,940 | |
| UNITED ARAB EMIRATES— 2.9% | | | | | | | | |
| Financials — 1.8% | | | | | | | | |
| Emaar Properties PJSC | | | 102,571 | | | | 231,526 | |
| National Bank of Abu Dhabi PJSC | | | 24,380 | | | | 68,706 | |
| | | | | | | | 300,232 | |
| Industrials — 0.6% | | | | | | | | |
| DP World | | | 4,272 | | | | 101,460 | |
| Telecommunications — 0.5% | | | | | | | | |
| Emirates Telecommunications Group PJSC | | | 16,000 | | | | 77,764 | |
The accompanying notes are an integral part of the financial statements.
| Schedule of Investments | October 31, 2017 |
Global X Next Emerging & Frontier ETF
| | | Shares | | | Value | |
| COMMON STOCK — continued | | | | | | | | |
| TOTAL UNITED ARAB EMIRATES | | | | | | $ | 479,456 | |
| UNITED KINGDOM— 1.5% | | | | | | | | |
| Basic Materials — 1.1% | | | | | | | | |
| Antofagasta | | | 4,950 | | | | 62,743 | |
| KAZ Minerals * | | | 11,210 | | | | 121,026 | |
| | | | | | | | 183,769 | |
| Health Care — 0.4% | | | | | | | | |
| Mediclinic International | | | 7,098 | | | | 54,858 | |
| TOTAL UNITED KINGDOM | | | | | | | 238,627 | |
| UNITED STATES— 1.8% | | | | | | | | |
| Basic Materials — 0.3% | | | | | | | | |
| Southern Copper | | | 1,137 | | | | 48,834 | |
| Oil & Gas — 1.1% | | | | | | | | |
| Kosmos Energy * | | | 8,338 | | | | 64,036 | |
| Occidental Petroleum | | | 912 | | | | 58,888 | |
| Seadrill Partners | | | 15,136 | | | | 57,971 | |
| | | | | | | | 180,895 | |
| Telecommunications — 0.4% | | | | | | | | |
| VEON ADR | | | 17,953 | | | | 70,196 | |
| TOTAL UNITED STATES | | | | | | | 299,925 | |
| VIETNAM— 1.1% | | | | | | | | |
| Consumer Goods — 0.5% | | | | | | | | |
| Vietnam Dairy Products JSC | | | 11,200 | | | | 74,461 | |
| Financials — 0.1% | | | | | | | | |
| Bank for Foreign Trade of Vietnam JSC | | | 10,800 | | | | 19,686 | |
| Industrials — 0.5% | | | | | | | | |
| Hoa Phat Group JSC * | | | 52,600 | | | | 85,689 | |
| TOTAL VIETNAM | | | | | | | 179,836 | |
| TOTAL COMMON STOCK | | | | | | | | |
| (Cost $15,760,780) | | | | | | | 16,184,477 | |
| | | | | | | | | |
| PREFERRED STOCK — 0.3% | | | | | | | | |
| CHILE— 0.3% | | | | | | | | |
| Basic Materials — 0.3% | | | | | | | | |
| Sociedad Quimica y Minera de Chile | | | | | | | | |
| (Cost $28,869) | | | 870 | | | | 52,012 | |
The accompanying notes are an integral part of the financial statements.
| Schedule of Investments | October 31, 2017 |
Global X Next Emerging & Frontier ETF
| | | Face Amount | | | Value | |
| CORPORATE OBLIGATION — 0.1% |
| Bank Muscat SAOG | | | | | | | | |
| 0.035%, 03/19/18 | | | | | | | | |
| (Cost $–) | | $ | 22,009 | | | $ | 5,946 | |
| TOTAL INVESTMENTS — 99.7% | | | | | | | | |
| (Cost $15,789,649) | | | | | | $ | 16,242,435 | |
Percentages are based on Net Assets of $16,293,934.
| * | Non-income producing security. |
| ADR — American Depositary Receipt |
| Cl — Class |
| NVDR — Non-Voting Depositary Receipt |
| PJSC — Public Joint Stock Company |
| Ser — Series |
The following is a summary of the level of inputs used as of October 31, 2017, in valuing the Fund's investments carried at value:
| Investments in Securities | | Level 1 | | | Level 2 | | | Level 3 | | | Total | |
| Common Stock | | $ | 16,184,477 | | | $ | — | | | $ | — | | | $ | 16,184,477 | |
| Preferred Stock | | | 52,012 | | | | — | | | | — | | | | 52,012 | |
| Corporate Obligation | | | — | | | | 5,946 | | | | — | | | | 5,946 | |
| Total Investments in Securities | | $ | 16,236,489 | | | $ | 5,946 | | | $ | — | | | $ | 16,242,435 | |
For the year ended October 31, 2017, there have been no transfers between Level 1, Level 2 and Level 3 investments.
For the year ended October 31, 2017, there were no Level 3 investments.
The accompanying notes are an integral part of the financial statements.
| Schedule of Investments | October 31, 2017 |
| | |
| Global X MSCI Portugal ETF |
Sector Weightings (unaudited)†:
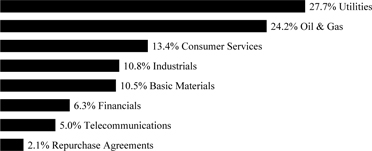
† Sector weightings percentages are based on the total market value of investments. Repurchase agreements purchased from cash collateral received for securities lending activity are included in total investments. Please see Note 2 and Note 8 in Notes to Financial Statements for more detailed information.
| | | Shares | | | Value | |
| COMMON STOCK — 100.0% | | | | | | | | |
| NETHERLANDS— 1.7% | | | | | | | | |
| Telecommunications — 1.7% | | | | | | | | |
| Altice * | | | 56,650 | | | $ | 1,068,775 | |
| PORTUGAL— 98.3% | | | | | | | | |
| Basic Materials — 10.7% | | | | | | | | |
| Altri | | | 309,431 | | | | 1,977,178 | |
| Navigator | | | 561,452 | | | | 2,864,130 | |
| Semapa-Sociedade de Investimento e Gestao | | | 98,017 | | | | 1,959,974 | |
| | | | | | | | 6,801,282 | |
| Consumer Services — 13.7% | | | | | | | | |
| Ibersol SGPS | | | 72,696 | | | | 1,054,351 | |
| Jeronimo Martins | | | 142,295 | | | | 2,585,946 | |
| NOS SGPS | | | 434,578 | | | | 2,604,197 | |
| Sonae | | | 2,048,724 | | | | 2,453,476 | |
| | | | | | | | 8,697,970 | |
| Financials — 6.5% | | | | | | | | |
| Banco Comercial Portugues, Cl R * | | | 10,242,947 | | | | 3,060,677 | |
| Banco Espirito Santo *(A) (B) (C) | | | 2,085,614 | | | | — | |
| BANIF - Banco Internacional do Funchal *(A) (B) (C) (D) | | | 55,479,410 | | | | 646 | |
| Sonae Capital | | | 1,073,902 | | | | 1,065,883 | |
| | | | | | | | 4,127,206 | |
| Industrials — 11.0% | | | | | | | | |
| Corticeira Amorim SGPS | | | 125,873 | | | | 1,755,222 | |
| CTT-Correios de Portugal | | | 354,709 | | | | 2,089,222 | |
| Mota-Engil | | | 530,332 | | | | 2,130,200 | |
| Teixeira Duarte | | | 2,889,447 | | | | 1,067,036 | |
| | | | | | | | 7,041,680 | |
| Oil & Gas — 24.6% | | | | | | | | |
| Galp Energia | | | 844,587 | | | | 15,702,996 | |
The accompanying notes are an integral part of the financial statements.
| Schedule of Investments | October 31, 2017 |
| | |
| Global X MSCI Portugal ETF |
| | | Shares/Face
Amount | | | Value | |
| COMMON STOCK — continued | | | | | | | | |
| Telecommunications — 3.6% | | | | | | | | |
| Pharol SGPS * | | | 3,034,773 | | | $ | 1,506,056 | |
| Sonaecom | | | 275,555 | | | | 739,277 | |
| | | | | | | | 2,245,333 | |
| Utilities — 28.2% | | | | | | | | |
| EDP Renovaveis | | | 342,257 | | | | 2,830,844 | |
| Energias de Portugal | | | 3,677,420 | | | | 13,121,862 | |
| REN - Redes Energeticas Nacionais (D) | | | 640,895 | | | | 2,035,998 | |
| | | | | | | | 17,988,704 | |
| TOTAL PORTUGAL | | | | | | | 62,605,171 | |
| TOTAL COMMON STOCK | | | | | | | | |
| (Cost $61,661,435) | | | | | | | 63,673,946 | |
| | | | | | | | | |
| REPURCHASE AGREEMENTS (E) — 2.1% | | | | | | | | |
| Barclays Bank | | | | | | | | |
| 1.050%, dated 10/31/17, to be repurchased on 11/01/17 repurchase price $805,563 (collateralized by U.S Treasury Obligations, ranging in par value $0-$268,645, 0.000%-9.000%, 11/15/17-08/15/47, with a total market value of $821,650) | | $ | 805,539 | | | | 805,539 | |
| Deutsche Bank | | | | | | | | |
| 1.040%, dated 10/31/17, to be repurchased on 11/01/17 repurchase price $550,561 (collateralized by U.S. Treasury Obligations, par value $533,698, 3.625%, 02/15/20 with a total market value of $561,137) | | | 550,545 | | | | 550,545 | |
| TOTAL REPURCHASE AGREEMENTS | | | | | | | | |
| (Cost $1,356,084) | | | | | | | 1,356,084 | |
| TOTAL INVESTMENTS — 102.1% | | | | | | | | |
| (Cost $63,017,519) | | | | | | $ | 65,030,030 | |
Percentages are based on Net Assets of $63,704,542.
| * | Non-income producing security. |
| (A) | Level 3 security in accordance with fair value hierarchy. |
| (B) | Security considered illiquid. The total value of such securities as of October 31, 2017 was $646 and represented 0.0% of Net Assets. |
| (C) | Security is fair valued using methods determined in good faith by the Fair Value Committee of the Fund. The total value of such securities as of October 31, 2017, was $646 and represents 0.0% of Net Assets. |
| (D) | This security or a partial position of this security is on loan at October 31, 2017. The total value of securities on loan at October 31, 2017 was $1,185,710. |
| (E) | Security was purchased with cash collateral held from securities on loan. The total value of such securities as of October 31, 2017 was $1,356,084. |
Cl — Class
The accompanying notes are an integral part of the financial statements.
| Schedule of Investments | October 31, 2017 |
| | |
| Global X MSCI Portugal ETF |
The following is a summary of the level of inputs used as of October 31, 2017, in valuing the Fund's investments carried at value:
| Investments in Securities | | Level 1 | | | Level 2 | | | Level 3(1) | | | Total | |
| Common Stock | | $ | 63,673,300 | | | $ | — | | | $ | 646 | | | $ | 63,673,946 | |
| Repurchase Agreements | | | — | | | | 1,356,084 | | | | — | | | | 1,356,084 | |
| Total Investments in Securities | | $ | 63,673,300 | | | $ | 1,356,084 | | | $ | 646 | | | $ | 65,030,030 | |
|
(1) A reconciliation of Level 3 investments and disclosures of significant unobservable inputs are presented when the Fund has a significant amount of Level 3 investments at the beginning and/or end of the period in relation to Net Assets. Management has concluded that Level 3 investments are not material in relation to Net Assets.
For the year ended October 31, 2017, there have been no transfers between Level 1, Level 2 and Level 3 investments.
The accompanying notes are an integral part of the financial statements.
| Schedule of Investments | October 31, 2017 |
| | |
| Global X MSCI Pakistan ETF |
Sector Weightings (unaudited)†:
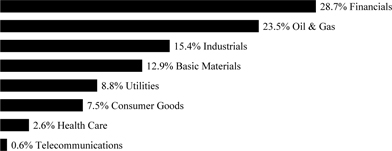
† Sector weightings percentages are based on the total market value of investments.
| | | Shares | | | Value | |
| COMMON STOCK — 99.9% | | | | | | | | |
| PAKISTAN— 99.9% | | | | | | | | |
| Basic Materials — 12.9% | | | | | | | | |
| Dawood Hercules | | | 135,100 | | | $ | 146,957 | |
| Engro | | | 1,083,990 | | | | 2,861,071 | |
| Engro Fertilizers | | | 2,010,800 | | | | 1,240,631 | |
| Fauji Fertilizer | | | 2,458,100 | | | | 1,868,749 | |
| Fauji Fertilizer Bin Qasim | | | 1,465,000 | | | | 460,077 | |
| International Steels | | | 316,900 | | | | 319,292 | |
| | | | | | | | 6,896,777 | |
| Consumer Goods — 7.5% | | | | | | | | |
| Honda Atlas Cars Pakistan | | | 107,100 | | | | 526,253 | |
| Indus Motor | | | 79,090 | | | | 1,277,100 | |
| Nishat Mills | | | 886,200 | | | | 1,093,963 | |
| Pak Elektron | | | 1,096,400 | | | | 614,009 | |
| PAK Suzuki Motor | | | 117,350 | | | | 568,585 | |
| | | | | | | | 4,079,910 | |
| Financials — 28.6% | | | | | | | | |
| Askari Bank | | | 855,500 | | | | 156,262 | |
| Bank Al Habib | | | 4,011,700 | | | | 2,097,350 | |
| Bank Alfalah * | | | 2,017,200 | | | | 764,673 | |
| Habib Bank | | | 2,657,450 | | | | 4,048,930 | |
| MCB Bank | | | 1,920,940 | | | | 3,625,048 | |
| National Bank of Pakistan | | | 2,163,900 | | | | 906,769 | |
| United Bank | | | 2,181,590 | | | | 3,709,128 | |
| | | | | | | | 15,308,160 | |
| Health Care — 2.6% | | | | | | | | |
| Ferozsons Laboratories | | | 75,530 | | | | 194,585 | |
| Searle | | | 404,687 | | | | 1,174,047 | |
| | | | | | | | 1,368,632 | |
| Industrials — 15.4% | | | | | | | | |
| DG Khan Cement | | | 845,260 | | | | 1,094,220 | |
| Fauji Cement | | | 3,168,200 | | | | 837,354 | |
The accompanying notes are an integral part of the financial statements.
| Schedule of Investments | October 31, 2017 |
| | |
| Global X MSCI Pakistan ETF |
| | | Shares | | | Value | |
| COMMON STOCK — continued | | | | | | | | |
| Industrials — continued | | | | | | | | |
| Kohat Cement | | | 151,200 | | | $ | 209,787 | |
| Lucky Cement * | | | 592,010 | | | | 2,736,110 | |
| Maple Leaf Cement Factory | | | 1,361,999 | | | | 872,140 | |
| Millat Tractors | | | 81,880 | | | | 868,572 | |
| Packages | | | 162,530 | | | | 809,016 | |
| Pakistan International Bulk Terminal * | | | 1,838,442 | | | | 297,928 | |
| Thal | | | 108,400 | | | | 523,111 | |
| | | | | | | | 8,248,238 | |
| Oil & Gas — 23.5% | | | | | | | | |
| Attock Petroleum | | | 39,100 | | | | 226,430 | |
| Byco Petroleum Pakistan * | | | 1,050,000 | | | | 146,832 | |
| National Refinery | | | 126,700 | | | | 708,418 | |
| Oil & Gas Development | | | 2,836,640 | | | | 3,868,182 | |
| Pakistan Oilfields | | | 390,120 | | | | 2,185,835 | |
| Pakistan Petroleum | | | 1,599,700 | | | | 2,729,673 | |
| Pakistan State Oil | | | 777,036 | | | | 2,507,008 | |
| Shell Pakistan | | | 62,500 | | | | 196,753 | |
| | | | | | | | 12,569,131 | |
| Telecommunications — 0.6% | | | | | | | | |
| Pakistan Telecommunication | | | 2,732,380 | | | | 342,407 | |
| Utilities — 8.8% | | | | | | | | |
| Hub Power | | | 2,449,642 | | | | 2,386,270 | |
| K-Electric * | | | 8,642,800 | | | | 454,560 | |
| Kot Addu Power | | | 1,417,500 | | | | 862,867 | |
| SUI Northern Gas Pipeline | | | 689,600 | | | | 749,994 | |
| SUI Southern Gas * | | | 889,800 | | | | 254,180 | |
| | | | | | | | 4,707,871 | |
| TOTAL INVESTMENTS — 99.9% | | | | | | | | |
| (Cost $65,434,211) | | | | | | $ | 53,521,126 | |
Percentages are based on Net Assets of $53,576,287.
| * | Non-income producing security. |
As of October 31, 2017, all of the Fund's investments were considered Level 1, in accordance with authoritative guidance on fair value measurements and disclosure under U.S. GAAP.
For the period ended October 31, 2017, there have been no transfers between Level 1, Level 2 or Level 3 investments.
The accompanying notes are an integral part of the financial statements.
| Statements of Assets and Liabilities |
| October 31, 2017 |
| | | Global X China
Consumer ETF | | | Global X China
Energy ETF | | | Global X China
Financials ETF | | | Global X China
Industrials ETF | |
| Assets: | | | | | | | | | | | | | | | | |
| Cost of Investments | | $ | 130,740,254 | | | $ | 2,082,662 | | | $ | 43,815,344 | | | $ | 4,557,042 | |
| Cost of Repurchase Agreement | | | 5,980,517 | | | | — | | | | — | | | | — | |
| Cost of Foreign Currency | | | 9,670 | | | | 445 | | | | 2 | | | | 3 | |
| | | | | | | | | | | | | | | | | |
| Investments, at Value | | $ | 156,093,924 | * | | $ | 1,751,751 | | | $ | 50,182,375 | | | $ | 4,006,552 | |
| Repurchase Agreement, at Value | | | 5,980,517 | | | | — | | | | — | | | | — | |
| Cash | | | 326,962 | | | | 5,233 | | | | 82,262 | | | | — | |
| Foreign Currency, at Value | | | 8,384 | | | | 445 | | | | 2 | | | | 3 | |
| Receivable for Investment Securities Sold | | | 19,021,825 | | | | 102,638 | | | | 2,881,037 | | | | 309,118 | |
| Unrealized Appreciation on Foreign Spot Currency Contracts | | | 8,797 | | | | 444 | | | | — | | | | — | |
| Dividend and Interest Receivable | | | 10,051 | | | | — | | | | 18,780 | | | | 13,665 | |
| Total Assets | | | 181,450,460 | | | | 1,860,511 | | | | 53,164,456 | | | | 4,329,338 | |
| Liabilities: | | | | | | | | | | | | | | | | |
| Obligation to Return Securities Lending Collateral | | | 5,980,517 | | | | — | | | | — | | | | — | |
| Payable for Investment Securities Purchased | | | 19,325,174 | | | | 105,615 | | | | 2,885,346 | | | | 309,854 | |
| Payable due to Investment Adviser | | | 86,395 | | | | 961 | | | | 27,791 | | | | 2,229 | |
| Cash Overdraft | | | — | | | | — | | | | — | | | | 2,236 | |
| Unrealized Depreciation on Foreign Spot Currency Contracts | | | 8,797 | | | | 444 | | | | — | | | | — | |
| Total Liabilities | | | 25,400,883 | | | | 107,020 | | | | 2,913,137 | | | | 314,319 | |
| Net Assets | | $ | 156,049,577 | | | $ | 1,753,491 | | | $ | 50,251,319 | | | $ | 4,015,019 | |
| Net Assets Consist of: | | | | | | | | | | | | | | | | |
| Paid-in Capital | | $ | 173,318,389 | | | $ | 3,191,064 | | | $ | 47,199,959 | | | $ | 6,723,151 | |
| Undistributed Net Investment Income | | | 1,448,596 | | | | 61,750 | | | | 917,566 | | | | 54,165 | |
| Accumulated Net Realized Loss on Investments and Foreign Currency Transactions | | | (44,071,077 | ) | | | (1,168,412 | ) | | | (4,233,255 | ) | | | (2,211,817 | ) |
| Net Unrealized Appreciation (Depreciation) on Investments | | | 25,353,670 | | | | (330,911 | ) | | | 6,367,031 | | | | (550,490 | ) |
| Net Unrealized Appreciation (Depreciation) on Foreign Currency Translations | | | (1 | ) | | | — | | | | 18 | | | | 10 | |
| Net Assets | | $ | 156,049,577 | | | $ | 1,753,491 | | | $ | 50,251,319 | | | $ | 4,015,019 | |
| Outstanding Shares of Beneficial Interest (unlimited authorization — no par value) | | | 8,950,000 | | | | 150,000 | | | | 2,850,000 | | | | 250,000 | |
| Net Asset Value, Offering and Redemption Price Per Share | | $ | 17.44 | | | $ | 11.69 | | | $ | 17.63 | | | $ | 16.06 | |
| *Includes Market Value of Securities on Loan | | $ | 5,626,645 | | | $ | — | | | $ | — | | | $ | — | |
The accompanying notes are an integral part of the financial statements.
| Statements of Assets and Liabilities |
| October 31, 2017 |
| | | Global X China
Materials ETF | | | Global X NASDAQ
China Technology
ETF | | | Global X FTSE
Southeast Asia
ETF | | | Global X MSCI
Colombia ETF | |
| Assets: | | | | | | | | | | | | | | | | |
| Cost of Investments | | $ | 4,961,881 | | | $ | 14,687,525 | | | $ | 13,727,666 | | | $ | 92,273,511 | |
| Cost of Repurchase Agreement | | | — | | | | — | | | | — | | | | 3,251,175 | |
| Cost of Foreign Currency | | | 3,133 | | | | 2 | | | | 2 | | | | 130,045 | |
| | | | | | | | | | | | | | | | | |
| Investments, at Value | | $ | 5,341,899 | | | $ | 19,176,747 | | | $ | 14,288,949 | | | $ | 92,702,555 | * |
| Repurchase Agreement, at Value | | | — | | | | — | | | | — | | | | 3,251,175 | |
| Cash | | | 57,423 | | | | 21,630 | | | | 18,113 | | | | 191,169 | |
| Foreign Currency, at Value | | | 3,133 | | | | 2 | | | | 2 | | | | 23,230 | |
| Receivable for Investment Securities Sold | | | 649,307 | | | | 110,803 | | | | — | | | | — | |
| Dividend and Interest Receivable | | | 9,581 | | | | — | | | | 20,593 | | | | 137,332 | |
| Unrealized Appreciation on Foreign Spot Currency Contracts | | | 3,132 | | | | — | | | | — | | | | — | |
| Total Assets | | | 6,064,475 | | | | 19,309,182 | | | | 14,327,657 | | | | 96,305,461 | |
| Liabilities: | | | | | | | | | | | | | | | | |
| Obligation to Return Securities Lending Collateral | | | — | | | | — | | | | — | | | | 3,251,175 | |
| Payable for Investment Securities Purchased | | | 661,754 | | | | 292,345 | | | | — | | | | — | |
| Payable due to Investment Adviser | | | 2,490 | | | | 9,818 | | | | 7,839 | | | | 40,947 | |
| Unrealized Depreciation on Foreign Spot Currency Contracts | | | 3,132 | | | | — | | | | — | | | | — | |
| Payable due to Custodian | | | — | | | | — | | | | — | | | | 28,970 | |
| Total Liabilities | | | 667,376 | | | | 302,163 | | | | 7,839 | | | | 3,321,092 | |
| Net Assets | | $ | 5,397,099 | | | $ | 19,007,019 | | | $ | 14,319,818 | | | $ | 92,984,369 | |
| Net Assets Consist of: | | | | | | | | | | | | | | | | |
| Paid-in Capital | | $ | 6,428,064 | | | $ | 17,478,186 | | | $ | 19,001,433 | | | $ | 176,741,626 | |
| Undistributed Net Investment Income | | | 58,996 | | | | 37,241 | | | | 241,638 | | | | 1,219,909 | |
| Accumulated Net Realized Loss on Investments and Foreign Currency Transactions | | | (1,469,976 | ) | | | (2,997,630 | ) | | | (5,484,475 | ) | | | (85,406,054 | ) |
| Net Unrealized Appreciation (Depreciation) on Investments | | | 380,018 | | | | 4,489,222 | | | | 561,283 | | | | 429,044 | |
| Net Unrealized Appreciation (Depreciation) on Foreign Currency Translations | | | (3 | ) | | | — | | | | (61 | ) | | | (156 | ) |
| Net Assets | | $ | 5,397,099 | | | $ | 19,007,019 | | | $ | 14,319,818 | | | $ | 92,984,369 | |
| Outstanding Shares of Beneficial Interest (unlimited authorization — no par value) | | | 249,971 | | | | 650,000 | | | | 900,000 | | | | 9,730,000 | |
| Net Asset Value, Offering and Redemption Price Per Share | | $ | 21.59 | | | $ | 29.24 | | | $ | 15.91 | | | $ | 9.56 | |
| *Includes Market Value of Securities on Loan | | $ | — | | | $ | — | | | $ | — | | | $ | 3,173,958 | |
The accompanying notes are an integral part of the financial statements.
| Statements of Assets and Liabilities |
| October 31, 2017 |
| | | Global X MSCI
Argentina ETF | | | Global X MSCI
Greece ETF | | | Global X MSCI
Norway ETF | | | Global X FTSE
Nordic Region
ETF | |
| Assets: | | | | | | | | | | | | | | | | |
| Cost of Investments | | $ | 151,946,685 | | | $ | 332,617,845 | | | $ | 158,477,571 | | | $ | 36,517,157 | |
| Cost of Repurchase Agreement | | | — | | | | 5,670,468 | | | | 49,261,166 | | | | 1,713,641 | |
| Cost of Foreign Currency | | | — | | | | — | | | | 1 | | | | — | |
| | | | | | | | | | | | | | | | | |
| Investments, at Value | | $ | 183,121,177 | | | $ | 349,203,263 | * | | $ | 164,305,858 | * | | $ | 38,450,747 | * |
| Repurchase Agreement, at Value | | | — | | | | 5,670,468 | | | | 49,261,166 | | | | 1,713,641 | |
| Cash | | | 289,686 | | | | 806,043 | | | | 246,751 | | | | — | |
| Foreign Currency, at Value | | | — | | | | — | | | | 1 | | | | — | |
| Receivable for Investment Securities Sold | | | 122,736 | | | | — | | | | — | | | | — | |
| Dividend and Interest Receivable | | | 93,857 | | | | 5,567 | | | | 728,013 | | | | 49,756 | |
| Reclaim Receivable | | | 2,808 | | | | — | | | | — | | | | 724,039 | |
| Unrealized Appreciation on Foreign Spot Currency Contracts | | | 48 | | | | — | | | | — | | | | — | |
| Total Assets | | | 183,630,312 | | | | 355,685,341 | | | | 214,541,789 | | | | 40,938,183 | |
| Liabilities: | | | | | | | | | | | | | | | | |
| Obligation to Return Securities Lending Collateral | | | — | | | | 5,670,468 | | | | 49,261,166 | | | | 1,713,641 | |
| Payable due to Investment Adviser | | | 85,839 | | | | 162,909 | | | | 70,472 | | | | 16,735 | |
| Payable for Investment Securities Purchased | | | 75,138 | | | | — | | | | 473,733 | | | | — | |
| Cash Overdraft | | | 24 | | | | 10 | | | | — | | | | 744,239 | |
| Unrealized Depreciation on Foreign Spot Currency Contracts | | | — | | | | — | | | | 304 | | | | — | |
| Payable due to Custodian | | | 1,261 | | | | 33,664 | | | | — | | | | — | |
| Due to Broker | | | 343 | | | | — | | | | — | | | | — | |
| Foreign Tax Payable | | | — | | | | 29,817 | | | | — | | | | — | |
| Total Liabilities | | | 162,605 | | | | 5,896,868 | | | | 49,805,675 | | | | 2,474,615 | |
| Net Assets | | $ | 183,467,707 | | | $ | 349,788,473 | | | $ | 164,736,114 | | | $ | 38,463,568 | |
| Net Assets Consist of: | | | | | | | | | | | | | | | | |
| Paid-in Capital | | $ | 157,550,187 | | | $ | 524,276,029 | | | $ | 186,821,131 | | | $ | 39,829,596 | |
| Undistributed Net Investment Income | | | 202,378 | | | | 4,452,163 | | | | 3,614,177 | | | | 743,838 | |
| Accumulated Net Realized Loss on Investments and Foreign Currency Transactions | | | (5,459,268 | ) | | | (195,525,147 | ) | | | (31,525,898 | ) | | | (3,983,260 | ) |
| Net Unrealized Appreciation (Depreciation) on Investments | | | 31,174,492 | | | | 16,585,418 | | | | 5,828,287 | | | | 1,933,590 | |
| Net Unrealized Appreciation (Depreciation) on Foreign Currency Translations | | | (82 | ) | | | 10 | | | | (1,583 | ) | | | (60,196 | ) |
| Net Assets | | $ | 183,467,707 | | | $ | 349,788,473 | | | $ | 164,736,114 | | | $ | 38,463,568 | |
| Outstanding Shares of Beneficial Interest (unlimited authorization — no par value) | | | 5,724,975 | | | | 37,600,000 | | | | 12,200,000 | | | | 1,610,000 | |
| Net Asset Value, Offering and Redemption Price Per Share | | $ | 32.05 | | | $ | 9.30 | | | $ | 13.50 | | | $ | 23.89 | |
| *Includes Market Value of Securities on Loan | | $ | — | | | $ | 5,402,172 | | | $ | 46,316,939 | | | $ | 1,620,128 | |
The accompanying notes are an integral part of the financial statements.
| Statements of Assets and Liabilities |
| October 31, 2017 |
| | | Global X MSCI
Nigeria ETF | | | Global X Next
Emerging &
Frontier ETF | | | Global X MSCI
Portugal ETF | | | Global X MSCI
Pakistan ETF | |
| Assets: | | | | | | | | | | | | | | | | |
| Cost of Investments | | $ | 59,175,831 | | | $ | 15,789,649 | | | $ | 61,661,435 | | | $ | 65,434,211 | |
| Cost of Repurchase Agreement | | | — | | | | — | | | | 1,356,084 | | | | — | |
| Cost of Foreign Currency | | | 61,475 | | | | 4,029 | | | | — | | | | 234,618 | |
| | | | | | | | | | | | | | | | | |
| Investments, at Value | | $ | 64,476,767 | | | $ | 16,242,435 | | | $ | 63,673,946 | * | | $ | 53,521,126 | |
| Repurchase Agreement, at Value | | | — | | | | — | | | | 1,356,084 | | | | — | |
| Cash | | | 89,231 | | | | 47,839 | | | | — | | | | — | |
| Foreign Currency, at Value | | | 11,552 | | | | 234 | | | | — | | | | 2,155 | |
| Dividend and Interest Receivable | | | 49,994 | | | | 13,068 | | | | 575 | | | | 860,936 | |
| Receivable for Investment Securities Sold | | | 11,548 | | | | 519 | | | | — | | | | — | |
| Reclaim Receivable | | | 131 | | | | 3,513 | | | | 86,468 | | | | — | |
| Unrealized Appreciation on Foreign Spot Currency Contracts | | | — | | | | 2 | | | | — | | | | — | |
| Receivable for Capital Shares Sold | | | — | | | | 90 | | | | — | | | | — | |
| Total Assets | | | 64,639,223 | | | | 16,307,700 | | | | 65,117,073 | | | | 54,384,217 | |
| Liabilities: | | | | | | | | | | | | | | | | |
| Obligation to Return Securities Lending Collateral | | | — | | | | — | | | | 1,356,084 | | | | — | |
| Payable due to Investment Adviser | | | 37,427 | | | | 6,785 | | | | 29,028 | | | | 30,895 | |
| Payable for Investment Securities Purchased | | | 11,548 | | | | 609 | | | | — | | | | — | |
| Cash Overdraft | | | — | | | | — | | | | 27,064 | | | | 653,955 | |
| Payable due to Custodian | | | 30,940 | | | | 4,965 | | | | — | | | | 18,673 | |
| Accrued Foreign Capital Gains Tax on Appreciated Securities | | | — | | | | 1,407 | | | | — | | | | 104,407 | |
| Due to Broker | | | — | | | | — | | | | 355 | | | | — | |
| Total Liabilities | | | 79,915 | | | | 13,766 | | | | 1,412,531 | | | | 807,930 | |
| Net Assets | | $ | 64,559,308 | | | $ | 16,293,934 | | | $ | 63,704,542 | | | $ | 53,576,287 | |
| Net Assets Consist of: | | | | | | | | | | | | | | | | |
| Paid-in Capital | | $ | 75,723,326 | | | $ | 37,165,021 | | | $ | 71,529,018 | | | $ | 62,544,568 | |
| Undistributed Net Investment Income | | | 1,360,193 | | | | 260,778 | | | | 1,153,141 | | | | 1,352,980 | |
| Accumulated Net Realized Gain (Loss) on Investments and Foreign Currency Transactions | | | (17,825,204 | ) | | | (21,584,101 | ) | | | (10,992,520 | ) | | | 1,696,018 | |
| Net Unrealized Appreciation (Depreciation) on Investments | | | 5,300,936 | | | | 452,786 | | | | 2,012,511 | | | | (11,913,085 | ) |
| Net Unrealized Appreciation (Depreciation) on Foreign Currency Translations | | | 57 | | | | 857 | | | | 2,392 | | | | 213 | |
| Foreign Capital Gains Tax on Appreciated Securities | | | — | | | | (1,407 | ) | | | — | | | | (104,407 | ) |
| Net Assets | | $ | 64,559,308 | | | $ | 16,293,934 | | | $ | 63,704,542 | | | $ | 53,576,287 | |
| Outstanding Shares of Beneficial Interest (unlimited authorization — no par value) | | | 3,012,135 | | | | 700,000 | | | | 5,100,000 | | | | 3,950,000 | |
| Net Asset Value, Offering and Redemption Price Per Share | | $ | 21.43 | | | $ | 23.28 | | | $ | 12.49 | | | $ | 13.56 | |
| *Includes Market Value of Securities on Loan | | $ | — | | | $ | — | | | $ | 1,185,710 | | | $ | — | |
The accompanying notes are an integral part of the financial statements.
| Statements of Operations |
| For the year ended October 31, 2017 |
| | | Global X China
Consumer ETF | | | Global X China
Energy ETF | | | Global X China
Financials ETF | | | Global X China
Industrials ETF | |
| Investment Income: | | | | | | | | | | | | | | | | |
| Dividend Income | | $ | 2,076,724 | | | $ | 76,647 | | | $ | 1,235,303 | | | $ | 91,920 | |
| Interest Income | | | 260 | | | | 19 | | | | 118 | | | | 16 | |
| Security Lending Income | | | 64,330 | | | | — | | | | — | | | | — | |
| Less: Foreign Taxes Withheld | | | (34,229 | ) | | | (4,224 | ) | | | (84,197 | ) | | | (4,827 | ) |
| Total Investment Income | | | 2,107,085 | | | | 72,442 | | | | 1,151,224 | | | | 87,109 | |
| Supervision and Administration Fees(1) | | | 588,116 | | | | 10,510 | | | | 231,632 | | | | 24,287 | |
| Custodian Fees | | | 6,043 | | | | 117 | | | | 830 | | | | 45 | |
| Total Expenses | | | 594,159 | | | | 10,627 | | | | 232,462 | | | | 24,332 | |
| Net Investment Income | | | 1,512,926 | | | | 61,815 | | | | 918,762 | | | | 62,777 | |
| Net Realized Gain on: | | | | | | | | | | | | | | | | |
| Investments | | | (2,023,884 | )(2) | | | (155,541 | ) | | | (152,691 | )(2) | | | (4,019 | )(2) |
| Foreign Currency Transactions | | | (4,816 | ) | | | (63 | ) | | | (1,190 | ) | | | (130 | ) |
| Net Realized Loss on Investments and Foreign Currency Transactions | | | (2,028,700 | ) | | | (155,604 | ) | | | (153,881 | ) | | | (4,149 | ) |
| Net Change in Unrealized Appreciation on: | | | | | | | | | | | | | | | | |
| Investments | | | 37,454,176 | | | | 296,239 | | | | 9,449,169 | | | | 934,580 | |
| Foreign Currency Translations | | | (6 | ) | | | (1 | ) | | | 14 | | | | 9 | |
| Net Change in Unrealized Appreciation on Investments and Foreign Currency Translations | | | 37,454,170 | | | | 296,238 | | | | 9,449,183 | | | | 934,589 | |
| Net Realized and Unrealized Gain on Investments and Foreign Currency Transactions and Translations | | | 35,425,470 | | | | 140,634 | | | | 9,295,302 | | | | 930,440 | |
| Net Increase in Net Assets Resulting from Operations | | $ | 36,938,396 | | | $ | 202,449 | | | $ | 10,214,064 | | | $ | 993,217 | |
| (1) | The Supervision and Administration fees reflect the supervisory and administrative fee, which includes fees paid by the Funds for the investment advisory services provided by the Adviser. (See Note 3 in Notes to Financial Statements.) |
| (2) | Includes realized gains/(losses) as a result of in-kind transactions. (See Note 4 in Notes to Financial Statements). |
The accompanying notes are an integral part of the financial statements.
| Statements of Operations |
| For the year ended October 31, 2017 |
| | | Global X China
Materials ETF | | | Global X
NASDAQ China
Technology ETF | | | Global X FTSE
Southeast Asia
ETF | | | Global X MSCI
Colombia ETF | |
| Investment Income: | | | | | | | | | | | | | | | | |
| Dividend Income | | $ | 79,191 | | | $ | 248,250 | | | $ | 366,942 | | | $ | 2,265,379 | |
| Interest Income | | | 24 | | | | 88 | | | | 72 | | | | 884 | |
| Security Lending Income | | | — | | | | — | | | | — | | | | 11,261 | |
| Less: Foreign Taxes Withheld | | | (2,367 | ) | | | (1,969 | ) | | | (19,325 | ) | | | 1,102 | |
| Total Investment Income | | | 76,848 | | | | 246,369 | | | | 347,689 | | | | 2,278,626 | |
| Supervision and Administration Fees(1) | | | 17,603 | | | | 89,548 | | | | 78,306 | | | | 632,803 | |
| Custodian Fees | | | 26 | | | | 107 | | | | 98 | | | | 121,756 | |
| Total Expenses | | | 17,629 | | | | 89,655 | | | | 78,404 | | | | 754,559 | |
| Waiver of Supervision and Administration Fees | | | – | | | | – | | | | – | | | | (178,804 | ) |
| Net Expenses | | | 17,629 | | | | 89,655 | | | | 78,404 | | | | 575,755 | |
| Net Investment Income | | | 59,219 | | | | 156,714 | | | | 269,285 | | | | 1,702,871 | |
| Net Realized Gain on: | | | | | | | | | | | | | | | | |
| Investments (2) | | | (222,726 | ) | | | (291,265 | ) | | | (361,378 | ) | | | (9,568,250 | ) |
| Foreign Currency Transactions | | | (222 | ) | | | (62 | ) | | | (2,871 | ) | | | 58,690 | |
| Net Realized Loss on Investments and Foreign Currency Transactions | | | (222,948 | ) | | | (291,327 | ) | | | (364,249 | ) | | | (9,509,560 | ) |
| Net Change in Unrealized Appreciation on: | | | | | | | | | | | | | | | | |
| Investments | | | 1,197,075 | | | | 4,011,282 | | | | 2,135,899 | | | | 11,274,216 | |
| Foreign Currency Translations | | | (2 | ) | | | — | | | | (23 | ) | | | 357 | |
| Net Change in Unrealized Appreciation on Investments and Foreign Currency Translations | | | 1,197,073 | | | | 4,011,282 | | | | 2,135,876 | | | | 11,274,573 | |
| Net Realized and Unrealized Gain on Investments and Foreign Currency Transactions and Translations | | | 974,125 | | | | 3,719,955 | | | | 1,771,627 | | | | 1,765,013 | |
| Net Increase in Net Assets Resulting from Operations | | $ | 1,033,344 | | | $ | 3,876,669 | | | $ | 2,040,912 | | | $ | 3,467,884 | |
| (1) | The Supervision and Administration fees reflect the supervisory and administrative fee, which includes fees paid by the Funds for the investment advisory services provided by the Adviser. (See Note 3 in Notes to Financial Statements.) |
| (2) | Includes realized gains/(losses) as a result of in-kind transactions. (See Note 4 in Notes to Financial Statements). |
The accompanying notes are an integral part of the financial statements.
| Statements of Operations |
| For the year ended October 31, 2017 |
| | | Global X MSCI
Argentina ETF | | | Global X MSCI
Greece ETF | | | Global X MSCI
Norway ETF | | | Global X FTSE
Nordic Region
ETF | |
| Investment Income: | | | | | | | | | | | | | | | | |
| Dividend Income | | $ | 1,280,349 | | | $ | 8,406,327 | | | $ | 5,477,708 | | | $ | 1,123,730 | |
| Interest Income | | | 552 | | | | 3,856 | | | | 648 | | | | — | |
| Security Lending Income | | | — | | | | 70,735 | | | | 534,993 | | | | 33,845 | |
| Less: Foreign Taxes Withheld | | | (67,027 | ) | | | (841,920 | ) | | | (1,118,216 | ) | | | (116,370 | ) |
| Total Investment Income | | | 1,213,874 | | | | 7,638,998 | | | | 4,895,133 | | | | 1,041,205 | |
| Supervision and Administration Fees(1) | | | 1,003,635 | | | | 1,824,157 | | | | 626,007 | | | | 178,465 | |
| Custodian Fees | | | 5,962 | | | | 195,853 | | | | 448 | | | | 17,557 | |
| Other Fees | | | 149 | | | | — | | | | — | | | | — | |
| Total Expenses | | | 1,009,746 | | | | 2,020,010 | | | | 626,455 | | | | 196,022 | |
| Waiver of Supervision and Administration Fees | | | (123,845 | ) | | | – | | | | – | | | | – | |
| Net Expenses | | | 885,901 | | | | 2,020,010 | | | | 626,455 | | | | 196,022 | |
| Net Investment Income | | | 327,973 | | | | 5,618,988 | | | | 4,268,678 | | | | 845,183 | |
| Net Realized Gain on: | | | | | | | | | | | | | | | | |
| Investments (2) | | | 15,416,126 | | | | 12,512,923 | | | | (83,802 | ) | | | 441,850 | |
| Foreign Currency Transactions | | | (26,298 | ) | | | 11,861 | | | | (18,293 | ) | | | 984 | |
| Net Realized Gain (Loss) on Investments and Foreign Currency Transactions | | | 15,389,828 | | | | 12,524,784 | | | | (102,095 | ) | | | 442,834 | |
| Net Change in Unrealized Appreciation on: | | | | | | | | | | | | | | | | |
| Investments | | | 21,715,334 | | | | 53,233,992 | | | | 23,370,632 | | | | 7,044,280 | |
| Foreign Currency Translations | | | (1,808 | ) | | | 56 | | | | (2,144 | ) | | | 44,401 | |
| Net Change in Unrealized Appreciation on Investments and Foreign Currency Translations | | | 21,713,526 | | | | 53,234,048 | | | | 23,368,488 | | | | 7,088,681 | |
| Net Realized and Unrealized Gain on Investments and Foreign Currency Transactions and Translations | | | 37,103,354 | | | | 65,758,832 | | | | 23,266,393 | | | | 7,531,515 | |
| Net Increase in Net Assets Resulting from Operations | | $ | 37,431,327 | | | $ | 71,377,820 | | | $ | 27,535,071 | | | $ | 8,376,698 | |
| (1) | The Supervision and Administration fees reflect the supervisory and administrative fee, which includes fees paid by the Funds for the investment advisory services provided by the Adviser. (See Note 3 in Notes to Financial Statements.) |
| (2) | Includes realized gains/(losses) as a result of in-kind transactions. (See Note 4 in Notes to Financial Statements). |
The accompanying notes are an integral part of the financial statements.
| Statements of Operations |
| For the year ended October 31, 2017 |
| | | Global X MSCI
Nigeria ETF | | | Global X Next
Emerging &
Frontier ETF | | | Global X MSCI
Portugal ETF | | | Global X MSCI
Pakistan ETF | |
| Investment Income: | | | | | | | | | | | | | | | | |
| Dividend Income | | $ | 2,021,309 | | | $ | 393,904 | | | $ | 1,594,788 | | | $ | 2,005,999 | |
| Interest Income | | | 2,114 | | | | 7,418 | | | | 142 | | | | 7 | |
| Security Lending Income | | | — | | | | — | | | | 46,415 | | | | — | |
| Less: Foreign Taxes Withheld | | | (184,647 | ) | | | (36,657 | ) | | | (239,090 | ) | | | (248,547 | ) |
| Total Investment Income | | | 1,838,776 | | | | 364,665 | | | | 1,402,255 | | | | 1,757,459 | |
| Supervision and Administration Fees(1) | | | 307,534 | | | | 72,854 | | | | 197,014 | | | | 216,083 | |
| Custodian Fees | | | 178,697 | | | | 11,056 | | | | 17,820 | | | | 67,359 | |
| Total Expenses | | | 486,231 | | | | 83,910 | | | | 214,834 | | | | 283,442 | |
| Net Investment Income | | | 1,352,545 | | | | 280,755 | | | | 1,187,421 | | | | 1,474,017 | |
| Net Realized Gain on: | | | | | | | | | | | | | | | | |
| Investments | | | (7,519,926 | ) | | | (223,131 | )(2) | | | (3,175,778 | )(2) | | | 1,893,477 | |
| Foreign Currency Transactions | | | 7,654 | | | | (5,480 | ) | | | (34,276 | ) | | | (52,129 | ) |
| Net Realized Gain (Loss) on Investments and Foreign Currency Transactions | | | (7,512,272 | ) | | | (228,611 | ) | | | (3,210,054 | ) | | | 1,841,348 | |
| Net Change in Unrealized Appreciation on: | | | | | | | | | | | | | | | | |
| Investments | | | 20,889,620 | | | | 2,395,381 | | | | 11,745,951 | | | | (12,119,918 | ) |
| Foreign Capital Gains Tax on Appreciated Securities | | | — | | | | 37 | | | | — | | | | 30,617 | |
| Foreign Currency Translations | | | 43 | | | | 1,969 | | | | 21,331 | | | | 382 | |
| Net Change in Unrealized Appreciation (Depreciation) on Investments and Foreign Currency Translations | | | 20,889,663 | | | | 2,397,387 | | | | 11,767,282 | | | | (12,088,919 | ) |
| Net Realized and Unrealized Gain (Loss) on Investments and Foreign Currency Transactions and Translations | | | 13,377,391 | | | | 2,168,776 | | | | 8,557,228 | | | | (10,247,571 | ) |
| Net Increase (Decrease) in Net Assets Resulting from Operations | | $ | 14,729,936 | | | $ | 2,449,531 | | | $ | 9,744,649 | | | $ | (8,773,554 | ) |
| (1) | The Supervision and Administration fees reflect the supervisory and administrative fee, which includes fees paid by the Funds for the investment advisory services provided by the Adviser. (See Note 3 in Notes to Financial Statements.) |
| (2) | Includes realized gains/(losses) as a result of in-kind transactions. (See Note 4 in Notes to Financial Statements). |
The accompanying notes are an integral part of the financial statements.
| Statements of Changes in Net Assets |
| | | Global X China Consumer ETF | | | Global X China Energy ETF | |
| | | Year Ended
October 31, 2017 | | | Year Ended
October 31, 2016 | | | Year Ended
October 31, 2017 | | | Year Ended
October 31, 2016 | |
| Operations: | | | | | | | | | | | | | | | | |
| Net Investment Income | | $ | 1,512,926 | | | $ | 1,327,430 | | | $ | 61,815 | | | $ | 33,354 | |
| Net Realized Loss on Investments and Foreign Currency Transactions | | | (2,028,700 | )(1) | | | (13,185,592 | )(1) | | | (155,604 | ) | | | (254,864 | ) |
| Net Change in Unrealized Appreciation (Depreciation) on Investments and Foreign Currency Translations | | | 37,454,170 | | | | 2,818,911 | | | | 296,238 | | | | 113,320 | |
| Net Increase (Decrease) in Net Assets Resulting from Operations | | | 36,938,396 | | | | (9,039,251 | ) | | | 202,449 | | | | (108,190 | ) |
| Dividends and Distributions from: | | | | | | | | | | | | | | | | |
| Net Investment Income | | | (998,941 | ) | | | (4,048,651 | ) | | | (32,233 | ) | | | (49,338 | ) |
| Total Dividends and Distributions | | | (998,941 | ) | | | (4,048,651 | ) | | | (32,233 | ) | | | (49,338 | ) |
| Capital Share Transactions: | | | | | | | | | | | | | | | | |
| Issued | | | 59,493,386 | | | | 12,709,523 | | | | — | | | | — | |
| Redeemed | | | (12,405,900 | ) | | | (20,549,924 | ) | | | — | | | | — | |
| Increase (Decrease) in Net Assets from Capital Share Transactions | | | 47,087,486 | | | | (7,840,401 | ) | | | — | | | | — | |
| Total Increase (Decrease) in Net Assets | | | 83,026,941 | | | | (20,928,303 | ) | | | 170,216 | | | | (157,528 | ) |
| Net Assets: | | | | | | | | | | | | | | | | |
| Beginning of Year | | | 73,022,636 | | | | 93,950,939 | | | | 1,583,275 | | | | 1,740,803 | |
| End of Year | | $ | 156,049,577 | | | $ | 73,022,636 | | | $ | 1,753,491 | | | $ | 1,583,275 | |
| Undistributed Net Investment Income | | $ | 1,448,596 | | | $ | 922,520 | | | $ | 61,750 | | | $ | 32,231 | |
| Share Transactions: | | | | | | | | | | | | | | | | |
| Issued | | | 3,800,000 | | | | 1,200,000 | | | | — | | | | — | |
| Redeemed | | | (950,000 | ) | | | (1,950,000 | ) | | | — | | | | — | |
| Net Increase (Decrease) in Shares Outstanding from Share Transactions | | | 2,850,000 | | | | (750,000 | ) | | | — | | | | — | |
| (1) | Includes realized gains/(losses) as a result of in-kind transactions. (See Note 4 in Notes to Financial Statements). |
The accompanying notes are an integral part of the financial statements.
| Statements of Changes in Net Assets |
| | | Global X China Financials ETF | | | Global X China Industrials ETF | |
| | | Year Ended
October 31, 2017 | | | Year Ended
October 31, 2016 | | | Year Ended
October 31, 2017 | | | Year Ended
October 31, 2016 | |
| Operations: | | | | | | | | | | | | | | | | |
| Net Investment Income | | $ | 918,762 | | | $ | 533,098 | | | $ | 62,777 | | | $ | 59,170 | |
| Net Realized Loss on Investments and Foreign Currency Transactions(1) | | | (153,881 | ) | | | (10,834,154 | ) | | | (4,149 | ) | | | (790,050 | ) |
| Net Change in Unrealized Appreciation (Depreciation) on Investments and Foreign Currency Translations | | | 9,449,183 | | | | 1,268,196 | | | | 934,589 | | | | (1,350 | ) |
| Net Increase (Decrease) in Net Assets Resulting from Operations | | | 10,214,064 | | | | (9,032,860 | ) | | | 993,217 | | | | (732,230 | ) |
| Dividends and Distributions from: | | | | | | | | | | | | | | | | |
| Net Investment Income | | | (528,238 | ) | | | (2,772,013 | ) | | | (59,685 | ) | | | (103,249 | ) |
| Total Dividends and Distributions | | | (528,238 | ) | | | (2,772,013 | ) | | | (59,685 | ) | | | (103,249 | ) |
| Capital Share Transactions: | | | | | | | | | | | | | | | | |
| Issued | | | 13,671,514 | | | | 11,582,475 | | | | — | | | | — | |
| Redeemed | | | (1,394,630 | ) | | | (28,846,647 | ) | | | (688,805 | ) | | | (2,616,503 | ) |
| Increase (Decrease) in Net Assets from Capital Share Transactions | | | 12,276,884 | | | | (17,264,172 | ) | | | (688,805 | ) | | | (2,616,503 | ) |
| Total Increase (Decrease) in Net Assets | | | 21,962,710 | | | | (29,069,045 | ) | | | 244,727 | | | | (3,451,982 | ) |
| Net Assets: | | | | | | | | | | | | | | | | |
| Beginning of Year | | | 28,288,609 | | | | 57,357,654 | | | | 3,770,292 | | | | 7,222,274 | |
| End of Year | | $ | 50,251,319 | | | $ | 28,288,609 | | | $ | 4,015,019 | | | $ | 3,770,292 | |
| Undistributed Net Investment Income | | $ | 917,566 | | | $ | 528,232 | | | $ | 54,165 | | | $ | 51,038 | |
| Share Transactions: | | | | | | | | | | | | | | | | |
| Issued | | | 900,000 | | | | 800,000 | | | | — | | | | — | |
| Redeemed | | | (100,000 | ) | | | (2,600,000 | ) | | | (50,000 | ) | | | (200,000 | ) |
| Net Increase (Decrease) in Shares Outstanding from Share Transactions | | | 800,000 | | | | (1,800,000 | ) | | | (50,000 | ) | | | (200,000 | ) |
| (1) | Includes realized gains/(losses) as a result of in-kind transactions. (See Note 4 in Notes to Financial Statements) |
The accompanying notes are an integral part of the financial statements.
| Statements of Changes in Net Assets |
| | | Global X China Materials ETF | | | Global X NASDAQ China Technology
ETF | |
| | | Year Ended
October 31, 2017 | | | Year Ended
October 31, 2016 | | | Year Ended
October 31, 2017 | | | Year Ended
October 31, 2016 | |
| Operations: | | | | | | | | | | | | | | | | |
| Net Investment Income | | $ | 59,219 | | | $ | 16,403 | | | $ | 156,714 | | | $ | 286,431 | |
| Net Realized Gain (Loss) on Investments and Foreign Currency Transactions(1) | | | (222,948 | ) | | | (241,694 | ) | | | (291,327 | ) | | | 118,539 | |
| Net Change in Unrealized Appreciation (Depreciation) on Investments and Foreign Currency Translations | | | 1,197,073 | | | | 309,175 | | | | 4,011,282 | | | | 331,619 | |
| Net Increase in Net Assets Resulting from Operations | | | 1,033,344 | | | | 83,884 | | | | 3,876,669 | | | | 736,589 | |
| Dividends and Distributions from: | | | | | | | | | | | | | | | | |
| Net Investment Income | | | (16,197 | ) | | | (70,832 | ) | | | (528,298 | ) | | | (100,894 | ) |
| Total Dividends and Distributions | | | (16,197 | ) | | | (70,832 | ) | | | (528,298 | ) | | | (100,894 | ) |
| Capital Share Transactions: | | | | | | | | | | | | | | | | |
| Issued | | | 3,862,280 | | | | — | | | | 4,112,680 | | | | — | |
| Redeemed | | | (823,898 | ) | | | — | | | | (2,394,276 | ) | | | (2,099,886 | ) |
| Increase (Decrease) in Net Assets from Capital Share Transactions | | | 3,038,382 | | | | — | | | | 1,718,404 | | | | (2,099,886 | ) |
| Total Increase (Decrease) in Net Assets | | | 4,055,529 | | | | 13,052 | | | | 5,066,775 | | | | (1,464,191 | ) |
| Net Assets: | | | | | | | | | | | | | | | | |
| Beginning of Year | | | 1,341,570 | | | | 1,328,518 | | | | 13,940,244 | | | | 15,404,435 | |
| End of Year | | $ | 5,397,099 | | | $ | 1,341,570 | | | $ | 19,007,019 | | | $ | 13,940,244 | |
| Undistributed Net Investment Income | | $ | 58,996 | | | $ | 16,196 | | | $ | 37,241 | | | $ | 277,404 | |
| Share Transactions: | | | | | | | | | | | | | | | | |
| Issued | | | 200,000 | | | | — | | | | 150,000 | | | | — | |
| Redeemed | | | (50,000 | ) | | | — | | | | (100,000 | ) | | | (100,000 | ) |
| Net Increase (Decrease) in Shares Outstanding from Share Transactions | | | 150,000 | | | | — | | | | 50,000 | | | | (100,000 | ) |
| (1) | Includes realized gains/(losses) as a result of in-kind transactions. (See Note 4 in Notes to Financial Statements.) |
The accompanying notes are an integral part of the financial statements.
| Statements of Changes in Net Assets |
| | | Global X FTSE Southeast Asia ETF | | | Global X MSCI Colombia ETF | |
| | | Year Ended
October 31, 2017 | | | Year Ended
October 31, 2016 | | | Year Ended
October 31, 2017 | | | Year Ended
October 31, 2016 | |
| Operations: | | | | | | | | | | | | | | | | |
| Net Investment Income | | $ | 269,285 | | | $ | 302,964 | | | $ | 1,702,871 | | | $ | 1,372,278 | |
| Net Realized Loss on Investments and Foreign Currency Transactions(1) | | | (364,249 | ) | | | (1,810,378 | ) | | | (9,509,560 | ) | | | (18,116,087 | ) |
| Net Change in Unrealized Appreciation (Depreciation) on Investments and Foreign Currency Translations | | | 2,135,876 | | | | 2,385,847 | | | | 11,274,573 | | | | 23,181,270 | |
| Net Increase in Net Assets Resulting from Operations | | | 2,040,912 | | | | 878,433 | | | | 3,467,884 | | | | 6,437,461 | |
| Dividends and Distributions from: | | | | | | | | | | | | | | | | |
| Net Investment Income | | | (284,922 | ) | | | (486,151 | ) | | | (1,265,662 | ) | | | (948,793 | ) |
| Total Dividends and Distributions | | | (284,922 | ) | | | (486,151 | ) | | | (1,265,662 | ) | | | (948,793 | ) |
| Capital Share Transactions: | | | | | | | | | | | | | | | | |
| Issued | | | 1,545,296 | | | | — | | | | 23,943,306 | | | | 22,093,246 | |
| Redeemed | | | (1,330,835 | ) | | | (2,418,748 | ) | | | (21,921,654 | ) | | | (5,437,401 | ) |
| Increase (Decrease) in Net Assets from Capital Share Transactions | | | 214,461 | | | | (2,418,748 | ) | | | 2,021,652 | | | | 16,655,845 | |
| Total Increase (Decrease) in Net Assets | | | 1,970,451 | | | | (2,026,466 | ) | | | 4,223,874 | | | | 22,144,513 | |
| Net Assets: | | | | | | | | | | | | | | | | |
| Beginning of Year | | | 12,349,367 | | | | 14,375,833 | | | | 88,760,495 | | | | 66,615,982 | |
| End of Year | | $ | 14,319,818 | | | $ | 12,349,367 | | | $ | 92,984,369 | | | $ | 88,760,495 | |
| Undistributed Net Investment Income | | $ | 241,638 | | | $ | 260,146 | | | $ | 1,219,909 | | | $ | 724,010 | |
| Share Transactions: | | | | | | | | | | | | | | | | |
| Issued | | | 100,000 | | | | — | | | | 2,450,000 | | | | 2,650,000 | |
| Redeemed | | | (100,000 | ) | | | (200,000 | ) | | | (2,350,000 | ) | | | (600,000 | ) |
| Net Increase (Decrease) in Shares Outstanding from Share Transactions | | | — | | | | (200,000 | ) | | | 100,000 | | | | 2,050,000 | |
| (1) | Includes realized gains/(losses) as a result of in-kind transactions. (See Note 4 in Notes to Financial Statements). |
The accompanying notes are an integral part of the financial statements.
| Statements of Changes in Net Assets |
| | | Global X MSCI Argentina ETF | | | Global X MSCI Greece ETF | |
| | | Year Ended
October 31, 2017 | | | Year Ended
October 31, 2016 | | | Year Ended
October 31, 2017 | | | Year Ended
October 31, 2016 | |
| Operations: | | | | | | | | | | | | | | | | |
| Net Investment Income | | $ | 327,973 | | | $ | 374,182 | | | $ | 5,618,988 | | | $ | 4,178,333 | |
| Net Realized Gain (Loss) on Investments and Foreign Currency Transactions(1) | | | 15,389,828 | | | | 3,129,729 | | | | 12,524,784 | | | | (134,815,500 | ) |
| Net Change in Unrealized Appreciation (Depreciation) on Investments and Foreign Currency Translations | | | 21,713,526 | | | | 12,204,462 | | | | 53,234,048 | | | | 39,582,204 | |
| Net Increase (Decrease) in Net Assets Resulting from Operations | | | 37,431,327 | | | | 15,708,373 | | | | 71,377,820 | | | | (91,054,963 | ) |
| Dividends and Distributions from: | | | | | | | | | | | | | | | | |
| Net Investment Income | | | (308,816 | ) | | | (213,754 | ) | | | (5,196,758 | ) | | | (3,840,043 | ) |
| Total Dividends and Distributions | | | (308,816 | ) | | | (213,754 | ) | | | (5,196,758 | ) | | | (3,840,043 | ) |
| Capital Share Transactions: | | | | | | | | | | | | | | | | |
| Issued | | | 107,177,896 | | | | 78,356,541 | | | | 116,402,043 | | | | 71,752,872 | |
| Redeemed | | | (51,434,300 | ) | | | (18,604,618 | ) | | | (78,355,928 | ) | | | (46,203,761 | ) |
| Increase in Net Assets from Capital Share Transactions | | | 55,743,596 | | | | 59,751,923 | | | | 38,046,115 | | | | 25,549,111 | |
| Total Increase (Decrease) in Net Assets | | | 92,866,107 | | | | 75,246,542 | | | | 104,227,177 | | | | (69,345,895 | ) |
| Net Assets: | | | | | | | | | | | | | | | | |
| Beginning of Year | | | 90,601,600 | | | | 15,355,058 | | | | 245,561,296 | | | | 314,907,191 | |
| End of Year | | $ | 183,467,707 | | | $ | 90,601,600 | | | $ | 349,788,473 | | | $ | 245,561,296 | |
| Undistributed Net Investment Income | | $ | 202,378 | | | $ | 209,519 | | | $ | 4,452,163 | | | $ | 4,017,796 | |
| Share Transactions: | | | | | | | | | | | | | | | | |
| Issued | | | 3,700,000 | | | | 3,900,000 | | | | 12,400,000 | | | | 8,850,000 | |
| Redeemed | | | (1,800,000 | ) | | | (850,000 | ) | | | (8,200,000 | ) | | | (5,700,000 | ) |
| Net Increase in Shares Outstanding from Share Transactions | | | 1,900,000 | | | | 3,050,000 | | | | 4,200,000 | | | | 3,150,000 | |
| (1) | Includes realized gains/(losses) as a result of in-kind transactions. (See Note 4 in Notes to Financial Statements). |
The accompanying notes are an integral part of the financial statements.
| Statements of Changes in Net Assets |
| | | Global X MSCI Norway ETF | | | Global X FTSE Nordic Region ETF | |
| | | Year Ended
October 31, 2017 | | | Year Ended
October 31, 2016 | | | Year Ended
October 31, 2017 | | | Year Ended
October 31, 2016 | |
| Operations: | | | | | | | | | | | | | | | | |
| Net Investment Income | | $ | 4,268,678 | | | $ | 3,062,802 | | | $ | 845,183 | | | $ | 1,412,597 | |
| Net Realized Gain (Loss) on Investments and Foreign Currency Transactions(1) | | | (102,095 | ) | | | (13,126,251 | ) | | | 442,834 | | | | (480,279 | ) |
| Net Change in Unrealized Appreciation (Depreciation) on Investments and Foreign Currency Translations | | | 23,368,488 | | | | 19,197,278 | | | | 7,088,681 | | | | (6,052,917 | ) |
| Net Increase (Decrease) in Net Assets Resulting from Operations | | | 27,535,071 | | | | 9,133,829 | | | | 8,376,698 | | | | (5,120,599 | ) |
| Dividends and Distributions from: | | | | | | | | | | | | | | | | |
| Net Investment Income | | | (3,382,974 | ) | | | (2,212,531 | ) | | | (1,335,962 | ) | | | (1,490,826 | ) |
| Total Dividends and Distributions | | | (3,382,974 | ) | | | (2,212,531 | ) | | | (1,335,962 | ) | | | (1,490,826 | ) |
| Capital Share Transactions: | | | | | | | | | | | | | | | | |
| Issued | | | 67,394,304 | | | | 54,452,738 | | | | 3,497,127 | | | | — | |
| Redeemed | | | (40,807,392 | ) | | | (12,400,772 | ) | | | (12,972,942 | ) | | | (5,085,717 | ) |
| Increase (Decrease) in Net Assets from Capital Share Transactions | | | 26,586,912 | | | | 42,051,966 | | | | (9,475,815 | ) | | | (5,085,717 | ) |
| Total Increase (Decrease) in Net Assets | | | 50,739,009 | | | | 48,973,264 | | | | (2,435,079 | ) | | | (11,697,142 | ) |
| Net Assets: | | | | | | | | | | | | | | | | |
| Beginning of Year | | | 113,997,105 | | | | 65,023,841 | | | | 40,898,647 | | | | 52,595,789 | |
| End of Year | | $ | 164,736,114 | | | $ | 113,997,105 | | | $ | 38,463,568 | | | $ | 40,898,647 | |
| Undistributed Net Investment Income | | $ | 3,614,177 | | | $ | 2,694,337 | | | $ | 743,838 | | | $ | 1,107,674 | |
| Share Transactions: | | | | | | | | | | | | | | | | |
| Issued | | | 5,150,000 | | | | 5,450,000 | | | | 150,000 | | | | — | |
| Redeemed | | | (3,250,000 | ) | | | (1,200,000 | ) | | | (650,000 | ) | | | (250,000 | ) |
| Net Increase (Decrease) in Shares Outstanding from Share Transactions | | | 1,900,000 | | | | 4,250,000 | | | | (500,000 | ) | | | (250,000 | ) |
| (1) | Includes realized gains/(losses) as a result of in-kind transactions. (See Note 4 in Notes to Financial Statements). |
The accompanying notes are an integral part of the financial statements.
| Statements of Changes in Net Assets |
| | | Global X MSCI Nigeria ETF | | | Global X Next Emerging & Frontier
ETF | |
| | | Year Ended
October 31, 2017 | | | Year Ended
October 31, 2016 | | | Year Ended
October 31, 2017 | | | Year Ended
October 31, 2016 | |
| Operations: | | | | | | | | | | | | | | | | |
| Net Investment Income | | $ | 1,352,545 | | | $ | 817,156 | | | $ | 280,755 | | | $ | 461,590 | |
| Net Realized Loss on Investments and Foreign Currency Transactions | | | (7,512,272 | ) | | | (4,864,663 | ) | | | (228,611 | )(1) | | | (30,843,618 | )(1) |
| Net Change in Unrealized Appreciation (Depreciation) on Investments and Foreign Currency Translations | | | 20,889,663 | | | | (7,935,087 | ) | | | 2,397,387 | | | | 27,364,278 | |
| Net Increase (Decrease) in Net Assets Resulting from Operations | | | 14,729,936 | | | | (11,982,594 | ) | | | 2,449,531 | | | | (3,017,750 | ) |
| Dividends and Distributions from: | | | | | | | | | | | | | | | | |
| Net Investment Income | | | (706,374 | ) | | | (850,578 | ) | | | (337,103 | ) | | | (2,414,376 | ) |
| Total Dividends and Distributions | | | (706,374 | ) | | | (850,578 | ) | | | (337,103 | ) | | | (2,414,376 | ) |
| Capital Share Transactions: | | | | | | | | | | | | | | | | |
| Issued | | | 25,280,343 | | | | 18,433,905 | | | | — | | | | 2,018,082 | |
| Redeemed | | | (2,753,139 | ) | | | (2,215,314 | ) | | | (930,290 | ) | | | (88,399,190 | ) |
| Increase (Decrease) in Net Assets from Capital Share Transactions | | | 22,527,204 | | | | 16,218,591 | | | | (930,290 | ) | | | (86,381,108 | ) |
| Total Increase (Decrease) in Net Assets | | | 36,550,766 | | | | 3,385,419 | | | | 1,182,138 | | | | (91,813,234 | ) |
| Net Assets: | | | | | | | | | | | | | | | | |
| Beginning of Year | | | 28,008,542 | | | | 24,623,123 | | | | 15,111,796 | | | | 106,925,030 | |
| End of Year | | $ | 64,559,308 | | | $ | 28,008,542 | | | $ | 16,293,934 | | | $ | 15,111,796 | |
| Undistributed Net Investment Income | | $ | 1,360,193 | | | $ | 706,368 | | | $ | 260,778 | | | $ | 322,196 | |
| Share Transactions: | | | | | | | | | | | | | | | | |
| Issued | | | 1,537,500 | (2) | | | 925,000 | (2) | | | — | | | | 100,000 | |
| Redeemed | | | (150,365 | )(2) | | | (75,000 | )(2) | | | (50,000 | ) | | | (4,900,000 | ) |
| Net Increase (Decrease) in Shares Outstanding from Share Transactions | | | 1,387,135 | | | | 850,000 | | | | (50,000 | ) | | | (4,800,000 | ) |
| (1) | Includes realized gains/(losses) as a result of in-kind transactions. (See Note 4 in Notes to Financial Statements). |
| (2) | Adjusted to reflect the effect of a 1 for 4 reverse share split on March 16, 2017. (See Note 9 in Notes to Financial Statements). |
The accompanying notes are an integral part of the financial statements.
Statements of Changes in Net Assets
| | | Global X MSCI Portugal ETF | | | Global X MSCI Pakistan ETF | |
| | | Year Ended
October 31, 2017 | | | Year Ended
October 31, 2016 | | | Year Ended
October 31, 2017 | | | Year Ended
October 31, 2016 | |
| Operations: | | | | | | | | | | | | | | | | |
| Net Investment Income | | $ | 1,187,421 | | | $ | 1,131,946 | | | $ | 1,474,017 | | | $ | 297,924 | |
| Net Realized Gain (Loss) on Investments and Foreign Currency Transactions | | | (3,210,054 | )(1) | | | (3,363,618 | )(1) | | | 1,841,348 | (1) | | | (137,610 | ) |
| Net Change in Unrealized Appreciation (Depreciation) on Investments and Foreign Currency Translations | | | 11,767,282 | | | | 74,482 | | | | (12,088,919 | ) | | | 554,585 | |
| Net Increase (Decrease) in Net Assets Resulting from Operations | | | 9,744,649 | | | | (2,157,190 | ) | | | (8,773,554 | ) | | | 714,899 | |
| Dividends and Distributions from: | | | | | | | | | | | | | | | | |
| Net Investment Income | | | (878,665 | ) | | | (1,260,520 | ) | | | (363,656 | ) | | | (146,008 | ) |
| Net Realized Gains | | | — | | | | — | | | | — | | | | (18,840 | ) |
| Total Dividends and Distributions | | | (878,665 | ) | | | (1,260,520 | ) | | | (363,656 | ) | | | (164,848 | ) |
| Capital Share Transactions: | | | | | | | | | | | | | | | | |
| Issued | | | 36,796,138 | | | | 5,179,446 | | | | 69,427,851 | | | | 4,446,623 | |
| Redeemed | | | (7,651,145 | ) | | | (13,516,694 | ) | | | (17,377,887 | ) | | | — | |
| Increase (Decrease) in Net Assets from Capital Share Transactions | | | 29,144,993 | | | | (8,337,248 | ) | | | 52,049,964 | | | | 4,446,623 | |
| Total Increase (Decrease) in Net Assets | | | 38,010,977 | | | | (11,754,958 | ) | | | 42,912,754 | | | | 4,996,674 | |
| Net Assets: | | | | | | | | | | | | | | | | |
| Beginning of Year | | | 25,693,565 | | | | 37,448,523 | | | | 10,663,533 | | | | 5,666,859 | |
| End of Year | | $ | 63,704,542 | | | $ | 25,693,565 | | | $ | 53,576,287 | | | $ | 10,663,533 | |
| Undistributed Net Investment Income | | $ | 1,153,141 | | | $ | 868,860 | | | $ | 1,352,980 | | | $ | 258,559 | |
| Share Transactions: | | | | | | | | | | | | | | | | |
| Issued | | | 3,250,000 | | | | 500,000 | | | | 4,200,000 | | | | 300,000 | |
| Redeemed | | | (750,000 | ) | | | (1,350,000 | ) | | | (950,000 | ) | | | — | |
| Net Increase (Decrease) in Shares Outstanding from Share Transactions | | | 2,500,000 | | | | (850,000 | ) | | | 3,250,000 | | | | 300,000 | |
(1) Includes realized gains(losses) as a result of in-kind transactions. (See Note 4 in Notes to Financial Statements).
The accompanying notes are an integral part of the financial statements.
Financial Highlights
Selected Per Share Data & Ratios
For a Share Outstanding Throughout the Period
| | | Net
Asset
Value,
Beginning
of Period ($) | | | Net
Investment
Income ($)* | | | Net Realized
and
Unrealized
Gain (Loss)
on
Investments
($) | | | Total from
Operations
($) | | | Distribution
from Net
Investment
Income ($) | | | Distribution
from Capital
Gains ($) | | | Total from
Distributions
($) | | | Net
Asset
Value,
End of
Period
($) | | | Total
Return
(%)** | | | Net Assets
End of
Period
($)(000) | | | Ratio of
Expenses
to Average
Net Assets
(%) | | | Ratio of Net
Investment
Income to
Average
Net Assets
(%) | | | Portfolio
Turnover
(%)†† | |
| Global X China Consumer ETF |
| 2017 | | | 11.97 | | | | 0.24 | | | | 5.40 | | | | 5.64 | | | | (0.17 | ) | | | — | | | | (0.17 | ) | | | 17.44 | | | | 47.90 | | | | 156,050 | | | | 0.65 | | | | 1.67 | | | | 34.72 | |
| 2016 | | | 13.72 | | | | 0.20 | | | | (1.36 | ) | | | (1.16 | ) | | | (0.59 | ) | | | — | | | | (0.59 | ) | | | 11.97 | | | | (8.57 | ) | | | 73,023 | | | | 0.65 | | | | 1.71 | | | | 38.13 | |
| 2015 | | | 13.82 | | | | 0.53 | | | | (0.37 | ) | | | 0.16 | | | | (0.26 | ) | | | — | | | | (0.26 | ) | | | 13.72 | | | | 1.34 | | | | 93,951 | | | | 0.65 | | | | 3.86 | | | | 24.57 | |
| 2014 | | | 15.87 | | | | 0.17 | | | | (2.07 | ) | | | (1.90 | ) | | | (0.15 | ) | | | — | | | | (0.15 | ) | | | 13.82 | | | | (12.09 | ) | | | 134,014 | | | | 0.65 | | | | 1.18 | | | | 18.89 | |
| 2013 | | | 14.00 | | | | 0.16 | | | | 1.88 | | | | 2.04 | | | | (0.17 | ) | | | — | | | | (0.17 | ) | | | 15.87 | | | | 14.66 | | | | 170,554 | | | | 0.65 | | | | 1.11 | | | | 27.76 | |
| Global X China Energy ETF |
| 2017 | | | 10.56 | | | | 0.41 | | | | 0.93 | | | | 1.34 | | | | (0.21 | ) | | | — | | | | (0.21 | ) | | | 11.69 | | | | 13.13 | | | | 1,753 | | | | 0.65 | | | | 3.82 | | | | 11.85 | |
| 2016 | | | 11.61 | | | | 0.22 | | | | (0.94 | ) | | | (0.72 | ) | | | (0.33 | ) | | | — | | | | (0.33 | ) | | | 10.56 | | | | (6.11 | ) | | | 1,583 | | | | 0.65 | | | | 2.19 | | | | 22.19 | |
| 2015 | | | 15.03 | | | | 0.22 | | | | (3.31 | ) | | | (3.09 | ) | | | (0.33 | ) | | | — | | | | (0.33 | ) | | | 11.61 | | | | (20.89 | ) | | | 1,741 | | | | 0.65 | | | | 1.66 | | | | 15.62 | |
| 2014 | | | 15.11 | | | | 0.29 | | | | (0.09 | ) | | | 0.20 | | | | (0.28 | ) | | | — | | | | (0.28 | ) | | | 15.03 | | | | 1.34 | | | | 4,509 | | | | 0.65 | | | | 1.90 | | | | 12.65 | |
| 2013 | | | 13.76 | | | | 0.26 | | | | 1.34 | | | | 1.60 | | | | (0.25 | ) | | | — | | | | (0.25 | ) | | | 15.11 | | | | 11.72 | | | | 4,534 | | | | 0.65 | | | | 1.82 | | | | 24.41 | |
| Global X China Financials ETF |
| 2017 | | | 13.80 | | | | 0.39 | | | | 3.70 | | | | 4.09 | | | | (0.26 | ) | | | — | | | | (0.26 | ) | | | 17.63 | | | | 30.32 | | | | 50,251 | | | | 0.65 | | | | 2.58 | | | | 19.12 | |
| 2016 | | | 14.90 | | | | 0.25 | | | | (0.62 | ) | | | (0.37 | ) | | | (0.73 | ) | | | — | | | | (0.73 | ) | | | 13.80 | | | | (2.56 | ) | | | 28,289 | | | | 0.65 | | | | 1.92 | | | | 18.43 | |
| 2015 | | | 13.50 | | | | 0.54 | | | | 1.02 | | | | 1.56 | | | | (0.16 | ) | | | — | | | | (0.16 | ) | | | 14.90 | | | | 11.50 | | | | 57,358 | | | | 0.65 | | | | 3.34 | | | | 15.88 | |
| 2014 | | | 13.29 | | | | 0.23 | | | | 0.05 | ^ | | | 0.28 | | | | (0.07 | ) | | | — | | | | (0.07 | ) | | | 13.50 | | | | 2.08 | | | | 48,585 | | | | 0.65 | | | | 1.76 | | | | 6.90 | |
| 2013 | | | 12.03 | | | | 0.27 | | | | 1.36 | | | | 1.63 | | | | (0.37 | ) | | | — | | | | (0.37 | ) | | | 13.29 | | | | 13.61 | | | | 42,518 | | | | 0.65 | | | | 2.09 | | | | 33.49 | |
| Global X China Industrials ETF |
| 2017 | | | 12.57 | | | | 0.24 | | | | 3.45 | | | | 3.69 | | | | (0.20 | ) | | | — | | | | (0.20 | ) | | | 16.06 | | | | 29.88 | | | | 4,015 | | | | 0.65 | | | | 1.68 | | | | 21.53 | |
| 2016 | | | 14.44 | | | | 0.18 | | | | (1.71 | ) | | | (1.53 | ) | | | (0.34 | ) | | | — | | | | (0.34 | ) | | | 12.57 | | | | (10.60 | ) | | | 3,770 | | | | 0.65 | | | | 1.47 | | | | 14.08 | |
| 2015 | | | 12.93 | | | | 0.21 | | | | 1.40 | | | | 1.61 | | | | (0.10 | ) | | | — | | | | (0.10 | ) | | | 14.44 | | | | 12.49 | | | | 7,222 | | | | 0.65 | | | | 1.38 | | | | 23.87 | |
| 2014 | | | 12.14 | | | | 0.15 | | | | 0.83 | | | | 0.98 | | | | (0.19 | ) | | | — | | | | (0.19 | ) | | | 12.93 | | | | 8.13 | | | | 5,821 | | | | 0.65 | | | | 1.24 | | | | 10.61 | |
| 2013 | | | 11.40 | | | | 0.15 | | | | 0.75 | | | | 0.90 | | | | (0.16 | ) | | | — | | | | (0.16 | ) | | | 12.14 | | | | 7.89 | | | | 4,248 | | | | 0.65 | | | | 1.28 | | | | 19.01 | |
| Global X China Materials ETF |
| 2017 | | | 13.42 | | | | 0.38 | | | | 7.95 | | | | 8.33 | | | | (0.16 | ) | | | — | | | | (0.16 | ) | | | 21.59 | | | | 62.79 | | | | 5,397 | | | | 0.65 | | | | 2.19 | | | | 49.80 | |
| 2016 | | | 13.29 | | | | 0.16 | | | | 0.68 | | | | 0.84 | | | | (0.71 | ) | | | — | | | | (0.71 | ) | | | 13.42 | | | | 6.84 | | | | 1,342 | | | | 0.65 | | | | 1.31 | | | | 26.33 | |
| 2015 | | | 14.80 | | | | 0.40 | | | | (1.70 | ) | | | (1.30 | ) | | | (0.21 | ) | | | — | | | | (0.21 | ) | | | 13.29 | | | | (8.95 | ) | | | 1,329 | | | | 0.65 | | | | 2.39 | | | | 28.59 | |
| 2014 | | | 15.13 | | | | 0.19 | | | | (0.27 | ) | | | (0.08 | ) | | | (0.25 | ) | | | — | | | | (0.25 | ) | | | 14.80 | | | | (0.57 | ) | | | 2,959 | | | | 0.65 | | | | 1.26 | | | | 13.51 | |
| 2013(1) | | | 16.28 | | | | 0.17 | | | | (1.05 | ) | | | (0.88 | ) | | | (0.27 | ) | | | — | | | | (0.27 | ) | | | 15.13 | | | | (5.63 | ) | | | 2,269 | | | | 0.65 | | | | 1.65 | | | | 31.07 | |
| Global X NASDAQ China Technology ETF |
| 2017 | | | 23.23 | | | | 0.28 | | | | 6.69 | | | | 6.97 | | | | (0.96 | ) | | | — | | | | (0.96 | ) | | | 29.24 | | | | 31.56 | | | | 19,007 | | | | 0.65 | | | | 1.14 | | | | 42.59 | |
| 2016 | | | 22.01 | | | | 0.45 | | | | 0.91 | | | | 1.36 | | | | (0.14 | ) | | | — | | | | (0.14 | ) | | | 23.23 | | | | 6.20 | | | | 13,940 | | | | 0.65 | | | | 2.09 | | | | 42.02 | |
| 2015 | | | 23.48 | | | | 0.12 | | | | (1.52 | ) | | | (1.40 | ) | | | (0.07 | ) | | | — | | | | (0.07 | ) | | | 22.01 | | | | (5.94 | ) | | | 15,404 | | | | 0.65 | | | | 0.52 | | | | 44.95 | |
| 2014 | | | 20.63 | | | | 0.06 | | | | 2.80 | | | | 2.86 | | | | (0.01 | ) | | | — | | | | (0.01 | ) | | | 23.48 | | | | 13.85 | | | | 22,307 | | | | 0.65 | | | | 0.29 | | | | 64.79 | |
| 2013 | | | 13.77 | | | | 0.02 | | | | 6.92 | | | | 6.94 | | | | (0.08 | ) | | | — | | | | (0.08 | ) | | | 20.63 | | | | 50.68 | | | | 10,317 | | | | 0.65 | | | | 0.14 | | | | 57.24 | |
| (1) | Per share amounts have been restated for a 1 for 2 reverse share split on May 16, 2013. See Note 9 in the Notes to Financial Statements. |
| ^ | The amount shown for a share outstanding throughout the period does not accord with the aggregate net gains on investments for the period because of the sales and repurchases of fund shares in relation to fluctuating |
| * | Per share data calculated using average shares method. |
| ** | Total Return is for the period indicated and has not been annualized. The return shown does not reflect the deduction of taxes that a shareholder would pay on Fund distributions or the redemption of Fund shares. |
| †† | Portfolio turnover rate is for the period indicated and periods of less than one year have not been annualized. Excludes effect of in-kind transfers. |
Amounts designated as “—” are either $0 or have been rounded to $0.
The accompanying notes are an integral part of the financial statements.
Financial Highlights
Selected Per Share Data & Ratios
For a Share Outstanding Throughout the Period
| | | Net
Asset Value,
Beginning
of Period
($) | | | Net
Investment
Income ($)* | | | Net Realized
and
Unrealized
Gain (Loss)
on
Investments
($) | | | Total from
Operations
($) | | | Distribution
from Net
Investment
Income ($) | | | Distribution From
Capital
Gains ($) | | | Total from
Distributions
($) | | | Net
Asset
Value,
End of
Period
($) | | | Total
Return
(%)** | | | Net Assets
End of
Period
($)(000) | | | Ratio of
Expenses to Average
Net Assets (%) | | | Ratio of Net
Investment
Income to
Average
Net Assets
(%) | | | Portfolio
Turnover
(%)†† | |
| Global X FTSE Southeast Asia ETF |
| 2017 | | | 13.72 | | | | 0.32 | | | | 2.23 | | | | 2.55 | | | | (0.36 | ) | | | — | | | | (0.36 | ) | | | 15.91 | | | | 19.19 | | | | 14,320 | | | | 0.65 | | | | 2.23 | | | | 7.78 | |
| 2016 | | | 13.07 | | | | 0.31 | | | | 0.78 | | | | 1.09 | | | | (0.44 | ) | | | — | | | | (0.44 | ) | | | 13.72 | | | | 8.75 | | | | 12,349 | | | | 0.65 | | | | 2.40 | | | | 12.94 | |
| 2015 | | | 16.76 | | | | 0.34 | | | | (3.61 | ) | | | (3.27 | ) | | | (0.42 | ) | | | — | | | | (0.42 | ) | | | 13.07 | | | | (19.97 | ) | | | 14,376 | | | | 0.65 | | | | 2.26 | | | | 24.06 | |
| 2014 | | | 17.12 | | | | 0.39 | | | | (0.16 | ) | | | 0.23 | | | | (0.59 | ) | | | — | | | | (0.59 | ) | | | 16.76 | | | | 1.68 | | | | 29,336 | | | | 0.65 | | | | 2.36 | | | | 8.36 | |
| 2013 | | | 16.75 | | | | 0.47 | | | | 0.28 | ^ | | | 0.75 | | | | (0.38 | ) | | | — | | | | (0.38 | ) | | | 17.12 | | | | 4.50 | | | | 49,634 | | | | 0.65 | | | | 2.73 | | | | 24.07 | |
| Global X MSCI Colombia ETF |
| 2017 | | | 9.22 | | | | 0.18 | | | | 0.29 | | | | 0.47 | | | | (0.13 | ) | | | — | | | | (0.13 | ) | | | 9.56 | | | | 5.24 | | | | 92,984 | | | | 0.62 | @ | | | 1.83 | | | | 40.93 | |
| 2016 | | | 8.79 | | | | 0.16 | | | | 0.39 | | | | 0.55 | | | | (0.12 | ) | | | — | | | | (0.12 | ) | | | 9.22 | | | | 6.55 | | | | 88,760 | | | | 0.65 | @ | | | 1.82 | | | | 37.60 | |
| 2015 | | | 17.42 | | | | 0.31 | | | | (8.53 | ) | | | (8.22 | ) | | | (0.41 | ) | | | — | | | | (0.41 | ) | | | 8.79 | | | | (47.93 | ) | | | 66,616 | | | | 0.61 | @ | | | 2.80 | | | | 66.93 | |
| 2014 | | | 20.55 | | | | 0.40 | | | | (2.78 | ) | | | (2.38 | ) | | | (0.75 | ) | | | — | | | | (0.75 | ) | | | 17.42 | | | | (11.73 | ) | | | 100,688 | | | | 0.66 | @ | | | 2.12 | | | | 47.57 | |
| 2013 | | | 21.89 | | | | 0.42 | | | | (1.31 | ) | | | (0.89 | ) | | | (0.45 | ) | | | — | | | | (0.45 | ) | | | 20.55 | | | | (4.21 | ) | | | 149,625 | | | | 0.75 | @ | | | 2.05 | | | | 52.06 | |
| Global X MSCI Argentina ETF |
| 2017 | | | 23.69 | | | | 0.07 | | | | 8.37 | | | | 8.44 | | | | (0.08 | ) | | | — | | | | (0.08 | ) | | | 32.05 | | | | 35.79 | | | | 183,468 | | | | 0.65 | ‡ | | | 0.24 | | | | 24.45 | |
| 2016 | | | 19.81 | | | | 0.15 | | | | 3.89 | | | | 4.04 | | | | (0.16 | ) | | | — | | | | (0.16 | ) | | | 23.69 | | | | 20.65 | | | | 90,602 | | | | 0.74 | | | | 0.69 | | | | 20.88 | |
| 2015 | | | 21.18 | | | | 0.11 | | | | (1.39 | ) | | | (1.28 | ) | | | (0.09 | ) | | | — | | | | (0.09 | ) | | | 19.81 | | | | (6.04 | ) | | | 15,355 | | | | 0.74 | | | | 0.58 | | | | 26.88 | |
| 2014 | | | 20.29 | | | | 0.10 | | | | 0.91 | ^ | | | 1.01 | | | | (0.12 | ) | | | — | | | | (0.12 | ) | | | 21.18 | | | | 5.03 | | | | 20,652 | | | | 0.74 | | | | 0.49 | | | | 95.29 | |
| 2013(1) | | | 16.84 | | | | 0.10 | | | | 3.53 | | | | 3.63 | | | | (0.18 | ) | | | — | | | | (0.18 | ) | | | 20.29 | | | | 21.73 | | | | 6,595 | | | | 0.74 | | | | 0.57 | | | | 26.52 | |
| Global X MSCI Greece ETF |
| 2017 | | | 7.35 | | | | 0.15 | | | | 1.95 | | | | 2.10 | | | | (0.15 | ) | | | — | | | | (0.15 | ) | | | 9.30 | | | | 29.04 | | | | 349,788 | | | | 0.61 | | | | 1.69 | | | | 21.59 | |
| 2016 | | | 10.41 | | | | 0.13 | | | | (3.07 | ) | | | (2.94 | ) | | | (0.12 | ) | | | — | | | | (0.12 | ) | | | 7.35 | | | | (28.33 | ) | | | 245,561 | | | | 0.62 | | | | 1.71 | | | | 76.19 | |
| 2015 | | | 15.84 | | | | 0.18 | | | | (5.48 | ) | | | (5.30 | ) | | | (0.13 | ) | | | — | | | | (0.13 | ) | | | 10.41 | | | | (33.66 | ) | | | 314,907 | | | | 0.62 | | | | 1.61 | | | | 29.35 | |
| 2014 | | | 22.60 | | | | 0.08 | | | | (6.83 | ) | | | (6.75 | ) | | | (0.01 | ) | | | — | | | | (0.01 | ) | | | 15.84 | | | | (29.83 | ) | | | 140,201 | | | | 0.62 | | | | 0.38 | | | | 64.19 | |
| 2013 | | | 16.16 | | | | 0.15 | | | | 6.32 | | | | 6.47 | | | | (0.02 | ) | | | (0.01 | ) | | | (0.03 | ) | | | 22.60 | | | | 40.14 | | | | 94,938 | | | | 0.61 | | | | 0.84 | | | | 77.29 | |
| Global X MSCI Norway ETF |
| 2017 | | | 11.07 | | | | 0.41 | | | | 2.34 | | | | 2.75 | | | | (0.32 | ) | | | — | | | | (0.32 | ) | | | 13.50 | | | | 25.53 | | | | 164,736 | | | | 0.50 | | | | 3.41 | | | | 9.53 | |
| 2016 | | | 10.75 | | | | 0.35 | | | | 0.34 | | | | 0.69 | | | | (0.37 | ) | | | — | | | | (0.37 | ) | | | 11.07 | | | | 6.86 | | | | 113,997 | | | | 0.50 | | | | 3.39 | | | | 16.62 | |
| 2015 | | | 14.82 | | | | 0.34 | | | | (3.58 | ) | | | (3.24 | ) | | | (0.83 | ) | | | — | | | | (0.83 | ) | | | 10.75 | | | | (22.50 | ) | | | 65,024 | | | | 0.50 | | | | 2.76 | | | | 16.05 | |
| 2014 | | | 16.76 | | | | 0.63 | | | | (2.18 | ) | | | (1.55 | ) | | | (0.39 | ) | | | — | | | | (0.39 | ) | | | 14.82 | | | | (9.46 | ) | | | 183,038 | | | | 0.50 | | | | 3.76 | | | | 26.50 | |
| 2013 | | | 15.09 | | | | 0.50 | | | | 1.60 | | | | 2.10 | | | | (0.43 | ) | | | — | | | | (0.43 | ) | | | 16.76 | | | | 14.21 | | | | 80,465 | | | | 0.50 | | | | 3.23 | | | | 11.01 | |
| Global X FTSE Nordic Region ETF |
| 2017 | | | 19.38 | | | | 0.51 | | | | 4.72 | | | | 5.23 | | | | (0.72 | ) | | | — | | | | (0.72 | ) | | | 23.89 | | | | 27.97 | | | | 38,464 | | | | 0.55 | | | | 2.37 | | | | 6.79 | |
| 2016 | | | 22.29 | | | | 0.63 | | | | (2.91 | ) | | | (2.28 | ) | | | (0.63 | ) | | | — | | | | (0.63 | ) | | | 19.38 | | | | (10.54 | ) | | | 40,899 | | | | 0.51 | | | | 3.01 | | | | 10.90 | |
| 2015 | | | 24.36 | | | | 0.59 | | | | (1.81 | ) | | | (1.22 | ) | | | (0.85 | ) | | | — | | | | (0.85 | ) | | | 22.29 | | | | (5.05 | ) | | | 52,596 | | | | 0.50 | | | | 2.53 | | | | 7.76 | |
| 2014 | | | 23.74 | | | | 0.79 | | | | 0.46 | | | | 1.25 | | | | (0.63 | ) | | | — | | | | (0.63 | ) | | | 24.36 | | | | 5.30 | | | | 59,927 | | | | 0.50 | | | | 3.16 | | | | 6.05 | |
| 2013 | | | 18.65 | | | | 0.62 | | | | 4.97 | | | | 5.59 | | | | (0.50 | ) | | | — | | | | (0.50 | ) | | | 23.74 | | | | 30.54 | | | | 56,015 | | | | 0.50 | | | | 2.92 | | | | 8.95 | |
| (1) | Per share amounts have been restated for a 1 for 2 reverse share split on May 16, 2013. See Note 9 in the Notes to Financial Statements. |
| ^ | The amount shown for a share outstanding throughout the period does not accord with the aggregate net gains on investments for the period because of the sales and repurchases of fund shares in relation to fluctuating |
| * | Per share data calculated using average shares method. |
| ** | Total Return is for the period indicated and has not been annualized. The return shown does not reflect the deduction of taxes that a shareholder would pay on Fund distributions or the redemption of Fund shares. |
| †† | Portfolio turnover rate is for the period indicated and periods of less than one year have not been annualized. Excludes effect of in-kind transfers |
| @ | The ratio of Expenses to Average Net Assets includes the effect of a waiver. If these offsets were excluded, the ratio would have been 0.81%, 0.84%, 0.79%, 0.78% and 0.80% for the years ended October 31, 2017, 2016, 2015, 2014 and 2013, respectively. |
| ‡ | The ratio of Expenses to Average Net Assets includes the effect of a waiver. If these offsets were excluded, the ratio would have been 0.74% for the year ended October 31, 2017. |
Amounts designated as “—” are either $0 or have been rounded to $0.
The accompanying notes are an integral part of the financial statements.
Financial Highlights
Selected Per Share Data & Ratios
For a Share Outstanding Throughout the Period
| | | Net
Asset
Value,
Beginning
of Period
($) | | | Net
Investment
Income ($)* | | | Net Realized
and
Unrealized
Gain (Loss)
on
Investments
($) | | | Total from
Operations
($) | | | Distribution
from Net
Investment
Income ($) | | | Distribution
from
Capital
Gains ($) | | | Total from
Distributions
($) | | | Net
Asset
Value,
End of
Period
($) | | | Total
Return
(%)** | | | Net Assets
End of
Period
($)(000) | | | Ratio of
Expenses
to Average
Net Assets
(%) | | | Ratio of Net
Investment
Income to
Average
Net Assets
(%) | | | Portfolio
Turnover
(%)†† | |
| Global X MSCI Nigeria ETF |
| 2017(1) | | | 17.24 | | | | 0.54 | | | | 4.07 | | | | 4.61 | | | | (0.42 | ) | | | — | | | | (0.42 | ) | | | 21.43 | | | | 27.52 | | | | 64,559 | | | | 1.07 | | | | 2.99 | | | | 21.07 | |
| 2016(1) | | | 31.76 | | | | 0.86 | | | | (14.16 | ) | | | (13.30 | ) | | | (1.22 | ) | | | — | | | | (1.22 | ) | | | 17.24 | | | | (43.30 | ) | | | 28,009 | | | | 1.02 | @ | | | 3.80 | | | | 29.61 | |
| 2015(1) | | | 52.08 | | | | 1.37 | | | | (20.47 | ) | | | (19.10 | ) | | | (1.22 | ) | | | — | | | | (1.22 | ) | | | 31.76 | | | | (37.25 | ) | | | 24,623 | | | | 0.68 | @ | | | 3.72 | | | | 34.00 | |
| 2014(1) | | | 59.68 | | | | 1.88 | | | | (8.65 | ) | | | (6.77 | ) | | | (0.68 | ) | | | (0.15 | ) | | | (0.83 | ) | | | 52.08 | | | | (11.55 | ) | | | 16,924 | | | | 0.68 | @ | | | 3.14 | | | | 54.75 | |
| 2013(1)(2) | | | 61.24 | | | | 1.21 | | | | (2.77 | ) | | | (1.56 | ) | | | — | | | | — | | | | — | | | | 59.68 | | | | (2.55 | ) | | | 5,970 | | | | 0.68 | @† | | | 3.54 | † | | | 5.44 | |
| Global X Next Emerging & Frontier ETF |
| 2017 | | | 20.15 | | | | 0.40 | | | | 3.21 | | | | 3.61 | | | | (0.48 | ) | | | — | | | | (0.48 | ) | | | 23.28 | | | | 18.53 | | | | 16,294 | | | | 0.56 | | | | 1.89 | | | | 7.93 | |
| 2016 | | | 19.27 | | | | 0.20 | | | | 1.14 | ^ | | | 1.34 | | | | (0.46 | ) | | | — | | | | (0.46 | ) | | | 20.15 | | | | 7.33 | | | | 15,112 | | | | 0.56 | | | | 1.13 | | | | 9.35 | |
| 2015 | | | 25.55 | | | | 0.49 | | | | (6.37 | ) | | | (5.88 | ) | | | (0.40 | ) | | | — | | | | (0.40 | ) | | | 19.27 | | | | (23.29 | ) | | | 106,925 | | | | 0.58 | | | | 2.22 | | | | 19.72 | |
| 2014(3) | | | 25.08 | | | | 0.51 | | | | 0.01 | | | | 0.52 | | | | (0.05 | ) | | | — | | | | (0.05 | ) | | | 25.55 | | | | 2.07 | | | | 152,027 | | | | 0.58 | †‡ | | | 2.00 | † | | | 24.14 | |
| Global X MSCI Portugal ETF |
| 2017 | | | 9.88 | | | | 0.36 | | | | 2.65 | | | | 3.01 | | | | (0.40 | ) | | | — | | | | (0.40 | ) | | | 12.49 | | | | 31.88 | | | | 63,705 | | | | 0.60 | | | | 3.31 | | | | 25.31 | |
| 2016 | | | 10.85 | | | | 0.42 | | | | (0.93 | ) | | | (0.51 | ) | | | (0.46 | ) | | | — | | | | (0.46 | ) | | | 9.88 | | | | (4.86 | ) | | | 25,694 | | | | 0.61 | | | | 4.26 | | | | 27.20 | |
| 2015 | | | 12.65 | | | | 0.30 | | | | (1.87 | ) | | | (1.57 | ) | | | (0.23 | ) | | | — | | | | (0.23 | ) | | | 10.85 | | | | (12.39 | ) | | | 37,449 | | | | 0.61 | | | | 2.68 | | | | 35.26 | |
| 2014(4) | | | 15.04 | | | | 0.38 | | | | (2.77 | ) | | | (2.39 | ) | | | — | | | | — | | | | — | | | | 12.65 | | | | (15.89 | ) | | | 36,692 | | | | 0.61 | † | | | 2.58 | † | | | 53.58 | |
| Global X MSCI Pakistan ETF |
| 2017 | | | 15.23 | | | | 0.75 | | | | (1.90 | ) | | | (1.15 | ) | | | (0.52 | ) | | | — | | | | (0.52 | ) | | | 13.56 | | | | (8.25 | ) | | | 53,576 | | | | 0.89 | | | | 4.64 | | | | 65.51 | |
| 2016 | | | 14.17 | | | | 0.58 | | | | 0.90 | | | | 1.48 | | | | (0.37 | ) | | | (0.05 | ) | | | (0.42 | ) | | | 15.23 | | | | 10.87 | | | | 10,664 | | | | 0.91 | | | | 4.01 | | | | 21.22 | |
| 2015(5) | | | 15.28 | | | | 0.35 | | | | (1.46 | ) | | | (1.11 | ) | | | — | | | | — | | | | — | | | | 14.17 | | | | (7.26 | ) | | | 5,667 | | | | 0.90 | † | | | 4.43 | † | | | 19.31 | |
| (1) | Per share amounts have been adjusted for a 1 for 4 reverse share split on March 16, 2017 (See Note 9 in the Notes to Financial Statements). |
| (2) | The Fund commenced operations on April 2,2013. |
| (3) | The Fund commenced operations on November 6, 2013. |
| (4) | The Fund commenced operations on November 12, 2013. |
| (5) | The Fund commenced operations on April 22, 2015. |
| ^ | The amount shown for a share outstanding throughout the period does not accord with the aggregate net gains on investments for the period because of the sales and repurchases of fund shares in relation to fluctuating |
| * | Per share data calculated using average shares method. |
| ** | Total Return is for the period indicated and has not been annualized. The return shown does not reflect the deduction of taxes that a shareholder would pay on Fund distributions or the redemption of Fund shares. |
| †† | Portfolio turnover rate is for the period indicated and has not been annualized. Excludes effect of in-kind transfers. |
| @ | The ratio of Expenses to Average Net Assets includes the effect of a waiver. If these offsets were excluded, the ratio would have been 1.10%, 0.92%, 0.92% and 0.92% for the years and or period ended October 31, 2016, 2015 ,2014, and 2013, respectively. |
| ‡ | The ratio of Expenses to Average Net Assets includes the effect of income taxes. If these expenses were excluded, the ratio would have been 0.58% for the Global X Next Emerging & Frontier ETF. |
Amounts designated as “—” are either $0 or have been rounded to $0.
The accompanying notes are an integral part of the financial statements.
Notes to Financial Statements
October 31, 2017
1. ORGANIZATION
The Global X Funds (the "Trust") is a Delaware statutory trust formed on March 6, 2008. The Trust is registered under the Investment Company Act of 1940, as amended, as an open-end management investment company. As of October 31, 2017, the Trust had ninety-six portfolios, fifty-two of which were operational. The financial statements herein and the related notes pertain to the Global X China Consumer ETF, Global X China Energy ETF, Global X China Financials ETF, Global X China Industrials ETF, Global X China Materials ETF, Global X NASDAQ China Technology ETF, Global X MSCI Greece ETF, Global X MSCI Norway ETF, Global X FTSE Nordic Region ETF, Global X FTSE Southeast Asia ETF, Global X MSCI Argentina ETF, Global X MSCI Colombia ETF, Global X MSCI Nigeria ETF, Global X MSCI Pakistan ETF, Global X MSCI Portugal ETF and Global X Next Emerging & Frontier ETF (each a “Fund”, and collectively, the “Funds”). Each Fund (except for the Global X Next Emerging & Frontier ETF) had elected non-diversification status.
2. SIGNIFICANT ACCOUNTING POLICIES
The following is a summary of the Significant Accounting Policies followed by the Funds.
USE OF ESTIMATES — The Funds are investment companies that apply the accounting and reporting guidance issued in Topic 946 by the U.S. Financial Accounting Standards Board. The preparation of financial statements in conformity with U.S. generally accepted accounting principles ("U.S. GAAP") requires management to make estimates and assumptions that affect the reported amounts of assets and liabilities and disclosure of contingent assets and liabilities at the date of the financial statements and the reported amounts of increases and decreases in net assets from operations during the reporting period. Actual results could differ from those estimates.
RETURN OF CAPITAL ESTIMATES — Distributions received by the Funds from underlying master limited partnership (“MLP”) investments generally are comprised of income and return of capital. The Funds record investment income and return of capital based on estimates made at the time such distributions are received. Such estimates are based on historical information available from the MLPs and other industry sources. These estimates may subsequently be revised based on information received from the MLPs after their tax reporting periods are concluded.
SECURITY VALUATION — Securities listed on a securities exchange, market or automated quotation system for which quotations are readily available (except for securities traded on NASDAQ and the Nigerian Stock Exchange), including securities traded over the counter, are valued at the last quoted sale price on the primary exchange or market (foreign or domestic) on which they are traded (or at approximately 4:00 pm if a security’s primary exchange is normally open at that time), or, if there is no such reported sale, at the most recent mean between the quoted bid and asked prices, which approximate fair value (absent both bid and asked prices on such exchange, the bid price may be used).
For securities traded on NASDAQ and the Nigerian Stock Exchange, the Official Closing Price will be used. If available, debt securities are priced based upon valuations provided by independent, third-party pricing agents. Such values generally reflect the last reported sales price if the security is actively traded. The third-party pricing agents may also value debt securities at an evaluated bid price by employing methodologies that utilize actual market transactions, broker-supplied valuations,
Notes to Financial Statements (continued)
October 31, 2017
2. SIGNIFICANT ACCOUNTING POLICIES (continued)
or other methodologies designed to identify the market value for such securities. Debt obligations with remaining maturities of sixty days or less may be valued at their amortized cost, which appr- oximates market value. The prices for foreign securities are reported in local currency and converted to U.S. dollars using currency exchange rates. Prices for most securities held by the Funds are provided daily by recognized independent pricing agents. If a security price cannot be obtained from an independent, third-party pricing agent, the Funds seek to obtain a bid price from at least one independent broker.
Securities for which market prices are not "readily available" are valued in accordance with Fair Value Procedures established by the Board of Trustees (the “Board”). The Funds’ Fair Value Procedures are implemented through a Fair Value Committee (the "Committee") designated by the Board. Some of the more common reasons that may necessitate that a security be valued using the Fair Value Procedures include: the security's trading has been halted or suspended; the security has been de-listed from its primary trading exchange; the security's primary trading market is temporarily closed at a time when, under normal conditions, it would be open; the security has not been traded for an extended period of time; the security's primary pricing source is not able or willing to provide a price; or trading of the security is subject to local government-imposed restrictions. In addition, the Funds may fair value a security if an event that may materially affect the value of the Funds’ security that traded outside of the United States (a “Significant Event”) has occurred between the time of the security's last close and the time that the Funds calculate their net asset values. A Significant Event may relate to a single issuer or to an entire market sector. Events that may be Significant Events include: government actions, natural disaster, armed conflict, acts of terrorism and significant market fluctuations. If Global X Management Company LLC, the Funds investment adviser (the “Adviser”) becomes aware of a Significant Event that has occurred with respect to a security or group of security after the closing of the exchange or market on which the security or securities principally trade, but before the time at which the Funds calculate their net asset values, it may request that a Committee meeting be called. When a security is valued in accordance with the Fair Value Procedures, the Committee will determine the value after taking into consideration relevant information reasonably available to the Committee. As of October 31, 2017, there were securities valued using Fair Value Procedures of $312, $194,512, $49,889 and $646 in Global X China Industrials ETF, Global X China Materials ETF, Global X NASDAQ China Technology ETF and Global X MSCI Portugal ETF, respectively. There were no other securities priced using the Fair Value Procedures.
In accordance with the authoritative guidance on fair value measurements and disclosure under U.S. GAAP, the Funds disclose the fair value of their investments in a hierarchy that prioritizes the inputs to valuation techniques used to measure the fair value. The objective of a fair value measurement is to determine the price that would be received upon the sale of an asset or paid to transfer a liability in an orderly transaction between market participants at the measurement date (an exit price). Accordingly, the fair value hierarchy gives the highest priority to quoted prices (unadjusted) in active markets for identical assets or liabilities (Level 1) and the lowest priority to unobservable inputs (Level 3). The three levels of the fair value hierarchy are described below:
Level 1 – Unadjusted quoted prices in active markets for identical, unrestricted assets or liabilities that the Funds have the ability to access at the measurement date
Notes to Financial Statements (continued)
October 31, 2017
2. SIGNIFICANT ACCOUNTING POLICIES (continued)
Level 2 – Other significant observable inputs (including quoted prices in non-active markets, quoted prices for similar investments, fair value of investments for which the Funds have the ability to fully redeem tranches at net asset value as of the measurement date or within the near term, and short-term investments valued at amortized cost)
Level 3 – Significant unobservable inputs (including the Funds’ own assumptions in determining the fair value of investments, fair value of investments for which the Funds do not have the ability to fully redeem tranches at net asset value as of the measurement date or within the near term)
Investments are classified within the level of the lowest significant input considered in determining fair value. Investments classified within Level 3 whose fair value measurement considers several inputs may include Level 1 or Level 2 inputs as components of the overall fair value measurement. For the year ended October 31, 2017, there have been no significant changes to the Funds’ fair valuation methodologies.
The following table summarizes the quantitative inputs and assumptions used for items categorized as material Level 3 investments as of October 31, 2017. The disclosures below also include qualitative information on the sensitivity of the fair value measurements to changes in the significant unobservable inputs.
Global X China Materials ETF
| Assets | | Fair Value at 10/31/17 | | | Valuation Technique(s) | | Unobservable Input | | Discount Percentage | |
| Common Stock | | $ | 194,512 | | | Discount from the Last Traded Price | | Last Traded Price Comparability Adjustment % | | | 0.6 | % |
Global X China Industrials
| Assets | | Fair Value at 10/31/17 | | | Valuation Technique(s) | | Unobservable Input | | Discount Percentage | |
| Common Stock | | $ | 312 | | | Discount from the Last Traded Price | | Last Traded Price Comparability Adjustment % | | | 99.8 | % |
| Common Stock | | $ | 37,221 | | | Discount from the Last Traded Price | | Last Traded Price Comparability Adjustment % | | | 1.0 | % |
DUE TO/FROM BROKERS — Due to/from brokers includes cash and collateral balances with the Funds’ clearing brokers or counterparties at October 31, 2017. The Funds continuously monitor the credit standing of each broker or counterparty with whom they conduct business. In the event a broker or counterparty is unable to fulfill its obligations, the Funds would be subject to counterparty credit risk.
REPURCHASE AGREEMENTS — Securities pledged as collateral for repurchase agreements by Deutsche Bank are held by Citibank N.A. whereas the collateral for repurchase agreements by Barclays Bank are held by BNY and are designated as being held on each Fund’s behalf by its custodian under a book-entry system. Each Fund monitors the adequacy of the collateral on a daily basis and can require the seller to provide additional collateral in the event the market value of the
Notes to Financial Statements (continued)
October 31, 2017
2. SIGNIFICANT ACCOUNTING POLICIES (continued)
securities pledged falls below the carrying value of the repurchase agreement, including accrued interest. It is the Funds’ policy to only enter into repurchase agreements with banks and other financial institutions which are deemed by the Adviser to be creditworthy. The Fund bears the risk of loss in the event that the other party to a repurchase agreement defaults on its obligations and the Fund is prevented from exercising its rights to dispose of the underlying securities received as collateral and the risk of a possible decline in the value of the underlying securities during the period. For financial statement purposes, the Funds record the securities lending collateral (included in repurchase agreements, at value or restricted cash) as an asset and the obligation to return securities lending collateral as a liability on the Statements of Assets and Liabilities.
Repurchase agreements are entered into by the Funds under Master Repurchase Agreements (“MRA”) which permit the Funds, under certain circumstances, including an event of default (such as bankruptcy or insolvency), to offset payables and/or receivables under the MRA with collateral held and/or posted to the counterparty and create one single net payment due to or from the Funds.
At October 31, 2017, the open repurchase agreements by counterparty which are subject to a MRA on a net payment basis are as follows:
| | | | | | Fair Value of Non-cash | | | Cash Collateral | | | | |
| | | Repurchase Agreements | | | Collateral Received | | | Received | | | Net Amount(2) | |
| Global X China Consumer ETF | | | | | | | | | | | | | | | | |
| Barclays Bank | | $ | 3,552,540 | | | $ | 3,552,540 | | | $ | - | | | $ | - | |
| Deutsche Bank | | | 2,427,977 | | | | 2,427,977 | | | | - | | | | - | |
| Global X MSCI Colombia ETF(1) | | | | | | | | | | | | | | | | |
| Barclays Bank | | | 1,931,259 | | | | 1,931,259 | | | | - | | | | - | |
| Deutsche Bank | | | 1,319,916 | | | | 1,319,916 | | | | - | | | | - | |
| Global X MSCI Greece ETF | | | | | | | | | | | | | | | | |
| Barclays Bank | | | 3,368,365 | | | | 3,368,365 | | | | - | | | | - | |
| Deutsche Bank | | | 2,302,103 | | | | 2,302,103 | | | | - | | | | - | |
| Global X MSCI Norway ETF | | | | | | | | | | | | | | | | |
| Barclays Bank | | | 29,262,061 | | | | 29,262,061 | | | | - | | | | - | |
| Deutsche Bank | | | 19,999,105 | | | | 19,999,105 | | | | - | | | | - | |
| Global X FTSE Nordic Region ETF | | | | | | | | | | | | | | | | |
| Barclays Bank | | | 1,017,935 | | | | 1,017,935 | | | | - | | | | - | |
| Deutsche Bank | | | 695,706 | | | | 695,706 | | | | - | | | | - | |
| Global X MSCI Portugal ETF | | | | | | | | | | | | | | | | |
| Barclays Bank | | | 805,539 | | | | 805,539 | | | | - | | | | - | |
| Deutsche Bank | | | 550,545 | | | | 550,545 | | | | - | | | | - | |
(1)Net Amount represents the net amount receivable due from the counterparty in the event of default.
FEDERAL INCOME TAXES — It is each Fund’s intention to qualify or continue to qualify as a regulated investment company for Federal income tax purposes by complying with the appropriate provisions of Subchapter M of the Internal Revenue Code of 1986, as amended. Accordingly, no provisions for Federal income taxes have been made in the financial statements.
The Funds evaluate tax positions taken or expected to be taken in the course of preparing the Funds’ tax returns to determine whether it is "more-likely-than-not" (i.e., greater than 50 percent) that each
Notes to Financial Statements (continued)
October 31, 2017
2. SIGNIFICANT ACCOUNTING POLICIES (continued)
tax position will be sustained upon examination by a taxing authority based on the technical merits of the position. Tax positions not deemed to meet the more-likely-than-not threshold are recorded as a tax benefit or expense in the current year.
If the Funds have foreign tax filings that have not been made, the tax years that remain subject to examination may date back to the inception of each Fund.
The Funds did not record any tax provision in the current period. However, management’s conclusions regarding tax positions may be subject to review and adjustment at a later date based on factors including, but not limited to, examination by tax authorities (i.e., the last three tax year ends, as applicable), and on-going analysis of and changes to tax laws, regulations and interpretations thereof.
As of and during the year ended October 31, 2017, the Funds did not have a liability for any unrecognized tax benefits as income tax expense in the Statement of Operations. During the year, the Funds did not incur any interest or penalties.
SECURITY TRANSACTIONS AND INVESTMENT INCOME — Security transactions are accounted for on the trade date for financial reporting purposes. Costs used in determining realized gains and losses on the sale of investment securities are based on specific identification. Dividend income is recorded on the ex-dividend date. Interest income is recognized on the accrual basis from the settlement date.
FOREIGN CURRENCY TRANSACTIONS AND TRANSLATION — The books and records of the Funds are maintained in U.S. dollars. Investment securities and other assets and liabilities denominated in a foreign currency are translated into U.S. dollars on the date of valuation. Purchases and sales of investment securities, income and expenses are translated into U.S. dollars at the relevant rates of exchange prevailing on the respective dates of such transactions. The Funds do not isolate that portion of realized or unrealized gains and losses resulting from changes in the foreign exchange rate from fluctuations arising from changes in the market prices of the securities. These gains and losses are included in net realized and unrealized gains and losses on investments on the Statement of Operations. Net realized and unrealized gains and losses on foreign currency transactions and translations represent net foreign exchange gains or losses from foreign currency spot contracts, disposition of foreign currencies, currency gains or losses realized between trade and settlement dates on securities transactions and the difference between the amount of the investment income and foreign withholding taxes recorded on the Funds’ books and the U.S. dollar equivalent amounts actually received or paid.
DIVIDENDS AND DISTRIBUTIONS TO SHAREHOLDERS — The Funds distribute their net investment income on a pro rata basis. Any net investment income and net realized capital gains are distributed at least annually. All distributions are recorded on the ex-dividend date.
CASH OVERDRAFT CHARGES — Per the terms of an agreement with BBH, if a Fund has a cash overdraft on a given day, it will be assessed an overdraft charge of LIBOR plus 2.00%. Cash overdraft charges are included in custodian fees on the Statements of Operations.
CREATION UNITS — The Funds issue and redeem their shares (“Shares”) on a continuous basis at Net Asset Value (“NAV”) and only in large blocks of 50,000 Shares, referred to as “Creation Units”.
Notes to Financial Statements (continued)
October 31, 2017
2. SIGNIFICANT ACCOUNTING POLICIES (continued)
Purchasers of Creation Units (“Authorized Participants”) at NAV must pay a standard creation transaction fee per transaction. The fee is a single charge and will be the same regardless of the number of Creation Units purchased by an Authorized Participant on the same day.
An Authorized Participant who holds Creation Units and wishes to redeem at NAV would also pay a standard redemption fee per transaction to Brown Brothers Harriman & Co. (“BBH”), the Funds’ custodian (“Custodian”), on the date of such redemption, regardless of the number of Creation Units redeemed that day. If a Creation Unit is purchased or redeemed for cash, an additional variable fee may be charged. The following table discloses Creation Unit breakdown:
| | | Creation Unit | | | Creation | | | Value at | | | Redemption | |
| | | Shares | | | Fee | | | October 31, 2017 | | | Fee | |
| Global X China Consumer ETF | | | 50,000 | | | $ | 1,600 | | | $ | 872,000 | | | $ | 1,600 | |
| Global X China Energy ETF | | | 50,000 | | | | 1,600 | | | | 584,500 | | | | 1,600 | |
| Global X China Financials ETF | | | 50,000 | | | | 1,600 | | | | 881,500 | | | | 1,600 | |
| Global X China Industrials ETF | | | 50,000 | | | | 1,600 | | | | 803,000 | | | | 1,600 | |
| Global X China Materials ETF | | | 50,000 | | | | 1,600 | | | | 1,079,500 | | | | 1,600 | |
| Global X NASDAQ China Technology ETF | | | 50,000 | | | | 1,600 | | | | 1,462,000 | | | | 1,600 | |
| Global X FTSE Southeast Asia ETF | | | 50,000 | | | | 2,300 | | | | 795,500 | | | | 2,300 | |
| Global X MSCI Colombia ETF | | | 50,000 | | | | 2,500 | | | | 478,000 | | | | 2,500 | |
| Global X MSCI Argentina ETF | | | 50,000 | | | | 500 | | | | 1,602,500 | | | | 500 | |
| Global X MSCI Greece ETF | | | 50,000 | | | | 1,000 | | | | 465,000 | | | | 1,000 | |
| Global X MSCI Norway ETF | | | 50,000 | | | | 2,300 | | | | 675,000 | | | | 2,300 | |
| Global X FTSE Nordic Region ETF | | | 50,000 | | | | 1,300 | | | | 1,194,500 | | | | 1,300 | |
| Global X MSCI Nigeria ETF | | | 50,000 | | | | 2,300 | | | | 1,071,500 | | | | 2,300 | |
| Global X Next Emerging & Frontier ETF | | | 50,000 | | | | 9,500 | | | | 1,164,000 | | | | 9,500 | |
| Global X MSCI Portugal ETF | | | 50,000 | | | | 1,000 | | | | 624,500 | | | | 1,000 | |
| Global X MSCI Pakistan ETF | | | 50,000 | | | | 3,800 | | | | 678,000 | | | | 3,800 | |
3. RELATED PARTIES AND SERVICE PROVIDER TRANSACTIONS
The Adviser serves as the investment adviser and the administrator for the Funds. Subject to the supervision of the Board, the Adviser is responsible for managing the investment activities of the Funds and the Funds’ business affairs and other administrative matters and provides or causes to be furnished all supervisory, administrative and other services reasonably necessary for the operation of the Funds, including certain distribution services (provided pursuant to a separate distribution services agreement), certain shareholder and distribution-related services (provided pursuant to a separate Rule 12b-1 Plan and related agreements) and investment advisory services (provided pursuant to a separate Investment Advisory Agreement), under what is essentially an "all-in" fee structure. For the Advisers service to the Funds, under the Supervision and Administration Agreement, each Fund pays a monthly fee to the Adviser at the annual rate below (stated as a percentage of the average daily net assets of the Fund). In addition, the Funds bear other expenses, directly and indirectly that are not covered by the Supervision and Administration Agreement, which may vary and affect the total expense ratios of the Funds, such as taxes, brokerage fees, commissions and other transaction expenses, interest expenses, acquired fund fees and extraordinary expenses
Notes to Financial Statements (continued)
October 31, 2017
3. RELATED PARTIES AND SERVICE PROVIDER TRANSACTIONS (continued)
(such as litigation and indemnification expenses). In addition, the Global X MSCI Colombia ETF, Global X MSCI Argentina ETF, Global X MSCI Greece ETF, Global X MSCI Nigeria ETF, Global X Next Emerging & Frontier ETF, Global X MSCI Portugal ETF and Global X MSCI Pakistan ETF pay custodial fees that are not covered by the Supervision and Administration Agreement. Pursuant to an agreement with the Custodian, the Global X MSCI Colombia ETF, Global X MSCI Argentina ETF, Global X MSCI Greece ETF, Global X MSCI Nigeria ETF, Global X Next Emerging & Frontier ETF, Global X MSCI Portugal ETF and Global X MSCI Pakistan ETF may pay up to 0.16%, 0.01%, 0.07%, 0.42%, 0.07%, 0.06% and 0.23%, respectively, in Custody Fees (in addition to the Supervision and Administration Fee).
| | | Supervision |
| | | and |
| | | Administration |
| | | Fee |
| Global X China Consumer ETF | | 0.65% |
| Global X China Energy ETF | | 0.65% |
| Global X China Financials ETF | | 0.65% |
| Global X China Industrials ETF | | 0.65% |
| Global X China Materials ETF | | 0.65% |
| Global X NASDAQ China Technology ETF | | 0.65% |
| Global X FTSE Southeast Asia ETF | | 0.65% |
| Global X MSCI Colombia ETF* | | 0.61% |
| Global X MSCI Argentina ETF** | | 0.59% |
| Global X MSCI Greece ETF | | 0.55% |
| Global X MSCI Norway ETF | | 0.50% |
| Global X FTSE Nordic Region ETF | | 0.50% |
| Global X MSCI Nigeria ETF*** | | 0.68% |
| Global X Next Emerging & Frontier ETF | | 0.49% |
| Global X MSCI Portugal ETF | | 0.55% |
| Global X MSCI Pakistan ETF | | 0.68% |
*Pursuant to an expense limitation agreement, the Adviser has agreed to waive or reimburse fees and/or limit fund expenses to the extent necessary to assure that the operating expenses of the Global X MSCI Colombia ETF (the “Fund”) (exclusive of taxes, brokerage fees, commissions, and other transaction expenses and extraordinary expenses (such as litigation and indemnification expenses)) will not exceed 0.61% of the Fund’s average daily net assets per year until at least March 1, 2018. The Fund (at a later date) may reimburse the Adviser for the fees and expenses it waived or reimbursed and/or limited pursuant to the expense limitation agreement during any of the prior three fiscal years, provided that, among other things, any reimbursement made to the Adviser does not cause Total Annual Fund Operating Expenses to exceed the maximum permitted rate during the period in which it is paid and the Board has approved such reimbursement to the Adviser. As of October 31, 2017, the amounts of waivers/reimbursements subject to recoupment for Global X MSCI Colombia ETF were $178,804 expiring 2020, $145,757 expiring 2019, and $133,125 expiring in 2018. As of October 31, 2017, there had been no recoupment of previously waived and reimbursed fees.
**Pursuant to an Expense Limitation Agreement, the Adviser has contractually agreed to waive or reimburse fees and/or limit Fund expenses to the extent necessary to assure that the operating expenses of the Global X MSCI Argentina ETF (the "Fund") (exclusive of taxes, brokerage fees, commissions, and other transaction expenses, interest and extraordinary expenses (such as
Notes to Financial Statements (continued)
October 31, 2017
3. RELATED PARTIES AND SERVICE PROVIDER TRANSACTIONS (continued)
litigation and indemnification expenses)) will not exceed 0.59% of the Fund’s average daily net assets per year until at least May 1, 2018. Pursuant to the Expense Limitation Agreement, the Fund (at a later date) may reimburse the Adviser for the fees and expenses it waived or reimbursed and/or limited pursuant to the Expense Limitation Agreement during any of the prior three fiscal years, provided that, among other things, any reimbursement made to the Adviser does not cause Total Annual Fund Operating Expenses of the Fund to exceed 0.59% during the period in which it is paid and the Board has approved such reimbursement to the Adviser. As of October 31, 2017, the amounts of waivers/reimbursements subject to recoupment for Global X MSCI Argentina ETF were $123,845 expiring 2020. As of October 31, 2017, there had been no recoupment of previously waived and reimbursed fees.
***Effective March 1, 2016, the Adviser discontinued an expense limitation agreement that had been in place with respect to the Global X MSCI Nigeria ETF. As of October 31, 2017, the amounts of waivers/reimbursements subject to recoupment for Global X MSCI Nigeria ETF were $15,742 expiring in 2019 and $58,656 expiring in 2018. As of October 31, 2017, there had been no recoupment of previously waived and reimbursed fees.
SEI Investments Global Funds Services (“SEIGFS”) serves as sub-administrator to the Funds. As sub-administrator, SEIGFS provides the Funds with the required general administrative services, including, without limitation: office space, equipment, and personnel; clerical and general back office services; bookkeeping, internal accounting and secretarial services; the calculation of NAV; and assistance with the preparation and filing of reports, registration statements, proxy statements and other materials required to be filed or furnished by the Funds under federal and state securities laws. As compensation for these services, the SEIGFS receives certain out-of-pocket costs, transaction fees and asset-based fees which are accrued daily and paid monthly by the Adviser.
SEI Investments Distribution Co. (“SIDCO”) serves as each Fund’s underwriter and distributor of Creation Units pursuant to a Distribution Agreement. SIDCO has no obligation to sell any specific quantity of Fund Shares. SIDCO bears the following costs and expenses relating to the distribution of Shares: (i) the costs of processing and maintaining records of creations of Creation Units; (ii) all costs of maintaining the records required of a registered broker/dealer; (iii) the expenses of maintaining its registration or qualification as a dealer or broker under Federal or state laws; (iv) filing fees; and (v) all other expenses incurred in connection with the distribution services as contemplated in the Distribution Agreement. SIDCO receives no fee for its distribution services under the Distribution Agreement, rather the Adviser compensates SIDCO for certain expenses, out-of-pocket costs, and transaction fees.
BBH serves as transfer agent and custodian of certain Funds’ assets. As custodian, BBH has agreed to (1) make receipts and disbursements of money on behalf of the Fund, (2) collect and receive all income and other payments and distributions on account of the Funds’ portfolio investments, (3) respond to correspondence from shareholders, security brokers and others relating to its duties; and (4) make periodic reports to the Funds concerning the Funds’ operations. BBH does not exercise any supervisory function over the purchase and sale of securities. As compensation for these services, BBH receives certain out-of-pocket costs, transaction fees and asset-based fees which are accrued daily and paid monthly by the Adviser from its fees. BBH also serves as transfer agent. As transfer agent, BBH has agreed to (1) issue and redeem shares of each Fund, (2) make dividend and other distributions to shareholders of each Fund, (3) respond to correspondence by shareholders and others relating to its duties; (4) maintain shareholder accounts, and (5) make periodic reports to the Funds. As compensation for these services, BBH receives certain out of-pocket costs, transaction fees and asset-based fees which are accrued daily and paid monthly by the Adviser from its fees.
Notes to Financial Statements (continued)
October 31, 2017
4. INVESTMENT TRANSACTIONS
For the year ended October 31, 2017, the purchases and sales of investments in securities, excluding in-kind transactions, long-term U.S. Government and short-term securities were:
| | | | | | Sales and | |
| | | Purchases | | | Maturities | |
| Global X China Consumer ETF | | $ | 32,167,146 | | | $ | 31,512,765 | |
| Global X China Energy ETF | | | 220,951 | | | | 191,468 | |
| Global X China Financials ETF | | | 7,417,722 | | | | 6,872,064 | |
| Global X China Industrials ETF | | | 819,885 | | | | 798,599 | |
| Global X China Materials ETF | | | 1,451,910 | | | | 1,384,229 | |
| Global X NASDAQ China Technology ETF | | | 5,982,414 | | | | 6,189,049 | |
| Global X FTSE Southeast Asia ETF | | | 959,956 | | | | 937,974 | |
| Global X MSCI Colombia ETF | | | 37,961,958 | | | | 38,055,294 | |
| Global X MSCI Argentina ETF | | | 34,191,789 | | | | 32,826,011 | |
| Global X MSCI Greece ETF | | | 71,308,151 | | | | 70,378,762 | |
| Global X MSCI Norway ETF | | | 12,583,102 | | | | 11,890,371 | |
| Global X FTSE Nordic Region ETF | | | 2,420,271 | | | | 2,864,052 | |
| Global X MSCI Nigeria ETF | | | 33,151,591 | | | | 9,436,327 | |
| Global X Next Emerging & Frontier ETF | | | 1,177,330 | | | | 1,465,515 | |
| Global X MSCI Portugal ETF | | | 9,636,853 | | | | 9,254,705 | |
| Global X MSCI Pakistan ETF | | | 73,491,935 | | | | 20,792,773 | |
During the year ended October 31, 2017, there were no purchases or sales of long-term U.S. Government securities for the Funds.
Notes to Financial Statements (continued)
October 31, 2017
4. INVESTMENT TRANSACTIONS (continued)
For the year ended October 31, 2017, in-kind transactions associated with creations and redemptions were:
| | | | | | Sales and | | | Realized | |
| | | Purchases | | | Maturities | | | Gain/(Loss) | |
| Global X China Consumer ETF | | $ | 59,418,280 | | | $ | 12,389,046 | | | $ | 1,868,852 | |
| Global X China Financials ETF | | | 13,636,459 | | | | 1,395,729 | | | | 100,070 | |
| Global X China Industrials ETF | | | - | | | | 685,305 | | | | 55,110 | |
| Global X China Materials ETF | | | 3,783,954 | | | | 822,939 | | | | 105,132 | |
| Global X NASDAQ China Technology ETF | | | 4,096,896 | | | | 2,363,171 | | | | 597,429 | |
| Global X FTSE Southeast Asia ETF | | | 1,203,176 | | | | 1,030,597 | | | | (95,948 | ) |
| Global X MSCI Colombia ETF | | | 7,104,849 | | | | 6,100,974 | | | | 853,890 | |
| Global X MSCI Argentina ETF | | | 104,228,654 | | | | 50,146,596 | | | | 17,011,676 | |
| Global X MSCI Greece ETF | | | 115,144,814 | | | | 77,641,139 | | | | 24,189,607 | |
| Global X MSCI Norway ETF | | | 67,332,225 | | | | 40,587,472 | | | | 9,009,777 | |
| Global X FTSE Nordic Region ETF | | | 3,499,734 | | | | 12,958,926 | | | | 983,586 | |
| Global X Next Emerging & Frontier ETF | | | - | | | | 721,337 | | | | 4,312 | |
| Global X MSCI Portugal ETF | | | 36,748,356 | | | | 7,652,313 | | | | 835,739 | |
For the year ended October 31, 2016, in-kind transactions associated with creations and redemptions were:
| | | | | | Sales and | | | Realized | |
| | | Purchases | | | Maturities | | | Gain/(Loss) | |
| Global X China Consumer ETF | | | 8,335,368 | | | | 20,544,683 | | | | (565,301 | ) |
| Global X China Financials ETF | | | 11,578,774 | | | | 28,868,519 | | | | (8,507,920 | ) |
| Global X China Industrials ETF | | | - | | | | 2,574,819 | | | | (228,240 | ) |
| Global X NASDAQ China Technology ETF | | | - | | | | 2,061,309 | | | | 293,542 | |
| Global X Southeast Asia ETF | | | - | | | | 1,770,489 | | | | (504,981 | ) |
| Global X MSCI Colombia ETF | | | 6,492,950 | | | | 1,635,821 | | | | 422,324 | |
| Global X MSCI Argentina ETF | | | 76,581,806 | | | | 18,250,743 | | | | 5,345,023 | |
| Global X MSCI Greece ETF | | | 71,815,387 | | | | 46,240,196 | | | | (977,470 | ) |
| Global X MSCI Norway ETF | | | 54,480,759 | | | | 12,411,440 | | | | 264,023 | |
| Global X FTSE Nordic Region ETF | | | - | | | | 5,083,458 | | | | 793,419 | |
| Global X Next Emerging & Frontier ETF | | | 1,568,756 | | | | 65,046,354 | | | | (19,651,937 | ) |
| Global X MSCI Portugal ETF | | | 5,189,524 | | | | 13,500,567 | | | | (549,784 | ) |
Notes to Financial Statements (continued)
October 31, 2017
5. TAX INFORMATION
The amount and character of income and capital gain distributions to be paid, if any, are determined in accordance with Federal income tax regulations, which may differ from U.S. GAAP. As a result, net investment income (loss) and net realized gain (loss) on investment transactions for a reporting period may differ significantly from distributions during such period. These book/tax differences may be temporary or permanent. To the extent these differences are permanent in nature, they are charged or credited to undistributed net investment income (loss), accumulated net realized gain (loss) or paid-in capital, as appropriate, in the period that the differences arise.
The following differences, primarily attributable to redemptions in-kind, sales of passive foreign investment companies, and foreign currency, have been reclassified to/from the following accounts during the fiscal period ended October 31, 2017.
| Global X Funds | | Paid-in
Capital | | | Undistributed
Net
Investment
Income
(Loss) | | | Accumulated
Net Realized
Gain/(Loss) | |
| Global X China Consumer ETF | | $ | 1,548,611 | | | $ | 12,091 | | | $ | (1,560,702 | ) |
| Global X China Energy ETF | | | – | | | | (63 | ) | | | 63 | |
| Global X China Financials ETF | | | 35,652 | | | | (1,190 | ) | | | (34,462 | ) |
| Global X China Industrials ETF | | | 46,246 | | | | 35 | | | | (46,281 | ) |
| Global X China Materials ETF | | | 105,132 | | | | (222 | ) | | | (104,910 | ) |
| Global X NASDAQ China Technology ETF | | | 501,138 | | | | 131,421 | | | | (632,559 | ) |
| Global X FTSE Southeast Asia ETF | | | (106,579 | ) | | | (2,871 | ) | | | 109,450 | |
| Global X MSCI Colombia ETF | | | (1,142,873 | ) | | | 58,690 | | | | 1,084,183 | |
| Global X MSCI Argentina ETF | | | 15,520,701 | | | | (26,298 | ) | | | (15,494,403 | ) |
| Global X MSCI Greece ETF | | | 5,110,278 | | | | 12,137 | | | | (5,122,415 | ) |
| Global X MSCI Norway ETF | | | 6,695,292 | | | | 34,136 | | | | (6,729,428 | ) |
| Global X FTSE Nordic Region ETF | | | 580,445 | | | | 126,943 | | | | (707,388 | ) |
| Global X MSCI Nigeria ETF | | | – | | | | 7,654 | | | | (7,654 | ) |
| Global X Next Emerging & Frontier ETF | | | 3,984 | | | | (5,070 | ) | | | 1,086 | |
| Global X MSCI Portugal ETF | | | 437,082 | | | | (24,475 | ) | | | (412,607 | ) |
| Global X MSCI Pakistan ETF | | | – | | | | (15,940 | ) | | | 15,940 | |
Notes to Financial Statements (continued)
October 31, 2017
5. TAX INFORMATION (continued)
The tax character of dividends and distributions declared during the periods ended October 31, 2017 and 2016 were as follows:
| Global X Funds | | Ordinary Income | | | Long-Term
Capital Gain | | | Return of Capital | | | Totals | |
| | | | |
| Global X China Consumer ETF |
| 2017 | | $ | 998,941 | | | $ | – | | | $ | – | | | $ | 998,941 | |
| 2016 | | | 4,048,651 | | | | – | | | | – | | | | 4,048,651 | |
| Global X China Energy ETF |
| 2017 | | $ | 32,233 | | | $ | – | | | $ | – | | | $ | 32,233 | |
| 2016 | | | 49,338 | | | | – | | | | – | | | | 49,338 | |
| Global X China Financials ETF |
| 2017 | | $ | 528,238 | | | $ | – | | | $ | – | | | $ | 528,238 | |
| 2016 | | | 2,772,013 | | | | – | | | | – | | | | 2,772,013 | |
| Global X China Industrials ETF |
| 2017 | | $ | 59,685 | | | $ | – | | | $ | – | | | $ | 59,685 | |
| 2016 | | | 103,249 | | | | – | | | | – | | | | 103,249 | |
| Global X China Materials ETF |
| 2017 | | $ | 16,197 | | | $ | – | | | $ | – | | | $ | 16,197 | |
| 2016 | | | 70,832 | | | | – | | | | – | | | | 70,832 | |
| Global X NASDAQ China Technology ETF |
| 2017 | | $ | 528,298 | | | $ | – | | | $ | – | | | $ | 528,298 | |
| 2016 | | | 100,894 | | | | – | | | | – | | | | 100,894 | |
| Global X FTSE Southeast Asia ETF |
| 2017 | | $ | 284,922 | | | $ | – | | | $ | – | | | $ | 284,922 | |
| 2016 | | | 486,151 | | | | – | | | | – | | | | 486,151 | |
| Global X MSCI Colombia ETF |
| 2017 | | $ | 1,265,662 | | | $ | – | | | $ | – | | | $ | 1,265,662 | |
| 2016 | | | 948,793 | | | | – | | | | – | | | | 948,793 | |
| Global X MSCI Argentina ETF |
| 2017 | | $ | 308,816 | | | $ | – | | | $ | – | | | $ | 308,816 | |
| 2016 | | | 213,754 | | | | – | | | | – | | | | 213,754 | |
| Global X MSCI Greece ETF |
| 2017 | | $ | 5,196,758 | | | $ | – | | | $ | – | | | $ | 5,196,758 | |
| 2016 | | | 3,840,043 | | | | – | | | | – | | | | 3,840,043 | |
| Global X MSCI Norway ETF |
| 2017 | | $ | 3,382,974 | | | $ | – | | | $ | – | | | $ | 3,382,974 | |
| 2016 | | | 2,212,531 | | | | – | | | | – | | | | 2,212,531 | |
| Global X FTSE Nordic Region ETF |
| 2017 | | $ | 1,335,962 | | | $ | – | | | $ | – | | | $ | 1,335,962 | |
| 2016 | | | 1,490,826 | | | | – | | | | – | | | | 1,490,826 | |
| Global X MSCI Nigeria ETF |
| 2017 | | $ | 706,374 | | | $ | – | | | $ | – | | | $ | 706,374 | |
| 2016 | | | 850,578 | | | | – | | | | – | | | | 850,578 | |
| Global X Next Emerging & Frontier ETF |
| 2017 | | $ | 337,103 | | | $ | – | | | $ | – | | | $ | 337,103 | |
| 2016 | | | 2,414,376 | | | | – | | | | – | | | | 2,414,376 | |
| Global X MSCI Portugal ETF |
| 2017 | | $ | 878,665 | | | $ | – | | | $ | – | | | $ | 878,665 | |
| 2016 | | | 1,260,520 | | | | – | | | | – | | | | 1,260,520 | |
| Global X MSCI Pakistan ETF |
| 2017 | | $ | 363,656 | | | $ | – | | | $ | – | | | $ | 363,656 | |
| 2016 | | | 164,848 | | | | – | | | | – | | | | 164,848 | |
Notes to Financial Statements (continued)
October 31, 2017
5. TAX INFORMATION (continued)
As of October 31, 2017, the components of tax basis distributable earnings (accumulated losses) were as follows:
| | | Global X Funds | |
| | | Global X China
Consumer ETF | | | Global X China
Energy ETF | | | Global X China
Financials ETF | | | Global X China
Industrials ETF | |
| Undistributed Ordinary Income | | $ | 1,451,473 | | | $ | 61,751 | | | $ | 927,639 | | | $ | 79,368 | |
| Capital Loss Carryforwards | | | (41,709,640 | ) | | | (1,163,324 | ) | | | (3,247,017 | ) | | | (2,199,662 | ) |
| Unrealized Appreciation (Depreciation) on Investments and Foreign Currency | | | 22,989,360 | | | | (335,999 | ) | | | 5,370,741 | | | | (587,835 | ) |
| Other Temporary Differences | | | (5 | ) | | | (1 | ) | | | (3 | ) | | | (3 | ) |
| Total Distributable Earnings (Accumulated Losses) | | $ | (17,268,812 | ) | | $ | (1,437,573 | ) | | $ | 3,051,360 | | | $ | (2,708,132 | ) |
| | | Global X Funds | |
| | | Global X China
Materials ETF | | | Global X
NASDAQ China
Technology ETF | | | Global X FTSE
Southeast Asia
ETF | | | Global X MSCI
Colombia ETF | |
| Undistributed Ordinary Income | | $ | 58,997 | | | $ | 570,365 | | | $ | 241,636 | | | $ | 1,536,733 | |
| Capital Loss Carryforwards | | | (1,396,891 | ) | | | (2,744,099 | ) | | | (5,365,479 | ) | | | (76,235,695 | ) |
| Unrealized Appreciation (Depreciation) on Investments and Foreign Currency | | | 306,930 | | | | 3,702,567 | | | | 442,229 | | | | (9,058,290 | ) |
| Other Temporary Differences | | | (1 | ) | | | – | | | | (1 | ) | | | (5 | ) |
| Total Distributable Earnings (Accumulated Losses) | | $ | (1,030,965 | ) | | $ | 1,528,833 | | | $ | (4,681,615 | ) | | $ | (83,757,257 | ) |
| | | Global X Funds | |
| | | Global X MSCI
Argentina ETF | | | Global X MSCI
Greece ETF | | | Global X MSCI
Norway ETF | | | Global X FTSE
Nordic Region
ETF | |
| Undistributed Ordinary Income | | $ | 202,378 | | | $ | 5,474,984 | | | $ | 3,690,668 | | | $ | 1,186,859 | |
| Capital Loss Carryforwards | | | (3,830,730 | ) | | | (123,424,920 | ) | | | (26,147,824 | ) | | | (3,737,366 | ) |
| Unrealized Appreciation (Depreciation) on Investments and Foreign Currency | | | 29,545,874 | | | | (56,537,616 | ) | | | 372,148 | | | | 1,184,480 | |
| Other Temporary Differences | | | (2 | ) | | | (4 | ) | | | (9 | ) | | | (1 | ) |
| Total Distributable Earnings (Accumulated Losses) | | $ | 25,917,520 | | | $ | (174,487,556 | ) | | $ | (22,085,017 | ) | | $ | (1,366,028 | ) |
| | | Global X Funds | |
| | | Global X MSCI
Nigeria ETF | | | Global X Next
Emerging &
Frontier ETF | | | Global X MSCI
Portugal ETF | | | Global X MSCI
Pakistan ETF | |
| Undistributed Ordinary Income | | $ | 1,360,192 | | | $ | 265,938 | | | $ | 1,558,589 | | | $ | 2,393,635 | |
| Undistributed Long-Term Capital Gain | | | – | | | | – | | | | – | | | | 1,522,378 | |
| Capital Loss Carryforwards | | | (7,772,704 | ) | | | (21,337,408 | ) | | | (9,561,140 | ) | | | – | |
| Unrealized Appreciation (Depreciation) on Investments and Foreign Currency | | | (4,751,507 | ) | | | 200,385 | | | | 178,076 | | | | (12,884,295 | ) |
| Other Temporary Differences | | | 1 | | | | (2 | ) | | | (1 | ) | | | 1 | |
| Total Accumulated Losses | | $ | (11,164,018 | ) | | $ | (20,871,087 | ) | | $ | (7,824,476 | ) | | $ | (8,968,281 | ) |
Notes to Financial Statements (continued)
October 31, 2017
5. TAX INFORMATION (continued)
For Federal income tax purposes, capital losses incurred in taxable years beginning before December 22, 2010 may be carried forward for a maximum period of eight years and applied against future gains. As of October 31, 2017, the Funds that had capital loss carryforwards are listed below:
| | | | | | | | | Global X | | | Global X | | | Global X | |
| | | | | | Global X | | | China | | | China | | | China | |
| | | Global X China | | | China | | | Financials | | | Industrials | | | Materials | |
| Expiration date | | Consumer ETF | | | Energy ETF | | | ETF | | | ETF | | | ETF | |
| October 2019 | | $ | 1,341,121 | | | $ | 33,912 | | | $ | - | | | $ | - | | | $ | - | |
| October 2018 | | | 173,208 | | | | - | | | | 551,954 | | | | 94,810 | | | | - | |
| | | $ | 1,514,329 | | | $ | 33,912 | | | $ | 551,954 | | | $ | 94,810 | | | $ | - | |
| | | | | | Global X | | | Global X | | | Global X | | | | |
| | | Global X | | | FTSE | | | MSCI | | | MSCI | | | Global X | |
| | | NASDAQ China | | | Southeast | | | Colombia | | | Argentina | | | MSCI | |
| Expiration date | | Technology ETF | | | Asia ETF | | | ETF | | | ETF | | | Greece ETF | |
| October 2019 | | $ | 236,466 | | | $ | - | | | $ | 8,249,654 | | | $ | 414,683 | | | $ | - | |
| October 2018 | | | - | | | | - | | | | - | | | | - | | | | - | |
| | | $ | 236,466 | | | $ | - | | | $ | 8,249,654 | | | $ | 414,683 | | | $ | - | |
| | | | | | | | | | | | Global X | | | Global X | |
| | | | | | Global X | | | Global X | | | Next | | | MSCI | |
| | | Global X MSCI | | | FTSE Nordic | | | MSCI | | | Emerging & | | | Portugal | |
| Expiration date | | Norway ETF | | | Region ETF | | | Nigeria ETF | | | Frontier ETF | | | ETF | |
| October 2019 | | $ | 1,802,290 | | | $ | - | | | $ | - | | | $ | - | | | $ | - | |
| October 2018 | | | - | | | | - | | | | - | | | | - | | | | - | |
| | | $ | 1,802,290 | | | $ | - | | | $ | - | | | $ | - | | | $ | - | |
| | | Global X MSCI | | | | | | | | | | | | | |
| Expiration date | | Pakistan ETF | | | | | | | | | | | | | |
| October 2019 | | $ | - | | | | | | | | | | | | | | | | | |
| October 2018 | | | - | | | | | | | | | | | | | | | | | |
| | | $ | - | | | | | | | | | | | | | | | | | |
Notes to Financial Statements (continued)
October 31, 2017
5. TAX INFORMATION (continued)
For taxable years beginning after December 22, 2010, a registered investment company (“RIC”) is permitted to carry forward net capital losses to offset capital gains realized in later years, and the losses carried forward retain their original character as either long-term or short-term losses. Net capital losses of a RIC realized in taxable years beginning before that date (pre-2011 losses) can be carried forward up to 8 years and are characterized in later years as short-term losses. If a Fund uses pre-2011 loss carryforwards in later years, the carryforwards will not reduce the Fund’s current earnings and profits, while loss carryforwards from later years will reduce the Fund’s current earnings and profits. To the extent that later year capital gains are offset by pre-2011 loss carryforwards, distributions of such gains will be treated as ordinary dividend distributions. Losses carried forward under these new provisions are as follows:
| | | Short-Term
Loss | | | Long-Term
Loss | | | Total | |
| Global X China Consumer ETF | | $ | 717,059 | | | $ | 39,478,252 | | | $ | 40,195,311 | |
| Global X China Energy ETF | | | 118,470 | | | | 1,010,942 | | | | 1,129,412 | |
| Global X China Financials ETF | | | 1,775,586 | | | | 919,477 | | | | 2,695,063 | |
| Global X China Industrials ETF | | | 276,432 | | | | 1,828,420 | | | | 2,104,852 | |
| Global X China Materials ETF | | | 83,468 | | | | 1,313,423 | | | | 1,396,891 | |
| Global X NASDAQ China Technology ETF | | | 1,738,729 | | | | 768,904 | | | | 2,507,633 | |
| Global X FTSE Southeast Asia ETF | | | 1,770,485 | | | | 3,594,994 | | | | 5,365,479 | |
| Global X MSCI Colombia ETF | | | 20,917,808 | | | | 47,068,233 | | | | 67,986,041 | |
| Global X MSCI Argentina ETF | | | 1,289,644 | | | | 2,126,403 | | | | 3,416,047 | |
| Global X MSCI Greece ETF | | | 58,340,484 | | | | 65,084,436 | | | | 123,424,920 | |
| Global X MSCI Norway ETF | | | 6,513,435 | | | | 17,832,099 | | | | 24,345,534 | |
| Global X FTSE Nordic Region ETF | | | 1,247,107 | | | | 2,490,259 | | | | 3,737,366 | |
| Global X MSCI Nigeria ETF | | | 3,935,372 | | | | 3,837,332 | | | | 7,772,704 | |
| Global X Next Emerging & Frontier ETF | | | 4,903,800 | | | | 16,433,608 | | | | 21,337,408 | |
| Global X MSCI Portugal ETF | | | 2,637,641 | | | | 6,923,499 | | | | 9,561,140 | |
During the year ended October 31, 2017, Global X MSCI Pakistan ETF utilized capital loss carryforwards to offset capital gains in the amount of $96,696.
Notes to Financial Statements (continued)
October 31, 2017
5. TAX INFORMATION (continued)
The Federal tax cost and aggregate gross unrealized appreciation and depreciation on investments held by the Funds at October 31, 2017 were as follows:
| Global X Funds | | Federal Tax
Cost | | | Aggregated
Gross
Unrealized
Appreciation | | | Aggregated
Gross
Unrealized
Depreciation | | | Net
Unrealized
Appreciation
(Depreciation) | |
| Global X China Consumer ETF | | $ | 139,085,080 | | | $ | 30,435,614 | | | $ | (7,446,253 | ) | | $ | 22,989,361 | |
| Global X China Energy ETF | | | 2,087,750 | | | | 132,223 | | | | (468,222 | ) | | | (335,999 | ) |
| Global X China Financials ETF | | | 44,811,652 | | | | 6,706,370 | | | | (1,335,647 | ) | | | 5,370,723 | |
| Global X China Industrials ETF | | | 4,594,397 | | | | 378,677 | | | | (966,522 | ) | | | (587,845 | ) |
| Global X China Materials ETF | | | 5,034,966 | | | | 683,846 | | | | (376,913 | ) | | | 306,933 | |
| Global X NASDAQ China Technology ETF | | | 15,474,180 | | | | 5,399,153 | | | | (1,696,586 | ) | | | 3,702,567 | |
| Global X FTSE Southeast Asia ETF | | | 13,846,659 | | | | 1,473,875 | | | | (1,031,585 | ) | | | 442,290 | |
| Global X MSCI Colombia ETF | | | 105,011,864 | | | | 4,894,279 | | | | (13,952,413 | ) | | | (9,058,134 | ) |
| Global X MSCI Argentina ETF | | | 153,575,221 | | | | 34,135,299 | | | | (4,589,343 | ) | | | 29,545,956 | |
| Global X MSCI Greece ETF | | | 411,411,357 | | | | 46,823,126 | | | | (103,360,752 | ) | | | (56,537,626 | ) |
| Global X MSCI Norway ETF | | | 213,193,293 | | | | 15,255,647 | | | | (14,881,916 | ) | | | 373,731 | |
| Global X FTSE Nordic Region ETF | | | 38,919,712 | | | | 5,314,935 | | | | (4,070,259 | ) | | | 1,244,676 | |
| Global X MSCI Nigeria ETF | | | 69,228,330 | | | | 9,955,236 | | | | (14,706,799 | ) | | | (4,751,563 | ) |
| Global X Next Emerging & Frontier ETF | | | 16,041,500 | | | | 2,441,704 | | | | (2,240,769 | ) | | | 200,935 | |
| Global X MSCI Portugal ETF | | | 64,854,346 | | | | 6,197,626 | | | | (6,021,942 | ) | | | 175,684 | |
| Global X MSCI Pakistan ETF | | | 66,301,227 | | | | 572,333 | | | | (13,352,434 | ) | | | (12,780,101 | ) |
The preceding differences between book and tax cost are primarily due to mark to market treatment of passive foreign investment companies and wash sales.
6. CONCENTRATION OF RISKS
The Funds invest in securities of foreign issuers in several countries. These investments may involve certain considerations and risks not typically associated with investments in the United States as a result of, among other factors, the possibility of future political and economic developments and the level of governmental supervision and regulation of securities markets in the respective countries.
The securities markets of emerging market countries are less liquid and subject to greater price volatility, and have a smaller market capitalization, than the U.S. securities markets. In certain countries, there may be fewer publicly traded securities and the market may be dominated by a few issuers or sectors.
Issuers and securities markets in such countries are typically not subject to as extensive and frequent accounting, financial and other reporting requirements or as comprehensive government regulations or issuers and securities markets in the U.S. In particular, the assets and profits appearing on the financial statements of emerging market country issuers may not reflect their financial position or results of operations in the same manner as financial statements for U.S. issuers. Substantially less information may be publicly available about emerging market country issuers than is available about issuers in the United States.
Notes to Financial Statements (CONTINUED)
October 31, 2017
6. CONCENTRATION OF RISKS (continued)
The Funds may be subject to taxes imposed by countries in which it invests. Such taxes are generally based on either income, gains earned or gains repatriated. The Funds accrue and apply such taxes to net investment income, net realized gains and net unrealized gains as income and/or capital gains are earned.
The Funds use a replication strategy. A replication strategy is an indexing strategy that involves investing in the securities of the underlying index in approximately the same proportions as the underlying index. The Funds may utilize a representative sampling strategy with respect to their underlying index when a replication strategy might be detrimental to its shareholders, such as when there are practical difficulties or substantial costs involved in compiling a portfolio of equity securities to follow its underlying index, or, in certain instances, when securities in the underlying index become temporarily illiquid, unavailable or less liquid, or due to legal restrictions (such as diversification requirements that apply to the Funds but not the underlying indexes).
Certain Funds may invest in commodity related securities, which are susceptible to fluctuations in certain commodity markets. Any negative changes in commodity markets could have a great impact on those securities.
A more complete description of risks is included in each Fund’s prospectus and SAI.
7. LOANS OF PORTFOLIO SECURITIES
The Funds may lend portfolio securities having a market value up to one-third of the Funds’ total assets. Security loans made pursuant to a securities lending agreement are initially required to be secured by collateral equal to at least 102% of the value of domestic equity securities and ADRs and 105% of the value of foreign equity securities (other than ADRs). Such collateral received in connection with these loans will be cash and can be invested in repurchase agreements or U.S. Treasury obligations and is recognized in the Schedule of Investments and Statement of Assets and Liabilities. The obligation to return securities lending collateral is also recognized as a liability in the Statement of Assets and Liabilities. It is the Funds’ policy to obtain additional collateral from or return excess collateral to the borrower by the end of the next business day, following the valuation date of the securities loaned. Therefore, the value of the collateral held may be temporarily less than the value of the securities on loan. Lending securities entails a risk of loss to the Funds if and to the extent that the market value of the securities loans were to increase and the borrower did not increase the collateral accordingly, and the borrower fails to return the securities. In the event the borrower may not provide additional collateral when required or may not return the securities when due, the agency agreement requires the lending agent to indemnify the Funds by replacing either the security or the security’s current market value to the fund. The Funds could suffer a loss if the value of an investment purchased with cash collateral falls below the market value of loaned securities or if the value of an investment purchased with cash collateral falls below the value of the original cash collateral received. The Funds could also experience delays and costs in gaining access to the collateral. The Funds bear the risk of any deficiency in the amount of the collateral available for return to the borrower due to any loss on the collateral invested.
Notes to Financial Statements (CONTINUED)
October 31, 2017
7. LOANS OF PORTFOLIO SECURITIES (continued)
As of October 31, 2017, the value of the securities on loan was $5,626,645, $3,173,958, $5,402,172, $46,316,939, $1,620,128 and $1,185,710 for the Global X China Consumer ETF, Global X MSCI Colombia ETF, Global X MSCI Greece ETF, Global X MSCI Norway ETF, Global X FTSE Nordic Region ETF and Global X MSCI Portugal ETF, respectively. The value of securities purchased with the cash collateral held from securities on loan was $5,980,517, $3,251,175, $5,670,468, $49,261,166, $1,713,641 and $1,356,084 for the Global X China Consumer ETF, Global X MSCI Colombia ETF, Global X MSCI Greece ETF, Global X MSCI Norway ETF, Global X FTSE Nordic Region ETF and Global X MSCI Portugal ETF, respectively.
At October 31, 2017, the following Funds had securities on loan, by counterparty:
| | | Market Value | | | Cash Collateral | |
| Global X China Consumer ETF | | | | | | | | |
| Credit Suisse | | $ | 864,545 | | | $ | 938,098 | |
| Goldman Sachs | | | 2,566,639 | | | | 2,700,427 | |
| JPMorgan | | | 1,103,861 | | | | 1,160,460 | |
| Morgan Stanley | | | 1,091,600 | | | | 1,181,532 | |
| Global X MSCI Colombia ETF | | | | | | | | |
| BMO Capital Markets | | | 44,360 | | | | 48,000 | |
| Credit Suisse | | | 77,630 | | | | 78,750 | |
| Goldman Sachs | | | 1,791,035 | | | | 1,816,875 | |
| ML Pierce, Fenner & Smith | | | 1,260,933 | | | | 1,307,550 | |
| Global X MSCI Greece ETF | | | | | | | | |
| Barclays | | | 527,229 | | | | 557,759 | |
| BNP Paribas | | | 67,500 | | | | 75,000 | |
| Deutsche Bank | | | 1,555,143 | | | | 1,637,509 | |
| ML Pierce, Fenner & Smith | | | 3,252,301 | | | | 3,400,200 | |
| Global X MSCI Norway ETF | | | | | | | | |
| Citigroup | | | 936,246 | | | | 962,095 | |
| Credit Suisse | | | 179,750 | | | | 181,500 | |
| Deutsche Bank | | | 119,187 | | | | 139,986 | |
| JPMorgan | | | 3,519,289 | | | | 3,716,765 | |
| ML Pierce, Fenner & Smith | | | 3,716,663 | | | | 3,973,920 | |
| Morgan Stanley | | | 465,415 | | | | 499,981 | |
| Scotia Capital | | | 399,907 | | | | 432,000 | |
| SG Americas Securities | | | 19,825,359 | | | | 21,330,399 | |
| UBS Securities | | | 17,155,123 | | | | 18,024,520 | |
| Global X FTSE Nordic Region ETF | | | | | | | | |
| Deutsche Bank | | | 571,173 | | | | 592,320 | |
| ML Pierce, Fenner & Smith | | | 1,048,954 | | | | 1,121,321 | |
| Global X MSCI Portugal ETF | | | | | | | | |
| Jefferies | | | 1,185,574 | | | | 1,239,014 | |
| ML Pierce, Fenner & Smith | | | 61 | | | | 52,500 | |
| Morgan Stanley | | | 75 | | | | 64,570 | |
Notes to Financial Statements (CONCLUDED)
October 31, 2017
8. CONTRACTUAL OBLIGATIONS
The Funds enter into contracts in the normal course of business that contain a variety of indemnifications. The Funds’ maximum exposure under these contracts is unknown. However the Funds have not had prior gains or losses pursuant to these contracts. Management has reviewed the Funds’ existing contracts and expects the risk of loss to be remote.
Pursuant to the Trust’s organizational documents, the Trustees of the Trust and the Trust’s officers are indemnified against certain liabilities that may arise out of the performance of their duties.
9. REVERSE SHARE SPLIT
Effective May 16, 2013, each of the Global X China Materials ETF and the Global X MSCI Argentina ETF executed a 1-for-2 reverse share split for shareholders of record after the close of markets on May 15, 2013. The effect of this transaction for each Fund was to divide the number of outstanding shares of the Funds by two, resulting in a corresponding increase in the net asset value per share. The per share data in the financial highlights for each of the years in the period then ended, have been given retroactive effect to reflect these reverse share splits. There were no changes in net assets, results of operations or total return as a result of these transactions.
Effective March 16, 2017, the Global X MSCI Nigeria ETF executed a 1-for-4 reverse share split for shareholders of record after the close of markets on March 15, 2017. The effect of this transaction was to divide the number of outstanding shares of the Fund by four, resulting in a corresponding increase in the net asset value per share. The per share data in the financial highlights for each of the years in the period then ended have been given retroactive effect to reflect these reverse share splits. There were no changes in net assets, results of operations or total return as a result of these transactions.
10. REGULATORY MATTERS
In October 2016, the U.S. Securities and Exchange Commission adopted new rules and amended existing rules (together, final rules) intended to modernize the reporting and disclosure of information by registered investment companies. In part, the final rules amended Regulation S-X and require standardized, enhanced disclosures about derivatives in investment company financial statements, as well as other amendments. As of August 1, 2017, management has implemented the amendments to Regulation S-X, which did not have a material impact on the Fund’s financial statements and related disclosures nor impact the Fund’s net assets or results of operations.
11. SUBSEQUENT EVENTS
The Funds have been evaluated regarding the need for additional disclosures and/or adjustments resulting from subsequent events. Based on this evaluation, please note the additional disclosure:
On November 1, 2017, the Trust entered into an agreement with BBH in which BBH will serve as the new securities lending agent for the Trust and each of its series.
Report of Independent Registered Public Accounting Firm
October 31, 2017
To the Board of Trustees and Shareholders of Global X China Consumer ETF, Global X China Energy ETF, Global X China Financials ETF, Global X China Industrials ETF, Global X China Materials ETF, Global X NASDAQ China Technology ETF, Global X FTSE Southeast Asia ETF, Global X MSCI Colombia ETF, Global X MSCI Argentina ETF, Global X MSCI Greece ETF, Global X MSCI Norway ETF, Global X FTSE Nordic Region ETF, Global X MSCI Nigeria ETF, Global X Next Emerging & Frontier ETF, Global X MSCI Portugal ETF and Global X MSCI Pakistan ETF.
In our opinion, the accompanying statements of assets and liabilities, including the schedules of investments, and the related statements of operations and of changes in net assets and the financial highlights present fairly, in all material respects, the financial position of Global X China Consumer ETF, Global X China Energy ETF, Global X China Financials ETF, Global X China Industrials ETF, Global X China Materials ETF, Global X NASDAQ China Technology ETF, Global X FTSE Southeast Asia ETF, Global X MSCI Colombia ETF, Global X MSCI Argentina ETF, Global X MSCI Greece ETF, Global X MSCI Norway ETF, Global X FTSE Nordic Region ETF, Global X MSCI Nigeria ETF, Global X Next Emerging & Frontier ETF, Global X MSCI Portugal ETF and Global X MSCI Pakistan ETF (sixteen series of Global X Funds, hereafter referred to as the "Funds") as of October 31, 2017, the results of each of their operations for the year then ended, and the changes in each of their net assets and the financial highlights for each of the two years in the period then ended, in conformity with accounting principles generally accepted in the United States of America. These financial statements and financial highlights (hereafter referred to as "financial statements") are the responsibility of the Funds’ management. Our responsibility is to express an opinion on these financial statements based on our audits. We conducted our audits of these financial statements in accordance with the standards of the Public Company Accounting Oversight Board (United States). Those standards require that we plan and perform the audit to obtain reasonable assurance about whether the financial statements are free of material misstatement. An audit includes examining, on a test basis, evidence supporting the amounts and disclosures in the financial statements, assessing the accounting principles used and significant estimates made by management, and evaluating the overall financial statement presentation. We believe that our audits, which included confirmation of securities as of October 31, 2017 by correspondence with the custodian and brokers and the application of alternative auditing procedures where confirmations of securities purchased had not been received, provide a reasonable basis for the opinions expressed above.
The financial statements, as of and for the year or period ended October 31, 2015 and the financial highlights for each of the years or periods ended on or prior to October 31, 2015 (not presented herein, other than the financial highlights) were audited by other auditors whose report dated December 30, 2015 expressed an unqualified opinion on those financial statements and financial highlights.
PricewaterhouseCoopers LLP
Philadelphia, Pennsylvania
December 21, 2017
Disclosure of Fund Expenses (UNAUDITED)
ETFs such as the Funds have operating expenses. As a shareholder of an ETF, your investment is affected by these ongoing costs, which include (among others) costs for portfolio management, administrative services, brokerage fees, and shareholder reports like this one. It is important for you to understand the impact of these costs on your investment returns. In addition, a shareholder is responsible for brokerage fees incurred in the purchase or sale of share of the Fund on the secondary market.
Operating expenses such as these are deducted from an ETF’s gross income and directly reduce your final investment return. These expenses are expressed as a percentage of the ETF’s average net assets; this percentage is known as the ETF’s expense ratio.
The following examples use the expense ratio and are intended to help you understand the ongoing costs (in dollars) of investing in a Fund and to compare these costs with those of other funds. The examples are based on an investment of $1,000 made at the beginning of the period shown and held for the entire period from May 1, 2017 through October 31, 2017.
The table on the next page illustrates the Funds’ costs in two ways:
Actual Fund Return. This section helps you to estimate the actual expenses that a Fund incurred over the period. The “Expenses Paid During Period” column shows the actual dollar expense cost incurred by a $1,000 investment in the Fund, and the “Ending Account Value” number is derived from deducting that expense cost from the Fund’s gross investment return.
You can use this information, together with the actual amount you invested in the Funds, to estimate the expenses you paid over that period. Simply divide your actual account value by $1,000 to arrive at a ratio (for example, an $8,600 account value divided by $1,000 = 8.6), then multiply that ratio by the number shown for your Funds under “Expenses Paid During Period.”
Hypothetical 5% Return. This section helps you compare a Fund’s costs with those of other funds. It assumes that the Funds had an annual 5% return before expenses during the year, but that the expense ratio (Column 3) for the period is unchanged. This example is useful in making comparisons because the Securities and Exchange Commission requires all funds to make this 5% calculation. You can assess your Fund’s comparative cost by comparing the hypothetical result for your Fund in the “Expenses Paid During Period” column with those that appear in the same charts in the shareholder reports for other funds.
NOTE: Because the return is set at 5% for comparison purposes — NOT your Fund’s actual return — the account values shown may not apply to your specific investment.
Disclosure of Fund Expenses (UNAUDITED) (CONTINUED)
| | | Beginning Account Value 5/1/2017 | | | Ending Account Value 10/31/2017 | | | Annualized Expense Ratios | | | Expenses Paid During Period(1) | |
| Global X China Consumer ETF | | | | | | | | | | | | | | | | |
| Actual Fund Return | | $ | 1,000.00 | | | $ | 1,283.50 | | | | 0.65 | % | | $ | 3.80 | |
| Hypothetical 5% Return | | | 1,000.00 | | | | 1,021.88 | | | | 0.65 | | | | 3.36 | |
| Global X China Energy ETF | | | | | | | | | | | | | | | | |
| Actual Fund Return | | $ | 1,000.00 | | | $ | 1,093.50 | | | | 0.65 | % | | $ | 3.49 | |
| Hypothetical 5% Return | | | 1,000.00 | | | | 1,021.87 | | | | 0.65 | | | | 3.37 | |
| Global X China Financials ETF | | | | | | | | | | | | | | | | |
| Actual Fund Return | | $ | 1,000.00 | | | $ | 1,217.50 | | | | 0.65 | % | | $ | 3.65 | |
| Hypothetical 5% Return | | | 1,000.00 | | | | 1,021.91 | | | | 0.65 | | | | 3.33 | |
| Global X China Industrials ETF | | | | | | | | | | | | | | | | |
| Actual Fund Return | | $ | 1,000.00 | | | $ | 1,134.20 | | | | 0.65 | % | | $ | 3.51 | |
| Hypothetical 5% Return | | | 1,000.00 | | | | 1,021.92 | | | | 0.65 | | | | 3.32 | |
| Global X China Materials ETF | | | | | | | | | | | | | | | | |
| Actual Fund Return | | $ | 1,000.00 | | | $ | 1,314.30 | | | | 0.65 | % | | $ | 3.80 | |
| Hypothetical 5% Return | | | 1,000.00 | | | | 1,021.92 | | | | 0.65 | | | | 3.32 | |
| Global X NASDAQ China Technology ETF | | | | | | | | | | | | | | | | |
| Actual Fund Return | | $ | 1,000.00 | | | $ | 1,240.00 | | | | 0.65 | % | | $ | 3.67 | |
| Hypothetical 5% Return | | | 1,000.00 | | | | 1,021.93 | | | | 0.65 | | | | 3.31 | |
| Global X FTSE Southeast Asia ETF | | | | | | | | | | | | | | | | |
| Actual Fund Return | | $ | 1,000.00 | | | $ | 1,103.30 | | | | 0.65 | % | | $ | 3.45 | |
| Hypothetical 5% Return | | | 1,000.00 | | | | 1,021.92 | | | | 0.65 | | | | 3.32 | |
| Global X MSCI Colombia ETF | | | | | | | | | | | | | | | | |
| Actual Fund Return | | $ | 1,000.00 | | | $ | 1,013.80 | | | | 0.61 | % | | $ | 3.10 | |
| Hypothetical 5% Return | | | 1,000.00 | | | | 1,022.13 | | | | 0.61 | | | | 3.11 | |
| Global X MSCI Argentina ETF | | | | | | | | | | | | | | | | |
| Actual Fund Return | | $ | 1,000.00 | | | $ | 1,117.50 | | | | 0.59 | % | | $ | 3.17 | |
| Hypothetical 5% Return | | | 1,000.00 | | | | 1,022.21 | | | | 0.59 | | | | 3.03 | |
| Global X MSCI Greece ETF | | | | | | | | | | | | | | | | |
| Actual Fund Return | | $ | 1,000.00 | | | $ | 1,083.90 | | | | 0.60 | % | | $ | 3.16 | |
| Hypothetical 5% Return | | | 1,000.00 | | | | 1,022.17 | | | | 0.60 | | | | 3.07 | |
| Global X MSCI Norway ETF | | | | | | | | | | | | | | | | |
| Actual Fund Return | | $ | 1,000.00 | | | $ | 1,197.90 | | | | 0.50 | % | | $ | 2.77 | |
| Hypothetical 5% Return | | | 1,000.00 | | | | 1,022.68 | | | | 0.50 | | | | 2.55 | |
| Global X FTSE Nordic Region ETF | | | | | | | | | | | | | | | | |
| Actual Fund Return | | $ | 1,000.00 | | | $ | 1,113.80 | | | | 0.56 | % | | $ | 2.96 | |
| Hypothetical 5% Return | | | 1,000.00 | | | | 1,022.13 | | | | 0.56 | | | | 2.83 | |
| Global X MSCI Nigeria ETF | | | | | | | | | | | | | | | | |
| Actual Fund Return | | $ | 1,000.00 | | | $ | 1,273.30 | | | | 1.02 | % | | $ | 5.82 | |
| Hypothetical 5% Return | | | 1,000.00 | | | | 1,020.08 | | | | 1.02 | | | | 5.17 | |
| Global X Next Emerging & Frontier ETF | | | | | | | | | | | | | | | | |
| Actual Fund Return | | $ | 1,000.00 | | | $ | 1,095.50 | | | | 0.57 | % | | $ | 2.99 | |
| Hypothetical 5% Return | | | 1,000.00 | | | | 1,022.35 | | | | 0.57 | | | | 2.89 | |
| Global X MSCI Portugal ETF | | | | | | | | | | | | | | | | |
| Actual Fund Return | | $ | 1,000.00 | | | $ | 1,204.10 | | | | 0.60 | % | | $ | 3.32 | |
| Hypothetical 5% Return | | | 1,000.00 | | | | 1,022.24 | | | | 0.60 | | | | 3.05 | |
| Global X MSCI Pakistan ETF | | | | | | | | | | | | | | | | |
| Actual Fund Return | | $ | 1,000.00 | | | $ | 770.90 | | | | 0.88 | % | | $ | 3.94 | |
| Hypothetical 5% Return | | | 1,000.00 | | | | 1,020.75 | | | | 0.88 | | | | 4.50 | |
Disclosure of Fund Expenses (UNAUDITED) (CONCLUDED)
| (1) | Expenses are equal to the Fund’s annualized expense ratio multiplied by the average account value over the period, multiplied by 184/365 (to reflect the one-half year period.). |
Supplemental Information (UNAUDITED)
NAV is the price per Share at which the Funds issue and redeem Shares. It is calculated in accordance with the standard formula for valuing mutual fund shares. The “Market Price” of the Funds generally is determined using the midpoint between the highest bid and the lowest offer on the stock exchange on which the Shares of the Funds are listed for trading, as of the time that the Funds’ NAV is calculated. The Funds’ Market Price may be at, above or below their NAV. The NAV of the Funds will fluctuate with changes in the market value of the Funds’ holdings. The Market Price of the Funds will fluctuate in accordance with changes in their NAV, as well as market supply and demand.
Premiums or discounts are the differences (expressed as a percentage) between the NAV and Market Price of the Funds on a given day, generally at the time NAV is calculated. A premium is the amount that the Funds are trading above the reported NAV, expressed as a percentage of the NAV. A discount is the amount that the Funds are trading below the reported NAV, expressed as a percentage of the NAV.
Further information regarding premiums and discounts is available on the Funds’ website at www.GlobalXFunds.com.
Trustees and Officers of the Trust (UNAUDITED)
Set forth below are the names, addresses, years of birth, positions with the Trust, Term of Office and Length of Time Served, the principal occupations for the last five years, number of Funds in fund complex overseen by the Trustees, and other directorships outside the fund complex of each of the persons currently serving as Trustees and Officers of the Trust.
Name, Address (Year of Birth) | Position(s) Held with Trust | Principal Occupation(s) During the Past 5 Years | Number of Funds in Trust Overseen by Trustee | Other Directorships Held by Trustees |
| Independent Trustees2 | |
Sanjay Ram Bharwani 600 Lexington Ave, 20th floor New York, NY 10022 (1974) | Trustee (since 2008) | CEO of Risk Advisors Inc. (consulting firm) (since 2007). | 523 | None. |
Scott R. Chichester1 600 Lexington Ave, 20th floor New York, NY 10022 (1970) | Trustee (since 2008) | CFO, AdeptPros Inc. (app development, training and consulting) (since 2012); Founder, Madison Park Advisors LLC (advisory services) (since 2011); CFO, Sterling Seal & Supply Inc. (since 2011); President & Treasurer, Bayview Acquisition Corp (2010-2012); Founder and President, DirectPay USA LLC (payroll company) (since 2006); Proprietor, Scott R. Chichester CPA (CPA firm) (since 2001). | 523 | Director of AdeptPros Inc. (since 2015); Director of Sterling Seal & Supply Inc. (since 2011); Director of Bayview Acquisition Corp. (2010-2012); Trustee of ARK ETF Trust (since 2014). |
Kartik Kiran Shah 600 Lexington Ave, 20th floor New York, NY 10022 (1977) | Trustee (since 2008) | Chief Business Officer, Oxeia Biopharmaceuticals, Inc. (since 2014); Vice President, Business Development, Cynvenio Biosystems (2012-2014); Independent Consultant, Self-Employed (non-financial services) (2011-2012). | 523 | Director of Oxeia Biopharmaceuticals, Inc. (since 2014). |
Trustees and Officers of the Trust (UNAUDITED)(CONTINUED)
The Trust’s Statement of Additional Information (“SAI”) includes additional information about the Trustees and Officers. The SAI may be obtained without charge by calling 1-888-493-8631. The following chart lists Trustees and Officers as of October 31, 2017.
Name, Address (Year of Birth) | Position(s) Held with Funds | Principal Occupation(s) During the Past 5 Years | Other Directorships Held by Trustees |
| Interested Trustee / Officers2 | |
Bruno del Ama 600 Lexington Avenue, 20th Floor New York, NY 10022 (1976) | Trustee (since 2008); President, Chief Executive Officer (since 2008). | Chief Executive Officer, Global X Management Company ("GXMC") (since 2008); Chief Compliance Officer, GXMC (2008-2013). | None. |
Luis Berruga 600 Lexington Avenue, 20th Floor New York, NY 10022 (1977) | Chief Operating Officer, Treasurer, Principal Accounting Officer and Chief Financial Officer (since 9/2015). | Chief Financial Officer, GXMC (since 9/2015) and Chief Operating Officer (since 2/2014); Investment Banker, Jefferies (2012-2014); Regional Product Specialist, Morgan Stanley (2005-2012). | None. |
Daphne Tippens Chisolm 600 Lexington Avenue, 20th Floor New York, NY 10022 (1969) | Secretary (since 2012). | General Counsel, GXMC (since 2011); Chief Compliance Officer, GXMC (1/2014 - 5/2014 and 2/2015 - 9/2016). | None. |
Joe Costello 600 Lexington Avenue, 20th Floor New York, NY 10022 (1974) | Chief Compliance Officer (since 9/2016). | Chief Compliance Officer, FlexShares Funds (2011-2015); Vice President, Northern Trust Investments (2003 - 2015). | None. |
Trustees and Officers of the Trust (UNAUDITED)(CONCLUDED)
Name, Address (Year of Birth) | Position(s) Held with Funds | Principal Occupation(s) During the Past 5 Years | Other Directorships Held by Trustees |
Lisa Whittaker4 One Freedom Valley Drive Oaks, PA 19456 (1978) | Assistant Secretary (since 2013). | Counsel at SEI Investments (since 2012); Associate Counsel and Compliance Officer at The Glendale Trust Company (2011-2012); Associate of Drinker Biddle & Reath LLP (2006-2011). | None. |
Eric Kleinschmidt4 One Freedom Valley Drive Oaks, PA 19456 (1962) | Assistant Treasurer (since 2016). | Director, Fund Accounting, SEI Investments Global Funds Services (2004 to present). | None. |
| 1 | Mr. Chichester is currently married to a sister of Mr. del Ama’s wife. While an “immediate family member” (as defined in Section 2(a)(19) of the 1940 Act) of Mr. del Ama would be considered an Interested Person, Mr. Chichester is not considered an immediate family member for this purpose. Although this fact was taken into consideration in determining whether Mr. Chichester should be considered to be an Independent Trustee for purposes of the Section 2(a)(19) of the 1940 Act, it was determined that this relationship was not one that should disqualify Mr. Chichester from serving as an Independent Trustee of the Trust. |
| 2 | Each Trustee serves until his or her successor is duly elected or appointed and qualified. |
| 3 | As of October 31, 2017, the Trust had ninety-six investment portfolios, fifty-two of which were operational. |
| 4 | These officers of the Trust also serve as officers of one or more mutual funds for which SEI Investments Company or an affiliate acts as investment manager, administrator or distributor. |
Notice to Shareholders (UNAUDITED)
For shareholders that do not have an October 31, 2017 tax year end, this notice is for informational purposes only. For shareholders with an October 31, 2017 tax year end, please consult your tax advisor as to the pertinence of this notice. For the fiscal year ended October 31, 2017, the Funds have designated the following items with regard to distributions paid during the year.
| | | Long-Term
Capital Gain
Distributions | | | Ordinary
Income
Distributions | | | Total
Distributions | | | Qualifying for Corporate Dividends Received Deduction (1) | | | Qualifying Dividend Income (2) | | | U.S. Government Interest(3) | | | Interest Related Dividends(4) | | | Short Term Capital Gain Dividends(5) | | | Foreign Tax Credit | |
| Global X China Consumer ETF | | | 0.00 | % | | | 100.00 | % | | | 100.00 | % | | | 0.00 | % | | | 80.50 | % | | | 0.00 | % | | | 0.01 | % | | | 0.00 | % | | | 2.79 | % |
| Global X China Energy ETF | | | 0.00 | % | | | 100.00 | % | | | 100.00 | % | | | 0.00 | % | | | 73.70 | % | | | 0.03 | % | | | 0.00 | % | | | 0.00 | % | | | 11.59 | % |
| Global X China Financials ETF | | | 0.00 | % | | | 100.00 | % | | | 100.00 | % | | | 0.00 | % | | | 98.40 | % | | | 0.00 | % | | | 0.01 | % | | | 0.00 | % | | | 13.75 | % |
| Global X China Industrials ETF | | | 0.00 | % | | | 100.00 | % | | | 100.00 | % | | | 0.00 | % | | | 87.53 | % | | | 0.00 | % | | | 0.01 | % | | | 0.00 | % | | | 7.48 | % |
| Global X China Materials ETF | | | 0.00 | % | | | 100.00 | % | | | 100.00 | % | | | 0.00 | % | | | 73.29 | % | | | 0.00 | % | | | 0.01 | % | | | 0.00 | % | | | 12.70 | % |
| Global X NASDAQ China Technology ETF | | | 0.00 | % | | | 100.00 | % | | | 100.00 | % | | | 0.00 | % | | | 17.32 | % | | | 0.00 | % | | | 0.00 | % | | | 0.00 | % | | | 0.00 | % |
| Global X FTSE Southeast Asia ETF | | | 0.00 | % | | | 100.00 | % | | | 100.00 | % | | | 0.00 | % | | | 43.23 | % | | | 0.00 | % | | | 0.01 | % | | | 0.00 | % | | | 6.35 | % |
| Global X MSCI Colombia ETF | | | 0.00 | % | | | 100.00 | % | | | 100.00 | % | | | 0.00 | % | | | 54.96 | % | | | 0.00 | % | | | 0.02 | % | | | 0.00 | % | | | 0.00 | % |
| Global X MSCI Argentina ETF | | | 0.00 | % | | | 100.00 | % | | | 100.00 | % | | | 0.00 | % | | | 100.00 | % | | | 0.00 | % | | | 0.03 | % | | | 0.00 | % | | | 17.83 | % |
| Global X MSCI Greece ETF | | | 0.00 | % | | | 100.00 | % | | | 100.00 | % | | | 4.32 | % | | | 100.00 | % | | | 0.00 | % | | | 0.03 | % | | | 0.00 | % | | | 13.94 | % |
| Global X MSCI Norway ETF | | | 0.00 | % | | | 100.00 | % | | | 100.00 | % | | | 0.00 | % | | | 48.68 | % | | | 0.00 | % | | | 0.00 | % | | | 0.00 | % | | | 13.83 | % |
| Global X FTSE Nordic Region ETF | | | 0.00 | % | | | 100.00 | % | | | 100.00 | % | | | 0.00 | % | | | 99.43 | % | | | 0.00 | % | | | 0.00 | % | | | 0.00 | % | | | 1.56 | % |
| Global X MSCI Nigeria ETF | | | 0.00 | % | | | 100.00 | % | | | 100.00 | % | | | 0.00 | % | | | 0.00 | % | | | 0.01 | % | | | 0.05 | % | | | 0.00 | % | | | 20.72 | % |
| Global X Next Emerging & Frontier ETF | | | 0.00 | % | | | 100.00 | % | | | 100.00 | % | | | 0.24 | % | | | 84.46 | % | | | 0.00 | % | | | 0.36 | % | | | 0.00 | % | | | 9.72 | % |
| Global X MSCI Portugal ETF | | | 0.00 | % | | | 100.00 | % | | | 100.00 | % | | | 0.00 | % | | | 89.78 | % | | | 0.01 | % | | | 0.08 | % | | | 0.00 | % | | | 21.39 | % |
| Global X MSCI Pakistan ETF | | | 0.00 | % | | | 100.00 | % | | | 100.00 | % | | | 0.00 | % | | | 84.32 | % | | | 0.00 | % | | | 0.00 | % | | | 0.00 | % | | | 40.60 | % |
(1) Qualifying dividends represent dividends which qualify for the corporate dividends received deduction and is reflected as a percentage of ordinary Income distributions (the total of short term capital gain and net investment income distributions).
(2) The percentage in this column represents the amount of "Qualifying Dividend Income" as created by the Jobs and Growth Relief Reconciliation Act of 2003 and its reflected as a percentage of ordinary income distributions (the total of short term capital gain and net investment income distributions). It is the intention of each of the aforementioned funds to designate the maximum amount permitted by law.
(3) ‘‘U.S. Government Interest’’ represents the amount of interest that was derived from U.S. Government obligations and distributed during the fiscal year. Generally, interest from direct U.S. Government obligations is exempt from state income tax. However, for shareholders who are residents of California, Connecticut and New York, the statutory threshold requirements were not satisfied to permit exemption of these amounts from state income.
(4) The percentage in this column represents the amount of "Interest Related Dividends" is reflected as a percentage of ordinary income distribution. Interest related dividends is exempt from U.S. withholding tax when paid to foreign investors.
(5) The percentage of this column represents the amount of “Short Term Capital Gain Dividend” is reflected as a percentage of short term capital gain distribution that is exempted from U.S. withholding tax when paid to foreign investors.
Notice to Shareholders (UNAUDITED)
The Funds intend to pass through a foreign tax credit to shareholders. For the fiscal year ended October 31, 2017, the total amount of foreign source income and foreign tax credit are as follows:
| Fund Name | | Foreign Source Income | | | Foreign Tax Credit Pass Through | |
| Global X China Consumer ETF | | $ | 2,076,724 | | | $ | 28,687 | |
| Global X China Energy ETF | | | 76,647 | | | | 4,224 | |
| Global X China Financials ETF | | | 1,235,303 | | | | 84,197 | |
| Global X China Industrials ETF | | | 91,921 | | | | 4,827 | |
| Global X China Materials ETF | | | 79,192 | | | | 2,357 | |
| Global X FTSE Southeast Asia ETF | | | 366,942 | | | | 19,326 | |
| Global X MSCI Argentina ETF | | | 1,280,349 | | | | 66,997 | |
| Global X MSCI Greece ETF | | | 8,570,927 | | | | 841,920 | |
| Global X MSCI Norway ETF | | | 5,477,708 | | | | 542,825 | |
| Global X FTSE Nordic Region ETF | | | 1,123,685 | | | | 21,106 | |
| Global X MSCI Nigeria ETF | | | 2,021,309 | | | | 184,647 | |
| Global X Next Emerging & Frontier ETF | | | 390,906 | | | | 36,285 | |
| Global X MSCI Portugal ETF | | | 1,594,639 | | | | 239,090 | |
| Global X MSCI Pakistan ETF | | | 2,006,006 | | | | 248,547 | |
The information reported herein may differ from the information and distributions taxable to the shareholders for the calendar year ending December 31, 2017. Complete information will be computed and reported in conjunction with your 2017 Form 1099-DIV.
Notes
Notes
600 Lexington Avenue, 20th floor
New York, NY 10022
1-888-GXFund-1
(1-888-493-8631)
www.globalxfunds.com
Investment Adviser and Administrator:
Global X Management Company LLC
600 Lexington Avenue, 20th floor
New York, NY 10022
Distributor:
SEI Investments Distribution Co.
One Freedom Valley Drive
Oaks, PA 19456
Sub-Administrator:
SEI Investments Global Funds Services
One Freedom Valley Drive
Oaks, PA 19456
Counsel for Global X Funds and the Independent Trustees:
Stradley Ronon Stevens & Young, LLP
1250 Connecticut Avenue, N.W.
Suite 500
Washington, DC 20036
Custodian and Transfer Agent:
Brown Brothers Harriman & Co.
50 Post Office Square
Boston, MA 02110
Independent Registered Public Accounting Firm:
PricewaterhouseCoopers LLP
Two Commerce Square
Suite 1800
2001 Market Street
Philadelphia, PA 19103
This information must be preceded or accompanied by a prospectus for the funds described.
GLX-AR-002-0700
Global X SuperDividend® ETF (ticker: SDIV)
Global X SuperDividend® U.S. ETF (ticker: DIV)
Global X MSCI SuperDividend® EAFE ETF (tickler: EFAS)
Global X MSCI SuperDividend® Emerging Markets ETF (ticker: SDEM)
Global X SuperDividend® REIT ETF (ticker: SRET)
Global X SuperIncome™ Preferred ETF (ticker: SPFF)
Global X Social Media ETF (ticker: SOCL)
(Formerly, Global X Social Media Index ETF)
Global X | JPMorgan Efficiente Index ETF (ticker: EFFE)
Global X | JPMorgan US Sector Rotator Index ETF (ticker: SCTO)
Global X Guru® Index ETF (ticker: GURU)
Global X Scientific Beta US ETF (ticker: SCIU)
Global X Scientific Beta Europe ETF (ticker: SCID)
Global X Scientific Beta Japan ETF (ticker: SCIJ)
Global X Scientific Beta Asia ex-Japan ETF (ticker: SCIX)
Global X YieldCo Index ETF (ticker: YLCO)
Global X S&P 500® Catholic Values ETF (ticker: CATH)
Annual Report
October 31, 2017
Table of Contents
The Funds file their complete schedules of Fund holdings with the Securities and Exchange Commission (the “Commission”) for the first and third quarters of each fiscal year on Form N-Q within sixty days after the end of the period. The Funds’ Forms N-Q are available on the Commission’s website at http://www.sec.gov, and may be reviewed and copied at the Commission's Public Reference Room in Washington, DC. Information on the operation of the Public Reference Room may be obtained by calling 1-800-SEC-0330.
A description of the policies and procedures that the Funds use to determine how to vote proxies relating to Fund securities, as well as information relating to how the Funds voted proxies relating to Fund securities during the most recent 12-month period ended June 30, is available (i) without charge, upon request, by calling 1-888-GXFund-1; and (ii) on the Commission’s website at http://www.sec.gov.
| Management Discussion of Fund Performance (unaudited) |
| Global X SuperDividend® ETF |
Global X SuperDividend® ETF
The Global X SuperDividend® ETF (“Fund”) seeks investment results that correspond generally to the price and yield performance, before fees and expenses, of the Solactive Global SuperDividend® Index (“Underlying Index”). The Fund is passively managed, which means the investment adviser does not attempt to take defensive positions in declining markets.
The Fund generally seeks to fully replicate the Underlying Index.
The Underlying Index tracks the performance of 100 equally-weighted companies that rank among the highest dividend yielding equity securities in the world, including emerging market countries, as defined by the index provider.
For the 12-month period ended October 31, 2017 (the “reporting period”), the Fund increased 12.69%, while the Underlying Index increased 13.51%. The Fund had a net asset value of $20.43 per share on October 31, 2016 and ended the reporting period with a net asset value of $21.51 on October 31, 2017.
During the reporting period, the highest returns came from China Evergrande Group and GEO Group, which returned 177.05% and 97.63%, respectively. The worst performers were Carillion and Windstream Holdings, which returned -76.35% and -72.17%, respectively.
Stocks held by the Fund have among the highest dividend yields in the world. High dividend investing is a value-oriented strategy that was held back by the performance of value stocks versus the performance of the broader MSCI ACWI. Over the last four quarters, from Q4 2016 to Q3 2017, the Fund had an approximate average exposure of 47% US stocks, 14% to stocks in Australia, 7% to stocks in Singapore and 4% to stocks in Canada. Among the sectors, Real Estate Investment Trusts, Mortgage REITs and Financials received the highest average allocations of 30%, 20% and 12%, respectively.
| | | AVERAGE TOTAL RETURN FOR THE YEAR ENDED OCTOBER 31, 2017 | |
| | | One Year Return | | | Three Year Return | | | Five Year Return | | | Annualized
Inception to Date* | |
| | | Net Asset
Value | | | Market Price | | | Net Asset
Value | | | Market Price | | | Net Asset
Value | | | Market Price | | | Net Asset
Value | | | Market Price | |
| Global X SuperDividend® ETF | | | 12.69 | % | | | 12.73 | % | | | 2.89 | % | | | 2.82 | % | | | 6.74 | % | | | 6.71 | % | | | 4.90 | % | | | 4.91 | % |
| Solactive Global SuperDividend® Index | | | 13.51 | % | | | 13.51 | % | | | 2.76 | % | | | 2.76 | % | | | 6.57 | % | | | 6.57 | % | | | 4.54 | % | | | 4.54 | % |
| MSCI ACWI ** | | | 23.20 | % | | | 23.20 | % | | | 7.92 | % | | | 7.92 | % | | | 10.80 | % | | | 10.80 | % | | | 8.55 | % | | | 8.55 | % |
| S&P 500 Index | | | 23.63 | % | | | 23.63 | % | | | 10.77 | % | | | 10.77 | % | | | 15.18 | % | | | 15.18 | % | | | 13.94 | % | | | 13.94 | % |
Growth of a $10,000 Investment
(at Net Asset Value)

* The Fund commenced operations on June 8, 2011.
** As of March 1, 2017, the Fund changed its broad based benchmark from the S&P 500 Index to the MSCI ACWI. The new benchmark is a more appropriate comparison for the Fund.
The MSCI ACWI (All Country World Index) Index is a free float-adjusted market capitalization weighted index that is designed to measure the equity market performance of developed and emerging markets.
Management Discussion of Fund Performance (unaudited)
Global X SuperDividend® ETF
The S&P 500 Index is a market capitalization weighted composite index of 500 large capitalization U.S. companies.
The performance data quoted herein represents past performance and the return and value of an investment in the Fund will fluctuate so that, when redeemed, it may be worth less than its original cost. Past performance is no guarantee of future performance and should not be considered as a representation of the future results of the Fund. The Fund's performance assumes the reinvestment of all dividends and all capital gains. Index returns assume reinvestment of dividends and, unlike the Fund's returns, do not reflect any fees or expenses. If such fees and expenses were included in the index returns, the performance would have been lower. Please note that one cannot invest directly in an unmanaged index.
There are no assurances that the Fund will meet its stated objectives.
The Fund’s holdings and allocations are subject to change and should not be considered recommendations to buy individual securities.
The graph and table do not reflect the deduction of taxes that a shareholder would pay on Fund distributions or the redemption or sale of Fund shares.
See definition of comparative indices above.
Management Discussion of Fund Performance (unaudited)
Global X SuperDividend® U.S. ETF
Global X SuperDividend® U.S. ETF
The Global X SuperDividend® U.S. ETF ("Fund") seeks to provide investment results that correspond generally to the price and yield performance, before fees and expenses, of the INDXX SuperDividend® U.S. Low Volatility Index ("Underlying Index").The Fund is passively managed, which means the investment adviser does not attempt to take defensive positions in declining markets. The Fund generally seeks to fully replicate the Underlying Index.
The Underlying Index tracks the performance of 50 equally-weighted common stocks including master limited partnerships ("MLPs") and real estate investment trusts ("REITs") that rank among the highest dividend yielding equity securities in the United States, as defined by the index provider. The Underlying Index is comprised of securities that the index provider determines to have lower relative volatility, as measured by the beta, a measure of a security's sensitivity to the movements of the broader market, of each security relative to the market benchmark.
For the 12-month period ended October 31, 2017 (the “reporting period”), the Fund increased 11.64%, while the Underlying Index increased 13.29%. The Fund had a net asset value of $24.00 per share on October 31, 2016 and ended the reporting period with a net asset value of $25.18 on October 31, 2017.
During the reporting period, the highest returns came from ClubCorp Holdings and Delek Logistics Partners, which returned 43.69% and 35.62%, respectively. The worst performers were Icahn Enterprises and DineEquity, which returned
-88.59% and -35.10%, respectively.
The Fund invests in many of the highest yielding stocks in the U.S. High dividend investing is a value-oriented strategy that was held back by the performance of value stocks versus the performance of the broader S&P 500. Over the last four quarters, from Q4 2016 to Q3 2017, the Fund had an average exposure to the utilities sector of 24%. Mortgage REITs at 23%, consumer discretionary at 15% and MLPs at 12%. Given the income oriented nature of these sectors, they can be affected by changes in interest rates, particularly in the short term.
| | | AVERAGE TOTAL RETURN FOR THE YEAR ENDED OCTOBER 31, 2017 | |
| | | One Year Return | | | Three Year Return | | | Annualized Inception to Date* | |
| | | Net Asset Value | | | Market Price | | | Net Asset Value | | | Market Price | | | Net Asset Value | | | Market Price | |
| Global X SuperDividend® U.S. ETF | | | 11.64 | % | | | 11.62 | % | | | 1.36 | % | | | 1.28 | % | | | 6.69 | % | | | 6.81 | % |
| INDXX SuperDividend® U.S. Low Volatility Index | | | 13.29 | % | | | 13.29 | % | | | 2.38 | % | | | 2.38 | % | | | 7.49 | % | | | 7.49 | % |
| S&P 500 Index | | | 23.63 | % | | | 23.63 | % | | | 10.77 | % | | | 10.77 | % | | | 13.80 | % | | | 13.80 | % |
Growth of a $10,000 Investment
(at Net Asset Value)
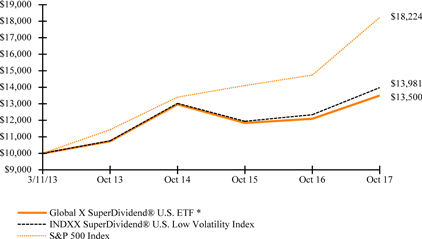
* The Fund commenced operations on March 11, 2013.
The S&P 500 Index is a market capitalization weighted composite index of 500 large capitalization U.S. companies.
The performance data quoted herein represents past performance and the return and value of an investment in the Fund will fluctuate so that, when redeemed, it may be worth less than its original cost. Past performance is no guarantee of future performance and should not be considered as a representation of the future results of the Fund. The Fund's performance assumes the reinvestment of all dividends and all capital gains. Index returns assume reinvestment of dividends and, unlike the Fund's returns, do not reflect any fees or expenses. If such fees and expenses were included in the index returns, the performance would have been lower. Please note that one cannot invest directly in an unmanaged index.
Management Discussion of Fund Performance (unaudited)
Global X SuperDividend® U.S. ETF
There are no assurances that the Fund will meet its stated objectives.
The Fund’s holdings and allocations are subject to change and should not be considered recommendations to buy individual securities.
The graph and table do not reflect the deduction of taxes that a shareholder would pay on Fund distributions or the redemption or sale of Fund shares.
See definition of comparative indices above.
Management Discussion of Fund Performance (unaudited)
Global X MSCI SuperDividend® EAFE ETF
Global X MSCI SuperDividend® EAFE ETF
The Global X MSCI SuperDividend® EAFE ETF ("Fund") seeks to provide investment results that correspond generally to the price and yield performance, before fees and expenses, of the MSCI EAFE Top 50 Dividend Index ("Underlying Index").The Fund is passively managed, which means the investment adviser does not attempt to take defensive positions in declining markets. The Fund generally seeks to fully replicate the Underlying Index.
The Underlying Index tracks the performance of 50 equally-weighted companies that rank among the highest dividend yielding equity securities in Europe, Australasia, and the Far East, as defined by the index provider.
For the 10-month period ended October 31, 2017, the Fund increased 20.33%, while the Underlying Index increased 20.63%. The Fund had a net asset value of $14.87 per share on November 14, 2016 and ended the reporting period with a net asset value of $18.13 on October 31, 2017.
During the reporting period, the highest returns came from Berkeley Group Holdings and Credit Agricole, which returned 80.00% and 68.90%, respectively. The worst performers were Petrofac and Telstra Corporation, which returned -42.98% and -22.79%, respectively.
Stocks held by the Fund are among those with the highest dividend yields from international developed markets across Europe, Australasia, and the Far East. European economies grew at their fastest pace in almost a decade during the period, supported by stronger global growth, a fall in the unemployment rate, and the resilience of private consumption. Growth in Asian economies was largely driven by a revival in global trade, notably in Japan, Singapore, and Hong Kong. Strong commodity prices and higher resource exports provided further impetus to growth in Australia. During the period Q4 2016 to Q3 2017, the Fund had an average approximate exposure of 23% to stocks in Britain, 16% to stocks in Australia, and 12% to stocks in France. Financials, Consumer Discretionary, and Utilities stocks had the highest average allocation in the Fund at 32%, 16%, and 13% respectively.
| | | AVERAGE TOTAL RETURN FOR THE PERIOD ENDED
OCTOBER 31, 2017* | |
| | | Cumulative Inception to Date | |
| | | Net Asset Value | | | Market Price | |
| Global X MSCI SuperDividend® EAFE ETF | | | 26.19 | % | | | 25.98 | % |
| MSCI EAFE Top 50 Dividend Index | | | 26.66 | % | | | 26.66 | % |
| MSCI EAFE Index | | | 26.19 | % | | | 26.19 | % |
Growth of a $10,000 Investment
(at Net Asset Value)
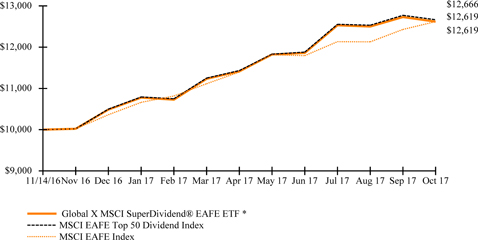
* The Fund commenced operations on November 14, 2016.
Management Discussion of Fund Performance (unaudited)
Global X MSCI SuperDividend® EAFE ETF
��
The MSCI EAFE Index (Europe, Australasia, Far East) is a free float-adjusted market capitalization index that is designed to measure the equity market performance of developed markets, excluding the US & Canada.
The performance data quoted herein represents past performance and the return and value of an investment in the Fund will fluctuate so that, when redeemed, it may be worth less than its original cost. Past performance is no guarantee of future performance and should not be considered as a representation of the future results of the Fund. The Fund's performance assumes the reinvestment of all dividends and all capital gains. Index returns assume reinvestment of dividends and, unlike the Fund's returns, do not reflect any fees or expenses. If such fees and expenses were included in the index returns, the performance would have been lower. Please note that one cannot invest directly in an unmanaged index.
There are no assurances that the Fund will meet its stated objectives.
The Fund’s holdings and allocations are subject to change and should not be considered recommendations to buy individual securities.
The graph and table do not reflect the deduction of taxes that a shareholder would pay on Fund distributions or the redemption or sale of Fund shares.
See definition of comparative indices above.
Management Discussion of Fund Performance (unaudited)
Global X MSCI SuperDividend® Emerging Markets ETF
Global X MSCI SuperDividend® Emerging Markets ETF
The Global X MSCI SuperDividend® Emerging Markets ETF (“Fund”) seeks investment results that correspond generally to the price and yield performance, before fees and expenses, of the MSCI Emerging Markets Top 50 Dividend Index ("Underlying Index"). The Fund is passively managed, which means the investment adviser does not attempt to take defensive positions in declining markets. The Fund generally seeks to fully replicate the Underlying Index.
The Underlying Index tracks the performance of 50 equally-weighted companies that rank among the highest dividend yielding equity securities in emerging markets, as defined by the index provider. The Underlying Index may include components from the following countries: Brazil, Chile, Colombia, Mexico, Peru, Czech Republic, Egypt, Greece, Hungary, Poland, Qatar, Russia, South Africa, Turkey, United Arab Emirates, China, India, Indonesia, Malaysia, Philippines, Thailand, Korea, and Taiwan.
For the 12-month period ended October 31, 2017 (the “reporting period”), the Fund increased 11.95%, while the Underlying Index increased 14.67%. The Fund had a net asset value of $14.96 per share on October 31, 2016 and ended the reporting period with a net asset value of $15.94 on October 31, 2017.
During the reporting period, the highest returns came from Braskem and Turkiye Petrol Rafinerileri, which returned 101.02% and 84.88%, respectively. The worst performers were Multiplus and Telkom, which returned -23.28% and -22.44%, respectively.
Stocks held by the Fund are among those with the highest dividend yields in emerging markets. High dividend investing is a value-oriented strategy that was held back by the performance of value stocks versus the performance of the broader MSCI Emerging Market Index. During the reporting period, emerging markets witnessed strong performance, backed by a weak U.S. dollar, stabilization in oil prices, and higher-than-expected growth in China. From Q4 2016 to Q3 2017, the Fund had an average approximate exposure of 16% to stocks in South Africa, 13% to stocks in Brazil, and 13% to stocks in Taiwan. Financials, Utilities, and Materials stocks had the highest average allocations in the Fund at 29%, 17%, and 13% respectively.
| | | AVERAGE TOTAL RETURN FOR THE YEAR ENDED OCTOBER 31, 2017 | |
| | | One Year Return | | | Annualized Inception to Date* | |
| | | Net Asset Value | | | Market Price | | | Net Asset Value | | | Market Price | |
| Global X MSCI SuperDividend® Emerging Markets ETF | | | 11.95 | % | | | 12.26 | % | | | 8.23 | % | | | 8.38 | % |
| Hybrid INDXX SuperDividend® Emerging Markets Index/MSCI EM Top 50 Dividend Index** | | | 14.67 | % | | | 14.67 | % | | | 9.92 | % | | | 9.92 | % |
| MSCI Emerging Markets Index*** | | | 26.45 | % | | | 26.45 | % | | | 9.49 | % | | | 9.49 | % |
| S&P 500 Index | | | 23.63 | % | | | 23.63 | % | | | 10.71 | % | | | 10.71 | % |
Growth of a $10,000 Investment
(at Net Asset Value)

* The Fund commenced operations on March 16, 2015.
Management Discussion of Fund Performance (unaudited)
Global X MSCI SuperDividend® Emerging Markets ETF
** Hybrid Index performance reflects the performance of the INDXX SuperDividend® Emerging Markets Index through November 15, 2016 and the MSCI Emerging Markets Top 50 Dividend Index thereafter. Effective November 16, 2016, the Fund’s Underlying Index changed from the INDXX SuperDividend® Emerging Markets Index to the MSCI Emerging Markets Top 50 Dividend Index. This change was due to the planned migration to the new underlying Index, in an effort to provide broader exposure to the local market.
*** As of March 1, 2017, the Fund changed its broad based benchmark from the S&P 500 Index to the MSCI Emerging Markets Index. The new benchmark is a more appropriate comparison for the fund.
The MSCI Emerging Markets Index is a free float-adjusted market capitalization index that is designed to measure equity market performance of emerging markets.
The S&P 500 Index is a market capitalization weighted composite index of 500 large capitalization U.S. companies.
The performance data quoted herein represents past performance and the return and value of an investment in the Fund will fluctuate so that, when redeemed, it may be worth less than its original cost. Past performance is no guarantee of future performance and should not be considered as a representation of the future results of the Fund. The Fund's performance assumes the reinvestment of all dividends and all capital gains. Index returns assume reinvestment of dividends and, unlike the Fund's returns, do not reflect any fees or expenses. If such fees and expenses were included in the index returns, the performance would have been lower. Please note that one cannot invest directly in an unmanaged index.
There are no assurances that the Fund will meet its stated objectives.
The Fund’s holdings and allocations are subject to change and should not be considered recommendations to buy individual securities.
The graph and table do not reflect the deduction of taxes that a shareholder would pay on Fund distributions or the redemption or sale of Fund shares.
See definition of comparative indices above and on previous page.
Management Discussion of Fund Performance (unaudited)
Global X SuperDividend® REIT ETF
Global X SuperDividend® REIT ETF
The Global X SuperDividend® REIT ETF (“Fund”) seeks investment results that correspond generally to the price and yield performance, before fees and expenses, of the Solactive Global SuperDividend® REIT Index (“Underlying Index”). The Fund generally seeks to fully replicate the Underlying Index.
The Underlying Index tracks the performance of real estate investment trusts (“REITs”) that rank among the highest-yielding REITs globally, as determined by the index provider. The index provider screens the highest yielding REITs to exclude REITs that have historically exhibited the highest volatility, as determined by the index provider.
For the 12-month period ended October 31, 2017 (the “reporting period”), the Fund increased 13.00%, while the Underlying Index increased 11.49%. The Fund had a net asset value of $14.60 per share on October 31, 2016 and ended the reporting period with a net asset value of $15.29 on October 31, 2017.
During the reporting period, the highest returns came from Two Harbors Investment and Chimera Investment, which returned 30.57% and 29.80%, respectively. The worst performers were Spirit Realty Capital and CYS Investments, which returned -11.60% and -9.33%, respectively.
The Fund invests in Real Estate Investment Trusts (“REITs”) that are among those with the highest dividend yields around the world. During the reporting period, many central banks continued their easy money policies that have kept interest rates around the world at record lows. Despite these dovish monetary policies, some investors maintained concerns over rates rising in the United States, the eventual tapering of Europe’s Quantitative Easing program, and stubbornly low inflation. As a result, longer duration bonds, like the 10 year treasuries maintained low yields relative to short term treasuries, resulting in flat yield curves. This particularly affected the mortgage REIT segment, which relies on steeper yield curves for income. During the period Q4 2016 to Q3 2017, the Fund had an average approximate exposure of 46% to mortgage REITs and 54% to equity REITs. Geographically, the Fund had an average approximate exposure of 69% to U.S. REITs, 11% to Singapore REITs, and 11% to Canadian REITs.
| | | AVERAGE ANNUAL TOTAL RETURN FOR THE YEAR ENDED OCTOBER 31, 2017 | |
| | | One Year Return | | | Annualized Inception to Date* | |
| | | Net Asset Value | | | Market Price | | | Net Asset Value | | | Market Price | |
| Global X SuperDividend® REIT ETF | | | 13.00 | % | | | 12.97 | % | | | 8.75 | % | | | 8.81 | % |
| Solactive Global SuperDividend® REIT Index | | | 11.49 | % | | | 11.49 | % | | | 6.94 | % | | | 6.94 | % |
| S&P 500 Index | | | 23.63 | % | | | 23.63 | % | | | 10.71 | % | | | 10.71 | % |
Growth of a $10,000 Investment
(at Net Asset Value)
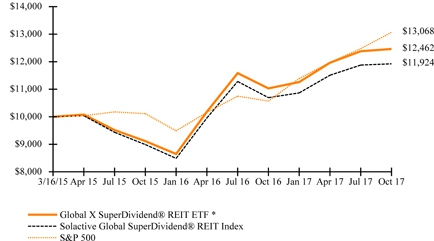
* The Fund commenced operations on March 16, 2015.
The S&P 500 Index is a market capitalization weighted composite index of 500 large capitalization U.S. companies.
Management Discussion of Fund Performance (unaudited)
Global X SuperDividend® REIT ETF
The performance data quoted herein represents past performance and the return and value of an investment in the Fund will fluctuate so that, when redeemed, it may be worth less than its original cost. Past performance is no guarantee of future performance and should not be considered as a representation of the future results of the Fund. The Fund's performance assumes the reinvestment of all dividends and all capital gains. Index returns assume reinvestment of dividends and, unlike the Fund's returns, do not reflect any fees or expenses. If such fees and expenses were included in the index returns, the performance would have been lower. Please note that one cannot invest directly in an unmanaged index.
There are no assurances that the Fund will meet its stated objectives.
The Fund’s holdings and allocations are subject to change and should not be considered recommendations to buy individual securities.
The graph and table do not reflect the deduction of taxes that a shareholder would pay on Fund distributions or the redemption or sale of Fund shares.
See definition of comparative indices above.
Management Discussion of Fund Performance (unaudited)
Global X SuperIncome™ Preferred ETF
Global X SuperIncome™ Preferred ETF
The Global X SuperIncome™ Preferred ETF (“Fund”) seeks investment results that correspond generally to the price and yield performance, before fees and expenses, of the S&P Enhanced Yield North American Preferred Stock Index (“Underlying Index”).The Fund is passively managed, which means the investment adviser does not attempt to take defensive positions in declining markets. The Fund generally seeks to fully replicate the Underlying Index.
The Underlying Index tracks the performance of the highest-yielding preferred securities in the United States and Canada, as determined by the index provider. The Underlying Index is comprised of preferred stocks that meet certain criteria relating to size, liquidity, issuer concentration and rating, maturity and other requirements, as determined by the index provider. The Underlying Index does not seek to directly reflect the performance of the companies issuing the preferred stock.
For the 12-month period ended October 31, 2017 (the “reporting period”), the Fund increased 1.31%, while the Underlying Index increased 1.99%. The Fund had a net asset value of $13.16 per share on October 31, 2016 and ended the reporting period with a net asset value of $12.44 on October 31, 2017.
During the reporting period, the highest returns came from Deutsche Bank Contingent Capital Trust II and Belden, which returned 19.49% and 18.58%, respectively. The worst performers were Frontier Communications and Southwestern Energy, which returned -67.95% and -41.67%, respectively.
The Fund invests in preferred shares that are among those with the highest dividend yields in the U.S. and Canada. Preferred shares have benefitted from low government bond yields in the U.S. and Canada. In addition, credit spreads have been tightening as economic conditions improve and investors hunt for higher yielding investments. During the period Q4 2016 to Q3 2017, the Fund had an average approximate exposure of 67% to the Financials sector, 8% to the Real Estate sector, and 8% to the Energy sector.
| | | AVERAGE TOTAL RETURN FOR THE YEAR ENDED OCTOBER 31, 2017 | |
| | | One Year Return | | | Three Year Return | | | Five Year Return | | | Annualized
Inception to Date* | |
| | | Net Asset
Value | | | Market Price | | | Net Asset
Value | | | Market Price | | | Net Asset
Value | | | Market Price | | | Net Asset
Value | | | Market Price | |
| Global X SuperIncome™ Preferred ETF | | | 1.31 | % | | | 0.83 | % | | | 1.24 | % | | | 0.98 | % | | | 3.11 | % | | | 3.02 | % | | | 3.47 | % | | | 3.72 | % |
| S&P Enhanced Yield North American Preferred Stock Index | | | 1.99 | % | | | 1.99 | % | | | 2.07 | % | | | 2.07 | % | | | 3.80 | % | | | 3.80 | % | | | 4.17 | % | | | 4.17 | % |
| S&P 500 Index | | | 23.63 | % | | | 23.63 | % | | | 10.77 | % | | | 10.77 | % | | | 15.18 | % | | | 15.18 | % | | | 15.32 | % | | | 15.32 | % |
Growth of a $10,000 Investment
(at Net Asset Value)
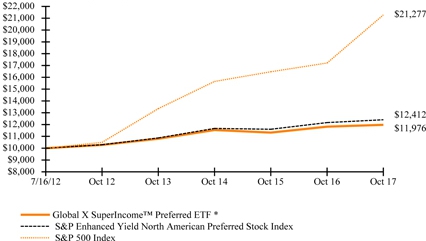
* Fund commenced operations on July 16, 2012.
The S&P 500 Index is a market capitalization weighted composite index of 500 large capitalization U.S. companies.
Management Discussion of Fund Performance (unaudited)
Global X SuperIncome™ Preferred ETF
The performance data quoted herein represents past performance and the return and value of an investment in the Fund will fluctuate so that, when redeemed, it may be worth less than its original cost. Past performance is no guarantee of future performance and should not be considered as a representation of the future results of the Fund. The Fund's performance assumes the reinvestment of all dividends and all capital gains. Index returns assume reinvestment of dividends and, unlike the Fund's returns, do not reflect any fees or expenses. If such fees and expenses were included in the index returns, the performance would have been lower. Please note that one cannot invest directly in an unmanaged index.
There are no assurances that the Fund will meet its stated objectives.
The Fund’s holdings and allocations are subject to change and should not be considered recommendations to buy individual securities.
The graph and table do not reflect the deduction of taxes that a shareholder would pay on Fund distributions or the redemption or sale of Fund shares.
See definition of comparative indices above.
Management Discussion of Fund Performance (unaudited)
Global X Social Media ETF
Global X Social Media ETF
The Global X Social Media ETF (“Fund”) seeks to provide investment results that correspond generally to the price and yield performance, before fees and expenses, of the Solactive Social Media Total Return Index (“Underlying Index”).
The Fund is passively managed, which means the investment adviser does not attempt to take defensive positions in declining markets. The Fund generally seeks to fully replicate the Underlying Index.
The Underlying Index tracks the equity performance of the largest and most liquid companies involved in the social media industry, including companies that provide social networking, file sharing, and other web-based media applications, as defined by the index provider.
For the 12-month period ended October 31, 2017 (the “reporting period”), the Fund increased 39.09%, while the Underlying Index increased 39.71%. The Fund had a net asset value of $23.53 per share on October 31, 2016 and ended the reporting period with a net asset value of $32.67 on October 31, 2017.
During the reporting period, the highest returns came from Weibo and IAC, which returned 101.37% and 100.26%, respectively. The worst performers were PChome Online and Pandora Media, which returned -42.18% and -35.48%, respectively.
Social media has been one of the fastest growing industries in the technology sector, delivering strong growth during the reporting period. Over the course of the reporting period, major social media platforms succeeded in continuing to monetize their growing user bases through innovative advertising products. Such products include video advertising and hyper-targeted ads that are finding new ways to reach consumers and more accurate methods of targeting high value customers. This growth was not just witnessed in the US, where mobile penetration is very high, but also in foreign markets like China Japan, and Russia. Geographically, the Fund had an average exposure of 47% in the US, 29% in China, 9 % in Japan, and 8% in Russia.
| | | AVERAGE TOTAL RETURN FOR THE YEAR ENDED OCTOBER 31, 2017 | |
| | | One Year Return | | | Three Year Return | | | Five Year Return | | | Annualized Inception to Date* | |
| | | Net Asset Value | | | Market Price | | | Net Asset Value | | | Market Price | | | Net Asset Value | | | Market Price | | | Net Asset Value | | | Market Price | |
| Global X Social Media ETF | | | 39.09 | % | | | 39.36 | % | | | 19.27 | % | | | 19.27 | % | | | 20.82 | % | | | 21.10 | % | | | 14.25 | % | | | 14.28 | % |
| Solactive Social Media Total Return Index | | | 39.71 | % | | | 39.71 | % | | | 19.87 | % | | | 19.87 | % | | | 21.35 | % | | | 21.35 | % | | | 14.83 | % | | | 14.83 | % |
| MSCI ACWI ** | | | 23.20 | % | | | 23.20 | % | | | 7.92 | % | | | 7.92 | % | | | 10.80 | % | | | 10.80 | % | | | 10.81 | % | | | 10.81 | % |
| S&P 500 Index | | | 23.63 | % | | | 23.63 | % | | | 10.77 | % | | | 10.77 | % | | | 15.18 | % | | | 15.18 | % | | | 15.27 | % | | | 15.27 | % |
Growth of a $10,000 Investment
(at Net Asset Value)
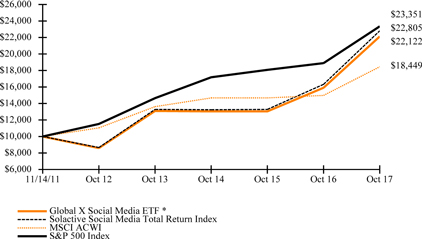
* The Fund commenced operations on November 14, 2011.
** As of March 1, 2017, the Fund changed its broad based benchmark from the S&P 500 Index to the MSCI ACWI. The new benchmark is a more appropriate comparison for the fund.
The MSCI ACWI (All Country World Index) Index is a free float-adjusted market capitalization weighted index that is designed to measure the equity market performance of developed and emerging market.
Management Discussion of Fund Performance (unaudited)
Global X Social Media ETF
The S&P 500 Index is a market capitalization weighted composite index of 500 large capitalization U.S. companies.
The performance data quoted herein represents past performance and the return and value of an investment in the Fund will fluctuate so that, when redeemed, it may be worth less than its original cost. Past performance is no guarantee of future performance and should not be considered as a representation of the future results of the Fund. The Fund's performance assumes the reinvestment of all dividends and all capital gains. Index returns assume reinvestment of dividends and, unlike the Fund's returns, do not reflect any fees or expenses. If such fees and expenses were included in the index returns, the performance would have been lower. Please note that one cannot invest directly in an unmanaged index.
There are no assurances that the Fund will meet its stated objectives.
The Fund’s holdings and allocations are subject to change and should not be considered recommendations to buy individual securities.
The graph and table do not reflect the deduction of taxes that a shareholder would pay on Fund distributions or the redemption or sale of Fund shares.
See definition of comparative indices above.
Management Discussion of Fund Performance (unaudited)
Global X | JPMorgan Efficiente Index ETF
Global X | JPMorgan Efficiente Index ETF
The Global X | JPMorgan Efficiente Index ETF (“Fund”) seeks investment results that correspond generally to the price and yield performance, before fees and expenses, of the JPMorgan ETF Efficiente 10 TR Series X Index (“Underlying Index”). The Fund is passively managed, which means the investment adviser does not attempt to take defensive positions in declining markets. The Fund generally seeks to fully replicate the Underlying Index.
The Underlying Index tracks the total return performance of a portfolio of eleven exchange-traded funds (each, an "ETF") and two exchange-traded products (each an "ETP") (each ETP and ETF, a "Constituent" and together the "Constituents"), as defined by the index provider. The share prices of the ETFs and ETPs are expected to track the performance of equities or bonds in developed or emerging markets, real estate investments, U.S. Treasury bonds, U.S. Treasury Inflation Protected Securities, a single commodity or a portfolio of commodity futures contracts. The Underlying Index allocates index weights among the Constituents based on a proprietary methodology created by the index provider. On a monthly basis and subject to certain weighting constraints, the Underlying Index is rebalanced to reallocate index weights among the Constituents so that the resulting portfolio would have had the highest return during the previous six months and an annualized volatility level of 10% or less over the same period (subject to upward adjustment under limited circumstances). This methodology is informed by the “modern portfolio theory” approach to asset allocation, which suggests that an investor allocate assets in a manner that maximizes return for a given risk appetite. Since the index weights assigned to the Constituents at each monthly rebalancing are determined based on past performance, there is no guarantee that any monthly rebalancing will result in the Underlying Index achieving the highest possible returns for the relevant month.
For the 12-month period ended October 31, 2017 (the “reporting period”), the Fund increased 12.29%, while the Underlying Index increased 13.12%. The Fund had a net asset value of $24.05 per share on October 31, 2016 and ended the reporting period with a net asset value of $26.18 on October 31, 2017.
During the reporting period, the highest returns came from Vanguard FTSE Developed Markets ETF and Vanguard S&P 500 ETF, which returned 22.53% and 21.59%, respectively. The worst performers were iShares S&P GSCI Commodity Indexed Trust and iShares JP Morgan USD Emerging Markets Bond ETF, which returned -4.67% and -4.32%, respectively.
During the reporting period, the Fund’s five asset classes had an approximate average weighting of 44% in ETFs with exposure to developed market equities, 18% in ETFs with exposure to Bonds, 27% in ETFs with exposure to emerging markets, 8% in ETFs with exposure to Alternatives, and 3% in ETFs with exposure to Short Term US Treasuries or Inflation Protected Securities. The emerging market equities sub-asset class had, on average, 20% of the ETF’s exposure, followed by the U.S. Large Cap Equities at 18%, Developed Market Equities outside the U.S. at 14%, and U.S. Small Cap Equities at 13%.
| | | AVERAGE TOTAL RETURN FOR THE YEAR ENDED OCTOBER 31, 2017 | |
| | | One Year Return | | | Three Year Return | | | Annualized Inception to Date* | |
| | | Net Asset Value | | | Market Price | | | Net Asset Value | | | Market Price | | | Net Asset Value | | | Market Price | |
| Global X | JPMorgan Efficiente Index ETF | | | 12.29 | % | | | 12.34 | % | | | 3.72 | % | | | 3.72 | % | | | 4.42 | % | | | 4.42 | % |
| JPMorgan ETF Efficiente 10 TR Series X Index | | | 13.12 | % | | | 13.12 | % | | | 4.49 | % | | | 4.49 | % | | | 5.21 | % | | | 5.21 | % |
| Bloomberg Barclays US Aggregate Bond Index | | | 0.90 | % | | | 0.90 | % | | | 2.40 | % | | | 2.40 | % | | | 2.23 | % | | | 2.23 | % |
| S&P 500 Index | | | 23.63 | % | | | 23.63 | % | | | 10.77 | % | | | 10.77 | % | | | 12.38 | % | | | 12.38 | % |
Management Discussion of Fund Performance (unaudited)
Global X | JPMorgan Efficiente Index ETF
Growth of a $10,000 Investment
(at Net Asset Value)
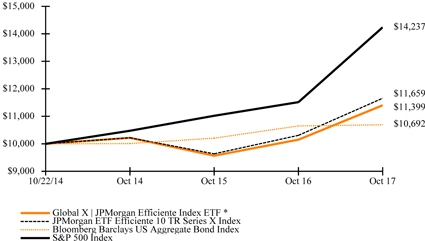
* The Fund commenced operations on October 22, 2014.
The S&P 500 Index is a market capitalization weighted composite index of 500 large capitalization U.S. companies.
The Bloomberg Barclays US Aggregate Bond Index covers the USD-denominated, investment-grade, fixed-rate, taxable bond market of SEC-registered securities. The index includes bonds from the Treasury, Government-Related, Corporate, MBS (agency fixed-rate and hybrid ARM passthroughs), ABS, and CMBS sectors.
The performance data quoted herein represents past performance and the return and value of an investment in the Fund will fluctuate so that, when redeemed, it may be worth less than its original cost. Past performance is no guarantee of future performance and should not be considered as a representation of the future results of the Fund. The Fund's performance assumes the reinvestment of all dividends and all capital gains. Index returns assume reinvestment of dividends and, unlike the Fund's returns, do not reflect any fees or expenses. If such fees and expenses were included in the index returns, the performance would have been lower. Please note that one cannot invest directly in an unmanaged index.
There are no assurances that the Fund will meet its stated objectives.
The Fund’s holdings and allocations are subject to change and should not be considered recommendations to buy individual securities.
The graph and table do not reflect the deduction of taxes that a shareholder would pay on Fund distributions or the redemption or sale of Fund shares.
See definition of comparative indices above and on previous page.
Management Discussion of Fund Performance (unaudited)
Global X | JPMorgan US Sector Rotator Index ETF
Global X | JPMorgan US Sector Rotator Index ETF
The Global X | JPMorgan US Sector Rotator Index ETF (“Fund”) seeks investment results that correspond generally to the price and yield performance, before fees and expenses, of the JPMorgan U.S. Sector Rotator TR Series X Index (“Underlying Index”), which is composed of underlying equity exchange-traded funds ("ETFs") and a fixed income ETF. The Fund is passively managed, which means the investment adviser does not attempt to take defensive positions in declining markets. The Fund generally seeks to fully replicate the Underlying Index.
The Underlying Index aims to participate in the best-performing U.S. sectors of the market while limiting its exposure to the market during periods of high volatility or market declines, as defined by the index provider. The Underlying Index rebalances monthly to reflect changing market conditions by tracking the performance of a portfolio that may include one U.S. Treasury Bond ETF and zero to five ETFs selected out of a pool of ten U.S. sector ETFs. The sectors represented by all the U.S. sector ETFs are: consumer discretionary, consumer staples, energy, financials, healthcare, industrial, utilities, materials, technology and real estate. On each monthly rebalancing date, the Underlying Index seeks to select up to five U.S. sector ETFs with the highest positive performance during the prior month. The Underlying Index will include an allocation to the U.S. Treasury Bond ETF if fewer than five U.S. sector ETFs have positive performance during the prior month. The U.S. sector ETFs selected for inclusion in the Underlying Index each month are equal-volatility weighted, based on each U.S. sector ETF’s realized volatility during the prior month, meaning that each U.S. sector ETF has the same amount of volatility contribution to the Underlying Index as of such monthly rebalancing date. If the overall realized volatility of the portfolio of selected U.S. sector ETFs exceeds 20%, based on each U.S. sector ETF’s realized volatility during the prior month, the weight assigned on a monthly rebalancing date to each U.S. sector ETF is adjusted down proportionally and the exposure is re-allocated to the U.S. Treasury Bond ETF in order to reduce the overall volatility of the Underlying Index to 20% as of such monthly rebalancing date. Since the index weights assigned to the U.S. sector ETF and the U.S. Treasury Bond ETF are determined on past performance, there is no guarantee that any monthly rebalancing will result in the Underlying Index achieving the highest possible returns for the relevant month.
For the 12-month period ended October 31, 2017 (the “reporting period”), the Fund increased 9.65%, while the Underlying Index increased 10.56%. The Fund had a net asset value of $23.79 per share on October 31, 2016 and ended the reporting period with a net asset value of $25.51 on October 31, 2017.
During the reporting period, the highest returns came from Financial Select Sector SPDR Fund and Materials Select Sector SPDR Fund, which returned 15.63% and 15.53%, respectively. The worst performers were Utilities Select Sector SPDR Fund and Energy Select Sector SPDR Fund, which returned -5.78% and -2.81%, respectively.
The Fund seeks to participate in flat or rising markets through a sector-rotation strategy while allocating exposure to a short-term Treasury ETF during periods of high volatility or declining markets. During the period Q4 2016 to Q3 2017, the Fund had an approximate average weighting of just 5% to a short-term Treasury ETF, as equity performance was generally strong and volatility remained low. Among equity sectors, ETFs with exposure to the Consumer Discretionary sector and Information Technology sector had the highest average approximate weightings at 15%. This was followed by ETFs with exposure to Materials sector, which had an average approximate weighting of 14%.
| | | AVERAGE TOTAL RETURN FOR THE YEAR ENDED OCTOBER 31, 2017 | |
| | | One Year Return | | | Three Year Return | | | Annualized Inception to Date* | |
| | | Net Asset Value | | | Market Price | | | Net Asset Value | | | Market Price | | | Net Asset Value | | | Market Price | |
| Global X | JPMorgan US Sector Rotator Index ETF | | | 9.65 | % | | | 9.75 | % | | | 1.55 | % | | | 1.56 | % | | | 2.05 | % | | | 2.05 | % |
| JPMorgan US Sector Rotator TR Series X Index | | | 10.56 | % | | | 10.56 | % | | | 2.48 | % | | | 2.48 | % | | | 2.99 | % | | | 2.99 | % |
| S&P 500 Index | | | 23.63 | % | | | 23.63 | % | | | 10.77 | % | | | 10.77 | % | | | 12.38 | % | | | 12.38 | % |
Management Discussion of Fund Performance (unaudited)
Global X | JPMorgan US Sector Rotator Index ETF
Growth of a $10,000 Investment
(at Net Asset Value)
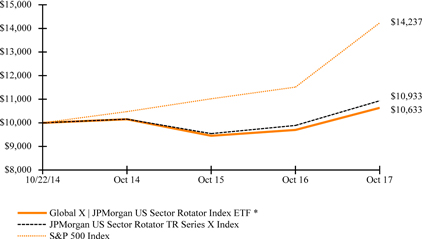
* The Fund commenced operations on October 22, 2014.
The S&P 500 Index is a market capitalization weighted composite index of 500 large capitalization U.S. companies.
The performance data quoted herein represents past performance and the return and value of an investment in the Fund will fluctuate so that, when redeemed, it may be worth less than its original cost. Past performance is no guarantee of future performance and should not be considered as a representation of the future results of the Fund. The Fund's performance assumes the reinvestment of all dividends and all capital gains. Index returns assume reinvestment of dividends and, unlike the Fund's returns, do not reflect any fees or expenses. If such fees and expenses were included in the index returns, the performance would have been lower. Please note that one cannot invest directly in an unmanaged index.
There are no assurances that the Fund will meet its stated objectives.
The Fund’s holdings and allocations are subject to change and should not be considered recommendations to buy individual securities.
The graph and table do not reflect the deduction of taxes that a shareholder would pay on Fund distributions or the redemption or sale of Fund shares.
See definition of comparative indices above and on previous page.
Management Discussion of Fund Performance (unaudited)
Global X Guru® Index ETF
Global X Guru® Index ETF
The Global X Guru® Index ETF (“Fund”) seeks investment results that correspond generally to the price and yield performance, before fees and expenses, of the Solactive Guru Index (“Underlying Index”).The Fund is passively managed, which means the investment adviser does not attempt to take defensive positions in declining markets. The Fund generally seeks to fully replicate the Underlying Index.
The Underlying Index is comprised of the top U.S. listed equity positions reported on Form 13F by a select group of entities characterized as hedge funds, as defined by the index provider. Hedge funds are selected by the index provider from a pool of thousands of privately offered pooled investment vehicles based on the size of their reported equity holdings and the efficacy of replicating their publicly disclosed positions. Hedge funds must have minimum reported holdings of $500 million in their Form 13F to be considered for the Underlying Index. Additional filters are applied to eliminate hedge funds that have high turnover rates for equity holdings. Only hedge funds with a concentrated top holding are included in the selection process. Once the hedge fund pool has been determined, the index provider utilizes Form 13F filings to compile the top stock holding from each of these hedge funds. The stocks are screened for liquidity, equal weighted, and rebalanced quarterly following the Form 13F filing timeline.
For the 12-month period ended October 31, 2017 (the “reporting period”), the Fund increased 24.30%, while the Underlying Index increased 24.61%. The Fund had a net asset value of $23.14 per share on October 31, 2016 and ended the reporting period with a net asset value of $28.70 on October 31, 2017.
During the reporting period, the highest returns came from GrubHub and Spirit AeroSystems Holdings, which returned 60.12% and 60.08%, respectively. The worst performers were Sprint and Buffalo Wild Wings, which returned -27.01% and -25.59%, respectively.
The Fund’s investments are among the top U.S. listed equity positions reported on Form 13F by major hedge funds. During the reporting period, hedge funds remained uniquely positioned to potentially generate alpha due to their deep talent pool and ability to make high conviction investments. Over the reporting period, the Fund indeed outperformed the benchmark S&P 500 index by approximately 67 basis points. The Fund rebalances quarterly, resulting in dynamic exposures that can change significantly throughout the year. Earlier in the period, the Fund benefitted from its exposure to biotech stocks that performed well due to a decreased likelihood of government intervention in drug pricing. Later in the period, the Fund took a larger position in energy companies as hedge funds looked for a potential rebound in oil prices.
| | | AVERAGE TOTAL RETURN FOR THE YEAR ENDED OCTOBER 31, 2017 | |
| | | One Year Return | | | Three Year Return | | | Five Year Return | | | Annualized Inception to Date* | |
| | | Net Asset Value | | | Market Price | | | Net Asset Value | | | Market Price | | | Net Asset Value | | | Market Price | | | Net Asset Value | | | Market Price | |
| Global X Guru® Index ETF | | | 24.30 | % | | | 24.17 | % | | | 3.55 | % | | | 3.53 | % | | | 12.43 | % | | | 12.42 | % | | | 14.36 | % | | | 14.34 | % |
| Solactive Guru Index | | | 24.61 | % | | | 24.61 | % | | | 3.82 | % | | | 3.82 | % | | | 12.91 | % | | | 12.91 | % | | | 14.85 | % | | | 14.85 | % |
| S&P 500 Index | | | 23.63 | % | | | 23.63 | % | | | 10.77 | % | | | 10.77 | % | | | 15.18 | % | | | 15.18 | % | | | 16.25 | % | | | 16.25 | % |
Growth of a $10,000 Investment
(at Net Asset Value)

* The Fund commenced operations on June 4, 2012.
Management Discussion of Fund Performance (unaudited)
Global X Guru® Index ETF
The S&P 500 Index is a market capitalization weighted composite index of 500 large capitalization U.S. companies.
The performance data quoted herein represents past performance and the return and value of an investment in the Fund will fluctuate so that, when redeemed, it may be worth less than its original cost. Past performance is no guarantee of future performance and should not be considered as a representation of the future results of the Fund. The Fund's performance assumes the reinvestment of all dividends and all capital gains. Index returns assume reinvestment of dividends and, unlike the Fund's returns, do not reflect any fees or expenses. If such fees and expenses were included in the index returns, the performance would have been lower. Please note that one cannot invest directly in an unmanaged index.
There are no assurances that the Fund will meet its stated objectives.
The Fund’s holdings and allocations are subject to change and should not be considered recommendations to buy individual securities.
The graph and table do not reflect the deduction of taxes that a shareholder would pay on Fund distributions or the redemption or sale of Fund shares.
See definition of comparative indices above and on previous page.
Management Discussion of Fund Performance (unaudited)
Global X Scientific Beta US ETF
Global X Scientific Beta US ETF
The Global X Scientific Beta US ETF (“Fund”) seeks investment results that correspond generally to the price and yield performance, before fees and expenses, of the Scientific Beta United States Multi-Beta Multi-Strategy Equal Risk Contribution Index (“Underlying Index”). The Fund is passively managed, which means the investment adviser does not attempt to take defensive positions in declining markets. The Fund generally seeks to fully replicate the Underlying Index.
The Underlying Index generally comprises approximately 500 or less U.S. listed common stocks selected based on a proprietary methodology developed by the index provider. The objective of the Underlying Index is to outperform traditional market capitalization-weighted indexes, with lower volatility. The Underlying Index’s components are selected by applying four factors that have been widely recognized by academic literature to outperform market capitalization weighted-indexes over the long run: Value, Size, Low-Volatility and Momentum. Each of these factors is applied by using the following metrics: price-to-book ratio for Value; free-float market capitalization for Size; historical volatility over the trailing 104 week period for Low-Volatility; and one-year-minus-one-month total returns for Momentum. Finally, components are weighted by employing a proprietary, multi-step process that combines multiple weighting methodologies to diversify the risks associated with any one weighting scheme.
For the 12-month period ended October 31, 2017 (the “reporting period”), the Fund increased 19.52%, while the Underlying Index increased 19.82%. The Fund had a net asset value of $25.46 per share on October 31, 2016 and ended the reporting period with a net asset value of $30.04 on October 31, 2017.
During the reporting period, the highest returns came from Nvidia and Micron Technology, which returned 191.98% and 158.22%, respectively. The worst performers were Foot Locker and Mattel, which returned -53.84% and -52.77%, respectively.
While the Fund demonstrated strong positive performance over the reporting period, it lagged the benchmark S&P 500. Factor investing proved challenging during the period as benchmark returns were driven by high growth names that tend to be underweighted in multi-factor strategies, particularly those that seek to deliver more diversified exposure than the S&P 500. During the reporting period, the Momentum factor was the best-performing factor and it outperformed the S&P 500 in the first three quarters of 2017. However, other factors tended to lag behind. During the same quarters, only Value in Q2 joined Momentum in outperforming the S&P 500. The Fund had an average approximate weighting of 20% to stocks in the financials sector, 12% to health care, 11% to consumer discretionary, and 11% to industrials.
| | | AVERAGE TOTAL RETURN FOR THE YEAR ENDED OCTOBER 31, 2017 | |
| | | One Year Return | | | Annualized Inception to Date* | |
| | | Net Asset Value | | | Market Price | | | Net Asset Value | | | Market Price | |
| Global X Scientific Beta US ETF | | | 19.52 | % | | | 19.59 | % | | | 8.99 | % | | | 9.03 | % |
| Scientific Beta US Multi-Beta Multi-Strategy Equal Risk Contribution Index | | | 19.82 | % | | | 19.82 | % | | | 9.29 | % | | | 9.29 | % |
| S&P 500 Index | | | 23.63 | % | | | 23.63 | % | | | 10.92 | % | | | 10.92 | % |
Management Discussion of Fund Performance (unaudited)
Global X Scientific Beta US ETF
Growth of a $10,000 Investment
(at Net Asset Value)
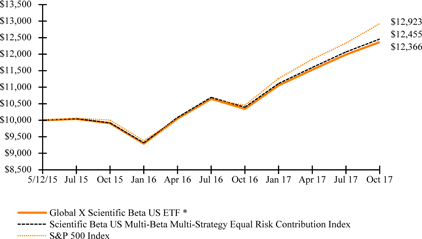
* Fund commenced operations on May 12, 2015.
The S&P 500 Index is a market capitalization weighted composite index of 500 large capitalization U.S. companies.
The performance data quoted herein represents past performance and the return and value of an investment in the Fund will fluctuate so that, when redeemed, it may be worth less than its original cost. Past performance is no guarantee of future performance and should not be considered as a representation of the future results of the Fund. The Fund's performance assumes the reinvestment of all dividends and all capital gains. Index returns assume reinvestment of dividends and, unlike the Fund's returns, do not reflect any fees or expenses. If such fees and expenses were included in the index returns, the performance would have been lower. Please note that one cannot invest directly in an unmanaged index.
There are no assurances that the Fund will meet its stated objectives.
The Fund’s holdings and allocations are subject to change and should not be considered recommendations to buy individual securities.
The graph and table do not reflect the deduction of taxes that a shareholder would pay on Fund distributions or the redemption or sale of Fund shares.
See definition of comparative indices above and on previous page.
Management Discussion of Fund Performance (unaudited)
Global X Scientific Beta Europe ETF
Global X Scientific Beta Europe ETF
The Global X Scientific Beta Europe ETF (“Fund”) seeks investment results that correspond generally to the price and yield performance, before fees and expenses, of the Scientific Beta Extended Developed Europe Multi-Beta Multi-Strategy Equal Risk Contribution Index (“Underlying Index”). The Fund is passively managed, which means the investment adviser does not attempt to take defensive positions in declining markets. The Fund generally seeks to fully replicate the Underlying Index.
The Underlying Index generally comprises approximately 600 or less European-listed common stocks selected based on a proprietary methodology developed by the index provider. The objective of the Underlying Index is to outperform traditional market capitalization-weighted indexes, with lower volatility. The components of the Underlying Index are selected from a universe of the 600 largest, as measured by free float market capitalization, and most liquid stocks that are ordinarily traded principally on a stock exchange in one of the following 16 developed European countries: Austria, Belgium, Denmark, Finland, France, Germany, Greece, Ireland, Italy, Netherlands, Norway, Portugal, Spain, Sweden, Switzerland and the United Kingdom. The Underlying Index’s components are selected by applying four factors that have been widely recognized by academic literature to outperform market capitalization weighted-indexes over the long run: Value, Size, Low-Volatility and Momentum. Each of these factors is applied by using the following metrics: price-to-book ratio for Value; free-float market capitalization for Size; historical volatility over the trailing 104 week period for Low-Volatility; and one-year-minus-one-month total returns for Momentum. Finally, components are weighted by employing a proprietary, multi-step process that combines multiple weighting methodologies to diversify the risks associated with any one weighting scheme.
For the 12-month period ended October 31, 2017 (the “reporting period”), the Fund increased 29.54%, while the Underlying Index increased 29.82%. The Fund had a net asset value of $22.63 per share on October 31, 2016 and ended the reporting period with a net asset value of $28.43 on October 31, 2017.
During the reporting period, the highest returns came from Ams and Deutsche Lufthansa, which returned 226.81% and 157.64%, respectively. The worst performers were Banco Popular Espanol and Provident Financial, which returned -67.56% and -64.64%, respectively.
From Q4 2016 to Q3 2017, the Fund had an average weighting of approximately 22% to the Financials sector, with other notable sector exposures of approximately 18% to Industrials, and 11% to the Consumer Discretionary sector. The Fund had an average approximate exposure of 21% to Low-Volatility stocks, 18% to Mid Cap stocks, 43% to Value stocks, and 18% to Momentum stocks, as defined by the index provider. During the period, the Fund benefited primarily from the exposure to Value, which generated strong performance.
| | | AVERAGE TOTAL RETURN FOR THE YEAR ENDED OCTOBER 31, 2017 | |
| | | One Year Return | | | Annualized Inception to Date* | |
| | | Net Asset Value | | | Market Price | | | Net Asset Value | | | Market Price | |
| Global X Scientific Beta Europe ETF | | | 29.54 | % | | | 29.28 | % | | | 7.48 | % | | | 7.66 | % |
| Scientific Beta Extended Developed Europe Multi-Beta Multi-Strategy Equal Risk Contribution Index | | | 29.82 | % | | | 29.82 | % | | | 7.78 | % | | | 7.78 | % |
| MSCI EAFE Index ** | | | 23.44 | % | | | 23.44 | % | | | 4.45 | % | | | 4.45 | % |
| S&P 500 Index | | | 23.63 | % | | | 23.63 | % | | | 10.92 | % | | | 10.92 | % |
Management Discussion of Fund Performance (unaudited)
Global X Scientific Beta Europe ETF
Growth of a $10,000 Investment
(at Net Asset Value)
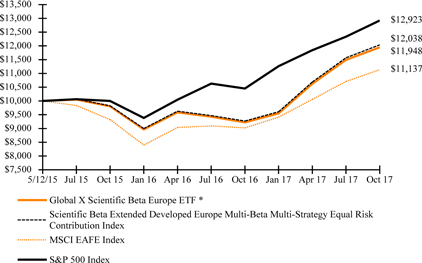
* Fund commenced operations on May 12, 2015.
** As of March 1, 2017, the Fund changed its broad based benchmark from the S&P 500 Index to the MSCI EAFE Index. The new benchmark is a more appropriate comparison for the fund.
The MSCI EAFE Index (Europe, Australasia, Far East) is a free float-adjusted market capitalization index that is designed to measure the equity market performance of developed markets, excluding the US & Canada.
The S&P 500 Index is a market capitalization weighted composite index of 500 large capitalization U.S. companies.
The performance data quoted herein represents past performance and the return and value of an investment in the Fund will fluctuate so that, when redeemed, it may be worth less than its original cost. Past performance is no guarantee of future performance and should not be considered as a representation of the future results of the Fund. The Fund's performance assumes the reinvestment of all dividends and all capital gains. Index returns assume reinvestment of dividends and, unlike the Fund's returns, do not reflect any fees or expenses. If such fees and expenses were included in the index returns, the performance would have been lower. Please note that one cannot invest directly in an unmanaged index.
There are no assurances that the Fund will meet its stated objectives.
The Fund’s holdings and allocations are subject to change and should not be considered recommendations to buy individual securities.
The graph and table do not reflect the deduction of taxes that a shareholder would pay on Fund distributions or the redemption or sale of Fund shares.
See definition of comparative indices above and on previous page.
Management Discussion of Fund Performance (unaudited)
Global X Scientific Beta Japan ETF
Global X Scientific Beta Japan ETF
The Global X Scientific Beta Japan ETF (“Fund”) seeks investment results that correspond generally to the price and yield performance, before fees and expenses, of the Scientific Beta Japan Multi-Beta Multi-Strategy Equal Risk Contribution Index (“Underlying Index”). The Fund is passively managed, which means the investment adviser does not attempt to take defensive positions in declining markets. The Fund generally seeks to fully replicate the Underlying Index.
The Underlying Index generally comprises approximately 500 or less Japanese-listed common stocks selected based on a proprietary methodology developed by the index provider. The objective of the Underlying Index is to outperform traditional market capitalization-weighted indexes, with lower volatility. The components of the Underlying Index are selected from a universe of the 500 largest, as measured by free float market capitalization, and most liquid stocks traded principally on a stock exchange in and incorporated or domiciled (i.e., maintain a principal place of business) in Japan. The Underlying Index’s components are selected by applying four factors that have been widely recognized by academic literature to outperform market capitalization weighted-indexes over the long run: Value, Size, Low-Volatility and Momentum. Each of these factors is applied by using the following metrics: price-to-book ratio for Value; free-float market capitalization for Size; historical volatility over the trailing 104 week period for Low-Volatility; and one-year-minus one month total returns for Momentum. Finally, components are weighted by employing a proprietary, multi-step process that combines multiple weighting methodologies to diversify the risks associated with any one weighting scheme.
For the 12-month period ended October 31, 2017 (the “reporting period”), the Fund increased 18.17%, while the Underlying Index increased 18.59%. The Fund had a net asset value of $27.38 per share on October 31, 2016 and ended the reporting period with a net asset value of $31.47 on October 31, 2017.
During the reporting period, the highest returns came from Yaskawa Electric and Tokyo Electron, which returned 125.08 % and 99.35%, respectively. The worst performers were Toho Gas and Sosei Group, which returned -39.02% and -26.81%, respectively.
During the period Q4 2016 to Q3 2017, the Fund had an average weighting of approximately 25% to the Industrials sector, with other notable sector exposures of approximately 16% to Consumer Discretionary stocks, and 12% to the Materials sector. The Fund had an average approximate exposure of 13% to Low-Volatility stocks, 16% to Mid Cap stocks, 59% to Value stocks, and 12% to Momentum stocks, as defined by the index provider. The Fund benefited from the higher exposure to Value stocks, which was the best performing factor.
| | | AVERAGE TOTAL RETURN FOR THE YEAR ENDED OCTOBER 31, 2017 | |
| | | One Year Return | | | Annualized Inception to Date* | |
| | | Net Asset Value | | | Market Price | | | Net Asset Value | | | Market Price | |
| Global X Scientific Beta Japan ETF | | | 18.17 | % | | | 18.73 | % | | | 11.28 | % | | | 11.67 | % |
| Scientific Beta Japan Multi-Beta Multi-Strategy Equal Risk Contribution Index | | | 18.59 | % | | | 18.59 | % | | | 11.59 | % | | | 11.59 | % |
| MSCI EAFE Index** | | | 23.44 | % | | | 23.44 | % | | | 4.45 | % | | | 4.45 | % |
| S&P 500 Index | | | 23.63 | % | | | 23.63 | % | | | 10.92 | % | | | 10.92 | % |
Management Discussion of Fund Performance (unaudited)
Global X Scientific Beta Japan ETF
Growth of a $10,000 Investment
(at Net Asset Value)
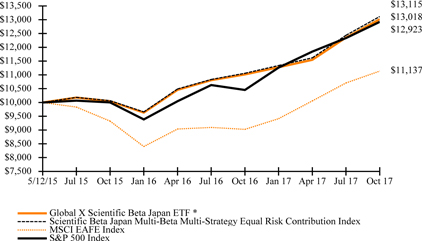
* Fund commenced operations on May 12, 2015.
** As of March 1, 2017, the Fund changed its broad based benchmark from the S&P 500 Index to the MSCI EAFE Index. The new benchmark is a more appropriate comparison for the fund.
The MSCI EAFE Index (Europe, Australasia, Far East) is a free float-adjusted market capitalization index that is designed to measure the equity market performance of developed markets, excluding the US & Canada.
The S&P 500 Index is a market capitalization weighted composite index of 500 large capitalization U.S. companies.
The performance data quoted herein represents past performance and the return and value of an investment in the Fund will fluctuate so that, when redeemed, it may be worth less than its original cost. Past performance is no guarantee of future performance and should not be considered as a representation of the future results of the Fund. The Fund's performance assumes the reinvestment of all dividends and all capital gains. Index returns assume reinvestment of dividends and, unlike the Fund's returns, do not reflect any fees or expenses. If such fees and expenses were included in the index returns, the performance would have been lower. Please note that one cannot invest directly in an unmanaged index.
There are no assurances that the Fund will meet its stated objectives.
The Fund’s holdings and allocations are subject to change and should not be considered recommendations to buy individual securities.
The graph and table do not reflect the deduction of taxes that a shareholder would pay on Fund distributions or the redemption or sale of Fund shares.
See definition of comparative indices above and on previous page.
Management Discussion of Fund Performance (unaudited)
Global X Scientific Beta Asia ex-Japan ETF
Global X Scientific Beta Asia ex-Japan ETF
The Global X Scientific Beta Asia ex-Japan ETF (“Fund”) seeks investment results that correspond generally to the price and yield performance, before fees and expenses, of the Scientific Beta Developed Asia-Pacific ex-Japan Multi-Beta Multi- Strategy Equal Risk Contribution Index (“Underlying Index”). The Fund is passively managed, which means the investment adviser does not attempt to take defensive positions in declining markets. The Fund generally seeks to fully replicate the Underlying Index.
The Underlying Index generally comprises approximately 400 or less Asian-listed common stocks selected based on a proprietary methodology developed by the index provider. The objective of the Underlying Index is to outperform traditional market capitalization-weighted indexes, with lower volatility. The components of the Underlying Index are selected from a universe of the 400 largest, as measured by free float market capitalization, and most liquid stocks traded principally on a stock exchange in and incorporated or domiciled (i.e., maintain a principal place of business) in developed markets in Asia, excluding Japan, but may include Hong Kong, New Zealand, Singapore, South Korea and Australia. The Underlying Index’s components are selected by applying four factors that have been widely recognized by academic literature to outperform market capitalization weighted-indexes over the long run: Value, Size, Low-Volatility and Momentum. Each of these factors is applied by using the following metrics: price-to-book ratio for Value; free-float market capitalization for Size; historical volatility over the trailing 104 week period for Low-Volatility; and one-year-minus- one month total returns for Momentum. Finally, components are weighted by employing a proprietary, multi-step process that combines multiple weighting methodologies to diversify the risks associated with any one weighting scheme.
For the 12-month period ended October 31, 2017 (the “reporting period”), the Fund increased 17.43%, while the Underlying Index increased 17.93%. The Fund had a net asset value of $22.96 per share on October 31, 2016 and ended the reporting period with a net asset value of $25.71 on October 31, 2017.
During the reporting period, the highest returns came from Venture Corporation and Global Logistic Properties, which returned 117.94% and 94.60%, respectively. The worst performers were Downer EDI and Esprit Holdings, which returned -88.10% and -36.62%, respectively.
During the period Q4 2016 to Q3 2017, the Fund had an average weighting of approximately 26% to stocks in the Real Estate sector, with other large average exposures of approximately 17% to industrials sector, and 12% to consumer discretionary stocks. The Fund had an average approximate exposure of 22% to low-volatility stocks, 24% to mid cap stocks, 29% to value stocks, and 23% to momentum stocks, as defined by the index provider. The Fund benefited from the exposure to Value, which was the best performing factor.
| | | AVERAGE TOTAL RETURN FOR THE YEAR ENDED OCTOBER 31, 2017 | |
| | | One Year Return | | | Annualized Inception to Date* | |
| | | Net Asset Value | | | Market Price | | | Net Asset Value | | | Market Price | |
| Global X Scientific Beta Asia ex-Japan ETF | | | 17.43 | % | | | 17.77 | % | | | 4.52 | % | | | 4.80 | % |
| Scientific Beta Developed Asia-Pacific ex-Japan Multi-Beta Multi-Strategy Equal Risk Contribution Index | | | 17.93 | % | | | 17.93 | % | | | 4.24 | % | | | 4.24 | % |
| MSCI EAFE Index ** | | | 23.44 | % | | | 23.44 | % | | | 4.45 | % | | | 4.45 | % |
| S&P 500 Index | | | 23.63 | % | | | 23.63 | % | | | 10.92 | % | | | 10.92 | % |
Management Discussion of Fund Performance (unaudited)
Global X Scientific Beta Asia ex-Japan ETF
Growth of a $10,000 Investment
(at Net Asset Value)
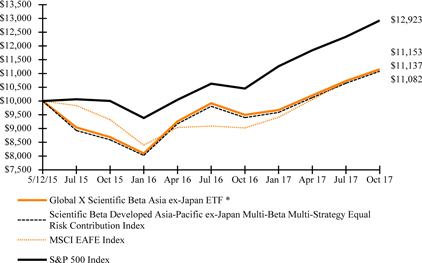
* Fund commenced operations on May 12, 2015.
** As of March 1, 2017, the Fund changed its broad based benchmark from the S&P 500 Index to the MSCI EAFE Index. The new benchmark is a more appropriate comparison for the fund.
The MSCI EAFE Index (Europe, Australasia, Far East) is a free float-adjusted market capitalization index that is designed to measure the equity market performance of developed markets, excluding the US & Canada.
The S&P 500 Index is a market capitalization weighted composite index of 500 large capitalization U.S. companies.
The performance data quoted herein represents past performance and the return and value of an investment in the Fund will fluctuate so that, when redeemed, it may be worth less than its original cost. Past performance is no guarantee of future performance and should not be considered as a representation of the future results of the Fund. The Fund's performance assumes the reinvestment of all dividends and all capital gains. Index returns assume reinvestment of dividends and, unlike the Fund's returns, do not reflect any fees or expenses. If such fees and expenses were included in the index returns, the performance would have been lower. Please note that one cannot invest directly in an unmanaged index.
There are no assurances that the Fund will meet its stated objectives.
The Fund’s holdings and allocations are subject to change and should not be considered recommendations to buy individual securities.
The graph and table do not reflect the deduction of taxes that a shareholder would pay on Fund distributions or the redemption or sale of Fund shares.
See definition of comparative indices above and on previous page.
Management Discussion of Fund Performance (unaudited)
Global X YieldCo Index ETF
Global X YieldCo Index ETF
The Global X YieldCo Index ETF (“Fund”) seeks to track, before fees and expenses, the price and yield performance of the INDXX Global YieldCo Index (“Underlying Index”). The Fund is passively managed, which means the investment adviser does not attempt to take defensive positions in declining markets. The Fund generally seeks to fully replicate the Underlying Index.
The Underlying Index comprises publicly traded companies that are formed to own operating assets that produce defined cash flows (“Yieldcos”), as well as companies that have publicly announced plans to spin-off a YieldCo in an initial public offering, as determined by the index provider. The components of the Underlying Index are YieldCos selected from the universe of global publicly listed equities, which have a minimum market capitalization of $500 million and an Average Daily Value Traded (“ADVT”) over the last three months greater than $1 million. If less than 20 securities satisfy this criteria, the market capitalization and ADVT requirements are lowered. If there are still fewer than 20 securities, the parent companies of proposed YieldCos with the nearest anticipated listing dates will be included in the Underlying Index until there are 20 Underlying Index constituents. If a parent company is a part of the Underlying Index, and its corresponding YieldCo becomes publicly listed, the listed YieldCo will replace the parent entity in the index during the subsequent index rebalance. Underlying Index constituents are ranked by market capitalization. The remaining securities are weighted based on their market capitalization, with a cap of 4.75% on any of the securities falling outside of the top five by market capitalization. If any parent companies of YieldCos are Underlying Index constituents, they are each capped at a 4.75% weighting. Companies that are structured as partnerships are capped at a 25% weighting in the aggregate.
For the 12-month period ended October 31, 2017 (the “reporting period”), the Fund increased 17.30%, while the Underlying Index increased 18.12%. The Fund had a net asset value of $11.16 per share on October 31, 2016 and ended the reporting period with a net asset value of $12.53 on October 31, 2017.
During the reporting period, the highest returns came from NextEra Energy Partners and TerraForm Global, which returned 50.30% and 33.33%, respectively. The worst performers were Innergex Renewable Energy and TransAlta Renewables, which returned -1.75% and 3.78%, respectively.
YieldCos are entities that generally consist of fully developed renewable energy assets such as solar and wind farms. These entities tend to enter into long-term contracts with customers to deliver electricity at pre-specified prices. Despite uncertainties related to the U.S. tax policy and the government’s commitment to fight climate change, renewable energy sources continued to grow in prominence around the world as they battled more entrenched fossil fuels for market share in the power generation space. Declining costs of solar and wind technologies as well as various government incentives led to the adoption of renewables by many municipalities, communities, and corporations. In 2017, renewable energy dominated new electrical generation in the US, amounting to over 60% of the total new generation capacity. Despite the growth of the solar and wind in electric generation, the YieldCo space itself shrunk as some companies delayed or abandoned plans to spinoff their YieldCos. In addition, some existing YieldCos were taken private.
| | | AVERAGE TOTAL RETURN FOR THE YEAR ENDED OCTOBER 31, 2017 | |
| | | One Year Return | | | Annualized Inception to Date* | |
| | | Net Asset Value | | | Market Price | | | Net Asset Value | | | Market Price | |
| Global X YieldCo Index ETF | | | 17.30 | % | | | 16.04 | % | | | -3.11 | % | | | -3.21 | % |
| INDXX Global YieldCo Index | | | 18.12 | % | | | 18.12 | % | | | -2.74 | % | | | -2.74 | % |
| MSCI ACWI ** | | | 23.20 | % | | | 23.20 | % | | | 7.36 | % | | | 7.36 | % |
| S&P 500 Index | | | 23.63 | % | | | 23.63 | % | | | 10.54 | % | | | 10.54 | % |
Management Discussion of Fund Performance (unaudited)
Global X YieldCo Index ETF
Growth of a $10,000 Investment
(at Net Asset Value)
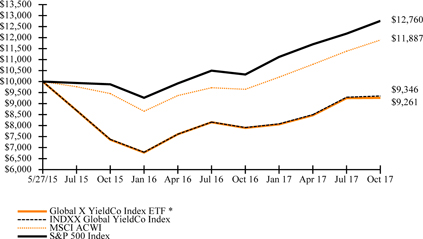
* Fund commenced operations on May 27, 2015.
** As of March 1, 2017, the Fund changed its broad based benchmark from the S&P 500 Index to the MSCI ACWI. The new benchmark is a more appropriate comparison for the fund.
The MSCI ACWI (All Country World Index) Index is a free float-adjusted market capitalization weighted index that is designed to measure the equity market performance of developed and emerging markets.
The S&P 500 Index is a market capitalization weighted composite index of 500 large capitalization U.S. companies.
The performance data quoted herein represents past performance and the return and value of an investment in the Fund will fluctuate so that, when redeemed, it may be worth less than its original cost. Past performance is no guarantee of future performance and should not be considered as a representation of the future results of the Fund. The Fund's performance assumes the reinvestment of all dividends and all capital gains. Index returns assume reinvestment of dividends and, unlike the Fund's returns, do not reflect any fees or expenses. If such fees and expenses were included in the index returns, the performance would have been lower. Please note that one cannot invest directly in an unmanaged index.
There are no assurances that the Fund will meet its stated objectives.
The Fund’s holdings and allocations are subject to change and should not be considered recommendations to buy individual securities.
The graph and table do not reflect the deduction of taxes that a shareholder would pay on Fund distributions or the redemption or sale of Fund shares.
See definition of comparative indices above and on previous page.
Management Discussion of Fund Performance (unaudited)
Global X S&P 500® Catholic Values ETF
Global X S&P 500® Catholic Values ETF
The Global X S&P 500® Catholic Values ETF (“Fund”) seeks investment results that correspond generally to the price and yield performance, before fees and expenses, of the S&P 500® Catholic Values Index (“Underlying Index”). The Fund is passively managed, which means the investment adviser does not attempt to take defensive positions in declining markets. The Fund generally seeks to fully replicate the Underlying Index.
The S&P 500® Catholic Values Index is designed to provide exposure to U.S. equity securities included in the S&P 500® Index while maintaining alignment with the moral and social teachings of the Catholic Church. The Underlying Index is based on the S&P 500® Index, and generally comprises approximately 500 or less U.S. listed common stocks. All index constituents are members of the S&P 500® Index and follow the eligibility criteria for that index. From this starting universe, constituents are screened to exclude companies involved in activities which are perceived to be inconsistent with Catholic values as outlined in the Socially Responsible Investment Guidelines of the United States Conference of Catholic Bishops (“USCCB”). The Underlying Index then reweights the remaining constituents so that the Underlying Index’s sector exposures matches the sector exposures of the S&P 500® Index.
For the 12-month period ended October 31, 2017 (the “reporting period”), the Fund increased 24.27%, while the Underlying Index increased 24.61%. The Fund had a net asset value of $25.74 per share on October 31, 2016 and ended the reporting period with a net asset value of $31.83 on October 31, 2017.
During the reporting period, the highest returns came from Nvidia and Micron Technology, which returned 191.98% and 158.22%, respectively. The worst performers were Under Armour, Class A and Under Armour, Class C, which returned -59.74% and -55.41%, respectively.
The Fund provides exposure to companies within the S&P 500 whose business practices align with the investment guidelines set by the USCCB. As of October 31, 2017, the Fund had 466 holdings compared with 505 holdings of the S&P 500. To mitigate the potential performance differences between the S&P 500 and the Fund, the Fund’s sector exposures are reweighted to align with those of the S&P 500 on a quarterly basis. Over the reporting period, the Fund had a tracking difference of 64 basis points with the S&P 500. Between Q4 2016 and Q3 2017, information technology had the highest average weighting of 22% in the Fund, followed by financials at 15%, and health care at 14%.
| | | AVERAGE TOTAL RETURN FOR THE YEAR ENDED OCTOBER 31, 2017 | |
| | | One Year Return | | | Annualized Inception to Date* | |
| | | Net Asset Value | | | Market Price | | | Net Asset Value | | | Market Price | |
| Global X S&P 500® Catholic Values ETF | | | 24.27 | % | | | 23.92 | % | | | 17.01 | % | | | 17.03 | % |
| S&P 500® Catholic Values Index | | | 24.61 | % | | | 24.61 | % | | | 17.31 | % | | | 17.31 | % |
| S&P 500 Index | | | 23.63 | % | | | 23.63 | % | | | 16.78 | % | | | 16.78 | % |
Management Discussion of Fund Performance (unaudited)
Global X S&P 500® Catholic Values ETF
Growth of a $10,000 Investment
(at Net Asset Value)
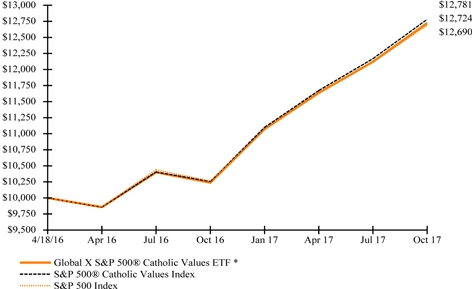
* Fund commenced operations on April 18, 2016.
The S&P 500 Index is a market capitalization weighted composite index of 500 large capitalization U.S. companies.
The performance data quoted herein represents past performance and the return and value of an investment in the Fund will fluctuate so that, when redeemed, it may be worth less than its original cost. Past performance is no guarantee of future performance and should not be considered as a representation of the future results of the Fund. The Fund's performance assumes the reinvestment of all dividends and all capital gains. Index returns assume reinvestment of dividends and, unlike the Fund's returns, do not reflect any fees or expenses. If such fees and expenses were included in the index returns, the performance would have been lower. Please note that one cannot invest directly in an unmanaged index.
There are no assurances that the Fund will meet its stated objectives.
The Fund’s holdings and allocations are subject to change and should not be considered recommendations to buy individual securities.
The graph and table do not reflect the deduction of taxes that a shareholder would pay on Fund distributions or the redemption or sale of Fund shares.
See definition of comparative indices above and on previous page.
| Schedule of Investments | October 31, 2017 |
Global X SuperDividend® ETF
Sector Weightings (unaudited)†:
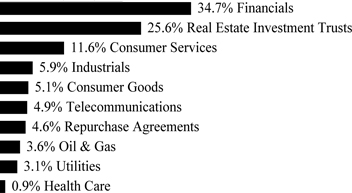
† Sector weightings percentages are based on the total market value of investments. Repurchase agreements purchased from cash collateral received for securities lending activity are included in total investments. Please see Notes 2 and 7 in Notes to Financial Statements for more detailed information.
| | | Shares | | | Value | |
| COMMON STOCK — 99.4% |
| AUSTRALIA— 14.3% | | | | | | | | |
| Consumer Services — 3.7% | | | | | | | | |
| G8 Education | | | 4,196,947 | | | $ | 14,674,077 | |
| Harvey Norman Holdings (A) | | | 2,140,900 | | | | 6,204,984 | |
| Nine Entertainment Holdings | | | 13,418,113 | | | | 15,432,461 | |
| | | | | | | | 36,311,522 | |
| Financials — 8.9% | | | | | | | | |
| Bank of Queensland | | | 1,108,978 | | | | 11,360,093 | |
| Bendigo and Adelaide Bank | | | 1,008,689 | | | | 8,801,405 | |
| Commonwealth Bank of Australia | | | 145,220 | | | | 8,643,875 | |
| Genworth Mortgage Insurance Australia | | | 4,608,114 | | | | 10,034,461 | |
| IOOF Holdings | | | 1,509,116 | | | | 12,450,516 | |
| National Australia Bank | | | 399,239 | | | | 9,997,735 | |
| Platinum Asset Management (A) | | | 3,326,359 | | | | 18,618,490 | |
| Westpac Banking | | | 374,034 | | | | 9,461,192 | |
| | | | | | | | 89,367,767 | |
| Real Estate Investment Trusts — 1.0% | | | | | | | | |
| Cromwell Property Group | | | 12,509,854 | | | | 9,591,902 | |
| Telecommunications — 0.7% | | | | | | | | |
| Telstra | | | 2,581,652 | | | | 7,007,344 | |
| TOTAL AUSTRALIA | | | | | | | 142,278,535 | |
| BRAZIL— 2.5% | | | | | | | | |
| Consumer Services — 1.7% | | | | | | | | |
| Estacio Participacoes | | | 1,903,700 | | | | 17,068,037 | |
| Utilities — 0.8% | | | | | | | | |
| AES Tiete Energia | | | 1,945,600 | | | | 7,701,872 | |
| TOTAL BRAZIL | | | | | | | 24,769,909 | |
The accompanying notes are an integral part of the financial statements.
| Schedule of Investments | October 31, 2017 |
Global X SuperDividend® ETF
| | | Shares | | | Value | |
| COMMON STOCK — continued |
| CANADA— 3.0% | | | | | | | | |
| Consumer Services — 0.9% | | | | | | | | |
| Corus Entertainment | | | 992,955 | | | $ | 9,220,131 | |
| Real Estate Investment Trusts — 2.1% | | | | | | | | |
| Cominar | | | 862,428 | | | | 9,259,176 | |
| Dream Global | | | 1,296,951 | | | | 11,217,907 | |
| | | | | | | | 20,477,083 | |
| TOTAL CANADA | | | | | | | 29,697,214 | |
| CHINA— 1.6% | | | | | | | | |
| Financials — 1.6% | | | | | | | | |
| Guangzhou R&F Properties | | | 7,522,500 | | | | 16,025,013 | |
| FRANCE— 2.6% | | | | | | | | |
| Consumer Goods — 1.2% | | | | | | | | |
| Kaufman & Broad | | | 257,866 | | | | 11,394,156 | |
| Utilities — 1.4% | | | | | | | | |
| Electricite de France (A) | | | 1,091,050 | | | | 14,286,183 | |
| TOTAL FRANCE | | | | | | | 25,680,339 | |
| GREECE— 1.3% | | | | | | | | |
| Consumer Services — 1.3% | | | | | | | | |
| OPAP | | | 1,119,961 | | | | 12,551,141 | |
| HONG KONG— 3.2% | | | | | | | | |
| Consumer Goods — 3.2% | | | | | | | | |
| Li & Fung | | | 27,101,200 | | | | 13,651,685 | |
| Pacific Textiles Holdings | | | 8,578,100 | | | | 9,026,917 | |
| Texwinca Holdings | | | 15,199,200 | | | | 9,175,861 | |
| TOTAL HONG KONG | | | | | | | 31,854,463 | |
| ITALY— 1.0% | | | | | | | | |
| Financials — 1.0% | | | | | | | | |
| Azimut Holding | | | 517,770 | | | | 10,229,819 | |
| MEXICO— 1.9% | | | | | | | | |
| Financials — 1.9% | | | | | | | | |
| Concentradora Hipotecaria SAPI | | | 8,946,019 | | | | 9,114,252 | |
| Grupo Financiero Santander Mexico | | | 1,150,477 | | | | 9,687,016 | |
| TOTAL MEXICO | | | | | | | 18,801,268 | |
| NEW ZEALAND— 3.2% | | | | | | | | |
| Consumer Services — 2.2% | | | | | | | | |
| Air New Zealand | | | 6,443,400 | | | | 14,566,343 | |
| SKY Network Television | | | 4,107,884 | | | | 7,035,253 | |
| | | | | | | | 21,601,596 | |
| Telecommunications — 1.0% | | | | | | | | |
| Spark New Zealand | | | 4,017,612 | | | | 10,128,318 | |
The accompanying notes are an integral part of the financial statements.
| Schedule of Investments | October 31, 2017 |
Global X SuperDividend® ETF
| | | Shares | | | Value | |
| COMMON STOCK — continued |
| TOTAL NEW ZEALAND | | | | | | $ | 31,729,914 | |
| NORWAY— 1.2% | | | | | | | | |
| Industrials — 1.2% | | | | | | | | |
| Ocean Yield (A) | | | 1,324,319 | | | | 11,775,285 | |
| PORTUGAL— 1.0% | | | | | | | | |
| Industrials — 1.0% | | | | | | | | |
| CTT-Correios de Portugal | | | 1,727,020 | | | | 10,172,078 | |
| RUSSIA— 0.9% | | | | | | | | |
| Telecommunications — 0.9% | | | | | | | | |
| MegaFon PJSC GDR | | | 868,512 | | | | 9,075,950 | |
| SINGAPORE— 8.1% | | | | | | | | |
| Financials — 0.7% | | | | | | | | |
| CapitaLand Retail China Trust | | | 5,787,300 | | | | 7,051,467 | |
| Industrials — 1.1% | | | | | | | | |
| Hutchison Port Holdings Trust | | | 25,182,290 | | | | 10,828,385 | |
| Real Estate Investment Trusts — 4.7% | | | | | | | | |
| Ascendas | | | 5,421,049 | | | | 10,902,579 | |
| Mapletree Greater China Commercial Trust | | | 13,665,000 | | | | 11,785,360 | |
| Mapletree Industrial Trust | | | 8,348,200 | | | | 11,887,484 | |
| Mapletree Logistics Trust | | | 13,083,409 | | | | 12,196,073 | |
| | | | | | | | 46,771,496 | |
| Telecommunications — 1.6% | | | | | | | | |
| M1 | | | 5,102,500 | | | | 6,741,412 | |
| StarHub | | | 4,934,706 | | | | 9,526,040 | |
| | | | | | | | 16,267,452 | |
| TOTAL SINGAPORE | | | | | | | 80,918,800 | |
| SOUTH AFRICA— 1.7% | | | | | | | | |
| Real Estate Investment Trusts — 1.7% | | | | | | | | |
| Emira Property Fund | | | 9,148,074 | | | | 8,480,951 | |
| Redefine Properties | | | 11,115,950 | | | | 8,340,156 | |
| TOTAL SOUTH AFRICA | | | | | | | 16,821,107 | |
| SPAIN— 1.0% | | | | | | | | |
| Utilities — 1.0% | | | | | | | | |
| Saeta Yield | | | 937,427 | | | | 10,471,671 | |
| TAIWAN— 0.9% | | | | | | | | |
| Industrials — 0.9% | | | | | | | | |
| Highwealth Construction | | | 6,444,800 | | | | 8,611,729 | |
| THAILAND— 0.8% | | | | | | | | |
| Financials — 0.8% | | | | | | | | |
| Sansiri NVDR | | | 107,859,800 | | | | 7,597,590 | |
The accompanying notes are an integral part of the financial statements.
| Schedule of Investments | October 31, 2017 |
Global X SuperDividend® ETF
| | | Shares | | | Value | |
| COMMON STOCK — continued |
| TURKEY— 1.0% | | | | | | | | |
| Health Care — 1.0% | | | | | | | | |
| EIS Eczacibasi Ilac ve Sinai ve Finansal Yatirimlar Sanayi ve Ticaret | | | 8,016,415 | | | $ | 9,734,015 | |
| UNITED KINGDOM— 0.8% | | | | | | | | |
| Oil & Gas — 0.8% | | | | | | | | |
| BP ADR | | | 198,387 | | | | 8,068,399 | |
| UNITED STATES— 47.4% | | | | | | | | |
| Consumer Goods — 0.9% | | | | | | | | |
| Vector Group | | | 452,223 | | | | 9,397,194 | |
| Consumer Services — 2.3% | | | | | | | | |
| Gannett | | | 814,032 | | | | 7,082,078 | |
| New Media Investment Group | | | 652,534 | | | | 10,420,968 | |
| RR Donnelley & Sons | | | 534,038 | | | | 4,913,150 | |
| | | | | | | | 22,416,196 | |
| Financials — 20.9% | | | | | | | | |
| AGNC Investment | | | 500,776 | | | | 10,080,621 | |
| Annaly Capital Management | | | 910,242 | | | | 10,431,373 | |
| Anworth Mortgage Asset | | | 1,829,920 | | | | 10,229,253 | |
| Apollo Commercial Real Estate Finance | | | 545,293 | | | | 9,853,445 | |
| Armour Residential | | | 446,575 | | | | 11,186,704 | |
| Artisan Partners Asset Management, Cl A | | | 320,807 | | | | 11,035,761 | |
| Blackstone Mortgage Trust, Cl A | | | 319,137 | | | | 10,158,131 | |
| Capstead Mortgage | | | 940,568 | | | | 8,295,810 | |
| Chimera Investment | | | 524,172 | | | | 9,592,348 | |
| CYS Investments | | | 1,259,138 | | | | 10,073,104 | |
| Invesco Mortgage Capital | | | 625,469 | | | | 10,770,576 | |
| Ladder Capital, Cl A | | | 701,592 | | | | 9,429,396 | |
| MFA Financial | | | 1,220,359 | | | | 10,055,758 | |
| MTGE Investment | | | 611,473 | | | | 11,067,661 | |
| New Residential Investment | | | 593,240 | | | | 10,458,821 | |
| New York Mortgage Trust | | | 1,503,923 | | | | 9,068,656 | |
| PennyMac Mortgage Investment Trust | | | 574,278 | | | | 9,222,905 | |
| Redwood Trust | | | 575,484 | | | | 9,040,854 | |
| Starwood Property Trust | | | 426,263 | | | | 9,168,917 | |
| Two Harbors Investment | | | 1,058,304 | | | | 10,371,379 | |
| Waddell & Reed Financial, Cl A (A) | | | 511,007 | | | | 9,550,721 | |
| | | | | | | | 209,142,194 | |
| Industrials — 2.1% | | | | | | | | |
| Costamare (A) | | | 1,599,869 | | | | 9,935,186 | |
| Nordic American Offshore | | | 47,777 | | | | 62,588 | |
| Ship Finance International (A) | | | 697,971 | | | | 10,399,768 | |
| | | | | | | | 20,397,542 | |
The accompanying notes are an integral part of the financial statements.
| Schedule of Investments | October 31, 2017 |
Global X SuperDividend® ETF
| | | Shares / Face
Amount | | | Value | |
| COMMON STOCK — continued |
| Oil & Gas — 2.9% | | | | | | | | |
| CVR Energy (A) | | | 410,216 | | | $ | 11,260,429 | |
| Pattern Energy Group, Cl A | | | 464,998 | | | | 10,727,504 | |
| Targa Resources | | | 167,073 | | | | 6,933,530 | |
| | | | | | | | 28,921,463 | |
| Real Estate Investment Trusts — 17.5% | | | | | | | | |
| Ashford Hospitality Trust | | | 1,290,002 | | | | 9,068,714 | |
| CBL & Associates Properties (A) | | | 931,743 | | | | 7,304,865 | |
| Franklin Street Properties | | | 787,953 | | | | 7,879,530 | |
| Gaming and Leisure Properties | | | 303,030 | | | | 11,072,716 | |
| Gladstone Commercial | | | 318,510 | | | | 6,898,926 | |
| Global Net Lease | | | 397,551 | | | | 8,587,102 | |
| Government Properties Income Trust | | | 491,979 | | | | 8,939,258 | |
| Hospitality Properties Trust | | | 302,679 | | | | 8,650,566 | |
| Independence Realty Trust | | | 1,095,278 | | | | 11,117,072 | |
| Lexington Realty Trust | | | 863,712 | | | | 8,740,765 | |
| Medical Properties Trust | | | 733,205 | | | | 9,700,302 | |
| New Senior Investment Group | | | 942,782 | | | | 8,428,471 | |
| Omega Healthcare Investors (A) | | | 306,007 | | | | 8,831,362 | |
| Sabra Health Care | | | 814,464 | | | | 16,224,123 | |
| Select Income | | | 373,650 | | | | 9,027,384 | |
| Senior Housing Properties Trust | | | 488,176 | | | | 8,982,438 | |
| Uniti Group | | | 365,980 | | | | 6,404,650 | |
| VEREIT | | | 1,102,281 | | | | 8,696,997 | |
| Washington Prime Group | | | 1,038,877 | | | | 8,134,407 | |
| | | | | | | | 172,689,648 | |
| Telecommunications — 0.8% | | | | | | | | |
| CenturyLink (A) | | | 392,845 | | | | 7,460,126 | |
| TOTAL UNITED STATES | | | | | | | 470,424,363 | |
| TOTAL COMMON STOCK | | | | | | | | |
| (Cost $977,631,036) | | | | | | | 987,288,602 | |
| |
| REPURCHASE AGREEMENTS (B) — 4.8% |
| Barclays Bank | | | | | | | | |
| 1.050%, dated 10/31/17, to be repurchased on 11/01/17 repurchase price $28,047,636 (collateralized by U.S Treasury Obligations, ranging in par value $0-$5,979,809, 0.000%-9.000%, 11/15/17-8/15/47, with a total market value of $28,607,754) | | $ | 28,046,818 | | | | 28,046,818 | |
The accompanying notes are an integral part of the financial statements.
| Schedule of Investments | October 31, 2017 |
Global X SuperDividend® ETF
| | | Face Amount | | | Value | |
| REPURCHASE AGREEMENTS (B) — continued |
| Deutsche Bank | | | | | | | | |
| 1.040%, dated 10/31/17, to be repurchased on 11/01/17 repurchase price $19,169,102 (collateralized by U.S. Treasury Obligations, par value $18,581,991, 3.625%, 02/15/20, with a total market value of $19,537,347) | | $ | 19,168,548 | | | $ | 19,168,548 | |
| | | | | | | | | |
| TOTAL REPURCHASE AGREEMENTS | | | | | | | | |
| (Cost $47,215,366) | | | | | | | 47,215,366 | |
| TOTAL INVESTMENTS — 104.2% | | | | | | | | |
| (Cost $1,024,846,402) | | | | | | $ | 1,034,503,968 | |
Percentages are based on Net Assets of $992,893,431.
| (A) | This security or a partial position of this security is on loan at October 31, 2017. The total value of securities on loan at October 31, 2017 was $45,096,945. |
| (B) | Security was purchased with cash collateral held from securities on loan. The total value of such securities as of October 31, 2017 was $47,215,366. |
ADR — American Depositary Receipt
Cl — Class
GDR — Global Depositary Receipt
NVDR — Non-Voting Depositary Receipt
PJSC — Private Joint Stock Company
The following is a summary of the level of inputs used as of October 31, 2017, in valuing the Fund's investments carried at value:
| Investments in Securities | | Level 1 | | | Level 2 | | | Level 3 | | | Total | |
| Common Stock | | $ | 987,288,602 | | | $ | — | | | $ | — | | | $ | 987,288,602 | |
| Repurchase Agreements | | | — | | | | 47,215,366 | | | | — | | | | 47,215,366 | |
| Total Investments in Securities | | $ | 987,288,602 | | | $ | 47,215,366 | | | $ | — | | | $ | 1,034,503,968 | |
For the year ended October 31, 2017, there have been no transfers between Level 1, Level 2 or Level 3 investments.
As of October 31, 2017, there were no Level 3 investments.
The accompanying notes are an integral part of the financial statements.
| Schedule of Investments | October 31, 2017 |
Global X SuperDividend® U.S. ETF
Sector Weightings (unaudited)†:
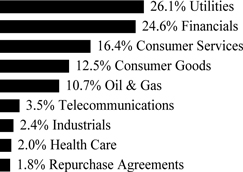
† Sector weightings percentages are based on the total market value of investments. Repurchase agreements purchased from cash collateral received for securities lending activity are included in total investments. Please see Notes 2 and 7 in Notes to Financial Statements for more detailed information.
| | | Shares | | | Value | |
| COMMON STOCK — 81.0% |
| UNITED STATES— 81.0% | | | | | | | | |
| Consumer Goods — 12.7% | | | | | | | | |
| Altria Group | | | 113,081 | | | $ | 7,262,062 | |
| B&G Foods (A) | | | 178,807 | | | | 5,686,063 | |
| Coca-Cola | | | 200,397 | | | | 9,214,254 | |
| Flowers Foods | | | 440,340 | | | | 8,379,670 | |
| Philip Morris International | | | 79,773 | | | | 8,347,447 | |
| Universal | | | 122,236 | | | | 7,010,234 | |
| Vector Group | | | 389,235 | | | | 8,088,303 | |
| | | | | | | | 53,988,033 | |
| Consumer Services — 12.9% | | | | | | | | |
| DineEquity | | | 139,317 | | | | 6,632,882 | |
| DSW, Cl A | | | 389,851 | | | | 7,465,647 | |
| H&R Block | | | 403,286 | | | | 9,977,296 | |
| Regal Entertainment Group, Cl A (A) | | | 390,850 | | | | 6,390,397 | |
| Six Flags Entertainment | | | 133,273 | | | | 8,368,212 | |
| Student Transportation | | | 1,509,506 | | | | 8,845,705 | |
| Target | | | 125,606 | | | | 7,415,778 | |
| | | | | | | | 55,095,917 | |
| Financials — 23.1% | | | | | | | | |
| AGNC Investment | | | 437,052 | | | | 8,797,857 | |
| Annaly Capital Management | | | 796,791 | | | | 9,131,225 | |
| Apollo Commercial Real Estate Finance | | | 483,105 | | | | 8,729,707 | |
| Armour Residential (A) | | | 391,362 | | | | 9,803,618 | |
| Chimera Investment | | | 461,004 | | | | 8,436,373 | |
| CYS Investments | | | 1,120,149 | | | | 8,961,192 | |
| MFA Financial | | | 1,075,375 | | | | 8,861,090 | |
The accompanying notes are an integral part of the financial statements.
| Schedule of Investments | October 31, 2017 |
Global X SuperDividend® U.S. ETF
| | | Shares | | | Value | |
| COMMON STOCK — continued |
| Financials — continued | | | | | | | | |
| MTGE Investment | | | 538,211 | | | $ | 9,741,619 | |
| New York Mortgage Trust | | | 1,345,053 | | | | 8,110,670 | |
| PennyMac Mortgage Investment Trust | | | 510,509 | | | | 8,198,775 | |
| Two Harbors Investment | | | 945,673 | | | | 9,267,595 | |
| | | | | | | | 98,039,721 | |
| Health Care — 2.0% | | | | | | | | |
| Pfizer | | | 245,222 | | | | 8,597,484 | |
| Industrials — 2.4% | | | | | | | | |
| Fortress Transportation & Infrastructure Investors | | | 569,679 | | | | 10,385,248 | |
| Oil & Gas — 2.0% | | | | | | | | |
| ExxonMobil | | | 100,407 | | | | 8,368,924 | |
| Telecommunications — 3.5% | | | | | | | | |
| AT&T | | | 201,677 | | | | 6,786,431 | |
| Verizon Communications | | | 170,068 | | | | 8,141,155 | |
| | | | | | | | 14,927,586 | |
| Utilities — 22.4% | | | | | | | | |
| Ameren | | | 154,649 | | | | 9,586,692 | |
| Avangrid | | | 202,505 | | | | 10,475,583 | |
| Avista | | | 208,464 | | | | 10,890,159 | |
| Consolidated Edison | | | 111,623 | | | | 9,605,159 | |
| Duke Energy | | | 104,864 | | | | 9,260,540 | |
| Entergy | | | 111,852 | | | | 9,648,353 | |
| FirstEnergy | | | 267,047 | | | | 8,799,199 | |
| Northwest Natural Gas | | | 140,023 | | | | 9,290,526 | |
| PPL | | | 234,812 | | | | 8,819,539 | |
| Southern | | | 172,119 | | | | 8,984,612 | |
| | | | | | | | 95,360,362 | |
| TOTAL COMMON STOCK | | | | | | | | |
| (Cost $320,162,672) | | | | | | | 344,763,275 | |
| |
| MASTER LIMITED PARTNERSHIPS — 18.7% |
| CANADA— 2.2% | | | | | | | | |
| Utilities — 2.2% | | | | | | | | |
| Brookfield Renewable Partners | | | 280,786 | | | | 9,473,720 | |
| UNITED STATES— 16.5% | | | | | | | | |
| Consumer Services — 3.7% | | | | | | | | |
| Cedar Fair | | | 125,877 | | | | 7,879,900 | |
| CrossAmerica Partners | | | 312,386 | | | | 8,015,825 | |
| | | | | | | | 15,895,725 | |
| Financials — 1.9% | | | | | | | | |
| Ellington Financial | | | 532,519 | | | | 8,136,890 | |
The accompanying notes are an integral part of the financial statements.
| Schedule of Investments | October 31, 2017 |
Global X SuperDividend® U.S. ETF
| | | Shares / Face
Amount | | | Value | |
| MASTER LIMITED PARTNERSHIPS — continued |
| Oil & Gas — 9.0% | | | | | | | | |
| Delek Logistics Partners | | | 255,458 | | | $ | 7,842,561 | |
| PBF Logistics | | | 399,435 | | | | 7,868,869 | |
| Phillips 66 Partners | | | 147,185 | | | | 7,419,596 | |
| Transmontaigne Partners | | | 192,702 | | | | 8,008,695 | |
| Valero Energy Partners | | | 164,481 | | | | 7,066,104 | |
| | | | | | | | 38,205,825 | |
| Utilities — 1.9% | | | | | | | | |
| AmeriGas Partners | | | 172,110 | | | | 7,787,977 | |
| | | | | | | | | |
| TOTAL UNITED STATES | | | | | | | 70,026,417 | |
| TOTAL MASTER LIMITED PARTNERSHIPS | | | | | | | | |
| (Cost $77,066,779) | | | | | | | 79,500,137 | |
| |
| REPURCHASE AGREEMENTS (B) — 1.8% |
| Barclays Bank | | | | | | | | |
| 1.050%, dated 10/31/17, to be repurchased on 11/01/17 repurchase price $4,570,668 (collateralized by U.S Treasury Obligations, ranging in par value $0-$1,524,261, 0.000%-9.000%, 11/15/17-8/15/47, with a total market value of $4,661,945) | | $ | 4,570,535 | | | | 4,570,535 | |
| Deutsche Bank | | | | | | | | |
| 1.040%, dated 10/31/17, to be repurchased on 11/01/17 repurchase price $3,123,796 (collateralized by U.S. Treasury Obligations, par value $3,028,183, 3.625%, 02/15/20, with a total market value of $3,183,824) | | | 3,123,724 | | | | 3,123,724 | |
| | | | | | | | | |
| TOTAL REPURCHASE AGREEMENTS | | | | | | | | |
| (Cost $7,694,259) | | | | | | | 7,694,259 | |
| TOTAL INVESTMENTS — 101.5% | | | | | | | | |
| (Cost $404,923,710) | | | | | | $ | 431,957,671 | |
Percentages are based on Net Assets of $425,579,275.
| (A) | This security or a partial position of this security is on loan at October 31, 2017. The total value of securities on loan at October 31, 2017 was $7,507,034. |
| (B) | Security was purchased with cash collateral held from securities on loan. The total value of such securities as of October 31, 2017 was $7,694,259. |
Cl — Class
The accompanying notes are an integral part of the financial statements.
| Schedule of Investments | October 31, 2017 |
Global X SuperDividend® U.S. ETF
The following is a summary of the level of inputs used as of October 31, 2017, in valuing the Fund's investments carried at value:
| Investments in Securities | | Level 1 | | | Level 2 | | | Level 3 | | | Total | |
| Common Stock | | $ | 344,763,275 | | | $ | — | | | $ | — | | | $ | 344,763,275 | |
| Master Limited Partnerships | | | 79,500,137 | | | | — | | | | — | | | | 79,500,137 | |
| Repurchase Agreements | | | — | | | | 7,694,259 | | | | — | | | | 7,694,259 | |
| Total Investments in Securities | | $ | 424,263,412 | | | $ | 7,694,259 | | | $ | — | | | $ | 431,957,671 | |
For the year ended October 31, 2017, there have been no transfers between Level 1, Level 2 or Level 3 investments.
As of October 31, 2017, there were no Level 3 investments.
The accompanying notes are an integral part of the financial statements.
| Schedule of Investments | October 31, 2017 |
Global X MSCI SuperDividend® EAFE ETF
Sector Weightings (unaudited)†:
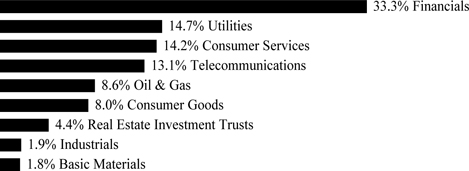
† Sector weightings percentages are based on the total market value of investments.
| | | Shares | | | Value | |
| COMMON STOCK — 100.0% |
| AUSTRALIA— 13.7% | | | | | | | | |
| Basic Materials — 1.8% | | | | | | | | |
| Fortescue Metals Group | | | 9,124 | | | $ | 32,460 | |
| Consumer Services — 2.0% | | | | | | | | |
| Harvey Norman Holdings | | | 12,517 | | | | 36,278 | |
| Financials — 6.4% | | | | | | | | |
| Bank of Queensland | | | 4,086 | | | | 41,856 | |
| Bendigo and Adelaide Bank | | | 3,973 | | | | 34,667 | |
| National Australia Bank | | | 1,573 | | | | 39,391 | |
| | | | | | | | 115,914 | |
| Industrials — 1.9% | | | | | | | | |
| Aurizon Holdings | | | 8,769 | | | | 34,828 | |
| Telecommunications — 1.6% | | | | | | | | |
| Telstra | | | 10,788 | | | | 29,282 | |
| TOTAL AUSTRALIA | | | | | | | 248,762 | |
| FINLAND— 2.7% | | | | | | | | |
| Utilities — 2.7% | | | | | | | | |
| Fortum | | | 2,276 | | | | 48,335 | |
| FRANCE— 13.8% | | | | | | | | |
| Consumer Services — 5.3% | | | | | | | | |
| Casino Guichard Perrachon | | | 595 | | | | 33,988 | |
| Lagardere SCA | | | 1,145 | | | | 37,715 | |
| SES, Cl A | | | 1,510 | | | | 24,557 | |
| | | | | | | | 96,260 | |
| Financials — 2.1% | | | | | | | | |
| Credit Agricole | | | 2,220 | | | | 38,741 | |
| Oil & Gas — 2.0% | | | | | | | | |
| Total | | | 656 | | | | 36,582 | |
The accompanying notes are an integral part of the financial statements.
| Schedule of Investments | October 31, 2017 |
Global X MSCI SuperDividend® EAFE ETF
| | | Shares | | | Value | |
| COMMON STOCK — continued |
| Real Estate Investment Trusts — 2.2% | | | | | | | | |
| ICADE | | | 447 | | | $ | 39,055 | |
| Utilities — 2.2% | | | | | | | | |
| Engie | | | 2,357 | | | | 39,841 | |
| TOTAL FRANCE | | | | | | | 250,479 | |
| HONG KONG— 7.2% | | | | | | | | |
| Consumer Services — 2.1% | | | | | | | | |
| Sands China | | | 8,172 | | | | 38,494 | |
| Telecommunications — 3.1% | | | | | | | | |
| HKT Trust & HKT | | | 27,440 | | | | 33,518 | |
| PCCW | | | 41,700 | | | | 22,983 | |
| | | | | | | | 56,501 | |
| Utilities — 2.0% | | | | | | | | |
| HK Electric Investments & HK Electric Investments (A) | | | 38,921 | | | | 35,819 | |
| TOTAL HONG KONG | | | | | | | 130,814 | |
| ITALY— 8.3% | | | | | | | | |
| Financials — 6.2% | | | | | | | | |
| Intesa Sanpaolo | | | 11,349 | | | | 38,156 | |
| Intesa Sanpaolo | | | 11,928 | | | | 37,629 | |
| Poste Italiane (A) | | | 4,992 | | | | 36,492 | |
| | | | | | | | 112,277 | |
| Utilities — 2.1% | | | | | | | | |
| Snam | | | 7,323 | | | | 37,416 | |
| TOTAL ITALY | | | | | | | 149,693 | |
| LUXEMBOURG— 1.2% | | | | | | | | |
| Consumer Services — 1.2% | | | | | | | | |
| RTL Group | | | 300 | | | | 22,259 | |
| NETHERLANDS— 2.1% | | | | | | | | |
| Financials — 2.1% | | | | | | | | |
| ING Groep | | | 2,106 | | | | 38,910 | |
| NEW ZEALAND— 2.0% | | | | | | | | |
| Telecommunications — 2.0% | | | | | | | | |
| Spark New Zealand | | | 14,186 | | | | 35,763 | |
| NORWAY— 2.1% | | | | | | | | |
| Consumer Goods — 2.1% | | | | | | | | |
| Marine Harvest | | | 1,926 | | | | 37,546 | |
| PORTUGAL— 2.0% | | | | | | | | |
| Utilities — 2.0% | | | | | | | | |
| Energias de Portugal | | | 10,264 | | | | 36,624 | |
The accompanying notes are an integral part of the financial statements.
| Schedule of Investments | October 31, 2017 |
Global X MSCI SuperDividend® EAFE ETF
| | | Shares | | | Value | |
| COMMON STOCK — continued |
| SINGAPORE— 4.1% | | | | | | | | |
| Real Estate Investment Trusts — 2.2% | | | | | | | | |
| Ascendas | | | 19,330 | | | $ | 38,876 | |
| Telecommunications — 1.9% | | | | | | | | |
| StarHub | | | 18,251 | | | | 35,232 | |
| TOTAL SINGAPORE | | | | | | | 74,108 | |
| SPAIN— 4.0% | | | | | | | | |
| Financials — 2.1% | | | | | | | | |
| Banco Bilbao Vizcaya Argentaria | | | 4,286 | | | | 37,512 | |
| Utilities — 1.9% | | | | | | | | |
| Endesa | | | 1,496 | | | | 34,245 | |
| TOTAL SPAIN | | | | | | | 71,757 | |
| SWEDEN— 8.4% | | | | | | | | |
| Financials — 5.9% | | | | | | | | |
| Nordea Bank | | | 2,709 | | | | 32,747 | |
| Skandinaviska Enskilda Banken, Cl A | | | 2,957 | | | | 36,451 | |
| Swedbank, Cl A | | | 1,509 | | | | 37,456 | |
| | | | | | | | 106,654 | |
| Telecommunications — 2.5% | | | | | | | | |
| Tele2, Cl B | | | 3,597 | | | | 45,758 | |
| TOTAL SWEDEN | | | | | | | 152,412 | |
| SWITZERLAND— 2.0% | | | | | | | | |
| Financials — 2.0% | | | | | | | | |
| Zurich Insurance Group | | | 121 | | | | 36,963 | |
| UNITED KINGDOM— 26.4% | | | | | | | | |
| Consumer Goods — 5.9% | | | | | | | | |
| Berkeley Group Holdings | | | 811 | | | | 40,289 | |
| Persimmon | | | 1,123 | | | | 41,786 | |
| Taylor Wimpey | | | 9,400 | | | | 24,903 | |
| | | | | | | | 106,978 | |
| Consumer Services — 3.6% | | | | | | | | |
| Next | | | 440 | | | | 28,753 | |
| Pearson | | | 3,911 | | | | 36,537 | |
| | | | | | | | 65,290 | |
| Financials — 6.5% | | | | | | | | |
| Direct Line Insurance Group | | | 7,767 | | | | 38,338 | |
| HSBC Holdings | | | 4,105 | | | | 40,029 | |
| Legal & General Group | | | 10,965 | | | | 38,878 | |
| | | | | | | | 117,245 | |
| Oil & Gas — 6.6% | | | | | | | | |
| BP | | | 5,783 | | | | 39,181 | |
| Royal Dutch Shell, Cl A | | | 1,289 | | | | 40,491 | |
The accompanying notes are an integral part of the financial statements.
| Schedule of Investments | October 31, 2017 |
Global X MSCI SuperDividend® EAFE ETF
| | | Shares | | | Value | |
| COMMON STOCK — continued |
| Oil & Gas — continued | | | | | | | | |
| Royal Dutch Shell, Cl B | | | 1,261 | | | $ | 40,549 | |
| | | | | | | | 120,221 | |
| Telecommunications — 2.0% | | | | | | | | |
| Vodafone Group | | | 12,396 | | | | 35,491 | |
| Utilities — 1.8% | | | | | | | | |
| SSE | | | 1,809 | | | | 33,199 | |
| TOTAL UNITED KINGDOM | | | | | | | 478,424 | |
| TOTAL INVESTMENTS — 100.0% | | | | | | | | |
| (Cost $1,664,206) | | | | | | $ | 1,812,849 | |
Percentages are based on Net Assets of $1,813,210.
| (A) | Security sold within terms of a private placement memorandum, exempt from registration under Section 144A of the Securities Act of 1933, as amended, and may be sold only to dealers in that program or other "accredited investors." The total value of such securities as of October 31, 2017 was $72,311 and represents 4.0% of Net Assets. |
Cl — Class
As of October 31, 2017, all of the Fund's investments were considered Level 1, in accordance with authoritative guidance on fair value measurements and disclosure under U.S. GAAP.
For the period ended October 31, 2017, there have been no transfers between Level 1, Level 2 or Level 3 investments.
The accompanying notes are an integral part of the financial statements.
| Schedule of Investments | October 31, 2017 |
Global X MSCI SuperDividend® Emerging Markets ETF
Sector Weightings (unaudited)†:
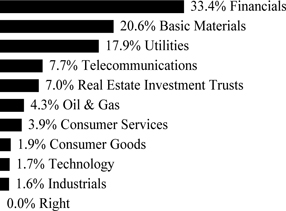
† Sector weightings percentages are based on the total market value of investments.
| | | Shares | | | Value | |
| COMMON STOCK — 89.6% |
| BRAZIL— 7.8% | | | | | | | | |
| Financials — 2.0% | | | | | | | | |
| Itausa - Investimentos Itau | | | 79,300 | | | $ | 254,043 | |
| Utilities — 5.8% | | | | | | | | |
| EDP - Energias do Brasil | | | 62,854 | | | | 276,675 | |
| Engie Brasil Energia | | | 22,700 | | | | 248,417 | |
| Transmissora Alianca de Energia Eletrica | | | 34,620 | | | | 216,947 | |
| | | | | | | | 742,039 | |
| TOTAL BRAZIL | | | | | | | 996,082 | |
| CHINA— 5.8% | | | | | | | | |
| Basic Materials — 2.0% | | | | | | | | |
| Sinopec Shanghai Petrochemical, Cl H | | | 415,900 | | | | 247,882 | |
| Consumer Goods — 1.9% | | | | | | | | |
| Chongqing Changan Automobile, Cl B | | | 183,530 | | | | 240,181 | |
| Financials — 1.9% | | | | | | | | |
| Bank of Communications, Cl H | | | 328,280 | | | | 247,416 | |
| TOTAL CHINA | | | | | | | 735,479 | |
| CZECH REPUBLIC— 3.9% | | | | | | | | |
| Financials — 1.9% | | | | | | | | |
| Moneta Money Bank (A) | | | 71,800 | | | | 245,449 | |
| Telecommunications — 2.0% | | | | | | | | |
| O2 Czech Republic | | | 21,170 | | | | 257,859 | |
| TOTAL CZECH REPUBLIC | | | | | | | 503,308 | |
The accompanying notes are an integral part of the financial statements.
| Schedule of Investments | October 31, 2017 |
Global X MSCI SuperDividend® Emerging Markets ETF
| | | Shares | | | Value | |
| COMMON STOCK — continued |
| EGYPT— 2.3% | | | | | | | | |
| Financials — 2.3% | | | | | | | | |
| Egyptian Financial Group-Hermes Holding | | | 222,610 | | | $ | 296,111 | |
| GREECE— 2.1% | | | | | | | | |
| Consumer Services — 2.1% | | | | | | | | |
| OPAP | | | 23,620 | | | | 264,704 | |
| HONG KONG— 1.9% | | | | | | | | |
| Utilities — 1.9% | | | | | | | | |
| China Resources Power Holdings | | | 124,450 | | | | 239,272 | |
| INDIA— 4.5% | | | | | | | | |
| Basic Materials — 2.8% | | | | | | | | |
| Vedanta | | | 69,032 | | | | 353,679 | |
| Financials — 1.7% | | | | | | | | |
| Power Finance | | | 102,810 | | | | 221,029 | |
| TOTAL INDIA | | | | | | | 574,708 | |
| MALAYSIA— 3.4% | | | | | | | | |
| Utilities — 3.4% | | | | | | | | |
| YTL | | | 717,631 | | | | 215,281 | |
| YTL Power International | | | 717,621 | | | | 220,363 | |
| TOTAL MALAYSIA | | | | | | | 435,644 | |
| MEXICO— 3.4% | | | | | | | | |
| Financials — 1.8% | | | | | | | | |
| Grupo Financiero Santander Mexico, Cl B | | | 131,585 | | | | 222,102 | |
| Real Estate Investment Trusts — 1.6% | | | | | | | | |
| Fibra Uno Administracion | | | 132,800 | | | | 209,437 | |
| TOTAL MEXICO | | | | | | | 431,539 | |
| PAKISTAN— 4.9% | | | | | | | | |
| Basic Materials — 1.4% | | | | | | | | |
| Engro | | | 69,430 | | | | 183,253 | |
| Financials — 3.5% | | | | | | | | |
| MCB Bank | | | 109,210 | | | | 206,093 | |
| United Bank | | | 136,000 | | | | 231,226 | |
| | | | | | | | 437,319 | |
| TOTAL PAKISTAN | | | | | | | 620,572 | |
| QATAR— 3.4% | | | | | | | | |
| Financials — 3.4% | | | | | | | | |
| Barwa Real Estate | | | 25,930 | | | | 213,736 | |
| Doha Bank QPSC | | | 28,366 | | | | 219,713 | |
| TOTAL QATAR | | | | | | | 433,449 | |
The accompanying notes are an integral part of the financial statements.
| Schedule of Investments | October 31, 2017 |
Global X MSCI SuperDividend® Emerging Markets ETF
| | | Shares | | | Value | |
| COMMON STOCK — continued |
| RUSSIA— 17.4% | | | | | | | | |
| Basic Materials — 8.9% | | | | | | | | |
| Alrosa PJSC | | | 189,100 | | | $ | 243,725 | |
| MMC Norilsk Nickel | | | 1,643 | | | | 298,268 | |
| Novolipetsk Steel PJSC | | | 128,690 | | | | 293,815 | |
| Severstal PJSC | | | 19,068 | | | | 293,575 | |
| | | | | | | | 1,129,383 | |
| Financials — 2.2% | | | | | | | | |
| Moscow Exchange MICEX-RTS PJSC | | | 137,270 | | | | 277,666 | |
| Oil & Gas — 4.2% | | | | | | | | |
| Gazprom PJSC | | | 127,700 | | | | 275,555 | |
| Lukoil PJSC | | | 4,920 | | | | 261,070 | |
| | | | | | | | 536,625 | |
| Telecommunications — 2.1% | | | | | | | | |
| Sistema PJSC FC GDR | | | 61,760 | | | | 272,130 | |
| TOTAL RUSSIA | | | | | | | 2,215,804 | |
| SOUTH AFRICA— 14.8% | | | | | | | | |
| Consumer Services — 1.8% | | | | | | | | |
| Truworths International | | | 43,690 | | | | 232,828 | |
| Financials — 6.2% | | | | | | | | |
| Barclays Africa Group | | | 36,620 | | | | 362,905 | |
| Liberty Holdings | | | 30,280 | | | | 237,764 | |
| MMI Holdings | | | 148,470 | | | | 197,383 | |
| | | | | | | | 798,052 | |
| Real Estate Investment Trusts — 5.3% | | | | | | | | |
| Fortress Income Fund, Cl A | | | 190,370 | | | | 227,912 | |
| Growthpoint Properties | | | 129,370 | | | | 224,228 | |
| Redefine Properties | | | 297,460 | | | | 223,180 | |
| | | | | | | | 675,320 | |
| Telecommunications — 1.5% | | | | | | | | |
| Telkom SOC | | | 49,500 | | | | 185,381 | |
| TOTAL SOUTH AFRICA | | | | | | | 1,891,581 | |
| TAIWAN— 5.1% | | | | | | | | |
| Financials — 1.8% | | | | | | | | |
| Mega Financial Holding | | | 303,210 | | | | 238,269 | |
| Industrials — 1.6% | | | | | | | | |
| Highwealth Construction | | | 148,280 | | | | 198,136 | |
| Technology — 1.7% | | | | | | | | |
| Pegatron | | | 82,400 | | | | 213,107 | |
| TOTAL TAIWAN | | | | | | | 649,512 | |
The accompanying notes are an integral part of the financial statements.
| Schedule of Investments | October 31, 2017 |
Global X MSCI SuperDividend® Emerging Markets ETF
| | | Shares | | | Value | |
| COMMON STOCK — continued |
| TURKEY— 4.2% | | | | | | | | |
| Basic Materials — 2.2% | | | | | | | | |
| Petkim Petrokimya Holding | | | 159,860 | | | $ | 279,588 | |
| Telecommunications — 2.0% | | | | | | | | |
| Turkcell Iletisim Hizmetleri | | | 68,100 | | | | 254,172 | |
| TOTAL TURKEY | | | | | | | 533,760 | |
| UNITED ARAB EMIRATES— 4.7% | | | | | | | | |
| Financials — 4.7% | | | | | | | | |
| DAMAC Properties Dubai PJSC | | | 314,875 | | | | 338,653 | |
| Dubai Islamic Bank PJSC | | | 156,310 | | | | 260,471 | |
| TOTAL UNITED ARAB EMIRATES | | | | | | | 599,124 | |
| TOTAL COMMON STOCK | | | | | | | | |
| (Cost $11,402,399) | | | | | | | 11,420,649 | |
| |
| PREFERRED STOCK — 9.9% |
| BRAZIL— 9.9% | | | | | | | | |
| Basic Materials — 3.2% | | | | | | | | |
| Braskem*(B) | | | 25,750 | | | | 412,145 | |
| Utilities — 6.7% | | | | | | | | |
| Centrais Eletricas Brasileiras(B) | | | 49,654 | | | | 384,622 | |
| Cia Energetica de Minas Gerais(B) | | | 110,553 | | | | 261,230 | |
| Cia Paranaense de Energia(B) | | | 27,100 | | | | 207,018 | |
| | | | | | | | 852,870 | |
| TOTAL BRAZIL | | | | | | | 1,265,015 | |
| TOTAL PREFERRED STOCK | | | | | | | | |
| (Cost $1,034,103) | | | | | | | 1,265,015 | |
| | | Number Of
Rights | | | | |
| RIGHT — 0.0% |
| Brazil — 0.0% | | | | | | | | |
| Cia Energetica de Minas Gerais, 11/29/17* (Cost $–) | | | 17,564 | | | | 6,282 | |
| | | | | | | | | |
| TOTAL INVESTMENTS — 99.5% | | | | | | | | |
| (Cost $12,436,502) | | | | | | $ | 12,691,946 | |
Percentages are based on Net Assets of $12,748,327.
| * | Non-income producing security. |
| (A) | Security sold within terms of a private placement memorandum, exempt from registration under Section 144A of the Securities Act of 1933, as amended, and may be sold only to dealers in that program or other "accredited investors." The total value of such securities as of October 31, 2017 was $245,449 and represents 1.9% of Net Assets. |
| (B) | There’s currently no stated interest rate. |
The accompanying notes are an integral part of the financial statements.
| Schedule of Investments | October 31, 2017 |
Global X MSCI SuperDividend® Emerging Markets ETF
Cl — Class
GDR — Global Depositary Receipt
PJSC — Public Joint Stock Company
As of October 31, 2017, all of the Fund's investments were considered Level 1, in accordance with authoritative guidance on fair value measurements and disclosure under U.S. GAAP.
For the year ended October 31, 2017, there have been no transfers between Level 1, Level 2 or Level 3 investments.
The accompanying notes are an integral part of the financial statements.
| Schedule of Investments | October 31, 2017 |
Global X SuperDividend® REIT ETF
Sector Weightings (unaudited)†:

† Sector weightings percentages are based on the total market value of investments.
| | | Shares | | | Value | |
| COMMON STOCK — 99.4% |
| AUSTRALIA— 9.5% | | | | | | | | |
| Real Estate Investment Trusts — 9.5% | | | | | | | | |
| Charter Hall Retail | | | 508,994 | | | $ | 1,584,496 | |
| Stockland | | | 532,100 | | | | 1,844,099 | |
| Vicinity Centres | | | 744,702 | | | | 1,513,146 | |
| TOTAL AUSTRALIA | | | | | | | 4,941,741 | |
| CANADA— 9.7% | | | | | | | | |
| Real Estate Investment Trusts — 9.7% | | | | | | | | |
| Artis | | | 174,631 | | | | 1,884,351 | |
| Cominar | | | 148,298 | | | | 1,592,153 | |
| H&R | | | 94,939 | | | | 1,577,530 | |
| TOTAL CANADA | | | | | | | 5,054,034 | |
| NETHERLANDS— 3.3% | | | | | | | | |
| Real Estate Investment Trusts — 3.3% | | | | | | | | |
| Wereldhave | | | 37,900 | | | | 1,722,567 | |
| SINGAPORE— 14.8% | | | | | | | | |
| Real Estate Investment Trusts — 14.8% | | | | | | | | |
| Ascendas | | | 968,777 | | | | 1,948,362 | |
| CapitaLand Commercial Trust | | | 1,565,952 | | | | 1,994,221 | |
| CapitaLand Mall Trust | | | 1,189,092 | | | | 1,763,040 | |
| Suntec | | | 1,385,200 | | | | 1,982,634 | |
| TOTAL SINGAPORE | | | | | | | 7,688,257 | |
| UNITED STATES— 62.1% | | | | | | | | |
| Financials — 45.8% | | | | | | | | |
| AGNC Investment | | | 86,305 | | | | 1,737,320 | |
| Annaly Capital Management | | | 162,691 | | | | 1,864,439 | |
| Apollo Commercial Real Estate Finance | | | 95,997 | | | | 1,734,666 | |
| Armour Residential | | | 75,938 | | | | 1,902,247 | |
| Blackstone Mortgage Trust, Cl A | | | 52,553 | | | | 1,672,762 | |
| Capstead Mortgage | | | 151,088 | | | | 1,332,596 | |
| Chimera Investment | | | 93,855 | | | | 1,717,547 | |
| MFA Financial | | | 209,393 | | | | 1,725,398 | |
| MTGE Investment | | | 101,973 | | | | 1,845,711 | |
| New Residential Investment | | | 104,210 | | | | 1,837,222 | |
| Orchid Island Capital, Cl A | | | 143,948 | | | | 1,433,722 | |
| PennyMac Mortgage Investment Trust | | | 96,640 | | | | 1,552,038 | |
| Starwood Property Trust | | | 72,733 | | | | 1,564,487 | |
The accompanying notes are an integral part of the financial statements.
| Schedule of Investments | October 31, 2017 |
Global X SuperDividend® REIT ETF
| | | Shares | | | Value | |
| COMMON STOCK — continued |
| Financials — continued | | | | | | | | |
| Two Harbors Investment | | | 191,630 | | | $ | 1,877,974 | |
| | | | | | | | 23,798,129 | |
| Real Estate Investment Trusts — 16.3% | | | | | | | | |
| Apple Hospitality | | | 80,518 | | | | 1,525,011 | |
| Chesapeake Lodging Trust | | | 63,298 | | | | 1,766,014 | |
| Gaming and Leisure Properties | | | 52,573 | | | | 1,921,016 | |
| Hospitality Properties Trust | | | 51,627 | | | | 1,475,500 | |
| WP Carey | | | 26,210 | | | | 1,786,212 | |
| | | | | | | | 8,473,753 | |
| TOTAL COMMON STOCK (Cost $50,362,335) | | | | | | | 32,271,882 | |
| TOTAL INVESTMENTS — 99.4% | | | | | | | | |
| (Cost $50,362,335) | | | | | | $ | 51,678,481 | |
Percentages are based on Net Assets of $51,986,120.
Cl — Class
As of October 31, 2017, all of the Fund's investments were considered Level 1, in accordance with authoritative guidance on fair value measurements and disclosure under U.S. GAAP.
For the year ended October 31, 2017, there have been no transfers between Level 1, Level 2 or Level 3 investments.
The accompanying notes are an integral part of the financial statements.
| Schedule of Investments | October 31, 2017 |
Global X SuperIncome™ Preferred ETF
Sector Weightings (unaudited)†:
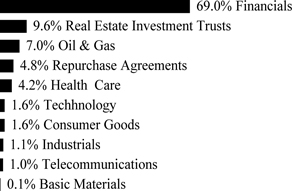
† Sector weightings percentages are based on the total market value of investments. Repurchase agreements purchased from cash collateral received for securities lending activity are included in total investments. Please see Notes 2 and 7 in Notes to Financial Statements for more detailed information.
| | | Shares | | | Value | |
| PREFERRED STOCK — 99.4% |
| GERMANY— 5.0% | | | | | | | | |
| Financials — 5.0% | | | | | | | | |
| Deutsche Bank Contingent Capital Trust II, 6.550%(A) | | | 87,308 | | | $ | 2,247,308 | |
| Deutsche Bank Contingent Capital Trust III, 7.600% | | | 216,405 | | | | 5,635,186 | |
| Deutsche Bank Contingent Capital Trust V, 8.050% | | | 152,049 | | | | 4,009,532 | |
| TOTAL GERMANY | | | | | | | 11,892,026 | |
| NETHERLANDS— 7.4% | | | | | | | | |
| Financials — 7.4% | | | | | | | | |
| Aegon, 8.000% | | | 137,510 | | | | 3,613,763 | |
| Aegon, 6.375% | | | 267,275 | | | | 6,922,423 | |
| ING Groep, 6.375% | | | 278,164 | | | | 7,148,815 | |
| TOTAL NETHERLANDS | | | | | | | 17,685,001 | |
| UNITED KINGDOM— 12.1% | | | | | | | | |
| Financials — 12.1% | | | | | | | | |
| Barclays Bank, Ser 5, 8.125% | | | 452,132 | | | | 12,062,882 | |
| HSBC Holdings, 8.125%(A) | | | 163,246 | | | | 4,445,188 | |
| HSBC Holdings, Ser 2, 8.000%(A) | | | 280,163 | | | | 7,536,385 | |
| Royal Bank of Scotland Group, Ser S, 6.600% | | | 174,970 | | | | 4,487,980 | |
| TOTAL UNITED KINGDOM | | | | | | | 28,532,435 | |
| UNITED STATES— 74.9% | | | | | | | | |
| Basic Materials — 0.1% | | | | | | | | |
| NuStar Logistics, 7.625%, VAR ICE LIBOR USD 3 Month+6.734% | | | 7,279 | | | | 182,848 | |
| Consumer Goods — 1.7% | | | | | | | | |
| CHS, Ser 4, 7.500% | | | 138,639 | | | | 3,972,007 | |
The accompanying notes are an integral part of the financial statements.
| Schedule of Investments | October 31, 2017 |
Global X SuperIncome™ Preferred ETF
| | | Shares | | | Value | |
| PREFERRED STOCK — continued |
| Financials — 47.5% | | | | | | | | |
| AGNC Investment, 7.000%, VAR ICE LIBOR USD 3 Month+5.111%(A) | | | 50,634 | | | $ | 1,354,459 | |
| Allstate, Ser E, 6.625% | | | 186,918 | | | | 5,015,010 | |
| AmTrust Financial Services, 6.950% | | | 77,773 | | | | 1,796,556 | |
| Annaly Capital Management, 7.625% | | | 67,393 | | | | 1,711,108 | |
| Annaly Capital Management, 6.950%, VAR ICE LIBOR USD 3 Month+4.993% | | | 164,994 | | | | 4,355,842 | |
| Apollo Global Management, 6.375%(A) | | | 73,380 | | | | 1,924,757 | |
| Ares Management, 7.000% | | | 68,439 | | | | 1,835,534 | |
| Bank of America, 6.625% | | | 11,645 | | | | 302,886 | |
| Bank of America, 6.625% | | | 104,949 | | | | 2,833,623 | |
| Capital One Financial, Ser B, 6.000% | | | 28,101 | | | | 713,484 | |
| Capital One Financial, Ser C, 6.250% | | | 120,178 | | | | 3,208,753 | |
| Capital One Financial, Ser D, 6.700% | | | 132,732 | | | | 3,590,401 | |
| Charles Schwab, 6.000% | | | 17,294 | | | | 438,922 | |
| Chimera Investment, 8.000%, VAR ICE LIBOR USD 3 Month+5.791% | | | 87,294 | | | | 2,256,550 | |
| Citigroup, 6.875%, VAR ICE LIBOR USD 3 Month+4.130% | | | 31,540 | | | | 911,191 | |
| Citigroup, Ser J, 7.125%, VAR ICE LIBOR USD 3 Month+4.040% | | | 84,962 | | | | 2,446,906 | |
| Citigroup, Ser L, 6.875% | | | 46,122 | | | | 1,244,833 | |
| Citigroup Capital XIII, 7.750%, VAR ICE LIBOR USD 3 Month+6.370% | | | 222,879 | | | | 6,066,766 | |
| Countrywide Capital V, 7.000% | | | 235,901 | | | | 6,057,938 | |
| Discover Financial Services, Ser B, 6.500% | | | 151,864 | | | | 3,857,346 | |
| GMAC Capital Trust I, Ser 2, 7.100%, VAR ICE LIBOR USD 3 Month+5.785% | | | 450,752 | | | | 11,836,747 | |
| Hartford Financial Services Group, 7.875%, VAR ICE LIBOR USD 3 Month+5.596% | | | 161,479 | | | | 4,833,066 | |
| Huntington Bancshares, 6.250% | | | 160,347 | | | | 4,451,233 | |
| Invesco Mortgage Capital, 7.500%, VAR ICE LIBOR USD 3 Month+5.289% | | | 68,008 | | | | 1,728,763 | |
| JPMorgan Chase, Ser T, 6.700% | | | 243,762 | | | | 6,520,633 | |
| Merrill Lynch Capital Trust I, 6.450% | | | 158,044 | | | | 4,093,340 | |
| Morgan Stanley, Ser E, 7.125%, VAR ICE LIBOR USD 3 Month+4.320%(A) | | | 192,597 | | | | 5,575,683 | |
| Morgan Stanley, Ser F, 6.875%, VAR ICE LIBOR USD 3 Month+3.940%(A) | | | 190,847 | | | | 5,448,682 | |
| Morgan Stanley, Ser G, 6.625% | | | 90,818 | | | | 2,432,106 | |
| Two Harbors Investment, 7.625%, VAR ICE LIBOR USD 3 Month+5.352% | | | 48,939 | | | | 1,299,820 | |
| Wells Fargo, 7.500%* | | | 6,364 | | | | 8,336,840 | |
| Wells Fargo, Ser J, 8.000% | | | 137,258 | | | | 3,502,824 | |
| | | | | | | | 111,982,602 | |
| Health Care — 4.4% | | | | | | | | |
| Allergan, 5.500%* | | | 15,994 | | | | 10,295,178 | |
| Industrials — 1.2% | | | | | | | | |
| Stericycle, 5.250%* | | | 49,585 | | | | 2,823,370 | |
| Oil & Gas — 7.3% | | | | | | | | |
| Hess, 8.000%* | | | 78,665 | | | | 4,342,308 | |
| Kinder Morgan, Ser A, 9.750%* (A) | | | 214,403 | | | | 8,061,553 | |
The accompanying notes are an integral part of the financial statements.
| Schedule of Investments | October 31, 2017 |
Global X SuperIncome™ Preferred ETF
| | | Shares/Face
Amount | | | Value | |
| PREFERRED STOCK — continued |
| Oil & Gas — continued | | | | | | | | |
| NuStar Energy, 8.500%, VAR ICE LIBOR USD 3 Month+6.766% | | | 58,260 | | | $ | 1,529,325 | |
| NuStar Energy, 7.625%, VAR ICE LIBOR USD 3 Month+5.643% | | | 9,768 | | | | 248,595 | |
| Southwestern Energy, 0.000%* | | | 116 | | | | 644 | |
| Southwestern Energy, Ser B, 6.250%* | | | 240,600 | | | | 3,062,838 | |
| | | | | | | | 17,245,263 | |
| Real Estate Investment Trusts — 10.0% | | | | | | | | |
| Annaly Capital Management, Ser C, 7.625% | | | 67,146 | | | | 1,704,165 | |
| Annaly Capital Management, Ser D, 7.500% | | | 118,623 | | | | 3,013,024 | |
| CBL & Associates Properties, Ser D, 7.375%(A) | | | 119,278 | | | | 2,943,781 | |
| Colony NorthStar, 7.150% | | | 14,804 | | | | 378,243 | |
| Colony NorthStar, 7.125% | | | 71,896 | | | | 1,831,191 | |
| Crown Castle International, 6.875%* | | | 3,654 | | | | 4,007,707 | |
| Digital Realty Trust, Ser H, 7.375% | | | 96,872 | | | | 2,585,514 | |
| VEREIT, Ser F, 6.700% | | | 285,498 | | | | 7,300,184 | |
| | | | | | | | 23,763,809 | |
| Techhnology — 1.7% | | | | | | | | |
| Belden, 6.750%* | | | 37,427 | | | | 4,022,654 | |
| Telecommunications — 1.0% | | | | | | | | |
| Frontier Communications, Ser A, 11.125%* | | | 121,703 | | | | 2,419,456 | |
| TOTAL UNITED STATES | | | | | | | 176,707,187 | |
| TOTAL PREFERRED STOCK | | | | | | | | |
| (Cost $251,830,640) | | | | | | | 234,816,649 | |
| |
| REPURCHASE AGREEMENTS (B) — 5.0% |
| Barclays Bank | | | | | | | | |
| 1.050%, dated 10/31/17, to be repurchased on 11/01/17, repurchase price $7,026,571 (collateralized by U.S Treasury Obligations, ranging in par value $0-$2,343,274, 0.000%-9.000%, 11/15/17-8/15/47, with a total market value of $7,166,893) | | $ | 7,026,366 | | | | 7,026,366 | |
| Deutsche Bank | | | | | | | | |
| 1.040%, dated 10/31/17, to be repurchased on 11/01/17, repurchase price $4,802,297 (collateralized by U.S. Treasury Obligations, par value $4,655,212, 3.625%, 02/15/20, with a total market value of $4,894,550). | | | 4,802,158 | | | | 4,802,158 | |
| TOTAL REPURCHASE AGREEMENTS | | | | | | | | |
| (Cost $11,828,524) | | | | | | | 11,828,524 | |
| TOTAL INVESTMENTS — 104.4% | | | | | | | | |
| (Cost $263,659,164) | | | | | | $ | 246,645,173 | |
Percentages are based on Net Assets of $236,330,507
| * | Non-income producing security. |
| (A) | This security or a partial position of this security is on loan at October 31, 2017. The total value of securities on loan at October 31, 2017 was $11,553,181. |
| (B) | Security was purchased with cash collateral held from securities on loan. The total value of such securities as of October 31, 2017 was $11,828,524. |
The accompanying notes are an integral part of the financial statements.
| Schedule of Investments | October 31, 2017 |
Global X SuperIncome™ Preferred ETF
ICE —Intercontinental Exchange
LIBOR — London Interbank Offered Rate
Ser — Series
USD —United States Dollar
VAR —Variable Rate
The following is a summary of the level of inputs used as of October 31, 2017, in valuing the Fund's investments carried at value:
| Investments in Securities | | Level 1 | | | Level 2 | | | Level 3 | | | Total | |
| Preferred Stock | | $ | 234,816,649 | | | $ | — | | | $ | — | | | $ | 234,816,649 | |
| Repurchase Agreements | | | — | | | | 11,828,524 | | | | — | | | | 11,828,524 | |
| Total Investments in Securities | | $ | 234,816,649 | | | $ | 11,828,524 | | | $ | — | | | $ | 246,645,173 | |
For the year ended October 31, 2017, there have been no transfers between Level 1, Level 2 or Level 3 investments.
As of October 31, 2017, there were no Level 3 investments.
The accompanying notes are an integral part of the financial statements.
| Schedule of Investments | October 31, 2017 |
Global X Social Media ETF
Sector Weightings (unaudited)†:
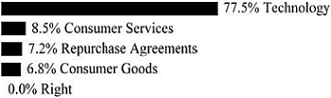
† Sector weightings percentages are based on the total market value of investments. Repurchase agreements purchased from cash collateral received for securities lending activity are included in total investments. Please see Notes 2 and 7 in Notes to Financial Statements for more detailed information.
| | | Shares | | | Value | |
| COMMON STOCK — 99.8% |
| CHINA— 18.4% | | | | | | | | |
| Consumer Goods — 0.5% | | | | | | | | |
| Changyou.com ADR * | | | 21,309 | | | $ | 825,511 | |
| Consumer Services — 0.1% | | | | | | | | |
| Renren ADR * (A) | | | 21,558 | | | | 238,216 | |
| Technology — 17.8% | | | | | | | | |
| Baidu ADR * | | | 28,574 | | | | 6,970,341 | |
| NetEase ADR | | | 27,592 | | | | 7,778,737 | |
| SINA * | | | 67,800 | | | | 7,298,670 | |
| Weibo ADR * (A) | | | 36,466 | | | | 3,378,575 | |
| YY ADR * | | | 43,404 | | | | 3,923,287 | |
| | | | | | | | 29,349,610 | |
| TOTAL CHINA | | | | | | | 30,413,337 | |
| GERMANY— 5.3% | | | | | | | | |
| Technology — 5.3% | | | | | | | | |
| United Internet | | | 122,350 | | | | 7,740,857 | |
| XING | | | 3,300 | | | | 980,685 | |
| TOTAL GERMANY | | | | | | | 8,721,542 | |
| HONG KONG— 9.8% | | | | | | | | |
| Technology — 9.8% | | | | | | | | |
| Tencent Holdings | | | 361,095 | | | | 16,189,986 | |
| JAPAN— 9.3% | | | | | | | | |
| Consumer Goods — 4.2% | | | | | | | | |
| Nexon | | | 258,902 | | | | 6,926,534 | |
| Consumer Services — 2.5% | | | | | | | | |
| Dena | | | 133,541 | | | | 3,122,577 | |
| Gree | | | 141,335 | | | | 954,008 | |
| | | | | | | | 4,076,585 | |
| Technology — 2.6% | | | | | | | | |
| LINE * | | | 45,270 | | | | 1,858,528 | |
| Mixi | | | 51,740 | | | | 2,513,463 | |
| | | | | | | | 4,371,991 | |
The accompanying notes are an integral part of the financial statements.
| Schedule of Investments | October 31, 2017 |
Global X Social Media ETF
| | | Shares | | | Value | |
| COMMON STOCK — continued |
| TOTAL JAPAN | | | | | | $ | 15,375,110 | |
| RUSSIA— 7.6% | | | | | | | | |
| Technology — 7.6% | | | | | | | | |
| Mail.Ru Group GDR * | | | 131,127 | | | | 4,261,627 | |
| Yandex, Cl A * | | | 244,514 | | | | 8,271,909 | |
| TOTAL RUSSIA | | | | | | | 12,533,536 | |
| TAIWAN— 0.4% | | | | | | | | |
| Consumer Services — 0.4% | | | | | | | | |
| PChome Online | | | 110,644 | | | | 640,176 | |
| UNITED STATES— 49.0% | | | | | | | | |
| Consumer Goods — 2.6% | | | | | | | | |
| Glu Mobile * (A) | | | 132,470 | | | | 531,205 | |
| Zynga, Cl A * | | | 960,533 | | | | 3,746,079 | |
| | | | | | | | 4,277,284 | |
| Consumer Services — 6.1% | | | | | | | | |
| ANGI Homeservices * | | | 61,867 | | | | 773,337 | |
| Groupon, Cl A * | | | 540,935 | | | | 2,580,260 | |
| Pandora Media * (A) | | | 287,286 | | | | 2,100,061 | |
| Yelp, Cl A * | | | 97,836 | | | | 4,570,898 | |
| | | | | | | | 10,024,556 | |
| Technology — 40.3% | | | | | | | | |
| Alphabet, Cl A * | | | 7,726 | | | | 7,981,267 | |
| Facebook, Cl A * | | | 94,125 | | | | 16,948,147 | |
| IAC * | | | 62,469 | | | | 8,061,624 | |
| Match Group * (A) | | | 48,698 | | | | 1,302,185 | |
| Meet Group * | | | 85,256 | | | | 289,018 | |
| Momo ADR * | | | 177,400 | | | | 5,405,378 | |
| Snap, Cl A * (A) | | | 649,854 | | | | 9,968,760 | |
| Twitter * | | | 804,300 | | | | 16,584,666 | |
| | | | | | | | 66,541,045 | |
| TOTAL UNITED STATES | | | | | | | 80,842,885 | |
| TOTAL COMMON STOCK | | | | | | | | |
| (Cost $143,072,574) | | | | | | | 164,716,572 | |
| | | Number Of
Rights | | | | |
| RIGHT — 0.0% |
| Hong Kong — 0.0% | | | | | | | | |
Tencent Holdings, 11/10/17 * (C) (Cost $–) | | | 347 | | | | — | |
The accompanying notes are an integral part of the financial statements.
| Schedule of Investments | October 31, 2017 |
Global X Social Media ETF
| | | Face Amount | | | Value | |
| REPURCHASE AGREEMENTS (B) — 7.8% |
| Barclays Bank | | | | | | | | |
| 1.050%, dated 10/31/17, to be repurchased on 11/01/17 repurchase price $7,639,913 (collateralized by U.S Treasury Obligations, ranging in par value $0-$2,547,816, 0.000%-9.000%, 11/15/17-8/15/47, with a total market value of $7,792,484) | | $ | 7,639,690 | | | $ | 7,639,690 | |
| Deutsche Bank | | | | | | | | |
| 1.040%, dated 10/31/17, to be repurchased on 11/01/17 repurchase price $5,221,484 (collateralized by U.S. Treasury Obligations, par value $5,061,560, 3.625%, 02/15/20, with a total market value of $5,321,790) | | | 5,221,333 | | | | 5,221,333 | |
| | | | | | | | | |
| TOTAL REPURCHASE AGREEMENTS | | | | | | | | |
| (Cost $12,861,023) | | | | | | | 12,861,023 | |
| TOTAL INVESTMENTS — 107.6% | | | | | | | | |
| (Cost $155,933,597) | | | | | | $ | 177,577,595 | |
Percentages are based on Net Assets of $164,997,532.
| * | Non-income producing security. |
| (A) | This security or a partial position of this security is on loan at October 31, 2017. The total value of securities on loan at October 31, 2017 was $12,668,197. |
| (B) | Security was purchased with cash collateral held from securities on loan. The total value of such securities as of October 31, 2017 was $12,861,023. |
| (C) | Level 3 security in accordance with fair value hierarchy. |
ADR — American Depositary Receipt
Cl — Class
GDR — Global Depositary Receipt
The following is a summary of the level of inputs used as of October 31, 2017, in valuing the Fund's investments carried at value:
| Investments in Securities | | Level 1 | | | Level 2 | | | Level 3(1) | | | Total | |
| Common Stock | | $ | 164,716,572 | | | $ | — | | | $ | — | | | $ | 164,716,572 | |
| Right | | | — | | | | — | | | | — | (2) | | | — | |
| Repurchase Agreements | | | — | | | | 12,861,023 | | | | — | | | | 12,861,023 | |
| Total Investments in Securities | | $ | 164,716,572 | | | $ | 12,861,023 | | | $ | — | | | $ | 177,577,595 | |
(1) A reconciliation of Level 3 investments and disclosures of significant unobservable inputs are presented when the Fund has a significant amount of Level 3 investments at the beginning and/or end of the period in relation to Net Assets. Management has concluded that Level 3 investments are not material in relation to Net Assets.
(2) Amounts designated as "-" are $0 or have been rounded to $0
For the year ended October 31, 2017, there have been no transfers between Level 1, Level 2 or Level 3 investments.
The accompanying notes are an integral part of the financial statements.
| Schedule of Investments | October 31, 2017 |
Global X | JPMorgan Efficiente Index ETF
Sector Weightings (unaudited)†:

† Sector weightings percentages are based on the total market value of investments.
| | | Shares | | | Value | |
| EXCHANGE TRADED FUNDS — 100.0% |
| iShares Core S&P Small-Cap ETF | | | 13,778 | | | $ | 1,031,421 | |
| iShares iBoxx $ Investment Grade Corporate Bond ETF | | | 4,284 | | | | 518,964 | |
| iShares JP Morgan USD Emerging Markets Bond ETF | | | 8,949 | | | | 1,040,321 | |
| Vanguard FTSE Developed Markets ETF | | | 23,914 | | | | 1,056,521 | |
| Vanguard FTSE Emerging Markets ETF | | | 23,777 | | | | 1,061,167 | |
| Vanguard S&P 500 ETF | | | 2,239 | | | | 528,695 | |
| | | | | | | | | |
| TOTAL INVESTMENTS — 100.0% | | | | | | | | |
| (Cost $4,901,666) | | | | | | $ | 5,237,089 | |
Percentages are based on Net Assets of $5,236,648.
ETF — Exchange Traded Fund
FTSE — Financial Times Stock Exchange
S&P — Standard & Poor's
USD — U.S. Dollar
As of October 31, 2017, all of the Fund's investments were considered Level 1, in accordance with authoritative guidance on fair value measurements and disclosure under U.S. GAAP.
For the year ended October 31, 2017, there have been no transfers between Level 1, Level 2 or Level 3 investments.
The accompanying notes are an integral part of the financial statements.
| Schedule of Investments | October 31, 2017 |
Global X | JPMorgan US Sector Rotator Index ETF
Sector Weightings (unaudited)†:
† Sector weightings percentages are based on the total market value of investments.
| | | Shares | | | Value | |
| EXCHANGE TRADED FUNDS — 100.0% |
| Consumer Discretionary Select Sector SPDR Fund | | | 14,336 | | | $ | 1,318,768 | |
| Energy Select Sector SPDR Fund | | | 11,637 | | | | 790,269 | |
| Financial Select Sector SPDR Fund | | | 25,001 | | | | 665,027 | |
| Industrial Select Sector SPDR Fund | | | 18,081 | | | | 1,293,334 | |
| Materials Select Sector SPDR Fund | | | 17,527 | | | | 1,034,093 | |
| | | | | | | | | |
| TOTAL INVESTMENTS — 100.0% | | | | | | | | |
| (Cost $4,992,578) | | | | | | $ | 5,101,491 | |
Percentages are based on Net Assets of $5,102,108.
SPDR — Standard & Poor’s Depositary Receipts
As of October 31, 2017, all of the Fund's investments were considered Level 1, in accordance with authoritative guidance on fair value measurements and disclosure under U.S. GAAP.
For the year ended October 31, 2017, there have been no transfers between Level 1, Level 2 or Level 3 investment.
The accompanying notes are an integral part of the financial statements.
| Schedule of Investments | October 31, 2017 |
Global X Guru® Index ETF
Sector Weightings (unaudited)†:
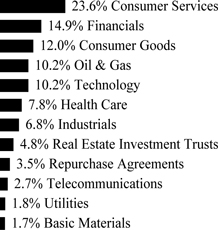
† Sector weightings percentages are based on the total market value of investments. Repurchase agreements purchased from cash collateral received for securities lending activity are included in total investments. Please see Notes 2 and 7 in Notes to Financial Statements for more detailed information.
| | | Shares | | | Value | |
| COMMON STOCK — 99.9% |
| CANADA— 1.8% | | | | | | | | |
| Consumer Services — 1.8% | | | | | | | | |
| Restaurant Brands International | | | 15,405 | | | $ | 995,009 | |
| CHINA— 1.8% | | | | | | | | |
| Technology — 1.8% | | | | | | | | |
| Baidu ADR * | | | 4,087 | | | | 996,983 | |
| IRELAND— 1.9% | | | | | | | | |
| Health Care — 1.9% | | | | | | | | |
| Horizon Pharma * | | | 77,140 | | | | 1,046,019 | |
| NETHERLANDS— 1.7% | | | | | | | | |
| Technology — 1.7% | | | | | | | | |
| NXP Semiconductors * | | | 8,162 | | | | 955,362 | |
| UNITED STATES— 92.7% | | | | | | | | |
| Basic Materials — 1.8% | | | | | | | | |
| Celanese, Cl A | | | 9,399 | | | | 980,410 | |
| Consumer Goods — 12.5% | | | | | | | | |
| Adient | | | 13,952 | | | | 1,176,991 | |
| Constellation Brands, Cl A | | | 4,634 | | | | 1,015,263 | |
| Cooper-Standard Holding * | | | 9,146 | | | | 1,019,596 | |
| Herbalife * (A) | | | 14,748 | | | | 1,071,000 | |
| Mondelez International, Cl A | | | 20,996 | | | | 869,864 | |
| Monsanto | | | 7,831 | | | | 948,334 | |
| Procter & Gamble | | | 9,989 | | | | 862,450 | |
| | | | | | | | 6,963,498 | |
The accompanying notes are an integral part of the financial statements.
| Schedule of Investments | October 31, 2017 |
Global X Guru® Index ETF
| | | Shares | | | Value | |
| COMMON STOCK — continued |
| Consumer Services — 22.6% | | | | | | | | |
| AutoNation * (A) | | | 22,059 | | | $ | 1,045,597 | |
| Buffalo Wild Wings * | | | 8,391 | | | | 991,816 | |
| Charter Communications, Cl A * | | | 2,316 | | | | 773,938 | |
| Delta Air Lines | | | 18,395 | | | | 920,302 | |
| GrubHub * (A) | | | 16,944 | | | | 1,033,923 | |
| Hilton Worldwide Holdings | | | 14,804 | | | | 1,070,033 | |
| Home Depot | | | 6,132 | | | | 1,016,563 | |
| ILG | | | 34,907 | | | | 1,035,691 | |
| Marriott International, Cl A | | | 9,172 | | | | 1,095,871 | |
| MGM Resorts International | | | 29,150 | | | | 913,852 | |
| Netflix * | | | 5,466 | | | | 1,073,686 | |
| Time Warner | | | 9,056 | | | | 890,114 | |
| United Continental Holdings * | | | 13,753 | | | | 804,275 | |
| | | | | | | | 12,665,661 | |
| Financials — 15.4% | | | | | | | | |
| Athene Holding, Cl A * | | | 17,428 | | | | 908,522 | |
| Bank of America | | | 37,629 | | | | 1,030,658 | |
| Berkshire Hathaway, Cl B * | | | 5,190 | | | | 970,218 | |
| CIT Group | | | 19,753 | | | | 920,885 | |
| Investors Bancorp | | | 69,817 | | | | 959,984 | |
| JPMorgan Chase | | | 9,931 | | | | 999,158 | |
| MetLife | | | 19,273 | | | | 1,032,647 | |
| Realogy Holdings | | | 26,561 | | | | 858,717 | |
| Western Union | | | 47,860 | | | | 950,500 | |
| | | | | | | | 8,631,289 | |
| Health Care — 6.2% | | | | | | | | |
| Allergan | | | 3,984 | | | | 706,084 | |
| DENTSPLY SIRONA | | | 17,130 | | | | 1,046,129 | |
| HCA Healthcare * | | | 11,620 | | | | 879,053 | |
| Incyte * | | | 7,287 | | | | 825,253 | |
| | | | | | | | 3,456,519 | |
| Industrials — 7.0% | | | | | | | | |
| First Data, Cl A * | | | 51,476 | | | | 916,788 | |
| Macquarie Infrastructure | | | 12,657 | | | | 880,294 | |
| Sherwin-Williams | | | 2,769 | | | | 1,094,170 | |
| Spirit Aerosystems Holdings, Cl A | | | 13,100 | | | | 1,049,310 | |
| | | | | | | | 3,940,562 | |
| Oil & Gas — 10.6% | | | | | | | | |
| Baker Hughes a GE | | | 26,839 | | | | 843,550 | |
| Cheniere Energy * | | | 21,817 | | | | 1,019,727 | |
| ExxonMobil | | | 11,801 | | | | 983,613 | |
| Hess | | | 22,625 | | | | 999,120 | |
| Marathon Petroleum | | | 17,745 | | | | 1,060,086 | |
The accompanying notes are an integral part of the financial statements.
| Schedule of Investments | October 31, 2017 |
Global X Guru® Index ETF
| | | Shares / Face
Amount | | | Value | |
| COMMON STOCK — continued |
| Oil & Gas — continued | | | | | | | | |
| Pioneer Natural Resources | | | 6,887 | | | $ | 1,030,777 | |
| | | | | | | | 5,936,873 | |
| Real Estate Investment Trusts — 4.9% | | | | | | | | |
| American Tower, Cl A | | | 6,593 | | | | 947,216 | |
| Crown Castle International | | | 8,936 | | | | 956,867 | |
| VEREIT | | | 108,598 | | | | 856,838 | |
| | | | | | | | 2,760,921 | |
| Technology — 7.1% | | | | | | | | |
| Apple | | | 5,699 | | | | 963,359 | |
| Dycom Industries * | | | 11,291 | | | | 991,689 | |
| Facebook, Cl A * | | | 5,386 | | | | 969,803 | |
| GoDaddy, Cl A * | | | 22,090 | | | | 1,031,603 | |
| | | | | | | | 3,956,454 | |
| Telecommunications — 2.8% | | | | | | | | |
| CenturyLink (A) | | | 44,811 | | | | 850,961 | |
| Sprint * (A) | | | 110,951 | | | | 725,620 | |
| | | | | | | | 1,576,581 | |
| Utilities — 1.8% | | | | | | | | |
| Vistra Energy | | | 52,594 | | | | 1,022,427 | |
| TOTAL UNITED STATES | | | | | | | 51,891,195 | |
| TOTAL COMMON STOCK | | | | | | | | |
| (Cost $50,598,162) | | | | | | | 55,884,568 | |
| |
| REPURCHASE AGREEMENTS (B) — 3.6% |
| Barclays Bank | | | | | | | | |
| 1.050%, dated 10/31/17, to be repurchased on 11/01/17 repurchase price $1,213,038 (collateralized by U.S Treasury Obligations, ranging in par value $0-$404,533, 0.000%-9.000%, 11/15/17-8/15/47, with a total market value of $1,237,262) | | $ | 1,213,002 | | | | 1,213,002 | |
| Deutsche Bank | | | | | | | | |
| 1.040%, dated 10/31/17, to be repurchased on 11/01/17 repurchase price $829,049 (collateralized by U.S. Treasury Obligations, par value $803,656, 3.625%, 02/15/20, with a total market value of $844,975) | | | 829,024 | | | | 829,025 | |
| | | | | | | | | |
| TOTAL REPURCHASE AGREEMENTS | | | | | | | | |
| (Cost $2,042,027) | | | | | | | 2,042,027 | |
| TOTAL INVESTMENTS — 103.5% | | | | | | | | |
| (Cost $52,640,189) | | | | | | $ | 57,926,595 | |
Percentages are based on Net Assets of $55,955,789.
| * | Non-income producing security. |
| (A) | This security or a partial position of this security is on loan at October 31, 2017. The total value of securities on loan at October 31, 2017 was $2,026,333. |
| (B) | Security was purchased with cash collateral held from securities on loan. The total value of such securities as of October 31, 2017 was $2,042,027. |
The accompanying notes are an integral part of the financial statements.
| Schedule of Investments | October 31, 2017 |
Global X Guru® Index ETF
ADR — American Depositary Receipt
Cl — Class
The following is a summary of the level of inputs used as of October 31, 2017, in valuing the Fund's investments carried at value:
| Investments in Securities | | Level 1 | | | Level 2 | | | Level 3 | | | Total | |
| Common Stock | | $ | 55,884,568 | | | $ | — | | | $ | — | | | $ | 55,884,568 | |
| Repurchase Agreements | | | — | | | | 2,042,027 | | | | — | | | | 2,042,027 | |
| Total Investments in Securities | | $ | 55,884,568 | | | $ | 2,042,027 | | | $ | — | | | $ | 57,926,595 | |
For the year ended October 31, 2017, there have been no transfers between Level 1, Level 2 or Level 3 investments.
As of October 31, 2017, there were no Level 3 investments.
The accompanying notes are an integral part of the financial statements.
| Schedule of Investments | October 31, 2017 |
Global X Scientific Beta US ETF
Sector Weightings (unaudited)†:
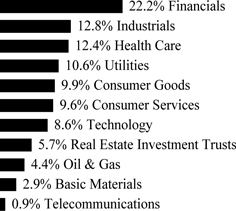
† Sector weightings percentages are based on the total market value of investments.
| | | Shares | | | Value | |
| COMMON STOCK — 99.9% |
| UNITED STATES— 99.9% | | | | | | | | |
| Basic Materials — 2.9% | | | | | | | | |
| Air Products & Chemicals | | | 514 | | | $ | 81,947 | |
| Albemarle | | | 2,268 | | | | 319,539 | |
| Arconic | | | 8,396 | | | | 210,907 | |
| Celanese, Cl A | | | 2,687 | | | | 280,281 | |
| DowDuPont | | | 6,670 | | | | 482,308 | |
| Eastman Chemical | | | 3,309 | | | | 300,490 | |
| Ecolab | | | 538 | | | | 70,295 | |
| FMC | | | 2,218 | | | | 205,963 | |
| Freeport-McMoRan Copper & Gold * | | | 19,318 | | | | 270,066 | |
| International Flavors & Fragrances | | | 2,028 | | | | 298,968 | |
| International Paper | | | 1,563 | | | | 89,513 | |
| Mosaic | | | 10,856 | | | | 242,523 | |
| Newmont Mining | | | 17,156 | | | | 620,361 | |
| Nucor | | | 2,784 | | | | 160,999 | |
| Praxair | | | 986 | | | | 144,074 | |
| Steel Dynamics | | | 5,444 | | | | 202,571 | |
| | | | | | | | 3,980,805 | |
| Consumer Goods — 9.8% | | | | | | | | |
| Activision Blizzard | | | 1,679 | | | | 109,958 | |
| Altria Group | | | 4,617 | | | | 296,504 | |
| Archer-Daniels-Midland | | | 1,966 | | | | 80,351 | |
| Autoliv | | | 2,976 | | | | 371,583 | |
| BorgWarner | | | 6,151 | | | | 324,281 | |
| Brown-Forman, Cl B | | | 3,736 | | | | 213,026 | |
| Bunge | | | 6,301 | | | | 433,383 | |
| Campbell Soup | | | 6,495 | | | | 307,668 | |
The accompanying notes are an integral part of the financial statements.
| Schedule of Investments | October 31, 2017 |
Global X Scientific Beta US ETF
| | | Shares | | | Value | |
| COMMON STOCK — continued |
| Consumer Goods — continued | | | | | | | | |
| Church & Dwight | | | 5,041 | | | $ | 227,702 | |
| Clorox | | | 3,559 | | | | 450,320 | |
| Coca-Cola | | | 3,411 | | | | 156,838 | |
| Colgate-Palmolive | | | 1,107 | | | | 77,988 | |
| Conagra Brands | | | 8,446 | | | | 288,515 | |
| Constellation Brands, Cl A | | | 2,020 | | | | 442,562 | |
| Coty, Cl A | | | 5,147 | | | | 79,264 | |
| Delphi Automotive | | | 694 | | | | 68,970 | |
| DR Horton | | | 7,739 | | | | 342,141 | |
| Dr Pepper Snapple Group | | | 3,327 | | | | 284,991 | |
| Electronic Arts * | | | 1,447 | | | | 173,061 | |
| Estee Lauder, Cl A | | | 3,281 | | | | 366,848 | |
| Ford Motor | | | 6,884 | | | | 84,467 | |
| General Mills | | | 1,656 | | | | 85,980 | |
| General Motors | | | 2,512 | | | | 107,966 | |
| Genuine Parts | | | 1,410 | | | | 124,404 | |
| Goodyear Tire & Rubber | | | 7,253 | | | | 221,869 | |
| Hanesbrands | | | 8,680 | | | | 195,300 | |
| Harley-Davidson | | | 3,113 | | | | 147,369 | |
| Hasbro | | | 3,841 | | | | 355,638 | |
| Hershey | | | 5,246 | | | | 557,020 | |
| Hormel Foods | | | 10,002 | | | | 311,662 | |
| Ingredion | | | 1,331 | | | | 166,841 | |
| JM Smucker | | | 3,775 | | | | 400,339 | |
| Kellogg | | | 2,574 | | | | 160,952 | |
| Kimberly-Clark | | | 647 | | | | 72,794 | |
| Kraft Heinz | | | 1,379 | | | | 106,638 | |
| Lear | | | 1,206 | | | | 211,762 | |
| Lennar, Cl A | | | 4,708 | | | | 262,095 | |
| LKQ * | | | 4,316 | | | | 162,670 | |
| Mattel | | | 6,009 | | | | 84,847 | |
| McCormick | | | 2,924 | | | | 291,026 | |
| Mohawk Industries * | | | 1,591 | | | | 416,460 | |
| Molson Coors Brewing, Cl B | | | 3,847 | | | | 311,107 | |
| Mondelez International, Cl A | | | 4,173 | | | | 172,887 | |
| Monsanto | | | 2,210 | | | | 267,631 | |
| Newell Brands | | | 2,803 | | | | 114,306 | |
| NIKE, Cl B | | | 1,990 | | | | 109,430 | |
| PepsiCo | | | 2,278 | | | | 251,104 | |
| Philip Morris International | | | 2,022 | | | | 211,582 | |
| Procter & Gamble | | | 1,387 | | | | 119,754 | |
| PVH | | | 3,745 | | | | 474,904 | |
| Snap-On | | | 936 | | | | 147,682 | |
| Stanley Black & Decker | | | 3,471 | | | | 560,740 | |
The accompanying notes are an integral part of the financial statements.
| Schedule of Investments | October 31, 2017 |
Global X Scientific Beta US ETF
| | | Shares | | | Value | |
| COMMON STOCK — continued |
| Consumer Goods — continued | | | | | | | | |
| Tapestry | | | 3,019 | | | $ | 123,628 | |
| Tesla * | | | 353 | | | | 117,030 | |
| Tyson Foods, Cl A | | | 7,607 | | | | 554,626 | |
| Whirlpool | | | 899 | | | | 147,373 | |
| | | | | | | | 13,307,837 | |
| Consumer Services — 9.6% | | | | | | | | |
| Advance Auto Parts | | | 912 | | | | 74,547 | |
| Alaska Air Group | | | 3,162 | | | | 208,787 | |
| Amazon.com * | | | 79 | | | | 87,317 | |
| American Airlines Group | | | 2,350 | | | | 110,027 | |
| AutoZone * | | | 246 | | | | 145,017 | |
| Best Buy | | | 12,048 | | | | 674,447 | |
| Cardinal Health | | | 1,692 | | | | 104,735 | |
| CarMax * | | | 1,081 | | | | 81,183 | |
| Carnival | | | 5,503 | | | | 365,344 | |
| CBS, Cl B | | | 1,575 | | | | 88,389 | |
| Charter Communications, Cl A * | | | 938 | | | | 313,451 | |
| Chipotle Mexican Grill, Cl A * | | | 850 | | | | 231,115 | |
| Comcast, Cl A | | | 10,396 | | | | 374,568 | |
| Costco Wholesale | | | 1,148 | | | | 184,920 | |
| CVS Health | | | 4,263 | | | | 292,143 | |
| Darden Restaurants | | | 6,022 | | | | 495,430 | |
| Delta Air Lines | | | 3,728 | | | | 186,512 | |
| DISH Network, Cl A * | | | 1,794 | | | | 87,081 | |
| Dollar Tree * | | | 1,885 | | | | 172,006 | |
| eBay * | | | 4,698 | | | | 176,833 | |
| Expedia | | | 1,378 | | | | 171,782 | |
| Foot Locker | | | 6,648 | | | | 199,972 | |
| Hilton Worldwide Holdings | | | 3,773 | | | | 272,713 | |
| Interpublic Group | | | 5,694 | | | | 109,610 | |
| Kroger | | | 5,504 | | | | 113,933 | |
| L Brands | | | 3,142 | | | | 135,231 | |
| Las Vegas Sands | | | 1,495 | | | | 94,753 | |
| Liberty Interactive QVC Group, Cl A * | | | 7,163 | | | | 162,743 | |
| Macy's | | | 12,438 | | | | 233,337 | |
| Marriott International, Cl A | | | 1,588 | | | | 189,734 | |
| McDonald's | | | 2,566 | | | | 428,291 | |
| MercadoLibre | | | 558 | | | | 134,093 | |
| MGM Resorts International | | | 7,352 | | | | 230,485 | |
| Netflix * | | | 596 | | | | 117,072 | |
| Nielsen Holdings | | | 3,755 | | | | 139,198 | |
| Norwegian Cruise Line Holdings * | | | 2,854 | | | | 159,111 | |
| Ross Stores | | | 2,175 | | | | 138,091 | |
| Royal Caribbean Cruises | | | 3,878 | | | | 479,980 | |
The accompanying notes are an integral part of the financial statements.
| Schedule of Investments | October 31, 2017 |
Global X Scientific Beta US ETF
| | | Shares | | | Value | |
| COMMON STOCK — continued |
| Consumer Services — continued | | | | | | | | |
| Sirius XM Holdings | | | 56,723 | | | $ | 308,573 | |
| Southwest Airlines | | | 2,239 | | | | 120,592 | |
| Starbucks | | | 2,184 | | | | 119,771 | |
| Sysco | | | 6,570 | | | | 365,424 | |
| Target | | | 7,361 | | | | 434,593 | |
| Tiffany | | | 5,911 | | | | 553,388 | |
| Time Warner | | | 4,914 | | | | 482,997 | |
| TJX | | | 1,965 | | | | 137,157 | |
| Tractor Supply | | | 1,168 | | | | 70,384 | |
| Ulta Beauty * | | | 1,137 | | | | 229,435 | |
| United Continental Holdings * | | | 3,895 | | | | 227,780 | |
| Walgreens Boots Alliance | | | 3,678 | | | | 243,741 | |
| Wal-Mart Stores | | | 7,646 | | | | 667,572 | |
| Walt Disney | | | 2,657 | | | | 259,881 | |
| Wyndham Worldwide | | | 1,904 | | | | 203,442 | |
| Wynn Resorts | | | 1,533 | | | | 226,102 | |
| Yum! Brands | | | 3,947 | | | | 293,854 | |
| | | | | | | | 12,908,667 | |
| Financials — 22.2% | | | | | | | | |
| Affiliated Managers Group | | | 835 | | | | 155,728 | |
| Aflac | | | 3,159 | | | | 265,008 | |
| Alleghany * | | | 780 | | | | 441,652 | |
| Allstate | | | 4,879 | | | | 457,943 | |
| Ally Financial | | | 16,806 | | | | 439,141 | |
| American Express | | | 3,419 | | | | 326,583 | |
| American International Group | | | 5,535 | | | | 357,616 | |
| Ameriprise Financial | | | 1,243 | | | | 194,579 | |
| Annaly Capital Management | | | 78,299 | | | | 897,307 | |
| Aon | | | 2,237 | | | | 320,853 | |
| Arch Capital Group * | | | 9,144 | | | | 911,108 | |
| Arthur J Gallagher | | | 8,444 | | | | 534,758 | |
| Bank of America | | | 17,815 | | | | 487,953 | |
| Bank of New York Mellon | | | 7,374 | | | | 379,392 | |
| BB&T | | | 10,128 | | | | 498,703 | |
| Berkshire Hathaway, Cl B * | | | 1,639 | | | | 306,395 | |
| BlackRock, Cl A | | | 239 | | | | 112,528 | |
| Capital One Financial | | | 1,423 | | | | 131,172 | |
| Cboe Global Markets | | | 1,456 | | | | 164,615 | |
| CBRE Group, Cl A * | | | 3,896 | | | | 153,191 | |
| Charles Schwab | | | 9,039 | | | | 405,309 | |
| Chubb | | | 1,895 | | | | 285,804 | |
| Cincinnati Financial | | | 4,819 | | | | 338,149 | |
| CIT Group | | | 6,025 | | | | 280,885 | |
| Citigroup | | | 2,582 | | | | 189,777 | |
The accompanying notes are an integral part of the financial statements.
| Schedule of Investments | October 31, 2017 |
Global X Scientific Beta US ETF
| | | Shares | | | Value | |
| COMMON STOCK — continued |
| Financials — continued | | | | | | | | |
| Citizens Financial Group | | | 18,697 | | | $ | 710,673 | |
| CME Group, Cl A | | | 6,026 | | | | 826,587 | |
| Comerica | | | 9,038 | | | | 710,116 | |
| Discover Financial Services | | | 3,824 | | | | 254,410 | |
| E*TRADE Financial * | | | 10,329 | | | | 450,241 | |
| Equifax | | | 1,265 | | | | 137,290 | |
| Everest Re Group | | | 2,735 | | | | 649,426 | |
| Fifth Third Bancorp | | | 22,933 | | | | 662,764 | |
| First Republic Bank | | | 6,741 | | | | 656,573 | |
| FNF Group | | | 21,874 | | | | 818,525 | |
| Franklin Resources | | | 4,184 | | | | 176,272 | |
| Goldman Sachs Group | | | 833 | | | | 201,986 | |
| Hartford Financial Services Group | | | 6,334 | | | | 348,687 | |
| Huntington Bancshares | | | 44,130 | | | | 608,994 | |
| IHS Markit * | | | 7,259 | | | | 309,306 | |
| Intercontinental Exchange | | | 9,031 | | | | 596,949 | |
| Invesco | | | 5,236 | | | | 187,397 | |
| JPMorgan Chase | | | 5,542 | | | | 557,581 | |
| KeyCorp | | | 43,711 | | | | 797,726 | |
| Liberty Broadband, Cl C * | | | 4,365 | | | | 381,021 | |
| Lincoln National | | | 3,774 | | | | 285,994 | |
| Loews | | | 10,714 | | | | 530,450 | |
| M&T Bank | | | 3,174 | | | | 529,328 | |
| Markel * | | | 518 | | | | 561,667 | |
| Marsh & McLennan | | | 2,732 | | | | 221,101 | |
| Mastercard, Cl A | | | 1,584 | | | | 235,652 | |
| MetLife | | | 4,256 | | | | 228,036 | |
| Moody's | | | 1,243 | | | | 177,016 | |
| Morgan Stanley | | | 3,847 | | | | 192,350 | |
| MSCI, Cl A | | | 1,272 | | | | 149,282 | |
| Nasdaq | | | 5,520 | | | | 401,028 | |
| Northern Trust | | | 4,970 | | | | 464,794 | |
| PNC Financial Services Group | | | 4,773 | | | | 652,899 | |
| Principal Financial Group | | | 3,956 | | | | 260,503 | |
| Progressive | | | 8,575 | | | | 417,174 | |
| Prudential Financial | | | 1,513 | | | | 167,126 | |
| Raymond James Financial | | | 4,505 | | | | 381,934 | |
| Regions Financial | | | 50,030 | | | | 774,464 | |
| S&P Global | | | 1,054 | | | | 164,919 | |
| State Street | | | 2,434 | | | | 223,928 | |
| SunTrust Banks | | | 4,767 | | | | 287,021 | |
| SVB Financial Group * | | | 922 | | | | 202,176 | |
| Synchrony Financial | | | 4,350 | | | | 141,897 | |
| T Rowe Price Group | | | 846 | | | | 78,593 | |
The accompanying notes are an integral part of the financial statements.
| Schedule of Investments | October 31, 2017 |
Global X Scientific Beta US ETF
| | | Shares | | | Value | |
| COMMON STOCK — continued |
| Financials — continued | | | | | | | | |
| TD Ameritrade Holding | | | 6,609 | | | $ | 330,384 | |
| Torchmark | | | 3,505 | | | | 294,876 | |
| Travelers | | | 1,821 | | | | 241,191 | |
| Unum Group | | | 6,921 | | | | 360,169 | |
| US Bancorp | | | 6,970 | | | | 379,029 | |
| Visa, Cl A | | | 974 | | | | 107,120 | |
| Wells Fargo | | | 4,388 | | | | 246,342 | |
| Western Union | | | 4,399 | | | | 87,364 | |
| Willis Towers Watson | | | 2,572 | | | | 414,298 | |
| XL Group | | | 12,490 | | | | 505,470 | |
| Zions Bancorporation | | | 4,549 | | | | 211,346 | |
| | | | | | | | 29,985,594 | |
| Health Care — 12.4% | | | | | | | | |
| Abbott Laboratories | | | 6,809 | | | | 369,252 | |
| Aetna | | | 5,636 | | | | 958,289 | |
| Alexion Pharmaceuticals * | | | 648 | | | | 77,540 | |
| Align Technology * | | | 761 | | | | 181,864 | |
| Allergan | | | 1,523 | | | | 269,921 | |
| Anthem | | | 4,267 | | | | 892,699 | |
| Baxter International | | | 10,467 | | | | 674,808 | |
| Becton Dickinson | | | 1,701 | | | | 354,948 | |
| BioMarin Pharmaceutical * | | | 2,300 | | | | 188,807 | |
| Boston Scientific * | | | 6,724 | | | | 189,213 | |
| Centene * | | | 5,166 | | | | 483,899 | |
| Cigna | | | 3,661 | | | | 722,023 | |
| Cooper | | | 2,825 | | | | 678,735 | |
| CR Bard | | | 1,134 | | | | 370,897 | |
| DaVita * | | | 4,947 | | | | 300,481 | |
| DENTSPLY SIRONA | | | 3,498 | | | | 213,623 | |
| Eli Lilly | | | 2,427 | | | | 198,868 | |
| Express Scripts Holding * | | | 6,287 | | | | 385,330 | |
| Henry Schein * | | | 2,096 | | | | 164,746 | |
| Hologic * | | | 11,398 | | | | 431,414 | |
| Humana | | | 2,548 | | | | 650,632 | |
| IDEXX Laboratories * | | | 1,438 | | | | 238,952 | |
| Illumina * | | | 1,140 | | | | 233,917 | |
| Incyte * | | | 1,317 | | | | 149,150 | |
| Intuitive Surgical * | | | 1,137 | | | | 426,784 | |
| Johnson & Johnson | | | 861 | | | | 120,032 | |
| Laboratory Corp of America Holdings * | | | 3,517 | | | | 540,598 | |
| Medtronic | | | 3,180 | | | | 256,054 | |
| Merck | | | 4,789 | | | | 263,826 | |
| Mylan * | | | 6,102 | | | | 217,903 | |
| Perrigo | | | 3,398 | | | | 275,204 | |
The accompanying notes are an integral part of the financial statements.
| Schedule of Investments | October 31, 2017 |
Global X Scientific Beta US ETF
| | | Shares | | | Value | |
| COMMON STOCK — continued |
| Health Care — continued | | | | | | | | |
| Pfizer | | | 12,640 | | | $ | 443,158 | |
| Quest Diagnostics | | | 4,835 | | | | 453,426 | |
| Quintiles IMS Holdings * | | | 5,105 | | | | 551,850 | |
| ResMed | | | 5,359 | | | | 451,121 | |
| Stryker | | | 1,932 | | | | 299,209 | |
| Thermo Fisher Scientific | | | 1,407 | | | | 272,719 | |
| UnitedHealth Group | | | 2,170 | | | | 456,177 | |
| Universal Health Services, Cl B | | | 3,429 | | | | 352,158 | |
| Varian Medical Systems * | | | 3,968 | | | | 413,426 | |
| Vertex Pharmaceuticals * | | | 875 | | | | 127,951 | |
| Waters * | | | 2,524 | | | | 494,830 | |
| Zimmer Biomet Holdings | | | 3,762 | | | | 457,534 | |
| Zoetis, Cl A | | | 6,835 | | | | 436,210 | |
| | | | | | | | 16,690,178 | |
| Industrials — 12.8% | | | | | | | | |
| 3M | | | 925 | | | | 212,926 | |
| Advanced Micro Devices * | | | 9,131 | | | | 100,304 | |
| Agilent Technologies | | | 4,020 | | | | 273,481 | |
| Alliance Data Systems | | | 562 | | | | 125,736 | |
| AMETEK | | | 4,168 | | | | 281,298 | |
| Amphenol, Cl A | | | 3,640 | | | | 316,680 | |
| Automatic Data Processing | | | 1,551 | | | | 180,319 | |
| Ball | | | 6,500 | | | | 279,045 | |
| Boeing | | | 1,053 | | | | 271,653 | |
| Broadridge Financial Solutions | | | 1,808 | | | | 155,343 | |
| Caterpillar | | | 644 | | | | 87,455 | |
| CH Robinson Worldwide | | | 4,689 | | | | 368,227 | |
| Cintas | | | 1,762 | | | | 262,608 | |
| CSX | | | 1,758 | | | | 88,656 | |
| Cummins | | | 1,703 | | | | 301,227 | |
| Danaher | | | 4,403 | | | | 406,265 | |
| Deere | | | 1,257 | | | | 167,030 | |
| Dover | | | 2,363 | | | | 225,643 | |
| Eaton | | | 2,303 | | | | 184,286 | |
| Emerson Electric | | | 1,174 | | | | 75,676 | |
| Expeditors International of Washington | | | 7,428 | | | | 433,647 | |
| Fastenal | | | 2,170 | | | | 101,925 | |
| FedEx | | | 1,231 | | | | 277,972 | |
| Fidelity National Information Services | | | 3,253 | | | | 301,748 | |
| Fiserv * | | | 1,337 | | | | 173,048 | |
| Fluor | | | 2,890 | | | | 124,530 | |
| Fortive | | | 1,492 | | | | 107,812 | |
| Fortune Brands Home & Security | | | 1,446 | | | | 95,523 | |
| General Dynamics | | | 1,045 | | | | 212,114 | |
The accompanying notes are an integral part of the financial statements.
| Schedule of Investments | October 31, 2017 |
Global X Scientific Beta US ETF
| | | Shares | | | Value | |
| COMMON STOCK — continued |
| Industrials — continued | | | | | | | | |
| General Electric | | | 7,059 | | | $ | 142,310 | |
| Global Payments | | | 1,072 | | | | 111,434 | |
| Honeywell International | | | 1,095 | | | | 157,855 | |
| Huntington Ingalls Industries | | | 798 | | | | 185,798 | |
| Illinois Tool Works | | | 964 | | | | 150,885 | |
| Ingersoll-Rand | | | 3,024 | | | | 267,926 | |
| JB Hunt Transport Services | | | 1,826 | | | | 194,268 | |
| Kansas City Southern | | | 3,000 | | | | 312,660 | |
| L3 Technologies | | | 2,584 | | | | 483,673 | |
| Lockheed Martin | | | 1,075 | | | | 331,272 | |
| Martin Marietta Materials | | | 2,537 | | | | 550,148 | |
| Masco | | | 4,198 | | | | 167,164 | |
| Mettler-Toledo International * | | | 619 | | | | 422,548 | |
| Norfolk Southern | | | 2,400 | | | | 315,408 | |
| Northrop Grumman | | | 882 | | | | 260,658 | |
| PACCAR | | | 1,331 | | | | 95,473 | |
| Packaging Corp of America | | | 874 | | | | 101,620 | |
| Parker-Hannifin | | | 986 | | | | 180,054 | |
| Paychex | | | 2,750 | | | | 175,423 | |
| PayPal Holdings * | | | 1,246 | | | | 90,410 | |
| Pentair | | | 2,519 | | | | 177,489 | |
| Raytheon | | | 1,849 | | | | 333,190 | |
| Republic Services, Cl A | | | 10,528 | | | | 685,057 | |
| Rockwell Automation | | | 963 | | | | 193,390 | |
| Rockwell Collins | | | 1,732 | | | | 234,859 | |
| Roper Technologies | | | 1,478 | | | | 381,575 | |
| Sealed Air | | | 3,175 | | | | 140,430 | |
| Sherwin-Williams | | | 209 | | | | 82,586 | |
| TE Connectivity | | | 2,966 | | | | 269,817 | |
| Textron | | | 3,580 | | | | 188,809 | |
| Total System Services | | | 4,973 | | | | 358,305 | |
| TransDigm Group | | | 633 | | | | 175,658 | |
| Union Pacific | | | 1,616 | | | | 187,117 | |
| United Parcel Service, Cl B | | | 972 | | | | 114,239 | |
| United Rentals * | | | 1,578 | | | | 223,255 | |
| United Technologies | | | 1,350 | | | | 161,676 | |
| Vantiv, Cl A * | | | 6,492 | | | | 454,440 | |
| Verisk Analytics, Cl A * | | | 3,734 | | | | 317,577 | |
| Vulcan Materials | | | 3,156 | | | | 384,243 | |
| Waste Management | | | 4,100 | | | | 336,897 | |
| Westrock | | | 4,236 | | | | 259,794 | |
| WW Grainger | | | 1,581 | | | | 312,564 | |
| Xylem | | | 5,527 | | | | 367,711 | |
| | | | | | | | 17,229,842 | |
The accompanying notes are an integral part of the financial statements.
| Schedule of Investments | October 31, 2017 |
Global X Scientific Beta US ETF
| | | Shares | | | Value | |
| COMMON STOCK — continued |
| Oil & Gas — 4.4% | | | | | | | | |
| Andeavor | | | 3,226 | | | $ | 342,730 | |
| Baker Hughes a GE | | | 3,464 | | | | 108,874 | |
| Cabot Oil & Gas | | | 5,241 | | | | 145,176 | |
| Cheniere Energy * | | | 4,203 | | | | 196,448 | |
| Chevron | | | 1,591 | | | | 184,381 | |
| Cimarex Energy | | | 946 | | | | 110,616 | |
| Concho Resources * | | | 1,831 | | | | 245,739 | |
| ConocoPhillips | | | 3,343 | | | | 170,994 | |
| Devon Energy | | | 2,390 | | | | 88,191 | |
| Diamondback Energy * | | | 904 | | | | 96,873 | |
| EOG Resources | | | 4,722 | | | | 471,586 | |
| EQT | | | 5,806 | | | | 363,107 | |
| ExxonMobil | | | 4,950 | | | | 412,582 | |
| Hess | | | 3,437 | | | | 151,778 | |
| Kinder Morgan | | | 14,236 | | | | 257,814 | |
| Marathon Oil | | | 12,276 | | | | 174,565 | |
| Marathon Petroleum | | | 5,061 | | | | 302,344 | |
| National Oilwell Varco | | | 9,770 | | | | 334,036 | |
| Noble Energy | | | 5,849 | | | | 163,012 | |
| Occidental Petroleum | | | 7,282 | | | | 470,199 | |
| Phillips 66 | | | 1,294 | | | | 117,858 | |
| Pioneer Natural Resources | | | 1,141 | | | | 170,773 | |
| Schlumberger | | | 2,886 | | | | 184,704 | |
| Targa Resources | | | 3,930 | | | | 163,095 | |
| Valero Energy | | | 5,823 | | | | 459,376 | |
| Williams | | | 3,489 | | | | 99,436 | |
| | | | | | | | 5,986,287 | |
| Real Estate Investment Trusts — 5.7% | | | | | | | | |
| Alexandria Real Estate Equities | | | 2,603 | | | | 322,668 | |
| American Tower, Cl A | | | 1,184 | | | | 170,105 | |
| AvalonBay Communities | | | 1,152 | | | | 208,892 | |
| Crown Castle International | | | 1,624 | | | | 173,898 | |
| Digital Realty Trust | | | 4,722 | | | | 559,274 | |
| Duke Realty | | | 11,862 | | | | 337,830 | |
| Equinix | | | 540 | | | | 250,290 | |
| Equity Residential | | | 2,711 | | | | 182,342 | |
| Essex Property Trust | | | 1,873 | | | | 491,531 | |
| Extra Space Storage | | | 3,281 | | | | 267,697 | |
| Federal Realty Investment Trust | | | 1,398 | | | | 168,487 | |
| GGP | | | 9,352 | | | | 181,990 | |
| HCP | | | 7,265 | | | | 187,728 | |
| Host Hotels & Resorts | | | 14,249 | | | | 278,710 | |
| Kimco Realty | | | 9,068 | | | | 164,675 | |
| Macerich | | | 7,126 | | | | 389,080 | |
The accompanying notes are an integral part of the financial statements.
| Schedule of Investments | October 31, 2017 |
Global X Scientific Beta US ETF
| | | Shares | | | Value | |
| COMMON STOCK — continued |
| Real Estate Investment Trusts — continued | | | | | | | | |
| Mid-America Apartment Communities | | | 3,019 | | | $ | 308,995 | |
| ProLogis | | | 4,746 | | | | 306,497 | |
| Public Storage | | | 380 | | | | 78,755 | |
| Realty Income | | | 10,820 | | | | 580,709 | |
| Regency Centers | | | 2,561 | | | | 157,629 | |
| SBA Communications, Cl A * | | | 2,795 | | | | 439,318 | |
| SL Green Realty | | | 2,340 | | | | 223,891 | |
| UDR | | | 9,574 | | | | 371,376 | |
| Ventas | | | 2,583 | | | | 162,083 | |
| VEREIT | | | 39,890 | | | | 314,732 | |
| Vornado Realty Trust | | | 2,062 | | | | 154,361 | |
| Welltower | | | 2,933 | | | | 196,394 | |
| Weyerhaeuser | | | 2,800 | | | | 100,548 | |
| | | | | | | | 7,730,485 | |
| Technology — 8.6% | | | | | | | | |
| Adobe Systems * | | | 1,018 | | | | 178,313 | |
| Akamai Technologies * | | | 3,921 | | | | 204,872 | |
| Amdocs | | | 5,256 | | | | 342,166 | |
| ANSYS * | | | 2,680 | | | | 366,383 | |
| Apple | | | 596 | | | | 100,748 | |
| Autodesk * | | | 633 | | | | 79,100 | |
| CA | | | 6,819 | | | | 220,799 | |
| Cadence Design Systems * | | | 3,796 | | | | 163,835 | |
| CDK Global | | | 3,174 | | | | 201,739 | |
| CDW | | | 1,602 | | | | 112,140 | |
| Cerner * | | | 2,636 | | | | 177,983 | |
| Check Point Software Technologies * | | | 4,566 | | | | 537,464 | |
| Cisco Systems | | | 5,227 | | | | 178,502 | |
| Citrix Systems * | | | 1,870 | | | | 154,481 | |
| Corning | | | 8,434 | | | | 264,069 | |
| F5 Networks * | | | 2,070 | | | | 251,029 | |
| Facebook, Cl A * | | | 535 | | | | 96,332 | |
| Gartner * | | | 2,172 | | | | 272,173 | |
| Harris | | | 2,770 | | | | 385,916 | |
| Hewlett Packard Enterprise | | | 5,563 | | | | 77,437 | |
| HP | | | 5,586 | | | | 120,378 | |
| Intel | | | 3,152 | | | | 143,385 | |
| International Business Machines | | | 859 | | | | 132,337 | |
| Intuit | | | 1,058 | | | | 159,779 | |
| Juniper Networks | | | 13,309 | | | | 330,462 | |
| KLA-Tencor | | | 2,379 | | | | 259,049 | |
| Lam Research | | | 1,533 | | | | 319,738 | |
| Maxim Integrated Products | | | 5,486 | | | | 288,234 | |
| Microchip Technology | | | 1,829 | | | | 173,389 | |
The accompanying notes are an integral part of the financial statements.
| Schedule of Investments | October 31, 2017 |
Global X Scientific Beta US ETF
| | | Shares | | | Value | |
| COMMON STOCK — continued |
| Technology — continued | | | | | | | | |
| Micron Technology * | | | 9,687 | | | $ | 429,231 | |
| Microsoft | | | 1,845 | | | | 153,467 | |
| Motorola Solutions | | | 4,996 | | | | 452,338 | |
| NetApp | | | 9,699 | | | | 430,829 | |
| NVIDIA | | | 625 | | | | 129,256 | |
| Oracle | | | 1,420 | | | | 72,278 | |
| Palo Alto Networks * | | | 1,379 | | | | 202,989 | |
| Qorvo * | | | 2,591 | | | | 196,424 | |
| QUALCOMM | | | 1,725 | | | | 87,992 | |
| Red Hat * | | | 784 | | | | 94,731 | |
| Seagate Technology | | | 6,075 | | | | 224,593 | |
| ServiceNow * | | | 3,412 | | | | 431,174 | |
| Skyworks Solutions | | | 1,874 | | | | 213,374 | |
| Symantec | | | 11,249 | | | | 365,592 | |
| Synopsys * | | | 5,088 | | | | 440,214 | |
| Texas Instruments | | | 1,782 | | | | 172,302 | |
| Twitter * | | | 20,720 | | | | 427,247 | |
| VeriSign * | | | 1,067 | | | | 114,724 | |
| Western Digital | | | 3,625 | | | | 323,604 | |
| Workday, Cl A * | | | 1,009 | | | | 111,989 | |
| Xilinx | | | 2,639 | | | | 194,468 | |
| | | | | | | | 11,561,048 | |
| Telecommunications — 0.9% | | | | | | | | |
| AT&T | | | 10,088 | | | | 339,461 | |
| CenturyLink | | | 8,459 | | | | 160,637 | |
| T-Mobile US * | | | 10,762 | | | | 643,245 | |
| Verizon Communications | | | 2,159 | | | | 103,351 | |
| | | | | | | | 1,246,694 | |
| Utilities — 10.6% | | | | | | | | |
| Alliant Energy | | | 12,539 | | | | 542,437 | |
| Ameren | | | 10,659 | | | | 660,751 | |
| American Electric Power | | | 5,651 | | | | 420,491 | |
| American Water Works | | | 7,122 | | | | 625,027 | |
| CenterPoint Energy | | | 20,670 | | | | 611,419 | |
| CMS Energy | | | 14,957 | | | | 723,470 | |
| Consolidated Edison | | | 8,136 | | | | 700,103 | |
| Dominion Energy | | | 1,585 | | | | 128,607 | |
| DTE Energy | | | 6,849 | | | | 756,541 | |
| Duke Energy | | | 7,897 | | | | 697,384 | |
| Edison International | | | 9,328 | | | | 745,774 | |
| Entergy | | | 4,729 | | | | 407,923 | |
| Eversource Energy | | | 7,936 | | | | 497,111 | |
| Exelon | | | 10,024 | | | | 403,065 | |
| FirstEnergy | | | 12,172 | | | | 401,067 | |
The accompanying notes are an integral part of the financial statements.
| Schedule of Investments | October 31, 2017 |
Global X Scientific Beta US ETF
| | | Shares | | | Value | |
| COMMON STOCK — continued |
| Utilities — continued | | | | | | | | |
| NextEra Energy | | | 4,922 | | | $ | 763,254 | |
| NiSource | | | 11,296 | | | | 297,875 | |
| ONEOK | | | 3,193 | | | | 173,284 | |
| PG&E | | | 8,387 | | | | 484,517 | |
| Pinnacle West Capital | | | 6,170 | | | | 541,171 | |
| PPL | | | 5,373 | | | | 201,810 | |
| Public Service Enterprise Group | | | 4,828 | | | | 237,538 | |
| SCANA | | | 7,307 | | | | 315,224 | |
| Sempra Energy | | | 1,495 | | | | 175,662 | |
| Southern | | | 12,178 | | | | 635,692 | |
| WEC Energy Group | | | 13,058 | | | | 879,979 | |
| Westar Energy, Cl A | | | 6,943 | | | | 371,312 | |
| Xcel Energy | | | 19,470 | | | | 964,154 | |
| | | | | | | | 14,362,642 | |
| TOTAL UNITED STATES | | | | | | | 134,990,079 | |
| TOTAL INVESTMENTS — 99.9% | | | | | | | | |
| (Cost $120,872,101) | | | | | | $ | 134,990,079 | |
Percentages are based on Net Assets of $135,183,988.
| * | Non-income producing security. |
Cl — Class
S&P — Standard & Poor's
As of October 31, 2017, all of the Fund's investments were considered Level 1, in accordance with authoritative guidance on fair value measurements and disclosure under U.S. GAAP.
For the year ended October 31, 2017, there have been no transfers between Level 1, Level 2 or Level 3 investments.
The accompanying notes are an integral part of the financial statements.
| Schedule of Investments | October 31, 2017 |
Global X Scientific Beta Europe ETF
Sector Weightings (unaudited)†:
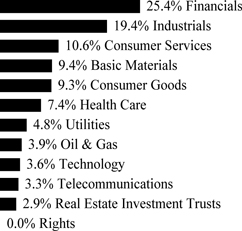
† Sector weightings percentages are based on the total market value of investments.
| | | Shares | | | Value | |
| COMMON STOCK — 99.1% |
| ARGENTINA— 0.3% | | | | | | | | |
| Basic Materials — 0.3% | | | | | | | | |
| Tenaris | | | 5,253 | | | $ | 71,904 | |
| AUSTRIA— 1.8% | | | | | | | | |
| Basic Materials — 0.2% | | | | | | | | |
| voestalpine | | | 701 | | | | 38,573 | |
| Financials — 0.8% | | | | | | | | |
| BUWOG | | | 2,027 | | | | 58,467 | |
| Erste Group Bank | | | 908 | | | | 39,021 | |
| IMMOFINANZ | | | 11,008 | | | | 27,840 | |
| Raiffeisen Bank International | | | 1,346 | | | | 46,899 | |
| | | | | | | | 172,227 | |
| Industrials — 0.3% | | | | | | | | |
| ANDRITZ | | | 424 | | | | 23,976 | |
| Wienerberger | | | 1,699 | | | | 43,662 | |
| | | | | | | | 67,638 | |
| Oil & Gas — 0.3% | | | | | | | | |
| OMV | | | 1,154 | | | | 69,342 | |
| Technology — 0.2% | | | | | | | | |
| AMS | | | 484 | | | | 44,161 | |
| TOTAL AUSTRIA | | | | | | | 391,941 | |
| BELGIUM— 3.5% | | | | | | | | |
| Basic Materials — 0.4% | | | | | | | | |
| Solvay | | | 254 | | | | 37,742 | |
| Umicore | | | 874 | | | | 39,066 | |
| | | | | | | | 76,808 | |
The accompanying notes are an integral part of the financial statements.
| Schedule of Investments | October 31, 2017 |
Global X Scientific Beta Europe ETF
| | | Shares | | | Value | |
| COMMON STOCK — continued |
| Consumer Goods — 0.0% | | | | | | | | |
| Anheuser-Busch InBev | | | 75 | | | $ | 9,178 | |
| Ontex Group | | | 297 | | | | 10,447 | |
| | | | | | | | 19,625 | |
| Consumer Services — 0.4% | | | | | | | | |
| Colruyt | | | 626 | | | | 32,022 | |
| Telenet Group Holding * | | | 548 | | | | 37,908 | |
| | | | | | | | 69,930 | |
| Financials — 1.7% | | | | | | | | |
| Ackermans & van Haaren | | | 529 | | | | 90,620 | |
| Ageas | | | 1,185 | | | | 57,489 | |
| Groupe Bruxelles Lambert | | | 468 | | | | 50,256 | |
| KBC Group | | | 783 | | | | 65,046 | |
| Sofina | | | 703 | | | | 105,728 | |
| | | | | | | | 369,139 | |
| Health Care — 0.3% | | | | | | | | |
| UCB | | | 987 | | | | 71,851 | |
| Industrials — 0.2% | | | | | | | | |
| bpost | | | 1,134 | | | | 31,989 | |
| Real Estate Investment Trusts — 0.4% | | | | | | | | |
| Cofinimmo | | | 667 | | | | 84,656 | |
| Telecommunications — 0.1% | | | | | | | | |
| Proximus | | | 801 | | | | 26,603 | |
| TOTAL BELGIUM | | | | | | | 750,601 | |
| DENMARK— 4.5% | | | | | | | | |
| Consumer Goods — 0.4% | | | | | | | | |
| Carlsberg, Cl B | | | 556 | | | | 63,499 | |
| Royal Unibrew | | | 428 | | | | 24,644 | |
| | | | | | | | 88,143 | |
| Financials — 1.2% | | | | | | | | |
| Danske Bank | | | 2,027 | | | | 77,334 | |
| Jyske Bank | | | 1,600 | | | | 90,425 | |
| Sydbank | | | 1,606 | | | | 62,655 | |
| Tryg | | | 1,176 | | | | 28,003 | |
| | | | | | | | 258,417 | |
| Health Care — 1.5% | | | | | | | | |
| Christian Hansen Holding | | | 738 | | | | 64,585 | |
| Coloplast, Cl B | | | 350 | | | | 30,794 | |
| Genmab * | | | 77 | | | | 15,550 | |
| GN Store Nord | | | 1,322 | | | | 43,732 | |
| H Lundbeck | | | 892 | | | | 53,009 | |
| Novozymes, Cl B | | | 540 | | | | 29,825 | |
The accompanying notes are an integral part of the financial statements.
| Schedule of Investments | October 31, 2017 |
Global X Scientific Beta Europe ETF
| | | Shares | | | Value | |
| COMMON STOCK — continued |
| Health Care — continued | | | | | | | | |
| William Demant Holding * | | | 2,741 | | | $ | 79,086 | |
| | | | | | | | 316,581 | |
| Industrials — 0.7% | | | | | | | | |
| A P Moller - Maersk, Cl B | | | 31 | | | | 59,548 | |
| DSV | | | 607 | | | | 46,944 | |
| ISS | | | 669 | | | | 28,320 | |
| Nets * (A) | | | 450 | | | | 11,490 | |
| | | | | | | | 146,302 | |
| Oil & Gas — 0.1% | | | | | | | | |
| Vestas Wind Systems | | | 136 | | | | 11,998 | |
| Technology — 0.1% | | | | | | | | |
| SimCorp | | | 517 | | | | 31,582 | |
| Telecommunications — 0.4% | | | | | | | | |
| TDC | | | 14,927 | | | | 88,264 | |
| Utilities — 0.1% | | | | | | | | |
| Orsted (A) | | | 421 | | | | 23,595 | |
| TOTAL DENMARK | | | | | | | 964,882 | |
| FINLAND— 3.4% | | | | | | | | |
| Basic Materials — 0.7% | | | | | | | | |
| Outokumpu | | | 3,277 | | | | 30,998 | |
| Stora Enso, Cl R | | | 4,330 | | | | 67,745 | |
| UPM-Kymmene | | | 1,570 | | | | 47,187 | |
| | | | | | | | 145,930 | |
| Consumer Goods — 0.2% | | | | | | | | |
| Amer Sports | | | 682 | | | | 16,978 | |
| Nokian Renkaat | | | 594 | | | | 27,243 | |
| | | | | | | | 44,221 | |
| Consumer Services — 0.4% | | | | | | | | |
| Kesko, Cl B | | | 1,590 | | | | 81,222 | |
| Financials — 0.3% | | | | | | | | |
| Sampo, Cl A | | | 1,024 | | | | 53,657 | |
| Health Care — 0.2% | | | | | | | | |
| Orion, Cl B | | | 1,070 | | | | 43,876 | |
| Industrials — 0.4% | | | | | | | | |
| Huhtamaki | | | 716 | | | | 30,511 | |
| Kone, Cl B | | | 300 | | | | 16,240 | |
| Konecranes, Cl A | | | 280 | | | | 12,904 | |
| Metso | | | 594 | | | | 21,597 | |
| Wartsila Abp | | | 140 | | | | 9,019 | |
| | | | | | | | 90,271 | |
| Oil & Gas — 0.5% | | | | | | | | |
| Neste | | | 1,870 | | | | 104,196 | |
The accompanying notes are an integral part of the financial statements.
| Schedule of Investments | October 31, 2017 |
Global X Scientific Beta Europe ETF
| | | Shares | | | Value | |
| COMMON STOCK — continued |
| Technology — 0.2% | | | | | | | | |
| Nokia | | | 6,140 | | | $ | 30,156 | |
| Tieto | | | 884 | | | | 27,094 | |
| | | | | | | | 57,250 | |
| Telecommunications — 0.2% | | | | | | | | |
| Elisa | | | 974 | | | | 39,248 | |
| Utilities — 0.3% | | | | | | | | |
| Fortum | | | 2,825 | | | | 59,994 | |
| TOTAL FINLAND | | | | | | | 719,865 | |
| FRANCE— 15.0% | | | | | | | | |
| Basic Materials — 0.4% | | | | | | | | |
| Air Liquide | | | 181 | | | | 23,046 | |
| Arkema | | | 221 | | | | 27,921 | |
| Imerys | | | 525 | | | | 47,821 | |
| | | | | | | | 98,788 | |
| Consumer Goods — 2.0% | | | | | | | | |
| Christian Dior | | | 61 | | | | 20,945 | |
| Cie Generale des Etablissements Michelin, Cl B | | | 346 | | | | 50,061 | |
| Cie Plastic Omnium | | | 323 | | | | 13,471 | |
| Danone | | | 130 | | | | 10,622 | |
| Faurecia | | | 602 | | | | 43,768 | |
| Hermes International | | | 88 | | | | 45,676 | |
| L'Oreal | | | 131 | | | | 29,156 | |
| LVMH Moet Hennessy Louis Vuitton | | | 69 | | | | 20,586 | |
| Pernod Ricard | | | 400 | | | | 59,995 | |
| Peugeot | | | 1,159 | | | | 27,496 | |
| Renault | | | 150 | | | | 14,878 | |
| SEB | | | 248 | | | | 46,225 | |
| Societe BIC | | | 295 | | | | 31,159 | |
| Ubisoft Entertainment * | | | 398 | | | | 30,369 | |
| | | | | | | | 444,407 | |
| Consumer Services — 2.0% | | | | | | | | |
| Air France-KLM * | | | 2,360 | | | | 36,978 | |
| Carrefour | | | 843 | | | | 16,970 | |
| Casino Guichard Perrachon | | | 428 | | | | 24,449 | |
| Elior Group (A) | | | 2,540 | | | | 72,139 | |
| Eutelsat Communications | | | 2,560 | | | | 64,148 | |
| JCDecaux | | | 452 | | | | 17,297 | |
| Lagardere SCA | | | 2,409 | | | | 79,350 | |
| Publicis Groupe | | | 479 | | | | 31,226 | |
| Sodexo | | | 154 | | | | 19,600 | |
| Vivendi | | | 1,790 | | | | 44,468 | |
| | | | | | | | 406,625 | |
The accompanying notes are an integral part of the financial statements.
| Schedule of Investments | October 31, 2017 |
Global X Scientific Beta Europe ETF
| | | Shares | | | Value | |
| COMMON STOCK — continued |
| Financials — 1.9% | | | | | | | | |
| Amundi (A) | | | 349 | | | $ | 29,589 | |
| AXA | | | 690 | | | | 20,843 | |
| BNP Paribas | | | 594 | | | | 46,390 | |
| CNP Assurances | | | 1,506 | | | | 35,044 | |
| Credit Agricole | | | 1,689 | | | | 29,475 | |
| Natixis | | | 5,148 | | | | 40,373 | |
| Nexity | | | 910 | | | | 55,920 | |
| SCOR | | | 1,453 | | | | 60,335 | |
| Societe Generale | | | 566 | | | | 31,517 | |
| Wendel | | | 381 | | | | 64,269 | |
| | | | | | | | 413,755 | |
| Health Care — 1.6% | | | | | | | | |
| BioMerieux | | | 522 | | | | 40,949 | |
| Essilor International | | | 106 | | | | 13,423 | |
| Eurofins Scientific | | | 65 | | | | 40,662 | |
| Ipsen | | | 427 | | | | 51,633 | |
| Orpea | | | 1,001 | | | | 119,934 | |
| Sanofi | | | 649 | | | | 61,460 | |
| | | | | | | | 328,061 | |
| Industrials — 4.0% | | | | | | | | |
| Aeroports de Paris | | | 249 | | | | 41,944 | |
| Airbus | | | 118 | | | | 12,062 | |
| Alstom | | | 2,995 | | | | 121,208 | |
| Bollore | | | 9,272 | | | | 44,826 | |
| Bouygues | | | 2,450 | | | | 117,633 | |
| Bureau Veritas | | | 399 | | | �� | 10,688 | |
| Cie de Saint-Gobain | | | 438 | | | | 25,696 | |
| Dassault Aviation | | | 27 | | | | 42,116 | |
| Edenred | | | 706 | | | | 20,356 | |
| Eiffage | | | 565 | | | | 59,033 | |
| Eurazeo | | | 533 | | | | 49,555 | |
| Groupe Eurotunnel | | | 1,290 | | | | 16,215 | |
| Legrand | | | 245 | | | | 18,201 | |
| Rexel | | | 2,076 | | | | 37,062 | |
| Safran | | | 182 | | | | 19,173 | |
| Schneider Electric | | | 301 | | | | 26,456 | |
| SPIE | | | 600 | | | | 15,783 | |
| Teleperformance | | | 212 | | | | 30,970 | |
| Thales | | | 438 | | | | 45,657 | |
| Vinci | | | 553 | | | | 54,146 | |
| Zodiac Aerospace | | | 1,490 | | | | 42,613 | |
| | | | | | | | 851,393 | |
| Oil & Gas — 0.3% | | | | | | | | |
| Total | | | 1,099 | | | | 61,287 | |
The accompanying notes are an integral part of the financial statements.
| Schedule of Investments | October 31, 2017 |
Global X Scientific Beta Europe ETF
| | | Shares | | | Value | |
| COMMON STOCK — continued |
| Real Estate Investment Trusts — 0.9% | | | | | | | | |
| Fonciere Des Regions | | | 456 | | | $ | 46,444 | |
| Gecina | | | 367 | | | | 59,556 | |
| ICADE | | | 562 | | | | 49,102 | |
| Klepierre | | | 651 | | | | 25,895 | |
| | | | | | | | 180,997 | |
| Technology — 0.5% | | | | | | | | |
| Atos | | | 134 | | | | 20,824 | |
| Capgemini | | | 249 | | | | 30,269 | |
| Dassault Systemes | | | 256 | | | | 27,189 | |
| Iliad | | | 61 | | | | 15,232 | |
| Ingenico Group | | | 160 | | | | 15,534 | |
| | | | | | | | 109,048 | |
| Telecommunications — 0.2% | | | | | | | | |
| Orange | | | 3,465 | | | | 56,855 | |
| Utilities — 1.2% | | | | | | | | |
| Electricite de France | | | 1,466 | | | | 19,196 | |
| Engie | | | 2,098 | | | | 35,463 | |
| Rubis SCA | | | 1,676 | | | | 105,198 | |
| Suez | | | 1,855 | | | | 32,631 | |
| Veolia Environnement | | | 1,931 | | | | 45,755 | |
| | | | | | | | 238,243 | |
| TOTAL FRANCE | | | | | | | 3,189,459 | |
| GERMANY— 12.1% | | | | | | | | |
| Basic Materials — 2.4% | | | | | | | | |
| Aurubis | | | 822 | | | | 67,270 | |
| BASF | | | 570 | | | | 62,165 | |
| Bayer | | | 253 | | | | 32,921 | |
| Brenntag | | | 306 | | | | 17,330 | |
| Covestro (A) | | | 146 | | | | 14,008 | |
| Evonik Industries | | | 2,342 | | | | 85,341 | |
| K+S | | | 1,976 | | | | 47,926 | |
| LANXESS | | | 473 | | | | 36,962 | |
| Linde | | | 426 | | | | 92,008 | |
| Symrise | | | 445 | | | | 34,634 | |
| | | | | | | | 490,565 | |
| Consumer Goods — 1.3% | | | | | | | | |
| adidas | | | 54 | | | | 12,018 | |
| Bayerische Motoren Werke | | | 205 | | | | 20,897 | |
| Beiersdorf | | | 299 | | | | 33,543 | |
| Daimler | | | 233 | | | | 19,350 | |
| HUGO BOSS | | | 410 | | | | 36,701 | |
| OSRAM Licht | | | 926 | | | | 70,852 | |
The accompanying notes are an integral part of the financial statements.
| Schedule of Investments | October 31, 2017 |
Global X Scientific Beta Europe ETF
| | | Shares | | | Value | |
| COMMON STOCK — continued |
| Consumer Goods — continued | | | | | | | | |
| Rheinmetall | | | 667 | | | $ | 78,674 | |
| | | | | | | | 272,035 | |
| Consumer Services — 0.9% | | | | | | | | |
| Axel Springer | | | 449 | | | | 30,285 | |
| Deutsche Lufthansa | | | 2,603 | | | | 83,086 | |
| Fielmann | | | 370 | | | | 32,435 | |
| ProSiebenSat.1 Media | | | 263 | | | | 9,175 | |
| TUI | | | 1,620 | | | | 29,257 | |
| Zalando * (A) | | | 474 | | | | 23,719 | |
| | | | | | | | 207,957 | |
| Financials — 2.5% | | | | | | | | |
| Aareal Bank | | | 829 | | | | 34,289 | |
| Allianz | | | 252 | | | | 58,522 | |
| Commerzbank | | | 4,410 | | | | 60,442 | |
| Deutsche Annington Immobilien | | | 1,345 | | | | 59,164 | |
| Deutsche Bank | | | 2,016 | | | | 32,762 | |
| Deutsche EuroShop | | | 830 | | | | 30,240 | |
| Deutsche Wohnen | | | 2,005 | | | | 85,406 | |
| Hannover Rueck | | | 433 | | | | 54,301 | |
| LEG Immobilien | | | 630 | | | | 63,997 | |
| Muenchener Rueckversicherungs-Gesellschaft in Muenchen | | | 301 | | | | 67,342 | |
| | | | | | | | 546,465 | |
| Health Care — 0.7% | | | | | | | | |
| Fresenius & KGaA | | | 418 | | | | 34,919 | |
| Fresenius Medical Care & KGaA | | | 152 | | | | 14,700 | |
| Gerresheimer | | | 402 | | | | 31,957 | |
| Merck KGaA | | | 377 | | | | 40,357 | |
| STADA Arzneimittel | | | 217 | | | | 20,868 | |
| | | | | | | | 142,801 | |
| Industrials — 2.2% | | | | | | | | |
| Deutsche Post | | | 418 | | | | 19,147 | |
| Duerr | | | 129 | | | | 17,785 | |
| Fraport Frankfurt Airport Services Worldwide | | | 637 | | | | 60,449 | |
| GEA Group | | | 1,089 | | | | 52,515 | |
| HeidelbergCement | | | 405 | | | | 41,269 | |
| HOCHTIEF | | | 166 | | | | 29,297 | |
| KION Group | | | 1,004 | | | | 80,364 | |
| MAN | | | 434 | | | | 47,970 | |
| MTU Aero Engines | | | 408 | | | | 68,799 | |
| Siemens | | | 131 | | | | 18,694 | |
| Wirecard | | | 346 | | | | 34,080 | |
| | | | | | | | 470,369 | |
The accompanying notes are an integral part of the financial statements.
| Schedule of Investments | October 31, 2017 |
Global X Scientific Beta Europe ETF
| | | Shares | | | Value | |
| COMMON STOCK — continued |
| Technology — 0.6% | | | | | | | | |
| Dialog Semiconductor * | | | 1,312 | | | $ | 65,187 | |
| SAP | | | 226 | | | | 25,711 | |
| Software | | | 503 | | | | 25,613 | |
| United Internet | | | 437 | | | | 27,648 | |
| | | | | | | | 144,159 | |
| Telecommunications — 1.0% | | | | | | | | |
| Deutsche Telekom | | | 1,610 | | | | 29,334 | |
| Drillisch | | | 565 | | | | 39,755 | |
| Freenet | | | 2,113 | | | | 70,609 | |
| Telefonica Deutschland Holding | | | 13,489 | | | | 68,560 | |
| | | | | | | | 208,258 | |
| Utilities — 0.5% | | | | | | | | |
| RWE | | | 2,141 | | | | 53,524 | |
| Uniper | | | 1,430 | | | | 40,181 | |
| | | | | | | | 93,705 | |
| TOTAL GERMANY | | | | | | | 2,576,314 | |
| IRELAND— 1.3% | | | | | | | | |
| Consumer Goods — 0.3% | | | | | | | | |
| Glanbia | | | 2,234 | | | | 43,175 | |
| Kerry Group, Cl A | | | 277 | | | | 27,897 | |
| | | | | | | | 71,072 | |
| Consumer Services — 0.2% | | | | | | | | |
| Paddy Power Betfair | | | 376 | | | | 38,458 | |
| Financials — 0.2% | | | | | | | | |
| Bank of Ireland Group * | | | 6,692 | | | | 52,450 | |
| Industrials — 0.6% | | | | | | | | |
| CRH | | | 961 | | | | 36,239 | |
| Kingspan Group | | | 390 | | | | 16,392 | |
| Smurfit Kappa Group | | | 2,286 | | | | 68,188 | |
| | | | | | | | 120,819 | |
| TOTAL IRELAND | | | | | | | 282,799 | |
| ISLE OF MAN— 0.2% | | | | | | | | |
| Financials — 0.2% | | | | | | | | |
| Paysafe Group * | | | 6,134 | | | | 47,734 | |
| ITALY— 5.0% | | | | | | | | |
| Consumer Goods — 0.8% | | | | | | | | |
| Davide Campari-Milano | | | 4,517 | | | | 36,203 | |
| Ferrari | | | 136 | | | | 16,303 | |
| Fiat Chrysler Automobiles * | | | 2,638 | | | | 45,605 | |
| Luxottica Group | | | 476 | | | | 27,304 | |
| Moncler | | | 1,534 | | | | 43,568 | |
| | | | | | | | 168,983 | |
The accompanying notes are an integral part of the financial statements.
| Schedule of Investments | October 31, 2017 |
Global X Scientific Beta Europe ETF
| | | Shares | | | Value | |
| COMMON STOCK — continued |
| Financials — 1.9% | | | | | | | | |
| Assicurazioni Generali | | | 1,453 | | | $ | 26,473 | |
| Azimut Holding | | | 410 | | | | 8,101 | |
| Banco BPM * | | | 11,473 | | | | 40,016 | |
| BPER Banca | | | 6,311 | | | | 30,761 | |
| EXOR | | | 611 | | | | 39,184 | |
| Intesa Sanpaolo | | | 15,391 | | | | 51,744 | |
| Mediobanca | | | 5,556 | | | | 60,906 | |
| Poste Italiane (A) | | | 2,429 | | | | 17,756 | |
| UniCredit | | | 2,487 | | | | 47,601 | |
| Unione di Banche Italiane SCpA | | | 10,463 | | | | 49,145 | |
| UnipolSai Assicurazioni | | | 14,422 | | | | 32,862 | |
| | | | | | | | 404,549 | |
| Health Care — 0.3% | | | | | | | | |
| Recordati | | | 1,507 | | | | 70,065 | |
| Industrials — 0.5% | | | | | | | | |
| Atlantia | | | 424 | | | | 13,830 | |
| CNH Industrial | | | 1,567 | | | | 20,025 | |
| Leonardo | | | 2,461 | | | | 42,517 | |
| Prysmian | | | 544 | | | | 18,758 | |
| | | | | | | | 95,130 | |
| Oil & Gas — 0.3% | | | | | | | | |
| Eni | | | 2,845 | | | | 46,532 | |
| Saipem * | | | 7,000 | | | | 29,422 | |
| | | | | | | | 75,954 | |
| Telecommunications — 0.1% | | | | | | | | |
| Telecom Italia * | | | 15,260 | | | | 13,244 | |
| Utilities — 1.1% | | | | | | | | |
| A2A | | | 31,481 | | | | 54,094 | |
| Enel | | | 6,592 | | | | 40,892 | |
| Snam | | | 20,582 | | | | 105,163 | |
| Terna Rete Elettrica Nazionale | | | 4,674 | | | | 28,205 | |
| | | | | | | | 228,354 | |
| TOTAL ITALY | | | | | | | 1,056,279 | |
| LUXEMBOURG— 0.1% | | | | | | | | |
| Consumer Services — 0.1% | | | | | | | | |
| B&M European Value Retail | | | 3,111 | | | | 16,413 | |
| NETHERLANDS— 5.2% | | | | | | | | |
| Basic Materials — 0.6% | | | | | | | | |
| Akzo Nobel | | | 582 | | | | 52,708 | |
| ArcelorMittal | | | 1,059 | | | | 30,367 | |
| Koninklijke DSM | | | 672 | | | | 57,335 | |
| | | | | | | | 140,410 | |
The accompanying notes are an integral part of the financial statements.
| Schedule of Investments | October 31, 2017 |
Global X Scientific Beta Europe ETF
| | | Shares | | | Value | |
| COMMON STOCK — continued |
| Consumer Goods — 0.3% | | | | | | | | |
| Coca-Cola European Partners | | | 358 | | | $ | 14,687 | |
| Heineken | | | 101 | | | | 9,843 | |
| Heineken Holding | | | 98 | | | | 9,099 | |
| Unilever | | | 529 | | | | 30,754 | |
| | | | | | | | 64,383 | |
| Consumer Services — 0.5% | | | | | | | | |
| Koninklijke Ahold Delhaize | | | 3,599 | | | | 67,732 | |
| RELX | | | 1,182 | | | | 26,699 | |
| Wolters Kluwer | | | 479 | | | | 23,481 | |
| | | | | | | | 117,912 | |
| Financials — 1.3% | | | | | | | | |
| ABN AMRO Group (A) | | | 909 | | | | 28,078 | |
| Aegon | | | 8,416 | | | | 49,688 | |
| ASR Nederland | | | 760 | | | | 31,165 | |
| Euronext (A) | | | 452 | | | | 26,860 | |
| ING Groep | | | 2,379 | | | | 43,954 | |
| NN Group | | | 2,324 | | | | 97,355 | |
| | | | | | | | 277,100 | |
| Health Care — 0.3% | | | | | | | | |
| Galapagos * | | | 181 | | | | 17,562 | |
| Koninklijke Philips | | | 1,151 | | | | 46,869 | |
| | | | | | | | 64,431 | |
| Industrials — 0.7% | | | | | | | | |
| Aalberts Industries | | | 689 | | | | 33,988 | |
| Boskalis Westminster | | | 1,245 | | | | 44,526 | |
| Koninklijke Vopak | | | 248 | | | | 10,740 | |
| Philips Lighting (A) | | | 780 | | | | 29,554 | |
| PostNL | | | 2,942 | | | | 12,547 | |
| | | | | | | | 131,355 | |
| Oil & Gas — 0.3% | | | | | | | | |
| SBM Offshore | | | 3,041 | | | | 54,273 | |
| Real Estate Investment Trusts — 0.3% | | | | | | | | |
| Unibail-Rodamco | | | 115 | | | | 28,783 | |
| Wereldhave | | | 805 | | | | 36,588 | |
| | | | | | | | 65,371 | |
| Technology — 0.9% | | | | | | | | |
| ASM International | | | 835 | | | | 55,951 | |
| ASML Holding | | | 56 | | | | 10,099 | |
| Gemalto | | | 711 | | | | 28,145 | |
| NXP Semiconductors * | | | 789 | | | | 92,352 | |
| | | | | | | | 186,547 | |
| Telecommunications — 0.0% | | | | | | | | |
| Altice * | | | 410 | | | | 7,735 | |
The accompanying notes are an integral part of the financial statements.
| Schedule of Investments | October 31, 2017 |
Global X Scientific Beta Europe ETF
| | | Shares | | | Value | |
| COMMON STOCK — continued |
| TOTAL NETHERLANDS | | | | | | $ | 1,109,517 | |
| NORWAY— 1.8% | | | | | | | | |
| Basic Materials — 0.5% | | | | | | | | |
| Norsk Hydro | | | 4,442 | | | | 34,284 | |
| Yara International | | | 1,155 | | | | 54,744 | |
| | | | | | | | 89,028 | |
| Consumer Goods — 0.2% | | | | | | | | |
| Marine Harvest | | | 996 | | | | 19,416 | |
| Orkla | | | 3,250 | | | | 31,758 | |
| | | | | | | | 51,174 | |
| Financials — 0.6% | | | | | | | | |
| DnB | | | 2,135 | | | | 41,098 | |
| Gjensidige Forsikring | | | 3,466 | | | | 65,110 | |
| Storebrand | | | 3,325 | | | | 28,427 | |
| | | | | | | | 134,635 | |
| Oil & Gas — 0.5% | | | | | | | | |
| Statoil | | | 1,597 | | | | 32,284 | |
| Subsea 7 | | | 3,964 | | | | 66,520 | |
| | | | | | | | 98,804 | |
| TOTAL NORWAY | | | | | | | 373,641 | |
| PORTUGAL— 0.4% | | | | | | | | |
| Consumer Services — 0.1% | | | | | | | | |
| Jeronimo Martins | | | 838 | | | | 15,229 | |
| Oil & Gas — 0.2% | | | | | | | | |
| Galp Energia | | | 2,934 | | | | 54,551 | |
| Utilities — 0.1% | | | | | | | | |
| Energias de Portugal | | | 5,243 | | | | 18,708 | |
| TOTAL PORTUGAL | | | | | | | 88,488 | |
| SPAIN— 4.1% | | | | | | | | |
| Basic Materials — 0.1% | | | | | | | | |
| Acerinox | | | 2,132 | | | | 30,636 | |
| Consumer Goods — 0.1% | | | | | | | | |
| Viscofan | | | 396 | | | | 23,979 | |
| Consumer Services — 0.1% | | | | | | | | |
| Industria de Diseno Textil | | | 480 | | | | 17,947 | |
| Financials — 1.5% | | | | | | | | |
| Banco Bilbao Vizcaya Argentaria | | | 3,126 | | | | 27,359 | |
| Banco de Sabadell | | | 9,438 | | | | 18,900 | |
| Banco Santander | | | 3,738 | | | | 25,357 | |
| Bankia | | | 7,907 | | | | 37,757 | |
| Bankinter | | | 8,230 | | | | 77,687 | |
The accompanying notes are an integral part of the financial statements.
| Schedule of Investments | October 31, 2017 |
Global X Scientific Beta Europe ETF
| | | Shares | | | Value | |
| COMMON STOCK — continued |
| Financials — continued | | | | | | | | |
| Bolsas y Mercados Espanoles SHMSF | | | 980 | | | $ | 33,673 | |
| CaixaBank | | | 11,974 | | | | 56,047 | |
| Mapfre | | | 9,946 | | | | 32,547 | |
| | | | | | | | 309,327 | |
| Health Care — 0.1% | | | | | | | | |
| Grifols | | | 850 | | | | 26,612 | |
| Industrials — 0.7% | | | | | | | | |
| Abertis Infraestructuras | | | 2,426 | | | | 52,481 | |
| Acciona | | | 231 | | | | 19,136 | |
| Aena SME (A) | | | 162 | | | | 29,724 | |
| Amadeus IT Group, Cl A | | | 393 | | | | 26,668 | |
| Ferrovial | | | 1,402 | | | | 30,460 | |
| | | | | | | | 158,469 | |
| Oil & Gas — 0.2% | | | | | | | | |
| Repsol | | | 1,792 | | | | 33,579 | |
| Real Estate Investment Trusts — 0.2% | | | | | | | | |
| Merlin Properties Socimi | | | 2,972 | | | | 39,227 | |
| Telecommunications — 0.1% | | | | | | | | |
| Cellnex Telecom (A) | | | 796 | | | | 19,765 | |
| Utilities — 1.0% | | | | | | | | |
| Enagas | | | 569 | | | | 16,392 | |
| Endesa | | | 4,217 | | | | 96,532 | |
| Gas Natural SDG | | | 1,434 | | | | 30,688 | |
| Iberdrola | | | 6,468 | | | | 52,277 | |
| Red Electrica | | | 901 | | | | 19,953 | |
| | | | | | | | 215,842 | |
| TOTAL SPAIN | | | | | | | 875,383 | |
| SWEDEN— 6.3% | | | | | | | | |
| Basic Materials — 0.6% | | | | | | | | |
| BillerudKorsnas | | | 2,292 | | | | 39,451 | |
| Boliden | | | 1,300 | | | | 45,498 | |
| Hexpol | | | 1,346 | | | | 13,618 | |
| Svenska Cellulosa, Cl B | | | 2,800 | | | | 26,288 | |
| | | | | | | | 124,855 | |
| Consumer Goods — 0.3% | | | | | | | | |
| Dometic Group (A) | | | 2,670 | | | | 23,218 | |
| Husqvarna, Cl B | | | 3,013 | | | | 29,440 | |
| Swedish Match | | | 558 | | | | 21,022 | |
| | | | | | | | 73,680 | |
| Consumer Services — 0.4% | | | | | | | | |
| Hennes & Mauritz, Cl B | | | 984 | | | | 24,706 | |
The accompanying notes are an integral part of the financial statements.
| Schedule of Investments | October 31, 2017 |
Global X Scientific Beta Europe ETF
| | | Shares | | | Value | |
| COMMON STOCK — continued |
| Consumer Services — continued | | | | | | | | |
| ICA Gruppen | | | 1,516 | | | $ | 55,919 | |
| | | | | | | | 80,625 | |
| Financials — 2.3% | | | | | | | | |
| Castellum | | | 2,816 | | | | 45,175 | |
| Fabege | | | 2,111 | | | | 44,581 | |
| Fastighets Balder, Cl B * | | | 1,085 | | | | 28,253 | |
| Hufvudstaden, Cl A | | | 1,555 | | | | 25,595 | |
| Industrivarden, Cl C | | | 2,040 | | | | 52,439 | |
| Intrum Justitia | | | 627 | | | | 21,974 | |
| Investor, Cl B | | | 852 | | | | 42,224 | |
| Kinnevik | | | 917 | | | | 30,089 | |
| L E Lundbergforetagen, Cl B | | | 418 | | | | 32,629 | |
| Nordea Bank | | | 4,368 | | | | 52,801 | |
| Skandinaviska Enskilda Banken, Cl A | | | 4,043 | | | | 49,838 | |
| Svenska Handelsbanken, Cl A | | | 3,916 | | | | 56,131 | |
| Swedbank, Cl A | | | 1,475 | | | | 36,612 | |
| | | | | | | | 518,341 | |
| Health Care — 0.3% | | | | | | | | |
| Elekta, Cl B | | | 3,774 | | | | 36,290 | |
| Getinge, Cl B | | | 679 | | | | 13,366 | |
| Swedish Orphan Biovitrum * | | | 870 | | | | 12,886 | |
| | | | | | | | 62,542 | |
| Industrials — 1.3% | | | | | | | | |
| Alfa Laval | | | 560 | | | | 14,188 | |
| Atlas Copco, Cl A | | | 319 | | | | 13,992 | |
| Saab, Cl B | | | 944 | | | | 48,239 | |
| Sandvik | | | 772 | | | | 14,100 | |
| Securitas, Cl B | | | 903 | | | | 15,845 | |
| Skanska, Cl B | | | 1,490 | | | | 32,695 | |
| SKF, Cl B | | | 790 | | | | 18,373 | |
| Trelleborg, Cl B | | | 2,344 | | | | 58,069 | |
| Volvo, Cl B | | | 3,062 | | | | 60,677 | |
| | | | | | | | 276,178 | |
| Oil & Gas — 0.2% | | | | | | | | |
| Lundin Petroleum * | | | 1,726 | | | | 40,595 | |
| Technology — 0.3% | | | | | | | | |
| Hexagon, Cl B | | | 259 | | | | 13,281 | |
| Telefonaktiebolaget LM Ericsson, Cl B | | | 6,880 | | | | 43,309 | |
| | | | | | | | 56,590 | |
| Telecommunications — 0.6% | | | | | | | | |
| Tele2, Cl B | | | 6,559 | | | | 83,439 | |
| Telia | | | 7,540 | | | | 34,900 | |
| | | | | | | | 118,339 | |
The accompanying notes are an integral part of the financial statements.
| Schedule of Investments | October 31, 2017 |
Global X Scientific Beta Europe ETF
| | | Shares | | | Value | |
| COMMON STOCK — continued |
| TOTAL SWEDEN | | | | | | $ | 1,351,745 | |
| SWITZERLAND— 10.4% | | | | | | | | |
| Basic Materials — 0.8% | | | | | | | | |
| Clariant | | | 2,202 | | | | 55,448 | |
| EMS-Chemie Holding | | | 87 | | | | 57,081 | |
| Givaudan | | | 15 | | | | 33,527 | |
| | | | | | | | 146,056 | |
| Consumer Goods — 1.1% | | | | | | | | |
| Aryzta | | | 1,332 | | | | 42,320 | |
| Barry Callebaut | | | 35 | | | | 54,670 | |
| Chocoladefabriken Lindt & Spruengli | | | 4 | | | | 23,174 | |
| Cie Financiere Richemont | | | 465 | | | | 42,917 | |
| Nestle | | | 255 | | | | 21,463 | |
| Swatch Group | | | 122 | | | | 47,855 | |
| | | | | | | | 232,399 | |
| Consumer Services — 0.2% | | | | | | | | |
| Dufry * | | | 356 | | | | 53,036 | |
| Financials — 3.8% | | | | | | | | |
| Baloise Holding | | | 461 | | | | 72,748 | |
| Cembra Money Bank | | | 408 | | | | 36,592 | |
| Credit Suisse Group | | | 3,043 | | | | 48,020 | |
| GAM Holding | | | 2,304 | | | | 35,942 | |
| Helvetia Holding | | | 110 | | | | 59,204 | |
| Julius Baer Group | | | 1,025 | | | | 60,669 | |
| Pargesa Holding | | | 710 | | | | 59,511 | |
| Partners Group Holding | | | 101 | | | | 67,989 | |
| PSP Swiss Property | | | 813 | | | | 71,611 | |
| Swiss Life Holding | | | 207 | | | | 72,018 | |
| Swiss Prime Site | | | 977 | | | | 83,458 | |
| Swiss Re | | | 536 | | | | 50,465 | |
| UBS Group | | | 1,762 | | | | 30,015 | |
| Zurich Insurance Group | | | 227 | | | | 69,343 | |
| | | | | | | | 817,585 | |
| Health Care — 1.2% | | | | | | | | |
| Lonza Group | | | 122 | | | | 32,434 | |
| Novartis | | | 359 | | | | 29,605 | |
| Roche Holding | | | 97 | | | | 22,430 | |
| Sonova Holding | | | 284 | | | | 51,313 | |
| Straumann Holding | | | 131 | | | | 91,534 | |
| Vifor Pharma | | | 146 | | | | 18,792 | |
| | | | | | | | 246,108 | |
| Industrials — 2.4% | | | | | | | | |
| ABB | | | 860 | | | | 22,501 | |
| Adecco Group | | | 236 | | | | 18,739 | |
The accompanying notes are an integral part of the financial statements.
| Schedule of Investments | October 31, 2017 |
Global X Scientific Beta Europe ETF
| | | Shares | | | Value | |
| COMMON STOCK — continued |
| Industrials — continued | | | | | | | | |
| DKSH Holding | | | 564 | | | $ | 47,330 | |
| dormakaba Holding | | | 56 | | | | 55,449 | |
| Flughafen Zurich | | | 311 | | | | 67,704 | |
| Geberit | | | 94 | | | | 42,587 | |
| Georg Fischer | | | 33 | | | | 40,687 | |
| Kuehne + Nagel International | | | 193 | | | | 33,729 | |
| LafargeHolcim | | | 453 | | | | 25,609 | |
| OC Oerlikon | | | 3,656 | | | | 58,684 | |
| Schindler Holding | | | 124 | | | | 28,126 | |
| SGS | | | 5 | | | | 12,360 | |
| Sika | | | 8 | | | | 59,269 | |
| | | | | | | | 512,774 | |
| Technology — 0.7% | | | | | | | | |
| Logitech International | | | 867 | | | | 30,999 | |
| STMicroelectronics | | | 3,767 | | | | 88,645 | |
| Temenos Group | | | 383 | | | | 44,263 | |
| | | | | | | | 163,907 | |
| Telecommunications — 0.2% | | | | | | | | |
| Sunrise Communications Group (A) | | | 278 | | | | 23,148 | |
| Swisscom | | | 34 | | | | 17,191 | |
| | | | | | | | 40,339 | |
| TOTAL SWITZERLAND | | | | | | | 2,212,204 | |
| UNITED KINGDOM— 23.7% | | | | | | | | |
| Basic Materials — 2.3% | | | | | | | | |
| Anglo American | | | 2,931 | | | | 55,270 | |
| Antofagasta | | | 4,482 | | | | 56,811 | |
| BHP Billiton | | | 2,406 | | | | 43,533 | |
| Centamin | | | 21,242 | | | | 39,294 | |
| Croda International | | | 586 | | | | 32,559 | |
| Fresnillo | | | 2,022 | | | | 34,960 | |
| Glencore | | | 8,601 | | | | 41,461 | |
| Polymetal International | | | 2,063 | | | | 23,957 | |
| Randgold Resources | | | 741 | | | | 72,767 | |
| Rio Tinto | | | 1,068 | | | | 50,327 | |
| Victrex | | | 998 | | | | 31,781 | |
| | | | | | | | 482,720 | |
| Consumer Goods — 2.0% | | | | | | | | |
| Barratt Developments | | | 3,795 | | | | 32,984 | |
| Bellway | | | 1,234 | | | | 59,812 | |
| Berkeley Group Holdings | | | 1,165 | | | | 57,876 | |
| British American Tobacco | | | 261 | | | | 16,883 | |
| Britvic | | | 1,891 | | | | 19,009 | |
| Burberry Group | | | 456 | | | | 11,517 | |
The accompanying notes are an integral part of the financial statements.
| Schedule of Investments | October 31, 2017 |
Global X Scientific Beta Europe ETF
| | | Shares | | | Value | |
| COMMON STOCK — continued |
| Consumer Goods — continued | | | | | | | | |
| Coca-Cola HBC | | | 561 | | | $ | 18,960 | |
| Diageo | | | 754 | | | | 25,753 | |
| Kerry Group, Cl A | | | 161 | | | | 16,216 | |
| Persimmon | | | 1,132 | | | | 42,121 | |
| Reckitt Benckiser Group | | | 125 | | | | 11,180 | |
| Tate & Lyle | | | 5,988 | | | | 51,408 | |
| Taylor Wimpey | | | 9,536 | | | | 25,263 | |
| Unilever | | | 458 | | | | 25,967 | |
| | | | | | | | 414,949 | |
| Consumer Services — 5.3% | | | | | | | | |
| ASOS * | | | 442 | | | | 33,439 | |
| Booker Group | | | 7,185 | | | | 19,197 | |
| Carnival | | | 1,767 | | | | 116,408 | |
| Compass Group | | | 1,149 | | | | 25,222 | |
| Daily Mail & General Trust, Cl A | | | 2,243 | | | | 20,657 | |
| Dixons Carphone | | | 7,695 | | | | 17,719 | |
| Domino's Pizza Group | | | 4,886 | | | | 21,781 | |
| easyJet | | | 1,152 | | | | 20,484 | |
| Firstgroup * | | | 25,861 | | | | 37,776 | |
| Greene King | | | 4,069 | | | | 29,233 | |
| GVC Holdings * | | | 6,396 | | | | 79,627 | |
| Inchcape | | | 4,559 | | | | 47,313 | |
| Informa | | | 3,724 | | | | 34,468 | |
| J Sainsbury | | | 7,471 | | | | 24,059 | |
| Just Eat * | | | 1,643 | | | | 17,018 | |
| Kingfisher | | | 15,546 | | | | 64,534 | |
| Ladbrokes Coral Group | | | 15,790 | | | | 26,714 | |
| Marks & Spencer Group | | | 8,358 | | | | 38,192 | |
| Merlin Entertainments (A) | | | 2,957 | | | | 14,875 | |
| MoneySuperMarket.com | | | 2,982 | | | | 12,866 | |
| National Express Group | | | 8,923 | | | | 43,547 | |
| Pearson | | | 5,932 | | | | 55,418 | |
| Playtech | | | 1,994 | | | | 26,056 | |
| RELX | | | 1,258 | | | | 28,951 | |
| Saga | | | 20,251 | | | | 51,391 | |
| SSP Group | | | 5,243 | | | | 40,730 | |
| Tesco | | | 14,894 | | | | 35,878 | |
| UBM | | | 3,315 | | | | 30,969 | |
| WH Smith | | | 1,151 | | | | 31,288 | |
| Whitbread | | | 240 | | | | 11,770 | |
| William Hill | | | 11,702 | | | | 40,155 | |
| WM Morrison Supermarkets | | | 13,555 | | | | 40,357 | |
| | | | | | | | 1,138,092 | |
The accompanying notes are an integral part of the financial statements.
| Schedule of Investments | October 31, 2017 |
Global X Scientific Beta Europe ETF
| | | Shares | | | Value | |
| COMMON STOCK — continued |
| Financials — 5.0% | | | | | | | | |
| 3i Group | | | 2,447 | | | $ | 31,228 | |
| Admiral Group | | | 1,365 | | | | 34,875 | |
| Aviva | | | 2,397 | | | | 16,075 | |
| Barclays | | | 5,781 | | | | 14,275 | |
| Beazley | | | 10,943 | | | | 73,458 | |
| Capital & Counties Properties | | | 5,090 | | | | 17,973 | |
| Close Brothers Group | | | 3,160 | | | | 58,287 | |
| CYBG * | | | 3,134 | | | | 13,110 | |
| Direct Line Insurance Group | | | 13,822 | | | | 68,225 | |
| Hiscox | | | 6,318 | | | | 119,810 | |
| HSBC Holdings | | | 7,907 | | | | 77,102 | |
| IG Group Holdings | | | 4,232 | | | | 36,726 | |
| Intermediate Capital Group | | | 3,491 | | | | 45,107 | |
| Investec | | | 3,378 | | | | 23,124 | |
| Jardine Lloyd Thompson Group | | | 2,568 | | | | 44,435 | |
| Legal & General Group | | | 5,367 | | | | 19,029 | |
| Lloyds Banking Group | | | 26,267 | | | | 23,820 | |
| Man Group | | | 20,692 | | | | 53,197 | |
| Metro Bank * | | | 180 | | | | 8,502 | |
| NEX Group | | | 3,334 | | | | 28,092 | |
| Old Mutual | | | 5,845 | | | | 14,825 | |
| Phoenix Group Holdings | | | 4,716 | | | | 47,408 | |
| Provident Financial | | | 743 | | | | 9,191 | |
| Royal Bank of Scotland Group * | | | 12,804 | | | | 48,034 | |
| RSA Insurance Group | | | 6,950 | | | | 58,052 | |
| Standard Chartered | | | 2,690 | | | | 26,806 | |
| Standard Life Aberdeen | | | 3,716 | | | | 21,209 | |
| Unite Group | | | 3,959 | | | | 36,959 | |
| | | | | | | | 1,068,934 | |
| Health Care — 1.0% | | | | | | | | |
| AstraZeneca | | | 157 | | | | 10,491 | |
| BTG * | | | 2,846 | | | | 28,496 | |
| ConvaTec Group (A) | | | 4,800 | | | | 12,487 | |
| GlaxoSmithKline | | | 596 | | | | 10,744 | |
| Hikma Pharmaceuticals | | | 562 | | | | 8,687 | |
| Indivior | | | 6,745 | | | | 33,285 | |
| Mediclinic International | | | 1,119 | | | | 8,648 | |
| NMC Health | | | 480 | | | | 18,434 | |
| Shire | | | 590 | | | | 29,154 | |
| Smith & Nephew | | | 550 | | | | 10,379 | |
| UDG Healthcare | | | 3,229 | | | | 39,643 | |
| | | | | | | | 210,448 | |
| Industrials — 4.9% | | | | | | | | |
| Aggreko | | | 2,420 | | | | 30,112 | |
The accompanying notes are an integral part of the financial statements.
| Schedule of Investments | October 31, 2017 |
Global X Scientific Beta Europe ETF
| | | Shares | | | Value | |
| COMMON STOCK — continued |
| Industrials — continued | | | | | | | | |
| Ashtead Group | | | 790 | | | $ | 20,352 | |
| Babcock International Group | | | 2,121 | | | | 22,871 | |
| BAE Systems | | | 4,748 | | | | 37,421 | |
| Balfour Beatty | | | 11,305 | | | | 41,134 | |
| BBA Aviation | | | 18,756 | | | | 79,254 | |
| Bunzl | | | 290 | | | | 9,031 | |
| Cobham | | | 11,486 | | | | 21,201 | |
| DCC | | | 160 | | | | 15,171 | |
| DS Smith | | | 4,405 | | | | 30,476 | |
| Electrocomponents | | | 3,622 | | | | 33,404 | |
| Experian | | | 946 | | | | 19,924 | |
| Ferguson | | | 247 | | | | 17,269 | |
| G4S | | | 5,579 | | | | 20,818 | |
| Halma | | | 1,760 | | | | 27,626 | |
| Hays | | | 6,289 | | | | 15,567 | |
| HomeServe | | | 2,563 | | | | 29,134 | |
| Howden Joinery Group | | | 1,718 | | | | 9,356 | |
| IMI | | | 1,096 | | | | 17,785 | |
| Intertek Group | | | 391 | | | | 28,168 | |
| Kingspan Group | | | 530 | | | | 22,165 | |
| Meggitt | | | 8,910 | | | | 61,349 | |
| Melrose Industries | | | 18,818 | | | | 54,952 | |
| QinetiQ Group | | | 9,420 | | | | 30,535 | |
| Rentokil Initial | | | 14,006 | | | | 62,456 | |
| Rolls-Royce Holdings | | | 2,104 | | | | 27,186 | |
| Rotork | | | 3,657 | | | | 12,758 | |
| Royal Mail | | | 8,545 | | | | 42,484 | |
| RPC Group | | | 963 | | | | 12,053 | |
| Smiths Group | | | 825 | | | | 17,211 | |
| Spectris | | | 1,526 | | | | 51,877 | |
| Spirax-Sarco Engineering | | | 368 | | | | 27,611 | |
| Travis Perkins | | | 860 | | | | 17,359 | |
| Weir Group | | | 3,231 | | | | 83,795 | |
| | | | | | | | 1,049,865 | |
| Oil & Gas — 1.0% | | | | | | | | |
| BP | | | 9,939 | | | | 67,338 | |
| John Wood Group | | | 7,450 | | | | 70,390 | |
| Royal Dutch Shell, Cl A | | | 1,899 | | | | 59,653 | |
| Tullow Oil * | | | 13,445 | | | | 32,495 | |
| | | | | | | | 229,876 | |
| Real Estate Investment Trusts — 1.1% | | | | | | | | |
| British Land | | | 1,680 | | | | 13,408 | |
| Derwent London | | | 586 | | | | 20,824 | |
| Great Portland Estates | | | 4,025 | | | | 33,219 | |
The accompanying notes are an integral part of the financial statements.
| Schedule of Investments | October 31, 2017 |
Global X Scientific Beta Europe ETF
| | | Shares | | | Value | |
| COMMON STOCK — continued |
| Real Estate Investment Trusts — continued | | | | | | | | |
| Hammerson | | | 3,099 | | | $ | 21,564 | |
| Intu Properties | | | 8,023 | | | | 23,013 | |
| Land Securities Group | | | 1,493 | | | | 19,152 | |
| Segro | | | 5,944 | | | | 42,861 | |
| Shaftesbury | | | 3,568 | | | | 46,908 | |
| | | | | | | | 220,949 | |
| Technology — 0.1% | | | | | | | | |
| Micro Focus International | | | 564 | | | | 19,810 | |
| Telecommunications — 0.4% | | | | | | | | |
| BT Group, Cl A | | | 5,390 | | | | 18,632 | |
| Inmarsat | | | 901 | | | | 7,430 | |
| Vodafone Group | | | 19,173 | | | | 54,893 | |
| | | | | | | | 80,955 | |
| Utilities — 0.6% | | | | | | | | |
| National Grid | | | 5,791 | | | | 69,673 | |
| Pennon Group | | | 2,794 | | | | 29,460 | |
| Severn Trent | | | 280 | | | | 7,849 | |
| SSE | | | 662 | | | | 12,149 | |
| United Utilities Group | | | 763 | | | | 8,440 | |
| | | | | | | | 127,571 | |
| TOTAL UNITED KINGDOM | | | | | | | 5,044,169 | |
| TOTAL COMMON STOCK | | | | | | | | |
| (Cost $18,614,426) | | | | | | | 21,123,338 | |
| |
| PREFERRED STOCK — 0.7% |
| GERMANY— 0.7% | | | | | | | | |
| Basic Materials — 0.2% | | | | | | | | |
| FUCHS PETROLUB (B) | | | 624 | | | | 35,034 | |
| Consumer Goods — 0.3% | | | | | | | | |
| Henkel & KGaA (B) | | | 185 | | | | 25,970 | |
| Porsche Automobil Holding (B) | | | 390 | | | | 28,308 | |
| Volkswagen (B) | | | 149 | | | | 27,061 | |
| | | | | | | | 81,339 | |
| Industrials — 0.2% | | | | | | | | |
| Sartorius (B) | | | 347 | | | $ | 32,343 | |
The accompanying notes are an integral part of the financial statements.
| Schedule of Investments | October 31, 2017 |
Global X Scientific Beta Europe ETF
| | | Number Of
Rights | | | Value | |
| | | | | | | | | |
| PREFERRED STOCK — continued |
| TOTAL PREFERRED STOCK | | | | | | | | |
| (Cost $127,014) | | | | | | $ | 148,716 | |
| | | | | | | | | |
| RIGHTS — 0.0% |
| Banco Santander, 11/2/17 * | | | 3,738 | | | | 179 | |
| Ferrovial, 11/14/17 * | | | 1,402 | | | | 674 | |
| | | | | | | | | |
| TOTAL RIGHTS (Cost $ –) | | | | | | | 853 | |
| TOTAL INVESTMENTS — 99.8% | | | | | | | | |
| (Cost $18,741,440) | | | | | | $ | 21,272,907 | |
Percentages are based on Net Assets of $21,323,267.
| * | Non-income producing security. |
| (A) | Security sold within terms of a private placement memorandum, exempt from registration under Section 144A of the Securities Act of 1933, as amended, and may be sold only to dealers in that program or other "accredited investors." The total value of such securities as of October 31, 2017 was $400,005 and represents 1.9% of Net Assets. |
| (B) | There’s currently no stated interest rate. |
ADR — American Depositary Receipt
Cl — Class
As of October 31, 2017, all of the Fund's investments were considered Level 1, in accordance with authoritative guidance on fair value measurements and disclosure under U.S. GAAP.
For the year ended October 31, 2017, there have been no transfers between Level 1, Level 2 or Level 3 investments.
The accompanying notes are an integral part of the financial statements.
| Schedule of Investments | October 31, 2017 |
Global X Scientific Beta Japan ETF
Sector Weightings (unaudited)†:
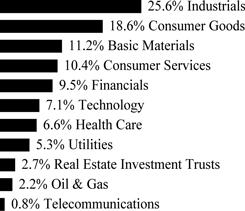
† Sector weightings percentages are based on the total market value of investments.
| | | Shares | | | Value | |
| COMMON STOCK — 99.9% |
| JAPAN— 99.9% | | | | | | | | |
| Basic Materials — 11.2% | | | | | | | | |
| Air Water | | | 3,762 | | | $ | 71,645 | |
| Asahi Kasei | | | 18,906 | | | | 227,778 | |
| Daicel | | | 7,113 | | | | 88,013 | |
| DIC | | | 1,300 | | | | 47,936 | |
| JFE Holdings | | | 4,819 | | | | 102,631 | |
| JSR | | | 4,542 | | | | 87,458 | |
| Kaneka | | | 10,749 | | | | 88,164 | |
| Kansai Paint | | | 1,084 | | | | 27,732 | |
| Kobe Steel | | | 6,038 | | | | 50,481 | |
| Kuraray | | | 8,094 | | | | 158,348 | |
| Mitsubishi Chemical Holdings | | | 8,472 | | | | 87,792 | |
| Mitsubishi Gas Chemical | | | 2,510 | | | | 60,944 | |
| Mitsui Chemicals | | | 3,550 | | | | 108,721 | |
| Nippon Steel & Sumitomo Metal | | | 2,352 | | | | 55,907 | |
| Nissan Chemical Industries | | | 1,160 | | | | 43,029 | |
| Nitto Denko | | | 142 | | | | 13,128 | |
| Oji Holdings | | | 15,019 | | | | 87,500 | |
| Shin-Etsu Chemical | | | 274 | | | | 28,719 | |
| Sumitomo Chemical | | | 9,426 | | | | 65,865 | |
| Sumitomo Metal Mining | | | 3,327 | | | | 130,468 | |
| Teijin | | | 5,860 | | | | 123,409 | |
| Toray Industries | | | 6,840 | | | | 68,833 | |
| Tosoh | | | 5,569 | | | | 119,486 | |
| | | | | | | | 1,943,987 | |
| Consumer Goods — 18.6% | | | | | | | | |
| Aisin Seiki | | | 2,669 | | | | 137,173 | |
The accompanying notes are an integral part of the financial statements.
| Schedule of Investments | October 31, 2017 |
Global X Scientific Beta Japan ETF
| | | Shares | | | Value | |
| COMMON STOCK — continued |
| Consumer Goods — continued | | | | | | | | |
| Ajinomoto | | | 591 | | | $ | 11,840 | |
| Asahi Group Holdings | | | 705 | | | | 32,021 | |
| Bridgestone | | | 3,254 | | | | 154,352 | |
| Calbee | | | 802 | | | | 26,926 | |
| Casio Computer | | | 1,909 | | | | 28,023 | |
| Coca-Cola Bottlers Japan | | | 890 | | | | 30,938 | |
| Denso | | | 2,180 | | | | 118,794 | |
| Ezaki Glico | | | 355 | | | | 19,651 | |
| Honda Motor | | | 2,642 | | | | 81,913 | |
| Japan Tobacco | | | 287 | | | | 9,464 | |
| JTEKT | | | 6,815 | | | | 111,314 | |
| Kewpie | | | 484 | | | | 12,020 | |
| Kirin Holdings | | | 1,739 | | | | 41,390 | |
| Konami Holdings | | | 1,335 | | | | 64,617 | |
| Kose | | | 84 | | | | 10,150 | |
| Lion | | | 2,047 | | | | 39,200 | |
| Makita | | | 888 | | | | 37,120 | |
| Mazda Motor | | | 2,426 | | | | 34,630 | |
| Mitsubishi Motors | | | 24,563 | | | | 194,766 | |
| Nexon | | | 851 | | | | 22,767 | |
| NGK Spark Plug | | | 5,572 | | | | 125,484 | |
| NH Foods | | | 8,081 | | | | 231,842 | |
| Nichirei | | | 2,210 | | | | 56,636 | |
| Nikon | | | 9,670 | | | | 182,370 | |
| Nintendo | | | 38 | | | | 14,648 | |
| Nissan Motor | | | 6,994 | | | | 67,613 | |
| Nisshin Seifun Group | | | 6,540 | | | | 114,477 | |
| Nissin Foods Holdings | | | 842 | | | | 52,833 | |
| NSK | | | 5,409 | | | | 76,877 | |
| Panasonic | | | 685 | | | | 10,251 | |
| Pigeon | | | 250 | | | | 8,811 | |
| Rinnai | | | 439 | | | | 37,437 | |
| Sega Sammy Holdings | | | 4,560 | | | | 63,767 | |
| Sekisui Chemical | | | 5,869 | | | | 117,555 | |
| Sekisui House | | | 2,735 | | | | 50,810 | |
| Sharp * | | | 600 | | | | 18,930 | |
| Sony | | | 320 | | | | 12,428 | |
| Stanley Electric | | | 4,310 | | | | 157,978 | |
| Sumitomo Electric Industries | | | 2,931 | | | | 49,564 | |
| Sumitomo Rubber Industries | | | 5,649 | | | | 106,587 | |
| Suntory Beverage & Food | | | 559 | | | | 25,532 | |
| Suzuki Motor | | | 265 | | | | 14,401 | |
| Toyo Suisan Kaisha | | | 817 | | | | 31,312 | |
| Toyota Industries | | | 1,237 | | | | 75,224 | |
The accompanying notes are an integral part of the financial statements.
| Schedule of Investments | October 31, 2017 |
Global X Scientific Beta Japan ETF
| | | Shares | | | Value | |
| COMMON STOCK — continued |
| Consumer Goods — continued | | | | | | | | |
| Toyota Motor | | | 1,466 | | | $ | 90,182 | |
| Yakult Honsha | | | 340 | | | | 27,947 | |
| Yamaha | | | 825 | | | | 32,236 | |
| Yamaha Motor | | | 3,592 | | | | 106,530 | |
| Yamazaki Baking | | | 1,983 | | | | 35,601 | |
| | | | | | | | 3,214,932 | |
| Consumer Services — 10.3% | | | | | | | | |
| Aeon | | | 8,218 | | | | 126,600 | |
| ANA Holdings | | | 3,121 | | | | 119,369 | |
| Central Japan Railway | | | 282 | | | | 51,049 | |
| Dai Nippon Printing | | | 3,012 | | | | 71,702 | |
| Dena | | | 680 | | | | 15,900 | |
| Dentsu | | | 794 | | | | 33,715 | |
| FamilyMart UNY Holdings | | | 1,202 | | | | 68,124 | |
| Fast Retailing | | | 55 | | | | 18,204 | |
| Hakuhodo DY Holdings | | | 1,334 | | | | 18,326 | |
| Hankyu Hanshin Holdings | | | 2,350 | | | | 91,101 | |
| Isetan Mitsukoshi Holdings | | | 6,420 | | | | 69,381 | |
| J Front Retailing | | | 4,922 | | | | 72,251 | |
| Japan Airlines | | | 2,061 | | | | 70,193 | |
| Keihan Holdings | | | 659 | | | | 20,066 | |
| Keikyu | | | 2,261 | | | | 46,541 | |
| Keisei Electric Railway | | | 814 | | | | 24,428 | |
| Kintetsu Group Holdings | | | 325 | | | | 12,442 | |
| Lawson | | | 385 | | | | 25,073 | |
| Marui Group | | | 4,691 | | | | 71,213 | |
| Nagoya Railroad | | | 5,004 | | | | 112,032 | |
| Nankai Electric Railway | | | 1,421 | | | | 36,591 | |
| Nitori Holdings | | | 300 | | | | 43,444 | |
| Oriental Land | | | 283 | | | | 22,549 | |
| Park24 | | | 1,552 | | | | 35,771 | |
| Seibu Holdings | | | 2,279 | | | | 40,494 | |
| Shimamura | | | 173 | | | | 19,214 | |
| Start Today | | | 1,298 | | | | 35,297 | |
| Tobu Railway | | | 2,988 | | | | 87,302 | |
| Toho | | | 960 | | | | 31,682 | |
| Tsuruha Holdings | | | 302 | | | | 37,288 | |
| USS | �� | | 1,228 | | | | 24,640 | |
| West Japan Railway | | | 1,248 | | | | 87,568 | |
| Yamada Denki | | | 29,338 | | | | 155,429 | |
| | | | | | | | 1,794,979 | |
| Financials — 9.5% | | | | | | | | |
| Aozora Bank | | | 2,424 | | | | 94,397 | |
| Bank of Kyoto | | | 1,184 | | | | 61,685 | |
The accompanying notes are an integral part of the financial statements.
| Schedule of Investments | October 31, 2017 |
Global X Scientific Beta Japan ETF
| | | Shares | | | Value | |
| COMMON STOCK — continued |
| Financials — continued | | | | | | | | |
| Chiba Bank | | | 10,233 | | | $ | 77,628 | |
| Concordia Financial Group | | | 6,400 | | | | 33,512 | |
| Credit Saison | | | 2,687 | | | | 53,773 | |
| Dai-ichi Life Holdings | | | 3,820 | | | | 72,027 | |
| Daito Trust Construction | | | 134 | | | | 23,391 | |
| Daiwa Securities Group | | | 6,004 | | | | 37,288 | |
| Fukuoka Financial Group | | | 16,264 | | | | 83,159 | |
| Hachijuni Bank | | | 7,460 | | | | 46,350 | |
| Hiroshima Bank | | | 5,070 | | | | 42,566 | |
| Japan Post Bank | | | 3,000 | | | | 37,781 | |
| Japan Post Holdings | | | 2,660 | | | | 30,619 | |
| Kyushu Financial Group | | | 5,760 | | | | 36,345 | |
| Mitsubishi UFJ Financial Group | | | 6,566 | | | | 44,060 | |
| Mitsubishi UFJ Lease & Finance | | | 10,422 | | | | 54,481 | |
| Mitsui Fudosan | | | 1,568 | | | | 36,237 | |
| Mizuho Financial Group | | | 46,122 | | | | 83,168 | |
| MS&AD Insurance Group Holdings | | | 1,287 | | | | 43,436 | |
| Nomura Holdings | | | 7,365 | | | | 42,052 | |
| ORIX | | | 2,261 | | | | 38,572 | |
| Resona Holdings | | | 17,517 | | | | 93,759 | |
| Shinsei Bank | | | 5,726 | | | | 95,795 | |
| Shizuoka Bank | | | 6,230 | | | | 60,145 | |
| Sompo Holdings | | | 1,091 | | | | 43,580 | |
| Sumitomo Mitsui Financial Group | | | 1,121 | | | | 44,562 | |
| Sumitomo Mitsui Trust Holdings | | | 1,195 | | | | 46,746 | |
| Suruga Bank | | | 1,008 | | | | 22,780 | |
| T&D Holdings | | | 3,105 | | | | 47,779 | |
| Tokio Marine Holdings | | | 1,050 | | | | 44,863 | |
| Tokyo Tatemono | | | 3,201 | | | | 44,537 | |
| Tokyu Fudosan Holdings | | | 7,321 | | | | 47,677 | |
| | | | | | | | 1,664,750 | |
| Health Care — 6.7% | | | | | | | | |
| Alfresa Holdings | | | 3,505 | | | | 66,658 | |
| Astellas Pharma | | | 910 | | | | 12,081 | |
| Daiichi Sankyo | | | 4,769 | | | | 109,121 | |
| Hisamitsu Pharmaceutical | | | 432 | | | | 23,685 | |
| Kobayashi Pharmaceutical | | | 615 | | | | 35,396 | |
| Kyowa Hakko Kirin | | | 7,077 | | | | 130,043 | |
| Medipal Holdings | | | 3,282 | | | | 60,597 | |
| Miraca Holdings | | | 673 | | | | 31,213 | |
| Mitsubishi Tanabe Pharma | | | 9,313 | | | | 204,406 | |
| Nippon Shinyaku | | | 416 | | | | 29,361 | |
| Otsuka Holdings | | | 2,884 | | | | 120,101 | |
| Santen Pharmaceutical | | | 500 | | | | 7,916 | |
The accompanying notes are an integral part of the financial statements.
| Schedule of Investments | October 31, 2017 |
Global X Scientific Beta Japan ETF
| | | Shares | | | Value | |
| COMMON STOCK — continued |
| Health Care — continued | | | | | | | | |
| Sumitomo Dainippon Pharma | | | 7,308 | | | $ | 103,996 | |
| Suzuken | | | 2,685 | | | | 96,289 | |
| Taisho Pharmaceutical Holdings | | | 978 | | | | 74,105 | |
| Takeda Pharmaceutical | | | 463 | | | | 26,057 | |
| Terumo | | | 287 | | | | 11,884 | |
| | | | | | | | 1,142,909 | |
| Industrials — 25.5% | | | | | | | | |
| Alps Electric | | | 1,053 | | | | 31,925 | |
| Amada Holdings | | | 8,707 | | | | 107,353 | |
| Asahi Glass | | | 1,926 | | | | 75,087 | |
| Disco | | | 244 | | | | 56,109 | |
| FANUC | | | 130 | | | | 30,169 | |
| Fuji Electric | | | 22,846 | | | | 164,263 | |
| Hamamatsu Photonics | | | 1,029 | | | | 33,099 | |
| Haseko | | | 1,085 | | | | 15,660 | |
| Hino Motors | | | 7,493 | | | | 95,682 | |
| Hirose Electric | | | 203 | | | | 30,353 | |
| Hitachi | | | 11,979 | | | | 94,563 | |
| Hoshizaki | | | 479 | | | | 45,147 | |
| Hoya | | | 397 | | | | 21,448 | |
| IHI | | | 1,044 | | | | 37,348 | |
| Isuzu Motors | | | 3,341 | | | | 48,470 | |
| ITOCHU | | | 3,045 | | | | 53,005 | |
| JGC | | | 5,127 | | | | 85,232 | |
| Kajima | | | 22,681 | | | | 234,136 | |
| Kawasaki Heavy Industries | | | 1,615 | | | | 55,856 | |
| Keyence | | | 45 | | | | 24,882 | |
| Komatsu | | | 6,232 | | | | 202,762 | |
| Kurita Water Industries | | | 4,458 | | | | 140,846 | |
| Kyocera | | | 2,525 | | | | 167,614 | |
| LIXIL Group | | | 9,280 | | | | 253,990 | |
| Mabuchi Motor | | | 455 | | | | 23,665 | |
| Marubeni | | | 14,293 | | | | 95,182 | |
| Minebea | | | 2,764 | | | | 50,157 | |
| MISUMI Group | | | 963 | | | | 26,272 | |
| Mitsubishi | | | 2,457 | | | | 57,268 | |
| Mitsubishi Electric | | | 3,219 | | | | 54,717 | |
| Mitsubishi Heavy Industries | | | 857 | | | | 33,328 | |
| Mitsubishi Materials | | | 2,289 | | | | 86,419 | |
| Mitsui | | | 7,033 | | | | 104,539 | |
| Mitsui OSK Lines | | | 2,233 | | | | 67,798 | |
| Murata Manufacturing | | | 75 | | | | 11,676 | |
| Nabtesco | | | 1,069 | | | | 42,241 | |
| Nidec | | | 101 | | | | 13,328 | |
The accompanying notes are an integral part of the financial statements.
| Schedule of Investments | October 31, 2017 |
Global X Scientific Beta Japan ETF
| | | Shares | | | Value | |
| COMMON STOCK — continued |
| Industrials — continued | | | | | | | | |
| Nippon Express | | | 1,589 | | | $ | 100,265 | |
| Nippon Yusen | | | 3,157 | | | | 66,207 | |
| Obayashi | | | 14,694 | | | | 191,385 | |
| Omron | | | 380 | | | | 21,135 | |
| Persol Holdings | | | 1,166 | | | | 28,752 | |
| Recruit Holdings | | | 1,190 | | | | 29,072 | |
| Secom | | | 155 | | | | 11,700 | |
| Shimadzu | | | 786 | | | | 16,242 | |
| Shimizu | | | 14,908 | | | | 174,362 | |
| SMC | | | 66 | | | | 25,115 | |
| Sohgo Security Services | | | 191 | | | | 9,144 | |
| Sojitz | | | 26,803 | | | | 80,435 | |
| Sumitomo | | | 5,399 | | | | 77,614 | |
| Sumitomo Heavy Industries | | | 2,875 | | | | 119,929 | |
| Taiheiyo Cement | | | 4,437 | | | | 176,496 | |
| Taisei | | | 810 | | | | 44,695 | |
| TDK | | | 1,550 | | | | 118,265 | |
| THK | | | 690 | | | | 25,018 | |
| Toppan Printing | | | 8,723 | | | | 88,128 | |
| Toyo Seikan Group Holdings | | | 3,499 | | | | 61,370 | |
| Toyota Tsusho | | | 1,746 | | | | 62,999 | |
| Yamato Holdings | | | 930 | | | | 18,918 | |
| Yaskawa Electric | | | 984 | | | | 34,985 | |
| Yokogawa Electric | | | 2,540 | | | | 47,791 | |
| | | | | | | | 4,401,611 | |
| Oil & Gas — 2.2% | | | | | | | | |
| Idemitsu Kosan | | | 1,950 | | | | 56,545 | |
| Inpex | | | 13,538 | | | | 143,505 | |
| JXTG Holdings | | | 35,741 | | | | 183,440 | |
| | | | | | | | 383,490 | |
| Real Estate Investment Trusts — 2.7% | | | | | | | | |
| Activia Properties | | | 10 | | | | 39,162 | |
| Advance Residence Investment | | | 22 | | | | 51,752 | |
| Daiwa House, Cl A | | | 5 | | | | 11,661 | |
| GLP J-Reit | | | 42 | | | | 42,174 | |
| Japan Hotel Investment, Cl A | | | 53 | | | | 35,029 | |
| Japan Prime Realty Investment | | | 9 | | | | 28,949 | |
| Japan Real Estate Investment | | | 5 | | | | 23,409 | |
| Japan Retail Fund Investment | | | 31 | | | | 54,945 | |
| Nippon Building Fund | | | 3 | | | | 14,468 | |
| Nippon Prologis | | | 26 | | | | 54,641 | |
| Nomura Real Estate Master Fund | | | 22 | | | | 27,512 | |
| Orix JREIT | | | 31 | | | | 42,586 | |
The accompanying notes are an integral part of the financial statements.
| Schedule of Investments | October 31, 2017 |
Global X Scientific Beta Japan ETF
| | | Shares | | | Value | |
| COMMON STOCK — continued |
| Real Estate Investment Trusts — continued | | | | | | | | |
| United Urban Investment | | | 26 | | | $ | 37,365 | |
| | | | | | | | 463,653 | |
| Technology — 7.1% | | | | | | | | |
| Brother Industries | | | 1,049 | | | | 25,286 | |
| Canon | | | 4,403 | | | | 164,409 | |
| FUJIFILM Holdings | | | 2,031 | | | | 82,684 | |
| Fujitsu | | | 3,029 | | | | 23,415 | |
| Konica Minolta | | | 11,600 | | | | 100,861 | |
| NEC | | | 5,833 | | | | 159,133 | |
| Nomura Research Institute | | | 685 | | | | 28,846 | |
| NTT Data | | | 1,455 | | | | 16,864 | |
| Obic | | | 467 | | | | 30,700 | |
| Otsuka | | | 1,046 | | | | 70,881 | |
| Ricoh | | | 10,236 | | | | 94,226 | |
| Rohm | | | 1,918 | | | | 176,558 | |
| Seiko Epson | | | 6,358 | | | | 150,851 | |
| Square Enix Holdings | | | 526 | | | | 21,155 | |
| Tokyo Electron | | | 77 | | | | 13,387 | |
| Trend Micro | | | 884 | | | | 47,067 | |
| Yahoo Japan | | | 3,200 | | | | 14,278 | |
| | | | | | | | 1,220,601 | |
| Telecommunications — 0.8% | | | | | | | | |
| Nippon Telegraph & Telephone | | | 2,442 | | | | 117,619 | |
| NTT DOCOMO | | | 595 | | | | 14,353 | |
| | | | | | | | 131,972 | |
| Utilities — 5.3% | | | | | | | | |
| Chubu Electric Power | | | 6,195 | | | | 79,434 | |
| Chugoku Electric Power | | | 8,182 | | | | 90,799 | |
| Electric Power Development | | | 5,452 | | | | 136,504 | |
| Kansai Electric Power | | | 10,530 | | | | 143,406 | |
| Kyushu Electric Power | | | 9,272 | | | | 105,262 | |
| Osaka Gas | | | 4,238 | | | | 81,623 | |
| Toho Gas | | | 2,345 | | | | 65,317 | |
| Tohoku Electric Power | | | 5,725 | | | | 74,667 | |
| Tokyo Electric Power Holdings * | | | 11,797 | | | | 48,172 | |
| Tokyo Gas | | | 3,979 | | | | 98,766 | |
| | | | | | | | 923,950 | |
| TOTAL COMMON STOCK | | | | | | | | |
| (Cost $15,014,971) | | | | | | | 17,286,834 | |
| TOTAL INVESTMENTS — 99.9% | | | | | | | | |
| (Cost $15,014,971) | | | | | | $ | 17,286,834 | |
Percentages are based on Net Assets of $17,308,552.
The accompanying notes are an integral part of the financial statements.
| Schedule of Investments | October 31, 2017 |
Global X Scientific Beta Japan ETF
| * | Non-income producing security. |
As of October 31, 2017, all of the Fund's investments were considered Level 1, in accordance with authoritative guidance on fair value measurements and disclosure under U.S. GAAP.
For the year ended October 31, 2017, there have been no transfers between Level 1, Level 2 or Level 3 investments.
The accompanying notes are an integral part of the financial statements.
| Schedule of Investments | October 31, 2017 |
Global X Scientific Beta Asia ex-Japan ETF
Sector Weightings (unaudited)†:
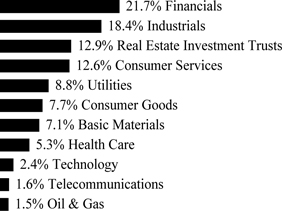
† Sector weightings percentages are based on the total market value of investments.
| | | Shares | | | Value | |
| COMMON STOCK — 99.7% |
| AUSTRALIA— 35.9% | | | | | | | | |
| Basic Materials — 7.1% | | | | | | | | |
| Alumina | | | 25,084 | | | $ | 45,005 | |
| BHP Billiton | | | 848 | | | | 17,256 | |
| BlueScope Steel | | | 4,703 | | | | 46,302 | |
| Fortescue Metals Group | | | 7,521 | | | | 26,758 | |
| Iluka Resources | | | 2,530 | | | | 18,215 | |
| Incitec Pivot | | | 7,339 | | | | 21,496 | |
| Newcrest Mining | | | 1,449 | | | | 24,898 | |
| Northern Star Resources | | | 4,270 | | | | 17,090 | |
| Orica | | | 1,195 | | | | 19,122 | |
| Rio Tinto | | | 189 | | | | 10,064 | |
| South32 | | | 8,415 | | | | 21,744 | |
| | | | | | | | 267,950 | |
| Consumer Goods — 1.0% | | | | | | | | |
| Coca-Cola Amatil | | | 2,264 | | | | 14,148 | |
| Treasury Wine Estates | | | 2,187 | | | | 26,243 | |
| | | | | | | | 40,391 | |
| Consumer Services — 3.9% | | | | | | | | |
| Aristocrat Leisure | | | 646 | | | | 11,665 | |
| Crown Resorts | | | 1,490 | | | | 13,264 | |
| Domino's Pizza Enterprises | | | 333 | | | | 11,896 | |
| Qantas Airways | | | 3,790 | | | | 17,872 | |
| Star Entertainment Grp | | | 8,276 | | | | 36,486 | |
| TABCORP Holdings | | | 3,492 | | | | 12,022 | |
| Tatts Group | | | 5,967 | | | | 19,079 | |
| Wesfarmers | | | 600 | | | | 19,230 | |
The accompanying notes are an integral part of the financial statements.
| Schedule of Investments | October 31, 2017 |
Global X Scientific Beta Asia ex-Japan ETF
| | | Shares | | | Value | |
| COMMON STOCK — continued |
| Consumer Services — continued | | | | | | | | |
| Woolworths | | | 490 | | | $ | 9,723 | |
| | | | | | | | 151,237 | |
| Financials — 5.1% | | | | | | | | |
| ASX | | | 402 | | | | 16,638 | |
| Australia & New Zealand Banking Group | | | 692 | | | | 15,875 | |
| Bank of Queensland | | | 1,722 | | | | 17,640 | |
| Bendigo and Adelaide Bank | | | 2,792 | | | | 24,362 | |
| Challenger | | | 1,385 | | | | 14,124 | |
| Lend Lease Group | | | 1,339 | | | | 16,642 | |
| Macquarie Group | | | 263 | | | | 19,833 | |
| Magellan Financial Group | | | 524 | | | | 9,751 | |
| National Australia Bank | | | 664 | | | | 16,628 | |
| QBE Insurance Group | | | 1,068 | | | | 8,746 | |
| REA Group | | | 460 | | | | 25,493 | |
| Suncorp Group | | | 937 | | | | 9,756 | |
| | | | | | | | 195,488 | |
| Health Care — 3.0% | | | | | | | | |
| Ansell | | | 1,664 | | | | 30,621 | |
| Cochlear | | | 307 | | | | 41,410 | |
| CSL | | | 142 | | | | 15,126 | |
| Healthscope | | | 9,515 | | | | 14,299 | |
| Sonic Healthcare | | | 829 | | | | 13,838 | |
| | | | | | | | 115,294 | |
| Industrials — 5.8% | | | | | | | | |
| ALS | | | 3,236 | | | | 19,428 | |
| Amcor | | | 761 | | | | 9,243 | |
| Aurizon Holdings | | | 9,736 | | | | 38,669 | |
| Boral | | | 4,468 | | | | 24,495 | |
| CIMIC Group | | | 319 | | | | 11,826 | |
| Computershare | | | 1,930 | | | | 23,056 | |
| Downer EDI | | | 5,290 | | | | 28,352 | |
| Macquarie Atlas Roads Group | | | 3,946 | | | | 18,032 | |
| Orora | | | 8,024 | | | | 20,918 | |
| SEEK | | | 638 | | | | 8,986 | |
| Sydney Airport | | | 3,148 | | | | 17,162 | |
| Transurban Group | | | 1,218 | | | | 11,328 | |
| | | | | | | | 231,495 | |
| Oil & Gas — 1.0% | | | | | | | | |
| Santos | | | 5,312 | | | | 18,328 | |
| Woodside Petroleum | | | 743 | | | | 17,507 | |
| | | | | | | | 35,835 | |
| Real Estate Investment Trusts — 5.5% | | | | | | | | |
| Dexus | | | 3,831 | | | | 28,699 | |
The accompanying notes are an integral part of the financial statements.
| Schedule of Investments | October 31, 2017 |
Global X Scientific Beta Asia ex-Japan ETF
| | | Shares | | | Value | |
| COMMON STOCK — continued |
| Real Estate Investment Trusts — continued | | | | | | | | |
| Goodman Group | | | 6,308 | | | $ | 40,434 | |
| GPT Group | | | 5,819 | | | | 22,710 | |
| Mirvac Group | | | 18,044 | | | | 33,343 | |
| Scentre Group | | | 7,120 | | | | 21,946 | |
| Stockland | | | 9,002 | | | | 31,198 | |
| Vicinity Centres | | | 6,643 | | | | 13,498 | |
| Westfield | | | 2,813 | | | | 16,759 | |
| | | | | | | | 208,587 | |
| Telecommunications — 0.2% | | | | | | | | |
| Telstra | | | 2,352 | | | | 6,384 | |
| Utilities — 3.3% | | | | | | | | |
| AGL Energy | | | 2,046 | | | | 39,643 | |
| AusNet Services | | | 32,398 | | | | 43,969 | |
| Origin Energy * | | | 2,486 | | | | 15,135 | |
| Spark Infrastructure Group | | | 15,510 | | | | 30,206 | |
| | | | | | | | 128,953 | |
| TOTAL AUSTRALIA | | | | | | | 1,381,614 | |
| HONG KONG— 31.3% | | | | | | | | |
| Consumer Goods — 6.1% | | | | | | | | |
| Li & Fung | | | 53,109 | | | | 26,753 | |
| Samsonite International | | | 6,220 | | | | 25,951 | |
| Shenzhou International Group Holdings | | | 7,604 | | | | 64,910 | |
| Techtronic Industries | | | 5,684 | | | | 33,331 | |
| WH Group (A) | | | 17,500 | | | | 17,720 | |
| Yue Yuen Industrial Holdings | | | 16,248 | | | | 62,270 | |
| | | | | | | | 230,935 | |
| Consumer Services — 3.5% | | | | | | | | |
| Galaxy Entertainment Group | | | 1,600 | | | | 10,890 | |
| MTR | | | 16,188 | | | | 93,786 | |
| Sands China | | | 2,690 | | | | 12,671 | |
| Wynn Macau | | | 7,733 | | | | 19,824 | |
| | | | | | | | 137,171 | |
| Financials — 9.3% | | | | | | | | |
| AIA Group | | | 2,647 | | | | 19,916 | |
| Bank of East Asia | | | 1,918 | | | | 8,408 | |
| CK Asset Holdings | | | 1,032 | | | | 8,486 | |
| Hang Lung Group | | | 8,407 | | | | 29,525 | |
| Hang Lung Properties | | | 8,643 | | | | 19,852 | |
| Hang Seng Bank | | | 430 | | | | 10,180 | |
| Henderson Land Development | | | 1,521 | | | | 9,913 | |
| Hopewell Holdings | | | 14,299 | | | | 54,892 | |
| Hysan Development | | | 7,705 | | | | 37,232 | |
| New World Development | | | 11,993 | | | | 17,862 | |
The accompanying notes are an integral part of the financial statements.
| Schedule of Investments | October 31, 2017 |
Global X Scientific Beta Asia ex-Japan ETF
| | | Shares | | | Value | |
| COMMON STOCK — continued |
| Financials — continued | | | | | | | | |
| Sino Land | | | 13,438 | | | $ | 23,149 | |
| Sun Hung Kai Properties | | | 1,647 | | | | 26,937 | |
| Swire Properties | | | 14,354 | | | | 48,481 | |
| Wharf Holdings | | | 1,938 | | | | 17,624 | |
| Wheelock | | | 3,950 | | | | 27,492 | |
| | | | | | | | 359,949 | |
| Health Care — 0.6% | | | | | | | | |
| CSPC Pharmaceutical Group | | | 14,400 | | | | 25,028 | |
| Industrials — 3.3% | | | | | | | | |
| CK Hutchison Holdings | | | 2,533 | | | | 32,158 | |
| NWS Holdings | | | 32,997 | | | | 66,740 | |
| Swire Pacific, Cl A | | | 2,846 | | | | 28,107 | |
| | | | | | | | 127,005 | |
| Oil & Gas — 0.0% | | | | | | | | |
| Hanergy Thin Film Power Group *(B) | | | 29,000 | | | | 37 | |
| Real Estate Investment Trusts — 1.6% | | | | | | | | |
| Link | | | 7,445 | | | | 62,552 | |
| Technology — 2.3% | | | | | | | | |
| ASM Pacific Technology | | | 3,260 | | | | 47,426 | |
| VTech Holdings | | | 3,113 | | | | 44,250 | |
| | | | | | | | 91,676 | |
| Telecommunications — 1.0% | | | | | | | | |
| PCCW | | | 69,145 | | | | 38,110 | |
| Utilities — 3.6% | | | | | | | | |
| CK Infrastructure Holdings | | | 3,093 | | | | 26,919 | |
| CLP Holdings | | | 4,443 | | | | 45,189 | |
| Hong Kong & China Gas | | | 7,248 | | | | 13,731 | |
| Power Assets Holdings | | | 5,844 | | | | 50,636 | |
| | | | | | | | 136,475 | |
| TOTAL HONG KONG | | | | | | | 1,208,938 | |
| NEW ZEALAND— 4.8% | | | | | | | | |
| Health Care — 1.6% | | | | | | | | |
| Fisher & Paykel Healthcare | | | 3,399 | | | | 30,852 | |
| Ryman Healthcare | | | 4,783 | | | | 30,472 | |
| | | | | | | | 61,324 | |
| Industrials — 1.1% | | | | | | | | |
| Auckland International Airport | | | 5,148 | | | | 21,971 | |
| Fletcher Building | | | 4,096 | | | | 20,652 | |
| | | | | | | | 42,623 | |
| Telecommunications — 0.2% | | | | | | | | |
| Spark New Zealand | | | 3,648 | | | | 9,197 | |
The accompanying notes are an integral part of the financial statements.
| Schedule of Investments | October 31, 2017 |
Global X Scientific Beta Asia ex-Japan ETF
| | | Shares | | | Value | |
| COMMON STOCK — continued |
| Utilities — 1.9% | | | | | | | | |
| Contact Energy | | | 14,388 | | | $ | 56,675 | |
| Meridian Energy | | | 7,349 | | | | 14,348 | |
| | | | | | | | 71,023 | |
| TOTAL NEW ZEALAND | | | | | | | 184,167 | |
| SINGAPORE— 27.7% | | | | | | | | |
| Consumer Goods — 0.5% | | | | | | | | |
| Thai Beverage | | | 28,605 | | | | 20,576 | |
| Consumer Services — 5.2% | | | | | | | | |
| ComfortDelGro | | | 12,970 | | | | 19,230 | |
| Dairy Farm International Holdings | | | 4,444 | | | | 36,352 | |
| Genting Singapore | | | 55,705 | | | | 49,883 | |
| Jardine Cycle & Carriage | | | 500 | | | | 14,456 | |
| Singapore Airlines | | | 8,012 | | | | 60,396 | |
| Singapore Press Holdings | | | 8,913 | | | | 17,664 | |
| | | | | | | | 197,981 | |
| Financials — 7.3% | | | | | | | | |
| CapitaLand | | | 8,648 | | | | 23,296 | |
| City Developments | | | 4,877 | | | | 46,322 | |
| DBS Group Holdings | | | 1,837 | | | | 30,716 | |
| Global Logistic Properties | | | 11,118 | | | | 27,093 | |
| Hongkong Land Holdings | | | 5,873 | | | | 42,579 | |
| Oversea-Chinese Banking | | | 2,373 | | | | 20,727 | |
| Singapore Exchange | | | 2,800 | | | | 15,763 | |
| United Overseas Bank | | | 1,764 | | | | 31,877 | |
| UOL Group | | | 6,204 | | | | 41,166 | |
| | | | | | | | 279,539 | |
| Industrials — 8.2% | | | | | | | | |
| Jardine Matheson Holdings | | | 615 | | | | 39,397 | |
| Jardine Strategic Holdings | | | 967 | | | | 40,556 | |
| SATS | | | 15,988 | | | | 55,155 | |
| Singapore Technologies Engineering | | | 9,925 | | | | 25,352 | |
| Venture | | | 9,207 | | | | 131,712 | |
| Wilmar International | | | 10,313 | | | | 25,661 | |
| | | | | | | | 317,833 | |
| Oil & Gas — 0.5% | | | | | | | | |
| Keppel | | | 3,202 | | | | 17,627 | |
| Real Estate Investment Trusts — 5.8% | | | | | | | | |
| Ascendas | | | 23,538 | | | | 47,339 | |
| CapitaLand Commercial Trust | | | 39,665 | | | | 50,512 | |
| CapitaLand Mall Trust | | | 38,433 | | | | 56,983 | |
| Mapletree Commercial Trust | | | 27,153 | | | | 30,992 | |
| Suntec | | | 29,511 | | | | 42,239 | |
| | | | | | | | 228,065 | |
The accompanying notes are an integral part of the financial statements.
| Schedule of Investments | October 31, 2017 |
Global X Scientific Beta Asia ex-Japan ETF
| | | Shares | | | Value | |
| COMMON STOCK — continued |
| Telecommunications — 0.2% | | | | | | | | |
| Singapore Telecommunications | | | 2,615 | | | $ | 7,198 | |
| TOTAL SINGAPORE | | | | | | | 1,068,819 | |
| TOTAL COMMON STOCK | | | | | | | | |
| (Cost $3,421,334) | | | | | | | 3,843,538 | |
| TOTAL INVESTMENTS — 99.7% | | | | | | | | |
| (Cost $3,421,334) | | | | | | $ | 3,843,538 | |
Percentages are based on Net Assets of $3,856,842.
| * | Non-income producing security. |
| (A) | Security sold within terms of a private placement memorandum, exempt from registration under Section 144A of the Securities Act of 1933, as amended, and may be sold only to dealers in that program or other "accredited investors." The total value of such securities as of October 31, 2017 was $17,720 and represents 0.5% of Net Assets. |
| (B) | Level 3 security in accordance with fair value hierarchy. |
Cl — Class
The following is a summary of the level of inputs used as of October 31, 2017, in valuing the Fund's investments carried at value:
| Investments in Securities | | Level 1 | | | Level 2 | | | Level 3(1) | | | Total | |
| Common Stock | | | | | | | | | | | | | | | | |
| Australia | | $ | 1,381,614 | | | $ | – | | | $ | – | | | $ | 1,381,614 | |
| Hong Kong | | | 1,208,901 | | | | – | | | | 37 | | | | 1,208,938 | |
| New Zealand | | | 184,167 | | | | – | | | | – | | | | 184,167 | |
| Singapore | | | 1,068,819 | | | | – | | | | – | | | | 1,068,819 | |
| Total Investments in Securities | | $ | 3,843,501 | | | $ | – | | | $ | 37 | | | $ | 3,843,538 | |
(1) A reconciliation of Level 3 investments and disclosures of significant unobservable inputs are presented when the Fund has a significant amount of Level 3 investments at the beginning and/or end of the period in relation to Net Assets. Management has concluded that Level 3 investments are not material in relation to Net Assets.
For the year ended October 31, 2017, there have been no transfers between Level 1, Level 2 or Level 3 investments.
The accompanying notes are an integral part of the financial statements.
| Schedule of Investments | October 31, 2017 |
Global X YieldCo Index ETF
Sector Weightings (unaudited)†:
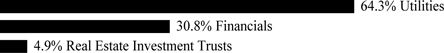
† Sector weightings percentages are based on the total market value of investments.
| | | Shares | | | Value | |
| COMMON STOCK — 89.1% |
| CANADA— 26.3% | | | | | | | | |
| Utilities — 26.3% | | | | | | | | |
| Canadian Solar * | | | 52,270 | | | $ | 920,475 | |
| Innergex Renewable Energy | | | 79,863 | | | | 872,911 | |
| Northland Power | | | 104,158 | | | | 1,993,311 | |
| TransAlta Renewables | | | 136,539 | | | | 1,473,321 | |
| | | | | | | | 5,260,018 | |
| TOTAL CANADA | | | | | | | 5,260,018 | |
| SPAIN— 4.1% | | | | | | | | |
| Utilities — 4.1% | | | | | | | | |
| Saeta Yield | | | 73,806 | | | | 824,461 | |
| UNITED KINGDOM— 21.3% | | | | | | | | |
| Financials — 21.3% | | | | | | | | |
| Bluefield Solar Income Fund | | | 339,092 | | | | 522,345 | |
| Foresight Solar Fund | | | 374,242 | | | | 544,188 | |
| Greencoat UK Wind | | | 599,580 | | | | 959,436 | |
| John Laing Environmental Assets Group | | | 342,198 | | | | 497,592 | |
| NextEnergy Solar Fund | | | 516,917 | | | | 768,813 | |
| Renewables Infrastructure Group | | | 673,331 | | | | 973,730 | |
| | | | | | | | 4,266,104 | |
| TOTAL UNITED KINGDOM | | | | | | | 4,266,104 | |
| UNITED STATES— 37.4% | | | | | | | | |
| Financials — 9.3% | | | | | | | | |
| NRG Yield, Cl A | | | 102,198 | | | | 1,875,333 | |
| Real Estate Investment Trusts — 4.9% | | | | | | | | |
| Hannon Armstrong Sustainable Infrastructure Capital | | | 41,024 | | | | 987,037 | |
| Utilities — 23.2% | | | | | | | | |
| 8Point3 Energy Partners, Cl A (A) | | | 25,713 | | | | 389,295 | |
| Atlantica Yield | | | 44,264 | | | | 990,628 | |
| NextEra Energy Partners | | | 33,894 | | | | 1,333,390 | |
| Pattern Energy Group, Cl A | | | 38,215 | | | | 881,620 | |
| TerraForm Power, Cl A | | | 78,837 | | | | 1,058,781 | |
| | | | | | | | 4,653,714 | |
| TOTAL UNITED STATES | | | | | | | 7,516,084 | |
| TOTAL COMMON STOCK | | | | | | | | |
| (Cost $16,523,633) | | | | | | | 17,866,667 | |
The accompanying notes are an integral part of the financial statements.
| Schedule of Investments | October 31, 2017 |
Global X YieldCo Index ETF
| | | Shares | | | Value | |
| MASTER LIMITED PARTNERSHIP — 10.2% |
| CANADA — 10.2% | | | | | | | | |
| Utilities — 10.2% | | | | | | | | |
| Brookfield Renewable Partners | | | 60,682 | | | $ | 2,047,411 | |
| TOTAL MASTER LIMITED PARTNERSHIP | | | | | | | | |
| (Cost $1,802,764) | | | | | | | 2,047,411 | |
| | | | | | | | | |
| PREFERRED STOCK — 0.3% |
| CANADA— 0.3% | | | | | | | | |
| Utilities — 0.3% | | | | | | | | |
| Brookfield Renewable Partners, 5.75%, VAR Canadian Govt Bonds 5 Year Note+5.010% | | | | | | | | |
| (Cost $57,497) | | | 2,867 | | | | 57,336 | |
| TOTAL PREFERRED STOCK | | | | | | | | |
| (Cost $57,497) | | | | | | | 57,336 | |
| | | | | | | | | |
| TOTAL INVESTMENTS — 99.6% | | | | | | | | |
| (Cost $18,383,894) | | | | | | $ | 19,971,414 | |
Percentages are based on Net Assets of $20,046,395.
| * | Non-income producing security. |
Cl — Class
VAR — Variable Rate
As of October 31, 2017, all of the Fund's investments were considered Level 1, in accordance with authoritative guidance on fair value measurements and disclosure under U.S. GAAP.
For the period ended October 31, 2017, there have been no transfers between Level 1, Level 2 or Level 3 investments.
The accompanying notes are an integral part of the financial statements.
| Schedule of Investments | October 31, 2017 |
Global X S&P 500® Catholic Values ETF
Sector Weightings (unaudited)†:
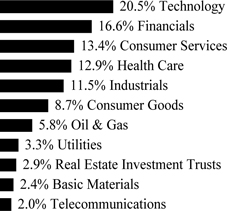
† Sector weightings percentages are based on the total market value of investments.
| | | Shares | | | Value | |
| COMMON STOCK — 99.9% |
| UNITED STATES— 99.9% | | | | | | | | |
| Basic Materials — 2.4% | | | | | | | | |
| Air Products & Chemicals | | | 1,123 | | | $ | 179,040 | |
| Albemarle | | | 587 | | | | 82,702 | |
| Arconic | | | 2,991 | | | | 75,134 | |
| Avery Dennison | | | 444 | | | | 47,139 | |
| CF Industries Holdings | | | 1,210 | | | | 45,956 | |
| DowDuPont | | | 12,134 | | | | 877,411 | |
| Eastman Chemical | | | 746 | | | | 67,744 | |
| Ecolab | | | 1,384 | | | | 180,833 | |
| FMC | | | 685 | | | | 63,609 | |
| Freeport-McMoRan Copper & Gold * | | | 7,255 | | | | 101,425 | |
| International Flavors & Fragrances | | | 423 | | | | 62,359 | |
| International Paper | | | 2,152 | | | | 123,246 | |
| LyondellBasell Industries, Cl A | | | 1,746 | | | | 180,763 | |
| Mosaic | | | 1,848 | | | | 41,284 | |
| Newmont Mining | | | 2,770 | | | | 100,163 | |
| Nucor | | | 1,657 | | | | 95,824 | |
| PPG Industries | | | 1,327 | | | | 154,250 | |
| Praxair | | | 1,484 | | | | 216,842 | |
| | | | | | | | 2,695,724 | |
| Consumer Goods — 8.6% | | | | | | | | |
| Activision Blizzard | | | 3,952 | | | | 258,817 | |
| Altria Group | | | 11,117 | | | | 713,934 | |
| Archer-Daniels-Midland | | | 3,034 | | | | 124,000 | |
| BorgWarner | | | 1,055 | | | | 55,620 | |
| Brown-Forman, Cl B | | | 984 | | | | 56,108 | |
| Campbell Soup | | | 1,029 | | | | 48,744 | |
The accompanying notes are an integral part of the financial statements.
| Schedule of Investments | October 31, 2017 |
Global X S&P 500® Catholic Values ETF
| | | Shares | | | Value | |
| COMMON STOCK — continued |
| Consumer Goods — continued | | | | | | | | |
| Clorox | | | 666 | | | $ | 84,269 | |
| Coca-Cola | | | 22,268 | | | | 1,023,882 | |
| Colgate-Palmolive | | | 5,088 | | | | 358,450 | |
| Conagra Brands | | | 2,203 | | | | 75,254 | |
| Constellation Brands, Cl A | | | 933 | | | | 204,411 | |
| Coty, Cl A | | | 2,305 | | | | 35,497 | |
| Delphi Automotive | | | 1,409 | | | | 140,026 | |
| DR Horton | | | 1,766 | | | | 78,075 | |
| Dr Pepper Snapple Group | | | 962 | | | | 82,405 | |
| Electronic Arts * | | | 1,642 | | | | 196,383 | |
| Estee Lauder, Cl A | | | 1,182 | | | | 132,159 | |
| Ford Motor | | | 20,465 | | | | 251,106 | |
| General Mills | | | 3,104 | | | | 161,160 | |
| General Motors | | | 6,870 | | | | 295,272 | |
| Genuine Parts | | | 760 | | | | 67,054 | |
| Goodyear Tire & Rubber | | | 1,332 | | | | 40,746 | |
| Hanesbrands | | | 1,967 | | | | 44,258 | |
| Harley-Davidson | | | 933 | | | | 44,168 | |
| Hasbro | | | 592 | | | | 54,813 | |
| Hershey | | | 740 | | | | 78,573 | |
| Hormel Foods | | | 1,410 | | | | 43,936 | |
| JM Smucker | | | 592 | | | | 62,782 | |
| Kellogg | | | 1,330 | | | | 83,165 | |
| Kimberly-Clark | | | 2,033 | | | | 228,733 | |
| Kraft Heinz | | | 3,439 | | | | 265,937 | |
| Leggett & Platt | | | 676 | | | | 31,948 | |
| Lennar, Cl A | | | 999 | | | | 55,614 | |
| Leucadia National | | | 1,702 | | | | 43,061 | |
| LKQ * | | | 1,601 | | | | 60,342 | |
| Mattel | | | 1,785 | | | | 25,204 | |
| McCormick | | | 596 | | | | 59,320 | |
| Michael Kors Holdings * | | | 880 | | | | 42,953 | |
| Mohawk Industries * | | | 342 | | | | 89,522 | |
| Molson Coors Brewing, Cl B | | | 962 | | | | 77,797 | |
| Mondelez International, Cl A | | | 8,706 | | | | 360,689 | |
| Monsanto | | | 2,297 | | | | 278,167 | |
| Monster Beverage * | | | 2,134 | | | | 123,623 | |
| NIKE, Cl B | | | 6,935 | | | | 381,355 | |
| Philip Morris International | | | 9,008 | | | | 942,597 | |
| Procter & Gamble | | | 14,800 | | | | 1,277,832 | |
| PulteGroup | | | 1,597 | | | | 48,277 | |
| PVH | | | 444 | | | | 56,304 | |
| Ralph Lauren, Cl A | | | 296 | | | | 26,471 | |
| Snap-On | | | 461 | | | | 72,737 | |
The accompanying notes are an integral part of the financial statements.
| Schedule of Investments | October 31, 2017 |
Global X S&P 500® Catholic Values ETF
| | | Shares | | | Value | |
| COMMON STOCK — continued |
| Consumer Goods — continued | | | | | | | | |
| Stanley Black & Decker | | | 1,230 | | | $ | 198,706 | |
| Tapestry | | | 1,453 | | | | 59,500 | |
| Under Armour, Cl A * | | | 964 | | | | 12,069 | |
| Under Armour, Cl C * | | | 969 | | | | 11,173 | |
| VF | | | 1,708 | | | | 118,962 | |
| Whirlpool | | | 399 | | | | 65,408 | |
| | | | | | | | 9,909,368 | |
| Consumer Services — 13.4% | | | | | | | | |
| Advance Auto Parts | | | 370 | | | | 30,244 | |
| Alaska Air Group | | | 1,016 | | | | 67,086 | |
| Amazon.com * | | | 2,096 | | | | 2,316,666 | |
| American Airlines Group | | | 3,366 | | | | 157,596 | |
| AmerisourceBergen, Cl A | | | 1,714 | | | | 131,892 | |
| AutoZone * | | | 148 | | | | 87,246 | |
| Best Buy | | | 1,422 | | | | 79,604 | |
| Cardinal Health | | | 3,280 | | | | 203,032 | |
| CarMax * | | | 964 | | | | 72,396 | |
| Carnival | | | 2,231 | | | | 148,116 | |
| CBS, Cl B | | | 2,035 | | | | 114,204 | |
| Charter Communications, Cl A * | | | 1,056 | | | | 352,884 | |
| Chipotle Mexican Grill, Cl A * | | | 148 | | | | 40,241 | |
| Comcast, Cl A | | | 24,694 | | | | 889,726 | |
| Costco Wholesale | | | 2,535 | | | | 408,338 | |
| CVS Health | | | 5,878 | | | | 402,819 | |
| Darden Restaurants | | | 648 | | | | 53,311 | |
| Delta Air Lines | | | 5,187 | | | | 259,505 | |
| Discovery Communications, Cl A * | | | 796 | | | | 15,028 | |
| Discovery Communications, Cl C * | | | 1,188 | | | | 21,158 | |
| DISH Network, Cl A * | | | 1,200 | | | | 58,248 | |
| Dollar General | | | 1,339 | | | | 108,245 | |
| Dollar Tree * | | | 1,227 | | | | 111,964 | |
| eBay * | | | 5,260 | | | | 197,986 | |
| Expedia | | | 665 | | | | 82,899 | |
| Foot Locker | | | 701 | | | | 21,086 | |
| Gap | | | 1,144 | | | | 29,733 | |
| H&R Block | | | 1,131 | | | | 27,981 | |
| Hilton Worldwide Holdings | | | 1,064 | | | | 76,906 | |
| Home Depot | | | 6,234 | | | | 1,033,473 | |
| Interpublic Group | | | 2,080 | | | | 40,040 | |
| Kohl's | | | 936 | | | | 39,087 | |
| Kroger | | | 4,931 | | | | 102,072 | |
| L Brands | | | 1,259 | | | | 54,187 | |
| Lowe's | | | 4,490 | | | | 358,976 | |
| Macy's | | | 1,610 | | | | 30,204 | |
The accompanying notes are an integral part of the financial statements.
| Schedule of Investments | October 31, 2017 |
Global X S&P 500® Catholic Values ETF
| | | Shares | | | Value | |
| COMMON STOCK — continued |
| Consumer Services — continued | | | | | | | | |
| Marriott International, Cl A | | | 1,670 | | | $ | 199,532 | |
| McDonald's | | | 4,265 | | | | 711,870 | |
| McKesson | | | 2,290 | | | | 315,746 | |
| Netflix * | | | 2,274 | | | | 446,682 | |
| News | | | 584 | | | | 8,118 | |
| News, Cl A | | | 1,988 | | | | 27,156 | |
| Nielsen Holdings | | | 2,725 | | | | 101,016 | |
| Nordstrom | | | 614 | | | | 24,345 | |
| Omnicom Group | | | 1,241 | | | | 83,383 | |
| O'Reilly Automotive * | | | 497 | | | | 104,842 | |
| priceline.com * | | | 259 | | | | 495,198 | |
| Ross Stores | | | 2,072 | | | | 131,551 | |
| Royal Caribbean Cruises | | | 892 | | | | 110,403 | |
| Scripps Networks Interactive, Cl A | | | 518 | | | | 43,139 | |
| Signet Jewelers | | | 368 | | | | 24,130 | |
| Southwest Airlines | | | 4,289 | | | | 231,006 | |
| Starbucks | | | 7,580 | | | | 415,687 | |
| Sysco | | | 2,674 | | | | 148,728 | |
| Target | | | 2,936 | | | | 173,341 | |
| Tiffany | | | 588 | | | | 55,049 | |
| Time Warner | | | 4,063 | | | | 399,352 | |
| TJX | | | 3,408 | | | | 237,878 | |
| Tractor Supply | | | 666 | | | | 40,133 | |
| TripAdvisor * | | | 592 | | | | 22,200 | |
| Twenty-First Century Fox, Cl A | | | 5,568 | | | | 145,603 | |
| Twenty-First Century Fox, Cl B | | | 2,511 | | | | 63,905 | |
| Ulta Beauty * | | | 298 | | | | 60,133 | |
| United Continental Holdings * | | | 1,997 | | | | 116,785 | |
| Viacom, Cl B | | | 1,801 | | | | 43,278 | |
| Walgreens Boots Alliance | | | 5,315 | | | | 352,225 | |
| Wal-Mart Stores | | | 8,482 | | | | 740,563 | |
| Walt Disney | | | 8,109 | | | | 793,141 | |
| Wyndham Worldwide | | | 593 | | | | 63,362 | |
| Wynn Resorts | | | 444 | | | | 65,486 | |
| Yum! Brands | | | 1,819 | | | | 135,425 | |
| | | | | | | | 15,354,570 | |
| Financials — 16.6% | | | | | | | | |
| Affiliated Managers Group | | | 296 | | | | 55,204 | |
| Aflac | | | 2,021 | | | | 169,542 | |
| Allstate | | | 1,924 | | | | 180,587 | |
| American Express | | | 3,884 | | | | 370,999 | |
| American International Group | | | 4,545 | | | | 293,652 | |
| Ameriprise Financial | | | 817 | | | | 127,893 | |
| Aon | | | 1,303 | | | | 186,889 | |
The accompanying notes are an integral part of the financial statements.
| Schedule of Investments | October 31, 2017 |
Global X S&P 500® Catholic Values ETF
| | | Shares | | | Value | |
| COMMON STOCK — continued |
| Financials — continued | | | | | | | | |
| Arthur J Gallagher | | | 916 | | | $ | 58,010 | |
| Assurant | | | 296 | | | | 29,792 | |
| Bank of America | | | 50,806 | | | | 1,391,576 | |
| Bank of New York Mellon | | | 5,385 | | | | 277,058 | |
| BB&T | | | 4,225 | | | | 208,039 | |
| Berkshire Hathaway, Cl B * | | | 10,012 | | | | 1,871,644 | |
| BlackRock, Cl A | | | 644 | | | | 303,215 | |
| Brighthouse Financial * | | | 494 | | | | 30,717 | |
| Capital One Financial | | | 2,520 | | | | 232,294 | |
| Cboe Global Markets | | | 488 | | | | 55,173 | |
| CBRE Group, Cl A * | | | 1,544 | | | | 60,710 | |
| Charles Schwab | | | 6,126 | | | | 274,690 | |
| Chubb | | | 2,420 | | | | 364,985 | |
| Cincinnati Financial | | | 783 | | | | 54,943 | |
| Citigroup | | | 14,216 | | | | 1,044,876 | |
| Citizens Financial Group | | | 2,697 | | | | 102,513 | |
| CME Group, Cl A | | | 1,767 | | | | 242,379 | |
| Comerica | | | 894 | | | | 70,242 | |
| Discover Financial Services | | | 1,894 | | | | 126,008 | |
| E*TRADE Financial * | | | 1,416 | | | | 61,723 | |
| Equifax | | | 968 | | | | 105,057 | |
| Everest Re Group | | | 211 | | | | 50,102 | |
| Fifth Third Bancorp | | | 3,956 | | | | 114,328 | |
| Franklin Resources | | | 1,852 | | | | 78,025 | |
| Goldman Sachs Group | | | 1,895 | | | | 459,500 | |
| Hartford Financial Services Group | | | 1,992 | | | | 109,660 | |
| Huntington Bancshares | | | 5,671 | | | | 78,260 | |
| IHS Markit * | | | 2,818 | | | | 120,075 | |
| Intercontinental Exchange | | | 3,080 | | | | 203,588 | |
| Invesco | | | 2,146 | | | | 76,805 | |
| JPMorgan Chase | | | 18,229 | | | | 1,834,019 | |
| KeyCorp | | | 5,655 | | | | 103,204 | |
| Lincoln National | | | 1,202 | | | | 91,088 | |
| Loews | | | 1,424 | | | | 70,502 | |
| M&T Bank | | | 814 | | | | 135,751 | |
| Marsh & McLennan | | | 2,684 | | | | 217,216 | |
| Mastercard, Cl A | | | 4,891 | | | | 727,634 | |
| MetLife | | | 5,592 | | | | 299,619 | |
| Moody's | | | 888 | | | | 126,460 | |
| Morgan Stanley | | | 7,287 | | | | 364,350 | |
| Nasdaq | | | 592 | | | | 43,009 | |
| Navient | | | 1,612 | | | | 20,086 | |
| Northern Trust | | | 1,114 | | | | 104,181 | |
| People's United Financial | | | 1,656 | | | | 30,901 | |
The accompanying notes are an integral part of the financial statements.
| Schedule of Investments | October 31, 2017 |
Global X S&P 500® Catholic Values ETF
| | | Shares | | | Value | |
| COMMON STOCK — continued |
| Financials — continued | | | | | | | | |
| PNC Financial Services Group | | | 2,537 | | | $ | 347,036 | |
| Principal Financial Group | | | 1,406 | | | | 92,585 | |
| Progressive | | | 3,025 | | | | 147,166 | |
| Prudential Financial | | | 2,242 | | | | 247,651 | |
| Raymond James Financial | | | 667 | | | | 56,548 | |
| Regions Financial | | | 6,477 | | | | 100,264 | |
| S&P Global | | | 1,351 | | | | 211,391 | |
| State Street | | | 1,838 | | | | 169,096 | |
| SunTrust Banks | | | 2,590 | | | | 155,944 | |
| Synchrony Financial | | | 4,094 | | | | 133,546 | |
| T Rowe Price Group | | | 1,265 | | | | 117,519 | |
| Torchmark | | | 592 | | | | 49,805 | |
| Travelers | | | 1,480 | | | | 196,026 | |
| Unum Group | | | 1,192 | | | | 62,032 | |
| US Bancorp | | | 8,339 | | | | 453,475 | |
| Visa, Cl A | | | 9,631 | | | | 1,059,218 | |
| Wells Fargo | | | 23,229 | | | | 1,304,076 | |
| Western Union | | | 2,542 | | | | 50,484 | |
| Willis Towers Watson | | | 672 | | | | 108,246 | |
| XL Group | | | 1,424 | | | | 57,629 | |
| Zions Bancorporation | | | 1,044 | | | | 48,504 | |
| | | | | | | | 18,977,014 | |
| Health Care — 12.9% | | | | | | | | |
| AbbVie | | | 16,967 | | | | 1,531,271 | |
| Aetna | | | 3,578 | | | | 608,366 | |
| Alexion Pharmaceuticals * | | | 2,351 | | | | 281,321 | |
| Align Technology * | | | 757 | | | | 180,908 | |
| Anthem | | | 2,786 | | | | 582,859 | |
| Baxter International | | | 5,303 | | | | 341,884 | |
| Biogen Idec * | | | 2,247 | | | | 700,300 | |
| Boston Scientific * | | | 14,770 | | | | 415,628 | |
| Celgene * | | | 8,322 | | | | 840,272 | |
| Centene * | | | 1,753 | | | | 164,204 | |
| Cigna | | | 2,671 | | | | 526,775 | |
| CR Bard | | | 744 | | | | 243,340 | |
| DaVita * | | | 1,621 | | | | 98,460 | |
| DENTSPLY SIRONA | | | 2,382 | | | | 145,469 | |
| Edwards Lifesciences * | | | 2,234 | | | | 228,382 | |
| Eli Lilly | | | 10,300 | | | | 843,982 | |
| Express Scripts Holding * | | | 6,230 | | | | 381,837 | |
| Gilead Sciences | | | 13,891 | | | | 1,041,269 | |
| Henry Schein * | | | 1,636 | | | | 128,590 | |
| Hologic * | | | 2,840 | | | | 107,494 | |
| Humana | | | 1,560 | | | | 398,346 | |
The accompanying notes are an integral part of the financial statements.
| Schedule of Investments | October 31, 2017 |
Global X S&P 500® Catholic Values ETF
| | | Shares | | | Value | |
| COMMON STOCK — continued |
| Health Care — continued | | | | | | | | |
| IDEXX Laboratories * | | | 904 | | | $ | 150,218 | |
| Illumina * | | | 1,530 | | | | 313,941 | |
| Incyte * | | | 1,750 | | | | 198,188 | |
| Intuitive Surgical * | | | 1,205 | | | | 452,309 | |
| Laboratory Corp of America Holdings * | | | 1,040 | | | | 159,858 | |
| Medtronic | | | 14,409 | | | | 1,160,212 | |
| Patterson | | | 850 | | | | 31,450 | |
| Quest Diagnostics | | | 1,414 | | | | 132,605 | |
| Quintiles IMS Holdings * | | | 1,592 | | | | 172,095 | |
| Regeneron Pharmaceuticals * | | | 835 | | | | 336,188 | |
| ResMed | | | 1,485 | | | | 125,007 | |
| Stryker | | | 3,413 | | | | 528,571 | |
| Varian Medical Systems * | | | 966 | | | | 100,648 | |
| Vertex Pharmaceuticals * | | | 2,734 | | | | 399,793 | |
| Waters * | | | 818 | | | | 160,369 | |
| Zimmer Biomet Holdings | | | 2,110 | | | | 256,618 | |
| Zoetis, Cl A | | | 5,154 | | | | 328,928 | |
| | | | | | | | 14,797,955 | |
| Industrials — 11.5% | | | | | | | | |
| 3M | | | 4,655 | | | | 1,071,534 | |
| Accenture, Cl A | | | 3,244 | | | | 461,817 | |
| Acuity Brands | | | 370 | | | | 61,864 | |
| Advanced Micro Devices * | | | 4,089 | | | | 44,918 | |
| Allegion | | | 799 | | | | 66,629 | |
| Alliance Data Systems | | | 242 | | | | 54,143 | |
| AMETEK | | | 1,871 | | | | 126,274 | |
| Amphenol, Cl A | | | 1,626 | | | | 141,462 | |
| AO Smith | | | 1,114 | | | | 65,949 | |
| Automatic Data Processing | | | 2,369 | | | | 275,420 | |
| Ball | | | 1,785 | | | | 76,630 | |
| Caterpillar | | | 4,636 | | | | 629,568 | |
| CH Robinson Worldwide | | | 1,144 | | | | 89,838 | |
| Cintas | | | 697 | | | | 103,881 | |
| CSX | | | 7,178 | | | | 361,987 | |
| Cummins | | | 1,203 | | | | 212,787 | |
| Deere | | | 2,494 | | | | 331,403 | |
| Dover | | | 1,259 | | | | 120,222 | |
| Eaton | | | 3,371 | | | | 269,747 | |
| Emerson Electric | | | 5,016 | | | | 323,332 | |
| Expeditors International of Washington | | | 1,469 | | | | 85,760 | |
| Fastenal | | | 2,348 | | | | 110,286 | |
| FedEx | | | 1,927 | | | | 435,136 | |
| Fidelity National Information Services | | | 1,710 | | | | 158,620 | |
| Fiserv * | | | 1,147 | | | | 148,456 | |
The accompanying notes are an integral part of the financial statements.
| Schedule of Investments | October 31, 2017 |
Global X S&P 500® Catholic Values ETF
| | | Shares | | | Value | |
| COMMON STOCK — continued |
| Industrials — continued | | | | | | | | |
| FLIR Systems | | | 740 | | | $ | 34,647 | |
| Flowserve | | | 1,067 | | | | 47,023 | |
| Fortive | | | 2,437 | | | | 176,098 | |
| Fortune Brands Home & Security | | | 1,251 | | | | 82,641 | |
| Global Payments | | | 813 | | | | 84,511 | |
| Illinois Tool Works | | | 2,421 | | | | 378,934 | |
| Ingersoll-Rand | | | 1,992 | | | | 176,491 | |
| Jacobs Engineering Group | | | 993 | | | | 57,802 | |
| JB Hunt Transport Services | | | 729 | | | | 77,558 | |
| Johnson Controls International | | | 7,302 | | | | 302,229 | |
| Kansas City Southern | | | 875 | | | | 91,193 | |
| Martin Marietta Materials | | | 323 | | | | 70,043 | |
| Masco | | | 2,651 | | | | 105,563 | |
| Mettler-Toledo International * | | | 278 | | | | 189,771 | |
| Norfolk Southern | | | 2,253 | | | | 296,089 | |
| PACCAR | | | 2,732 | | | | 195,966 | |
| Packaging Corp of America | | | 468 | | | | 54,414 | |
| Parker-Hannifin | | | 1,034 | | | | 188,819 | |
| Paychex | | | 1,684 | | | | 107,422 | |
| PayPal Holdings * | | | 5,906 | | | | 428,539 | |
| Pentair | | | 1,346 | | | | 94,839 | |
| Quanta Services * | | | 1,275 | | | | 48,106 | |
| Republic Services, Cl A | | | 1,867 | | | | 121,486 | |
| Robert Half International | | | 1,067 | | | | 55,239 | |
| Rockwell Automation | | | 1,039 | | | | 208,652 | |
| Roper Technologies | | | 816 | | | | 210,667 | |
| Sealed Air | | | 1,034 | | | | 45,734 | |
| Sherwin-Williams | | | 428 | | | | 169,124 | |
| Stericycle * | | | 697 | | | | 49,382 | |
| TE Connectivity | | | 1,858 | | | | 169,022 | |
| Total System Services | | | 888 | | | | 63,980 | |
| TransDigm Group | | | 379 | | | | 105,173 | |
| Union Pacific | | | 6,266 | | | | 725,540 | |
| United Parcel Service, Cl B | | | 5,346 | | | | 628,316 | |
| United Rentals * | | | 676 | | | | 95,640 | |
| United Technologies | | | 5,784 | | | | 692,691 | |
| Verisk Analytics, Cl A * | | | 1,261 | | | | 107,248 | |
| Vulcan Materials | | | 670 | | | | 81,572 | |
| Waste Management | | | 3,162 | | | | 259,822 | |
| Westrock | | | 1,330 | | | | 81,569 | |
| WW Grainger | | | 444 | | | | 87,779 | |
| Xerox | | | 1,122 | | | | 34,008 | |
| Xylem | | | 1,461 | | | | 97,200 | |
| | | | | | | | 13,206,205 | |
The accompanying notes are an integral part of the financial statements.
| Schedule of Investments | October 31, 2017 |
Global X S&P 500® Catholic Values ETF
| | | Shares | | | Value | |
| COMMON STOCK — continued |
| Oil & Gas — 5.8% | | | | | | | | |
| Anadarko Petroleum | | | 2,928 | | | $ | 144,555 | |
| Andeavor | | | 739 | | | | 78,511 | |
| Apache | | | 1,985 | | | | 82,119 | |
| Baker Hughes a GE | | | 2,244 | | | | 70,529 | |
| Cabot Oil & Gas | | | 2,427 | | | | 67,228 | |
| Chesapeake Energy * | | | 3,658 | | | | 14,266 | |
| Chevron | | | 9,789 | | | | 1,134,447 | |
| Cimarex Energy | | | 502 | | | | 58,699 | |
| Concho Resources * | | | 784 | | | | 105,221 | |
| ConocoPhillips | | | 6,401 | | | | 327,411 | |
| Devon Energy | | | 2,742 | | | | 101,180 | |
| EOG Resources | | | 3,026 | | | | 302,207 | |
| EQT | | | 895 | | | | 55,973 | |
| ExxonMobil | | | 21,893 | | | | 1,824,782 | |
| Halliburton | | | 4,512 | | | | 192,843 | |
| Helmerich & Payne | | | 590 | | | | 32,043 | |
| Hess | | | 1,394 | | | | 61,559 | |
| Kinder Morgan | | | 10,028 | | | | 181,607 | |
| Marathon Oil | | | 4,428 | | | | 62,966 | |
| Marathon Petroleum | | | 2,738 | | | | 163,568 | |
| National Oilwell Varco | | | 1,981 | | | | 67,730 | |
| Newfield Exploration * | | | 1,036 | | | | 31,898 | |
| Noble Energy | | | 2,252 | | | | 62,763 | |
| Occidental Petroleum | | | 3,986 | | | | 257,376 | |
| Phillips 66 | | | 2,303 | | | | 209,757 | |
| Pioneer Natural Resources | | | 886 | | | | 132,608 | |
| Range Resources | | | 960 | | | | 17,386 | |
| Schlumberger | | | 7,199 | | | | 460,736 | |
| TechnipFMC | | | 2,439 | | | | 66,804 | |
| Valero Energy | | | 2,359 | | | | 186,102 | |
| Williams | | | 4,267 | | | | 121,610 | |
| | | | | | | | 6,676,484 | |
| Real Estate Investment Trusts — 2.9% | | | | | | | | |
| Alexandria Real Estate Equities | | | 469 | | | | 58,137 | |
| American Tower, Cl A | | | 2,219 | | | | 318,803 | |
| Apartment Investment & Management, Cl A | | | 814 | | | | 35,800 | |
| AvalonBay Communities | | | 734 | | | | 133,096 | |
| Boston Properties | | | 814 | | | | 98,641 | |
| Crown Castle International | | | 1,967 | | | | 210,626 | |
| Digital Realty Trust | | | 1,057 | | | | 125,191 | |
| Duke Realty | | | 1,761 | | | | 50,153 | |
| Equinix | | | 416 | | | | 192,816 | |
| Equity Residential | | | 1,910 | | | | 128,467 | |
| Essex Property Trust | | | 351 | | | | 92,113 | |
The accompanying notes are an integral part of the financial statements.
| Schedule of Investments | October 31, 2017 |
Global X S&P 500® Catholic Values ETF
| | | Shares | | | Value | |
| COMMON STOCK — continued |
| Real Estate Investment Trusts — continued | | | | | | | | |
| Extra Space Storage | | | 666 | | | $ | 54,339 | |
| Federal Realty Investment Trust | | | 370 | | | | 44,592 | |
| GGP | | | 3,035 | | | | 59,061 | |
| HCP | | | 2,432 | | | | 62,843 | |
| Host Hotels & Resorts | | | 3,862 | | | | 75,541 | |
| Iron Mountain | | | 1,271 | | | | 50,840 | |
| Kimco Realty | | | 2,191 | | | | 39,789 | |
| Macerich | | | 640 | | | | 34,944 | |
| Mid-America Apartment Communities | | | 559 | | | | 57,214 | |
| ProLogis | | | 2,732 | | | | 176,433 | |
| Public Storage | | | 781 | | | | 161,862 | |
| Realty Income | | | 1,433 | | | | 76,909 | |
| Regency Centers | | | 763 | | | | 46,963 | |
| SBA Communications, Cl A * | | | 608 | | | | 95,565 | |
| Simon Property Group | | | 1,617 | | | | 251,168 | |
| SL Green Realty | | | 518 | | | | 49,562 | |
| UDR | | | 1,389 | | | | 53,879 | |
| Ventas | | | 1,845 | | | | 115,774 | |
| Vornado Realty Trust | | | 888 | | | | 66,476 | |
| Welltower | | | 1,883 | | | | 126,086 | |
| Weyerhaeuser | | | 3,904 | | | | 140,193 | |
| | | | | | | | 3,283,876 | |
| Technology — 20.5% | | | | | | | | |
| Adobe Systems * | | | 2,588 | | | | 453,314 | |
| Akamai Technologies * | | | 896 | | | | 46,816 | |
| Alphabet, Cl A * | | | 1,552 | | | | 1,603,278 | |
| Alphabet, Cl C * | | | 1,586 | | | | 1,612,391 | |
| Analog Devices | | | 1,913 | | | | 174,657 | |
| ANSYS * | | | 443 | | | | 60,563 | |
| Apple | | | 27,037 | | | | 4,570,334 | |
| Applied Materials | | | 5,677 | | | | 320,353 | |
| Autodesk * | | | 1,042 | | | | 130,208 | |
| Broadcom | | | 2,103 | | | | 555,003 | |
| CA | | | 1,616 | | | | 52,326 | |
| Cadence Design Systems * | | | 1,409 | | | | 60,812 | |
| Cerner * | | | 3,412 | | | | 230,378 | |
| Cisco Systems | | | 26,084 | | | | 890,769 | |
| Citrix Systems * | | | 814 | | | | 67,245 | |
| Cognizant Technology Solutions, Cl A | | | 3,167 | | | | 239,647 | |
| DXC Technology | | | 1,475 | | | | 134,992 | |
| F5 Networks * | | | 351 | | | | 42,566 | |
| Facebook, Cl A * | | | 12,401 | | | | 2,232,925 | |
| Garmin | | | 592 | | | | 33,513 | |
| Gartner * | | | 471 | | | | 59,021 | |
The accompanying notes are an integral part of the financial statements.
| Schedule of Investments | October 31, 2017 |
Global X S&P 500® Catholic Values ETF
| | | Shares | | | Value | |
| COMMON STOCK — continued |
| Technology — continued | | | | | | | | |
| Hewlett Packard Enterprise | | | 8,717 | | | $ | 121,341 | |
| HP | | | 8,969 | | | | 193,282 | |
| Intel | | | 24,567 | | | | 1,117,553 | |
| International Business Machines | | | 4,477 | | | | 689,727 | |
| Intuit | | | 1,271 | | | | 191,946 | |
| Juniper Networks | | | 1,968 | | | | 48,865 | |
| KLA-Tencor | | | 814 | | | | 88,636 | |
| Lam Research | | | 844 | | | | 176,033 | |
| Microchip Technology | | | 1,252 | | | | 118,690 | |
| Micron Technology * | | | 5,457 | | | | 241,800 | |
| Microsoft | | | 40,309 | | | | 3,352,903 | |
| Motorola Solutions | | | 870 | | | | 78,770 | |
| NetApp | | | 1,478 | | | | 65,653 | |
| NVIDIA | | | 3,116 | | | | 644,420 | |
| Oracle | | | 15,678 | | | | 798,010 | |
| Qorvo * | | | 666 | | | | 50,489 | |
| QUALCOMM | | | 7,869 | | | | 401,398 | |
| Red Hat * | | | 962 | | | | 116,238 | |
| salesforce.com * | | | 3,503 | | | | 358,497 | |
| Seagate Technology | | | 1,554 | | | | 57,451 | |
| Skyworks Solutions | | | 962 | | | | 109,533 | |
| Symantec | | | 3,233 | | | | 105,073 | |
| Synopsys * | | | 797 | | | | 68,956 | |
| Texas Instruments | | | 5,213 | | | | 504,045 | |
| VeriSign * | | | 493 | | | | 53,007 | |
| Western Digital | | | 1,581 | | | | 141,136 | |
| Xilinx | | | 1,332 | | | | 98,155 | |
| | | | | | | | 23,562,718 | |
| Telecommunications — 2.0% | | | | | | | | |
| AT&T | | | 32,883 | | | | 1,106,514 | |
| CenturyLink | | | 5,082 | | | | 96,507 | |
| Verizon Communications | | | 21,843 | | | | 1,045,624 | |
| | | | | | | | 2,248,645 | |
| Utilities — 3.3% | | | | | | | | |
| AES | | | 3,440 | | | | 36,567 | |
| Alliant Energy | | | 1,183 | | | | 51,177 | |
| Ameren | | | 1,264 | | | | 78,355 | |
| American Electric Power | | | 2,577 | | | | 191,755 | |
| American Water Works | | | 945 | | | | 82,933 | |
| CenterPoint Energy | | | 2,243 | | | | 66,348 | |
| CMS Energy | | | 1,478 | | | | 71,491 | |
| Consolidated Edison | | | 1,589 | | | | 136,733 | |
| Dominion Energy | | | 3,275 | | | | 265,733 | |
| DTE Energy | | | 960 | | | | 106,042 | |
The accompanying notes are an integral part of the financial statements.
| Schedule of Investments | October 31, 2017 |
Global X S&P 500® Catholic Values ETF
| | | Shares | | | Value | |
| COMMON STOCK — continued |
| Utilities — continued | | | | | | | | |
| Duke Energy | | | 3,692 | | | $ | 326,041 | |
| Edison International | | | 1,706 | | | | 136,395 | |
| Entergy | | | 960 | | | | 82,810 | |
| Eversource Energy | | | 1,638 | | | | 102,604 | |
| Exelon | | | 4,829 | | | | 194,174 | |
| FirstEnergy | | | 2,236 | | | | 73,676 | |
| NextEra Energy | | | 2,426 | | | | 376,200 | |
| NiSource | | | 1,704 | | | | 44,934 | |
| NRG Energy | | | 1,631 | | | | 40,775 | |
| ONEOK | | | 2,012 | | | | 109,191 | |
| PG&E | | | 2,734 | | | | 157,943 | |
| Pinnacle West Capital | | | 592 | | | | 51,924 | |
| PPL | | | 3,556 | | | | 133,563 | |
| Public Service Enterprise Group | | | 2,668 | | | | 131,266 | |
| SCANA | | | 740 | | | | 31,924 | |
| Sempra Energy | | | 1,326 | | | | 155,805 | |
| Southern | | | 5,223 | | | | 272,641 | |
| WEC Energy Group | | | 1,636 | | | | 110,250 | |
| Xcel Energy | | | 2,666 | | | | 132,020 | |
| | | | | | | | 3,751,270 | |
| TOTAL COMMON STOCK (COST $102,641,702) | | | | | | | 114,463,829 | |
| TOTAL INVESTMENTS — 99.9% | | | | | | | | |
| (Cost $102,641,702) | | | | | | $ | 114,463,829 | |
Percentages are based on Net Assets of $114,580,740.
| * | Non-income producing security. |
Cl — Class
S&P — Standard & Poor's
As of October 31, 2017, all of the Fund's investments were considered Level 1, in accordance with authoritative guidance on fair value measurements and disclosure under U.S. GAAP.
For the period ended October 31, 2017, there have been no transfers between Level 1, Level 2 or Level 3 investments.
The accompanying notes are an integral part of the financial statements.
Statements of Assets and Liabilities
October 31, 2017
| | | Global X SuperDividend® ETF | | | Global X SuperDividend® U.S. ETF | | | Global X MSCI SuperDividend® EAFE ETF | | | Global X MSCI SuperDividend® Emerging Markets ETF | |
| Assets: | | | | | | | | | | | | | | | | |
| Cost of Investments | | $ | 977,631,036 | | | $ | 397,229,451 | | | $ | 1,664,206 | | | $ | 12,436,502 | |
| Cost of Repurchase Agreement | | | 47,215,366 | | | | 7,694,259 | | | | — | | | | — | |
| Cost of Foreign Currency | | | 41,491 | | | | — | | | | 1 | | | | 9,223 | |
| Investments, at Value | | $ | 987,288,602 | * | | $ | 424,263,412 | * | | $ | 1,812,849 | | | $ | 12,691,946 | |
| Repurchase Agreement, at Value | | | 47,215,366 | | | | 7,694,259 | | | | — | | | | — | |
| Cash | | | 2,829,564 | | | | 824,629 | | | | — | | | | 23,138 | |
| Foreign Currency, at Value | | | 41,533 | | | | — | | | | 1 | | | | 9,404 | |
| Dividend and Interest Receivable | | | 2,838,732 | | | | 622,252 | | | | 1,939 | | | | 29,175 | |
| Reclaim Receivable | | | 364,260 | | | | 20,348 | | | | 3,153 | | | | — | |
| Unrealized Appreciation on Spot Contracts | | | 156 | | | | — | | | | — | | | | 6 | |
| Due from Broker | | | 28,003 | | | | 12,073 | | | | — | | | | 18,142 | |
| Total Assets | | | 1,040,606,216 | | | | 433,436,973 | | | | 1,817,942 | | | | 12,771,811 | |
| Liabilities: | | | | | | | | | | | | | | | | |
| Obligation to Return Securities Lending Collateral | | | 47,215,366 | | | | 7,694,259 | | | | — | | | | — | |
| Payable due to Investment Adviser | | | 497,419 | | | | 163,439 | | | | 851 | | | | 7,081 | |
| Cash Overdraft | | | — | | | | — | | | | 3,881 | | | | — | |
| Accrued Foreign Capital Gains Tax on Appreciated Securities | | | — | | | | — | | | | — | | | | 16,403 | |
| Total Liabilities | | | 47,712,785 | | | | 7,857,698 | | | | 4,732 | | | | 23,484 | |
| Net Assets | | $ | 992,893,431 | | | $ | 425,579,275 | | | $ | 1,813,210 | | | $ | 12,748,327 | |
| Net Assets Consist of: | | | | | | | | | | | | | | | | |
| Paid-in Capital | | $ | 1,090,047,715 | | | $ | 451,980,900 | | | $ | 1,629,030 | | | $ | 12,661,951 | |
| Undistributed (Distributions in Excess of) Net Investment Income | | | (5,559,018 | ) | | | — | | | | 21,675 | | | | 78,164 | |
| Accumulated Net Realized Gain (Loss) on Investments and Foreign Currency Transactions | | | (101,230,049 | ) | | | (53,435,586 | ) | | | 13,684 | | | | (230,768 | ) |
| Net Unrealized Appreciation on Investments | | | 9,657,566 | | | | 27,033,961 | | | | 148,643 | | | | 255,444 | |
| Net Unrealized Appreciation (Depreciation) on Foreign Currency Translations | | | (22,783 | ) | | | — | | | | 178 | | | | (61 | ) |
| Foreign Capital Gains Tax on Appreciated Securities | | | — | | | | — | | | | — | | | | (16,403 | ) |
| Net Assets | | $ | 992,893,431 | | | $ | 425,579,275 | | | $ | 1,813,210 | | | $ | 12,748,327 | |
| Outstanding Shares of Beneficial Interest (unlimited authorization — no par value) | | | 46,150,000 | | | | 16,900,000 | | | | 100,000 | | | | 800,000 | |
| Net Asset Value, Offering and Redemption Price Per Share | | $ | 21.51 | | | $ | 25.18 | | | $ | 18.13 | | | $ | 15.94 | |
| *Includes Market Value of Securities on Loan | | $ | 45,096,945 | | | $ | 7,507,034 | | | $ | — | | | $ | — | |
The accompanying notes are an integral part of the financial statements.
Statements of Assets and Liabilities
October 31, 2017
| | | Global X SuperDividend® REIT ETF | | | Global X SuperIncome™ Preferred ETF | | | Global X Social Media ETF | | | Global X | JPMorgan Efficiente Index ETF | |
| Assets: | | | | | | | | | | | | | | | | |
| Cost of Investments | | $ | 50,362,335 | | | $ | 251,830,640 | | | $ | 143,072,574 | | | $ | 4,901,666 | |
| Cost of Repurchase Agreement | | | — | | | | 11,828,524 | | | | 12,861,023 | | | | — | |
| Cost of Foreign Currency | | | 6,776 | | | | — | | | | — | | | | — | |
| Investments, at Value | | $ | 51,678,481 | | | $ | 234,816,649 | * | | $ | 164,716,572 | * | | $ | 5,237,089 | |
| Repurchase Agreement, at Value | | | — | | | | 11,828,524 | | | | 12,861,023 | | | | — | |
| Cash | | | 220,098 | | | | 971,299 | | | | 326,921 | | | | 2,618 | |
| Foreign Currency, at Value | | | 6,776 | | | | — | | | | — | | | | — | |
| Dividend and Interest Receivable | | | 103,070 | | | | 438,728 | | | | 42,489 | | | | — | |
| Reclaim Receivable | | | 2,312 | | | | — | | | | 13,811 | | | | — | |
| Unrealized Appreciation on Foreign Spot Currency Contracts | | | 27 | | | | — | | | | — | | | | — | |
| Receivable for Capital Shares Sold | | | — | | | | — | | | | 1,633,567 | | | | — | |
| Receivable for Investment Securities Sold | | | — | | | | 4,304,435 | | | | 19,074,124 | | | | — | |
| Total Assets | | | 52,010,764 | | | | 252,359,635 | | | | 198,668,507 | | | | 5,239,707 | |
| Liabilities: | | | | | | | | | | | | | | | | |
| Obligation to Return Securities Lending Collateral | | | — | | | | 11,828,524 | | | | 12,861,023 | | | | — | |
| Payable due to Investment Adviser | | | 24,644 | | | | 118,602 | | | | 88,710 | | | | 3,059 | |
| Payable for Investment Securities Purchased | | | — | | | | 1,594,298 | | | | 20,720,773 | | | | — | |
| Payable for Capital Shares Redeemed | | | — | | | | 2,487,704 | | | | — | | | | — | |
| Unrealized Depreciation on Foreign Spot Currency Contracts | | | — | | | | — | | | | 469 | | | | — | |
| Total Liabilities | | | 24,644 | | | | 16,029,128 | | | | 33,670,975 | | | | 3,059 | |
| Net Assets | | $ | 51,986,120 | | | $ | 236,330,507 | | | $ | 164,997,532 | | | $ | 5,236,648 | |
| Net Assets Consist of: | | | | | | | | | | | | | | | | |
| Paid-in Capital | | $ | 51,065,309 | | | $ | 279,818,000 | | | $ | 158,344,392 | | | $ | 6,661,861 | |
| Undistributed (Distributions in Excess of) Net Investment Income | | | (654,976 | ) | | | 199,762 | | | | 605,595 | | | | 105,750 | |
| Accumulated Net Realized Gain (Loss) on Investments and Foreign Currency Transactions | | | 259,675 | | | | (26,673,264 | ) | | | (15,599,056 | ) | | | (1,866,386 | ) |
| Net Unrealized Appreciation (Depreciation) on Investments | | | 1,316,146 | | | | (17,013,991 | ) | | | 21,643,998 | | | | 335,423 | |
| Net Unrealized Appreciation (Depreciation) on Foreign Currency Translations | | | (34 | ) | | | — | | | | 2,603 | | | | — | |
| Net Assets | | $ | 51,986,120 | | | $ | 236,330,507 | | | $ | 164,997,532 | | | $ | 5,236,648 | |
| Outstanding Shares of Beneficial Interest (unlimited authorization — no par value) | | | 3,400,000 | | | | 19,000,000 | | | | 5,050,000 | | | | 200,000 | |
| Net Asset Value, Offering and Redemption Price Per Share | | $ | 15.29 | | | $ | 12.44 | | | $ | 32.67 | | | $ | 26.18 | |
| *Includes Market Value of Securities on Loan | | $ | — | | | $ | 11,553,181 | | | $ | 12,668,197 | | | $ | — | |
The accompanying notes are an integral part of the financial statements.
Statements of Assets and Liabilities
October 31, 2017
| | | Global X | JPMorgan US Sector Rotator Index ETF | | | Global X Guru® Index ETF | | | Global X Scientific Beta US ETF | | | Global X Scientific Beta Europe ETF | |
| Assets: | | | | | | | | | | | | | | | | |
| Cost of Investments | | $ | 4,992,578 | | | $ | 50,598,162 | | | $ | 120,872,101 | | | $ | 18,741,440 | |
| Cost of Repurchase Agreement | | | — | | | | 2,042,027 | | | | — | | | | — | |
| Cost of Foreign Currency | | | — | | | | — | | | | — | | | | 1,602 | |
| Investments, at Value | | $ | 5,101,491 | | | $ | 55,884,568 | * | | $ | 134,990,079 | | | $ | 21,272,907 | |
| Repurchase Agreement, at Value | | | — | | | | 2,042,027 | | | | — | | | | — | |
| Cash | | | 3,860 | | | | 84,672 | | | | 137,762 | | | | 5,630 | |
| Foreign Currency, at Value | | | — | | | | — | | | | — | | | | 1,600 | |
| Dividend and Interest Receivable | | | — | | | | 21,324 | | | | 78,070 | | | | 17,974 | |
| Reclaim Receivable | | | — | | | | 767 | | | | — | | | | 35,709 | |
| Total Assets | | | 5,105,351 | | | | 58,033,358 | | | | 135,205,911 | | | | 21,333,820 | |
| Liabilities: | | | | | | | | | | | | | | | | |
| Obligation to Return Securities Lending Collateral | | | — | | | | 2,042,027 | | | | — | | | | — | |
| Payable due to Investment Adviser | | | 3,243 | | | | 35,542 | | | | 21,709 | | | | 6,943 | |
| Unrealized Depreciation on Foreign Spot Currency Contracts | | | — | | | | — | | | | — | | | | 2 | |
| Due to Broker | | | — | | | | — | | | | 214 | | | | 3,608 | |
| Total Liabilities | | | 3,243 | | | | 2,077,569 | | | | 21,923 | | | | 10,553 | |
| Net Assets | | $ | 5,102,108 | | | $ | 55,955,789 | | | $ | 135,183,988 | | | $ | 21,323,267 | |
| Net Assets Consist of: | | | | | | | | | | | | | | | | |
| Paid-in Capital | | $ | 6,839,154 | | | $ | 80,140,265 | | | $ | 120,925,967 | | | $ | 19,025,354 | |
| Undistributed Net Investment Income | | | 53,269 | | | | 135,050 | | | | 1,398,110 | | | | 369,916 | |
| Accumulated Net Realized Loss on Investments and Foreign Currency Transactions | | | (1,899,228 | ) | | | (29,605,932 | ) | | | (1,258,067 | ) | | | (604,289 | ) |
| Net Unrealized Appreciation on Investments | | | 108,913 | | | | 5,286,406 | | | | 14,117,978 | | | | 2,531,467 | |
| Net Unrealized Appreciation on Foreign Currency Translations | | | — | | | | — | | | | — | | | | 819 | |
| Net Assets | | $ | 5,102,108 | | | $ | 55,955,789 | | | $ | 135,183,988 | | | $ | 21,323,267 | |
| Outstanding Shares of Beneficial Interest (unlimited authorization — no par value) | | | 200,000 | | | | 1,950,000 | | | | 4,500,000 | | | | 750,000 | |
| Net Asset Value, Offering and Redemption Price Per Share | | $ | 25.51 | | | $ | 28.70 | | | $ | 30.04 | | | $ | 28.43 | |
| *Includes Market Value of Securities on Loan | | $ | — | | | $ | 2,026,333 | | | $ | — | | | $ | — | |
The accompanying notes are an integral part of the financial statements.
Statements of Assets and Liabilities
October 31, 2017
| | | Global X Scientific Beta Japan ETF | | | Global X Scientific Beta Asia ex-Japan ETF | | | Global X YieldCo Index ETF | | | Global X S&P 500® Catholic Values ETF | |
| Assets: | | | | | | | | | | | | | | | | |
| Cost of Investments | | $ | 15,014,971 | | | $ | 3,421,334 | | | $ | 18,383,894 | | | $ | 102,641,702 | |
| Cost of Foreign Currency | | | 182 | | | | — | | | | 6,110 | | | | — | |
| Investments, at Value | | $ | 17,286,834 | | | $ | 3,843,538 | | | $ | 19,971,414 | | | $ | 114,463,829 | |
| Foreign Currency, at Value | | | 182 | | | | — | | | | 6,176 | | | | — | |
| Cash | | | — | | | | 10,230 | | | | 3,234 | | | | 52,463 | |
| Dividend and Interest Receivable | | | 134,308 | | | | 4,288 | | | | 19,702 | | | | 93,411 | |
| Unrealized Appreciation on Foreign Spot Currency Contracts | | | 1 | | | | — | | | | 23 | | | | — | |
| Receivable for Investment Securities Sold | | | — | | | | — | | | | 54,356 | | | | — | |
| Reclaim Receivable | | | — | | | | 36 | | | | 1,557 | | | | 863 | |
| Total Assets | | | 17,421,325 | | | | 3,858,092 | | | | 20,056,462 | | | | 114,610,566 | |
| Liabilities: | | | | | | | | | | | | | | | | |
| Cash Overdraft | | | 107,151 | | | | — | | | | — | | | | — | |
| Payable due to Investment Adviser | | | 5,622 | | | | 1,250 | | | | 9,298 | | | | 27,419 | |
| Payable for Foreign Capital Gains Tax on Appreciated Securities | | | — | | | | — | | | | 769 | | | | — | |
| Due to Broker | | | — | | | | — | | | | — | | | | 2,407 | |
| Total Liabilities | | | 112,773 | | | | 1,250 | | | | 10,067 | | | | 29,826 | |
| Net Assets | | $ | 17,308,552 | | | $ | 3,856,842 | | | $ | 20,046,395 | | | $ | 114,580,740 | |
| Net Assets Consist of: | | | | | | | | | | | | | | | | |
| Paid-in Capital | | $ | 15,201,991 | | | $ | 3,676,889 | | | $ | 19,593,533 | | | $ | 101,601,149 | |
| Undistributed (Distributions in Excess of) Net Investment Income | | | 177,696 | | | | 108,830 | | | | (62,978 | ) | | | 1,275,311 | |
| Accumulated Net Realized Loss on Investments and Foreign Currency Transactions | | | (341,633 | ) | | | (351,081 | ) | | | (1,071,671 | ) | | | (117,847 | ) |
| Net Unrealized Appreciation on Investments | | | 2,271,863 | | | | 422,204 | | | | 1,587,520 | | | | 11,822,127 | |
| Net Unrealized Depreciation on Foreign Currency Translations | | | (1,365 | ) | | | — | | | | (9 | ) | | | — | |
| Net Assets | | $ | 17,308,552 | | | $ | 3,856,842 | | | $ | 20,046,395 | | | $ | 114,580,740 | |
| Outstanding Shares of Beneficial Interest (unlimited authorization — no par value) | | | 550,000 | | | | 150,000 | | | | 1,600,000 | | | | 3,600,000 | |
| Net Asset Value, Offering and Redemption Price Per Share | | $ | 31.47 | | | $ | 25.71 | | | $ | 12.53 | | | $ | 31.83 | |
The accompanying notes are an integral part of the financial statements.
Statements of Operations
For the year ended October 31, 2017
| | | Global X SuperDividend® ETF | | | Global X SuperDividend® U.S. ETF | | | Global X MSCI SuperDividend® EAFE ETF(1) | | | Global X MSCI SuperDividend® Emerging Markets ETF | |
| Investment Income: | | | | | | | | | | | | | | | | |
| Dividend Income | | $ | 51,376,251 | | | $ | 13,956,823 | | | $ | 95,256 | | | $ | 620,955 | |
| Interest Income | | | 5,205 | | | | 1,867 | | | | — | | | | — | |
| Security Lending Income | | | 1,226,099 | | | | 190,339 | | | | — | | | | — | |
| Less: Foreign Taxes Withheld | | | (2,073,167 | ) | | | (90,452 | ) | | | (6,547 | ) | | | (71,966 | ) |
| Total Investment Income | | | 50,534,388 | | | | 14,058,577 | | | | 88,709 | | | | 548,989 | |
| Supervision and Administration Fees(2) | | | 5,186,440 | | | | 1,754,120 | | | | 8,914 | | | | 60,380 | |
| Custodian Fees | | | 23,798 | | | | 9,027 | | | | 77 | | | | 1,150 | |
| Total Expenses | | | 5,210,238 | | | | 1,763,147 | | | | 8,991 | | | | 61,530 | |
| Waiver of Supervision and Administration Fees | | | – | | | | – | | | | – | | | | (181 | ) |
| Net Expenses | | | 5,210,238 | | | | 1,763,147 | | | | 8,991 | | | | 61,349 | |
| Net Investment Income | | | 45,324,150 | | | | 12,295,430 | | | | 79,718 | | | | 487,640 | |
| Net Realized Gain (Loss) on: | | | | | | | | | | | | | | | | |
| Investments (3) | | | 7,673,679 | | | | 9,835,037 | | | | 156,918 | | | | 733,195 | |
| Affiliated Investments | | | — | | | | — | | | | — | | | | (41,279 | ) |
| Foreign Currency Transactions | | | (496,299 | ) | | | — | | | | 369 | | | | (4,554 | ) |
| Net Realized Gain on Investments and Foreign Currency Transactions | | | 7,177,380 | | | | 9,835,037 | | | | 157,287 | | | | 687,362 | |
| Net Change in Unrealized Appreciation (Depreciation) on: | | | | | | | | | | | | | | | | |
| Investments | | | 50,186,878 | | | | 18,157,096 | | | | 148,643 | | | | (365,084 | ) |
| Foreign Capital Gains Tax on Appreciated Securities | | | — | | | | — | | | | — | | | | (16,403 | ) |
| Foreign Currency Translations | | | 34,666 | | | | — | | | | 178 | | | | (69 | ) |
| Net Change in Unrealized Appreciation (Depreciation) on Investments and Foreign Currency Translations | | | 50,221,544 | | | | 18,157,096 | | | | 148,821 | | | | (381,556 | ) |
| Net Realized and Unrealized Gain on Investments and Foreign Currency Transactions and Translations | | | 57,398,924 | | | | 27,992,133 | | | | 306,108 | | | | 305,806 | |
| Net Increase in Net Assets Resulting from Operations | | $ | 102,723,074 | | | $ | 40,287,563 | | | $ | 385,826 | | | $ | 793,446 | |
| (1) | The Fund commenced operations on November 14, 2016. |
| (2) | The Supervision and Administration fees reflect the supervisory and administrative fee, which includes fees paid by the Funds for the investment advisory services provided by the Adviser. (See Note 3 in Notes to Financial Statements.) |
| (3) | Includes realized gains (losses) as a result of in-kind redemptions. (See Note 4 in Notes to Financial Statements.) |
The accompanying notes are an integral part of the financial statements.
Statements of Operations
For the year ended October 31, 2017
| | | Global X SuperDividend® REIT ETF | | | Global X SuperIncome™ Preferred ETF | | | Global X Social Media ETF | | | Global X | JPMorgan Efficiente Index ETF | |
| Investment Income: | | | | | | | | | | | | | | | | |
| Dividend Income | | $ | 2,591,277 | | | $ | 15,991,881 | | | $ | 806,186 | | | $ | 149,517 | |
| Interest Income | | | 129 | | | | 3,632 | | | | 1,234 | | | | 82 | |
| Security Lending Income | | | — | | | | 299,972 | | | | 361,036 | | | | — | |
| Less: Foreign Taxes Withheld | | | (72,074 | ) | | | — | | | | (29,145 | ) | | | — | |
| Total Investment Income | | | 2,519,332 | | | | 16,295,485 | | | | 1,139,311 | | | | 149,599 | |
| Supervision and Administration Fees(1) | | | 230,986 | | | | 1,354,687 | | | | 740,547 | | | | 43,750 | |
| Tax Expense | | | — | | | | — | | | | — | | | | 4,565 | |
| Custodian Fees | | | 1,412 | | | | 819 | | | | 437 | | | | 97 | |
| Total Expenses | | | 232,398 | | | | 1,355,506 | | | | 740,984 | | | | 48,412 | |
| Net Expenses | | | 232,398 | | | | 1,355,506 | | | | 740,984 | | | | 48,412 | |
| Net Investment Income | | | 2,286,934 | | | | 14,939,979 | | | | 398,327 | | | | 101,187 | |
| Net Realized Gain (Loss) on: | | | | | | | | | | | | | | | | |
| Investments (2) | | | 474,972 | | | | (3,935,918 | ) | | | 16,529,319 | | | | 302,416 | |
| Foreign Currency Transactions | | | 13,124 | | | | — | | | | 8,238 | | | | — | |
| Net Realized Gain (Loss) on Investments and Foreign Currency Transactions | | | 488,096 | | | | (3,935,918 | ) | | | 16,537,557 | | | | 302,416 | |
| Net Change in Unrealized Appreciation (Depreciation) on: | | | | | | | | | | | | | | | | |
| Investments | | | 1,814,027 | | | | (8,268,967 | ) | | | 20,941,964 | | | | 331,982 | |
| Foreign Currency Translations | | | 34 | | | | — | | | | 4,087 | | | | — | |
| Net Change in Unrealized Appreciation (Depreciation) on Investments and Foreign Currency Translations | | | 1,814,061 | | | | (8,268,967 | ) | | | 20,946,051 | | | | 331,982 | |
| Net Realized and Unrealized Gain (Loss) on Investments and Foreign Currency Transactions and Translations | | | 2,302,157 | | | | (12,204,885 | ) | | | 37,483,608 | | | | 634,398 | |
| Net Increase in Net Assets Resulting from Operations | | $ | 4,589,091 | | | $ | 2,735,094 | | | $ | 37,881,935 | | | $ | 735,585 | |
| (1) | The Supervision and Administration fees reflect the supervisory and administrative fee, which includes fees paid by the Funds for the investment advisory services provided by the Adviser. (See Note 3 in Notes to Financial Statements.) |
| (2) | Includes realized gains (losses) as a result of in-kind redemptions. (See Note 4 in Notes to Financial Statements.) |
The accompanying notes are an integral part of the financial statements.
Statements of Operations
For the year ended October 31, 2017
| | | Global X | JPMorgan US Sector Rotator Index ETF | | | Global X Guru® Index ETF | | | Global X Scientific Beta US ETF | | | Global X Scientific Beta Europe ETF | |
| Investment Income: | | | | | | | | | | | | | | | | |
| Dividend Income | | $ | 156,103 | | | $ | 721,613 | | | $ | 1,912,113 | | | $ | 521,642 | |
| Interest Income | | | 143 | | | | 340 | | | | 1 | | | | — | |
| Security Lending Income | | | — | | | | 11,114 | | | | — | | | | — | |
| Less: Foreign Taxes Withheld | | | — | | | | (2,228 | ) | | | — | | | | (45,935 | ) |
| Total Investment Income | | | 156,246 | | | | 730,839 | | | | 1,912,114 | | | | 475,707 | |
| Supervision and Administration Fees(1) | | | 49,672 | | | | 424,964 | | | | 355,867 | | | | 64,722 | |
| Custodian Fees | | | 84 | | | | 359 | | | | 54 | | | | 75 | |
| Total Expenses | | | 49,756 | | | | 425,323 | | | | 355,921 | | | | 64,797 | |
| Waiver of Supervision and Administration Fees | | | – | | | | – | | | | (162,684 | ) | | | – | |
| Net Expenses | | | 49,756 | | | | 425,323 | | | | 193,237 | | | | 64,797 | |
| Net Investment Income | | | 106,490 | | | | 305,516 | | | | 1,718,877 | | | | 410,910 | |
| Net Realized Gain (Loss) on: | | | | | | | | | | | | | | | | |
| Investments (2) | | | 592,175 | | | | 5,169,392 | | | | 2,455,435 | | | | 1,272,321 | |
| Foreign Currency Transactions | | | — | | | | — | | | | — | | | | (2,455 | ) |
| Net Realized Gain on Investments and Foreign Currency Transactions | | | 592,175 | | | | 5,169,392 | | | | 2,455,435 | | | | 1,269,866 | |
| Net Change in Unrealized Appreciation on: | | | | | | | | | | | | | | | | |
| Investments | | | 30,028 | | | | 6,897,293 | | | | 12,815,043 | | | | 2,749,755 | |
| Foreign Currency Translations | | | — | | | | — | | | | — | | | | 1,645 | |
| Net Change in Unrealized Appreciation on Investments and Foreign Currency Translations | | | 30,028 | | | | 6,897,293 | | | | 12,815,043 | | | | 2,751,400 | |
| Net Realized and Unrealized Gain on Investments and Foreign Currency Transactions and Translations | | | 622,203 | | | | 12,066,685 | | | | 15,270,478 | | | | 4,021,266 | |
| Net Increase in Net Assets Resulting from Operations | | $ | 728,693 | | | $ | 12,372,201 | | | $ | 16,989,355 | | | $ | 4,432,176 | |
| (1) | The Supervision and Administration fees reflect the supervisory and administrative fee, which includes fees paid by the Funds for the investment advisory services provided by the Adviser. (See Note 3 in Notes to Financial Statements.) |
| (2) | Includes realized gains (losses) as a result of in-kind redemptions. (See Note 4 in Notes to Financial Statements.) |
The accompanying notes are an integral part of the financial statements.
Statements of Operations
For the year ended October 31, 2017
| | | Global X Scientific Beta Japan ETF | | | Global X Scientific Beta Asia ex-Japan ETF | | | Global X YieldCo Index ETF | | | Global X S&P 500® Catholic Values ETF | |
| Investment Income: | | | | | | | | | | | | | | | | |
| Dividend Income | | $ | 371,335 | | | $ | 129,032 | | | $ | 353,281 | | | $ | 1,711,140 | |
| Interest Income | | | — | | | | — | | | | 18 | | | | — | |
| Less: Foreign Taxes Withheld | | | (39,982 | ) | | | (3,352 | ) | | | (26,184 | ) | | | — | |
| Total Investment Income | | | 331,353 | | | | 125,680 | | | | 327,115 | | | | 1,711,140 | |
| Supervision and Administration Fees(1) | | | 62,034 | | | | 11,269 | | | | 70,197 | | | | 344,787 | |
| Custodian Fees | | | 1,091 | | | | 44 | | | | 394 | | | | 89 | |
| Total Expenses | | | 63,125 | | | | 11,313 | | | | 70,591 | | | | 344,876 | |
| Waiver of Supervision and Administration Fees | | | – | | | | – | | | | – | | | | (88,406 | ) |
| Net Expenses | | | 63,125 | | | | 11,313 | | | | 70,591 | | | | 256,470 | |
| Net Investment Income | | | 268,228 | | | | 114,367 | | | | 256,524 | | | | 1,454,670 | |
| Net Realized Gain (Loss) on: | | | | | | | | | | | | | | | | |
| Investments (2) | | | 1,343,255 | | | | (10,700 | ) | | | 268,165 | | | | 3,679,540 | |
| Foreign Currency Transactions | | | (9,018 | ) | | | (88 | ) | | | 380 | | | | — | |
| Net Realized Gain (Loss) on Investments and Foreign Currency Transactions | | | 1,334,237 | | | | (10,788 | ) | | | 268,545 | | | | 3,679,540 | |
| Net Change in Unrealized Appreciation on: | | | | | | | | | | | | | | | | |
| Investments | | | 1,127,370 | | | | 382,154 | | | | 1,235,994 | | | | 12,367,503 | |
| Foreign Currency Translations | | | 2,364 | | | | — | | | | 18 | | | | — | |
| Net Change in Unrealized Appreciation on Investments and Foreign Currency Translations | | | 1,129,734 | | | | 382,154 | | | | 1,236,012 | | | | 12,367,503 | |
| Net Realized and Unrealized Gain on Investments and Foreign Currency Transactions and Translations | | | 2,463,971 | | | | 371,366 | | | | 1,504,557 | | | | 16,047,043 | |
| Net Increase in Net Assets Resulting from Operations | | $ | 2,732,199 | | | $ | 485,733 | | | $ | 1,761,081 | | | $ | 17,501,713 | |
| (1) | The Supervision and Administration fees reflect the supervisory and administrative fee, which includes fees paid by the Funds for the investment advisory services provided by the Adviser. (See Note 3 in Notes to Financial Statements.) |
| (2) | Includes realized gains (losses) as a result of in-kind redemptions. (See Note 4 in Notes to Financial Statements.) |
The accompanying notes are an integral part of the financial statements.
Statements of Changes in Net Assets
| | | Global X SuperDividend® ETF | | | Global X SuperDividend® U.S. ETF | |
| | | Year Ended October 31, 2017 | | | Year Ended October 31, 2016 | | | Year Ended October 31, 2017 | | | Year Ended October 31, 2016 | |
| Operations: | | | | | | | | | | | | | | | | |
| Net Investment Income | | $ | 45,324,150 | | | $ | 44,596,638 | | | $ | 12,295,430 | | | $ | 11,198,049 | |
| Net Realized Gain (Loss) on Investments and Foreign Currency Transactions(1) | | | 7,177,380 | | | | (47,197,182 | ) | | | 9,835,037 | | | | (35,817,624 | ) |
| Net Change in Unrealized Appreciation (Depreciation) on Investments and Foreign Currency Translations | | | 50,221,544 | | | | 42,724,965 | | | | 18,157,096 | | | | 29,835,507 | |
| Net Increase in Net Assets Resulting from Operations | | | 102,723,074 | | | | 40,124,421 | | | | 40,287,563 | | | | 5,215,932 | |
| Dividends and Distributions from: | | | | | | | | | | | | | | | | |
| Net Investment Income | | | (50,713,102 | ) | | | (50,746,230 | ) | | | (14,750,888 | ) | | | (12,821,203 | ) |
| Return of Capital | | | (9,476,648 | ) | | | (5,683,920 | ) | | | (9,099,887 | ) | | | (8,107,347 | ) |
| Total Dividends and Distributions | | | (60,189,750 | ) | | | (56,430,150 | ) | | | (23,850,775 | ) | | | (20,928,550 | ) |
| Capital Share Transactions: | | | | | | | | | | | | | | | | |
| Issued | | | 169,457,269 | | | | 49,804,205 | | | | 100,563,759 | | | | 127,291,547 | |
| Redeemed | | | (20,913,187 | ) | | | (112,348,453 | ) | | | (29,817,886 | ) | | | (48,180,940 | ) |
| Increase (Decrease) in Net Assets from Capital Share Transactions | | | 148,544,082 | | | | (62,544,248 | ) | | | 70,745,873 | | | | 79,110,607 | |
| Total Increase (Decrease) in Net Assets | | | 191,077,406 | | | | (78,849,977 | ) | | | 87,182,661 | | | | 63,397,989 | |
| Net Assets: | | | | | | | | | | | | | | | | |
| Beginning of Year | | | 801,816,025 | | | | 880,666,002 | | | | 338,396,614 | | | | 274,998,625 | |
| End of Year | | $ | 992,893,431 | | | $ | 801,816,025 | | | $ | 425,579,275 | | | $ | 338,396,614 | |
| Distributions in Excess of Net Investment Income | | $ | (5,559,018 | ) | | $ | (1,599,748 | ) | | $ | — | | | $ | (1 | ) |
| Share Transactions: | | | | | | | | | | | | | | | | |
| Issued | | | 7,900,000 | | | | 2,400,000 | | | | 4,000,000 | | | | 5,200,000 | |
| Redeemed | | | (1,000,000 | ) | | | (5,800,000 | ) | | | (1,200,000 | ) | | | (2,000,000 | ) |
| Net Increase (Decrease) in Shares Outstanding from Share Transactions | | | 6,900,000 | | | | (3,400,000 | ) | | | 2,800,000 | | | | 3,200,000 | |
| (1) | Includes realized gains (losses) as a result of in-kind redemptions. (See Note 4 in Notes to Financial Statements.) |
The accompanying notes are an integral part of the financial statements.
Statements of Changes in Net Assets
| | | Global X MSCI SuperDividend® EAFE ETF | | | Global X MSCI SuperDividend® Emerging Markets ETF | |
| | | Period Ended October 31, 2017(1) | | | Year Ended October 31, 2017 | | | Year Ended October 31, 2016 | |
| Operations: | | | | | | | | | | | | |
| Net Investment Income | | $ | 79,718 | | | $ | 487,640 | | | $ | 147,339 | |
| Net Realized Gain (Loss) on Investments and Foreign Currency Transactions(2) | | | 157,287 | | | | 687,362 | | | | (739,339 | ) |
| Net Change in Unrealized Appreciation (Depreciation) on Investments and Foreign Currency Translations | | | 148,821 | | | | (381,556 | ) | | | 1,090,676 | |
| Net Increase in Net Assets Resulting from Operations | | | 385,826 | | | | 793,446 | | | | 498,676 | |
| Dividends and Distributions from: | | | | | | | | | | | | |
| Net Investment Income | | | (58,777 | ) | | | (411,165 | ) | | | (191,294 | ) |
| Total Dividends and Distributions | | | (58,777 | ) | | | (411,165 | ) | | | (191,294 | ) |
| Capital Share Transactions: | | | | | | | | | | | | |
| Issued | | | 2,351,238 | | | | 9,447,157 | | | | — | |
| Redeemed | | | (865,077 | ) | | | (821,544 | ) | | | — | |
| Increase in Net Assets from Capital Share Transactions | | | 1,486,161 | | | | 8,625,613 | | | | — | |
| Total Increase in Net Assets | | | 1,813,210 | | | | 9,007,894 | | | | 307,382 | |
| Net Assets: | | | | | | | | | | | | |
| Beginning of Year | | | — | | | | 3,740,433 | | | | 3,433,051 | |
| End of Year | | $ | 1,813,210 | | | $ | 12,748,327 | | | $ | 3,740,433 | |
| Undistributed Net Investment Income | | $ | 21,675 | | | $ | 78,164 | | | $ | 1,635 | |
| Share Transactions: | | | | | | | | | | | | |
| Issued | | | 150,000 | | | | 600,000 | | | | — | |
| Redeemed | | | (50,000 | ) | | | (50,000 | ) | | | — | |
| Net Increase in Shares Outstanding from Share Transactions | | | 100,000 | | | | 550,000 | | | | — | |
| (1) | The Fund commenced operations on November 14, 2016. |
| (2) | Includes realized gains (losses) as a result of in-kind redemptions. (See Note 4 in Notes to Financial Statements.) |
The accompanying notes are an integral part of the financial statements.
Statements of Changes in Net Assets
| | | Global X SuperDividend® REIT ETF | | | Global X SuperIncome™ Preferred ETF | |
| | | Year Ended October 31, 2017 | | | Year Ended October 31, 2016 | | | Year Ended October 31, 2017 | | | Year Ended October 31, 2016 | |
| Operations: | | | | | | | | | | | | | | | | |
| Net Investment Income | | $ | 2,286,934 | | | $ | 763,778 | | | $ | 14,939,979 | | | $ | 14,698,378 | |
| Net Realized Gain (Loss) on Investments and Foreign Currency Transactions(1) | | | 488,096 | | | | (107,212 | ) | | | (3,935,918 | ) | | | (15,342,553 | ) |
| Net Change in Unrealized Appreciation (Depreciation) on Investments and Foreign Currency Translations | | | 1,814,061 | | | | (135,303 | ) | | | (8,268,967 | ) | | | 8,059,993 | |
| Net Increase in Net Assets Resulting from Operations | | | 4,589,091 | | | | 521,263 | | | | 2,735,094 | | | | 7,415,818 | |
| Dividends and Distributions from: | | | | | | | | | | | | | | | | |
| Net Investment Income | | | (2,947,750 | ) | | | (892,500 | ) | | | (15,532,201 | ) | | | (14,776,181 | ) |
| Return of Capital | | | — | | | | — | | | | (716,030 | ) | | | — | |
| Total Dividends and Distributions | | | (2,947,750 | ) | | | (892,500 | ) | | | (16,248,231 | ) | | | (14,776,181 | ) |
| Capital Share Transactions: | | | | | | | | | | | | | | | | |
| Issued | | | 25,482,477 | | | | 30,719,755 | | | | 40,670,341 | | | | 37,190,345 | |
| Redeemed | | | (9,440,021 | ) | | | — | | | | (23,032,945 | ) | | | (33,050,541 | ) |
| Increase in Net Assets from Capital Share Transactions | | | 16,042,456 | | | | 30,719,755 | | | | 17,637,396 | | | | 4,139,804 | |
| Total Increase (Decrease) in Net Assets | | | 17,683,797 | | | | 30,348,518 | | | | 4,124,259 | | | | (3,220,559 | ) |
| Net Assets: | | | | | | | | | | | | | | | | |
| Beginning of Year | | | 34,302,323 | | | | 3,953,805 | | | | 232,206,248 | | | | 235,426,807 | |
| End of Year | | $ | 51,986,120 | | | $ | 34,302,323 | | | $ | 236,330,507 | | | $ | 232,206,248 | |
| Undistributed (Distributions in Excess of) Net Investment Income | | $ | (654,976 | ) | | $ | (80,141 | ) | | $ | 199,762 | | | $ | 513,583 | |
| Share Transactions: | | | | | | | | | | | | | | | | |
| Issued | | | 1,700,000 | | | | 2,050,000 | | | | 3,150,000 | | | | 2,750,000 | |
| Redeemed | | | (650,000 | ) | | | — | | | | (1,800,000 | ) | | | (2,550,000 | ) |
| Net Increase in Shares Outstanding from Share Transactions | | | 1,050,000 | | | | 2,050,000 | | | | 1,350,000 | | | | 200,000 | |
| (1) | Includes realized gains (losses) as a result of in-kind redemptions. (See Note 4 in Notes to Financial Statements.) |
The accompanying notes are an integral part of the financial statements.
Statements of Changes in Net Assets
| | | Global X Social Media ETF | | | Global X | JPMorgan Efficiente Index ETF | |
| | | Year Ended October 31, 2017 | | | Year Ended October 31, 2016 | | | Year Ended October 31, 2017 | | | Year Ended October 31, 2016 | |
| Operations: | | | | | | | | | | | | | | | | |
| Net Investment Income | | $ | 398,327 | | | $ | 98,737 | | | $ | 101,187 | | | $ | 157,576 | |
| Net Realized Gain (Loss) on Investments and Foreign Currency Transactions(1) | | | 16,537,557 | | | | (9,550,529 | ) | | | 302,416 | | | | 264,481 | |
| Net Change in Unrealized Appreciation (Depreciation) on Investments and Foreign Currency Translations | | | 20,946,051 | | | | 15,461,891 | | | | 331,982 | | | | (22,888 | ) |
| Net Increase in Net Assets Resulting from Operations | | | 37,881,935 | | | | 6,010,099 | | | | 735,585 | | | | 399,169 | |
| Dividends and Distributions from: | | | | | | | | | | | | | | | | |
| Net Investment Income | | | (126,360 | ) | | | (6,875 | ) | | | (198,988 | ) | | | (312,783 | ) |
| Total Dividends and Distributions | | | (126,360 | ) | | | (6,875 | ) | | | (198,988 | ) | | | (312,783 | ) |
| Capital Share Transactions: | | | | | | | | | | | | | | | | |
| Issued | | | 68,430,889 | | | | 94,491,559 | | | | — | | | | 1,121,897 | |
| Redeemed | | | (75,299,670 | ) | | | (43,528,797 | ) | | | (2,514,605 | ) | | | (2,296,047 | ) |
| Increase (Decrease) in Net Assets from Capital Share Transactions | | | (6,868,781 | ) | | | 50,962,762 | | | | (2,514,605 | ) | | | (1,174,150 | ) |
| Total Increase (Decrease) in Net Assets | | | 30,886,794 | | | | 56,965,986 | | | | (1,978,008 | ) | | | (1,087,764 | ) |
| Net Assets: | | | | | | | | | | | | | | | | |
| Beginning of Year | | | 134,110,738 | | | | 77,144,752 | | | | 7,214,656 | | | | 8,302,420 | |
| End of Year | | $ | 164,997,532 | | | $ | 134,110,738 | | | $ | 5,236,648 | | | $ | 7,214,656 | |
| Undistributed Net Investment Income | | $ | 605,595 | | | $ | 60,572 | | | $ | 105,750 | | | $ | 95,278 | |
| Share Transactions: | | | | | | | | | | | | | | | | |
| Issued | | | 2,500,000 | | | | 4,150,000 | | | | — | | | | 50,000 | |
| Redeemed | | | (3,150,000 | ) | | | (2,450,000 | ) | | | (100,000 | ) | | | (100,000 | ) |
| Net Increase (Decrease) in Shares Outstanding from Share Transactions | | | (650,000 | ) | | | 1,700,000 | | | | (100,000 | ) | | | (50,000 | ) |
| (1) | Includes realized gains (losses) as a result of in-kind redemptions. (See Note 4 in Notes to Financial Statements.) |
The accompanying notes are an integral part of the financial statements.
Statements of Changes in Net Assets
| | | Global X | JPMorgan US Sector Rotator Index ETF | | | Global X Guru® Index ETF | |
| | | Year Ended October 31, 2017 | | | Year Ended October 31, 2016 | | | Year Ended October 31, 2017 | | | Year Ended October 31, 2016 | |
| Operations: | | | | | | | | | | | | | | | | |
| Net Investment Income | | $ | 106,490 | | | $ | 208,806 | | | $ | 305,516 | | | $ | 574,870 | |
| Net Realized Gain (Loss) on Investments and Foreign Currency Transactions(1) | | | 592,175 | | | | 397,550 | | | | 5,169,392 | | | | (18,740,544 | ) |
| Net Change in Unrealized Appreciation (Depreciation) on Investments and Foreign Currency Translations | | | 30,028 | | | | (106,031 | ) | | | 6,897,293 | | | | 8,344,218 | |
| Net Increase (Decrease) in Net Assets Resulting from Operations | | | 728,693 | | | | 500,325 | | | | 12,372,201 | | | | (9,821,456 | ) |
| Dividends and Distributions from: | | | | | | | | | | | | | | | | |
| Net Investment Income | | | (190,176 | ) | | | (197,183 | ) | | | (122,367 | ) | | | (635,053 | ) |
| Return of Capital | | | — | | | | — | | | | — | | | | (125,403 | ) |
| Total Dividends and Distributions | | | (190,176 | ) | | | (197,183 | ) | | | (122,367 | ) | | | (760,456 | ) |
| Capital Share Transactions: | | | | | | | | | | | | | | | | |
| Issued | | | — | | | | 3,404,929 | | | | — | | | | 10,209,709 | |
| Redeemed | | | (6,142,683 | ) | | | (7,129,086 | ) | | | (15,307,477 | ) | | | (125,119,219 | ) |
| Decrease in Net Assets from Capital Share Transactions | | | (6,142,683 | ) | | | (3,724,157 | ) | | | (15,307,477 | ) | | | (114,909,510 | ) |
| Total Decrease in Net Assets | | | (5,604,166 | ) | | | (3,421,015 | ) | | | (3,057,643 | ) | | | (125,491,422 | ) |
| Net Assets: | | | | | | | | | | | | | | | | |
| Beginning of Year | | | 10,706,274 | | | | 14,127,289 | | | | 59,013,432 | | | | 184,504,854 | |
| End of Year | | $ | 5,102,108 | | | $ | 10,706,274 | | | $ | 55,955,789 | | | $ | 59,013,432 | |
| Undistributed Net Investment Income | | $ | 53,269 | | | $ | 143,599 | | | $ | 135,050 | | | $ | 3 | |
| Share Transactions: | | | | | | | | | | | | | | | | |
| Issued | | | — | | | | 150,000 | | | | — | | | | 450,000 | |
| Redeemed | | | (250,000 | ) | | | (300,000 | ) | | | (600,000 | ) | | | (5,600,000 | ) |
| Net Decrease in Shares Outstanding from Share Transactions | | | (250,000 | ) | | | (150,000 | ) | | | (600,000 | ) | | | (5,150,000 | ) |
| (1) | Includes realized gains (losses) as a result of in-kind redemptions. (See Note 4 in Notes to Financial Statements.) |
The accompanying notes are an integral part of the financial statements.
Statements of Changes in Net Assets
| | | Global X Scientific Beta US ETF | | | Global X Scientific Beta Europe ETF | |
| | | Year Ended October 31, 2017 | | | Year Ended October 31, 2016 | | | Year Ended October 31, 2017 | | | Year Ended October 31, 2016 | |
| Operations: | | | | | | | | | | | | | | | | |
| Net Investment Income | | $ | 1,718,877 | | | $ | 617,728 | | | $ | 410,910 | | | $ | 307,060 | |
| Net Realized Gain (Loss) on Investments and Foreign Currency Transactions(1) | | | 2,455,435 | | | | (471,109 | ) | | | 1,269,866 | | | | (280,728 | ) |
| Net Change in Unrealized Appreciation (Depreciation) on Investments and Foreign Currency Translations | | | 12,815,043 | | | | 1,327,566 | | | | 2,751,400 | | | | (154,353 | ) |
| Net Increase (Decrease) in Net Assets Resulting from Operations | | | 16,989,355 | | | | 1,474,185 | | | | 4,432,176 | | | | (128,021 | ) |
| Dividends and Distributions from: | | | | | | | | | | | | | | | | |
| Net Investment Income | | | (942,969 | ) | | | (29,000 | ) | | | (373,503 | ) | | | (34,296 | ) |
| Total Dividends and Distributions | | | (942,969 | ) | | | (29,000 | ) | | | (373,503 | ) | | | (34,296 | ) |
| Capital Share Transactions: | | | | | | | | | | | | | | | | |
| Issued | | | 64,474,236 | | | | 62,290,080 | | | | 10,288,569 | | | | 10,168,892 | |
| Redeemed | | | (11,538,411 | ) | | | — | | | | (5,471,340 | ) | | | — | |
| Increase in Net Assets from Capital Share Transactions | | | 52,935,825 | | | | 62,290,080 | | | | 4,817,229 | | | | 10,168,892 | |
| Total Increase in Net Assets | | | 68,982,211 | | | | 63,735,265 | | | | 8,875,902 | | | | 10,006,575 | |
| Net Assets: | | | | | | | | | | | | | | | | |
| Beginning of Year | | | 66,201,777 | | | | 2,466,512 | | | | 12,447,365 | | | | 2,440,790 | |
| End of Year | | $ | 135,183,988 | | | $ | 66,201,777 | | | $ | 21,323,267 | | | $ | 12,447,365 | |
| Undistributed Net Investment Income | | $ | 1,398,110 | | | $ | 622,202 | | | $ | 369,916 | | | $ | 296,809 | |
| Share Transactions: | | | | | | | | | | | | | | | | |
| Issued | | | 2,300,000 | | | | 2,500,000 | | | | 400,000 | | | | 450,000 | |
| Redeemed | | | (400,000 | ) | | | — | | | | (200,000 | ) | | | — | |
| Net Increase in Shares Outstanding from Share Transactions | | | 1,900,000 | | | | 2,500,000 | | | | 200,000 | | | | 450,000 | |
| (1) | Includes realized gains (losses) as a result of in-kind redemptions. (See Note 4 in Notes to Financial Statements.) |
The accompanying notes are an integral part of the financial statements.
Statements of Changes in Net Assets
| | | Global X Scientific Beta Japan ETF | | | Global X Scientific Beta Asia ex-Japan ETF | |
| | | Year Ended October 31, 2017 | | | Year Ended October 31, 2016 | | | Year Ended October 31, 2017 | | | Year Ended October 31, 2016 | |
| Operations: | | | | | | | | | | | | | | | | |
| Net Investment Income | | $ | 268,228 | | | $ | 189,188 | | | $ | 114,367 | | | $ | 79,533 | |
| Net Realized Gain (Loss) on Investments and Foreign Currency Transactions(1) | | | 1,334,237 | | | | (99,791 | ) | | | (10,788 | ) | | | (206,781 | ) |
| Net Change in Unrealized Appreciation on Investments and Foreign Currency Translations | | | 1,129,734 | | | | 1,142,600 | | | | 382,154 | | | | 322,760 | |
| Net Increase in Net Assets Resulting from Operations | | | 2,732,199 | | | | 1,231,997 | | | | 485,733 | | | | 195,512 | |
| Dividends and Distributions from: | | | | | | | | | | | | | | | | |
| Net Investment Income | | | (372,358 | ) | | | (20,668 | ) | | | (101,714 | ) | | | (62,417 | ) |
| Net Realized Gains | | | — | | | | (1,165 | ) | | | — | | | | — | |
| Total Dividends and Distributions | | | (372,358 | ) | | | (21,833 | ) | | | (101,714 | ) | | | (62,417 | ) |
| Capital Share Transactions: | | | | | | | | | | | | | | | | |
| Issued | | | 7,230,845 | | | | 9,959,734 | | | | 1,176,937 | | | | — | |
| Redeemed | | | (5,970,573 | ) | | | — | | | | — | | | | — | |
| Increase in Net Assets from Capital Share Transactions | | | 1,260,272 | | | | 9,959,734 | | | | 1,176,937 | | | | — | |
| Total Increase in Net Assets | | | 3,620,113 | | | | 11,169,898 | | | | 1,560,956 | | | | 133,095 | |
| Net Assets: | | | | | | | | | | | | | | | | |
| Beginning of Year | | | 13,688,439 | | | | 2,518,541 | | | | 2,295,886 | | | | 2,162,791 | |
| End of Year | | $ | 17,308,552 | | | $ | 13,688,439 | | | $ | 3,856,842 | | | $ | 2,295,886 | |
| Undistributed Net Investment Income | | $ | 177,696 | | | $ | 281,015 | | | $ | 108,830 | | | $ | 76,164 | |
| Share Transactions: | | | | | | | | | | | | | | | | |
| Issued | | | 250,000 | | | | 400,000 | | | | 50,000 | | | | — | |
| Redeemed | | | (200,000 | ) | | | — | | | | — | | | | — | |
| Net Increase in Shares Outstanding from Share Transactions | | | 50,000 | | | | 400,000 | | | | 50,000 | | | | — | |
| (1) | Includes realized gains (losses) as a result of in-kind redemptions. (See Note 4 in Notes to Financial Statements.) |
The accompanying notes are an integral part of the financial statements.
Statements of Changes in Net Assets
| | | Global X YieldCo Index ETF | | | Global X S&P 500® Catholic Values ETF | |
| | | Year Ended October 31, 2017 | | | Year Ended October 31, 2016 | | | Year Ended October 31, 2017 | | | Period Ended October 31, 2016(1) | |
| Operations: | | | | | | | | | | | | | | | | |
| Net Investment Income | | $ | 256,524 | | | $ | 187,223 | | | $ | 1,454,670 | | | $ | 145,542 | |
| Net Realized Gain (Loss) on Investments and Foreign Currency Transactions(2) | | | 268,545 | | | | (878,128 | ) | | | 3,679,540 | | | | (15,451 | ) |
| Net Change in Unrealized Appreciation (Depreciation) on Investments and Foreign Currency Translations | | | 1,236,012 | | | | 1,238,942 | | | | 12,367,503 | | | | (545,376 | ) |
| Net Increase (Decrease) in Net Assets Resulting from Operations | | | 1,761,081 | | | | 548,037 | | | | 17,501,713 | | | | (415,285 | ) |
| Dividends and Distributions from: | | | | | | | | | | | | | | | | |
| Net Investment Income | | | (421,625 | ) | | | (199,159 | ) | | | (325,821 | ) | | | — | |
| Net Realized Gains | | | — | | | | — | | | | (4,312 | ) | | | — | |
| Return of Capital | | | — | | | | (76,200 | ) | | | — | | | | — | |
| Total Dividends and Distributions | | | (421,625 | ) | | | (275,359 | ) | | | (330,133 | ) | | | — | |
| Capital Share Transactions: | | | | | | | | | | | | | | | | |
| Issued | | | 13,196,907 | | | | 4,187,034 | | | | 80,954,875 | | | | 40,314,242 | |
| Redeemed | | | (1,185,410 | ) | | | (1,083,579 | ) | | | (23,444,672 | ) | | | — | |
| Increase in Net Assets from Capital Share Transactions | | | 12,011,497 | | | | 3,103,455 | | | | 57,510,203 | | | | 40,314,242 | |
| Total Increase in Net Assets | | | 13,350,953 | | | | 3,376,133 | | | | 74,681,783 | | | | 39,898,957 | |
| Net Assets: | | | | | | | | | | | | | | | | |
| Beginning of Year | | | 6,695,442 | | | | 3,319,309 | | | | 39,898,957 | | | | — | |
| End of Year | | $ | 20,046,395 | | | $ | 6,695,442 | | | $ | 114,580,740 | | | $ | 39,898,957 | |
| Undistributed (Distributions in Excess of) Net Investment Income | | $ | (62,978 | ) | | $ | (16 | ) | | $ | 1,275,311 | | | $ | 146,462 | |
| Share Transactions: | | | | | | | | | | | | | | | | |
| Issued | | | 1,100,000 | | | | 400,000 | | | | 2,850,000 | | | | 1,550,000 | |
| Redeemed | | | (100,000 | ) | | | (100,000 | ) | | | (800,000 | ) | | | — | |
| Net Increase in Shares Outstanding from Share Transactions | | | 1,000,000 | | | | 300,000 | | | | 2,050,000 | | | | 1,550,000 | |
| (1) | The Fund commenced operations on April 18, 2016. |
| (2) | Includes realized gains (losses) as a result of in-kind redemptions. (See Note 4 in Notes to Financial Statements.) |
The accompanying notes are an integral part of the financial statements.
Financial Highlights
| | Selected Per Share Data & Ratios |
| | For a Share Outstanding Throughout the Period |
| | | Net Asset Value, Beginning of Period ($) | | | Net Investment
Income ($)* | | | Net Realized and Unrealized Gain (Loss) on Investments ($) | | | Total from Operations ($) | | | Distribution from Net Investment Income ($) | | | Distribution from Capital Gains ($) | | | Return of Capital ($) | | | Total from Distributions ($) | | | Net Asset Value, End of Period ($) | | | Total Return (%)** | | | Net Assets End of Period ($)(000) | | | Ratio of Expenses to Average Net Assets (%) | | | Ratio of Net Investment Income (Loss) to Average Net Assets (%) | | | Portfolio Turnover (%)†† | |
| Global X SuperDividend® ETF |
| 2017 | | | 20.43 | | | | 1.08 | | | | 1.45 | | | | 2.53 | | | | (1.22 | ) | | | — | | | | (0.23 | ) | | | (1.45 | ) | | | 21.51 | | | | 12.69 | | | | 992,893 | | | | 0.58 | | | | 5.07 | | | | 67.38 | |
| 2016 | | | 20.65 | | | | 1.15 | | | | 0.08 | | | | 1.23 | | | | (1.30 | ) | | | — | | | | (0.15 | ) | | | (1.45 | ) | | | 20.43 | | | | 6.23 | | | | 801,816 | | | | 0.58 | | | | 5.67 | | | | 39.06 | |
| 2015 | | | 24.24 | | | | 1.26 | | | | (3.36 | ) | | | (2.10 | ) | | | (1.44 | ) | | | (0.05 | ) | | | — | | | | (1.49 | ) | | | 20.65 | | | | (9.01 | ) | | | 880,666 | | | | 0.58 | | | | 5.58 | | | | 26.12 | |
| 2014 | | | 23.74 | | | | 1.40 | | | | 0.56 | | | | 1.96 | | | | (1.46 | ) | | | — | | | | — | | | | (1.46 | ) | | | 24.24 | | | | 8.41 | | | | 1,037,576 | | | | 0.58 | | | | 5.71 | | | | 33.63 | |
| 2013 | | | 21.86 | | | | 1.34 | | | | 2.27 | | | | 3.61 | | | | (1.73 | ) | | | — | | | | — | | | | (1.73 | ) | | | 23.74 | | | | 17.34 | | | | 775,238 | | | | 0.58 | | | | 5.93 | | | | 43.64 | |
| Global X SuperDividend® U.S. ETF |
| 2017 | | | 24.00 | | | | 0.79 | # | | | 1.94 | | | | 2.73 | | | | (0.96 | ) | | | — | | | | (0.59 | ) | | | (1.55 | ) | | | 25.18 | | | | 11.64 | | | | 425,579 | | | | 0.45 | | | | 3.15# | | | | 53.01 | |
| 2016 | | | 25.23 | | | | 0.92 | # | | | (0.40 | ) | | | 0.52 | | | | (1.07 | ) | | | — | | | | (0.68 | ) | | | (1.75 | ) | | | 24.00 | | | | 2.13 | | | | 338,397 | | | | 0.45 | | | | 3.77# | | | | 53.45 | |
| 2015 | | | 29.60 | | | | 1.71 | | | | (4.19 | ) | | | (2.48 | ) | | | (1.23 | ) | | | — | | | | (0.66 | ) | | | (1.89 | ) | | | 25.23 | | | | (8.67 | ) | | | 274,999 | | | | 0.45 | | | | 6.25 | | | | 42.51 | |
| 2014 | | | 25.94 | | | | 1.78 | | | | 3.45 | | | | 5.23 | | | | (1.41 | ) | | | — | | | | (0.16 | ) | | | (1.57 | ) | | | 29.60 | | | | 20.80 | | | | 276,715 | | | | 0.45 | | | | 6.32 | | | | 40.04 | |
| 2013(1) | | | 25.15 | | | | 0.98 | | | | 0.82 | | | | 1.80 | | | | (0.91 | ) | | | — | | | | (0.10 | ) | | | (1.01 | ) | | | 25.94 | | | | 7.32 | | | | 51,879 | | | | 0.45 | † | | | 6.02 | † | | | 20.36 | |
| Global X MSCI SuperDividend® EAFE ETF |
| 2017(2) | | | 14.87 | | | | 0.81 | | | | 3.04 | | | | 3.85 | | | | (0.59 | ) | | | — | | | | — | | | | (0.59 | ) | | | 18.13 | | | | 26.19 | | | | 1,813 | | | | 0.56 | † | | | 4.97 | † | | | 45.40 | |
| Global X MSCI SuperDividend® Emerging Markets ETF |
| 2017 | | | 14.96 | | | | 0.83 | | | | 0.91 | | | | 1.74 | | | | (0.76 | ) | | | — | | | | — | | | | (0.76 | ) | | | 15.94 | | | | 11.95 | | | | 12,748 | | | | 0.66 | | | | 5.25 | | | | 122.32 | |
| 2016 | | | 13.73 | | | | 0.59 | | | | 1.41 | | | | 2.00 | | | | (0.77 | ) | | | — | | | | — | | | | (0.77 | ) | | | 14.96 | | | | 15.58 | | | | 3,740 | | | | 0.65 | | | | 4.49 | | | | 64.83 | |
| 2015(3) | | | 14.90 | | | | 0.66 | | | | (1.34 | ) | | | (0.68 | ) | | | (0.49 | ) | | | — | | | | — | | | | (0.49 | ) | | | 13.73 | | | | (4.89 | ) | | | 3,433 | | | | 0.65 | † | | | 6.72 | † | | | 1.25 | |
| Global X SuperDividend® REIT ETF |
| 2017 | | | 14.60 | | | | 0.86 | | | | 0.96 | | | | 1.82 | | | | (1.13 | ) | | | — | | | | — | | | | (1.13 | ) | | | 15.29 | | | | 13.00 | | | | 51,986 | | | | 0.58 | | | | 5.74 | | | | 54.96 | |
| 2016 | | | 13.18 | | | | 0.91 | | | | 1.72 | | | | 2.63 | | | | (1.21 | ) | | | — | | | | — | | | | (1.21 | ) | | | 14.60 | | | | 21.01 | | | | 34,302 | | | | 0.56 | | | | 6.23 | | | | 16.87 | |
| 2015(3) | | | 15.12 | | | | 0.63 | | | | (1.95 | ) | | | (1.32 | ) | | | (0.62 | ) | | | — | | | | — | | | | (0.62 | ) | | | 13.18 | | | | (8.86 | ) | | | 3,954 | | | | 0.54 | † | | | 7.20 | † | | | 1.45 | |
| Global X SuperIncome™ Preferred ETF |
| 2017 | | | 13.16 | | | | 0.82 | | | | (0.65 | ) | | | 0.17 | | | | (0.85 | ) | | | — | | | | (0.04 | ) | | | (0.89 | ) | | | 12.44 | | | | 1.31 | | | | 236,331 | | | | 0.58 | | | | 6.39 | | | | 45.12 | |
| 2016 | | | 13.49 | | | | 0.91 | | | | (0.33 | ) | | | 0.58 | | | | (0.91 | ) | | | — | | | | — | | | | (0.91 | ) | | | 13.16 | | | | 4.44 | | | | 232,206 | | | | 0.58 | | | | 6.81 | | | | 47.62 | |
| 2015 | | | 14.74 | | | | 0.95 | | | | (1.21 | ) | | | (0.26 | ) | | | (0.99 | ) | | | — | | | | — | | | | (0.99 | ) | | | 13.49 | | | | (1.95 | ) | | | 235,427 | | | | 0.58 | | | | 6.68 | | | | 76.54 | |
| 2014 | | | 14.81 | | | | 1.01 | | | | (0.02 | ) | | | 0.99 | | | | (1.06 | ) | | | — | | | | — | | | | (1.06 | ) | | | 14.74 | | | | 6.89 | | | | 162,875 | | | | 0.58 | | | | 6.78 | | | | 85.07 | |
| 2013^ | | | 14.65 | | | | 0.31 | | | | 0.18 | | | | 0.49 | | | | (0.33 | ) | | | — | | | | — | | | | (0.33 | ) | | | 14.81 | | | | 3.38 | | | | 59,965 | | | | 0.58 | | | | 6.34 | | | | 61.86 | |
| 2013(4) | | | 15.02 | | | | 1.13 | | | | (0.47 | ) | | | 0.66 | | | | (1.02 | ) | | | (0.01 | ) | | | — | | | | (1.03 | ) | | | 14.65 | | | | 4.46 | | | | 35,169 | | | | 0.58 | † | | | 7.84 | † | | | 91.98 | |
| Global X Social Media ETF |
| 2017 | | | 23.53 | | | | 0.10 | | | | 9.08 | | | | 9.18 | | | | (0.04 | ) | | | — | | | | — | | | | (0.04 | ) | | | 32.67 | | | | 39.09 | | | | 164,998 | | | | 0.65 | | | | 0.35 | | | | 41.40 | |
| 2016 | | | 19.29 | | | | 0.02 | | | | 4.22 | | | | 4.24 | | | | — | | | | — | | | | — | | | | * ** | | | | 23.53 | | | | 21.99 | | | | 134,111 | | | | 0.65 | | | | 0.12 | | | | 39.89 | |
| 2015 | | | 19.30 | | | | 0.01 | | | | (0.01 | ) | | | — | | | | (0.01 | ) | | | — | | | | — | | | | (0.01 | ) | | | 19.29 | | | | — | | | | 77,145 | | | | 0.65 | | | | 0.04 | | | | 26.51 | |
| 2014 | | | 19.38 | | | | — | | | | (0.08 | ) | | | (0.08 | ) | | | — | | | | — | | | | — | | | | — | | | | 19.30 | | | | (0.41 | ) | | | 126,418 | | | | 0.65 | | | | (0.01 | ) | | | 26.52 | |
| 2013 | | | 12.83 | | | | — | | | | 6.66 | | | | 6.66 | | | | (0.11 | ) | | | — | | | | — | | | | (0.11 | ) | | | 19.38 | | | | 52.34 | | | | 95,948 | | | | 0.65 | | | | (0.01 | ) | | | 55.96 | |
| Global X | JPMorgan Efficiente Index ETF |
| 2017 | | | 24.05 | | | | 0.40 | | | | 2.51 | | | | 2.91 | | | | (0.78 | ) | | | — | | | | — | | | | (0.78 | ) | | | 26.18 | | | | 12.29 | | | | 5,237 | | | | 0.76 | | | | 1.60 | | | | 232.58 | |
| 2016 | | | 23.72 | | | | 0.51 | | | | 0.86 | | | | 1.37 | | | | (1.04 | ) | | | — | | | | — | | | | (1.04 | ) | | | 24.05 | | | | 6.12 | | | | 7,215 | | | | 0.69 | | | | 2.15 | | | | 387.39 | |
| 2015 | | | 25.49 | | | | 0.43 | | | | (2.04 | ) | | | (1.61 | ) | | | (0.16 | ) | | | — | | | | — | | | | (0.16 | ) | | | 23.72 | | | | (6.37 | ) | | | 8,302 | | | | 0.69 | | | | 1.70 | | | | 311.58 | |
| 2014(5) | | | 24.95 | | | | — | | | | 0.54 | | | | 0.54 | | | | — | | | | — | | | | — | | | | — | | | | 25.49 | | | | 2.16 | | | | 2,549 | | | | 0.69 | † | | | (0.69 | )† | | | — | |
| Global X | JPMorgan US Sector Rotator Index ETF |
| 2017 | | | 23.79 | | | | 0.37 | | | | 1.89 | | | | 2.26 | | | | (0.54 | ) | | | — | | | | — | | | | (0.54 | ) | | | 25.51 | | | | 9.65 | | | | 5,102 | | | | 0.69 | | | | 1.48 | | | | 815.61 | |
| 2016 | | | 23.55 | | | | 0.35 | | | | 0.25 | | | | 0.60 | | | | (0.36 | ) | | | — | | | | — | | | | (0.36 | ) | | | 23.79 | | | | 2.60 | | | | 10,706 | | | | 0.69 | | | | 1.50 | | | | 839.83 | |
| 2015 | | | 25.41 | | | | 0.20 | | | | (1.94 | ) | | | (1.74 | ) | | | (0.11 | ) | | | (0.01 | ) | | | — | | | | (0.12 | ) | | | 23.55 | | | | (6.90 | ) | | | 14,127 | | | | 0.69 | | | | 0.82 | | | | 907.92 | |
| 2014(5) | | | 25.03 | | | | — | | | | 0.38 | | | | 0.38 | | | | — | | | | — | | | | — | | | | — | | | | 25.41 | | | | 1.52 | | | | 2,541 | | | | 0.69 | † | | | (0.69 | )† | | | 63.35 | |
| * | Per share data calculated using average shares method. |
| ** | Total return is based on the change in net asset value of a share during the year or period and assumes reinvestment of dividends and distributions at net asset value. Total return is for the period indicated and periods of less than one year have not been annualized. The return shown does not reflect the deduction of taxes that a shareholder would pay on Fund distributions or the redemption of Fund shares. |
| *** | Amount rounds to less than $0.00. |
| †† | Portfolio turnover rate is for the period indicated and periods of less than one year have not been annualized. Excludes effect of in-kind transfers. |
| # | Effective November 1, 2015, the Fund changed its method for estimating the characterization of amounts distributed by master limited partnerships, which correspondingly impacted the financial highlight ratios and per share disclosures to the extent that the fund recorded investment income that differed from amounts previously estimated. |
| ^ | For the period July 1, 2013 to October 31, 2013. Effective July 1, 2013 the Global X Guru® Index ETF (formerly Global X Top Guru Holdings Index ETF) and Global X SuperIncome™ Preferred ETF each changed their fiscal year end to October 31. |
| (1) | The Fund commenced operations on March 11, 2013. |
| (2) | The Fund commenced operations on November 14, 2016. |
| (3) | The Fund commenced operations on March 16, 2015. |
| (4) | The Fund commenced operations on July 16, 2012. |
| (5) | The Fund commenced operations on October 22, 2014. |
Amounts designated as “—” are $0 or have been rounded to $0.
The accompanying notes are an integral part of the financial statements.
Financial Highlights
| | Selected Per Share Data & Ratios |
| | For a Share Outstanding Throughout the Period |
| | | Net Asset Value, Beginning of Period ($) | | | Net Investment Income ($)* | | | Net Realized and Unrealized Gain (Loss) on Investments ($) | | | Total from Operations ($) | | | Distribution from Net Investment Income ($) | | | Distribution from Capital Gains ($) | | | Return of Capital ($) | | | Total from Distributions ($) | | | Net Asset Value, End of Period ($) | | | Total Return (%)** | | | Net Assets End of Period ($)(000) | | | Ratio of Expenses to Average Net Assets (%) | | | Ratio of Net Investment Income to Average Net Assets (%) | | | Portfolio Turnover (%)†† | |
| Global X Guru® Index ETF |
| 2017 | | | 23.14 | | | | 0.14# | | | | 5.47 | | | | 5.61 | | | | (0.05 | ) | | | — | | | | — | | | | (0.05 | ) | | | 28.70 | | | | 24.30 | | | | 55,956 | | | | 0.75 | | | | 0.54 | # | | | 94.71 | |
| 2016 | | | 23.96 | | | | 0.12# | | | | (0.83 | ) | | | (0.71 | ) | | | (0.09 | ) | | | — | | | | (0.02 | ) | | | (0.11 | ) | | | 23.14 | | | | (2.97 | ) | | | 59,013 | | | | 0.75 | | | | 0.52 | # | | | 102.07 | |
| 2015 | | | 26.30 | | | | 0.10 | | | | (2.16 | ) | | | (2.06 | ) | | | (0.28 | ) | | | — | | | | — | | | | (0.28 | ) | | | 23.96 | | | | (7.94 | ) | | | 184,505 | | | | 0.75 | | | | 0.39 | | | | 129.71 | |
| 2014 | | | 23.99 | | | | 0.22 | | | | 2.12 | | | | 2.34 | | | | (0.03 | ) | | | — | | | | — | | | | (0.03 | ) | | | 26.30 | | | | 9.76 | | | | 436,586 | | | | 0.75 | | | | 0.88 | | | | 128.37 | |
| 2013^ | | | 20.68 | | | | 0.01 | | | | 3.30 | | | | 3.31 | | | | — | | | | — | | | | — | | | | — | | | | 23.99 | | | | 16.01 | | | | 241,060 | | | | 0.75 | † | | | 0.10 | † | | | 24.89 | |
| 2013 | | | 15.83 | | | | 0.17 | | | | 5.66 | | | | 5.83 | | | | (0.20 | ) | | | (0.78 | ) | | | — | | | | (0.98 | ) | | | 20.68 | | | | 38.08 | | | | 52,740 | | | | 0.75 | | | | 0.85 | | | | 77.25 | |
| Global X Scientific Beta US ETF |
| 2017 | | | 25.46 | | | | 0.48 | | | | 4.44 | | | | 4.92 | | | | (0.34 | ) | | | — | | | | — | | | | (0.34 | ) | | | 30.04 | | | | 19.52 | | | | 135,184 | | | | 0.19 | @ | | | 1.69 | | | | 28.46 | |
| 2016 | | | 24.67 | | | | 0.46 | | | | 0.62 | | | | 1.08 | | | | (0.29 | ) | | | — | | | | — | | | | (0.29 | ) | | | 25.46 | | | | 4.43 | | | | 66,202 | | | | 0.20 | @ | | | 1.82 | | | | 32.54 | |
| 2015(1) | | | 24.90 | | | | 0.18 | | | | (0.41 | ) | | | (0.23 | ) | | | — | | | | — | | | | — | | | | — | | | | 24.67 | | | | (0.92 | ) | | | 2,467 | | | | 0.35 | † | | | 1.55 | † | | | 20.90 | |
| Global X Scientific Beta Europe ETF |
| 2017 | | | 22.63 | | | | 0.61 | | | | 5.87 | | | | 6.48 | | | | (0.68 | ) | | | — | | | | — | | | | (0.68 | ) | | | 28.43 | | | | 29.54 | | | | 21,323 | | | | 0.38 | | | | 2.41 | | | | 26.52 | |
| 2016 | | | 24.41 | | | | 0.66 | | | | (2.10 | ) | | | (1.44 | ) | | | (0.34 | ) | | | — | | | | — | | | | (0.34 | ) | | | 22.63 | | | | (5.96 | ) | | | 12,447 | | | | 0.38 | | | | 2.89 | | | | 35.72 | |
| 2015(1) | | | 24.89 | | | | 0.25 | | | | (0.73 | ) | | | (0.48 | ) | | | — | | | | — | | | | — | | | | — | | | | 24.41 | | | | (1.93 | ) | | | 2,441 | | | | 0.38 | † | | | 2.22 | † | | | 17.53 | |
| Global X Scientific Beta Japan ETF |
| 2017 | | | 27.38 | | | | 0.47 | | | | 4.36 | | | | 4.83 | | | | (0.74 | ) | | | — | | | | — | | | | (0.74 | ) | | | 31.47 | | | | 18.17 | | | | 17,309 | | | | 0.39 | | | | 1.64 | | | | 17.80 | |
| 2016 | | | 25.19 | | | | 0.44 | | | | 1.97 | | | | 2.41 | | | | (0.21 | ) | | | (0.01 | ) | | | — | | | | (0.22 | ) | | | 27.38 | | | | 9.63 | | | | 13,688 | | | | 0.38 | | | | 1.75 | | | | 82.57 | |
| 2015(1) | | | 25.07 | | | | 0.12 | | | | — | | | | 0.12 | | | | — | | | | — | | | | — | | | | — | | | | 25.19 | | | | 0.48 | | | | 2,519 | | | | 0.38 | † | | | 1.02 | † | | | 20.31 | |
| Global X Scientific Beta Asia ex-Japan ETF |
| 2017 | | | 22.96 | | | | 0.92 | | | | 2.85 | | | | 3.77 | | | | (1.02 | ) | | | — | | | | — | | | | (1.02 | ) | | | 25.71 | | | | 17.43 | | | | 3,857 | | | | 0.38 | | | | 3.86 | | | | 53.22 | |
| 2016 | | | 21.63 | | | | 0.80 | | | | 1.15 | | | | 1.95 | | | | (0.62 | ) | | | — | | | | — | | | | (0.62 | ) | | | 22.96 | | | | 9.29 | | | | 2,296 | | | | 0.38 | | | | 3.61 | | | | 74.44 | |
| 2015(1) | | | 24.89 | | | | 0.44 | | | | (3.70 | ) | | | (3.26 | ) | | | — | | | | — | | | | — | | | | — | | | | 21.63 | | | | (13.10 | ) | | | 2,163 | | | | 0.38 | † | | | 4.17 | † | | | 59.21 | |
| Global X YieldCo Index ETF |
| 2017 | | | 11.16 | | | | 0.28 | # | | | 1.59 | | | | 1.87 | | | | (0.50 | ) | | | — | | | | — | | | | (0.50 | ) | | | 12.53 | | | | 17.30 | | | | 20,046 | | | | 0.65 | | | | 2.37# | | | | 25.99 | |
| 2016 | | | 11.06 | | | | 0.41 | # | | | 0.35 | | | | 0.76 | | | | (0.48 | ) | | | — | | | | (0.18 | ) | | | (0.66 | ) | | | 11.16 | | | | 7.25 | | | | 6,695 | | | | 0.66 | | | | 3.78# | | | | 40.25 | |
| 2015(2) | | | 15.19 | | | | 0.20 | | | | (4.19 | ) | | | (3.99 | ) | | | (0.14 | ) | | | — | | | | — | | | | (0.14 | ) | | | 11.06 | | | | (26.39 | ) | | | 3,319 | | | | 0.65 | † | | | 3.72 | † | | | 22.97 | |
| Global X S&P 500® Catholic Values ETF |
| 2017 | | | 25.74 | | | | 0.48 | | | | 5.74 | | | | 6.22 | | | | (0.13 | ) | | | ** * | | | | — | | | | (0.13 | ) | | | 31.83 | | | | 24.27 | | | | 114,581 | | | | 0.29@ | | | | 1.64 | | | | 6.09 | |
| 2016(3) | | | 25.14 | | | | 0.24 | | | | 0.36 | | | | 0.60 | | | | — | | | | — | | | | — | | | | — | | | | 25.74 | | | | 2.39 | | | | 39,899 | | | | 0.29@† | | | | 1.75 | † | | | 2.80 | |
| * | Per share data calculated using average shares method. |
| ** | Total return is based on the change in net asset value of a share during the year or period and assumes reinvestment of dividends and distributions at net asset value. Total return is for the period indicated and periods of less than one year have not been annualized. The return shown does not reflect the deduction of taxes that a shareholder would pay on Fund distributions or the redemption of Fund shares. |
| *** | Amount rounds to less than $0.00. |
| †† | Portfolio turnover rate is for the period indicated and periods of less than one year have not been annualized. Excludes effect of in-kind transfers. |
| # | Effective November 1, 2015, the Fund changed its method for estimating the characterization of amounts distributed by master limited partnerships, which correspondingly impacted the financial highlight ratios and per share disclosures to the extent that the fund recorded investment income that differed from amounts previously estimated. |
| @ | The ratio of Expenses to Average Net Assets includes the effect of a waiver. If these offsets were excluded, the ratio would have been 0.35% and 0.39%, for the Global X Scientific Beta US ETF and the Global X S&P 500® Catholic Values ETF, respectively. |
| ^ | For the period July 1, 2013 to October 31, 2013. Effective July 1, 2013 the Global X Guru® Index ETF (formerly Global X Top Guru Holdings Index ETF) changed its fiscal year end to October 31. |
| (1) | The Fund commenced operations on May 12, 2015. |
| (2) | The Fund commenced operations on May 27, 2015. |
| (3) | The Fund commenced operations on April 18, 2016. |
Amounts designated as “—” are $0 or have been rounded to $0.
The accompanying notes are an integral part of the financial statements.
Notes to Financial Statements
October 31, 2017
1. ORGANIZATION
The Global X Funds (the "Trust") is a Delaware statutory trust formed on March 6, 2008. The Trust is registered under the Investment Company Act of 1940, as amended, as an open-end management investment company. As of October 31, 2017, the Trust had ninety-six portfolios, fifty-two of which were operational. The financial statements herein and the related notes pertain to the Global X SuperDividend® ETF, Global X SuperDividend® U.S. ETF, Global X MSCI SuperDividend® EAFE ETF, Global X MSCI SuperDividend® Emerging Markets ETF, Global X SuperDividend® REIT ETF, Global X SuperIncome™ Preferred ETF, Global X Social Media ETF, Global X | JPMorgan Efficiente Index ETF, Global X | JPMorgan US Sector Rotator Index ETF , Global X Guru® Index ETF, Global X Scientific Beta US ETF, Global X Scientific Beta Europe ETF, Global X Scientific Beta Japan ETF, Global X Scientific Beta Asia ex-Japan ETF, Global X YieldCo Index ETF and Global X S&P 500® Catholic Values ETF (each a “Fund” collectively, the “Funds”). Each Fund (except the Global X SuperDividend® ETF, Global X SuperDividend® U.S. ETF, Global X Guru® Index ETF, Global X Scientific Beta US ETF, Global X Scientific Beta Europe ETF, Global X Scientific Beta Japan ETF, Global X Scientific Beta Asia ex-Japan ETF, and Global X S&P 500® Catholic Values ETF) had elected non-diversification status.
2. SIGNIFICANT ACCOUNTING POLICIES
The following is a summary of the significant accounting policies followed by the Funds.
USE OF ESTIMATES – The Funds are investment companies that apply the accounting and reporting guidance issued in Topic 946 by the U.S. Financial Accounting Standards Board. The preparation of financial statements in conformity with U.S. generally accepted accounting principles ("U.S. GAAP") requires management to make estimates and assumptions that affect the reported amounts of assets and liabilities and disclosure of contingent assets and liabilities at the date of the financial statements and the reported amounts of increases and decreases in net assets from operations during the reporting period. Actual results could materially differ from those estimates.
RETURN OF CAPITAL ESTIMATES – Distributions received by the Funds from underlying MLP investments generally are comprised of income and return of capital. The Funds record investment income and return of capital based on estimates made at the time such distributions are received. Such estimates are based on historical information available from the MLPs and other industry sources. These estimates may subsequently be revised based on information received from the MLPs after their tax reporting periods are concluded.
MLPs – Certain funds may invest in MLPs. MLPs are publicly traded partnerships engaged in the transportation, storage and processing of minerals and natural resources. By confining their operations to these specific activities, their interests, or units, are able to trade on public securities exchanges exactly like the shares of a corporation, without entity level taxation. To qualify as an MLP and to not be taxed as a corporation, a partnership must receive at least 90% of its income from qualifying sources as set forth in Section 7704(d) of the Internal Revenue Code of 1986, as amended (the “Code”). These qualifying sources include natural resource-based activities such as the processing, transportation and storage of mineral or natural resources. MLPs generally have two classes of owners: the general partner and limited partners. The general partner of an MLP is typically owned by a major energy company, an investment fund, the direct management of the MLP, or is an entity owned by one or more of such parties. The general partner may be structured as a private or publicly traded corporation or other entity.
Notes to Financial Statements (Continued)
October 31, 2017
2. SIGNIFICANT ACCOUNTING POLICIES (continued)
The general partner typically controls the operations and management of the MLP through an up to 2% equity interest in the MLP plus, in many cases, ownership of common units and subordinated units.
Limited partners typically own the remainder of the partnership, through ownership of common units, and have a limited role in the partnership’s operations and management. MLPs are typically structured such that common units and general partner interests have first priority to receive quarterly cash distributions up to an established minimum amount (“minimum quarterly distributions” or “MQD”). Common and general partner interests also accrue arrearages in distributions to the extent the MQD is not paid. Once common and general partner interests have been paid, subordinated units receive distributions of up to the MQD; however, subordinated units do not accrue arrearages. Distributable cash in excess of the MQD is paid to both common and subordinated units and is distributed to both common and subordinated units generally on a pro rata basis. The general partner is also eligible to receive incentive distributions if the general partner operates the business in a manner which results in distributions paid per common unit surpassing specified target levels. As the general partner increases cash distributions to the limited partners, the general partner receives an increasingly higher percentage of the incremental cash distributions.
SECURITY VALUATION - Securities listed on a securities exchange, market or automated quotation system for which quotations are readily available (except for securities traded on NASDAQ), including securities traded over the counter, are valued at the last quoted sale price on the primary exchange or market (foreign or domestic) on which they are traded (or at approximately 4:00 pm EST if a security’s primary exchange is normally open at that time), or, if there is no such reported sale, at the most recent mean between the quoted bid and asked prices which approximates fair value (absent both bid and asked prices on such exchange, the bid price may be used).
For securities traded on NASDAQ, the NASDAQ official closing price will be used. If available, debt securities are priced based upon valuations provided by independent, third-party pricing agents. Such values generally reflect the last reported sales price if the security is actively traded. The third-party pricing agents may also value debt securities at an evaluated bid price by employing methodologies that utilize actual market transactions, broker-supplied valuations, or other methodologies designed to identify the market value for such securities. Debt obligations with remaining maturities of sixty days or less may be valued at their amortized cost, which approximates market value. The prices for foreign securities are reported in local currency and converted to U.S. dollars using currency exchange rates as of the reporting date. The exchange rates used by the Trust for valuation are captured as of the New York or London close each day. Prices for most securities held in the Funds are provided daily by recognized independent pricing agents. If a security price cannot be obtained from an independent, third-party pricing agent, the Funds seek to obtain a bid price from at least one independent broker.
Securities for which market prices are not "readily available" are valued in accordance with fair value procedures established by the Board. The Funds’ fair value procedures are implemented through a fair value committee (the “Committee”) designated by the Board. Some of the more common reasons that may necessitate that a security be valued using fair value procedures include: the security's trading has been halted or suspended; the security has been de-listed from its primary trading exchange; the security's primary trading market is temporarily closed at a time when under normal conditions it would be open; the security has not been traded for an extended period of time; the security's primary pricing
Notes to Financial Statements (Continued)
October 31, 2017
2. SIGNIFICANT ACCOUNTING POLICIES (continued)
source is not able or willing to provide a price; or, trading of the security is subject to local government-imposed restrictions.time; the security's primary pricing source is not able or willing to provide a price; or, trading of the security is subject to local government-imposed restrictions. In addition, the Funds may fair value a security if an event that may materially affect the value of the Funds’ security that traded outside the United States (a “Significant Event”) has occurred between the time of the security's last close and the time that the Funds calculate their net asset values. A Significant Event may relate to a single issuer or to an entire market sector. Events that may be Significant Events include: government actions, natural disasters, armed conflict, acts of terrorism and significant market fluctuations. If Global X Management Company LLC, the Fund’s investment advisor (the “Adviser”), becomes aware of a Significant Event that has occurred with respect to a security or group of securities after the closing of the exchange or market on which the security or securities principally trade, but before the time at which the Funds calculate net asset values, it may request that a Committee meeting be called. When a security is valued in accordance with the Fair Value Procedures, the Committee will determine the value after taking into consideration all relevant information reasonably available to the Committee. As of October 31, 2017, there were two funds, Global X Scientific Beta Europe ETF and Global X Scientific Bet Asia ex-Japan ETF, with fair valued securities valued at $0 and $37, respectively. There were no other securities priced using the Fair Value Procedures.
In accordance with the authoritative guidance on fair value measurements and disclosure under U.S. GAAP, the Funds disclose the fair value of their investments in a hierarchy that prioritizes the inputs to valuation techniques used to measure the fair value. The objective of a fair value measurement is to determine the price that would be received to sell an asset or paid to transfer a liability in an orderly transaction between market participants at the measurement date (an exit price). Accordingly, the fair value hierarchy gives the highest priority to quoted prices (unadjusted) in active markets for identical assets or liabilities (Level 1) and the lowest priority to unobservable inputs (Level 3). The three levels of the fair value hierarchy are described below:
Level 1 – Unadjusted quoted prices in active markets for identical, unrestricted assets or liabilities that the Funds have the ability to access at the measurement date
Level 2 – Other significant observable inputs (including quoted prices in non-active markets, quoted prices for similar investments, fair value of investments for which the Funds have the ability to fully redeem tranches at net asset value as of the measurement date or within the near term, and short-term investments valued at amortized cost)
Level 3 – Significant unobservable inputs (including the Funds’ own assumptions in determining the fair value of investments, and fair value of investments for which the Funds do not have the ability to fully redeem tranches at net asset value as of the measurement date or within the near term)
Investments are classified within the level of the lowest significant input considered in determining fair value. Investments classified within Level 3 whose fair value measurement considers several inputs may include Level 1 or Level 2 inputs as components of the overall fair value measurement.
For the year or period ended October 31, 2017, there have been no significant changes to the Funds’ fair valuation methodologies.
Notes to Financial Statements (Continued)
October 31, 2017
2. SIGNIFICANT ACCOUNTING POLICIES (continued)
The unobservable inputs used to determine fair value of Level 3 assets may have similar or diverging impacts on valuation. Significant increases and decreases in these inputs in isolation and interrelationships between those inputs could result in significantly higher or lower fair value measurement.
DUE TO/FROM BROKERS – Due to/from brokers includes cash and collateral balances with the Funds’ clearing brokers or counterparties at October 31, 2017. The Funds continuously monitor the credit standing of each broker or counterparty with whom they conduct business. In the event a broker or counterparty is unable to fulfill its obligations, the Funds would be subject to counterparty credit risk.
REPURCHASE AGREEMENTS - Securities pledged as collateral for repurchase agreements by Deutsche Bank are held by Citibank N.A. whereas the collateral for repurchase agreements by Barclays Bank are held by BNY Mellon and are designated as being held on each Fund’s behalf by its custodian under a book-entry system. Each Fund monitors the adequacy of the collateral on a daily basis and can require the seller to provide additional collateral in the event the market value of the securities pledged falls below the carrying value of the repurchase agreement, including accrued interest.
It is the Funds’ policy to only enter into repurchase agreements with banks and other financial institutions which are deemed by the Adviser to be creditworthy. The Funds bear the risk of loss in the event that the other party to a repurchase agreement defaults on its obligations, and the Funds are prevented from exercising their rights to dispose of the underlying securities received as collateral and the risk of a possible decline in the value of the underlying securities during the period. For financial statement purposes, the Funds record the securities lending collateral (included in Repurchase Agreements, at value or restricted cash) as an asset and the obligation to return securities lending collateral as a liability on the Statements of Assets and Liabilities.
Repurchase agreements are entered into by the Funds under Master Repurchase Agreements (“MRA”) which permit the Funds, under certain circumstances, including an event of default (such as bankruptcy or insolvency), to offset payables and/or receivables under a MRA with collateral held and/or posted to the counterparty and create one single net payment due to or from the Funds.
Notes to Financial Statements (Continued)
October 31, 2017
2. SIGNIFICANT ACCOUNTING POLICIES (continued)
At October 31, 2017, the open repurchase agreements by counterparty which are subject to a MRA on a net payment basis are as follows:
| | | | | | Fair Value of Non-cash | | | Cash Collateral | | | | |
| | | Repurchase Agreements | | | Collateral Received(1) | | | Received | | | Net Amount (2) | |
| Global X SuperDividend® ETF | | | | | | | | | | | | | | | | |
| Barclays Bank | | $ | 28,046,818 | | | $ | 28,046,818 | | | $ | - | | | $ | - | |
| Deutsche Bank | | | 19,168,548 | | | | 19,168,548 | | | | - | | | | - | |
| Global X SuperDividend® U.S. ETF | | | | | | | | | | | | | | | | |
| Barclays Bank | | | 4,570,535 | | | | 4,570,535 | | | | - | | | | - | |
| Deutsche Bank | | | 3,123,724 | | | | 3,123,724 | | | | - | | | | - | |
| Global X SuperIncome™ Preferred ETF | | | | | | | | | | | | | | | | |
| Barclays Bank | | | 7,026,366 | | | | 7,026,366 | | | | - | | | | - | |
| Deutsche Bank | | | 4,802,158 | | | | 4,802,158 | | | | - | | | | - | |
| Global X Social Media ETF | | | | | | | | | | | | | | | | |
| Barclays Bank | | | 7,639,690 | | | | 7,639,690 | | | | - | | | | - | |
| Deutsche Bank | | | 5,221,333 | | | | 5,221,333 | | | | - | | | | - | |
| Global X Guru® Index ETF | | | | | | | | | | | | | | | | |
| Barclays Bank | | | 1,213,002 | | | | 1,213,002 | | | | - | | | | - | |
| Deutsche Bank | | | 829,025 | | | | 829,025 | | | | - | | | | - | |
(1) Excess collateral received is not presented in the table above. Please refer to the Schedule of Investments for the market value of the collateral received for each Fund.
(2) Net Amount represents the net amount receivable due from the counterparty in the event of default.
FEDERAL INCOME TAXES – It is each Fund’s intention to qualify, or continue to qualify, as a regulated investment company for Federal income tax purposes by complying with the appropriate provisions of Subchapter M of the Internal Revenue Code of 1986, as amended. Accordingly, no provisions for Federal income taxes have been made in the financial statements except as described below.
The Funds evaluate tax positions taken or expected to be taken in the course of preparing the Funds’ tax returns to determine whether it is "more-likely-than-not" (i.e., greater than 50 percent) that each tax position will be sustained upon examination by a taxing authority based on the technical merits of the position. Tax positions not deemed to meet the more-likely-than-not threshold are recorded as a tax benefit or expense in the current year. The Funds did not record any tax provisions in the current period; however, management’s conclusions regarding tax positions may be subject to review and adjustment at a later date based on factors including, but not limited to, examination by tax authorities (i.e., the last three tax year ends, as applicable), on-going analysis of and changes to tax laws, regulations and interpretations thereof. As of December 31, 2017, the tax years that remain subject to examination by the major tax jurisdictions under the statute of limitations is from inception forward.
If the Funds have foreign tax filings that have not been made, the tax years that remain subject to examination may date back to the inception of the Fund.
As of and during the reporting period ended October 31, 2017, the Funds did not have a liability for any unrecognized tax benefits. The Funds recognize interest and penalties, if any, related to unrecognized tax benefits as income tax expense in the Statement of Operations. During the reporting period, the Funds did not incur any interest or penalties.
Notes to Financial Statements (Continued)
October 31, 2017
2. SIGNIFICANT ACCOUNTING POLICIES (continued)
SECURITY TRANSACTIONS AND INVESTMENT INCOME – Security transactions are accounted for on the trade date for financial reporting purposes. Costs used in determining realized gains and losses on the sale of investment securities are based on specific identification. Dividend income is recorded on the ex-dividend date. Interest income is recognized on the accrual basis from the settlement date.
FOREIGN CURRENCY TRANSACTIONS AND TRANSLATION – The books and records of the Funds are maintained in U.S. dollars. Investment securities and other assets and liabilities denominated in a foreign currency are translated into U.S. dollars on the date of valuation. Purchases and sales of investment securities, income and expenses are translated into U.S. dollars at the relevant rates of exchange prevailing on the respective dates of such transactions. The Funds do not isolate that portion of realized or unrealized gains and losses resulting from changes in the foreign exchange rate from fluctuations arising from changes in the market prices of the securities. These gains and losses are included in net realized and unrealized gains and losses on investments on the Statement of Operations. Net realized and unrealized gains and losses on foreign currency transactions and translations represent net foreign exchange gains or losses from foreign currency spot contracts, disposition of foreign currencies, currency gains or losses realized between trade and settlement dates on securities transactions and the difference between the amount of the investment income and foreign withholding taxes recorded on the Funds’ books and the U.S. dollar equivalent amounts actually received or paid.
DIVIDENDS AND DISTRIBUTIONS TO SHAREHOLDERS – The Funds distribute their net investment income on a pro rata basis. Any net investment income and net realized capital gains are distributed at least annually. All distributions are recorded on ex-dividend date.
INVESTMENTS IN REITs – With respect to the Funds, dividend income is recorded based on the income included in distributions received from real estate investment trust (“REIT”) investments using published REIT reclassifications, including some management estimates when actual amounts are not available. Distributions received in excess of these estimated amounts are recorded as a reduction of the cost of investments or reclassified to capital gains. The actual amounts of income, return of capital, and capital gains are only determined by each REIT after its fiscal year end, and may differ from the estimated amounts.
CREATION UNITS – The Funds issue and redeem their shares (“Shares”) on a continuous basis at Net Asset Value (“NAV”) and only in large blocks of 50,000 Shares, referred to as “Creation Units”. Purchasers of Creation Units (“Authorized Participants”) at NAV must pay a standard creation transaction fee per transaction. The fee is a single charge and will be the same regardless of the number of Creation Units purchased by an Authorized Participant on the same day.
An Authorized Participant who holds Creation Units and wishes to redeem at NAV would also pay a standard redemption fee per transaction to Brown Brothers Harriman & Co. (“BBH”), the Funds’ custodian (“Custodian”), on the date of such redemption, regardless of the number of Creation Units redeemed that day.
Notes to Financial Statements (Continued)
October 31, 2017
2. SIGNIFICANT ACCOUNTING POLICIES (concluded)
If a Creation Unit is purchased or redeemed for cash, an additional variable fee may be charged. The following table discloses Creation Unit breakdown:
| | | | | | Creation | | | Value at October | | | | |
| | | Creation Unit Shares | | | Fee | | | 31, 2017 | | | Redemption Fee | |
| Global X SuperDividend® ETF | | | 50,000 | | | $ | 3,800 | | | $ | 1,075,500 | | | $ | 3,800 | |
| Global X SuperDividend® U.S. ETF | | | 50,000 | | | | 500 | | | | 1,259,000 | | | | 750 | |
| Global X MSCI SuperDividend® EAFE ETF | | | 50,000 | | | | 1,200 | | | | 906,500 | | | | 3,000 | |
| Global X MSCI SuperDividend® Emerging Markets ETF | | | 50,000 | | | | 3,000 | | | | 797,000 | | | | 3,000 | |
| Global X SuperDividend® REIT ETF | | | 50,000 | | | | 500 | | | | 764,500 | | | | 750 | |
| Global X SuperIncome™ Preferred ETF | | | 50,000 | | | | 500 | | | | 622,000 | | | | 500 | |
| Global X Social Media ETF | | | 50,000 | | | | 300 | | | | 1,633,500 | | | | 1,000 | |
| Global X | JPMorgan Efficiente Index ETF | | | 50,000 | | | | 500 | | | | 1,309,000 | | | | 500 | |
| Global X | JPMorgan US Sector Rotator Index ETF | | | 50,000 | | | | 500 | | | | 1,275,500 | | | | 500 | |
| Global X Guru® Index ETF | | | 50,000 | | | | 300 | | | | 1,435,000 | | | | 750 | |
| Global X Scientific Beta US ETF | | | 50,000 | | | | 2,300 | | | | 1,502,000 | | | | 2,500 | |
| Global X Scientific Beta Europe ETF | | | 50,000 | | | | 10,500 | | | | 1,421,500 | | | | 10,500 | |
| Global X Scientific Beta Japan ETF | | | 50,000 | | | | 4,500 | | | | 1,573,500 | | | | 5,500 | |
| Global X Scientific Beta Asia ex-Japan ETF | | | 50,000 | | | | 6,500 | | | | 1,285,500 | | | | 11,000 | |
| Global X YieldCo Index ETF | | | 50,000 | | | | 500 | | | | 626,500 | | | | 500 | |
| Global X S&P 500® Catholic Values ETF | | | 50,000 | | | | 2,300 | | | | 1,591,500 | | | | 2,300 | |
CASH OVERDRAFT CHARGES – Per the terms of an agreement with BBH, if a Fund has a cash overdraft on a given day, it will be assessed an overdraft charge of LIBOR plus 2.00%. Cash overdraft charges are included in custodian fees on the Statement of Operations.
3. RELATED PARTY TRANSACTIONS AND SERVICE PROVIDER TRANSACTIONS
The Adviser serves as the investment adviser and the administrator for the Funds. Subject to the supervision of the Board, the Adviser is responsible for managing the investment activities of the Funds and the Funds’ business affairs and other administrative matters and provides or causes to be furnished all supervisory, administrative and other services reasonably necessary for the operation of the Funds, including certain distribution services (provided pursuant to a separate Distribution Agreement), certain shareholder and distribution-related services (provided pursuant to a separate Rule 12b-1 Plan and related agreements) and investment advisory services (provided pursuant to a separate Investment Advisory Agreement), under what is essentially an "all-in" fee structure. For its service to the Funds, under the Supervision and Administration Agreement, each Fund pays a monthly fee to the Adviser at the annual rate below (stated as a percentage of the average daily net assets of the Fund). In addition, the Funds bear other expenses, directly and indirectly, that are not covered by the Supervision and Administration Agreement, which may vary and affect the total expense ratios of the Funds, such as taxes, brokerage fees, commissions, acquired fund fees, and other transaction expenses, interest expenses and extraordinary expenses (such as litigation and indemnification expenses).
Notes to Financial Statements (Continued)
October 31, 2017
3. RELATED PARTY TRANSACTIONS AND SERVICE PROVIDER TRANSACTIONS (continued)
The following table discloses supervision and administration fees pursuant to the agreement:
| | | Supervision and | |
| | | Administration Fee | |
| Global X SuperDividend® ETF | | | 0.58 | % |
| Global X SuperDividend® U.S. ETF | | | 0.45 | % |
| Global X MSCI SuperDividend® EAFE ETF | | | 0.55 | % |
| Global X MSCI SuperDividend® Emerging Markets ETF | | | 0.65 | % |
| Global X SuperDividend® REIT ETF | | | 0.58 | % |
| Global X SuperIncomeTM Preferred ETF | | | 0.58 | % |
| Global X Social Media ETF | | | 0.65 | % |
| Global X | JPMorgan Efficiente Index ETF | | | 0.69 | % |
| Global X | JPMorgan US Sector Rotator Index ETF | | | 0.69 | % |
| Global X Guru® Index ETF | | | 0.75 | % |
| Global X Scientific Beta US ETF* | | | 0.19 | % |
| Global X Scientific Beta Europe ETF | | | 0.38 | % |
| Global X Scientific Beta Japan ETF | | | 0.38 | % |
| Global X Scientific Beta Asia ex-Japan ETF | | | 0.38 | % |
| Global X YieldCo Index ETF | | | 0.65 | % |
| Global X S&P 500® Catholic Values ETF** | | | 0.29 | % |
*Effective March 1, 2016, pursuant to an expense limitation agreement, the Adviser has contractually agreed to reimburse or waive fees and/or limit fund expenses to the extent necessary to assure that the operating expenses of the Global X Scientific Beta US ETF (the “Fund) (exclusive of taxes, brokerage fees, commissions, and other transaction expenses, interest, and extraordinary expenses (such as litigation and indemnification expenses)) will not exceed 0.19% of the Fund’s average daily net assets per year until at least March 1, 2018. The Fund (at a later date) may reimburse the Adviser for the fees it reimbursed or waived and/or limited pursuant to the expense limitation agreement during any of the prior three fiscal years, provided that, among other things, reimbursement to be made to the Adviser does not cause Total Annual Fund Operating Expenses of the Fund to exceed 0.19% during the year in which it is paid and the Board of Trustees has approved such reimbursement to the Adviser. As of October 31, 2017, the amounts of waivers/reimbursements subject to recoupment for Global X Scientific Beta US ETF were $162,684 expiring 2020 and $50,604 expiring 2019. As of October 31, 2017, there had been no recoupment of previously waived and reimbursed fees.
**Pursuant to an expense limitation agreement, the Adviser has contractually agreed to waive or reimburse fees and/or limit fund expenses to the extent necessary to assure that the operating expenses of the Global X S&P 500® Catholic Values ETF (the “Fund) (exclusive of taxes, brokerage fees, commissions, and other transaction expenses, interest and extraordinary expenses (such as litigation and indemnification expenses)) will not exceed 0.29% of the Fund’s average daily net assets per year until at least March 1, 2018. The Fund (at a later date) may reimburse the Adviser for the fees and expenses it waived or reimbursed and/or limited pursuant to the expense limitation agreement during any of the prior three fiscal years, provided that, among other things, any reimbursement made to the Adviser does not cause Total Annual Fund Operating Expenses of the Fund to exceed 0.29% during the period in which it is paid and the Board of Trustees has approved such reimbursement to the Adviser. As of October 31, 2017, the amounts of waivers/reimbursements subject to recoupment for Global X S&P 500® Catholic Values ETF were $88,406 expiring 2020 and $8,298 expiring 2019. As of October 31, 2017, there had been no recoupment of previously waived and reimbursed fees.
SEI Investments Global Funds Services (“SEIGFS”) serves as sub-administrator to the Funds. As sub-administrator, SEIGFS provides the Funds with the required general administrative services, including, without limitation: office space, equipment, and personnel; clerical and general back office services; bookkeeping, internal accounting and secretarial services; the calculation of NAV; and assistance with the preparation and filing of reports, registration statements, proxy statements, and other materials required to be filed or furnished by the Funds under federal and state securities laws. As compensation for these services, the SEIGFS receives certain out-of-pocket costs, transaction fees, and asset-based fees which are accrued daily and paid monthly by the Adviser. SEI Investments Distribution Co. (“SIDCO”) serves as each Fund’s underwriter and distributor of Creation Units pursuant to a distribution agreement. SIDCO has no obligation to sell any specific quantity of Fund Shares.
Notes to Financial Statements (Continued)
October 31, 2017
3. RELATED PARTY TRANSACTIONS AND SERVICE PROVIDER TRANSACTIONS (concluded)
SIDCO bears the following costs and expenses relating to the distribution of Shares: (1) the costs of processing and maintaining records of creations of Creation Units; (2) all costs of maintaining the records required of a registered broker/dealer; (3) the expenses of maintaining its registration or qualification as a dealer or broker under Federal or state laws; (4) filing fees; and (5) all other expenses incurred in connection with the distribution services as contemplated in the distribution agreement. SIDCO receives no fee from the Funds for its distribution services under the distribution agreement, rather the Adviser compensates SIDCO for certain expenses, out-of-pocket costs, and transaction fees.
BBH serves as custodian of the Funds’ assets. As custodian, BBH has agreed to (1) make receipts and disbursements of money on behalf of the Funds, (2) collect and receive all income and other payments and distributions on account of the Funds’ portfolio investments, (3) respond to correspondence from shareholders, security brokers and others relating to its duties; and (4) make periodic reports to the Funds concerning the Funds’ operations. BBH does not exercise any supervisory function over the purchase and sale of securities. BBH also serves as the Fund’s transfer agent. As transfer agent, BBH has agreed to (1) issue and redeem shares of each Fund, (2) make dividend and other distributions to shareholders of each Fund, (3) respond to correspondence by shareholders and others relating to its duties; (4) maintain shareholder accounts, and (5) make periodic reports to the Funds. As compensation for these services, BBH receives certain out-of-pocket costs, transaction fees and asset-based fees which are accrued daily and paid monthly by the Adviser from its fees.
4. INVESTMENT TRANSACTIONS
For the year or period ended October 31, 2017, the purchases and sales of investments in securities excluding in-kind transactions, long-term U.S. Government and short-term securities were:
| | | | | | Sales and | |
| | | Purchases | | | Maturities | |
| Global X SuperDividend® ETF | | $ | 601,694,876 | | | $ | 600,441,563 | |
| Global X SuperDividend® U.S. ETF | | | 206,078,864 | | | | 213,555,895 | |
| Global X MSCI SuperDividend® EAFE ETF | | | 832,833 | | | | 798,524 | |
| Global X MSCI SuperDividend® Emerging Markets ETF | | | 15,938,809 | | | | 11,314,006 | |
| Global X SuperDividend® REIT ETF | | | 22,007,947 | | | | 22,320,223 | |
| Global X SuperIncome™ Preferred ETF | | | 105,282,856 | | | | 106,610,093 | |
| Global X Social Media ETF | | | 48,194,558 | | | | 48,075,575 | |
| Global X | JPMorgan Efficiente Index ETF | | | 14,822,870 | | | | 14,900,282 | |
| Global X | JPMorgan US Sector Rotator Index ETF | | | 59,540,662 | | | | 59,604,419 | |
| Global X Guru® Index ETF | | | 54,009,877 | | | | 53,456,785 | |
| Global X Scientific Beta US ETF | | | 29,524,828 | | | | 28,652,722 | |
| Global X Scientific Beta Europe ETF | | | 4,552,615 | | | | 4,513,715 | |
| Global X Scientific Beta Japan ETF | | | 2,892,182 | | | | 2,971,820 | |
| Global X Scientific Beta Asia ex-Japan ETF | | | 1,560,864 | | | | 1,557,634 | |
| Global X YieldCo Index ETF | | | 2,859,729 | | | | 3,149,350 | |
| Global X S&P 500® Catholic Values ETF | | | 6,307,032 | | | | 5,274,227 | |
Notes to Financial Statements (Continued)
October 31, 2017
4. INVESTMENT TRANSACTIONS (concluded)
For the year ended October 31, 2017, there were no purchases and sales of long-term U.S. Government securities.
For the year or periods ended October 31, 2017 in-kind transactions associated with creations and redemptions were:
| | | | | | Sales and | | | | |
| | | Purchases | | | Maturities | | | Realized Gain | |
| Global X SuperDividend® ETF | | $ | 163,240,027 | | | $ | 20,590,005 | | | $ | 2,861,114 | |
| Global X SuperDividend® U.S. ETF | | | 100,539,399 | | | | 23,933,355 | | | | 3,420,825 | |
| Global X MSCI SuperDividend® EAFE ETF | | | 2,345,995 | | | | 872,903 | | | | 142,869 | |
| Global X MSCI SuperDividend® Emerging Markets ETF | | | 4,822,071 | | | | 813,727 | | | | 152,182 | |
| Global X SuperDividend® REIT ETF | | | 25,401,109 | | | | 9,432,919 | | | | 431,276 | |
| Global X SuperIncome™ Preferred ETF | | | 40,625,775 | | | | 23,004,344 | | | | 557,950 | |
| Global X Social Media ETF | | | 67,999,034 | | | | 74,870,376 | | | | 13,127,991 | |
| Global X | JPMorgan Efficiente Index ETF | | | - | | | | 2,515,599 | | | | 199,439 | |
| Global X | JPMorgan US Sector Rotator Index ETF | | | - | | | | 6,154,295 | | | | 121,486 | |
| Global X Guru® Index ETF | | | - | | | | 15,308,084 | | | | 1,594,422 | |
| Global X Scientific Beta US ETF | | | 64,441,946 | | | | 11,532,295 | | | | 3,237,833 | |
| Global X Scientific Beta Europe ETF | | | 10,268,569 | | | | 5,472,878 | | | | 1,599,139 | |
| Global X Scientific Beta Japan ETF | | | 7,186,396 | | | | 5,950,909 | | | | 1,488,551 | |
| Global X Scientific Beta Asia ex-Japan ETF | | | 1,180,298 | | | | - | | | | - | |
| Global X YieldCo Index ETF | | | 13,132,948 | | | | 945,833 | | | | 259,096 | |
| Global X S&P 500® Catholic Values ETF | | | 80,897,365 | | | | 23,330,073 | | | | 3,783,252 | |
For the year or periods ended October 31, 2016, in-kind transactions associated with creations and redemptions were:
| | | | | | Sales and | | | | |
| | | Purchases | | | Maturities | | | Realized Gain | |
| Global X SuperDividend® ETF | | $ | 49,567,614 | | | $ | 110,361,789 | | | $ | 1,670,902 | |
| Global X SuperDividend® U.S. ETF | | | 127,157,535 | | | | 38,867,485 | | | | 4,168,310 | |
| Global X MSCI SuperDividend® Emerging Markets ETF | | | - | | | | - | | | | - | |
| Global X SuperDividend® REIT ETF | | | 30,674,729 | | | | - | | | | - | |
| Global X SuperIncome™ Preferred ETF | | | 37,158,930 | | | | 33,003,074 | | | | (2,067,492 | ) |
| Global X Social Media ETF | | | 93,518,723 | | | | 43,082,274 | | | | 700,608 | |
| Global X | JPMorgan Efficiente Index ETF | | | 1,122,106 | | | | 2,290,750 | | | | 7,626 | |
| Global X | JPMorgan US Sector Rotator Index ETF | | | 3,399,243 | | | | 7,134,820 | | | | (12,025 | ) |
| Global X Guru® Index ETF | | | 10,236,109 | | | | 125,096,107 | | | | 891,469 | |
| Global X Scientific Beta US ETF | | | 62,260,200 | | | | - | | | | - | |
| Global X Scientific Beta Europe ETF | | | 10,270,697 | | | | - | | | | - | |
| Global X Scientific Beta Japan ETF | | | 9,969,557 | | | | - | | | | - | |
| Global X Scientific Beta Asia ex-Japan ETF | | | - | | | | - | | | | - | |
| Global X YieldCo Index ETF | | | 4,183,988 | | | | 911,080 | | | | 29,597 | |
| Global X S&P 500® Catholic Values ETF | | | 40,304,954 | | | | - | | | | - | |
5. TAX INFORMATION
The Global X SuperDividend® REIT ETF has a tax year that ends on December 31. The following tax disclosures are representative as of October 31, 2017. Accordingly, the disclosures are for informational use by shareholders and are subject to change attributable to activity through the end of the tax year ending December 31, 2017.
Notes to Financial Statements (Continued)
October 31, 2017
5. TAX INFORMATION (continued)
The amount and character of income and capital gain distributions to be paid, if any, are determined in accordance with Federal income tax regulations, which may differ from U.S. GAAP. As a result, net investment income (loss) and net realized gain (loss) on investment transactions for a reporting period may differ significantly from distributions during such period. These book/tax differences may be temporary or permanent. To the extent these differences are permanent in nature, they are charged or credited to undistributed net investment income (loss), accumulated net realized gain (loss) or paid-in capital, as appropriate, in the period that the differences arise.
The following differences, primarily attributable to preferred stock interest, foreign currency, redemptions in-kind, REIT adjustments, MLP adjustments, non-deductible excise tax paid, sale of RIC shares, net operating loss, return of capital distribution and sales of passive foreign investment companies have been reclassified to/from the following accounts during the fiscal year ended October 31, 2017:
| Global X Funds | | Paid-in
Capital | | | Undistributed
Net
Investment
Income | | | Accumulated
Net Realized
Loss | |
| Global X SuperDividend® ETF | | $ | 2,828,774 | | | $ | 1,429,682 | | | $ | (4,258,456 | ) |
| Global X SuperDividend® U.S. ETF | | | 5,772,413 | | | | 2,455,459 | | | | (8,227,872 | ) |
| Global X MSCI SuperDividend® EAFE ETF | | | 142,869 | | | | 734 | | | | (143,603 | ) |
| Global X MSCI SuperDividend® Emerging Markets ETF | | | 151,600 | | | | 54 | | | | (151,654 | ) |
| Global X SuperDividend® REIT ETF | | | – | | | | 85,981 | | | | (85,981 | ) |
| Global X SuperIncome™ Preferred ETF | | | 189,391 | | | | 278,401 | | | | (467,792 | ) |
| Global X Social Media ETF | | | 12,082,013 | | | | 273,056 | | | | (12,355,069 | ) |
| Global X | JPMorgan Efficiente Index ETF | | | 194,874 | | | | 108,273 | | | | (303,147 | ) |
| Global X | JPMorgan US Sector Rotator Index ETF | | | 121,486 | | | | (6,644 | ) | | | (114,842 | ) |
| Global X Guru® Index ETF | | | 1,882,377 | | | | (48,102 | ) | | | (1,834,275 | ) |
| Global X Scientific Beta US ETF | | | 3,210,062 | | | | – | | | | (3,210,062 | ) |
| Global X Scientific Beta Europe ETF | | | 1,550,233 | | | | 35,700 | | | | (1,585,933 | ) |
| Global X Scientific Beta Japan ETF | | | 1,474,985 | | | | 811 | | | | (1,475,796 | ) |
| Global X Scientific Beta Asia ex-Japan ETF | | | – | | | | 20,013 | | | | (20,013 | ) |
| Global X YieldCo Index ETF | | | 170,135 | | | | 102,139 | | | | (272,274 | ) |
| Global X S&P 500® Catholic Values ETF | | | 3,776,704 | | | | – | | | | (3,776,704 | ) |
These reclassifications have no impact on net assets or net asset value per share.
Notes to Financial Statements (Continued)
October 31, 2017
5. TAX INFORMATION (continued)
The tax character of dividends and distributions declared during the years or periods ended October 31, 2017 and October 31, 2016 were as follows:
| Global X Funds | | Ordinary Income | | | Long-Term
Capital Gain | | | Return of Capital | | | Totals | |
| | | | |
| Global X SuperDividend® ETF |
| 2017 | | $ | 50,713,102 | | | $ | – | | | $ | 9,476,648 | | | $ | 60,189,750 | |
| 2016 | | | 50,746,230 | | | | – | | | | 5,683,920 | | | | 56,430,150 | |
| Global X SuperDividend® U.S. ETF |
| 2017 | | $ | 14,750,888 | | | $ | – | | | $ | 9,099,887 | | | $ | 23,850,775 | |
| 2016 | | | 12,821,203 | | | | – | | | | 8,107,347 | | | | 20,928,550 | |
| Global X MSCI SuperDividend® EAFE ETF |
| 2017 | | $ | 58,664 | | | $ | 113 | | | $ | – | | | $ | 58,777 | |
| Global X MSCI SuperDividend® Emerging Markets ETF |
| 2017 | | $ | 411,165 | | | $ | – | | | $ | – | | | $ | 411,165 | |
| 2016 | | | 191,294 | | | | – | | | | – | | | | 191,294 | |
| Global X SuperDividend® REIT ETF(1) |
| 2017 | | $ | 1,512,300 | | | $ | – | | | $ | – | | | $ | 1,512,300 | |
| 2016 | | | 210,363 | | | | 10,512 | | | | – | | | | 220,875 | |
| Global X SuperIncome™ Preferred ETF |
| 2017 | | $ | 15,532,201 | | | $ | – | | | $ | 716,030 | | | $ | 16,248,231 | |
| 2016 | | | 14,776,181 | | | | – | | | | – | | | | 14,776,181 | |
| Global X Social Media ETF |
| 2017 | | $ | 126,360 | | | $ | – | | | $ | – | | | $ | 126,360 | |
| 2016 | | | 6,875 | | | | – | | | | – | | | | 6,875 | |
| Global X | JPMorgan Efficiente Index ETF |
| 2017 | | $ | 198,988 | | | $ | – | | | $ | – | | | $ | 198,988 | |
| 2016 | | | 312,783 | | | | – | | | | – | | | | 312,783 | |
| Global X | JPMorgan US Sector Rotator Index ETF |
| 2017 | | $ | 190,176 | | | $ | – | | | $ | – | | | $ | 190,176 | |
| 2016 | | | 197,183 | | | | – | | | | – | | | | 197,183 | |
| Global X Guru® Index ETF |
| 2017 | | $ | 122,367 | | | $ | – | | | $ | – | | | $ | 122,367 | |
| 2016 | | | 635,053 | | | | – | | | | 125,403 | | | | 760,456 | |
| Global X Scientific Beta US ETF |
| 2017 | | $ | 942,969 | | | $ | – | | | $ | – | | | $ | 942,969 | |
| 2016 | | | 29,000 | | | | – | | | | – | | | | 29,000 | |
| Global X Scientific Beta Europe ETF |
| 2017 | | $ | 373,503 | | | $ | – | | | $ | – | | | $ | 373,503 | |
| 2016 | | | 34,296 | | | | – | | | | – | | | | 34,296 | |
| Global X Scientific Beta Japan ETF |
| 2017 | | $ | 372,358 | | | $ | – | | | $ | – | | | $ | 372,358 | |
| 2016 | | | 21,833 | | | | – | | | | – | | | | 21,833 | |
| Global X Scientific Beta Asia ex-Japan ETF |
| 2017 | | $ | 101,714 | | | $ | – | | | $ | – | | | $ | 101,714 | |
| 2016 | | | 62,417 | | | | – | | | | – | | | | 62,417 | |
| Global X YieldCo Index ETF |
| 2017 | | $ | 421,625 | | | $ | – | | | $ | – | | | $ | 421,625 | |
| 2016 | | | 199,159 | | | | – | | | | 76,200 | | | | 275,359 | |
| Global X S&P 500® Catholic Values ETF |
| 2017 | | $ | 330,133 | | | $ | – | | | $ | – | | | $ | 330,133 | |
| 2016 | | | – | | | | – | | | | – | | | | – | |
(1) The Global X SuperDividend® REIT ETF has a tax year that ends on December 31.
Notes to Financial Statements (Continued)
October 31, 2017
5. TAX INFORMATION (continued)
As of October 31, 2017, the components of tax basis distributable earnings (accumulated losses) were as follows:
| | | Global X Funds | |
| | | Global X
SuperDividend® ETF | | | Global X
SuperDividend®
U.S. ETF | | | Global X MSCI
SuperDividend®
EAFE ETF | |
| Undistributed Ordinary Income | | $ | – | | | $ | – | | | $ | 41,494 | |
| Capital Loss Carryforwards | | | (97,650,388 | ) | | | (51,441,041 | ) | | | – | |
| Unrealized Appreciation on Investments and Foreign Currency | | | 496,107 | | | | 25,039,414 | | | | 142,688 | |
| Other Temporary Differences | | | (3 | ) | | | 2 | | | | (2 | ) |
| Total Distributable Earnings (Accumulated Losses) | | $ | (97,154,284 | ) | | $ | (26,401,625 | ) | | $ | 184,180 | |
| | | | | | | | | | | | | |
| | | Global X Funds | |
| | | Global X MSCI
SuperDividend®
Emerging Markets
ETF | | | Global X
SuperDividend®
REIT ETF(1) | | | Global X
SuperIncome™
Preferred ETF | |
| Undistributed Ordinary Income | | $ | 138,432 | | | $ | 204,179 | | | $ | – | |
| Capital Loss Carryforwards | | | (163,583 | ) | | | (192,181 | ) | | | (24,532,422 | ) |
| Unrealized Appreciation (Depreciation) on Investments and Foreign Currency | | | 111,529 | | | | (1,092,871 | ) | | | (18,653,485 | ) |
| Other Temporary Differences | | | (2 | ) | | | (287,375 | ) | | | (301,586 | ) |
| Total Distributable Earnings (Accumulated Losses) | | $ | 86,376 | | | $ | (1,368,248 | ) | | $ | (43,487,493 | ) |
| | | | | | | | | | | | | |
| | | Global X Funds | |
| | | Global X Social
Media ETF | | | Global X |
JPMorgan
Efficiente Index
ETF | | | Global X |
JPMorgan US
Sector Rotator
Index ETF | |
| Undistributed Ordinary Income | | $ | 2,573,540 | | | $ | 105,750 | | | $ | 53,268 | |
| Capital Loss Carryforwards | | | (13,992,387 | ) | | | (1,864,221 | ) | | | (1,838,450 | ) |
| Unrealized Appreciation on Investments and Foreign Currency | | | 18,071,984 | | | | 333,255 | | | | 48,134 | |
| Other Temporary Differences | | | 3 | | | | 3 | | | | 2 | |
| Total Distributable Earnings (Accumulated Losses) | | $ | 6,653,140 | | | $ | (1,425,213 | ) | | $ | (1,737,046 | ) |
| | | | | | | | | | | | | |
| | | Global X Funds | |
| | | Global X Guru®
Index ETF | | | Global X Scientific
Beta US ETF | | | Global X Scientific
Beta Europe ETF | |
| Undistributed Ordinary Income | | $ | 135,049 | | | $ | 1,398,111 | | | $ | 483,063 | |
| Capital Loss Carryforwards | | | (29,492,154 | ) | | | (695,864 | ) | | | (456,013 | ) |
| Unrealized Appreciation on Investments and Foreign Currency | | | 5,172,631 | | | | 13,555,773 | | | | 2,270,867 | |
| Other Temporary Differences | | | (2 | ) | | | 1 | | | | (4 | ) |
| Total Distributable Earnings (Accumulated Losses) | | $ | (24,184,476 | ) | | $ | 14,258,021 | | | $ | 2,297,913 | |
| | | | | | | | | | | | | |
(1) The Global X SuperDividend® REIT ETF has a tax year that ends on December 31.
Notes to Financial Statements (Continued)
October 31, 2017
5. TAX INFORMATION (continued)
| | | Global X Funds | |
| | | Global X Scientific
Beta Japan ETF | | | Global X Scientific
Beta Asia ex-
Japan ETF | | | Global X YieldCo
Index ETF | |
| Undistributed Ordinary Income | | $ | 325,459 | | | $ | 149,279 | | | $ | 10,704 | |
| Capital Loss Carryforwards | | | (264,637 | ) | | | (345,285 | ) | | | (900,338 | ) |
| Unrealized Appreciation on Investments and Foreign Currency | | | 2,045,744 | | | | 375,960 | | | | 1,342,493 | |
| Other Temporary Differences | | | (5 | ) | | | (1 | ) | | | 3 | |
| Total Distributable Earnings | | $ | 2,106,561 | | | $ | 179,953 | | | $ | 452,862 | |
| | | Global X Funds | |
| | | Global X S&P
500® Catholic
Values ETF | |
| Undistributed Ordinary Income | | $ | 1,291,701 | |
| Undistributed Long-Term Capital Gain | | | 21,227 | |
| Unrealized Appreciation on Investments and Foreign Currency | | | 11,666,661 | |
| Other Temporary Differences | | | 2 | |
| Total Distributable Earnings | | $ | 12,979,591 | |
For taxable years beginning after December 22, 2010, a RIC is permitted to carry forward net capital losses to offset capital gains realized in later years, and the losses carried forward retain their original character as either long-term or short-term losses. Net capital losses of a RIC realized in taxable years beginning before that date (pre-2011 losses) can be carried forward up to 8 years and are characterized in later years as short-term losses. If a Fund uses pre-2011 loss carryforwards in later years, the carryforwards will not reduce the Fund’s current earnings and profits, while loss carryforwards from later years will reduce the Fund’s current earnings and profits. To the extent that later year capital gains are offset by pre-2011 loss carryforwards, distributions of such gains will be treated as ordinary dividend distributions. Losses carried forward under these new provisions are as follows:
| | | Short-Term | | | Long-Term | | | | |
| Global X Funds | | Loss | | | Loss | | | Total | |
| Global X SuperDividend® ETF | | $ | (53,093,160 | ) | | $ | (44,557,228 | ) | | $ | (97,650,388 | ) |
| Global X SuperDividend® U.S. ETF | | | (40,060,305 | ) | | | (11,380,736 | ) | | | (51,441,041 | ) |
| Global X MSCI SuperDividend® Emerging Markets ETF | | | (54,187 | ) | | | (109,396 | ) | | | (163,583 | ) |
| Global X SuperDividend® REIT ETF | | | (192,181 | ) | | | - | | | | (192,181 | ) |
| Global X SuperIncome™ Preferred ETF | | | (9,454,764 | ) | | | (15,077,658 | ) | | | (24,532,422 | ) |
| Global X Social Media ETF | | | (1,303,796 | ) | | | (12,688,591 | ) | | | (13,992,387 | ) |
| Global X | JPMorgan Efficiente Index ETF | | | (1,864,221 | ) | | | - | | | | (1,864,221 | ) |
| Global X | JPMorgan US Sector Rotator Index ETF | | | (1,838,450 | ) | | | - | | | | (1,838,450 | ) |
| Global X Guru® Index ETF | | | (27,599,901 | ) | | | (1,892,253 | ) | | | (29,492,154 | ) |
| Global X Scientific Beta US ETF | | | (695,864 | ) | | | - | | | | (695,864 | ) |
| Global X Scientific Beta Europe ETF | | | (355,376 | ) | | | (100,637 | ) | | | (456,013 | ) |
| Global X Scientific Beta Japan ETF | | | (264,637 | ) | | | - | | | | (264,637 | ) |
| Global X Scientific Beta Asia ex-Japan ETF | | | (275,129 | ) | | | (70,156 | ) | | | (345,285 | ) |
| Global X YieldCo Index ETF | | | (509,745 | ) | | | (390,593 | ) | | | (900,338 | ) |
Notes to Financial Statements (Continued)
October 31, 2017
5. TAX INFORMATION (concluded)
During the year ended October 31, 2017 the following funds utilized capital loss carryforwards to offset capital gains amounting to:
| | | Short-Term | | | Long-Term | | | | |
| Global X Funds | | Loss | | | Loss | | | Total | |
| Global X SuperDividend® ETF | | $ | - | | | $ | 3,712,459 | | | $ | 3,712,459 | |
| Global X MSCI SuperDividend® Emerging Markets ETF | | | 705,953 | | | | - | | | | 705,953 | |
| Global X | JPMorgan Efficiente Index ETF | | | 87,218 | | | | - | | | | 87,218 | |
| Global X | JPMorgan US Sector Rotator Index ETF | | | 474,843 | | | | - | | | | 474,843 | |
| Global X Guru® Index ETF | | | 1,359,833 | | | | 2,140,221 | | | | 3,500,054 | |
| Global X YieldCo Index ETF | | | 11,855 | | | | - | | | | 11,855 | |
The Federal tax cost and aggregate gross unrealized appreciation and depreciation on investments held by the Funds at October 31, 2017 were as follows:
| Global X Funds | | Federal Tax
Cost | | | Aggregated
Gross
Unrealized
Appreciation | | | Aggregated
Gross
Unrealized
Depreciation | | | Net
Unrealized
Appreciation
(Depreciation) | |
| Global X SuperDividend® ETF | | $ | 1,033,985,078 | | | $ | 76,388,568 | | | $ | (75,869,678 | ) | | $ | 518,890 | |
| Global X SuperDividend® U.S. ETF | | | 406,918,258 | | | | 34,584,191 | | | | (9,544,778 | ) | | | 25,039,413 | |
| Global X MSCI SuperDividend® EAFE ETF | | | 1,670,339 | | | | 173,488 | | | | (30,978 | ) | | | 142,510 | |
| Global X MSCI SuperDividend® Emerging Markets ETF | | | 12,563,955 | | | | 550,591 | | | | (422,600 | ) | | | 127,991 | |
| Global X SuperDividend® REIT ETF | | | 50,462,544 | | | | 2,301,203 | | | | (1,085,266 | ) | | | 1,215,937 | |
| Global X SuperIncome™ Preferred ETF | | | 265,298,659 | | | | 3,155,644 | | | | (21,809,130 | ) | | | (18,653,486 | ) |
| Global X Social Media ETF | | | 159,508,213 | | | | 28,370,266 | | | | (10,300,884 | ) | | | 18,069,382 | |
| Global X | JPMorgan Efficiente Index ETF | | | 4,903,833 | | | | 343,547 | | | | (10,291 | ) | | | 333,256 | |
| Global X | JPMorgan US Sector Rotator Index ETF | | | 5,053,356 | | | | 115,372 | | | | (67,237 | ) | | | 48,135 | |
| Global X Guru® Index ETF | | | 52,753,965 | | | | 7,749,617 | | | | (2,576,987 | ) | | | 5,172,630 | |
| Global X Scientific Beta US ETF | | | 121,434,306 | | | | 17,297,059 | | | | (3,741,286 | ) | | | 13,555,773 | |
| Global X Scientific Beta Europe ETF | | | 19,002,859 | | | | 2,890,791 | | | | (620,743 | ) | | | 2,270,048 | |
| Global X Scientific Beta Japan ETF | | | 15,239,726 | | | | 2,438,074 | | | | (390,966 | ) | | | 2,047,108 | |
| Global X Scientific Beta Asia ex-Japan ETF | | | 3,467,579 | | | | 492,560 | | | | (116,601 | ) | | | 375,959 | |
| Global X YieldCo Index ETF | | | 18,628,912 | | | | 1,504,979 | | | | (162,477 | ) | | | 1,342,502 | |
| Global X S&P 500® Catholic Values ETF | | | 102,797,168 | | | | 14,869,746 | | | | (3,203,085 | ) | | | 11,666,661 | |
The preceding differences between book and tax cost are primarily due to mark-to-market treatment of passive foreign investment companies, MLP adjustments and wash sales.
6. CONCENTRATION OF RISKS
The Funds invest in securities of foreign issuers in various countries. These investments may involve certain considerations and risks not typically associated with investments in the United States as a result of, among other factors, the possibility of future political and economic developments, the level of governmental supervision and regulation of securities markets in the respective countries.
Notes to Financial Statements (Continued)
October 31, 2017
6. CONCENTRATION OF RISKS (concluded)
The securities markets of emerging countries are less liquid, subject to greater price volatility, and have a smaller market capitalization than those of U.S. securities markets. In certain countries, there may be fewer publicly traded securities and the market may be dominated by a few issuers or sectors. Issuers and securities markets in such countries are not subject to as extensive and frequent accounting, financial and other reporting requirements or as comprehensive government regulations as are issuers and securities markets in the U.S. In particular, the assets and profits appearing on the financial statements of emerging country issuers may not reflect their financial position or results of operations in the same manner as financial statements for U.S. issuers. Substantially less information may be publicly available about emerging country issuers than is available about issuers in the United States.
The Funds may be subject to taxes imposed by countries in which they invest. Such taxes are generally based on either income or gains earned or repatriated. The Funds accrue and apply such taxes to net investment income, net realized gains and net unrealized gains as income and/or capital gains are earned.
The Funds use a replication strategy. A replication strategy is an indexing strategy that involves investing in the securities of an underlying index in approximately the same proportions as in the underlying index. The Funds may utilize a representative sampling strategy with respect to their underlying indices when a replication strategy might be detrimental to their shareholders, such as when there are practical difficulties or substantial costs involved in compiling a portfolio of equity securities to follow their underlying indices, or, in certain instances, when securities in the underlying indices become temporarily illiquid, unavailable or less liquid, or due to legal restrictions (such as diversification requirements that apply to the Funds but not the underlying indices).
7. LOANS OF PORTFOLIO SECURITIES
The Funds may lend portfolio securities having a market value up to one-third of the Funds’ total assets. Security loans made pursuant to a securities lending agreement are initially required to be secured by collateral equal to at least 102% of the value of domestic equity securities and ADRs and 105% of the value of foreign equity securities (other than ADRs). Such collateral received in connection with these loans will be cash and can be invested in repurchase agreements or U.S. Treasury obligations and is recognized in the Schedule of Investments and Statement of Assets and Liabilities. The obligation to return securities lending collateral is also recognized as a liability in the Statement of Assets and Liabilities. It is the Funds’ policy to obtain additional collateral from or return excess collateral to the borrower by the end of the next business day, following the valuation date of the securities loaned. Therefore, the value of the collateral held may be temporarily less than the value of the securities on loan.
Lending securities entails a risk of loss to the Funds if and to the extent that the market value of the securities loans were to increase and the borrower did not increase the collateral accordingly, and the borrower fails to return the securities. In the event the borrower may not provide additional collateral when required or may not return the securities when due, the agency agreement requires the lending agent to indemnify the Funds by replacing either the security or the security’s current market value to the fund. The Funds could suffer a loss if the value of an investment purchased with cash collateral falls below the market value of loaned securities or if the value of an investment purchased with cash collateral falls below the value of the original cash collateral received. The Funds could also experience
Notes to Financial Statements (Continued)
October 31, 2017
7. LOANS OF PORTFOLIO SECURITIES (continued)
delays and costs in gaining access to the collateral. The Funds bear the risk of any deficiency in the amount of the collateral available for return to the borrower due to any loss on the collateral invested.
As of October 31, 2017 the value of securities on loan was $45,096,945, $7,507,034, $11,553,181, $12,668,197 and $2,026,333 for the Global X SuperDividend® ETF, Global X SuperDividend® U.S. ETF, Global X SuperIncome™ Preferred ETF, Global X Social Media ETF and Global X Guru® Index ETF, respectively and the value of securities purchased with the cash collateral held from securities on loan was $47,215,366, $7,694,259, $11,828,524, $12,861,023 and $2,042,027 for the Global X SuperDividend® ETF, Global X SuperDividend® U.S. ETF, Global X SuperIncome™ Preferred ETF, Global X Social Media ETF and Global X Guru® Index ETF, respectively.
As of October 31, 2017, the following Funds had securities on loan, by counterparty:
| | | Market Value | | | Cash Collateral | |
| Global X Super Dividend® ETF | | | | | | | | |
| Barclays Bank | | $ | 3,964,774 | | | $ | 4,172,116 | |
| BNP Prime Brokerage | | | 613,107 | | | | 639,678 | |
| Citigroup | | | 378,189 | | | | 395,850 | |
| Credit Suisse | | | 1,956,265 | | | | 2,065,813 | |
| Deutsche Bank | | | 279,863 | | | | 295,000 | |
| Goldman Sachs & Co. | | | 14,673,933 | | | | 15,387,376 | |
| JPMorgan | | | 6,381,119 | | | | 6,656,439 | |
| Merrill Lynch Pierce Fenner & Smith | | | 3,067,192 | | | | 3,224,310 | |
| Morgan Stanley | | | 3,188,137 | | | | 3,355,000 | |
| National Financial Services | | | 3,294,000 | | | | 3,360,000 | |
| Scotia Capital | | | 664,126 | | | | 699,484 | |
| SG Americas Securties | | | 6,636,241 | | | | 6,964,300 | |
| Global X Super Dividend® U.S. ETF | | | | | | | | |
| Barclays Bank | | | 140,610 | | | | 141,900 | |
| Citigroup | | | 3,265,860 | | | | 3,399,370 | |
| Credit Suisse | | | 1,906,500 | | | | 1,936,450 | |
| Deutsche Bank | | | 2,194,064 | | | | 2,216,539 | |
| Global X SuperIncome™ Preferred ETF | | | | | | | | |
| Credit Suisse | | | 4,738,690 | | | | 4,852,117 | |
| Deutsche Bank | | | 509,465 | | | | 523,800 | |
| Goldman Sachs & Co. | | | 208,650 | | | | 212,550 | |
| JPMorgan | | | 5,453,784 | | | | 5,582,457 | |
| Merrill Lynch Pierce Fenner & Smith | | | 57,706 | | | | 59,400 | |
| National Financial Services | | | 584,886 | | | | 598,200 | |
| Global X Social Media ETF | | | | | | | | |
| Barclays Bank | | | 1,776,970 | | | | 1,849,285 | |
| BNP Prime Brokerage | | | 743,990 | | | | 776,000 | |
| Credit Suisse | | | 136,434 | | | | 135,817 | (1) |
| Deutsche Bank | | | 7,006,157 | | | | 6.995,921 | (1) |
| JPMorgan | | | 2,106,182 | | | | 2,196,800 | |
| Merrill Lynch Pierce Fenner & Smith | | | 898,464 | | | | 907,200 | |
Notes to Financial Statements (Concluded)
October 31, 2017
7. LOANS OF PORTFOLIO SECURITIES (concluded)
| | | Market Value | | | Cash Collateral | |
| Global X Guru® Index ETF | | | | | | | | |
| Barclays Bank | | | 642,542 | | | | 654,752 | |
| Credit Suisse | | | 209,224 | | | | 215,183 | |
| Goldman Sachs & Co. | | | 113,940 | | | | 114,000 | |
| JPMorgan | | | 824,663 | | | | 822,205 | (1) |
| Merrill Lynch Pierce Fenner & Smith | | | 235,964 | | | | 235,887 | (1) |
(1) It is the Funds' policy to obtain additional collateral from or return excess collateral to the borrower by the end of the next business day, following the valuation date of the securities loaned. Therefore, the value of the collateral held may be temporarily less than the value of the securities on loan.
8. CONTRACTUAL OBLIGATIONS
The Funds enter into contracts in the normal course of business that contain a variety of indemnifications. The Funds’ maximum exposure under these contracts is unknown; however the Funds have not had prior gains or losses pursuant to these contracts. Management has reviewed the Funds’ existing contracts and expects the risk of loss to be remote.
Pursuant to the Trust’s organizational documents, the Trustees of the Trust and the Trust’s officers are indemnified against certain liabilities that may arise out of the performance of their duties.
9. REGULATORY MATTERS
In October 2016, the U.S. Securities and Exchange Commission adopted new rules and amended existing rules (together, final rules) intended to modernize the reporting and disclosure of information by registered investment companies. In part, the final rules amended Regulation S-X and require standardized, enhanced disclosures about derivatives in investment company financial statements, as well as other amendments. As of August 1, 2017, management has implemented the amendments to Regulation S-X, which did not have a material impact on the Fund’s financial statements and related disclosures or impact the Fund’s net assets or results of operations.
10. SUBSEQUENT EVENTS
The Funds have been evaluated regarding the need for additional disclosures and/or adjustments resulting from subsequent events. Based on this evaluation, please note the additional disclosure:
On November 1, 2017, the Trust entered into an agreement with BBH in which BBH will serve as the new securities lending agent for the Trust and each of its series.
Report of Independent Registered Public Accounting Firm
October 31, 2017
To the Board of Trustees and Shareholders of Global X SuperDividend® ETF, Global X SuperDividend® U.S. ETF, Global X MSCI SuperDividend® EAFE ETF, Global X MSCI SuperDividend® Emerging Markets ETF, Global X SuperDividend® REIT ETF, Global X SuperIncome™ Preferred ETF, Global X Social Media ETF, Global X | JPMorgan Efficiente Index ETF, Global X | JPMorgan US Sector Rotator Index ETF, Global X Guru® Index ETF, Global X Scientific Beta US ETF, Global X Scientific Beta Europe ETF, Global X Scientific Beta Japan ETF, Global X Scientific Beta Asia ex-Japan ETF, Global X YieldCo Index ETF and Global X S&P 500® Catholic Values ETF
In our opinion, the accompanying statements of assets and liabilities, including the schedules of investments, and the related statements of operations and of changes in net assets and the financial highlights present fairly, in all material respects, the financial position of Global X SuperDividend® ETF, Global X SuperDividend® U.S. ETF, Global X MSCI SuperDividend® EAFE ETF, Global X MSCI SuperDividend® Emerging Markets ETF, Global X SuperDividend® REIT ETF, Global X SuperIncome™ Preferred ETF, Global X Social Media ETF, Global X | JPMorgan Efficiente Index ETF, Global X | JPMorgan US Sector Rotator Index ETF, Global X Guru® Index ETF, Global X Scientific Beta US ETF, Global X Scientific Beta Europe ETF, Global X Scientific Beta Japan ETF, Global X Scientific Beta Asia ex-Japan ETF, Global X YieldCo Index ETF and Global X S&P 500® Catholic Values ETF (sixteen series of Global X Funds, hereafter referred to as the "Funds") as of October 31, 2017, the results of operations for the year then ended, and the changes in net assets and the financial highlights for each of the two years in the period then ended for Global X SuperDividend® ETF, Global X SuperDividend® U.S. ETF, Global X MSCI SuperDividend® Emerging Markets ETF, Global X SuperDividend® REIT ETF, Global X SuperIncome™ Preferred ETF, Global X Social Media ETF, Global X | JPMorgan Efficiente Index ETF, Global X | JPMorgan US Sector Rotator Index ETF, Global X Guru® Index ETF, Global X Scientific Beta US ETF, Global X Scientific Beta Europe ETF, Global X Scientific Beta Japan ETF, Global X Scientific Beta Asia ex-Japan ETF and Global X YieldCo Index ETF, the results of operations, the changes in net assets and the financial highlights for the period November 14, 2016 (commencement of operations) through October 31, 2017 for Global X MSCI SuperDividend® EAFE ETF, the results of operations for the year then ended, and the changes in net assets and the financial highlights for the year then ended and for the period April 18, 2016 (commencement of operations) through October 31, 2016 for Global X S&P 500® Catholic Values ETF, in conformity with accounting principles generally accepted in the United States of America. These financial statements and financial highlights (hereafter referred to as "financial statements") are the responsibility of the Funds’ management. Our responsibility is to express an opinion on these financial statements based on our audits. We conducted our audits of these financial statements in accordance with the standards of the Public Company Accounting Oversight Board (United States). Those standards require that we plan and perform the audit to obtain reasonable assurance about whether the financial statements are free of material misstatement. An audit includes examining, on a test basis, evidence supporting the amounts and disclosures in the financial statements, assessing the accounting principles used and significant estimates made by management, and evaluating the overall financial statement presentation. We believe that our audits, which included confirmation of securities as of October 31, 2017 by correspondence with the custodian and brokers and the application of alternative auditing procedures where confirmations of securities purchased had not been received, provide a reasonable basis for the opinions expressed above.
The financial statements, as of and for the year or period ended October 31, 2015 and the financial highlights for each of the years or periods ended on or prior to October 31, 2015 (not presented herein, other than the financial highlights) were audited by other auditors whose report dated December 30, 2015 expressed an unqualified opinion on those financial statements and financial highlights.
PricewaterhouseCoopers LLP
Philadelphia, Pennsylvania
December 21, 2017
Disclosure of Fund Expenses (unaudited)
All ETFs (such as the Funds) have operating expenses. As a shareholder of an ETF, your investment is affected by these ongoing costs, which include (among others) costs for ETF management, administrative services, commissions, and shareholder reports like this one. It is important for you to understand the impact of these costs on your investment returns. In addition, a shareholder is responsible for brokerage fees as a result of their investment in a Fund.
Operating expenses such as these are deducted from the Funds’ gross income and directly reduce its final investment return. These expenses are expressed as a percentage of the Funds’ average net assets; this percentage is known as the Funds’ expense ratio.
The following examples use the expense ratio and are intended to help you understand the ongoing costs (in dollars) of investing in a Fund and to compare these costs with those of other funds. The examples are based on an investment of $1,000 made at the beginning of the period shown and held for the entire period (May 1, 2017 through October 31, 2017).
The table on the next page illustrates the Funds’ costs in two ways:
Actual Fund Return. This section helps you to estimate the actual expenses that your Fund incurred over the period. The “Expenses Paid During Period” column shows the actual dollar expense cost incurred by a $1,000 investment in the Fund, and the “Ending Account Value” number is derived from deducting that expense cost from the Fund’s gross investment return.
You can use this information, together with the actual amount you invested in the Fund, to estimate the expenses you paid over that period. Simply divide your actual account value by $1,000 to arrive at a ratio (for example, an $8,600 account value divided by $1,000 = 8.6), then multiply that ratio by the number shown for your Fund under “Expenses Paid During Period.”
Hypothetical 5% Return. This section helps you compare your Fund’s costs with those of other funds. It assumes that the Fund had an annual 5% return before expenses during the year, but that the expense ratio (Column 3) for the period is unchanged. This example is useful in making comparisons because the Securities and Exchange Commission requires all funds to make this 5% calculation. You can assess your Fund’s comparative cost by comparing the hypothetical result for your Fund in the “Expenses Paid During Period” column with those that appear in the same charts in the shareholder reports for other funds.
NOTE: Because the return is set at 5% for comparison purposes — NOT your Fund’s actual return — the account values shown may not apply to your specific investment.
Disclosure of Fund Expenses (unaudited) (continued)
| | | Beginning
Account
Value
5/1/2017 | | | Ending
Account
Value
10/31/2017 | | | Annualized
Expense
Ratios | | | Expenses
Paid
During
Period(1) | |
| Global X SuperDividend® ETF |
| Actual Fund Return | | $ | 1,000.00 | | | $ | 1,029.40 | | | | 0.58 | % | | $ | 2.97 | |
| Hypothetical 5% Return | | | 1,000.00 | | | | 1,022.28 | | | | 0.58 | | | | 2.96 | |
| Global X SuperDividend® U.S. ETF |
| Actual Fund Return | | $ | 1,000.00 | | | $ | 1,015.10 | | | | 0.45 | % | | $ | 2.29 | |
| Hypothetical 5% Return | | | 1,000.00 | | | | 1,022.94 | | | | 0.45 | | | | 2.29 | |
| Global X MSCI SuperDividend® EAFE ETF |
| Actual Fund Return | | $ | 1,000.00 | | | $ | 1,105.50 | | | | 0.56 | % | | $ | 2.97 | |
| Hypothetical 5% Return | | | 1,000.00 | | | | 1,022.38 | | | | 0.56 | | | | 2.85 | |
| Global X MSCI SuperDividend® Emerging Markets ETF |
| Actual Fund Return | | $ | 1,000.00 | | | $ | 1,035.80 | | | | 0.65 | % | | $ | 3.34 | |
| Hypothetical 5% Return | | | 1,000.00 | | | | 1,021.93 | | | | 0.65 | | | | 3.31 | |
| Global X SuperDividend® REIT ETF |
| Actual Fund Return | | $ | 1,000.00 | | | $ | 1,041.80 | | | | 0.58 | % | | $ | 2.98 | |
| Hypothetical 5% Return | | | 1,000.00 | | | | 1,022.28 | | | | 0.58 | | | | 2.96 | |
| Global X SuperIncome™ Preferred ETF |
| Actual Fund Return | | $ | 1,000.00 | | | $ | 992.00 | | | | 0.58 | % | | $ | 2.91 | |
| Hypothetical 5% Return | | | 1,000.00 | | | | 1,022.28 | | | | 0.58 | | | | 2.96 | |
| Global X Social Media ETF |
| Actual Fund Return | | $ | 1,000.00 | | | $ | 1,230.50 | | | | 0.65 | % | | $ | 3.65 | |
| Hypothetical 5% Return | | | 1,000.00 | | | | 1,021.93 | | | | 0.65 | | | | 3.31 | |
| Global X | JPMorgan Efficiente Index ETF |
| Actual Fund Return | | $ | 1,000.00 | | | $ | 1,046.40 | | | | 0.84 | % | | $ | 4.33 | |
| Hypothetical 5% Return | | | 1,000.00 | | | | 1,020.97 | | | | 0.84 | | | | 4.28 | |
| Global X | JPMorgan US Sector Rotator Index ETF |
| Actual Fund Return | | $ | 1,000.00 | | | $ | 1,016.70 | | | | 0.69 | % | | $ | 3.51 | |
| Hypothetical 5% Return | | | 1,000.00 | | | | 1,021.73 | | | | 0.69 | | | | 3.52 | |
| Global X Guru® Index ETF |
| Actual Fund Return | | $ | 1,000.00 | | | $ | 1,089.20 | | | | 0.75 | % | | $ | 3.95 | |
| Hypothetical 5% Return | | | 1,000.00 | | | | 1,021.42 | | | | 0.75 | | | | 3.82 | |
| Global X Scientific Beta US ETF |
| Actual Fund Return | | $ | 1,000.00 | | | $ | 1,072.50 | | | | 0.19 | % | | $ | 0.99 | |
| Hypothetical 5% Return | | | 1,000.00 | | | | 1,024.25 | | | | 0.19 | | | | 0.97 | |
| Global X Scientific Beta Europe ETF |
| Actual Fund Return | | $ | 1,000.00 | | | $ | 1,124.60 | | | | 0.38 | % | | $ | 2.03 | |
| Hypothetical 5% Return | | | 1,000.00 | | | | 1,023.29 | | | | 0.38 | | | | 1.94 | |
| Global X Scientific Beta Japan ETF |
| Actual Fund Return | | $ | 1,000.00 | | | $ | 1,127.60 | | | | 0.39 | % | | $ | 2.09 | |
| Hypothetical 5% Return | | | 1,000.00 | | | | 1,023.24 | | | | 0.39 | | | | 1.99 | |
| Global X Scientific Beta Asia ex-Japan ETF |
| Actual Fund Return | | $ | 1,000.00 | | | $ | 1,093.10 | | | | 0.38 | % | | $ | 2.00 | |
| Hypothetical 5% Return | | | 1,000.00 | | | | 1,023.29 | | | | 0.38 | | | | 1.94 | |
| Global X YieldCo Index ETF |
| Actual Fund Return | | $ | 1,000.00 | | | $ | 1,093.60 | | | | 0.65 | % | | $ | 3.43 | |
| Hypothetical 5% Return | | | 1,000.00 | | | | 1,021.93 | | | | 0.65 | | | | 3.31 | |
| Global X S&P 500® Catholic Values ETF |
| Actual Fund Return | | $ | 1,000.00 | | | $ | 1,093.40 | | | | 0.29 | % | | $ | 1.53 | |
| Hypothetical 5% Return | | | 1,000.00 | | | | 1,023.74 | | | | 0.29 | | | | 1.48 | |
| (1) | Expenses are equal to the Fund’s annualized expense ratio multiplied by the average account value over the period, multiplied 184/365 (to reflect the one-half year period), unless otherwise noted. |
Supplemental Information (unaudited)
NAV is the price per Share at which the Funds issue and redeem Shares. It is calculated in accordance with the standard formula for valuing mutual fund shares. The “Market Price” of the Funds generally is determined using the midpoint between the highest bid and the lowest offer on the stock exchange on which the Shares of the Funds are listed for trading, as of the time that the Funds’ NAV is calculated. The Funds’ Market Price may be at, above or below their NAV. The NAV of the Funds will fluctuate with changes in the market value of the Funds’ holdings. The Market Price of the Funds will fluctuate in accordance with changes in its NAV, as well as market supply and demand.
Premiums or discounts are the differences (expressed as a percentage) between the NAV and Market Price of the Funds on a given day, generally at the time NAV is calculated. A premium is the amount that the Funds are trading above the reported NAV, expressed as a percentage of the NAV. A discount is the amount that the Funds are trading below the reported NAV, expressed as a percentage of the NAV.
Further information regarding premiums and discounts is available on the Funds’ website at www.GlobalXFunds.com
Trustees and Officers of the Trust (unaudited)
Set forth below are the names, addresses, years of birth, position with the Trust, Term of Office and Length of Time Served, the principal occupations for the last five years, number of Funds in fund complex overseen by Trustee, and other directorships outside the fund complex of each of the persons currently serving as Trustees and Officers of the Trust.
Name,
Address (Year of
Birth) | Position(s)
Held with Trust | Principal Occupation(s) During the Past 5 Years | Number of
Funds in
Trust
Overseen
by Trustee | Other Directorships Held by Trustees |
| Independent Trustees2 | |
Sanjay Ram Bharwani 600 Lexington Avenue, 20th Floor New York, NY 10022 (1974) | Trustee (since 2008) | CEO of Risk Advisors Inc. (consulting firm) (since 2007). | 523 | None. |
Scott R. Chichester1 600 Lexington Avenue, 20th Floor New York, NY 10022 (1970) | Trustee (since 2008) | CFO, AdeptPros Inc. (app development, training and consulting) (since 2012); Founder, Madison Park Advisors LLC (advisory services) (since 2011); CFO, Sterling Seal & Supply Inc. (since 2011); President & Treasurer, Bayview Acquisition Corp (2010-2012); Founder and President, DirectPay USA LLC (payroll company) (since 2006); Proprietor, Scott R. Chichester CPA (CPA firm) (since 2001). | 523 | Director of AdeptPros Inc. (since 2015); Director of Sterling Seal & Supply Inc. (since 2011);Director of Bayview Acquisition Corp. (2010-2012); Trustee of ARK ETF Trust (since 2014). |
Kartik Kiran Shah 600 Lexington Avenue, 20th Floor New York, NY 10022 (1977) | Trustee (since 2008) | Chief Business Officer, Oxeia Biopharmaceuticals, Inc. (since 2014); Vice President, Business Development, Cynvenio Biosystems (2012-2014); Independent Consultant, Self-Employed (non-financial services) (2011-2012). | 523 | Director of Oxeia Biopharmaceuticals, Inc. (since 2014). |
Trustees and Officers of the Trust (unaudited)(concluded)
The Trust’s Statement of Additional Information (“SAI”) includes additional information about the Trustees and Officers. The SAI may be obtained without charge by calling 1-888-493-8631. The following chart lists Trustees and Officers as of October 31, 2017.
Name, Address (Year of Birth) | Position(s) Held with Funds | Principal Occupation(s) During the Past 5 Years | Other
Directorships Held by Trustees
During the Past 5 Years |
| Interested Trustee / Officers2 |
Bruno del Ama 600 Lexington Avenue, 20th floor New York, NY 10022 (1976) | Trustee (since 2008); President, Chief Executive Officer (since 2008). | Chief Executive Officer, Global X Management Company ("GXMC") (since 2008); Chief Compliance Officer, GXMC (2008-2013). | None. |
Luis Berruga 600 Lexington Avenue, 20th Floor New York, NY 10022 (1977) | Chief Operating Officer, Treasurer, Principal Accounting Officer and Chief Financial Officer (since 9/2015). | Chief Financial Officer, GXMC (since 9/2015) and Chief Operating Officer (since 2/2014); Investment Banker, Jefferies (2012-2014); Regional Product Specialist, Morgan Stanley (2005-2012). | None. |
Daphne Tippens Chisolm 600 Lexington Avenue, 20th Floor New York, NY 10022 (1969) | Secretary (since 2012). | General Counsel, GXMC (since 2011); Chief Compliance Officer, GXMC (1/2014 - 5/2014 and 2/2015 - 9/2016). | None. |
Joe Costello 600 Lexington Avenue, 20th Floor New York, NY 10022 (1974) | Chief Compliance Officer (since 9/2016). | Chief Compliance Officer, FlexShares Funds (2011-2015); Vice President, Northern Trust Investments (2003 - 2015). | None. |
Lisa K. Whittaker4 One Freedom Valley Drive Oaks, PA 19456 (1978) | Assistant Secretary (since 2013). | Counsel at SEI Investments (since 2012); Associate Counsel and Compliance Officer at The Glendale Trust Company (2011-2012); Associate of Drinker Biddle & Reath LLP (2006-2011). | None. |
Eric Kleinschmidt4 One Freedom Valley Drive Oaks, PA 19456 (1968) | Assistant Treasurer (since 2016). | Director, Fund Accounting, SEI Investments Global Funds Services (2004 to present). | None. |
| 1 | Mr. Chichester is currently married to a sister of Mr. del Ama’s wife. While an “immediate family member” (as defined in Section 2(a)(19) of the 1940 Act) of Mr. del Ama would be considered an Interested Person, Mr. Chichester is not considered an immediate family member for this purpose. Although this fact was taken into consideration in determining whether Mr. Chichester should be considered to be an Independent Trustee for purposes of the Section 2(a)(19) of the 1940 Act, it was determined that this relationship was not one that should disqualify Mr. Chichester from serving as an Independent Trustee of the Trust. |
| 2 | Each Trustee serves until his or her successor is duly elected or appointed and qualified. |
| 3 | As of October 31, 2017, the Trust had ninety-six investment portfolios, fifty-two of which were operational. |
| 4 | These officers of the Trust also serve as officers of one or more mutual funds for which SEI Investments Company or an affiliate acts as investment manager, administrator or distributor. |
NOTICE TO SHAREHOLDERS (unaudited)
For shareholders that do not have an October 31, 2017 tax year end, this notice is for informational purposes only. For shareholders with an October 31, 2017 tax year end, please consult your tax advisor as to the pertinence of this notice. For the fiscal year ended October 31, 2017, the Funds are designating the following items with regard to distributions paid during the year.
| | | Return of
Capital | | | Long-Term
Capital Gain
Distributions | | | Ordinary
Income
Distributions | | | Total
Distributions | | | Qualifying
for
Corporate
Dividends
Received
Deduction
(1) | | | Qualifying
Dividend
Income (2) | | | U.S.
Government
Interest (3) | | | Interest
Related
Dividends
(4) | | | Short
Term
Capital
Gain
Dividends
(5) | | | Foreign
Tax
Credit | |
| Global X SuperDividend® ETF | | | 15.74 | % | | | 0.00 | % | | | 84.26 | % | | | 100.00 | % | | | 10.11 | % | | | 44.12 | % | | | 0.00 | % | | | 0.01 | % | | | 0.00 | % | | | 0.00 | % |
| Global X SuperDividend® U.S. ETF | | | 38.15 | % | | | 0.00 | % | | | 61.85 | % | | | 100.00 | % | | | 12.66 | % | | | 12.66 | % | | | 0.00 | % | | | 2.99 | % | | | 0.00 | % | | | 0.00 | % |
| Global X MSCI SuperDividend® EAFE ETF | | | 0.00 | % | | | 0.18 | % | | | 99.82 | % | | | 100.00 | % | | | 0.00 | % | | | 78.74 | % | | | 0.00 | % | | | 0.00 | % | | | 0.00 | % | | | 6.55 | % |
| Global X MSCI SuperDividend® Emerging Markets ETF | | | 0.00 | % | | | 0.00 | % | | | 100.00 | % | | | 100.00 | % | | | 0.05 | % | | | 59.93 | % | | | 0.00 | % | | | 0.00 | % | | | 0.00 | % | | | 14.90 | % |
| Global X SuperDividend® REIT ETF | | | 0.00 | % | | | 0.00 | % | | | 100.00 | % | | | 100.00 | % | | | 0.00 | % | | | 0.00 | % | | | 0.00 | % | | | 0.00 | % | | | 0.00 | % | | | 0.00 | % |
| Global X SuperIncome™ Preferred ETF | | | 4.41 | % | | | 0.00 | % | | | 95.59 | % | | | 100.00 | % | | | 9.88 | % | | | 14.56 | % | | | 0.00 | % | | | 19.10 | % | | | 0.00 | % | | | 0.00 | % |
| Global X Social Media ETF | | | 0.00 | % | | | 0.00 | % | | | 100.00 | % | | | 100.00 | % | | | 0.00 | % | | | 0.00 | % | | | 0.00 | % | | | 0.02 | % | | | 0.00 | % | | | 0.00 | % |
| Global X | JPMorgan Efficiente Index ETF | | | 0.00 | % | | | 0.00 | % | | | 100.00 | % | | | 100.00 | % | | | 6.38 | % | | | 16.91 | % | | | 0.00 | % | | | 0.02 | % | | | 0.00 | % | | | 0.00 | % |
| Global X | JPMorgan US Sector Rotator Index ETF | | | 0.00 | % | | | 0.00 | % | | | 100.00 | % | | | 100.00 | % | | | 46.14 | % | | | 39.90 | % | | | 0.00 | % | | | 0.06 | % | | | 0.00 | % | | | 0.00 | % |
| Global X Guru® Index ETF | | | 0.00 | % | | | 0.00 | % | | | 100.00 | % | | | 100.00 | % | | | 100.00 | % | | | 100.00 | % | | | 0.00 | % | | | 0.69 | % | | | 0.00 | % | | | 0.00 | % |
| Global X Scientific Beta US ETF | | | 0.00 | % | | | 0.00 | % | | | 100.00 | % | | | 100.00 | % | | | 90.90 | % | | | 91.83 | % | | | 0.00 | % | | | 0.00 | % | | | 0.00 | % | | | 0.00 | % |
| Global X Scientific Beta Europe ETF | | | 0.00 | % | | | 0.00 | % | | | 100.00 | % | | | 100.00 | % | | | 0.24 | % | | | 91.66 | % | | | 0.00 | % | | | 0.00 | % | | | 0.00 | % | | | 7.91 | % |
| Global X Scientific Beta Japan ETF | | | 0.00 | % | | | 0.00 | % | | | 100.00 | % | | | 100.00 | % | | | 0.00 | % | | | 61.32 | % | | | 0.00 | % | | | 0.00 | % | | | 0.00 | % | | | 9.70 | % |
| Global X Scientific Beta Asia ex-Japan ETF | | | 0.00 | % | | | 0.00 | % | | | 100.00 | % | | | 100.00 | % | | | 0.15 | % | | | 32.71 | % | | | 0.00 | % | | | 0.00 | % | | | 0.00 | % | | | 3.19 | % |
| Global X YieldCo Index ETF | | | 0.00 | % | | | 0.00 | % | | | 100.00 | % | | | 100.00 | % | | | 25.53 | % | | | 68.39 | % | | | 0.00 | % | | | 0.68 | % | | | 0.00 | % | | | 0.00 | % |
| Global X S&P 500® Catholic Values ETF | | | 0.00 | % | | | 0.00 | % | | | 100.00 | % | | | 100.00 | % | | | 91.26 | % | | | 91.66 | % | | | 0.00 | % | | | 0.00 | % | | | 100.00 | % | | | 0.00 | % |
| (1) | Qualifying dividends represent dividends which qualify for the corporate dividends received deduction and is reflected as a percentage of ordinary Income distributions (the total of short term capital gain and net investment income distributions). |
| (2) | The percentage in this column represents the amount of "Qualifying Dividend Income" as created by the Jobs and Growth Relief Reconciliation Act of 2003 and its reflected as a percentage of ordinary income distributions (the total of short term capital gain and net investment income distributions). It is the intention of each of the aforementioned funds to designate the maximum amount permitted by law. |
| (3) | "U.S. Government Interest" represents the amount of interest that was derived from U.S. Government obligations and distributed during the fiscal year. Generally, interest from direct U.S. Government obligations is exempt from state income tax. However, for shareholders who are residents of California, Connecticut and New York, the statutory threshold requirements were not satisfied to permit exemption of these amounts from state income. |
| (4) | The percentage in this column represents the amount of "Qualifying Interest Income" as created by the American Jobs Creation Act of 2004 and is a percentage of net investment income that is exempt from U.S. withholding tax when paid for foreign investors. |
| (5) | The percentage of this column represents the amount of “Short Term Capital Gain Dividend” is reflected as a percentage of short term capital gain distribution that is exempted from U.S. withholding tax when paid to foreign investors. |
NOTICE TO SHAREHOLDERS (unaudited)
The Funds intend to pass through a foreign tax credit to shareholders. For the fiscal year ended October 31, 2017, the total amount of foreign source income and foreign tax credit are as follows:
| | | Foreign | | | Foreign Tax | |
| | | Source | | | Credit Pass | |
| | | Income | | | through | |
| Global X MSCI SuperDividend® EAFE ETF | | | 95,617 | | | | 4,123 | |
| Global X MSCI SuperDividend® Emerging Markets ETF | | | 623,018 | | | | 71,966 | |
| Global X Scientific Beta Europe ETF | | | 522,113 | | | | 32,094 | |
| Global X Scientific Beta Japan ETF | | | 369,501 | | | | 39,982 | |
| Global X Scientific Beta Asia ex-Japan ETF | | | 129,925 | | | | 3,353 | |
The information reported herein may differ from the information and distributions taxable to the shareholders for the calendar year ending December 31, 2017. Complete information will be computed and reported in conjunction with your 2017 Form 1099-DIV.
NOTES
NOTES
600 Lexington Avenue, 20th Floor
New York, NY 10022
1-888-GXFund-1
(1-888-493-8631)
www.globalxfunds.com
Investment Adviser and Administrator:
Global X Management Company LLC
600 Lexington Avenue, 20th Floor
New York, NY 10022
Distributor:
SEI Investments Distribution Co.
One Freedom Valley Drive
Oaks, PA 19456
Sub-Administrator:
SEI Investments Global Funds Services
One Freedom Valley Drive
Oaks, PA 19456
Counsel for Global X Funds and the Independent Trustees:
Stradley Ronon Stevens & Young, LLP
1250 Connecticut Avenue, N.W.
Suite 500
Washington, DC 2006
Custodian and Transfer Agent:
Brown Brothers Harriman & Co.
50 Post Office Square
Boston, MA 02110
Independent Registered Public Accounting Firm:
PricewaterhouseCoopers LLP
Two Commerce Square
Suite 1800
Philadelphia, PA 19103
This information must be preceded or accompanied by a current prospectus for the Funds described.
GLX-AR-003-0700
The registrant has adopted a code of ethics that applies to the registrant’s principal executive officer, principal financial officer, comptroller or principal accounting officer, and any person who performs a similar function.
| Item 3. | Audit Committee Financial Expert. |
(a)(1) The registrant’s board of trustees has determined that the registrant has at least one audit committee financial expert serving on the audit committee.
(a)(2) The audit committee financial expert is Scott Chichester and is independent as defined in Form N-CSR Item 3(a)(2).
| Item 4. | Principal Accountant Fees and Services. |
Fees billed by Pricewaterhouse Coopers LLP in 2017 and 2016 related to the registrant.
In 2017 and 2016, Pricewaterhouse Coopers LLP billed the registrant aggregate fees for services rendered to the registrant for the last two fiscal years as follows:
| | 2017 | 2016 |
| | | All fees and services to the Trust that were pre-approved | All fees and services to service affiliates that were pre-approved | All other fees and services to service affiliates that did not require pre-approval | All fees and services to the Trust that were pre-approved | All fees and services to service affiliates that were pre-approved | All other fees and services to service affiliates that did not require pre-approval |
| (a) | Audit Fees | $570,650 | $0 | $0 | $532,690 | $0 | $0 |
| (b) | Audit-Related Fees | $0 | $0 | $0 | $0 | $0 | $0 |
| (c) | Tax Fees | $182,990 | $0 | $0 | $201,260 | $0 | $0 |
| (d) | All Other Fees | $0 | $0 | $0 | $0 | $0 | $0 |
(e)(1) Not applicable.
(e)(2) Percentage of fees billed applicable to non-audit services pursuant to waiver of pre-approval requirement were as follows for Pricewaterhouse Coopers LLP in 2017 and 2016:
| | 2017 | 2016 |
Audit-Related Fees | 0% | 0% |
| Tax Fees | 0% | 0% |
All Other Fees | 0% | 0% |
(f) Not applicable.
(g) The aggregate non-audit fees and services billed by Pricewaterhouse Coopers LLP in 2017 and 2016 for the last two fiscal years were $0 and $0, respectively.
(h) During the past fiscal year, all non-audit services provided by registrant’s principal accountant to either registrant’s investment adviser or to any entity controlling, controlled by, or under common control with registrant’s investment adviser that provides ongoing services to registrant were pre-approved by the audit committee of registrant’s Board of Trustees. Included in the audit committee’s pre-approval was the review and consideration as to whether the provision of these non-audit services is compatible with maintaining the principal accountant’s independence.
| Item 5. | Audit Committee of Listed Registrants. |
The Registrant has a separately-designated standing Audit Committee, which is composed of the Registrant's Independent Trustees, Scott R. Chichester, Sanjay Ram Bharwani and Kartik Kiran Shah.
| Item 6. | Schedule of Investments. |
Not applicable.
| Item 7. | Disclosure of Proxy Voting Policies and Procedures for Closed-End Management Investment Companies. |
Not applicable to open-end management investment companies.
| Item 8. | Portfolio Managers of Closed-End Management Investment Companies. |
Not applicable to open-end management investment companies. Effective for closed-end management investment companies for fiscal years ending on or after December 31, 2005.
| Item 9. | Purchases of Equity Securities by Closed-End Management Company and Affiliated Purchasers. |
Not applicable to open-end management investment companies.
| Item 10. | Submission of Matters to a Vote of Security Holders. |
There have been no material changes.
| Item 11. | Controls and Procedures. |
(a) The certifying officers, whose certifications are included herewith, have evaluated the registrant’s disclosure controls and procedures within 90 days of the filing date of this report. In their opinion, based on their evaluation, the registrant’s disclosure controls and procedures are adequately designed, and are operating effectively to ensure, that information required to be disclosed by the registrant in the reports it files or submits under the Securities Exchange Act of 1934 is recorded, processed, summarized and reported within the time periods specified in the Securities and Exchange Commission’s rules and forms.
(b) There were no significant changes in the registrant’s internal control over financial reporting that occurred during the last fiscal quarter of the period covered by this report that has materially affected, or is reasonably likely to materially affect, the registrants internal control over financial reporting.
(a)(1) Code of Ethics attached hereto.
(a)(2) A separate certification for the principal executive officer and the principal financial officer of the registrant as required by Rule 30a-2(a) under the Investment Company Act of 1940, as amended (17 CFR 270.30a-2(a)), are filed herewith.
(b) Officer certifications as required by Rule 30a-2(b) under the Investment Company Act of 1940, as amended (17 CFR 270.30a-2(b)) also accompany this filing as an Exhibit.
SIGNATURES
Pursuant to the requirements of the Securities Exchange Act of 1934 and the Investment Company Act of 1940, the registrant has duly caused this report to be signed on its behalf by the undersigned, thereunto duly authorized.
| (Registrant) | Global X Funds | |
| | | |
| | | |
| By (Signature and Title)* | /s/ Bruno del Ama | |
| | Bruno del Ama | |
| | President | |
Date: December 29, 2017
Pursuant to the requirements of the Securities Exchange Act of 1934 and the Investment Company Act of 1940, this report has been signed below by the following persons on behalf of the registrant and in the capacities and on the dates indicated.
| By (Signature and Title)* | /s/ Bruno del Ama | |
| | Bruno del Ama | |
| | President | |
| | | |
| Date: December 29, 2017 | | |
| | | |
| | | |
| By (Signature and Title)* | /s/ Luis Berruga | |
| Luis Berruga | |
| | Chief Financial Officer | |
Date: December 29, 2017
| * | Print the name and title of each signing officer under his or her signature. |