Annual Report
October 31, 2018
| Management Discussion of Fund Performance | 1 |
| Schedule of Investments | |
| Global X China Consumer ETF | 33 |
| Global X China Energy ETF | 36 |
| Global X China Financials ETF | 38 |
| Global X China Industrials ETF | 40 |
| Global X China Materials ETF | 43 |
| Global X NASDAQ China Technology ETF | 45 |
| Global X FTSE Southeast Asia ETF | 48 |
| Global X MSCI Colombia ETF | 51 |
| Global X MSCI Argentina ETF | 53 |
| Global X MSCI Greece ETF | 56 |
| Global X MSCI Norway ETF | 59 |
| Global X FTSE Nordic Region ETF | 63 |
| Global X MSCI Nigeria ETF | 66 |
| Global X Next Emerging & Frontier ETF | 68 |
| Global X MSCI Portugal ETF | 80 |
| Global X MSCI Pakistan ETF | 83 |
| Statements of Assets and Liabilities | 85 |
| Statements of Operations | 89 |
| Statements of Changes in Net Assets | 93 |
| Financial Highlights | 101 |
| Notes to Financial Statements | 104 |
| Report of Independent Registered Public Accounting Firm | 124 |
| Disclosure of Fund Expenses | 126 |
| Approval of Investment Advisory Agreement | 129 |
| Shareholder Voting Results | 134 |
| Supplemental Information | 138 |
| Trustees and Officers of the Trust | 139 |
| Notice to Shareholders | 141 |
Shares are bought and sold at market price (not NAV) and are not individually redeemed from a Fund. Shares may only be redeemed directly from a Fund by Authorized Participants, in very large creation/redemption units. Brokerage commissions will reduce returns.
The Funds file their complete schedules of Fund holdings with the Securities and Exchange Commission (the “Commission”) for the first and third quarters of each fiscal year on Form N-Q within sixty days after the end of the period. The Funds’ Forms N-Q are available on the Commission’s website at http://www.sec.gov, and may be reviewed and copied at the Commission's Public Reference Room in Washington, DC. Information on the operation of the Public Reference Room may be obtained by calling 1-800-SEC-0330.
A description of the policies and procedures that Global X Funds uses to determine how to vote proxies relating to Fund securities, as well as information relating to how the Funds voted proxies relating to Fund securities during the most recent 12-month period ended June 30, is available (i) without charge, upon request, by calling 1-888-GXFund-1; and (ii) on the Commission’s website at http://www.sec.gov.
Management Discussion of Fund Performance (unaudited) |
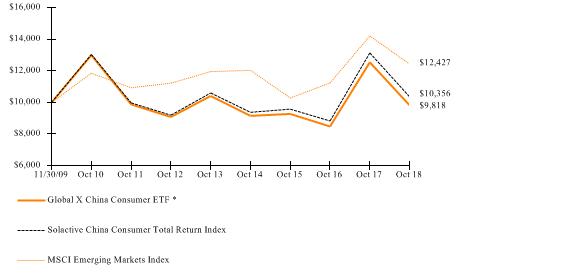
Global X China Consumer ETF
|
Global X China Consumer ETF
The Global X China Consumer ETF (“Fund”) seeks to provide investment results that correspond generally to the price and yield performance, before fees and expenses, of the Solactive China Consumer Total Return Index (“Underlying Index”). The Fund is passively managed, which means the investment adviser does not attempt to take defensive positions in declining markets. The Fund generally seeks to fully replicate the Underlying Index.
The Underlying Index is designed to measure the equity performance of the investable universe of companies in the consumer sector of the Chinese economy, as defined by the index provider. It is comprised of securities of companies that have their main business operations in the consumer sector and generally includes companies whose businesses involve: general retail, diversified consumer services, food production and retail, beverages, household goods, leisure goods, personal goods, automobiles, auto components and distributors, tobacco, media, and travel and leisure.
For the 12-month period ended October 31, 2018 (the “reporting period”), the Fund decreased 21.70%, while the Underlying Index decreased 21.16%. The Fund had a net asset value of $17.44 per share on October 31, 2017 and ended the reporting period with a net asset value of $13.57 on October 31, 2018.
During the reporting period, the highest returns came from Shenzhou International Group Holdings and China Resources Beer Holdings, which returned 31.61% and 21.19%, respectively. The worst performers were Brilliance China Automotive Holdings and Li & Fung, which returned -65.11% and -54.70%, respectively.
China’s policies designed to transform the country from a manufacturing and exports-led economy to one driven more by consumption and services are supporting growth of the country’s consumer sectors. During the first half of 2018, the economy expanded by 6.8%. Over that time, retail sales in China grew by 9.4% year-over-year, accelerated in part by robust growth of the country’s e-commerce industry which is now the largest in the world. Yet despite these growth figures, sentiment around consumer stocks in China began to sour as broader concerns about a trade war-induced slowdown in the domestic economy weighed on the outlook for Chinese consumer stocks. Among the stocks most hurt were those from the automobile industry, which depend on both domestic demand and global supply chains for profitability. In addition, the Chinese yuan (CNY) depreciated approximately 5% against the US dollar during the period, hurting overall fund performance.
| | AVERAGE ANNUAL TOTAL RETURN FOR THE YEAR ENDED OCTOBER 31, 2018 |
| | One Year Return | Three Year Return | Five Year Return | Annualized Inception to Date* |
| | Net Asset Value | Market Price | Net Asset Value | Market Price | Net Asset Value | Market Price | Net Asset Value | Market Price |
| Global X China Consumer ETF | -21.70% | -21.70% | 1.92% | 2.03% | -1.16% | -1.02% | -0.21% | -0.20% |
| Solactive China Consumer Total Return Index | -21.16% | -21.16% | 2.64% | 2.64% | -0.46% | -0.46% | 0.39% | 0.39% |
| MSCI Emerging Markets Index | -12.52% | -12.52% | 6.52% | 6.52% | 0.78% | 0.78% | 2.47% | 2.47% |
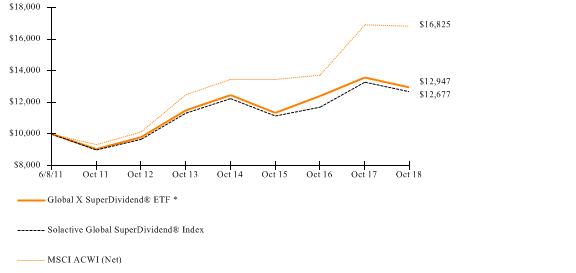
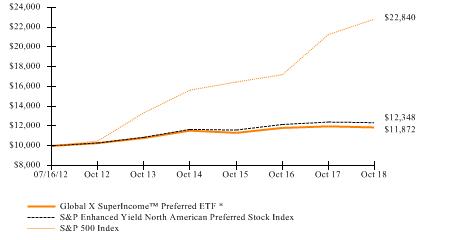
Growth of a $10,000 Investment
(At Net Asset Value)
Management Discussion of Fund Performance (unaudited) |
Global X China Consumer ETF
|
*Fund commenced operations on November 30, 2009.
The MSCI Emerging Markets Index is a free float-adjusted market capitalization index that is designed to measure equity market performance
of emerging markets.
The performance data quoted herein represents past performance and the return and value of an investment in the Fund will fluctuate so that, when redeemed, it may be worth less than its original cost. Past performance is no guarantee of future performance and should not be considered as a representation of the future results of the Fund. The Fund's performance assumes the reinvestment of all dividends and all capital gains. Index returns assume reinvestment of dividends and, unlike the Fund's returns, do not reflect any fees or expenses. If such fees and expenses were included in the index returns, the performance would have been lower. Please note that one cannot invest directly in an unmanaged index.
There are no assurances that the Fund will meet its stated objectives.
The Fund’s holdings and allocations are subject to change and should not be considered recommendations to buy individual securities.
The graph and table do not reflect the deduction of taxes that a shareholder would pay on Fund distributions or the redemption or sale of Fund shares.
See definition of comparative indices above.
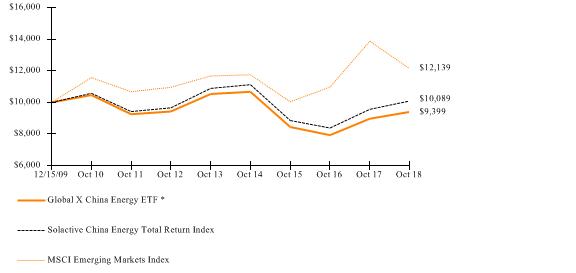
Management Discussion of Fund Performance (unaudited) |
Global X China Energy ETF |
Global X China Energy ETF
The Global X China Energy ETF (“Fund”) seeks to provide investment results that correspond generally to the price and yield performance, before fees and expenses, of the Solactive China Energy Total Return Index (“Underlying Index”). The Fund is passively managed, which means the investment adviser does not attempt to take defensive positions in declining markets. The Fund generally seeks to fully replicate the Underlying Index.
The Underlying Index is designed to measure the equity performance of the investable universe of companies in the energy sector of the Chinese economy, as defined by the index provider. It is comprised of securities of companies that have their main business operations in the energy sector and generally includes companies whose businesses involve: oil, gas, consumable fuels, alternative energy and electricity production and distribution, and energy equipment and services.
For the 12-month period ended October 31, 2018 (the “reporting period”), the Fund increased 4.77%, while the Underlying Index increased 5.50%. The Fund had a net asset value of $ 11.69 per share on October 31, 2017 and ended the reporting period with a net asset value of $11.82 on October 31, 2018.
During the reporting period, the highest returns came from CNOOC and KunLun Energy, which returned 31.82% and 27.08%, respectively. The worst performers were Panda Green Energy Group and JinkoSolar Holding, which returned
-75.12% and -69.73%, respectively.
Despite a broader selloff in Chinese equities, the energy sector delivered positive performance over the reporting period and was among the best performing sectors in the country. In light of higher equity volatility in China and the emerging markets more broadly, many investors shifted towards defensive sectors. China’s energy sector is dominated by State-Owned Enterprises (SOEs), which bulwarks the sector’s defensive status through implicit and explicit support from the government. Also supporting stronger performance in this sector were record crude oil imports, which grew 8.1% from the end of December 2017 to October 2018. Some Chinese energy companies also benefitted from higher oil prices over the period, which increased over 20%. Despite these positive tailwinds, Chinese energy companies had to grapple with concerns around changing US trade rules due to the implementation of tariffs and sanctions on certain oil-exporting nations.
| | AVERAGE ANNUAL TOTAL RETURN FOR THE YEAR ENDED OCTOBER 31, 2018 |
| | One Year Return | Three Year Return | Five Year Return | Annualized Inception to Date* |
| | Net Asset Value | Market Price | Net Asset Value | Market Price | Net Asset Value | Market Price | Net Asset Value | Market Price |
| Global X China Energy ETF | 4.77% | 5.58% | 3.63% | 3.69% | -2.25% | -2.14% | -0.70% | -0.67% |
| Solactive China Energy Total Return Index | 5.50% | 5.50% | 4.45% | 4.45% | -1.51% | -1.51% | 0.10% | 0.10% |
| MSCI Emerging Markets Index | -12.52% | -12.52% | 6.52% | 6.52% | 0.78% | 0.78% | 2.21% | 2.21% |
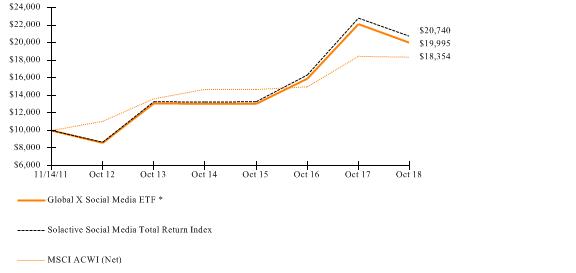
Growth of a $10,000 Investment
(At Net Asset Value)
Management Discussion of Fund Performance (unaudited) |
Global X China Energy ETF |
*Fund commenced operations on December 15, 2009.
The MSCI Emerging Markets Index is a free float-adjusted market capitalization index that is designed to measure equity market performance
of emerging markets.
The performance data quoted herein represents past performance and the return and value of an investment in the Fund will fluctuate so that, when redeemed, it may be worth less than its original cost. Past performance is no guarantee of future performance and should not be considered as a representation of the future results of the Fund. The Fund's performance assumes the reinvestment of all dividends and all capital gains. Index returns assume reinvestment of dividends and, unlike the Fund's returns, do not reflect any fees or expenses. If such fees and expenses were included in the index returns, the performance would have been lower. Please note that one cannot invest directly in an unmanaged index.
There are no assurances that the Fund will meet its stated objectives.
The Fund’s holdings and allocations are subject to change and should not be considered recommendations to buy individual securities.
The graph and table do not reflect the deduction of taxes that a shareholder would pay on Fund distributions or the redemption or sale of Fund shares.
See definition of comparative indices above.
Management Discussion of Fund Performance (unaudited) |
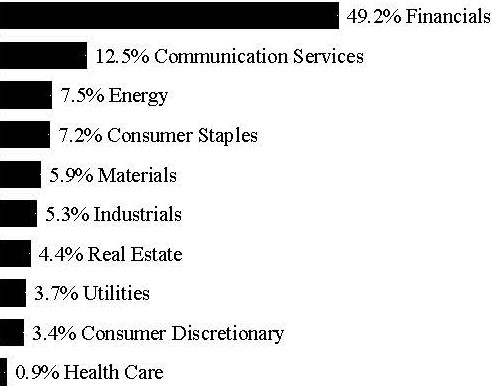
| Global X China Financials ETF |
Global X China Financials ETF
The Global X China Financials ETF (“Fund”) seeks to provide investment results that correspond generally to the price and yield performance, before fees and expenses, of the Solactive China Financials Total Return Index (“Underlying Index”). The Fund is passively managed, which means the investment adviser does not attempt to take defensive positions in declining markets. The Fund generally seeks to fully replicate the Underlying Index.
The Underlying Index is designed to measure the equity performance of the investable universe of companies in the financials sector of the Chinese economy, as defined by the index provider. It is comprised of securities of companies that have their main business operations in the financials sector and generally includes companies whose businesses involve: banking; insurance, real estate, and financial services.
For the 12-month period ended October 31, 2018 (the “reporting period”), the Fund decreased 11.04%, while the Underlying Index decreased 10.44%. The Fund had a net asset value of $17.63 per share on October 31, 2017 and ended the reporting period with a net asset value of $15.39 on October 31, 2018.
During the reporting period, the highest returns came from Agile Group Holdings and China Resources Land, which returned 36.86% and 17.69%, respectively. The worst performers were Qudian and Sunac China Holdings, which returned -57.88% and -45.59%, respectively.
Chinese financial firms, many of which are state-owned, are often depended on to help stimulate the country’s growth through easing lending policies. At the same time, concerns around the country’s growing public and private debt requires the government to take a cautious approach around relying too heavily on easy access to credit. In the context of China’s structurally decelerating growth after years of rapid expansion, as well as near term headwinds like slowing global growth and increased trade tensions, the government sought to mostly ease credit conditions during the reporting period. The government lowered bank reserve requirements four times from the beginning of 2018 through the end of the reporting period to help facilitate more lending. Despite efforts to broaden access to credit Chinese financial firms still suffered negative performance during the reporting period, caused by slowing domestic growth, a depreciated yuan, and rising concerns around geopolitical tensions.
| | AVERAGE ANNUAL TOTAL RETURN FOR THE YEAR ENDED OCTOBER 31, 2018 |
| | One Year Return | Three Year Return | Five Year Return | Annualized Inception to Date* |
| | Net Asset Value | Market Price | Net Asset Value | Market Price | Net Asset Value | Market Price | Net Asset Value | Market Price |
| Global X China Financials ETF | -11.04% | -11.27% | 4.15% | 4.21% | 5.16% | 5.25% | 2.16% | 2.14% |
| Solactive China Financials Total Return Index | -10.44% | -10.44% | 4.99% | 4.99% | 5.95% | 5.95% | 2.73% | 2.73% |
| MSCI Emerging Markets Index | -12.52% | -12.52% | 6.52% | 6.52% | 0.78% | 0.78% | 2.32% | 2.32% |
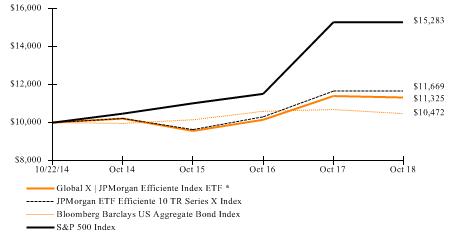
Growth of a $10,000 Investment
(At Net Asset Value)
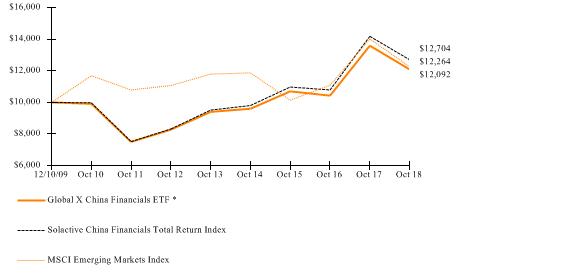
*Fund commenced operations on December 10, 2009.
Management Discussion of Fund Performance (unaudited) |
Global X China Financials ETF |
The MSCI Emerging Markets Index is a free float-adjusted market capitalization index that is designed to measure equity market performance of emerging markets.
The performance data quoted herein represents past performance and the return and value of an investment in the Fund will fluctuate so that, when redeemed, it may be worth less than its original cost. Past performance is no guarantee of future performance and should not be considered as a representation of the future results of the Fund. The Fund's performance assumes the reinvestment of all dividends and all capital gains. Index returns assume reinvestment of dividends and, unlike the Fund's returns, do not reflect any fees or expenses. If such fees and expenses were included in the index returns, the performance would have been lower. Please note that one cannot invest directly in an unmanaged index.
There are no assurances that the Fund will meet its stated objectives.
The Fund’s holdings and allocations are subject to change and should not be considered recommendations to buy individual securities.
The graph and table do not reflect the deduction of taxes that a shareholder would pay on Fund distributions or the redemption or sale of Fund shares.
See definition of comparative indices above.
Management Discussion of Fund Performance (unaudited) |
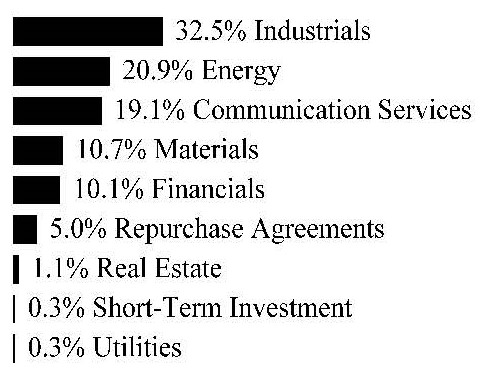
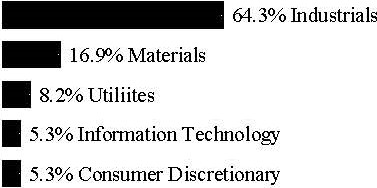
| Global X China Industrials ETF |
Global X China Industrials ETF
The Global X China Industrials ETF (“Fund”) seeks to provide investment results that correspond generally to the price and yield performance, before fees and expenses, of the Solactive China Industrials Total Return Index (“Underlying Index”). The Fund is passively managed, which means the investment adviser does not attempt to take defensive positions in declining markets. The Fund generally seeks to fully replicate the Underlying Index.
The Underlying Index is designed to measure the equity performance of the investable universe of companies in the industrials sector of the Chinese economy, as defined by the index provider. It is comprised of securities of companies that have their main business operations in the industrials sector and generally includes companies whose businesses involve: construction and materials, electronic and electrical equipment, industrial engineering, industrial transportation, and support services, and trading companies, shipbuilding and aerospace.
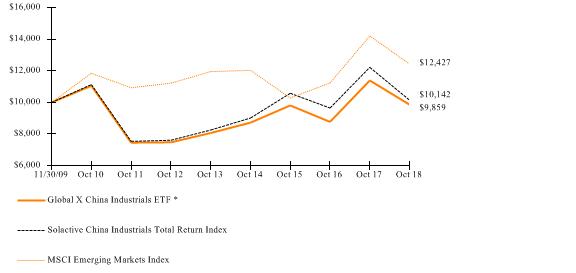
For the 12-month period ended October 31, 2018 (the “reporting period”), the Fund decreased 13.44%, while the Underlying Index decreased 17.01%. The Fund had a net asset value of $16.06 per share on October 31, 2017 and ended the reporting period with a net asset value of $13.59 on October 31, 2018.
During the reporting period, the highest returns came from China Resources Cement Holdings and Guangdong Investment, which returned 36.86% and 28.11%, respectively. The worst performers were Noble Group and China Shipping Container, which returned -70.55% and -54.50%, respectively.
China’s industrial sector, which accounts for approximately one-third of gross domestic product, performed negatively over the period, but began recovering in response to supportive government policies, increased investment in infrastructure, and a growing trade surplus. Despite rising trade tensions with the US, China’s trade surplus benefitted from a depreciated yuan, which made its goods cheaper abroad. Value-added industrial output increased 6.4% over the period, generally keeping pace with China’s overall GDP growth. Industrials also benefitted from the fact that many of these companies are state-owned, which offers greater implicit and explicit support for these firms during periods of stress.
| | AVERAGE ANNUAL TOTAL RETURN FOR THE YEAR ENDED OCTOBER 31, 2018 |
| | One Year Return | Three Year Return | Five Year Return | Annualized Inception to Date* |
| | Net Asset Value | Market Price | Net Asset Value | Market Price | Net Asset Value | Market Price | Net Asset Value | Market Price |
| Global X China Industrials ETF | -13.44% | -16.24% | 0.17% | -1.59% | 4.10% | 3.38% | -0.16% | -0.64% |
| Solactive China Industrials Total Return Index | -17.01% | -17.01% | -1.40% | -1.40% | 4.21% | 4.21% | 0.16% | 0.16% |
| MSCI Emerging Markets Index | -12.52% | 12.52% | 6.52% | 6.52% | 0.78% | 0.78% | 2.47% | 2.47% |
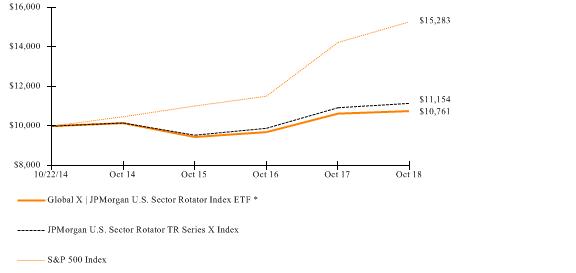
Growth of a $10,000 Investment
(At Net Asset Value)
*Fund commenced operations on November 30, 2009.
Management Discussion of Fund Performance (unaudited) |
Global X China Industrials ETF |
The MSCI Emerging Markets Index is a free float-adjusted market capitalization index that is designed to measure equity market performance
of emerging markets.
The performance data quoted herein represents past performance and the return and value of an investment in the Fund will fluctuate so that, when redeemed, it may be worth less than its original cost. Past performance is no guarantee of future performance and should not be considered as a representation of the future results of the Fund. The Fund's performance assumes the reinvestment of all dividends and all capital gains. Index returns assume reinvestment of dividends and, unlike the Fund's returns, do not reflect any fees or expenses. If such fees and expenses were included in the index returns, the performance would have been lower. Please note that one cannot invest directly in an unmanaged index.
There are no assurances that the Fund will meet its stated objectives.
The Fund’s holdings and allocations are subject to change and should not be considered recommendations to buy individual securities.
The graph and table do not reflect the deduction of taxes that a shareholder would pay on Fund distributions or the redemption or sale of Fund shares.
See definition of comparative indices above.
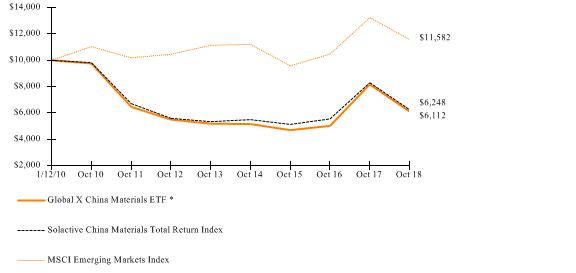
Management Discussion of Fund Performance (unaudited) |
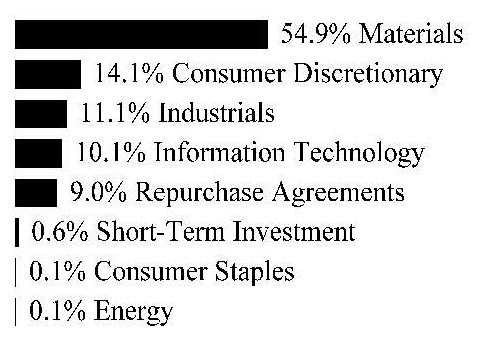
| Global X China Materials ETF |
Global X China Materials ETF
The Global X China Materials ETF (“Fund”) seeks to provide investment results that correspond generally to the price and yield performance, before fees and expenses, of the Solactive China Materials Total Return Index (“Underlying Index”). The Fund is passively managed, which means the investment adviser does not attempt to take defensive positions in declining markets. The Fund generally seeks to fully replicate the Underlying Index.
The Underlying Index is designed to measure the equity performance of the investable universe of companies in the materials sector of the Chinese economy, as defined by the index provider. It is comprised of securities of companies that have their main business operations in the basic materials sector and generally includes companies whose businesses involve: chemicals, metals and mining, and forestry and paper products.
For the 12-month period ended October 31, 2018 (the “reporting period”), the Fund decreased 25.20%, while the Underlying Index decreased 24.70%. The Fund had a net asset value of $21.59 per share on October 31, 2017 and ended the reporting period with a net asset value of $15.97 on October 31, 2018.
During the reporting period, the highest returns came from China Metal Resources Utilization and China Oriental Group, which returned 46.35% and 32.10%, respectively. The worst performers were Mobile Internet (China) Holdings and Munsun Capital Group, which returned -91.11% and -72.39%, respectively.
During the reporting period, China’s Materials sector initially benefitted from an increase in global commodity prices, including Brent Crude oil prices which increased by nearly 24%. As a provider of raw materials for the Industrials sector, Materials firms also benefitted from a rebound in industrial output, which grew by 6.4% in the first three quarters of 2018, spurred by a depreciated yuan. However, Materials began experiencing lower profitability in Q3 2018, as tariffs from the US were imposed on key industrial metals like steel and aluminium, which disrupted supply chains and pressured profitability.
| | AVERAGE ANNUAL TOTAL RETURN FOR THE YEAR ENDED OCTOBER 31, 2018 |
| | One Year Return | Three Year Return | Five Year Return | Annualized Inception to Date* |
| | Net Asset Value | Market Price | Net Asset Value | Market Price | Net Asset Value | Market Price | Net Asset Value | Market Price |
| Global X China Materials ETF | -25.20% | -25.85% | 9.17% | 9.08% | 3.33% | 3.21% | -5.44% | -5.54% |
| Solactive China Materials Total Return Index | -24.70% | -24.70% | 6.79% | 6.79% | 3.19% | 3.19% | -5.20% | -5.20% |
| MSCI Emerging Markets Index | -12.52% | -12.52% | 6.52% | 6.52% | 0.78% | 0.78% | 1.68% | 1.68% |
Growth of a $10,000 Investment
(At Net Asset Value)
*Fund commenced operations on January 12, 2010.
Management Discussion of Fund Performance (unaudited) |
| Global X China Materials ETF |
The MSCI Emerging Markets Index is a free float-adjusted market capitalization index that is designed to measure equity market performance
of emerging markets.
The performance data quoted herein represents past performance and the return and value of an investment in the Fund will fluctuate so that, when redeemed, it may be worth less than its original cost. Past performance is no guarantee of future performance and should not be considered as a representation of the future results of the Fund. The Fund's performance assumes the reinvestment of all dividends and all capital gains. Index returns assume reinvestment of dividends and, unlike the Fund's returns, do not reflect any fees or expenses. If such fees and expenses were included in the index returns, the performance would have been lower. Please note that one cannot invest directly in an unmanaged index.
There are no assurances that the Fund will meet its stated objectives.
The Fund’s holdings and allocations are subject to change and should not be considered recommendations to buy individual securities.
The graph and table do not reflect the deduction of taxes that a shareholder would pay on Fund distributions or the redemption or sale of Fund shares.
See definition of comparative indices above.
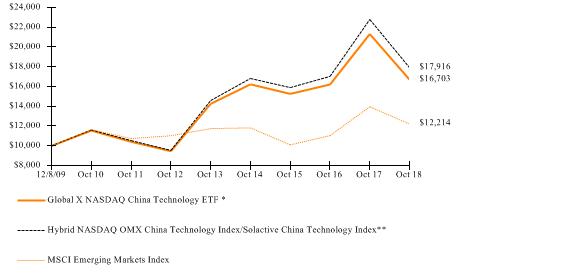
Management Discussion of Fund Performance (unaudited) |
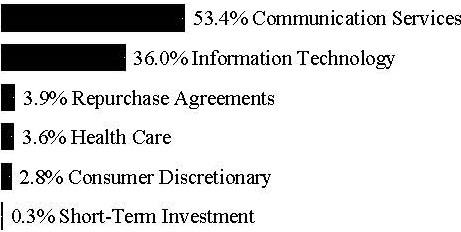
| Global X NASDAQ China Technology ETF |
Global X NASDAQ China Technology ETF
The Global X NASDAQ China Technology ETF (“Fund”) seeks to provide investment results that correspond generally to the price and yield performance, before fees and expenses, of the NASDAQ OMX China Technology Index (“Underlying Index”). The Fund is passively managed, which means the investment adviser does not attempt to take defensive positions in declining markets. The Fund generally seeks to fully replicate the Underlying Index.
The Underlying Index is designed to track the performance of the technology sector in China as defined by the index provider. It is comprised of securities of companies that have their main business operations in the technology sector and generally includes companies whose businesses involve: computer services, internet, software, computer hardware, electronic office equipment, semiconductors, and telecommunications equipment.
For the 12-month period ended October 31, 2018 (the “reporting period”), the Fund decreased 21.70%, while the Underlying Index decreased 21.43%. The Fund had a net asset value of $29.24 per share on October 31, 2017 and ended the reporting period with a net asset value of $22.40 on October 31, 2018.
During the reporting period, the highest returns came from HKBN and Kingdee International Software Group, which returned 54.63% and 52.69%, respectively. The worst performers were Link Motion and Green Leader Holdings Group, which returned -85.43% and -84.04%, respectively.
Chinese government policies have long supported the development of a domestic technology industry as a means for modernizing the economy. Despite the strong government support and growing domestic demand, many of China’s technology companies have faced recent challenges from trade tensions affecting key supply chain infrastructure and intense scrutiny driven by the US’s national- and cyber-security concerns. Despite these challenges which particularly affect technology exports, China’s technology sector is becoming increasingly domestic-focused. The country has more than 730 million online users, of which an estimated 90% have access to mobile internet. Increasingly, these internet users purchase items online, use social media, and play interactive mobile games, helping to drive the growth prospects of the country’s technology firms, in spite of geopolitical tensions.
| | AVERAGE ANNUAL TOTAL RETURN FOR THE YEAR ENDED OCTOBER 31, 2018 |
| | One Year Return | Three Year Return | Five Year Return | Annualized Inception to Date* |
| | Net Asset Value | Market Price | Net Asset Value | Market Price | Net Asset Value | Market Price | Net Asset Value | Market Price |
| Global X NASDAQ China Technology ETF | -21.70% | -21.96% | 3.04% | 3.54% | 3.22% | 3.30% | 5.94% | 6.00% |
| Hybrid NASDAQ OMX China Technology Index/Solactive China Technology Index** | -21.43% | -21.43% | 4.05% | 4.05% | 4.19% | 4.19% | 6.78% | 6.78% |
| MSCI Emerging Markets Index | -12.52% | -12.52% | 6.52% | 6.52% | 0.78% | 0.78% | 2.27% | 2.27% |
Growth of a $10,000 Investment
(At Net Asset Value)
*Fund commenced operations on December 8, 2009.
** Reflects performance of Solactive China Technology Index through December 13, 2011 and NASDAQ OMX China Technology Index thereafter.
Management Discussion of Fund Performance (unaudited) |
| Global X NASDAQ China Technology ETF |
The MSCI Emerging Markets Index is a free float-adjusted market capitalization index that is designed to measure equity market performance
of emerging markets.
The performance data quoted herein represents past performance and the return and value of an investment in the Fund will fluctuate so that, when redeemed, it may be worth less than its original cost. Past performance is no guarantee of future performance and should not be considered as a representation of the future results of the Fund. The Fund's performance assumes the reinvestment of all dividends and all capital gains. Index returns assume reinvestment of dividends and, unlike the Fund's returns, do not reflect any fees or expenses. If such fees and expenses were included in the index returns, the performance would have been lower. Please note that one cannot invest directly in an unmanaged index.
There are no assurances that the Fund will meet its stated objectives.
The Fund’s holdings and allocations are subject to change and should not be considered recommendations to buy individual securities.
The graph and table do not reflect the deduction of taxes that a shareholder would pay on Fund distributions or the redemption or sale of Fund shares.
See definition of comparative indices above.
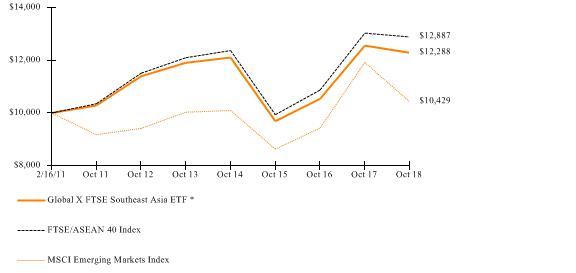
Management Discussion of Fund Performance (unaudited) |
Global X FTSE Southeast Asia ETF |
Global X FTSE Southeast Asia ETF
The Global X FTSE Southeast Asia ETF (“Fund”) seeks to provide investment results that correspond generally to the price and yield performance, before fees and expenses, of the FTSE/ASEAN 40 Index (“Underlying Index”). The Fund is passively managed, which means the investment adviser does not attempt to take defensive positions in declining markets. The Fund generally seeks to fully replicate the Underlying Index.
The Underlying Index tracks the equity performance of the 40 largest and most liquid companies in the five Association of Southeast Asian Nations ("ASEAN") regions: Singapore, Malaysia, Indonesia, Thailand and the Philippines, as defined by the index provider.
For the 12-month period ended October 31, 2018 (the “reporting period”), the Fund decreased 2.15%, while the Underlying Index decreased 1.53%. The Fund had a net asset value of $15.91 per share on October 31, 2017 and ended the reporting period with a net asset value of $15.32 on October 31, 2018.
During the reporting period, the highest returns came from PTT Exploration & Production and Petronas Chemicals Group, which returned 67.98 % and 32.68%, respectively. The worst performers were Axiata Group and PT Bank Negara Indonesia, which returned -34.64% and -28.39%, respectively.
The Southeast Asia region includes many high growth and dynamic economies, such as Singapore, Malaysia, Indonesia, the Philippines, and Thailand. Southeast Asia maintained much of its economic momentum, despite some broader global headwinds, with growth in these economies being driven primarily by domestic demand. Indonesia, the region’s largest economy, grew 5.2% year-over-year in the first half (“H1”) of 2018, backed by a 5.1% year-over-year increase in private consumption and an 8.4% year-over-year rise in investment – the highest growth in investment since 2012. Although broad economic expansion moderated in Malaysia, a 7.4% year-over-year increase in private consumption in H1 2018 helped clock economic growth of 4.9% year-over-year during the period, despite investments and exports weakening. Economic growth in the Philippines eased to 6.3% year-over-year in H1 2018. This growth was driven by investment growth of 16.4% year-over-year, and the nation’s ratio of fixed investment to GDP reached 27.2% in the period – the highest in over two decades. Singapore grew at 4.2% year-over-year on robust exports and domestic demand.
| | AVERAGE ANNUAL TOTAL RETURN FOR THE YEAR ENDED OCTOBER 31, 2018 |
| | One Year Return | Three Year Return | Five Year Return | Annualized Inception to Date* |
| | Net Asset Value | Market Price | Net Asset Value | Market Price | Net Asset Value | Market Price | Net Asset Value | Market Price |
| Global X FTSE Southeast Asia ETF | -2.15% | -2.48% | 8.24% | 8.36% | 0.63% | 0.63% | 2.71% | 2.66% |
| FTSE/ASEAN 40 Index | -1.53% | -1.53% | 9.02% | 9.02% | 1.27% | 1.27% | 3.35% | 3.35% |
| MSCI Emerging Markets Index | -12.52% | -12.52% | 6.52% | 6.52% | 0.78% | 0.78% | 0.55% | 0.55% |
Growth of a $10,000 Investment
(At Net Asset Value)
*Fund commenced operations on February 16, 2011.
Management Discussion of Fund Performance (unaudited) |
Global X FTSE Southeast Asia ETF |
The MSCI Emerging Markets Index is a free float-adjusted market capitalization index that is designed to measure equity market performance
of emerging markets.
The performance data quoted herein represents past performance and the return and value of an investment in the Fund will fluctuate so that, when redeemed, it may be worth less than its original cost. Past performance is no guarantee of future performance and should not be considered as a representation of the future results of the Fund. The Fund's performance assumes the reinvestment of all dividends and all capital gains. Index returns assume reinvestment of dividends and, unlike the Fund's returns, do not reflect any fees or expenses. If such fees and expenses were included in the index returns, the performance would have been lower. Please note that one cannot invest directly in an unmanaged index.
There are no assurances that the Fund will meet its stated objectives.
The Fund’s holdings and allocations are subject to change and should not be considered recommendations to buy individual securities.
The graph and table do not reflect the deduction of taxes that a shareholder would pay on Fund distributions or the redemption or sale of Fund shares.
See definition of comparative indices above.
Management Discussion of Fund Performance (unaudited) |
Global X MSCI Colombia ETF |
Global X MSCI Colombia ETF
The Global X MSCI Colombia ETF (“Fund”) seeks to provide investment results that correspond generally to the price and yield performance, before fees and expenses, of the MSCI All Colombia Select 25/50 Index (the “Underlying Index”). The Fund is passively managed, which means the investment adviser does not attempt to take defensive positions in declining markets. The Fund generally seeks to fully replicate the Underlying Index.
The Underlying Index is designed to represent the performance of the broad Colombia equity universe, as defined by the index provider.
For the 12-month period ended October 31, 2018 (the “reporting period”), the Fund decreased 7.55%, while the Underlying Index decreased 6.92%. The Fund had a net asset value of $9.56 per share on October 31, 2017 and ended the reporting period with a net asset value of $8.68 on October 31, 2018.
During the reporting period, the highest returns came from Ecopetrol and Grupo Aval Acciones y Valores, which returned 118.59% and 5.18%, respectively. The worst performers were Cemex Latam Holdings and Cementos Argos, which returned -56.19% and -42.12%, respectively.
Despite efforts to diversify, Colombia’s economy, currency, and equity markets still remain affected by changing oil prices, as it is the country’s main export. During the reporting period, oil prices improved over 20%, helping the economy to grow 2.7% year-over-year in Q3 2018, after growing 2.2% and 2.8% year-over-year in Q1 2018 and Q2 2018, respectively. Private consumption picked up significantly, with increased consumer confidence and declining inflation boosting the real income of consumers. Investments also received some support from policy rate cuts and higher oil prices. Export earnings, particularly from oil and coal, had increased as a result of improved terms of trade, facilitating a reduction in the current account deficit. Further, the fiscal policy remained prudent, striking a balance between the fiscal rule to reduce the central government deficit to 1% of GDP by 2022 and the spending needs to stimulate economic growth.
| | AVERAGE ANNUAL TOTAL RETURN FOR THE YEAR ENDED OCTOBER 31, 2018 |
| | One Year Return | Three Year Return | Five Year Return | Annualized Inception to Date* |
| | Net Asset Value | Market Price | Net Asset Value | Market Price | Net Asset Value | Market Price | Net Asset Value | Market Price |
| Global X MSCI Colombia ETF | -7.55% | -7.98% | 1.21% | 1.25% | -13.78% | -13.87% | 3.61% | 3.55% |
| Hybrid MSCI All Colombia Select 25/50 Index/MSCI All Colombia Capped Index/FTSE Colombia 20 Index** | -6.92% | -6.92% | 1.81% | 1.81% | -13.02% | -13.02% | 4.55% | 4.55% |
| MSCI Emerging Markets Index | -12.52% | -12.52% | 6.52% | 6.52% | 0.78% | 0.78% | 8.69% | 8.69% |
Growth of a $10,000 Investment
(At Net Asset Value)
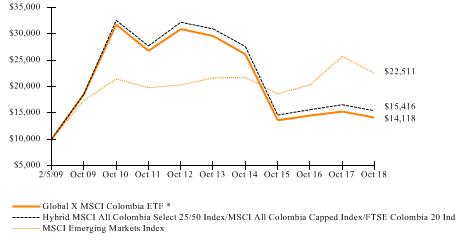
*Fund commenced operations on February 5, 2009.
Management Discussion of Fund Performance (unaudited) |
Global X MSCI Colombia ETF |
**Reflects performance of the FTSE Colombia 20 Index through July 14, 2014, the MSCI All Colombia Capped Index through August 30, 2016 and the MSCI All Colombia Select 25/50 Index, thereafter. The inception of the MSCI All Colombia Select 25/50 Index (“New Index”) was on July 15, 2016. Effective on or around August 31, 2016, the Fund began to track the New Index. This change was due to the planned migration to the New Index, potentially improving the trading characteristics of the Fund.
The MSCI Emerging Markets Index is a free float-adjusted market capitalization index that is designed to measure equity market performance
of emerging markets.
The performance data quoted herein represents past performance and the return and value of an investment in the Fund will fluctuate so that, when redeemed, it may be worth less than its original cost. Past performance is no guarantee of future performance and should not be considered as a representation of the future results of the Fund. The Fund's performance assumes the reinvestment of all dividends and all capital gains. The Fund’s performace reflects contractual fee waivers in effect until March 1, 2018. Absent these waivers performance would have been lower. Index returns assume reinvestment of dividends and, unlike the Fund's returns, do not reflect any fees or expenses. If such fees and expenses were included in the index returns, the performance would have been lower. Please note that one cannot invest directly in an unmanaged index.
There are no assurances that the Fund will meet its stated objectives.
The Fund’s holdings and allocations are subject to change and should not be considered recommendations to buy individual securities.
The graph and table do not reflect the deduction of taxes that a shareholder would pay on Fund distributions or the redemption or sale of Fund shares.
See definition of comparative indices above.
Management Discussion of Fund Performance (unaudited) |
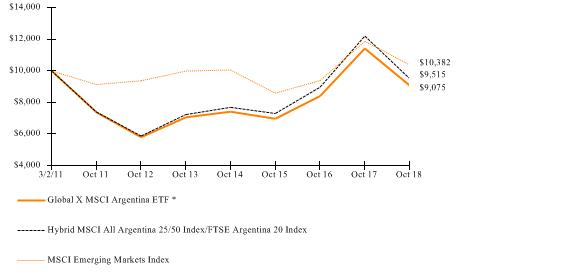
| Global X MSCI Argentina ETF |
Global X MSCI Argentina ETF
The Global X MSCI Argentina ETF (“Fund”) seeks to provide investment results that correspond generally to the price and yield performance, before fees and expenses, of the MSCI All Argentina 25/50 Index (“Underlying Index”). The Fund is passively managed, which means the investment adviser does not attempt to take defensive positions in declining markets. The Fund generally seeks to fully replicate the Underlying Index.
The Underlying Index is designed to represent the performance of the broad Argentina equity universe, while including a minimum number of constituents, as defined by the index provider. The broad Argentina equity universe includes securities that are classified in Argentina according to the MSCI Global Investable Market Index Methodology, together with companies that are headquartered or listed in Argentina and carry out the majority of their operations in Argentina.
For the 12-month period ended October 31, 2018 (the “reporting period”), the Fund decreased 20.48%, while the Underlying Index decreased 22.02%. The Fund had a net asset value of $32.05 per share on October 31, 2017 and ended the reporting period with a net asset value of $25.36 on October 31, 2018.
During the reporting period, the highest returns came from Globant and MercadoLibre, which returned 36.48% and 35.10%, respectively. The worst performers were Grupo Supervielle and Phoenix Global Resources, which returned
-68.73% and -63.98%, respectively.
After a few quarters of economic recovery, assisted by a series of ambitious reforms by the government led by Mauricio Macri, Argentina’s economy again slipped into a phase of negative growth. The economy contracted 4.2% year-over-year in Q2 2018 after expanding 3.9% year-over-year in Q1 2018. The nation’s pro-market policies even prompted MSCI to announce an upgrade of Argentina to emerging market status from frontier market status beginning June 2019. However, rising US interest rates, a broader emerging market selloff, and a severe drought, together with existing economic imbalances of double-digit inflation and large fiscal and current account deficits, led to a steep fall in the country’s currency and economic outlook. The government’s decision to increase interest rates to support the currency led to a slide in investment and rising unemployment that negatively impacted consumption and growth. Exports were impacted by the drought, worsening the current account further. As it was difficult to finance the twin deficits, the country entered into a US$57 billion financing agreement with the International Monetary Fund to help provide stabilization to its currency. However, tight fiscal and monetary policies are expected to likely to keep the economy in recession in the near term.
| | AVERAGE ANNUAL TOTAL RETURN FOR THE YEAR ENDED OCTOBER 31, 2018 |
| | One Year Return | Three Year Return | Five Year Return | Annualized Inception to Date* |
| | Net Asset Value | Market Price | Net Asset Value | Market Price | Net Asset Value | Market Price | Net Asset Value | Market Price |
| Global X MSCI Argentina ETF | -20.48% | -20.60% | 9.21% | 8.95% | 5.15% | 5.02% | -1.26% | -1.29% |
| Hybrid FTSE Argentina 20 Index/MSCI All Argentina 25/50 Index** | -22.02% | -22.02% | 9.23% | 9.23% | 5.64% | 5.64% | -0.65% | -0.65% |
| MSCI Emerging Markets Index | -12.52% | -12.52% | 6.52% | 6.52% | 0.78% | 0.78% | 0.49% | 0.49% |
Growth of a $10,000 Investment
(At Net Asset Value)
Management Discussion of Fund Performance (unaudited) |
| Global X MSCI Argentina ETF |
*Fund commenced operations on March 2, 2011.
**Reflects performance of the FTSE Argentina 20 Index through August 14, 2014 and the MSCI All Argentina 25/50 Index (“New Index”) thereafter.
The MSCI Emerging Markets Index is a free float-adjusted market capitalization index that is designed to measure equity market performance
of emerging markets.
The performance data quoted herein represents past performance and the return and value of an investment in the Fund will fluctuate so that, when redeemed, it may be worth less than its original cost. Past performance is no guarantee of future performance and should not be considered as a representation of the future results of the Fund. The Fund's performance assumes the reinvestment of all dividends and all capital gains. Index returns assume reinvestment of dividends and, unlike the Fund's returns, do not reflect any fees or expenses. If such fees and expenses were included in the index returns, the performance would have been lower. Please note that one cannot invest directly in an unmanaged index.
There are no assurances that the Fund will meet its stated objectives.
The Fund’s holdings and allocations are subject to change and should not be considered recommendations to buy individual securities.
The graph and table do not reflect the deduction of taxes that a shareholder would pay on Fund distributions or the redemption or sale of Fund shares.
See definition of comparative indices above.
Management Discussion of Fund Performance (unaudited) |
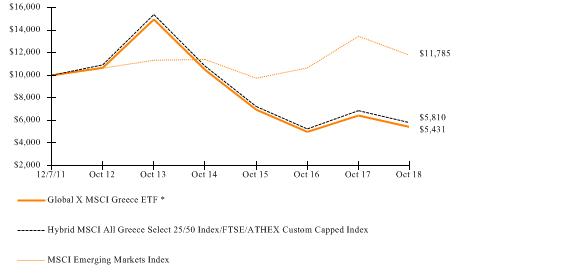
Global X MSCI Greece ETF |
Global X MSCI Greece ETF
The Global X MSCI Greece ETF (“Fund”) seeks to provide investment results that correspond generally to the price and yield performance, before fees and expenses, of the MSCI All Greece Select 25/50 Index (“Underlying Index”). The Fund is passively managed, which means the investment adviser does not attempt to take defensive positions in declining markets. The Fund generally seeks to fully replicate the Underlying Index.
The Underlying Index is designed to represent the performance of the broad Greece equity universe, as defined by the index provider.
For the 12-month period ended October 31, 2018 (the “reporting period”), the Fund decreased 15.63%, while the Underlying Index decreased 15.46%. The Fund had a net asset value of $9.30 per share on October 31, 2017 and ended the reporting period with a net asset value of $7.68 on October 31, 2018.
During the reporting period, the highest returns came from Terna Energy and GasLog, which returned 50.40% and 22.57%, respectively. The worst performers were Folli Follie and Aegean Marine Petroleum Network, which returned -65.53% and -60.31%, respectively.
After more than eight years into the debt-driven crisis, Greece exited its economic bailout program in August 2018. Reforms undertaken by the country, including significant austerity measures and asset sales, have stimulated an economic recovery that is gaining traction. Q2 2018 marked the sixth consecutive quarter of positive growth, with the GDP expanding 1.8% year-over-year. The country also successfully reversed its extraordinary fiscal deficit, which stood at 15% of GDP in 2009, and has turned into a surplus of approximately 3.5% as of April 2018. Economic growth has been primarily driven by exports. Industrial production is also picking up with improved confidence. Private consumption, which had been stagnant, is growing as wages have started to rise with strong growth in employment. A public debt of around 180% of GDP and high level of bad loans in the banking system remain concerns, making the economy vulnerable to external shocks.
| | AVERAGE ANNUAL TOTAL RETURN FOR THE YEAR ENDED OCTOBER 31, 2018 |
| | One Year Return | Three Year Return | Five Year Return | Annualized Inception to Date* |
| | Net Asset Value | Market Price | Net Asset Value | Market Price | Net Asset Value | Market Price | Net Asset Value | Market Price |
| Global X MSCI Greece ETF | -15.63% | -15.43% | -7.94% | -8.08% | -18.33% | -18.41% | -8.47% | -8.44% |
| Hybrid MSCI All Greece Select 25/50 Index/ FTSE/ATHEX Custom Capped Index** | -15.46% | -15.46% | -7.09% | -7.09% | -17.70% | -17.70% | -7.57% | -7.57% |
| MSCI Emerging Markets Index | -12.52% | -12.52% | 6.52% | 6.52% | 0.78% | 0.78% | 2.41% | 2.41% |
Growth of a $10,000 Investment
(At Net Asset Value)
*Fund commenced operations on December 7, 2011.
Management Discussion of Fund Performance (unaudited) |
Global X MSCI Greece ETF |
** Reflects performance of the FTSE/ATHEX Custom Capped Index through February 29, 2016 and MSCI All Greece Select 25/50 Index, thereafter. The inception of the MSCI All Greece Select 25/50 Index (“New Index”) was on December 23, 2015. Effective on or around March 1, 2016, the Fund began to track the New Index. The change was due to the planned migration to the New Index, potentially allowing for broader exposure to the local market.
The MSCI Emerging Markets Index is a free float-adjusted market capitalization index that is designed to measure equity market performance of emerging markets.
The performance data quoted herein represents past performance and the return and value of an investment in the Fund will fluctuate so that, when redeemed, it may be worth less than its original cost. Past performance is no guarantee of future performance and should not be considered as a representation of the future results of the Fund. The Fund's performance assumes the reinvestment of all dividends and all capital gains. Index returns assume reinvestment of dividends and, unlike the Fund's returns, do not reflect any fees or expenses. If such fees and expenses were included in the index returns, the performance would have been lower. Please note that one cannot invest directly in an unmanaged index.
There are no assurances that the Fund will meet its stated objectives.
The Fund’s holdings and allocations are subject to change and should not be considered recommendations to buy individual securities.
The graph and table do not reflect the deduction of taxes that a shareholder would pay on Fund distributions or the redemption or sale of Fund shares.
See definition of comparative indices above.
Management Discussion of Fund Performance (unaudited) |
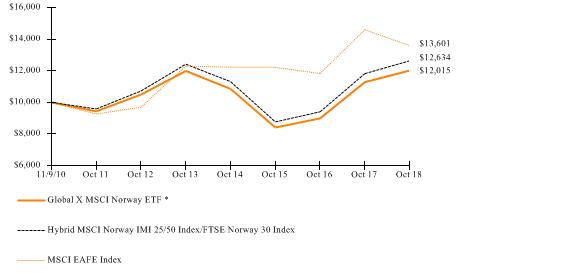
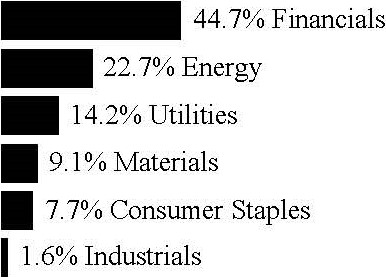
| Global X MSCI Norway ETF |
Global X MSCI Norway ETF
The Global X MSCI Norway ETF (“Fund”) seeks investment results that correspond generally to the price and yield performance, before fees and expenses, of the MSCI Norway IMI 25/50 Index (“Underlying Index”). The Fund is passively managed, which means the investment adviser does not attempt to take defensive positions in declining markets. The Fund generally seeks to fully replicate the Underlying Index.
The Underlying Index is designed to represent the performance of the broad Norway equity universe, as defined by the index provider. The Underlying Index may include large-, mid- or small-capitalization companies.
For the 12-month period ended October 31, 2018 (the “reporting period”), the Fund increased 6.47%, while the Underlying Index increased 6.86%. The Fund had a net asset value of $13.50 per share on October 31, 2017 and ended the reporting period with a net asset value of $13.97 on October 31, 2018.
During the reporting period, the highest returns came from BW Offshore and Petroleum Geo-Services, which returned 96.51% and 91.78%, respectively. The worst performers were Protector Forsikring and XXL, which returned -57.34% and
-50.67%, respectively.
Norway’s economy continued to benefit from its pivot away from reliance on oil revenues to fund its expenditure. This includes a more diversified energy export portfolio, as Norway is now the third largest natural gas exporter and quickly becoming a hydropower exporter with its subsea cables connecting Norway to Germany and the UK. Efforts to diversify exports are complemented by policy reform that reduce corporate tax rates, simplify business regulation, improve education and skill development programs, and increase labor force participation. Although the government has worked to reduce its reliance on oil-related income, Norway still largely benefitted from higher Brent Crude oil prices, which increased nearly 24% over the reporting period.
| | AVERAGE ANNUAL TOTAL RETURN FOR THE YEAR ENDED OCTOBER 31, 2018 |
| | One Year Return | Three Year Return | Five Year Return | Annualized Inception to Date* |
| | Net Asset Value | Market Price | Net Asset Value | Market Price | Net Asset Value | Market Price | Net Asset Value | Market Price |
| Global X MSCI Norway ETF | 6.47% | 5.02% | 12.61% | 12.23% | 0.04% | -0.17% | 2.33% | 2.20% |
| Hybrid MSCI Norway IMI 25/50 Index/FTSE Norway 30 Index** | 6.86% | 6.86% | 12.94% | 12.94% | 0.34% | 0.34% | 2.97% | 2.97% |
| MSCI EAFE Index | -6.85% | -6.85% | 3.62% | 3.62% | 2.02% | 2.02% | 3.93% | 3.93% |
Growth of a $10,000 Investment
(At Net Asset Value)
*Fund commenced operations on November 9, 2010.
**Reflects performance of the FTSE Norway 30 Index through July 14, 2014 and the MSCI Norway IMI 25/50 Index thereafter.
Management Discussion of Fund Performance (unaudited) |
| Global X MSCI Norway ETF |
The MSCI EAFE Index (Europe, Australasia, Far East) is a free float-adjusted market capitalization index that is designed to measure the equity market performance of developed markets, excluding the US & Canada.
The performance data quoted herein represents past performance and the return and value of an investment in the Fund will fluctuate so that, when redeemed, it may be worth less than its original cost. Past performance is no guarantee of future performance and should not be considered as a representation of the future results of the Fund. The Fund's performance assumes the reinvestment of all dividends and all capital gains. Index returns assume reinvestment of dividends and, unlike the Fund's returns, do not reflect any fees or expenses. If such fees and expenses were included in the index returns, the performance would have been lower. Please note that one cannot invest directly in an unmanaged index.
There are no assurances that the Fund will meet its stated objectives.
The Fund’s holdings and allocations are subject to change and should not be considered recommendations to buy individual securities.
The graph and table do not reflect the deduction of taxes that a shareholder would pay on Fund distributions or the redemption or sale of Fund shares.
See definition of comparative indices above.
Management Discussion of Fund Performance (unaudited) |
Global X FTSE Nordic Region ETF |
Global X FTSE Nordic Region ETF
The Global X FTSE Nordic Region ETF (“Fund”) seeks investment results that correspond generally to the price and yield performance, before fees and expenses, of the FTSE Nordic 30 Index (“Underlying Index”). The Fund is passively managed, which means the investment adviser does not attempt to take defensive positions in declining markets. The Fund generally seeks to fully replicate the Underlying Index.
For the 12-month period ended October 31, 2018 (the “reporting period”), the Fund decreased 9.67%, while the Underlying Index decreased 9.52%. The Fund had a net asset value of $23.89 per share on October 31, 2017 and ended the reporting period with a net asset value of $20.82 on October 31, 2018.
During the reporting period, the highest returns came from Telefonaktiebolaget LM Ericsson and Equinor, which returned 41.29% and 34.06%, respectively. The worst performers were Danske Bank and A.P. Moller - Maersk, which returned
-47.56% and -32.81%, respectively.
Growth in the Nordic region was robust, supported by both domestic and external factors. Sweden’s economy grew at a strong pace, bolstered by exports and domestic demand. Exports were supported by a weaker currency and growth in the country’s key trading partners. Denmark’s economy experienced a steady upturn, supported by private consumption and business investments. Rising income, led by employment growth, boosted overall consumption. Finland’s economy benefitted from employment gains and income growth, which boosted private consumption and residential investment. Business investment was supported by high capacity utilization and growing exports. Norway’s economy strengthened on increases in oil prices and an associated pick-up in investment, and rising income from employment growth.
| | AVERAGE ANNUAL TOTAL RETURN FOR THE YEAR ENDED OCTOBER 31, 2018 |
| | One Year Return | Three Year Return | Five Year Return | Annualized Inception to Date* |
| | Net Asset Value | Market Price | Net Asset Value | Market Price | Net Asset Value | Market Price | Net Asset Value | Market Price |
| Global X FTSE Nordic Region ETF | -9.67% | -10.15% | 1.13% | 1.09% | 0.67% | 0.54% | 6.71% | 6.66% |
| FTSE Nordic 30 Index | -9.52% | -9.52% | 1.06% | 1.06% | 0.59% | 0.59% | 6.66% | 6.66% |
| MSCI EAFE Index | -6.85% | -6.85% | 3.62% | 3.62% | 2.02% | 2.02% | 5.64% | 5.64% |
Growth of a $10,000 Investment
(At Net Asset Value)

*Fund commenced operations on August 17, 2009.
The MSCI EAFE Index (Europe, Australasia, Far East) is a free float-adjusted market capitalization index that is designed to measure the equity market performance of developed markets, excluding the US & Canada.
Management Discussion of Fund Performance (unaudited) |
Global X FTSE Nordic Region ETF |
The performance data quoted herein represents past performance and the return and value of an investment in the Fund will fluctuate so that, when redeemed, it may be worth less than its original cost. Past performance is no guarantee of future performance and should not be considered as a representation of the future results of the Fund. The Fund's performance assumes the reinvestment of all dividends and all capital gains. Index returns assume reinvestment of dividends and, unlike the Fund's returns, do not reflect any fees or expenses. If such fees and expenses were included in the index returns, the performance would have been lower. Please note that one cannot invest directly in an unmanaged index.
There are no assurances that the Fund will meet its stated objectives.
The Fund’s holdings and allocations are subject to change and should not be considered recommendations to buy individual securities.
The graph and table do not reflect the deduction of taxes that a shareholder would pay on Fund distributions or the redemption or sale of Fund shares.
See definition of comparative indices on the previous page.
Management Discussion of Fund Performance (unaudited) |
Global X MSCI Nigeria ETF |
Global X MSCI Nigeria ETF
The Global X MSCI Nigeria ETF (“Fund”) seeks to provide investment results that correspond generally to the price and yield performance, before fees and expenses, of the MSCI All Nigeria Select 25/50 Index (“Underlying Index”). The Fund is passively managed, which means the investment adviser does not attempt to take defensive positions in declining markets. The Fund generally seeks to fully replicate the Underlying Index.
The Underlying Index is designed to represent the performance of the broad Nigeria equity universe, while including a minimum number of constituents, as defined by the index provider.
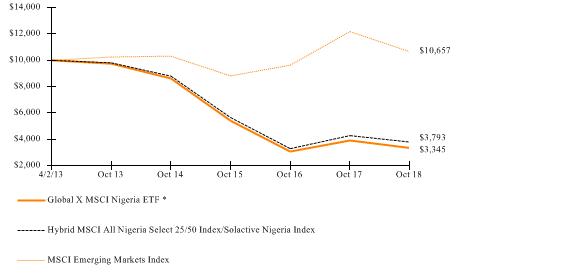
For the 12-month period ended October 31, 2018 (the “reporting period”), the Fund decreased 14.46%, while the Underlying Index decreased 11.43%. The Fund had a net asset value of $21.43 per share on October 31, 2017 and ended the reporting period with a net asset value of $17.98 on October 31, 2018.
During the reporting period, the highest returns came from Diamond Bank and Seplat Petroleum Development Co., which returned 38.45% and 33.25%, respectively. The worst performers were Lafarge Africa and Nigerian Breweries, which returned -62.02% and -43.76%, respectively.
Nigeria’s economy continued its recovery from a deep recession that was originally caused by the selloff in oil prices from 2014-2016. In Q2 2018, the economy registered growth of 1.5%, its fifth consecutive quarter of positive economic growth. However, the pace of overall economic growth remains slow compared to previous levels in the early 2010’s. Higher oil prices as well as growth in non-oil sectors supported economic expansion during the review period. The non-oil sector was the major growth driver in Q2 2018, with services growing the fastest since 2016. Activity in non-oil non-agriculture remains weak as low purchasing power due to a weakened currency is affecting consumer demand, and as private sector lending remains low. Reforms are under way to improve the business environment, increase private investment, raise spending in priority sectors, such as agriculture and infrastructure, create jobs, improve healthcare for the growing population, and provide macroeconomic stability and economic diversification.
| | AVERAGE ANNUAL TOTAL RETURN FOR THE YEAR ENDED OCTOBER 31, 2018 |
| | One Year Return | Three Year Return | Five Year Return | Annualized Inception to Date* |
| | Net Asset Value | Market Price | Net Asset Value | Market Price | Net Asset Value | Market Price | Net Asset Value | Market Price |
| Global X MSCI Nigeria ETF | -14.46% | -11.77% | -14.80% | -14.49% | -19.25% | -19.34% | -17.82% | -17.39% |
| Hybrid MSCI All Nigeria Select 25/50 Index/Solactive Nigeria Index** | -11.43% | -11.43% | -12.45% | -12.45% | -17.31% | -17.31% | -15.95% | -15.95% |
| MSCI Emerging Markets Index | -12.52% | -12.52% | 6.52% | 6.52% | 0.78% | 0.78% | 1.15% | 1.15% |
Growth of a $10,000 Investment
(At Net Asset Value)
Management Discussion of Fund Performance (unaudited) |
Global X MSCI Nigeria ETF |
*Fund commenced operations on April 2, 2013.
**Reflects performance of the Solactive Nigeria Index through August 14, 2014 and the MSCI All Nigeria Select 25/50 Index thereafter.
The MSCI Emerging Markets Index is a free float-adjusted market capitalization index that is designed to measure equity market performance
of emerging markets.
The performance data quoted herein represents past performance and the return and value of an investment in the Fund will fluctuate so that, when redeemed, it may be worth less than its original cost. Past performance is no guarantee of future performance and should not be considered as a representation of the future results of the Fund. The Fund's performance assumes the reinvestment of all dividends and all capital gains. The Fund’s performance reflects contractual fee waivers in effect from its inception through February 29, 2016. Absent these waivers performance would have been lower. Index returns assume reinvestment of dividends and, unlike the Fund's returns, do not reflect any fees or expenses. If such fees and expenses were included in the index returns, the performance would have been lower. Please note that one cannot invest directly in an unmanaged index.
There are no assurances that the Fund will meet its stated objectives.
The Fund’s holdings and allocations are subject to change and should not be considered recommendations to buy individual securities.
The graph and table do not reflect the deduction of taxes that a shareholder would pay on Fund distributions or the redemption or sale of Fund shares.
See definition of comparative indices above.
Management Discussion of Fund Performance (unaudited) |
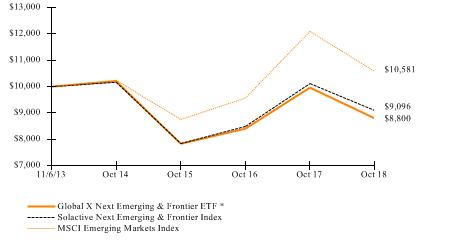
Global X Next Emerging & Frontier ETF |
Global X Next Emerging & Frontier ETF
The Global X Next Emerging & Frontier ETF (“Fund”) seeks to provide investment results that correspond generally to the price and yield performance, before fees and expenses, of the Solactive Next Emerging & Frontier Index (“Underlying Index”). The Fund is passively managed, which means the investment adviser does not attempt to take defensive positions in declining markets. The Fund generally seeks to fully replicate the Underlying Index.
The Underlying Index is designed to reflect equity performance of next emerging markets and frontier markets companies, as defined by the index provider. Next Emerging markets are defined as emerging market countries, excluding the BRICs (Brazil, Russia, India and China) and excluding the most developed tier of emerging markets (South Korea and Taiwan). Frontier markets are those emerging market countries that generally have smaller economies or less developed capital markets.
For the 12-month period ended October 31, 2018 (the “reporting period”), the Fund decreased 11.66%, while the Underlying Index decreased 11.15%. The Fund had a net asset value of $23.28 per share on October 31, 2017 and ended the reporting period with a net asset value of $20.22 on October 31, 2018.
During the reporting period, the highest returns came from Ecopetrol and Qatar National Bank, which returned 118.27% and 68.10%, respectively. The worst performers were Turk Telekomunikasyon and Banco Macro, which returned -66.38% and -63.56%, respectively.
While demonstrating high growth potential, many emerging and frontier market equities depend on high commodity prices and a weak dollar to fuel their expansions. During the reporting period, oil, a key export for many emerging & frontier markets appreciated by approximately 24%. Yet other export prices were mixed, with copper and soybean prices falling and corn rising. In addition, slowing growth in China hurt many emerging and frontier countries that depend on China as a major trade partner. Further, rising interest rates in the US caused the US dollar to appreciate, which increased the borrowing costs for many companies in the developing world while reducing the value of their stock prices in dollar-terms.
| | AVERAGE ANNUAL TOTAL RETURN FOR THE YEAR ENDED OCTOBER 31, 2018 |
| | One Year Return | Three Year Return | Annualized Inception to Date* |
| | Net Asset Value | Market Price | Net Asset Value | Market Price | Net Asset Value | Market Price |
| Global X Next Emerging & Frontier ETF | -11.66% | -11.99% | 3.97% | 4.23% | -2.53% | -2.64% |
| Solactive Next Emerging & Frontier Index | -11.15% | -11.15% | 4.67% | 4.67% | -1.88% | -1.88% |
| MSCI Emerging Markets Index | -12.52% | -12.52% | 6.52% | 6.52% | 1.14% | 1.14% |
Growth of a $10,000 Investment
(At Net Asset Value)
*Fund commenced operations on November 6, 2013.
The MSCI Emerging Markets Index is a free float-adjusted market capitalization index that is designed to measure equity market performance of emerging markets.
Management Discussion of Fund Performance (unaudited) |
Global X Next Emerging & Frontier ETF |
The performance data quoted herein represents past performance and the return and value of an investment in the Fund will fluctuate so that, when redeemed, it may be worth less than its original cost. Past performance is no guarantee of future performance and should not be considered as a representation of the future results of the Fund. The Fund's performance assumes the reinvestment of all dividends and all capital gains. Index returns assume reinvestment of dividends and, unlike the Fund's returns, do not reflect any fees or expenses. If such fees and expenses were included in the index returns, the performance would have been lower. Please note that one cannot invest directly in an unmanaged index.
There are no assurances that the Fund will meet its stated objectives.
The Fund’s holdings and allocations are subject to change and should not be considered recommendations to buy individual securities.
The graph and table do not reflect the deduction of taxes that a shareholder would pay on Fund distributions or the redemption or sale of Fund shares.
See definition of comparative indices above.
Management Discussion of Fund Performance (unaudited) |
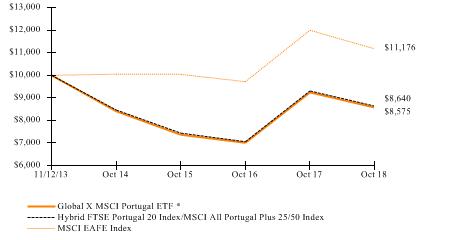
Global X MSCI Portugal ETF |
Global X MSCI Portugal ETF
The Global X MSCI Portugal ETF (“Fund”) seeks to provide investment results that correspond generally to the price and yield performance, before fees and expenses, of the MSCI All Portugal Plus 25/50 Index (“Underlying Index”). The Fund is passively managed, which means the investment adviser does not attempt to take defensive positions in declining markets. The Fund generally seeks to fully replicate the Underlying Index.
The Underlying Index is designed to represent the performance of the broad Portugal equity universe, while including a minimum number of constituents, as defined by the index provider.
For the 12-month period ended October 31, 2018 (the “reporting period”), the Fund decreased 7.26%, while the Underlying Index decreased 7.18%. The Fund had a net asset value of $12.49 per share on October 31, 2017 and ended the reporting period with a net asset value of $11.24 on October 31, 2018.
During the reporting period, the highest returns came from Altri and Banco Espirito Santo, which returned 42.96% and 12.50%, respectively. The worst performers were Pharol and Altice Europe, which returned -64.57% and
-50.78 %, respectively.
The Portuguese economy grew at by 2.1% year-over-year in Q3 2018, which is significantly higher than the European Union’s broad growth rate of 0.3%. The growth was supported by strong domestic demand, mainly private consumption, as the labor market continued to improve, pulling the unemployment rate further down. In September 2018, the unemployment rate fell to a 14-year low of 6.6%. Private investment growth continued with increasing capacity utilization, while rising housing prices drove additional residential investments. Fiscal policy was expansionary during the reporting period, but efforts are underway to move towards a balanced budget and reducing the ratio of public debt to GDP further. In Q2 2018, the debt-to-GDP ratio stood at approximately 125%, down from almost 130% in Q3 2017. The government targets to reduce the ratio to around 122% by end 2018 to further ease the country’s debt load.
| | AVERAGE ANNUAL TOTAL RETURN FOR THE YEAR ENDED OCTOBER 31, 2018 |
| | One Year Return | Three Year Return | Annualized Inception to Date* |
| | Net Asset Value | Market Price | Net Asset Value | Market Price | Net Asset Value | Market Price |
| Global X MSCI Portugal ETF | -7.26% | -8.24% | 5.18% | 5.10% | -3.05% | -3.24% |
| Hybrid FTSE Portugal 20 Index/MSCI All Portugal Plus 25/50 Index** | -7.18% | -7.18% | 5.10% | 5.10% | -2.90% | -2.90% |
| MSCI EAFE Index | -6.85% | -6.85% | 3.62% | 3.62% | 2.26% | 2.26% |
Growth of a $10,000 Investment
(At Net Asset Value)
*Fund commenced operations on November 12, 2013.
** Hybrid index performance reflects the performance of the FTSE Portugal 20 Index through December 5, 2016, and the MSCI All Portugal Plus 25/50 Index thereafter.
Management Discussion of Fund Performance (unaudited) |
Global X MSCI Portugal ETF |
The MSCI EAFE Index (Europe, Australasia, Far East) is a free float-adjusted market capitalization index that is designed to measure the equity market performance of developed markets, excluding the US & Canada.
The performance data quoted herein represents past performance and the return and value of an investment in the Fund will fluctuate so that, when redeemed, it may be worth less than its original cost. Past performance is no guarantee of future performance and should not be considered as a representation of the future results of the Fund. The Fund's performance assumes the reinvestment of all dividends and all capital gains. Index returns assume reinvestment of dividends and, unlike the Fund's returns, do not reflect any fees or expenses. If such fees and expenses were included in the index returns, the performance would have been lower. Please note that one cannot invest directly in an unmanaged index.
There are no assurances that the Fund will meet its stated objectives.
The Fund’s holdings and allocations are subject to change and should not be considered recommendations to buy individual securities.
The graph and table do not reflect the deduction of taxes that a shareholder would pay on Fund distributions or the redemption or sale of Fund shares.
See definition of comparative indices above and on previous page.
Management Discussion of Fund Performance (unaudited) |
Global X MSCI Pakistan ETF |
Global X MSCI Pakistan ETF
The Global X MSCI Pakistan ETF (“Fund”) seeks to provide investment results that correspond generally to the price and yield performance, before fees and expenses, of the MSCI All Pakistan Select 25/50 Index (“Underlying Index”). The Fund is passively managed, which means the investment adviser does not attempt to take defensive positions in declining markets. The Fund generally seeks to fully replicate the Underlying Index.
The Underlying Index is designed to represent the performance of the broad Pakistan equity universe, while including a minimum number of constituents, as defined by the index provider. The broad Pakistan equity universe includes securities that are classified in Pakistan according to the MSCI Global Investable Market Index Methodology, together with companies that are headquartered or listed in Pakistan and carry out the majority of their operations in Pakistan.
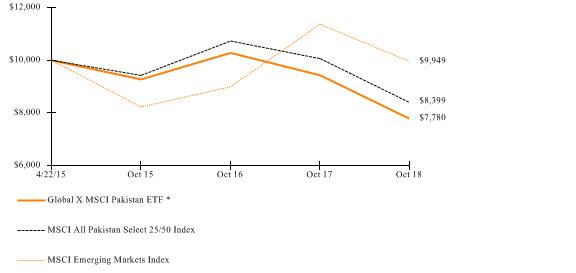
For the 12-month period ended October 31, 2018 (the “reporting period”), the Fund decreased 17.53%, while the Underlying Index decreased 16.54%. The Fund had a net asset value of $13.56 per share on October 31, 2017 and ended the reporting period with a net asset value of $10.26 on October 31, 2018.
During the reporting period, the highest returns came from Pakistan International Bulk Terminal and Bank Alfalah, which returned 25.50% and 20.18 %, respectively. The worst performers were Honda Atlas Cars (Pakistan) and National Refinery, which returned -61.52% and -60.29%, respectively.
Pakistan’s economy gained momentum during the reporting period, growing at its highest rate in 13 years in the financial year (FY) ending June 2018, clocking growth of 5.8% year-over-year. This growth was supported by higher agricultural growth, which nearly doubled year-over-year to 3.8% during the year, and robust growth in the services sector. Private consumption slowed slightly to 6.3%, but remained the largest contributor to GDP growth with an 81% share as of June 2018. However, the rising budget deficit, swelling current account deficit, rising debt obligations, and falling foreign exchange reserves remain concerns that battered the country’s currency. The newly formed government is taking measures, such as imposing import tariffs and raising the policy rate, to deal with the current macroeconomic imbalances, but the efficacy of such policies remain uncertain.
| | AVERAGE ANNUAL TOTAL RETURN FOR THE YEAR ENDED OCTOBER 31, 2018 |
| | One Year Return | Three Year Return | Annualized Inception to Date* |
| | Net Asset Value | Market Price | Net Asset Value | Market Price | Net Asset Value | Market Price |
| Global X MSCI Pakistan ETF* | -17.53% | -19.15% | -5.69% | -6.77% | -6.88% | -7.55% |
| MSCI All Pakistan Select 25/50 Index | -16.54% | -16.54% | -3.78% | -3.78% | -4.83% | -4.83% |
| MSCI Emerging Markets Index | -12.52% | -12.52% | 6.52% | 6.52% | -0.15% | -0.15% |
Growth of a $10,000 Investment
(At Net Asset Value)
Management Discussion of Fund Performance (unaudited) |
Global X MSCI Pakistan ETF |
*Fund commenced operations on April 22, 2015.
The MSCI Emerging Markets Index is a free float-adjusted market capitalization index that is designed to measure equity market performance of emerging markets.
The performance data quoted herein represents past performance and the return and value of an investment in the Fund will fluctuate so that, when redeemed, it may be worth less than its original cost. Past performance is no guarantee of future performance and should not be considered as a representation of the future results of the Fund. The Fund's performance assumes the reinvestment of all dividends and all capital gains. Index returns assume reinvestment of dividends and, unlike the Fund's returns, do not reflect any fees or expenses. If such fees and expenses were included in the index returns, the performance would have been lower. Please note that one cannot invest directly in an unmanaged index.
There are no assurances that the Fund will meet its stated objectives.
The Fund’s holdings and allocations are subject to change and should not be considered recommendations to buy individual securities.
The graph and table do not reflect the deduction of taxes that a shareholder would pay on Fund distributions or the redemption or sale of Fund shares.
See definition of comparative indices above.
The accompanying notes are an integral part of the financial statements.
The accompanying notes are an integral part of the financial statements.
The accompanying notes are an integral part of the financial statements.
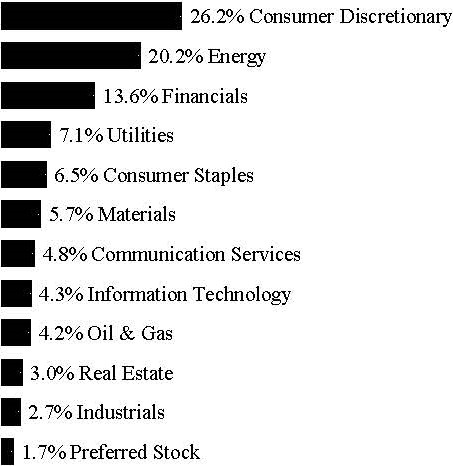
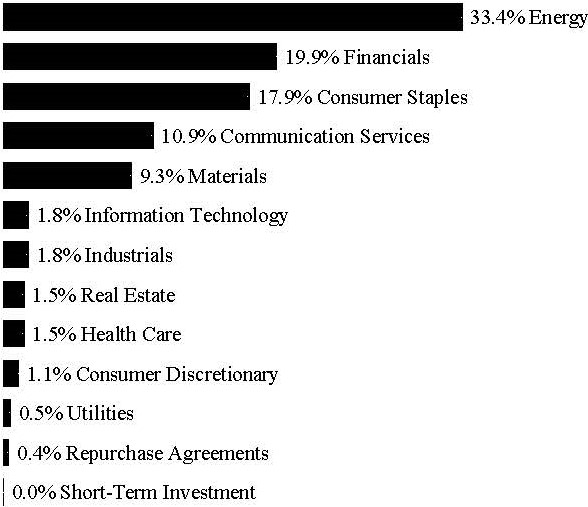
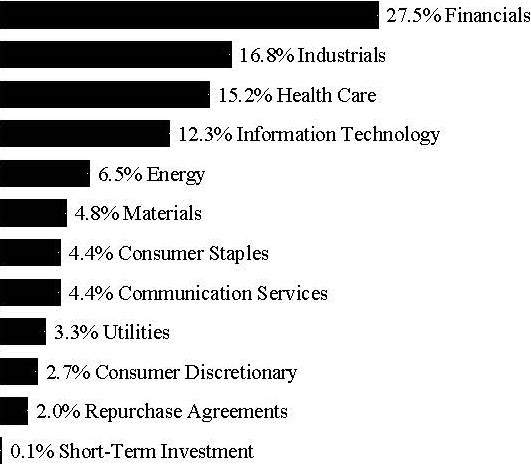
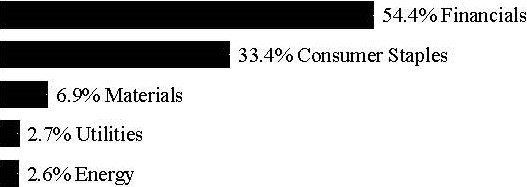
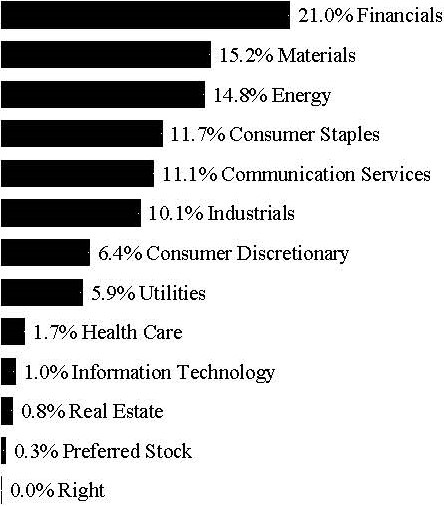
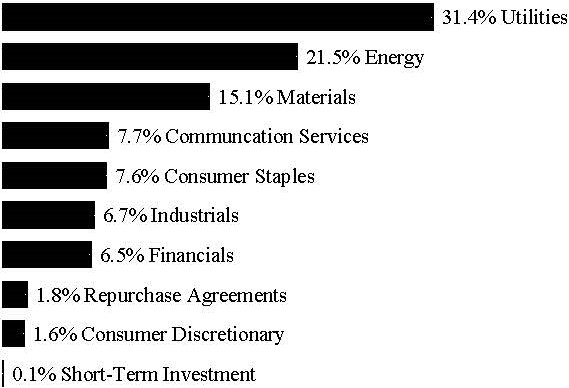
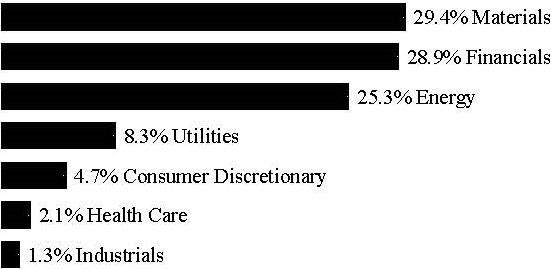
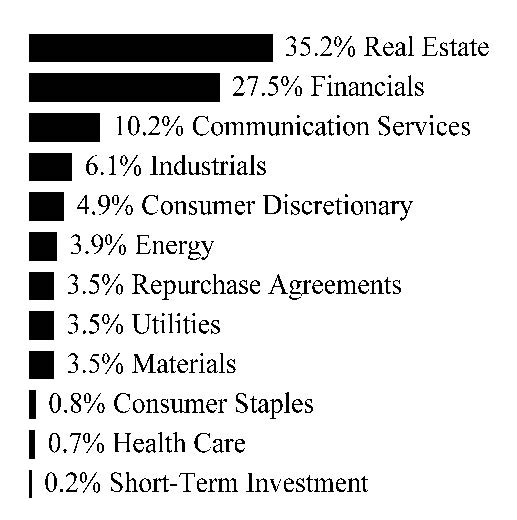
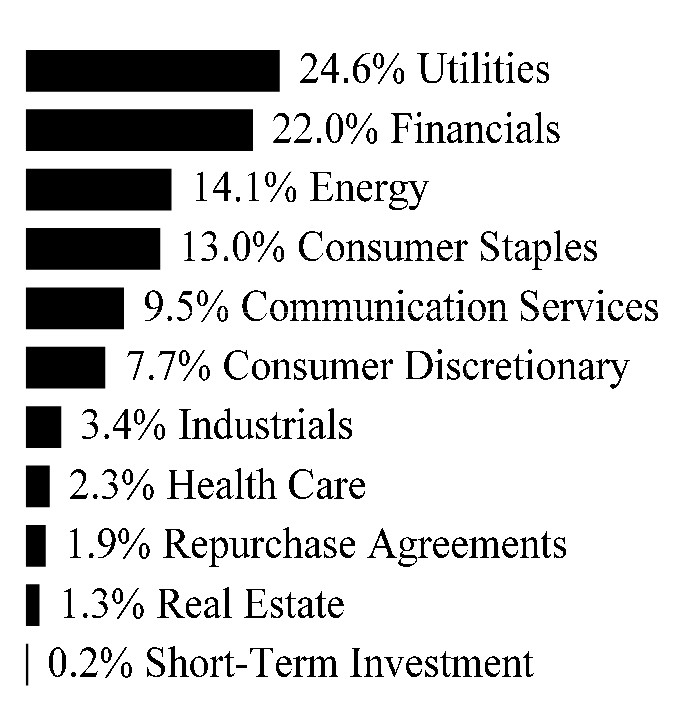
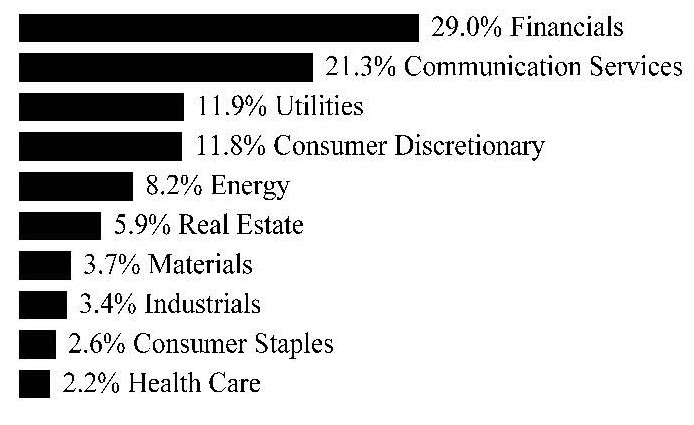
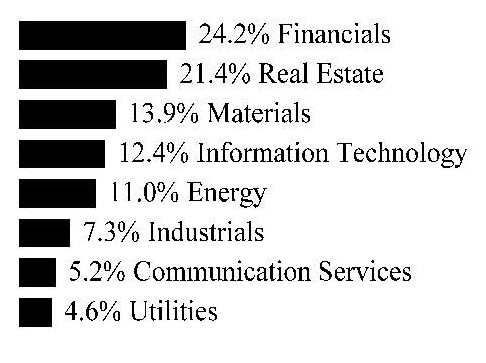
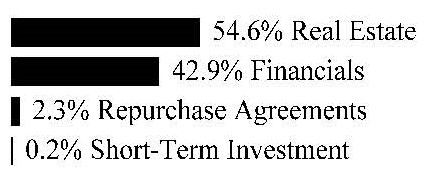
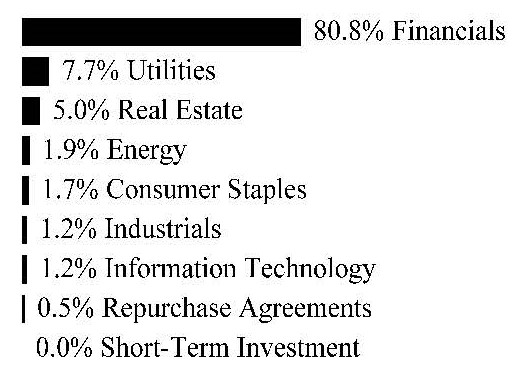
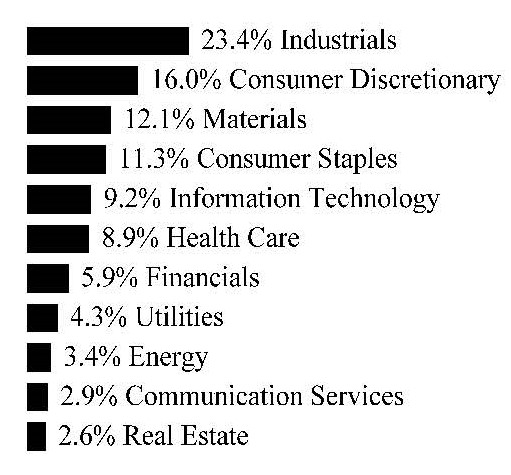
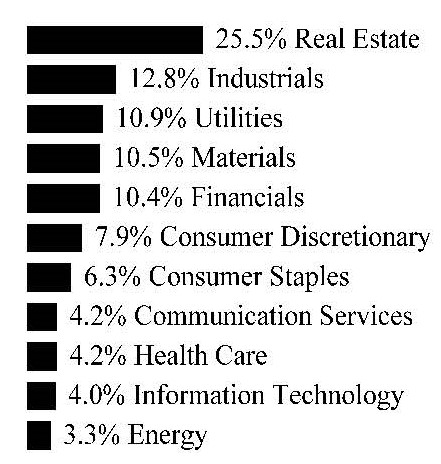
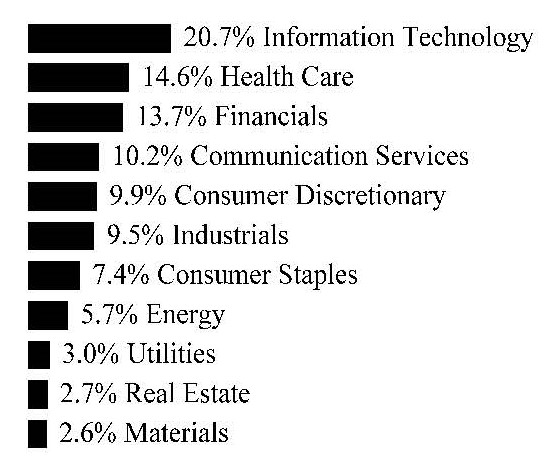
Schedule of Investments | | October 31, 2018 |
Global X China Financials ETF
___________________________________________________________________________________________________________________________________________________________________________________________________________________________________________________________________________________________________________________________________________________________
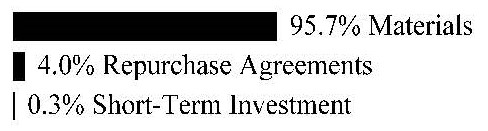
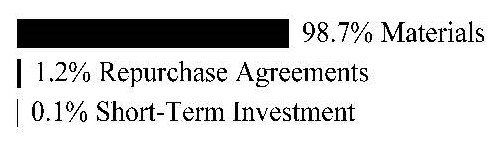
| Sector Weightings (unaudited)†: |
† Sector weightings percentages are based on the total market value of investments.
|
| | Shares | | Value | |
| COMMON STOCK — 99.9% | | | | | | |
| CHINA— 46.2% | | | | | | |
| Financials — 45.1% | | | | | | |
| Agricultural Bank of China, Cl H | | | 1,992,788 | | | $ | 874,454 | |
| Bank of China, Cl H | | | 3,536,234 | | | | 1,506,623 | |
| Bank of Communications, Cl H | | | 528,671 | | | | 396,534 | |
| China Citic Bank, Cl H | | | 655,022 | | | | 405,242 | |
| China Construction Bank, Cl H | | | 3,974,626 | | | | 3,153,580 | |
| China Life Insurance, Cl H | | | 524,340 | | | | 1,044,747 | |
| China Merchants Bank, Cl H | | | 273,734 | | | | 1,054,515 | |
| China Minsheng Banking, Cl H | | | 472,826 | | | | 348,615 | |
| China Pacific Insurance Group, Cl H | | | 195,412 | | | | 727,866 | |
| CITIC Securities, Cl H | | | 156,496 | | | | 275,486 | |
| Country Garden Holdings | | | 539,897 | | | | 577,817 | |
| Industrial & Commercial Bank of China, Cl H | | | 2,218,737 | | | | 1,500,026 | |
| PICC Property & Casualty, Cl H | | | 485,663 | | | | 470,832 | |
| Ping An Insurance Group of China, Cl H | | | 156,814 | | | | 1,477,245 | |
Qudian ADR * | | | 18,159 | | | | 75,723 | |
| | | | | | | | 13,889,305 | |
| Real Estate — 1.1% | | | | | | | | |
| Guangzhou R&F Properties | | | 66,193 | | | | 103,857 | |
| Longfor Group Holdings | | | 98,038 | | | | 238,110 | |
| | | | | | | | 341,967 | |
| TOTAL CHINA | | | | | | | 14,231,272 | |
| HONG KONG— 53.7% | | | | | | | | |
| Financials — 26.8% | | | | | | | | |
| AIA Group | | | 393,900 | | | | 2,982,111 | |
| BOC Hong Kong Holdings | | | 252,800 | | | | 944,848 | |
| China Taiping Insurance Holdings | | | 101,930 | | | | 340,659 | |
| Haitong Securities, Cl H | | | 191,100 | | | | 192,333 | |
| Hang Seng Bank | | | 51,040 | | | | 1,195,365 | |
| Hong Kong Exchanges & Clearing | | | 57,550 | | | | 1,526,954 | |
| New China Life Insurance, Cl H | | | 68,111 | | | | 318,426 | |
| People's Insurance Group of China, Cl H | | | 491,500 | | | | 200,628 | |
| Postal Savings Bank of China, Cl H | | | 872,400 | | | | 520,809 | |
| | | | | | | | 8,222,133 | |
| Industrials — 4.9% | | | | | | | | |
| CK Hutchison Holdings | | | 142,350 | | | | 1,433,596 | |
The accompanying notes are an integral part of the financial statements.
Schedule of Investments | | October 31, 2018 |
| | |
| Global X China Financials ETF |
| | | Shares
| | Value | |
| COMMON STOCK — continued | | | | | | | | |
| Industrials — continued | | | | | | | | |
Country Garden Services Holdings * | | | 72,118 | | | $ | 93,098 | |
| | | | | | | | 1,526,694 | |
| Real Estate — 22.0% | | | | | | | | |
| China Evergrande Group | | | 123,961 | | | | 295,695 | |
| China Overseas Land & Investment | | | 339,266 | | | | 1,062,451 | |
| China Resources Land | | | 188,708 | | | | 640,308 | |
| China Vanke, Cl H | | | 87,700 | | | | 270,168 | |
| CK Asset Holdings | | | 174,550 | | | | 1,133,326 | |
Future Land Development Holdings * | | | 117,000 | | | | 67,161 | |
| Henderson Land Development | | | 84,000 | | | | 391,101 | |
| New World Development | | | 397,600 | | | | 504,139 | |
| Shimao Property Holdings | | | 69,404 | | | | 135,809 | |
| Sun Hung Kai Properties | | | 102,100 | | | | 1,327,141 | |
| Sunac China Holdings | | | 159,500 | | | | 433,369 | |
| Wharf Real Estate Investment | | | 81,100 | | | | 502,258 | |
| | | | | | | | 6,762,926 | |
| TOTAL HONG KONG | | | | | | | 16,511,753 | |
| TOTAL INVESTMENTS — 99.9% | | | | | | | | |
| (Cost $32,872,512) | | | | | | $ | 30,743,025 | |
| | | | | | |
| Percentages are based on Net Assets of $30,783,511. | | | | | |
| * | Non-income producing security. |
| ADR — American Depositary Receipt |
| Cl — Class |
| As of October 31, 2018, all of the Fund's investments were considered Level 1, in accordance with authoritative guidance on fair value measurements and disclosure under U.S. GAAP. |
For the year ended October 31, 2018, there have been no transfers between Level 1, Level 2 or Level 3 investments.
As of October 31, 2018, there were no Level 3 investments.
The accompanying notes are an integral part of the financial statements.
| Schedule of Investments | | October 31, 2018 |
| | | |
| | Global X China Industrials ETF | |
| Sector Weightings (unaudited)†: |
| † Sector weightings percentages are based on the total market value of investments. |
| | | | | | | |
| | Shares | | Value | |
| COMMON STOCK — 100.2% | | | | | | |
| CHINA— 53.0% | | | | | | |
| Industrials — 38.6% | | | | | | |
BEST ADR * | | | 4,796 | | | $ | 30,167 | |
| China Communications Construction, Cl H | | | 96,443 | | | | 88,208 | |
China COSCO Holdings, Cl H * | | | 69,132 | | | | 24,692 | |
| China Lesso Group Holdings | | | 25,955 | | | | 13,674 | |
| China Railway Construction, Cl H | | | 50,701 | | | | 64,157 | |
| China Railway Group, Cl H | | | 103,998 | | | | 92,862 | |
| CRRC | | | 110,353 | | | | 96,848 | |
| Guangshen Railway, Cl H | | | 38,248 | | | | 14,295 | |
| Haitian International Holdings | | | 17,126 | | | | 33,424 | |
| Jiangsu Expressway, Cl H | | | 32,819 | | | | 44,041 | |
| Shanghai Electric Group, Cl H | | | 71,471 | | | | 23,248 | |
| Sinotrans, Cl H | | | 54,600 | | | | 19,014 | |
| Sinotruk Hong Kong | | | 17,800 | | | | 25,567 | |
| Weichai Power, Cl H | | | 52,096 | | | | 51,502 | |
| Yangzijiang Shipbuilding Holdings | | | 60,073 | | | | 53,791 | |
| Zhejiang Expressway, Cl H | | | 38,440 | | | | 32,216 | |
| Zhuzhou CRRC Times Electric, Cl H | | | 14,723 | | | | 78,691 | |
| | | | | | | | 786,397 | |
| Information Technology — 1.4% | | | | | | | | |
| Hollysys Automation Technologies | | | 1,489 | | | | 28,619 | |
| Materials — 13.0% | | | | | | | | |
| Anhui Conch Cement, Cl H | | | 17,177 | | | | 88,740 | |
| China National Building Material, Cl H | | | 103,837 | | | | 74,175 | |
China Shanshui Cement Group * | | | 243,752 | | | | 102,297 | |
| | | | | | | | 265,212 | |
| TOTAL CHINA | | | | | | | 1,080,228 | |
| HONG KONG— 47.2% | | | | | | | | |
| Consumer Discretionary — 5.3% | | | | | | | | |
| Minth Group | | | 18,600 | | | | 60,265 | |
| Xinyi Glass Holdings | | | 47,700 | | | | 47,217 | |
| | | | | | | | 107,482 | |
| Industrials — 25.8% | | | | | | | | |
| AviChina Industry & Technology, Cl H | | | 58,690 | | | | 39,080 | |
The accompanying notes are an integral part of the financial statements.
| Schedule of Investments | | October 31, 2018 |
| | | |
| | Global X China Industrials ETF | |
| | | Shares
| | Value | |
| COMMON STOCK — continued | | | | | | | | |
| Industrials — continued | | | | | | | | |
| Beijing Capital International Airport, Cl H | | | 43,931 | | | $ | 47,577 | |
| BYD, Cl H | | | 14,914 | | | | 96,644 | |
| China Everbright International | | | 91,950 | | | | 73,308 | |
China High Speed Transmission Equipment Group (A) (B) | | | 11,350 | | | | 10,583 | |
| China Merchants Holdings International | | | 34,331 | | | | 58,420 | |
| China State Construction International Holdings | | | 44,410 | | | | 31,667 | |
| COSCO Pacific | | | 43,430 | | | | 44,319 | |
Orient Overseas International * | | | 3,140 | | | | 18,425 | |
| Seaspan, Cl A | | | 2,635 | | | | 23,557 | |
| Shanghai Industrial Holdings | | | 11,939 | | | | 25,098 | |
| Shenzhen International Holdings | | | 23,906 | | | | 45,742 | |
| Zoomlion Heavy Industry Science and Technology | | | 37,100 | | | | 11,879 | |
| | | | | | | | 526,299 | |
| Information Technology — 3.9% | | | | | | | | |
| Sunny Optical Technology Group | | | 9,194 | | | | 79,750 | |
| Materials — 4.0% | | | | | | | | |
| China Resources Cement Holdings | | | 58,621 | | | | 51,671 | |
| Lee & Man Paper Manufacturing | | | 34,500 | | | | 29,530 | |
| | | | | | | | 81,201 | |
| Utiliites — 8.2% | | | | | | | | |
| Beijing Enterprises Water Group | | | 137,130 | | | | 69,795 | |
| Guangdong Investment | | | 54,160 | | | | 96,721 | |
| | | | | | | | 166,516 | |
| TOTAL HONG KONG | | | | | | | 961,248 | |
| TOTAL INVESTMENTS — 100.2% | | | | | | | | |
| (Cost $2,761,027) | | | | | | $ | 2,041,476 | |
| | | | | | |
| Percentages are based on Net Assets of $2,038,184. | | | | | |
| * | Non-income producing security. |
| (A) | Level 3 security in accordance with fair value hierarchy. |
| (B) | Security is fair valued using methods determined in good faith by the Fair Value Committee of the Fund. The total value of such securities as of October 31, 2018, was $10,583 and represents 0.5% of net assets. |
| ADR — American Depositary Receipt |
| Cl — Class |
| The following is a summary of the level of inputs used as of October 31, 2018, in valuing the Fund's investments carried at value: | |
| | | | | | | | | |
| Investments in Securities | Level 1 | | Level 2 | | Level 3 | | Total | |
| Common Stock | | $ | 2,030,893 | | | $ | — | | | $ | 10,583 | | | $ | 2,041,476 | |
| Total Investments in Securities | | $ | 2,030,893 | | | $ | — | | | $ | 10,583 | | | $ | 2,041,476 | |
The accompanying notes are an integral part of the financial statements.
| Schedule of Investments | | October 31, 2018 |
| | | |
| | Global X China Industrials ETF | |
The following is a reconciliation of investments in which significant unobservable inputs (Level 3) were used in determining fair value:
| | | Investments in Common Stock | |
| | | | |
| Beginning Balance as of October 31, 2017 | | $ | 37,533 | |
| Transfers out of Level 3 | | | (102,297 | ) |
| Transfers into Level 3 | | | 10,584 | |
| Net sales | | | (31,982 | ) |
| Realized gain (loss) | | | (61,468 | ) |
| Change in unrealized appreciation (depreciation) | | | 158,213 | |
| Ending Balance as of October 31, 2018 | | $ | 10,583 | |
For the year ended October 31, 2018, the transfers in and out of Level 3 were due to changes in the availability of
observable inputs to determine fair value. Transfers between levels are recognized at period end.
For the year ended October 31, 2018, there have been no transfers between Level 1 and Level 2 instruments.
The accompanying notes are an integral part of the financial statements.
| Schedule of Investments | | October 31, 2018 |
| | | |
| | Global X China Materials ETF | |
| Sector Weightings (unaudited)†: |
| † Sector weightings percentages are based on the total market value of investments. |
| | | | | | | |
| | Shares | | Value | |
| COMMON STOCK — 100.1% | | | | | | |
| CHINA— 63.2% | | | | | | |
| Energy — 1.7% | | | | | | |
Sinopec Yizheng Chemical Fibre, Cl H * | | | 365,514 | | | $ | 40,564 | |
| Industrials — 4.8% | | | | | | | | |
| Fosun International | | | 78,140 | | | | 114,029 | |
| Information Technology — 0.7% | | | | | | | | |
Daqo New Energy ADR * | | | 865 | | | | 18,468 | |
| Materials — 56.0% | | | | | | | | |
Aluminum Corp of China, Cl H * | | | 297,039 | | | | 107,609 | |
| Angang Steel, Cl H | | | 134,624 | | | | 114,542 | |
| Asia Cement China Holdings | | | 55,200 | | | | 47,388 | |
| BBMG, Cl H | | | 279,140 | | | | 76,912 | |
| China BlueChemical | | | 230,209 | | | | 78,700 | |
| China Hongqiao Group | | | 172,700 | | | | 115,656 | |
| China Molybdenum, Cl H | | | 329,954 | | | | 122,480 | |
| Dongyue Group | | | 138,300 | | | | 73,742 | |
| Jiangxi Copper, Cl H | | | 105,991 | | | | 116,815 | |
| Maanshan Iron & Steel, Cl H | | | 220,025 | | | | 117,880 | |
Real Gold Mining *(A) (B) (C) | | | 97,864 | | | | — | |
Sinofert Holdings * | | | 227,430 | | | | 25,530 | |
| Sinopec Shanghai Petrochemical, Cl H | | | 248,350 | | | | 108,978 | |
| Zhaojin Mining Industry | | | 130,684 | | | | 115,358 | |
| Zijin Mining Group, Cl H | | | 323,059 | | | | 119,920 | |
| | | | | | | | 1,341,510 | |
| TOTAL CHINA | | | | | | | 1,514,571 | |
| HONG KONG— 36.9% | | | | | | | | |
| Energy — 2.1% | | | | | | | | |
China Unienergy Group * | | | 30,600 | | | | 49,182 | |
| Industrials — 5.1% | | | | | | | | |
| Citic Pacific | | | 80,940 | | | | 121,419 | |
| Information Technology — 8.2% | | | | | | | | |
| Kingboard Holdings | | | 39,500 | | | | 105,811 | |
| Kingboard Laminates Holdings | | | 118,700 | | | | 90,849 | |
| | | | | | | | 196,660 | |
| Materials — 21.5% | | | | | | | | |
China Lumena New Materials *(A) (B) (C) | | | 1,950 | | | | — | |
The accompanying notes are an integral part of the financial statements.
| Schedule of Investments | | October 31, 2018 |
| | | |
| | Global X China Materials ETF | |
| | | Shares
| | Value | |
| COMMON STOCK — continued | | | | | | | | |
| Materials — continued | | | | | | | | |
| China Oriental Group | | | 134,800 | | | $ | 106,610 | |
| CPMC Holdings | | | 59,900 | | | | 19,637 | |
Fufeng Group * | | | 197,754 | | | | 83,749 | |
MMG * | | | 286,100 | | | | 107,296 | |
| Nine Dragons Paper Holdings | | | 122,070 | | | | 116,474 | |
| West China Cement | | | 299,560 | | | | 44,326 | |
| Xiwang Special Steel | | | 97,900 | | | | 19,107 | |
Youyuan International Holdings * | | | 56,700 | | | | 18,733 | |
| | | | | | | | 515,932 | |
| TOTAL HONG KONG | | | | | | | 883,193 | |
| TOTAL INVESTMENTS — 100.1% | | | | | | | | |
| (Cost $3,249,495) | | | | | | $ | 2,397,764 | |
| | | | | | |
| Percentages are based on Net Assets of $2,394,840. | | | | | |
| | | | | | | | | |
| | | | | | | | | |
| * | Non-income producing security. |
| (A) | Level 3 security in accordance with fair value hierarchy. |
| (B) | Security considered illiquid. The total value of such securities as of October 31, 2018 was $0 and represented 0.0% of Net Assets. |
| (C) | Security is fair valued using methods determined in good faith by the Fair Value Committee of the Fund. The total value of such securities as of October 31, 2018, was $0 and represents 0.0% of net assets. |
| ADR — American Depositary Receipt |
| Cl — Class |
| The following is a summary of the level of inputs used as of October 31, 2018, in valuing the Fund's investments carried at value: | | | | |
| | | | | | | | | | | | | |
| Investments in Securities | | Level 1 | | | Level 2 | | | Level 3 | | | Total | |
| Common Stock | | $ | 2,397,764 | | | $ | — | | | $ | — | (1) | | $ | 2,397,764 | |
| Total Investments in Securities | | $ | 2,397,764 | | | $ | — | | | $ | — | | | $ | 2,397,764 | |
The following is a reconciliation of investments in which significant unobservable inputs (Level 3) were used in determining fair value:
| | | Investments in Common Stock | |
| | | | |
| Beginning Balance as of October 31, 2017 | | $ | 194,512 | |
| Net sales | | | (194,259 | ) |
| Realized gain (loss) | | | 55,792 | |
| Change in unrealized appreciation (depreciation) | | | (56,045 | ) |
| Ending Balance as of October 31, 2018 | | $ | — | |
For the year ended October 31, 2018, there have been no transfers between Level 1 and Level 2 instruments.
(1)Amounts designated as “—“ are $0 or have been rounded to $0.
The accompanying notes are an integral part of the financial statements.
| Schedule of Investments | | October 31, 2018 |
| | | |
| | Global X NASDAQ China Technology ETF | |
| Sector Weightings (unaudited)†: |
| † Sector weightings percentages are based on the total market value of investments. Repurchase agreements purchased from cash collateral received for securities lending activity are included in total investments. Please see Note 2 and Note 7 in Notes to Financial Statements for more detailed information. |
| | | | | | | |
| | Shares | | Value | |
| COMMON STOCK — 99.8% | | | | |
| CHINA— 72.8% | | | | | | |
| Communication Services — 53.8% | | | | |
Autohome ADR * | | | 14,158 | | | $ | 1,024,756 | |
Baidu ADR * | | | 10,336 | | | | 1,964,460 | |
| China Communications Services, Cl H | | | 854,853 | | | | 691,350 | |
Momo ADR * | | | 50,569 | | | | 1,697,601 | |
| NetEase ADR | | | 11,840 | | | | 2,460,944 | |
SINA * | | | 16,482 | | | | 1,043,476 | |
Sogou ADR * (A) | | | 33,908 | | | | 197,006 | |
Sohu.com ADR * | | | 8,207 | | | | 148,301 | |
| Tencent Holdings | | | 54,045 | | | | 1,840,705 | |
Weibo ADR * | | | 20,538 | | | | 1,211,947 | |
YY ADR * | | | 15,302 | | | | 977,798 | |
| | | | | | | | 13,258,344 | |
| Consumer Discretionary — 2.9% | | | | | |
500.com ADR, Cl A * (A) | | | 7,537 | | | | 55,246 | |
Baozun ADR * (A) | | | 16,477 | | | | 655,949 | |
| | | | | | | | 711,195 | |
| Information Technology — 16.1% | | | | | |
21Vianet Group ADR * | | | 17,094 | | | | 185,897 | |
Cheetah Mobile ADR * | | | 15,092 | | | | 143,827 | |
Coolpad Group *(B) (C) (D) | | | 777,435 | | | | 17,850 | |
GDS Holdings ADR * | | | 16,406 | | | | 385,049 | |
Gridsum Holding ADR * (A) | | | 4,440 | | | | 23,843 | |
| Kingdee International Software Group | | | 738,689 | | | | 603,058 | |
| Kingsoft | | | 334,200 | | | | 473,202 | |
| Lenovo Group | | | 1,793,073 | | | | 1,141,342 | |
Link Motion ADR * | | | 32,206 | | | | 17,262 | |
O-Net Technologies Group * | | | 155,500 | | | | 67,243 | |
| Shanghai Baosight Software, Cl B | | | 86,289 | | | | 148,848 | |
| Travelsky Technology, Cl H | | | 312,095 | | | | 756,410 | |
| | | | | | | | 3,963,831 | |
| TOTAL CHINA | | | | | | | 17,933,370 | |
The accompanying notes are an integral part of the financial statements.
| Schedule of Investments | | October 31, 2018 |
| | | |
| | Global X NASDAQ China Technology ETF | |
| | Shares/Face Amount | | Value | |
| COMMON STOCK — continued | | | | | |
| HONG KONG— 27.0% | | | | | |
| Communication Services — 1.7% | | | | | |
| HKBN | | | 225,170 | | | $ | 337,781 | |
| Tian Ge Interactive Holdings | | | 186,500 | | | | 98,253 | |
| | | | | | | | 436,034 | |
| Health Care — 3.8% | | | | | |
Alibaba Health Information Technology * | | | 1,155,109 | | | | 934,177 | |
| Information Technology — 21.5% | | | | | |
| ASM Pacific Technology | | | 97,033 | | | | 837,964 | |
| BYD Electronic International | | | 239,381 | | | | 280,623 | |
| China Goldjoy Group | | | 4,110,400 | | | | 167,784 | |
Chinasoft International * | | | 775,356 | | | | 454,963 | |
Comba Telecom Systems Holdings * | | | 506,100 | | | | 71,014 | |
Digital China Holdings * | | | 265,348 | | | | 127,269 | |
FIH Mobile * | | | 1,128,309 | | | | 105,067 | |
Green Leader Holdings Group * | | | 2,051,300 | | | | 17,532 | |
| Hua Hong Semiconductor | | | 150,000 | | | | 260,989 | |
| Legend Holdings, Cl H | | | 207,900 | | | | 564,873 | |
Meitu * | | | 717,500 | | | | 374,337 | |
| Nanfang Communication Holdings | | | 105,100 | | | | 67,704 | |
National Agricultural Holdings *(B) (C) (D) | | | 204,200 | | | | 6,200 | |
| PAX Global Technology | | | 262,980 | | | | 129,487 | |
Semiconductor Manufacturing International * (A) | | | 991,221 | | | | 818,073 | |
| SUNeVision Holdings | | | 227,900 | | | | 122,680 | |
| VTech Holdings | | | 62,180 | | | | 729,719 | |
| Yangtze Optical Fibre and Cable Joint Stock, Cl H | | | 65,100 | | | | 158,610 | |
| | | | | | | | 5,294,888 | |
| TOTAL HONG KONG | | | | 6,665,099 | |
| TOTAL COMMON STOCK | | | | | |
| (Cost $27,693,623) | | | | 24,598,469 | |
| | | | | | | | | |
SHORT-TERM INVESTMENT(E)(F) — 0.3% | | | | |
| Fidelity Investments Money Market Government Portfolio, Cl Institutional, 2.060% | |
| (Cost $70,009) | | | 70,009 | | | | 70,009 | |
| | | | | | | | | |
REPURCHASE AGREEMENTS(E) — 4.0% | | | | |
| BNP Paribas | | | | | | | | |
| 2.190%, dated 10/31/18, to be repurchased on 11/01/18, repurchase price $222,129 (collateralized by U.S. Treasury Obligations, ranging in par value $76,576 - $144,187, 3.500%, 5/15/2020, with a total market value of $226,604) | | $ | 222,116 | | | | 222,116 | |
The accompanying notes are an integral part of the financial statements.
| Schedule of Investments | | October 31, 2018 |
| | | |
| | Global X NASDAQ China Technology ETF | |
| | Face Amount | | Value | |
REPURCHASE AGREEMENTS(E) — continued | |
| RBC Capital Markets | | | | | |
| 2.160%, dated 10/31/18, to be repurchased on 11/01/18, repurchase price $771,281 (collateralized by U.S. Treasury Obligations, ranging in par value $77,123 - $154,247, 2.000% - 2.625%, 2/15/2025 - 05/15/2025, with a total market value of $789,048) | | $ | 771,234 | | | $ | 771,234 | |
| | | | – | | | | — | |
| TOTAL REPURCHASE AGREEMENTS | | | | | | | | |
| (Cost $993,350) | | | | | | | 993,350 | |
| TOTAL INVESTMENTS — 104.1% | | | | | |
| (Cost $28,756,982) | | | $ | 25,661,828 | |
| | |
| Percentages are based on Net Assets of $24,644,908. | |
| * | Non-income producing security. |
| (A) | This security or a partial position of this security is on loan at October 31, 2018. The total value of securities on loan at October 31, 2018 was $1,045,307. |
| (B) | Level 3 security in accordance with fair value hierarchy. |
| (C) | Security considered illiquid. The total value of such securities as of October 31, 2018 was $24,050 and represented 0.1% of Net Assets. |
| (D) | Security is fair valued using methods determined in good faith by the Fair Value Committee of the Fund. The total value of such securities as of October 31, 2018, was $24,050 and represents 0.1% of net assets. |
| (E) | Security was purchased with cash collateral held from securities on loan. The total value of such securities as of October 31, 2018, was $1,063,359. |
| (F) | The rate reported on the Schedule of Investments is the 7-day effective yield as of October 31, 2018. |
| ADR — American Depositary Receipt |
| Cl — Class |
Amounts designated as “—” are either $0 or have been rounded to $0.
| The following is a summary of the level of inputs used as of October 31, 2018, in valuing the Fund's investments carried at value: | | | | |
| | | | | | | | | | | | | |
| Investments in Securities | | Level 1 | | | Level 2 | | | Level 3(1) | | | Total | |
| Common Stock | | $ | 24,574,419 | | | $ | — | | | $ | 24,050 | | | $ | 24,598,469 | |
| Short-Term Investment | | | 70,009 | | | | — | | | | — | | | | 70,009 | |
| Repurchase Agreements | | | — | | | | 993,350 | | | | — | | | | 993,350 | |
| Total Investments in Securities | | $ | 24,644,428 | | | $ | 993,350 | | | $ | 24,050 | | | $ | 25,661,828 | |
(1) A reconciliation of Level 3 investments and disclosures of significant unobservable inputs are presented when the Fund
has a significant amount of Level 3 investments at the beginning and/or end of the period in relation to Net Assets. Management has concluded that Level 3 investments are not material in relation to Net Assets.
For the year ended October 31, 2018, the transfers into Level 3 were due to changes in the availability of observable inputs to determine fair value. Transfers between levels are recognized at period end.
The accompanying notes are an integral part of the financial statements.
| Schedule of Investments | | October 31, 2018 |
| | | |
| | Global X FTSE Southeast Asia ETF | |
| Sector Weightings (unaudited)†: |
| † Sector weightings percentages are based on the total market value of investments. |
| | | | | | | |
| | Shares | | Value | |
| COMMON STOCK — 99.8% | | | | | | |
| INDONESIA— 18.2% | | | | | | |
| Communication Services — 3.2% | | | | | | |
| Telekomunikasi Indonesia Persero | | | 2,241,300 | | | $ | 567,604 | |
| Consumer Discretionary — 2.8% | | | | | | | | |
| Astra International | | | 958,781 | | | | 498,232 | |
| Consumer Staples — 2.0% | | | | | | | | |
| Gudang Garam | | | 21,300 | | | | 101,298 | |
| Hanjaya Mandala Sampoerna | | | 406,700 | | | | 99,786 | |
| Unilever Indonesia | | | 53,576 | | | | 152,332 | |
| | | | | | | | 353,416 | |
| Financials — 10.2% | | | | | | | | |
| Bank Central Asia | | | 458,796 | | | | 713,733 | |
| Bank Mandiri | | | 872,180 | | | | 392,990 | |
| Bank Negara Indonesia Persero | | | 351,300 | | | | 169,266 | |
| Bank Rakyat Indonesia Persero | | | 2,507,000 | | | | 519,458 | |
| | | | | | | | 1,795,447 | |
| TOTAL INDONESIA | | | | | | | 3,214,699 | |
| MALAYSIA— 21.3% | | | | | | | | |
| Communication Services — 2.9% | | | | | | | | |
| Axiata Group | | | 209,788 | | | | 170,959 | |
| DiGi.com | | | 173,000 | | | | 178,188 | |
| Maxis | | | 130,806 | | | | 163,488 | |
| | | | | | | | 512,635 | |
| Consumer Staples — 1.2% | | | | | | | | |
| Sime Darby Plantation | | | 166,596 | | | | 209,415 | |
| Financials — 10.9% | | | | | | | | |
| CIMB Group Holdings | | | 310,975 | | | | 425,087 | |
| Malayan Banking | | | 277,431 | | | | 629,184 | |
The accompanying notes are an integral part of the financial statements.
| Schedule of Investments | | October 31, 2018 |
| | | |
| | Global X FTSE Southeast Asia ETF | |
| | | Shares
| | Value | |
| COMMON STOCK — continued | | | | | | | | |
| Financials — continued | | | | | | | | |
| Public Bank | | | 146,199 | | | $ | 859,480 | |
| | | | | | | | 1,913,751 | |
| Health Care — 0.9% | | | | | | | | |
| IHH Healthcare | | | 133,380 | | | | 159,374 | |
| Materials — 1.7% | | | | | | | | |
| Petronas Chemicals Group | | | 133,424 | | | | 298,127 | |
| Utilities — 3.7% | | | | | | | | |
| Tenaga Nasional | | | 187,745 | | | | 659,542 | |
| TOTAL MALAYSIA | | | | | | | 3,752,844 | |
| PHILIPPINES— 5.1% | | | | | | | | |
| Industrials — 2.2% | | | | | | | | |
| SM Investments | | | 22,680 | | | | 381,497 | |
| Real Estate — 2.9% | | | | | | | | |
| Ayala Land | | | 327,660 | | | | 242,813 | |
| SM Prime Holdings | | | 425,200 | | | | 268,606 | |
| | | | | | | | 511,419 | |
| TOTAL PHILIPPINES | | | | | | | 892,916 | |
| SINGAPORE— 30.0% | | | | | | | | |
| Communication Services — 4.6% | | | | | | | | |
| Singapore Telecommunications | | | 353,604 | | | | 806,895 | |
| Consumer Discretionary — 0.6% | | | | | | | | |
| Jardine Cycle & Carriage | | | 4,618 | | | | 100,944 | |
| Consumer Staples — 1.2% | | | | | | | | |
| Wilmar International | | | 91,951 | | | | 209,825 | |
| Financials — 21.2% | | | | | | | | |
| DBS Group Holdings | | | 85,873 | | | | 1,454,781 | |
| Oversea-Chinese Banking | | | 155,166 | | | | 1,203,410 | |
| United Overseas Bank | | | 60,847 | | | | 1,071,238 | |
| | | | | | | | 3,729,429 | |
| Industrials — 0.9% | | | | | | | | |
| Singapore Airlines | | | 23,843 | | | | 163,223 | |
| Real Estate — 1.5% | | | | | | | | |
| CapitaLand | | | 118,318 | | | | 268,283 | |
| TOTAL SINGAPORE | | | | | | | 5,278,599 | |
| THAILAND— 25.2% | | | | | | | | |
| Communication Services — 1.8% | | | | | | | | |
| Advanced Info Service NVDR | | | 53,061 | | | | 313,724 | |
| Consumer Staples — 2.8% | | | | | | | | |
| CP ALL NVDR | | | 247,173 | | | | 501,430 | |
The accompanying notes are an integral part of the financial statements.
| Schedule of Investments | | October 31, 2018 |
| | | |
| | Global X FTSE Southeast Asia ETF | |
| | | Shares
| | Value | |
| COMMON STOCK — continued | | | | | | | | |
| Energy — 7.5% | | | | | | | | |
| PTT NVDR | | | 679,940 | | | $ | 1,046,062 | |
| PTT Exploration & Production NVDR | | | 66,110 | | | | 278,200 | |
| | | | | | | | 1,324,262 | |
| Financials — 6.8% | | | | | | | | |
| Bangkok Bank | | | 5,100 | | | | 31,846 | |
| Bangkok Bank NVDR | | | 17,611 | | | | 109,969 | |
| Kasikornbank NVDR | | | 95,408 | | | | 574,175 | |
| Siam Commercial Bank NVDR | | | 114,031 | | | | 472,979 | |
| | | | | | | | 1,188,969 | |
| Industrials — 2.2% | | | | | | | | |
| Airports of Thailand NVDR | | | 202,000 | | | | 389,985 | |
| Materials — 4.1% | | | | | | | | |
| PTT Global Chemical NVDR | | | 95,700 | | | | 223,011 | |
| Siam Cement NVDR | | | 40,226 | | | | 507,224 | |
| | | | | | | | 730,235 | |
| TOTAL THAILAND | | | | | | | 4,448,605 | |
| TOTAL INVESTMENTS — 99.8% | | | | | | | | |
| (Cost $18,802,932) | | | | | | $ | 17,587,663 | |
| | | | | | |
| Percentages are based on Net Assets of $17,614,200. | | | | | |
| | | | | | | | | |
| NVDR — Non-Voting Depositary Receipt |
| As of October 31, 2018, all of the Fund's investments were considered Level 1, in accordance with authoritative guidance on fair value measurements and disclosure under U.S. GAAP. |
For the year ended October 31, 2018, there have been no transfers between Level 1, Level 2 or Level 3 investments.
As of October 31, 2018, there were no Level 3 investments.
The accompanying notes are an integral part of the financial statements.
| Schedule of Investments | | October 31, 2018 |
| | | |
| | Global X MSCI Colombia ETF | |
| Sector Weightings (Unaudited)† |
| † Sector weightings percentages are based on the total market value of investments. |
| | | Shares | | | Value | |
| COMMON STOCK — 88.6% | | | | | | |
| CHILE— 4.5% | | | | | | |
| Energy — 2.2% | | | | | | |
| Empresas COPEC | | | 126,300 | | | $ | 1,769,388 | |
| Utilities — 2.3% | | | | | | | | |
| Enersis | | | 11,862,899 | | | | 1,868,593 | |
| TOTAL CHILE | | | | | | | 3,637,981 | |
| COLOMBIA— 84.1% | | | | | | | | |
| Consumer Staples — 7.6% | | | | | | | | |
| Almacenes Exito | | | 678,816 | | | | 2,928,933 | |
| Grupo Nutresa | | | 481,962 | | | | 3,336,262 | |
| | | | | | | | 6,265,195 | |
| Energy — 20.5% | | | | | | | | |
Canacol Energy * | | | 690,123 | | | | 1,939,124 | |
| Ecopetrol ADR | | | 642,924 | | | | 14,954,412 | |
| | | | | | | | 16,893,536 | |
| Financials — 36.9% | | | | | | | | |
| Banco de Bogota | | | 130,018 | | | | 2,583,817 | |
| BanColombia | | | 564,879 | | | | 5,309,502 | |
| BanColombia ADR | | | 295,962 | | | | 10,932,836 | |
Financiera Colombiana * | | | 407,674 | | | | 2,492,997 | |
| Grupo Aval Acciones y Valores ADR | | | 466,811 | | | | 3,281,681 | |
| Grupo de Inversiones Suramericana | | | 585,128 | | | | 5,703,259 | |
| | | | | | | | 30,304,092 | |
| Materials — 7.2% | | | | | | | | |
| Cementos Argos | | | 1,076,781 | | | | 2,346,427 | |
Cemex Latam Holdings * | | | 886,217 | | | | 1,375,475 | |
| Grupo Argos | | | 469,018 | | | | 2,183,852 | |
| | | | | | | | 5,905,754 | |
| Utilities — 11.9% | | | | | | | | |
| Celsia ESP | | | 2,175,788 | | | | 2,688,080 | |
| Grupo Energia Bogota ESP | | | 6,357,206 | | | | 3,660,604 | |
The accompanying notes are an integral part of the financial statements.
| Schedule of Investments | | October 31, 2018 |
| | | |
| | Global X MSCI Colombia ETF | |
| | Shares
| | | Value | |
| COMMON STOCK — continued | | | | | | | | |
| | | | 942,450 | | | $ | 3,498,904 | |
| Utilities — continued | | | | | | | | |
| Interconexion Electrica | | | | | | | | |
| | | | | | | | 9,847,588 | |
| TOTAL COLOMBIA | | | | | | | 69,216,165 | |
| TOTAL COMMON STOCK | | | | | | | | |
| (Cost $79,983,462) | | | | | | | 72,854,146 | |
| | | | | | | | | |
PREFERRED STOCK — 11.2%(A) | | | | | | | | |
| COLOMBIA— 11.2% | | | | | | | | |
| Financials — 7.7% | | | | | | | | |
| Banco Davivienda | | | 373,390 | | | | 3,593,080 | |
| Grupo Aval Acciones y Valores | | | 1,431,941 | | | | 502,281 | |
| Grupo de Inversiones Suramericana | | | 248,317 | | | | 2,266,190 | |
| | | | | | | | 6,361,551 | |
| Industrials — 1.6% | | | | | | | | |
| Avianca Holdings | | | 2,206,289 | | | | 1,352,608 | |
| Materials — 1.9% | | | | | | | | |
| Cementos Argos GDR | | | 363,393 | | | | 654,255 | |
| Grupo Argos | | | 217,301 | | | | 876,895 | |
| | | | | | | | 1,531,150 | |
| TOTAL PREFERRED STOCK | | | | | | | | |
| (Cost $11,495,038) | | | | | | | 9,245,309 | |
| TOTAL INVESTMENTS — 99.8% | | | | | | | | |
| (Cost $91,478,500) | | | | | | $ | 82,099,455 | |
| | | | | | |
| Percentages are based on Net Assets of $82,282,257. | | | | | |
| | | | | | | | | |
| * | Non-income producing security. |
| (A) | There’s currently no stated interest rate. |
| ADR — American Depositary Receipt |
GDR — Global Depositary Receipt
| As of October 31, 2018, all of the Fund's investments were considered Level 1, in accordance with authoritative guidance on fair value measurements and disclosure under U.S. GAAP. |
For the year ended October 31, 2018, there have been no transfers between Level 1, Level 2, and Level 3 investments.
As of October 31, 2018, there were no Level 3 investments.
The accompanying notes are an integral part of the financial statements.
| Schedule of Investments | | October 31, 2018 |
| | | |
| | Global X MSCI Argentina ETF | |
| Sector Weightings (unaudited)†: |
| † Sector weightings percentages are based on the total market value of investments. |
| | | | | | | |
| | Shares | | Value | |
| COMMON STOCK — 98.2% | | | | | | |
| ARGENTINA— 62.9% | | | | | | |
| Communication Services — 4.8% | | | | | | |
| Telecom Argentina ADR | | | 238,533 | | | $ | 4,319,832 | |
| Consumer Discretionary — 22.0% | | | | | | | | |
MercadoLibre * | | | 60,580 | | | | 19,658,210 | |
| Consumer Staples — 2.8% | | | | | | | | |
Adecoagro * | | | 309,741 | | | | 2,477,928 | |
| Energy — 4.6% | | | | | | | | |
YPF ADR * | | | 276,557 | | | | 4,148,355 | |
| Financials — 13.6% | | | | | | | | |
| Banco Macro ADR | | | 93,475 | | | | 4,177,398 | |
| BBVA Banco Frances ADR | | | 199,382 | | | | 2,187,220 | |
| Grupo Financiero Galicia ADR | | | 190,653 | | | | 4,396,458 | |
| Grupo Supervielle ADR | | | 170,285 | | | | 1,420,177 | |
| | | | | | | | 12,181,253 | |
| Materials — 1.7% | | | | | | | | |
Loma Negra Cia Industrial Argentina ADR * | | | 168,782 | | | | 1,520,726 | |
| Oil & Gas — 3.4% | | | | | | | | |
| Transportadora de Gas del Sur ADR | | | 206,949 | | | | 3,006,969 | |
| Real Estate — 3.0% | | | | | | | | |
| Cresud SACIF y A ADR | | | 118,405 | | | | 1,406,651 | |
| IRSA Inversiones y Representaciones ADR | | | 91,332 | | | | 1,221,109 | |
| | | | | | | | 2,627,760 | |
| Utilities — 7.0% | | | | | | | | |
| Central Puerto ADR | | | 195,810 | | | | 1,875,860 | |
Empresa Distribuidora Y Comercializadora Norte ADR * | | | 23,866 | | | | 544,145 | |
The accompanying notes are an integral part of the financial statements.
| Schedule of Investments | | October 31, 2018 |
| | | |
| | Global X MSCI Argentina ETF | |
| | | Shares
| | Value | |
| COMMON STOCK — continued | | | | | | | | |
| Utilities — continued | | | | | | | | |
Pampa Energia ADR * | | | 117,344 | | | $ | 3,885,260 | |
| | | | | | | | 6,305,265 | |
| TOTAL ARGENTINA | | | | | | | 56,246,298 | |
| CANADA— 4.0% | | | | | | | | |
| Materials — 4.0% | | | | | | | | |
| Pan American Silver | | | 112,484 | | | | 1,660,815 | |
SSR Mining * | | | 192,647 | | | | 1,892,363 | |
| TOTAL CANADA | | | | | | | 3,553,178 | |
| CHILE— 3.7% | | | | | | | | |
| Consumer Staples — 3.7% | | | | | | | | |
| Cencosud | | | 733,050 | | | | 1,524,997 | |
| Cia Cervecerias Unidas | | | 144,698 | | | | 1,797,798 | |
| TOTAL CHILE | | | | | | | 3,322,795 | |
| LUXEMBOURG— 15.6% | | | | | | | | |
| Energy — 15.6% | | | | | | | | |
| Tenaris | | | 939,059 | | | | 13,975,707 | |
| SPAIN— 1.7% | | | | | | | | |
| Industrials — 1.7% | | | | | | | | |
| Prosegur Cia de Seguridad | | | 279,183 | | | | 1,552,546 | |
| UNITED KINGDOM— 0.8% | | | | | | | | |
| Oil & Gas — 0.8% | | | | | | | | |
Phoenix Global Resources * | | | 2,847,605 | | | | 672,214 | |
| UNITED STATES— 6.5% | | | | | | | | |
| Consumer Discretionary — 1.2% | | | | | | | | |
Despegar.com * | | | 65,004 | | | | 1,044,614 | |
| Industrials — 1.0% | | | | | | | | |
America Airports * | | | 110,472 | | | | 876,043 | |
| Information Technology — 4.3% | | | | | | | | |
Globant * | | | 75,447 | | | | 3,884,012 | |
| TOTAL UNITED STATES | | | | | | | 5,804,669 | |
| URUGUAY— 3.0% | | | | | | | | |
| Consumer Discretionary — 3.0% | | | | | | | | |
| Arcos Dorados Holdings, Cl A | | | 371,760 | | | | 2,680,390 | |
| TOTAL COMMON STOCK | | | | | | | | |
| (Cost $115,370,828) | | | | | | | 87,807,797 | |
| | | | | | | | | |
| | | | | | | | | |
| | | | | | | | | |
The accompanying notes are an integral part of the financial statements.
| Schedule of Investments | | October 31, 2018 |
| | | |
| | Global X MSCI Argentina ETF | |
| | | Shares
| | Value | |
| PREFERRED STOCK — 1.7% | | | | | | | | |
| CHILE— 1.7% | | | | | | | | |
| Consumer Staples — 1.7% | | | | | | | | |
Embotelladora Andina(A) | | | | | | | | |
| (Cost $2,048,605) | | | 444,804 | | | $ | 1,536,749 | |
| TOTAL INVESTMENTS — 99.9% | | | | | | | | |
| (Cost $117,419,433) | | | | | | $ | 89,344,546 | |
| | | | | | |
| Percentages are based on Net Assets of $89,390,954. | | | | | |
| | | | | | | | | |
| * | Non-income producing security. |
| (A) | There’s currently no stated interest rate. |
| ADR — American Depositary Receipt |
| Cl — Class |
| As of October 31, 2018, all of the Fund's investments were considered Level 1, in accordance with authoritative guidance on fair value measurements and disclosure under U.S. GAAP. |
For the year ended October 31, 2018, there have been no transfers between Level 1, Level 2 and Level 3 investments.
As of October 31, 2018, there were no Level 3 investments.
The accompanying notes are an integral part of the financial statements.
| Schedule of Investments | | October 31, 2018 |
| | | |
| | | |
| Sector Weightings (unaudited)†: |
| † Sector weightings percentages are based on the total market value of investments. Repurchase agreements purchased from cash collateral received for securities lending activity are included in total investments. Please see Note 2 and Note 7 in Notes to Financial Statements for more detailed information. |
| | | | | | | |
| | Shares | | Value | |
| COMMON STOCK — 100.0% | | | | |
| GREECE— 95.1% | | | | | | |
| Communication Services — 12.6% | | | | |
| Hellenic Telecommunications Organization | | | 2,901,645 | | | $ | 32,384,064 | |
| Consumer Discretionary — 21.4% | | | | | |
FF Group *(A)(B)(C) | | | 452,712 | | | | 861,751 | |
FF Group ADR *(A)(B)(C) | | | 200,300 | | | | 381,278 | |
| JUMBO | | | 808,509 | | | | 11,799,173 | |
| JUMBO ADR | | | 340,000 | | | | 4,961,858 | |
| OPAP | | | 1,903,620 | | | | 17,902,315 | |
| OPAP ADR | | | 1,404,900 | | | | 6,715,422 | |
| Titan Cement | | | 345,246 | | | | 7,604,589 | |
| Titan Cement ADR | | | 439,800 | | | | 4,843,649 | |
| | | | | | | | 55,070,035 | |
| Consumer Staples — 1.7% | | | | | |
| Sarantis | | | 566,523 | | | | 4,506,148 | |
| Energy — 17.8% | | | | | | | | |
Capital Product Partners (D) | | | 1,736,606 | | | | 4,793,033 | |
Dorian LPG * | | | 423,010 | | | | 3,362,930 | |
| GasLog | | | 645,942 | | | | 13,215,973 | |
| Hellenic Petroleum | | | 933,306 | | | | 7,423,556 | |
| Motor Oil Hellas Corinth Refineries | | | 381,004 | | | | 9,022,495 | |
| Motor Oil Hellas Corinth Refineries ADR | | | 368,300 | | | | 4,360,819 | |
Tsakos Energy Navigation (E) | | | 1,082,014 | | | | 3,570,646 | |
| | | | | | | | 45,749,452 | |
| Financials — 22.0% | | | | | | | | |
Alpha Bank AE * | | | 16,502,150 | | | | 24,961,612 | |
Eurobank Ergasias * | | | 16,187,399 | | | | 10,913,018 | |
| Hellenic Exchanges - Athens Stock Exchange | | | 949,466 | | | | 4,195,608 | |
The accompanying notes are an integral part of the financial statements.
| Schedule of Investments | | October 31, 2018 |
| | | |
| | | |
| | Shares/Face Amount | | Value | |
| COMMON STOCK — continued | | | | | |
| Financials — continued | | | | | |
National Bank of Greece * | | | 6,234,576 | | | $ | 10,808,096 | |
Piraeus Bank * (E) | | | 3,993,227 | | | | 5,881,908 | |
| | | | | | | | 56,760,242 | |
| Industrials — 9.7% | | | | | | | | |
| Aegean Airlines | | | 550,650 | | | | 4,167,762 | |
Ellaktor * | | | 2,208,475 | | | | 3,187,959 | |
GEK Terna Holding Real Estate Construction * | | | 1,108,777 | | | | 5,873,226 | |
| Mytilineos Holdings | | | 946,606 | | | | 8,376,665 | |
| Mytilineos Holdings ADR | | | 426,200 | | | | 3,724,988 | |
| | | | | | | | 25,330,600 | |
| Real Estate — 3.7% | | | | | | | | |
Grivalia Properties ‡ | | | 692,916 | | | | 5,958,998 | |
LAMDA Development * | | | 508,082 | | | | 3,511,676 | |
| | | | | | | | 9,470,674 | |
| Utilities — 6.2% | | | | | | | | |
| Athens Water Supply & Sewage | | | 711,623 | | | | 4,192,800 | |
| Holding ADMIE IPTO | | | 2,033,328 | | | | 3,718,449 | |
Public Power (E) | | | 2,060,596 | | | | 3,095,902 | |
| Terna Energy | | | 741,266 | | | | 5,148,555 | |
| | | | | | | | 16,155,706 | |
| TOTAL GREECE | | | | | | | 245,426,921 | |
| MONACO— 4.9% | | | | | | | | |
| Energy — 4.9% | | | | | | | | |
GasLog Partners(E) | | | 508,475 | | | | 12,635,604 | |
| TOTAL COMMON STOCK | | | | | |
| (Cost $331,134,059) | | | | | | | 258,062,525 | |
| | | | | | | | | |
SHORT-TERM INVESTMENT(F)(G) — 0.2% | | | | | |
| Fidelity Investments Money Market Government Portfolio, Cl Institutional, 2.060% | |
| (Cost $520,853) | | | 520,853 | | | | 520,853 | |
| | | | | | | | | |
REPURCHASE AGREEMENTS(F) — 2.9% | | | | | |
| BNP Paribas | | | | | | | | |
| 2.190%, dated 10/31/18, to be repurchased on 11/01/18, repurchase price $1,652,601 (collateralized by U.S. Treasury Obligations, ranging in par value $569,709 - $1,072,727, 3.500%, 5/15/2020, with a total market value of $1,685,897) | | $ | 1,652,500 | | | | 1,652,500 | |
The accompanying notes are an integral part of the financial statements.
| Schedule of Investments | | October 31, 2018 |
| | | |
| | | |
| | Face Amount | | Value | |
REPURCHASE AGREEMENTS(F) — continued | | | | | |
| RBC Capital Markets | | | | | | | | |
| 2.160%, dated 10/31/18, to be repurchased on 11/01/18, repurchase price $5,738,191 (collateralized by U.S. Treasury Obligations, ranging in par value $573,785 - $1,147,569, 2.000% - 2.625%, 2/15/2025 - 05/15/2025, with a total market value of $5,870,375) | | $ | 5,737,847 | | | $ | 5,737,847 | |
| | | | – | | | | — | |
| TOTAL REPURCHASE AGREEMENTS | | | | | | | | |
| (Cost $7,390,347) | | | | | | | 7,390,347 | |
| TOTAL INVESTMENTS — 103.1% | | | | | |
| (Cost $339,045,259) | | | | | | $ | 265,973,725 | |
| | | | | |
| Percentages are based on Net Assets of $257,900,546. | | | | |
| | | | | | | | | |
| * | Non-income producing security. |
| ‡ | Real Estate Investment Trust |
| (A) | Security is fair valued using methods determined in good faith by the Fair Value Committee of the Fund. The total value of such securities as of October 31, 2018, was $1,243,029 and represents 0.5% of Net Assets. |
| (B) | Level 3 security in accordance with fair value hierarchy. |
| (C) | Security considered illiquid. The total value of such securities as of October 31, 2018 was $1,243,029 and represented 0.5% of Net Assets. |
| (D) | Security considered Master Limited Partnership. At October 31, 2018, these securities amounted to $4,793,033 or 1.9% of net assets. |
| (E) | This security or a partial position of this security is on loan at October 31, 2018. The total value of securities on loan at October 31, 2018 was $7,592,452. |
| (F) | Security was purchased with cash collateral held from securities on loan. The total value of such securities as of October 31, 2018, was $7,911,200. |
| (G) | The rate reported on the Schedule of Investments is the 7-day effective yield as of October 31, 2018. |
| ADR — American Depositary Receipt |
| Cl — Class |
| The following is a summary of the level of inputs used as of October 31, 2018, in valuing the Fund's investments carried at value: | |
| | | | | | | | | |
| Investments in Securities | Level 1 | | Level 2 | | Level 3(1) | | Total | |
| Common Stock | | $ | 256,819,496 | | | $ | — | | | $ | 1,243,029 | | | $ | 258,062,525 | |
| Short-Term Investment | | | 520,853 | | | | — | | | | — | | | | 520,853 | |
| Repurchase Agreements | | | — | | | | 7,390,347 | | | | — | | | | 7,390,347 | |
| Total Investments in Securities | | $ | 257,340,349 | | | $ | 7,390,347 | | | $ | 1,243,029 | | | $ | 265,973,725 | |
(1) A reconciliation of Level 3 investments and disclosures of significant unobservable inputs are presented when the Fund
has a significant amount of Level 3 investments at the beginning and/or end of the period in relation to Net Assets. Management has concluded that Level 3 investments are not material in relation to Net Assets.
For the year ended October 31, 2018, there have been no transfers between Level 1, Level 2 or Level 3 investments.
The accompanying notes are an integral part of the financial statements.
| Schedule of Investments | | October 31, 2018 |
| | | |
| | | |
| Sector Weightings (unaudited)†: |
| † Sector weightings percentages are based on the total market value of investments. Repurchase agreements purchased from cash collateral received for securities lending activity are included in total investments. Please see Note 2 and Note 7 in Notes to Financial Statements for more detailed information. |
| | | | | | | |
| | Shares | | Value | |
| COMMON STOCK — 99.8% | | | | | | |
| NORWAY— 99.8% | | | | | | |
| Communication Services — 10.9% | | | | |
Otello * | | | 157,420 | | | $ | 265,958 | |
| Schibsted, Cl B | | | 110,946 | | | | 3,524,421 | |
Telenor (A) | | | 763,176 | | | | 14,042,340 | |
| | | | | | | | 17,832,719 | |
| Consumer Discretionary — 1.2% | | | | | | | | |
| Europris | | | 170,400 | | | | 455,146 | |
Gaming Innovation Group * (A) | | | 376,600 | | | | 138,902 | |
Kongsberg Automotive Holding * | | | 626,293 | | | | 588,667 | |
| XXL | | | 126,904 | | | | 655,285 | |
| | | | | | | | 1,838,000 | |
| Consumer Staples — 17.9% | | | | | | | | |
| Austevoll Seafood | | | 120,528 | | | | 1,944,520 | |
| Bakkafrost P | | | 49,505 | | | | 2,788,317 | |
| Grieg Seafood | | | 54,900 | | | | 802,766 | |
| Leroy Seafood Group | | | 361,900 | | | | 3,344,742 | |
| Marine Harvest | | | 403,333 | | | | 9,789,461 | |
| Norway Royal Salmon | | | 13,936 | | | | 411,202 | |
| Orkla | | | 803,447 | | | | 6,953,371 | |
| Salmar | | | 61,253 | | | | 3,243,040 | |
| | | | | | | | 29,277,419 | |
| Energy — 33.4% | | | | | | | | |
Akastor * | | | 272,885 | | | | 533,760 | |
The accompanying notes are an integral part of the financial statements.
| Schedule of Investments | | October 31, 2018 |
| | | |
| | | |
| | | Shares
| | Value | |
| COMMON STOCK — continued | | | | | |
| Energy — continued | | | | | | | | |
| Aker BP | | | 124,912 | | | $ | 4,131,558 | |
Aker Solutions * | | | 200,866 | | | | 1,328,759 | |
Borr Drilling * | | | 432,000 | | | | 1,685,864 | |
BW LPG * | | | 113,150 | | | | 537,011 | |
BW Offshore * | | | 101,298 | | | | 652,023 | |
| DNO International | | | 842,524 | | | | 1,626,918 | |
| Equinor | | | 1,234,582 | | | | 32,212,426 | |
FLEX LNG * | | | 156,500 | | | | 275,576 | |
Frontline * | | | 112,864 | | | | 819,796 | |
| Hoegh LNG Holdings | | | 69,488 | | | | 324,500 | |
Kvaerner * | | | 101,200 | | | | 176,514 | |
Northern Drilling * | | | 37,650 | | | | 319,836 | |
| Ocean Yield | | | 84,807 | | | | 645,768 | |
Odfjell Drilling * | | | 100,800 | | | | 370,582 | |
Petroleum Geo-Services * | | | 383,090 | | | | 1,200,553 | |
Subsea 7 * | | | 302,564 | | | | 3,832,020 | |
| TGS Nopec Geophysical | | | 119,434 | | | | 4,019,998 | |
| | | | | | | | 54,693,462 | |
| Financials — 19.9% | | | | | | | | |
Axactor * (A) | | | 130,940 | | | | 344,294 | |
| B2Holding | | | 203,615 | | | | 344,488 | |
| DnB | | | 1,015,084 | | | | 18,423,794 | |
| Gjensidige Forsikring | | | 234,522 | | | | 3,644,111 | |
Norwegian Finance Holding * | | | 121,300 | | | | 1,087,449 | |
Protector Forsikring * | | | 87,009 | | | | 403,732 | |
| Sbanken | | | 80,055 | | | | 800,078 | |
| Sparebank 1 Nord Norge | | | 138,239 | | | | 1,108,550 | |
| Sparebank 1 Oestlandet | | | 33,437 | | | | 348,495 | |
| SpareBank 1 SMN | | | 159,300 | | | | 1,629,968 | |
| Storebrand | | | 540,438 | | | | 4,511,286 | |
| | | | | | | | 32,646,245 | |
| Health Care — 1.5% | | | | | | | | |
| Aker, Cl A | | | 27,700 | | | | 2,112,529 | |
Nordic Nanovector * (A) | | | 42,100 | | | | 278,498 | |
| | | | | | | | 2,391,027 | |
| Industrials — 1.8% | | | | | | | | |
| Golden Ocean Group | | | 122,360 | | | | 920,799 | |
Norwegian Air Shuttle * (A) | | | 46,204 | | | | 1,181,906 | |
| Stolt-Nielsen | | | 39,140 | | | | 528,079 | |
Wallenius Wilhelmsen Logistics, Cl B * | | | 113,027 | | | | 388,638 | |
| | | | | | | | 3,019,422 | |
| Information Technology — 1.8% | | | | | | | | |
| Atea | | | 104,351 | | | | 1,380,595 | |
| Evry | | | 156,083 | | | | 575,681 | |
The accompanying notes are an integral part of the financial statements.
| Schedule of Investments | | October 31, 2018 |
| | | |
| | | |
| | Shares/Face Amount | | Value | |
| COMMON STOCK — continued | | | | | |
| Information Technology — continued | | | | | |
Nordic Semiconductor * | | | 169,704 | | | $ | 726,875 | |
REC Silicon * (A) | | | 3,045,594 | | | | 218,501 | |
| | | | | | | | 2,901,652 | |
| Materials — 9.4% | | | | | | | | |
| Borregaard | | | 132,017 | | | | 1,193,736 | |
| Norsk Hydro | | | 1,338,862 | | | | 6,970,726 | |
| Yara International | | | 166,227 | | | | 7,173,217 | |
| | | | | | | | 15,337,679 | |
| Real Estate — 1.5% | | | | | | | | |
| Entra | | | 123,672 | | | | 1,680,360 | |
| Norwegian Property | | | 302,390 | | | | 372,009 | |
| Selvaag Bolig | | | 90,358 | | | | 405,833 | |
| | | | | | | | 2,458,202 | |
| Utilities — 0.5% | | | | | | | | |
| Scatec Solar | | | 114,810 | | | | 784,073 | |
| TOTAL COMMON STOCK | | | | | | | | |
| (Cost $163,677,308) | | | | | | | 163,179,900 | |
| | | | | | | | | |
SHORT-TERM INVESTMENT(B)(C) — 0.0% | | | | | |
| Fidelity Investments Money Market Government Portfolio, Cl Institutional, 2.060% | |
| (Cost $43,102) | | | 43,102 | | | | 43,102 | |
| | | | | | | | | |
REPURCHASE AGREEMENTS(B) — 0.4% | | | | | |
| BNP Paribas | | | | | | | | |
| 2.190%, dated 10/31/18, to be repurchased on 11/01/18, repurchase price $136,759 (collateralized by U.S. Treasury Obligations, ranging in par value $47,146 - $88,772, 3.500%, 5/15/2020, with a total market value of $139,514) | | $ | 136,750 | | | | 136,750 | |
| RBC Capital Markets | | | | | | | | |
| 2.160%, dated 10/31/18, to be repurchased on 11/01/18, repurchase price $474,856 (collateralized by U.S. Treasury Obligations, ranging in par value $47,483 - $94,966 , 2.000% - 2.625%, 2/15/2025 - 05/15/2025, with a total market value of $485,795) | | | 474,828 | | | | 474,828 | |
| | | | – | | | | — | |
| TOTAL REPURCHASE AGREEMENTS | | | | | | | | |
| (Cost $611,578) | | | | | | | 611,578 | |
| TOTAL INVESTMENTS — 100.2% | | | | | |
| (Cost $164,331,988) | | | | | | $ | 163,834,580 | |
| | | | | | |
| Percentages are based on Net Assets of $163,471,398. | | | | | |
| | | | | | | | | |
| * | Non-income producing security. |
| (A) | This security or a partial position of this security is on loan at October 31, 2018. The total value of securities on loan at October 31, 2018 was $623,039. |
| (B) | Security was purchased with cash collateral held from securities on loan. The total value of such securities as of October 31, 2018, was $654,680. |
| | |
| (C) | The rate reported on the Schedule of Investments is the 7-day effective yield as of October 31, 2018. |
The accompanying notes are an integral part of the financial statements.
| Schedule of Investments | | October 31, 2018 |
| | | |
| | | |
| The following is a summary of the level of inputs used as of October 31, 2018, in valuing the Fund's investments carried at value: | |
| | | | | | | | | |
| Investments in Securities | Level 1 | | Level 2 | | Level 3 | | Total | |
| Common Stock | | $ | 163,179,900 | | | $ | — | | | $ | — | | | $ | 163,179,900 | |
| Short-Term Investment | | | 43,102 | | | | — | | | | — | | | | 43,102 | |
| Repurchase Agreements | | | — | | | | 611,578 | | | | — | | | | 611,578 | |
| Total Investments in Securities | | $ | 163,223,002 | | | $ | 611,578 | | | $ | — | | | $ | 163,834,580 | |
For the year ended October 31, 2018, there have been no transfers between Level 1, Level 2 and Level 3 investments.
As of October 31, 2018, there were no Level 3 investments.
The accompanying notes are an integral part of the financial statements.
| Schedule of Investments | | October 31, 2018 |
| | | |
| | Global X MSCI Nordic Region ETF | |
| Sector Weightings (unaudited)†: |
| † Sector weightings percentages are based on the total market value of investments. Repurchase agreements purchased from cash collateral received for securities lending activity are included in total investments. Please see Note 2 and Note 7 in Notes to Financial Statements for more detailed information. |
| | | | | | | |
| | Shares
| | Value | |
| COMMON STOCK — 99.9% | | | | |
| DENMARK— 27.1% | | | | | | |
| Consumer Staples — 2.1% | | | | | | |
| Carlsberg, Cl B | | | 4,595 | | | $ | 507,043 | |
| Financials — 2.3% | | | | | | | | |
| Danske Bank | | | 29,199 | | | | 560,283 | |
| Health Care — 15.4% | | | | | | | | |
| Coloplast, Cl B | | | 5,744 | | | | 536,480 | |
| Novo Nordisk, Cl B | | | 73,867 | | | | 3,196,001 | |
| | | | | | | | 3,732,481 | |
| Industrials — 3.7% | | | | | | | | |
| A P Moller - Maersk, Cl B | | | 285 | | | | 362,012 | |
| Vestas Wind Systems | | | 8,339 | | | | 523,158 | |
| | | | | | | | 885,170 | |
| Materials — 1.9% | | | | | | | | |
| Novozymes, Cl B | | | 8,994 | | | | 444,599 | |
| Utilities — 1.7% | | | | | | | | |
| Orsted | | | 6,537 | | | | 415,468 | |
| TOTAL DENMARK | | | | | | | 6,545,044 | |
| FINLAND— 21.8% | | | | | | | | |
| Energy — 2.0% | | | | | | | | |
| Neste | | | 6,008 | | | | 495,306 | |
| Financials — 9.1% | | | | | | | | |
| Nordea Bank Abp | | | 138,006 | | | | 1,201,779 | |
| Sampo, Cl A | | | 21,293 | | | | 980,968 | |
| | | | | | | | 2,182,747 | |
The accompanying notes are an integral part of the financial statements.
| Schedule of Investments | | October 31, 2018 |
| | | |
| | Global X MSCI Nordic Region ETF | |
| | | Shares | | Value | |
| COMMON STOCK — continued | | | | | |
| Industrials — 3.4% | | | | | | | | |
| Kone, Cl B | | | 16,908 | | | $ | 824,164 | |
| Information Technology — 5.7% | | | | | |
| Nokia | | | 242,930 | | | | 1,376,265 | |
| Utilities — 1.6% | | | | | | | | |
| Fortum | | | 18,699 | | | | 393,972 | |
| TOTAL FINLAND | | | | | | | 5,272,454 | |
| NORWAY— 10.3% | | | | | | | | |
| Communication Services — 2.2% | | | | | |
Telenor (A) | | | 28,897 | | | | 531,701 | |
| Energy — 4.6% | | | | | | | | |
| Equinor | | | 42,761 | | | | 1,115,710 | |
| Financials — 3.5% | | | | | | | | |
| DnB | | | 46,022 | | | | 835,300 | |
| TOTAL NORWAY | | | | | | | 2,482,711 | |
| SWEDEN— 40.7% | | | | | | | | |
| Communication Services — 2.2% | | | | | |
| Telia | | | 117,858 | | | | 532,055 | |
| Consumer Discretionary — 2.8% | | | | | |
Hennes & Mauritz, Cl B (A) | | | 38,012 | | | | 672,676 | |
| Consumer Staples — 2.5% | | | | | | | | |
| Essity, Cl B | | | 26,340 | | | | 602,036 | |
| Financials — 13.1% | | | | | | | | |
| Investor, Cl B | | | 19,690 | | | | 854,626 | |
| Skandinaviska Enskilda Banken, Cl A | | | 62,310 | | | | 646,027 | |
| Svenska Handelsbanken, Cl A | | | 63,488 | | | | 691,445 | |
| Swedbank, Cl A | | | 43,428 | | | | 979,300 | |
| | | | | | | | 3,171,398 | |
| Industrials — 10.1% | | | | | | | | |
| Assa Abloy, Cl B | | | 39,807 | | | | 794,859 | |
| Atlas Copco, Cl A | | | 27,272 | | | | 676,153 | |
| Volvo, Cl B | | | 64,919 | | | | 971,686 | |
| | | | | | | | 2,442,698 | |
| Information Technology — 6.9% | | | | | |
| Hexagon, Cl B | | | 10,837 | | | | 531,908 | |
| Telefonaktiebolaget LM Ericsson, Cl B | | | 128,920 | | | | 1,125,336 | |
| | | | | | | | 1,657,244 | |
| Materials — 3.1% | | | | | | | | |
| Sandvik | | | 46,742 | | | | 741,044 | |
| TOTAL SWEDEN | | | | | | | 9,819,151 | |
| TOTAL COMMON STOCK | | | | | | | | |
| (Cost $26,968,561) | | | | | | | 24,119,360 | |
| | | | | | | | | |
The accompanying notes are an integral part of the financial statements.
| Schedule of Investments | | October 31, 2018 |
| | | |
| | Global X MSCI Nordic Region ETF | |
| | Shares/Face Amount | | Value | |
SHORT-TERM INVESTMENT(B)(C) — 0.1% | | | | | |
| Fidelity Investments Money Market Government Portfolio, Cl Institutional, 2.060% | |
| (Cost $35,004) | | | 35,004 | | | $ | 35,004 | |
| | | | | | | | | |
REPURCHASE AGREEMENTS(B) — 2.1% | | | | | |
| BNP Paribas | | | | | | | | |
| 2.190%, dated 10/31/18, to be repurchased on 11/01/18, repurchase price $111,063 (collateralized by U.S. Treasury Obligations, ranging in par value $38,287 - $72,092, 3.500%, 5/15/2020, with a total market value of $113,300) | | $ | 111,056 | | | | 111,056 | |
| RBC Capital Markets | | | | | | | | |
| 2.160%, dated 10/31/18, to be repurchased on 11/01/18, repurchase price $385,634 (collateralized by U.S. Treasury Obligations, ranging in par value $38,561 - $77,122, 2.000% - 2.625%, 2/15/2025 - 05/15/2025, with a total market value of $394,517) | | | 385,610 | | | | 385,610 | |
| | | | – | | | | — | |
| TOTAL REPURCHASE AGREEMENTS | | | | | | | | |
| (Cost $496,666) | | | | | | | 496,666 | |
| TOTAL INVESTMENTS — 102.1% | | | | | |
| (Cost $27,500,231) | | | | | | $ | 24,651,030 | |
| | | | | | |
| Percentages are based on Net Assets of $24,148,753. | | | | | |
| | | | | | | | | |
| (A) | This security or a partial position of this security is on loan at October 31, 2018. The total value of securities on loan at October 31, 2018 was $508,780. |
| (B) | Security was purchased with cash collateral held from securities on loan. The total value of such securities as of October 31, 2018, was $531,670. |
| (C) | The rate reported on the Schedule of Investments is the 7-day effective yield as of October 31, 2018. |
| The following is a summary of the level of inputs used as of October 31, 2018, in valuing the Fund's investments carried at value: | | | |
| | | | | | | | | |
| Investments in Securities | Level 1 | | Level 2 | | Level 3 | | Total | |
| Common Stock | | $ | 24,119,360 | | | $ | — | | | $ | — | | | $ | 24,119,360 | |
| Short-Term Investment | | | 35,004 | | | | — | | | | — | | | | 35,004 | |
| Repurchase Agreements | | | — | | | | 496,666 | | | | — | | | | 496,666 | |
| Total Investments in Securities | | $ | 24,154,364 | | | $ | 496,666 | | | $ | — | | | $ | 24,651,030 | |
For the year ended October 31, 2018, there have been no transfers between Level 1, Level 2 and Level 3 investments.
As of October 31, 2018, there were no Level 3 investments.
The accompanying notes are an integral part of the financial statements.
| Schedule of Investments | | October 31, 2018 |
| | | |
| | Global X MSCI Nigeria ETF | |
| Sector Weightings (unaudited)†: |
| † Sector weightings percentages are based on the total market value of investments. |
| | Shares
| | | Value | |
| COMMON STOCK — 99.8% | | | | | | |
| NIGERIA— 99.8% | | | | | | |
| Consumer Staples — 33.3% | | | | | | |
| Dangote Sugar Refinery | | | 32,146,297 | | | $ | 1,222,090 | |
| Flour Mills of Nigeria | | | 20,082,151 | | | | 1,009,640 | |
| Guinness Nigeria | | | 7,693,014 | | | | 1,547,080 | |
| Nestle Nigeria | | | 1,159,196 | | | | 4,406,861 | |
| Nigerian Breweries | | | 16,608,236 | | | | 3,770,024 | |
| Unilever Nigeria | | | 13,580,488 | | | | 1,575,037 | |
| | | | | | | | 13,530,732 | |
| Energy — 2.6% | | | | | | | | |
Oando * | | | 73,277,071 | | | | 1,069,886 | |
| Financials — 54.3% | | | | | | | | |
| Access Bank | | | 75,052,116 | | | | 1,633,366 | |
Diamond Bank * | | | 254,486,672 | | | | 988,502 | |
Ecobank Transnational * | | | 34,780,769 | | | | 1,533,037 | |
| FBN Holdings | | | 74,267,531 | | | | 1,636,750 | |
| Fidelity Bank | | | 205,641,520 | | | | 1,155,671 | |
| First City Monument Bank | | | 170,055,007 | | | | 698,022 | |
| Guaranty Trust Bank | | | 63,576,174 | | | | 6,567,786 | |
| Stanbic IBTC Holdings | | | 14,174,076 | | | | 1,844,973 | |
| United Bank for Africa | | | 87,488,032 | | | | 1,904,009 | |
| Zenith Bank | | | 63,568,096 | | | | 4,115,290 | |
| | | | | | | | 22,077,406 | |
| Materials — 6.9% | | | | | | | | |
| Dangote Cement | | | 3,316,812 | | | | 1,909,679 | |
| Lafarge Africa | | | 18,308,225 | | | | 882,628 | |
| | | | | | | | 2,792,307 | |
| Utilities — 2.7% | | | | | | | | |
| Transnational Corp of Nigeria | | | 304,259,902 | | | | 1,106,400 | |
| TOTAL COMMON STOCK | | | | | | | | |
| (Cost $41,681,940) | | | | | | | 40,576,731 | |
| TOTAL INVESTMENTS — 99.8% | | | | | | | | |
| (Cost $41,681,940) | | | | | | $ | 40,576,731 | |
| | | | | | |
| Percentages are based on Net Assets of $40,674,994. | | | | | |
| | | | | | | | | |
The accompanying notes are an integral part of the financial statements.
| Schedule of Investments | | October 31, 2018 |
| | | |
| | Global X MSCI Nigeria ETF | |
| * | Non-income producing security. |
| As of October 31, 2018, all of the Fund's investments were considered Level 1, in accordance with authoritative guidance on fair value measurements and disclosure under U.S. GAAP. |
For the year ended October 31, 2018, there have been no transfers between Level 1, Level 2 and Level 3 investments.
As of October 31, 2018, there were no Level 3 investments.
The accompanying notes are an integral part of the financial statements.
| Schedule of Investments | | October 31, 2018 |
| | | |
| | Global X Next Emerging & Frontier ETF | |
| Sector Weightings (unaudited)†: |
| † Sector weightings percentages are based on the total market value of investments. |
| | | | | | | |
| | Shares | | Value | |
| COMMON STOCK — 99.5% | | | | | | |
| ARGENTINA— 3.3% | | | | | | |
| Consumer Discretionary — 1.8% | | | | | | |
| MercadoLibre | | | 710 | | | $ | 230,395 | |
| Energy — 1.2% | | | | | | | | |
| Tenaris ADR | | | 1,729 | | | | 50,539 | |
YPF ADR * | | | 7,452 | | | | 111,780 | |
| | | | | | | | 162,319 | |
| Financials — 0.3% | | | | | | | | |
| Banco Macro ADR | | | 932 | | | | 41,651 | |
| TOTAL ARGENTINA | | | | | | | 434,365 | |
| AUSTRALIA— 2.7% | | | | | | | | |
| Energy — 2.1% | | | | | | | | |
| Oil Search | | | 26,747 | | | | 147,296 | |
| Santos | | | 22,150 | | | | 104,240 | |
| Woodside Petroleum | | | 980 | | | | 24,206 | |
| | | | | | | | 275,742 | |
| Materials — 0.6% | | | | | | | | |
| St. Barbara | | | 27,640 | | | | 81,494 | |
| TOTAL AUSTRALIA | | | | | | | 357,236 | |
| CANADA— 2.1% | | | | | | | | |
| Materials — 2.1% | | | | | | | | |
B2Gold * | | | 31,810 | | | | 78,723 | |
| Barrick Gold | | | 3,422 | | | | 42,946 | |
Endeavour Mining * | | | 3,354 | | | | 51,565 | |
| First Quantum Minerals | | | 9,432 | | | | 94,374 | |
The accompanying notes are an integral part of the financial statements.
| Schedule of Investments | | October 31, 2018 |
| | | |
| | Global X Next Emerging & Frontier ETF | |
| | | Shares | | Value | |
| COMMON STOCK — continued | | | | | | | | |
| Materials — continued | | | | | | | | |
| Lucara Diamond | | | 6,010 | | | $ | 9,976 | |
| TOTAL CANADA | | | | | | | 277,584 | |
| CHILE— 4.0% | | | | | | | | |
| Consumer Discretionary — 0.9% | | | | | | | | |
| SACI Falabella | | | 16,430 | | | | 123,869 | |
| Consumer Staples — 0.6% | | | | | | | | |
| Cencosud | | | 10,530 | | | | 21,906 | |
| Cia Cervecerias Unidas ADR | | | 1,830 | | | | 45,878 | |
| | | | | | | | 67,784 | |
| Energy — 0.2% | | | | | | | | |
| Empresas COPEC | | | 2,060 | | | | 28,859 | |
| Financials — 0.5% | | | | | | | | |
| Banco de Chile | | | 226,680 | | | | 31,383 | |
| Banco Santander Chile | | | 459,850 | | | | 33,731 | |
| | | | | | | | 65,114 | |
| Industrials — 0.6% | | | | | | | | |
| Latam Airlines Group | | | 8,730 | | | | 79,353 | |
| Materials — 0.3% | | | | | | | | |
| Empresas CMPC | | | 10,400 | | | | 35,584 | |
| Utilities — 0.9% | | | | | | | | |
| Enersis | | | 510,963 | | | | 80,485 | |
| Enersis Chile | | | 477,262 | | | | 41,518 | |
| | | | | | | | 122,003 | |
| TOTAL CHILE | | | | | | | 522,566 | |
| COLOMBIA— 0.9% | | | | | | | | |
| Consumer Staples — 0.0% | | | | | | | | |
| Almacenes Exito | | | 1,430 | | | | 6,170 | |
| Energy — 0.7% | | | | | | | | |
| Ecopetrol | | | 76,028 | | | | 88,265 | |
| Financials — 0.1% | | | | | | | | |
| Grupo de Inversiones Suramericana | | | 1,171 | | | | 11,414 | |
| Materials — 0.1% | | | | | | | | |
| Cementos Argos | | | 4,546 | | | | 9,906 | |
| TOTAL COLOMBIA | | | | | | | 115,755 | |
| CZECH REPUBLIC— 1.4% | | | | | | | | |
| Consumer Staples — 0.1% | | | | | | | | |
| Philip Morris CR | | | 21 | | | | 13,206 | |
| Financials — 0.2% | | | | | | | | |
| Komercni Banka | | | 655 | | | | 24,886 | |
| Utilities — 1.1% | | | | | | | | |
| CEZ | | | 6,071 | | | | 144,495 | |
The accompanying notes are an integral part of the financial statements.
| Schedule of Investments | | October 31, 2018 |
| | | |
| | Global X Next Emerging & Frontier ETF | |
| | | Shares | | Value | |
| COMMON STOCK — continued | | | | | | | | |
| TOTAL CZECH REPUBLIC | | | | | | $ | 182,587 | |
| EGYPT— 0.4% | | | | | | | | |
| Communication Services — 0.0% | | | | | | | | |
Global Telecom Holding SAE * | | | 29,903 | | | | 4,635 | |
| Financials — 0.3% | | | | | | | | |
| Commercial International Bank Egypt SAE | | | 6,975 | | | | 31,225 | |
| Industrials — 0.1% | | | | | | | | |
| ElSewedy Electric | | | 19,600 | | | | 16,579 | |
| TOTAL EGYPT | | | | | | | 52,439 | |
| HONG KONG— 0.6% | | | | | | | | |
| Consumer Discretionary — 0.6% | | | | | | | | |
| NagaCorp | | | 82,633 | | | | 75,472 | |
| HUNGARY— 1.7% | | | | | | | | |
| Energy — 0.2% | | | | | | | | |
| MOL Hungarian Oil & Gas | | | 3,156 | | | | 33,073 | |
| Financials — 1.2% | | | | | | | | |
| OTP Bank Nyrt | | | 4,310 | | | | 154,760 | |
| Health Care — 0.3% | | | | | | | | |
| Richter Gedeon Nyrt | | | 1,786 | | | | 33,186 | |
| TOTAL HUNGARY | | | | | | | 221,019 | |
| INDONESIA— 10.0% | | | | | | | | |
| Communication Services — 1.7% | | | | | | | | |
| Telekomunikasi Indonesia Persero | | | 884,735 | | | | 224,057 | |
| Consumer Discretionary — 1.1% | | | | | | | | |
| Astra International | | | 288,167 | | | | 149,746 | |
| Consumer Staples — 1.0% | | | | | | | | |
| Gudang Garam | | | 9,554 | | | | 45,437 | |
| Hanjaya Mandala Sampoerna | | | 87,000 | | | | 21,346 | |
| Indofood CBP Sukses Makmur TBK | | | 51,200 | | | | 30,058 | |
| Unilever Indonesia | | | 11,499 | | | | 32,695 | |
| | | | | | | | 129,536 | |
| Energy — 0.9% | | | | | | | | |
| Adaro Energy | | | 639,760 | | | | 69,436 | |
| United Tractors | | | 19,450 | | | | 42,860 | |
| | | | | | | | 112,296 | |
| Financials — 4.6% | | | | | | | | |
| Bank Central Asia | | | 167,958 | | | | 261,287 | |
| Bank Mandiri | | | 457,636 | | | | 206,203 | |
| Bank Rakyat Indonesia Persero | | | 634,570 | | | | 131,485 | |
| | | | | | | | 598,975 | |
The accompanying notes are an integral part of the financial statements.
| Schedule of Investments | | October 31, 2018 |
| | | |
| | Global X Next Emerging & Frontier ETF | |
| | | Shares | | Value | |
| COMMON STOCK — continued | | | | | | | | |
| Health Care — 0.2% | | | | | | | | |
| Kalbe Farma | | | 268,700 | | | $ | 24,214 | |
| Materials — 0.5% | | | | | | | | |
| Chandra Asri Petrochemical | | | 55,500 | | | | 17,560 | |
| Indah Kiat Pulp & Paper | | | 64,730 | | | | 54,181 | |
| | | | | | | | 71,741 | |
| TOTAL INDONESIA | | | | | | | 1,310,565 | |
| JAPAN— 0.9% | | | | | | | | |
| Energy — 0.6% | | | | | | | | |
| Inpex | | | 6,700 | | | | 77,149 | |
| Industrials — 0.3% | | | | | | | | |
| Namura Shipbuilding | | | 8,640 | | | | 38,509 | |
| TOTAL JAPAN | | | | | | | 115,658 | |
| KENYA— 0.4% | | | | | | | | |
| Communication Services — 0.4% | | | | | | | | |
| Safaricom | | | 214,700 | | | | 48,891 | |
| KUWAIT— 1.1% | | | | | | | | |
| Financials — 1.1% | | | | | | | | |
| Kuwait Finance House | | | 52,521 | | | | 101,464 | |
| National Bank of Kuwait SAK | | | 16,344 | | | | 44,215 | |
| TOTAL KUWAIT | | | | | | | 145,679 | |
| MALAYSIA— 10.0% | | | | | | | | |
| Communication Services — 2.1% | | | | | | | | |
| Axiata Group | | | 76,167 | | | | 62,070 | |
| DiGi.com | | | 118,902 | | | | 122,468 | |
| Maxis | | | 79,176 | | | | 98,958 | |
| | | | | | | | 283,496 | |
| Consumer Discretionary — 0.3% | | | | | | | | |
| Genting | | | 10,400 | | | | 18,243 | |
| Genting Malaysia | | | 24,200 | | | | 25,967 | |
| | | | | | | | 44,210 | |
| Consumer Staples — 1.3% | | | | | | | | |
| IOI | | | 19,900 | | | | 21,400 | |
| Kuala Lumpur Kepong | | | 3,480 | | | | 20,724 | |
| Nestle Malaysia | | | 780 | | | | 26,805 | |
| PPB Group | | | 6,200 | | | | 24,833 | |
| Sime Darby Plantation | | | 57,389 | | | | 72,139 | |
| | | | | | | | 165,901 | |
| Energy — 0.7% | | | | | | | | |
| Dialog Group | | | 106,030 | | | | 85,898 | |
| Petronas Dagangan | | | 2,600 | | | | 16,155 | |
| | | | | | | | 102,053 | |
The accompanying notes are an integral part of the financial statements.
| Schedule of Investments | | October 31, 2018 |
| | | |
| | Global X Next Emerging & Frontier ETF | |
| | | Shares
| | Value | |
| COMMON STOCK — continued | | | | | | | | |
| Financials — 2.9% | | | | | | | | |
| CIMB Group Holdings | | | 40,290 | | | $ | 55,074 | |
| Malayan Banking | | | 63,196 | | | | 143,322 | |
| Public Bank | | | 30,410 | | | | 178,776 | |
| | | | | | | | 377,172 | |
| Health Care — 0.4% | | | | | | | | |
| Hartalega Holdings | | | 14,610 | | | | 21,857 | |
| IHH Healthcare | | | 22,672 | | | | 27,090 | |
| | | | | | | | 48,947 | |
| Industrials — 0.2% | | | | | | | | |
| MISC | | | 16,400 | | | | 23,907 | |
| Materials — 0.3% | | | | | | | | |
| Petronas Chemicals Group | | | 19,290 | | | | 43,102 | |
| Utilities — 1.8% | | | | | | | | |
| Petronas Gas | | | 3,489 | | | | 15,242 | |
| Tenaga Nasional | | | 62,083 | | | | 218,095 | |
| | | | | | | | 233,337 | |
| TOTAL MALAYSIA | | | | | | | 1,322,125 | |
| MEXICO— 7.6% | | | | | | | | |
| Communication Services — 1.2% | | | | | | | | |
| America Movil | | | 161,237 | | | | 117,120 | |
| Grupo Televisa | | | 13,911 | | | | 40,227 | |
| | | | | | | | 157,347 | |
| Consumer Staples — 2.4% | | | | | | | | |
| Arca Continental | | | 5,238 | | | | 26,422 | |
| Becle | | | 15,900 | | | | 19,589 | |
| Fomento Economico Mexicano | | | 3,980 | | | | 33,939 | |
| Gruma, Cl B | | | 3,560 | | | | 37,268 | |
| Grupo Bimbo, Ser A | | | 9,860 | | | | 18,526 | |
| Wal-Mart de Mexico | | | 71,030 | | | | 181,968 | |
| | | | | | | | 317,712 | |
| Financials — 1.1% | | | | | | | | |
| Grupo Elektra | | | 660 | | | | 28,020 | |
| Grupo Financiero Banorte, Cl O | | | 13,944 | | | | 76,953 | |
| Grupo Financiero Inbursa, Cl O | | | 30,900 | | | | 40,176 | |
| | | | | | | | 145,149 | |
| Industrials — 0.5% | | | | | | | | |
| Alfa, Cl A | | | 60,370 | | | | 63,825 | |
| Materials — 2.1% | | | | | | | | |
Cemex * | | | 79,779 | | | | 39,947 | |
| Grupo Mexico, Cl B | | | 52,778 | | | | 122,152 | |
| Industrias Penoles | | | 1,144 | | | | 16,174 | |
The accompanying notes are an integral part of the financial statements.
| Schedule of Investments | | October 31, 2018 |
| | | |
| | Global X Next Emerging & Frontier ETF | |
| | | Shares
| | Value | |
| COMMON STOCK — continued | | | | | | | | |
| Materials — continued | | | | | | | | |
| Mexichem | | | 36,760 | | | $ | 97,405 | |
| | | | | | | | 275,678 | |
| Utilities — 0.3% | | | | | | | | |
| Infraestructura Energetica Nova | | | 8,740 | | | | 34,367 | |
| TOTAL MEXICO | | | | | | | 994,078 | |
| NETHERLANDS— 0.4% | | | | | | | | |
| Communication Services — 0.4% | | | | | | | | |
| VEON ADR | | | 17,555 | | | | 49,330 | |
| NIGERIA— 0.3% | | | | | | | | |
| Financials — 0.3% | | | | | | | | |
| Guaranty Trust Bank | | | 433,410 | | | | 44,774 | |
| OMAN— 0.2% | | | | | | | | |
| Communication Services — 0.2% | | | | | | | | |
| Oman Telecommunications SAOG | | | 13,460 | | | | 27,976 | |
| PAKISTAN— 0.6% | | | | | | | | |
| Energy — 0.5% | | | | | | | | |
| Oil & Gas Development | | | 11,400 | | | | 13,688 | |
| Pakistan Petroleum | | | 38,180 | | | | 53,874 | |
| | | | | | | | 67,562 | |
| Financials — 0.1% | | | | | | | | |
| United Bank | | | 8,800 | | | | 9,964 | |
| TOTAL PAKISTAN | | | | | | | 77,526 | |
| PANAMA— 1.0% | | | | | | | | |
| Industrials — 1.0% | | | | | | | | |
| Copa Holdings, Cl A | | | 1,900 | | | | 137,617 | |
| PERU— 1.2% | | | | | | | | |
| Financials — 1.1% | | | | | | | | |
| Credicorp | | | 640 | | | | 144,454 | |
| Materials — 0.1% | | | | | | | | |
| Hochschild Mining | | | 7,800 | | | | 15,707 | |
| TOTAL PERU | | | | | | | 160,161 | |
| PHILIPPINES— 4.0% | | | | | | | | |
| Consumer Discretionary — 0.2% | | | | | | | | |
| Jollibee Foods | | | 4,800 | | | | 24,760 | |
| Consumer Staples — 0.2% | | | | | | | | |
| Universal Robina | | | 10,937 | | | | 26,573 | |
| Financials — 0.4% | | | | | | | | |
| Ayala | | | 2,000 | | | | 34,389 | |
| GT Capital Holdings | | | 1,149 | | | | 16,321 | |
| | | | | | | | 50,710 | |
The accompanying notes are an integral part of the financial statements.
| Schedule of Investments | | October 31, 2018 |
| | | |
| | Global X Next Emerging & Frontier ETF | |
| | | Shares
| | Value | |
| COMMON STOCK — continued | | | | | | | | |
| Industrials — 1.8% | | | | | | | | |
| Aboitiz Equity Ventures | | | 9,100 | | | $ | 7,994 | |
| International Container Terminal Services | | | 10,200 | | | | 17,253 | |
| JG Summit Holdings | | | 20,049 | | | | 17,724 | |
| SM Investments | | | 11,346 | | | | 190,849 | |
| | | | | | | | 233,820 | |
| Information Technology — 0.5% | | | | | | | | |
| PLDT | | | 2,704 | | | | 70,247 | |
| Real Estate — 0.6% | | | | | | | | |
| Ayala Land | | | 40,600 | | | | 30,087 | |
| SM Prime Holdings | | | 79,927 | | | | 50,491 | |
| | | | | | | | 80,578 | |
| Utilities — 0.3% | | | | | | | | |
| Manila Electric | | | 5,220 | | | | 35,883 | |
| TOTAL PHILIPPINES | | | | | | | 522,571 | |
| POLAND— 4.9% | | | | | | | | |
| Consumer Discretionary — 0.1% | | | | | | | | |
| LPP | | | 8 | | | | 16,395 | |
| Energy — 2.0% | | | | | | | | |
| Polski Koncern Naftowy Orlen S.A. | | | 9,906 | | | | 238,537 | |
| Polskie Gornictwo Naftowe i Gazownictwo | | | 17,200 | | | | 28,109 | |
| | | | | | | | 266,646 | |
| Financials — 1.6% | | | | | | | | |
| Bank Polska Kasa Opieki | | | 1,374 | | | | 37,555 | |
| Powszechna Kasa Oszczednosci Bank Polski | | | 6,681 | | | | 69,643 | |
| Powszechny Zaklad Ubezpieczen | | | 7,270 | | | | 74,360 | |
| Santander Bank Polska | | | 231 | | | | 20,528 | |
| | | | | | | | 202,086 | |
| Materials — 0.7% | | | | | | | | |
KGHM Polska Miedz * | | | 4,266 | | | | 96,756 | |
| Utilities — 0.5% | | | | | | | | |
PGE * | | | 25,530 | | | | 70,048 | |
| TOTAL POLAND | | | | | | | 651,931 | |
| QATAR— 2.1% | | | | | | | | |
| Communication Services — 0.2% | | | | | | | | |
| Ooredoo QPSC | | | 1,520 | | | | 28,751 | |
| Financials — 0.9% | | | | | | | | |
| Qatar National Bank | | | 2,250 | | | | 120,484 | |
| Industrials — 1.0% | | | | | | | | |
| Industries Qatar QSC | | | 3,476 | | | | 133,626 | |
| TOTAL QATAR | | | | | | | 282,861 | |
The accompanying notes are an integral part of the financial statements.
| Schedule of Investments | | October 31, 2018 |
| | | |
| | Global X Next Emerging & Frontier ETF | |
| | | Shares
| | Value | |
| COMMON STOCK — continued | | | | | | | | |
| SOUTH AFRICA— 9.6% | | | | | | | | |
| Communication Services — 2.4% | | | | | | | | |
| MTN Group | | | 5,743 | | | $ | 33,253 | |
| Naspers, Cl N | | | 1,186 | | | | 208,240 | |
| Vodacom Group | | | 8,500 | | | | 71,609 | |
| | | | | | | | 313,102 | |
| Consumer Discretionary — 0.8% | | | | | | | | |
| Mr Price Group | | | 4,890 | | | | 76,488 | |
Pepkor Holdings * | | | 18,560 | | | | 22,939 | |
| | | | | | | | 99,427 | |
| Consumer Staples — 1.5% | | | | | | | | |
| Bid | | | 4,350 | | | | 81,510 | |
| Shoprite Holdings | | | 5,134 | | | | 62,688 | |
| Tiger Brands | | | 3,073 | | | | 54,854 | |
| | | | | | | | 199,052 | |
| Financials — 1.8% | | | | | | | | |
| FirstRand | | | 26,320 | | | | 114,629 | |
| Remgro | | | 3,970 | | | | 51,131 | |
| Standard Bank Group | | | 7,395 | | | | 81,796 | |
| | | | | | | | 247,556 | |
| Health Care — 0.3% | | | | | | | | |
| Aspen Pharmacare Holdings | | | 3,451 | | | | 36,458 | |
| Industrials — 0.5% | | | | | | | | |
| Bidvest Group | | | 5,780 | | | | 71,934 | |
| Information Technology — 0.5% | | | | | | | | |
| Sasol | | | 1,983 | | | | 64,998 | |
| Materials — 1.8% | | | | | | | | |
| Anglo American Platinum | | | 1,795 | | | | 58,584 | |
| Gold Fields ADR | | | 34,279 | | | | 91,182 | |
| Kumba Iron Ore | | | 4,200 | | | | 82,201 | |
| | | | | | | | 231,967 | |
| TOTAL SOUTH AFRICA | | | | | | | 1,264,494 | |
| THAILAND— 12.9% | | | | | | | | |
| Communication Services — 1.1% | | | | | | | | |
| Advanced Info Service NVDR | | | 18,334 | | | | 108,400 | |
| Intouch Holdings PCL NVDR | | | 24,240 | | | | 38,755 | |
| True NVDR | | | 12,370 | | | | 2,202 | |
| | | | | | | | 149,357 | |
| Consumer Discretionary — 0.5% | | | | | | | | |
| Home Product Center NVDR | | | 132,860 | | | | 59,717 | |
| Minor International NVDR | | | 2,280 | | | | 2,510 | |
| | | | | | | | 62,227 | |
The accompanying notes are an integral part of the financial statements.
| Schedule of Investments | | October 31, 2018 |
| | | |
| | Global X Next Emerging & Frontier ETF | |
| | | Shares
| | Value | |
| COMMON STOCK — continued | | | | | | | | |
| Consumer Staples — 2.7% | | | | | | | | |
| Berli Jucker NVDR | | | 27,690 | | | $ | 46,567 | |
| Carabao Group NVDR | | | 29,400 | | | | 40,131 | |
| Charoen Pokphand Foods NVDR | | | 84,337 | | | | 64,239 | |
| CP ALL NVDR | | | 60,672 | | | | 123,083 | |
| Siam Makro NVDR | | | 680 | | | | 677 | |
| Thai Beverage | | | 166,017 | | | | 74,928 | |
| | | | | | | | 349,625 | |
| Energy — 2.8% | | | | | | | | |
| PTT NVDR | | | 156,850 | | | | 241,308 | |
| PTT Exploration & Production NVDR | | | 26,050 | | | | 109,622 | |
| Thai Oil NVDR | | | 8,330 | | | | 21,296 | |
| | | | | | | | 372,226 | |
| Financials — 0.5% | | | | | | | | |
| Kasikornbank NVDR | | | 1,770 | | | | 10,652 | |
| Siam Commercial Bank NVDR | | | 11,970 | | | | 49,649 | |
| | | | | | | | 60,301 | |
| Health Care — 0.2% | | | | | | | | |
| Bangkok Dusit Medical Services NVDR | | | 41,110 | | | | 30,383 | |
| Industrials — 2.3% | | | | | | | | |
| Airports of Thailand NVDR | | | 114,920 | | | | 221,867 | |
| CH Karnchang NVDR | | | 107,500 | | | | 82,692 | |
| | | | | | | | 304,559 | |
| Materials — 1.8% | | | | | | | | |
| Indorama Ventures NVDR | | | 18,980 | | | | 31,061 | |
| PTT Global Chemical NVDR | | | 29,941 | | | | 69,772 | |
| Siam Cement NVDR | | | 10,780 | | | | 135,929 | |
| | | | | | | | 236,762 | |
| Utilities — 1.0% | | | | | | | | |
| CK Power NVDR | | | 398,390 | | | | 60,089 | |
| Gulf Energy Development NVDR | | | 28,150 | | | | 66,235 | |
| | | | | | | | 126,324 | |
| TOTAL THAILAND | | | | | | | 1,691,764 | |
| TURKEY— 6.6% | | | | | | | | |
| Communication Services — 0.5% | | | | | | | | |
| Turk Telekomunikasyon | | | 10,436 | | | | 5,960 | |
| Turkcell Iletisim Hizmetleri | | | 31,260 | | | | 63,320 | |
| | | | | | | | 69,280 | |
| Consumer Discretionary — 0.1% | | | | | | | | |
| Ford Otomotiv Sanayi | | | 1,720 | | | | 18,418 | |
| Consumer Staples — 0.9% | | | | | | | | |
| BIM Birlesik Magazalar | | | 8,069 | | | | 114,339 | |
The accompanying notes are an integral part of the financial statements.
| Schedule of Investments | | October 31, 2018 |
| | | |
| | Global X Next Emerging & Frontier ETF | |
| | | Shares
| | Value | |
| COMMON STOCK — continued | | | | | | | | |
| Energy — 1.6% | | | | | | | | |
| Tupras Turkiye Petrol Rafinerileri | | | 8,963 | | | $ | 210,666 | |
| Financials — 0.6% | | | | | | | | |
| Akbank Turk | | | 23,670 | | | | 27,923 | |
| Turkiye Garanti Bankasi | | | 23,135 | | | | 28,860 | |
| Turkiye Is Bankasi, Cl C | | | 35,684 | | | | 25,410 | |
| | | | | | | | 82,193 | |
| Industrials — 1.3% | | | | | | | | |
| Aselsan Elektronik Sanayi Ve Ticaret | | | 10,580 | | | | 47,695 | |
| Enka Insaat ve Sanayi | | | 17,967 | | | | 14,974 | |
| KOC Holding | | | 34,636 | | | | 96,306 | |
| | | | | | | | 158,975 | |
| Materials — 1.6% | | | | | | | | |
| Eregli Demir ve Celik Fabrikalari | | | 129,723 | | | | 209,750 | |
| TOTAL TURKEY | | | | | | | 863,621 | |
| UKRAINE— 0.5% | | | | | | | | |
| Consumer Staples — 0.5% | | | | | | | | |
| Kernel Holding | | | 5,251 | | | | 67,307 | |
| UNITED ARAB EMIRATES— 1.8% | | | | | | | | |
| Communication Services — 0.6% | | | | | | | | |
| Emirates Telecommunications Group PJSC | | | 15,200 | | | | 72,005 | |
| Financials — 0.7% | | | | | | | | |
| National Bank of Abu Dhabi PJSC | | | 23,880 | | | | 89,848 | |
| Industrials — 0.5% | | | | | | | | |
| DP World | | | 3,991 | | | | 71,798 | |
| TOTAL UNITED ARAB EMIRATES | | | | 233,651 | |
| UNITED KINGDOM— 2.9% | | | | | | | | |
| Energy — 0.5% | | | | | | | | |
Tullow Oil * | | | 21,440 | | | | 61,857 | |
| Financials — 0.2% | | | | | | | | |
| Bank of Georgia Group | | | 1,694 | | | | 33,753 | |
| Health Care — 0.3% | | | | | | | | |
| Mediclinic International | | | 7,548 | | | | 36,311 | |
| Materials — 1.9% | | | | | | | | |
| Antofagasta | | | 5,440 | | | | 54,551 | |
| Central Asia Metals | | | 6,100 | | | | 16,914 | |
| Fresnillo | | | 9,981 | | | | 108,223 | |
| KAZ Minerals | | | 10,130 | | | | 67,151 | |
| | | | | | | | 246,839 | |
| TOTAL UNITED KINGDOM | | | | | | | 378,760 | |
The accompanying notes are an integral part of the financial statements.
| Schedule of Investments | | October 31, 2018 |
| | | |
| | Global X Next Emerging & Frontier ETF | |
| | | Shares
| | Value | |
| COMMON STOCK — continued | | | | | | | | |
| UNITED STATES— 1.3% | | | | | | | | |
| Communication Services — 0.2% | | | | | | | | |
Liberty Latin America, Cl C * | | | 1,190 | | | $ | 21,432 | |
| Energy — 0.8% | | | | | | | | |
Kosmos Energy * | | | 7,365 | | | | 47,799 | |
| Occidental Petroleum | | | 843 | | | | 56,540 | |
| | | | | | | | 104,339 | |
| Materials — 0.3% | | | | | | | | |
| Southern Copper | | | 1,191 | | | | 45,663 | |
| TOTAL UNITED STATES | | | | | | | 171,434 | |
| VIETNAM— 2.1% | | | | | | | | |
| Consumer Staples — 0.5% | | | | | | | | |
| Vietnam Dairy Products JSC | | | 12,400 | | | | 61,667 | |
| Financials — 0.5% | | | | | | | | |
| Bank for Foreign Trade of Vietnam JSC | | | 27,670 | | | | 65,899 | |
| Materials — 0.9% | | | | | | | | |
Hoa Phat Group JSC * | | | 71,320 | | | | 122,963 | |
| Real Estate — 0.2% | | | | | | | | |
Vingroup JSC * | | | 5,400 | | | | 22,483 | |
| TOTAL VIETNAM | | | | | | | 273,012 | |
| TOTAL COMMON STOCK | | | | | | | | |
| (Cost $14,570,011) | | | | | | | 13,074,809 | |
| | | | | | | | | |
| PREFERRED STOCK — 0.3% | | | | | | | | |
| CHILE— 0.3% | | | | | | | | |
| Materials — 0.3% | | | | | | | | |
Sociedad Quimica y Minera de Chile(A) | | | | | |
| (Cost $33,762) | | | 970 | | | | 41,867 | |
| | | | | | | | | |
| RIGHT — 0.0% | | | | | | | | |
| | | | | | | | | |
| | | Number Of Rights
| | | | | |
| Chile — 0.0% | | | | | | | | |
| SACI Falabella | | | 569 | | | | 57 | |
| | | | | | | | | |
| TOTAL RIGHT (Cost $–) | | | | | | | 57 | |
| TOTAL INVESTMENTS — 99.8% | | | | | | | | |
| (Cost $14,603,773) | | | | | | $ | 13,116,733 | |
| | | | | | |
| Percentages are based on Net Assets of $13,144,871. | | | | | |
| * | Non-income producing security. |
| (A) | There’s currently no stated interest rate. |
The accompanying notes are an integral part of the financial statements.
| Schedule of Investments | | October 31, 2018 |
| | | |
| | Global X Next Emerging & Frontier ETF | |
| ADR — American Depositary Receipt |
| Cl — Class |
| NVDR — Non-Voting Depositary Receipt |
| PJSC — Public Joint Stock Company |
| Ser — Series |
| As of October 31, 2018, all of the Fund's investments were considered Level 1, in accordance with authoritative guidance on fair value measurements and disclosure under U.S. GAAP. |
For the year ended October 31, 2018, there have been no transfers between Level 1, Level 2 and Level 3 investments.
For the year ended October 31, 2018, there were no Level 3 investments.
The accompanying notes are an integral part of the financial statements.
| Schedule of Investments | | October 31, 2018 |
| | | |
| | Global X MSCI Portugal ETF | |
| Sector Weightings (unaudited)†: |
| † Sector weightings percentages are based on the total market value of investments. Repurchase agreements purchased from cash collateral received for securities lending activity are included in total investments. Please see Note 2 and Note 7 in Notes to Financial Statements for more detailed information. |
| | | | | | | |
| | Shares | | Value | |
| COMMON STOCK — 99.9% | | | | | | |
| PORTUGAL— 99.9% | | | | | | |
| Communcation Services — 7.8% | | | | | | |
| NOS SGPS | | | 222,190 | | | $ | 1,248,697 | |
Pharol SGPS *(B) | | | 1,825,067 | | | | 320,938 | |
| Sonaecom | | | 146,461 | | | | 399,935 | |
| | | | | | | | 1,969,570 | |
| Consumer Discretionary — 1.6% | | | | | | | | |
| Ibersol SGPS | | | 41,337 | | | | 398,115 | |
| Consumer Staples — 7.8% | | | | | | | | |
| Jeronimo Martins | | | 83,241 | | | | 1,024,278 | |
| Sonae | | | 937,409 | | | | 939,459 | |
| | | | | | | | 1,963,737 | |
| Energy — 21.9% | | | | | | | | |
| Galp Energia | | | 318,224 | | | | 5,550,901 | |
| Financials — 6.6% | | | | | | | | |
Banco BPI, Cl G * (B) | | | 287,800 | | | | 478,053 | |
Banco Comercial Portugues, Cl R * | | | 4,402,991 | | | | 1,188,339 | |
Banco Espirito Santo *(A) (C) (D) | | | 2,085,614 | | | | — | |
BANIF - Banco Internacional do Funchal *(A) (C) (D) | | | 55,479,410 | | | | 12 | |
| | | | | | | | 1,666,404 | |
| Industrials — 6.9% | | | | | | | | |
| CTT-Correios de Portugal | | | 195,389 | | | | 750,500 | |
Mota-Engil * | | | 175,764 | | | | 350,106 | |
| Sonae Capital | | | 419,733 | | | | 366,197 | |
Teixeira Duarte * | | | 1,392,822 | | | | 279,331 | |
| | | | | | | | 1,746,134 | |
The accompanying notes are an integral part of the financial statements.
| Schedule of Investments | | October 31, 2018 |
| | | |
| | Global X MSCI Portugal ETF | |
| | Shares/Face Amount | | Value | |
| COMMON STOCK — continued | | | | | |
| Materials — 15.4% | | | | | | | | |
| Altri | | | 106,057 | | | $ | 931,305 | |
| Corticeira Amorim SGPS | | | 60,008 | | | | 659,526 | |
| Navigator | | | 238,154 | | | | 1,187,302 | |
| Semapa-Sociedade de Investimento e Gestao | | | 40,629 | | | | 777,069 | |
Sonae Industria SGPS * (B) | | | 145,285 | | | | 344,047 | |
| | | | | | | | 3,899,249 | |
| Utilities — 31.9% | | | | | | | | |
| EDP Renovaveis | | | 128,085 | | | | 1,152,311 | |
| Energias de Portugal | | | 1,638,367 | | | | 5,762,139 | |
| REN - Redes Energeticas Nacionais | | | 438,239 | | | | 1,168,876 | |
| | | | | | | | 8,083,326 | |
| TOTAL COMMON STOCK | | | | | | | | |
| (Cost $32,497,220) | | | | | | | 25,277,436 | |
| | | | | | | | | |
SHORT-TERM INVESTMENT(E)(F) — 0.1% | | | | | |
| Fidelity Investments Money Market Government Portfolio, Cl Institutional, 2.060% | |
| (Cost $33,397) | | | 33,397 | | | | 33,397 | |
| | | | | | | | | |
REPURCHASE AGREEMENTS(E) — 1.9% | | | | | |
| BNP Paribas | | | | | | | | |
| 2.190%, dated 10/31/18, to be repurchased on 11/01/18, repurchase price $105,964 (collateralized by U.S. Treasury Obligations, ranging in par value $36,530 - $68,783 , 3.500%, 5/15/2020, with a total market value of $108,099) | | $ | 105,958 | | | | 105,958 | |
| RBC Capital Markets | | | | | | | | |
| 2.160%, dated 10/31/18, to be repurchased on 11/01/18, repurchase price $367,932 (collateralized by U.S. Treasury Obligations, ranging in par value $36,791 - $73,582, 2.000% - 2.625%, 2/15/2025 - 05/15/2025, with a total market value of $376,407) | | | 367,910 | | | | 367,910 | |
| | | | – | | | | — | |
| TOTAL REPURCHASE AGREEMENTS | | | | | | | | |
| (Cost $473,868) | | | | | | | 473,868 | |
| TOTAL INVESTMENTS — 101.9% | | | | | |
| (Cost $33,004,485) | | | | | | $ | 25,784,701 | |
| | | | | | |
| Percentages are based on Net Assets of $25,295,178. | | | | | |
| | | | | | | | | |
| * | Non-income producing security. |
| (A) | Security is fair valued using methods determined in good faith by the Fair Value Committee of the Fund. The total value of such securities as of October 31, 2018, was $12 and represents 0.0% of Net Assets. |
| (B) | This security or a partial position of this security is on loan at October 31, 2018. The total value of securities on loan at October 31, 2018 was $487,546. |
| (C) | Level 3 security in accordance with fair value hierarchy. |
| (D) | Security considered illiquid. The total value of such securities as of October 31, 2018 was $12 and represented 0.0% of Net Assets. |
| (E) | Security was purchased with cash collateral held from securities on loan. The total value of such securities as of October 31, 2018, was $507,265. |
| (F) | The rate reported on the Schedule of Investments is the 7-day effective yield as of October 31, 2018. |
The accompanying notes are an integral part of the financial statements.
| Schedule of Investments | | October 31, 2018 |
| | | |
| | Global X MSCI Portugal ETF | |
Amounts designated as “—” are either $0 or have been rounded to $0.
| The following is a summary of the level of inputs used as of October 31, 2018, in valuing the Fund's investments carried at value: | |
| | | | | | | | | |
| Investments in Securities | Level 1 | | Level 2 | | Level 3(1) | | Total | |
| Common Stock | | $ | 25,277,424 | | | $ | — | | | $ | 12 | | | $ | 25,277,436 | |
| Short-Term Investment | | | 33,397 | | | | — | | | | — | | | | 33,397 | |
| Repurchase Agreements | | | — | | | | 473,868 | | | | — | | | | 473,868 | |
| Total Investments in Securities | | $ | 25,310,821 | | | $ | 473,868 | | | $ | 12 | | | $ | 25,784,701 | |
(1) A reconciliation of Level 3 investments and disclosures of significant unobservable inputs are presented when the Fund
has a significant amount of Level 3 investments at the beginning and/or end of the period in relation to Net Assets. Management has concluded that Level 3 investments are not material in relation to Net Assets.
For the year ended October 31, 2018, there have been no transfers between Level 1, Level 2 and Level 3 investments.
The accompanying notes are an integral part of the financial statements.
| Schedule of Investments | | October 31, 2018 |
| | | |
| | Global X MSCI Pakistan ETF | |
| Sector Weightings (unaudited)†: |
| † Sector weightings percentages are based on the total market value of investments. |
| | | | | | | |
| | Shares | | Value | |
| COMMON STOCK — 99.4% | | | | | | |
| PAKISTAN— 99.4% | | | | | | |
| Consumer Discretionary — 4.7% | | | | | | |
| Honda Atlas Cars Pakistan | | | 113,750 | | | $ | 202,374 | |
| Indus Motor | | | 74,190 | | | | 745,280 | |
| Nishat Mills | | | 835,400 | | | | 925,929 | |
| | | | | | | | 1,873,583 | |
| Energy — 25.1% | | | | | | | | |
| National Refinery | | | 118,800 | | | | 255,199 | |
| Oil & Gas Development | | | 2,726,240 | | | | 3,273,343 | |
| Pakistan Oilfields | | | 450,184 | | | | 1,851,646 | |
| Pakistan Petroleum | | | 1,913,730 | | | | 2,700,401 | |
| Pakistan State Oil | | | 864,862 | | | | 1,831,449 | |
| Shell Pakistan | | | 81,200 | | | | 165,927 | |
| | | | | | | | 10,077,965 | |
| Financials — 28.6% | | | | | | | | |
| Askari Bank | | | 1,509,800 | | | | 271,678 | |
| Bank Al Habib | | | 2,942,000 | | | | 1,706,638 | |
| Bank Alfalah | | | 2,611,660 | | | | 1,030,459 | |
| Habib Bank | | | 2,477,950 | | | | 2,726,447 | |
| MCB Bank | | | 1,784,240 | | | | 2,665,543 | |
National Bank of Pakistan * | | | 2,020,700 | | | | 735,466 | |
| United Bank | | | 2,065,590 | | | | 2,338,739 | |
| | | | | | | | 11,474,970 | |
| Health Care — 2.1% | | | | | | | | |
Searle * | | | 382,014 | | | | 848,266 | |
| Industrials — 1.3% | | | | | | | | |
| Pak Elektron | | | 1,019,200 | | | | 244,146 | |
Pakistan International Bulk Terminal * | | | 2,797,987 | | | | 261,251 | |
| | | | | | | | 505,397 | |
| Materials — 29.3% | | | | | | | | |
| DG Khan Cement | | | 1,106,060 | | | | 882,091 | |
| Engro | | | 1,105,690 | | | | 2,796,070 | |
| Engro Fertilizers | | | 2,256,700 | | | | 1,381,041 | |
The accompanying notes are an integral part of the financial statements.
| Schedule of Investments | | October 31, 2018 |
| | | |
| | Global X MSCI Pakistan ETF | |
| | | Shares
| | Value | |
| COMMON STOCK — continued | | | | | | | | |
| Materials — continued | | | | | | | | |
| Fauji Cement | | | 2,956,400 | | | $ | 586,255 | |
| Fauji Fertilizer | | | 2,282,400 | | | | 1,693,330 | |
| Fauji Fertilizer Bin Qasim | | | 1,374,000 | | | | 395,670 | |
| International Steels | | | 537,200 | | | | 376,760 | |
| Kohat Cement | | | 209,390 | | | | 170,549 | |
| Lucky Cement | | | 431,610 | | | | 1,620,310 | |
| Maple Leaf Cement Factory | | | 1,270,799 | | | | 479,328 | |
| Millat Tractors | | | 121,320 | | | | 912,134 | |
| Packages | | | 150,530 | | | | 448,628 | |
| | | | | | | | 11,742,166 | |
| Utilities — 8.3% | | | | | | | | |
| Hub Power | | | 2,582,142 | | | | 1,805,110 | |
K-Electric * | | | 8,119,400 | | | | 386,419 | |
| Kot Addu Power | | | 1,323,400 | | | | 537,358 | |
| SUI Northern Gas Pipeline | | | 778,500 | | | | 540,701 | |
| | | | | | | | 3,269,588 | |
| TOTAL COMMON STOCK | | | | | | | | |
| (Cost $53,326,925) | | | | | | | 39,791,935 | |
| TOTAL INVESTMENTS — 99.4% | | | | | | | | |
| (Cost $53,326,925) | | | | | | $ | 39,791,935 | |
| | | | | | |
| Percentages are based on Net Assets of $40,023,570. | | | | | |
| | | | | | | | | |
| * | Non-income producing security. |
| As of October 31, 2018, all of the Fund's investments were considered Level 1, in accordance with authoritative guidance on fair value measurements and disclosure under U.S. GAAP. |
For the year ended October 31, 2018, there have been no transfers between Level 1, Level 2 or Level 3 investments.
For the year ended October 31, 2018, there were no Level 3 investments.
The accompanying notes are an integral part of the financial statements.

Statements of Assets and Liabilities |
| October 31, 2018 |
| | | Global X China Consumer ETF | | | Global X China Energy ETF | | | Global X China Financials ETF | | | Global X China Industrials ETF | |
| Assets: | | | | | | | | | | | | |
| Cost of Investments | | $ | 172,530,228 | | | $ | 3,260,091 | | | $ | 32,872,512 | | | $ | 2,761,027 | |
| Cost of Repurchase Agreement | | | 1,112,141 | | | | — | | | | — | | | | — | |
| Cost of Foreign Currency | | | 34,604 | | | | 6 | | | | 6 | | | | 15 | |
| | | | | | | | | | | | | | | | | |
| Investments, at Value | | $ | 119,827,137 | * | | $ | 2,949,660 | | | $ | 30,743,025 | | | $ | 2,041,476 | |
| Repurchase Agreement, at Value | | | 1,112,141 | | | | — | | | | — | | | | — | |
| Cash | | | 214,700 | | | | — | | | | 7,358 | | | | 175 | |
| Foreign Currency, at Value | | | 34,615 | | | | 8 | | | | 6 | | | | 15 | |
| Receivable for Investment Securities Sold | | | 10,788,720 | | | | 143,850 | | | | 2,608,538 | | | | 160,710 | |
| Receivable for Capital Shares | | | — | | | | — | | | | — | | | | 18,902 | |
| Dividend and Interest Receivable | | | 3,113 | | | | 4,979 | | | | 26,184 | | | | 2,501 | |
| Total Assets | | | 131,980,426 | | | | 3,098,497 | | | | 33,385,111 | | | | 2,223,779 | |
| Liabilities: | | | | | | | | | | | | | | | | |
| Obligation to Return Securities Lending Collateral | | | 1,190,522 | | | | — | | | | — | | | | — | |
| Payable for Investment Securities Purchased | | | 9,963,130 | | | | 141,145 | | | | 2,583,916 | | | | 165,215 | |
| Payable for Capital Shares Redeemed | | | 652,582 | | | | — | | | | — | | | | — | |
| Payable due to Investment Adviser | | | 71,670 | | | | 1,670 | | | | 17,684 | | | | 1,478 | |
| Unrealized Depreciation on Spot Contracts | | | 36 | | | | — | | | | — | | | | — | |
| Cash Overdraft | | | — | | | | 978 | | | | — | | | | — | |
| Securities due to Broker | | | — | | | | — | | | | — | | | | 18,902 | |
| Total Liabilities | | | 11,877,940 | | | | 143,793 | | | | 2,601,600 | | | | 185,595 | |
| Net Assets | | $ | 120,102,486 | | | $ | 2,954,704 | | | $ | 30,783,511 | | | $ | 2,038,184 | |
| Net Assets Consist of: | | | | | | | | | | | | | | | | |
| Paid-in Capital | | $ | 222,977,993 | | | $ | 4,487,999 | | | $ | 35,483,563 | | | $ | 5,041,904 | |
| Total distributable loss | | | (102,875,507 | ) | | | (1,533,295 | ) | | | (4,700,052 | ) | | | (3,003,720 | ) |
| Net Assets | | $ | 120,102,486 | | | $ | 2,954,704 | | | $ | 30,783,511 | | | $ | 2,038,184 | |
| Outstanding Shares of Beneficial Interest | | | | | | | | | | | | | |
| (unlimited authorization — no par value) | | | 8,850,000 | | | | 250,000 | | | | 2,000,000 | | | | 150,000 | |
| Net Asset Value, Offering and Redemption Price Per Share | | $ | 13.57 | | | $ | 11.82 | | | $ | 15.39 | | | $ | 13.59 | |
| *Includes Market Value of Securities on Loan | | $ | 1,109,372 | | | $ | — | | | $ | — | | | $ | — | |
| | | | | | | | | | | | | | | | | |
The accompanying notes are an integral part of the financial statements.
Statements of Assets and Liabilities |
| October 31, 2018 |
| | | Global X China Materials ETF | | | Global X NASDAQ China Technology ETF | | | Global X FTSE Southeast Asia ETF | | | Global X MSCI Colombia ETF | |
| Assets: | | | | | | | | | | | | |
| Cost of Investments | | $ | 3,249,495 | | | $ | 27,763,632 | | | $ | 18,802,932 | | | $ | 91,478,500 | |
| Cost of Repurchase Agreement | | | — | | | | 993,350 | | | | — | | | | — | |
| Cost of Foreign Currency | | | 11 | | | | 8 | | | | 44,904 | | | | 2,560 | |
| | | | | | | | | | | | | | | | | |
| Investments, at Value | | $ | 2,397,764 | | | $ | 24,668,478 | * | | $ | 17,587,663 | | | $ | 82,099,455 | |
| Repurchase Agreement, at Value | | | — | | | | 993,350 | | | | — | | | | — | |
| Cash | | | 14,187 | | | | 50,815 | | | | — | | | | 199,565 | |
| Foreign Currency, at Value | | | 11 | | | | 9 | | | | 44,874 | | | | 2,529 | |
| Receivable for Investment Securities Sold | | | 253,569 | | | | — | | | | 40,563 | | | | — | |
| Dividend and Interest Receivable | | | 10,141 | | | | 9,781 | | | | 3,835 | | | | 27,138 | |
| Unrealized Appreciation on Spot Contracts | | | 3,134 | | | | — | | | | — | | | | — | |
| Total Assets | | | 2,678,806 | | | | 25,722,433 | | | | 17,676,935 | | | | 82,328,687 | |
| Liabilities: | | | | | | | | | | | | | | | | |
| Obligation to Return Securities Lending Collateral | | | — | | | | 1,063,359 | | | | — | | | | — | |
| Payable for Investment Securities Purchased | | | 282,132 | | | | — | | | | 40,674 | | | | — | |
| Payable due to Investment Adviser | | | 1,834 | | | | 14,166 | | | | 12,034 | | | | 46,430 | |
| Cash Overdraft | | | — | | | | — | | | | 10,027 | | | | — | |
| Total Liabilities | | | 283,966 | | | | 1,077,525 | | | | 62,735 | | | | 46,430 | |
| Net Assets | | $ | 2,394,840 | | | $ | 24,644,908 | | | $ | 17,614,200 | | | $ | 82,282,257 | |
| Net Assets Consist of: | | | | | | | | | | | | | | | | |
| Paid-in Capital | | $ | 4,625,086 | | | $ | 32,480,076 | | | $ | 24,018,735 | | | $ | 177,940,476 | |
| Total distributable loss | | | (2,230,246 | ) | | | (7,835,168 | ) | | | (6,404,535 | ) | | | (95,658,219 | ) |
| Net Assets | | $ | 2,394,840 | | | $ | 24,644,908 | | | $ | 17,614,200 | | | $ | 82,282,257 | |
| Outstanding Shares of Beneficial Interest | | | | | | | | | | | | | |
| (unlimited authorization — no par value) | | | 149,971 | | | | 1,100,000 | | | | 1,150,000 | | | | 9,480,000 | |
| Net Asset Value, Offering and Redemption Price Per Share | | $ | 15.97 | | | $ | 22.40 | | | $ | 15.32 | | | $ | 8.68 | |
| *Includes Market Value of Securities on Loan | | $ | — | | | $ | 1,045,307 | | | $ | — | | | $ | — | |
The accompanying notes are an integral part of the financial statements.
Statements of Assets and Liabilities |
| October 31, 2018 |
| | | | | | | | | | | | | |
| | | Global X MSCI Argentina ETF | | | Global X MSCI Greece ETF | | | Global X MSCI Norway ETF | | | Global X FTSE Nordic Region ETF | |
| Assets: | | | | | | | | | | | | |
| Cost of Investments | | $ | 117,419,433 | | | $ | 331,654,912 | | | $ | 163,720,410 | | | $ | 27,003,565 | |
| Cost of Repurchase Agreement | | | — | | | | 7,390,347 | | | | 611,578 | | | | 496,666 | |
| Cost of Foreign Currency | | | — | | | | — | | | | 1 | | | | — | |
| | | | | | | | | | | | | | | | | |
| Investments, at Value | | $ | 89,344,546 | | | $ | 258,583,378 | * | | $ | 163,223,002 | * | | $ | 24,154,364 | * |
| Repurchase Agreement, at Value | | | — | | | | 7,390,347 | | | | 611,578 | | | | 496,666 | |
| Cash | | | 84,110 | | | | — | | | | 38,997 | | | | — | |
| Foreign Currency, at Value | | | — | | | | — | | | | 1 | | | | — | |
| Dividend and Interest Receivable | | | 3,824 | | | | 112,739 | | | | 324,188 | | | | 12,484 | |
| Reclaim Receivable | | | 2,874 | | | | — | | | | — | | | | 703,848 | |
| Receivable for Investment Securities Sold | | | — | | | | — | | | | — | | | | 1,027,534 | |
| Total Assets | | | 89,435,354 | | | | 266,086,464 | | | | 164,197,766 | | | | 26,394,896 | |
| Liabilities: | | | | | | | | | | | | | | | | |
| Obligation to Return Securities Lending Collateral | | | — | | | | 7,911,200 | | | | 654,680 | | | | 531,670 | |
| Payable due to Investment Adviser | | | 44,336 | | | | 125,509 | | | | 71,688 | | | | 10,919 | |
| Cash Overdraft | | | 64 | | | | 90,308 | | | | — | | | | 676,245 | |
| Payable for Capital Shares Redeemed | | | — | | | | — | | | | — | | | | 1,027,309 | |
| Payable due to Custodian | | | — | | | | 57,046 | | | | — | | | | — | |
| Due to Broker | | | — | | | | 1,855 | | | | — | | | | — | |
| Total Liabilities | | | 44,400 | | | | 8,185,918 | | | | 726,368 | | | | 2,246,143 | |
| Net Assets | | $ | 89,390,954 | | | $ | 257,900,546 | | | $ | 163,471,398 | | | $ | 24,148,753 | |
| Net Assets Consist of: | | | | | | | | | | | | | | | | |
| Paid-in Capital | | $ | 122,759,751 | | | $ | 524,161,633 | | | $ | 191,619,917 | | | $ | 30,651,945 | |
| Total distributable loss | | | (33,368,797 | ) | | | (266,261,087 | ) | | | (28,148,519 | ) | | | (6,503,192 | ) |
| Net Assets | | $ | 89,390,954 | | | $ | 257,900,546 | | | $ | 163,471,398 | | | $ | 24,148,753 | |
| Outstanding Shares of Beneficial Interest | | | | | | | | | | | | | |
| (unlimited authorization — no par value) | | | 3,524,975 | | | | 33,600,000 | | | | 11,700,000 | | | | 1,160,000 | |
| Net Asset Value, Offering and Redemption Price Per Share | | $ | 25.36 | | | $ | 7.68 | | | $ | 13.97 | | | $ | 20.82 | |
| *Includes Market Value of Securities on Loan | | $ | — | | | $ | 7,592,452 | | | $ | 623,039 | | | $ | 508,780 | |
| | | | | | | | | | | | | | | | | |
| | | | | | | | | | | | | | | | | |
The accompanying notes are an integral part of the financial statements.
Statements of Assets and Liabilities |
| October 31, 2018 |
| | | | | | | | | | | | | |
| | | Global X MSCI Nigeria ETF | | | Global X Next Emerging & Frontier ETF | | | Global X MSCI Portugal ETF | | | Global X MSCI Pakistan ETF | |
| Assets: | | | | | | | | | | | | |
| Cost of Investments | | $ | 41,681,940 | | | $ | 14,603,773 | | | $ | 32,530,617 | | | $ | 53,326,925 | |
| Cost of Repurchase Agreement | | | — | | | | — | | | | 473,868 | | | | — | |
| Cost of Foreign Currency | | | 35,859 | | | | 8,615 | | | | — | | | | — | |
| | | | | | | | | | | | | | | | | |
| Investments, at Value | | $ | 40,576,731 | | | $ | 13,116,733 | | | $ | 25,310,833 | * | | $ | 39,791,935 | |
| Repurchase Agreement, at Value | | | — | | | | — | | | | 473,868 | | | | — | |
| Cash | | | 107,073 | | | | 22,479 | | | | — | | | | — | |
| Foreign Currency, at Value | | | 39,684 | | | | 8,609 | | | | — | | | | — | |
| Reclaim Receivable | | | 127 | | | | 2,923 | | | | 84,733 | | | | — | |
| Dividend and Interest Receivable | | | — | | | | 2,338 | | | | 7,793 | | | | 572,633 | |
| Total Assets | | | 40,723,615 | | | | 13,153,082 | | | | 25,877,227 | | | | 40,364,568 | |
| Liabilities: | | | | | | | | | | | | | | | | |
| Obligation to Return Securities Lending Collateral | | | — | | | | — | | | | 507,264 | | | | — | |
| Payable due to Investment Adviser | | | 23,879 | | | | 5,730 | | | | 12,823 | | | | 22,530 | |
| Cash Overdraft | | | — | | | | 13 | | | | 59,746 | | | | 301,828 | |
| Unrealized Depreciation on Spot Contracts | | | — | | | | 20 | | | | — | | | | — | |
| Payable due to Custodian | | | 24,742 | | | | 954 | | | | 1,871 | | | | 16,640 | |
| Payable for Foreign Capital Gains Tax on Appreciated Securities | | | — | | | | 1,494 | | | | — | | | | — | |
| Due to Broker | | | — | | | | — | | | | 345 | | | | — | |
| Total Liabilities | | | 48,621 | | | | 8,211 | | | | 582,049 | | | | 340,998 | |
| Net Assets | | $ | 40,674,994 | | | $ | 13,144,871 | | | $ | 25,295,178 | | | $ | 40,023,570 | |
| Net Assets Consist of: | | | | | | | | | | | | | | | | |
| Paid-in Capital | | $ | 61,175,952 | | | $ | 36,419,204 | | | $ | 41,928,578 | | | $ | 64,533,199 | |
| Total distributable loss | | | (20,500,958 | ) | | | (23,274,333 | ) | | | (16,633,400 | ) | | | (24,509,629 | ) |
| Net Assets | | $ | 40,674,994 | | | $ | 13,144,871 | | | $ | 25,295,178 | | | $ | 40,023,570 | |
| Outstanding Shares of Beneficial Interest | | | | | | | | | | | | | |
| (unlimited authorization — no par value) | | | 2,262,135 | | | | 650,000 | | | | 2,250,000 | | | | 3,900,000 | |
| Net Asset Value, Offering and Redemption Price Per Share | | $ | 17.98 | | | $ | 20.22 | | | $ | 11.24 | | | $ | 10.26 | |
| *Includes Market Value of Securities on Loan | | $ | — | | | $ | — | | | $ | 487,546 | | | $ | — | |
| | | | | | | | | | | | | | | | | |
| | | | | | | | | | | | | | | | | |
The accompanying notes are an integral part of the financial statements.
|
| For the year ended October 31, 2018 |
| | | Global X China Consumer ETF | | | Global X China Energy ETF | | | Global X China Financials ETF | | | Global X China Industrials ETF | |
| Investment Income: | | | | | | | | | | | | |
| Dividend Income | | $ | 4,768,459 | | | $ | 118,789 | | | $ | 1,801,663 | | | $ | 89,882 | |
| Interest Income | | | 2,119 | | | | 80 | | | | 356 | | | | 31 | |
| Security Lending Income | | | 173,117 | | | | — | | | | — | | | | — | |
| Less: Foreign Taxes Withheld | | | (94,297 | ) | | | (7,487 | ) | | | (107,959 | ) | | | (4,018 | ) |
| Total Investment Income | | | 4,849,398 | | | | 111,382 | | | | 1,694,060 | | | | 85,895 | |
Supervision and Administration Fees(1) | | | 1,787,292 | | | | 15,525 | | | | 331,408 | | | | 21,653 | |
Custodian Fees(2) | | | 5,102 | | | | 354 | | | | 3,443 | | | | 356 | |
| Total Expenses | | | 1,792,394 | | | | 15,879 | | | | 334,851 | | | | 22,009 | |
| Net Expenses | | | 1,792,394 | | | | 15,879 | | | | 334,851 | | | | 22,009 | |
| Net Investment Income | | | 3,057,004 | | | | 95,503 | | | | 1,359,209 | | | | 63,886 | |
| Net Realized Gain (Loss) on: | | | | | | | | | | | | | | | | |
Investments(3) | | | (1,037,895 | ) | | | (150,011 | ) | | | 1,373,318 | | | | (410,509 | ) |
| Foreign Currency Transactions | | | (634 | ) | | | 50 | | | | 1,016 | | | | 3 | |
| Net Realized Gain (Loss) on Investments and Foreign Currency Transactions | | | (1,038,529 | ) | | | (149,961 | ) | | | 1,374,334 | | | | (410,506 | ) |
| Net Change in Unrealized Appreciation (Depreciation) on: | | | | | | | | | | | | | |
| Investments | | | (78,056,761 | ) | | | 20,480 | | | | (8,496,518 | ) | | | (169,061 | ) |
| Foreign Currency Translations | | | (24 | ) | | | 7 | | | | 1 | | | | (8 | ) |
| Net Change in Unrealized Appreciation (Depreciation) on Investments and Foreign Currency Translations | | | (78,056,785 | ) | | | 20,487 | | | | (8,496,517 | ) | | | (169,069 | ) |
| Net Realized and Unrealized Loss on Investments and Foreign Currency Transactions and Translations | | | (79,095,314 | ) | | | (129,474 | ) | | | (7,122,183 | ) | | | (579,575 | ) |
| Net Decrease in Net Assets Resulting from Operations | | $ | (76,038,310 | ) | | $ | (33,971 | ) | | $ | (5,762,974 | ) | | $ | (515,689 | ) |
| (1) | The Supervision and Administration fees reflect the supervisory and administrative fee, which includes fees paid by the Funds for the investment advisory services provided by the Adviser. (See Note 3 in Notes to Financial Statements.) |
| (2) | See Note 2 in the Notes to Financial Statements. |
| (3) | Includes realized gains/(losses) as a result of in-kind transactions. (See Note 4 in Notes to Financial Statements).
|
The accompanying notes are an integral part of the financial statements.
|
| For the year ended October 31, 2018 |
| | | Global X China Materials ETF | | | Global X NASDAQ China Technology ETF | | | Global X FTSE Southeast Asia ETF | | | Global X MSCI Colombia ETF | |
| Investment Income: | | | | | | | | | | | | |
| Dividend Income | | $ | 141,244 | | | $ | 273,009 | | | $ | 755,353 | | | $ | 2,739,929 | |
| Interest Income | | | 70 | | | | 404 | | | | 378 | | | | 3,016 | |
| Security Lending Income | | | — | | | | 1,157 | | | | 658 | | | | 18,231 | |
| Less: Foreign Taxes Withheld | | | (5,461 | ) | | | (4,406 | ) | | | (33,899 | ) | | | (96,297 | ) |
| Total Investment Income | | | 135,853 | | | | 270,164 | | | | 722,490 | | | | 2,664,879 | |
Supervision and Administration Fees(1) | | | 30,189 | | | | 197,037 | | | | 130,716 | | | | 642,214 | |
Custodian Fees(2) | | | 445 | | | | 216 | | | | 293 | | | | 46,524 | |
| Total Expenses | | | 30,634 | | | | 197,253 | | | | 131,009 | | | | 688,738 | |
| Waiver of Supervision and Administration Fees | | | – | | | | – | | | | – | | | | (61,948 | ) |
| Net Expenses | | | 30,634 | | | | 197,253 | | | | 131,009 | | | | 626,790 | |
| Net Investment Income | | | 105,219 | | | | 72,911 | | | | 591,481 | | | | 2,038,089 | |
| Net Realized Gain (Loss) on: | | | | | | | | | | | | | | | | |
Investments(3) | | | 48,478 | | | | (725,660 | ) | | | 166,499 | | | | (907,233 | ) |
| Foreign Currency Transactions | | | 76 | | | | (749 | ) | | | (2,913 | ) | | | 108,764 | |
| Net Realized Gain (Loss) on Investments and Foreign Currency Transactions | | | 48,554 | | | | (726,409 | ) | | | 163,586 | | | | (798,469 | ) |
| Net Change in Unrealized Appreciation (Depreciation) on: | | | | | | | | | | | | | |
| Investments | | | (1,231,749 | ) | | | (7,584,376 | ) | | | (1,776,552 | ) | | | (9,808,089 | ) |
| Foreign Currency Translations | | | 4 | | | | 4 | | | | (106 | ) | | | 11 | |
| Net Change in Unrealized Depreciation on Investments and Foreign Currency Translations | | | (1,231,745 | ) | | | (7,584,372 | ) | | | (1,776,658 | ) | | | (9,808,078 | ) |
| Net Realized and Unrealized Loss on Investments and Foreign Currency Transactions and Translations | | | (1,183,191 | ) | | | (8,310,781 | ) | | | (1,613,072 | ) | | | (10,606,547 | ) |
| Net Decrease in Net Assets Resulting from Operations | | $ | (1,077,972 | ) | | $ | (8,237,870 | ) | | $ | (1,021,591 | ) | | $ | (8,568,458 | ) |
| (1) | The Supervision and Administration fees reflect the supervisory and administrative fee, which includes fees paid by the Funds for the investment advisory services provided by the Adviser. (See Note 3 in Notes to Financial Statements.) |
| (2) | See Note 2 in the Notes to Financial Statements. |
| (3) | Includes realized gains/(losses) as a result of in-kind transactions. (See Note 4 in Notes to Financial Statements). |
The accompanying notes are an integral part of the financial statements.
|
| For the year ended October 31, 2018 |
| | | Global X MSCI Argentina ETF | | | Global X MSCI Greece ETF | | | Global X MSCI Norway ETF | | | Global X FTSE Nordic Region ETF | |
| Investment Income: | | | | | | | | | | | | |
| Dividend Income | | $ | 2,976,068 | | | $ | 10,998,962 | | | $ | 6,296,908 | | | $ | 1,255,123 | |
| Interest Income | | | 6,565 | | | | 17,754 | | | | 1,980 | | | | 52 | |
| Security Lending Income | | | — | | | | 520,980 | | | | 317,288 | | | | 34,825 | |
| Less: Foreign Taxes Withheld | | | (125,836 | ) | | | (1,437,781 | ) | | | (1,441,888 | ) | | | (201,985 | ) |
| Total Investment Income | | | 2,856,797 | | | | 10,099,915 | | | | 5,174,288 | | | | 1,088,015 | |
Supervision and Administration Fees(1) | | | 1,114,004 | | | | 2,164,221 | | | | 822,881 | | | | 161,140 | |
Custodian Fees(2) | | | 15,429 | | | | 139,082 | | | | 1,609 | | | | 26,083 | |
| Total Expenses | | | 1,129,433 | | | | 2,303,303 | | | | 824,490 | | | | 187,223 | |
| Waiver of Supervision and Administration Fees | | | (105,611 | ) | | | – | | | | – | | | | – | |
| Net Expenses | | | 1,023,822 | | | | 2,303,303 | | | | 824,490 | | | | 187,223 | |
| Net Investment Income | | | 1,832,975 | | | | 7,796,612 | | | | 4,349,798 | | | | 900,792 | |
| Net Realized Gain (Loss) on: | | | | | | | | | | | | | | | | |
Investments(3) | | | 27,916,451 | | | | 11,940,291 | | | | 9,999,286 | | | | 954,254 | |
| Foreign Currency Transactions | | | 17,530 | | | | 44,996 | | | | (17,101 | ) | | | 6,263 | |
| Net Realized Gain on Investments and Foreign Currency Transactions | | | 27,933,981 | | | | 11,985,287 | | | | 9,982,185 | | | | 960,517 | |
| Net Change in Unrealized Appreciation (Depreciation) on: | | | | | | | | | | | | | |
| Investments | | | (59,249,379 | ) | | | (89,656,952 | ) | | | (6,325,695 | ) | | | (4,782,791 | ) |
| Foreign Currency Translations | | | 100 | | | | (91 | ) | | | (4,894 | ) | | | (48,101 | ) |
| Net Change in Unrealized Depreciation on Investments and Foreign Currency Translations | | | (59,249,279 | ) | | | (89,657,043 | ) | | | (6,330,589 | ) | | | (4,830,892 | ) |
| Net Realized and Unrealized Gain (Loss) on Investments and Foreign Currency Transactions and Translations | | | (31,315,298 | ) | | | (77,671,756 | ) | | | 3,651,596 | | | | (3,870,375 | ) |
| Net Increase (Decrease) in Net Assets Resulting from Operations | | $ | (29,482,323 | ) | | $ | (69,875,144 | ) | | $ | 8,001,394 | | | $ | (2,969,583 | ) |
| (1) | The Supervision and Administration fees reflect the supervisory and administrative fee, which includes fees paid by the Funds for the investment advisory services provided by the Adviser. (See Note 3 in Notes to Financial Statements.) |
| (2) | See Note 2 in the Notes to Financial Statements. |
| (3) | Includes realized gains/(losses) as a result of in-kind transactions. (See Note 4 in Notes to Financial Statements). |
The accompanying notes are an integral part of the financial statements.
|
| For the year ended October 31, 2018 |
| | | Global X MSCI Nigeria ETF | | | Global X Next Emerging & Frontier ETF | | | Global X MSCI Portugal ETF | | | Global X MSCI Pakistan ETF | |
| Investment Income: | | | | | | | | | | | | |
| Dividend Income | | $ | 2,997,089 | | | $ | 507,487 | | | $ | 1,847,844 | | | $ | 3,006,390 | |
| Interest Income | | | 10,283 | | | | 57,440 | | | | 378 | | | | 2,451 | |
| Security Lending Income | | | — | | | | — | | | | 52,808 | | | | — | |
| Less: Foreign Taxes Withheld | | | (267,005 | ) | | | (46,892 | ) | | | (277,177 | ) | | | (433,766 | ) |
| Total Investment Income | | | 2,740,367 | | | | 518,035 | | | | 1,623,853 | | | | 2,575,075 | |
Supervision and Administration Fees(1) | | | 447,517 | | | | 82,103 | | | | 256,582 | | | | 371,653 | |
Custodian Fees(2) | | | 129,671 | | | | 10,153 | | | | 10,763 | | | | 105,844 | |
| Total Expenses | | | 577,188 | | | | 92,256 | | | | 267,345 | | | | 477,497 | |
| Net Expenses | | | 577,188 | | | | 92,256 | | | | 267,345 | | | | 477,497 | |
| Net Investment Income | | | 2,163,179 | | | | 425,779 | | | | 1,356,508 | | | | 2,097,578 | |
| Net Realized Gain (Loss) on: | | | | | | | | | | | | | | | | |
Investments(3) | | | (3,577,716 | ) | | | (432,088 | ) | | | 6,367,227 | | | | (11,576,882 | ) |
| Foreign Currency Transactions | | | (156,152 | ) | | | (9,946 | ) | | | (2,257 | ) | | | (254,533 | ) |
| Net Realized Gain (Loss) on Investments and Foreign Currency Transactions | | | (3,733,868 | ) | | | (442,034 | ) | | | 6,364,970 | | | | (11,831,415 | ) |
| Net Change in Unrealized Appreciation (Depreciation) on: | | | | | | | | | | | | | |
| Investments | | | (6,406,145 | ) | | | (1,939,826 | ) | | | (9,232,295 | ) | | | (1,621,905 | ) |
| Foreign Capital Gains Tax on Appreciated Securities | | | — | | | | (87 | ) | | | — | | | | 104,407 | |
| Foreign Currency Translations | | | 87 | | | | (361 | ) | | | (2,387 | ) | | | (6,515 | ) |
| Net Change in Unrealized Depreciation on Investments and Foreign Currency Translations | | | (6,406,058 | ) | | | (1,940,274 | ) | | | (9,234,682 | ) | | | (1,524,013 | ) |
| Net Realized and Unrealized Loss on Investments and Foreign Currency Transactions and Translations | | | (10,139,926 | ) | | | (2,382,308 | ) | | | (2,869,712 | ) | | | (13,355,428 | ) |
| Net Decrease in Net Assets Resulting from Operations | | $ | (7,976,747 | ) | | $ | (1,956,529 | ) | | $ | (1,513,204 | ) | | $ | (11,257,850 | ) |
| (1) | The Supervision and Administration fees reflect the supervisory and administrative fee, which includes fees paid by the Funds for the investment advisory services provided by the Adviser. (See Note 3 in Notes to Financial Statements.) |
| (2) | See Note 2 in the Notes to Financial Statements. |
| (3) | Includes realized gains/(losses) as a result of in-kind transactions. (See Note 4 in Notes to Financial Statements). |
The accompanying notes are an integral part of the financial statements.
Statements of Changes in Net Assets |
| | | Global X China Consumer ETF | | | Global X China Energy ETF | |
| | | Year Ended October 31, 2018 | | | Year Ended October 31, 2017 | | | Year Ended October 31, 2018 | | | Year Ended October 31, 2017 | |
| Operations: | | | | | | | | | | | | |
| Net Investment Income | | $ | 3,057,004 | | | $ | 1,512,926 | | | $ | 95,503 | | | $ | 61,815 | |
| Net Realized Loss on Investments and Foreign Currency Transactions | | | (1,038,529 | )(1) | | | (2,028,700 | )(1) | | | (149,961 | ) | | | (155,604 | ) |
| Net Change in Unrealized Appreciation (Depreciation) on Investments and Foreign Currency Translations | | | (78,056,785 | ) | | | 37,454,170 | | | | 20,487 | | | | 296,238 | |
| Net Increase (Decrease) in Net Assets Resulting from Operations | | | (76,038,310 | ) | | | 36,938,396 | | | | (33,971 | ) | | | 202,449 | |
Distributions(2) | | | (1,451,475 | ) | | | (998,941 | ) | | | (61,751 | ) | | | (32,233 | ) |
| Capital Share Transactions: | | | | | | | | | | | | | | | | |
| Issued | | | 278,709,895 | | | | 59,493,386 | | | | 1,296,935 | | | | — | |
| Redeemed | | | (237,167,201 | ) | | | (12,405,900 | ) | | | — | | | | — | |
| Increase in Net Assets from Capital Share Transactions | | | 41,542,694 | | | | 47,087,486 | | | | 1,296,935 | | | | — | |
| Total Increase (Decrease) in Net Assets | | | (35,947,091 | ) | | | 83,026,941 | | | | 1,201,213 | | | | 170,216 | |
| Net Assets: | | | | | | | | | | | | | | | | |
| Beginning of Year | | | 156,049,577 | | | | 73,022,636 | | | | 1,753,491 | | | | 1,583,275 | |
| End of Year | | $ | 120,102,486 | * | | $ | 156,049,577 | * | | $ | 2,954,704 | † | | $ | 1,753,491 | † |
| Share Transactions: | | | | | | | | | | | | | | | | |
| Issued | | | 14,850,000 | | | | 3,800,000 | | | | 100,000 | | | | — | |
| Redeemed | | | (14,950,000 | ) | | | (950,000 | ) | | | — | | | | — | |
| Net Increase (Decrease) in Shares Outstanding from Share Transactions | | | (100,000 | ) | | | 2,850,000 | | | | 100,000 | | | | — | |
| | | | | | | | | | | | | | | | | |
| (1) | Includes realized gains (losses) as a result of in-kind redemptions. (See Note 4 in Notes to Financial Statements.) |
| (2) | Current year presentation of distributions conforms with S-X Disclosure Simplification. Prior year distributions have been consolidated to conform with S-X Disclosure Simplification. (see Note 10 in Notes to Financial Statements). |
| * | Includes undistributed (distributed in excess) net investment income $1,448,596, in 2017. The SEC eliminated the requirement to disclose undistributed net investment income in 2018. |
| † | Includes undistributed (distributed in excess) net investment income $61,750, in 2017. The SEC eliminated the requirement to disclose undistributed net investment income in 2018. |
The accompanying notes are an integral part of the financial statements.
Statements of Changes in Net Assets |
| | | Global X China Financials ETF | | | Global X China Industrials ETF | |
| | | Year Ended October 31, 2018 | | | Year Ended October 31, 2017 | | | Year Ended October 31, 2018 | | | Year Ended October 31, 2017 | |
| Operations: | | | | | | | | | | | | |
| Net Investment Income | | $ | 1,359,209 | | | $ | 918,762 | | | $ | 63,886 | | | $ | 62,777 | |
Net Realized Gain (Loss) on Investments and Foreign Currency Transactions(1) | | | 1,374,334 | | | | (153,881 | ) | | | (410,506 | ) | | | (4,149 | ) |
| Net Change in Unrealized Appreciation (Depreciation) on Investments and Foreign Currency Translations | | | (8,496,517 | ) | | | 9,449,183 | | | | (169,069 | ) | | | 934,589 | |
| Net Increase (Decrease) in Net Assets Resulting from Operations | | | (5,762,974 | ) | | | 10,214,064 | | | | (515,689 | ) | | | 993,217 | |
Distributions(2) | | | (957,793 | ) | | | (528,238 | ) | | | (86,463 | ) | | | (59,685 | ) |
| Capital Share Transactions: | | | | | | | | | | | | | | | | |
| Issued | | | 7,192,833 | | | | 13,671,514 | | | | — | | | | — | |
| Redeemed | | | (19,939,874 | ) | | | (1,394,630 | ) | | | (1,374,683 | ) | | | (688,805 | ) |
| Increase (Decrease) in Net Assets from Capital Share Transactions | | | (12,747,041 | ) | | | 12,276,884 | | | | (1,374,683 | ) | | | (688,805 | ) |
| Total Increase (Decrease) in Net Assets | | | (19,467,808 | ) | | | 21,962,710 | | | | (1,976,835 | ) | | | 244,727 | |
| Net Assets: | | | | | | | | | | | | | | | | |
| Beginning of Year | | | 50,251,319 | | | | 28,288,609 | | | | 4,015,019 | | | | 3,770,292 | |
| End of Year | | $ | 30,783,511 | * | | $ | 50,251,319 | * | | $ | 2,038,184 | † | | $ | 4,015,019 | † |
| Share Transactions: | | | | | | | | | | | | | | | | |
| Issued | | | 350,000 | | | | 900,000 | | | | — | | | | — | |
| Redeemed | | | (1,200,000 | ) | | | (100,000 | ) | | | (100,000 | ) | | | (50,000 | ) |
| Net Increase (Decrease) in Shares Outstanding from Share Transactions | | | (850,000 | ) | | | 800,000 | | | | (100,000 | ) | | | (50,000 | ) |
| (1) | Includes realized gains (losses) as a result of in-kind redemptions. (See Note 4 in Notes to Financial Statements.) |
| (2) | Current year presentation of distributions conforms with S-X Disclosure Simplification. Prior year distributions have been consolidated to conform with S-X Disclosure Simplification. (see Note 10 in Notes to Financial Statements). |
| * | Includes undistributed (distributed in excess) net investment income $917,566, in 2017. The SEC eliminated the requirement to disclose undistributed net investment income in 2018. |
| † | Includes undistributed (distributed in excess) net investment income $54,165, in 2017. The SEC eliminated the requirement to disclose undistributed net investment income in 2018. |
The accompanying notes are an integral part of the financial statements.
Statements of Changes in Net Assets |
| | | | | | | | | | | | | |
| | | Global X China Materials ETF | | | Global X NASDAQ China Technology ETF | |
| | | Year Ended October 31, 2018 | | | Year Ended October 31, 2017 | | | Year Ended October 31, 2018 | | | Year Ended October 31, 2017 | |
| Operations: | | | | | | | | | | | | |
| Net Investment Income | | $ | 105,219 | | | $ | 59,219 | | | $ | 72,911 | | | $ | 156,714 | |
Net Realized Gain (Loss) on Investments and Foreign Currency Transactions(1) | | | 48,554 | | | | (222,948 | ) | | | (726,409 | ) | | | (291,327 | ) |
| Net Change in Unrealized Appreciation (Depreciation) on Investments and Foreign Currency Translations | | | (1,231,745 | ) | | | 1,197,073 | | | | (7,584,372 | ) | | | 4,011,282 | |
| Net Increase (Decrease) in Net Assets Resulting from Operations | | | (1,077,972 | ) | | | 1,033,344 | | | | (8,237,870 | ) | | | 3,876,669 | |
Distributions(2) | | | (58,997 | ) | | | (16,197 | ) | | | (578,519 | ) | | | (528,298 | ) |
| Capital Share Transactions: | | | | | | | | | | | | | | | | |
| Issued | | | — | | | | 3,862,280 | | | | 15,927,280 | | | | 4,112,680 | |
| Redeemed | | | (1,865,290 | ) | | | (823,898 | ) | | | (1,473,002 | ) | | | (2,394,276 | ) |
| Increase (Decrease) in Net Assets from Capital Share Transactions | | | (1,865,290 | ) | | | 3,038,382 | | | | 14,454,278 | | | | 1,718,404 | |
| Total Increase (Decrease) in Net Assets | | | (3,002,259 | ) | | | 4,055,529 | | | | 5,637,889 | | | | 5,066,775 | |
| Net Assets: | | | | | | | | | | | | | | | | |
| Beginning of Year | | | 5,397,099 | | | | 1,341,570 | | | | 19,007,019 | | | | 13,940,244 | |
| End of Year | | $ | 2,394,840 | * | | $ | 5,397,099 | * | | $ | 24,644,908 | † | | $ | 19,007,019 | † |
| Share Transactions: | | | | | | | | | | | | | | | | |
| Issued | | | — | | | | 200,000 | | | | 500,000 | | | | 150,000 | |
| Redeemed | | | (100,000 | ) | | | (50,000 | ) | | | (50,000 | ) | | | (100,000 | ) |
| Net Increase (Decrease) in Shares Outstanding from Share Transactions | | | (100,000 | ) | | | 150,000 | | | | 450,000 | | | | 50,000 | |
| (1) | Includes realized gains (losses) as a result of in-kind redemptions. (See Note 4 in Notes to Financial Statements.) |
| (2) | Current year presentation of distributions conforms with S-X Disclosure Simplification. Prior year distributions have been consolidated to conform with S-X Disclosure Simplification. (see Note 10 in Notes to Financial Statements). |
| * | Includes undistributed (distributed in excess) net investment income $58,996, in 2017. The SEC eliminated the requirement to disclose undistributed net investment income in 2018. |
| † | Includes undistributed (distributed in excess) net investment income $37,241, in 2017. The SEC eliminated the requirement to disclose undistributed net investment income in 2018. |
The accompanying notes are an integral part of the financial statements.
Statements of Changes in Net Assets |
| | | | | | | | | | | | | |
| | | Global X FTSE Southeast Asia ETF | | | Global X MSCI Colombia ETF | |
| | | Year Ended October 31, 2018 | | | Year Ended October 31, 2017 | | | Year Ended October 31, 2018 | | | Year Ended October 31, 2017 | |
| Operations: | | | | | | | | | | | | |
| Net Investment Income | | $ | 591,481 | | | $ | 269,285 | | | $ | 2,038,089 | | | $ | 1,702,871 | |
Net Realized Gain (Loss) on Investments and Foreign Currency Transactions(1) | | | 163,586 | | | | (364,249 | ) | | | (798,469 | ) | | | (9,509,560 | ) |
| Net Change in Unrealized Appreciation (Depreciation) on Investments and Foreign Currency Translations | | | (1,776,658 | ) | | | 2,135,876 | | | | (9,808,078 | ) | | | 11,274,573 | |
| Net Increase (Decrease) in Net Assets Resulting from Operations | | | (1,021,591 | ) | | | 2,040,912 | | | | (8,568,458 | ) | | | 3,467,884 | |
Distributions(2) | | | (284,000 | ) | | | (284,922 | ) | | | (1,748,612 | ) | | | (1,265,662 | ) |
| Capital Share Transactions: | | | | | | | | | | | | | | | | |
| Issued | | | 10,002,534 | | | | 1,545,296 | | | | 31,346,354 | | | | 23,943,306 | |
| Redeemed | | | (5,402,561 | ) | | | (1,330,835 | ) | | | (31,731,396 | ) | | | (21,921,654 | ) |
| Increase (Decrease) in Net Assets from Capital Share Transactions | | | 4,599,973 | | | | 214,461 | | | | (385,042 | ) | | | 2,021,652 | |
| Total Increase (Decrease) in Net Assets | | | 3,294,382 | | | | 1,970,451 | | | | (10,702,112 | ) | | | 4,223,874 | |
| Net Assets: | | | | | | | | | | | | | | | | |
| Beginning of Year | | | 14,319,818 | | | | 12,349,367 | | | | 92,984,369 | | | | 88,760,495 | |
| End of Year | | $ | 17,614,200 | * | | $ | 14,319,818 | * | | $ | 82,282,257 | † | | $ | 92,984,369 | † |
| Share Transactions: | | | | | | | | | | | | | | | | |
| Issued | | | 600,000 | | | | 100,000 | | | | 2,850,000 | | | | 2,450,000 | |
| Redeemed | | | (350,000 | ) | | | (100,000 | ) | | | (3,100,000 | ) | | | (2,350,000 | ) |
| Net Increase (Decrease) in Shares Outstanding from Share Transactions | | | 250,000 | | | | — | | | | (250,000 | ) | | | 100,000 | |
| | | | | | | | | | | | | | | | | |
| | | | | | | | | | | | | | | | | |
| (1) | Includes realized gains (losses) as a result of in-kind redemptions. (See Note 4 in Notes to Financial Statements.) |
| (2) | Current year presentation of distributions conforms with S-X Disclosure Simplification. Prior year distributions have been consolidated to conform with S-X Disclosure Simplification. (see Note 10 in Notes to Financial Statements). |
| * | Includes undistributed (distributed in excess) net investment income $241,638, in 2017. The SEC eliminated the requirement to disclose undistributed net investment income in 2018. |
| † | Includes undistributed (distributed in excess) net investment income $1,219,909, in 2017. The SEC eliminated the requirement to disclose undistributed net investment income in 2018. |
| | |
The accompanying notes are an integral part of the financial statements.
Statements of Changes in Net Assets |
| | | | | | | | | | | | | |
| | | Global X MSCI Argentina ETF | | | Global X MSCI Greece ETF | |
| | | Year Ended October 31, 2018 | | | Year Ended October 31, 2017 | | | Year Ended October 31, 2018 | | | Year Ended October 31, 2017 | |
| Operations: | | | | | | | | | | | | |
| Net Investment Income | | $ | 1,832,975 | | | $ | 327,973 | | | $ | 7,796,612 | | | $ | 5,618,988 | |
Net Realized Gain on Investments and Foreign Currency Transactions(1) | | | 27,933,981 | | | | 15,389,828 | | | | 11,985,287 | | | | 12,524,784 | |
| Net Change in Unrealized Appreciation (Depreciation) on Investments and Foreign Currency Translations | | | (59,249,279 | ) | | | 21,713,526 | | | | (89,657,043 | ) | | | 53,234,048 | |
| Net Increase (Decrease) in Net Assets Resulting from Operations | | | (29,482,323 | ) | | | 37,431,327 | | | | (69,875,144 | ) | | | 71,377,820 | |
Distributions(2) | | | (1,050,485 | ) | | | (308,816 | ) | | | (8,523,662 | ) | | | (5,196,758 | ) |
| Capital Share Transactions: | | | | | | | | | | | | | | | | |
| Issued | | | 69,731,683 | | | | 107,177,896 | | | | 141,645,910 | | | | 116,402,043 | |
| Redeemed | | | (133,275,628 | ) | | | (51,434,300 | ) | | | (155,135,031 | ) | | | (78,355,928 | ) |
| Increase (Decrease) in Net Assets from Capital Share Transactions | | | (63,543,945 | ) | | | 55,743,596 | | | | (13,489,121 | ) | | | 38,046,115 | |
| Total Increase (Decrease) in Net Assets | | | (94,076,753 | ) | | | 92,866,107 | | | | (91,887,927 | ) | | | 104,227,177 | |
| Net Assets: | | | | | | | | | | | | | | | | |
| Beginning of Year | | | 183,467,707 | | | | 90,601,600 | | | | 349,788,473 | | | | 245,561,296 | |
| End of Year | | $ | 89,390,954 | * | | $ | 183,467,707 | * | | $ | 257,900,546 | † | | $ | 349,788,473 | † |
| Share Transactions: | | | | | | | | | | | | | | | | |
| Issued | | | 2,100,000 | | | | 3,700,000 | | | | 13,450,000 | | | | 12,400,000 | |
| Redeemed | | | (4,300,000 | ) | | | (1,800,000 | ) | | | (17,450,000 | ) | | | (8,200,000 | ) |
| Net Increase (Decrease) in Shares Outstanding from Share Transactions | | | (2,200,000 | ) | | | 1,900,000 | | | | (4,000,000 | ) | | | 4,200,000 | |
| | | | | | | | | | | | | | | | | |
| | | | | | | | | | | | | | | | | |
| (1) | Includes realized gains (losses) as a result of in-kind redemptions. (See Note 4 in Notes to Financial Statements.) |
| (2) | Current year presentation of distributions conforms with S-X Disclosure Simplification. Prior year distributions have been consolidated to conform with S-X Disclosure Simplification. (see Note 10 in Notes to Financial Statements). |
| * | Includes undistributed (distributed in excess) net investment income $202,378, in 2017. The SEC eliminated the requirement to disclose undistributed net investment income in 2018. |
| † | Includes undistributed (distributed in excess) net investment income $4,452,163, in 2017. The SEC eliminated the requirement to disclose undistributed net investment income in 2018. |
The accompanying notes are an integral part of the financial statements.
Statements of Changes in Net Assets |
| | | | | | | | | | | | | |
| | | Global X MSCI Norway ETF | | | Global X FTSE Nordic Region ETF | |
| | | Year Ended October 31, 2018 | | | Year Ended October 31, 2017 | | | Year Ended October 31, 2018 | | | Year Ended October 31, 2017 | |
| Operations: | | | | | | | | | | | | |
| Net Investment Income | | $ | 4,349,798 | | | $ | 4,268,678 | | | $ | 900,792 | | | $ | 845,183 | |
Net Realized Gain (Loss) on Investments and Foreign Currency Transactions(1) | | | 9,982,185 | | | | (102,095 | ) | | | 960,517 | | | | 442,834 | |
| Net Change in Unrealized Appreciation (Depreciation) on Investments and Foreign Currency Translations | | | (6,330,589 | ) | | | 23,368,488 | | | | (4,830,892 | ) | | | 7,088,681 | |
| Net Increase (Decrease) in Net Assets Resulting from Operations | | | 8,001,394 | | | | 27,535,071 | | | | (2,969,583 | ) | | | 8,376,698 | |
Distributions(2) | | | (4,071,466 | ) | | | (3,382,974 | ) | | | (1,206,770 | ) | | | (1,335,962 | ) |
| Capital Share Transactions: | | | | | | | | | | | | | | | | |
| Issued | | | 46,323,379 | | | | 67,394,304 | | | | 1,141,619 | | | | 3,497,127 | |
| Redeemed | | | (51,518,023 | ) | | | (40,807,392 | ) | | | (11,280,081 | ) | | | (12,972,942 | ) |
| Increase (Decrease) in Net Assets from Capital Share Transactions | | | (5,194,644 | ) | | | 26,586,912 | | | | (10,138,462 | ) | | | (9,475,815 | ) |
| Total Increase (Decrease) in Net Assets | | | (1,264,716 | ) | | | 50,739,009 | | | | (14,314,815 | ) | | | (2,435,079 | ) |
| Net Assets: | | | | | | | | | | | | | | | | |
| Beginning of Year | | | 164,736,114 | | | | 113,997,105 | | | | 38,463,568 | | | | 40,898,647 | |
| End of Year | | $ | 163,471,398 | * | | $ | 164,736,114 | * | | $ | 24,148,753 | † | | $ | 38,463,568 | † |
| Share Transactions: | | | | | | | | | | | | | | | | |
| Issued | | | 3,250,000 | | | | 5,150,000 | | | | 50,000 | | | | 150,000 | |
| Redeemed | | | (3,750,000 | ) | | | (3,250,000 | ) | | | (500,000 | ) | | | (650,000 | ) |
| Net Increase (Decrease) in Shares Outstanding from Share Transactions | | | (500,000 | ) | | | 1,900,000 | | | | (450,000 | ) | | | (500,000 | ) |
| | | | | | | | | | | | | | | | | |
| | | | | | | | | | | | | | | | | |
| (1) | Includes realized gains (losses) as a result of in-kind redemptions. (See Note 4 in Notes to Financial Statements.) |
| (2) | Current year presentation of distributions conforms with S-X Disclosure Simplification. Prior year distributions have been consolidated to conform with S-X Disclosure Simplification. (see Note 10 in Notes to Financial Statements). |
| * | Includes undistributed (distributed in excess) net investment income $3,614,177, in 2017. The SEC eliminated the requirement to disclose undistributed net investment income in 2018. |
| † | Includes undistributed (distributed in excess) net investment income $743,838, in 2017. The SEC eliminated the requirement to disclose undistributed net investment income in 2018. |
The accompanying notes are an integral part of the financial statements.
Statements of Changes in Net Assets |
| | | Global X MSCI Nigeria ETF | | | Global X Next Emerging & Frontier ETF | |
| | | Year Ended October 31, 2018 | | | Year Ended October 31, 2017 | | | Year Ended October 31, 2018 | | | Year Ended October 31, 2017 | |
| Operations: | | | | | | | | | | | | |
| Net Investment Income | | $ | 2,163,179 | | | $ | 1,352,545 | | | $ | 425,779 | | | $ | 280,755 | |
| Net Realized Loss on Investments and Foreign Currency Transactions | | | (3,733,868 | ) | | | (7,512,272 | ) | | | (442,034)( | )) | | | (228,611 | )(1) |
| Net Change in Unrealized Appreciation (Depreciation) on Investments and Foreign Currency Translations | | | (6,406,058 | ) | | | 20,889,663 | | | | (1,940,274 | ) | | | 2,397,387 | |
| Net Increase (Decrease) in Net Assets Resulting from Operations | | | (7,976,747 | ) | | | 14,729,936 | | | | (1,956,529 | ) | | | 2,449,531 | |
Distributions(2) | | | (1,360,193 | ) | | | (706,374 | ) | | | (288,733 | ) | | | (337,103 | ) |
| Capital Share Transactions: | | | | | | | | | | | | | | | | |
| Issued | | | 21,278,227 | | | | 25,280,343 | | | | 1,253,703 | | | | — | |
| Redeemed | | | (35,825,601 | ) | | | (2,753,139 | ) | | | (2,157,504 | ) | | | (930,290 | ) |
| Increase (Decrease) in Net Assets from Capital Share Transactions | | | (14,547,374 | | | | 22,527,204 | | | | (903,801 | ) | | | (930,290 | ) |
| Total Increase (Decrease) in Net Assets | | | (23,884,314 | ) | | | 36,550,766 | | | | (3,149,063 | ) | | | 1,182,138 | |
| Net Assets: | | | | | | | | | | | | | | | | |
| Beginning of Year | | | 64,559,308 | | | | 28,008,542 | | | | 16,293,934 | | | | 15,111,796 | |
| End of Year | | $ | 40,674,994 | * | | $ | 64,559,308 | * | | $ | 13,144,871 | † | | $ | 16,293,934 | † |
| Share Transactions: | | | | | | | | | | | | | | | | |
| Issued | | | 850,000 | | | | 1,537,500 | (3) | | | 50,000 | | | | ��� | |
| Redeemed | | | (1,600,000 | ) | | | (150,365 | )(3) | | | (100,000 | ) | | | (50,000 | ) |
| Net Increase (Decrease) in Shares Outstanding from Share Transactions | | | (750,000 | ) | | | 1,387,135 | | | | (50,000 | ) | | | (50,000 | ) |
| (1) | Includes realized gains (losses) as a result of in-kind redemptions. (See Note 4 in Notes to Financial Statements.) |
| (2) | Current year presentation of distributions conforms with S-X Disclosure Simplification. Prior year distributions have been consolidated to conform with S-X Disclosure Simplification. (see Note 10 in Notes to Financial Statements). |
| (3) | Adjusted to reflect the effect of a 1 for 4 reverse share split on March 16, 2017. (See Note 9 in Notes to Financial Statements). |
| * | Includes undistributed (distributed in excess) net investment income $1,360,193, in 2017. The SEC eliminated the requirement to disclose undistributed net investment income in 2018. |
| † | Includes undistributed (distributed in excess) net investment income $260,778, in 2017. The SEC eliminated the requirement to disclose undistributed net investment income in 2018. |
| | |
The accompanying notes are an integral part of the financial statements.
Statements of Changes in Net Assets |
| | | | | | | | | | | | | |
| | | Global X MSCI Portugal ETF | | | Global X MSCI Pakistan ETF | |
| | | Year Ended October 31, 2018 | | | Year Ended October 31, 2017 | | | Year Ended October 31, 2018 | | | Year Ended October 31, 2017 | |
| Operations: | | | | | | | | | | | | |
| Net Investment Income | | $ | 1,356,508 | | | $ | 1,187,421 | | | $ | 2,097,578 | | | $ | 1,474,017 | |
| Net Realized Gain (Loss) on Investments and Foreign Currency Transactions | | | 6,364,970 | (1) | | | (3,210,054 | )(1) | | | (11,831,415 | ) | | | 1,841,348 | |
| Net Change in Unrealized Appreciation (Depreciation) on Investments and Foreign Currency Translations | | | (9,234,682 | ) | | | 11,767,282 | | | | (1,524,013 | ) | | | (12,088,919 | ) |
| Net Increase (Decrease) in Net Assets Resulting from Operations | | | (1,513,204 | ) | | | 9,744,649 | | | | (11,257,850 | ) | | | (8,773,554 | ) |
| Distributions(2) | | | (1,558,591 | ) | | | (878,665 | ) | | | (4,283,498 | ) | | | (363,656 | ) |
| Capital Share Transactions: | | | | | | | | | | | | | | | | |
| Issued | | | 15,556,073 | | | | 36,796,138 | | | | 18,879,004 | | | | 69,427,851 | |
| Redeemed | | | (50,893,642 | ) | | | (7,651,145 | ) | | | (16,890,373 | ) | | | (17,377,887 | ) |
| Increase (Decrease) in Net Assets from Capital Share Transactions | | | (35,337,569 | ) | | | 29,144,993 | | | | 1,988,631 | | | | 52,049,964 | |
| Total Increase (Decrease) in Net Assets | | | (38,409,364 | ) | | | 38,010,977 | | | | (13,552,717 | ) | | | 42,912,754 | |
| Net Assets: | | | | | | | | | | | | | | | | |
| Beginning of Year | | | 63,704,542 | | | | 25,693,565 | | | | 53,576,287 | | | | 10,663,533 | |
| End of Year | | $ | 25,295,178 | * | | $ | 63,704,542 | * | | $ | 40,023,570 | † | | $ | 53,576,287 | † |
| Share Transactions: | | | | | | | | | | | | | | | | |
| Issued | | | 1,250,000 | | | | 3,250,000 | | | | 1,450,000 | | | | 4,200,000 | |
| Redeemed | | | (4,100,000 | ) | | | (750,000 | ) | | | (1,500,000 | ) | | | (950,000 | ) |
| Net Increase (Decrease) in Shares Outstanding from Share Transactions | | | (2,850,000 | ) | | | 2,500,000 | | | | (50,000 | ) | | | 3,250,000 | |
| (1) | Includes realized gains (losses) as a result of in-kind redemptions. (See Note 4 in Notes to Financial Statements.) |
| (2) | Current year presentation of distributions conforms with S-X Disclosure Simplification. Prior year distributions have been consolidated to conform with S-X Disclosure Simplification. (see Note 10 in Notes to Financial Statements). |
| * | Includes undistributed (distributed in excess) net investment income $1,153,141, in 2017. The SEC eliminated the requirement to disclose undistributed net investment income in 2018. |
| † | Includes undistributed (distributed in excess) net investment income $1,352,980, in 2017. The SEC eliminated the requirement to disclose undistributed net investment income in 2018. |
The accompanying notes are an integral part of the financial statements.
Selected Per Share Data & Ratios
For a Share Outstanding Throughout the Period | |
| | | Net
Asset Value, Beginning
of Period ($) | | | Net Investment Income ($)* | | | Net Realized and Unrealized Gain (Loss) on Investments ($) | | | Total from Operations ($) | | | Distribution from Net Investment Income ($) | | | Total from Distributions ($) | | | Net
Asset Value,
End of
Period ($) | | | Total Return (%)** | | | Net Assets End of Period ($)(000) | | | Ratio of Expenses to Average Net Assets (%) | | | Ratio of Net Investment Income to Average Net Assets (%) | | | Portfolio Turnover (%)†† | |
| Global X China Consumer ETF | | | | | | | | | | | | | | | | | | | | | | | | | | | | | | | | | | | | |
| 2018 | | | 17.44 | | | | 0.20 | | | | (3.95 | ) | | | (3.75 | ) | | | (0.12 | ) | | | (0.12 | ) | | | 13.57 | | | | (21.70 | ) | | | 120,102 | | | | 0.65 | | | | 1.11 | | | | 17.92 | |
| 2017 | | | 11.97 | | | | 0.24 | | | | 5.40 | | | | 5.64 | | | | (0.17 | ) | | | (0.17 | ) | | | 17.44 | | | | 47.90 | | | | 156,050 | | | | 0.65 | | | | 1.67 | | | | 34.72 | |
| 2016 | | | 13.72 | | | | 0.20 | | | | (1.36 | ) | | | (1.16 | ) | | | (0.59 | ) | | | (0.59 | ) | | | 11.97 | | | | (8.57 | ) | | | 73,023 | | | | 0.65 | | | | 1.71 | | | | 38.13 | |
| 2015 | | | 13.82 | | | | 0.53 | | | | (0.37 | ) | | | 0.16 | | | | (0.26 | ) | | | (0.26 | ) | | | 13.72 | | | | 1.34 | | | | 93,951 | | | | 0.65 | | | | 3.86 | | | | 24.57 | |
| 2014 | | | 15.87 | | | | 0.17 | | | | (2.07 | ) | | | (1.90 | ) | | | (0.15 | ) | | | (0.15 | ) | | | 13.82 | | | | (12.09 | ) | | | 134,014 | | | | 0.65 | | | | 1.18 | | | | 18.89 | |
| Global X China Energy ETF | | | | | | | | | | | | | | | | | | | | | | | | | | | | | | | | | | | | | | | | | | | | | | | | |
| 2018 | | | 11.69 | | | | 0.49 | | | | 0.05 | | | | 0.54 | | | | (0.41 | ) | | | (0.41 | ) | | | 11.82 | | | | 4.77 | | | | 2,955 | | | | 0.65 | | | | 4.00 | | | | 14.60 | |
| 2017 | | | 10.56 | | | | 0.41 | | | | 0.93 | | | | 1.34 | | | | (0.21 | ) | | | (0.21 | ) | | | 11.69 | | | | 13.13 | | | | 1,754 | | | | 0.65 | | | | 3.82 | | | | 11.85 | |
| 2016 | | | 11.61 | | | | 0.22 | | | | (0.94 | ) | | | (0.72 | ) | | | (0.33 | ) | | | (0.33 | ) | | | 10.56 | | | | (6.11 | ) | | | 1,583 | | | | 0.65 | | | | 2.19 | | | | 22.19 | |
| 2015 | | | 15.03 | | | | 0.22 | | | | (3.31 | ) | | | (3.09 | ) | | | (0.33 | ) | | | (0.33 | ) | | | 11.61 | | | | (20.89 | ) | | | 1,741 | | | | 0.65 | | | | 1.66 | | | | 15.62 | |
| 2014 | | | 15.11 | | | | 0.29 | | | | (0.09 | ) | | | 0.20 | | | | (0.28 | ) | | | (0.28 | ) | | | 15.03 | | | | 1.34 | | | | 4,509 | | | | 0.65 | | | | 1.90 | | | | 12.65 | |
| Global X China Financials ETF | | | | | | | | | | | | | | | | | | | | | | | | | | | | | | | | | | | | | | | | | | | | | | | | |
| 2018 | | | 17.63 | | | | 0.48 | | | | (2.38 | ) | | | (1.90 | ) | | | (0.34 | ) | | | (0.34 | ) | | | 15.39 | | | | (11.04 | ) | | | 30,784 | | | | 0.66 | | | | 2.67 | | | | 15.09 | |
| 2017 | | | 13.80 | | | | 0.39 | | | | 3.70 | | | | 4.09 | | | | (0.26 | ) | | | (0.26 | ) | | | 17.63 | | | | 30.32 | | | | 50,251 | | | | 0.65 | | | | 2.58 | | | | 19.12 | |
| 2016 | | | 14.90 | | | | 0.25 | | | | (0.62 | ) | | | (0.37 | ) | | | (0.73 | ) | | | (0.73 | ) | | | 13.80 | | | | (2.56 | ) | | | 28,289 | | | | 0.65 | | | | 1.92 | | | | 18.43 | |
| 2015 | | | 13.50 | | | | 0.54 | | | | 1.02 | | | | 1.56 | | | | (0.16 | ) | | | (0.16 | ) | | | 14.90 | | | | 11.50 | | | | 57,358 | | | | 0.65 | | | | 3.34 | | | | 15.88 | |
| 2014 | | | 13.29 | | | | 0.23 | | | 0.05 | ^ | | | 0.28 | | | | (0.07 | ) | | | (0.07 | ) | | | 13.50 | | | | 2.08 | | | | 48,585 | | | | 0.65 | | | | 1.76 | | | | 6.90 | |
| Global X China Industrials ETF | | | | | | | | | | | | | | | | | | | | | | | | | | | | | | | | | | | | | | | | | | | | | | | | |
| 2018 | | | 16.06 | | | | 0.29 | | | | (2.41 | ) | | | (2.12 | ) | | | (0.35 | ) | | | (0.35 | ) | | | 13.59 | | | | (13.44 | ) | | | 2,038 | | | | 0.66 | | | | 1.92 | | | | 18.28 | |
| 2017 | | | 12.57 | | | | 0.24 | | | | 3.45 | | | | 3.69 | | | | (0.20 | ) | | | (0.20 | ) | | | 16.06 | | | | 29.88 | | | | 4,015 | | | | 0.65 | | | | 1.68 | | | | 21.53 | |
| 2016 | | | 14.44 | | | | 0.18 | | | | (1.71 | ) | | | (1.53 | ) | | | (0.34 | ) | | | (0.34 | ) | | | 12.57 | | | | (10.60 | ) | | | 3,770 | | | | 0.65 | | | | 1.47 | | | | 14.08 | |
| 2015 | | | 12.93 | | | | 0.21 | | | | 1.40 | | | | 1.61 | | | | (0.10 | ) | | | (0.10 | ) | | | 14.44 | | | | 12.49 | | | | 7,222 | | | | 0.65 | | | | 1.38 | | | | 23.87 | |
| 2014 | | | 12.14 | | | | 0.15 | | | | 0.83 | | | | 0.98 | | | | (0.19 | ) | | | (0.19 | ) | | | 12.93 | | | | 8.13 | | | | 5,821 | | | | 0.65 | | | | 1.24 | | | | 10.61 | |
| Global X China Materials ETF | | | | | | | | | | | | | | | | | | | | | | | | | | | | | | | | | | | | | | | | | | | | | | | | |
| 2018 | | | 21.59 | | | | 0.46 | | | | (5.84 | ) | | | (5.38 | ) | | | (0.24 | ) | | | (0.24 | ) | | | 15.97 | | | | (25.20 | ) | | | 2,395 | | | | 0.66 | | | | 2.27 | | | | 26.95 | |
| 2017 | | | 13.42 | | | | 0.38 | | | | 7.95 | | | | 8.33 | | | | (0.16 | ) | | | (0.16 | ) | | | 21.59 | | | | 62.79 | | | | 5,397 | | | | 0.65 | | | | 2.19 | | | | 49.80 | |
| 2016 | | | 13.29 | | | | 0.16 | | | | 0.68 | | | | 0.84 | | | | (0.71 | ) | | | (0.71 | ) | | | 13.42 | | | | 6.84 | | | | 1,342 | | | | 0.65 | | | | 1.31 | | | | 26.33 | |
| 2015 | | | 14.80 | | | | 0.40 | | | | (1.70 | ) | | | (1.30 | ) | | | (0.21 | ) | | | (0.21 | ) | | | 13.29 | | | | (8.95 | ) | | | 1,329 | | | | 0.65 | | | | 2.39 | | | | 28.59 | |
| 2014 | | | 15.13 | | | | 0.19 | | | | (0.27 | ) | | | (0.08 | ) | | | (0.25 | ) | | | (0.25 | ) | | | 14.80 | | | | (0.57 | ) | | | 2,959 | | | | 0.65 | | | | 1.26 | | | | 13.51 | |
| Global X NASDAQ China Technology ETF | | | | | | | | | | | | | | | | | | | | | | | | | | | | | | | | | | | | | | | | | | | | | | | | |
| 2018 | | | 29.24 | | | | 0.07 | | | | (6.23 | ) | | | (6.16 | ) | | | (0.68 | ) | | | (0.68 | ) | | | 22.40 | | | | (21.70 | ) | | | 24,645 | | | | 0.65 | | | | 0.24 | | | | 33.79 | |
| 2017 | | | 23.23 | | | | 0.28 | | | | 6.69 | | | | 6.97 | | | | (0.96 | ) | | | (0.96 | ) | | | 29.24 | | | | 31.56 | | | | 19,007 | | | | 0.65 | | | | 1.14 | | | | 42.59 | |
| 2016 | | | 22.01 | | | | 0.45 | | | | 0.91 | | | | 1.36 | | | | (0.14 | ) | | | (0.14 | ) | | | 23.23 | | | | 6.20 | | | | 13,940 | | | | 0.65 | | | | 2.09 | | | | 42.02 | |
| 2015 | | | 23.48 | | | | 0.12 | | | | (1.52 | ) | | | (1.40 | ) | | | (0.07 | ) | | | (0.07 | ) | | | 22.01 | | | | (5.94 | ) | | | 15,404 | | | | 0.65 | | | | 0.52 | | | | 44.95 | |
| 2014 | | | 20.63 | | | | 0.06 | | | | 2.80 | | | | 2.86 | | | | (0.01 | ) | | | (0.01 | ) | | | 23.48 | | | | 13.85 | | | | 22,307 | | | | 0.65 | | | | 0.29 | | | | 64.79 | |
| ^ | The amount shown for a share outstanding throughout the period does not accord with the aggregate net gains on investments for the period because of the sales and repurchases of fund shares in relation to fluctuating market value of the investment of the Fund. |
| * | Per share data calculated using average shares method. |
| ** | Total Return is for the period indicated and has not been annualized. The return shown does not reflect the deduction of taxes that a shareholder would pay on Fund distributions or the redemption of Fund shares. |
| †† | Portfolio turnover rate is for the period indicated and periods of less than one year have not been annualized. Excludes effect of in-kind transfers. |
The accompanying notes are an integral part of the financial statements.
Selected Per Share Data & Ratios
For a Share Outstanding Throughout the Period | |
| | | Net
Asset Value, Beginning
of Period ($) | | | Net Investment Income ($)* | | | Net Realized and Unrealized Gain (Loss) on Investments ($) | | | Total from Operations ($) | | | Distribution from Net Investment Income ($) | | | Total from Distributions ($) | | | Net
Asset Value,
End of
Period ($) | | | Total Return (%)** | | | Net Assets End of Period ($)(000) | | | Ratio of Expenses to Average Net Assets (%) | | | Ratio of Net Investment Income to Average Net Assets (%) | | | Portfolio Turnover (%)†† | |
| Global X FTSE Southeast Asia ETF | | | | | | | | | | | | | | | | | | | | | | | | | | | | | | | | | | | | |
| 2018 | | | 15.91 | | | | 0.49 | | | | (0.81 | ) | | | (0.32 | ) | | | (0.27 | ) | | | (0.27 | ) | | | 15.32 | | | | (2.15 | ) | | | 17,614 | | | | 0.65 | | | | 2.94 | | | | 11.98 | |
| 2017 | | | 13.72 | | | | 0.32 | | | | 2.23 | | | | 2.55 | | | | (0.36 | ) | | | (0.36 | ) | | | 15.91 | | | | 19.19 | | | | 14,320 | | | | 0.65 | | | | 2.23 | | | | 7.78 | |
| 2016 | | | 13.07 | | | | 0.31 | | | | 0.78 | | | | 1.09 | | | | (0.44 | ) | | | (0.44 | ) | | | 13.72 | | | | 8.75 | | | | 12,349 | | | | 0.65 | | | | 2.40 | | | | 12.94 | |
| 2015 | | | 16.76 | | | | 0.34 | | | | (3.61 | ) | | | (3.27 | ) | | | (0.42 | ) | | | (0.42 | ) | | | 13.07 | | | | (19.97 | ) | | | 14,376 | | | | 0.65 | | | | 2.26 | | | | 24.06 | |
| 2014 | | | 17.12 | | | | 0.39 | | | | (0.16 | ) | | | 0.23 | | | | (0.59 | ) | | | (0.59 | ) | | | 16.76 | | | | 1.68 | | | | 29,336 | | | | 0.65 | | | | 2.36 | | | | 8.36 | |
| Global X MSCI Colombia ETF | | | | | | | | | | | | | | | | | | | | | | | | | | | | | | | | | | | | | | | | | | | | | | | | |
| 2018 | | | 9.56 | | | | 0.21 | | | | (0.91 | ) | | | (0.70 | ) | | | (0.18 | ) | | | (0.18 | ) | | | 8.68 | | | | (7.55 | ) | | | 82,282 | | | 0.62 | @ | | | 2.01 | | | | 39.15 | |
| 2017 | | | 9.22 | | | | 0.18 | | | | 0.29 | | | | 0.47 | | | | (0.13 | ) | | | (0.13 | ) | | | 9.56 | | | | 5.24 | | | | 92,984 | | | 0.62 | @
| | | 1.83 | | | | 40.93 | |
| 2016 | | | 8.79 | | | | 0.16 | | | | 0.39 | | | | 0.55 | | | | (0.12 | ) | | | (0.12 | ) | | | 9.22 | | | | 6.55 | | | | 88,760 | | | 0.65 | @
| | | 1.82 | | | | 37.60 | |
| 2015 | | | 17.42 | | | | 0.31 | | | | (8.53 | ) | | | (8.22 | ) | | | (0.41 | ) | | | (0.41 | ) | | | 8.79 | | | | (47.93 | ) | | | 66,616 | | | 0.61 | @
| | | 2.80 | | | | 66.93 | |
| 2014 | | | 20.55 | | | | 0.40 | | | | (2.78 | ) | | | (2.38 | ) | | | (0.75 | ) | | | (0.75 | ) | | | 17.42 | | | | (11.73 | ) | | | 100,688 | | | 0.66 | @
| | | 2.12 | | | | 47.57 | |
| Global X MSCI Argentina ETF | | | | | | | | | | | | | | | | | | | | | | | | | | | | | | | | | | | | | | | | | | | | | | | | |
| 2018 | | | 32.05 | | | | 0.35 | | | | (6.87 | ) | | | (6.52 | ) | | | (0.17 | ) | | | (0.17 | ) | | | 25.36 | | | | (20.48 | ) | | | 89,391 | | | | 0.60 | ‡ | | | 1.07 | | | | 34.46 | |
| 2017 | | | 23.69 | | | | 0.07 | | | | 8.37 | | | | 8.44 | | | | (0.08 | ) | | | (0.08 | ) | | | 32.05 | | | | 35.79 | | | | 183,468 | | | | 0.65 | ‡ | | | 0.24 | | | | 24.45 | |
| 2016 | | | 19.81 | | | | 0.15 | | | | 3.89 | | | | 4.04 | | | | (0.16 | ) | | | (0.16 | ) | | | 23.69 | | | | 20.65 | | | | 90,602 | | | | 0.74 | | | | 0.69 | | | | 20.88 | |
| 2015 | | | 21.18 | | | | 0.11 | | | | (1.39 | ) | | | (1.28 | ) | | | (0.09 | ) | | | (0.09 | ) | | | 19.81 | | | | (6.04 | ) | | | 15,355 | | | | 0.74 | | | | 0.58 | | | | 26.88 | |
| 2014 | | | 20.29 | | | | 0.10 | | | 0.91 | ^
| | | 1.01 | | | | (0.12 | ) | | | (0.12 | ) | | | 21.18 | | | | 5.03 | | | | 20,652 | | | | 0.74 | | | | 0.49 | | | | 95.29 | |
| Global X MSCI Greece ETF | | | | | | | | | | | | | | | | | | | | | | | | | | | | | | | | | | | | | | | | | | | | | | | | |
| 2018 | | | 9.30 | | | | 0.19 | | | | (1.59 | ) | | | (1.40 | ) | | | (0.22 | ) | | | (0.22 | ) | | | 7.68 | | | | (15.63 | ) | | | 257,901 | | | | 0.59 | | | | 1.98 | | | | 16.38 | |
| 2017 | | | 7.35 | | | | 0.15 | | | | 1.95 | | | | 2.10 | | | | (0.15 | ) | | | (0.15 | ) | | | 9.30 | | | | 29.04 | | | | 349,788 | | | | 0.61 | | | | 1.69 | | | | 21.59 | |
| 2016 | | | 10.41 | | | | 0.13 | | | | (3.07 | ) | | | (2.94 | ) | | | (0.12 | ) | | | (0.12 | ) | | | 7.35 | | | | (28.33 | ) | | | 245,561 | | | | 0.62 | | | | 1.71 | | | | 76.19 | |
| 2015 | | | 15.84 | | | | 0.18 | | | | (5.48 | ) | | | (5.30 | ) | | | (0.13 | ) | | | (0.13 | ) | | | 10.41 | | | | (33.66 | ) | | | 314,907 | | | | 0.62 | | | | 1.61 | | | | 29.35 | |
| 2014 | | | 22.60 | | | | 0.08 | | | | (6.83 | ) | | | (6.75 | ) | | | (0.01 | ) | | | (0.01 | ) | | | 15.84 | | | | (29.83 | ) | | | 140,201 | | | | 0.62 | | | | 0.38 | | | | 64.19 | |
| Global X MSCI Norway ETF | | | | | | | | | | | | | | | | | | | | | | | | | | | | | | | | | | | | | | | | | | | | | | | | |
| 2018 | | | 13.50 | | | | 0.37 | | | | 0.48 | | | | 0.85 | | | | (0.38 | ) | | | (0.38 | ) | | | 13.97 | | | | 6.47 | | | | 163,471 | | | | 0.50 | | | | 2.64 | | | | 9.55 | |
| 2017 | | | 11.07 | | | | 0.41 | | | | 2.34 | | | | 2.75 | | | | (0.32 | ) | | | (0.32 | ) | | | 13.50 | | | | 25.53 | | | | 164,736 | | | | 0.50 | | | | 3.41 | | | | 9.53 | |
| 2016 | | | 10.75 | | | | 0.35 | | | | 0.34 | | | | 0.69 | | | | (0.37 | ) | | | (0.37 | ) | | | 11.07 | | | | 6.86 | | | | 113,997 | | | | 0.50 | | | | 3.39 | | | | 16.62 | |
| 2015 | | | 14.82 | | | | 0.34 | | | | (3.58 | ) | | | (3.24 | ) | | | (0.83 | ) | | | (0.83 | ) | | | 10.75 | | | | (22.50 | ) | | | 65,024 | | | | 0.50 | | | | 2.76 | | | | 16.05 | |
| 2014 | | | 16.76 | | | | 0.63 | | | | (2.18 | ) | | | (1.55 | ) | | | (0.39 | ) | | | (0.39 | ) | | | 14.82 | | | | (9.46 | ) | | | 183,038 | | | | 0.50 | | | | 3.76 | | | | 26.50 | |
| Global X FTSE Nordic Region ETF | | | | | | | | | | | | | | | | | | | | | | | | | | | | | | | | | | | | | | | | | | | | | | | | |
| 2018 | | | 23.89 | | | | 0.63 | | | | (2.87 | ) | | | (2.24 | ) | | | (0.83 | ) | | | (0.83 | ) | | | 20.82 | | | | (9.67 | ) | | | 24,149 | | | | 0.58 | | | | 2.80 | | | | 7.37 | |
| 2017 | | | 19.38 | | | | 0.51 | | | | 4.72 | | | | 5.23 | | | | (0.72 | ) | | | (0.72 | ) | | | 23.89 | | | | 27.97 | | | | 38,464 | | | | 0.55 | | | | 2.37 | | | | 6.79 | |
| 2016 | | | 22.29 | | | | 0.63 | | | | (2.91 | ) | | | (2.28 | ) | | | (0.63 | ) | | | (0.63 | ) | | | 19.38 | | | | (10.54 | ) | | | 40,899 | | | | 0.51 | | | | 3.01 | | | | 10.90 | |
| 2015 | | | 24.36 | | | | 0.59 | | | | (1.81 | ) | | | (1.22 | ) | | | (0.85 | ) | | | (0.85 | ) | | | 22.29 | | | | (5.05 | ) | | | 52,596 | | | | 0.50 | | | | 2.53 | | | | 7.76 | |
| 2014 | | | 23.74 | | | | 0.79 | | | | 0.46 | | | | 1.25 | | | | (0.63 | ) | | | (0.63 | ) | | | 24.36 | | | | 5.30 | | | | 59,927 | | | | 0.50 | | | | 3.16 | | | | 6.05 | |
| ^ | The amount shown for a share outstanding throughout the period does not accord with the aggregate net gains on investments for the period because of the sales and repurchases of fund shares in relation to fluctuating market value of the investment of the Fund. |
| * | Per share data calculated using average shares method. |
| ** | Total Return is for the period indicated and has not been annualized. The return shown does not reflect the deduction of taxes that a shareholder would pay on Fund distributions or the redemption of Fund shares. |
| †† | Portfolio turnover rate is for the period indicated and periods of less than one year have not been annualized. Excludes effect of in-kind transfers |
| @ | The ratio of Expenses to Average Net Assets includes the effect of a waiver. If these offsets were excluded, the ratio would have been 0.68%, 0.81%, 0.84%, 0.79% and 0.78% for the years ended October 31, 2018, 2017, 2016, 2015, and 2014, respectively. |
| ‡ | The ratio of Expenses to Average Net Assets includes the effect of a waiver. If these offsets were excluded, the ratios would have been 0.66% and 0.74% for the years ended October 31, 2018 and 2017. |
The accompanying notes are an integral part of the financial statements.
Selected Per Share Data & Ratios
For a Share Outstanding Throughout the Period | |
| | | Net Asset Value, Beginning of Period ($) | | | Net Investment Income ($)* | | | Net Realized and Unrealized Gain (Loss) on Investments ($) | | | Total from Operations ($) | | | Distribution from Net Investment Income ($) | | | Distribution from Capital Gains ($) | | | Total from Distributions ($) | | | Net Asset Value, End of Period ($) | | | Total Return (%)** | | | Net Assets End of Period ($)(000) | | | Ratio of Expenses to Average Net Assets (%) | | | Ratio of Net Investment Income to Average Net Assets (%) | | | Portfolio Turnover (%)†† | |
| Global X MSCI Nigeria ETF | | | | | | | | | | | | | | | | | | | | | | | | | | | | | | | | | | | | | | | |
| 2018 | | | 21.43 | | | | 0.73 | | | | (3.76 | ) | | | (3.03 | ) | | | (0.42 | ) | | | — | | | | (0.42 | ) | | | 17.98 | | | | (14.46 | ) | | | 40,675 | | | | 0.88 | | | | 3.29 | | | | 62.52 | |
| 2017 | | | 17.24 | | | | 0.54 | | | | 4.07 | | | | 4.61 | | | | (0.42 | ) | | | — | | | | (0.42 | ) | | | 21.43 | | | | 27.52 | | | | 64,559 | | | | 1.07 | | | | 2.99 | | | | 21.07 | |
| 2016 | | | 31.76 | | | | 0.86 | | | | (14.16 | ) | | | (13.30 | ) | | | (1.22 | ) | | | — | | | | (1.22 | ) | | | 17.24 | | | | (43.30 | ) | | | 28,009 | | | 1.02 | @ | | | 3.80 | | | | 29.61 | |
| 2015 | | | 52.08 | | | | 1.37 | | | | (20.47 | ) | | | (19.10 | ) | | | (1.22 | ) | | | — | | | | (1.22 | ) | | | 31.76 | | | | (37.25 | ) | | | 24,623 | | | 0.68 | @
| | | 3.72 | | | | 34.00 | |
2014(1) | | | 59.68 | | | | 1.88 | | | | (8.65 | ) | | | (6.77 | ) | | | (0.68 | ) | | | (0.15 | ) | | | (0.83 | ) | | | 52.08 | | | | (11.55 | ) | | | 16,924 | | | 0.68 | @
| | | 3.14 | | | | 54.75 | |
| Global X Next Emerging & Frontier ETF | | | | | | | | | | | | | | | | | | | | | | | | | | | | | | | | | | | | | | | | | | | | | | | | | |
| 2018 | | | 23.28 | | | | 0.59 | | | | (3.24 | ) | | | (2.65 | ) | | | (0.41 | ) | | | — | | | | (0.41 | ) | | | 20.22 | | | | (11.66 | ) | | | 13,145 | | | | 0.55 | | | | 2.54 | | | | 14.62 | |
| 2017 | | | 20.15 | | | | 0.40 | | | | 3.21 | | | | 3.61 | | | | (0.48 | ) | | | — | | | | (0.48 | ) | | | 23.28 | | | | 18.53 | | | | 16,294 | | | | 0.56 | | | | 1.89 | | | | 7.93 | |
| 2016 | | | 19.27 | | | | 0.20 | | | 1.14 | ^
| | | 1.34 | | | | (0.46 | ) | | | — | | | | (0.46 | ) | | | 20.15 | | | | 7.33 | | | | 15,112 | | | | 0.56 | | | | 1.13 | | | | 9.35 | |
| 2015 | | | 25.55 | | | | 0.49 | | | | (6.37 | ) | | | (5.88 | ) | | | (0.40 | ) | | | — | | | | (0.40 | ) | | | 19.27 | | | | (23.29 | ) | | | 106,925 | | | | 0.58 | | | | 2.22 | | | | 19.72 | |
2014(2) | | | 25.08 | | | | 0.51 | | | | 0.01 | | | | 0.52 | | | | (0.05 | ) | | | — | | | | (0.05 | ) | | | 25.55 | | | | 2.07 | | | | 152,027 | | | | 0.58 | †‡ | | | 2.00 | † | | | 24.14 | |
| Global X MSCI Portugal ETF | | | | | | | | | | | | | | | | | | | | | | | | | | | | | | | | | | | | | | | | | | | | | | | | | | | | |
| 2018 | | | 12.49 | | | | 0.36 | | | | (1.25 | ) | | | (0.89 | ) | | | (0.36 | ) | | | — | | | | (0.36 | ) | | | 11.24 | | | | (7.26 | ) | | | 25,295 | | | | 0.57 | | | | 2.91 | | | | 21.05 | |
| 2017 | | | 9.88 | | | | 0.36 | | | | 2.65 | | | | 3.01 | | | | (0.40 | ) | | | — | | | | (0.40 | ) | | | 12.49 | | | | 31.88 | | | | 63,705 | | | | 0.60 | | | | 3.31 | | | | 25.31 | |
| 2016 | | | 10.85 | | | | 0.42 | | | | (0.93 | ) | | | (0.51 | ) | | | (0.46 | ) | | | — | | | | (0.46 | ) | | | 9.88 | | | | (4.86 | ) | | | 25,694 | | | | 0.61 | | | | 4.26 | | | | 27.20 | |
| 2015 | | | 12.65 | | | | 0.30 | | | | (1.87 | ) | | | (1.57 | ) | | | (0.23 | ) | | | — | | | | (0.23 | ) | | | 10.85 | | | | (12.39 | ) | | | 37,449 | | | | 0.61 | | | | 2.68 | | | | 35.26 | |
2014(3) | | | 15.04 | | | | 0.38 | | | | (2.77 | ) | | | (2.39 | ) | | | — | | | | — | | | | — | | | | 12.65 | | | | (15.89 | ) | | | 36,692 | | | | 0.61 | † | | | 2.58 | † | | | 53.58 | |
| Global X MSCI Pakistan ETF | | | | | | | | | | | | | | | | | | | | | | | | | | | | | | | | | | | | | | | | | | | | | | | | | | | | |
| 2018 | | | 13.56 | | | | 0.47 | | | | (2.68 | ) | | | (2.21 | ) | | | (0.44 | ) | | | (0.65 | ) | | | (1.09 | ) | | | 10.26 | | | | (17.53 | ) | | | 40,024 | | | | 0.87 | | | | 3.84 | | | | 44.05 | |
| 2017 | | | 15.23 | | | | 0.75 | | | | (1.90 | ) | | | (1.15 | ) | | | (0.52 | ) | | | — | | | | (0.52 | ) | | | 13.56 | | | | (8.25 | ) | | | 53,576 | | | | 0.89 | | | | 4.64 | | | | 65.51 | |
| 2016 | | | 14.17 | | | | 0.58 | | | | 0.90 | | | | 1.48 | | | | (0.37 | ) | | | (0.05 | ) | | | (0.42 | ) | | | 15.23 | | | | 10.87 | | | | 10,664 | | | | 0.91 | | | | 4.01 | | | | 21.22 | |
2015(4) | | | 15.28 | | | | 0.35 | | | | (1.46 | ) | | | (1.11 | ) | | | — | | | | — | | | | — | | | | 14.17 | | | | (7.26 | ) | | | 5,667 | | | | 0.90 | † | | | 4.43 | † | | | 19.31 | |
| (1) | Per share amounts have been adjusted for a 1 for 4 reverse share split on March 16, 2017 (See Note 9 in the Notes to Financial Statements). |
| (2) | The Fund commenced operations on November 6, 2013. |
| (3) | The Fund commenced operations on November 12, 2013. |
| (4) | The Fund commenced operations on April 22, 2015. |
| ^ | The amount shown for a share outstanding throughout the period does not accord with the aggregate net gains on investments for the period because of the sales and repurchases of fund shares in relation to fluctuating market value of the investment of the Fund. |
| * | Per share data calculated using average shares method. |
| ** | Total Return is for the period indicated and has not been annualized. The return shown does not reflect the deduction of taxes that a shareholder would pay on Fund distributions or the redemption of Fund shares. |
| † | Annualized. |
| †† | Portfolio turnover rate is for the period indicated and has not been annualized. Excludes effect of in-kind transfers. |
| @ | The ratio of Expenses to Average Net Assets includes the effect of a waiver. If these offsets were excluded, the ratio would have been 1.10%, 0.92%, and 0.92% for the years and or period ended October 31, 2016, 2015 , and 2014, respectively. |
| ‡ | The ratio of Expenses to Average Net Assets includes the effect of income taxes. If these expenses were excluded, the ratio would have been 0.58% for the Global X Next Emerging & Frontier ETF. |
| | |
Amounts designated as “—” are either $0 or have been rounded to $0.
The accompanying notes are an integral part of the financial statements.
Notes to Financial Statements |
| October 31, 2018 |
1. ORGANIZATION
The Global X Funds (the "Trust") is a Delaware statutory trust formed on March 6, 2008. The Trust is registered under the Investment Company Act of 1940, as amended, as an open-end management investment company. As of October 31, 2018, the Trust had ninety-seven investment portfolios, fifty-seven of which were operational. The financial statements herein and the related notes pertain to the Global X China Consumer ETF, Global X China Energy ETF, Global X China Financials ETF, Global X China Industrials ETF, Global X China Materials ETF, Global X NASDAQ China Technology ETF, Global X FTSE Southeast Asia ETF, Global X MSCI Colombia ETF, Global X MSCI Argentina ETF, Global X MSCI Greece ETF, Global X MSCI Norway ETF, Global X FTSE Nordic Region ETF, Global X MSCI Nigeria ETF, Global X Next Emerging & Frontier ETF, Global X MSCI Portugal ETF and Global X MSCI Pakistan ETF (each a “Fund”, and collectively, the “Funds”). Each Fund (except for the Global X Next Emerging & Frontier ETF) has elected non-diversified status.
2. SIGNIFICANT ACCOUNTING POLICIES
The following is a summary of the Significant Accounting Policies followed by the Funds.
USE OF ESTIMATES — The Funds are investment companies that apply the accounting and reporting guidance issued in Topic 946 by the U.S. Financial Accounting Standards Board. The preparation of financial statements in conformity with U.S. generally accepted accounting principles ("U.S. GAAP") requires management to make estimates and assumptions that affect the reported amounts of assets and liabilities and disclosure of contingent assets and liabilities at the date of the financial statements and the reported amounts of increases and decreases in net assets from operations during the reporting period. Actual results could differ from those estimates.
RETURN OF CAPITAL ESTIMATES — Distributions received by the Funds from underlying Master Limited Partnership (“MLP”) and real estate investment trust (“REIT”) investments generally are comprised of income and return of capital. The Funds record investment income and return of capital based on estimates made at the time such distributions are received. Such estimates are based on historical information available from the MLPs, REITs and other industry sources. These estimates may subsequently be revised based on information received from the MLPs and REITs after their tax reporting periods are concluded.
SECURITY VALUATION — Securities listed on a securities exchange, market or automated quotation system for which quotations are readily available (except for securities traded on NASDAQ and the Nigerian Stock Exchange), including securities traded over the counter, are valued at the last quoted sale price on the primary exchange or market (foreign or domestic) on which they are traded (or at approximately 4:00 pm if a security’s primary exchange is normally open at that time), or, if there is no such reported sale, at the most recent mean between the quoted bid and asked prices, which approximate fair value (absent both bid and asked prices on such exchange, the bid price may be used).
For securities traded on NASDAQ and the Nigerian Stock Exchange, the Official Closing Price will be used. If available, debt securities are priced based upon valuations provided by independent, third-party pricing agents. Such values generally reflect the last reported sales price if the security is actively traded. The third-party pricing agents may also value debt securities at an evaluated bid price by employing methodologies that utilize actual market transactions, broker-supplied valuations,
Notes to Financial Statements (continued) |
| October 31, 2018 |
2. SIGNIFICANT ACCOUNTING POLICIES (continued)
or other methodologies designed to identify the market value for such securities. Debt obligations with remaining maturities of sixty days or less may be valued at their amortized cost, which appr- oximates market value. The prices for foreign securities are reported in local currency and converted to U.S. dollars using currency exchange rates. Prices for most securities held by the Funds are provided daily by recognized independent pricing agents. If a security price cannot be obtained from an independent, third-party pricing agent, the Funds seek to obtain a bid price from at least one independent broker.
Securities for which market prices are not "readily available" are valued in accordance with Fair Value Procedures established by the Board of Trustees (the “Board”). The Funds’ Fair Value Procedures are implemented through a Fair Value Committee (the "Committee") designated by the Board. Some of the more common reasons that may necessitate that a security be valued using the Fair Value Procedures include: the security's trading has been halted or suspended; the security has been de-listed from its primary trading exchange; the security's primary trading market is temporarily closed at a time when, under normal conditions, it would be open; the security has not been traded for an extended period of time; the security's primary pricing source is not able or willing to provide a price; or trading of the security is subject to local government-imposed restrictions. In addition, the Funds may fair value a security if an event that may materially affect the value of the Funds’ security that traded outside of the United States (a “Significant Event”) has occurred between the time of the security's last close and the time that the Funds calculate their net asset values. A Significant Event may relate to a single issuer or to an entire market sector. Events that may be Significant Events include: government actions, natural disaster, armed conflict, acts of terrorism and significant market fluctuations. If Global X Management Company LLC, the Funds investment adviser (the “Adviser”) becomes aware of a Significant Event that has occurred with respect to a security or group of security after the closing of the exchange or market on which the security or securities principally trade, but before the time at which the Funds calculate their net asset values, it may request that a Committee meeting be called. When a security is valued in accordance with the Fair Value Procedures, the Committee will determine the value after taking into consideration relevant information reasonably available to the Committee. As of October 31, 2018, there were securities valued using Fair Value Procedures of $0, $10,583, $24,050, $1,243,029 and $12 in Global X China Materials ETF, Global X China Industrials ETF, Global X NASDAQ China Technology ETF, Global X MSCI Greece ETF and Global X MSCI Portugal ETF, respectively. There were no other securities priced using the Fair Value Procedures.
In accordance with the authoritative guidance on fair value measurements and disclosure under U.S. GAAP, the Funds disclose the fair value of their investments in a hierarchy that prioritizes the inputs to valuation techniques used to measure the fair value. The objective of a fair value measurement is to determine the price that would be received upon the sale of an asset or paid to transfer a liability in an orderly transaction between market participants at the measurement date (an exit price). Accordingly, the fair value hierarchy gives the highest priority to quoted prices (unadjusted) in active markets for identical assets or liabilities (Level 1) and the lowest priority to unobservable inputs (Level 3). The three levels of the fair value hierarchy are described below:
Level 1 – Unadjusted quoted prices in active markets for identical, unrestricted assets or liabilities that the Funds have the ability to access at the measurement date
Notes to Financial Statements (continued)
2. SIGNIFICANT ACCOUNTING POLICIES (continued)
Level 2 – Other significant observable inputs (including quoted prices in non-active markets, quoted prices for similar investments, fair value of investments for which the Funds have the ability to fully redeem tranches at net asset value as of the measurement date or within the near term, and short-term investments valued at amortized cost)
Level 3 – Significant unobservable inputs (including the Funds’ own assumptions in determining the fair value of investments, fair value of investments for which the Funds do not have the ability to fully redeem tranches at net asset value as of the measurement date or within the near term)
Investments are classified within the level of the lowest significant input considered in determining fair value. Investments classified within Level 3 whose fair value measurement considers several inputs may include Level 1 or Level 2 inputs as components of the overall fair value measurement. For the year ended October 31, 2018, there have been no significant changes to the Funds’ fair valuation methodologies.
The following table summarizes the quantitative inputs and assumptions used for items categorized as material Level 3 investments as of October 31, 2018. The disclosures below also include qualitative information on the sensitivity of the fair value measurements to changes in the significant unobservable inputs.
| Global X China Industrials | | | | | |
| Assets | | Fair Value at 10/31/18 | | Valuation Technique(s) | Unobservable Input |
| Common Stock | | $ | 10,583 | | Valued at Last Traded Price | October 30, 2018 Last Traded Price |
The unobservable inputs used to determine fair value of Level 3 assets may have similar or diverging impacts on valuation. Significant increases and decreases in these inputs in isolation and interrelationships between those inputs could result in significantly higher or lower fair value measurement.
DUE TO/FROM BROKERS — Due to/from brokers includes cash and collateral balances with the Funds’ clearing brokers or counterparties at October 31, 2018. The Funds continuously monitor the credit standing of each broker or counterparty with whom they conduct business. In the event broker or counterparty is unable to fulfill its obligations, the Funds would be subject to counterparty credit risk.
REPURCHASE AGREEMENTS — Securities pledged as collateral for repurchase agreements by BNP Paribas and RBC Capital Markts are held by Brown Brother Harriman & Co (“BBH”) and are designated as being held on each Fund’s behalf by its custodian under a book-entry system. Each Fund monitors the adequacy of the collateral on a daily basis and can require the seller to provide additional collateral in the event the market value of thesecurities pledged falls below the carrying value of the repurchase agreement, including accrued interest. It is the Funds’ policy to only enter into repurchase agreements with banks and other financial institutions which are deemed by the Adviser to be creditworthy. The Fund bears the risk of loss in the event that the counterparty to a repurchase agreement defaults on its obligations and the Fund is prevented from exercising its rights to dispose of the underlying securities received as collateral and the risk of a possible decline in the
Notes to Financial Statements (continued)
2. SIGNIFICANT ACCOUNTING POLICIES (continued)
value of the underlying securities during the period. For financial statement purposes, the Funds record the securities lending collateral (included in repurchase agreements, at value or restricted cash) as an asset and the obligation to return securities lending collateral as a liability on the Statements of Assets and Liabilities.
Repurchase agreements are entered into by the Funds under Master Repurchase Agreements (“MRA”) which permit the Funds, under certain circumstances, including an event of default (such as bankruptcy or insolvency), to offset payables and/or receivables under the MRA with collateral held and/or posted to the counterparty and create one single net payment due to or from the Funds.
As of October 31, 2018, the open repurchase agreements by counterparty which are subject to a MRA on a net payment basis are as follows:
|
Repurchase Agreements
| | Fair Value of Non-cash Collateral Received(1)
| | Cash Collateral Received
| |
Net Amount(2)
|
| Global X China Consumer ETF | | | | | | | | | | | | |
| BNP Paribas | | $ | 248,678 | | | $ | 248,678 | | | $ | - | | | $ | - | |
| RBC Capital Markets | | | 863,463 | | | | 863,463 | | | | - | | | | - | |
| Global X NASDAQ China Technology ETF | | | | | | | | | | | | | | | | |
| BNP Paribas | | | 222,116 | | | | 222,116 | | | | - | | | | - | |
| RBC Capital Markets | | | 771,234 | | | | 771,234 | | | | - | | | | - | |
| Global X MSCI Greece ETF | | | | | | | | | | | | | | | | |
| BNP Paribas | | | 1,652,500 | | | | 1,652,500 | | | | - | | | | - | |
| RBC Capital Markets | | | 5,737,847 | | | | 5,737,847 | | | | - | | | | - | |
| Global X MSCI Norway ETF | | | | | | | | | | | | | | | | |
| BNP Paribas | | | 136,750 | | | | 136,750 | | | | - | | | | - | |
| RBC Capital Markets | | | 474,828 | | | | 474,828 | | | | - | | | | - | |
| Global X FTSE Nordic Region ETF | | | | | | | | | | | | | | | | |
| BNP Paribas | | | 111,056 | | | | 111,056 | | | | - | | | | - | |
| RBC Capital Markets | | | 385,610 | | | | 385,610 | | | | - | | | | - | |
| Global X MSCI Portugal ETF | | | | | | | | | | | | | | | | |
| BNP Paribas | | | 105,958 | | | | 105,958 | | | | - | | | | - | |
| RBC Capital Markets | | | 367,910 | | | | 367,910 | | | | - | | | | - | |
(1) Excess collateral received is not presented in the table above. Please refer to the Schedule of Investments for the market value of the collateral received for each Fund.
(2) Net Amount represents the net amount receivable due from the counterparty in the event of default.
FEDERAL INCOME TAXES — It is each Fund’s intention to qualify or continue to qualify as a regulated investment company for Federal income tax purposes by complying with the appropriate provisions of Subchapter M of the Internal Revenue Code of 1986, as amended. Accordingly, no provisions for Federal income taxes have been made in the financial statements.
The Funds evaluate tax positions taken or expected to be taken in the course of preparing the Funds’ tax returns to determine whether it is "more-likely-than-not" (i.e., greater than 50 percent) that each tax position will be sustained upon examination by a taxing authority based on the technical merits
Notes to Financial Statements (continued)
2. SIGNIFICANT ACCOUNTING POLICIES (continued)
of the position. Tax positions not deemed to meet the more-likely-than-not threshold are recorded as a tax benefit or expense in the current year.
If the Funds have foreign tax filings that have not been made, the tax years that remain subject to examination may date back to the inception of each Fund.
The Funds did not record any tax provision in the current period. However, management’s conclusions regarding tax positions may be subject to review and adjustment at a later date based on factors including, but not limited to, examination by tax authorities (i.e., the last three tax year ends, as applicable), and on-going analysis of and changes to tax laws, regulations and interpretations thereof.
As of and during the year ended October 31, 2018, the Funds did not have a liability for any unrecognized tax benefits as income tax expense in the Statement of Operations. During the year, the Funds did not incur any interest or penalties.
SECURITY TRANSACTIONS AND INVESTMENT INCOME — Security transactions are accounted for on the trade date for financial reporting purposes. Costs used in determining realized gains and losses on the sale of investment securities are based on specific identification. Dividend income is recorded on the ex-dividend date. Interest income is recognized on the accrual basis from the settlement date.
FOREIGN CURRENCY TRANSACTIONS AND TRANSLATION — The books and records of the Funds are maintained in U.S. dollars. Investment securities and other assets and liabilities denominated in a foreign currency are translated into U.S. dollars on the date of valuation. Purchases and sales of investment securities, income and expenses are translated into U.S. dollars at the relevant rates of exchange prevailing on the respective dates of such transactions. The Funds do not isolate that portion of realized or unrealized gains and losses resulting from changes in the foreign exchange rate from fluctuations arising from changes in the market prices of the securities. These gains and losses are included in net realized and unrealized gains and losses on investments on the Statement of Operations. Net realized and unrealized gains and losses on foreign currency transactions and translations represent net foreign exchange gains or losses from foreign currency spot contracts, disposition of foreign currencies, currency gains or losses realized between trade and settlement dates on securities transactions and the difference between the amount of the investment income and foreign withholding taxes recorded on the Funds’ books and the U.S. dollar equivalent amounts actually received or paid.
DIVIDENDS AND DISTRIBUTIONS TO SHAREHOLDERS — The Funds distribute their net investment income on a pro rata basis. Any net investment income and net realized capital gains are distributed at least annually. All distributions are recorded on the ex-dividend date.
CASH OVERDRAFT CHARGES — Per the terms of an agreement with BBH, if a Fund has a cash overdraft on a given day, it will be assessed an overdraft charge of LIBOR plus 2.00%. Cash overdraft charges are included in custodian fees on the Statements of Operations.
CREATION UNITS — The Funds issue and redeem their shares (“Shares”) on a continuous basis at Net Asset Value (“NAV”) and only in large blocks of 50,000 Shares, referred to as “Creation Units”. Purchasers of Creation Units (“Authorized Participants”) at NAV must pay a standard creation
Notes to Financial Statements (continued)
2. SIGNIFICANT ACCOUNTING POLICIES (continued)
transaction fee per transaction. The fee is a single charge and will be the same regardless of the number of Creation Units purchased by an Authorized Participant on the same day.
An Authorized Participant who holds Creation Units and wishes to redeem at NAV would also pay a standard redemption fee per transaction to Brown Brothers Harriman & Co. (“BBH”), the Funds’ custodian (“Custodian”), on the date of such redemption, regardless of the number of Creation Units redeemed that day. If a Creation Unit is purchased or redeemed for cash, an additional variable fee may be charged. The following table discloses Creation Unit breakdown:
|
|
Creation Unit Shares
| | Creation Fee
| | Value at October 31, 2018
| | Redemption Fee
|
| Global X China Consumer ETF | | | 50,000 | | | $ | 1,500 | | | $ | 678,500 | | | $ | 1,500 | |
| Global X China Energy ETF | | | 50,000 | | | | 1,500 | | | | 591,000 | | | | 1,500 | |
| Global X China Financials ETF | | | 50,000 | | | | 1,500 | | | | 769,500 | | | | 1,500 | |
| Global X China Industrials ETF | | | 50,000 | | | | 1,500 | | | | 679,500 | | | | 1,500 | |
| Global X China Materials ETF | | | 50,000 | | | | 1,500 | | | | 798,500 | | | | 1,500 | |
| Global X NASDAQ China Technology ETF | | | 50,000 | | | | 1,500 | | | | 1,120,000 | | | | 1,500 | |
| Global X FTSE Southeast Asia ETF | | | 50,000 | | | | 2,100 | | | | 766,000 | | | | 2,100 | |
| Global X MSCI Colombia ETF | | | 50,000 | | | | 2,000 | | | | 434,000 | | | | 2,000 | |
| Global X MSCI Argentina ETF | | | 50,000 | | | | 500 | | | | 1,268,000 | | | | 500 | |
| Global X MSCI Greece ETF | | | 50,000 | | | | 800 | | | | 384,000 | | | | 800 | |
| Global X MSCI Norway ETF | | | 50,000 | | | | 1,200 | | | | 698,500 | | | | 1,200 | |
| Global X FTSE Nordic Region ETF | | | 50,000 | | | | 1,000 | | | | 1,041,000 | | | | 1,000 | |
| Global X MSCI Nigeria ETF | | | 50,000 | | | | 2,300 | | | | 899,000 | | | | 2,300 | |
| Global X Next Emerging & Frontier ETF | | | 50,000 | | | | 9,500 | | | | 1,011,000 | | | | 9,500 | |
| Global X MSCI Portugal ETF | | | 50,000 | | | | 1,000 | | | | 562,000 | | | | 1,000 | |
| Global X MSCI Pakistan ETF | | | 50,000 | | | | 3,500 | | | | 513,000 | | | | 3,500 |
3. RELATED PARTIES AND SERVICE PROVIDER TRANSACTIONS
On July 2, 2018, the Adviser consummated a transaction pursuant to which MAGI Merger Sub LLC, a direct, wholly-owned subsidiary of Horizons ETFs Management (USA) LLC (“Horizons”) and an indirect, wholly-owned subsidiary of Mirae Asset Global Investments Co., Ltd. (“Mirae”), merged with and into the Adviser. Pursuant to the terms of the transaction, Horizons acquired all of the equity interests of the Adviser, and the Adviser became a direct, wholly-owned subsidiary of Horizons and an indirect, wholly-owned subsidiary of Mirae. In this manner, the Adviser is ultimately controlled by Mirae, which is a leading financial services company in Korea and is the headquarters for the Mirae Asset Global Investments Group.
The Adviser serves as the investment adviser and the administrator for the Funds. Subject to the supervision of the Board, the Adviser is responsible for managing the investment activities of the Funds and the Funds’ business affairs and other administrative matters and provides or causes to be furnished all supervisory, administrative and other services reasonably necessary for the operation of the Funds, including certain distribution services (provided pursuant to a separate distribution services agreement), certain shareholder and distribution-related services (provided pursuant to a
Notes to Financial Statements (continued)
3. RELATED PARTIES AND SERVICE PROVIDER TRANSACTIONS (continued)
separate Rule 12b-1 Plan and related agreements) and investment advisory services (provided pursuant to a separate Investment Advisory Agreement), under what is essentially an "all-in" fee
structure. For the Advisers service to the Funds, under the Supervision and Administration Agreement, each Fund pays a monthly fee to the Adviser at the annual rate below (stated as a percentage of the average daily net assets of the Fund). In addition, the Funds bear other expenses, directly and indirectly that are not covered by the Supervision and Administration Agreement, which may vary and affect the total expense ratios of the Funds, such as taxes, brokerage fees, commissions and other transaction expenses, interest expenses, acquired fund fees and extraordinary expenses (such as litigation and indemnification expenses). In addition, the Global X MSCI Colombia ETF, Global X MSCI Argentina ETF, Global X MSCI Greece ETF, Global X MSCI Nigeria ETF, Global X Next Emerging & Frontier ETF, Global X MSCI Portugal ETF and Global X MSCI Pakistan ETF pay custodial fees that are not covered by the Supervision and Administration Agreement. Pursuant to an agreement with the Custodian, the Global X MSCI Colombia ETF, Global X MSCI Argentina ETF, Global X MSCI Greece ETF, Global X MSCI Nigeria ETF, Global X Next Emerging & Frontier ETF, Global X MSCI Portugal ETF and Global X MSCI Pakistan ETF may pay up to 0.16%, 0.01%, 0.07%, 0.42%, 0.07%, 0.06% and 0.23%, respectively, in Custody Fees (in addition to the Supervision and Administration Fee).
| | | Supervision and Administration Fee | |
| Global X China Consumer ETF | | | 0.65 | % |
| Global X China Energy ETF | | | 0.65 | % |
| Global X China Financials ETF | | | 0.65 | % |
| Global X China Industrials ETF | | | 0.65 | % |
| Global X China Materials ETF | | | 0.65 | % |
| Global X NASDAQ China Technology ETF | | | 0.65 | % |
| Global X FTSE Southeast Asia ETF | | | 0.65 | % |
| Global X MSCI Colombia ETF* | | | 0.61 | % |
| Global X MSCI Argentina ETF** | | | 0.59 | % |
| Global X MSCI Greece ETF | | | 0.55 | % |
| Global X MSCI Norway ETF | | | 0.50 | % |
| Global X FTSE Nordic Region ETF | | | 0.50 | % |
| Global X MSCI Nigeria ETF*** | | | 0.68 | % |
| Global X Next Emerging & Frontier ETF | | | 0.49 | % |
| Global X MSCI Portugal ETF | | | 0.55 | % |
| Global X MSCI Pakistan ETF | | | 0.68 | % |
*Pursuant to an expense limitation agreement in existence between the Global X MSCI Colombia ETF (the “Fund”) and the Adviser prior to March 1, 2018, the Adviser agreed to waive or reimburse fees and/or limit fund expenses to the extent necessary to assure that the operating expenses of the Fund (exclusive of taxes, brokerage fees, commissions, and other transaction expenses, interest and extraordinary expenses (such as litigation and indemnification expenses)) (“Total Annual Fund Operating Expenses”) would not exceed 0.61% of the Fund’s average daily net assets per year until at least March 1, 2018. Pursuant to the expense limitation agreement, the Fund (at a later date) could reimburse the Adviser for the fees and expenses it waived or reimbursed and/or limited during any of the prior three fiscal years, provided that, among other things, any reimbursement made to the Adviser would not cause Total Annual Fund Operating Expenses to exceed the maximum permitted rate during the period in which it is paid and the Board had approved such reimbursement to the Adviser. Although the Board voted on December 19, 2017, to permanently reduce the Fund’s fees to 0.61% and end the expense limitation agreement as of March 1, 2018, prior waived or reimbursed fees are still subject to recoupment. As of October 31, 2018, the amounts of waivers/reimbursements subject to recoupment for Global X MSCI Colombia ETF were $61,948 expiring 2021, $178,804 expiring 2020 and $145,757 expiring 2019. As of October 31, 2018, there had been no recoupment of previously waived and reimbursed fees.
Notes to Financial Statements (continued)
3. RELATED PARTIES AND SERVICE PROVIDER TRANSACTIONS (continued)
**Pursuant to an expense limitation agreement in existence between the Global X MSCI Argentina ETF (the “Fund”) and the Adviser prior to March 1, 2018, the Adviser agreed to waive or reimburse fees and/or limit Fund expenses to the extent necessary
to assure that the operating expenses of the Fund (exclusive of taxes, brokerage fees, commissions, and other transaction expenses,
interest and extraordinary expenses (such as litigation and indemnification expenses)) (“Total Annual Fund Operating Expenses”) would not exceed 0.59% of the Fund’s average daily net assets per year until at least May 1, 2018. Pursuant to the expense limitation agreement, the Fund (at a later date) could reimburse the Adviser for the fees and expenses it waived or reimbursed and/or limited during any of the prior three fiscal years, provided that, among other things, any reimbursement made to the Adviser would not cause Total Annual Fund Operating Expenses of the Fund to exceed 0.59% during the period in which it is paid and the Board had approved such reimbursement to the Adviser. Although the Board voted on December 19, 2017, to permanently reduce the Fund’s fees to 0.59% and end the expense limitation agreement as of March 1, 2018, prior waived or reimbursed fees are still subject to recoupment. As of October 31, 2018, the amounts of waivers/reimbursements subject to recoupment for Global X MSCI Argentina ETF were $105,611 expiring 2021 and $123,845 expiring 2020. As of October 31, 2018, there had been no recoupment of previously waived and reimbursed fees.
***Pursuant to an expense limitation agreement in existence between the Global X MSCI Nigeria ETF (the “Fund”) and the Adviser prior to March 2, 2016, the Adviser agreed to waive or reimburse fees and/or limit fund expenses to the extent necessary to assure that the operating expenses of the Fund (exclusive of taxes, brokerage fees, commissions, and other transaction expenses, interest and extraordinary expenses (such as litigation and indemnification expenses)) (“Total Annual Fund Operating Expenses”) would not exceed 0.68% of the Fund’s average daily net assets per year until at least March 1, 2016. Pursuant to the expense limitation agreement, the Fund (at a later date) could reimburse the Adviser for the fees and expenses it waived or reimbursed and/or limited during any of the prior three fiscal years, provided that, among other things, any reimbursement made to the Adviser would not cause Total Annual Fund Operating Expenses to exceed the maximum permitted rate during the period in which it is paid and the Board had approved such reimbursement to the Adviser. Although it was determined to end the expense limitation agreement as of March 2, 2016, prior waived or reimbursed fees are still subject to recoupment. As of October 31, 2018, the amounts of waivers/reimbursements subject to recoupment for Global X MSCI Nigeria ETF was $15,742 expiring in 2019. As of October 31, 2018, there had been no recoupment of previously waived and reimbursed fees.
SEI Investments Global Funds Services (“SEIGFS”) serves as sub-administrator to the Funds. As sub-administrator, SEIGFS provides the Funds with the required general administrative services, including, without limitation: office space, equipment, and personnel; clerical and general back office services; bookkeeping, internal accounting and secretarial services; the calculation of NAV; and assistance with the preparation and filing of reports, registration statements, proxy statements and other materials required to be filed or furnished by the Funds under federal and state securities laws. As compensation for these services, the SEIGFS receives certain out-of-pocket costs, transaction fees and asset-based fees which are accrued daily and paid monthly by the Adviser.
SEI Investments Distribution Co. (“SIDCO”) serves as each Fund’s underwriter and distributor of Creation Units pursuant to a Distribution Agreement. SIDCO has no obligation to sell any specific quantity of Fund Shares. SIDCO bears the following costs and expenses relating to the distribution of Shares: (i) the costs of processing and maintaining records of creations of Creation Units; (ii) all costs of maintaining the records required of a registered broker/dealer; (iii) the expenses of maintaining its registration or qualification as a dealer or broker under Federal or state laws; (iv) filing fees; and (v) all other expenses incurred in connection with the distribution services as contemplated in the Distribution Agreement. SIDCO receives no fee for its distribution services under the Distribution Agreement, rather the Adviser compensates SIDCO for certain expenses, out-of-pocket costs, and transaction fees.
BBH serves as transfer agent and custodian of the Funds’ assets. As custodian, BBH has agreed to (1) make receipts and disbursements of money on behalf of the Fund, (2) collect and receive all income and other payments and distributions on account of the Funds’ portfolio investments, (3)
Notes to Financial Statements (continued)
3. RELATED PARTIES AND SERVICE PROVIDER TRANSACTIONS (continued)
respond to correspondence from shareholders, security brokers and others relating to its duties; and (4) make periodic reports to the Funds concerning the Funds’ operations. BBH does not exercise any supervisory function over the purchase and sale of securities. As compensation for these services, BBH receives certain out-of-pocket costs, transaction fees and asset-based fees which are accrued daily and paid monthly by the Adviser from its fees. As transfer agent, BBH has agreed to (1) issue and redeem shares of each Fund, (2) make dividend and other distributions to shareholders of each Fund, (3) respond to correspondence by shareholders and others relating to its duties; (4) maintain shareholder accounts, and (5) make periodic reports to the Funds. As compensation for these services, BBH receives certain out of-pocket costs, transaction fees and asset-based fees which are accrued daily and paid monthly by the Adviser from its fees.
4. INVESTMENT TRANSACTIONS
For the year ended October 31, 2018, the purchases and sales of investments in securities, excluding in-kind transactions, long-term U.S. Government and short-term securities were:
| Purchases
| | Sales and Maturities
|
| Global X China Consumer ETF | | $ | 64,864,956 | | | $ | 48,243,809 | |
| Global X China Energy ETF | | | 381,831 | | | | 350,746 | |
| Global X China Financials ETF | | | 7,641,901 | | | | 8,912,643 | |
| Global X China Industrials ETF | | | 601,017 | | | | 610,273 | |
| Global X China Materials ETF | | | 1,330,036 | | | | 1,230,359 | |
| Global X NASDAQ China Technology ETF | | | 10,038,050 | | | | 10,763,999 | |
| Global X FTSE Southeast Asia ETF | | | 3,707,977 | | | | 2,365,246 | |
| Global X MSCI Colombia ETF | | | 39,698,793 | | | | 39,335,213 | |
| Global X MSCI Argentina ETF | | | 58,477,122 | | | | 60,474,846 | |
| Global X MSCI Greece 20 ETF | | | 63,766,197 | | | | 64,043,727 | |
| Global X MSCI Norway ETF | | | 16,058,980 | | | | 15,688,723 | |
| Global X FTSE Nordic Region ETF | | | 2,380,092 | | | | 2,751,424 | |
| Global X MSCI Nigeria ETF | | | 40,142,010 | | | | 54,058,214 | |
| Global X Next Emerging & Frontier ETF | | | 2,439,244 | | | | 2,581,604 | |
| Global X MSCI Portugal ETF | | | 9,809,468 | | | | 10,032,729 | |
| Global X MSCI Pakistan ETF | | | 24,036,224 | | | | 24,560,605 | |
During the year ended October 31, 2018, there were no purchases or sales of long-term U.S. Government securities for the Funds.
Notes to Financial Statements (continued)
4. INVESTMENT TRANSACTIONS (continued)
For the year ended October 31, 2018, in-kind transactions associated with creations and redemptions were:
| Purchases
| | Sales and Maturities
| | Realized Gain/(Loss)
|
| Global X China Consumer ETF | | $ | 260,688,317 | | | $ | 234,562,989 | | | $ | 10,027,901 | |
| Global X China Energy ETF | | | 1,296,349 | | | | - | | | | - | |
| Global X China Financials ETF | | | 7,196,907 | | | | 18,240,989 | | | | 2,191,078 | |
| Global X China Industrials ETF | | | - | | | | 1,376,251 | | | | (194,482 | ) |
| Global X China Materials ETF | | | - | | | | 1,860,542 | | | | 71,215 | |
| Global X NASDAQ China Technology ETF | | | 15,894,939 | | | | 1,437,495 | | | | 623,704 | |
| Global X FTSE Southeast Asia ETF | | | 7,809,638 | | | | 4,243,601 | | | | 429,315 | |
| Global X MSCI Colombia ETF | | | 9,666,195 | | | | 9,937,156 | | | | 3,004,222 | |
| Global X MSCI Argentina ETF | | | 65,918,040 | | | | 126,371,765 | | | | 29,835,545 | |
| Global X MSCI Greece 20 ETF | | | 141,539,720 | | | | 154,475,229 | | | | 24,334,250 | |
| Global X MSCI Norway ETF | | | 46,237,912 | | | | 51,407,718 | | | | 12,521,781 | |
| Global X FTSE Nordic Region ETF | | | 1,142,107 | | | | 11,273,626 | | | | 1,254,841 | |
| Global X Next Emerging & Frontier ETF | | | 966,426 | | | | 1,640,463 | | | | 158,958 | |
| Global X MSCI Portugal ETF | | | 15,551,675 | | | | 50,859,852 | | | | 6,901,925 | |
For the year ended October 31, 2017, in-kind transactions associated with creations and redemptions were:
| | | |
Sales andMaturities | |
| |
| | | Purchases | | | | Realized Gain/(Loss) | |
| Global X China Consumer ETF | | $ | 59,418,280 | | | $ | 12,389,046 | | | $ | 1,868,852 | |
| Global X China Financials ETF | | | 13,636,459 | | | | 1,395,729 | | | | 100,070 | |
| Global X China Industrials ETF | | | - | | | | 685,305 | | | | 55,110 | |
| Global X China Materials ETF | | | 3,783,954 | | | | 822,939 | | | | 105,132 | |
| Global X NASDAQ China Technology ETF | | | 4,096,896 | | | | 2,363,171 | | | | 597,429 | |
| Global X FTSE Southeast Asia ETF | | | 1,203,176 | | | | 1,030,597 | | | | (95,948 | ) |
| Global X MSCI Colombia ETF | | | 7,104,849 | | | | 6,100,974 | | | | 853,890 | |
| Global X MSCI Argentina ETF | | | 104,228,654 | | | | 50,146,596 | | | | 17,011,676 | |
| Global X MSCI Greece ETF | | | 115,144,814 | | | | 77,641,139 | | | | 24,189,607 | |
| Global X MSCI Norway ETF | | | 67,332,225 | | | | 40,587,472 | | | | 9,009,777 | |
| Global X FTSE Nordic Region ETF | | | 3,499,734 | | | | 12,958,926 | | | | 983,586 | |
| Global X Next Emerging & Frontier ETF | | | - | | | | 721,337 | | | | 4,312 | |
| Global X MSCI Portugal ETF | | | 36,748,356 | | | | 7,652,313 | | | | 835,739 | |
Notes to Financial Statements (continued)
5. TAX INFORMATION
The amount and character of income and capital gain distributions to be paid, if any, are determined in accordance with Federal income tax regulations, which may differ from U.S. GAAP. As a result, net investment income (loss) and net realized gain (loss) on investment transactions for a reporting period may differ significantly from distributions during such period. These book/tax differences may be temporary or permanent. To the extent these differences are permanent in nature, they are charged or credited to undistributed net investment income (loss), accumulated net realized gain (loss) or paid-in capital, as appropriate, in the period that the differences arise.
The following differences, primarily attributable to redemptions in-kind, expired capital loss carryforwards, sales of passive foreign investment companies, and foreign currency, have been reclassified to/from the following accounts during the fiscal period ended October 31, 2018:
| | | | | | Distributable (Loss)* | |
| | | | | Undistributed Net Investment Income | | | Accumulated Net Realized Loss | |
| Global X China Consumer ETF | | $ | 8,116,910 | | | $ | 2,160 | | | $ | (8,119,070 | ) |
| Global X China Energy ETF | | | – | | | | 50 | | | | (50 | ) |
| Global X China Financials ETF | | | 1,030,645 | | | | 4,842 | | | | (1,035,487 | ) |
| Global X China Industrials ETF | | | (306,564 | ) | | | 10,893 | | | | 295,671 | |
| Global X China Materials ETF | | | 62,312 | | | | 76 | | | | (62,388 | ) |
| Global X NASDAQ China Technology ETF | | | 547,612 | | | | 61,566 | | | | (609,178 | ) |
| Global X FTSE Southeast Asia ETF | | | 417,329 | | | | (2,913 | ) | | | (414,416 | ) |
| Global X MSCI Colombia ETF | | | 1,583,892 | | | | 108,764 | | | | (1,692,656 | ) |
| Global X MSCI Argentina ETF | | | 28,753,509 | | | | 17,530 | | | | (28,771,039 | ) |
| Global X MSCI Greece ETF | | | 13,374,725 | | | | 703,778 | | | | (14,078,503 | ) |
| Global X MSCI Norway ETF | | | 9,993,430 | | | | 19,101 | | | | (10,012,531 | ) |
| Global X FTSE Nordic Region ETF | | | 960,811 | | | | 183,596 | | | | (1,144,407 | ) |
| Global X MSCI Nigeria ETF | | | – | | | | (156,152 | ) | | | 156,152 | |
| Global X Next Emerging & Frontier ETF | | | 157,984 | | | | (14,867 | ) | | | (143,117 | ) |
| Global X MSCI Portugal ETF | | | 5,737,129 | | | | 277,841 | | | | (6,014,970 | ) |
| Global X MSCI Pakistan ETF | | | – | | | | (250,916 | ) | | | 250,916 | |
* The reporting simplification amendments to Regulation S-X simplifies the reporting requirements for Registered Investment Companies by combining the components of net assets attributable to Undistributed Net Investment Income, Accumulated Net Realized Gain/Loss, and Unrealized Gain/Loss to one line item “Total Distributable Earnings/(Loss)”. The table above provides the tax characteristics of distributable earnings/(loss) which are included in Total distributable (loss).
Notes to Financial Statements (continued)
5. TAX INFORMATION (continued)
The tax character of dividends and distributions declared during the periods ended October 31, 2018 and 2017 were as follows:
Global X Funds | | Ordinary Income | | | Long-Term Capital Gain | | | Return of Capital | | | Totals | |
| | | | | | | | | | | | | |
| Global X China Consumer ETF | | | | | | | | | | | | |
| 2018 | | $ | 1,451,475 | | | $ | – | | | $ | – | | | $ | 1,451,475 | |
| 2017 | | | 998,941 | | | | – | | | | – | | | | 998,941 | |
| Global X China Energy ETF | | | | | | | | | | | | | | | | |
| 2018 | | $ | 61,751 | | | $ | – | | | $ | – | | | $ | 61,751 | |
| 2017 | | | 32,233 | | | | – | | | | – | | | | 32,233 | |
| Global X China Financials ETF | | | | | | | | | | | | | | | | |
| 2018 | | $ | 957,793 | | | $ | – | | | $ | – | | | $ | 957,793 | |
| 2017 | | | 528,238 | | | | – | | | | – | | | | 528,238 | |
| Global X China Industrials ETF | | | | | | | | | | | | | | | | |
| 2018 | | $ | 86,463 | | | $ | – | | | $ | – | | | $ | 86,463 | |
| 2017 | | | 59,685 | | | | – | | | | – | | | | 59,685 | |
| Global X China Materials ETF | | | | | | | | | | | | | | | | |
| 2018 | | $ | 58,997 | | | $ | – | | | $ | – | | | $ | 58,997 | |
| 2017 | | | 16,197 | | | | – | | | | – | | | | 16,197 | |
| Global X NASDAQ China Technology ETF | | | | | | | | | | | | | | | | |
| 2018 | | $ | 578,519 | | | $ | – | | | $ | – | | | $ | 578,519 | |
| 2017 | | | 528,298 | | | | – | | | | – | | | | 528,298 | |
| Global X FTSE Southeast Asia ETF | | | | | | | | | | | | | | | | |
| 2018 | | $ | 284,000 | | | $ | – | | | $ | – | | | $ | 284,000 | |
| 2017 | | | 284,922 | | | | – | | | | – | | | | 284,922 | |
| Global X MSCI Colombia ETF | | | | | | | | | | | | | | | | |
| 2018 | | $ | 1,748,612 | | | $ | – | | | $ | – | | | $ | 1,748,612 | |
| 2017 | | | 1,265,662 | | | | – | | | | – | | | | 1,265,662 | |
| Global X MSCI Argentina ETF | | | | | | | | | | | | | | | | |
| 2018 | | $ | 1,050,485 | | | $ | – | | | $ | – | | | $ | 1,050,485 | |
| 2017 | | | 308,816 | | | | – | | | | – | | | | 308,816 | |
| Global X MSCI Greece ETF | | | | | | | | | | | | | | | | |
| 2018 | | $ | 8,523,662 | | | $ | – | | | $ | – | | | $ | 8,523,662 | |
| 2017 | | | 5,196,758 | | | | – | | | | – | | | | 5,196,758 | |
| Global X MSCI Norway ETF | | | | | | | | | | | | | | | | |
| 2018 | | $ | 4,071,466 | | | $ | – | | | $ | – | | | $ | 4,071,466 | |
| 2017 | | | 3,382,974 | | | | – | | | | – | | | | 3,382,974 | |
| Global X FTSE Nordic Region ETF | | | | | | | | | | | | | | | | |
| 2018 | | $ | 1,206,770 | | | $ | – | | | $ | – | | | $ | 1,206,770 | |
| 2017 | | | 1,335,962 | | | | – | | | | – | | | | 1,335,962 | |
| Global X MSCI Nigeria ETF | | | | | | | | | | | | | | | | |
| 2018 | | $ | 1,360,193 | | | $ | – | | | $ | – | | | $ | 1,360,193 | |
| 2017 | | | 706,374 | | | | – | | | | – | | | | 706,374 | |
| Global X Next Emerging & Frontier ETF | | | | | | | | | | | | | | | | |
| 2018 | | $ | 288,733 | | | $ | – | | | $ | – | | | $ | 288,733 | |
| 2017 | | | 337,103 | | | | – | | | | – | | | | 337,103 | |
| Global X MSCI Portugal ETF | | | | | | | | | | | | | | | | |
| 2018 | | $ | 1,558,591 | | | $ | – | | | $ | – | | | $ | 1,558,591 | |
| 2017 | | | 878,665 | | | | – | | | | – | | | | 878,665 | |
| Global X MSCI Pakistan ETF | | | | | | | | | | | | | | | | |
| 2018 | | $ | 2,761,116 | | | $ | 1,522,382 | | | $ | – | | | $ | 4,283,498 | |
| 2017 | | | 363,656 | | | | – | | | | – | | | | 363,656 | |
Notes to Financial Statements (continued)
5. TAX INFORMATION (continued)
As of October 31, 2018, the components of tax basis distributable earnings (accumulated losses) were as follows:
| | | |
| | Global X China Consumer ETF | | | Global X China Energy ETF | | | Global X China Financials ETF | | | Global X China Industrials ETF | |
| Undistributed Ordinary Income | | $ | 3,056,282 | | | $ | 95,554 | | | $ | 1,323,828 | | | $ | 42,485 | |
| Capital Loss Carryforwards | | | (52,094,462 | ) | | | (1,272,397 | ) | | | (3,228,266 | ) | | | (2,322,678 | ) |
| Unrealized Depreciation on Investments and Foreign Currency | | | (53,837,320 | ) | | | (356,450 | ) | | | (2,795,612 | ) | | | (723,524 | ) |
| Other Temporary Differences | | | (7 | ) | | | (2 | ) | | | (2 | ) | | | (3 | ) |
| Total Accumulated Losses | | $ | (102,875,507 | ) | | $ | (1,533,295 | ) | | $ | (4,700,052 | ) | | $ | (3,003,720 | ) |
| | | | | | | | | | | | | | | | | |
| | Global X Funds | |
| | Global X China Materials ETF | | | Global X NASDAQ China Technology ETF | | | Global X FTSE Southeast Asia ETF | | | Global X MSCI Colombia ETF | |
| Undistributed Ordinary Income | | $ | 105,295 | | | $ | 62,817 | | | $ | 546,204 | | | $ | 1,934,973 | |
| Capital Loss Carryforwards | | | (1,428,514 | ) | | | (3,956,651 | ) | | | (5,608,876 | ) | | | (79,235,565 | ) |
| Unrealized Depreciation on Investments and Foreign Currency | | | (907,028 | ) | | | (3,941,335 | ) | | | (1,341,862 | ) | | | (18,357,623 | ) |
| Other Temporary Differences | | | 1 | | | | 1 | | | | (1 | ) | | | (4 | ) |
| Total Accumulated Losses | | $ | (2,230,246 | ) | | $ | (7,835,168 | ) | | $ | (6,404,535 | ) | | $ | (95,658,219 | ) |
| | | | | | | | | | | | | | | | | |
| | Global X Funds | |
| | Global X MSCI Argentina ETF | | | Global X MSCI Greece ETF | | | Global X MSCI Norway ETF | | | Global X FTSE Nordic Region ETF | |
| Undistributed Ordinary Income | | $ | 1,002,400 | | | $ | 4,435,496 | | | $ | 3,919,337 | | | $ | 785,130 | |
| Capital Loss Carryforwards | | | (4,633,390 | ) | | | (134,395,488 | ) | | | (27,272,319 | ) | | | (4,033,599 | ) |
| Unrealized Depreciation on Investments and Foreign Currency | | | (29,737,802 | ) | | | (136,301,083 | ) | | | (4,795,527 | ) | | | (3,254,723 | ) |
| Other Temporary Differences | | | (5 | ) | | | (12 | ) | | | (10 | ) | | | – | |
| Total Accumulated Losses | | $ | (33,368,797 | ) | | $ | (266,261,087 | ) | | $ | (28,148,519 | ) | | $ | (6,503,192 | ) |
| | | | | | | | | | | | | | | | | |
| | Global X Funds | |
| | Global X MSCI Nigeria ETF | | | Global X Next Emerging & Frontier ETF | | | Global X MSCI Portugal ETF | | | Global X MSCI Pakistan ETF | |
| Undistributed Ordinary Income | | $ | 2,007,027 | | | $ | 398,925 | | | $ | 1,228,901 | | | $ | 1,475,561 | |
| Capital Loss Carryforwards | | | (13,979,228 | ) | | | (21,945,456 | ) | | | (10,135,426 | ) | | | (7,850,807 | ) |
| Unrealized Depreciation on Investments and Foreign Currency | | | (8,528,757 | ) | | | (1,727,802 | ) | | | (7,726,880 | ) | | | (18,134,381 | ) |
| Other Temporary Differences | | | – | | | | – | | | | 5 | | | | (2 | ) |
| Total Accumulated Losses | | $ | (20,500,958 | ) | | $ | (23,274,333 | ) | | $ | (16,633,400 | ) | | $ | (24,509,629 | ) |
| | | | | | | | | | | | | | | | | |
Notes to Financial Statements (continued)
5. TAX INFORMATION (continued)
For Federal income tax purposes, capital losses incurred in taxable years beginning before December 22, 2010 may be carried forward for a maximum period of eight years and applied against future gains. As of October 31, 2018, the Funds that had capital loss carryforwards are listed below:
| piration date | | Global X China Consumer ETF | | | Global X China Energy ETF | | | Global X China Financials
ETF | | | Global X China Industrials ETF | | | Global X China Materials ETF |
| October 2019 | | $ | 1,341,121 | | | $ | 33,912 | | | $ | - | | | $ | - | | $
| - |
| |
| Expiration date | | Global X NASDAQ China Technology ETF | | | Global X FTSE Southeast Asia ETF | | | Global X MSCI Colombia ETF | | | Global X MSCI
Argentina ETF | | | Global X MSCI Greece ETF |
| October 2019 | | $ | 236,466 | | | $ | - | | | $ | 8,249,654 | | | $ | 414,683 | | $ | - |
| |
| Expiration date | | Global X MSCI Norway ETF | | | Global X FTSE Nordic Region ETF | | | Global X MSCI Nigeria ETF | | | Global X Next Emerging & Frontier ETF | | | Global X MSCI Portugal ETF |
| October 2019 | | $ | 1,802,290 | | | $ | - | | | $ | - | | | $ | - | | $
| - |
| |
| Expiration date | | Global X MSCI Pakistan ETF | | | | | | | | | | | | | | | |
| October 2019 | | $ | - | | | | | | | | | | | | | | | |
Notes to Financial Statements (continued)
5. TAX INFORMATION (continued)
For taxable years beginning after December 22, 2010, a registered investment company (“RIC”) is permitted to carry forward net capital losses to offset capital gains realized in later years, and the losses carried forward retain their original character as either long-term or short-term losses. Net capital losses of a RIC realized in taxable years beginning before that date (pre-2011 losses) can be carried forward up to 8 years and are characterized in later years as short-term losses. If a Fund uses pre-2011 loss carryforwards in later years, the carryforwards will not reduce the Fund’s current earnings and profits, while loss carryforwards from later years will reduce the Fund’s current earnings and profits. To the extent that later year capital gains are offset by pre-2011 loss carryforwards, distributions of such gains will be treated as ordinary dividend distributions. Losses carried forward under these new provisions are as follows:
| | | Short-Term Loss | | | Long-Term Loss | | | Total | |
| Global X China Consumer ETF | | $ | 7,857,624 | | | $ | 42,895,717 | | | $ | 50,753,341 | |
| Global X China Energy ETF | | | 121,744 | | | | 1,116,741 | | | | 1,238,485 | |
| Global X China Financials ETF | | | 2,321,092 | | | | 907,174 | | | | 3,228,266 | |
| Global X China Industrials ETF | | | 296,038 | | | | 2,026,640 | | | | 2,322,678 | |
| Global X China Materials ETF | | | 73,836 | | | | 1,354,678 | | | | 1,428,514 | |
| Global X NASDAQ China Technology ETF | | | 2,472,622 | | | | 1,247,563 | | | | 3,720,185 | |
| Global X FTSE Southeast Asia ETF | | | 1,906,796 | | | | 3,702,080 | | | | 5,608,876 | |
| Global X MSCI Colombia ETF | | | 22,377,017 | | | | 48,608,894 | | | | 70,985,911 | |
| Global X MSCI Argentina ETF | | | 3,795,823 | | | | 422,884 | | | | 4,218,707 | |
| Global X MSCI Greece ETF | | | 63,449,791 | | | | 70,945,697 | | | | 134,395,488 | |
| Global X MSCI Norway ETF | | | 6,781,631 | | | | 18,688,398 | | | | 25,470,029 | |
| Global X FTSE Nordic Region ETF | | | 1,285,177 | | | | 2,748,422 | | | | 4,033,599 | |
| Global X MSCI Nigeria ETF | | | 4,976,161 | | | | 9,003,067 | | | | 13,979,228 | |
| Global X Next Emerging & Frontier ETF | | | 4,972,265 | | | | 16,973,191 | | | | 21,945,456 | |
| Global X MSCI Portugal ETF | | | 3,085,397 | | | | 7,050,029 | | | | 10,135,426 | |
| Global X MSCI Pakistan ETF | | | 1,174,223 | | | | 6,676,584 | | | | 7,850,807 | |
Notes to Financial Statements (continued)
5. TAX INFORMATION (continued)
The Federal tax cost and aggregate gross unrealized appreciation and depreciation on investments held by the Funds at October 31, 2018 were as follows:
| | | | | Aggregated Gross Unrealized
Appreciation | | | Aggregated Gross Unrealized
Depreciation | | | Net Unrealized Depreciation | |
| Global X China Consumer ETF | | $ | 174,776,573 | | | $ | 126,085 | | | $ | (53,963,403 | ) | | $ | (53,837,318 | ) |
| Global X China Energy ETF | | | 3,306,117 | | | | 164,243 | | | | (520,693 | ) | | | (356,450 | ) |
| Global X China Financials ETF | | | 33,538,656 | | | | 1,531,968 | | | | (4,327,580 | ) | | | (2,795,612 | ) |
| Global X China Industrials ETF | | | 2,765,002 | | | | 80,000 | | | | (803,526 | ) | | | (723,526 | ) |
| Global X China Materials ETF | | | 3,304,793 | | | | 58,195 | | | | (965,223 | ) | | | (907,028 | ) |
| Global X NASDAQ China Technology ETF | | | 29,603,167 | | | | 1,882,277 | | | | (5,823,612 | ) | | | (3,941,335 | ) |
| Global X FTSE Southeast Asia ETF | | | 18,929,358 | | | | 813,220 | | | | (2,155,081 | ) | | | (1,341,861 | ) |
| Global X MSCI Colombia ETF | | | 100,456,933 | | | | 6,040,463 | | | | (24,398,088 | ) | | | (18,357,625 | ) |
| Global X MSCI Argentina ETF | | | 119,082,366 | | | | 2,941,597 | | | | (32,679,400 | ) | | | (29,737,803 | ) |
| Global X MSCI Greece ETF | | | 402,274,727 | | | | 14,733,688 | | | | (151,034,771 | ) | | | (136,301,083 | ) |
| Global X MSCI Norway ETF | | | 168,623,630 | | | | 13,092,043 | | | | (17,887,570 | ) | | | (4,795,527 | ) |
| Global X FTSE Nordic Region ETF | | | 27,797,456 | | | | 1,067,785 | | | | (4,322,508 | ) | | | (3,254,723 | ) |
| Global X MSCI Nigeria ETF | | | 49,105,632 | | | | 6,260,355 | | | | (14,789,112 | ) | | | (8,528,757 | ) |
| Global X Next Emerging & Frontier ETF | | | 14,845,032 | | | | 1,471,549 | | | | (3,199,353 | ) | | | (1,727,804 | ) |
| Global X MSCI Portugal ETF | | | 33,511,581 | | | | 293,674 | | | | (8,020,550 | ) | | | (7,726,876 | ) |
| Global X MSCI Pakistan ETF | | | 57,920,014 | | | | 137,309 | | | | (18,271,690 | ) | | | (18,134,381 | ) |
The preceding differences between book and tax cost are primarily due to mark to market treatment of passive foreign investment companies and wash sales.
6. CONCENTRATION OF RISKS
The Funds invest in securities of foreign issuers in several countries. These investments may involve certain considerations and risks not typically associated with investments in the United States as a result of, among other factors, the possibility of future political and economic developments and the level of governmental supervision and regulation of securities markets in the respective countries.
The securities markets of emerging market countries are less liquid and subject to greater price volatility, and have a smaller market capitalization than the U.S. securities markets. In certain countries, there may be fewer publicly traded securities and the market may be dominated by a few issuers or sectors. Issuers and securities markets in such countries are not subject to as extensive and frequent accounting, financial and other reporting requirements or as comprehensive government regulations or issuers and securities markets in the U.S. In particular, the assets and profits appearing on the financial statements of emerging market country issuers may not reflect their financial position or results of operations in the same manner as financial statements for U.S. issuers. Substantially less information may be publicly available about emerging market country issuers than is available about issuers in the United States.
Notes to Financial Statements (continued)
6. CONCENTRATION OF RISKS (continued)
The Funds may be subject to taxes imposed by countries in which it invests. Such taxes are generally based on either income, gains earned or gains repatriated. The Funds accrue and apply such taxes to net investment income, net realized gains and net unrealized gains as income and/or capital gains are earned.
The Funds use a replication strategy. A replication strategy is an indexing strategy that involves investing in the securities of the underlying index in approximately the same proportions as the underlying index. Each Fund may utilize a representative sampling strategy with respect to its underlying index when a replication strategy might be detrimental to its shareholders, such as when there are practical difficulties or substantial costs involved in compiling a portfolio of equity securities to follow its underlying index, or, in certain instances, when securities in the underlying index become temporarily illiquid, unavailable or less liquid, or due to legal restrictions (such as diversification requirements that apply to a Fund but not the underlying indexes).
Certain Funds may invest in commodity related securities, which are susceptible to fluctuations in certain commodity markets. Any negative changes in commodity markets could have a great impact on those securities.
Please refer to each Fund’s prospectus and statement of additional information (“SAI”) for a more complete description of risks.
7. LOANS OF PORTFOLIO SECURITIES
The Funds may lend portfolio securities having a market value up to one-third of the Funds’ total assets. Security loans made pursuant to a securities lending agreement with BBH are initially required to be secured by collateral equal to at least 102% of the value of domestic equity securities and ADRs and 105% of the value of foreign equity securities (other than ADRs). Such collateral received in connection with these loans will be cash and can be invested in repurchase agreements, short-term investments or U.S. Treasury obligations and is recognized in the Schedule of Investments and Statement of Assets and Liabilities. The obligation to return securities lending collateral is also recognized as a liability in the Statement of Assets and Liabilities. It is the Funds’ policy to obtain additional collateral from or return excess collateral to the borrower by the end of the next business day, following the valuation date of the securities loaned. Therefore, the value of the collateral held may be temporarily less than the value of the securities on loan.
Lending securities entails a risk of loss to the Funds if and to the extent that the market value of the securities loans were to increase and the borrower did not increase the collateral accordingly, and the borrower fails to return the securities. In the event the borrower may not provide additional collateral when required or may not return the securities when due, the agency agreement requires the lending agent to indemnify the Funds by replacing either the security or the security’s current market value to the fund. The Funds could suffer a loss if the value of an investment purchased with cash collateral falls below the market value of loaned securities or if the value of an investment purchased with cash collateral falls below the value of the original cash collateral received. The Funds could also experience delays and costs in gaining access to the collateral. The Funds bear the risk of any deficiency in the amount of the collateral available for return to the borrower due to any loss on the collateral invested.
Notes to Financial Statements (continued)
7. LOANS OF PORTFOLIO SECURITIES (continued)
As of October 31, 2018, the value of the securities on loan was $1,109,372, $1,045,307, $7,592,452, $623,039, $508,780 and $487,546 for the Global X China Consumer ETF, Global X NASDAQ China Technology ETF, Global X MSCI Greece ETF, Global X MSCI Norway ETF, Global X FTSE Nordic Region ETF and Global X MSCI Portugal ETF, respectively. The cash collateral received from securities on loan was $1,190,522, $1,063,359, $7,390,347, $654,680, $531,670 and $507,265 for the Global X China Consumer ETF, Global X NASDAQ China Technology ETF, Global X MSCI Greece ETF, Global X MSCI Norway ETF, Global X FTSE Nordic Region ETF and Global X MSCI Portugal ETF, respectively.
At October 31, 2018, the following Funds had securities on loan, by counterparty:
| | | | | | |
| | | Market Value | | | Cash Collateral | |
| Global X China Consumer ETF | | | | | | |
| Credit Suisse | | $ | 5,224 | | | $ | 5,775 | |
| JPMorgan | | | 873,558 | | | | 929,816 | |
| Morgan Stanley | | | 222,352 | | | | 245,823 | |
| ML Pierce, Fenner & Smith | | | 8,238 | | | | 9,108 | |
| Global X NASDAQ China Technology ETF | | | | | | | | |
| JPMorgan | | | 1,045,307 | | | | 1,063,359 | |
| Global X MSCI Greece ETF | | | | | | | | |
| Credit Suisse | | | 2,728,091 | | | | 2,808,000 | |
| JPMorgan | | | 397,650 | | | | 421,750 | |
| UBS AG London Branch | | | 4,466,711 | | | | 4,681,450 | |
| Global X MSCI Norway ETF | | | | | | | | |
| Citigroup | | | 87,847 | | | | 92,675 | |
| Deutsche Bank | | | 129,138 | | | | 144,000 | |
| JPMorgan | | | 164,717 | | | | 167,079 | (1) |
| SG Americas Securities | | | 105,578 | | | | 111,891 | |
| UBS AG London Branch | | | 135,759 | | | | 139,035 | |
| Global X FTSE Nordic Region ETF | | | | | | | | |
| Deutsche Bank | | | 365,555 | | | | 379,882 | |
| SG Americas Securities | | | 143,225 | | | | 151,788 | |
| Global X MSCI Portugal ETF | | | | | | | | |
| Barclays Bank | | | 26,800 | | | | 26,976 | (1) |
| Citigroup | | | 31,652 | | | | 32,400 | |
| Credit Suisse | | | 38,107 | | | | 39,006 | |
| JPMorgan | | | 125,235 | | | | 128,936 | |
| ML Pierce, Fenner & Smith | | | 249,159 | | | | 262,500 | |
| Morgan Stanley | | | 16,593 | | | | 17,447 | |
(1) It is the Funds' policy to obtain additional collateral from or return excess collateral to the borrower by the end of the next business day, following the valuation date of the securities loaned. Therefore, the value of the collateral held may be temporarily less than the value of the securities on loan.
Notes to Financial Statements (continued)
8. CONTRACTUAL OBLIGATIONS
The Funds enter into contracts in the normal course of business that contain a variety of indemnifications. The Funds’ maximum exposure under these contracts is unknown. However the Funds have not had prior gains or losses pursuant to these contracts. Management has reviewed the Funds’ existing contracts and expects the risk of loss to be remote.
Pursuant to the Trust’s organizational documents, the Trustees of the Trust and the Trust’s officers are indemnified against certain liabilities that may arise out of the performance of their duties.
9. REVERSE SHARE SPLIT
Effective March 16, 2017, the Global X MSCI Nigeria ETF executed a 1-for-4 reverse share split for shareholders of record after the close of markets on March 15, 2017. The effect of this transaction was to divide the number of outstanding shares of the Fund by four, resulting in a corresponding increase in the net asset value per share. The per share data in the financial highlights for each of the years in the period then ended have been given retroactive effect to reflect these reverse share splits. There were no changes in net assets, results of operations or total return as a result of these transactions.
10. REGULATORY MATTERS
On August 17, 2018, the Commission adopted amendments to Regulation S-X. These changes are effective for periods after November 5, 2018. The updates to Registered Investment Companies were mainly focused on simplifying the presentation of distributable earnings by eliminating the need to present the components of distributable earnings on a book basis in the Statements of Assets and Liabilities. The update also impacted the presentation of undistributed net investment income and distributions to shareholders on the Statements of Changes in Net Assets. The amounts presented in the current Statements of Changes in Net Assets represent the aggregated total distributions of net investment income and realized capital gains, except for distributions classified as return of capital which are still presented separately. The disaggregated amounts from the prior fiscal year are broken out below if there were both distributions from net investment income and realized capital gains; otherwise, the amount on the current Statements of Changes in Net Assets for the prior fiscal year end represents distributions of net investment income.
11. NEW ACCOUNTING PRONOUNCEMENT
In August 2018, the Financial Accoutning Standrads Board (“FASB”) issued Accounting Standards Update 2018-13, Fair Value Measurement (Topic 820). The new guidance includes additions and modifications to disclosures requirements for fair value measurements. For public entities, the amendments are effective for financial statements issued for fiscal years beginning after December 15, 2019, and interim periods within those fiscal years. At this time, management is currently evaluating the impact of this new guidance on the financial statements and disclosures.
Notes to Financial Statements (concluded)
12. SUBSEQUENT EVENTS
The Funds have been evaluated by management regarding the need for additional disclosures and/or adjustments resulting from subsequent events. Based on this evaluation, please note the additional disclosures:
Effective December 5, 2018, the ticker of the Global X NASDAQ China Technology ETF, which was renamed Global X MSCI China Communication Services ETF on December 6, 2018, was changed from QQQC to CHIC.
Effective December 6, 2018:
| • | the Global X NASDAQ China Technology ETF was renamed Global X MSCI China Communication Services ETF and its underlying index was changed to the MSCI China Communication Services 10/50 Index; |
| • | the Global X China Consumer ETF was renamed Global X MSCI China Consumer Discretionary ETF (effective December 5, 2018) and its underlying index was changed to the MSCI China Consumer Discretionary 10/50 Index; |
| • | the Global X China Materials ETF was renamed Global X MSCI China Materials ETF and its underlying index was changed to the MSCI China Materials 10/50 Index; |
| • | the Global X China Industrials ETF was renamed Global X MSCI China Industrials ETF and its underlying index was changed to the MSCI China Industrials 10/50 Index; |
| • | the Global X China Energy ETF was renamed Global X MSCI China Energy ETF and its underlying index was changed to the MSCI China Energy IMI Plus 10/50 Index; and |
| • | Global X China Financials ETF was renamed Global X MSCI China Financials ETF and its underlying index was changed to MSCI China Financials 10/50 Index. |
Subsequent to the October 31, 2018 period end, the Global X MSCI China Large-Cap 50 ETF, Global X MSCI China Consumer Staples ETF, Global X MSCI China Health Care ETF, Global X MSCI China Information Technology ETF, Global X MSCI China Real Estate ETF and Global X MSCI China Utilities ETF commenced operations on December 7, 2018 and the Global X DAX Germany ETF plans to be launched on December 24, 2018.
Report of Independent Registered Public Accounting Firm
October 31, 2018
To the Board of Trustees and Shareholders of Global X China Consumer ETF, Global X China Energy ETF, Global X China Financials ETF, Global X China Industrials ETF, Global X China Materials ETF, Global X NASDAQ China Technology ETF, Global X FTSE Southeast Asia ETF, Global X MSCI Colombia ETF, Global X MSCI Argentina ETF, Global X MSCI Greece ETF, Global X MSCI Norway ETF, Global X FTSE Nordic Region ETF, Global X MSCI Nigeria ETF, Global X Next Emerging & Frontier ETF, Global X MSCI Portugal ETF and Global X MSCI Pakistan ETF
Opinions on the Financial Statements
We have audited the accompanying statements of assets and liabilities, including the schedules of investments, of Global X China Consumer ETF, Global X China Energy ETF, Global X China Financials ETF, Global X China Industrials ETF, Global X China Materials ETF, Global X NASDAQ China Technology ETF, Global X FTSE Southeast Asia ETF, Global X MSCI Colombia ETF, Global X MSCI Argentina ETF, Global X MSCI Greece ETF, Global X MSCI Norway ETF, Global X FTSE Nordic Region ETF, Global X MSCI Nigeria ETF, Global X Next Emerging & Frontier ETF, Global X MSCI Portugal ETF and Global X MSCI Pakistan ETF (sixteen of the funds constituting the Global X Funds, hereafter collectively referred to as the “Funds”) as of October 31, 2018, the related statements of operations for the year ended October 31, 2018, the statements of changes in net assets for each of the two years in the period ended October 31, 2018, including the related notes, and the financial highlights for each of the three years in the period ended October 31, 2018 (collectively referred to as the “financial statements”). In our opinion, the financial statements present fairly, in all material respects, the financial position of each of the Funds as of October 31, 2018, the results of each of their operations for the year then ended, the changes in each of their net assets for each of the two years in the period ended October 31, 2018 and each of the financial highlights for each of the three years in the period ended October 31, 2018 in conformity with accounting principles generally accepted in the United States of America.
The financial statements of the Funds as of and for the year ended October 31, 2015 and the financial highlights for each of the periods ended on or prior to October 31, 2015 (not presented herein, other than the financial highlights) were audited by other auditors whose report dated December 30, 2015 expressed an unqualified opinion on those financial statements and financial highlights.
Basis for Opinions
These financial statements are the responsibility of the Funds’ management. Our responsibility is to express an opinion on the Funds’ financial statements based on our audits. We are a public accounting firm registered with the Public Company Accounting Oversight Board (United States) (“PCAOB”) and are required to be independent with respect to the Funds in accordance with the U.S. federal securities laws and the applicable rules and regulations of the Securities and Exchange Commission and the PCAOB.
We conducted our audits of these financial statements in accordance with the standards of the PCAOB. Those standards require that we plan and perform the audit to obtain reasonable assurance about whether the financial statements are free of material misstatement, whether due to error or fraud.
Our audits included performing procedures to assess the risks of material misstatement of the financial statements, whether due to error or fraud, and performing procedures that respond to those risks. Such procedures included examining, on a test basis, evidence regarding the amounts and disclosures in the financial statements. Our audits also included evaluating the accounting principles used and significant estimates made by management, as well as evaluating the overall presentation of the financial statements.
Report of Independent Registered Public Accounting Firm
October 31, 2018
Our procedures included confirmation of securities owned as of October 31, 2018 by correspondence with the custodian and brokers: when replies were not received from brokers, we performed other auditing procedures. We believe that our audits provide a reasonable basis for our opinions.
PricewaterhouseCoopers LLP
Philadelphia, Pennsylvania
December 21, 2018
We have served as the auditor of one or more investment companies in the Global X Funds since 2016.
Disclosure of Fund Expenses (unaudited)
ETFs such as the Funds have operating expenses. As a shareholder of an ETF, your investment is affected by these ongoing costs, which include (among others) costs for portfolio management, administrative services, brokerage fees, and shareholder reports like this one. It is important for you to understand the impact of these costs on your investment returns. In addition, a shareholder is responsible for brokerage fees incurred in the purchase or sale of share of the Fund on the secondary market.
Operating expenses such as these are deducted from an ETF’s gross income and directly reduce your final investment return. These expenses are expressed as a percentage of the ETF’s average net assets; this percentage is known as the ETF’s expense ratio.
The following examples use the expense ratio and are intended to help you understand the ongoing costs (in dollars) of investing in a Fund and to compare these costs with those of other funds. The examples are based on an investment of $1,000 made at the beginning of the period shown and held for the entire period from May 1, 2018 through October 31, 2018.
The table on the next page illustrates the Funds’ costs in two ways:
Actual Fund Return. This section helps you to estimate the actual expenses that a Fund incurred over the period. The “Expenses Paid During Period” column shows the actual dollar expense cost incurred by a $1,000 investment in the Fund, and the “Ending Account Value” number is derived from deducting that expense cost from the Fund’s gross investment return.
You can use this information, together with the actual amount you invested in the Funds, to estimate the expenses you paid over that period. Simply divide your actual account value by $1,000 to arrive at a ratio (for example, an $8,600 account value divided by $1,000 = 8.6), then multiply that ratio by the number shown for your Funds under “Expenses Paid During Period.”
Hypothetical 5% Return. This section helps you compare a Fund’s costs with those of other funds. It assumes that the Funds had an annual 5% return before expenses during the year, but that the expense ratio (Column 3) for the period is unchanged. This example is useful in making comparisons because the Securities and Exchange Commission requires all funds to make this 5% calculation. You can assess your Fund’s comparative cost by comparing the hypothetical result for your Fund in the “Expenses Paid During Period” column with those that appear in the same charts in the shareholder reports for other funds.
NOTE: Because the return is set at 5% for comparison purposes — NOT your Fund’s actual return — the account values shown may not apply to your specific investment.
Disclosure of Fund Expenses (unaudited) (continued)
| | | Beginning Account Value 5/1/2018 | | | Ending Account Value 10/31/2018 | | | Annualized Expense Ratios | | | Expenses Paid During Period(1) | |
| Global X China Consumer ETF | | | | | | | | | | | | |
| Actual Fund Return | | $ | 1,000.00 | | | $ | 739.50 | | | | 0.65 | % | | $ | 2.87 | |
| Hypothetical 5% Return | | | 1,000.00 | | | | 1,021.91 | | | | 0.65 | | | | 3.33 | |
| | | | | | | | | | | | | | | | | |
| Global X China Energy ETF | | | | | | | | | | | | | | | | |
| Actual Fund Return | | $ | 1,000.00 | | | $ | 951.70 | | | | 0.67 | % | | $ | 3.30 | |
| Hypothetical 5% Return | | | 1,000.00 | | | | 1,021.83 | | | | 0.67 | | | | 3.41 | |
| | | | | | | | | | | | | | | | | |
| Global X China Financials ETF | | | | | | | | | | | | | | | | |
| Actual Fund Return | | $ | 1,000.00 | | | $ | 820.40 | | | | 0.66 | % | | $ | 3.05 | |
| Hypothetical 5% Return | | | 1,000.00 | | | | 1,021.85 | | | | 0.66 | | | | 3.39 | |
| | | | | | | | | | | | | | | | | |
| Global X China Industrials ETF | | | | | | | | | | | | | | | | |
| Actual Fund Return | | $ | 1,000.00 | | | $ | 895.30 | | | | 0.67 | % | | $ | 3.21 | |
| Hypothetical 5% Return | | | 1,000.00 | | | | 1,021.81 | | | | 0.67 | | | | 3.43 | |
| | | | | | | | | | | | | | | | | |
| Global X China Materials ETF | | | | | | | | | | | | | | | | |
| Actual Fund Return | | $ | 1,000.00 | | | $ | 750.10 | | | | 0.66 | % | | $ | 2.92 | |
| Hypothetical 5% Return | | | 1,000.00 | | | | 1,021.86 | | | | 0.66 | | | | 3.38 | |
| | | | | | | | | | | | | | | | | |
| Global X NASDAQ China Technology ETF | | | | | | | | | | | | | | | | |
| Actual Fund Return | | $ | 1,000.00 | | | $ | 768.40 | | | | 0.65 | % | | $ | 2.90 | |
| Hypothetical 5% Return | | | 1,000.00 | | | | 1,021.92 | | | | 0.65 | | | | 3.32 | |
| | | | | | | | | | | | | | | | | |
| Global X FTSE Southeast Asia ETF | | | | | | | | | | | | | | | | |
| Actual Fund Return | | $ | 1,000.00 | | | $ | 865.50 | | | | 0.65 | % | | $ | 3.07 | |
| Hypothetical 5% Return | | | 1,000.00 | | | | 1,021.92 | | | | 0.65 | | | | 3.32 | |
| | | | | | | | | | | | | | | | | |
| Global X MSCI Colombia ETF | | | | | | | | | | | | | | | | |
| Actual Fund Return | | $ | 1,000.00 | | | $ | 786.20 | | | | 0.62 | % | | $ | 2.79 | |
| Hypothetical 5% Return | | | 1,000.00 | | | | 1,022.08 | | | | 0.62 | | | | 3.16 | |
| | | | | | | | | | | | | | | | | |
| Global X MSCI Argentina ETF | | | | | | | | | | | | | | | | |
| Actual Fund Return | | $ | 1,000.00 | | | $ | 724.80 | | | | 0.59 | % | | $ | 2.58 | |
| Hypothetical 5% Return | | | 1,000.00 | | | | 1,022.21 | | | | 0.59 | | | | 3.03 | |
| | | | | | | | | | | | | | | | | |
| Global X MSCI Greece ETF | | | | | | | | | | | | | | | | |
| Actual Fund Return | | $ | 1,000.00 | | | $ | 717.10 | | | | 0.59 | % | | $ | 2.54 | |
| Hypothetical 5% Return | | | 1,000.00 | | | | 1,022.25 | | | | 0.59 | | | | 2.99 | |
| | | | | | | | | | | | | | | | | |
| Global X MSCI Norway ETF | | | | | | | | | | | | | | | | |
| Actual Fund Return | | $ | 1,000.00 | | | $ | 978.30 | | | | 0.50 | % | | $ | 2.50 | |
| Hypothetical 5% Return | | | 1,000.00 | | | | 1,022.68 | | | | 0.50 | | | | 2.55 | |
| | | | | | | | | | | | | | | | | |
| Global X FTSE Nordic Region ETF | | | | | | | | | | | | | | | | |
| Actual Fund Return | | $ | 1,000.00 | | | $ | 934.50 | | | | 0.59 | % | | $ | 2.89 | |
| Hypothetical 5% Return | | | 1,000.00 | | | | 1,022.22 | | | | 0.59 | | | | 3.02 | |
| | | | | | | | | | | | | | | | | |
| Global X MSCI Nigeria ETF | | | | | | | | | | | | | | | | |
| Actual Fund Return | | $ | 1,000.00 | | | $ | 745.70 | | | | 0.89 | % | | $ | 3.90 | |
| Hypothetical 5% Return | | | 1,000.00 | | | | 1,020.73 | | | | 0.89 | | | | 4.52 | |
| | | | | | | | | | | | | | | | | |
| Global X Next Emerging & Frontier ETF | | | | | | | | | | | | | | | | |
| Actual Fund Return | | $ | 1,000.00 | | | $ | 843.60 | | | | 0.55 | % | | $ | 2.56 | |
| Hypothetical 5% Return | | | 1,000.00 | | | | 1,022.43 | | | | 0.55 | | | | 2.81 | |
| | | | | | | | | | | | | | | | | |
| Global X MSCI Portugal ETF | | | | | | | | | | | | | | | | |
| Actual Fund Return | | $ | 1,000.00 | | | $ | 892.10 | | | | 0.59 | % | | $ | 2.79 | |
| Hypothetical 5% Return | | | 1,000.00 | | | | 1,022.25 | | | | 0.59 | | | | 2.98 | |
| | | | | | | | | | | | | | | | | |
| Global X MSCI Pakistan ETF | | | | | | | | | | | | | | | | |
| Actual Fund Return | | $ | 1,000.00 | | | $ | 801.60 | | | | 0.88 | % | | $ | 4.01 | |
| Hypothetical 5% Return | | | 1,000.00 | | | | 1,020.75 | | | | 0.88 | | | | 4.50 | |
Disclosure of Fund Expenses (unaudited) (concluded)
| (1) | Expenses are equal to the Fund’s annualized expense ratio multiplied by the average account value over the period, multiplied by 184/365 (to reflect the one-half year period.). |
Approval of Investment Advisory Agreement (unaudited)
Board Considerations in Approving the New Agreement
On February 12, 2018, Global X Management, LLC (“Global X Management”), investment adviser to each of the series of the Trust included in this annual report (each, a “Fund”), entered into an agreement and plan of merger (the “Acquisition Agreement”) pursuant to which MAGI Merger Sub LLC (“MAGI”), a direct, wholly-owned subsidiary of Horizons ETFs Management (USA) LLC (“Horizons”) and an indirect, wholly-owned subsidiary of Mirae Asset Global Investments Co., Ltd. (“Mirae”) would be merged with and into Global X Management (the “Transaction”). Because the closing of the Transaction (“Closing”) would result in a change of control of Global X Management under the Investment Company Act of 1940, as amended (the “1940 Act”), that would automatically terminate the investment advisory agreement currently in effect between the Trust, on behalf of each Fund, and Global X Management (“Current Agreement”), the Board of Trustees of the Trust, (the “Board”) including a majority of those trustees who are not "interested persons" of the Trust, as defined in the 1940 Act ("Independent Trustees"), were asked to consider approval of: (i) a new investment advisory agreement between the Trust, on behalf of each Fund, and Global X Management (“New Advisory Agreement”) and a Supervision and Administration Agreement between Global X Management and the Trust on behalf of each Fund; and (ii) an interim Investment Advisory Agreement (“New Interim Agreement,” together with the New Advisory Agreement, “New Agreements”) and an Interim Supervision and Administration Agreement between Global X Management and the Trust, on behalf of each Fund, to become effective should the Closing occur prior to a majority of a Fund’s outstanding voting shares approving the New Advisory Agreement.
At a telephonic meeting on February 16, 2018, the Board, the majority of whose Trustees are independent, received information from Mirae and Global X Management, and met with representatives of each. Following such meeting, the Independent Trustees requested and were provided with detailed materials relating to Mirae (including Horizons), Global X Management and the Transaction, and on February 23, 2018, the Board met at an in-person meeting called for the purpose of considering the New Agreements (the “Board Meeting”). At the Board Meeting, the Trustees discussed and approved the New Agreements between Global X and the Trust, on behalf of each Fund, and determined to recommend that Shareholders approve the New Advisory Agreement. The Independent Trustees met in executive session with their independent legal counsel during the Board Meeting to discuss the proposed Transaction and its possible effects on the Funds. At the Board Meeting, representatives of Mirae and Global X Management responded to questions from the Board, and discussed, among other things, the strategic rationale for the Transaction and Mirae’s general plans and intentions regarding the Funds. The Board, including the Independent Trustees, evaluated the terms of the New Agreements, reviewed the information provided by Mirae and Global X Management in connection with the consideration of approving the New Agreements on behalf of the Funds, and reviewed the duties and responsibilities of the Board in evaluating and approving the New Agreements.
In connection with the Board’s review of the New Agreements, Global X Management and Mirae advised the Board about a variety of matters, including the following:
| • | No material changes are currently contemplated as a result of the Transaction in the nature, quality, or extent of services currently provided to the Funds and their shareholders (“Shareholders”), including investment management and other shareholder services. |
Approval of Investment Advisory Agreement (unaudited) (continued)
| • | No material changes are currently contemplated in the operation of the Funds, and the same portfolio manager managing each Fund’s assets was expected to do so after the Transaction. (Ms. Harris subsequently ceased serving as portfolio manager, although her departure was for unrelated reasons and was not contemplated as part of the Transaction.) |
| • | Each Fund’s portfolio manager(s), as well as all of the other investment advisory personnel of Global X Management who currently assist in the management of the Funds, were expected to keep their current positions after the Transaction. |
| • | Horizons has agreed that it will, and will cause each of its affiliates to, conduct their business to enable reliance upon the conditions of Section 15(f) of the 1940 Act, including not imposing any “unfair burden” on the Funds for at least two years from the Closing. |
| • | The reputation, financial strength, and resources of Mirae, and the potential benefits to Shareholders of Mirae becoming the ultimate parent of the investment adviser to the Funds. |
| • | The long-term business goals of Mirae and Global X Management. |
| • | There will be no changes to the Funds’ key service providers. |
In addition to the information provided by Global X Management and Mirae as described above, the Board also considered, among other factors, the following:
| • | Mirae’s experience and success with past acquisitions. |
| • | The terms and conditions of the New Agreements will be substantially identical to the terms and conditions of the Current Agreement, including the continuation of the all-in fee structure, and that each Fund’s contractual fee rates under the New Agreements will remain the same as in the Current Agreement, with no increase in the overall fees paid by a Fund. |
| • | The capabilities, resources, and personnel of Horizons necessary for Global X Management to continue to provide the investment management services currently provided to each Fund. |
| • | The advisory fees paid by each Fund after the Transaction represent reasonable compensation to Global X Management in light of the services to be provided, the costs to Global X Management of providing those services, economies of scale, and the fees and other expenses paid by similar funds. |
| • | Global X Management and Horizons have agreed to pay all expenses of the Funds in connection with the proxy solicitation, and that the Funds will bear no costs in obtaining Shareholder approval of the New Advisory Agreement. |
In connection with their consideration of the New Agreements the Trustees noted that, on November 14, 2017, the Board had approved the continuation of the Current Agreement. The Independent Trustees considered that, in connection with the foregoing approvals, the Board had determined that Global X Management had the capabilities, resources and personnel necessary to provide the services to each Fund as required under the Current Agreement, and the advisory fee rates paid by each Fund, taking into account the unitary fees charged to the Funds, represented reasonable compensation to Global X Management in light of the services provided. The Trustees noted that the
Approval of Investment Advisory Agreement (unaudited) (continued)
Board also considered the cost to Global X Management of providing those services, potential economies of scale as each Fund’s assets grow, the fees and expenses paid by other comparable funds, and such other matters as the Board had considered relevant in the exercise of its reasonable business judgment. The Independent Trustees noted Global X Management’s confirmation that there had been no material changes to this information previously considered by the Board.
In considering whether to approve the New Agreements on behalf of the Funds, the Board reviewed the materials provided for the Board Meeting, including: (i) a copy of the New Agreements; (ii) information concerning the financial condition, businesses, operations and compliance programs of Global X Management and Horizons; and (iii) a copy of the current Form ADV for Horizons. In making its decision to approve the New Agreements, the Board, including the Independent Trustees, concluded that the information furnished was sufficiently responsive, and sufficient to allow the Trustees to form a reasonable business judgment for approval of the New Agreements.
During its review of this information, the Board focused on and analyzed the factors that the Board deemed relevant, including: (i) the nature, quality and extent of the services provided and expected to be provided to each Fund by Global X Management; (ii) the personnel and operations of Global X Management; (iii) the investment performance of the Funds; (iv) the expected profitability to Global X Management under the New Agreements; (v) any “fall-out” benefits to Global X Management (i.e., the ancillary benefits realized due to Global X Management’s relationship with the Trust); and (vi) possible conflicts of interest. The following are among the primary factors taken into account by the Board in approving the New Agreements.
The Board reviewed the services that Global X Management expects to provide to each Fund. In connection with the advisory services to be provided to each Fund, the Board noted the significant responsibilities of Global X Management as the Funds’ investment adviser, including: implementation of the investment management program of each Fund; management of the day-to-day investment and reinvestment of the assets of each Fund; determining daily baskets of deposit securities and cash components; executing portfolio security trades for purchases and redemptions of Fund shares conducted on a cash-in-lieu basis; and oversight of general portfolio compliance with relevant law. The Board considered that, for a period of time after the Closing, Global X Management expects its operations would be the same as its current operations. The Board considered that Global X Management’s key personnel who provide services to the Funds are expected to provide those same services after the Transaction. The Board also noted that the Transaction is not expected to result in any change in the structure or operations of the Funds and that the Adviser does not currently anticipate any immediate changes to the Funds’ key service providers. The Board also considered the services Global X Management has provided to each Fund under the Current Agreement and the additional resources anticipated to be made available to the Funds’ portfolio management team following the Closing. The Board reviewed Global X Management’s experience, resources, strengths and its prior performance as investment adviser to the Funds.
Based on its consideration and review of the foregoing information, the Board determined that the Funds would likely benefit from the nature, quality and extent of the services to be provided by Global X Management under the New Agreements, as well as Global X Management’s ability to render such services based on its experience, personnel, operations and resources, including as expected to be augmented following the Closing.
Approval of Investment Advisory Agreement (unaudited) (continued)
The Board considered the appropriateness of the advisory fees and expense ratios of the Funds under the all-in fee structure under the New Agreements (which is the same fee structure as under the Current Agreement). The Board noted Global X Management’s assumption of the contractual obligation to limit each Fund’s ordinary operating expenses through the all-in fee structure under the New Agreements, which cannot be changed without Shareholder approval. The Board also noted Global X Management’s agreement to further waive its advisory fees and assume certain expenses with respect to certain Funds under new fee waiver agreements.
The Board also noted that Horizons has agreed that it will, and will cause each of its affiliates to, conduct their business to enable reliance upon the conditions of Section 15(f) of the 1940 Act, including not imposing any “unfair burden” on the Funds for at least two years from the Closing. The Board considered the fact that the fee waivers and expense reimbursements under the new fee waiver agreements would be kept in place for a period of two years after the Closing, and that Global X Management did not expect to request that the Board implement the Funds’ Rule 12b-1 plans in the foreseeable future.
The Board discussed with the representatives from Global X Management the expected costs to be incurred by Global X Management in rendering services to the Funds, and the profitability of Global X Management in connection with its service as investment adviser to each Fund, including operational costs but excluding costs related to the Transaction or for marketing. The Board acknowledged Global X Management’s contractual obligation to limit each Fund’s expenses through the all-in fee structure under the New Agreements (which is the same as under the Current Agreement), its willingness to further waive fees with respect to certain Funds under the new fee waiver agreements in order to cap the costs paid by the applicable Funds’ Shareholders and the effect of such obligation and commitments, respectively, on Global X Management’s expected profitability. The Board discussed with Global X Management its experience in addressing economies of scale. The Board received information regarding Global X Management’s financial condition and reviewed Global X Management’s financial statements. The Board concluded that the expected profitability of Global X Management was reasonable for the Funds in relation to the performance and asset sizes of the Funds. The Board also considered that the Funds’ expenses were not expected to increase after the Transaction closed.
The Board also considered that Global X Management may experience reputational and other “fall-out” benefits (i.e., benefits to affiliates of Global X Management, including Mirae and/or Horizons following the Transaction) based on the success of the Funds, but that such benefits were not likely to result in an “unfair burden” to the Funds.
The Board considered the investment performance of the Funds, including tracking error and difference, and the ability of the portfolio management team of Global X Management to continue such performance following the Closing. The Board concluded that Global X Management’s experience in managing the Funds, along with Horizon’s desire to retain all of the investment advisory personnel of Global X Management who currently assist in the management of the Funds, demonstrated that Global X Management had the ability to continue to successfully manage the Funds.
No single factor was determinative to the decision of the Board to approve the New Agreements. Based on the foregoing and such other matters as were deemed relevant, the Board concluded that the advisory fee rates under the New Agreements were reasonable in relation to the services expected
Approval of Investment Advisory Agreement (unaudited) (concluded)
to be provided by Global X Management to each Fund, as well as the expected costs incurred and benefits gained by Global X Management in providing such services. The Board also found the investment advisory fees under the New Agreements and the Current Agreement continued to be reasonable in comparison to the fees charged by advisers to other comparable ETFs of similar size. The Board concluded that the Transaction would not result in an increase in advisory fee rates or net expense ratios, and was not expected to result in a decrease in the quality or quantity of services provided to the Funds, or impose an “unfair burden” on the Funds. The Board further concluded that, after the Transaction, Global X Management will have the capabilities, resources, and personnel necessary to provide the investment management services it currently provides to each Fund. As a result, the Board concluded that the approval of the New Agreements between Global X Management and the Trust, on behalf of each Fund, is in the best interests of each Fund.
Shareholder voting results (unaudited)
On May 11, 2018, a special Meeting of Shareholders of the Trust was held to elect the following four nominees to serve as members of the Board. Shares were voted as follows:
| | | Number of Shares Voted | % of Shares Voted | % of Total Outstanding Shares |
| Charles A. Baker | For | 372,438,195 | 97.28% | 68.98% |
| | Withheld | 10,414,231 | 2.72% | 1.93% |
| | | | | |
| Luis Berruga | For | 359,303,234 | 93.85% | 66.55% |
| | Withheld | 23,552,191 | 6.15% | 4.36% |
| | | | | |
| Sanjay Ram Bharwani | For | 358,443,432 | 93.62% | 66.39% |
| | Withheld | 24,412,956 | 6.38% | 4.48% |
| | | | | |
| Clifford J. Weber | For | 372,088,624 | 97.19% | 68.92% |
| | Withheld | 10,759,838 | 2.81% | 1.99% |
On May 11, 2018, a special Meeting of Shareholders of the below listed Funds was held to approve a new investment advisory agreement for the Funds. Shares were voted as follows:
| | | Number of Shares Voted | % of Shares Voted | % of Total Outstanding Shares |
| Global X MSCI Norway ETF | For | 7,682,315 | 75.66% | 70.16% |
| | Against | 34,159 | 0.34% | 0.31% |
| | Abstain | 11,332 | 0.11% | 0.10% |
| | Broker Non-Vote | 2,425,798 | 23.89% | 22.15% |
| Global X China Consumer ETF | For | 11,215,375 | 76.08% | 64.83% |
| | Against | 34,346 | 0.23% | 0.20% |
| | Abstain | 34,663 | 0.24% | 0.20% |
| | Broker Non-Vote | 3,456,293 | 23.45% | 19.98% |
Shareholder voting results (unaudited) (continued)
On June 8, 2018, a special Meeting of Shareholders of the below listed Funds was held to approve a new investment advisory agreement for the Funds. Shares were voted as follows:
| | | Number of Shares Voted | % of Shares Voted | % of Total Outstanding Shares |
| Global X China Materials ETF | For | 131,779 | 86.52% | 52.72% |
| | Against | 4,906 | 3.22% | 1.96% |
| | Abstain | 1,361 | 0.89% | 0.54% |
| | Broker Non-Vote | 14,266 | 9.37% | 5.71% |
| Global X China Energy ETF | For | 65,537 | 75.65% | 43.69% |
| | Against | 821 | 0.95% | 0.55% |
| | Abstain | 442 | 0.51% | 0.29% |
| | Broker Non-Vote | 19,835 | 22.89% | 13.22% |
| Global X MSCI Portugal ETF | For | 1,515,281 | 69.21% | 35.65% |
| | Against | 13,562 | 0.62% | 0.32% |
| | Abstain | 14,190 | 0.65% | 0.33% |
| | Broker Non-Vote | 646,236 | 29.52% | 15.21% |
| Global X MSCI Argentina ETF | For | 2,280,473 | 68.86% | 37.23% |
| | Against | 22,258 | 0.67% | 0.36% |
| | Abstain | 15,403 | 0.47% | 0.25% |
| | Broker Non-Vote | 993,786 | 30.01% | 16.23% |
| Global X MSCI Nigeria ETF | For | 1,416,580 | 68.59% | 39.22% |
| | Against | 23,662 | 1.15% | 0.66% |
| | Abstain | 9,964 | 0.48% | 0.28% |
| | Broker Non-Vote | 615,193 | 29.79% | 17.03% |
| Global X MSCI Pakistan ETF | For | 1,805,437 | 67.98% | 36.11% |
| | Against | 18,453 | 0.69% | 0.37% |
| | Abstain | 9,552 | 0.36% | 0.19% |
| | Broker Non-Vote | 822,412 | 30.97% | 16.45% |
| Global X Greece ETF | For | 16,547,890 | 67.61% | 37.69% |
| | Against | 202,428 | 0.83% | 0.46% |
| | Abstain | 113,965 | 0.47% | 0.26% |
| | Broker Non-Vote | 7,612,916 | 31.10% | 17.34% |
| Global X China Industrials ETF | For | 147,599 | 67.51% | 59.04% |
| | Against | 4,147 | 1.90% | 1.66% |
| | Abstain | 3,597 | 1.65% | 1.44% |
| | Broker Non-Vote | 63,289 | 28.95% | 25.32% |
Shareholder voting results (unaudited) (continued)
| Global X FTSE Nordic Region | For | 588,069 | 72.79% | 40.28% |
| | Against | 18,243 | 2.26% | 1.25% |
| | Abstain | 22,436 | 2.78% | 1.54% |
| | Broker Non-Vote | 179,175 | 22.18% | 12.27% |
| Global X FTSE Southeast Asia ETF | For | 466,995 | 68.48% | 40.61% |
| | Against | 36,917 | 5.41% | 3.21% |
| | Abstain | 3,373 | 0.49% | 0.29% |
| | Broker Non-Vote | 174,631 | 25.61% | 15.19% |
On June 15, 2018, a special Meeting of Shareholders of the below listed Fund was held to approve a new investment advisory agreement for the Fund. Shares were voted as follows:
| | | Number of Shares Voted | % of Shares Voted | % of Total Outstanding Shares |
| Global X China Financials ETF | For | 1,467,599 | 67.38% | 46.59% |
| | Against | 31,966 | 1.47% | 1.01% |
| | Abstain | 41,285 | 1.90% | 1.31% |
| | Broker Non-Vote | 637,229 | 29.26% | 20.23% |
On July 6, 2018, a special Meeting of Shareholders of the below listed Fund was held to approve a new investment advisory agreement for the Fund. Shares were voted as follows:
| | | Number of Shares Voted | % of Shares Voted | % of Total Outstanding Shares |
| Global X MSCI Colombia ETF | For | 4,500,023 | 76.48% | 46.49% |
| | Against | 67,659 | 1.15% | 0.70% |
| | Abstain | 151,318 | 2.57% | 1.56% |
| | Broker Non-Vote | 1,164,810 | 19.80% | 12.03% |
On July 27, 2018, a special Meeting of Shareholders of the below listed Fund was held to approve a new investment advisory agreement for the Fund. Shares were voted as follows:
| | | Number of Shares Voted | % of Shares Voted | % of Total Outstanding Shares |
| Global X Next Emerging & Frontier ETF | For | 368,304 | 67.66% | 49.11% |
| | Against | 10,593 | 1.95% | 1.41% |
| | Abstain | 4,128 | 0.76% | 0.55% |
| | Broker Non-Vote | 161,289 | 29.63% | 21.51% |
Shareholder voting results (unaudited) (concluded)
On August 3, 2018, a special Meeting of Shareholders of the below listed Fund was held to approve a new investment advisory agreement for the Fund. Shares were voted as follows:
| | | Number of Shares Voted | % of Shares Voted | % of Total Outstanding Shares |
| Global X NASDAQ China Technology ETF | For | 474,988 | 67.77% | 41.30% |
| | Against | 12,839 | 1.83% | 1.12% |
| | Abstain | 21,664 | 3.09% | 1.88% |
| | Broker Non-Vote | 191,406 | 27.31% | 16.64% |
Supplemental Information (unaudited)
NAV is the price per Share at which the Funds issue and redeem Shares. It is calculated in accordance with the standard formula for valuing mutual fund shares. The “Market Price” of the Funds generally is determined using the midpoint between the highest bid and the lowest offer on the stock exchange on which the Shares of the Funds are listed for trading, as of the time that the Funds’ NAV is calculated. The Funds’ Market Price may be at, above or below their NAV. The NAV of the Funds will fluctuate with changes in the market value of the Funds’ holdings. The Market Price of the Funds will fluctuate in accordance with changes in their NAV, as well as market supply and demand.
Premiums or discounts are the differences (expressed as a percentage) between the NAV and Market Price of the Funds on a given day, generally at the time NAV is calculated. A premium is the amount that the Funds are trading above the reported NAV, expressed as a percentage of the NAV. A discount is the amount that the Funds are trading below the reported NAV, expressed as a percentage of the NAV.
Further information regarding premiums and discounts is available on the Funds’ website at www.GlobalXFunds.com.
Trustees and Officers of the Trust (unaudited)
Set forth below are the names, addresses, years of birth, positions with the Trust, Term of Office and Length of Time Served, the principal occupations for the last five years, number of Funds in fund complex overseen by the Trustees, and other directorships outside the fund complex of each of the persons currently serving as Trustees and Officers of the Trust.
Name, Address (Year of Birth) | Position(s) Held with Trust | Principal Occupation(s) During the Past 5 Years | Number of Funds in Trust Overseen by Trustee | Other Directorships Held by Trustees |
Independent Trustees1 | |
Charles A. Baker 600 Lexington Avenue, 20th Floor New York, NY 10022 (1953) | Trustee (since 07/2018) | Chief Executive Officer of Investment Innovations LLC (investment consulting) (since 2013); Managing Director of NYSE Euronext (2003 to 2012). | 572 | Trustee of OSI ETF Trust (since 2016). |
Sanjay Ram Bharwani 600 Lexington Avenue, 20th Floor New York, NY 10022 (1974) | Trustee (since 2008) | CEO of Risk Advisors Inc. (since 2007) (consulting firm). | 572 | None. |
Clifford J. Weber 600 Lexington Avenue, 20th Floor New York, NY 10022 (1963) | Trustee (since 07/2018) | Owner, Financial Products Consulting Group LLC (consulting services to financial institutions) (since 2015); Formerly, Executive Vice President of Global Index and Exchange-Traded Products, NYSE Market, Inc., a subsidiary of Intercontinental Exchange (ETF/ETP listing exchange) (2013-2015); and Executive Vice President and Head of Strategy and Product Development, NYSE Liffe U.S., a division of NYSE Euronext (U.S. futures exchange) (2008-2013). | 572 | Lead Independent Trustee of Clough Funds Trust (since 2015); Chairman and Trustee of Clayton Street Trust (since 2016); Chairman and Trustee of Janus Detroit Street Trust (since 2016); Trustee of Elevation ETF Trust (2016-2018); Trustee of Clough Global Equity Fund (since 2017) ; Trustee of Clough Global Dividend and Income Fund (since 2017); and Clough Global Opportunities Fund (since 2017). |
Trustees and Officers of the Trust (unaudited) (concluded)
The Trust’s Statement of Additional Information (“SAI”) includes additional information about the Trustees and Officers. The SAI may be obtained without charge by calling 1-888-493-8631. The following chart lists Trustees and Officers as of October 31, 2018.
Name, Address (Year of Birth) | Position(s) Held with Funds | Principal Occupation(s) During the Past 5 Years | Number of Funds in Trust Overseen by Trustee | Other Directorships Held by Trustees |
Interested Trustee / Officers1 | | |
Luis Berruga 600 Lexington Avenue, 20th Floor New York, NY 10022 (1977) | Trustee (since 07/2018); President (since 2018) | Chief Executive Officer, GXMC (since 07/2018), Chief Financial Officer (since 2/2014) and Chief Operating Officer (9/2015 - 7/2018); Investment Banker, Jefferies (2012-2014). | 572 | None. |
Chang Kim 600 Lexington Avenue, 20th Floor New York, NY 10022 (1984) | Chief Operating Officer; Treasurer, Principal Accounting Officer; and Chief Financial Officer (since 7/2018). | Chief Operating Officer, GXMC (since 7/2018), Head of Portfolio Management & Portfolio Administration (1/2017-7/2018); and Portfolio Manager (9/2009 - 1/2017). | N/A | None. |
Lisa K. Whittaker 600 Lexington Avenue, 20th Floor New York, NY 10022 (1978) | Secretary (since 7/2018). | General Counsel, GXMC (since 7/2018); Counsel at SEI Investments (2012 - 7/2018); Associate Counsel and Compliance Officer at The Glendale Trust Company (2011-2012). | N/A | None. |
Joe Costello 600 Lexington Avenue, 20th Floor New York, NY 10022 (1974) | Chief Compliance Officer (since 9/2016). | Chief Compliance Officer, FlexShares Funds (2011-2015); Vice President, Northern Trust Investments (2003 - 2015). | N/A | None. |
Eric Kleinschmidt3 One Freedom Valley Drive Oaks, PA 19456 (1968) | Assistant Treasurer (since 2016). | Director, Fund Accounting, SEI Investments Global Funds Services (2004 to present). | N/A | None. |
Dianne Descoteaux3 One Freedom Valley Drive Oaks, PA 19456 (1977) | Assistant Secretary (since 11/2018). | Counsel at SEI Investments (2010-presentt). | N/A | None. |
1 Each Trustee serves until his or her successor is duly elected or appointed and qualified.
2 As of October 31, 2018, the Trust had ninety-seven investment portfolios, fifty-seven of which were operational.
3 These officers of the Trust also serve as officers of one or more mutual funds for which SEI Investments Company or an affiliate acts as investment manager, administrator or distributor.
notice to shareholders (unaudited)
For shareholders that do not have an October 31, 2018 tax year end, this notice is for informational purposes only. For shareholders with an October 31, 2018 tax year end, please consult your tax advisor as to the pertinence of this notice. For the fiscal year ended October 31, 2018, the Funds have designated the following items with regard to distributions paid during the year.
| | | Long-Term Capital Gain Distributions | | | Ordinary Income Distributions | | | | | | Qualifying for Corporate Dividends Received Deduction0F(1) | | | Qualifying Dividend Income(2) | | | U.S. Government Interest(3) | | | Interest Related DividendsF2F2F(4) | | | Short Term Capital Gain Dividends(5) | | | | |
| Global X China Consumer ETF | | | 0.00 | % | | | 100.00 | % | | | 100.00 | % | | | 0.00 | % | | | 55.24 | % | | | 0.00 | % | | | 0.01 | % | | | 0.00 | % | | | 0.00 | % |
| Global X China Energy ETF | | | 0.00 | % | | | 100.00 | % | | | 100.00 | % | | | 0.00 | % | | | 63.37 | % | | | 0.09 | % | | | 0.03 | % | | | 0.00 | % | | | 10.81 | % |
| Global X China Financials ETF | | | 0.00 | % | | | 100.00 | % | | | 100.00 | % | | | 0.00 | % | | | 86.72 | % | | | 0.00 | % | | | 0.01 | % | | | 0.00 | % | | | 10.13 | % |
| Global X China Industrials ETF | | | 0.00 | % | | | 100.00 | % | | | 100.00 | % | | | 0.00 | % | | | 52.72 | % | | | 0.00 | % | | | 0.01 | % | | | 0.00 | % | | | 4.44 | % |
| Global X China Materials ETF | | | 0.00 | % | | | 100.00 | % | | | 100.00 | % | | | 0.00 | % | | | 68.85 | % | | | 0.00 | % | | | 0.03 | % | | | 0.00 | % | | | 8.47 | % |
| Global X NASDAQ China Technology ETF | | | 0.00 | % | | | 100.00 | % | | | 100.00 | % | | | 0.00 | % | | | 14.98 | % | | | 0.00 | % | | | 0.01 | % | | | 0.00 | % | | | 0.00 | % |
| Global X FTSE Southeast Asia ETF | | | 0.00 | % | | | 100.00 | % | | | 100.00 | % | | | 0.00 | % | | | 64.22 | % | | | 0.00 | % | | | 0.03 | % | | | 0.00 | % | | | 10.66 | % |
| Global X MSCI Colombia ETF | | | 0.00 | % | | | 100.00 | % | | | 100.00 | % | | | 0.00 | % | | | 39.26 | % | | | 0.00 | % | | | 0.05 | % | | | 0.00 | % | | | 0.00 | % |
| Global X MSCI Argentina ETF | | | 0.00 | % | | | 100.00 | % | | | 100.00 | % | | | 0.00 | % | | | 100.00 | % | | | 0.20 | % | | | 0.09 | % | | | 0.00 | % | | | 0.00 | % |
| Global X MSCI Greece ETF | | | 0.00 | % | | | 100.00 | % | | | 100.00 | % | | | 0.55 | % | | | 99.49 | % | | | 0.00 | % | | | 0.08 | % | | | 0.00 | % | | | 14.43 | % |
| Global X MSCI Norway ETF | | | 0.00 | % | | | 100.00 | % | | | 100.00 | % | | | 0.00 | % | | | 60.50 | % | | | 0.00 | % | | | 0.01 | % | | | 0.00 | % | | | 15.05 | % |
| Global X FTSE Nordic Region ETF | | | 0.00 | % | | | 100.00 | % | | | 100.00 | % | | | 0.00 | % | | | 63.77 | % | | | 0.00 | % | | | 0.00 | % | | | 0.00 | % | | | 0.00 | % |
| Global X MSCI Nigeria ETF | | | 0.00 | % | | | 100.00 | % | | | 100.00 | % | | | 0.00 | % | | | 0.00 | % | | | 0.04 | % | | | 0.06 | % | | | 0.00 | % | | | 16.40 | % |
| Global X Next Emerging & Frontier ETF | | | 0.00 | % | | | 100.00 | % | | | 100.00 | % | | | 0.88 | % | | | 89.16 | % | | | 0.00 | % | | | 0.04 | % | | | 0.00 | % | | | 13.93 | % |
| Global X MSCI Portugal ETF | | | 0.00 | % | | | 100.00 | % | | | 100.00 | % | | | 0.00 | % | | | 63.78 | % | | | 0.00 | % | | | 0.00 | % | | | 0.00 | % | | | 11.51 | % |
| Global X MSCI Pakistan ETF | | | 32.27 | % | | | 67.73 | % | | | 100.00 | % | | | 0.00 | % | | | 77.34 | % | | | 0.01 | % | | | 0.02 | % | | | 0.00 | % | | | 9.20 | % |
(1) Qualifying dividends represent dividends which qualify for the corporate dividends received deduction and is reflected as a percentage of ordinary Income distributions (the total of short term capital gain and net investment income distributions).
(2) The percentage in this column represents the amount of "Qualifying Dividend Income" as created by the Jobs and Growth Relief Reconciliation Act of 2003 and its reflected as a percentage of ordinary income distributions (the total of short term capital gain and net investment income distributions). It is the intention of each of the aforementioned funds to designate the maximum amount permitted by law.
(3) ‘‘U.S. Government Interest’’ represents the amount of interest that was derived from U.S. Government obligations and distributed during the fiscal year. Generally, interest from direct U.S. Government obligations is exempt from state income tax. However, for shareholders who are residents of California, Connecticut and New York, the statutory threshold requirements were not satisfied to permit exemption of these amounts from state income.
(4) The percentage in this column represents the amount of "Interest Related Dividends" is reflected as a percentage of ordinary income distribution. Interest related dividends is exempt from U.S. withholding tax when paid to foreign investors.
(5) The percentage of this column represents the amount of “Short Term Capital Gain Dividend” is reflected as a percentage of short term capital gain distribution that is exempted from U.S. withholding tax when paid to foreign investors.
notice to shareholders (unaudited)
Certain Funds intend to pass through a foreign tax credit to shareholders. For the fiscal year ended October 31, 2018, the total amount of foreign source income and foreign tax credit are as follows:
Fund Name
| | Foreign Source Income | | | Foreign Tax Credit Pass Through | |
Global X China Energy ETF
| | $ | 118,791 | | | $ | 7,487 | |
Global X China Financials ETF
| | | 1,802,990 | | | | 107,959 | |
Global X China Industrials ETF
| | | 89,882 | | | | 4,016 | |
Global X China Materials ETF
| | | 141,244
| | | | 5,461 | |
Global X FTSE Southeast Asia ETF
| | | 755,354 | | | | 33,899 | |
Global X MSCI Greece ETF
| | | 11,923,861 | | | | 1,437,104
| |
Global X MSCI Norway ETF
| | | 6,296,910
| | | | 721,557
| |
Global X MSCI Nigeria ETF
| | | 2,997,090
| | | | 266,918
| |
Global X Next Emerging & Frontier ETF
| | | 559,803
| | | | 46,717
| |
Global X MSCI Portugal ETF
| | | 1,847,860
| | | | 202,678
| |
Global X MSCI Pakistan ETF
| | | 3,006,390
| | | | 433,766
| |
The information reported herein may differ from the information and distributions taxable to the shareholders for the calendar year ending December 31, 2018. Complete information will be computed and reported in conjunction with your 2018 Form 1099-DIV.
Notes
Notes
600 Lexington Avenue, 20th floor
New York, NY 10022
1-888-GXFund-1
(1-888-493-8631)
www.globalxfunds.com
Investment Adviser and Administrator:
Global X Management Company LLC
600 Lexington Avenue, 20th floor
New York, NY 10022
Distributor:
SEI Investments Distribution Co.
One Freedom Valley Drive
Oaks, PA 19456
Sub-Administrator:
SEI Investments Global Funds Services
One Freedom Valley Drive
Oaks, PA 19456
Counsel for Global X Funds and the Independent Trustees:
Stradley Ronon Stevens & Young, LLP
1250 Connecticut Avenue, N.W.
Suite 500
Washington, DC 20036
Custodian and Transfer Agent:
Brown Brothers Harriman & Co.
50 Post Office Square
Boston, MA 02110
Independent Registered Public Accounting Firm:
PricewaterhouseCoopers LLP
Two Commerce Square
Suite 1800
2001 Market Street
Philadelphia, PA 19103
This information must be preceded or accompanied by a prospectus for the funds described.
GLX-AR-002-0800