| Global X MLP & Energy Infrastructure ETF (ticker: MLPX) |
| Global X U.S. Preferred ETF (ticker: PFFD) |
Global X SuperDividend® Alternatives ETF (ticker: ALTY) |
Global X S&P 500® Quality Dividend ETF (ticker: QDIV) |
Global X TargetIncomeTM 5 ETF (ticker: TFIV) |
Global X TargetIncomeTM Plus 2 ETF (ticker: TFLT) |
| Global X Adaptive U.S. Factor ETF (ticker: AUSF) |
Annual Report
November 30, 2019
Beginning on January 1, 2021, as permitted by regulations adopted by the Securities and Exchange Commission, paper copies of the Funds’ (defined below) shareholder reports will no longer be sent by mail, unless you specifically request paper copies of the reports from your financial intermediary (such as a broker-dealer or bank). Instead, shareholder reports will be available on the Funds’ website (www.globalxetfs.com), and you will be notified by mail each time a report is posted and provided with a website link to access the report.
If you already elected to receive shareholder reports electronically, you will not be affected by this change and you need not take any action. You may elect to receive shareholder reports and other communications from the Funds electronically anytime by contacting your financial intermediary.
You may elect to receive all future Fund shareholder reports in paper free of charge. Please contact your financial intermediary to inform them that you wish to continue receiving paper copies of Fund shareholder reports and for details about whether your election to receive reports in paper will apply to all funds held with your financial intermediary.
| Management Discussion of Fund Performance | 1 |
| Schedules of Investments | |
| Global X MLP & Energy Infrastructure ETF | 16 |
| Global X U.S. Preferred ETF | 19 |
Global X SuperDividend® Alternatives ETF | 34 |
Global X S&P 500® Quality Dividend ETF | 39 |
Global X TargetIncomeTM 5 ETF | 43 |
Global X TargetIncomeTM Plus 2 ETF | 45 |
| Global X Adaptive U.S. Factor ETF | 47 |
| Statements of Assets and Liabilities | 57 |
| Statements of Operations | 59 |
| Statements of Changes in Net Assets | 61 |
| Financial Highlights | 65 |
| Notes to Financial Statements | 69 |
| Report of Independent Registered Public Accounting Firm | 84 |
| Disclosure of Fund Expenses | 86 |
| Approval of Investment Advisory Agreement | 88 |
| Supplemental Information | 92 |
| Trustees and Officers of the Trust | 93 |
| Notice to Shareholders | 96 |
Shares are bought and sold at market price (not NAV) and are not individually redeemed from the Fund. Shares may only be redeemed directly from the Fund by Authorized Participants, in very large creation/redemption units. Brokerage commissions will reduce returns.
The Funds file their complete schedules of Fund holdings with the Securities and Exchange Commission (the “SEC” or “Commission”) for the first and third quarters of each fiscal year on Form N-PORT. The Funds’ Forms N-PORT are available on the Commission’s website at https://www.sec.gov, and may be reviewed and copied at the Commission’s Public Reference Room in Washington, DC. Information on the operation of the Public Reference Room may be obtained by calling 1-800-SEC-0330.
A description of the policies and procedures that Global X Funds uses to determine how to vote proxies relating to Fund securities, as well as information relating to how the Funds voted proxies relating to Fund securities during the most recent 12-month period ended June 30, is available (i) without charge, upon request, by calling 1-888-493-8631; and (ii) on the Commission’s website at https://www.sec.gov.
| | |
Management DISCUSSION OF FUND PERFORMANCE (unaudited) |
Global X MLP & Energy Infrastructure ETF |
Global X MLP & Energy Infrastructure ETF
The Global X MLP & Energy Infrastructure ETF (“Fund”) seeks to provide investment results that correspond generally to the price and yield performance, before fees and expenses, of the Solactive MLP & Energy Infrastructure Index (“Underlying Index”). The Fund is passively managed, which means the investment adviser does not attempt to take defensive positions in declining markets. The Fund generally seeks to fully replicate the Underlying Index.
The Underlying Index tracks the performance of midstream master limited partnerships (“MLPs”) and energy infrastructure corporations. Midstream energy infrastructure MLPs and corporations principally own and operate assets used in energy logistics, including, but not limited to, pipelines, storage facilities and other assets used in transporting, storing, gathering, and processing natural gas, natural gas liquids, crude oil or refined products.
For the 12-month period ended November 30, 2019 (the “reporting period”), the Fund decreased 2.34%, while the Underlying Index decreased 1.86%. The Fund had a net asset value of $12.13 per share on November 30, 2018 and ended the reporting period with a net asset value of $11.15 on November 30, 2019.
During the reporting period, the highest returns came from Buckeye Partners, L.P. and TC PipeLines, L.P., which returned 48.84% and 40.55%, respectively. The worst performers were Antero Midstream Corp. and EnLink Midstream LLC, which returned -65.43% and -53.14%, respectively.
The Fund seeks to provide tax efficient exposure to midstream MLPs, the general partners of midstream MLPs, and energy infrastructure corporations. Midstream MLPs and energy infrastructure companies operate toll road-like business models, as they are compensated based on the volume of natural gas or crude oil that they transport, store, or process. During the reporting period, oil prices initially recovered from a low range of US $35-45 per barrel, before stabilizing roughly between US $50-60 per barrel. A production cut by Organization of Petroleum-Exporting Countries and allies (OPEC+) helped support oil prices as the demand was on the lower side due to a global economic slowdown. In addition, a surge in United States oil production strained infrastructure systems within the country, with many pipelines operating at full capacity, leaving little room for growth. The Fund underperformed the broad markets considering investors’ inclination towards high growth stocks in the low interest rate environment.
| | AVERAGE ANNUAL TOTAL RETURN FOR THE YEAR ENDED NOVEMBER 30, 2019 |
| | One Year Return | Three Year Return | Five Year Return | Annualized Inception to Date* |
| | Net Asset Value | Market Price | Net Asset Value | Market Price | Net Asset Value | Market Price | Net Asset Value | Market Price |
| Global X MLP & Energy Infrastructure ETF | -2.34% | -2.17% | -3.90% | -3.88% | -5.46% | -5.42% | -0.38% | -0.29% |
| Solactive MLP & Energy Infrastructure Index | -1.86% | -1.86% | -3.28% | -3.28% | -4.80% | -4.80% | 0.26% | 0.26% |
S&P 500® Index | 16.11% | 16.11% | 14.88% | 14.88% | 10.98% | 10.98% | 12.53% | 12.53% |
| | |
Management DISCUSSION OF FUND PERFORMANCE (unaudited) |
Global X MLP & Energy Infrastructure ETF |
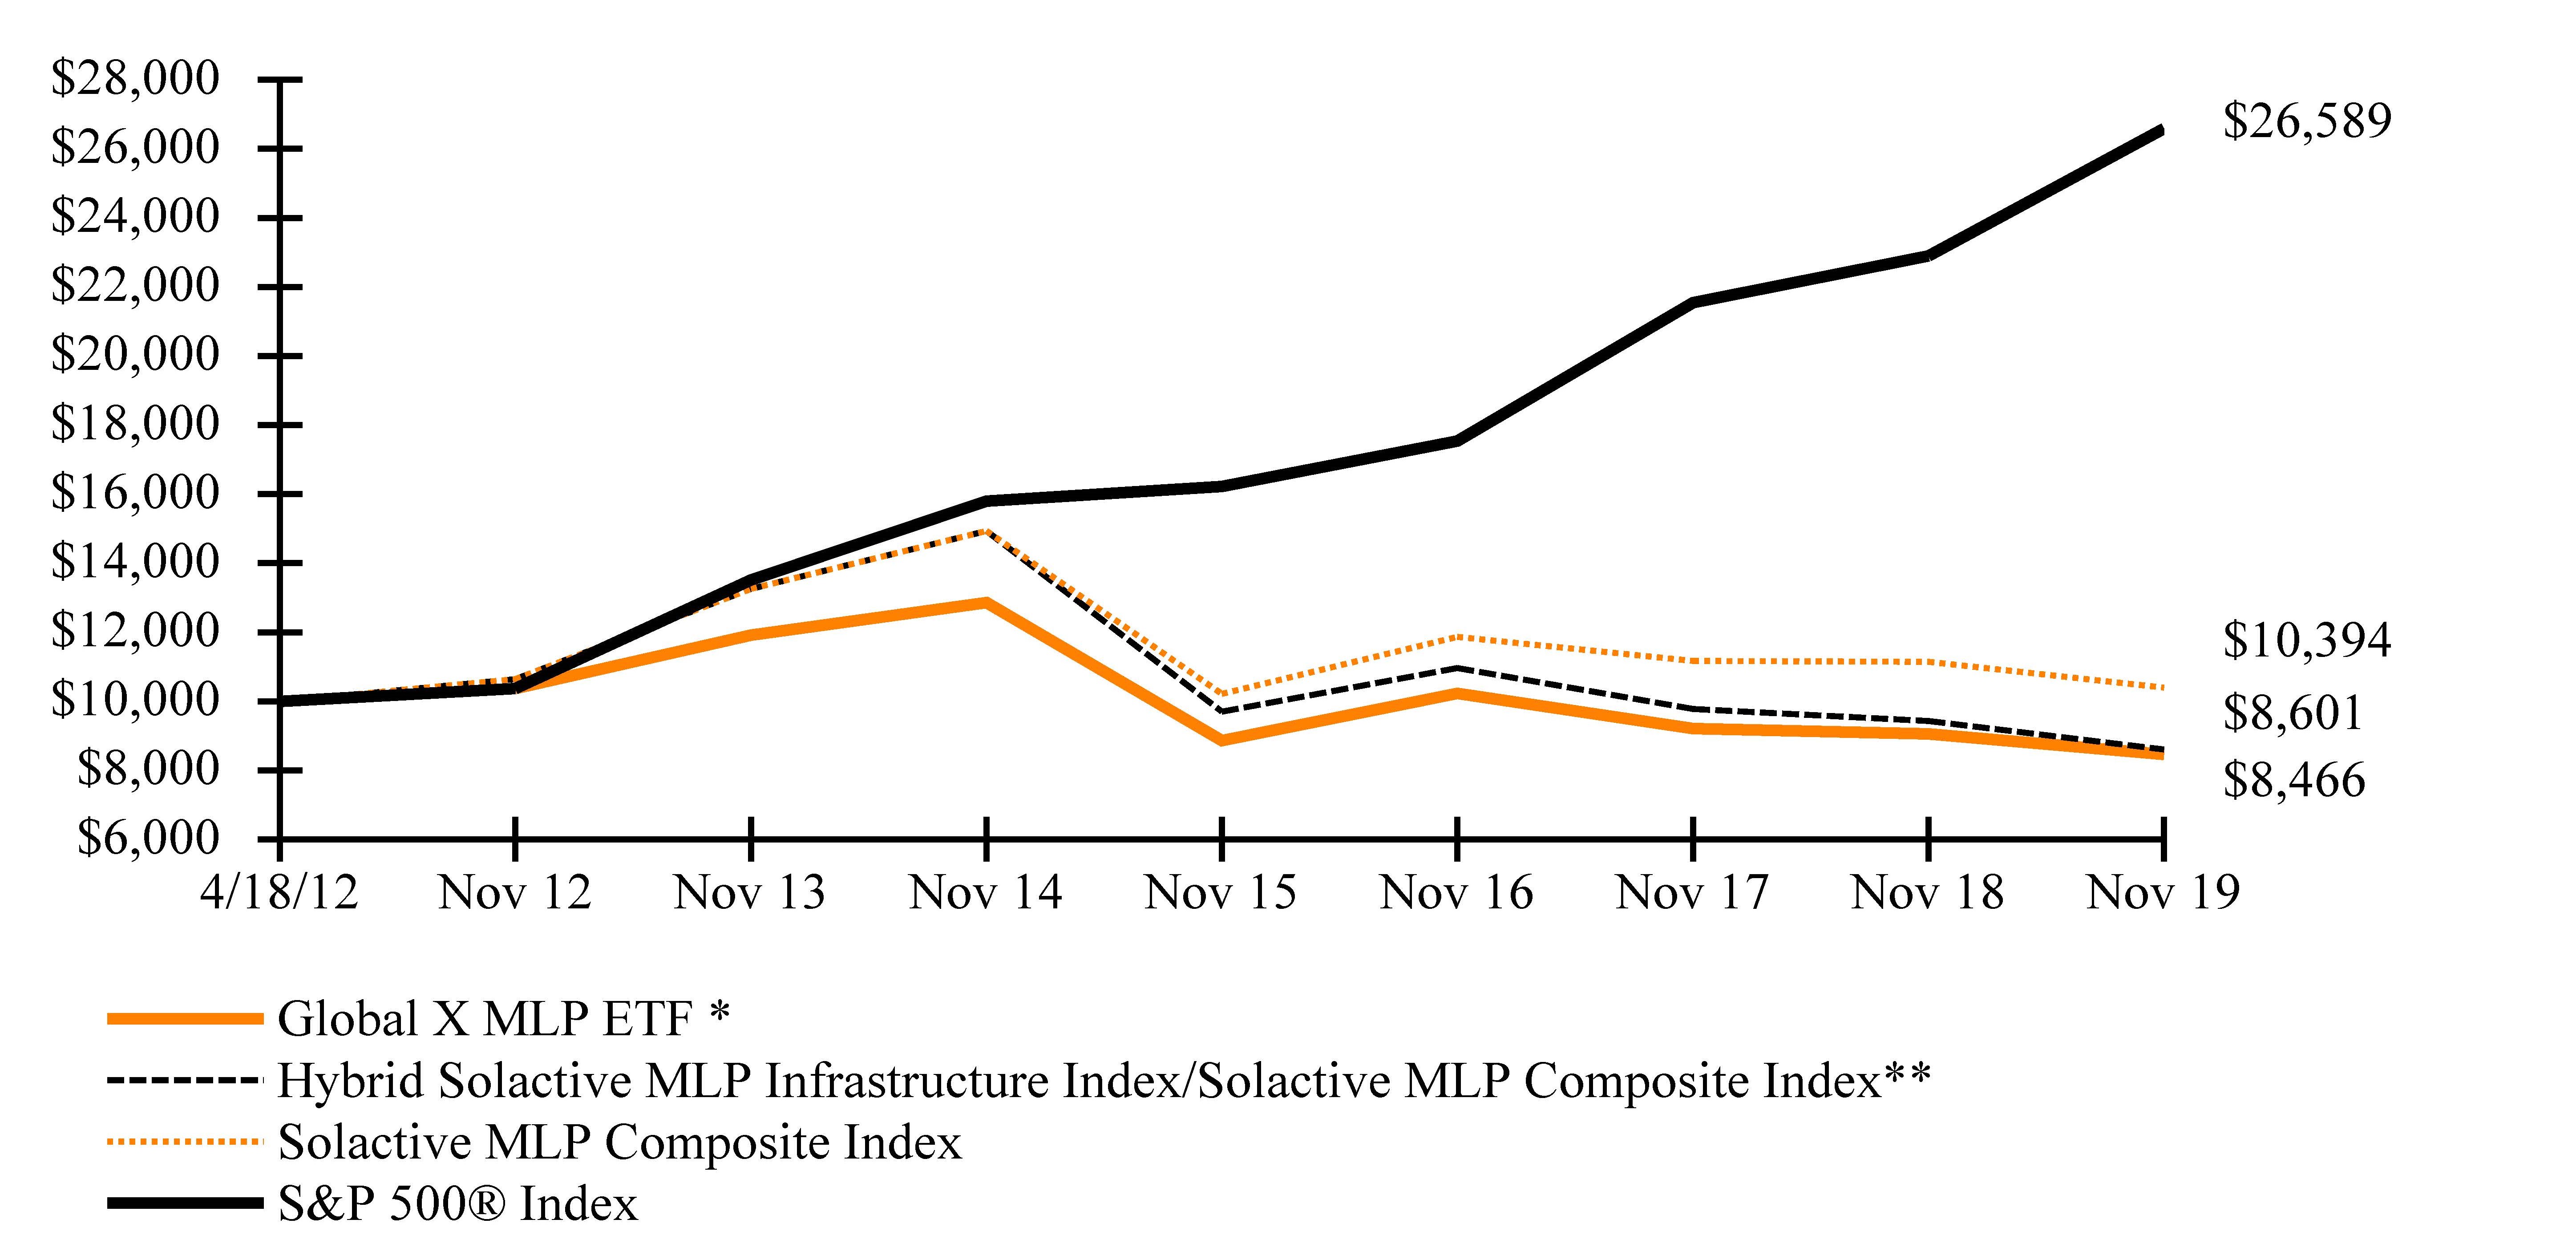
Growth of a $10,000 Investment
(at Net Asset Value)
* The Fund commenced investment operations on August 6, 2013.
The S&P 500® Index is a market capitalization weighted composite index of 500 large capitalization U.S. companies.
The Solactive MLP & Energy Infrastructure Index tracks the performance of MLPs and energy infrastructure corporations.
The performance data quoted herein represents past performance and the return and value of an investment in the Fund will fluctuate so that, when sold, it may be worth less than its original cost. Past performance is no guarantee of future performance and should not be considered as a representation of the future results of the Fund. The Fund’s performance assumes the reinvestment of all dividends and all capital gains. Index returns assume reinvestment of dividends and, unlike the Fund’s returns, do not reflect any fees or expenses. If such fees and expenses were included in the index returns, the performance would have been lower. Please note that one cannot invest directly in an unmanaged index.
There are no assurances that the Fund will meet its stated objectives.
The Fund’s holdings and allocations are subject to change and should not be considered recommendations to buy individual securities.
Returns shown do not reflect the deduction of taxes that a shareholder would pay on Fund distributions or the redemption of Fund shares.
See definition of comparative indices on the previous page and above.
| | |
Management DISCUSSION OF FUND PERFORMANCE (unaudited) |
Global X U.S. Preferred ETF |
Global X U.S. Preferred ETF
The Global X U.S. Preferred ETF (“Fund”) seeks to provide investment results that correspond generally to the price and yield performance, before fees and expenses, of the ICE BofAML Diversified Core U.S. Preferred Securities Index (“Underlying Index”). The Fund is passively managed, which means the investment adviser does not attempt to take defensive positions in declining markets. The Fund generally seeks to fully replicate the Underlying Index.
The Underlying Index is designed to track the broad-based performance of the U.S. preferred securities market. The Underlying Index includes different categories of preferred stock, such as floating, variable and fixed-rate preferreds, cumulative and non-cumulative preferreds, and trust preferreds. Qualifying preferred securities must be listed on a U.S. exchange, denominated in U.S. dollars, and have a minimum amount outstanding of $100 million. Qualifying securities must meet minimum price, liquidity, maturity and other requirements as determined by ICE Data Indices, LLC, the provider of the Underlying Index.
For the 12-month period ended November 30, 2019 (the “reporting period”), the Fund increased 14.25%, while the Underlying Index increased 14.54%. The Fund had a net asset value of $22.97 per share on November 30, 2018 and ended the reporting period with a net asset value of $24.79 on November 30, 2019.
During the reporting period, the highest returns came from Kimco Realty Corp. 5.125% and Kimco Realty Corp. 5.25%, which returned 37.50% and 37.44%, respectively. The worst performers were CBL & Associates Properties Inc. 6.625% and Nabors Industries Ltd 6%, which returned -30.79% and -25.24%, respectively.
The Fund’s holdings consist of broad exposure to United States preferred stocks, providing benchmark-like exposure to the asset class. Preferred stocks have historically offered high yield potential given that they are junior in the capital structure to traditional debt instruments. Preferred stocks performed positively during the reporting period, primarily due to investors preferring higher dividend yields than current in the low yield bond market, as well as rising uncertainties in the global equity market. During the reporting period, the Fund had an average approximate sector allocation of 69% to Financial Services, 10% to Real Estate, and 9% to Utilities.
| | AVERAGE ANNUAL TOTAL RETURN FOR THE YEAR ENDED NOVEMBER 30, 2019 |
| | One Year Return | Annualized Inception to Date* |
| | Net Asset Value | Market Price | Net Asset Value | Market Price |
| Global X U.S. Preferred ETF | 14.25% | 14.37% | 5.23% | 5.52% |
| ICE BofAML Diversified Core U.S. Preferred Securities Index | 14.54% | 14.54% | 5.49% | 5.49% |
S&P 500® Index | 16.11% | 16.11% | 13.29% | 13.29% |
| | |
Management DISCUSSION OF FUND PERFORMANCE (unaudited) |
Global X U.S. Preferred ETF |
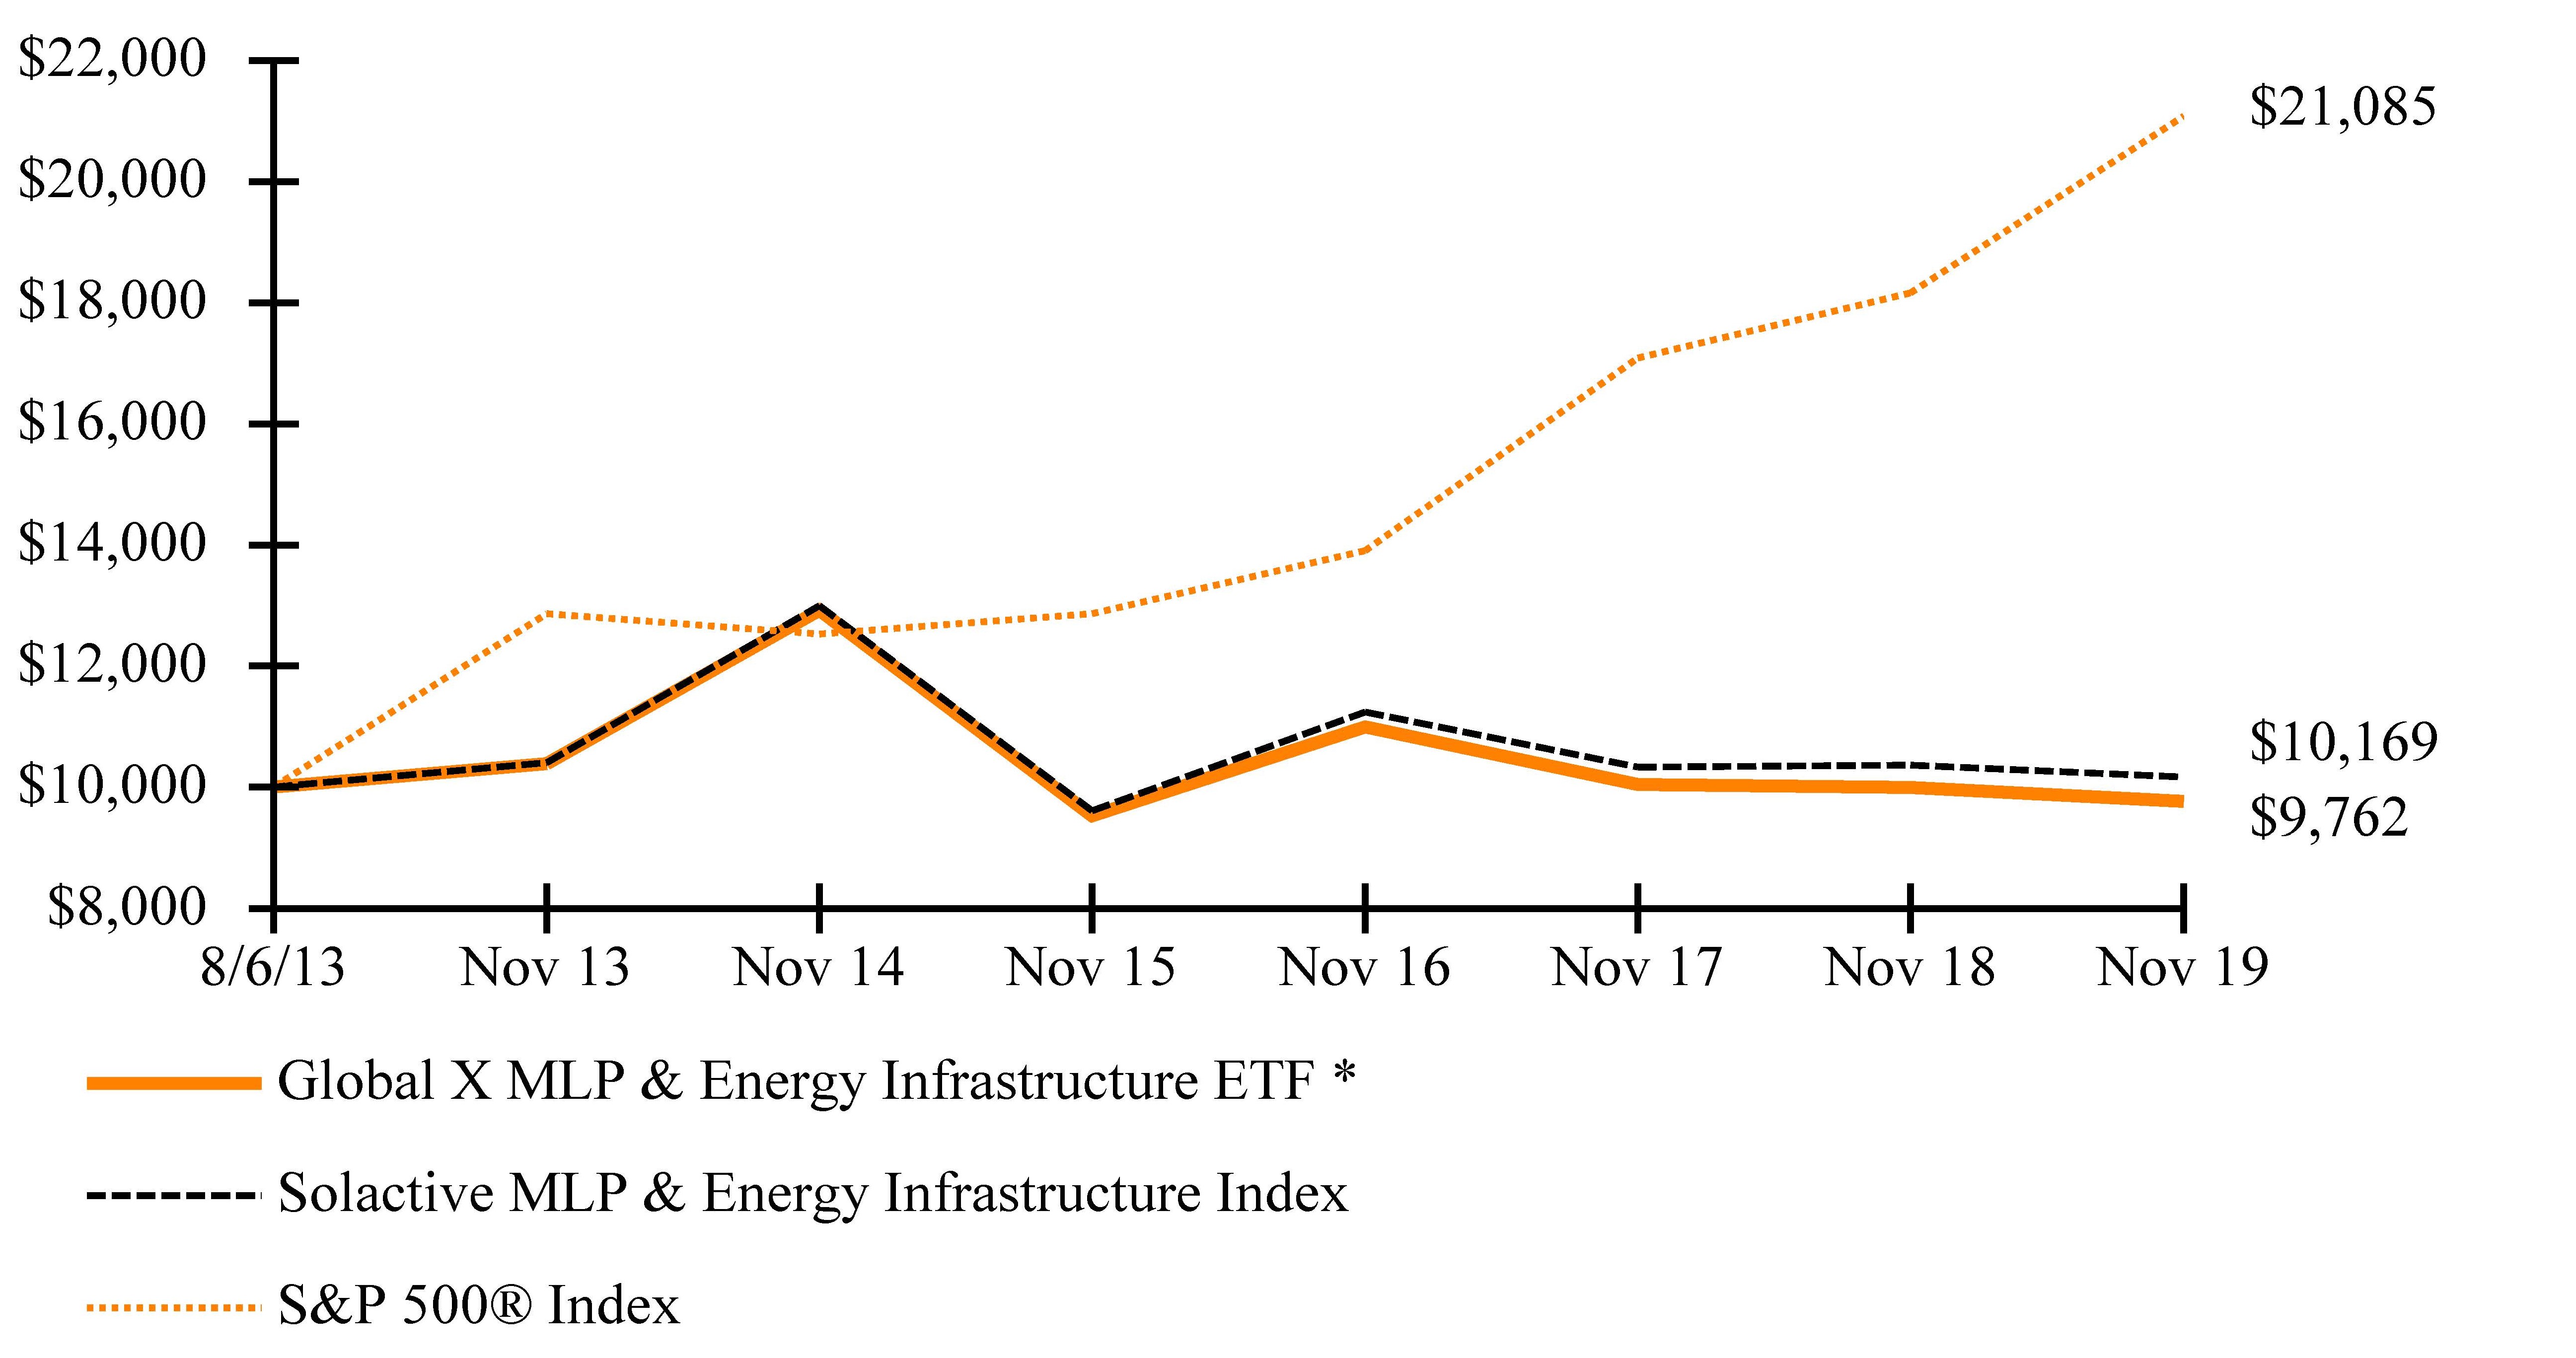
Growth of a $10,000 Investment
(at Net Asset Value)
* The Fund commenced investment operations on September 11, 2017.
The S&P 500® Index is a market capitalization weighted composite index of 500 large capitalization U.S. companies.
The ICE BofAML Diversified U.S. Preferred Securities Index was formerly known as BofA Merrill Lynch Diversified Core U.S. Preferred Securities Index.
The performance data quoted herein represents past performance and the return and value of an investment in the Fund will fluctuate so that, when sold, it may be worth less than its original cost. Past performance is no guarantee of future performance and should not be considered as a representation of the future results of the Fund. The Fund’s performance assumes the reinvestment of all dividends and all capital gains. Index returns assume reinvestment of dividends and, unlike the Fund’s returns, do not reflect any fees or expenses. If such fees and expenses were included in the index returns, the performance would have been lower. Please note that one cannot invest directly in an unmanaged index.
There are no assurances that the Fund will meet its stated objectives.
The Fund’s holdings and allocations are subject to change and should not be considered recommendations to buy individual securities.
Returns shown do not reflect the deduction of taxes that a shareholder would pay on Fund distributions or the redemption of Fund shares.
See definition of comparative indices on the previous page and above.
| | |
Management DISCUSSION OF FUND PERFORMANCE (unaudited) |
Global X SuperDividend® Alternatives ETF |
Global X SuperDividend® Alternatives ETF
The Global X SuperDividend® Alternatives ETF (“Fund”) seeks to provide investment results that correspond generally to the price and yield performance, before fees and expenses, of the Indxx SuperDividend® Alternatives Index (“Underlying Index”). The Fund is passively managed, which means the investment adviser does not attempt to take defensive positions in declining markets. The Fund generally seeks to fully replicate the Underlying Index.
The Underlying Index is comprised of securities that rank among the highest dividend-yielding securities in each eligible category of alternative income investments at the time of Underlying Index reconstitution, as defined by Indxx, LLC, the provider of the Underlying Index. Alternative income investments that are eligible for inclusion in the Underlying Index fall into one of four classes: Master Limited Partnerships (“MLPs”) and Infrastructure, Real Estate, Institutional Managers, and Fixed Income and Derivative Strategies. The MLPs and Infrastructure categories primarily consist of units of MLPs and shares of infrastructure companies. The Real Estate category provides exposure to global Real Estate Investment Trusts (“REITs”) and gains this exposure through investing directly in the Global X SuperDividend® REIT ETF. The Institutional Managers category primarily consists of shares of Business Development Companies (“BDCs”) and publicly listed private equity companies. The Fixed Income and Derivative Strategies category includes exposure to emerging market debt, mortgage and asset backed securities, and option-writing primarily through the purchase of publicly traded closed-end funds. Each of the Underlying Index components is selected from a universe of securities that are publicly traded in the United States. The Underlying Index assigns weights to each of the four categories in a method that seeks to equalize the volatility contribution of each category, which assigns less weight to higher volatility categories and more weight to lower volatility categories. The Underlying Index is reconstituted annually but may rebalance quarterly if any one category deviates more than 3% from its target weight.
For the 12-month period ended November 30, 2019 (the “reporting period”), the Fund increased 9.89%, while the Underlying Index increased 10.50%. The Fund had a net asset value of $14.52 per share on November 30, 2018 and ended the reporting period with a net asset value of $14.74 on November 30, 2019.
During the reporting period, the highest returns came from Buckeye Partners, L.P. and Entergy Corporation, which returned 47.51% and 38.67%, respectively. The worst performers were Alliance Resource Partners, L.P. and Enable Midstream Partners L.P., which returned -39.06% and -22.25%, respectively.
The Fund provides exposure to the highest yielding securities from various alternative income-generating asset classes, including REITs, MLPs and Infrastructure, BDCs, and Fixed Income and Derivative Strategies. The Federal Reserve reduced the interest rates over the reporting period, which helped the Fund’s strong performance. During the reporting period, the Fund had an average approximate exposure of 24% to REITs, 24% to BDCs, and 20% to MLPs and Infrastructure.
| | |
Management DISCUSSION OF FUND PERFORMANCE (unaudited) |
Global X SuperDividend® Alternatives ETF |
| | AVERAGE ANNUAL TOTAL RETURN FOR THE YEAR ENDED NOVEMBER 30, 2019 |
| | One Year Return | Three Year Return | Annualized Inception to Date* |
| | Net Asset Value | Market Price | Net Asset Value | Market Price | Net Asset Value | Market Price |
Global X SuperDividend® Alternatives ETF | 9.89% | 9.72% | 8.23% | 7.80% | 7.62% | 7.58% |
Indxx SuperDividend® Alternatives Index | 10.50% | 10.50% | 9.02% | 9.02% | 8.43% | 8.43% |
S&P 500® Index | 16.11% | 16.11% | 14.88% | 14.88% | 11.89% | 11.89% |
| | |
Management DISCUSSION OF FUND PERFORMANCE (unaudited) |
Global X SuperDividend® Alternatives ETF |
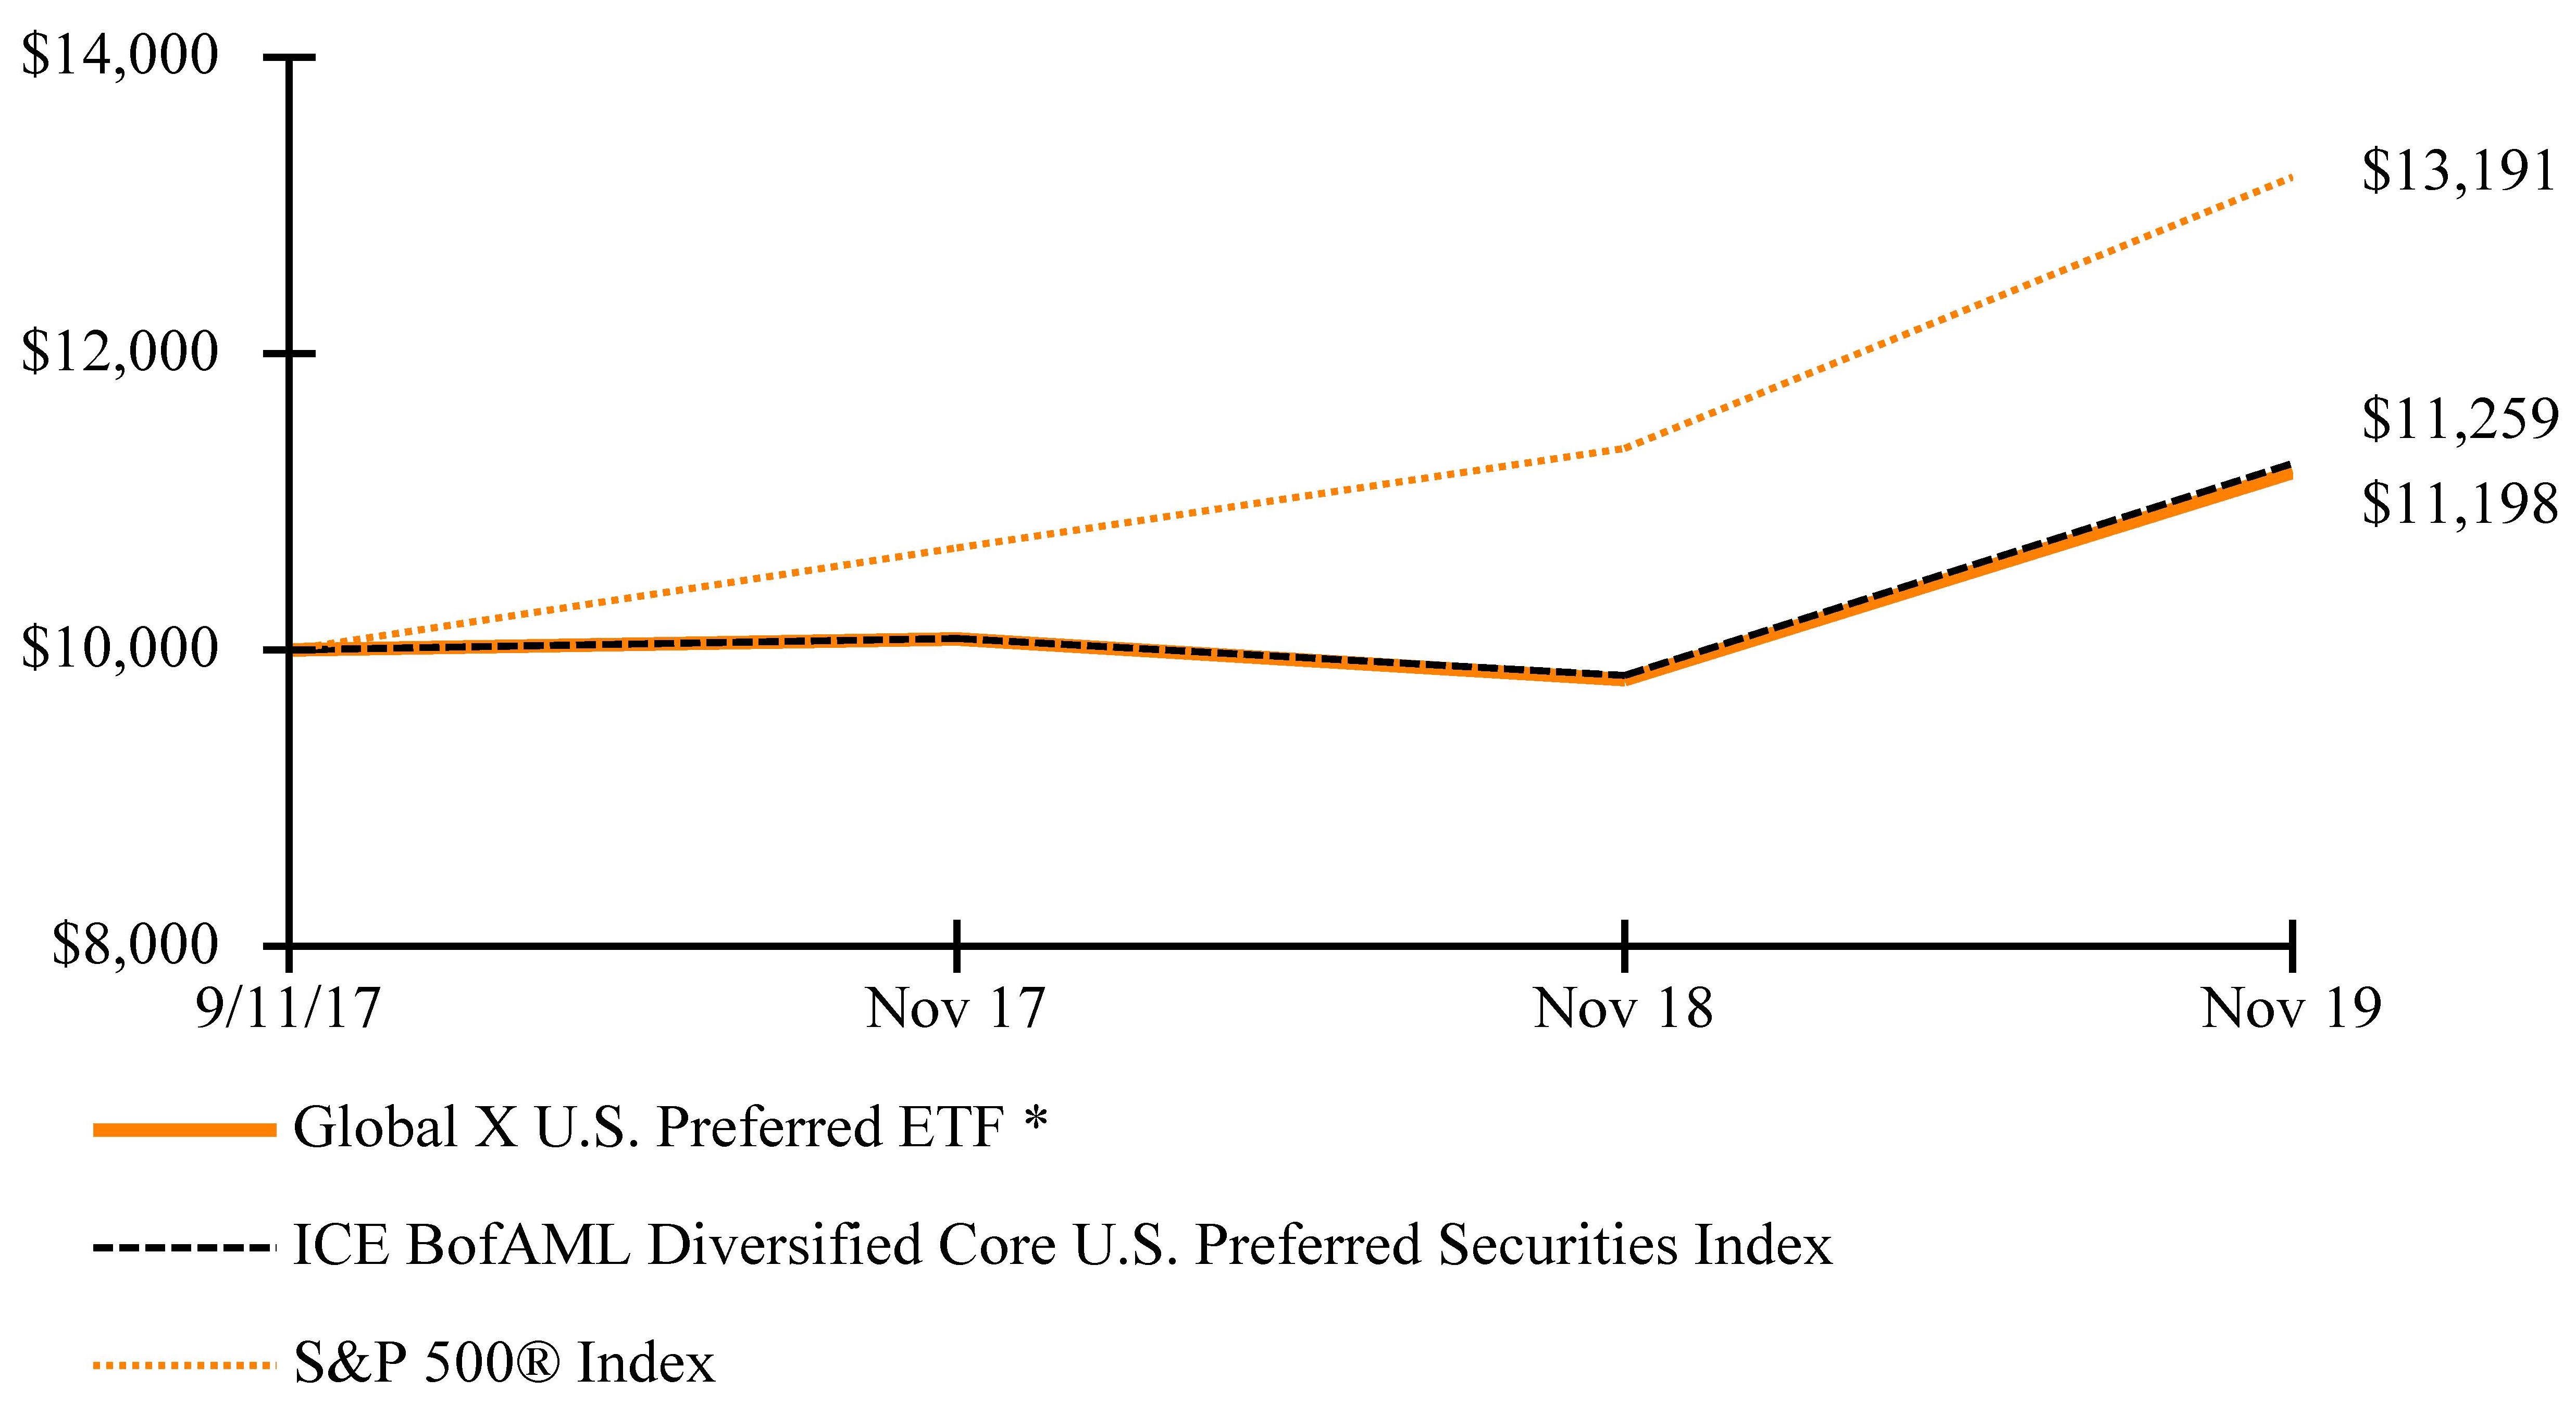
Growth of a $10,000 Investment
(at Net Asset Value)
* The Fund commenced investment operations on July 13, 2015.
The S&P 500® Index is a market capitalization weighted composite index of 500 large capitalization U.S. companies.
The Indxx SuperDividend® Alternatives Index is designed to track the performance of different Alternative asset classes, with an objective of providing a diversified portfolio of assets with a low volatility and high dividend yield.
The performance data quoted herein represents past performance and the return and value of an investment in the Fund will fluctuate so that, when sold, it may be worth less than its original cost. Past performance is no guarantee of future performance and should not be considered as a representation of the future results of the Fund. The Fund’s performance assumes the reinvestment of all dividends and all capital gains. Index returns assume reinvestment of dividends and, unlike the Fund’s returns, do not reflect any fees or expenses. If such fees and expenses were included in the index returns, the performance would have been lower. Please note that one cannot invest directly in an unmanaged index.
There are no assurances that the Fund will meet its stated objectives.
The Fund’s holdings and allocations are subject to change and should not be considered recommendations to buy individual securities.
Returns shown do not reflect the deduction of taxes that a shareholder would pay on Fund distributions or the redemption of Fund shares.
See definition of comparative indices on the previous page and above.
| | |
Management DISCUSSION OF FUND PERFORMANCE (unaudited) |
Global X S&P 500® Quality Dividend ETF |
Global X S&P 500® Quality Dividend ETF
The Global X S&P 500® Quality Dividend ETF (“Fund”) seeks to provide investment results that correspond generally to the price and yield performance, before fees and expenses, of the S&P 500® Quality High Dividend Index (“Underlying Index”). The Fund is passively managed, which means the investment adviser does not attempt to take defensive positions in declining markets. The Fund generally seeks to fully replicate the Underlying Index.
The Underlying Index is designed to provide exposure to U.S. equity securities included in the S&P 500® Index that exhibit high quality and dividend yield characteristics, as determined by Standard & Poor’s Financial Services LLC, the provider of the Underlying Index.
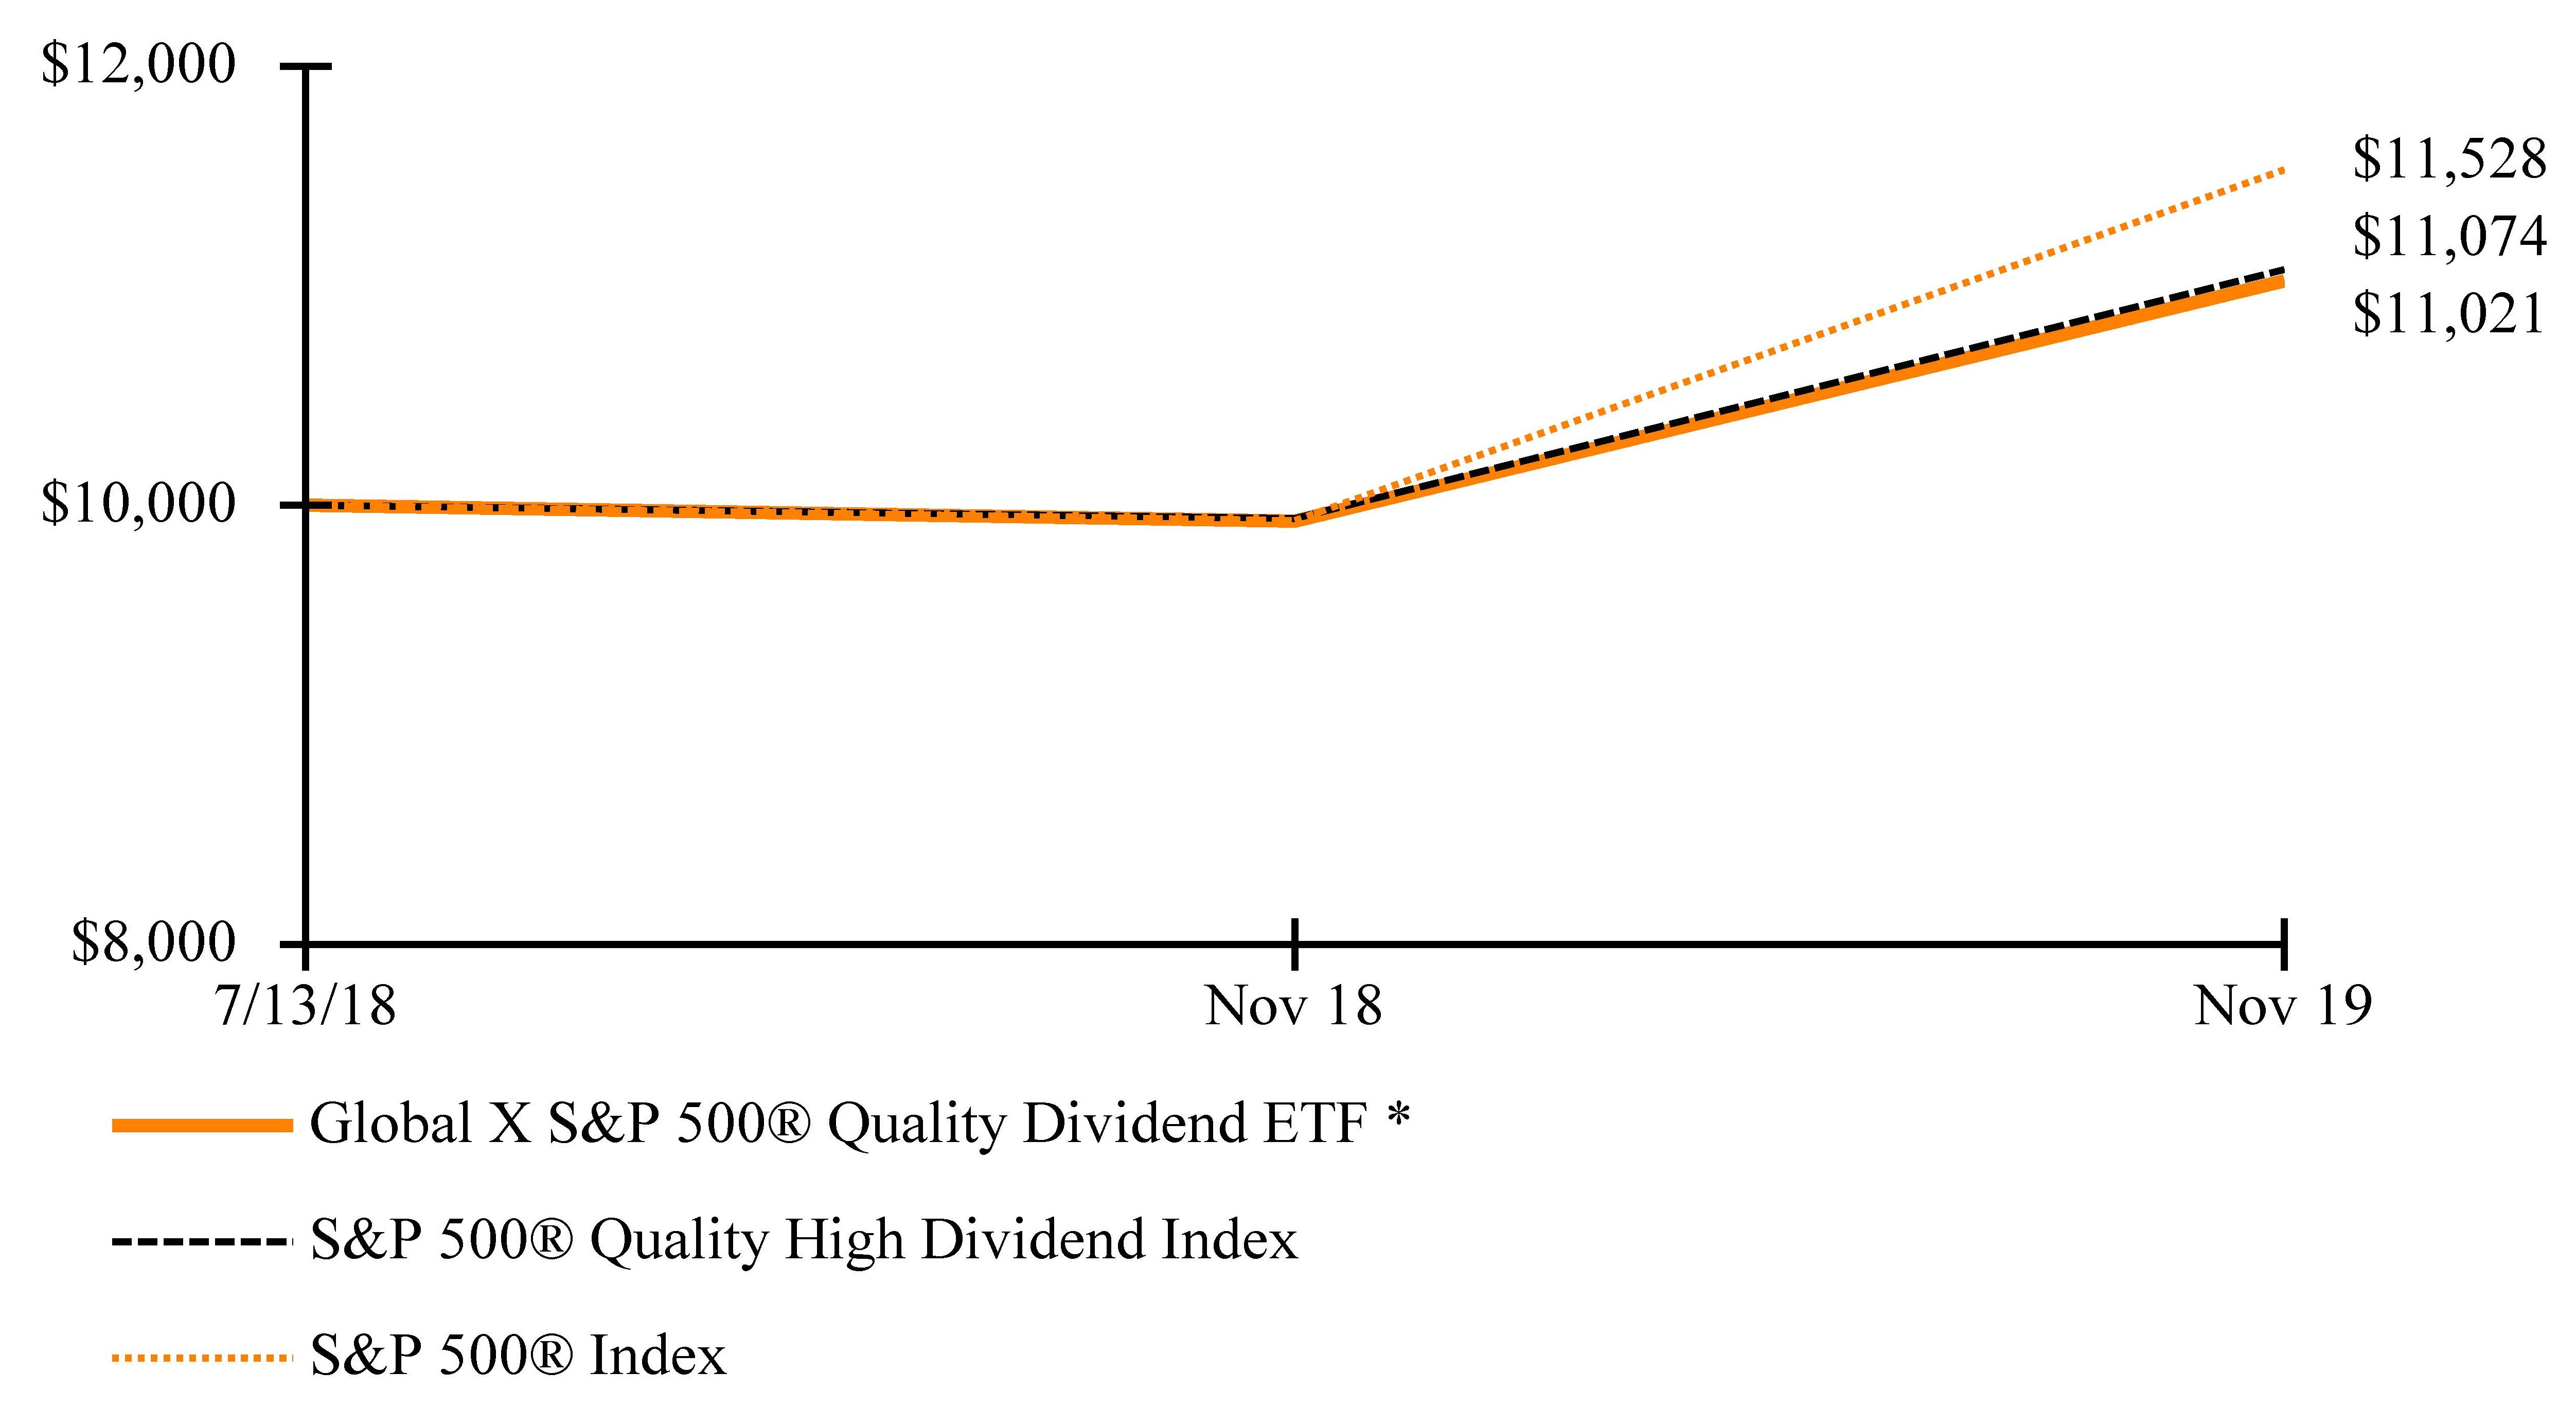
For the 12-month period ended November 30, 2019 (the “reporting period”), the Fund increased 11.01%, while the Underlying Index increased 11.40%. The Fund had a net asset value of $24.60 per share on November 30, 2018 and ended the reporting period with a net asset value of $26.51 on November 30, 2019.
During the reporting period, the highest returns came from Lam Research Corporation and Target Corporation, which returned 113.40% and 81.76%, respectively. The worst performers were Occidental Petroleum Corporation and Nordstrom, Inc., which returned -41.86% and -35.54%, respectively.
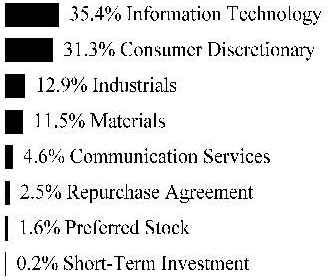
The Fund invests in companies that score in the top 200 of the S&P 500® Index based on a variety of quality metrics, including return-on-equity, accruals, financial leverage, and dividend yield. During the reporting period, the Fund benefited from the low interest rate environment, which helped the Fund to experience strong double-digit growth. However, the Fund underperformed the broad index due to its low exposure to low-yielding growth sectors, Information Technology, and Communication Services. Among the sectors, the Fund had an approximate average exposure of 17% to Consumer Discretionary, 16% to Information Technology, 13% to Financial Services, and 11% to Energy.
| | AVERAGE ANNUAL TOTAL RETURN FOR THE YEAR ENDED NOVEMBER 30, 2019 |
| | One Year Return | Annualized Inception to Date* |
| | Net Asset Value | Market Price | Net Asset Value | Market Price |
Global X S&P 500® Quality Dividend ETF | 11.01% | 11.19% | 7.29% | 7.35% |
S&P 500® Quality High Dividend Index | 11.40% | 11.40% | 7.65% | 7.65% |
S&P 500® Index | 16.11% | 16.11% | 10.83% | 10.83% |
| | |
Management DISCUSSION OF FUND PERFORMANCE (unaudited) |
Global X S&P 500® Quality Dividend ETF |
Growth of a $10,000 Investment
(at Net Asset Value)
* The Fund commenced investment operations on July 13, 2018.
The S&P 500® Index is a market capitalization weighted composite index of 500 large capitalization U.S. companies.
The S&P 500® Quality High Dividend Index measures the performance of S&P 500® stocks that exhibit both high quality and high dividend yield characteristics.
The performance data quoted herein represents past performance and the return and value of an investment in the Fund will fluctuate so that, when sold, it may be worth less than its original cost. Past performance is no guarantee of future performance and should not be considered as a representation of the future results of the Fund. The Fund’s performance assumes the reinvestment of all dividends and all capital gains. Index returns assume reinvestment of dividends and, unlike the Fund’s returns, do not reflect any fees or expenses. If such fees and expenses were included in the index returns, the performance would have been lower. Please note that one cannot invest directly in an unmanaged index.
There are no assurances that the Fund will meet its stated objectives.
The Fund’s holdings and allocations are subject to change and should not be considered recommendations to buy individual securities.
Returns shown do not reflect the deduction of taxes that a shareholder would pay on Fund distributions or the redemption of Fund shares.
See definition of comparative indices on the previous page and above.
| | |
Management DISCUSSION OF FUND PERFORMANCE (unaudited) |
Global X TargetIncomeTM 5 ETF |
Global X TargetIncomeTM 5 ETF
The Global X TargetIncomeTM 5 ETF (“Fund”) seeks to provide investment results that correspond generally to the price and yield performance, before fees and expenses, of the Wilshire TargetIncome 5% Plus Index℠ (“Underlying Index”). The Fund is passively managed, which means the investment adviser does not attempt to take defensive positions in declining markets. The Fund uses a representative sampling strategy with respect to the Underlying Index.
The Underlying Index seeks to provide broad exposure to income-producing asset classes using a portfolio of exchange-traded funds (each an “Underlying ETF”), with the goal, but not the guarantee, of providing exposure that may be sufficient to support an annualized yield of five percent (5.0%) for the Fund, net of fees. The Underlying Index targets an annualized yield that is somewhat higher than 5% (“5% Plus”), which is intended to provide the Fund with the ability to achieve the 5% target, net of fees. The Underlying Index allocates index weights among the Underlying ETFs based on a methodology developed by Wilshire Associates, the provider of the Underlying Index, which is designed to achieve the target income objective while also utilizing an optimization approach that seeks to minimize the overall risk of the portfolio.
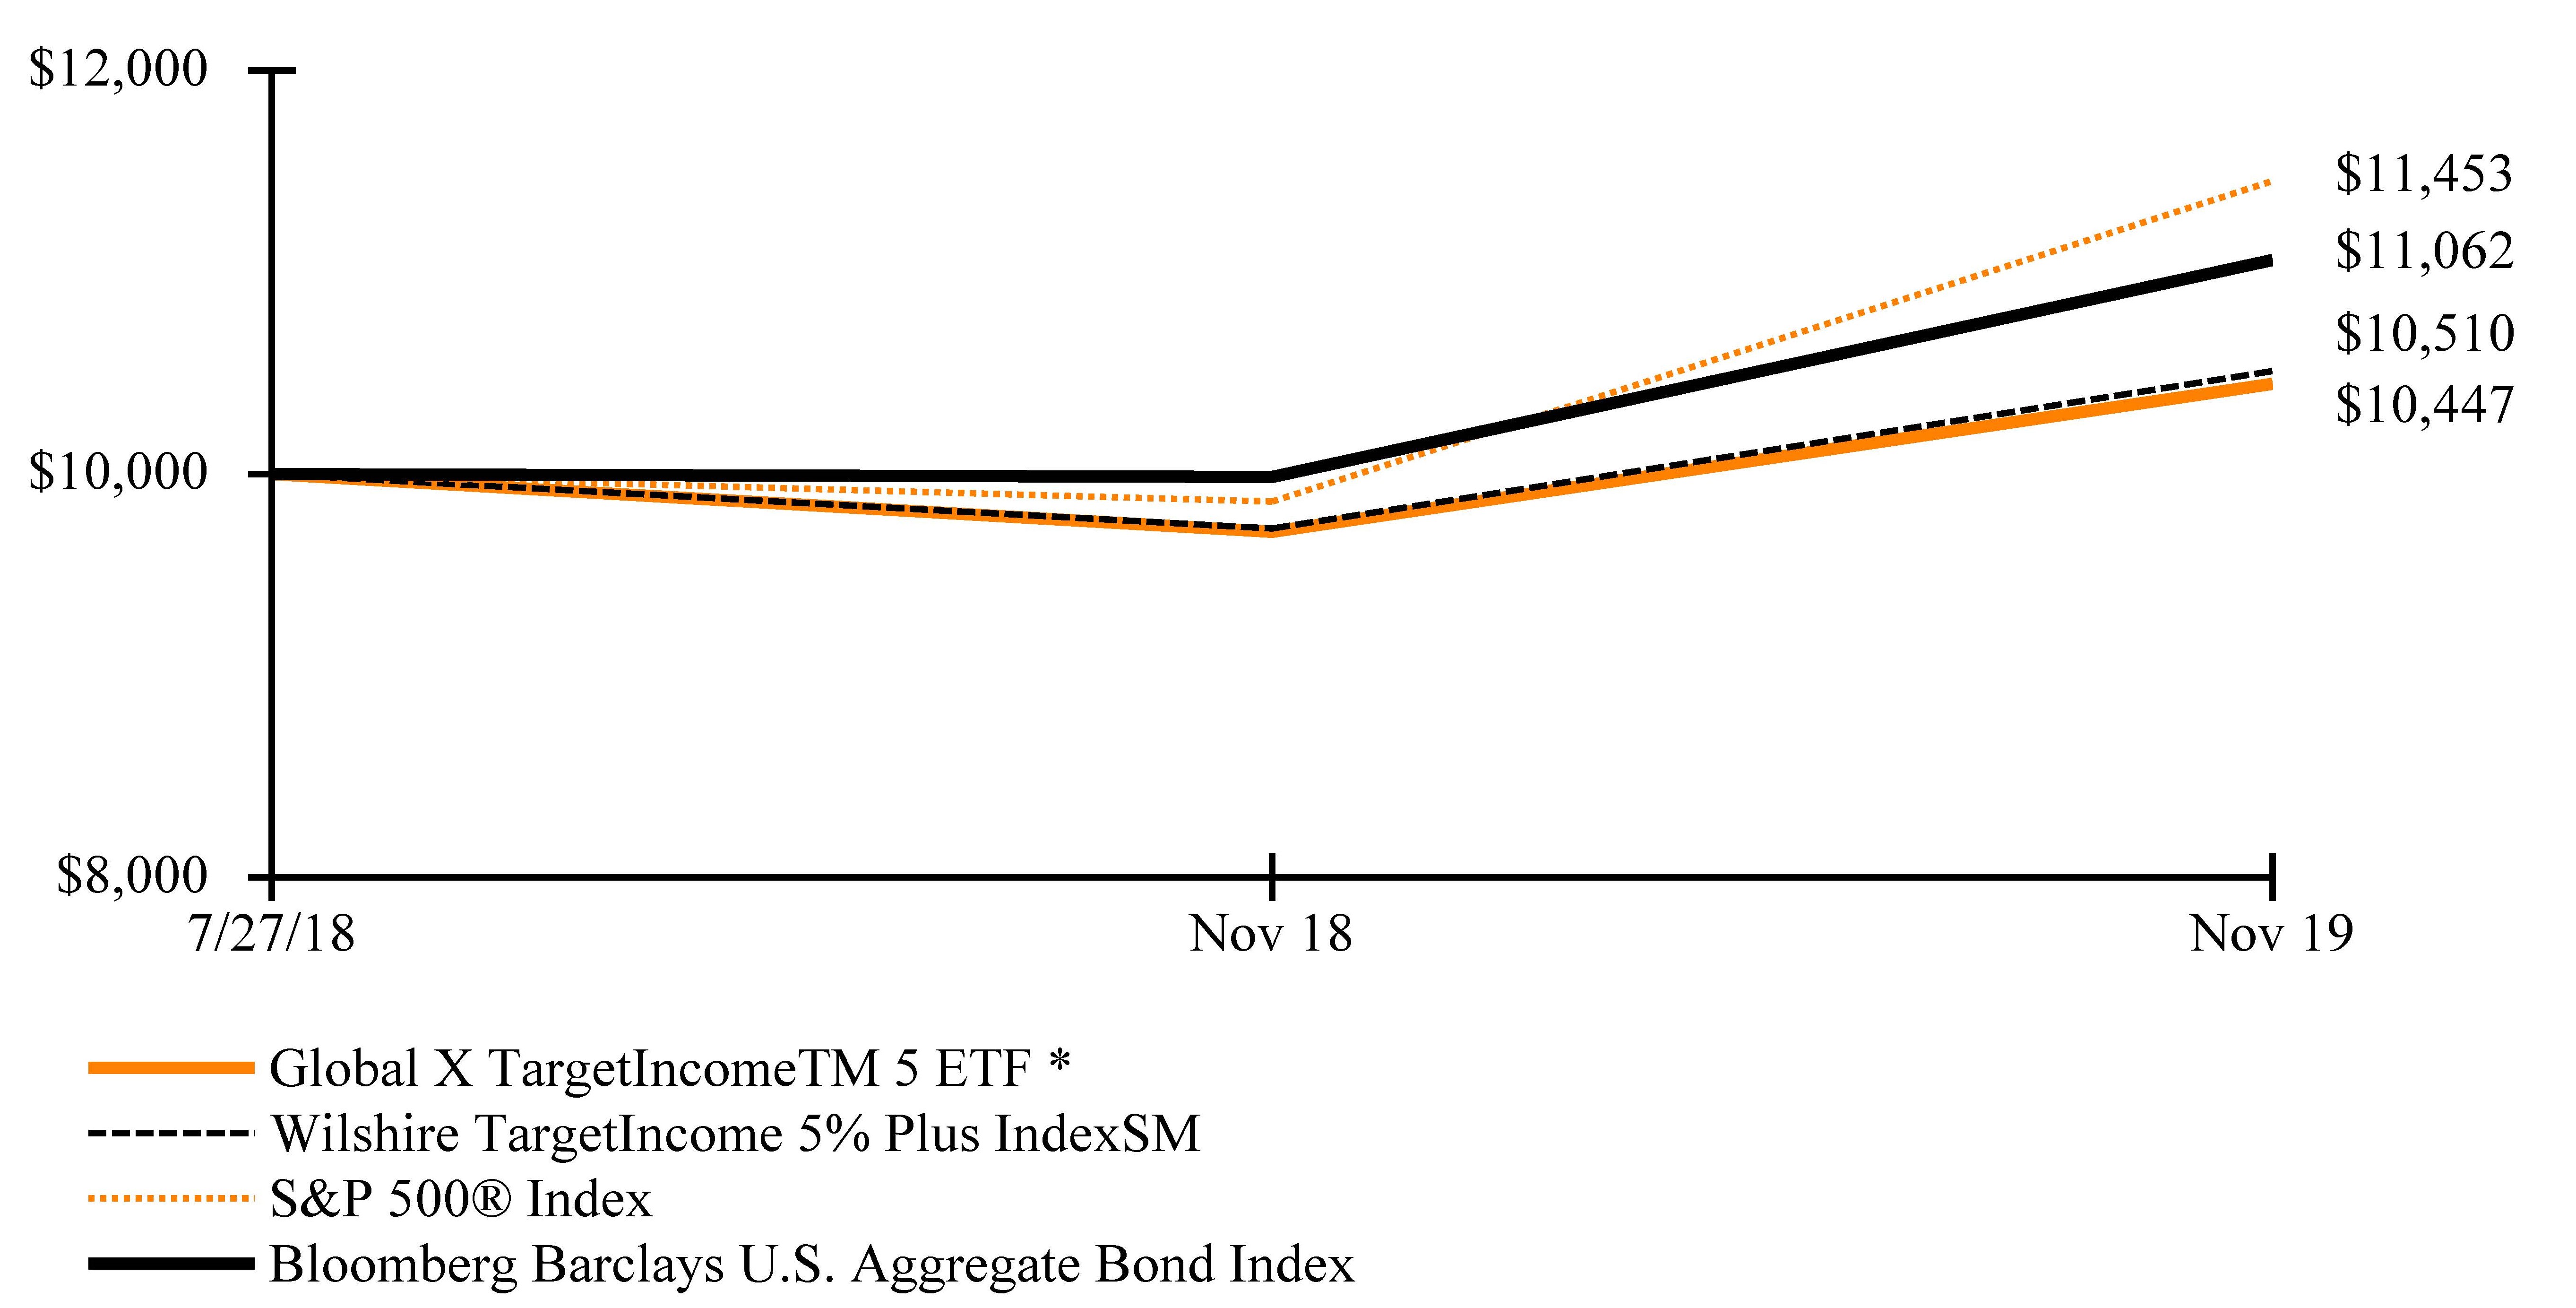
For the 12-month period ended November 30, 2019 (the “reporting period”), the Fund increased 7.54%, while the Underlying Index increased 8.02%. The Fund had a net asset value of $23.95 per share on November 30, 2018 and ended the reporting period with a net asset value of $24.23 on November 30, 2019.
During the reporting period, the highest returns came from Global X U.S. Preferred ETF and iShares 20+ Year Treasury Bond ETF, which returned 14.52% and 12.79%, respectively. The worst performer was Global X Superdividend ETF, which returned -2.04%.
The Fund had strong performance during the reporting period, as it had exposure to both equities and bonds. Equities and bonds made a comeback due to loose monetary policy, ease in trade tensions, strong earnings, and contracting global uncertainties. During the reporting period, the Fund had an average exposure of 20% to Preferred Securities, 19% to High Yield Bonds, 17% to Emerging Market Bonds, and 16% to Senior Loans.
| | AVERAGE ANNUAL TOTAL RETURN FOR THE YEAR ENDED NOVEMBER 30, 2019 |
| | One Year Return | Annualized Inception to Date* |
| | Net Asset Value | Market Price | Net Asset Value | Market Price |
Global X TargetIncomeTM 5 ETF | 7.54% | 7.58% | 3.31% | 3.40% |
Wilshire TargetIncome 5% Plus IndexSM | 8.02% | 8.02% | 3.77% | 3.77% |
S&P 500® Index | 16.11% | 16.11% | 10.61% | 10.61% |
| Bloomberg Barclays U.S. Aggregate Bond Index | 10.79% | 10.79% | 7.79% | 7.79% |
| | |
Management DISCUSSION OF FUND PERFORMANCE (unaudited) |
Global X TargetIncomeTM 5 ETF |
Growth of a $10,000 Investment
(at Net Asset Value)
* The Fund commenced investment operations on July 27, 2018.
The Wilshire TargetIncome 5% Plus IndexSM measures an investment strategy that provides broad exposure to income-producing asset classes, using a universe of exchange-traded funds (ETFs) with the goal of achieving an annualized target income yield in excess of 5%.
The S&P 500® Index is a market capitalization weighted composite index of 500 large capitalization U.S. companies.
The Bloomberg Barclays U.S. Aggregate Bond Index is a broad-based flagship benchmark that measures the investment grade, US dollar-denominated, fixed-rate taxable bond market.
The performance data quoted herein represents past performance and the return and value of an investment in the Fund will fluctuate so that, when sold, it may be worth less than its original cost. Past performance is no guarantee of future performance and should not be considered as a representation of the future results of the Fund. The Fund’s performance assumes the reinvestment of all dividends and all capital gains. Index returns assume reinvestment of dividends and, unlike the Fund’s returns, do not reflect any fees or expenses. If such fees and expenses were included in the index returns, the performance would have been lower. Please note that one cannot invest directly in an unmanaged index.
There are no assurances that the Fund will meet its stated objectives.
The Fund’s holdings and allocations are subject to change and should not be considered recommendations to buy individual securities.
Returns shown do not reflect the deduction of taxes that a shareholder would pay on Fund distributions or the redemption of Fund shares.
See definition of comparative indices above and on the previous page.
| | |
Management DISCUSSION OF FUND PERFORMANCE (unaudited) |
Global X TargetIncomeTM Plus 2 ETF |
Global X TargetIncomeTM Plus 2 ETF
The Global X TargetIncomeTM Plus 2 ETF (“Fund”) seeks to provide investment results that correspond generally to the price and yield performance, before fees and expenses, of the Wilshire TargetIncome 10-Year Treasury +2% Plus Index℠ (“Underlying Index”). The Fund is passively managed, which means the investment adviser does not attempt to take defensive positions in declining markets. The Fund uses a representative sampling strategy with respect to the Underlying Index.
The Underlying Index seeks to provide broad exposure to income-producing asset classes using a portfolio of exchange-traded funds (each an “Underlying ETF”), with the goal, but not the guarantee, of providing exposure that may be sufficient to support an annualized yield of the U.S. 10-Year Treasury yield plus two percent (2.0%) for the Fund, net of fees. The Underlying Index targets an annualized yield that is somewhat higher than the US 10-Year Treasury yield plus 2% (“US 10-Year Treasury +2% Plus”), which is intended to provide the Fund with the ability to achieve the US 10-Year Treasury yield plus 2% target, net of fees. The Underlying Index allocates index weights among the Underlying ETFs based on a methodology developed by Wilshire Associates, the provider of the Underlying Index, which is designed to achieve the target income objective while also utilizing an optimization approach that seeks to minimize the overall risk of the portfolio.
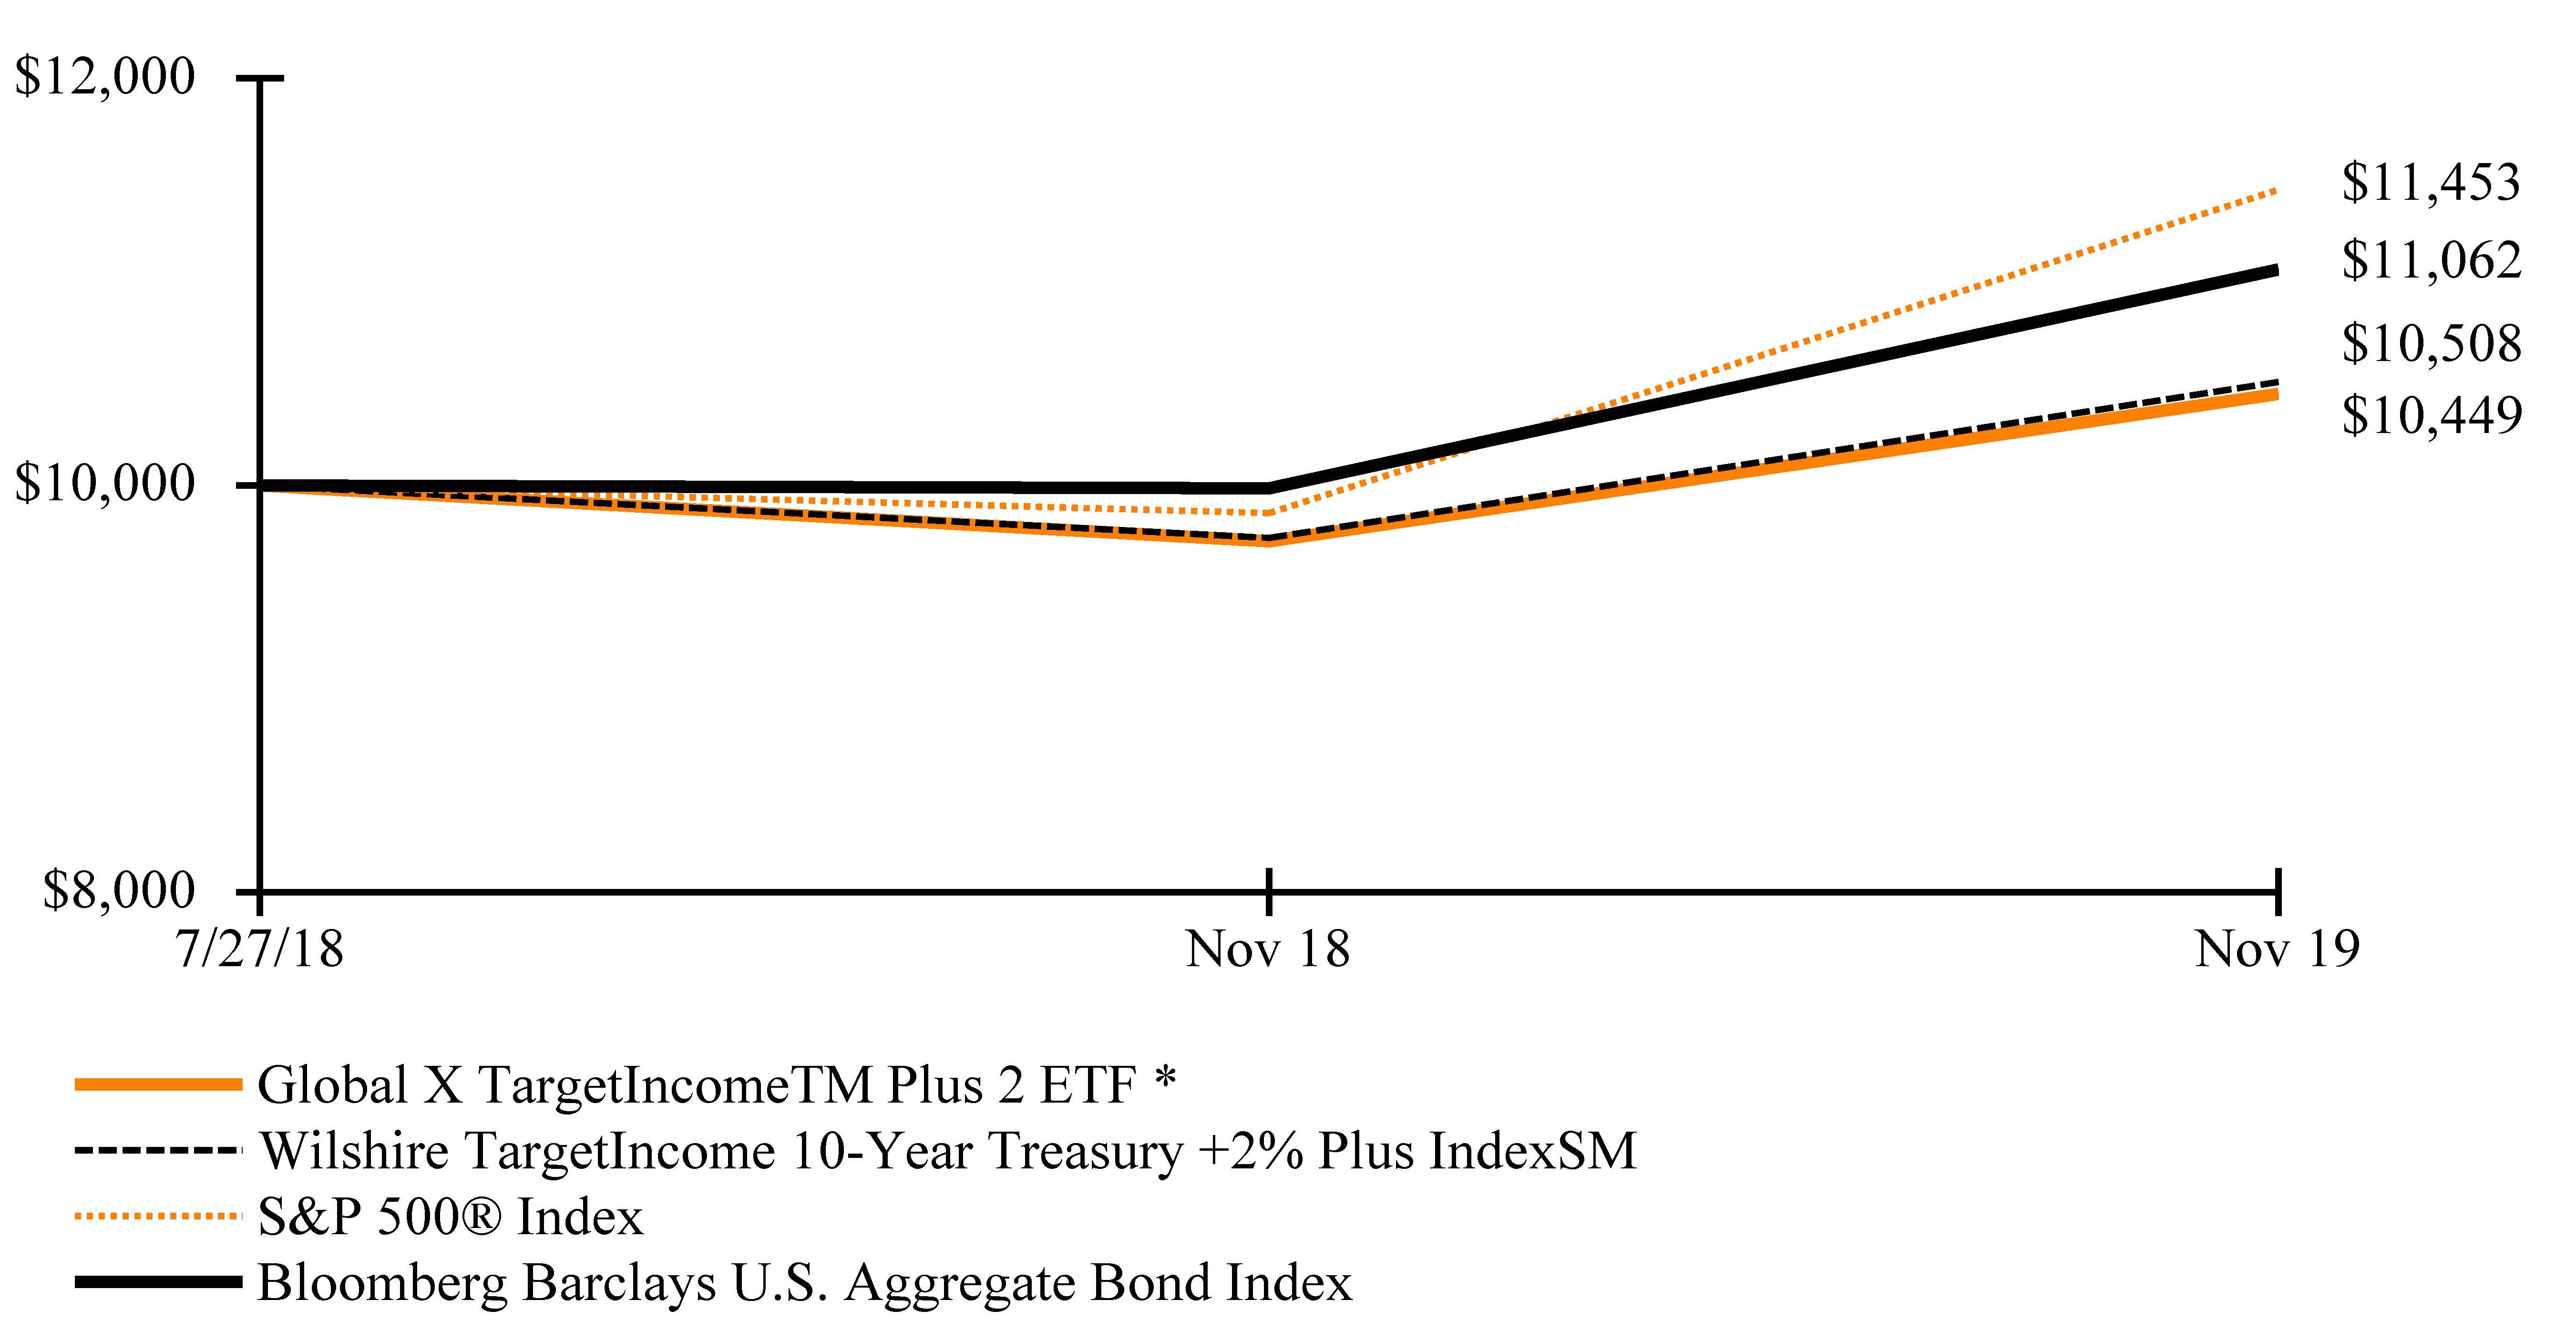
For the 12-month period ended November 30, 2019 (the “reporting period”), the Fund increased 7.44%, while the Underlying Index increased 7.87%. The Fund had a net asset value of $23.98 per share on November 30, 2018 and ended the reporting period with a net asset value of $24.37 on November 30, 2019.
During the reporting period, the highest returns came from iShares 20+ Year Treasury Bond ETF and Global X U.S. Preferred ETF, which returned 14.53% and 14.52%, respectively. The worst performers were Global X Superdividend® ETF and Global X SuperDividend® U.S. ETF, which returned -4.57% and -0.41%, respectively.
The Fund had strong performance during the reporting period as it had exposure to both equities and bonds. Equities and bonds made a comeback due to loose monetary policy, ease in trade tensions, strong earnings, and contracting global uncertainties. During the reporting period, the Fund had an average exposure of 20% to High Yield Bonds, 20% to Preferred Securities, and 18% to Senior Loans.
| | AVERAGE ANNUAL TOTAL RETURN FOR THE YEAR ENDED NOVEMBER 30, 2019 |
| | One Year Return | Annualized Inception to Date* |
| | Net Asset Value | Market Price | Net Asset Value | Market Price |
Global X TargetIncomeTM Plus 2 ETF | 7.44% | 7.48% | 3.32% | 3.42% |
Wilshire TargetIncome 10-Year Treasury +2% Plus IndexSM | 7.87% | 7.87% | 3.76% | 3.76% |
S&P 500® Index | 16.11% | 16.11% | 10.61% | 10.61% |
| Bloomberg Barclays U.S. Aggregate Bond Index | 10.79% | 10.79% | 7.79% | 7.79% |
| | |
Management DISCUSSION OF FUND PERFORMANCE (unaudited) |
Global X TargetIncomeTM Plus 2 ETF |
Growth of a $10,000 Investment
(at Net Asset Value)
* The Fund commenced investment operations on July 27, 2018.
The S&P 500® Index is a market capitalization weighted composite index of 500 large capitalization U.S. companies.
The Wilshire TargetIncome 10-Year Treasury +2% Plus IndexSM measures an investment strategy that provides broad exposure to income-producing asset classes, using a universe of exchange-traded funds (ETFs) with the goal of achieving an annualized target income yield in excess of the U.S. 10-Year Treasury plus 2% (U.S. 10-Year Treasury +2% Plus).
The Bloomberg Barclays U.S. Aggregate Bond Index is a broad-based flagship benchmark that measures the investment grade, US dollar-denominated, fixed-rate taxable bond market.
The performance data quoted herein represents past performance and the return and value of an investment in the Fund will fluctuate so that, when sold, it may be worth less than its original cost. Past performance is no guarantee of future performance and should not be considered as a representation of the future results of the Fund. The Fund’s performance assumes the reinvestment of all dividends and all capital gains. Index returns assume reinvestment of dividends and, unlike the Fund’s returns, do not reflect any fees or expenses. If such fees and expenses were included in the index returns, the performance would have been lower. Please note that one cannot invest directly in an unmanaged index.
There are no assurances that the Fund will meet its stated objectives.
The Fund’s holdings and allocations are subject to change and should not be considered recommendations to buy individual securities.
Returns shown do not reflect the deduction of taxes that a shareholder would pay on Fund distributions or the redemption of Fund shares.
See definition of comparative indices above and on the previous page.
| | |
Management DISCUSSION OF FUND PERFORMANCE (unaudited) |
Global X Adaptive U.S. Factor ETF |
Global X Adaptive U.S. Factor ETF
The Global X Adaptive U.S. Factor ETF (“Fund”) seeks to provide investment results that correspond generally to the price and yield performance, before fees and expenses, of the Adaptive Wealth Strategies U.S. Factor Index (“Underlying Index”). The Fund is passively managed, which means the investment adviser does not attempt to take defensive positions in declining markets. The Fund generally seeks to fully replicate the Underlying Index.
The Underlying Index is designed to dynamically allocate across three sub-indices that provide exposure to U.S. Equities that exhibit characteristics of one of three primary factors: value, momentum and low volatility. Each factor is represented by a sub-index that is derived from the Solactive U.S. Large & Mid Cap Index, which is designed to measure the 1,000 largest companies, by free float market capitalization, that are exchange-listed in the United States.
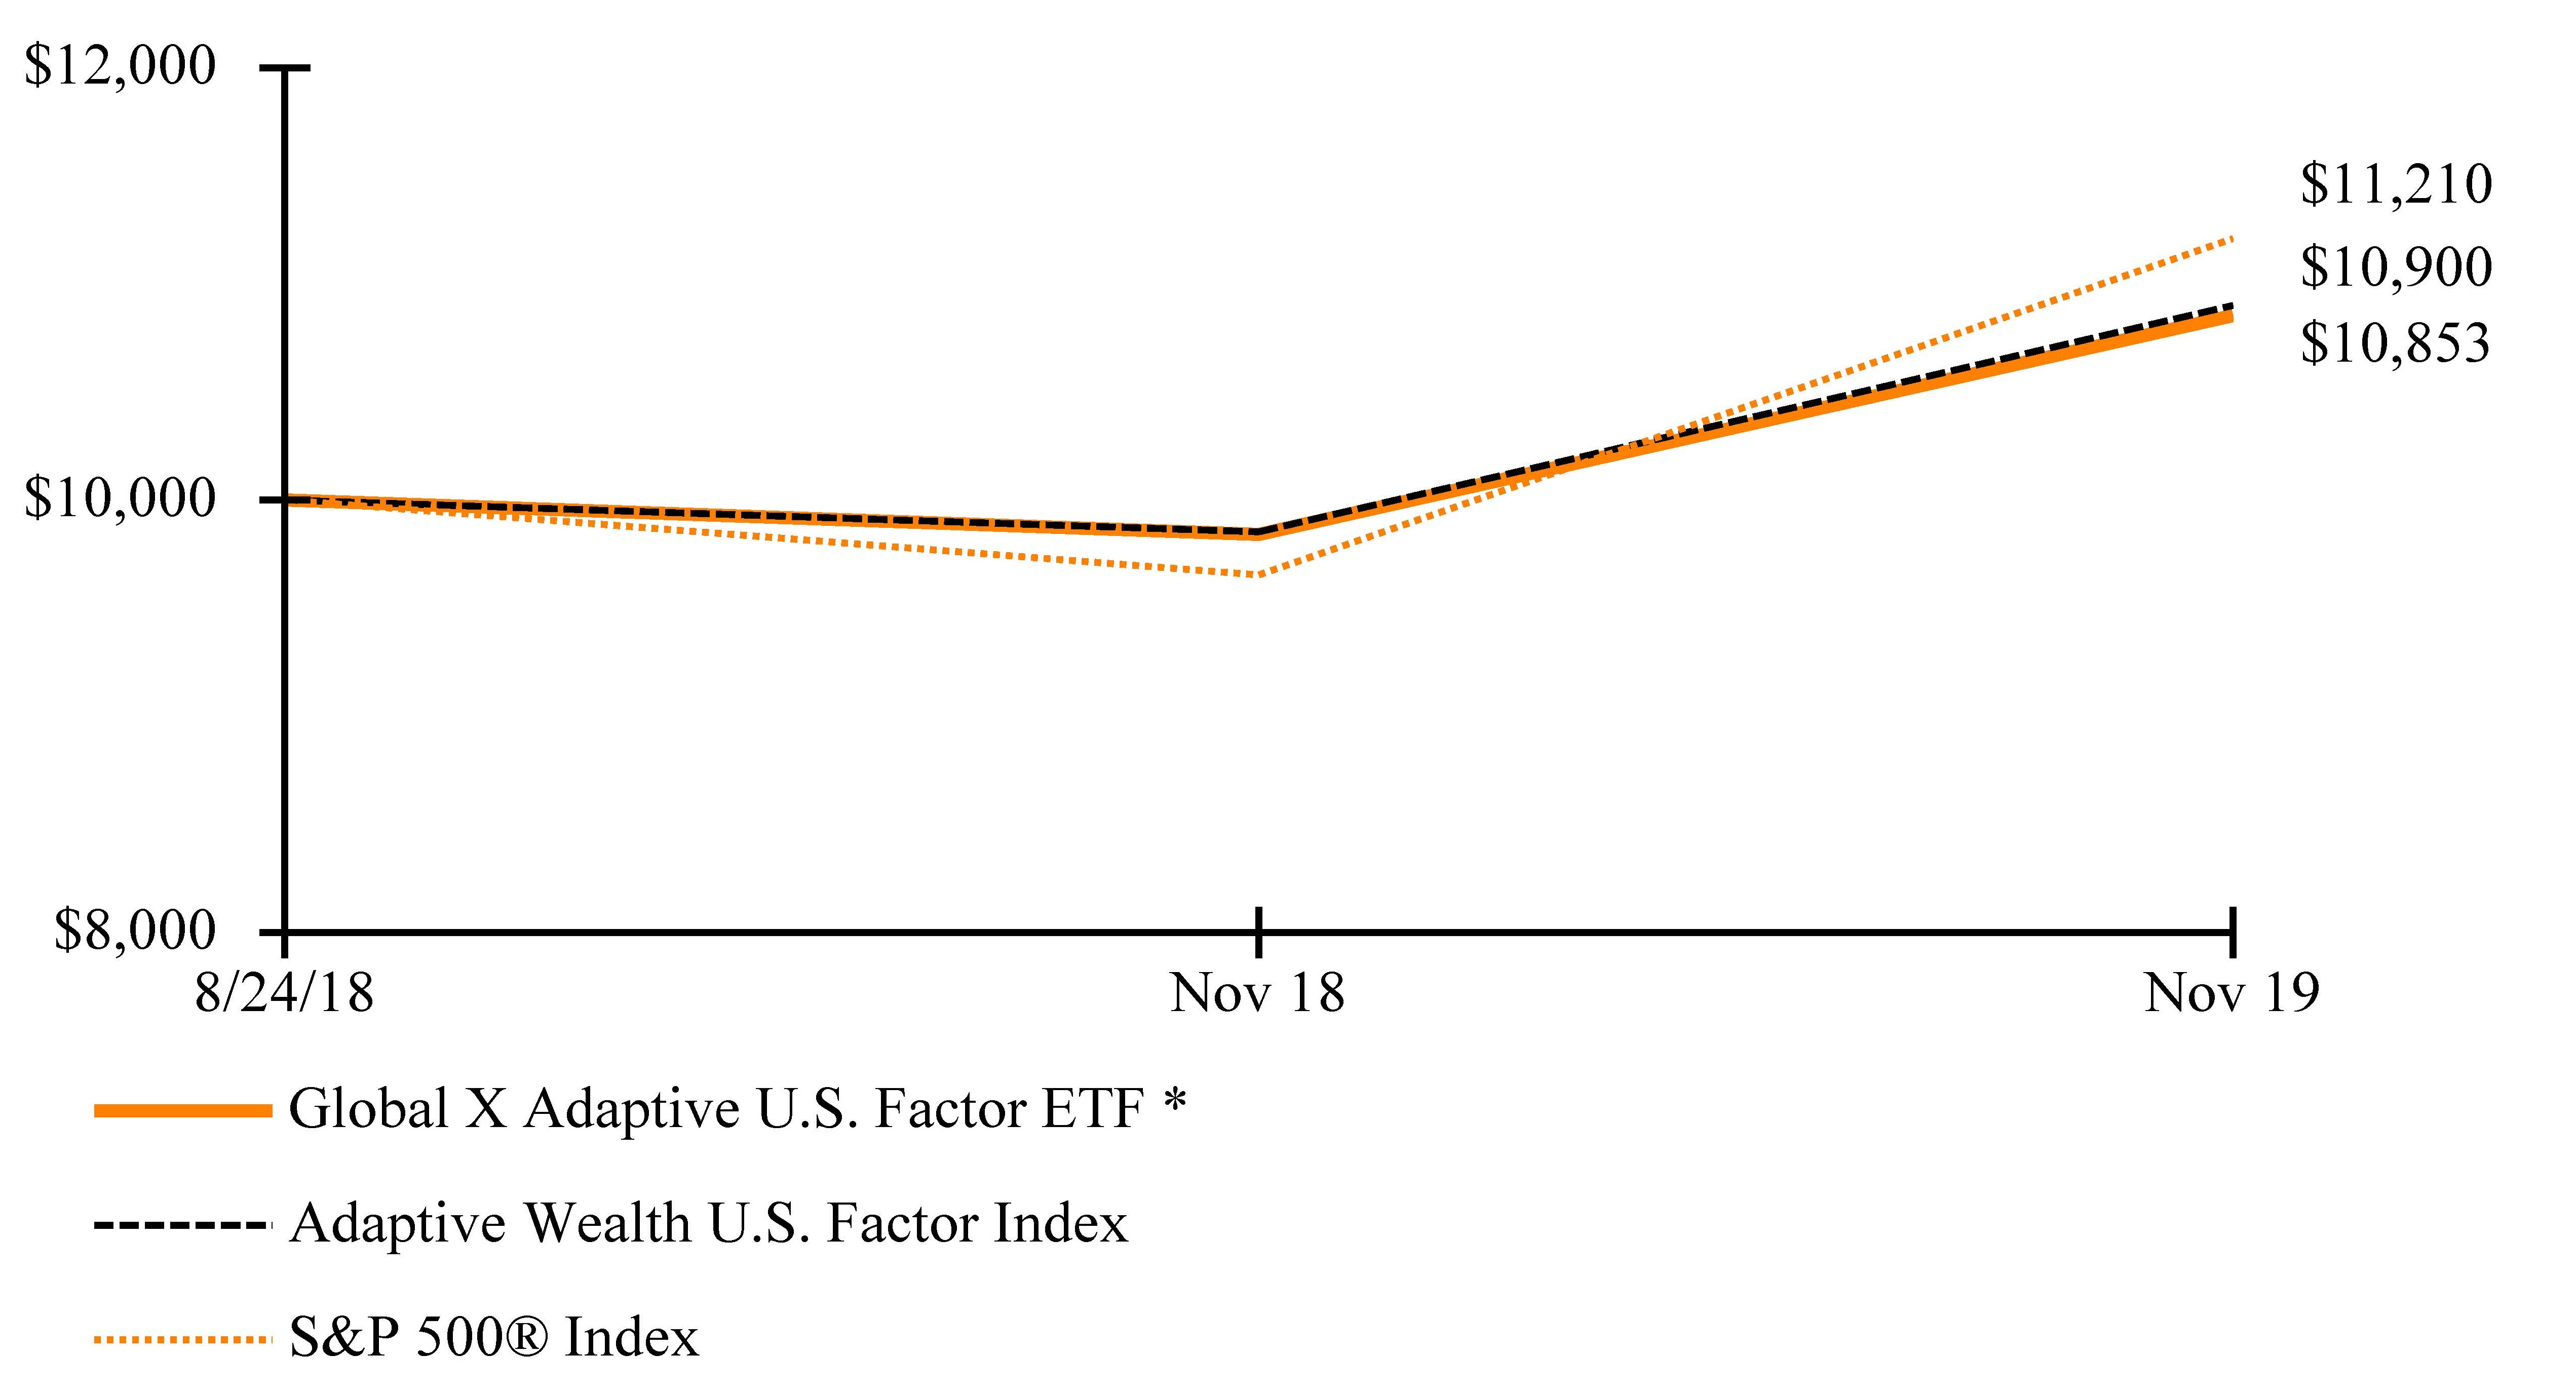
For the 12-month period ended November 30, 2019 (the “reporting period”), the Fund increased 10.27%, while the Underlying Index increased 10.65%. The Fund had a net asset value of $24.39 per share on November 30, 2018 and ended the reporting period with a net asset value of $25.79 on November 30, 2019.
During the reporting period, the highest returns came from Arrowhead Pharmaceuticals, Inc. and Sun Communities, Inc., which returned 86.16% and 62.11%, respectively. The worst performers were Peabody Energy Corporation and Macy’s Inc., which returned -58.99% and -52.12%, respectively.
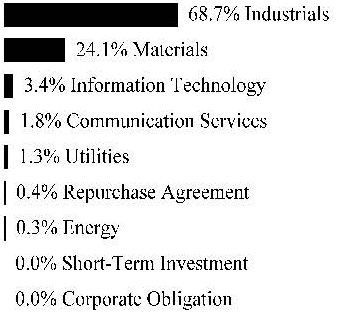
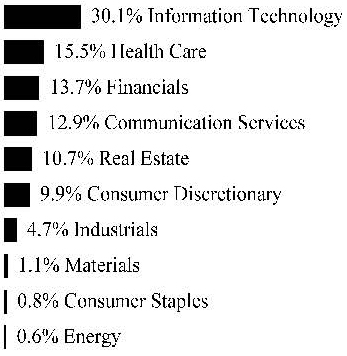
The Fund employs a dynamic multifactor investment strategy that allocates across three factors: value, momentum and low volatility. The index methodology allocates weight to the three sub-indices based on the relative performance of each sub-index since the last rebalance of the Underlying Index. During the reporting period, the Fund had an average sector approximate allocation of 32% to Financial Services, 11% to Real Estate, and 10% to Consumer Staples. Given that the Fund invests in United States equities, the Fund’s performance benefitted from a broad market rally across United States stocks during the reporting period, but experienced minor underperformance relative to the S&P 500® Index due to the lagging returns of the value sub-index.
| | AVERAGE ANNUAL TOTAL RETURN FOR THE YEAR ENDED NOVEMBER 30, 2019 |
| | One Year Return | Annualized Inception to Date* |
| | Net Asset Value | Market Price | Net Asset Value | Market Price |
| Global X Adaptive U.S. Factor ETF | 10.27% | 10.30% | 6.66% | 6.76% |
| Adaptive Wealth U.S. Factor Index | 10.65% | 10.65% | 7.04% | 7.04% |
S&P 500® Index | 16.11% | 16.11% | 9.42% | 9.42% |
| | |
Management DISCUSSION OF FUND PERFORMANCE (unaudited) |
Global X Adaptive U.S. Factor ETF |
Growth of a $10,000 Investment
(at Net Asset Value)
* The Fund commenced investment operations on August 24, 2018.
The S&P 500® Index is a market capitalization weighted composite index of 500 large capitalization U.S. companies.
The Adaptive Wealth Strategy U.S. Factor Index employs a reversion to the mean process to dictate which investment theme to own at any given time.
The performance data quoted herein represents past performance and the return and value of an investment in the Fund will fluctuate so that, when sold, it may be worth less than its original cost. Past performance is no guarantee of future performance and should not be considered as a representation of the future results of the Fund. The Fund’s performance assumes the reinvestment of all dividends and all capital gains. Index returns assume reinvestment of dividends and, unlike the Fund’s returns, do not reflect any fees or expenses. If such fees and expenses were included in the index returns, the performance would have been lower. Please note that one cannot invest directly in an unmanaged index.
There are no assurances that the Fund will meet its stated objectives.
The Fund’s holdings and allocations are subject to change and should not be considered recommendations to buy individual securities.
Returns shown do not reflect the deduction of taxes that a shareholder would pay on Fund distributions or the redemption of Fund shares.
See definition of comparative indices on the previous page and above.
| | |
| Schedule of Investments |
| November 30, 2019 |
Global X MLP & Energy Infrastructure ETF |
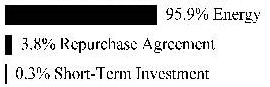
Sector Weightings (Unaudited)†:
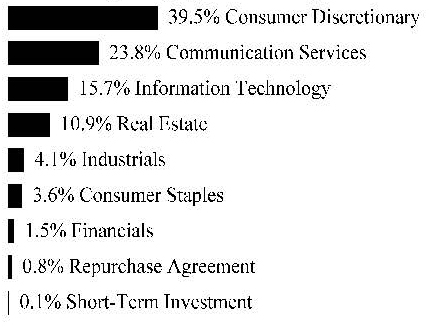
† Sector weightings percentages are based on the total market value of investments. Repurchase agreements purchased from cash collateral received for securities lending activity are included in total investments. Please see Notes 2 and 7 in Notes to Financial Statements for more detailed information.
| | | Shares | | | Value | |
| COMMON STOCK — 75.6% | | | | | | |
| Energy — 75.6% | | | | | | |
Antero Midstream (A) | | | 2,701,571 | | | $ | 12,373,195 | |
Archrock | | | 1,412,337 | | | | 11,877,754 | |
Cheniere Energy * | | | 458,526 | | | | 27,759,164 | |
Enbridge^ | | | 1,451,503 | | | | 55,157,114 | |
EnLink Midstream (A) | | | 2,433,171 | | | | 11,557,562 | |
Equitrans Midstream | | | 1,917,311 | | | | 19,115,591 | |
Kinder Morgan | | | 2,762,482 | | | | 54,172,272 | |
ONEOK | | | 707,163 | | | | 50,243,931 | |
Pembina Pipeline (A) | | | 1,130,080 | | | | 39,552,800 | |
Plains GP Holdings, Cl A | | | 1,585,411 | | | | 27,697,130 | |
Tallgrass Energy, Cl A | | | 1,416,897 | | | | 25,376,625 | |
Targa Resources | | | 732,923 | | | | 26,773,677 | |
TC Energy | | | 1,102,518 | | | | 56,151,242 | |
Williams | | | 1,983,633 | | | | 45,068,142 | |
| TOTAL COMMON STOCK | | | | | | | | |
(Cost $521,147,823) | | | | | | | 462,876,199 | |
| | | | | | | | | |
| MASTER LIMITED PARTNERSHIPS — 24.3% | | | | | | | | |
| Energy — 24.3% | | | | | | | | |
Cheniere Energy Partners | | | 66,262 | | | | 2,575,604 | |
Crestwood Equity Partners | | | 80,635 | | | | 2,557,742 | |
DCP Midstream | | | 125,523 | | | | 2,649,790 | |
Enable Midstream Partners | | | 142,832 | | | | 1,312,626 | |
Energy Transfer | | | 2,517,559 | | | | 29,732,372 | |
| | | Shares/Face Amount | | | Value | |
| MASTER LIMITED PARTNERSHIPS — continued | | | | | | |
| Energy — continued | | | | | | |
Enterprise Products Partners | | | 1,059,747 | | | $ | 27,892,541 | |
EQM Midstream Partners | | | 135,281 | | | | 3,134,461 | |
Genesis Energy | | | 178,407 | | | | 3,391,517 | |
Holly Energy Partners | | | 73,691 | | | | 1,647,731 | |
Magellan Midstream Partners | | | 374,034 | | | | 21,869,768 | |
MPLX | | | 640,563 | | | | 15,149,315 | |
NuStar Energy | | | 159,773 | | | | 4,508,794 | |
Phillips 66 Partners | | | 94,144 | | | | 5,246,645 | |
Plains All American Pipeline | | | 771,780 | | | | 13,428,972 | |
Shell Midstream Partners | | | 202,023 | | | | 3,971,772 | |
TC PipeLines | | | 97,941 | | | | 3,818,720 | |
Western Midstream Partners | | | 329,609 | | | | 5,843,968 | |
| TOTAL MASTER LIMITED PARTNERSHIPS | | | | | | | | |
(Cost $151,762,904) | | | | | | | 148,732,338 | |
| | | | | | | | | |
SHORT-TERM INVESTMENT(B)(C) — 0.3% | | | | | | | | |
| Fidelity Investments Money Market Government Portfolio, Cl Institutional, 1.570% | | | | | | | | |
(Cost $1,813,893) | | | 1,813,893 | | | | 1,813,893 | |
| | | | | | | | | |
REPURCHASE AGREEMENT(B) — 3.9% | | | | | | | | |
| RBC Capital Markets | | | | | | | | |
| 1.580%, dated 11/29/19, to be repurchased on 12/02/19, repurchase price $23,985,486 (collateralized by U.S. Treasury Obligations, ranging in par value $3,287,141- $3,529,905, 2.125%, 08/15/2021, with a total market value of $24,466,571) | | | | | | | | |
(Cost $23,982,327) | | $ | 23,982,327 | | | | 23,982,327 | |
| TOTAL INVESTMENTS — 104.1% | | | | | | | | |
(Cost $698,706,947) | | | | | | $ | 637,404,757 | |
Percentages are based on Net Assets of $612,299,814.
| * | Non-income producing security. |
| ^ | Canadian security listed on New York and Toronto Stock Exchanges. |
| (A) | This security or a partial position of this security is on loan at November 30, 2019. The total value of securities on loan at November 30, 2019 was $24,717,160. |
| (B) | Security was purchased with cash collateral held from securities on loan. The total value of such securities as of November 30, 2019, was $25,796,220. |
| (C) | The rate reported on the Schedule of Investments is the 7-day effective yield as of November 30, 2019. |
The following is a summary of the level of inputs used as of November 30, 2019, in valuing the Fund’s investments carried at value:
| Investments in Securities | | | | | | | | | | | | |
| Common Stock | | $ | 462,876,199 | | | $ | — | | | $ | — | | | $ | 462,876,199 | |
| Master Limited Partnerships | | | 148,732,338 | | | | — | | | | — | | | | 148,732,338 | |
| Short-Term Investment | | | 1,813,893 | | | | — | | | | — | | | | 1,813,893 | |
| Repurchase Agreement | | | — | | | | 23,982,327 | | | | — | | | | 23,982,327 | |
| Total Investments in Securities | | $ | 613,422,430 | | | $ | 23,982,327 | | | $ | — | | | $ | 637,404,757 | |
For the year ended November 30, 2019, there have been no transfers in or out of Level 3.
| | |
| Schedule of Investments |
| November 30, 2019 |
Global X U.S. Preferred ETF |
Sector Weightings (Unaudited)†:
† Sector weightings percentages are based on the total market value of investments. Repurchase agreements purchased from cash collateral received for securities lending activity are included in total investments. Please see Notes 2 and 7 in Notes to Financial Statements for more detailed information.
| | | Shares | | | Value | |
| PREFERRED STOCK — 99.6% | |
| BERMUDA— 1.6% | | | | | | |
| Financials — 1.5% | | | | |
| Aspen Insurance Holdings, 5.950%, VAR ICE LIBOR USD 3 Month+4.060% | | | 40,706 | | | $ | 1,108,424 | |
| Aspen Insurance Holdings, 5.625% | | | 37,014 | | | | 952,370 | |
| Enstar Group, 7.000%, VAR ICE LIBOR USD 3 Month+4.015% | | | 57,109 | | | | 1,525,952 | |
Enstar Group, 7.000% | | | 15,839 | | | | 420,050 | |
PartnerRe, 7.250% | | | 44,019 | | | | 1,190,714 | |
PartnerRe, 6.500% | | | 23,687 | | | | 627,469 | |
PartnerRe, 5.875% | | | 25,616 | | | | 650,902 | |
| RenaissanceRe Holdings, 5.750% | | | 37,022 | | | | 975,900 | |
| RenaissanceRe Holdings, 5.375% | | | 40,694 | | | | 1,020,199 | |
| | | | | | | | 8,471,980 | |
| | | Shares | | | Value | |
| PREFERRED STOCK — continued | |
| Industrials — 0.1% | | | | |
Triton International, 8.000% | | | 18,816 | | | $ | 508,032 | |
TOTAL BERMUDA | | | | | | | 8,980,012 | |
| CANADA— 0.6% | | | | | | | | |
| Energy — 0.6% | | | | | |
| Algonquin Power & Utilities, 6.875%, VAR ICE LIBOR USD 3 Month+3.677% | | | 42,546 | | | | 1,169,589 | |
| Enbridge, 6.375%, VAR ICE LIBOR USD 3 Month+3.593% | | | 83,683 | | | | 2,255,257 | |
TOTAL CANADA | | | | | | | 3,424,846 | |
| GERMANY— 1.3% | | | | | | | | |
| Financials — 1.3% | | | | | |
Deutsche Bank Contingent Capital Trust II, 6.550% (A) | | | 111,884 | | | | 2,846,329 | |
| Deutsche Bank Contingent Capital Trust V, 8.050% | | | 194,935 | | | | 4,957,197 | |
TOTAL GERMANY | | | | | | | 7,803,526 | |
| NETHERLANDS— 1.2% | | | | | | | | |
| Financials — 1.2% | | | | | |
Aegon, 6.375% | | | 140,312 | | | | 3,500,784 | |
| Aegon, 4.000%, VAR ICE LIBOR USD 3 Month+0.875% | | | 35,162 | | | | 845,646 | |
ING Groep, 6.125% | | | 97,767 | | | | 2,531,188 | |
TOTAL NETHERLANDS | | | | | | | 6,877,618 | |
| SPAIN— 0.1% | | | | | | | | |
| Financials — 0.1% | | | | | |
| Banco Santander, 4.000%, VAR ICE LIBOR USD 3 Month+0.520% | | | 30,991 | | | | 714,652 | |
TOTAL SPAIN | | | | | | | 714,652 | |
| | | Shares | | | Value | |
| PREFERRED STOCK — continued | |
| UNITED KINGDOM— 1.2% | | | | | | |
| Financials — 1.2% | | | | |
HSBC Holdings, 6.200% | | | 183,623 | | | $ | 4,774,198 | |
Prudential, 6.750% | | | 37,028 | | | | 991,610 | |
Prudential, 6.500% | | | 44,961 | | | | 1,204,955 | |
TOTAL UNITED KINGDOM | | | | | | | 6,970,763 | |
| UNITED STATES— 93.6% | | | | | | | | |
| Communication Services — 4.6% | | | | | |
AT&T, 5.625% | | | 115,609 | | | | 3,075,199 | |
AT&T, 5.350% (A) | | | 186,158 | | | | 4,845,693 | |
Qwest, 7.000% | | | 34,771 | | | | 895,701 | |
Qwest, 6.875% | | | 69,328 | | | | 1,747,759 | |
Qwest, 6.750% | | | 92,044 | | | | 2,378,417 | |
Qwest, 6.625% | | | 60,608 | | | | 1,541,867 | |
Qwest, 6.500% | | | 137,107 | | | | 3,419,449 | |
Qwest, 6.125% | | | 108,318 | | | | 2,651,625 | |
| Telephone & Data Systems, 7.000% | | | 44,406 | | | | 1,137,238 | |
| Telephone & Data Systems, 6.875% | | | 31,698 | | | | 804,178 | |
| Telephone & Data Systems, 5.875% | | | 28,848 | | | | 717,738 | |
United States Cellular, 7.250% | | | 40,712 | | | | 1,036,120 | |
United States Cellular, 7.250% | | | 44,942 | | | | 1,168,492 | |
United States Cellular, 6.950% | | | 51,265 | | | | 1,308,796 | |
| | | | | | | | 26,728,272 | |
| Consumer Discretionary — 1.6% | | | | | |
Brunswick, 6.625% | | | 18,449 | | | | 499,230 | |
Brunswick, 6.500% | | | 27,316 | | | | 739,717 | |
Brunswick, 6.375% | | | 32,423 | | | | 862,128 | |
| Dillard’s Capital Trust I, 7.500% | | | 26,815 | | | | 702,553 | |
eBay, 6.000% | | | 104,921 | | | | 2,740,536 | |
Ford Motor, 6.200% | | | 104,870 | | | | 2,699,354 | |
| | | Shares | | | Value | |
| PREFERRED STOCK — continued | |
| Consumer Discretionary — continued | | | | |
QVC, 6.375% | | | 33,682 | | | $ | 856,196 | |
| | | | | | | | 9,099,714 | |
| Consumer Staples — 0.1% | | | | | |
Energizer Holdings, 7.500% | | | 7,565 | | | | 791,829 | |
| Energy — 0.9% | | | | | |
| DCP Midstream, 7.950%, VAR ICE LIBOR USD 3 Month+4.882% | | | 14,958 | | | | 357,197 | |
| DCP Midstream, 7.875%, VAR ICE LIBOR USD 3 Month+4.919% | | | 23,783 | | | | 546,534 | |
Nabors Industries, 6.000% | | | 21,226 | | | | 357,021 | |
| NuStar Energy, 9.000%, VAR ICE LIBOR USD 3 Month+6.880% | | | 25,500 | | | | 635,715 | |
| NuStar Energy, 8.500%, VAR ICE LIBOR USD 3 Month+6.766% | | | 33,427 | | | | 795,897 | |
| NuStar Energy, 7.625%, VAR ICE LIBOR USD 3 Month+5.643% | | | 57,746 | | | | 1,266,947 | |
| NuStar Logistics, 8.735%, VAR ICE LIBOR USD 3 Month+6.734% | | | 57,416 | | | | 1,492,242 | |
| | | | | | | | 5,451,553 | |
| Financials — 59.1% | | | | | |
| Affiliated Managers Group, 5.875% | | | 41,014 | | | | 1,077,848 | |
Allied Capital, 6.875% | | | 31,128 | | | | 801,235 | |
Allstate, 5.625% | | | 42,533 | | | | 1,084,166 | |
Allstate, 5.625% | | | 80,103 | | | | 2,126,735 | |
| Allstate, 5.100%, VAR ICE LIBOR USD 3 Month+3.165% | | | 69,429 | | | | 1,823,205 | |
| American Financial Group, 6.250% | | | 20,824 | | | | 526,847 | |
| American Financial Group, 5.875% | | | 17,215 | | | | 462,223 | |
| American International Group, 5.850% | | | 73,464 | | | | 1,936,511 | |
| Apollo Global Management, 6.375% | | | 44,933 | | | | 1,190,725 | |
| Apollo Global Management, 6.375% | | | 41,188 | | | | 1,075,831 | |
| | | Shares | | | Value | |
| PREFERRED STOCK — continued | |
| Financials — continued | | | | |
Arch Capital Group, 5.450% | | | 49,393 | | | $ | 1,262,979 | |
Arch Capital Group, 5.250% | | | 64,353 | | | | 1,612,043 | |
| Associated Banc-Corp, 5.875% | | | 14,866 | | | | 400,044 | |
Assurant, 6.500% | | | 10,769 | | | | 1,398,570 | |
| Assured Guaranty Municipal Holdings, 6.250% | | | 34,017 | | | | 891,245 | |
| Athene Holding, 6.350%, VAR ICE LIBOR USD 3 Month+4.253% | | | 120,922 | | | | 3,325,355 | |
Axis Capital Holdings, 5.500% | | | 76,457 | | | | 1,935,127 | |
Axis Capital Holdings, 5.500% | | | 31,679 | | | | 794,192 | |
Bank of America, 7.250% | | | 10,891 | | | | 16,118,680 | |
Bank of America, 6.500% | | | 155,787 | | | | 3,981,916 | |
| Bank of America, 6.450%, VAR ICE LIBOR USD 3 Month+1.327% | | | 147,416 | | | | 3,928,636 | |
Bank of America, 6.200% | | | 156,254 | | | | 4,087,605 | |
Bank of America, 6.000% | | | 127,480 | | | | 3,364,197 | |
Bank of America, 6.000% | | | 191,748 | | | | 5,211,711 | |
Bank of America, 5.875% | | | 119,720 | | | | 3,226,454 | |
Bank of America, 5.375% | | | 196,751 | | | | 5,194,226 | |
| Bank of America, 4.000%, VAR ICE LIBOR USD 3 Month+0.500% | | | 59,853 | | | | 1,401,159 | |
| Bank of America, 4.000%, VAR ICE LIBOR USD 3 Month+0.350% | | | 46,787 | | | | 1,135,053 | |
| Bank of America, 4.000%, VAR ICE LIBOR USD 3 Month+0.750% | | | 29,363 | | | | 679,460 | |
| Bank of New York Mellon, 5.200% | | | 81,986 | | | | 2,103,761 | |
BB&T, 5.625% | | | 64,478 | | | | 1,688,034 | |
BB&T, 5.200% | | | 69,336 | | | | 1,747,267 | |
BB&T, 5.200% | | | 64,382 | | | | 1,622,426 | |
Brighthouse Financial, 6.600% | | | 60,799 | | | | 1,621,509 | |
Brighthouse Financial, 6.250% | | | 51,736 | | | | 1,341,514 | |
| Brightsphere Investment Group, 5.125% | | | 16,131 | | | | 401,017 | |
| | | Shares | | | Value | |
| PREFERRED STOCK — continued | |
| Financials — continued | | | | |
| Capital One Financial, Ser D, 6.700% | | | 70,208 | | | $ | 1,756,604 | |
| Capital One Financial, Ser C, 6.250% | | | 69,333 | | | | 1,734,712 | |
Capital One Financial, 6.200% | | | 69,376 | | | | 1,789,901 | |
Capital One Financial, 6.000% | | | 69,414 | | | | 1,820,729 | |
| Capital One Financial, Ser B, 6.000% | | | 122,561 | | | | 3,099,568 | |
Capital One Financial, 5.200% | | | 83,529 | | | | 2,112,448 | |
Charles Schwab, 6.000% | | | 83,586 | | | | 2,159,862 | |
Charles Schwab, 5.950% | | | 104,900 | | | | 2,735,792 | |
| Citigroup, Ser J, 7.125%, VAR ICE LIBOR USD 3 Month+4.040% | | | 133,354 | | | | 3,816,592 | |
| Citigroup, 6.875%, VAR ICE LIBOR USD 3 Month+4.130% | | | 210,686 | | | | 5,901,315 | |
Citigroup, 6.300% | | | 145,319 | | | | 3,785,560 | |
| Citigroup Capital XIII, 8.306%, VAR ICE LIBOR USD 3 Month+6.370% | | | 317,215 | | | | 8,758,306 | |
| Citizens Financial Group, 6.350%, VAR ICE LIBOR USD 3 Month+3.642% | | | 42,624 | | | | 1,175,996 | |
| Commerce Bancshares, 6.000% | | | 19,699 | | | | 512,174 | |
| Fifth Third Bancorp, 6.625%, VAR ICE LIBOR USD 3 Month+3.710% | | | 64,486 | | | | 1,815,281 | |
First Republic Bank, 5.500% | | | 22,408 | | | | 577,678 | |
First Republic Bank, 5.500% | | | 44,933 | | | | 1,189,826 | |
First Republic Bank, 5.125% | | | 28,013 | | | | 728,338 | |
Globe Life, 6.125% | | | 44,951 | | | | 1,206,035 | |
| GMAC Capital Trust I, Ser 2, 7.695%, VAR ICE LIBOR USD 3 Month+5.785% | | | 376,870 | | | | 9,772,239 | |
| Goldman Sachs Group, 6.375%, VAR ICE LIBOR USD 3 Month+3.550% | | | 97,856 | | | | 2,703,761 | |
| Goldman Sachs Group, 6.300% | | | 94,248 | | | | 2,469,298 | |
| Goldman Sachs Group, 5.500%, VAR ICE LIBOR USD 3 Month+3.640% | | | 140,355 | | | | 3,694,144 | |
| | | Shares | | | Value | |
| PREFERRED STOCK — continued | |
| Financials — continued | | | | |
| Goldman Sachs Group, 4.000%, VAR ICE LIBOR USD 3 Month+0.670% | | | 108,163 | | | $ | 2,524,524 | |
| Goldman Sachs Group, 4.000%, VAR ICE LIBOR USD 3 Month+0.750% | | | 29,972 | | | | 683,661 | |
| Goldman Sachs Group, 3.750%, VAR ICE LIBOR USD 3 Month+0.750% | | | 105,586 | | | | 2,276,434 | |
| Hanover Insurance Group, 6.350% | | | 23,273 | | | | 597,302 | |
| Hartford Financial Services Group, 7.875%, VAR ICE LIBOR USD 3 Month+5.596% | | | 83,744 | | | | 2,373,305 | |
| Hartford Financial Services Group, 6.000% | | | 51,122 | | | | 1,372,626 | |
| Huntington Bancshares, 6.250% | | | 83,614 | | | | 2,180,653 | |
| IBERIABANK, 6.100%, VAR ICE LIBOR USD 3 Month+3.859% | | | 13,568 | | | | 360,502 | |
JPMorgan Chase, 6.150% | | | 161,633 | | | | 4,142,654 | |
JPMorgan Chase, 6.125% | | | 201,330 | | | | 5,083,583 | |
JPMorgan Chase, 6.100% | | | 200,620 | | | | 5,135,872 | |
JPMorgan Chase, 6.000% (A) | | | 261,048 | | | | 7,220,588 | |
JPMorgan Chase, 5.750% | | | 239,207 | | | | 6,415,532 | |
JPMorgan Chase, 5.450% | | | 127,206 | | | | 3,181,422 | |
| KeyCorp, 6.125%, VAR ICE LIBOR USD 3 Month+3.892% | | | 69,538 | | | | 1,992,264 | |
KeyCorp, 5.650% | | | 60,768 | | | | 1,571,460 | |
KeyCorp, 5.625% | | | 62,327 | | | | 1,611,776 | |
KKR, 6.750% | | | 51,755 | | | | 1,359,086 | |
Legg Mason, 6.375% | | | 37,029 | | | | 976,455 | |
Legg Mason, 5.450% | | | 69,371 | | | | 1,762,717 | |
MetLife, 5.625% | | | 112,748 | | | | 2,972,037 | |
| MetLife, 4.000%, VAR ICE LIBOR USD 3 Month+1.000% | | | 83,492 | | | | 2,028,856 | |
| Morgan Stanley, Ser E, 7.125%, VAR ICE LIBOR USD 3 Month+4.320% | | | 120,965 | | | | 3,521,291 | |
| | | Shares | | | Value | |
| PREFERRED STOCK — continued | |
| Financials — continued | | | | |
| Morgan Stanley, Ser F, 6.875%, VAR ICE LIBOR USD 3 Month+3.940% | | | 119,145 | | | $ | 3,419,462 | |
| Morgan Stanley, Ser G, 6.625% | | | 70,021 | | | | 1,772,932 | |
| Morgan Stanley, 6.375%, VAR ICE LIBOR USD 3 Month+3.708% | | | 140,424 | | | | 3,910,808 | |
| Morgan Stanley, 5.850%, VAR ICE LIBOR USD 3 Month+3.491% | | | 140,397 | | | | 3,914,268 | |
| Morgan Stanley, 4.000%, VAR ICE LIBOR USD 3 Month+0.700% | | | 155,241 | | | | 3,457,217 | |
| National Rural Utilities Cooperative Finance, 5.500% | | | 33,972 | | | | 900,598 | |
Navient, 6.000% | | | 42,310 | | | | 981,592 | |
| New York Community Bancorp, 6.375%, VAR ICE LIBOR USD 3 Month+3.821% | | | 71,638 | | | | 1,932,794 | |
| New York Community Capital Trust V, 6.000% | | | 11,151 | | | | 559,780 | |
Northern Trust, 5.850% | | | 57,091 | | | | 1,444,973 | |
| Oaktree Capital Group, 6.625% | | | 26,967 | | | | 734,851 | |
| Oaktree Capital Group, 6.550% | | | 35,173 | | | | 947,209 | |
| People’s United Financial, 5.625%, VAR ICE LIBOR USD 3 Month+4.020% | | | 37,020 | | | | 989,174 | |
| PNC Financial Services Group, 6.125%, VAR ICE LIBOR USD 3 Month+4.067% | | | 211,373 | | | | 5,698,616 | |
| PNC Financial Services Group, 5.375% | | | 68,726 | | | | 1,740,142 | |
Prospect Capital, 6.250% | | | 32,611 | | | | 827,015 | |
Prudential Financial, 5.750% | | | 80,019 | | | | 2,045,286 | |
Prudential Financial, 5.700% | | | 99,151 | | | | 2,532,317 | |
Prudential Financial, 5.625% | | | 78,715 | | | | 2,077,289 | |
| Regions Financial, Ser A, 6.375% | | | 69,376 | | | | 1,768,394 | |
| Regions Financial, Ser B, 6.375%, VAR ICE LIBOR USD 3 Month+3.536% | | | 69,483 | | | | 1,913,562 | |
| Regions Financial, 5.700%, VAR ICE LIBOR USD 3 Month+3.148% | | | 69,499 | | | | 1,861,183 | |
| | | Shares | | | Value | |
| PREFERRED STOCK — continued | |
| Financials — continued | | | | |
| Reinsurance Group of America, 6.200%, VAR ICE LIBOR USD 3 Month+4.370% | | | 57,146 | | | $ | 1,556,086 | |
| Reinsurance Group of America, 5.750%, VAR ICE LIBOR USD 3 Month+4.040% | | | 57,158 | | | | 1,579,847 | |
| SLM, 3.819%, VAR ICE LIBOR USD 3 Month+1.700% | | | 14,798 | | | | 772,604 | |
State Street, 6.000% | | | 104,801 | | | | 2,655,657 | |
| State Street, 5.900%, VAR ICE LIBOR USD 3 Month+3.108% | | | 104,935 | | | | 2,819,603 | |
| State Street, 5.350%, VAR ICE LIBOR USD 3 Month+3.709% | | | 69,424 | | | | 1,893,193 | |
State Street, 5.250% | | | 70,143 | | | | 1,757,082 | |
Stifel Financial, 6.250% | | | 22,273 | | | | 589,566 | |
Stifel Financial, 6.250% | | | 22,165 | | | | 570,305 | |
Stifel Financial, 5.200% | | | 33,293 | | | | 863,953 | |
| Synovus Financial, 6.300%, VAR ICE LIBOR USD 3 Month+3.352% | | | 29,551 | | | | 775,418 | |
| Synovus Financial, 5.875%, VAR US Treas Yield Curve Rate T Note Const Mat 5 Yr+4.127% | | | 48,125 | | | | 1,254,138 | |
Unum Group, 6.250% | | | 44,934 | | | | 1,186,707 | |
| US Bancorp, 6.500%, VAR ICE LIBOR USD 3 Month+4.468% | | | 154,629 | | | | 4,219,825 | |
US Bancorp, 5.500% | | | 80,091 | | | | 2,122,412 | |
US Bancorp, 4.500% | | | 69,993 | | | | 1,765,923 | |
| US Bancorp, 3.500%, VAR ICE LIBOR USD 3 Month+0.600% | | | 139,953 | | | | 3,006,190 | |
| Valley National Bancorp, 5.500%, VAR ICE LIBOR USD 3 Month+3.578% | | | 14,683 | | | | 391,449 | |
| Voya Financial, 5.350%, VAR US Treas Yield Curve Rate T Note Const Mat 5 Yr+3.210% | | | 41,087 | | | | 1,098,666 | |
Webster Financial, 5.250% | | | 22,993 | | | | 582,643 | |
| | | Shares | | | Value | |
| PREFERRED STOCK — continued | |
| Financials — continued | | | | |
Wells Fargo, 7.500% | | | 14,057 | | | $ | 20,523,220 | |
| Wells Fargo, 6.625%, VAR ICE LIBOR USD 3 Month+3.690% | | | 117,727 | | | | 3,389,360 | |
Wells Fargo, 6.000% | | | 141,109 | | | | 3,647,668 | |
Wells Fargo, 6.000% | | | 113,028 | | | | 2,859,608 | |
| Wells Fargo, 5.850%, VAR ICE LIBOR USD 3 Month+3.090% | | | 247,659 | | | | 6,689,270 | |
Wells Fargo, 5.700% | | | 141,944 | | | | 3,657,897 | |
Wells Fargo, 5.625% | | | 96,372 | | | | 2,515,309 | |
Wells Fargo, 5.500% | | | 165,020 | | | | 4,278,969 | |
Wells Fargo, 5.250% | | | 87,065 | | | | 2,198,391 | |
Wells Fargo, 5.200% | | | 105,894 | | | | 2,666,411 | |
Wells Fargo, 5.125% | | | 93,056 | | | | 2,348,733 | |
Wells Fargo Real Estate Investment, 6.375% ‡ | | | 40,117 | | | | 1,014,158 | |
WR Berkley, 5.900% | | | 14,033 | | | | 365,139 | |
WR Berkley, 5.750% | | | 43,428 | | | | 1,110,454 | |
WR Berkley, 5.700% | | | 27,310 | | | | 735,185 | |
WR Berkley, 5.625% | | | 52,496 | | | | 1,325,524 | |
| Zions Bancorporation, 6.300%, VAR ICE LIBOR USD 3 Month+4.240% | | | 20,458 | | | | 557,685 | |
| | | | | | | | 346,013,975 | |
| Health Care — 2.1% | | | | | |
Avantor, 6.250% | | | 72,615 | | | | 4,367,066 | |
Change Healthcare, 6.000% | | | 19,518 | | | | 1,011,813 | |
Danaher, 4.750% | | | 5,796 | | | | 6,611,729 | |
| | | | | | | | 11,990,608 | |
| Industrials — 2.1% | | | | | |
| Air Lease, 6.150%, VAR ICE LIBOR USD 3 Month+3.650% | | | 35,383 | | | | 933,757 | |
Colfax, 5.750% | | | 16,524 | | | | 2,428,863 | |
Fortive, 5.000% | | | 4,945 | | | | 4,628,207 | |
| | | Shares | | | Value | |
| PREFERRED STOCK — continued | |
| Industrials — continued | | | | |
GATX, 5.625% | | | 22,160 | | | $ | 581,035 | |
Pitney Bowes, 6.700% | | | 63,820 | | | | 1,239,385 | |
| Stanley Black & Decker, 5.750% | | | 104,818 | | | | 2,652,944 | |
| | | | | | | | 12,464,191 | |
| Materials — 0.5% | | | | | |
| International Flavors & Fragrances, 6.000% | | | 57,655 | | | | 2,983,646 | |
| Real Estate — 7.6% | | | | | |
American Homes 4 Rent, 6.500% ‡ | | | 39,777 | | | | 1,046,533 | |
American Homes 4 Rent, 6.350% ‡ | | | 34,419 | | | | 895,582 | |
American Homes 4 Rent, 6.250% ‡ | | | 17,119 | | | | 457,591 | |
American Homes 4 Rent, 5.875% ‡ | | | 22,871 | | | | 595,561 | |
| Brookfield Property Partners, 6.500% | | | 25,702 | | | | 655,658 | |
CBL & Associates Properties, Ser D,
7.375% ‡ | | | 67,007 | | | | 732,386 | |
Digital Realty Trust, 6.625% ‡ | | | 30,058 | | | | 795,635 | |
Digital Realty Trust, 6.350% ‡ | | | 37,484 | | | | 967,087 | |
Digital Realty Trust, 5.875% ‡ | | | 37,452 | | | | 947,536 | |
Digital Realty Trust, 5.850% ‡ | | | 29,509 | | | | 788,185 | |
Digital Realty Trust, 5.250% ‡ | | | 29,535 | | | | 745,759 | |
EPR Properties, 5.750% ‡ | | | 20,785 | | | | 535,837 | |
Federal Realty Investment Trust, 5.000% ‡ | | | 22,029 | | | | 564,383 | |
Kimco Realty, 5.500% ‡ | | | 33,295 | | | | 840,366 | |
Kimco Realty, 5.250% ‡ | | | 39,100 | | | | 1,003,697 | |
Kimco Realty, 5.125% ‡ | | | 33,287 | | | | 843,160 | |
National Retail Properties, 5.200% ‡ | | | 51,713 | | | | 1,305,753 | |
Office Properties Income Trust, 5.875% ‡ | | | 46,434 | | | | 1,189,639 | |
PS Business Parks, 5.750% ‡ | | | 34,431 | | | | 870,416 | |
PS Business Parks, 5.250% ‡ | | | 34,008 | | | | 864,143 | |
PS Business Parks, 5.200% ‡ | | | 29,534 | | | | 748,687 | |
PS Business Parks, 5.200% ‡ | | | 28,043 | | | | 708,366 | |
| | | Shares | | | Value | |
| PREFERRED STOCK — continued | |
| Real Estate — continued | | | | |
Public Storage, 5.875% ‡ | | | 26,600 | | | $ | 672,980 | |
Public Storage, 5.600% ‡ | | | 40,413 | | | | 1,091,151 | |
Public Storage, 5.400% ‡ | | | 44,937 | | | | 1,154,881 | |
Public Storage, 5.375% ‡ | | | 70,936 | | | | 1,791,843 | |
Public Storage, 5.200% ‡ | | | 33,295 | | | | 838,701 | |
Public Storage, 5.200% ‡ | | | 69,330 | | | | 1,745,729 | |
Public Storage, 5.150% ‡ | | | 41,438 | | | | 1,067,443 | |
Public Storage, 5.125% ‡ | | | 29,541 | | | | 752,114 | |
Public Storage, 5.050% ‡ | | | 44,923 | | | | 1,144,638 | |
Public Storage, 4.950% ‡ | | | 48,746 | | | | 1,226,937 | |
Public Storage, 4.900% ‡ | | | 52,477 | | | | 1,319,797 | |
QTS Realty Trust, 6.500% ‡ | | | 11,069 | | | | 1,397,240 | |
RLJ Lodging Trust, 1.950% ‡ | | | 48,307 | | | | 1,376,267 | |
Senior Housing Properties Trust, 6.250% ‡ | | | 37,456 | | | | 954,379 | |
Senior Housing Properties Trust, 5.625% ‡ | | | 52,471 | | | | 1,265,600 | |
SL Green Realty, 6.500% ‡ | | | 34,445 | | | | 887,992 | |
Spirit Realty Capital, 6.000% ‡ | | | 25,495 | | | | 650,122 | |
VEREIT, Ser F, 6.700% ‡ | | | 136,389 | | | | 3,438,367 | |
Vornado Realty Trust, 5.700% ‡ | | | 44,935 | | | | 1,139,552 | |
Vornado Realty Trust, 5.400% ‡ | | | 44,923 | | | | 1,132,509 | |
Vornado Realty Trust, 5.250% ‡ | | | 47,877 | | | | 1,227,566 | |
Washington Prime Group, 7.500% ‡ | | | 14,656 | | | | 330,933 | |
| | | | | | | | 44,708,701 | |
| Utilities — 15.0% | | | | | |
Alabama Power, 5.000% | | | 37,023 | | | | 964,079 | |
| Algonquin Power & Utilities, 6.200%, VAR ICE LIBOR USD 3 Month+4.010% | | | 51,905 | | | | 1,432,578 | |
| American Electric Power, 6.125% | | | 56,382 | | | | 3,000,086 | |
Aqua America, 6.000% | | | 48,286 | | | | 2,873,500 | |
CenterPoint Energy, 7.000% | | | 68,573 | | | | 3,094,014 | |
| | | Shares | | | Value | |
| PREFERRED STOCK — continued | |
| Utilities — continued | | | | |
CMS Energy, 5.875% | | | 87,927 | | | $ | 2,325,669 | |
CMS Energy, 5.875% | | | 41,450 | | | | 1,101,741 | |
CMS Energy, 5.625% | | | 29,550 | | | | 768,005 | |
Dominion Energy, 7.250% | | | 49,269 | | | | 5,200,343 | |
Dominion Energy, 5.250% | | | 111,982 | | | | 2,852,182 | |
DTE Energy, 6.000% | | | 41,971 | | | | 1,113,071 | |
DTE Energy, 5.375% | | | 44,940 | | | | 1,143,723 | |
DTE Energy, 5.250% | | | 28,045 | | | | 702,527 | |
DTE Energy, 5.250% | | | 57,100 | | | | 1,470,896 | |
Duke Energy, 5.750% | | | 140,401 | | | | 3,786,615 | |
Duke Energy, 5.625% | | | 69,457 | | | | 1,855,891 | |
Duke Energy, 5.125% | | | 69,360 | | | | 1,749,953 | |
| Energy Transfer Operating, 7.625%, VAR ICE LIBOR USD 3 Month+4.738% | | | 63,597 | | | | 1,510,429 | |
| Energy Transfer Operating, 7.600%, VAR ICE LIBOR USD 3 Month+5.161% | | | 111,894 | | | | 2,698,883 | |
| Energy Transfer Operating, 7.375%, VAR ICE LIBOR USD 3 Month+4.530% | | | 64,330 | | | | 1,484,736 | |
Entergy Arkansas, 4.875% | | | 58,539 | | | | 1,492,744 | |
Entergy Louisiana, 4.875% | | | 39,988 | | | | 1,020,494 | |
Entergy Mississippi, 4.900% | | | 38,485 | | | | 1,006,383 | |
Georgia Power, 5.000% | | | 39,988 | | | | 1,011,296 | |
| NextEra Energy Capital Holdings, 5.650% | | | 96,089 | | | | 2,548,280 | |
| NextEra Energy Capital Holdings, 5.250% | | | 79,384 | | | | 2,032,230 | |
| NextEra Energy Capital Holdings, 5.125% | | | 69,346 | | | | 1,737,117 | |
| NextEra Energy Capital Holdings, 5.000% | | | 64,384 | | | | 1,611,532 | |
| NiSource, 6.500%, VAR US Treas Yield Curve Rate T Note Const Mat 5 Yr+3.632% | | | 69,481 | | | | 1,892,662 | |
| PPL Capital Funding, Ser B, 5.900% | | | 64,401 | | | | 1,642,225 | |
SCE Trust II, 5.100% | | | 59,980 | | | | 1,459,313 | |
| | | Shares | | | Value | |
| PREFERRED STOCK — continued | |
| Utilities — continued | | | | |
| SCE Trust III, 5.750%, VAR ICE LIBOR USD 3 Month+2.990% | | | 41,193 | | | $ | 996,459 | |
| SCE Trust IV, 5.375%, VAR ICE LIBOR USD 3 Month+3.132% | | | 48,736 | | | | 1,167,715 | |
| SCE Trust V, 5.450%, VAR ICE LIBOR USD 3 Month+3.790% | | | 44,920 | | | | 1,090,658 | |
SCE Trust VI, 5.000% | | | 67,829 | | | | 1,573,633 | |
Sempra Energy, 6.750% | | | 20,465 | | | | 2,408,935 | |
Sempra Energy, 6.000% | | | 61,295 | | | | 7,227,293 | |
Sempra Energy, 5.750% | | | 105,971 | | | | 2,792,336 | |
| South Jersey Industries, 7.250% | | | 21,310 | | | | 1,079,565 | |
Southern, 6.250% | | | 140,352 | | | | 3,643,538 | |
Southern, 5.250% | | | 111,983 | | | | 2,858,926 | |
Southern, 5.250% | | | 64,409 | | | | 1,650,159 | |
Spire, 5.900% | | | 34,010 | | | | 899,564 | |
| Tennessee Valley Authority, 3.550%, VAR US Treas Yield Curve Rate T Note Const Mat 30 Yr+0.940% | | | 41,108 | | | | 1,064,697 | |
| Tennessee Valley Authority, 3.360%, VAR US Treas Yield Curve Rate T Note Const Mat 30 Yr+0.840% | | | 35,509 | | | | 902,639 | |
| | | | | | | | 87,939,314 | |
TOTAL UNITED STATES | | | | | | | 548,171,803 | |
| TOTAL PREFERRED STOCK | | | | | | | | |
(Cost $576,040,141) | | | | | | | 582,943,220 | |
| | | | | | | | | |
SHORT-TERM INVESTMENT(B)(C)— 0.0% | |
| Fidelity Investments Money Market Government Portfolio, Cl Institutional, 1.570% | | | | | | | | |
(Cost $120,093) | | | 120,093 | | | | 120,093 | |
| | | Face Amount | | | Value | |
REPURCHASE AGREEMENT(B) — 0.3% | |
| RBC Capital Markets | | | | | | |
| 1.580%, dated 11/29/19, to be repurchased on 12/02/19, repurchase price $1,588,017 (collateralized by U.S. Treasury Obligations, ranging in par value $217,633 - $233,706, 2.125%, 08/15/2021, with a total market value of $1,619,869) | | | | | | |
(Cost $1,587,807) | | $ | 1,587,807 | | | $ | 1,587,807 | |
| | | | | | | | | |
| TOTAL INVESTMENTS — 99.9% | | | | | | | | |
(Cost $577,748,041) | | | | | | $ | 584,651,120 | |
Percentages are based on Net Assets of $585,150,138.
| ‡ | Real Estate Investment Trust |
| (A) | This security or a partial position of this security is on loan at November 30, 2019. The total value of securities on loan at November 30, 2019 was $1,668,103. |
| (B) | Security was purchased with cash collateral held from securities on loan. The total value of such securities as of November 30, 2019, was $1,707,900. |
| (C) | The rate reported on the Schedule of Investments is the 7-day effective yield as of November 30, 2019. |
| Cl — Class |
| ICE — Intercontinental Exchange |
| LIBOR — London Interbank Offered Rate |
| Ser — Series |
| USD — U.S. Dollar |
| VAR – Variable Rate |
The following is a summary of the level of inputs used as of November 30, 2019, in valuing the Fund’s investments carried at value:
| Investments in Securities | | Level 1 | | | Level 2 | | | Level 3 | | | Total | |
| Preferred Stock | | $ | 582,943,220 | | | $ | — | | | $ | — | | | $ | 582,943,220 | |
| Short-Term Investment | | | 120,093 | | | | — | | | | — | | | | 120,093 | |
| Repurchase Agreement | | | — | | | | 1,587,807 | | | | — | | | | 1,587,807 | |
| Total Investments in Securities | | $ | 583,063,313 | | | $ | 1,587,807 | | | $ | — | | | $ | 584,651,120 | |
For the year ended November 30, 2019, there have been no transfers in or out of Level 3.
| | |
| Schedule of Investments |
| November 30, 2019 |
Global X SuperDividend® Alternatives ETF |
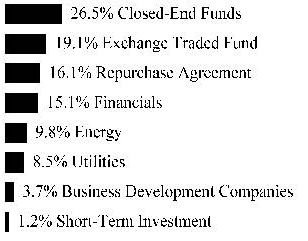
Sector Weightings (Unaudited)†:
† Sector weightings percentages are based on the total market value of investments. Repurchase agreements purchased from cash collateral received for securities lending activity are included in total investments. Please see Notes 2 and 7 in Notes to Financial Statements for more detailed information.
| | | Shares | | | Value | |
| CLOSED-END FUNDS — 31.8% | | | | | | |
| AllianzGI NFJ Dividend Interest & Premium Strategy Fund | | | 55,577 | | | $ | 710,830 | |
BlackRock Income Trust | | | 112,349 | | | | 676,341 | |
| Brookfield Real Assets Income Fund | | | 30,048 | | | | 658,652 | |
| Eaton Vance Risk-Managed Diversified Equity Income Fund | | | 73,784 | | | | 688,405 | |
| Eaton Vance Tax Managed Global Buy Write Opportunities Fund | | | 70,646 | | | | 724,828 | |
Eaton Vance Tax-Managed Buy-Write Opportunities Fund (A) | | | 47,123 | | | | 699,305 | |
| Morgan Stanley Emerging Markets Domestic Debt Fund | | | 102,175 | | | | 699,899 | |
Nuveen Mortgage and Income Fund (A) | | | 29,523 | | | | 658,953 | |
Stone Harbor Emerging Markets Income
Fund (A) | | | 52,315 | | | | 689,512 | |
| Templeton Emerging Markets Income Fund | | | 75,711 | | | | 668,528 | |
| Voya Global Equity Dividend and Premium Opportunity Fund | | | 113,609 | | | | 696,423 | |
| Western Asset Emerging Markets Debt Fund | | | 49,066 | | | | 690,359 | |
| Western Asset Mortgage Defined Opportunity Fund | | | 31,264 | | | | 650,291 | |
| | | Shares | | | Value | |
| | | | | | | |
| TOTAL CLOSED-END FUNDS | | | | | | |
(Cost $9,100,365) | | | | | $ | 8,912,326 | |
| COMMON STOCK — 30.0% | | | | | | | |
| Energy — 2.9% | | | | | | | |
Kinder Morgan | | | 20,446 | | | | 400,946 | |
ONEOK | | | 5,768 | | | | 409,816 | |
| | | | | | | | 810,762 | |
| Financials — 18.3% | | | | | | | | |
Apollo Investment | | | 25,974 | | | | 438,441 | |
Ares Capital | | | 22,422 | | | | 419,964 | |
BlackRock Capital Investment | | | 83,116 | | | | 411,424 | |
BlackRock TCP Capital | | | 30,911 | | | | 447,591 | |
Hercules Capital | | | 31,300 | | | | 448,529 | |
Main Street Capital (A) | | | 9,709 | | | | 418,555 | |
New Mountain Finance | | | 30,897 | | | | 417,110 | |
| PennantPark Floating Rate Capital | | | 36,227 | | | | 455,012 | |
PennantPark Investment | | | 66,700 | | | | 412,206 | |
Prospect Capital | | | 63,317 | | | | 412,827 | |
Solar Capital | | | 20,316 | | | | 421,557 | |
TPG Specialty Lending | | | 20,107 | | | | 434,110 | |
| | | | | | | | 5,137,326 | |
| Utilities — 8.8% | | | | | | | | |
Avista | | | 8,674 | | | | 410,107 | |
CenterPoint Energy | | | 14,104 | | | | 346,394 | |
Dominion Energy | | | 5,223 | | | | 434,083 | |
Duke Energy | | | 4,394 | | | | 387,419 | |
PPL | | | 13,383 | | | | 455,423 | |
Southern | | | 6,847 | | | | 424,446 | |
| | | | | | | | 2,457,872 | |
| TOTAL COMMON STOCK | | | | | | | | |
(Cost $8,390,600) | | | | | | | 8,405,960 | |
| | | | | | | | | |
| EXCHANGE TRADED FUND — 22.9% | | | | | | | | |
Global X SuperDividend REIT ETF (A) (B) | | | 419,203 | | | | 6,423,112 | |
| | | Shares | | | Value | |
| TOTAL EXCHANGE TRADED FUND | | | | | | |
(Cost $6,240,616) | | | | | $ | 6,423,112 | |
| | | | | | | | |
| MASTER LIMITED PARTNERSHIPS — 10.4% | | | | | | | |
| Energy — 9.0% | | | | | | | |
Alliance Resource Partners | | | 26,524 | | | | 278,502 | |
Black Stone Minerals | | | 29,836 | | | | 354,153 | |
Enable Midstream Partners | | | 35,130 | | | | 322,845 | |
Holly Energy Partners | | | 16,776 | | | | 375,111 | |
MPLX | | | 15,235 | | | | 360,308 | |
Sunoco | | | 13,378 | | | | 416,724 | |
USA Compression Partners | | | 24,424 | | | | 401,531 | |
| | | | | | | | 2,509,174 | |
| Utilities — 1.4% | | | | | | | | |
Suburban Propane Partners | | | 17,766 | | | | 398,314 | |
| TOTAL MASTER LIMITED PARTNERSHIPS | | | | | | | | |
(Cost $3,217,868) | | | | | | | 2,907,488 | |
| | | | | | | | | |
| BUSINESS DEVELOPMENT COMPANIES — 4.4% | |
Goldman Sachs BDC | | | 20,657 | | | | 432,351 | |
Golub Capital BDC | | | 22,286 | | | | 409,171 | |
TCG BDC | | | 29,116 | | | | 394,813 | |
| TOTAL BUSINESS DEVELOPMENT COMPANIES | | | | | | | | |
(Cost $1,335,614) | | | | | | | 1,236,335 | |
| | | | | | | | | |
SHORT-TERM INVESTMENT (C)(D)— 1.5% | |
| Fidelity Investments Money Market Government Portfolio, Cl Institutional, 1.570% | | | | | | | | |
(Cost $409,407) | | | 409,407 | | | | 409,407 | |
| | | | | | | | | |
| | | Face Amount | | | Value | |
REPURCHASE AGREEMENT (C)— 19.3% | |
| RBC Capital Markets | | | | | | |
| 1.580%, dated 11/29/19, to be repurchased on 12/02/19 , repurchase price $5,413,672 (collateralized by U.S. Treasury Obligations, ranging in par value $741,928 - $796,721, 2.125%, 08/15/2021, with a total market value of $5,522,254) | | | | | | |
(Cost $5,412,958) | | $ | 5,412,958 | | | $ | 5,412,958 | |
| | | | | | | | | |
| TOTAL INVESTMENTS — 120.3% | | | | | | | | |
(Cost $34,107,428) | | | | | | $ | 33,707,586 | |
Percentages are based on Net Assets of $28,012,092.
| (A) | This security or a partial position of this security is on loan at November 30, 2019. The total value of securities on loan at November 30, 2019 was $5,678,657. |
| (B) | Affiliated investment. |
| (C) | Security was purchased with cash collateral held from securities on loan. The total value of such securities as of November 30, 2019, was $5,822,365. |
| (D) | The rate reported on the Schedule of Investments is the 7-day effective yield as of November 30, 2019. |
| BDC — Business Development Companies |
| Cl — Class |
| ETF — Exchange Traded Fund |
| REIT — Real Estate Investment Trust |
The following is a summary of the level of inputs used as of November 30, 2019, in valuing the Fund’s investments carried at value:
| Investments in Securities | | Level 1 | | | Level 2 | | | Level 3 | | | Total | |
| Closed-End Funds | | $ | 8,912,326 | | | $ | — | | | $ | — | | | $ | 8,912,326 | |
| Common Stock | | | 8,405,960 | | | | — | | | | — | | | | 8,405,960 | |
| Exchange Traded Fund | | | 6,423,112 | | | | — | | | | — | | | | 6,423,112 | |
| Master Limited Partnerships | | | 2,907,488 | | | | — | | | | — | | | | 2,907,488 | |
| Business Development Companies | | | 1,236,335 | | | | — | | | | — | | | | 1,236,335 | |
| Short-Term Investment | | | 409,407 | | | | — | | | | — | | | | 409,407 | |
| Repurchase Agreement | | | — | | | | 5,412,958 | | | | — | | | | 5,412,958 | |
| Total Investments in Securities | | $ | 28,294,628 | | | $ | 5,412,958 | | | $ | — | | | $ | 33,707,586 | |
For the year ended November 30, 2019, there have been no transfers in or out of Level 3.
The following is a summary of the Fund’s transactions with affiliates for the year ended November 30, 2019:
| | | Value at 11/30/2018 | | | Purchases at Cost | | | Proceeds from Sales | | | Changes in Unrealized Appreciation | | | Realized Gain | | | Value at 11/30/2019 | | | Shares | | | Dividend Income | |
Global X SuperDividend® REIT ETF | | $ | 3,686,838 | | | $ | 2,890,751 | | | $ | (359,237 | ) | | $ | 185,784 | | | $ | 18,976 | | | $ | 6,423,112 | | | | 419,203 | | | $ | 382,055 | |
| | |
| Schedule of Investments |
| November 30, 2019 |
Global X S&P 500® Quality Dividend ETF |
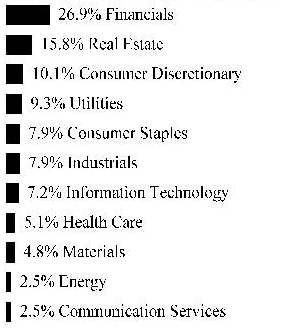
Sector Weightings (Unaudited)†:
† Sector weightings percentages are based on the total market value of investments.
| | | Shares | | | Value | |
| COMMON STOCK — 99.7% | | | | | | |
| UNITED KINGDOM— 1.5% | | | | | | |
| Real Estate — 1.5% | | | | | | |
Healthpeak Properties ‡ | | | 3,892 | | | $ | 135,753 | |
| UNITED STATES— 98.2% | | | | | | | | |
| Communication Services — 1.1% | | | | | | | | |
Viacom, Cl B | | | 4,254 | | | | 102,394 | |
| Consumer Discretionary — 13.5% | | | | | | | | |
Best Buy | | | 1,864 | | | | 150,313 | |
Carnival | | | 2,312 | | | | 104,225 | |
Darden Restaurants | | | 1,045 | | | | 123,770 | |
Garmin | | | 1,543 | | | | 150,736 | |
Genuine Parts | | | 1,193 | | | | 124,513 | |
Kohl’s | | | 2,617 | | | | 123,025 | |
Ralph Lauren, Cl A | | | 1,096 | | | | 117,645 | |
Target | | | 1,402 | | | | 175,264 | |
Tiffany | | | 1,374 | | | | 183,841 | |
Total Consumer Discretionary | | | | | | | 1,253,332 | |
| | | | | | | | | |
| | | | | | | | | |
| | | Shares | | | Value | |
| COMMON STOCK — continued | |
| Consumer Staples — 8.4% | | | | |
Archer-Daniels-Midland | | | 3,012 | | | $ | 129,305 | |
Coca-Cola | | | 2,437 | | | | 130,137 | |
Molson Coors Brewing, Cl B | | | 2,276 | | | | 114,892 | |
PepsiCo | | | 943 | | | | 128,088 | |
Procter & Gamble | | | 1,107 | | | | 135,120 | |
Walgreens Boots Alliance | | | 2,379 | | | | 141,788 | |
Total Consumer Staples | | | | | | | 779,330 | |
| Energy — 9.8% | | | | | |
Baker Hughes, Cl A | | | 5,644 | | | | 126,538 | |
Chevron | | | 1,018 | | | | 119,238 | |
Exxon Mobil | | | 1,683 | | | | 114,663 | |
HollyFrontier | | | 3,099 | | | | 159,754 | |
Occidental Petroleum | | | 2,492 | | | | 96,116 | |
Phillips 66 | | | 1,459 | | | | 167,377 | |
Schlumberger | | | 3,420 | | | | 123,804 | |
Total Energy | | | | | | | 907,490 | |
| Financials — 15.2% | | | | | |
American International Group | | | 2,345 | | | | 123,487 | |
Ameriprise Financial | | | 803 | | | | 131,588 | |
Bank of New York Mellon | | | 2,811 | | | | 137,655 | |
BlackRock, Cl A | | | 280 | | | | 138,574 | |
Fifth Third Bancorp | | | 4,566 | | | | 137,848 | |
Franklin Resources | | | 3,683 | | | | 101,246 | |
Huntington Bancshares | | | 9,362 | | | | 139,400 | |
Principal Financial Group | | | 2,238 | | | | 123,314 | |
Prudential Financial | | | 1,238 | | | | 115,902 | |
T Rowe Price Group | | | 1,162 | | | | 143,576 | |
Unum Group | | | 3,717 | | | | 114,261 | |
Total Financials | | | | | | | 1,406,851 | |
| Health Care — 8.7% | | | | | |
Amgen | | | 710 | | | | 166,652 | |
Bristol-Myers Squibb | | | 2,584 | | | | 147,132 | |
| | | Shares | | | Value | |
| COMMON STOCK — continued | |
| Health Care — continued | | | | |
Gilead Sciences | | | 1,885 | | | $ | 126,747 | |
Johnson & Johnson | | | 893 | | | | 122,779 | |
Merck | | | 1,510 | | | | 131,642 | |
Pfizer | | | 2,873 | | | | 110,668 | |
Total Health Care | | | | | | | 805,620 | |
| Industrials — 11.8% | | | | | |
3M
| | | 751 | | | | 127,497 | |
CH Robinson Worldwide | | | 1,494 | | | | 114,814 | |
Cummins | | | 763 | | | | 139,522 | |
Eaton | | | 1,571 | | | | 145,318 | |
Fastenal | | | 3,889 | | | | 138,137 | |
Illinois Tool Works | | | 826 | | | | 143,997 | |
Johnson Controls International | | | 3,080 | | | | 131,916 | |
Rockwell Automation | | | 799 | | | | 156,476 | |
Total Industrials | | | | | | | 1,097,677 | |
| Information Technology — 16.9% | | | | | |
Cisco Systems | | | 2,248 | | | | 101,857 | |
Corning | | | 3,975 | | | | 115,434 | |
Intel | | | 2,707 | | | | 157,141 | |
Juniper Networks | | | 4,612 | | | | 115,577 | |
KLA | | | 1,139 | | | | 186,637 | |
Lam Research | | | 706 | | | | 188,382 | |
NetApp | | | 2,014 | | | | 122,028 | |
Paychex | | | 1,420 | | | | 122,290 | |
QUALCOMM | | | 1,819 | | | | 151,977 | |
Seagate Technology | | | 2,825 | | | | 168,596 | |
Texas Instruments | | | 1,147 | | | | 137,881 | |
Total Information Technology | | | | | | | 1,567,800 | |
| Materials — 6.0% | | | | | |
Celanese, Cl A | | | 1,200 | | | | 150,684 | |
Dow | | | 2,402 | | | | 128,195 | |
Nucor | | | 2,418 | | | | 136,278 | |
| | | Shares | | | Value | |
| COMMON STOCK — continued | |
| Materials — continued | | | | |
Packaging Corp of America | | | 1,311 | | | $ | 146,701 | |
Total Materials | | | | | | | 561,858 | |
| Real Estate — 6.8% | | | | | |
Apartment Investment & Management, Cl A ‡ | | | 2,446 | | | | 131,521 | |
AvalonBay Communities ‡ | | | 601 | | | | 128,860 | |
Host Hotels & Resorts ‡ | | | 6,711 | | | | 117,375 | |
Kimco Realty ‡ | | | 6,677 | | | | 144,358 | |
Public Storage ‡ | | | 506 | | | | 106,604 | |
Total Real Estate | | | | | | | 628,718 | |
TOTAL UNITED STATES | | | | | | | 9,111,070 | |
| TOTAL COMMON STOCK | | | | | | | | |
(Cost $8,550,685) | | | | | | | 9,246,823 | |
| TOTAL INVESTMENTS — 99.7% | | | | | | | | |
(Cost $8,550,685) | | | | | | $ | 9,246,823 | |
Percentages are based on Net Assets of $9,278,206
| ‡ | Real Estate Investment Trust |
Cl — Class
As of November 30, 2019, all of the Fund’s investments were considered Level 1, in accordance with authoritative guidance on fair value measurements and disclosure under U.S. GAAP.
For the year ended November 30, 2019, there have been no transfers in or out of Level 3.
| | |
| Schedule of Investments |
| November 30, 2019 |
Global X TargetIncomeTM 5 ETF |
Sector Weightings (Unaudited)†:
† Sector weightings percentages are based on the total market value of investments.
| | | Shares | | | Value | |
| EXCHANGE TRADED FUNDS — 100.0% | | | | | | |
Global X SuperDividend® ETF (A) | | | 11,147 | | | $ | 191,394 | |
Global X U.S. Preferred ETF (A) | | | 9,676 | | | | 240,642 | |
| iShares 20+ Year Treasury Bond ETF | | | 820 | | | | 115,145 | |
SPDR Blackstone | | | 5,258 | | | | 243,077 | |
| VanEck Vectors J.P. Morgan EM Local Currency Bond ETF | | | 5,497 | | | | 181,126 | |
| Xtrackers USD High Yield Corporate Bond ETF | | | 4,817 | | | | 240,176 | |
| TOTAL EXCHANGE TRADED FUNDS | | | | | | | | |
(Cost $1,226,047) | | | | | | | 1,211,560 | |
| | | | | | | | | |
| TOTAL INVESTMENTS — 100.0% | | | | | | | | |
(Cost $1,226,047) | | | | | | $ | 1,211,560 | |
Percentages are based on Net Assets of $1,211,717.
| (A) | Affiliated investment. |
| ETF — Exchange Traded Fund |
| EM — Emerging Markets |
| SPDR — Standard & Poor’s Depository Receipts |
| USD — U.S. Dollar |
As of November 30, 2019, all of the Fund’s investments were considered Level 1, in accordance with authoritative guidance on fair value measurements and disclosure under U.S. GAAP.
For the year ended November 30, 2019, there have been no transfers in or out of Level 3.
| | |
| Schedule of Investments |
| November 30, 2019 |
Global X TargetIncomeTM 5 ETF |
The following is a summary of the transactions with affiliates for the year ended November 30, 2019:
| | | Value at 11/30/2018 | | | Purchases at Cost | | | Proceeds from Sales | | | Changes in Unrealized Appreciation | | | Realized Gain/Loss | | | Value at 11/30/2019 | | | Shares | | | Dividend Income | |
Global X SuperDividend® ETF | | $ | 459,486 | | | $ | 197,944 | | | $ | (420,115 | ) | | $ | 14,923 | | | $ | (60,844 | ) | | $ | 191,394 | | | | 11,147 | | | $ | 20,445 | |
Global X SuperDividend® U.S. ETF | | $ | 360,810 | | | $ | 67,667 | | | $ | (419,981 | ) | | $ | 10,499 | | | $ | (18,995 | ) | | $ | - | | | | - | | | $ | 12,024 | |
| Global X U.S. Preferred ETF | | $ | 462,559 | | | $ | 15,111 | | | $ | (269,419 | ) | | $ | 30,986 | | | $ | 1,405 | | | $ | 240,642 | | | | 9,676 | | | $ | 19,511 | |
| Totals: | | $ | 1,282,855 | | | $ | 280,722 | | | $ | (1,109,515 | ) | | $ | 56,408 | | | $ | (78,434 | ) | | $ | 432,036 | | | | 20,823 | | | $ | 51,980 | |
| | |
| Schedule of Investments |
| November 30, 2019 |
Global X TargetIncomeTM Plus 2 ETF |
Sector Weightings (Unaudited)†:
† Sector weightings percentages are based on the total market value of investments.
| | | Shares | | | Value | |
| EXCHANGE TRADED FUNDS — 100.0% | | | | | | |
Global X U.S. Preferred ETF (A) | | | 78,421 | | | $ | 1,950,330 | |
| iShares Core U.S. Aggregate Bond ETF | | | 17,161 | | | | 1,936,791 | |
Schwab US TIPS ETF | | | 25,577 | | | | 1,449,704 | |
SPDR Blackstone | | | 42,611 | | | | 1,969,907 | |
| VanEck Vectors J.P. Morgan EM Local Currency Bond ETF | | | 14,854 | | | | 489,439 | |
| Xtrackers USD High Yield Corporate Bond ETF | | | 39,035 | | | | 1,946,285 | |
| TOTAL EXCHANGE TRADED FUNDS | | | | | | | | |
(Cost $9,736,495) | | | | | | | 9,742,456 | |
| | | | | | | | | |
| TOTAL INVESTMENTS — 100.0% | | | | | | | | |
(Cost $9,736,495) | | | | | | $ | 9,742,456 | |
Percentages are based on Net Assets of $9,747,091.
| (A) | Affiliated investment. |
| ETF — Exchange Traded Fund |
| EM — Emerging Markets |
| SPDR — Standard & Poor’s Depository Receipts |
| TIPS — Treasury Inflation Protected Security |
| USD — U.S. Dollar |
As of November 30, 2019, all of the Fund’s investments were considered Level 1, in accordance with authoritative guidance on fair value measurements and disclosure under U.S. GAAP.
For the year ended November 30, 2019, there have been no transfers in or out of Level 3.
| | |
| Schedule of Investments |
| November 30, 2019 |
Global X TargetIncomeTM Plus 2 ETF |
The following is a summary of the transactions with affiliates for the year ended November 30, 2019:
| | | Value at 11/30/2018 | | | Purchases at Cost | | | Proceeds from Sales | | | Changes in Unrealized Appreciation | | | Realized Gain/Loss | | | Value at 11/30/2019 | | | Shares | | | Dividend Income | |
Global X SuperDividend® ETF | | $ | 459,620 | | | $ | 11,956 | | | $ | (431,321 | ) | | $ | 37,282 | | | $ | (77,537 | ) | | $ | - | | | | - | | | $ | 18,125 | |
| Global X U.S. Preferred ETF | | $ | 462,697 | | | $ | 1,732,651 | | | $ | (270,068 | ) | | $ | 24,855 | | | $ | 195 | | | $ | 1,950,330 | | | | 78,421 | | | $ | 27,415 | |
Global X SuperDividend® U.S. ETF | | $ | 120,050 | | | $ | 109,185 | | | $ | (232,121 | ) | | $ | 3,121 | | | $ | (235 | ) | | $ | - | | | | - | | | $ | 4,034 | |
| Totals: | | $ | 1,042,367 | | | $ | 1,853,792 | | | $ | (933,510 | ) | | $ | 65,258 | | | $ | (77,577 | ) | | $ | 1,950,330 | | | | 78,421 | | | $ | 49,574 | |
| | |
| Schedule of Investments |
| November 30, 2019 |
Global X Adaptive U.S. Factor ETF |
Sector Weightings (Unaudited)†:
† Sector weightings percentages are based on the total market value of investments.
| | | Shares | | | Value | |
| COMMON STOCK — 99.9% | | | | | | |
| UNITED KINGDOM— 0.3% | | | | | | |
| Real Estate — 0.3% | | | | | | |
Healthpeak Properties ‡ | | | 15,176 | | | $ | 529,339 | |
| UNITED STATES— 99.6% | | | | | | | | |
| Communication Services — 2.4% | | | | | | | | |
Altice USA, Cl A * | | | 10,575 | | | | 270,508 | |
AT&T | | | 31,976 | | | | 1,195,263 | |
Cable One | | | 155 | | | | 237,925 | |
Liberty Broadband, Cl C * | | | 497 | | | | 59,387 | |
Omnicom Group | | | 716 | | | | 56,908 | |
Snap, Cl A * | | | 38,529 | | | | 587,567 | |
T-Mobile US * | | | 766 | | | | 60,169 | |
Verizon Communications | | | 18,348 | | | | 1,105,284 | |
Viacom, Cl B | | | 33,914 | | | | 816,310 | |
Walt Disney | | | 419 | | | | 63,512 | |
Zynga, Cl A * | | | 26,241 | | | | 163,481 | |
Total Communication Services | | | | | | | 4,616,314 | |
| | | Shares | | | Value | |
| COMMON STOCK — continued | | | | | | |
| Consumer Discretionary — 10.1% | | | | | | |
AutoZone * | | | 986 | | | $ | 1,161,429 | |
Bright Horizons Family Solutions * | | | 2,415 | | | | 363,506 | |
Carnival | | | 16,918 | | | | 762,664 | |
Chipotle Mexican Grill, Cl A * | | | 1,271 | | | | 1,034,492 | |
| Cracker Barrel Old Country Store | | | 5,144 | | | | 790,839 | |
Dollar General | | | 7,134 | | | | 1,122,606 | |
Dunkin’ Brands Group | | | 735 | | | | 56,264 | |
Ford Motor | | | 80,817 | | | | 732,202 | |
Gap | | | 42,390 | | | | 704,098 | |
Garmin | | | 12,135 | | | | 1,185,468 | |
General Motors | | | 20,333 | | | | 731,988 | |
Genuine Parts | | | 528 | | | | 55,107 | |
Goodyear Tire & Rubber | | | 47,506 | | | | 759,621 | |
L Brands | | | 42,221 | | | | 808,110 | |
Macy’s | | | 47,506 | | | | 727,792 | |
McDonald’s | | | 5,255 | | | | 1,021,992 | |
NVR * | | | 118 | | | | 447,443 | |
PulteGroup | | | 8,475 | | | | 336,034 | |
Qurate Retail, Cl A * | | | 74,211 | | | | 702,036 | |
Starbucks | | | 44,859 | | | | 3,832,304 | |
Toll Brothers | | | 18,204 | | | | 731,255 | |
TopBuild * | | | 1,628 | | | | 179,536 | |
Yum! Brands | | | 9,280 | | | | 934,218 | |
Total Consumer Discretionary | | | | | | | 19,181,004 | |
| Consumer Staples — 7.9% | | | | | | | | |
Church & Dwight | | | 727 | | | | 51,064 | |
Coca-Cola | | | 17,654 | | | | 942,724 | |
Estee Lauder, Cl A | | | 6,386 | | | | 1,248,271 | |
Flowers Foods | | | 34,098 | | | | 734,130 | |
Hershey | | | 6,346 | | | | 940,223 | |
Keurig Dr Pepper | | | 1,988 | | | | 61,509 | |
Molson Coors Brewing, Cl B | | | 12,515 | | | | 631,757 | |
Mondelez International, Cl A | | | 44,457 | | | | 2,335,771 | |
| | | Shares | | | Value | |
| COMMON STOCK — continued | | | | | | |
| Consumer Staples — continued | | | | | | |
PepsiCo | | | 8,126 | | | $ | 1,103,755 | |
Performance Food Group * | | | 4,798 | | | | 225,794 | |
Procter & Gamble | | | 31,080 | | | | 3,793,625 | |
Sysco | | | 14,167 | | | | 1,141,152 | |
US Foods Holding * | | | 16,099 | | | | 640,257 | |
Walmart | | | 9,360 | | | | 1,114,682 | |
Total Consumer Staples | | | | | | | 14,964,714 | |
| Energy — 2.5% | | | | | | | | |
Baker Hughes, Cl A | | | 32,195 | | | | 721,812 | |
Chevron | | | 466 | | | | 54,583 | |
Exxon Mobil | | | 3,365 | | | | 229,257 | |
Marathon Oil | | | 61,981 | | | | 722,079 | |
Murphy Oil | | | 37,042 | | | | 852,336 | |
Occidental Petroleum | | | 17,343 | | | | 668,920 | |
Phillips 66 | | | 6,828 | | | | 783,308 | |
Tallgrass Energy, Cl A | | | 38,910 | | | | 696,878 | |
Total Energy | | | | | | | 4,729,173 | |
| Financials — 26.9% | | | | | | | | |
AGNC Investment ‡ | | | 63,901 | | | | 1,106,765 | |
Ally Financial | | | 24,161 | | | | 769,286 | |
American Financial Group | | | 7,189 | | | | 788,705 | |
Annaly Capital Management ‡ | | | 116,345 | | | | 1,085,499 | |
Arch Capital Group * | | | 16,112 | | | | 676,221 | |
Associated Banc-Corp | | | 36,048 | | | | 772,869 | |
Assured Guaranty | | | 16,009 | | | | 794,847 | |
Athene Holding, Cl A * | | | 17,729 | | | | 798,160 | |
AXA Equitable Holdings | | | 33,022 | | | | 816,964 | |
Bank OZK | | | 24,829 | | | | 736,925 | |
Blackstone Group, Cl A | | | 20,180 | | | | 1,094,160 | |
Blackstone Mortgage Trust, Cl A ‡ | | | 50,998 | | | | 1,868,057 | |
Brighthouse Financial * | | | 19,509 | | | | 802,990 | |
Capital One Financial | | | 8,024 | | | | 802,480 | |
| | | Shares | | | Value | |
| COMMON STOCK — continued | | | | | | |
| Financials — continued | | | | | | |
Chimera Investment ‡ | | | 39,755 | | | $ | 809,809 | |
Cincinnati Financial | | | 6,941 | | | | 743,034 | |
CIT Group | | | 16,729 | | | | 761,504 | |
Citigroup | | | 10,275 | | | | 771,858 | |
Citizens Financial Group | | | 20,691 | | | | 795,776 | |
CME Group, Cl A | | | 272 | | | | 55,143 | |
Comerica | | | 11,319 | | | | 796,971 | |
Erie Indemnity, Cl A | | | 748 | | | | 126,636 | |
Fifth Third Bancorp | | | 26,333 | | | | 794,993 | |
First Horizon National | | | 46,409 | | | | 746,257 | |
FNB | | | 61,167 | | | | 759,694 | |
Goldman Sachs Group | | | 3,523 | | | | 779,816 | |
Hancock Whitney | | | 18,495 | | | | 751,082 | |
Hanover Insurance Group | | | 5,595 | | | | 760,528 | |
Huntington Bancshares | | | 51,444 | | | | 766,001 | |
IBERIABANK | | | 10,045 | | | | 733,185 | |
Invesco | | | 43,079 | | | | 756,467 | |
Jefferies Financial Group | | | 38,973 | | | | 814,536 | |
KeyCorp | | | 40,835 | | | | 791,791 | |
Lincoln National | | | 12,043 | | | | 711,139 | |
MarketAxess Holdings | | | 1,225 | | | | 494,679 | |
MetLife | | | 15,992 | | | | 798,161 | |
MFA Financial ‡ | | | 244,996 | | | | 1,876,669 | |
Morgan Stanley | | | 16,214 | | | | 802,269 | |
Navient | | | 57,531 | | | | 825,570 | |
New Residential Investment ‡ | | | 47,053 | | | | 729,321 | |
Old Republic International | | | 31,130 | | | | 702,293 | |
PacWest Bancorp | | | 19,969 | | | | 743,646 | |
People’s United Financial | | | 43,941 | | | | 725,027 | |
PNC Financial Services Group | | | 5,087 | | | | 779,379 | |
Principal Financial Group | | | 12,983 | | | | 715,363 | |
Progressive | | | 10,883 | | | | 795,003 | |
Prudential Financial | | | 8,128 | | | | 760,943 | |
| | | Shares | | | Value | |
| COMMON STOCK — continued | | | | | | |
| Financials — continued | | | | | | |
Regions Financial | | | 45,726 | | | $ | 760,881 | |
Starwood Property Trust ‡ | | | 75,753 | | | | 1,855,949 | |
State Street | | | 11,293 | | | | 848,104 | |
Sterling Bancorp | | | 36,960 | | | | 754,723 | |
SunTrust Banks | | | 10,783 | | | | 763,868 | |
Synchrony Financial | | | 21,213 | | | | 793,578 | |
Synovus Financial | | | 21,572 | | | | 821,677 | |
TCF Financial | | | 19,680 | | | | 836,203 | |
Two Harbors Investment ‡ | | | 3,953 | | | | 57,477 | |
Umpqua Holdings | | | 45,921 | | | | 751,727 | |
United Bankshares | | | 18,786 | | | | 711,426 | |
Unum Group | | | 25,432 | | | | 781,780 | |
Valley National Bancorp | | | 64,228 | | | | 743,760 | |
Wells Fargo | | | 14,615 | | | | 795,933 | |
| White Mountains Insurance Group | | | 50 | | | | 55,346 | |
Willis Towers Watson | | | 4,178 | | | | 820,726 | |
WR Berkley | | | 4,828 | | | | 328,304 | |
Zions Bancorp | | | 15,529 | | | | 773,034 | |
Total Financials | | | | | | | 50,942,967 | |
| Health Care — 5.1% | | | | | | | | |
Arrowhead Pharmaceuticals * | | | 2,689 | | | | 196,324 | |
Chemed | | | 456 | | | | 196,089 | |
Danaher | | | 21,775 | | | | 3,178,714 | |
DENTSPLY SIRONA | | | 18,144 | | | | 1,025,862 | |
Eli Lilly | | | 513 | | | | 60,200 | |
Johnson & Johnson | | | 8,259 | | | | 1,135,530 | |
Medtronic | | | 558 | | | | 62,156 | |
Merck | | | 6,108 | | | | 532,495 | |
Pfizer | | | 27,455 | | | | 1,057,566 | |
Quest Diagnostics | | | 534 | | | | 56,898 | |
| Universal Health Services, Cl B | | | 381 | | | | 53,146 | |
Veeva Systems, Cl A * | | | 3,498 | | | | 521,832 | |
| | | | | | | | | |
| | | Shares | | | Value | |
| COMMON STOCK — continued | | | | | | |
| Health Care — continued | | | | | | |
Zoetis, Cl A | | | 12,267 | | | $ | 1,478,419 | |
Total Health Care | | | | | | | 9,555,231 | |
| Industrials — 7.9% | | | | | | | | |
Air Lease, Cl A | | | 16,873 | | | | 783,413 | |
Armstrong World Industries | | | 1,759 | | | | 168,899 | |
Cintas | | | 2,565 | | | | 659,359 | |
Copart * | | | 7,755 | | | | 690,195 | |
HEICO | | | 1,215 | | | | 157,816 | |
Ingersoll-Rand | | | 6,377 | | | | 836,089 | |
Johnson Controls International | | | 22,887 | | | | 980,250 | |
L3Harris Technologies | | | 274 | | | | 55,099 | |
Lockheed Martin | | | 2,993 | | | | 1,170,353 | |
Macquarie Infrastructure | | | 18,545 | | | | 777,963 | |
Mercury Systems * | | | 1,666 | | | | 122,035 | |
Northrop Grumman | | | 155 | | | | 54,524 | |
PACCAR | | | 9,910 | | | | 806,377 | |
Raytheon | | | 270 | | | | 58,703 | |
Republic Services, Cl A | | | 18,366 | | | | 1,628,146 | |
Ryder System | | | 13,843 | | | | 726,619 | |
TransDigm Group * | | | 1,759 | | | | 997,529 | |
Verisk Analytics, Cl A | | | 4,915 | | | | 724,864 | |
WABCO Holdings * | | | 8,277 | | | | 1,115,326 | |
Waste Management | | | 22,121 | | | | 2,497,682 | |
Total Industrials | | | | | | | 15,011,241 | |
| Information Technology — 7.2% | | | | | | | | |
Accenture, Cl A | | | 298 | | | | 59,946 | |
Alteryx, Cl A * | | | 1,799 | | | | 204,241 | |
Amdocs | | | 17,232 | | | | 1,194,178 | |
Anaplan * | | | 2,957 | | | | 159,441 | |
Automatic Data Processing | | | 342 | | | | 58,407 | |
Avalara * | | | 2,343 | | | | 182,824 | |
Black Knight * | | | 1,072 | | | | 67,547 | |
| | | Shares | | | Value | |
| COMMON STOCK — continued | | | | | | |
| Information Technology — continued | | | | | | |
| Booz Allen Hamilton Holding, Cl A | | | 3,984 | | | $ | 289,876 | |
Citrix Systems | | | 10,774 | | | | 1,215,415 | |
Coupa Software * | | | 1,841 | | | | 282,575 | |
Cypress Semiconductor | | | 11,665 | | | | 273,544 | |
DXC Technology | | | 26,606 | | | | 993,202 | |
Entegris | | | 4,599 | | | | 217,625 | |
Fair Isaac * | | | 719 | | | | 264,412 | |
| Fidelity National Information Services | | | 8,798 | | | | 1,215,444 | |
Genpact | | | 1,443 | | | | 58,730 | |
| International Business Machines | | | 409 | | | | 54,990 | |
Jack Henry & Associates | | | 6,940 | | | | 1,054,464 | |
Keysight Technologies * | | | 4,876 | | | | 521,878 | |
KLA | | | 5,572 | | | | 913,028 | |
Manhattan Associates * | | | 2,071 | | | | 172,949 | |
MAXIMUS | | | 733 | | | | 54,718 | |
Motorola Solutions | | | 324 | | | | 54,205 | |
Oracle | | | 1,015 | | | | 56,982 | |
Paychex | | | 13,285 | | | | 1,144,104 | |
Seagate Technology | | | 13,268 | | | | 791,834 | |
Teradyne | | | 5,278 | | | | 330,350 | |
VMware, Cl A * | | | 4,833 | | | | 752,112 | |
Xerox Holdings | | | 24,267 | | | | 944,714 | |
Total Information Technology | | | | | | | 13,583,735 | |
| Materials — 4.8% | | | | | | | | |
Air Products & Chemicals | | | 7,022 | | | | 1,659,509 | |
AptarGroup | | | 659 | | | | 73,887 | |
Ball | | | 14,239 | | | | 940,628 | |
Ecolab | | | 7,425 | | | | 1,386,025 | |
| LyondellBasell Industries, Cl A | | | 8,438 | | | | 780,852 | |
Martin Marietta Materials | | | 2,218 | | | | 595,311 | |
Newmont Goldcorp | | | 1,430 | | | | 54,912 | |
Nucor | | | 14,055 | | | | 792,140 | |
Olin | | | 40,325 | | | | 706,494 | |
| | | Shares | | | Value | |
| COMMON STOCK — continued | | | | | | |
| Materials — continued | | | | | | |
Royal Gold | | | 5,877 | | | $ | 689,196 | |
Sonoco Products | | | 943 | | | | 57,080 | |
Vulcan Materials | | | 4,246 | | | | 602,380 | |
Westrock | | | 19,460 | | | | 784,822 | |
Total Materials | | | | | | | 9,123,236 | |
| Real Estate — 15.5% | | | | | | | | |
American Tower, Cl A ‡ | | | 16,485 | | | | 3,528,284 | |
Americold Realty Trust ‡ | | | 7,388 | | | | 277,936 | |
Apple Hospitality REIT ‡ | | | 44,680 | | | | 726,497 | |
Brixmor Property Group ‡ | | | 35,382 | | | | 776,281 | |
CubeSmart ‡ | | | 1,595 | | | | 49,190 | |
EastGroup Properties ‡ | | | 1,182 | | | | 160,977 | |
EPR Properties ‡ | | | 9,362 | | | | 663,953 | |
Equinix ‡ | | | 2,521 | | | | 1,429,029 | |
Equity Commonwealth ‡ * | | | 51,743 | | | | 1,699,757 | |
Equity LifeStyle Properties ‡ | | | 18,777 | | | | 1,391,000 | |
Equity Residential ‡ | | | 13,456 | | | | 1,145,106 | |
Essex Property Trust ‡ | | | 2,257 | | | | 704,590 | |
Extra Space Storage ‡ | | | 4,667 | | | | 494,935 | |
First Industrial Realty Trust ‡ | | | 3,541 | | | | 150,776 | |
Host Hotels & Resorts ‡ | | | 44,176 | | | | 772,638 | |
Invitation Homes ‡ | | | 15,011 | | | | 458,286 | |
Kimco Realty ‡ | | | 35,012 | | | | 756,959 | |
Medical Properties Trust ‡ | | | 47,678 | | | | 989,795 | |
Mid-America Apartment Communities ‡ | | | 3,642 | | | | 495,713 | |
Omega Healthcare Investors ‡ | | | 5,687 | | | | 239,025 | |
Outfront Media ‡ | | | 4,488 | | | | 112,110 | |
Park Hotels & Resorts ‡ | | | 31,223 | | | | 738,424 | |
PS Business Parks ‡ | | | 766 | | | | 135,268 | |
Public Storage ‡ | | | 229 | | | | 48,246 | |
Realty Income ‡ | | | 9,135 | | | | 700,015 | |
Rexford Industrial Realty ‡ | | | 4,194 | | | | 200,725 | |
RLJ Lodging Trust ‡ | | | 44,100 | | | | 753,669 | |
| | | Shares | | | Value | |
| COMMON STOCK — continued | | | | | | |
| Real Estate — continued | | | | | | |
Sabra Health Care ‡ | | | 31,090 | | | $ | 692,685 | |
SBA Communications, Cl A ‡ | | | 4,149 | | | | 981,114 | |
Service Properties Trust ‡ | | | 28,409 | | | | 661,646 | |
Spirit Realty Capital ‡ | | | 15,212 | | | | 797,109 | |
STORE Capital ‡ | | | 6,363 | | | | 259,038 | |
Sun Communities ‡ | | | 4,876 | | | | 803,126 | |
Sunstone Hotel Investors ‡ | | | 53,553 | | | | 749,742 | |
Terreno Realty ‡ | | | 2,535 | | | | 146,320 | |
UDR ‡ | | | 7,165 | | | | 344,278 | |
VEREIT ‡ | | | 108,211 | | | | 1,056,139 | |
VICI Properties ‡ | | | 31,475 | | | | 778,377 | |
Weingarten Realty Investors ‡ | | | 25,286 | | | | 805,106 | |
Welltower ‡ | | | 13,563 | | | | 1,147,023 | |
WP Carey ‡ | | | 7,168 | | | | 597,955 | |
Total Real Estate | | | | | | | 29,418,842 | |
| Utilities — 9.3% | | | | | | | | |
Alliant Energy | | | 1,022 | | | | 54,166 | |
Ameren | | | 712 | | | | 52,923 | |
American Electric Power | | | 16,479 | | | | 1,505,357 | |
American States Water | | | 1,393 | | | | 118,809 | |
American Water Works | | | 6,344 | | | | 767,814 | |
Black Hills | | | 1,596 | | | | 122,206 | |
CenterPoint Energy | | | 1,854 | | | | 45,534 | |
CMS Energy | | | 9,149 | | | | 560,834 | |
Consolidated Edison | | | 585 | | | | 50,831 | |
DTE Energy | | | 424 | | | | 52,975 | |
Duke Energy | | | 2,935 | | | | 258,779 | |
Entergy | | | 8,532 | | | | 993,039 | |
Evergy | | | 983 | | | | 62,194 | |
Eversource Energy | | | 12,712 | | | | 1,050,520 | |
Exelon | | | 1,201 | | | | 53,324 | |
FirstEnergy | | | 15,058 | | | | 718,116 | |
Hawaiian Electric Industries | | | 26,505 | | | | 1,157,473 | |
| | | Shares | | | Value | |
| COMMON STOCK — continued | | | | | | |
| Utilities — continued | | | | | | |
National Fuel Gas | | | 1,204 | | | $ | 54,204 | |
NextEra Energy | | | 16,214 | | | | 3,791,157 | |
NorthWestern | | | 1,453 | | | | 103,991 | |
PNM Resources | | | 2,202 | | | | 106,687 | |
Portland General Electric | | | 2,279 | | | | 126,507 | |
PPL | | | 24,120 | | | | 820,804 | |
Southern | | | 46,848 | | | | 2,904,107 | |
WEC Energy Group | | | 11,395 | | | | 1,010,167 | |
Xcel Energy | | | 17,742 | | | | 1,090,956 | |
Total Utilities | | | | | | | 17,633,474 | |
TOTAL UNITED STATES | | | | | | | 188,759,931 | |
| TOTAL COMMON STOCK | | | | | | | | |
(Cost $179,778,614) | | | | | | | 189,289,270 | |
| TOTAL INVESTMENTS — 99.9% | | | | | | | | |
(Cost $179,778,614) | | | | | | $ | 189,289,270 | |
Percentages are based on Net Assets of $189,563,866.
| * | Non-income producing security. |
| ‡ | Real Estate Investment Trust |
| Cl — Class |
| REIT — Real Estate Investment Trust |
As of November 30, 2019, all of the Fund’s investments were considered Level 1, in accordance with authoritative guidance on fair value measurements and disclosure under U.S. GAAP.
For the year ended November 30, 2019, there have been no transfers in or out of Level 3.
| | |
Statements of Assets and Liabilities |
| |
|
| | | Global X MLP & Energy Infrastructure ETF | | | Global X U.S. Preferred ETF | | | Global X SuperDividend® Alternatives ETF | | | Global X S&P 500® Quality Dividend ETF | |
| Assets: | | | | | | | | | | | | |
| Cost of Investments | | $ | 674,724,620 | | | $ | 576,160,234 | | | $ | 22,453,854 | | | $ | 8,550,685 | |
| Cost of Repurchase Agreement | | | 23,982,327 | | | | 1,587,807 | | | | 5,412,958 | | | | — | |
| Cost of Affiliated Investments | | | — | | | | — | | | | 6,240,616 | | | | — | |
| Investments, at Value | | $ | 613,422,430 | * | | $ | 583,063,313 | * | | $ | 21,871,516 | * | | $ | 9,246,823 | |
| Repurchase Agreement, at Value | | | 23,982,327 | | | | 1,587,807 | | | | 5,412,958 | | | | — | |
| Affiliated Investments, at Value | | | — | | | | — | | | | 6,423,112 | | | | — | |
| Cash | | | 372,407 | | | | — | | | | 70,107 | | | | 9,278 | |
| Receivable for Investment Securities Sold | | | 28,622,810 | | | | — | | | | — | | | | — | |
| Receivable for Capital Shares Sold | | | 2,804,800 | | | | 6,210,124 | | | | — | | | | — | |
| Dividend and Interest Receivable | | | 960,372 | | | | 3,254,436 | | | | 74,460 | | | | 23,674 | |
| Due from Broker | | | — | | | | 17,220 | | | | — | | | | — | |
| Reclaim Receivable | | | 1,485 | | | | 300 | | | | — | | | | — | |
| Total Assets | | | 670,166,631 | | | | 594,133,200 | | | | 33,852,153 | | | | 9,279,775 | |
| Liabilities: | | | | | | | | | | | | | | | | |
| Obligation to Return Securities Lending Collateral | | | 25,796,220 | | | | 1,707,900 | | | | 5,822,365 | | | | — | |
| Payable for Investment Securities Purchased | | | 31,828,833 | | | | 6,178,487 | | | | — | | | | — | |
| Payable due to Investment Adviser | | | 219,720 | | | | 105,747 | | | | 17,696 | | | | 1,569 | |
| Due to Broker | | | 22,044 | | | | — | | | | — | | | | — | |
| Cash Overdraft | | | — | | | | 990,928 | | | | — | | | | — | |
| Total Liabilities | | | 57,866,817 | | | | 8,983,062 | | | | 5,840,061 | | | | 1,569 | |
| Net Assets | | $ | 612,299,814 | | | $ | 585,150,138 | | | $ | 28,012,092 | | | $ | 9,278,206 | |
| Net Assets Consist of: | | | | | | | | | | | | | | | | |
| Paid-in Capital | | $ | 789,845,134 | | | $ | 579,587,855 | | | $ | 28,394,322 | | | $ | 8,763,417 | |
| Total Distributable Earnings/(Loss) | | | (177,545,320 | ) | | | 5,562,283 | | | | (382,230 | ) | | | 514,789 | |
| Net Assets | | $ | 612,299,814 | | | $ | 585,150,138 | | | $ | 28,012,092 | | | $ | 9,278,206 | |
| Outstanding Shares of Beneficial Interest | | | | | | | | | | | | | | | | |
| (unlimited authorization — no par value) | | | 54,900,000 | | | | 23,600,000 | | | | 1,900,000 | | | | 350,002 | |
| Net Asset Value, Offering and Redemption Price Per Share | | $ | 11.15 | | | $ | 24.79 | | | $ | 14.74 | | | $ | 26.51 | |
| *Includes Market Value of Securities on Loan | | $ | 24,717,160 | | | $ | 1,668,103 | | | $ | 5,678,657 | | | $ | — | |
Amounts designated as “—” are either $0 or have been rounded to $0.
| | |
Statements of Assets and Liabilities |
| |
|
| | | Global X TargetIncomeTM 5 ETF | | | Global X TargetIncomeTM Plus 2 ETF | | | Global X Adaptive U.S. Factor ETF | |
| Assets: | | | | | | | | | |
| Cost of Investments | | $ | 772,941 | | | $ | 7,782,246 | | | $ | 179,778,614 | |
| Cost of Affiliated Investments | | | 453,106 | | | | 1,954,249 | | | | — | |
| Investments, at Value | | $ | 779,524 | | | $ | 7,792,126 | | | $ | 189,289,270 | |
| Affiliated Investments, at Value | | | 432,036 | | | | 1,950,330 | | | | — | |
| Cash | | | 546 | | | | 7,758 | | | | — | |
| Dividend and Interest Receivable | | | — | | | | — | | | | 357,177 | |
| Total Assets | | | 1,212,106 | | | | 9,750,214 | | | | 189,646,447 | |
| Liabilities: | | | | | | | | | | | | |
| Payable due to Investment Adviser | | | 389 | | | | 3,123 | | | | 41,257 | |
| Cash Overdraft | | | — | | | | — | | | | 41,324 | |
| Total Liabilities | | | 389 | | | | 3,123 | | | | 82,581 | |
| Net Assets | | $ | 1,211,717 | | | $ | 9,747,091 | | | $ | 189,563,866 | |
| Net Assets Consist of: | | | | | | | | | | | | |
| Paid-in Capital | | $ | 1,296,582 | | | $ | 9,793,364 | | | $ | 180,221,765 | |
| Total Distributable Earnings/(Loss) | | | (84,865 | ) | | | (46,273 | ) | | | 9,342,101 | |
| Net Assets | | $ | 1,211,717 | | | $ | 9,747,091 | | | $ | 189,563,866 | |
| Outstanding Shares of Beneficial Interest | | | | | | | | | | | | |
| (unlimited authorization — no par value) | | | 50,002 | | | | 400,002 | | | | 7,350,002 | |
| Net Asset Value, Offering and Redemption Price Per Share | | $ | 24.23 | | | $ | 24.37 | | | $ | 25.79 | |
Amounts designated as “—” are either $0 or have been rounded to $0.
| | |
|
| For the year ended November 30, 2019
|
|
| | | Global X MLP & Energy Infrastructure ETF | | | Global X U.S. Preferred ETF | | | Global X SuperDividend® Alternatives ETF | | | Global X S&P 500® Quality Dividend ETF | |
| Investment Income: | | | | | | | | | | | | |
| Dividend Income | | $ | 26,614,976 | | | $ | 19,073,836 | | | $ | 1,164,380 | | | $ | 218,904 | |
| Dividend Income, from Affiliated Investments | | | — | | | | — | | | | 382,055 | | | | — | |
| Interest Income | | | 12,196 | | | | 15,993 | | | | 439 | | | | — | |
| Security Lending Income | | | 127,977 | | | | 11,232 | | | | 45,742 | | | | — | |
| Less: Foreign Taxes Withheld | | | (1,411,870 | ) | | | (10,893 | ) | | | — | | | | (89 | ) |
| Total Investment Income | | | 25,343,279 | | | | 19,090,168 | | | | 1,592,616 | | | | 218,815 | |
Supervision and Administration Fees(1) | | | 3,271,799 | | | | 755,984 | | | | 167,135 | | | | 20,438 | |
Custodian Fees(2) | | | 6,516 | | | | 16,714 | | | | 508 | | | | 27 | |
| Total Expenses | | | 3,278,315 | | | | 772,698 | | | | 167,643 | | | | 20,465 | |
| Waiver of Supervision and Administration Fees | | | – | | | | – | | | | – | | | | (1,485 | ) |
| Net Expenses | | | 3,278,315 | | | | 772,698 | | | | 167,643 | | | | 18,980 | |
| Net Investment Income | | | 22,064,964 | | | | 18,317,470 | | | | 1,424,973 | | | | 199,835 | |
| Net Realized Gain (Loss) on: | | | | | | | | | | | | | | | | |
Investments(3) | | | (4,353,061 | ) | | | 1,226,274 | | | | 312,348 | | | | 197,625 | |
| Affiliated Investments | | | — | | | | — | | | | 18,976 | | | | — | |
| Net Realized Gain (Loss) on Investments | | | (4,353,061 | ) | | | 1,226,274 | | | | 331,324 | | | | 197,625 | |
| Net Change in Unrealized Appreciation (Depreciation) on: | | | | | | | | | | | | | | | | |
| Investments | | | (23,439,187 | ) | | | 16,220,217 | | | | (13,991 | ) | | | 740,007 | |
| Affiliated Investments | | | — | | | | — | | | | 185,784 | | | | — | |
| Net Change in Unrealized Appreciation (Depreciation) on Investments | | | (23,439,187 | ) | | | 16,220,217 | | | | 171,793 | | | | 740,007 | |
| Net Realized and Unrealized Gain (Loss) on Investments | | | (27,792,248 | ) | | | 17,446,491 | | | | 503,117 | | | | 937,632 | |
| Net Increase (Decrease) in Net Assets Resulting from Operations | | $ | (5,727,284 | ) | | $ | 35,763,961 | | | $ | 1,928,090 | | | $ | 1,137,467 | |
| (1) | The Supervision and Administration fees reflect the supervisory and administrative fee, which includes fees paid by the Funds for the investment advisory services provided by the Adviser. (See Note 3 in Notes to Financial Statements.) |
| (2) | See Note 2 in the Notes to Financial Statements. |
| (3) | Includes realized gains (losses) as a result of in-kind redemptions. (See Note 4 in Notes to Financial Statements.) |
Amounts designated as “—” are either $0 or have been rounded to $0.
| | |
|
| For the year ended November 30, 2019
|
|
| | | Global X TargetIncomeTM 5 ETF | | | Global X TargetIncomeTM Plus 2 ETF | | | Global X Adaptive U.S. Factor ETF | |
| Investment Income: | | | | | | | | | |
| Dividend Income | | $ | 52,856 | | | $ | 81,463 | | | $ | 5,745,032 | |
| Dividend Income, from Affiliated Investments | | | 51,980 | | | | 49,574 | | | | — | |
| Less: Foreign Taxes Withheld | | | — | | | | — | | | | (2,175 | ) |
| Total Investment Income | | | 104,836 | | | | 131,037 | | | | 5,742,857 | |
Supervision and Administration Fees(1) | | | 6,406 | | | | 10,725 | | | | 397,375 | |
| Tax Expense | | | 153 | | | | 126 | | | | — | |
Custodian Fees(2) | | | — | | | | — | | | | 3,203 | |
| Total Expenses | | | 6,559 | | | | 10,851 | | | | 400,578 | |
| Net Expenses | | | 6,559 | | | | 10,851 | | | | 400,578 | |
| Net Investment Income | | | 98,277 | | | | 120,186 | | | | 5,342,279 | |
| Net Realized Gain (Loss) on: | | | | | | | | | | | | |
Investments(3) | | | 3,046 | | | | 303 | | | | 1,114,850 | |
| Affiliated Investments | | | (78,434 | ) | | | (77,577 | ) | | | — | |
| Net Realized Gain (Loss) on Investments | | | (75,388 | ) | | | (77,274 | ) | | | 1,114,850 | |
| Net Change in Unrealized Appreciation on: | | | | | | | | | | | | |
| Investments | | | 47,763 | | | | 54,826 | | | | 10,482,959 | |
| Affiliated Investments | | | 56,408 | | | | 65,258 | | | | — | |
| Net Change in Unrealized Appreciation on Investments | | | 104,171 | | | | 120,084 | | | | 10,482,959 | |
| Net Realized and Unrealized Gain on Investments | | | 28,783 | | | | 42,810 | | | | 11,597,809 | |
| Net Increase in Net Assets Resulting from Operations | | $ | 127,060 | | | $ | 162,996 | | | $ | 16,940,088 | |
| (1) | The Supervision and Administration fees reflect the supervisory and administrative fee, which includes fees paid by the Funds for the investment advisory services provided by the Adviser. (See Note 3 in Notes to Financial Statements.) |
| (2) | See Note 2 in the Notes to Financial Statements. |
| (3) | Includes realized gains (losses) as a result of in-kind redemptions. (See Note 4 in Notes to Financial Statements.) |
Amounts designated as “—” are either $0 or have been rounded to $0.
| | |
Statements of Changes in Net Assets
|
| | | Global X MLP & Energy Infrastructure ETF | | | Global X U.S. Preferred ETF | |
| | | Year Ended November 30, 2019 | | | Year Ended November 30, 2018 | | | Year Ended November 30, 2019 | | | Year Ended November 30, 2018 | |
| Operations: | | | | | | | | | | | | |
| Net Investment Income | | $ | 22,064,964 | | | $ | 12,113,906 | | | $ | 18,317,470 | | | $ | 4,898,282 | |
Net Realized Gain (Loss) on Investments (1) | | | (4,353,061 | ) | | | (7,555,644 | ) | | | 1,226,274 | | | | (694,008 | ) |
| Net Change in Unrealized Appreciation (Depreciation) on Investments | | | (23,439,187 | ) | | | (19,778,970 | ) | | | 16,220,217 | | | | (9,302,641 | ) |
| Net Increase (Decrease) in Net Assets Resulting from Operations | | | (5,727,284 | ) | | | (15,220,708 | ) | | | 35,763,961 | | | | (5,098,367 | ) |
| Distributions | | | (40,058,250 | ) | | | (19,402,441 | ) | | | (17,959,180 | ) | | | (4,563,490 | ) |
| Return of Capital | | | (3,644,335 | ) | | | (4,853,774 | ) | | | — | | | | — | |
| Capital Share Transactions: | | | | | | | | | | | | | | | | |
| Issued | | | 494,176,845 | | | | 360,284,760 | | | | 435,976,798 | | | | 187,348,034 | |
| Redeemed | | | (372,827,734 | ) | | | (86,407,153 | ) | | | (56,945,881 | ) | | | (15,647,962 | ) |
| Increase in Net Assets from Capital Share Transactions | | | 121,349,111 | | | | 273,877,607 | | | | 379,030,917 | | | | 171,700,072 | |
| Total Increase in Net Assets | | | 71,919,242 | | | | 234,400,684 | | | | 396,835,698 | | | | 162,038,215 | |
| Net Assets: | | | | | | | | | | | | | | | | |
| Beginning of Year | | | 540,380,572 | | | | 305,979,888 | | | | 188,314,440 | | | | 26,276,225 | |
| End of Year | | $ | 612,299,814 | | | $ | 540,380,572 | | | $ | 585,150,138 | | | $ | 188,314,440 | |
| Share Transactions: | | | | | | | | | | | | | | | | |
| Issued | | | 40,550,000 | | | | 27,400,000 | | | | 17,750,000 | | | | 7,800,000 | |
| Redeemed | | | (30,200,000 | ) | | | (6,750,000 | ) | | | (2,350,000 | ) | | | (650,000 | ) |
| Net Increase in Shares Outstanding from Share Transactions | | | 10,350,000 | | | | 20,650,000 | | | | 15,400,000 | | | | 7,150,000 | |
| (1) | Includes realized gains (losses) as a result of in-kind redemptions. (See Note 4 in Notes to Financial Statements.) |
Amounts designated as “—” are either $0 or have been rounded to $0.
| | |
Statements of Changes in Net Assets
|
| | | Global X SuperDividend® Alternatives ETF | | | Global X S&P 500® Quality Dividend ETF | |
| | | Year Ended November 30, 2019 | | | Year Ended November 30, 2018 | | | Year Ended November 30, 2019 | | | Period Ended November 30, 2018(1) | |
| Operations: | | | | | | | | | | | | |
| Net Investment Income | | $ | 1,424,973 | | | $ | 866,273 | | | $ | 199,835 | | | $ | 25,456 | |
Net Realized Gain on Investments(2) | | | 331,324 | | | | 143,910 | | | | 197,625 | | | | 534 | |
| Net Change in Unrealized Appreciation (Depreciation) on Investments | | | 171,793 | | | | (808,145 | ) | | | 740,007 | | | | (43,869 | ) |
| Net Increase (Decrease) in Net Assets Resulting from Operations | | | 1,928,090 | | | | 202,038 | | | | 1,137,467 | | | | (17,879 | ) |
| Distributions | | | (1,722,480 | ) | | | (1,065,740 | ) | | | (188,336 | ) | | | (22,480 | ) |
| Capital Share Transactions: | | | | | | | | | | | | | | | | |
| Issued | | | 12,578,798 | | | | 6,778,230 | | | | 9,451,209 | | | | 2,500,050 | |
| Redeemed | | | (1,470,485 | ) | | | (765,122 | ) | | | (3,581,825 | ) | | | — | |
| Increase in Net Assets from Capital Share Transactions | | | 11,108,313 | | | | 6,013,108 | | | | 5,869,384 | | | | 2,500,050 | |
| Total Increase in Net Assets | | | 11,313,923 | | | | 5,149,406 | | | | 6,818,515 | | | | 2,459,691 | |
| Net Assets: | | | | | | | | | | | | | | | | |
| Beginning of Year | | | 16,698,169 | | | | 11,548,763 | | | | 2,459,691 | | | | — | |
| End of Year | | $ | 28,012,092 | | | $ | 16,698,169 | | | $ | 9,278,206 | | | $ | 2,459,691 | |
| Share Transactions: | | | | | | | | | | | | | | | | |
| Issued | | | 850,000 | | | | 450,000 | | | | 400,000 | | | | 100,002 | |
| Redeemed | | | (100,000 | ) | | | (50,000 | ) | | | (150,000 | ) | | | — | |
| Net Increase in Shares Outstanding from Share Transactions | | | 750,000 | | | | 400,000 | | | | 250,000 | | | | 100,002 | |
| (1) | The Fund commenced operations on July 13, 2018. |
| (2) | Includes realized gains (losses) as a result of in-kind redemptions. (See Note 4 in Notes to Financial Statements.) |
Amounts designated as “—” are either $0 or have been rounded to $0.
| | |
Statements of Changes in Net Assets
|
| | | Global X TargetIncomeTM 5 ETF | | | Global X TargetIncomeTM Plus 2 ETF | |
| | | Year Ended November 30, 2019 | | | Period Ended November 30, 2018(1) | | | Year Ended November 30, 2019 | | | Period Ended November 30, 2018(1) | |
| Operations: | | | | | | | | | | | | |
| Net Investment Income | | $ | 98,277 | | | $ | 46,577 | | | $ | 120,186 | | | $ | 45,916 | |
Net Realized Gain (Loss) on Investments(2) | | | (75,388 | ) | | | 1,455 | | | | (77,274 | ) | | | 593 | |
| Net Change in Unrealized Appreciation (Depreciation) on Investments | | | 104,171 | | | | (118,658 | ) | | | 120,084 | | | | (114,123 | ) |
| Net Increase (Decrease) in Net Assets Resulting from Operations | | | 127,060 | | | | (70,626 | ) | | | 162,996 | | | | (67,614 | ) |
| Distributions | | | (106,201 | ) | | | (33,991 | ) | | | (129,966 | ) | | | (33,891 | ) |
| Capital Share Transactions: | | | | | | | | | | | | | | | | |
| Issued | | | — | | | | 2,500,050 | | | | 8,525,580 | | | | 2,500,050 | |
| Redeemed | | | (1,204,575 | ) | | | — | | | | (1,210,064 | ) | | | — | |
| Increase (Decrease) in Net Assets from Capital Share Transactions | | | (1,204,575 | ) | | | 2,500,050 | | | | 7,315,516 | | | | 2,500,050 | |
| Total Increase (Decrease) in Net Assets | | | (1,183,716 | ) | | | 2,395,433 | | | | 7,348,546 | | | | 2,398,545 | |
| Net Assets: | | | | | | | | | | | | | | | | |
| Beginning of Year | | | 2,395,433 | | | | — | | | | 2,398,545 | | | | — | |
| End of Year | | $ | 1,211,717 | | | $ | 2,395,433 | | | $ | 9,747,091 | | | $ | 2,398,545 | |
| Share Transactions: | | | | | | | | | | | | | | | | |
| Issued | | | — | | | | 100,002 | | | | 350,000 | | | | 100,002 | |
| Redeemed | | | (50,000 | ) | | | — | | | | (50,000 | ) | | | — | |
| Net Increase (Decrease) in Shares Outstanding from Share Transactions | | | (50,000 | ) | | | 100,002 | | | | 300,000 | | | | 100,002 | |
| (1) | The Fund commenced operations on July 27, 2018 |
| (2) | Includes realized gains (losses) as a result of in-kind redemptions. (See Note 4 in Notes to Financial Statements.) |
Amounts designated as “—” are either $0 or have been rounded to $0.
| | |
Statements of Changes in Net Assets
|
| | | Global X Adaptive U.S. Factor ETF | |
| | | Year Ended November 30, 2019 | | | Period Ended November 30, 2018(1) | |
| Operations: | | | | | | |
| Net Investment Income | | $ | 5,342,279 | | | $ | 560,116 | |
Net Realized Gain (Loss) on Investments(2) | | | 1,114,850 | | | | (49,533 | ) |
| Net Change in Unrealized Appreciation (Depreciation) on Investments | | | 10,482,959 | | | | (972,303 | ) |
| Net Increase (Decrease) in Net Assets Resulting from Operations | | | 16,940,088 | | | | (461,720 | ) |
| Distributions | | | (6,134,537 | ) | | | (662,778 | ) |
| Return of Capital | | | — | | | | (101,182 | ) |
| Capital Share Transactions: | | | | | | | | |
| Issued | | | 80,979,739 | | | | 103,663,213 | |
| Redeemed | | | (4,658,957 | ) | | | — | |
| Increase in Net Assets from Capital Share Transactions | | | 76,320,782 | | | | 103,663,213 | |
| Total Increase in Net Assets | | | 87,126,333 | | | | 102,437,533 | |
| Net Assets: | | | | | | | | |
| Beginning of Year | | | 102,437,533 | | | | — | |
| End of Year | | $ | 189,563,866 | | | $ | 102,437,533 | |
| Share Transactions: | | | | | | | | |
| Issued | | | 3,350,000 | | | | 4,200,002 | |
| Redeemed | | | (200,000 | ) | | | — | |
| Net Increase in Shares Outstanding from Share Transactions | | | 3,150,000 | | | | 4,200,002 | |
| (1) | The Fund commenced operations on August 24, 2018 |
| (2) | Includes realized gains (losses) as a result of in-kind redemptions. (See Note 4 in Notes to Financial Statements.) |
Amounts designated as “—” are either $0 or have been rounded to $0.
Selected Per Share Data & Ratios
For a Share Outstanding Throughout the Period
| | | Net Asset Value, Beginning of Period ($) | | | Net Investment Income ($)* | | | Net Realized and Unrealized Gain (Loss) on Investments ($) | | | Total from Operations ($) | | | Distribution from Net Investment Income ($) | | | Distribution from Capital Gains ($) | |
| Global X MLP & Energy Infrastructure ETF | | | | | | | | | | | | | | | | | | |
| 2019 | | | 12.13 | | | | 0.38 | | | | (0.63 | ) | | | (0.25 | ) | | | (0.67 | ) | | | — | |
| 2018 | | | 12.80 | | | | 0.35 | | | | (0.37 | ) | | | (0.02 | ) | | | (0.52 | ) | | | — | |
| 2017 | | | 14.82 | | | | 0.31 | | | | (1.54 | ) | | | (1.23 | ) | | | (0.72 | ) | | | — | |
| 2016 | | | 13.47 | | | | 0.36 | | | | 1.59 | | | | 1.95 | | | | (0.60 | ) | | | — | |
| 2015 | | | 18.92 | | | | 0.27 | | | | (5.15 | ) | | | (4.88 | ) | | | (0.33 | ) | | | — | |
| Global X U.S. Preferred ETF | | | | | | | | | | | | | | | | | | | | | | | | |
| 2019 | | | 22.97 | | | | 1.36 | | | | 1.83 | | | | 3.19 | | | | (1.37 | ) | | | — | |
| 2018 | | | 25.03 | | | | 1.44 | | | | (2.08 | ) | | | (0.64 | ) | | | (1.42 | ) | | | — | |
2017(1) | | | 25.08 | | | | 0.44 | | | | (0.25 | ) | | | 0.19 | | | | (0.24 | ) | | | — | |
Global X SuperDividend® Alternatives ETF | | | | | | | | | | | | | | | | | | | | | | | | |
| 2019 | | | 14.52 | | | | 0.94 | | | | 0.44 | | | | 1.38 | | | | (1.07 | ) | | | (0.09 | ) |
| 2018 | | | 15.40 | | | | 0.92 | | | | (0.64 | ) | | | 0.28 | | | | (1.16 | ) | | | — | |
| 2017 | | | 14.65 | | | | 1.04 | | | | 0.85 | | | | 1.89 | | | | (1.01 | ) | | | — | |
| 2016 | | | 14.43 | | | | 0.99 | #
| | | 0.53 | ^
| | | 1.52 | | | | (1.15 | ) | | | — | |
2015(2) | | | 15.04 | | | | 0.45 | | | | (0.76 | ) | | | (0.31 | ) | | | (0.30 | ) | | | — | |
| Return of Capital ($) | | | Total from Distributions ($) | | | Net Asset Value, End of Period ($) | | | Total Return (%)** | | | Net Assets End of Period ($)(000) | | | Ratio of Expenses to Average Net Assets (%) | | | Ratio of Net Investment Income to Average Net Assets (%) | | | Portfolio Turnover (%)†† | |
| | | | | | | | | | | | | | | | | | | | | | | |
| | (0.06 | ) | | | (0.73 | ) | | | 11.15 | | | | (2.34 | ) | | | 612,300 | | | | 0.45 | | | | 3.03 | | | | 36.57 | |
| | (0.13 | ) | | | (0.65 | ) | | | 12.13 | | | | (0.43 | ) | | | 540,381 | | | | 0.45 | | | | 2.65 | | | | 25.68 | |
| | (0.07 | ) | | | (0.79 | ) | | | 12.80 | | | | (8.71 | ) | | | 305,980 | | | | 0.45 | | | | 2.20 | | | | 40.42 | |
| | — | | | | (0.60 | ) | | | 14.82 | | | | 15.45 | | | | 130,451 | | | | 0.45 | | | | 2.79 | | | | 56.14 | |
| | (0.24 | ) | | | (0.57 | ) | | | 13.47 | | | | (26.30 | ) | | | 97,682 | | | | 0.45 | | | | 1.56 | | | | 33.36 | |
| | | | | | | | | | | | | | | | | | | | | | | | | | | | | | | |
| | — | | | | (1.37 | ) | | | 24.79 | | | | 14.25 | | | | 585,150 | | | | 0.24 | | | | 5.57 | | | | 32.93 | |
| | — | | | | (1.42 | ) | | | 22.97 | | | | (2.72 | ) | | | 188,314 | | | | 0.23 | | | | 5.98 | | | | 42.90 | |
| | — | | | | (0.24 | ) | | | 25.03 | | | | 0.75 | | | | 26,276 | | | | 0.23 | † | | | 8.01 | † | | | 3.82 | |
| | | | | | | | | | | | | | | | | | | | | | | | | | | | | | | |
| | — | | | | (1.16 | ) | | | 14.74 | | | | 9.89 | | | | 28,012 | | | | 0.75 | | | | 6.39 | | | | 18.16 | |
| | — | | | | (1.16 | ) | | | 14.52 | | | | 1.89 | | | | 16,698 | | | | 0.75 | | | | 6.19 | | | | 18.32 | |
| | (0.13 | ) | | | (1.14 | ) | | | 15.40 | | | | 13.24 | | | | 11,549 | | | | 0.75 | | | | 6.75 | | | | 34.84 | |
| | (0.15 | ) | | | (1.30 | ) | | | 14.65 | | | | 11.04 | | | | 5,127 | | | | 0.75 | | | | 6.78 | | | | 30.80 | |
| | — | | | | (0.30 | ) | | | 14.43 | | | | (2.02 | ) | | | 1,443 | | | | 0.75 | † | | | 8.04 | † | | | 21.50 | |
| * | Per share data calculated using average shares method. |
| ** | Total Return is for the period indicated and has not been annualized. The return shown does not reflect the deduction of taxes that a shareholder would pay on Fund distributions or the redemption of Fund shares. |
| # | Effective November 1, 2015, the Fund changed its method for estimating the characterization of amounts distributed by master limited partnerships, which correspondingly impacted the financial highlight ratios and per share disclosures to the extent that the fund recorded investment income that differed from amounts previously estimated. |
| ^ | The amount shown for a share outstanding throughout the period does not accord with the aggregate net gains on investments for the period because of the sales and repurchases of fund shares in relation to fluctuating market value of the investments of the Fund. |
| † | Annualized. |
| †† | Portfolio turnover rate is for the period indicated and periods of less than one year have not been annualized. Excludes effect of in-kind transfers. |
| (1) | The Fund commenced operations on September 11, 2017. |
| (2) | The Fund commenced operations on July 13, 2015. |
Amounts designated as “—” are either $0 or have been rounded to $0.
Selected Per Share Data & Ratios
For a Share Outstanding Throughout the Period
| | | Net Asset Value, Beginning of Period ($) | | | Net Investment Income ($)* | | | Net Realized and Unrealized Gain (Loss) on Investments ($) | | | Total from Operations ($) | | | Distribution from Net Investment Income ($) | |
Global X S&P 500® Quality Dividend ETF | | | | | | | | | | | | | | | |
| 2019 | | | 24.60 | | | | 0.75 | | | | 1.89 | | | | 2.64 | | | | (0.73 | ) |
2018(1) | | | 25.00 | | | | 0.26 | | | | (0.44 | ) | | | (0.18 | ) | | | (0.22 | ) |
Global X TargetIncomeTM 5 ETF | | | | | | | | | | | | | | | | | | | | |
| 2019 | | | 23.95 | | | | 1.43 | | | | 0.30 | | | | 1.73 | | | | (1.44 | ) |
2018(2) | | | 25.00 | | | | 0.48 | | | | (1.19 | ) | | | (0.71 | ) | | | (0.34 | ) |
Global X TargetIncomeTM Plus 2 ETF | | | | | | | | | | | | | | | | | | | | |
| 2019 | | | 23.98 | | | | 1.06 | | | | 0.67 | | | | 1.73 | | | | (1.33 | ) |
2018(2) | | | 25.00 | | | | 0.47 | | | | (1.15 | ) | | | (0.68 | ) | | | (0.34 | ) |
| Global X Adaptive U.S. Factor ETF | | | | | | | | | | | | | | | | | | | | |
| 2019 | | | 24.39 | | | | 0.89 | | | | 1.53 | | | | 2.42 | | | | (1.02 | ) |
2018(3) | | | 25.00 | | | | 0.22 | | | | (0.61 | ) | | | (0.39 | ) | | | (0.19 | ) |
| Distribution from Capital Gains ($) | | | Return of Capital ($) | | | Total from Distributions ($) | | | Net Asset Value, End of Period ($) | | | Total Return (%)** | | | Net Assets End of Period ($)(000) | | | Ratio of Expenses to Average Net Assets (%) | | | Ratio of Net Investment Income to Average Net Assets (%) | | | Portfolio Turnover (%)†† | |
| | | | | | | | | | | | | | | | | | | | | | | | | | |
| | — | | | | — | | | | (0.73 | ) | | | 26.51 | | | | 11.01 | | | | 9,278 | | | | 0.28 | ‡ | | | 2.99 | | | | 49.18 | |
| | — | | | | — | | | | (0.22 | ) | | | 24.60 | | | | (0.72 | ) | | | 2,460 | | | | 0.36 | † | | | 2.70 | † | | | 1.18 | |
| | | | | | | | | | | | | | | | | | | | | | | | | | | | | | | | | | | |
| | (0.01 | ) | | | — | | | | (1.45 | ) | | | 24.23 | | | | 7.54 | | | | 1,212 | | | | 0.40 | | | | 5.98 | | | | 63.30 | |
| | — | | | | — | | | | (0.34 | ) | | | 23.95 | | | | (2.86 | ) | | | 2,395 | | | | 0.39 | † | | | 5.65 | † | | | 16.00 | |
| | | | | | | | | | | | | | | | | | | | | | | | | | | | | | | | | | | |
| | (0.01 | ) | | | — | | | | (1.34 | ) | | | 24.37 | | | | 7.44 | | | | 9,747 | | | | 0.39 | | | | 4.37 | | | | 31.54 | |
| | — | | | | — | | | | (0.34 | ) | | | 23.98 | | | | (2.74 | ) | | | 2,399 | | | | 0.39 | † | | | 5.57 | † | | | 11.11 | |
| | | | | | | | | | | | | | | | | | | | | | | | | | | | | | | | | | | |
| | — | ^
| | | — | | | | (1.02 | ) | | | 25.79 | | | | 10.27 | | | | 189,564 | | | | 0.27 | | | | 3.63 | | | | 112.43 | |
| | — | | | | (0.03 | ) | | | (0.22 | ) | | | 24.39 | | | | (1.58 | ) | | | 102,438 | | | | 0.27 | † | | | 3.31 | † | | | 28.89 | |
| * | Per share data calculated using average shares method. |
| ** | Total Return is for the period indicated and has not been annualized. The return shown does not reflect the deduction of taxes that a shareholder would pay on Fund distributions or the redemption of Fund shares. |
| † | Annualized. |
| †† | Portfolio turnover rate is for the period indicated and periods of less than one year have not been annualized. Excludes effect of in-kind transfers. |
| ‡ | Effective April 1, 2019, the Fund’s fees were permanently lowered to 0.20%. Prior to April 1, 2019, the ratio of Expenses to Average Net Assets included the effect of a waiver. If these offsets were excluded, the ratio would have been 0.31% and 0.35%, for the years ended November 30, 2019 and 2018, respectively. |
| (1) | The Fund commenced operations on July 13, 2018. |
| (2) | The Fund commenced operations on July 27, 2018. |
| (3) | The Fund commenced operations on August 24, 2018. |
| ^ | Amount is less than $0.005. |
| | |
Notes to Financial Statements |
| |
|
1. ORGANIZATION
The Global X Funds (the “Trust”) is a Delaware statutory trust formed on March 6, 2008. The Trust is registered under the Investment Company Act of 1940, as amended, as an open-end management investment company. As of November 30, 2019, the Trust had eighty portfolios, seventy-two of which were operational. The financial statements herein and the related notes pertain to the Global X MLP & Energy Infrastructure ETF, Global X U.S. Preferred ETF, Global X SuperDividend® Alternatives ETF, Global X S&P 500® Quality Dividend ETF, Global X TargetIncomeTM 5 ETF, Global X TargetIncomeTM Plus 2 ETF, and Global X Adaptive U.S. Factor ETF (each a “Fund” and collectively, the “Funds”). Each Fund, other than the Global X SuperDividend® Alternatives ETF, has elected non-diversified status.
2. SIGNIFICANT ACCOUNTING POLICIES
The following is a summary of the significant accounting policies followed by the Funds:
USE OF ESTIMATES – The Funds are investment companies that apply the accounting and reporting guidance issued in Topic 946 by the U.S. Financial Accounting Standards Board. The preparation of financial statements in conformity with U.S. generally accepted accounting principles (“U.S. GAAP”) requires management to make estimates and assumptions that affect the reported amounts of assets and liabilities and disclosure of contingent assets and liabilities at the date of the financial statements and the reported amounts of increases and decreases in net assets from operations during the reporting period. Actual results could materially differ from those estimates.
RETURN OF CAPITAL ESTIMATES – Distributions received by the Funds from underlying master limited partnership (“MLP”) and real estate investment trust (“REIT”) investments generally are comprised of income and return of capital. The Funds record investment income and return of capital based on estimates made at the time such distributions are received. Such estimates are based on historical information available from the MLPs, REITs and other industry sources. These estimates may subsequently be revised based on information received from the MLPs and REITs after their tax reporting periods are concluded.
MLPs – Certain Funds may invest in MLPs in addition to other exchange-traded securities. MLPs are publicly-traded partnerships engaged in the transportation, storage and processing of minerals and natural resources. By confining their operations to these specific activities, their interests, or units, are able to trade on public securities exchanges exactly like the shares of a corporation, without entity-level taxation. To qualify as an MLP, and to not be taxed as a corporation, a partnership must receive at least 90% of its income from qualifying sources as set forth in Section 7704(d) of the Internal Revenue Code of 1986, as amended (the “Code”). These qualifying sources include natural resource-based activities, such as the processing, transportation and storage of mineral or natural resources. MLPs generally have two classes of owners, the general partner and
2. SIGNIFICANT ACCOUNTING POLICIES (continued)
limited partners. The general partner of an MLP is typically owned by a major energy company, an investment fund, the direct management of the MLP, or is an entity owned by one or more of such parties. The general partner may be structured as a private or publicly-traded corporation or other entity. The general partner typically controls the operations and management of the MLP through an up to 2% equity interest in the MLP plus, in many cases, ownership of common units and subordinated units.
Limited partners typically own the remainder of the partnership, through ownership of common units, and have a limited role in the partnership’s operations and management. MLPs are typically structured such that common units and general partner interests have first priority to receive quarterly cash distributions up to an established minimum amount (“minimum quarterly distributions” or “MQD”). Common and general partner interests also accrue arrearages in distributions to the extent the MQD is not paid. Once common and general partner interests have been paid, subordinated units receive distributions of up to the MQD; however, subordinated units do not accrue arrearages. Distributable cash in excess of the MQD is paid to both common and subordinated units and is distributed to both common and subordinated units generally on a pro rata basis. The general partner is also eligible to receive incentive distributions if the general partner operates the business in a manner which results in distributions paid per common unit surpassing specified target levels. As the general partner increases cash distributions to the limited partners, the general partner receives an increasingly higher percentage of the incremental cash distributions.
SECURITY VALUATION – Securities listed on a securities exchange, market or automated quotation system for which quotations are readily available (except for securities traded on the NASDAQ Stock Market (“NASDAQ”)), including securities traded over the counter, are valued at the last quoted sale price on the primary exchange or market (foreign or domestic) on which they are traded (or at approximately 4:00 pm if a security’s primary exchange is normally open at that time), or, if there is no such reported sale, at the most recent mean between the quoted bid and asked prices (absent both bid and asked prices on such exchange, the bid price may be used).
For securities traded on NASDAQ, the NASDAQ Official Closing Price will be used. If available, debt securities are priced based upon valuations provided by independent, third-party pricing agents. Such values generally reflect the last reported sales price if the security is actively traded. The third-party pricing agents may also value debt securities at an evaluated bid price by employing methodologies that utilize actual market transactions, broker-supplied valuations, or other methodologies designed to identify the market value for such securities. Debt obligations with remaining maturities of sixty days or less will be valued at their market value. Prices for most securities held in the Funds are provided daily by recognized independent pricing agents. If a security price cannot be obtained from an independent, third-party pricing agent, the Funds seek to obtain a bid
2. SIGNIFICANT ACCOUNTING POLICIES (continued)
price from at least one independent broker. The prices for foreign securities are reported in local currency and converted to U.S. dollars using currency exchange rates as of the reporting date. The exchange rates used by the Trust for valuation are captured as of the New York or London close each day.
Securities for which market prices are not “readily available” are valued in accordance with Fair Value Procedures established by the Board of Trustees (the “Board”). The Funds’ Fair Value Procedures are implemented through a fair value committee (the “Committee”) designated by the Board. Some of the more common reasons that may necessitate that a security be valued using the Fair Value Procedures include: the security’s trading has been halted or suspended; the security has been de-listed from its primary trading exchange; the security’s primary trading market is temporarily closed at a time when, under normal conditions, it would be open; the security has not been traded for an extended period of time; the security’s primary pricing source is not able or willing to provide a price; or trading of the security is subject to local government-imposed restrictions. In addition, the Funds may fair value their securities if an event that may materially affect the value of the Funds’ securities that traded outside of the United States (a “Significant Event”) has occurred between the time of the securities’ last close and the time that the Funds calculate their net asset values. A Significant Event may relate to a single issuer or to an entire market sector. Events that may be Significant Events include: government actions, natural disasters, armed conflict, acts of terrorism and significant market fluctuations. If Global X Management Company LLC, the Funds’ investment adviser (the “Adviser”), becomes aware of a Significant Event that has occurred with respect to a security or group of securities after the closing of the exchange or market on which the security or securities principally trade, but before the time at which the Funds calculate their net asset values, it may request that a Committee meeting be called. When a security is valued in accordance with the Fair Value Procedures, the Committee will determine the value after taking into consideration all relevant information reasonably available to the Committee. As of November 30, 2019, there were no securities priced using the Fair Value Procedures.
In accordance with the authoritative guidance on fair value measurements and disclosure under U.S. GAAP, the Funds disclose the fair value of their investments in a hierarchy that prioritizes the inputs to valuation techniques used to measure the fair value. The objective of a fair value measurement is to determine the price that would be received to sell an asset or paid to transfer a liability in an orderly transaction between market participants at the measurement date (an exit price). Accordingly, the fair value hierarchy gives the highest priority to quoted prices (unadjusted) in active markets for identical assets or liabilities (Level 1) and the lowest priority to unobservable inputs (Level 3). The three levels of the fair value hierarchy are described below:
Level 1 – Unadjusted quoted prices in active markets for identical, unrestricted assets or liabilities that the Funds have the ability to access at the measurement date;
2. SIGNIFICANT ACCOUNTING POLICIES (continued)
Level 2 – Other significant observable inputs (including quoted prices in non-active markets, quoted prices for similar investments and fair value of investments for which the
Funds have the ability to fully redeem tranches at net asset value as of the measurement date or within the near term, and short-term investments valued at amortized cost); and
Level 3 – Significant unobservable inputs (including the Funds’ own assumptions in determining the fair value of investments, and fair value of investments for which the Funds do not have the ability to fully redeem tranches at net asset value as of the measurement date or within the near term).
Investments are classified within the level of the lowest significant input considered in determining fair value. Investments classified within Level 3 whose fair value measurement considers several inputs may include Level 1 or Level 2 inputs as components of the overall fair value measurement.
For the period ended November 30, 2019, there have been no significant changes to the Funds’ fair valuation methodologies.
REPURCHASE AGREEMENTS – Securities pledged as collateral for repurchase agreements by RBC Capital Markets are held by Brown Brothers Harriman & Co. (“BBH”), the Funds’ custodian (“Custodian”) and are designated as being held on each Fund’s behalf by its custodian under a book-entry system. Each Fund monitors the adequacy of the collateral on a daily basis and can require the seller to provide additional collateral in the event the market value of the securities pledged falls below the carrying value of the repurchase agreement, including accrued interest.
It is the Funds’ policy to only enter into repurchase agreements with banks and other financial institutions which are deemed by the Adviser to be creditworthy. The Funds bear the risk of loss in the event that the other party to a repurchase agreement defaults on its obligations, and the Funds are prevented from exercising their rights to dispose of the underlying securities received as collateral and the risk of a possible decline in the value of the underlying securities during the period.
Repurchase agreements are entered into by the Funds under Master Repurchase Agreements (“MRA”) which permit the Funds, under certain circumstances, including an event of default (such as bankruptcy or insolvency), to offset payables and/or receivables under an MRA with collateral held and/or posted to the counterparty, and create one single net payment due to or from the Funds.
2. SIGNIFICANT ACCOUNTING POLICIES (continued)
As of November 30, 2019, the open repurchase agreements by counterparty which are subject to an MRA on a net payment basis are as follows:
| | | Repurchase Agreements | | | Fair Value of Non-cash Collateral Received(1) | | | Cash Collateral Received | | | Net Amount(2) | |
| Global X MLP & Energy Infrastructure ETF | | | | | | | | | | | | |
| RBC Capital Markets | | $ | 23,982,327 | | | $ | 23,982,327 | | | $ | - | | | $ | - | |
| Global X U.S. Preferred ETF | | | | | | | | | | | | | | | | |
| RBC Capital Markets | | | 1,587,807 | | | | 1,587,807 | | | | - | | | | - | |
Global X SuperDividend® Alternatives ETF | | | | | | | | | | | | | | | | |
| RBC Capital Markets | | | 5,412,958 | | | | 5,412,958 | | | | - | | | | - | |
(1) Excess collateral received is not presented in the table above. Please refer to the Schedule of Investments for the market value of the collateral received for each Fund.
(2) Net Amount represents the net amount receivable due from the counterparty in the event of default.
FEDERAL INCOME TAXES – It is each Fund’s intention to continue to qualify as a regulated investment company for federal income tax purposes by complying with the appropriate provisions of Subchapter M of the Code. Accordingly, no provisions for federal income taxes have been made in the financial statements.
The Funds evaluate tax positions taken or expected to be taken in the course of preparing the Funds’ tax returns to determine whether it is “more-likely-than-not” (i.e., greater than 50%) that each tax position will be sustained upon examination by a taxing authority based on the technical merits of the position. Tax positions not deemed to meet the more-likely-than-not threshold are recorded as a tax benefit or expense in the current year. The Funds did not record any tax provisions in the current period; however, management’s conclusions regarding tax positions may be subject to review and adjustment at a later date based on factors including, but not limited to, examination by tax authorities (i.e., the last three tax year ends, as applicable), on-going analysis of and changes to tax laws, regulations and interpretations thereof. Any foreign tax filings that have not been made will be filed within the prescribed period.
SECURITY TRANSACTIONS AND INVESTMENT INCOME – Security transactions are accounted for on the trade date for financial reporting purposes. Costs used in determining realized gains and losses on the sale of investment securities are based on specific identification. Dividend income is recorded on the ex-dividend date. Interest income is recognized on the accrual basis from the settlement date.
FOREIGN CURRENCY TRANSACTIONS AND TRANSLATION – The books and records of the Funds are maintained in U.S. dollars. Investment securities and other assets and liabilities denominated in a foreign currency are translated into U.S. dollars on the
2. SIGNIFICANT ACCOUNTING POLICIES (continued)
date of valuation. Purchases and sales of investment securities, income and expenses are translated into U.S. dollars at the relevant rates of exchange prevailing on the respective dates of such transactions. The Funds do not isolate that portion of realized or unrealized gains and losses resulting from changes in the foreign exchange rate from fluctuations arising from changes in the market prices of the securities. These gains and losses are included in net realized and unrealized gains and losses on investments on the Statement of Operations. Net realized and unrealized gains and losses on foreign currency transactions and translations represent net foreign exchange gains or losses from foreign currency spot contracts, disposition of foreign currencies, currency gains or losses realized between trade and settlement dates on securities transactions and the difference between the amount of the investment income and foreign withholding taxes recorded on the Funds’ books and the U.S. dollar equivalent amounts actually received or paid.
DIVIDENDS AND DISTRIBUTIONS TO SHAREHOLDERS – The Funds distribute their net investment income on a pro rata basis. Any net realized capital gains are distributed annually. All distributions are recorded on the ex-dividend date.
CREATION UNITS – The Funds issue and redeem their shares (“Shares”) on a continuous basis at Net Asset Value (“NAV”) and only in large blocks of 50,000 Shares, referred to as “Creation Units”. Purchasers of Creation Units (“Authorized Participants”) at NAV must pay a standard creation transaction fee per transaction. The fee is a single charge and will be the same regardless of the number of Creation Units purchased by an Authorized Participant on the same day.
An Authorized Participant who holds Creation Units and wishes to redeem at NAV would also pay a standard redemption fee per transaction to BBH, the Funds’ custodian, on the date of such redemption, regardless of the number of Creation Units redeemed that day.
If a Creation Unit is purchased or redeemed for cash, an additional variable fee may be charged. The following table discloses Creation Unit breakdown:
| | | Creation Unit Shares | | | Creation Fee | | | Value at November 30, 2019 | | | Redemption Fee | |
| Global X MLP & Energy Infrastructure ETF | | | 50,000 | | | $ | 250 | | | $ | 557,500 | | | $ | 250 | |
| Global X U.S. Preferred ETF | | | 50,000 | | | | 650 | | | | 1,239,500 | | | | 650 | |
Global X SuperDividend® Alternatives ETF | | | 50,000 | | | | 300 | | | | 737,000 | | | | 300 | |
Global X S&P 500® Quality Dividend ETF | | | 50,000 | | | | 500 | | | | 1,325,500 | | | | 500 | |
| Global X TargetIncomeTM 5 ETF | | | 50,000 | | | | 250 | | | | 1,211,500 | | | | 250 | |
| Global X TargetIncomeTM Plus 2 ETF | | | 50,000 | | | | 250 | | | | 1,213,500 | | | | 250 | |
| Global X Adaptive U.S. Factor ETF | | | 50,000 | | | | 1,000 | | | | 1,289,500 | | | | 1,000 | |
2. SIGNIFICANT ACCOUNTING POLICIES (continued)
CASH OVERDRAFT CHARGES – Per the terms of an agreement with BBH, if a Fund has a cash overdraft on a given day, it will be assessed an overdraft charge of LIBOR plus 2.00%. Cash overdraft charges are included in custodian fees on the Statement of Operations.
3. RELATED PARTY AND SERVICE PROVIDER TRANSACTIONS
On July 2, 2018, the Adviser consummated a transaction pursuant to which it became an indirect, wholly-owned subsidiary of Mirae Asset Global Investments Co., Ltd. (“Mirae”). In this manner, the Adviser is ultimately controlled by Mirae, which is a leading financial services company in Korea and is the headquarters for the Mirae Asset Global Investments Group.
The Adviser serves as the investment adviser and the administrator for the Funds. Subject to the supervision of the Board, the Adviser is responsible for managing the investment activities of the Funds and the Funds’ business affairs and other administrative matters and provides or causes to be furnished all supervisory, administrative and other services reasonably necessary for the operation of the Funds, including certain distribution services (provided pursuant to a separate distribution agreement), certain shareholder and distribution-related services (provided pursuant to a separate Rule 12b-1 Plan and related agreements) and investment advisory services (provided pursuant to a separate investment advisory agreement), under what is essentially an “all-in” fee structure. For the Adviser’s services to the respective Funds, under the supervision and administration agreement, the Funds pay a monthly fee to the Adviser at the annual rate below (stated as a percentage of the average daily net assets of the respective Fund) (the “Supervision and Administration Fee”). In addition, the Funds bear other expenses, directly and indirectly, that are not covered by the supervision and administration agreement, which may vary and affect the total expense ratios of the Funds, such as taxes, brokerage fees, commissions, acquired fund fees and expenses, and other transaction expenses, interest expenses and extraordinary expenses (such as litigation and indemnification expenses).
The following table discloses the rates of Supervision and Administration Fees paid by the Funds pursuant to the supervision and administration agreement:
| | | Supervision and Administration Fee |
| Global X MLP & Energy Infrastructure ETF | | 0.45% |
| Global X U.S. Preferred ETF | | 0.23% |
Global X SuperDividend® Alternatives ETF | | 0.75% |
Global X S&P 500® Quality Dividend ETF* | | 0.20% |
Global X TargetIncomeTM 5 ETF | | 0.39% |
Global X TargetIncomeTM Plus 2 ETF | | 0.39% |
| Global X Adaptive U.S. Factor ETF | | 0.27% |
3. RELATED PARTY TRANSACTIONS AND SERVICE PROVIDER TRANSACTIONS (continued)
* Pursuant to an expense limitation agreement in effect between the Global X S&P 500® Quality Dividend ETF (the “Fund”) and the Adviser from July 26, 2019 until September 13, 2019, the Adviser contractually agreed to waive 0.15% of the management fee it received from the Fund. After giving effect to such waiver, the net management fee received by the Adviser from the Fund was 0.20%. Effective September 13, 2019, the Board of Trustees voted to permanently reduce the Fund’s management fee to 0.20%.
SEI Investments Global Funds Services (“SEIGFS”) serves as sub-administrator to the Funds. As sub-administrator, SEIGFS provides the Funds with required general administrative services, including, without limitation: office space, equipment, and personnel; clerical and general back office services; bookkeeping, internal accounting and secretarial services; the calculation of NAVs; and assistance with the preparation and filing of reports, registration statements, proxy statements and other materials required to be filed or furnished by the Funds under federal and state securities laws. As compensation for these services, SEIGFS receives certain out-of-pocket costs, transaction fees and asset-based fees which are accrued daily and paid monthly by the Adviser.
SEI Investments Distribution Co. (“SIDCO”) serves as the Funds’ underwriter and distributor of Creation Units pursuant to a distribution agreement. SIDCO has no obligation to sell any specific quantity of Fund Shares. SIDCO bears the following costs and expenses relating to the distribution of Shares: (1) the costs of processing and maintaining records of creations of Creation Units; (2) all costs of maintaining the records required of a registered broker/dealer; (3) the expenses of maintaining its registration or qualification as a dealer or broker under federal or state laws; (4) filing fees; and (5) all other expenses incurred in connection with the distribution services as contemplated in the distribution agreement. SIDCO receives no fee from the Funds for its distribution services under the distribution agreement; rather, the Adviser compensates SIDCO for certain expenses, out-of-pocket costs, and transaction fees.
BBH serves as custodian and transfer agent of the Funds’ assets. As custodian, BBH has agreed to (1) make receipts and disbursements of money on behalf of the Funds, (2) collect and receive all income and other payments and distributions on account of the Funds’ portfolio investments, (3) respond to correspondence from shareholders, security brokers and others relating to its duties, and (4) make periodic reports to the Funds concerning the Funds’ operations. BBH does not exercise any supervisory function over the purchase and sale of securities. As transfer agent, BBH has agreed to (1) issue and redeem Shares of each Fund, (2) make dividend and other distributions to shareholders of each Fund, (3) respond to correspondence by shareholders and others relating to its duties, (4) maintain shareholder accounts, and (5) make periodic reports to the Funds. As compensation for these services, BBH receives certain out-of-pocket costs, transaction fees and asset-based fees which are accrued daily and paid monthly by the Adviser from its fees.
4. INVESTMENT TRANSACTIONS
For the period ended November 30, 2019, the purchases and sales of investments in securities, excluding in-kind transactions, long-term U.S. Government, and short-term securities were:
| 2019 | | Purchases | | | Sales and Maturities | |
| Global X MLP & Energy Infrastructure ETF | | $ | 259,527,917 | | | $ | 362,823,968 | |
| Global X U.S. Preferred ETF | | | 110,138,594 | | | | 111,265,294 | |
Global X SuperDividend® Alternatives ETF | | | 4,033,507 | | | | 4,467,667 | |
Global X S&P 500® Quality Dividend ETF | | | 3,164,454 | | | | 3,171,905 | |
Global X TargetIncomeTM 5 ETF | | | 1,047,899 | | | | 1,052,333 | |
Global X TargetIncomeTM Plus 2 ETF | | | 939,842 | | | | 943,324 | |
| Global X Adaptive U.S. Factor ETF | | | 164,912,804 | | | | 164,630,975 | |
For the periods ended November 30, 2019 and November 30, 2018, in-kind transactions associated with creations and redemptions were, respectively:
| 2019 | | Purchases | | | Sales | | | Realized Gain / (Loss) | |
| Global X MLP & Energy Infrastructure ETF | | $ | 493,182,191 | | | $ | 284,980,056 | | | $ | 31,252,724 | |
| Global X U.S. Preferred ETF | | | 435,632,340 | | | | 55,599,414 | | | | 2,931,505 | |
| Global X SuperDividend® Alternatives ETF | | | 12,537,203 | | | | 1,303,100 | | | | 94,283 | |
| Global X S&P 500® Quality Dividend ETF | | | 9,443,686 | | | | 3,574,879 | | | | 393,983 | |
| Global X TargetIncomeTM 5 ETF | | | - | | | | 1,204,732 | | | | 1,260 | |
| Global X TargetIncomeTM Plus 2 ETF | | | 8,518,609 | | | | 1,210,230 | | | | (22,076 | ) |
| Global X Adaptive U.S. Factor ETF | | | 80,114,085 | | | | 4,658,062 | | | | 329,700 | |
| 2018 | | Purchases | | | Sales | | | Realized Gain / (Loss) | |
| Global X MLP & Energy Infrastructure ETF | | $ | 359,870,402 | | | $ | 65,805,098 | | | $ | 8,464,512 | |
| Global X U.S. Preferred ETF | | | 187,143,953 | | | | 15,601,458 | | | | (99,142 | ) |
| Global X SuperDividend® Alternatives ETF | | | 6,768,917 | | | | 681,610 | | | | 77,709 | |
| Global X S&P 500® Quality Dividend ETF | | | 2,502,749 | | | | - | | | | - | |
| Global X TargetIncomeTM 5 ETF | | | 2,497,545 | | | | - | | | | - | |
| Global X TargetIncomeTM Plus 2 ETF | | | 2,498,093 | | | | - | | | | - | |
| Global X Adaptive U.S. Factor ETF | | | 103,623,782 | | | | - | | | | - | |
During the period ended November 30, 2019, there were no purchases or sales of long-term U.S. Government securities by the Funds.
5. TAX INFORMATION
The amount and character of income and capital gain distributions to be paid, if any, are determined in accordance with federal income tax regulations, which may differ from U.S. GAAP. As a result, net investment income (loss) and net realized gain (loss) on investment transactions for a reporting period may differ significantly from distributions during such period. These book/tax differences may be temporary or permanent. To the extent these differences are permanent in nature, they are charged or credited to undistributed net investment income (loss), accumulated net realized gain (loss) or paid-in capital, as appropriate, in the period that the differences arise.
5. TAX INFORMATION (continued)
The following differences, primarily attributable to reclassification of distributions, preferred stock interest, non-deductible excise tax paid, redemptions in-kind, REIT adjustments, MLP adjustments and return of capital distribution have been reclassified to/from the following accounts during the fiscal year ended November 30, 2019:
| Global X Funds | | Paid-in Capital | | | Distributable Earnings (Loss) | |
| Global X MLP & Energy Infrastructure ETF | | | 16,704,506 | | | | (16,704,506 | ) |
| Global X U.S. Preferred ETF | | | 2,814,287 | | | | (2,814,287 | ) |
Global X SuperDividend® Alternatives ETF | | | (60,266 | ) | | | 60,266 | |
Global X S&P 500® Quality Dividend ETF | | | 393,983 | | | | (393,983 | ) |
Global X TargetIncomeTM 5 ETF | | | 1,107 | | | | (1,107 | ) |
Global X TargetIncomeTM Plus 2 ETF | | | (22,202 | ) | | | 22,202 | |
| Global X Adaptive U.S. Factor ETF | | | 338,952 | | | | (338,952 | ) |
The tax character of dividends and distributions declared during the years or periods ended November 30, 2019 and November 30, 2018 were as follows:
| Global X Funds | | Ordinary Income | | | Long-Term Capital Gain | | | Return of Capital | | | Totals | |
| Global X MLP & Energy Infrastructure ETF | | | | | | | | | | | | |
| 2019 | | $ | 40,058,250 | | | $ | – | | | $ | 3,644,335 | | | $ | 43,702,585 | |
| 2018 | | | 19,402,441 | | | | – | | | | 4,853,774 | | | | 24,256,215 | |
| Global X U.S. Preferred ETF | | | | | | | | | | | | | | | | |
| 2019 | | $ | 17,959,180 | | | $ | – | | | $ | – | | | $ | 17,959,180 | |
| 2018 | | | 4,563,490 | | | | – | | | | – | | | | 4,563,490 | |
Global X SuperDividend® Alternatives ETF | | | | | | | | | | | | | | | | |
| 2019 | | $ | 1,697,638 | | | $ | 24,842 | | | $ | – | | | $ | 1,722,480 | |
| 2018 | | | 1,065,740 | | | | – | | | | – | | | | 1,065,740 | |
Global X S&P 500® Quality Dividend ETF | | | | | | | | | | | | | | | | |
| 2019 | | $ | 187,572 | | | $ | 764 | | | $ | – | | | $ | 188,336 | |
| 2018 | | | 22,480 | | | | – | | | | – | | | | 22,480 | |
Global X TargetIncomeTM 5 ETF | | | | | | | | | | | | | | | | |
| 2019 | | $ | 106,201 | | | $ | – | | | $ | – | | | $ | 106,201 | |
| 2018 | | | 33,991 | | | | – | | | | – | | | | 33,991 | |
Global X TargetIncomeTM Plus 2 ETF | | | | | | | | | | | | | | | | |
| 2019 | | $ | 129,966 | | | $ | – | | | $ | – | | | $ | 129,966 | |
| 2018 | | | 33,891 | | | | – | | | | – | | | | 33,891 | |
| Global X Adaptive U.S. Factor ETF | | | | | | | | | | | | | | | | |
| 2019 | | $ | 5,613,976 | | | $ | 520,561 | | | $ | – | | | $ | 6,134,537 | |
| 2018 | | | 662,778 | | | | – | | | | 101,182 | | | | 763,960 | |
5. TAX INFORMATION (continued)
As of November 30, 2019, the components of tax basis distributable earnings (accumulated losses) were as follows:
| | | Global X Funds | |
| | | Global X MLP & Energy Infrastructure ETF | | | Global X U.S. Preferred ETF | | | Global X SuperDividend® Alternatives ETF | | | Global X S&P 500® Quality Dividend ETF | |
| Undistributed Ordinary Income | | $ | – | | | $ | 1,830,288 | | | $ | – | | | $ | 17,961 | |
| Undistributed Long-Term Capital Gain | | | – | | | | – | | | | 184,432 | | | | – | |
| Post October Losses | | | – | | | | – | | | | (18,772 | ) | | | – | |
| Capital Loss Carryforwards | | | (76,432,065 | ) | | | (554,032 | ) | | | – | | | | (183,482 | ) |
| Unrealized Appreciation (Depreciation) on Investments and Foreign Currency | | | (101,113,250 | ) | | | 5,844,435 | | | | (547,884 | ) | | | 680,311 | |
| Other Temporary Differences | | | (5 | ) | | | (1,558,408 | ) | | | (6 | ) | | | (1 | ) |
| Total Distributable Earnings (Accumulated Losses) | | $ | (177,545,320 | ) | | $ | 5,562,283 | | | $ | (382,230 | ) | | $ | 514,789 | |
| | | Global X Funds | |
| | | Global X TargetIncomeTM 5 ETF | | | Global X TargetIncomeTM Plus 2 ETF | | | Global X Adaptive U.S. Factor ETF | |
| Undistributed Ordinary Income | | $ | 6,272 | | | $ | 3,213 | | | $ | – | |
| Undistributed Long-Term Capital Gain | | | – | | | | – | | | | 376,896 | |
| Capital Loss Carryforwards | | | (76,603 | ) | | | (52,821 | ) | | | – | |
| Unrealized Appreciation (Depreciation) on Investments and Foreign Currency | | | (14,534 | ) | | | 3,335 | | | | 8,965,201 | |
| Other Temporary Differences | | | – | | | | – | | | | 4 | |
| Total Distributable Earnings (Accumulated Losses) | | $ | (84,865 | ) | | $ | (46,273 | ) | | $ | 9,342,101 | |
5. TAX INFORMATION (continued)
For taxable years beginning after December 22, 2010, a registered investment company is permitted to carry forward net capital losses to offset capital gains realized in later years, and the losses carried forward retain their original character as either long-term or short-term losses. Losses carried forward under these provisions are as follows:
| Global X Funds | | Short-Term Loss | | | Long-Term Loss | | | Total | |
| Global X MLP & Energy Infrastructure ETF | | $ | 26,646,056 | | | $ | 49,786,009 | | | $ | 76,432,065 | |
| Global X U.S. Preferred ETF | | $ | 554,032 | | | $ | – | | | $ | 554,032 | |
Global X S&P 500® Quality Dividend ETF | | $ | 183,482 | | | $ | – | | | $ | 183,482 | |
Global X TargetIncomeTM 5 ETF | | $ | 72,558 | | | $ | 4,045 | | | $ | 76,603 | |
Global X TargetIncomeTM Plus 2 ETF | | $ | 39,129 | | | $ | 13,692 | | | $ | 52,821 | |
The federal tax cost and aggregate gross unrealized appreciation and depreciation on investments held by the Funds at November 30, 2019, were as follows:
| Global X Funds | | Federal Tax Cost | | | Aggregated Gross Unrealized Appreciation | | | Aggregated Gross Unrealized Depreciation | | | Net Unrealized Appreciation (Depreciation) | |
| Global X MLP & Energy Infrastructure ETF | | $ | 738,518,009 | | | $ | 25,810,648 | | | $ | (126,923,898 | ) | | $ | (101,113,250 | ) |
| Global X U.S. Preferred ETF | | | 578,806,685 | | | | 10,546,688 | | | | (4,702,253 | ) | | | 5,844,435 | |
Global X SuperDividend® Alternatives ETF | | | 34,255,471 | | | | 740,322 | | | | (1,288,206 | ) | | | (547,884 | ) |
Global X S&P 500® Quality Dividend ETF | | | 8,566,513 | | | | 975,412 | | | | (295,101 | ) | | | 680,311 | |
Global X TargetIncomeTM 5 ETF | | | 1,226,093 | | | | 15,162 | | | | (29,696 | ) | | | (14,534 | ) |
Global X TargetIncomeTM Plus 2 ETF | | | 9,739,120 | | | | 21,133 | | | | (17,798 | ) | | | 3,335 | |
| Global X Adaptive U.S. Factor ETF | | | 180,324,069 | | | | 10,114,789 | | | | (1,149,588 | ) | | | 8,965,201 | |
The preceding differences between book and tax cost are primarily due to preferred stock adjustments, MLP adjustments and wash sales.
6. CONCENTRATION OF RISKS
The Funds may invest in securities in a particular asset class. Securities and other assets held in each Fund’s portfolio may underperform in comparison to the general securities markets, a particular securities market or other asset classes. The Funds, except for Global X U.S. Preferred ETF, Global X TargetIncomeTM 5 ETF and Global X TargetIncomeTM Plus 2 ETF, use a replication strategy. A replication strategy is an indexing strategy that involves investing in the securities of an underlying index in approximately the same proportions as in the underlying index. These Funds may utilize a representative sampling strategy with respect to their underlying index when a replication strategy might be detrimental to its shareholders, such as when there are practical difficulties or substantial costs involved in compiling a portfolio of equity securities to follow its underlying index, or, in certain instances, when securities in the underlying index become temporarily illiquid, unavailable or less liquid, or due to legal
6. CONCENTRATION OF RISKS (continued)
restrictions (such as diversification requirements that apply to the Funds but not the underlying index). The Global X U.S. Preferred ETF, Global X TargetIncomeTM 5 ETF and Global X TargetIncomeTM Plus 2 ETF use a representative sampling strategy. Representative sampling is an indexing strategy that involves investing in a representative sample of securities that collectively has an investment profile similar to the Fund’s underlying index in terms of key risk factors, performance attributes and other characteristics. A more complete description of risks is included in each Funds’ prospectus and statement of additional information.
7. LOANS OF PORTFOLIO SECURITIES
The Funds may lend portfolio securities having a market value up to one-third of the Funds’ total assets. Security loans made pursuant to a securities lending agreement with BBH are required at all times to be secured by collateral equal to at least 102% for U.S.-based securities and 105% for foreign-based securities. Such collateral received in connection with these loans will be cash and can be invested in repurchase agreements, short-term investments or U.S. Treasury obligations and is recognized in the Schedule of Investments and Statement of Assets and Liabilities. The obligation to return securities lending collateral is also recognized as a liability in the Statement of Assets and Liabilities. It is the Funds’ policy to obtain additional collateral from or return excess collateral to the borrower by the end of the next business day, following the valuation date of the securities loaned. Therefore, the value of the collateral held may be temporarily less than the value of the securities on loan.
Lending securities entails a risk of loss to the Funds if and to the extent that the market values of the securities loaned were to increase and the borrower did not increase the collateral accordingly and the borrower failed to return the securities. The Funds could also experience delays and costs gaining access to the collateral. The Funds bear the risk of any deficiency in the amount of the collateral available for return to the borrower due to any loss on the collateral invested.
As of November 30, 2019, the value of securities on loan was $24,717,160, $1,668,103, and $5,678,657 for the Global X MLP & Energy Infrastructure ETF, Global X U.S. Preferred ETF, and Global X SuperDividend® Alternatives ETF, respectively, and the cash collateral received from securities on loan was $25,796,220, $1,707,900 and $5,822,365 for Global X MLP & Energy Infrastructure ETF, Global X U.S. Preferred ETF, and Global X SuperDividend® Alternatives ETF, respectively.
7. LOANS OF PORTFOLIO SECURITIES (continued)
As of November 30, 2019, the following Funds had securities on loan, by counterparty:
| | | Market Value | | | Cash Collateral | |
| Global X MLP & Energy Infrastructure | | | | | | |
| BOFA Securities, Inc. | | $ | 12,677,364 | | | $ | 13,109,200 | |
| Citigroup | | | 2,370,150 | | | | 2,484,000 | |
| Credit Suisse | | | 830,354 | | | | 906,500 | |
| JPMorgan | | | 7,099,350 | | | | 7,473,000 | |
| Morgan Stanley | | | 1,739,942 | | | | 1,823,520 | |
| Global X U.S. Preferred ETF | | | | | | | | |
| JPMorgan | | | 1,336,183 | | | | 1,367,700 | |
| National Financial Services | | | 331,920 | | | | 340,200 | |
Global X SuperDividend® Alternatives ETF | | | | | | | | |
| BOFA Securities, Inc. | | | 50,084 | | | | 52,250 | |
| JPMorgan | | | 1,863,095 | | | | 1,917,050 | |
| Scotia Capital | | | 3,127,261 | | | | 3,194,165 | |
| Wells Fargo Securities, LLC | | | 638,217 | | | | 658,900 | |
8. CONTRACTUAL OBLIGATIONS
The Funds enter into contracts in the normal course of business that contain a variety of indemnifications. The Funds’ maximum exposure under these arrangements is unknown; however, the Funds have not had prior gains or losses pursuant to these contracts. Management has reviewed the Funds’ existing contracts and expects the risk of loss to be remote.
Pursuant to the Trust’s organizational documents, the Trustees of the Trust and the Trust’s officers are indemnified against certain liabilities that may arise out of the performance of their duties.
9. REGULATORY MATTERS
On August 17, 2018, the SEC adopted amendments to Regulation S-X. These changes are effective for periods after November 5, 2018. The updates to registered investment companies were mainly focused on the presentation of distributable earnings, eliminating the need to present the components of distributable earnings on a book basis in the financial statements. The update also impacted the presentation of undistributed net investment income and distribution to shareholders on the Statement of Changes in Net Assets. The amounts presented in the current Statement of Changes in Net Assets represent the aggregated total distributions of net investment income and realized capital gains, except for distributions classified as return of capital which are still presented separately.
| | |
Notes to Financial Statements (concluded) |
| |
|
10. NEW ACCOUNTING PRONOUNCEMENTS
In August 2018, the Financial Accounting Standards Board (“FASB”) issued Accounting Standards Update 2018-13, Fair Value Measurement (Topic 820). The new guidance includes additions and modifications to disclosure requirements for fair value measurements. For public entities, the amendments are effective for financial statements issued for fiscal years beginning after December 15, 2019, and interim periods within those fiscal years. Management elected to early adopt the removal of certain disclosures and delay the adoption of additional disclosure until the effective date.
11. SUBSEQUENT EVENTS
The Funds have been evaluated regarding the need for additional disclosures and/or adjustments resulting from subsequent events. Based on this evaluation, no additional adjustments were required to the financial statements.
| | |
Report of Independent Registered Public Accounting Firm
|
To the Board of Trustees and Shareholders of each of the seven funds indicated in the table below
Opinion on the Financial Statements
We have audited the accompanying statements of assets and liabilities, including the schedules of investments, of each of the funds indicated in the table below (seven of the funds constituting the Global X Funds, hereafter collectively referred to as the “Funds”) as of November 30, 2019, the related statements of operations, the statements of changes in net assets, including the related notes, and the financial highlights for each of the periods indicated in the table below (collectively referred to as the “financial statements”). In our opinion, the financial statements present fairly, in all material respects, the financial position of each of the Funds as of November 30, 2019, the results of each of their operations, the changes in each of their net assets, and each of their financial highlights for each of the periods indicated in the table below, in conformity with accounting principles generally accepted in the United States of America.
| Global X MLP & Energy Infrastructure ETF (1) | Global X TargetIncome™ 5 ETF (4) |
| Global X U.S. Preferred ETF (2) | Global X TargetIncome™ Plus 2 ETF (4) |
Global X SuperDividend® Alternatives ETF (1) | Global X Adaptive U.S. Factor ETF (5) |
Global X S&P 500® Quality Dividend ETF (3) | |
| | (1) | The related statements of operations for the year ended November 30, 2019, the statements of changes in net assets for each of the two years in the period ended November 30, 2019, including the related notes, and the financial highlights for each of the four years in the period ended November 30, 2019 |
| | (2) | The related statement of operations for the year ended November 30, 2019, the statements of changes in net assets for each of the two years in the period ended November 30, 2019, including the related notes, and the financial highlights for each of the two years in the period ended November 30, 2019, and the period September 11, 2017 (commencement of operations) through November 30, 2017 |
| | (3) | The related statement of operations for the year ended November 30, 2019, the statements of changes in net assets, including the related notes, and the financial highlights for the year ended November 30, 2019, and the period July 13, 2018 (commencement of operations) through November 30, 2018 |
| | (4) | The related statements of operations for the year ended November 30, 2019, the statements of changes in net assets, including the related notes, and the financial highlights for the year ended November 30, 2019 and the period July 27, 2018 (commencement of operations) through November 30, 2018 |
| | (5) | The related statement of operations for the year ended November 30, 2019, the statements of changes in net assets, including the related notes, and the financial highlights for the year ended November 30, 2019 and the period August 24, 2018 (commencement of operations) through November 30, 2018 |
| | |
Report of Independent Registered Public Accounting Firm |
The financial statements, as of and for the year ended November 30, 2015 and the financial highlights for each of the years or periods ended on or prior to November 30, 2015 (not presented herein, other than the financial highlights) were audited by other auditors whose report dated January 29, 2016 expressed an unqualified opinion on those financial statements and financial highlights.
Basis for Opinion
These financial statements are the responsibility of the Funds’ management. Our responsibility is to express an opinion on the Funds’ financial statements based on our audits. We are a public accounting firm registered with the Public Company Accounting Oversight Board (United States) (PCAOB) and are required to be independent with respect to the Funds in accordance with the U.S. federal securities laws and the applicable rules and regulations of the Securities and Exchange Commission and the PCAOB.
We conducted our audits of these financial statements in accordance with the standards of the PCAOB. Those standards require that we plan and perform the audit to obtain reasonable assurance about whether the financial statements are free of material misstatement, whether due to error or fraud.
Our audits included performing procedures to assess the risks of material misstatement of the financial statements, whether due to error or fraud, and performing procedures that respond to those risks. Such procedures included examining, on a test basis, evidence regarding the amounts and disclosures in the financial statements. Our audits also included evaluating the accounting principles used and significant estimates made by management, as well as evaluating the overall presentation of the financial statements. Our procedures included confirmation of securities owned as of November 30, 2019 by correspondence with the custodian, transfer agent and brokers; when replies were not received from brokers, we performed other auditing procedures. We believe that our audits provide a reasonable basis for our opinions.
PricewaterhouseCoopers LLP
Philadelphia, Pennsylvania
January 27, 2020
We have served as the auditor of one or more investment companies in the Global X Funds since 2016.
| | |
Disclosure of Fund Expenses (unaudited)
|
All exchange traded funds (“ETFs”) have operating expenses. As a shareholder of an ETF, your investment is affected by these ongoing costs, which include (among others) costs for ETF management, administrative services, commissions, and shareholder reports like this one. It is important for you to understand the impact of these costs on your investment returns. In addition, a shareholder is responsible for any brokerage fees as a result of his or her investment in the Fund. Shareholders may incur brokerage commissions on their purchases and sales of Fund shares, which are not reflected in the examples below.
Operating expenses such as these are deducted from an ETF’s gross income and directly reduce its final investment return. These expenses are expressed as a percentage of the ETF’s average net assets; this percentage is known as the ETF’s expense ratio.
The following examples use the expense ratio and are intended to help you understand the ongoing costs (in dollars) of investing in your Fund and to compare these costs with those of other funds. The examples are based on an investment of $1,000 made at the beginning of the six-month period shown and held for the entire period (June 1, 2019 to November 30, 2019).
The table below illustrates your Fund’s costs in two ways:
Actual Fund Return. This section helps you to estimate the actual expenses that your Fund incurred over the period. The “Expenses Paid During Period” column shows the actual dollar expense cost incurred by a $1,000 investment in the Fund, and the “Ending Account Value” number is derived from deducting that expense cost from the Fund’s gross investment return.
You can use this information, together with the actual amount you invested in the Fund, to estimate the expenses you paid over that period. Simply divide your actual account value by $1,000 to arrive at a ratio (for example, an $8,600 account value divided by $1,000 = 8.6), then multiply that ratio by the number shown for your Fund under “Expenses Paid During Period.”
Hypothetical 5% Return. This section helps you compare your Fund’s costs with those of other funds. It assumes that the Fund had an annual 5% return before expenses during the year, but that the expense ratio (Column 3) for the period is unchanged. This example is useful in making comparisons because the Securities and Exchange Commission requires all funds to make this 5% calculation. You can assess your Fund’s comparative cost by comparing the hypothetical result for your Fund in the “Expenses Paid During Period” column with those that appear in the same charts in the shareholder reports for other funds.
NOTE: Because the return is set at 5% for comparison purposes — NOT your Fund’s actual return — the account values shown may not apply to your specific investment.
| | |
Disclosure of Fund Expenses (unaudited) (concluded)
|
| | | Beginning Account Value 6/1/2019 | | | Ending Account Value 11/30/2019 | | | Annualized Expense Ratios | | | Expenses Paid During Period(1) | |
| Global X MLP & Energy Infrastructure ETF | | | | | | | | | | | | |
| Actual Fund Return | | $ | 1,000.00 | | | $ | 913.80 | | | | 0.45 | % | | $ | 2.16 | |
| Hypothetical 5% Return | | | 1,000.00 | | | | 1,022.81 | | | | 0.45 | | | | 2.28 | |
| | | | | | | | | | | | | | | | | |
| Global X U.S. Preferred ETF | | | | | | | | | | | | | | | | |
| Actual Fund Return | | $ | 1,000.00 | | | $ | 1,055.40 | | | | 0.24 | % | | $ | 1.24 | |
| Hypothetical 5% Return | | | 1,000.00 | | | | 1,023.87 | | | | 0.24 | | | | 1.22 | |
| | | | | | | | | | | | | | | | | |
Global X SuperDividend® Alternatives ETF | | | | | | | | | | | | | | | | |
| Actual Fund Return | | $ | 1,000.00 | | | $ | 1,057.70 | | | | 0.75 | % | | $ | 3.87 | |
| Hypothetical 5% Return | | | 1,000.00 | | | | 1,021.31 | | | | 0.75 | | | | 3.80 | |
| | | | | | | | | | | | | | | | | |
Global X S&P 500® Quality Dividend ETF | | | | | | | | | | | | | | | | |
| Actual Fund Return | | $ | 1,000.00 | | | $ | 1,145.80 | | | | 0.24 | % | | $ | 1.29 | |
| Hypothetical 5% Return | | | 1,000.00 | | | | 1,023.87 | | | | 0.24 | | | | 1.22 | |
| | | | | | | | | | | | | | | | | |
Global X TargetIncomeTM 5 ETF | | | | | | | | | | | | | | | | |
| Actual Fund Return | | $ | 1,000.00 | | | $ | 1,057.30 | | | | 0.40 | % | | $ | 2.06 | |
| Hypothetical 5% Return | | | 1,000.00 | | | | 1,023.06 | | | | 0.40 | | | | 2.03 | |
| | | | | | | | | | | | | | | | | |
Global X TargetIncomeTM Plus 2 ETF | | | | | | | | | | | | | | | | |
| Actual Fund Return | | $ | 1,000.00 | | | $ | 1,045.20 | | | | 0.40 | % | | $ | 2.05 | |
| Hypothetical 5% Return | | | 1,000.00 | | | | 1,023.06 | | | | 0.40 | | | | 2.03 | |
| | | | | | | | | | | | | | | | | |
| Global X Adaptive U.S. Factor ETF | | | | | | | | | | | | | | | | |
| Actual Fund Return | | $ | 1,000.00 | | | $ | 1,120.60 | | | | 0.27 | % | | $ | 1.44 | |
| Hypothetical 5% Return | | | 1,000.00 | | | | 1,023.72 | | | | 0.27 | | | | 1.37 | |
(1) | Expenses are equal to the Fund’s annualized expense ratio multiplied by the average account value over the period, multiplied by 183/365 (to reflect the one-half year period.) |
| | |
Approval of Investment Advisory Agreement (unaudited)
|
Approval of New Investment Advisory and Supervision and Administration Agreements
Section 15(c) of the Investment Company Act of 1940, as amended (“1940 Act”), requires that the board of trustees of an exchange-traded fund (“ETF”), including a majority of those trustees who are not “interested persons” of the ETF, as defined in the 1940 Act (“Independent Trustees”), consider on an initial basis and periodically thereafter (as required by the 1940 Act), at an in person meeting called for such purpose, the terms of each ETF’s investment advisory agreement and whether to approve entering into, or renewing, each agreement.
At a Board meeting of the Global X Funds (the “Trust”) held in person on November 15, 2019, called for such purpose, the Board of Trustees (the “Board”) (including the Trust’s Independent Trustees, voting separately) considered and unanimously approved the continuation of (i) the Investment Advisory Agreement (“Renewal Investment Advisory Agreement”) for each Fund included in this Annual Report (each, a “Renewal Fund”); and (ii) the Supervision and Administration Agreement between the Trust (“Renewal Supervision and Administration Agreement”), on behalf of each Renewal Fund, and Global X Management Company LLC (“Global X Management”). The Renewal Investment Advisory Agreement and the Renewal Supervision and Administration Agreement are referred to herein as the “Renewal Agreements.”
In advance of the Board meeting, the Board (including the Trust’s Independent Trustees) and the Independent Trustees’ independent legal counsel requested (in writing) detailed information from Global X Management in connection with the Board’s consideration of the Renewal Agreements and received and reviewed written responses from Global X Management and supporting materials relating to those requests for information. In the course of their consideration of the Renewal Agreements, the Trust’s Independent Trustees were advised by their independent legal counsel and, in addition to meeting with management of Global X Management, the Independent Trustees met separately in executive session with their counsel.
RENEWAL AGREEMENTS
In determining to approve the continuation of the Renewal Agreements for the Renewal Funds, the Board considered a variety of factors, including the factors discussed in greater detail below.
Nature, Extent and Quality of Services
With respect to this factor, the Board considered:
| • | the terms of the Renewal Agreements and the range of services that would continue to be provided to each Renewal Fund in accordance with the Renewal Agreements; |
| • | Global X Management’s key personnel and the portfolio managers who would continue to provide investment advisory, supervision and administrative services to each Renewal Fund; |
| | |
Approval of Investment Advisory Agreement (unaudited)
|
| • | Global X Management’s responsibilities under the Renewal Agreements, among other things, to: (i) manage the investment operations of the Renewal Funds and the composition of the Renewal Funds’ assets, including the purchase, retention and disposition of their holdings, (ii) provide quarterly reports to the Trust’s officers and the Board and other reports as the Board deems necessary or appropriate, (iii) vote proxies, exercise consents, and exercise all other rights relating to securities and assets held by the Renewal Funds, (iv) select broker-dealers to execute portfolio transactions for the Renewal Funds when necessary, (v) assist in the preparation and filing of reports and proxy statements (if any) to the shareholders of the Renewal Funds, and the periodic updating of the registration statement, prospectuses, statement of additional information, and other reports and documents for the Renewal Funds that are required to be filed by the Trust with the U.S. Securities and Exchange Commission and other regulatory and governmental bodies, and (vi) monitor anticipated purchases and redemptions of the shares (including Creation Units) of the Renewal Funds by shareholders and new investors; |
| • | the nature, extent and quality of all of the services (including advisory, administrative and compliance services) that have been provided by Global X Management or made available to the Renewal Funds; and |
| • | the quality of Global X Management’s resources and personnel that would continue to be made available to the Renewal Funds, including Global X Management’s experience and the professional qualifications of Global X Management’s key personnel. |
Based on these considerations, the Board concluded that it was satisfied with the nature, extent and quality of the services provided to the Renewal Funds by Global X Management.
Performance
The Board considered the performance of each Renewal Fund. The Board examined the performance of the Renewal Funds for the one-year, three-year, five-year and since-inception periods, as applicable. Also, the Board considered the total return and investments performance of the Renewal Funds relative to (i) the performance of unaffiliated comparable ETFs and/or other registered funds, which performance information is publicly available from such registered funds as well as other third party sources; and (ii) the performance of pertinent indexes. The Board considered instances of under-performance and over-performance with respect to the competitor funds. The Board also considered the Renewal Funds’ tracking against their underlying indexes in absolute terms.
Based on these considerations and comparisons, the Board concluded that the investment performance of the Renewal Funds did not adversely affect the Board’s approval of the continuance of the Renewal Agreements.
| | |
Approval of Investment Advisory Agreement (unaudited)
|
Cost of Services and Profitability
The Board considered Global X Management’s cost to provide investment management, supervision and administrative and related services to the Renewal Funds. In this regard, the Board considered the management fee (“Management Fee”) that has been borne or is expected to be borne by the Renewal Funds under the Renewal Agreements for the various investment advisory, supervisory and administrative services that the Renewal Funds require under a unitary fee structure (including the types of fees and expenses that are not included within the unitary fee and would be borne by the Renewal Funds).
In addition, the Board considered expected profitability to Global X Management, as applicable, from all services provided or expected to be provided to the Renewal Funds and all aspects of Global X Management’s relationship with the Renewal Funds. In connection with these considerations, Global X Management provided the Board with financial information regarding its operations and the services provided to the Renewal Funds and discussed with the Board its current and expected, as applicable, profitability with respect to the Renewal Funds.
Based on these considerations, the Board concluded that the Management Fee rate paid by the Renewal Funds to Global X Management, in light of the nature, extent and quality of the services provided, was reasonable and in the best interests of the Renewal Funds’ shareholders.
Comparison of Fees and Services
With respect to this factor, the Board considered:
| • | comparative information with respect to the Management Fee paid to Global X Management by the Renewal Funds. In connection with this consideration, Global X Management provided the Board with comparative expense data for the Renewal Funds, including fees and expenses paid by unaffiliated similar specialized and/or focused ETFs and/or other comparable registered funds. The Board considered Global X Management’s detailed explanation of the fee structures of any Renewal Fund that was above the average or median for its peer group; |
| • | the structure of the unitary Management Fee (which includes as one component the investment advisory fee for the Renewal Funds) and the current total expense ratios for the Renewal Funds. In this regard, the Board took into consideration that the purpose of adopting a unitary Management Fee structure for the Renewal Funds was to create a simple, all-inclusive fee that would provide a level of predictability with respect to the overall expense ratios (i.e., the total fees) of the Renewal Funds and that the proposed Management Fees for the Renewal Funds were set at competitive levels to make the Renewal Funds viable in the marketplace; and |
| • | that, under the unified Management Fee structure, Global X Management is responsible for most ordinary expenses of the Renewal Funds, including the costs of various third-party services required by the Renewal Funds, including investment advisory, administrative, audit, certain custody, portfolio accounting, legal, transfer agency and printing costs, but that the Renewal Funds would bear other expenses not covered under the proposed all-inclusive Management Fee, such as taxes, brokerage fees, commissions, and other transaction expenses, interest expenses, and extraordinary expenses. |
| | |
Approval of Investment Advisory Agreement (unaudited)
|
Based on these considerations, the Board concluded that the services received and the fees charged under the Renewal Agreements were reasonable on a comparative basis.
Economies of Scale
With respect to this factor, the Board considered:
| • | the extent to which economies of scale would be realized as the Renewal Funds grow and whether the unitary Management Fee for the Renewal Funds reflected these economies of scale; |
| • | the significant investment of time, personnel and other resources that Global X Management has made and intends to continue to make in the Renewal Funds in order to seek to assure that the Renewal Funds are attractive to investors; and |
| • | that the unitary Management Fee would provide a high level of certainty as to the total level of expenses for the Renewal Funds and their shareholders. |
Based on these considerations, the Board concluded that the unitary Management Fee for the Renewal Funds appropriately addressed economies of scale.
Other Benefits
In considering the Renewal Agreements, in addition to the factors discussed above, the Board considered any other benefits realized by Global X Management as a result of its relationships with the Renewal Funds and concluded that, in the exercise of the Board’s business judgement, all information the Board considered supported approval of the continuation of the Renewal Agreements.
Conclusion
After full consideration of the factors above, as well as other factors that were instructive in their consideration, the Board, including all of the Trust’s Independent Trustees voting separately, concluded, in the exercise of its business judgement, that the Renewal Agreements were fair and reasonable and in the best interest of each Renewal Fund.
In reaching this decision, the Board did not assign relative weights to the factors discussed above nor did the Board deem any one factor or group of them to be controlling in and of themselves. Each member of the Board may have assigned different weights to the various factors.
| | |
Supplemental Information (unaudited)
|
Net asset value, or “NAV”, is the price per Share at which the Funds issue and redeem Shares. It is calculated in accordance with the standard formula for valuing mutual fund shares. The “Market Price” of the Funds generally is determined using the midpoint between the highest bid and the lowest offer on the stock exchange on which the Shares of the Funds are listed for trading, as of the time that the Fund’s NAV is calculated. The Funds’ Market Price may be at, above or below their NAV. The NAV of the Funds will fluctuate with changes in the market value of the Funds’ holdings. The Market Price of the Funds will fluctuate in accordance with changes in their NAV, as well as market supply and demand.
Premiums or discounts are the differences (expressed as a percentage) between the NAV and Market Price of the Funds on a given day, generally at the time NAV is calculated. A premium is the amount that the Funds are trading above the reported NAV, expressed as a percentage of the NAV. A discount is the amount that the Funds are trading below the reported NAV, expressed as a percentage of the NAV.
Further information regarding premiums and discounts is available on the Funds’ website at www.globalxetfs.com.
| | |
Trustees and Officers of the Trust (unaudited)
|
Set forth below are the names, addresses, years of birth, position with the Trust, Term of Office and Length of Time Served, the principal occupations for the last five years, number of Funds in fund complex overseen by Trustee, and other directorships outside the fund complex of each of the persons currently serving as Trustees and Officers of the Trust.
| Name, Address (Year of Birth) | Position(s) Held with Trust | Principal Occupation(s) During the Past 5 Years | Number of Funds in Trust Overseen by Trustee | Other Directorships Held by Trustees |
| Independent Trustees | | | | |
Charles A. Baker 605 3rd Avenue, 43rd Floor New York, NY 10158 (1953) | Trustee (since 07/2018) | Chief Executive Officer of Investment Innovations LLC (investment consulting) (since 2013); Managing Director of NYSE Euronext (2003 to 2012). | 722 | Trustee of OSI ETF Trust (since 2016) |
Susan M. Ciccarone 605 3rd Avenue, 43rd Floor New York, NY 10158 (1973) | Trustee (since 09/2019) | Partner, Further Global Capital Management (private equity) (since 2017); formerly Chief Operating Officer (2014-2016) and Chief Financial Officer (2012-2016), Emerging Global Advisors, LLC (ETF issuer). | 722 | Chairman, Payment Alliance International, Inc. (since 2019); Director, Casa Holdco LP, parent of Celink (since 2018). |
Clifford J. Weber 605 3rd Avenue, 43rd Floor New York, NY 10158 (1963) | Trustee (since 07/2018) | Owner, Financial Products Consulting Group LLC (consulting services to financial institutions) (since 2015); Formerly, Executive Vice President of Global Index and Exchange-Traded Products, NYSE Market, Inc., a subsidiary of Intercontinental Exchange (ETF/ETP listing exchange) (2013-2015). | 722 | Chairman (since 2017) and Trustee of Clough Funds Trust (since 2015); Chairman and Trustee of Clayton Street Trust (since 2016); Chairman and Trustee of Janus Detroit Street Trust (since 2016); Chairman and Trustee of Elevation ETF Trust (2016-2018); Trustee of Clough Global Equity Fund (since 2017); Trustee of Clough Global Dividend and Income Fund (since 2017); and Trustee of Clough Global Opportunities Fund (since 2017). |
| | |
Trustees and Officers of the Trust (unaudited)
|
The Trust’s Statement of Additional Information (“SAI”) includes additional information about the Trustees and Officers. The SAI may be obtained without charge by calling 1-888-493-8631. The following chart lists Trustees and Officers as of November 30, 2019.
| Name, Address (Year of Birth) | Position(s) Held with Funds | Principal Occupation(s) During the Past 5 Years | Number of Operational Funds in Trust Overseen by Trustee | Other Directorships Held by Trustees |
Interested Trustee / Officers1 |
Luis Berruga 605 3rd Avenue, 43rd Floor New York, NY 10158 (1977) | Trustee (since 07/2018); President (since 2018) | Chief Executive Officer, GXMC (since 07/2018), Chief Financial Officer (since 2/2014) and Chief Operating Officer (9/2015 - 7/2018); Investment Banker, Jefferies (2012-2014) | 722 | None |
Chang Kim 605 3rd Avenue, 43rd Floor New York, NY 10158 (1984) | Chief Operating Officer; Treasurer, Principal Accounting Officer; and Chief Financial Officer (since 7/2018) | Chief Operating Officer, GXMC (since 7/2018), Head of Portfolio Management & Portfolio Administration (1/2017-7/2018); and Portfolio Manager (9/2009 - 1/2017) | N/A | None |
Lisa K. Whittaker 605 3rd Avenue, 43rd Floor New York, NY 10158 (1978) | Secretary (since 7/2018) | General Counsel, GXMC (since 7/2018); Counsel at SEI Investments (2012 - 7/2018) | N/A | None |
Joe Costello 605 3rd Avenue, 43rd Floor New York, NY 10158 (1974) | Chief Compliance Officer (since 9/2016) | Chief Compliance Officer, FlexShares Funds (2011-2015); Vice President, Northern Trust Investments (2003 - 2015) | N/A | None |
Eric Kleinschmidt3 One Freedom Valley Drive Oaks, PA 19456 (1968) | Assistant Treasurer (since 2016) | Director, Fund Accounting, SEI Investments Global Funds Services (2004 to present) | N/A | None |
| | |
Trustees and Officers of the Trust (unaudited)
|
Dianne Descoteaux3 One Freedom Valley Drive Oaks, PA 19456 (1977) | Assistant Secretary (since 11/2018) | Counsel at SEI Investments (2010-present). | N/A | None |
1 | Each Trustee serves until his successor is duly elected or appointed and qualified. |
2 | As of November 30, 2019, the Trust had eighty investment portfolios, seventy-two of which were operational. |
3 | These officers of the Trust also serve as officers of one or more funds for which SEI Investments Company or an affiliate acts as investment manager, administrator or distributor. |
| | |
Notice to Shareholders (unaudited)
|
For shareholders that do not have a November 30, 2019 tax year end, this notice is for informational purposes only. For shareholders with a November 30, 2019 tax year end, please consult your tax advisor as to the pertinence of this notice. For the fiscal year ended November 30, 2019, the Fund has designated the following items with regard to distributions paid during the year.
| | | Long-Term Capital Gain Distributions | | | Ordinary Income Distributions | | | Return of Capital | | | Total Distributions | | | Qualifying for Corporate Dividends Received Deduction(1) | | | Qualifying Dividend Income(2) | |
| | | | | | | | | | | | | | | | | | | |
| Global X MLP & Energy Infrastructure ETF | | | 0.00 | % | | | 91.66 | % | | | 8.34 | % | | | 100.00 | % | | | 3.11 | % | | | 54.71 | % |
Global X SuperDividend® Alternatives ETF | | | 1.44 | % | | | 98.56 | % | | | 0.00 | % | | | 100.00 | % | | | 67.39 | % | | | 62.88 | % |
| Global X U.S. Preferred ETF | | | 0.00 | % | | | 100.00 | % | | | 0.00 | % | | | 100.00 | % | | | 65.60 | % | | | 69.86 | % |
Global X S&P 500® Quality Dividend ETF | | | 0.41 | % | | | 99.59 | % | | | 0.00 | % | | | 100.00 | % | | | 83.73 | % | | | 96.19 | % |
| Global X TargetIncomeTM 5 ETF | | | 0.00 | % | | | 100.00 | % | | | 0.00 | % | | | 100.00 | % | | | 58.91 | % | | | 66.69 | % |
| Global X TargetIncomeTM Plus 2 ETF | | | 0.00 | % | | | 100.00 | % | | | 0.00 | % | | | 100.00 | % | | | 53.11 | % | | | 42.25 | % |
| Global XAdaptive U.S. Factor ETF | | | 8.49 | % | | | 91.51 | % | | | 0.00 | % | | | 100.00 | % | | | 54.08 | % | | | 56.11 | % |
(1) Qualifying dividends represent dividends which qualify for the corporate dividends received deduction and is reflected as a percentage of ordinary income distributions (the total of short term capital gain and net investment income distributions).
(2) The percentage in this column represents the amount of “Qualifying Dividend Income” as created by the Jobs and Growth Relief Reconciliation Act of 2003 and is reflected as a percentage of ordinary income distributions (the total of short term capital gain and net investment income distributions). It is the intention of the Fund to designate the maximum amount permitted by law.
| | |
Notice to Shareholders (unaudited)
|
| | | U.S. Government Interest(3) | | | Interest Related Dividends(4) | | | Short Term Capital Gain Dividends(5) | | | Qualifying Business Income(6) | | | Foreign Tax Credit | |
| | | | | | | | | | | | | | | | |
| Global X MLP & Energy Infrastructure ETF | | | 0.00 | % | | | 0.32 | % | | | 0.00 | % | | | 8.98 | % | | | 0.00 | % |
Global X SuperDividend® Alternatives ETF | | | 0.00 | % | | | 0.23 | % | | | 100.00 | % | | | 0.00 | % | | | 0.00 | % |
| Global X U.S. Preferred ETF | | | 0.00 | % | | | 5.59 | % | | | 0.00 | % | | | 0.00 | % | | | 0.00 | % |
Global X S&P 500® Quality Dividend ETF | | | 0.00 | % | | | 0.00 | % | | | 0.00 | % | | | 0.00 | % | | | 0.00 | % |
| Global X TargetIncomeTM 5 ETF | | | 0.00 | % | | | 0.00 | % | | | 100.00 | % | | | 0.00 | % | | | 0.00 | % |
| Global X TargetIncomeTM Plus 2 ETF | | | 0.00 | % | | | 0.00 | % | | | 100.00 | % | | | 0.00 | % | | | 0.00 | % |
| Global XAdaptive U.S. Factor ETF | | | 0.00 | % | | | 0.00 | % | | | 0.00 | % | | | 0.00 | % | | | 0.00 | % |
(3) “U.S. Government Interest” represents the amount of interest that was derived from U.S. Government obligations and distributed during the fiscal year. Generally, interest from direct U.S. Government obligations is exempt from state income tax. However, for shareholders who are residents of California, Connecticut and New York, the statutory threshold requirements were not satisfied to permit exemption of these amounts from state income.
(4) The percentage in this column represents the amount of “Qualifying Interest Income” as created by the American Jobs Creation Act of 2004 and is a percentage of net investment income that is exempt from U.S. withholding tax when paid for foreign investors.
(5) The percentage of this column represents the amount of “Short Term Capital Gain Dividend” and is reflected as a percentage of short term capital gain distribution that is exempted from U.S. withholding tax when paid to foreign investors.
(6) The percentage of this column represents that amount of ordinary dividend income that qualified for 20% Business Income Deduction.
The information reported herein may differ from the information and distributions taxable to the shareholders for the calendar year ending December 31, 2019. Complete information will be computed and reported in conjunction with your 2019 Form 1099-DIV.
605 3rd Avenue, 43rd Floor
New York, NY 10158
1-888-493-8631
www.globalxetfs.com
Investment Adviser and Administrator:
Global X Management Company LLC
605 3rd Avenue, 43rd Floor
New York, NY 10158
Distributor:
SEI Investments Distribution Co.
One Freedom Valley Drive
Oaks, PA 19456
Sub-Administrator:
SEI Investments Global Funds Services
One Freedom Valley Drive
Oaks, PA 19456
Counsel for Global X Funds and the Independent Trustees:
Stradley Ronon Stevens & Young, LLP
2000 K Street, N.W.
Suite 700
Washington, DC 20006
Custodian and Transfer Agent:
Brown Brothers Harriman & Co.
50 Post Office Square
Boston, MA 02110
Independent Registered Public Accounting Firm:
PricewaterhouseCoopers LLP
Two Commerce Square
Suite 1800
2001 Market Street
Philadelphia, PA 19103
This information must be preceded or accompanied by a current prospectus for the Funds described.
GLX-AR-006-0700