Global X SuperDividend® ETF (ticker: SDIV) |
Global X SuperDividend® U.S. ETF (ticker: DIV) |
Global X MSCI SuperDividend® Emerging Markets ETF (ticker: SDEM) |
Global X MSCI SuperDividend® EAFE ETF (ticker: EFAS) |
Global X SuperDividend® REIT ETF (ticker: SRET) |
| Global X SuperIncome™ Preferred ETF (ticker: SPFF) |
| Global X YieldCo & Renewable Energy Income ETF (ticker: YLCO) |
| Global X Social Media ETF (ticker: SOCL) |
| Global X E-commerce ETF (ticker: EBIZ) |
Global X Guru® Index ETF (ticker: GURU) |
| Global X Scientific Beta U.S. ETF (ticker: SCIU) |
| Global X Scientific Beta Europe ETF (ticker: SCID) |
| Global X Scientific Beta Japan ETF (ticker: SCIJ) |
| Global X Scientific Beta Asia ex-Japan ETF (ticker: SCIX) |
Global X S&P 500® Catholic Values ETF (ticker: CATH) |
Global X NASDAQ 100® Covered Call ETF (ticker: QYLD) |
Global X S&P 500® Covered Call ETF (ticker: HSPX) |
| Global X Russell 2000 Covered Call ETF (ticker: RYLD) |
Annual Report
October 31, 2019
Beginning on January 1, 2021, as permitted by regulations adopted by the Securities and Exchange Commission, paper copies of the Funds’ (defined below) shareholder reports will no longer be sent by mail, unless you specifically request paper copies of the reports from your financial intermediary (such as a broker-dealer or bank). Instead, shareholder reports will be available on the Funds’ website (www.globalxetfs.com), and you will be notified by mail each time a report is posted and provided with a website link to access the report.
If you already elected to receive shareholder reports electronically, you will not be affected by this change and you need not take any action. You may elect to receive shareholder reports and other communications from the Funds electronically anytime by contacting your financial intermediary.
You may elect to receive all future Fund shareholder reports in paper free of charge. Please contact your financial intermediary to inform them that you wish to continue receiving paper copies of Fund shareholder reports and for details about whether your election to receive reports in paper will apply to all funds held with your financial intermediary.
| Management Discussion of Fund Performance | 1 |
| Schedules of Investments | |
Global X SuperDividend® ETF | 46 |
Global X SuperDividend® U.S. ETF | 55 |
Global X MSCI SuperDividend® Emerging Markets ETF | 60 |
Global X MSCI SuperDividend® EAFE ETF | 66 |
Global X SuperDividend® REIT ETF | 71 |
| Global X SuperIncome™ Preferred ETF | 74 |
| Global X YieldCo & Renewable Energy Income ETF | 79 |
| Global X Social Media ETF | 83 |
| Global X E-commerce ETF | 87 |
Global X Guru® Index ETF | 90 |
| Global X Scientific Beta U.S. ETF | 95 |
| Global X Scientific Beta Europe ETF | 109 |
| Global X Scientific Beta Japan ETF | 134 |
| Global X Scientific Beta Asia ex-Japan ETF | 143 |
Global X S&P 500® Catholic Values ETF | 151 |
Global X NASDAQ 100® Covered Call ETF | 167 |
Global X S&P 500® Covered Call ETF | 173 |
| Global X Russell 2000 Covered Call ETF | 192 |
| Statements of Assets and Liabilities | 194 |
| Statements of Operations | 199 |
| Statements of Changes in Net Assets | 204 |
| Financial Highlights | 213 |
| Notes To Financials | 223 |
| Report of Independent Registered Public Accounting Firm | 248 |
| Disclosure of Fund Expenses | 251 |
| Supplemental Information | 254 |
| Trustees and Officers of the Trust | 255 |
| Notice to Shareholders | 258 |
Shares are bought and sold at market price (not NAV) and are not individually redeemed from a Fund. Shares may only be redeemed directly from a Fund by Authorized Participants, in very large creation/redemption units. Brokerage commissions will reduce returns.
The Funds file their complete schedules of Fund holdings with the Securities and Exchange Commission (the “SEC” or “Commission”) for the first and third quarters of each fiscal year on Form N-PORT. The Funds’ Forms N-PORT are available on the Commission’s website at https://www.sec.gov/, and may be reviewed and copied at the Commission’s Public Reference Room in Washington, DC. Information on the operation of the Public Reference Room may be obtained by calling 1-800-SEC-0330.
A description of the policies and procedures that the Global X Funds use to determine how to vote proxies relating to Fund securities, as well as information relating to how the Funds voted proxies relating to Fund securities during the most recent 12-month period ended June 30, is available (i) without charge, upon request, by calling 1-888-493-8631; and (ii) on the Commission’s website at https://www.sec.gov/.
| | |
Management Discussion of Fund Performance (unaudited) |
| Global X SuperDividend® ETF | |
Global X SuperDividend® ETF
The Global X SuperDividend® ETF (“Fund”) seeks to provide investment results that correspond generally to the price and yield performance, before fees and expenses, of the Solactive Global SuperDividend® Index (“Underlying Index”). The Fund is passively managed, which means the investment adviser does not attempt to take defensive positions in declining markets. The Fund generally seeks to fully replicate the Underlying Index.
The Underlying Index tracks the performance of 100 equally-weighted companies that rank among the highest dividend yielding equity securities in the world, including emerging market countries, as defined by Solactive AG, the provider of the Underlying Index.
For the 12-month period ended October 31, 2019 (the “reporting period”), the Fund decreased 1.02%, while the Underlying Index decreased 1.09%. The Fund had a net asset value of $19.06 per share on October 31, 2018 and ended the reporting period with a net asset value of $17.25 on October 31, 2019.
During the reporting period, the highest returns came from Genworth Mortgage Insurance Australia Ltd. and Pattern Energy Group, Inc., which returned 93.4% and 68.7%, respectively. The worst performers were GameStop Corp. and Kier Group PLC, which returned -71.06% and -70.11%, respectively.
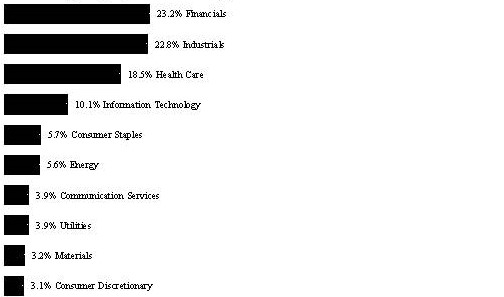
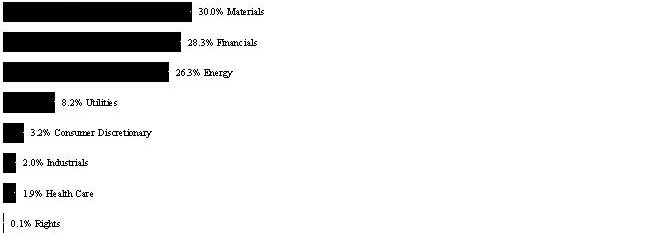
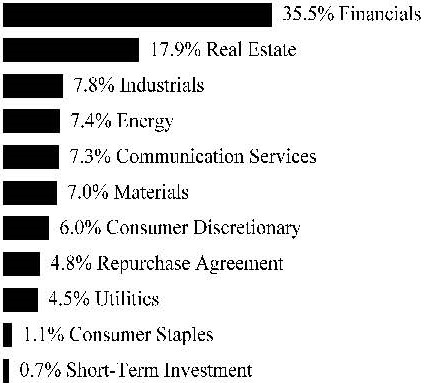
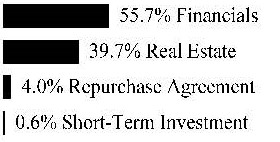
Stocks held by the Fund have among the highest dividend yields in the world. High dividend investing is a deep value-oriented strategy that was held back by the performance of deep value stocks versus the performance of the broader MSCI ACWI. During the reporting period, the Fund had an approximate average geographic stock exposure of 45% to the United States, 13% to Australia, 7% to the United Kingdom, and 4% to Russia. Among the sectors, the Fund had an approximate average exposure of 23% to Real Estate Investment Trusts (“REITs”), 19% to Mortgage REITs, and 14% to Financial Services, and 10% to Communication Services.
| | AVERAGE TOTAL RETURN FOR THE YEAR ENDED OCTOBER 31, 2019 |
| | One Year Return | Three Year Return | Five Year Return | Annualized Inception to Date* |
| | Net Asset Value | Market Price | Net Asset Value | Market Price | Net Asset Value | Market Price | Net Asset Value | Market Price |
Global X SuperDividend® ETF | -1.02% | -1.23% | 2.08% | 2.02% | 0.56% | 0.47% | 3.00% | 2.98% |
Solactive Global SuperDividend® Index | -1.09% | -1.09% | 2.33% | 2.33% | 0.48% | 0.48% | 2.73% | 2.73% |
| MSCI ACWI (Net) | 12.59% | 12.59% | 11.33% | 11.33% | 7.08% | 7.08% | 7.90% | 7.90% |
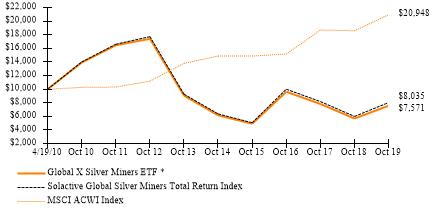
Growth of a $10,000 Investment
(at Net Asset Value)
* The Fund commenced operations on June 8, 2011.
The MSCI ACWI (Net) (All Country World Index) Index is a free float-adjusted market capitalization weighted index that is designed to measure the equity market performance of developed and emerging markets.
The performance data quoted herein represents past performance and the return and value of an investment in the Fund will fluctuate so that, when redeemed, it may be worth less than its original cost. Past performance is no guarantee of future performance and should not be considered as a representation of the future results of the Fund. The Fund’s performance assumes the reinvestment of all dividends and all capital gains. Index returns assume reinvestment of dividends and, unlike the Fund’s returns, do not reflect any fees or expenses. If such fees and expenses were included in the index returns, the performance would have been lower. Please note that one cannot invest directly in an unmanaged index.
There are no assurances that the Fund will meet its stated objectives.
The Fund’s holdings and allocations are subject to change and should not be considered recommendations to buy individual securities.
The graph and table do not reflect the deduction of taxes that a shareholder would pay on Fund distributions or the redemption or sale of Fund shares.
See definition of comparative indices above.
| | |
Management Discussion of Fund Performance (unaudited) |
| Global X SuperDividend® U.S. ETF | |
Global X SuperDividend® U.S. ETF
The Global X SuperDividend® U.S. ETF (“Fund”) seeks to provide investment results that correspond generally to the price and yield performance, before fees and expenses, of the Indxx SuperDividend® U.S. Low Volatility Index (“Underlying Index”). The Fund is passively managed, which means the investment adviser does not attempt to take defensive positions in declining markets. The Fund generally seeks to fully replicate the Underlying Index.
The Underlying Index tracks the performance of 50 equally-weighted common stocks including master limited partnerships (“MLPs”) and real estate investment trusts (“REITs”) that rank among the highest dividend yielding equity securities in the United States, as defined by Indxx LLC, the provider of the Underlying Index. The Underlying Index is comprised of securities that the index provider determines to have lower relative volatility, as measured by the beta, a measure of a security’s sensitivity to the movements of the broader market, of each security relative to the market benchmark.
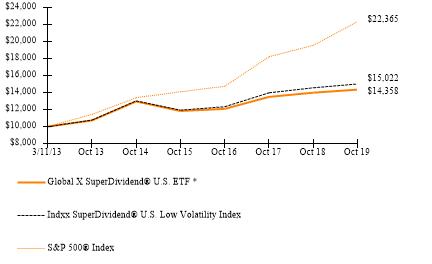
For the 12-month period ended October 31, 2019 (the “reporting period”), the Fund increased 2.61%, while the Underlying Index increased 3.13%. The Fund had a net asset value of $24.53 per share on October 31, 2018 and ended the reporting period with a net asset value of $23.34 on October 31, 2019.
During the reporting period, the highest returns came from Pattern Energy Group, Inc. and Southern Co. Ltd., which returned 68.7% and 45.87%, respectively. The worst performers were Quad/Graphics, Inc. and AMC Entertainment Holdings, Inc., which returned -69.36% and -48.18%, respectively.
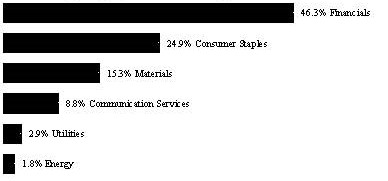
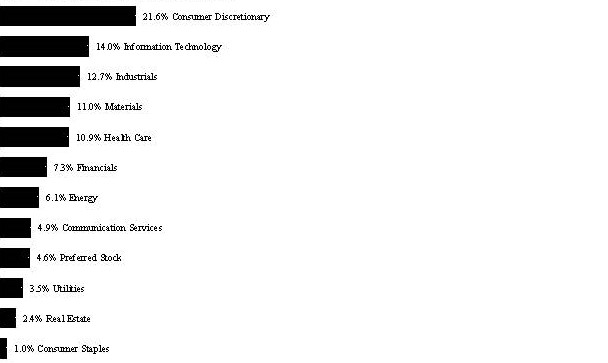
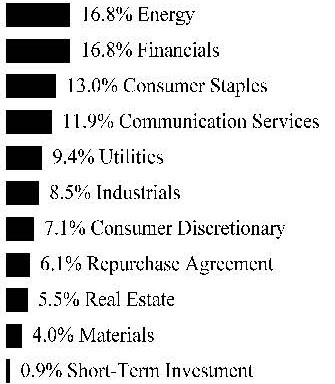
The Fund invests in many of the highest yielding stocks in the United States High dividend investing is a value-oriented strategy that experienced a comeback during the fiscal year, but experienced underperformance versus the broader S&P 500® Index. The Fund’s lack of exposure to the Information Technology sector held back its performance relative to the benchmark. During the reporting period, the Fund had an average exposure of 18% to Mortgage REITs, 14% to MLPs, 14% to the Consumer Staples sector, and 13% to Utilities sector. Given the income oriented nature of these sectors, they can be affected by changes in interest rates, particularly in the short term.
| | AVERAGE TOTAL RETURN FOR THE YEAR ENDED OCTOBER 31, 2019 |
| | One Year Return | Three Year Return | Five Year Return | Annualized Inception to Date* |
| | Net Asset Value | Market Price | Net Asset Value | Market Price | Net Asset Value | Market Price | Net Asset Value | Market Price |
Global X SuperDividend® U.S. ETF | 2.61% | 2.52% | 5.89% | 5.87% | 2.06% | 2.01% | 5.60% | 5.68% |
Indxx SuperDividend® U.S. Low Volatility Index | 3.13% | 3.13% | 6.78% | 6.78% | 2.90% | 2.90% | 6.33% | 6.33% |
S&P 500® Index | 14.33% | 14.33% | 14.91% | 14.91% | 10.78% | 10.78% | 12.88% | 12.88% |
Growth of a $10,000 Investment
(at Net Asset Value)
* The Fund commenced operations on March 11, 2013.
The S&P 500® Index is a market capitalization weighted composite index of 500 large capitalization U.S. companies.
The performance data quoted herein represents past performance and the return and value of an investment in the Fund will fluctuate so that, when redeemed, it may be worth less than its original cost. Past performance is no guarantee of future performance and should not be considered as a representation of the future results of the Fund. The Fund’s performance assumes the reinvestment of all dividends and all capital gains. Index returns assume reinvestment of dividends and, unlike the Fund’s returns, do not reflect any fees or expenses. If such fees and expenses were included in the index returns, the performance would have been lower. Please note that one cannot invest directly in an unmanaged index.
There are no assurances that the Fund will meet its stated objectives.
The Fund’s holdings and allocations are subject to change and should not be considered recommendations to buy individual securities.
The graph and table do not reflect the deduction of taxes that a shareholder would pay on Fund distributions or the redemption or sale of Fund shares.
See definition of comparative indices on the previous page.
| | |
Management Discussion of Fund Performance (unaudited) |
Global X MSCI SuperDividend® Emerging Markets ETF |
Global X MSCI SuperDividend® Emerging Markets ETF
The Global X MSCI SuperDividend® Emerging Markets ETF (“Fund”) seeks to provide investment results that correspond generally to the price and yield performance, before fees and expenses, of the MSCI Emerging Markets Top 50 Dividend Index (“Underlying Index”). The Fund is passively managed, which means the investment adviser does not attempt to take defensive positions in declining markets. The Fund generally seeks to fully replicate the Underlying Index.
The Underlying Index tracks the performance of 50 equally-weighted companies that rank among the highest dividend yielding equity securities in emerging markets, as defined by MSCI, Inc., the provider of the Underlying Index. The Underlying Index may include components from the following countries: Brazil, Chile, China, Colombia, Czech Republic, Egypt, Greece, Hungary, India, Indonesia, Korea, Malaysia, Mexico, Pakistan, Peru, Philippines, Poland, Qatar, Russia, South Africa, Taiwan, Thailand, Turkey and United Arab Emirates.
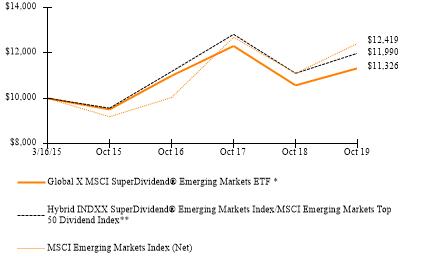
For the 12-month period ended October 31, 2019 (the “reporting period”), the Fund increased 7.14%, while the Underlying Index increased 7.99%. The Fund had a net asset value of $12.91 per share on October 31, 2018 and ended the reporting period with a net asset value of $12.95 on October 31, 2019.
During the reporting period, the highest returns came from MMC Norilsk Nickel PJSC and Gazprom PJSC, which returned 85.95% and 84.53%, respectively. The worst performers were China Oriental Group Co. Ltd. and Au Optronics Corp., which returned
-37.19% and -36.46%, respectively.
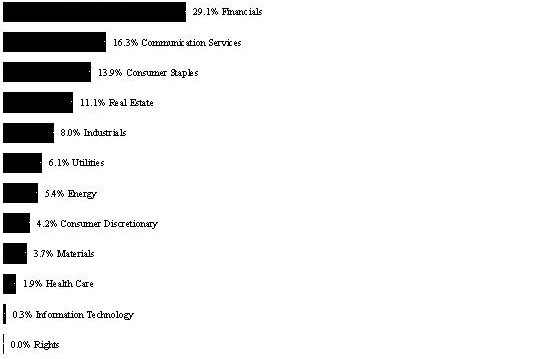
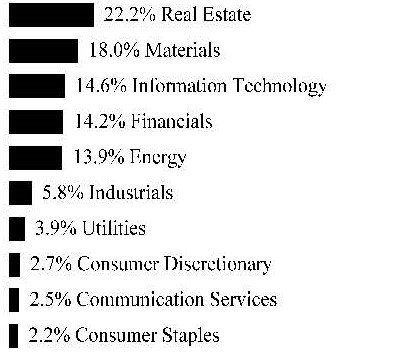
Stocks held by the Fund are among those with the highest dividend yields in emerging markets. Emerging markets made a comeback as the MSCI Emerging Markets Index and the high dividend stocks in emerging markets had strong returns. During the reporting period, emerging markets stocks, including high dividend stocks, fared well especially due to the easing of trade tensions, central banks on a rate cut path along with developed markets, improving earnings expectations, and steps such as corporate tax rate cuts. During the reporting period, the Fund had an average approximate stock exposure of 22% in China, 16% in Russia, 13% in South Africa, and 10% in Taiwan. Across the sectors, the Fund had the highest exposure to Real Estate at 25%, Financial Services at 18%, Materials at 16%, and Information Technology at 15%.
| | AVERAGE TOTAL RETURN FOR THE YEAR ENDED OCTOBER 31, 2019 |
| | One Year Return | Three Year Return | Annualized Inception to Date* |
| | Net Asset Value | Market Price | Net Asset Value | Market Price | Net Asset Value | Market Price |
Global X MSCI SuperDividend® Emerging Markets ETF | 7.14% | 6.97% | 1.00% | 0.76% | 2.73% | 2.59% |
Hybrid INDXX SuperDividend® Emerging Markets Index/MSCI Emerging Markets Top 50 Dividend Index** | 7.99% | 7.99% | 2.35% | 2.35% | 4.00% | 4.00% |
| MSCI Emerging Markets Index (Net) | 11.86% | 11.86% | 7.36% | 7.36% | 4.79% | 4.79% |
Growth of a $10,000 Investment
(at Net Asset Value)
* The Fund commenced operations on March 16, 2015.
** Hybrid Index performance reflects the performance of the INDXX SuperDividend® Emerging Markets Index through November 15, 2016 and the MSCI Emerging Markets Top 50 Dividend Index thereafter.
The MSCI Emerging Markets Index (Net) is a free float-adjusted market capitalization index that is designed to measure equity market performance of emerging markets.
The performance data quoted herein represents past performance and the return and value of an investment in the Fund will fluctuate so that, when redeemed, it may be worth less than its original cost. Past performance is no guarantee of future performance and should not be considered as a representation of the future results of the Fund. The Fund’s performance assumes the reinvestment of all dividends and all capital gains. Index returns assume reinvestment of dividends and, unlike the Fund’s returns, do not reflect any fees or expenses. If such fees and expenses were included in the index returns, the performance would have been lower. Please note that one cannot invest directly in an unmanaged index.
There are no assurances that the Fund will meet its stated objectives.
The Fund’s holdings and allocations are subject to change and should not be considered recommendations to buy individual securities.
The graph and table do not reflect the deduction of taxes that a shareholder would pay on Fund distributions or the redemption or sale of Fund shares.
See definition of comparative indices on the previous page.
| | |
Management Discussion of Fund Performance (unaudited) |
| Global X MSCI SuperDividend® EAFE ETF | |
Global X MSCI SuperDividend® EAFE ETF
The Global X MSCI SuperDividend® EAFE ETF (“Fund”) seeks to provide investment results that correspond generally to the price and yield performance, before fees and expenses, of the MSCI EAFE Top 50 Dividend Index (“Underlying Index”). The Fund is passively managed, which means the investment adviser does not attempt to take defensive positions in declining markets. The Fund generally seeks to fully replicate the Underlying Index.
The Underlying Index tracks the performance of 50 equally-weighted companies that rank among the highest dividend yielding equity securities in Europe, Australasia, and the Far East, as defined by MSCI, Inc., the provider of the Underling Index.
For the 12-month period ended October 31, 2019 (the “reporting period”), the Fund increased 7.81%, while the Underlying Index increased 8.31%. The Fund had a net asset value of $15.96 per share on October 31, 2018 and ended the reporting period with a net asset value of $16.11 on October 31, 2019.
During the reporting period, the highest returns came from Poste Italiane S.p.A. and Stockland Corp. Ltd., which returned 76.76% and 41.15%, respectively. The worst performers were Centrica PLC and Royal Mail Group PLC, which returned -44.40% and
-40.82%, respectively.
Stocks held by the Fund are among those with the highest dividend yields in international developed markets across Europe, Australasia, and the Far East. Similar to the MSCI EAFE Index, high dividend yielders in these regions experienced solid performance during the reporting period as uncertainties over trade wars dwindled, expectations for a smoother Brexit, and preference to high dividend equities in a low interest rate environment. During the reporting period, the Fund had an average stock approximate exposure of 24% to the United Kingdom, 20% to Australia, 11% to France, and 9% to Hong Kong.
| | AVERAGE TOTAL RETURN FOR THE YEAR ENDED OCTOBER 31, 2019 * |
| | One Year Return | Annualized Inception to Date* |
| | Net Asset Value | Market Price | Net Asset Value | Market Price |
Global X MSCI SuperDividend® EAFE ETF | 7.81% | 8.19% | 8.82% | 8.57% |
| MSCI EAFE Top 50 Dividend Index | 8.31% | 8.31% | 9.24% | 9.24% |
| MSCI EAFE Index (Net) | 11.04% | 11.04% | 9.41% | 9.41% |
Growth of a $10,000 Investment
(at Net Asset Value)
* The Fund commenced operations on November 14, 2016.
The MSCI EAFE Index (Net) (Europe, Australasia, Far East) is a free float-adjusted market capitalization index that is designed to measure the equity market performance of developed markets, excluding the US & Canada.
The performance data quoted herein represents past performance and the return and value of an investment in the Fund will fluctuate so that, when redeemed, it may be worth less than its original cost. Past performance is no guarantee of future performance and should not be considered as a representation of the future results of the Fund. The Fund’s performance assumes the reinvestment of all dividends and all capital gains. Index returns assume reinvestment of dividends and, unlike the Fund’s returns, do not reflect any fees or expenses. If such fees and expenses were included in the index returns, the performance would have been lower. Please note that one cannot invest directly in an unmanaged index.
There are no assurances that the Fund will meet its stated objectives.
The Fund’s holdings and allocations are subject to change and should not be considered recommendations to buy individual securities.
The graph and table do not reflect the deduction of taxes that a shareholder would pay on Fund distributions or the redemption or sale of Fund shares.
See definition of comparative indices above.
| | |
Management Discussion of Fund Performance (unaudited) |
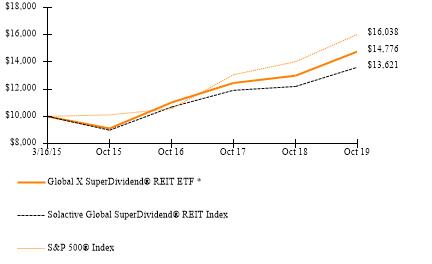
| Global X SuperDividend® REIT ETF | |
Global X SuperDividend® REIT ETF
The Global X SuperDividend® REIT ETF (“Fund”) seeks to provide investment results that correspond generally to the price and yield performance, before fees and expenses, of the Solactive Global SuperDividend® REIT Index (“Underlying Index”). The Fund is passively managed, which means the investment adviser does not attempt to take defensive positions in declining markets. The Fund generally seeks to fully replicate the Underlying Index.
The Underlying Index tracks the performance of real estate investment trusts (“REITs”) that rank among the highest-yielding REITs globally, as determined by Solactive AG, the provider of the Underlying Index. Solactive AG screens the highest yielding REITs to exclude REITs that have historically exhibited the highest volatility, as determined by Solactive AG.
For the 12-month period ended October 31, 2019 (the “reporting period”), the Fund increased 13.68%, while the Underlying Index increased 11.64%. The Fund had a net asset value of $14.62 per share on October 31, 2018 and ended the reporting period with a net asset value of $15.33 on October 31, 2019.
During the reporting period, the highest returns came from Independence Realty Trust, Inc. and VEREIT, Inc., which returned 65.64% and 43.22%, respectively. The worst performers were ARMOUR Residential REIT, Inc. and Park Hotels & Resorts, Inc., which returned -13.89% and -12.79%, respectively.
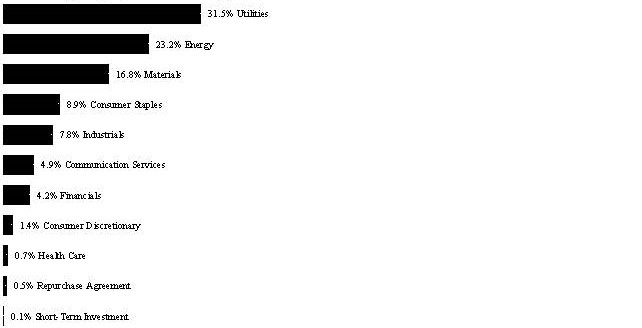
The Fund invests in REITs that are among those with the highest dividend yields around the world. During the reporting period, REITs reported strong performance as the global economy continued to grow, valuations were reasonable, and interest rates declined globally. As the global bond yields generally descended, high dividend REITs yield widened relative to the short-term U.S. treasuries. During the reporting period, the Fund had an average approximate exposure of 55% to Mortgage REITs and 45% to Equity REITs. Geographically, the Fund had an average approximate exposure of 87% to United States REITs, 5% to France REITs, and 4% to Australian REITs.
| | AVERAGE ANNUAL TOTAL RETURN FOR THE YEAR ENDED OCTOBER 31, 2019 |
| | One Year Return | Three Year Return | Annualized Inception to Date* |
| | Net Asset Value | Market Price | Net Asset Value | Market Price | Net Asset Value | Market Price |
Global X SuperDividend® REIT ETF | 13.68% | 13.59% | 10.24% | 10.20% | 8.81% | 8.82% |
Solactive Global SuperDividend® REIT Index | 11.64% | 11.64% | 8.41% | 8.41% | 6.92% | 6.92% |
S&P 500® Index | 14.33% | 14.33% | 14.91% | 14.91% | 10.74% | 10.74% |
Growth of a $10,000 Investment
(at Net Asset Value)
* The Fund commenced operations on March 16, 2015.
The S&P 500® Index is a market capitalization weighted composite index of 500 large capitalization U.S. companies.
The performance data quoted herein represents past performance and the return and value of an investment in the Fund will fluctuate so that, when redeemed, it may be worth less than its original cost. Past performance is no guarantee of future performance and should not be considered as a representation of the future results of the Fund. The Fund’s performance assumes the reinvestment of all dividends and all capital gains. Index returns assume reinvestment of dividends and, unlike the Fund’s returns, do not reflect any fees or expenses. If such fees and expenses were included in the index returns, the performance would have been lower. Please note that one cannot invest directly in an unmanaged index.
There are no assurances that the Fund will meet its stated objectives.
The Fund’s holdings and allocations are subject to change and should not be considered recommendations to buy individual securities.
The graph and table do not reflect the deduction of taxes that a shareholder would pay on Fund distributions or the redemption or sale of Fund shares.
See definition of comparative indices on the previous page.
| | |
Management Discussion of Fund Performance (unaudited) |
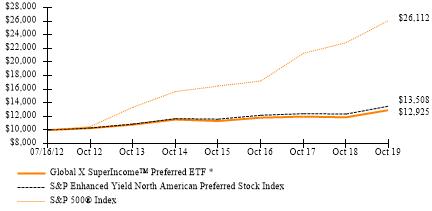
| Global X SuperIncome™ Preferred ETF | |
Global X SuperIncome™ Preferred ETF
The Global X SuperIncomeTM Preferred ETF (“Fund”) seeks to provide investment results that correspond generally to the price and yield performance, before fees and expenses, of the S&P Enhanced Yield North American Preferred Stock Index (“Underlying Index”). The Fund is passively managed, which means the investment adviser does not attempt to take defensive positions in declining markets. The Fund generally seeks to fully replicate the Underlying Index.
The Underlying Index tracks the performance of the highest-yielding preferred securities in the United States and Canada, as determined by Standard & Poor’s Financial Services, LLC, a subsidiary of the McGraw-Hill Companies (“S&P”), the index provider of the Underlying Index. The Underlying Index is comprised of preferred stocks that meet certain criteria relating to size, liquidity, issuer concentration and rating, maturity and other requirements, as determined by S&P. The Underlying Index does not seek to directly reflect the performance of the companies issuing the preferred stock.
For the 12-month period ended October 31, 2019 (the “reporting period”), the Fund increased 8.87%, while the Underlying Index increased 9.40%. The Fund had a net asset value of $11.49 per share on October 31, 2018 and ended the reporting period with a net asset value of $11.73 on October 31, 2019.
During the reporting period, the highest returns came from QTS Realty Trust, Inc. 6.5% and Sempra Energy 6.75%, which returned 36.11% and 24.05%, respectively. The worst performers were CBL & Associates Properties Inc. 7.375% and Nabors Industries Ltd 6%, which returned -43.02% and -20.64%, respectively.
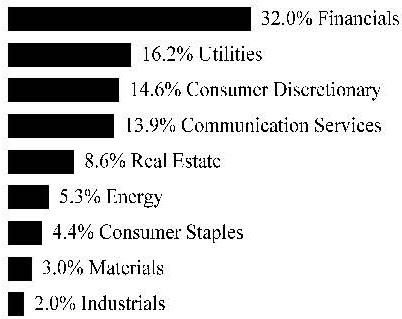
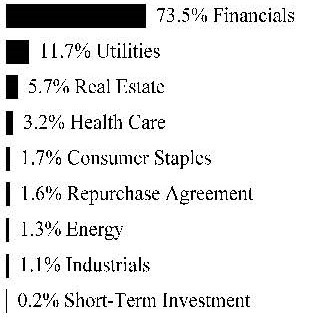
The Fund invests in preferred shares that are among those with the highest dividend yields in the U.S. and Canada. Preferred shares strengthened during the reporting period as a result of loose monetary policy, reducing interest rates, and credit spread narrowing. During the reporting period, the Fund had an average approximate sector exposure of 79% to the Financials Services, 7% to Utilities, and 6% to Real Estate.
| | AVERAGE TOTAL RETURN FOR THE YEAR ENDED OCTOBER 31, 2019 |
| | One Year Return | Three Year Return | Five Year Return | Annualized Inception to Date* |
| | Net Asset Value | Market Price | Net Asset Value | Market Price | Net Asset Value | Market Price | Net Asset Value | Market Price |
| Global X SuperIncome™ Preferred ETF | 8.87% | 9.24% | 3.02% | 3.00% | 2.29% | 2.22% | 3.58% | 3.83% |
| S&P Enhanced Yield North American Preferred Stock Index | 9.40% | 9.40% | 3.54% | 3.54% | 2.96% | 2.96% | 4.21% | 4.21% |
S&P 500® Index | 14.33% | 14.33% | 14.91% | 14.91% | 10.78% | 10.78% | 14.06% | 14.06% |
Growth of a $10,000 Investment
(at Net Asset Value)
* Fund commenced operations on July 16, 2012.
The S&P 500® Index is a market capitalization weighted composite index of 500 large capitalization U.S. companies.
The performance data quoted herein represents past performance and the return and value of an investment in the Fund will fluctuate so that, when redeemed, it may be worth less than its original cost. Past performance is no guarantee of future performance and should not be considered as a representation of the future results of the Fund. The Fund’s performance assumes the reinvestment of all dividends and all capital gains. Index returns assume reinvestment of dividends and, unlike the Fund’s returns, do not reflect any fees or expenses. If such fees and expenses were included in the index returns, the performance would have been lower. Please note that one cannot invest directly in an unmanaged index.
There are no assurances that the Fund will meet its stated objectives.
The Fund’s holdings and allocations are subject to change and should not be considered recommendations to buy individual securities.
The graph and table do not reflect the deduction of taxes that a shareholder would pay on Fund distributions or the redemption or sale of Fund shares.
See definition of comparative indices above.
| | |
Management Discussion of Fund Performance (unaudited) |
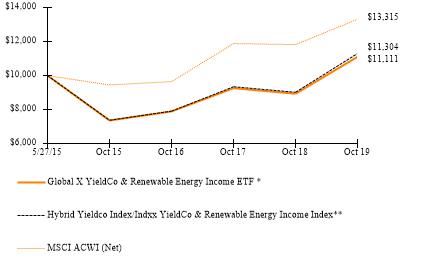
| Global X YieldCo & Renewable Energy Income ETF | |
Global X YieldCo & Renewable Energy Income ETF
The Global X YieldCo & Renewable Energy Income ETF (“Fund”) seeks to provide investment results that correspond generally to the price and yield performance, before fees and expenses, of the Indxx YieldCo & Renewable Energy Income Index (“Underlying Index”). The Fund is passively managed, which means the investment adviser does not attempt to take defensive positions in declining markets. The Fund generally seeks to fully replicate the Underlying Index.
The Underlying Index is designed to provide exposure to publicly traded companies that are formed to own operating assets that produce defined cash flows (“YieldCos”), as well as companies that are involved in the production of renewable energy such as solar, wind and hydroelectric power (“Renewable Energy Companies”) that meet minimum dividend yield criteria, as determined by Indxx, LLC, the index provider. A YieldCo is a dividend growth-oriented public company, created by a parent company, which bundles renewable and/or conventional long-term contracted operating assets in order to generate systematic cash flows. YieldCos typically allocate cash available for distribution each year or quarter to shareholders in the form of dividends. Renewable Energy Companies include but are not limited to companies involved in the production of renewable energy, such as solar, wind, and hydroelectric power, as well as companies that produce renewable energy components and systems, biofuels and smart grid technology. The components of the Underlying Index are YieldCos and Renewable Energy Companies selected from the universe of global publicly listed equities that have a minimum market capitalization of $500 million, an Average Daily Value Traded (“ADVT”) over the last six months greater than $2 million and a trailing 12-month dividend yield greater than 2%, in addition to satisfying certain trading and free-float requirements. If less than 30 securities satisfy these criteria, the market capitalization requirement is relaxed. If there are still fewer than 30 securities, then the yield threshold is relaxed and the highest yielding securities from the selection pool are added.
For the 12-month period ended October 31, 2019 (the “reporting period”), the Fund increased 24.34%, while the Underlying Index increased 25.29%. The Fund had a net asset value of $11.52 per share on October 31, 2018 and ended the reporting period with a net asset value of $13.79 on October 31, 2019.
During the reporting period, the highest returns came from Falck Renewables S.p.A. and Pattern Energy Group, Inc., which returned 80.41% and 68.7%, respectively. The worst performers were Green Plains Inc. and Colbun S.A., which returned -39.24% and -16.92%, respectively.
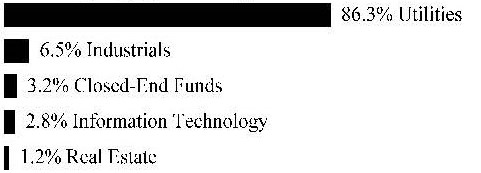
YieldCos are entities that generally consist of fully developed renewable energy assets, such as solar and wind farms. These entities tend to enter into long-term contracts with customers to deliver electricity at pre-specified prices. Renewable energy continued to see market share growth relative to fossil fuels, as government policies encouraged the use of renewable energy and the shift to clean energy sources created greater adoption of these energy sources. During the reporting period, Yieldcos performed strongly due to
increasing customer demand, cost competitiveness, innovation, and more international support for combating climate change.
| | AVERAGE TOTAL RETURN FOR THE YEAR ENDED OCTOBER 31, 2019 |
| | One Year Return | Three Year Return | Annualized Inception to Date* |
| | Net Asset Value | Market Price | Net Asset Value | Market Price | Net Asset Value | Market Price |
| Global X YieldCo & Renewable Energy Income ETF | 24.34% | 24.76% | 12.07% | 11.89% | 2.41% | 2.49% |
| Hybrid Yieldco Index/Indxx YieldCo & Renewable Energy Income Index** | 25.29% | 25.29% | 12.63% | 12.63% | 2.81% | 2.81% |
| MSCI ACWI (Net) | 12.59% | 12.59% | 11.33% | 11.33% | 6.68% | 6.68% |
Growth of a $10,000 Investment
(at Net Asset Value)
* Fund commenced operations on May 27, 2015.
** Hybrid Index performance reflects the performance of the Indxx YieldCo Index through November 16, 2018 and the Indxx YieldCo & Renewable Energy Income Index thereafter.
The MSCI ACWI (Net) (All Country World Index) Index is a free float-adjusted market capitalization weighted index that is designed to measure the equity market performance of developed and emerging markets.
The performance data quoted herein represents past performance and the return and value of an investment in the Fund will fluctuate so that, when redeemed, it may be worth less than its original cost. Past performance is no guarantee of future performance and should not be considered as a representation of the future results of the Fund. The Fund’s performance assumes the reinvestment of all dividends and
all capital gains. Index returns assume reinvestment of dividends and, unlike the Fund’s returns, do not reflect any fees or expenses. If such fees and expenses were included in the index returns, the performance would have been lower. Please note that one cannot invest directly in an unmanaged index.
There are no assurances that the Fund will meet its stated objectives.
The Fund’s holdings and allocations are subject to change and should not be considered recommendations to buy individual securities.
The graph and table do not reflect the deduction of taxes that a shareholder would pay on Fund distributions or the redemption or sale of Fund shares.
High short term performance of the fund is unusual and investors should not expect such performance to be repeated.
See definition of comparative indices on the previous page.
| | |
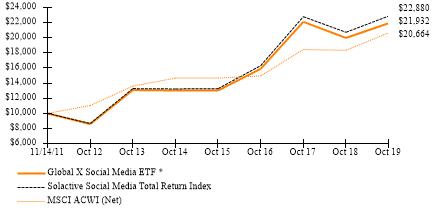
Management Discussion of Fund Performance (unaudited) |
| Global X Social Media ETF | |
Global X Social Media ETF
The Global X Social Media ETF (“Fund”) seeks to provide investment results that correspond generally to the price and yield performance, before fees and expenses, of the Solactive Social Media Total Return Index (“Underlying Index”). The Fund is passively managed, which means the investment adviser does not attempt to take defensive positions in declining markets. The Fund generally seeks to fully replicate the Underlying Index.
The Underlying Index tracks the equity performance of the largest and most liquid companies involved in the social media industry, including companies that provide social networking, file sharing, and other web-based media applications, as defined by Solactive AG, the provider of the Underlying Index.
For the 12-month period ended October 31, 2019 (the “reporting period”), the Fund increased 9.69%, while the Underlying Index increased 10.35%. The Fund had a net asset value of $29.10 per share on October 31, 2018 and ended the reporting period with a net asset value of $31.92 on October 31, 2019.
During the reporting period, the highest returns came from Snap, Inc. and AfreecaTV Co., Ltd., which returned 127.84% and 112.91%, respectively. The worst performers were ANGI Homeservices Inc. and Baidu, Inc., which returned -64.21% and -46.41%, respectively.
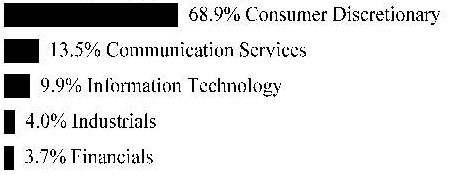
Digital advertising spending, for the first time, will constitute nearly half of the global advertising market by the end of 2019. Digital advertising spending in countries, such as China, the United Kingdom, and the United States, has already exceeded the 50% mark, surpassing traditional advertising spending like radio and television. The social media industry is going through revolutionary changes with the introduction of new platforms and consolidation of the existing ones. New features are being introduced to keep users engaged and entertained. In 2019, there was an escalation of concerns surrounding data privacy, freedom of speech, and political manipulation pertaining to digital media. However, social media companies have been able to weather the storm for the most part and provide higher returns as a result of greater mobile penetration around the world and new monetization opportunities. Moreover, the industry is moving towards a more regulated environment as lawmakers around the world are currently focused on curbing unwanted social media content that is illegal, hateful, fake, and violent in nature, something that could enhance user engagement and platform satisfaction.
| | AVERAGE TOTAL RETURN FOR THE YEAR ENDED OCTOBER 31, 2019 |
| | One Year Return | Three Year Return | Five Year Return | Annualized Inception to Date* |
| | Net Asset Value | Market Price | Net Asset Value | Market Price | Net Asset Value | Market Price | Net Asset Value | Market Price |
| Global X Social Media ETF | 9.69% | 9.22% | 11.31% | 11.14% | 10.96% | 10.82% | 10.37% | 10.30% |
| Solactive Social Media Total Return Index | 10.35% | 10.35% | 11.92% | 11.92% | 11.56% | 11.56% | 10.96% | 10.96% |
| MSCI ACWI (Net) | 12.59% | 12.59% | 11.33% | 11.33% | 7.08% | 7.08% | 9.54% | 9.54% |
Growth of a $10,000 Investment
(at Net Asset Value)
* The Fund commenced operations on November 14, 2011.
The MSCI ACWI (Net) (All Country World Index) Index is a free float-adjusted market capitalization weighted index that is designed to measure the equity market performance of developed and emerging market
The performance data quoted herein represents past performance and the return and value of an investment in the Fund will fluctuate so that, when redeemed, it may be worth less than its original cost. Past performance is no guarantee of future performance and should not be considered as a representation of the future results of the Fund. The Fund’s performance assumes the reinvestment of all dividends and all capital gains. Index returns assume reinvestment of dividends and, unlike the Fund’s returns, do not reflect any fees or expenses. If such fees and expenses were included in the index returns, the performance would have been lower. Please note that one cannot invest directly in an unmanaged index.
There are no assurances that the Fund will meet its stated objectives.
The Fund’s holdings and allocations are subject to change and should not be considered recommendations to buy individual securities.
The graph and table do not reflect the deduction of taxes that a shareholder would pay on Fund distributions or the redemption or sale of Fund shares.
See definition of comparative indices above.
| | |
Management Discussion of Fund Performance (unaudited) |
| | |
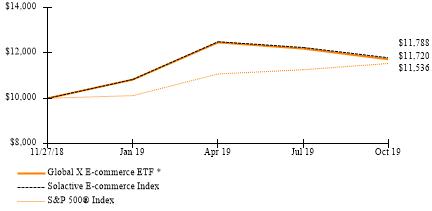
Global X E-commerce ETF
The Global X E-commerce ETF (“Fund”) seeks to provide investment results that correspond generally to the price and yield performance, before fees and expenses, of the Solactive E-commerce Index (“Underlying Index”). The Fund is passively managed, which means the investment adviser does not attempt to take defensive positions in declining markets. The Fund generally seeks to fully replicate the Underlying Index.
The Underlying Index is designed to provide exposure to exchange-listed companies that are positioned to benefit from the increased adoption of e-commerce as a distribution model, including but not limited to companies whose principal business is in operating e-commerce platforms, providing e-commerce software and services, and/or selling goods and services online (collectively, “E-commerce Companies”), as defined by Solactive AG, the provider of the Underlying Index (“Index Provider”).
For the period from the Fund’s commencement date on November 27, 2018 through October 31, 2019 (the “reporting period”), the Fund increased 17.20%, while the Underlying Index increased 17.91%. The Fund had a net asset value of $15.00 per share on November 27, 2018 and ended the reporting period with a net asset value of $17.58 on October 31, 2019.
During the reporting period, the highest returns came from Vipshop Holdings Ltd. and Shopify, Inc., which returned 137.45% and 126.98%, respectively. The worst performers were Fang Holdings Limited and Stamps.com Inc., which returned -78.32% and -58.24%, respectively.
E-commerce (electronic commerce) involves buying or selling products electronically through online services. Though e-commerce is already well-established as an industry, it still has substantial growth potential given the vast size of the brick and mortar retail market. Consumers increasingly prefer online shopping over traditional methods and the trend will only accelerate with the introduction of new technologies that simplify the ordering process. Worldwide, online sales are expected to reach $3.46 trillion at year-end, up 18% year-over-year. In the United States, the country with the greatest average allocation, e-commerce showed record sales during Black Friday of $7.4 billion, up 20% year-over-year while brick and mortar retail sales fell by 6.2% compared to last year. However, E-Commerce Companies face headwinds in the form of legal complications related to data privacy and intellectual property rights. During the reporting period, the Fund saw large exposures to Internet & Direct Marketing Retail companies (68% average exposure) and Interactive Media & Services companies (11% average exposure). Geographically, the Fund maintained an average stock allocation of 48% to stocks in the United States, followed by China at 26%, and Japan at 8%.
| | AVERAGE TOTAL RETURN FOR THE PERIOD ENDED OCTOBER 31, 2019 | |
| | Cumulative Inception to Date* | |
| | Net Asset Value | Market Price | |
| Global X E-commerce ETF | 17.20% | 17.53% | |
| Solactive E-commerce Index | 17.91% | 17.91% | |
S&P 500® Index | 15.36% | 15.36% | |
Growth of a $10,000 Investment
(at Net Asset Value)
* The Fund commenced operations on November 27, 2018.
The S&P 500® Index is a market capitalization weighted composite index of 500 large capitalization U.S. companies.
The performance data quoted herein represents past performance and the return and value of an investment in the Fund will fluctuate so that, when redeemed, it may be worth less than its original cost. Past performance is no guarantee of future performance and should not be considered as a representation of the future results of the Fund. The Fund’s performance assumes the reinvestment of all dividends and all capital gains. Index returns assume reinvestment of dividends and, unlike the Fund’s returns, do not reflect any fees or expenses. If such fees and expenses were included in the index returns, the performance would have been lower. Please note that one cannot invest directly in an unmanaged index.
There are no assurances that the Fund will meet its stated objectives.
The Fund’s holdings and allocations are subject to change and should not be considered recommendations to buy individual securities.
The graph and table do not reflect the deduction of taxes that a shareholder would pay on Fund distributions or the redemption or sale of Fund shares.
See definition of comparative indices above.
| | |
Management Discussion of Fund Performance (unaudited) |
| | |
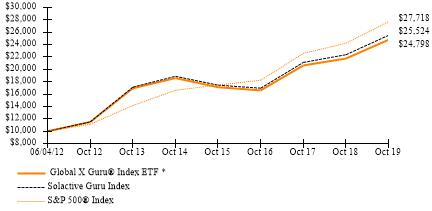
Global X Guru® Index ETF
The Global X Global X Guru® Index ETF (“Fund”) seeks to provide investment results that correspond generally to the price and yield performance, before fees and expenses, of the Solactive Guru Index (“Underlying Index”). The Fund is passively managed, which means the investment adviser does not attempt to take defensive positions in declining markets. The Fund generally seeks to fully replicate the Underlying Index.
The Underlying Index is comprised of the top U.S. listed equity positions reported on Form 13F by a select group of entities characterized as hedge funds, as defined by Solactive AG, the provider of the Underlying Index. Hedge funds are selected by the index provider from a pool of thousands of privately offered pooled investment vehicles based on the size of their reported equity holdings and the efficacy of replicating their publicly disclosed positions. Hedge funds must have minimum reported holdings of $500 million in their Form 13F to be considered for the Underlying Index. Additional filters are applied to eliminate hedge funds that have high turnover rates for equity holdings. Only hedge funds with a concentrated top holding are included in the selection process. Once the hedge fund pool has been determined Solactive AG utilizes Form 13F filings to compile the top stock holding from each of these hedge funds. The stocks are screened for liquidity, equal weighted, and rebalanced quarterly following the Form 13F filing timeline.
For the 12-month period ended October 31, 2019 (the “reporting period”), the Fund increased 13.90%, while the Underlying Index increased 14.06%. The Fund had a net asset value of $30.09 per share on October 31, 2018 and ended the reporting period with a net asset value of $34.02 on October 31, 2019.
During the reporting period, the highest returns came from Array BioPharma Inc. and XPO Logistics, Inc., which returned 105.81% and 52.31%, respectively. The worst performers were PG&E Corporation and ABIOMED, Inc., which returned -44.11% and
-39.16%, respectively.
The Fund’s investments are among the highest conviction United States listed equity positions reported on Form 13F by major hedge funds. Over the reporting period, the Fund delivered positive performance but lagged the S&P 500® Index by approximately 0.43%. The Fund rebalances quarterly, resulting in dynamic exposures that can change significantly throughout the year. Earlier in the reporting period, the Fund benefitted from its exposure to the Utilities and Real Estate sectors, which was supported by investors de-risking due to increased volatility, trade conflicts, and segments of the yield curve showing signs of inversion. Later, the Fund benefitted from its strong selection of companies in the Information Technology sector, which rallied in the early part of 2019 as a result of potential trade resolution and accommodative monetary policy, along with the Communication Services and Industrials sectors. Towards the end of the reporting period, the Fund significantly increased its exposure to the Health Care sector, which was underperforming all other sectors. However, the Fund primarily underperformed against
the S&P 500® Index due to overall reduced average relative exposure to the Information Technology sector, which exhibited strong performance during the reporting period.
| | AVERAGE TOTAL RETURN FOR THE YEAR ENDED OCTOBER 31, 2019 |
| | One Year Return | Three Year Return | Five Year Return | Annualized Inception to Date* |
| | Net Asset Value | Market Price | Net Asset Value | Market Price | Net Asset Value | Market Price | Net Asset Value | Market Price |
Global X Guru® Index ETF | 13.90% | 13.87% | 14.28% | 14.28% | 5.92% | 5.93% | 13.05% | 13.05% |
| Solactive Guru Index | 14.06% | 14.06% | 14.59% | 14.59% | 6.21% | 6.21% | 13.49% | 13.49% |
S&P 500® Index | 14.33% | 14.33% | 14.91% | 14.91% | 10.78% | 10.78% | 14.75% | 14.75% |
Growth of a $10,000 Investment
(at Net Asset Value)
* The Fund commenced operations on June 4, 2012.
The S&P 500® Index is a market capitalization weighted composite index of 500 large capitalization U.S. companies.
The performance data quoted herein represents past performance and the return and value of an investment in the Fund will fluctuate so that, when redeemed, it may be worth less than its original cost. Past performance is no guarantee of future performance and should not be considered as a representation of the future results of the Fund. The Fund’s performance assumes the reinvestment of all dividends and all capital gains. Index returns assume reinvestment of dividends and, unlike the Fund’s returns, do not reflect any fees or expenses. If such fees and expenses were included in the index returns, the performance would have been lower. Please note that one cannot invest directly in an unmanaged index.
There are no assurances that the Fund will meet its stated objectives.
The Fund’s holdings and allocations are subject to change and should not be considered recommendations to buy individual securities.
The graph and table do not reflect the deduction of taxes that a shareholder would pay on Fund distributions or the redemption or sale of Fund shares.
See definition of comparative indices on the previous page.
| | |
Management Discussion of Fund Performance (unaudited) |
| Global X Scientific Beta U.S. ETF | |
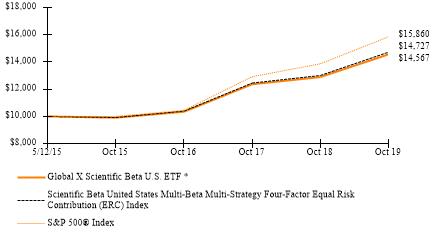
Global X Scientific Beta U.S. ETF
The Global X Scientific Beta US ETF (“Fund”) seeks to provide investment results that correspond generally to the price and yield performance, before fees and expenses, of the SciBeta United States MBMS Four-Factor ERC Index (“Underlying Index”). The Fund is passively managed, which means the investment adviser does not attempt to take defensive positions in declining markets. The Fund generally seeks to fully replicate the Underlying Index.
The Underlying Index generally comprises approximately 500 or less U.S. listed common stocks selected based on a proprietary methodology developed by EDHEC Risk Institute Asia Ltd., the provider of the Underlying Index. The objective of the Underlying Index is to outperform traditional market capitalization-weighted indexes, with similar or lower volatility. The Underlying Index’s components are selected by applying four factors that have been widely recognized by academic literature to outperform market capitalization weighted-indexes over the long run: Value, Size, Low-Volatility and Momentum. Each of these factors is applied by using the following metrics: price-to-book ratio for Value; free-float market capitalization for Size; historical volatility over the trailing 104 week period for Low-Volatility; and one-year-minus-one-month total returns for Momentum. Finally, components are weighted by employing a proprietary, multi-step process that combines multiple weighting methodologies to diversify the risks associated with any one weighting scheme.
For the 12-month period ended October 31, 2019 (the “reporting period”), the Fund increased 12.97%, while the Underlying Index increased 13.17%. The Fund had a net asset value of $30.87 per share on October 31, 2018 and ended the reporting period with a net asset value of $33.80 on October 31, 2019.
During the reporting period, the highest returns came from Advanced Micro Devices, Inc. and KLA Corporation, which returned 100.41% and 89.79%, respectively. The worst performers were PG&E Corporation and DXC Technology Co., which returned -84.98% and -61.36%, respectively.
The Fund showed strong positive performance over the reporting period. The Fund had an average approximate exposure of 21% to Low-Volatility stocks, which performed best among other factors and was also the only factor that outperformed the S&P 500® Index by 8.00% during the reporting period. The Fund’s strategy to underweight the Information Technology and Communication Services sectors and overweight the Utilities and Real Estate sectors, as compared to the S&P 500® Index, has helped lower the risk (measured by standard deviation) versus the benchmark. The Fund had an average approximate stock weighting of 15% to the Information Technology sector, 14% to the Financial Services sector, 13% to the Utilities sector, and 12% to the Consumer Discretionary sector.
| | AVERAGE TOTAL RETURN FOR THE YEAR ENDED OCTOBER 31, 2019 |
| | One Year Return | Three Year Return | Annualized Inception to Date* |
| | Net Asset Value | Market Price | Net Asset Value | Market Price | Net Asset Value | Market Price |
| Global X Scientific Beta U.S. ETF | 12.97% | 12.97% | 12.08% | 12.06% | 8.78% | 8.78% |
| Scientific Beta United States Multi-Beta Multi-Strategy Four-Factor Equal Risk Contribution (ERC) Index | 13.17% | 13.17% | 12.31% | 12.31% | 9.04% | 9.04% |
S&P 500® Index | 14.33% | 14.33% | 14.91% | 14.91% | 10.86% | 10.86% |
Growth of a $10,000 Investment
(at Net Asset Value)
* Fund commenced operations on May 12, 2015.
The S&P 500® Index is a market capitalization weighted composite index of 500 large capitalization U.S. companies.
The performance data quoted herein represents past performance and the return and value of an investment in the Fund will fluctuate so that, when redeemed, it may be worth less than its original cost. Past performance is no guarantee of future performance and should not be considered as a representation of the future results of the Fund. The Fund’s performance assumes the reinvestment of all dividends and all capital gains. Index returns assume reinvestment of dividends and, unlike the Fund’s returns, do not reflect any fees or expenses. If such fees and expenses were included in the index returns, the performance would have been lower. Please note that one cannot invest directly in an unmanaged index.
There are no assurances that the Fund will meet its stated objectives.
The Fund’s holdings and allocations are subject to change and should not be considered recommendations to buy individual securities.
The graph and table do not reflect the deduction of taxes that a shareholder would pay on Fund distributions or the redemption or sale of Fund shares.
See definition of comparative indices above.
| | |
Management Discussion of Fund Performance (unaudited) |
| Global X Scientific Beta Europe ETF | |
Global X Scientific Beta Europe ETF
The Global X Scientific Beta Europe ETF (“Fund”) seeks to provide investment results that correspond generally to the price and yield performance, before fees and expenses, of the SciBeta Extended Developed Europe MBMS Four-Factor ERC Index (“Underlying Index”). The Fund is passively managed, which means the investment adviser does not attempt to take defensive positions in declining markets. The Fund generally seeks to fully replicate the Underlying Index.
The Underlying Index generally comprises approximately 600 or less European-listed common stocks selected based on a proprietary methodology developed by EDHEC Risk Institute Asia Ltd., the provider of the Underlying Index (“Index Provider”). The objective of the Underlying Index is to outperform traditional market capitalization-weighted indexes, with similar or lower volatility. The components of the Underlying Index are selected from a universe of the 600 largest, as measured by free float market capitalization, and most liquid stocks that are ordinarily traded principally on a stock exchange in one of the following 15 developed European countries: Austria, Belgium, Denmark, Finland, France, Germany, Ireland, Italy, Netherlands, Norway, Portugal, Spain, Sweden, Switzerland and the United Kingdom. The Underlying Index’s components are selected by applying four factors that have been widely recognized by academic literature to outperform market capitalization weighted-indexes over the long run: Value, Size, Low-Volatility and Momentum. Each of these factors is applied by using the following metrics: price-to-book ratio for Value; free-float market capitalization for Size; historical volatility over the trailing 104-week period for Low-Volatility; and one-year-minus-one-month total returns for Momentum. Finally, components are weighted by employing a proprietary, multi-step process that combines multiple weighting methodologies to diversify the risks associated with any one weighting scheme.
For the 12-month period ended October 31, 2019 (the “reporting period”), the Fund increased 8.45%, while the Underlying Index increased 8.92%. The Fund had a net asset value of $24.83 per share on October 31, 2018 and ended the reporting period with a net asset value of $24.90 on October 31, 2019.
During the reporting period, the highest returns came from ASM International N.V. and Poste Italiane S.p.A., which returned 137.69% and 76.76%, respectively. The worst performers were Saga plc and Intu Properties plc, which returned -69.14% and -61.56%, respectively.
During the reporting period, the Fund had an average weighting of approximately 17% to the Financial Services sector, with other notable sector exposures of approximately 16% to the Industrials sector, and 11% to the Consumer Discretionary sector. The Fund had an average approximate exposure of 31% to Low-Volatility stocks, 17% to Mid Cap stocks, 29% to Value stocks, and 23% to Momentum stocks, as defined by the Index Provider. The Fund benefited primarily from its exposure to Low-Volatility stocks, which had the
best performance among the four factors. All the factors other than Low-Volatility stocks posted negative returns during the reporting period. The Fund’s performance was primarily the result of broad European market weakness caused by global trade conflicts, uncertainty surrounding Brexit, and the Germany and Italian economies struggling with slowdown in the automobile sector.
| | AVERAGE TOTAL RETURN FOR THE YEAR ENDED OCTOBER 31, 2019 |
| | One Year Return | Three Year Return | Annualized Inception to Date* |
| | Net Asset Value | Market Price | Net Asset Value | Market Price | Net Asset Value | Market Price |
| Global X Scientific Beta Europe ETF | 8.45% | 8.63% | 8.84% | 8.55% | 3.96% | 3.91% |
| Scientific Beta Extended Developed Europe Multi-Beta Multi-Strategy Four-Factor Equal Risk Contribution (ERC) Index | 8.92% | 8.92% | 9.18% | 9.18% | 4.29% | 4.29% |
| MSCI EAFE Index (Net) | 11.04% | 11.04% | 8.48% | 8.48% | 3.21% | 3.21% |
Growth of a $10,000 Investment
(at Net Asset Value)
* Fund commenced operations on May 12, 2015.
The MSCI EAFE Index (Net) (Europe, Australasia, Far East) is a free float-adjusted market capitalization index that is designed to measure the equity market performance of developed markets, excluding the US & Canada.
The performance data quoted herein represents past performance and the return and value of an investment in the Fund will fluctuate so that, when redeemed, it may be worth less than its original cost.
Past performance is no guarantee of future performance and should not be considered as a representation of the future results of the Fund. The Fund’s performance assumes the reinvestment of all dividends and all capital gains. Index returns assume reinvestment of dividends and, unlike the Fund’s returns, do not reflect any fees or expenses. If such fees and expenses were included in the index returns, the performance would have been lower. Please note that one cannot invest directly in an unmanaged index.
There are no assurances that the Fund will meet its stated objectives.
The Fund’s holdings and allocations are subject to change and should not be considered recommendations to buy individual securities.
The graph and table do not reflect the deduction of taxes that a shareholder would pay on Fund distributions or the redemption or sale of Fund shares.
See definition of comparative indices on the previous page.
| | |
Management Discussion of Fund Performance (unaudited) |
| Global X Scientific Beta Japan ETF | |
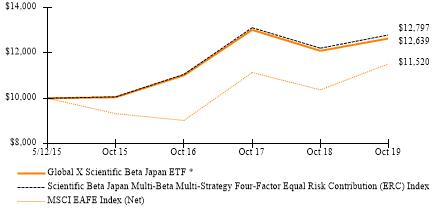
Global X Scientific Beta Japan ETF
The Global X Scientific Beta Japan ETF (“Fund”) seeks to provide investment results that correspond generally to the price and yield performance, before fees and expenses, of the SciBeta Japan MBMS Four-Factor ERC Index (“Underlying Index”). The Fund is passively managed, which means the investment adviser does not attempt to take defensive positions in declining markets. The Fund generally seeks to fully replicate the Underlying Index.
The Underlying Index generally comprises approximately 300 or less Japanese-listed common stocks selected based on a proprietary methodology developed by EDHEC Risk Institute Asia Ltd., the provider of the Underlying Index (“Index Provider”). The objective of the Underlying Index is to outperform traditional market capitalization-weighted indexes, with similar or lower volatility. The components of the Underlying Index are selected from a universe of 300 of the largest, most liquid stocks trading principally on a stock exchange in and incorporated or domiciled (i.e. maintain a place of business) in Japan. The Underlying Index’s components are selected by applying four factors that have been widely recognized by academic literature to outperform market capitalization weighted-indexes over the long run: Value, Size, Low-Volatility and Momentum. Each of these factors is applied by using the following metrics: price-to-book ratio for Value; free-float market capitalization for Size; historical volatility over the trailing 104-week period for Low-Volatility; and one-year-minus-one-month total returns for Momentum.
For the 12-month period ended October 31, 2019 (the “reporting period”), the Fund increased 4.50%, while the Underlying Index increased 4.79%. The Fund had a net asset value of $28.03 per share on October 31, 2018 and ended the reporting period with a net asset value of $28.37 on October 31, 2019.
During the reporting period, the highest returns came from Advantest Corp. and BANDAI NAMCO Holdings Inc., which returned 82.06% and 78.13%, respectively. The worst performers were Credit Saison Co., Ltd. and T&D Holdings, Inc., which returned
-40.44% and -33.62%, respectively.
During the reporting period, the Fund had an average weighting of approximately 21% to the Industrials sector, with other notable sector exposures of approximately 14% to the Consumer Discretionary sector, and 12% to the Consumer Staples sector. The Fund had an average approximate exposure of 23% to Low-Volatility stocks, 21% to Mid Cap stocks, 27% to Value stocks, and 29% to Momentum stocks, as defined by the Index Provider. The Fund benefited from its exposure to the Low-Volatility factor, which was the best performing among the four factors that also outperformed the MSCI Japan Index, despite all contributing negative returns. The Fund was negatively affected by Japanese market weakness caused by a global economic slowdown due to a trade war between the United States and China, an increase in consumption tax by the Japanese government, and a slowdown in Asian exports markets.
| AVERAGE TOTAL RETURN FOR THE YEAR ENDED OCTOBER 31, 2019 |
| | One Year Return | Three Year Return | Annualized Inception to Date* |
| | Net Asset Value | Market Price | Net Asset Value | Market Price | Net Asset Value | Market Price |
| Global X Scientific Beta Japan ETF | 4.50% | 4.45% | 4.69% | 4.33% | 5.38% | 5.23% |
| Scientific Beta Japan Multi-Beta Multi-Strategy Four-Factor Equal Risk Contribution (ERC) Index | 4.79% | 4.79% | 4.98% | 4.98% | 5.67% | 5.67% |
| MSCI EAFE Index (Net) | 11.04% | 11.04% | 8.48% | 8.48% | 3.21% | 3.21% |
Growth of a $10,000 Investment
(at Net Asset Value)
* Fund commenced operations on May 12, 2015.
The MSCI EAFE Index (Net) (Europe, Australasia, Far East) is a free float-adjusted market capitalization index that is designed to measure the equity market performance of developed markets, excluding the US & Canada.
The performance data quoted herein represents past performance and the return and value of an investment in the Fund will fluctuate so that, when redeemed, it may be worth less than its original cost. Past performance is no guarantee of future performance and should not be considered as a representation of the future results of the Fund. The Fund’s performance assumes the reinvestment of all dividends and all capital gains. Index returns assume reinvestment of dividends and, unlike the Fund’s returns, do not reflect any fees or expenses. If such fees and expenses were included in the index returns, the performance would have been lower. Please note that one cannot invest directly in an unmanaged index.
There are no assurances that the Fund will meet its stated objectives.
The Fund’s holdings and allocations are subject to change and should not be considered recommendations to buy individual securities.
The graph and table do not reflect the deduction of taxes that a shareholder would pay on Fund distributions or the redemption or sale of Fund shares.
See definition of comparative indices above.
| | |
Management Discussion of Fund Performance (unaudited) |
| Global X Scientific Beta Asia ex-Japan ETF | |
Global X Scientific Beta Asia ex-Japan ETF
The Global X Scientific Beta Asia ex-Japan ETF (“Fund”) seeks to provide investment results that correspond generally to the price and yield performance, before fees and expenses, of the SciBeta Developed Asia-Pacific ex-Japan MBMS Four-Factor ERC Index (“Underlying Index”). The Fund is passively managed, which means the investment adviser does not attempt to take defensive positions in declining markets. The Fund generally seeks to fully replicate the Underlying Index.
The Underlying Index generally comprises approximately 150 or less Asian-listed common stocks selected based on a proprietary methodology developed by EDHEC Risk Institute Asia Ltd., the provider of the Underlying Index (“Index Provider”). The objective of the Underlying Index is to outperform traditional market capitalization-weighted indexes, with similar or lower volatility. The components of the Underlying Index are selected from a universe of 150 of the largest, most liquid stocks traded principally on a stock exchange in and incorporated or domiciled (i.e. maintain a principal place of business) in developed markets in Asia, excluding Japan, but including Hong Kong, New Zealand, Singapore, and Australia. The Underlying Index’s components are selected by applying four factors that have been widely recognized by academic literature to outperform market capitalization weighted-indexes over the long run: Value, Size, Low-Volatility and Momentum. Each of these factors is applied by using the following metrics: price-to-book ratio for Value; free-float market capitalization for Size; historical volatility over the trailing 104-week period for Low-Volatility; and one-year-minus- one-month total returns for Momentum. Finally, components are weighted by employing a proprietary, multi-step process that combines multiple weighting methodologies to diversify the risks associated with any one weighting scheme.
For the 12-month period ended October 31, 2019 (the “reporting period”), the Fund increased 12.17%, while the Underlying Index increased 12.64%. The Fund had a net asset value of $23.22 per share on October 31, 2018 and ended the reporting period with a net asset value of $24.37 on October 31, 2019.
During the reporting period, the highest returns came from Fortescue Metals Group Ltd and Xero Limited, which returned 151.18% and 68.58%, respectively. The worst performers were CIMIC Group Limited and Dairy Farm International Holdings Limited, which returned 9.33% and -31.28%, respectively.
During the reporting period, the Fund had an average weighting of approximately 26% to stocks in the Real Estate sector, 15% to stocks in the Industrials sector, and 13% to stocks in the Utilities sector. The Fund had an average approximate exposure of 23% to Low-Volatility stocks, 22% to Mid Cap stocks, 25% to Value stocks, and 30% to Momentum stocks, as defined by the Index Provider. The Fund benefited from its exposure to Low-Volatility stocks, which was the best performing factor. However, the Fund’s performance was negatively affected by weakness out of the Asia ex-Japan markets,
which were hurt by trade conflicts, fears of global economic slowdown and the region’s high exposure to China.
| | AVERAGE TOTAL RETURN FOR THE YEAR ENDED OCTOBER 31, 2019 |
| | One Year Return | Three Year Return | Annualized Inception to Date* |
| | Net Asset Value | Market Price | Net Asset Value | Market Price | Net Asset Value | Market Price |
| Global X Scientific Beta Asia ex-Japan ETF | 12.17% | 11.51% | 7.46% | 7.06% | 3.75% | 3.57% |
| Scientific Beta Developed Asia-Pacific ex-Japan Multi-Beta Multi-Strategy Four- Factor Equal Risk Contribution (ERC) Index | 12.64% | 12.64% | 7.87% | 7.87% | 3.76% | 3.76% |
| MSCI EAFE Index (Net) | 11.04% | 11.04% | 8.48% | 8.48% | 3.21% | 3.21% |
Growth of a $10,000 Investment
(at Net Asset Value)
* Fund commenced operations on May 12, 2015.
The MSCI EAFE Index (Net) (Europe, Australasia, Far East) is a free float-adjusted market capitalization index that is designed to measure the equity market performance of developed markets, excluding the US & Canada.
The performance data quoted herein represents past performance and the return and value of an investment in the Fund will fluctuate so that, when redeemed, it may be worth less than its original cost. Past performance is no guarantee of future performance and should not be considered as a representation of the future results of the Fund. The Fund’s performance assumes the reinvestment of all dividends and all capital gains. Index returns assume reinvestment of dividends and, unlike the Fund’s returns, do not reflect any fees or expenses. If such fees and expenses were included in the index returns, the performance would have been lower. Please note that one cannot invest directly in an unmanaged index.
There are no assurances that the Fund will meet its stated objectives.
The Fund’s holdings and allocations are subject to change and should not be considered recommendations to buy individual securities.
The graph and table do not reflect the deduction of taxes that a shareholder would pay on Fund distributions or the redemption or sale of Fund shares.
See definition of comparative indices on the previous page.
| | |
Management Discussion of Fund Performance (unaudited) |
| Global X S&P 500® Catholic Values ETF | |
Global X S&P 500® Catholic Values ETF
The Global X S&P 500® Catholic Values ETF (“Fund”) seeks to provide investment results that correspond generally to the price and yield performance, before fees and expenses, of the S&P 500® Catholic Values Index (“Underlying Index”). The Fund is passively managed, which means the investment adviser does not attempt to take defensive positions in declining markets. The Fund generally seeks to fully replicate the Underlying Index.
The Underlying Index is designed to provide exposure to U.S. equity securities included in the S&P 500® Index while maintaining alignment with the moral and social teachings of the Catholic Church. The Underlying Index is based on the S&P 500® Index, and generally comprises approximately 500 or less U.S. listed common stocks. All index constituents are members of the S&P 500® Index and follow the eligibility criteria for that index. From this starting universe, constituents are screened to exclude companies involved in activities which are perceived to be inconsistent with Catholic values as outlined in the Socially Responsible Investment Guidelines of the United States Conference of Catholic Bishops (“USCCB”). The Underlying Index then reweights the remaining constituents so that the Underlying Index’s sector exposures matches the sector exposures of the S&P 500® Index.
For the 12-month period ended October 31, 2019 (the “reporting period”), the Fund increased 13.86%, while the Underlying Index increased 14.23%. The Fund had a net asset value of $33.59 per share on October 31, 2018 and ended the reporting period with a net asset value of $37.23 on October 31, 2019.
During the reporting period, the highest returns came from Lam Research Corporation and KLA Corporation, which returned 95.92% and 89.79%, respectively. The worst performers were PG&E Corporation and DXC Technology Co., which returned -86.41% and -61.36%, respectively.
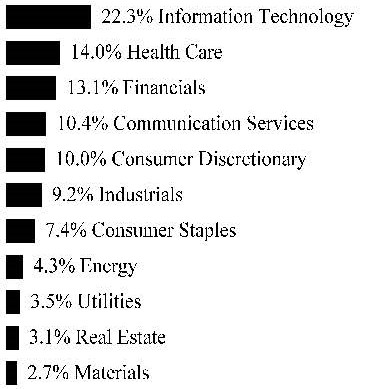
The Fund provides exposure to companies within the S&P 500® Index whose business practices align with the investment guidelines set by the USCCB. As of October 31, 2019, the Fund had 459 equity holdings compared with 505 holdings of the S&P 500® Index. To mitigate the potential performance differences between the S&P 500® Index and the Fund, the Fund’s sector exposures are reweighted to align with those of the S&P 500® Index on a quarterly basis. Over the reporting period, the Information Technology sector had the highest average weighting of 21% in the Fund, followed by the Health Care sector at 14%, and the Financial Services sector at 13%. The Fund benefited from a broad equity market rally in the United States during the reporting period that was supported primarily by expanding valuations as the U.S. Federal Reserve cut interest rates.
| | AVERAGE TOTAL RETURN FOR THE YEAR ENDED OCTOBER 31, 2019 |
| | One Year Return | Three Year Return | Annualized Inception to Date* |
| | Net Asset Value | Market Price | Net Asset Value | Market Price | Net Asset Value | Market Price |
Global X S&P 500® Catholic Values ETF | 13.86% | 13.85% | 14.78% | 14.68% | 13.17% | 13.18% |
S&P 500® Catholic Values Index | 14.23% | 14.23% | 15.12% | 15.12% | 13.50% | 13.50% |
S&P 500® Index | 14.33% | 14.33% | 14.91% | 14.91% | 13.35% | 13.35% |
Growth of a $10,000 Investment
(at Net Asset Value)
* Fund commenced operations on April 18, 2016.
The S&P 500® Index is a market capitalization weighted composite index of 500 large capitalization U.S. companies.
The performance data quoted herein represents past performance and the return and value of an investment in the Fund will fluctuate so that, when redeemed, it may be worth less than its original cost. Past performance is no guarantee of future performance and should not be considered as a representation of the future results of the Fund. The Fund’s performance assumes the reinvestment of all dividends and all capital gains. Index returns assume reinvestment of dividends and, unlike the Fund’s returns, do not reflect any fees or expenses. If such fees and expenses were included in the index returns, the performance would have been lower. Please note that one cannot invest directly in an unmanaged index.
There are no assurances that the Fund will meet its stated objectives.
The Fund’s holdings and allocations are subject to change and should not be considered recommendations to buy individual securities.
The graph and table do not reflect the deduction of taxes that a shareholder would pay on Fund distributions or the redemption or sale of Fund shares.
See definition of comparative indices above.
| | |
Management Discussion of Fund Performance (unaudited) |
| Global X NASDAQ 100® Covered Call ETF | |
Global X NASDAQ 100® Covered Call ETF
The Global X NASDAQ® 100 Covered Call ETF (“Fund”) seeks to provide investment results that correspond generally to the price and yield performance, before fees and expenses, of the CBOE Nasdaq-100® BuyWrite V2 Index (“Underlying Index”). The Fund is passively managed, which means the investment adviser does not attempt to take defensive positions in declining markets. The Fund generally seeks to fully replicate the Underlying Index.
The CBOE NASDAQ-100® BuyWrite Index (“BXN Index”) is a benchmark index that measures the performance of a theoretical portfolio that holds a portfolio of the stocks included in the NASDAQ-100® Index (“Reference Index”), and “writes” (or sells) a succession of one-month at-the-money Reference Index covered call options. The Underlying Index replicates the methodology used to calculate the BXN Index, with one exception: the written Reference Index covered call options are held until one day prior to the expiration dates (i.e., generally the Thursday preceding the third Friday of the month) and are liquidated at a volume-weighted average price determined at the close.
For the 12-month period ended October 31, 2019 (the “reporting period”), the Fund increased 9.39%, while the Underlying Index increased 11.55%. The Fund had a net asset value of $23.45 per share on October 31, 2018 and ended the reporting period with a net asset value of $23.10 on October 31, 2019.
During the reporting period, the highest returns came from Advanced Micro Devices, Inc. and Lam Research Corporation, which returned 100.41% and 95.92%, respectively. The worst performers were Baidu, Inc. and Mylan N.V., which returned -46.41% and -38.72%, respectively.
The Fund invests in stocks of the Reference Index and “writes” or “sells” corresponding call options on the same index. The Fund performed well during the reporting period as volatility helped generate higher income in options writing, since the Reference Index had an average approximate exposure of 44% to the volatile Information Technology sector, supported by global uncertainties (market volatility). Other drivers that impacted performance were the constituents of the Reference Index, which had positive performance during the year. Given the Fund’s options writing strategy, it gives up the profit potential if the Reference Index rises above the strike price of the Reference Index call option.
| | AVERAGE TOTAL RETURN FOR THE YEAR ENDED OCTOBER 31, 2019 |
| | One Year Return | Three Year Return | Five Year Return | Annualized Inception to Date* |
| | Net Asset Value | Market Price | Net Asset Value | Market Price | Net Asset Value | Market Price | Net Asset Value | Market Price |
Global X NASDAQ 100® Covered Call ETF | 9.39% | 9.19% | 11.84% | 11.66% | 9.16% | 9.15% | 8.64% | 8.64% |
Hybrid CBOE NASDAQ-100® BuyWrite Index/CBOE NASDAQ-100® BuyWrite V2 Index** | 11.55% | 11.55% | 13.19% | 13.19% | 10.28% | 10.28% | 9.64% | 9.64% |
NASDAQ 100® Total Return Index | 17.34% | 17.34% | 20.30% | 20.30% | 15.56% | 15.56% | 16.79% | 16.79% |
Growth of a $10,000 Investment
(at Net Asset Value)
* The Fund commenced operations on December 11, 2013.
** Hybrid Index performance reflects the performance of the CBOE NASDAQ-100® BuyWrite Index through October 14, 2015 and CBOE NASDAQ-100® BuyWrite V2 Index thereafter.
The Fund operated as the Horizons NASDAQ 100® Covered Call ETF (the “Predecessor Fund”), a series of Horizons ETF Trust I, prior to the Fund’s acquisition of the assets and assumption of the liabilities of the Predecessor Fund on December 24, 2018 (See Note 1 in Notes to Financial Statements).
On October 14, 2015, the Advisor changed the Fund’s primary benchmark from the BXN Index to BXNT Index in connection with a change in the Fund’s principal strategies. The Advisor believes the BXNT Index is a better measure of the Fund’s performance. Returns reflect a blended benchmark.
The Nasdaq-100® Index includes 100 of the largest domestic and international non-financial companies listed on The Nasdaq Stock Market based on market capitalization.
The performance data quoted herein represents past performance and the return and value of an investment in the Fund will fluctuate so that, when redeemed, it may be worth less than its original cost. Past performance is no guarantee of future performance and should not be considered as a representation of the future results of the Fund. The Fund’s performance assumes the reinvestment of all dividends and all capital gains. Index returns assume reinvestment of dividends and, unlike the Fund’s returns, do not reflect any fees or expenses. If such fees and expenses were included in the index returns, the performance would have been lower. Please note that one cannot invest directly in an unmanaged index.
There are no assurances that the Fund will meet its stated objectives.
The Fund’s holdings and allocations are subject to change and should not be considered recommendations to buy individual securities.
The graph and table do not reflect the deduction of taxes that a shareholder would pay on Fund distributions or the redemption or sale of Fund shares.
See definition of comparative indices on the previous page.
| | |
Management Discussion of Fund Performance (unaudited) |
| Global X S&P 500® Covered Call ETF | |
Global X S&P 500® Covered Call ETF
The Global X S&P 500® Covered Call ETF (“Fund”) seeks to provide investment results that correspond generally to the price and yield performance, before fees and expenses, of the Cboe S&P 500 2% OTM BuyWrite Index (“Underlying Index”). The Fund is passively managed, which means the investment adviser does not attempt to take defensive positions in declining markets. The Fund generally seeks to fully replicate the Underlying Index.
The Underlying Index is comprised of two parts: (1) all the equity securities in the S&P 500® Index (“Reference Index”) in substantially similar weight as the Reference Index; and (2) short (written) call options on up to 100% of the Reference Index. The Underlying Index measures the performance of a hypothetical portfolio that employs a covered call strategy. A covered call strategy is generally considered to be an investment strategy in which an investor buys a security, and sells (or “writes”) a call option on that security in an attempt to generate more income. Each time the Fund writes a covered call option, the Fund receives a payment of money from the investor who buys the option from the Fund, which is called the premium. If the value of the Fund’s call option that it has written declines because of a decline in the value of the Reference Index, the premium that the Fund received for writing the covered call option offsets this loss to some extent.
For the 12-month period ended October 31, 2019 (the “reporting period”), the Fund increased 8.40%, while the Underlying Index increased 10.05%. The Fund had a net asset value of $48.56 per share on October 31, 2018 and ended the reporting period with a net asset value of $49.39 on October 31, 2019.
During the reporting period, the highest returns came from Lam Research Corporation and KLA Corporation, which returned 95.92% and 89.79%, respectively. The worst performers were PG&E Corporation and DXC Technology Co., which returned -86.41% and -61.36%, respectively.
The Fund invests in stocks that are part of the Reference Index and “writes” or “sells” corresponding call options on the same index. The Reference Index registered strong double-digit returns in the reporting period, which contributed to the Fund’s performance. However the Fund was impacted by call-option writing, which limited its gains, leading to its underperformance versus the broad Reference Index. Given the Fund’s options-writing strategy, it cedes potential profits when the Reference Index rises above the strike price of the index call option.
| | AVERAGE TOTAL RETURN FOR THE YEAR ENDED OCTOBER 31, 2019 |
| | One Year Return | Three Year Return | Five Year Return | Annualized Inception to Date* |
| | Net Asset Value | Market Price | Net Asset Value | Market Price | Net Asset Value | Market Price | Net Asset Value | Market Price |
Global X S&P 500® Covered Call ETF | 8.40% | 8.37% | 9.99% | 10.01% | 6.96% | 7.11% | 8.59% | 8.72% |
| Hybrid S&P 500® Stock Covered Call Index/CBOE S&P 500 2% OTM BuyWrite Index** | 10.05% | 10.05% | 10.52% | 10.52% | 7.04% | 7.04% | 8.69% | 8.69% |
S&P 500® Index | 14.33% | 14.33% | 14.91% | 14.91% | 10.78% | 10.78% | 12.98% | 12.98% |
Growth of a $10,000 Investment
(at Net Asset Value)
* The Fund commenced operations on June 21, 2013.
** Hybrid Index performance reflects the performance of the S&P 500® Stock Covered Call Index through September 14, 2017 and CBOE S&P 500 2% OTM BuyWrite Index thereafter.
The Fund operated as the Horizons S&P 500® Covered Call ETF (the “Predecessor Fund”), a series of Horizons ETF Trust I, prior to the Fund’s acquisition of the assets and assumption of the liabilities of the Predecessor Fund on December 24, 2018 (See Note 1 in Notes to Financial Statements).
The S&P 500® Index is a market capitalization weighted composite index of 500 large capitalization U.S. companies.
The performance data quoted herein represents past performance and the return and value of an investment in the Fund will fluctuate so that, when redeemed, it may be worth less than its original cost. Past performance is no guarantee of future performance and should not be considered as a representation
of the future results of the Fund. The Fund’s performance assumes the reinvestment of all dividends and all capital gains. Index returns assume reinvestment of dividends and, unlike the Fund’s returns, do not reflect any fees or expenses. If such fees and expenses were included in the index returns, the performance would have been lower. Please note that one cannot invest directly in an unmanaged index.
There are no assurances that the Fund will meet its stated objectives.
The Fund’s holdings and allocations are subject to change and should not be considered recommendations to buy individual securities.
The graph and table do not reflect the deduction of taxes that a shareholder would pay on Fund distributions or the redemption or sale of Fund shares.
See definition of comparative indices on the previous page.
Global X Russell 2000 Covered Call ETF
The Global X Russell 2000 Covered Call ETF (“Fund”) seeks to provide investment results that correspond generally to the price and yield performance, before fees and expenses, of the Cboe Russell 2000 BuyWrite Index (“Underlying Index”). The Fund is passively managed, which means the investment adviser does not attempt to take defensive positions in declining markets. The Fund generally uses a representative sampling strategy with respect to the Underlying Index.
The Underlying Index measures the performance of a theoretical portfolio that holds a portfolio of the stocks included in the Russell 2000 Index (the “Reference Index”), and “writes” (or sells) a succession of one-month at-the-money covered call options on the Reference Index. The written covered call options on the Reference Index are held until expiration. The Reference Index is an equity benchmark which measures the performance of the small-capitalization sector of the U.S. equity market, as defined by FTSE Russell (the “Index Provider”). In seeking to track the Underlying Index, the Fund follows a “buy-write” (also called a covered call) investment strategy on the Reference Index in which the Fund purchases the component securities of the Reference Index or purchases other investments (including other underlying ETFs) that have economic characteristics that are substantially identical to the economic characteristics of such component securities, and also writes (or sells) call options that correspond to the Reference Index.
For the period from the Fund’s commencement date on April 17, 2019 through October 31, 2019 (the “reporting period”), the Fund increased 5.99%, while the Underlying Index increased 6.90%. The Fund had a net asset value of $25.00 per share on April 17, 2019 and ended the reporting period with a net asset value of $25.24 on October 31, 2019.
During the reporting period, Vanguard Russell 2000 ETF, the only holding of the Fund (other than written call options) returned 5.01%.
The Fund invests in stocks that are part of the Reference Index and “writes” or “sells” corresponding call options on the same index. Throughout the reporting period, there was high volatility in the small cap space, as well as the broader market, which led the Fund to collect higher option premiums and outperform the Reference Index. Given the Fund’s options-writing strategy, it cedes profit potential when the Reference Index rises above the strike price of the index call option.
| | |
Management Discussion of Fund Performance (unaudited) |
| Global X Russell 2000 Covered Call ETF | |
| | AVERAGE TOTAL RETURN FOR THE YEAR PERIOD ENDED OCTOBER 31, 2019 | |
| | Cumulative Inception to Date* | |
| | Net Asset Value | Market Price | |
| Global X Russell 2000 Covered Call ETF | 5.99% | 5.96% | |
| CBOE Russell 2000 BuyWrite Index | 6.90% | 6.90% | |
| Russell 2000 Index | 0.41% | 0.41% | |
Growth of a $10,000 Investment
(at Net Asset Value)
* The Fund commenced operations on April 17, 2019.
The Russell 2000 Index is an index measuring the performance of approximately 2,000 smallest-cap American companies in the Russell 3000 Index, which is made up of 3,000 of the largest U.S. stocks. It is a market-cap weighted index.
The performance data quoted herein represents past performance and the return and value of an investment in the Fund will fluctuate so that, when redeemed, it may be worth less than its original cost. Past performance is no guarantee of future performance and should not be considered as a representation of the future results of the Fund. The Fund’s performance assumes the reinvestment of all dividends and all capital gains. Index returns assume reinvestment of dividends and, unlike the Fund’s returns, do not reflect any fees or expenses. If such fees and expenses were included in the index returns, the performance would have been lower. Please note that one cannot invest directly in an unmanaged index.
There are no assurances that the Fund will meet its stated objectives.
The Fund’s holdings and allocations are subject to change and should not be considered recommendations to buy individual securities.
The graph and table do not reflect the deduction of taxes that a shareholder would pay on Fund distributions or the redemption or sale of Fund shares.
See definition of comparative indices above.
| | |
| Schedule of Investments |
| October 31, 2019 |
| Global X SuperDividend® ETF | |
| Sector Weightings (Unaudited)†: |
| † Sector weightings percentages are based on the total market value of investments. Repurchase agreements purchased from cash collateral received for securities lending activity are included in total investments. Please see Note 2 and 7 in Notes to Financial Statements for more detailed information. |
| | | | | | | |
| COMMON STOCK — 99.4% | |
| AUSTRALIA— 14.9% | | | | | | |
| Communication Services — 1.8% | | | | |
Nine Entertainment Holdings | | | 8,221,722 | | | $ | 10,422,444 | |
Southern Cross Media Group | | | 11,572,638 | | | | 6,537,853 | |
| | | | | | | | 16,960,297 | |
| Consumer Discretionary — 2.3% | | | | | |
Harvey Norman Holdings (A) | | | 3,795,702 | | | | 10,695,581 | |
Super Retail Group | | | 1,744,794 | | | | 11,431,774 | |
| | | | | | | | 22,127,355 | |
| Financials — 9.0% | | | | | |
Bank of Queensland (A) | | | 1,529,068 | | | | 9,533,762 | |
Bendigo and Adelaide Bank | | | 1,384,918 | | | | 10,161,612 | |
| Commonwealth Bank of Australia | | | 187,326 | | | | 10,151,751 | |
| Genworth Mortgage Insurance Australia | | | 5,799,081 | | | | 15,581,624 | |
IOOF Holdings (A) | | | 2,062,701 | | | | 10,487,732 | |
| | | | | | | |
COMMON STOCK — continued | |
| Financials — continued | | | | | |
National Australia Bank | | | 555,714 | | | $ | 10,953,632 | |
Perpetual | | | 272,820 | | | | 6,753,398 | |
Westpac Banking | | | 512,774 | | | | 9,965,934 | |
| | | | | | | | 83,589,445 | |
| Materials — 1.8% | | | | | |
Alumina | | | 5,280,872 | | | | 8,258,866 | |
CSR | | | 2,787,927 | | | | 7,951,896 | |
| | | | | | | | 16,210,762 | |
TOTAL AUSTRALIA | | | | | | | 138,887,859 | |
| BELGIUM— 1.3% | | | | | | | | |
| Industrials — 1.3% | | | | | |
bpost | | | 1,051,907 | | | | 12,028,970 | |
| BRAZIL— 3.2% | | | | | | | | |
| Energy — 0.9% | | | | | |
Enauta Participacoes | | | 2,572,200 | | | | 8,432,182 | |
| Utilities — 2.3% | | | | | |
| Cia de Transmissao de Energia Eletrica Paulista | | | 1,803,160 | | | | 10,587,007 | |
| Transmissora Alianca de Energia Eletrica | | | 1,450,500 | | | | 10,435,044 | |
| | | | | | | | 21,022,051 | |
TOTAL BRAZIL | | | | | | | 29,454,233 | |
| CANADA— 2.2% | | | | | | | | |
| Financials — 1.0% | | | | | |
Alaris Royalty (A) | | | 652,653 | | | | 9,722,636 | |
| Materials — 1.2% | | | | | |
Chemtrade Logistics Income Fund (A) | | | 1,365,441 | | | | 10,856,209 | |
TOTAL CANADA | | | | | | | 20,578,845 | |
| | | | | | | |
COMMON STOCK — continued | |
| CZECH REPUBLIC— 1.0% | | | | | | | | |
| Financials — 1.0% | | | | | |
Moneta Money Bank | | | 2,935,622 | | | $ | 9,764,692 | |
| GERMANY— 0.8% | | | | | | | | |
| Financials — 0.8% | | | | | |
Deutsche Pfandbriefbank | | | 582,270 | | | | 7,957,703 | |
| HONG KONG— 3.3% | | | | | | | | |
| Consumer Discretionary — 0.8% | | | | | |
Genting Hong Kong * | | | 70,550,500 | | | | 7,741,229 | |
| Materials — 0.7% | | | | | |
| Sinopec Shanghai Petrochemical, Cl H | | | 22,671,800 | | | | 6,305,998 | |
| Real Estate — 1.8% | | | | | |
Agile Group Holdings | | | 7,454,500 | | | | 10,081,746 | |
Yuzhou Properties | | | 15,225,200 | | | | 6,449,298 | |
| | | | | | | | 16,531,044 | |
TOTAL HONG KONG | | | | | | | 30,578,271 | |
| INDONESIA— 0.6% | | | | | | | | |
| Energy — 0.6% | | | | | |
Indo Tambangraya Megah | | | 6,408,300 | | | | 6,071,838 | |
| ITALY— 0.8% | | | | | | | | |
| Financials — 0.8% | | | | | |
Intesa Sanpaolo | | | 2,841,194 | | | | 7,119,309 | |
| MEXICO— 1.2% | | | | | | | | |
| Real Estate — 1.2% | | | | | |
PLA Administradora Industrial S de RL ‡ | | | 6,741,277 | | | | 11,178,030 | |
| MONACO— 2.4% | | | | | | | | |
| Energy — 0.8% | | | | | |
GasLog Partners | | | 361,839 | | | | 7,168,031 | |
| | | | | | | |
COMMON STOCK — continued | |
| Industrials — 1.6% | | | | | |
Costamare | | | 1,947,815 | | | $ | 15,309,826 | |
TOTAL MONACO | | | | | | | 22,477,857 | |
| NETHERLANDS— 3.0% | | | | | | | | |
| Communication Services — 1.0% | | | | | |
VEON ADR | | | 3,857,918 | | | | 9,259,003 | |
| Industrials — 1.1% | | | | | |
PostNL | | | 4,338,021 | | | | 9,960,112 | |
| Real Estate — 0.9% | | | | | |
Wereldhave ‡ (A) | | | 355,301 | | | | 8,403,487 | |
TOTAL NETHERLANDS | | | | | | | 27,622,602 | |
| NEW ZEALAND— 1.2% | | | | | | | | |
| Industrials — 1.2% | | | | | |
Air New Zealand | | | 6,076,449 | | | | 11,008,554 | |
| NIGERIA— 0.7% | | | | | | | | |
| Financials — 0.7% | | | | | |
Zenith Bank | | | 133,779,323 | | | | 6,278,119 | |
| NORWAY— 0.8% | | | | | | | | |
| Energy — 0.8% | | | | | |
Ocean Yield | | | 1,358,909 | | | | 7,607,712 | |
| POLAND— 0.5% | | | | | | | | |
| Materials — 0.5% | | | | | |
Ciech *(A) | | | 600,380 | | | | 5,098,902 | |
| RUSSIA— 2.6% | | | | | | | | |
| Communication Services — 0.8% | | | | | |
Mobile TeleSystems ADR | | | 792,797 | | | | 7,095,533 | |
| Materials — 1.8% | | | | | |
Novolipetsk Steel PJSC GDR | | | 395,949 | | | | 7,744,762 | |
Severstal PJSC GDR | | | 665,330 | | | | 9,088,408 | |
| | | | | | | | 16,833,170 | |
| | | | | | | |
COMMON STOCK — continued | |
TOTAL RUSSIA | | | | | | $ | 23,928,703 | |
| SINGAPORE— 1.0% | | | | | | | | |
| Real Estate — 1.0% | | | | | |
CapitaLand Retail China Trust ‡ | | | 8,833,777 | | | | 9,866,153 | |
| SOUTH AFRICA— 2.4% | | | | | | | | |
| Real Estate — 2.4% | | | | | |
Corporate Real Estate ‡ (A) | | | 40,674,602 | | | | 8,343,647 | |
Fortress, Cl B ‡ | | | 11,994,492 | | | | 7,158,395 | |
Redefine Properties ‡ | | | 14,307,179 | | | | 7,161,425 | |
TOTAL SOUTH AFRICA | | | | | | | 22,663,467 | |
| SPAIN— 0.9% | | | | | | | | |
| Communication Services — 0.9% | | | | | |
| Atresmedia de Medios de Comunicacion | | | 1,997,924 | | | | 8,354,217 | |
| THAILAND— 1.2% | | | | | | | | |
| Communication Services — 1.2% | | | | | |
Jasmine International NVDR | | | 53,282,600 | | | | 11,028,854 | |
| TURKEY— 0.8% | | | | | | | | |
| Materials — 0.8% | | | | | |
Iskenderun Demir ve Celik (A) | | | 7,149,450 | | | | 7,596,811 | |
| UNITED KINGDOM— 8.5% | | | | | | | | |
| Consumer Discretionary — 3.1% | | | | | |
Crest Nicholson Holdings | | | 1,620,682 | | | | 8,145,353 | |
Marston’s | | | 7,151,515 | | | | 11,410,220 | |
Persimmon | | | 319,250 | | | | 9,406,473 | |
| | | | | | | | 28,962,046 | |
| Financials — 1.0% | | | | | |
Standard Life Aberdeen | | | 2,219,383 | | | | 8,716,133 | |
| Industrials — 1.9% | | | | | |
Galliford Try | | | 978,690 | | | | 9,282,865 | |
| | | | | | | |
COMMON STOCK — continued | |
| Industrials — continued | | | | | |
Royal Mail | | | 3,137,494 | | | $ | 8,590,757 | |
| | | | | | | | 17,873,622 | |
| Materials — 0.6% | | | | | |
Evraz | | | 1,202,900 | | | | 5,715,643 | |
| Real Estate — 0.8% | | | | | |
NewRiver REIT ‡ | | | 2,817,436 | | | | 7,327,959 | |
| Utilities — 1.1% | | | | | |
SSE | | | 631,022 | | | | 10,480,289 | |
TOTAL UNITED KINGDOM | | | | | | | 79,075,692 | |
| UNITED STATES— 44.1% | | | | | | | | |
| Communication Services — 2.0% | | | | | |
National CineMedia | | | 1,341,782 | | | | 11,264,260 | |
New Media Investment Group (A) | | | 827,548 | | | | 7,290,698 | |
| | | | | | | | 18,554,958 | |
| Consumer Staples — 1.2% | | | | | |
Vector Group | | | 929,463 | | | | 11,339,448 | |
| Energy — 4.6% | | | | | |
EnLink Midstream | | | 726,687 | | | | 4,541,794 | |
SemGroup, Cl A | | | 685,539 | | | | 11,037,178 | |
Ship Finance International | | | 818,524 | | | | 11,844,042 | |
Tallgrass Energy, Cl A | | | 326,628 | | | | 6,094,879 | |
Targa Resources | | | 244,190 | | | | 9,494,107 | |
| | | | | | | | 43,012,000 | |
| Financials — 23.1% | | | | | |
AG Mortgage Investment Trust ‡ | | | 565,017 | | | | 8,836,866 | |
AGNC Investment ‡ | | | 562,514 | | | | 9,590,864 | |
Annaly Capital Management ‡ | | | 961,366 | | | | 8,633,067 | |
Apollo Commercial Real Estate Finance ‡ | | | 540,323 | | | | 9,887,911 | |
Arbor Realty Trust ‡ (A) | | | 776,616 | | | | 10,608,575 | |
Armour Residential ‡ | | | 500,280 | | | | 8,369,684 | |
| | | | | | | |
COMMON STOCK — continued | |
| Financials — continued | | | | | |
| Artisan Partners Asset Management, Cl A | | | 363,151 | | | $ | 9,932,180 | |
BGC Partners, Cl A | | | 1,723,364 | | | | 8,961,493 | |
Blackstone Mortgage Trust, Cl A ‡ | | | 277,845 | | | | 10,085,773 | |
Chimera Investment ‡ | | | 523,479 | | | | 10,605,684 | |
Granite Point Mortgage Trust ‡ | | | 343,578 | | | | 6,390,551 | |
Invesco Mortgage Capital ‡ | | | 619,323 | | | | 9,748,144 | |
KKR Real Estate Finance Trust ‡ | | | 332,212 | | | | 6,660,851 | |
Ladder Capital, Cl A ‡ | | | 589,634 | | | | 10,182,979 | |
MFA Financial ‡ | | | 1,363,053 | | | | 10,345,572 | |
New Residential Investment ‡ | | | 594,215 | | | | 9,412,366 | |
New York Mortgage Trust ‡ | | | 1,664,500 | | | | 10,419,770 | |
PennyMac Mortgage Investment Trust ‡ | | | 479,093 | | | | 10,966,439 | |
Ready Capital ‡ | | | 515,893 | | | | 8,166,586 | |
Redwood Trust ‡ | | | 622,371 | | | | 10,169,542 | |
Starwood Property Trust ‡ | | | 441,101 | | | | 10,851,085 | |
TPG RE Finance Trust ‡ | | | 323,548 | | | | 6,545,376 | |
Two Harbors Investment ‡ | | | 705,753 | | | | 9,788,794 | |
| | | | | | | | 215,160,152 | |
| Industrials — 1.2% | | | | | |
Macquarie Infrastructure | | | 247,623 | | | | 10,682,456 | |
| Real Estate — 10.6% | | | | | |
CoreCivic ‡ | | | 516,592 | | | | 7,883,194 | |
GEO Group ‡ | | | 508,148 | | | | 7,734,012 | |
Global Net Lease ‡ | | | 537,717 | | | | 10,474,727 | |
Kite Realty Group Trust ‡ | | | 628,067 | | | | 11,192,154 | |
Office Properties Income Trust ‡ | | | 334,736 | | | | 10,671,384 | |
Omega Healthcare Investors ‡ | | | 262,679 | | | | 11,568,383 | |
Sabra Health Care ‡ | | | 541,190 | | | | 13,313,274 | |
Service Properties Trust ‡ | | | 375,333 | | | | 9,495,925 | |
SITE Centers ‡ | | | 594,106 | | | | 9,226,466 | |
Washington Prime Group ‡ (A) | | | 1,869,306 | | | | 7,888,471 | |
| | | | | | | | 99,447,990 | |
| | | | | | | |
COMMON STOCK — continued | |
| Utilities — 1.4% | | | | | |
Pattern Energy Group, Cl A | | | 454,498 | | | $ | 12,739,579 | |
TOTAL UNITED STATES | | | | | | | 410,936,583 | |
| TOTAL COMMON STOCK | | | | | | | | |
(Cost $963,075,308) | | | | | | | 927,163,976 | |
| | |
SHORT-TERM INVESTMENT(B)(C) — 0.7% | |
| Fidelity Investments Money Market Government Portfolio, Cl Institutional, 1.760% | | | | | | | | |
(Cost $6,557,200) | | | 6,557,200 | | | | 6,557,200 | |
| | |
REPURCHASE AGREEMENT(B) — 5.1% | |
| RBC Capital Markets | | | | | | | | |
| 1.680%, dated 10/31/19, to be repurchased on 11/01/19 repurchase price $47,201,739 (collateralized by U.S. Treasury Obligations, ranging in par value $4,938,040 - $7,181,198, 3.000%, 09/30/2025, with a total market value of $48,025,228) | | | | | | | | |
(Cost $47,199,536) | | $ | 47,199,536 | | | | 47,199,536 | |
| TOTAL INVESTMENTS — 105.2% | | | | | | | | |
(Cost $1,016,832,044) | | | | | | $ | 980,920,712 | |
| Percentages are based on Net Assets of $932,110,509. |
| ‡ | Real Estate Investment Trust |
| * | Non-income producing security. |
| (A) | This security or a partial position of this security is on loan at October 31, 2019. The total value of securities on loan at October 31, 2019 was $50,887,061. |
| (B) | Security was purchased with cash collateral held from securities on loan. The total value of such securities as of October 31, 2019, was $53,756,736. |
| (C) | The rate reported on the Schedule of Investments is the 7-day effective yield as of October 31, 2019. |
| ADR — American Depositary Receipt |
| Cl — Class |
| GDR — Global Depositary Receipt |
| NVDR — Non-Voting Depositary Receipt |
| PJSC — Public Joint Stock Company |
| REIT — Real Estate Investment Trust |
The following is a summary of the level of inputs used as of October 31, 2019, in valuing the Fund’s investments carried at value:
| Investments in Securities | | | | | | | | | | | | |
| Common Stock | | $ | 927,163,976 | | | $ | — | | | $ | — | | | $ | 927,163,976 | |
| Short-Term Investment | | | 6,557,200 | | | | — | | | | — | | | | 6,557,200 | |
| Repurchase Agreement | | | — | | | | 47,199,536 | | | | — | | | | 47,199,536 | |
| Total Investments in Securities | | $ | 933,721,176 | | | $ | 47,199,536 | | | $ | — | | | $ | 980,920,712 | |
For the year ended October 31, 2019, there have been no transfers in or out of Level 3.
| | |
| Schedule of Investments |
| October 31, 2019 |
| Global X SuperDividend® U.S. ETF | |
| Sector Weightings (Unaudited)†: |
| † Sector weightings percentages are based on the total market value of investments. Repurchase agreements purchased from cash collateral received for securities lending activity are included in total investments. Please see Note 2 and 7 in Notes to Financial Statements for more detailed information. |
| | | | | | | |
| COMMON STOCK — 78.7% | | | | | | |
| UNITED STATES— 78.7% | | | | | | |
| Communication Services — 12.7% | | | | | | |
AMC Entertainment Holdings, Cl A (A) | | | 856,231 | | | $ | 8,022,885 | |
AT&T | | | 376,246 | | | | 14,481,709 | |
Gannett | | | 1,104,089 | | | | 11,979,366 | |
National CineMedia | | | 1,695,388 | | | | 14,232,782 | |
New Media Investment Group (A) | | | 921,576 | | | | 8,119,084 | |
Verizon Communications | | | 205,999 | | | | 12,456,759 | |
| | | | | | | | 69,292,585 | |
| Consumer Discretionary — 5.3% | | | | | | | | |
Buckle (A) | | | 632,380 | | | | 13,229,390 | |
Chico’s FAS | | | 2,083,944 | | | | 7,168,767 | |
Six Flags Entertainment | | | 205,407 | | | | 8,666,121 | |
| | | | | | | | 29,064,278 | |
| | | | | | | |
| COMMON STOCK — continued | | | | | | | | |
| Consumer Staples — 14.0% | | | | | | | | |
Altria Group | | | 231,304 | | | $ | 10,360,106 | |
B&G Foods (A) | | | 438,683 | | | | 6,821,521 | |
Coty, Cl A | | | 1,026,490 | | | | 11,999,668 | |
General Mills | | | 244,227 | | | | 12,421,385 | |
Philip Morris International | | | 136,000 | | | | 11,075,840 | |
Universal | | | 194,223 | | | | 10,643,421 | |
Vector Group | | | 1,049,906 | | | | 12,808,853 | |
| | | | | | | | 76,130,794 | |
| Energy — 4.4% | | | | | | | | |
Exxon Mobil | | | 146,655 | | | | 9,909,478 | |
Ship Finance International | | | 961,616 | | | | 13,914,584 | |
| | | | | | | | 23,824,062 | |
| Financials — 15.2% | | | | | | | | |
AG Mortgage Investment Trust ‡ | | | 677,330 | | | | 10,593,441 | |
Apollo Commercial Real Estate Finance ‡ | | | 655,873 | | | | 12,002,476 | |
Chimera Investment ‡ | | | 644,946 | | | | 13,066,606 | |
MFA Financial ‡ | | | 1,628,368 | | | | 12,359,313 | |
New Residential Investment ‡ | | | 579,817 | | | | 9,184,301 | |
New York Mortgage Trust ‡ | | | 1,911,800 | | | | 11,967,868 | |
PennyMac Mortgage Investment Trust ‡ | | | 593,239 | | | | 13,579,241 | |
| | | | | | | | 82,753,246 | |
| Industrials — 6.9% | | | | | | | | |
Air Castle Ltd. | | | 440,876 | | | | 12,000,645 | |
Covanta Holding | | | 704,112 | | | | 10,167,377 | |
Macquarie Infrastructure | | | 280,321 | | | | 12,093,048 | |
Quad | | | 740,515 | | | | 3,354,533 | |
| | | | | | | | 37,615,603 | |
| Materials — 4.3% | | | | | | | | |
Innophos Holdings | | | 370,000 | | | | 12,069,400 | |
| Schweitzer-Mauduit International | | | 277,008 | | | | 11,216,054 | |
| | | | | | | | 23,285,454 | |
| | | | | | | |
| COMMON STOCK — continued | | | | | | | | |
| Real Estate — 5.9% | | | | | | | | |
Global Net Lease ‡ | | | 598,762 | | | $ | 11,663,884 | |
Pennsylvania Real Estate Investment Trust ‡ (A) | | | 1,977,279 | | | | 10,914,580 | |
Washington Prime Group ‡ (A) | | | 2,314,646 | | | | 9,767,806 | |
| | | | | | | | 32,346,270 | |
| Utilities — 10.0% | | | | | | | | |
Duke Energy | | | 129,385 | | | | 12,195,830 | |
Pattern Energy Group, Cl A | | | 555,776 | | | | 15,578,401 | |
PPL | | | 373,257 | | | | 12,500,377 | |
Southern | | | 231,398 | | | | 14,499,399 | |
| | | | | | | | 54,774,007 | |
| TOTAL COMMON STOCK | | | | | | | | |
(Cost $429,778,212) | | | | | | | 429,086,299 | |
| | | | | | | | | |
| MASTER LIMITED PARTNERSHIPS — 20.8% | | | | | | | | |
| Consumer Discretionary — 2.3% | | | | | | | | |
Cedar Fair | | | 221,655 | | | | 12,361,700 | |
| Energy — 13.6% | | | | | | | | |
Alliance Resource Partners | | | 653,903 | | | | 7,454,494 | |
CrossAmerica Partners | | | 549,235 | | | | 10,303,649 | |
Delek Logistics Partners | | | 387,963 | | | | 12,523,446 | |
NGL Energy Partners | | | 592,509 | | | | 6,665,726 | |
PBF Logistics | | | 506,491 | | | | 10,965,530 | |
Phillips 66 Partners | | | 228,051 | | | | 12,745,770 | |
USA Compression Partners | | | 763,603 | | | | 13,492,865 | |
| | | | | | | | 74,151,480 | |
| Financials — 2.7% | | | | | | | | |
Compass Diversified Holdings | | | 724,634 | | | | 14,963,692 | |
| | | | | | | |
| MASTER LIMITED PARTNERSHIPS — continued | | | | | | | | |
| Industrials — 2.2% | | | | | | | | |
| Fortress Transportation & Infrastructure Investors | | | 748,433 | | | $ | 11,862,663 | |
| TOTAL MASTER LIMITED PARTNERSHIPS | | | | | | | | |
(Cost $100,200,129) | | | | | | | 113,339,535 | |
| | | | | | | | | |
SHORT-TERM INVESTMENT(B)(C) — 0.9% | | | | | | | | |
| Fidelity Investments Money Market Government Portfolio, Cl Institutional, 1.760% | | | | | | | | |
(Cost $4,971,020) | | | 4,971,020 | | | | 4,971,020 | |
| | | | | | | | | |
REPURCHASE AGREEMENT(B) — 6.6% | | | | | | | | |
| RBC Capital Markets | | | | | | | | |
| 1.680%, dated 10/31/19, to be repurchased on 11/01/19 repurchase price $35,783,686 (collateralized by U.S. Treasury Obligations, ranging in par value $3,743,533 - $5,444,074, 3.000%, 09/30/2025, with a total market value of $36,407,977) | | | | | | | | |
(Cost $35,782,016) | | $ | 35,782,016 | | | | 35,782,016 | |
| TOTAL INVESTMENTS — 107.0% | | | | | | | | |
(Cost $570,731,377) | | | | | | $ | 583,178,870 | |
| Percentages are based on Net Assets of $544,884,449. | | |
| ‡ | Real Estate Investment Trust |
| (A) | This security or a partial position of this security is on loan at October 31, 2019. The total value of securities on loan at October 31, 2019 was $38,804,473. |
| (B) | Security was purchased with cash collateral held from securities on loan. The total value of such securities as of October 31, 2019, was $40,753,036. |
| (C) | The rate reported on the Schedule of Investments is the 7-day effective yield as of October 31, 2019. |
The following is a summary of the level of inputs used as of October 31, 2019, in valuing the Fund’s investments carried at value:
| Investments in Securities | | | | | | | | | | | | |
| Common Stock | | $ | 429,086,299 | | | $ | — | | | $ | — | | | $ | 429,086,299 | |
| Master Limited Partnerships | | | 113,339,535 | | | | — | | | | — | | | | 113,339,535 | |
| Short-Term Investment | | | 4,971,020 | | | | — | | | | — | | | | 4,971,020 | |
| Repurchase Agreement | | | — | | | | 35,782,016 | | | | — | | | | 35,782,016 | |
| Total Investments in Securities | | $ | 547,396,854 | | | $ | 35,782,016 | | | $ | — | | | $ | 583,178,870 | |
For the year ended October 31, 2019, there have been no transfers in or out of Level 3.
| | |
| Schedule of Investments |
| October 31, 2019 |
Global X MSCI SuperDividend® Emerging Markets ETF |
| Sector Weightings (Unaudited)†: |
| † Sector weightings percentages are based on the total market value of investments. |
| | | | | | | |
| COMMON STOCK — 97.2% | | | | | | |
| ARGENTINA— 1.3% | | | | | | |
| Energy — 1.3% | | | | | | |
| Transportadora de Gas del Sur ADR | | | 30,013 | | | $ | 226,898 | |
| BRAZIL— 9.6% | | | | | | | | |
| Consumer Discretionary — 2.7% | | | | | | | | |
Petrobras Distribuidora | | | 66,000 | | | | 464,947 | |
| Financials — 2.5% | | | | | | | | |
Itausa - Investimentos Itau | | | 130,415 | | | | 445,394 | |
| Information Technology — 2.2% | | | | | | | | |
Cielo | | | 202,300 | | | | 380,975 | |
| Utilities — 2.2% | | | | | | | | |
Engie Brasil Energia | | | 34,821 | | | | 392,586 | |
TOTAL BRAZIL | | | | | | | 1,683,902 | |
| CHILE— 1.6% | | | | | | | | |
| Utilities — 1.6% | | | | | | | | |
Colbun | | | 1,648,273 | | | | 284,603 | |
| | | | | | | |
| COMMON STOCK — continued | | | | | | | | |
| CHINA— 1.6% | | | | | | | | |
| Materials — 1.6% | | | | | | | | |
Maanshan Iron & Steel, Cl H | | | 754,000 | | | $ | 285,719 | |
| EGYPT— 2.2% | | | | | | | | |
| Consumer Staples — 2.2% | | | | | | | | |
Eastern SAE | | | 378,639 | | | | 377,701 | |
| HONG KONG— 14.2% | | | | | | | | |
| Financials — 1.8% | | | | | | | | |
| Bank of Communications CO, Cl H | | | 449,080 | | | | 307,114 | |
| Information Technology — 1.8% | | | | | | | | |
Lenovo Group | | | 441,500 | | | | 308,690 | |
| Materials — 3.2% | | | | | | | | |
China Oriental Group | | | 583,300 | | | | 203,917 | |
Nine Dragons Paper Holdings | | | 398,000 | | | | 346,321 | |
| | | | | | | | 550,238 | |
| Real Estate — 7.4% | | | | | | | | |
Agile Group Holdings | | | 267,300 | | | | 361,506 | |
Guangzhou R&F Properties | | | 188,000 | | | | 292,157 | |
KWG Group Holdings | | | 330,200 | | | | 333,667 | |
Yuzhou Properties | | | 732,300 | | | | 310,198 | |
| | | | | | | | 1,297,528 | |
TOTAL HONG KONG | | | | | | | 2,463,570 | |
| INDIA— 1.9% | | | | | | | | |
| Energy — 1.9% | | | | | | | | |
Indian Oil | | | 163,595 | | | | 338,590 | |
| INDONESIA— 1.6% | | | | | | | | |
| Energy — 1.6% | | | | | | | | |
| Tambang Batubara Bukit Asam Persero | | | 1,711,400 | | | | 274,321 | |
| | | | | | | |
| COMMON STOCK — continued | | | | | | | | |
| MALAYSIA— 1.5% | | | | | | | | |
| Industrials — 1.5% | | | | | | | | |
AirAsia Group | | | 583,300 | | | $ | 266,628 | |
| MEXICO— 2.4% | | | | | | | | |
| Real Estate — 2.4% | | | | | | | | |
Fibra Uno Administracion ‡ | | | 280,300 | | | | 427,205 | |
| PAKISTAN— 1.9% | | | | | | | | |
| Financials — 1.9% | | | | | | | | |
MCB Bank | | | 295,810 | | | | 328,633 | |
| PHILIPPINES— 1.8% | | | | | | | | |
| Industrials — 1.8% | | | | | | | | |
DMCI Holdings | | | 1,944,000 | | | | 314,518 | |
| QATAR— 2.1% | | | | | | | | |
| Real Estate — 2.1% | | | | | | | | |
Barwa Real Estate | | | 385,780 | | | | 362,364 | |
| RUSSIA— 20.5% | | | | | | | | |
| Energy — 6.8% | | | | | | | | |
Gazprom PJSC | | | 114,420 | | | | 464,315 | |
LUKOIL PJSC | | | 4,466 | | | | 412,611 | |
Tatneft PJSC | | | 26,930 | | | | 314,478 | |
| | | | | | | | 1,191,404 | |
| Financials — 2.3% | | | | | | | | |
| Moscow Exchange MICEX-RTS PJSC | | | 273,940 | | | | 406,306 | |
| Materials — 11.4% | | | | | | | | |
Alrosa PJSC | | | 265,850 | | | | 309,163 | |
| Magnitogorsk Iron & Steel Works PJSC | | | 524,300 | | | | 298,928 | |
MMC Norilsk Nickel PJSC | | | 1,711 | | | | 477,692 | |
Novolipetsk Steel PJSC | | | 143,550 | | | | 280,149 | |
PhosAgro PJSC GDR | | | 22,549 | | | | 283,666 | |
| | | | | | | |
| COMMON STOCK — continued | | | | | | | | |
| Materials — continued | | | | | | | | |
Severstal PJSC | | | 23,878 | | | $ | 328,777 | |
| | | | | | | | 1,978,375 | |
TOTAL RUSSIA | | | | | | | 3,576,085 | |
| SOUTH AFRICA— 9.2% | | | | | | | | |
| Financials — 3.9% | | | | | | | | |
Absa Group | | | 29,625 | | | | 304,599 | |
Liberty Holdings | | | 50,085 | | | | 386,921 | |
| | | | | | | | 691,520 | |
| Real Estate — 5.3% | | | | | | | | |
Fortress REIT, Cl A ‡ | | | 259,547 | | | | 362,007 | |
Growthpoint Properties ‡ | | | 206,684 | | | | 303,368 | |
Redefine Properties ‡ | | | 512,737 | | | | 256,649 | |
| | | | | | | | 922,024 | |
TOTAL SOUTH AFRICA | | | | | | | 1,613,544 | |
| SOUTH KOREA— 1.7% | | | | | | | | |
| Financials — 1.7% | | | | | | | | |
Orange Life Insurance | | | 12,638 | | | | 304,151 | |
| TAIWAN— 10.6% | | | | | | | | |
| Information Technology — 10.6% | | | | | | | | |
Inventec | | | 461,000 | | | | 334,689 | |
Lite-On Technology | | | 258,500 | | | | 426,297 | |
Micro-Star International | | | 145,800 | | | | 431,070 | |
Nanya Technology | | | 125,000 | | | | 287,446 | |
Walsin Technology | | | 63,000 | | | | 379,774 | |
TOTAL TAIWAN | | | | | | | 1,859,276 | |
| THAILAND— 2.0% | | | | | | | | |
| Real Estate — 2.0% | | | | | |
Land & Houses NVDR | | | 1,093,500 | | | | 351,282 | |
| | | | | | | |
| COMMON STOCK — continued | |
| TURKEY— 6.6% | | | | | | | | |
| Energy — 2.2% | | | | | |
| Tupras Turkiye Petrol Rafinerileri | | | 17,933 | | | $ | 390,834 | |
| Industrials — 2.5% | | | | | |
TAV Havalimanlari Holding | | | 93,736 | | | | 427,941 | |
| Materials — 1.9% | | | | | |
| Eregli Demir ve Celik Fabrikalari | | | 285,417 | | | | 326,759 | |
TOTAL TURKEY | | | | | | | 1,145,534 | |
| UNITED ARAB EMIRATES— 2.9% | | | | | | | | |
| Real Estate — 2.9% | | | | | |
Aldar Properties PJSC | | | 790,439 | | | | 505,754 | |
| TOTAL COMMON STOCK | | | | | | | | |
(Cost $17,044,645) | | | | | | | 16,990,278 | |
| | |
| PREFERRED STOCK — 2.4% | |
| BRAZIL— 2.4% | | | | | | | | |
| Communication Services — 2.4% | | | | | |
Telefonica Brasil (A) | | | | | | | | |
(Cost $390,755) | | | 32,400 | | | | 428,406 | |
| TOTAL INVESTMENTS — 99.6% | | | | | | | | |
(Cost $17,435,400) | | | | | | $ | 17,418,684 | |
| Percentages are based on Net Assets of $17,488,778. |
| ‡ | Real Estate Investment Trust |
| (A) | There’s currently no stated interest rate. |
| ADR — American Depositary Receipt |
| Cl — Class |
| GDR — Global Depositary Receipt |
| NVDR — Non-Voting Depositary Receipt |
| PJSC — Public Joint Stock Company |
| REIT — Real Estate Investment Trust |
| As of October 31, 2019, all of the Fund’s investments were considered Level 1, in accordance with authoritative guidance on fair value measurements and disclosure under U.S. GAAP. |
For the year ended October 31, 2019, there have been no transfers in or out of Level 3.
| | |
| Schedule of Investments |
| October 31, 2019 |
Global X MSCI SuperDividend® EAFE ETF |
| Sector Weightings (Unaudited)†: |
| † Sector weightings percentages are based on the total market value of investments. |
| | | | | | | |
| COMMON STOCK — 100.0% | | | | | | |
| AUSTRALIA— 18.6% | | | | | | |
| Consumer Discretionary — 2.1% | | | | | | |
Harvey Norman Holdings | | | 137,914 | | | $ | 388,616 | |
| Financials — 12.3% | | | | | | | | |
| Australia & New Zealand Banking Group | | | 19,497 | | | | 359,185 | |
Bank of Queensland | | | 57,787 | | | | 360,303 | |
Bendigo and Adelaide Bank | | | 48,556 | | | | 356,272 | |
| Commonwealth Bank of Australia | | | 7,117 | | | | 385,691 | |
National Australia Bank | | | 21,401 | | | | 421,833 | |
Westpac Banking | | | 20,113 | | | | 390,903 | |
| | | | | | | | 2,274,187 | |
| Materials — 1.8% | | | | | | | | |
Alumina | | | 213,658 | | | | 334,144 | |
| Real Estate — 2.4% | | | | | | | | |
Stockland ‡ | | | 133,450 | | | | 449,590 | |
TOTAL AUSTRALIA | | | | | | | 3,446,537 | |
| | | | | | | |
| COMMON STOCK — continued | | | | | | | | |
| FINLAND— 4.0% | | | | | | | | |
| Financials — 1.8% | | | | | | | | |
Sampo, Cl A | | | 8,040 | | | $ | 329,551 | |
| Utilities — 2.2% | | | | | | | | |
Fortum | | | 16,595 | | | | 405,275 | |
TOTAL FINLAND | | | | | | | 734,826 | |
| FRANCE— 11.0% | | | | | | | | |
| Communication Services — 2.0% | | | | | | | | |
Eutelsat Communications | | | 20,110 | | | | 381,407 | |
| Consumer Staples — 2.9% | | | | | | | | |
Casino Guichard Perrachon | | | 9,881 | | | | 533,217 | |
| Energy — 1.9% | | | | | |
Total | | | 6,643 | | | | 349,329 | |
| Industrials — 2.0% | | | | | |
Credit Agricole | | | 28,531 | | | | 371,940 | |
| Real Estate — 2.2% | | | | | |
ICADE ‡ | | | 4,124 | | | | 403,962 | |
TOTAL FRANCE | | | | | | | 2,039,855 | |
| GERMANY— 3.8% | | | | | | | | |
| Communication Services — 3.8% | | | | | |
RTL Group | | | 6,862 | | | | 348,788 | |
| Telefonica Deutschland Holding | | | 110,491 | | | | 350,701 | |
TOTAL GERMANY | | | | | | | 699,489 | |
| HONG KONG— 7.8% | | | | | | | | |
| Communication Services — 3.9% | | | | | |
HKT Trust & HKT | | | 232,120 | | | | 361,313 | |
PCCW | | | 608,865 | | | | 362,008 | |
| | | | | | | | 723,321 | |
| | | | | | | |
| COMMON STOCK — continued | |
| Consumer Discretionary — 1.9% | | | | | |
Yue Yuen Industrial Holdings | | | 128,400 | | | $ | 362,050 | |
| Utilities — 2.0% | | | | | |
| HK Electric Investments & HK Electric Investments | | | 367,570 | | | | 366,740 | |
TOTAL HONG KONG | | | | | | | 1,452,111 | |
| ITALY— 4.2% | | | | | | | | |
| Financials — 2.3% | | | | | |
Poste Italiane | | | 34,540 | | | | 419,255 | |
| Utilities — 1.9% | | | | | |
Snam | | | 69,066 | | | | 354,446 | |
TOTAL ITALY | | | | | | | 773,701 | |
| JAPAN— 1.7% | | | | | | | | |
| Consumer Discretionary — 1.7% | | | | | |
Nissan Motor | | | 50,300 | | | | 320,770 | |
| NETHERLANDS— 3.7% | | | | | | | | |
| Financials — 1.9% | | | | | |
ING Groep | | | 31,148 | | | | 351,950 | |
| Real Estate — 1.8% | | | | | |
Unibail-Rodamco-Westfield ‡ | | | 2,209 | | | | 341,698 | |
TOTAL NETHERLANDS | | | | | | | 693,648 | |
| NEW ZEALAND— 2.3% | | | | | | | | |
| Communication Services — 2.3% | | | | | |
Spark New Zealand | | | 145,018 | | | | 416,641 | |
| PORTUGAL— 2.2% | | | | | | | | |
| Utilities — 2.2% | | | | | |
Energias de Portugal | | | 98,816 | | | | 406,800 | |
| SINGAPORE— 2.1% | | | | | | | | |
| Real Estate — 2.1% | | | | | |
Ascendas Real Estate Investment Trust ‡ | | | 167,420 | | | | 389,964 | |
| | | | | | | |
| COMMON STOCK — continued | |
| SPAIN— 4.0% | | | | | | | | |
| Utilities — 4.0% | | | | | |
Enagas | | | 14,591 | | | $ | 361,218 | |
Endesa | | | 14,033 | | | | 382,004 | |
TOTAL SPAIN | | | | | | | 743,222 | |
| SWEDEN— 5.7% | | | | | | | | |
| Financials — 5.7% | | | | | |
Nordea Bank Abp | | | 47,201 | | | | 346,035 | |
| Skandinaviska Enskilda Banken, Cl A | | | 38,869 | | | | 373,266 | |
Swedbank, Cl A | | | 23,718 | | | | 332,470 | |
TOTAL SWEDEN | | | | | | | 1,051,771 | |
| SWITZERLAND— 2.3% | | | | | | | | |
| Financials — 2.3% | | | | | |
Zurich Insurance Group | | | 1,101 | | | | 430,135 | |
| UNITED KINGDOM— 26.6% | | | | | | | | |
| Communication Services — 1.9% | | | | | |
BT Group, Cl A | | | 135,658 | | | | 359,332 | |
| Consumer Discretionary — 8.8% | | | | | |
Barratt Developments | | | 45,700 | | | | 373,264 | |
Persimmon | | | 13,161 | | | | 387,779 | |
Taylor Wimpey | | | 185,024 | | | | 396,241 | |
TUI | | | 35,697 | | | | 466,537 | |
| | | | | | | | 1,623,821 | |
| Consumer Staples — 1.6% | | | | | |
Imperial Brands | | | 13,132 | | | | 287,585 | |
| Energy — 3.5% | | | | | |
BP | | | 50,684 | | | | 320,907 | |
Royal Dutch Shell, Cl A | | | 11,043 | | | | 319,087 | |
| | | | | | | | 639,994 | |
| | | | | | | |
| COMMON STOCK — continued | |
| Financials — 5.7% | | | | | |
HSBC Holdings | | | 42,501 | | | $ | 320,627 | |
Legal & General Group | | | 99,124 | | | | 338,238 | |
Standard Life Aberdeen | | | 105,400 | | | | 413,935 | |
| | | | | | | | 1,072,800 | |
| Materials — 1.2% | | | | | |
Evraz | | | 48,267 | | | | 229,343 | |
| Utilities — 3.9% | | | | | |
Centrica | | | 296,452 | | | | 278,346 | |
SSE | | | 26,370 | | | | 437,964 | |
| | | | | | | | 716,310 | |
TOTAL UNITED KINGDOM | | | | | | | 4,929,185 | |
| TOTAL COMMON STOCK | | | | | | | | |
(Cost $18,022,122) | | | | | | | 18,528,655 | |
| TOTAL INVESTMENTS — 100.0% | | | | | | | | |
(Cost $18,022,122) | | | | | | $ | 18,528,655 | |
| Percentages are based on Net Assets of $18,527,117. |
| ‡ | Real Estate Investment Trust |
| As of October 31, 2019, all of the Fund’s investments were considered Level 1, in accordance with authoritative guidance on fair value measurements and disclosure under U.S. GAAP. |
For the year ended October 31, 2019, there have been no transfers in or out of Level 3.
| | |
| Schedule of Investments |
| October 31, 2019 |
Global X SuperDividend® REIT ETF |
| Sector Weightings (Unaudited)†: |
| † Sector weightings percentages are based on the total market value of investments. Repurchase agreements purchased from cash collateral received for securities lending activity are included in total investments. Please see Note 2 and 7 in Notes to Financial Statements for more detailed information. |
| | | | | | | |
| COMMON STOCK — 99.3% | | | | | | |
| AUSTRALIA— 3.9% | | | | | | |
| Real Estate — 3.9% | | | | | | |
Stockland ‡ | | | 4,273,370 | | | $ | 14,396,877 | |
| FRANCE— 3.7% | | | | | | | | |
| Real Estate — 3.7% | | | | | | | | |
Klepierre ‡ | | | 359,501 | | | | 13,391,948 | |
| NETHERLANDS— 5.8% | | | | | | | | |
| Real Estate — 5.8% | | | | | | | | |
Unibail-Rodamco-Westfield ‡ | | | 69,203 | | | | 10,704,639 | |
Wereldhave ‡ (A) | | | 440,831 | | | | 10,426,420 | |
TOTAL NETHERLANDS | | | | | | | 21,131,059 | |
| UNITED STATES— 85.9% | | | | | | | | |
| Financials — 58.0% | | | | | | | | |
AGNC Investment ‡ | | | 643,137 | | | | 10,965,486 | |
Annaly Capital Management ‡ | | | 1,130,361 | | | | 10,150,642 | |
Apollo Commercial Real Estate Finance ‡ | | | 654,235 | | | | 11,972,501 | |
Arbor Realty Trust ‡ (A) | | | 1,024,525 | | | | 13,995,012 | |
Armour Residential ‡ | | | 550,033 | | | | 9,202,052 | |
Blackstone Mortgage Trust, Cl A ‡ | | | 341,067 | | | | 12,380,732 | |
Chimera Investment ‡ | | | 618,163 | | | | 12,523,981 | |
Colony Credit Real Estate ‡ | | | 740,403 | | | | 10,609,975 | |
Granite Point Mortgage Trust ‡ | | | 598,691 | | | | 11,135,653 | |
| | | | | | | |
| COMMON STOCK — continued | | | | | | |
| Financials — continued | | | | | | |
Invesco Mortgage Capital ‡ | | | 732,250 | | | $ | 11,525,615 | |
KKR Real Estate Finance Trust ‡ | | | 568,632 | | | | 11,401,072 | |
Ladder Capital, Cl A ‡ | | | 693,823 | | | | 11,982,323 | |
MFA Financial ‡ | | | 1,609,854 | | | | 12,218,792 | |
New York Mortgage Trust ‡ | | | 1,902,513 | | | | 11,909,731 | |
PennyMac Mortgage Investment Trust ‡ | | | 581,295 | | | | 13,305,843 | |
Redwood Trust ‡ | | | 719,138 | | | | 11,750,715 | |
Starwood Property Trust ‡ | | | 539,342 | | | | 13,267,813 | |
Two Harbors Investment ‡ | | | 817,603 | | | | 11,340,154 | |
| | | | | | | | 211,638,092 | |
| Real Estate — 27.9% | | | | | |
Apple Hospitality REIT ‡ | | | 753,867 | | | | 12,423,728 | |
Chatham Lodging Trust ‡ | | | 593,647 | | | | 10,715,328 | |
Gaming and Leisure Properties ‡ | | | 320,546 | | | | 12,937,237 | |
Independence Realty Trust ‡ | | | 1,118,258 | | | | 17,221,172 | |
Omega Healthcare Investors ‡ | | | 296,485 | | | | 13,057,199 | |
Park Hotels & Resorts ‡ | | | 404,331 | | | | 9,400,696 | |
Service Properties Trust ‡ | | | 442,437 | | | | 11,193,656 | |
VEREIT ‡ | | | 1,496,290 | | | | 14,723,494 | |
| | | | | | | | 101,672,510 | |
TOTAL UNITED STATES | | | | | | | 313,310,602 | |
| TOTAL COMMON STOCK | | | | | | | | |
(Cost $349,855,552) | | | | | | | 362,230,486 | |
| | |
SHORT-TERM INVESTMENT(B)(C) — 0.6% | |
| Fidelity Investments Money Market Government Portfolio, Cl Institutional, 1.760% | | | | | | | | |
(Cost $2,227,145) | | | 2,227,145 | | | | 2,227,145 | |
| | | | | | | |
REPURCHASE AGREEMENT(B) — 4.4% | |
| RBC Capital Markets | | | | | | | | |
| 1.680%, dated 10/31/19, to be repurchased on 11/01/19 repurchase price $16,032,013 (collateralized by U.S. Treasury Obligations, ranging in par value $1,677,199 - $2,439,085, 3.000%, 09/30/2025, with a total market value of $16,311,709) | | | | | | | | |
(Cost $16,031,265) | | $ | 16,031,265 | | | $ | 16,031,265 | |
| TOTAL INVESTMENTS — 104.3% | | | | | | | | |
(Cost $368,113,962) | | | | | | $ | 380,488,896 | |
| Percentages are based on Net Assets of $364,789,567. |
| ‡ | Real Estate Investment Trust |
| (A) | This security or a partial position of this security is on loan at October 31, 2019. The total value of securities on loan at October 31, 2019 was $17,644,285. |
| (B) | Security was purchased with cash collateral held from securities on loan. The total value of such securities as of October 31, 2019, was $18,258,410. |
| (C) | The rate reported on the Schedule of Investments is the 7-day effective yield as of October 31, 2019. |
| Cl — Class |
| REIT — Real Estate Investment Trust |
The following is a summary of the level of inputs used as of October 31, 2019, in valuing the Fund’s investments carried at value:
| Investments in Securities | | | | | | | | | | | | |
| Common Stock | | $ | 362,230,486 | | | $ | — | | | $ | — | | | $ | 362,230,486 | |
| Short-Term Investment | | | 2,227,145 | | | | — | | | | — | | | | 2,227,145 | |
| Repurchase Agreement | | | — | | | | 16,031,265 | | | | — | | | | 16,031,265 | |
| Total Investments in Securities | | $ | 364,457,631 | | | $ | 16,031,265 | | | $ | — | | | $ | 380,488,896 | |
For the year ended October 31, 2019, there have been no transfers in or out of Level 3.
| | |
| Schedule of Investments |
| October 31, 2019 |
Global X SuperIncome™ Preferred ETF |
| Sector Weightings (Unaudited)†: |
| † Sector weightings percentages are based on the total market value of investments. Repurchase agreements purchased from cash collateral received for securities lending activity are included in total investments. Please see Note 2 and 7 in Notes to Financial Statements for more detailed information. |
| | | | | | | |
| PREFERRED STOCK — 99.5% | | | | | | |
| GERMANY— 5.0% | | | | | | |
| Financials — 5.0% | | | | | | |
Deutsche Bank Contingent Capital Trust II, 6.550%(A) | | | 143,352 | | | $ | 3,648,308 | |
Deutsche Bank Contingent Capital Trust V, 8.050%(A) | | | 249,311 | | | | 6,409,786 | |
TOTAL GERMANY | | | | | | | 10,058,094 | |
| NETHERLANDS— 5.4% | | | | | | | | |
| Financials — 5.4% | | | | | | | | |
Aegon, 6.375%(A) | | | 248,055 | | | | 6,280,753 | |
ING Groep, 6.125% | | | 175,107 | | | | 4,568,542 | |
TOTAL NETHERLANDS | | | | | | | 10,849,295 | |
| UNITED KINGDOM— 4.7% | | | | | | | | |
| Financials — 4.7% | | | | | | | | |
HSBC Holdings, 6.200% | | | 358,663 | | | | 9,450,770 | |
| | | | | | | |
| PREFERRED STOCK — continued | | | | | | | | |
| UNITED STATES— 84.4% | | | | | | | | |
| Consumer Staples — 1.7% | | | | | | | | |
CHS, Ser 4, 7.500% | | | 127,276 | | | $ | 3,523,000 | |
| Energy — 1.3% | | | | | | | | |
| NuStar Logistics, 8.735%, VAR ICE LIBOR USD 3 Month+6.734% | | | 99,729 | | | | 2,597,940 | |
| Financials — 59.5% | | | | | | | | |
AGNC Investment, 7.000%, VAR ICE LIBOR USD 3 Month+5.111%‡ | | | 81,617 | | | | 2,116,329 | |
Annaly Capital Management, 6.950%, VAR ICE LIBOR USD 3 Month+4.993%‡ | | | 177,414 | | | | 4,619,860 | |
Annaly Capital Management, 6.750%, VAR ICE LIBOR USD 3 Month+4.989%‡ | | | 99,445 | | | | 2,582,587 | |
Annaly Capital Management, 6.500%, VAR ICE LIBOR USD 3 Month+4.172%‡ | | | 105,032 | | | | 2,715,077 | |
| Apollo Global Management, 6.375% | | | 74,166 | | | | 1,997,290 | |
Bank of America, 6.500% | | | 195,059 | | | | 4,985,708 | |
Bank of America, 6.200% | | | 194,924 | | | | 5,081,669 | |
Brighthouse Financial, 6.600% | | | 105,263 | | | | 2,935,785 | |
| Capital One Financial, Ser C, 6.250% | | | 123,242 | | | | 3,121,720 | |
| Capital One Financial, Ser D, 6.700% | | | 123,695 | | | | 3,136,905 | |
Charles Schwab, 5.950% | | | 185,043 | | | | 4,942,499 | |
| Citigroup, 6.875%, VAR ICE LIBOR USD 3 Month+4.130% | | | 113,860 | | | | 3,222,238 | |
| Citigroup, Ser J, 7.125%, VAR ICE LIBOR USD 3 Month+4.040% | | | 72,615 | | | | 2,094,943 | |
| Citigroup Capital XIII, 8.306%, VAR ICE LIBOR USD 3 Month+6.370% | | | 170,865 | | | | 4,662,906 | |
| Fifth Third Bancorp, 6.625%, VAR ICE LIBOR USD 3 Month+3.710% | | | 111,831 | | | | 3,189,420 | |
| GMAC Capital Trust I, Ser 2, 7.943%, VAR ICE LIBOR USD 3 Month+5.785% | | | 382,619 | | | | 10,104,968 | |
| Goldman Sachs Group, 6.375%, VAR ICE LIBOR USD 3 Month+3.550% | | | 171,550 | | | | 4,825,701 | |
| | | | | | | | | |
| | | | | | | |
| PREFERRED STOCK — continued | |
| Financials — continued | | | | | |
Goldman Sachs Group, 6.300% | | | 166,045 | | | $ | 4,371,965 | |
| Hartford Financial Services Group, 7.875%, VAR ICE LIBOR USD 3 Month+5.596% | | | 149,892 | | | | 4,261,429 | |
Invesco Mortgage Capital, 7.500%, VAR ICE LIBOR USD 3 Month+5.289%‡ | | | 71,445 | | | | 1,906,153 | |
JPMorgan Chase, 6.150% | | | 284,571 | | | | 7,316,320 | |
| Morgan Stanley, Ser E, 7.125%, VAR ICE LIBOR USD 3 Month+4.320% | | | 141,494 | | | | 4,113,231 | |
| Morgan Stanley, Ser F, 6.875%, VAR ICE LIBOR USD 3 Month+3.940% | | | 138,821 | | | | 3,950,846 | |
Morgan Stanley, Ser G, 6.625% | | | 81,201 | | | | 2,068,189 | |
New Residential Investment, 7.125%, VAR ICE LIBOR USD 3 Month+5.640%‡ | | | 69,292 | | | | 1,767,639 | |
| New York Community Bancorp, 6.375%, VAR ICE LIBOR USD 3 Month+3.821% | | | 126,092 | | | | 3,520,488 | |
Oaktree Capital Group, 6.550% | | | 58,021 | | | | 1,560,185 | |
| Regions Financial, Ser A, 6.375% | | | 124,763 | | | | 3,217,638 | |
Two Harbors Investment, 7.250%, VAR ICE LIBOR USD 3 Month+5.011%‡ | | | 72,196 | | | | 1,850,383 | |
| US Bancorp, 6.500%, VAR ICE LIBOR USD 3 Month+4.468% | | | 271,815 | | | | 7,436,858 | |
| Wells Fargo, 6.625%, VAR ICE LIBOR USD 3 Month+3.690% | | | 206,099 | | | | 5,950,078 | |
| | | | | | | | 119,627,007 | |
| Health Care — 3.2% | | | | | |
Avantor, 6.250% | | | 122,989 | | | | 6,396,658 | |
| Industrials — 1.1% | | | | | |
Pitney Bowes, 6.700% | | | 109,539 | | | | 2,274,030 | |
| Real Estate — 5.7% | | | | | |
Brookfield Property Partners, 6.375%(A) | | | 61,009 | | | | 1,673,477 | |
RLJ Lodging Trust, 1.950%‡ | | | 78,655 | | | | 2,144,922 | |
UMH Properties, 6.750%‡ | | | 59,287 | | | | 1,594,820 | |
| | | | | | | | | |
| | | | | | | |
| PREFERRED STOCK — continued | |
| Real Estate — continued | | | | | |
VEREIT, Ser F, 6.700%‡ | | | 241,767 | | | $ | 6,140,882 | |
| | | | | | | | 11,554,101 | |
| Utilities — 11.9% | | | | | |
CenterPoint Energy, 7.000% | | | 123,104 | | | | 6,278,304 | |
| Energy Transfer Operating, 7.625%, VAR ICE LIBOR USD 3 Month+4.738% | | | 104,903 | | | | 2,589,006 | |
| Energy Transfer Operating, 7.600%, VAR ICE LIBOR USD 3 Month+5.161% | | | 189,291 | | | | 4,785,277 | |
| Energy Transfer Operating, 7.375%, VAR ICE LIBOR USD 3 Month+4.530% | | | 106,805 | | | | 2,586,817 | |
| NiSource, 6.500%, VAR US Treas Yield Curve Rate T Note Const Mat 5 Yr+3.632% | | | 124,040 | | | | 3,437,148 | |
Sempra Energy, 6.750% | | | 35,973 | | | | 4,175,386 | |
| | | | | | | | 23,851,938 | |
TOTAL UNITED STATES | | | | | | | 169,824,674 | |
| TOTAL PREFERRED STOCK | | | | | | | | |
(Cost $197,368,373) | | | | | | | 200,182,833 | |
| | |
SHORT-TERM INVESTMENT(B)(C) — 0.2% | |
| Fidelity Investments Money Market Government Portfolio, Cl Institutional, 1.760% | | | | | | | | |
(Cost $462,067) | | | 462,067 | | | | 462,067 | |
| | |
REPURCHASE AGREEMENT(B) — 1.7% | |
| RBC Capital Markets | | | | | | | | |
| 1.680%, dated 10/31/19, to be repurchased on 11/01/19, repurchase price $3,326,168 (collateralized by U.S. Treasury Obligations, ranging in par value $347,969 - $506,038, 3.000%, 09/30/2025, with a total market value of $3,384,197) | | | | | | | | |
(Cost $3,326,013) | | $ | 3,326,013 | | | | 3,326,013 | |
| | |
| | | | |
| TOTAL INVESTMENTS — 101.4% | | | | | | | | |
(Cost $201,156,453) | | | | | | $ | 203,970,913 | |
| Percentages are based on Net Assets of $201,091,992. |
| * | Non-income producing security. |
| ‡ | Real Estate Investment Trust |
| (A) | This security or a partial position of this security is on loan at October 31, 2019. The total value of securities on loan at October 31, 2019 was $3,705,414. |
| (B) | Security was purchased with cash collateral held from securities on loan. The total value of such securities as of October 31, 2019, was $3,788,080. |
| (C) | The rate reported on the Schedule of Investments is the 7-day effective yield as of October 31, 2019. |
| Cl — Class |
| ICE — Intercontinental Exchange |
| LIBOR — London Interbank Offered Rate |
| Ser — Series |
| USD — U.S. Dollar |
| VAR – Variable Rate |
The following is a summary of the level of inputs used as of October 31, 2019, in valuing the Fund’s investments carried at value:
| Investments in Securities | | | | | | | | | | | | |
| Preferred Stock | | $ | 200,182,833 | | | $ | — | | | $ | — | | | $ | 200,182,833 | |
| Short-Term Investment | | | 462,067 | | | | — | | | | — | | | | 462,067 | |
| Repurchase Agreement | | | — | | | | 3,326,013 | | | | — | | | | 3,326,013 | |
| Total Investments in Securities | | $ | 200,644,900 | | | $ | 3,326,013 | | | $ | — | | | $ | 203,970,913 | |
For the year ended October 31, 2019, there have been no transfers in or out of Level 3.
| | |
| Schedule of Investments |
| October 31, 2019 |
Global X YieldCo & Renewable Energy Income ETF |
| Sector Weightings (Unaudited)†: |
| † Sector weightings percentages are based on the total market value of investments. |
| | | | | | | |
COMMON STOCK — 91.8% | | | | | | |
| AUSTRALIA— 5.3% | | | | | | |
| Utilities — 5.3% | | | | | | |
AGL Energy | | | 103,446 | | | $ | 1,409,706 | |
| BRAZIL— 5.5% | | | | | | | | |
| Utilities — 5.5% | | | | | | | | |
Engie Brasil Energia | | | 129,492 | | | | 1,459,947 | |
| CANADA— 9.9% | | | | | | | | |
| Utilities — 9.9% | | | | | | | | |
Algonquin Power & Utilities | | | 77,882 | | | | 1,071,926 | |
Boralex | | | 13,956 | | | | 231,476 | |
Innergex Renewable Energy | | | 20,904 | | | | 261,469 | |
Northland Power | | | 28,288 | | | | 566,040 | |
TransAlta Renewables | | | 41,714 | | | | 450,036 | |
TOTAL CANADA | | | | | | | 2,580,947 | |
| CHILE— 11.5% | | | | | | | | |
| Utilities — 11.5% | | | | | | | | |
Colbun | | | 2,694,171 | | | | 465,196 | |
Enel Americas | | | 8,746,935 | | | | 1,634,841 | |
Enel Chile | | | 10,784,175 | | | | 887,597 | |
TOTAL CHILE | | | | | | | 2,987,634 | |
| | | | | | | |
| COMMON STOCK — continued | | | | | | | | |
| CHINA— 1.1% | | | | | | | | |
| Utilities — 1.1% | | | | | | | | |
| China Longyuan Power Group, Cl H | | | 523,200 | | | $ | 283,038 | |
| DENMARK— 11.3% | | | | | | | | |
| Industrials — 5.9% | | | | | | | | |
Vestas Wind Systems | | | 19,129 | | | | 1,562,181 | |
| Utilities — 5.4% | | | | | | |
Orsted | | | 16,137 | | | | 1,416,168 | |
TOTAL DENMARK | | | | | | | 2,978,349 | |
| HONG KONG— 4.4% | | | | | | | | |
| Industrials — 0.6% | | | | | |
| Xinjiang Goldwind Science & Technology, Cl H | | | 120,841 | | | | 144,466 | |
| Information Technology — 2.7% | | | | | |
Xinyi Solar Holdings | | | 1,272,000 | | | | 720,579 | |
| Utilities — 1.1% | | | | | |
Huaneng Renewables, Cl H | | | 787,100 | | | | 301,275 | |
TOTAL HONG KONG | | | | | | | 1,166,320 | |
| ITALY— 5.3% | | | | | | | | |
| Utilities — 5.3% | | | | | |
ACEA | | | 33,575 | | | | 668,249 | |
ERG | | | 23,964 | | | | 507,170 | |
Falck Renewables | | | 45,560 | | | | 202,909 | |
TOTAL ITALY | | | | | | | 1,378,328 | |
| NEW ZEALAND— 9.2% | | | | | | | | |
| Utilities — 9.2% | | | | | |
Contact Energy | | | 113,105 | | | | 535,304 | |
Mercury NZ | | | 215,016 | | | | 684,624 | |
Meridian Energy | | | 404,712 | | | | 1,193,894 | |
TOTAL NEW ZEALAND | | | | | | | 2,413,822 | |
| | | | | | | |
| COMMON STOCK — continued | |
| PORTUGAL— 6.5% | | | | | | | | |
| Utilities — 6.5% | | | | | |
Energias de Portugal | | | 409,313 | | | $ | 1,685,035 | |
| RUSSIA— 2.0% | | | | | | | | |
| Utilities — 2.0% | | | | | |
RusHydro PJSC | | | 67,227,900 | | | | 534,917 | |
| THAILAND— 0.7% | | | | | | | | |
| Utilities — 0.7% | | | | | |
BCPG NVDR | | | 312,800 | | | | 186,468 | |
| UNITED STATES— 19.1% | | | | | | | | |
| Real Estate — 1.2% | | | | | |
Hannon Armstrong Sustainable Infrastructure Capital ‡ | | | 10,344 | | | | 308,872 | |
| Utilities — 17.9% | | | | | |
Atlantica Yield | | | 16,009 | | | | 384,376 | |
Avista | | | 10,424 | | | | 500,665 | |
Clearway Energy, Cl A | | | 5,390 | | | | 92,546 | |
Hawaiian Electric Industries | | | 17,167 | | | | 775,090 | |
IDACORP | | | 7,951 | | | | 855,687 | |
NextEra Energy Partners | | | 8,957 | | | | 472,034 | |
NorthWestern | | | 7,956 | | | | 576,969 | |
Pattern Energy Group, Cl A | | | 15,686 | | | | 439,679 | |
TerraForm Power, Cl A | | | 32,984 | | | | 560,068 | |
| | | | | | | | 4,657,114 | |
TOTAL UNITED STATES | | | | | | | 4,965,986 | |
| TOTAL COMMON STOCK | | | | | | | | |
(Cost $21,458,906) | | | | | | | 24,030,497 | |
| | |
MASTER LIMITED PARTNERSHIP — 4.6% | |
| Utilities — 4.6% | | | | | |
| Brookfield Renewable Partners | | | | | | | | |
(Cost $795,746) | | | 28,387 | | | | 1,210,338 | |
| | | | | | | |
CLOSED-END FUNDS — 3.2% | |
| UNITED KINGDOM— 3.2% | | | | | | | | |
Utilities — 3.2% | |
Greencoat UK Wind | | | 242,213 | | | $ | 456,970 | |
| | | | | | | | | |
| Renewables Infrastructure Group | | | 231,212 | | | | 391,337 | |
| TOTAL CLOSED-END FUNDS | | | | | | | | |
(Cost $743,065) | | | | | | | 848,307 | |
| TOTAL INVESTMENTS — 99.6% | | | | | | | | |
(Cost $22,997,717) | | | | | | $ | 26,089,142 | |
| Percentages are based on Net Assets of $26,204,933. |
| ‡ | Real Estate Investment Trust |
| Cl — Class |
| NVDR — Non-Voting Depositary Receipt |
| PJSC — Public Joint Stock Company |
| As of October 31, 2019, all of the Fund’s investments were considered Level 1, in accordance with authoritative guidance on fair value measurements and disclosure under U.S. GAAP. |
For the year ended October 31, 2019, there have been no transfers in or out of Level 3.
| | |
| Schedule of Investments |
| October 31, 2019 |
Global X Social Media ETF |
| Sector Weightings (Unaudited)†: |
| † Sector weightings percentages are based on the total market value of investments. Repurchase agreements purchased from cash collateral received for securities lending activity are included in total investments. Please see Note 2 and 7 in Notes to Financial Statements for more detailed information. |
| | | | | | | |
| COMMON STOCK — 99.8% | | | | | | |
| CHINA— 26.8% | | | | | | |
| Communication Services — 26.8% | | | | | | |
Baidu ADR * | | | 53,695 | | | $ | 5,468,836 | |
Bilibili ADR * | | | 30,791 | | | | 486,190 | |
Changyou.com ADR (A) | | | 7,922 | | | | 75,734 | |
HUYA ADR * | | | 19,640 | | | | 436,794 | |
Momo ADR | | | 40,715 | | | | 1,364,767 | |
NetEase ADR | | | 20,012 | | | | 5,720,630 | |
SINA * | | | 33,693 | | | | 1,334,243 | |
Tencent Holdings | | | 288,515 | | | | 11,809,027 | |
Tencent Music Entertainment Group ADR * | | | 100,933 | | | | 1,396,913 | |
Weibo ADR * | | | 51,381 | | | | 2,527,431 | |
YY ADR * | | | 33,317 | | | | 1,893,738 | |
TOTAL CHINA | | | | | | | 32,514,303 | |
| GERMANY— 1.9% | | | | | | | | |
| Communication Services — 1.9% | | | | | | | | |
New Work | | | 1,437 | | | | 452,900 | |
United Internet | | | 62,780 | | | | 1,891,791 | |
TOTAL GERMANY | | | | | | | 2,344,691 | |
| | | | | | | |
COMMON STOCK — continued | | | | | | | | |
| HONG KONG— 0.2% | | | | | | | | |
| Information Technology — 0.2% | | | | | | | | |
Meitu * | | | 1,114,700 | | | $ | 247,468 | |
| JAPAN— 5.9% | | | | | | | | |
| Communication Services — 5.9% | | | | | | | | |
DeNA | | | 57,071 | | | | 975,072 | |
Gree | | | 60,535 | | | | 288,382 | |
Kakaku.com | | | 69,620 | | | | 1,624,821 | |
LINE * (A) | | | 25,190 | | | | 929,726 | |
Mixi | | | 22,430 | | | | 435,093 | |
Nexon | | | 252,384 | | | | 2,929,947 | |
TOTAL JAPAN | | | | | | | 7,183,041 | |
| RUSSIA— 6.0% | | | | | | | | |
| Communication Services — 6.0% | | | | | |
Mail.Ru Group GDR * | | | 97,982 | | | | 2,081,138 | |
Yandex, Cl A * | | | 153,514 | | | | 5,125,832 | |
TOTAL RUSSIA | | | | | | | 7,206,970 | |
| SOUTH KOREA— 10.5% | | | | | | | | |
| Communication Services — 10.5% | | | | | |
AfreecaTV | | | 3,703 | | | | 235,207 | |
Com2uSCorp | | | 4,269 | | | | 360,688 | |
Kakao | | | 22,930 | | | | 2,788,770 | |
NAVER | | | 66,539 | | | | 9,379,343 | |
TOTAL SOUTH KOREA | | | | | | | 12,764,008 | |
| TAIWAN— 0.2% | | | | | | | | |
| Consumer Discretionary — 0.2% | | | | | |
PChome Online | | | 52,144 | | | | 226,113 | |
| | | | | | | |
| COMMON STOCK — continued | |
| UNITED STATES— 48.3% | | | | | | | | |
| Communication Services — 47.7% | | | | | |
Alphabet, Cl A * | | | 4,614 | | | $ | 5,808,103 | |
ANGI Homeservices, Cl A * (A) | | | 46,727 | | | | 320,080 | |
Facebook, Cl A * | | | 63,943 | | | | 12,254,676 | |
Glu Mobile * | | | 67,196 | | | | 398,472 | |
IAC * | | | 24,955 | | | | 5,671,024 | |
Match Group (A) | | | 29,623 | | | | 2,162,183 | |
Meet Group * | | | 42,192 | | | | 179,738 | |
Pinterest, Cl A * | | | 84,626 | | | | 2,127,498 | |
Snap, Cl A * (A) | | | 559,165 | | | | 8,421,025 | |
Spotify Technology * | | | 49,064 | | | | 7,079,935 | |
Twitter * | | | 307,315 | | | | 9,210,230 | |
Yelp, Cl A * | | | 37,216 | | | | 1,284,324 | |
Zynga, Cl A * | | | 476,916 | | | | 2,942,572 | |
| | | | | | | | 57,859,860 | |
| Consumer Discretionary — 0.6% | | | | | |
Groupon, Cl A * | | | 257,942 | | | | 717,079 | |
TOTAL UNITED STATES | | | | | | | 58,576,939 | |
| TOTAL COMMON STOCK | | | | | | | | |
(Cost $119,840,046) | | | | | | | 121,063,533 | |
| | |
SHORT-TERM INVESTMENT(B)(C) — 0.7% | |
| Fidelity Investments Money Market Government Portfolio, Cl Institutional, 1.760% | | | | | | | | |
(Cost $887,576) | | | 887,576 | | | | 887,576 | |
| | | | | | | |
REPURCHASE AGREEMENT(B) — 5.3% | |
| RBC Capital Markets | | | | | | | | |
| 1.680%, dated 10/31/19, to be repurchased on 11/01/19, repurchase price $6,389,177 (collateralized by U.S. Treasury Obligations, ranging in par value $668,408 - $972,039, 3.000%, 09/30/2025, with a total market value of $6,500,642) | | | | | | | | |
(Cost $6,388,879) | | $ | 6,388,879 | | | $ | 6,388,879 | |
| TOTAL INVESTMENTS — 105.8% | | | | | | | | |
(Cost $127,116,501) | | | | | | $ | 128,339,988 | |
| Percentages are based on Net Assets of $121,289,129. |
| * | Non-income producing security. |
| (A) | This security or a partial position of this security is on loan at October 31, 2019. The total value of securities on loan at October 31, 2019 was $7,144,660. |
| (B) | Security was purchased with cash collateral held from securities on loan. The total value of such securities as of October 31, 2019, was $7,276,455. |
| (C) | The rate reported on the Schedule of Investments is the 7-day effective yield as of October 31, 2019. |
| ADR — American Depositary Receipt |
| Cl — Class |
| GDR — Global Depositary Receipt |
The following is a summary of the level of inputs used as of October 31, 2019, in valuing the Fund’s investments carried at value:
| Investments in Securities | | | | | | | | | | | | |
| Common Stock | | $ | 121,063,533 | | | $ | — | | | $ | — | | | $ | 121,063,533 | |
| Short-Term Investment | | | 887,576 | | | | — | | | | — | | | | 887,576 | |
| Repurchase Agreement | | | — | | | | 6,388,879 | | | | — | | | | 6,388,879 | |
| Total Investments in Securities | | $ | 121,951,109 | | | $ | 6,388,879 | | | $ | — | | | $ | 128,339,988 | |
For the year ended October 31, 2019, there have been no transfers in or out of Level 3.
| | |
| Schedule of Investments |
| October 31, 2019 |
|
| Sector Weightings (Unaudited)†: | |
| † Sector weightings percentages are based on the total market value of investments. | |
| | | | | | | |
| COMMON STOCK — 100.0% | | | | | | |
| ARGENTINA— 3.4% | | | | | | |
| Consumer Discretionary — 3.4% | | | | | | |
MercadoLibre * | | | 232 | | | $ | 120,993 | |
| CHINA— 28.4% | | | | | | | | |
| Communication Services — 8.6% | | | | | | | | |
58.com ADR * | | | 2,566 | | | | 135,510 | |
NetEase ADR | | | 585 | | | | 167,228 | |
| | | | | | | | 302,738 | |
| Consumer Discretionary — 18.9% | | | | | | | | |
Alibaba Group Holding ADR * | | | 864 | | | | 152,643 | |
Baozun ADR * | | | 1,237 | | | | 53,834 | |
Ctrip.com International ADR * | | | 4,014 | | | | 132,422 | |
JD.com ADR * | | | 4,831 | | | | 150,486 | |
Uxin ADR | | | 5,314 | | | | 15,942 | |
Vipshop Holdings ADR * | | | 13,808 | | | | 159,343 | |
| | | | | | | | 664,670 | |
| Financials — 0.9% | | | | | | | | |
LexinFintech Holdings ADR * | | | 2,687 | | | | 30,471 | |
TOTAL CHINA | | | | | | | 997,879 | |
| | | | | | | |
COMMON STOCK — continued | | | | | | | | |
| GERMANY— 1.2% | | | | | | | | |
| Consumer Discretionary — 1.2% | | | | | | | | |
Rocket Internet * | | | 1,620 | | | $ | 43,051 | |
| JAPAN— 3.8% | | | | | | | | |
| Consumer Discretionary — 3.8% | | | | | | | | |
Rakuten | | | 13,980 | | | | 134,233 | |
| SOUTH KOREA— 0.3% | | | | | | | | |
| Information Technology — 0.3% | | | | | | | | |
Cafe24 * | | | 222 | | | | 11,620 | |
| UNITED KINGDOM— 10.5% | | | | | | | | |
| Consumer Discretionary — 10.5% | | | | | |
ASOS * | | | 1,262 | | | | 57,646 | |
Just Eat * | | | 13,932 | | | | 132,505 | |
Ocado Group * | | | 10,442 | | | | 179,572 | |
TOTAL UNITED KINGDOM | | | | | | | 369,723 | |
| UNITED STATES— 52.4% | | | | | | | | |
| Communication Services — 4.9% | | | | | |
ANGI Homeservices, Cl A * | | | 1,902 | | | | 13,029 | |
TripAdvisor * | | | 2,493 | | | | 100,717 | |
Yelp, Cl A * | | | 1,713 | | | | 59,116 | |
| | | | | | | | 172,862 | |
| Consumer Discretionary — 31.1% | | | | | |
Amazon.com * | | | 75 | | | | 133,250 | |
Booking Holdings * | | | 80 | | | | 163,901 | |
eBay | | | 3,723 | | | | 131,236 | |
Etsy * | | | 2,287 | | | | 101,749 | |
Expedia Group | | | 1,113 | | | | 152,103 | |
Groupon, Cl A * | | | 11,092 | | | | 30,836 | |
Lands’ End * | | | 1,031 | | | | 12,444 | |
Overstock.com * | | | 659 | | | | 6,939 | |
| | | | | | | |
COMMON STOCK — continued | |
| Consumer Discretionary — continued | | | | | |
PetMed Express | | | 681 | | | $ | 15,946 | |
Qurate Retail, Cl A * | | | 9,301 | | | | 88,732 | |
Shutterstock * | | | 438 | | | | 17,774 | |
Stamps.com * | | | 388 | | | | 32,759 | |
Wayfair, Cl A * | | | 993 | | | | 81,654 | |
Williams-Sonoma | | | 1,845 | | | | 123,228 | |
| | | | | | | | 1,092,551 | |
| Financials — 2.8% | | | | | |
eHealth * | | | 496 | | | | 34,244 | |
LendingTree * | | | 179 | | | | 64,413 | |
| | | | | | | | 98,657 | |
| Industrials — 4.0% | | | | | |
CoStar Group * | | | 256 | | | | 140,677 | |
| Information Technology — 9.6% | | | | | |
GoDaddy, Cl A * | | | 2,052 | | | | 133,442 | |
LivePerson * | | | 1,382 | | | | 56,731 | |
Shopify, Cl A * | | | 463 | | | | 145,183 | |
| | | | | | | | 335,356 | |
TOTAL UNITED STATES | | | | | | | 1,840,103 | |
| TOTAL COMMON STOCK | | | | | | | | |
(Cost $3,579,875) | | | | | | | 3,517,602 | |
| TOTAL INVESTMENTS — 100.0% | | | | | | | | |
(Cost $3,579,875) | | | | | | $ | 3,517,602 | |
| Percentages are based on Net Assets of $3,516,808. |
| * | Non-income producing security. |
| ADR — American Depositary Receipt |
| Cl — Class |
| As of October 31, 2019, all of the Fund’s investments were considered Level 1, in accordance with authoritative guidance on fair value measurements and disclosure under U.S. GAAP. |
For the year ended October 31, 2019, there have been no transfers in or out of Level 3.
| | |
| Schedule of Investments |
| October 31, 2019 |
|
| Sector Weightings (Unaudited)†: |
| † Sector weightings percentages are based on the total market value of investments. Repurchase agreements purchased from cash collateral received for securities lending activity are included in total investments. Please see Note 2 and 7 in Notes to Financial Statements for more detailed information. |
| | | | | | | |
COMMON STOCK — 98.3% | | | | | | |
| CANADA— 4.8% | | | | | | |
| Consumer Discretionary — 1.5% | | | | | | |
| Restaurant Brands International | | | 12,606 | | | $ | 824,937 | |
| Energy — 1.7% | | | | | | | | |
Cenovus Energy | | | 113,532 | | | | 963,887 | |
| Materials — 1.6% | | | | | | | | |
Teck Resources, Cl B | | | 55,807 | | | | 883,425 | |
TOTAL CANADA | | | | | | | 2,672,249 | |
| CHINA— 1.7% | | | | | | | | |
| Consumer Discretionary — 1.7% | | | | | | | | |
JD.com ADR * | | | 30,542 | | | | 951,383 | |
| | | | | | | |
| COMMON STOCK — continued | | | | | | | | |
| MEXICO— 2.4% | | | | | | | | |
| Communication Services — 2.4% | | | | | | | | |
Grupo Televisa ADR | | | 119,223 | | | $ | 1,317,414 | |
| SINGAPORE— 1.4% | | | | | | | | |
| Communication Services — 1.4% | | | | | | | | |
Sea ADR * | | | 26,969 | | | | 802,597 | |
| UNITED STATES— 88.0% | | | | | | | | |
| Communication Services — 12.2% | | | | | | | | |
Alphabet, Cl A * | | | 792 | | | | 996,970 | |
Charter Communications, Cl A * | | | 2,419 | | | | 1,131,753 | |
Facebook, Cl A * | | | 5,080 | | | | 973,582 | |
Liberty Broadband, Cl C * | | | 9,337 | | | | 1,102,420 | |
Liberty Global * | | | 36,050 | | | | 860,513 | |
Netflix * | | | 3,136 | | | | 901,318 | |
Walt Disney | | | 6,953 | | | | 903,334 | |
| | | | | | | | 6,869,890 | |
| Consumer Discretionary — 5.1% | | | | | |
Amazon.com * | | | 522 | | | | 927,417 | |
DR Horton | | | 19,750 | | | | 1,034,307 | |
General Motors | | | 25,267 | | | | 938,922 | |
| | | | | | | | 2,900,646 | |
| Consumer Staples — 8.3% | | | | | |
Conagra Brands | | | 31,947 | | | | 864,166 | |
Constellation Brands, Cl A | | | 4,772 | | | | 908,255 | |
Mondelez International, Cl A | | | 17,248 | | | | 904,658 | |
Post Holdings * | | | 9,684 | | | | 996,484 | |
Procter & Gamble | | | 7,850 | | | | 977,403 | |
| | | | | | | | 4,650,966 | |
| Energy — 1.8% | | | | | |
Hess | | | 15,558 | | | | 1,022,938 | |
| Financials — 9.0% | | | | | |
Arch Capital Group * | | | 23,840 | | | | 995,558 | |
| | | | | | | |
| COMMON STOCK — continued | |
Berkshire Hathaway, Cl B * | | | 4,677 | | | $ | 994,237 | |
Citigroup | | | 15,127 | | | | 1,087,026 | |
Franklin Resources | | | 34,118 | | | | 939,951 | |
Investors Bancorp | | | 85,719 | | | | 1,032,914 | |
| | | | | | | | 5,049,686 | |
| Health Care — 22.3% | | | | | |
ABIOMED * | | | 4,830 | | | | 1,002,612 | |
Amicus Therapeutics * | | | 92,852 | | | | 782,743 | |
Bausch Health * | | | 44,134 | | | | 1,096,289 | |
Baxter International | | | 10,813 | | | | 829,357 | |
Celgene * | | | 9,941 | | | | 1,073,926 | |
Cigna | | | 5,808 | | | | 1,036,496 | |
DaVita * | | | 15,893 | | | | 931,330 | |
Elanco Animal Health * | | | 31,774 | | | | 858,533 | |
Humana * | | | 3,187 | | | | 937,615 | |
Incyte * | | | 11,508 | | | | 965,751 | |
Neurocrine Biosciences * | | | 9,777 | | | | 972,714 | |
PerkinElmer | | | 11,500 | | | | 988,540 | |
WellCare Health Plans * | | | 3,402 | | | | 1,009,033 | |
| | | | | | | | 12,484,939 | |
| Industrials — 9.2% | | | | | |
Delta Air Lines | | | 16,134 | | | | 888,660 | |
| Spirit Aerosystems Holdings, Cl A | | | 12,926 | | | | 1,057,606 | |
United Airlines Holdings * | | | 11,358 | | | | 1,031,761 | |
United Technologies | | | 7,497 | | | | 1,076,419 | |
XPO Logistics * | | | 14,263 | | | | 1,089,693 | |
| | | | | | | | 5,144,139 | |
| Information Technology — 8.6% | | | | | |
Adobe * | | | 3,259 | | | | 905,774 | |
Microsoft | | | 6,893 | | | | 988,249 | |
NortonLifeLock | | | 39,817 | | | | 911,013 | |
Palo Alto Networks * | | | 4,322 | | | | 982,780 | |
| | | | | | | |
| COMMON STOCK — continued | |
SolarWinds * (A) | | | 54,791 | | | $ | 1,038,289 | |
| | | | | | | | 4,826,105 | |
| Materials — 5.4% | | | | | |
Berry Global Group * | | | 23,642 | | | | 981,379 | |
Celanese, Cl A | | | 8,634 | | | | 1,046,009 | |
Sherwin-Williams | | | 1,783 | | | | 1,020,447 | |
| | | | | | | | 3,047,835 | |
| Real Estate — 1.6% | | | | | |
American Tower, Cl A ‡ | | | 4,137 | | | | 902,197 | |
| Utilities — 4.5% | | | | | |
FirstEnergy | | | 21,026 | | | | 1,015,976 | |
PG&E * | | | 64,436 | | | | 397,570 | |
Vistra Energy | | | 41,025 | | | | 1,108,906 | |
| | | | | | | | 2,522,452 | |
TOTAL UNITED STATES | | | | | | | 49,421,793 | |
| TOTAL COMMON STOCK | | | | | | | | |
(Cost $49,252,768) | | | | | | | 55,165,436 | |
| | |
MASTER LIMITED PARTNERSHIP — 1.6% | |
| Energy — 1.6% | | | | | |
| Enterprise Products Partners | | | | | | | | |
(Cost $834,736) | | | 33,297 | | | | 866,721 | |
| | |
SHORT-TERM INVESTMENT(B)(C) — 0.0% | |
| Fidelity Investments Money Market Government Portfolio, Cl Institutional, 1.760% | | | | | | | | |
(Cost $3,569) | | | 3,569 | | | | 3,569 | |
| | | | | | | |
REPURCHASE AGREEMENT(B) — 0.0% | |
| Royal Bank of Canada | | | | | | |
| 1.680%, dated 10/31/19, to be repurchased on 11/01/19 repurchase price $25,692 (collateralized by U.S. Treasury Obligations, ranging in par value $2,688 - $3,909, 3.000%, 09/30/2025, with a total market value of $26,142) | | | | | | |
(Cost $25,691) | | $ | 25,691 | | | $ | 25,691 | |
| TOTAL INVESTMENTS — 99.9% | | | | | | | | |
(Cost $50,116,764) | | | | | | $ | 56,061,417 | |
| Percentages are based on Net Assets of $56,133,998. |
| * | Non-income producing security. |
| ‡ | Real Estate Investment Trust |
| (A) | This security or a partial position of this security is on loan at October 31, 2019. The total value of securities on loan at October 31, 2019 was $26,530. |
| (B) | Security was purchased with cash collateral held from securities on loan. The total value of such securities as of October 31, 2019, was $29,260. |
| (C) | The rate reported on the Schedule of Investments is the 7-day effective yield as of October 31, 2019. |
| ADR — American Depositary Receipt |
| Cl — Class |
The following is a summary of the level of inputs used as of October 31, 2019, in valuing the Fund’s investments carried at value:
| Investments in Securities | | | | | | | | | | | | |
| Common Stock | | $ | 55,165,436 | | | $ | — | | | $ | — | | | $ | 55,165,436 | |
| Master Limited Partnership | | | 866,721 | | | | — | | | | — | | | | 866,721 | |
| Short-Term Investment | | | 3,569 | | | | — | | | | — | | | | 3,569 | |
| Repurchase Agreement | | | — | | | | 25,691 | | | | — | | | | 25,691 | |
| Total Investments in Securities | | $ | 56,035,726 | | | $ | 25,691 | | | $ | — | | | $ | 56,061,417 | |
For the year ended October 31, 2019, there have been no transfers in or out of Level 3.
| | |
| Schedule of Investments |
| October 31, 2019 |
Global X Scientific Beta U.S. ETF |
| Sector Weightings (Unaudited)†: |
| † Sector weightings percentages are based on the total market value of investments. |
| | | | | | | |
COMMON STOCK — 99.8% | | | | | | |
| UNITED KINGDOM— 0.6% | | | | | | |
| Materials — 0.6% | | | | | | |
Linde | | | 2,811 | | | $ | 557,562 | |
| UNITED STATES— 99.2% | | | | | | | | |
| Communication Services — 4.5% | | | | | | | | |
Activision Blizzard | | | 4,893 | | | | 274,155 | |
Alphabet, Cl A * | | | 169 | | | | 212,737 | |
AT&T | | | 8,986 | | | | 345,871 | |
CBS, Cl B | | | 1,086 | | | | 39,139 | |
CenturyLink | | | 4,384 | | | | 56,729 | |
Charter Communications, Cl A * | | | 917 | | | | 429,028 | |
Comcast, Cl A | | | 10,561 | | | | 473,344 | |
Electronic Arts * | | | 3,365 | | | | 324,386 | |
Facebook, Cl A * | | | 466 | | | | 89,309 | |
Fox, Cl A | | | 4,328 | | | | 138,669 | |
IAC * | | | 2,019 | | | | 458,818 | |
Sirius XM Holdings | | | 12,696 | | | | 85,317 | |
| | | | | | | |
COMMON STOCK — continued | | | | | | | | |
| Communication Services — continued | | | | | | | | |
T-Mobile US * | | | 6,180 | | | $ | 510,839 | |
Verizon Communications | | | 6,005 | | | | 363,122 | |
Viacom, Cl B | | | 11,280 | | | | 243,197 | |
Walt Disney | | | 3,406 | | | | 442,507 | |
| | | | | | | | 4,487,167 | |
| Consumer Discretionary — 12.3% | | | | | | | | |
Advance Auto Parts | | | 1,899 | | | | 308,550 | |
Amazon.com * | | | 101 | | | | 179,443 | |
AutoZone * | | | 330 | | | | 377,645 | |
Best Buy | | | 4,113 | | | | 295,437 | |
BorgWarner | | | 3,282 | | | | 136,794 | |
Burlington Stores * | | �� | 318 | | | | 61,110 | |
Carnival | | | 4,275 | | | | 183,355 | |
Chipotle Mexican Grill, Cl A * | | | 410 | | | | 319,045 | |
Darden Restaurants | | | 3,055 | | | | 342,985 | |
Dollar General | | | 2,197 | | | | 352,267 | |
Dollar Tree * | | | 2,213 | | | | 244,315 | |
DR Horton | | | 7,643 | | | | 400,264 | |
eBay | | | 7,679 | | | | 270,685 | |
Expedia Group | | | 710 | | | | 97,028 | |
Ford Motor | | | 17,078 | | | | 146,700 | |
General Motors | | | 4,886 | | | | 181,564 | |
Genuine Parts | | | 2,517 | | | | 258,194 | |
Hasbro | | | 2,752 | | | | 267,797 | |
Home Depot | | | 1,376 | | | | 322,782 | |
Kohl’s | | | 4,439 | | | | 227,543 | |
Lear | | | 1,018 | | | | 119,890 | |
Lennar, Cl A | | | 5,602 | | | | 333,879 | |
LKQ * | | | 5,227 | | | | 177,666 | |
Lowe’s | | | 2,115 | | | | 236,055 | |
Lululemon Athletica * | | | 1,473 | | | | 300,890 | |
Macy’s | | | 6,066 | | | | 91,961 | |
| | | | | | | |
COMMON STOCK — continued | |
| Consumer Discretionary — continued | | | | |
McDonald’s | | | 2,380 | | | $ | 468,146 | |
MGM Resorts International | | | 8,458 | | | | 241,053 | |
Mohawk Industries * | | | 1,208 | | | | 173,203 | |
NIKE, Cl B | | | 7,166 | | | | 641,715 | |
Norwegian Cruise Line Holdings * | | | 3,035 | | | | 154,057 | |
NVR * | | | 46 | | | | 167,283 | |
O’Reilly Automotive * | | | 450 | | | | 195,979 | |
PVH | | | 1,753 | | | | 152,791 | |
Ross Stores | | | 2,522 | | | | 276,588 | |
Royal Caribbean Cruises | | | 1,607 | | | | 174,890 | |
Starbucks | | | 3,011 | | | | 254,610 | |
Tapestry | | | 6,777 | | | | 175,253 | |
Target | | | 6,585 | | | | 704,002 | |
Tiffany | | | 2,575 | | | | 320,613 | |
TJX | | | 9,341 | | | | 538,509 | |
Tractor Supply | | | 2,009 | | | | 190,895 | |
Ulta Beauty * | | | 1,208 | | | | 281,645 | |
VF | | | 4,699 | | | | 386,681 | |
Whirlpool | | | 1,113 | | | | 169,310 | |
Wynn Resorts | | | 1,222 | | | | 148,277 | |
Yum! Brands | | | 2,514 | | | | 255,699 | |
| | | | | | | | 12,305,043 | |
| Consumer Staples — 7.3% | | | | | |
Archer-Daniels-Midland | | | 5,235 | | | | 220,079 | |
Brown-Forman, Cl B | | | 3,385 | | | | 221,785 | |
Bunge | | | 4,107 | | | | 221,778 | |
Church & Dwight | | | 3,471 | | | | 242,762 | |
Clorox | | | 1,948 | | | | 287,700 | |
Coca-Cola | | | 5,808 | | | | 316,130 | |
Colgate-Palmolive | | | 3,016 | | | | 206,898 | |
Conagra Brands | | | 7,718 | | | | 208,772 | |
Constellation Brands, Cl A | | | 831 | | | | 158,164 | |
| | | | | | | |
COMMON STOCK — continued | |
| Consumer Staples — continued | | | | |
Costco Wholesale | | | 1,217 | | | $ | 361,583 | |
Estee Lauder, Cl A | | | 2,429 | | | | 452,450 | |
Hershey | | | 2,369 | | | | 347,935 | |
Hormel Foods | | | 7,373 | | | | 301,482 | |
JM Smucker | | | 3,108 | | | | 328,453 | |
Kellogg | | | 1,035 | | | | 65,754 | |
Kimberly-Clark | | | 1,922 | | | | 255,395 | |
Kraft Heinz | | | 4,932 | | | | 159,452 | |
Kroger | | | 5,982 | | | | 147,396 | |
McCormick | | | 1,808 | | | | 290,528 | |
Molson Coors Brewing, Cl B | | | 2,091 | | | | 110,238 | |
Mondelez International, Cl A | | | 5,781 | | | | 303,213 | |
PepsiCo | | | 1,820 | | | | 249,649 | |
Procter & Gamble | | | 2,133 | | | | 265,580 | |
Sysco | | | 5,732 | | | | 457,815 | |
Tyson Foods, Cl A | | | 4,074 | | | | 337,286 | |
Walgreens Boots Alliance | | | 2,201 | | | | 120,571 | |
Walmart | | | 5,786 | | | | 678,466 | |
| | | | | | | | 7,317,314 | |
| Energy — 3.8% | | | | | |
Apache | | | 8,037 | | | | 174,081 | |
Cabot Oil & Gas | | | 5,691 | | | | 106,080 | |
Chevron | | | 2,202 | | | | 255,740 | |
Concho Resources | | | 1,788 | | | | 120,726 | |
ConocoPhillips | | | 3,515 | | | | 194,028 | |
Devon Energy | | | 5,221 | | | | 105,882 | |
EOG Resources | | | 1,836 | | | | 127,253 | |
Exxon Mobil | | | 2,689 | | | | 181,696 | |
Hess | | | 5,766 | | | | 379,115 | |
HollyFrontier | | | 1,267 | | | | 69,609 | |
Kinder Morgan | | | 18,693 | | | | 373,486 | |
Marathon Oil | | | 18,062 | | | | 208,255 | |
| | | | | | | |
COMMON STOCK — continued | |
| Energy — continued | | | | |
National Oilwell Varco | | | 8,951 | | | $ | 202,472 | |
Noble Energy | | | 11,821 | | | | 227,672 | |
Occidental Petroleum | | | 6,009 | | | | 243,365 | |
Phillips 66 | | | 3,471 | | | | 405,482 | |
Targa Resources | | | 3,374 | | | | 131,181 | |
Valero Energy | | | 2,263 | | | | 219,466 | |
Williams | | | 2,817 | | | | 62,847 | |
| | | | | | | | 3,788,436 | |
| Financials — 13.3% | | | | | |
Aflac | | | 5,750 | | | | 305,670 | |
Alleghany * | | | 362 | | | | 281,741 | |
Allstate | | | 1,778 | | | | 189,215 | |
Ally Financial | | | 7,356 | | | | 225,314 | |
American Express | | | 1,740 | | | | 204,067 | |
American International Group | | | 3,358 | | | | 177,840 | |
Annaly Capital Management ‡ | | | 35,679 | | | | 320,397 | |
Aon | | | 1,141 | | | | 220,396 | |
Arch Capital Group * | | | 11,282 | | | | 471,136 | |
Arthur J Gallagher | | | 2,853 | | | | 260,251 | |
Bank of America | | | 19,801 | | | | 619,177 | |
Bank of New York Mellon | | | 1,729 | | | | 80,831 | |
BB&T | | | 2,857 | | | | 151,564 | |
Berkshire Hathaway, Cl B * | | | 1,431 | | | | 304,202 | |
Capital One Financial | | | 839 | | | | 78,237 | |
Chubb | | | 2,473 | | | | 376,935 | |
Cincinnati Financial | | | 3,182 | | | | 360,234 | |
Citigroup | | | 1,157 | | | | 83,142 | |
Citizens Financial Group | | | 3,305 | | | | 116,204 | |
CME Group, Cl A | | | 4,142 | | | | 852,216 | |
Comerica | | | 1,214 | | | | 79,420 | |
Everest Re Group | | | 1,147 | | | | 294,882 | |
FactSet Research Systems | | | 651 | | | | 165,042 | |
| | | | | | | |
| COMMON STOCK — continued | |
| Financials — continued | | | | |
Fidelity National Financial | | | 6,085 | | | $ | 278,936 | |
Fifth Third Bancorp | | | 10,794 | | | | 313,890 | |
Franklin Resources | | | 3,578 | | | | 98,574 | |
Globe Life | | | 1,926 | | | | 187,458 | |
Goldman Sachs Group | | | 428 | | | | 91,327 | |
| Hartford Financial Services Group | | | 6,963 | | | | 397,448 | |
Intercontinental Exchange | | | 6,141 | | | | 579,219 | |
JPMorgan Chase | | | 4,394 | | | | 548,898 | |
KeyCorp | | | 3,169 | | | | 56,947 | |
Lincoln National | | | 1,840 | | | | 103,923 | |
Loews | | | 3,620 | | | | 177,380 | |
M&T Bank | | | 1,023 | | | | 160,130 | |
Markel * | | | 216 | | | | 252,936 | |
MarketAxess Holdings | | | 319 | | | | 117,580 | |
Marsh & McLennan | | | 2,231 | | | | 231,176 | |
MetLife | | | 1,550 | | | | 72,525 | |
Morgan Stanley | | | 2,023 | | | | 93,159 | |
MSCI, Cl A | | | 1,412 | | | | 331,199 | |
Nasdaq | | | 1,364 | | | | 136,086 | |
PNC Financial Services Group | | | 1,946 | | | | 285,478 | |
Principal Financial Group | | | 1,095 | | | | 58,451 | |
Prudential Financial | | | 2,117 | | | | 192,943 | |
Raymond James Financial | | | 655 | | | | 54,686 | |
Regions Financial | | | 18,197 | | | | 292,972 | |
S&P Global | | | 1,225 | | | | 316,038 | |
State Street | | | 1,914 | | | | 126,458 | |
SunTrust Banks | | | 3,061 | | | | 209,189 | |
Travelers | | | 2,021 | | | | 264,872 | |
Unum Group | | | 4,473 | | | | 123,187 | |
US Bancorp | | | 5,623 | | | | 320,623 | |
Wells Fargo | | | 4,159 | | | | 214,729 | |
Willis Towers Watson | | | 1,536 | | | | 287,078 | |
| | | | | | | |
COMMON STOCK — continued | |
| Financials — continued | | | | |
Zions Bancorp | | | 2,255 | | | $ | 109,300 | |
| | | | | | | | 13,302,908 | |
| Health Care — 9.4% | | | | | |
Abbott Laboratories | | | 3,638 | | | | 304,173 | |
Agilent Technologies | | | 4,339 | | | | 328,679 | |
Alexion Pharmaceuticals * | | | 1,487 | | | | 156,730 | |
Allergan | | | 666 | | | | 117,289 | |
Anthem | | | 1,327 | | | | 357,069 | |
Baxter International | | | 3,544 | | | | 271,825 | |
Boston Scientific * | | | 5,073 | | | | 211,544 | |
Bristol-Myers Squibb | | | 2,266 | | | | 130,001 | |
Centene | | | 1,412 | | | | 74,949 | |
Cerner | | | 894 | | | | 60,005 | |
Cooper | | | 1,452 | | | | 422,532 | |
Danaher | | | 2,200 | | | | 303,204 | |
DENTSPLY SIRONA | | | 3,545 | | | | 194,195 | |
Edwards Lifesciences * | | | 1,200 | | | | 286,056 | |
Elanco Animal Health * | | | 3,817 | | | | 103,135 | |
Eli Lilly | | | 1,767 | | | | 201,350 | |
Gilead Sciences | | | 1,837 | | | | 117,035 | |
HCA Healthcare | | | 1,726 | | | | 230,490 | |
Henry Schein * | | | 3,127 | | | | 195,703 | |
Hologic * | | | 6,512 | | | | 314,595 | |
Humana * | | | 295 | | | | 86,789 | |
IDEXX Laboratories * | | | 1,307 | | | | 372,508 | |
IQVIA Holdings * | | | 2,280 | | | | 329,278 | |
Johnson & Johnson | | | 1,606 | | | | 212,056 | |
Laboratory Corp of America Holdings * | | | 2,106 | | | | 347,006 | |
Medtronic | | | 1,669 | | | | 181,754 | |
Merck | | | 2,644 | | | | 229,129 | |
Mettler-Toledo International * | | | 330 | | | | 232,630 | |
Mylan * | | | 2,762 | | | | 52,892 | |
| | | | | | | |
COMMON STOCK — continued | |
| Health Care — continued | | | | |
Perrigo | | | 3,332 | | | $ | 176,663 | |
Pfizer | | | 7,115 | | | | 273,003 | |
Quest Diagnostics | | | 2,182 | | | | 220,928 | |
ResMed | | | 467 | | | | 69,079 | |
STERIS | | | 1,869 | | | | 264,594 | |
Stryker | | | 1,087 | | | | 235,085 | |
Thermo Fisher Scientific | | | 1,035 | | | | 312,549 | |
UnitedHealth Group | | | 307 | | | | 77,579 | |
| Universal Health Services, Cl B | | | 2,733 | | | | 375,678 | |
Varian Medical Systems * | | | 1,412 | | | | 170,584 | |
Veeva Systems, Cl A * | | | 729 | | | | 103,394 | |
Waters * | | | 266 | | | | 56,291 | |
WellCare Health Plans * | | | 1,007 | | | | 298,676 | |
Zimmer Biomet Holdings | | | 637 | | | | 88,053 | |
Zoetis, Cl A | | | 1,974 | | | | 252,514 | |
| | | | | | | | 9,399,271 | |
| Industrials — 10.3% | | | | | |
| 3M | | | 418 | | | | 68,966 | |
AMETEK | | | 1,683 | | | | 154,247 | |
Arconic | | | 5,824 | | | | 159,985 | |
CH Robinson Worldwide | | | 1,003 | | | | 75,867 | |
Cintas | | | 1,151 | | | | 309,239 | |
Copart * | | | 1,085 | | | | 89,665 | |
CoStar Group * | | | 948 | | | | 520,945 | |
CSX | | | 1,816 | | | | 127,610 | |
Cummins | | | 2,183 | | | | 376,524 | |
Delta Air Lines | | | 5,250 | | | | 289,170 | |
Dover | | | 3,146 | | | | 326,838 | |
Eaton | | | 2,501 | | | | 217,862 | |
Emerson Electric | | | 2,007 | | | | 140,791 | |
| Expeditors International of Washington | | | 1,490 | | | | 108,681 | |
Fastenal | | | 5,946 | | | | 213,699 | |
| | | | | | | |
COMMON STOCK — continued | |
| Industrials — continued | | | | | |
FedEx | | | 459 | | | $ | 70,071 | |
Fortive | | | 4,212 | | | | 290,628 | |
| Fortune Brands Home & Security | | | 1,231 | | | | 73,921 | |
Honeywell International | | | 1,304 | | | | 225,240 | |
Huntington Ingalls Industries | | | 552 | | | | 124,564 | |
IDEX | | | 687 | | | | 106,849 | |
IHS Markit * | | | 6,310 | | | | 441,826 | |
Illinois Tool Works | | | 931 | | | | 156,948 | |
Ingersoll-Rand | | | 2,482 | | | | 314,941 | |
Jacobs Engineering Group | | | 4,069 | | | | 380,777 | |
JB Hunt Transport Services | | | 1,356 | | | | 159,412 | |
Johnson Controls International | | | 6,676 | | | | 289,271 | |
Kansas City Southern | | | 2,331 | | | | 328,158 | |
L3Harris Technologies | | | 2,818 | | | | 581,381 | |
Masco | | | 1,591 | | | | 73,584 | |
Nielsen Holdings | | | 3,435 | | | | 69,250 | |
Norfolk Southern | | | 1,587 | | | | 288,834 | |
Raytheon | | | 1,132 | | | | 240,222 | |
Republic Services, Cl A | | | 3,935 | | | | 344,352 | |
Rockwell Automation | | | 367 | | | | 63,120 | |
Roper Technologies | | | 897 | | | | 302,253 | |
Snap-On | | | 1,336 | | | | 217,327 | |
Southwest Airlines | | | 2,200 | | | | 123,486 | |
Stanley Black & Decker | | | 810 | | | | 122,577 | |
Textron | | | 3,687 | | | | 169,934 | |
Union Pacific | | | 1,337 | | | | 221,220 | |
United Technologies | | | 2,196 | | | | 315,302 | |
Verisk Analytics, Cl A | | | 1,994 | | | | 288,532 | |
Waste Management | | | 2,006 | | | | 225,093 | |
WW Grainger | | | 402 | | | | 124,154 | |
Xylem | | | 3,972 | | | | 304,613 | |
| | | | | | | | 10,217,929 | |
| | | | | | | |
COMMON STOCK — continued | |
| Information Technology — 15.2% | | | | | |
Accenture, Cl A | | | 1,160 | | | $ | 215,087 | |
Adobe * | | | 1,271 | | | | 353,249 | |
Advanced Micro Devices * | | | 6,400 | | | | 217,152 | |
Akamai Technologies * | | | 3,433 | | | | 296,955 | |
Amdocs | | | 3,056 | | | | 199,251 | |
Amphenol, Cl A | | | 1,721 | | | | 172,668 | |
Analog Devices | | | 3,373 | | | | 359,663 | |
ANSYS * | | | 1,709 | | | | 376,236 | |
Apple | | | 690 | | | | 171,644 | |
Applied Materials | | | 3,132 | | | | 169,942 | |
Arista Networks * | | | 589 | | | | 144,052 | |
Autodesk * | | | 1,801 | | | | 265,395 | |
Automatic Data Processing | | | 789 | | | | 128,000 | |
Broadcom | | | 2,060 | | | | 603,271 | |
Broadridge Financial Solutions | | | 1,291 | | | | 161,659 | |
Cadence Design Systems * | | | 4,869 | | | | 318,189 | |
CDW | | | 2,274 | | | | 290,867 | |
Check Point Software Technologies * | | | 4,290 | | | | 482,239 | |
Cisco Systems | | | 5,289 | | | | 251,281 | |
Citrix Systems | | | 1,200 | | | | 130,632 | |
| Cognizant Technology Solutions, Cl A | | | 4,294 | | | | 261,676 | |
Corning | | | 6,123 | | | | 181,425 | |
DXC Technology | | | 4,326 | | | | 119,700 | |
F5 Networks * | | | 1,754 | | | | 252,716 | |
| Fidelity National Information Services | | | 1,799 | | | | 237,036 | |
Fiserv * | | | 2,769 | | | | 293,902 | |
Fortinet * | | | 2,278 | | | | 185,794 | |
Gartner * | | | 1,326 | | | | 204,310 | |
GoDaddy, Cl A * | | | 1,538 | | | | 100,016 | |
Hewlett Packard Enterprise | | | 10,466 | | | | 171,747 | |
Intel | | | 3,104 | | | | 175,469 | |
| International Business Machines | | | 1,406 | | | | 188,024 | |
| | | | | | | |
COMMON STOCK — continued | |
| Information Technology — continued | | | | | |
Intuit | | | 793 | | | $ | 204,197 | |
Juniper Networks | | | 7,009 | | | | 173,963 | |
Keysight Technologies * | | | 2,742 | | | | 276,695 | |
KLA | | | 1,640 | | | | 277,226 | |
Lam Research | | | 493 | | | | 133,623 | |
Marvell Technology Group | | | 9,215 | | | | 224,754 | |
Mastercard, Cl A | | | 803 | | | | 222,279 | |
Maxim Integrated Products | | | 2,855 | | | | 167,474 | |
Microchip Technology | | | 1,775 | | | | 167,365 | |
Micron Technology * | | | 4,755 | | | | 226,100 | |
Microsoft | | | 1,667 | | | | 238,998 | |
Motorola Solutions | | | 2,075 | | | | 345,114 | |
NetApp | | | 1,261 | | | | 70,465 | |
NortonLifeLock | | | 7,753 | | | | 177,389 | |
Okta, Cl A * | | | 1,343 | | | | 146,481 | |
Paychex | | | 2,458 | | | | 205,587 | |
Paycom Software * | | | 771 | | | | 163,090 | |
Qorvo * | | | 2,958 | | | | 239,184 | |
QUALCOMM | | | 5,180 | | | | 416,679 | |
salesforce.com * | | | 1,263 | | | | 197,647 | |
Seagate Technology | | | 2,028 | | | | 117,685 | |
ServiceNow * | | | 1,190 | | | | 294,239 | |
Skyworks Solutions | | | 3,794 | | | | 345,482 | |
Splunk * | | | 1,958 | | | | 234,882 | |
Synopsys * | | | 2,756 | | | | 374,127 | |
TE Connectivity | | | 1,786 | | | | 159,847 | |
Texas Instruments | | | 1,974 | | | | 232,912 | |
Twilio, Cl A * | | | 1,960 | | | | 189,258 | |
VeriSign * | | | 1,900 | | | | 361,038 | |
Visa, Cl A | | | 1,319 | | | | 235,916 | |
VMware, Cl A | | | 878 | | | | 138,961 | |
Western Digital | | | 3,701 | | | | 191,156 | |
| | | | | | | |
COMMON STOCK — continued | |
| Information Technology — continued | | | | | |
Western Union | | | 3,095 | | | $ | 77,561 | |
Xilinx | | | 2,296 | | | | 208,339 | |
| | | | | | | | 15,114,960 | |
| Materials — 2.9% | | | | | |
Air Products & Chemicals | | | 1,793 | | | | 382,375 | |
Albemarle | | | 1,430 | | | | 86,858 | |
Ball | | | 3,994 | | | | 279,460 | |
Celanese, Cl A | | | 901 | | | | 109,156 | |
Dow | | | 2,894 | | | | 146,118 | |
DuPont de Nemours | | | 2,069 | | | | 136,368 | |
Eastman Chemical | | | 2,387 | | | | 181,508 | |
Ecolab | | | 1,178 | | | | 226,258 | |
| Freeport-McMoRan Copper & Gold | | | 11,846 | | | | 116,328 | |
| International Flavors & Fragrances | | | 1,181 | | | | 144,094 | |
International Paper | | | 2,586 | | | | 112,956 | |
Mosaic | | | 3,187 | | | | 63,358 | |
Newmont Goldcorp | | | 5,671 | | | | 225,309 | |
Nucor | | | 2,576 | | | | 138,717 | |
Packaging Corp of America | | | 610 | | | | 66,771 | |
PPG Industries | | | 3,385 | | | | 423,531 | |
Westrock | | | 2,852 | | | | 106,579 | |
| | | | | | | | 2,945,744 | |
| Real Estate — 5.8% | | | | | |
Alexandria Real Estate Equities ‡ | | | 1,652 | | | | 262,255 | |
AvalonBay Communities ‡ | | | 1,090 | | | | 237,249 | |
Boston Properties ‡ | | | 977 | | | | 134,044 | |
CBRE Group, Cl A * | | | 3,527 | | | | 188,871 | |
Duke Realty ‡ | | | 7,869 | | | | 276,517 | |
Equity Residential ‡ | | | 2,853 | | | | 252,947 | |
Essex Property Trust ‡ | | | 1,607 | | | | 525,698 | |
Federal Realty Investment Trust ‡ | | | 994 | | | | 135,194 | |
HCP ‡ | | | 8,590 | | | | 323,156 | |
| | | | | | | |
COMMON STOCK — continued | |
| Real Estate — continued | | | | | |
Host Hotels & Resorts ‡ | | | 7,099 | | | $ | 116,353 | |
Mid-America Apartment Communities ‡ | | | 2,031 | | | | 282,289 | |
ProLogis ‡ | | | 3,880 | | | | 340,509 | |
Public Storage ‡ | | | 1,897 | | | | 422,766 | |
Realty Income ‡ | | | 4,069 | | | | 332,804 | |
Regency Centers ‡ | | | 4,179 | | | | 280,996 | |
SL Green Realty ‡ | | | 1,752 | | | | 146,467 | |
Sun Communities ‡ | | | 1,542 | | | | 250,806 | |
UDR ‡ | | | 4,654 | | | | 233,863 | |
Ventas ‡ | | | 3,604 | | | | 234,620 | |
Vornado Realty Trust ‡ | | | 862 | | | | 56,573 | |
Welltower ‡ | | | 3,863 | | | | 350,335 | |
WP Carey ‡ | | | 3,705 | | | | 341,082 | |
| | | | | | | | 5,725,394 | |
| Utilities — 14.4% | | | | | |
Alliant Energy | | | 5,217 | | | | 278,275 | |
Ameren | | | 9,031 | | | | 701,709 | |
American Electric Power | | | 7,172 | | | | 676,965 | |
American Water Works | | | 2,314 | | | | 285,247 | |
Atmos Energy | | | 3,621 | | | | 407,290 | |
CenterPoint Energy | | | 13,526 | | | | 393,201 | |
CMS Energy | | | 10,279 | | | | 657,034 | |
Consolidated Edison | | | 4,312 | | | | 397,653 | |
Dominion Energy | | | 12,417 | | | | 1,025,023 | |
DTE Energy | | | 3,692 | | | | 470,065 | |
Duke Energy | | | 12,205 | | | | 1,150,443 | |
Edison International | | | 5,025 | | | | 316,073 | |
Entergy | | | 6,910 | | | | 839,427 | |
Evergy | | | 6,710 | | | | 428,836 | |
Eversource Energy | | | 4,051 | | | | 339,231 | |
Exelon | | | 11,618 | | | | 528,503 | |
FirstEnergy | | | 15,038 | | | | 726,636 | |
| | | | | | | |
COMMON STOCK — continued | |
| Utilities — continued | | | | | |
NextEra Energy | | | 2,213 | | | $ | 527,446 | |
NiSource | | | 11,220 | | | | 314,609 | |
Pinnacle West Capital | | | 4,068 | | | | 382,880 | |
PPL | | | 14,841 | | | | 497,025 | |
| Public Service Enterprise Group | | | 5,991 | | | | 379,290 | |
Sempra Energy | | | 2,698 | | | | 389,888 | |
Southern | | | 15,856 | | | | 993,537 | |
WEC Energy Group | | | 7,220 | | | | 681,568 | |
Xcel Energy | | | 8,634 | | | | 548,345 | |
| | | | | | | | 14,336,199 | |
TOTAL UNITED STATES | | | | | | | 98,940,365 | |
| TOTAL COMMON STOCK | | | | | | | | |
(Cost $89,001,841) | | | | | | | 99,497,927 | |
| TOTAL INVESTMENTS — 99.8% | | | | | | | | |
(Cost $89,001,841) | | | | | | $ | 99,497,927 | |
| Percentages are based on Net Assets of $99,716,274. |
| * | Non-income producing security. |
| ‡ | Real Estate Investment Trust |
| As of October 31, 2019, all of the Fund’s investments were considered Level 1, in accordance with authoritative guidance on fair value measurements and disclosure under U.S. GAAP. |
For the year ended October 31, 2019, there have been no transfers in or out of Level 3.
| | |
| Schedule of Investments |
| October 31, 2019 |
Global X Scientific Beta Europe ETF |
| Sector Weightings (Unaudited)†: |
| † Sector weightings percentages are based on the total market value of investments. |
| | | | | | | |
COMMON STOCK — 98.6% | | | | | | |
| AUSTRIA— 1.4% | | | | | | |
| Energy — 0.1% | | | | | | |
OMV | | | 83 | | | $ | 4,845 | |
| Financials — 0.5% | | | | | | | | |
Erste Group Bank | | | 554 | | | | 19,574 | |
Raiffeisen Bank International | | | 237 | | | | 5,830 | |
| | | | | | | | 25,404 | |
| Industrials — 0.2% | | | | | | | | |
ANDRITZ | | | 227 | | | | 10,201 | |
| Materials — 0.3% | | | | | | | | |
voestalpine | | | 169 | | | | 4,233 | |
Wienerberger | | | 323 | | | | 8,735 | |
| | | | | | | | 12,968 | |
| Real Estate — 0.3% | | | | | | | | |
IMMOFINANZ | | | 392 | | | | 11,261 | |
Verbund | | | 92 | | | | 4,978 | |
| | | | | | | | 16,239 | |
| | | | | | | |
COMMON STOCK — continued | | | | | | | | |
TOTAL AUSTRIA | | | | | | $ | 69,657 | |
| BELGIUM— 2.7% | | | | | | | | |
| Communication Services — 0.3% | | | | | | | | |
Proximus | | | 433 | | | | 13,299 | |
| Consumer Discretionary — 0.5% | | | | | | | | |
Ageas | | | 441 | | | | 25,407 | |
| Consumer Staples — 0.3% | | | | | | | | |
Colruyt | | | 257 | | | | 14,290 | |
| Financials — 0.6% | | | | | | | | |
Ackermans & van Haaren | | | 58 | | | | 8,884 | |
Groupe Bruxelles Lambert | | | 103 | | | | 10,341 | |
Sofina | | | 31 | | | | 6,855 | |
| | | | | | | | 26,080 | |
| Health Care — 0.5% | | | | | |
UCB | | | 323 | | | | 26,039 | |
| Materials — 0.2% | | | | | |
Solvay | | | 110 | | | | 11,965 | |
| Real Estate — 0.3% | | | | | |
Cofinimmo ‡ | | | 77 | | | | 11,391 | |
Warehouses De Pauw CVA ‡ | | | 22 | | | | 4,079 | |
| | | | | | | | 15,470 | |
TOTAL BELGIUM | | | | | | | 132,550 | |
| DENMARK— 3.2% | | | | | | | | |
| Consumer Staples — 0.4% | | | | | |
Carlsberg, Cl B | | | 68 | | | | 9,571 | |
Royal Unibrew | | | 140 | | | | 11,483 | |
| | | | | | | | 21,054 | |
| Financials — 0.5% | | | | | |
Danske Bank | | | 690 | | | | 9,850 | |
Jyske Bank | | | 273 | | | | 9,080 | |
| | | | | | | |
COMMON STOCK — continued | |
| Financials — continued | | | | | |
Tryg | | | 202 | | | $ | 5,645 | |
| | | | | | | | 24,575 | |
| Health Care — 1.0% | | | | | |
Coloplast, Cl B | | | 220 | | | | 26,523 | |
Demant * | | | 87 | | | | 2,297 | |
Genmab * | | | 24 | | | | 5,233 | |
GN Store Nord | | | 177 | | | | 7,783 | |
H Lundbeck | | | 114 | | | | 3,890 | |
Novo Nordisk, Cl B | | | 136 | | | | 7,432 | |
| | | | | | | | 53,158 | |
| Industrials — 0.7% | | | | | |
A P Moller - Maersk, Cl B | | | 11 | | | | 14,027 | |
DSV PANALPINA | | | 91 | | | | 8,834 | |
ISS | | | 325 | | | | 8,509 | |
| | | | | | | | 31,370 | |
| Information Technology — 0.1% | | | | | |
SimCorp | | | 58 | | | | 5,184 | |
| Materials — 0.3% | | | | | |
Christian Hansen Holding | | | 111 | | | | 8,524 | |
Novozymes, Cl B | | | 93 | | | | 4,381 | |
| | | | | | | | 12,905 | |
| Utilities — 0.2% | | | | | |
Orsted | | | 115 | | | | 10,092 | |
TOTAL DENMARK | | | | | | | 158,338 | |
| FINLAND— 3.7% | | | | | | | | |
| Communication Services — 0.5% | | | | | |
Elisa | | | 423 | | | | 23,110 | |
| Consumer Discretionary — 0.3% | | | | | |
Nokian Renkaat | | | 490 | | | | 13,995 | |
| | | | | | | |
COMMON STOCK — continued | |
| Consumer Staples — 0.4% | | | | | |
Kesko, Cl B | | | 318 | | | $ | 21,173 | |
| Energy — 0.2% | | | | | |
Neste | | | 291 | | | | 10,506 | |
| Financials — 0.1% | | | | | |
Sampo, Cl A | | | 131 | | | | 5,370 | |
| Health Care — 0.3% | | | | | |
Orion, Cl B | | | 293 | | | | 12,990 | |
| Industrials — 0.6% | | | | | |
Kone, Cl B | | | 187 | | | | 11,901 | |
Konecranes, Cl A | | | 194 | | | | 5,984 | |
Metso | | | 122 | | | | 4,611 | |
Valmet | | | 339 | | | | 7,579 | |
| | | | | | | | 30,075 | |
| Information Technology — 0.5% | | | | | |
Nokia | | | 4,956 | | | | 18,210 | |
Tieto | | | 203 | | | | 5,775 | |
| | | | | | | | 23,985 | |
| Materials — 0.3% | | | | | |
Huhtamaki | | | 100 | | | | 4,630 | |
Stora Enso, Cl R | | | 459 | | | | 5,953 | |
UPM-Kymmene | | | 179 | | | | 5,819 | |
| | | | | | | | 16,402 | |
| Utilities — 0.5% | | | | | |
Fortum | | | 1,093 | | | | 26,693 | |
TOTAL FINLAND | | | | | | | 184,299 | |
| FRANCE— 16.2% | | | | | | | | |
| Communication Services — 1.7% | | | | | |
Eutelsat Communications | | | 826 | | | | 15,666 | |
Iliad | | | 29 | | | | 3,002 | |
JCDecaux | | | 159 | | | | 4,346 | |
| | | | | | | |
COMMON STOCK — continued | |
| Communication Services — continued | | | | | |
Lagardere SCA | | | 565 | | | $ | 12,619 | |
Orange | | | 907 | | | | 14,612 | |
Publicis Groupe | | | 225 | | | | 9,677 | |
Ubisoft Entertainment * | | | 63 | | | | 3,721 | |
Vivendi | | | 813 | | | | 22,639 | |
| | | | | | | | 86,282 | |
| Consumer Discretionary — 2.5% | | | | | |
Accor | | | 142 | | | | 6,103 | |
Christian Dior | | | 15 | | | | 7,403 | |
| Cie Generale des Etablissements Michelin SCA, Cl B | | | 200 | | | | 24,343 | |
Elior Group | | | 470 | | | | 6,077 | |
EssilorLuxottica | | | 172 | | | | 26,252 | |
Hermes International | | | 22 | | | | 15,831 | |
Kering | | | 10 | | | | 5,692 | |
Peugeot | | | 762 | | | | 19,298 | |
Renault | | | 102 | | | | 5,207 | |
Sodexo | | | 47 | | | | 5,170 | |
| | | | | | | | 121,376 | |
| Consumer Staples — 1.2% | | | | | |
Carrefour | | | 822 | | | | 13,990 | |
Danone | | | 111 | | | | 9,209 | |
Pernod Ricard | | | 146 | | | | 26,957 | |
Remy Cointreau | | | 51 | | | | 6,822 | |
| | | | | | | | 56,978 | |
| Energy — 0.3% | | | | | |
Total | | | 277 | | | | 14,566 | |
| Financials — 1.7% | | | | | |
Amundi | | | 35 | | | | 2,499 | |
AXA | | | 786 | | | | 20,769 | |
BNP Paribas | | | 90 | | | | 4,701 | |
CNP Assurances | | | 616 | | | | 12,219 | |
| | | | | | | |
COMMON STOCK — continued | |
| Financials — continued | | | | | |
Eurazeo | | | 156 | | | $ | 10,877 | |
| LVMH Moet Hennessy Louis Vuitton | | | 22 | | | | 9,388 | |
SCOR | | | 340 | | | | 14,331 | |
Societe Generale | | | 164 | | | | 4,656 | |
Wendel | | | 17 | | | | 2,409 | |
| | | | | | | | 81,849 | |
| Health Care — 0.8% | | | | | |
BioMerieux | | | 59 | | | | 4,828 | |
Casino Guichard Perrachon | | | 190 | | | | 10,253 | |
Ipsen | | | 21 | | | | 2,237 | |
Sanofi | | | 209 | | | | 19,265 | |
Sartorius Stedim Biotech | | | 18 | | | | 2,695 | |
| | | | | | | | 39,278 | |
| Industrials — 3.9% | | | | | |
Aeroports de Paris | | | 42 | | | | 7,984 | |
Air France-KLM * | | | 832 | | | | 9,909 | |
Alstom | | | 669 | | | | 28,922 | |
Bollore | | | 2,380 | | | | 10,302 | |
Bouygues | | | 277 | | | | 11,743 | |
Bureau Veritas | | | 183 | | | | 4,673 | |
Cie de Saint-Gobain | | | 263 | | | | 10,701 | |
Credit Agricole | | | 867 | | | | 11,303 | |
Dassault Aviation | | | 2 | | | | 2,778 | |
Eiffage | | | 96 | | | | 10,316 | |
Elis | | | 118 | | | | 2,255 | |
Getlink | | | 453 | | | | 7,586 | |
Legrand | | | 127 | | | | 9,915 | |
Rexel | | | 499 | | | | 6,179 | |
Safran | | | 99 | | | | 15,667 | |
Schneider Electric | | | 117 | | | | 10,868 | |
Societe BIC | | | 117 | | | | 8,126 | |
Teleperformance | | | 100 | | | | 22,670 | |
| | | | | | | |
COMMON STOCK — continued | |
| Industrials — continued | | | | | |
Thales | | | 37 | | | $ | 3,618 | |
Vinci | | | 43 | | | | 4,826 | |
| | | | | | | | 200,341 | |
| Information Technology — 0.8% | | | | | |
Capgemini | | | 76 | | | | 8,559 | |
Dassault Systemes | | | 100 | | | | 15,178 | |
Ingenico Group | | | 79 | | | | 8,438 | |
Natixis | | | 760 | | | | 3,486 | |
Sopra Steria Group | | | 42 | | | | 5,759 | |
| | | | | | | | 41,420 | |
| Materials — 0.6% | | | | | |
Air Liquide | | | 78 | | | | 10,364 | |
Arkema | | | 98 | | | | 10,019 | |
L’Oreal | | | 35 | | | | 10,223 | |
| | | | | | | | 30,606 | |
| Real Estate — 1.1% | | | | | |
Covivio ‡ | | | 144 | | | | 16,306 | |
Gecina ‡ | | | 81 | | | | 13,899 | |
ICADE ‡ | | | 97 | | | | 9,502 | |
Klepierre ‡ | | | 321 | | | | 11,958 | |
Nexity | | | 68 | | | | 3,519 | |
| | | | | | | | 55,184 | |
| Utilities — 1.6% | | | | | |
Electricite de France | | | 993 | | | | 10,250 | |
Engie | | | 650 | | | | 10,874 | |
Rubis SCA | | | 339 | | | | 19,648 | |
Suez | | | 1,580 | | | | 24,634 | |
Veolia Environnement | | | 581 | | | | 15,278 | |
| | | | | | | | 80,684 | |
TOTAL FRANCE | | | | | | | 808,564 | |
| | | | | | | |
COMMON STOCK — continued | |
| GERMANY— 10.5% | | | | | | | | |
| Communication Services — 1.0% | | | | | |
Deutsche Telekom | | | 912 | | | $ | 16,044 | |
Freenet | | | 110 | | | | 2,442 | |
Scout24 | | | 328 | | | | 20,291 | |
| Telefonica Deutschland Holding | | | 3,271 | | | | 10,382 | |
United Internet | | | 52 | | | | 1,567 | |
| | | | | | | | 50,726 | |
| Consumer Discretionary — 1.6% | | | | | |
adidas | | | 37 | | | | 11,428 | |
Allianz | | | 40 | | | | 9,773 | |
Bayerische Motoren Werke | | | 190 | | | | 14,565 | |
Continental | | | 60 | | | | 8,025 | |
Daimler | | | 285 | | | | 16,664 | |
Fielmann | | | 94 | | | | 7,257 | |
HUGO BOSS | | | 63 | | | | 2,651 | |
Puma | | | 136 | | | | 10,234 | |
| | | | | | | | 80,597 | |
| Consumer Staples — 0.4% | | | | | |
Beiersdorf | | | 96 | | | | 11,369 | |
METRO | | | 584 | | | | 9,512 | |
| | | | | | | | 20,881 | |
| Energy — 0.2% | | | | | |
BASF | | | 133 | | | | 10,124 | |
| Financials — 0.8% | | | | | |
Aareal Bank | | | 170 | | | | 5,713 | |
Commerzbank | | | 513 | | | | 3,069 | |
Hannover Rueck | | | 98 | | | | 17,363 | |
| Muenchener Rueckversicherungs-Gesellschaft in Muenchen | | | 47 | | | | 13,056 | |
| | | | | | | | 39,201 | |
| | | | | | | |
COMMON STOCK — continued | |
| Health Care — 1.4% | | | | | |
Bayer | | | 65 | | | $ | 5,046 | |
Carl Zeiss Meditec | | | 54 | | | | 5,889 | |
Evotec * | | | 97 | | | | 2,217 | |
| Fresenius Medical Care & KGaA | | | 325 | | | | 23,525 | |
Gerresheimer | | | 63 | | | | 5,079 | |
Merck KGaA | | | 156 | | | | 18,605 | |
Siemens Healthineers | | | 175 | | | | 7,438 | |
| | | | | | | | 67,799 | |
| Industrials — 1.5% | | | | | |
Brenntag | | | 213 | | | | 10,693 | |
Deutsche Lufthansa | | | 568 | | | | 9,851 | |
Deutsche Post | | | 174 | | | | 6,163 | |
| Fraport Frankfurt Airport Services Worldwide | | | 63 | | | | 5,267 | |
GEA Group | | | 287 | | | | 8,776 | |
HOCHTIEF | | | 47 | | | | 5,862 | |
Knorr-Bremse | | | 68 | | | | 6,865 | |
OSRAM Licht | | | 266 | | | | 11,871 | |
Rheinmetall | | | 57 | | | | 6,858 | |
Siemens | | | 79 | | | | 9,112 | |
| | | | | | | | 81,318 | |
| Information Technology — 0.8% | | | | | |
Bechtle | | | 112 | | | | 12,139 | |
Infineon Technologies | | | 246 | | | | 4,769 | |
Nemetschek | | | 72 | | | | 3,663 | |
SAP | | | 73 | | | | 9,675 | |
Siltronic | | | 48 | | | | 4,564 | |
Software | | | 177 | | | | 5,628 | |
| | | | | | | | 40,438 | |
| Materials — 1.1% | | | | | |
Aurubis | | | 116 | | | | 5,693 | |
Covestro | | | 154 | | | | 7,396 | |
Evonik Industries | | | 446 | | | | 11,768 | |
| | | | | | | |
COMMON STOCK — continued | |
| Materials — continued | | | | | |
HeidelbergCement | | | 171 | | | $ | 12,709 | |
K+S | | | 117 | | | | 1,666 | |
LANXESS | | | 96 | | | | 6,244 | |
Symrise, Cl A | | | 101 | | | | 9,722 | |
| | | | | | | | 55,198 | |
| Real Estate — 1.4% | | | | | |
Aroundtown | | | 1,330 | | | | 11,227 | |
Deutsche EuroShop | | | 228 | | | | 6,822 | |
Deutsche Wohnen | | | 391 | | | | 14,708 | |
LEG Immobilien | | | 73 | | | | 8,380 | |
TAG Immobilien | | | 387 | | | | 9,404 | |
Vonovia | | | 251 | | | | 13,360 | |
| | | | | | | | 63,901 | |
| Utilities — 0.3% | | | | | |
Uniper | | | 478 | | | | 14,900 | |
TOTAL GERMANY | | | | | | | 525,083 | |
| IRELAND— 1.7% | | | | | | | | |
| Consumer Discretionary — 0.3% | | | | | |
Flutter Entertainment | | | 148 | | | | 15,293 | |
| Consumer Staples — 0.8% | | | | | |
Glanbia | | | 797 | | | | 8,883 | |
Kerry Group, Cl A | | | 241 | | | | 29,146 | |
| | | | | | | | 38,029 | |
| Financials — 0.2% | | | | | |
AIB Group | | | 908 | | | | 2,909 | |
Bank of Ireland Group | | | 1,318 | | | | 6,341 | |
| | | | | | | | 9,250 | |
| Industrials — 0.1% | | | | | |
Kingspan Group | | | 125 | | | | 6,479 | |
| Materials — 0.3% | | | | | |
CRH | | | 414 | | | | 15,094 | |
| | | | | | | |
COMMON STOCK — continued | |
TOTAL IRELAND | | | | | $ | 84,145 | |
| ITALY— 5.9% | | | | | | | |
| Communication Services — 0.2% | | | | | |
Telecom Italia * | | | 13,820 | | | | 8,090 | |
| Consumer Discretionary — 0.2% | | | | | |
Fiat Chrysler Automobiles | | | 366 | | | | 5,687 | |
Moncler | | | 53 | | | | 2,042 | |
Pirelli & C | | | 583 | | | | 3,371 | |
| | | | | | | | 11,100 | |
| Consumer Staples — 0.3% | | | | | |
Davide Campari-Milano | | | 1,380 | | | | 12,648 | |
| Energy — 0.5% | | | | | |
Eni | | | 934 | | | | 14,140 | |
Saipem * | | | 2,430 | | | | 11,007 | |
| | | | | | | | 25,147 | |
| Financials — 1.6% | | | | | |
BPER Banca | | | 1,088 | | | | 4,864 | |
EXOR | | | 99 | | | | 7,590 | |
| Mediobanca Banca di Credito Finanziario | | | 1,469 | | | | 17,454 | |
Poste Italiane | | | 2,085 | | | | 25,308 | |
UniCredit | | | 1,286 | | | | 16,310 | |
| Unione di Banche Italiane SCpA | | | 1,934 | | | | 5,884 | |
| | | | | | | | 77,410 | |
| Health Care — 0.2% | | | | | |
DiaSorin | | | 35 | | | | 3,944 | |
Recordati | | | 124 | | | | 5,211 | |
| | | | | | | | 9,155 | |
| Industrials — 0.6% | | | | | |
Interpump Group | | | 108 | | | | 2,959 | |
Leonardo | | | 1,200 | | | | 13,937 | |
| | | | | | | |
COMMON STOCK — continued | |
| Industrials — continued | | | | |
Prysmian | | | 477 | | | $ | 11,021 | |
| | | | | | | | 27,917 | |
| Information Technology — 0.3% | | | | | |
Assicurazioni Generali | | | 743 | | | | 15,066 | |
| Utilities — 2.0% | | | | | |
A2A
| | | 7,633 | | | | 15,320 | |
Enel | | | 3,828 | | | | 29,638 | |
Hera | | | 3,520 | | | | 15,072 | |
Italgas | | | 420 | | | | 2,703 | |
Snam | | | 5,061 | | | | 25,973 | |
Terna Rete Elettrica Nazionale | | | 2,464 | | | | 16,285 | |
| | | | | | | | 104,991 | |
TOTAL ITALY | | | | | | | 291,524 | |
| LUXEMBOURG— 0.1% | | | | | | | | |
| Energy — 0.1% | | | | | |
Tenaris | | | 458 | | | | 4,626 | |
| NETHERLANDS— 6.6% | | | | | | | | |
| Communication Services — 0.2% | | | | | |
Koninklijke KPN | | | 3,354 | | | | 10,402 | |
| Consumer Discretionary — 0.1% | | | | | |
Takeaway.com * | | | 60 | | | | 4,887 | |
| Consumer Staples — 1.6% | | | | | |
Heineken | | | 82 | | | | 8,367 | |
Koninklijke Ahold Delhaize | | | 2,236 | | | | 55,692 | |
Unilever | | | 194 | | | | 11,460 | |
| | | | | | | | 75,519 | |
| Energy — 0.5% | | | | | |
Koninklijke Vopak | | | 189 | | | | 10,372 | |
SBM Offshore | | | 762 | | | | 13,105 | |
| | | | | | | | 23,477 | |
| | | | | | | |
COMMON STOCK — continued | |
| Financials — 1.1% | | | | |
ABN AMRO Bank | | | 652 | | | $ | 12,141 | |
ASR Nederland | | | 310 | | | | 11,347 | |
Euronext | | | 81 | | | | 6,529 | |
ING Groep | | | 419 | | | | 4,734 | |
NN Group | | | 578 | | | | 22,035 | |
| | | | | | | | 56,786 | |
| Health Care — 0.4% | | | | | |
Aegon | | | 886 | | | | 3,831 | |
Koninklijke Philips | | | 317 | | | | 13,888 | |
| | | | | | | | 17,719 | |
| Industrials — 0.9% | | | | | |
Aalberts | | | 233 | | | | 9,374 | |
Boskalis Westminster | | | 190 | | | | 4,172 | |
IMCD | | | 112 | | | | 8,734 | |
Signify | | | 362 | | | | 10,597 | |
Wolters Kluwer | | | 149 | | | | 10,975 | |
| | | | | | | | 43,852 | |
| Information Technology — 0.6% | | | | | |
ASML Holding | | | 39 | | | | 10,225 | |
BE Semiconductor Industries | | | 231 | | | | 8,538 | |
NXP Semiconductors | | | 119 | | | | 13,528 | |
| | | | | | | | 32,291 | |
| Materials — 1.1% | | | | | |
Akzo Nobel | | | 250 | | | | 23,024 | |
ArcelorMittal | | | 249 | | | | 3,675 | |
ASM International | | | 173 | | | | 17,382 | |
Koninklijke DSM | | | 110 | | | | 13,039 | |
| | | | | | | | 57,120 | |
| Real Estate — 0.1% | | | | | |
Unibail-Rodamco-Westfield ‡ | | | 47 | | | | 7,270 | |
TOTAL NETHERLANDS | | | | | | | 329,323 | |
| | | | | | | |
COMMON STOCK — continued | |
| NORWAY— 2.1% | | | | | | |
| Communication Services — 0.2% | | | | |
Telenor | | | 471 | | | $ | 8,831 | |
| Consumer Staples — 0.6% | | | | | |
Mowi | | | 760 | | | | 18,559 | |
Orkla | | | 1,905 | | | | 18,330 | |
| | | | | | | | 36,889 | |
| Energy — 0.5% | | | | | |
Equinor | | | 752 | | | | 13,932 | |
Subsea 7 | | | 597 | | | | 5,593 | |
TGS Nopec Geophysical | | | 81 | | | | 2,101 | |
| | | | | | | | 21,626 | |
| Financials — 0.5% | | | | | |
DnB | | | 508 | | | | 9,246 | |
Gjensidige Forsikring | | | 237 | | | | 4,437 | |
Storebrand | | | 1,268 | | | | 8,977 | |
| | | | | | | | 22,660 | |
| Materials — 0.3% | | | | | |
Norsk Hydro | | | 2,556 | | | | 9,034 | |
Yara International | | | 171 | | | | 6,666 | |
| | | | | | | | 15,700 | |
TOTAL NORWAY | | | | | | | 105,706 | |
| PORTUGAL— 0.9% | | | | | | | | |
| Consumer Staples — 0.1% | | | | | |
Jeronimo Martins | | | 423 | | | | 7,100 | |
| Energy — 0.4% | | | | | |
Galp Energia | | | 1,105 | | | | 17,604 | |
| Utilities — 0.4% | | | | | |
Energias de Portugal | | | 5,341 | | | | 21,988 | |
TOTAL PORTUGAL | | | | | | | 46,692 | |
| | | | | | | |
COMMON STOCK — continued | |
| SPAIN— 4.0% | | | | | | |
| Communication Services — 0.2% | | | | |
Telefonica | | | 1,125 | | | $ | 8,629 | |
| Consumer Discretionary — 0.2% | | | | | |
Industria de Diseno Textil | | | 373 | | | | 11,631 | |
| Consumer Staples — 0.1% | | | | | |
Viscofan | | | 87 | | | | 4,715 | |
| Energy — 0.4% | | | | | |
Repsol | | | 1,243 | | | | 20,384 | |
| Financials — 0.4% | | | | | |
| Banco Bilbao Vizcaya Argentaria | | | 768 | | | | 4,047 | |
Banco Santander | | | 920 | | | | 3,689 | |
Bankinter | | | 398 | | | | 2,753 | |
Mapfre | | | 3,273 | | | | 9,129 | |
| | | | | | | | 19,618 | |
| Industrials — 0.4% | | | | | |
| ACS Actividades de Construccion y Servicios | | | 89 | | | | 3,613 | |
Aena SME | | | 28 | | | | 5,139 | |
Ferrovial | | | 349 | | | | 10,303 | |
| | | | | | | | 19,055 | |
| Information Technology — 0.1% | | | | | |
Amadeus IT Group, Cl A | | | 73 | | | | 5,403 | |
| Materials — 0.1% | | | | | |
Acerinox | | | 666 | | | | 6,225 | |
| Real Estate — 0.5% | | | | | |
Inmobiliaria Colonial Socimi ‡ | | | 218 | | | | 2,816 | |
Merlin Properties Socimi ‡ | | | 1,292 | | | | 19,027 | |
| | | | | | | | 21,843 | |
| Utilities — 1.6% | | | | | |
Acciona | | | 99 | | | | 10,321 | |
| | | | | | | |
COMMON STOCK — continued | |
| Utilities — continued | | | | |
Enagas | | | 535 | | | $ | 13,245 | |
Endesa | | | 775 | | | | 21,097 | |
Iberdrola | | | 1,398 | | | | 14,361 | |
Naturgy Energy Group | | | 612 | | | | 16,667 | |
Red Electrica | | | 261 | | | | 5,256 | |
| | | | | | | | 80,947 | |
TOTAL SPAIN | | | | | | | 198,450 | |
| SWEDEN— 6.9% | | | | | | | | |
| Communication Services — 0.5% | | | | | |
Tele2, Cl B | | | 347 | | | | 4,972 | |
Telia | | | 4,334 | | | | 19,096 | |
| | | | | | | | 24,068 | |
| Consumer Discretionary — 0.4% | | | | | |
Dometic Group | | | 991 | | | | 9,202 | |
Hennes & Mauritz, Cl B | | | 324 | | | | 6,785 | |
Husqvarna, Cl B | | | 589 | | | | 4,515 | |
| | | | | | | | 20,502 | |
| Consumer Staples — 0.9% | | | | | |
AAK | | | 291 | | | | 5,168 | |
Essity, Cl B | | | 434 | | | | 13,573 | |
ICA Gruppen | | | 463 | | | | 20,521 | |
Swedish Match | | | 128 | | | | 6,021 | |
| | | | | | | | 45,283 | |
| Energy — 0.1% | | | | | |
Lundin Petroleum | | | 166 | | | | 5,493 | |
| Financials — 1.3% | | | | | |
Industrivarden, Cl C | | | 523 | | | | 11,340 | |
Investor, Cl B | | | 284 | | | | 14,577 | |
Kinnevik | | | 164 | | | | 4,492 | |
L E Lundbergforetagen, Cl B | | | 211 | | | | 7,959 | |
Nordea Bank Abp | | | 893 | | | | 6,532 | |
| | | | | | | |
COMMON STOCK — continued | |
| Financials — continued | | | | |
| Skandinaviska Enskilda Banken, Cl A | | | 1,484 | | | $ | 14,251 | |
Svenska Handelsbanken, Cl A | | | 383 | | | | 3,843 | |
| | | | | | | | 62,994 | |
| Health Care — 0.3% | | | | | |
Getinge, Cl B | | | 623 | | | | 10,650 | |
Swedish Orphan Biovitrum * | | | 418 | | | | 6,634 | |
| | | | | | | | 17,284 | |
| Industrials — 1.4% | | | | | |
Alfa Laval | | | 219 | | | | 5,071 | |
Assa Abloy, Cl B | | | 568 | | | | 13,501 | |
Atlas Copco, Cl A | | | 162 | | | | 5,736 | |
Epiroc, Cl A | | | 741 | | | | 8,353 | |
Nibe Industrier, Cl B | | | 422 | | | | 5,782 | |
Securitas, Cl B | | | 799 | | | | 12,805 | |
SKF, Cl B | | | 249 | | | | 4,511 | |
Trelleborg, Cl B | | | 554 | | | | 8,967 | |
Volvo, Cl B | | | 282 | | | | 4,227 | |
| | | | | | | | 68,953 | |
| Information Technology — 0.8% | | | | | |
Hexagon, Cl B | | | 476 | | | | 24,353 | |
| Telefonaktiebolaget LM Ericsson, Cl B | | | 1,869 | | | | 16,365 | |
| | | | | | | | 40,718 | |
| Materials — 0.6% | | | | | |
BillerudKorsnas | | | 617 | | | | 7,422 | |
Boliden | | | 338 | | | | 9,109 | |
Sandvik | | | 223 | | | | 3,943 | |
Svenska Cellulosa, Cl B | | | 850 | | | | 8,678 | |
| | | | | | | | 29,152 | |
| Real Estate — 0.6% | | | | | |
Castellum | | | 504 | | | | 10,319 | |
Fabege | | | 748 | | | | 11,180 | |
| | | | | | | |
COMMON STOCK — continued | |
| Real Estate — continued | | | | |
Fastighets Balder, Cl B * | | | 197 | | | $ | 7,647 | |
| | | | | | | | 29,146 | |
TOTAL SWEDEN | | | | | | | 343,593 | |
| SWITZERLAND— 8.5% | | | | | | | | |
| Communication Services — 0.5% | | | | | |
| Sunrise Communications Group | | | 145 | | | | 11,263 | |
Swisscom | | | 22 | | | | 11,237 | |
| | | | | | | | 22,500 | |
| Consumer Discretionary — 0.4% | | | | | |
Cie Financiere Richemont | | | 86 | | | | 6,763 | |
Dufry | | | 69 | | | | 5,984 | |
Swatch Group | | | 32 | | | | 8,854 | |
| | | | | | | | 21,601 | |
| Consumer Staples — 0.9% | | | | | |
Barry Callebaut | | | 5 | | | | 10,540 | |
| Chocoladefabriken Lindt & Spruengli | | | 2 | | | | 14,857 | |
Nestle | | | 194 | | | | 20,706 | |
| | | | | | | | 46,103 | |
| Financials — 2.0% | | | | | |
Baloise Holding | | | 54 | | | | 9,971 | |
Cembra Money Bank | | | 62 | | | | 6,560 | |
Credit Suisse Group | | | 368 | | | | 4,561 | |
Helvetia Holding | | | 93 | | | | 13,044 | |
Pargesa Holding | | | 110 | | | | 8,684 | |
Partners Group Holding | | | 6 | | | | 4,677 | |
Swiss Life Holding | | | 20 | | | | 9,996 | |
Swiss Re | | | 268 | | | | 28,057 | |
UBS Group | | | 370 | | | | 4,365 | |
Zurich Insurance Group | | | 30 | | | | 11,720 | |
| | | | | | | | 101,635 | |
| | | | | | | |
COMMON STOCK — continued | |
| Health Care — 1.4% | | | | |
Alcon * | | | 149 | | | $ | 8,797 | |
Lonza Group | | | 10 | | | | 3,598 | |
Novartis | | | 113 | | | | 9,859 | |
Roche Holding | | | 53 | | | | 15,941 | |
Sonova Holding | | | 81 | | | | 18,552 | |
Straumann Holding | | | 5 | | | | 4,458 | |
Tecan Group | | | 18 | | | | 4,254 | |
Vifor Pharma | | | 35 | | | | 5,500 | |
| | | | | | | | 70,959 | |
| Industrials — 1.3% | | | | | |
Adecco Group | | | 84 | | | | 4,978 | |
DKSH Holding | | | 49 | | | | 2,325 | |
dormakaba Holding | | | 8 | | | | 5,120 | |
Flughafen Zurich | | | 15 | | | | 2,701 | |
Geberit | | | 21 | | | | 10,654 | |
Kuehne + Nagel International | | | 64 | | | | 10,335 | |
Schindler Holding | | | 40 | | | | 9,778 | |
SGS | | | 4 | | | | 10,410 | |
VAT Group | | | 34 | | | | 4,984 | |
| | | | | | | | 61,285 | |
| Information Technology — 0.4% | | | | | |
Logitech International | | | 109 | | | | 4,458 | |
STMicroelectronics | | | 452 | | | | 10,257 | |
Temenos | | | 32 | | | | 4,564 | |
| | | | | | | | 19,279 | |
| Materials — 1.0% | | | | | |
Clariant | | | 589 | | | | 12,063 | |
EMS-Chemie Holding | | | 14 | | | | 8,754 | |
Givaudan | | | 4 | | | | 11,744 | |
LafargeHolcim | | | 186 | | | | 9,591 | |
Sika | | | 37 | | | | 6,356 | |
| | | | | | | | 48,508 | |
| | | | | | | |
COMMON STOCK — continued | |
| Real Estate — 0.6% | | | | |
PSP Swiss Property | | | 121 | | | $ | 16,003 | |
Swiss Prime Site | | | 137 | | | | 14,106 | |
| | | | | | | | 30,109 | |
TOTAL SWITZERLAND | | | | | | | 421,979 | |
| UNITED KINGDOM— 24.2% | | | | | | | | |
| Communication Services — 1.8% | | | | | |
Auto Trader Group | | | 1,606 | | | | 11,683 | |
BT Group, Cl A | | | 3,239 | | | | 8,579 | |
Informa | | | 2,235 | | | | 22,413 | |
Pearson | | | 936 | | | | 8,263 | |
Rightmove | | | 1,865 | | | | 14,446 | |
Vodafone Group | | | 12,596 | | | | 25,655 | |
| | | | | | | | 91,039 | |
| Consumer Discretionary — 5.1% | | | | | |
B&M European Value Retail | | | 1,289 | | | | 6,176 | |
Barratt Developments | | | 1,854 | | | | 15,143 | |
Bellway | | | 258 | | | | 10,550 | |
Berkeley Group Holdings | | | 275 | | | | 15,661 | |
Burberry Group | | | 316 | | | | 8,358 | |
Carnival | | | 414 | | | | 16,564 | |
Compass Group | | | 1,713 | | | | 45,574 | |
Dixons Carphone | | | 3,574 | | | | 6,070 | |
GVC Holdings | | | 861 | | | | 9,916 | |
Inchcape | | | 1,009 | | | | 8,421 | |
InterContinental Hotels Group | | | 72 | | | | 4,342 | |
JD Sports Fashion | | | 275 | | | | 2,734 | |
Just Eat * | | | 586 | | | | 5,573 | |
Kingfisher | | | 5,510 | | | | 14,774 | |
Marks & Spencer Group | | | 5,770 | | | | 13,552 | |
Merlin Entertainments | | | 1,852 | | | | 10,892 | |
MoneySuperMarket.com | | | 1,743 | | | | 7,739 | |
Persimmon | | | 396 | | | | 11,668 | |
| | | | | | | |
COMMON STOCK — continued | |
| Consumer Discretionary — continued | | | | |
Playtech | | | 1,095 | | | $ | 5,564 | |
SSP Group | | | 1,087 | | | | 8,960 | |
Taylor Wimpey | | | 3,245 | | | | 6,949 | |
WH Smith | | | 285 | | | | 8,069 | |
Whitbread | | | 103 | | | | 5,413 | |
William Hill | | | 1,727 | | | | 4,416 | |
| | | | | | | | 253,078 | |
| Consumer Staples — 1.7% | | | | | |
Britvic | | | 770 | | | | 9,834 | |
Coca-Cola European Partners | | | 277 | | | | 14,822 | |
Coca-Cola HBC | | | 325 | | | | 9,883 | |
Diageo | | | 279 | | | | 11,425 | |
J Sainsbury | | | 1,449 | | | | 3,816 | |
Tate & Lyle | | | 2,258 | | | | 19,664 | |
Tesco | | | 1,420 | | | | 4,322 | |
WM Morrison Supermarkets | | | 4,915 | | | | 12,646 | |
| | | | | | | | 86,412 | |
| Energy — 0.9% | | | | | |
BP | | | 2,543 | | | | 16,101 | |
Great Portland Estates ‡ | | | 1,011 | | | | 10,304 | |
Royal Dutch Shell, Cl A | | | 481 | | | | 13,898 | |
Schroders | | | 64 | | | | 2,563 | |
Tullow Oil | | | 1,174 | | | | 3,128 | |
| | | | | | | | 45,994 | |
| Financials — 2.6% | | | | | |
3i Group | | | 817 | | | | 11,924 | |
Aviva | | | 837 | | | | 4,497 | |
Barclays | | | 2,198 | | | | 4,773 | |
Close Brothers Group | | | 245 | | | | 4,385 | |
Direct Line Insurance Group | | | 2,869 | | | | 10,102 | |
Hargreaves Lansdown | | | 118 | | | | 2,706 | |
HSBC Holdings | | | 2,731 | | | | 20,602 | |
| | | | | | | |
COMMON STOCK — continued | |
| Financials — continued | | | | |
IG Group Holdings | | | 784 | | | $ | 6,446 | |
Lloyds Banking Group | | | 6,743 | | | | 4,956 | |
Man Group | | | 1,035 | | | | 1,922 | |
Phoenix Group Holdings | | | 1,795 | | | | 16,357 | |
Quilter | | | 3,256 | | | | 5,768 | |
Royal Bank of Scotland Group | | | 1,948 | | | | 5,362 | |
RSA Insurance Group | | | 1,189 | | | | 8,034 | |
Standard Chartered | | | 723 | | | | 6,558 | |
Standard Life Aberdeen | | | 2,081 | | | | 8,173 | |
TP ICAP | | | 1,478 | | | | 6,558 | |
| | | | | | | | 129,123 | |
| Health Care — 0.8% | | | | | |
GlaxoSmithKline | | | 497 | | | | 11,374 | |
Hikma Pharmaceuticals | | | 269 | | | | 6,997 | |
Mediclinic International | | | 581 | | | | 2,752 | |
Smith & Nephew | | | 780 | | | | 16,679 | |
UDG Healthcare | | | 318 | | | | 3,180 | |
| | | | | | | | 40,982 | |
| Industrials — 5.2% | | | | | |
Aggreko | | | 1,144 | | | | 11,706 | |
BAE Systems | | | 2,271 | | | | 16,933 | |
Balfour Beatty | | | 1,079 | | | | 3,147 | |
BBA Aviation | | | 3,127 | | | | 12,285 | |
Bunzl | | | 642 | | | | 16,682 | |
Cobham | | | 7,428 | | | | 15,167 | |
easyJet | | | 341 | | | | 5,463 | |
Experian | | | 460 | | | | 14,452 | |
Ferguson | | | 152 | | | | 12,954 | |
Firstgroup * | | | 5,316 | | | | 8,881 | |
Howden Joinery Group | | | 1,142 | | | | 8,532 | |
IMI | | | 205 | | | | 2,661 | |
Intertek Group | | | 125 | | | | 8,657 | |
| | | | | | | |
COMMON STOCK — continued | |
| Industrials — continued | | | | |
Meggitt | | | 2,358 | | | $ | 19,052 | |
National Express Group | | | 2,123 | | | | 12,263 | |
RELX | | | 986 | | | | 23,706 | |
Rentokil Initial | | | 3,483 | | | | 20,485 | |
Rotork | | | 566 | | | | 2,207 | |
Royal Mail | | | 2,640 | | | | 7,229 | |
Smiths Group | | | 429 | | | | 8,957 | |
Spirax-Sarco Engineering | | | 122 | | | | 12,511 | |
Travis Perkins | | | 748 | | | | 13,870 | |
| | | | | | | | 257,800 | |
| Information Technology — 0.9% | | | | | |
AVEVA Group | | | 117 | | | | 6,331 | |
Electrocomponents | | | 998 | | | | 8,784 | |
Halma | | | 362 | | | | 8,776 | |
Micro Focus International | | | 435 | | | | 5,967 | |
Sage Group | | | 849 | | | | 7,908 | |
Spectris | | | 267 | | | | 8,264 | |
| | | | | | | | 46,030 | |
| Materials — 1.9% | | | | | |
Anglo American | | | 799 | | | | 20,489 | |
Antofagasta | | | 828 | | | | 9,291 | |
BHP Group | | | 642 | | | | 13,581 | |
Croda International | | | 139 | | | | 8,662 | |
Evraz | | | 723 | | | | 3,435 | |
Glencore | | | 1,375 | | | | 4,139 | |
Mondi | | | 385 | | | | 7,959 | |
Rio Tinto | | | 318 | | | | 16,517 | |
Smurfit Kappa Group | | | 229 | | | | 7,639 | |
Victrex | | | 108 | | | | 3,069 | |
| | | | | | | | 94,781 | |
| Real Estate — 1.6% | | | | | |
British Land ‡ | | | 1,249 | | | | 10,030 | |
| | | | | | | |
COMMON STOCK — continued | |
| Real Estate — continued | | | | |
Derwent London ‡ | | | 391 | | | $ | 17,961 | |
Hammerson ‡ | | | 1,976 | | | | 7,415 | |
Land Securities Group ‡ | | | 873 | | | | 10,619 | |
Segro ‡ | | | 987 | | | | 10,782 | |
Shaftesbury ‡ | | | 691 | | | | 8,450 | |
Tritax Big Box REIT ‡ | | | 2,150 | | | | 4,181 | |
Unite Group ‡ | | | 738 | | | | 10,743 | |
| | | | | | | | 80,181 | |
| Utilities — 1.7% | | | | | |
Centrica | | | 7,132 | | | | 6,696 | |
National Grid | | | 1,723 | | | | 20,095 | |
Pennon Group | | | 2,048 | | | | 23,803 | |
SSE | | | 1,700 | | | | 28,234 | |
United Utilities Group | | | 469 | | | | 5,281 | |
| | | | | | | | 84,109 | |
TOTAL UNITED KINGDOM | | | | | | | 1,209,529 | |
| TOTAL COMMON STOCK | | | | | | | | |
(Cost $5,065,057) | | | | | | | 4,914,058 | |
| | |
| PREFERRED STOCK — 0.7% | |
| GERMANY— 0.7% | | | | | | | | |
| Consumer Discretionary — 0.2% | | | | | |
Porsche Automobil Holding(A) | | | 71 | | | | 5,228 | |
Volkswagen(A) | | | 28 | | | | 5,332 | |
| | | | | | | | 10,560 | |
| Consumer Staples — 0.4% | | | | | |
Henkel & KGaA(A) | | | 160 | | | | 16,633 | |
| Materials — 0.1% | | | | | |
FUCHS PETROLUB(A) | | | 154 | | | | 6,577 | |
| | | | | | | |
| PREFERRED STOCK — continued | |
TOTAL GERMANY | | |
| | | $ | 33,770 | |
| TOTAL PREFERRED STOCK | | | | | | | | |
(Cost $35,311) | | | | | | | 33,770 | |
| TOTAL INVESTMENTS — 99.3% | | | | | | | | |
(Cost $5,100,368) | | | | | | $ | 4,947,828 | |
| Percentages are based on Net Assets of $4,980,309. |
| ‡ | Real Estate Investment Trust |
| * | Non-income producing security. |
| (A) | There’s currently no stated interest rate. |
| Cl — Class |
| REIT — Real Estate Investment Trust |
| As of October 31, 2019, all of the Fund’s investments were considered Level 1, in accordance with authoritative guidance on fair value measurements and disclosure under U.S. GAAP. |
For the year ended October 31, 2019, there have been no transfers in or out of Level 3.
| | |
| Schedule of Investments |
| October 31, 2019 |
Global X Scientific Beta Japan ETF |
| Sector Weightings (Unaudited)†: |
| † Sector weightings percentages are based on the total market value of investments. |
| | | | | | | |
| COMMON STOCK — 99.3% | | | | | | |
| JAPAN— 99.3% | | | | | | |
| Communication Services — 4.0% | | | | | | |
Dentsu | | | 330 | | | $ | 11,874 | |
Hakuhodo DY Holdings | | | 584 | | | | 8,795 | |
KDDI | | | 468 | | | | 12,983 | |
Konami Holdings | | | 230 | | | | 10,148 | |
| Nippon Telegraph & Telephone | | | 582 | | | | 28,943 | |
NTT DOCOMO | | | 535 | | | | 14,723 | |
Softbank | | | 400 | | | | 5,495 | |
Square Enix Holdings | | | 176 | | | | 8,368 | |
Toho | | | 320 | | | | 12,936 | |
| | | | | | | | 114,265 | |
| Consumer Discretionary — 14.1% | | | | | | | | |
Asics | | | 480 | | | | 8,294 | |
Bandai Namco Holdings | | | 390 | | | | 24,056 | |
Bridgestone | | | 404 | | | | 16,903 | |
Casio Computer | | | 1,039 | | | | 16,964 | |
| | | | | | | |
COMMON STOCK — continued | | | | | | | | |
| Consumer Discretionary — continued | | | | | | | | |
Denso | | | 250 | | | $ | 11,706 | |
Haseko | | | 250 | | | | 3,249 | |
Honda Motor | | | 312 | | | | 8,491 | |
Isetan Mitsukoshi Holdings | | | 1,270 | | | | 10,197 | |
Isuzu Motors | | | 1,211 | | | | 14,199 | |
J Front Retailing | | | 862 | | | | 11,044 | |
Marui Group | | | 140 | | | | 3,130 | |
Mazda Motor | | | 2,416 | | | | 22,460 | |
Mitsubishi Motors | | | 2,653 | | | | 12,221 | |
Nikon | | | 1,090 | | | | 14,015 | |
Nissan Motor | | | 2,914 | | | | 18,583 | |
Oriental Land | | | 85 | | | | 12,490 | |
| Pan Pacific International Holdings | | | 1,064 | | | | 16,801 | |
Panasonic | | | 1,300 | | | | 11,026 | |
Rinnai | | | 89 | | | | 6,578 | |
Sega Sammy Holdings | | | 1,160 | | | | 16,396 | |
Sekisui Chemical | | | 799 | | | | 14,035 | |
Sekisui House | | | 545 | | | | 11,807 | |
Stanley Electric | | | 390 | | | | 10,931 | |
Sumitomo Electric Industries | | | 641 | | | | 8,873 | |
Sumitomo Rubber Industries | | | 1,119 | | | | 14,937 | |
Toyota Industries | | | 167 | | | | 10,134 | |
Toyota Motor | | | 206 | | | | 14,372 | |
USS | | | 550 | | | | 10,715 | |
Yamada Denki | | | 4,648 | | | | 22,486 | |
Yamaha | | | 235 | | | | 11,021 | |
Yamaha Motor | | | 542 | | | | 10,729 | |
| | | | | | | | 398,843 | |
| Consumer Staples — 11.3% | | | | | |
Aeon | | | 738 | | | | 14,917 | |
Ajinomoto | | | 551 | | | | 10,497 | |
| Coca-Cola Bottlers Japan Holdings | | | 517 | | | | 11,798 | |
| | | | | | | |
COMMON STOCK — continued | |
| Consumer Staples — continued | | | | | |
Ezaki Glico | | | 366 | | | $ | 17,030 | |
FamilyMart | | | 320 | | | | 7,980 | |
Kao | | | 252 | | | | 20,383 | |
Kewpie | | | 714 | | | | 16,248 | |
Kikkoman | | | 100 | | | | 4,838 | |
Kirin Holdings | | | 362 | | | | 7,719 | |
Kobayashi Pharmaceutical | | | 129 | | | | 10,370 | |
Lawson | | | 225 | | | | 12,446 | |
Lion | | | 727 | | | | 15,293 | |
MEIJI Holdings | | | 90 | | | | 6,510 | |
NH Foods | | | 655 | | | | 27,537 | |
Nichirei | | | 280 | | | | 6,436 | |
Nisshin Seifun Group | | | 460 | | | | 9,149 | |
Nissin Foods Holdings | | | 182 | | | | 13,805 | |
Pigeon | | | 130 | | | | 6,397 | |
Seven & i Holdings | | | 290 | | | | 10,999 | |
Shiseido | | | 177 | | | | 14,683 | |
Suntory Beverage & Food | | | 397 | | | | 16,966 | |
Toyo Suisan Kaisha | | | 577 | | | | 24,338 | |
Tsuruha Holdings | | | 77 | | | | 8,711 | |
Unicharm | | | 300 | | | | 10,237 | |
Yakult Honsha | | | 143 | | | | 8,228 | |
Yamazaki Baking | | | 533 | | | | 9,102 | |
| | | | | | | | 322,617 | |
| Energy — 0.5% | | | | | |
Idemitsu Kosan | | | 278 | | | | 8,242 | |
Inpex | | | 688 | | | | 6,418 | |
| | | | | | | | 14,660 | |
| Financials — 7.1% | | | | | |
Aozora Bank | | | 334 | | | | 8,623 | |
Bank of Kyoto | | | 64 | | | | 2,569 | |
Chiba Bank | | | 1,093 | | | | 6,016 | |
| | | | | | | |
| COMMON STOCK — continued | |
| Financials — continued | | | | | |
Concordia Financial Group | | | 1,000 | | | $ | 4,126 | |
Daiwa Securities Group | | | 1,804 | | | | 8,172 | |
Fukuoka Financial Group | | | 222 | | | | 4,333 | |
Japan Post Bank | | | 1,450 | | | | 14,512 | |
Japan Post Holdings | | | 3,190 | | | | 29,391 | |
| Mitsubishi UFJ Financial Group | | | 900 | | | | 4,744 | |
| Mitsubishi UFJ Lease & Finance | | | 2,352 | | | | 14,556 | |
Mizuho Financial Group | | | 7,422 | | | | 11,589 | |
| MS&AD Insurance Group Holdings | | | 260 | | | | 8,439 | |
Nomura Holdings | | | 1,300 | | | | 5,956 | |
ORIX | | | 301 | | | | 4,751 | |
Resona Holdings | | | 1,100 | | | | 4,834 | |
Shinsei Bank | | | 656 | | | | 10,328 | |
Shizuoka Bank | | | 1,030 | | | | 7,927 | |
Sompo Holdings | | | 370 | | | | 14,628 | |
| Sumitomo Mitsui Financial Group | | | 371 | | | | 13,316 | |
| Sumitomo Mitsui Trust Holdings | | | 200 | | | | 7,356 | |
Tokio Marine Holdings | | | 270 | | | | 14,656 | |
| | | | | | | | 200,822 | |
| Health Care — 7.1% | | | | | |
Alfresa Holdings | | | 475 | | | | 10,686 | |
Astellas Pharma | | | 510 | | | | 8,768 | |
Chugai Pharmaceutical | | | 80 | | | | 6,771 | |
Daiichi Sankyo | | | 113 | | | | 7,463 | |
Hisamitsu Pharmaceutical | | | 89 | | | | 4,174 | |
Hoya | | | 170 | | | | 15,101 | |
Kyowa Kirin | | | 597 | | | | 11,023 | |
Medipal Holdings | | | 642 | | | | 14,739 | |
Mitsubishi Tanabe Pharma | | | 1,383 | | | | 16,657 | |
Olympus | | | 800 | | | | 10,952 | |
Otsuka Holdings | | | 509 | | | | 21,366 | |
Shionogi | | | 140 | | | | 8,441 | |
| | | | | | | |
COMMON STOCK — continued | |
| Health Care — continued | | | | | |
Sumitomo Dainippon Pharma | | | 518 | | | $ | 9,114 | |
Suzuken | | | 173 | | | | 9,282 | |
| Taisho Pharmaceutical Holdings | | | 156 | | | | 11,212 | |
Takeda Pharmaceutical | | | 433 | | | | 15,733 | |
Terumo | | | 564 | | | | 18,521 | |
| | | | | | | | 200,003 | |
| Industrials — 20.4% | | | | | |
AGC | | | 225 | | | | 7,971 | |
Amada Holdings | | | 1,377 | | | | 15,833 | |
ANA Holdings | | | 462 | | | | 15,906 | |
Central Japan Railway | | | 62 | | | | 12,787 | |
Dai Nippon Printing | | | 580 | | | | 15,602 | |
Daikin Industries | | | 64 | | | | 9,016 | |
East Japan Railway | | | 140 | | | | 12,755 | |
Fuji Electric | | | 379 | | | | 12,166 | |
Hankyu Hanshin Holdings | | | 210 | | | | 8,450 | |
Hino Motors | | | 1,243 | | | | 11,866 | |
ITOCHU | | | 1,115 | | | | 23,424 | |
Japan Airport Terminal | | | 176 | | | | 8,775 | |
JTEKT | | | 245 | | | | 3,159 | |
Kajima | | | 780 | | | | 10,794 | |
Kawasaki Heavy Industries | | | 185 | | | | 4,489 | |
Keihan Holdings | | | 179 | | | | 8,478 | |
Keio | | | 60 | | | | 3,724 | |
Keisei Electric Railway | | | 291 | | | | 11,965 | |
Kintetsu Group Holdings | | | 171 | | | | 9,348 | |
Kurita Water Industries | | | 500 | | | | 14,523 | |
Kyushu Railway | | | 630 | | | | 20,862 | |
LIXIL Group | | | 860 | | | | 16,118 | |
Marubeni | | | 1,892 | | | | 13,403 | |
Mitsubishi | | | 822 | | | | 21,017 | |
Mitsubishi Electric | | | 639 | | | | 9,200 | |
| | | | | | | |
COMMON STOCK — continued | |
| Industrials — continued | | | | | |
Mitsubishi Heavy Industries | | | 577 | | | $ | 23,495 | |
Mitsui | | | 1,053 | | | | 18,190 | |
Mitsui OSK Lines | | | 493 | | | | 13,572 | |
Nagoya Railroad | | | 624 | | | | 19,914 | |
Nankai Electric Railway | | | 331 | | | | 8,647 | |
Nippon Express | | | 109 | | | | 6,261 | |
Nippon Yusen | | | 597 | | | | 10,840 | |
NSK | | | 899 | | | | 8,449 | |
Obayashi | | | 1,294 | | | | 13,406 | |
Odakyu Electric Railway | | | 160 | | | | 3,912 | |
Recruit Holdings | | | 122 | | | | 4,075 | |
Secom | | | 108 | | | | 10,055 | |
Shimizu | | | 1,348 | | | | 12,644 | |
Sohgo Security Services | | | 61 | | | | 3,335 | |
Sojitz | | | 4,563 | | | | 14,435 | |
Sumitomo | | | 559 | | | | 9,116 | |
Sumitomo Heavy Industries | | | 396 | | | | 12,436 | |
THK | | | 193 | | | | 5,633 | |
Tobu Railway | | | 408 | | | | 13,681 | |
Tokyu | | | 410 | | | | 7,779 | |
Toppan Printing | | | 966 | | | | 17,970 | |
Toshiba | | | 330 | | | | 11,310 | |
Toyota Tsusho | | | 266 | | | | 9,276 | |
West Japan Railway | | | 188 | | | | 16,377 | |
| | | | | | | | 576,439 | |
| Information Technology — 12.7% | | | | | |
Advantest | | | 450 | | | | 20,585 | |
Alps Alpine | | | 300 | | | | 6,505 | |
Brother Industries | | | 739 | | | | 14,048 | |
Canon | | | 423 | | | | 11,590 | |
Disco | | | 40 | | | | 8,836 | |
FUJIFILM Holdings | | | 541 | | | | 23,921 | |
| | | | | | | |
COMMON STOCK — continued | |
| Information Technology — continued | | | | | |
Fujitsu | | | 372 | | | $ | 33,106 | |
Hamamatsu Photonics | | | 492 | | | | 19,250 | |
Hirose Electric | | | 26 | | | | 3,302 | |
Hitachi | | | 237 | | | | 8,921 | |
Konica Minolta | | | 2,754 | | | | 20,355 | |
Kyocera | | | 195 | | | | 12,883 | |
NEC | | | 753 | | | | 29,951 | |
Nomura Research Institute | | | 405 | | | | 8,658 | |
NTT Data | | | 600 | | | | 7,948 | |
Obic | | | 30 | | | | 3,788 | |
Omron | | | 80 | | | | 4,736 | |
Otsuka | | | 338 | | | | 13,726 | |
Renesas Electronics * | | | 2,400 | | | | 16,428 | |
Ricoh | | | 2,836 | | | | 25,447 | |
Rohm | | | 151 | | | | 12,096 | |
Seiko Epson | | | 1,073 | | | | 15,265 | |
Shimadzu | | | 316 | | | | 8,530 | |
Trend Micro | | | 367 | | | | 18,672 | |
Yokogawa Electric | | | 470 | | | | 8,682 | |
| | | | | | | | 357,229 | |
| Materials — 7.6% | | | | | |
Air Water | | | 232 | | | | 4,382 | |
Asahi Kasei | | | 1,436 | | | | 16,094 | |
Daicel | | | 1,503 | | | | 13,569 | |
DIC | | | 270 | | | | 7,817 | |
JFE Holdings | | | 559 | | | | 7,069 | |
JSR | | | 542 | | | | 10,273 | |
Kaneka | | | 240 | | | | 8,070 | |
Kobe Steel | | | 838 | | | | 4,558 | |
Kuraray | | | 924 | | | | 11,094 | |
Mitsubishi Chemical Holdings | | | 622 | | | | 4,779 | |
Mitsubishi Gas Chemical | | | 718 | | | | 10,248 | |
| | | | | | | |
COMMON STOCK — continued | |
| Materials — continued | | | | | |
Mitsubishi Materials | | | 529 | | | $ | 15,316 | |
Mitsui Chemicals | | | 510 | | | | 12,280 | |
Nippon Steel | | | 212 | | | | 3,121 | |
Nissan Chemical | | | 160 | | | | 6,631 | |
Oji Holdings | | | 3,269 | | | | 17,085 | |
Sumitomo Chemical | | | 876 | | | | 4,044 | |
Taiheiyo Cement | | | 227 | | | | 6,467 | |
Teijin | | | 590 | | | | 11,909 | |
Toray Industries | | | 1,970 | | | | 14,044 | |
Tosoh | | | 1,129 | | | | 15,644 | |
Toyo Seikan Group Holdings | | | 719 | | | | 11,486 | |
| | | | | | | | 215,980 | |
| Real Estate — 8.2% | | | | | |
Advance Residence Investment ‡ | | | 4 | | | | 13,283 | |
Daiwa House REIT Investment, Cl A ‡ | | | 7 | | | | 20,364 | |
GLP J-Reit ‡ | | | 6 | | | | 7,815 | |
Japan Hotel REIT Investment, Cl A ‡ | | | 19 | | | | 15,765 | |
Japan Prime Realty Investment ‡ | | | 5 | | | | 24,004 | |
Japan Real Estate Investment ‡ | | | 2 | | | | 13,635 | |
Japan Retail Fund Investment ‡ | | | 13 | | | | 30,305 | |
Nippon Building Fund ‡ | | | 3 | | | | 22,756 | |
Nippon Prologis REIT ‡ | | | 5 | | | | 13,968 | |
Nomura Real Estate Master Fund ‡ | | | 6 | | | | 11,461 | |
Orix JREIT ‡ | | | 11 | | | | 24,868 | |
Tokyo Tatemono | | | 700 | | | | 10,030 | |
Tokyu Fudosan Holdings | | | 500 | | | | 3,335 | |
United Urban Investment ‡ | | | 12 | | | | 24,199 | |
| | | | | | | | 235,788 | |
| Utilities — 6.3% | | | | | |
Chubu Electric Power | | | 1,055 | | | | 15,863 | |
Chugoku Electric Power | | | 2,162 | | | | 28,819 | |
Electric Power Development | | | 491 | | | | 11,963 | |
| | | | | | | |
COMMON STOCK — continued | |
| Utilities — continued | | | | | |
Kansai Electric Power | | | 990 | | | $ | 11,580 | |
Kyushu Electric Power | | | 2,352 | | | | 23,541 | |
Osaka Gas | | | 455 | | | | 8,935 | |
Toho Gas | | | 635 | | | | 24,817 | |
Tohoku Electric Power | | | 1,695 | | | | 17,467 | |
Tokyo Electric Power Holdings * | | | 2,797 | | | | 12,988 | |
Tokyo Gas | | | 959 | | | | 23,473 | |
| | | | | | | | 179,446 | |
| TOTAL COMMON STOCK | | | | | | | | |
(Cost $2,861,972) | | | | | | | 2,816,092 | |
| TOTAL INVESTMENTS — 99.3% | | | | | | | | |
(Cost $2,861,972) | | | | | | $ | 2,816,092 | |
| Percentages are based on Net Assets of $2,836,837. |
| * | Non-income producing security. |
| ‡ | Real Estate Investment Trust |
| Cl — Class |
| REIT — Real Estate Investment Trust |
As of October 31, 2019, all of the Fund’s investments were considered Level 1, in accordance with authoritative guidance on fair value measurements and disclosure under U.S. GAAP. |
For the year ended October 31, 2019, there have been no transfers in or out of Level 3.
| | |
| Schedule of Investments |
| October 31, 2019 |
Global X Scientific Beta Asia ex-Japan ETF |
| Sector Weightings (Unaudited)†: |
| † Sector weightings percentages are based on the total market value of investments. |
| | | | | | | |
| COMMON STOCK — 99.6% | | | | | | |
| AUSTRALIA— 42.0% | | | | | | |
| Communication Services — 0.9% | | | | | | |
Telstra | | | 9,426 | | | $ | 22,664 | |
| Consumer Discretionary — 3.6% | | | | | | | | |
Crown Resorts | | | 3,686 | | | | 31,642 | |
Star Entertainment Grp | | | 7,219 | | | | 23,376 | |
TABCORP Holdings | | | 4,245 | | | | 14,038 | |
Wesfarmers | | | 698 | | | | 19,120 | |
| | | | | | | | 88,176 | |
| Consumer Staples — 2.6% | | | | | | | | |
Coca-Cola Amatil | | | 5,121 | | | | 35,810 | |
Coles Group | | | 531 | | | | 5,484 | |
Woolworths Group | | | 816 | | | | 20,981 | |
| | | | | | | | 62,275 | |
| Energy — 3.7% | | | | | | | | |
Caltex Australia | | | 1,117 | | | | 20,986 | |
| | | | | | | |
COMMON STOCK — continued | | | | | | | | |
| Energy — continued | | | | | | | | |
Origin Energy | | | 1,118 | | | $ | 6,054 | |
Santos | | | 5,375 | | | | 30,070 | |
Woodside Petroleum | | | 914 | | | | 20,276 | |
Worley | | | 1,194 | | | | 11,237 | |
| | | | | | | | 88,623 | |
| Financials — 4.1% | | | | | | | | |
Bank of Queensland | | | 935 | | | | 5,830 | |
Bendigo and Adelaide Bank | | | 809 | | | | 5,936 | |
CIMIC Group | | | 543 | | | | 12,349 | |
Insurance Australia Group | | | 2,756 | | | | 15,076 | |
Macquarie Group | | | 118 | | | | 10,887 | |
Medibank Pvt | | | 2,472 | | | | 5,756 | |
National Australia Bank | | | 434 | | | | 8,554 | |
QBE Insurance Group | | | 2,240 | | | | 19,446 | |
Suncorp Group | | | 1,841 | | | | 17,059 | |
| | | | | | | | 100,893 | |
| Health Care — 2.1% | | | | | |
Ansell | | | 1,308 | | | | 24,872 | |
CSL | | | 62 | | | | 10,936 | |
Sonic Healthcare | | | 921 | | | | 18,109 | |
| | | | | | | | 53,917 | |
| Industrials — 4.7% | | | | | |
ALS | | | 2,835 | | | | 15,762 | |
Aurizon Holdings | | | 9,902 | | | | 40,250 | |
Brambles | | | 3,344 | | | | 27,577 | |
Qube Holdings | | | 8,219 | | | | 18,403 | |
SEEK | | | 416 | | | | 6,500 | |
Transurban Group | | | 604 | | | | 6,175 | |
| | | | | | | | 114,667 | |
| Information Technology — 2.4% | | | | | |
Computershare | | | 2,774 | | | | 30,273 | |
Link Administration Holdings | | | 1,290 | | | | 4,977 | |
| | | | | | | |
COMMON STOCK — continued | |
| Information Technology — continued | | | | | |
Xero * | | | 512 | | | $ | 24,336 | |
| | | | | | | | 59,586 | |
| Materials — 8.5% | | | | | |
BHP Group | | | 631 | | | | 15,629 | |
BlueScope Steel | | | 1,781 | | | | 16,356 | |
Boral | | | 3,435 | | | | 11,904 | |
Fortescue Metals Group | | | 4,005 | | | | 24,585 | |
Iluka Resources | | | 918 | | | | 5,945 | |
Incitec Pivot | | | 13,784 | | | | 32,763 | |
Newcrest Mining | | | 1,226 | | | | 26,437 | |
Orica | | | 2,355 | | | | 37,155 | |
Orora | | | 7,219 | | | | 15,368 | |
Rio Tinto | | | 192 | | | | 12,022 | |
South32 | | | 5,631 | | | | 9,893 | |
| | | | | | | | 208,057 | |
| Real Estate — 5.5% | | | | | |
Dexus ‡ | | | 2,356 | | | | 19,429 | |
Goodman Group ‡ | | | 1,907 | | | | 18,906 | |
GPT Group ‡ | | | 6,398 | | | | 26,227 | |
Lendlease Group | | | 555 | | | | 7,146 | |
Mirvac Group ‡ | | | 6,669 | | | | 14,749 | |
Scentre Group ‡ | | | 7,298 | | | | 19,257 | |
Vicinity Centres ‡ | | | 14,464 | | | | 26,607 | |
| | | | | | | | 132,321 | |
| Utilities — 3.9% | | | | | |
AGL Energy | | | 1,224 | | | | 16,680 | |
APA Group | | | 2,341 | | | | 18,790 | |
AusNet Services | | | 21,649 | | | | 27,593 | |
Spark Infrastructure Group | | | 21,494 | | | | 29,913 | |
| | | | | | | | 92,976 | |
TOTAL AUSTRALIA | | | | | | | 1,024,155 | |
| | | | | | | |
COMMON STOCK — continued | |
| HONG KONG— 24.7% | | | | | | | | |
| Communication Services — 1.3% | | | | | |
PCCW | | | 53,445 | | | $ | 31,776 | |
| Consumer Discretionary — 1.6% | | | | | |
Samsonite International | | | 5,400 | | | | 11,120 | |
Yue Yuen Industrial Holdings | | | 9,871 | | | | 27,833 | |
| | | | | | | | 38,953 | |
| Consumer Staples — 1.1% | | | | | |
Vitasoy International Holdings | | | 1,700 | | | | 6,919 | |
WH Group | | | 18,500 | | | | 19,639 | |
| | | | | | | | 26,558 | |
| Industrials — 2.8% | | | | | |
CK Hutchison Holdings | | | 1,928 | | | | 17,834 | |
MTR | | | 2,400 | | | | 13,780 | |
NWS Holdings | | | 17,497 | | | | 26,075 | |
Techtronic Industries | | | 1,200 | | | | 9,416 | |
| | | | | | | | 67,105 | |
| Information Technology — 0.7% | | | | | |
ASM Pacific Technology | | | 1,200 | | | | 16,796 | |
Hanergy Thin Film Power Group *(A)(B) (C) | | | 29,000 | | | | — | |
| | | | | | | | 16,796 | |
| Real Estate — 11.2% | | | | | |
CK Asset Holdings | | | 1,143 | | | | 7,977 | |
Hang Lung Group | | | 9,497 | | | | 23,822 | |
Hang Lung Properties | | | 6,583 | | | | 14,497 | |
Henderson Land Development | | | 1,124 | | | | 5,629 | |
Hysan Development | | | 6,485 | | | | 25,608 | |
Link ‡ | | | 4,735 | | | | 51,623 | |
New World Development | | | 8,273 | | | | 11,864 | |
Sino Land | | | 11,498 | | | | 17,223 | |
Sun Hung Kai Properties | | | 788 | | | | 11,954 | |
| | | | | | | |
COMMON STOCK — continued | |
| Real Estate — continued | | | | | |
Swire Pacific, Cl A | | | 3,046 | | | $ | 29,031 | |
Swire Properties | | | 9,904 | | | | 31,211 | |
Wharf Holdings | | | 8,230 | | | | 18,712 | |
Wharf Real Estate Investment | | | 1,570 | | | | 9,255 | |
Wheelock | | | 2,591 | | | | 16,050 | |
| | | | | | | | 274,456 | |
| Utilities — 6.0% | | | | | |
CLP Holdings | | | 6,057 | | | | 62,867 | |
Hong Kong & China Gas | | | 21,124 | | | | 41,021 | |
Power Assets Holdings | | | 6,016 | | | | 42,946 | |
| | | | | | | | 146,834 | |
TOTAL HONG KONG | | | | | | | 602,478 | |
| NEW ZEALAND— 7.2% | | | | | | | | |
| Communication Services — 1.9% | | | | | |
Spark New Zealand | | | 16,311 | | | | 46,863 | |
| Health Care — 0.8% | | | | | |
Fisher & Paykel Healthcare | | | 1,664 | | | | 20,435 | |
| Materials — 1.0% | | | | | |
Fletcher Building | | | 7,894 | | | | 23,186 | |
| Utilities — 3.5% | | | | | |
Contact Energy | | | 9,293 | | | | 43,982 | |
Meridian Energy | | | 13,707 | | | | 40,435 | |
| | | | | | | | 84,417 | |
TOTAL NEW ZEALAND | | | | | | | 174,901 | |
| SINGAPORE— 25.7% | | | | | | | | |
| Communication Services — 1.5% | | | | | |
Singapore Press Holdings | | | 13,073 | | | | 21,325 | |
| Singapore Telecommunications | | | 6,300 | | | | 15,276 | |
| | | | | | | | 36,601 | |
| | | | | | | |
COMMON STOCK — continued | |
| Consumer Discretionary — 0.7% | | | | | |
Genting Singapore | | | 25,035 | | | $ | 17,292 | |
| Consumer Staples — 4.1% | | | | | |
| Dairy Farm International Holdings | | | 2,627 | | | | 15,841 | |
Thai Beverage | | | 31,005 | | | | 20,845 | |
Wilmar International | | | 21,733 | | | | 59,884 | |
| | | | | | | | 96,570 | |
| Financials — 2.8% | | | | | |
City Developments | | | 2,000 | | | | 15,857 | |
Oversea-Chinese Banking | | | 863 | | | | 6,950 | |
Singapore Exchange | | | 6,110 | | | | 40,136 | |
United Overseas Bank | | | 380 | | | | 7,491 | |
| | | | | | | | 70,434 | |
| Industrials — 7.2% | | | | | |
ComfortDelGro | | | 18,390 | | | | 31,079 | |
Jardine Matheson Holdings | | | 475 | | | | 27,132 | |
Jardine Strategic Holdings | | | 629 | | | | 20,336 | |
Keppel | | | 3,282 | | | | 16,543 | |
SATS | | | 5,218 | | | | 19,362 | |
Singapore Airlines | | | 4,212 | | | | 29,123 | |
| Singapore Technologies Engineering | | | 10,815 | | | | 31,707 | |
| | | | | | | | 175,282 | |
| Information Technology — 1.1% | | | | | |
Venture | | | 2,267 | | | | 26,369 | |
| Real Estate — 8.3% | | | | | |
Ascendas Real Estate Investment Trust ‡ | | | 11,478 | | | | 26,735 | |
CapitaLand | | | 8,158 | | | | 21,580 | |
CapitaLand Commercial Trust ‡ | | | 30,275 | | | | 45,602 | |
CapitaLand Mall Trust ‡ | | | 15,533 | | | | 28,990 | |
Hongkong Land Holdings | | | 3,200 | | | | 17,600 | |
Mapletree Commercial Trust ‡ | | | 14,867 | | | | 25,453 | |
Suntec Real Estate Investment Trust ‡ | | | 22,541 | | | | 30,807 | |
| | | | | | | |
COMMON STOCK — continued | |
| Real Estate — continued | | | | | |
UOL Group | | | 1,264 | | | $ | 7,244 | |
| | | | | | | | 204,011 | |
TOTAL SINGAPORE | | | | | | | 626,559 | |
| TOTAL COMMON STOCK | | | | | | | | |
(Cost $2,433,681) | | | | | | | 2,428,093 | |
| | |
| RIGHT — 0.0% | |
| | | Number Of
Rights | | | | | |
Singapore — 0.0% | | | | | |
Mapletree Commercial Trust*#(A)(B)(C) | | | 1,136 | | | | 75 | |
| | | | | | | | | |
TOTAL RIGHT (Cost $–) | | | | | | | 75 | |
| TOTAL INVESTMENTS — 99.6% | | | | | | | | |
(Cost $2,433,681) | | | | | | $ | 2,428,168 | |
| Percentages are based on Net Assets of $2,436,765. |
| * | Non-income producing security. |
| ‡ | Real Estate Investment Trust |
| # | Expiration unavailable. |
| (A) | Level 3 security in accordance with fair value hierarchy. |
| (B) | Security is deemed illiquid at October 31, 2019 (Unaudited). The total value of such securities as of October 31, 2019 was $75 and represented 0.0% of Net Assets. |
| (C) | Security is fair valued using methods determined in good faith by the Fair Value Committee of the Fund. The total value of such securities as of October 31, 2019, was $75 and represents 0.0% of net assets. |
The following is a summary of the level of inputs used as of October 31, 2019, in valuing the Fund’s investments carried at value:
| Investments in Securities | | | | | | | | | | | | |
| Common Stock | | $ | 2,428,093 | | | $ | — | | | $ | — | | | $ | 2,428,093 | |
| Right | | | — | | | | — | | | | 75 | | | | 75 | |
| Total Investments in Securities | | $ | 2,428,093 | | | $ | — | | | $ | 75 | | | $ | 2,428,168 | |
(1) A reconciliation of Level 3 investments and disclosures of significant unobservable inputs are presented when the Fund has a significant amount of Level 3 investments at the beginning and/or end of the period in relation to Net Assets. Management has concluded that Level 3 investments are not material in relation to Net Assets.
For the year ended October 31, 2019, there have been no transfers in or out of Level 3.
| | |
| Schedule of Investments |
| October 31, 2019 |
Global X S&P 500® Catholic Values ETF |
| Sector Weightings (Unaudited)†: |
| † Sector weightings percentages are based on the total market value of investments. |
| | | | | | | |
| COMMON STOCK — 99.8% | | | | | | |
| UNITED KINGDOM— 0.5% | | | | | | |
| Materials — 0.5% | | | | | | |
Linde | | | 5,977 | | | $ | 1,185,539 | |
| UNITED STATES— 99.3% | | | | | | | | |
| Communication Services — 10.4% | | | | | | | | |
Activision Blizzard | | | 8,477 | | | | 474,966 | |
Alphabet, Cl A * | | | 3,253 | | | | 4,094,876 | |
Alphabet, Cl C * | | | 3,290 | | | | 4,145,762 | |
AT&T | | | 79,148 | | | | 3,046,406 | |
CBS, Cl B | | | 3,863 | | | | 139,223 | |
CenturyLink | | | 10,753 | | | | 139,144 | |
Charter Communications, Cl A * | | | 1,738 | | | | 813,140 | |
Comcast, Cl A | | | 49,061 | | | | 2,198,913 | |
Discovery, Cl A * | | | 1,715 | | | | 46,228 | |
Discovery, Cl C * | | | 3,785 | | | | 95,533 | |
DISH Network, Cl A * | | | 2,578 | | | | 88,632 | |
| | | | | | | |
| COMMON STOCK — continued | | | | | | |
| Communication Services — continued | | | | | | |
Electronic Arts * | | | 3,232 | | | $ | 311,565 | |
Facebook, Cl A * | | | 26,208 | | | | 5,022,763 | |
Fox, Cl A | | | 3,821 | | | | 122,425 | |
Fox, Cl B | | | 1,750 | | | | 54,670 | |
Interpublic Group | | | 4,364 | | | | 94,917 | |
Netflix * | | | 4,739 | | | | 1,362,036 | |
News, Cl A | | | 4,263 | | | | 58,446 | |
News, Cl B | | | 1,313 | | | | 18,540 | |
Omnicom Group | | | 2,561 | | | | 197,684 | |
Take-Two Interactive Software * | | | 1,247 | | | | 150,076 | |
T-Mobile US * | | | 3,306 | | | | 273,274 | |
TripAdvisor * | | | 1,205 | | | | 48,682 | |
Twitter * | | | 8,143 | | | | 244,046 | |
Verizon Communications | | | 44,898 | | | | 2,714,982 | |
Viacom, Cl B | | | 3,907 | | | | 84,235 | |
Walt Disney | | | 19,580 | | | | 2,543,834 | |
| | | | | | | | 28,584,998 | |
| Consumer Discretionary — 10.0% | | | | | |
Advance Auto Parts | | | 777 | | | | 126,247 | |
Amazon.com * | | | 4,569 | | | | 8,117,560 | |
Aptiv | | | 2,972 | | | | 266,143 | |
AutoZone * | | | 287 | | | | 328,437 | |
Best Buy | | | 2,535 | | | | 182,089 | |
Booking Holdings * | | | 466 | | | | 954,727 | |
BorgWarner | | | 2,265 | | | | 94,405 | |
Capri Holdings * | | | 1,771 | | | | 55,025 | |
CarMax * | | | 2,013 | | | | 187,551 | |
Carnival | | | 4,541 | | | | 194,763 | |
Chipotle Mexican Grill, Cl A * | | | 266 | | | | 206,991 | |
Darden Restaurants | | | 1,377 | | | | 154,596 | |
Dollar General | | | 2,895 | | | | 464,184 | |
Dollar Tree * | | | 2,667 | | | | 294,437 | |
| | | | | | | |
COMMON STOCK — continued | |
| Consumer Discretionary — continued | | | | |
DR Horton | | | 3,793 | | | $ | 198,638 | |
eBay | | | 9,353 | | | | 329,693 | |
Expedia Group | | | 1,430 | | | | 195,424 | |
Ford Motor | | | 43,816 | | | | 376,379 | |
Gap | | | 2,440 | | | | 39,674 | |
Garmin | | | 1,302 | | | | 122,063 | |
General Motors | | | 14,312 | | | | 531,834 | |
Genuine Parts | | | 1,651 | | | | 169,360 | |
H&R Block | | | 2,346 | | | | 58,627 | |
Hanesbrands | | | 4,149 | | | | 63,106 | |
Harley-Davidson | | | 1,905 | | | | 74,124 | |
Hasbro | | | 1,300 | | | | 126,503 | |
Hilton Worldwide Holdings | | | 3,238 | | | | 313,956 | |
Home Depot | | | 11,999 | | | | 2,814,726 | |
Kohl’s | | | 1,908 | | | | 97,804 | |
L Brands | | | 2,657 | | | | 45,275 | |
Leggett & Platt | | | 1,486 | | | | 76,232 | |
Lennar, Cl A | | | 3,141 | | | | 187,204 | |
LKQ * | | | 3,473 | | | | 118,047 | |
Lowe’s | | | 8,752 | | | | 976,811 | |
Macy’s | | | 3,455 | | | | 52,378 | |
Marriott International, Cl A | | | 3,072 | | | | 388,762 | |
McDonald’s | | | 8,385 | | | | 1,649,329 | |
Mohawk Industries * | | | 746 | | | | 106,961 | |
NIKE, Cl B | | | 13,780 | | | | 1,233,999 | |
Nordstrom | | | 1,281 | | | | 45,988 | |
Norwegian Cruise Line Holdings * | | | 2,382 | | | | 120,910 | |
O’Reilly Automotive * | | | 855 | | | | 372,361 | |
PulteGroup | | | 3,149 | | | | 123,567 | |
PVH | | | 930 | | | | 81,059 | |
Ralph Lauren, Cl A | | | 620 | | | | 59,557 | |
Ross Stores | | | 4,037 | | | | 442,738 | |
| | | | | | | |
COMMON STOCK — continued | |
| Consumer Discretionary — continued | | | | |
Royal Caribbean Cruises | | | 1,938 | | | $ | 210,913 | |
Starbucks | | | 13,112 | | | | 1,108,750 | |
Tapestry | | | 3,172 | | | | 82,028 | |
Target | | | 5,805 | | | | 620,612 | |
Tiffany | | | 1,223 | | | | 152,276 | |
TJX | | | 13,521 | | | | 779,486 | |
Tractor Supply | | | 1,395 | | | | 132,553 | |
Ulta Beauty * | | | 622 | | | | 145,019 | |
Under Armour, Cl A * | | | 2,094 | | | | 43,241 | |
Under Armour, Cl C * | | | 2,096 | | | | 38,776 | |
VF | | | 3,652 | | | | 300,523 | |
Whirlpool | | | 682 | | | | 103,746 | |
Wynn Resorts | | | 1,143 | | | | 138,692 | |
Yum! Brands | | | 3,470 | | | | 352,934 | |
| | | | | | | | 27,429,793 | |
| Consumer Staples — 7.3% | | | | | |
Altria Group | | | 39,150 | | | | 1,753,529 | |
Brown-Forman, Cl B | | | 3,836 | | | | 251,335 | |
Campbell Soup | | | 4,424 | | | | 204,875 | |
Clorox | | | 2,579 | | | | 380,893 | |
Coca-Cola | | | 81,036 | | | | 4,410,789 | |
Conagra Brands | | | 11,245 | | | | 304,177 | |
Constellation Brands, Cl A | | | 3,474 | | | | 661,206 | |
Costco Wholesale | | | 9,245 | | | | 2,746,782 | |
Coty, Cl A | | | 6,122 | | | | 71,566 | |
Estee Lauder, Cl A | | | 4,610 | | | | 858,705 | |
General Mills | | | 12,525 | | | | 637,022 | |
Hormel Foods | | | 6,312 | | | | 258,098 | |
JM Smucker | | | 2,633 | | | | 278,255 | |
Kellogg | | | 5,820 | | | | 369,745 | |
Kimberly-Clark | | | 7,179 | | | | 953,945 | |
Kraft Heinz | | | 14,457 | | | | 467,395 | |
| | | | | | | |
COMMON STOCK — continued | |
| Consumer Staples — continued | | | | |
Kroger | | | 16,409 | | | $ | 404,318 | |
Lamb Weston Holdings | | | 3,386 | | | | 264,243 | |
McCormick | | | 2,845 | | | | 457,163 | |
Molson Coors Brewing, Cl B | | | 4,346 | | | | 229,121 | |
Mondelez International, Cl A | | | 30,235 | | | | 1,585,825 | |
Monster Beverage * | | | 7,968 | | | | 447,244 | |
Sysco | | | 11,012 | | | | 879,528 | |
Tyson Foods, Cl A | | | 6,088 | | | | 504,026 | |
Walgreens Boots Alliance | | | 15,801 | | | | 865,579 | |
| | | | | | | | 20,245,364 | |
| Energy — 4.3% | | | | | |
Apache | | | 4,245 | | | | 91,947 | |
Baker Hughes, Cl A | | | 5,514 | | | | 118,000 | |
Cabot Oil & Gas | | | 5,034 | | | | 93,834 | |
Chevron | | | 20,647 | | | | 2,397,942 | |
Cimarex Energy | | | 1,069 | | | | 45,133 | |
Concho Resources | | | 2,193 | | | | 148,071 | |
ConocoPhillips | | | 12,296 | | | | 678,739 | |
Devon Energy | | | 4,671 | | | | 94,728 | |
Diamondback Energy | | | 1,652 | | | | 141,676 | |
EOG Resources | | | 6,283 | | | | 435,475 | |
Exxon Mobil | | | 46,050 | | | | 3,111,598 | |
Halliburton | | | 9,730 | | | | 187,302 | |
Helmerich & Payne | | | 1,238 | | | | 46,425 | |
Hess | | | 2,903 | | | | 190,872 | |
HollyFrontier | | | 1,822 | | | | 100,101 | |
Kinder Morgan | | | 21,384 | | | | 427,252 | |
Marathon Oil | | | 9,380 | | | | 108,151 | |
Marathon Petroleum | | | 7,282 | | | | 465,684 | |
National Oilwell Varco | | | 4,253 | | | | 96,203 | |
Noble Energy | | | 5,595 | | | | 107,760 | |
Occidental Petroleum | | | 9,778 | | | | 396,009 | |
| | | | | | | |
COMMON STOCK — continued | |
| Energy — continued | | | | |
ONEOK | | | 4,438 | | | $ | 309,906 | |
Phillips 66 | | | 4,540 | | | | 530,363 | |
Pioneer Natural Resources | | | 1,906 | | | | 234,476 | |
Schlumberger | | | 15,013 | | | | 490,774 | |
TechnipFMC | | | 4,987 | | | | 98,394 | |
Valero Energy | | | 4,515 | | | | 437,865 | |
Williams | | | 13,460 | | | | 300,293 | |
| | | | | | | | 11,884,973 | |
| Financials — 13.1% | | | | | |
Affiliated Managers Group | | | 620 | | | | 49,526 | |
Aflac | | | 8,106 | | | | 430,915 | |
Allstate | | | 3,584 | | | | 381,409 | |
American Express | | | 7,499 | | | | 879,482 | |
American International Group | | | 9,398 | | | | 497,718 | |
Ameriprise Financial | | | 1,562 | | | | 235,690 | |
Aon | | | 2,598 | | | | 501,830 | |
Arthur J Gallagher | | | 1,984 | | | | 180,980 | |
Assurant | | | 630 | | | | 79,424 | |
Bank of America | | | 91,075 | | | | 2,847,915 | |
Bank of New York Mellon | | | 9,507 | | | | 444,452 | |
BB&T | | | 8,531 | | | | 452,570 | |
Berkshire Hathaway, Cl B * | | | 21,354 | | | | 4,539,433 | |
BlackRock, Cl A | | | 1,318 | | | | 608,521 | |
Capital One Financial | | | 5,129 | | | | 478,279 | |
Cboe Global Markets | | | 1,253 | | | | 144,283 | |
Charles Schwab | | | 12,844 | | | | 522,879 | |
Chubb | | | 4,970 | | | | 757,527 | |
Cincinnati Financial | | | 1,674 | | | | 189,514 | |
Citigroup | | | 24,916 | | | | 1,790,464 | |
Citizens Financial Group | | | 5,195 | | | | 182,656 | |
CME Group, Cl A | | | 3,871 | | | | 796,459 | |
Comerica | | | 1,698 | | | | 111,083 | |
| | | | | | | |
COMMON STOCK — continued | |
| Financials — continued | | | | |
Discover Financial Services | | | 3,533 | | | $ | 283,559 | |
E*TRADE Financial | | | 2,625 | | | | 109,699 | |
Everest Re Group | | | 454 | | | | 116,719 | |
Fifth Third Bancorp | | | 7,490 | | | | 217,809 | |
First Republic Bank | | | 1,766 | | | | 187,832 | |
Franklin Resources | | | 3,380 | | | | 93,119 | |
Globe Life | | | 1,192 | | | | 116,017 | |
Goldman Sachs Group | | | 3,708 | | | | 791,213 | |
| Hartford Financial Services Group | | | 3,858 | | | | 220,215 | |
Huntington Bancshares | | | 11,972 | | | | 169,164 | |
Intercontinental Exchange | | | 6,150 | | | | 580,068 | |
Invesco | | | 4,553 | | | | 76,581 | |
JPMorgan Chase | | | 35,119 | | | | 4,387,066 | |
KeyCorp | | | 11,160 | | | | 200,545 | |
Lincoln National | | | 2,323 | | | | 131,203 | |
Loews | | | 3,041 | | | | 149,009 | |
M&T Bank | | | 1,489 | | | | 233,073 | |
MarketAxess Holdings | | | 378 | | | | 139,327 | |
Marsh & McLennan | | | 5,466 | | | | 566,387 | |
MetLife | | | 8,445 | | | | 395,142 | |
Moody’s | | | 1,860 | | | | 410,483 | |
Morgan Stanley | | | 14,057 | | | | 647,325 | |
MSCI, Cl A | | | 915 | | | | 214,622 | |
Nasdaq | | | 1,257 | | | | 125,411 | |
Northern Trust | | | 2,396 | | | | 238,833 | |
People’s United Financial | | | 3,881 | | | | 62,756 | |
PNC Financial Services Group | | | 4,908 | | | | 720,004 | |
Principal Financial Group | | | 2,950 | | | | 157,471 | |
Progressive | | | 6,490 | | | | 452,353 | |
Prudential Financial | | | 4,420 | | | | 402,839 | |
Raymond James Financial | | | 1,399 | | | | 116,803 | |
Regions Financial | | | 10,910 | | | | 175,651 | |
| | | | | | | |
COMMON STOCK — continued | |
| Financials — continued | | | | |
S&P Global | | | 2,687 | | | $ | 693,219 | |
State Street | | | 4,085 | | | | 269,896 | |
SunTrust Banks | | | 4,786 | | | | 327,075 | |
SVB Financial Group * | | | 594 | | | | 131,559 | |
Synchrony Financial | | | 7,018 | | | | 248,227 | |
T Rowe Price Group | | | 2,539 | | | | 294,016 | |
Travelers | | | 2,932 | | | | 384,268 | |
Unum Group | | | 2,487 | | | | 68,492 | |
US Bancorp | | | 16,311 | | | | 930,053 | |
Wells Fargo | | | 44,465 | | | | 2,295,728 | |
Willis Towers Watson | | | 1,438 | | | | 268,762 | |
Zions Bancorp | | | 2,178 | | | | 105,568 | |
| | | | | | | | 36,008,170 | |
| Health Care — 14.0% | | | | | |
AbbVie | | | 34,624 | | | | 2,754,339 | |
ABIOMED * | | | 1,041 | | | | 216,091 | |
Alexion Pharmaceuticals * | | | 5,233 | | | | 551,558 | |
Align Technology * | | | 1,697 | | | | 428,136 | |
AmerisourceBergen, Cl A | | | 3,673 | | | | 313,601 | |
Anthem | | | 6,030 | | | | 1,622,552 | |
Baxter International | | | 11,999 | | | | 920,323 | |
Biogen Idec * | | | 4,334 | | | | 1,294,609 | |
Boston Scientific * | | | 32,501 | | | | 1,355,292 | |
Cardinal Health | | | 6,948 | | | | 343,579 | |
Celgene * | | | 16,477 | | | | 1,780,010 | |
Cerner | | | 7,576 | | | | 508,501 | |
Cigna | | | 8,967 | | | | 1,600,251 | |
CVS Health | | | 30,428 | | | | 2,020,114 | |
DaVita * | | | 2,869 | | | | 168,123 | |
DENTSPLY SIRONA | | | 5,170 | | | | 283,213 | |
Edwards Lifesciences * | | | 4,922 | | | | 1,173,306 | |
Eli Lilly | | | 20,323 | | | | 2,315,806 | |
| | | | | | | |
COMMON STOCK — continued | |
| Health Care — continued | | | | |
Gilead Sciences | | | 29,927 | | | $ | 1,906,649 | |
Henry Schein * | | | 3,525 | | | | 220,612 | |
Hologic * | | | 6,203 | | | | 299,667 | |
Humana * | | | 3,180 | | | | 935,556 | |
IDEXX Laboratories * | | | 2,035 | | | | 579,995 | |
Incyte * | | | 4,068 | | | | 341,387 | |
Intuitive Surgical * | | | 2,708 | | | | 1,497,389 | |
IQVIA Holdings * | | | 4,253 | | | | 614,218 | |
Laboratory Corp of America Holdings * | | | 2,388 | | | | 393,471 | |
McKesson | | | 4,482 | | | | 596,106 | |
Medtronic | | | 31,780 | | | | 3,460,842 | |
Mettler-Toledo International * | | | 579 | | | | 408,160 | |
Quest Diagnostics | | | 3,102 | | | | 314,078 | |
Regeneron Pharmaceuticals * | | | 1,854 | | | | 567,843 | |
ResMed | | | 3,261 | | | | 482,367 | |
Stryker | | | 7,573 | | | | 1,637,813 | |
Teleflex | | | 1,068 | | | | 371,034 | |
Varian Medical Systems * | | | 2,104 | | | | 254,184 | |
Vertex Pharmaceuticals * | | | 5,995 | | | | 1,171,903 | |
Waters * | | | 1,664 | | | | 352,136 | |
WellCare Health Plans * | | | 1,206 | | | | 357,700 | |
Zimmer Biomet Holdings | | | 4,783 | | | | 661,154 | |
Zoetis, Cl A | | | 11,272 | | | | 1,441,914 | |
| | | | | | | | 38,515,582 | |
| Industrials — 9.2% | | | | | |
3M
| | | 9,927 | | | | 1,637,856 | |
Alaska Air Group | | | 2,094 | | | | 145,386 | |
Allegion | | | 1,625 | | | | 188,565 | |
American Airlines Group | | | 6,437 | | | | 193,496 | |
AMETEK | | | 3,878 | | | | 355,419 | |
AO Smith | | | 2,371 | | | | 117,791 | |
Arconic | | | 7,108 | | | | 195,257 | |
| | | | | | | |
COMMON STOCK — continued | |
| Industrials — continued | | | | |
Caterpillar | | | 9,916 | | | $ | 1,366,424 | |
CH Robinson Worldwide | | | 2,138 | | | | 161,718 | |
Cintas | | | 1,442 | | | | 387,422 | |
Copart * | | | 3,367 | | | | 278,249 | |
CSX | | | 13,473 | | | | 946,747 | |
Cummins | | | 2,537 | | | | 437,582 | |
Deere | | | 5,481 | | | | 954,460 | |
Delta Air Lines | | | 9,959 | | | | 548,542 | |
Dover | | | 2,272 | | | | 236,038 | |
Eaton | | | 7,013 | | | | 610,902 | |
Emerson Electric | | | 10,579 | | | | 742,117 | |
Equifax | | | 2,034 | | | | 278,068 | |
| Expeditors International of Washington | | | 2,702 | | | | 197,084 | |
Fastenal | | | 9,046 | | | | 325,114 | |
FedEx | | | 4,132 | | | | 630,791 | |
Flowserve | | | 2,217 | | | | 108,278 | |
Fortive | | | 5,149 | | | | 355,281 | |
| Fortune Brands Home & Security | | | 2,514 | | | | 150,966 | |
IDEX | | | 1,237 | | | | 192,391 | |
IHS Markit * | | | 6,742 | | | | 472,076 | |
Illinois Tool Works | | | 5,190 | | | | 874,930 | |
Ingersoll-Rand | | | 4,231 | | | | 536,872 | |
JB Hunt Transport Services | | | 1,476 | | | | 173,519 | |
Johnson Controls International | | | 13,292 | | | | 575,942 | |
Kansas City Southern | | | 1,669 | | | | 234,962 | |
Masco | | | 5,008 | | | | 231,620 | |
Nielsen Holdings | | | 5,778 | | | | 116,484 | |
Norfolk Southern | | | 4,601 | | | | 837,382 | |
PACCAR | | | 5,767 | | | | 438,638 | |
Parker-Hannifin | | | 2,196 | | | | 402,944 | |
Pentair | | | 2,761 | | | | 114,499 | |
Quanta Services | | | 2,552 | | | | 107,312 | |
| | | | | | | |
COMMON STOCK — continued | |
| Industrials — continued | | | | |
Republic Services, Cl A | | | 3,440 | | | $ | 301,034 | |
Robert Half International | | | 2,148 | | | | 123,016 | |
Rockwell Automation | | | 1,926 | | | | 331,253 | |
Rollins | | | 2,362 | | | | 90,016 | |
Roper Technologies | | | 1,780 | | | | 599,789 | |
Snap-On | | | 948 | | | | 154,211 | |
Southwest Airlines | | | 8,212 | | | | 460,940 | |
Stanley Black & Decker | | | 2,657 | | | | 402,084 | |
TransDigm Group | | | 797 | | | | 419,445 | |
Union Pacific | | | 12,054 | | | | 1,994,454 | |
United Airlines Holdings * | | | 3,713 | | | | 337,289 | |
United Parcel Service, Cl B | | | 11,992 | | | | 1,381,119 | |
United Rentals * | | | 1,360 | | | | 181,655 | |
Verisk Analytics, Cl A | | | 2,663 | | | | 385,336 | |
Wabtec | | | 2,980 | | | | 206,723 | |
Waste Management | | | 6,710 | | | | 752,929 | |
WW Grainger | | | 723 | | | | 223,291 | |
Xylem | | | 3,043 | | | | 233,368 | |
| | | | | | | | 25,437,076 | |
| Information Technology — 22.3% | | | | | |
Accenture, Cl A | | | 6,955 | | | | 1,289,596 | |
Adobe * | | | 5,323 | | | | 1,479,421 | |
Advanced Micro Devices * | | | 11,541 | | | | 391,586 | |
Akamai Technologies * | | | 1,873 | | | | 162,015 | |
Alliance Data Systems | | | 504 | | | | 50,400 | |
Amphenol, Cl A | | | 3,233 | | | | 324,367 | |
Analog Devices | | | 4,102 | | | | 437,396 | |
ANSYS * | | | 929 | | | | 204,519 | |
Apple | | | 46,630 | | | | 11,599,678 | |
Applied Materials | | | 10,318 | | | | 559,855 | |
Arista Networks * | | | 600 | | | | 146,742 | |
Autodesk * | | | 2,459 | | | | 362,358 | |
| | | | | | | |
COMMON STOCK — continued | |
| Information Technology — continued | | | | |
Automatic Data Processing | | | 4,745 | | | $ | 769,781 | |
Broadcom | | | 4,321 | | | | 1,265,405 | |
Broadridge Financial Solutions | | | 1,337 | | | | 167,419 | |
Cadence Design Systems * | | | 3,102 | | | | 202,716 | |
Cisco Systems | | | 46,483 | | | | 2,208,408 | |
Citrix Systems | | | 1,409 | | | | 153,384 | |
| Cognizant Technology Solutions, Cl A | | | 6,253 | | | | 381,058 | |
DXC Technology | | | 2,896 | | | | 80,132 | |
F5 Networks * | | | 692 | | | | 99,703 | |
| Fidelity National Information Services | | | 6,580 | | | | 866,981 | |
Fiserv * | | | 6,091 | | | | 646,499 | |
FleetCor Technologies * | | | 924 | | | | 271,859 | |
FLIR Systems | | | 1,550 | | | | 79,918 | |
Fortinet * | | | 1,663 | | | | 135,634 | |
Gartner * | | | 1,038 | | | | 159,935 | |
Global Payments | | | 3,288 | | | | 556,264 | |
Hewlett Packard Enterprise | | | 14,889 | | | | 244,328 | |
HP | | | 16,634 | | | | 288,933 | |
Intel | | | 49,134 | | | | 2,777,545 | |
| International Business Machines | | | 9,720 | | | | 1,299,856 | |
Intuit | | | 2,822 | | | | 726,665 | |
IPG Photonics * | | | 435 | | | | 58,412 | |
Jack Henry & Associates | | | 895 | | | | 126,696 | |
Juniper Networks | | | 4,052 | | | | 100,571 | |
Keysight Technologies * | | | 2,140 | | | | 215,947 | |
KLA | | | 1,783 | | | | 301,398 | |
Lam Research | | | 1,651 | | | | 447,487 | |
Mastercard, Cl A | | | 9,865 | | | | 2,730,731 | |
Maxim Integrated Products | | | 2,940 | | | | 172,460 | |
Microchip Technology | | | 2,651 | | | | 249,963 | |
Micron Technology * | | | 12,193 | | | | 579,777 | |
Microsoft | | | 83,822 | | | | 12,017,560 | |
| | | | | | | |
COMMON STOCK — continued | |
| Information Technology — continued | | | | |
Motorola Solutions | | | 1,842 | | | $ | 306,361 | |
NetApp | | | 2,660 | | | | 148,641 | |
NortonLifeLock | | | 6,991 | | | | 159,954 | |
NVIDIA | | | 6,615 | | | | 1,329,747 | |
Oracle | | | 23,976 | | | | 1,306,452 | |
Paychex | | | 3,607 | | | | 301,689 | |
PayPal Holdings * | | | 12,809 | | | | 1,333,417 | |
Qorvo * | | | 1,395 | | | | 112,800 | |
QUALCOMM | | | 13,195 | | | | 1,061,406 | |
salesforce.com * | | | 9,561 | | | | 1,496,201 | |
Seagate Technology | | | 2,750 | | | | 159,583 | |
Skyworks Solutions | | | 2,015 | | | | 183,486 | |
Synopsys * | | | 1,688 | | | | 229,146 | |
TE Connectivity | | | 3,675 | | | | 328,913 | |
Texas Instruments | | | 10,241 | | | | 1,208,336 | |
VeriSign * | | | 1,141 | | | | 216,813 | |
Visa, Cl A | | | 18,903 | | | | 3,380,990 | |
Western Digital | | | 3,307 | | | | 170,807 | |
Western Union | | | 5,213 | | | | 130,638 | |
Xerox Holdings | | | 2,356 | | | | 79,939 | |
Xilinx | | | 2,858 | | | | 259,335 | |
| | | | | | | | 61,296,012 | |
| Materials — 2.2% | | | | | |
Air Products & Chemicals | | | 2,373 | | | | 506,066 | |
Albemarle | | | 1,238 | | | | 75,196 | |
Amcor | | | 16,534 | | | | 157,404 | |
Avery Dennison | | | 933 | | | | 119,293 | |
Ball | | | 3,697 | | | | 258,679 | |
Celanese, Cl A | | | 1,362 | | | | 165,006 | |
CF Industries Holdings | | | 2,580 | | | | 117,003 | |
Corteva | | | 8,156 | | | | 215,155 | |
Dow | | | 8,154 | | | | 411,695 | |
| | | | | | | |
COMMON STOCK — continued | |
| Materials — continued | | | | |
DuPont de Nemours | | | 8,156 | | | $ | 537,563 | |
Eastman Chemical | | | 1,559 | | | | 118,546 | |
Ecolab | | | 2,744 | | | | 527,041 | |
FMC | | | 1,498 | | | | 137,067 | |
| Freeport-McMoRan Copper & Gold | | | 16,691 | | | | 163,906 | |
| International Flavors & Fragrances | | | 1,131 | | | | 137,993 | |
International Paper | | | 4,417 | | | | 192,935 | |
| LyondellBasell Industries, Cl A | | | 2,686 | | | | 240,934 | |
Martin Marietta Materials | | | 728 | | | | 190,670 | |
Mosaic | | | 3,942 | | | | 78,367 | |
Newmont Goldcorp | | | 9,058 | | | | 359,874 | |
Nucor | | | 3,411 | | | | 183,682 | |
Packaging Corp of America | | | 1,038 | | | | 113,619 | |
PPG Industries | | | 2,537 | | | | 317,429 | |
Sealed Air | | | 1,634 | | | | 68,252 | |
Sherwin-Williams | | | 881 | | | | 504,214 | |
Vulcan Materials | | | 1,447 | | | | 206,733 | |
Westrock | | | 2,850 | | | | 106,505 | |
| | | | | | | | 6,210,827 | |
| Real Estate — 3.1% | | | | | |
Alexandria Real Estate Equities ‡ | | | 1,260 | | | | 200,025 | |
American Tower, Cl A ‡ | | | 4,786 | | | | 1,043,730 | |
Apartment Investment & Management, Cl A ‡ | | | 1,609 | | | | 88,302 | |
AvalonBay Communities ‡ | | | 1,544 | | | | 336,067 | |
Boston Properties ‡ | | | 1,705 | | | | 233,926 | |
CBRE Group, Cl A * | | | 3,388 | | | | 181,427 | |
Crown Castle International ‡ | | | 4,583 | | | | 636,075 | |
Digital Realty Trust ‡ | | | 2,272 | | | | 288,635 | |
Duke Realty ‡ | | | 3,873 | | | | 136,097 | |
Equinix ‡ | | | 925 | | | | 524,272 | |
Equity Residential ‡ | | | 4,088 | | | | 362,442 | |
Essex Property Trust ‡ | | | 756 | | | | 247,310 | |
| | | | | | | |
COMMON STOCK — continued | |
| Real Estate — continued | | | | |
Extra Space Storage ‡ | | | 1,395 | | | $ | 156,617 | |
Federal Realty Investment Trust ‡ | | | 778 | | | | 105,816 | |
HCP ‡ | | | 5,247 | | | | 197,392 | |
Host Hotels & Resorts ‡ | | | 8,241 | | | | 135,070 | |
Iron Mountain ‡ | | | 2,945 | | | | 96,596 | |
Kimco Realty ‡ | | | 4,702 | | | | 101,375 | |
Macerich ‡ | | | 1,288 | | | | 35,420 | |
Mid-America Apartment Communities ‡ | | | 1,207 | | | | 167,761 | |
ProLogis ‡ | | | 6,819 | | | | 598,435 | |
Public Storage ‡ | | | 1,672 | | | | 372,623 | |
Realty Income ‡ | | | 3,183 | | | | 260,338 | |
Regency Centers ‡ | | | 1,714 | | | | 115,249 | |
SBA Communications, Cl A ‡ | | | 1,265 | | | | 304,422 | |
Simon Property Group ‡ | | | 3,349 | | | | 504,627 | |
SL Green Realty ‡ | | | 1,022 | | | | 85,439 | |
UDR ‡ | | | 2,996 | | | | 150,549 | |
Ventas ‡ | | | 3,957 | | | | 257,601 | |
Vornado Realty Trust ‡ | | | 1,931 | | | | 126,732 | |
Welltower ‡ | | | 4,102 | | | | 372,010 | |
Weyerhaeuser ‡ | | | 8,353 | | | | 243,991 | |
| | | | | | | | 8,666,371 | |
| Utilities — 3.4% | | | | | |
AES | | | 7,349 | | | | 125,301 | |
Alliant Energy | | | 2,561 | | | | 136,604 | |
Ameren | | | 2,714 | | | | 210,878 | |
American Electric Power | | | 5,485 | | | | 517,729 | |
American Water Works | | | 1,998 | | | | 246,293 | |
Atmos Energy | | | 1,251 | | | | 140,712 | |
CenterPoint Energy | | | 5,369 | | | | 156,077 | |
CMS Energy | | | 3,161 | | | | 202,051 | |
Consolidated Edison | | | 3,448 | | | | 317,975 | |
Dominion Energy | | | 8,829 | | | | 728,833 | |
| | | | | | | |
COMMON STOCK — continued | |
| Utilities — continued | | | | |
DTE Energy | | | 2,018 | | | $ | 256,932 | |
Duke Energy | | | 7,919 | | | | 746,445 | |
Edison International | | | 3,638 | | | | 228,830 | |
Entergy | | | 2,027 | | | | 246,240 | |
Evergy | | | 2,723 | | | | 174,027 | |
Eversource Energy | | | 3,505 | | | | 293,509 | |
Exelon | | | 10,496 | | | | 477,463 | |
FirstEnergy | | | 5,542 | | | | 267,789 | |
NextEra Energy | | | 5,185 | | | | 1,235,793 | |
NiSource | | | 3,827 | | | | 107,309 | |
NRG Energy | | | 2,994 | | | | 120,119 | |
Pinnacle West Capital | | | 1,240 | | | | 116,709 | |
PPL | | | 7,779 | | | | 260,519 | |
| Public Service Enterprise Group | | | 5,656 | | | | 358,081 | |
Sempra Energy | | | 2,958 | | | | 427,461 | |
Southern | | | 11,204 | | | | 702,043 | |
WEC Energy Group | | | 3,499 | | | | 330,306 | |
Xcel Energy | | | 5,718 | | | | 363,150 | |
| | | | | | | | 9,495,178 | |
TOTAL UNITED STATES | | | | | | | 273,774,344 | |
| TOTAL COMMON STOCK | | | | | | | | |
(Cost $239,251,299) | | | | | | | 274,959,883 | |
| TOTAL INVESTMENTS — 99.8% | | | | | | | | |
(Cost $239,251,299) | | | | | | $ | 274,959,883 | |
| Percentages are based on Net Assets of $275,510,772. |
| * | Non-income producing security. |
| ‡ | Real Estate Investment Trust |
| As of October 31, 2019, all of the Fund’s investments were considered Level 1, in accordance with authoritative guidance on fair value measurements and disclosure under U.S. GAAP. |
For the year ended October 31, 2019, there have been no transfers in or out of Level 3.
| | |
| Schedule of Investments |
| October 31, 2019 |
Global X NASDAQ 100® Covered Call ETF |
| Sector Weightings (Unaudited)†: |
| † Sector weightings percentages are based on the total market value of investments. |
| | | | | | | |
COMMON STOCK — 102.6% | | | | | | |
| ARGENTINA— 0.3% | | | | | | |
| Consumer Discretionary — 0.3% | | | | | | |
MercadoLibre * (A) | | | 4,423 | | | $ | 2,306,683 | |
| CHINA— 1.1% | | | | | | | | |
| Communication Services — 0.5% | | | | | | | | |
Baidu ADR * (A) | | | 25,760 | | | | 2,623,656 | |
NetEase ADR (A) | | | 6,702 | | | | 1,915,834 | |
| | | | | | | | 4,539,490 | |
| Consumer Discretionary — 0.6% | | | | | | | | |
Ctrip.com International ADR * (A) | | | 44,773 | | | | 1,477,061 | |
JD.com ADR * (A) | | | 85,236 | | | | 2,655,101 | |
| | | | | | | | 4,132,162 | |
TOTAL CHINA | | | | | | | 8,671,652 | |
| NETHERLANDS— 0.7% | | | | | | | | |
| Information Technology — 0.7% | | | | | | | | |
ASML Holding, Cl G (A) | | | 6,673 | | | | 1,748,126 | |
NXP Semiconductors (A) | | | 30,325 | | | | 3,447,346 | |
TOTAL NETHERLANDS | | | | | | | 5,195,472 | |
| | | | | | | |
| COMMON STOCK — continued | | | | | | | | |
| UNITED STATES— 100.5% | | | | | | | | |
| Communication Services — 21.6% | | | | | | | | |
Activision Blizzard (A) | | | 70,507 | | | $ | 3,950,507 | |
Alphabet, Cl A * (A) | | | 25,139 | | | | 31,644,973 | |
Alphabet, Cl C * (A) | | | 28,573 | | | | 36,005,123 | |
Charter Communications, Cl A * (A) | | | 20,172 | | | | 9,437,672 | |
Comcast, Cl A (A) | | | 410,435 | | | | 18,395,697 | |
Electronic Arts * (A) | | | 26,181 | | | | 2,523,848 | |
Facebook, Cl A * (A) | | | 198,302 | | | | 38,004,578 | |
Fox, Cl A (A) | | | 31,455 | | | | 1,007,818 | |
Fox, Cl B (A) | | | 24,122 | | | | 753,571 | |
Liberty Global * (A) | | | 44,327 | | | | 1,058,085 | |
Liberty Global, Cl A * (A) | | | 19,598 | | | | 492,890 | |
Netflix * (A) | | | 39,535 | | | | 11,362,755 | |
Sirius XM Holdings (A) | | | 401,879 | | | | 2,700,627 | |
Take-Two Interactive Software * (A) | | | 10,397 | | | | 1,251,279 | |
T-Mobile US * (A) | | | 77,791 | | | | 6,430,204 | |
| | | | | | | | 165,019,627 | |
| Consumer Discretionary — 15.2% | | | | | |
Amazon.com * (A) | | | 40,434 | | | | 71,837,470 | |
Booking Holdings * (A) | | | 3,875 | | | | 7,938,984 | |
Dollar Tree * (A) | | | 21,891 | | | | 2,416,766 | |
eBay (A) | | | 75,918 | | | | 2,676,110 | |
Expedia Group (A) | | | 12,703 | | | | 1,735,992 | |
Hasbro (A) | | | 11,596 | | | | 1,128,407 | |
Lululemon Athletica * (A) | | | 11,218 | | | | 2,291,501 | |
Marriott International, Cl A (A) | | | 29,416 | | | | 3,722,595 | |
O’Reilly Automotive * (A) | | | 6,783 | | | | 2,954,064 | |
Ross Stores (A) | | | 32,610 | | | | 3,576,339 | |
Starbucks (A) | | | 109,165 | | | | 9,230,992 | |
Tesla * (A) | | | 16,230 | | | | 5,111,152 | |
Ulta Beauty * (A) | | | 5,415 | | | | 1,262,507 | |
| | | | | | | |
| COMMON STOCK — continued | |
| Consumer Discretionary — continued | | | | | |
Wynn Resorts (A) | | | 9,893 | | | $ | 1,200,417 | |
| | | | | | | | 117,083,296 | |
| Consumer Staples — 6.1% | | | | | |
Costco Wholesale (A) | | | 39,723 | | | | 11,802,101 | |
Kraft Heinz (A) | | | 108,778 | | | | 3,516,793 | |
Mondelez International, Cl A (A) | | | 131,364 | | | | 6,890,042 | |
Monster Beverage * (A) | | | 50,080 | | | | 2,810,990 | |
PepsiCo (A) | | | 126,496 | | | | 17,351,457 | |
Walgreens Boots Alliance (A) | | | 80,957 | | | | 4,434,824 | |
| | | | | | | | 46,806,207 | |
| Financials — 0.3% | | | | | |
Willis Towers Watson (A) | | | 11,918 | | | | 2,227,474 | |
| Health Care — 7.9% | | | | | |
Alexion Pharmaceuticals * (A) | | | 20,611 | | | | 2,172,399 | |
Align Technology * (A) | | | 7,345 | | | | 1,853,070 | |
Amgen (A) | | | 54,583 | | | | 11,639,825 | |
Biogen Idec * (A) | | | 16,502 | | | | 4,929,312 | |
BioMarin Pharmaceutical * (A) | | | 16,370 | | | | 1,198,448 | |
Celgene * (A) | | | 64,534 | | | | 6,971,608 | |
Cerner (A) | | | 28,096 | | | | 1,885,804 | |
Gilead Sciences (A) | | | 115,393 | | | | 7,351,688 | |
Henry Schein * (A) | | | 13,821 | | | | 864,987 | |
IDEXX Laboratories * (A) | | | 7,925 | | | | 2,258,704 | |
Illumina * (A) | | | 13,155 | | | | 3,887,566 | |
Incyte * (A) | | | 19,652 | | | | 1,649,196 | |
Intuitive Surgical * (A) | | | 10,374 | | | | 5,736,304 | |
Mylan * (A) | | | 47,228 | | | | 904,416 | |
Regeneron Pharmaceuticals * (A) | | | 9,937 | | | | 3,043,504 | |
Vertex Pharmaceuticals * (A) | | | 23,010 | | | | 4,497,995 | |
| | | | | | | | 60,844,826 | |
| Industrials — 2.3% | | | | | |
American Airlines Group (A) | | | 41,946 | | | | 1,260,897 | |
| | | | | | | |
| COMMON STOCK — continued | |
| Industrials — continued | | | | | |
Cintas (A) | | | 9,088 | | | $ | 2,441,673 | |
CSX (A) | | | 71,834 | | | | 5,047,776 | |
Fastenal (A) | | | 52,632 | | | | 1,891,594 | |
JB Hunt Transport Services (A) | | | 9,958 | | | | 1,170,662 | |
PACCAR (A) | | | 31,893 | | | | 2,425,782 | |
United Airlines Holdings * (A) | | | 22,703 | | | | 2,062,340 | |
Verisk Analytics, Cl A (A) | | | 15,082 | | | | 2,182,365 | |
| | | | | | | | 18,483,089 | |
| Information Technology — 46.7% | | | | | |
Adobe * (A) | | | 43,843 | | | | 12,185,284 | |
Advanced Micro Devices * (A) | | | 96,687 | | | | 3,280,590 | |
Analog Devices (A) | | | 33,019 | | | | 3,520,816 | |
Apple (A) | | | 369,317 | | | | 91,871,298 | |
Applied Materials (A) | | | 82,862 | | | | 4,496,092 | |
Autodesk * (A) | | | 20,239 | | | | 2,982,419 | |
Automatic Data Processing (A) | | | 39,489 | | | | 6,406,300 | |
Broadcom (A) | | | 35,916 | | | | 10,518,001 | |
Cadence Design Systems * (A) | | | 25,797 | | | | 1,685,834 | |
Check Point Software Technologies * (A) | | | 14,273 | | | | 1,604,428 | |
Cisco Systems (A) | | | 387,382 | | | | 18,404,519 | |
Citrix Systems (A) | | | 12,259 | | | | 1,334,515 | |
Cognizant Technology Solutions, Cl A (A) | | | 49,980 | | | | 3,045,781 | |
Fiserv * (A) | | | 61,892 | | | | 6,569,217 | |
Intel (A) | | | 400,963 | | | | 22,666,439 | |
Intuit (A) | | | 23,659 | | | | 6,092,193 | |
KLA (A) | | | 14,452 | | | | 2,442,966 | |
Lam Research (A) | | | 13,167 | | | | 3,568,784 | |
Maxim Integrated Products (A) | | | 25,049 | | | | 1,469,374 | |
Microchip Technology (A) | | | 21,798 | | | | 2,055,333 | |
Micron Technology * (A) | | | 100,348 | | | | 4,771,547 | |
Microsoft (A) | | | 623,982 | | | | 89,460,298 | |
NetApp (A) | | | 20,565 | | | | 1,149,172 | |
| | | Shares/Number of Contracts | | | | |
| COMMON STOCK — continued | |
| Information Technology — continued | | | | | |
NortonLifeLock (A) | | | 58,104 | | | $ | 1,329,420 | |
NVIDIA (A) | | | 55,532 | | | | 11,163,043 | |
Paychex (A) | | | 33,107 | | | | 2,769,069 | |
PayPal Holdings * (A) | | | 106,287 | | | | 11,064,478 | |
QUALCOMM (A) | | | 110,815 | | | | 8,913,959 | |
Skyworks Solutions (A) | | | 16,188 | | | | 1,474,079 | |
Synopsys * (A) | | | 14,043 | | | | 1,906,337 | |
Texas Instruments (A) | | | 84,288 | | | | 9,945,141 | |
VeriSign * (A) | | | 10,447 | | | | 1,985,139 | |
Western Digital (A) | | | 26,756 | | | | 1,381,947 | |
Workday, Cl A * (A) | | | 15,119 | | | | 2,451,697 | |
Xilinx (A) | | | 23,372 | | | | 2,120,775 | |
| | | | | | | | 358,086,284 | |
| Utilities — 0.4% | | | | | |
Xcel Energy (A) | | | 47,436 | | | | 3,012,660 | |
TOTAL UNITED STATES | | | | | | | 771,563,463 | |
| TOTAL COMMON STOCK | | | | | | | | |
(Cost $667,150,573) | | | | | | | 787,737,270 | |
| TOTAL INVESTMENTS — 102.6% | | | | | | | | |
(Cost $667,150,573) | | | | | | $ | 787,737,270 | |
WRITTEN OPTION— (2.7)%(1) | | | | | | | | |
| UNITED STATES— (2.7)% | | | | | | | | |
| (Premiums Received $12,107,234) | | | (975 | ) | | $ | (20,928,375 | ) |
| Percentages are based on Net Assets of $768,036,356. |
A list of the exchange traded option contracts held by the Fund at October 31, 2019, is as follows:
| | | | | | | | | | | | | |
| WRITTEN OPTION — (2.7)% | | | | | | | | | | | | | |
| Call Options | | | | | | | | | | | | | |
November 19 Calls on NDX* | | | (975 | ) | | $ | (12,107,234 | ) | | $ | 214.65 | | 11/15/19 | | $ | (20,928,375 | ) |
| | | | | | | | | | | | | | | | | | |
| Total Written Option | | | | | | | | | | | | | | | | | |
| * | Non-income producing security. |
| (A) | All or a portion of these securities has been segregated as collateral for writtenoptions contracts. The aggregate market value of collateral at October 31, 2019 was $314,950,263. |
| (1) | Refer to table below for details on Options Contracts. |
| + | Represents Cost. |
| ADR — American Depositary Receipt |
| Cl — Class |
| NDX — Nasdaq 100® Index |
| As of October 31, 2019, all of the Fund’s investments were considered Level 1, in accordance with authoritative guidance on fair value measurements and disclosure under U.S. GAAP. |
For the year ended October 31, 2019, there have been no transfers in or out of Level 3.
| | |
| Schedule of Investments |
| October 31, 2019 |
Global X S&P 500® Covered Call ETF |
| Sector Weightings (Unaudited)†: |
| † Sector weightings percentages are based on the total market value of investments. |
| | | | | | | |
| COMMON STOCK — 100.6% | | | | | | |
| UNITED KINGDOM— 0.4% | | | | | | |
| Materials — 0.4% | | | | | | |
Linde (A) | | | 2,831 | | | $ | 561,529 | |
| UNITED STATES— 100.2% | | | | | | | | |
| Communication Services — 10.5% | | | | | | | | |
Activision Blizzard (A) | | | 4,016 | | | | 225,017 | |
Alphabet, Cl A * (A) | | | 1,586 | | | | 1,996,457 | |
Alphabet, Cl C * (A) | | | 1,602 | | | | 2,018,696 | |
AT&T (A) | | | 38,989 | | | | 1,500,687 | |
CBS, Cl B (A) | | | 1,793 | | | | 64,620 | |
CenturyLink (A) | | | 5,367 | | | | 69,449 | |
Charter Communications, Cl A * (A) | | | 852 | | | | 398,617 | |
Comcast, Cl A (A) | | | 24,175 | | | | 1,083,523 | |
Discovery, Cl A * (A) | | | 866 | | | | 23,343 | |
Discovery, Cl C * (A) | | | 1,814 | | | | 45,785 | |
DISH Network, Cl A * (A) | | | 1,274 | | | | 43,800 | |
| | | | | | | |
| COMMON STOCK — continued | | | | | | | | |
| Communication Services — continued | | | | | | | | |
Electronic Arts * (A) | | | 1,606 | | | $ | 154,818 | |
Facebook, Cl A * (A) | | | 12,753 | | | | 2,444,112 | |
Fox, Cl A (A) | | | 1,933 | | | | 61,933 | |
Fox, Cl B (A) | | | 866 | | | | 27,054 | |
Interpublic Group (A) | | | 2,166 | | | | 47,111 | |
Netflix * (A) | | | 2,352 | | | | 675,988 | |
News, Cl A (A) | | | 2,131 | | | | 29,216 | |
News, Cl B (A) | | | 684 | | | | 9,658 | |
Omnicom Group (A) | | | 1,163 | | | | 89,772 | |
Take-Two Interactive Software * (A) | | | 559 | | | | 67,276 | |
T-Mobile US * (A) | | | 1,709 | | | | 141,266 | |
TripAdvisor * (A) | | | 582 | | | | 23,513 | |
Twitter * (A) | | | 3,894 | | | | 116,703 | |
Verizon Communications (A) | | | 22,060 | | | | 1,333,968 | |
Viacom, Cl B (A) | | | 1,963 | | | | 42,322 | |
Walt Disney (A) | | | 9,566 | | | | 1,242,815 | |
| | | | | | | | 13,977,519 | |
| Consumer Discretionary — 10.0% | | | | | |
Advance Auto Parts (A) | | | 370 | | | | 60,118 | |
Amazon.com * (A) | | | 2,206 | | | | 3,919,312 | |
Aptiv (A) | | | 1,381 | | | | 123,669 | |
AutoZone * (A) | | | 131 | | | | 149,914 | |
Best Buy (A) | | | 1,236 | | | | 88,782 | |
Booking Holdings * (A) | | | 224 | | | | 458,925 | |
BorgWarner (A) | | | 1,130 | | | | 47,098 | |
Capri Holdings * (A) | | | 839 | | | | 26,068 | |
CarMax * (A) | | | 867 | | | | 80,778 | |
Carnival (A) | | | 2,117 | | | | 90,798 | |
Chipotle Mexican Grill, Cl A * (A) | | | 127 | | | | 98,826 | |
Darden Restaurants (A) | | | 690 | | | | 77,466 | |
Dollar General (A) | | | 1,366 | | | | 219,024 | |
Dollar Tree * (A) | | | 1,256 | | | | 138,662 | |
| | | | | | | |
| COMMON STOCK — continued | |
| Consumer Discretionary — continued | | | | |
DR Horton (A) | | | 1,890 | | | $ | 98,979 | |
eBay (A) | | | 4,075 | | | | 143,644 | |
Expedia Group (A) | | | 681 | | | | 93,065 | |
Ford Motor (A) | | | 20,831 | | | | 178,938 | |
Gap (A) | | | 1,205 | | | | 19,593 | |
Garmin (A) | | | 655 | | | | 61,406 | |
General Motors (A) | | | 6,571 | | | | 244,179 | |
Genuine Parts (A) | | | 816 | | | | 83,705 | |
H&R Block (A) | | | 1,149 | | | | 28,713 | |
Hanesbrands (A) | | | 2,015 | | | | 30,648 | |
Harley-Davidson (A) | | | 922 | | | | 35,875 | |
Hasbro (A) | | | 622 | | | | 60,527 | |
Hilton Worldwide Holdings (A) | | | 1,561 | | | | 151,355 | |
Home Depot (A) | | | 5,842 | | | | 1,370,416 | |
Kohl’s (A) | | | 936 | | | | 47,979 | |
L Brands (A) | | | 1,342 | | | | 22,868 | |
Las Vegas Sands (A) | | | 1,793 | | | | 110,879 | |
Leggett & Platt (A) | | | 730 | | | | 37,449 | |
Lennar, Cl A (A) | | | 1,473 | | | | 87,791 | |
LKQ * (A) | | | 1,727 | | | | 58,701 | |
Lowe’s (A) | | | 4,029 | | | | 449,677 | |
Macy’s (A) | | | 1,699 | | | | 25,757 | |
Marriott International, Cl A (A) | | | 1,466 | | | | 185,522 | |
McDonald’s (A) | | | 4,041 | | | | 794,865 | |
MGM Resorts International (A) | | | 2,611 | | | | 74,414 | |
Mohawk Industries * (A) | | | 356 | | | | 51,043 | |
Newell Brands (A) | | | 2,145 | | | | 40,691 | |
NIKE, Cl B (A) | | | 6,562 | | | | 587,627 | |
Nordstrom (A) | | | 633 | | | | 22,725 | |
Norwegian Cruise Line Holdings * (A) | | | 1,239 | | | | 62,892 | |
NVR * (A) | | | 15 | | | | 54,549 | |
O’Reilly Automotive * (A) | | | 387 | | | | 168,542 | |
| | | | | | | |
| COMMON STOCK — continued | |
| Consumer Discretionary — continued | | | | |
PulteGroup (A) | | | 1,494 | | | $ | 58,625 | |
PVH (A) | | | 427 | | | | 37,217 | |
Ralph Lauren, Cl A (A) | | | 309 | | | | 29,683 | |
Ross Stores (A) | | | 1,862 | | | | 204,205 | |
Royal Caribbean Cruises (A) | | | 951 | | | | 103,497 | |
Starbucks (A) | | | 6,275 | | | | 530,614 | |
Tapestry (A) | | | 1,592 | | | | 41,169 | |
Target (A) | | | 2,717 | | | | 290,475 | |
Tiffany (A) | | | 594 | | | | 73,959 | |
TJX (A) | | | 6,435 | | | | 370,978 | |
Tractor Supply (A) | | | 690 | | | | 65,564 | |
Ulta Beauty * (A) | | | 302 | | | | 70,411 | |
Under Armour, Cl A * (A) | | | 1,036 | | | | 21,393 | |
Under Armour, Cl C * (A) | | | 1,062 | | | | 19,647 | |
VF (A) | | | 1,728 | | | | 142,197 | |
Whirlpool (A) | | | 319 | | | | 48,526 | |
Wynn Resorts (A) | | | 557 | | | | 67,587 | |
Yum! Brands (A) | | | 1,544 | | | | 157,040 | |
| | | | | | | | 13,397,241 | |
| Consumer Staples — 7.5% | | | | | |
Altria Group (A) | | | 9,732 | | | | 435,896 | |
Archer-Daniels-Midland (A) | | | 3,113 | | | | 130,871 | |
Brown-Forman, Cl B (A) | | | 948 | | | | 62,113 | |
Campbell Soup (A) | | | 717 | | | | 33,204 | |
Church & Dwight (A) | | | 1,380 | | | | 96,517 | |
Clorox (A) | | | 680 | | | | 100,429 | |
Coca-Cola (A) | | | 20,510 | | | | 1,116,359 | |
Colgate-Palmolive (A) | | | 4,552 | | | | 312,267 | |
Conagra Brands (A) | | | 2,744 | | | | 74,225 | |
Constellation Brands, Cl A (A) | | | 896 | | | | 170,536 | |
Costco Wholesale (A) | | | 2,309 | | | | 686,027 | |
Coty, Cl A (A) | | | 1,368 | | | | 15,992 | |
| | | | | | | |
| COMMON STOCK — continued | |
| Consumer Staples — continued | | | | |
Estee Lauder, Cl A (A) | | | 1,176 | | | $ | 219,054 | |
General Mills (A) | | | 3,260 | | | | 165,804 | |
Hershey (A) | | | 729 | | | | 107,068 | |
Hormel Foods (A) | | | 1,497 | | | | 61,212 | |
JM Smucker (A) | | | 627 | | | | 66,261 | |
Kellogg (A) | | | 1,384 | | | | 87,926 | |
Kimberly-Clark (A) | | | 1,872 | | | | 248,752 | |
Kraft Heinz (A) | | | 3,348 | | | | 108,241 | |
Kroger (A) | | | 4,314 | | | | 106,297 | |
Lamb Weston Holdings (A) | | | 839 | | | | 65,476 | |
McCormick (A) | | | 660 | | | | 106,055 | |
Molson Coors Brewing, Cl B (A) | | | 1,032 | | | | 54,407 | |
Mondelez International, Cl A (A) | | | 7,518 | | | | 394,319 | |
Monster Beverage * (A) | | | 2,116 | | | | 118,771 | |
PepsiCo (A) | | | 7,448 | | | | 1,021,642 | |
Philip Morris International (A) | | | 8,157 | | | | 664,306 | |
Procter & Gamble (A) | | | 13,360 | | | | 1,663,454 | |
Sysco (A) | | | 2,563 | | | | 204,707 | |
Tyson Foods, Cl A (A) | | | 1,620 | | | | 134,120 | |
Walgreens Boots Alliance (A) | | | 4,118 | | | | 225,584 | |
Walmart (A) | | | 7,494 | | | | 878,746 | |
| | | | | | | | 9,936,638 | |
| Energy — 4.3% | | | | | |
Apache (A) | | | 2,110 | | | | 45,703 | |
Baker Hughes, Cl A (A) | | | 2,943 | | | | 62,980 | |
Cabot Oil & Gas (A) | | | 2,197 | | | | 40,952 | |
Chevron (A) | | | 10,124 | | | | 1,175,801 | |
Cimarex Energy (A) | | | 537 | | | | 22,672 | |
Concho Resources (A) | | | 1,073 | | | | 72,449 | |
ConocoPhillips (A) | | | 5,761 | | | | 318,007 | |
Devon Energy (A) | | | 2,375 | | | | 48,165 | |
Diamondback Energy (A) | | | 833 | | | | 71,438 | |
| | | | | | | |
| COMMON STOCK — continued | |
| Energy — continued | | | | |
EOG Resources (A) | | | 2,979 | | | $ | 206,475 | |
Exxon Mobil (A) | | | 22,590 | | | | 1,526,406 | |
Halliburton (A) | | | 4,847 | | | | 93,305 | |
Helmerich & Payne (A) | | | 605 | | | | 22,687 | |
Hess (A) | | | 1,314 | | | | 86,396 | |
HollyFrontier (A) | | | 818 | | | | 44,941 | |
Kinder Morgan (A) | | | 10,228 | | | | 204,355 | |
Marathon Oil (A) | | | 4,665 | | | | 53,787 | |
Marathon Petroleum (A) | | | 3,566 | | | | 228,046 | |
National Oilwell Varco (A) | | | 2,125 | | | | 48,068 | |
Noble Energy (A) | | | 2,685 | | | | 51,713 | |
Occidental Petroleum (A) | | | 4,884 | | | | 197,802 | |
ONEOK (A) | | | 2,207 | | | | 154,115 | |
Phillips 66 (A) | | | 2,299 | | | | 268,569 | |
Pioneer Natural Resources (A) | | | 896 | | | | 110,226 | |
Schlumberger (A) | | | 7,528 | | | | 246,090 | |
TechnipFMC (A) | | | 2,401 | | | | 47,372 | |
Valero Energy (A) | | | 2,104 | | | | 204,046 | |
Williams (A) | | | 6,528 | | | | 145,640 | |
| | | | | | | | 5,798,206 | |
| Financials — 13.0% | | | | | |
Affiliated Managers Group (A) | | | 308 | | | | 24,603 | |
Aflac (A) | | | 3,954 | | | | 210,195 | |
Allstate (A) | | | 1,672 | | | | 177,934 | |
American Express (A) | | | 3,668 | | | | 430,183 | |
American International Group (A) | | | 4,481 | | | | 237,314 | |
Ameriprise Financial (A) | | | 732 | | | | 110,452 | |
Aon (A) | | | 1,210 | | | | 233,724 | |
Arthur J Gallagher (A) | | | 1,013 | | | | 92,406 | |
Assurant (A) | | | 305 | | | | 38,451 | |
Bank of America (A) | | | 44,687 | | | | 1,397,362 | |
Bank of New York Mellon (A) | | | 4,664 | | | | 218,042 | |
| | | | | | | |
| COMMON STOCK — continued | |
| Financials — continued | | | | |
BB&T (A) | | | 4,194 | | | $ | 222,492 | |
Berkshire Hathaway, Cl B * (A) | | | 10,390 | | | | 2,208,706 | |
BlackRock, Cl A (A) | | | 636 | | | | 293,641 | |
Capital One Financial (A) | | | 2,555 | | | | 238,254 | |
Cboe Global Markets (A) | | | 629 | | | | 72,429 | |
Charles Schwab (A) | | | 6,322 | | | | 257,369 | |
Chubb (A) | | | 2,432 | | | | 370,685 | |
Cincinnati Financial (A) | | | 841 | | | | 95,210 | |
Citigroup (A) | | | 12,017 | | | | 863,542 | |
Citizens Financial Group (A) | | | 2,462 | | | | 86,564 | |
CME Group, Cl A (A) | | | 1,921 | | | | 395,246 | |
Comerica (A) | | | 835 | | | | 54,626 | |
Discover Financial Services (A) | | | 1,590 | | | | 127,613 | |
E*TRADE Financial (A) | | | 1,322 | | | | 55,246 | |
Everest Re Group (A) | | | 223 | | | | 57,331 | |
Fifth Third Bancorp (A) | | | 3,783 | | | | 110,010 | |
First Republic Bank (A) | | | 913 | | | | 97,107 | |
Franklin Resources (A) | | | 1,526 | | | | 42,041 | |
Globe Life (A) | | | 584 | | | | 56,841 | |
Goldman Sachs Group (A) | | | 1,706 | | | | 364,026 | |
Hartford Financial Services Group (A) | | | 2,014 | | | | 114,959 | |
Huntington Bancshares (A) | | | 5,250 | | | | 74,182 | |
Intercontinental Exchange (A) | | | 2,890 | | | | 272,585 | |
Invesco (A) | | | 2,246 | | | | 37,778 | |
JPMorgan Chase (A) | | | 16,939 | | | | 2,116,020 | |
KeyCorp (A) | | | 5,454 | | | | 98,008 | |
Lincoln National (A) | | | 1,043 | | | | 58,909 | |
Loews (A) | | | 1,222 | | | | 59,878 | |
M&T Bank (A) | | | 751 | | | | 117,554 | |
MarketAxess Holdings (A) | | | 206 | | | | 75,930 | |
Marsh & McLennan (A) | | | 2,735 | | | | 283,401 | |
MetLife (A) | | | 4,136 | | | | 193,524 | |
| | | | | | | |
| COMMON STOCK — continued | |
| Financials — continued | | | | |
Moody’s (A) | | | 878 | | | $ | 193,766 | |
Morgan Stanley (A) | | | 6,487 | | | | 298,726 | |
MSCI, Cl A (A) | | | 438 | | | | 102,737 | |
Nasdaq (A) | | | 647 | | | | 64,551 | |
Northern Trust (A) | | | 1,198 | | | | 119,417 | |
People’s United Financial (A) | | | 2,013 | | | | 32,550 | |
PNC Financial Services Group (A) | | | 2,309 | | | | 338,730 | |
Principal Financial Group (A) | | | 1,305 | | | | 69,661 | |
Progressive (A) | | | 3,133 | | | | 218,370 | |
Prudential Financial (A) | | | 2,046 | | | | 186,472 | |
Raymond James Financial (A) | | | 711 | | | | 59,361 | |
Regions Financial (A) | | | 5,476 | | | | 88,164 | |
S&P Global (A) | | | 1,314 | | | | 338,999 | |
State Street (A) | | | 2,077 | | | | 137,227 | |
SunTrust Banks (A) | | | 2,426 | | | | 165,793 | |
SVB Financial Group * (A) | | | 282 | | | | 62,457 | |
Synchrony Financial (A) | | | 2,999 | | | | 106,075 | |
T Rowe Price Group (A) | | | 1,243 | | | | 143,940 | |
Travelers (A) | | | 1,424 | | | | 186,629 | |
Unum Group (A) | | | 1,236 | | | | 34,039 | |
US Bancorp (A) | | | 7,574 | | | | 431,869 | |
Wells Fargo (A) | | | 21,361 | | | | 1,102,868 | |
Willis Towers Watson (A) | | | 688 | | | | 128,587 | |
Zions Bancorp (A) | | | 955 | | | | 46,289 | |
| | | | | | | | 17,399,650 | |
| Health Care — 14.1% | | | | | |
Abbott Laboratories (A) | | | 9,300 | | | | 777,573 | |
AbbVie (A) | | | 7,933 | | | | 631,070 | |
ABIOMED * (A) | | | 239 | | | | 49,612 | |
Agilent Technologies (A) | | | 1,686 | | | | 127,714 | |
Alexion Pharmaceuticals * (A) | | | 1,239 | | | | 130,591 | |
Align Technology * (A) | | | 395 | | | | 99,654 | |
| | | | | | | |
| COMMON STOCK — continued | |
| Health Care — continued | | | | |
Allergan (A) | | | 1,665 | | | $ | 293,223 | |
AmerisourceBergen, Cl A (A) | | | 775 | | | | 66,170 | |
Amgen (A) | | | 3,182 | | | | 678,562 | |
Anthem (A) | | | 1,326 | | | | 356,800 | |
Baxter International (A) | | | 2,538 | | | | 194,665 | |
Becton Dickinson (A) | | | 1,445 | | | | 369,920 | |
Biogen Idec * (A) | | | 945 | | | | 282,281 | |
Boston Scientific * (A) | | | 7,211 | | | | 300,699 | |
Bristol-Myers Squibb (A) | | | 8,824 | | | | 506,233 | |
Cardinal Health (A) | | | 1,572 | | | | 77,735 | |
Celgene * (A) | | | 3,765 | | | | 406,733 | |
Centene (A) | | | 2,210 | | | | 117,307 | |
Cerner (A) | | | 1,773 | | | | 119,004 | |
Cigna (A) | | | 2,044 | | | | 364,772 | |
Cooper (A) | | | 273 | | | | 79,443 | |
CVS Health (A) | | | 7,002 | | | | 464,863 | |
Danaher (A) | | | 3,371 | | | | 464,591 | |
DaVita * (A) | | | 632 | | | | 37,035 | |
DENTSPLY SIRONA (A) | | | 1,270 | | | | 69,571 | |
Edwards Lifesciences * (A) | | | 1,117 | | | | 266,270 | |
Eli Lilly (A) | | | 4,446 | | | | 506,622 | |
Gilead Sciences (A) | | | 6,833 | | | | 435,330 | |
HCA Healthcare (A) | | | 1,462 | | | | 195,235 | |
Henry Schein * (A) | | | 750 | | | | 46,939 | |
Hologic * (A) | | | 1,529 | | | | 73,866 | |
Humana * (A) | | | 707 | | | | 207,999 | |
IDEXX Laboratories * (A) | | | 451 | | | | 128,539 | |
Illumina * (A) | | | 752 | | | | 222,231 | |
Incyte * (A) | | | 970 | | | | 81,402 | |
Intuitive Surgical * (A) | | | 619 | | | | 342,276 | |
IQVIA Holdings * (A) | | | 935 | | | | 135,033 | |
Johnson & Johnson (A) | | | 13,977 | | | | 1,845,523 | |
| | | | | | | |
| COMMON STOCK — continued | |
| Health Care — continued | | | | |
Laboratory Corp of America Holdings * (A) | | | 523 | | | $ | 86,175 | |
McKesson (A) | | | 924 | | | | 122,892 | |
Medtronic (A) | | | 7,134 | | | | 776,893 | |
Merck (A) | | | 13,647 | | | | 1,182,649 | |
Mettler-Toledo International * (A) | | | 130 | | | | 91,642 | |
Mylan * (A) | | | 2,690 | | | | 51,513 | |
PerkinElmer (A) | | | 623 | | | | 53,553 | |
Perrigo (A) | | | 726 | | | | 38,493 | |
Pfizer (A) | | | 29,472 | | | | 1,130,841 | |
Quest Diagnostics (A) | | | 753 | | | | 76,241 | |
Regeneron Pharmaceuticals * (A) | | | 431 | | | | 132,007 | |
ResMed (A) | | | 788 | | | | 116,561 | |
Stryker (A) | | | 1,657 | | | | 358,359 | |
Teleflex (A) | | | 237 | | | | 82,336 | |
Thermo Fisher Scientific (A) | | | 2,123 | | | | 641,104 | |
UnitedHealth Group (A) | | | 5,051 | | | | 1,276,388 | |
Universal Health Services, Cl B (A) | | | 408 | | | | 56,084 | |
Varian Medical Systems * (A) | | | 517 | | | | 62,459 | |
Vertex Pharmaceuticals * (A) | | | 1,401 | | | | 273,867 | |
Waters * (A) | | | 350 | | | | 74,067 | |
WellCare Health Plans * (A) | | | 278 | | | | 82,455 | |
Zimmer Biomet Holdings (A) | | | 1,132 | | | | 156,476 | |
Zoetis, Cl A (A) | | | 2,473 | | | | 316,346 | |
| | | | | | | | 18,792,487 | |
| Industrials — 9.3% | | | | | |
| | | 3,099 | | | | 511,304 | |
Alaska Air Group (A) | | | 682 | | | | 47,351 | |
Allegion (A) | | | 523 | | | | 60,689 | |
American Airlines Group (A) | | | 2,137 | | | | 64,238 | |
AMETEK (A) | | | 1,164 | | | | 106,681 | |
AO Smith (A) | | | 800 | | | | 39,744 | |
Arconic (A) | | | 1,745 | | | | 47,935 | |
| | | | | | | |
| COMMON STOCK — continued | |
| Industrials — continued | | | | |
Boeing (A) | | | 2,836 | | | $ | 963,985 | |
Caterpillar (A) | | | 2,925 | | | | 403,065 | |
CH Robinson Worldwide (A) | | | 783 | | | | 59,226 | |
Cintas (A) | | | 434 | | | | 116,603 | |
Copart * (A) | | | 1,128 | | | | 93,218 | |
CSX (A) | | | 4,147 | | | | 291,410 | |
Cummins (A) | | | 794 | | | | 136,949 | |
Deere (A) | | | 1,676 | | | | 291,859 | |
Delta Air Lines (A) | | | 3,142 | | | | 173,061 | |
Dover (A) | | | 761 | | | | 79,060 | |
Eaton (A) | | | 2,131 | | | | 185,631 | |
Emerson Electric (A) | | | 3,374 | | | | 236,686 | |
Equifax (A) | | | 678 | | | | 92,689 | |
Expeditors International of Washington (A) | | | 886 | | | | 64,625 | |
Fastenal (A) | | | 3,184 | | | | 114,433 | |
FedEx (A) | | | 1,309 | | | | 199,832 | |
Flowserve (A) | | | 733 | | | | 35,800 | |
Fortive (A) | | | 1,573 | | | | 108,537 | |
Fortune Brands Home & Security (A) | | | 822 | | | | 49,361 | |
General Dynamics (A) | | | 1,221 | | | | 215,873 | |
General Electric (A) | | | 47,072 | | | | 469,779 | |
Honeywell International (A) | | | 3,819 | | | | 659,656 | |
Huntington Ingalls Industries (A) | | | 214 | | | | 48,291 | |
IDEX (A) | | | 406 | | | | 63,145 | |
IHS Markit * (A) | | | 2,030 | | | | 142,141 | |
Illinois Tool Works (A) | | | 1,578 | | | | 266,019 | |
Ingersoll-Rand (A) | | | 1,309 | | | | 166,099 | |
Jacobs Engineering Group (A) | | | 560 | | | | 52,405 | |
JB Hunt Transport Services (A) | | | 478 | | | | 56,193 | |
Johnson Controls International (A) | | | 4,199 | | | | 181,943 | |
Kansas City Southern (A) | | | 574 | | | | 80,808 | |
L3Harris Technologies (A) | | | 1,188 | | | | 245,096 | |
| | | | | | | |
| COMMON STOCK — continued | |
| Industrials — continued | | | | |
Lockheed Martin (A) | | | 1,319 | | | $ | 496,841 | |
Masco (A) | | | 1,489 | | | | 68,866 | |
Nielsen Holdings (A) | | | 1,909 | | | | 38,485 | |
Norfolk Southern (A) | | | 1,427 | | | | 259,714 | |
Northrop Grumman (A) | | | 826 | | | | 291,148 | |
PACCAR (A) | | | 1,843 | | | | 140,179 | |
Parker-Hannifin (A) | | | 694 | | | | 127,342 | |
Pentair (A) | | | 908 | | | | 37,655 | |
Quanta Services (A) | | | 823 | | | | 34,607 | |
Raytheon (A) | | | 1,482 | | | | 314,495 | |
Republic Services, Cl A (A) | | | 1,153 | | | | 100,899 | |
Robert Half International (A) | | | 686 | | | | 39,287 | |
Rockwell Automation (A) | | | 641 | | | | 110,246 | |
Rollins (A) | | | 746 | | | | 28,430 | |
Roper Technologies (A) | | | 547 | | | | 184,317 | |
Snap-On (A) | | | 319 | | | | 51,892 | |
Southwest Airlines (A) | | | 2,421 | | | | 135,891 | |
Stanley Black & Decker (A) | | | 842 | | | | 127,420 | |
Textron (A) | | | 1,252 | | | | 57,705 | |
TransDigm Group (A) | | | 271 | | | | 142,622 | |
Union Pacific (A) | | | 3,696 | | | | 611,540 | |
United Airlines Holdings * (A) | | | 1,219 | | | | 110,734 | |
United Parcel Service, Cl B (A) | | | 3,746 | | | | 431,427 | |
United Rentals * (A) | | | 413 | | | | 55,164 | |
United Technologies (A) | | | 4,253 | | | | 610,646 | |
Verisk Analytics, Cl A (A) | | | 865 | | | | 125,166 | |
Wabtec (A) | | | 852 | | | | 59,103 | |
Waste Management (A) | | | 2,001 | | | | 224,532 | |
WW Grainger (A) | | | 244 | | | | 75,357 | |
Xylem (A) | | | 1,005 | | | | 77,073 | |
| | | | | | | | 12,390,203 | |
| | | | | | | |
| COMMON STOCK — continued | |
| Information Technology — 22.5% | | | | |
Accenture, Cl A (A) | | | 3,347 | | | $ | 620,601 | |
Adobe * (A) | | | 2,580 | | | | 717,059 | |
Advanced Micro Devices * (A) | | | 5,602 | | | | 190,076 | |
Akamai Technologies * (A) | | | 830 | | | | 71,795 | |
Alliance Data Systems (A) | | | 267 | | | | 26,700 | |
Amphenol, Cl A (A) | | | 1,598 | | | | 160,327 | |
Analog Devices (A) | | | 1,979 | | | | 211,021 | |
ANSYS * (A) | | | 430 | | | | 94,665 | |
Apple (A) | | | 22,560 | | | | 5,612,026 | |
Applied Materials (A) | | | 5,026 | | | | 272,711 | |
Arista Networks * (A) | | | 290 | | | | 70,925 | |
Autodesk * (A) | | | 1,173 | | | | 172,853 | |
Automatic Data Processing (A) | | | 2,313 | | | | 375,238 | |
Broadcom (A) | | | 2,132 | | | | 624,356 | |
Broadridge Financial Solutions (A) | | | 601 | | | | 75,257 | |
Cadence Design Systems * (A) | | | 1,554 | | | | 101,554 | |
CDW (A) | | | 722 | | | | 92,351 | |
Cisco Systems (A) | | | 22,624 | | | | 1,074,866 | |
Citrix Systems (A) | | | 675 | | | | 73,481 | |
Cognizant Technology Solutions, Cl A (A) | | | 2,861 | | | | 174,349 | |
Corning (A) | | | 4,302 | | | | 127,468 | |
DXC Technology (A) | | | 1,391 | | | | 38,489 | |
F5 Networks * (A) | | | 312 | | | | 44,953 | |
Fidelity National Information Services (A) | | | 3,240 | | | | 426,902 | |
Fiserv * (A) | | | 3,017 | | | | 320,224 | |
FleetCor Technologies * (A) | | | 476 | | | | 140,049 | |
FLIR Systems (A) | | | 761 | | | | 39,237 | |
Fortinet * (A) | | | 829 | | | | 67,613 | |
Gartner * (A) | | | 501 | | | | 77,194 | |
Global Payments (A) | | | 1,545 | | | | 261,383 | |
Hewlett Packard Enterprise (A) | | | 6,829 | | | | 112,064 | |
HP (A) | | | 8,060 | | | | 140,002 | |
| | | | | | | |
| COMMON STOCK — continued | |
| Information Technology — continued | | | | |
Intel (A) | | | 23,619 | | | $ | 1,335,182 | |
International Business Machines (A) | | | 4,652 | | | | 622,112 | |
Intuit (A) | | | 1,394 | | | | 358,955 | |
IPG Photonics * (A) | | | 214 | | | | 28,736 | |
Jack Henry & Associates (A) | | | 405 | | | | 57,332 | |
Juniper Networks (A) | | | 1,785 | | | | 44,304 | |
Keysight Technologies * (A) | | | 983 | | | | 99,195 | |
KLA (A) | | | 877 | | | | 148,248 | |
Lam Research (A) | | | 748 | | | | 202,738 | |
Leidos Holdings (A) | | | 767 | | | | 66,139 | |
Mastercard, Cl A (A) | | | 4,762 | | | | 1,318,169 | |
Maxim Integrated Products (A) | | | 1,410 | | | | 82,711 | |
Microchip Technology (A) | | | 1,298 | | | | 122,388 | |
Micron Technology * (A) | | | 6,006 | | | | 285,585 | |
Microsoft (A) | | | 40,559 | | | | 5,814,944 | |
Motorola Solutions (A) | | | 908 | | | | 151,019 | |
NetApp (A) | | | 1,321 | | | | 73,817 | |
NortonLifeLock (A) | | | 2,666 | | | | 60,998 | |
NVIDIA (A) | | | 3,191 | | | | 641,455 | |
Oracle (A) | | | 11,684 | | | | 636,661 | |
Paychex (A) | | | 1,686 | | | | 141,017 | |
PayPal Holdings * (A) | | | 6,248 | | | | 650,417 | |
Qorvo * (A) | | | 694 | | | | 56,117 | |
QUALCOMM (A) | | | 6,516 | | | | 524,147 | |
salesforce.com * (A) | | | 4,701 | | | | 735,659 | |
Seagate Technology (A) | | | 1,328 | | | | 77,064 | |
Skyworks Solutions (A) | | | 894 | | | | 81,408 | |
Synopsys * (A) | | | 768 | | | | 104,256 | |
TE Connectivity (A) | | | 1,837 | | | | 164,412 | |
Texas Instruments (A) | | | 4,900 | | | | 578,151 | |
VeriSign * (A) | | | 558 | | | | 106,031 | |
Visa, Cl A (A) | | | 9,219 | | | | 1,648,910 | |
| | | | | | | |
| COMMON STOCK — continued | |
| Information Technology — continued | | | | |
Western Digital (A) | | | 1,628 | | | $ | 84,086 | |
Western Union (A) | | | 2,513 | | | | 62,976 | |
Xerox Holdings (A) | | | 1,155 | | | | 39,189 | |
Xilinx (A) | | | 1,391 | | | | 126,219 | |
| | | | | | | | 29,938,536 | |
| Materials — 2.3% | | | | | |
Air Products & Chemicals (A) | | | 1,173 | | | | 250,154 | |
Albemarle (A) | | | 616 | | | | 37,416 | |
Amcor (A) | | | 8,398 | | | | 79,949 | |
Avery Dennison (A) | | | 479 | | | | 61,245 | |
Ball (A) | | | 1,780 | | | | 124,547 | |
Celanese, Cl A (A) | | | 656 | | | | 79,474 | |
CF Industries Holdings (A) | | | 1,270 | | | | 57,595 | |
Corteva (A) | | | 4,027 | | | | 106,232 | |
Dow (A) | | | 3,772 | | | | 190,448 | |
DuPont de Nemours (A) | | | 4,023 | | | | 265,156 | |
Eastman Chemical (A) | | | 789 | | | | 59,996 | |
Ecolab (A) | | | 1,290 | | | | 247,770 | |
FMC (A) | | | 742 | | | | 67,893 | |
Freeport-McMoRan Copper & Gold (A) | | | 7,612 | | | | 74,750 | |
International Flavors & Fragrances (A) | | | 573 | | | | 69,912 | |
International Paper (A) | | | 2,117 | | | | 92,470 | |
LyondellBasell Industries, Cl A (A) | | | 1,407 | | | | 126,208 | |
Martin Marietta Materials (A) | | | 341 | | | | 89,311 | |
Mosaic (A) | | | 1,961 | | | | 38,985 | |
Newmont Goldcorp (A) | | | 4,281 | | | | 170,084 | |
Nucor (A) | | | 1,638 | | | | 88,207 | |
Packaging Corp of America (A) | | | 529 | | | | 57,904 | |
PPG Industries (A) | | | 1,295 | | | | 162,030 | |
Sealed Air (A) | | | 774 | | | | 32,330 | |
Sherwin-Williams (A) | | | 439 | | | | 251,248 | |
Vulcan Materials (A) | | | 732 | | | | 104,581 | |
| | | | | | | |
| COMMON STOCK — continued | |
| Materials — continued | | | | |
Westrock (A) | | | 1,426 | | | $ | 53,290 | |
| | | | | | | | 3,039,185 | |
| Real Estate — 3.2% | | | | | |
Alexandria Real Estate Equities ‡ (A) | | | 612 | | | | 97,155 | |
American Tower, Cl A ‡ (A) | | | 2,371 | | | | 517,068 | |
Apartment Investment & Management, Cl A ‡ (A) | | | 858 | | | | 47,087 | |
AvalonBay Communities ‡ (A) | | | 768 | | | | 167,163 | |
Boston Properties ‡ (A) | | | 723 | | | | 99,196 | |
CBRE Group, Cl A * (A) | | | 1,730 | | | | 92,641 | |
Crown Castle International ‡ (A) | | | 2,255 | | | | 312,971 | |
Digital Realty Trust ‡ (A) | | | 1,144 | | | | 145,334 | |
Duke Realty ‡ (A) | | | 1,983 | | | | 69,683 | |
Equinix ‡ (A) | | | 435 | | | | 246,549 | |
Equity Residential ‡ (A) | | | 1,755 | | | | 155,598 | |
Essex Property Trust ‡ (A) | | | 350 | | | | 114,496 | |
Extra Space Storage ‡ (A) | | | 707 | | | | 79,375 | |
Federal Realty Investment Trust ‡ (A) | | | 404 | | | | 54,948 | |
HCP ‡ (A) | | | 2,626 | | | | 98,790 | |
Host Hotels & Resorts ‡ (A) | | | 4,108 | | | | 67,330 | |
Iron Mountain ‡ (A) | | | 1,529 | | | | 50,151 | |
Kimco Realty ‡ (A) | | | 2,354 | | | | 50,752 | |
Macerich ‡ (A) | | | 603 | | | | 16,582 | |
Mid-America Apartment Communities ‡ (A) | | | 627 | | | | 87,147 | |
ProLogis ‡ (A) | | | 3,407 | | | | 298,998 | |
Public Storage ‡ (A) | | | 807 | | | | 179,848 | |
Realty Income ‡ (A) | | | 1,587 | | | | 129,801 | |
Regency Centers ‡ (A) | | | 878 | | | | 59,037 | |
SBA Communications, Cl A ‡ (A) | | | 603 | | | | 145,112 | |
Simon Property Group ‡ (A) | | | 1,678 | | | | 252,841 | |
SL Green Realty ‡ (A) | | | 427 | | | | 35,697 | |
UDR ‡ (A) | | | 1,516 | | | | 76,179 | |
| | | | | | | |
| COMMON STOCK — continued | |
| Real Estate — continued | | | | |
Ventas ‡ (A) | | | 1,994 | | | $ | 129,809 | |
Vornado Realty Trust ‡ (A) | | | 709 | | | | 46,532 | |
Welltower ‡ (A) | | | 2,103 | | | | 190,721 | |
Weyerhaeuser ‡ (A) | | | 4,165 | | | | 121,660 | |
| | | | | | | | 4,236,251 | |
| Utilities — 3.5% | | | | | |
AES (A) | | | 3,684 | | | | 62,812 | |
Alliant Energy (A) | | | 1,295 | | | | 69,075 | |
Ameren (A) | | | 1,353 | | | | 105,128 | |
American Electric Power (A) | | | 2,649 | | | | 250,039 | |
American Water Works (A) | | | 1,004 | | | | 123,763 | |
Atmos Energy (A) | | | 633 | | | | 71,200 | |
CenterPoint Energy (A) | | | 2,826 | | | | 82,152 | |
CMS Energy (A) | | | 1,580 | | | | 100,994 | |
Consolidated Edison (A) | | | 1,694 | | | | 156,221 | |
Dominion Energy (A) | | | 4,284 | | | | 353,644 | |
DTE Energy (A) | | | 1,009 | | | | 128,466 | |
Duke Energy (A) | | | 3,890 | | | | 366,671 | |
Edison International (A) | | | 1,831 | | | | 115,170 | |
Entergy (A) | | | 1,026 | | | | 124,638 | |
Evergy (A) | | | 1,250 | | | | 79,888 | |
Eversource Energy (A) | | | 1,762 | | | | 147,550 | |
Exelon (A) | | | 5,250 | | | | 238,823 | |
FirstEnergy (A) | | | 2,601 | | | | 125,680 | |
NextEra Energy (A) | | | 2,589 | | | | 617,062 | |
NiSource (A) | | | 1,903 | | | | 53,360 | |
NRG Energy (A) | | | 1,406 | | | | 56,409 | |
Pinnacle West Capital (A) | | | 626 | | | | 58,919 | |
PPL (A) | | | 3,814 | | | | 127,731 | |
Public Service Enterprise Group (A) | | | 2,683 | | | | 169,861 | |
Sempra Energy (A) | | | 1,479 | | | | 213,730 | |
Southern (A) | | | 5,650 | | | | 354,029 | |
| | | Shares/Number of Contracts | | | | |
| COMMON STOCK — continued | |
| Utilities — continued | | | | |
WEC Energy Group (A) | | | 1,638 | | | $ | 154,627 | |
Xcel Energy (A) | | | 2,839 | | | | 180,305 | |
| | | | | | | | 4,687,947 | |
TOTAL UNITED STATES | | | | | | | 133,593,863 | |
| TOTAL COMMON STOCK | | | | | | | | |
(Cost $116,486,555) | | | | | | | 134,155,392 | |
| TOTAL INVESTMENTS — 100.6% | | | | | | | | |
(Cost $116,486,555) | | | | | | $ | 134,155,392 | |
WRITTEN OPTION— (0.5)%(1) | | | | | | | | |
| UNITED STATES— (0.5)% | | | | | | | | |
| (Premiums Received $459,498) | | | (441 | ) | | $ | (637,245 | ) |
| Percentages are based on Net Assets of $133,353,094. |
A list of the exchange traded option contracts held by the Fund at October 31, 2019, is as follows:
| | | | | | | | | | | | | |
WRITTEN OPTION — (0.5)% | | | | | | | | | | | | | |
| Call Options | | | | | | | | | | | | | |
November 19 Calls on SPX* | | | (441 | ) | | $ | (459,498 | ) | | $ | 14.45 | | 11/15/19 | | $ | (637,245 | ) |
| | | | | | | | | | | | | | | | | | |
| Total Written Option | | | | | | | | | | | | | | | | | |
| * | Non-income producing security. |
| ‡ | Real Estate Investment Trust |
| (A) | All or a portion of these securities has been segregated as collateral for writtenoptions contracts. The aggregate market value of collateral at October 31, 2019 was $67,105,115. |
| (1) | Refer to table below for details on Options Contracts. |
| + | Represents Cost. |
| Cl — Class |
SPX — Standard & Poor’s 500® Index |
| As of October 31, 2019, all of the Fund’s investments were considered Level 1, in accordance with authoritative guidance on fair value measurements and disclosure under U.S. GAAP. |
For the year ended October 31, 2019, there have been no transfers in or out of Level 3.
| | |
| Schedule of Investments |
| October 31, 2019 |
Global X Russell 2000 Covered Call ETF |
| Sector Weightings (Unaudited)†: |
| † Sector weightings percentages are based on the total market value of investments. |
| | | Shares/Number of Contracts | | | | |
| | | | | | | |
EXCHANGE TRADED FUND — 101.9%‡ | | | | | | |
| Vanguard Russell 2000 ETF (A) | | | | | | |
(Cost $8,904,334) | | | 72,023 | | | $ | 9,005,036 | |
| | | | | | | | | |
| TOTAL INVESTMENTS — 101.9% | | | | | | | | |
(Cost $8,904,334) | | | | | | $ | 9,005,036 | |
WRITTEN OPTION— (2.1)%(1) | | | | | | | | |
| UNITED STATES— (2.1)% | | | | | | | | |
| (Premiums Received $142,671) | | | (57 | ) | | $ | (182,970 | ) |
| Percentages are based on Net Assets of $8,833,383. | | |
A list of the exchange traded option contracts held by the Fund at October 31, 2019, is as follows:
| | | | | | | | | | | | | |
WRITTEN OPTION — (2.1)% | | | | | | | | | | | | | |
| Call Options | | | | | | | | | | | | | |
November 19 Calls on RUT* | | | (57 | ) | | $ | (142,671 | ) | | $ | 32.10 | | 11/15/19 | | $ | (182,970 | ) |
| | | | | | | | | | | | | | | | | | |
| Total Written Option | | | | | | | | | | | | | | | | | |
| + | Represents Cost |
| ‡ | For financial information on the Vanguard Russell 2000 ETF, please go to the Securities Exchange Commission’s website at http://www.sec.gov. |
| * | Non-Income Producing Security. |
| (A) | All or a portion of these securities has been segregated as collateral for writtenoptions contracts. The aggregate market value of collateral at October 31, 2019 was $4,501,140. |
| (1) | Refer to table below for details on Options Contracts. |
| ETF — Exchange Traded Fund |
| RUT — Russell 2000 Index |
| As of October 31, 2019, all of the Fund’s investments were considered Level 1, in accordance with authoritative guidance on fair value measurements and disclosure under U.S. GAAP. |
For the year ended October 31, 2019, there have been no transfers in or out of Level 3.
| | |
Statements of Assets and Liabilities |
| |
|
| | | Global X SuperDividend® ETF | | | Global X SuperDividend® U.S. ETF | | | Global X MSCI SuperDividend® Emerging Markets ETF | | | Global X MSCI SuperDividend® EAFE ETF | |
| Assets: | | | | | | | | | | | | |
| Cost of Investments | | $ | 969,632,508 | | | $ | 534,949,361 | | | $ | 17,435,400 | | | $ | 18,022,122 | |
| Cost of Repurchase Agreement | | | 47,199,536 | | | | 35,782,016 | | | | — | | | | — | |
| Cost of Foreign Currency | | | 754,939 | | | | — | | | | (11 | ) | | | — | |
| Investments, at Value | | $ | 933,721,176 | * | | $ | 547,396,854 | * | | $ | 17,418,684 | | | $ | 18,528,655 | |
| Repurchase Agreement, at Value | | | 47,199,536 | | | | 35,782,016 | | | | — | | | | — | |
| Cash | | | — | | | | 889,062 | | | | — | | | | — | |
| Foreign Currency, at Value | | | 764,187 | | | | — | | | | 9 | | | | 3 | |
| Dividend and Interest Receivable | | | 4,064,725 | | | | 1,762,235 | | | | 85,586 | | | | 64,816 | |
| Reclaim Receivable | | | 1,215,318 | | | | 8,115 | | | | — | | | | 4,337 | |
| Receivable for Capital Shares Sold | | | — | | | | 1,166,771 | | | | — | | | | — | |
| Due from Custodian | | | 3,516 | | | | — | | | | — | | | | — | |
| Total Assets | | | 986,968,458 | | | | 587,005,053 | | | | 17,504,279 | | | | 18,597,811 | |
| Liabilities: | | | | | | | | | | | | | | | | |
| Obligation to Return Securities Lending Collateral | | | 53,756,736 | | | | 40,753,036 | | | | — | | | | — | |
| Cash Overdraft | | | 638,329 | | | | — | | | | 3,680 | | | | 62,241 | |
| Payable due to Investment Adviser | | | 451,351 | | | | 203,806 | | | | 9,488 | | | | 8,453 | |
| Unrealized Depreciation on Spot Contracts | | | 1,193 | | | | — | | | | — | | | | — | |
| Payable for Investment Securities Purchased | | | — | | | | 1,161,429 | | | | — | | | | — | |
| Accrued Foreign Capital Gains Tax on Appreciated Securities | | | — | | | | — | | | | 2,333 | | | | — | |
| Due to Broker | | | 10,340 | | | | 2,333 | | | | — | | | | — | |
| Total Liabilities | | | 54,857,949 | | | | 42,120,604 | | | | 15,501 | | | | 70,694 | |
| Net Assets | | $ | 932,110,509 | | | $ | 544,884,449 | | | $ | 17,488,778 | | | $ | 18,527,117 | |
| Net Assets Consist of: | | | | | | | | | | | | | | | | |
| Paid-in Capital | | $ | 1,257,187,213 | | | $ | 594,130,877 | | | $ | 21,101,511 | | | $ | 18,460,325 | |
| Total Distributable Earnings/(Loss) | | | (325,076,704 | ) | | | (49,246,428 | ) | | | (3,612,733 | ) | | | 66,792 | |
| Net Assets | | $ | 932,110,509 | | | $ | 544,884,449 | | | $ | 17,488,778 | | | $ | 18,527,117 | |
| Outstanding Shares of Beneficial Interest | | | | | | | | | | | | | | | | |
| (unlimited authorization — no par value) | | | 54,050,000 | | | | 23,350,000 | | | | 1,350,000 | | | | 1,150,000 | |
| Net Asset Value, Offering and Redemption Price Per Share | | $ | 17.25 | | | $ | 23.34 | | | $ | 12.95 | | | $ | 16.11 | |
| *Includes Market Value of Securities on Loan | | $ | 50,887,061 | | | $ | 38,804,473 | | | $ | — | | | $ | — | |
| | |
Statements of Assets and Liabilities |
| |
|
| | | Global X SuperDividend® REIT ETF | | | Global X SuperIncome™ Preferred ETF | | | Global X YieldCo & Renewable Energy Income ETF | | | Global X Social Media ETF | |
| Assets: | | | | | | | | | | | | |
| Cost of Investments | | $ | 352,082,697 | | | $ | 197,830,440 | | | $ | 22,997,717 | | | $ | 120,727,622 | |
| Cost of Repurchase Agreement | | | 16,031,265 | | | | 3,326,013 | | | | — | | | | 6,388,879 | |
| Cost of Foreign Currency | | | (17 | ) | | | — | | | | 2,324 | | | | — | |
| Investments, at Value | | $ | 364,457,631 | * | | $ | 200,644,900 | * | | $ | 26,089,142 | | | $ | 121,951,109 | * |
| Repurchase Agreement, at Value | | | 16,031,265 | | | | 3,326,013 | | | | — | | | | 6,388,879 | |
| Cash | | | 1,731,532 | | | | 418,644 | | | | 146,111 | | | | — | |
| Foreign Currency, at Value | | | 1 | | | | — | | | | 2,327 | | | | — | |
| Receivable for Capital Shares Sold | | | 5,364,507 | | | | — | | | | 689,603 | | | | — | |
| Dividend and Interest Receivable | | | 973,622 | | | | 619,789 | | | | 9,143 | | | | 27,153 | |
| Reclaim Receivable | | | 2,966 | | | | — | | | | 10,020 | | | | — | |
| Receivable for Investment Securities Sold | | | — | | | | — | | | | — | | | | 12,492,577 | |
| Due from Broker | | | 2,461,741 | | | | 8,925 | | | | 565,264 | | | | — | |
| Total Assets | | | 391,023,265 | | | | 205,018,271 | | | | 27,511,610 | | | | 140,859,718 | |
| Liabilities: | | | | | | | | | | | | | | | | |
| Obligation to Return Securities Lending Collateral | | | 18,258,410 | | | | 3,788,080 | | | | — | | | | 7,276,455 | |
| Payable for Investment Securities Purchased | | | 5,347,024 | | | | — | | | | 726,692 | | | | 12,149,178 | |
| Due to Authorized Participants | | | 2,461,741 | | | | — | | | | 565,264 | | | | — | |
| Payable due to Investment Adviser | | | 166,192 | | | | 98,151 | | | | 13,665 | | | | 68,562 | |
| Cash Overdraft | | | — | | | | — | | | | — | | | | 76,394 | |
| Unrealized Depreciation on Spot Contracts | | | — | | | | — | | | | 154 | | | | — | |
| Due to Broker | | | 331 | | | | 40,048 | | | | 902 | | | | — | |
| Total Liabilities | | | 26,233,698 | | | | 3,926,279 | | | | 1,306,677 | | | | 19,570,589 | |
| Net Assets | | $ | 364,789,567 | | | $ | 201,091,992 | | | $ | 26,204,933 | | | $ | 121,289,129 | |
| Net Assets Consist of: | | | | | | | | | | | | | | | | |
| Paid-in Capital | | $ | 355,786,014 | | | $ | 256,971,016 | | | $ | 24,414,687 | | | $ | 152,098,755 | |
| Total Distributable Earnings/(Loss) | | | 9,003,553 | | | | (55,879,024 | ) | | | 1,790,246 | | | | (30,809,626 | ) |
| Net Assets | | $ | 364,789,567 | | | $ | 201,091,992 | | | $ | 26,204,933 | | | $ | 121,289,129 | |
| Outstanding Shares of Beneficial Interest | | | | | | | | | | | | | | | | |
| (unlimited authorization — no par value) | | | 23,800,000 | | | | 17,150,000 | | | | 1,900,000 | | | | 3,800,000 | |
| Net Asset Value, Offering and Redemption Price Per Share | | $ | 15.33 | | | $ | 11.73 | | | $ | 13.79 | | | $ | 31.92 | |
| *Includes Market Value of Securities on Loan | | $ | 17,644,285 | | | $ | 3,705,414 | | | $ | — | | | $ | 7,144,660 | |
| | | | | | | | | | | | | | | | | |
| | |
Statements of Assets and Liabilities |
| |
|
| | | | | | | | | Global X Scientific Beta U.S. ETF | | | Global X Scientific Beta Europe ETF | |
| Assets: | | | | | | | | | | | | |
| Cost of Investments | | $ | 3,579,875 | | | $ | 50,091,073 | | | $ | 89,001,841 | | | $ | 5,100,368 | |
| Cost of Repurchase Agreement | | | — | | | | 25,691 | | | | — | | | | — | |
| Cost of Foreign Currency | | | — | | | | — | | | | — | | | | 1,196 | |
| Investments, at Value | | $ | 3,517,602 | | | $ | 56,035,726 | * | | $ | 99,497,927 | | | $ | 4,947,828 | |
| Repurchase Agreement, at Value | | | — | | | | 25,691 | | | | — | | | | — | |
| Cash | | | 2,146 | | | | 98,032 | | | | 156,421 | | | | 8,077 | |
| Foreign Currency, at Value | | | — | | | | — | | | | — | | | | 1,125 | |
| Receivable for Capital Shares Sold | | | 879,194 | | | | — | | | | — | | | | — | |
| Dividend and Interest Receivable | | | 664 | | | | 41,250 | | | | 77,331 | | | | 4,507 | |
| Unrealized Appreciation on Spot Contracts | | | — | | | | — | | | | — | | | | 13 | |
| Receivable for Investment Securities Sold | | | — | | | | 1,699,573 | | | | — | | | | 12,784 | |
| Reclaim Receivable | | | — | | | | — | | | | 541 | | | | 27,936 | |
| Total Assets | | | 4,399,606 | | | | 57,900,272 | | | | 99,732,220 | | | | 5,002,270 | |
| Liabilities: | | | | | | | | | | | | | | | | |
| Obligation to Return Securities Lending Collateral | | | — | | | | 29,260 | | | | — | | | | — | |
| Payable for Investment Securities Purchased | | | 881,289 | | | | — | | | | — | | | | 16,879 | |
| Payable due to Investment Adviser | | | 1,503 | | | | 35,984 | | | | 15,946 | | | | 1,567 | |
| Payable for Capital Shares Redeemed | | | — | | | | 1,701,030 | | | | — | | | | — | |
| Due to Custodian | | | 6 | | | | — | | | | — | | | | — | |
| Due to Broker | | | — | | | | — | | | | — | | | | 3,515 | |
| Total Liabilities | | | 882,798 | | | | 1,766,274 | | | | 15,946 | | | | 21,961 | |
| Net Assets | | $ | 3,516,808 | | | $ | 56,133,998 | | | $ | 99,716,274 | | | $ | 4,980,309 | |
| Net Assets Consist of: | | | | | | | | | | | | | | | | |
| Paid-in Capital | | $ | 3,621,247 | | | $ | 72,454,490 | | | $ | 95,040,260 | | | $ | 6,156,754 | |
| Total Distributable Earnings/(Loss) | | | (104,439 | ) | | | (16,320,492 | ) | | | 4,676,014 | | | | (1,176,445 | ) |
| Net Assets | | $ | 3,516,808 | | | $ | 56,133,998 | | | $ | 99,716,274 | | | $ | 4,980,309 | |
| Outstanding Shares of Beneficial Interest | | | | | | | | | | | | | | | | |
| (unlimited authorization — no par value) | | | 200,002 | | | | 1,650,000 | | | | 2,950,000 | | | | 200,000 | |
| Net Asset Value, Offering and Redemption Price Per Share | | $ | 17.58 | | | $ | 34.02 | | | $ | 33.80 | | | $ | 24.90 | |
| *Includes Market Value of Securities on Loan | | $ | — | | | $ | 26,530 | | | $ | — | | | $ | — | |
| | |
Statements of Assets and Liabilities |
| |
|
| | | Global X Scientific Beta Japan ETF | | | Global X Scientific Beta Asia ex-Japan ETF | | | Global X S&P 500® Catholic Values ETF | |
| Assets: | | | | | | | | | |
| Cost of Investments | | $ | 2,861,972 | | | $ | 2,433,681 | | | $ | 239,251,299 | |
| Investments, at Value | | $ | 2,816,092 | | | $ | 2,428,168 | | | $ | 274,959,883 | |
| Cash | | | — | | | | 5,722 | | | | 365,957 | |
| Dividend and Interest Receivable | | | 24,198 | | | | 1,686 | | | | 251,325 | |
| Receivable for Investment Securities Sold | | | — | | | | 1,960 | | | | — | |
| Reclaim Receivable | | | — | | | | — | | | | 2,208 | |
| Total Assets | | | 2,840,290 | | | | 2,437,536 | | | | 275,579,373 | |
| Liabilities: | | | | | | | | | | | | |
| Cash Overdraft | | | 2,561 | | | | — | | | | — | |
| Payable due to Investment Adviser | | | 892 | | | | 771 | | | | 66,209 | |
| Due to Broker | | | — | | | | — | | | | 2,392 | |
| Total Liabilities | | | 3,453 | | | | 771 | | | | 68,601 | |
| Net Assets | | $ | 2,836,837 | | | $ | 2,436,765 | | | $ | 275,510,772 | |
| Net Assets Consist of: | | | | | | | | | | | | |
| Paid-in Capital | | $ | 3,542,318 | | | $ | 2,967,109 | | | $ | 239,493,980 | |
| Total Distributable Earnings/(Loss) | | | (705,481 | ) | | | (530,344 | ) | | | 36,016,792 | |
| Net Assets | | $ | 2,836,837 | | | $ | 2,436,765 | | | $ | 275,510,772 | |
| Outstanding Shares of Beneficial Interest | | | | | | | | | | | | |
| (unlimited authorization — no par value) | | | 100,000 | | | | 100,000 | | | | 7,400,000 | |
| Net Asset Value, Offering and Redemption Price Per Share | | $ | 28.37 | | | $ | 24.37 | | | $ | 37.23 | |
| | |
Statements of Assets and Liabilities |
| |
|
| | | Global X NASDAQ 100® Covered Call ETF | | | Global X S&P 500® Covered Call ETF | | | Global X Russell 2000 Covered Call ETF | |
| Assets: | | | | | | | | | |
| Cost of Investments | | $ | 667,150,573 | | | $ | 116,486,555 | | | $ | 8,904,334 | |
| Investments, at Value | | $ | 787,737,270 | | | $ | 134,155,392 | | | $ | 9,005,036 | |
| Cash | | | 1,696,334 | | | | — | | | | 18,323 | |
| Receivable for Capital Shares Sold | | | 3,465,748 | | | | — | | | | — | |
| Dividend and Interest Receivable | | | 141,526 | | | | 119,984 | | | | — | |
| Reclaim Receivable | | | — | | | | 871 | | | | — | |
| Due from Custodian | | | — | | | | — | | | | — | |
| Total Assets | | | 793,040,878 | | | | 134,276,247 | | | | 9,023,359 | |
| Liabilities: | | | | | | | | | | | | |
| Options written at value (Premiums received $12,107,234, $459,498 and $142,671, respectively) | | | 20,928,375 | | | | 637,245 | | | | 182,970 | |
| Payable for Investment Securities Purchased | | | 3,560,089 | | | | — | | | | — | |
| Payable due to Investment Adviser | | | 489,927 | | | | 91,841 | | | | 4,846 | |
| Cash Overdraft | | | — | | | | 168,886 | | | | — | |
| Due to Broker | | | 26,131 | | | | 25,181 | | | | 2,160 | |
| Total Liabilities | | | 25,004,522 | | | | 923,153 | | | | 189,976 | |
| Net Assets | | $ | 768,036,356 | | | $ | 133,353,094 | | | $ | 8,833,383 | |
| Net Assets Consist of: | | | | | | | | | | | | |
| Paid-in Capital | | $ | 768,036,349 | | | $ | 133,326,602 | | | $ | 8,790,388 | |
| Total Distributable Earnings/(Loss) | | | 7 | | | | 26,492 | | | | 42,995 | |
| Net Assets | | $ | 768,036,356 | | | $ | 133,353,094 | | | $ | 8,833,383 | |
| Outstanding Shares of Beneficial Interest | | | | | | | | | | | | |
| (unlimited authorization — no par value) | | | 33,250,000 | | | | 2,700,000 | | | | 350,000 | |
| Net Asset Value, Offering and Redemption Price Per Share | | $ | 23.10 | | | $ | 49.39 | | | $ | 25.24 | |
| | | | | | | | | | | | | |
| | |
|
| For the year ended October 31, 2019
|
|
| | | Global X SuperDividend® ETF | | | Global X SuperDividend® U.S. ETF | | | Global X MSCI SuperDividend® Emerging Markets ETF | | | Global X MSCI SuperDividend® EAFE ETF | |
| Investment Income: | | | | | | | | | | | | |
| Dividend Income | | $ | 71,044,028 | | | $ | 23,955,323 | | | $ | 1,403,562 | | | $ | 566,190 | |
| Interest Income | | | 32,743 | | | | 15,124 | | | | 687 | | | | 60 | |
| Security Lending Income | | | 404,656 | | | | 367,575 | | | | — | | | | — | |
| Less: Foreign Taxes Withheld | | | (1,959,395 | ) | | | (10,715 | ) | | | (135,141 | ) | | | (33,059 | ) |
| Total Investment Income | | | 69,522,032 | | | | 24,327,307 | | | | 1,269,108 | | | | 533,191 | |
Supervision and Administration Fees(1) | | | 5,293,929 | | | | 2,072,413 | | | | 115,011 | | | | 50,688 | |
Custodian Fees(2) | | | 97,213 | | | | 30,780 | | | | 2,271 | | | | 477 | |
| Total Expenses | | | 5,391,142 | | | | 2,103,193 | | | | 117,282 | | | | 51,165 | |
| Net Investment Income | | | 64,130,890 | | | | 22,224,114 | | | | 1,151,826 | | | | 482,026 | |
| Net Realized Loss on: | | | | | | | | | | | | | | | | |
Investments(3) | | | (134,851,141 | ) | | | (8,535,081 | ) | | | (1,778,619 | ) | | | (81,183 | ) |
| Foreign Currency Transactions | | | (820,827 | ) | | | — | | | | (12,781 | ) | | | (2,383 | ) |
| Net Realized Loss on Investments and Foreign Currency Transactions | | | (135,671,968 | ) | | | (8,535,081 | ) | | | (1,791,400 | ) | | | (83,566 | ) |
| Net Change in Unrealized Appreciation (Depreciation) on: | | | | | | | | | | | | | | | | |
| Investments | | | 59,347,116 | | | | 2,304,041 | | | | 1,737,420 | | | | 1,253,815 | |
| Foreign Capital Gains Tax on Appreciated Securities | | | — | | | | — | | | | (2,053 | ) | | | — | |
| Foreign Currency Translations | | | 384,444 | | | | — | | | | (705 | ) | | | 2,521 | |
| Net Change in Unrealized Appreciation on Investments and Foreign Currency Translations | | | 59,731,560 | | | | 2,304,041 | | | | 1,734,662 | | | | 1,256,336 | |
| Net Realized and Unrealized Gain (Loss) on Investments and Foreign Currency Transactions and Translations | | | (75,940,408 | ) | | | (6,231,040 | ) | | | (56,738 | ) | | | 1,172,770 | |
| Net Increase (Decrease) in Net Assets Resulting from Operations | | $ | (11,809,518 | ) | | $ | 15,993,074 | | | $ | 1,095,088 | | | $ | 1,654,796 | |
| (1) | The Supervision and Administration fees reflect the supervisory and administrative fee, which includes fees paid by the Funds for the investment advisory services provided by the Adviser. (See Note 3 in Notes to Financial Statements.) |
| (2) | See Note 2 in Notes to Financial Statements. |
| (3) | Includes realized gains (losses) as a result of in-kind redemptions. (See Note 4 in Notes to Financial Statements.) |
| | | Global X SuperDividend® REIT ETF | | | Global X SuperIncome™ Preferred ETF | | | Global X YieldCo & Renewable Energy Income ETF | | | Global X Social Media ETF | |
| Investment Income: | | | | | | | | | | | | |
| Dividend Income | | $ | 15,611,280 | | | $ | 11,696,630 | | | $ | 392,756 | | | $ | 405,853 | |
| Interest Income | | | 3,004 | | | | 9,606 | | | | 744 | | | | 2,496 | |
| Security Lending Income | | | 75,714 | | | | 142,541 | | | | — | | | | 38,145 | |
| Less: Foreign Taxes Withheld | | | (337,606 | ) | | | — | | | | (85,348 | ) | | | (20,003 | ) |
| Total Investment Income | | | 15,352,392 | | | | 11,848,777 | | | | 308,152 | | | | 426,491 | |
Supervision and Administration Fees(1) | | | 1,221,133 | | | | 1,089,704 | | | | 120,510 | | | | 864,615 | |
Custodian Fees(2) | | | 13,506 | | | | 7,213 | | | | 493 | | | | 582 | |
| Total Expenses | | | 1,234,639 | | | | 1,096,917 | | | | 121,003 | | | | 865,197 | |
| Net Investment Income (Loss) | | | 14,117,753 | | | | 10,751,860 | | | | 187,149 | | | | (438,706 | ) |
| Net Realized Gain (Loss) on: | | | | | | | | | | | | | | | | |
Investments(3) | | | 1,230,098 | | | | (2,026,921 | ) | | | 224,522 | | | | 1,656,044 | |
| Foreign Currency Transactions | | | (34,216 | ) | | | — | | | | (33,696 | ) | | | 23,955 | |
| Net Realized Gain (Loss) on Investments and Foreign Currency Transactions | | | 1,195,882 | | | | (2,026,921 | ) | | | 190,826 | | | | 1,679,999 | |
| Net Change in Unrealized Appreciation (Depreciation) on: | | | | | | | | | | | | | | | | |
| Investments | | | 14,953,031 | | | | 6,821,972 | | | | 3,484,302 | | | | 11,082,072 | |
| Foreign Currency Translations | | | 970 | | | | — | | | | (57 | ) | | | (24 | ) |
| Net Change in Unrealized Appreciation on Investments and Foreign Currency Translations | | | 14,954,001 | | | | 6,821,972 | | | | 3,484,245 | | | | 11,082,048 | |
| Net Realized and Unrealized Gain on Investments and Foreign Currency Transactions and Translations | | | 16,149,883 | | | | 4,795,051 | | | | 3,675,071 | | | | 12,762,047 | |
| Net Increase in Net Assets Resulting from Operations | | $ | 30,267,636 | | | $ | 15,546,911 | | | $ | 3,862,220 | | | $ | 12,323,341 | |
| | | | | | | | | | | | | | | | | |
| (1) | The Supervision and Administration fees reflect the supervisory and administrative fee, which includes fees paid by the Funds for the investment advisory services provided by the Adviser. (See Note 3 in Notes to Financial Statements.) |
| (2) | See Note 2 in the Notes to Financial Statements. |
| (3) | Includes realized gains (losses) as a result of in-kind redemptions. (See Note 4 in Notes to Financial Statements.) |
| | | | | | | | | Global X Scientific Beta U.S. ETF | | | Global X Scientific Beta Europe ETF | |
| Investment Income: | | | | | | | | | | | | |
| Dividend Income | | $ | 7,598 | | | $ | 559,047 | | | $ | 2,017,876 | | | $ | 190,802 | |
| Interest Income | | | — | | | | 7,552 | | | | 4,149 | | | | 193 | |
| Security Lending Income | | | — | | | | 81,939 | | | | — | | | | — | |
| Less: Foreign Taxes Withheld | | | (352 | ) | | | (6,763 | ) | | | — | | | | (30,519 | ) |
| Total Investment Income | | | 7,246 | | | | 641,775 | | | | 2,022,025 | | | | 160,476 | |
Supervision and Administration Fees(1) | | | 13,645 | | | | 425,632 | | | | 225,614 | | | | 20,281 | |
Custodian Fees(2) | | | 30 | | | | 1,462 | | | | 1,255 | | | | 619 | |
| Total Expenses | | | 13,675 | | | | 427,094 | | | | 226,869 | | | | 20,900 | |
| Waiver of Supervision and Administration Fees | | | – | | | | – | | | | (32,075 | ) | | | – | |
| Net Expenses | | | 13,675 | | | | 427,094 | | | | 194,794 | | | | 20,900 | |
| Net Investment Income (Loss) | | | (6,429 | ) | | | 214,681 | | | | 1,827,231 | | | | 139,576 | |
| Net Realized Gain (Loss) on: | | | | | | | | | | | | | | | | |
Investments(3) | | | 273,723 | | | | 1,800,709 | | | | 1,173,339 | | | | (592,468 | ) |
| Foreign Currency Transactions | | | 1,052 | | | | — | | | | — | | | | 911 | |
| Net Realized Gain (Loss) on Investments and Foreign Currency Transactions | | | 274,775 | | | | 1,800,709 | | | | 1,173,339 | | | | (591,557 | ) |
| Net Change in Unrealized Appreciation (Depreciation) on: | | | | | | | | | | | | | | | | |
| Investments | | | (62,273 | ) | | | 5,386,322 | | | | 8,393,384 | | | | 827,864 | |
| Foreign Currency Translations | | | — | | | | — | | | | — | | | | 805 | |
| Net Change in Unrealized Appreciation (Depreciation) on Investments and Foreign Currency Translations | | | (62,273 | ) | | | 5,386,322 | | | | 8,393,384 | | | | 828,669 | |
| Net Realized and Unrealized Gain on Investments and Foreign Currency Transactions and Translations | | | 212,502 | | | | 7,187,031 | | | | 9,566,723 | | | | 237,112 | |
| Net Increase in Net Assets Resulting from Operations | | $ | 206,073 | | | $ | 7,401,712 | | | $ | 11,393,954 | | | $ | 376,688 | |
| | | | | | | | | | | | | | | | | |
* The Fund commenced operations on November 27, 2018.
| (1) | The Supervision and Administration fees reflect the supervisory and administrative fee, which includes fees paid by the Funds for the investment advisory services provided by the Adviser. (See Note 3 in Notes to Financial Statements.) |
| (2) | See Note 2 in the Notes to Financial Statements. |
| (3) | Includes realized gains (losses) as a result of in-kind redemptions. (See Note 4 in Notes to Financial Statements.) |
| | | Global X Scientific Beta Japan ETF | | | Global X Scientific Beta Asia ex-Japan ETF | | | Global X S&P 500® Catholic Values ETF | |
| Investment Income: | | | | | | | | | |
| Dividend Income | | $ | 77,609 | | | $ | 106,114 | | | $ | 4,438,114 | |
| Interest Income | | | 45 | | | | 113 | | | | 7,153 | |
| Less: Foreign Taxes Withheld | | | (5,104 | ) | | | (2,795 | ) | | | — | |
| Total Investment Income | | | 72,550 | | | | 103,432 | | | | 4,445,267 | |
Supervision and Administration Fees(1) | | | 14,249 | | | | 9,878 | | | | 662,610 | |
Custodian Fees(2) | | | 584 | | | | 98 | | | | 407 | |
| Total Expenses | | | 14,833 | | | | 9,976 | | | | 663,017 | |
| Net Investment Income | | | 57,717 | | | | 93,456 | | | | 3,782,250 | |
| Net Realized Gain (Loss) on: | | | | | | | | | | | | |
Investments(3) | | | (361,860 | ) | | | (306,282 | ) | | | 6,721,506 | |
| Foreign Currency Transactions | | | 857 | | | | 1,132 | | | | — | |
| Net Realized Gain (Loss) on Investments and Foreign Currency Transactions | | | (361,003 | ) | | | (305,150 | ) | | | 6,721,506 | |
| Net Change in Unrealized Appreciation (Depreciation) on: | | | | | | | | | | | | |
| Investments | | | 387,525 | | | | 406,137 | | | | 21,644,396 | |
| Foreign Currency Translations | | | (76 | ) | | | — | | | | — | |
| Net Change in Unrealized Appreciation on Investments and Foreign Currency Translations | | | 387,449 | | | | 406,137 | | | | 21,644,396 | |
| Net Realized and Unrealized Gain on Investments and Foreign Currency Transactions and Translations | | | 26,446 | | | | 100,987 | | | | 28,365,902 | |
| Net Increase in Net Assets Resulting from Operations | | $ | 84,163 | | | $ | 194,443 | | | $ | 32,148,152 | |
| (1) | The Supervision and Administration fees reflect the supervisory and administrative fee, which includes fees paid by the Funds for the investment advisory services provided by the Adviser. (See Note 3 in Notes to Financial Statements.) |
| (2) | See Note 2 in the Notes to Financial Statements. |
| (3) | Includes realized gains (losses) as a result of in-kind redemptions. (See Note 4 in Notes to Financial Statements.) |
| | | Global X NASDAQ 100® Covered Call ETF* | | | Global X S&P 500® Covered Call ETF* | | | Global X Russell 2000 Covered Call ETF** | |
| Investment Income: | | | | | | | | | |
| Dividend Income | | $ | 5,763,880 | | | $ | 2,003,333 | | | $ | 39,868 | |
| Interest Income | | | — | | | | 780 | | | | — | |
| Less: Foreign Taxes Withheld | | | (5,374 | ) | | | (18 | ) | | | — | |
| Total Investment Income | | | 5,758,506 | | | | 2,004,095 | | | | 39,868 | |
Supervision and Administration Fees(1) | | | 3,120,087 | | | | 642,764 | | | | 15,979 | |
Custodian Fees(2) | | | 8,630 | | | | 3,717 | | | | 160 | |
| Broker Fees | | | 1,278,689 | | | | 209,025 | | | | 9,562 | |
| Total Expenses | | | 4,407,406 | | | | 855,506 | | | | 25,701 | |
| Waiver of Supervision and Administration Fees | | | – | | | | – | | | | (3,995 | ) |
| Net Expenses | | | 4,407,406 | | | | 855,506 | | | | 21,706 | |
| Net Investment Income | | | 1,351,100 | | | | 1,148,589 | | | | 18,162 | |
| Net Realized Gain (Loss) on: | | | | | | | | | | | | |
Investments(3) | | | (4,203,258 | ) | | | 2,655,594 | | | | (7,550 | ) |
| Written Options | | | (16,047,980 | ) | | | (3,492,656 | ) | | | 229,560 | |
| Net Realized Gain (Loss) on Investments and Written Options | | | (20,251,238 | ) | | | (837,062 | ) | | | 222,010 | |
| Net Change in Unrealized Appreciation (Depreciation) on: | | | | | | | | | | | | |
| Investments | | | 87,211,205 | | | | 9,558,849 | | | | 100,702 | |
| Written Options | | | (13,909,777 | ) | | | (533,032 | ) | | | (40,299 | ) |
| Net Change in Unrealized Appreciation on Investments and Written Options | | | 73,301,428 | | | | 9,025,817 | | | | 60,403 | |
| Net Realized and Unrealized Gain on Investments and Written Options | | | 53,050,190 | | | | 8,188,755 | | | | 282,413 | |
| Net Increase in Net Assets Resulting from Operations | | $ | 54,401,290 | | | $ | 9,337,344 | | | $ | 300,575 | |
| | | | | | | | | | | | | |
| * | The financial statements include the financial information of the Predecessor Fund through December 21, 2018 (See Note 1). |
| ** | The Fund commenced operations on April 17, 2019. |
| (1) | The Supervision and Administration fees reflect the supervisory and administrative fee, which includes fees paid by the Funds for the investment advisory services provided by the Adviser. (See Note 3 in Notes to Financial Statements.) |
| (2) | See Note 2 in the Notes to Financial Statements. |
| (3) | Includes realized gains (losses) as a result of in-kind redemptions. (See Note 4 in Notes to Financial Statements.) |
| | |
Statements of Changes in Net Assets
|
| | | Global X SuperDividend® ETF | | | Global X SuperDividend® U.S. ETF | |
| | | Year Ended October 31, 2019 | | | Year Ended October 31, 2018 | | | Year Ended October 31, 2019 | | | Year Ended October 31, 2018 | |
| Operations: | | | | | | | | | | | | |
| Net Investment Income | | $ | 64,130,890 | | | $ | 62,435,723 | | | $ | 22,224,114 | | | $ | 17,750,149 | |
Net Realized Gain (Loss) on Investments and Foreign Currency Transactions(1) | | | (135,671,968 | ) | | | (2,401,689 | ) | | | (8,535,081 | ) | | | 13,296,322 | |
| Net Change in Unrealized Appreciation (Depreciation) on Investments and Foreign Currency Translations | | | 59,731,560 | | | | (104,940,755 | ) | | | 2,304,041 | | | | (16,890,509 | ) |
| Net Increase (Decrease) in Net Assets Resulting from Operations | | | (11,809,518 | ) | | | (44,906,721 | ) | | | 15,993,074 | | | | 14,155,962 | |
| Distributions | | | (71,080,700 | ) | | | (65,545,294 | ) | | | (29,513,428 | ) | | | (22,214,715 | ) |
| Return of Capital | | | (10,387,010 | ) | | | (5,188,066 | ) | | | (5,156,842 | ) | | | (3,376,555 | ) |
| Capital Share Transactions: | | | | | | | | | | | | | | | | |
| Issued | | | 166,372,434 | | | | 260,902,153 | | | | 163,958,810 | | | | 47,496,144 | |
| Redeemed | | | (53,952,618 | ) | | | (225,187,582 | ) | | | (13,708,213 | ) | | | (48,329,063 | ) |
| Increase (Decrease) in Net Assets from Capital Share Transactions | | | 112,419,816 | | | | 35,714,571 | | | | 150,250,597 | | | | (832,919 | ) |
| Total Increase (Decrease) in Net Assets | | | 19,142,588 | | | | (79,925,510 | ) | | | 131,573,401 | | | | (12,268,227 | ) |
| Net Assets: | | | | | | | | | | | | | | | | |
| Beginning of Year | | | 912,967,921 | | | | 992,893,431 | | | | 413,311,048 | | | | 425,579,275 | |
| End of Year | | $ | 932,110,509 | | | $ | 912,967,921 | | | $ | 544,884,449 | | | $ | 413,311,048 | |
| Share Transactions: | | | | | | | | | | | | | | | | |
| Issued | | | 9,400,000 | | | | 12,550,000 | | | | 7,100,000 | | | | 1,900,000 | |
| Redeemed | | | (3,250,000 | ) | | | (10,800,000 | ) | | | (600,000 | ) | | | (1,950,000 | ) |
| Net Increase (Decrease) in Shares Outstanding from Share Transactions | | | 6,150,000 | | | | 1,750,000 | | | | 6,500,000 | | | | (50,000 | ) |
| (1) | Includes realized gains (losses) as a result of in-kind redemptions. (See Note 4 in Notes to Financial Statements.) |
| | | Global X MSCI SuperDividend® Emerging Markets ETF | | | Global X MSCI SuperDividend® EAFE ETF | |
| | | Year Ended October 31, 2019 | | | Year Ended October 31, 2018 | | | Year Ended October 31, 2019 | | | Year Ended October 31, 2018 | |
| Operations: | | | | | | | | | | | | |
| Net Investment Income | | $ | 1,151,826 | | | $ | 875,886 | | | $ | 482,026 | | | $ | 333,715 | |
Net Realized Gain (Loss) on Investments and Foreign Currency Transactions(1) | | | (1,791,400 | ) | | | (1,403,076 | ) | | | (83,566 | ) | | | 151,717 | |
| Net Change in Unrealized Appreciation (Depreciation) on Investments and Foreign Currency Translations | | | 1,734,662 | | | | (1,993,585 | ) | | | 1,256,336 | | | | (896,496 | ) |
| Net Increase (Decrease) in Net Assets Resulting from Operations | | | 1,095,088 | | | | (2,520,775 | ) | | | 1,654,796 | | | | (411,064 | ) |
| Distributions | | | (1,146,140 | ) | | | (855,368 | ) | | | (547,298 | ) | | | (295,154 | ) |
| Capital Share Transactions: | | | | | | | | | | | | | | | | |
| Issued | | | 7,384,916 | | | | 8,743,882 | | | | 16,548,006 | | | | 8,980,111 | |
| Redeemed | | | (2,105,142 | ) | | | (5,856,010 | ) | | | (3,916,333 | ) | | | (5,299,157 | ) |
| Increase in Net Assets from Capital Share Transactions | | | 5,279,774 | | | | 2,887,872 | | | | 12,631,673 | | | | 3,680,954 | |
| Total Increase (Decrease) in Net Assets | | | 5,228,722 | | | | (488,271 | ) | | | 13,739,171 | | | | 2,974,736 | |
| Net Assets: | | | | | | | | | | | | | | | | |
| Beginning of Year | | | 12,260,056 | | | | 12,748,327 | | | | 4,787,946 | | | | 1,813,210 | |
| End of Year | | $ | 17,488,778 | | | $ | 12,260,056 | | | $ | 18,527,117 | | | $ | 4,787,946 | |
| Share Transactions: | | | | | | | | | | | | | | | | |
| Issued | | | 550,000 | | | | 550,000 | | | | 1,100,000 | | | | 500,000 | |
| Redeemed | | | (150,000 | ) | | | (400,000 | ) | | | (250,000 | ) | | | (300,000 | ) |
| Net Increase in Shares Outstanding from Share Transactions | | | 400,000 | | | | 150,000 | | | | 850,000 | | | | 200,000 | |
| | | | | | | | | | | | | | | | | |
| (1) | Includes realized gains (losses) as a result of in-kind redemptions. (See Note 4 in Notes to Financial Statements.) |
| | | Global X SuperDividend® REIT ETF | | | Global X SuperIncome™ Preferred ETF | |
| | | Year Ended October 31, 2019 | | | Year Ended October 31, 2018 | | | Year Ended October 31, 2019 | | | Year Ended October 31, 2018 | |
| Operations: | | | | | | | | | | | | |
| Net Investment Income | | $ | 14,117,753 | | | $ | 4,808,758 | | | $ | 10,751,860 | | | $ | 13,492,476 | |
Net Realized Gain (Loss) on Investments and Foreign Currency Transactions(1) | | | 1,195,882 | | | | 856,506 | | | | (2,026,921 | ) | | | (28,163,755 | ) |
| Net Change in Unrealized Appreciation (Depreciation) on Investments and Foreign Currency Translations | | | 14,954,001 | | | | (3,894,198 | ) | | | 6,821,972 | | | | 13,006,479 | |
| Net Increase (Decrease) in Net Assets Resulting from Operations | | | 30,267,636 | | | | 1,771,066 | | | | 15,546,911 | | | | (1,664,800 | ) |
| Distributions | | | (16,433,940 | ) | | | (6,474,049 | ) | | | (11,905,843 | ) | | | (14,835,000 | ) |
| Return of Capital | | | — | | | | — | | | | (83,858 | ) | | | — | |
| Capital Share Transactions: | | | | | | | | | | | | | | | | |
| Issued | | | 232,547,489 | | | | 89,973,693 | | | | 35,371,469 | | | | 2,378,589 | |
| Redeemed | | | — | | | | (18,848,448 | ) | | | (23,990,686 | ) | | | (36,055,297 | ) |
| Increase (Decrease) in Net Assets from Capital Share Transactions | | | 232,547,489 | | | | 71,125,245 | | | | 11,380,783 | | | | (33,676,708 | ) |
| Total Increase (Decrease) in Net Assets | | | 246,381,185 | | | | 66,422,262 | | | | 14,937,993 | | | | (50,176,508 | ) |
| Net Assets: | | | | | | | | | | | | | | | | |
| Beginning of Year | | | 118,408,382 | | | | 51,986,120 | | | | 186,153,999 | | | | 236,330,507 | |
| End of Year | | $ | 364,789,567 | | | $ | 118,408,382 | | | $ | 201,091,992 | | | $ | 186,153,999 | |
| Share Transactions: | | | | | | | | | | | | | | | | |
| Issued | | | 15,700,000 | | | | 5,950,000 | | | | 3,050,000 | | | | 200,000 | |
| Redeemed | | | — | | | | (1,250,000 | ) | | | (2,100,000 | ) | | | (3,000,000 | ) |
| Net Increase (Decrease) in Shares Outstanding from Share Transactions | | | 15,700,000 | | | | 4,700,000 | | | | 950,000 | | | | (2,800,000 | ) |
| (1) | Includes realized gains (losses) as a result of in-kind redemptions. (See Note 4 in Notes to Financial Statements.) |
| | | Global X YieldCo & Renewable Energy Income ETF | | | Global X Social Media ETF | |
| | | Year Ended October 31, 2019 | | | Year Ended October 31, 2018 | | | Year Ended October 31, 2019 | | | Year Ended October 31, 2018 | |
| Operations: | | | | | | | | | | | | |
| Net Investment Income (Loss) | | $ | 187,149 | | | $ | 632,314 | | | $ | (438,706 | ) | | $ | (293,991 | ) |
Net Realized Gain on Investments and Foreign Currency Transactions(1) | | | 190,826 | | | | 701,352 | | | | 1,679,999 | | | | 12,232,575 | |
| Net Change in Unrealized Appreciation (Depreciation) on Investments and Foreign Currency Translations | | | 3,484,245 | | | | (1,980,386 | ) | | | 11,082,048 | | | | (31,505,148 | ) |
| Net Increase (Decrease) in Net Assets Resulting from Operations | | | 3,862,220 | | | | (646,720 | ) | | | 12,323,341 | | | | (19,566,564 | ) |
| Distributions | | | (644,590 | ) | | | (843,401 | ) | | | — | | | | (2,573,545 | ) |
| Return of Capital | | | — | | | | (154,396 | ) | | | — | | | | — | |
| Capital Share Transactions: | | | | | | | | | | | | | | | | |
| Issued | | | 9,218,950 | | | | 5,365,866 | | | | 6,158,958 | | | | 82,487,710 | |
| Redeemed | | | (1,787,815 | ) | | | (8,211,576 | ) | | | (26,689,127 | ) | | | (95,849,176 | ) |
| Increase (Decrease) in Net Assets from Capital Share Transactions | | | 7,431,135 | | | | (2,845,710 | ) | | | (20,530,169 | ) | | | (13,361,466 | ) |
| Total Increase (Decrease) in Net Assets | | | 10,648,765 | | | | (4,490,227 | ) | | | (8,206,828 | ) | | | (35,501,575 | ) |
| Net Assets: | | | | | | | | | | | | | | | | |
| Beginning of Year | | | 15,556,168 | | | | 20,046,395 | | | | 129,495,957 | | | | 164,997,532 | |
| End of Year | | $ | 26,204,933 | | | $ | 15,556,168 | | | $ | 121,289,129 | | | $ | 129,495,957 | |
| Share Transactions: | | | | | | | | | | | | | | | | |
| Issued | | | 700,000 | | | | 450,000 | | | | 200,000 | | | | 2,300,000 | |
| Redeemed | | | (150,000 | ) | | | (700,000 | ) | | | (850,000 | ) | | | (2,900,000 | ) |
| Net Increase (Decrease) in Shares Outstanding from Share Transactions | | | 550,000 | | | | (250,000 | ) | | | (650,000 | ) | | | (600,000 | ) |
| (1) | Includes realized gains (losses) as a result of in-kind redemptions. (See Note 4 in Notes to Financial Statements.) |
| | | | | | | |
| | | Period Ended October 31, 2019(1) | | | Year Ended October 31, 2019 | | | Year Ended October 31, 2018 | |
| Operations: | | | | | | | | | |
| Net Investment Income (Loss) | | $ | (6,429 | ) | | $ | 214,681 | | | $ | 209,448 | |
Net Realized Gain on Investments and Foreign Currency Transactions(2) | | | 274,775 | | | | 1,800,709 | | | | 7,401,404 | |
| Net Change in Unrealized Appreciation (Depreciation) on Investments and Foreign Currency Translations | | | (62,273 | ) | | | 5,386,322 | | | | (4,728,075 | ) |
| Net Increase in Net Assets Resulting from Operations | | | 206,073 | | | | 7,401,712 | | | | 2,882,777 | |
| Distributions | | | — | | | | (310,767 | ) | | | (302,653 | ) |
| Return of Capital | | | — | | | | (82,434 | ) | | | — | |
| Capital Share Transactions: | | | | | | | | | | | | |
| Issued | | | 4,225,143 | | | | 1,570,034 | | | | 1,601,325 | |
| Redeemed | | | (914,408 | ) | | | (9,624,431 | ) | | | (2,957,354 | ) |
| Increase (Decrease) in Net Assets from Capital Share Transactions | | | 3,310,735 | | | | (8,054,397 | ) | | | (1,356,029 | ) |
| Total Increase (Decrease) in Net Assets | | | 3,516,808 | | | | (1,045,886 | ) | | | 1,224,095 | |
| Net Assets: | | | | | | | | | | | | |
| Beginning of Year | | | — | | | | 57,179,884 | | | | 55,955,789 | |
| End of Year | | $ | 3,516,808 | | | $ | 56,133,998 | | | $ | 57,179,884 | |
| Share Transactions: | | | | | | | | | | | | |
| Issued | | | 250,002 | | | | 50,000 | | | | 50,000 | |
| Redeemed | | | (50,000 | ) | | | (300,000 | ) | | | (100,000 | ) |
| Net Increase (Decrease) in Shares Outstanding from Share Transactions | | | 200,002 | | | | (250,000 | ) | | | (50,000 | ) |
| | | | | | | | | | | | | |
| (1) | The Fund commenced operations on November 27, 2018 |
| (2) | Includes realized gains (losses) as a result of in-kind redemptions. (See Note 4 in Notes to Financial Statements.) |
| | | Global X Scientific Beta U.S. ETF | | | Global X Scientific Beta Europe ETF | |
| | | Year Ended October 31, 2019 | | | Year Ended October 31, 2018 | | | Year Ended October 31, 2019 | | | Year Ended October 31, 2018 | |
| Operations: | | | | | | | | | | | | |
| Net Investment Income | | $ | 1,827,231 | | | $ | 2,262,680 | | | $ | 139,576 | | | $ | 291,190 | |
Net Realized Gain (Loss) on Investments and Foreign Currency Transactions(1) | | | 1,173,339 | | | | 16,116,337 | | | | (591,557 | ) | | | 2,210,628 | |
| Net Change in Unrealized Appreciation (Depreciation) on Investments and Foreign Currency Translations | | | 8,393,384 | | | | (12,015,276 | ) | | | 828,669 | | | | (3,513,676 | ) |
| Net Increase (Decrease) in Net Assets Resulting from Operations | | | 11,393,954 | | | | 6,363,741 | | | | 376,688 | | | | (1,011,858 | ) |
| Distributions | | | (3,062,493 | ) | | | (1,913,894 | ) | | | (423,851 | ) | | | (494,437 | ) |
| Capital Share Transactions: | | | | | | | | | | | | | | | | |
| Issued | | | 1,686,481 | | | | 47,858,633 | | | | — | | | | 2,761,131 | |
| Redeemed | | | (36,888,553 | ) | | | (60,905,583 | ) | | | (4,906,432 | ) | | | (12,644,199 | ) |
| Decrease in Net Assets from Capital Share Transactions | | | (35,202,072 | ) | | | (13,046,950 | ) | | | (4,906,432 | ) | | | (9,883,068 | ) |
| Total Decrease in Net Assets | | | (26,870,611 | ) | | | (8,597,103 | ) | | | (4,953,595 | ) | | | (11,389,363 | ) |
| Net Assets: | | | | | | | | | | | | | | | | |
| Beginning of Year | | | 126,586,885 | | | | 135,183,988 | | | | 9,933,904 | | | | 21,323,267 | |
| End of Year | | $ | 99,716,274 | | | $ | 126,586,885 | | | $ | 4,980,309 | | | $ | 9,933,904 | |
| Share Transactions: | | | | | | | | | | | | | | | | |
| Issued | | | 50,000 | | | | 1,500,000 | | | | — | | | | 100,000 | |
| Redeemed | | | (1,200,000 | ) | | | (1,900,000 | ) | | | (200,000 | ) | | | (450,000 | ) |
| Net Decrease in Shares Outstanding from Share Transactions | | | (1,150,000 | ) | | | (400,000 | ) | | | (200,000 | ) | | | (350,000 | ) |
| | | | | | | | | | | | | | | | | |
| (1) | Includes realized gains (losses) as a result of in-kind redemptions. (See Note 4 in Notes to Financial Statements.) |
| | | Global X Scientific Beta Japan ETF | | | Global X Scientific Beta Asia ex-Japan ETF | |
| | | Year Ended October 31, 2019 | | | Year Ended October 31, 2018 | | | Year Ended October 31, 2019 | | | Year Ended October 31, 2018 | |
| Operations: | | | | | | | | | | | | |
| Net Investment Income | | $ | 57,717 | | | $ | 137,505 | | | $ | 93,456 | | | $ | 167,905 | |
Net Realized Gain (Loss) on Investments and Foreign Currency Transactions(1) | | | (361,003 | ) | | | 2,006,602 | | | | (305,150 | ) | | | 316,795 | |
| Net Change in Unrealized Appreciation (Depreciation) on Investments and Foreign Currency Translations | | | 387,449 | | | | (2,703,846 | ) | | | 406,137 | | | | (833,854 | ) |
| Net Increase (Decrease) in Net Assets Resulting from Operations | | | 84,163 | | | | (559,739 | ) | | | 194,443 | | | | (349,154 | ) |
| Distributions | | | (176,524 | ) | | | (339,465 | ) | | | (210,319 | ) | | | (167,280 | ) |
| Capital Share Transactions: | | | | | | | | | | | | | | | | |
| Issued | | | — | | | | 1,549,503 | | | | 1,143,206 | | | | 2,583,767 | |
| Redeemed | | | (5,479,512 | ) | | | (9,550,141 | ) | | | (2,173,540 | ) | | | (2,441,200 | ) |
| Increase (Decrease) in Net Assets from Capital Share Transactions | | | (5,479,512 | ) | | | (8,000,638 | ) | | | (1,030,334 | ) | | | 142,567 | |
| Total Decrease in Net Assets | | | (5,571,873 | ) | | | (8,899,842 | ) | | | (1,046,210 | ) | | | (373,867 | ) |
| Net Assets: | | | | | | | | | | | | | | | | |
| Beginning of Year | | | 8,408,710 | | | | 17,308,552 | | | | 3,482,975 | | | | 3,856,842 | |
| End of Year | | $ | 2,836,837 | | | $ | 8,408,710 | | | $ | 2,436,765 | | | $ | 3,482,975 | |
| Share Transactions: | | | | | | | | | | | | | | | | |
| Issued | | | — | | | | 50,000 | | | | 50,000 | | | | 100,000 | |
| Redeemed | | | (200,000 | ) | | | (300,000 | ) | | | (100,000 | ) | | | (100,000 | ) |
| Net Decrease in Shares Outstanding from Share Transactions | | | (200,000 | ) | | | (250,000 | ) | | | (50,000 | ) | | | — | |
| | | | | | | | | | | | | | | | | |
| (1) | Includes realized gains (losses) as a result of in-kind redemptions. (See Note 4 in Notes to Financial Statements.) |
| | | Global X S&P 500® Catholic Values ETF | | | Global X NASDAQ 100® Covered Call ETF* | |
| | | Year Ended October 31, 2019 | | | Year Ended October 31, 2018 | | | Year Ended October 31, 2019 | | | Year Ended October 31, 2018 | |
| Operations: | | | | | | | | | | | | |
| Net Investment Income | | $ | 3,782,250 | | | $ | 2,510,258 | | | $ | 1,351,100 | | | $ | 732,520 | |
Net Realized Gain (Loss) on Investments, Written Options and Foreign Currency Transactions(1) | | | 6,721,506 | | | | 4,506,579 | | | | (20,251,238 | ) | | | (2,708,662 | ) |
| Net Change in Unrealized Appreciation (Depreciation) on Investments, Written Options and Foreign Currency Translations | | | 21,644,396 | | | | 2,242,061 | | | | 73,301,428 | | | | 11,297,314 | |
| Net Increase in Net Assets Resulting from Operations | | | 32,148,152 | | | | 9,258,898 | | | | 54,401,290 | | | | 9,321,172 | |
| Distributions | | | (4,718,097 | ) | | | (1,688,672 | ) | | | (42,482,025 | ) | | | (9,059,626 | ) |
| Return of Capital | | | — | | | | — | | | | (12,331,150 | ) | | | (17,698,697 | ) |
| Capital Share Transactions: | | | | | | | | | | | | | | | | |
| Issued | | | 126,239,636 | | | | 40,013,214 | | | | 391,863,250 | | | | 283,373,920 | |
| Redeemed | | | (25,948,245 | ) | | | (14,374,854 | ) | | | (18,616,590 | ) | | | (28,715,190 | ) |
| Increase in Net Assets from Capital Share Transactions | | | 100,291,391 | | | | 25,638,360 | | | | 373,246,660 | | | | 254,658,730 | |
| Total Increase in Net Assets | | | 127,721,446 | | | | 33,208,586 | | | | 372,834,775 | | | | 237,221,579 | |
| Net Assets: | | | | | | | | | | | | | | | | |
| Beginning of Year | | | 147,789,326 | | | | 114,580,740 | | | | 395,201,581 | | | | 157,980,002 | |
| End of Year | | $ | 275,510,772 | | | $ | 147,789,326 | | | $ | 768,036,356 | | | $ | 395,201,581 | |
| Share Transactions: | | | | | | | | | | | | | | | | |
| Issued | | | 3,750,000 | | | | 1,200,000 | | | | 17,250,000 | | | | 11,500,000 | |
| Redeemed | | | (750,000 | ) | | | (400,000 | ) | | | (850,000 | ) | | | (1,150,000 | ) |
| Net Increase in Shares Outstanding from Share Transactions | | | 3,000,000 | | | | 800,000 | | | | 16,400,000 | | | | 10,350,000 | |
| | | | | | | | | | | | | | | | | |
| * | The financial statements include the financial information of the Predecessor Funds through December 21, 2018 (See Note 1 in Notes to Financial Statements). |
| (1) | Includes realized gains (losses) as a result of in-kind redemptions. (See Note 4 in Notes to Financial Statements.) |
| | | Global X S&P 500® Covered Call ETF* | | | Global X Russell 2000 Covered Call ETF | |
| | | Year Ended October 31, 2019 | | | Year Ended October 31, 2018 | | | Period Ended October 31, 2019(1) | |
| Operations: | | | | | | | | | |
| Net Investment Income | | $ | 1,148,589 | | | $ | 723,281 | | | $ | 18,162 | |
Net Realized Gain (Loss) on Investments and Written Options(2) | | | (837,062 | ) | | | 5,438,118 | | | | 222,010 | |
| Net Change in Unrealized Appreciation (Depreciation) on Investments and Written Options | | | 9,025,817 | | | | (4,843,961 | ) | | | 60,403 | |
| Net Increase in Net Assets Resulting from Operations | | | 9,337,344 | | | | 1,317,438 | | | | 300,575 | |
| Distributions | | | (5,450,400 | ) | | | (1,882,552 | ) | | | (257,580 | ) |
| Return of Capital | | | (780,262 | ) | | | (3,049,443 | ) | | | — | |
| Capital Share Transactions: | | | | | | | | | | | | |
| Issued | | | 64,332,407 | | | | 38,709,355 | | | | 8,790,388 | |
| Redeemed | | | (11,786,529 | ) | | | (20,022,760 | ) | | | — | |
| Increase in Net Assets from Capital Share Transactions | | | 52,545,878 | | | | 18,686,595 | | | | 8,790,388 | |
| Total Increase in Net Assets | | | 55,652,560 | | | | 15,072,038 | | | | 8,833,383 | |
| Net Assets: | | | | | | | | | | | | |
| Beginning of Year | | | 77,700,534 | | | | 62,628,496 | | | | — | |
| End of Year | | $ | 133,353,094 | | | $ | 77,700,534 | | | $ | 8,833,383 | |
| Share Transactions: | | | | | | | | | | | | |
| Issued | | | 1,350,000 | | | | 750,000 | | | | 350,000 | |
| Redeemed | | | (250,000 | ) | | | (400,000 | ) | | | — | |
| Net Increase in Shares Outstanding from Share Transactions | | | 1,100,000 | | | | 350,000 | | | | 350,000 | |
| * | The financial statements include the financial information of the Predecessor Funds through December 21, 2018 (See Note 1 in Notes to Financial Statements). |
| (1) | The Fund commenced operations on April 17, 2019. |
| (2) | Includes realized gains (losses) as a result of in-kind redemptions. (See Note 4 in Notes to Financial Statements.) |
Selected Per Share Data & Ratios
For a Share Outstanding Throughout the Period
| | | Net
Asset Value, Beginning
of Period
($) | | | Net Investment Income
($)* | | | Net Realized and Unrealized Gain (Loss) on Investments
($) | | | Total from Operations
($) | | | Distribution from Net Investment Income ($) | | | Distribution from Capital Gains ($) | |
Global X SuperDividend® ETF | |
| 2019 | | | 19.06 | | | | 1.24 | | | | (1.47 | ) | | | (0.23 | ) | | | (1.38 | ) | | | — | |
| 2018 | | | 21.51 | | | | 1.35 | | | | (2.26 | ) | | | (0.91 | ) | | | (1.43 | ) | | | — | |
| 2017 | | | 20.43 | | | | 1.08 | | | | 1.45 | | | | 2.53 | | | | (1.22 | ) | | | — | |
| 2016 | | | 20.65 | | | | 1.15 | | | | 0.08 | | | | 1.23 | | | | (1.30 | ) | | | — | |
| 2015 | | | 24.24 | | | | 1.26 | | | | (3.36 | ) | | | (2.10 | ) | | | (1.44 | ) | | | (0.05 | ) |
Global X SuperDividend® U.S. ETF | |
| 2019 | | | 24.53 | | | | 1.12 | | | | (0.56 | ) | | | 0.56 | | | | (1.49 | ) | | | — | |
| 2018 | | | 25.18 | | | | 1.07 | | | | (0.17 | ) | | | 0.90 | | | | (1.35 | ) | | | — | |
| 2017 | | | 24.00 | | | | 0.79 | | | | 1.94 | | | | 2.73 | | | | (0.96 | ) | | | — | |
| 2016 | | | 25.23 | | | | 0.92 | #
| | | (0.40 | ) | | | 0.52 | | | | (1.07 | ) | | | — | |
| 2015 | | | 29.60 | | | | 1.71 | | | | (4.19 | ) | | | (2.48 | ) | | | (1.23 | ) | | | — | |
Global X MSCI SuperDividend® Emerging Markets ETF | |
| 2019 | | | 12.91 | | | | 0.87 | | | | 0.05 | | | | 0.92 | | | | (0.88 | ) | | | — | |
| 2018 | | | 15.94 | | | | 0.90 | | | | (3.02 | ) | | | (2.12 | ) | | | (0.91 | ) | | | — | |
| 2017 | | | 14.96 | | | | 0.83 | | | | 0.91 | | | | 1.74 | | | | (0.76 | ) | | | — | |
| 2016 | | | 13.73 | | | | 0.59 | | | | 1.41 | | | | 2.00 | | | | (0.77 | ) | | | — | |
2015(2) | | | 14.90 | | | | 0.66 | | | | (1.34 | ) | | | (0.68 | ) | | | (0.49 | ) | | | — | |
Global X MSCI SuperDividend® EAFE ETF | |
| 2019 | | | 15.96 | | | | 0.82 | | | | 0.36 | | | | 1.18 | | | | (1.03 | ) | | | — | |
| 2018 | | | 18.13 | | | | 1.12 | | | | (2.04 | ) | | | (0.92 | ) | | | (1.10 | ) | | | (0.15 | ) |
2017(1) | | | 14.87 | | | | 0.81 | | | | 3.04 | | | | 3.85 | | | | (0.59 | ) | | | — | |
| | | | | | | | | | | | | | | | | | | | | | | | | |
| Return of Capital ($) | | | Total from Distributions ($) | | | Net
Asset Value,
End of
Period ($) | | | Total Return (%)** | | | Net Assets End of Period ($)(000) | | | Ratio of Expenses to Average Net Assets (%) | | | Ratio of Net Investment Income to Average Net Assets (%) | | | Portfolio Turnover (%)†† | |
| | | | | | | | | | | | | | | | | | | | | | | |
| | (0.20 | ) | | | (1.58 | ) | | | 17.25 | | | | (1.02 | ) | | | 932,111 | | | | 0.59 | | | | 7.03 | | | | 56.85 | |
| | (0.11 | ) | | | (1.54 | ) | | | 19.06 | | | | (4.65 | ) | | | 912,968 | | | | 0.59 | | | | 6.48 | | | | 59.48 | |
| | (0.23 | ) | | | (1.45 | ) | | | 21.51 | | | | 12.69 | | | | 992,893 | | | | 0.58 | | | | 5.07 | | | | 67.38 | |
| | (0.15 | ) | | | (1.45 | ) | | | 20.43 | | | | 6.23 | | | | 801,816 | | | | 0.58 | | | | 5.67 | | | | 39.06 | |
| | — | | | | (1.49 | ) | | | 20.65 | | | | (9.01 | ) | | | 880,666 | | | | 0.58 | | | | 5.58 | | | | 26.12 | |
| | | | | | | | | | | | | | | | | | | | | | | | | | | | | | | |
| | (0.26 | ) | | | (1.75 | ) | | | 23.34 | | | | 2.61 | | | | 544,884 | | | | 0.46 | | | | 4.83 | | | | 60.00 | |
| | (0.20 | ) | | | (1.55 | ) | | | 24.53 | | | | 3.66 | | | | 413,311 | | | | 0.46 | | | | 4.31 | | | | 33.25 | |
| | (0.59 | ) | | | (1.55 | ) | | | 25.18 | | | | 11.64 | | | | 425,579 | | | | 0.45 | | | | 3.15 | | | | 53.01 | |
| | (0.68 | ) | | | (1.75 | ) | | | 24.00 | | | | 2.13 | | | | 338,397 | | | | 0.45 | | | | 3.77 | #
| | | 53.45 | |
| | (0.66 | ) | | | (1.89 | ) | | | 25.23 | | | | (8.67 | ) | | | 274,999 | | | | 0.45 | | | | 6.25 | | | | 42.51 | |
| | | | | | | | | | | | | | | | | | | | | | | | | | | | | | | |
| | — | | | | (0.88 | ) | | | 12.95 | | | | 7.14 | | | | 17,489 | | | | 0.66 | | | | 6.51 | | | | 66.65 | |
| | — | | | | (0.91 | ) | | | 12.91 | | | | (14.10 | ) | | | 12,260 | | | | 0.67 | | | | 5.89 | | | | 79.52 | |
| | — | | | | (0.76 | ) | | | 15.94 | | | | 11.95 | | | | 12,748 | | | | 0.66 | | | | 5.25 | | | | 122.32 | |
| | — | | | | (0.77 | ) | | | 14.96 | | | | 15.58 | | | | 3,740 | | | | 0.65 | | | | 4.49 | | | | 64.83 | |
| | — | | | | (0.49 | ) | | | 13.73 | | | | (4.89 | ) | | | 3,433 | | | | 0.65 | † | | | 6.72 | † | | | 1.25 | |
| | | | | | | | | | | | | | | | | | | | | | | | | | | | | | | |
| | — | | | | (1.03 | ) | | | 16.11 | | | | 7.81 | | | | 18,527 | | | | 0.56 | | | | 5.23 | | | | 29.81 | |
| | — | | | | (1.25 | ) | | | 15.96 | | | | (5.59 | ) | | | 4,788 | | | | 0.56 | | | | 6.36 | | | | 52.96 | |
| | — | | | | (0.59 | ) | | | 18.13 | | | | 26.19 | | | | 1,813 | | | | 0.56 | † | | | 4.97 | † | | | 45.40 | |
| | | | | | | | | | | | | | | | | | | | | | | | | | | | | | | |
| * | Per share data calculated using average shares method. |
| ** | Total Return is for the period indicated and has not been annualized. The return shown does not reflect the deduction of taxes that a shareholder would pay on Fund distributions or the redemption of Fund shares. |
| # | Effective November 1, 2015, the Fund changed its method for estimating the characterization of amounts distributed by master limited partnerships, which correspondingly impacted the financial highlight ratios and per share disclosures to the extent that the fund recorded investment income that differed from amounts previously estimated. |
| † | Annualized. |
| †† | Portfolio turnover rate is for the period indicated and periods of less than one year have not been annualized. Excludes effect of in-kind transfers. |
| (1) | The Fund commenced operations on November 14, 2016. |
| (2) | The Fund commenced operations on March 16, 2015. |
Amounts designated as “—” are $0 or have been rounded to $0.
Selected Per Share Data & Ratios
For a Share Outstanding Throughout the Period
| | | Net
Asset Value, Beginning
of Period
($) | | | Net Investment Income (Loss)
($)* | | | Net Realized and Unrealized Gain (Loss) on Investments
($) | | | Total from Operations
($) | | | Distribution from Net Investment Income ($) | | | Return of Capital ($) | |
Global X SuperDividend® REIT ETF | |
| 2019 | | | 14.62 | | | | 0.99 | | | | 0.91 | | | | 1.90 | | | | (1.19 | ) | | | — | |
| 2018 | | | 15.29 | | | | 0.92 | | | | (0.28 | ) | | | 0.64 | | | | (1.31 | ) | | | — | |
| 2017 | | | 14.60 | | | | 0.86 | | | | 0.96 | | | | 1.82 | | | | (1.13 | ) | | | — | |
| 2016 | | | 13.18 | | | | 0.91 | | | | 1.72 | | | | 2.63 | | | | (1.21 | ) | | | — | |
2015(1) | | | 15.12 | | | | 0.63 | | | | (1.95 | ) | | | (1.32 | ) | | | (0.62 | ) | | | — | |
| Global X SuperIncome™ Preferred ETF | |
| 2019 | | | 11.49 | | | | 0.66 | | | | 0.32 | | | | 0.98 | | | | (0.73 | ) | | | (0.01 | ) |
| 2018 | | | 12.44 | | | | 0.78 | | | | (0.88 | ) | | | (0.10 | ) | | | (0.85 | ) | | | — | |
| 2017 | | | 13.16 | | | | 0.82 | | | | (0.65 | ) | | | 0.17 | | | | (0.85 | ) | | | (0.04 | ) |
| 2016 | | | 13.49 | | | | 0.91 | | | | (0.33 | ) | | | 0.58 | | | | (0.91 | ) | | | — | |
| 2015 | | | 14.74 | | | | 0.95 | | | | (1.21 | ) | | | (0.26 | ) | | | (0.99 | ) | | | — | |
| Global X YieldCo & Renewable Energy Income ETF | |
| 2019 | | | 11.52 | | | | 0.13 | | | | 2.61 | | | | 2.74 | | | | (0.47 | ) | | | — | |
| 2018 | | | 12.53 | | | | 0.37 | | | | (0.80 | ) | | | (0.43 | ) | | | (0.50 | ) | | | (0.08 | ) |
| 2017 | | | 11.16 | | | | 0.28 | | | | 1.59 | | | | 1.87 | | | | (0.50 | ) | | | — | |
| 2016 | | | 11.06 | | | | 0.41 | # | | | 0.35 | | | | 0.76 | | | | (0.48 | ) | | | (0.18 | ) |
2015(2) | | | 15.19 | | | | 0.20 | | | | (4.19 | ) | | | (3.99 | ) | | | (0.14 | ) | | | — | |
| Global X Social Media ETF | |
| 2019 | | | 29.10 | | | | (0.10 | ) | | | 2.92 | | | | 2.82 | | | | — | | | | — | |
| 2018 | | | 32.67 | | | | (0.06 | ) | | | (3.02 | ) | | | (3.08 | ) | | | (0.49 | ) | | | — | |
| 2017 | | | 23.53 | | | | 0.10 | | | | 9.08 | | | | 9.18 | | | | (0.04 | ) | | | — | |
| 2016 | | | 19.29 | | | | 0.02 | | | | 4.22 | | | | 4.24 | | | | — | | | | — | |
| 2015 | | | 19.30 | | | | 0.01 | | | | (0.01 | ) | | | — | | | | (0.01 | ) | | | — | |
| | | | | | | | | | | | | | | | | | | | | | | | | |
Total from Distributions ($) | | | Net
Asset Value,
End of
Period ($) | | | Total Return (%)** | | | Net Assets End of Period ($)(000) | | | Ratio of Expenses to Average Net Assets (%) | | | Ratio of Net Investment Income (Loss) to Average Net Assets (%) | | | Portfolio Turnover (%)†† | |
| | | | | | | | | | | | | | | | | | | | |
| | (1.19 | ) | | | 15.33 | | | | 13.68 | | | | 364,790 | | | | 0.59 | | | | 6.71 | | | | 34.16 | |
| | (1.31 | ) | | | 14.62 | | | | 4.30 | | | | 118,408 | | | | 0.59 | | | | 6.15 | | | | 41.61 | |
| | (1.13 | ) | | | 15.29 | | | | 13.00 | | | | 51,986 | | | | 0.58 | | | | 5.74 | | | | 54.96 | |
| | (1.21 | ) | | | 14.60 | | | | 21.01 | | | | 34,302 | | | | 0.56 | | | | 6.23 | | | | 16.87 | |
| | (0.62 | ) | | | 13.18 | | | | (8.86 | ) | | | 3,954 | | | | 0.54 | † | | | 7.20 | † | | | 1.45 | |
| | | | | | | | | | | | | | | | | | | | | | | | | | | |
| | (0.74 | ) | | | 11.73 | | | | 8.87 | | | | 201,092 | | | | 0.58 | | | | 5.72 | | | | 55.98 | |
| | (0.85 | ) | | | 11.49 | | | | (0.87 | ) | | | 186,154 | | | | 0.58 | | | | 6.48 | | | | 105.48 | |
| | (0.89 | ) | | | 12.44 | | | | 1.31 | | | | 236,331 | | | | 0.58 | | | | 6.39 | | | | 45.12 | |
| | (0.91 | ) | | | 13.16 | | | | 4.44 | | | | 232,206 | | | | 0.58 | | | | 6.81 | | | | 47.62 | |
| | (0.99 | ) | | | 13.49 | | | | (1.95 | ) | | | 235,427 | | | | 0.58 | | | | 6.68 | | | | 76.54 | |
| | | | | | | | | | | | | | | | | | | | | | | | | | | |
| | (0.47 | ) | | | 13.79 | | | | 24.34 | | | | 26,205 | | | | 0.65 | | | | 1.01 | | | | 87.06 | |
| | (0.58 | ) | | | 11.52 | | | | (3.50 | ) | | | 15,556 | | | | 0.65 | | | | 3.07 | | | | 33.50 | |
| | (0.50 | ) | | | 12.53 | | | | 17.30 | | | | 20,046 | | | | 0.65 | | | | 2.37 | | | | 25.99 | |
| | (0.66 | ) | | | 11.16 | | | | 7.25 | | | | 6,695 | | | | 0.66 | | | | 3.78 | # | | | 40.25 | |
| | (0.14 | ) | | | 11.06 | | | | (26.39 | ) | | | 3,319 | | | | 0.65 | † | | | 3.72 | † | | | 22.97 | |
| | | | | | | | | | | | | | | | | | | | | | | | | | | |
| | — | | | | 31.92 | | | | 9.69 | | | | 121,289 | | | | 0.65 | | | | (0.33 | ) | | | 16.92 | |
| | (0.49 | ) | | | 29.10 | | | | (9.61 | ) | | | 129,496 | | | | 0.65 | | | | (0.16 | ) | | | 21.36 | |
| | (0.04 | ) | | | 32.67 | | | | 39.09 | | | | 164,998 | | | | 0.65 | | | | 0.35 | | | | 41.40 | |
| | | *** | | | 23.53 | | | | 21.99 | | | | 134,111 | | | | 0.65 | | | | 0.12 | | | | 39.89 | |
| | (0.01 | ) | | | 19.29 | | | | — | | | | 77,145 | | | | 0.65 | | | | 0.04 | | | | 26.51 | |
| | | | | | | | | | | | | | | | | | | | | | | | | | | |
| * | Per share data calculated using average shares method. |
| ** | Total Return is for the period indicated and has not been annualized. The return shown does not reflect the deduction of taxes that a shareholder would pay on Fund distributions or the redemption of Fund shares. |
| *** | Amount rounds to less than $0.005. |
| # | Effective November 1, 2015, the Fund changed its method for estimating the characterization of amounts distributed by master limited partnerships, which correspondingly impacted the financial highlight ratios and per share disclosures to the extent that the fund recorded investment income that differed from amounts previously estimated. |
| † | Annualized. |
| †† | Portfolio turnover rate is for the period indicated and periods of less than one year have not been annualized. Excludes effect of in-kind transfers. |
| (1) | The Fund commenced operations on March 16, 2015. |
| (2) | The Fund commenced operations on May 27, 2015. |
Amounts designated as “—” are $0 or have been rounded to $0.
Selected Per Share Data & Ratios
For a Share Outstanding Throughout the Period
| | | Net
Asset Value, Beginning
of Period
($) | | | Net Investment Income (Loss)
($)* | | | Net Realized and Unrealized Gain (Loss) on Investments
($) | | | Total from Operations
($) | | | Distribution from Net Investment Income ($) | | | Return of Capital ($) | |
| Global X E-commerce ETF | |
2019(1) | | | 15.00 | | | | (0.05 | ) | | | 2.63 | | | | 2.58 | | | | — | | | | — | |
Global X Guru® Index ETF | |
| 2019 | | | 30.09 | | | | 0.12 | | | | 4.02 | | | | 4.14 | | | | (0.17 | ) | | | (0.04 | ) |
| 2018 | | | 28.70 | | | | 0.11 | | | | 1.44 | | | | 1.55 | | | | (0.16 | ) | | | — | |
| 2017 | | | 23.14 | | | | 0.14 | | | | 5.47 | | | | 5.61 | | | | (0.05 | ) | | | — | |
| 2016 | | | 23.96 | | | | 0.12# | | | | (0.83 | ) | | | (0.71 | ) | | | (0.09 | ) | | | (0.02 | ) |
| 2015 | | | 26.30 | | | | 0.10 | | | | (2.16 | ) | | | (2.06 | ) | | | (0.28 | ) | | | — | |
| Global X Scientific Beta U.S. ETF | |
| 2019 | | | 30.87 | | | | 0.57 | | | | 3.27 | | | | 3.84 | | | | (0.91 | ) | | | — | |
| 2018 | | | 30.04 | | | | 0.52 | | | | 0.77 | | | | 1.29 | | | | (0.46 | ) | | | — | |
| 2017 | | | 25.46 | | | | 0.48 | | | | 4.44 | | | | 4.92 | | | | (0.34 | ) | | | — | |
| 2016 | | | 24.67 | | | | 0.46 | | | | 0.62 | | | | 1.08 | | | | (0.29 | ) | | | — | |
2015(2) | | | 24.90 | | | | 0.18 | | | | (0.41 | ) | | | (0.23 | ) | | | — | | | | — | |
| Global X Scientific Beta Europe ETF | |
| 2019 | | | 24.83 | | | | 0.63 | | | | 1.24 | | | | 1.87 | | | | (1.80 | ) | | | — | |
| 2018 | | | 28.43 | | | | 0.72 | | | | (2.91 | ) | | | (2.19 | ) | | | (1.41 | ) | | | — | |
| 2017 | | | 22.63 | | | | 0.61 | | | | 5.87 | | | | 6.48 | | | | (0.68 | ) | | | — | |
| 2016 | | | 24.41 | | | | 0.66 | | | | (2.10 | ) | | | (1.44 | ) | | | (0.34 | ) | | | — | |
2015(2) | | | 24.89 | | | | 0.25 | | | | (0.73 | ) | | | (0.48 | ) | | | — | | | | — | |
| | | | | | | | | | | | | | | | | | | | | | | | | |
| Total from Distributions ($) | | | Net
Asset Value,
End of
Period ($) | | | Total Return (%)** | | | Net Assets End of Period ($)(000) | | | Ratio of Expenses to Average Net Assets (%) | | | Ratio of Net Investment Income (Loss) to Average Net Assets (%) | | | Portfolio Turnover (%)†† | |
| | | | | | | | | | | | | | | | | | | | |
| | — | | | | 17.58 | | | | 17.20 | | | | 3,517 | | | | 0.68 | † | | | (0.32 | )† | | | 23.50 | |
| | | | | | | | | | | | | | | | | | | | | | | | | | | |
| | (0.21 | ) | | | 34.02 | | | | 13.90 | | | | 56,134 | | | | 0.75 | | | | 0.38 | | | | 126.44 | |
| | (0.16 | ) | | | 30.09 | | | | 5.40 | | | | 57,180 | | | | 0.75 | | | | 0.36 | | | | 112.64 | |
| | (0.05 | ) | | | 28.70 | | | | 24.30 | | | | 55,956 | | | | 0.75 | | | | 0.54 | | | | 94.71 | |
| | (0.11 | ) | | | 23.14 | | | | (2.97 | ) | | | 59,013 | | | | 0.75 | | | | 0.52# | | | | 102.07 | |
| | (0.28 | ) | | | 23.96 | | | | (7.94 | ) | | | 184,505 | | | | 0.75 | | | | 0.39 | | | | 129.71 | |
| | | | | | | | | | | | | | | | | | | | | | | | | | | |
| | (0.91 | ) | | | 33.80 | | | | 12.97 | | | | 99,716 | | | | 0.19 | ‡ | | | 1.79 | | | | 45.16 | |
| | (0.46 | ) | | | 30.87 | | | | 4.28 | | | | 126,587 | | | | 0.19 | ‡ | | | 1.64 | | | | 38.94 | |
| | (0.34 | ) | | | 30.04 | | | | 19.52 | | | | 135,184 | | | | 0.19 | ‡ | | | 1.69 | | | | 28.46 | |
| | (0.29 | ) | | | 25.46 | | | | 4.43 | | | | 66,202 | | | | 0.20 | ‡ | | | 1.82 | | | | 32.54 | |
| | — | | | | 24.67 | | | | (0.92 | ) | | | 2,467 | | | | 0.35 | † | | | 1.55 | † | | | 20.90 | |
| | | | | | | | | | | | | | | | | | | | | | | | | | | |
| | (1.80 | ) | | | 24.90 | | | | 8.45 | | | | 4,980 | | | | 0.39 | | | | 2.62 | | | | 36.82 | |
| | (1.41 | ) | | | 24.83 | | | | (8.21 | ) | | | 9,934 | | | | 0.39 | | | | 2.61 | | | | 45.07 | |
| | (0.68 | ) | | | 28.43 | | | | 29.54 | | | | 21,323 | | | | 0.38 | | | | 2.41 | | | | 26.52 | |
| | (0.34 | ) | | | 22.63 | | | | (5.96 | ) | | | 12,447 | | | | 0.38 | | | | 2.89 | | | | 35.72 | |
| | — | | | | 24.41 | | | | (1.93 | ) | | | 2,441 | | | | 0.38 | † | | | 2.22 | † | | | 17.53 | |
| | | | | | | | | | | | | | | | | | | | | | | | | | | |
| * | Per share data calculated using average shares method. |
| ** | Total Return is for the period indicated and has not been annualized. The return shown does not reflect the deduction of taxes that a shareholder would pay on Fund distributions or the redemption of Fund shares. |
| # | Effective November 1, 2015, the Fund changed its method for estimating the characterization of amounts distributed by master limited partnerships, which correspondingly impacted the financial highlight ratios and per share disclosures to the extent that the fund recorded investment income that differed from amounts previously estimated. |
| † | Annualized. |
| †† | Portfolio turnover rate is for the period indicated and periods of less than one year have not been annualized. Excludes effect of in-kind transfers. |
| ‡ | The ratio of Expenses to Average Net Assets includes the effect of a waiver. If these offsets were excluded, the ratio would have been 0.22%, 0.30%, 0.35% and 0.35% for the years ended October 31, 2019, 2018, 2017 and 2016, respectively. |
| (1) | The Fund commenced operations on November 27, 2018. |
| (2) | The Fund commenced operations on May 12, 2015. |
Amounts designated as “—” are $0 or have been rounded to $0.
Selected Per Share Data & Ratios
For a Share Outstanding Throughout the Period
| | | Net
Asset Value, Beginning
of Period
($) | | | Net Investment Income
($)* | | | Net Realized and Unrealized Gain (Loss) on Investments
($) | | | Total from Operations
($) | | | Distribution from Net Investment Income ($) | | | Distribution from Capital Gains ($) | |
| Global X Scientific Beta Japan ETF | |
| 2019 | | | 28.03 | | | | 0.42 | | | | 0.76 | | | | 1.18 | | | | (0.84 | ) | | | — | |
| 2018 | | | 31.47 | | | | 0.48 | | | | (2.56 | ) | | | (2.08 | ) | | | (1.36 | ) | | | — | |
| 2017 | | | 27.38 | | | | 0.47 | | | | 4.36 | | | | 4.83 | | | | (0.74 | ) | | | — | |
| 2016 | | | 25.19 | | | | 0.44 | | | | 1.97 | | | | 2.41 | | | | (0.21 | ) | | | (0.01 | ) |
2015(1) | | | 25.07 | | | | 0.12 | | | | — | | | | 0.12 | | | | — | | | | — | |
| Global X Scientific Beta Asia ex-Japan ETF | |
| 2019 | | | 23.22 | | | | 0.87 | | | | 1.83 | | | | 2.70 | | | | (1.55 | ) | | | — | |
| 2018 | | | 25.71 | | | | 0.96 | | | | (2.33 | ) | | | (1.37 | ) | | | (1.12 | ) | | | — | |
| 2017 | | | 22.96 | | | | 0.92 | | | | 2.85 | | | | 3.77 | | | | (1.02 | ) | | | — | |
| 2016 | | | 21.63 | | | | 0.80 | | | | 1.15 | | | | 1.95 | | | | (0.62 | ) | | | — | |
2015(1) | | | 24.89 | | | | 0.44 | | | | (3.70 | ) | | | (3.26 | ) | | | — | | | | — | |
Global X S&P 500® Catholic Values ETF | |
| 2019 | | | 33.59 | | | | 0.58 | | | | 3.92 | | | | 4.50 | | | | (0.81 | ) | | | (0.05 | ) |
| 2018 | | | 31.83 | | | | 0.58 | | | | 1.60 | | | | 2.18 | | | | (0.41 | ) | | | (0.01 | ) |
| 2017 | | | 25.74 | | | | 0.48 | | | | 5.74 | | | | 6.22 | | | | (0.13 | ) | | | | *** |
2016(2) | | | 25.14 | | | | 0.24 | | | | 0.36 | | | | 0.60 | | | | — | | | | — | |
| Total from Distributions ($) | | | Net
Asset Value,
End of
Period ($) | | | Total Return (%)** | | | Net Assets End of Period ($)(000) | | | Ratio of Expenses to Average Net Assets (%) | | | Ratio of Net Investment Income to Average Net Assets (%) | | | Portfolio Turnover (%)†† | |
| | | | | | | | | | | | | | | | | | | | |
| | (0.84 | ) | | | 28.37 | | | | 4.50 | | | | 2,837 | | | | 0.40 | | | | 1.54 | | | | 46.64 | |
| | (1.36 | ) | | | 28.03 | | | | (7.09 | ) | | | 8,409 | | | | 0.39 | | | | 1.56 | | | | 42.93 | |
| | (0.74 | ) | | | 31.47 | | | | 18.17 | | | | 17,309 | | | | 0.39 | | | | 1.64 | | | | 17.80 | |
| | (0.22 | ) | | | 27.38 | | | | 9.63 | | | | 13,688 | | | | 0.38 | | | | 1.75 | | | | 82.57 | |
| | — | | | | 25.19 | | | | 0.48 | | | | 2,519 | | | | 0.38 | † | | | 1.02 | † | | | 20.31 | |
| | | | | | | | | | | | | | | | | | | | | | | | | | | |
| | (1.55 | ) | | | 24.37 | | | | 12.17 | | | | 2,437 | | | | 0.38 | | | | 3.60 | | | | 42.04 | |
| | (1.12 | ) | | | 23.22 | | | | (5.78 | ) | | | 3,483 | | | | 0.38 | | | | 3.76 | | | | 42.88 | |
| | (1.02 | ) | | | 25.71 | | | | 17.43 | | | | 3,857 | | | | 0.38 | | | | 3.86 | | | | 53.22 | |
| | (0.62 | ) | | | 22.96 | | | | 9.29 | | | | 2,296 | | | | 0.38 | | | | 3.61 | | | | 74.44 | |
| | — | | | | 21.63 | | | | (13.10 | ) | | | 2,163 | | | | 0.38 | † | | | 4.17 | † | | | 59.21 | |
| | | | | | | | | | | | | | | | | | | | | | | | | | | |
| | (0.86 | ) | | | 37.23 | | | | 13.86 | | | | 275,511 | | | | 0.29 | | | | 1.66 | | | | 8.54 | |
| | (0.42 | ) | | | 33.59 | | | | 6.86 | | | | 147,789 | | | 0.29 | @
| | | 1.72 | | | | 4.33 | |
| | (0.13 | ) | | | 31.83 | | | | 24.27 | | | | 114,581 | | | 0.29 | @
| | | 1.64 | | | | 6.09 | |
| | — | | | | 25.74 | | | | 2.39 | | | | 39,899 | | | 0.29 | @†
| | | 1.75 | † | | | 2.80 | |
| @ | The ratio of Expenses to Average Net Assets includes the effect of a waiver. If these offsets were excluded, the ratio would have been 0.32%, 39% and 0.39%, for the years ended October 31, 2018, 2017 and 2016, respectively. |
| * | Per share data calculated using average shares method. |
| ** | Total Return is for the period indicated and has not been annualized. The return shown does not reflect the deduction of taxes that a shareholder would pay on Fund distributions or the redemption of Fund shares. |
| *** | Amount rounds to less than $0.005. |
| † | Annualized. |
| †† | Portfolio turnover rate is for the period indicated and periods of less than one year have not been annualized. Excludes effect of in-kind transfers. |
| (1) | The Fund commenced operations on May 12, 2015. |
| (2) | The Fund commenced operations on April 18, 2016. |
Amounts designated as “—” are $0 or have been rounded to $0.
Selected Per Share Data & Ratios
For a Share Outstanding Throughout the Period
n
| | | Net
Asset Value, Beginning
of Period
($) | | | Net Investment Income
($)* | | | Net Realized and Unrealized Gain (Loss) on Investments
($) | | | Total from Operations
($) | | | Distribution from Net Investment Income ($) | | | Distribution from Capital Gains ($) | |
Global X NASDAQ 100® Covered Call ETF(1) | |
| 2019 | | | 23.45 | | | | 0.06 | | | | 1.95 | | | | 2.01 | | | | (1.83 | ) | | | — | |
| 2018 | | | 24.30 | | | | 0.07 | | | | 1.71 | | | | 1.78 | | | | (0.87 | ) | | | (0.11 | ) |
| 2017 | | | 22.06 | | | | 0.12 | | | | 3.93 | | | | 4.05 | | | | (1.81 | ) | | | — | |
| 2016 | | | 23.51 | | | | 0.15 | | | | 0.53 | | | | 0.68 | | | | (1.06 | ) | | | — | |
| 2015 | | | 24.04 | | | | 0.16 | | | | 1.47 | | | | 1.63 | | | | (1.92 | ) | | | — | |
Global X S&P 500® Covered Call ETF(1) | |
| 2019 | | | 48.56 | | | | 0.56 | | | | 3.30 | | | | 3.86 | | | | (2.27 | ) | | | (0.39 | ) |
| 2018 | | | 50.10 | | | | 0.62 | | | | 1.88 | | | | 2.50 | | | | (0.22 | ) | | | (1.22 | ) |
2017(2) | | | 47.62 | | | | 0.34 | | | | 2.67 | | | | 3.01 | | | | (0.53 | ) | | | — | |
2017(3) | | | 43.11 | | | | 0.66 | | | | 5.39 | | | | 6.05 | | | | (1.54 | ) | | | — | |
2016(3) | | | 45.39 | | | | 0.70 | | | | (0.90 | ) | | | (0.20 | ) | | | (1.50 | ) | | | — | |
2015(3) | | | 44.85 | | | | 0.63 | | | | 2.03 | | | | 2.66 | | | | (0.83 | ) | | | (0.63 | ) |
| Global X Russell 2000 Covered Call ETF | |
2019(4) | | | 25.00 | | | | 0.09 | | | | 1.37 | | | | 1.46 | | | | (1.22 | ) | | | — | |
| Return of Capital ($) | | | Total from Distributions ($) | | | Net
Asset Value,
End of
Period ($) | | | Total Return (%)** | | | Net Assets End of Period ($)(000) | | | Ratio of Expenses to Average Net Assets (%) | | | Ratio of Net Investment Income to Average Net Assets (%) | | | Portfolio Turnover (%)†† | |
| | | | | | | | | | | | | | | | | | | | | | | |
| | (0.53 | ) | | | (2.36 | ) | | | 23.10 | | | | 9.39 | | | | 768,036 | | | | 0.85 | ‡ | | | 0.26 | | | | 11.82 | |
| | (1.65 | ) | | | (2.63 | ) | | | 23.45 | | | | 7.44 | | | | 395,202 | | | 0.68 | ^^
| | | 0.30 | | | | 15.00 | |
| | — | | | | (1.81 | ) | | | 24.30 | | | | 19.04 | | | | 157,980 | | | | 0.60 | | | | 0.53 | | | | 4.00 | |
| | (1.07 | ) | | | (2.13 | ) | | | 22.06 | | | | 3.32 | | | | 52,952 | | | | 0.60 | | | | 0.69 | | | | 9.00 | |
| | (0.24 | ) | | | (2.16 | ) | | | 23.51 | | | | 7.25 | | | | 22,337 | | | | 0.60 | | | | 0.67 | | | | 13.00 | |
| | | | | | | | | | | | | | | | | | | | | | | | | | | | | | | |
| | (0.37 | ) | | | (3.03 | ) | | | 49.39 | | | | 8.40 | | | | 133,353 | | | 0.87 | ^ | | | 1.16 | | | | 3.92 | |
| | (2.60 | ) | | | (4.04 | ) | | | 48.56 | | | | 4.97 | | | | 77,701 | | | | 0.65 | | | | 1.22 | | | | 4.00 | |
| | — | | | | (0.53 | ) | | | 50.10 | | | | 6.35 | | | | 62,628 | | | | 0.65 | † | | | 1.39 | † | | | 8.00 | |
| | — | | | | (1.54 | ) | | | 47.62 | | | | 14.29 | | | | 64,413 | | | | 0.65 | | | | 1.46 | | | | 21.00 | |
| | (0.58 | ) | | | (2.08 | ) | | | 43.11 | | | | (0.29 | ) | | | 60,459 | | | | 0.65 | | | | 1.61 | | | | 7.00 | |
| | (0.66 | ) | | | (2.12 | ) | | | 45.39 | | | | 5.97 | | | | 77,276 | | | | 0.65 | | | | 1.39 | | | | 12.00 | |
| | | | | | | | | | | | | | | | | | | | | | | | | | | | | | | |
| | — | | | | (1.22 | ) | | | 25.24 | | | | 5.99 | | | | 8,833 | | | | 0.82 | †# | | | 0.68 | † | | | 5.82 | |
| | | | | | | | | | | | | | | | | | | | | | | | | | | | | | | |
| * | Per share data calculated using average shares method. |
| ** | Total Return is for the period indicated and has not been annualized. The return shown does not reflect the deduction of taxes that a shareholder would pay on Fund distributions or the redemption of Fund shares. |
| † | Annualized. |
| †† | Portfolio turnover rate is for the period indicated and periods of less than one year have not been annualized. Excludes effect of in-kind transfers. |
| ‡ | Excluding broker fees on written options, the ratio of expenses to average net assets would have been 0.60%. |
| ^ | Excluding broker fees on written options, the ratio of expenses to average net assets would have been 0.65%. |
| ^^ | Includes excise tax. If this excise expense was not included, the ratio would have been 0.60%. |
| # | Excluding broker fees on written options, the ratio of expenses to average net assets would have been 0.60%. The ratio of Expenses to Average Net Assets includes the effect of a waiver. If these offsets were excluded, the ratio would have been 0.97%. |
| (1) | The financial statements include the financial information of the Predecessor Funds through December 21, 2018 (See Note 1 in notes to Financial Statements). As a result of the Reorganization, the Fund assumed the performance and accounting history of the Predecessor Fund. Accordingly, performance figures for the Fund for periods prior to the date of the Reorganization represent the performance of the Predecessor Fund. |
| (2) | Effective October 31, 2017, the Predecessor Fund changed its fiscal year end from April 30 to October 31. The information presented is from May 1, 2017 through October 31, 2017. |
| (3) | For the year or period ended April 30. |
| (4) | The Fund commenced operations on April 17, 2019. |
Amounts designated as “—” are $0 or have been rounded to $0.
| | |
Notes to Financial Statements |
| |
|
1. ORGANIZATION
The Global X Funds (the “Trust”) is a Delaware statutory trust formed on March 6, 2008. The Trust is registered under the Investment Company Act of 1940, as amended, as an open-end management investment company. As of October 31, 2019, the Trust had one hundred and one portfolios, seventy-two of which were operational. The financial statements herein and the related notes pertain to the Global X SuperDividend® ETF, Global X SuperDividend® U.S. ETF, Global X MSCI SuperDividend® Emerging Markets ETF, Global X MSCI SuperDividend® EAFE ETF, Global X SuperDividend® REIT ETF, Global X SuperIncome™ Preferred ETF, Global X YieldCo & Renewable Energy Income ETF, Global X Social Media ETF, Global X E-commerce ETF, Global X Guru® Index ETF, Global X Scientific Beta U.S. ETF, Global X Scientific Beta Europe ETF, Global X Scientific Beta Japan ETF, Global X Scientific Beta Asia ex-Japan ETF, Global X S&P 500® Catholic Values ETF, Global X Nasdaq 100® Covered Call ETF, Global X S&P 500® Covered Call ETF, and Global X Russell 2000 Covered Call ETF (each a “Fund”, collectively, the “Funds”). Each Fund (except the Global X SuperDividend® ETF, Global X SuperDividend® U.S. ETF, Global X MSCI SuperDividend® Emerging Markets ETF, Global X SuperDividend® REIT ETF, Global X SuperIncomeTM Preferred ETF, Global X Guru® Index ETF, Global X Scientific Beta U.S. ETF, Global X Scientific Beta Europe ETF, Global X Scientific Beta Japan ETF, Global X Scientific Beta Asia ex-Japan ETF, Global X S&P 500® Catholic Values ETF, and Global X S&P 500® Covered Call ETF) has elected non-diversified status.
Effective November 19, 2018, the Global X YieldCo Index ETF was renamed the Global X YieldCo & Renewable Energy Income ETF, and its underlying index was changed to the Index YieldCo & Renewable Energy Income Index. On June 13, 2019, the Global X | JPMorgan Efficiente Index ETF and Global X | JPMorgan U.S. Sector Rotator Index ETF were liquidated.
On December 24, 2018, the shareholders of the Horizons NASDAQ 100® Covered Call ETF and Horizons S&P 500® Covered Call ETF (together, the “Predecessor Funds”) approved a proposed agreement and plan of reorganization (the “Reorganization”) that provided for (a) the transfer of all the assets and assumption of certain of the liabilities of each Predecessor Fund to the Global X Nasdaq 100® Covered Call ETF and the Global X S&P 500® Covered Call ETF (together, the “Successor Funds”), respectively; (b) the issuance of shares of the Successor Fund to the shareholders of the corresponding Predecessor Fund; and (c) the liquidation and termination of the Predecessor Fund. The effective date of the Reorganization of each Predecessor Fund was December 24, 2018. The Successor Funds had no operations prior to the Reorganization. The Predecessor Funds had substantially similar investment objectives, investment strategies, policies and restrictions as those of the Successor Funds. The financial statements and financial highlights include the financial information of the Predecessor Funds through December 21, 2018.
2. SIGNIFICANT ACCOUNTING POLICIES
The following is a summary of the significant accounting policies followed by the Funds:
USE OF ESTIMATES – The Funds are investment companies that apply the accounting and reporting guidance issued in Topic 946 by the U.S. Financial Accounting Standards Board. The preparation of financial statements in conformity with U.S. generally accepted accounting principles (“U.S. GAAP”) requires management to make estimates and assumptions that affect the reported amounts of assets and liabilities and disclosure of contingent assets and liabilities at the date of the financial statements and the reported amounts of increases and decreases in net assets from operations during the reporting period. Actual results could materially differ from those estimates.
RETURN OF CAPITAL ESTIMATES – Distributions received by the Funds from underlying master limited partnership (“MLP”) and real estate investment trust (“REIT”) investments generally are comprised of income and return of capital. The Funds record investment income and return of capital based on estimates made at the time such distributions are received. Such estimates are based on historical information available from the MLPs, REITs and other industry sources. These estimates may subsequently be revised based on information received from the MLPs and REITs after their tax reporting periods are concluded.
MLPs – Certain Funds may invest in MLPs. MLPs are publicly traded partnerships engaged in the transportation, storage and processing of minerals and natural resources. By confining their operations to these specific activities, their interests, or units, are able to trade on public securities exchanges exactly like the shares of a corporation, without entity level taxation. To qualify as an MLP and to not be taxed as a corporation, a partnership must receive at least 90% of its income from qualifying sources as set forth in Section 7704(d) of the Internal Revenue Code of 1986, as amended (the “Code”). These qualifying sources include natural resource-based activities such as the processing, transportation and storage of mineral or natural resources. MLPs generally have two classes of owners: the general partner and limited partners. The general partner of an MLP is typically owned by a major energy company, an investment fund, the direct management of the MLP, or is an entity owned by one or more of such parties. The general partner may be structured as a private or publicly traded corporation or other entity.
The general partner typically controls the operations and management of the MLP through an up to 2% equity interest in the MLP plus, in many cases, ownership of common units and subordinated units.
Limited partners typically own the remainder of the partnership through ownership of common units, and have a limited role in the partnership’s operations and management. MLPs are typically structured such that common units and general partner interests have first priority to receive quarterly cash distributions up to an established minimum amount (“minimum quarterly distributions” or “MQD”). Common and general partner interests
2. SIGNIFICANT ACCOUNTING POLICIES (continued)
also accrue arrearages in distributions to the extent the MQD is not paid. Once common and general partner interests have been paid, subordinated units receive distributions of up to the MQD; however, subordinated units do not accrue arrearages. Distributable cash in excess of the MQD is paid to both common and subordinated units and is distributed to both common and subordinated units generally on a pro rata basis. The general partner is also eligible to receive incentive distributions if the general partner operates the business in a manner which results in distributions paid per common unit surpassing specified target levels. As the general partner increases cash distributions to the limited partners, the general partner receives an increasingly higher percentage of the incremental cash distributions.
SECURITY VALUATION - Securities listed on a securities exchange, market or automated quotation system for which quotations are readily available (except for securities traded on NASDAQ), including securities traded over the counter, are valued at the last quoted sale price on the primary exchange or market (foreign or domestic) on which they are traded (or at approximately 4:00 pm EST if a security’s primary exchange is normally open at that time), or, if there is no such reported sale, at the most recent mean between the quoted bid and asked prices, which approximates fair value (absent both bid and asked prices on such exchange, the bid price may be used).
For securities traded on NASDAQ, the NASDAQ official closing price will be used. If available, debt securities are priced based upon valuations provided by independent, third-party pricing agents. Such values generally reflect the last reported sales price if the security is actively traded. The third-party pricing agents may also value debt securities at an evaluated bid price by employing methodologies that utilize actual market transactions, broker-supplied valuations, or other methodologies designed to identify the market value for such securities. Debt obligations with remaining maturities of sixty days or less may be valued at their amortized cost, which approximates market value. The prices for foreign securities are reported in local currency and converted to U.S. dollars using currency exchange rates as of the reporting date. The exchange rates used by the Trust for valuation are captured as of the New York or London close each day. Prices for most securities held in the Funds are provided daily by recognized independent pricing agents. If a security price cannot be obtained from an independent, third-party pricing agent, the Funds seek to obtain a bid price from at least one independent broker.
Securities for which market prices are not “readily available” are valued in accordance with fair value procedures (the “Fair Value Procedures”) established by the Board of Trustees (the “Board”) of the Trust. The Funds’ Fair Value Procedures are implemented through a fair value committee (the “Committee”) designated by the Board. Some of the more common reasons that may necessitate that a security be valued using the Fair Value Procedures include: the security’s trading has been halted or suspended; the security has
2. SIGNIFICANT ACCOUNTING POLICIES (continued)
been de-listed from its primary trading exchange; the security’s primary trading market is temporarily closed at a time when, under normal conditions, it would be open; the security has not been traded for an extended period of time; the security’s primary pricing source is not able or willing to provide a price; the security’s primary pricing source is not able or willing to provide a price; or trading of the security is subject to local government-imposed restrictions. In addition, the Funds may fair value a security if an event that may materially affect the value of the Funds’ security that is traded outside the United States (a “Significant Event”) has occurred between the time of the security’s last close and the time that the Funds calculate their net asset values. A Significant Event may relate to a single issuer or to an entire market sector. Events that may be Significant Events include: government actions, natural disasters, armed conflict, acts of terrorism and significant market fluctuations. If Global X Management Company LLC, the Funds’ investment advisor (the “Adviser”), becomes aware of a Significant Event that has occurred with respect to a security or group of securities after the closing of the exchange or market on which the security or securities principally trade, but before the time at which the Funds calculate their net asset values, it may request that a Committee meeting be called. When a security is valued in accordance with the Fair Value Procedures, the Committee will determine the value after taking into consideration all relevant information reasonably available to the Committee. As of October 31, 2019, Global X Scientific Beta Asia ex-Japan ETF has two fair valued securities valued at $75. There were no other securities priced using the Fair Value Procedures.
In accordance with the authoritative guidance on fair value measurements and disclosure under U.S. GAAP, the Funds disclose the fair value of their investments in a hierarchy that prioritizes the inputs to valuation techniques used to measure the fair value. The objective of a fair value measurement is to determine the price that would be received to sell an asset or paid to transfer a liability in an orderly transaction between market participants at the measurement date (an exit price). Accordingly, the fair value hierarchy gives the highest priority to quoted prices (unadjusted) in active markets for identical assets or liabilities (Level 1) and the lowest priority to unobservable inputs (Level 3). The three levels of the fair value hierarchy are described below:
Level 1 – Unadjusted quoted prices in active markets for identical, unrestricted assets or liabilities that the Funds have the ability to access at the measurement date
Level 2 – Other significant observable inputs (including quoted prices in non-active markets, quoted prices for similar investments, fair value of investments for which the Funds have the ability to fully redeem tranches at net asset value as of the measurement date or within the near term, and short-term investments valued at amortized cost)
Level 3 – Significant unobservable inputs (including the Funds’ own assumptions in determining the fair value of investments, and fair value of investments for
2. SIGNIFICANT ACCOUNTING POLICIES (continued)
which the Funds do not have the ability to fully redeem tranches at net asset value as of the measurement date or within the near term)
Investments are classified within the level of the lowest significant input considered in determining fair value. Investments classified within Level 3 whose fair value measurement considers several inputs may include Level 1 or Level 2 inputs as components of the overall fair value measurement.
For the year ended October 31, 2019, there have been no significant changes to the Funds’ fair valuation methodologies.
The unobservable inputs used to determine fair value of Level 3 assets may have similar or diverging impacts on valuation. Significant increases and decreases in these inputs in isolation and interrelationships between those inputs could result in significantly higher or lower fair value measurement.
DUE TO/FROM BROKERS – Due to/from brokers includes cash and collateral balances with the Funds’ clearing brokers or counterparties at October 31, 2019. The Funds continuously monitor the credit standing of each broker or counterparty with whom they conduct business. In the event a broker or counterparty is unable to fulfill its obligations, the Funds would be subject to counterparty credit risk.
REPURCHASE AGREEMENTS - Securities pledged as collateral for repurchase agreements by RBC Capital Markets are held by Brown Brothers Harriman & Co. (“BBH”), the Funds’ custodian (“Custodian”), and are designated as being held on each Fund’s behalf by its custodian under a book-entry system. Each Fund monitors the adequacy of the collateral on a daily basis and can require the seller to provide additional collateral in the event the market value of the securities pledged falls below the carrying value of the repurchase agreement, including accrued interest.
It is the Funds’ policy to only enter into repurchase agreements with banks and other financial institutions which are deemed by the Adviser to be creditworthy. The Funds bear the risk of loss in the event that the counterparty to a repurchase agreement defaults on its obligations, and the Funds are prevented from exercising their rights to dispose of the underlying securities received as collateral and the risk of a possible decline in the value of the underlying securities during the period. For financial statement purposes, the Funds record the securities lending collateral (included in Repurchase Agreements, at value or restricted cash) as an asset and the obligation to return securities lending collateral as a liability on the Statements of Assets and Liabilities.
Repurchase agreements are entered into by the Funds under Master Repurchase Agreements (“MRA”) which permit the Funds, under certain circumstances, including an event of default (such as bankruptcy or insolvency), to offset payables and/or receivables under an MRA with collateral held and/or posted to the counterparty and create one single net payment due to or from the Funds.
2. SIGNIFICANT ACCOUNTING POLICIES (continued)
As of October 31, 2019, the open repurchase agreements by counterparty which are subject to an MRA on a net payment basis are as follows:
| | | Repurchase Agreements | | | Fair Value of Non-cash Collateral Received(1) | | | Cash Collateral Received | | | Net Amount(2) | |
Global X SuperDividend® ETF | | | | | | | | | | | | |
| RBC Capital Markets | | $ | 47,199,536 | | | $ | 47,199,536 | | | $ | - | | | $ | - | |
Global X SuperDividend® U.S. ETF | | | | | | | | | | | | | | | | |
| RBC Capital Markets | | | 35,782,016 | | | | 35,782,016 | | | | - | | | | - | |
Global X SuperDividend® REIT ETF | | | | | | | | | | | | | | | | |
| RBC Capital Markets | | | 16,031,265 | | | | 16,031,265 | | | | - | | | | - | |
| Global X SuperIncome™ Preferred ETF | | | | | | | | | | | | | | | | |
| RBC Capital Markets | | | 3,326,013 | | | | 3,326,013 | | | | - | | | | - | |
| Global X Social Media ETF | | | | | | | | | | | | | | | | |
| RBC Capital Markets | | | 6,388,879 | | | | 6,388,879 | | | | - | | | | - | |
Global X Guru® Index ETF | | | | | | | | | | | | | | | | |
| RBC Capital Markets | | | 25,691 | | | | 25,691 | | | | - | | | | - | |
(1) Excess collateral received is not presented in the table above. Please refer to the Schedule of Investments for the market value of the collateral received for each Fund. |
(2) Net Amount represents the net amount receivable due from the counterparty in the event of default. | | | | | |
FEDERAL INCOME TAXES – It is each Fund’s intention to qualify, or continue to qualify, as a regulated investment company for Federal income tax purposes by complying with the appropriate provisions of Subchapter M of the Internal Revenue Code of 1986, as amended. Accordingly, no provisions for Federal income taxes have been made in the financial statements except as described below.
The Funds evaluate tax positions taken or expected to be taken in the course of preparing the Funds’ tax returns to determine whether it is “more-likely-than-not” (i.e., greater than 50 percent) that each tax position will be sustained upon examination by a taxing authority based on the technical merits of the position. Tax positions not deemed to meet the more-likely-than-not threshold are recorded as a tax benefit or expense in the current year. The Funds did not record any tax provisions in the current period; however, management’s conclusions regarding tax positions may be subject to review and adjustment at a later date based on factors including, but not limited to, examination by tax authorities (i.e., the last three tax year ends, as applicable), on-going analysis of and changes to tax laws, regulations and interpretations thereof.
If a Fund has foreign tax filings that have not been made, the tax years that remain subject to examination may date back to the inception of the Fund.
As of and during the reporting period ended October 31, 2019, the Funds did not have a liability for any unrecognized tax benefits. The Funds recognize interest and penalties, if any, related to unrecognized tax benefits as income tax expense in the Statement of Operations. During the reporting period, the Funds did not incur any interest or penalties.
2. SIGNIFICANT ACCOUNTING POLICIES (continued)
SECURITY TRANSACTIONS AND INVESTMENT INCOME – Security transactions are accounted for on the trade date for financial reporting purposes. Costs used in determining realized gains and losses on the sale of investment securities are based on specific identification. Dividend income is recorded on the ex-dividend date. Interest income is recognized on the accrual basis from the settlement date.
FOREIGN CURRENCY TRANSACTIONS AND TRANSLATION – The books and records of the Funds are maintained in U.S. dollars. Investment securities and other assets and liabilities denominated in a foreign currency are translated into U.S. dollars on the date of valuation. Purchases and sales of investment securities, income and expenses are translated into U.S. dollars at the relevant rates of exchange prevailing on the respective dates of such transactions. The Funds do not isolate that portion of realized or unrealized gains and losses resulting from changes in the foreign exchange rate from fluctuations arising from changes in the market prices of the securities. These gains and losses are included in net realized and unrealized gains and losses on investments on the Statement of Operations. Net realized and unrealized gains and losses on foreign currency transactions and translations represent net foreign exchange gains or losses from foreign currency spot contracts, disposition of foreign currencies, currency gains or losses realized between trade and settlement dates on securities transactions and the difference between the amount of the investment income and foreign withholding taxes recorded on the Funds’ books and the U.S. dollar equivalent amounts actually received or paid.
DIVIDENDS AND DISTRIBUTIONS TO SHAREHOLDERS – The Funds distribute their net investment income on a pro rata basis. Any net investment income and net realized capital gains are distributed at least annually. All distributions are recorded on ex-dividend date.
INVESTMENTS IN REITs – With respect to the Funds, dividend income is recorded based on the income included in distributions received from REIT investments using published REIT reclassifications, including some management estimates when actual amounts are not available. Distributions received in excess of these estimated amounts are recorded as a reduction of the cost of investments or reclassified to capital gains. The actual amounts of income, return of capital, and capital gains are only determined by each REIT after its fiscal year end, and may differ from the estimated amounts.
CREATION UNITS – The Funds issue and redeem their shares (“Shares”) on a continuous basis at Net Asset Value (“NAV”) and only in large blocks of 50,000 Shares, referred to as “Creation Units”. Purchasers of Creation Units (“Authorized Participants”) at NAV must pay a standard creation transaction fee per transaction. The fee is a single charge and will be the same regardless of the number of Creation Units purchased by an Authorized Participant on the same day.
An Authorized Participant who holds Creation Units and wishes to redeem at NAV would also pay a standard redemption fee per transaction to BBH, on the date of such redemption, regardless of the number of Creation Units redeemed that day.
2. SIGNIFICANT ACCOUNTING POLICIES (continued)
If a Creation Unit is purchased or redeemed for cash, an additional variable fee may be charged. The following table discloses Creation Unit breakdown:
| | | Creation Unit Shares | | | Creation Fee | | | Value at October 31, 2019 | | | Redemption Fee | |
Global X SuperDividend® ETF | | | 50,000 | | | $ | 2,500 | | | $ | 862,500 | | | $ | 2,500 | |
Global X SuperDividend® U.S. ETF | | | 50,000 | | | | 500 | | | | 1,167,000 | | | | 500 | |
Global X MSCI SuperDividend® Emerging Markets ETF | | | 50,000 | | | | 3,000 | | | | 647,500 | | | | 3,000 | |
Global X MSCI SuperDividend® EAFE ETF | | | 50,000 | | | | 1,000 | | | | 805,500 | | | | 1,000 | |
Global X SuperDividend® REIT ETF | | | 50,000 | | | | 500 | | | | 766,500 | | | | 500 | |
Global X SuperIncome™ Preferred ETF | | | 50,000 | | | | 500 | | | | 586,500 | | | | 500 | |
| Global X YieldCo & Renewable Energy Income ETF | | | 50,000 | | | | 500 | | | | 689,500 | | | | 500 | |
| Global X Social Media ETF | | | 50,000 | | | | 300 | | | | 1,596,000 | | | | 300 | |
| Global X E-commerce ETF | | | 50,000 | | | | 500 | | | | 879,000 | | | | 500 | |
Global X Guru® Index ETF | | | 50,000 | | | | 300 | | | | 1,701,000 | | | | 300 | |
| Global X Scientific Beta U.S. ETF | | | 50,000 | | | | 1,500 | | | | 1,690,000 | | | | 1,500 | |
| Global X Scientific Beta Europe ETF | | | 50,000 | | | | 8,900 | | | | 1,245,000 | | | | 8,900 | |
| Global X Scientific Beta Japan ETF | | | 50,000 | | | | 2,800 | | | | 1,418,500 | | | | 2,800 | |
| Global X Scientific Beta Asia ex-Japan ETF | | | 50,000 | | | | 2,800 | | | | 1,218,500 | | | | 2,800 | |
Global X S&P 500® Catholic Values ETF | | | 50,000 | | | | 1,300 | | | | 1,861,500 | | | | 1,300 | |
Global X NASDAQ 100® Covered Call ETF | | | 50,000 | | | | 500 | | | | 1,155,000 | | | | 500 | |
Global X S&P 500® Covered Call ETF | | | 50,000 | | | | 1,300 | | | | 2,469,500 | | | | 1,300 | |
Global X Russell 2000® Covered Call ETF | | | 50,000 | | | | 250 | | | | 1,262,000 | | | | 250 | |
CASH OVERDRAFT CHARGES – Per the terms of an agreement with BBH, if a Fund has a cash overdraft on a given day, it will be assessed an overdraft charge of LIBOR plus 2.00%. Cash overdraft charges are included in custodian fees on the Statement of Operations.
3. RELATED PARTY TRANSACTIONS AND SERVICE PROVIDER TRANSACTIONS
On July 2, 2018, the Adviser consummated a transaction pursuant to which it became an indirect, wholly-owned subsidiary of Mirae Asset Global Investments Co., Ltd. (“Mirae”). In this manner, the Adviser is ultimately controlled by Mirae, which is a leading financial services company in Korea and is the headquarters for the Mirae Asset Global Investments Group.
The Adviser serves as the investment adviser and the administrator for the Funds. Subject to the supervision of the Board, the Adviser is responsible for managing the investment
3. RELATED PARTY TRANSACTIONS AND SERVICE PROVIDER TRANSACTIONS (continued)
activities of the Funds and the Funds’ business affairs and other administrative matters and provides, or causes to be furnished, all supervisory, administrative and other services reasonably necessary for the operation of the Funds, including certain distribution services (provided pursuant to a separate Distribution Agreement), certain shareholder and distribution-related services (provided pursuant to a separate Rule 12b-1 Plan and related agreements) and investment advisory services (provided pursuant to a separate Investment Advisory Agreement), under what is essentially an “all-in” fee structure. For the Adviser’s service to the Funds, under the Supervision and Administration Agreement, each Fund pays a monthly fee to the Adviser at the annual rate below (stated as a percentage of the average daily net assets of the Fund). In addition, the Funds bear other expenses, directly and indirectly, that are not covered by the Supervision and Administration Agreement, which may vary and affect the total expense ratios of the Funds, such as taxes, brokerage fees, commissions, custodian fees, acquired fund fees, and other transaction expenses, interest expenses and extraordinary expenses (such as litigation and indemnification expenses).
The following table discloses supervision and administration fees pursuant to the Supervision and Administration Agreement:
| | Supervision and |
| | Administration Fee |
Global X SuperDividend® ETF | 0.58% |
Global X SuperDividend® U.S. ETF | 0.45% |
Global X MSCI SuperDividend® Emerging Markets ETF | 0.65% |
Global X MSCI SuperDividend® EAFE ETF | 0.55% |
Global X SuperDividend® REIT ETF | 0.58% |
Global X SuperIncomeTM Preferred ETF | 0.58% |
| Global X YieldCo & Renewable Energy Income ETF | 0.65% |
| Global X Social Media ETF | 0.65% |
| Global X E-commerce ETF | 0.68% |
Global X Guru® Index ETF | 0.75% |
| Global X Scientific Beta U.S. ETF* | 0.19% |
| Global X Scientific Beta Europe ETF | 0.38% |
| Global X Scientific Beta Japan ETF | 0.38% |
| Global X Scientific Beta Asia ex-Japan ETF | 0.38% |
Global X S&P 500® Catholic Values ETF** | 0.29% |
Global X NASDAQ 100® Covered Call ETF | 0.60% |
Global X S&P 500® Covered Call ETF | 0.65% |
Global X Russell 2000® Covered Call ETF*** | 0.60% |
3. RELATED PARTY TRANSACTIONS AND SERVICE PROVIDER TRANSACTIONS (continued)
* Pursuant to an expense limitation agreement in existence between the Global X Scientific Beta U.S. ETF (the “Fund”) and the Adviser prior to March 1, 2019, the Adviser contractually agreed to reimburse or waive fees and/or limit fund expenses to the extent necessary to assure that the operating expenses of the Fund (exclusive of taxes, brokerage fees, commissions, and other transaction expenses, interest, and extraordinary expenses (such as litigation and indemnification expenses)) (“Total Annual Fund Operating Expenses”) would not exceed 0.19% of the Fund’s average daily net assets per year until March 1, 2019. Pursuant to the expense limitation agreement, the Fund (at a later date) may reimburse the Adviser for the fees it reimbursed or waived and/or limited pursuant to the expense limitation agreement during any of the prior three fiscal years, provided that, among other things, reimbursement to be made to the Adviser does not cause Total Annual Fund Operating Expenses of the Fund to exceed 0.19% during the year in which it is paid and the Board of Trustees has approved such reimbursement to the Adviser. Although the Board voted on November 13, 2018, to permanently reduce the Fund’s fees to 0.19% and end the expense limitation agreement as of March 1, 2019, prior waived or reimbursed fees are still subject to recoupment. As of October 31, 2019, the amounts of waivers/reimbursements subject to recoupment for Global X Scientific Beta U.S. ETF were $32,075 expiring in 2022, $155,018 expiring in 2021 and $162,684 expiring 2020. As of October 31, 2019, there had been no recoupment of previously waived and reimbursed fees.
**Pursuant to an expense limitation agreement in existence between the Global X S&P 500® Catholic Values ETF (the “Fund”) and the Adviser prior to March 1, 2018, the Adviser agreed to waive or reimburse fees and/or limit fund expenses to the extent necessary to assure that the operating expenses of the Fund (exclusive of taxes, brokerage fees, commissions, and other transaction expenses and extraordinary expenses (such as litigation and indemnification expenses)) (“Total Annual Fund Operating Expenses”) would not exceed 0.29% of the Fund’s average daily net assets per year until at least March 1, 2018. Pursuant to the expense limitation agreement, the Fund (at a later date) could reimburse the Adviser for the fees and expenses it waived or reimbursed and/or limited during any of the prior three fiscal years, provided that, among other things, any reimbursement made to the Adviser would not cause Total Annual Fund Operating Expenses to exceed the maximum permitted rate during the period in which it is paid and the Board had approved such reimbursement to the Adviser. Although the Board voted on December 19, 2017, to permanently reduce the Fund’s fees to 0.29% and end the expense limitation agreement as of March 1, 2018, prior waived or reimbursed fees are still subject to recoupment. As of October 31, 2019, the amounts of waivers/reimbursements subject to recoupment for the Fund were $0 expiring in 2022, $43,032 expiring 2021 and $88,406 expiring 2020. As of October 31, 2019 there had been no recoupment of previously waived and reimbursed fees.
***Pursuant to an expense limitation agreement in existence between the Global X Russell 2000® Covered Call ETF (the “Fund”) and the Adviser, the Adviser agreed to waive or reimburse fees and/or limit fund expenses to the extent necessary to assure that the operating expenses of the Fund (exclusive of taxes, brokerage fees, commissions, and other transaction expenses and extraordinary expenses (such as litigation and indemnification expenses)) (“Total Annual Fund Operating Expenses”) would not exceed 0.60% of the Fund’s average daily net assets per year until at least March 1, 2020.
SEI Investments Global Funds Services (“SEIGFS”) serves as sub-administrator to the Funds. As sub-administrator, SEIGFS provides the Funds with required general
3. RELATED PARTY TRANSACTIONS AND SERVICE PROVIDER TRANSACTIONS (continued)
administrative services, including, without limitation: office space, equipment, and personnel; clerical and general back office services; bookkeeping, internal accounting and secretarial services; the calculation of NAV; and assistance with the preparation and filing of reports, registration statements, proxy statements, and other materials required to be filed or furnished by the Funds under federal and state securities laws. As compensation for these services, SEIGFS receives certain out-of-pocket costs, transaction fees, and asset-based fees which are accrued daily and paid monthly by the Adviser.
SEI Investments Distribution Co. (“SIDCO”) serves as each Fund’s underwriter and distributor of Creation Units pursuant to a distribution agreement. SIDCO has no obligation to sell any specific quantity of Fund Shares.
SIDCO bears the following costs and expenses relating to the distribution of Shares: (1) the costs of processing and maintaining records of creations of Creation Units; (2) all costs of maintaining the records required of a registered broker/dealer; (3) the expenses of maintaining its registration or qualification as a dealer or broker under Federal or state laws; (4) filing fees; and (5) all other expenses incurred in connection with the distribution services as contemplated in the distribution agreement. SIDCO receives no fee from the Funds for its distribution services under the distribution agreement, rather, the Adviser compensates SIDCO for certain expenses, out-of-pocket costs, and transaction fees.
BBH serves as custodian and transfer agent of the Funds’ assets. As custodian, BBH has agreed to (1) make receipts and disbursements of money on behalf of the Funds, (2) collect and receive all income and other payments and distributions on account of the Funds’ portfolio investments, (3) respond to correspondence from shareholders, security brokers and others relating to its duties; and (4) make periodic reports to the Funds concerning the Funds’ operations. BBH does not exercise any supervisory function over the purchase and sale of securities. As transfer agent, BBH has agreed to (1) issue and redeem Shares of each Fund, (2) make dividend and other distributions to shareholders of each Fund, (3) respond to correspondence by shareholders and others relating to its duties; (4) maintain shareholder accounts, and (5) make periodic reports to the Funds. As compensation for these services, BBH receives certain out-of-pocket costs, transaction fees and asset-based fees which are accrued daily and paid monthly by the Adviser from its fees.
4. INVESTMENT TRANSACTIONS
For the year ended October 31, 2019, the purchases and sales of investments in securities, excluding in-kind transactions, long-term U.S. Government and short-term securities, were:
| | | Purchases | | | Sales and Maturities | |
Global X SuperDividend® ETF | | $ | 517,155,902 | | | $ | 527,656,156 | |
Global X SuperDividend® U.S. ETF | | | 274,894,773 | | | | 288,324,543 | |
Global X MSCI SuperDividend® Emerging Markets ETF | | | 13,450,697 | | | | 11,673,348 | |
Global X MSCI SuperDividend® EAFE ETF | | | 2,752,726 | | | | 2,796,454 | |
Global X SuperDividend® REIT ETF | | | 72,518,920 | | | | 74,696,312 | |
| Global X SuperIncome™ Preferred ETF | | | 104,727,882 | | | | 104,447,597 | |
| Global X YieldCo & Renewable Energy Income ETF | | | 16,896,650 | | | | 16,281,496 | |
| Global X Social Media ETF | | | 22,298,471 | | | | 25,085,251 | |
| Global X E-commerce ETF | | | 521,845 | | | | 523,790 | |
Global X Guru® Index ETF | | | 71,570,846 | | | | 71,704,811 | |
| Global X Scientific Beta U.S. ETF | | | 46,147,187 | | | | 47,393,679 | |
| Global X Scientific Beta Europe ETF | | | 1,995,278 | | | | 2,311,650 | |
| Global X Scientific Beta Japan ETF | | | 1,801,646 | | | | 1,988,572 | |
| Global X Scientific Beta Asia ex-Japan ETF | | | 1,117,046 | | | | 1,235,237 | |
Global X S&P 500® Catholic Values ETF | | | 19,464,354 | | | | 20,707,970 | |
Global X NASDAQ 100® Covered Call ETF | | | 62,893,968 | | | | 134,780,491 | |
Global X S&P 500® Covered Call ETF | | | 3,902,245 | | | | 11,822,604 | |
Global X Russell 2000® Covered Call ETF | | | 2,256,816 | | | | 317,422 | |
For the year ended October 31, 2019, there were no purchases and sales of long-term U.S. Government securities.
4. INVESTMENT TRANSACTIONS (continued)
For the year or period ended October 31, 2019, in-kind transactions associated with creations and redemptions were:
| | | Purchases | | | Sales and Maturities | | | Realized Gain/(Loss) | |
Global X SuperDividend® ETF | | $ | 159,532,230 | | | $ | 51,670,555 | | | $ | 3,130,258 | |
Global X SuperDividend® U.S. ETF | | | 162,330,008 | | | | 10,936,835 | | | | 1,467,887 | |
Global X MSCI SuperDividend® Emerging Markets ETF | | | 4,785,344 | | | | 1,348,969 | | | | 204,853 | |
Global X MSCI SuperDividend® EAFE ETF | | | 16,543,011 | | | | 3,918,835 | | | | 297,261 | |
Global X SuperDividend® REIT ETF | | | 232,009,138 | | | | - | | | | 2,340,737 | |
| Global X SuperIncome™ Preferred ETF | | | 35,254,234 | | | | 23,945,663 | | | | 421,606 | |
| Global X YieldCo & Renewable Energy Income ETF | | | 7,668,802 | | | | 1,112,529 | | | | 86,352 | |
| Global X Social Media ETF | | | 5,555,728 | | | | 23,964,734 | | | | 4,282,069 | |
| Global X E-commerce ETF | | | 4,222,945 | | | | 915,083 | | | | 310,512 | |
Global X Guru® Index ETF | | | 1,570,297 | | | | 9,615,875 | | | | 1,456,153 | |
| Global X Scientific Beta U.S. ETF | | | 1,688,338 | | | | 36,865,680 | | | | 5,531,690 | |
| Global X Scientific Beta Europe ETF | | | - | | | | 4,887,777 | | | | (88,518 | ) |
| Global X Scientific Beta Japan ETF | | | - | | | | 5,420,190 | | | | 93,771 | |
| Global X Scientific Beta Asia ex-Japan ETF | | | 1,140,394 | | | | 2,167,909 | | | | (137,752 | ) |
Global X S&P 500® Catholic Values ETF | | | 125,994,006 | | | | 25,909,462 | | | | 7,602,498 | |
Global X NASDAQ 100® Covered Call ETF | | | 400,390,591 | | | | 19,208,117 | | | | 7,515,508 | |
Global X S&P 500® Covered Call ETF | | | 64,563,871 | | | | 11,666,563 | | | | 4,316,460 | |
Global X Russell 2000® Covered Call ETF | | | 6,972,490 | | | | - | | | | - | |
For the year or periods ended October 31, 2018, in-kind transactions associated with creations and redemptions were:
| | | Purchases | | | Sales and Maturities | | | Realized Gain/(Loss) | |
Global X SuperDividend® ETF | | $ | 240,644,166 | | | $ | 221,106,105 | | | $ | 41,303,284 | |
Global X SuperDividend® U.S. ETF | | | 47,271,954 | | | | 38,963,333 | | | | 5,097,607 | |
Global X MSCI SuperDividend® Emerging Markets ETF | | | 5,355,584 | | | | 3,580,626 | | | | 115,219 | |
Global X MSCI SuperDividend® EAFE ETF | | | 8,970,943 | | | | 5,298,977 | | | | 230,297 | |
Global X SuperDividend® REIT ETF | | | 84,884,669 | | | | 18,794,473 | | | | 2,340,737 | |
| Global X SuperIncome™ Preferred ETF | | | 2,373,774 | | | | 36,003,463 | | | | 611,264 | |
| Global X YieldCo & Renewable Energy Income ETF | | | 5,352,778 | | | | 5,718,608 | | | | 833,279 | |
| Global X Social Media ETF | | | 82,152,619 | | | | 93,857,420 | | | | 26,110,123 | |
Global X Guru® Index ETF | | | 1,601,847 | | | | 2,957,338 | | | | 344,141 | |
| Global X Scientific Beta U.S. ETF | | | 47,719,015 | | | | 60,833,480 | | | | 17,260,151 | |
| Global X Scientific Beta Europe ETF | | | 2,756,025 | | | | 12,630,613 | | | | 2,237,847 | |
| Global X Scientific Beta Japan ETF | | | 1,528,075 | | | | 9,526,117 | | | | 1,935,130 | |
| Global X Scientific Beta Asia ex-Japan ETF | | | 2,158,811 | | | | 2,432,589 | | | | 366,756 | |
Global X S&P 500® Catholic Values ETF | | | 39,989,665 | | | | 14,377,326 | | | | 4,395,266 | |
4. INVESTMENT TRANSACTIONS (continued)
To the extent consistent with its investment policies, certain Funds may either purchase or write options.
When a Fund purchases an option, the premium paid by it is recorded as an asset of the Fund. When a Fund writes an option, an amount equal to the net premium (the premium less the commission) received by the Fund is included in the liability section of the Fund’s statement of assets and liabilities as a deferred credit. The amount of this asset or deferred credit will be subsequently marked-to-market to reflect the current value of the option purchased or written. The current value of the traded option is the last sale price or, in the absence of a sale, the current bid price. If an option purchased by a Fund expires unexercised, the Fund realizes a loss equal to the premium paid. If a Fund enters into a closing sale transaction on an option purchased by it, the Fund will realize a gain if the premium received by the Fund on the closing transaction is more than the premium paid to purchase the option, or a loss if it is less. If an option written by a Fund expires on the stipulated expiration date or if a Fund enters into a closing purchase transaction, it will realize a gain (or loss if the cost of a closing purchase transaction exceeds the net premium received when the option is sold) and the deferred credit related to such option will be eliminated. If an option written by a Fund is exercised, the proceeds of the sale will be increased by the net premium originally received and the Fund will realize a gain or loss.
Risks may arise from an imperfect correlation between the change in market value of the securities held and the prices of options relating to the securities purchased or sold and from possible lack of a liquid secondary market for an option. The maximum exposure to loss for any purchased option is limited to the premium initially paid for the option. Written uncovered call options subject a fund to unlimited risk of loss. Written covered call options limit the upside potential of a security above the strike price. Put options written expose a fund to risk of loss if the value of the security declines below the strike price.
Global X NASDAQ 100® Covered Call ETF, Global X S&P 500® Covered Call ETF and Global X Russell 2000 Covered Call ETF may write covered call and/or put options that correspond to their respective reference index. By writing a covered call option, the Funds, in exchange for the premium, forego the opportunity for capital appreciation above the strike price should the market of the price of the underlying security increase. Conversely, by writing a put option, the Funds, in exchange for the premium, accept the risk of having to purchase a security at a fixed strike price even should the price of the underlying security decrease, exposing the Fund to downside risk in the underlying security.
When the written option expires, is terminated or is sold, the Funds will record a gain or loss. The net realized gain or loss on options contracts is reflected in the Statements of Operations and the net unrealized gains/(losses) are included as a component of the net change in unrealized appreciation/(depreciation) on options contracts in the Statement of Operations.
4. INVESTMENT TRANSACTIONS (continued)
For the year ended October 31, 2019, the monthly average notional value of the written options contracts held by the Global X NASDAQ 100® Covered Call ETF, Global X S&P 500® Covered Call ETF, and Global X Russell 2000 Covered Call ETF were $9,801,002, $506,954, and $96,864, respectively.
5. TAX INFORMATION
The Global X SuperDividend® REIT ETF has a tax year that ends on December 31. The following tax disclosures are representative as of October 31, 2019. Accordingly, the disclosures are for informational use by shareholders and are subject to change attributable to activity through the end of the tax year ending December 31, 2019.
The amount and character of income and capital gain distributions to be paid, if any, are determined in accordance with Federal income tax regulations, which may differ from U.S. GAAP. As a result, net investment income (loss) and net realized gain (loss) on investment transactions for a reporting period may differ significantly from distributions during such period. These book/tax differences may be temporary or permanent. To the extent these differences are permanent in nature, they are charged or credited to undistributed net investment income (loss), accumulated net realized gain (loss) or paid-in capital, as appropriate, in the period that the differences arise.
The following differences, primarily attributable to preferred stock interest, foreign currency, redemptions in-kind, REIT adjustments, MLP adjustments, net operating loss, return of capital distribution and sales of passive foreign investment companies have been reclassified to/from the following accounts during the fiscal year ended October 31, 2019:
| | | | | Distributable Earnings (Loss) | |
Global X SuperDividend® ETF | | $ | (4,031,148 | ) | | $ | 4,031,148 | |
Global X SuperDividend® U.S. ETF | | | (2,330,190 | ) | | | 2,330,190 | |
Global X MSCI SuperDividend® Emerging Markets ETF | | | 203,411 | | | | (203,411 | ) |
Global X MSCI SuperDividend® EAFE ETF | | | 293,561 | | | | (293,561 | ) |
Global X SuperDividend® REIT ETF | | | 658,283 | | | | (658,283 | ) |
| Global X SuperIncome™ Preferred ETF | | | 311,101 | | | | (311,101 | ) |
| Global X Yieldco & Renewable Energy Income ETF | | | (213,230 | ) | | | 213,230 | |
| Global X Social Media ETF | | | 3,780,021 | | | | (3,780,021 | ) |
| Global X E-commerce ETF | | | 310,512 | | | | (310,512 | ) |
Global X Guru® Index ETF | | | 1,461,539 | | | | (1,461,539 | ) |
| Global X Scientific Beta U.S. ETF | | | 5,303,790 | | | | (5,303,790 | ) |
| Global X Scientific Beta Europe ETF | | | (116,666 | ) | | | 116,666 | |
| Global X Scientific Beta Japan ETF | | | 37,628 | | | | (37,628 | ) |
| Global X Scientific Beta Asia ex-Japan ETF | | | (153,575 | ) | | | 153,575 | |
Global X S&P 500® Catholic Values ETF | | | 7,584,806 | | | | (7,584,806 | ) |
Global X NASDAQ 100® Covered Call ETF | | | 7,515,508 | | | | (7,515,508 | ) |
Global X S&P 500® Covered Call ETF | | | 3,841,820 | | | | (3,841,820 | ) |
5. TAX INFORMATION (continued)
The tax character of dividends and distributions declared during the years or periods ended October 31, 2019 and October 31, 2018 were as follows:
| Global X Funds | | Ordinary Income | | | Long-Term Capital Gain | | | Return of Capital | | | Totals | |
Global X SuperDividend® ETF | |
| 2019 | | $ | 71,080,700 | | | $ | – | | | $ | 10,387,010 | | | $ | 81,467,710 | |
| 2018 | | | 65,545,294 | | | | – | | | | 5,188,066 | | | | 70,733,360 | |
7675 Global X SuperDividend® U.S. ETF | |
| 2019 | | $ | 29,513,428 | | | $ | – | | | $ | 5,156,842 | | | $ | 34,670,270 | |
| 2018 | | | 22,214,715 | | | | – | | | | 3,376,555 | | | | 25,591,270 | |
7730 Global X MSCI SuperDividend® Emerging Markets ETF | |
| 2019 | | $ | 1,146,140 | | | $ | – | | | $ | – | | | $ | 1,146,140 | |
| 2018 | | | 855,368 | | | | – | | | | – | | | | 855,368 | |
7935 Global X MSCI SuperDividend® EAFE ETF | |
| 2019 | | $ | 547,298 | | | $ | – | | | $ | – | | | $ | 547,298 | |
| 2018 | | | 295,154 | | | | – | | | | – | | | | 295,154 | |
7735 Global X SuperDividend® REIT ETF | |
| 2019 | | $ | 7,369,085 | | | $ | – | | | $ | – | | | $ | 7,369,085 | |
| 2018 | | | 3,906,264 | | | | – | | | | – | | | | 3,906,264 | |
7665 Global X SuperIncome™ Preferred ETF | |
| 2019 | | $ | 11,905,843 | | | $ | – | | | $ | 83,858 | | | $ | 11,989,701 | |
| 2018 | | | 14,835,000 | | | | – | | | | – | | | | 14,835,000 | |
7785 Global X YieldCo & Renewable Energy Income ETF | |
| 2019 | | $ | 644,590 | | | $ | – | | | $ | – | | | $ | 644,590 | |
| 2018 | | | 843,401 | | | | – | | | | 154,396 | | | | 997,797 | |
7625 Global X Social Media ETF | |
| 2019 | | $ | – | | | $ | – | | | $ | – | | | $ | – | |
| 2018 | | | 2,573,545 | | | | – | | | | – | | | | 2,573,545 | |
7991 Global X E-commerce ETF | |
| 2019 | | $ | – | | | $ | – | | | $ | – | | | $ | – | |
7660 Global X Guru® Index ETF | |
| 2019 | | $ | 310,767 | | | $ | – | | | $ | 82,434 | | | $ | 393,201 | |
| 2018 | | | 302,653 | | | | – | | | | – | | | | 302,653 | |
7750 Global X Scientific Beta U.S. ETF | |
| 2019 | | $ | 3,062,493 | | | $ | – | | | $ | – | | | $ | 3,062,493 | |
| 2018 | | | 1,913,894 | | | | – | | | | – | | | | 1,913,894 | |
7755 Global X Scientific Beta Europe ETF | |
| 2019 | | $ | 423,851 | | | $ | – | | | $ | – | | | $ | 423,851 | |
| 2018 | | | 494,437 | | | | – | | | | – | | | | 494,437 | |
7760 Global X Scientific Beta Japan ETF | |
| 2019 | | $ | 176,524 | | | $ | – | | | $ | – | | | $ | 176,524 | |
| 2018 | | | 339,465 | | | | – | | | | – | | | | 339,465 | |
7765 Global X Scientific Beta Asia ex-Japan ETF | |
| 2019 | | $ | 210,319 | | | $ | – | | | $ | – | | | $ | 210,319 | |
| 2018 | | | 167,280 | | | | – | | | | – | | | | 167,280 | |
5. TAX INFORMATION (continued)
| Global X Funds | | Ordinary Income | | | Long-Term Capital Gain | | | Return of Capital | | | Totals | |
Global X S&P 500® Catholic Values ETF | |
| 2019 | | $ | 4,530,406 | | | $ | 187,691 | | | $ | – | | | $ | 4,718,097 | |
| 2018 | | | 1,665,617 | | | | 23,055 | | | | – | | | | 1,688,672 | |
Global X NASDAQ 100® Covered Call ETF | |
| 2019 | | $ | 40,380,150 | | | $ | 2,101,875 | | | $ | 12,331,150 | | | $ | 54,813,175 | |
| 2018 | | | 8,264,567 | | | | 795,059 | | | | 17,698,697 | | | | 26,758,323 | |
Global X S&P 500® Covered Call ETF | |
| 2019 | | $ | 4,867,892 | | | $ | 582,508 | | | $ | 780,262 | | | $ | 6,230,662 | |
| 2018 | | | 1,551,694 | | | | 330,858 | | | | 3,049,443 | | | | 4,931,995 | |
| Global X Russell 2000 Covered Call ETF | |
| 2019 | | $ | 158,257 | | | $ | 99,323 | | | $ | – | | | $ | 257,580 | |
As of October 31, 2019, the components of tax basis distributable earnings (accumulated losses) were as follows:
| | | Global X Funds | |
| | | Global X SuperDividend® ETF | | | Global X SuperDividend® U.S. ETF | | | Global X MSCI SuperDividend® Emerging Markets ETF | | | Global X MSCI SuperDividend® EAFE ETF | |
| Undistributed Ordinary Income | | $ | – | | | $ | – | | | $ | 153,453 | | | $ | 34,602 | |
| Capital Loss Carryforwards | | | (281,822,507 | ) | | | (54,987,089 | ) | | | (3,672,269 | ) | | | (422,592 | ) |
| Unrealized Appreciation (Depreciation) on Investments and Foreign Currency | | | (43,291,328 | ) | | | 5,740,654 | | | | (93,917 | ) | | | 454,785 | |
| Other Temporary Differences | | | 37,131 | | | | 7 | | | | – | | | | (3 | ) |
| Total Distributable Earnings (Accumulated Losses) | | $ | (325,076,704 | ) | | $ | (49,246,428 | ) | | $ | (3,612,733 | ) | | $ | 66,792 | |
| | | | | | | | | | | | | | | | | |
5. TAX INFORMATION (continued)
| | | Global X Funds | |
| | | Global X SuperDividend® REIT ETF(1) | | | Global X SuperIncome™ Preferred ETF | | | Global X YieldCo & Renewable Energy Income ETF | | | Global X Social Media ETF | |
| Undistributed Ordinary Income | | $ | – | | | $ | – | | | $ | 23,496 | | | $ | – | |
| Capital Loss Carryforwards | | | (1,523,254 | ) | | | (58,493,702 | ) | | | (831,842 | ) | | | (30,480,743 | ) |
| Unrealized Appreciation (Depreciation) on Investments and Foreign Currency | | | (12,236,773 | ) | | | 2,857,547 | | | | 2,598,592 | | | | 85,867 | |
| Late Year Loss Deferral | | | – | | | | – | | | | – | | | | (414,750 | ) |
| Other Temporary Differences | | | (658,111 | ) | | | (242,869 | ) | | | – | | | | – | |
| Total Distributable Earnings (Accumulated Losses) | | $ | (14,418,138 | ) | | $ | (55,879,024 | ) | | $ | 1,790,246 | | | $ | (30,809,626 | ) |
| | | | | | | | | | | | | | | | | |
(1) The Global X SuperDividend® REIT ETF has a tax year that ends on December 31.
| | | Global X Funds | |
| | | | | | | | | Global X Scientific Beta U.S. ETF | | | Global X Scientific Beta Europe ETF | |
| Undistributed Ordinary Income | | $ | – | | | $ | – | | | $ | 584,800 | | | $ | 28,792 | |
| Capital Loss Carryforwards | | | (956 | ) | | | (22,227,150 | ) | | | (5,933,099 | ) | | | (1,022,121 | ) |
| Unrealized Appreciation (Depreciation) on Investments and Foreign Currency | | | (98,569 | ) | | | 5,906,661 | | | | 10,024,311 | | | | (183,104 | ) |
| Late Year Loss Deferral | | | (4,913 | ) | | | – | | | | – | | | | – | |
| Other Temporary Differences | | | (1 | ) | | | (3 | ) | | | 2 | | | | (12 | ) |
| Total Distributable Earnings (Accumulated Losses) | | $ | (104,439 | ) | | $ | (16,320,492 | ) | | $ | 4,676,014 | | | $ | (1,176,445 | ) |
| | | | | | | | | | | | | | | | | |
5. TAX INFORMATION (continued)
| | | Global X Funds | |
| | | Global X Scientific Beta Japan ETF | | | Global X Scientific Beta Asia ex-Japan ETF | | | Global X S&P 500® Catholic Values ETF | | | Global X NASDAQ 100® Covered Call ETF | |
| Undistributed Ordinary Income | | $ | 59,854 | | | $ | 57,849 | | | $ | 1,501,864 | | | $ | – | |
| Undistributed Long-Term Capital Gain | | | – | | | | – | | | | 109,497 | | | | – | |
| Capital Loss Carryforwards | | | (673,928 | ) | | | (506,863 | ) | | | – | | | | – | |
| Unrealized Appreciation (Depreciation) on Investments and Foreign Currency | | | (91,398 | ) | | | (81,330 | ) | | | 34,405,428 | | | | – | |
| Other Temporary Differences | | | (9 | ) | | | – | | | | 3 | | | | 7 | |
| Total Distributable Earnings (Accumulated Losses) | | $ | (705,481 | ) | | $ | (530,344 | ) | | $ | 36,016,792 | | | $ | 7 | |
| | | | | | | | | | | | | | | | | |
| | | Global X Funds | |
| | | Global X S&P 500® Covered Call ETF | | | Global X Russell 2000 Covered Call ETF | |
| Undistributed Ordinary Income | | $ | – | | | $ | – | |
| Undistributed Long-Term Capital Gain | | | – | | | | 74,655 | |
| Unrealized Appreciation on Investments and Foreign Currency | | | – | | | | 93,152 | |
| Other Temporary Differences | | | 26,492 | | | | (124,812 | ) |
| Total Distributable Earnings | | $ | 26,492 | | | $ | 42,995 | |
| | | | | | | | | |
For taxable years beginning after December 22, 2010, a RIC is permitted to carry forward net capital losses to offset capital gains realized in later years, and the losses carried forward retain their original character as either long-term or short-term losses. Losses carried forward under these provisions are as follows:
5. TAX INFORMATION (continued)
| Global X Funds | | Short-Term Loss | | | Long-Term Loss | | | Total | |
Global X SuperDividend® ETF | | $ | 113,887,686 | | | $ | 167,934,821 | | | $ | 281,822,507 | |
Global X SuperDividend® U.S. ETF | | | 54,987,089 | | | | - | | | | 54,987,089 | |
Global X MSCI SuperDividend® Emerging Markets ETF | | | 2,830,905 | | | | 841,364 | | | | 3,672,269 | |
Global X MSCI SuperDividend® EAFE ETF | | | 115,549 | | | | 307,043 | | | | 422,592 | |
| Global X SuperIncome™ Preferred ETF | | | 15,368,042 | | | | 43,125,660 | | | | 58,493,702 | |
| Global X YieldCo & Renewable Energy Income ETF | | | 151,818 | | | | 680,024 | | | | 831,842 | |
| Global X Social Media ETF | | | 9,904,721 | | | | 20,576,022 | | | | 30,480,743 | |
| Global X E-commerce ETF | | | 956 | | | | - | | | | 956 | |
Global X Guru® Index ETF | | | 22,227,150 | | | | - | | | | 22,227,150 | |
| Global X Scientific Beta U.S. ETF | | | 5,810,669 | | | | 122,430 | | | | 5,933,099 | |
| Global X Scientific Beta Europe ETF | | | 753,064 | | | | 269,057 | | | | 1,022,121 | |
| Global X Scientific Beta Japan ETF | | | 491,326 | | | | 182,602 | | | | 673,928 | |
| Global X Scientific Beta Asia ex-Japan ETF | | | 384,751 | | | | 122,112 | | | | 506,863 | |
During the year ended October 31, 2019, the following Funds utilized capital loss carryforwards to offset capital gains amounting to:
| Global X Funds | | Short-Term Loss | | | Long-Term Loss | | | Total | |
| Global X SuperDividend® U.S. ETF | | $ | - | | | $ | 6,609,240 | | | $ | 6,609,240 | |
| Global X SuperIncome™ Preferred ETF | | | 56,496 | | | | - | | | | 56,496 | |
| Global X YieldCo & Renewable Energy Income ETF | | | 385,282 | | | | - | | | | 385,282 | |
| Global X Social Media ETF | | | 337,457 | | | | - | | | | 337,457 | |
Global X Guru® Index ETF | | | 342,150 | | | | - | | | | 342,150 | |
| Global X Scientific Beta U.S. ETF | | | - | | | | 172,383 | | | | 172,383 | |
Global X NASDAQ 100® Covered Call ETF | | | 4,403,752 | | | | - | | | | 4,403,752 | |
The Federal tax cost and aggregate gross unrealized appreciation and depreciation on investments held by the Funds at October 31, 2019 were as follows:
5. TAX INFORMATION (continued)
| | | | | Aggregated Gross Unrealized Appreciation | | | Aggregated Gross Unrealized Depreciation | | | Net Unrealized Appreciation (Depreciation) | |
Global X SuperDividend® ETF | | $ | 1,024,548,960 | | | $ | 65,843,726 | | | $ | (109,135,054 | ) | | $ | (43,291,328 | ) |
Global X SuperDividend® U.S. ETF | | | 577,438,216 | | | | 51,244,008 | | | | (45,503,354 | ) | | | 5,740,654 | |
Global X MSCI SuperDividend® Emerging Markets ETF | | | 17,511,709 | | | | 1,505,750 | | | | (1,599,667 | ) | | | (93,917 | ) |
Global X MSCI SuperDividend® EAFE ETF | | | 18,075,997 | | | | 992,652 | | | | (537,867 | ) | | | 454,785 | |
Global X SuperDividend® REIT ETF | | | 369,003,042 | | | | 20,361,080 | | | | (8,875,226 | ) | | | 11,485,854 | |
| Global X SuperIncome™ Preferred ETF | | | 201,113,366 | | | | 3,813,070 | | | | (955,523 | ) | | | 2,857,547 | |
| Global X YieldCo & Renewable Energy Income ETF | | | 23,490,494 | | | | 3,300,236 | | | | (701,644 | ) | | | 2,598,592 | |
| Global X Social Media ETF | | | 128,254,131 | | | | 16,138,972 | | | | (16,053,105 | ) | | | 85,867 | |
| Global X E-commerce ETF | | | 3,616,171 | | | | 176,141 | | | | (274,710 | ) | | | (98,569 | ) |
Global X Guru® Index ETF | | | 50,154,756 | | | | 7,889,049 | | | | (1,982,388 | ) | | | 5,906,661 | |
| Global X Scientific Beta U.S. ETF | | | 89,473,616 | | | | 14,314,779 | | | | (4,290,468 | ) | | | 10,024,311 | |
| Global X Scientific Beta Europe ETF | | | 5,130,752 | | | | 344,595 | | | | (527,738 | ) | | | (183,143 | ) |
| Global X Scientific Beta Japan ETF | | | 2,907,472 | | | | 188,350 | | | | (279,748 | ) | | | (91,398 | ) |
| Global X Scientific Beta Asia ex-Japan ETF | | | 2,509,498 | | | | 167,363 | | | | (248,693 | ) | | | (81,330 | ) |
Global X S&P 500® Catholic Values ETF | | | 240,554,455 | | | | 43,888,629 | | | | (9,483,201 | ) | | | 34,405,428 | |
Global X NASDAQ 100® Covered Call ETF | | | 766,808,895 | | | | 128,590,080 | | | | (128,590,080 | ) | | | – | |
Global X S&P 500® Covered Call ETF | | | 133,518,147 | | | | 21,417,948 | | | | (21,417,948 | ) | | | – | |
| Global X Russell 2000 Covered Call ETF | | | 8,728,914 | | | | 93,152 | | | | – | | | | 93,152 | |
| | | | | | | | | | | | | | | | | |
The preceding differences between book and tax cost are primarily due to mark-to-market treatment of passive foreign investment companies, MLP adjustments and wash sales.
The Funds invest in securities of foreign issuers in various countries. These investments may involve certain considerations and risks not typically associated with investments in the United States as a result of, among other factors, the possibility of future political and economic developments, the level of governmental supervision and regulation of securities markets in the respective countries.
6. CONCENTRATION OF RISKS
The securities markets of emerging countries are less liquid, subject to greater price volatility, and have a smaller market capitalization than those of United States securities markets. In certain countries, there may be fewer publicly traded securities and the market may be dominated by a few issuers or sectors. Issuers and securities markets in such countries are not subject to as extensive and frequent accounting, financial and other
6. CONCENTRATION OF RISKS (continued)
reporting requirements or as comprehensive government regulations as are issuers and securities markets in the U.S. In particular, the assets and profits appearing on the financial statements of emerging country issuers may not reflect their financial position or results of operations in the same manner as financial statements for U.S. issuers. Substantially less information may be publicly available about emerging country issuers than is available about issuers in the United States.
The Funds may be subject to taxes imposed by countries in which they invest. Such taxes are generally based on either income or gains earned or repatriated. The Funds accrue and apply such taxes to net investment income, net realized gains and net unrealized gains as income and/or capital gains are earned.
Except for the Global X Russell 2000® Covered Call Fund, which uses a representative sampling strategy, the Funds use a replication strategy. A replication strategy is an indexing strategy that involves investing in the securities of an underlying index in approximately the same proportions as in the underlying index. A representative sampling strategy is an indexing strategy that involves investing in a representative sample of securities (including indirect investments through underlying ETFs) that collectively has an investment profile similar to an underlying index in terms of key risk factors, performance attributes and other characteristics. Each Fund may utilize a representative sampling strategy with respect to its underlying indices when a replication strategy might be detrimental to its shareholders, such as when there are practical difficulties or substantial costs involved in compiling a portfolio of equity securities to follow their underlying indices, or, in certain instances, when securities in the underlying indices become temporarily illiquid, unavailable or less liquid, or due to legal restrictions (such as diversification requirements that apply to a Fund but not the underlying indices).
Please refer to each Fund’s prospectus and statement of additional information (“SAI”) for a more complete description of risks.
7. LOANS OF PORTFOLIO SECURITIES
The Funds may lend portfolio securities having a market value up to one-third of the Funds’ total assets. Security loans made pursuant to a securities lending agreement with BBH are initially required to be secured by collateral equal to at least 102% of the value of domestic equity securities and American Depositary Receipts (“ADRs”) and 105% of the value of foreign equity securities (other than ADRs). Such collateral received in connection with these loans will be cash and can be invested in repurchase agreements, short term investments or U.S. Treasury obligations and is recognized in the Schedule of Investments and Statement of Assets and Liabilities. The obligation to return securities lending collateral is also recognized as a liability in the Statement of Assets and Liabilities. It is the Funds’ policy to obtain additional collateral from or return excess collateral to the borrower by the end of the next business day, following the valuation date of the securities loaned. Therefore, the value of the collateral held may be temporarily less than the value of the securities on loan.
7. LOANS OF PORTFOLIO SECURITIES (continued)
Lending securities entails a risk of loss to the Funds if and to the extent that the market value of the securities loans were to increase and the borrower did not increase the collateral accordingly, and the borrower fails to return the securities. In the event the borrower may not provide additional collateral when required or may not return the securities when due, the securities lending agency agreement requires the lending agent to indemnify the Funds by replacing either the security or the security’s current market value to the Funds. The Funds could suffer a loss if the value of an investment purchased with cash collateral falls below the market value of loaned securities or if the value of an investment purchased with cash collateral falls below the value of the original cash collateral received. The Funds could also experience delays and costs in gaining access to the collateral. The Funds bear the risk of any deficiency in the amount of the collateral available for return to the borrower due to any loss on the collateral invested.
As of October 31, 2019, the value of securities on loan was $50,887,061, $38,804,473, $17,644,285, $3,705,414, $7,144,660 and $26,530 for the Global X SuperDividend® ETF, Global X SuperDividend® U.S. ETF, Global X SuperDividend® REIT ETF, Global X SuperIncome™ Preferred ETF, Global X Social Media ETF and Global X Guru® Index ETF, respectively, and the cash collateral received from securities on loan was $53,756,736, $40,753,036, $18,258,410, $3,788,080, $7,276,455 and $29,260 for Global X SuperDividend® ETF, Global X SuperDividend® U.S. ETF, Global X SuperDividend® REIT ETF, Global X SuperIncome™ Preferred ETF, Global X Social Media ETF and Global X Guru® Index ETF, respectively.
As of October 31, 2019, the following Funds had securities on loan, by counterparty:
| | | Market Value | | | Cash Collateral | |
Global X SuperDividend® ETF | | | | | | |
| Barclays Capital | | $ | 14,428 | | | $ | 15,386 | |
| BNP Prime Brokerage | | | 2,618,960 | | | | 2,763,666 | |
| BOFA Securities, Inc. | | | 3,483,300 | | | | 3,570,000 | |
| Citigroup | | | 1,177,765 | | | | 1,237,579 | |
| Credit Suisse | | | 1,986,877 | | | | 2,140,096 | |
| Goldman Sachs & Co. | | | 5,283,075 | | | | 5,888,421 | |
| JPMorgan | | | 3,221,119 | | | | 3,432,579 | |
| Morgan Stanley | | | 17,336,980 | | | | 18,256,007 | |
| National Financial Services | | | 14,977 | | | | 15,810 | |
| Scotia Capital | | | 3,909,358 | | | | 4,125,363 | |
| UBS Securities LLC | | | 7,367,091 | | | | 7,727,361 | |
| Wells Fargo Securities, LLC | | | 4,473,131 | | | | 4,584,468 | |
7. LOANS OF PORTFOLIO SECURITIES (continued)
Global X SuperDividend® U.S. ETF | | | | | | |
| Barclays Capital | | $ | 271,731 | | | $ | 287,825 | |
| BNP Prime Brokerage | | | 12,181 | | | | 12,480 | |
| BOFA Securities, Inc. | | | 3,489,961 | | | | 3,679,125 | |
| Citigroup | | | 1,751,361 | | | | 1,842,230 | |
| Goldman Sachs & Co. | | | 1,525,602 | | | | 1,596,980 | |
| JPMorgan | | | 8,576,360 | | | | 9,182,576 | |
| Morgan Stanley | | | 14,257,732 | | | | 14,824,000 | |
| National Financial Services | | | 7,921,787 | | | | 8,293,120 | |
| Wells Fargo Securities, LLC | | | 997,758 | | | | 1,034,700 | |
Global X SuperDividend® REIT ETF | | | | | | | | |
| BOFA Securities, Inc. | | | 43,712 | | | | 44,800 | |
| Citigroup | | | 83,326 | | | | 84,790 | |
| Credit Suisse | | | 202,341 | | | | 212,079 | |
| Goldman Sachs & Co. | | | 4,988,341 | | | | 5,228,409 | |
| JPMorgan | | | 5,464,628 | | | | 5,655,600 | |
| Wells Fargo Securities, LLC | | | 6,861,937 | | | | 7,032,732 | |
| Global X SuperIncome™ Preferred ETF | | | | | | | | |
| JPMorgan | | | 876,557 | | | | 901,360 | |
| National Financial Services | | | 120,692 | | | | 121,440 | (1)
|
| UBS Securities LLC | | | 109,720 | | | | 110,680 | (1)
|
| Wells Fargo Securities, LLC | | | 2,598,445 | | | | 2,654,600 | |
| Global X Social Media ETF | | | | | | | | |
| Barclays Capital | | | 1,681,106 | | | | 1,733,158 | |
| BNP Prime Brokerage | | | 4,420,110 | | | | 4,461,200 | (1) |
| Goldman Sachs & Co. | | | 237,709 | | | | 242,914 | |
| JPMorgan | | | 756,625 | | | | 788,840 | |
| National Financial Services | | | 49,110 | | | | 50,343 | |
Global X Guru® Index ETF | | | | | | | | |
| Goldman Sachs & Co. | | | 26,530 | | | | 29,260 | |
(1) It is the Funds’ policy to obtain additional collateral from or return excess collateral to the borrower by the end of the next business day, following the valuation date of the securities loaned. Therefore, the value of the collateral held may be temporarily less than the value of the securities on loan.
8. CONTRACTUAL OBLIGATIONS
The Funds enter into contracts in the normal course of business that contain a variety of indemnifications. The Funds’ maximum exposure under these contracts is unknown; however, the Funds have not had prior gains or losses pursuant to these contracts. Management has reviewed the Funds’ existing contracts and expects the risk of loss to be remote.
| | |
Notes to Financial Statements (concluded) |
| |
|
8. CONTRACTUAL OBLIGATIONS (continued)
Pursuant to the Trust’s organizational documents, the Trustees of the Trust and the Trust’s officers are indemnified against certain liabilities that may arise out of the performance of their duties.
9. REGULATORY MATTERS
On August 17, 2018, the Commission adopted amendments to Regulation S-X. These changes are effective for periods after November 5, 2018. The updates to RICs were mainly focused on simplifying the presentation of distributable earnings by eliminating the need to present the components of distributable earnings on a book basis in the Statement of Assets and Liabilities. The update also impacted the presentation of undistributed net investment income and distributions to shareholders on the Statements of Changes in Net Assets. The amounts presented in the current Statements of Changes in Net Assets represent the aggregated total distributions of net investment income and realized capital gains, except for distributions classified as return of capital which are still presented separately.
10. NEW ACCOUNTING PRONOUNCEMENTS
In August 2018, the Financial Accounting Standards Board (“FASB”) issued Accounting Standards Update 2018-13, Fair Value Measurement (Topic 820). The new guidance includes additions and modifications to disclosure requirements for fair value measurements. For public entities, the amendments are effective for financial statements issued for fiscal years beginning after December 15, 2019, and interim periods within those fiscal years. Management elected to early adopt the removal of certain disclosures and delay the adoption of additional disclosure until the effective date.
12. SUBSEQUENT EVENTS
The Funds have been evaluated by management regarding the need for additional disclosures and/or adjustments resulting from subsequent events. Based on this evaluation, no additional adjustments were required to the financial statements except as follows:
On November 15, 2019, the Board approved the extension of the expense limitation agreement in existence between the Global X Russell 2000® Covered Call ETF (the “Fund”) and the Adviser, under which the Adviser agrees to waive or reimburse fees and/or limit fund expenses to the extent necessary to assure that the operating expenses of the fund (exclusive of taxes, brokerage fees, commissions, and other transaction expenses and extraordinary expenses (such as litigation and indemnification expenses)) (“Total Annual Fund Operating Expenses”) would not exceed 0.60% of the Fund’s average daily net assets per year until March 1, 2021.
Effective November 18, 2019, the Management Fee of the Global X E-commerce ETF was reduced to 0.50%.END
| | |
Report of Independent Registered Public Accounting Firm
|
To the Board of Trustees and Shareholders of each of the eighteen funds listed in the table below
Opinions on the Financial Statements
We have audited the accompanying statements of assets and liabilities, including the schedules of investments, of each of the funds listed in the table below (eighteen of the funds constituting the Global X Funds, hereafter collectively referred to as the “Funds”) as of October 31, 2019, the related statements of operations, the statements of changes in net assets, including the related notes, and the financial highlights for each of the periods indicated in the table below (collectively referred to as the “financial statements”). In our opinion, the financial statements present fairly, in all material respects, the financial position of each of the Funds as of October 31, 2019, the results of each of their operations, the changes in each of their net assets, and each of the financial highlights for each of the periods indicated in the table below, in conformity with accounting principles generally accepted in the United States of America.
Global X SuperDividend® ETF (1) | Global X Guru™ Index ETF (1) |
| Global X SuperDividend™ U.S. ETF (1) | Global X Scientific Beta U.S. ETF (1) |
Global X MSCI SuperDividend® Emerging Markets ETF (1) | Global X Scientific Beta Europe ETF (1) |
Global X MSCI SuperDividend® EAFE ETF (2) | Global X Scientific Beta Japan ETF (1) |
Global X SuperDividend® REIT ETF (1) | Global X Scientific Beta Asia ex-Japan ETF (1) |
| Global X SuperIncome™ Preferred ETF (1) | Global X S&P 500® Catholic Values ETF (3) |
| Global X YieldCo & Renewable Energy Income ETF (1) | Global X Nasdaq 100® Covered Call ETF (6) |
| Global X E-commerce ETF (4) | Global X S&P 500® Covered Call ETF (6) |
| Global X Social Media Index ETF (1) | Global X Russell 2000 Covered Call ETF (5) |
| (1) | The related statements of operations for the year ended October 31, 2019, the statements of changes in net assets for each of the two years in the period ended October 31, 2019, including the related notes, and the financial highlights for each of the four years in the period ended October 31, 2019 |
| (2) | The related statements of operations for the year ended October 31, 2019, the statements of changes in net assets for each of the two years in the period ended October 31, 2019, including the related notes, and the financial highlights for each of the two years ended October 31, 2019 and the period November 14, 2016 (commencement of operations) through October 31, 2017 |
| (3) | The related statements of operations for the year ended October 31, 2019, the statements of changes in net assets for each of the two years in the period ended October 31, 2019, including the related notes, and the financial highlights for each of the three years ended October 31, 2019 and the period April 18, 2016
|
| | |
Report of Independent Registered Public Accounting Firm
|
| | (commencement of operations) through October 31, 2016 |
| (4) | The related statement of operations, the statement of changes in net assets, including the related notes, and the financial highlights for the period November 27, 2018 (commencement of operations) through October 31, 2019 |
| (5) | The related statement of operations, the statement of changes in net assets, including the related notes, and the financial highlights for the period April 17, 2019 (commencement of operations) through October 31, 2019
|
| (6) | The related statement of operations, the statement of changes in net assets, including the related notes, and the financial highlights for the year ended October 31, 2019 |
The financial statements of the Funds, listed in the table below, as of and for the year ended October 31, 2015 and the financial highlights for each of the periods ended on or prior to October 31, 2015 (not presented herein, other than the financial highlights) were audited by other auditors whose report dated December 30, 2015 expressed an unqualified opinion on those financial statements and financial highlights.
Global X SuperDividend® ETF | Global X Social Media Index ETF |
| Global X SuperDividend™ U.S. ETF | Global X Guru™ Index ETF |
Global X MSCI SuperDividend® Emerging Markets ETF | Global X Scientific Beta U.S. ETF |
Global X SuperDividend® REIT ETF | Global X Scientific Beta Europe ETF |
| Global X SuperIncome™ Preferred ETF | Global X Scientific Beta Japan ETF |
| Global X YieldCo & Renewable Energy Income ETF | Global X Scientific Beta Asia ex-Japan ETF |
The financial statements of the Funds, listed in the table below, as of and for the year ended October 31, 2018 and the financial highlights for each of the periods ended on or prior to October 31, 2018 (not presented herein, other than the statement of changes in net assets and the financial highlights) were audited by other auditors whose report dated December 28, 2018 expressed an unqualified opinion on those financial statements and financial highlights.
| Global X Nasdaq 100® Covered Call ETF | Global X S&P 500® Covered Call ETF |
Basis for Opinions
These financial statements are the responsibility of the Funds’ management. Our responsibility is to express an opinion on the Funds’ financial statements based on our audits. We are a public accounting firm registered with the Public Company Accounting Oversight Board (United States) (PCAOB) and are required to be independent with respect to the Funds in accordance with the U.S. federal securities laws and the applicable rules and regulations of the Securities and Exchange Commission and the PCAOB.
| | |
Report of Independent Registered Public Accounting Firm
|
We conducted our audits of these financial statements in accordance with the standards of the PCAOB. Those standards require that we plan and perform the audit to obtain reasonable assurance about whether the financial statements are free of material misstatement, whether due to error or fraud.
Our audits included performing procedures to assess the risks of material misstatement of the financial statements, whether due to error or fraud, and performing procedures that respond to those risks. Such procedures included examining, on a test basis, evidence regarding the amounts and disclosures in the financial statements. Our audits also included evaluating the accounting principles used and significant estimates made by management, as well as evaluating the overall presentation of the financial statements. Our procedures included confirmation of securities owned as of October 31, 2019 by correspondence with the custodian and brokers: when replies were not received from brokers, we performed other auditing procedures. We believe that our audits provide a reasonable basis for our opinions.
PricewaterhouseCoopers LLP
Philadelphia, Pennsylvania
December 27, 2019
We have served as the auditor of one or more investment companies in the Global X Funds since 2016.
| | |
Disclosure of Fund Expenses (unaudited)
|
All ETFs (such as the Funds) have operating expenses. As a shareholder of an ETF, your investment is affected by these ongoing costs, which include (among others) costs for ETF management, administrative services, commissions, and shareholder reports like this one. It is important for you to understand the impact of these costs on your investment returns. In addition, a shareholder is responsible for brokerage fees as a result of the shareholder’s investment in a Fund.
Operating expenses such as these are deducted from the Funds’ gross income and directly reduce their final investment returns. These expenses are expressed as a percentage of the Funds’ average net assets; this percentage is known as the Funds’ expense ratio.
The following examples use the expense ratio and are intended to help you understand the ongoing costs (in dollars) of investing in a Fund and to compare these costs with those of other funds. The examples are based on an investment of $1,000 made at the beginning of the period shown and held for the entire period (May 1, 2019 through October 31, 2019).
The table on the next page illustrates the Funds’ costs in two ways:
Actual Fund Return. This section helps you to estimate the actual expenses that your Fund incurred over the period. The “Expenses Paid During Period” column shows the actual dollar expense cost incurred by a $1,000 investment in the Fund, and the “Ending Account Value” number is derived from deducting that expense cost from the Fund’s gross investment return.
You can use this information, together with the actual amount you invested in the Fund, to estimate the expenses you paid over that period. Simply divide your actual account value by $1,000 to arrive at a ratio (for example, an $8,600 account value divided by $1,000 = 8.6), then multiply that ratio by the number shown for your Fund under “Expenses Paid During Period.”
Hypothetical 5% Return. This section helps you compare your Fund’s costs with those of other funds. It assumes that the Fund had an annual 5% return before expenses during the year, but that the expense ratio (Column 3) for the period is unchanged. This example is useful in making comparisons because the Securities and Exchange Commission requires all funds to make this 5% calculation. You can assess your Fund’s comparative cost by comparing the hypothetical result for your Fund in the “Expenses Paid During Period” column with those that appear in the same charts in the shareholder reports for other funds.
NOTE: Because the return is set at 5% for comparison purposes — NOT your Fund’s actual return — the account values shown may not apply to your specific investment.
| | |
Disclosure of Fund Expenses (unaudited) (continued)
|
| | | Beginning Account Value 5/1/2019 | | | Ending Account Value 10/31/2019 | | | Annualized Expense Ratios | | | Expenses Paid During Period(1) | |
Global X SuperDividend® ETF | |
| Actual Fund Return | | $ | 1,000.00 | | | $ | 1,014.50 | | | | 0.59 | % | | $ | 3.00 | |
| Hypothetical 5% Return | | | 1,000.00 | | | | 1,022.23 | | | | 0.59 | | | | 3.01 | |
| | | | | | | | | | | | | | | | | |
Global X SuperDividend® U.S. ETF | |
| Actual Fund Return | | $ | 1,000.00 | | | $ | 1,033.90 | | | | 0.46 | % | | $ | 2.36 | |
| Hypothetical 5% Return | | | 1,000.00 | | | | 1,022.89 | | | | 0.46 | | | | 2.35 | |
| | | | | | | | | | | | | | | | | |
Global X MSCI SuperDividend® Emerging Markets ETF | |
| Actual Fund Return | | $ | 1,000.00 | | | $ | 966.90 | | | | 0.67 | % | | $ | 3.32 | |
| Hypothetical 5% Return | | | 1,000.00 | | | | 1,021.83 | | | | 0.67 | | | | 3.41 | |
| | |
Global X MSCI SuperDividend® EAFE ETF | |
| Actual Fund Return | | $ | 1,000.00 | | | $ | 1,033.10 | | | | 0.55 | % | | $ | 2.82 | |
| Hypothetical 5% Return | | | 1,000.00 | | | | 1,022.43 | | | | 0.55 | | | | 2.80 | |
| | | | | | | | | | | | | | | | | |
Global X SuperDividend® REIT ETF | |
| Actual Fund Return | | $ | 1,000.00 | | | $ | 1,055.90 | | | | 0.58 | % | | $ | 3.01 | |
| Hypothetical 5% Return | | | 1,000.00 | | | | 1,022.28 | | | | 0.58 | | | | 2.96 | |
| | | | | | | | | | | | | | | | | |
| Global X SuperIncome™ Preferred ETF | |
| Actual Fund Return | | $ | 1,000.00 | | | $ | 1,044.70 | | | | 0.58 | % | | $ | 2.99 | |
| Hypothetical 5% Return | | | 1,000.00 | | | | 1,022.28 | | | | 0.58 | | | | 2.96 | |
| | | | | | | | | | | | | | | | | |
| Global X YieldCo & Renewable Energy Income ETF | |
| Actual Fund Return | | $ | 1,000.00 | | | $ | 1,081.70 | | | | 0.65 | % | | $ | 3.41 | |
| Hypothetical 5% Return | | | 1,000.00 | | | | 1,021.93 | | | | 0.65 | | | | 3.31 | |
| | |
| Global X Social Media ETF | |
| Actual Fund Return | | $ | 1,000.00 | | | $ | 936.60 | | | | 0.65 | % | | $ | 3.17 | |
| Hypothetical 5% Return | | | 1,000.00 | | | | 1,021.93 | | | | 0.65 | | | | 3.31 | |
| | | | | | | | | | | | | | | | | |
| Global X E-Commerce ETF | |
| Actual Fund Return | | $ | 1,000.00 | | | $ | 940.10 | | | | 0.68 | % | | $ | 3.33 | |
| Hypothetical 5% Return | | | 1,000.00 | | | | 1,021.78 | | | | 0.68 | | | | 3.47 | |
| | | | | | | | | | | | | | | | | |
Global X Guru® Index ETF | |
| Actual Fund Return | | $ | 1,000.00 | | | $ | 1,016.00 | | | | 0.75 | % | | $ | 3.81 | |
| Hypothetical 5% Return | | | 1,000.00 | | | | 1,021.42 | | | | 0.75 | | | | 3.82 | |
| | | | | | | | | | | | | | | | | |
| Global X Scientific Beta U.S. ETF | |
| Actual Fund Return | | $ | 1,000.00 | | | $ | 1,040.50 | | | | 0.19 | % | | $ | 0.98 | |
| Hypothetical 5% Return | | | 1,000.00 | | | | 1,024.25 | | | | 0.19 | | | | 0.97 | |
| | | | | | | | | | | | | | | | | |
| | |
Disclosure of Fund Expenses (unaudited) (concluded)
|
| | | Beginning Account Value 5/1/2019 | | | Ending Account Value 10/31/2019 | | | Annualized Expense Ratios | | | Expenses Paid During Period(1) | |
| Global X Scientific Beta Europe ETF | |
| Actual Fund Return | | $ | 1,000.00 | | | $ | 1,024.10 | | | | 0.38 | % | | $ | 1.94 | |
| Hypothetical 5% Return | | | 1,000.00 | | | | 1,023.29 | | | | 0.38 | | | | 1.94 | |
| | | | | | | | | | | | | | | | | |
| Global X Scientific Beta Japan ETF | |
| Actual Fund Return | | $ | 1,000.00 | | | $ | 1,054.70 | | | | 0.39 | % | | $ | 2.02 | |
| Hypothetical 5% Return | | | 1,000.00 | | | | 1,023.24 | | | | 0.39 | | | | 1.99 | |
| | | | | | | | | | | | | | | | | |
| Global X Scientific Beta Asia ex-Japan ETF | |
| Actual Fund Return | | $ | 1,000.00 | | | $ | 999.10 | | | | 0.38 | % | | $ | 1.91 | |
| Hypothetical 5% Return | | | 1,000.00 | | | | 1,023.29 | | | | 0.38 | | | | 1.94 | |
| | | | | | | | | | | | | | | | | |
Global X S&P 500® Catholic Values ETF | |
| Actual Fund Return | | $ | 1,000.00 | | | $ | 1,039.10 | | | | 0.29 | % | | $ | 1.49 | |
| Hypothetical 5% Return | | | 1,000.00 | | | | 1,023.74 | | | | 0.29 | | | | 1.48 | |
| | | | | | | | | | | | | | | | | |
Global X NASDAQ 100® Covered Call ETF | |
| Actual Fund Return | | $ | 1,000.00 | | | $ | 1,063.60 | | | | 0.85 | % | | $ | 4.42 | |
| Hypothetical 5% Return | | | 1,000.00 | | | | 1,020.92 | | | | 0.85 | | | | 4.33 | |
| | | | | | | | | | | | | | | | | |
Global X S&P 500® Covered Call ETF | |
| Actual Fund Return | | $ | 1,000.00 | | | $ | 1,040.80 | | | | 0.88 | % | | $ | 4.53 | |
| Hypothetical 5% Return | | | 1,000.00 | | | | 1,020.77 | | | | 0.88 | | | | 4.48 | |
| | | | | | | | | | | | | | | | | |
| Global X Russell 2000 Covered Call ETF | |
| Actual Fund Return | | $ | 1,000.00 | | | $ | 1,052.80 | | | | 0.82 | % | | $ | 4.24 | |
| Hypothetical 5% Return | | | 1,000.00 | | | | 1,021.07 | | | | 0.82 | | | | 4.18 | |
| (1) | Expenses are equal to the Fund’s annualized expense ratio multiplied by the average account value over the period, multiplied 184/365 (to reflect the one-half year period), unless otherwise noted. |
| | |
Supplemental Information (unaudited)
|
NAV is the price per Share at which the Funds issue and redeem Shares. It is calculated in accordance with the standard formula for valuing mutual fund shares. The “Market Price” of the Funds generally is determined using the midpoint between the highest bid and the lowest offer on the stock exchange on which the Shares of the Funds are listed for trading, as of the time that the Funds’ NAV is calculated. The Funds’ Market Price may be at, above or below their NAV. The NAV of the Funds will fluctuate with changes in the market value of the Funds’ holdings. The Market Price of the Funds will fluctuate in accordance with changes in its NAV, as well as market supply and demand.
Premiums or discounts are the differences (expressed as a percentage) between the NAV and Market Price of the Funds on a given day, generally at the time NAV is calculated. A premium is the amount that the Funds are trading above the reported NAV, expressed as a percentage of the NAV. A discount is the amount that the Funds are trading below the reported NAV, expressed as a percentage of the NAV.
Further information regarding premiums and discounts is available on the Funds’ website at www.globalxetfs.com
| | |
Trustees and Officers of the Trust (unaudited)
|
Set forth below are the names, addresses, years of birth, positions with the Trust, Term of Office and Length of Time Served, the principal occupations for the last five years, number of Funds in fund complex overseen by Trustee, and other directorships outside the fund complex of each of the persons currently serving as Trustees and Officers of the Trust.
Name, Address (Year of Birth) | Position(s) Held with Trust | Principal Occupation(s) During the Past 5 Years | Number of Funds in Trust Overseen by Trustee | Other Directorships Held by Trustees |
Independent Trustees 1 | |
Charles A. Baker 600 Lexington Avenue, 20th Floor New York, NY 10022 (1953) | Trustee (since 07/2018) | Chief Executive Officer of Investment Innovations LLC (investment consulting) (since 2013); Managing Director of NYSE Euronext (2003 to 2012). | 72 2 | Trustee of OSI ETF Trust (since 2016). |
Susan M.Ciccarone 600 LexingtonAvenue, 20th Floor New York, NY 10022 (1973) | Trustee (since 09/2019) | Partner, Further Global Capital Management (private equity) (since 2017); formerly Chief Operating Officer (2014-2016) and Chief Financial Officer (2012-2016), Emerging Global Advisors, LLC (ETF issuer). | 72 2 | Chairman, Payment Alliance International, Inc. (since 2019); Director, Casa Holdco LP, parent of Celink (since 2018). |
Clifford J. Weber 600 Lexington Avenue, 20th Floor New York, NY 10022 (1963) | Trustee (since 07/2018) | Owner, Financial Products Consulting Group LLC (consulting services to financial institutions) (since 2015); Formerly, Executive Vice President of Global Index and Exchange-Traded Products, NYSE Market, Inc., a subsidiary of Intercontinental Exchange (ETF/ETP listing exchange) (2013-2015). | 72 2 | Chairman (since 2017) and Trustee of Clough Funds Trust (since 2015); Chairman and Trustee of Clayton Street Trust (since 2016); Chairman and Trustee of Janus Detroit Street Trust (since 2016); Chairman and Trustee of Elevation ETF Trust (2016-2018); Trustee of Clough Global Equity Fund (since 2017); Trustee of Clough Global Dividend and Income Fund (since 2017); and Clough Global Opportunities Fund (since 2017). |
| | |
Trustees and Officers of the Trust (unaudited) (continued)
|
The Trust’s Statement of Additional Information (“SAI”) includes additional information about the Trustees and Officers. The SAI may be obtained without charge by calling 1-888-493-8631. The following chart lists Trustees and Officers as of October 31, 2019.
Name, Address (Year of Birth) | Position(s) Held with Funds | Principal Occupation(s) During the Past 5 Years | Number of Operational Funds in Trust Overseen by Trustee | Other Directorships Held by Trustees |
Interested Trustee/Officers 1 |
Luis Berruga 600 Lexington Avenue, 20th Floor New York, NY 10022 (1977) | Trustee (since 07/2018); President (since 2018) | Chief Executive Officer, GXMC (since 07/2018), Chief Financial Officer (since 2/2014) and Chief Operating Officer (9/2015 - 7/2018); Investment Banker, Jefferies (2012-2014) | 72 2 | None |
| | | | | |
Chang Kim 600 Lexington Avenue, 20th Floor New York, NY 10022 (1984) | Chief Operating Officer; Treasurer, Principal Accounting Officer; and Chief Financial Officer (since 7/2018) | Chief Operating Officer, GXMC (since 7/2018), Head of Portfolio Management & Portfolio Administration (1/2017-7/2018); and Portfolio Manager (9/2009 - 1/2017) | N/A | None |
| | | | | |
Lisa K. Whittaker 600 Lexington Avenue, 20th Floor New York, NY 10022 (1978) | Secretary (since 7/2018) | General Counsel, GXMC (since 7/2018); Counsel at SEI Investments (2012 - 7/2018) | N/A | None |
Joe Costello 600 Lexington Avenue, 20th Floor New York, NY 10022 (1974) | Chief Compliance Officer (since 9/2016) | Chief Compliance Officer, FlexShares Funds (2011-2015); Vice President, Northern Trust Investments (2003 - 2015) | N/A | None |
Eric Kleinschmidt 3 One Freedom Valley Drive Oaks, PA 19456 (1968) | Assistant Treasurer (since 2016) | Director, Fund Accounting, SEI Investments Global Funds Services (2004 to present) | N/A | None |
| | |
Trustees and Officers of the Trust (unaudited) (concluded)
|
Dianne Descoteaux 3 One Freedom Valley Drive Oaks, PA 19456 (1977) | Assistant Secretary (since 11/2018) | Counsel at SEI Investments (2010-present). | N/A | None |
1 | Each Trustee serves until his or her successor is duly elected or appointed and qualified. |
2 | As of October 31, 2019, the Trust had one hundred and one portfolios, seventy-two of which were operational. |
3 | These officers of the Trust also serve as officers of one or more mutual funds for which SEI Investments Company or an affiliate acts as investment manager, administrator or distributor. |
| | |
Notice to Shareholders (unaudited)
|
For shareholders that do not have an October 31, 2019 tax year end, this notice is for informational purposes only. For shareholders with an October 31, 2019 tax year end, please consult your tax advisor as to the pertinence of this notice. For the fiscal year ended October 31, 2019, the Funds are designating the following items with regard to distributions paid during the year.
| | Return of Capital | Long-Term Capital Gain Distributions | Ordinary Income Distributions | Total Distributions | Qualifying for Corporate Dividends Received Deduction(1) | Qualifying Dividend Income(2) |
| | | | | | | |
Global X SuperDividend® ETF | 12.75% | 0.00% | 87.25% | 100.00% | 8.78% | 45.81% |
Global X SuperDividend® U.S. ETF | 14.87% | 0.00% | 85.13% | 100.00% | 47.28% | 50.11% |
Global X MSCI SuperDividend® Emerging Markets ETF | 0.00% | 0.00% | 100.00% | 100.00% | 0.00% | 57.76% |
Global X MSCI SuperDividend® EAFE ETF | 0.00% | 0.00% | 100.00% | 100.00% | 0.00% | 93.13% |
Global X SuperDividend® REIT ETF | 0.00% | 0.00% | 0.00% | 0.00% | 0.00% | 0.00% |
| Global X SuperIncome™ Preferred ETF | 0.70% | 0.00% | 99.30% | 100.00% | 54.67% | 66.97% |
| Global X YieldCo & Renewable Energy Income ETF | 0.00% | 0.00% | 100.00% | 100.00% | 4.88% | 29.61% |
| Global X Social Media ETF | 0.00% | 0.00% | 0.00% | 0.00% | 0.00% | 0.00% |
| Global X e-Commerce ETF | 0.00% | 0.00% | 0.00% | 0.00% | 0.00% | 0.00% |
| Global X Guru® Index ETF | 20.96% | 0.00% | 79.04% | 100.00% | 100.00% | 100.00% |
| Global X Scientific Beta U.S. ETF | 0.00% | 0.00% | 100.00% | 100.00% | 94.09% | 98.99% |
| Global X Scientific Beta Europe ETF | 0.00% | 0.00% | 100.00% | 100.00% | 0.08% | 98.46% |
| Global X Scientific Beta Japan ETF | 0.00% | 0.00% | 100.00% | 100.00% | 0.00% | 12.93% |
| Global X Scientific Beta Asia ex-Japan ETF | 0.00% | 0.00% | 100.00% | 100.00% | 0.00% | 40.10% |
Global X S&P 500® Catholic Values ETF | 0.00% | 3.98% | 96.02% | 100.00% | 97.16% | 99.08% |
Global X NASDAQ 100® Covered Call ETF | 22.50% | 3.83% | 73.67% | 100.00% | 0.00% | 0.00% |
Global X S&P 500® Covered Call ETF | 12.52% | 9.35% | 78.13% | 100.00% | 0.00% | 0.00% |
| Global X Russell 2000 Covered Call ETF | 0.00% | 38.56% | 61.44% | 100.00% | 25.19% | 25.19% |
(1) Qualifying dividends represent dividends which qualify for the corporate dividends received deduction and is reflected as a percentage of ordinary Income distributions (the total of short term capital gain and net investment income distributions).
(2) The percentage in this column represents the amount of "Qualifying Dividend Income" as created by the Jobs and Growth Relief Reconciliation Act of 2003 and is reflected as a percentage of ordinary income distributions (the total of short term capital gain and net investment income distributions). It is the intention of each of the aforementioned funds to designate the maximum amount permitted by law.
| | |
Notice to Shareholders (unaudited)
|
| | U.S. Government Interest(3) | Interest Related Dividends(4) | Short Term Capital Gain Dividends(5) | Qualifying Business Income(6) | Foreign Tax Credit |
| | | | | | |
Global X SuperDividend® ETF | 0.00% | 0.04% | 0.00% | 34.22% | 0.00% |
Global X SuperDividend® U.S. ETF | 0.00% | 3.56% | 0.00% | 24.03% | 0.00% |
Global X MSCI SuperDividend® Emerging Markets ETF | 0.00% | 0.05% | 0.00% | 0.00% | 10.55% |
Global X MSCI SuperDividend® EAFE ETF | 0.00% | 0.01% | 0.00% | 0.00% | 0.00% |
Global X SuperDividend® REIT ETF | 0.00% | 0.00% | 0.00% | 0.00% | 0.00% |
| Global X SuperIncome™ Preferred ETF | 0.00% | 0.74% | 0.00% | 0.00% | 0.00% |
| Global X YieldCo & Renewable Energy Income ETF | 0.00% | 0.39% | 0.00% | 0.00% | 0.00% |
| Global X Social Media ETF | 0.00% | 0.00% | 0.00% | 0.00% | 0.00% |
| Global X e-Commerce ETF | 0.00% | 0.00% | 0.00% | 0.00% | 0.00% |
| Global X Guru® Index ETF | 0.00% | 0.95% | 0.00% | 0.00% | 0.00% |
| Global X Scientific Beta U.S. ETF | 0.00% | 0.12% | 0.00% | 1.01% | 0.00% |
| Global X Scientific Beta Europe ETF | 0.00% | 0.04% | 0.00% | 0.00% | 0.00% |
| Global X Scientific Beta Japan ETF | 0.00% | 0.01% | 0.00% | 0.00% | 0.00% |
| Global X Scientific Beta Asia ex-Japan ETF | 0.00% | 0.04% | 0.00% | 0.00% | 0.00% |
Global X S&P 500® Catholic Values ETF | 0.00% | 0.11% | 100.00% | 0.92% | 0.00% |
Global X NASDAQ 100® Covered Call ETF | 0.00% | 0.00% | 100.00% | 0.00% | 0.00% |
Global X S&P 500® Covered Call ETF | 0.00% | 0.01% | 100.00% | 0.00% | 0.00% |
| Global X Russell 2000 Covered Call ETF | 0.00% | 0.00% | 100.00% | 0.00% | 0.00% |
(3) "U.S. Government Interest" represents the amount of interest that was derived from U.S. Government obligations and distributed during the fiscal year. Generally, interest from direct U.S. Government obligations is exempt from state income tax. However, for shareholders who are residents of California, Connecticut and New York, the statutory threshold requirements were not satisfied to permit exemption of these amounts from state income.
(4) The percentage in this column represents the amount of "Qualifying Interest Income" as created by the American Jobs Creation Act of 2004 and is a percentage of net investment income that is exempt from U.S. withholding tax when paid for foreign investors.
(5) The percentage of this column represents the amount of “Short Term Capital Gain Dividend” and is reflected as a percentage of short term capital gain distribution that is exempted from U.S. withholding tax when paid to foreign investors.
(6) The percentage of this column represents that amount of ordinary dividend income that qualified for 20% Business Income Deduction.
| | |
Notice to Shareholders (unaudited)
|
Certain Funds intend to pass through a foreign tax credit to shareholders. For the fiscal year ended October 31, 2019 the total amount of foreign source income and foreign tax credit are as follows:
| Global X Funds | | Foreign Source Income | | | Foreign Tax Credit Pass through | |
Global X MSCI SuperDividend® Emerging Markets ETF | | $ | 1,289,782 | | | $ | 135,141 | |
The information reported herein may differ from the information and distributions taxable to the shareholders for the calendar year ending December 31, 2019. Complete information will be computed and reported in conjunction with your 2019 Form 1099-DIV.
600 Lexington Avenue, 20th Floor
New York, NY 10022
1-888-493-8631
www.globalxetfs.com
Investment Adviser and Administrator:
Global X Management Company LLC
600 Lexington Avenue, 20th Floor
New York, NY 10022
Distributor:
SEI Investments Distribution Co.
One Freedom Valley Drive
Oaks, PA 19456
Sub-Administrator:
SEI Investments Global Funds Services
One Freedom Valley Drive
Oaks, PA 19456
Counsel for Global X Funds and the Independent Trustees:
Stradley Ronon Stevens & Young, LLP
2000 K Street, N.W.
Suite 700
Washington, DC 20006
Custodian and Transfer Agent:
Brown Brothers Harriman & Co.
50 Post Office Square
Boston, MA 02110
Independent Registered Public Accounting Firm:
PricewaterhouseCoopers LLP
Two Commerce Square
Suite 1800
Philadelphia, PA 19103
This information must be preceded or accompanied by a current prospectus for the Funds described.
GLX-AR-003-0900