| |
| Global X Social Media ETF (ticker: SOCL) |
| Global X Lithium & Battery Tech ETF (ticker: LIT) |
| Global X E-commerce ETF (ticker: EBIZ) |
Global X SuperDividend® ETF (ticker: SDIV) |
Global X SuperDividend® U.S. ETF (ticker: DIV) |
Global X MSCI SuperDividend® EAFE ETF (ticker: EFAS) |
Global X MSCI SuperDividend® Emerging Markets ETF (ticker: SDEM) |
Global X SuperDividend® REIT ETF (ticker: SRET) |
Global X NASDAQ 100® Covered Call ETF (ticker: QYLD) |
Global X S&P 500® Covered Call ETF (ticker: XYLD) |
| Global X Russell 2000 Covered Call ETF (ticker: RYLD) |
| Global X Nasdaq 100 Covered Call & Growth ETF (ticker: QYLG) |
| Global X S&P 500 Covered Call & Growth ETF (ticker: XYLG) |
Global X SuperIncome™ Preferred ETF (ticker: SPFF) |
| Global X YieldCo & Renewable Energy Income ETF (ticker: YLCO) |
Global X S&P 500® Catholic Values ETF (ticker: CATH) |
| Global X S&P Catholic Values Developed ex-U.S. ETF (ticker: CEFA) |
Global X Guru® Index ETF (ticker: GURU) |
| |
Annual Report
October 31, 2020
Beginning on January 1, 2021, as permitted by regulations adopted by the Securities and Exchange Commission, paper copies of the Funds’ (defined below) shareholder reports will no longer be sent by mail, unless you specifically request paper copies of the reports from your financial intermediary (such as a broker-dealer or bank). Instead, shareholder reports will be available on the Funds’ website (www.globalxetfs.com), and you will be notified by mail each time a report is posted and provided with a website link to access the report.
If you already elected to receive shareholder reports electronically, you will not be affected by this change and you need not take any action. You may elect to receive shareholder reports and other communications from the Funds electronically anytime by contacting your financial intermediary.
You may elect to receive all future Fund shareholder reports in paper free of charge. Please contact your financial intermediary to inform them that you wish to continue receiving paper copies of Fund shareholder reports and for details about whether your election to receive reports in paper will apply to all funds held with your financial intermediary.
| Management Discussion of Fund Performance | 1 |
| Schedules of Investments | |
Global X Social Media ETF
| 51 |
| Global X Lithium & Battery Tech ETF | 55
|
| Global X E-commerce ETF | 60
|
| Global X SuperDividend® ETF | 64
|
| Global X SuperDividend® U.S. ETF | 73
|
| Global X MSCI SuperDividend® EAFE ETF | 77
|
Global X MSCI SuperDividend® Emerging Markets ETF
| 82
|
| Global X SuperDividend® REIT ETF | 87
|
| Global X NASDAQ 100® Covered Call ETF | 90
|
Global X S&P 500® Covered Call ETF
| 96
|
| Global X Russell 2000 Covered Call ETF | 114
|
| Global X Nasdaq 100® Covered Call & Growth ETF | 116
|
Global X Global X S&P 500® Covered Call & Growth ETF
| 122
|
| Global X SuperIncome™ Preferred ETF | 140
|
| Global X YieldCo & Renewable Energy Income ETF | 146
|
| Global X S&P 500® Catholic Values ETF | 151
|
| Global X S&P Catholic Values Developed ex-US ETF | 167
|
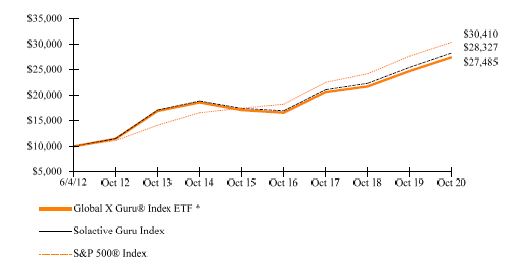
| Global X Guru® Index ETF | 190
|
| Statements of Assets and Liabilities | 194
|
| Statements of Operations | 199
|
| Statements of Changes in Net Assets | 204
|
| Financial Highlights | 213
|
| Notes to Financial Statements | 227
|
Report of Independent Registered Public Accounting Firm | 252
|
| Disclosure of Fund Expenses | 255
|
| Liquidity Risk Management Program | 258
|
Approval of Investment Adivisory Aggreement
| 259
|
| Supplemental Information | 264
|
| Trustees and Officers of the Trust | 265
|
| Notice to Shareholders | 267
|
|
|
|
|
|
|
|
|
|
|
Shares are bought and sold at market price (not NAV) and are not individually redeemed from a Fund. Shares may only be redeemed directly from a Fund by Authorized Participants, in very large creation/redemption units. Brokerage commissions will reduce returns.
The Funds file their complete schedules of Fund holdings with the Securities and Exchange Commission (the “SEC” or “Commission”) for the first and third quarters of each fiscal year as an exhibit to its reports on Form N-PORT. The Funds’ Forms N-PORT are available on the Commission’s website at https://www.sec.gov/, and may be reviewed and copied at the Commission’s Public Reference Room in Washington, DC. Information on the operation of the Public Reference Room may be obtained by calling 1-800-SEC-0330.
A description of the policies and procedures that the Global X Funds use to determine how to vote proxies relating to Fund securities, as well as information relating to how the Funds voted proxies relating to Fund securities during the most recent 12-month period ended June 30, is available (i) without charge, upon request, by calling 1-888-493-8631; and (ii) on the Commission’s website at https://www.sec.gov/.
Management Discussion of Fund Performance (unaudited)
Global X Social Media ETF
Global X Social Media ETF
The Global X Social Media ETF (“Fund”) seeks to provide investment results that correspond generally to the price and yield performance, before fees and expenses, of the Solactive Social Media Total Return Index (“Underlying Index”). The Fund is passively managed, which means the investment adviser does not attempt to take defensive positions in declining markets. The Fund generally seeks to fully replicate the Underlying Index.
The Underlying Index tracks the equity performance of the largest and most liquid companies involved in the social media industry, including companies that provide social networking, file sharing, and other web-based media applications, as defined by Solactive AG, the provider of the Underlying Index.
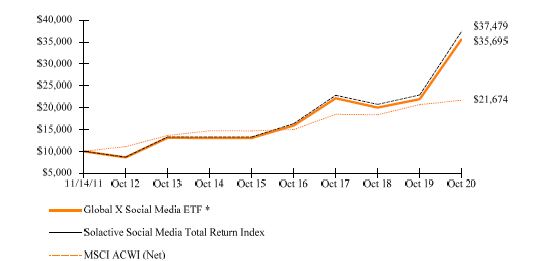
For the 12-month period ended October 31, 2020 (the “reporting period”), the Fund increased 62.75%, while the Underlying Index increased 63.76%. The Fund had a net asset value of $31.92 per share on October 31, 2019 and ended the reporting period with a net asset value of $51.95 per share on October 31, 2020.
During the reporting period, the highest returns came from Bilibili, Inc. and Snap, Inc., which returned 182.90% and 161.55%, respectively. The worst performers were Groupon, Inc. and Momo Inc., which returned -65.13% and -53.77%, respectively.
Over 4.5 billion people use the internet with global internet penetration nearing 60% of the world’s population. With the global COVID-19 pandemic limiting physical, in-person interactions, during the reporting period use of internet services like social media spiked across many demographic segments. So even though the broader global economic climate was challenging during the reporting period, social media stocks performed well.
The social media industry is undergoing revolutionary changes with the introduction of new platforms and the consolidation of existing ones. Rather than focusing on user growth, many established social media platforms now focus on maximizing average revenue per user (ARPU). Advertising represents one avenue for doing so. Advertising spending on social media reached $89 billion in 2019 and continues to grow by double-digit percentage points.
Management Discussion of Fund Performance (unaudited)
Global X Social Media ETF
Increasingly, social media platforms are looking beyond advertising to diversifiy their revenue sources and maintain high growth. One emerging revenue channel is rooted in social commerce, which describes the combination of social media and e-commerce. Providing examples, Facebook Shops, Instagram Shops and now Snapchat enable users to browse and purchase products from a variety of businesses within the social media platform’s app. While just a small source of revenue currently, social commerce is growing quickly and could become a major contributor to top-line growth for the industry.
| | AVERAGE TOTAL RETURN FOR THE YEAR ENDED OCTOBER 31, 2020 |
| | One Year Return | Three Year Return | Five Year Return | Annualized Inception to Date* |
| | Net Asset Value | Market Price | Net Asset Value | Market Price | Net Asset Value | Market Price | Net Asset Value | Market Price |
| Global X Social Media ETF | 62.75% | 64.07% | 17.29% | 17.35% | 22.32% | 22.35% | 15.26% | 15.30% |
| Solactive Social Media Total Return Index | 63.76% | 63.76% | 18.01% | 18.01% | 23.06% | 23.06% | 15.87% | 15.87% |
| MSCI ACWI (Net) | 4.89% | 4.89% | 5.52% | 5.52% | 8.11% | 8.11% | 9.01% | 9.01% |
Growth of a $10,000 Investment
(at Net Asset Value)
* The Fund commenced operations on November 14, 2011.
Management Discussion of Fund Performance (unaudited)
Global X Social Media ETF
The MSCI ACWI (Net) (All Country World Index) Index is a free float-adjusted market capitalization weighted index that is designed to measure the equity market performance of developed and emerging market
The performance data quoted herein represents past performance and the return and value of an investment in the Fund will fluctuate so that, when redeemed, it may be worth less than its original cost. Past performance is no guarantee of future performance and should not be considered as a representation of the future results of the Fund. The Fund’s performance assumes the reinvestment of all dividends and all capital gains. Index returns assume reinvestment of dividends and, unlike the Fund’s returns, do not reflect any fees or expenses. If such fees and expenses were included in the index returns, the performance would have been lower. Please note that one cannot invest directly in an unmanaged index. Performance figures for the periods shown may reflect contractual fee waivers and/or expense reimbursements. In the absence of fee waiver sand/or expense reimbursements (if applicable), returns would have been lower.
There are no assurances that the Fund will meet its stated objectives.
The Fund’s holdings and allocations are subject to change and should not be considered recommendations to buy individual securities.
The graph and table do not reflect the deduction of taxes that a shareholder would pay on Fund distributions or the redemption or sale of Fund shares.
See definition of comparative indices above.
Management Discussion of Fund Performance (unaudited)
Global X Lithium & Battery Tech ETF
Global X Lithium & Battery Tech ETF
The Global X Lithium & Battery Tech ETF (“Fund”) seeks to provide investment results that correspond generally to the price and yield performance, before fees and expenses, of the Solactive Global Lithium Index (“Underlying Index”). The Fund is passively managed, which means the investment adviser does not attempt to take defensive positions in declining markets. The Fund generally seeks to fully replicate the Underlying Index.
The Underlying Index is designed to measure broad-based equity market performance of global companies involved in the lithium industry, as defined by Solactive AG, the provider of the Underlying Index.
For the 12-month period ended October 31, 2020 (the “reporting period”), the Fund increased 73.82%, while the Underlying Index increased 73.42%. The Fund had a net asset value of $25.04 per share on October 31, 2019 and ended the reporting period with a net asset value of $42.86 per share on October 31, 2020.
During the reporting period, the highest returns came from Tesla Inc. and BYD Company Ltd., which returned 516.09% and 322.54%, respectively. The worst performers were Nemaska Lithium Inc. and Leclanche SA, which returned -100.00% and -56.23%, respectively.
Despite the challenges facing the global economy in wake of the COVID-19 pandemic, certain industries and themes have been accelerated during the crisis. One that benefited was lithium and battery technology, including lithium miners and battery producers. Lithium is a key raw material for state-of-the-art lithium-ion batteries, of which the biggest sources of demand growth are coming from the increased adoption of electric vehicles and renewable energy. Various governments recently indicated new legislation to mitigate the impact of climate change, including supporting electric mobility and battery storage. In April 2020, China, the world’s largest market for electric cars, announced that it would extend subsidies and tax breaks for new-energy vehicles by two years amid broader efforts to achieve carbon neutrality by 2060. In the U.S., the Democratic Party’s economic policies includes plans to revitalize the country’s infrastructure, including greater support for electric vehicles. The policy tailwinds, as well as a broader market environment starved for long term growth, helped propel the Fund to robust returns during the reporting period.
Management Discussion of Fund Performance (unaudited)
Global X Lithium & Battery Tech ETF
| | AVERAGE ANNUAL TOTAL RETURN FOR THE YEAR ENDED OCTOBER 31, 2020 |
| | One Year Return | Three Year Return | Five Year Return | Annualized Inception to Date* |
| | Net Asset Value | Market Price | Net Asset Value | Market Price | Net Asset Value | Market Price | Net Asset Value | Market Price |
| Global X Lithium & Battery Tech ETF | 73.82% | 76.04% | 5.89% | 6.06% | 18.20% | 18.22% | 4.77% | 4.84% |
| Solactive Global Lithium Index | 73.42% | 73.42% | 5.81% | 5.81% | 18.28% | 18.28% | 5.24% | 5.24% |
| MSCI ACWI Index | 4.89% | 4.89% | 5.52% | 5.52% | 8.11% | 8.11% | 8.78% | 8.78% |
Growth of a $10,000 Investment
(at Net Asset Value)
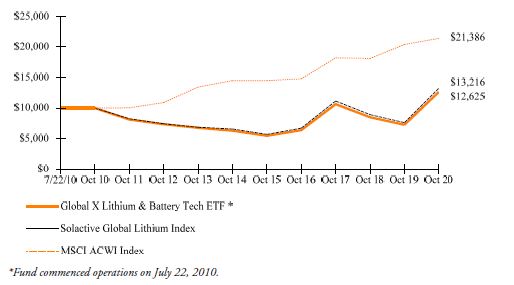
*Fund commenced operations on July 22, 2010.
The MSCI ACWI (All Country World Index) Index is a free float-adjusted market capitalization weighted index that is designed to measure the equity market performance of developed and emerging markets.
The performance data quoted herein represents past performance and the return and value of an investment in the Fund will fluctuate so that, when redeemed, it may be worth less than its original cost. Past performance is no guarantee of future performance and should not be considered as a representation of the future results of the Fund. The Fund’s performance assumes the reinvestment of all dividends and all capital gains. Index returns assume reinvestment of dividends and, unlike the Fund’s returns, do not reflect any fees or expenses. If such fees and expenses were included in the index returns, the performance would have been lower. Please note that one cannot invest directly in an unmanaged index. Performance figures for the periods shown may reflect contractual fee waivers and/or expense reimbursements. In the absence of fee waiver sand/or expense reimbursements (if applicable), returns would have been lower.
Management Discussion of Fund Performance (unaudited)
Global X Lithium & Battery Tech ETF
There are no assurances that the Fund will meet its stated objectives.
The Fund’s holdings and allocations are subject to change and should not be considered recommendations to buy individual securities.
The graph and table do not reflect the deduction of taxes that a shareholder would pay on Fund distributions or the redemption or sale of Fund shares.
See definition of comparative indices above.
Management Discussion of Fund Performance (unaudited)
Global X E-commerce ETF
Global X E-commerce ETF
The Global X E-commerce ETF (“Fund”) seeks to provide investment results that correspond generally to the price and yield performance, before fees and expenses, of the Solactive E-commerce Index (“Underlying Index”). The Fund is passively managed, which means the investment adviser does not attempt to take defensive positions in declining markets. The Fund generally seeks to fully replicate the Underlying Index.
The Underlying Index is designed to provide exposure to exchange-listed companies that are positioned to benefit from the increased adoption of e-commerce as a distribution model, including but not limited to companies whose principal business is in operating e-commerce platforms, providing e-commerce software and services, and/or selling goods and services online (collectively, “E-commerce Companies”), as defined by Solactive AG, the provider of the Underlying Index.
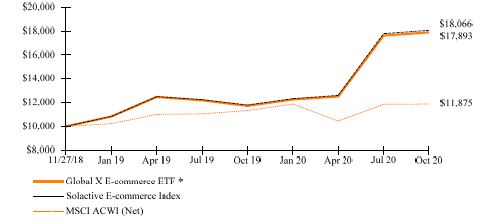
For the 12-month period ended October 31, 2020 (the “reporting period”), the Fund increased 52.67%, while the Underlying Index increased 53.22%. The Fund had a net asset value of $17.58 per share on October 31, 2019 and ended the reporting period with a net asset value of $26.79 per share on October 31, 2020.
During the reporting period, the highest returns came from Overstock.com, Inc. and Wayfair, Inc., which returned 442.97% and 201.63%, respectively. The worst performers were Uxin Ltd and Groupon, Inc., which returned -68.00% and -65.13%, respectively.
E-commerce (electronic commerce) facilitates the buying and selling of products electronically, through online services and platforms. Though e-commerce is not new, total e-commerce sales still pale in comparison to the size of the traditional brick and mortar retail market. But amid the global pandemic, shopping from the comfort and safety of one’s own home surged in popularity. In the U.S., for example, e-commerce penetration reached 14.3% in Q3-2020, up from 11.2% a year earlier. The pandemic even accelerated e-commerce adoption in shopping categories that historically lagged in online sales, with groceries and healthcare sales increasingly moving online. Beyond the pandemic, e-commerce companies are proving to be disruptive with innovations such as social commerce, or the intersection between social media and e-commerce. Through social commerce, companies are leveraging social elements for the greater adoption of e-commerce. During the reporting period, the Fund saw large exposures to Internet & Direct Marketing Retail (67% average exposure) and Internet Services & Infrastructure (10% average exposure). During the reporting period, the Fund geographically maintained an average stock allocation of 50% to stocks in the United States, followed by China at 27%, and United Kingdom at 8%.
Management Discussion of Fund Performance (unaudited)
Global X E-commerce ETF
| | AVERAGE TOTAL RETURN FOR THE YEAR ENDED OCTOBER 31, 2020 | |
| | One Year Return | Annualized Inception to Date* | |
| | Net Asset Value | Market Price | Net Asset Value | Market Price | |
| Global X E-commerce ETF | 52.67% | 52.52% | 35.29% | 35.42% | |
| Solactive E-commerce Index | 53.22% | 53.22% | 35.88% | 35.88% | |
| MSCI ACWI (Net) | 4.89% | 4.89% | 9.32% | 9.32% | |
Growth of a $10,000 Investment
(at Net Asset Value)
* The Fund commenced operations on November 27, 2018.
The MSCI ACWI (Net) (All Country World Index) Index is a free float-adjusted market capitalization weighted index that is designed to measure the equity market performance of developed and emerging markets.
The performance data quoted herein represents past performance and the return and value of an investment in the Fund will fluctuate so that, when redeemed, it may be worth less than its original cost. Past performance is no guarantee of future performance and should not be considered as a representation of the future results of the Fund. The Fund’s performance assumes the reinvestment of all dividends and all capital gains. Index returns assume reinvestment of dividends and, unlike the Fund’s returns, do not reflect any fees or expenses. If such fees and expenses were included in the index returns, the performance would have been lower. Please note that one cannot invest directly in an unmanaged index. Performance figures for the periods shown may reflect contractual fee waivers and/or expense reimbursements. In the absence of fee waiver sand/or expense reimbursements (if applicable), returns would have been lower.
There are no assurances that the Fund will meet its stated objectives.
The Fund’s holdings and allocations are subject to change and should not be considered recommendations to buy individual securities.
The graph and table do not reflect the deduction of taxes that a shareholder would pay on Fund distributions or the redemption or sale of Fund shares.
See definition of comparative indices above.
Management Discussion of Fund Performance (unaudited)
Global X SuperDividend® ETF
Global X SuperDividend® ETF
The Global X SuperDividend® ETF (“Fund”) seeks to provide investment results that correspond generally to the price and yield performance, before fees and expenses, of the Solactive Global SuperDividend® Index (“Underlying Index”). The Fund is passively managed, which means the investment adviser does not attempt to take defensive positions in declining markets. The Fund generally seeks to fully replicate the Underlying Index.
The Underlying Index tracks the performance of 100 equally-weighted companies that rank among the highest dividend yielding equity securities in the world, including emerging market countries, as defined by Solactive AG, the provider of the Underlying Index.
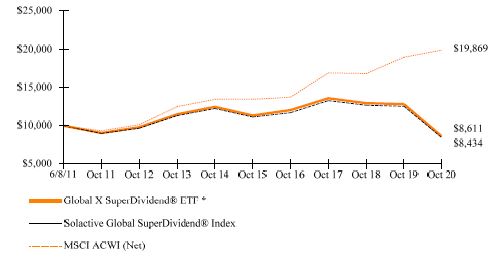
For the 12-month period ended October 31, 2020 (the “reporting period”), the Fund decreased 32.80%, while the Underlying Index decreased 32.74%. The Fund had a net asset value of $17.25 per share on October 31, 2019 and ended the reporting period with a net asset value of $10.61 per share on October 31, 2020.
During the reporting period, the highest returns came from B&G Foods, Inc. and Kumba Iron Ore Ltd, which returned 91.31% and 82.23%, respectively. The worst performers were GasLog Partners LP and Gannett Co., Inc., which returned -82.56% and -70.37%, respectively.
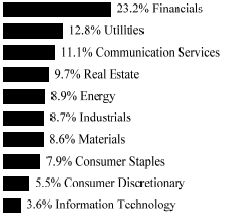
The Fund seeks to invest in many of the highest dividend/yielding stocks in the world. High-dividend investing is a deep value-oriented strategy that was held back by the performance of deep-value stocks versus the performance of the broader MSCI ACWI. Economic challenges stemming from the COVID-19 pandemic strained the financial resources of many dividend-paying stocks globally as they suffered from lower demand or the inability to produce goods and services amid lockdowns. In addition, some governments sought to regulate dividend payments during the pandemic to help companies preserve cash, putting further pressure on these stocks. During the reporting period, the Fund had approximate average exposure of 29% to U.S. stocks, 10% to Australian stocks, 7% to South African stocks and 7% to Chinese stocks. By sector, the Fund had approximate average exposure of 15% to real estate investment trusts (REITs), 14% to financial services, 14% to materials, and 13% to mortgage REITs.
Management Discussion of Fund Performance (unaudited)
Global X SuperDividend® ETF
| | AVERAGE TOTAL RETURN FOR THE YEAR ENDED OCTOBER 31, 2020 |
| | One Year Return | Three Year Return | Five Year Return | Annualized Inception to Date* |
| | Net Asset Value | Market Price | Net Asset Value | Market Price | Net Asset Value | Market Price | Net Asset Value | Market Price |
Global X SuperDividend® ETF | -32.80% | -32.65% | -14.08% | -14.07% | -5.36% | -5.29% | -1.58% | -1.57% |
Solactive Global SuperDividend® Index | -32.74% | -32.74% | -14.05% | -14.05% | -5.42% | -5.42% | -1.80% | -1.80% |
| MSCI ACWI (Net) | 4.89% | 4.89% | 5.52% | 5.52% | 8.11% | 8.11% | 7.57% | 7.57% |
Growth of a $10,000 Investment
(at Net Asset Value)
* The Fund commenced operations on June 8, 2011.
The MSCI ACWI (Net) (All Country World Index) Index is a free float-adjusted market capitalization weighted index that is designed to measure the equity market performance of developed and emerging markets.
The performance data quoted herein represents past performance and the return and value of an investment in the Fund will fluctuate so that, when redeemed, it may be worth less than its original cost. Past performance is no guarantee of future performance and should not be considered as a representation of the future results of the Fund. The Fund’s performance assumes the reinvestment of all dividends and all capital gains. Index returns assume reinvestment of dividends and, unlike the Fund’s returns, do not reflect any fees or expenses. If such fees and expenses were included in the index returns, the performance would have been lower. Please note that one cannot invest directly in an unmanaged index. Performance figures for the periods shown may reflect contractual fee waivers and/or expense reimbursements. In the absence of fee waiver sand/or expense reimbursements (if applicable), returns would have been lower.
Management Discussion of Fund Performance (unaudited)
Global X SuperDividend® ETF
There are no assurances that the Fund will meet its stated objectives.
The Fund’s holdings and allocations are subject to change and should not be considered recommendations to buy individual securities.
The graph and table do not reflect the deduction of taxes that a shareholder would pay on Fund distributions or the redemption or sale of Fund shares.
See definition of comparative indices above.
Management Discussion of Fund Performance (unaudited)
Global X SuperDividend® U.S. ETF
Global X SuperDividend® U.S. ETF
The Global X SuperDividend® U.S. ETF (“Fund”) seeks to provide investment results that correspond generally to the price and yield performance, before fees and expenses, of the Indxx SuperDividend® U.S. Low Volatility Index (“Underlying Index”). The Fund is passively managed, which means the investment adviser does not attempt to take defensive positions in declining markets. The Fund generally seeks to fully replicate the Underlying Index.
The Underlying Index tracks the performance of 50 equally-weighted common stocks including master limited partnerships (“MLPs”) and real estate investment trusts (“REITs”) that rank among the highest dividend yielding equity securities in the United States, as defined by Indxx, LLC, the provider of the Underlying Index. The Underlying Index is comprised of securities that Indxx LLC determines to have lower relative volatility, as measured by the beta, a measure of a security’s sensitivity to the movements of the broader market, of each security relative to the market benchmark.
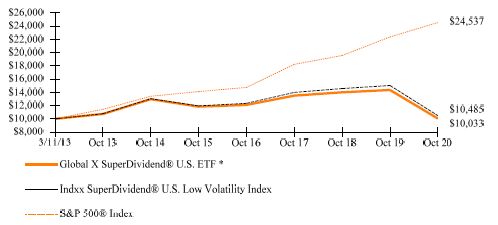
For the 12-month period ended October 31, 2020 (the “reporting period”), the Fund decreased 30.12%, while the Underlying Index decreased 30.23%. The Fund had a net asset value of $23.34 per share on October 31, 2019 and ended the reporting period with a net asset value of $14.99 per share on October 31, 2020.
During the reporting period, the highest returns came from B&G Foods, Inc. and Arbor Realty Trust, Inc., which returned 87.02% and 47.38%, respectively. The worst performers were AG Mortgage Investment Trust, Inc. and MFA Financial, Inc., which returned -84.33% and -74.15%, respectively.
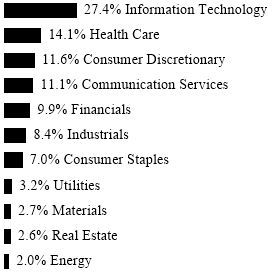
The Fund seeks to invest in many of the highest dividend/yielding stocks in the U.S. High-dividend investing aims to be a value-oriented strategy seeking low-volatility returns. During the reporting period, the COVID-19 pandemic affected many dividend paying stocks in the U.S. more severely than other parts of the market as the U.S. government restricted dividend payments by companies receiving emergency loans. The Fund recovered some of its earlier losses after stimulus measures were put in place by the Federal Reserve to reduce interest rates and improve liquidity. The Fund’s lack of exposure to the Information Technology sector hurt its performance relative to the broad-based benchmark, which was largely led by high tech growth names. During the reporting period, the Fund had average exposure of 21% to Consumer Staples, 17% to MLPs, 13% to Utilities, and 9% to mortgage REITs.
Management Discussion of Fund Performance (unaudited)
Global X SuperDividend® U.S. ETF
| | AVERAGE TOTAL RETURN FOR THE YEAR ENDED OCTOBER 31, 2020 |
| | One Year Return | Three Year Return | Five Year Return | Annualized Inception to Date* |
| | Net Asset Value | Market Price | Net Asset Value | Market Price | Net Asset Value | Market Price | Net Asset Value | Market Price |
Global X SuperDividend® U.S. ETF | -30.12% | -30.05% | -9.42% | -9.40% | -3.26% | -3.25% | 0.04% | 0.13% |
Indxx SuperDividend® U.S. Low Volatility Index | -30.23% | -30.23% | -9.15% | -9.15% | -2.57% | -2.57% | 0.62% | 0.62% |
S&P 500® Index | 9.71% | 9.71% | 10.42% | 10.42% | 11.71% | 11.71% | 12.46% | 12.46% |
Growth of a $10,000 Investment
(at Net Asset Value)
* The Fund commenced operations on March 11, 2013.
The S&P 500® Index is a market capitalization weighted composite index of 500 large capitalization U.S. companies.
The performance data quoted herein represents past performance and the return and value of an investment in the Fund will fluctuate so that, when redeemed, it may be worth less than its original cost. Past performance is no guarantee of future performance and should not be considered as a representation of the future results of the Fund. The Fund’s performance assumes the reinvestment of all dividends and all capital gains. Index returns assume reinvestment of dividends and, unlike the Fund’s returns, do not reflect any fees or expenses. If such fees and expenses were included in the index returns, the performance would have been lower. Please note that one cannot invest directly in an unmanaged index. Performance figures for the periods shown may reflect contractual fee waivers and/or expense reimbursements. In the absence of fee waiver sand/or expense reimbursements (if applicable), returns would have been lower.
There are no assurances that the Fund will meet its stated objectives.
The Fund’s holdings and allocations are subject to change and should not be considered recommendations to buy individual securities.
Management Discussion of Fund Performance (unaudited)
Global X SuperDividend® U.S. ETF
The graph and table do not reflect the deduction of taxes that a shareholder would pay on Fund distributions or the redemption or sale of Fund shares.
See definition of comparative indices on the previous page.
Management Discussion of Fund Performance (unaudited)
Global X MSCI SuperDividend® EAFE ETF
Global X MSCI SuperDividend® EAFE ETF
The Global X MSCI SuperDividend® EAFE ETF (“Fund”) seeks to provide investment results that correspond generally to the price and yield performance, before fees and expenses, of the MSCI EAFE Top 50 Dividend Index (“Underlying Index”). The Fund is passively managed, which means the investment adviser does not attempt to take defensive positions in declining markets. The Fund generally seeks to fully replicate the Underlying Index.
The Underlying Index tracks the performance of 50 equally-weighted companies that rank among the highest dividend yielding equity securities in Europe, Australasia, and the Far East, as defined by MSCI, Inc., the provider of the Underlying Index.
For the 12-month period ended October 31, 2020 (the “reporting period”), the Fund decreased 25.24%, while the Underlying Index decreased 24.78%. The Fund had a net asset value of $16.11 per share on October 31, 2019 and ended the reporting period with a net asset value of $11.44 per share on October 31, 2020.
During the reporting period, the highest returns came from Pandora AS and Fortescue Metals Group Ltd, which returned 59.03% and 39.79%, respectively. The worst performers were Micro Focus International PLC and Unibail-Rodamco-Westfield SE, which returned -65.41% and -62.89%, respectively.
The Fund seeks to invest in many of the highest dividend/yielding stocks in international developed markets, including those in Europe, Australasia, and the Far East. The COVID-19 pandemic negatively impacted economies around the world as stringent lockdowns reduced both the supply of goods and services, as well as demand. As global economies came to a standstill several firms reduced or suspended dividend payments to preserve cash, but this negatively impacted their share prices. During the reporting period, the Fund had an average exposure of 19% to stocks in the U.K., 16% to stocks in Australia, 11% to stocks in France, and 9% to stocks in Spain.
Management Discussion of Fund Performance (unaudited)
Global X MSCI SuperDividend® EAFE ETF
| | AVERAGE TOTAL RETURN FOR THE YEAR ENDED OCTOBER 31, 2020 * |
| | One Year Return | Three Year Return | Annualized Inception to Date* |
| | Net Asset Value | Market Price | Net Asset Value | Market Price | Net Asset Value | Market Price |
Global X MSCI SuperDividend® EAFE ETF | -25.24% | -25.70% | -8.71% | -9.05% | -1.02% | -1.34% |
| MSCI EAFE Top 50 Dividend Index | -24.78% | -24.78% | -8.28% | -8.28% | -0.58% | -0.58% |
| MSCI EAFE Index (Net) | -6.86% | -6.86% | -1.24% | -1.24% | 5.05% | 5.05% |
Growth of a $10,000 Investment
(at Net Asset Value)
* The Fund commenced operations on November 14, 2016.
The MSCI EAFE Index (Net) (Europe, Australasia, Far East) is a free float-adjusted market capitalization index that is designed to measure the equity market performance of developed markets, excluding the US & Canada.
The performance data quoted herein represents past performance and the return and value of an investment in the Fund will fluctuate so that, when redeemed, it may be worth less than its original cost. Past performance is no guarantee of future performance and should not be considered as a representation of the future results of the Fund. The Fund’s performance assumes the reinvestment of all dividends and all capital gains. Index returns assume reinvestment of dividends and, unlike the Fund’s returns, do not reflect any fees or expenses. If such fees and expenses were included in the index returns, the performance would have been lower. Please note that one cannot invest directly in an unmanaged index. Performance figures for the periods shown may reflect contractual fee waivers and/or expense reimbursements. In the absence of fee waiver sand/or expense reimbursements (if applicable), returns would have been lower.
There are no assurances that the Fund will meet its stated objectives.
Management Discussion of Fund Performance (unaudited)
Global X MSCI SuperDividend® EAFE ETF
The Fund’s holdings and allocations are subject to change and should not be considered recommendations to buy individual securities.
The graph and table do not reflect the deduction of taxes that a shareholder would pay on Fund distributions or the redemption or sale of Fund shares.
See definition of comparative indices above.
Management Discussion of Fund Performance (unaudited)
Global X MSCI SuperDividend® Emerging Markets ETF
Global X MSCI SuperDividend® Emerging Markets ETF
The Global X MSCI SuperDividend® Emerging Markets ETF (“Fund”) seeks to provide investment results that correspond generally to the price and yield performance, before fees and expenses, of the MSCI Emerging Markets Top 50 Dividend Index (“Underlying Index”). The Fund is passively managed, which means the investment adviser does not attempt to take defensive positions in declining markets. The Fund generally seeks to fully replicate the Underlying Index.
The Underlying Index tracks the performance of 50 equally-weighted companies that rank among the highest dividend yielding equity securities in emerging markets, as defined by MSCI, Inc., the provider of the Underlying Index. The Underlying Index may include components from the following countries: Brazil, Chile, China, Colombia, Czech Republic, Egypt, Greece, Hungary, India, Indonesia, Korea, Malaysia, Mexico, Pakistan, Peru, Philippines, Poland, Qatar, Russia, South Africa, Taiwan, Thailand, Turkey and United Arab Emirates.
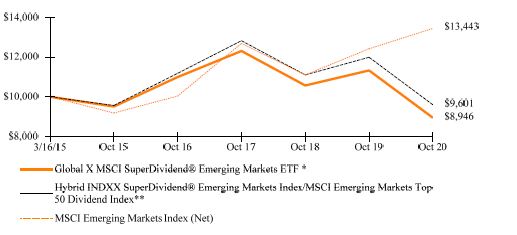
For the 12-month period ended October 31, 2020 (the “reporting period”), the Fund decreased 21.01%, while the Underlying Index decreased 19.92%. The Fund had a net asset value of $12.95 per share on October 31, 2019 and ended the reporting period with a net asset value of $9.53 per share on October 31, 2020.
During the reporting period, the highest returns came from KWG Group Holdings Ltd and Micro-Star International Co., Ltd, which returned 81.88% and 40.03%, respectively. The worst performers were Redefine Properties Ltd and AirAsia Group BHD, which returned -76.95% and -65.28%, respectively.
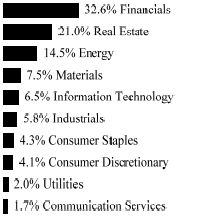
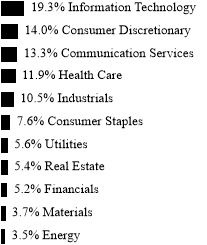
The Fund seeks to invest in many of the highest dividend/yielding stocks in emerging markets. The COVID-19 pandemic introduced major challenges for economies around the world. The stringent lockdowns in certain emerging economies limited the ability of businesses to produce goods for domestic consumption or export purposes. In addition, the global economic slowdown reduced demand for commodities and goods. In some cases, these challenges caused firms to suspend or reduce their dividends to preserve cash. However, in the second half of 2020, as lockdowns started easing, certain emerging markets led the global economic comeback with support from central banks and containment of the coronavirus. During the reporting period, the Fund had an average approximate stock exposure of 23% in China, 17% in Russia, 12% in Taiwan, and 10% in Brazil. Across the sectors, the Fund had the highest exposure to Real Estate at 22%, Financial Services at 20%, Materials at 17%, and Information Technology at 15%.
Management Discussion of Fund Performance (unaudited)
Global X MSCI SuperDividend® Emerging Markets ETF
| | AVERAGE TOTAL RETURN FOR THE YEAR ENDED OCTOBER 31, 2020 |
| | One Year Return | Three Year Return | Five Year Return | Annualized Inception to Date* |
| | Net Asset Value | Market Price | Net Asset Value | Market Price | Net Asset Value | Market Price | Net Asset Value | Market Price |
Global X MSCI SuperDividend® Emerging Markets ETF | -21.01% | -20.18% | -10.09% | -10.07% | -1.22% | -1.11% | -1.96% | -1.89% |
Hybrid INDXX SuperDividend® Emerging Markets Index/MSCI Emerging Markets Top 50 Dividend Index** | -19.92% | -19.92% | -9.19% | -9.19% | 0.08% | 0.08% | -0.72% | -0.72% |
| MSCI Emerging Markets Index (Net) | 8.25% | 8.25% | 1.94% | 1.94% | 7.92% | 7.92% | 5.39% | 5.39% |
Growth of a $10,000 Investment
(at Net Asset Value)
* The Fund commenced operations on March 16, 2015.
** Hybrid Index performance reflects the performance of the INDXX SuperDividend® Emerging Markets Index through November 15, 2016 and the MSCI Emerging Markets Top 50 Dividend Index thereafter.
The MSCI Emerging Markets Index (Net) is a free float-adjusted market capitalization index that is designed to measure equity market performance of emerging markets.
Management Discussion of Fund Performance (unaudited)
Global X MSCI SuperDividend® Emerging Markets ETF
The performance data quoted herein represents past performance and the return and value of an investment in the Fund will fluctuate so that, when redeemed, it may be worth less than its original cost. Past performance is no guarantee of future performance and should not be considered as a representation of the future results of the Fund. The Fund’s performance assumes the reinvestment of all dividends and all capital gains. Index returns assume reinvestment of dividends and, unlike the Fund’s returns, do not reflect any fees or expenses. If such fees and expenses were included in the index returns, the performance would have been lower. Please note that one cannot invest directly in an unmanaged index.
Performance figures for the periods shown may reflect contractual fee waivers and/or expense reimbursements. In the absence of fee waiver sand/or expense reimbursements (if applicable), returns would have been lower.
There are no assurances that the Fund will meet its stated objectives.
The Fund’s holdings and allocations are subject to change and should not be considered recommendations to buy individual securities.
The graph and table do not reflect the deduction of taxes that a shareholder would pay on Fund distributions or the redemption or sale of Fund shares.
See definition of comparative indices on the previous page.
Management Discussion of Fund Performance (unaudited)
Global X SuperDividend® REIT ETF
Global X SuperDividend® REIT ETF
The Global X SuperDividend® REIT ETF (“Fund”) seeks to provide investment results that correspond generally to the price and yield performance, before fees and expenses, of the Solactive Global SuperDividend® REIT Index (“Underlying Index”). The Fund is passively managed, which means the investment adviser does not attempt to take defensive positions in declining markets. The Fund generally seeks to fully replicate the Underlying Index.
The Underlying Index tracks the performance of real estate investment trusts (“REITs”) that rank among the highest-yielding REITs globally, as determined by Solactive AG, the provider of the Underlying Index. Solactive AG screens the highest yielding REITs to exclude REITs that have historically exhibited the highest volatility, as determined by the index provider.
For the 12-month period ended October 31, 2020 (the “reporting period”), the Fund decreased 45.94%, while the Underlying Index decreased 47.22%. The Fund had a net asset value of $15.33 per share on October 31, 2019 and ended the reporting period with a net asset value of $7.56 per share on October 31, 2020.
During the reporting period, the highest returns came from Arbor Realty Trust, Inc. and SITE Centers Corp, which returned 100.74% and 28.71%, respectively. The worst performers were Invesco Mortgage Capital Inc. and Granite Point Mortgage Trust Inc., which returned -82.01% and -75.25%, respectively.
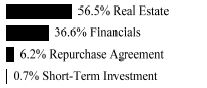
The Fund seeks to invest in many of the highest dividend/yielding REITs around the world. During the reporting period, REITs suffered as the global economy coped with the COVID-19 crisis. The stringent lockdowns imposed to prevent the spread of the virus affected hotels, malls, office buildings and other commercial properties as many tenants defaulted, declared bankruptcy, or renegotiated rents. This forced some property owners to default on their mortgage payments, impacting the mortgage-backed security market and entities like mortgage REITs that invest in them. The Federal Reserve took the unusual step of buying mortgage-backed securities to stabilize the markets, but these actions may have come too late as some mortgage REITs were forced to sell their assets during the height of the financial challenges associated with the pandemic as they faced margin calls from lenders. During the reporting period, the Fund had an average approximate exposure of 48% to Mortgage REITs and 52% to Equity REITs. Geographically, the Fund had an average approximate exposure of 86% to U.S. REITs, 7% to Singapore REITs, and 2% to Australian REITs. While many REITs suffered in this environment, the high exposure to mortgage REITs in particular contributed to the Fund’s negative performance during the reporting period.
Management Discussion of Fund Performance (unaudited)
Global X SuperDividend® REIT ETF
| | AVERAGE ANNUAL TOTAL RETURN FOR THE YEAR ENDED OCTOBER 31, 2020 |
| | One Year Return | Three Year Return | Five Year Return | Annualized Inception to Date* |
| | Net Asset Value | Market Price | Net Asset Value | Market Price | Net Asset Value | Market Price | Net Asset Value | Market Price |
Global X SuperDividend® REIT ETF | -45.94% | -45.88% | -13.78% | -13.77% | -2.60% | -2.63% | -3.92% | -3.89% |
Solactive Global SuperDividend® REIT Index | -47.22% | -47.22% | -15.51% | -15.51% | -4.36% | -4.36% | -5.68% | -5.68% |
S&P 500® Index | 9.71% | 9.71% | 10.42% | 10.42% | 11.71% | 11.71% | 10.55% | 10.55% |
Growth of a $10,000 Investment
(at Net Asset Value)

* The Fund commenced operations on March 16, 2015.
The S&P 500® Index is a market capitalization weighted composite index of 500 large capitalization U.S. companies.
The performance data quoted herein represents past performance and the return and value of an investment in the Fund will fluctuate so that, when redeemed, it may be worth less than its original cost. Past performance is no guarantee of future performance and should not be considered as a representation of the future results of the Fund. The Fund’s performance assumes the reinvestment of all dividends and all capital gains. Index returns assume reinvestment of dividends and, unlike the Fund’s returns, do not reflect any fees or expenses. If such fees and expenses were included in the index returns, the performance would have been lower. Please note that one cannot invest directly in an unmanaged index. Performance figures for the periods shown may reflect contractual fee waivers and/or expense reimbursements. In the absence of fee waiver sand/or expense reimbursements (if applicable), returns would have been lower.
Management Discussion of Fund Performance (unaudited)
Global X SuperDividend® REIT ETF
There are no assurances that the Fund will meet its stated objectives.
The Fund’s holdings and allocations are subject to change and should not be considered recommendations to buy individual securities.
The graph and table do not reflect the deduction of taxes that a shareholder would pay on Fund distributions or the redemption or sale of Fund shares.
See definition of comparative indices on the previous page.
Management Discussion of Fund Performance (unaudited)
Global X NASDAQ 100® Covered Call ETF
Global X NASDAQ 100® Covered Call ETF
The Global X NASDAQ® 100 Covered Call ETF (“Fund”) seeks to provide investment results that correspond generally to the price and yield performance, before fees and expenses, of the CBOE Nasdaq-100® BuyWrite V2 Index (“Underlying Index”). The Fund is passively managed, which means the investment adviser does not attempt to take defensive positions in declining markets. The Fund generally seeks to fully replicate the Underlying Index.
The CBOE NASDAQ-100® BuyWrite Index (“BXN Index”) is a benchmark index that measures the performance of a theoretical portfolio that holds a portfolio of the stocks included in the NASDAQ-100® Index (“Reference Index”), and “writes” (or sells) a succession of one-month at-the-money Reference Index covered call options. The Underlying Index replicates the methodology used to calculate the BXN Index, with one exception: the written Reference Index covered call options are held until one day prior to the expiration dates (i.e., generally the Thursday preceding the third Friday of the month) and are liquidated at a volume-weighted average price determined at the close.
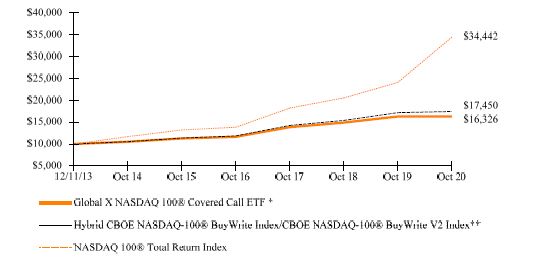
For the 12-month period ended October 31, 2020 (the “reporting period”), the Fund increased 0.21%, while the Underlying Index increased 1.55%. The Fund had a net asset value of $23.10 per share on October 31, 2019 and ended the reporting period with a net asset value of $20.65 per share on October 31, 2020.
During the reporting period, the highest returns came from Tesla Inc. and Zoom Video Communications, Inc., which returned 516.09% and 214.66%, respectively. The worst performers were American Airlines Group, Inc. and United Airlines Holdings, Inc., which returned -61.25% and -59.45%, respectively.
The Fund invests in stocks of the Reference Index and “writes” or “sells” corresponding at-the-money call options on the same index. The strategy tends to produce higher yields in volatile and uncertain times, when it can collect higher option premiums. The Fund underperformed the Reference Index during the reporting period, despite volatility spiking to its highest levels since 2008. While the Fund outperformed during the selloff due to receiving some of its highest option premiums ever, the Fund did not participate fully in the ensuing stock rally as it sells at-the-money covered calls, which effectively limit upside participation. Given the Fund’s options-writing strategy, it gives up profit potential if the Reference Index rises above the strike price of the Reference Index call option. While the Fund may not have enjoyed the fruits of the tech-fueled rally largely in the second quarter of 2020, it continued to receive strong options premiums, providing a steady stream of income to the Fund through the volatile period.
Management Discussion of Fund Performance (unaudited)
Global X NASDAQ 100® Covered Call ETF
| | AVERAGE TOTAL RETURN FOR THE YEAR ENDED OCTOBER 31, 2020 |
| | One Year Return | Three Year Return | Five Year Return | Annualized Inception to Date* |
| | Net Asset Value | Market Price | Net Asset Value | Market Price | Net Asset Value | Market Price | Net Asset Value | Market Price |
Global X NASDAQ 100® Covered Call ETF | 0.21% | 0.30% | 5.61% | 5.54% | 7.63% | 7.65% | 7.38% | 7.39% |
Hybrid CBOE NASDAQ-100® BuyWrite Index/CBOE NASDAQ-100® BuyWrite V2 Index** | 1.55% | 1.55% | 7.01% | 7.01% | 8.96% | 8.96% | 8.41% | 8.41% |
NASDAQ 100® Total Return Index | 38.02% | 38.02% | 22.20% | 22.20% | 20.24% | 20.24% | 19.65% | 19.65% |
Growth of a $10,000 Investment
(at Net Asset Value)
* The Fund commenced operations on December 11, 2013.
** Hybrid Index performance reflects the performance of the CBOE NASDAQ-100® BuyWrite Index through October 14, 2015 and CBOE NASDAQ-100® BuyWrite V2 Index thereafter.
The Fund operated as the Horizons NASDAQ 100® Covered Call ETF (the “Predecessor Fund”), a series of Horizons ETF Trust I, prior to the Fund’s acquisition of the assets and assumption of the liabilities of the Predecessor Fund on December 24, 2018 (See Note 1 in Notes to Financial Statements).
On October 14, 2015, Global X Management Company LLC (The “Advisor”) changed the Fund’s primary benchmark from the BXN Index to BXNT Index in connection with a change in the Fund’s principal strategies. The Advisor believes the BXNT Index is a better measure of the Fund’s performance. Returns reflect a blended benchmark.
Management Discussion of Fund Performance (unaudited)
Global X NASDAQ 100® Covered Call ETF
The Nasdaq-100® Index includes 100 of the largest domestic and international non-financial companies listed on The Nasdaq Stock Market based on market capitalization.
The performance data quoted herein represents past performance and the return and value of an investment in the Fund will fluctuate so that, when redeemed, it may be worth less than its original cost. Past performance is no guarantee of future performance and should not be considered as a representation of the future results of the Fund. The Fund’s performance assumes the reinvestment of all dividends and all capital gains. Index returns assume reinvestment of dividends and, unlike the Fund’s returns, do not reflect any fees or expenses. If such fees and expenses were included in the index returns, the performance would have been lower. Please note that one cannot invest directly in an unmanaged index. Performance figures for the periods shown may reflect contractual fee waivers and/or expense reimbursements. In the absence of fee waiver sand/or expense reimbursements (if applicable), returns would have been lower.
There are no assurances that the Fund will meet its stated objectives.
The Fund’s holdings and allocations are subject to change and should not be considered recommendations to buy individual securities.
The graph and table do not reflect the deduction of taxes that a shareholder would pay on Fund distributions or the redemption or sale of Fund shares.
See definition of comparative indices on the previous page.
Management Discussion of Fund Performance (unaudited)
Global X S&P 500® Covered Call ETF
Global X S&P 500® Covered Call ETF
The Global X S&P 500® Covered Call ETF (“Fund”) seeks to provide investment results that correspond generally to the price and yield performance, before fees and expenses, of the CBOE S&P 500 BuyWrite Index (“Underlying Index”). The Fund is passively managed, which means the investment adviser does not attempt to take defensive positions in declining markets. The Fund generally seeks to fully replicate the Underlying Index.
The Underlying Index measures the total rate of return of a S&P 500® Index covered call strategy. This strategy (“BXM covered call strategy”) consists of holding a portfolio indexed to the S&P 500® Index and selling a succession of one-month at-the-money S&P 500® Index call options. A covered call strategy is generally considered to be an investment strategy in which an investor buys a security, and sells (or “writes”) a call option on that security in an attempt to generate more income. Each time the Fund writes a covered call option, the Fund receives a payment of money from the investor who buys the option from the Fund, which is called the premium. If the value of the Fund’s call option that it has written declines because of a decline in the value of the S&P 500® Index, the premium that the Fund received for writing the covered call option offsets this loss to some extent.
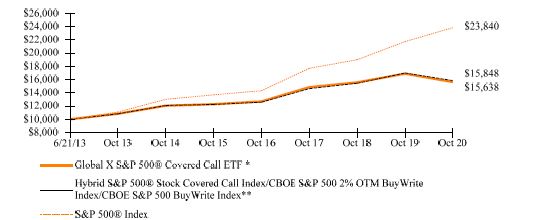
For the 12-month period ended October 31, 2020 (the “reporting period”), the Fund decreased 7.42%, while the Underlying Index decreased 6.73%. The Fund had a net asset value of $49.39 per share on October 31, 2019 and ended the reporting period with a net asset value of $42.45 per share on October 31, 2020.
During the reporting period, the highest returns came from Carrier Global Corp and NVIDIA Corporation, which returned 152.96% and 149.94%, respectively. The worst performers were Occidental Petroleum Corporation and Coty Inc., which returned -75.49% and -73.35%, respectively.
The Fund invests in stocks that are part of the S&P 500® Index and “writes” or “sells” corresponding at-the-money call options on the same index. The S&P 500® Index registered strong returns in the reporting period despite a rapid selloff in March associated with the COVID-19 pandemic outbreak. U.S. large cap stocks generally rallied as historic fiscal and monetary stimulus helped support the fragile economic recovery. In particular, technology stocks, which make up the largest sector in the S&P 500® Index benefitted from the work-from-home environment that created a surge in demand for software and connectivity. The Fund’s option-writing strategy benefitted from elevated levels of volatility during the reporting period, delivering higher than usual income from writing options. Though due to the Fund’s at-the-money option writing strategy, it was not able to participate in fully in the stock recovery in the second quarter of 2020, contributing to the Fund’s underperformance versus the benchmark.
Management Discussion of Fund Performance (unaudited)
Global X S&P 500® Covered Call ETF
| | AVERAGE TOTAL RETURN FOR THE YEAR ENDED OCTOBER 31, 2020 |
| | One Year Return | Three Year Return | Five Year Return | Annualized Inception to Date* |
| | Net Asset Value | Market Price | Net Asset Value | Market Price | Net Asset Value | Market Price | Net Asset Value | Market Price |
Global X S&P 500® Covered Call ETF | -7.42% | -6.59% | 1.75% | 2.07% | 4.95% | 5.15% | 6.26% | 6.50% |
Hybrid S&P 500® Stock Covered Call Index/CBOE S&P 500 2% OTM BuyWrite Index/CBOE S&P 500 BuyWrite Index** | -6.73% | -6.73% | 2.70% | 2.70% | 5.29% | 5.29% | 6.45% | 6.45% |
S&P 500® Index | 9.71% | 9.71% | 10.42% | 10.42% | 11.71% | 11.71% | 12.53% | 12.53% |
Growth of a $10,000 Investment
(at Net Asset Value)
* The Fund commenced operations on June 21, 2013.
** Hybrid Index performance reflects the performance of the S&P 500® Stock Covered Call Index through September 14, 2017, the CBOE S&P 500 2% OTM BuyWrite Index through August 20, 2020 and the CBOE S&P 500 BuyWrite Index thereafter.
The Fund operated as the Horizons S&P 500® Covered Call ETF (the “Predecessor Fund”), a series of Horizons ETF Trust I, prior to the Fund’s acquisition of the assets and assumption of the liabilities of the Predecessor Fund on December 24, 2018 (See Note 1 in Notes to Financial Statements).
The S&P 500® Index is a market capitalization weighted composite index of 500 large capitalization U.S. companies.
Management Discussion of Fund Performance (unaudited)
Global X S&P 500® Covered Call ETF
The performance data quoted herein represents past performance and the return and value of an investment in the Fund will fluctuate so that, when redeemed, it may be worth less than its original cost. Past performance is no guarantee of future performance and should not be considered as a representation of the future results of the Fund. The Fund’s performance assumes the reinvestment of all dividends and all capital gains. Index returns assume reinvestment of dividends and, unlike the Fund’s returns, do not reflect any fees or expenses. If such fees and expenses were included in the index returns, the performance would have been lower. Please note that one cannot invest directly in an unmanaged index. Performance figures for the periods shown may reflect contractual fee waivers and/or expense reimbursements. In the absence of fee waiver sand/or expense reimbursements (if applicable), returns would have been lower.
There are no assurances that the Fund will meet its stated objectives.
The Fund’s holdings and allocations are subject to change and should not be considered recommendations to buy individual securities.
The graph and table do not reflect the deduction of taxes that a shareholder would pay on Fund distributions or the redemption or sale of Fund shares.
See definition of comparative indices on the previous page.
Management Discussion of Fund Performance (unaudited)
Global X Russell 2000 Covered Call ETF
Global X Russell 2000 Covered Call ETF
The Global X Russell 2000 Covered Call ETF (“Fund”) seeks to provide investment results that correspond generally to the price and yield performance, before fees and expenses, of the CBOE Russell 2000 BuyWrite Index (“Underlying Index”). The Fund is passively managed, which means the investment adviser does not attempt to take defensive positions in declining markets. The Fund generally seeks to fully replicate the Underlying Index.
The Underlying Index measures the performance of a theoretical portfolio that holds a portfolio of the stocks included in the Russell 2000 Index (the “Reference Index”), and “writes” (or sells) a succession of one-month at-the-money covered call options on the Reference Index. The written covered call options on the Reference Index are held until expiration. The Reference Index is an equity benchmark which measures the performance of the small-capitalization sector of the U.S. equity market, as defined by FTSE Russell (the “Index Provider”). In seeking to track the Underlying Index, the Fund follows a “buy-write” (also called a covered call) investment strategy on the Reference Index in which the Fund purchases the component securities of the Reference Index or purchases other investments (including other underlying ETFs) that have economic characteristics that are substantially identical to the economic characteristics of such component securities, and also writes (or sells) call options that correspond to the Reference Index.
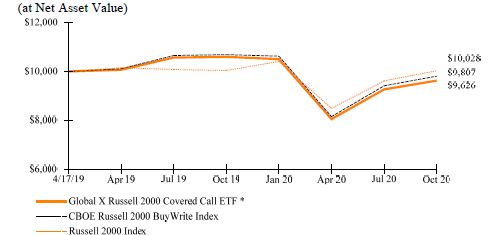
From the inception of the Fund on April 17, 2019 to the period ended October 31, 2020 (the “reporting period”), the Fund decreased 9.18%, while the Underlying Index decreased 8.26%. The Fund had a net asset value of $25.24 per share on October 31, 2019 and ended the reporting period with a net asset value of $20.45 per share on October 31, 2020.
During the reporting period, Vanguard Russell 2000 ETF, the only holding of the fund returned 0.14%.
The Fund invests in stocks that are part of the Reference Index and “writes” or “sells” corresponding at-the-money call options on the same index. During the reporting period, the U.S. markets faced significant volatility due to factors ranging from trade tensions to the COVID-19 pandemic and U.S. elections. There was high volatility in the small-cap space as well as in the broader market, resulting in the Fund collecting higher than usual option premiums. This provided a steady stream of income to the Fund despite the many challenges facing the small cap space, such as rising bankruptcies of small businesses during the pandemic.
Management Discussion of Fund Performance (unaudited)
Global X Russell 2000 Covered Call ETF
| AVERAGE TOTAL RETURN FOR THE YEAR ENDED OCTOBER 31, 2020 | |
| | One Year Return | Annualized Inception to Date* | |
| | Net Asset Value | Market Price | Net Asset Value | Market Price | |
| Global X Russell 2000 Covered Call ETF | -9.18% | -9.13% | -2.45% | -2.43% | |
| CBOE Russell 2000 BuyWrite Index | -8.26% | -8.26% | -1.26% | -1.26% | |
| Russell 2000 Index | -0.14% | -0.14% | 0.18% | 0.18% | |
Growth of a $10,000 Investment
(at Net Asset Value)
* The Fund commenced operations on April 17, 2019.
The Russell 2000 Index is an index measuring the performance of approximately 2,000 smallest-cap American companies in the Russell 3000 Index, which is made up of 3,000 of the largest U.S. stocks. It is a market-cap weighted index.
The performance data quoted herein represents past performance and the return and value of an investment in the Fund will fluctuate so that, when redeemed, it may be worth less than its original cost. Past performance is no guarantee of future performance and should not be considered as a representation of the future results of the Fund. The Fund’s performance assumes the reinvestment of all dividends and all capital gains. Index returns assume reinvestment of dividends and, unlike the Fund’s returns, do not reflect any fees or expenses. If such fees and expenses were included in the index returns, the performance would have been lower. Please note that one cannot invest directly in an unmanaged index. Performance figures for the periods shown may reflect contractual fee waivers and/or expense reimbursements. In the absence of fee waiver sand/or expense reimbursements (if applicable), returns would have been lower.
There are no assurances that the Fund will meet its stated objectives.
The Fund’s holdings and allocations are subject to change and should not be considered recommendations to buy individual securities.
The graph and table do not reflect the deduction of taxes that a shareholder would pay on Fund distributions or the redemption or sale of Fund shares.
See definition of comparative indices above.
Management Discussion of Fund Performance (unaudited)
Global X NASDAQ 100® Covered Call & Growth ETF
Global X NASDAQ 100® Covered Call & Growth ETF
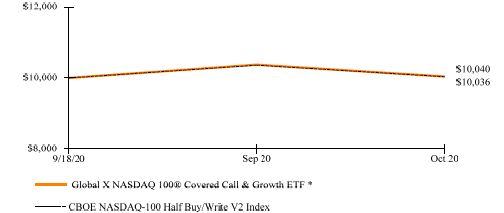
The Global X NASDAQ 100® Covered Call & Growth ETF (“Fund”) seeks to provide investment results that correspond generally to the price and yield performance, before fees and expenses, of the CBOE NASDAQ-100 Half BuyWrite V2 Index (“Underlying Index”). The Fund is passively managed, which means the investment adviser does not attempt to take defensive positions in declining markets. The Fund generally seeks to fully replicate the Underlying Index.
The Underlying Index measures the performance of a theoretical portfolio that holds a portfolio of the stocks included in the NASDAQ 100® Index (the “Reference Index”), and “writes” (or sells) a succession of one-month at-the-money covered call options on the Reference Index. The written covered call options on the Reference Index correspond to approximately 50% of the value of the portfolio of stocks in the Reference Index. The written covered call options on the Reference Index are held until one day prior to expiration. In seeking to track the Underlying Index, the Fund follows a “buy-write” investment strategy on the Reference Index in which the Fund purchases the component securities of the Reference Index and also writes (or sells) call options that correspond to approximately 50% of the value of the portfolio of stocks in the Reference Index. By only writing call options on approximately 50% of the value of the portfolio of stocks in the Reference Index, the strategy can provide income generation from the call options while allowing for some potential upside exposure to the growth of the underlying constituents of the Reference Index, relative to a 100% covered call strategy.
From the inception of the Fund on September 18, 2020 to the period ended October 31, 2020 (the “reporting period”), the Fund increased 0.40%, while the Underlying Index increased 0.36%. The Fund had a net asset value of $26.30 per share on September 18, 2020 and ended the reporting period with a net asset value of $26.27 per share on October 31, 2020.
During the reporting period, the highest returns came from Align Technology, Inc. and MercadoLibre, Inc., which returned 32.75% and 21.64%, respectively. The worst performers were Vertex Pharmaceuticals Incorporated and DexCom, Inc., which returned -21.49% and -17.91%, respectively.
The Fund follows a “covered call” or “buy-write” strategy in which the Fund buys the stocks on the Reference Index and “writes” or “sells” corresponding call options on approximately 50% of the value of the portfolio of stocks in the same index. Since its launch, the Fund has had nearly half of its exposure to the technology sector. In addition, global economic uncertainties have elevated market volatility which have helped the Fund generate higher than usual income from its option writing.
Management Discussion of Fund Performance (unaudited)
Global X NASDAQ 100® Covered Call & Growth ETF
| | AVERAGE TOTAL RETURN FOR THE PERIOD ENDED OCTOBER 31, 2020 |
| | Cumulative Inception to Date* |
| | Net Asset Value | Market Price |
Global X NASDAQ 100® Covered Call & Growth ETF | 0.40% | 0.05% |
| CBOE NASDAQ-100 Half BuyWrite V2 Index** | 0.36% | 0.36% |
Growth of a $10,000 Investment
(at Net Asset Value)
* The Fund commenced operations on September 18, 2020.
** The CBOE NASDAQ-100 Half BuyWrite V2 Index measures the total rate of return of a hypothetical “covered call” strategy applied to the NASDAQ 100® Index that only writes half a unit of an at-the-money monthly Call option for every notional unit of the long position.
The performance data quoted herein represents past performance and the return and value of an investment in the Fund will fluctuate so that, when redeemed, it may be worth less than its original cost. Past performance is no guarantee of future performance and should not be considered as a representation of the future results of the Fund. The Fund’s performance assumes the reinvestment of all dividends and all capital gains. Index returns assume reinvestment of dividends and, unlike the Fund’s returns, do not reflect any fees or expenses. If such fees and expenses were included in the index returns, the performance would have been lower. Please note that one cannot invest directly in an unmanaged index. Performance figures for the periods shown may reflect contractual fee waivers and/or expense reimbursements. In the absence of fee waiver sand/or expense reimbursements (if applicable), returns would have been lower.
There are no assurances that the Fund will meet its stated objectives.
The Fund’s holdings and allocations are subject to change and should not be considered recommendations to buy individual securities.
The graph and table do not reflect the deduction of taxes that a shareholder would pay on Fund distributions or the redemption or sale of Fund shares.
See definition of comparative indices on the previous page.
Management Discussion of Fund Performance (unaudited)
Global X S&P 500® Covered Call & Growth ETF
Global X S&P 500® Covered Call & Growth ETF
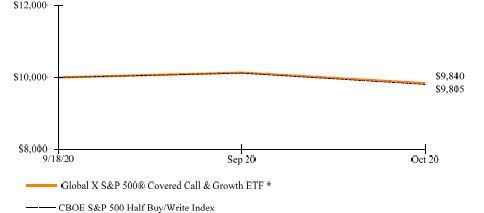
The Global X S&P 500® Covered Call & Growth ETF (“Fund”) seeks to provide investment results that correspond generally to the price and yield performance, before fees and expenses, of the CBOE S&P 500 Half BuyWrite Index (“Underlying Index”). The Fund is passively managed, which means the investment adviser does not attempt to take defensive positions in declining markets. The Fund generally seeks to fully replicate the Underlying Index.
The Underlying Index measures the performance of a theoretical portfolio that holds a portfolio of the stocks included in the S&P 500® Index (the “Reference Index”), and “writes” (or sells) a succession of one-month at-the-money covered call options on the Reference Index. The written covered call options on the Reference Index correspond to approximately 50% of the value of the portfolio of stocks in the Reference Index. The written covered call options on the Reference Index are held until expiration. In seeking to track the Underlying Index, the Fund follows a “buy-write” investment strategy on the Reference Index in which the Fund purchases the component securities of the Reference Index and also writes (or sells) call options that correspond to approximately 50% of the value of the portfolio of stocks in the Reference Index. By only writing call options on approximately 50% of the value of the portfolio of stocks in the Reference Index, the strategy can provide income generation from the call options while allowing for some potential upside exposure to the growth of the underlying constituents of the Reference Index, relative to a 100% covered call strategy.
From the inception of the Fund on September 18, 2020 to the period ended October 31, 2020 (the “reporting period”), the Fund decreased 1.60%, while the Underlying Index decreased 1.95%. The Fund had a net asset value of $25.22 per share on September 18, 2020 and ended the reporting period with a net asset value of $24.69 per share on October 31, 2020.
During the reporting period, the highest returns came from Paycom Software, Inc. and Align Technology, Inc., which returned 33.03% and 32.75%, respectively. The worst performers were Apache Corporation and National Oilwell Varco, Inc., which returned -34.21% and -28.45%, respectively.
The Fund follows a “covered-call” or “buy-write” strategy, where it buys stocks on the Reference Index and “writes” or “sells” corresponding call options on approximately 50% of the value of the portfolio of stocks in the same index. The Reference Index fell modestly during the reporting period, as the leadup to the U.S. presidential election and ongoing COVID-19 pandemic contributed to uncertainty in the marketplace. During this period of rising volatility, the Fund was able to collect higher premiums by writing call options.
Management Discussion of Fund Performance (unaudited)
Global X S&P 500® Covered Call & Growth ETF
| | AVERAGE TOTAL RETURN FOR THE PERIOD ENDED OCTOBER 31, 2020 | |
| | Cumulative Inception to Date* | |
| | Net Asset Value | Market Price | |
Global X S&P 500® Covered Call & Growth ETF | -1.60% | -1.96% | |
| CBOE S&P 500 Half BuyWrite Index** | -1.95% | -1.95% | |
Growth of a $10,000 Investment
(at Net Asset Value)
* The Fund commenced operations on September 18, 2020.
** The CBOE S&P 500 Half BuyWrite Index (the “BXMH Index”) measures the total rate of return of a hypothetical “covered call” strategy applied to the S&P 500 Composite Price Index (the “S&P 500® Index”) that only writes half a unit of an at-the-money monthly Call option for every notional unit of the long position.
The performance data quoted herein represents past performance and the return and value of an investment in the Fund will fluctuate so that, when redeemed, it may be worth less than its original cost. Past performance is no guarantee of future performance and should not be considered as a representation of the future results of the Fund. The Fund’s performance assumes the reinvestment of all dividends and all capital gains. Index returns assume reinvestment of dividends and, unlike the Fund’s returns, do not reflect any fees or expenses. If such fees and expenses were included in the index returns, the performance would have been lower. Please note that one cannot invest directly in an unmanaged index. Performance figures for the periods shown may reflect contractual fee waivers and/or expense reimbursements. In the absence of fee waiver sand/or expense reimbursements (if applicable), returns would have been lower.
There are no assurances that the Fund will meet its stated objectives.
The Fund’s holdings and allocations are subject to change and should not be considered recommendations to buy individual securities.
The graph and table do not reflect the deduction of taxes that a shareholder would pay on Fund distributions or the redemption or sale of Fund shares.
See definition of comparative indices on the previous page.
Management Discussion of Fund Performance (unaudited)
Global X SuperIncome™ Preferred ETF
Global X SuperIncome™ Preferred ETF
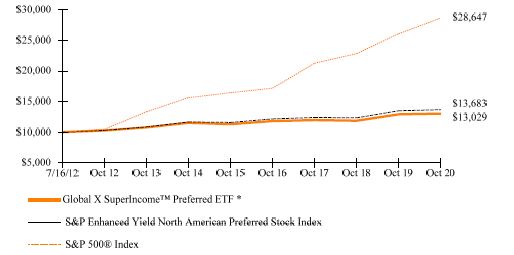
The Global X SuperIncomeTM Preferred ETF (“Fund”) seeks to provide investment results that correspond generally to the price and yield performance, before fees and expenses, of the S&P Enhanced Yield North American Preferred Stock Index (“Underlying Index”). The Fund is passively managed, which means the investment adviser does not attempt to take defensive positions in declining markets. The Fund generally seeks to fully replicate the Underlying Index.
The Underlying Index tracks the performance of the highest-yielding preferred securities in the United States and Canada, as determined by Standard & Poor’s Financial Services, LLC, a subsidiary of the McGraw-Hill Companies (“S&P”), the index provider of the Underlying Index. The Underlying Index is comprised of preferred stocks that meet certain criteria relating to size, liquidity, issuer concentration and rating, maturity and other requirements, as determined by S&P. The Underlying Index does not seek to directly reflect the performance of the companies issuing the preferred stock.
For the 12-month period ended October 31, 2020 (the “reporting period”), the Fund increased 0.81%, while the Underlying Index increased 1.29%. The Fund had a net asset value of $11.73 per share on October 31, 2019 and ended the reporting period with a net asset value of $11.12 per share on October 31, 2020.
During the reporting period, the highest returns came from Avantor, Inc. and Synchrony Financial Depositary which, returned 57.45% and 32.36%, respectively. The worst performers were Invesco Mortgage Capital Inc. and Pitney Bowes Inc., which returned
-52.43% and -41.35%, respectively.
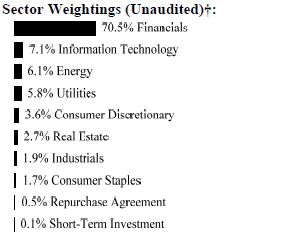
The Fund seeks to invest in many of the highest dividend/yielding preferred shares in the U.S. and Canada. During the reporting period, economic shock from efforts to combat the COVID-19 crisis led to a widening of credit spreads and resulting steep initial losses for preferreds. Later in the period, preferreds and other credit securities rebounded strongly due to highly supportive fiscal and monetary measures introduced by governments and central banks. The Federal Reserve played an important role in providing liquidity to the market and helping to tighten credit spreads, which positively impacted high yield preferreds. During the reporting period, the Fund had an average approximate exposure of 74% to the Financial sector, 6% to Utilities, and 6% to the Energy sector.
Management Discussion of Fund Performance (unaudited)
Global X SuperIncome™ Preferred ETF
| | AVERAGE TOTAL RETURN FOR THE YEAR ENDED OCTOBER 31, 2020 |
| | One Year Return | Three Year Return | Five Year Return | Annualized Inception to Date* |
| | Net Asset Value | Market Price | Net Asset Value | Market Price | Net Asset Value | Market Price | Net Asset Value | Market Price |
Global X SuperIncome™ Preferred ETF | 0.81% | 0.11% | 2.85% | 2.76% | 2.86% | 2.73% | 3.24% | 3.37% |
| S&P Enhanced Yield North American Preferred Stock Index | 1.29% | 1.29% | 3.30% | 3.30% | 3.35% | 3.35% | 3.85% | 3.85% |
S&P 500® Index | 9.71% | 9.71% | 10.42% | 10.42% | 11.71% | 11.71% | 13.52% | 13.52% |
Growth of a $10,000 Investment
(at Net Asset Value)
* Fund commenced operations on July 16, 2012.
The S&P 500® Index is a market capitalization weighted composite index of 500 large capitalization U.S. companies.
The performance data quoted herein represents past performance and the return and value of an investment in the Fund will fluctuate so that, when redeemed, it may be worth less than its original cost. Past performance is no guarantee of future performance and should not be considered as a representation of the future results of the Fund. The Fund’s performance assumes the reinvestment of all dividends and all capital gains. Index returns assume reinvestment of dividends and, unlike the Fund’s returns, do not reflect any fees or expenses. If such fees and expenses were included in the index returns, the performance would have been lower. Please note that one cannot invest directly in an unmanaged index. Performance figures for the periods shown may reflect contractual fee waivers and/or expense reimbursements. In the absence of fee waiver sand/or expense reimbursements (if applicable), returns would have been lower.
There are no assurances that the Fund will meet its stated objectives.
Management Discussion of Fund Performance (unaudited)
Global X SuperIncome™ Preferred ETF
The Fund’s holdings and allocations are subject to change and should not be considered recommendations to buy individual securities.
The graph and table do not reflect the deduction of taxes that a shareholder would pay on Fund distributions or the redemption or sale of Fund shares.
See definition of comparative indices above.
Management Discussion of Fund Performance (unaudited)
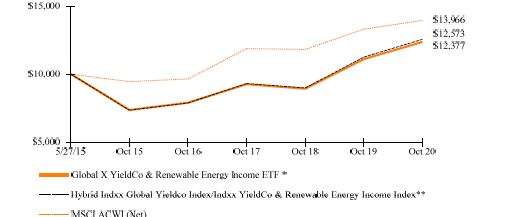
Global X YieldCo & Renewable Energy Income ETF
Global X YieldCo & Renewable Energy Income ETF
The Global X YieldCo & Renewable Energy Income ETF (“Fund”) seeks to provide investment results that correspond generally to the price and yield performance, before fees and expenses, of the Indxx YieldCo & Renewable Energy Income Index (“Underlying Index”). The Fund is passively managed, which means the investment adviser does not attempt to take defensive positions in declining markets. The Fund generally seeks to fully replicate the Underlying Index.
The Underlying Index comprises publicly traded companies that are formed to own operating assets that produce defined cash flows (“Yieldcos”), as well as companies that have publicly announced plans to spin-off a YieldCo in an initial public offering, as determined by the Indxx, LLC, the index provider. The components of the Underlying Index are YieldCos selected from the universe of global publicly listed equities, which have a minimum market capitalization of $500 million and an Average Daily Value Traded (“ADVT”) over the last three months greater than $1 million. If less than 20 securities satisfy this criteria, the market capitalization and ADVT requirements are lowered. If there are still fewer than 20 securities, the parent companies of proposed YieldCos with the nearest anticipated listing dates will be included in the Underlying Index until there are 20 Underlying Index constituents. If a parent company is a part of the Underlying Index, and its corresponding YieldCo becomes publicly listed, the listed YieldCo will replace the parent entity in the index during the subsequent index rebalance. Underlying Index constituents are ranked by market capitalization. The remaining securities are weighted based on their market capitalization, with a cap of 4.75% on any of the securities falling outside of the top five by market capitalization. If any parent companies of YieldCos are Underlying Index constituents, they are each capped at a 4.75% weighting. Companies that are structured as partnerships are capped at a 25% weighting in the aggregate.
For the 12-month period ended October 31, 2020 (the “reporting period”), the Fund increased 11.39%, while the Underlying Index increased 11.67%. The Fund had a net asset value of $13.79 per share on October 31, 2019 and ended the reporting period with a net asset value of $14.87 per share on October 31, 2020.
During the reporting period, the highest returns came from Encavis AG and Boralex Inc., which returned 92.82% and 79.14%, respectively. The worst performers were ENGIE Brasil Energia SA and BCPG Public Company Limited NVDR, which returned -35.44% and -35.15%, respectively.
YieldCos are entities that generally consist of renewable energy assets such as solar and wind farms. These entities tend to enter into long-term contracts with customers to deliver electricity at pre-specified prices. Renewable energy continued to see market share growth relative to fossil fuels as government policies encouraged the use of renewable energy and the shift to clean energy sources created greater adoption of these energy sources. During the reporting period, renewable energy firms generally performed well due to increasing customer demand, cost competitiveness, innovation, and
Management Discussion of Fund Performance (unaudited)
Global X YieldCo & Renewable Energy Income ETF
government supporting for renewables. Renewable energy accounted for 90% of the new electricity generation year to date. As governments globally are entangled with issues led by the current COVID-19 pandemic crisis, they have realized climate risk is the next big issue; hence, the adoption for renewable energy has started to accelerate. Further supporting share prices was the ultra-low interest rate environment, established by the Federal Reserve and central banks around the world to support the faltering economy. The above average dividend yields of Utilities, like renewable energy producers, created more demand for these securities.
| | AVERAGE TOTAL RETURN FOR THE YEAR ENDED OCTOBER 31, 2020 |
| | One Year Return | Three Year Return | Five Year Return | Annualized Inception to Date* |
| | Net Asset Value | Market Price | Net Asset Value | Market Price | Net Asset Value | Market Price | Net Asset Value | Market Price |
| Global X YieldCo & Renewable Energy Income ETF | 11.39% | 10.89% | 10.15% | 10.21% | 10.95% | 10.86% | 4.01% | 3.99% |
| Hybrid Indxx Global Yieldco Index/Indxx YieldCo & Renewable Energy Income Index** | 11.67% | 11.67% | 10.54% | 10.54% | 11.34% | 11.34% | 4.38% | 4.38% |
| MSCI ACWI (Net) | 4.89% | 4.89% | 5.52% | 5.52% | 8.11% | 8.11% | 6.34% | 6.34% |
Growth of a $10,000 Investment
(at Net Asset Value)
* Fund commenced operations on May 27, 2015.
** Hybrid Index performance reflects the performance of the Indxx Global YieldCo Index through November 18, 2018 and the Indxx YieldCo & Renewable Energy Income Index thereafter.
Management Discussion of Fund Performance (unaudited)
Global X YieldCo & Renewable Energy Income ETF
The MSCI ACWI (Net) (All Country World Index) Index is a free float-adjusted market capitalization weighted index that is designed to measure the equity market performance of developed and emerging markets.
The performance data quoted herein represents past performance and the return and value of an investment in the Fund will fluctuate so that, when redeemed, it may be worth less than its original cost. Past performance is no guarantee of future performance and should not be considered as a representation of the future results of the Fund. The Fund’s performance assumes the reinvestment of all dividends and all capital gains. Index returns assume reinvestment of dividends and, unlike the Fund’s returns, do not reflect any fees or expenses. If such fees and expenses were included in the index returns, the performance would have been lower. Please note that one cannot invest directly in an unmanaged index. Performance figures for the periods shown may reflect contractual fee waivers and/or expense reimbursements. In the absence of fee waiver sand/or expense reimbursements (if applicable), returns would have been lower.
There are no assurances that the Fund will meet its stated objectives.
The Fund’s holdings and allocations are subject to change and should not be considered recommendations to buy individual securities.
The graph and table do not reflect the deduction of taxes that a shareholder would pay on Fund distributions or the redemption or sale of Fund shares.
High short term performance of the fund is unusual and investors should not expect such performance to be repeated.
See definition of comparative indices on the previous page.
Management Discussion of Fund Performance (unaudited)
Global X S&P 500® Catholic Values ETF
Global X S&P 500® Catholic Values ETF
The Global X S&P 500® Catholic Values ETF (“Fund”) seeks to provide investment results that correspond generally to the price and yield performance, before fees and expenses, of the S&P 500® Catholic Values Index (“Underlying Index”). The Fund is passively managed, which means the investment adviser does not attempt to take defensive positions in declining markets. The Fund generally seeks to fully replicate the Underlying Index.
The Underlying Index is designed to provide exposure to U.S. equity securities included in the S&P 500® Index while maintaining alignment with the moral and social teachings of the Catholic Church. The Underlying Index is based on the S&P 500® Index, and generally comprises approximately 500 or less U.S. listed common stocks. All index constituents are members of the S&P 500® Index and follow the eligibility criteria for that index. From this starting universe, constituents are screened to exclude companies involved in activities which are perceived to be inconsistent with Catholic values as outlined in the Socially Responsible Investment Guidelines of the United States Conference of Catholic Bishops (“USCCB”). The Underlying Index then reweights the remaining constituents so that the Underlying Index’s sector exposures match the sector exposures of the S&P 500® Index.
For the 12-month period ended October 31, 2020 (the “reporting period”), the Fund increased 9.89%, while the Underlying Index increased 10.28%. The Fund had a net asset value of $37.23 per share on October 31, 2019 and ended the reporting period with a net asset value of $40.32 per share on October 31, 2020.
During the reporting period, the highest returns came from NVIDIA Corporation and Advanced Micro Devices, Inc., which returned 149.94% and 121.90%, respectively. The worst performers were Occidental Petroleum Corporation and Coty Inc., which returned -75.49% and -73.35%, respectively.
The Fund provides exposure to companies within the S&P 500® Index whose business practices align with the investment guidelines set by the USCCB and as implemented by the Underlying Index. As of October 31, 2020, the Fund had 455 equity holdings compared with the 505 holdings of the S&P 500® Index. To mitigate the potential performance differences between the S&P 500® Index and the Fund, the Fund’s sector exposures are reweighted to align with those of the S&P 500® Index on a quarterly basis. Over the reporting period, information technology had the highest average weighting of 26% in the Fund, followed by healthcare at 14% and financials at 11%. On a sector return contribution basis, Information Technology, Consumer Discretionary, and Communication Services exposures contributed the most positively to returns. In Information Technology, exposure to cloud computing companies drove performance as the COVID-19 pandemic and work-from-home practices upped demand for such services. On the Consumer side of the equation, exposure to e-commerce companies drove performance as consumers looked to the internet to purchase goods.
Management Discussion of Fund Performance (unaudited)
Global X S&P 500® Catholic Values ETF
| | AVERAGE TOTAL RETURN FOR THE YEAR ENDED OCTOBER 31, 2020 |
| | One Year Return | Three Year Return | Annualized Inception to Date* |
| | Net Asset Value | Market Price | Net Asset Value | Market Price | Net Asset Value | Market Price |
Global X S&P 500® Catholic Values ETF | 9.89% | 9.10% | 10.17% | 9.91% | 12.44% | 12.27% |
S&P 500® Catholic Values Index | 10.28% | 10.28% | 10.53% | 10.53% | 12.77% | 12.77% |
S&P 500® Index | 9.71% | 9.71% | 10.42% | 10.42% | 12.53% | 12.53% |
Growth of a $10,000 Investment
(at Net Asset Value)
* Fund commenced operations on April 18, 2016.
The S&P 500® Index is a market capitalization weighted composite index of 500 large capitalization U.S. companies.
The performance data quoted herein represents past performance and the return and value of an investment in the Fund will fluctuate so that, when redeemed, it may be worth less than its original cost. Past performance is no guarantee of future performance and should not be considered as a representation of the future results of the Fund. The Fund’s performance assumes the reinvestment of all dividends and all capital gains. Index returns assume reinvestment of dividends and, unlike the Fund’s returns, do not reflect any fees or expenses. If such fees and expenses were included in the index returns, the performance would have been lower. Please note that one cannot invest directly in an unmanaged index. Performance figures for the periods shown may reflect contractual fee waivers and/or expense reimbursements. In the absence of fee waiver sand/or expense reimbursements (if applicable), returns would have been lower.
Management Discussion of Fund Performance (unaudited)
Global X S&P 500® Catholic Values ETF
There are no assurances that the Fund will meet its stated objectives.
The Fund’s holdings and allocations are subject to change and should not be considered recommendations to buy individual securities.
The graph and table do not reflect the deduction of taxes that a shareholder would pay on Fund distributions or the redemption or sale of Fund shares.
See definition of comparative indices on the previous page.
Management Discussion of Fund Performance (unaudited)
Global X S&P Catholic Values Developed ex-US ETF
Global X S&P Catholic Values Developed ex-US ETF
The Global X S&P Catholic Values Developed ex-U.S. ETF (“Fund”) seeks investment results that correspond generally to the price and yield performance, before fees and expenses, of the S&P Developed ex-U.S. Catholic Values Index (“Underlying Index”). The Fund is passively managed, which means the investment adviser does not attempt to take defensive positions in declining markets. The Fund generally seeks to fully replicate the Underlying Index.
The Underlying Index is designed to provide exposure to developed market equity securities outside the U.S. while maintaining alignment with the moral and social teachings of the Catholic Church. The Underlying Index is based on the S&P EPAC ex-Korea Large Cap Index, a benchmark index that provides exposure to the large capitalization segment of developed markets within the Europe and Asia Pacific regions, excluding Korea. The S&P EPAC ex-Korea Large Cap Index does not target any specific sector exposure. All index constituents are members of the S&P EPAC ex-Korea Large Cap Index and follow the eligibility criteria for that index.
From the inception of the Fund on June 22, 2020 to the period ended October 31, 2020 (the “reporting period”), the Fund decreased 0.28%, while the Underlying Index decreased 0.19%. The Fund had a net asset value of $25.00 per share on June 18, 2020 and ended the reporting period with a net asset value of $24.98 per share on October 31, 2020.
During the reporting period, the highest returns came from Vestas Wind Systems AS and Kinnevik AB, which returned 68.05% and 62.55%, respectively. The worst performers were Wirecard AG and BP PLC, which returned -91.17% and -34.39%, respectively.
The Fund provides exposure to companies whose business practices align with the investment guidelines set by the United States Conference of Catholic Bishops in the developed markets ex-U.S. To mitigate the potential performance differences between the international equity benchmarks and the Fund, the selected companies are re-weighted to match the sector weights of the S&P EPAC ex-Korea Large Cap index on a quarterly basis. Since launch until October 31, 2020, Financials had the highest average weighting of 16% in the Fund, followed by Health Care at 15% and Industrials at 14%. Geographically, the Fund had approximate average exposure of 35% to Japanese stocks, 9% to French stocks, and 9% to Australian and German stocks.
Management Discussion of Fund Performance (unaudited)
Global X S&P Catholic Values Developed ex-US ETF
| | AVERAGE TOTAL RETURN FOR THE YEAR ENDED OCTOBER 31, 2020 |
| | Cumulative Inception to Date* |
| | Net Asset Value | Market Price |
| Global X S&P Catholic Values Developed ex-US ETF | -0.28% | -20.00% |
| S&P Developed ex-U.S. Catholic Values Index | -0.19% | -0.19% |
| MSCI EAFE Index (Net) | -0.49% | -0.49% |
Growth of a $10,000 Investment
(at Net Asset Value)
* Fund commenced operations on June 22, 2020.
The MSCI EAFE Index (Net) (Europe, Australasia, Far East) is a free float-adjusted market capitalization index that is designed to measure the equity market performance of developed markets, excluding the US & Canada.
The performance data quoted herein represents past performance and the return and value of an investment in the Fund will fluctuate so that, when redeemed, it may be worth less than its original cost. Past performance is no guarantee of future performance and should not be considered as a representation of the future results of the Fund. The Fund’s performance assumes the reinvestment of all dividends and all capital gains. Index returns assume reinvestment of dividends and, unlike the Fund’s returns, do not reflect any fees or expenses. If such fees and expenses were included in the index returns, the performance would have been lower. Please note that one cannot invest directly in an unmanaged index. Performance figures for the periods shown may reflect contractual fee waivers and/or expense reimbursements. In the absence of fee waiver sand/or expense reimbursements (if applicable), returns would have been lower.
There are no assurances that the Fund will meet its stated objectives.
Management Discussion of Fund Performance (unaudited)
Global X S&P Catholic Values Developed ex-US ETF
The Fund’s holdings and allocations are subject to change and should not be considered recommendations to buy individual securities.
The graph and table do not reflect the deduction of taxes that a shareholder would pay on Fund distributions or the redemption or sale of Fund shares.
See definition of comparative indices above.
Past performance is no guarantee of future performance and should not be considered as a representation of the future results of the Fund. The Fund’s performance assumes the reinvestment of all dividends and all capital gains. Index returns assume reinvestment of dividends and, unlike the Fund’s returns, do not reflect any fees or expenses. If such fees and expenses were included in the index returns, the performance would have been lower. Please note that one cannot invest directly in an unmanaged index.
There are no assurances that the Fund will meet its stated objectives.
Management Discussion of Fund Performance (unaudited)
Global X Guru® Index ETF
Global X Guru® Index ETF
The Global X Global X Guru® Index ETF (“Fund”) seeks to provide investment results that correspond generally to the price and yield performance, before fees and expenses, of the Solactive Guru Index (“Underlying Index”). The Fund is passively managed, which means the investment adviser does not attempt to take defensive positions in declining markets. The Fund generally seeks to fully replicate the Underlying Index.
The Underlying Index is comprised of the top U.S. listed equity positions reported on Form 13F by a select group of entities characterized as hedge funds, as defined by Solactive AG, the provider of the Underlying Index. Hedge funds are selected by Solactive AG, from a pool of thousands of privately offered pooled investment vehicles based on the size of their reported equity holdings and the efficacy of replicating their publicly disclosed positions. Hedge funds must have minimum reported holdings of $500 million in their Form 13F to be considered for the Underlying Index. Additional filters are applied to eliminate hedge funds that have high turnover rates for equity holdings. Only hedge funds with a concentrated top holding are included in the selection process. Once the hedge fund pool has been determined, the index provider utilizes Form 13F filings to compile the top stock holding from each of these hedge funds. The stocks are screened for liquidity, equal weighted, and rebalanced quarterly following the Form 13F filing timeline.
For the 12-month period ended October 31, 2020 (the “reporting period”), the Fund increased 10.84%, while the Underlying Index increased 10.95%. The Fund had a net asset value of $34.02 per share on October 31, 2019 and ended the reporting period with a net asset value of $37.31 per share on October 31, 2020.
During the reporting period, the highest returns came from Immunomedics, Inc. and JD.com, Inc., which returned 434.43% and 161.70%, respectively. The worst performers were Spirit AeroSystems Holdings, Inc. and United Airlines Holdings, Inc., which returned -73.07% and -62.73%, respectively.
The Fund’s investments are among the highest-conviction U.S.-listed equity positions reported on Form 13F by major hedge funds. Over the reporting period, the Fund delivered positive performance and exceeded the S&P 500® Index by approximately 1.13%. The Fund rebalances quarterly, resulting in dynamic exposures that can change significantly throughout the year.
Management Discussion of Fund Performance (unaudited)
Global X Guru® Index ETF
Earlier in the reporting period, the 11-year bull run of the S&P 500® Index was disrupted by the COVID-19 pandemic as negative investor sentiment prompted a major sell-off in equities that saw the S&P 500® Index drop 19.60% in the first calendar quarter of 2020. During this time, the Fund underperformed, down 24.72% due to weakness in Financials, Communication Services, and Industrials. However, moderate resilience versus the market in fund exposures to Information Technology, Consumer Discretionary, and Health Care offset some of that weakness.
In the second calendar quarter, the Fund saw strong returns versus the market, benefitting from its selection of companies in the Healthcare sector, which was helped by government and consumer spending on healthcare services amid the pandemic. Additional strength came from Information Technology and Communication Services exposures which benefitted from the use of digital technologies due to social distancing norms and policies, as well as from Consumer Discretionary holdings driven up by large-scale e-commerce adoption and direct payments from the federal government to consumers to support the economy. The story was much of the same on the tail end of the reporting period with exposures to Healthcare, Consumer Discretionary, and Communication Services benefitting from the aforementioned trends. Additionally, Industrials exposure increased by weight as relevant fund holdings mostly outperformed the market. Overall, the Fund fared well against the S&P 500® Index during the reporting period, due to its Consumer Discretionary, Healthcare, and Communication Services sector exposures.
| | AVERAGE TOTAL RETURN FOR THE YEAR ENDED OCTOBER 31, 2020 |
| | One Year Return | Three Year Return | Five Year Return | Annualized Inception to Date* |
| | Net Asset Value | Market Price | Net Asset Value | Market Price | Net Asset Value | Market Price | Net Asset Value | Market Price |
Global X Guru® Index ETF | 10.84% | 10.51% | 9.99% | 9.92% | 9.92% | 9.87% | 12.78% | 12.74% |
| Solactive Guru Index | 10.95% | 10.95% | 10.24% | 10.24% | 10.16% | 10.16% | 13.17% | 13.17% |
S&P 500® Index | 9.71% | 9.71% | 10.42% | 10.42% | 11.71% | 11.71% | 14.13% | 14.13% |
Management Discussion of Fund Performance (unaudited)
Global X Guru® Index ETF
Growth of a $10,000 Investment
(at Net Asset Value)
* The Fund commenced operations on June 4, 2012.
The S&P 500® Index is a market capitalization weighted composite index of 500 large capitalization U.S. companies.
The performance data quoted herein represents past performance and the return and value of an investment in the Fund will fluctuate so that, when redeemed, it may be worth less than its original cost. Past performance is no guarantee of future performance and should not be considered as a representation of the future results of the Fund. The Fund’s performance assumes the reinvestment of all dividends and all capital gains. Index returns assume reinvestment of dividends and, unlike the Fund’s returns, do not reflect any fees or expenses. If such fees and expenses were included in the index returns, the performance would have been lower. Please note that one cannot invest directly in an unmanaged index. Performance figures for the periods shown may reflect contractual fee waivers and/or expense reimbursements. In the absence of fee waiver sand/or expense reimbursements (if applicable), returns would have been lower.
There are no assurances that the Fund will meet its stated objectives.
The Fund’s holdings and allocations are subject to change and should not be considered recommendations to buy individual securities.
The graph and table do not reflect the deduction of taxes that a shareholder would pay on Fund distributions or the redemption or sale of Fund shares.
See definition of comparative indices on the previous page.
The registrant has adopted a code of ethics that applies to the registrant’s principal executive officer, principal financial officer, comptroller or principal accounting officer, and any person who performs a similar function.
(a)(1) The registrant’s board of trustees has determined that the registrant has at least one audit committee financial expert serving on the audit committee.
(a)(2) The audit committee financial experts are Charles A. Baker and Susan M. Ciccarone and each is independent as defined in Form N-CSR Item 3(a)(2).
Item 4. Principal Accountant Fees and Services.
Fees billed by Pricewaterhouse Coopers LLP (“PwC”) relate to the registrant.
PWC billed the registrant aggregate fees for services rendered to the registrant for the last two fiscal years as follows: