| |
| Global X MSCI China Energy ETF (ticker: CHIE) |
| Global X MSCI China Materials ETF (ticker: CHIM) |
| Global X MSCI China Industrials ETF (ticker: CHII) |
| Global X MSCI China Consumer Discretionary ETF (ticker: CHIQ) |
| Global X MSCI China Consumer Staples ETF (ticker: CHIS) |
| Global X MSCI China Health Care ETF (ticker: CHIH) |
| Global X MSCI China Financials ETF (ticker: CHIX) |
| Global X MSCI China Information Technology ETF (ticker: CHIK) |
| Global X MSCI China Communication Services ETF (ticker: CHIC) |
| Global X MSCI China Utilities ETF (ticker: CHIU) |
| Global X MSCI China Real Estate ETF (ticker: CHIR) |
| Global X MSCI China Large-Cap 50 ETF (ticker: CHIL) |
| Global X MSCI Greece ETF (ticker: GREK) |
| Global X MSCI Norway ETF (ticker: NORW) |
| Global X DAX Germany ETF (ticker: DAX) |
| Global X MSCI Portugal ETF (ticker: PGAL) |
| Global X MSCI Colombia ETF (ticker: GXG) |
| Global X MSCI Argentina ETF (ticker: ARGT) |
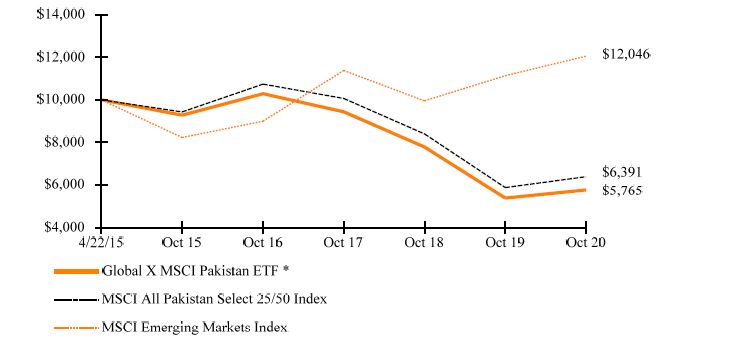
| Global X MSCI Pakistan ETF (ticker: PAK) |
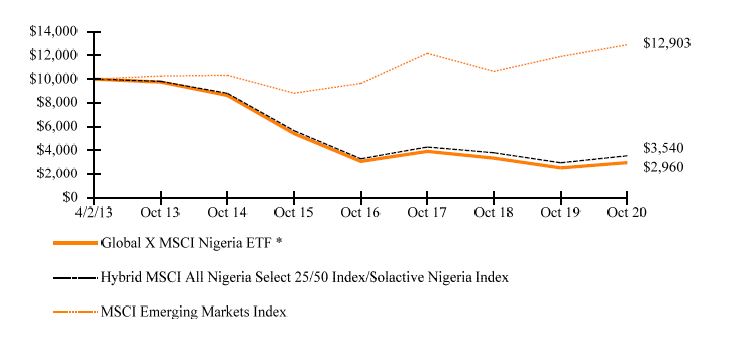
| Global X MSCI Nigeria ETF (ticker: NGE) |
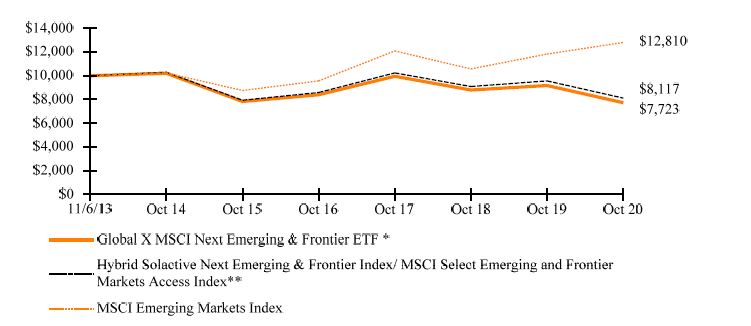
| Global X MSCI Next Emerging & Frontier ETF (ticker: EMFM) |
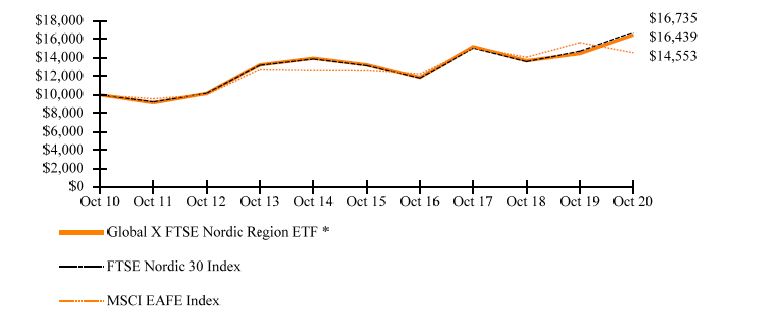
| Global X FTSE Nordic Region ETF (ticker: GXF) |
| Global X FTSE Southeast Asia ETF (ticker: ASEA) |
| |
Annual Report
October 31, 2020
Beginning on January 1, 2021, as permitted by regulations adopted by the Securities and Exchange Commission, paper copies of the Funds’ (defined below) shareholder reports will no longer be sent by mail, unless you specifically request paper copies of the reports from your financial intermediary (such as a broker-dealer or bank). Instead, shareholder reports will be available on the Funds’ website (www.globalxetfs.com), and you will be notified by mail each time a report is posted and provided with a website link to access the report.
If you already elected to receive shareholder reports electronically, you will not be affected by this change and you need not take any action. You may elect to receive shareholder reports and other communications from the Funds electronically anytime by contacting your financial intermediary.
You may elect to receive all future Fund shareholder reports in paper free of charge. Please contact your financial intermediary to inform them that you wish to continue receiving paper copies of Fund shareholder reports and for details about whether your election to receive reports in paper will apply to all funds held with your financial intermediary.
| Management Discussion of Fund Performance | 1 |
| Schedules of Investments | |
| Global X MSCI China Energy ETF | 70 |
| Global X MSCI China Materials ETF | 72 |
| Global X MSCI China Industrials ETF | 76 |
| Global X MSCI China Consumer Discretionary ETF | 81 |
| Global X MSCI China Consumer Staples ETF | 85 |
| Global X MSCI China Health Care ETF | 88 |
| Global X MSCI China Financials ETF | 92 |
| Global X MSCI China Information Technology ETF | 97 |
| Global X MSCI China Communication Services ETF | 101 |
| Global X MSCI China Utilities ETF | 104 |
| Global X MSCI China Real Estate ETF | 106 |
| Global X MSCI China Large-Cap 50 ETF | 109 |
| Global X MSCI Greece ETF | 112 |
| Global X MSCI Norway ETF | 116 |
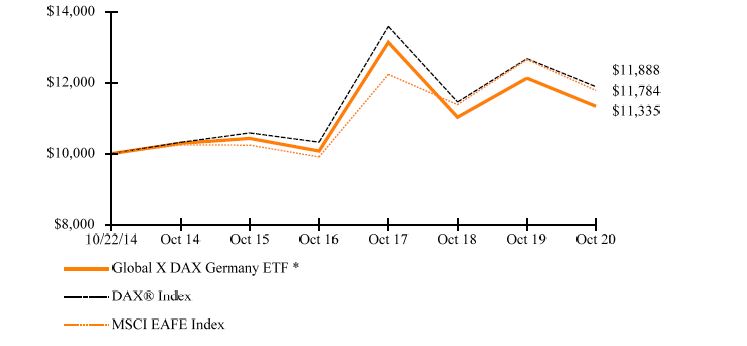
| Global X DAX Germany ETF | 121 |
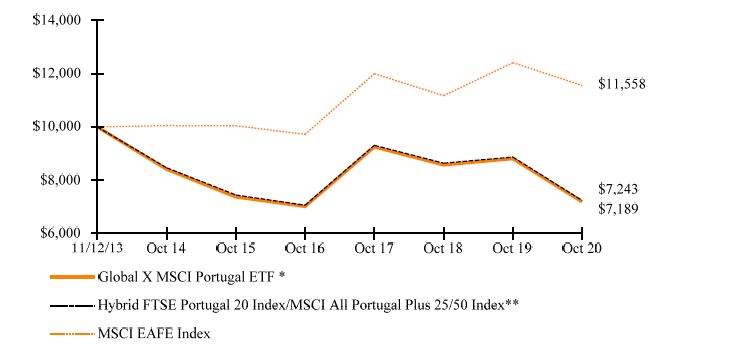
| Global X MSCI Portugal ETF | 124 |
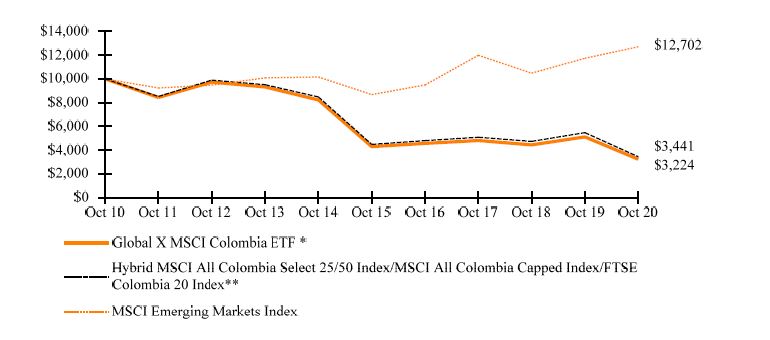
| Global X MSCI Colombia ETF | 128 |
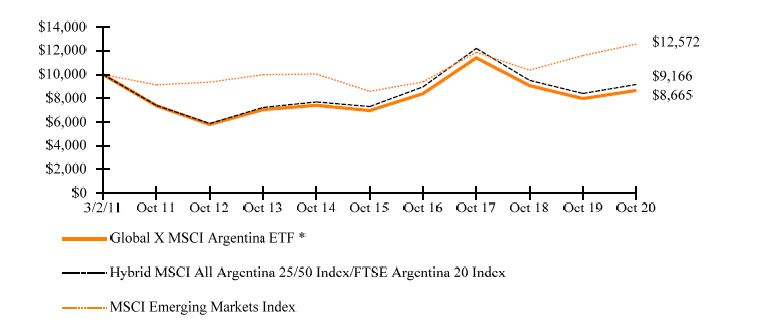
| Global X MSCI Argentina ETF | 132 |
| Global X MSCI Pakistan ETF | 136 |
| Global X MSCI Nigeria ETF | 139 |
| Global X MSCI Next Emerging & Frontier ETF | 141 |
| Global X FTSE Nordic Region ETF | 155 |
| Global X FTSE Southeast Asia ETF | 159 |
| Statements of Assets and Liabilities | 163 |
| Statements of Operations | 169 |
| Statements of Changes in Net Assets | 175 |
| Financial Highlights | 187 |
| Notes to Financial Statements | 201 |
| Report of Independent Registered Public Accounting Firm | 228 |
| Disclosure of Fund Expenses | 230 |
| Liquidity Risk Management Program | 234 |
| Supplemental Information | 235 |
| Trustees and Officers of the Trust | 236 |
| Notice to Shareholders | 238 |
Shares are bought and sold at market price (not NAV) and are not individually redeemed from a Fund. Shares may only be redeemed directly from a Fund by Authorized Participants, in very large creation/redemption units. Brokerage commissions will reduce returns.
The Funds file their complete schedules of Fund holdings with the Securities and Exchange Commission (the “SEC” or “Commission”) for the first and third quarters of each fiscal year as an exhibit to its reports on Form N-PORT. The Funds’ Forms N-PORT are available on the Commission’s website at https://www.sec.gov, and may be reviewed and copied at the Commission’s Public Reference Room in Washington, DC. Information on the operation of the Public Reference Room may be obtained by calling 1-800-SEC-0330.
A description of the policies and procedures that Global X Funds uses to determine how to vote proxies relating to Fund securities, as well as information relating to how the Funds voted proxies relating to Fund securities during the most recent 12-month period ended June 30, is available (i) without charge, upon request, by calling 1-888-493-8631; and (ii) on the Commission’s website at https://www.sec.gov.
Management Discussion of Fund Performance (unaudited) |
| Global X MSCI China Energy ETF |
Global X MSCI China Energy ETF
The Global X MSCI China Energy ETF (“Fund”) seeks to provide investment results that correspond generally to the price and yield performance, before fees and expenses, of the MSCI China Energy IMI Plus 10/50 Index (“Underlying Index”). The Fund is passively managed, which means the investment adviser does not attempt to take defensive positions in declining markets. The Fund generally seeks to fully replicate the Underlying Index.
The Underlying Index is designed to measure the equity performance of the investable universe of companies in the Energy sector of the Chinese economy, as defined by MSCI, Inc., the provider of the Underlying Index. It is comprised of securities of companies that have their main business operations in the Energy sector and generally includes companies whose businesses involve: oil, gas, consumable fuels, alternative energy and electricity production and distribution, and energy equipment and services.
For the 12-month period ended October 31, 2020 (the “reporting period”), the Fund decreased 22.05%, while the Underlying Index decreased 21.33%. The Fund had a net asset value of $10.43 per share on October 31, 2019 and ended the reporting period with a net asset value of $7.79 per share on October 31, 2020.
During the reporting period, the highest returns came from COSCO SHIPPING Energy Transportation and Shaanxi Coal Industry, which returned 17.56% and 14.65%, respectively. The worst performers were China LNG Group and Honghua Group, which returned -68.56% and -59.14%, respectively.
During the reporting period, China imposed strict lockdown measures to combat the COVID-19 pandemic, bringing many industries to a standstill. As economic activities experienced a 10% quarter-over-quarter contraction in the first quarter of 2020, demand for energy decreased significantly. Electricity demand dropped quickly in the first quarter of 2020 due to a decline in power demand but recovered completely by June, resulting in a demand recovery for electricity plant fuels. Continued expectations for lower oil prices also hurt certain Energy firms in the oil & gas segment. As a net importer of oil, China’s demand for oil gas has seen a strong recovery in the second half of 2020, with lower oil prices and China’s economic recovery from COVID-19 lockdowns resulting in a pick-up in domestic oil demand. As a result, China imported almost 13% of total global oil supplies from April to September. Although China remains a net importer of gas, the country continues is producing more liquified natural gas, potentially helping to offset some of the longer-term reliance on foreign oil producers.
Management Discussion of Fund Performance (unaudited) |
| Global X MSCI China Energy ETF |
| | AVERAGE ANNUAL TOTAL RETURN FOR THE YEAR ENDED OCTOBER 31, 2020 |
| | One Year Return | Three Year Return | Five Year Return | Annualized Inception to Date* |
| | Net Asset Value | Market Price | Net Asset Value | Market Price | Net Asset Value | Market Price | Net Asset Value | Market Price |
| Global X MSCI China Energy ETF | -22.05% | -20.56% | -8.77% | -8.12% | -4.21% | -3.92% | -3.47% | -3.33% |
| Hybrid Solactive China Energy Total Return Index/ MSCI China Energy IMI Plus 10/50 Index** | -21.33% | -21.33% | -7.94% | -7.94% | -3.37% | -3.37% | -2.65% | -2.65% |
| MSCI Emerging Markets Index | 8.25% | 8.25% | 1.94% | 1.94% | 7.92% | 7.92% | 3.60% | 3.60% |
Growth of a $10,000 Investment
(At Net Asset Value)
*Fund commenced operations on December 15, 2009.
** Reflects performance of Solactive China Energy Total Return Index through December 5, 2018 and MSCI China Energy IMI Plus 10/50 Index thereafter.
The MSCI Emerging Markets Index is a free float-adjusted market capitalization index that is designed to measure equity market performance of emerging markets.
The performance data quoted herein represents past performance and the return and value of an investment in the Fund will fluctuate so that, when redeemed, it may be worth less than its original cost. Past performance is no guarantee of future performance and should not be considered as a representation of the future results of the Fund. The Fund’s performance assumes the reinvestment of all dividends and all capital gains. Index returns assume reinvestment of dividends and, unlike the Fund’s returns, do not reflect any fees or expenses. If such fees and expenses were included in the index returns, the performance would have been lower. Please note that one cannot invest directly in an unmanaged index.
Management Discussion of Fund Performance (unaudited) |
| Global X MSCI China Energy ETF |
Performance figures for the periods shown may reflect contractual fee waivers and/or expense reimbursements. In the absence of fee waivers and/or expense reimbursements (if applicable), returns would have been lower.
There are no assurances that the Fund will meet its stated objectives.
The Fund’s holdings and allocations are subject to change and should not be considered recommendations to buy individual securities.
The graph and table do not reflect the deduction of taxes that a shareholder would pay on Fund distributions or the redemption or sale of Fund shares.
See definition of comparative indices above.
Management Discussion of Fund Performance (unaudited) |
| Global X MSCI China Materials ETF |
Global X MSCI China Materials ETF
The Global X MSCI China Materials ETF (“Fund”) seeks to provide investment results that correspond generally to the price and yield performance, before fees and expenses, of the MSCI China Materials 10/50 Index (“Underlying Index”). The Fund is passively managed, which means the investment adviser does not attempt to take defensive positions in declining markets. The Fund generally seeks to fully replicate the Underlying Index.
The Underlying Index is designed to measure the equity performance of the investable universe of companies in the Materials sector of the Chinese economy, as defined by MSCI, Inc., the provider of the Underlying Index. It is comprised of securities of companies that have their main business operations in the Materials sector and generally includes companies whose businesses involve: chemicals, metals and mining, and forestry and paper products.
For the 12-month period ended October 31, 2020 (the “reporting period”), the Fund increased 29.88%, while the Underlying Index increased 30.96%. The Fund had a net asset value of $14.50 per share on October 31, 2019 and ended the reporting period with a net asset value of $18.18 per share on October 31, 2020.
During the reporting period, the highest returns came from Ganfeng Lithium and Inner Mongolia Junzheng Energy & Chemical Group, which returned 194.24% and 183.61%, respectively. The worst performers were China Zhongwang Holdings and Beijing SJ Environmental Protection and New Material, which returned -54.71% and -40.27%, respectively.
During the reporting period, COVID-19 pandemic caused unprecedented damage to the global economy, leading to widespread business closures, while disrupting factory production, global supply chains, and consumer demand. Significant disruptions in supply chains and a collapse of international trade had a severe impact on China’s Materials sector in the early months of the pandemic. Although industrial output suffered a severe contraction in the first quarter of 2020, it ultimately managed to rebound. Growth in exports and automobile and retail sales in China during the latter half of the year contributed significantly to the recovery of the Materials sector. China’s building materials segment also contributed, with its value-added output improving during the first three quarters of 2020. Despite the global slowdown, imports of unwrought copper and iron ore were strong as of October 2020.
Management Discussion of Fund Performance (unaudited) |
| Global X MSCI China Materials ETF |
| | AVERAGE ANNUAL TOTAL RETURN FOR THE YEAR ENDED OCTOBER 31, 2020 |
| | One Year Return | Three Year Return | Five Year Return | Annualized Inception to Date* |
| | Net Asset Value | Market Price | Net Asset Value | Market Price | Net Asset Value | Market Price | Net Asset Value | Market Price |
| Global X MSCI China Materials ETF | 29.88% | 32.10% | -2.00% | -1.84% | 10.36% | 10.61% | -2.40% | -2.36% |
| Hybrid Solactive China Materials Total Return Index/ MSCI China Materials 10/50 Index** | 30.96% | 30.96% | -1.19% | -1.19% | 9.30% | 9.30% | -2.04% | -2.04% |
| MSCI Emerging Markets Index | 8.25% | 8.25% | 1.94% | 1.94% | 7.92% | 7.92% | 3.18% | 3.18% |
Growth of a $10,000 Investment
(At Net Asset Value)
*Fund commenced operations on January 12, 2010.
** Reflects performance of Solactive China Materials Total Return Index through December 5, 2018 and MSCI China Materials 10/50 Index thereafter.
The MSCI Emerging Markets Index is a free float-adjusted market capitalization index that is designed to measure equity market performance of emerging markets.
The performance data quoted herein represents past performance and the return and value of an investment in the Fund will fluctuate so that, when redeemed, it may be worth less than its original cost. Past performance is no guarantee of future performance and should not be considered as a representation of the future results of the Fund. The Fund’s performance assumes the reinvestment of all dividends and all capital gains. Index returns assume reinvestment of dividends and, unlike the Fund’s returns, do not reflect any fees or expenses. If such fees and expenses were included in the index returns, the performance would have been lower. Please note that one cannot invest directly in an unmanaged index.
Management Discussion of Fund Performance (unaudited) |
| Global X MSCI China Materials ETF |
Performance figures for the periods shown may reflect contractual fee waivers and/or expense reimbursements. In the absence of fee waivers and/or expense reimbursements (if applicable), returns would have been lower.
There are no assurances that the Fund will meet its stated objectives.
The Fund’s holdings and allocations are subject to change and should not be considered recommendations to buy individual securities.
The graph and table do not reflect the deduction of taxes that a shareholder would pay on Fund distributions or the redemption or sale of Fund shares.
See definition of comparative indices above.
Management Discussion of Fund Performance (unaudited) |
| Global X MSCI China Industrials ETF |
Global X MSCI China Industrials ETF
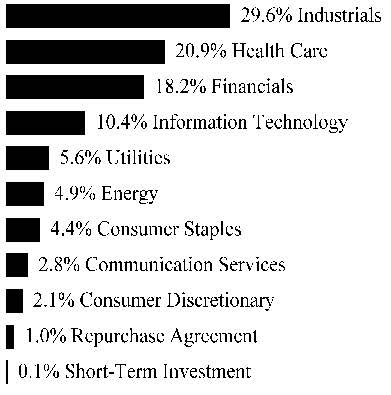
The Global X MSCI China Industrials ETF (“Fund”) seeks to provide investment results that correspond generally to the price and yield performance, before fees and expenses, of the MSCI China Industrials 10/50 Index (“Underlying Index”). The Fund is passively managed, which means the investment adviser does not attempt to take defensive positions in declining markets. The Fund generally seeks to fully replicate the Underlying Index.
The Underlying Index is designed to measure the equity performance of the investable universe of companies in the Industrials sector of the Chinese economy, as defined by MSCI, Inc., the provider of the Underlying Index. It is comprised of securities of companies that have their main business operations in the Industrials sector and generally includes companies whose businesses involve: construction and materials, electronic and electrical equipment, industrial engineering, industrial transportation, and support services, and trading companies, shipbuilding and aerospace.
For the 12-month period ended October 31, 2020 (the “reporting period”), the Fund increased 5.57%, while the Underlying Index increased 6.41%. The Fund had a net asset value of $12.92 per share on October 31, 2019 and ended the reporting period with a net asset value of $13.43 per share on October 31, 2020.
During the reporting period, the highest returns came from Contemporary Amperex Technology and Shenzhen Inovance Technology, which returned 278.28% and 171.55%, respectively. The worst performers were BEST, Inc and CITIC, which returned -55.23% and -42.87%, respectively.
During the reporting period, strict lockdowns imposed by China’s government to combat the COVID-19 pandemic temporarily paralyzed major swathes of the economy. As a result, the economy contracted 10% quarter-over-quarter in the first quarter of 2020. Worldwide lockdowns and the plummeting of international trade had a significant negative impact on China’s Industrials sector, resulting in a contraction in the first quarter of 2020. However, it improved gradually in the following months and recorded modest growth as lockdowns eased, workers returned to their jobs, and global trade recovered. Manufacturing output contributed significantly to this recovery. A rise in consumer confidence and a gradual recovery in retail sales, automobile sales, and exports further strengthened the recovery. As the economy recovered, industrial giants saw profit growth for the fourth straight month in August. While the automobiles and electronics industries recorded significant recoveries in profits, profit declines in the mining and raw materials industries continued to persist with weak global demand.
Management Discussion of Fund Performance (unaudited) |
| Global X MSCI China Industrials ETF |
| | AVERAGE ANNUAL TOTAL RETURN FOR THE YEAR ENDED OCTOBER 31, 2020 |
| | One Year Return | Three Year Return | Five Year Return | Annualized Inception to Date* |
| | Net Asset Value | Market Price | Net Asset Value | Market Price | Net Asset Value | Market Price | Net Asset Value | Market Price |
| Global X MSCI China Industrials ETF | 5.57% | 6.97% | -3.50% | -3.56% | 0.85% | 0.41% | 0.21% | 0.11% |
| Hybrid Solactive China Industrials Total Return Index/ MSCI China Industrials 10/50 Index** | 6.41% | 6.41% | -4.05% | -4.05% | 0.40% | 0.40% | 0.70% | 0.70% |
| MSCI Emerging Markets Index | 8.25% | 8.25% | 1.94% | 1.94% | 7.92% | 7.92% | 3.81% | 3.81% |
Growth of a $10,000 Investment
(At Net Asset Value)
*Fund commenced operations on November 30, 2009.
** Reflects performance of Solactive China Industrials Total Return Index through December 5, 2018 and MSCI China Industrials 10/50 Index thereafter.
The MSCI Emerging Markets Index is a free float-adjusted market capitalization index that is designed to measure equity market performance of emerging markets.
The performance data quoted herein represents past performance and the return and value of an investment in the Fund will fluctuate so that, when redeemed, it may be worth less than its original cost. Past performance is no guarantee of future performance and should not be considered as a representation of the future results of the Fund. The Fund’s performance assumes the reinvestment of all dividends and all capital gains. Index returns assume reinvestment of dividends and, unlike the Fund’s returns, do not reflect any fees or expenses. If such fees and expenses were included in the index returns, the performance would have been lower. Please note that one cannot invest directly in an unmanaged index.
Management Discussion of Fund Performance (unaudited) |
| Global X MSCI China Industrials ETF |
Performance figures for the periods shown may reflect contractual fee waivers and/or expense reimbursements. In the absence of fee waivers and/or expense reimbursements (if applicable), returns would have been lower.
There are no assurances that the Fund will meet its stated objectives.
The Fund’s holdings and allocations are subject to change and should not be considered recommendations to buy individual securities.
The graph and table do not reflect the deduction of taxes that a shareholder would pay on Fund distributions or the redemption or sale of Fund shares.
See definition of comparative indices above.
Management Discussion of Fund Performance (unaudited) |
| Global X MSCI China Consumer Discretionary ETF |
Global X MSCI China Consumer Discretionary ETF
The Global X MSCI China Consumer Discretionary ETF (“Fund”) seeks to provide investment results that correspond generally to the price and yield performance, before fees and expenses, of the MSCI China Consumer Discretionary 10/50 Index (“Underlying Index”). The Fund is passively managed, which means the investment adviser does not attempt to take defensive positions in declining markets. The Fund generally seeks to fully replicate the Underlying Index.
The Underlying Index is designed to measure the equity performance of the investable universe of companies in the consumer discretionary sector of the Chinese economy, as defined by MSCI, Inc., the provider of the Underlying Index. It is comprised of securities of companies that have their main business operations in the consumer staples sector and generally includes companies whose businesses involve: general retail, diversified consumer services, food production and retail, beverages, household goods, leisure goods, personal goods, automobiles, auto components and distributors, tobacco, media, and travel and leisure.
For the 12-month period ended October 31, 2020 (the “reporting period”), the Fund increased 67.98%, while the Underlying Index increased 69.02%. The Fund had a net asset value of $17.68 per share on October 31, 2019 and ended the reporting period with a net asset value of $29.45 per share on October 31, 2020.
During the reporting period, the highest returns came from NIO Inc and BYD Company, which returned 2,008.96% and 322.54%, respectively. The worst performers were Luckin Coffee Inc and China First Capital Group, which returned -94.54% and -90.30%, respectively.
Years of wage growth and urbanization have substantially increased the consumption habits of millions of Chinese citizens. Improving the consumption component is vital, as maintaining higher economic growth primarily on exports and investment has become more difficult for China amid rising trade tensions and reduced labor competitiveness. The government had taken a series of measures to adjust the growth model of the Chinese economy from an export-led economy to a consumption-oriented one. Promoting consumer-focused areas like e-commerce, automobiles, education, and tourism, have helped achieve these goals. However, such efforts suffered a major blow during the reporting period when the economy came to a halt due to strict lockdown measures imposed to contain the COVID-19 pandemic. The economy contracted 10% quarter-over-quarter in the first quarter of 2020, recording the first contraction since 1992. It gained momentum in the second and third quarters and grew 11.7% and 2.7% quarter-over-quarter, respectively, as lockdown measures were effective at containing the virus and allowed workers to return to their jobs. Retail sales, since plummeting early in the year, continued to recover gradually alongside rising consumer confidence.
Management Discussion of Fund Performance (unaudited) |
| Global X MSCI China Consumer Discretionary ETF |
| | AVERAGE ANNUAL TOTAL RETURN FOR THE YEAR ENDED OCTOBER 31, 2020 |
| | One Year Return | Three Year Return | Five Year Return | Annualized Inception to Date* |
| | Net Asset Value | Market Price | Net Asset Value | Market Price | Net Asset Value | Market Price | Net Asset Value | Market Price |
| Global X MSCI China Consumer Discretionary ETF | 67.98% | 69.29% | 20.85% | 20.94% | 19.01% | 19.13% | 7.55% | 7.57% |
| Hybrid Solactive China Consumer Total Return Index/MSCI China Consumer Discretionary 10/50 Index** | 69.02% | 69.02% | 21.66% | 21.66% | 19.82% | 19.82% | 8.20% | 8.20% |
| MSCI Emerging Markets Index | 8.25% | 8.25% | 1.94% | 1.94% | 7.92% | 7.92% | 3.81% | 3.81% |
Growth of a $10,000 Investment
(At Net Asset Value)
*Fund commenced operations on November 30, 2009.
** Reflects performance of Solactive China Total Return Index through December 5, 2018 and MSCI China Consumer Discretionary 10/50 Index thereafter.
The MSCI Emerging Markets Index is a free float-adjusted market capitalization index that is designed to measure equity market performance of emerging markets.
The performance data quoted herein represents past performance and the return and value of an investment in the Fund will fluctuate so that, when redeemed, it may be worth less than its original cost. High short term performance of the fund is unusual and investors should not expect such performance to be repeated. Past performance is no guarantee of future performance and should not be considered as a representation of the future results of the Fund. The Fund’s performance assumes the reinvestment of all dividends and all capital gains. Index returns assume reinvestment of dividends and, unlike the Fund’s returns, do not reflect any fees or expenses. If such fees and expenses were included in the index returns, the performance would have been lower. Please note that one cannot invest directly in an unmanaged index.
Management Discussion of Fund Performance (unaudited) |
| Global X MSCI China Consumer Discretionary ETF |
Performance figures for the periods shown may reflect contractual fee waivers and/or expense reimbursements. In the absence of fee waivers and/or expense reimbursements (if applicable), returns would have been lower.
There are no assurances that the Fund will meet its stated objectives.
The Fund’s holdings and allocations are subject to change and should not be considered recommendations to buy individual securities.
The graph and table do not reflect the deduction of taxes that a shareholder would pay on Fund distributions or the redemption or sale of Fund shares.
See definition of comparative indices above.
Management Discussion of Fund Performance (unaudited) |
| Global X MSCI China Consumer Staples ETF |
Global X MSCI China Consumer Staples ETF
The Global X MSCI China Consumer Staples ETF (“Fund”) seeks to provide investment results that correspond generally to the price and yield performance, before fees and expenses, of the MSCI China Consumer Staples 10/50 Index (“Underlying Index”). The Fund is passively managed, which means the investment adviser does not attempt to take defensive positions in declining markets. The Fund generally seeks to fully replicate the Underlying Index.
The Underlying Index is designed to measure the equity performance of the investable universe of companies in the consumer staples sector of the Chinese economy, as defined by MSCI, Inc., the provider of the Underlying Index. It is comprised of securities of companies that have their main business operations in the consumer staples sector and generally includes companies whose businesses involve: personal products, packaged foods and meat, brewers, agriculture products, hypermarkets and supermarkets, and, distillers & vintners.
For the 12-month period ended October 31, 2020 (the “reporting period”), the Fund increased 42.48%, while the Underlying Index increased 42.76%. The Fund had a net asset value of $21.08 per share on October 31, 2019 and ended the reporting period with a net asset value of $29.04 per share on October 31, 2020.
During the reporting period, the highest returns came from Shanxi Xinghuacun Fen Wine Factory and Tongwei, which returned 167.33% and 156.96%, respectively. The worst performers were Wen’s Foodstuff Group and Tech-bank Food, which returned -38.36% and -22.56%, respectively.
China’s economy is in a transition phase as wages continue to rise and the middle class expands. This transformation has led to a substantial increase in domestic demand for basic consumer goods, which in turn has contributed to the expansion of the Consumer Staples sector. The momentum in consumer expenditure has been a key component in supporting economic growth in China. Amid the economic slowdown due to the COVID-19 pandemic and trade conflicts with the U.S., China has depended heavily on domestic consumption to stabilize the economy during a weak environment. Further supporting consumption in China has been the country’s aggressive curbs to the spread of COVID-19. Early and aggressive lockdowns allowed workers to return to their jobs faster, avoiding lost wages and contributing to consumption growth. For example, despite the pandemic, industrial output rose 6.9% in October from a year earlier and consumer confidence increased to 120.50 points in September from 116.40 points in August, showing signs of strengthening consumerism.
Management Discussion of Fund Performance (unaudited) |
| Global X MSCI China Consumer Staples ETF |
| | AVERAGE ANNUAL TOTAL RETURN FOR THE YEAR ENDED OCTOBER 31, 2020 |
| | One Year Return | Annualized Inception to Date* |
| | Net Asset Value | Market Price | Net Asset Value | Market Price |
| Global X MSCI China Consumer Staples ETF | 42.48% | 41.96% | 44.68% | 45.02% |
| MSCI China Consumer Staples 10/50 Index | 42.76% | 42.76% | 45.37% | 45.37% |
| MSCI Emerging Markets Index | 8.25% | 8.25% | 9.03% | 9.03% |
Growth of a $10,000 Investment
(At Net Asset Value)
*Fund commenced operations on December 7, 2018.
The MSCI Emerging Markets Index is a free float-adjusted market capitalization index that is designed to measure equity market performance of emerging markets.
The performance data quoted herein represents past performance and the return and value of an investment in the Fund will fluctuate so that, when redeemed, it may be worth less than its original cost. High short term performance of the fund is unusual and investors should not expect such performance to be repeated. Past performance is no guarantee of future performance and should not be considered as a representation of the future results of the Fund. The Fund’s performance assumes the reinvestment of all dividends and all capital gains. Index returns assume reinvestment of dividends and, unlike the Fund’s returns, do not reflect any fees or expenses. If such fees and expenses were included in the index returns, the performance would have been lower. Please note that one cannot invest directly in an unmanaged index.
Performance figures for the periods shown may reflect contractual fee waivers and/or expense reimbursements. In the absence of fee waivers and/or expense reimbursements (if applicable), returns would have been lower.
There are no assurances that the Fund will meet its stated objectives.
Management Discussion of Fund Performance (unaudited) |
| Global X MSCI China Consumer Staples ETF |
The Fund’s holdings and allocations are subject to change and should not be considered recommendations to buy individual securities.
The graph and table do not reflect the deduction of taxes that a shareholder would pay on Fund distributions or the redemption or sale of Fund shares.
See definition of comparative indices above.
Management Discussion of Fund Performance (unaudited) |
| Global X MSCI China Health Care ETF |
Global X MSCI China Health Care ETF
The Global X MSCI China Health Care ETF (“Fund”) seeks to provide investment results that correspond generally to the price and yield performance, before fees and expenses, of the MSCI China Health Care 10/50 Index (“Underlying Index”). The Fund is passively managed, which means the investment adviser does not attempt to take defensive positions in declining markets. The Fund generally seeks to fully replicate the Underlying Index.
The Underlying Index is designed to measure the equity performance of the investable universe of companies in the healthcare sector of the Chinese economy, as defined by MSCI, Inc., the provider of the Underlying Index. It is comprised of securities of companies that have their main business operations in the healthcare sector and generally includes companies whose businesses involve: Biotechnology, Health Care Equipment & Supplies, Health Care Providers & Services, Health Care Technology, Life Sciences Tools & Services, and Pharmaceuticals.
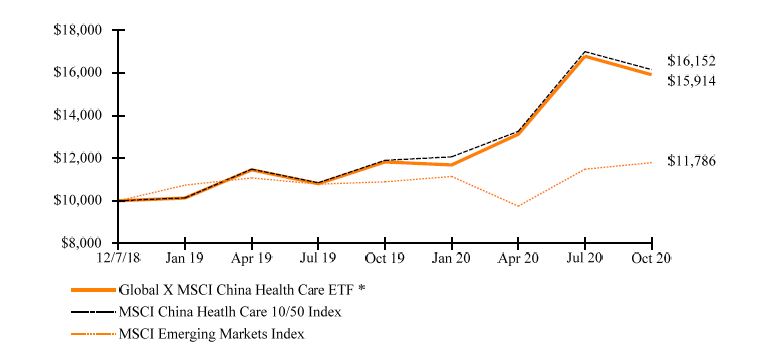
For the 12-month period ended October 31, 2020 (the “reporting period”), the Fund increased 34.62%, while the Underlying Index increased 35.77%. The Fund had a net asset value of $17.70 per share on October 31, 2019 and ended the reporting period with a net asset value of $23.68 per share on October 31, 2020.
During the reporting period, the highest returns came from Chongqing Zhifei Biological Products and Alibaba Health Information Technology, which returned 247.26% and 158.74%, respectively. The worst performers were 3SBio, Inc and China Resources Pharmaceutical Group, which returned -50.29% and -44.64%, respectively.
An aging population, alongside trends in rising wages and living standards, and broader access to health care have been key to the modernization of China’s Health Care sector. These secular trends combined with the sheer size of China’s population have created substantial growth opportunities for private companies in the Health Care space. Beyond just China’s domestic health care market, China plays an important role in the global healthcare industry. Chinese firms manufacture about 40% of active pharmaceutical ingredients used worldwide and export a significant volume of medical supplies all over the world. The government of China, with a key focus on the healthcare industry, has announced a number of reforms to strengthen the healthcare system in the country. The China Healthcare Report 2020 outlines major investments in research and development (R&D) as well as innovation and rapid growth of the biopharmaceutical industry. These efforts are expected to continue to grow the sector’s strong momentum.
Management Discussion of Fund Performance (unaudited) |
| Global X MSCI China Health Care ETF |
| | AVERAGE ANNUAL TOTAL RETURN FOR THE YEAR ENDED OCTOBER 31, 2020 |
| | One Year Return | Annualized Inception to Date* |
| | Net Asset Value | Market Price | Net Asset Value | Market Price |
| Global X MSCI China Health Care ETF | 34.62% | 36.65% | 27.74% | 28.13% |
| MSCI China Healh Care 10/50 Index | 35.77% | 35.77% | 28.68% | 28.68% |
| MSCI Emerging Markets Index | 8.25% | 8.25% | 9.03% | 9.03% |
Growth of a $10,000 Investment
(At Net Asset Value)
*Fund commenced operations on December 7, 2018.
The MSCI Emerging Markets Index is a free float-adjusted market capitalization index that is designed to measure equity market performance of emerging markets.
The performance data quoted herein represents past performance and the return and value of an investment in the Fund will fluctuate so that, when redeemed, it may be worth less than its original cost. High short term performance of the fund is unusual and investors should not expect such performance to be repeated. Past performance is no guarantee of future performance and should not be considered as a representation of the future results of the Fund. The Fund’s performance assumes the reinvestment of all dividends and all capital gains. Index returns assume reinvestment of dividends and, unlike the Fund’s returns, do not reflect any fees or expenses. If such fees and expenses were included in the index returns, the performance would have been lower. Please note that one cannot invest directly in an unmanaged index.
Performance figures for the periods shown may reflect contractual fee waivers and/or expense reimbursements. In the absence of fee waivers and/or expense reimbursements (if applicable), returns would have been lower.
There are no assurances that the Fund will meet its stated objectives.
Management Discussion of Fund Performance (unaudited) |
| Global X MSCI China Health Care ETF |
The Fund’s holdings and allocations are subject to change and should not be considered recommendations to buy individual securities.
The graph and table do not reflect the deduction of taxes that a shareholder would pay on Fund distributions or the redemption or sale of Fund shares.
See definition of comparative indices above.
Management Discussion of Fund Performance (unaudited) |
| Global X MSCI China Financials ETF |
Global X MSCI China Financials ETF
The Global X MSCI China Financials ETF (“Fund”) seeks to provide investment results that correspond generally to the price and yield performance, before fees and expenses, of the MSCI China Financials 10/50 Index (“Underlying Index”). The Fund is passively managed, which means the investment adviser does not attempt to take defensive positions in declining markets. The Fund generally seeks to fully replicate the Underlying Index.
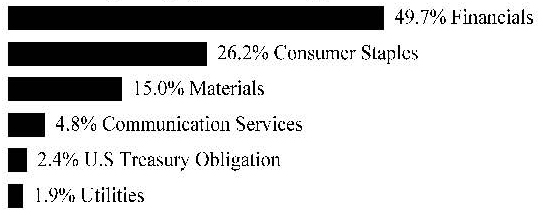
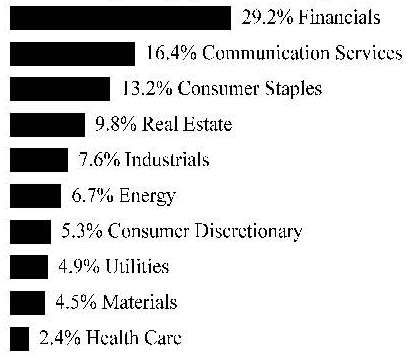
The Underlying Index is designed to measure the equity performance of the investable universe of companies in the Financials sector of the Chinese economy, as defined by MSCI, Inc., the provider of the Underlying Index. It is comprised of securities of companies that have their main business operations in the Financials sector and generally includes companies whose businesses involve: banking; insurance, real estate, and financial services.
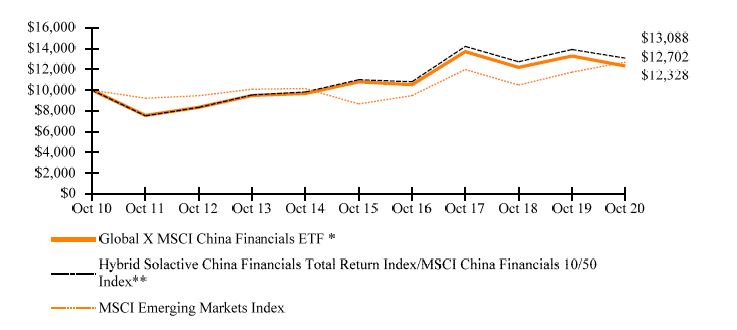
For the 12-month period ended October 31, 2020 (the “reporting period”), the Fund decreased 7.24%, while the Underlying Index decreased 5.94%. The Fund had a net asset value of $15.83 per share on October 31, 2019 and ended the reporting period with a net asset value of $14.25 per share on October 31, 2020.
During the reporting period, the highest returns came from East Money Information and CSC Financial, which returned 97.79% and 97.40%, respectively. The worst performers were China Ding Yi Feng Holdings and Anxin Trust, which returned -94.32% and -55.25%, respectively.
The COVID-19 pandemic has caused widespread economic issues, which have impacted Financials around the world. China’s Financials sector has not been immune as lockdowns and reduced economic activity locally and around the world, have put pressure on debtors in China. Beijing made decisive and proactive efforts to contain the spread on the virus and stabilize the economy. Yet the pandemic has still negatively impacted banks’ asset quality. Smaller banks are experiencing a deterioration in asset quality and a sharp rise in credit risks, while large state-owned commercial banks are generally in better shape, as they have sufficient capital buffers. Small and medium-sized banks are more vulnerable, as these institutions account for a much larger share of the loans to small and medium enterprises (SMEs). Joint stock banks, urban commercial banks, and rural commercial banks comprise 70% of SME loans, while large commercial banks account for only 30% of SME loans. The pandemic has mostly affected SME borrowers, with a quick deterioration in the quality of their loans. The industry-wide non-performing loan (NPL) ratio for banks accelerated to over 2% in the first quarter of 2020. Despite these recent challenges, China has continued to open its Financials sector to a more global audience and the banking sector has significantly increased its focus on digital transformation to remain competitive and increase profitability.
Management Discussion of Fund Performance (unaudited) |
| Global X MSCI China Financials ETF |
| | AVERAGE ANNUAL TOTAL RETURN FOR THE YEAR ENDED OCTOBER 31, 2020 |
| | One Year Return | Three Year Return | Five Year Return | Annualized Inception to Date* |
| | Net Asset Value | Market Price | Net Asset Value | Market Price | Net Asset Value | Market Price | Net Asset Value | Market Price |
| Global X MSCI China Financials ETF | -7.24% | -5.23% | -3.48% | -3.23% | 2.69% | 2.94% | 1.86% | 1.94% |
| Hybrid Solactive China Financials Total Return Index/MSCI China Financials 10/50 Index** | -5.94% | -5.94% | -2.72% | -2.72% | 3.53% | 3.53% | 2.48% | 2.48% |
| MSCI Emerging Markets Index | 8.25% | 8.25% | 1.94% | 1.94% | 7.92% | 7.92% | 3.69% | 3.69% |
Growth of a $10,000 Investment
(At Net Asset Value)
*Fund commenced operations on December 10, 2009.
** Reflects performance of Solactive China Financials Total Return Index through December 5, 2018 and MSCI China Financials 10/50 Index thereafter.
The MSCI Emerging Markets Index is a free float-adjusted market capitalization index that is designed to measure equity market performance of emerging markets.
The performance data quoted herein represents past performance and the return and value of an investment in the Fund will fluctuate so that, when redeemed, it may be worth less than its original cost. Past performance is no guarantee of future performance and should not be considered as a representation of the future results of the Fund. The Fund’s performance assumes the reinvestment of all dividends and all capital gains. Index returns assume reinvestment of dividends and, unlike the Fund’s returns, do not reflect any fees or expenses. If such fees and expenses were included in the index returns, the performance would have been lower. Please note that one cannot invest directly in an unmanaged index.
Performance figures for the periods shown may reflect contractual fee waivers and/or expense reimbursements. In the absence of fee waivers and/or expense reimbursements (if applicable), returns would have been lower.
Management Discussion of Fund Performance (unaudited) |
| Global X MSCI China Financials ETF |
There are no assurances that the Fund will meet its stated objectives.
The Fund’s holdings and allocations are subject to change and should not be considered recommendations to buy individual securities.
The graph and table do not reflect the deduction of taxes that a shareholder would pay on Fund distributions or the redemption or sale of Fund shares.
See definition of comparative indices above.
Management Discussion of Fund Performance (unaudited) |
| Global X MSCI China Information Technology ETF |
Global X MSCI China Information Technology ETF
The Global X MSCI China Information Technology ETF (“Fund”) seeks to provide investment results that correspond generally to the price and yield performance, before fees and expenses, of the MSCI China Information Technology 10/50 Index (“Underlying Index”). The Fund is passively managed, which means the investment adviser does not attempt to take defensive positions in declining markets. The Fund generally seeks to fully replicate the Underlying Index.
The Underlying Index is designed to track the performance of the Information Technology sector in China as defined by MSCI, Inc., the provider of the Underlying Index. It is comprised of securities of companies that have their main business operations in the Information Technology sector and generally includes companies whose businesses involve: communications equipment, electronic equipment, instruments & components, IT Services, semiconductors & semiconductor equipment, software, and, technology hardware, storage & peripherals.
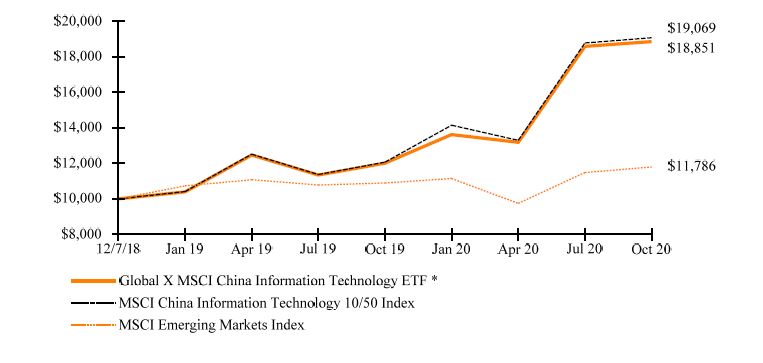
For the 12-month period ended October 31, 2020 (the “reporting period”), the Fund increased 57.01%, while the Underlying Index increased 58.09%. The Fund had a net asset value of $17.92 per share on October 31, 2019 and ended the reporting period with a net asset value of $27.78 per share on October 31, 2020.
During the reporting period, the highest returns came from LONGi Green Energy Technology and Xinyi Solar Holdings, which returned 252.48% and 228.92%, respectively. The worst performers were GCL System Integration Technology and China Railway Signal & Communication Corp, which returned -42.51% and -41.43%, respectively.
During the reporting period, China’s technology giants saw their businesses thrive despite the COVID-19 pandemic. Strict lockdowns forced people to rely more on digital services rather than physical, in-person experiences. The government encouraged domestic consumption in the low-mobility environment by promoting the use of digital technologies such as e-commerce, cloud computing, 5G, and gaming. Industrial output of information transmission, software and IT service industry grew in the first six months of 2020. Beyond the pandemic, increased support for the domestic technology industry has led to numerous projects to implement digitalization across the economy. New infrastructure developments, such as the construction of 5G towers, is expected to provide further support for the sector’s growth.
Management Discussion of Fund Performance (unaudited) |
| Global X MSCI China Information Technology ETF |
| | AVERAGE ANNUAL TOTAL RETURN FOR THE YEAR ENDED OCTOBER 31, 2020 |
| | One Year Return | Annualized Inception to Date* |
| | Net Asset Value | Market Price | Net Asset Value | Market Price |
| Global X MSCI China Information Technology ETF | 57.01% | 59.41% | 39.66% | 40.08% |
| MSCI China Information Technology 10/50 Index | 58.09% | 58.09% | 40.42% | 40.42% |
| MSCI Emerging Markets Index | 8.25% | 8.25% | 9.03% | 9.03% |
Growth of a $10,000 Investment
(At Net Asset Value)
*Fund commenced operations on December 7, 2018.
The MSCI Emerging Markets Index is a free float-adjusted market capitalization index that is designed to measure equity market performance of emerging markets.
The performance data quoted herein represents past performance and the return and value of an investment in the Fund will fluctuate so that, when redeemed, it may be worth less than its original cost. High short term performance of the fund is unusual and investors should not expect such performance to be repeated. Past performance is no guarantee of future performance and should not be considered as a representation of the future results of the Fund. The Fund’s performance assumes the reinvestment of all dividends and all capital gains. Index returns assume reinvestment of dividends and, unlike the Fund’s returns, do not reflect any fees or expenses. If such fees and expenses were included in the index returns, the performance would have been lower. Please note that one cannot invest directly in an unmanaged index.
Performance figures for the periods shown may reflect contractual fee waivers and/or expense reimbursements. In the absence of fee waivers and/or expense reimbursements (if applicable), returns would have been lower.
Management Discussion of Fund Performance (unaudited) |
| Global X MSCI China Information Technology ETF |
There are no assurances that the Fund will meet its stated objectives.
The Fund’s holdings and allocations are subject to change and should not be considered recommendations to buy individual securities.
The graph and table do not reflect the deduction of taxes that a shareholder would pay on Fund distributions or the redemption or sale of Fund shares.
See definition of comparative indices above.
Management Discussion of Fund Performance (unaudited) |
| Global X MSCI China Communication Services ETF |
Global X MSCI China Communication Services ETF
The Global X MSCI China Communication Services ETF (“Fund”) seeks to provide investment results that correspond generally to the price and yield performance, before fees and expenses, of the MSCI China Communication Services 10/50 Index (“Underlying Index”). The Fund is passively managed, which means the investment adviser does not attempt to take defensive positions in declining markets. The Fund generally seeks to fully replicate the Underlying Index.
The Underlying Index is designed to measure the equity performance of the investable universe of companies in the communication services sector of the Chinese economy, as defined by MSCI, Inc., the provider of the Underlying Index. It is comprised of securities of companies that have their main business operations in the communication services sector and generally includes companies whose businesses involve: Diversified Telecommunication Services, Entertainment, Interactive Media & Services, Media, Software, and, Wireless Telecommunication Services.
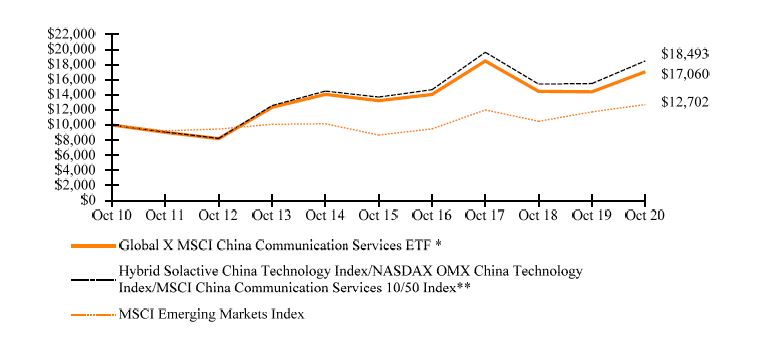
For the 12-month period ended October 31, 2020 (the “reporting period”), the Fund increased 18.61%, while the Underlying Index increased 19.49%. The Fund had a net asset value of $22.18 per share on October 31, 2019 and ended the reporting period with a net asset value of $26.13 per share on October 31, 2020.
During the reporting period, the highest returns came from Mango Excellent Media Co. Ltd. Class A and China Literature Ltd, which returned 188.24% and 108.03%, respectively. The worst performers were Momo Inc Sponsored ADR Class A and China Unicom (Hong Kong) Limited, which returned -53.77% and -35.82%, respectively.
Rapid urbanization and the emerging middle class have driven the surge in demand for communications services in China. China’s communications industry saw steady growth in the first half of this year, despite the impact of the COVID-19 pandemic, given that more people become increasingly reliant on digital and virtual platforms to stay connected from home during the COVID-19 pandemic. The combined revenue of the sector rose 3.2% year-over-year, reaching 692.7 billion yuan in the first half of 2020. Revenue from the data and internet business saw stable growth, and the number of fixed broadband internet users increased steadily, signaling prospects of an advancing digital economy. China is home to the world’s largest telecommunications market with about 1.6 billion subscribers. China’s aim to become a pioneer in 5G technology has so far been successful domestically, despite western governments’ reservation towards using Chinese 5G technology.
Management Discussion of Fund Performance (unaudited) |
| Global X MSCI China Communication Services ETF |
| | AVERAGE ANNUAL TOTAL RETURN FOR THE YEAR ENDED OCTOBER 31, 2020 |
| | One Year Return | Three Year Return | Five Year Return | Annualized Inception to Date* |
| | Net Asset Value | Market Price | Net Asset Value | Market Price | Net Asset Value | Market Price | Net Asset Value | Market Price |
| Global X MSCI China Communication Services ETF | 18.61% | 20.24% | -2.61% | -2.86% | 5.24% | 5.45% | 6.42% | 6.43% |
| Hybrid Solactive China Technology Index/NASDAX OMX China Technology Index/MSCI China Communication Services 10/50 Index ** | 19.49% | 19.49% | -1.97% | -1.97% | 6.19% | 6.19% | 7.26% | 7.26% |
| MSCI Emerging Markets Index | 8.25% | 8.25% | 1.94% | 1.94% | 7.92% | 7.92% | 3.65% | 3.65% |
Growth of a $10,000 Investment
(At Net Asset Value)
*Fund commenced operations on December 8, 2009.
** Reflects performance of Solactive China Technology Index through December 13, 2011, NASDAQ OMX China Technology Index through December 5, 2018 and the MSCI China Communication Services 10/50 Index thereafter.
The MSCI Emerging Markets Index is a free float-adjusted market capitalization index that is designed to measure equity market performance of emerging markets.
The performance data quoted herein represents past performance and the return and value of an investment in the Fund will fluctuate so that, when redeemed, it may be worth less than its original cost. Past performance is no guarantee of future performance and should not be considered as a representation of the future results of the Fund. The Fund’s performance assumes the reinvestment of all dividends and all capital gains. Index returns assume reinvestment of dividends and, unlike the Fund’s returns, do not
Management Discussion of Fund Performance (unaudited) |
| Global X MSCI China Communication Services ETF |
reflect any fees or expenses. If such fees and expenses were included in the index returns, the performance would have been lower. Please note that one cannot invest directly in an unmanaged index.
Performance figures for the periods shown may reflect contractual fee waivers and/or expense reimbursements. In the absence of fee waivers and/or expense reimbursements (if applicable), returns would have been lower.
There are no assurances that the Fund will meet its stated objectives.
The Fund’s holdings and allocations are subject to change and should not be considered recommendations to buy individual securities.
The graph and table do not reflect the deduction of taxes that a shareholder would pay on Fund distributions or the redemption or sale of Fund shares.
See definition of comparative indices above.
Management Discussion of Fund Performance (unaudited) |
| Global X MSCI China Utilities ETF |
Global X MSCI China Utilities ETF
The Global X MSCI China Utilities ETF (“Fund”) seeks to provide investment results that correspond generally to the price and yield performance, before fees and expenses, of the MSCI China Utilities 10/50 Index (“Underlying Index”). The Fund is passively managed, which means the investment adviser does not attempt to take defensive positions in declining markets. The Fund generally seeks to fully replicate the Underlying Index.
The Underlying Index is designed to measure the equity performance of the investable universe of companies in the Utilities sector of the Chinese economy, as defined by MSCI, Inc., the provider of the Underlying Index. It is comprised of securities of companies that have their main business operations in the Utilities sector and generally includes companies whose businesses involve: independent power and renewable electricity producers, gas utilities, and, water utilities.
For the 12-month period ended October 31, 2020 (the “reporting period”), the Fund decreased 10.92%, while the Underlying Index decreased 10.18%. The Fund had a net asset value of $15.81 per share on October 31, 2019 and ended the reporting period with a net asset value of $13.70 per share on October 31, 2020.
During the reporting period, the highest returns came from China Longyuan Power Group and SDIC Power Holdings, which returned 30.00% and 19.57%, respectively. The worst performers were Towngas China and Beijing Enterprises Holdings, which returned -37.95% and -33.53%, respectively.
During the reporting period, strict lockdowns imposed by China’s government to combat the COVID-19 pandemic hindered economic activities across the country. Worldwide lockdowns also triggered a collapse in international trade, which in turn led to a sharp fall in electricity demand by manufacturers and businesses in China. Industrial activities account for more than 65% of national power demand. However, during China’s lockdown period, residential electricity demand and electricity demand from the telecom and internet sectors recorded a significant increase, mildly offsetting the lost industrial demand. As the economy recovered gradually in the second quarter of 2020, demand for power rose 3.9% quarter-over-quarter. One bright spot in the Energy sector is renewable energy production, which rose to 33% of total electric power in September from 23% in January, while the share of coal power generation fell to 60% in September 2020 from 69% in January.
Management Discussion of Fund Performance (unaudited) |
| Global X MSCI China Utilities ETF |
| | AVERAGE ANNUAL TOTAL RETURN FOR THE YEAR ENDED OCTOBER 31, 2020 |
| | One Year Return | Annualized Inception to Date* |
| | Net Asset Value | Market Price | Net Asset Value | Market Price |
| Global X MSCI China Utilities ETF | -10.92% | -11.09% | -2.86% | -2.60% |
| MSCI China Utilities 10/50 Index | -10.18% | -10.18% | -2.08% | -2.08% |
| MSCI Emerging Markets Index | 8.25% | 8.25% | 9.03% | 9.03% |
Growth of a $10,000 Investment
(At Net Asset Value)
*Fund commenced operations on December 7, 2018.
The MSCI Emerging Markets Index is a free float-adjusted market capitalization index that is designed to measure equity market performance of emerging markets.
The performance data quoted herein represents past performance and the return and value of an investment in the Fund will fluctuate so that, when redeemed, it may be worth less than its original cost. Past performance is no guarantee of future performance and should not be considered as a representation of the future results of the Fund. The Fund’s performance assumes the reinvestment of all dividends and all capital gains. Index returns assume reinvestment of dividends and, unlike the Fund’s returns, do not reflect any fees or expenses. If such fees and expenses were included in the index returns, the performance would have been lower. Please note that one cannot invest directly in an unmanaged index.
Performance figures for the periods shown may reflect contractual fee waivers and/or expense reimbursements. In the absence of fee waivers and/or expense reimbursements (if applicable), returns would have been lower.
Management Discussion of Fund Performance (unaudited) |
| Global X MSCI China Utilities ETF |
There are no assurances that the Fund will meet its stated objectives.
The Fund’s holdings and allocations are subject to change and should not be considered recommendations to buy individual securities.
The graph and table do not reflect the deduction of taxes that a shareholder would pay on Fund distributions or the redemption or sale of Fund shares.
See definition of comparative indices above.
Management Discussion of Fund Performance (unaudited) |
| Global X MSCI China Real Estate ETF |
Global X MSCI China Real Estate ETF
The Global X MSCI China Real Estate ETF (“Fund”) seeks to provide investment results that correspond generally to the price and yield performance, before fees and expenses, of the MSCI China Real Estate 10/50 Index (“Underlying Index”). The Fund is passively managed, which means the investment adviser does not attempt to take defensive positions in declining markets. The Fund generally seeks to fully replicate the Underlying Index.
The Underlying Index is designed to measure the equity performance of the investable universe of companies in the Real Estate sector of the Chinese economy, as defined by MSCI, Inc., the provider of the Underlying Index. It is comprised of securities of companies that have their main business operations in the Real Estate sector and generally includes companies whose businesses involve: Real Estate Development, Diversified Real Estate Activities, and, Real Estate Management & Development.
For the 12-month period ended October 31, 2020 (the “reporting period”), the Fund decreased 2.55%, while the Underlying Index decreased 2.08%. The Fund had a net asset value of $17.23 per share on October 31, 2019 and ended the reporting period with a net asset value of $16.18 per share on October 31, 2020.
During the reporting period, the highest returns came from KWG Group Holdings and Longfor Group Holdings, which returned 81.88% and 36.10%, respectively. The worst performers were Sino-Ocean Group Holding and Poly Property Services, which returned -45.68% and -36.05%, respectively.
The COVID-19 pandemic had a significant negative impact on China’s real estate sector in the first quarter of 2020, with every core performance metric plunging into negative territory across both realty and construction. The housing segment suffered in particularly, with a sharp fall in sales volumes; even house and rental prices experienced a decline. Big cities suffered major challenges as well; residential mass market sales by square meterage in Beijing plummeted and transaction volumes also slumped during the first quarter in 2020. However, the sector managed to bounce back, owing to cheaper credit and incremental policy easing. Property sales by floor area grew gradually in August, September and October 2020 as the economy began to find even footing. Property investment also expanded sharply in September and October 2020. The regulators, however, remain concerned about high property prices in China amid cheaper credit to support the coronavirus-stricken economy. Regulators have taken a series of measures to control property prices and cut the availability of mortgage loans to spur household spending instead of repaying debt to stimulate the economy.
Management Discussion of Fund Performance (unaudited) |
| Global X MSCI China Real Estate ETF |
| | AVERAGE ANNUAL TOTAL RETURN FOR THE YEAR ENDED OCTOBER 31, 2020 |
| | One Year Return | Annualized Inception to Date* |
| | Net Asset Value | Market Price | Net Asset Value | Market Price |
| Global X MSCI China Real Estate ETF | -2.55% | -2.59% | 6.94% | 6.57% |
| MSCI China Real Estate 10/50 Index | -2.08% | -2.08% | 7.62% | 7.62% |
| MSCI Emerging Markets Index | 8.25% | 8.25% | 9.03% | 9.03% |
Growth of a $10,000 Investment
(At Net Asset Value)
*Fund commenced operations on December 7, 2018.
The MSCI Emerging Markets Index is a free float-adjusted market capitalization index that is designed to measure equity market performance of emerging markets.
The performance data quoted herein represents past performance and the return and value of an investment in the Fund will fluctuate so that, when redeemed, it may be worth less than its original cost. High short term performance of the fund is unusual and investors should not expect such performance to be repeated. Past performance is no guarantee of future performance and should not be considered as a representation of the future results of the Fund. The Fund’s performance assumes the reinvestment of all dividends and all capital gains. Index returns assume reinvestment of dividends and, unlike the Fund’s returns, do not reflect any fees or expenses. If such fees and expenses were included in the index returns, the performance would have been lower. Please note that one cannot invest directly in an unmanaged index.
Performance figures for the periods shown may reflect contractual fee waivers and/or expense reimbursements. In the absence of fee waivers and/or expense reimbursements (if applicable), returns would have been lower.
Management Discussion of Fund Performance (unaudited) |
| Global X MSCI China Real Estate ETF |
There are no assurances that the Fund will meet its stated objectives.
The Fund’s holdings and allocations are subject to change and should not be considered recommendations to buy individual securities.
The graph and table do not reflect the deduction of taxes that a shareholder would pay on Fund distributions or the redemption or sale of Fund shares.
See definition of comparative indices above.
Management Discussion of Fund Performance (unaudited) |
| Global X MSCI China Large-Cap 50 ETF |
Global X MSCI China Large-Cap 50 ETF
The Global X MSCI China Large-Cap 50 ETF (“Fund”) seeks to provide investment results that correspond generally to the price and yield performance, before fees and expenses, of the MSCI China Top 50 Select Index (“Underlying Index”). The Fund is passively managed, which means the investment adviser does not attempt to take defensive positions in declining markets. The Fund generally seeks to fully replicate the Underlying Index.
The Underlying Index is designed to represent the performance of the broad China equity universe, while including the 50 largest constituents, as defined by MSCI, Inc., the provider of the Underlying Index. The broad China equity universe includes securities that are classified in China according to the MSCI Global Investable Market Index Methodology, together with companies that are headquartered or listed in China and carry out the majority of their operations in China.
For the 12-month period ended October 31, 2020 (the “reporting period”), the Fund increased 30.23%, while the Underlying Index increased 30.71%. The Fund had a net asset value of $27.60 per share on October 31, 2019 and ended the reporting period with a net asset value of $35.40 per share on October 31, 2020.
During the reporting period, the highest returns came from Meituan and JD.com ADR, which returned 211.03% and 161.70%, respectively. The worst performers were CNOOC and Geely Automobile Holdings, which returned -35.01% and -31.46%, respectively.
China suffered a major economic downturn in the first quarter of 2020 as strict lockdown measures to control the spread of the COVID-19 pandemic disrupted economic activities, including industrial operations and consumption. The economy recorded its first contraction since 1992, when it suffered a 10% contraction quarter-over-quarter in the first quarter of 2020. The export-led economy suffered further due to global lockdowns and major disruptions to international trade. However, the government initiated a series of measures to get the economy back on track. These included increased policy support, on both fiscal and monetary fronts. While the government took measures to stimulate the economy and spur consumption with increased expenditure, the People’s Bank of China (PBoC) laid out a number of monetary-easing measures, including cuts in lending rates and banks’ reserve requirement ratios (RRR). The economy responded and grew 11.7% and 2.7% quarter-over-quarter in the second and third quarters of 2020, respectively. As consumer confidence improved from 116.40 points in August to 120.50 points in September, retail sales also improved during August and September. In addition, exports saw a gradual growth, while industrial output increased in October 2020. Large firms in China immensely benefitted from the stimulus measures and the quick economic revival, while many other countries lagged behind as they struggled to contain the virus.
Management Discussion of Fund Performance (unaudited) |
| Global X MSCI China Large-Cap 50 ETF |
| | AVERAGE ANNUAL TOTAL RETURN FOR THE YEAR ENDED OCTOBER 31, 2020 |
| | One Year Return | Annualized Inception to Date* |
| | Net Asset Value | Market Price | Net Asset Value | Market Price |
| Global X MSCI China Large-Cap 50 ETF | 30.23% | 31.02% | 21.59% | 21.69% |
| MSCI China Top 50 Select Index | 30.71% | 30.71% | 22.02% | 22.02% |
| MSCI Emerging Markets Index | 8.25% | 8.25% | 9.03% | 9.03% |
Growth of a $10,000 Investment
(At Net Asset Value)
*Fund commenced operations on December 7, 2018.
The MSCI Emerging Markets Index is a free float-adjusted market capitalization index that is designed to measure equity market performance of emerging markets.
The performance data quoted herein represents past performance and the return and value of an investment in the Fund will fluctuate so that, when redeemed, it may be worth less than its original cost. Past performance is no guarantee of future performance and should not be considered as a representation of the future results of the Fund. The Fund’s performance assumes the reinvestment of all dividends and all capital gains. Index returns assume reinvestment of dividends and, unlike the Fund’s returns, do not reflect any fees or expenses. If such fees and expenses were included in the index returns, the performance would have been lower. Please note that one cannot invest directly in an unmanaged index.
Performance figures for the periods shown may reflect contractual fee waivers and/or expense reimbursements. In the absence of fee waivers and/or expense reimbursements (if applicable), returns would have been lower.
There are no assurances that the Fund will meet its stated objectives.
Management Discussion of Fund Performance (unaudited) |
| Global X MSCI China Large-Cap 50 ETF |
The Fund’s holdings and allocations are subject to change and should not be considered recommendations to buy individual securities.
The graph and table do not reflect the deduction of taxes that a shareholder would pay on Fund distributions or the redemption or sale of Fund shares.
See definition of comparative indices above.
Management Discussion of Fund Performance (unaudited) |
| Global X MSCI Greece ETF |
Global X MSCI Greece ETF
The Global X MSCI Greece ETF (“Fund”) seeks to provide investment results that correspond generally to the price and yield performance, before fees and expenses, of the MSCI All Greece Select 25/50 Index (“Underlying Index”). The Fund is passively managed, which means the investment adviser does not attempt to take defensive positions in declining markets. The Fund generally seeks to fully replicate the Underlying Index.
The Underlying Index is designed to represent the performance of the broad Greece equity universe, as defined by MSCI, Inc., the provider of the Underlying Index.
For the 12-month period ended October 31, 2020 (the “reporting period”), the Fund decreased 39.39%, while the Underlying Index decreased 39.11%. The Fund had a net asset value of $9.97 per share on October 31, 2019 and ended the reporting period with a net asset value of $17.68 per share on October 31, 2020, following a 1:3 reverse share split on April 28, 2020.
During the reporting period, the highest returns came from Terna Energy S.A. and Public Power Corporation S.A., which returned 69.68% and 58.10%, respectively. The worst performers were GasLog Ltd and GasLog Partners LP, which returned -80.65% and -80.20%, respectively.
The Greek government acted swiftly in the early stages of the COVID-19 pandemic and imposed a strict lockdown in March that largely contained the spread of the first wave of the virus in Europe. Economic contraction, however, was inevitable. Growth came to a halt when the economy contracted -0.5% and -15.2% year-over-year in the first and second quarters, respectively. Lockdown measures had a negative impact on business activity, and global travel restrictions adversely affected the tourism-dependent economy. Tourism revenue in the peak months of July and August plummeted over -75% in comparison to 2019’s figures. This year’s services exports, which include receipts from tourism, contracted -48.3% in the second quarter. Industrial production also took a substantial hit in the early stages of the pandemic, but began to show signs of recovery in the third quarter of 2020. The Greek government announced a tax relief package and additional stimulus in September to boost jobs and the economy. The European Economic Recovery Plan, agreed on by European Union leaders, is also likely to bolster economic growth in the future.
Management Discussion of Fund Performance (unaudited) |
| Global X MSCI Greece ETF |
| | AVERAGE ANNUAL TOTAL RETURN FOR THE YEAR ENDED OCTOBER 31, 2020 |
| | One Year Return | Three Year Return | Five Year Return | Annualized Inception to Date* |
| | Net Asset Value | Market Price | Net Asset Value | Market Price | Net Asset Value | Market Price | Net Asset Value | Market Price |
| Global X MSCI Greece ETF | -39.39% | -38.11% | -11.94% | -11.59% | -8.78% | -8.69% | -8.82% | -8.70% |
| Hybrid MSCI All Greece Select 25/50 Index/ FTSE/ATHEX Custom Capped Index** | -39.11% | -39.11% | -11.51% | -11.51% | -8.05% | -8.05% | -7.99% | -7.99% |
| MSCI Emerging Markets Index | 8.25% | 8.25% | 1.94% | 1.94% | 7.92% | 7.92% | 4.08% | 4.08% |
Growth of a $10,000 Investment
(At Net Asset Value)
*Fund commenced operations on December 7, 2011.
** Reflects performance of the FTSE/ATHEX Custom Capped Index through February 29, 2016 and MSCI All Greece Select 25/50 Index, thereafter. The inception of the MSCI All Greece Select 25/50 Index (“New Index”) was on December 23, 2015. Effective on or around March 1, 2016, the Fund began to track the New Index. The change was due to the planned migration to the New Index, potentially allowing for broader exposure to the local market.
The MSCI Emerging Markets Index is a free float-adjusted market capitalization index that is designed to measure equity market performance of emerging markets.
The performance data quoted herein represents past performance and the return and value of an investment in the Fund will fluctuate so that, when redeemed, it may be worth less than its original cost. Past performance is no guarantee of future performance and should not be considered as a representation of the future results of the Fund. The Fund’s performance assumes the reinvestment of all dividends and all capital gains. Index returns assume reinvestment of dividends and, unlike the Fund’s returns, do not reflect any fees or expenses. If such fees and expenses were included in the index returns, the performance would have been lower. Please note that one cannot invest directly in an unmanaged index.
Management Discussion of Fund Performance (unaudited) |
| Global X MSCI Greece ETF |
Performance figures for the periods shown may reflect contractual fee waivers and/or expense reimbursements. In the absence of fee waivers and/or expense reimbursements (if applicable), returns would have been lower.
There are no assurances that the Fund will meet its stated objectives.
The Fund’s holdings and allocations are subject to change and should not be considered recommendations to buy individual securities.
The graph and table do not reflect the deduction of taxes that a shareholder would pay on Fund distributions or the redemption or sale of Fund shares.
See definition of comparative indices above.
Management Discussion of Fund Performance (unaudited) |
| Global X MSCI Norway ETF |
Global X MSCI Norway ETF
The Global X MSCI Norway ETF (“Fund”) seeks to provide investment results that correspond generally to the price and yield performance, before fees and expenses, of the MSCI Norway IMI 25/50 Index (“Underlying Index”). The Fund is passively managed, which means the investment adviser does not attempt to take defensive positions in declining markets. The Fund generally seeks to fully replicate the Underlying Index.
The Underlying Index is designed to represent the performance of the broad Norway equity universe, as defined by MSCI, Inc., the provider of the Underlying Index. The Underlying Index may include large-, mid- or small-capitalization companies.
For the 12-month period ended October 31, 2020 (the “reporting period”), the Fund decreased 16.32%, while the Underlying Index decreased 16.13%. The Fund had a net asset value of $11.69 per share on October 31, 2019 and ended the reporting period with a net asset value of $9.59 per share on October 31, 2020.
During the reporting period, the highest returns came from NEL ASA and Europris ASA, which returned 119.02% and 100.50%, respectively. The worst performers were Norwegian Air Shuttle ASA and Borr Drilling Limited, which returned -98.70% and -90.85%, respectively.
Norway’s economy, like many other economies, plunged into recession in the first half of 2020 as a result of the COVID-19 pandemic. The lockdown measures taken to combat the pandemic brought many industries to a standstill. As a result, economic growth plummeted -1.7% and -5.1% quarter over quarter in the first and second quarters of 2020, respectively. Unemployment rose from a pre-pandemic level of 3.7% in February to 6.7% by the end of October. The Norwegian government’s quarterly public spending exceeded its overall income for the first time in 25 years in the second quarter of 2020. This was mainly due to a sharp fall in tax revenue and the low price of crude oil. Private consumption tumbled -4.3% and -10.8% in the first and second quarters, respectively, mainly due to a contraction in household spending on the food, transport and recreation sectors. Despite its severe economic decline, Norway is facing a milder recession than most of Europe, as early and swift government measures helped control the spread of the virus.
Management Discussion of Fund Performance (unaudited) |
| Global X MSCI Norway ETF |
| | AVERAGE ANNUAL TOTAL RETURN FOR THE YEAR ENDED OCTOBER 31, 2020 |
| | One Year Return | Three Year Return | Five Year Return | Annualized Inception to Date* |
| | Net Asset Value | Market Price | Net Asset Value | Market Price | Net Asset Value | Market Price | Net Asset Value | Market Price |
| Global X MSCI Norway ETF | -16.32% | -15.79% | -7.02% | -7.06% | 1.52% | 1.57% | -0.97% | -0.95% |
| Hybrid MSCI Norway IMI 25/50 Index/FTSE Norway 30 Index** | -16.13% | -16.13% | -6.75% | -6.75% | 1.80% | 1.80% | -0.42% | -0.42% |
| MSCI EAFE Index | -6.86% | -6.86% | -1.24% | -1.24% | 2.85% | 2.85% | 3.48% | 3.48% |
Growth of a $10,000 Investment
(At Net Asset Value)
*Fund commenced operations on November 9, 2010.
**Reflects performance of the FTSE Norway 30 Index through July 14, 2014 and the MSCI Norway IMI 25/50 Index thereafter.
The MSCI EAFE Index (Europe, Australasia, Far East) is a free float-adjusted market capitalization index that is designed to measure the equity market performance of developed markets, excluding the US & Canada.
The performance data quoted herein represents past performance and the return and value of an investment in the Fund will fluctuate so that, when redeemed, it may be worth less than its original cost. Past performance is no guarantee of future performance and should not be considered as a representation of the future results of the Fund. The Fund’s performance assumes the reinvestment of all dividends and all capital gains. Index returns assume reinvestment of dividends and, unlike the Fund’s returns, do not reflect any fees or expenses. If such fees and expenses were included in the index returns, the performance would have been lower. Please note that one cannot invest directly in an unmanaged index.
Performance figures for the periods shown may reflect contractual fee waivers and/or expense reimbursements. In the absence of fee waivers and/or expense reimbursements (if applicable), returns would have been lower.
Management Discussion of Fund Performance (unaudited) |
| Global X MSCI Norway ETF |
There are no assurances that the Fund will meet its stated objectives.
The Fund’s holdings and allocations are subject to change and should not be considered recommendations to buy individual securities.
The graph and table do not reflect the deduction of taxes that a shareholder would pay on Fund distributions or the redemption or sale of Fund shares.
See definition of comparative indices above.
Management Discussion of Fund Performance (unaudited) |
| Global X DAX Germany ETF |
Global X DAX Germany ETF
The Global X DAX Germany ETF (“Fund”) seeks to provide investment results that correspond generally to the price and yield performance, before fees and expenses, of the DAX® Index (“Underlying Index”). The Fund is passively managed, which means the investment adviser does not attempt to take defensive positions in declining markets. The Fund generally seeks to fully replicate the Underlying Index.
The Underlying Index tracks the segment of the largest and most actively traded companies - known as blue chips - on the German equities market. The Underlying Index contains the shares of among the 30 largest German companies in terms of liquidity and free-float market capitalization admitted to the Frankfurt Stock Exchange in the Prime Standard segment. Liquidity is defined as book order volume, which is the sum of the daily turnover over the prior 12-month period. The Prime Standard segment is a market segment of the Frankfurt Stock Exchange which includes companies with higher transparency and reporting standards than those of the General Standard, which is the minimum reporting standard currently required by European Union regulation. The 30 stocks contained in the Index generally represent about 80% of the market capitalization listed in Germany.
For the 12-month period ended October 31, 2020 (the “reporting period”), the Fund decreased by 6.53%, while the Underlying Index decreased by 6.22%. The Fund had a net asset value of $27.28 per share on October 31, 2019 and ended the reporting period with a net asset value of $25.21 per share on October 31, 2020.
During the reporting period, the highest returns came from Infineon Technologies AG and Deutsche Post AG, which returned 45.43% and 28.86% respectively. The worst performers were Wirecard AG and Bayer AG, which returned -98.83% and -36.67%, respectively.
The COVID-19 pandemic has led Germany into recession, and the economy is expected to experience the largest slump since World War II. The economy contracted -2.2% and -10.1% quarter on quarter in the first quarter and the second quarter of 2020, respectively, recording the largest declines since quarterly gross domestic product calculations for Germany were first recorded in 1970. As a leading exporter of manufactured goods, Germany was affected severely by disruptions to international trade caused by the COVID-19 health crisis. Exports and imports of goods and services as well as household expenditure and capital formation in machinery and equipment recorded large slumps. The government, however, raised its expenditure during the crisis to support the economy. Gross domestic product recoved and grew 8.2% quarter-over-quarter in the third quarter of 2020.
Management Discussion of Fund Performance (unaudited) |
| Global X DAX Germany ETF |
| | AVERAGE ANNUAL TOTAL RETURN FOR THE YEAR ENDED OCTOBER 31, 2020 |
| | One Year Return | Three Year Return | Five Year Return | Annualized Inception to Date* |
| | Net Asset Value | Market Price | Net Asset Value | Market Price | Net Asset Value | Market Price | Net Asset Value | Market Price |
| Global X DAX Germany ETF* | -6.53% | -5.53% | -4.80% | -4.71% | 1.68% | 2.02% | 2.10% | 2.28% |
DAX® Index | -6.22% | -6.22% | -4.35% | -4.35% | 2.35% | 2.35% | 2.91% | 2.91% |
| MSCI EAFE Index | -6.86% | -6.86% | -1.24% | -1.24% | 2.85% | 2.85% | 2.76% | 2.76% |
Growth of a $10,000 Investment
(At Net Asset Value)
*Fund commenced operations on October 22, 2014. The financial statements include the financial information of the Predecessor Funds through December 21, 2018 (See Note 1 in Notes to Financial Statements).
The MSCI EAFE Index (Europe, Australasia, Far East) is a free float-adjusted market capitalization index that is designed to measure the equity market performance of developed markets, excluding the US & Canada.
The performance data quoted herein represents past performance and the return and value of an investment in the Fund will fluctuate so that, when redeemed, it may be worth less than its original cost. Past performance is no guarantee of future performance and should not be considered as a representation of the future results of the Fund. The Fund’s performance assumes the reinvestment of all dividends and all capital gains. Index returns assume reinvestment of dividends and, unlike the Fund’s returns, do not reflect any fees or expenses. If such fees and expenses were included in the index returns, the performance would have been lower. Please note that one cannot invest directly in an unmanaged index.
Performance figures for the periods shown may reflect contractual fee waivers and/or expense reimbursements. In the absence of fee waivers and/or expense reimbursements (if applicable), returns would have been lower.
Management Discussion of Fund Performance (unaudited) |
| Global X DAX Germany ETF |
There are no assurances that the Fund will meet its stated objectives.
The Fund’s holdings and allocations are subject to change and should not be considered recommendations to buy individual securities.
The graph and table do not reflect the deduction of taxes that a shareholder would pay on Fund distributions or the redemption or sale of Fund shares.
See definition of comparative indices above and on previous page.
Management Discussion of Fund Performance (unaudited) |
| Global X MSCI Portugal ETF |
Global X MSCI Portugal ETF
The Global X MSCI Portugal ETF (“Fund”) seeks to provide investment results that correspond generally to the price and yield performance, before fees and expenses, of the MSCI All Portugal Plus 25/50 Index (“Underlying Index”). The Fund is passively managed, which means the investment adviser does not attempt to take defensive positions in declining markets. The Fund generally seeks to fully replicate the Underlying Index.
The Underlying Index is designed to represent the performance of the broad Portugal equity universe, while including a minimum number of constituents, as defined by MSCI, Inc., the provider of the Underlying Index.
For the 12-month period ended October 31, 2020 (the “reporting period”), the Fund decreased 18.37%, while the Underlying Index decreased 18.33%. The Fund had a net asset value of $10.71 per share on October 31, 2019 and ended the reporting period with a net asset value of $8.50 per share on October 31, 2020.
During the reporting period, the highest returns came from Banco Espirito Santo SA and EDP Renovaveis SA, which returned 300.00% and 67.99%, respectively. The worst performers were Banco Comercial Portugues SA and Ramada Investimentos e Industria, SA, which returned -61.22% and -50.15%, respectively.
Portugal was one of the most affected countries on the European continent to be hit by the COVID-19 pandemic because of its heavy reliance on exports and tourism, both of which tumbled during the pandemic. Domestic demand tumbled by -10.60% and exports plunged -36.10%, while imports slumped by -28.10% in the second quarter of 2020. To tackle the crisis, the government announced a €3 billion package to provide loans to companies and other measures, such as easing layoff legislation and suspending mortgage payments, to help firms and families. As a result, domestic demand, exports and imports all showed signs of a recovery in third quarter of 2020, although gross domestic product shrank 5.80% year-on-year extending the recession for the third straight quarter. These broad economic challenges led to the Fund’s negative performance during the reporting period.
Management Discussion of Fund Performance (unaudited) |
| Global X MSCI Portugal ETF |
| | AVERAGE ANNUAL TOTAL RETURN FOR THE YEAR ENDED OCTOBER 31, 2020 |
| | One Year Return | Three Year Return | Five Year Return | Annualized Inception to Date* |
| | Net Asset Value | Market Price | Net Asset Value | Market Price | Net Asset Value | Market Price | Net Asset Value | Market Price |
| Global X MSCI Portugal ETF | -18.37% | -18.61% | -8.04% | -8.22% | -0.49% | -0.44% | -4.63% | -4.69% |
| Hybrid FTSE Portugal 20 Index/MSCI All Portugal Plus 25/50 Index** | -18.33% | -18.33% | -8.02% | -8.02% | -0.54% | -0.54% | -4.52% | -4.52% |
| MSCI EAFE Index | -6.86% | -6.86% | -1.24% | -1.24% | 2.85% | 2.85% | 2.10% | 2.10% |
Growth of a $10,000 Investment
(At Net Asset Value)
*Fund commenced operations on November 12, 2013.
** Hybrid index performance reflects the performance of the FTSE Portugal 20 Index through December 5, 2016, and the MSCI All Portugal Plus 25/50 Index thereafter.
The MSCI EAFE Index (Europe, Australasia, Far East) is a free float-adjusted market capitalization index that is designed to measure the equity market performance of developed markets, excluding the US & Canada.
The performance data quoted herein represents past performance and the return and value of an investment in the Fund will fluctuate so that, when redeemed, it may be worth less than its original cost. Past performance is no guarantee of future performance and should not be considered as a representation of the future results of the Fund. The Fund’s performance assumes the reinvestment of all dividends and all capital gains. Index returns assume reinvestment of dividends and, unlike the Fund’s returns, do not
Management Discussion of Fund Performance (unaudited) |
| Global X MSCI Portugal ETF |
reflect any fees or expenses. If such fees and expenses were included in the index returns, the performance would have been lower. Please note that one cannot invest directly in an unmanaged index.
Performance figures for the periods shown may reflect contractual fee waivers and/or expense reimbursements. In the absence of fee waivers and/or expense reimbursements (if applicable), returns would have been lower.
There are no assurances that the Fund will meet its stated objectives.
The Fund’s holdings and allocations are subject to change and should not be considered recommendations to buy individual securities.
The graph and table do not reflect the deduction of taxes that a shareholder would pay on Fund distributions or the redemption or sale of Fund shares.
See definition of comparative indices above and on previous page.
Management Discussion of Fund Performance (unaudited) |
| Global X MSCI Colombia ETF |
Global X MSCI Colombia ETF
The Global X MSCI Colombia ETF (“Fund”) seeks to provide investment results that correspond generally to the price and yield performance, before fees and expenses, of the MSCI All Colombia Select 25/50 Index (“Underlying Index”). The Fund is passively managed, which means the investment adviser does not attempt to take defensive positions in declining markets. The Fund generally seeks to fully replicate the Underlying Index.
The Underlying Index is designed to represent the performance of the broad Colombia equity universe, as defined by MSCI, Inc., the provider of the Underlying Index.
For the 12-month period ended October 31, 2020 (the “reporting period”), the Fund decreased 36.91%, while the Underlying Index decreased 37.08%. The Fund had a net asset value of $9.54 per share on October 31, 2019 and ended the reporting period with a net asset value of $23.26 per share on October 31, 2020, following a 1:4 reverse share split on April 28, 2020.
During the reporting period, the highest returns came from GRUPO ENERGIA BOGOTA S.A. E.S.P and Interconexion Electrica SA ESP, which returned 2.65% and -3.22%, respectively. The worst performers were Avianca Holdings SA Pfd and Grupo de Inversiones Suramericana SA Pfd, which returned -96.93% and -51.15%, respectively.
Colombia’s gross domestic product grew 1.1% year-over-year in the first quarter of 2020, but the economy contracted on a quarter-over-quarter basis from the fourth quarter of 2019. The economy showed signs of a slowdown in the first quarter of 2020 when the construction, entertainment and recreation, and mining sectors contracted -9.2%, -3.2% and -3.0% year-over-year, respectively, despite 6.8% and 2.6% year-over-year growth in agricultural and real estate activities, respectively. As the pandemic led to a deterioration in economic activities around the world, Colombia’s second-quarter gross domestic product plummeted -15.7% year-over-year. Government lockdown measures led to the shutdown of businesses and a significant increase in unemployment. While private consumption plummeted -15.9% year-over-year, fixed investment contracted significantly by -32.2% year-over-year. Construction and manufacturing activities further contracted -31.7% and -25.4%, respectively, during the second quarter of 2020. The government responded promptly and announced a fiscal package to stimulate the economy. The government also announced further assistance by providing special lines of credit and loan guarantees for firms severely affected by the pandemic. In addition, the central bank slashed the intervention rate by 2.5% between March and September, its lowest historical level. The central bank also introduced a range of measures to increase liquidity to buffer the economic downturn. Despite these efforts to stimulate economic growth, the challenging backdrop led to negative performance during the reporting period for Colombian equities.
Management Discussion of Fund Performance (unaudited) |
| Global X MSCI Colombia ETF |
| | AVERAGE ANNUAL TOTAL RETURN FOR THE YEAR ENDED OCTOBER 31, 2020 |
| | One Year Return | Three Year Return | Five Year Return | Annualized Inception to Date* |
| | Net Asset Value | Market Price | Net Asset Value | Market Price | Net Asset Value | Market Price | Net Asset Value | Market Price |
| Global X MSCI Colombia ETF | -36.91% | -36.88% | -12.45% | -12.67% | -5.53% | -5.56% | 0.21% | 0.14% |
| Hybrid MSCI All Colombia Select 25/50 Index/MSCI All Colombia Capped Index/FTSE Colombia 20 Index** | -37.08% | -37.08% | -12.19% | -12.19% | -5.15% | -5.15% | 0.98% | 0.98% |
| MSCI Emerging Markets Index | 8.25% | 8.25% | 1.94% | 1.94% | 7.92% | 7.92% | 8.92% | 8.92% |
Growth of a $10,000 Investment
(At Net Asset Value)
*Fund commenced operations on February 5, 2009.
**Reflects performance of the FTSE Colombia 20 Index through July 14, 2014, the MSCI All Colombia Capped Index through August 30, 2016 and the MSCI All Colombia Select 25/50 Index, thereafter. The inception of the MSCI All Colombia Select 25/50 Index (“New Index”) was on July 15, 2016. Effective on or around August 31, 2016, the Fund began to track the New Index. This change was due to the planned migration to the New Index, potentially improving the trading characteristics of the Fund.
The MSCI Emerging Markets Index is a free float-adjusted market capitalization index that is designed to measure equity market performance of emerging markets.
The performance data quoted herein represents past performance and the return and value of an investment in the Fund will fluctuate so that, when redeemed, it may be worth less than its original cost.
Management Discussion of Fund Performance (unaudited) |
| Global X MSCI Colombia ETF |
Past performance is no guarantee of future performance and should not be considered as a representation of the future results of the Fund. The Fund’s performance assumes the reinvestment of all dividends and all capital gains. Index returns assume reinvestment of dividends and, unlike the Fund’s returns, do not reflect any fees or expenses. If such fees and expenses were included in the index returns, the performance would have been lower. Please note that one cannot invest directly in an unmanaged index.
Performance figures for the periods shown may reflect contractual fee waivers and/or expense reimbursements. In the absence of fee waivers and/or expense reimbursements (if applicable), returns would have been lower.
There are no assurances that the Fund will meet its stated objectives.
The Fund’s holdings and allocations are subject to change and should not be considered recommendations to buy individual securities.
The graph and table do not reflect the deduction of taxes that a shareholder would pay on Fund distributions or the redemption or sale of Fund shares.
See definition of comparative indices above.
Management Discussion of Fund Performance (unaudited) |
| Global X MSCI Argentina ETF |
Global X MSCI Argentina ETF
The Global X MSCI Argentina ETF (“Fund”) seeks to provide investment results that correspond generally to the price and yield performance, before fees and expenses, of the MSCI All Argentina 25/50 Index (“Underlying Index”). The Fund is passively managed, which means the investment adviser does not attempt to take defensive positions in declining markets. The Fund generally seeks to fully replicate the Underlying Index.
The Underlying Index is designed to represent the performance of the broad Argentina equity universe, while including a minimum number of constituents, as defined by MSCI, Inc., the provider of the Underlying Index. The broad Argentina equity universe includes securities that are classified in Argentina according to the MSCI Global Investable Market Index Methodology, together with companies that are headquartered or listed in Argentina and carry out the majority of their operations in Argentina.
For the 12-month period ended October 31, 2020 (the “reporting period”), the Fund increased 8.61%, while the Underlying Index increased 9.03%. The Fund had a net asset value of $21.83 per share on October 31, 2019 and ended the reporting period with a net asset value of $23.64 per share on October 31, 2020.
During the reporting period, the highest returns came from MercadoLibre, Inc. and Globant SA, which returned 132.79% and 93.66%, respectively. The worst performers were Phoenix Global Resources plc and YPF SA Sponsored ADR Class D, which returned -67.55% and -65.60%, respectively.
Argentina experienced its most severe economic contraction in 16 years, and the country entered a third year of recession, with the economy shrinking -4.6% and -19.8% year-over-year in the first and second quarters, respectively. As the country’s longstanding economic crisis deepened, the unemployment rate rose to 13.1% and the poverty rate expanded to 40.9% in the second quarter of 2020, a significant increase from 35.5% in the second half of 2019. Domestic demand plummeted -8.2% and -23.1% year-over-year in the first and second quarters, respectively, driven by lockdown measures as a result of the COVID-19 pandemic and low consumer confidence. Private consumption tumbled -6.3% and -22.3% year-over-year in the first and second quarters, respectively, amid elevated economic uncertainty. Fixed investment also fell a sharp -18.3% and -38.4% year-over-year over the first and second quarters, due to business closures and a contraction in investment in construction and machinery equipment. However, the Argentine government managed to restructure USD $65 billion worth of foreign debt in September. This created crucial fiscal breathing space with foreign creditors, despite the bumpy fiscal road ahead. In addition, the existing negative sentiment heading into 2020 meant that the economic challenges this year were less shocking to the market, already somewhat being priced-in. Therefore despite the aforementioned economic challenges, equity prices still increased over the reporting period.
Management Discussion of Fund Performance (unaudited) |
| Global X MSCI Argentina ETF |
| | AVERAGE ANNUAL TOTAL RETURN FOR THE YEAR ENDED OCTOBER 31, 2020 |
| | One Year Return | Three Year Return | Five Year Return | Annualized Inception to Date* |
| | Net Asset Value | Market Price | Net Asset Value | Market Price | Net Asset Value | Market Price | Net Asset Value | Market Price |
| Global X MSCI Argentina ETF | 8.61% | 8.05% | -8.77% | -8.87% | 4.46% | 4.27% | -1.47% | -1.52% |
| Hybrid FTSE Argentina 20 Index/MSCI All Argentina 25/50 Index** | 9.03% | 9.03% | -9.10% | -9.10% | 4.65% | 4.65% | -0.90% | -0.90% |
| MSCI Emerging Markets Index | 8.25% | 8.25% | 1.94% | 1.94% | 7.92% | 7.92% | 2.39% | 2.39% |
Growth of a $10,000 Investment
(At Net Asset Value)
*Fund commenced operations on March 2, 2011.
**Reflects performance of the FTSE Argentina 20 Index through August 14, 2014 and the MSCI All Argentina 25/50 Index (“New Index”) thereafter.
The MSCI Emerging Markets Index is a free float-adjusted market capitalization index that is designed to measure equity market performance of emerging markets.
The performance data quoted herein represents past performance and the return and value of an investment in the Fund will fluctuate so that, when redeemed, it may be worth less than its original cost. Past performance is no guarantee of future performance and should not be considered as a representation of the future results of the Fund. The Fund’s performance assumes the reinvestment of all dividends and all capital gains. Index returns assume reinvestment of dividends and, unlike the Fund’s returns, do not reflect any fees or expenses. If such fees and expenses were included in the index returns, the performance would have been lower. Please note that one cannot invest directly in an unmanaged index.
Performance figures for the periods shown may reflect contractual fee waivers and/or expense reimbursements. In the absence of fee waivers and/or expense reimbursements (if applicable), returns would have been lower.
Management Discussion of Fund Performance (unaudited) |
| Global X MSCI Argentina ETF |
There are no assurances that the Fund will meet its stated objectives.
The Fund’s holdings and allocations are subject to change and should not be considered recommendations to buy individual securities.
The graph and table do not reflect the deduction of taxes that a shareholder would pay on Fund distributions or the redemption or sale of Fund shares.
See definition of comparative indices above.
Management Discussion of Fund Performance (unaudited) |
| Global X MSCI Pakistan ETF |
Global X MSCI Pakistan ETF
The Global X MSCI Pakistan ETF (“Fund”) seeks to provide investment results that correspond generally to the price and yield performance, before fees and expenses, of the MSCI All Pakistan Select 25/50 Index (“Underlying Index”). The Fund is passively managed, which means the investment adviser does not attempt to take defensive positions in declining markets. The Fund generally seeks to fully replicate the Underlying Index.
The Underlying Index is designed to represent the performance of the broad Pakistan equity universe, while including a minimum number of constituents, as defined by MSCI, Inc., the provider of the Underlying Index. The broad Pakistan equity universe includes securities that are classified in Pakistan according to the MSCI Global Investable Market Index Methodology, together with companies that are headquartered or listed in Pakistan and carry out the majority of their operations in Pakistan.
For the 12-month period ended October 31, 2020 (the “reporting period”), the Fund increased 6.99%, while the Underlying Index increased 8.64%. The Fund had a net asset value of $6.58 per share on October 31, 2019 and ended the reporting period with a net asset value of $27.40 per share on October 31, 2020, following a 1:4 reverse share split on April 28, 2020.
During the reporting period, the highest returns came from Maple Leaf Cement Factory Ltd and Honda Atlas Cars (Pakistan) Ltd, which returned 153.04% and 130.10% respectively. The worst performers were Pakistan Petroleum Limited and Oil & Gas Development Co. Ltd, which returned -29.25% and -25.05%, respectively.
Pakistan entered 2020 coming off a relatively slow growth rate of 1.9% in 2019, due to monetary and fiscal tightening implemented to control the country’s high current account and fiscal deficits. In the second quarter of 2020, a series of actions were taken to curtail the spread of the COVID-19 pandemic, including partial lockdowns, restrictions on air travel, and the closure of non-essential businesses. Although these restrictions were gradually removed, disruptions to domestic demand and supply were inevitable, as households reduced consumption and businesses were unable to operate. Surging food inflation, rising energy prices, and a weaker rupee caused consumer price inflation (CPI) to rise from an average of 6.8% in fiscal year 2019 to an average of 10.7% in fiscal year 2020. The central bank’s policy rate was subsequently lowered to 7% in June from 13.25% in March to help stimulate growth. The central bank also implemented multiple measures to provide liquidity support to firms. While total exports contracted -7.5% amid weak global demand, imports were down -19.3%. This helped narrow the current account deficit from 4.8% of gross domestic product in fiscal year 2019 to 1.1% of gross domestic product in fiscal year 2020. Despite the global economic slowdown, remittances continued to increase and recorded over $2 billion for the fourth consecutive month as of September 2020.
Management Discussion of Fund Performance (unaudited) |
| Global X MSCI Pakistan ETF |
| | AVERAGE ANNUAL TOTAL RETURN FOR THE YEAR ENDED OCTOBER 31, 2020 |
| | One Year Return | Three Year Return | Five Year Return | Annualized Inception to Date* |
| | Net Asset Value | Market Price | Net Asset Value | Market Price | Net Asset Value | Market Price | Net Asset Value | Market Price |
| Global X MSCI Pakistan ETF* | 6.99% | 6.07% | -15.14% | -15.56% | -9.07% | -9.61% | -9.48% | -9.83% |
| MSCI All Pakistan Select 25/50 Index | 8.64% | 8.64% | -14.05% | -14.05% | -7.48% | -7.48% | -7.78% | -7.78% |
| MSCI Emerging Markets Index | 8.25% | 8.25% | 1.94% | 1.94% | 7.92% | 7.92% | 3.42% | 3.42% |
Growth of a $10,000 Investment
(At Net Asset Value)
*Fund commenced operations on April 22, 2015.
The MSCI Emerging Markets Index is a free float-adjusted market capitalization index that is designed to measure equity market performance of emerging markets.
The performance data quoted herein represents past performance and the return and value of an investment in the Fund will fluctuate so that, when redeemed, it may be worth less than its original cost. Past performance is no guarantee of future performance and should not be considered as a representation of the future results of the Fund. The Fund’s performance assumes the reinvestment of all dividends and all capital gains. Index returns assume reinvestment of dividends and, unlike the Fund’s returns, do not reflect any fees or expenses. If such fees and expenses were included in the index returns, the performance would have been lower. Please note that one cannot invest directly in an unmanaged index.
Performance figures for the periods shown may reflect contractual fee waivers and/or expense reimbursements. In the absence of fee waivers and/or expense reimbursements (if applicable), returns would have been lower.
Management Discussion of Fund Performance (unaudited) |
| Global X MSCI Pakistan ETF |
There are no assurances that the Fund will meet its stated objectives.
The Fund’s holdings and allocations are subject to change and should not be considered recommendations to buy individual securities.
The graph and table do not reflect the deduction of taxes that a shareholder would pay on Fund distributions or the redemption or sale of Fund shares.
See definition of comparative indices above.
Management Discussion of Fund Performance (unaudited) |
| Global X MSCI Nigeria ETF |
Global X MSCI Nigeria ETF
The Global X MSCI Nigeria ETF (“Fund”) seeks to provide investment results that correspond generally to the price and yield performance, before fees and expenses, of the MSCI All Nigeria Select 25/50 Index (“Underlying Index”). The Fund is passively managed, which means the investment adviser does not attempt to take defensive positions in declining markets. The Fund generally seeks to fully replicate the Underlying Index.
The Underlying Index is designed to represent the performance of the broad Nigeria equity universe, while including a minimum number of constituents, as defined by MSCI, Inc., the provider of the Underlying Index.
For the 12-month period ended October 31, 2020 (the “reporting period”), the Fund increased 17.25%, while the Underlying Index increased 19.96%. The Fund had a net asset value of $12.23 per share on October 31, 2019 and ended the reporting period with a net asset value of $14.25 per share on October 31, 2020.
During the reporting period, the highest returns came from Flour Mills Nigeria Plc and FCMB Group Plc, which returned 100.10% and 98.54%, respectively. The worst performers were Unilever Nigeria PLC and Oando PLC, which returned -51.18% and -32.83%, respectively.
Nigeria managed to largely avoid the global economic slowdown that was felt by many countries around the world in the first quarter of 2020. The economy grew by 1.9% year-over-year in the first quarter of 2020, supported by growth in both oil and non-oil segments. The domestic oil industry recorded a real growth rate of 5.1% year-over-year, while the non-oil portions of the economy reported a real growth rate of 1.6% in the first quarter of 2020. The Information Technology, Financials and agricultural industries were major contributors to growth. Nigeria felt the impact of the pandemic in the second quarter of 2020 when its economy contracted 6.1% year-over-year. In the second quarter, both the oil and non-oil segments experienced sizeable contractions of -6.6% and -6.1% year-over-year, respectively. Extremely low oil prices globally and a fall in average daily oil production - due to low domestic and international demand - were especially challenging, as the country depends mainly on oil sales for government revenue and foreign exchange.
Management Discussion of Fund Performance (unaudited) |
| Global X MSCI Nigeria ETF |
| | AVERAGE ANNUAL TOTAL RETURN FOR THE YEAR ENDED OCTOBER 31, 2020 |
| | One Year Return | Three Year Return | Five Year Return | Annualized Inception to Date* |
| | Net Asset Value | Market Price | Net Asset Value | Market Price | Net Asset Value | Market Price | Net Asset Value | Market Price |
| Global X MSCI Nigeria ETF | 17.25% | -9.50% | -8.87% | -15.16% | -11.36% | -15.42% | -14.84% | -17.24% |
| Hybrid MSCI All Nigeria Select 25/50Index/Solactive Nigeria Index** | 19.96% | 19.96% | -6.15% | -6.15% | -8.93% | -8.93% | -12.79% | -12.79% |
| MSCI Emerging Markets Index | 8.25% | 8.25% | 1.94% | 1.94% | 7.92% | 7.92% | 3.42% | 3.42% |
Growth of a $10,000 Investment
(At Net Asset Value)
*Fund commenced operations on April 2, 2013.
**Reflects performance of the Solactive Nigeria Index through August 14, 2014 and the MSCI All Nigeria Select 25/50 Index thereafter.
The MSCI Emerging Markets Index is a free float-adjusted market capitalization index that is designed to measure equity market performance of emerging markets.
The performance data quoted herein represents past performance and the return and value of an investment in the Fund will fluctuate so that, when redeemed, it may be worth less than its original cost. Past performance is no guarantee of future performance and should not be considered as a representation of the future results of the Fund. The Fund’s performance assumes the reinvestment of all dividends and all capital gains. Index returns assume reinvestment of dividends and, unlike the Fund’s returns, do not reflect any fees or expenses. If such fees and expenses were included in the index returns, the performance would have been lower. Please note that one cannot invest directly in an unmanaged index.
Performance figures for the periods shown may reflect contractual fee waivers and/or expense reimbursements. In the absence of fee waivers and/or expense reimbursements (if applicable), returns would have been lower.
Management Discussion of Fund Performance (unaudited) |
| Global X MSCI Nigeria ETF |
There are no assurances that the Fund will meet its stated objectives.
The Fund’s holdings and allocations are subject to change and should not be considered recommendations to buy individual securities.
The graph and table do not reflect the deduction of taxes that a shareholder would pay on Fund distributions or the redemption or sale of Fund shares.
See definition of comparative indices above.
Management Discussion of Fund Performance (unaudited) |
| Global X MSCI Next Emerging & Frontier ETF |
Global X MSCI Next Emerging & Frontier ETF
The Global X MSCI Next Emerging & Frontier ETF (“Fund”) seeks to provide investment results that correspond generally to the price and yield performance, before fees and expenses, of the MSCI Select Emerging and Frontier Markets Access Index (“Underlying Index”). The Fund is passively managed, which means the investment adviser does not attempt to take defensive positions in declining markets. The Fund generally seeks to fully replicate the Underlying Index.
The Underlying Index is designed to reflect equity performance of next emerging markets and frontier markets companies, as defined by MSCI, Inc., the provider of the Underlying Index. Next Emerging markets are defined as emerging market countries, excluding the BRICs (Brazil, Russia, India and China) and excluding the most developed tier of emerging markets (South Korea and Taiwan). Frontier markets are those emerging market countries that generally have smaller economies or less developed capital markets.
For the 12-month period ended October 31, 2020 (the “reporting period”), the Fund decreased 15.85%, while the Underlying Index decreased 15.16%. The Fund had a net asset value of $20.09 per share on October 31, 2019 and ended the reporting period with a net asset value of $16.46 per share on October 31, 2020.
During the reporting period, the highest returns came from Hoa Phat Group JSC and Dino Polska S.A., which returned 71.54% and 52.50%, respectively. The worst performers were Redefine Properties and Alpha Bank AE, which returned -76.95% and -71.04%, respectively.
The COVID-19 pandemic during the reporting period brought the global economy to a standstill, as lockdown measures adopted to slow the spread of the coronavirus brought several businesses to a grinding halt. Like their developed market peers, many emerging and frontier markets suffered. External forces, like disrupted supply chains, collapsing international trade, and weakened global demand, played major roles. But internal challenges impacted developing economies as well, including feeble domestic demand, shuttered industrial output, and overrun public health care systems. As a result, many firms in these markets came under pressure. The volume of merchandise trade shrank 14.3% quarter-over-quarter in the second quarter of 2020. The types of goods exported have been an important determinant of growth during the pandemic. Countries with a large share of technology-related exports have seen a quicker rebound in exports, while those relying heavily on energy or metals exports have endured lower prices and demand. Economic activities in the developed world also significantly influence low- and middle-income countries. Obtaining additional financing can be difficult for these countries, especially if investors are convinced debt levels are no longer sustainable. As a result, fiscal stimulus as a percentage of gross domestic product in these economies has been significantly smaller compared to advanced economies. However, the International
Management Discussion of Fund Performance (unaudited) |
| Global X MSCI Next Emerging & Frontier ETF |
Monetary Fund, the World Bank, and other multilateral institutions have stepped in to provide emergency financing, and has strengthened access to financing for emerging markets.
| | AVERAGE ANNUAL TOTAL RETURN FOR THE YEAR ENDED OCTOBER 31, 2020 |
| | One Year Return | Three Year Return | Five Year Return | Annualized Inception to Date* |
| | Net Asset Value | Market Price | Net Asset Value | Market Price | Net Asset Value | Market Price | Net Asset Value | Market Price |
| Global X MSCI Next Emerging & Frontier ETF | -15.85% | -16.02% | -8.13% | -8.07% | -0.27% | 0.00% | -3.63% | -3.63% |
| Hybrid Solactive Next Emerging & Frontier Index/ MSCI Select Emerging and Frontier Markets Access Index** | -15.16% | -15.16% | -7.44% | -7.44% | 0.46% | 0.46% | -2.94% | -2.94% |
| MSCI Emerging Markets Index | 8.25% | 8.25% | 1.94% | 1.94% | 7.92% | 7.92% | 3.61% | 3.61% |
Growth of a $10,000 Investment
(At Net Asset Value)
*Fund commenced operations on November 6, 2013.
** Reflects performance of the Solactive Next Emerging & Frontier Index through January 15, 2019 and the MSCI Select Emerging and Frontier Markets Access Index thereafter.
The MSCI Emerging Markets Index is a free float-adjusted market capitalization index that is designed to measure equity market performance of emerging markets.
Management Discussion of Fund Performance (unaudited) |
| Global X MSCI Next Emerging & Frontier ETF |
The performance data quoted herein represents past performance and the return and value of an investment in the Fund will fluctuate so that, when redeemed, it may be worth less than its original cost. Past performance is no guarantee of future performance and should not be considered as a representation of the future results of the Fund. The Fund’s performance assumes the reinvestment of all dividends and all capital gains. Index returns assume reinvestment of dividends and, unlike the Fund’s returns, do not reflect any fees or expenses. If such fees and expenses were included in the index returns, the performance would have been lower. Please note that one cannot invest directly in an unmanaged index.
Performance figures for the periods shown may reflect contractual fee waivers and/or expense reimbursements. In the absence of fee waivers and/or expense reimbursements (if applicable), returns would have been lower.
There are no assurances that the Fund will meet its stated objectives.
The Fund’s holdings and allocations are subject to change and should not be considered recommendations to buy individual securities.
The graph and table do not reflect the deduction of taxes that a shareholder would pay on Fund distributions or the redemption or sale of Fund shares.
See definition of comparative indices above.
Management Discussion of Fund Performance (unaudited) |
| Global X FTSE Nordic Region ETF |
Global X FTSE Nordic Region ETF
The Global X FTSE Nordic Region ETF (“Fund”) seeks to provide investment results that correspond generally to the price and yield performance, before fees and expenses, of the FTSE Nordic 30 Index (“Underlying Index”). The Fund is passively managed, which means the investment adviser does not attempt to take defensive positions in declining markets. The Fund generally seeks to fully replicate the Underlying Index.
The Underlying Index is designed to reflect the equity market performance of companies in Sweden, Denmark, Norway and Finland, as defined by FTSE International Limited (“FTSE”), the provider of the Underlying Index (“Index Provider”). The starting universe of the Underlying Index is the FTSE All-World Index - Nordic Region. The Underlying Index tracks the equity performance of among the 30 largest and most liquid companies in Sweden, Denmark, Norway and Finland. The Fund’s investment objective and Underlying Index may be changed without shareholder approval.
For the 12-month period ended October 31, 2020 (the “reporting period”), the Fund increased 13.70%, while the Underlying Index increased 13.74%. The Fund had a net asset value of $20.69 per share on October 31, 2019 and ended the reporting period with a net asset value of $23.37 per share on October 31, 2020.
During the reporting period, the highest returns came from Vestas Wind Systems A/S and Orsted, which returned 111.88% and 83.51%, respectively. The worst performers were Equinor ASA and DNB ASA, which returned -27.77% and -26.02%, respectively.
The outbreak of the COVID-19 pandemic had a negative effect on Nordic countries broadly as their economies contended with continued fallout from the health crisis. Yet at the same time, increases in government spending and their largely services-based economies that could continue remotely during lockdown orders helped protect the economies versus others in Europe. Norway’s economy showed signs of a recovery following a 1.5% cut in interest rates. Denmark suffered a -7.4% decline in gross domestic product during the second quarter compared to the first quarter of 2020. The Finnish economy showed unexpected resilience and recorded only a -4.5% quarter-over- quarter contraction in the second quarter, which was one of the smallest declines in the euro area. Sweden’s gross domestic product contracted by -8.3% quarter-over-quarter in the second quarter, which was the worst contraction in the Nordic region during the reporting period. Sweden had among the laxest policies implemented to contain the virus. Although Swedish domestic economy showed some resilience, Swedish exports were negatively affected. In addition, Swedish households’ real disposable income decreased by 7.7% quarter-over-quarter during the second quarter of 2020. Despite weakness in Sweden, the relative strength of Nordic economies amid the pandemic led to positive equity returns over the reporting period.
Management Discussion of Fund Performance (unaudited) |
| Global X FTSE Nordic Region ETF |
| | AVERAGE ANNUAL TOTAL RETURN FOR THE YEAR ENDED OCTOBER 31, 2020 |
| | One Year Return | Three Year Return | Five Year Return | Annualized Inception to Date* |
| | Net Asset Value | Market Price | Net Asset Value | Market Price | Net Asset Value | Market Price | Net Asset Value | Market Price |
| Global X FTSE Nordic Region ETF | 13.70% | 13.76% | 2.69% | 2.69% | 4.39% | 4.48% | 7.20% | 7.21% |
| FTSE Nordic 30 Index | 13.74% | 13.74% | 3.62% | 3.62% | 4.88% | 4.88% | 7.39% | 7.39% |
| MSCI EAFE Index | -6.86% | -6.86% | -1.24% | -1.24% | 2.85% | 2.85% | 4.93% | 4.93% |
Growth of a $10,000 Investment
(At Net Asset Value)
*Fund commenced operations on August 17, 2009.
The MSCI EAFE Index (Europe, Australasia, Far East) is a free float-adjusted market capitalization index that is designed to measure the equity market performance of developed markets, excluding the US & Canada.
The performance data quoted herein represents past performance and the return and value of an investment in the Fund will fluctuate so that, when redeemed, it may be worth less than its original cost. Past performance is no guarantee of future performance and should not be considered as a representation of the future results of the Fund. The Fund’s performance assumes the reinvestment of all dividends and all capital gains. Index returns assume reinvestment of dividends and, unlike the Fund’s returns, do not reflect any fees or expenses. If such fees and expenses were included in the index returns, the performance would have been lower. Please note that one cannot invest directly in an unmanaged index.
Performance figures for the periods shown may reflect contractual fee waivers and/or expense reimbursements. In the absence of fee waivers and/or expense reimbursements (if applicable), returns would have been lower.
Management Discussion of Fund Performance (unaudited) |
| Global X FTSE Nordic Region ETF |
There are no assurances that the Fund will meet its stated objectives.
The Fund’s holdings and allocations are subject to change and should not be considered recommendations to buy individual securities.
The graph and table do not reflect the deduction of taxes that a shareholder would pay on Fund distributions or the redemption or sale of Fund shares.
See definition of comparative indices on the previous page.
Management Discussion of Fund Performance (unaudited) |
| Global X FTSE Southeast Asia ETF |
Global X FTSE Southeast Asia ETF
The Global X FTSE Southeast Asia ETF (“Fund”) seeks to provide investment results that correspond generally to the price and yield performance, before fees and expenses, of the FTSE ASEAN 40 Index (“Underlying Index”). The Fund is passively managed, which means the investment adviser does not attempt to take defensive positions in declining markets. The Fund generally seeks to fully replicate the Underlying Index.
The Underlying Index tracks the equity performance of the 40 largest and most liquid companies in five of the Association of Southeast Asian Nations (“ASEAN”) nations: Singapore, Malaysia, Indonesia, Thailand and the Philippines, as defined by MSCI, Inc., the provider of the Underlying Index.
For the 12-month period ended October 31, 2020 (the “reporting period”), the Fund decreased 24.82%, while the Underlying Index decreased 24.37%. The Fund had a net asset value of $15.95 per share on October 31, 2019 and ended the reporting period with a net asset value of $11.66 per share on October 31, 2020.
During the reporting period, the highest returns came from Wilmar International Limited and Sime Darby Plantation Bhd, which returned 11.00% and -0.66%, respectively. The worst performers were PTT Global Chemical Plc NVDR and Kasikornbank Public Co. Ltd. NVDR, which returned -48.28% and -44.40%, respectively.
Southeast Asian economies experienced a steep economic contraction during the reporting period as the COVID-19 pandemic weighed on the region’s services sector and hampered export demand. Indonesia’s economy was hit by external and domestic demand shocks. Thailand’s economy suffered amid a drought in tourism, exports, and domestic activity. Thailand also experienced a contraction in household spending and fixed investment during the first half of 2020. The Philippines also entered into a recession as a result of the pandemic. The Philippine economy contracted in the third quarter as sharp declines in industry, services, household consumption, exports and gross capital formation presented headwinds. Similarly, Singapore’s economy suffered significantly during the first half of 2020 due to a collapse of economic activities. The construction and services sectors suffered the biggest decline in 2020. However, Singapore’s economy expanded 7.9% in the third quarter on a quarter-on-quarter basis, mainly due to a phased re-opening of the economy. The difficult economic situation for a previously fast-growing region hurt equity prices significantly during the reporting period.
Management Discussion of Fund Performance (unaudited) |
| Global X FTSE Southeast Asia ETF |
| | AVERAGE ANNUAL TOTAL RETURN FOR THE YEAR ENDED OCTOBER 31, 2020 |
| | One Year Return | Three Year Return | Five Year Return | Annualized Inception to Date* |
| | Net Asset Value | Market Price | Net Asset Value | Market Price | Net Asset Value | Market Price | Net Asset Value | Market Price |
| Global X FTSE Southeast Asia ETF | -24.82% | -24.46% | -7.11% | -7.05% | 0.76% | 0.94% | 0.07% | 0.08% |
| FTSE/ASEAN 40 Index | -24.37% | -24.37% | -6.49% | -6.49% | 1.47% | 1.47% | 0.70% | 0.70% |
| MSCI Emerging Markets Index | 8.25% | 8.25% | 1.91% | 1.94% | 7.92% | 7.92% | 2.43% | 2.43% |
Growth of a $10,000 Investment
(At Net Asset Value)
*Fund commenced operations on February 16, 2011.
The MSCI Emerging Markets Index is a free float-adjusted market capitalization index that is designed to measure equity market performance of emerging markets.
The performance data quoted herein represents past performance and the return and value of an investment in the Fund will fluctuate so that, when redeemed, it may be worth less than its original cost. Past performance is no guarantee of future performance and should not be considered as a representation of the future results of the Fund. The Fund’s performance assumes the reinvestment of all dividends and all capital gains. Index returns assume reinvestment of dividends and, unlike the Fund’s returns, do not reflect any fees or expenses. If such fees and expenses were included in the index returns, the performance would have been lower. Please note that one cannot invest directly in an unmanaged index.
Performance figures for the periods shown may reflect contractual fee waivers and/or expense reimbursements. In the absence of fee waivers and/or expense reimbursements (if applicable), returns would have been lower.
There are no assurances that the Fund will meet its stated objectives.
The Fund’s holdings and allocations are subject to change and should not be considered recommendations to buy individual securities.
Management Discussion of Fund Performance (unaudited) |
| Global X FTSE Southeast Asia ETF |
The graph and table do not reflect the deduction of taxes that a shareholder would pay on Fund distributions or the redemption or sale of Fund shares.
See definition of comparative indices above.
| Schedule of Investments | | October 31, 2020 |
| | Global X MSCI China Energy ETF | |
Sector Weightings (Unaudited)†:
† Sector weightings percentages are based on the total market value of investments.
| | | Shares | | | Value | |
| COMMON STOCK — 100.0% | | | | | | |
| CHINA— 100.0% | | | | | | |
| Energy — 100.0% | | | | | | |
| China Merchants Energy Shipping, Cl A | | | 72,900 | | | $ | 63,034 | |
China Oilfield Services, Cl H | | | 95,386 | | | | 57,319 | |
China Petroleum & Chemical, Cl A * | | | 5,950 | | | | 3,465 | |
| China Petroleum & Chemical, Cl H | | | 335,897 | | | | 130,377 | |
China Shenhua Energy, Cl A | | | 1,500 | | | | 3,730 | |
China Shenhua Energy, Cl H | | | 92,830 | | | | 160,406 | |
| China Suntien Green Energy, Cl H | | | 247,200 | | | | 57,378 | |
CNOOC | | | 134,785 | | | | 122,360 | |
| COSCO SHIPPING Energy Transportation, Cl A | | | 31,600 | | | | 31,051 | |
| COSCO SHIPPING Energy Transportation, Cl H | | | 90,400 | | | | 35,555 | |
Guanghui Energy, Cl A * | | | 147,250 | | | | 63,331 | |
| Inner Mongolia Yitai Coal, Cl B | | | 108,594 | | | | 67,980 | |
| Offshore Oil Engineering, Cl A | | | 84,975 | | | | 53,678 | |
PetroChina, Cl A | | | 5,100 | | | | 3,100 | |
PetroChina, Cl H | | | 435,863 | | | | 121,965 | |
Shaanxi Coal Industry, Cl A | | | 65,136 | | | | 85,113 | |
| Shanxi Lu’an Environmental Energy Development, Cl A | | | 65,765 | | | | 57,748 | |
Shanxi Meijin Energy, Cl A * | | | 65,100 | | | | 57,942 | |
| Shanxi Xishan Coal & Electricity Power, Cl A | | | 97,753 | | | | 67,590 | |
Sinopec Kantons Holdings | | | 154,900 | | | | 55,929 | |
Wison Engineering Services | | | 585,700 | | | | 58,911 | |
| Yantai Jereh Oilfield Services Group, Cl A | | | 14,000 | | | | 55,885 | |
Yanzhou Coal Mining, Cl A | | | 46,664 | | | | 62,788 | |
Yanzhou Coal Mining, Cl H | | | 111,025 | | | | 80,604 | |
| Schedule of Investments | | October 31, 2020 |
| | Global X MSCI China Energy ETF | |
| | | | | | | Value | |
| COMMON STOCK — continued | | | | | | | | |
| TOTAL COMMON STOCK | | | | | | | | |
(Cost $2,099,372) | | | | | | $ | 1,557,239 | |
| TOTAL INVESTMENTS — 100.0% | | | | | | | | |
(Cost $2,099,372) | | | | | | $ | 1,557,239 | |
Percentages are based on Net Assets of $1,557,608.
| * | Non-income producing security. |
Cl — Class
As of October 31, 2020, all of the Fund’s investments were considered Level 1, in accordance with authoritative guidance on fair value measurements and disclosure under U.S. GAAP.
For the year ended October 31, 2020, there were no transfers in or out of Level 3.
| Schedule of Investments | | October 31, 2020 |
| | Global X MSCI China Materials ETF | |
Sector Weightings (Unaudited)†:
† Sector weightings percentages are based on the total market value of investments.
| | | Shares | | | Value | |
| COMMON STOCK — 100.0% | | | | | | |
| CHINA— 95.6% | | | | | | |
| Materials — 95.6% | | | | | | |
Aluminum Corp of China, Cl A * | | | 34,100 | | | $ | 14,615 | |
Aluminum Corp of China, Cl H * | | | 159,239 | | | | 34,703 | |
Angang Steel, Cl A | | | 19,610 | | | | 7,731 | |
Anhui Conch Cement, Cl A | | | 500 | | | | 3,796 | |
Anhui Conch Cement, Cl H | | | 22,920 | | | | 142,902 | |
Baoshan Iron & Steel, Cl A | | | 41,700 | | | | 33,254 | |
BBMG, Cl A | | | 23,600 | | | | 10,608 | |
| Beijing Oriental Yuhong Waterproof Technology, Cl A | | | 5,550 | | | | 30,724 | |
China Hongqiao Group | | | 67,300 | | | | 48,599 | |
China Jushi, Cl A | | | 9,400 | | | | 19,583 | |
China Lumena New Materials *(A)(B)(C) | | | 48 | | | | — | |
China Molybdenum, Cl A | | | 41,600 | | | | 24,539 | |
China Molybdenum, Cl H | | | 128,754 | | | | 46,655 | |
| China National Building Material, Cl H | | | 125,400 | | | | 143,756 | |
| China Northern Rare Earth Group High-Tech, Cl A | | | 9,600 | | | | 14,437 | |
| China Resources Cement Holdings | | | 87,500 | | | | 114,187 | |
Ganfeng Lithium, Cl A | | | 2,900 | | | | 26,340 | |
GEM, Cl A | | | 15,400 | | | | 11,039 | |
| Guangdong HEC Technology Holding, Cl A | | | 9,600 | | | | 8,158 | |
| Guangdong Hongda Blasting, Cl A | | | 2,052 | | | | 14,605 | |
Guocheng Mining, Cl A * | | | 1,300 | | | | 2,048 | |
Hengli Petrochemical, Cl A | | | 13,320 | | | | 38,391 | |
Hengyi Petrochemical, Cl A | | | 9,800 | | | | 16,860 | |
Hesteel, Cl A | | | 32,400 | | | | 9,967 | |
Huaxin Cement, Cl A | | | 3,500 | | | | 12,638 | |
Hunan Valin Steel, Cl A | | | 18,100 | | | | 13,731 | |
| Schedule of Investments | | October 31, 2020 |
| | Global X MSCI China Materials ETF | |
| | | Shares | | | Value | |
| COMMON STOCK — continued | | | | | | | | |
| Materials — continued | | | | | | | | |
| Inner Mongolia BaoTou Steel Union, Cl A | | | 111,600 | | | $ | 18,999 | |
| Inner Mongolia Junzheng Energy & Chemical Industry Group, Cl A | | | 21,600 | | | | 22,677 | |
Jiangsu Shagang, Cl A | | | 6,000 | | | | 11,604 | |
| Jiangsu Yangnong Chemical, Cl A | | | 900 | | | | 12,513 | |
Jiangxi Copper, Cl A | | | 5,900 | | | | 13,040 | |
Jiangxi Copper, Cl H | | | 44,991 | | | | 53,491 | |
| Jinduicheng Molybdenum, Cl A | | | 9,200 | | | | 7,790 | |
| Lee & Man Paper Manufacturing | | | 51,900 | | | | 39,152 | |
Lomon Billions Group, Cl A | | | 4,700 | | | | 17,365 | |
Maanshan Iron & Steel, Cl A | | | 21,100 | | | | 8,130 | |
Pangang Group Vanadium Titanium & Resources, Cl A * | | | 28,600 | | | | 8,499 | |
Real Gold Mining *(A)(B)(C) | | | 97,864 | | | | — | |
| Rongsheng Petro Chemical, Cl A | | | 13,200 | | | | 37,572 | |
| Sansteel Minguang Fujian, Cl A | | | 8,100 | | | | 7,959 | |
Shandong Gold Mining, Cl A | | | 8,120 | | | | 28,836 | |
| Shandong Hualu Hengsheng Chemical, Cl A | | | 4,500 | | | | 18,998 | |
| Shandong Nanshan Aluminum, Cl A | | | 34,900 | | | | 12,248 | |
| Shandong Sinocera Functional Material, Cl A | | | 2,843 | | | | 17,407 | |
| Shandong Sun Paper Industry JSC, Cl A | | | 7,900 | | | | 16,410 | |
| Shanghai Putailai New Energy Technology, Cl A | | | 1,147 | | | | 19,090 | |
| Shanxi Taigang Stainless Steel, Cl A | | | 18,100 | | | | 9,461 | |
| Sinopec Shanghai Petrochemical, Cl A | | | 18,000 | | | | 8,897 | |
| Sinopec Shanghai Petrochemical, Cl H | | | 141,550 | | | | 26,102 | |
Tangshan Jidong Cement, Cl A | | | 3,800 | | | | 8,507 | |
Tianqi Lithium, Cl A | | | 4,250 | | | | 12,567 | |
Tongkun Group, Cl A | | | 5,700 | | | | 12,879 | |
| Tongling Nonferrous Metals Group, Cl A | | | 32,900 | | | | 10,662 | |
Transfar Zhilian, Cl A | | | 10,500 | | | | 8,499 | |
| Wanhua Chemical Group, Cl A | | | 6,700 | | | | 78,534 | |
| Weihai Guangwei Composites, Cl A | | | 1,400 | | | | 13,813 | |
Xiamen Tungsten, Cl A | | | 4,700 | | | | 9,419 | |
| Schedule of Investments | | October 31, 2020 |
| | Global X MSCI China Materials ETF | |
| | | Shares | | | Value | |
| COMMON STOCK — continued | | | | | | | | |
| Materials — continued | | | | | | | | |
Yintai Gold, Cl A | | | 7,420 | | | $ | 11,059 | |
| Yunnan Energy New Material, Cl A | | | 2,200 | | | | 32,788 | |
Zhaojin Mining Industry | | | 39,984 | | | | 51,302 | |
Zhejiang Huayou Cobalt, Cl A * | | | 2,830 | | | | 16,812 | |
Zhejiang Juhua, Cl A | | | 8,700 | | | | 8,666 | |
| Zhejiang Longsheng Group, Cl A | | | 8,400 | | | | 16,671 | |
Zhongjin Gold, Cl A | | | 13,500 | | | | 18,749 | |
Zijin Mining Group, Cl A | | | 31,700 | | | | 33,091 | |
Zijin Mining Group, Cl H | | | 184,459 | | | | 133,441 | |
TOTAL CHINA | | | | | | | 1,737,565 | |
| HONG KONG— 4.4% | | | | | | | | |
| Materials — 4.4% | | | | | | | | |
Nine Dragons Paper Holdings | | | 60,270 | | | | 80,051 | |
| TOTAL COMMON STOCK | | | | | | | | |
(Cost $1,733,306) | | | | | | | 1,817,616 | |
| TOTAL INVESTMENTS — 100.0% | | | | | | | | |
(Cost $1,733,306) | | | | | | $ | 1,817,616 | |
Percentages are based on Net Assets of $1,817,929.
| * | Non-income producing security. |
| (A) | Level 3 security in accordance with fair value hierarchy. |
| (B) | Security considered illiquid (Unaudited). The total value of such securities as of October 31, 2020 was $0 and represented 0.0% of Net Assets. |
| (C) | Security is fair valued using methods determined in good faith by the Fair Value Committee of the Fund. The total value of such securities as of October 31, 2020, was $0 and represents 0.0% of net assets. |
Cl — Class
The following is a summary of the level of inputs used as of October 31, 2020, in valuing the Fund’s investments carried at value:
| Investments in Securities | | Level 1 | | | Level 2 | | | Level 3(1) | | | Total | |
| Common Stock | | $ | 1,817,616 | | | $ | — | | | $ | — | | | $ | 1,817,616 | |
| Total Investments in Securities | | $ | 1,817,616 | | | $ | — | | | $ | — | | | $ | 1,817,616 | |
| Schedule of Investments | | October 31, 2020 |
| | Global X MSCI China Materials ETF | |
(1) A reconciliation of Level 3 investments and disclosures of significant unobservable inputs are presented when the Fund has a significant amount of Level 3 investments at the beginning and/or end of the period in relation to Net Assets. Management has concluded that Level 3 investments are not material in relation to Net Assets.
For the year ended October 31, 2020, there were no transfers in or out of Level 3.
Amounts designated as “—“ are $0 or have been rounded to $0.
| Schedule of Investments | | October 31, 2020 |
| | Global X MSCI China Industrials ETF | |
Sector Weightings (Unaudited)†:
† Sector weightings percentages are based on the total market value of investments.
| | | Shares | | | Value | |
| COMMON STOCK — 99.9% | | | | | | |
| CHINA— 98.8% | | | | | | |
| Industrials — 98.8% | | | | | | |
51job ADR * | | | 448 | | | $ | 31,405 | |
| AECC Aero-Engine Control, Cl A | | | 1,200 | | | | 3,200 | |
AECC Aviation Power, Cl A | | | 2,300 | | | | 12,551 | |
Air China, Cl A | | | 6,200 | | | | 6,287 | |
Air China, Cl H | | | 30,800 | | | | 19,859 | |
A-Living Services, Cl H | | | 7,150 | | | | 29,965 | |
AVIC Aircraft, Cl A | | | 2,900 | | | | 10,485 | |
| AVIC Electromechanical Systems, Cl A | | | 3,700 | | | | 5,840 | |
AVIC Shenyang Aircraft, Cl A | | | 1,100 | | | | 8,514 | |
| AviChina Industry & Technology, Cl H | | | 42,090 | | | | 21,656 | |
AVICOPTER, Cl A | | | 600 | | | | 4,486 | |
| Beijing Capital International Airport, Cl H | | | 30,431 | | | | 18,561 | |
| Beijing New Building Materials, Cl A | | | 1,700 | | | | 8,771 | |
| Beijing Originwater Technology, Cl A | | | 3,300 | | | | 3,824 | |
| Beijing-Shanghai High Speed Railway, Cl A | | | 2,300 | | | | 1,917 | |
BEST ADR * | | | 3,371 | | | | 8,663 | |
Bohai Leasing, Cl A * | | | 6,100 | | | | 2,314 | |
| Centre Testing International Group, Cl A | | | 800 | | | | 3,205 | |
| China Aerospace Times Electronics, Cl A | | | 2,800 | | | | 2,764 | |
China Avionics Systems, Cl A | | | 1,400 | | | | 3,360 | |
| China Communications Construction, Cl A | | | 4,300 | | | | 4,746 | |
| China Communications Construction, Cl H | | | 73,543 | | | | 38,408 | |
| China Communications Services, Cl H | | | 39,900 | | | | 23,153 | |
| China Conch Venture Holdings | | | 26,860 | | | | 119,322 | |
China Eastern Airlines, Cl A | | | 9,600 | | | | 6,580 | |
China Eastern Airlines, Cl H | | | 31,000 | | | | 12,312 | |
| China Everbright Environment Group | | | 61,250 | | | | 30,804 | |
| Schedule of Investments | | October 31, 2020 |
| | Global X MSCI China Industrials ETF | |
| | | Shares | | | Value | |
| COMMON STOCK — continued | | | | | | | | |
| Industrials — continued | | | | | | | | |
China Gezhouba Group, Cl A | | | 4,600 | | | $ | 4,774 | |
China Lesso Group Holdings | | | 18,000 | | | | 29,061 | |
China Meheco, Cl A | | | 1,100 | | | | 2,474 | |
| China Merchants Holdings International | | | 23,031 | | | | 24,413 | |
| China National Chemical Engineering, Cl A | | | 5,100 | | | | 4,029 | |
| China Railway Construction, Cl A | | | 11,800 | | | | 14,679 | |
| China Railway Construction, Cl H | | | 33,301 | | | | 22,502 | |
China Railway Group, Cl A | | | 20,600 | | | | 16,520 | |
China Railway Group, Cl H | | | 62,998 | | | | 28,920 | |
China Shipbuilding Industry, Cl A * | | | 23,000 | | | | 14,289 | |
China Southern Airlines, Cl A * | | | 9,600 | | | | 7,899 | |
China Southern Airlines, Cl H * | | | 28,700 | | | | 14,989 | |
China Spacesat, Cl A | | | 1,200 | | | | 5,622 | |
| China State Construction Engineering, Cl A | | | 41,900 | | | | 31,974 | |
| China State Construction International Holdings | | | 34,010 | | | | 23,507 | |
CITIC | | | 96,100 | | | | 68,529 | |
| Contemporary Amperex Technology, Cl A | | | 2,326 | | | | 85,857 | |
| COSCO SHIPPING Development, Cl A | | | 7,200 | | | | 2,247 | |
COSCO SHIPPING Holdings, Cl A * | | | 8,800 | | | | 8,595 | |
COSCO SHIPPING Holdings, Cl H * | | | 43,132 | | | | 27,532 | |
COSCO SHIPPING Ports | | | 29,530 | | | | 17,250 | |
| Country Garden Services Holdings | | | 22,300 | | | | 139,899 | |
CRRC, Cl A | | | 24,600 | | | | 19,801 | |
CRRC, Cl H | | | 72,653 | | | | 28,106 | |
Daqin Railway, Cl A | | | 15,300 | | | | 14,646 | |
Dongfang Electric, Cl A | | | 2,700 | | | | 4,274 | |
Eve Energy, Cl A | | | 1,900 | | | | 15,103 | |
Fangda Carbon New Material, Cl A * | | | 3,763 | | | | 3,523 | |
Fosun International | | | 42,300 | | | | 50,946 | |
Gotion High-Tech, Cl A * | | | 1,200 | | | | 4,724 | |
Greentown Service Group | | | 24,400 | | | | 26,713 | |
| Guangzhou Baiyun International Airport, Cl A | | | 2,100 | | | | 3,936 | |
| Schedule of Investments | | October 31, 2020 |
| | Global X MSCI China Industrials ETF | |
| | | Shares | | | Value | |
| COMMON STOCK — continued | | | | | | | | |
| Industrials — continued | | | | | | | | |
Hainan Airlines Holding, Cl A * | | | 14,600 | | | $ | 3,380 | |
Haitian International Holdings | | | 10,726 | | | | 26,556 | |
| Hefei Meiya Optoelectronic Technology, Cl A | | | 700 | | | | 4,418 | |
Hongfa Technology, Cl A | | | 800 | | | | 6,141 | |
| Inner Mongolia First Machinery Group, Cl A | | | 1,800 | | | | 2,916 | |
Jiangsu Expressway, Cl H | | | 20,619 | | | | 20,606 | |
| Jiangsu Hengli Hydraulic, Cl A | | | 1,332 | | | | 15,050 | |
| Jiangsu Zhongtian Technology, Cl A | | | 3,200 | | | | 5,271 | |
Juneyao Airlines, Cl A | | | 1,700 | | | | 2,716 | |
| Metallurgical Corp of China, Cl A | | | 18,400 | | | | 7,117 | |
Nanyang Topsec Technologies Group, Cl A * | | | 1,100 | | | | 3,458 | |
NARI Technology, Cl A | | | 4,700 | | | | 14,571 | |
| Power Construction Corp of China, Cl A | | | 14,400 | | | | 8,258 | |
Sany Heavy Industry, Cl A | | | 8,500 | | | | 32,940 | |
SF Holding, Cl A | | | 2,900 | | | | 35,859 | |
| Shanghai Construction Group, Cl A | | | 9,200 | | | | 4,177 | |
Shanghai Electric Group, Cl A * | | | 8,400 | | | | 6,197 | |
Shanghai Electric Group, Cl H * | | | 44,971 | | | | 12,758 | |
Shanghai Industrial Holdings | | | 7,239 | | | | 9,652 | |
| Shanghai International Airport, Cl A | | | 1,000 | | | | 9,871 | |
| Shanghai International Port Group, Cl A | | | 8,800 | | | | 5,493 | |
| Shanghai M&G Stationery, Cl A | | | 900 | | | | 10,806 | |
| Shanghai Tunnel Engineering, Cl A | | | 3,100 | | | | 2,583 | |
Shenzhen Airport, Cl A | | | 2,100 | | | | 2,503 | |
Shenzhen Expressway, Cl H | | | 12,000 | | | | 10,677 | |
| Shenzhen Inovance Technology, Cl A | | | 1,700 | | | | 16,309 | |
| Shenzhen International Holdings | | | 17,906 | | | | 27,800 | |
Siasun Robot & Automation, Cl A * | | | 1,600 | | | | 3,195 | |
| Sinopec Engineering Group, Cl H | | | 23,800 | | | | 9,238 | |
Sinotrans, Cl A | | | 4,600 | | | | 2,803 | |
Sinotruk Hong Kong | | | 11,500 | | | | 29,303 | |
Spring Airlines, Cl A | | | 900 | | | | 5,728 | |
STO Express, Cl A | | | 1,400 | | | | 2,946 | |
| Schedule of Investments | | October 31, 2020 |
| | Global X MSCI China Industrials ETF | |
| | | Shares | | | Value | |
| COMMON STOCK — continued | | | | | | | | |
| Industrials — continued | | | | | | | | |
Sunwoda Electronic, Cl A | | | 1,600 | | | $ | 6,662 | |
| Suzhou Gold Mantis Construction Decoration, Cl A | | | 2,600 | | | | 3,828 | |
TBEA, Cl A | | | 3,700 | | | | 4,536 | |
Weichai Power, Cl A | | | 6,200 | | | | 14,009 | |
Weichai Power, Cl H | | | 32,096 | | | | 60,592 | |
| XCMG Construction Machinery, Cl A | | | 8,100 | | | | 6,484 | |
Xiamen C & D, Cl A | | | 2,800 | | | | 3,496 | |
| Xinjiang Goldwind Science & Technology, Cl A | | | 3,547 | | | | 6,134 | |
| Xinjiang Goldwind Science & Technology, Cl H | | | 12,571 | | | | 16,535 | |
Yunda Holding, Cl A | | | 2,340 | | | | 6,748 | |
Zhejiang Chint Electrics, Cl A * | | | 2,200 | | | | 9,633 | |
| Zhejiang Dingli Machinery, Cl A | | | 490 | | | | 6,660 | |
Zhejiang Expressway, Cl H | | | 24,140 | | | | 16,436 | |
| Zhejiang Sanhua Intelligent Controls, Cl A | | | 3,640 | | | | 13,291 | |
| Zhejiang Weixing New Building Materials, Cl A | | | 1,600 | | | | 4,468 | |
Zhengzhou Yutong Bus, Cl A | | | 2,300 | | | | 5,496 | |
| Zhuzhou CRRC Times Electric, Cl H | | | 9,123 | | | | 27,999 | |
| Zoomlion Heavy Industry Science and Technology | | | 22,200 | | | | 19,552 | |
| Zoomlion Heavy Industry Science and Technology, Cl A | | | 6,600 | | | | 7,294 | |
ZTO Express Cayman ADR * | | | 6,203 | | | | 179,763 | |
TOTAL CHINA | | | | | | | 1,991,197 | |
| SINGAPORE— 1.1% | | | | | | | | |
| Industrials — 1.1% | | | | | | | | |
BOC Aviation | | | 3,520 | | | | 21,719 | |
| TOTAL COMMON STOCK | | | | | | | | |
(Cost $2,244,139) | | | | | | | 2,012,916 | |
| TOTAL INVESTMENTS — 99.9% | | | | | | | | |
(Cost $2,244,139) | | | | | | $ | 2,012,916 | |
| Schedule of Investments | | October 31, 2020 |
| | Global X MSCI China Industrials ETF | |
Percentages are based on Net Assets of $2,014,151.
| * | Non-income producing security. |
ADR — American Depositary Receipt
Cl — Class
As of October 31, 2020, all of the Fund’s investments were considered Level 1, in accordance with authoritative guidance on fair value measurements and disclosure under U.S. GAAP.
For the year ended October 31, 2020, there were no transfers in or out of Level 3.
| Schedule of Investments | | October 31, 2020 |
| | Global X MSCI China Consumer Discretionary ETF | |
Sector Weightings (Unaudited)†:
† Sector weightings percentages are based on the total market value of investments. Repurchase agreements purchased from cash collateral received for securities lending activity are included in total investments. Please see Note 2 and 7 in Notes to Financial Statements for more detailed information.
| | | Shares | | | Value | |
| COMMON STOCK — 100.0% | | | | | | |
| CHINA— 100.0% | | | | | | |
| Consumer Discretionary — 100.0% | | | | | | |
Alibaba Group Holding ADR * | | | 111,216 | | | $ | 33,886,403 | |
ANTA Sports Products | | | 1,112,696 | | | | 12,239,175 | |
BAIC BluePark New Energy Technology, Cl A * | | | 243,800 | | | | 241,752 | |
BAIC Motor, Cl H | | | 2,440,900 | | | | 900,207 | |
Baozun ADR * (A) | | | 81,845 | | | | 2,994,709 | |
| Bosideng International Holdings | | | 4,525,400 | | | | 1,978,260 | |
| Brilliance China Automotive Holdings | | | 4,393,400 | | | | 3,790,124 | |
BTG Hotels Group, Cl A | | | 81,000 | | | | 209,508 | |
BYD, Cl A | | | 158,094 | | | | 3,773,008 | |
BYD, Cl H | | | 925,300 | | | | 18,387,039 | |
| Changzhou Xingyu Automotive Lighting Systems, Cl A | | | 22,400 | | | | 543,220 | |
China East Education Holdings | | | 793,900 | | | | 1,525,382 | |
| China Education Group Holdings | | | 1,090,300 | | | | 1,810,875 | |
| China Tourism Group Duty Free, Cl A | | | 168,900 | | | | 5,029,481 | |
China Yuhua Education | | | 1,652,000 | | | | 1,305,861 | |
| Chongqing Changan Automobile, Cl A | | | 375,083 | | | | 925,349 | |
Dongfeng Motor Group, Cl H | | | 3,931,946 | | | | 2,763,317 | |
| Fuyao Glass Industry Group, Cl A | | | 169,151 | | | | 946,766 | |
| Fuyao Glass Industry Group, Cl H | | | 730,000 | | | | 3,092,323 | |
Geely Automobile Holdings | | | 5,492,000 | | | | 11,274,575 | |
GOME Retail Holdings * (A) | | | 14,018,200 | | | | 1,554,595 | |
Great Wall Motor, Cl H | | | 4,504,397 | | | | 7,283,847 | |
| Schedule of Investments | | October 31, 2020 |
| | Global X MSCI China Consumer Discretionary ETF | |
| | | Shares | | | Value | |
| COMMON STOCK — continued | | | | | | | | |
| Consumer Discretionary — continued | | | | | | | | |
| Gree Electric Appliances of Zhuhai, Cl A | | | 262,600 | | | $ | 2,291,390 | |
GSX Techedu ADR * (A) | | | 111,221 | | | | 7,387,299 | |
| Guangzhou Automobile Group, Cl H | | | 4,270,823 | | | | 4,378,298 | |
Haidilao International Holding | | | 1,144,900 | | | | 7,558,996 | |
Haier Electronics Group | | | 1,820,900 | | | | 6,903,352 | |
Haier Smart Home, Cl A | | | 534,319 | | | | 1,983,673 | |
| Hangzhou Robam Appliances, Cl A | | | 80,232 | | | | 437,689 | |
| Huayu Automotive Systems, Cl A | | | 281,017 | | | | 1,305,992 | |
Huazhu Group ADR | | | 228,394 | | | | 9,051,254 | |
JD.com ADR * | | | 406,030 | | | | 33,099,566 | |
Joyoung, Cl A | | | 62,800 | | | | 331,620 | |
Koolearn Technology Holding * | | | 333,400 | | | | 1,076,961 | |
Li Ning | | | 2,441,900 | | | | 12,595,473 | |
Liaoning Cheng Da, Cl A | | | 140,800 | | | | 474,152 | |
Meituan, Cl B * | | | 967,960 | | | | 35,973,110 | |
NavInfo, Cl A | | | 166,100 | | | | 352,230 | |
New Oriental Education & Technology Group ADR * | | | 99,895 | | | | 16,021,160 | |
| Ningbo Joyson Electronic, Cl A | | | 105,200 | | | | 376,733 | |
Ningbo Tuopu Group, Cl A | | | 87,735 | | | | 501,680 | |
NIO ADR * | | | 882,750 | | | | 26,994,495 | |
| Offcn Education Technology, Cl A | | | 140,002 | | | | 826,265 | |
Oppein Home Group, Cl A | | | 33,556 | | | | 615,822 | |
Pinduoduo ADR * | | | 177,753 | | | | 15,994,215 | |
SAIC Motor, Cl A | | | 674,000 | | | | 2,330,125 | |
Shandong Linglong Tyre, Cl A | | | 112,532 | | | | 502,476 | |
| Shanghai Jinjiang International Hotels, Cl A | | | 76,627 | | | | 511,629 | |
| Shanghai Yuyuan Tourist Mart Group, Cl A | | | 273,226 | | | | 354,985 | |
| Shenzhen Overseas Chinese Town, Cl A | | | 708,800 | | | | 694,378 | |
| Shenzhou International Group Holdings | | | 745,362 | | | | 12,869,878 | |
| Songcheng Performance Development, Cl A | | | 219,280 | | | | 543,595 | |
Suning.com, Cl A | | | 829,200 | | | | 1,199,918 | |
| Suofeiya Home Collection, Cl A | | | 37,700 | | | | 158,766 | |
| Schedule of Investments | | October 31, 2020 |
| | Global X MSCI China Consumer Discretionary ETF | |
| | | Shares | | | Value | |
| COMMON STOCK — continued | | | | | | | | |
| Consumer Discretionary — continued | | | | | | | | |
TAL Education Group ADR * | | | 232,982 | | | $ | 15,483,984 | |
TCL Technology Group, Cl A | | | 1,209,905 | | | | 1,089,524 | |
Tongcheng-Elong Holdings * (A) | | | 1,232,200 | | | | 2,043,378 | |
| Topsports International Holdings | | | 1,794,000 | | | | 2,452,194 | |
Trip.com Group ADR * | | | 406,556 | | | | 11,692,551 | |
Vipshop Holdings ADR * | | | 590,616 | | | | 12,639,182 | |
| Weifu High-Technology Group, Cl A | | | 73,800 | | | | 283,132 | |
Wuchan Zhongda Group, Cl A | | | 428,300 | | | | 282,708 | |
Xiamen Intretech, Cl A | | | 36,300 | | | | 318,589 | |
XPeng ADR * | | | 150,530 | | | | 2,917,271 | |
Yum China Holdings | | | 280,115 | | | | 14,910,521 | |
Zhejiang Semir Garment, Cl A | | | 194,987 | | | | 242,851 | |
Zhejiang Supor, Cl A | | | 49,400 | | | | 521,277 | |
| Zhejiang Wanfeng Auto Wheel, Cl A | | | 182,500 | | | | 196,229 | |
Zhongsheng Group Holdings | | | 826,300 | | | | 5,871,052 | |
TOTAL CHINA | | | | | | | 393,097,394 | |
| TOTAL COMMON STOCK | | | | | | | | |
(Cost $296,332,008) | | | | | | | 393,097,394 | |
| | | | | | | | | |
SHORT-TERM INVESTMENT(B)(C) — 0.2% | | | | | | | | |
| Fidelity Investments Money Market Government Portfolio, Cl Institutional, 0.010% | | | | | | | | |
(Cost $821,529) | | | 821,529 | | | | 821,529 | |
| Schedule of Investments | | October 31, 2020 |
| | Global X MSCI China Consumer Discretionary ETF | |
| | | Face Amount | | | Value | |
REPURCHASE AGREEMENT(B) — 1.8% | | | | | | | | |
| BNP Paribas | | | | | | | | |
| 0.060%, dated 10/30/20, to be repurchased on 11/02/20, repurchase price $7,116,856 (collateralized by U.S. Treasury Obligations, ranging in par value $334,709 - $1,153,839, 1.625%, 11/15/2022, with a total market value of $7,257,743) | | | | | | | | |
(Cost $7,116,820) | | $ | 7,116,820 | | | $ | 7,116,820 | |
| TOTAL INVESTMENTS — 102.0% | | | | | | | | |
(Cost $304,270,357) | | | | | | $ | 401,035,743 | |
Percentages are based on Net Assets of $393,117,708.
| * | Non-income producing security. |
| (A) | This security or a partial position of this security is on loan at October 31, 2020. The total value of securities on loan at October 31, 2020 was $7,359,469. |
| (B) | Security was purchased with cash collateral held from securities on loan. The total value of such securities as of October 31, 2020, was $7,938,349. |
| (C) | The rate reported on the Schedule of Investments is the 7-day effective yield as of October 31, 2020. |
ADR — American Depositary Receipt
Cl — Class
The following is a summary of the level of inputs used as of October 31, 2020, in valuing the Fund’s investments carried at value:
| Investments in Securities | | Level 1 | | | Level 2 | | | Level 3 | | | Total | |
| Common Stock | | $ | 393,097,394 | | | $ | — | | | $ | — | | | $ | 393,097,394 | |
| Short-Term Investment | | | 821,529 | | | | — | | | | — | | | | 821,529 | |
| Repurchase Agreement | | | — | | | | 7,116,820 | | | | — | | | | 7,116,820 | |
| Total Investments in Securities | | $ | 393,918,923 | | | $ | 7,116,820 | | | $ | — | | | $ | 401,035,743 | |
For the year ended October 31, 2020, there were no transfers in or out of Level 3.
Amounts designated as “—“ are $0 or have been rounded to $0.
| Schedule of Investments | | October 31, 2020 |
| | Global X MSCI China Consumer Staples ETF | |
Sector Weightings (Unaudited)†:
† Sector weightings percentages are based on the total market value of investments.
| | | Shares | | | Value | |
| COMMON STOCK — 99.7% | | | | | | |
| CHINA— 98.9% | | | | | | |
| Consumer Staples — 98.9% | | | | | | |
Angel Yeast, Cl A | | | 9,354 | | | $ | 73,784 | |
Anhui Gujing Distillery, Cl A | | | 3,976 | | | | 124,809 | |
Anhui Gujing Distillery, Cl B | | | 17,200 | | | | 195,181 | |
Anhui Kouzi Distillery, Cl A | | | 6,300 | | | | 51,538 | |
| Beijing Dabeinong Technology Group, Cl A | | | 93,400 | | | | 115,630 | |
| Beijing Shunxin Agriculture, Cl A | | | 7,930 | | | | 65,062 | |
Beijing Yanjing Brewery, Cl A | | | 31,500 | | | | 40,926 | |
By-health, Cl A | | | 16,800 | | | | 64,904 | |
C&S Paper, Cl A | | | 12,900 | | | | 38,991 | |
Chacha Food, Cl A | | | 4,900 | | | | 43,569 | |
China Feihe | | | 183,600 | | | | 416,215 | |
China Mengniu Dairy | | | 345,800 | | | | 1,625,359 | |
| China Resources Beer Holdings | | | 228,700 | | | | 1,417,053 | |
Chongqing Brewery, Cl A | | | 5,372 | | | | 85,776 | |
| Chongqing Fuling Zhacai Group, Cl A | | | 8,600 | | | | 53,658 | |
Dali Foods Group | | | 443,000 | | | | 274,203 | |
| Foshan Haitian Flavouring & Food, Cl A | | | 30,193 | | | | 722,332 | |
Fujian Sunner Development, Cl A * | | | 11,600 | | | | 38,163 | |
Guangdong Haid Group, Cl A | | | 16,691 | | | | 153,519 | |
Heilongjiang Agriculture, Cl A | | | 19,700 | | | | 51,190 | |
| Henan Shuanghui Investment & Development, Cl A | | | 38,640 | | | | 288,520 | |
Hengan International Group | | | 107,800 | | | | 747,178 | |
| Inner Mongolia Yili Industrial Group, Cl A | | | 75,529 | | | | 448,127 | |
| Jiangsu King’s Luck Brewery JSC, Cl A | | | 13,200 | | | | 102,209 | |
| Jiangsu Yanghe Brewery Joint-Stock, Cl A | | | 19,244 | | | | 482,979 | |
| Jiangxi Zhengbang Technology, Cl A | | | 26,500 | | | | 67,672 | |
| Schedule of Investments | | October 31, 2020 |
| | Global X MSCI China Consumer Staples ETF | |
| | | Shares | | | Value | |
| COMMON STOCK — continued | | | | | | | | |
| Consumer Staples — continued | | | | | | | | |
| Jonjee Hi-Tech Industrial And Commercial Holding, Cl A | | | 8,500 | | | $ | 79,780 | |
Juewei Food, Cl A | | | 6,900 | | | | 83,568 | |
Kweichow Moutai, Cl A | | | 6,416 | | | | 1,600,127 | |
| Laobaixing Pharmacy Chain JSC, Cl A | | | 4,560 | | | | 48,710 | |
Luzhou Laojiao, Cl A | | | 19,647 | | | | 506,120 | |
Muyuan Foods, Cl A | | | 40,060 | | | | 424,036 | |
New Hope Liuhe, Cl A | | | 57,400 | | | | 230,414 | |
Proya Cosmetics, Cl A | | | 1,800 | | | | 46,533 | |
Shanghai Jahwa United, Cl A | | | 7,400 | | | | 45,552 | |
| Shanxi Xinghuacun Fen Wine Factory, Cl A | | | 12,449 | | | | 418,521 | |
Sichuan Swellfun, Cl A | | | 5,568 | | | | 55,071 | |
Sun Art Retail Group | | | 411,300 | | | | 444,456 | |
| Tingyi Cayman Islands Holding | | | 313,500 | | | | 572,437 | |
Toly Bread, Cl A | | | 6,000 | | | | 56,969 | |
Tongwei, Cl A | | | 71,300 | | | | 326,886 | |
Tsingtao Brewery, Cl A | | | 7,400 | | | | 87,546 | |
Tsingtao Brewery, Cl H | | | 83,600 | | | | 690,481 | |
Uni-President China Holdings | | | 272,400 | | | | 235,347 | |
Want Want China Holdings | | | 885,800 | | | | 584,833 | |
Wens Foodstuffs Group | | | 75,144 | | | | 212,653 | |
Wuliangye Yibin, Cl A | | | 37,698 | | | | 1,375,622 | |
Yifeng Pharmacy Chain, Cl A | | | 5,862 | | | | 89,214 | |
Yihai International Holding | | | 77,240 | | | | 1,021,918 | |
Yonghui Superstores, Cl A | | | 142,700 | | | | 166,435 | |
Yuan Longping High-tech Agriculture, Cl A * | | | 14,400 | | | | 36,020 | |
TOTAL CHINA | | | | | | | 17,227,796 | |
| Schedule of Investments | | October 31, 2020 |
| | Global X MSCI China Consumer Staples ETF | |
| | | Shares | | | Value | |
| HONG KONG— 0.8% | | | | | | | | |
| Consumer Staples — 0.8% | | | | | | | | |
Vinda International Holdings | | | 57,200 | | | $ | 151,209 | |
| TOTAL COMMON STOCK | | | | | | | | |
(Cost $14,760,845) | | | | | | | 17,379,005 | |
| TOTAL INVESTMENTS — 99.7% | | | | | | | | |
(Cost $14,760,845) | | | | | | $ | 17,379,005 | |
Percentages are based on Net Assets of $17,423,630.
| * | Non-income producing security. |
Cl — Class
As of October 31, 2020, all of the Fund’s investments were considered Level 1, in accordance with authoritative guidance on fair value measurements and disclosure under U.S. GAAP.
For the year ended October 31, 2020, there have been no transfers in or out of Level 3.
| Schedule of Investments | | October 31, 2020 |
| | Global X MSCI China Health Care ETF | |
Sector Weightings (Unaudited)†:
† Sector weightings percentages are based on the total market value of investments.
| | | Shares | | | Value | |
| COMMON STOCK — 100.0% | | | | | | |
| CHINA— 90.0% | | | | | | |
| Health Care — 90.0% | | | | | | |
3SBio * | | | 121,200 | | | $ | 112,685 | |
Aier Eye Hospital Group, Cl A | | | 20,999 | | | | 195,243 | |
AK Medical Holdings | | | 22,700 | | | | 50,582 | |
Alibaba Health Information Technology * | | | 261,900 | | | | 683,891 | |
Apeloa Pharmaceutical, Cl A | | | 3,600 | | | | 10,967 | |
| Asymchem Laboratories Tianjin, Cl A | | | 980 | | | | 40,119 | |
Autobio Diagnostics, Cl A | | | 1,200 | | | | 31,200 | |
| Beijing Tiantan Biological Products, Cl A | | | 5,400 | | | | 27,789 | |
Beijing Tongrentang, Cl A | | | 11,104 | | | | 44,607 | |
Betta Pharmaceuticals, Cl A | | | 1,600 | | | | 25,583 | |
BGI Genomics, Cl A * | | | 1,593 | | | | 35,446 | |
CanSino Biologics, Cl H * | | | 3,840 | | | | 74,722 | |
| Changchun High & New Technology Industry Group, Cl A | | | 1,708 | | | | 95,528 | |
| Chengdu Kanghong Pharmaceutical Group, Cl A | | | 2,800 | | | | 17,771 | |
China Medical System Holdings | | | 130,300 | | | | 136,435 | |
| China National Accord Medicines, Cl A | | | 1,700 | | | | 12,600 | |
China National Medicines, Cl A | | | 2,800 | | | | 17,892 | |
| China Resources Pharmaceutical Group | | | 166,600 | | | | 83,140 | |
| China Resources Sanjiu Medical & Pharmaceutical, Cl A | | | 4,400 | | | | 17,794 | |
| China Traditional Chinese Medicine Holdings | | | 247,300 | | | | 98,539 | |
| Chongqing Zhifei Biological Products, Cl A | | | 6,493 | | | | 155,318 | |
CSPC Pharmaceutical Group | | | 663,008 | | | | 698,503 | |
| Da An Gene of Sun Yat-Sen University, Cl A | | | 2,960 | | | | 16,709 | |
Dong-E-E-Jiao, Cl E | | | 5,500 | | | | 31,417 | |
Genscript Biotech * | | | 94,000 | | | | 130,184 | |
| Schedule of Investments | | October 31, 2020 |
| | Global X MSCI China Health Care ETF | |
| | | Shares | | | Value | |
| COMMON STOCK — continued | | | | | | | | |
| Health Care — continued | | | | | | | | |
| Guangzhou Baiyunshan Pharmaceutical Holdings, Cl A | | | 11,059 | | | $ | 50,404 | |
| Guangzhou Kingmed Diagnostics Group, Cl A | | | 1,900 | | | | 29,889 | |
| Guangzhou Wondfo Biotech, Cl A | | | 800 | | | | 9,104 | |
| Hangzhou Tigermed Consulting, Cl A | | | 3,616 | | | | 66,960 | |
Hansoh Pharmaceutical Group * | | | 83,900 | | | | 373,799 | |
Huadong Medicine, Cl A | | | 14,211 | | | | 59,189 | |
| Hualan Biological Engineering, Cl A | | | 8,670 | | | | 66,291 | |
| Hubei Jumpcan Pharmaceutical, Cl A | | | 2,800 | | | | 9,241 | |
Innovent Biologics * | | | 77,500 | | | | 571,643 | |
Jafron Biomedical, Cl A | | | 3,600 | | | | 42,633 | |
| Jiangsu Hengrui Medicine, Cl A | | | 27,127 | | | | 359,898 | |
| Jiangsu Yuyue Medical Equipment & Supply, Cl A | | | 3,700 | | | | 17,068 | |
| Jilin Aodong Pharmaceutical Group, Cl A | | | 4,500 | | | | 11,297 | |
Jinyu Bio-Technology, Cl A | | | 4,600 | | | | 16,253 | |
| Joincare Pharmaceutical Group Industry, Cl A | | | 7,300 | | | | 16,418 | |
Jointown Pharmaceutical Group, Cl A * | | | 15,170 | | | | 41,141 | |
| Lepu Medical Technology Beijing, Cl A | | | 8,501 | | | | 39,063 | |
| Livzon Pharmaceutical Group, Cl A | | | 2,200 | | | | 15,888 | |
Luye Pharma Group | | | 148,200 | | | | 85,616 | |
Meinian Onehealth Healthcare Holdings, Cl A * | | | 31,320 | | | | 79,700 | |
| Nanjing King-Friend Biochemical Pharmaceutical, Cl A | | | 3,200 | | | | 18,723 | |
Ovctek China, Cl A | | | 2,332 | | | | 23,737 | |
Ping An Healthcare and Technology * | | | 39,000 | | | | 502,911 | |
| Shandong Buchang Pharmaceuticals, Cl A | | | 9,287 | | | | 33,577 | |
| Shandong Weigao Group Medical Polymer, Cl H | | | 198,100 | | | | 382,668 | |
| Shanghai Fosun Pharmaceutical Group, Cl A | | | 9,574 | | | | 77,750 | |
| Shanghai Fosun Pharmaceutical Group, Cl H | | | 48,900 | | | | 200,838 | |
| Shanghai Pharmaceuticals Holding, Cl A | | | 8,900 | | | | 26,476 | |
| Shanghai Pharmaceuticals Holding, Cl H | | | 77,300 | | | | 119,615 | |
| Schedule of Investments | | October 31, 2020 |
| | Global X MSCI China Health Care ETF | |
| | | Shares | | | Value | |
| COMMON STOCK — continued | | | | | | | | |
| Health Care — continued | | | | | | | | |
| Shanghai RAAS Blood Products, Cl A | | | 12,700 | | | $ | 16,159 | |
| Shenzhen Hepalink Pharmaceutical Group, Cl A | | | 4,500 | | | | 13,373 | |
| Shenzhen Kangtai Biological Products, Cl A | | | 3,143 | | | | 85,106 | |
| Shenzhen Mindray Bio-Medical Electronics, Cl A | | | 4,461 | | | | 257,684 | |
| Shenzhen Salubris Pharmaceuticals, Cl A | | | 7,300 | | | | 33,599 | |
| Shijiazhuang Yiling Pharmaceutical, Cl A | | | 5,691 | | | | 22,649 | |
| Sichuan Kelun Pharmaceutical, Cl A | | | 12,000 | | | | 41,934 | |
Sinopharm Group, Cl H | | | 114,700 | | | | 262,092 | |
| Tianjin Chase Sun Pharmaceutical, Cl A | | | 12,300 | | | | 10,139 | |
| Tonghua Dongbao Pharmaceutical, Cl A | | | 17,400 | | | | 37,210 | |
Topchoice Medical, Cl A * | | | 1,500 | | | | 50,460 | |
Walvax Biotechnology, Cl A | | | 7,300 | | | | 54,268 | |
| Winning Health Technology Group, Cl A | | | 9,070 | | | | 24,096 | |
WuXi AppTec, Cl A | | | 10,720 | | | | 180,453 | |
WuXi AppTec, Cl H | | | 24,240 | | | | 386,035 | |
Wuxi Biologics Cayman * | | | 41,260 | | | | 1,152,430 | |
Yifan Pharmaceutical, Cl A | | | 5,400 | | | | 18,314 | |
Yunnan Baiyao Group, Cl A | | | 8,410 | | | | 129,310 | |
Zai Lab ADR * | | | 4,781 | | | | 392,281 | |
| Zhangzhou Pientzehuang Pharmaceutical, Cl A | | | 3,766 | | | | 128,959 | |
Zhejiang Conba Pharmaceutical, Cl A * | | | 12,400 | | | | 9,277 | |
| Zhejiang Huahai Pharmaceutical, Cl A | | | 6,210 | | | | 31,244 | |
Zhejiang NHU, Cl A | | | 10,000 | | | | 43,382 | |
| Zhejiang Wolwo Bio-Pharmaceutical, Cl A | | | 2,123 | | | | 19,168 | |
TOTAL CHINA | | | | | | | 9,592,076 | |
| HONG KONG— 10.0% | | | | | | | | |
| Health Care — 10.0% | | | | | | | | |
Hutchison China MediTech ADR * | | | 6,368 | | | | 187,474 | |
Sino Biopharmaceutical | | | 778,400 | | | | 784,940 | |
SSY Group | | | 161,100 | | | | 87,874 | |
| Schedule of Investments | | October 31, 2020 |
| | Global X MSCI China Health Care ETF | |
| | | | | | | Value | |
| COMMON STOCK — continued | | | | | | | | |
TOTAL HONG KONG | | | | | | $ | 1,060,288 | |
| TOTAL COMMON STOCK | | | | | | | | |
(Cost $9,222,161) | | | | | | | 10,652,364 | |
| TOTAL INVESTMENTS — 100.0% | | | | | | | | |
(Cost $9,222,161) | | | | | | $ | 10,652,364 | |
Percentages are based on Net Assets of $10,656,457.
| * | Non-income producing security. |
ADR — American Depositary Receipt
Cl — Class
As of October 31, 2020, all of the Fund’s investments were considered Level 1, in accordance with authoritative guidance on fair value measurements and disclosure under U.S. GAAP.
For the year ended October 31, 2020, there were no transfers in or out of Level 3.
| Schedule of Investments | | October 31, 2020 |
| | Global X MSCI China Financials ETF | |
Sector Weightings (Unaudited)†:
† Sector weightings percentages are based on the total market value of investments. Repurchase agreements purchased from cash collateral received for securities lending activity are included in total investments. Please see Note 2 and 7 in Notes to Financial Statements for more detailed information.
| | | Shares | | | Value | |
| COMMON STOCK — 99.9% | | | | | | |
| CHINA— 99.9% | | | | | | |
| Financials — 99.9% | | | | | | |
| Agricultural Bank of China, Cl A | | | 638,200 | | | $ | 300,217 | |
| Agricultural Bank of China, Cl H | | | 4,394,088 | | | | 1,484,556 | |
Avic Capital, Cl A | | | 139,600 | | | | 91,104 | |
Bank of Beijing, Cl A | | | 214,200 | | | | 149,384 | |
Bank of Chengdu, Cl A | | | 64,500 | | | | 99,694 | |
Bank of China Ltd., Cl A | | | 343,300 | | | | 163,031 | |
Bank of China Ltd., Cl H | | | 11,007,334 | | | | 3,477,562 | |
| Bank of Communications, Cl A | | | 344,500 | | | | 233,054 | |
| Bank of Communications, Cl H | | | 1,687,271 | | | | 828,965 | |
Bank of Hangzhou, Cl A | | | 84,045 | | | | 162,787 | |
Bank of Jiangsu, Cl A | | | 133,100 | | | | 119,459 | |
Bank of Nanjing, Cl A | | | 109,384 | | | | 124,964 | |
Bank of Ningbo, Cl A | | | 56,100 | | | | 284,678 | |
Bank of Shanghai, Cl A | | | 140,298 | | | | 164,471 | |
Caitong Securities, Cl A | | | 59,700 | | | | 114,474 | |
Changjiang Securities, Cl A | | | 86,100 | | | | 96,820 | |
| China Cinda Asset Management, Cl H | | | 2,609,500 | | | | 487,924 | |
| China CITIC Bank Corp Ltd., Cl A | | | 93,700 | | | | 70,664 | |
| China CITIC Bank Corp Ltd., Cl H | | | 1,779,222 | | | | 722,715 | |
China Construction Bank, Cl A | | | 25,400 | | | | 23,859 | |
China Construction Bank, Cl H | | | 6,350,826 | | | | 4,381,377 | |
China Everbright | | | 313,200 | | | | 412,762 | |
China Everbright Bank, Cl A | | | 371,600 | | | | 217,535 | |
| Schedule of Investments | | October 31, 2020 |
| | Global X MSCI China Financials ETF | |
| | | Shares | | | Value | |
| COMMON STOCK — continued | | | | | | | | |
| Financials — continued | | | | | | | | |
China Everbright Bank, Cl H | | | 1,133,200 | | | $ | 391,623 | |
China Galaxy Securities, Cl A | | | 60,100 | | | | 105,458 | |
China Galaxy Securities, Cl H | | | 954,000 | | | | 521,604 | |
| China Great Wall Securities, Cl A | | | 39,000 | | | | 72,103 | |
| China Huarong Asset Management, Cl H | | | 3,180,200 | | | | 332,174 | |
China International Capital, Cl H * | | | 293,000 | | | | 681,602 | |
China Life Insurance, Cl A | | | 2,102 | | | | 14,465 | |
China Life Insurance, Cl H | | | 904,340 | | | | 1,963,814 | |
China Merchants Bank, Cl A | | | 166,229 | | | | 988,251 | |
China Merchants Bank, Cl H | | | 562,134 | | | | 2,921,269 | |
| China Merchants Securities, Cl A | | | 75,830 | | | | 234,299 | |
| China Minsheng Banking, Cl A | | | 311,000 | | | | 245,224 | |
| China Minsheng Banking, Cl H | | | 1,226,526 | | | | 670,609 | |
| China Pacific Insurance Group, Cl A | | | 57,900 | | | | 275,914 | |
| China Pacific Insurance Group, Cl H | | | 441,112 | | | | 1,373,702 | |
| China Reinsurance Group, Cl H | | | 2,543,500 | | | | 242,711 | |
| China Taiping Insurance Holdings | | | 365,330 | | | | 549,301 | |
| Chongqing Rural Commercial Bank, Cl H | | | 992,300 | | | | 395,392 | |
CITIC Securities, Cl A | | | 87,400 | | | | 373,681 | |
CITIC Securities, Cl H | | | 406,696 | | | | 876,865 | |
CSC Financial, Cl A | | | 27,900 | | | | 178,285 | |
Dongxing Securities, Cl A | | | 46,300 | | | | 84,355 | |
East Money Information, Cl A | | | 80,440 | | | | 280,857 | |
Everbright Securities, Cl A | | | 56,557 | | | | 151,945 | |
Far East Horizon | | | 582,900 | | | | 572,012 | |
First Capital Securities, Cl A | | | 97,800 | | | | 145,030 | |
Founder Securities, Cl A * | | | 99,700 | | | | 138,318 | |
GF Securities Ltd., Cl A | | | 65,600 | | | | 150,867 | |
GF Securities Ltd., Cl H | | | 387,300 | | | | 498,930 | |
Guosen Securities, Cl A | | | 57,745 | | | | 115,123 | |
Guotai Junan Securities, Cl A | | | 73,244 | | | | 201,260 | |
Guotai Junan Securities, Cl H (A) | | | 254,900 | | | | 331,327 | |
Guoyuan Securities, Cl A | | | 71,820 | | | | 89,772 | |
| Schedule of Investments | | October 31, 2020 |
| | Global X MSCI China Financials ETF | |
| | | Shares | | | Value | |
| COMMON STOCK — continued | | | | | | | | |
| Financials — continued | | | | | | | | |
Haitong Securities Ltd., Cl A | | | 99,400 | | | $ | 208,412 | |
Haitong Securities Ltd., Cl H | | | 668,100 | | | | 563,438 | |
| Hithink RoyalFlush Information Network, Cl A | | | 7,460 | | | | 150,531 | |
Huaan Securities Ltd., Cl A | | | 81,500 | | | | 96,881 | |
Huatai Securities Ltd., Cl A | | | 71,300 | | | | 216,788 | |
Huatai Securities Ltd., Cl H | | | 359,100 | | | | 579,757 | |
Huaxi Securities, Cl A | | | 53,400 | | | | 92,505 | |
Huaxia Bank, Cl A | | | 139,300 | | | | 126,064 | |
| Hubei Biocause Pharmaceutical, Cl A | | | 119,900 | | | | 89,170 | |
| Industrial & Commercial Bank of China, Cl A | | | 245,200 | | | | 180,158 | |
| Industrial & Commercial Bank of China, Cl H | | | 7,661,137 | | | | 4,307,312 | |
Industrial Bank, Cl A | | | 185,400 | | | | 492,831 | |
Industrial Securities, Cl A | | | 99,600 | | | | 115,273 | |
| Jiangsu Changshu Rural Commercial Bank, Cl A | | | 61,000 | | | | 61,672 | |
Nanjing Securities, Cl A | | | 45,800 | | | | 85,359 | |
| New China Life Insurance C, Cl A | | | 21,317 | | | | 204,376 | |
| New China Life Insurance C, Cl H | | | 174,611 | | | | 694,630 | |
Noah Holdings ADR * | | | 11,703 | | | | 308,140 | |
Northeast Securities, Cl A | | | 52,400 | | | | 72,932 | |
Oceanwide Holdings, Cl A | | | 31,100 | | | | 19,088 | |
Orient Securities, Cl A | | | 74,100 | | | | 118,848 | |
Pacific Securities, Cl A * | | | 137,300 | | | | 77,095 | |
| People’s Insurance Group of China, Cl A | | | 88,100 | | | | 87,228 | |
| People’s Insurance Group of China, Cl H | | | 1,961,000 | | | | 581,610 | |
| PICC Property & Casualty, Cl H | | | 1,195,463 | | | | 807,782 | |
Ping An Bank, Cl A | | | 10,300 | | | | 27,303 | |
| Ping An Insurance Group of China, Cl A | | | 1,600 | | | | 18,597 | |
| Ping An Insurance Group of China, Cl H | | | 401,414 | | | | 4,117,744 | |
| Postal Savings Bank of China, Cl A | | | 41,400 | | | | 28,440 | |
| Postal Savings Bank of China, Cl H | | | 1,594,100 | | | | 781,134 | |
| Qingdao Rural Commercial Bank, Cl A | | | 106,800 | | | | 75,121 | |
| Schedule of Investments | | October 31, 2020 |
| | Global X MSCI China Financials ETF | |
| | | Shares/Face Amount | | | Value | |
| COMMON STOCK — continued | | | | | | | | |
| Financials — continued | | | | | | | | |
SDIC Capital, Cl A | | | 46,400 | | | $ | 96,802 | |
Sealand Securities, Cl A | | | 106,310 | | | | 82,555 | |
| Shanghai Pudong Development Bank, Cl A | | | 261,014 | | | | 360,947 | |
Shanxi Securities, Cl A | | | 83,940 | | | | 94,141 | |
| Shenwan Hongyuan Group, Cl A | | | 231,000 | | | | 173,864 | |
Sinolink Securities, Cl A | | | 60,600 | | | | 135,205 | |
SooChow Securities, Cl A | | | 70,980 | | | | 103,562 | |
Southwest Securities, Cl A | | | 129,800 | | | | 97,695 | |
Tianfeng Securities, Cl A | | | 98,700 | | | | 86,374 | |
Western Securities, Cl A | | | 58,800 | | | | 79,907 | |
Zheshang Securities, Cl A | | | 48,300 | | | | 107,185 | |
ZhongAn Online P&C Insurance, Cl H * | | | 98,000 | | | | 509,281 | |
| TOTAL COMMON STOCK | | | | | | | | |
(Cost $55,982,938) | | | | | | | 47,693,935 | |
| | | | | | | | | |
SHORT-TERM INVESTMENT(B)(C) — 0.1% | | | | | | | | |
| Fidelity Investments Money Market Government Portfolio, Cl Institutional, 0.010% | | | | | | | | |
(Cost $18,215) | | | 18,215 | | | | 18,215 | |
| | | | | | | | | |
REPURCHASE AGREEMENT(B) — 0.3% | | | | | | | | |
| BNP Paribas | | | | | | | | |
| 0.060%, dated 10/30/20, to be repurchased on 11/02/20, repurchase price $157,796 (collateralized by U.S. Treasury Obligations, ranging in par value $7,421 - $25,583, 1.625%, 11/15/2022, with a total market value of $160,919) | | | | | | | | |
(Cost $157,796) | | $ | 157,796 | | | | 157,796 | |
| TOTAL INVESTMENTS — 100.3% | | | | | | | | |
(Cost $56,158,949) | | | | | | $ | 47,869,946 | |
Percentages are based on Net Assets of $47,726,532.
| * | Non-income producing security. |
| Schedule of Investments | | October 31, 2020 |
| | Global X MSCI China Financials ETF | |
| (A) | This security or a partial position of this security is on loan at October 31, 2020. The total value of securities on loan at October 31, 2020 was $166,956. |
| (B) | Security was purchased with cash collateral held from securities on loan. The total value of such securities as of October 31, 2020, was $176,011. |
| (C) | The rate reported on the Schedule of Investments is the 7-day effective yield as of October 31, 2020. |
ADR — American Depositary Receipt
Cl — Class
Ltd. — Limited
The following is a summary of the level of inputs used as of October 31, 2020, in valuing the Fund’s investments carried at value:
| Investments in Securities | | Level 1 | | | Level 2 | | | Level 3 | | | Total | |
| Common Stock | | $ | 47,693,935 | | | $ | — | | | $ | — | | | $ | 47,693,935 | |
| Short-Term Investment | | | 18,215 | | | | — | | | | — | | | | 18,215 | |
| Repurchase Agreement | | | — | | | | 157,796 | | | | — | | | | 157,796 | |
| Total Investments in Securities | | $ | 47,712,150 | | | $ | 157,796 | | | $ | — | | | $ | 47,869,946 | |
For the year ended October 31, 2020, there were no transfers in or out of Level 3.
Amounts designated as “—“ are $0 or have been rounded to $0.
| Schedule of Investments | | October 31, 2020 |
| | Global X MSCI China Information Technology ETF | |
Sector Weightings (Unaudited)†:
† Sector weightings percentages are based on the total market value of investments.
| | | Shares | | | Value | |
| COMMON STOCK — 99.8% | | | | | | |
| CHINA— 98.0% | | | | | | |
| Information Technology — 98.0% | | | | | | |
360 Security Technology, Cl A | | | 34,059 | | | $ | 80,414 | |
AAC Technologies Holdings | | | 123,000 | | | | 647,923 | |
Accelink Technologies, Cl A | | | 4,500 | | | | 21,101 | |
Addsino, Cl A | | | 7,300 | | | | 21,934 | |
Aisino, Cl A | | | 28,500 | | | | 66,055 | |
| AVIC Jonhon Optronic Technology, Cl A | | | 7,100 | | | | 58,740 | |
| Beijing E-Hualu Information Technology, Cl A | | | 3,040 | | | | 14,423 | |
| Beijing Shiji Information Technology, Cl A | | | 13,500 | | | | 74,271 | |
| Beijing Sinnet Technology, Cl A | | | 10,100 | | | | 28,824 | |
Beijing Thunisoft, Cl A | | | 4,500 | | | | 15,651 | |
BOE Technology Group, Cl A | | | 349,000 | | | | 246,522 | |
BYD Electronic International | | | 130,600 | | | | 560,807 | |
| Chaozhou Three-Circle Group, Cl A | | | 22,600 | | | | 104,727 | |
| China Greatwall Technology Group, Cl A | | | 20,300 | | | | 45,928 | |
| China National Software & Service, Cl A | | | 3,000 | | | | 31,410 | |
| China Railway Signal & Communication, Cl H | | | 374,700 | | | | 123,211 | |
| China TransInfo Technology, Cl A | | | 9,000 | | | | 29,824 | |
| Dawning Information Industry, Cl A | | | 8,200 | | | | 43,815 | |
DHC Software, Cl A | | | 49,600 | | | | 67,627 | |
| Fiberhome Telecommunication Technologies, Cl A | | | 6,100 | | | | 21,508 | |
| Foxconn Industrial Internet, Cl A | | | 46,500 | | | | 94,788 | |
| Fujian Star-net Communication, Cl A | | | 3,400 | | | | 12,176 | |
GCL System Integration Technology, Cl A * | | | 44,700 | | | | 23,097 | |
GDS Holdings ADR * | | | 11,390 | | | | 957,215 | |
| Gigadevice Semiconductor Beijing, Cl A | | | 3,624 | | | | 105,371 | |
| Schedule of Investments | | October 31, 2020 |
| | Global X MSCI China Information Technology ETF | |
| | | Shares | | | Value | |
| COMMON STOCK — continued | | | | | | | | |
| Information Technology — continued | | | | | | | | |
Glodon, Cl A | | | 7,500 | | | $ | 79,489 | |
GoerTek, Cl A | | | 50,200 | | | | 340,052 | |
| GRG Banking Equipment, Cl A | | | 15,100 | | | | 26,045 | |
| Guangzhou Haige Communications Group, Cl A | | | 35,900 | | | | 59,992 | |
| Guangzhou Shiyuan Electronic Technology, Cl A | | | 4,700 | | | | 72,119 | |
| Hangzhou Hikvision Digital Technology, Cl A | | | 90,800 | | | | 608,835 | |
| Hangzhou Silan Microelectronics, Cl A | | | 8,200 | | | | 18,491 | |
Hengtong Optic-electric, Cl A | | | 29,900 | | | | 65,460 | |
Holitech Technology, Cl A * | | | 25,600 | | | | 16,936 | |
Hua Hong Semiconductor * | | | 96,400 | | | | 353,660 | |
Huagong Tech, Cl A | | | 5,600 | | | | 19,469 | |
Hubei Kaile Science & Technology, Cl A * | | | 10,500 | | | | 19,397 | |
Hundsun Technologies, Cl A | | | 16,381 | | | | 227,359 | |
Iflytek | | | 28,100 | | | | 159,630 | |
| Inspur Electronic Information Industry, Cl A | | | 10,652 | | | | 48,518 | |
Kingboard Holdings | | | 131,200 | | | | 443,263 | |
| Kingdee International Software Group | | | 390,700 | | | | 1,025,261 | |
Kingsoft | | | 142,500 | | | | 760,750 | |
Legend Holdings, Cl H | | | 72,450 | | | | 97,536 | |
Lenovo Group | | | 1,212,500 | | | | 758,316 | |
Lens Technology, Cl A | | | 46,600 | | | | 231,252 | |
Leyard Optoelectronic, Cl A | | | 18,700 | | | | 19,911 | |
Lingyi iTech Guangdong, Cl A | | | 45,100 | | | | 87,759 | |
| LONGi Green Energy Technology, Cl A | | | 44,650 | | | | 506,695 | |
| Luxshare Precision Industry, Cl A | | | 71,643 | | | | 586,945 | |
| Maxscend Microelectronics, Cl A | | | 900 | | | | 58,298 | |
| NAURA Technology Group, Cl A | | | 3,680 | | | | 93,975 | |
| Newland Digital Technology, Cl A | | | 7,900 | | | | 18,617 | |
Ninestar, Cl A | | | 16,100 | | | | 70,086 | |
OFILM Group, Cl A | | | 42,000 | | | | 96,905 | |
Sanan Optoelectronics, Cl A | | | 62,100 | | | | 206,158 | |
| Schedule of Investments | | October 31, 2020 |
| | Global X MSCI China Information Technology ETF | |
| | | Shares | | | Value | |
| COMMON STOCK — continued | | | | | | | | |
| Information Technology — continued | | | | | | | | |
Sangfor Technologies, Cl A | | | 2,510 | | | $ | 71,309 | |
Semiconductor Manufacturing International * | | | 525,300 | | | | 1,541,044 | |
SG Micro, Cl A | | | 900 | | | | 36,638 | |
| Shanghai 2345 Network Holding Group, Cl A | | | 93,460 | | | | 37,684 | |
| Shanghai Baosight Software, Cl A | | | 5,600 | | | | 53,129 | |
Shengyi Technology, Cl A | | | 16,600 | | | | 59,273 | |
Shennan Circuits, Cl A | | | 3,582 | | | | 57,665 | |
| Shenzhen Goodix Technology, Cl A | | | 3,450 | | | | 88,514 | |
| Shenzhen Kaifa Technology, Cl A | | | 8,700 | | | | 27,531 | |
| Shenzhen Kingdom Sci-Tech, Cl A | | | 6,600 | | | | 17,475 | |
| Shenzhen Sunway Communication, Cl A | | | 6,100 | | | | 43,270 | |
| Sunny Optical Technology Group | | | 103,860 | | | | 1,716,971 | |
| Suzhou Dongshan Precision Manufacturing, Cl A | | | 22,800 | | | | 86,144 | |
| Thunder Software Technology, Cl A | | | 2,600 | | | | 33,252 | |
| Tianjin 712 Communication & Broadcasting, Cl A | | | 4,100 | | | | 26,347 | |
| Tianjin Zhonghuan Semiconductor, Cl A | | | 20,900 | | | | 72,848 | |
Tianma Microelectronics, Cl A | | | 38,500 | | | | 81,988 | |
| Tianshui Huatian Technology, Cl A | | | 17,300 | | | | 37,151 | |
| TongFu Microelectronics, Cl A | | | 4,800 | | | | 17,856 | |
Travelsky Technology, Cl H | | | 186,000 | | | | 390,476 | |
Tunghsu Optoelectronic Technology, Cl A * | | | 92,400 | | | | 37,671 | |
| Unigroup Guoxin Microelectronics, Cl A | | | 4,500 | | | | 72,121 | |
Unisplendour, Cl A | | | 20,813 | | | | 68,379 | |
| Universal Scientific Industrial Shanghai, Cl A | | | 7,700 | | | | 25,125 | |
Venustech Group, Cl A | | | 5,700 | | | | 26,252 | |
Visionox Technology, Cl A * | | | 9,100 | | | | 17,707 | |
| Wangsu Science & Technology, Cl A | | | 36,300 | | | | 42,121 | |
| Westone Information Industry, Cl A | | | 5,100 | | | | 14,060 | |
Will Semiconductor, Cl A | | | 4,730 | | | | 139,875 | |
Wingtech Technology, Cl A | | | 7,940 | | | | 119,285 | |
Wonders Information, Cl A * | | | 5,600 | | | | 18,248 | |
| Schedule of Investments | | October 31, 2020 |
| | Global X MSCI China Information Technology ETF | |
| | | Shares | | | Value | |
| COMMON STOCK — continued | | | | | | | | |
| Information Technology — continued | | | | | | | | |
Wuhan Guide Infrared, Cl A | | | 10,470 | | | $ | 52,942 | |
Wuhu Token Science, Cl A | | | 12,100 | | | | 17,998 | |
| WUS Printed Circuit Kunshan, Cl A | | | 10,900 | | | | 29,984 | |
| Wuxi Lead Intelligent Equipment, Cl A | | | 12,000 | | | | 107,469 | |
Wuxi Taiji Industry, Cl A | | | 10,000 | | | | 15,203 | |
Xiaomi, Cl B * | | | 787,700 | | | | 2,234,653 | |
Xinyi Solar Holdings | | | 664,000 | | | | 1,207,296 | |
| Yealink Network Technology, Cl A | | | 4,800 | | | | 43,339 | |
| Yonyou Network Technology, Cl A | | | 35,956 | | | | 231,697 | |
| Zhejiang Dahua Technology, Cl A | | | 46,600 | | | | 157,346 | |
| Zhejiang Jingsheng Mechanical & Electrical, Cl A | | | 6,800 | | | | 29,449 | |
Zhongji Innolight, Cl A | | | 4,000 | | | | 28,255 | |
ZTE, Cl A | | | 40,600 | | | | 195,656 | |
ZTE, Cl H | | | 139,100 | | | | 306,366 | |
TOTAL CHINA | | | | | | | 20,409,603 | |
| HONG KONG— 1.8% | | | | | | | | |
| Information Technology — 1.8% | | | | | | | | |
| Kingboard Laminates Holdings | | | 241,300 | | | | 383,972 | |
| TOTAL COMMON STOCK | | | | | | | | |
(Cost $17,681,427) | | | | | | | 20,793,575 | |
| TOTAL INVESTMENTS — 99.8% | | | | | | | | |
(Cost $17,681,427) | | | | | | $ | 20,793,575 | |
Percentages are based on Net Assets of $20,831,889.
| * | Non-income producing security. |
ADR — American Depositary Receipt
Cl — Class
As of October 31, 2020, all of the Fund’s investments were considered Level 1, in accordance with authoritative guidance on fair value measurements and disclosure under U.S. GAAP.
For the year ended October 31, 2020, there were no transfers in or out of Level 3.
| Schedule of Investments | | October 31, 2020 |
| | Global X MSCI China Communication Services ETF | |
Sector Weightings (Unaudited)†:
† Sector weightings percentages are based on the total market value of investments. Repurchase agreements purchased from cash collateral received for securities lending activity are included in total investments. Please see Note 2 and 7 in Notes to Financial Statements for more detailed information.
| | | Shares | | | Value | |
| COMMON STOCK — 99.9% | | | | | | |
| CHINA— 98.0% | | | | | | |
| Communication Services — 98.0% | | | | | | |
Autohome ADR | | | 6,052 | | | $ | 578,268 | |
Baidu ADR * | | | 11,492 | | | | 1,529,011 | |
Beijing Enlight Media, Cl A | | | 179,300 | | | | 325,598 | |
Beijing Kunlun Tech, Cl A | | | 72,100 | | | | 263,797 | |
Bilibili ADR * | | | 9,250 | | | | 413,198 | |
China Film, Cl A | | | 155,381 | | | | 293,765 | |
China Literature * | | | 600 | | | | 4,913 | |
China Mobile | | | 213,200 | | | | 1,296,270 | |
| China South Publishing & Media Group, Cl A | | | 174,172 | | | | 272,849 | |
China Telecom, Cl H | | | 1,295,800 | | | | 407,713 | |
China Tower, Cl H | | | 2,764,800 | | | | 431,396 | |
China Unicom Hong Kong | | | 566,000 | | | | 347,416 | |
| China United Network Communications, Cl A | | | 442,000 | | | | 314,854 | |
| Chinese Universe Publishing and Media Group, Cl A | | | 140,250 | | | | 242,329 | |
| Focus Media Information Technology, Cl A | | | 403,900 | | | | 563,364 | |
| G-bits Network Technology Xiamen, Cl A | | | 4,774 | | | | 335,258 | |
Giant Network Group, Cl A | | | 119,600 | | | | 338,997 | |
HUYA ADR * (A) | | | 16,610 | | | | 372,064 | |
iQIYI ADR * | | | 20,781 | | | | 513,291 | |
JOYY ADR | | | 6,047 | | | | 552,575 | |
Leo Group, Cl A | | | 553,400 | | | | 261,979 | |
| Schedule of Investments | | October 31, 2020 |
| | Global X MSCI China Communication Services ETF | |
| | | Shares | | | Value | |
| COMMON STOCK — continued | | | | | | | | |
| Communication Services — continued | | | | | | | | |
Mango Excellent Media, Cl A | | | 45,120 | | | $ | 498,619 | |
Momo ADR * | | | 16,862 | | | | 252,930 | |
NanJi E-Commerce, Cl A | | | 130,500 | | | | 359,368 | |
NetEase ADR | | | 17,015 | | | | 1,476,732 | |
Oriental Pearl Group, Cl A | | | 238,000 | | | | 326,278 | |
Perfect World, Cl A | | | 75,810 | | | | 317,788 | |
SINA * | | | 11,073 | | | | 474,478 | |
Tencent Holdings | | | 24,695 | | | | 1,882,015 | |
Tencent Music Entertainment Group ADR * | | | 241 | | | | 3,586 | |
Wanda Film Holding, Cl A * | | | 124,300 | | | | 285,493 | |
Weibo ADR * | | | 9,249 | | | | 384,296 | |
| Wuhu Sanqi Interactive Entertainment Network Technology Group, Cl A | | | 65,051 | | | | 287,550 | |
Youzu Interactive, Cl A | | | 93,600 | | | | 218,895 | |
Zhejiang Century Huatong Group, Cl A * | | | 169,620 | | | | 216,070 | |
| | | | | | | | 16,643,003 | |
| Information Technology — 0.0% | | | | | | | | |
National Agricultural Holdings *(B)(C)(D) | | | 204,200 | | | | 3 | |
TOTAL CHINA | | | | | | | 16,643,006 | |
| HONG KONG— 1.9% | | | | | | | | |
| Communication Services — 1.9% | | | | | | | | |
Alibaba Pictures Group * | | | 2,533,000 | | | | 329,900 | |
| TOTAL COMMON STOCK | | | | | | | | |
(Cost $16,891,396) | | | | | | | 16,972,906 | |
| | | | | | | | | |
SHORT-TERM INVESTMENT(E)(F) — 0.2% | | | | | | | | |
| Fidelity Investments Money Market Government Portfolio, Cl Institutional, 0.010% | | | | | | | | |
(Cost $28,809) | | | 28,809 | | | | 28,809 | |
| | | | | | | | | |
| Schedule of Investments | | October 31, 2020 |
| | Global X MSCI China Communication Services ETF | |
| | | Face Amount | | | Value | |
REPURCHASE AGREEMENT(E) — 1.5% | | | | | | | | |
| BNP Paribas | | | | | | | | |
| 0.060%, dated 10/30/20, to be repurchased on 11/02/20, repurchase price $249,571 (collateralized by U.S. Treasury Obligations, ranging in par value $11,738 - $40,463, 1.625%, 11/15/2022, with a total market value of $254,516) | | | | | | | | |
(Cost $249,571) | | $ | 249,571 | | | $ | 249,571 | |
| TOTAL INVESTMENTS — 101.6% | | | | | | | | |
(Cost $17,169,776) | | | | | | $ | 17,251,286 | |
Percentages are based on Net Assets of $16,984,281.
| * | Non-income producing security. |
| (A) | This security or a partial position of this security is on loan at October 31, 2020. The total value of securities on loan at October 31, 2020 was $277,760. |
| (B) | Level 3 security in accordance with fair value hierarchy. |
| (C) | Security considered illiquid (Unaudited). The total value of such securities as of October 31, 2020 was $3 and represented 0.0% of Net Assets. |
| (D) | Security is fair valued using methods determined in good faith by the Fair Value Committee of the Fund. The total value of such securities as of October 31, 2020, was $3 and represents 0.0% of net assets. |
| (E) | Security was purchased with cash collateral held from securities on loan. The total value of such securities as of October 31, 2020, was $278,380. |
| (F) | The rate reported on the Schedule of Investments is the 7-day effective yield as of October 31, 2020. |
ADR — American Depositary Receipt
Cl — Class
The following is a summary of the level of inputs used as of October 31, 2020, in valuing the Fund’s investments carried at value:
| Investments in Securities | | Level 1 | | | Level 2 | | | Level 3(1) | | | Total | |
| Common Stock | | $ | 16,972,903 | | | $ | — | | | $ | 3 | | | $ | 16,972,906 | |
| Short-Term Investment | | | 28,809 | | | | — | | | | — | | | | 28,809 | |
| Repurchase Agreement | | | — | | | | 249,571 | | | | — | | | | 249,571 | |
| Total Investments in Securities | | $ | 17,001,712 | | | $ | 249,571 | | | $ | 3 | | | $ | 17,251,286 | |
(1) A reconciliation of Level 3 investments and disclosures of significant unobservable inputs are presented when the Fund has a significant amount of Level 3 investments at the beginning and/or end of the period in relation to Net Assets. Management has concluded that Level 3 investments are not material in relation to Net Assets.
For the year ended October 31, 2020, there were no transfers in or out of Level 3.
Amounts designated as “—“ are $0 or have been rounded to $0.
| Schedule of Investments | | October 31, 2020 |
| | Global X MSCI China Utilities ETF | |
Sector Weightings (Unaudited)†:
† Sector weightings percentages are based on the total market value of investments.
| | | Shares | | | Value | |
| COMMON STOCK — 99.7% | | | | | | |
| CHINA— 99.7% | | | | | | |
| Utilities — 99.7% | | | | | | |
Beijing Enterprises Holdings | | | 18,000 | | | $ | 54,082 | |
| Beijing Enterprises Water Group | | | 155,600 | | | | 58,991 | |
CGN Power, Cl H | | | 297,400 | | | | 63,661 | |
| Chengdu Xingrong Environment, Cl A | | | 20,500 | | | | 15,215 | |
China Gas Holdings | | | 43,390 | | | | 132,886 | |
| China Longyuan Power Group, Cl H | | | 94,500 | | | | 64,585 | |
| China National Nuclear Power, Cl A | | | 53,800 | | | | 35,592 | |
| China Power International Development | | | 232,900 | | | | 44,749 | |
China Resources Gas Group | | | 26,920 | | | | 116,638 | |
| China Resources Power Holdings | | | 52,050 | | | | 54,098 | |
China Yangtze Power, Cl A | | | 46,000 | | | | 130,247 | |
ENN Energy Holdings | | | 10,890 | | | | 137,550 | |
GD Power Development, Cl A | | | 100,800 | | | | 29,504 | |
Guangdong Investment | | | 77,060 | | | | 114,077 | |
| Huadian Power International, Cl A | | | 45,300 | | | | 22,730 | |
| Huaneng Power International, Cl A | | | 15,600 | | | | 11,369 | |
| Huaneng Power International, Cl H | | | 106,900 | | | | 39,838 | |
Hubei Energy Group, Cl A | | | 29,100 | | | | 17,209 | |
| Inner Mongolia MengDian HuaNeng Thermal Power, Cl A | | | 39,300 | | | | 15,083 | |
Kunlun Energy | | | 79,260 | | | | 51,104 | |
Luenmei Quantum, Cl A | | | 10,200 | | | | 20,107 | |
SDIC Power Holdings, Cl A | | | 27,200 | | | | 37,533 | |
Shanghai Electric Power, Cl A | | | 17,500 | | | | 18,686 | |
Shenergy, Cl A | | | 32,800 | | | | 25,569 | |
Shenzhen Energy Group, Cl A | | | 26,480 | | | | 21,433 | |
| Sichuan Chuantou Energy, Cl A | | | 22,200 | | | | 33,385 | |
| Schedule of Investments | | October 31, 2020 |
| | Global X MSCI China Utilities ETF | |
| | | | | | | Value | |
| COMMON STOCK — continued | | | | | | | | |
| TOTAL COMMON STOCK | | | | | | | | |
(Cost $1,467,433) | | | | | | $ | 1,365,921 | |
| TOTAL INVESTMENTS — 99.7% | | | | | | | | |
(Cost $1,467,433) | | | | | | $ | 1,365,921 | |
Percentages are based on Net Assets of $1,369,802.
Cl — Class
As of October 31, 2020, all of the Fund’s investments were considered Level 1, in accordance with authoritative guidance on fair value measurements and disclosure under U.S. GAAP.
The following is a reconciliation of investments in which significant unobservable inputs (Level 3) were used in determining fair value:
| | | Investments in | |
| | | Common Stock | |
| Beginning Balance as of October 31, 2019 | | $ | 68,089 | |
| Transfers out of Level 3 | | | (63,661 | ) |
| Transfers into Level 3 | | | - | |
| Net purchases | | | 16,219 | |
| Net sales | | | (8,729 | ) |
| Realized gain/(loss) | | | (365 | ) |
| Change in unrealized appreciation/(depreciation) | | | (11,553 | ) |
| Ending Balance as of October 31, 2020 | | $ | - | |
| Schedule of Investments | | October 31, 2020 |
| | Global X MSCI China Real Estate ETF | |
Sector Weightings (Unaudited)†:
† Sector weightings percentages are based on the total market value of investments.
| | | Shares | | | Value | |
| COMMON STOCK — 99.8% | | | | | | |
| CHINA— 96.5% | | | | | | |
| Real Estate — 96.5% | | | | | | |
Agile Group Holdings | | | 101,700 | | | $ | 139,012 | |
| Beijing Capital Development, Cl A | | | 9,400 | | | | 8,661 | |
China Aoyuan Group | | | 103,800 | | | | 97,176 | |
China Enterprise | | | 15,600 | | | | 9,132 | |
China Evergrande Group | | | 134,300 | | | | 266,700 | |
| China Fortune Land Development, Cl A | | | 18,720 | | | | 39,334 | |
China Jinmao Holdings Group | | | 417,600 | | | | 210,554 | |
| China Merchants Property Operation & Service, Cl A | | | 2,200 | | | | 8,361 | |
| China Merchants Shekou Industrial Zone Holdings, Cl A | | | 32,900 | | | | 69,080 | |
| China Overseas Land & Investment | | | 231,900 | | | | 580,135 | |
| China Overseas Property Holdings | | | 17,100 | | | | 12,370 | |
China Resources Land | | | 159,700 | | | | 649,728 | |
China Vanke, Cl A | | | 13,900 | | | | 57,188 | |
China Vanke, Cl H | | | 90,600 | | | | 280,392 | |
CIFI Holdings Group | | | 242,400 | | | | 167,230 | |
Country Garden Holdings | | | 515,100 | | | | 633,676 | |
| Financial Street Holdings, Cl A | | | 28,700 | | | | 28,587 | |
Gemdale, Cl A | | | 29,600 | | | | 59,012 | |
| Grandjoy Holdings Group, Cl A | | | 11,400 | | | | 7,763 | |
| Greenland Holdings Group, Cl A | | | 51,200 | | | | 47,329 | |
Guangzhou R&F Properties | | | 143,500 | | | | 181,715 | |
| Jiangsu Zhongnan Construction Group, Cl A | | | 13,700 | | | | 18,454 | |
Jinke Properties Group, Cl A | | | 40,300 | | | | 46,642 | |
Kaisa Group Holdings | | | 219,000 | | | | 101,665 | |
KE Holdings ADR * | | | 5,588 | | | | 389,763 | |
| Schedule of Investments | | October 31, 2020 |
| | Global X MSCI China Real Estate ETF | |
| | | Shares | | | Value | |
| COMMON STOCK — continued | | | | | | | | |
| Real Estate — continued | | | | | | | | |
KWG Group Holdings | | | 100,100 | | | $ | 132,178 | |
KWG Living Group Holdings * | | | 50,050 | | | | 39,240 | |
Logan Property Holdings | | | 108,100 | | | | 168,948 | |
Longfor Group Holdings | | | 125,800 | | | | 687,007 | |
| Poly Developments and Holdings Group, Cl A | | | 49,753 | | | | 114,124 | |
Poly Property Services | | | 7,000 | | | | 50,323 | |
| RiseSun Real Estate Development, Cl A | | | 33,200 | | | | 34,855 | |
Seazen Group | | | 176,200 | | | | 131,783 | |
Seazen Holdings, Cl A | | | 11,200 | | | | 54,376 | |
| Shanghai Lujiazui Finance & Trade Zone Development, Cl B | | | 107,469 | | | | 88,340 | |
| Shanghai Zhangjiang High-Tech Park Development, Cl A | | | 9,000 | | | | 25,416 | |
Shenzhen Investment | | | 292,900 | | | | 89,137 | |
Shimao Property Holdings | | | 77,600 | | | | 273,682 | |
| Sichuan Languang Development, Cl A | | | 11,100 | | | | 8,172 | |
Sino-Ocean Group Holding | | | 316,200 | | | | 60,346 | |
SOHO China * | | | 225,500 | | | | 60,193 | |
Sunac China Holdings | | | 155,600 | | | | 573,855 | |
Xinhu Zhongbao, Cl A | | | 81,800 | | | | 39,091 | |
Yango Group, Cl A | | | 14,700 | | | | 15,059 | |
Youngor Group, Cl A | | | 10,300 | | | | 10,967 | |
Yuexiu Property | | | 623,100 | | | | 120,525 | |
Yuzhou Properties | | | 180,900 | | | | 69,749 | |
Zhenro Properties Group | | | 104,400 | | | | 60,178 | |
Zhongtian Financial Group, Cl A * | | | 19,300 | | | | 8,762 | |
TOTAL CHINA | | | | | | | 7,025,965 | |
| Schedule of Investments | | October 31, 2020 |
| | Global X MSCI China Real Estate ETF | |
| | | Shares | | | Value | |
| COMMON STOCK — continued | | | | | | | | |
| HONG KONG— 3.3% | | | | | | | | |
| Real Estate — 3.3% | | | | | | | | |
Wharf Holdings | | | 117,600 | | | $ | 242,635 | |
| TOTAL COMMON STOCK | | | | | | | | |
(Cost $8,060,464) | | | | | | | 7,268,600 | |
| TOTAL INVESTMENTS — 99.8% | | | | | | | | |
(Cost $8,060,464) | | | | | | $ | 7,268,600 | |
Percentages are based on Net Assets of $7,280,617.
| * | Non-income producing security. |
ADR — American Depositary Receipt
Cl — Class
As of October 31, 2020, all of the Fund’s investments were considered Level 1, in accordance with authoritative guidance on fair value measurements and disclosure under U.S. GAAP.
For the year ended October 31, 2020, there were no transfers in or out of Level 3.
| Schedule of Investments | | October 31, 2020 |
| | Global X MSCI China Large-Cap 50 ETF | |
Sector Weightings (Unaudited)†:
† Sector weightings percentages are based on the total market value of investments.
| | | Shares | | | Value | |
| COMMON STOCK — 100.1% | | | | | | |
| CHINA— 99.4% | | | | | | |
| Communication Services — 17.0% | | | | | | |
Baidu ADR * | | | 956 | | | $ | 127,196 | |
China Mobile | | | 19,860 | | | | 120,750 | |
NetEase ADR | | | 1,460 | | | | 126,713 | |
Tencent Holdings | | | 6,900 | | | | 525,852 | |
| | | | | | | | 900,511 | |
| Consumer Discretionary — 34.3% | | | | | | | | |
Alibaba Group Holding ADR * | | | 1,734 | | | | 528,331 | |
ANTA Sports Products | | | 4,200 | | | | 46,198 | |
| China International Travel Service, Cl A | | | 1,800 | | | | 53,600 | |
Geely Automobile Holdings | | | 19,500 | | | | 40,032 | |
JD.com ADR * | | | 2,669 | | | | 217,577 | |
Meituan Dianping, Cl B * | | | 9,149 | | | | 340,012 | |
New Oriental Education & Technology Group ADR * | | | 626 | | | | 100,398 | |
NIO ADR * | | | 3,492 | | | | 106,785 | |
Pinduoduo ADR * | | | 771 | | | | 69,375 | |
| Schedule of Investments | | October 31, 2020 |
| | Global X MSCI China Large-Cap 50 ETF | |
| | | Shares | | | Value | |
| COMMON STOCK — continued | | | | | | | | |
| Consumer Discretionary — continued | | | | | | | | |
| Shenzhou International Group Holdings | | | 4,000 | | | $ | 69,067 | |
TAL Education Group ADR * | | | 1,513 | | | | 100,554 | |
Trip.com Group ADR * | | | 1,873 | | | | 53,867 | |
Yum China Holdings | | | 1,779 | | | | 94,696 | |
| | | | | | | | 1,820,492 | |
| Consumer Staples — 11.3% | | | | | | | | |
China Mengniu Dairy | | | 15,100 | | | | 70,974 | |
| Foshan Haitian Flavouring & Food, Cl A | | | 3,040 | | | | 72,729 | |
Kweichow Moutai, Cl A | | | 1,131 | | | | 282,067 | |
Muyuan Foodstuff, Cl A | | | 3,480 | | | | 36,836 | |
Wuliangye Yibin, Cl A | | | 3,738 | | | | 136,402 | |
| | | | | | | | 599,008 | |
| Energy — 1.1% | | | | | | | | |
CNOOC | | | 66,900 | | | | 60,733 | |
| Financials — 17.7% | | | | | | | | |
Bank of China, Cl H | | | 289,200 | | | | 91,367 | |
China Construction Bank, Cl H | | | 279,900 | | | | 193,101 | |
China Life Insurance, Cl H | | | 31,350 | | | | 68,078 | |
China Merchants Bank, Cl H | | | 16,650 | | | | 86,526 | |
CITIC Securities, Cl A | | | 11,200 | | | | 47,886 | |
| Industrial & Commercial Bank of China, Cl H | | | 203,000 | | | | 114,133 | |
Industrial Bank, Cl A | | | 21,100 | | | | 56,088 | |
Ping An Bank, Cl A | | | 20,800 | | | | 55,135 | |
| Ping An Insurance Group of China, Cl H | | | 17,940 | | | | 184,030 | |
| Shanghai Pudong Development Bank, Cl A | | | 30,800 | | | | 42,592 | |
| | | | | | | | 938,936 | |
| Health Care — 4.8% | | | | | | | | |
CSPC Pharmaceutical Group | | | 33,120 | | | | 34,893 | |
| Jiangsu Hengrui Medicine, Cl A | | | 5,396 | | | | 71,590 | |
| Shenzhen Mindray Bio-Medical Electronics, Cl A | | | 1,160 | | | | 67,006 | |
Wuxi Biologics Cayman * | | | 2,880 | | | | 80,441 | |
| | | | | | | | 253,930 | |
| Schedule of Investments | | October 31, 2020 |
| | Global X MSCI China Large-Cap 50 ETF | |
| | | Shares | | | Value | |
| COMMON STOCK — continued | | | | | | | | |
| Industrials — 2.4% | | | | | | | | |
| Contemporary Amperex Technology, Cl A | | | 2,400 | | | $ | 88,588 | |
ZTO Express Cayman ADR * | | | 1,338 | | | | 38,775 | |
| | | | | | | | 127,363 | |
| Information Technology — 6.0% | | | | | | | | |
| Hangzhou Hikvision Digital Technology, Cl A | | | 9,700 | | | | 65,041 | |
| Luxshare Precision Industry, Cl A | | | 7,799 | | | | 63,894 | |
Semiconductor Manufacturing International * | | | 11,800 | | | | 34,617 | |
| Sunny Optical Technology Group | | | 3,340 | | | | 55,216 | |
Xiaomi, Cl B * | | | 34,600 | | | | 98,158 | |
| | | | | | | | 316,926 | |
| Real Estate — 3.6% | | | | | | | | |
| China Overseas Land & Investment | | | 17,900 | | | | 44,780 | |
China Resources Land | | | 14,100 | | | | 57,364 | |
China Vanke, Cl A | | | 10,500 | | | | 43,200 | |
Sunac China Holdings | | | 12,950 | | | | 47,760 | |
| | | | | | | | 193,104 | |
| Utilities — 1.2% | | | | | | | | |
China Yangtze Power, Cl A | | | 22,200 | | | | 62,858 | |
TOTAL CHINA | | | | | | | 5,273,861 | |
| HONG KONG— 0.7% | | | | | | | | |
| Health Care — 0.7% | | | | | | | | |
Sino Biopharmaceutical | | | 39,200 | | | | 39,529 | |
| TOTAL COMMON STOCK | | | | | | | | |
(Cost $4,362,476) | | | | | | | 5,313,390 | |
| TOTAL INVESTMENTS — 100.1% | | | | | | | | |
(Cost $4,362,476) | | | | | | $ | 5,313,390 | |
Percentages are based on Net Assets of $5,309,667.
| * | Non-income producing security. |
ADR — American Depositary Receipt
Cl — Class
As of October 31, 2020, all of the Fund’s investments were considered Level 1, in accordance with authoritative guidance on fair value measurements and disclosure under U.S. GAAP.
For the year ended October 31, 2020, there were no transfers in or out of Level 3.
| Schedule of Investments | | October 31, 2020 |
| | Global X MSCI Greece ETF | |
Sector Weightings (Unaudited)†:
† Sector weightings percentages are based on the total market value of investments. Repurchase agreements purchased from cash collateral received for securities lending activity are included in total investments. Please see Note 2 and 7 in Notes to Financial Statements for more detailed information.
| | | Shares | | | Value | |
| COMMON STOCK — 99.7% | | | | | | |
| GREECE— 93.8% | | | | | | |
| Communication Services — 20.6% | | | | | | |
| Hellenic Telecommunications Organization | | | 1,691,053 | | | $ | 22,495,370 | |
| Consumer Discretionary — 20.7% | | | | | | | | |
FF Group *(A)(B)(C) | | | 452,712 | | | | 5,273 | |
FF Group ADR *(A)(B)(C) | | | 200,300 | | | | 2,333 | |
JUMBO | | | 445,179 | | | | 6,222,799 | |
JUMBO ADR (D) | | | 340,000 | | | | 4,752,588 | |
OPAP | | | 747,128 | | | | 6,026,770 | |
OPAP ADR | | | 1,404,900 | | | | 5,521,257 | |
| | | | | | | | 22,531,020 | |
| Consumer Staples — 2.3% | | | | | | | | |
Sarantis | | | 258,433 | | | | 2,543,750 | |
| Energy — 8.2% | | | | | | | | |
GasLog (D) | | | 372,448 | | | | 886,426 | |
GasLog Partners | | | 287,418 | | | | 922,612 | |
| Schedule of Investments | | October 31, 2020 |
| | Global X MSCI Greece ETF | |
| | | Shares | | | Value | |
| COMMON STOCK — continued | | | | | | | | |
| Energy — continued | | | | | | | | |
Hellenic Petroleum | | | 482,373 | | | $ | 2,359,946 | |
| Motor Oil Hellas Corinth Refineries | | | 228,088 | | | | 2,125,506 | |
Motor Oil Hellas Corinth Refineries ADR (D) | | | 368,300 | | | | 1,716,057 | |
Tsakos Energy Navigation (D) | | | 114,203 | | | | 887,357 | |
| | | | | | | | 8,897,904 | |
| Financials — 14.2% | | | | | | | | |
Alpha Bank AE * | | | 8,702,007 | | | | 4,389,117 | |
Eurobank Ergasias * | | | 11,311,769 | | | | 3,751,352 | |
| Hellenic Exchanges - Athens Stock Exchange | | | 492,244 | | | | 1,462,145 | |
National Bank of Greece * | | | 4,004,627 | | | | 4,182,449 | |
Piraeus Bank * | | | 2,275,706 | | | | 1,736,310 | |
| | | | | | | | 15,521,373 | |
| Industrials — 11.6% | | | | | | | | |
Aegean Airlines * | | | 262,045 | | | | 805,842 | |
Ellaktor * (D) | | | 1,180,912 | | | | 1,843,283 | |
GEK Terna Holding Real Estate Construction * | | | 453,298 | | | | 3,057,259 | |
Mytilineos Holdings | | | 207,821 | | | | 2,270,712 | |
Mytilineos Holdings ADR | | | 426,200 | | | | 4,656,789 | |
| | | | | | | | 12,633,885 | |
| Real Estate — 2.9% | | | | | | | | |
LAMDA Development * | | | 541,788 | | | | 3,187,063 | |
| Utilities — 13.3% | | | | | | | | |
| Athens Water Supply & Sewage | | | 343,155 | | | | 2,658,164 | |
Holding ADMIE IPTO | | | 953,111 | | | | 2,353,689 | |
Public Power * (D) | | | 853,661 | | | | 4,773,056 | |
Terna Energy | | | 357,582 | | | | 4,765,094 | |
| | | | | | | | 14,550,003 | |
TOTAL GREECE | | | | | | | 102,360,368 | |
| UNITED STATES— 5.9% | | | | | | | | |
| Energy — 2.3% | | | | | | | | |
Dorian LPG * | | | 301,147 | | | | 2,469,405 | |
| Materials — 3.6% | | | | | | | | |
Titan Cement International * | | | 315,277 | | | | 3,914,888 | |
| Schedule of Investments | | October 31, 2020 |
| | Global X MSCI Greece ETF | |
| | | Shares/Face Amount | | | Value | |
| COMMON STOCK — continued | | | | | | | | |
TOTAL UNITED STATES | | | | | | $ | 6,384,293 | |
| TOTAL COMMON STOCK | | | | | | | | |
(Cost $194,244,240) | | | | | | | 108,744,661 | |
| | | | | | | | | |
SHORT-TERM INVESTMENT(E)(F) — 0.4% | | | | | | | | |
| Fidelity Investments Money Market Government Portfolio, Cl Institutional, 0.010% | | | | | | | | |
(Cost $385,653) | | | 385,653 | | | | 385,653 | |
| | | | | | | | | |
REPURCHASE AGREEMENT(E) — 3.1% | | | | | | | | |
| BNP Paribas | | | | | | | | |
| 0.060%, dated 10/30/20, to be repurchased on 11/02/20, repurchase price $3,340,892 (collateralized by U.S. Treasury Obligations, ranging in par value $157,124 - $541,651, 1.625%, 11/15/2022, with a total market value of $3,407,030) | | | | | | | | |
(Cost $3,340,874) | | $ | 3,340,874 | | | | 3,340,874 | |
| TOTAL INVESTMENTS — 103.2% | | | | | | | | |
(Cost $197,970,767) | | | | | | $ | 112,471,188 | |
Percentages are based on Net Assets of $109,015,603.
| * | Non-income producing security. |
| (A) | Level 3 security in accordance with fair value hierarchy. |
| (B) | Security considered illiquid (Unaudited). The total value of such securities as of October 31, 2020 was $7,606 and represented 0.0% of Net Assets. |
| (C) | Security is fair valued using methods determined in good faith by the Fair Value Committee of the Fund. The total value of such securities as of October 31, 2020, was $7,606 and represents 0.0% of net assets. |
| (D) | This security or a partial position of this security is on loan at October 31, 2020. The total value of securities on loan at October 31, 2020 was $3,532,659. |
| (E) | Security was purchased with cash collateral held from securities on loan. The total value of such securities as of October 31, 2020, was $3,726,527. |
| (F) | The rate reported on the Schedule of Investments is the 7-day effective yield as of October 31, 2020. |
| Schedule of Investments | | October 31, 2020 |
| | Global X MSCI Greece ETF | |
ADR — American Depositary Receipt
Cl — Class
The following is a summary of the level of inputs used as of October 31, 2020, in valuing the Fund’s investments carried at value:
| Investments in Securities | | Level 1 | | | Level 2 | | | Level 3(1) | | | Total | |
| Common Stock | | $ | 108,737,055 | | | $ | — | | | $ | 7,606 | | | $ | 108,744,661 | |
| Short-Term Investment | | | 385,653 | | | | — | | | | — | | | | 385,653 | |
| Repurchase Agreement | | | — | | | | 3,340,874 | | | | — | | | | 3,340,874 | |
| Total Investments in Securities | | $ | 109,122,708 | | | $ | 3,340,874 | | | $ | 7,606 | | | $ | 112,471,188 | |
| (1) | A reconciliation of Level 3 investments and disclosures of significant unobservable inputs are presented when the Fund has a significant amount of Level 3 investments at the beginning and/or end of the period in relation to Net Assets. Management has concluded that Level 3 investments are not material in relation to Net Assets. |
For the year ended October 31, 2020, there were no transfers in or out of Level 3.
Amounts designated as “—“ are $0 or have been rounded to $0.
| Schedule of Investments | | October 31, 2020 |
| | Global X MSCI Norway ETF | |
Sector Weightings (Unaudited)†:
† Sector weightings percentages are based on the total market value of investments. Repurchase agreements purchased from cash collateral received for securities lending activity are included in total investments. Please see Note 2 and 7 in Notes to Financial Statements for more detailed information.
| | | Shares | | | Value | |
| COMMON STOCK — 99.9% | | | | | | |
| BRAZIL— 4.9% | | | | | | |
| Materials — 4.9% | | | | | | |
Yara International | | | 46,881 | | | $ | 1,630,733 | |
| FAROE ISLANDS— 2.6% | | | | | | | | |
| Consumer Staples — 2.6% | | | | | | | | |
Bakkafrost P/F | | | 15,578 | | | | 886,553 | |
| FRANCE— 3.2% | | | | | | | | |
| Communication Services — 3.2% | | | | | | | | |
Adevinta, Cl B * | | | 68,572 | | | | 1,058,116 | |
| NORWAY— 87.1% | | | | | | | | |
| Communication Services — 12.9% | | | | | | | | |
Schibsted, Cl B | | | 30,149 | | | | 1,080,574 | |
Telenor | | | 212,005 | | | | 3,264,738 | |
| | | | | | | | 4,345,312 | |
| Schedule of Investments | | October 31, 2020 |
| | Global X MSCI Norway ETF | |
| | | Shares | | | Value | |
| COMMON STOCK — continued | | | | | | | | |
| Consumer Discretionary — 0.8% | | | | | | | | |
Europris | | | 49,099 | | | $ | 254,257 | |
| Consumer Staples — 15.8% | | | | | | | | |
Austevoll Seafood | | | 31,075 | | | | 211,147 | |
Grieg Seafood (A) | | | 15,207 | | | | 107,305 | |
Leroy Seafood Group | | | 93,468 | | | | 438,453 | |
Mowi | | | 127,336 | | | | 2,006,849 | |
Norway Royal Salmon | | | 3,955 | | | | 84,737 | |
Orkla | | | 172,838 | | | | 1,628,778 | |
Salmar | | | 16,207 | | | | 818,077 | |
| | | | | | | | 5,295,346 | |
| Energy — 13.3% | | | | | | | | |
BW Offshore | | | 27,630 | | | | 65,904 | |
DNO International (A) | | | 221,655 | | | | 91,525 | |
Equinor | | | 294,810 | | | | 3,739,541 | |
Frontline | | | 32,217 | | | | 176,777 | |
Ocean Yield | | | 23,926 | | | | 52,814 | |
TGS Nopec Geophysical | | | 34,899 | | | | 321,284 | |
| | | | | | | | 4,447,845 | |
| Financials — 22.5% | | | | | | | | |
Aker, Cl A | | | 7,589 | | | | 302,167 | |
DnB * | | | 278,209 | | | | 3,745,796 | |
Gjensidige Forsikring | | | 61,084 | | | | 1,158,563 | |
Norwegian Finance Holding | | | 36,049 | | | | 257,955 | |
Protector Forsikring | | | 24,895 | | | | 117,849 | |
Sbanken | | | 22,664 | | | | 143,445 | |
Sparebank 1 Nord Norge | | | 34,709 | | | | 231,663 | |
Sparebank 1 Oestlandet | | | 10,049 | | | | 89,464 | |
SpareBank 1 SMN | | | 42,301 | | | | 362,434 | |
SpareBank 1 SR-Bank * | | | 50,182 | | | | 397,934 | |
Storebrand | | | 143,879 | | | | 754,101 | |
| | | | | | | | 7,561,371 | |
| Schedule of Investments | | October 31, 2020 |
| | Global X MSCI Norway ETF | |
| | | Shares | | | Value | |
| COMMON STOCK — continued | | | | | | |
| Industrials — 9.7% | | | | | | |
Bonheur | | | 5,542 | | | $ | 117,115 | |
Golden Ocean Group | | | 33,173 | | | | 107,305 | |
Hexagon Composites | | | 23,973 | | | | 109,246 | |
Kongsberg Gruppen | | | 25,624 | | | | 414,430 | |
NEL, Cl A * | | | 374,492 | | | | 708,329 | |
Norwegian Air Shuttle * (A) | | | 144,180 | | | | 9,128 | |
Stolt-Nielsen | | | 10,460 | | | | 96,296 | |
TOMRA Systems | | | 32,165 | | | | 1,294,494 | |
Veidekke | | | 29,703 | | | | 340,569 | |
Wallenius Wilhelmsen, Cl B | | | 30,527 | | | | 58,123 | |
| | | | | | | | 3,255,035 | |
| Information Technology — 2.7% | | | | | | | | |
Atea | | | 27,878 | | | | 321,977 | |
Crayon Group Holding * | | | 8,156 | | | | 90,273 | |
Nordic Semiconductor * | | | 47,491 | | | | 498,815 | |
| | | | | | | | 911,065 | |
| Materials — 4.9% | | | | | | | | |
Borregaard | | | 31,852 | | | | 425,855 | |
Elkem | | | 68,491 | | | | 144,737 | |
Norsk Hydro | | | 387,043 | | | | 1,082,312 | |
| | | | | | | | 1,652,904 | |
| Real Estate — 2.2% | | | | | | | | |
Entra | | | 49,357 | | | | 643,370 | |
Selvaag Bolig | | | 21,096 | | | | 104,941 | |
| | | | | | | | 748,311 | |
| Utilities — 2.3% | | | | | | | | |
Fjordkraft Holding | | | 23,841 | | | | 195,290 | |
Scatec Solar * | | | 26,770 | | | | 588,115 | |
| | | | | | | | 783,405 | |
TOTAL NORWAY | | | | | | | 29,254,851 | |
| Schedule of Investments | | October 31, 2020 |
| | Global X MSCI Norway ETF | |
| | | Shares/Face Amount | | | Value | |
| COMMON STOCK — continued | | | | | | |
| SINGAPORE— 0.5% | | | | | | |
| Energy — 0.5% | | | | | | |
BW LPG | | | 32,984 | | | $ | 143,201 | |
Hafnia | | | 23,784 | | | | 35,133 | |
TOTAL SINGAPORE | | | | | | | 178,334 | |
| UNITED KINGDOM— 1.6% | | | | | | | | |
| Energy — 1.6% | | | | | | | | |
FLEX LNG | | | 9,120 | | | | 58,247 | |
Subsea 7 | | | 72,008 | | | | 473,683 | |
TOTAL UNITED KINGDOM | | | | | | | 531,930 | |
| TOTAL COMMON STOCK | | | | | | | | |
(Cost $47,063,424) | | | | | | | 33,540,517 | |
| | | | | | | | | |
SHORT-TERM INVESTMENT(B)(C) — 0.1% | | | | | | | | |
| Fidelity Investments Money Market Government Portfolio, Cl Institutional, 0.010% | | | | | | | | |
(Cost $15,770) | | | 15,770 | | | | 15,770 | |
| | | | | | | | | |
REPURCHASE AGREEMENT(B) — 0.4% | | | | | | | | |
| BNP Paribas | | | | | | | | |
0.060%, dated 10/30/20, to be repurchased on 11/02/20, repurchase price $136,611 (collateralized by U.S. Treasury Obligations, ranging in par value $6,425 - $22,149, 1.625%, 11/15/2022, with a total market value of $139,319)
| | | | | | | | |
(Cost $136,611) | | $ | 136,611 | | | | 136,611 | |
| TOTAL INVESTMENTS — 100.4% | | | | | | | | |
(Cost $47,215,805) | | | | | | $ | 33,692,898 | |
Percentages are based on Net Assets of $33,569,933.
| Schedule of Investments | | October 31, 2020 |
| | Global X MSCI Norway ETF | |
| * | Non-income producing security. |
| (A) | This security or a partial position of this security is on loan at October 31, 2020. The total value of securities on loan at October 31, 2020 was $144,944. |
| (B) | Security was purchased with cash collateral held from securities on loan. The total value of such securities as of October 31, 2020, was $152,381. |
| (C) | The rate reported on the Schedule of Investments is the 7-day effective yield as of October 31, 2020. |
Cl — Class
The following is a summary of the level of inputs used as of October 31, 2020, in valuing the Fund’s investments carried at value:
| Investments in Securities | | Level 1 | | | Level 2 | | | Level 3 | | | Total | |
| Common Stock | | $ | 33,540,517 | | | $ | — | | | $ | — | | | $ | 33,540,517 | |
| Short-Term Investment | | | 15,770 | | | | — | | | | — | | | | 15,770 | |
| Repurchase Agreement | | | — | | | | 136,611 | | | | — | | | | 136,611 | |
| Total Investments in Securities | | $ | 33,556,287 | | | $ | 136,611 | | | $ | — | | | $ | 33,692,898 | |
For the year ended October 31, 2020, there were no transfers in or out of Level 3.
Amounts designated as “—“ are $0 or have been rounded to $0.
| Schedule of Investments | | October 31, 2020 |
| | Global X DAX Germany ETF | |
Sector Weightings (Unaudited)†:
† Sector weightings percentages are based on the total market value of investments.
| | | Shares | | | Value | |
| COMMON STOCK — 95.6% | | | | | | |
| GERMANY— 85.4% | | | | | | |
| Communication Services — 4.8% | | | | | | |
Deutsche Telekom | | | 75,007 | | | $ | 1,141,950 | |
| Consumer Discretionary — 14.1% | | | | | | | | |
adidas | | | 4,218 | | | | 1,252,900 | |
Bayerische Motoren Werke | | | 7,407 | | | | 506,293 | |
Continental | | | 2,485 | | | | 264,224 | |
Daimler | | | 19,454 | | | | 1,006,148 | |
Delivery Hero * | | | 3,066 | | | | 352,786 | |
| | | | | | | | 3,382,351 | |
| Consumer Staples — 1.0% | | | | | | | | |
Beiersdorf | | | 2,282 | | | | 238,971 | |
| Financials — 14.6% | | | | | | | | |
Allianz | | | 9,577 | | | | 1,685,189 | |
Deutsche Bank | | | 47,645 | | | | 438,500 | |
Deutsche Boerse | | | 4,242 | | | | 624,332 | |
| Schedule of Investments | | October 31, 2020 |
| | Global X DAX Germany ETF | |
| | | Shares | | | Value | |
| COMMON STOCK — continued | | | | | | | | |
| Financials — continued | | | | | | | | |
| Muenchener Rueckversicherungs-Gesellschaft in Muenchen | | | 3,243 | | | $ | 758,543 | |
| | | | | | | | 3,506,564 | |
| Health Care — 9.3% | | | | | | | | |
Bayer | | | 22,862 | | | | 1,074,819 | |
Fresenius & KGaA | | | 9,489 | | | | 351,936 | |
| Fresenius Medical Care & KGaA | | | 4,577 | | | | 349,641 | |
Merck KGaA | | | 2,984 | | | | 441,962 | |
| | | | | | | | 2,218,358 | |
| Industrials — 14.4% | | | | | | | | |
Deutsche Post | | | 22,882 | | | | 1,013,921 | |
MTU Aero Engines | | | 1,236 | | | | 210,996 | |
Siemens | | | 19,077 | | | | 2,237,739 | |
| | | | | | | | 3,462,656 | |
| Information Technology — 11.2% | | | | | | | | |
Infineon Technologies | | | 30,110 | | | | 838,259 | |
SAP | | | 17,245 | | | | 1,837,836 | |
| | | | | | | | 2,676,095 | |
| Materials — 6.5% | | | | | | | | |
BASF | | | 21,377 | | | | 1,172,090 | |
Covestro | | | 3,885 | | | | 185,407 | |
HeidelbergCement | | | 3,449 | | | | 197,343 | |
| | | | | | | | 1,554,840 | |
| Real Estate — 4.8% | | | | | | | | |
Deutsche Wohnen | | | 7,371 | | | | 372,036 | |
Vonovia | | | 12,280 | | | | 784,165 | |
| | | | | | | | 1,156,201 | |
| Utilities — 4.7% | | | | | | | | |
E.ON | | | 51,593 | | | | 537,998 | |
RWE | | | 15,638 | | | | 579,084 | |
| | | | | | | | 1,117,082 | |
TOTAL GERMANY | | | | | | | 20,455,068 | |
| Schedule of Investments | | October 31, 2020 |
| | Global X DAX Germany ETF | |
| | | Shares | | | Value | |
| COMMON STOCK — continued | | | | | | | | |
| UNITED KINGDOM— 10.2% | | | | | | | | |
| Materials — 10.2% | | | | | | | | |
Linde | | | 11,181 | | | $ | 2,451,151 | |
| TOTAL COMMON STOCK | | | | | | | | |
(Cost $26,322,350) | | | | | | | 22,906,219 | |
| PREFERRED STOCK — 4.3% | | | | | | | | |
| GERMANY— 4.3% | | | | | | | | |
| Consumer Discretionary — 2.7% | | | | | | | | |
Volkswagen (A) | | | 4,354 | | | | 634,476 | |
| Consumer Staples — 1.6% | | | | | | | | |
Henkel & KGaA (A) | | | 4,027 | | | | 391,780 | |
| TOTAL PREFERRED STOCK | | | | | | | | |
(Cost $1,334,387) | | | | | | | 1,026,256 | |
| TOTAL INVESTMENTS — 99.9% | | | | | | | | |
(Cost $27,656,737) | | | | | | $ | 23,932,475 | |
Percentages are based on Net Assets of $23,947,960.
| * | Non-income producing security. |
| (A) | There’s currently no stated interest rate. |
As of October 31, 2020, all of the Fund’s investments were considered Level 1, in accordance with authoritative guidance on fair value measurements and disclosure under U.S. GAAP.
For the year ended October 31, 2020, there were no transfers in or out of Level 3.
| Schedule of Investments | | October 31, 2020 |
| | Global X MSCI Portugal ETF | |
Sector Weightings (Unaudited)†:
† Sector weightings percentages are based on the total market value of investments. Repurchase agreements purchased from cash collateral received for securities lending activity are included in total investments. Please see Note 2 and 7 in Notes to Financial Statements for more detailed information.
| | | Shares | | | Value | |
| COMMON STOCK — 100.0% | | | | | | |
| NETHERLANDS— 4.7% | | | | | | |
| Communication Services — 4.7% | | | | | | |
Altice Europe * | | | 126,937 | | | $ | 625,310 | |
| PORTUGAL— 89.3% | | | | | | | | |
| Communication Services — 6.0% | | | | | | | | |
NOS SGPS | | | 161,542 | | | | 554,731 | |
Pharol SGPS * (A) | | | 1,226,779 | | | | 128,611 | |
Sonaecom | | | 58,653 | | | | 102,483 | |
| | | | | | | | 785,825 | |
| Consumer Discretionary — 0.9% | | | | | | | | |
Ibersol SGPS * | | | 26,138 | | | | 111,740 | |
| Consumer Staples — 9.3% | | | | | | | | |
Jeronimo Martins | | | 41,608 | | | | 661,090 | |
Sonae | | | 959,991 | | | | 564,714 | |
| | | | | | | | 1,225,804 | |
| Energy — 16.9% | | | | | | | | |
Galp Energia | | | 275,456 | | | | 2,231,294 | |
| Schedule of Investments | | October 31, 2020 |
| | Global X MSCI Portugal ETF | |
| | | Shares | | | Value | |
| COMMON STOCK — continued | | | | | | | | |
| Financials — 3.7% | | | | | | | | |
Banco Comercial Portugues, Cl R * (A) | | | 5,528,780 | | | $ | 485,591 | |
Banco Espirito Santo *(B)(C)(D) | | | 2,085,614 | | | | — | |
BANIF - Banco Internacional do Funchal *(B)(C)(D) | | | 55,479,410 | | | | 13 | |
| | | | | | | | 485,604 | |
| Industrials — 6.6% | | | | | | | | |
CTT-Correios de Portugal * | | | 205,656 | | | | 503,072 | |
Mota-Engil * (A) | | | 151,992 | | | | 194,399 | |
Sonae Capital * | | | 160,570 | | | | 144,021 | |
Teixeira Duarte * (A) | | | 310,651 | | | | 31,482 | |
| | | | | | | | 872,974 | |
| Materials — 15.8% | | | | | | | | |
Altri | | | 129,515 | | | | 499,968 | |
Corticeira Amorim SGPS | | | 55,952 | | | | 642,632 | |
Navigator * | | | 251,440 | | | | 553,855 | |
Ramada Investimentos E Industria * | | | 12,072 | | | | 41,624 | |
| Semapa-Sociedade de Investimento e Gestao | | | 44,812 | | | | 336,685 | |
| | | | | | | | 2,074,764 | |
| Utilities — 30.1% | | | | | | | | |
Energias de Portugal (A) | | | 677,526 | | | | 3,339,961 | |
| REN - Redes Energeticas Nacionais | | | 235,533 | | | | 618,683 | |
| | | | | | | | 3,958,644 | |
TOTAL PORTUGAL | | | | | | | 11,746,649 | |
| SPAIN— 6.0% | | | | | | | | |
| Utilities — 6.0% | | | | | | | | |
EDP Renovaveis | | | 41,843 | | | | 795,450 | |
| TOTAL COMMON STOCK | | | | | | | | |
(Cost $21,845,346) | | | | | | | 13,167,409 | |
| | | | | | | | | |
SHORT-TERM INVESTMENT(E)(F) — 2.4% | | | | | | | | |
| Fidelity Investments Money Market Government Portfolio, Cl Institutional, 0.010% | | | | | | | | |
(Cost $319,224) | | | 319,224 | | | | 319,224 | |
| | | | | | | | | |
| Schedule of Investments | | October 31, 2020 |
| | Global X MSCI Portugal ETF | |
| | | Face Amount | | | Value | |
REPURCHASE AGREEMENT(E) — 21.0% | | | | | | | | |
| BNP Paribas | | | | | | | | |
0.060%, dated 10/30/20, to be repurchased on 11/02/20, repurchase price $2,765,417 (collateralized by U.S. Treasury Obligations, ranging in par value $130,059 - $448,350, 1.625%, 11/15/2022, with a total market value of $2,820,159)
| | | | | | | | |
(Cost $2,765,402) | | $ | 2,765,402 | | | $ | 2,765,402 | |
| TOTAL INVESTMENTS — 123.4% | | | | | | | | |
(Cost $24,929,972) | | | | | | $ | 16,252,035 | |
| | | | | | | | | |
Percentages are based on Net Assets of $13,169,088.
| * | Non-income producing security. |
| (A) | This security or a partial position of this security is on loan at October 31, 2020. The total value of securities on loan at October 31, 2020 was $530,714. |
| (B) | Level 3 security in accordance with fair value hierarchy. |
| (C) | Security considered illiquid (Unaudited). The total value of such securities as of October 31, 2020 was $13 and represented 0.0% of Net Assets. |
| (D) | Security is fair valued using methods determined in good faith by the Fair Value Committee of the Fund. The total value of such securities as of October 31, 2020, was $13 and represents 0.0% of net assets. |
| (E) | Security was purchased with cash collateral held from securities on loan. The total value of such securities as of October 31, 2020, was $3,084,626. |
| (F) | The rate reported on the Schedule of Investments is the 7-day effective yield as of October 31, 2020. |
Cl — Class
The following is a summary of the level of inputs used as of October 31, 2020, in valuing the Fund’s investments carried at value:
| Investments in Securities | | Level 1 | | | Level 2 | | | Level 3(1) | | | Total | |
| Common Stock | | $ | 13,167,396 | | | $ | — | | | $ | 13 | | | $ | 13,167,409 | |
| Short-Term Investment | | | 319,224 | | | | — | | | | — | | | | 319,224 | |
| Repurchase Agreement | | | — | | | | 2,765,402 | | | | — | | | | 2,765,402 | |
| Total Investments in Securities | | $ | 13,486,620 | | | $ | 2,765,402 | | | $ | 13 | | | $ | 16,252,035 | |
| Schedule of Investments | | October 31, 2020 |
| | Global X MSCI Portugal ETF | |
(1) A reconciliation of Level 3 investments and disclosures of significant unobservable inputs are presented when the Fund has a significant amount of Level 3 investments at the beginning and/or end of the period in relation to Net Assets. Management has concluded that Level 3 investments are not material in relation to Net Assets.
For the year ended October 31, 2020, there were no transfers in or out of Level 3.
Amounts designated as “—“ are $0 or have been rounded to $0.
| Schedule of Investments | | October 31, 2020 |
| | Global X MSCI Colombia ETF | |
Sector Weightings (Unaudited)†:
† Sector weightings percentages are based on the total market value of investments. Repurchase agreements purchased from cash collateral received for securities lending activity are included in total investments. Please see Note 2 and 7 in Notes to Financial Statements for more detailed information.
| | | Shares | | | Value | |
| COMMON STOCK — 92.6% | | | | | | |
| CHILE— 5.3% | | | | | | |
| Energy — 3.0% | | | | | | |
Empresas COPEC | | | 132,245 | | | $ | 1,008,030 | |
| Utilities — 2.3% | | | | | | | | |
Enel Americas | | | 6,006,467 | | | | 796,175 | |
TOTAL CHILE | | | | | | | 1,804,205 | |
| COLOMBIA— 85.6% | | | | | | | | |
| Consumer Staples — 4.7% | | | | | | | | |
Grupo Nutresa | | | 293,142 | | | | 1,622,884 | |
| Energy — 14.3% | | | | | | | | |
Canacol Energy | | | 438,190 | | | | 1,186,385 | |
Ecopetrol ADR (A) | | | 400,196 | | | | 3,701,813 | |
| | | | | | | | 4,888,198 | |
| Financials — 36.8% | | | | | | | | |
Banco de Bogota | | | 70,791 | | | | 1,249,561 | |
BanColombia | | | 395,870 | | | | 2,516,134 | |
BanColombia ADR | | | 183,945 | | | | 4,688,758 | |
Financiera Colombiana * | | | 221,159 | | | | 1,491,740 | |
| Grupo Aval Acciones y Valores ADR | | | 271,584 | | | | 1,232,991 | |
| Schedule of Investments | | October 31, 2020 |
| | Global X MSCI Colombia ETF | |
| | | Shares | | | Value | |
| COMMON STOCK — continued | | | | | | | | |
| Financials — continued | | | | | | | | |
| Grupo de Inversiones Suramericana | | | 266,012 | | | $ | 1,387,114 | |
| | | | | | | | 12,566,298 | |
| Materials — 9.8% | | | | | | | | |
Cementos Argos | | | 1,249,616 | | | | 1,476,659 | |
Cemex Latam Holdings * | | | 953,187 | | | | 792,540 | |
Grupo Argos | | | 396,854 | | | | 1,093,378 | |
| | | | | | | | 3,362,577 | |
| Utilities — 20.0% | | | | | | | | |
Celsia ESP | | | 1,284,416 | | | | 1,401,490 | |
Grupo Energia Bogota ESP | | | 2,534,908 | | | | 1,578,296 | |
Interconexion Electrica | | | 710,060 | | | | 3,842,593 | |
| | | | | | | | 6,822,379 | |
TOTAL COLOMBIA | | | | | | | 29,262,336 | |
| UNITED STATES— 1.7% | | | | | | | | |
| Materials — 1.7% | | | | | | | | |
Tecnoglass | | | 130,779 | | | | 589,813 | |
| TOTAL COMMON STOCK | | | | | | | | |
(Cost $47,663,452) | | | | | | | 31,656,354 | |
| | | | | | | | | |
| PREFERRED STOCK — 7.0% | | | | | | | | |
| COLOMBIA— 7.0% | | | | | | | | |
| Financials — 5.5% | | | | | | | | |
Banco Davivienda (B) | | | 222,631 | | | | 1,451,420 | |
Grupo Aval Acciones y Valores (B) | | | 1,431,941 | | | | 330,621 | |
Grupo de Inversiones Suramericana (B) | | | 25,964 | | | | 112,554 | |
| | | | | | | | 1,894,595 | |
| Materials — 1.5% | | | | | | | | |
Grupo Argos (B) | | | 224,076 | | | | 499,930 | |
| TOTAL PREFERRED STOCK | | | | | | | | |
(Cost $4,041,044) | | | | | | | 2,394,525 | |
| Schedule of Investments | | October 31, 2020 |
| | Global X MSCI Colombia ETF | |
| | | Shares/Face Amount | | | Value | |
SHORT-TERM INVESTMENT(C)(D) — 0.8% | | | | | | |
| Fidelity Investments Money Market Government Portfolio, Cl Institutional, 0.010% | | | | | | |
(Cost $286,983) | | | 286,983 | | | $ | 286,983 | |
| | | | | | | | | |
REPURCHASE AGREEMENT(C) — 7.3% | | | | | | | | |
| BNP Paribas | | | | | | | | |
| 0.060%, dated 10/30/20, to be repurchased on 11/02/20, repurchase price $2,486,111 (collateralized by U.S. Treasury Obligations, ranging in par value $116,923 - $403,067, 1.625%, 11/15/2022, with a total market value of $2,535,325) | | | | | | | | |
(Cost $2,486,099) | | $ | 2,486,099 | | | | 2,486,099 | |
| TOTAL INVESTMENTS — 107.7% | | | | | | | | |
(Cost $54,477,578) | | | | | | $ | 36,823,961 | |
Percentages are based on Net Assets of $34,180,506.
| * | Non-income producing security. |
| (A) | This security or a partial position of this security is on loan at October 31, 2020. The total value of securities on loan at October 31, 2020 was $2,775,925. |
| (B) | There’s currently no stated interest rate. |
| (C) | Security was purchased with cash collateral held from securities on loan. The total value of such securities as of October 31, 2020, was $2,773,082. |
| (D) | The rate reported on the Schedule of Investments is the 7-day effective yield as of October 31, 2020. |
ADR — American Depositary Receipt
Cl — Class
| Schedule of Investments | | October 31, 2020 |
| | Global X MSCI Colombia ETF | |
The following is a summary of the level of inputs used as of October 31, 2020, in valuing the Fund’s investments carried at value:
| Investments in Securities | | Level 1 | | | Level 2 | | | Level 3 | | | Total | |
| Common Stock | | $ | 31,656,354 | | | $ | — | | | $ | — | | | $ | 31,656,354 | |
| Preferred Stock | | | 2,394,525 | | | | — | | | | — | | | | 2,394,525 | |
| Short-Term Investment | | | 286,983 | | | | — | | | | — | | | | 286,983 | |
| Repurchase Agreement | | | — | | | | 2,486,099 | | | | — | | | | 2,486,099 | |
| Total Investments in Securities | | $ | 34,337,862 | | | $ | 2,486,099 | | | $ | — | | | $ | 36,823,961 | |
For the year ended October 31, 2020, there were no transfers in or out of Level 3.
Amounts designated as “—“ are $0 or have been rounded to $0.
| Schedule of Investments | | October 31, 2020 |
| | Global X MSCI Argentina ETF | |
Sector Weightings (Unaudited)†:
† Sector weightings percentages are based on the total market value of investments. Repurchase agreements purchased from cash collateral received for securities lending activity are included in total investments. Please see Note 2 and 7 in Notes to Financial Statements for more detailed information.
| | | Shares | | | Value | |
| COMMON STOCK — 95.9% | | | | | | |
| ARGENTINA— 78.1% | | | | | | |
| Communication Services — 3.5% | | | | | | |
Telecom Argentina ADR | | | 209,040 | | | $ | 1,339,946 | |
| Consumer Discretionary — 26.9% | | | | | | | | |
Despegar.com * | | | 124,104 | | | | 843,907 | |
MercadoLibre * (A) | | | 7,816 | | | | 9,489,015 | |
| | | | | | | | 10,332,922 | |
| Energy — 5.2% | | | | | | | | |
Transportadora de Gas del Sur ADR * (A) | | | 184,872 | | | | 891,083 | |
YPF ADR | | | 346,976 | | | | 1,117,263 | |
| | | | | | | | 2,008,346 | |
| Financials — 7.8% | | | | | | | | |
Banco BBVA Argentina ADR * (A) | | | 169,471 | | | | 411,814 | |
Banco Macro ADR * | | | 101,875 | | | | 1,215,369 | |
Grupo Financiero Galicia ADR | | | 183,019 | | | | 1,145,699 | |
| Schedule of Investments | | October 31, 2020 |
| | Global X MSCI Argentina ETF | |
| | | Shares | | | Value | |
| COMMON STOCK — continued | | | | | | | | |
| Financials — continued | | | | | | | | |
Grupo Supervielle ADR (A) | | | 140,107 | | | $ | 239,583 | |
| | | | | | | | 3,012,465 | |
| Industrials — 0.3% | | | | | | | | |
America Airports * (A) | | | 75,163 | | | | 129,280 | |
| Information Technology — 25.8% | | | | | | | | |
Globant * | | | 54,819 | | | | 9,900,860 | |
| Materials — 1.6% | | | | | | | | |
| Loma Negra Cia Industrial Argentina ADR | | | 141,432 | | | | 605,329 | |
| Real Estate — 1.5% | | | | | | | | |
Cresud SACIF y A ADR * | | | 76,914 | | | | 242,279 | |
IRSA Inversiones y Representaciones ADR * | | | 54,385 | | | | 199,593 | |
| IRSA Propiedades Comerciales ADR | | | 14,662 | | | | 118,762 | |
| | | | | | | | 560,634 | |
| Utilities — 5.5% | | | | | | | | |
Central Puerto ADR (A) | | | 233,388 | | | | 506,452 | |
Empresa Distribuidora Y Comercializadora Norte ADR * | | | 51,920 | | | | 172,375 | |
Pampa Energia ADR * (A) | | | 121,440 | | | | 1,432,992 | |
| | | | | | | | 2,111,819 | |
TOTAL ARGENTINA | | | | | | | 30,001,601 | |
| BRAZIL— 6.3% | | | | | | | | |
| Consumer Discretionary — 3.1% | | | | | | | | |
Arcos Dorados Holdings, Cl A | | | 298,860 | | | | 1,201,417 | |
| Consumer Staples — 3.2% | | | | | | | | |
Adecoagro * | | | 252,850 | | | | 1,223,794 | |
TOTAL BRAZIL | | | | | | | 2,425,211 | |
| CANADA— 4.2% | | | | | | | | |
| Materials — 4.2% | | | | | | | | |
SSR Mining * (A) | | | 86,286 | | | | 1,595,840 | |
| CHILE— 7.2% | | | | | | | | |
| Consumer Staples — 7.2% | | | | | | | | |
Cencosud | | | 1,023,036 | | | | 1,420,828 | |
Cia Cervecerias Unidas | | | 243,678 | | | | 1,353,714 | |
| Schedule of Investments | | October 31, 2020 |
| | Global X MSCI Argentina ETF | |
| | | Shares/Face Amount | | | Value | |
| COMMON STOCK — continued | | | | | | | | |
TOTAL CHILE | | | | | | $ | 2,774,542 | |
| UNITED KINGDOM— 0.1% | | | | | | | | |
| Energy — 0.1% | | | | | | | | |
Phoenix Global Resources PLC * | | | 771,291 | | | | 53,603 | |
| TOTAL COMMON STOCK | | | | | | | | |
(Cost $61,894,763) | | | | | | | 36,850,797 | |
| | | | | | | | | |
| PREFERRED STOCK — 4.0% | | | | | | | | |
| CHILE— 4.0% | | | | | | | | |
| Consumer Staples — 4.0% | | | | | | | | |
Embotelladora Andina (B) | | | | | | | | |
(Cost $1,843,004) | | | 741,791 | | | | 1,542,942 | |
| | | | | | | | | |
SHORT-TERM INVESTMENT(C)(D) — 1.7% | | | | | | | | |
| Fidelity Investments Money Market Government Portfolio, Cl Institutional, 0.010% | | | | | | | | |
(Cost $645,205) | | | 645,205 | | | | 645,205 | |
| | | | | | | | | |
REPURCHASE AGREEMENT(C) — 14.6% | | | | | | | | |
| BNP Paribas | | | | | | | | |
| 0.060%, dated 10/30/20, to be repurchased on 11/02/20, repurchase price $5,589,368 (collateralized by U.S. Treasury Obligations, ranging in par value $262,871 - $906,191, 1.625%, 11/15/2022, with a total market value of $5,700,017) | | | | | | | | |
(Cost $5,589,341) | | $ | 5,589,341 | | | | 5,589,341 | |
| TOTAL INVESTMENTS — 116.2% | | | | | | | | |
(Cost $69,972,313) | | | | | | $ | 44,628,285 | |
Percentages are based on Net Assets of $38,420,755.
| * | Non-income producing security. |
| Schedule of Investments | | October 31, 2020 |
| | Global X MSCI Argentina ETF | |
| (A) | This security or a partial position of this security is on loan at October 31, 2020. The total value of securities on loan at October 31, 2020 was $5,901,951. |
| (B) | There’s currently no stated interest rate. |
| (C) | Security was purchased with cash collateral held from securities on loan. The total value of such securities as of October 31, 2020, was $6,234,546. |
| (D) | The rate reported on the Schedule of Investments is the 7-day effective yield as of October 31, 2020. |
ADR — American Depositary Receipt
Cl — Class
PLC — Public Limited Company
The following is a summary of the level of inputs used as of October 31, 2020, in valuing the Fund’s investments carried at value:
| Investments in Securities | | Level 1 | | | Level 2 | | | Level 3 | | | Total | |
| Common Stock | | $ | 36,850,797 | | | $ | — | | | $ | — | | | $ | 36,850,797 | |
| Preferred Stock | | | 1,542,942 | | | | — | | | | — | | | | 1,542,942 | |
| Short-Term Investment | | | 645,205 | | | | — | | | | — | | | | 645,205 | |
| Repurchase Agreement | | | — | | | | 5,589,341 | | | | — | | | | 5,589,341 | |
| Total Investments in Securities | | $ | 39,038,944 | | | $ | 5,589,341 | | | $ | — | | | $ | 44,628,285 | |
For the year ended October 31, 2020, there were no transfers in or out of Level 3.
Amounts designated as “—“ are $0 or have been rounded to $0.
| Schedule of Investments | | October 31, 2020 |
| | Global X MSCI Pakistan ETF | |
Sector Weightings (Unaudited)†:
† Sector weightings percentages are based on the total market value of investments.
| | | Shares | | | Value | |
| COMMON STOCK — 99.8% | | | | | | |
| PAKISTAN— 99.8% | | | | | | |
| Consumer Discretionary — 3.5% | | | | | | |
Honda Atlas Cars Pakistan | | | 209,650 | | | $ | 413,450 | |
Nishat Mills | | | 1,048,636 | | | | 554,363 | |
PAK Suzuki Motor * | | | 188,600 | | | | 239,188 | |
| | | | | | | | 1,207,001 | |
| Energy — 20.4% | | | | | | | | |
Mari Petroleum | | | 135,283 | | | | 1,050,124 | |
Oil & Gas Development | | | 3,467,500 | | | | 2,022,275 | |
Pakistan Oilfields | | | 587,057 | | | | 1,167,408 | |
Pakistan Petroleum | | | 2,445,339 | | | | 1,264,646 | |
Pakistan State Oil * | | | 1,257,462 | | | | 1,541,686 | |
| | | | | | | | 7,046,139 | |
| Financials — 27.3% | | | | | | | | |
Bank Al Habib | | | 3,945,971 | | | | 1,652,037 | |
Bank Alfalah | | | 3,826,322 | | | | 789,866 | |
Habib Bank | | | 3,060,129 | | | | 2,485,351 | |
MCB Bank | | | 2,230,833 | | | | 2,314,663 | |
National Bank of Pakistan * | | | 2,881,195 | | | | 700,695 | |
United Bank | | | 2,180,283 | | | | 1,492,038 | |
| | | | | | | | 9,434,650 | |
| Schedule of Investments | | October 31, 2020 |
| | Global X MSCI Pakistan ETF | |
| | | Shares | | | Value | |
| COMMON STOCK — continued | | | | | | | | |
| | | | | | | | | |
| Health Care — 2.1% | | | | | | | | |
Searle | | | 481,310 | | | $ | 727,463 | |
| Industrials — 4.6% | | | | | | | | |
Millat Tractors | | | 152,202 | | | | 870,440 | |
Pak Elektron * | | | 1,747,752 | | | | 349,987 | |
Pakistan International Bulk Terminal * | | | 4,877,187 | | | | 379,946 | |
| | | | | | | | 1,600,373 | |
| Materials — 33.3% | | | | | | | | |
DG Khan Cement * | | | 1,253,429 | | | | 844,539 | |
Engro | | | 1,403,305 | | | | 2,664,002 | |
Engro Fertilizers | | | 2,814,153 | | | | 1,130,931 | |
Fauji Cement * | | | 4,315,168 | | | | 569,969 | |
Fauji Fertilizer | | | 2,372,825 | | | | 1,564,702 | |
Fauji Fertilizer Bin Qasim * | | | 2,314,028 | | | | 336,126 | |
International Steels * | | | 720,330 | | | | 315,515 | |
Lucky Cement * | | | 677,887 | | | | 2,847,717 | |
Maple Leaf Cement Factory * | | | 3,244,082 | | | | 855,976 | |
Packages | | | 130,528 | | | | 388,390 | |
| | | | | | | | 11,517,867 | |
| Utilities — 8.7% | | | | | | | | |
Hub Power | | | 3,683,334 | | | | 1,879,834 | |
K-Electric * | | | 15,232,900 | | | | 354,674 | |
Kot Addu Power | | | 2,051,048 | | | | 360,278 | |
SUI Northern Gas Pipeline | | | 1,146,985 | | | | 395,717 | |
| | | | | | | | 2,990,503 | |
TOTAL PAKISTAN | | | | | | | 34,523,996 | |
| TOTAL COMMON STOCK | | | | | | | | |
(Cost $35,956,086) | | | | | | | 34,523,996 | |
| | | | | | | | | |
| Schedule of Investments | | October 31, 2020 |
| | Global X MSCI Pakistan ETF | |
| | | Face Amount | | | Value | |
| U.S TREASURY OBLIGATION — 5.8% | | | | | | | | |
| United States Treasury Bill | | | | | | | | |
0.070%, 11/17/20(A) | | | | | | | | |
(Cost $1,999,938) | | $ | 2,000,000 | | | $ | 1,999,940 | |
| TOTAL INVESTMENTS — 105.7% | | | | | | | | |
(Cost $37,956,024) | | | | | | $ | 36,523,936 | |
Percentages are based on Net Assets of $34,555,398.
| * | Non-income producing security. |
| (A) | The rate reported on the Schedule of Investments is the effective yield at time of purchase. |
The following is a summary of the level of inputs used as of October 31, 2020, in valuing the Fund’s investments carried at value:
| Investments in Securities | | Level 1 | | | Level 2 | | | Level 3 | | | Total | |
| Common Stock | | $ | — | | | $ | 34,523,996 | | | $ | — | | | $ | 34,523,996 | |
| U.S Treasury Obligation | | | — | | | | 1,999,940 | | | | — | | | | 1,999,940 | |
| Total Investments in Securities | | $ | — | | | $ | 36,523,936 | | | $ | — | | | $ | 36,523,936 | |
For the year ended October 31, 2020, there were no transfers in or out of Level 3.
Amounts designated as “—“ are $0 or have been rounded to $0.
| Schedule of Investments | | October 31, 2020 |
| | Global X MSCI Nigeria ETF | |
Sector Weightings (Unaudited)†:
† Sector weightings percentages are based on the total market value of investments.
| | | Shares | | | Value | |
| COMMON STOCK — 96.4% | | | | | | |
| NIGERIA— 94.0% | | | | | | |
| Communication Services — 4.7% | | | | | | |
Nigeria Communications | | | 5,306,143 | | | $ | 1,977,803 | |
| Consumer Staples — 25.9% | | | | | | | | |
Dangote Sugar Refinery | | | 37,739,109 | | | | 1,348,070 | |
Flour Mills of Nigeria | | | 24,022,814 | | | | 1,750,426 | |
Nestle Nigeria | | | 1,211,123 | | | | 4,456,950 | |
Nigerian Breweries | | | 12,750,569 | | | | 1,716,226 | |
UAC of Nigeria | | | 38,739,565 | | | | 782,152 | |
Unilever Nigeria | | | 24,647,104 | | | | 886,793 | |
| | | | | | | | 10,940,617 | |
| Financials — 46.7% | | | | | | | | |
Access Bank | | | 67,702,942 | | | | 1,384,447 | |
FBN Holdings | | | 113,264,967 | | | | 1,905,682 | |
FCMB Group | | | 171,109,376 | | | | 1,386,308 | |
Fidelity Bank | | | 176,888,874 | | | | 1,149,254 | |
Guaranty Trust Bank | | | 66,031,216 | | | | 5,554,874 | |
Stanbic IBTC Holdings | | | 17,063,251 | | | | 2,053,791 | |
Sterling Bank | | | 212,093,700 | | | | 971,723 | |
United Bank for Africa | | | 87,003,212 | | | | 1,734,074 | |
Zenith Bank | | | 62,245,336 | | | | 3,560,743 | |
| | | | | | | | 19,700,896 | |
| Schedule of Investments | | October 31, 2020 |
| | Global X MSCI Nigeria ETF | |
| | | Shares/Face Amount | | | Value | |
| COMMON STOCK — continued | | | | | | | | |
| Materials — 14.8% | | | | | | | | |
Dangote Cement | | | 11,501,848 | | | $ | 4,763,533 | |
Lafarge Africa | | | 30,621,105 | | | | 1,482,190 | |
| | | | | | | | 6,245,723 | |
| Utilities — 1.9% | | | | | | | | |
Transnational Corp of Nigeria | | | 432,691,712 | | | | 795,204 | |
TOTAL NIGERIA | | | | | | | 39,660,243 | |
| TOGO— 2.4% | | | | | | | | |
| Financials — 2.4% | | | | | | | | |
Ecobank Transnational * | | | 71,328,071 | | | | 1,043,159 | |
| TOTAL COMMON STOCK | | | | | | | | |
(Cost $42,968,788) | | | | | | | 40,703,402 | |
| | | | | | | | | |
| U.S TREASURY OBLIGATION — 2.4% | | | | | | | | |
| United States Treasury Bill | | | | | | | | |
0.070%, 11/17/20(A) | | | | | | | | |
(Cost $999,969) | | $ | 1,000,000 | | | | 999,970 | |
| TOTAL INVESTMENTS — 98.8% | | | | | | | | |
(Cost $43,968,757) | | | | | | $ | 41,703,372 | |
Percentages are based on Net Assets of $42,199,143.
| * | Non-income producing security. |
| (A) | The rate reported on the Schedule of Investments is the effective yield at time of purchase. |
The following is a summary of the level of inputs used as of October 31, 2020, in valuing the Fund’s investments carried at value:
| Investments in Securities | | Level 1 | | | Level 2 | | | Level 3 | | | Total | |
| Common Stock | | $ | 40,703,402 | | | $ | — | | | $ | — | | | $ | 40,703,402 | |
| U.S Treasury Obligation | | | — | | | | 999,970 | | | | — | | | | 999,970 | |
| Total Investments in Securities | | $ | 40,703,402 | | | $ | 999,970 | | | $ | — | | | $ | 41,703,372 | |
For the year ended October 31, 2020, there were no transfers in or out of Level 3.
Amounts designated as “—“ are $0 or have been rounded to $0.
| Schedule of Investments | | October 31, 2020 |
| | Global X MSCI Next Emerging & Frontier ETF | |
Sector Weightings (Unaudited)†:
† Sector weightings percentages are based on the total market value of investments.
| | | Shares | | | Value | |
| COMMON STOCK — 99.8% | | | | | | |
| BAHRAIN— 0.7% | | | | | | |
| Financials — 0.7% | | | | | | |
Ahli United Bank BSC | | | 136,316 | | | $ | 105,201 | |
| BANGLADESH— 1.2% | | | | | | | | |
| Communication Services — 0.3% | | | | | | | | |
GrameenPhone | | | 9,276 | | | | 36,086 | |
| Financials — 0.1% | | | | | | | | |
BRAC Bank | | | 22,136 | | | | 10,840 | |
| Health Care — 0.8% | | | | | | | | |
Square Pharmaceuticals | | | 46,469 | | | | 108,784 | |
TOTAL BANGLADESH | | | | | | | 155,710 | |
| CHILE— 2.0% | | | | | | | | |
| Consumer Discretionary — 0.4% | | | | | | | | |
Falabella | | | 20,528 | | | | 56,225 | |
| Consumer Staples — 0.4% | | | | | | | | |
Cencosud | | | 38,880 | | | | 53,998 | |
| Financials — 0.8% | | | | | | | | |
Banco de Chile | | | 652,031 | | | | 50,290 | |
Banco de Credito e Inversiones | | | 841 | | | | 26,295 | |
| Schedule of Investments | | October 31, 2020 |
| | Global X MSCI Next Emerging & Frontier ETF | |
| | | Shares | | | Value | |
| COMMON STOCK — continued | | | | | | | | |
| Financials — continued | | | | | | | | |
Banco Santander Chile | | | 939,586 | | | $ | 32,860 | |
| | | | | | | | 109,445 | |
| Utilities — 0.4% | | | | | | | | |
Enel Chile | | | 752,913 | | | | 50,474 | |
TOTAL CHILE | | | | | | | 270,142 | |
| CZECH REPUBLIC— 0.8% | | | | | | | | |
| Financials — 0.2% | | | | | | | | |
Komercni Banka | | | 1,228 | | | | 24,852 | |
| Utilities — 0.6% | | | | | | | | |
CEZ | | | 4,413 | | | | 83,282 | |
TOTAL CZECH REPUBLIC | | | | | | | 108,134 | |
| EGYPT— 0.6% | | | | | | | | |
| Financials — 0.6% | | | | | | | | |
| Commercial International Bank Egypt S.A.E. | | | 20,108 | | | | 78,191 | |
| ESTONIA— 0.1% | | | | | | | | |
| Industrials — 0.1% | | | | | | | | |
Tallink Grupp | | | 17,834 | | | | 12,838 | |
| GREECE— 0.9% | | | | | | | | |
| Communication Services — 0.6% | | | | | | | | |
| Hellenic Telecommunications Organization | | | 6,434 | | | | 85,589 | |
| Consumer Discretionary — 0.3% | | | | | | | | |
OPAP | | | 5,772 | | | | 46,560 | |
TOTAL GREECE | | | | | | | 132,149 | |
| INDONESIA— 9.5% | | | | | | | | |
| Communication Services — 1.5% | | | | | | | | |
| Telekomunikasi Indonesia Persero | | | 1,188,935 | | | | 212,992 | |
| Consumer Discretionary — 1.3% | | | | | | | | |
Astra International | | | 485,367 | | | | 180,042 | |
| Consumer Staples — 2.0% | | | | | | | | |
Charoen Pokphand Indonesia | | | 175,900 | | | | 70,360 | |
Gudang Garam * | | | 11,354 | | | | 31,811 | |
| Indofood CBP Sukses Makmur TBK | | | 55,100 | | | | 36,357 | |
Indofood Sukses Makmur | | | 104,300 | | | | 49,921 | |
| Schedule of Investments | | October 31, 2020 |
| | Global X MSCI Next Emerging & Frontier ETF | |
| | | Shares | | | Value | |
| COMMON STOCK — continued | | | | | | | | |
| Consumer Staples — continued | | | | | | | | |
Unilever Indonesia | | | 182,395 | | | $ | 97,589 | |
| | | | | | | | 286,038 | |
| Energy — 0.4% | | | | | | | | |
United Tractors | | | 39,950 | | | | 57,705 | |
| Financials — 3.6% | | | | | | | | |
Bank Central Asia | | | 113,858 | | | | 225,381 | |
Bank Mandiri | | | 235,236 | | | | 92,888 | |
| Bank Negara Indonesia Persero | | | 92,600 | | | | 30,012 | |
Bank Rakyat Indonesia Persero | | | 701,570 | | | | 161,181 | |
| | | | | | | | 509,462 | |
| Health Care — 0.4% | | | | | | | | |
Kalbe Farma | | | 501,200 | | | | 52,262 | |
| Materials — 0.3% | | | | | | | | |
Semen Indonesia Persero | | | 70,400 | | | | 46,091 | |
TOTAL INDONESIA | | | | | | | 1,344,592 | |
| JORDAN— 0.1% | | | | | | | | |
| Financials — 0.1% | | | | | | | | |
Arab Bank * | | | 1,962 | | | | 11,180 | |
| KAZAKHSTAN— 0.7% | | | | | | | | |
| Energy — 0.5% | | | | | | | | |
NAC Kazatomprom JSC GDR | | | 4,636 | | | | 65,831 | |
| Financials — 0.2% | | | | | | | | |
| Halyk Savings Bank of Kazakhstan JSC GDR | | | 2,507 | | | | 25,020 | |
TOTAL KAZAKHSTAN | | | | | | | 90,851 | |
| KENYA— 1.9% | | | | | | | | |
| Communication Services — 1.7% | | | | | | | | |
Safaricom | | | 857,600 | | | | 243,171 | |
| Financials — 0.2% | | | | | | | | |
Equity Group Holdings | | | 70,300 | | | | 21,904 | |
TOTAL KENYA | | | | | | | 265,075 | |
| KUWAIT— 8.1% | | | | | | | | |
| Communication Services — 2.0% | | | | | | | | |
| Mobile Telecommunications KSC | | | 148,340 | | | | 284,262 | |
| Schedule of Investments | | October 31, 2020 |
| | Global X MSCI Next Emerging & Frontier ETF | |
| | | Shares | | | Value | |
| COMMON STOCK — continued | | | | | | | | |
| Financials — 4.3% | | | | | | | | |
Boubyan Bank KSCP | | | 26,528 | | | $ | 51,876 | |
Burgan Bank SAK | | | 17,789 | | | | 12,041 | |
Gulf Bank KSCP | | | 38,057 | | | | 27,504 | |
Kuwait Finance House | | | 99,716 | | | | 215,866 | |
National Bank of Kuwait SAK | | | 105,202 | | | | 290,699 | |
| | | | | | | | 597,986 | |
| Industrials — 1.2% | | | | | | | | |
| Agility Public Warehousing KSC | | | 79,442 | | | | 173,016 | |
| Real Estate — 0.6% | | | | | | | | |
Mabanee SAK | | | 39,198 | | | | 83,062 | |
TOTAL KUWAIT | | | | | | | 1,138,326 | |
| LUXEMBOURG— 0.1% | | | | | | | | |
| Financials — 0.1% | | | | | | | | |
Reinet Investments SCA | | | 992 | | | | 15,741 | |
| MALAYSIA— 7.7% | | | | | | | | |
| Communication Services — 1.5% | | | | | | | | |
Axiata Group | | | 79,867 | | | | 56,320 | |
DiGi.com | | | 85,702 | | | | 77,761 | |
Maxis | | | 64,576 | | | | 74,600 | |
| | | | | | | | 208,681 | |
| Consumer Staples — 1.0% | | | | | | | | |
Nestle Malaysia | | | 1,970 | | | | 66,094 | |
PPB Group | | | 17,600 | | | | 79,634 | |
| | | | | | | | 145,728 | |
| Financials — 2.7% | | | | | | | | |
CIMB Group Holdings | | | 93,590 | | | | 66,448 | |
Hong Leong Bank | | | 9,400 | | | | 33,483 | |
Malayan Banking | | | 57,100 | | | | 96,197 | |
Public Bank | | | 42,310 | | | | 153,558 | |
RHB Bank | | | 25,900 | | | | 26,367 | |
| | | | | | | | 376,053 | |
| Schedule of Investments | | October 31, 2020 |
| | Global X MSCI Next Emerging & Frontier ETF | |
| | | Shares | | | Value | |
| COMMON STOCK — continued | | | | | | |
| Health Care — 0.4% | | | | | | |
Kossan Rubber Industries | | | 35,200 | | | $ | 63,538 | |
| Industrials — 0.5% | | | | | | | | |
Gamuda | | | 51,700 | | | | 41,435 | |
Malaysia Airports Holdings | | | 31,700 | | | | 31,891 | |
| | | | | | | | 73,326 | |
| Utilities — 1.6% | | | | | | | | |
Petronas Gas | | | 21,789 | | | | 82,541 | |
Tenaga Nasional | | | 62,683 | | | | 143,922 | |
| | | | | | | | 226,463 | |
TOTAL MALAYSIA | | | | | | | 1,093,789 | |
| MEXICO— 6.6% | | | | | | | | |
| Communication Services — 0.6% | | | | | | | | |
Grupo Televisa | | | 65,711 | | | | 82,859 | |
| Consumer Staples — 2.3% | | | | | | | | |
| Kimberly-Clark de Mexico, Cl A | | | 41,600 | | | | 61,645 | |
Wal-Mart de Mexico | | | 110,011 | | | | 264,978 | |
| | | | | | | | 326,623 | |
| Financials — 1.4% | | | | | | | | |
Grupo Financiero Banorte, Cl O * | | | 37,544 | | | | 166,744 | |
Grupo Financiero Inbursa, Cl O * | | | 37,300 | | | | 27,540 | |
| | | | | | | | 194,284 | |
| Industrials — 1.4% | | | | | | | | |
| Grupo Aeroportuario del Pacifico, Cl B | | | 10,400 | | | | 86,284 | |
| Grupo Aeroportuario del Sureste, Cl B | | | 5,665 | | | | 65,235 | |
| Promotora y Operadora de Infraestructura | | | 6,617 | | | | 43,215 | |
| | | | | | | | 194,734 | |
| Real Estate — 0.5% | | | | | | | | |
Fibra Uno Administracion ‡ | | | 85,700 | | | | 64,725 | |
| Utilities — 0.4% | | | | | | | | |
| Infraestructura Energetica Nova | | | 15,640 | | | | 52,174 | |
TOTAL MEXICO | | | | | | | 915,399 | |
| Schedule of Investments | | October 31, 2020 |
| | Global X MSCI Next Emerging & Frontier ETF | |
| | | Shares | | | Value | |
| COMMON STOCK — continued | | | | | | | | |
| MOROCCO— 2.4% | | | | | | | | |
| Communication Services — 1.4% | | | | | | | | |
Maroc Telecom | | | 12,534 | | | $ | 192,076 | |
| Consumer Staples — 0.3% | | | | | | | | |
Cosumar | | | 1,901 | | | | 41,752 | |
| Financials — 0.4% | | | | | | | | |
Attijariwafa Bank | | | 1,045 | | | | 42,780 | |
Banque Centrale Populaire | | | 700 | | | | 18,194 | |
| | | | | | | | 60,974 | |
| Materials — 0.3% | | | | | | | | |
Ciments du Maroc | | | 242 | | | | 38,264 | |
TOTAL MOROCCO | | | | | | | 333,066 | |
| NIGERIA— 0.9% | | | | | | | | |
| Financials — 0.3% | | | | | | | | |
Guaranty Trust Bank | | | 334,550 | | | | 28,144 | |
Zenith Bank | | | 355,651 | | | | 20,345 | |
| | | | | | | | 48,489 | |
| Materials — 0.6% | | | | | | | | |
Dangote Cement | | | 204,272 | | | | 84,600 | |
TOTAL NIGERIA | | | | | | | 133,089 | |
| OMAN— 0.5% | | | | | | | | |
| Communication Services — 0.3% | | | | | | | | |
| Oman Telecommunications SAOG | | | 22,731 | | | | 36,134 | |
| Financials — 0.2% | | | | | | | | |
BankMuscat SAOG | | | 32,459 | | | | 30,351 | |
TOTAL OMAN | | | | | | | 66,485 | |
| PERU— 0.8% | | | | | | | | |
| Financials — 0.8% | | | | | | | | |
Credicorp | | | 979 | | | | 112,272 | |
| PHILIPPINES— 4.7% | | | | | | | | |
| Communication Services — 0.5% | | | | | | | | |
PLDT | | | 2,381 | | | | 65,330 | |
| Financials — 0.4% | | | | | | | | |
BDO Unibank | | | 28,610 | | | | 52,550 | |
| Schedule of Investments | | October 31, 2020 |
| | Global X MSCI Next Emerging & Frontier ETF | |
| | | Shares | | | Value | |
| COMMON STOCK — continued | | | | | | | | |
| Industrials — 1.3% | | | | | | | | |
Aboitiz Equity Ventures | | | 54,273 | | | $ | 49,956 | |
SM Investments | | | 6,638 | | | | 130,291 | |
| | | | | | | | 180,247 | |
| Real Estate — 2.5% | | | | | | | | |
Ayala Land | | | 222,970 | | | | 152,025 | |
SM Prime Holdings | | | 278,527 | | | | 193,933 | |
| | | | | | | | 345,958 | |
TOTAL PHILIPPINES | | | | | | | 644,085 | |
| POLAND— 2.2% | | | | | | | | |
| Communication Services — 0.3% | | | | | | | | |
Cyfrowy Polsat | | | 7,836 | | | | 48,791 | |
| Consumer Staples — 0.5% | | | | | | | | |
Dino Polska * | | | 1,339 | | | | 73,441 | |
| Energy — 0.3% | | | | | | | | |
| Polskie Gornictwo Naftowe i Gazownictwo | | | 47,267 | | | | 49,727 | |
| Financials — 1.1% | | | | | | | | |
Bank Polska Kasa Opieki | | | 2,619 | | | | 27,930 | |
| Powszechna Kasa Oszczednosci Bank Polski | | | 12,590 | | | | 60,207 | |
| Powszechny Zaklad Ubezpieczen | | | 8,685 | | | | 47,329 | |
Santander Bank Polska | | | 577 | | | | 17,905 | |
| | | | | | | | 153,371 | |
TOTAL POLAND | | | | | | | 325,330 | |
| QATAR— 4.0% | | | | | | | | |
| Energy — 0.4% | | | | | | | | |
Qatar Fuel QSC | | | 13,282 | | | | 62,744 | |
| Financials — 1.4% | | | | | | | | |
Commercial Bank PSQC | | | 28,162 | | | | 32,872 | |
Masraf Al Rayan QSC | | | 52,757 | | | | 62,233 | |
| Qatar International Islamic Bank QSC | | | 12,136 | | | | 27,669 | |
Qatar Islamic Bank SAQ | | | 16,658 | | | | 74,117 | |
| | | | | | | | 196,891 | |
| Industrials — 0.9% | | | | | | | | |
Industries Qatar QSC | | | 49,752 | | | | 123,184 | |
| Schedule of Investments | | October 31, 2020 |
| | Global X MSCI Next Emerging & Frontier ETF | |
| | | Shares | | | Value | |
| COMMON STOCK — continued | | | | | | | | |
| Materials — 0.4% | | | | | | | | |
| Mesaieed Petrochemical Holding | | | 119,938 | | | $ | 61,105 | |
| Real Estate — 0.4% | | | | | | | | |
Barwa Real Estate | | | 55,363 | | | | 50,680 | |
| Utilities — 0.5% | | | | | | | | |
Qatar Electricity & Water QSC | | | 14,703 | | | | 67,438 | |
TOTAL QATAR | | | | | | | 562,042 | |
| ROMANIA— 1.4% | | | | | | | | |
| Energy — 0.8% | | | | | | | | |
OMV Petrom | | | 802,135 | | | | 60,129 | |
| Societatea Nationala de Gaze Naturale ROMGAZ | | | 7,771 | | | | 47,923 | |
| | | | | | | | 108,052 | |
| Financials — 0.5% | | | | | | | | |
Banca Transilvania | | | 114,492 | | | | 51,824 | |
BRD-Groupe Societe Generale | | | 5,507 | | | | 15,009 | |
| | | | | | | | 66,833 | |
| Real Estate — 0.1% | | | | | | | | |
NEPI Rockcastle | | | 5,677 | | | | 20,114 | |
TOTAL ROMANIA | | | | | | | 194,999 | |
| SAUDI ARABIA— 10.2% | | | | | | | | |
| Communication Services — 2.2% | | | | | | | | |
Etihad Etisalat * | | | 6,515 | | | | 48,642 | |
Saudi Telecom | | | 9,603 | | | | 255,291 | |
| | | | | | | | 303,933 | |
| Consumer Discretionary — 0.3% | | | | | | | | |
Jarir Marketing | | | 1,015 | | | | 46,876 | |
| Consumer Staples — 0.7% | | | | | | | | |
Almarai JSC | | | 3,963 | | | | 54,526 | |
Savola Group | | | 4,143 | | | | 50,596 | |
| | | | | | | | 105,122 | |
| Energy — 2.0% | | | | | | | | |
Saudi Arabian Oil | | | 31,475 | | | | 282,833 | |
| Schedule of Investments | | October 31, 2020 |
| | Global X MSCI Next Emerging & Frontier ETF | |
| | | Shares | | | Value | |
| COMMON STOCK — continued | | | | | | | | |
| Financials — 3.4% | | | | | | | | |
Al Rajhi Bank | | | 10,325 | | | $ | 181,155 | |
Alinma Bank * | | | 8,116 | | | | 33,068 | |
Arab National Bank | | | 5,710 | | | | 28,898 | |
Bank AlBilad | | | 3,497 | | | | 21,689 | |
Banque Saudi Fransi | | | 5,056 | | | | 40,040 | |
Bupa Arabia for Cooperative Insurance * | | | 571 | | | | 17,448 | |
Riyad Bank | | | 11,278 | | | | 54,130 | |
Samba Financial Group | | | 8,194 | | | | 60,303 | |
Saudi British Bank | | | 5,986 | | | | 38,020 | |
| | | | | | | | 474,751 | |
| Materials — 1.1% | | | | | | | | |
Saudi Arabian Fertilizer | | | 3,245 | | | | 65,241 | |
Saudi Kayan Petrochemical * | | | 12,692 | | | | 32,083 | |
Yanbu National Petrochemical | | | 4,012 | | | | 61,512 | |
| | | | | | | | 158,836 | |
| Utilities — 0.5% | | | | | | | | |
Saudi Electricity | | | 13,202 | | | | 66,603 | |
TOTAL SAUDI ARABIA | | | | | | | 1,438,954 | |
| SOUTH AFRICA— 6.6% | | | | | | | | |
| Communication Services — 0.4% | | | | | | | | |
MultiChoice Group | | | 6,114 | | | | 50,410 | |
| Consumer Discretionary — 2.5% | | | | | | | | |
Mr Price Group | | | 3,585 | | | | 27,109 | |
Naspers, Cl N | | | 1,666 | | | | 324,133 | |
| | | | | | | | 351,242 | |
| Consumer Staples — 0.9% | | | | | | | | |
Clicks Group | | | 3,412 | | | | 49,546 | |
Shoprite Holdings | | | 6,577 | | | | 52,179 | |
Tiger Brands | | | 2,175 | | | | 26,971 | |
| | | | | | | | 128,696 | |
| Financials — 2.3% | | | | | | | | |
Absa Group | | | 5,368 | | | | 28,719 | |
Capitec Bank Holdings | | | 490 | | | | 34,378 | |
| Schedule of Investments | | October 31, 2020 |
| | Global X MSCI Next Emerging & Frontier ETF | |
| | | Shares | | | Value | |
| COMMON STOCK — continued | | | | | | | | |
| Financials — continued | | | | | | | | |
Discovery | | | 2,698 | | | $ | 17,767 | |
FirstRand | | | 34,961 | | | | 80,901 | |
Nedbank Group | | | 2,537 | | | | 14,986 | |
Old Mutual | | | 35,067 | | | | 20,243 | |
Remgro | | | 3,948 | | | | 20,985 | |
Sanlam | | | 12,619 | | | | 36,710 | |
Standard Bank Group | | | 9,696 | | | | 63,294 | |
| | | | | | | | 317,983 | |
| Industrials — 0.2% | | | | | | | | |
Bidvest Group | | | 4,065 | | | | 33,338 | |
| Materials — 0.3% | | | | | | | | |
Harmony Gold Mining * | | | 7,302 | | | | 35,839 | |
TOTAL SOUTH AFRICA | | | | | | | 917,508 | |
| SRI LANKA— 0.3% | | | | | | | | |
| Industrials — 0.3% | | | | | | | | |
John Keells Holdings | | | 55,599 | | | | 39,489 | |
| THAILAND— 8.9% | | | | | | | | |
| Communication Services — 1.2% | | | | | | | | |
Advanced Info Service NVDR | | | 19,334 | | | | 107,006 | |
Intouch Holdings PCL NVDR | | | 36,200 | | | | 62,139 | |
| | | | | | | | 169,145 | |
| Consumer Discretionary — 0.5% | | | | | | | | |
Central Retail NVDR | | | 27,000 | | | | 23,173 | |
Home Product Center NVDR | | | 95,160 | | | | 42,744 | |
| | | | | | | | 65,917 | |
| Consumer Staples — 1.3% | | | | | | | | |
Berli Jucker NVDR | | | 17,890 | | | | 16,502 | |
CP ALL NVDR | | | 94,972 | | | | 163,784 | |
| | | | | | | | 180,286 | |
| Energy — 1.9% | | | | | | | | |
PTT NVDR | | | 185,950 | | | | 184,951 | |
| PTT Exploration & Production NVDR | | | 22,450 | | | | 56,724 | |
| Schedule of Investments | | October 31, 2020 |
| | Global X MSCI Next Emerging & Frontier ETF | |
| | | Shares | | | Value | |
| COMMON STOCK — continued | | | | | | | | |
| Energy — continued | | | | | | | | |
Thai Oil NVDR | | | 16,730 | | | $ | 18,384 | |
| | | | | | | | 260,059 | |
| Financials — 0.5% | | | | | | | | |
Bangkok Bank NVDR | | | 4,700 | | | | 14,589 | |
Kasikornbank NVDR | | | 14,570 | | | | 35,645 | |
| Siam Commercial Bank NVDR | | | 6,970 | | | | 14,536 | |
| | | | | | | | 64,770 | |
| Health Care — 0.8% | | | | | | | | |
| Bangkok Dusit Medical Services NVDR | | | 154,610 | | | | 86,811 | |
Bumrungrad Hospital NVDR | | | 6,900 | | | | 20,146 | |
| | | | | | | | 106,957 | |
| Industrials — 1.3% | | | | | | | | |
Airports of Thailand NVDR | | | 69,620 | | | | 115,596 | |
| Bangkok Expressway & Metro NVDR | | | 114,100 | | | | 30,019 | |
| BTS Group Holdings PCL NVDR | | | 126,700 | | | | 36,180 | |
| | | | | | | | 181,795 | |
| Real Estate — 0.5% | | | | | | | | |
Central Pattana NVDR | | | 36,200 | | | | 44,717 | |
Land & Houses NVDR | | | 124,700 | | | | 25,606 | |
| | | | | | | | 70,323 | |
| Utilities — 0.9% | | | | | | | | |
Electricity Generating | | | 4,800 | | | | 25,565 | |
Energy Absolute NVDR | | | 22,200 | | | | 27,067 | |
Global Power Synergy NVDR | | | 10,500 | | | | 17,434 | |
| Gulf Energy Development NVDR | | | 37,600 | | | | 34,382 | |
Ratch Group NVDR | | | 11,900 | | | | 17,754 | |
| | | | | | | | 122,202 | |
TOTAL THAILAND | | | | | | | 1,221,454 | |
| TURKEY— 2.0% | | | | | | | | |
| Communication Services — 0.4% | | | | | | | | |
Turkcell Iletisim Hizmetleri | | | 31,943 | | | | 55,632 | |
| Consumer Staples — 0.7% | | | | | | | | |
BIM Birlesik Magazalar | | | 12,474 | | | | 99,399 | |
| Schedule of Investments | | October 31, 2020 |
| | Global X MSCI Next Emerging & Frontier ETF | |
| | | Shares | | | Value | |
| COMMON STOCK — continued | | | | | | | | |
| Energy — 0.2% | | | | | | | | |
Tupras Turkiye Petrol Rafinerileri * | | | 3,750 | | | $ | 33,438 | |
| Financials — 0.4% | | | | | | | | |
Akbank Turk * | | | 50,526 | | | | 28,750 | |
Turkiye Garanti Bankasi | | | 32,785 | | | | 25,812 | |
| | | | | | | | 54,562 | |
| Materials — 0.3% | | | | | | | | |
| Eregli Demir ve Celik Fabrikalari | | | 40,305 | | | | 45,820 | |
TOTAL TURKEY | | | | | | | 288,851 | |
| UNITED ARAB EMIRATES— 4.9% | | | | | | | | |
| Communication Services — 1.6% | | | | | | | | |
| Emirates Telecommunications Group PJSC | | | 47,779 | | | | 219,569 | |
| Financials — 2.2% | | | | | | | | |
Abu Dhabi Commercial Bank PJSC (A)(B)(C) | | | 39,957 | | | | 63,854 | |
Dubai Islamic Bank PJSC | | | 29,371 | | | | 33,264 | |
Emirates NBD Bank PJSC | | | 36,467 | | | | 94,316 | |
First Abu Dhabi Bank PJSC | | | 39,429 | | | | 123,016 | |
| | | | | | | | 314,450 | |
| Real Estate — 1.1% | | | | | | | | |
Aldar Properties PJSC | | | 104,864 | | | | 78,224 | |
Emaar Properties PJSC | | | 95,773 | | | | 69,617 | |
| | | | | | | | 147,841 | |
| TOTAL UNITED ARAB EMIRATES | | | | | | | 681,860 | |
| VIETNAM— 9.0% | | | | | | | | |
| Consumer Staples — 2.8% | | | | | | | | |
Masan Group | | | 33,150 | | | | 120,116 | |
Saigon Beer Alcohol Beverage | | | 4,300 | | | | 34,185 | |
Vietnam Dairy Products JSC | | | 52,176 | | | | 243,072 | |
| | | | | | | | 397,373 | |
| Energy — 0.1% | | | | | | | | |
| Vietnam National Petroleum Group | | | 6,700 | | | | 14,161 | |
| Financials — 0.4% | | | | | | | | |
| Bank for Foreign Trade of Vietnam JSC | | | 9,230 | | | | 33,046 | |
| Schedule of Investments | | October 31, 2020 |
| | Global X MSCI Next Emerging & Frontier ETF | |
| | | Shares | | | Value | |
| COMMON STOCK — continued | | | | | | | | |
| Financials — continued | | | | | | | | |
| Bank for Investment and Development of Vietnam JSC | | | 3,580 | | | $ | 5,945 | |
Ho Chi Minh City Development Joint Stock Commercial Bank * | | | 8,294 | | | | 8,658 | |
Saigon Thuong Tin Commercial JSB * | | | 11,470 | | | | 6,581 | |
| | | | | | | | 54,230 | |
| Industrials — 0.3% | | | | | | | | |
Vietjet Aviation JSC * | | | 10,920 | | | | 47,670 | |
| Materials — 1.1% | | | | | | | | |
Hoa Phat Group JSC | | | 115,486 | | | | 152,188 | |
| Real Estate — 4.2% | | | | | | | | |
No Va Land Investment Group * | | | 17,080 | | | | 45,679 | |
Vincom Retail JSC * | | | 66,040 | | | | 72,072 | |
Vingroup JSC * | | | 60,330 | | | | 277,155 | |
Vinhomes JSC * | | | 59,710 | | | | 195,750 | |
| | | | | | | | 590,656 | |
| Utilities — 0.1% | | | | | | | | |
PetroVietnam Gas JSC | | | 4,160 | | | | 12,633 | |
TOTAL VIETNAM | | | | | | | 1,268,911 | |
| TOTAL COMMON STOCK | | | | | | | | |
(Cost $15,790,381) | | | | | | | 13,965,713 | |
| TOTAL INVESTMENTS — 99.8% | | | | | | | | |
(Cost $15,790,381) | | | | | | $ | 13,965,713 | |
Percentages are based on Net Assets of $13,991,067.
| * | Non-income producing security. |
| ‡ | Real Estate Investment Trust |
| (A) | Security considered illiquid (Unaudited). The total value of such securities as of October 31, 2020 was $63,854 and represented 0.5% of Net Assets. |
| (B) | Security is fair valued using methods determined in good faith by the Fair Value Committee of the Fund. The total value of such securities as of October 31, 2020, was $63,854 and represents 0.5% of Net assets. |
| (C) | Level 3 security in accordance with fair value hierarchy. |
| Schedule of Investments | | October 31, 2020 |
| | Global X MSCI Next Emerging & Frontier ETF | |
Cl — Class
GDR — Global Depositary Receipt
NVDR — Non-Voting Depositary Receipt
PJSC — Public Joint Stock Company
The following is a summary of the level of inputs used as of October 31, 2020, in valuing the Fund’s investments carried at value:
| Investments in Securities | | Level 1 | | | Level 2 | | | Level 3(1) | | | Total | |
| Common Stock | | $ | 8,010,618 | | | $ | 5,891,241 | | | $ | 63,854 | | | $ | 13,965,713 | |
| Total Investments in Securities | | $ | 8,010,618 | | | $ | 5,891,241 | | | $ | 63,854 | | | $ | 13,965,713 | |
| (1) | A reconciliation of Level 3 investments and disclosures of significant unobservable inputs are presented when the Fund has a significant amount of Level 3 investments at the beginning and/or end of the period in relation to Net Assets. Management has concluded that Level 3 investments are not material in relation to Net Assets. |
For the year ended October 31, 2020, there were no transfers in or out of Level 3.
Amounts designated as “—“ are $0 or have been rounded to $0.
| Schedule of Investments | | October 31, 2020 |
| | Global X FTSE Nordic Region ETF | |
Sector Weightings (Unaudited)†:
† Sector weightings percentages are based on the total market value of investments. Repurchase agreements purchased from cash collateral received for securities lending activity are included in total investments. Please see Note 2 and 7 in Notes to Financial Statements for more detailed information.
| | | Shares | | | Value | |
| COMMON STOCK — 99.9% | | | | | | |
| DENMARK— 38.5% | | | | | | |
| Consumer Staples — 1.9% | | | | | | |
Carlsberg, Cl B | | | 3,459 | | | $ | 437,824 | |
| Health Care — 21.1% | | | | | | | | |
Coloplast, Cl B | | | 4,635 | | | | 676,455 | |
Genmab * | | | 2,055 | | | | 684,523 | |
Novo Nordisk, Cl B | | | 56,338 | | | | 3,618,829 | |
| | | | | | | | 4,979,807 | |
| Industrials — 11.1% | | | | | | | | |
A P Moller - Maersk, Cl B | | | 202 | | | | 322,684 | |
DSV PANALPINA | | | 7,023 | | | | 1,137,270 | |
Vestas Wind Systems | | | 6,824 | | | | 1,164,835 | |
| | | | | | | | 2,624,789 | |
| Utilities — 4.4% | | | | | | | | |
Orsted | | | 6,572 | | | | 1,043,159 | |
TOTAL DENMARK | | | | | | | 9,085,579 | |
| Schedule of Investments | | October 31, 2020 |
| | Global X FTSE Nordic Region ETF | |
| | | Shares | | | Value | |
| COMMON STOCK — continued | | | | | | | | |
| FINLAND— 18.2% | | | | | | | | |
| Energy — 3.2% | | | | | | | | |
Neste | | | 14,505 | | | $ | 754,920 | |
| Financials — 6.4% | | | | | | | | |
Nordea Bank Abp | | | 112,588 | | | | 847,216 | |
Sampo, Cl A | | | 17,603 | | | | 664,357 | |
| | | | | | | | 1,511,573 | |
| Industrials — 4.6% | | | | | | | | |
Kone, Cl B | | | 13,680 | | | | 1,089,007 | |
| Information Technology — 2.8% | | | | | | | | |
Nokia | | | 195,699 | | | | 661,084 | |
| Utilities — 1.2% | | | | | | | | |
Fortum | | | 15,025 | | | | 282,655 | |
TOTAL FINLAND | | | | | | | 4,299,239 | |
| NORWAY— 5.3% | | | | | | | | |
| Communication Services — 1.4% | | | | | | | | |
Telenor | | | 21,825 | | | | 336,091 | |
| Energy — 1.8% | | | | | | | | |
Equinor | | | 33,631 | | | | 426,595 | |
| Financials — 2.1% | | | | | | | | |
DnB | | | 36,352 | | | | 489,442 | |
TOTAL NORWAY | | | | | | | 1,252,128 | |
| SWEDEN— 37.9% | | | | | | | | |
| Communication Services — 1.4% | | | | | | | | |
Telia (A) | | | 89,197 | | | | 341,911 | |
| Consumer Discretionary — 2.1% | | | | | | | | |
Hennes & Mauritz, Cl B | | | 30,471 | | | | 495,004 | |
| Consumer Staples — 2.6% | | | | | | | | |
Essity, Cl B | | | 21,167 | | | | 613,288 | |
| Financials — 9.9% | | | | | | | | |
Investor, Cl B | | | 15,814 | | | | 949,428 | |
| Skandinaviska Enskilda Banken, Cl A | | | 50,091 | | | | 429,376 | |
Svenska Handelsbanken, Cl A * | | | 51,845 | | | | 420,065 | |
| Schedule of Investments | | October 31, 2020 |
| | Global X FTSE Nordic Region ETF | |
| | | Shares/Face Amount | | | Value | |
| COMMON STOCK — continued | | | | | | | | |
| Financials — continued | | | | | | | | |
Swedbank, Cl A | | | 34,804 | | | $ | 545,453 | |
| | | | | | | | 2,344,322 | |
| Industrials — 14.2% | | | | | | | | |
Assa Abloy, Cl B | | | 31,944 | | | | 685,451 | |
Atlas Copco, Cl A | | | 21,959 | | | | 969,278 | |
Sandvik | | | 37,527 | | | | 668,232 | |
Volvo, Cl B | | | 52,316 | | | | 1,017,679 | |
| | | | | | | | 3,340,640 | |
| Information Technology — 7.7% | | | | | | | | |
Hexagon, Cl B | | | 8,882 | | | | 649,001 | |
| Telefonaktiebolaget LM Ericsson, Cl B | | | 104,643 | | | | 1,167,148 | |
| | | | | | | | 1,816,149 | |
TOTAL SWEDEN | | | | | | | 8,951,314 | |
| TOTAL COMMON STOCK | | | | | | | | |
(Cost $22,876,975) | | | | | | | 23,588,260 | |
| | | | | | | | | |
SHORT-TERM INVESTMENT(B)(C) — 0.1% | | | | | | | | |
| Fidelity Investments Money Market Government Portfolio, Cl Institutional, 0.010% | | | | | | | | |
(Cost $27,762) | | | 27,762 | | | | 27,762 | |
| | | | | | | | | |
REPURCHASE AGREEMENT(B) — 1.0% | | | | | | | | |
| BNP Paribas | | | | | | | | |
| 0.060%, dated 10/30/20, to be repurchased on 11/02/20, repurchase price $240,495 (collateralized by U.S. Treasury Obligations, ranging in par value $11,311 - $38,991, 1.625%, 11/15/2022, with a total market value of $245,257) | | | | | | | | |
(Cost $240,495) | | $ | 240,495 | | | | 240,495 | |
| TOTAL INVESTMENTS — 101.0% | | | | | | | | |
(Cost $23,145,232) | | | | | | $ | 23,856,517 | |
Percentages are based on Net Assets of $23,608,638.
| Schedule of Investments | | October 31, 2020 |
| | Global X FTSE Nordic Region ETF | |
| * | Non-income producing security. |
| (A) | This security or a partial position of this security is on loan at October 31, 2020. The total value of securities on loan at October 31, 2020 was $256,430. |
| (B) | Security was purchased with cash collateral held from securities on loan. The total value of such securities as of October 31, 2020, was $268,257. |
| (C) | The rate reported on the Schedule of Investments is the 7-day effective yield as of October 31, 2020. |
Cl — Class
The following is a summary of the level of inputs used as of October 31, 2020, in valuing the Fund’s investments carried at value:
| Investments in Securities | | Level 1 | | | Level 2 | | | Level 3 | | | Total | |
| Common Stock | | $ | 23,588,260 | | | $ | — | | | $ | — | | | $ | 23,588,260 | |
| Short-Term Investment | | | 27,762 | | | | — | | | | — | | | | 27,762 | |
| Repurchase Agreement | | | — | | | | 240,495 | | | | — | | | | 240,495 | |
| Total Investments in Securities | | $ | 23,616,022 | | | $ | 240,495 | | | $ | — | | | $ | 23,856,517 | |
For the year ended October 31, 2020, there were no transfers in or out of Level 3.
Amounts designated as “—“ are $0 or have been rounded to $0.
| Schedule of Investments | | October 31, 2020 |
| | Global X FTSE Southeast Asia ETF | |
Sector Weightings (Unaudited)†:
† Sector weightings percentages are based on the total market value of investments.
| | | Shares | | | Value | |
| COMMON STOCK — 99.9% | | | | | | |
| CHINA— 2.1% | | | | | | |
| Consumer Staples — 2.1% | | | | | | |
Wilmar International | | | 150,751 | | | $ | 446,015 | |
| INDONESIA— 21.0% | | | | | | | | |
| Communication Services — 2.8% | | | | | | | | |
| Telekomunikasi Indonesia Persero | | | 3,294,400 | | | | 590,176 | |
| Consumer Discretionary — 2.5% | | | | | | | | |
Astra International | | | 1,434,781 | | | | 532,218 | |
| Consumer Staples — 1.8% | | | | | | | | |
Gudang Garam * | | | 33,100 | | | | 92,737 | |
Hanjaya Mandala Sampoerna | | | 635,400 | | | | 61,476 | |
Unilever Indonesia | | | 412,380 | | | | 220,641 | |
| | | | | | | | 374,854 | |
| Financials — 13.9% | | | | | | | | |
Bank Central Asia | | | 687,496 | | | | 1,360,890 | |
Bank Mandiri | | | 1,315,580 | | | | 519,486 | |
| Bank Negara Indonesia Persero | | | 531,900 | | | | 172,390 | |
| Schedule of Investments | | October 31, 2020 |
| | Global X FTSE Southeast Asia ETF | |
| | | Shares | | | Value | |
| COMMON STOCK — continued | | | | | | | | |
| Financials — continued | | | | | | | | |
Bank Rakyat Indonesia Persero | | | 3,762,000 | | | $ | 864,295 | |
| | | | | | | | 2,917,061 | |
TOTAL INDONESIA | | | | | | | 4,414,309 | |
| MALAYSIA— 18.1% | | | | | | | | |
| Communication Services — 2.2% | | | | | | | | |
Axiata Group | | | 323,788 | | | | 228,327 | |
DiGi.com | | | 263,400 | | | | 238,994 | |
| | | | | | | | 467,321 | |
| Consumer Staples — 1.4% | | | | | | | | |
Sime Darby Plantation | | | 252,696 | | | | 294,356 | |
| Financials — 8.9% | | | | | | | | |
CIMB Group Holdings | | | 500,775 | | | | 355,544 | |
Malayan Banking | | | 426,731 | | | | 718,921 | |
Public Bank | | | 220,199 | | | | 799,182 | |
| | | | | | | | 1,873,647 | |
| Health Care — 1.2% | | | | | | | | |
IHH Healthcare | | | 214,080 | | | | 256,072 | |
| Materials — 1.4% | | | | | | | | |
Petronas Chemicals Group | | | 200,024 | | | | 281,622 | |
| Utilities — 3.0% | | | | | | | | |
Tenaga Nasional | | | 277,245 | | | | 636,562 | |
TOTAL MALAYSIA | | | | | | | 3,809,580 | |
| PHILIPPINES— 6.9% | | | | | | | | |
| Financials — 1.2% | | | | | | | | |
BDO Unibank | | | 141,340 | | | | 259,610 | |
| Industrials — 1.7% | | | | | | | | |
Ayala | | | 23,020 | | | | 362,898 | |
| Real Estate — 4.0% | | | | | | | | |
Ayala Land | | | 558,600 | | | | 380,864 | |
SM Prime Holdings | | | 647,400 | | | | 450,772 | |
| | | | | | | | 831,636 | |
TOTAL PHILIPPINES | | | | | | | 1,454,144 | |
| Schedule of Investments | | October 31, 2020 |
| | Global X FTSE Southeast Asia ETF | |
| | | Shares | | | Value | |
| COMMON STOCK — continued | | | | | | | | |
| SINGAPORE— 28.2% | | | | | | | | |
| Communication Services — 3.8% | | | | | | | | |
| Singapore Telecommunications | | | 528,904 | | | $ | 786,287 | |
| Consumer Discretionary — 0.5% | | | | | | | | |
Jardine Cycle & Carriage | | | 7,218 | | | | 93,879 | |
| Financials — 22.3% | | | | | | | | |
DBS Group Holdings | | | 127,183 | | | | 1,895,404 | |
Oversea-Chinese Banking | | | 244,966 | | | | 1,510,519 | |
United Overseas Bank | | | 91,497 | | | | 1,272,448 | |
| | | | | | | | 4,678,371 | |
| Real Estate — 1.6% | | | | | | | | |
CapitaLand | | | 177,518 | | | | 334,106 | |
TOTAL SINGAPORE | | | | | | | 5,892,643 | |
| THAILAND— 23.6% | | | | | | | | |
| Communication Services — 2.1% | | | | | | | | |
Advanced Info Service NVDR | | | 79,261 | | | | 438,679 | |
| Consumer Staples — 3.1% | | | | | | | | |
CP ALL NVDR | | | 370,673 | | | | 639,245 | |
| Energy — 6.0% | | | | | | | | |
PTT NVDR | | | 1,017,440 | | | | 1,011,972 | |
| PTT Exploration & Production NVDR | | | 97,510 | | | | 246,376 | |
| | | | | | | | 1,258,348 | |
| Financials — 3.9% | | | | | | | | |
Bangkok Bank | | | 17,000 | | | | 52,771 | |
Bangkok Bank NVDR | | | 17,611 | | | | 54,668 | |
Kasikornbank NVDR | | | 142,708 | | | | 349,129 | |
| Siam Commercial Bank NVDR | | | 170,731 | | | | 356,061 | |
| | | | | | | | 812,629 | |
| Health Care — 1.7% | | | | | | | | |
| Bangkok Dusit Medical Services NVDR | | | 631,800 | | | | 354,744 | |
| Industrials — 2.4% | | | | | | | | |
Airports of Thailand NVDR | | | 304,700 | | | | 505,919 | |
| Materials — 3.1% | | | | | | | | |
Siam Cement NVDR | | | 59,926 | | | | 649,875 | |
| Schedule of Investments | | October 31, 2020 |
| | Global X FTSE Southeast Asia ETF | |
| | | Shares | | | Value | |
| Utilities — 1.3% | | | | | | | | |
| Gulf Energy Development NVDR | | | 302,210 | | | $ | 276,345 | |
TOTAL THAILAND | | | | | | | 4,935,784 | |
| TOTAL COMMON STOCK | | | | | | | | |
(Cost $27,364,286) | | | | | | | 20,952,475 | |
| TOTAL INVESTMENTS — 99.9% | | | | | | | | |
(Cost $27,364,286) | | | | | | $ | 20,952,475 | |
Percentages are based on Net Assets of $20,981,156.
| * | Non-income producing security. |
NVDR — Non-Voting Depositary Receipt
The following is a summary of the level of inputs used as of October 31, 2020, in valuing the Fund’s investments carried at value:
| Investments in Securities | | Level 1 | | | Level 2 | | | Level 3 | | | Total | |
| Common Stock | | $ | 16,538,166 | | | $ | 4,414,309 | | | $ | — | | | $ | 20,952,475 | |
| Total Investments in Securities | | $ | 16,538,166 | | | $ | 4,414,309 | | | $ | — | | | $ | 20,952,475 | |
For the year ended October 31, 2020, there were no transfers in or out of Level 3.
| | Statements of Assets and Liabilities | |
| | October 31, 2020 | |
| | | Global X MSCI China Energy ETF | | | Global X MSCI China Materials ETF | | | Global X MSCI China Industrials ETF | | | Global X MSCI China Consumer Discretionary ETF | |
| Assets: | | | | | | | | | | | | |
| Cost of Investments | | $ | 2,099,372 | | | $ | 1,733,306 | | | $ | 2,244,139 | | | $ | 297,153,537 | |
| Cost of Repurchase Agreement | | | — | | | | — | | | | — | | | | 7,116,820 | |
| Cost of Foreign Currency | | | 23 | | | | 22 | | | | 381 | | | | 29 | |
| Investments, at Value | | $ | 1,557,239 | | | $ | 1,817,616 | | | $ | 2,012,916 | | | $ | 393,918,923 | * |
| Repurchase Agreement, at Value | | | — | | | | — | | | | — | | | | 7,116,820 | |
| Cash | | | — | | | | 1,291 | | | | 189 | | | | 199,228 | |
| Foreign Currency, at Value | | | 23 | | | | 22 | | | | 381 | | | | 29 | |
| Dividend and Interest Receivable | | | 12,104 | | | | 13 | | | | 1,801 | | | | 11,209 | |
| Total Assets | | | 1,569,366 | | | | 1,818,942 | | | | 2,015,287 | | | | 401,246,209 | |
| Liabilities: | | | | | | | | | | | | | | | | |
| Obligation to Return Securities Lending Collateral | | | — | | | | — | | | | — | | | | 7,938,349 | |
| Cash Overdraft | | | 10,861 | | | | — | | | | — | | | | — | |
| Payable due to Investment Adviser | | | 897 | | | | 1,013 | | | | 1,136 | | | | 190,152 | |
| Total Liabilities | | | 11,758 | | | | 1,013 | | | | 1,136 | | | | 8,128,501 | |
| Net Assets | | $ | 1,557,608 | | | $ | 1,817,929 | | | $ | 2,014,151 | | | $ | 393,117,708 | |
| Net Assets Consist of: | | | | | | | | | | | | | | | | |
| Paid-in Capital | | $ | 3,789,904 | | | $ | 3,817,388 | | | $ | 5,042,038 | | | $ | 374,417,885 | |
| Total Distributable Earnings/(Loss) | | | (2,232,296 | ) | | | (1,999,459 | ) | | | (3,027,887 | ) | | | 18,699,823 | |
| Net Assets | | $ | 1,557,608 | | | $ | 1,817,929 | | | $ | 2,014,151 | | | $ | 393,117,708 | |
| Outstanding Shares of Beneficial Interest | | | | | | | | | | | | | | | | |
| (unlimited authorization — no par value) | | | 200,000 | | | | 99,971 | | | | 150,000 | | | | 13,350,000 | |
| Net Asset Value, Offering and Redemption Price Per Share | | $ | 7.79 | | | $ | 18.18 | | | $ | 13.43 | | | $ | 29.45 | |
| *Includes Market Value of Securities on Loan | | $ | — | | | $ | — | | | $ | — | | | $ | 7,359,469 | |
| | Statements of Assets and Liabilities | |
| | October 31, 2020 | |
| | | Global X MSCI China Consumer Staples ETF | | | Global X MSCI China Health Care ETF | | | Global X MSCI China Financials ETF | | | Global X MSCI China Information Technology ETF | |
| Assets: | | | | | | | | | | | | |
| Cost of Investments | | $ | 14,760,845 | | | $ | 9,222,161 | | | $ | 56,001,153 | | | $ | 17,681,427 | |
| Cost of Repurchase Agreement | | | — | | | | — | | | | 157,796 | | | | — | |
| Cost of Foreign Currency | | | 5 | | | | — | | | | 25 | | | | 10 | |
| Investments, at Value | | $ | 17,379,005 | | | $ | 10,652,364 | | | $ | 47,712,150 | * | | $ | 20,793,575 | |
| Repurchase Agreement, at Value | | | — | | | | — | | | | 157,796 | | | | — | |
| Cash | | | 52,962 | | | | 8,108 | | | | 52,335 | | | | 49,027 | |
| Foreign Currency, at Value | | | 6 | | | | 8 | | | | 25 | | | | 10 | |
| Dividend and Interest Receivable | | | 598 | | | | 1,978 | | | | 124 | | | | 8 | |
| Total Assets | | | 17,432,571 | | | | 10,662,458 | | | | 47,922,430 | | | | 20,842,620 | |
| Liabilities: | | | | | | | | | | | | | | | | |
| Obligation to Return Securities Lending Collateral | | | — | | | | — | | | | 176,011 | | | | — | |
| Payable due to Investment Adviser | | | 8,941 | | | | 6,001 | | | | 19,887 | | | | 10,731 | |
| Total Liabilities | | | 8,941 | | | | 6,001 | | | | 195,898 | | | | 10,731 | |
| Net Assets | | $ | 17,423,630 | | | $ | 10,656,457 | | | $ | 47,726,532 | | | $ | 20,831,889 | |
| Net Assets Consist of: | | | | | | | | | | | | | | | | |
| Paid-in Capital | | $ | 14,781,266 | | | $ | 9,323,187 | | | $ | 60,947,649 | | | $ | 17,609,202 | |
| Total Distributable Earnings/(Loss) | | | 2,642,364 | | | | 1,333,270 | | | | (13,221,117 | ) | | | 3,222,687 | |
| Net Assets | | $ | 17,423,630 | | | $ | 10,656,457 | | | $ | 47,726,532 | | | $ | 20,831,889 | |
| Outstanding Shares of Beneficial Interest | | | | | | | | | | | | | | | | |
| (unlimited authorization — no par value) | | | 600,002 | | | | 450,002 | | | | 3,350,000 | | | | 750,002 | |
| Net Asset Value, Offering and Redemption Price Per Share | | $ | 29.04 | | | $ | 23.68 | | | $ | 14.25 | | | $ | 27.78 | |
| *Includes Market Value of Securities on Loan | | $ | — | | | $ | — | | | $ | 166,956 | | | $ | — | |
| | Statements of Assets and Liabilities | |
| | October 31, 2020 | |
| | | Global X MSCI China Communication Services ETF | | | Global X MSCI China Utilities ETF | | | Global X MSCI China Real Estate ETF | | | Global X MSCI China Large-Cap 50 ETF | |
| Assets: | | | | | | | | | | | | |
| Cost of Investments | | $ | 16,920,205 | | | $ | 1,467,433 | | | $ | 8,060,464 | | | $ | 4,362,476 | |
| Cost of Repurchase Agreement | | | 249,571 | | | | — | | | | — | | | | — | |
| Cost of Foreign Currency | | | 13 | | | | 9 | | | | 15,347 | | | | 5 | |
| Investments, at Value | | $ | 17,001,715 | * | | $ | 1,365,921 | | | $ | 7,268,600 | | | $ | 5,313,390 | |
| Repurchase Agreement, at Value | | | 249,571 | | | | — | | | | — | | | | — | |
| Cash | | | 20,824 | | | | 1,910 | | | | — | | | | — | |
| Foreign Currency, at Value | | | 13 | | | | 9 | | | | 15,346 | | | | 5 | |
| Dividend and Interest Receivable | | | 61 | | | | 64 | | | | 28,654 | | | | — | |
| Unrealized Appreciation on Spot Contracts | | | — | | | | — | | | | 2 | | | | — | |
| Receivable for Investment Securities Sold | | | — | | | | 2,654 | | | | — | | | | — | |
| Total Assets | | | 17,272,184 | | | | 1,370,558 | | | | 7,312,602 | | | | 5,313,395 | |
| Liabilities: | | | | | | | | | | | | | | | | |
| Obligation to Return Securities Lending Collateral | | | 278,380 | | | | — | | | | — | | | | — | |
| Payable due to Investment Adviser | | | 9,523 | | | | 756 | | | | 4,156 | | | | 1,016 | |
| Payable for Investment Securities Purchased | | | — | | | | — | | | | 3,629 | | | | — | |
| Cash Overdraft | | | — | | | | — | | | | 24,200 | | | | 2,712 | |
| Total Liabilities | | | 287,903 | | | | 756 | | | | 31,985 | | | | 3,728 | |
| Net Assets | | $ | 16,984,281 | | | $ | 1,369,802 | | | $ | 7,280,617 | | | $ | 5,309,667 | |
| Net Assets Consist of: | | | | | | | | | | | | | | | | |
| Paid-in Capital | | $ | 22,599,286 | | | $ | 1,502,076 | | | $ | 7,991,281 | | | $ | 4,401,938 | |
| Total Distributable Earnings/(Loss) | | | (5,615,005 | ) | | | (132,274 | ) | | | (710,664 | ) | | | 907,729 | |
| Net Assets | | $ | 16,984,281 | | | $ | 1,369,802 | | | $ | 7,280,617 | | | $ | 5,309,667 | |
| Outstanding Shares of Beneficial Interest | | | | | | | | | | | | | | | | |
| (unlimited authorization — no par value) | | | 650,000 | | | | 100,002 | | | | 450,002 | | | | 150,002 | |
| Net Asset Value, Offering and Redemption Price Per Share | | $ | 26.13 | | | $ | 13.70 | | | $ | 16.18 | | | $ | 35.40 | |
| *Includes Market Value of Securities on Loan | | $ | 277,760 | | | $ | — | | | $ | — | | | $ | — | |
| | Statements of Assets and Liabilities | |
| | October 31, 2020 | |
| | | Global X MSCI Greece ETF | | | Global X MSCI Norway ETF | | | Global X DAX Germany ETF | | | Global X MSCI Portugal ETF | |
| Assets: | | | | | | | | | | | | |
| Cost of Investments | | $ | 194,629,893 | | | $ | 47,079,194 | | | $ | 27,656,737 | | | $ | 22,164,570 | |
| Cost of Repurchase Agreement | | | 3,340,874 | | | | 136,611 | | | | — | | | | 2,765,402 | |
| Investments, at Value | | $ | 109,130,314 | * | | $ | 33,556,287 | * | | $ | 23,932,475 | | | $ | 13,486,633 | * |
| Repurchase Agreement, at Value | | | 3,340,874 | | | | 136,611 | | | | — | | | | 2,765,402 | |
| Cash | | | 362,501 | | | | 42,161 | | | | — | | | | — | |
| Dividend and Interest Receivable | | | 40,817 | | | | 7,425 | | | | — | | | | 1,012 | |
| Reclaim Receivable | | | — | | | | — | | | | 101,497 | | | | 143,358 | |
| Due from Broker | | | 5,822 | | | | — | | | | 1,265,752 | | | | — | |
| Total Assets | | | 112,880,328 | | | | 33,742,484 | | | | 25,299,724 | | | | 16,396,405 | |
| Liabilities: | | | | | | | | | | | | | | | | |
| Obligation to Return Securities Lending Collateral | | | 3,726,527 | | | | 152,381 | | | | — | | | | 3,084,626 | |
| Payable due to Investment Adviser | | | 56,951 | | | | 14,201 | | | | 4,263 | | | | 6,696 | |
| Payable for Capital Shares Redeemed | | | — | | | | — | | | | 1,265,752 | | | | — | |
| Cash Overdraft | | | — | | | | — | | | | 81,749 | | | | 133,709 | |
| Due to Custodian | | | 75,121 | | | | — | | | | — | | | | 1,935 | |
| Due to Broker | | | 6,126 | | | | 5,969 | | | | — | | | | 351 | |
| Total Liabilities | | | 3,864,725 | | | | 172,551 | | | | 1,351,764 | | | | 3,227,317 | |
| Net Assets | | $ | 109,015,603 | | | $ | 33,569,933 | | | $ | 23,947,960 | | | $ | 13,169,088 | |
| Net Assets Consist of: | | | | | | | | | | | | | | | | |
| Paid-in Capital | | $ | 400,692,620 | | | $ | 82,401,892 | | | $ | 29,416,918 | | | $ | 35,350,774 | |
| Total Distributable Loss | | | (291,677,017 | ) | | | (48,831,959 | ) | | | (5,468,958 | ) | | | (22,181,686 | ) |
| Net Assets | | $ | 109,015,603 | | | $ | 33,569,933 | | | $ | 23,947,960 | | | $ | 13,169,088 | |
| Outstanding Shares of Beneficial Interest | | | | | | | | | | | | | | | | |
| (unlimited authorization — no par value) | | | 6,165,644 | | | | 3,500,000 | | | | 950,000 | | | | 1,550,000 | |
| Net Asset Value, Offering and Redemption Price Per Share | | $ | 17.68 | | | $ | 9.59 | | | $ | 25.21 | | | $ | 8.50 | |
| *Includes Market Value of Securities on Loan | | $ | 3,532,659 | | | $ | 144,944 | | | $ | — | | | $ | 530,714 | |
| | Statements of Assets and Liabilities | |
| | October 31, 2020 | |
| | | Global X MSCI Colombia ETF | | | Global X MSCI Argentina ETF | | | Global X MSCI Pakistan ETF | | | Global X MSCI Nigeria ETF | |
| Assets: | | | | | | | | | | | | |
| Cost of Investments | | $ | 51,991,479 | | | $ | 64,382,972 | | | $ | 37,956,024 | | | $ | 43,968,757 | |
| Cost of Repurchase Agreement | | | 2,486,099 | | | | 5,589,341 | | | | — | | | | — | |
| Cost of Foreign Currency | | | 59,262 | | | | — | | | | — | | | | 2,359,054 | |
| Investments, at Value | | $ | 34,337,862 | * | | $ | 39,038,944 | * | | $ | 36,523,936 | | | $ | 41,703,372 | |
| Repurchase Agreement, at Value | | | 2,486,099 | | | | 5,589,341 | | | | — | | | | — | |
| Cash | | | 71,725 | | | | — | | | | — | | | | — | |
| Foreign Currency, at Value | | | 59,175 | | | | — | | | | — | | | | 2,356,415 | |
| Dividend and Interest Receivable | | | 17,027 | | | | 7,391 | | | | 209,674 | | | | 3,578 | |
| Receivable for Investment Securities Sold | | | — | | | | 136,941 | | | | — | | | | — | |
| Total Assets | | | 36,971,888 | | | | 44,772,617 | | | | 36,733,610 | | | | 44,063,365 | |
| Liabilities: | | | | | | | | | | | | | | | | |
| Obligation to Return Securities Lending Collateral | | | 2,773,082 | | | | 6,234,546 | | | | — | | | | — | |
| Payable due to Investment Adviser | | | 18,173 | | | | 20,468 | | | | 20,234 | | | | 130,650 | |
| Unrealized Depreciation on Spot Contracts | | | 127 | | | | — | | | | — | | | | — | |
| Cash Overdraft | | | — | | | | 96,848 | | | | 2,082,485 | | | | 1,694,635 | |
| Due to Authorized Participants | | | — | | | | — | | | | 25,885 | | | | — | |
| Due to Custodian | | | — | | | | — | | | | 49,608 | | | | 38,937 | |
| Total Liabilities | | | 2,791,382 | | | | 6,351,862 | | | | 2,178,212 | | | | 1,864,222 | |
| Net Assets | | $ | 34,180,506 | | | $ | 38,420,755 | | | $ | 34,555,398 | | | $ | 42,199,143 | |
| Net Assets Consist of: | | | | | | | | | | | | | | | | |
| Paid-in Capital | | $ | 140,677,408 | | | $ | 88,061,833 | | | $ | 75,054,444 | | | $ | 71,665,504 | |
| Total Distributable Loss | | | (106,496,902 | ) | | | (49,641,078 | ) | | | (40,499,046 | ) | | | (29,466,361 | ) |
| Net Assets | | $ | 34,180,506 | | | $ | 38,420,755 | | | $ | 34,555,398 | | | $ | 42,199,143 | |
| Outstanding Shares of Beneficial Interest | | | | | | | | | | | | | | | | |
| (unlimited authorization — no par value) | | | 1,469,699 | | | | 1,624,975 | | | | 1,262,293 | | | | 2,962,135 | |
| Net Asset Value, Offering and Redemption Price Per Share | | $ | 23.26 | | | $ | 23.64 | | | $ | 27.38 | | | $ | 14.25 | |
| *Includes Market Value of Securities on Loan | | $ | 2,775,925 | | | $ | 5,901,951 | | | $ | — | | | $ | — | |
| | Statements of Assets and Liabilities | |
| | October 31, 2020 | |
| | | Global X MSCI Next Emerging & Frontier ETF | | | Global X FTSE Nordic Region ETF | | | Global X FTSE Southeast Asia ETF | |
| Assets: | | | | | | | | | |
| Cost of Investments | | $ | 15,790,381 | | | $ | 22,904,737 | | | $ | 27,364,286 | |
| Cost of Repurchase Agreement | | | — | | | | 240,495 | | | | — | |
| Cost of Foreign Currency | | | 60,876 | | | | — | | | | 2,253 | |
| Investments, at Value | | $ | 13,965,713 | | | $ | 23,616,022 | * | | $ | 20,952,475 | |
| Repurchase Agreement, at Value | | | — | | | | 240,495 | | | | — | |
| Cash | | | — | | | | — | | | | 38,124 | |
| Foreign Currency, at Value | | | 60,788 | | | | — | | | | 2,253 | |
| Reclaim Receivable | | | 5,761 | | | | 136,769 | | | | — | |
| Dividend and Interest Receivable | | | 4,233 | | | | 18,751 | | | | 73 | |
| Total Assets | | | 14,036,495 | | | | 24,012,037 | | | | 20,992,925 | |
| Liabilities: | | | | | | | | | | | | |
| Obligation to Return Securities Lending Collateral | | | — | | | | 268,257 | | | | — | |
| Cash Overdraft | | | 22,391 | | | | 124,732 | | | | — | |
| Payable due to Investment Adviser | | | 5,920 | | | | 10,410 | | | | 11,769 | |
| Payable due to Custodian | | | 17,117 | | | | — | | | | — | |
| Total Liabilities | | | 45,428 | | | | 403,399 | | | | 11,769 | |
| Net Assets | | $ | 13,991,067 | | | $ | 23,608,638 | | | $ | 20,981,156 | |
| Net Assets Consist of: | | | | | | | | | | | | |
| Paid-in Capital | | $ | 40,816,258 | | | $ | 27,949,308 | | | $ | 33,983,852 | |
| Total Distributable Loss | | | (26,825,191 | ) | | | (4,340,670 | ) | | | (13,002,696 | ) |
| Net Assets | | $ | 13,991,067 | | | $ | 23,608,638 | | | $ | 20,981,156 | |
| Outstanding Shares of Beneficial Interest | | | | | | | | | | | | |
| (unlimited authorization — no par value) | | | 850,000 | | | | 1,010,000 | | | | 1,800,000 | |
| Net Asset Value, Offering and Redemption Price Per Share | | $ | 16.46 | | | $ | 23.37 | | | $ | 11.66 | |
| *Includes Market Value of Securities on Loan | | $ | — | | | $ | 256,430 | | | $ | — | |
| | Statements of Operations | |
| | For the year ended October 31, 2020 | |
| | | Global X MSCI China Energy ETF | | | Global X MSCI China Materials ETF | | | Global X MSCI China Industrials ETF | | | Global X MSCI China Consumer Discretionary ETF | |
| Investment Income: | | | | | | | | | | | | |
| Dividend Income | | $ | 101,182 | | | $ | 48,480 | | | $ | 49,649 | | | $ | 1,249,052 | |
| Interest Income | | | 16 | | | | 39 | | | | 7 | | | | 945 | |
| Security Lending Income | | | — | | | | — | | | | — | | | | 411,383 | |
| Less: Foreign Taxes Withheld | | | (10,030 | ) | | | (3,396 | ) | | | (2,581 | ) | | | (59,155 | ) |
| Total Investment Income | | | 91,168 | | | | 45,123 | | | | 47,075 | | | | 1,602,225 | |
Supervision and Administration Fees(1) | | | 10,437 | | | | 11,256 | | | | 12,924 | | | | 1,206,428 | |
Custodian Fees(2) | | | 157 | | | | 105 | | | | 106 | | | | 3,673 | |
| Total Expenses | | | 10,594 | | | | 11,361 | | | | 13,030 | | | | 1,210,101 | |
| Net Investment Income | | | 80,574 | | | | 33,762 | | | | 34,045 | | | | 392,124 | |
| Net Realized Gain (Loss) on: | | | | | | | | | | | | | | | | |
Investments(3) | | | (234,940 | ) | | | (179,282 | ) | | | (114,065 | ) | | | 5,490,596 | |
| Foreign Currency Transactions | | | (195 | ) | | | (634 | ) | | | (294 | ) | | | (23,909 | ) |
| Net Realized Gain (Loss) on Investments and Foreign Currency Transactions | | | (235,135 | ) | | | (179,916 | ) | | | (114,359 | ) | | | 5,466,687 | |
| Net Change in Unrealized Appreciation (Depreciation) on: | | | | | | | | | | | | | | | | |
| Investments | | | (246,011 | ) | | | 652,840 | | | | 187,483 | | | | 93,331,250 | |
| Foreign Currency Translations | | | — | | | | (2 | ) | | | (1 | ) | | | — | |
| Net Change in Unrealized Appreciation (Depreciation) on Investments and Foreign Currency Translations | | | (246,011 | ) | | | 652,838 | | | | 187,482 | | | | 93,331,250 | |
| Net Realized and Unrealized Gain (Loss) on Investments and Foreign Currency Transactions and Translations | | | (481,146 | ) | | | 472,922 | | | | 73,123 | | | | 98,797,937 | |
| Net Increase (Decrease) in Net Assets Resulting from Operations | | $ | (400,572 | ) | | $ | 506,684 | | | $ | 107,168 | | | $ | 99,190,061 | |
| (1) | The Supervision and Administration fees reflect the supervisory and administrative fee, which includes fees paid by the Funds for the investment advisory services provided by the Adviser. (See Note 3 in Notes to Financial Statements.) |
| (2) | See Note 2 in the Notes to Financial Statements. |
| (3) | Includes realized gains/(losses) as a result of in-kind transactions. (See Note 4 in Notes to Financial Statements). |
| | Statements of Operations | |
| | For the year ended October 31, 2020 | |
| | | Global X MSCI China Consumer Staples ETF | | | Global X MSCI China Health Care ETF | | | Global X MSCI China Financials ETF | | | Global X MSCI China Information Technology ETF | |
| Investment Income: | | | | | | | | | | | | |
| Dividend Income | | $ | 156,123 | | | $ | 51,344 | | | $ | 1,623,598 | | | $ | 116,364 | |
| Interest Income | | | — | | | | — | | | | 638 | | | | — | |
| Security Lending Income | | | — | | | | — | | | | 26,195 | | | | — | |
| Less: Foreign Taxes Withheld | | | (5,447 | ) | | | (2,927 | ) | | | (158,210 | ) | | | (4,214 | ) |
| Total Investment Income | | | 150,676 | | | | 48,417 | | | | 1,492,221 | | | | 112,150 | |
Supervision and Administration Fees(1) | | | 52,651 | | | | 38,896 | | | | 287,558 | | | | 71,068 | |
Custodian Fees(2) | | | 57 | | | | 90 | | | | 1,984 | | | | 214 | |
| Total Expenses | | | 52,708 | | | | 38,986 | | | | 289,542 | | | | 71,282 | |
| Net Investment Income | | | 97,968 | | | | 9,431 | | | | 1,202,679 | | | | 40,868 | |
| Net Realized Gain (Loss) on: | | | | | | | | | | | | | | | �� | |
Investments(3) | | | 196,065 | | | | 377,235 | | | | (5,170,471 | ) | | | 538,035 | |
| Foreign Currency Transactions | | | (6,409 | ) | | | (2,786 | ) | | | (8,858 | ) | | | (4,975 | ) |
| Net Realized Gain (Loss) on Investments and Foreign Currency Transactions | | | 189,656 | | | | 374,449 | | | | (5,179,329 | ) | | | 533,060 | |
| Net Change in Unrealized Appreciation (Depreciation) on: | | | | | | | | | | | | | | | | |
| Investments | | | 2,217,392 | | | | 1,195,910 | | | | (437,572 | ) | | | 3,058,492 | |
| Foreign Currency Translations | | | — | | | | 10 | | | | — | | | | (1 | ) |
| Net Change in Unrealized Appreciation (Depreciation) on Investments and Foreign Currency Translations | | | 2,217,392 | | | | 1,195,920 | | | | (437,572 | ) | | | 3,058,491 | |
| Net Realized and Unrealized Gain (Loss) on Investments and Foreign Currency Transactions and Translations | | | 2,407,048 | | | | 1,570,369 | | | | (5,616,901 | ) | | | 3,591,551 | |
| Net Increase (Decrease) in Net Assets Resulting from Operations | | $ | 2,505,016 | | | $ | 1,579,800 | | | $ | (4,414,222 | ) | | $ | 3,632,419 | |
| (1) | The Supervision and Administration fees reflect the supervisory and administrative fee, which includes fees paid by the Funds for the investment advisory services provided by the Adviser. (See Note 3 in Notes to Financial Statements.) |
| (2) | See Note 2 in the Notes to Financial Statements. |
| (3) | Includes realized gains/(losses) as a result of in-kind transactions. (See Note 4 in Notes to Financial Statements). |
| | Statements of Operations | |
| | For the year ended October 31, 2020 | |
| | | Global X MSCI China Communication Services ETF | | | Global X MSCI China Utilities ETF | | | Global X MSCI China Real Estate ETF | | | Global X MSCI China Large-Cap 50 ETF | |
| Investment Income: | | | | | | | | | | | | |
| Dividend Income | | $ | 272,014 | | | $ | 51,047 | | | $ | 399,631 | | | $ | 63,999 | |
| Interest Income | | | 201 | | | | 1 | | | | — | | | | — | |
| Security Lending Income | | | 507 | | | | — | | | | — | | | | — | |
| Less: Foreign Taxes Withheld | | | (19,513 | ) | | | (2,448 | ) | | | (8,279 | ) | | | (5,297 | ) |
| Total Investment Income | | | 253,209 | | | | 48,600 | | | | 391,352 | | | | 58,702 | |
Supervision and Administration Fees(1) | | | 124,732 | | | | 9,201 | | | | 47,197 | | | | 8,901 | |
Custodian Fees(2) | | | 386 | | | | 74 | | | | 589 | | | | 66 | |
| Total Expenses | | | 125,118 | | | | 9,275 | | | | 47,786 | | | | 8,967 | |
| Net Investment Income | | | 128,091 | | | | 39,325 | | | | 343,566 | | | | 49,735 | |
| Net Realized Gain (Loss) on: | | | | | | | | | | | | | | | | |
Investments(3) | | | 277,888 | | | | (54,122 | ) | | | 196,849 | | | | (61,796 | ) |
| Foreign Currency Transactions | | | (3,027 | ) | | | (140 | ) | | | (3,383 | ) | | | (169 | ) |
| Net Realized Gain (Loss) on Investments and Foreign Currency Transactions | | | 274,861 | | | | (54,262 | ) | | | 193,466 | | | | (61,965 | ) |
| Net Change in Unrealized Appreciation (Depreciation) on: | | | | | | | | | | | | | | | | |
| Investments | | | 2,567,580 | | | | (155,763 | ) | | | (1,001,996 | ) | | | 833,560 | |
| Foreign Currency Translations | | | (8 | ) | | | 1 | | | | (9 | ) | | | 3 | |
| Net Change in Unrealized Appreciation (Depreciation) on Investments and Foreign Currency Translations | | | 2,567,572 | | | | (155,762 | ) | | | (1,002,005 | ) | | | 833,563 | |
| Net Realized and Unrealized Gain (Loss) on Investments and Foreign Currency Transactions and Translations | | | 2,842,433 | | | | (210,024 | ) | | | (808,539 | ) | | | 771,598 | |
| Net Increase (Decrease) in Net Assets Resulting from Operations | | $ | 2,970,524 | | | $ | (170,699 | ) | | $ | (464,973 | ) | | $ | 821,333 | |
| (1) | The Supervision and Administration fees reflect the supervisory and administrative fee, which includes fees paid by the Funds for the investment advisory services provided by the Adviser. (See Note 3 in Notes to Financial Statements.) |
| (2) | See Note 2 in the Notes to Financial Statements. |
| (3) | Includes realized gains/(losses) as a result of in-kind transactions. (See Note 4 in Notes to Financial Statements). |
| | Statements of Operations | |
| | For the year ended October 31, 2020 | |
| | | Global X MSCI Greece ETF | | | Global X MSCI Norway ETF | | | Global X DAX Germany ETF | | | Global X MSCI Portugal ETF | |
| Investment Income: | | | | | | | | | | | | |
| Dividend Income | | $ | 5,874,856 | | | $ | 1,389,076 | | | $ | 744,006 | | | $ | 572,608 | |
| Interest Income | | | 4,369 | | | | 508 | | | | — | | | | 363 | |
| Security Lending Income | | | 1,160,939 | | | | 69,983 | | | | — | | | | 20,613 | |
| Less: Foreign Taxes Withheld | | | (279,354 | ) | | | (306,364 | ) | | | (66,111 | ) | | | (85,843 | ) |
| Total Investment Income | | | 6,760,810 | | | | 1,153,203 | | | | 677,895 | | | | 507,741 | |
Supervision and Administration Fees(1) | | | 1,094,783 | | | | 238,657 | | | | 87,042 | | | | 95,615 | |
Custodian Fees(2) | | | 68,965 | | | | 112 | | | | 827 | | | | 5,886 | |
| Total Expenses | | | 1,163,748 | | | | 238,769 | | | | 87,869 | | | | 101,501 | |
| Waiver of Supervision and Administration Fees | | | – | | | | – | | | | (48,356 | ) | | | – | |
| Net Expenses | | | 1,163,748 | | | | 238,769 | | | | 39,513 | | | | 101,501 | |
| Net Investment Income | | | 5,597,062 | | | | 914,434 | | | | 638,382 | | | | 406,240 | |
| Net Realized Gain (Loss) on: | | | | | | | | | | | | | | | | |
Investments(3) | | | (38,676,269 | ) | | | (12,016,178 | ) | | | 355,271 | | | | (774,341 | ) |
| Foreign Currency Transactions | | | 2,932 | | | | (8,633 | ) | | | 1,526 | | | | (2,585 | ) |
| Net Realized Gain (Loss) on Investments and Foreign Currency Transactions | | | (38,673,337 | ) | | | (12,024,811 | ) | | | 356,797 | | | | (776,926 | ) |
| Net Change in Unrealized Appreciation (Depreciation) on: | | | | | | | | | | | | | | | | |
| Investments | | | (79,130,003 | ) | | | 3,873,510 | | | | (2,857,269 | ) | | | (2,711,349 | ) |
| Foreign Currency Translations | | | (172 | ) | | | 28 | | | | 4,291 | | | | 7,083 | |
| Net Change in Unrealized Appreciation (Depreciation) on Investments and Foreign Currency Translations | | | (79,130,175 | ) | | | 3,873,538 | | | | (2,852,978 | ) | | | (2,704,266 | ) |
| Net Realized and Unrealized Loss on Investments and Foreign Currency Transactions and Translations | | | (117,803,512 | ) | | | (8,151,273 | ) | | | (2,496,181 | ) | | | (3,481,192 | ) |
| Net Decrease in Net Assets Resulting from Operations | | $ | (112,206,450 | ) | | $ | (7,236,839 | ) | | $ | (1,857,799 | ) | | $ | (3,074,952 | ) |
| (1) | The Supervision and Administration fees reflect the supervisory and administrative fee, which includes fees paid by the Funds for the investment advisory services provided by the Adviser. (See Note 3 in Notes to Financial Statements.) |
| (2) | See Note 2 in the Notes to Financial Statements. |
| (3) | Includes realized gains/(losses) as a result of in-kind transactions. (See Note 4 in Notes to Financial Statements). |
| | Statements of Operations | |
| | For the year ended October 31, 2020 | |
| | | Global X MSCI Colombia ETF | | | Global X MSCI Argentina ETF | | | Global X MSCI Pakistan ETF | | | Global X MSCI Nigeria ETF | |
| Investment Income: | | | | | | | | | | | | |
| Dividend Income | | $ | 2,449,261 | | | $ | 470,605 | | | $ | 1,734,677 | | | $ | 2,886,483 | |
| Interest Income | | | 753 | | | | 838 | | | | 595 | | | | 445 | |
| Security Lending Income | | | 4,244 | | | | 20,698 | | | | — | | | | — | |
| Less: Foreign Taxes Withheld | | | (198,781 | ) | | | (47,856 | ) | | | (286,642 | ) | | | (224,363 | ) |
| Total Investment Income | | | 2,255,477 | | | | 444,285 | | | | 1,448,630 | | | | 2,662,565 | |
Supervision and Administration Fees(1) | | | 304,028 | | | | 309,772 | | | | 290,077 | | | | 235,205 | |
Custodian Fees(2) | | | 3,123 | | | | 2,177 | | | | 94,034 | | | | 73,587 | |
| Total Expenses | | | 307,151 | | | | 311,949 | | | | 384,111 | | | | 308,792 | |
| Net Investment Income | | | 1,948,326 | | | | 132,336 | | | | 1,064,519 | | | | 2,353,773 | |
| Net Realized Gain (Loss) on: | | | | | | | | | | | | | | | | |
Investments(3) | | | (8,753,560 | ) | | | (14,052,989 | ) | | | (21,393,274 | ) | | | (3,177,955 | ) |
| Foreign Currency Transactions | | | (63,973 | ) | | | 4,860 | | | | (284,349 | ) | | | (72,242 | ) |
| Net Realized Loss on Investments and Foreign Currency Transactions | | | (8,817,533 | ) | | | (14,048,129 | ) | | | (21,677,623 | ) | | | (3,250,197 | ) |
| Net Change in Unrealized Appreciation (Depreciation) on: | | | | | | | | | | | | | | | | |
| Investments | | | (17,912,028 | ) | | | 16,510,147 | | | | 20,503,686 | | | | 6,207,903 | |
| Foreign Currency Translations | | | (399 | ) | | | (68 | ) | | | 7,116 | | | | (2,538 | ) |
| Net Change in Unrealized Appreciation (Depreciation) on Investments and Foreign Currency Translations | | | (17,912,427 | ) | | | 16,510,079 | | | | 20,510,802 | | | | 6,205,365 | |
| Net Realized and Unrealized Gain (Loss) on Investments and Foreign Currency Transactions and Translations | | | (26,729,960 | ) | | | 2,461,950 | | | | (1,166,821 | ) | | | 2,955,168 | |
| Net Increase (Decrease) in Net Assets Resulting from Operations | | $ | (24,781,634 | ) | | $ | 2,594,286 | | | $ | (102,302 | ) | | $ | 5,308,941 | |
| (1) | The Supervision and Administration fees reflect the supervisory and administrative fee, which includes fees paid by the Funds for the investment advisory services provided by the Adviser. (See Note 3 in Notes to Financial Statements.) |
| (2) | See Note 2 in the Notes to Financial Statements. |
| (3) | Includes realized gains/(losses) as a result of in-kind transactions. (See Note 4 in Notes to Financial Statements). |
| | Statements of Operations | |
| | For the year ended October 31, 2020 | |
| | | Global X MSCI Next Emerging & Frontier ETF | | | Global X FTSE Nordic Region ETF | | | Global X FTSE Southeast Asia ETF | |
| Investment Income: | | | | | | | | | |
| Dividend Income | | $ | 498,172 | | | $ | 313,992 | | | $ | 815,526 | |
| Interest Income | | | 160 | | | | 423 | | | | 239 | |
| Security Lending Income | | | — | | | | 3,876 | | | | 1,438 | |
| Less: Foreign Taxes Withheld | | | (33,123 | ) | | | (51,488 | ) | | | (46,542 | ) |
| Total Investment Income | | | 465,209 | | | | 266,803 | | | | 770,661 | |
Supervision and Administration Fees(1) | | | 74,579 | | | | 93,757 | | | | 146,393 | |
Custodian Fees(2) | | | 31,830 | | | | 1,538 | | | | 425 | |
| Total Expenses | | | 106,409 | | | | 95,295 | | | | 146,818 | |
| Net Investment Income | | | 358,800 | | | | 171,508 | | | | 623,843 | |
| Net Realized Gain (Loss) on: | | | | | | | | | | | | |
Investments(3) | | | (1,438,322 | ) | | | 30,195 | | | | (856,788 | ) |
| Foreign Currency Transactions | | | (9,095 | ) | | | (2,718 | ) | | | (12,748 | ) |
| Net Realized Gain (Loss) on Investments and Foreign Currency Transactions | | | (1,447,417 | ) | | | 27,477 | | | | (869,536 | ) |
| Net Change in Unrealized Appreciation (Depreciation) on: | | | | | | | | | | | | |
| Investments | | | (1,911,910 | ) | | | 1,975,809 | | | | (6,450,229 | ) |
| Foreign Currency Translations | | | (273 | ) | | | 4,024 | | | | (35 | ) |
| Net Change in Unrealized Appreciation (Depreciation) on Investments and Foreign Currency Translations | | | (1,912,183 | ) | | | 1,979,833 | | | | (6,450,264 | ) |
| Net Realized and Unrealized Gain (Loss) on Investments and Foreign Currency Transactions and Translations | | | (3,359,600 | ) | | | 2,007,310 | | | | (7,319,800 | ) |
| Net Increase (Decrease) in Net Assets Resulting from Operations | | $ | (3,000,800 | ) | | $ | 2,178,818 | | | $ | (6,695,957 | ) |
| (1) | The Supervision and Administration fees reflect the supervisory and administrative fee, which includes fees paid by the Funds for the investment advisory services provided by the Adviser. (See Note 3 in Notes to Financial Statements.) |
| (2) | See Note 2 in the Notes to Financial Statements. |
| (3) | Includes realized gains/(losses) as a result of in-kind transactions. (See Note 4 in Notes to Financial Statements) |
| | Statements of Changes in Net Assets | |
| | | |
| | | Global X MSCI China Energy ETF | | | Global X MSCI China Materials ETF | |
| | | Year Ended October 31, 2020 | | | Year Ended October 31, 2019 | | | Year Ended October 31, 2020 | | | Year Ended October 31, 2019 | |
| Operations: | | | | | | | | | | | | |
| Net Investment Income | | $ | 80,574 | | | $ | 56,817 | | | $ | 33,762 | | | $ | 78,356 | |
Net Realized Loss on Investments and Foreign Currency Transactions(1) | | | (235,135 | ) | | | (263,806 | ) | | | (179,916 | ) | | | (431,845 | ) |
| Net Change in Unrealized Appreciation (Depreciation) on Investments and Foreign Currency Translations | | | (246,011 | ) | | | 14,295 | | | | 652,838 | | | | 283,201 | |
| Net Increase (Decrease) in Net Assets Resulting from Operations | | | (400,572 | ) | | | (192,694 | ) | | | 506,684 | | | | (70,288 | ) |
| Distributions | | | (68,891 | ) | | | (123,563 | ) | | | (57,446 | ) | | | (149,448 | ) |
| Capital Share Transactions: | | | | | | | | | | | | | | | | |
| Issued | | | 463,155 | | | | — | | | | — | | | | — | |
| Redeemed | | | — | | | | (1,074,531 | ) | | | (806,413 | ) | | | — | |
| Increase (Decrease) in Net Assets from Capital Share Transactions | | | 463,155 | | | | (1,074,531 | ) | | | (806,413 | ) | | | — | |
| Total Decrease in Net Assets | | | (6,308 | ) | | | (1,390,788 | ) | | | (357,175 | ) | | | (219,736 | ) |
| Net Assets: | | | | | | | | | | | | | | | | |
| Beginning of Year | | | 1,563,916 | | | | 2,954,704 | | | | 2,175,104 | | | | 2,394,840 | |
| End of Year | | $ | 1,557,608 | | | $ | 1,563,916 | | | $ | 1,817,929 | | | $ | 2,175,104 | |
| Share Transactions: | | | | | | | | | | | | | | | | |
| Issued | | | 50,000 | | | | — | | | | — | | | | — | |
| Redeemed | | | — | | | | (100,000 | ) | | | (50,000 | ) | | | — | |
| Net Increase (Decrease) in Shares Outstanding from Share Transactions | | | 50,000 | | | | (100,000 | ) | | | (50,000 | ) | | | — | |
| (1) | Includes realized gains (losses) as a result of in-kind redemptions. (See Note 4 in Notes to Financial Statements.) |
| | Statements of Changes in Net Assets | |
| | | |
| | | Global X MSCI China Industrials ETF | | | Global X MSCI China Consumer Discretionary ETF | |
| | | Year Ended October 31, 2020 | | | Year Ended October 31, 2019 | | | Year Ended October 31, 2020 | | | Year Ended October 31, 2019 | |
| Operations: | | | | | | | | | | | | |
| Net Investment Income | | $ | 34,045 | | | $ | 40,829 | | | $ | 392,124 | | | $ | 1,457,518 | |
Net Realized Gain (Loss) on Investments and Foreign Currency Transactions(1) | | | (114,359 | ) | | | (373,576 | ) | | | 5,466,687 | | | | (20,246,748 | ) |
| Net Change in Unrealized Appreciation (Depreciation) on Investments and Foreign Currency Translations | | | 187,482 | | | | 300,844 | | | | 93,331,250 | | | | 56,137,252 | |
| Net Increase (Decrease) in Net Assets Resulting from Operations | | | 107,168 | | | | (31,903 | ) | | | 99,190,061 | | | | 37,348,022 | |
| Distributions | | | (31,434 | ) | | | (67,864 | ) | | | (1,388,311 | ) | | | (3,541,990 | ) |
| Capital Share Transactions: | | | | | | | | | | | | | | | | |
| Issued | | | — | | | | — | | | | 183,805,858 | | | | 26,355,509 | |
| Redeemed | | | — | | | | — | | | | (44,975,491 | ) | | | (23,778,436 | ) |
| Increase in Net Assets from Capital Share Transactions | | | — | | | | — | | | | 138,830,367 | | | | 2,577,073 | |
| Total Increase (Decrease) in Net Assets | | | 75,734 | | | | (99,767 | ) | | | 236,632,117 | | | | 36,383,105 | |
| Net Assets: | | | | | | | | | | | | | | | | |
| Beginning of Year | | | 1,938,417 | | | | 2,038,184 | | | | 156,485,591 | | | | 120,102,486 | |
| End of Year | | $ | 2,014,151 | | | $ | 1,938,417 | | | $ | 393,117,708 | | | $ | 156,485,591 | |
| Share Transactions: | | | | | | | | | | | | | | | | |
| Issued | | | — | | | | — | | | | 6,750,000 | | | | 1,600,000 | |
| Redeemed | | | — | | | | — | | | | (2,250,000 | ) | | | (1,600,000 | ) |
| Net Increase in Shares Outstanding from Share Transactions | | | — | | | | — | | | | 4,500,000 | | | | — | |
| (1) | Includes realized gains (losses) as a result of in-kind redemptions. (See Note 4 in Notes to Financial Statements.) |
| | Statements of Changes in Net Assets | |
| | | |
| | | Global X MSCI China Consumer Staples ETF | | | Global X MSCI China Health Care ETF | |
| | | Year Ended October 31, 2020 | | | Period Ended October 31, 2019(1) | | | Year Ended October 31, 2020 | | | Period Ended October 31, 2019(1) | |
| Operations: | | | | | | | | | | | | |
| Net Investment Income | | $ | 97,968 | | | $ | 27,628 | | | $ | 9,431 | | | $ | 9,374 | |
Net Realized Gain on Investments and Foreign Currency Transactions(2) | | | 189,656 | | | | 203,706 | | | | 374,449 | | | | 100,560 | |
| Net Change in Unrealized Appreciation (Depreciation) on Investments and Foreign Currency Transactions | | | 2,217,392 | | | | 400,768 | | | | 1,195,920 | | | | 234,293 | |
| Net Increase in Net Assets Resulting from Operations | | | 2,505,016 | | | | 632,102 | | | | 1,579,800 | | | | 344,227 | |
| Distributions | | | (136,449 | ) | | | (13,493 | ) | | | (16,313 | ) | | | (2,880 | ) |
| Capital Share Transactions: | | | | | | | | | | | | | | | | |
| Issued | | | 17,224,623 | | | | 2,441,052 | | | | 8,387,711 | | | | 3,099,609 | |
| Redeemed | | | (4,278,090 | ) | | | (951,131 | ) | | | (1,950,081 | ) | | | (785,616 | ) |
| Increase in Net Assets from Capital Share Transactions | | | 12,946,533 | | | | 1,489,921 | | | | 6,437,630 | | | | 2,313,993 | |
| Total Increase in Net Assets | | | 15,315,100 | | | | 2,108,530 | | | | 8,001,117 | | | | 2,655,340 | |
| Net Assets: | | | | | | | | | | | | | | | | |
| Beginning of Year/Period | | | 2,108,530 | | | | — | | | | 2,655,340 | | | | — | |
| End of Year/Period | | $ | 17,423,630 | | | $ | 2,108,530 | | | $ | 10,656,457 | | | $ | 2,655,340 | |
| Share Transactions: | | | | | | | | | | | | | | | | |
| Issued | | | 700,000 | | | | 150,002 | | | | 400,000 | | | | 200,002 | |
| Redeemed | | | (200,000 | ) | | | (50,000 | ) | | | (100,000 | ) | | | (50,000 | ) |
| Net Increase in Shares Outstanding from Share Transactions | | | 500,000 | | | | 100,002 | | | | 300,000 | | | | 150,002 | |
| (1) | The Fund commenced operations on December 7, 2018 |
| (2) | Includes realized gains (losses) as a result of in-kind redemptions. (See Note 4 in Notes to Financial Statements.) |
| | Statements of Changes in Net Assets | |
| | | |
| | | Global X MSCI China Financials ETF | | | Global X MSCI China Information Technology ETF | |
| | | Year Ended October 31, 2020 | | | Year Ended October 31, 2019 | | | Year Ended October 31, 2020 | | | Period Ended October 31, 2019(1) | |
| Operations: | | | | | | | | | | | | |
| Net Investment Income | | $ | 1,202,679 | | | $ | 2,815,432 | | | $ | 40,868 | | | $ | 22,228 | |
Net Realized Gain (Loss) on Investments and Foreign Currency Transactions(2) | | | (5,179,329 | ) | | | (2,761,859 | ) | | | 533,060 | | | | 125,893 | |
| Net Change in Unrealized Appreciation (Depreciation) on Investments and Foreign Currency Translations | | | (437,572 | ) | | | (5,721,964 | ) | | | 3,058,491 | | | | 53,657 | |
| Net Increase (Decrease) in Net Assets Resulting from Operations | | | (4,414,222 | ) | | | (5,668,391 | ) | | | 3,632,419 | | | | 201,778 | |
| Distributions | | | (1,795,211 | ) | | | (2,438,433 | ) | | | (53,606 | ) | | | (12,360 | ) |
| Capital Share Transactions: | | | | | | | | | | | | | | | | |
| Issued | | | 19,693,103 | | | | 78,511,082 | | | | 21,163,623 | | | | 3,298,330 | |
| Redeemed | | | (25,917,000 | ) | | | (41,027,907 | ) | | | (5,702,612 | ) | | | (1,695,683 | ) |
| Increase (Decrease) in Net Assets from Capital Share Transactions | | | (6,223,897 | ) | | | 37,483,175 | | | | 15,461,011 | | | | 1,602,647 | |
| Total Increase (Decrease) in Net Assets | | | (12,433,330 | ) | | | 29,376,351 | | | | 19,039,824 | | | | 1,792,065 | |
| Net Assets: | | | | | | | | | | | | | | | | |
| Beginning of Year/Period | | | 60,159,862 | | | | 30,783,511 | | | | 1,792,065 | | | | — | |
| End of Year/Period | | $ | 47,726,532 | | | $ | 60,159,862 | | | $ | 20,831,889 | | | $ | 1,792,065 | |
| Share Transactions: | | | | | | | | | | | | | | | | |
| Issued | | | 1,300,000 | | | | 4,500,000 | | | | 900,000 | | | | 200,002 | |
| Redeemed | | | (1,750,000 | ) | | | (2,700,000 | ) | | | (250,000 | ) | | | (100,000 | ) |
| Net Increase (Decrease) in Shares Outstanding from Share Transactions | | | (450,000 | ) | | | 1,800,000 | | | | 650,000 | | | | 100,002 | |
| (1) | The Fund commenced operations on December 7, 2018. |
| (2) | Includes realized gains (losses) as a result of in-kind redemptions. (See Note 4 in Notes to Financial Statements.) |
| | Statements of Changes in Net Assets | |
| | | |
| | | Global X MSCI China Communication Services ETF | | | Global X MSCI China Utilities ETF | |
| | | Year Ended October 31, 2020 | | | Year Ended October 31, 2019 | | | Year Ended October 31, 2020 | | | Period Ended October 31, 2019(1) | |
| Operations: | | | | | | | | | | | | |
| Net Investment Income | | $ | 128,091 | | | $ | 98,084 | | | $ | 39,325 | | | $ | 32,847 | |
Net Realized Gain (Loss) on Investments and Foreign Currency Transactions(2) | | | 274,861 | | | | (323,084 | ) | | | (54,262 | ) | | | 3,972 | |
| Net Change in Unrealized Appreciation (Depreciation) on Investments and Foreign Currency Translations | | | 2,567,572 | | | | 609,088 | | | | (155,762 | ) | | | 54,251 | |
| Net Increase (Decrease) in Net Assets Resulting from Operations | | | 2,970,524 | | | | 384,088 | | | | (170,699 | ) | | | 91,070 | |
| Distributions | | | (133,251 | ) | | | (115,344 | ) | | | (40,333 | ) | | | (12,312 | ) |
| Capital Share Transactions: | | | | | | | | | | | | | | | | |
| Issued | | | 32,668 | | | | 3,542,417 | | | | — | | | | 1,502,076 | |
| Redeemed | | | (6,956,872 | ) | | | (7,384,857 | ) | | | — | | | | — | |
| Increase (Decrease) in Net Assets from Capital Share Transactions | | | (6,924,204 | ) | | | (3,842,440 | ) | | | — | | | | 1,502,076 | |
| Total Increase (Decrease) in Net Assets | | | (4,086,931 | ) | | | (3,573,696 | ) | | | (211,032 | ) | | | 1,580,834 | |
| Net Assets: | | | | | | | | | | | | | | | | |
| Beginning of Year/Period | | | 21,071,212 | | | | 24,644,908 | | | | 1,580,834 | | | | — | |
| End of Year/Period | | $ | 16,984,281 | | | $ | 21,071,212 | | | $ | 1,369,802 | | | $ | 1,580,834 | |
| Share Transactions: | | | | | | | | | | | | | | | | |
| Issued | | | — | | | | 150,000 | | | | — | | | | 100,002 | |
| Redeemed | | | (300,000 | ) | | | (300,000 | ) | | | — | | | | — | |
| Net Increase (Decrease) in Shares Outstanding from Share Transactions | | | (300,000 | ) | | | (150,000 | ) | | | — | | | | 100,002 | |
| (1) | The Fund commenced operations on December 7, 2018. |
| (2) | Includes realized gains (losses) as a result of in-kind redemptions. (See Note 4 in Notes to Financial Statements.) |
| | Statements of Changes in Net Assets | |
| | | |
| | | Global X MSCI China Real Estate ETF | | | Global X MSCI China Large-Cap 50 ETF | |
| | | Year Ended October 31, 2020 | | | Period Ended October 31, 2019(1) | | | Year Ended October 31, 2020 | | | Period Ended October 31, 2019(1) | |
| Operations: | | | | | | | | | | | | |
| Net Investment Income | | $ | 343,566 | | | $ | 65,807 | | | $ | 49,735 | | | $ | 54,725 | |
Net Realized Gain (Loss) on Investments and Foreign Currency Transactions(2) | | | 193,466 | | | | (28,873 | ) | | | (61,965 | ) | | | 96,014 | |
| Net Change in Unrealized Appreciation (Depreciation) on Investments and Foreign Currency Transactions | | | (1,002,005 | ) | | | 210,125 | | | | 833,563 | | | | 117,351 | |
| Net Increase (Decrease) in Net Assets Resulting from Operations | | | (464,973 | ) | | | 247,059 | | | | 821,333 | | | | 268,090 | |
| Distributions | | | (171,559 | ) | | | (26,242 | ) | | | (45,697 | ) | | | (21,830 | ) |
| Capital Share Transactions: | | | | | | | | | | | | | | | | |
| Issued | | | 12,160,366 | | | | 1,502,246 | | | | 1,774,049 | | | | 3,902,789 | |
| Redeemed | | | (5,966,280 | ) | | | — | | | | — | | | | (1,389,067 | ) |
| Increase in Net Assets from Capital Share Transactions | | | 6,194,086 | | | | 1,502,246 | | | | 1,774,049 | | | | 2,513,722 | |
| Total Increase in Net Assets | | | 5,557,554 | | | | 1,723,063 | | | | 2,549,685 | | | | 2,759,982 | |
| Net Assets: | | | | | | | | | | | | | | | | |
| Beginning of Year/Period | | | 1,723,063 | | | | — | | | | 2,759,982 | | | | — | |
| End of Year/Period | | $ | 7,280,617 | | | $ | 1,723,063 | | | $ | 5,309,667 | | | $ | 2,759,982 | |
| Share Transactions: | | | | | | | | | | | | | | | | |
| Issued | | | 700,000 | | | | 100,002 | | | | 50,000 | | | | 150,002 | |
| Redeemed | | | (350,000 | ) | | | — | | | | — | | | | (50,000 | ) |
| Net Increase in Shares Outstanding from Share Transactions | | | 350,000 | | | | 100,002 | | | | 50,000 | | | | 100,002 | |
| (1) | The Fund commenced operations on December 7, 2018. |
| (2) | Includes realized gains (losses) as a result of in-kind redemptions. (See Note 4 in Notes to Financial Statements.) |
| | Statements of Changes in Net Assets | |
| | | |
| | | Global X MSCI Greece ETF | | | Global X MSCI Norway ETF | |
| | | Year Ended October 31, 2020 | | | Year Ended October 31, 2019 | | | Year Ended October 31, 2020 | | | Year Ended October 31, 2019 | |
| Operations: | | | | | | | | | | | | |
| Net Investment Income | | $ | 5,597,062 | | | $ | 7,261,688 | | | $ | 914,434 | | | $ | 3,192,473 | |
Net Realized Gain (Loss) on Investments and Foreign Currency Transactions(1) | | | (38,673,337 | ) | | | 7,147,977 | | | | (12,024,811 | ) | | | (609,830 | ) |
| Net Change in Unrealized Appreciation (Depreciation) on Investments and Foreign Currency Translations | | | (79,130,175 | ) | | | 66,702,125 | | | | 3,873,538 | | | | (16,892,602 | ) |
| Net Increase (Decrease) in Net Assets Resulting from Operations | | | (112,206,450 | ) | | | 81,111,790 | | | | (7,236,839 | ) | | | (14,309,959 | ) |
| Distributions | | | (6,932,583 | ) | | | (7,386,717 | ) | | | (1,003,442 | ) | | | (6,822,589 | ) |
| Capital Share Transactions: | | | | | | | | | | | | | | | | |
| Issued | | | 6,798,787 | | | | 122,188,425 | | | | 12,924,167 | | | | 28,417,866 | |
| Redeemed | | | (117,484,191 | ) | | | (114,974,004 | ) | | | (49,437,188 | ) | | | (92,433,481 | ) |
| Increase (Decrease) in Net Assets from Capital Share Transactions | | | (110,685,404 | ) | | | 7,214,421 | | | | (36,513,021 | ) | | | (64,015,615 | ) |
| Total Increase (Decrease) in Net Assets | | | (229,824,437 | ) | | | 80,939,494 | | | | (44,753,302 | ) | | | (85,148,163 | ) |
| Net Assets: | | | | | | | | | | | | | | | | |
| Beginning of Year | | | 338,840,040 | | | | 257,900,546 | | | | 78,323,235 | | | | 163,471,398 | |
| End of Year | | $ | 109,015,603 | | | $ | 338,840,040 | | | $ | 33,569,933 | | | $ | 78,323,235 | |
| Share Transactions: | | | | | | | | | | | | | | | | |
| Issued | | | 300,000 | | | | 14,000,000 | | | | 1,300,000 | | | | 2,150,000 | |
| Redeemed | | | (5,467,689 | ) | | | (13,600,000 | ) | | | (4,500,000 | ) | | | (7,150,000 | ) |
| Net Increase (Decrease) in Shares Outstanding from Share Transactions | | | (5,167,689 | ) | | | 400,000 | | | | (3,200,000 | ) | | | (5,000,000 | ) |
| (1) | Includes realized gains (losses) as a result of in-kind redemptions. (See Note 4 in Notes to Financial Statements.) |
| | Statements of Changes in Net Assets | |
| | | |
| | | Global X DAX Germany ETF | | | Global X MSCI Portugal ETF | |
| | | Year Ended October 31, 2020 | | | Year Ended October 31, 2019* | | | Year Ended October 31, 2020 | | | Year Ended October 31, 2019 | |
| Operations: | | | | | | | | | | | | |
| Net Investment Income | | $ | 638,382 | | | $ | 404,378 | | | $ | 406,240 | | | $ | 806,252 | |
Net Realized Gain (Loss) on Investments and Foreign Currency Transactions(1) | | | 356,797 | | | | (573,031 | ) | | | (776,926 | ) | | | (1,490,574 | ) |
| Net Change in Unrealized Appreciation (Depreciation) on Investments and Foreign Currency Translations | | | (2,852,978 | ) | | | 1,686,382 | | | | (2,704,266 | ) | | | 1,251,984 | |
| Net Increase (Decrease) in Net Assets Resulting from Operations | | | (1,857,799 | ) | | | 1,517,729 | | | | (3,074,952 | ) | | | 567,662 | |
| Distributions | | | (221,929 | ) | | | (666,693 | ) | | | (491,011 | ) | | | (1,885,103 | ) |
| Return of Capital | | | — | | | | (10,877 | ) | | | — | | | | — | |
| Capital Share Transactions: | | | | | | | | | | | | | | | | |
| Issued | | | 16,211,600 | | | | — | | | | — | | | | 5,527,566 | |
| Redeemed | | | (6,554,406 | ) | | | (1,320,546 | ) | | | (5,751,454 | ) | | | (7,018,798 | ) |
| Increase (Decrease) in Net Assets from Capital Share Transactions | | | 9,657,194 | | | | (1,320,546 | ) | | | (5,751,454 | ) | | | (1,491,232 | ) |
| Total Increase (Decrease) in Net Assets | | | 7,577,466 | | | | (480,387 | ) | | | (9,317,417 | ) | | | (2,808,673 | ) |
| Net Assets: | | | | | | | | | | | | | | | | |
| Beginning of Year | | | 16,370,494 | | | | 16,850,881 | | | | 22,486,505 | | | | 25,295,178 | |
| End of Year | | $ | 23,947,960 | | | $ | 16,370,494 | | | $ | 13,169,088 | | | $ | 22,486,505 | |
| Share Transactions: | | | | | | | | | | | | | | | | |
| Issued | | | 600,000 | | | | — | | | | — | | | | 500,000 | |
| Redeemed | | | (250,000 | ) | | | (50,000 | ) | | | (550,000 | ) | | | (650,000 | ) |
| Net Increase (Decrease) in Shares Outstanding from Share Transactions | | | 350,000 | | | | (50,000 | ) | | | (550,000 | ) | | | (150,000 | ) |
| * | The financial statements include the financial information of the Predecessor Fund through December 21, 2018 (See Note 1 in Notes to Financial Statements). |
| (1) | Includes realized gains (losses) as a result of in-kind redemptions. (See Note 4 in Notes to Financial Statements.) |
| | Statements of Changes in Net Assets | |
| | | |
| | | Global X MSCI Colombia ETF | | | Global X MSCI Argentina ETF | |
| | | Year Ended October 31, 2020 | | | Year Ended October 31, 2019 | | | Year Ended October 31, 2020 | | | Year Ended October 31, 2019 | |
| Operations: | | | | | | | | | | | | |
| Net Investment Income | | $ | 1,948,326 | | | $ | 2,194,900 | | | $ | 132,336 | | | $ | 947,404 | |
Net Realized Gain (Loss) on Investments and Foreign Currency Transactions(1) | | | (8,817,533 | ) | | | (1,132,564 | ) | | | (14,048,129 | ) | | | 4,097,803 | |
| Net Change in Unrealized Appreciation (Depreciation) on Investments and Foreign Currency Translations | | | (17,912,427 | ) | | | 9,637,684 | | | | 16,510,079 | | | | (13,779,241 | ) |
| Net Increase (Decrease) in Net Assets Resulting from Operations | | | (24,781,634 | ) | | | 10,700,020 | | | | 2,594,286 | | | | (8,734,034 | ) |
| Distributions | | | (1,868,308 | ) | | | (3,425,053 | ) | | | (231,396 | ) | | | (1,862,692 | ) |
| Capital Share Transactions: | | | | | | | | | | | | | | | | |
| Issued | | | — | | | | 7,168,432 | | | | 12,850,316 | | | | 23,447,588 | |
| Redeemed | | | (11,451,496 | ) | | | (24,443,712 | ) | | | (36,273,962 | ) | | | (42,760,305 | ) |
| Decrease in Net Assets from Capital Share Transactions | | | (11,451,496 | ) | | | (17,275,280 | ) | | | (23,423,646 | ) | | | (19,312,717 | ) |
| Total Decrease in Net Assets | | | (38,101,438 | ) | | | (10,000,313 | ) | | | (21,060,756 | ) | | | (29,909,443 | ) |
| Net Assets: | | | | | | | | | | | | | | | | |
| Beginning of Year | | | 72,281,944 | | | | 82,282,257 | | | | 59,481,511 | | | | 89,390,954 | |
| End of Year | | $ | 34,180,506 | | | $ | 72,281,944 | | | $ | 38,420,755 | | | $ | 59,481,511 | |
| Share Transactions: | | | | | | | | | | | | | | | | |
| Issued | | | — | | | | 750,000 | | | | 550,000 | | | | 850,000 | |
| Redeemed | | | (425,301 | ) | | | (2,650,000 | ) | | | (1,650,000 | ) | | | (1,650,000 | ) |
| Net Decrease in Shares Outstanding from Share Transactions | | | (425,301 | ) | | | (1,900,000 | ) | | | (1,100,000 | ) | | | (800,000 | ) |
| (1) | Includes realized gains (losses) as a result of in-kind redemptions. (See Note 4 in Notes to Financial Statements.) |
| | Statements of Changes in Net Assets | |
| | | |
| | | Global X MSCI Pakistan ETF | | | Global X MSCI Nigeria ETF | |
| | | Year Ended October 31, 2020 | | | Year Ended October 31, 2019 | | | Year Ended October 31, 2020 | | | Year Ended October 31, 2019 | |
| Operations: | | | | | | | | | | | | |
| Net Investment Income | | $ | 1,064,519 | | | $ | 1,786,076 | | | $ | 2,353,773 | | | $ | 2,080,153 | |
Net Realized Loss on Investments and Foreign Currency Transactions(1) | | | (21,677,623 | ) | | | (5,515,582 | ) | | | (3,250,197 | ) | | | (4,923,709 | ) |
| Net Change in Unrealized Appreciation (Depreciation) on Investments and Foreign Currency Transactions | | | 20,510,802 | | | | (8,397,889 | ) | | | 6,205,365 | | | | (7,368,323 | ) |
| Net Increase (Decrease) in Net Assets Resulting from Operations | | | (102,302 | ) | | | (12,127,395 | ) | | | 5,308,941 | | | | (10,211,879 | ) |
| Distributions | | | (1,334,151 | ) | | | (2,425,569 | ) | | | (235,024 | ) | | | (3,827,441 | ) |
| Capital Share Transactions: | | | | | | | | | | | | | | | | |
| Issued | | | 13,669,139 | | | | 16,333,858 | | | | 5,534,985 | | | | 6,742,660 | |
| Redeemed | | | (19,481,752 | ) | | | — | | | | (970,502 | ) | | | (817,591 | ) |
| Increase (Decrease) in Net Assets from Capital Share Transactions | | | (5,812,613 | ) | | | 16,333,858 | | | | 4,564,483 | | | | 5,925,069 | |
| Total Increase (Decrease) in Net Assets | | | (7,249,066 | ) | | | 1,780,894 | | | | 9,638,400 | | | | (8,114,251 | ) |
| Net Assets: | | | | | | | | | | | | | | | | |
| Beginning of Year | | | 41,804,464 | | | | 40,023,570 | | | | 32,560,743 | | | | 40,674,994 | |
| End of Year | | $ | 34,555,398 | | | $ | 41,804,464 | | | $ | 42,199,143 | | | $ | 32,560,743 | |
| Share Transactions: | | | | | | | | | | | | | | | | |
| Issued | | | 425,000 | | | | 2,450,000 | | | | 400,000 | | | | 450,000 | |
| Redeemed | | | (750,207 | ) | | | — | | | | (100,000 | ) | | | (50,000 | ) |
| Net Increase (Decrease) in Shares Outstanding from Share Transactions | | | (325,207 | ) | | | 2,450,000 | | | | 300,000 | | | | 400,000 | |
| (1) | Includes realized gains (losses) as a result of in-kind redemptions. (See Note 4 in Notes to Financial Statements.) |
| | Statements of Changes in Net Assets | |
| | | |
| | | Global X MSCI Next Emerging & Frontier ETF | | | Global X FTSE Nordic Region ETF | |
| | | Year Ended October 31, 2020 | | | Year Ended October 31, 2019 | | | Year Ended October 31, 2020 | | | Year Ended October 31, 2019 | |
| Operations: | | | | | | | | | | | | |
| Net Investment Income | | $ | 358,800 | | | $ | 429,655 | | | $ | 171,508 | | | $ | 66,437 | |
Net Realized Gain (Loss) on Investments and Foreign Currency Transactions(1) | | | (1,447,417 | ) | | | (1,596,752 | ) | | | 27,477 | | | | (577,358 | ) |
| Net Change in Unrealized Appreciation (Depreciation) on Investments and Foreign Currency Translations | | | (1,912,183 | ) | | | 1,576,445 | | | | 1,979,833 | | | | 1,690,864 | |
| Net Increase (Decrease) in Net Assets Resulting from Operations | | | (3,000,800 | ) | | | 409,348 | | | | 2,178,818 | | | | 1,179,943 | |
| Distributions | | | (425,178 | ) | | | (725,137 | ) | | | (123,078 | ) | | | (946,666 | ) |
| Return of Capital | | | — | | | | — | | | | — | | | | (410,291 | ) |
| Capital Share Transactions: | | | | | | | | | | | | | | | | |
| Issued | | | 760,268 | | | | 5,248,374 | | | | 5,909,404 | | | | — | |
| Redeemed | | | (1,420,679 | ) | | | — | | | | (1,112,245 | ) | | | (7,216,000 | ) |
| Increase (Decrease) in Net Assets from Capital Share Transactions | | | (660,411 | ) | | | 5,248,374 | | | | 4,797,159 | | | | (7,216,000 | ) |
| Total Increase (Decrease) in Net Assets | | | (4,086,389 | ) | | | 4,932,585 | | | | 6,852,899 | | | | (7,393,014 | ) |
| Net Assets: | | | | | | | | | | | | | | | | |
| Beginning of Year | | | 18,077,456 | | | | 13,144,871 | | | | 16,755,739 | | | | 24,148,753 | |
| End of Year | | $ | 13,991,067 | | | $ | 18,077,456 | | | $ | 23,608,638 | | | $ | 16,755,739 | |
| Share Transactions: | | | | | | | | | | | | | | | | |
| Issued | | | 50,000 | | | | 250,000 | | | | 250,000 | | | | — | |
| Redeemed | | | (100,000 | ) | | | — | | | | (50,000 | ) | | | (350,000 | ) |
| Net Increase (Decrease) in Shares Outstanding from Share Transactions | | | (50,000 | ) | | | 250,000 | | | | 200,000 | | | | (350,000 | ) |
| (1) | Includes realized gains (losses) as a result of in-kind redemptions. (See Note 4 in Notes to Financial Statements.) |
| | Statements of Changes in Net Assets | |
| | | |
| | | Global X FTSE Southeast Asia ETF | |
| | | Year Ended October 31, 2020 | | | Year Ended October 31, 2019 | |
| Operations: | | | | | | |
| Net Investment Income | | $ | 623,843 | | | $ | 587,288 | |
Net Realized Loss on Investments and Foreign Currency Transactions(1) | | | (869,536 | ) | | | (208,036 | ) |
| Net Change in Unrealized Appreciation (Depreciation) on Investments and Foreign Currency Translations | | | (6,450,264 | ) | | | 1,253,888 | |
| Net Increase (Decrease) in Net Assets Resulting from Operations | | | (6,695,957 | ) | | | 1,633,140 | |
| Distributions | | | (646,024 | ) | | | (911,494 | ) |
| Capital Share Transactions: | | | | | | | | |
| Issued | | | 2,574,247 | | | | 7,987,304 | |
| Redeemed | | | (574,260 | ) | | | — | |
| Increase in Net Assets from Capital Share Transactions | | | 1,999,987 | | | | 7,987,304 | |
| Total Increase (Decrease) in Net Assets | | | (5,341,994 | ) | | | 8,708,950 | |
| Net Assets: | | | | | | | | |
| Beginning of Year | | | 26,323,150 | | | | 17,614,200 | |
| End of Year | | $ | 20,981,156 | | | $ | 26,323,150 | |
| Share Transactions: | | | | | | | | |
| Issued | | | 200,000 | | | | 500,000 | |
| Redeemed | | | (50,000 | ) | | | — | |
| Net Increase in Shares Outstanding from Share Transactions | | | 150,000 | | | | 500,000 | |
| (1) | Includes realized gains (losses) as a result of in-kind redemptions. (See Note 4 in Notes to Financial Statements.) |
Selected Per Share Data & Ratios
For a Share Outstanding Throughout the Period
| | | Net Asset Value, Beginning of Period ($) | | | Net Investment Income ($)* | | | Net Realized and Unrealized Gain (Loss) on Investments ($) | | | Total from Operations ($) | | | Distribution from Net Investment Income ($) | |
| Global X MSCI China Energy ETF | | | | | | | | | | | | | | | |
| 2020 | | | 10.43 | | | | 0.44 | | | | (2.66 | ) | | | (2.22 | ) | | | (0.42 | ) |
| 2019 | | | 11.82 | | | | 0.30 | | | | (1.12 | ) | | | (0.82 | ) | | | (0.57 | ) |
| 2018 | | | 11.69 | | | | 0.49 | | | | 0.05 | | | | 0.54 | | | | (0.41 | ) |
| 2017 | | | 10.56 | | | | 0.41 | | | | 0.93 | | | | 1.34 | | | | (0.21 | ) |
| 2016 | | | 11.61 | | | | 0.22 | | | | (0.94 | ) | | | (0.72 | ) | | | (0.33 | ) |
| Global X MSCI China Materials ETF | | | | | | | | | | | | | | | | | | | | |
| 2020 | | | 14.50 | | | | 0.32 | | | | 3.93 | | | | 4.25 | | | | (0.57 | ) |
| 2019 | | | 15.97 | | | | 0.52 | | | | (0.99 | ) | | | (0.47 | ) | | | (1.00 | ) |
| 2018 | | | 21.59 | | | | 0.46 | | | | (5.84 | ) | | | (5.38 | ) | | | (0.24 | ) |
| 2017 | | | 13.42 | | | | 0.38 | | | | 7.95 | | | | 8.33 | | | | (0.16 | ) |
| 2016 | | | 13.29 | | | | 0.16 | | | | 0.68 | | | | 0.84 | | | | (0.71 | ) |
| Global X MSCI China Industrials ETF | | | | | | | | | | | | | | | | | | | | |
| 2020 | | | 12.92 | | | | 0.23 | | | | 0.49 | | | | 0.72 | | | | (0.21 | ) |
| 2019 | | | 13.59 | | | | 0.27 | | | | (0.49 | ) | | | (0.22 | ) | | | (0.45 | ) |
| 2018 | | | 16.06 | | | | 0.29 | | | | (2.41 | ) | | | (2.12 | ) | | | (0.35 | ) |
| 2017 | | | 12.57 | | | | 0.24 | | | | 3.45 | | | | 3.69 | | | | (0.20 | ) |
| 2016 | | | 14.44 | | | | 0.18 | | | | (1.71 | ) | | | (1.53 | ) | | | (0.34 | ) |
| Total from Distributions ($) | | | Net Asset Value, End of Period ($) | | | Total Return (%)** | | | Net Assets End of Period ($)(000) | | | Ratio of Expenses to Average Net Assets (%) | | | Ratio of Net Investment Income to Average Net Assets (%) | | | Portfolio Turnover (%)†† | |
| | | | | | | | | | | | | | | | | | | | |
| | (0.42 | ) | | | 7.79 | | | | (22.05 | ) | | | 1,558 | | | | 0.66 | | | | 5.02 | | | | 34.18 | |
| | (0.57 | ) | | | 10.43 | | | | (7.04 | ) | | | 1,564 | | | | 0.66 | | | | 2.67 | | | | 109.41 | |
| | (0.41 | ) | | | 11.82 | | | | 4.77 | | | | 2,955 | | | | 0.65 | | | | 4.00 | | | | 14.60 | |
| | (0.21 | ) | | | 11.69 | | | | 13.13 | | | | 1,754 | | | | 0.65 | | | | 3.82 | | | | 11.85 | |
| | (0.33 | ) | | | 10.56 | | | | (6.11 | ) | | | 1,583 | | | | 0.65 | | | | 2.19 | | | | 22.19 | |
| | | | | | | | | | | | | | | | | | | | | | | | | | | |
| | (0.57 | ) | | | 18.18 | | | | 29.88 | | | | 1,818 | | | | 0.66 | | | | 1.95 | | | | 36.02 | |
| | (1.00 | ) | | | 14.50 | | | | (3.13 | ) | | | 2,175 | | | | 0.66 | | | | 3.30 | | | | 65.67 | |
| | (0.24 | ) | | | 15.97 | | | | (25.20 | ) | | | 2,395 | | | | 0.66 | | | | 2.27 | | | | 26.95 | |
| | (0.16 | ) | | | 21.59 | | | | 62.79 | | | | 5,397 | | | | 0.65 | | | | 2.19 | | | | 49.80 | |
| | (0.71 | ) | | | 13.42 | | | | 6.84 | | | | 1,342 | | | | 0.65 | | | | 1.31 | | | | 26.33 | |
| | | | | | | | | | | | | | | | | | | | | | | | | | | |
| | (0.21 | ) | | | 13.43 | | | | 5.57 | | | | 2,014 | | | | 0.66 | | | | 1.71 | | | | 19.54 | |
| | (0.45 | ) | | | 12.92 | | | | (1.66 | ) | | | 1,938 | | | | 0.66 | | | | 1.99 | | | | 80.17 | |
| | (0.35 | ) | | | 13.59 | | | | (13.44 | ) | | | 2,038 | | | | 0.66 | | | | 1.92 | | | | 18.28 | |
| | (0.20 | ) | | | 16.06 | | | | 29.88 | | | | 4,015 | | | | 0.65 | | | | 1.68 | | | | 21.53 | |
| | (0.34 | ) | | | 12.57 | | | | (10.60 | ) | | | 3,770 | | | | 0.65 | | | | 1.47 | | | | 14.08 | |
| * | Per share data calculated using average shares method. |
| ** | Total Return is for the period indicated and has not been annualized. The return shown does not reflect the deduction of taxes that a shareholder would pay on Fund distributions or the redemption of Fund shares. |
| †† | Portfolio turnover rate is for the period indicated and periods of less than one year have not been annualized. Excludes effect of in-kind transfers. |
Selected Per Share Data & Ratios
For a Share Outstanding Throughout the Period
| | | Net Asset Value, Beginning of Period ($) | | | Net Investment Income ($)* | | | Net Realized and Unrealized Gain (Loss) on Investments ($) | | | Total from Operations ($) | | | Distribution from Net Investment Income ($) | |
| Global X MSCI China Consumer Discretionary ETF | | | | | | | | | | | | | | | |
| 2020 | | | 17.68 | | | | 0.04 | | | | 11.89 | | | | 11.93 | | | | (0.16 | ) |
| 2019 | | | 13.57 | | | | 0.16 | | | | 4.35 | | | | 4.51 | | | | (0.40 | ) |
| 2018 | | | 17.44 | | | | 0.20 | | | | (3.95 | ) | | | (3.75 | ) | | | (0.12 | ) |
| 2017 | | | 11.97 | | | | 0.24 | | | | 5.40 | | | | 5.64 | | | | (0.17 | ) |
| 2016 | | | 13.72 | | | | 0.20 | | | | (1.36 | ) | | | (1.16 | ) | | | (0.59 | ) |
| Global X MSCI China Consumer Staples ETF | | | | | | | | | | | | | | | | | | | | |
| 2020 | | | 21.08 | | | | 0.31 | | | | 8.41 | | | | 8.72 | | | | (0.25 | ) |
2019(1) | | | 15.00 | | | | 0.28 | | | | 5.93 | | | | 6.21 | | | | (0.13 | ) |
| Global X MSCI China Health Care ETF | | | | | | | | | | | | | | | | | | | | |
| 2020 | | | 17.70 | | | | 0.03 | | | | 6.06 | | | | 6.09 | | | | (0.04 | ) |
2019(1) | | | 15.00 | | | | 0.09 | | | | 2.64 | | | | 2.73 | | | | (0.03 | ) |
| Global X MSCI China Financials ETF | | | | | | | | | | | | | | | | | | | | |
| 2020 | | | 15.83 | | | | 0.41 | | | | (1.50 | ) | | | (1.09 | ) | | | (0.49 | ) |
| 2019 | | | 15.39 | | | | 0.67 | | | | 0.65 | | | | 1.32 | | | | (0.88 | ) |
| 2018 | | | 17.63 | | | | 0.48 | | | | (2.38 | ) | | | (1.90 | ) | | | (0.34 | ) |
| 2017 | | | 13.80 | | | | 0.39 | | | | 3.70 | | | | 4.09 | | | | (0.26 | ) |
| 2016 | | | 14.90 | | | | 0.25 | | | | (0.62 | ) | | | (0.37 | ) | | | (0.73 | ) |
| Distribution from Capital Gains ($) | | | Total from Distributions ($) | | | Net Asset Value, End of Period ($) | | | Total Return (%)** | | | Net Assets End of Period ($)(000) | | | Ratio of Expenses to Average Net Assets (%) | | | Ratio of Net Investment Income to Average Net Assets (%) | | | Portfolio Turnover (%)†† | |
| | | | | | | | | | | | | | | | | | | | | | | |
| | — | | | | (0.16 | ) | | | 29.45 | | | | 67.98 | | | | 393,118 | | | | 0.65 | | | | 0.21 | | | | 32.56 | |
| | — | | | | (0.40 | ) | | | 17.68 | | | | 34.20 | | | | 156,486 | | | | 0.65 | | | | 1.03 | | | | 83.41 | |
| | — | | | | (0.12 | ) | | | 13.57 | | | | (21.70 | ) | | | 120,102 | | | | 0.65 | | | | 1.11 | | | | 17.92 | |
| | — | | | | (0.17 | ) | | | 17.44 | | | | 47.90 | | | | 156,050 | | | | 0.65 | | | | 1.67 | | | | 34.72 | |
| | — | | | | (0.59 | ) | | | 11.97 | | | | (8.57 | ) | | | 73,023 | | | | 0.65 | | | | 1.71 | | | | 38.13 | |
| | | | | | | | | | | | | | | | | | | | | | | | | | | | | | | |
| | (0.51 | ) | | | (0.76 | ) | | | 29.04 | | | | 42.48 | | | | 17,424 | | | | 0.65 | | | | 1.21 | | | | 44.54 | |
| | — | | | | (0.13 | ) | | | 21.08 | | | | 41.48 | | | | 2,109 | | | | 0.67 | † | | | 1.66 | † | | | 29.25 | |
| | | | | | | | | | | | | | | | | | | | | | | | | | | | | | | |
| | (0.07 | ) | | | (0.11 | ) | | | 23.68 | | | | 34.62 | | | | 10,656 | | | | 0.65 | | | | 0.16 | | | | 31.60 | |
| | — | | | | (0.03 | ) | | | 17.70 | | | | 18.22 | | | | 2,655 | | | | 0.66 | † | | | 0.60 | † | | | 12.20 | |
| | | | | | | | | | | | | | | | | | | | | | | | | | | | | | | |
| | — | | | | (0.49 | ) | | | 14.25 | | | | (7.24 | ) | | | 47,727 | | | | 0.65 | | | | 2.72 | | | | 21.72 | |
| | — | | | | (0.88 | ) | | | 15.83 | | | | 8.95 | | | | 60,160 | | | | 0.66 | | | | 4.11 | | | | 54.17 | |
| | — | | | | (0.34 | ) | | | 15.39 | | | | (11.04 | ) | | | 30,784 | | | | 0.66 | | | | 2.67 | | | | 15.09 | |
| | — | | | | (0.26 | ) | | | 17.63 | | | | 30.32 | | | | 50,251 | | | | 0.65 | | | | 2.58 | | | | 19.12 | |
| | — | | | | (0.73 | ) | | | 13.80 | | | | (2.56 | ) | | | 28,289 | | | | 0.65 | | | | 1.92 | | | | 18.43 | |
| (1) | The Fund commenced operations on December 7, 2018. |
| * | Per share data calculated using average shares method. |
| ** | Total Return is for the period indicated and has not been annualized. The return shown does not reflect the deduction of taxes that a shareholder would pay on Fund distributions or the redemption of Fund shares. |
| † | Annualized. |
| †† | Portfolio turnover rate is for the period indicated and periods of less than one year have not been annualized. Excludes effect of in-kind transfers. |
Amounts designated as “—“ are $0 or have been rounded to $0.
Selected Per Share Data & Ratios
For a Share Outstanding Throughout the Period
| | | Net Asset Value, Beginning of Period ($) | | | Net Investment Income ($)* | | | Net Realized and Unrealized Gain (Loss) on Investments
($) | | | Total from Operations
($) | | | Distribution from Net Investment Income ($) | |
| Global X MSCI China Information Technology ETF | | | | | | | | | | | | | | | |
| 2020 | | | 17.92 | | | | 0.09 | | | | 10.03 | | | | 10.12 | | | | (0.10 | ) |
2019(1) | | | 15.00 | | | | 0.19 | | | | 2.81 | | | | 3.00 | | | | (0.08 | ) |
| Global X MSCI China Communication Services ETF | | | | | | | | | | | | | | | | | | | | |
| 2020 | | | 22.18 | | | | 0.16 | | | | 3.96 | | | | 4.12 | | | | (0.17 | ) |
| 2019 | | | 22.40 | | | | 0.09 | | | | (0.21 | ) | | | (0.12 | ) | | | (0.10 | ) |
| 2018 | | | 29.24 | | | | 0.07 | | | | (6.23 | ) | | | (6.16 | ) | | | (0.68 | ) |
| 2017 | | | 23.23 | | | | 0.28 | | | | 6.69 | | | | 6.97 | | | | (0.96 | ) |
| 2016 | | | 22.01 | | | | 0.45 | | | | 0.91 | | | | 1.36 | | | | (0.14 | ) |
| Global X MSCI China Utilities ETF | | | | | | | | | | | | | | | | | | | | |
| 2020 | | | 15.81 | | | | 0.39 | | | | (2.09 | ) | | | (1.70 | ) | | | (0.35 | ) |
2019(1) | | | 15.00 | | | | 0.33 | | | | 0.60 | | | | 0.93 | | | | (0.12 | ) |
| Global X MSCI China Real Estate ETF | | | | | | | | | | | | | | | | | | | | |
| 2020 | | | 17.23 | | | | 0.81 | | | | (1.17 | ) | | | (0.36 | ) | | | (0.69 | ) |
2019(1) | | | 15.00 | | | | 0.67 | | | | 1.82 | | | | 2.49 | | | | (0.26 | ) |
| Global X MSCI China Large-Cap 50 ETF | | | | | | | | | | | | | | | | | | | | |
| 2020 | | | 27.60 | | | | 0.49 | | | | 7.77 | | | | 8.26 | | | | (0.46 | ) |
2019(1) | | | 25.00 | | | | 0.55 | | | | 2.27 | | | | 2.82 | | | | (0.22 | ) |
| Distribution from Capital Gains ($) | | | Total from Distributions ($) | | | Net Asset Value, End of Period ($) | | | Total Return (%)** | | | Net Assets End of Period ($)(000) | | | Ratio of Expenses to Average Net Assets (%) | | | Ratio of Net Investment Income to Average Net Assets (%) | | | Portfolio Turnover (%)†† | |
| | | | | | | | | | | | | | | | | | | | | | | |
| | (0.16 | ) | | | (0.26 | ) | | | 27.78 | | | | 57.01 | | | | 20,832 | | | | 0.65 | | | | 0.37 | | | | 29.01 | |
| | — | | | | (0.08 | ) | | | 17.92 | | | | 20.06 | | | | 1,792 | | | | 0.66 | † | | | 1.29 | † | | | 36.75 | |
| | | | | | | | | | | | | | | | | | | | | | | | | | | | | | | |
| | — | | | | (0.17 | ) | | | 26.13 | | | | 18.61 | | | | 16,984 | | | | 0.65 | | | | 0.67 | | | | 27.78 | |
| | — | | | | (0.10 | ) | | | 22.18 | | | | (0.54 | ) | | | 21,071 | | | | 0.66 | | | | 0.39 | | | | 114.67 | |
| | — | | | | (0.68 | ) | | | 22.40 | | | | (21.70 | ) | | | 24,645 | | | | 0.65 | | | | 0.24 | | | | 33.79 | |
| | — | | | | (0.96 | ) | | | 29.24 | | | | 31.56 | | | | 19,007 | | | | 0.65 | | | | 1.14 | | | | 42.59 | |
| | — | | | | (0.14 | ) | | | 23.23 | | | | 6.20 | | | | 13,940 | | | | 0.65 | | | | 2.09 | | | | 42.02 | |
| | | | | | | | | | | | | | | | | | | | | | | | | | | | | | | |
| | (0.06 | ) | | | (0.41 | ) | | | 13.70 | | | | (10.92 | ) | | | 1,370 | | | | 0.66 | | | | 2.78 | | | | 37.12 | |
| | — | | | | (0.12 | ) | | | 15.81 | | | | 6.24 | | | | 1,581 | | | | 0.66 | † | | | 2.42 | † | | | 28.26 | |
| | | | | | | | | | | | | | | | | | | | | | | | | | | | | | | |
| | — | | | | (0.69 | ) | | | 16.18 | | | | (2.55 | ) | | | 7,281 | | | | 0.66 | | | | 4.73 | | | | 25.75 | |
| | — | | | | (0.26 | ) | | | 17.23 | | | | 16.56 | | | | 1,723 | | | | 0.65 | † | | | 4.44 | † | | | 14.00 | |
| | | | | | | | | | | | | | | | | | | | | | | | | | | | | | | |
| | — | | | | (0.46 | ) | | | 35.40 | | | | 30.23 | | | | 5,310 | | | | 0.29 | | | | 1.62 | | | | 20.32 | |
| | — | | | | (0.22 | ) | | | 27.60 | | | | 11.27 | | | | 2,760 | | | | 0.29 | † | | | 2.26 | † | | | 12.46 | |
| (1) | The Fund commenced operations on December 7, 2018. |
| * | Per share data calculated using average shares method. |
| ** | Total Return is for the period indicated and has not been annualized. The return shown does not reflect the deduction of taxes that a shareholder would pay on Fund distributions or the redemption of Fund shares. |
| † | Annualized. |
| †† | Portfolio turnover rate is for the period indicated and periods of less than one year have not been annualized. Excludes effect of in-kind transfers. |
Amounts designated as “—“ are $0 or have been rounded to $0.
Selected Per Share Data & Ratios
For a Share Outstanding Throughout the Period
| | | Net
Asset Value, Beginning
of Period
($) | | | Net Investment Income
($)* | | | Net Realized and Unrealized Gain (Loss) on Investments
($) | | | Total from Operations
($) | | | Distribution from Net Investment Income ($) | |
| Global X MSCI Greece ETF | | | | | | | | | | | | | | | |
2020(1) | | | 29.91 | | | | 0.66 | | | | (12.20 | ) | | | (11.54 | ) | | | (0.69 | ) |
2019(1) | | | 23.04 | | | | 0.63 | | | | 6.87 | | | | 7.50 | | | | (0.63 | ) |
2018(1) | | | 27.90 | | | | 0.57 | | | | (4.77 | ) | | | (4.20 | ) | | | (0.66 | ) |
2017(1) | | | 22.05 | | | | 0.45 | | | | 5.85 | | | | 6.30 | | | | (0.45 | ) |
2016(1) | | | 31.23 | | | | 0.39 | | | | (9.21 | ) | | | (8.82 | ) | | | (0.36 | ) |
| Global X MSCI Norway ETF | | | | | | | | | | | | | | | | | | | | |
| 2020 | | | 11.69 | | | | 0.20 | | | | (2.09 | ) | | | (1.89 | ) | | | (0.21 | ) |
| 2019 | | | 13.97 | | | | 0.42 | | | | (1.80 | ) | | | (1.38 | ) | | | (0.90 | ) |
| 2018 | | | 13.50 | | | | 0.37 | | | | 0.48 | | | | 0.85 | | | | (0.38 | ) |
| 2017 | | | 11.07 | | | | 0.41 | | | | 2.34 | | | | 2.75 | | | | (0.32 | ) |
| 2016 | | | 10.75 | | | | 0.35 | | | | 0.34 | | | | 0.69 | | | | (0.37 | ) |
Global X DAX Germany ETF(2) | | | | | | | | | | | | | | | | | | | | |
| 2020 | | | 27.28 | | | | 0.87 | | | | (2.64 | ) | | | (1.77 | ) | | | (0.30 | ) |
2019(3) | | | 25.92 | | | | 0.67 | | | | 1.82 | | | | 2.49 | | | | (1.11 | ) |
2018(3) | | | 31.25 | | | | 0.77 | | | | (5.75 | )‡ | | | (4.98 | ) | | | (0.35 | ) |
2017(3) | | | 24.73 | | | | 0.48 | | | | 6.91 | | | | 7.39 | | | | (0.83 | ) |
2016(3) | | | 25.82 | | | | 0.45 | | | | (1.33 | ) | | | (0.88 | ) | | | (0.21 | ) |
| Return of Capital ($) | | | Total from Distributions ($) | | | Net Asset Value, End of Period ($) | | | Total Return (%)** | | | Net Assets End of Period ($)(000) | | | Ratio of Expenses to Average Net Assets (%) | | | Ratio of Net Investment Income to Average Net Assets (%) | | | Portfolio Turnover (%)†† | |
| | | | | | | | | | | | | | | | | | | | | | | |
| | — | | | | (0.69 | ) | | | 17.68 | | | | (39.39 | ) | | | 109,016 | | | | 0.58 | | | | 2.81 | | | | 28.48 | |
| | — | | | | (0.63 | ) | | | 29.91 | | | | 33.57 | | | | 338,840 | | | | 0.57 | | | | 2.43 | | | | 12.67 | |
| | — | | | | (0.66 | ) | | | 23.04 | | | | (15.63 | ) | | | 257,901 | | | | 0.59 | | | | 1.98 | | | | 16.38 | |
| | — | | | | (0.45 | ) | | | 27.90 | | | | 29.04 | | | | 349,788 | | | | 0.61 | | | | 1.69 | | | | 21.59 | |
| | — | | | | (0.36 | ) | | | 22.05 | | | | (28.33 | ) | | | 245,561 | | | | 0.62 | | | | 1.71 | | | | 76.19 | |
| | | | | | | | | | | | | | | | | | | | | | | | | | | | | | | |
| | — | | | | (0.21 | ) | | | 9.59 | | | | (16.32 | ) | | | 33,570 | | | | 0.50 | | | | 1.92 | | | | 8.38 | |
| | — | | | | (0.90 | ) | | | 11.69 | | | | (9.77 | ) | | | 78,323 | | | | 0.50 | | | | 3.36 | | | | 9.63 | |
| | — | | | | (0.38 | ) | | | 13.97 | | | | 6.47 | | | | 163,471 | | | | 0.50 | | | | 2.64 | | | | 9.55 | |
| | — | | | | (0.32 | ) | | | 13.50 | | | | 25.53 | | | | 164,736 | | | | 0.50 | | | | 3.41 | | | | 9.53 | |
| | — | | | | (0.37 | ) | | | 11.07 | | | | 6.86 | | | | 113,997 | | | | 0.50 | | | | 3.39 | | | | 16.62 | |
| | | | | | | | | | | | | | | | | | | | | | | | | | | | | | | |
| | — | | | | (0.30 | ) | | | 25.21 | | | | (6.53 | ) | | | 23,948 | | | | 0.20 | + | | | 3.30 | | | | 10.93 | |
| | (0.02 | ) | | | (1.13 | ) | | | 27.28 | | | | 9.98 | | | | 16,370 | | | | 0.21 | + | | | 2.65 | | | | 15.36 | |
| | — | | | | (0.35 | ) | | | 25.92 | | | (16.05) | @
| | | 16,851 | | | | 0.20 | | | | 2.57 | | | | 7.00 | |
| | (0.04 | ) | | | (0.87 | ) | | | 31.25 | | | | 30.40 | | | | 17,186 | | | | 0.38 | | | | 1.74 | | | | 9.00 | |
| | — | | | | (0.21 | ) | | | 24.73 | | | | (3.41 | ) | | | 13,601 | | | | 0.45 | | | | 1.86 | | | | 14.00 | |
| (1) | Per share amounts have been adjusted for a 1 for 3 reverse share split on April 28, 2020 (See Note 9 in the Notes to Financial Statements). |
| (2) | The financial statements include the financial information of the Predecessor Fund through December 21, 2018 (See Note 1 in Notes to Financial Statements). |
| (3) | As a result of the Reorganization, the Fund assumed the performance and accounting history of the Predecessor Fund. Accordingly, performance figures for the Fund for periods prior to the date of the Reorganization represent the performance of the Predecessor Fund (See Note 1 in Notes to Financial Statements). |
| * | Per share data calculated using average shares method. |
| ** | Total Return is for the period indicated and has not been annualized. The return shown does not reflect the deduction of taxes that a shareholder would pay on Fund distributions or the redemption of Fund shares. |
| †† | Portfolio turnover rate is for the period indicated and periods of less than one year have not been annualized. Excludes effect of in-kind transfers. |
| + | The ratio of Expenses to Average Net Assets includes the effect of a waiver. If these offsets were excluded, the ratio would have been 0.45% and 0.46% for the years ended October 31, 2020 and October 31, 2019, respectively. |
| ‡ | Includes a $0.10 gain per share derived from a payment from the prior administrator of the Predecessor Fund. |
| @ | Before payment from the prior administrator of the Predecessor Fund for the loss resulting from an error, the total return for the period would have been (16.37%). |
Amounts designated as “—“ are $0 or have been rounded to $0.
Selected Per Share Data & Ratios
For a Share Outstanding Throughout the Period
| | | Net Asset Value, Beginning of Period ($) | | | Net Investment Income ($)* | | | Net Realized and Unrealized Gain (Loss) on Investments ($) | | | Total from Operations ($) | | | Distribution from Net Investment Income ($) | | | Total from Distributions ($) | |
| Global X MSCI Portugal ETF | | | | | | | | | | | | | | | | | | |
| 2020 | | | 10.71 | | | | 0.23 | | | | (2.16 | ) | | | (1.93 | ) | | | (0.28 | ) | | | (0.28 | ) |
| 2019 | | | 11.24 | | | | 0.36 | | | | (0.11 | ) | | | 0.25 | | | | (0.78 | ) | | | (0.78 | ) |
| 2018 | | | 12.49 | | | | 0.36 | | | | (1.25 | ) | | | (0.89 | ) | | | (0.36 | ) | | | (0.36 | ) |
| 2017 | | | 9.88 | | | | 0.36 | | | | 2.65 | | | | 3.01 | | | | (0.40 | ) | | | (0.40 | ) |
| 2016 | | | 10.85 | | | | 0.42 | | | | (0.93 | ) | | | (0.51 | ) | | | (0.46 | ) | | | (0.46 | ) |
| Global X MSCI Colombia ETF | | | | | | | | | | | | | | | | | | | | | | | | |
2020(1) | | | 38.16 | | | | 1.14 | | | | (15.00 | ) | | | (13.86 | ) | | | (1.04 | ) | | | (1.04 | ) |
2019(1) | | | 34.72 | | | | 1.04 | | | | 3.96 | | | | 5.00 | | | | (1.56 | ) | | | (1.56 | ) |
2018(1) | | | 38.24 | | | | 0.84 | | | | (3.64 | ) | | | (2.80 | ) | | | (0.72 | ) | | | (0.72 | ) |
2017(1) | | | 36.88 | | | | 0.72 | | | | 1.16 | | | | 1.88 | | | | (0.52 | ) | | | (0.52 | ) |
2016(1) | | | 35.16 | | | | 0.64 | | | | 1.56 | | | | 2.20 | | | | (0.48 | ) | | | (0.48 | ) |
| Global X MSCI Argentina ETF | | | | | | | | | | | | | | | | | | | | | | | | |
| 2020 | | | 21.83 | | | | 0.06 | | | | 1.83 | | | | 1.89 | | | | (0.08 | ) | | | (0.08 | ) |
| 2019 | | | 25.36 | | | | 0.29 | | | | (3.26 | ) | | | (2.97 | ) | | | (0.56 | ) | | | (0.56 | ) |
| 2018 | | | 32.05 | | | | 0.35 | | | | (6.87 | ) | | | (6.52 | ) | | | (0.17 | ) | | | (0.17 | ) |
| 2017 | | | 23.69 | | | | 0.07 | | | | 8.37 | | | | 8.44 | | | | (0.08 | ) | | | (0.08 | ) |
| 2016 | | | 19.81 | | | | 0.15 | | | | 3.89 | | | | 4.04 | | | | (0.16 | ) | | | (0.16 | ) |
| | | | | | | | | | | | | | | | | | | | | | | | | |
| Net Asset Value, End of Period ($) | | | Total Return (%)** | | | Net Assets End of Period ($)(000) | | | Ratio of Expenses to Average Net Assets (%) | | | Ratio of Net Investment Income to Average Net Assets (%) | | | Portfolio Turnover (%)†† | |
| | | | | | | | | | | | | | | | | |
| | 8.50 | | | | (18.37 | ) | | | 13,169 | | | | 0.58 | | | | 2.34 | | | | 25.19 | |
| | 10.71 | | | | 2.72 | | | | 22,487 | | | | 0.58 | | | | 3.41 | | | | 20.74 | |
| | 11.24 | | | | (7.26 | ) | | | 25,295 | | | | 0.57 | | | | 2.91 | | | | 21.05 | |
| | 12.49 | | | | 31.88 | | | | 63,705 | | | | 0.60 | | | | 3.31 | | | | 25.31 | |
| | 9.88 | | | | (4.86 | ) | | | 25,694 | | | | 0.61 | | | | 4.26 | | | | 27.20 | |
| | | | | | | | | | | | | | | | | | | | | | | |
| | 23.26 | | | | (36.91 | ) | | | 34,181 | | | | 0.62 | | | | 3.91 | | | | 20.85 | |
| | 38.16 | | | | 15.05 | | | | 72,282 | | | | 0.62 | | | | 2.81 | | | | 18.05 | |
| | 34.72 | | | | (7.55 | ) | | | 82,282 | | | 0.62 | @ | | | 2.01 | | | | 39.15 | |
| | 38.24 | | | | 5.24 | | | | 92,984 | | | 0.62 | @
| | | 1.83 | | | | 40.93 | |
| | 36.88 | | | | 6.55 | | | | 88,760 | | | 0.65 | @
| | | 1.82 | | | | 37.60 | |
| | | | | | | | | | | | | | | | | | | | | | | |
| | 23.64 | | | | 8.61 | | | | 38,421 | | | | 0.60 | | | | 0.25 | | | | 49.17 | |
| | 21.83 | | | | (12.08 | ) | | | 59,482 | | | | 0.60 | | | | 1.08 | | | | 28.88 | |
| | 25.36 | | | | (20.48 | ) | | | 89,391 | | | | 0.60 | ‡ | | | 1.07 | | | | 34.46 | |
| | 32.05 | | | | 35.79 | | | | 183,468 | | | | 0.65 | ‡ | | | 0.24 | | | | 24.45 | |
| | 23.69 | | | | 20.65 | | | | 90,602 | | | | 0.74 | | | | 0.69 | | | | 20.88 | |
| (1) | Per share amounts have been adjusted for a 1 for 4 reverse share split on April 28, 2020 (See Note 9 in the Notes to Financial Statements). |
| * | Per share data calculated using average shares method. |
| ** | Total Return is for the period indicated and has not been annualized. The return shown does not reflect the deduction of taxes that a shareholder would pay on Fund distributions or the redemption of Fund shares. |
| ‡ | The ratio of Expenses to Average Net Assets includes the effect of a waiver. If these offsets were excluded, the ratios would have been 0.66% and 0.74% for the years ended October 31, 2018 and 2017. |
| †† | Portfolio turnover rate is for the period indicated and periods of less than one year have not been annualized. Excludes effect of in-kind transfers. |
| @ | The ratio of Expenses to Average Net Assets includes the effect of a waiver. If these offsets were excluded, the ratio would have been 0.68%, 0.81% and 0.84% for the years ended October 31, 2018, 2017 and 2016, respectively. |
Selected Per Share Data & Ratios
For a Share Outstanding Throughout the Period
| | | Net Asset Value, Beginning of Period ($) | | | Net Investment Income ($)* | | | Net Realized and Unrealized Gain (Loss) on Investments ($) | | | Total from Operations ($) | | | Distribution from Net Investment Income ($) | | | Distribution from Capital Gains ($) | |
| Global X MSCI Pakistan ETF | | | | | | | | | | | | | | | | | | |
2020(1) | | | 26.32 | | | | 0.68 | | | | 1.17 | | | | 1.85 | | | | (0.79 | ) | | | — | |
2019(1) | | | 41.04 | | | | 1.52 | | | | (13.88 | ) | | | (12.36 | ) | | | (2.36 | ) | | | — | |
2018(1) | | | 54.24 | | | | 1.88 | | | | (10.72 | ) | | | (8.84 | ) | | | (1.76 | ) | | | (2.60 | ) |
2017(1) | | | 60.92 | | | | 3.00 | | | | (7.60 | ) | | | (4.60 | ) | | | (2.08 | ) | | | — | |
2016(1) | | | 56.68 | | | | 2.32 | | | | 3.60 | | | | 5.92 | | | | (1.48 | ) | | | (0.20 | ) |
| Global X MSCI Nigeria ETF | | | | | | | | | | | | | | | | | | | | | | | | |
| 2020 | | | 12.23 | | | | 0.80 | | | | 1.30 | | | | 2.10 | | | | (0.08 | ) | | | — | |
| 2019 | | | 17.98 | | | | 0.87 | | | | (4.96 | ) | | | (4.09 | ) | | | (1.66 | ) | | | — | |
| 2018 | | | 21.43 | | | | 0.73 | | | | (3.76 | ) | | | (3.03 | ) | | | (0.42 | ) | | | — | |
2017(2) | | | 17.24 | | | | 0.54 | | | | 4.07 | | | | 4.61 | | | | (0.42 | ) | | | — | |
2016(2) | | | 31.76 | | | | 0.86 | | | | (14.16 | ) | | | (13.30 | ) | | | (1.22 | ) | | | — | |
| Global X MSCI Next Emerging & Frontier ETF | | | | | | | | | | | | | | | | | | | | | | | | |
| 2020 | | | 20.09 | | | | 0.41 | | | | (3.55 | ) | | | (3.14 | ) | | | (0.49 | ) | | | — | |
| 2019 | | | 20.22 | | | | 0.55 | | | | 0.31 | | | | 0.86 | | | | (0.99 | ) | | | — | |
| 2018 | | | 23.28 | | | | 0.59 | | | | (3.24 | ) | | | (2.65 | ) | | | (0.41 | ) | | | — | |
| 2017 | | | 20.15 | | | | 0.40 | | | | 3.21 | | | | 3.61 | | | | (0.48 | ) | | | — | |
| 2016 | | | 19.27 | | | | 0.20 | | | | 1.14 | | | | 1.34 | | | | (0.46 | ) | | | — | |
| Total from Distributions ($) | | | Net Asset Value, End of Period ($) | | | Total Return (%)** | | | Net Assets End of Period ($)(000) | | | Ratio of Expenses to Average Net Assets (%) | | | Ratio of Net Investment Income to Average Net Assets (%) | | | Portfolio Turnover (%)†† | |
| | | | | | | | | | | | | | | | | | | | |
| | (0.79 | ) | | | 27.38 | | | | 6.99 | | | | 34,555 | | | | 0.96 | | | | 2.44 | | | | 52.38 | |
| | (2.36 | ) | | | 26.32 | | | | (30.73 | ) | | | 41,804 | | | | 0.88 | | | | 5.14 | | | | 19.09 | |
| | (4.36 | ) | | | 41.04 | | | | (17.53 | ) | | | 40,024 | | | | 0.87 | | | | 3.84 | | | | 44.05 | |
| | (2.08 | ) | | | 54.24 | | | | (8.25 | ) | | | 53,576 | | | | 0.89 | | | | 4.64 | | | | 65.51 | |
| | (1.68 | ) | | | 60.92 | | | | 10.87 | | | | 10,664 | | | | 0.91 | | | | 4.01 | | | | 21.22 | |
| | | | | | | | | | | | | | | | | | | | | | | | | | | |
| | (0.08 | ) | | | 14.25 | | | | 17.25 | | | | 42,199 | | | | 0.89 | | | | 6.81 | | | | 18.79 | |
| | (1.66 | ) | | | 12.23 | | | | (24.55 | ) | | | 32,561 | | | | 0.89 | | | | 5.70 | | | | 45.62 | |
| | (0.42 | ) | | | 17.98 | | | | (14.46 | ) | | | 40,675 | | | | 0.88 | | | | 3.29 | | | | 62.52 | |
| | (0.42 | ) | | | 21.43 | | | | 27.52 | | | | 64,559 | | | | 1.07 | | | | 2.99 | | | | 21.07 | |
| | (1.22 | ) | | | 17.24 | | | | (43.30 | ) | | | 28,009 | | | 1.02 | @
| | | 3.80 | | | | 29.61 | |
| | | | | | | | | | | | | | | | | | | | | | | | | | | |
| | (0.49 | ) | | | 16.46 | | | | (15.85 | ) | | | 13,991 | | | | 0.70 | | | | 2.36 | | | | 31.66 | |
| | (0.99 | ) | | | 20.09 | | | | 4.29 | | | | 18,077 | | | | 0.66 | | | | 2.66 | | | | 78.67 | |
| | (0.41 | ) | | | 20.22 | | | | (11.66 | ) | | | 13,145 | | | | 0.55 | | | | 2.54 | | | | 14.62 | |
| | (0.48 | ) | | | 23.28 | | | | 18.53 | | | | 16,294 | | | | 0.56 | | | | 1.89 | | | | 7.93 | |
| | (0.46 | ) | | | 20.15 | | | | 7.33 | | | | 15,112 | | | | 0.56 | | | | 1.13 | | | | 9.35 | |
| (1) | Per share amounts have been adjusted for a 1 for 4 reverse share split on April 28, 2020 (See Note 9 in the Notes to Financial Statements). |
| (2) | Per share amounts have been adjusted for a 1 for 4 reverse share split on March 16, 2017 (See Note 9 in the Notes to Financial Statements). |
| * | Per share data calculated using average shares method. |
| ** | Total Return is for the period indicated and has not been annualized. The return shown does not reflect the deduction of taxes that a shareholder would pay on Fund distributions or the redemption of Fund shares. |
| †† | Portfolio turnover rate is for the period indicated and periods of less than one year have not been annualized. Excludes effect of in-kind transfers. |
| @ | The ratio of Expenses to Average Net Assets includes the effect of a waiver. If these offsets were excluded, the ratio would have been 1.10% for the year ended October 31, 2016. |
Amounts designated as “—“ are $0 or have been rounded to $0.
Selected Per Share Data & Ratios
For a Share Outstanding Throughout the Period
| | | Net Asset Value, Beginning of Period ($) | | | Net Investment Income ($)* | | | Net Realized and Unrealized Gain (Loss) on Investments ($) | | | Total from Operations
($) | | | Distribution from Net Investment Income ($) | | | Return of Capital ($) | |
| Global X FTSE Nordic Region ETF | | | | | | | | | | | | | | | | | | |
| 2020 | | | 20.69 | | | | 0.20 | | | | 2.62 | | | | 2.82 | | | | (0.14 | ) | | | — | |
| 2019 | | | 20.82 | | | | 0.06 | | | | 1.02 | | | | 1.08 | | | | (0.84 | ) | | | (0.37 | ) |
| 2018 | | | 23.89 | | | | 0.63 | | | | (2.87 | ) | | | (2.24 | ) | | | (0.83 | ) | | | — | |
| 2017 | | | 19.38 | | | | 0.51 | | | | 4.72 | | | | 5.23 | | | | (0.72 | ) | | | — | |
| 2016 | | | 22.29 | | | | 0.63 | | | | (2.91 | ) | | | (2.28 | ) | | | (0.63 | ) | | | — | |
| Global X FTSE Southeast Asia ETF | | | | | | | | | | | | | | | | | | | | | | | | |
| 2020 | | | 15.95 | | | | 0.37 | | | | (4.27 | ) | | | (3.90 | ) | | | (0.39 | ) | | | — | |
| 2019 | | | 15.32 | | | | 0.44 | | | | 0.91 | | | | 1.35 | | | | (0.72 | ) | | | — | |
| 2018 | | | 15.91 | | | | 0.49 | | | | (0.81 | ) | | | (0.32 | ) | | | (0.27 | ) | | | — | |
| 2017 | | | 13.72 | | | | 0.32 | | | | 2.23 | | | | 2.55 | | | | (0.36 | ) | | | — | |
| 2016 | | | 13.07 | | | | 0.31 | | | | 0.78 | | | | 1.09 | | | | (0.44 | ) | | | — | |
| Total from Distributions ($) | | | Net Asset Value, End of Period ($) | | | Total Return (%)** | | | Net Assets End of Period ($)(000) | | | Ratio of Expenses to Average Net Assets (%) | | | Ratio of Net Investment Income to Average Net Assets (%) | | | Portfolio Turnover (%)†† | |
| | | | | | | | | | | | | | | | | | | | |
| | (0.14 | ) | | | 23.37 | | | | 13.70 | | | | 23,609 | | | | 0.51 | | | | 0.92 | | | | 4.90 | |
| | (1.21 | ) | | | 20.69 | | | | 5.44 | | | | 16,756 | | | | 0.56 | | | | 0.30 | | | | 4.27 | |
| | (0.83 | ) | | | 20.82 | | | | (9.67 | ) | | | 24,149 | | | | 0.58 | | | | 2.80 | | | | 7.37 | |
| | (0.72 | ) | | | 23.89 | | | | 27.97 | | | | 38,464 | | | | 0.55 | | | | 2.37 | | | | 6.79 | |
| | (0.63 | ) | | | 19.38 | | | | (10.54 | ) | | | 40,899 | | | | 0.51 | | | | 3.01 | | | | 10.90 | |
| | | | | | | | | | | | | | | | | | | | | | | | | | | |
| | (0.39 | ) | | | 11.66 | | | | (24.82 | ) | | | 20,981 | | | | 0.65 | | | | 2.77 | | | | 5.98 | |
| | (0.72 | ) | | | 15.95 | | | | 8.94 | | | | 26,323 | | | | 0.65 | | | | 2.76 | | | | 7.01 | |
| | (0.27 | ) | | | 15.32 | | | | (2.15 | ) | | | 17,614 | | | | 0.65 | | | | 2.94 | | | | 11.98 | |
| | (0.36 | ) | | | 15.91 | | | | 19.19 | | | | 14,320 | | | | 0.65 | | | | 2.23 | | | | 7.78 | |
| | (0.44 | ) | | | 13.72 | | | | 8.75 | | | | 12,349 | | | | 0.65 | | | | 2.40 | | | | 12.94 | |
| * | Per share data calculated using average shares method. |
| ** | Total Return is for the period indicated and has not been annualized. The return shown does not reflect the deduction of taxes that a shareholder would pay on Fund distributions or the redemption of Fund shares. |
| †† | Portfolio turnover rate is for the period indicated and periods of less than one year have not been annualized. Excludes effect of in-kind transfers. |
Amounts designated as “—“ are $0 or have been rounded to $0.
| | Notes to Financial Statements | |
| | October 31, 2020 | |
1. ORGANIZATION
The Global X Funds (the “Trust”) is a Delaware statutory trust formed on March 6, 2008. The Trust is registered under the Investment Company Act of 1940, as amended, as an open-end management investment company. As of October 31, 2020, the Trust had eighty-seven portfolios, seventy-seven of which were operational. The financial statements herein and the related notes pertain to the Global X MSCI China Energy ETF, Global X MSCI China Materials ETF, Global X MSCI China Industrials ETF, Global X MSCI China Consumer Discretionary ETF, Global X MSCI China Consumer Staples ETF, Global X MSCI China Health Care ETF, Global X MSCI China Financials ETF, Global X MSCI China Information Technology ETF, Global X MSCI China Communication Services ETF, Global X MSCI China Utilities ETF, Global X MSCI China Real Estate ETF, Global X MSCI China Large-Cap 50 ETF, Global X MSCI Greece ETF, Global X MSCI Norway ETF, Global X DAX Germany ETF, Global X MSCI Portugal ETF, Global X MSCI Colombia ETF, Global X MSCI Argentina ETF, Global X MSCI Pakistan ETF, Global X MSCI Nigeria ETF, Global X MSCI Next Emerging & Frontier ETF, Global X FTSE Nordic Region ETF and Global X FTSE Southeast Asia ETF (each a “Fund”, and collectively, the “Funds”). Each Fund (except for the Global X MSCI Next Emerging & Frontier ETF) has elected non-diversified status.
On December 24, 2018, the shareholders of the Horizons DAX Germany ETF (the “Predecessor Fund”) approved a proposed agreement and plan of reorganization (the “Reorganization”) that provided for (a) the transfer of all the assets to the Global X DAX Germany ETF (the “Germany Fund”) and the assumption of certain of the liabilities of the Predecessor Fund; (b) the issuance of shares of the Germany Fund to the shareholders of the Predecessor Fund; and (c) the liquidation and termination of the Predecessor Fund. The effective date of the Reorganization was December 24, 2018. The Germany Fund had no operations prior to the Reorganization. The Predecessor Fund had substantially similar investment objectives, investment strategies, policies and restrictions as those of the Germany Fund. The financial statements and financial highlights include the financial information of the Predecessor Fund through December 21, 2018.
Effective December 6, 2018, the Global X China Consumer ETF changed its name to Global X MSCI China Consumer Discretionary ETF, and its underlying index was changed to MSCI China Consumer Discretionary 10/50 Index.
Effective December 6, 2018, the Global X China Energy ETF changed its name to Global X MSCI China Energy ETF, and its underlying index was changed to MSCI China Energy IMI Plus 10/50 Index.
Effective December 6, 2018, the Global X China Financials ETF changed its name to Global X MSCI China Financials ETF, and its underlying index was changed to MSCI China Financials 10/50 Index.
| | Notes to Financial Statements (continued) | |
| | October 31, 2020 | |
1. ORGANIZATION (continued)
Effective December 6, 2018, the Global X China Industrials ETF changed its name to Global X MSCI China Industrials ETF, and its underlying index was changed to MSCI China Industrials 10/50 Index.
Effective December 6, 2018, the Global X China Materials ETF changed its name to Global X MSCI China Materials ETF, and its underlying index was changed to MSCI China Materials 10/50 Index.
Effective December 6, 2018, the Global X NASDAQ China Technology ETF changed its name to Global X MSCI China Communication Services ETF, and its underlying index was changed to MSCI China Communication Services 10/50 Index.
Effective January 16, 2019, the Global X Next Emerging & Frontier ETF changed its name to Global X MSCI Next Emerging & Frontier ETF, and its underlying index was changed to the MSCI Select Emerging and Frontier Markets Access Index.
2. SIGNIFICANT ACCOUNTING POLICIES
The following is a summary of the Significant Accounting Policies followed by the Funds.
USE OF ESTIMATES — The Funds are investment companies that apply the accounting and reporting guidance issued in Topic 946 by the U.S. Financial Accounting Standards Board. The preparation of financial statements in conformity with U.S. generally accepted accounting principles (“U.S. GAAP”) requires management to make estimates and assumptions that affect the reported amounts of assets and liabilities and disclosure of contingent assets and liabilities at the date of the financial statements and the reported amounts of increases and decreases in net assets from operations during the reporting period. Actual results could differ from those estimates.
RETURN OF CAPITAL ESTIMATES — Distributions received by the Funds from underlying Master Limited Partnership (“MLP”) and real estate investment trust (“REIT”) investments generally are comprised of income and return of capital. The Funds record investment income and return of capital based on estimates made at the time such distributions are received. Such estimates are based on historical information available from the MLPs, REITs and other industry sources. These estimates may subsequently be revised based on information received from the MLPs and REITs after their tax reporting periods are concluded.
SECURITY VALUATION — Securities listed on a securities exchange, market or automated quotation system for which quotations are readily available (except for
| | Notes to Financial Statements (continued) | |
| | October 31, 2020 | |
2. SIGNIFICANT ACCOUNTING POLICIES (continued)
securities traded on NASDAQ), including securities traded over the counter, are valued at the last quoted sale price on the primary exchange or market (foreign or domestic) on which they are traded (or at approximately 4:00 pm Eastern Time if a security’s primary exchange is normally open at that time), or, if there is no such reported sale, at the most recent mean between the quoted bid and asked prices, which approximate fair value (absent both bid and asked prices on such exchange, the bid price may be used).
For securities traded on NASDAQ, the NASDAQ Official Closing Price will be used. If available, debt securities are priced based upon valuations provided by independent, third-party pricing agents. Such values generally reflect the last reported sales price if the security is actively traded. The third-party pricing agents may also value debt securities at an evaluated bid price by employing methodologies that utilize actual market transactions, broker-supplied valuations, or other methodologies designed to identify the market value for such securities. Debt obligations with remaining maturities of sixty days or less will be valued at amortized cost, which approximates market value. The prices for foreign securities are reported in local currency and converted to U.S. dollars using currency exchange rates. Prices for most securities held by the Funds are provided daily by recognized independent pricing agents. If a security price cannot be obtained from an independent, third-party pricing agent, the Funds seek to obtain a bid price from at least one independent broker.
Securities for which market prices are not “readily available” are valued in accordance with Fair Value Procedures established by the Board of Trustees (the “Board”). The Funds’ Fair Value Procedures are implemented through a Fair Value Committee (the “Committee”) designated by the Board. Some of the more common reasons that may necessitate that a security be valued using the Fair Value Procedures include: the security’s trading has been halted or suspended; the security has been de-listed from its primary trading exchange; the security’s primary trading market is temporarily closed at a time when, under normal conditions, it would be open; the security has not been traded for an extended period of time; the security’s primary pricing source is not able or willing to provide a price; or trading of the security is subject to local government-imposed restrictions. In addition, the Funds may fair value a security if an event that may materially affect the value of the Funds’ security that traded outside of the United States (a “Significant Event”) has occurred between the time of the security’s last close and the time that the Funds calculate their net asset values. A Significant Event may relate to a single issuer or to an entire market sector. Events that may be Significant Events include: government actions, natural disasters, armed conflict, acts of terrorism and significant market fluctuations. If Global X Management Company LLC, the Funds’ investment adviser (the “Adviser”), becomes aware of a Significant Event that has occurred with respect to a security or group of securities after the closing of the exchange or market on which the security or securities principally trade, but before the time at which the Funds calculate their net asset values, it may request that a Committee meeting be called.
| | Notes to Financial Statements (continued) | |
| | October 31, 2020 | |
2. SIGNIFICANT ACCOUNTING POLICIES (continued)
When a security is valued in accordance with the Fair Value Procedures, the Committee will determine the value after taking into consideration relevant information reasonably available to the Committee. As of October 31, 2020, there were securities valued using the Fair Value Procedures of $3, $7,606, $13 and $63,854 in Global X MSCI China Communication Services ETF, Global X MSCI Greece ETF, Global X MSCI Portugal ETF and Global X MSCI Next Emerging & Frontier ETF, respectively. There were no other securities priced using the Fair Value Procedures.
In accordance with the authoritative guidance on fair value measurements and disclosure under U.S. GAAP, the Funds disclose the fair value of their investments in a hierarchy that prioritizes the inputs to valuation techniques used to measure the fair value. The objective of a fair value measurement is to determine the price that would be received upon the sale of an asset or paid to transfer a liability in an orderly transaction between market participants at the measurement date (an exit price). Accordingly, the fair value hierarchy gives the highest priority to quoted prices (unadjusted) in active markets for identical assets or liabilities (Level 1) and the lowest priority to unobservable inputs (Level 3). The three levels of the fair value hierarchy are described below:
Level 1 – Unadjusted quoted prices in active markets for identical, unrestricted assets or liabilities that the Funds have the ability to access at the measurement date
Level 2 – Other significant observable inputs (including quoted prices in non-active markets, quoted prices for similar investments, fair value of investments for which the Funds have the ability to fully redeem tranches at net asset value as of the measurement date or within the near term, and short-term investments valued at amortized cost)
Level 3 – Significant unobservable inputs (including the Funds’ own assumptions in determining the fair value of investments, fair value of investments for which the Funds do not have the ability to fully redeem tranches at net asset value as of the measurement date or within the near term)
Investments are classified within the level of the lowest significant input considered in determining fair value. Investments classified within Level 3 whose fair value measurement considers several inputs may include Level 1 or Level 2 inputs as components of the overall fair value measurement. For the year ended October 31, 2020, there have been no significant changes to the Funds’ fair valuation methodologies.
The unobservable inputs used to determine fair value of Level 3 assets may have similar or diverging impacts on valuation. Significant increases and decreases in these inputs in isolation and interrelationships between those inputs could result in significantly higher or lower fair value measurement.
| | Notes to Financial Statements (continued) | |
| | October 31, 2020 | |
2. SIGNIFICANT ACCOUNTING POLICIES (continued)
DUE TO/FROM BROKERS — Due to/from brokers includes cash and collateral balances with the Funds’ clearing brokers or counterparties at October 31, 2020. The Funds continuously monitor the credit standing of each broker or counterparty with whom they conduct business. In the event a broker or counterparty is unable to fulfill its obligations, the Funds would be subject to counterparty credit risk.
REPURCHASE AGREEMENTS — Securities pledged as collateral for repurchase agreements by BNP Paribas are held by Brown Brothers Harriman & Co. (“BBH”), the Funds’ custodian (“custodian”), and are designated as being held on each Fund’s behalf by the custodian under a book-entry system. Each Fund monitors the adequacy of the collateral on a daily basis and can require the seller to provide additional collateral in the event the market value of the securities pledged falls below the carrying value of the repurchase agreement, including accrued interest. It is the Funds’ policy to only enter into repurchase agreements with banks and other financial institutions which are deemed by the Adviser to be creditworthy. The Fund bears the risk of loss in the event that the counterparty to a repurchase agreement defaults on its obligations and the Fund is prevented from exercising its rights to dispose of the underlying securities received as collateral and the risk of a possible decline in the value of the underlying securities during the period. For financial statement purposes, the Funds record the securities lending collateral (included in repurchase agreements, at value or restricted cash) as an asset and the obligation to return securities lending collateral as a liability on the Statements of Assets and Liabilities.
Repurchase agreements are entered into by the Funds under Master Repurchase Agreements (“MRA”) which permit the Funds, under certain circumstances, including an event of default (such as bankruptcy or insolvency), to offset payables and/or receivables under the MRA with collateral held and/or posted to the counterparty and create one single net payment due to or from the Funds.
| | Notes to Financial Statements (continued) | |
| | October 31, 2020 | |
2. SIGNIFICANT ACCOUNTING POLICIES (continued)
As of October 31, 2020, the open repurchase agreements by counterparty which are subject to an MRA on a net payment basis are as follows:
| | | Repurchase Agreements | | | Fair Value of Non-cash Collateral Received(1) | | | Cash Collateral Received | | | Net Amount(2) | |
| Global X MSCI China Consumer Discretionary ETF | | | | | | | | | | | | |
| BNP Paribas | | $ | 7,116,820 | | | $ | 7,116,820 | | | $ | – | | | $ | – | |
| Global X China Financials ETF | | | | | | | | | | | | | | | | |
| BNP Paribas | | | 157,796 | | | | 157,796 | | | | – | | | | – | |
| Global X MSCI China Communication Services ETF | | | | | | | | | | | | | | | | |
| BNP Paribas | | | 249,571 | | | | 249,571 | | | | – | | | | – | |
| Global X MSCI Greece ETF | | | | | | | | | | | | | | | | |
| BNP Paribas | | | 3,340,874 | | | | 3,340,874 | | | | – | | | | – | |
| Global X Norway ETF | | | | | | | | | | | | | | | | |
| BNP Paribas | | | 136,311 | | | | 136,311 | | | | – | | | | – | |
| Global X MSCI Portugal ETF | | | | | | | | | | | | | | | | |
| BNP Paribas | | | 2,765,402 | | | | 2,765,402 | | | | – | | | | – | |
| Global X MSCI Colombia ETF | | | | | | | | | | | | | | | | |
| BNP Paribas | | | 2,486,099 | | | | 2,486,099 | | | | – | | | | – | |
| Global X MSCI Argentina ETF | | | | | | | | | | | | | | | | |
| BNP Paribas | | | 5,589,341 | | | | 5,589,341 | | | | – | | | | – | |
| Global X FTSE Nordic Region ETF | | | | | | | | | | | | | | | | |
| BNP Paribas | | | 240,495 | | | | 240,495 | | | | – | | | | – | |
| (1) | Excess collateral received is not presented in the table above. Please refer to the Schedules of Investments for the market value of the collateral received for each Fund. |
| (2) | Net Amount represents the net amount receivable due from the counterparty in the event of default. |
FEDERAL INCOME TAXES — It is each Fund’s intention to qualify or continue to qualify as a regulated investment company for Federal income tax purposes by complying with the appropriate provisions of Subchapter M of the Internal Revenue Code of 1986, as amended. Accordingly, no provisions for Federal income taxes have been made in the financial statements except as described below.
The Funds evaluate tax positions taken or expected to be taken in the course of preparing the Funds’ tax returns to determine whether it is “more-likely-than-not” (i.e., greater than 50 percent) that each tax position will be sustained upon examination by a taxing authority based on the technical merits of the position. Tax positions not deemed to meet the more-likely-than-not threshold are recorded as a tax benefit or expense in the current year. The Funds did not record any tax positions in the current period; however, management’s conclusion regarding tax positions may be subject to review and adjustment at a later date based on factors including, but not limited to, examination by tax authorities (i.e., the last three tax year ends, as applicable), and on-going analysis of and changes to tax laws and regulations, and interpretations therof.
| | Notes to Financial Statements (continued) | |
| | October 31, 2020 | |
2. SIGNIFICANT ACCOUNTING POLICIES (continued)
If the Funds have foreign tax filings that have not been made, the tax years that remain subject to examination may date back to the inception of each Fund.
As of and during the year ended October 31, 2020, the Funds did not have a liability for any unrecognized tax benefits. The Funds recognize interest and penalties, if any, related to unrecognized tax benefits as in income tax expense on the Statement of Operations. During the reporting period, the Funds did not incur any interest or penalties.
SECURITY TRANSACTIONS AND INVESTMENT INCOME — Security transactions are accounted for on the trade date for financial reporting purposes. Costs used in determining realized gains and losses on the sale of investment securities are based on specific identification. Dividend income is recorded on the ex-dividend date. Interest income is recognized on the accrual basis from the settlement date.
FOREIGN CURRENCY TRANSACTIONS AND TRANSLATION — The books and records of the Funds are maintained in U.S. dollars. Investment securities and other assets and liabilities denominated in a foreign currency are translated into U.S. dollars on the date of valuation. Purchases and sales of investment securities, income and expenses are translated into U.S. dollars at the relevant rates of exchange prevailing on the respective dates of such transactions. The Funds do not isolate that portion of realized or unrealized gains and losses resulting from changes in the foreign exchange rate from fluctuations arising from changes in the market prices of the securities. These gains and losses are included in net realized and unrealized gains and losses on investments on the Statement of Operations. Net realized and unrealized gains and losses on foreign currency transactions and translations represent net foreign exchange gains or losses from foreign currency spot contracts, disposition of foreign currencies, currency gains or losses realized between trade and settlement dates on securities transactions and the difference between the amount of the investment income and foreign withholding taxes recorded on the Funds’ books and the U.S. dollar equivalent amounts actually received or paid.
DIVIDENDS AND DISTRIBUTIONS TO SHAREHOLDERS — The Funds distribute their net investment income on a pro rata basis. Any net investment income and net realized capital gains are distributed at least annually. All distributions are recorded on the ex-dividend date.
CASH OVERDRAFT CHARGES — Per the terms of an agreement with BBH, if a Fund has a cash overdraft on a given day, it will be assessed an overdraft charge of LIBOR plus 2.00%. Cash overdraft charges are included in custodian fees on the Statements of Operations.
CREATION UNITS — The Funds issue and redeem their shares (“Shares”) on a continuous basis at net asset value (“NAV”) and only in large blocks of 50,000 Shares, referred to as “Creation Units”. Purchasers of Creation Units (“Authorized Participants”)
| | Notes to Financial Statements (continued) | |
| | October 31, 2020 | |
2. SIGNIFICANT ACCOUNTING POLICIES (continued)
at NAV must pay a standard creation transaction fee per transaction. The fee is a single charge and will be the same regardless of the number of Creation Units purchased by an Authorized Participant on the same day. An Authorized Participant who holds Creation Units and wishes to redeem at NAV would also pay a standard redemption fee per transaction to BBH on the date of such redemption, regardless of the number of Creation Units redeemed that day. If a Creation Unit is purchased or redeemed for cash, an additional variable fee may be charged. The following table discloses Creation Unit breakdown:
| | | Creation Unit Shares | | | Creation Fee | | | Value at October 31, 2020 | | | Redemption Fee | |
| | | | | | | | | | | | | |
| Global X MSCI China Energy ETF | | | 50,000 | | | $ | 800 | | | $ | 389,500 | | | $ | 800 | |
| Global X MSCI China Materials ETF | | | 50,000 | | | | 1,200 | | | | 909,000 | | | | 1,200 | |
| Global X MSCI China Industrials ETF | | | 50,000 | | | | 1,500 | | | | 671,500 | | | | 1,500 | |
| Global X MSCI China Consumer Discretionary ETF | | | 50,000 | | | | 1,600 | | | | 1,472,500 | | | | 1,600 | |
| Global X MSCI China Consumer Staples ETF | | | 50,000 | | | | 1,000 | | | | 1,452,000 | | | | 1,000 | |
| Global X MSCI China Health Care ETF | | | 50,000 | | | | 1,000 | | | | 1,184,000 | | | | 1,000 | |
| Global X MSCI China Financials ETF | | | 50,000 | | | | 1,800 | | | | 712,500 | | | | 1,800 | |
| Global X MSCI China Information Technology ETF | | | 50,000 | | | | 1,200 | | | | 1,389,000 | | | | 1,200 | |
| Global X MSCI China Communication Services ETF | | | 50,000 | | | | 800 | | | | 1,306,500 | | | | 800 | |
| Global X MSCI China Utilities ETF | | | 50,000 | | | | 1,000 | | | | 685,000 | | | | 1,000 | |
| Global X MSCI China Real Estate ETF | | | 50,000 | | | | 1,200 | | | | 809,000 | | | | 1,200 | |
| Global X MSCI China Large-Cap 50 ETF | | | 50,000 | | | | 1,300 | | | | 1,770,000 | | | | 1,300 | |
| Global X MSCI Greece ETF | | | 50,000 | | | | 500 | | | | 884,000 | | | | 500 | |
| Global X MSCI Norway ETF | | | 50,000 | | | | 1,200 | | | | 479,500 | | | | 1,200 | |
| Global X DAX Germany ETF | | | 50,000 | | | | 500 | | | | 1,260,500 | | | | 500 | |
| Global X MSCI Portugal ETF | | | 50,000 | | | | 1,000 | | | | 425,000 | | | | 1,000 | |
| Global X MSCI Colombia ETF | | | 50,000 | | | | 2,000 | | | | 1,163,000 | | | | 2,000 | |
| Global X MSCI Argentina ETF | | | 50,000 | | | | 500 | | | | 1,182,000 | | | | 500 | |
| Global X MSCI Pakistan ETF | | | 50,000 | | | | 2,800 | | | | 1,370,000 | | | | 2,800 | |
| Global X MSCI Nigeria ETF | | | 50,000 | | | | 2,000 | | | | 712,500 | | | | 2,000 | |
| Global X MSCI Next Emerging & Frontier ETF | | | 50,000 | | | | 9,500 | | | | 823,000 | | | | 9,500 | |
| Global X FTSE Nordic Region ETF | | | 50,000 | | | | 1,000 | | | | 1,168,500 | | | | 1,000 | |
| Global X FTSE Southeast Asia ETF | | | 50,000 | | | | 2,100 | | | | 583,000 | | | | 2,100 | |
3. RELATED PARTIES AND SERVICE PROVIDER TRANSACTIONS
On July 2, 2018, the Adviser consummated a transaction pursuant to which it became an indirect, wholly-owned subsidiary of Mirae Asset Global Investments Co., Ltd. (“Mirae”). In this manner, the Adviser is ultimately controlled by Mirae, which is a leading financial services company in Korea and is the headquarters for the Mirae Asset Global Investments Group.
| | Notes to Financial Statements (continued) | |
| | October 31, 2020 | |
3. RELATED PARTIES AND SERVICE PROVIDER TRANSACTIONS (continued)
The Adviser serves as the investment adviser and the administrator for the Funds. Subject to the supervision of the Board, the Adviser is responsible for managing the investment activities of the Funds and the Funds’ business affairs and other administrative matters and provides or causes to be furnished all supervisory, administrative and other services reasonably necessary for the operation of the Funds, including certain distribution services (provided pursuant to a separate distribution services agreement), certain shareholder and distribution-related services (provided pursuant to a separate Rule 12b-1 Plan and related agreements) and investment advisory services (provided pursuant to a separate Investment Advisory Agreement), under what is essentially an “all-in” fee structure.
For the Adviser’s service to the Funds, under the Supervision and Administration Agreement, each Fund pays a monthly fee to the Adviser at the annual rate below (stated as a percentage of the average daily net assets of the Fund). In addition, the Funds bear other expenses, directly and indirectly that are not covered by the Supervision and Administration Agreement, which may vary and affect the total expense ratios of the Funds, such as taxes, brokerage fees, commissions, custodian fees and other transaction expenses, interest expenses, acquired fund fees and extraordinary expenses (such as litigation and indemnification expenses).
| | Notes to Financial Statements (continued) | |
| | October 31, 2020 | |
3. RELATED PARTIES AND SERVICE PROVIDER TRANSACTIONS (continued)
| | Supervision and Administration Fee |
| Global X MSCI China Energy ETF | 0.65% |
| Global X MSCI China Materials ETF | 0.65% |
| Global X MSCI China Industrials ETF | 0.65% |
| Global X MSCI China Consumer Discretionary ETF | 0.65% |
| Global X MSCI China Consumer Staples ETF | 0.65% |
| Global X MSCI China Health Care ETF | 0.65% |
| Global X MSCI China Financials ETF | 0.65% |
| Global X MSCI China Information Technology ETF | 0.65% |
| Global X MSCI China Communication Services ETF | 0.65% |
| Global X MSCI China Utilities ETF | 0.65% |
| Global X MSCI China Real Estate ETF | 0.65% |
| Global X MSCI China Large-Cap 50 ETF | 0.29% |
| Global X MSCI Greece ETF | 0.55% |
| Global X MSCI Norway ETF | 0.50% |
| Global X DAX Germany ETF*** | 0.45% |
| Global X MSCI Portugal ETF | 0.55% |
| Global X MSCI Colombia ETF* | 0.61% |
| Global X MSCI Argentina ETF** | 0.59% |
| Global X MSCI Pakistan ETF | 0.68% |
| Global X MSCI Nigeria ETF | 0.68% |
| Global X MSCI Next Emerging & Frontier ETF | 0.49% |
| Global X FTSE Nordic Region ETF | 0.50% |
| Global X FTSE Southeast Asia ETF | 0.65% |
*Pursuant to an expense limitation agreement in existence between the Global X MSCI Colombia ETF (the “ Colombia Fund”) and the Adviser prior to March 1, 2018, the Adviser agreed to waive or reimburse fees and/or limit fund expenses to the extent necessary to assure that the operating expenses of the Colombia Fund (exclusive of taxes, brokerage fees, commissions, custodian fees, and other transaction expenses, interest and extraordinary expenses (such as litigation and indemnification expenses)) (“Total Annual Fund Operating Expenses”) would not exceed 0.61% of the Colombia Fund’s average daily net assets per year until at least March 1, 2018. Pursuant to the expense limitation agreement, the Colombia Fund (at a later date) could reimburse the Adviser for the fees and expenses it waived or reimbursed and/or limited during any of the prior three fiscal years, provided that, among other things, any reimbursement made to the Adviser would not cause Total Annual Fund Operating Expenses to exceed the maximum permitted rate during the period in
| | Notes to Financial Statements (continued) | |
| | October 31, 2020 | |
3. RELATED PARTIES AND SERVICE PROVIDER TRANSACTIONS (continued)
which it is paid and the Board had approved such reimbursement to the Adviser. Although the Board voted on December 19, 2017 to permanently reduce the Colombia Fund’s fees to 0.61% and end the expense limitation agreement as of March 1, 2018, prior waived or reimbursed fees are still subject to recoupment. As of October 31, 2020, the amounts of waivers/reimbursements subject to recoupment for the Colombia Fund were $61,948 (expiring 2021). As of October 31, 2020, there had been no recoupment of previously waived and reimbursed fees.
**Pursuant to an expense limitation agreement in existence between the Global X MSCI Argentina ETF (the “Argentina Fund”) and the Adviser prior to May 1, 2018, the Adviser agreed to waive or reimburse fees and/or limit Fund expenses to the extent necessary to assure that the operating expenses of the Argentina Fund (exclusive of taxes, brokerage fees, commissions, custodian fees, and other transaction expenses, interest and extraordinary expenses (such as litigation and indemnification expenses)) (“Total Annual Fund Operating Expenses”) would not exceed 0.59% of the Argentina Fund’s average daily net assets per year until at least May 1, 2018. Pursuant to the expense limitation agreement, the Argentina Fund (at a later date) could reimburse the Adviser for the fees and expenses it waived or reimbursed and/or limited during any of the prior three fiscal years, provided that, among other things, any reimbursement made to the Adviser would not cause Total Annual Fund Operating Expenses of the Argentina Fund to exceed 0.59% during the period in which it is paid and the Board had approved such reimbursement to the Adviser. Although the Board voted on December 19, 2017 to permanently reduce the Argentina Fund’s fees to 0.59% and end the expense limitation agreement as of March 1, 2018, prior waived or reimbursed fees are still subject to recoupment. As of October 31, 2020, the amounts of waivers/reimbursements subject to recoupment for the Argentina Fund were $105,611 (expiring 2021). As of October 31, 2020, there had been no recoupment of previously waived and reimbursed fees.
***Effective August 1, 2017, Horizons ETFs Management (US) LLC (the “Predecessor Adviser”), contractually agreed to waive a portion of its management fee, which was 0.45% of the average daily net assets of the Predecessor Fund, and/or reimburse fees or expenses to 0.20% of the average daily net assets until July 31, 2019. The Board approved an Expense Limitation Agreement whereby the Adviser, effective as of the Reorganization, contractually agreed to reimburse or waive fees and/or limit the Germany Fund’s expenses to the extent necessary to assure that operating expenses (exclusive of taxes, brokerage fees, commissions and other transaction expenses, interest, and extraordinary expenses (such as litigation and indemnification expenses)) will not exceed 0.20% of the Germany Fund’s average daily net assets per year until at least March 1, 2021.
SEI Investments Global Funds Services (“SEIGFS”) serves as sub-administrator to the Funds. As sub-administrator, SEIGFS provides the Funds with the required general administrative services, including, without limitation: office space, equipment, and personnel; clerical and general back office services; bookkeeping, internal accounting and secretarial services; the calculation of NAV; and assistance with the preparation and filing of reports, registration statements, proxy statements and other materials required to be filed or furnished by the Funds under federal and state securities laws. As
| | Notes to Financial Statements (continued) | |
| | October 31, 2020 | |
3. RELATED PARTIES AND SERVICE PROVIDER TRANSACTIONS (continued)
compensation for these services, SEIGFS receives certain out-of-pocket costs, transaction fees and asset-based fees which are accrued daily and paid monthly by the Adviser.
SEI Investments Distribution Co. (“SIDCO”) serves as each Fund’s underwriter and distributor of Creation Units pursuant to a Distribution Agreement. SIDCO has no obligation to sell any specific quantity of Fund Shares. SIDCO bears the following costs and expenses relating to the distribution of Shares: (i) the costs of processing and maintaining records of creations of Creation Units; (ii) all costs of maintaining the records required of a registered broker/dealer; (iii) the expenses of maintaining its registration or qualification as a dealer or broker under Federal or state laws; (iv) filing fees; and (v) all other expenses incurred in connection with the distribution services as contemplated in the Distribution Agreement. SIDCO receives no fee for its distribution services under the Distribution Agreement, rather the Adviser compensates SIDCO for certain expenses, out-of-pocket costs, and transaction fees.
BBH serves as transfer agent and Custodian of the Funds’ assets. As Custodian, BBH has agreed to (1) make receipts and disbursements of money on behalf of the Fund, (2) collect and receive all income and other payments and distributions on account of the Funds’ portfolio investments, (3) respond to correspondence from shareholders, security brokers and others relating to its duties; and (4) make periodic reports to the Funds concerning the Funds’ operations. BBH does not exercise any supervisory function over the purchase and sale of securities. As compensation for these services, BBH receives certain out-of-pocket costs, transaction fees and asset-based fees which are accrued daily and paid monthly by the Adviser from its fees. As transfer agent, BBH has agreed to (1) issue and redeem shares of each Fund, (2) make dividend and other distributions to shareholders of each Fund, (3) respond to correspondence by shareholders and others relating to its duties; (4) maintain shareholder accounts, and (5) make periodic reports to the Funds. As compensation for these services, BBH receives certain out of-pocket costs, transaction fees and asset-based fees which are accrued daily and paid monthly by the Adviser from its fees.
| | Notes to Financial Statements (continued) | |
| | October 31, 2020 | |
4. INVESTMENT TRANSACTIONS
For the year ended October 31, 2020, the purchases and sales of investments in securities, excluding in-kind transactions, long-term U.S. Government and short-term securities were:
| | | Purchases | | | Sales and Maturities | |
| Global X MSCI China Energy ETF | | $ | 1,011,100 | | | $ | 533,991 | |
| Global X MSCI China Materials ETF | | | 619,590 | | | | 942,337 | |
| Global X MSCI China Industrials ETF | | | 381,766 | | | | 381,825 | |
| Global X MSCI China Consumer Discretionary ETF | | | 144,383,255 | | | | 61,725,461 | |
| Global X MSCI China Consumer Staples ETF | | | 18,791,600 | | | | 3,569,279 | |
| Global X MSCI China Health Care ETF | | | 9,454,956 | | | | 1,920,561 | |
| Global X MSCI China Financials ETF | | | 24,268,531 | | | | 9,653,822 | |
| Global X MSCI China Information Technology ETF | | | 21,333,297 | | | | 3,166,950 | |
| Global X MSCI China Communication Services ETF | | | 5,237,959 | | | | 7,400,400 | |
| Global X MSCI China Utilities ETF | | | 522,828 | | | | 521,517 | |
| Global X MSCI China Real Estate ETF | | | 13,510,049 | | | | 1,804,904 | |
| Global X MSCI China Large-Cap 50 ETF | | | 1,897,495 | | | | 634,492 | |
| Global X MSCI Greece ETF | | | 57,011,372 | | | | 57,422,240 | |
| Global X MSCI Norway ETF | | | 4,787,306 | | | | 4,054,533 | |
| Global X DAX Germany ETF | | | 2,601,240 | | | | 2,068,699 | |
| Global X MSCI Portugal ETF | | | 4,342,700 | | | | 4,350,406 | |
| Global X MSCI Colombia ETF | | | 10,317,502 | | | | 17,463,170 | |
| Global X MSCI Argentina ETF | | | 25,199,180 | | | | 27,425,539 | |
| Global X MSCI Pakistan ETF | | | 21,871,586 | | | | 27,838,422 | |
| Global X MSCI Nigeria ETF | | | 11,151,055 | | | | 6,404,111 | |
| Global X MSCI Next Emerging & Frontier ETF | | | 4,808,983 | | | | 5,221,103 | |
| Global X FTSE Nordic Region ETF | | | 1,272,125 | | | | 910,566 | |
| Global X FTSE Southeast Asia ETF | | | 1,721,566 | | | | 1,342,756 | |
During the year ended October 31, 2020, there were no purchases or sales of long-term U.S. Government securities for the Funds.
| | Notes to Financial Statements (continued) | |
| | October 31, 2020 | |
4. INVESTMENT TRANSACTIONS (continued)
For the year ended October 31, 2020, in-kind transactions associated with creations and redemptions were:
| | | Purchases | | | Sales and Maturities | | | Realized Gain/(Loss) | |
| Global X MSCI China Materials ETF | | $ | – | | | $ | 503,499 | | | $ | 9,330 | |
| Global X MSCI China Consumer Discretionary ETF | | | 95,439,580 | | | | 40,246,660 | | | | 11,569,839 | |
| Global X MSCI China Consumer Staples ETF | | | – | | | | 2,359,647 | | | | 217,114 | |
| Global X MSCI China Health Care ETF | | | 325,187 | | | | 1,431,871 | | | | 477,251 | |
| Global X MSCI China Financials ETF | | | 125,640 | | | | 21,519,835 | | | | (3,087,371 | ) |
| Global X MSCI China Information Technology ETF | | | 861,404 | | | | 3,622,313 | | | | 435,527 | |
| Global X MSCI China Communication Services ETF | | | – | | | | 4,752,664 | | | | 269,368 | |
| Global X MSCI China Real Estate ETF | | | – | | | | 5,348,336 | | | | 295,031 | |
| Global X MSCI China Large-Cap 50 ETF | | | 522,801 | | | | – | | | | – | |
| Global X MSCI Greece ETF | | | 6,806,665 | | | | 117,213,745 | | | | (23,705,917 | ) |
| Global X MSCI Norway ETF | | | 12,518,174 | | | | 49,771,316 | | | | (7,419,655 | ) |
| Global X DAX Germany ETF | | | 16,196,555 | | | | 6,537,418 | | | | 1,372,275 | |
| Global X MSCI Portugal ETF | | | – | | | | 5,751,994 | | | | 404,886 | |
| Global X MSCI Colombia ETF | | | – | | | | 4,250,418 | | | | (373,292 | ) |
| Global X MSCI Argentina ETF | | | 11,622,517 | | | | 32,767,167 | | | | 4,759,481 | |
| Global X MSCI Next Emerging & Frontier ETF | | | 333,226 | | | | 625,784 | | | | (171,539 | ) |
| Global X FTSE Nordic Region ETF | | | 5,918,400 | | | | 1,111,825 | | | | 289,941 | |
| Global X FTSE Southeast Asia ETF | | | 2,093,095 | | | | 460,399 | | | | (11,727 | ) |
For the year ended October 31, 2019, in-kind transactions associated with creations and redemptions were:
| | | Purchases | | | Sales and Maturities | | | Realized Gain/(Loss) | |
| Global X MSCI China Energy ETF | | $ | – | | | $ | 849,880 | | | $ | (49,384 | ) |
| Global X MSCI China Consumer Discretionary ETF | | | 14,227,232 | | | | 21,430,344 | | | | 1,136,331 | |
| Global X MSCI China Consumer Staples ETF | | | 644,217 | | | | 733,187 | | | | 127,698 | |
| Global X MSCI China Health Care ETF | | | 688,666 | | | | 767,285 | | | | 94,400 | |
| Global X MSCI China Financials ETF | | | 4,496,360 | | | | 35,637,848 | | | | (2,187,542 | ) |
| Global X MSCI China Information Technology ETF | | | 1,912,081 | | | | 1,351,005 | | | | 127,520 | |
| Global X MSCI China Communication Services ETF | | | 2,928,502 | | | | 6,119,465 | | | | 1,537,083 | |
| Global X MSCI China Large-Cap 50 ETF | | | 1,184,305 | | | | 1,230,981 | | | | 114,167 | |
| Global X MSCI Greece ETF | | | 121,989,870 | | | | 114,890,905 | | | | 18,314,024 | |
| Global X MSCI Norway ETF | | | 28,402,701 | | | | 92,279,600 | | | | 3,925,448 | |
| Global X DAX Germany ETF | | | – | | | | 1,308,110 | | | | 57,684 | |
| Global X MSCI Portugal ETF | | | 5,525,084 | | | | 7,024,100 | | | | 448,381 | |
| Global X MSCI Colombia ETF | | | 2,630,689 | | | | 9,119,282 | | | | 2,450,328 | |
| Global X MSCI Argentina ETF | | | 22,008,833 | | | | 40,005,941 | | | | 4,436,996 | |
| Global X MSCI Next Emerging & Frontier ETF | | | 2,917,400 | | | | – | | | | – | |
| Global X FTSE Nordic Region ETF | | | – | | | | 7,264,558 | | | | (17,968 | ) |
| Global X FTSE Southeast Asia ETF | | | 6,485,264 | | | | – | | | | – | |
| | Notes to Financial Statements (continued) | |
| | October 31, 2020 | |
5. TAX INFORMATION
The amount and character of income and capital gain distributions to be paid, if any, are determined in accordance with Federal income tax regulations, which may differ from U.S. GAAP. As a result, net investment income (loss) and net realized gain (loss) on investment transactions for a reporting period may differ significantly from distributions during such period. These book/tax differences may be temporary or permanent. To the extent these differences are permanent in nature, they are charged or credited to undistributed net investment income (loss), accumulated net realized gain (loss) or paid in capital, as appropriate, in the period that the differences arise.
The following differences, primarily attributable to redemptions in-kind, sales of passive foreign investment companies, and foreign currency, have been reclassified to/from the following accounts during the fiscal period ended October 31, 2020:
| Global X Funds | | Paid-in Capital | | | Distributable Earnings (Loss) | |
| Global X MSCI China Materials ETF | | $ | (1,285 | ) | | $ | 1,285 | |
| Global X MSCI China Consumer Discretionary ETF | | | 10,240,098 | | | | (10,240,098 | ) |
| Global X MSCI China Consumer Staples ETF | | | 217,114 | | | | (217,114 | ) |
| Global X MSCI China Health Care ETF | | | 477,164 | | | | (477,164 | ) |
| Global X MSCI China Financials ETF | | | (3,200,235 | ) | | | 3,200,235 | |
| Global X MSCI China Information Technology ETF | | | 418,024 | | | | (418,024 | ) |
| Global X MSCI China Communication Services ETF | | | (101,874 | ) | | | 101,874 | |
| Global X MSCI China Real Estate ETF | | | 294,949 | | | | (294,949 | ) |
| Global X MSCI Greece ETF | | | (37,648,089 | ) | | | 37,648,089 | |
| Global X MSCI Norway ETF | | | (7,997,310 | ) | | | 7,997,310 | |
| Global X DAX Germany ETF | | | 1,312,322 | | | | (1,312,322 | ) |
| Global X MSCI Portugal ETF | | | 216,501 | | | | (216,501 | ) |
| Global X MSCI Colombia ETF | | | (940,451 | ) | | | 940,451 | |
| Global X MSCI Argentina ETF | | | 4,461,901 | | | | (4,461,901 | ) |
| Global X MSCI Next Emerging & Frontier ETF | | | (190,909 | ) | | | 190,909 | |
| Global X FTSE Nordic Region ETF | | | 273,092 | | | | (273,092 | ) |
| Global X FTSE Southeast Asia ETF | | | (22,174 | ) | | | 22,174 | |
The tax character of dividends and distributions declared during the periods ended October 31, 2020 and 2019 were as follows:
| Global X Funds | | Ordinary Income | | | Long-Term Capital Gain | | | Return of Capital | | | Totals | |
| Global X MSCI China Energy ETF | | | | | | | | | | | | |
| 2020 | | $ | 68,891 | | | $ | – | | | $ | – | | | $ | 68,891 | |
| 2019 | | | 123,563 | | | | – | | | | – | | | | 123,563 | |
| Global X MSCI China Materials ETF | | | | | | | | | | | | | | | | |
| 2020 | | $ | 57,446 | | | $ | – | | | $ | – | | | $ | 57,446 | |
| 2019 | | | 149,448 | | | | – | | | | – | | | | 149,448 | |
| | Notes to Financial Statements (continued) | |
| | October 31, 2020 | |
5. TAX INFORMATION (continued)
| Global X Funds | | Ordinary Income | | | Long-Term Capital Gain | | | Return of Capital | | | Totals | |
| Global X MSCI China Industrials ETF | | | | | | | | | | | | |
| 2020 | | $ | 31,434 | | | $ | – | | | $ | – | | | $ | 31,434 | |
| 2019 | | | 67,864 | | | | – | | | | – | | | | 67,864 | |
| Global X MSCI China Consumer Discretionary ETF | | | | | | | | | | | | | | | | |
| 2020 | | $ | 1,388,311 | | | $ | – | | | $ | – | | | $ | 1,388,311 | |
| 2019 | | | 3,541,990 | | | | – | | | | – | | | | 3,541,990 | |
| Global X MSCI China Consumer Staples ETF | | | | | | | | | | | | | | | | |
| 2020 | | $ | 136,194 | | | $ | 255 | | | $ | – | | | $ | 136,449 | |
| 2019 | | | 13,493 | | | | – | | | | – | | | | 13,493 | |
| Global X MSCI China Health Care ETF | | | | | | | | | | | | | | | | |
| 2020 | | $ | 16,313 | | | $ | – | | | $ | – | | | $ | 16,313 | |
| 2019 | | | 2,880 | | | | – | | | | – | | | | 2,880 | |
| Global X MSCI China Financials ETF | | | | | | | | | | | | | | | | |
| 2020 | | $ | 1,795,211 | | | $ | – | | | $ | – | | | $ | 1,795,211 | |
| 2019 | | | 2,438,433 | | | | – | | | | – | | | | 2,438,433 | |
| Global X MSCI China Information Technology ETF | | | | | | | | | | | | | | | | |
| 2020 | | $ | 53,606 | | | $ | – | | | $ | – | | | $ | 53,606 | |
| 2019 | | | 12,360 | | | | – | | | | – | | | | 12,360 | |
| Global X MSCI China Communication Services ETF | | | | | | | | | | | | | | | | |
| 2020 | | $ | 133,251 | | | $ | – | | | $ | – | | | $ | 133,251 | |
| 2019 | | | 115,344 | | | | – | | | | – | | | | 115,344 | |
| Global X MSCI China Utilities ETF | | | | | | | | | | | | | | | | |
| 2020 | | $ | 40,333 | | | $ | – | | | $ | – | | | $ | 40,333 | |
| 2019 | | | 12,312 | | | | – | | | | – | | | | 12,312 | |
| Global X MSCI China Real Estate ETF | | | | | | | | | | | | | | | | |
| 2020 | | $ | 171,559 | | | $ | – | | | $ | – | | | $ | 171,559 | |
| 2019 | | | 26,242 | | | | – | | | | – | | | | 26,242 | |
| Global X MSCI China Large-Cap 50 ETF | | | | | | | | | | | | | | | | |
| 2020 | | $ | 45,697 | | | $ | – | | | $ | – | | | $ | 45,697 | |
| 2019 | | | 21,830 | | | | – | | | | – | | | | 21,830 | |
| Global X MSCI Greece ETF | | | | | | | | | | | | | | | | |
| 2020 | | $ | 6,932,583 | | | $ | – | | | $ | – | | | $ | 6,932,583 | |
| 2019 | | | 7,386,717 | | | | – | | | | – | | | | 7,386,717 | |
| Global X MSCI Norway ETF | | | | | | | | | | | | | | | | |
| 2020 | | $ | 1,003,442 | | | $ | – | | | $ | – | | | $ | 1,003,442 | |
| 2019 | | | 6,822,589 | | | | – | | | | – | | | | 6,822,589 | |
| Global X DAX Germany ETF | | | | | | | | | | | | | | | | |
| 2020 | | $ | 221,929 | | | $ | – | | | $ | – | | | $ | 221,929 | |
| 2019 | | | 666,693 | | | | 10,877 | | | | – | | | | 677,570 | |
| Global X MSCI Portugal ETF | | | | | | | | | | | | | | | | |
| 2020 | | $ | 491,011 | | | $ | – | | | $ | – | | | $ | 491,011 | |
| 2019 | | | 1,885,103 | | | | – | | | | – | | | | 1,885,103 | |
| Global X MSCI Colombia ETF | | | | | | | | | | | | | | | | |
| 2020 | | $ | 1,868,308 | | | $ | – | | | $ | – | | | $ | 1,868,308 | |
| 2019 | | | 3,425,053 | | | | – | | | | – | | | | 3,425,053 | |
| | Notes to Financial Statements (continued) | |
| | October 31, 2020 | |
5. TAX INFORMATION (continued)
| Global X Funds | | Ordinary Income | | | Long-Term Capital Gain | | | Return of Capital | | | Totals | |
| Global X MSCI Argentina ETF | | | | | | | | | | | | |
| 2020 | | $ | 231,396 | | | $ | – | | | $ | – | | | $ | 231,396 | |
| 2019 | | | 1,862,692 | | | | – | | | | – | | | | 1,862,692 | |
| Global X MSCI Pakistan ETF | | | | | | | | | | | | | | | | |
| 2020 | | $ | 1,334,151 | | | $ | – | | | $ | – | | | $ | 1,334,151 | |
| 2019 | | | 2,425,569 | | | | – | | | | – | | | | 2,425,569 | |
| Global X MSCI Nigeria ETF | | | | | | | | | | | | | | | | |
| 2020 | | $ | 235,024 | | | $ | – | | | $ | – | | | $ | 235,024 | |
| 2019 | | | 3,827,441 | | | | – | | | | – | | | | 3,827,441 | |
| Global X MSCI Next Emerging & Frontier ETF | | | | | | | | | | | | | | | | |
| 2020 | | $ | 425,178 | | | $ | – | | | $ | – | | | $ | 425,178 | |
| 2019 | | | 725,137 | | | | – | | | | – | | | | 725,137 | |
| Global X FTSE Nordic Region ETF | | | | | | | | | | | | | | | | |
| 2020 | | $ | 123,078 | | | $ | – | | | $ | – | | | $ | 123,078 | |
| 2019 | | | 946,666 | | | | – | | | | 410,291 | | | | 1,356,957 | |
| Global X FTSE Southeast Asia ETF | | | | | | | | | | | | | | | | |
| 2020 | | $ | 646,024 | | | $ | – | | | $ | – | | | $ | 646,024 | |
| 2019 | | | 911,494 | | | | – | | | | – | | | | 911,494 | |
As of October 31, 2020, the components of tax basis distributable earnings (accumulated losses) were as follows:
| | | Global X Funds | |
| | | Global X MSCI China Energy ETF | | | Global X MSCI China Materials ETF | | | Global X MSCI China Industrials ETF | |
| Undistributed Ordinary Income | | $ | 40,350 | | | $ | 19,980 | | | $ | 19,074 | |
| Capital Loss Carryforwards | | | (1,668,732 | ) | | | (2,067,049 | ) | | | (2,797,414 | ) |
| Unrealized Appreciation (Depreciation) on Investments and Foreign Currency | | | (603,911 | ) | | | 47,609 | | | | (249,541 | ) |
| Other Temporary Differences | | | (3 | ) | | | 1 | | | | (6 | ) |
| Total Accumulated Losses | | $ | (2,232,296 | ) | | $ | (1,999,459 | ) | | $ | (3,027,887 | ) |
| | | Global X Funds | |
| | | Global X MSCI China Consumer Discretionary ETF | | | Global X MSCI China Consumer Staples ETF | | | Global X MSCI China Health Care ETF | |
| Undistributed Ordinary Income | | $ | 380,746 | | | $ | 78,878 | | | $ | 7,700 | |
| Capital Loss Carryforwards | | | (74,894,661 | ) | | | – | | | | (2,145 | ) |
| Unrealized Appreciation on Investments and Foreign Currency | | | 93,213,747 | | | | 2,563,484 | | | | 1,327,713 | |
| Other Temporary Differences | | | (9 | ) | | | 2 | | | | 2 | |
| Total Distributable Earnings | | $ | 18,699,823 | | | $ | 2,642,364 | | | $ | 1,333,270 | |
| | Notes to Financial Statements (continued) | |
| | October 31, 2020 | |
5. TAX INFORMATION (continued)
| | | Global X Funds | |
| | | Global X MSCI China Financials ETF | | | Global X MSCI China Information Technology ETF | | | Global X MSCI China Communication Services ETF | |
| Undistributed Ordinary Income | | $ | 1,091,406 | | | $ | 151,593 | | | $ | 201,302 | |
| Undistributed Long-Term Capital Gain | | | – | | | | 11,323 | | | | – | |
| Capital Loss Carryforwards | | | (5,743,192 | ) | | | – | | | | (5,437,252 | ) |
| Unrealized Appreciation (Depreciation) on Investments and Foreign Currency | | | (8,569,328 | ) | | | 3,059,771 | | | | (379,057 | ) |
| Other Temporary Differences | | | (3 | ) | | | – | | | | 2 | |
| Total Distributable Earnings (Accumulated Losses) | | $ | (13,221,117 | ) | | $ | 3,222,687 | | | $ | (5,615,005 | ) |
| | | Global X Funds | |
| | | Global X MSCI China Utilities ETF | | | Global X MSCI China Real Estate ETF | | | Global X MSCI China Large-Cap 50 ETF | |
| Undistributed Ordinary Income | | $ | 24,987 | | | $ | 210,764 | | | $ | 36,387 | |
| Capital Loss Carryforwards | | | (47,164 | ) | | | (99,233 | ) | | | (79,514 | ) |
| Unrealized Appreciation (Depreciation) on Investments and Foreign Currency | | | (110,099 | ) | | | (822,196 | ) | | | 950,856 | |
| Other Temporary Differences | | | 2 | | | | 1 | | | | – | |
| Total Distributable Earnings (Accumulated Losses) | | $ | (132,274 | ) | | $ | (710,664 | ) | | $ | 907,729 | |
| | | Global X Funds | |
| | | Global X MSCI Greece ETF | | | Global X MSCI Norway ETF | | | Global X DAX Germany ETF | |
| Undistributed Ordinary Income | | $ | 2,897,219 | | | $ | 194,675 | | | $ | 417,979 | |
| Capital Loss Carryforwards | | | (161,240,577 | ) | | | (35,010,331 | ) | | | (1,754,293 | ) |
| Unrealized Depreciation on Investments and Foreign Currency | | | (133,333,642 | ) | | | (14,016,289 | ) | | | (4,132,644 | ) |
| Other Temporary Differences | | | (17 | ) | | | (14 | ) | | | – | |
| Total Accumulated Losses | | $ | (291,677,017 | ) | | $ | (48,831,959 | ) | | $ | (5,468,958 | ) |
| | | Global X Funds | |
| | | Global X MSCI Portugal ETF | | | Global X MSCI Colombia ETF | | | Global X MSCI Argentina ETF | |
| Undistributed Ordinary Income | | $ | 64,939 | | | $ | 674,782 | | | $ | – | |
| Capital Loss Carryforwards | | | (13,171,877 | ) | | | (84,678,101 | ) | | | (20,640,114 | ) |
| Unrealized Depreciation on Investments and Foreign Currency | | | (9,074,748 | ) | | | (22,493,582 | ) | | | (28,996,246 | ) |
| Late Year Loss Deferral | | | – | | | | – | | | | (4,715 | ) |
| Other Temporary Differences | | | – | | | | (1 | ) | | | (3 | ) |
| Total Accumulated Losses | | $ | (22,181,686 | ) | | $ | (106,496,902 | ) | | $ | (49,641,078 | ) |
| | Notes to Financial Statements (continued) | |
| | October 31, 2020 | |
5. TAX INFORMATION (continued)
| | | Global X Funds | |
| | | Global X MSCI Pakistan ETF | | | Global X MSCI Nigeria ETF | | | Global X MSCI Next Emerging & Frontier ETF | |
| Undistributed Ordinary Income | | $ | 287,332 | | | $ | 2,258,506 | | | $ | 207,771 | |
| Capital Loss Carryforwards | | | (33,733,889 | ) | | | (23,600,101 | ) | | | (24,845,859 | ) |
| Unrealized Depreciation on Investments and Foreign Currency | | | (7,052,485 | ) | | | (8,124,761 | ) | | | (2,187,103 | ) |
| Other Temporary Differences | | | (4 | ) | | | (5 | ) | | | – | |
| Total Accumulated Losses | | $ | (40,499,046 | ) | | $ | (29,466,361 | ) | | $ | (26,825,191 | ) |
| | | Global X Funds | |
| | | Global X FTSE Nordic Region ETF | | | Global X FTSE Southeast Asia ETF | |
| Undistributed Ordinary Income | | $ | 160,794 | | | $ | 185,783 | |
| Capital Loss Carryforwards | | | (4,780,636 | ) | | | (6,356,641 | ) |
| Unrealized Appreciation (Depreciation) on Investments and Foreign Currency | | | 279,173 | | | | (6,831,837 | ) |
| Other Temporary Differences | | | (1 | ) | | | (1 | ) |
| Total Accumulated Losses | | $ | (4,340,670 | ) | | $ | (13,002,696 | ) |
| | Notes to Financial Statements (continued) | |
| | October 31, 2020 | |
5. TAX INFORMATION (continued)
For taxable years beginning after December 22, 2010, a registered investment company (“RIC”) is permitted to carry forward net capital losses to offset capital gains realized in later years, and the losses carried forward retain their original character as either long-term or short-term losses. Losses carried forward under these new provisions are as follows:u
| | | Short-Term Loss | | | Long-Term Loss | | | Total | |
| Global X MSCI China Energy ETF | | $ | 306,632 | | | $ | 1,362,100 | | | $ | 1,668,732 | |
| Global X MSCI China Materials ETF | | | 154,741 | | | | 1,912,308 | | | | 2,067,049 | |
| Global X MSCI China Industrials ETF | | | 406,049 | | | | 2,391,365 | | | | 2,797,414 | |
| Global X MSCI China Consumer Discretionary ETF | | | 23,289,728 | | | | 51,604,933 | | | | 74,894,661 | |
| Global X MSCI China Health Care ETF | | | – | | | | 2,145 | | | | 2,145 | |
| Global X MSCI China Financials ETF | | | 4,791,338 | | | | 951,854 | | | | 5,743,192 | |
| Global X MSCI China Communication Services ETF | | | 3,702,393 | | | | 1,734,859 | | | | 5,437,252 | |
| Global X MSCI China Utilities ETF | | | 5,007 | | | | 42,157 | | | | 47,164 | |
| Global X MSCI China Real Estate ETF | | | 89,342 | | | | 9,891 | | | | 99,233 | |
| Global X MSCI China Large-Cap 50 ETF | | | 25,430 | | | | 54,084 | | | | 79,514 | |
| Global X MSCI Greece ETF | | | 73,787,487 | | | | 87,453,090 | | | | 161,240,577 | |
| Global X MSCI Norway ETF | | | 9,144,185 | | | | 25,866,146 | | | | 35,010,331 | |
| Global X DAX Germany ETF | | | 694,159 | | | | 1,060,134 | | | | 1,754,293 | |
| Global X MSCI Portugal ETF | | | 3,551,982 | | | | 9,619,895 | | | | 13,171,877 | |
| Global X MSCI Colombia ETF | | | 24,852,439 | | | | 59,825,662 | | | | 84,678,101 | |
| Global X MSCI Argentina ETF | | | 3,431,689 | | | | 17,208,425 | | | | 20,640,114 | |
| Global X MSCI Pakistan ETF | | | 1,263,376 | | | | 32,470,513 | | | | 33,733,889 | |
| Global X MSCI Nigeria ETF | | | 6,714,611 | | | | 16,885,490 | | | | 23,600,101 | |
| Global X MSCI Next Emerging & Frontier ETF | | | 6,113,114 | | | | 18,732,745 | | | | 24,845,859 | |
| Global X FTSE Nordic Region ETF | | | 1,410,682 | | | | 3,369,954 | | | | 4,780,636 | |
| Global X FTSE Southeast Asia ETF | | | 2,176,933 | | | | 4,179,708 | | | | 6,356,641 | |
During the year ended October 31, 2020 the following funds utilized capital loss carryforwards to offset capital gains amounting to:
| | | Short-Term Loss | | | Long-Term Loss | | | Total | |
| Global X MSCI China Industrials ETF | | $ | 657 | | | $ | – | | | $ | 657 | |
| Global X MSCI Portugal ETF | | | 19,310 | | | | – | | | | 19,310 | |
| Global X MSCI Pakistan ETF | | | 22,513 | | | | – | | | | 22,513 | |
| Global X FTSE Nordic Region ETF | | | 36,039 | | | | – | | | | 36,039 | |
| | Notes to Financial Statements (continued) | |
| | October 31, 2020 | |
5. TAX INFORMATION (continued)
The Federal tax cost and aggregate gross unrealized appreciation and depreciation on investments held by the Funds at October 31, 2020 were as follows:
| Global X Funds | | Federal Tax Cost | | | Aggregated Gross Unrealized Appreciation | | | Aggregated Gross Unrealized Depreciation | | | Net Unrealized Appreciation (Depreciation) | |
| Global X MSCI China Energy ETF | | $ | 2,161,143 | | | $ | 22,419 | | | $ | (626,330 | ) | | $ | (603,911 | ) |
| Global X MSCI China Materials ETF | | | 1,770,007 | | | | 424,390 | | | | (376,781 | ) | | | 47,609 | |
| Global X MSCI China Industrials ETF | | | 2,262,458 | | | | 436,245 | | | | (685,786 | ) | | | (249,541 | ) |
| Global X MSCI China Consumer Discretionary ETF | | | 307,821,996 | | | | 106,456,656 | | | | (13,242,909 | ) | | | 93,213,747 | |
| Global X MSCI China Consumer Staples ETF | | | 14,815,521 | | | | 3,106,246 | | | | (542,762 | ) | | | 2,563,484 | |
| Global X MSCI China Health Care ETF | | | 9,324,660 | | | | 1,988,773 | | | | (661,060 | ) | | | 1,327,713 | |
| Global X MSCI China Financials ETF | | | 56,439,274 | | | | 1,413,984 | | | | (9,983,312 | ) | | | (8,569,328 | ) |
| Global X MSCI China Information Technology ETF | | | 17,733,804 | | | | 4,068,332 | | | | (1,008,561 | ) | | | 3,059,771 | |
| Global X MSCI China Communication Services ETF | | | 17,630,343 | | | | 3,246,447 | | | | (3,625,504 | ) | | | (379,057 | ) |
| Global X MSCI China Utilities ETF | | | 1,476,020 | | | | 89,144 | | | | (199,243 | ) | | | (110,099 | ) |
| Global X MSCI China Real Estate ETF | | | 8,090,780 | | | | 341,466 | | | | (1,163,662 | ) | | | (822,196 | ) |
| Global X MSCI China Large-Cap 50 ETF | | | 4,362,534 | | | | 1,205,826 | | | | (254,970 | ) | | | 950,856 | |
| Global X MSCI Greece ETF | | | 245,804,744 | | | | 7,276,522 | | | | (140,610,164 | ) | | | (133,333,642 | ) |
| Global X MSCI Norway ETF | | | 47,709,145 | | | | 1,250,957 | | | | (15,267,246 | ) | | | (14,016,289 | ) |
| Global X DAX Germany ETF | | | 28,065,860 | | | | 1,008,218 | | | | (5,140,862 | ) | | | (4,132,644 | ) |
| Global X MSCI Portugal ETF | | | 25,332,659 | | | | 1,070,326 | | | | (10,145,074 | ) | | | (9,074,748 | ) |
| Global X MSCI Colombia ETF | | | 59,317,225 | | | | 1,637,087 | | | | (24,130,669 | ) | | | (22,493,582 | ) |
| Global X MSCI Argentina ETF | | | 73,624,528 | | | | 10,096,834 | | | | (39,093,080 | ) | | | (28,996,246 | ) |
| Global X MSCI Pakistan ETF | | | 43,580,129 | | | | 3,065,034 | | | | (10,117,519 | ) | | | (7,052,485 | ) |
| Global X MSCI Nigeria ETF | | | 49,825,496 | | | | 4,939,929 | | | | (13,064,692 | ) | | | (8,124,763 | ) |
| Global X MSCI Next Emerging & Frontier ETF | | | 16,153,708 | | | | 832,617 | | | | (3,019,720 | ) | | | (2,187,103 | ) |
| Global X FTSE Nordic Region ETF | | | 23,579,258 | | | | 4,295,305 | | | | (4,016,132 | ) | | | 279,173 | |
| Global X FTSE Southeast Asia ETF | | | 27,784,312 | | | | 269,933 | | | | (7,101,770 | ) | | | (6,831,837 | ) |
The preceding differences between book and tax cost are primarily due to mark to market treatment of passive foreign investment companies and wash sales.
6. CONCENTRATION OF RISKS
The Funds invest in securities of foreign issuers in several countries. These investments may involve certain considerations and risks not typically associated with investments in the United States as a result of, among other factors, the possibility of future political and economic developments and the level of governmental supervision and regulation of securities markets in the respective countries.
The securities markets of emerging market countries are less liquid and subject to greater price volatility, and have a smaller market capitalization than the U.S. securities markets.
| | Notes to Financial Statements (continued) | |
| | October 31, 2020 | |
6. CONCENTRATION OF RISKS (continued)
In certain countries, there may be fewer publicly traded securities and the market may be dominated by a few issuers or sectors. Issuers and securities markets in such countries are not subject to as extensive and frequent accounting, financial and other reporting requirements or as comprehensive government regulations or issuers and securities markets in the U.S. In particular, the assets and profits appearing on the financial statements of emerging market country issuers may not reflect their financial position or results of operations in the same manner as financial statements for U.S. issuers.
Substantially less information may be publicly available about emerging market country issuers than is available about issuers in the United States.
The Funds may be subject to taxes imposed by countries in which they invest. Such taxes are generally based on either income, gains earned or gains repatriated. The Funds accrue and apply such taxes to net investment income, net realized gains and net unrealized gains as income and/or capital gains are earned.
The Funds use a replication strategy. A replication strategy is an indexing strategy that involves investing in the securities of the underlying index in approximately the same proportions as the underlying index. Each Fund may utilize a representative sampling strategy with respect to its underlying index when a replication strategy might be detrimental to its shareholders, such as when there are practical difficulties or substantial costs involved in compiling a portfolio of equity securities to follow its underlying index, or, in certain instances, when securities in the underlying index become temporarily illiquid, unavailable or less liquid, or due to legal restrictions (such as diversification requirements that apply to a Fund but not the underlying indexes).
Certain Funds may invest in commodity related securities, which are susceptible to fluctuations in certain commodity markets. Any negative changes in commodity markets could have a great impact on those securities.
The London Interbank Offered Rate, or “LIBOR,” the offered rate for short-term Eurodollar deposits between major international banks, is used extensively in the United States and globally as a reference rate in various financing and commercial transactions. Plans are underway to phase out the use of LIBOR by the end of 2021. There remains uncertainty regarding the nature of any replacement rate and the impact of the transition from LIBOR on the financial markets generally, transactions that use LIBOR as a reference rate and financial institutions that engage in such transactions, including issuers of securities in which a Fund may invest. As such, the potential effect of a transition away from LIBOR on a Fund investments cannot yet be determined.
Economic conditions, such as volatile currency exchange rates and interest rates, political events, military action and other conditions may, without prior warning, lead to foreign government intervention (including intervention by the U.S. government with respect to
| | Notes to Financial Statements (continued) | |
| | October 31, 2020 | |
6. CONCENTRATION OF RISKS (continued)
foreign governments, economic sectors, foreign companies and related securities and interests) and the imposition of capital controls (i.e., government measures designed to limit the flow of foreign capital in and out of the domestic economy) and/or sanctions, which may also include retaliatory actions of one government against another government, such as seizure of assets. Capital controls and/or sanctions include the prohibition of, or restrictions on, the ability to transfer currency, securities or other assets. Capital controls and/or sanctions may also impact the ability of a Fund to buy, sell or otherwise transfer securities or currency, negatively impact the value and/or liquidity of such instruments, adversely affect the trading market and price for shares of a Fund, and cause a Fund to decline in value.
Recently the U.S. imposed economic sanctions, which take effect on January 11, 2021, on certain Chinese companies with ties to the Chinese military. These sanctions may result in the decline of the value and liquidity of these securities and may impair the ability of a Fund to buy, sell, receive or deliver those impacted securities, which may have a negative impact on the Fund’s investments. In addition, the Fund’s index providers may reconstitute the Fund’s underlying index to exclude the sanctioned securities, which could result in increased portfolio turnover and higher transactions costs.
Please refer to each Fund’s prospectus and statement of additional information (“SAI”) for a more complete description of risks.
7. LOANS OF PORTFOLIO SECURITIES
The Funds may lend portfolio securities having a market value up to one-third of the Funds’ total assets. Security loans made pursuant to a securities lending agreement with BBH are initially required to be secured by collateral equal to at least 102% of the value of domestic equity securities and ADRs and 105% of the value of foreign equity securities (other than ADRs). Such collateral received in connection with these loans will be cash and can be invested in repurchase agreements, short-term investments or U.S. Treasury obligations and is recognized in the Schedules of Investments and Statements of Assets and Liabilities. The obligation to return securities lending collateral is also recognized as a liability in the Statements of Assets and Liabilities. It is the Funds’ policy to obtain additional collateral from or return excess collateral to the borrower by the end of the next business day, following the valuation date of the securities loaned. Therefore, the value of the collateral held may be temporarily less than the value of the securities on loan.
Lending securities entails a risk of loss to the Funds if and to the extent that the market value of the securities loans were to increase and the borrower did not increase the collateral accordingly, and the borrower fails to return the securities. In the event the borrower may not provide additional collateral when required or may not return the
| | Notes to Financial Statements (continued) | |
| | October 31, 2020 | |
7. LOANS OF PORTFOLIO SECURITIES (continued)
securities when due, the security lending agency agreement requires the lending agent to indemnify the Funds by replacing either the security or the security’s current market value to the Funds. The Funds could suffer a loss if the value of an investment purchased with cash collateral falls below the market value of loaned securities or if the value of an investment purchased with cash collateral falls below the value of the original cash collateral received. The Funds could also experience delays and costs in gaining access to the collateral. The Funds bear the risk of any deficiency in the amount of the collateral available for return to the borrower due to any loss on the collateral invested.
As of October 31, 2020, the value of the securities on loan was $7,359,469, $166,956, $277,760, $3,532,659, $144,944, $530,714, $2,775,925, $5,901,951 and $256,430 for the Global X China Consumer Discretionary ETF, Global X China Financials ETF, Global X China Communication Services ETF, Global X MSCI Greece ETF, Global X MSCI Norway ETF, Global X MSCI Portugal ETF, Global X MSCI Colombia ETF, Global X MSCI Argentina ETF, and Global X FTSE Nordic Region ETF, respectively. The cash collateral received from securities on loan was $7,938,349, $176,011, $278,380, $3,726,527, $152,381, $3,084,626, $2,773,082, $6,234,546 and $268,257 for the Global X China Consumer Discretionary ETF, Global X China Financials ETF, Global X China Communication Services ETF, Global X MSCI Greece ETF, Global X MSCI Norway ETF, Global X MSCI Portugal ETF, Global X MSCI Colombia ETF, Global X MSCI Argentina ETF, and Global X FTSE Nordic Region ETF, respectively.
At October 31, 2020, the following Funds had securities on loan, by counterparty:
| | | Market Value | | | Cash Collateral | |
| Global X MSCI China Consumer Discretionary ETF | | | | | | |
| Barclays Capital | | $ | 69,521 | | | $ | 73,150 | |
| BofA Securities, Inc. | | | 267,736 | | | | 289,710 | |
| Goldman Sachs | | | 3,482,467 | | | | 3,684,850 | |
| JPMorgan | | | 1,117,100 | | | | 1,185,147 | |
| Morgan Stanley and Co. | | | 2,257,990 | | | | 2,531,218 | |
| Natl Financial Services Group | | | 164,655 | | | | 174,274 | |
| Global X China Financials ETF | | | | | | | | |
| JPMorgan | | | 166,956 | | | | 176,011 | |
| Global X MSCI China Communication Services ETF | | | | | | | | |
| UBS Securities LLC | | | 277,760 | | | | 278,380 | (1) |
| | Notes to Financial Statements (continued) | |
| | October 31, 2020 | |
7. LOANS OF PORTFOLIO SECURITIES (continued)
| | | Market Value | | | Cash Collateral | |
| Global X MSCI Greece ETF | | | | | | |
| Barclays Capital | | | 910,378 | | | | 987,950 | |
| BofA Securities, Inc. | | | 6,057 | | | | 6,475 | |
| Citigroup | | | 31,080 | | | | 32,000 | |
| JPMorgan | | | 209,195 | | | | 240,250 | |
| Morgan Stanley and Co. | | | 114,219 | | | | 117,600 | |
| UBS AG London Branch | | | 2,261,730 | | | | 2,342,252 | |
| Global X MSCI Norway ETF | | | | | | | | |
| BofA Securities, Inc. | | | 5,021 | | | | 5,551 | |
| Credit Suisse | | | 59,446 | | | | 63,345 | |
| Morgan Stanley and Co. | | | 80,477 | | | | 83,485 | |
| Global X MSCI Portugal ETF | | | | | | | | |
| BofA Securities, Inc. | | | 434,133 | | | | 2,983,914 | |
| JPMorgan | | | 96,581 | | | | 100,712 | |
| Global X MSCI Colombia ETF | | | | | | | | |
| Barclays Capital | | | 103,600 | | | | 103,600 | (1) |
| Goldman Sachs | | | 2,629,775 | | | | 2,626,932 | (1) |
| JPMorgan | | | 42,550 | | | | 42,550 | (1) |
| Global X MSCI Argentina ETF | | | | | | | | |
| BofA Securities, Inc. | | | 1,548,035 | | | | 1,612,470 | |
| Goldman Sachs | | | 2,687,898 | | | | 2,914,876 | |
| JPMorgan | | | 1,666,018 | | | | 1,707,200 | |
| Global X FTSE Nordic Region ETF | | | | | | | | |
| BofA Securities, Inc. | | | 256,430 | | | | 268,257 | |
| (1) | It is the Funds’ policy to obtain additional collateral from or return excess collateral to the borrower by the end of the next business day, following the valuation date of the securities loaned. Therefore, the value of the collateral held may be temporarily less than the value of the securities on loan. |
8. CONTRACTUAL OBLIGATIONS
The Funds enter into contracts in the normal course of business that contain a variety of indemnifications. The Funds’ maximum exposure under these contracts is unknown. However, the Funds have not had prior gains or losses pursuant to these contracts.
Management has reviewed the Funds’ existing contracts and expects the risk of loss to be remote.
| | Notes to Financial Statements (continued) | |
| | October 31, 2020 | |
8. CONTRACTUAL OBLIGATIONS (continued)
Pursuant to the Trust’s organizational documents, the Trustees of the Trust and the Trust’s officers are indemnified against certain liabilities that may arise out of the performance of their duties.
9. REVERSE SHARE SPLIT
Effective April 28, 2020, each of the Global X MSCI Colombia ETF, Global X MSCI Greece ETF and Global X MSCI Pakistan ETF executed a reverse share split for shareholders of record after the close of markets on April 27, 2020. The effect of this transaction for each Fund was to divide the number of outstanding Shares of the Fund by the applicable ratio below, resulting in a corresponding increase in the NAV per Share. The capital share activity presented in the statement of changes in net assets for each of the years in the period then ended, and per share data in the financial highlights for each of the years in the period then ended, have been given retroactive effect to reflect these reverse share splits. There were no changes in net assets, results of operations or total return as a result of these transactions. The details of the reverse splits are as follows:
| Fund Name | | Ratio |
| Global X MSCI Colombia ETF | | 1:4 |
| Global X MSCI Greece ETF | | 1:3 |
| Global X MSCI Pakistan ETF | | 1:4 |
Effective March 16, 2017, the Global X MSCI Nigeria ETF executed a 1-for-4 reverse share split for shareholders of record after the close of markets on March 15, 2017. The effect of this transaction was to divide the number of outstanding shares of the Fund by four, resulting in a corresponding increase in the NAV per share. The per share data in the financial highlights for each of the years in the period then ended have been given retroactive effect to reflect these reverse share splits. There were no changes in net assets, results of operations or total return as a result of this transaction.
10. NEW ACCOUNTING PRONOUNCEMENT
In August 2018, the Financial Accounting Standards Board (“FASB”) issued Accounting Standards Update 2018-13, Fair Value Measurement (Topic 820). The new guidance includes additions and modifications to disclosures requirements for fair value measurements. For public entities, the amendments are effective for financial statements issued for fiscal years beginning after December 15, 2019, and interim periods within those fiscal years. The adoption of this guidance did not have a material impact on the financial statements.
| | Notes to Financial Statements (concluded) | |
| | October 31, 2020 | |
11. SUBSEQUENT EVENTS
The Funds have been evaluated by management regarding the need for additional disclosures and/or adjustments resulting from subsequent events. Based on this evaluation, no additional disclosures were required to the financial statements.
12. OTHER MATTER
The rapid and global spread of a highly contagious novel coronavirus respiratory disease, designated COVID-19, has resulted in extreme volatility in the financial markets and severe losses; reduced liquidity of many instruments; restrictions on international and, in some cases, local travel; significant disruptions to business operations (including business closures); strained healthcare systems; disruptions to supply chains, consumer demand and employee availability; and widespread uncertainty regarding the duration and long-term effects of this pandemic. Some sectors of the economy and individual issuers have experienced particularly large losses. In addition, the COVID-19 pandemic may result in a sustained economic downturn or a global recession, domestic and foreign political and social instability, damage to diplomatic and international trade relations and increased volatility and/or decreased liquidity in the securities markets. The COVID-19 pandemic could adversely affect the value and liquidity of the Funds’ investments and negatively impact Fund performance. In addition, the outbreak of COVID-19, and measures taken to mitigate its effects, could result in disruptions to the services provided to the Funds by their service providers.
| | Report of Independent Registered Public Accounting Firm | |
| | | |
To the Board of Trustees and Shareholders of each of the twenty-three funds listed in the table below.
Opinions on the Financial Statements
We have audited the accompanying statements of assets and liabilities, including the schedules of investments, of each of the funds listed in the table below (twenty-three of the funds constituting the Global X Funds, hereafter collectively referred to as the “Funds”) as of October 31, 2020, the related statements of operations for the year ended October 31, 2020, the statements of changes in net assets for each of the periods indicated in the table below, including the related notes, and the financial highlights for each of the periods indicated therein (collectively referred to as the “financial statements”). In our opinion, the financial statements present fairly, in all material respects, the financial position of each of the Funds as of October 31, 2020, the results of each of their operations for the year then ended, the changes in each of their net assets for each of the periods indicated in the table below and each of the financial highlights for each of the periods indicated therein, in conformity with accounting principles generally accepted in the United States of America.
| Global X MSCI Colombia ETF (1) | Global X MSCI Portugal ETF (1) |
| Global X MSCI Norway ETF (1) | Global X MSCI Pakistan ETF (1) |
| Global X MSCI China Industrials ETF (1) | Global X FTSE Southeast Asia ETF (1) |
| Global X FTSE Nordic Region ETF (1) | Global X MSCI Nigeria ETF (1) |
| Global X MSCI China Consumer Discretionary ETF (1) | Global X DAX Germany ETF (1) |
| Global X MSCI China Energy ETF (1) | Global X MSCI China Consumer Staples ETF (2) |
| Global X MSCI China Financials ETF (1) | Global X MSCI China Health Care ETF (2) |
| Global X MSCI China Communication Services ETF (1) | Global X MSCI China Information Technology ETF (2) |
| Global X MSCI China Materials ETF (1) | Global X MSCI China Real Estate ETF (2) |
| Global X MSCI Argentina ETF (1) | Global X MSCI China Utilities ETF (2) |
| Global X MSCI Greece ETF (1) | Global X MSCI China Large-Cap 50 ETF (2) |
| Global X MSCI Next Emerging & Frontier ETF (1) | |
(1) The statements of changes in net assets for each of the two years in the period ended October 31, 2020. (2) The statements of changes in net assets for the year ended October 31, 2020 and the period December 7, 2018 (date of commencement) through October 31, 2019. |
The financial statements of the Global X DAX Germany ETF as of and for the year ended October 31, 2018 and the financial highlights for each of the periods ended on or prior to October 31, 2018 (not presented herein, other than the financial highlights) were audited by other auditors whose report dated December 28, 2018 expressed an unqualified opinion on those financial statements and financial highlights.
| | Report of Independent Registered Public Accounting Firm | |
| | (concluded) | |
Basis for Opinions
These financial statements are the responsibility of the Funds’ management. Our responsibility is to express an opinion on the Funds’ financial statements based on our audits. We are a public accounting firm registered with the Public Company Accounting Oversight Board (United States) (PCAOB) and are required to be independent with respect to the Funds in accordance with the U.S. federal securities laws and the applicable rules and regulations of the Securities and Exchange Commission and the PCAOB.
We conducted our audits of these financial statements in accordance with the standards of the PCAOB. Those standards require that we plan and perform the audit to obtain reasonable assurance about whether the financial statements are free of material misstatement, whether due to error or fraud.
Our audits included performing procedures to assess the risks of material misstatement of the financial statements, whether due to error or fraud, and performing procedures that respond to those risks. Such procedures included examining, on a test basis, evidence regarding the amounts and disclosures in the financial statements. Our audits also included evaluating the accounting principles used and significant estimates made by management, as well as evaluating the overall presentation of the financial statements. Our procedures included confirmation of securities owned as of October 31, 2020, by correspondence with the custodian and brokers: when replies were not received from brokers, we performed other auditing procedures. We believe that our audits provide a reasonable basis for our opinions.
/s/PricewaterhouseCoopers LLP
Philadelphia, Pennsylvania
December 24, 2020
We have served as the auditor of one or more investment companies in the Global X Funds since 2016.
| | Disclosure of Fund Expenses (unaudited) | |
| | | |
ETFs such as the Funds have operating expenses. As a shareholder of an ETF, your investment is affected by these ongoing costs, which include (among others) costs for portfolio management, administrative services, brokerage fees, and shareholder reports like this one. It is important for you to understand the impact of these costs on your investment returns. In addition, a shareholder is responsible for brokerage fees incurred in the purchase or sale of share of the Fund on the secondary market.
Operating expenses such as these are deducted from an ETF’s gross income and directly reduce your final investment return. These expenses are expressed as a percentage of the ETF’s average net assets; this percentage is known as the ETF’s expense ratio.
The following examples use the expense ratio and are intended to help you understand the ongoing costs (in dollars) of investing in a Fund and to compare these costs with those of other funds. The examples are based on an investment of $1,000 made at the beginning of the period shown and held for the entire period from May 1, 2020 through October 31, 2020.
The table on the next page illustrates the Funds’ costs in two ways:
Actual Fund Return. This section helps you to estimate the actual expenses that a Fund incurred over the period. The “Expenses Paid During Period” column shows the actual dollar expense cost incurred by a $1,000 investment in the Fund, and the “Ending Account Value” number is derived from deducting that expense cost from the Fund’s gross investment return.
You can use this information, together with the actual amount you invested in the Funds, to estimate the expenses you paid over that period. Simply divide your actual account value by $1,000 to arrive at a ratio (for example, an $8,600 account value divided by $1,000 = 8.6), then multiply that ratio by the number shown for your Funds under “Expenses Paid During Period.”
Hypothetical 5% Return. This section helps you compare a Fund’s costs with those of other funds. It assumes that the Funds had an annual 5% return before expenses during the year, but that the expense ratio (Column 3) for the period is unchanged. This example is useful in making comparisons because the Securities and Exchange Commission requires all funds to make this 5% calculation. You can assess your Fund’s comparative cost by comparing the hypothetical result for your Fund in the “Expenses Paid During Period” column with those that appear in the same charts in the shareholder reports for other funds.
NOTE: Because the return is set at 5% for comparison purposes — NOT your Fund’s actual return — the account values shown may not apply to your specific investment.
| | Disclosure of Fund Expenses (unaudited) (continued) | |
| | | |
| | | Beginning Account Value 5/1/2020 | | | Ending Account Value 10/31/2020 | | | Annualized Expense Ratios | | | Expenses Paid During Period(1) | |
| Global X MSCI China Energy ETF | | | | | | | | | | | | |
| Actual Fund Return | | $ | 1,000.00 | | | $ | 1,135.80 | | | | 0.65 | % | | $ | 3.49 | |
| Hypothetical 5% Return | | | 1,000.00 | | | | 1,021.87 | | | | 0.65 | | | | 3.30 | |
| | | | | | | | | | | | | | | | | |
| Global X MSCI China Materials ETF | | | | | | | | | | | | | | | | |
| Actual Fund Return | | $ | 1,000.00 | | | $ | 1,209.10 | | | | 0.65 | % | | $ | 3.61 | |
| Hypothetical 5% Return | | | 1,000.00 | | | | 1,021.87 | | | | 0.65 | | | | 3.30 | |
| | | | | | | | | | | | | | | | | |
| Global X MSCI China Industrials ETF | | | | | | | | | | | | | | | | |
| Actual Fund Return | | $ | 1,000.00 | | | $ | 1,051.50 | | | | 0.65 | % | | $ | 3.35 | |
| Hypothetical 5% Return | | | 1,000.00 | | | | 1,021.87 | | | | 0.65 | | | | 3.30 | |
| | | | | | | | | | | | | | | | | |
| Global X MSCI China Consumer Discretionary ETF | | | | | | | | | | | | | | | | |
| Actual Fund Return | | $ | 1,000.00 | | | $ | 1,676.60 | | | | 0.65 | % | | $ | 4.37 | |
| Hypothetical 5% Return | | | 1,000.00 | | | | 1,021.87 | | | | 0.65 | | | | 3.30 | |
| | | | | | | | | | | | | | | | | |
| Global X MSCI China Consumer Staples ETF | | | | | | | | | | | | | | | | |
| Actual Fund Return | | $ | 1,000.00 | | | $ | 1,286.10 | | | | 0.65 | % | | $ | 3.74 | |
| Hypothetical 5% Return | | | 1,000.00 | | | | 1,021.87 | | | | 0.65 | | | | 3.30 | |
| | | | | | | | | | | | | | | | | |
| Global X MSCI China Health Care ETF | | | | | | | | | | | | | | | | |
| Actual Fund Return | | $ | 1,000.00 | | | $ | 1,213.10 | | | | 0.65 | % | | $ | 3.62 | |
| Hypothetical 5% Return | | | 1,000.00 | | | | 1,021.87 | | | | 0.65 | | | | 3.30 | |
| | | | | | | | | | | | | | | | | |
| Global X MSCI China Financials ETF | | | | | | | | | | | | | | | | |
| Actual Fund Return | | $ | 1,000.00 | | | $ | 1,005.10 | | | | 0.66 | % | | $ | 3.33 | |
| Hypothetical 5% Return | | | 1,000.00 | | | | 1,021.82 | | | | 0.66 | | | | 3.35 | |
| | | | | | | | | | | | | | | | | |
| Global X MSCI China Information Technology ETF | | | | | | | | | | | | | | | | |
| Actual Fund Return | | $ | 1,000.00 | | | $ | 1,430.00 | | | | 0.65 | % | | $ | 3.97 | |
| Hypothetical 5% Return | | | 1,000.00 | | | | 1,021.87 | | | | 0.65 | | | | 3.30 | |
| | | | | | | | | | | | | | | | | |
| Global X MSCI China Communication Services ETF | | | | | | | | | | | | | | | | |
| Actual Fund Return | | $ | 1,000.00 | | | $ | 1,135.80 | | | | 0.65 | % | | $ | 3.49 | |
| Hypothetical 5% Return | | | 1,000.00 | | | | 1,021.87 | | | | 0.65 | | | | 3.30 | |
| | | | | | | | | | | | | | | | | |
| Global X MSCI China Utilities ETF | | | | | | | | | | | | | | | | |
| Actual Fund Return | | $ | 1,000.00 | | | $ | 1,002.60 | | | | 0.66 | % | | $ | 3.32 | |
| Hypothetical 5% Return | | | 1,000.00 | | | | 1,021.82 | | | | 0.66 | | | | 3.35 | |
| | | | | | | | | | | | | | | | | |
| Global X MSCI China Real Estate ETF | | | | | | | | | | | | | | | | |
| Actual Fund Return | | $ | 1,000.00 | | | $ | 979.20 | | | | 0.66 | % | | $ | 3.28 | |
| Hypothetical 5% Return | | | 1,000.00 | | | | 1,021.82 | | | | 0.66 | | | | 3.35 | |
| | Disclosure of Fund Expenses (unaudited) (continued) | |
| | | |
| | | Beginning Account Value 5/1/2020 | | | Ending Account Value 10/31/2020 | | | Annualized Expense Ratios | | | Expenses Paid During Period(1) | |
| Global X MSCI China Large-Cap 50 ETF | | | | | | | | | | | | |
| Actual Fund Return | | $ | 1,000.00 | | | $ | 1,277.30 | | | | 0.29 | % | | $ | 1.66 | |
| Hypothetical 5% Return | | | 1,000.00 | | | | 1,023.68 | | | | 0.29 | | | | 1.48 | |
| | | | | | | | | | | | | | | | | |
| Global X MSCI Greece ETF | | | | | | | | | | | | | | | | |
| Actual Fund Return | | $ | 1,000.00 | | | $ | 941.30 | | | | 0.58 | % | | $ | 2.83 | |
| Hypothetical 5% Return | | | 1,000.00 | | | | 1,022.22 | | | | 0.58 | | | | 2.95 | |
| | | | | | | | | | | | | | | | | |
| Global X MSCI Norway ETF | | | | | | | | | | | | | | | | |
| Actual Fund Return | | $ | 1,000.00 | | | $ | 1,099.80 | | | | 0.50 | % | | $ | 2.64 | |
| Hypothetical 5% Return | | | 1,000.00 | | | | 1,022.62 | | | | 0.50 | | | | 2.54 | |
| | | | | | | | | | | | | | | | | |
| Global X DAX Germany ETF | | | | | | | | | | | | | | | | |
| Actual Fund Return | | $ | 1,000.00 | | | $ | 1,127.20 | | | | 0.21 | % | | $ | 1.12 | |
| Hypothetical 5% Return | | | 1,000.00 | | | | 1,024.08 | | | | 0.21 | | | | 1.07 | |
| | | | | | | | | | | | | | | | | |
| Global X MSCI Portugal ETF | | | | | | | | | | | | | | | | |
| Actual Fund Return | | $ | 1,000.00 | | | $ | 989.00 | | | | 0.58 | % | | $ | 2.90 | |
| Hypothetical 5% Return | | | 1,000.00 | | | | 1,022.22 | | | | 0.58 | | | | 2.95 | |
| | | | | | | | | | | | | | | | | |
| Global X MSCI Colombia ETF | | | | | | | | | | | | | | | | |
| Actual Fund Return | | $ | 1,000.00 | | | $ | 1,037.90 | | | | 0.62 | % | | $ | 3.18 | |
| Hypothetical 5% Return | | | 1,000.00 | | | | 1,022.02 | | | | 0.62 | | | | 3.15 | |
| | | | | | | | | | | | | | | | | |
| Global X MSCI Argentina ETF | | | | | | | | | | | | | | | | |
| Actual Fund Return | | $ | 1,000.00 | | | $ | 1,298.90 | | | | 0.60 | % | | $ | 3.47 | |
| Hypothetical 5% Return | | | 1,000.00 | | | | 1,022.12 | | | | 0.60 | | | | 3.05 | |
| | | | | | | | | | | | | | | | | |
| Global X MSCI Pakistan ETF | | | | | | | | | | | | | | | | |
| Actual Fund Return | | $ | 1,000.00 | | | $ | 1,134.10 | | | | 1.00 | % | | $ | 5.36 | |
| Hypothetical 5% Return | | | 1,000.00 | | | | 1,020.11 | | | | 1.00 | | | | 5.08 | |
| | | | | | | | | | | | | | | | | |
| Global X MSCI Nigeria ETF | | | | | | | | | | | | | | | | |
| Actual Fund Return | | $ | 1,000.00 | | | $ | 1,420.70 | | | | 0.90 | % | | $ | 5.48 | |
| Hypothetical 5% Return | | | 1,000.00 | | | | 1,020.61 | | | | 0.90 | | | | 4.57 | |
| | | | | | | | | | | | | | | | | |
| Global X MSCI Next Emerging & Frontier ETF | | | | | | | | | | | | | | | | |
| Actual Fund Return | | $ | 1,000.00 | | | $ | 1,067.60 | | | | 0.72 | % | | $ | 3.74 | |
| Hypothetical 5% Return | | | 1,000.00 | | | | 1,021.52 | | | | 0.72 | | | | 3.66 | |
| | | | | | | | | | | | | | | | | |
| Global X FTSE Nordic Region ETF | | | | | | | | | | | | | | | | |
| Actual Fund Return | | $ | 1,000.00 | | | $ | 1,188.20 | | | | 0.51 | % | | $ | 2.81 | |
| Hypothetical 5% Return | | | 1,000.00 | | | | 1,022.57 | | | | 0.51 | | | | 2.59 | |
| | Disclosure of Fund Expenses (unaudited) (concluded) | |
| | | |
| | | Beginning Account Value 5/1/2020 | | | Ending Account Value 10/31/2020 | | | Annualized Expense Ratios | | | Expenses Paid During Period(1) | |
| Global X FTSE Southeast Asia ETF | | | | | | | | | | | | |
| Actual Fund Return | | $ | 1,000.00 | | | $ | 984.80 | | | | 0.65 | % | | $ | 3.24 | |
| Hypothetical 5% Return | | | 1,000.00 | | | | 1,021.87 | | | | 0.65 | | | | 3.30 | |
| (1) | Expenses are equal to the Fund’s annualized expense ratio multiplied by the average account value over the period, multiplied by 184/366 (to reflect the one-half year period). |
| | Liquidity Risk Management Program (unaudited) | |
| | | |
Pursuant to Rule 22e-4 under the 1940 Act, the Adviser has adopted, and the Board has approved, a liquidity risk management program (the “Program”) to govern the Funds’ approach to managing liquidity risk. The Program is overseen by the Funds’ Liquidity Risk Management Committee (the “Committee”), and the Program’s principal objectives include assessing, managing and periodically reviewing each Fund’s liquidity risk, based on factors specific to the circumstances of the Funds.
At a meeting of the Board held on May 29, 2020, the Trustees received a report from the Committee addressing the operations of the Program and assessing its adequacy and effectiveness of implementation for the period from December 1, 2018 through December 31, 2019. The Committee’s report noted that the Committee had determined that the Program is reasonably designed to assess and manage each Fund’s liquidity risk and operated adequately and effectively to manage each Fund’s liquidity risk for the period covered by the report. The Committee’s report noted that during the period covered by the report, there were no liquidity events that impacted the Funds or their ability to timely meet redemptions without dilution to existing shareholders. The Committee’s report further noted that no material changes have been made to the Program since its implementation.
There can be no assurance that the Program will achieve its objectives in the future. Please refer to the prospectus for more information regarding a Fund’s exposure to liquidity risk and other principal risks to which an investment in the Fund may be subject.
| | Supplemental Information (unaudited) | |
| | | |
NAV is the price per Share at which a Fund issues and redeems Shares. It is calculated in accordance with the standard formula for valuing mutual fund shares. The “Market Price” of a Fund generally is determined using the midpoint between the highest bid and the lowest offer on the stock exchange on which the Shares of the Fund are listed for trading, as of the time that the Fund’s NAV is calculated. The Fund’s Market Price may be at, above or below its NAV. The NAV of a Fund will fluctuate with changes in the market value of the Fund’s holdings. The Market Price of a Fund will fluctuate in accordance with changes in their NAV, as well as market supply and demand.
Premiums or discounts are the differences (expressed as a percentage) between the NAV and Market Price of a Fund on a given day, generally at the time NAV is calculated. A premium is the amount that a Fund is trading above the reported NAV, expressed as a percentage of the NAV. A discount is the amount that a Fund is trading below the reported NAV, expressed as a percentage of the NAV.
Further information regarding premiums and discounts is available on the Funds’ website at www.globalxetfs.com.
| | Trustees and Officers of the Trust (unaudited) | |
| | | |
Set forth below are the names, addresses, years of birth, positions with the Trust, Term of Office and Length of Time Served, the principal occupations for the last five years, number of Funds in fund complex overseen by the Trustees, and other directorships outside the fund complex of each of the persons currently serving as Trustees and Officers of the Trust.
Name, Address (Year of Birth) | Position(s) Held with Trust | Principal Occupation(s) During the Past 5 Years | Number of Funds in Trust Overseen by Trustee | Other Directorships Held by Trustees |
Independent Trustees1 | | | | |
Charles A. Baker 605 Third Avenue, 43rd Floor New York, NY 10158 (1953) | Trustee (since 07/2018) | Chief Executive Officer of Investment Innovations LLC (investment consulting) (since 2013); Managing Director of NYSE Euronext (2003 to 2012). | 772 | Trustee of OSI ETF Trust (since 2016). |
Susan M. Ciccarone 605 Third Avenue, 43rd Floor New York, NY 10158 (1973) | Trustee (since 9/30/2019) | Partner, Further Global Capital Management (private equity) (since 2017); formerly Chief Operating Officer (2014-2016) and Chief Financial Officer (2012-2016), Emerging Global Advisors, LLC (ETF issuer). | 772 | Chairman, Payment Alliance International, Inc. (since 2019); Director, Casa Holdco LP, parent of Celink (since 2018). |
Clifford J. Weber 605 Third Avenue, 43rd Floor New York, NY 10158 (1963) | Trustee (since 07/2018) | Owner, Financial Products Consulting Group LLC (consulting services to financial institutions) (since 2015); Formerly, Executive Vice President of Global Index and Exchange-Traded Products, NYSE Market, Inc., a subsidiary of Intercontinental Exchange (ETF/ETP listing exchange) (2013-2015). | 772 | Chairman (since 2017) and Trustee (since 2015) of Clough Funds Trust; Chairman and Trustee of Clayton Street Trust (since 2016); Chairman and Trustee of Janus Detroit Street Trust (since 2016); Chairman and Trustee of Elevation ETF Trust (2016-2018); Trustee of Clough Global Equity Fund (since 2017); Trustee of Clough Global Dividend and Income Fund (since 2017); and Trustee of Clough Global Opportunities Fund (since 2017). |
| | Trustees and Officers of the Trust (unaudited) (continued) | |
| | | |
The Trust’s SAI includes additional information about the Trustees and Officers. The SAI may be obtained without charge by calling 1-888-493-8631. The following chart lists Trustees and Officers as of October 31, 2020.
Name, Address (Year of Birth) | Position(s) Held with Funds | Principal Occupation(s) During the Past 5 Years | Number of Funds in Trust Overseen by Trustee | Other Directorships Held by Trustees |
Interested Trustee / Officers1 | | | | |
Luis Berruga 605 Third Avenue, 43rd Floor New York, NY 10158 (1977) | Trustee (since 07/2018); President (since 2018) | Chief Executive Officer, GXMC (since 07/2018), Chief Financial Officer (since 2/2014) and Chief Operating Officer (9/2015 - 7/2018); Investment Banker, Jefferies (2012-2014). | 772 | None. |
Chang Kim 605 Third Avenue, 43rd Floor New York, NY 10158 (1984) | Chief Operating Officer; Treasurer, Principal Accounting Officer; and Chief Financial Officer (since 7/2018) | Chief Operating Officer, GXMC (since 7/2018), Head of Portfolio Management & Portfolio Administration (1/2017-7/2018); and Portfolio Manager (since 9/2009). | N/A | None. |
Susan Lively 605 Third Avenue, 43rd Floor New York, NY 10158 (1981) | Secretary (since 9/2020) | General Counsel, GXMC (since 9/2020); Senior Corporate Counsel at Franklin Templeton (previously, Managing Director and Associate General Counsel at Legg Mason & Co., LLC) (2014-2020). | N/A | None. |
Eric Griffith3 One Freedom Valley Drive Oaks, PA 19456 (1969) | Assistant Secretary (since 2/2020) | Counsel, SEI Investments (since 10/2019); Vice President and Assistant General Counsel, JPMorgan Chase & Co. (2012-2018). | N/A | None. |
Joe Costello 605 Third Avenue, 43rd Floor New York, NY 10158 (1974) | Chief Compliance Officer (since 9/2016) | Chief Compliance Officer, FlexShares Funds (2011-2015); Vice President, Northern Trust Investments (2003 - 2015). | N/A | None. |
1 | Each Trustee serves until his or her successor is duly elected or appointed and qualified. |
2 | As of October 31, 2020, the Trust had eighty-seven investment portfolios, seventy-seven of which were operational. |
3 | This officer of the Trust also serves as an officer of one or more mutual funds for which SEI Investments Company or an affiliate acts as investment manager, administrator or distributor. |
| | Notice to Shareholders (unaudited) | |
| | | |
For shareholders that do not have an October 31, 2020 tax year end, this notice is for informational purposes only. For shareholders with an October 31, 2020 tax year end, please consult your tax advisor as to the pertinence of this notice. For the fiscal year ended October 31, 2020, the Funds have designated the following items with regard to distributions paid during the year.
| | | Long- Term Capital Gain Distributions | | | Return of Capital | | | Ordinary Income Distributions | | | Total Distributions | | | Qualifying for Corporate Dividends Received Deduction(1) | | | Qualifying Dividend Income(2) | |
| Global X MSCI China Energy ETF | | | 0.00 | % | | | 0.00 | % | | | 100.00 | % | | | 100.00 | % | | | 0.00 | % | | | 94.61 | % |
| Global X MSCI China Materials ETF | | | 0.00 | % | | | 0.00 | % | | | 100.00 | % | | | 100.00 | % | | | 0.00 | % | | | 77.79 | % |
| Global X MSCI China Industrials ETF | | | 0.00 | % | | | 0.00 | % | | | 100.00 | % | | | 100.00 | % | | | 0.00 | % | | | 68.03 | % |
| Global X MSCI China Consumer Discretionary ETF | | | 0.00 | % | | | 0.00 | % | | | 100.00 | % | | | 100.00 | % | | | 4.41 | % | | | 68.81 | % |
| Global X MSCI China Consumer Staples ETF | | | 0.19 | % | | | 99.81 | % | | | 100.00 | % | | | 100.00 | % | | | 0.00 | % | | | 22.72 | % |
| Global X MSCI China Health Care ETF | | | 0.00 | % | | | 0.00 | % | | | 100.00 | % | | | 100.00 | % | | | 0.00 | % | | | 50.62 | % |
| Global X MSCI China Financials ETF | | | 0.00 | % | | | 0.00 | % | | | 100.00 | % | | | 100.00 | % | | | 0.00 | % | | | 100.00 | % |
| Global X MSCI China Information Technology ETF | | | 0.00 | % | | | 0.00 | % | | | 100.00 | % | | | 100.00 | % | | | 0.00 | % | | | 20.05 | % |
| Global X MSCI China Communication Services ETF | | | 0.00 | % | | | 0.00 | % | | | 100.00 | % | | | 100.00 | % | | | 39.87 | % | | | 66.16 | % |
| Global X MSCI China Utilities ETF | | | 0.00 | % | | | 0.00 | % | | | 100.00 | % | | | 100.00 | % | | | 0.00 | % | | | 46.27 | % |
| Global X MSCI China Real Estate ETF | | | 0.00 | % | | | 0.00 | % | | | 100.00 | % | | | 100.00 | % | | | 0.00 | % | | | 23.15 | % |
| Global X MSCI China Large-Cap 50 ETF | | | 0.00 | % | | | 0.00 | % | | | 100.00 | % | | | 100.00 | % | | | 0.78 | % | | | 91.08 | % |
| Global X MSCI Greece ETF | | | 0.00 | % | | | 0.00 | % | | | 100.00 | % | | | 100.00 | % | | | 0.00 | % | | | 82.96 | % |
| Global X MSCI Norway ETF | | | 0.00 | % | | | 0.00 | % | | | 100.00 | % | | | 100.00 | % | | | 0.00 | % | | | 53.33 | % |
| Global X DAX Germany ETF | | | 0.00 | % | | | 0.00 | % | | | 100.00 | % | | | 100.00 | % | | | 0.00 | % | | | 74.78 | % |
| Global X MSCI Portugal ETF | | | 0.00 | % | | | 0.00 | % | | | 100.00 | % | | | 100.00 | % | | | 0.00 | % | | | 100.00 | % |
| Global X MSCI Colombia ETF | | | 0.00 | % | | | 0.00 | % | | | 100.00 | % | | | 100.00 | % | | | 0.00 | % | | | 44.57 | % |
| Global X MSCI Argentina ETF | | | 0.00 | % | | | 0.00 | % | | | 100.00 | % | | | 100.00 | % | | | 0.00 | % | | | 69.97 | % |
| Global X MSCI Pakistan ETF | | | 0.00 | % | | | 0.00 | % | | | 100.00 | % | | | 100.00 | % | | | 0.00 | % | | | 100.00 | % |
| Global X MSCI Nigeria ETF | | | 0.00 | % | | | 0.00 | % | | | 100.00 | % | | | 100.00 | % | | | 0.00 | % | | | 0.00 | % |
| Global X Next Emerging & Frontier ETF | | | 0.00 | % | | | 0.00 | % | | | 100.00 | % | | | 100.00 | % | | | 0.08 | % | | | 51.41 | % |
| Global X FTSE Nordic Region ETF | | | 0.00 | % | | | 0.00 | % | | | 100.00 | % | | | 100.00 | % | | | 0.00 | % | | | 95.56 | % |
| Global X FTSE Southeast Asia ETF | | | 0.00 | % | | | 0.00 | % | | | 100.00 | % | | | 100.00 | % | | | 0.00 | % | | | 51.62 | % |
| | Notice to Shareholders (unaudited) | |
| | | |
| | | U.S. Government Interest(3) | | | Interest Related Dividends(4) | | | Short Term Capital Gain Dividends(5) | | | Foreign Tax Credit | |
| Global X MSCI China Energy ETF | | | 0.00 | % | | | 0.05 | % | | | 0.00 | % | | | 12.71 | % |
| Global X MSCI China Materials ETF | | | 0.00 | % | | | 0.07 | % | | | 0.00 | % | | | 0.00 | % |
| Global X MSCI China Industrials ETF | | | 0.00 | % | | | 0.04 | % | | | 0.00 | % | | | 0.00 | % |
| Global X MSCI China Consumer Discretionary ETF | | | 0.00 | % | | | 0.30 | % | | | 0.00 | % | | | 0.00 | % |
| Global X MSCI China Consumer Staples ETF | | | 0.00 | % | | | 0.00 | % | | | 100.00 | % | | | 0.00 | % |
| Global X MSCI China Health Care ETF | | | 0.00 | % | | | 0.00 | % | | | 100.00 | % | | | 0.00 | % |
| Global X MSCI China Financials ETF | | | 0.00 | % | | | 0.17 | % | | | 0.00 | % | | | 8.10 | % |
| Global X MSCI China Information Technology ETF | | | 0.00 | % | | | 0.00 | % | | | 100.00 | % | | | 0.00 | % |
| Global X MSCI China Communication Services ETF | | | 0.00 | % | | | 0.22 | % | | | 0.00 | % | | | 12.77 | % |
| Global X MSCI China Utilities ETF | | | 0.00 | % | | | 0.00 | % | | | 100.00 | % | | | 0.00 | % |
| Global X MSCI China Real Estate ETF | | | 0.00 | % | | | 0.00 | % | | | 0.00 | % | | | 0.00 | % |
| Global X MSCI China Large-Cap 50 ETF | | | 0.00 | % | | | 0.00 | % | | | 0.00 | % | | | 0.00 | % |
| Global X MSCI China Large-Cap 50 ETF | | | 0.00 | % | | | 0.07 | % | | | 0.00 | % | | | 3.87 | % |
| Global X MSCI Norway ETF | | | 0.00 | % | | | 0.05 | % | | | 0.00 | % | | | 12.49 | % |
| Global X DAX Germany ETF | | | 0.00 | % | | | 0.00 | % | | | 0.00 | % | | | 22.95 | % |
| Global X MSCI Portugal ETF | | | 0.06 | % | | | 0.06 | % | | | 0.00 | % | | | 14.32 | % |
| Global X MSCI Colombia ETF | | | 0.00 | % | | | 0.05 | % | | | 0.00 | % | | | 8.15 | % |
| Global X MSCI Argentina ETF | | | 0.01 | % | | | 0.18 | % | | | 0.00 | % | | | 0.00 | % |
| Global X MSCI Pakistan ETF | | | 0.00 | % | | | 0.05 | % | | | 0.00 | % | | | 17.69 | % |
| Global X MSCI Nigeria ETF | | | 0.01 | % | | | 0.04 | % | | | 0.00 | % | | | 48.84 | % |
| Global X Next Emerging & Frontier ETF | | | 0.00 | % | | | 0.07 | % | | | 0.00 | % | | | 7.23 | % |
| Global X FTSE Nordic Region ETF | | | 0.00 | % | | | 0.10 | % | | | 0.00 | % | | | 0.00 | % |
| Global X FTSE Southeast Asia ETF | | | 0.00 | % | | | 0.05 | % | | | 0.00 | % | | | 6.72 | % |
| | Notice to Shareholders (unaudited) | |
| | | |
(1) | Qualifying dividends represent dividends which qualify for the corporate dividends received deduction and is reflected as a percentage of ordinary Income distributions (the total of short term capital gain and net investment income distributions). |
(2) | The percentage in this column represents the amount of “Qualifying Dividend Income” as created by the Jobs and Growth Relief Reconciliation Act of 2003 and its reflected as a percentage of ordinary income distributions (the total of short term capital gain and net investment income distributions). It is the intention of each of the aforementioned funds to designate the maximum amount permitted by law. |
(3) | ‘‘U.S. Government Interest’’ represents the amount of interest that was derived from U.S. Government obligations and distributed during the fiscal year. Generally, interest from direct U.S. Government obligations is exempt from state income tax. However, for shareholders who are residents of California, Connecticut and New York, the statutory threshold requirements were not satisfied to permit exemption of these amounts from state income. |
(4) | The percentage in this column represents the amount of “Interest Related Dividends” is reflected as a percentage of ordinary income distribution. Interest related dividends is exempt from U.S. withholding tax when paid to foreign investors. |
(5) | The percentage of this column represents the amount of “Short Term Capital Gain Dividend” is reflected as a percentage of short term capital gain distribution that is exempted from U.S. withholding tax when paid to foreign investors. |
| | Notice to Shareholders (unaudited) | |
| | | |
Certain Funds intend to pass through a foreign tax credit to shareholders. For the fiscal year ended October 31, 2020, the total amount of foreign source income and foreign tax credit are as follows:
| Fund Name | | Foreign Source Income | | | Foreign Tax Credit Pass Through | |
| Global X MSCI China Energy ETF | | $ | 90,571 | | | $ | 10,030 | |
| Global X MSCI China Financials ETF | | | 1,337,228 | | | | 158,210 | |
| Global X MSCI China Communication Services ETF | | | 192,047 | | | | 19,513 | |
| Global X MSCI Greece ETF | | | 5,033,798 | | | | 279,354 | |
| Global X MSCI Norway ETF | | | 1,004,359 | | | | 143,283 | |
| Global X Dax Germany ETF | | | 704,574 | | | | 66,111 | |
| Global X MSCI Portugal ETF | | | 470,782 | | | | 82,063 | |
| Global X MSCI Colombia ETF | | | 2,100,792 | | | | 165,838 | |
| Global X MSCI Pakistan ETF | | | 1,315,236 | | | | 286,642 | |
| Global X MSCI Nigeria ETF | | | 2,569,815 | | | | 224,363 | |
| Global X MSCI Next Emerging & Frontier ETF | | | 406,200 | | | | 33,122 | |
| Global X FTSE Southeast Asia ETF | | | 666,686 | | | | 46,542 | |
The information reported herein may differ from the information and distributions taxable to the shareholders for the calendar year ending December 31, 2020. Complete information will be computed and reported in conjunction with your 2020 Form 1099-DIV.
605 Third Avenue, 43rd floor
New York, NY 10158
1-888-493-8631
www.globalxetfs.com
Investment Adviser and Administrator:
Global X Management Company LLC
605 Third Avenue, 43rd floor
New York, NY 10158
Distributor:
SEI Investments Distribution Co.
One Freedom Valley Drive
Oaks, PA 19456
Sub-Administrator:
SEI Investments Global Funds Services
One Freedom Valley Drive
Oaks, PA 19456
Counsel for Global X Funds and the Independent Trustees:
Stradley Ronon Stevens & Young, LLP
2000 K Street, N.W.
Suite 700
Washington, DC 20006
Custodian and Transfer Agent:
Brown Brothers Harriman & Co.
50 Post Office Square
Boston, MA 02110
Independent Registered Public Accounting Firm:
PricewaterhouseCoopers LLP
Two Commerce Square
Suite 1800
2001 Market Street
Philadelphia, PA 19103
This information must be preceded or accompanied by a prospectus for the funds described.
GLX-AR-002-1000
Item 2. Code of Ethics.
The registrant has adopted a code of ethics that applies to the registrant’s principal executive officer, principal financial officer, comptroller or principal accounting officer, and any person who performs a similar function.
Item 3 Audit Committee Financial Expert.
(a)(1) The registrant’s board of trustees has determined that the registrant has at least one audit committee financial expert serving on the audit committee.
(a)(2) The audit committee financial experts are Charles A. Baker and Susan M. Ciccarone and each is independent as defined in Form N-CSR Item 3(a)(2).
Item 4. Principal Accountant Fees and Services.
Fees billed by Pricewaterhouse Coopers LLP (“PwC”) relate to the registrant.
PWC billed the registrant aggregate fees for services rendered to the registrant for the last two fiscal years as follows:
| | 2020 | 2019 |
| | | All fees and services to the Trust that were pre-approved | All fees and services to service affiliates that were pre-approved | All other fees and services to service affiliates that did not require pre-approval | All fees and services to the Trust that were pre-approved | All fees and services to service affiliates that were pre-approved | All other fees and services to service affiliates that did not require pre-approval |
(a) | Audit Fees | $1,056,304 | $0 | $0 | $915,763 | $0 | $0 |
(b) | Audit-Related Fees | $0 | $0 | $0 | $0 | $0 | $0 |
(c) | Tax Fees | $330,942 | $0 | $0 | $285,396 | $0 | $0 |
(d) | All Other Fees | $0 | $0 | $0 | $0 | $0 | $0 |
(e)(1) Not applicable.
(e)(2) Percentage of fees billed applicable to non-audit services pursuant to waiver of pre-approval requirement were as follows (PwC):
| | 2020 | 2019 |
Audit-Related Fees
| 0% | 0% |
Tax Fees | 0% | 0% |
All Other Fees
| 0% | 0% |
(f) Not applicable.
(g) The aggregate non-audit fees and services billed by PwC for the last two fiscal years were $330,942 and $285,396, respectively.
(h) During the past fiscal year, all non-audit services provided by registrant’s principal accountant to either registrant’s investment adviser or to any entity controlling, controlled by, or under common control with registrant’s investment adviser that provides ongoing services to registrant were pre-approved by the audit committee of registrant’s Board of Trustees. Included in the audit committee’s pre-approval was the review and consideration as to whether the provision of these non-audit services is compatible with maintaining the principal accountant’s independence.
Item 5. Audit Committee of Listed Registrants.
The Registrant has a separately-designated standing Audit Committee, which is composed of the Registrant's Independent Trustees, Charles A. Baker, Susan M. Ciccarone and Clifford J. Weber.
Item 6. Investments.
Not applicable.
Item 7. Disclosure of Proxy Voting Policies and Procedures for Closed-End Management Investment Companies.
Not applicable to open-end management investment companies.
Item 8. Portfolio Managers of Closed-End Management Investment Companies.
Not applicable to open-end management investment companies.
Item 9. Purchases of Equity Securities by Closed-End Management Investment Company and Affiliated Purchasers.
Not applicable to open-end management investment companies.
Item 10. Submission of Matters to a Vote of Security Holders.
There have been no material changes.
Item 11. Controls and Procedures.
(a) The certifying officers, whose certifications are included herewith, have evaluated the registrant’s disclosure controls and procedures within 90 days of the filing date of this report. In their opinion, based on their evaluation, the registrant’s disclosure controls and procedures are adequately designed, and are operating effectively to ensure, that information required to be disclosed by the registrant in the reports it files or submits under the Securities Exchange Act of 1934 is recorded, processed, summarized and reported within the time periods specified in the Securities and Exchange Commission’s rules and forms.
(b) There were no significant changes in the registrant’s internal control over financial reporting that occurred during the period covered by this report that has materially affected, or is reasonably likely to materially affect, the registrant’s internal control over financial reporting.
Item 12. Disclosure of Securities Lending Activities for Closed-End Management Investment Companies.
Not applicable to open-end management investment companies.
Item 13. Exhibits.
(a)(1) Code of Ethics attached hereto.
(a)(2) A separate certification for the principal executive officer and the principal financial officer of the registrant as required by Rule 30a-2(a) under the Investment Company Act of 1940, as amended (17 CFR 270.30a-2(a)), are filed herewith.
(b) Officer certifications as required by Rule 30a-2(b) under the Investment Company Act of 1940, as amended (17 CFR 270.30a-2(b)) also accompany this filing as an Exhibit.
SIGNATURES
Pursuant to the requirements of the Securities Exchange Act of 1934 and the Investment Company Act of 1940, the registrant has duly caused this report to be signed on its behalf by the undersigned, thereunto duly authorized.
/s/ Luis Berruga
Luis Berruga
President
Date: January 8, 2021
Pursuant to the requirements of the Securities Exchange Act of 1934 and the Investment Company Act of 1940, this report has been signed below by the following persons on behalf of the registrant and in the capacities and on the dates indicated.
/s/ Luis Berruga
Luis Berruga
President
Date: January 8, 2021
/s/ John Belanger
John Belanger
Chief Financial Officer
Date: January 8, 2021