UNITED STATES
SECURITIES AND EXCHANGE COMMISSION
Washington, D.C. 20549
________
FORM N-CSR
________
CERTIFIED SHAREHOLDER REPORT OF REGISTERED MANAGEMENT
INVESTMENT COMPANIES
Investment Company Act file number 811-22209
Global X Funds
(Exact name of registrant as specified in charter)
________
600 Lexington Avenue, 20th Floor
New York, NY 10022
(Address of principal executive offices) (Zip code)
Bruno del Ama
Global X Management Company LLC
600 Lexington Ave, 20th Floor
New York, NY 10022
(Name and address of agent for service)
With a copy to:
| Daphne Tippens Chisolm, Esq. | Eric S. Purple, Esq. |
| Global X Management Company LLC | Stradley Ronon Stevens & Young, LLP |
| 600 Lexington Ave, 20th Floor | 1250 Connecticut Avenue, N.W. |
| New York, NY 10022 | Suite 500 |
| | Washington, DC 20036 |
Registrant’s telephone number, including area code: (212) 644-6440
Date of fiscal year end: November 30, 2017
Date of reporting period: November 30, 2017
| Item 1. | Reports to Stockholders. |

Global X MLP ETF (ticker: MLPA)
Annual Report
November 30, 2017
Shares are bought and sold at market price (not NAV) and are not individually redeemed from the Fund. Shares may only be redeemed directly from the Fund by Authorized Participants, in very large creation/redemption units. Brokerage commissions will reduce returns.
The Fund files its complete schedule of Fund holdings with the Securities and Exchange Commission (the “Commission”) for the first and third quarters of each fiscal year on Form N-Q within sixty days after the end of the period. The Fund’s Form N-Q is available on the Commission’s website at http://www.sec.gov, and may be reviewed and copied at the Commission's Public Reference Room in Washington, DC. Information on the operation of the Public Reference Room may be obtained by calling 1-800-SEC-0330.
A description of the policies and procedures that Global X Funds uses to determine how to vote proxies relating to Fund securities, as well as information relating to how the Fund voted proxies relating to Fund securities during the most recent 12-month period ended June 30, is available (i) without charge, upon request, by calling 1-888-GXFund-1; and (ii) on the Commission’s website at http://www.sec.gov.
| Management Discussion of Fund Performance (unaudited) |
| GLOBAL X MLP ETF |
Global X MLP ETF
The Global X MLP ETF (“Fund”) seeks to provide investment results that correspond generally to the price and yield performance, before fees and expenses, of the Solactive MLP Infrastructure Index (“Underlying Index”). The Fund is passively managed, which means the investment adviser does not attempt to take defensive positions in declining markets. The Fund generally seeks to fully replicate the Underlying Index.
The Underlying Index is intended to give investors a means of tracking the performance of the energy infrastructure master limited partnership (“MLP”) asset class in the United States, which includes MLPs engaged in transportation, storage, and processing of natural resources.
For the 12-month period ended November 30, 2017 (the “Reporting Period”), the Fund decreased -9.85%, while the Underlying Index decreased -10.83%. The Fund had a net asset value of $11.24 per share on November 30, 2016 and ended the Reporting Period with a net asset value of $9.42 on November 30, 2017.
During the Reporting Period, the highest returns came from ONEOK Partners and MPLX, which returned 26.25% and 16.22%, respectively. The worst performers were Plains All American Pipeline and Enbridge Energy Partners, which returned -36.43% and -34.82%, respectively.
The Fund seeks to provide tax efficient exposure to midstream MLPs, the general partners of midstream MLPs, and energy infrastructure corporations. Midstream MLPs operate toll road-like business models where they are compensated based on the volumes of natural gas or crude oil that they transport, store, or process. During the Reporting Period under review, oil prices remained low, hovering around $50/barrel, which weighed on MLP performance. Lower near-term growth expectations also affected MLP performance. While oil output fell across the world, U.S. oil production rebounded as drilling costs declined. But cuts in capital expenditures by exploration & production companies towards the end of the Reporting Period raised concerns about a potential future production slowdown, contributing to a selloff in MLP units. In addition, distribution cuts and reductions in distribution growth forecasts by some MLPs also negatively impacted performance. Despite these woes, midstream MLPs fared better than the broader energy sector due to generally less oil price sensitivity. MLPs benefited from higher storage and transportation volumes. To cope with oil price weakness, many MLPs sought to reduce debt levels to reduce their cost of capital. In addition, some MLPs pursued other alternatives that would reduce their cost of capital, such as simplifications in the business structure and waivers or cancellations of Incentive Distribution Right structures.
| | | AVERAGE TOTAL RETURN FOR THE YEAR ENDED NOVEMBER 30, 2017 | |
| | | One Year Return | | | Three Year Return | | | Five Year Return | | | Annualized Inception to Date* | |
| | | Net Asset | | | | | | Net Asset | | | | | | Net Asset | | | | | | Net Asset | | | | |
| | | Value | | | Market Price | | | Value | | | Market Price | | | Value | | | Market Price | | | Value | | | Market Price | |
| Global X MLP ETF | | | -9.85 | % | | | -9.77 | % | | | -10.51 | % | | | -10.53 | % | | | -2.34 | % | | | -2.43 | % | | | -1.44 | % | | | -1.45 | % |
| Hybrid Solactive MLP Infrastructure | | | | | | | | | | | | | | | | | | | | | | | | | | | | | | | | |
| Index/Solactive MLP Composite Index** | | | -10.83 | % | | | -10.83 | % | | | -13.17 | % | | | -13.17 | % | | | -1.69 | % | | | -1.69 | % | | | -0.40 | % | | | -0.40 | % |
| Solactive MLP Composite Index | | | -5.93 | % | | | -5.93 | % | | | -0.88 | % | | | -0.88 | % | | | -0.53 | % | | | -0.53 | % | | | -0.19 | % | | | -0.19 | % |
| S&P 500 Index | | | 22.87 | % | | | 22.87 | % | | | 10.91 | % | | | 10.91 | % | | | 15.74 | % | | | 15.74 | % | | | 14.63 | % | | | 14.63 | % |
| Management Discussion of Fund Performance (unaudited) |
| GLOBAL X MLP ETF |
Growth of a $10,000 Investment
(at Net Asset Value)
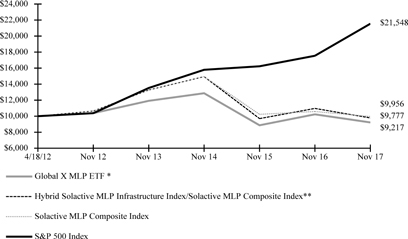
*The Fund commenced investment operations on April 18, 2012.
**Reflects performance of Solactive MLP Composite Index through March 31, 2015 and Solactive MLP Infrastructure Index thereafter.
The S&P 500 Index is a market capitalization weighted composite index of 500 large capitalization U.S. companies.
The performance data quoted herein represents past performance and the return and value of an investment in the Fund will fluctuate so that, when sold, it may be worth less than its original cost. Past performance is no guarantee of future performance and should not be considered as a representation of the future results of the Fund. The Fund's performance assumes the reinvestment of all dividends and all capital gains. Index returns assume reinvestment of dividends and, unlike the Fund's returns, do not reflect any fees or expenses. If such fees and expenses were included in the index returns, the performance would have been lower. Please note that one cannot invest directly in an unmanaged index.
There are no assurances that the Fund will meet its stated objectives.
The Fund’s holdings and allocations are subject to change and should not be considered recommendations to buy individual securities. Returns shown do not reflect the deduction of taxes that a shareholder would pay on Fund distributions or the redemption of Fund shares. See definition of comparative indices above and on previous page.
| Schedule of Investments | November 30, 2017 |
Global X MLP ETF
Sector Weightings (unaudited)†:

† Sector weightings percentages are based on the total market value of investments.
| | | Shares | | | Value | |
| MASTER LIMITED PARTNERSHIPS — 99.9% | | | | | | | | |
| UNITED STATES— 99.9% | | | | | | | | |
| Oil & Gas — 99.9% | | | | | | | | |
| Andeavor Logistics | | | 729,450 | | | $ | 32,650,182 | |
| Antero Midstream Partners | | | 753,199 | | | | 20,750,632 | |
| Buckeye Partners | | | 685,180 | | | | 31,470,317 | |
| DCP Midstream Partners | | | 785,881 | | | | 27,615,858 | |
| Enbridge Energy Partners | | | 1,870,725 | | | | 27,349,999 | |
| Energy Transfer Partners | | | 3,695,160 | | | | 61,376,608 | |
| EnLink Midstream Partners | | | 1,424,718 | | | | 22,781,241 | |
| Enterprise Products Partners | | | 2,806,644 | | | | 69,127,642 | |
| Equities Midstream Partners | | | 476,759 | | | | 32,715,203 | |
| Genesis Energy | | | 933,040 | | | | 20,032,369 | |
| Magellan Midstream Partners | | | 838,363 | | | | 56,170,321 | |
| MPLX | | | 1,387,943 | | | | 49,771,636 | |
| NuStar Energy | | | 772,895 | | | | 22,460,329 | |
| Phillips 66 Partners | | | 456,151 | | | | 21,375,236 | |
| Plains All American Pipeline | | | 1,710,093 | | | | 33,346,813 | |
| Shell Midstream Partners | | | 856,372 | | | | 23,164,863 | |
| Spectra Energy Partners | | | 642,003 | | | | 26,270,763 | |
| Tallgrass Energy Partners | | | 404,159 | | | | 17,750,663 | |
| TC PipeLines | | | 457,940 | | | | 23,267,931 | |
| Western Gas Partners | | | 662,930 | | | | 29,712,523 | |
| Williams Partners | | | 1,169,441 | | | | 42,918,485 | |
| | | | | | | | | |
| TOTAL MASTER LIMITED PARTNERSHIPS | | | | | | | | |
| (Cost $697,943,832) | | | | | | | 692,079,614 | |
| | | | | | | | | |
| TOTAL INVESTMENTS — 99.9% | | | | | | | | |
| (Cost $697,943,832) | | | | | | $ | 692,079,614 | |
Percentages are based on Net Assets of $692,953,862.
As of November 30, 2017, all of the Fund's investments were considered Level 1, in accordance with authoritative guidance on fair value measurements and disclosure under U.S. GAAP.
For the year ended November 30, 2017, there have been no transfers between Level 1, Level 2 or Level 3 investments.
The accompanying notes are an integral part of the financial statements.
| Statement of Assets and Liabilities |
| November 30, 2017 |
| | | Global X MLP ETF | |
| Assets: | | | | |
| Cost of Investments | | $ | 697,943,832 | |
| Investments, at Value | | $ | 692,079,614 | |
| Cash | | | 779,584 | |
| Receivable for Investment Securities Sold | | | 21,933,603 | |
| Receivable for Capital Shares Sold | | | 7,040,884 | |
| Prepaid Expenses | | | 9,769 | |
| Total Assets | | | 721,843,454 | |
| Liabilities: | | | | |
| Payable for Investment Securities Purchased | | | 28,539,413 | |
| Foreign Currency Overdraft | | | 60,259 | |
| Franchise Tax Payable | | | 39,589 | |
| Other Accrued Expenses | | | 250,331 | |
| Total Liabilities | | | 28,889,592 | |
| Net Assets | | $ | 692,953,862 | |
| Net Assets Consist of: | | | | |
| Paid-in Capital | | $ | 772,086,845 | |
| Distributions in Excess of Net Investment Income, Net of Taxes | | | (10,849,389 | ) |
| Accumulated Net Realized Loss on Investments and Foreign Currency Transactions, Net of Taxes | | | (62,403,842 | ) |
| Net Unrealized Depreciation on Investments, Net of Taxes | | | (5,879,752 | ) |
| | | $ | 692,953,862 | |
| Net Assets | | | | |
| Outstanding Shares of Beneficial Interest | | | | |
| (unlimited authorization — no par value) | | | 73,600,000 | |
| Net Asset Value, Offering and Redemption Price Per Share | | $ | 9.42 | |
The accompanying notes are an integral part of the financial statements.
| Statement of Operations |
| For the year ended November 30, 2017 |
| | | Global X MLP ETF | |
| Investment Income: | | | | |
| Distributions From Master Limited Partnership | | $ | 40,698,000 | |
| Less: Return of Capital Distributions | | | (40,698,000 | ) |
| Interest Income | | | 2,431 | |
| Total Investment Income | | | 2,431 | |
| Supervision and Administration Fees(1) | | | 2,472,703 | |
| Franchise Tax Expense | | | 39,317 | |
| Custodian Fees | | | 20,213 | |
| Total Expenses | | | 2,532,233 | |
| Net Expenses | | | 2,532,233 | |
| Net Investment Loss, Before Taxes | | | (2,529,802 | ) |
| Tax Benefit/(Expense), Net of Valuation Allowance | | | 620,250 | |
| Net Investment Loss, Net of Taxes | | | (1,909,552 | ) |
| Net Realized Gain (Loss) on: | | | | |
| Investments | | | (9,578,254 | ) |
| Tax Benefit/(Expense), Net of Valuation Allowance | | | 12,232,250 | |
| Net Realized Gain on Investments | | | 2,653,996 | |
| Net Change in Unrealized Depreciation on: | | | | |
| Investments | | | (60,393,401 | ) |
| Tax Benefit/(Expense), Net of Valuation Allowance | | | (12,852,500 | ) |
| Net Change in Unrealized Depreciation on Investments | | | (73,245,901 | ) |
| Net Realized and Unrealized Loss on Investments and Foreign Currency Transactions and Translations | | | (70,591,905 | ) |
| Net Decrease in Net Assets Resulting from Operations | | $ | (72,501,457 | ) |
| (1) | The Supervision and Administration fees include fees paid by the Fund for the investment advisory services provided by the Adviser. (See Note 3 in Notes to Financial Statements.) |
The accompanying notes are an integral part of the financial statements.
| Statements of Changes in Net Assets |
| | | Global X MLP ETF | |
| | | Year Ended | | | Year Ended | |
| | | November 30, | | | November 30, | |
| | | 2017 | | | 2016 | |
| Operations: | | | | | | | | |
| Net Investment Loss, Net of Taxes | | $ | (1,909,552 | ) | | $ | (1,905,781 | ) |
| Net Realized Gain (Loss) on Investments, Net of Taxes | | | 2,653,996 | | | | (50,855,744 | ) |
| Net Change in Unrealized Appreciation (Depreciation) on Investments, Net of Taxes | | | (73,245,901 | ) | | | 93,706,347 | |
| Net Increase (Decrease) in Net Assets Resulting from Operations | | | (72,501,457 | ) | | | 40,944,822 | |
| Dividends and Distributions: | | | | | | | | |
| Net Investment Income | | | (434,399 | ) | | | (429,219 | ) |
| Return of Capital | | | (41,617,826 | ) | | | (21,600,606 | ) |
| Total Dividends and Distributions | | | (42,052,225 | ) | | | (22,029,825 | ) |
| Capital Share Transactions: | | | | | | | | |
| Issued | | | 469,721,783 | | | | 213,606,280 | |
| Redeemed | | | (35,779,807 | ) | | | (41,082,576 | ) |
| Increase in Net Assets from Capital Share Transactions | | | 433,941,976 | | | | 172,523,704 | |
| Total Increase (Decrease) in Net Assets | | | 319,388,294 | | | | 191,438,701 | |
| Net Assets: | | | | | | | | |
| Beginning of Year | | | 373,565,568 | | | | 182,126,867 | |
| End of Year | | $ | 692,953,862 | | | $ | 373,565,568 | |
| Distributions in Excess of Net Investment Income, Net of Taxes | | $ | (10,849,389 | ) | | $ | (8,505,438 | ) |
| | | | | | | | | |
| Share Transactions: | | | | | | | | |
| Issued | | | 43,800,000 | | | | 20,400,000 | |
| Redeemed | | | (3,450,000 | ) | | | (4,400,000 | ) |
| Net Increase in Shares Outstanding from Share Transactions | | | 40,350,000 | | | | 16,000,000 | |
The accompanying notes are an integral part of the financial statements.
Selected Per Share Data & Ratios
For a Share Outstanding Throughout the Year
| | | | | | | | | | | | | | | | | | | | | | | | | | | | | | | | | Ratio of | | | Ratio of Investment Income/(Loss) to | |
| | | | | | | | | | | | | | | | | | | | | | | | | | | | | | | | | Expenses to Average Net Assets | | | Average Net Assets | |
| | | | | | | | | Net Realized | | | | | | | | | | | | | | | | | | | | | | | | | | | | | | | | | | | | | | | | | | | |
| | | | | | | | | and | | | | | | | | | | | | | | | | | | | | | | | | | | | | | | | | | | | | | | | | | | | |
| | | | | | | | | Unrealized | | | | | | | | | | | | | | | | | | | | | Net | | | | | | | | | | | | | | | | | | | | | | |
| | | Net Asset | | | | | | Gain (Loss) | | | | | | Distribution | | | | | | | | | Net Asset | | | | | | Assets | | | Before Net | | | | | | | | | | | | | | | | | | | |
| | | Value, | | | Net | | | on | | | Total from | | | from Net | | | | | | Total from | | | Value, End | | | Total | | | End of | | | Deferred | | | | | | Total | | | Before Net | | | | | | Net | | | Portfolio | |
| | | Beginning | | | Investment | | | Investments | | | Operations | | | Investment | | | Return of | | | Distributions | | | of Period | | | Return | | | Period | | | Tax Expense | | | Net Tax | | | Expenses | | | Tax | | | Net Tax | | | Investment | | | Turnover | |
| | | of Period ($) | | | Loss ($)* | | | ($) | | | ($) | | | Income ($) | | | Capital ($) | | | ($) | | | ($) | | | (%)** | | | ($)(000) | | | (%) | | | Expense (%) | | | (%) | | | Benefit (%) | | | Benefit (%) | | | Loss (%) | | | (%)† | |
| Global X MLP ETF | | | | | | | | | | | | | | | | | | | | | | | | | | | | | | | | | | | | | | | | | | | | | | | | | | | | | | | | | | |
| 2017 | | | 11.24 | | | | (0.05 | ) | | | (0.98 | ) | | | (1.03 | ) | | | (0.00 | ) | | | (0.79 | ) | | | (0.79 | ) | | | 9.42 | | | | (9.85 | ) | | | 692,954 | | | | 0.46 | | | | (0.11 | ) | | | 0.35 | | | | (0.46 | ) | | | — | | | | (0.46 | ) | | | 35.11 | |
| 2016 | | | 10.56 | | | | (0.07 | ) | | | 1.58 | | | | 1.51 | | | | (0.02 | ) | | | (0.81 | ) | | | (0.83 | ) | | | 11.24 | | | | 15.34 | | | | 373,566 | | | | 0.47 | | | | 0.03 | | | | 0.50 | | | | (0.47 | ) | | | (0.23 | ) | | | (0.70 | ) | | | 37.20 | |
| 2015 | | | 16.45 | | | | (0.09 | ) | | | (4.83 | ) | | | (4.92 | ) | | | — | | | | (0.97 | ) | | | (0.97 | ) | | | 10.56 | | | | (31.08 | ) | | | 182,127 | | | | 0.45 | | | | (4.81 | ) | | | (4.36 | ) | | | (0.44 | ) | | | (0.18 | ) | | | (0.62 | ) | | | 47.44 | |
| 2014 | | | 16.11 | | | | (0.05 | ) | | | 1.32 | | | | 1.27 | | | | (0.60 | ) | | | (0.33 | ) | | | (0.93 | ) | | | 16.45 | | | | 7.95 | | | | 142,279 | | | | 0.47 | | | | 3.52 | | | | 3.99 | | | | (0.47 | ) | | | 0.17 | | | | (0.30 | ) | | | 30.65 | |
| 2013 | | | 14.85 | | | | (0.05 | ) | | | 2.22 | | | | 2.17 | | | | (0.26 | ) | | | (0.65 | ) | | | (0.91 | ) | | | 16.11 | | | | 14.85 | | | | 66,852 | | | | 0.47 | | | | 7.20 | | | | 7.67 | | | | (0.47 | ) | | | 0.18 | | | | (0.29 | ) | | | 14.15 | |
| * | Per share data calculated using average shares method. |
| ** | Total Return is based on the change in net asset value of a share during the year/period and assumes reinvestment of dividends and distributions at net asset value. Total Return is for the period indicated and has not been annualized. The return shown does not reflect the deduction of taxes that a shareholder would pay on Fund distributions or the redemption of Fund shares. |
| † | Portfolio turnover rate is for the period indicated and has not been annualized. Excludes effect of in-kind transfers. |
Amounts designated as “—” are either $0 or have been rounded to $0.
The accompanying notes are an integral part of the financial statements.
| Notes to Financial Statements |
| November 30, 2017 |
1. ORGANIZATION
The Global X Funds (the "Trust") is a Delaware statutory trust formed on March 6, 2008. The Trust is registered under the Investment Company Act of 1940, as amended, as an open-end management investment company. As of November 30, 2017, the Trust had ninety-six portfolios, fifty-two of which were operational. The financial statements herein and the related notes pertain to the Global X MLP ETF (“MLP”) (the “Fund”). The Fund has elected non-diversification status.
2. SIGNIFICANT ACCOUNTING POLICIES
The following is a summary of the significant accounting policies followed by the Fund.
USE OF ESTIMATES – The Fund is an investment company that applies the accounting and reporting guidance issued in Topic 946 by the U.S. Financial Accounting Standards Board. The preparation of financial statements in conformity with U.S. Generally Accepted Accounting Principles ("U.S. GAAP") requires management to make estimates and assumptions that affect the reported amounts of assets and liabilities and disclosure of contingent assets and liabilities at the date of the financial statements and the reported amounts of increases and decreases in net assets from operations during the Reporting Period. Actual results could differ from those estimates, and could have a material impact on the Fund.
RETURN OF CAPITAL ESTIMATES – Distributions received by the Fund from underlying master limited partnership (“MLP”) investments generally are comprised of income and return of capital. The Fund records investment income and return of capital based on estimates made at the time such distributions are received. Such estimates are based on historical information available from the MLPs and other industry sources. These estimates may subsequently be revised based on information received from the MLPs after their tax reporting periods are concluded.
MLPs – The Fund invests in MLPs in addition to other exchange-traded securities. MLPs are publicly-traded partnerships engaged in the transportation, storage and processing of minerals and natural resources. By confining their operations to these specific activities, their interests, or units, are able to trade on public securities exchanges exactly like the shares of a corporation, without entity-level taxation. To qualify as an MLP, and to not be taxed as a corporation, a partnership must receive at least 90% of its income from qualifying sources as set forth in Section 7704(d) of the Internal Revenue Code of 1986, as amended (the “Code”). These qualifying sources include natural resource-based activities such as the processing, transportation and storage of mineral or natural resources. MLPs generally have two classes of owners, the general partner and limited partners. The general partner of an MLP is typically owned by a major energy company, an investment fund, the direct management of the MLP, or is an entity owned by one or more of such parties. The general partner may be structured as a private or publicly-traded corporation or other entity. The general partner typically controls the operations and management of the MLP through an up to 2% equity interest in the MLP plus, in many cases, ownership of common units and subordinated units.
Limited partners typically own the remainder of the partnership, through ownership of common units, and have a limited role in the partnership’s operations and management. MLPs are typically structured such that common units and general partner interests have first priority to receive quarterly cash distributions up to an established minimum amount (“minimum quarterly distributions” or “MQD”). Common and general partner interests also accrue arrearages in distributions to the extent the MQD is not paid. Once common and general partner interests have been paid, subordinated units receive distributions of up to the MQD; however, subordinated units do not accrue arrearages. Distributable cash in excess of the MQD is paid to both common and subordinated units and is distributed to both common and subordinated units generally on a pro rata basis. The general partner is also eligible to receive incentive distributions if the general partner operates the business in a manner which results in distributions paid per common unit surpassing specified target levels. As the general partner increases cash distributions to the limited partners, the general partner receives an increasingly higher percentage of the incremental cash distributions.
| Notes to Financial Statements (continued) |
| November 30, 2017 |
2. SIGNIFICANT ACCOUNTING POLICIES (continued)
SECURITY VALUATION – Securities listed on a securities exchange, market or automated quotation system for which quotations are readily available (except for securities traded on NASDAQ), including securities traded over the counter, are valued at the last quoted sale price on the primary exchange or market (foreign or domestic) on which they are traded (or at approximately 4:00 pm if a security’s primary exchange is normally open at that time), or, if there is no such reported sale, at the most recent mean between the quoted bid and asked prices (absent both bid and asked prices on such exchange, the bid price may be used).
For securities traded on NASDAQ, the NASDAQ Official Closing Price will be used. If available, debt securities are priced based upon valuations provided by independent, third-party pricing agents. Such values generally reflect the last reported sales price if the security is actively traded. The third-party pricing agents may also value debt securities at an evaluated bid price by employing methodologies that utilize actual market transactions, broker-supplied valuations, or other methodologies designed to identify the market value for such securities. Debt obligations with remaining maturities of sixty days or less may be valued at their amortized cost, which approximates market value. Prices for most securities held in the Fund are provided daily by recognized independent pricing agents. If a security’s price cannot be obtained from an independent, third- party pricing agent, the Fund seeks to obtain a bid price from at least one independent broker.
Securities for which market prices are not "readily available" are valued in accordance with Fair Value Procedures established by the Board of Trustees (the “Board”). The Fund’s Fair Value Procedures are implemented through a Fair Value Committee (the “Committee”) designated by the Board. Some of the more common reasons that may necessitate that a security be valued using Fair Value Procedures include: the security's trading has been halted or suspended; the security has been de-listed from its primary trading exchange; the security's primary trading market is temporarily closed at a time when under normal conditions it would be open; the security has not been traded for an extended period of time; the security's primary pricing source is not able or willing to provide a price; or trading of the security is subject to local government- imposed restrictions. In addition, the Fund may fair value its securities if an event that may materially affect the value of the Fund’s securities that traded outside of the United States (a “Significant Event”) has occurred between the time of the security's last close and the time that the Fund calculates its net asset value. A Significant Event may relate to a single issuer or to an entire market sector. Events that may be Significant Events include: government actions, natural disasters, armed conflict, acts of terrorism and significant market fluctuations. If Global X Management Company LLC (the “Adviser”) becomes aware of a Significant Event that has occurred with respect to a security or group of securities after the closing of the exchange or market on which the security or securities principally trade, but before the time at which the Fund calculates net asset value, it may request that a Committee meeting be called. When a security is valued in accordance with the Fair Value Procedures, the Committee will determine the value after taking into consideration all relevant information reasonably available to the Committee. As of November 30, 2017, there were no securities priced using the Fair Value Procedures.
In accordance with the authoritative guidance on fair value measurements and disclosure under U.S. GAAP, the Fund discloses the fair value of its investments in a hierarchy that prioritizes the inputs to valuation techniques used to measure the fair value. The objective of a fair value measurement is to determine the price that would be received to sell an asset or paid to transfer a liability in an orderly transaction between market participants at the measurement date (an exit price). Accordingly, the fair value hierarchy gives the highest priority to quoted prices (unadjusted) in active markets for identical assets or liabilities (Level 1) and the lowest priority to unobservable inputs (Level 3). The three levels of the fair value hierarchy are described below:
Level 1 – Unadjusted quoted prices in active markets for identical, unrestricted assets or liabilities that the Fund has the ability to access at the measurement date;
| Notes to Financial Statements (continued) |
| November 30, 2017 |
2. SIGNIFICANT ACCOUNTING POLICIES (continued)
SECURITY VALUATION (continued)
Level 2 – Other significant observable inputs (including quoted prices in non-active markets, quoted prices for similar investments, fair value of investments for which the Fund has the ability to fully redeem tranches at net asset value as of the measurement date or within the near term, and short-term investments valued at amortized cost)
Level 3 – Significant unobservable inputs (including the Fund’s own assumptions in determining the fair value of investments and fair value of investments for which the Fund does not have the ability to fully redeem tranches at net asset value as of the measurement date or within the near term)
Investments are classified within the level of the lowest significant input considered in determining fair value. Investments classified within Level 3 whose fair value measurement considers several inputs may include Level 1 or Level 2 inputs as components of the overall fair value measurement.
For the year ended November 30, 2017, there have been no significant changes to the Fund’s fair valuation methodology.
FEDERAL INCOME TAXES – The Fund is taxed as a regular C-corporation for federal income tax purposes. For the Reporting Period, the maximum marginal regular federal income tax rate for a corporation is 35 percent. The Fund may be subject to a 20 percent federal alternative minimum tax on their federal alternative taxable income to the extent that their alternative minimum tax liability exceeds their regular federal income tax liability. This differs from most investment companies, which elect to be treated as “regulated investment companies” under Subchapter M of the Internal Revenue Code of 1986, as amended (the “Code”) in order to avoid paying entity-level income taxes. Under current law, the Fund is not eligible to elect treatment as regulated investment companies due to its investments primarily in MLPs invested in energy assets. As a result, the Fund will be obligated to pay applicable federal and state corporate income taxes on its taxable income as opposed to most other investment companies, which are not so obligated. The Fund expects that a portion of the distributions that are received from MLPs may be treated as a tax-deferred return of capital, thus reducing the Fund’s current tax liability. However, the amount of taxes currently paid by the Fund will vary depending on the amount of income and gains derived from investments and/or sales of MLP interests and such taxes have the potential to reduce an investor’s return from an investment in the Fund.
Cash distributions from MLPs to the Fund that exceed the Fund’s allocable share of such MLP’s net taxable income are considered tax-deferred return of capital that will reduce the Fund’s adjusted tax basis in the equity securities of the MLP. These reductions in the Fund’s adjusted tax basis in MLP equity securities will increase the amount of gain (or decrease the amount of loss) recognized by the Fund on a subsequent sale of the securities. The Fund will accrue deferred income taxes for any future tax liability associated with (i) that portion of MLP distributions considered to be a tax-deferred return of capital as well as (ii) capital appreciation of their investments. Upon the sale of an MLP security, the Fund may be liable for previously deferred taxes. The Fund will rely to some extent on information provided by the MLPs, which may not necessarily be timely, to estimate deferred tax liability for purposes of financial statement reporting and determining the Fund’s NAV. From time to time, the Adviser will modify the estimates or assumptions related to the Fund’s deferred tax liabilities as new information becomes available. The Fund will generally compute deferred income taxes based on the marginal regular federal income tax rate applicable to corporations and an estimated rate attributable to state taxes.
The Fund recognizes interest and penalties, if any, related to unrecognized tax benefits within the income tax expense line in the accompanying Statement of Operations. Accrued interest and penalties, if any, are included within the related tax liability line in the Statement of Assets and Liabilities. For the year ended November 30, 2017, the Fund did not incur any interest or penalties.
| Notes to Financial Statements (continued) |
| November 30, 2017 |
2. SIGNIFICANT ACCOUNTING POLICIES (continued)
FEDERAL INCOME TAXES (continued)
Since the Fund will be subject to taxation on their taxable income, the NAV of the Fund shares will also be reduced by the accrual of any current and deferred tax liabilities.
The Fund’s income tax expense/(benefit) consists of the following:
For the year ended November 30, 2017:
| | | Current | | | Deferred | | | Total | |
| | | MLP | | | MLP | | | MLP | |
| Federal | | $ | - | | | $ | (25,317,372 | ) | | $ | (25,317,372 | ) |
| State | | | - | | | | (1,495,644 | ) | | | (1,495,644 | ) |
| Valuation allowance | | | - | | | | 26,813,016 | | | | 26,813,016 | |
| Total tax expense (benefit) | | $ | - | | | $ | - | | | $ | - | |
Deferred income taxes reflect the net tax effect of temporary differences between the carrying amount of assets and liabilities for financial reporting and tax purposes.
Components of the Fund’s deferred tax assets and liabilities are as follows:
For the year ended November 30, 2017:
| | | MLP | |
| Deferred tax assets: | | | | |
| Net unrealized loss on investment securities | | $ | 16,452,994 | |
| Net operating loss carryforward | | | 5,445,711 | |
| Capital loss carryforward | | | 5,373,877 | |
| Other | | | 75,574 | |
| Less Valuation Allowance | | | (27,348,156 | ) |
| | | | | |
| Net Deferred Tax Asset | | $ | - | |
The Fund reviews the recoverability of its deferred tax assets based upon the weight of available evidence. When assessing the recoverability of its deferred tax assets, significant weight was given to the effects of potential future realized and unrealized gains on investments and the period over which these deferred tax assets can be realized. Currently, any capital losses that may be generated by the Fund are eligible to be carried back up to three years and can be carried forward for five years to offset capital gains recognized by the Fund in those years. Net operating losses that may be generated by the Fund are eligible to be carried back up to two years and can be carried forward for 20 years to offset income generated by the Fund in those years.
| Notes to Financial Statements (continued) |
| November 30, 2017 |
2. SIGNIFICANT ACCOUNTING POLICIES (continued)
FEDERAL INCOME TAXES (continued)
The Fund has estimated net operating loss carryforwards for federal tax income purposes as follows:
| | | Year Ended | | Amount | | | Expiration |
| Global X MLP ETF | | 11/30/2016 | | $ | 3,371,920 | | | 11/30/2036 |
| | | 11/30/2017 | | | 11,326,356 | | | 11/30/2037 |
The Fund has estimated capital loss carryforwards for federal tax income purposes as follows:
| | | Year Ended | | Amount | | | Expiration |
| Global X MLP ETF | | 11/30/2016 | | $ | 14,504,391 | | | 11/30/2021 |
Based upon the Fund’s assessment, it has been determined that it is not more likely than not that a portion of the Fund’s deferred tax assets will be realized through future taxable income of the appropriate character. Accordingly, a valuation allowance has been established for a portion of the Fund’s deferred tax assets. The Fund will continue to assess the need for a valuation allowance in the future. Significant increases or declines in the fair value of its portfolio of investments may change the Fund’s assessment of the recoverability of these assets and may result in the recording or removal of a valuation allowance against all or a portion of the Fund’s gross deferred tax assets.
Total income tax expense/(benefit) (current and deferred) during the Reporting Period differs from the amount computed by applying the federal statutory income tax rate of 35% for the Global X MLP ETF to net investment and realized and unrealized gain/(losses) on investment before taxes as follows:
For the year ended November 30, 2017:
| | | MLP | | | | |
| Income tax (benefit) at statutory rate | | $ | (25,375,510 | ) | | | -35.00 | % |
| State income taxes (net of federal benefit) | | | (1,486,280 | ) | | | -2.05 | % |
| Permanent differences, net | | | (19,202 | ) | | | -0.03 | % |
| Change in estimated state rate | | | (1,239 | ) | | | 0.00 | % |
| Other adjustments | | | 69,215 | | | | 0.10 | % |
| Change in valuation allowance | | | 26,813,016 | | | | 36.98 | % |
| | | $ | - | | | | 0.00 | % |
| Notes to Financial Statements (continued) |
| November 30, 2017 |
2. SIGNIFICANT ACCOUNTING POLICIES (continued)
FEDERAL INCOME TAXES (continued)
The Fund recognizes the tax benefits of uncertain tax positions only where the position is “more likely than not” to be sustained assuming examination by tax authorities. Management has analyzed the Fund’s tax positions, and has concluded that no liability for unrecognized tax benefits should be recorded related to uncertain tax positions taken on U.S. tax returns and state tax returns filed since inception of the Fund. No U.S. federal or state income tax returns are currently under examination. The tax years ended November 30, 2016, 2015, and 2014 remain subject to examination by tax authorities in the U.S. Due to the nature of the Fund’s investments, the Fund may be required to file income tax returns in several states. The Fund is not aware of any tax positions for which it is reasonably possible that the total amounts of unrecognized tax benefits will change materially in the next 12 months.
The Fund has accrued a state franchise tax liability for the year ended November 30, 2017. State franchise taxes are separate and distinct from state income taxes. State franchise taxes are imposed on a corporation for the right to conduct business in the state and typically are based off the net worth or capital apportioned to a state. Due to the nature of the Fund’s investments, the Fund may be required to file franchise state returns in several states.
The adjusted cost basis of investment and gross unrealized appreciation and depreciation of investments for federal income tax purposes were as follows:
| | | | | | Aggregated | | | Aggregated | | | | |
| | | | | | Gross | | | Gross | | | Net | |
| | | Federal Tax | | | Unrealized | | | Unrealized | | | Unrealized | |
| Global X Funds | | Cost | | | Appreciation | | | Depreciation | | | Appreciation | |
| Global X MLP ETF | | $ | 736,487,155 | | | $ | 18,835,095 | | | $ | (63,242,636 | ) | | $ | (44,407,541 | ) |
The difference between cost amounts for financial statement purposes and tax purposes is due primarily to the recognition of partnership adjustments, differing cost relief methodologies, and wash sales adjustments from the Fund’s investments in MLPs.
SECURITY TRANSACTIONS AND INVESTMENT INCOME – Security transactions are accounted for on the trade date for financial reporting purposes. Costs used in determining realized gains and losses on the sale of investment securities are based on specific identification. Dividend income is recorded on the ex-dividend date. Interest income is recognized on the accrual basis from the settlement date.
DIVIDENDS AND DISTRIBUTIONS TO SHAREHOLDERS – The Fund intends to declare and make quarterly distributions; however, the Board may determine to make distributions at its own discretion. Distributions from net investment income are determined in accordance with income tax regulations, which may differ from U.S. GAAP. These differences are primarily due to differing treatments of income and gains on various investment securities held by the Fund, timing differences and differing characterization of distributions made by the Fund.
The Fund also expects that a portion of the distributions it receives from MLPs may be treated as a tax deferred return of capital, thus reducing the Fund’s current tax liability. Return of capital distributions are not taxable income to the shareholder, but reduce the shareholder’s tax basis in the shareholder’s Fund shares. Such a reduction in tax basis will result in larger taxable gains and/or lower tax losses on a subsequent sale of Fund shares. Shareholders who periodically receive the payment of dividends or other distributions consisting of a return of capital may be under the impression that they are receiving net profits from the Fund when, in fact, they are not. Shareholders should not assume that the source of the distributions is from the net profits of the Fund.
| Notes to Financial Statements (continued) |
| November 30, 2017 |
2. SIGNIFICANT ACCOUNTING POLICIES (concluded)
DIVIDENDS AND DISTRIBUTIONS TO SHAREHOLDERS (continued)
For the year ended November 30, 2017, the Fund made the following tax basis distributions from MLP distributions received:
| | | MLP | |
| Net investment income | | $ | (434,399 | ) |
| Return of capital | | | (41,617,826 | ) |
| Total | | $ | (42,052,225 | ) |
CREATION UNITS –The Fund issues and redeems the shares (“Shares”) on a continuous basis at Net Asset Value (“NAV”) and only in large blocks of 50,000 Shares, referred to as “Creation Units”. Purchasers of Creation Units (“Authorized Participants”) at NAV must pay a standard creation transaction fee per transaction. The fee is a single charge and will be the same regardless of the number of Creation Units purchased by an Authorized Participant on the same day.
An Authorized Participant who holds Creation Units and wishes to redeem at NAV would also pay a standard redemption fee per transaction to Brown Brothers Harriman & Co. (“BBH”), the Fund’s custodian (“Custodian”), on the date of such redemption, regardless of the number of Creation Units redeemed that day.
If a Creation Unit is purchased or redeemed for cash, an additional variable fee may be charged. The following table discloses the Creation Unit breakdown:
| | | | | | | | | Value at | | | | |
| | | Creation | | | | | | November | | | Redemption | |
| | | Unit Shares | | | Creation Fee | | | 30, 2017 | | | Fee | |
| Global X MLP ETF* | | | 50,000 | | | $ | 250 | | | $ | 471,000 | | | $ | 250 | |
*On March 30, 2017, Global X MLP ETF changed its creation/ redemption fee from $500, to $250, respectively.
CASH OVERDRAFT CHARGES – Per the terms of the agreement with BBH, if the Fund has a cash overdraft on a given day, it will be assessed an overdraft charge of LIBOR plus 2.00%. Cash overdraft charges are included in custodian fees on the Statements of Operations.
3. RELATED PARTY TRANSACTIONS AND SERVICE PROVIDER TRANSACTIONS
The Adviser serves as the investment adviser and the administrator for the Fund. Subject to the supervision of the Board of Trustees, the Adviser is responsible for managing the investment activities of the Fund and the Fund’s business affairs and other administrative matters and provides or causes to be furnished all supervisory, administrative and other services reasonably necessary for the operation of the Fund, including certain distribution services, if any, (provided pursuant to a separate Distribution Agreement), certain shareholder and distribution-related services (provided pursuant to a separate Rule 12b-1 Plan and related agreements) and investment advisory services (provided pursuant to a separate Investment Advisory Agreement), under what is essentially an "all-in" fee structure, respectively. For its service to the Fund, under the Supervision and Administration Agreement, the Fund pays a monthly fee to the Adviser at the annual rate (stated as a percentage of the average daily net assets of the Fund). In addition, the Fund bears other expenses that are not covered by the Supervision and Administration Agreement, which may vary and affect the total expense ratios of the Fund, such as taxes, brokerage fees, commissions, acquired fund fees, other transaction expenses, interest expenses and extraordinary expenses (such as litigation and indemnification expenses). The following table discloses supervision and administration fees pursuant to the agreement:
| Notes to Financial Statements (continued) |
| November 30, 2017 |
3. RELATED PARTY TRANSACTIONS AND SERVICE PROVIDER TRANSACTIONS (concluded)
| | | Supervision and | |
| | | Administration Fee | |
| Global X MLP ETF | | | 0.45 | % |
SEI Investments Global Funds Services (“SEIGFS”) serves as sub-administrator to the Fund. As sub- administrator, SEIGFS provides the Fund with the required general administrative services, including, without limitation: office space, equipment, and personnel; clerical and general back office services; bookkeeping, internal accounting and secretarial services; the calculation of NAV; and assistance with the preparation and filing of reports, registration statements, proxy statements and other materials required to be filed or furnished by the Fund under federal and state securities laws. As compensation for these services, the SEIGFS receives certain out-of-pocket costs, transaction fees and asset-based fees which are accrued daily and paid monthly by the Adviser.
Cohen & Company, Ltd. (“Cohen”) prepares Federal Form 1120 and state tax returns for the Fund. In addition, among other things, Cohen has been engaged to assist the Fund in the calculation of the current and deferred tax provisions for financial statement purposes for the Fund’s year ended November 30, 2017.
SEI Investments Distribution Co. (“SIDCO”) serves as the Fund’s underwriter and distributor of Creation Units pursuant to a Distribution Agreement. SIDCO has no obligation to sell any specific quantity of Fund Shares. SIDCO bears the following costs and expenses relating to the distribution of Shares: (i) the costs of processing and maintaining records of creations of Creation Units; (ii) all costs of maintaining the records required of a registered broker/dealer; (iii) the expenses of maintaining its registration or qualification as a dealer or broker under Federal or state laws; (iv) filing fees; and (v) all other expenses incurred in connection with the distribution services as contemplated in the Distribution Agreement. SIDCO receives no fee for its distribution services under the Distribution Agreement, rather the Adviser compensates SIDCO for certain expenses, out-of-pocket costs, and transaction fees.
BBH serves as custodian of the Fund’s assets. As custodian, BBH has agreed to (1) make receipts and disbursements of money on behalf of the Fund, (2) collect and receive all income and other payments and distributions on account of the Fund’s portfolio investments, (3) respond to correspondence from shareholders, security brokers and others relating to its duties, and (4) make periodic reports to the Fund concerning the Fund’s operations. BBH does not exercise any supervisory function over the purchase and sale of securities. BBH also serves as the Fund’s transfer agent. As transfer agent, BBH has agreed to (1) issue and redeem shares of the Fund, (2) make dividend and other distributions to shareholders of the Fund, (3) respond to correspondence by shareholders and others relating to its duties, (4) maintain shareholder accounts, and (5) make periodic reports to the Fund. As compensation for these services, BBH receives certain out-of pocket costs, transaction fees and asset-based fees which are accrued daily and paid monthly by the Adviser from its fees.
4. INVESTMENT TRANSACTIONS
For the year ended November 30, 2017, the purchases and sales of investments in securities excluding in-kind transactions, long-term U.S. Government and short-term securities were:
| | | Purchases | | | Sales | |
| Global X MLP ETF | | $ | 195,483,716 | | | $ | 275,812,254 | |
| Notes to Financial Statements (continued) |
| November 30, 2017 |
4. INVESTMENT TRANSACTIONS (concluded)
For the year or period ended November 30, 2016 and November 30 2017, in-kind transactions associated with creations and redemptions were, respectively:
| | | | | | Sales and | | | Realized | |
| 2016 | | Purchases | | | Maturities | | | Gain/(Loss) | |
| Global X MLP ETF | | $ | 213,710,271 | | | $ | - | | | $ | - | |
| | | | | | Sales and | | | Realized | |
| 2017 | | Purchases | | | Maturities | | | Gain/(Loss) | |
| Global X MLP ETF | | $ | 469,517,457 | | | $ | - | | | $ | - | |
For the year ended November 30, 2017, there were no purchases or sales of long term U.S. Government securities for the Fund.
5. CONCENTRATION OF RISKS
The Fund uses a replication strategy. A replication strategy is an indexing strategy that involves investing in the securities of an underlying index in approximately the same proportions as in the underlying index. The Fund may utilize a representative sampling strategy with respect to its underlying index when a replication strategy might be detrimental to its shareholders, such as when there are practical difficulties or substantial costs involved in compiling a portfolio of equity securities to follow their underlying indices, or, in certain instances, when securities in their underlying indices become temporarily illiquid, unavailable or less liquid, or due to legal restrictions (such as diversification requirements that apply to the Fund but not its underlying index). A more complete description of risks is included in the Fund’s prospectus and SAI.
Under normal circumstances, the Fund invests at least 80% of its total assets in securities of its Underlying Index, which are subject to certain risks, such as supply and demand risk, depletion and exploration risk, and the risk associated with the hazards inherent in midstream energy industry activities. A substantial portion of the cash flow received by the Fund is derived from investment in equity securities of MLPs. The amount of cash that an MLP has available for distributions and the tax character of such distributions are dependent upon the amount of cash generated by the MLP’s operations.
MLPs operating in the energy sector are subject to risks that are specific to the industry they serve.
Midstream - Midstream MLPs that provide crude oil, refined product and natural gas services are subject to supply and demand fluctuations in the markets they serve which may be impacted by a wide range of factors including fluctuating commodity prices, weather, increased conservation or use of alternative fuel sources, increased governmental or environmental regulation, depletion, rising interest rates, declines in domestic or foreign production, accidents or catastrophic events, increasing operating expenses and economic conditions, among others.
Exploration and production - Exploration and production MLPs produce energy resources, including natural gas and crude oil. Exploration and production MLPs that own oil and gas reserves are particularly vulnerable to declines in the demand for and prices of crude oil and natural gas. Substantial downward adjustments in reserve estimates could have a material adverse effect on the value of such reserves and the financial condition of an MLP. Exploration and production MLPs seek to reduce cash flow volatility associated with commodity prices by executing multi-year hedging strategies that fix the price of gas and oil produced. There can be no assurance that the hedging strategies currently employed by these MLPs are currently effective or will remain effective.
| Notes to Financial Statements (continued) |
| November 30, 2017 |
5. CONCENTRATION OF RISKS (concluded)
Marine shipping - Marine shipping MLPs are primarily marine transporters of natural gas, crude oil or refined petroleum products. Marine shipping companies are exposed to many of the same risks as other energy companies. The highly cyclical nature of the marine transportation industry may lead to volatile changes in charter rates and vessel values, which may adversely affect the revenues, profitability and cash flows of MLPs with marine transportation assets.
Propane - Propane MLPs are distributors of propane to homeowners for space and water heating. MLPs with propane assets are subject to earnings variability based upon weather conditions in the markets they serve, fluctuating commodity prices, customer conservation and increased use of alternative fuels, increased governmental or environmental regulation, and accidents or catastrophic events, among others.
Natural Resource - MLPs with coal, timber, fertilizer and other mineral assets are subject to supply and demand fluctuations in the markets they serve, which will be impacted by a wide range of domestic and foreign factors including fluctuating commodity prices, the level of their customers’ coal stockpiles, weather, increased conservation or use of alternative fuel sources, increased governmental or environmental regulation, depletion, declines in production, mining accidents or catastrophic events, health claims and economic conditions, among others.
6. LOANS OF PORTFOLIO SECURITIES
The Fund may lend portfolio securities having a market value up to one-third of the Fund’s total assets. Security loans made pursuant to a securities lending agreement are required at all times to be secured by collateral equal to at least 102% for U.S.-based securities and 105% for foreign based securities. Such collateral received in connection with these loans will be cash and can be invested in repurchase agreements or U.S. Treasury obligations and is recognized in the Schedule of Investments and Statement of Assets and Liabilities. The obligation to return securities lending collateral is also recognized as a liability in the Statement of Assets and Liabilities. It is the Fund’s policy to obtain additional collateral from or return excess collateral to the borrower by the end of the next business day, following the valuation date of the securities loaned. Therefore, the value of the collateral held may be temporarily less than the value of the securities on loan. Lending securities entails a risk of loss to the Fund if and to the extent that the market value of the securities loans were to increase and the borrower did not increase the collateral accordingly, and the borrower fails to return the securities. The Fund could also experience delays and costs in gaining access to the collateral. The Fund bears the risk of any deficiency in the amount of the collateral available for return to the borrower due to any loss on the collateral invested. As of November 30, 2017, the Fund had no securities on loan.
7. CONTRACTUAL OBLIGATIONS
The Fund enters into contracts in the normal course of business that contain a variety of indemnifications. The Fund’s maximum exposure under these arrangements is unknown. However, the Fund has not had prior gains or losses pursuant to these contracts. Management has reviewed the Fund’s existing contracts and expects the risk of loss to be remote.
Pursuant to the Trust’s organizational documents, the Trustees of the Trust and the Trust’s officers are indemnified against certain liabilities that may arise out of the performance of their duties.
| Notes to Financial Statements (concluded) |
| November 30, 2017 |
8. REGULATORY MATTERS
In October 2016, the U.S. Securities and Exchange Commission adopted new rules and amended existing rules (together, final rules) intended to modernize the reporting and disclosure of information by registered investment companies. In part, the final rules amended Regulation S-X and require standardized, enhanced disclosures about derivatives in investment company financial statements, as well as other amendments. As of August 1, 2017, management has implemented the amendments to Regulation S-X, which did not have a material impact on the Fund’s financial statements and related disclosures or impact the Fund’s net assets or results of operations.
9. SUBSEQUENT EVENTS
The Fund has been evaluated regarding the need for additional disclosures and/or adjustments resulting from subsequent events. Based on this evaluation, please note the additional disclosure:
On November 1, 2017, the Trust entered into an agreement with BBH in which BBH will serve as the new securities lending agent for the Trust and each of its series. The agreement was implemented beginning January 1, 2018.
Tax Cuts and Jobs Act of 2017
On December 22, 2017, the Tax Cuts and Jobs Act of 2017 (“the Act”) was signed into law. The Act reduces the statutory income tax rate applicable to corporations from 35 percent to 21 percent. Additionally, the Act makes changes regarding the use of net operating losses, repeals the corporate alternative minimum tax, restricts corporate deductibility of interest expense, and makes significant changes to the U.S. international tax rules. These changes may affect the Fund’s estimates of the current income tax expense and the deferred tax asset and liability balances used in the calculation of their NAVs. Additionally, these and other changes in the Act may affect the business operations of the underlying MLPs in which the Fund invests in, thereby affecting the future amount of taxable income or loss allocated from the MLPs to the Fund.
As the Act was signed into law subsequent to the November 30, 2017 year-end of the Fund, the impact of the Act is not reflected in the amounts recorded in these financial statements.
As disclosed in Note 2, the Fund had a net deferred tax asset at November 30, 2017 which was fully offset by a valuation allowance. As a result of the 100% valuation allowance, the Fund has assessed that the reduction in the corporate tax rate had no impact on the Fund’s net asset values.
The Fund is continuing to assess the effects of the Act on the deferred tax asset and liability balances and valuation allowances and continually assess the recoverability of their deferred tax assets based upon the weight of available evidence. The Fund may also modify their estimates and assumptions regarding these balances as their evaluation of the Act continues and as new information regarding the Act or other matters becomes available. Any changes in the Fund’s estimates or assumptions regarding these amounts could result in future increases or decreases in the Fund’s NAV.
| Report of Independent Registered Public Accounting Firm |
To the Board of Trustees and Shareholders of Global X MLP ETF
In our opinion, the accompanying statement of assets and liabilities, including the schedule of investments, and the related statements of operations and of changes in net assets and the financial highlights present fairly, in all material respects, the financial position of Global X MLP ETF (one the funds constituting part of the series of Global X Funds, hereafter referred to as the "Fund") as of November 30, 2017, the results of its operations for the year then ended and the changes in its net assets and the financial highlights for each of the two years in the period then ended, in conformity with accounting principles generally accepted in the United States of America. These financial statements and financial highlights (hereafter referred to as "financial statements") are the responsibility of the Fund's management. Our responsibility is to express an opinion on these financial statements based on our audits. We conducted our audits of these financial statements in accordance with the standards of the Public Company Accounting Oversight Board (United States). Those standards require that we plan and perform the audit to obtain reasonable assurance about whether the financial statements are free of material misstatement. An audit includes examining, on a test basis, evidence supporting the amounts and disclosures in the financial statements, assessing the accounting principles used and significant estimates made by management, and evaluating the overall financial statement presentation. Our procedures included confirmation of securities owned as of November 30, 2017 by correspondence with the custodian and brokers; when replies were not received from brokers, we performed other auditing procedures. We believe that our audits provide a reasonable basis for our opinion.
The financial statements, as of and for the year ended November 30, 2015 and the financial highlights for each of the years ended on or prior to November 30, 2015 (not presented herein, other than the financial highlights) were audited by other auditors whose report dated January 29, 2016 expressed an unqualified opinion on those financial statements and financial highlights.
| /s/ PricewaterhouseCoopers LLP | |
| Philadelphia, Pennsylvania | |
| January 26, 2018 | |
| Disclosure of Fund Expenses (unaudited) |
All Exchange Traded Funds (“ETFs”) have operating expenses. As a shareholder of an ETF, your investment is affected by these ongoing costs, which include (among others) costs for ETF management, administrative services, commissions, and shareholder reports like this one. It is important for you to understand the impact of these costs on your investment returns. In addition, a shareholder is responsible for any brokerage fees as a result of his or her investment in the Fund, which is not reflected in the table below.
Operating expenses such as these are deducted from an ETF’s gross income and directly reduce its final investment return. These expenses are expressed as a percentage of the ETF’s average net assets; this percentage is known as the ETF’s expense ratio.
The following examples use the expense ratio and are intended to help you understand the ongoing costs (in dollars) of investing in your Fund and to compare these costs with those of other funds. The examples are based on an investment of $1,000 made at the beginning of the six-month period shown and held for the entire period (June 1, 2017 to November 30, 2017).
The table below illustrates your Fund’s costs in two ways:
Actual Fund Return. This section helps you to estimate the actual expenses that your Fund incurred over the period. The “Expenses Paid During Period” column shows the actual dollar expense cost incurred by a $1,000 investment in the Fund, and the “Ending Account Value” number is derived from deducting that expense cost from the Fund’s gross investment return.
You can use this information, together with the actual amount you invested in the Fund, to estimate the expenses you paid over that period. Simply divide your actual account value by $1,000 to arrive at a ratio (for example, an $8,600 account value divided by $1,000 = 8.6), then multiply that ratio by the number shown for your Fund under “Expenses Paid During Period.”
Hypothetical 5% Return. This section helps you compare your Fund’s costs with those of other funds. It assumes that the Fund had an annual 5% return before expenses during the year, but that the expense ratio (Column 3) for the period is unchanged. This example is useful in making comparisons because the Securities and Exchange Commission requires all funds to make this 5% calculation. You can assess your Fund’s comparative cost by comparing the hypothetical result for your Fund in the “Expenses Paid During Period” column with those that appear in the same charts in the shareholder reports for other funds.
NOTE: Because the return is set at 5% for comparison purposes — NOT your Fund’s actual return — the account values shown may not apply to your specific investment.
| | | Beginning | | | Ending | | | | | | Expenses | |
| | | Account | | | Account | | | Annualized | | | Paid | |
| | | Value | | | Value | | | Expense | | | During | |
| | | 6/1/2017 | | | 11/30/2017 | | | Ratios(2) | | | Period(1) | |
| Global X MLP ETF | | | | | | | | | | | | | | | | |
| Actual Fund Return | | $ | 1,000.00 | | | $ | 894.20 | | | | 0 .47 | % | | $ | 2.21 | |
| Hypothetical 5% Return | | | 1,000.00 | | | | 1,022.73 | | | | 0 .47 | | | | 2.36 | |
| (1) | Expenses are equal to the Fund’s annualized expense ratio multiplied by the average account value over the period, multiplied by 183/365 (to reflect the one-half year period.) |
| (2) | During the year ended November 30, 2017 the Fund had a tax benefit. During periods/years when the Fund had a tax expense, expenses could be higher. |
| Approval Of Investment Advisory Agreement (unaudited) |
Section 15(c) of the Investment Company Act of 1940, as amended ("1940 Act"), requires that the board of trustees of an exchange-traded fund (“ETF”), including a majority of those trustees who are not "interested persons" of the ETF, as defined in the 1940 Act ("Independent Trustees"), consider on an initial basis and periodically thereafter (as required by the 1940 Act), at an in person meeting called for such purpose, the terms of the fund’s investment advisory agreement and whether to approve entering into, or renewing, each agreement.
At an in person quarterly Board meeting held on November 14, 2017, called for such purpose, the Board of Trustees (including the Trust’s Independent Trustees voting separately) considered and unanimously approved the continuation of (i) the Investment Advisory Agreement ("Renewal Investment Advisory Agreement") for the Global X MLP Fund (the “Renewal Fund”) and (ii) the Supervision and Administration Agreement between the Trust ("Renewal Supervision and Administration Agreement"), on behalf of the Renewal Fund, and Global X Management Company LLC ("Global X Management"). The Renewal Investment Advisory Agreement and the Renewal Supervision and Administration Agreement are referred to herein as the "Renewal Agreements."
In advance of the Board meeting, the Board (including the Trust’s Independent Trustees) and the Independent Trustees’ independent legal counsel requested (in writing) detailed information from Global X Management in connection with their consideration of the Renewal Agreements and received and reviewed written responses from Global X Management and supporting materials relating to those requests for information. In the course of their consideration of the Renewal Agreements, the Trust’s Independent Trustees were advised by their counsel and, in addition to meeting with management of Global X Management, they met separately in executive session with their counsel.
In determining to approve the continuation of the Renewal Agreements for the Renewal Fund, the Board considered a variety of factors, including the factors discussed at greater detail below.
Nature, Extent and Quality of Services
With respect to this factor, the Board considered:
| • | the terms of the Renewal Agreements and the range of services that would continue to be provided to each Renewal Fund in accordance with the Renewal Agreements; |
| • | Global X Management’s key personnel and the portfolio managers who would continue to provide investment advisory, supervision and administrative services to the Renewal Fund; |
| • | Global X Management’s responsibilities under the Renewal Agreements, among other things, to: (i) manage the investment operations of the Renewal Fund and the composition of the Renewal Fund’ assets, including the purchase, retention and disposition of their holdings, (ii) provide quarterly reports to the Trust’s officers and the Board and other reports as the Board deems necessary or appropriate, (iii) vote proxies, exercise consents, and exercise all other rights relating to securities and assets held by the Renewal Fund, (iv) select broker- dealers to execute portfolio transactions for the Renewal Fund when necessary, (v) assist in the preparation and filing of reports and proxy statements (if any) to the shareholders of the Renewal Fund, and the periodic updating of the registration statement, prospectuses, statement of additional information, and other reports and documents for the Renewal Fund that are required to be filed by the Trust with the SEC and other regulatory and governmental bodies, |
| Approval Of Investment Advisory Agreement (unaudited) |
and (vi) monitor anticipated purchases and redemptions of the shares (including Creation Units) of the Renewal Fund by shareholders and new investors;
| • | the nature, extent and quality of all of the services (including advisory, administrative and compliance services) that have been provided by Global X Management or made available to the Renewal Fund and the adequacy of Global X Management’s personnel resources that would continue to be made available to the Renewal Fund; and |
| • | the nature, extent and quality of all of the services (including advisory, administrative and compliance services) that have been provided by Global X Management or made available to the Renewal Fund and the adequacy of Global X Management’s personnel resources that would continue to be made available to the Renewal Fund; and |
| • | Global X Management’s experience and the professional qualifications of Global X Management’s key personnel. |
Based on these considerations, the Board concluded that it was satisfied with the nature, extent and quality of the services provided to the Renewal Fund by Global X Management.
Performance
The Board considered the performance of the Renewal Fund. They examined the performance of the Renewal Fund for the one-year, three-year, five-year and since-inception periods. Also, the Board considered the total return and investments performance of the Renewal Fund relative to (i) the performance of unaffiliated comparable specialized and/or focused exchange-traded funds and other registered funds in the same classification as the Renewal Fund, which performance information is publicly available from such registered funds as well as other third party sources; and (ii) the performance of comparable registered funds and pertinent indexes. The Board considered instances of under-performance and over-performance with respect to the comparator funds. The Board also considered the Renewal Fund’s tracking against its underlying indexes in absolute terms.
Based on these considerations and comparisons, the Board concluded that the investment performance of the Renewal Fund did not adversely affect the Boards approval of the continuance of the Renewal Agreements.
Cost of Services and Profitability
The Board considered Global X Management’s cost to provide investment management and related services to the Renewal Fund. In this regard, the Board considered the management fee (“Management Fee”) that has been borne or expected to be borne by the Renewal Fund under the Renewal Agreements for the various investment advisory, supervisory and administrative services that the Renewal Fund require under a unitary fee structure (including the types of fees and expenses that are not included within the unitary fee and would be borne by the Renewal Fund).
| Approval Of Investment Advisory Agreement (unaudited) |
In addition, the Board considered the current and expected profitability to Global X Management from all services provided or expected to be provided to the Renewal Fund and all aspects of Global X Management’s relationship with the Renewal Fund. In connection with these considerations, Global X Management provided the Board with financial information regarding its operations and the services provided to the Renewal Fund and discussed with the Board its current and expected profitability with respect to the Renewal Fund.
Based on these considerations, the Board concluded that the Management Fee rate paid by the Renewal Fund to Global X Management, in light of the nature, extent and quality of the services provided, was reasonable and in the best interests of the Renewal Fund’s shareholders.
Comparison of Fees and Services
With respect to this factor, the Board considered:
| • | comparative information with respect to the Management Fee paid to Global X Management by the Renewal Fund. In connection with this consideration, Global X Management provided the Board with comparative expense data for the Renewal Fund, including fees and expenses paid by unaffiliated comparable specialized and/or focused exchange-traded funds and/or other comparable registered funds. The Board considered the Adviser’s detailed explanation of the fee structures of any Renewal Fund that was above the average and median for their peer groups; |
| • | the structure of the unified Management Fee (which includes as one component the investment advisory fee for the Renewal Fund) and the current total expense ratios for the Renewal Fund. In this regard, the Board took into consideration that the purpose of adopting a unitary Management Fee structure for the Renewal Fund was to create a simple, all-inclusive fee that would provide a level of predictability with respect to the overall expense ratio (i.e., the total fees) of the Renewal Fund and that the proposed Management Fee for the Renewal Fund was set at a competitive fee to make the Renewal Fund viable in the marketplace; and |
| • | that, under the unified Management Fee structure, Global X Management is responsible for most ordinary expenses of the Renewal Fund, including the costs of various third-party services required by the Renewal Fund, including investment advisory, administrative, audit, certain custody, portfolio accounting, legal, transfer agency and printing costs, but that the Renewal Fund would bear other expenses not covered under the proposed all-inclusive Management Fee, such as taxes, brokerage fees, commissions, and other transaction expenses, interest expenses, and extraordinary expenses. |
Based on these considerations, the Board concluded that the services received and the fees charged under the Renewal Agreements were reasonable on comparative basis.
Economies of Scale
With respect to this factor, the Board considered:
| • | the extent to which economies of scale would be realized as the Renewal Fund grow and whether the unitary Management Fee for the Renewal Fund reflected these economies of scale; |
| Approval Of Investment Advisory Agreement (unaudited) |
| • | the significant investment of time, personnel and other resources that Global X Management has made and intends to continue to make in the Renewal Fund in order to seek to assure that the Renewal Fund are attractive to investors; and |
| • | that the unitary Management Fee would provide a high level of certainty as to the total level of expenses for the Renewal Fund and their shareholders. |
Based on these considerations, the Board concluded that the unitary Management Fee for the Renewal Fund appropriately addressed economies of scale.
Other Benefits
In considering the Renewal Agreements, in addition to the categories discussed above, the Board considered any other benefits realized by Global X Management as a result of its relationships with the Renewal Fund and concluded that all information it considered supported approval of the continuation of the Renewal Agreements.
Conclusion
After full consideration of the factors above, as well as other factors that were instructive in their consideration, the Board, including all of the Trust’s Independent Trustees voting separately, concluded, in the exercise of their business judgement, that the Renewal Agreements were fair and reasonable and in the best interest of the Renewal Fund.
In reaching this decision, the Board did not assign relative weights to the factors discussed below nor did the Board deem any one factor or group of them to be controlling in and of themselves. Each member of the Board may have afforded different weight to the various factors.
| Supplemental Information (unaudited) |
Net asset value, or “NAV”, is the price per Share at which the Fund issues and redeems Shares. It is calculated in accordance with the standard formula for valuing mutual fund shares. The “Market Price” of the Fund generally is determined using the midpoint between the highest bid and the lowest offer on the stock exchange on which the Shares of the Fund are listed for trading, as of the time that the Fund’s NAV is calculated. The Fund’s Market Price may be at, above or below their NAV. The NAV of the Fund will fluctuate with changes in the market value of the Fund’s holdings. The Market Price of the Fund will fluctuate in accordance with changes in its NAV, as well as market supply and demand.
Premiums or discounts are the differences (expressed as a percentage) between the NAV and Market Price of the Fund on a given day, generally at the time NAV is calculated. A premium is the amount that the Fund is trading above the reported NAV, expressed as a percentage of the NAV. A discount is the amount that the Fund is trading below the reported NAV, expressed as a percentage of the NAV.
Further information regarding premiums and discounts is available on the Fund’s website at www.GlobalXFunds.com.
| Trustees and Officers of the Trust (unaudited) |
Set forth below are the names, addresses, year of birth, position with the Trust, term of office and length of time served, the principal occupations for the last five years, number of funds in fund complex overseen by the Trustees, and other directorships outside the fund complex of each of the persons currently serving as Trustees and Officers of the Trust.
Name,
Address
(Year of
Birth) | Position(s)
Held
with
Funds | Principal Occupation(s) During
the Past 5 Years | Number of
Operational
Funds in
Trust
Overseen by
Trustee | Other Directorships Held
by Trustees |
| Independent Trustees2 | |
Sanjay Ram Bharwani 600 Lexington Avenue, 20th Floor New York, NY 10022 (1974) | Trustee (since 2008) | CEO of Risk Advisors Inc. (consulting firm) (since 2007) | 523 | None |
Scott R. Chichester1 600 Lexington Avenue, 20th Floor New York, NY 10022 (1970) | Trustee (since 2008) | CFO, AdeptPros Inc. (app development, training and consulting) (since 2012); Founder, Madison Park Advisors LLC (advisory services) (since 2011); CFO, Sterling Seal & Supply Inc. (since 2011); President & Treasurer, Bayview Acquisition Corp (2010-2012); Founder and President, DirectPay USA LLC (payroll company) (since 2006); Proprietor, Scott R. Chichester CPA (CPA firm) (since 2001) | 523 | Director of AdeptPros Inc. (since 2015); Director of Sterling Seal & Supply Inc. (since 2011); Director of Bayview Acquisition Corp. (since 2010); Trustee of ARK ETF Trust (since 2014) |
Kartik Kiran Shah 600 Lexington Avenue, 20th Floor New York, NY 10022 (1977) | Trustee (since 2008) | Chief Business Officer, Oxeia Biopharmaceuticals, Inc. (since 2014); Vice President, Business Development, Cynvenio Biosystems (2012-2014); Independent Consultant, Self-Employed (non-financial services) (2011-2012) | 523 | Director of Oxeia Biopharmaceuticals, Inc. (since 2014) |
| Trustees and Officers of the Trust (unaudited) |
The Trust’s Statement of Additional Information (“SAI”) includes additional information about the Trustees and Officers. The SAI may be obtained without charge by calling 1-888-493-8631. The following chart lists Trustees and Officers as of November 30, 2017:
| | | | Number of Funds | |
| | | Principal Occupation(s) | in Trust | Other |
| Name, Address | Position(s) Held | During | Overseen by | Directorships Held |
| (Year of Birth) | with Funds | the Past 5 Years | Trustee | by Trustees |
| Interested Trustee / Officers2 | |
Bruno del Ama 600 Lexington Avenue, 20th Floor New York, NY 10022 (1976) | Trustee (since 2008), President, Chief Executive Officer (since 2008) | Chief Executive Officer, Global X Management Company (“GXMC”) (since 2008); Chief Compliance Officer, GXMC (2008-2013) | 523 | None |
Luis Berruga 600 Lexington Avenue, 20th Floor New York, NY 10022 (1977) | Chief Operating Officer, Treasurer, Principal Accounting Officer and Chief Financial Officer (since 9/2015) | Chief Financial Officer, GXMC (since 9/2015) and Chief Operating Officer (since 2/2014); Investment Banker, Jefferies (2012-2014); Regional Product Specialist, Morgan Stanley (2005 - 2012) | N/A | N/A |
Daphne Tippens Chisolm 600 Lexington Avenue, 20th Floor New York, NY 10022 (1969) | Secretary (since 2012) | General Counsel, GXMC (since 2011); Chief Compliance Officer, GXMC (1/2014 - 5/2014 and 2/2015-9/2016) | N/A | N/A |
Joe Costello 600 Lexington Avenue, 20th Floor New York, NY 10022 (1974) | Chief Compliance Officer (since 9/2016) | Chief Compliance Officer, FlexShares Funds (2011-2015); Vice President, Northern Trust Investments (2003 - 2015) | N/A | N/A |
| Trustees and Officers of the Trust (unaudited) |
Name, Address
(Year of Birth) | Position(s) Held
with Funds | Principal Occupation(s) During
the Past 5 Years | Other Directorships
Held
by Trustees |
Lisa Whittaker4 One Freedom Valley Drive Oaks, PA 19456 (1978) | Assistant Secretary (since 2013) | Counsel at SEI Investments (since 2012); Associate Counsel and Compliance Officer at The Glendale Trust Company (2011- 2012); Associate of Drinker Biddle & Reath LLP (2006-2011) | N/A |
Eric Kleinschmidt 4 One Freedom Valley Drive Oaks, PA 19456 (1968) | Assistant Treasurer (since 2016) | Director, Fund Accounting, SEI Investments Global Funds Services (2004 to present) | N/A |
| 1 | Mr. Chichester is currently married to a sister of Mr. del Ama’s wife. While an “immediate family member” (as defined in Section 2(a)(19) of the 1940 Act) of Mr. del Ama would be considered an Interested Person, Mr. Chichester is not considered an immediate family member for this purpose. Although this fact was taken into consideration in determining whether Mr. Chichester should be considered to be an Independent Trustee for purposes of the Section 2(a)(19) of the 1940 Act, it was determined that this relationship was not one that should disqualify Mr. Chichester from serving as an Independent Trustee of the Trust. |
| 2 | Each Trustee serves until his successor is duly elected or appointed and qualified. |
| 3 | As of November 30, 2017, the Trust had ninety-six investment portfolios, fifty-two of which were operational. |
| 4 | These officers of the Trust also serve as officers of one or more mutual funds for which SEI Investments Company or an affiliate acts as investment manager, administrator or distributor. |
600 Lexington Avenue, 20th Floor
New York, NY 10022
1-888-GXFund-1
(1-888-493-8631)
www.globalxfunds.com
Investment Adviser and Administrator:
Global X Management Company LLC
600 Lexington Avenue, 20th Floor
New York, NY 10022
Distributor:
SEI Investments Distribution Co.
One Freedom Valley Drive
Oaks, PA 19456
Sub-Administrator:
SEI Investments Global Funds Services
One Freedom Valley Drive
Oaks, PA 19456
Counsel for Global X Funds and the Independent Trustees:
Stradley Ronon Stevens & Young, LLP
1250 Connecticut Avenue, N.W.
Suite 500
Washington, DC 20036
Custodian and Transfer Agent:
Brown Brothers Harriman & Co.
50 Post Office Square
Boston, MA 02110
Independent Registered Public Accounting Firm:
PricewaterhouseCoopers LLP
Two Commerce Square
Suite 1800
2001 Market Street
Philadelphia, PA 19103
This information must be preceded or accompanied by a current prospectus for the Fund described.
GLX-AR-005-0600
Global X MLP & Energy Infrastructure ETF (ticker: MLPX)
Global X SuperDividend® Alternatives ETF (ticker: ALTY)
Global X U.S. Preferred ETF (ticker: PFFD)
Annual Report
November 30, 2017
Shares are bought and sold at market price (not NAV) and are not individually redeemed from the Fund. Shares may only be redeemed directly from a Fund by Authorized Participants, in very large creation/redemption units. Brokerage commissions will reduce returns.
The Funds file their complete schedule of Fund holdings with the Securities and Exchange Commission (the “Commission”) for the first and third quarters of each fiscal year on Form N-Q within sixty days after the end of the period. The Funds’ Forms N-Q are available on the Commission’s website at http://www.sec.gov, and may be reviewed and copied at the Commission's Public Reference Room in Washington, DC. Information on the operation of the Public Reference Room may be obtained by calling 1-800-SEC-0330.
A description of the policies and procedures that Global X Funds use to determine how to vote proxies relating to Fund securities, as well as information relating to how the Funds voted proxies relating to Fund securities during the most recent 12-month period ended June 30, is available (i) without charge, upon request, by calling 1-888-GXFund-1; and (ii) on the Commission’s website at http://www.sec.gov.
| Management Discussion of Fund Performance (unaudited) |
| Global X MLP & Energy Infrastructure ETF |
Global X MLP & Energy Infrastructure ETF
The Global X MLP & Energy Infrastructure ETF (“Fund”) seeks to provide investment results that correspond generally to the price and yield performance, before fees and expenses, of the Solactive MLP & Energy Infrastructure Index (“Underlying Index”). The Fund is passively managed, which means the investment adviser does not attempt to take defensive positions in declining markets. The Fund generally seeks to fully replicate the Underlying Index.
The Underlying Index tracks the performance of midstream master limited partnerships (“MLPs”) and energy infrastructure corporations. Midstream energy infrastructure MLPs and corporations principally own and operate assets used in energy logistics, including, but not limited to, pipelines, storage facilities and other assets used in transporting, storing, gathering, and processing natural gas, natural gas liquids, crude oil or refined products.
For the 12-month period ended November 30, 2017 (the “Reporting Period”), the Fund decreased -8.71%, while the Underlying Index decreased -8.06%. The Fund had a net asset value of $14.82 per share on November 30, 2016 and ended the Reporting Period with a net asset value of $12.80 on November 30, 2017.
During the Reporting Period, the highest returns came from Cheniere Energy Partners and ONEOK Partners, which returned 29.35% and 26.25%, respectively. The worst performers were Enbridge Energy Management and Plains GP Holdings, which returned -40.71% and -37.20%, respectively.
The Fund seeks to provide tax efficient exposure to midstream MLPs, the general partners of midstream MLPs, and energy infrastructure corporations. During the Reporting Period under review, general partners, energy infrastructure corporations, and MLPs struggled as they were forced to cope with the effects of a low oil price environment. Lower oil prices forced certain U.S. energy producers to scale back on their production in the second half of the year, hurting midstream transport oriented businesses. During the Reporting Period, the general partners of some MLPs elected to cut their distributions and use the additional cash flow to reduce debt and fund organic growth opportunities. In addition, general partners faced pressure to engage in Incentive Distribution Right (“IDR”) buyouts with their limited partners in order to alleviate cash flow concerns and lower the limited partner’s cost of capital. These IDR buyouts made investors rethink the total return potential of general partners, weighing on their performance.
| | | AVERAGE ANNUAL TOTAL RETURN | |
| | | FOR THE YEAR ENDED NOVEMBER 30, 2017 | |
| | | One Year Return | | | Three Year Return | | | Annualized Inception to Date* | |
| | | Net Asset Value | | | Market Price | | | Net Asset Value | | | Market Price | | | Net Asset Value | | | Market Price | |
| Global X MLP & Energy Infrastructure ETF | | | -8.71 | % | | | -8.83 | % | | | -8.08 | % | | | -8.06 | % | | | 0.09 | % | | | 0.18 | % |
| Solactive MLP & Energy Infrastructure Index | | | -8.06 | % | | | -8.06 | % | | | -7.37 | % | | | -7.37 | % | | | 0.76 | % | | | 0.76 | % |
| S&P 500 Index | | | 22.87 | % | | | 22.87 | % | | | 10.91 | % | | | 10.91 | % | | | 13.20 | % | | | 13.20 | % |
| Management Discussion of Fund Performance (unaudited) |
| Global X MLP & Energy Infrastructure ETF |
Growth of a $10,000 Investment
(at Net Asset Value)
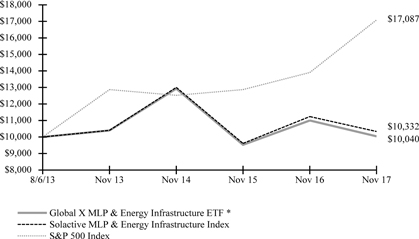
*The Fund commenced investment operations on August 6, 2013.
The S&P 500 Index is a market capitalization weighted composite index of 500 large capitalization U.S. companies.
The performance data quoted herein represents past performance and the return and value of an investment in the Fund will fluctuate so that, when sold, it may be worth less than its original cost. Past performance is no guarantee of future performance and should not be considered as a representation of the future results of the Fund. The Fund's performance assumes the reinvestment of all dividends and all capital gains. Index returns assume reinvestment of dividends and, unlike the Fund's returns, do not reflect any fees or expenses. If such fees and expenses were included in the index returns, the performance would have been lower. Please note that one cannot invest directly in an unmanaged index.
There are no assurances that the Fund will meet its stated objectives.
The Fund’s holdings and allocations are subject to change and should not be considered recommendations to buy individual securities.
Returns shown do not reflect the deduction of taxes that a shareholder would pay on Fund distributions or the redemption of Fund shares.
See definition of comparative indices above and on previous page.
| Management Discussion of Fund Performance (unaudited) |
| Global X SuperDividend® Alternatives ETF |
Global X SuperDividend® Alternatives ETF
The Global X SuperDividend® Alternatives ETF (“Fund”) seeks to track, before fees and expenses, the price and yield performance of the INDXX SuperDividend ® Alternatives Index (“Underlying Index”). The Fund is passively managed, which means the investment adviser does not attempt to take defensive positions in declining markets. The Fund generally seeks to fully replicate the Underlying Index.
The Underlying Index is comprised of securities that rank among the highest dividend-yielding securities in each eligible category of alternative income investments, at the time of Underlying Index reconstitution, as defined by the index provider. Alternative income investments that are eligible for inclusion in the Underlying Index fall into one of four classes: Master Limited Partnerships (“MLPs”) and Infrastructure, Real Estate, Institutional Managers, and Fixed Income and Derivative Strategies. The MLPs and Infrastructure categories primarily consist of units of MLPs and shares of infrastructure companies. The Real Estate category provides exposure to global Real Estate Investment Trusts (“REITs”), and gains this exposure through investing directly in the Global X SuperDividend® REIT ETF. The Institutional Managers category primarily consists of shares of Business Development Companies (“BDCs”) and publicly listed private equity companies. The Fixed Income and Derivative Strategies category includes exposure to emerging market debt, mortgage and asset backed securities, and option-writing primarily through the purchase of publicly traded closed-end funds (“CEFs”). Each of the Underlying Index components is selected from a universe of securities that are publicly traded in the U.S. The Underlying Index assigns weights to each of the four categories in a method that seeks to equalize the volatility contribution of each category, which assigns less weight to higher volatility categories and more weight to lower volatility categories. The Underlying Index is reconstituted annually, but may rebalance quarterly if any one category deviates more than 3% from its target weight.
For the 12-month period ended November 30, 2017 (the “Reporting Period”), the Fund increased 13.24%, while the Underlying Index increased 14.15%. The Fund had a net asset value of $14.65 per share on November 30, 2016 and ended the Reporting Period with a net asset value of $15.40 on November 30, 2017.
During the Reporting Period, the highest returns came from Apollo Global Management and Avangrid, which returned 61.76% and 52.77%, respectively. The worst performers were Icahn Enterprises and Enbridge Energy Partners, which returned -62.67% and -30.42%, respectively.
The Fund provides exposure to among the highest yielding securities from various alternative income-generating asset classes including REITs, MLPs & Infrastructure, BDCs, and Fixed Income & Derivative Strategies. As the Federal Reserve raised its short term rates, the yield on short -term bonds increased, but long-term yields largely remained range-bound. This helped mitigate the impact of rising short term rates for many alternative income investments that tend to be more sensitive to changes in longer duration securities. During the Reporting Period, the Fund had an average approximate exposure of 35% to Fixed Income & Derivative strategies, 23% to REITs, 22% to BDCs, and 19% to MLPs and Infrastructure.
| | | AVERAGE ANNUAL TOTAL RETURN | |
| | | FOR THE YEAR ENDED NOVEMBER 30, 2017 | |
| | | One Year Return | | | Annualized Inception to Date* | |
| | | Net Asset Value | | | Market Price | | | Net Asset Value | | | Market Price | |
| Global X SuperDividend® Alternatives ETF | | | 13.24 | % | | | 11.91 | % | | | 9.15 | % | | | 9.10 | % |
| INDXX SuperDividend® Alternatives Index | | | 14.15 | % | | | 14.15 | % | | | 10.04 | % | | | 10.04 | % |
| S&P 500 Index | | | 22.87 | % | | | 22.87 | % | | | 12.58 | % | | | 12.58 | % |
| Management Discussion of Fund Performance (unaudited) |
| Global X SuperDividend® Alternatives ETF |
Growth of a $10,000 Investment
(at Net Asset Value)
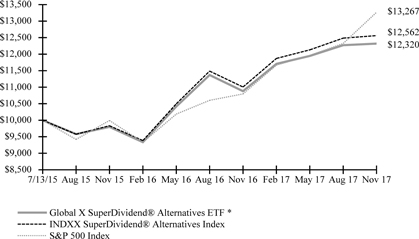
*The Fund commenced investment operations on July 13, 2015.
The S&P 500 Index is a market capitalization weighted composite index of 500 large capitalization U.S. companies.
The performance data quoted herein represents past performance and the return and value of an investment in the Fund will fluctuate so that, when sold, it may be worth less than its original cost. Past performance is no guarantee of future performance and should not be considered as a representation of the future results of the Fund. The Fund's performance assumes the reinvestment of all dividends and all capital gains. Index returns assume reinvestment of dividends and, unlike the Fund's returns, do not reflect any fees or expenses. If such fees and expenses were included in the index returns, the performance would have been lower. Please note that one cannot invest directly in an unmanaged index.
There are no assurances that the Fund will meet its stated objectives.
The Fund’s holdings and allocations are subject to change and should not be considered recommendations to buy individual securities.
Returns shown do not reflect the deduction of taxes that a shareholder would pay on Fund distributions or the redemption of Fund shares.
See definition of comparative indices above and on previous page.
| Management Discussion of Fund Performance (unaudited) |
| Global X U.S. Preferred ETF |
Global X U.S. Preferred ETF
The Global X U.S. Preferred ETF (“Fund”) seeks to provide investment results that correspond generally to the price and yield performance, before fees and expenses, of the ICE BofAML Diversified Core U.S. Preferred Securities Index (“Underlying Index”). The Fund is passively managed, which means the investment adviser does not attempt to take defensive positions in declining markets. The Fund generally seeks to fully replicate the Underlying Index.
The Underlying Index is designed to track the broad-based performance of the U.S. preferred securities market. The Underlying Index includes different categories of preferred stock, such as floating, variable and fixed-rate preferreds, cumulative and non-cumulative preferreds, and trust preferreds. Qualifying preferred securities must be listed on a U.S. exchange, denominated in U.S. dollars, and have a minimum amount outstanding of $100 million. Qualifying securities must meet minimum price, liquidity, maturity and other requirements as determined by the index provider.
For the period from the Fund's commencement date on September 11, 2017 through November 30, 2017 (the “Reporting Period”), the Fund increased 0.75%, while the Underlying Index increased 0.79%. The Fund had a net asset value of $25.08 per share on September 11, 2017 and ended the Reporting Period with a net asset value of $25.03 on November 30, 2017.
During the Reporting Period, the highest returns came from Rayonier Advanced Materials and Dynergy Inc, which returned 29.27% and 28.46%, respectively. The worst performers were Black Hills Corp and Kinder Morgan, which returned -15.03% and -12.59%, respectively.
The Fund’s holdings consist of broad exposure to U.S. preferred stocks, providing benchmark-like exposure to the asset class. Preferred stocks have historically offered high yield potential given that they are junior in the capital structure to traditional debt instruments. Despite rising short term rates in the U.S., much of this was anticipated by the market, resulting largely flat performance for the Fund during the Reporting Period. While rising interest rates generally are a headwind for preferred stock, they can benefit from an improving economic picture which reduces credit spreads versus U.S. treasuries with similar durations. An improving economic backdrop generally helped the Fund during the Reporting Period. From the Fund’s inception to November 30, 2017, the Fund had an average approximate allocation of 76% to Financials, 6% in Real Estate and 6% in Utilities.
| | | AVERAGE ANNUAL TOTAL RETURN FOR | |
| | | THE PERIOD ENDED NOVEMBER 30, 2017 | |
| | | Cumulative Inception to Date* | |
| | | Net Asset Value | | | Market Price | |
| Global X U.S. Preferred ETF | | | 0.75 | % | | | 1.55 | % |
| ICE BofAML Diversified Core U.S. Preferred Securities Index | | | 0.79 | % | | | 0.79 | % |
| S&P 500 Index | | | 6.90 | % | | | 6.90 | % |
| Management Discussion of Fund Performance (unaudited) |
| Global X U.S. Preferred ETF |
Growth of a $10,000 Investment
(at Net Asset Value)
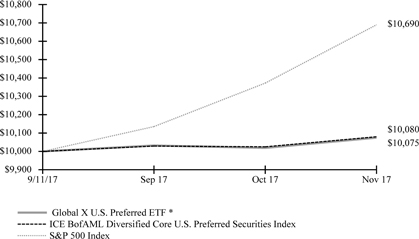
*The Fund commenced investment operations on September 11, 2017.
The S&P 500 Index is a market capitalization weighted composite index of 500 large capitalization U.S. companies.
The ICE BofAML Diversified U.S. Preferred Securities Index was formerly known as BofA Merrill Lynch Diversified Core U.S. Preferred Securities Index.
The performance data quoted herein represents past performance and the return and value of an investment in the Fund will fluctuate so that, when sold, it may be worth less than its original cost. Past performance is no guarantee of future performance and should not be considered as a representation of the future results of the Fund. The Fund's performance assumes the reinvestment of all dividends and all capital gains. Index returns assume reinvestment of dividends and, unlike the Fund's returns, do not reflect any fees or expenses. If such fees and expenses were included in the index returns, the performance would have been lower. Please note that one cannot invest directly in an unmanaged index.
There are no assurances that the Fund will meet its stated objectives.
The Fund’s holdings and allocations are subject to change and should not be considered recommendations to buy individual securities.
Returns shown do not reflect the deduction of taxes that a shareholder would pay on Fund distributions or the redemption of Fund shares.
See definition of comparative indices above and on previous page.
| Schedule of Investments | November 30, 2017 |
| Global X MLP & Energy Infrastructure ETF |
Sector Weightings (unaudited)†:

† Sector weightings percentages are based on the total market value of investments. Approximately 77% of the securities are Common Stock and 23% are Master Limited Partnerships.
| | | Shares | | | Value | |
| COMMON STOCK — 76.8% | | | | | | | | |
| | | | | | | | | |
| Oil & Gas — 76.8% | | | | | | | | |
| Antero Midstream GP | | | 605,304 | | | $ | 10,744,146 | |
| Cheniere Energy * | | | 394,211 | | | | 19,048,275 | |
| Cheniere Energy Partners Holdings | | | 389,829 | | | | 10,860,636 | |
| Enbridge ^ | | | 779,449 | | | | 29,393,022 | |
| Enbridge Energy Management * | | | 767,108 | | | | 10,355,958 | |
| EnLink Midstream | | | 601,896 | | | | 10,051,663 | |
| EQT | | | 54,936 | | | | 3,274,186 | |
| Kinder Morgan | | | 1,597,761 | | | | 27,529,422 | |
| ONEOK | | | 414,062 | | | | 21,489,818 | |
| Plains GP Holdings, Cl A | | | 658,204 | | | | 13,552,420 | |
| SemGroup, Cl A | | | 588,237 | | | | 14,117,688 | |
| Tallgrass Energy GP, Cl A | | | 554,263 | | | | 12,526,344 | |
| TransCanada ^ | | | 546,343 | | | | 26,240,854 | |
| Williams | | | 884,577 | | | | 25,696,962 | |
| | | | | | | | | |
| TOTAL COMMON STOCK | | | | | | | | |
| (Cost $248,832,393) | | | | | | | 234,881,394 | |
| | | | | | | | | |
| MASTER LIMITED PARTNERSHIPS — 23.7% | | | | | | | | |
| | | | | | | | | |
| Oil & Gas — 23.7% | | | | | | | | |
| Andeavor Logistics | | | 44,278 | | | | 1,981,883 | |
| Antero Midstream Partners | | | 43,394 | | | | 1,195,505 | |
| Boardwalk Pipeline Partners | | | 63,528 | | | | 853,816 | |
| Buckeye Partners | | | 73,785 | | | | 3,388,945 | |
| DCP Midstream Partners | | | 46,387 | | | | 1,630,039 | |
| Dominion Midstream Partners | | | 24,007 | | | | 771,825 | |
| Enable Midstream Partners | | | 148,598 | | | | 2,225,998 | |
| Energy Transfer Partners | | | 571,294 | | | | 9,489,193 | |
| EnLink Midstream Partners | | | 83,384 | | | | 1,333,310 | |
| Enterprise Products Partners | | | 552,204 | | | | 13,600,785 | |
| Equities Midstream Partners | | | 30,091 | | | | 2,064,844 | |
| Genesis Energy | | | 55,072 | | | | 1,182,396 | |
| Holly Energy Partners | | | 20,527 | | | | 679,649 | |
| Magellan Midstream Partners | | | 115,297 | | | | 7,724,899 | |
| MPLX | | | 145,323 | | | | 5,211,283 | |
| NuStar Energy | | | 45,801 | | | | 1,330,977 | |
| Phillips 66 Partners | | | 26,295 | | | | 1,232,184 | |
| Plains All American Pipeline | | | 222,235 | | | | 4,333,582 | |
The accompanying notes are an integral part of the financial statements.
| Schedule of Investments | November 30, 2017 |
| Global X MLP & Energy Infrastructure ETF |
| | | Shares | | | Value | |
| COMMON STOCK — continued | | | | | | | | |
| | | | | | | | | |
| Oil & Gas — continued | | | | | | | | |
| Shell Midstream Partners | | | 49,415 | | | $ | 1,336,676 | |
| Spectra Energy Partners | | | 37,637 | | | | 1,540,106 | |
| Tallgrass Energy Partners | | | 23,810 | | | | 1,045,735 | |
| TC PipeLines | | | 26,799 | | | | 1,361,657 | |
| Valero Energy Partners | | | 11,144 | | | | 463,145 | |
| Western Gas Partners | | | 39,825 | | | | 1,784,957 | |
| Williams Partners | | | 128,427 | | | | 4,713,271 | |
| | | | | | | | | |
| TOTAL MASTER LIMITED PARTNERSHIPS | | | | | | | | |
| (Cost $76,609,694) | | | | | | | 72,476,660 | |
| | | | | | | | | |
| TOTAL INVESTMENTS — 100.5% | | | | | | | | |
| (Cost $325,442,087) | | | | | | $ | 307,358,054 | |
Percentages are based on Net Assets of $305,979,888.
| ^ | Canadian security listed on the New York Stock Exchange and Toronto Stock Exchange. |
| * | Non-income producing security. |
Cl — Class
As of November 30, 2017, all of the Fund's investments were considered Level 1, in accordance with authoritative guidance on fair value measurements and disclosure under U.S. GAAP.
For the year ended November 30, 2017, there have been no transfers between Level 1, Level 2 or Level 3 investments.
The accompanying notes are an integral part of the financial statements.
| Schedule of Investments | November 30, 2017 |
| Global X SuperDividend® Alternatives ETF |
Sector Weightings (unaudited)†:
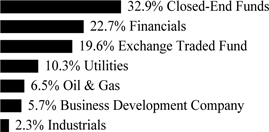
† Sector weightings percentages are based on the total market value of investments.
| | | Shares | | | Value | |
| COMMON STOCK — 32.8% | | | | | | | | |
| | | | | | | | | |
| Financials — 22.6% | | | | | | | | |
| Apollo Investment | | | 36,202 | | | $ | 217,574 | |
| Ares Capital | | | 13,384 | | | | 217,088 | |
| BlackRock Capital Investment | | | 29,407 | | | | 192,616 | |
| Hercules Capital | | | 17,305 | | | | 232,405 | |
| Main Street Capital | | | 5,560 | | | | 224,346 | |
| New Mountain Finance | | | 15,393 | | | | 217,811 | |
| PennantPark Floating Rate Capital | | | 15,325 | | | | 214,397 | |
| PennantPark Investment | | | 29,435 | | | | 212,521 | |
| Prospect Capital | | | 33,123 | | | | 226,893 | |
| Solar Capital | | | 10,137 | | | | 216,729 | |
| TCP Capital | | | 13,409 | | | | 212,533 | |
| TPG Specialty Lending | | | 10,577 | | | | 216,511 | |
| | | | | | | | 2,601,424 | |
| Industrials — 1.1% | | | | | | | | |
| Macquarie Infrastructure | | | 1,960 | | | | 130,889 | |
| Utilities — 9.1% | | | | | | | | |
| Avangrid | | | 2,985 | | | | 158,414 | |
| CenterPoint Energy | | | 4,839 | | | | 145,218 | |
| Duke Energy | | | 1,683 | | | | 150,090 | |
| Entergy | | | 1,850 | | | | 159,988 | |
| FirstEnergy | | | 4,630 | | | | 158,068 | |
| PPL | | | 3,705 | | | | 135,862 | |
| Southern | | | 2,873 | | | | 147,098 | |
| | | | | | | | 1,054,738 | |
| TOTAL COMMON STOCK | | | | | | | | |
| (Cost $3,735,571) | | | | | | | 3,787,051 | |
The accompanying notes are an integral part of the financial statements.
| Schedule of Investments | November 30, 2017 |
| Global X SuperDividend® Alternatives ETF |
| | | Shares | | | Value | |
| CLOSED-END FUNDS — 32.8% | | | | | | | | |
| AllianzGI NFJ Dividend Interest & Premium Strategy Fund | �� | | 22,134 | | | $ | 297,481 | |
| BlackRock Income Trust | | | 47,666 | | | | 293,146 | |
| Brookfield Real Assets Income Fund | | | 12,569 | | | | 290,847 | |
| Eaton Vance Risk-Managed Diversified Equity Income Fund | | | 31,697 | | | | 290,978 | |
| Eaton Vance Tax Managed Global Buy Write Opportunities Fund | | | 25,237 | | | | 298,301 | |
| Eaton Vance Tax-Managed Buy-Write Opportunities Fund | | | 19,522 | | | | 296,734 | |
| Morgan Stanley Emerging Markets Domestic Debt Fund | | | 37,134 | | | | 284,818 | |
| Nuveen Mortgage Opportunity Term Fund | | | 11,786 | | | | 302,900 | |
| Stone Harbor Emerging Markets Income Fund | | | 17,693 | | | | 268,757 | |
| Templeton Emerging Markets Income Fund | | | 25,635 | | | | 294,803 | |
| Voya Global Equity Dividend and Premium Opportunity Fund | | | 36,811 | | | | 291,175 | |
| Western Asset Emerging Markets Debt Fund | | | 19,081 | | | | 292,130 | |
| Western Asset Mortgage Defined Opportunity Fund | | | 11,655 | | | | 281,468 | |
| TOTAL CLOSED-END FUNDS | | | | | | | | |
| (Cost $3,674,271) | | | | | | | 3,783,538 | |
| | | | | | | | | |
| EXCHANGE TRADED FUND — 19.5% | | | | | | | | |
| Global X SuperDividend® REIT ETF (A) (Cost $2,122,052) | | | 145,219 | | | | 2,253,799 | |
| | | | | | | | | |
| MASTER LIMITED PARTNERSHIPS — 8.8% | | | | | | | | |
| Industrials — 1.2% | | | | | | | | |
| Icahn Enterprises | | | 2,571 | | | | 136,854 | |
| Oil & Gas — 6.5% | | | | | | | | |
| DCP Midstream Partners | | | 4,015 | | | | 141,088 | |
| Enable Midstream Partners | | | 8,871 | | | | 132,888 | |
| Energy Transfer Partners | | | 7,690 | | | | 127,731 | |
| EnLink Midstream Partners | | | 8,409 | | | | 134,460 | |
| Genesis Energy | | | 5,296 | | | | 113,705 | |
| NuStar Energy | | | 3,439 | | | | 99,937 | |
| | | | | | | | 749,809 | |
| Utilities — 1.1% | | | | | | | | |
| Suburban Propane Partners | | | 5,339 | | | | 128,883 | |
| | | | | | | | | |
| TOTAL MASTER LIMITED PARTNERSHIPS | | | | | | | | |
| (Cost $1,062,689) | | | | | | | 1,015,546 | |
The accompanying notes are an integral part of the financial statements.
| Schedule of Investments | November 30, 2017 |
| Global X SuperDividend® Alternatives ETF |
| | | Shares | | | Value | |
| BUSINESS DEVELOPMENT COMPANIES — 5.6% | | | | | | | | |
| Goldman Sachs BDC | | | 9,612 | | | $ | 210,311 | |
| Golub Capital BDC | | | 11,765 | | | | 222,829 | |
| TCG BDC | | | 11,753 | | | | 218,018 | |
| TOTAL BUSINESS DEVELOPMENT COMPANIES | | | | | | | | |
| (Cost $659,999) | | | | | | | 651,158 | |
| | | | | | | | | |
| TOTAL INVESTMENTS — 99.5% | | | | | | | | |
| (Cost $11,254,582) | | | | | | $ | 11,491,092 | |
Percentages are based on Net Assets of $11,548,763.
| (A) | Affiliated investment. |
ETF — Exchange Traded Fund
REIT — Real Estate Investment Trust
As of November 30, 2017, all of the Fund's investments were considered Level 1, in accordance with authoritative guidance on fair value measurements and disclosure under U.S. GAAP.
For the year ended November 30, 2017, there have been no transfers between Level 1, Level 2 or Level 3 investments.
The following is a summary of the Fund’s transactions with affiliates for the year ended November 30, 2017:
| | | | | | | | | | Changes in | | | | | | | | | | |
| Value at | | | Purchases at | | | Proceeds | | | Unrealized | | | Realized | | | Value at | | | Dividend | |
| 11/30/2016 | | | Cost | | | from Sales | | | Appreciation | | | Gain | | | 11/30/2017 | | | Income | |
| Global X SuperDividend® REIT ETF | | | | | | |
| $ | 1,205,242 | | | $ | 1,410,202 | | | $ | (509,969 | ) | | $ | 145,418 | | | $ | 2,906 | | | $ | 2,253,799 | | | $ | 145,668 | |
The accompanying notes are an integral part of the financial statements.
| Schedule of Investments | November 30, 2017 |
| Global X U.S. Preferred ETF |
Sector Weightings (unaudited)†:
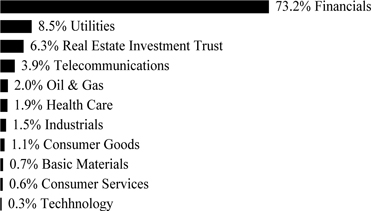
† Sector weightings percentages are based on the total market value of investments.
| | | Shares | | | Value | |
| PREFERRED STOCK — 100.6% | | | | | | | | |
| | | | | | | | | |
| BERMUDA — 1.1% | | | | | | | | |
| Financials — 1.1% | | | | | | | | |
| Aspen Insurance Holdings, 5.950%, VAR ICE LIBOR USD 3 Month+4.060% | | | 1,955 | | | $ | 53,000 | |
| Aspen Insurance Holdings, 5.625% | | | 1,603 | | | | 41,854 | |
| Axis Capital Holdings, 5.500% | | | 3,890 | | | | 99,195 | |
| PartnerRe, 7.250% | | | 2,082 | | | | 60,607 | |
| PartnerRe, 6.500% | | | 1,136 | | | | 30,752 | |
| TOTAL BERMUDA | | | | | | | 285,408 | |
| | | | | | | | | |
| GERMANY— 3.0% | | | | | | | | |
| Financials — 3.0% | | | | | | | | |
| Deutsche Bank Contingent Capital Trust II, 6.550% (A) | | | 5,847 | | | | 148,982 | |
| Deutsche Bank Contingent Capital Trust III, 7.600% (A) | | | 14,337 | | | | 367,457 | |
| Deutsche Bank Contingent Capital Trust V, 8.050% (A) | | | 10,072 | | | | 267,412 | |
| TOTAL GERMANY | | | | | | | 783,851 | |
| | | | | | | | | |
| NETHERLANDS — 2.3% | | | | | | | | |
| Financials — 2.3% | | | | | | | | |
| Aegon, 8.000% | | | 3,719 | | | | 99,223 | |
| Aegon, 6.375% | | | 7,291 | | | | 187,525 | |
| ING Groep, 6.375% | | | 7,291 | | | | 186,868 | |
| ING Groep, 6.125% | | | 5,124 | | | | 133,941 | |
| TOTAL NETHERLANDS | | | | | | | 607,557 | |
The accompanying notes are an integral part of the financial statements.
| Schedule of Investments | November 30, 2017 |
| Global X U.S. Preferred ETF |
| | | Shares | | | Value | |
| PREFERRED STOCK — continued | | | | | | | | |
| | | | | | | | | |
| UNITED KINGDOM — 7.8% | | | | | | | | |
| Financials — 7.8% | | | | | | | | |
| Barclays Bank, Ser 5, 8.125% | | | 18,126 | | | $ | 480,339 | |
| HSBC Holdings, 8.125% | | | 15,957 | | | | 438,977 | |
| HSBC Holdings, 6.200% | | | 9,495 | | | | 245,066 | |
| HSBC Holdings, Ser 2, 8.000% | | | 26,927 | | | | 720,836 | |
| Prudential, 6.500% | | | 2,125 | | | | 56,907 | |
| Royal Bank of Scotland Group, Ser S, 6.600% | | | 4,844 | | | | 125,266 | |
| TOTAL UNITED KINGDOM | | | | | | | 2,067,391 | |
| | | | | | | | | |
| UNITED STATES — 86.4% | | | | | | | | |
| Basic Materials — 0.7% | | | | | | | | |
| Pitney Bowes, 6.700% | | | 3,007 | | | | 69,913 | |
| Rayonier Advanced Materials, 8.000% | | | 314 | | | | 42,268 | |
| Rexnord Corp, 0.000% | | | 1,429 | | | | 81,024 | |
| | | | | | | | 193,205 | |
| Consumer Goods — 1.1% | | | | | | | | |
| Stanley Black & Decker, 5.750% | | | 5,486 | | | | 140,716 | |
| Stanley Black & Decker, 5.375% | | | 1,233 | | | | 151,042 | |
| | | | | | | | 291,758 | |
| Consumer Services — 0.6% | | | | | | | | |
| eBay, 6.000% | | | 5,483 | | | | 147,218 | |
| Financials — 59.4% | | | | | | | | |
| Aegon, 6.500% | | | 3,533 | | | | 90,975 | |
| Allstate, 6.750% | | | 2,732 | | | | 71,442 | |
| Allstate, 5.625% | | | 2,039 | | | | 52,729 | |
| Allstate, 5.100%, VAR ICE LIBOR USD 3 Month+3.165% | | | 3,533 | | | | 93,730 | |
| Allstate, Ser E, 6.625% | | | 5,465 | | | | 146,243 | |
| Apollo Global Management, 6.375% (A) | | | 1,955 | | | | 50,537 | |
| Arch Capital Group, 5.250% | | | 3,177 | | | | 79,520 | |
| Ares Management, 7.000% (A) | | | 2,189 | | | | 58,271 | |
| Argo Group US, 6.500% | | | 1,013 | | | | 25,467 | |
| Associated Banc-Corp, 5.375% | | | 710 | | | | 18,141 | |
| Axis Capital Holdings, 5.500% | | | 1,598 | | | | 40,781 | |
| Bancorp, 0.000% | | | 3,533 | | | | 90,939 | |
| Bank of America, 7.250% | | | 558 | | | | 735,444 | |
| Bank of America, 6.625% | | | 2,586 | | | | 69,408 | |
| Bank of America, 6.625% | | | 7,290 | | | | 194,133 | |
| Bank of America, 6.500% | | | 8,011 | | | | 215,496 | |
| Bank of America, 6.375% | | | 4,787 | | | | 123,744 | |
| Bank of America, 6.204% | | | 5,486 | | | | 141,100 | |
| Bank of America, 6.200% | | | 7,289 | | | | 196,730 | |
| Bank of America, 6.000% | | | 6,566 | | | | 176,560 | |
The accompanying notes are an integral part of the financial statements.
| Schedule of Investments | November 30, 2017 |
| Global X U.S. Preferred ETF |
| | | Shares | | | Value | |
| PREFERRED STOCK — continued | | | | | | | | |
| | | | | | | | | |
| Financials — continued | | | | | | | | |
| Bank of America, 4.000%, VAR ICE LIBOR USD 3 Month+0.500% | | | 4,287 | | | $ | 98,430 | |
| Bank of America, 4.000%, VAR ICE LIBOR USD 3 Month+0.350% | | | 3,448 | | | | 79,545 | |
| Bank of New York Mellon, 5.200% | | | 4,017 | | | | 102,474 | |
| BB&T, 5.850% | | | 4,222 | | | | 107,914 | |
| BB&T, 5.625% | | | 3,282 | | | | 88,351 | |
| BB&T, 5.625% | | | 8,375 | | | | 212,809 | |
| BB&T, 5.200% | | | 3,533 | | | | 89,986 | |
| BB&T, 5.200% | | | 3,177 | | | | 80,410 | |
| BOK Financial, 5.375% | | | 1,048 | | | | 26,976 | |
| Capital One Financial, 6.200% | | | 3,533 | | | | 95,285 | |
| Capital One Financial, 6.000% | | | 3,533 | | | | 94,967 | |
| Capital One Financial, 5.200% | | | 4,245 | | | | 107,101 | |
| Capital One Financial, Ser B, 6.000% | | | 6,390 | | | | 161,475 | |
| Capital One Financial, Ser C, 6.250% | | | 3,533 | | | | 93,307 | |
| Capital One Financial, Ser D, 6.700% | | | 3,533 | | | | 94,684 | |
| Charles Schwab, 6.000% | | | 3,260 | | | | 81,435 | |
| Charles Schwab, 6.000% | | | 4,398 | | | | 118,834 | |
| Charles Schwab, 5.950% | | | 5,482 | | | | 149,330 | |
| Citigroup, 6.875%, VAR ICE LIBOR USD 3 Month+4.130% | | | 10,862 | | | | 311,848 | |
| Citigroup, 6.300% | | | 6,566 | | | | 177,610 | |
| Citigroup, 5.800% | | | 4,222 | | | | 108,505 | |
| Citigroup, Ser J, 7.125%, VAR ICE LIBOR USD 3 Month+4.040% | | | 6,922 | | | | 202,053 | |
| Citigroup, Ser L, 6.875% | | | 3,387 | | | | 90,264 | |
| Countrywide Capital V, 7.000% | | | 10,869 | | | | 281,724 | |
| Dillard's Capital Trust I, 7.500% | | | 1,411 | | | | 36,192 | |
| Discover Financial Services, Ser B, 6.500% | | | 3,860 | | | | 96,539 | |
| Fifth Third Bancorp, 6.625%, VAR ICE LIBOR USD 3 Month+3.710% | | | 3,176 | | | | 91,437 | |
| First Republic Bank, 5.625% | | | 1,048 | | | | 26,546 | |
| First Republic Bank, 5.500% | | | 1,347 | | | | 34,146 | |
| First Republic Bank, 5.125% | | | 1,412 | | | | 35,681 | |
| GATX, 5.625% | | | 248 | | | | 6,582 | |
| Goldman Sachs Group, 6.375%, VAR ICE LIBOR USD 3 Month+3.550% | | | 5,117 | | | | 147,881 | |
| Goldman Sachs Group, 6.300% | | | 4,939 | | | | 138,144 | |
| Goldman Sachs Group, 6.200% | | | 5,846 | | | | 152,931 | |
| Goldman Sachs Group, 5.500%, VAR ICE LIBOR USD 3 Month+3.640% | | | 7,288 | | | | 197,796 | |
| Goldman Sachs Group, 4.000%, VAR ICE LIBOR USD 3 Month+0.750% | | | 1,411 | | | | 32,114 | |
| Goldman Sachs Group, 4.000%, VAR ICE LIBOR USD 3 Month+0.670% | | | 5,494 | | | | 124,604 | |
| Goldman Sachs Group, 3.750%, VAR ICE LIBOR USD 3 Month+0.750% | | | 5,134 | | | | 115,515 | |
| Hartford Financial Services Group, 7.875%, VAR ICE LIBOR USD 3 Month+5.596% | | | 4,393 | | | | 131,966 | |
| Huntington Bancshares, 6.250% | | | 2,481 | | | | 68,252 | |
| JPMorgan Chase, 6.300% | | | 6,422 | | | | 171,596 | |
| JPMorgan Chase, 6.150% | | | 8,372 | | | | 227,300 | |
The accompanying notes are an integral part of the financial statements.
| Schedule of Investments | November 30, 2017 |
| Global X U.S. Preferred ETF |
| | | Shares | | | Value | |
| PREFERRED STOCK — continued | | | | | | | | |
| | | | | | | | | |
| Financials — continued | | | | | | | | |
| JPMorgan Chase, 6.125% | | | 10,396 | | | $ | 280,692 | |
| JPMorgan Chase, 6.100% | | | 9,456 | | | | 256,163 | |
| JPMorgan Chase, 5.500% | | | 8,462 | | | | 211,635 | |
| JPMorgan Chase, 5.450% | | | 6,570 | | | | 167,009 | |
| JPMorgan Chase, Ser T, 6.700% | | | 6,748 | | | | 180,981 | |
| KeyCorp, 6.125%, VAR ICE LIBOR USD 3 Month+3.892% | | | 3,673 | | | | 105,672 | |
| KKR, 6.750% (A) | | | 2,440 | | | | 65,514 | |
| KKR Financial Holdings, Ser A, 7.375% | | | 2,649 | | | | 67,311 | |
| Legg Mason, 6.375% | | | 1,767 | | | | 47,444 | |
| Legg Mason, 5.450% | | | 3,533 | | | | 89,102 | |
| Merrill Lynch Capital Trust I, 6.450% | | | 7,653 | | | | 197,600 | |
| Merrill Lynch Capital Trust III, 7.375%, VAR ICE LIBOR USD 3 Month+1.666% | | | 5,484 | | | | 144,613 | |
| MetLife, 4.000%, VAR ICE LIBOR USD 3 Month+1.000% | | | 4,245 | | | | 104,767 | |
| Morgan Stanley, 6.375%, VAR ICE LIBOR USD 3 Month+3.708% | | | 7,286 | | | | 205,319 | |
| Morgan Stanley, 5.850%, VAR ICE LIBOR USD 3 Month+3.491% | | | 7,289 | | | | 197,022 | |
| Morgan Stanley, 4.000%, VAR ICE LIBOR USD 3 Month+0.700% | | | 8,023 | | | | 182,523 | |
| Morgan Stanley, Ser E, 7.125%, VAR ICE LIBOR USD 3 Month+4.320% | | | 6,291 | | | | 183,383 | |
| Morgan Stanley, Ser F, 6.875%, VAR ICE LIBOR USD 3 Month+3.940% | | | 6,201 | | | | 179,147 | |
| Morgan Stanley, Ser G, 6.625% | | | 3,533 | | | | 95,497 | |
| Navient, 6.000% | | | 470 | | | | 11,449 | |
| New York Community Bancorp, 6.375%, VAR ICE LIBOR USD 3 Month+3.821% | | | 3,782 | | | | 107,258 | |
| OM Asset Management, 5.125% | | | 879 | | | | 21,887 | |
| People's United Financial, 5.625%, VAR ICE LIBOR USD 3 Month+4.020% | | | 1,767 | | | | 47,338 | |
| PNC Financial Services Group, 6.125%, VAR ICE LIBOR USD 3 Month+4.067% | | | 10,897 | | | | 310,456 | |
| PPL Capital Funding, Ser B, 5.900% | | | 3,177 | | | | 81,172 | |
| Prudential Financial, 5.750% | | | 4,222 | | | | 107,028 | |
| Prudential Financial, 5.700% | | | 5,197 | | | | 131,640 | |
| Regions Financial, Ser A, 6.375% | | | 3,533 | | | | 89,279 | |
| Regions Financial, Ser B, 6.375%, VAR ICE LIBOR USD 3 Month+3.536% | | | 3,672 | | | | 104,946 | |
| Reinsurance Group of America, 6.200%, VAR ICE LIBOR USD 3 Month+4.370% | | | 2,837 | | | | 78,301 | |
| Reinsurance Group of America, 5.750%, VAR ICE LIBOR USD 3 Month+4.040% | | | 2,837 | | | | 78,783 | |
| SLM, 3.020%, VAR ICE LIBOR USD 3 Month+1.700% | | | 714 | | | | 49,088 | |
| State Street, 6.000% | | | 5,484 | | | | 144,887 | |
| State Street, 5.900%, VAR ICE LIBOR USD 3 Month+3.108% | | | 5,480 | | | | 152,618 | |
| State Street, 5.350%, VAR ICE LIBOR USD 3 Month+3.709% | | | 3,533 | | | | 96,486 | |
| Stifel Financial, 6.250% | | | 1,048 | | | | 28,820 | |
| SunTrust Banks, 5.875% | | | 3,177 | | | | 80,728 | |
| Torchmark, 6.125% | | | 2,125 | | | | 56,674 | |
The accompanying notes are an integral part of the financial statements.
| Schedule of Investments | November 30, 2017 |
| Global X U.S. Preferred ETF |
| | | Shares | | | Value | |
| PREFERRED STOCK — continued | | | | | | | | |
| | | | | | | | | |
| Financials — continued | | | | | | | | |
| US Bancorp, 6.500%, VAR ICE LIBOR USD 3 Month+4.468% | | | 8,007 | | | $ | 230,361 | |
| US Bancorp, 3.500%, VAR ICE LIBOR USD 3 Month+0.600% | | | 7,301 | | | | 166,390 | |
| Validus Holdings, 5.875% | | | 1,048 | | | | 26,829 | |
| Validus Holdings, 5.800% | | | 1,767 | | | | 44,599 | |
| Virtus Investment Partners, 7.250% | | | 171 | | | | 18,025 | |
| Wells Fargo, 7.500% | | | 630 | | | | 844,830 | |
| Wells Fargo, 6.625%, VAR ICE LIBOR USD 3 Month+3.690% | | | 5,383 | | | | 153,685 | |
| Wells Fargo, 6.000% | | | 5,768 | | | | 151,871 | |
| Wells Fargo, 6.000% | | | 5,134 | | | | 134,049 | |
| Wells Fargo, 5.850%, VAR ICE LIBOR USD 3 Month+3.090% | | | 10,993 | | | | 299,889 | |
| Wells Fargo, 5.700% | | | 5,610 | | | | 146,421 | |
| Wells Fargo, 5.625% | | | 3,721 | | | | 96,374 | |
| Wells Fargo, 5.500% | | | 6,403 | | | | 164,173 | |
| Wells Fargo, 5.250% | | | 3,869 | | | | 97,073 | |
| Wells Fargo, 5.125% | | | 4,035 | | | | 100,835 | |
| Wells Fargo, 0.000% | | | 4,821 | | | | 120,766 | |
| Wells Fargo, Ser J, 8.000% | | | 14,640 | | | | 374,784 | |
| Wells Fargo Real Estate Investment, 6.375% | | | 1,704 | | | | 45,292 | |
| WR Berkley, 5.750% | | | 2,060 | | | | 53,848 | |
| Zions Bancorporation, 6.300%, VAR ICE LIBOR USD 3 Month+4.240% | | | 985 | | | | 26,930 | |
| | | | | | | | 15,599,185 | |
| Health Care — 1.9% | | | | | | | | |
| Becton Dickinson and, 6.125% | | | 8,157 | | | | 494,967 | |
| Industrials — 1.5% | | | | | | | | |
| General Electric, 4.875% | | | 6,030 | | | | 151,172 | |
| General Electric, 4.875% | | | 4,639 | | | | 117,135 | |
| General Electric, 4.700% | | | 5,517 | | | | 137,208 | |
| | | | | | | | 405,515 | |
| Oil & Gas — 2.0% | | | | | | | | |
| Black Hills Corp, 0.000% | | | 1,053 | | | | 67,824 | |
| Chesapeake Energy, 4.500% | | | 461 | | | | 23,838 | |
| Hess, 8.000% | | | 1,766 | | | | 99,867 | |
| Kinder Morgan, Ser A, 9.750% | | | 5,828 | | | | 207,710 | |
| NuStar Energy, 8.500%, VAR ICE LIBOR USD 3 Month+6.766% (A) | | | 1,600 | | | | 38,384 | |
| NuStar Energy, 7.625%, VAR ICE LIBOR USD 3 Month+5.643% | | | 2,481 | | | | 55,178 | |
| Targa Resources Partners, 9.000%, VAR ICE LIBOR USD 1 Month+7.710% (A) | | | 885 | | | | 23,116 | |
| | | | | | | | 515,917 | |
| Real Estate Investment Trust — 6.4% | | | | | | | | |
| American Homes 4 Rent, 5.875% | | | 1,055 | | | | 27,356 | |
| Ashford Hospitality Prime, 5.500% | | | 858 | | | | 17,580 | |
| CBL & Associates Properties, Ser D, 7.375% | | | 3,216 | | | | 73,711 | |
| DDR, 6.375% | | | 1,241 | | | | 32,390 | |
The accompanying notes are an integral part of the financial statements.
| Schedule of Investments | November 30, 2017 |
| Global X U.S. Preferred ETF |
| | | Shares | | | Value | |
| PREFERRED STOCK — continued | | | | | | | | |
| | | | | | | | | |
| Real Estate Investment Trust — continued | | | | | | | | |
| Digital Realty Trust, 6.350% | | | 1,767 | | | $ | 48,080 | |
| Digital Realty Trust, Ser H, 7.375% | | | 2,586 | | | | 69,201 | |
| Government Properties Income Trust, 5.875% | | | 2,189 | | | | 56,104 | |
| Kimco Realty, 5.500% | | | 1,598 | | | | 40,174 | |
| National Retail Properties, 5.200% | | | 2,440 | | | | 61,000 | |
| PS Business Parks, 5.750% | | | 1,622 | | | | 41,102 | |
| PS Business Parks, 5.200% | | | 1,347 | | | | 34,147 | |
| PS Business Parks, Ser T, 6.000% | | | 2,597 | | | | 65,964 | |
| Public Storage, 5.625% | | | 2,039 | | | | 51,607 | |
| Public Storage, 5.400% | | | 2,125 | | | | 55,080 | |
| Public Storage, 5.375% | | | 3,509 | | | | 88,708 | |
| Public Storage, 5.200% | | | 1,598 | | | | 40,366 | |
| Public Storage, 5.200% | | | 3,177 | | | | 80,378 | |
| Public Storage, 5.150% | | | 1,979 | | | | 49,930 | |
| Public Storage, 5.125% | | | 1,411 | | | | 36,277 | |
| Public Storage, 4.950% | | | 2,294 | | | | 57,625 | |
| Public Storage, 4.900% | | | 2,481 | | | | 61,975 | |
| Senior Housing Properties Trust, 6.250% | | | 1,767 | | | | 47,038 | |
| Senior Housing Properties Trust, 5.625% | | | 2,481 | | | | 62,273 | |
| SL Green Realty, 6.500% | | | 1,621 | | | | 41,076 | |
| VEREIT, Ser F, 6.700% | | | 7,804 | | | | 200,016 | |
| Vornado Realty Trust, 5.700% | | | 2,125 | | | | 54,230 | |
| Washington Prime Group, 7.500% | | | 710 | | | | 17,565 | |
| Welltower, 6.500% | | | 2,624 | | | | 163,239 | |
| | | | | | | | 1,674,192 | |
| Techhnology — 0.3% | | | | | | | | |
| Belden, 6.750% | | | 799 | | | | 90,367 | |
| Telecommunications — 3.9% | | | | | | | | |
| Qwest, 7.500% | | | 1,156 | | | | 29,304 | |
| Qwest, 7.000% | | | 2,838 | | | | 68,112 | |
| Qwest, 7.000% | | | 1,662 | | | | 41,168 | |
| Qwest, 6.875% | | | 3,533 | | | | 86,594 | |
| Qwest, 6.750% | | | 4,841 | | | | 114,974 | |
| Qwest, 6.625% | | | 2,838 | | | | 67,544 | |
| Qwest, 6.500% | | | 7,136 | | | | 166,697 | |
| Qwest, 6.125% | | | 5,675 | | | | 130,128 | |
| Qwest, Ser 52, 7.000% | | | 3,719 | | | | 89,479 | |
| Telephone & Data Systems, 5.875% | | | 1,387 | | | | 34,467 | |
| United States Cellular, 7.250% | | | 1,955 | | | | 49,891 | |
| United States Cellular, 7.250% | | | 2,125 | | | | 54,719 | |
| Verizon Communications, 5.900% | | | 3,533 | | | | 92,565 | |
| | | | | | | | 1,025,642 | |
The accompanying notes are an integral part of the financial statements.
| Schedule of Investments | November 30, 2017 |
| Global X U.S. Preferred ETF |
| | | Shares | | | Value | |
| PREFERRED STOCK — continued | | | | | | | | |
| | | | | | | | | |
| Utilities — 8.6% | | | | | | | | |
| Dominion Energy, 6.750% | | | 5,090 | | | $ | 269,210 | |
| Dominion Energy, 5.250% | | | 5,847 | | | | 147,637 | |
| DTE Energy, 6.500% | | | 2,469 | | | | 138,782 | |
| DTE Energy, 6.000% | | | 1,978 | | | | 52,991 | |
| DTE Energy, 5.375% | | | 2,125 | | | | 54,379 | |
| DTE Energy, 5.250% | | | 1,411 | | | | 35,430 | |
| Duke Energy, 5.125% | | | 3,533 | | | | 89,703 | |
| Dynegy, 7.000% | | | 819 | | | | 67,240 | |
| Entergy Arkansas, 4.875% | | | 2,902 | | | | 72,028 | |
| Entergy Louisiana, 4.875% | | | 1,914 | | | | 47,735 | |
| Entergy Mississippi, 4.900% | | | 1,832 | | | | 45,800 | |
| NextEra Energy, 6.123% | | | 5,449 | | | | 307,324 | |
| NextEra Energy Capital Holdings, 5.250% | | | 3,533 | | | | 90,198 | |
| NextEra Energy Capital Holdings, 5.125% | | | 3,533 | | | | 88,678 | |
| NextEra Energy Capital Holdings, 5.000% | | | 3,177 | | | | 80,219 | |
| SCE Trust II, 5.100% | | | 2,838 | | | | 72,454 | |
| SCE Trust III, 5.750%, VAR ICE LIBOR USD 3 Month+2.990% | | | 1,955 | | | | 53,547 | |
| SCE Trust IV, 5.375%, VAR ICE LIBOR USD 3 Month+3.132% | | | 2,294 | | | | 60,997 | |
| SCE Trust V, 5.450%, VAR ICE LIBOR USD 3 Month+3.790% (A) | | | 2,125 | | | | 58,714 | |
| SCE Trust VI, 5.000% | | | 3,363 | | | | 84,344 | |
| Southern, 6.250% | | | 7,289 | | | | 195,054 | |
| Southern, 5.250% | | | 5,847 | | | | 148,572 | |
| | | | | | | | 2,261,036 | |
| TOTAL UNITED STATES | | | | | | | 22,699,002 | |
| TOTAL PREFERRED STOCK | | | | | | | | |
| (Cost $26,457,706) | | | | | | | 26,443,209 | |
| TOTAL INVESTMENTS — 100.6% | | | | | | | | |
| (Cost $26,457,706) | | | | | | $ | 26,443,209 | |
Percentages are based on Net Assets of $26,276,225
| (A) | Security considered Master Limited Partnership. At November 30, 2017, these securities amounted to 1,078,387 or 4.1% of net assets. |
ETF — Exchange Traded Fund
ICE — Intercontinental Exchange
LIBOR — London Interbank Offered Rate
USD — United States Dollar
VAR —Variable Rate
As of November 30, 2017, all of the Fund's investments were considered Level 1, in accordance with authoritative guidance on fair value measurements and disclosure under U.S. GAAP.
For the year ended November 30, 2017, there have been no transfers between Level 1, Level 2 or Level 3 investments.
The accompanying notes are an integral part of the financial statements.
| Statements of Assets and Liabilities |
| November 30, 2017 |
| | | Global X MLP & | | | Global X | | | | |
| | | Energy | | | SuperDividend® | | | Global X U.S. | |
| | | Infrastructure ETF | | | Alternatives ETF | | | Preferred ETF | |
| Assets: | | | | | | | | | | | | |
| Cost of Investments | | $ | 325,442,087 | | | $ | 9,132,530 | | | $ | 26,457,706 | |
| Cost of Affiliated Investments | | | — | | | | 2,122,052 | | | | — | |
| Investments, at Value | | $ | 307,358,054 | | | $ | 9,237,293 | | | $ | 26,443,209 | |
| Affiliated Investments, at Value | | | — | | | | 2,253,799 | | | | — | |
| Cash | | | — | | | | 39,926 | | | | 34,852 | |
| Due From Broker | | | — | | | | — | | | | 56,548 | |
| Receivable for Capital Shares Sold | | | — | | | | — | | | | 1,251,265 | |
| Receivable for Investment Securities Sold | | | 14,748,953 | | | | — | | | | 142,797 | |
| Dividend and Interest Receivable | | | 526,048 | | | | 24,869 | | | | 144,822 | |
| Reclaim Receivable | | | 34,515 | | | | — | | | | — | |
| Total Assets | | | 322,667,570 | | | | 11,555,887 | | | | 28,073,493 | |
| Liabilities: | | | | | | | | | | | | |
| Payable for Investment Securities Purchased | | | 16,556,248 | | | | — | | | | 1,793,507 | |
| Payable due to Investment Adviser | | | 110,833 | | | | 7,112 | | | | 3,761 | |
| Due to Custodian | | | 7,846 | | | | 12 | | | | — | |
| Due to Broker | | | 12,755 | | | | — | | | | — | |
| Total Liabilities | | | 16,687,682 | | | | 7,124 | | | | 1,797,268 | |
| Net Assets | | $ | 305,979,888 | | | $ | 11,548,763 | | | $ | 26,276,225 | |
| Net Assets Consist of: | | | | | | | | | | | | |
| Paid-in Capital | | $ | 381,857,420 | | | $ | 11,341,553 | | | $ | 26,158,170 | |
| Undistributed (Distributions in Excess of) Net Investment Income | | | (1 | ) | | | (106,878 | ) | | | 139,173 | |
| Accumulated Net Realized Gain (Loss) on | | | | | | | | | | | | |
| Investments and Foreign Currency Transactions | | | (57,793,498 | ) | | | 77,578 | | | | (6,621 | ) |
| Net Unrealized Appreciation (Depreciation) on Investments | | | (18,084,033 | ) | | | 236,510 | | | | (14,497 | ) |
| Net Assets | | $ | 305,979,888 | | | $ | 11,548,763 | | | $ | 26,276,225 | |
| Outstanding Shares of Beneficial Interest (unlimited authorization — no par value) | | | 23,900,000 | | | | 750,000 | | | | 1,050,000 | |
| Net Asset Value, Offering and Redemption Price Per Share | | $ | 12.80 | | | $ | 15.40 | | | $ | 25.03 | |
The accompanying notes are an integral part of the financial statements.
| Statements of Operations |
| For the year ended November 30, 2017 |
| | | Global X MLP & | | | | | | | |
| | | Energy | | | Global X | | | | |
| | | Infrastructure | | | SuperDividend® | | | Global X U.S. | |
| | | ETF | | | Alternatives ETF | | | Preferred ETF(1) | |
| Investment Income: | | | | | | | | | | | | |
| Dividend Income | | $ | 6,913,779 | | | $ | 419,688 | | | $ | 172,897 | |
| Dividend Income, from Affiliated Investments | | | — | | | | 145,668 | | | | — | |
| Security Lending Income | | | 7,238 | | | | — | | | | — | |
| Less: Foreign Taxes Withheld | | | (322,982 | ) | | | — | | | | — | |
| Total Investment Income | | | 6,598,035 | | | | 565,356 | | | | 172,897 | |
| Supervision and Administration Fees(2) | | | 1,118,331 | | | | 67,244 | | | | 4,730 | |
| Custodian Fees | | | 491 | | | | 120 | | | | — | |
| Total Expenses | | | 1,118,822 | | | | 67,364 | | | | 4,730 | |
| Net Expenses | | | 1,118,822 | | | | 67,364 | | | | 4,730 | |
| Net Investment Income | | | 5,479,213 | | | | 497,992 | | | | 168,167 | |
| Net Realized Gain (Loss) on: | | | | | | | | | | | | |
| Investments (3) | | | (10,546,512 | ) | | | 7,259 | | | | (6,165 | ) |
| Affiliated Investments | | | — | | | | 2,906 | | | | — | |
| Foreign Currency Transactions | | | (21 | ) | | | — | | | | — | |
| Net Realized Gain (Loss) on Investments and Foreign Currency Transactions | | | (10,546,533 | ) | | | 10,165 | | | | (6,165 | ) |
| Net Change in Unrealized Appreciation (Depreciation) on: | | | | | | | | | | | | |
| Investments | | | (22,017,976 | ) | | | 256,918 | | | | (14,497 | ) |
| Affiliated Investments | | | — | | | | 145,418 | | | | — | |
| Net Change in Unrealized Appreciation (Depreciation) on Investments and Foreign Currency Translations | | | (22,017,976 | ) | | | 402,336 | | | | (14,497 | ) |
| Net Realized and Unrealized Gain (Loss) on Investments and Foreign Currency Transactions and Translations | | | (32,564,509 | ) | | | 412,501 | | | | (20,662 | ) |
| Net Increase (Decrease) in Net Assets Resulting from Operations | | $ | (27,085,296 | ) | | $ | 910,493 | | | $ | 147,505 | |
| (1) | Fund Commenced Operations on September 11, 2017. |
| (2) | The Supervision and Administration fees include fees paid by the Funds for the investment advisory services provided by the Adviser. (See Note 3 in Notes to Financial Statements.) |
| (3) | Includes realized gains/(losses) as a result of in-kind transactions. (For detail by Fund, see Note 4 in Notes to Financial Statements.) |
The accompanying notes are an integral part of the financial statements.
| Statements of Changes in Net Assets |
| | | Global X MLP & Energy | | | Global X SuperDividend® Alternatives | |
| | | Infrastructure ETF | | | ETF | |
| | | Year Ended | | | Year Ended | | | Year Ended | | | Year Ended | |
| | | November 30, | | | November 30, | | | November 30, | | | November 30, | |
| | | 2017 | | | 2016 | | | 2017 | | | 2016 | |
| Operations: | | | | | | | | | | | | | | | | |
| Net Investment Income | | $ | 5,479,213 | | | $ | 2,533,998 | | | $ | 497,992 | | | $ | 158,010 | |
| Net Realized Gain (Loss) on Investments and Foreign Currency Transactions(1) | | | (10,546,533 | ) | | | (20,081,531 | ) | | | 10,165 | | | | 1,568 | |
| Net Change in Unrealized Appreciation (Depreciation) on Investments and Foreign Currency Translations | | | (22,017,976 | ) | | | 29,248,244 | | | | 402,336 | | | | (104,583 | ) |
| Net Increase (Decrease) in Net Assets Resulting from Operations | | | (27,085,296 | ) | | | 11,700,302 | | | | 910,493 | | | | 54,995 | |
| Dividends and Distributions from: | | | | | | | | | | | | | | | | |
| Net Investment Income | | | (11,328,219 | ) | | | (4,335,500 | ) | | | (566,361 | ) | | | (167,364 | ) |
| Return of Capital | | | (1,167,465 | ) | | | — | | | | (74,271 | ) | | | — | |
| Net Realized Gains | | | — | | | | — | | | | — | | | | (21,650 | ) |
| Total Dividends and Distributions | | | (12,495,684 | ) | | | (4,335,500 | ) | | | (640,632 | ) | | | (189,014 | ) |
| Capital Share Transactions: | | | | | | | | | | | | | | | | |
| Issued | | | 230,097,521 | | | | 50,083,651 | | | | 6,152,299 | | | | 3,817,357 | |
| Redeemed | | | (14,987,587 | ) | | | (24,679,663 | ) | | | — | | | | — | |
| Increase in Net Assets from Capital Share Transactions | | | 215,109,934 | | | | 25,403,988 | | | | 6,152,299 | | | | 3,817,357 | |
| Total Increase in Net Assets | | | 175,528,954 | | | | 32,768,790 | | | | 6,422,160 | | | | 3,683,338 | |
| Net Assets: | | | | | | | | | | | | | | | | |
| Beginning of Year | | | 130,450,934 | | | | 97,682,144 | | | | 5,126,603 | | | | 1,443,265 | |
| End of Year | | $ | 305,979,888 | | | $ | 130,450,934 | | | $ | 11,548,763 | | | $ | 5,126,603 | |
| Undistributed (Distributions in Excess of) Net Investment Income | | $ | (1 | ) | | $ | 1,855,410 | | | $ | (106,878 | ) | | $ | (19,533 | ) |
| Share Transactions: | | | | | | | | | | | | | | | | |
| Issued | | | 16,200,000 | | | | 3,700,000 | | | | 400,000 | | | | 250,000 | |
| Redeemed | | | (1,100,000 | ) | | | (2,150,000 | ) | | | — | | | | — | |
| Net Increase in Shares Outstanding from Share Transactions | | | 15,100,000 | | | | 1,550,000 | | | | 400,000 | | | | 250,000 | |
| (1) | Includes realized gains/(losses) as a result of in-kind transactions. (For detail by Fund, see Note 4 in Notes to Financial Statements.) |
The accompanying notes are an integral part of the financial statements.
| Statements of Changes in Net Assets |
| | | Global X U.S. | |
| | | Preferred ETF | |
| | | Period Ended | |
| | | November 30, | |
| | | 2017(1) | |
| Operations: | | | | |
| Net Investment Income | | $ | 168,167 | |
| Net Realized Loss on Investments and Foreign Currency Transactions | | | (6,165 | ) |
| Net Change in Unrealized Appreciation (Depreciation) on Investments and Foreign Currency Translations | | | (14,497 | ) |
| Net Increase in Net Assets Resulting from Operations | | | 147,505 | |
| Dividends and Distributions from: | | | | |
| Net Investment Income | | | (29,450 | ) |
| Total Dividends and Distributions | | | (29,450 | ) |
| Capital Share Transactions: | | | | |
| Issued | | | 26,158,170 | |
| Increase in Net Assets from Capital Share Transactions | | | 26,158,170 | |
| Total Increase in Net Assets | | | 26,276,225 | |
| Net Assets: | | | | |
| Beginning of Year | | | — | |
| End of Year | | $ | 26,276,225 | |
| Undistributed Net Investment Income | | $ | 139,173 | |
| Share Transactions: | | | | |
| Issued | | | 1,050,000 | |
| Net Increase in Shares Outstanding from Share Transactions | | | 1,050,000 | |
| (1) | Fund Commenced Operations on September 11, 2017. |
The accompanying notes are an integral part of the financial statements.
Selected Per Share Data & Ratios
For a Share Outstanding Throughout the Period
| | | | | | | | | Net Realized | | | | | | | | | | | | | | | | | | | | | | | | | | | | | | | |
| | | Net | | | | | | and | | | | | | | | | | | | | | | Net | | | | | | | | | | | | Ratio of Net | | | | |
| | | Asset | | | | | | Unrealized | | | | | | | | | | | | | | | Asset | | | | | | | | | Ratio of | | | Investment | | | | |
| | | Value, | | | | | | Gain (Loss) | | | | | | Distribution | | | | | | | | | Value, | | | | | | Net Assets | | | Expenses | | | Income to | | | | |
| | | Beginning | | | Net | | | on | | | Total from | | | from Net | | | | | | Total from | | | End of | | | Total | | | End of | | | to Average | | | Average | | | Portfolio | |
| | | of Period | | | Investment | | | Investments | | | Operations | | | Investment | | | | | | Distributions | | | Period | | | Return | | | Period | | | Net Assets | | | Net Assets | | | Turnover | |
| | | ($) | | | Income ($)* | | | ($) | | | ($) | | | Income ($) | | | Return of Capital ($) | | | ($) | | | ($) | | | (%)** | | | ($)(000) | | | (%) | | | (%) | | | (%)†† | |
| Global X MLP & Energy Infrastructure ETF | | | | | | | | | | | | |
| 2017 | | | 14.82 | | | | 0.31 | | | | (1.54 | ) | | | (1.23 | ) | | | (0.72 | ) | | | (0.07 | ) | | | (0.79 | ) | | | 12.80 | | | | (8.71 | ) | | | 305,980 | | | | 0.45 | | | | 2.20 | | | | 40.42 | |
| 2016 | | | 13.47 | | | | 0.36 | | | | 1.59 | | | | 1.95 | | | | (0.60 | ) | | | — | | | | (0.60 | ) | | | 14.82 | | | | 15.45 | | | | 130,451 | | | | 0.45 | | | | 2.79 | | | | 56.14 | |
| 2015 | | | 18.92 | | | | 0.27 | | | | (5.15 | ) | | | (4.88 | ) | | | (0.33 | ) | | | (0.24 | ) | | | (0.57 | ) | | | 13.47 | | | | (26.30 | ) | | | 97,682 | | | | 0.45 | | | | 1.56 | | | | 33.36 | |
| 2014 | | | 15.56 | | | | 0.26 | | | | 3.51 | | | | 3.77 | | | | (0.35 | ) | | | (0.06 | ) | | | (0.41 | ) | | | 18.92 | | | | 24.38 | | | | 179,736 | | | | 0.45 | | | | 1.37 | | | | 28.99 | |
| 2013(1) | | | 15.06 | | | | 0.12 | | | | 0.47 | | | | 0.59 | | | | (0.05 | ) | | | (0.04 | ) | | | (0.09 | ) | | | 15.56 | | | | 3.92 | | | | 21,778 | | | | 0.45 | † | | | 2.42 | † | | | — | |
| Global X SuperDividend® Alternatives ETF | | | | | | | | | | | | |
| 2017 | | | 14.65 | | | | 1.04 | | | | 0.85 | | | | 1.89 | | | | (1.01 | ) | | | (0.13 | ) | | | (1.14 | ) | | | 15.40 | | | | 13.24 | | | | 11,549 | | | | 0.75 | | | | 6.75 | | | | 34.84 | |
| 2016 | | | 14.43 | | | | 0.99 | # | | | 0.53 | ^ | | | 1.52 | | | | (1.15 | ) | | | (0.15 | ) | | | (1.30 | ) | | | 14.65 | | | | 11.04 | | | | 5,127 | | | | 0.75 | | | | 6.78 | | | | 30.80 | |
| 2015(2) | | | 15.04 | | | | 0.45 | | | | (0.76 | ) | | | (0.31 | ) | | | (0.30 | ) | | | — | | | | (0.30 | ) | | | 14.43 | | | | (2.02 | ) | | | 1,443 | | | | 0.75 | † | | | 8.04 | † | | | 21.50 | |
| Global X U.S. Preferred ETF | | | | | | | | | | | | |
| 2017(3) | | | 25.08 | | | | 0.44 | | | | (0.25 | ) | | | 0.19 | | | | (0.24 | ) | | | — | | | | (0.24 | ) | | | 25.03 | | | | 0.75 | | | | 26,276 | | | | 0.23 | † | | | 8.01 | † | | | 3.82 | |
| * | Per share data calculated using average shares method. |
| ** | Total Return is for the period indicated and has not been annualized. The return shown does not reflect the deduction of taxes that a shareholder would pay on Fund distributions or the redemption of Fund shares. |
| †† | Portfolio turnover rate is for the period indicated and has not been annualized. Excludes effect of in-kind transfers. |
| ^ | The amount shown for a share outstanding throughout the period does not accord with the aggregate net gains on investments for the period because of the sales and repurchases of fund shares in relation to fluctuating market value of the investments of the Fund. |
| # | Effective November 1, 2015, the Fund changed its method for estimating the characterization of amounts distributed by master limited partnerships, which correspondingly impacted the financial highlight ratios and per share disclosures to the extent that the fund recorded investment income that differed from amounts previously estimated. |
| (1) | The Fund commenced operations on August 6, 2013. |
| (2) | The Fund commenced operations on July 13, 2015. |
| (3) | The Fund commenced operations on September 11, 2017. |
Amounts designated as “—” are either $0 or have been rounded to $0.
The accompanying notes are an integral part of the financial statements.
| Notes to Financial Statements |
| November 30, 2017 |
1. ORGANIZATION
The Global X Funds (the "Trust") is a Delaware statutory trust formed on March 6, 2008. The Trust is registered under the Investment Company Act of 1940, as amended, as an open-end management investment company. As of November 30, 2017, the Trust had ninety- six series, fifty two of which were operational. The financial statements herein and the related notes pertain to the Global X MLP & Energy Infrastructure ETF, the Global X SuperDividend® Alternatives ETF, and the Global X U.S. Preferred ETF (each a “Fund” and collectively, the “Funds”). Each Fund has elected non-diversification status.
The Global X U.S. Preferred ETF commenced operations on September 11, 2017.
2. SIGNIFICANT ACCOUNTING POLICIES
The following is a summary of the significant accounting policies followed by the Funds.
USE OF ESTIMATES – The Funds are investment companies that apply the accounting and reporting guidance issued in Topic 946 by the U.S. Financial Accounting Standards Board. The preparation of financial statements in conformity with U.S. generally accepted accounting principles ("U.S. GAAP") requires management to make estimates and assumptions that affect the reported amounts of assets and liabilities and disclosure of contingent assets and liabilities at the date of the financial statements and the reported amounts of increases and decreases in net assets from operations during the reporting period. Actual results could differ from those estimates, and could have a material impact on the Funds.
RETURN OF CAPITAL ESTIMATES – Distributions received by the Funds from underlying master limited partnership (“MLP”) investments generally are comprised of income and return of capital. The Funds record investment income and return of capital based on estimates made at the time such distributions are received. Such estimates are based on historical information available from the MLPs and other industry sources. These estimates may subsequently be revised based on information received from the MLPs after their tax reporting periods are concluded. For the Global X SuperDividend® Alternatives ETF, this was effective from December 1, 2015. See Note 8.
MASTER LIMITED PARTNERSHIPS (“MLPs”) – The Funds invest in MLPs in addition to other exchange-traded securities. MLPs are publicly traded partnerships engaged in the transportation, storage and processing of minerals and natural resources. By confining their operations to these specific activities, their interests, or units, are able to trade on public securities exchanges exactly like the shares of a corporation, without entity-level taxation. To qualify as an MLP, and to not be taxed as a corporation, a partnership must receive at least 90% of its income from qualifying sources as set forth in Section 7704(d) of the Internal Revenue Code of 1986, as amended (the “Code”). These qualifying sources include natural resource-based activities such as the processing, transportation and storage of mineral or natural resources. MLPs generally have two classes of owners, the general partner and limited partners. The general partner of an MLP is typically owned by a major energy company, an investment fund, the direct management of the MLP, or is an entity owned by one or more of such parties. The general partner may be structured as a private or publicly-traded corporation or other entity. The general partner typically controls the operations and management of the MLP through an up to 2% equity interest in the MLP plus, in many cases, ownership of common units and subordinated units.
| Notes to Financial Statements (CONTINUED) |
| November 30, 2017 |
2. SIGNIFICANT ACCOUNTING POLICIES (continued)
Limited partners typically own the remainder of the partnership, through ownership of common units, and have a limited role in the partnership’s operations and management. MLPs are typically structured such that common units and general partner interests have first priority to receive quarterly cash distributions up to an established minimum amount (“minimum quarterly distributions” or “MQD”). Common and general partner interests also accrue arrearages in distributions to the extent the MQD is not paid. Once common and general partner interests have been paid, subordinated units receive distributions of up to the MQD; however, subordinated units do not accrue arrearages. Distributable cash in excess of the MQD is paid to both common and subordinated units and is distributed to both common and subordinated units generally on a pro rata basis. The general partner is also eligible to receive incentive distributions if the general partner operates the business in a manner which results in distributions paid per common unit surpassing specified target levels. As the general partner increases cash distributions to the limited partners, the general partner receives an increasingly higher percentage of the incremental cash distributions.
SECURITY VALUATION – Securities listed on a securities exchange, market or automated quotation system for which quotations are readily available (except for securities traded on NASDAQ), including securities traded over the counter, are valued at the last quoted sale price on the primary exchange or market (foreign or domestic) on which they are traded (or at approximately 4:00 pm if a security’s primary exchange is normally open at that time), or, if there is no such reported sale, at the most recent mean between the quoted bid and asked prices (absent both bid and asked prices on such exchange, the bid price may be used).
For securities traded on NASDAQ, the NASDAQ Official Closing Price will be used. If available, debt securities are priced based upon valuations provided by independent, third-party pricing agents. Such values generally reflect the last reported sales price if the security is actively traded. The third-party pricing agents may also value debt securities at an evaluated bid price by employing methodologies that utilize actual market transactions, broker-supplied valuations, or other methodologies designed to identify the market value for such securities. Debt obligations with remaining maturities of sixty days or less may be valued at their amortized cost, which approximates market value. Prices for most securities held in the Funds are provided daily by recognized independent pricing agents. If a security’s price cannot be obtained from an independent, third-party pricing agent, the Funds seek to obtain a bid price from at least one independent broker.
| Notes to Financial Statements (CONTINUED) |
| November 30, 2017 |
2. SIGNIFICANT ACCOUNTING POLICIES (continued)
Securities for which market prices are not "readily available" are valued in accordance with Fair Value Procedures established by the Board of Trustees (the “Board”). The Funds’ Fair Value Procedures are implemented through a fair value committee (the “Committee”) designated by the Board. Some of the more common reasons that may necessitate that a security be valued using Fair Value Procedures include: the security's trading has been halted or suspended; the security has been de-listed from its primary trading exchange; the security's primary trading market is temporarily closed at a time when under normal conditions it would be open; the security has not been traded for an extended period of time; the security's primary pricing source is not able or willing to provide a price; or trading of the security is subject to local government-imposed restrictions. In addition, the Fund may fair value its securities if an event that may materially affect the value of the Fund’s securities that traded outside of the United States (a “Significant Event”) has occurred between the time of the security's last close and the time that the Funds calculate their net asset value. A Significant Event may relate to a single issuer or to an entire market sector. Events that may be Significant Events include: government actions, natural disasters, armed conflict, acts of terrorism and significant market fluctuations. If Global X Management Company LLC (the “Adviser”) becomes aware of a Significant Event that has occurred with respect to a security or group of securities after the closing of the exchange or market on which the security or securities principally trade, but before the time at which the Funds calculate their net asset value, it may request that a Committee meeting be called. When a security is valued in accordance with the Fair Value Procedures, the Committee will determine the value after taking into consideration all relevant information reasonably available to the Committee. As of November 30, 2017, there were no securities priced using the Fair Value Procedures.
In accordance with the authoritative guidance on fair value measurements and disclosure under U.S. GAAP, the Funds disclose the fair value of their investments in a hierarchy that prioritizes the inputs to valuation techniques used to measure the fair value. The objective of a fair value measurement is to determine the price that would be received to sell an asset or paid to transfer a liability in an orderly transaction between market participants at the measurement date (an exit price). Accordingly, the fair value hierarchy gives the highest priority to quoted prices (unadjusted) in active markets for identical assets or liabilities (Level 1) and the lowest priority to unobservable inputs (Level 3). The three levels of the fair value hierarchy are described below:
Level 1 – Unadjusted quoted prices in active markets for identical, unrestricted assets or liabilities that the Fund has the ability to access at the measurement date;
Level 2 – Other significant observable inputs (including quoted prices in non-active markets, quoted prices for similar investments and fair value of investments for which the Fund has the ability to fully redeem tranches at net asset value as of the measurement date or within the near term, and short-term investments valued at amortized cost);
Level 3 – Significant unobservable inputs (including the Fund’s own assumptions in determining the fair value of investments, and fair value of investments for which the Fund does not have the ability to fully redeem tranches at net asset value as of the measurement date or within the near term).
| Notes to Financial Statements (CONTINUED) |
| November 30, 2017 |
2. SIGNIFICANT ACCOUNTING POLICIES (continued)
Investments are classified within the level of the lowest significant input considered in determining fair value. Investments classified within Level 3 whose fair value measurement considers several inputs may include Level 1 or Level 2 inputs as components of the overall fair value measurement.
For the year or period ended November 30, 2017, there have been no significant changes to the Funds’ fair valuation methodologies.
FEDERAL INCOME TAXES – It is each Fund’s intention to continue to qualify as a regulated investment company for Federal income tax purposes by complying with the appropriate provisions of Subchapter M of the Internal Revenue Code of 1986, as amended. Accordingly, no provisions for Federal income taxes have been made in the financial statements.
The Funds evaluate tax positions taken or expected to be taken in the course of preparing the Funds’ tax returns to determine whether it is "more-likely-than-not" (i.e., greater than 50 percent) that each tax position will be sustained upon examination by a taxing authority based on the technical merits of the position. Tax positions not deemed to meet the more-likely- than-not threshold are recorded as a tax benefit or expense in the current year. The Funds did not record any tax provisions in the current period; however, management’s conclusions regarding tax positions may be subject to review and adjustment at a later date based on factors including, but not limited to, examination by tax authorities (i.e., the last three tax year ends, as applicable), on-going analysis of and changes to tax laws, regulations and interpretations thereof. Any foreign tax filings that have not been made will be filed within the prescribed period.
SECURITY TRANSACTIONS AND INVESTMENT INCOME – Security transactions are accounted for on the trade date for financial reporting purposes. Costs used in determining realized gains and losses on the sale of investment securities are based on specific identification. Dividend income is recorded on the ex-dividend date. Interest income is recognized on the accrual basis from the settlement date.
DIVIDENDS AND DISTRIBUTIONS TO SHAREHOLDERS – The Funds distribute their net investment income on a pro rata basis. Any net realized capital gains are distributed annually. All distributions are recorded on the ex-dividend date.
| Notes to Financial Statements (CONTINUED) |
| November 30, 2017 |
2. SIGNIFICANT ACCOUNTING POLICIES (concluded)
CREATION UNITS – The Funds issue and redeem their shares (“Shares”) on a continuous basis at Net Asset Value (“NAV”) and only in large blocks of 50,000 Shares, referred to as “Creation Units”. Purchasers of Creation Units (“Authorized Participants”) at NAV must pay a standard creation transaction fee per transaction. The fee is a single charge and will be the same regardless of the number of Creation Units purchased by an Authorized Participant on the same day.
An Authorized Participant who holds Creation Units and wishes to redeem at NAV would also pay a standard redemption fee per transaction to Brown Brothers Harriman & Co. (“BBH”), the Funds’ custodian (“Custodian”), on the date of such redemption, regardless of the number of Creation Units redeemed that day.
If a Creation Unit is purchased or redeemed for cash, an additional variable fee may be charged. The following table discloses Creation Unit breakdown:
| | | | | | | | | Value at | | | | |
| | | Creation | | | | | | November 30, | | | Redemption | |
| | | Unit Shares | | | Creation Fee | | | 2017 | | | Fee | |
| Global X MLP & Energy Infrastructure ETF* | | | 50,000 | | | $ | 250 | | | $ | 640,000 | | | $ | 250 | |
| Global X SuperDividend® Alternatives ETF | | | 50,000 | | | $ | 500 | | | $ | 770,000 | | | $ | 500 | |
| Global X U.S. Preferred ETF | | | 50,000 | | | $ | 650 | | | $ | 1,251,500 | | | $ | 650 | |
*On March 30, 2017, Global X MLP Energy & Infrastructure ETF changed its creation/ redemption fee from $500, to $250, respectively.
3. RELATED PARTY TRANSACTIONS AND SERVICE PROVIDER TRANSACTIONS
The Adviser serves as the investment adviser and the administrator for the Funds. Subject to the supervision of the Board of Trustees, the Adviser is responsible for managing the investment activities of the Funds and the Funds’ business affairs and other administrative matters and provides or causes to be furnished all supervisory, administrative and other services reasonably necessary for the operation of the Funds, including certain distribution services (provided pursuant to a separate Distribution Agreement), certain shareholder and distribution-related services, if any (provided pursuant to a separate Rule 12b-1 Plan and related agreements) and investment advisory services (provided pursuant to a separate Investment Advisory Agreement), under what is essentially an "all-in" fee structure. For its service to the Funds, under the Supervision and Administration Agreement, the Funds pay a monthly fee to the Adviser at the annual rate below (stated as a percentage of the average daily net assets of the Fund). In addition, the Funds bear other expenses, directly and indirectly, that are not covered by the Supervision and Administration Agreement, which may vary and affect the total expense ratios of the Funds, such as taxes, brokerage fees, commissions, acquired fund fees, and other transaction expenses, interest expenses and extraordinary expenses (such as litigation and indemnification expenses), respectively. The following table discloses supervision and administration fees pursuant to the agreement:
| | | Supervision and | |
| | | Administration Fee | |
| Global X MLP & Energy Infrastructure ETF | | | 0.45 | % |
| Global X SuperDividend® Alternatives ETF | | | 0.75 | % |
| Global X U.S. Preferred ETF | | | 0.23 | % |
| Notes to Financial Statements (CONTINUED) |
| November 30, 2017 |
3. RELATED PARTY TRANSACTIONS AND SERVICE PROVIDER TRANSACTIONS (continued)
SEI Investments Global Funds Services (“SEIGFS”) serves as sub-administrator to the Funds. As sub-administrator, SEIGFS provides the Funds with the required general administrative services, including, without limitation: office space, equipment, and personnel; clerical and general back office services; bookkeeping, internal accounting and secretarial services; the calculation of NAV; and assistance with the preparation and filing of reports, registration statements, proxy statements and other materials required to be filed or furnished by the Funds under federal and state securities laws. As compensation for these services, the Sub-Administrator receives certain out-of-pocket costs, transaction fees and asset-based fees which are accrued daily and paid monthly by the Adviser.
SEI Investments Distribution Co. (“SIDCO”) serves as the Funds’ underwriter and distributor of Creation Units pursuant to a Distribution Agreement. SIDCO has no obligation to sell any specific quantity of Fund Shares. SIDCO bears the following costs and expenses relating to the distribution of Shares: (i) the costs of processing and maintaining records of creations of Creation Units; (ii) all costs of maintaining the records required of a registered broker/dealer; (iii) the expenses of maintaining its registration or qualification as a dealer or broker under Federal or state laws; (iv) filing fees; and (v) all other expenses incurred in connection with the distribution services as contemplated in the Distribution Agreement. SIDCO receives no fee from the Funds for its distribution services under the Distribution Agreement, rather the Adviser compensates SIDCO for certain expenses, out-of-pocket costs, and transaction fees.
BBH serves as custodian of the Funds’ assets. As custodian, BBH has agreed to (1) make receipts and disbursements of money on behalf of the Funds, (2) collect and receive all income and other payments and distributions on account of the Funds’ portfolio investments, (3) respond to correspondence from shareholders, security brokers and others relating to its duties, and (4) make periodic reports to the Funds concerning the Funds’ operations. BBH does not exercise any supervisory function over the purchase and sale of securities. BBH also serves as the Fund’s transfer agent. As transfer agent, BBH has agreed to (1) issue and redeem shares of each Fund, (2) make dividend and other distributions to shareholders of each Fund, (3) respond to correspondence by shareholders and others relating to its duties, (4) maintain shareholder accounts, and (5) make periodic reports to the Funds. As compensation for these services, BBH receives certain out-of pocket costs, transaction fees and asset-based fees which are accrued daily and paid monthly by the Adviser from its fees.
| Notes to Financial Statements (CONTINUED) |
| November 30, 2017 |
4. INVESTMENT TRANSACTIONS
For the year ended November 30, 2017, the purchases and sales of investments in securities excluding in-kind transactions, long-term U.S. Government and short-term securities were:
| | | Purchases | | | Sales | | | | |
| Global X MLP & Energy Infrastructure ETF | | $ | 99,260,779 | | | $ | 108,258,690 | | | | | |
| Global X SuperDividend® Alternatives ETF | | | 3,110,814 | | | | 3,186,051 | | | | | |
| Global X U.S. Preferred ETF | | | 868,446 | | | | 417,246 | | | | | |
For the year or period ended November 30, 2016, and November 30, 2017 in-kind transactions associated with creations and redemptions were, respectively:
| | | | | | Sales and | | | Realized | |
| 2016 | | Purchases | | | Maturities | | | Gain/(Loss) | |
| Global X MLP & Energy Infrastructure ETF | | $ | 50,027,890 | | | $ | 18,583,762 | | | $ | 691,843 | |
| Global X SuperDividend® Alternatives ETF | | | 3,812,390 | | | | - | | | | - | |
| Global X U.S. Preferred ETF | | | - | | | | - | | | | - | |
| | | | | | Sales and | | | Realized | |
| 2017 | | Purchases | | | Maturities | | | Gain/(Loss) | |
| Global X MLP & Energy Infrastructure ETF | | $ | 229,885,154 | | | $ | 11,071,545 | | | $ | 2,420,683 | |
| Global X SuperDividend® Alternatives ETF | | | 6,146,563 | | | | - | | | | - | |
| Global X U.S. Preferred ETF | | | 26,081,130 | | | | - | | | | - | |
During the year ended November 30, 2017, there were no purchases or sales of long-term U.S. Government securities for the Funds.
5. TAX INFORMATION
The amount and character of income and capital gain distributions to be paid, if any, are determined in accordance with Federal income tax regulations, which may differ from U.S. GAAP. As a result, net investment income (loss) and net realized gain (loss) on investment transactions for a reporting period may differ significantly from distributions during such period. These book/tax differences may be temporary or permanent. To the extent these differences are permanent in nature, they are charged or credited to undistributed net investment income (loss), accumulated net realized gain (loss) or paid-in capital, as appropriate, in the period that the differences arise.
The following differences, primarily attributable to investment in MLPs, foreign currency, redemptions in-kind and reclass of distributions have been reclassified to/from the following accounts during the fiscal year ended November 30, 2017.
| | | | | | Undistributed | | | | |
| | | | | | Net | | | Accumulated | |
| | | Paid-in | | | Investment | | | Net Realized | |
| Global X Funds | | Capital | | | Income | | | Loss | |
| Global X MLP & Energy Infrastructure ETF | | $ | 2,413,341 | | | $ | 3,993,595 | | | $ | (6,406,936 | ) |
| Global X SuperDividend® Alternatives ETF | | $ | (36,156 | ) | | $ | (18,976 | ) | | $ | 55,132 | |
| Global X U.S. Preferred ETF | | $ | – | | | $ | 456 | | | $ | (456 | ) |
| Notes to Financial Statements (CONTINUED) |
| November 30, 2017 |
5. TAX INFORMATION (continued)
The tax character of dividends and distributions declared during the years or periods ended November 30, 2017 and November 30, 2016 were as follows:
| Global X | | | | | Long-Term | | | | | | | |
| Funds | | Ordinary Income | | | Capital Gain | | | Return of Capital | | | Totals | |
| | | | | | | | | | |
| Global X MLP & Energy Infrastructure ETF | | | | | | |
| 2017 | | $ | 11,328,219 | | | $ | – | | | $ | 1,167,465 | | | $ | 12,495,684 | |
| 2016 | | | 4,335,500 | | | | – | | | | – | | | | 4,335,500 | |
| Global X SuperDividend® Alternatives ETF | | | | | | |
| 2017 | | $ | 566,361 | | | $ | – | | | $ | 74,271 | | | $ | 640,632 | |
| 2016 | | | 165,795 | | | | 1,569 | | | | 21,650 | | | | 189,014 | |
| Global X U.S. Preferred ETF | | | | | | |
| 2017 | | $ | 29,450 | | | $ | – | | | $ | – | | | $ | 29,450 | |
As of November 30, 2017, the components of tax basis distributable earnings (accumulated losses) were as follows:
| | | Global X Funds | |
| | | Global X MLP & | | | | | | | |
| | | Energy | | | Global X | | | | |
| | | Infrastructure | | | SuperDividend® | | | Global X U.S. | |
| | | ETF | | | Alternatives ETF | | | Preferred ETF | |
| Undistributed Ordinary Income | | $ | – | | | $ | – | | | $ | 147,299 | |
| Capital Loss Carryforwards | | | (30,753,194 | ) | | | – | | | | (951 | ) |
| Unrealized Appreciation (Depreciation) on Investments and Foreign Currency | | | (45,124,328 | ) | | | 207,214 | | | | 26,252 | |
| Post-October Losses | | | – | | | | – | | | | (4,891 | ) |
| Other Temporary Differences | | | (10 | ) | | | (4 | ) | | | (49,654 | ) |
| Total Distributable Earnings (Accumulated Losses) | | $ | (75,877,532 | ) | | $ | 207,210 | | | $ | 118,055 | |
For taxable years beginning after December 22, 2010, a RIC is permitted to carry forward net capital losses to offset capital gains realized in later years, and the losses carried forward retain their original character as either long-term or short-term losses. Losses carried forward under these new provisions are as follows:
| | | Short-Term | | | | | | | |
| | | Loss | | | Long-Term Loss | | | Total | |
| Global X MLP & Energy Infrastructure ETF | | $ | (10,797,362 | ) | | $ | (19,955,832 | ) | | $ | (30,753,194 | ) |
| Global X SuperDividend® Alternatives ETF | | | — | | | | — | | | | — | |
| Global X U.S. Preferred ETF | | | (951 | ) | | | — | | | | (951 | ) |
| Notes to Financial Statements (CONTINUED) |
| November 30, 2017 |
5. TAX INFORMATION (continued)
The Federal tax cost and aggregate gross unrealized appreciation and depreciation on investments held by the Funds at November 30, 2017, were as follows:
| | | | | | Aggregated | | | Aggregated | | | | |
| | | | | | Gross | | | Gross | | | Net | |
| | | Federal Tax | | | Unrealized | | | Unrealized | | | Unrealized | |
| Global X Funds | | Cost | | | Appreciation | | | Depreciation | | | Appreciation | |
| Global X MLP & Energy Infrastructure ETF | | $ | 352,482,383 | | | $ | 7,333,189 | | | $ | (52,457,518 | ) | | $ | (45,124,329 | ) |
| Global X SuperDividend® Alternatives ETF | | | 11,283,879 | | | | 434,335 | | | | (227,122 | ) | | | 207,213 | |
| Global X U.S. Preferred ETF | | | 26,416,956 | | | | 120,670 | | | | (94,417 | ) | | | 26,253 | |
The preceding differences between book and tax cost are primarily due to MLP adjustments and wash sales.
6. CONCENTRATION OF RISKS
The Funds use a replication strategy. A replication strategy is an indexing strategy that involves investing in the securities of an underlying Index in approximately the same proportions as in the underlying Index. The Funds may utilize a representative sampling strategy with respect to their underlying Index when a replication strategy might be detrimental to its shareholders, such as when there are practical difficulties or substantial costs involved in compiling a portfolio of equity securities to follow its underlying Index, or, in certain instances, when securities in the underlying Index become temporarily illiquid, unavailable or less liquid, or due to legal restrictions (such as diversification requirements that apply to the Funds but not the underlying Index).
Under normal circumstances, the MLP & Energy Infrastructure ETF intends to invest up to 25% of its total assets in securities that have economic characteristics of the MLP asset class, which are subject to certain risks, such as supply and demand risk, depletion and exploration risk, and the risk associated with the hazards inherent in midstream energy industry activities. A substantial portion of the cash flow received by the Fund is derived from investment in equity securities of MLPs. The amount of cash that an MLP has available for distributions and the tax character of such distributions are dependent upon the amount of cash generated by the MLP’s operations.
MLPs operating in the energy sector are subject to risks that are specific to the industry they serve.
Midstream - Midstream MLPs that provide crude oil, refined product and natural gas services are subject to supply and demand fluctuations in the markets they serve which may be impacted by a wide range of factors including fluctuating commodity prices, weather, increased conservation or use of alternative fuel sources, increased governmental or environmental regulation, depletion, rising interest rates, declines in domestic or foreign production, accidents or catastrophic events, increasing operating expenses and economic conditions, among others.
Exploration and production - Exploration and production MLPs produce energy resources, including natural gas and crude oil. Exploration and production MLPs that own oil and gas reserves are particularly vulnerable to declines in the demand for and prices of crude oil and natural gas. Substantial downward adjustments in reserve estimates could have a material adverse effect on the value of such reserves and the financial condition of an MLP. Exploration and production MLPs
| Notes to Financial Statements (CONTINUED) |
| November 30, 2017 |
6. CONCENTRATION OF RISKS (continued)
seek to reduce cash flow volatility associated with commodity prices by executing multi-year hedging strategies that fix the price of gas and oil produced. There can be no assurance that the hedging strategies currently employed by these MLPs are currently effective or will remain effective.
Marine shipping - Marine shipping MLPs are primarily marine transporters of natural gas, crude oil or refined petroleum products. Marine shipping companies are exposed to many of the same risks as other energy companies. The highly cyclical nature of the marine transportation industry may lead to volatile changes in charter rates and vessel values, which may adversely affect the revenues, profitability and cash flows of MLPs with marine transportation assets.
Propane - Propane MLPs are distributors of propane to homeowners for space and water heating. MLPs with propane assets are subject to earnings variability based upon weather conditions in the markets they serve, fluctuating commodity prices, customer conservation and increased use of alternative fuels, increased governmental or environmental regulation, and accidents or catastrophic events, among others.
Natural Resource - MLPs with coal, timber, fertilizer and other mineral assets are subject to supply and demand fluctuations in the markets they serve, which will be impacted by a wide range of domestic and foreign factors including fluctuating commodity prices, the level of their customers’ coal stockpiles, weather, increased conservation or use of alternative fuel sources, increased governmental or environmental regulation, depletion, declines in production, mining accidents or catastrophic events, health claims and economic conditions, among others.
7. LOANS OF PORTFOLIO SECURITIES
The Funds may lend portfolio securities having a market value up to one-third of the Funds total assets. Security loans made pursuant to a securities lending agreement are required at all times to be secured by collateral equal to at least 102% for U.S.-based securities and 105% for foreign-based securities. Such collateral received in connection with these loans will be cash and can be invested in repurchase agreements or U.S. Treasury obligations and is recognized in the Schedule of Investments and Statement of Assets and Liabilities. The obligation to return securities lending collateral is also recognized as a liability in the Statement of Assets and Liabilities. It is the Funds policy to obtain additional collateral from or return excess collateral to the borrower by the end of the next business day, following the valuation date of the securities loaned. Therefore, the value of the collateral held may be temporarily less than the value of the securities on loan. Lending securities entails a risk of loss to the Funds if and to the extent that the market value of the securities loans were to increase and the borrower did not increase the collateral accordingly, and the borrower fails to return the securities. The Funds could also experience delays and costs in gaining access to the collateral. The Funds bear the risk of any deficiency in the amount of the collateral available for return to the borrower due to any loss on the collateral invested. As of November 30, 2017, the Funds had no securities on loan.
| Notes to Financial Statements (CONCLUDED) |
| November 30, 2017 |
8. CHANGE IN ACCOUNTING ESTIMATE
Effective December 1, 2015, the Global X SuperDividend® Alternatives ETF changed its method for estimating the characterization of amounts distributed by master limited partnerships, which correspondingly impacted the net investment income, cost of investments and appreciation (depreciation) on investments and the associated financial highlight ratios and per share disclosures to the extent that the Fund recorded investment income that differed from amounts previously estimated. There is no impact to net assets, total return or the expense ratio as a result of management’s change in methodology.
9. CONTRACTUAL OBLIGATIONS
The Funds enter into contracts in the normal course of business that contain a variety of indemnifications. The Funds maximum exposure under these arrangements is unknown; however, the Funds have not had prior gains or losses pursuant to these contracts. Management has reviewed the Funds existing contracts and expects the risk of loss to be remote.
Pursuant to the Trust’s organizational documents, the Trustees of the Trust and the Trust’s officers are indemnified against certain liabilities that may arise out of the performance of their duties.
10. REGULATORY MATTERS
In October 2016, the U.S. Securities and Exchange Commission adopted new rules and amended existing rules (together, final rules) intended to modernize the reporting and disclosure of information by registered investment companies. In part, the final rules amended Regulation S-X and require standardized, enhanced disclosures about derivatives in investment company financial statements, as well as other amendments. As of August 1, 2017, management has implemented the amendments to Regulation S-X, which did not have a material impact on the Fund’s financial statements and related disclosures or impact the Fund’s net assets or results of operations.
11. SUBSEQUENT EVENTS
The Funds have been evaluated regarding the need for additional disclosures and/or adjustments resulting from subsequent events. Based on this evaluation, please note the additional disclosure:
On November 1, 2017 the Trust has entered into an agreement with BBH in which BBH will serve as the new securities lending agent for the Trust and each of its series. The agreement was implemented beginning January 1, 2018.
| Report of Independent Registered Public Accounting Firm |
To the Board of Trustees and Shareholders of Global X MLP & Energy Infrastructure ETF, Global X SuperDividend® Alternatives ETF and Global X U.S. Preferred ETF
In our opinion, the accompanying statements of assets and liabilities, including the schedules of investments, and the related statements of operations and of changes in net assets and the financial highlights present fairly, in all material respects, the financial position of Global X MLP & Energy Infrastructure ETF, Global X SuperDividend® Alternatives ETF and Global X U.S. Preferred ETF (three of the funds constituting part of the series of Global X Funds, hereafter referred to as the "Funds") as of November 30, 2017, the results of operations for the year then ended, and the changes in net assets and the financial highlights for each of the two years in the period then ended for Global X MLP & Energy Infrastructure ETF and Global X SuperDividend® Alternatives ETF, the results of operations, the changes in net assets and the financial highlights for the period September 11, 2017 (commencement of operations) through November 30, 2017 for Global X U.S. Preferred ETF, in conformity with accounting principles generally accepted in the United States of America. These financial statements and financial highlights (hereafter referred to as "financial statements") are the responsibility of the Funds’ management. Our responsibility is to express an opinion on these financial statements based on our audits. We conducted our audits of these financial statements in accordance with the standards of the Public Company Accounting Oversight Board (United States). Those standards require that we plan and perform the audit to obtain reasonable assurance about whether the financial statements are free of material misstatement. An audit includes examining, on a test basis, evidence supporting the amounts and disclosures in the financial statements, assessing the accounting principles used and significant estimates made by management, and evaluating the overall financial statement presentation. Our procedures included confirmation of securities owned as of November 30, 2017 by correspondence with the custodian and brokers; when replies were not received from brokers, we performed other auditing procedures. We believe that our audits provide a reasonable basis for our opinions.
The financial statements, as of and for the year or period ended November 30, 2015 and the financial highlights for each of the years or periods ended on or prior to November 30, 2015 (not presented herein, other than the financial highlights) were audited by other auditors whose report dated January 29, 2016 expressed an unqualified opinion on those financial statements and financial highlights.
| /s/ PricewaterhouseCoopers LLP | |
| Philadelphia, Pennsylvania | |
| January 26, 2018 | |
| Disclosure of Fund Expenses (Unaudited) |
All Exchange Traded Funds (“ETFs”) have operating expenses. As a shareholder of an ETF, your investment is affected by these ongoing costs, which include (among others) costs for ETF management, administrative services, commissions, and shareholder reports like this one. It is important for you to understand the impact of these costs on your investment returns. In addition, a shareholder is responsible for any brokerage fees as a result of his or her investment in the Fund, which is not reflected in the table below.
Operating expenses such as these are deducted from an ETF’s gross income and directly reduce its final investment return. These expenses are expressed as a percentage of the ETF’s average net assets; this percentage is known as the ETF’s expense ratio.
The following examples use the expense ratio and are intended to help you understand the ongoing costs (in dollars) of investing in your Fund and to compare these costs with those of other funds. The examples are based on an investment of $1,000 made at the beginning of the six-month period shown and held for the entire period (June 1, 2017 to November 30, 2017).
The table below illustrates your Fund’s costs in two ways:
Actual Fund Return. This section helps you to estimate the actual expenses that your Fund incurred over the period. The “Expenses Paid During Period” column shows the actual dollar expense cost incurred by a $1,000 investment in the Fund, and the “Ending Account Value” number is derived from deducting that expense cost from the Fund’s gross investment return.
You can use this information, together with the actual amount you invested in the Fund, to estimate the expenses you paid over that period. Simply divide your actual account value by $1,000 to arrive at a ratio (for example, an $8,600 account value divided by $1,000 = 8.6), then multiply that ratio by the number shown for your Fund under “Expenses Paid During Period.”
Hypothetical 5% Return. This section helps you compare your Fund’s costs with those of other funds. It assumes that the Fund had an annual 5% return before expenses during the year, but that the expense ratio (Column 3) for the period is unchanged. This example is useful in making comparisons because the Securities and Exchange Commission requires all funds to make this 5% calculation. You can assess your Fund’s comparative cost by comparing the hypothetical result for your Fund in the “Expenses Paid During Period” column with those that appear in the same charts in the shareholder reports for other funds.
| Disclosure of Fund Expenses (Unaudited) |
NOTE: Because the return is set at 5% for comparison purposes — NOT your Fund’s actual return — the account values shown may not apply to your specific investment.
| | | Beginning | | | Ending | | | | | | Expenses | |
| | | Account | | | Account | | | Annualized | | | Paid | |
| | | Value | | | Value | | | Expense | | | During | |
| | | 6/1/2017 | | | 11/30/2017 | | | Ratios | | | Period(1) | |
| Global X MLP & Energy Infrastructure ETF | | | | | | | | | | | | | | | | |
| Actual Fund Return | | $ | 1,000.00 | | | $ | 959.40 | | | | 0.45 | % | | $ | 2.20 | |
| Hypothetical 5% Return | | | 1,000.00 | | | | 1,022.82 | | | | 0.45 | | | | 2.27 | |
| Global X SuperDividend® Alternatives ETF | | | | | | | | | | | | | | | | |
| Actual Fund Return | | $ | 1,000.00 | | | $ | 1,031.30 | | | | 0.75 | % | | $ | 3.79 | |
| Hypothetical 5% Return | | | 1,000.00 | | | | 1,021.33 | | | | 0.75 | | | | 3.78 | |
| Global X U.S. Preferred ETF* | | | | | | | | | | | | | | | | |
| Actual Fund Return | | $ | 1,000.00 | | | $ | 1,007.50 | | | | 0.23 | % | | $ | 0.50 | (2) |
| Hypothetical 5% Return | | | 1,000.00 | | | | 1,023.94 | | | | 0.23 | | | | 1.14 | |
| * | Fund commenced operations on September 11, 2017. |
| (1) | Expenses are equal to the Fund’s annualized expense ratio multiplied by the average account value over the period, multiplied by 183/365 (to reflect the one-half year period.) |
| (2) | Expenses are equal to the Fund’s annualized expense ratio multiplied by the average account value over the period, multiplied by 80/365 (to reflect the one-half year period.) |
| Approval of Investment Advisory Agreement (unaudited) |
Section 15(c) of the Investment Company Act of 1940, as amended ("1940 Act"), requires that the board of trustees of an exchange-traded fund (“ETF”), including a majority of those trustees who are not "interested persons" of the ETF, as defined in the 1940 Act ("Independent Trustees"), consider on an initial basis and periodically thereafter (as required by the 1940 Act), at an in person meeting called for such purpose, the terms of each fund’s investment advisory agreement and whether to approve entering into, or renewing, each agreement.
At an in person quarterly Board meeting held on November 14, 2017, called for the purpose, the Board of Trustees (including the Trust’s Independent Trustees voting separately) considered and unanimously approved the continuation of (i) the Investment Advisory Agreement ("Renewal Investment Advisory Agreement") for each Fund included in this Annual Report (each, a “Renewal Fund”) and (ii) the Supervision and Administration Agreement between the Trust ("Renewal Supervision and Administration Agreement"), on behalf of each Renewal Fund, and Global X Management Company LLC ("Global X Management"). The Renewal Investment Advisory Agreement and the Renewal Supervision and Administration Agreement are referred to herein as the "Renewal Agreements."
On February 24, 2017, the Board of Trustees (including the Trust’s Independent Trustees voting separately) also initially considered and unanimously approved (i) the initial Investment Advisory Agreement (“New Investment Advisory Agreement”), for the Global X U.S. Preferred ETF (the “New Fund”) and (ii) the Supervision and Administration Agreement between the Trust (“New Supervision and Administration Agreement”), on behalf the fund, and Global X Management. The New Advisory Agreement and the New Supervision and Administration Agreement are referred to collectively as the “New Fund Agreements.”
In advance of the Board meeting, the Board (including the Trust’s Independent Trustees) and the Independent Trustees’ independent legal counsel requested (in writing) detailed information from Global X Management in connection with their consideration of the Renewal Agreements and received and reviewed written responses from Global X Management and supporting materials relating to those requests for information. In the course of their consideration of the Renewal Agreements, the Trust’s Independent Trustees were advised by their counsel and, in addition to meeting with management of Global X Management, they met separately in executive session with their counsel.
In determining to approve the continuation of the New Fund Agreements for the New Fund, the Board considered a variety of factors, including the factors discussed at greater detail below.
NEW FUND AGREEMENTS
Nature, Extent and Quality of Services
With respect to this factor, the Board considered:
| • | the terms of the New Fund Agreements and the range of services to be provided to the New Fund in accordance with the New Fund Agreements; |
| • | Global X Management’s key personnel and the portfolio managers who would provide investment advisory services to the New Fund; |
| Approval of Investment Advisory Agreement (unaudited) |
| • | Global X Management’s responsibilities under the New Fund Agreements to, among other things, (i) manage the investment operations of the New Fund and the composition of the New Fund’s assets, including the purchase, retention and disposition of its holdings, (ii) provide quarterly reports to the Trust’s officers and the Board and other reports as the Board deems necessary or appropriate, (iii) vote proxies, exercise consents, and exercise all other rights appertaining to securities and assets held by the New Fund, (iv) select broker-dealers to execute portfolio transactions for the New Fund when necessary, (v) assist in the preparation and filing of reports and proxy statements (if any) to the shareholders of the New Fund, and the periodic updating of the registration statement, prospectuses, statement of additional information, and other reports and documents for the New Fund that are required to be filed by the Trust with the Securities and Exchange Commission ("SEC") and other regulatory or governmental bodies, and (vi) monitor anticipated purchases and redemptions of the shares (including Creation Units) of the New Fund by shareholders and new investors; |
| • | the nature, extent and quality of all of the services (including advisory, administrative and compliance services) that would be provided by Global X Management or made available to the New Fund; and |
| • | the quality of Global X Management’s resources and personnel that would be made available to the New Fund, including Global X Management’s experience and the professional qualifications of Global X Management’s key personnel. |
Based on these considerations, the Board concluded that it was satisfied with the nature, extent and quality of the services to be provided to the New Fund by Global X Management.
Performance
The Board determined that, because the New Fund had not yet been operational for one calendar year, meaningful data relating to investment performance of the New Fund was not available and, therefore, could not be a factor in approving the New Fund Agreements.
Cost of Services and Profitability
With respect to this factor, the Board considered:
| • | Global X Management’s expected costs to provide investment management, supervision and administrative and related services to the New Fund; |
| • | The unitary fee (including the proposed investment advisory fee) ("Management Fee") that was proposed to be borne by the New Fund under the New Fund Agreements for the investment advisory, supervisory and administrative services that the New Fund requires under a unitary fee structure (including the types of fees and expenses that are not included within the unitary fee and would be borne by the New Fund) Fund; and |
| • | The expected profitability to Global X Management, if any, from all services to be provided to the New Fund and all aspects of the relationship between Global X Management and the New Fund. |
| Approval of Investment Advisory Agreement (unaudited) |
Based on these considerations, the Board concluded that the proposed Management Fee to be paid by the New Fund to Global X Management, in light of the nature, extent and quality of the services to be provided, was reasonable and in the best interests of the New Funds’ shareholders.
Comparison of Fees and Services
With respect to this factor, the Board considered:
| • | comparative information with respect to the proposed Management Fee to be paid to Global X Management by the New Fund. In connection with this consideration, Global X Management provided the Board with comparative expense data for the New Fund, including fees and expenses paid by unaffiliated comparable specialized and/or focused exchange-traded funds, and/or other comparable registered funds; |
| • | the structure of the proposed unitary Management Fee (which includes as one component the proposed investment advisory fee for the New Fund) and the expected total expense ratios for the New Fund. In this regard, the Board took into consideration that the purpose of adopting a unitary Management Fee structure for the New Fund was to create a simple, all-inclusive fee that would provide a level of predictability with respect to the overall expense ratio (i.e., the total fees) of the New Fund and that the proposed Management Fee for the New Fund was set at a competitive level to make the New Fund viable in the marketplace; and |
| • | that, under the unified Management Fee structure, Global X Management would be responsible for most ordinary expenses of the New Fund, including the costs of various third-party services required by the New Fund, including investment advisory, administrative, audit, certain custody, portfolio accounting, legal, transfer agency and printing costs, but that the New Fund would bear other expenses not covered under the proposed all-inclusive Management Fee, such as taxes, brokerage fees, commissions, and other transaction expenses, interest expenses, and extraordinary expenses. |
Based on these considerations, the Board concluded that the services to be received and the Fees to be charged under the New Fund Agreements were reasonable on a comparative basis.
Economies of Scale
With respect to this factor, the Board considered:
| • | the extent to which economies of scale would be realized as the New Fund grows and whether the proposed unitary Management Fee for the New Fund reflected these economies of scale; |
| • | the significant investment of time, personnel and other resources that Global X Management intends to make in the New Fund in order to seek to assure that the New Fund is attractive to investors; and |
| • | that the proposed unitary Management Fee would provide a high level of certainty as to the total level of expenses for the New Fund and its shareholders. |
Based on these considerations, the Board concluded that approval of the proposed unitary Management Fee for the New Fund appropriately addressed economies of scale.
| Approval of Investment Advisory Agreement (unaudited) |
Other Benefits
In considering the New Fund Agreements, in addition to the categories discussed above, the Board considered other benefits that may be realized by Global X Management as a result of its relationships with the New Fund. As a result, the Board concluded that, in the exercise of its business judgement, all information it considered supported approval of the New Fund Agreements.
Conclusion
After full consideration of the factors above, as well as other factors that were instructive in their consideration, the Board, including all of the Trust’s Independent Trustees voting separately, concluded, in the exercise of their business judgement, that the New Fund Agreements were fair and reasonable and in the best interest of the New Fund.
In reaching this decision, the Board did not assign relative weights to the factors discussed below nor did the Board deem any one factor or group of them to be controlling in and of themselves. Each member of the Board may have afforded different weight to the various factors.
| Approval of Investment Advisory Agreement (unaudited) |
RENEWAL AGREEMENTS
In determining to approve the continuation of the Renewal Agreements for the Renewal Funds, the Board considered a variety of factors, including the factors discussed at greater detail below.
Nature, Extent and Quality of Services
With respect to this factor, the Board considered:
| • | the terms of the Renewal Agreements and the range of services that would continue to be provided to each Renewal Fund in accordance with the Renewal Agreements; |
| • | Global X Management’s key personnel and the portfolio managers who would continue to provide investment advisory, supervision and administrative services to each Renewal Fund; |
| • | Global X Management’s responsibilities under the Renewal Agreements, among other things, to: (i) manage the investment operations of the Renewal Funds and the composition of the Renewal Funds’ assets, including the purchase, retention and disposition of their holdings, (ii) provide quarterly reports to the Trust’s officers and the Board and other reports as the Board deems necessary or appropriate, (iii) vote proxies, exercise consents, and exercise all other rights relating to securities and assets held by the Renewal Funds, (iv) select broker-dealers to execute portfolio transactions for the Renewal Funds when necessary, (v) assist in the preparation and filing of reports and proxy statements (if any) to the shareholders of the Renewal Funds, and the periodic updating of the registration statement, prospectuses, statement of additional information, and other reports and documents for the Renewal Funds that are required to be filed by the Trust with the SEC and other regulatory and governmental bodies, and (vi) monitor anticipated purchases and redemptions of the shares (including Creation Units) of the Renewal Funds by shareholders and new investors; |
| • | the nature, extent and quality of all of the services (including advisory, administrative and compliance services) that have been provided by Global X Management or made available to the Renewal Funds and the adequacy of Global X Management’s personnel resources that would continue to be made available to the Renewal Funds; and |
| • | Global X Management’s experience and the professional qualifications of Global X Management’s key personnel. |
Based on these considerations, the Board concluded that it was satisfied with the nature, extent and quality of the services provided to the Renewal Funds by Global X Management.
Performance
The Board considered the performance of each Renewal Fund. They examined the performance of the Renewal Funds for the one-year, three-year, and since-inception periods, as applicable. Also, the Board considered the total return and investments performance of the Renewal Funds relative to (i) the performance of unaffiliated comparable specialized and/or focused exchange-traded funds and other registered funds in the same classification as the Renewal Funds, which performance information is publicly available from such registered funds as well as other third party sources; and (ii) the performance of comparable registered funds and pertinent indexes. The Board considered instances of under-performance and over-performance with
| Approval of Investment Advisory Agreement (unaudited) |
respect to the comparator funds. The Board also considered the Renewal Funds’ tracking against their underlying indexes in absolute terms.
Based on these considerations and comparisons, the Board concluded that the investment performance of the Renewal Funds did not adversely affect the Boards approval of the continuance of the Renewal Agreements.
Cost of Services and Profitability
The Board considered Global X Management’s cost to provide investment management and related services to the Renewal Funds. In this regard, the Board considered the management fee (“Management Fee”) that has been borne or expected to be borne by the Renewal Funds under the Renewal Agreements for the various investment advisory, supervisory and administrative services that the Renewal Funds require under a unitary fee structure (including the types of fees and expenses that are not included within the unitary fee and would be borne by the Renewal Funds).
In addition, the Board considered expected profitability to Global X Management, as applicable, from all services provided or expected to be provided to the Renewal Funds and all aspects of Global X Management’s relationship with the Renewal Funds. In connection with these considerations, Global X Management provided the Board with financial information regarding its operations and the services provided to the Renewal Funds and discussed with the Board its current and expected, as applicable, profitability with respect to the Renewal Funds.
Based on these considerations, the Board concluded that the Management Fee rate paid by the Renewal Funds to Global X Management, in light of the nature, extent and quality of the services provided, was reasonable and in the best interests of The Renewal Funds’ shareholders.
Comparison of Fees and Services
With respect to this factor, the Board considered:
| • | comparative information with respect to the Management Fee paid to Global X Management by the Renewal Funds. In connection with this consideration, Global X Management provided the Board with comparative expense data for the Renewal Funds, including fees and expenses paid by unaffiliated comparable specialized and/or focused exchange-traded funds and/or other comparable registered funds. The Board considered the Adviser’s detailed explanation of the fee structures of any Renewal Fund that was above the average and median for their peer groups; |
| • | the structure of the unified Management Fee (which includes as one component the investment advisory fee for the Renewal Funds) and the current total expense ratios for the Renewal Funds. In this regard, the Board took into consideration that the purpose of adopting a unitary Management Fee structure for the Renewal Funds was to create a simple, all-inclusive fee that would provide a level of predictability with respect to the overall expense ratio (i.e., the total fees) of the Renewal Funds and that the proposed Management Fee for the Renewal Funds was set at a competitive fee to make the Renewal Funds viable in the marketplace; and |
| • | that, under the unified Management Fee structure, Global X Management is responsible for most ordinary expenses of the Renewal Funds, including the costs of various third-party services required by the Renewal Funds, including investment advisory, administrative, audit, certain custody, portfolio accounting, legal, transfer agency and printing costs, but that the Renewal Funds |
| Approval of Investment Advisory Agreement (unaudited) |
would bear other expenses not covered under the proposed all-inclusive Management Fee, such as taxes, brokerage fees, commissions, and other transaction expenses, interest expenses, and extraordinary expenses.
Based on these considerations, the Board concluded that the services received and the fees charged under the Renewal Agreements were reasonable on comparative basis.
Economies of Scale
With respect to this factor, the Board considered:
| • | the extent to which economies of scale would be realized as the Renewal Funds grow and whether the unitary Management Fee for the Renewal Funds reflected these economies of scale; |
| • | the significant investment of time, personnel and other resources that Global X Management has made and intends to continue to make in the Renewal Funds in order to seek to assure that the Renewal Funds are attractive to investors; and |
| • | that the unitary Management Fee would provide a high level of certainty as to the total level of expenses for the Renewal Funds and their shareholders. |
Based on these considerations, the Board concluded that the unitary Management Fee for the Renewal Funds appropriately addressed economies of scale.
Other Benefits
In considering the Renewal Agreements, in addition to the categories discussed above, The Board considered any other benefits realized by Global X Management as a result of its relationships with the Renewal Funds and concluded that all information it considered supported approval of the continuation of the Renewal Agreements.
Conclusion
After full consideration of the factors above, as well as other factors that were instructive in their consideration, the Board, including all of the Trust’s Independent Trustees voting separately, concluded, in the exercise of their business judgement, that the Renewal Agreements were fair and reasonable and in the best interest of each Renewal Fund.
In reaching this decision, the Board did not assign relative weights to the factors discussed below nor did the Board deem any one factor or group of them to be controlling in and of themselves. Each member of the Board may have afforded different weight to the various factors factors.
| Supplemental Information (Unaudited) |
Net asset value, or “NAV”, is the price per Share at which the Funds issue and redeem Shares. It is calculated in accordance with the standard formula for valuing mutual fund shares. The “Market Price” of the Funds generally is determined using the midpoint between the highest bid and the lowest offer on the stock exchange on which the Shares of the Funds are listed for trading, as of the time that the Fund’s NAV is calculated. The Funds’ Market Price may be at, above or below their NAV. The NAV of the Funds will fluctuate with changes in the market value of the Funds’ holdings. The Market Price of the Funds will fluctuate in accordance with changes in their NAV, as well as market supply and demand.
Premiums or discounts are the differences (expressed as a percentage) between the NAV and Market Price of the Funds on a given day, generally at the time NAV is calculated. A premium is the amount that the Funds are trading above the reported NAV, expressed as a percentage of the NAV. A discount is the amount that the Funds are trading below the reported NAV, expressed as a percentage of the NAV.
Further information regarding premiums and discounts is available on the Funds’ website at www.GlobalXFunds.com
| Trustees and Officers of the Trust (unaudited) |
Set forth below are the names, addresses, year of birth, position with the Trust, term of office and length of time served, the principal occupations for the last five years, number of funds in fund complex overseen by the Trustees, and other directorships outside the fund complex of each of the persons currently serving as Trustees and Officers of the Trust.
| | | | Number of | |
| | | | Operational | |
| Name, | Position(s) | | Funds in | |
| Address | Held | | Trust | |
| (Year of | with | Principal Occupation(s) During | Overseen by | Other Directorships Held |
| Birth) | Funds | the Past 5 Years | Trustee | by Trustees |
| Independent Trustees2 | | | |
Sanjay Ram Bharwani 600 Lexington Avenue, 20th Floor New York, NY 10022 (1974) | Trustee (since 2008) | CEO of Risk Advisors Inc. (consulting firm) (since 2007) | 523 | None |
Scott R. Chichester1 600 Lexington Ave, 20th Floor New York, NY 10022 (1970) | Trustee (since 2008) | CFO, AdeptPros Inc. (app development, training and consulting) (since 2012); Founder, Madison Park Advisors LLC (advisory services) (since 2011); CFO, Sterling Seal & Supply Inc. (since 2011); President & Treasurer, Bayview Acquisition Corp (2010-2012); Founder and President, DirectPay USA LLC (payroll company) (since 2006); Proprietor, Scott R. Chichester CPA (CPA firm) (since 2001) | 523 | Director of AdeptPros Inc. (since 2015); Director of Sterling Seal & Supply Inc. (since 2011); Director of Bayview Acquisition Corp. (since 2010); Trustee of ARK ETF Trust (since 2014) |
Kartik Kiran Shah 600 Lexington Ave, 20th Floor New York, NY 10022 (1977) | Trustee (since 2008) | Chief Business Officer, Oxeia Biopharmaceuticals, Inc. (since 2014); Vice President, Business Development, Cynvenio Biosystems (2012-2014); Independent Consultant, Self-Employed (non-financial services) (2011-2012) | 523 | Director of Oxeia Biopharmaceuticals, Inc. (since 2014) |
| Trustees and Officers of the Trust (unaudited) |
The Trust’s Statement of Additional Information (“SAI”) includes additional information about the Trustees and Officers. The SAI may be obtained without charge by calling 1-888-493-8631. The following chart lists Trustees and Officers as of November 30, 2017:
| | | | Number of Funds | |
| | | Principal Occupation(s) | in Trust | Other |
| Name, Address | Position(s) Held | During | Overseen by | Directorships Held |
| (Year of Birth) | with Funds | the Past 5 Years | Trustee | by Trustees |
| Interested Trustee / Officers2 | | | |
Bruno del Ama 600 Lexington Ave, 20th Floor New York, NY 10022 (1976) | Trustee (since 2008), President, Chief Executive Officer (since 2008) | Chief Executive Officer, Global X Management Company (“GXMC”) (since 2008); Chief Compliance Officer, GXMC (2008-2013) | 523 | None |
Luis Berruga 600 Lexington Ave, 20th Floor New York, NY 10022 (1977) | Chief Operating Officer, Treasurer, Principal Accounting Officer and Chief Financial Officer (since 9/2015) | Chief Financial Officer, GXMC (since 9/2015) and Chief Operating Officer (since 2/2014); Investment Banker, Jefferies (2012-2014); Regional Product Specialist, Morgan Stanley (2005 - 2012) | N/A | N/A |
Daphne Tippens Chisolm 600 Lexington Ave, 20th Floor New York, NY 10022 (1969) | Secretary (since 2012) | General Counsel, GXMC (since 2011); Chief Compliance Officer, GXMC (1/2014 - 5/2014 and 2/2015 - 9/2016) | N/A | N/A |
Joe Costello 600 Lexington Ave, 20th Floor New York, NY 10022 (1974) | Chief Compliance Officer (since 9/2016) | Chief Compliance Officer, FlexShares Funds (2011-2015); Vice President, Northern Trust Investments (2003 - 2015) | N/A | N/A |
| Trustees and Officers of the Trust (unaudited) |
| | | | Other Directorships |
| Name, Address | Position(s) Held | Principal Occupation(s) During | Held |
| (Year of Birth) | with Funds | the Past 5 Years | by Trustees |
Lisa Whittaker4 One Freedom Valley Drive Oaks, PA 19456 (1978) | Assistant Secretary (since 2013) | Counsel at SEI Investments (since 2012); Associate Counsel and Compliance Officer at The Glendale Trust Company (2011- 2012); Associate of Drinker Biddle & Reath LLP (2006-2011) | N/A |
Eric Kleinschmidt4 One Freedom Valley Drive Oaks, PA 19456 (1968) | Assistant Treasurer (since 2016) | Director, Fund Accounting, SEI Investments Global Funds Services (2004 to present) | N/A |
| 1 | Mr. Chichester is currently married to a sister of Mr. del Ama’s wife. While an “immediate family member” (as defined in Section 2(a)(19) of the 1940 Act) of Mr. del Ama would be considered an Interested Person, Mr. Chichester is not considered an immediate family member for this purpose. Although this fact was taken into consideration in determining whether Mr. Chichester should be considered to be an Independent Trustee for purposes of the Section 2(a)(19) of the 1940 Act, it was determined that this relationship was not one that should disqualify Mr. Chichester from serving as an Independent Trustee of the Trust. |
| 2 | Each Trustee serves until his successor is duly elected or appointed and qualified. |
| 3 | As of November 30, 2017, the Trust had ninety-six investment portfolios, fifty-two of which were operational. |
| 4 | These officers of the Trust also serve as officers of one or more mutual funds for which SEI Investments Company or an affiliate acts as investment manager, administrator or distributor. |
| Notice to Shareholders (unaudited) |
For shareholders that do not have a November 30, 2017 tax year end, this notice is for informational purposes only. For shareholders with a November 30, 2017 tax year end, please consult your tax advisor as to the pertinence of this notice. For the fiscal year ended November 30, 2017, the Fund has designated the following items with regard to distributions paid during the year.
| | | | | | | | | | | | | | | Qualifying | | | | | | | | | | | | | | | | |
| | | | | | | | | | | | | | | for | | | | | | | | | | | | | | | | |
| | | | | | | | | | | | | | | Corporate | | | | | | | | | | | | | | | | |
| | | Long-Term | | | Ordinary | | | | | | | | | Dividends | | | Qualifying | | | U.S. | | | Interest | | | Short Term | | | Foreign | |
| | | Capital Gain | | | Income | | | Return of | | | Total | | | Received | | | Dividend | | | Government | | | Related | | | Capital Gain | | | Tax | |
| | | Distributions | | | Distributions | | | Capital | | | Distributions | | | Deduction (1) | | | Income (2) | | | Interest (3) | | | Dividends (4) | | | Dividends (5) | | | Credit | |
| Global X MLP & Energy | | | | | | | | | | | | | | | | | | | | | | | | | | | | | | | | | | | | | | | | |
| Infrastructure ETF | | | 0.00 | % | | | 90.66 | % | | | 9.34 | % | | | 100.00 | % | | | 48.95 | % | | | 68.60 | % | | | 0.00 | % | | | 0.23 | % | | | 0.00 | % | | | 0.00 | % |
| Global X SuperDividend® | | | | | | | | | | | | | | | | | | | | | | | | | | | | | | | | | | | | | | | | |
| Alternatives ETF | | | 0.00 | % | | | 88.41 | % | | | 11.59 | % | | | 100.00 | % | | | 80.55 | % | | | 84.56 | % | | | 0.00 | % | | | 0.17 | % | | | 100.00 | % | | | 0.00 | % |
| Global X U.S. Preferred ETF | | | 0.00 | % | | | 100.00 | % | | | 0.00 | % | | | 100.00 | % | | | 0.08 | % | | | 0.08 | % | | | 0.00 | % | | | 48.24 | % | | | 0.00 | % | | | 0.00 | % |
| (1) | Qualifying dividends represent dividends which qualify for the corporate dividends received deduction and is reflected as a percentage of ordinary income distributions (the total of short term capital gain and net investment income distributions). |
| (2) | The percentage in this column represents the amount of "Qualifying Dividend Income" as created by the Jobs and Growth Relief Reconciliation Act of 2003 and is reflected as a percentage of ordinary income distributions (the total of short term capital gain and net investment income distributions). It is the intention of the Fund to designate the maximum amount permitted by law. |
| (3) | "U.S. Government Interest" represents the amount of interest that was derived from U.S. Government obligations and distributed during the fiscal year. Generally, interest from direct U.S. Government obligations is exempt from state income tax. |
| (4) | The percentage in this column represents the amount of "Interest Related Dividend" and is reflected as a percentage of ordinary income distributions. Interest related dividends is exempted from U.S. withholding tax when paid to foreign investors. |
| (5) | The percentage in this column represents the amount of "Short Term Capital Gain Dividend" and is reflected as a percentage of short term capital gain distribution that is exempted from U.S. withholding tax when paid to foreign investors. |
600 Lexington Avenue, 20th Floor
New York, NY 10022
1-888-GXFund-1
(1-888-493-8631)
www.globalxfunds.com
Investment Adviser and Administrator:
Global X Management Company LLC
600 Lexington Avenue, 20th Floor
New York, NY 10022
Distributor:
SEI Investments Distribution Co.
One Freedom Valley Drive
Oaks, PA 19456
Sub-Administrator:
SEI Investments Global Funds Services
One Freedom Valley Drive
Oaks, PA 19456
Counsel for Global X Funds and the Independent Trustees:
Stradley Ronon Stevens & Young, LLP
1250 Connecticut Avenue, N.W.
Suite 500
Washington, DC 20036
Custodian and Transfer Agent:
Brown Brothers Harriman & Co.
50 Post Office Square
Boston, MA 02110
Independent Registered Public Accounting Firm:
PricewaterhouseCoopers LLP
Two Commerce Square
Suite 1800
2001 Market Street
Philadelphia, PA 19103
This information must be preceded or accompanied by a current prospectus for the Funds described.
GLX-AR-006-0500
Global X FinTech ETF (ticker: FINX)
(formerly, Global X FinTech Thematic ETF)
Global X Internet of Things ETF (ticker: SNSR)
(formerly, Global X Internet of Things Thematic ETF)
Global X Robotics & Artificial Intelligence ETF (ticker: BOTZ)
(formerly, Global X Robotics & Artificial Intelligence Thematic ETF)
Global X Health & Wellness Thematic ETF (ticker: BFIT)
Global X Longevity Thematic ETF (ticker: LNGR)
Global X Millennials Thematic ETF (ticker: MILN)
Global X U.S. Infrastructure Development ETF (ticker: PAVE)
Global X Conscious Companies ETF (ticker: KRMA)
Global X Founder-Run Companies ETF (ticker: BOSS)
Global X Iconic U.S. Brands ETF (ticker: LOGO)
Annual Report
November 30, 2017
Shares are bought and sold at market price (not NAV) and are not individually redeemed from the Fund. Shares may only be redeemed directly from a Fund by Authorized Participants, in very large creation/redemption units. Brokerage commissions will reduce returns.
The Funds file their complete schedules of Fund holdings with the Securities and Exchange Commission (the “Commission”) for the first and third quarters of each fiscal year on Form N-Q within sixty days after the end of the period. The Funds’ Forms N -Q are available on the Commission’s website at http://www.sec.gov, and may be reviewed and copied at the Commission's Public Reference Room in Washington, DC. Information on the operation of the Public Reference Room may be obtained by calling 1-800-SEC-0330.
A description of the policies and procedures that Global X Funds uses to determine how to vote proxies relating to Fund securities, as well as information relating to how the Funds voted proxies relating to Fund securities during the most recent 12-month period ended June 30, is available (i) without charge, upon request, by calling 1-888-GXFund-1; and (ii) on the Commission’s website at http://www.sec.gov
| Management Discussion of Fund Performance (unaudited) |
| Global X FinTech ETF |
Global X FinTech ETF
The Global X FinTech ETF (“Fund”) seeks to provide investment results that correspond generally to the price and yield performance, before fees and expenses, of the INDXX Global Fintech Thematic Index (“Underlying Index”). The Fund is passively managed, which means the investment adviser does not attempt to take defensive positions in declining markets. The Fund generally seeks to fully replicate the Underlying Index.
The Underlying Index is designed to provide exposure to exchange-listed companies in developed markets that provide financial technology products and services, including companies involved in mobile payments, peer-to-peer and marketplace lending, financial analytics software and alternative currencies, as defined by the index provider.
For the 12-month period ended November 30, 2017 (the “Reporting Period”), the Fund increased 46.14%, while the Underlying Index increased 47.24%. The Fund had a net asset value of $14.91 per share on November 30, 2016 and ended the reporting period with a net asset value of $21.79 on November 30, 2017.
During the Reporting Period, the highest returns came from Square and LendingTree, which returned 203.09% and 188.12%, respectively. The worst performers were GFT Technologies and LendingClub, which returned -25.83% and -22.79%, respectively.
Financial Technology, or FinTech, is the application of cutting edge software and hardware to facilitate or improve traditional financial services. In some instances, these companies can be disruptive to entrenched industry players, such as peer-to-peer lenders look to disintermediate banks from the lending process. In other instances, FinTech firms can help improve existing processes or reduce costs at established firms, such as creating customized software to help a real estate firm manage their properties. During the Reporting Period, FINX experienced strong returns driven by a confluence of factors including a general tailwind for technology companies broadly, as well as the continued adoption of prominent FinTech categories like digital payments. During the Reporting Period, the Fund saw an average approximate exposure of 43% to the Data Processing and Outsourced Services sub-industry, 36% to Application Software, and 6% to Internet Software and Services. Geographically, the Fund maintained a high allocation of 67% to stocks in the United States, followed by Germany at 8%, and Switzerland at 7%.
| | | AVERAGE TOTAL RETURN FOR THE YEAR ENDED NOVEMBER 30, 2017 | |
| | | One Year Return | | | Annualized Inception to Date* | |
| | | Net Asset Value | | | Market Price | | | Net Asset Value | | | Market Price | |
| Global X FinTech ETF | | | 46.14 | % | | | 46.12 | % | | | 35.33 | % | | | 35.53 | % |
| INDXX Global Fintech Thematic Index | | | 47.24 | % | | | 47.24 | % | | | 36.27 | % | | | 36.27 | % |
| MSCI ACWI Index | | | 24.64 | % | | | 24.64 | % | | | 19.71 | % | | | 19.71 | % |
Growth of a 10,000 Investment
(at Net Asset Value)
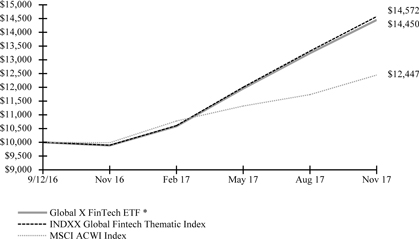
* The Fund commenced operations on September 12, 2016.
The MSCI ACWI (All Country World Index) Index is a free float-adjusted market capitalization weighted index that is designed to measure the equity market performance of developed and emerging markets.
The accompanying notes are an integral part of the financial statements.
| Management Discussion of Fund Performance (unaudited) |
| Global X FinTech ETF |
The performance data quoted herein represents past performance and the return and value of an investment in the Fund will fluctuate so that, when sold, it may be worth less than its original cost. Past performance is no guarantee of future performance and should not be considered as a representation of the future results of the Fund. The Fund's performance assumes the reinvestment of all dividends and all capital gains. Index returns assume reinvestment of dividends and, unlike the Fund's returns, do not reflect any fees or expenses. If such fees and expenses were included in the index returns, the performance would have been lower. Please note that one cannot invest directly in an unmanaged index.
There are no assurances that the Fund will meet its stated objectives.
The Fund’s holdings and allocations are subject to change and should not be considered recommendations to buy individual securities.
The graph and table do not reflect the deduction of taxes that a shareholder would pay on Fund distributions or the redemption or sale of Fund shares.
See definition of comparative indices on previous page.
The accompanying notes are an integral part of the financial statements.
| Management Discussion of Fund Performance (unaudited) |
| Global X Internet of Things ETF |
Global X Internet of Things ETF
The Global X Internet of Things ETF (“Fund”) seeks to provide investment results that correspond generally to the price and yield performance, before fees and expenses, of the INDXX Global Internet of Things Thematic Index (“Underlying Index”). The Fund is passively managed, which means the investment adviser does not attempt to take defensive positions in declining markets. The Fund generally seeks to fully replicate the Underlying Index.
The Underlying Index is designed to provide exposure to exchange-listed companies in developed markets that facilitate the Internet of Things industry, including companies involved in wearable technology, home automation, connected automotive technology, sensors, networking infrastructure/software, smart metering and energy control devices, as defined by the index provider. The Internet of Things refers to the network of physical objects (devices, vehicles, equipment, homes, buildings) that are connected to the internet through embedded devices and software, which allows these physical objects to collect, analyze and exchange data.
For the 12-month period ended November 30, 2017 (the “Reporting Period”), the Fund increased 30.04%, while the Underlying Index increased 30.29%. The Fund had a net asset value of $15.52 per share on November 30, 2016 and ended the Reporting Period with a net asset value of $20.12 on November 30, 2017.
During the Reporting Period, the highest returns came from ams AG and STMicroelectronics, which returned 235.19% and 126.08%, respectively. The worst performers were Fingerprint Cards and Telit Communications, which returned -43.66% and -38.66%, respectively.
With the advent of high speed wireless internet and cheap internet-capable chips, things are getting “smarter.” From home appliances and cars, to public infrastructure and factories, many everyday objects are being connected to networks and the worldwide web as part of the spread of the Internet of Things. There are over approximately 12 billion devices connected to the internet, and the number is expected to grow to more than 45 billion by 2023, according to some estimates. During the reporting period, the Fund benefited from a broad increase in technology stocks as well as the continued proliferation of the Internet of Things theme. During the Reporting Period, the Fund had an average approximate allocation of 39% to the Semiconductors sub-industry, followed by 16% to Electrical Components and Equipment, and 10% to Communications Equipment. Geographically, the Fund’s exposures came predominately from the United States at 60%, followed by Switzerland at 17%.
| | | AVERAGE TOTAL RETURN FOR THE YEAR ENDED NOVEMBER 30, 2017 | |
| | | One Year Return | | | Annualized Inception to Date* | |
| | | Net Asset Value | | | Market Price | | | Net Asset Value | | | Market Price | |
| Global X Internet of Things ETF | | | 30.04 | % | | | 29.47 | % | | | 27.35 | % | | | 27.55 | % |
| INDXX Global Internet of Things Thematic Index | | | 30.29 | % | | | 30.29 | % | | | 27.33 | % | | | 27.33 | % |
| MSCI ACWI Index | | | 24.64 | % | | | 24.64 | % | | | 19.71 | % | | | 19.71 | % |
Growth of a 10,000 Investment
(at Net Asset Value)
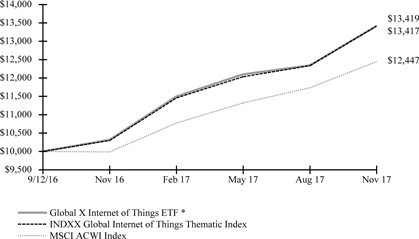
* The Fund commenced operations on September 12, 2016.
The MSCI ACWI (All Country World Index) Index is a free float-adjusted market capitalization weighted index that is designed to measure the equity market performance of developed and emerging markets.
The accompanying notes are an integral part of the financial statements.
| Management Discussion of Fund Performance (unaudited) |
| Global X Internet of Things ETF |
The performance data quoted herein represents past performance and the return and value of an investment in the Fund will fluctuate so that, when sold, it may be worth less than its original cost. Past performance is no guarantee of future performance and should not be considered as a representation of the future results of the Fund. The Fund's performance assumes the reinvestment of all dividends and all capital gains. Index returns assume reinvestment of dividends and, unlike the Fund's returns, do not reflect any fees or expenses. If such fees and expenses were included in the index returns, the performance would have been lower. Please note that one cannot invest directly in an unmanaged index.
There are no assurances that the Fund will meet its stated objectives.
The Fund’s holdings and allocations are subject to change and should not be considered recommendations to buy individual securities.
The graph and table do not reflect the deduction of taxes that a shareholder would pay on Fund distributions or the redemption or sale of Fund shares.
See definition of comparative indices on previous page.
The accompanying notes are an integral part of the financial statements.
| Management Discussion of Fund Performance (unaudited) |
| Global X Robotics & Artificial Intelligence ETF |
Global X Robotics & Artificial Intelligence ETF
The Global X Robotics & Artificial Intelligence ETF (“Fund”) seeks to provide investment results that correspond generally to the price and yield performance, before fees and expenses, of the INDXX Global Robotics & Artificial Intelligence Thematic Index (“Underlying Index”). The Fund is passively managed, which means the investment adviser does not attempt to take defensive positions in declining markets. The Fund generally seeks to fully replicate the Underlying Index.
The Underlying Index is designed to provide exposure to exchange-listed companies in developed markets that are involved in the development of robotics and/or artificial intelligence, including companies involved in developing industrial robots and production systems, automated inventory management, unmanned vehicles, voice/image/text recognition, and medical robots or robotic instruments, as defined by the index provider.
For the 12-month period ended November 30, 2017 (the “Reporting Period”), the Fund increased 61.22%, while the Underlying Index increased 60.65%. The Fund had a net asset value of $14.87 per share on November 30, 2016 and ended the Reporting Period with a net asset value of $23.96 on November 30, 2017.
During the Reporting Period, the highest returns came from Yaskawa Electric and Daifuku, which returned 190.15% and 186.32%, respectively. The worst performers were TransEnterix and QinetiQ Group, which returned -54.65% and -1.27%, respectively.
Robotics and artificial intelligence (AI) combines the rapidly improving abilities of both physical and cognitive technologies. Increasingly, these technologies are being viewed as highly disruptive to existing processes in areas such as industrial manufacturing, transportation, defense, health care, and agriculture. In addition to these commercial uses, robotics and AI are also appearing in consumer capacities, through the development of electronic toys, drones, personal assistants, and home appliances. Given the rapid growth of these commercial and consumer segments, as well as rising expectations for future growth, the Fund experienced strong performance over the Reporting Period. Over the Reporting Period, the Fund saw an average approximate allocation of 30% to Industrial Machinery, 17% to Electronic Equipment and Instruments, 11% to Electronic Components, and 10% to Healthcare Equipment. It was exposed predominately to Japan (47%), followed by the United States (24%) and Switzerland (9%).
| | | AVERAGE TOTAL RETURN FOR THE YEAR ENDED NOVEMBER 30, 2017 | |
| | | One Year Return | | | Annualized Inception to Date* | |
| | | Net Asset Value | | | Market Price | | | Net Asset Value | | | Market Price | |
| Global X Robotics & Artificial Intelligence ETF | | | 61.22 | % | | | 59.03 | % | | | 48.32 | % | | | 48.12 | % |
| INDXX Global Robotics & Artificial Intelligence Thematic Index | | | 60.65 | % | | | 60.65 | % | | | 47.78 | % | | | 47.78 | % |
| MSCI ACWI Index | | | 24.64 | % | | | 24.64 | % | | | 19.71 | % | | | 19.71 | % |
(at Net Asset Value)
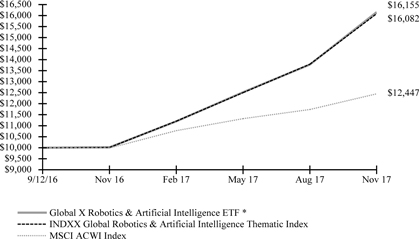
* The Fund commenced operations on September 12, 2016.
The MSCI ACWI (All Country World Index) Index is a free float-adjusted market capitalization weighted index that is designed to measure the equity market performance of developed and emerging markets.
The accompanying notes are an integral part of the financial statements.
| Management Discussion of Fund Performance (unaudited) |
| Global X Robotics & Artificial Intelligence ETF |
The performance data quoted herein represents past performance and the return and value of an investment in the Fund will fluctuate so that, when sold, it may be worth less than its original cost. Past performance is no guarantee of future performance and should not be considered as a representation of the future results of the Fund. The Fund's performance assumes the reinvestment of all dividends and all capital gains. Index returns assume reinvestment of dividends and, unlike the Fund's returns, do not reflect any fees or expenses. If such fees and expenses were included in the index returns, the performance would have been lower. Please note that one cannot invest directly in an unmanaged index.
There are no assurances that the Fund will meet its stated objectives.
The Fund’s holdings and allocations are subject to change and should not be considered recommendations to buy individual securities.
The graph and table do not reflect the deduction of taxes that a shareholder would pay on Fund distributions or the redemption or sale of Fund shares.
See definition of comparative indices on previous page.
The accompanying notes are an integral part of the financial statements.
| Management Discussion of Fund Performance (unaudited) |
| Global X Health & Wellness Thematic ETF |
Global X Health & Wellness Thematic ETF
The Global X Health & Wellness Thematic ETF (“Fund”) seeks to provide investment results that correspond generally to the price and yield performance, before fees and expenses, of the INDXX Global Health & Wellness Thematic Index (“Underlying Index”). The Fund is passively managed, which means the investment adviser does not attempt to take defensive positions in declining markets. The Fund generally seeks to fully replicate the Underlying Index.
The Underlying Index is designed to provide exposure to exchange-listed companies in developed markets that provide products and services that facilitate physical wellness through active and healthy lifestyles, including but not limited to companies involved in fitness equipment, fitness technology, athletic apparel, nutritional supplements, and organic/natural food offerings, as defined by the index provider.
For the 12-month period ended November 30, 2017 (the “Reporting Period”), the Fund increased 14.38%, while the Underlying Index increased 13.70%. The Fund had a net asset value of $14.72 per share on November 30, 2016 and ended the Reporting Period with a net asset value of $16.75 on November 30, 2017.
During the Reporting Period, the highest returns came from Weight Watchers International and Sanderson Farms, which returned 318.92% and 113.51%, respectively. The worst performers were Vitamin Shoppe and Bellamy's Australia, which returned -84.91% and -63.00%, respectively.
Population and average life expectancies have been on the rise around the globe, amid a backdrop of rapidly increasing health care costs. These trends have contributed to an increased desire among consumers to proactively lead healthy lifestyles. Rather than waiting to treat symptoms as they appear, many people are seeking to optimize their health and improve their quality of life by enhancing their physical and mental wellbeing. In an effort to capture this trend, the Fund had an average allocation of approximately 20% in the Apparel, Accessories and Luxury Goods sub-industry, 19% in the Packaged Foods and Meats sub -industry, and 17% in the Footwear sub -industry during the Reporting Period. Geographically, the Fund’s exposures came mainly from the United States at 43% and Japan at 15%.
| | | AVERAGE TOTAL RETURN FOR THE YEAR ENDED NOVEMBER 30, 2017 | |
| | | One Year Return | | | Annualized Inception to Date* | |
| | | Net Asset Value | | | Market Price | | | Net Asset Value | | | Market Price | |
| Global X Health & Wellness Thematic ETF | | | 14.38 | % | | | 14.12 | % | | | 7.10 | % | | | 7.81 | % |
| INDXX Global Health & Wellness Thematic Index | | | 13.70 | % | | | 13.70 | % | | | 6.26 | % | | | 6.26 | % |
| MSCI ACWI Index | | | 24.64 | % | | | 24.64 | % | | | 19.38 | % | | | 19.38 | % |
Growth of a 10,000 Investment
(at Net Asset Value)
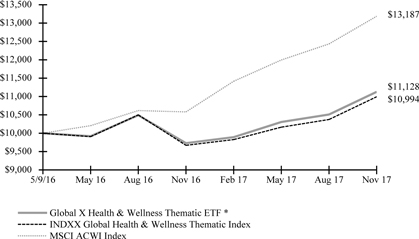
* The Fund commenced operations on May 9, 2016.
The MSCI ACWI (All Country World Index) Index is a free float-adjusted market capitalization weighted index that is designed to measure the equity market performance of developed and emerging markets.
The accompanying notes are an integral part of the financial statements.
| Management Discussion of Fund Performance (unaudited) |
| Global X Health & Wellness Thematic ETF |
The performance data quoted herein represents past performance and the return and value of an investment in the Fund will fluctuate so that, when sold, it may be worth less than its original cost. Past performance is no guarantee of future performance and should not be considered as a representation of the future results of the Fund. The Fund's performance assumes the reinvestment of all dividends and all capital gains. Index returns assume reinvestment of dividends and, unlike the Fund's returns, do not reflect any fees or expenses. If such fees and expenses were included in the index returns, the performance would have been lower. Please note that one cannot invest directly in an unmanaged index.
There are no assurances that the Fund will meet its stated objectives.
The Fund’s holdings and allocations are subject to change and should not be considered recommendations to buy individual securities.
The graph and table do not reflect the deduction of taxes that a shareholder would pay on Fund distributions or the redemption or sale of Fund shares.
See definition of comparative indices on previous page.
The accompanying notes are an integral part of the financial statements.
| Management Discussion of Fund Performance (unaudited) |
| Global X Longevity Thematic ETF |
Global X Longevity Thematic ETF
The Global X Longevity Thematic ETF (“Fund”) seeks to provide investment results that correspond generally to the price and yield performance, before fees and expenses, of the INDXX Global Longevity Thematic Index (“Underlying Index”). The Fund is passively managed, which means the investment adviser does not attempt to take defensive positions in declining markets. The Fund generally seeks to fully replicate the Underlying Index.
The Underlying Index is designed to provide exposure to exchange-listed companies in developed markets that facilitate the demographic trend of longer average life spans and the aging of the global population, including but not limited to companies involved in biotechnology, medical devices, pharmaceuticals, senior living facilities and specialized health care services, as defined by the index provider.
For the 12-month period ended November 30, 2017 (the “Reporting Period”), the Fund increased 30.58%, while the Underlying Index increased 30.76%. The Fund had a net asset value of $15.17 per share on November 30, 2016 and ended the Reporting Period with a net asset value of $19.60 on November 30, 2017.
During the Reporting Period, the highest returns came from Kite Pharma and bluebird bio, which returned 253.01% and 186.33%, respectively. The worst performers were Axovant Sciences and Radius Health, which returned -59.20% and -46.81%, respectively.
Around the world, people are living longer while at the same time, birth rates are falling. These trends are combining to create a powerful demographic shift of a growing senior population, both in total size and as a percentage of the overall population. Senior citizens have distinct needs from other demographic groups, and in particular depend on pharmaceuticals, biomedical devices, senior housing and care. The Fund’s exposures to these segments heavily tilts towards the Health Care and Real Estate sectors, but is geographically agnostic. Over the Reporting Period, the Fund saw an average approximate allocation of 36% to Biotechnology, followed by Healthcare Equipment (34%) and Healthcare REITs (10%). The Fund benefitted from its Health Care-heavy exposures. It was predominately exposed to the United States (69%), followed by Denmark (7%) and Ireland (4%).
| | | AVERAGE TOTAL RETURN FOR THE YEAR ENDED NOVEMBER 30, 2017 | |
| | | One Year Return | | | Annualized Inception to Date* | |
| | | Net Asset Value | | | Market Price | | | Net Asset Value | | | Market Price | |
| Global X Longevity Thematic ETF | | | 30.58 | % | | | 31.32 | % | | | 17.92 | % | | | 20.06 | % |
| INDXX Global Longevity Thematic Index | | | 30.76 | % | | | 30.76 | % | | | 17.91 | % | | | 17.91 | % |
| MSCI ACWI Index | | | 24.64 | % | | | 24.64 | % | | | 19.39 | % | | | 19.39 | % |
Growth of a 10,000 Investment
(at Net Asset Value)
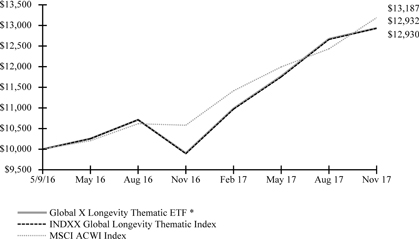
* The Fund commenced operations on May 9, 2016.
The MSCI ACWI (All Country World Index) Index is a free float-adjusted market capitalization weighted index that is designed to measure the equity market performance of developed and emerging markets.
The accompanying notes are an integral part of the financial statements.
| Management Discussion of Fund Performance (unaudited) |
| Global X Longevity Thematic ETF |
The performance data quoted herein represents past performance and the return and value of an investment in the Fund will fluctuate so that, when sold, it may be worth less than its original cost. Past performance is no guarantee of future performance and should not be considered as a representation of the future results of the Fund. The Fund's performance assumes the reinvestment of all dividends and all capital gains. Index returns assume reinvestment of dividends and, unlike the Fund's returns, do not reflect any fees or expenses. If such fees and expenses were included in the index returns, the performance would have been lower. Please note that one cannot invest directly in an unmanaged index.
There are no assurances that the Fund will meet its stated objectives.
The Fund’s holdings and allocations are subject to change and should not be considered recommendations to buy individual securities.
The graph and table do not reflect the deduction of taxes that a shareholder would pay on Fund distributions or the redemption or sale of Fund shares.
See definition of comparative indices on previous page.
The accompanying notes are an integral part of the financial statements.
| Management Discussion of Fund Performance (unaudited) |
| Global X Millennials Thematic ETF |
Global X Millennials Thematic ETF
The Global X Millennials Thematic ETF (“Fund”) seeks to provide investment results that correspond generally to the price and yield performance, before fees and expenses, of the INDXX Millennials Thematic Index (“Underlying Index”). The Fund is passively managed, which means the investment adviser does not attempt to take defensive positions in declining markets. The Fund generally seeks to fully replicate the Underlying Index.
The Underlying Index is designed to measure the performance of U.S. listed companies that provide exposure to the millennial generation, as defined by the index provider. The millennial generation refers to the demographic generational group in the United States with birth years ranging from 1980 to 2000.
For the 12-month period ended November 30, 2017 (the “Reporting Period”), the Fund increased 23.05%, while the Underlying Index increased 23.50%. The Fund had a net asset value of $15.58 per share on November 30, 2016 and ended the Reporting Period with a net asset value of $19.11 on November 30, 2017.
During the Reporting Period, the highest returns came from Square and LendingTree, which returned 203.09% and 188.12%, respectively. The worst performers were Vitamin Shoppe and GNC Holdings, which returned -84.91% and -60.79%, respectively.
Millennials are the largest generation in the United States and are a moving into their prime spending years. Currently, the U.S. workforce consists of approximately 55 million millennials, and continues to grow. While this generation has grown up in rapidly changing times, they possess unique spending habits that favor different companies and business models than their Generation X and Baby Boomer counterparts. Over the long term, certain companies involved in areas such as social media, live experiences, fast-casual dining, health and wellness, education, employment, housing and home goods, and financial software and services are expected to potentially benefit from the rising spending power of millennials. In seeking to gain exposure to these various segments, the Fund saw an average approximate allocation of 17% to Internet Software and Services, 15% to Internet & Direct Marketing Retail, and 10% to Residential REITs. The Fund benefitted from its Information Technology and Consumer Discretionary exposures.
| | | AVERAGE TOTAL RETURN FOR THE YEAR ENDED NOVEMBER 30, 2017 | |
| | | One Year Return | | | Annualized Inception to Date* | |
| | | Net Asset Value | | | Market Price | | | Net Asset Value | | | Market Price | |
| Global X MillennialsThematic ETF | | | 23.05 | % | | | 22.97 | % | | | 17.13 | % | | | 16.88 | % |
| INDXX Millennials Thematic Index | | | 23.50 | % | | | 23.50 | % | | | 17.53 | % | | | 17.53 | % |
| S&P 500 Index | | | 22.87 | % | | | 22.87 | % | | | 20.13 | % | | | 20.13 | % |
Growth of a 10,000 Investment
(at Net Asset Value)
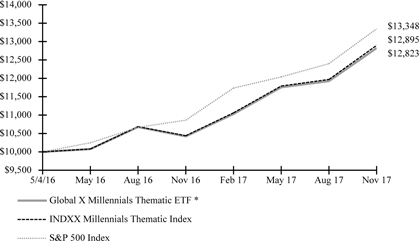
* The Fund commenced operations on May 4, 2016.
The S&P 500 Index is a market capitalization weighted composite index of 500 large capitalization U.S. companies.
The accompanying notes are an integral part of the financial statements.
| Management Discussion of Fund Performance (unaudited) |
| Global X Millennials Thematic ETF |
The performance data quoted herein represents past performance and the return and value of an investment in the Fund will fluctuate so that, when sold, it may be worth less than its original cost. Past performance is no guarantee of future performance and should not be considered as a representation of the future results of the Fund. The Fund's performance assumes the reinvestment of all dividends and all capital gains. Index returns assume reinvestment of dividends and, unlike the Fund's returns, do not reflect any fees or expenses. If such fees and expenses were included in the index returns, the performance would have been lower. Please note that one cannot invest directly in an unmanaged index.
There are no assurances that the Fund will meet its stated objectives.
The Fund’s holdings and allocations are subject to change and should not be considered recommendations to buy individual securities.
The graph and table do not reflect the deduction of taxes that a shareholder would pay on Fund distributions or the redemption or sale of Fund shares.
See definition of comparative indices on previous page.
The accompanying notes are an integral part of the financial statements.
| Management Discussion of Fund Performance (unaudited) |
| Global X U.S. Infrastructure Development ETF |
Global X U.S. Infrastructure Development ETF
The Global X U.S. Infrastructure Development ETF (“Fund”) seeks to provide investment results that correspond generally to the price and yield performance, before fees and expenses, of the INDXX U.S. Infrastructure Development Index (“Underlying Index”). The Fund is passively managed, which means the investment adviser does not attempt to take defensive positions in declining markets. The Fund generally seeks to fully replicate the Underlying Index.
The Underlying Index is designed to measure the performance of U.S. listed companies that provide exposure to domestic infrastructure development, including companies involved in construction and engineering; production of infrastructure raw materials, composites and products; industrial transportation; and producers/distributors of heavy construction equipment, as defined by the index provider.
For the period from the Fund's commencement date on March 6, 2017 through November 30, 2017 (the “Reporting Period”), the Fund increased 7.88%, while the Underlying Index increased 8.29%. The Fund had a net asset value of $14.98 per share on March 6, 2017 and ended the reporting period with a net asset value of $16.16 on November 30, 2017.
During the Reporting Period, the highest returns came from Manitowoc and Calgon Carbon Corporation, which returned 59.44% and 57.71%, respectively. The worst performers were Team Inc. and Chicago Bridge & Iron, which returned -57.30% and -47.86%, respectively.
The Fund invests in companies that are expected to benefit from a potential increase in infrastructure activities in the United States. These activities could include the development of new public or private infrastructure, as well as repairs to existing infrastructure. These companies include raw material producers, heavy equipment manufacturers, and engineering and construction companies. The performance of these companies was largely impacted by politics in Washington as many are influenced by infrastructure spending at the federal level. However, due to continued political gridlock, many state and local governments are looking to address their own infrastructure needs. From the Fund’s inception to November 30, 2017, the Fund saw an average approximate allocation of 66% to Industrials, 27% to Materials, and 4 % to Information Technology.
| | | AVERAGE TOTAL RETURN FOR THE | |
| | | PERIOD ENDED NOVEMBER 30, 2017 | |
| | | Cumulative Inception to Date* | |
| | | Net Asset Value | | | Market Price | |
| Global X U.S. Infrastructure Development ETF | | | 7.88 | % | | | 8.08 | % |
| INDXX U.S. Infrastructure Development Index | | | 8.29 | % | | | 8.29 | % |
| S&P 500 Index | | | 13.14 | % | | | 13.14 | % |
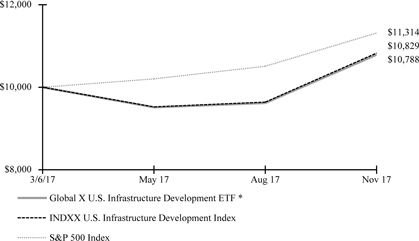
* The Fund commenced operations on March 6, 2017.
The S&P 500 Index is a market capitalization weighted composite index of 500 large capitalization U.S. companies.
The accompanying notes are an integral part of the financial statements.
| Management Discussion of Fund Performance (unaudited) |
| Global X U.S. Infrastructure Development ETF |
The performance data quoted herein represents past performance and the return and value of an investment in the Fund will fluctuate so that, when sold, it may be worth less than its original cost. Past performance is no guarantee of future performance and should not be considered as a representation of the future results of the Fund. The Fund's performance assumes the reinvestment of all dividends and all capital gains. Index returns assume reinvestment of dividends and, unlike the Fund's returns, do not reflect any fees or expenses. If such fees and expenses were included in the index returns, the performance would have been lower. Please note that one cannot invest directly in an unmanaged index.
There are no assurances that the Fund will meet its stated objectives.
The Fund’s holdings and allocations are subject to change and should not be considered recommendations to buy individual securities.
The graph and table do not reflect the deduction of taxes that a shareholder would pay on Fund distributions or the redemption or sale of Fund shares.
See definition of comparative indices on previous page.
The accompanying notes are an integral part of the financial statements.
| Management Discussion of Fund Performance (unaudited) |
| Global X Conscious Companies ETF |
Global X Conscious Companies ETF
The Global X Conscious Companies ETF (“Fund”) seeks to provide investment results that correspond generally to the price and yield performance, before fees and expenses, of the Concinnity Conscious Companies Index (“Underlying Index”). The Fund is passively managed, which means the investment adviser does not attempt to take defensive positions in declining markets. The Fund generally seeks to fully replicate the Underlying Index.
The Underlying Index is designed to provide exposure to companies listed in the United States that operate their businesses in a sustainable and responsible manner, as measured by their ability to achieve positive outcomes that are consistent with a multi-stakeholder operating system (“MsOS”), as defined by the index provider. The MsOS is a corporate governance structure that seeks to account for the multiple stakeholders that are critical for the ongoing success of the business, and incorporate the considerations of these stakeholders into the corporate decision-making and problem-solving process. The index provider conducts its analysis based on the following five key stakeholder groups: (1) Customers, (2) Employees, (3) Suppliers, (4) Stock and Debt Holders, and (5) Communities in which the companies operate.
For the 12-month period ended November 30, 2017 (the “Reporting Period”), the Fund increased 22.95%, while the Underlying Index increased 23.51%. The Fund had a net asset value of $15.79 per share on November 30, 2016 and ended the Reporting Period with a net asset value of $19.23 on November 30, 2017.
During the Reporting Period, the highest returns came from NVIDIA and Boeing, which returned 118.53% and 89.03%, respectively. The worst performers were General Electric and Chipotle Mexican Grill, which returned -38.50% and -31.40%, respectively.
While aligning investments with one’s personal values continues to gain traction, there are a variety of available methods to achieve this goal. Many values-based strategies apply a negative screening approach which starts with a broad market index and removes companies that score poorly in the pillars of Environmental, Social, and Governance (ESG). The Fund takes a different approach, looking to positively identify companies that seek beneficial outcomes for a variety of stakeholders, including employees, suppliers, customers, investors, and local communities. The investment adviser believes this methodology more proactively identifies the companies looking to have a positive influence across a number of measures. During the Reporting Period, the Fund had the highest average approximate exposure to the consumer discretionary (17%), information technology (16%), and industrials (15%) sectors.
| | | AVERAGE TOTAL RETURN FOR THE YEAR ENDED NOVEMBER 30, 2017 | |
| | | One Year Return | | | Annualized Inception to Date* | |
| | | Net Asset Value | | | Market Price | | | Net Asset Value | | | Market Price | |
| Global X Conscious Companies ETF | | | 22.95 | % | | | 22.78 | % | | | 19.92 | % | | | 19.96 | % |
| Concinnity Conscious Companies Index | | | 23.51 | % | | | 23.51 | % | | | 20.40 | % | | | 20.40 | % |
| S&P 500 Index | | | 22.87 | % | | | 22.87 | % | | | 19.11 | % | | | 19.11 | % |
Growth of a 10,000 Investment
(at Net Asset Value)
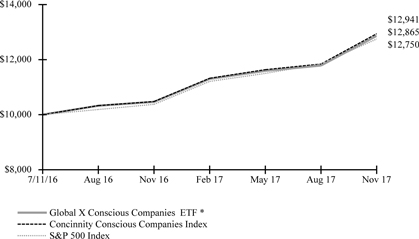
* The Fund commenced operations on July 11, 2016.
The S&P 500 Index is a market capitalization weighted composite index of 500 large capitalization U.S. companies.
The accompanying notes are an integral part of the financial statements.
| Management Discussion of Fund Performance (unaudited) |
| Global X Conscious Companies ETF |
The performance data quoted herein represents past performance and the return and value of an investment in the Fund will fluctuate so that, when sold, it may be worth less than its original cost. Past performance is no guarantee of future performance and should not be considered as a representation of the future results of the Fund. The Fund's performance assumes the reinvestment of all dividends and all capital gains. Index returns assume reinvestment of dividends and, unlike the Fund's returns, do not reflect any fees or expenses. If such fees and expenses were included in the index returns, the performance would have been lower. Please note that one cannot invest directly in an unmanaged index.
There are no assurances that the Fund will meet its stated objectives.
The Fund’s holdings and allocations are subject to change and should not be considered recommendations to buy individual securities.
The graph and table do not reflect the deduction of taxes that a shareholder would pay on Fund distributions or the redemption or sale of Fund shares.
See definition of comparative indices on previous page.
The accompanying notes are an integral part of the financial statements.
| Management Discussion of Fund Performance (unaudited) |
| Global X Founder-Run Companies ETF |
Global X Founder-Run Companies ETF
The Global X Founder-Run Companies ETF (“Fund”) seeks to provide investment results that correspond generally to the price and yield performance, before fees and expenses, of the Solactive U.S. Founder-Run Companies Index (“Underlying Index”). The Fund is passively managed, which means the investment adviser does not attempt to take defensive positions in declining markets. The Fund generally seeks to fully replicate the Underlying Index.
The Underlying Index is designed to provide exposure to U.S. companies in which a founder or co-founder of the company is serving as the Chief Executive Officer of the company, as defined by the index provider.
For the period from the Fund's commencement date on February 13, 2017 through November 30, 2017 (the “Reporting Period”), the Fund increased 15.91%, while the Underlying Index increased 16.58%. The Fund had a net asset value of $15.02 per share on February 13, 2017 and ended the reporting period with a net asset value of $17.41 on November 30, 2017.
During the Reporting Period, the highest returns came from Kite Pharma and Juno Therapeutics, which returned 233.13% and 147.04%, respectively. The worst performers were Intercept Pharmaceuticals and Medicines Company, which returned -49.92% and -42.74%, respectively.
The Fund seeks to outperform the broad market over the long term by harnessing the unique characteristics of firms that are run by their original founders. A significant portion of these founders’ personal wealth is often tied to the companies they lead. Therefore, these companies often focus on long-term value creation through innovation and entrepreneurialism and are less concerned with short term growth targets. In addition, founders tend to pay themselves lower salaries and take on less debt than average. The Fund saw an average approximate allocation of 28% in the Information Technology sector, 21% in the Health Care sector, and 14% in the Consumer Discretionary sector from the Fund’s inception to November 30, 2017.
| | | AVERAGE TOTAL RETURN FOR THE | |
| | | PERIOD ENDED NOVEMBER 30, 2017 | |
| | | Cumulative Inception to Date* | |
| | | Net Asset Value | | | Market Price | |
| Global X Founder-Run Companies ETF | | | 15.91 | % | | | 16.91 | % |
| Solactive U.S. Founder-Run Companies Index | | | 16.58 | % | | | 16.58 | % |
| S&P 500 Index | | | 15.60 | % | | | 15.60 | % |
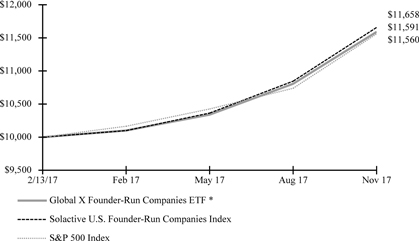
* The Fund commenced operations on February 13, 2017.
The S&P 500 Index is a market capitalization weighted composite index of 500 large capitalization U.S. companies.
The accompanying notes are an integral part of the financial statements.
| Management Discussion of Fund Performance (unaudited) |
| Global X Founder-Run Companies ETF |
The performance data quoted herein represents past performance and the return and value of an investment in the Fund will fluctuate so that, when sold, it may be worth less than its original cost. Past performance is no guarantee of future performance and should not be considered as a representation of the future results of the Fund. The Fund's performance assumes the reinvestment of all dividends and all capital gains. Index returns assume reinvestment of dividends and, unlike the Fund's returns, do not reflect any fees or expenses. If such fees and expenses were included in the index returns, the performance would have been lower. Please note that one cannot invest directly in an unmanaged index.
There are no assurances that the Fund will meet its stated objectives.
The Fund’s holdings and allocations are subject to change and should not be considered recommendations to buy individual securities.
The graph and table do not reflect the deduction of taxes that a shareholder would pay on Fund distributions or the redemption or sale of Fund shares.
See definition of comparative indices on previous page.
The accompanying notes are an integral part of the financial statements.
| Management Discussion of Fund Performance (unaudited) |
| Global X Iconic U.S. Brands ETF |
Global X Iconic U.S. Brands ETF
The Global X Iconic U.S. Brands ETF (“Fund”) seeks to provide investment results that correspond generally to the price and yield performance, before fees and expenses, of the Accuvest Iconic U.S. Brands Index (“Underlying Index”). The Fund is passively managed, which means the investment adviser does not attempt to take defensive positions in declining markets. The Fund generally seeks to fully replicate the Underlying Index.
The Underlying Index is designed to track the broad-based performance of U.S. listed and domiciled securities with iconic brands, as defined by the index provider. Companies with iconic brands are defined by the index provider as the leading companies from a select list of Business-to-Consumer and Business-to-Business sub-industries that provide exposure to consumer spending or to the consumption supply chain.
For the period from the Fund's commencement date on October 16, 2017 through November 30, 2017 (the “Reporting Period”), the Fund increased 3.48%, while the Underlying Index increased 3.52%. The Fund had a net asset value of $14.96 per share on October 16, 2017, its inception date, and ended the Reporting Period with a net asset value of $15.48 on November 30, 2017.
During the Reporting Period, the highest returns came from Anthem Inc. and Kroger Co., which returned 27.86% and 27.23%, respectively. The worst performers were Newell Brands Inc and Celgene Corp., which returned -27.01% and -26.25%, respectively.
Approximately 70% of U.S. gross domestic product stems from the consumption of goods and services. The companies that are in the best position to benefit from the economy’s high dependence on consumption tend to be large, well-known brands with established loyal customer bases. The Fund seeks to invest in these companies including those from traditional consumer sectors, like Consumer Discretionary and Consumer Staples, as well as less traditional sectors that play an important role in consumption, like Information Technology, Health Care, and Financials, amongst others. During the Reporting Period, the Fund had the highest average approximate exposure to the Consumer Discretionary (35%), Information Technology (16%), and Financials (15%) sectors.
| | | AVERAGE TOTAL RETURN FOR THE | |
| | | PERIOD ENDED NOVEMBER 30, 2017 | |
| | | Cumulative Inception to Date* | |
| | | Net Asset Value | | | Market Price | |
| Global X Iconic U.S. Brands ETF | | | 3.48 | % | | | 3.20 | % |
| Accuvest Iconic U.S. Brands Index | | | 3.52 | % | | | 3.52 | % |
| S&P 500 Index | | | 3.81 | % | | | 3.81 | % |
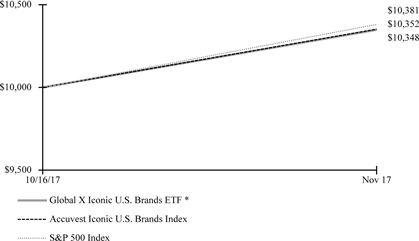
* The Fund commenced operations on October 16, 2017.
The S&P 500 Index is a market capitalization weighted composite index of 500 large capitalization U.S. companies.
The accompanying notes are an integral part of the financial statements.
| Management Discussion of Fund Performance (unaudited) |
| Global X Iconic U.S. Brands ETF |
The performance data quoted herein represents past performance and the return and value of an investment in the Fund will fluctuate so that, when sold, it may be worth less than its original cost. Past performance is no guarantee of future performance and should not be considered as a representation of the future results of the Fund. The Fund's performance assumes the reinvestment of all dividends and all capital gains. Index returns assume reinvestment of dividends and, unlike the Fund's returns, do not reflect any fees or expenses. If such fees and expenses were included in the index returns, the performance would have been lower. Please note that one cannot invest directly in an unmanaged index.
There are no assurances that the Fund will meet its stated objectives.
The Fund’s holdings and allocations are subject to change and should not be considered recommendations to buy individual securities.
The graph and table do not reflect the deduction of taxes that a shareholder would pay on Fund distributions or the redemption or sale of Fund shares.
See definition of comparative indices above.
The accompanying notes are an integral part of the financial statements.
| Schedule of Investments | November 30, 2017 |
Sector Weightings (unaudited)†:

† Sector weightings percentages are based on the total market value of investments.
| | | Shares | | | Value | |
| COMMON STOCK — 99.8% | | | | | | | | |
| AUSTRALIA — 3.2% | | | | | | | | |
| Technology — 3.2% | | | | | | | | |
| IRESS | | | 91,580 | | | $ | 756,411 | |
| MYOB Group | | | 322,900 | | | | 855,504 | |
| TOTAL AUSTRALIA | | | | | | | 1,611,915 | |
| CHINA— 2.5% | | | | | | | | |
| Financials — 2.5% | | | | | | | | |
| Yirendai ADR | | | 31,214 | | | | 1,244,190 | |
| DENMARK — 8.0% | | | | | | | | |
| Industrials — 5.4% | | | | | | | | |
| Nets * (A) | | | 103,620 | | | | 2,717,624 | |
| Technology — 2.6% | | | | | | | | |
| SimCorp | | | 21,610 | | | | 1,302,133 | |
| TOTAL DENMARK | | | | | | | 4,019,757 | |
| GERMANY — 9.2% | | | | | | | | |
| Financials — 1.0% | | | | | | | | |
| Hypoport * | | | 3,280 | | | | 507,244 | |
| Technology — 8.2% | | | | | | | | |
| GFT Technologies | | | 13,792 | | | | 203,506 | |
| Wirecard | | | 36,206 | | | | 3,866,325 | |
| | | | | | | | 4,069,831 | |
| TOTAL GERMANY | | | | | | | 4,577,075 | |
| ISLE OF MAN — 4.1% | | | | | | | | |
| Technology — 4.1% | | | | | | | | |
| Paysafe Group * | | | 258,350 | | | | 2,051,091 | |
| JAPAN — 0.4% | | | | | | | | |
| Technology — 0.4% | | | | | | | | |
| Metaps * | | | 6,900 | | | | 192,377 | |
| SWITZERLAND — 7.7% | | | | | | | | |
| Financials — 1.0% | | | | | | | | |
| Leonteq | | | 8,570 | | | | 507,505 | |
| Technology — 6.7% | | | | | | | | |
| Temenos Group | | | 26,863 | | | | 3,321,113 | |
The accompanying notes are an integral part of the financial statements.
| Schedule of Investments | November 30, 2017 |
| | | Shares | | | Value | |
| COMMON STOCK — continued | | | | | | | | |
| TOTAL SWITZERLAND | | | | | | $ | 3,828,618 | |
| UNITED STATES — 64.7% | | | | | | | | |
| Financials — 13.5% | | | | | | | | |
| Black Knight * | | | 37,279 | | | | 1,673,827 | |
| HealthEquity * | | | 32,000 | | | | 1,659,840 | |
| LendingClub * | | | 215,455 | | | | 941,538 | |
| LendingTree * | | | 6,376 | | | | 1,925,234 | |
| On Deck Capital * | | | 38,250 | | | | 202,343 | |
| Virtu Financial, Cl A | | | 21,495 | | | | 350,369 | |
| | | | | | | | 6,753,151 | |
| Technology — 51.2% | | | | | | | | |
| Blucora * | | | 22,717 | | | | 466,834 | |
| Bottomline Technologies * | | | 21,591 | | | | 719,628 | |
| Ellie Mae * | | | 18,172 | | | | 1,606,223 | |
| Envestnet * | | | 23,390 | | | | 1,149,619 | |
| Fidelity National Information Services | | | 28,639 | | | | 2,701,517 | |
| First Data, Cl A * | | | 130,849 | | | | 2,152,466 | |
| Fiserv * | | | 18,850 | | | | 2,477,833 | |
| Guidewire Software * | | | 29,940 | | | | 2,227,237 | |
| Intuit | | | 17,348 | | | | 2,727,453 | |
| Mitek Systems * | | | 17,599 | | | | 158,391 | |
| PayPal Holdings * | | | 45,117 | | | | 3,416,710 | |
| Square, Cl A * | | | 84,525 | | | | 3,315,071 | |
| SS&C Technologies Holdings | | | 62,793 | | | | 2,592,723 | |
| | | | | | | | 25,711,705 | |
| TOTAL UNITED STATES | | | | | | | 32,464,856 | |
| TOTAL COMMON STOCK | | | | | | | | |
| (Cost $46,802,345) | | | | | | | 49,989,879 | |
| TOTAL INVESTMENTS — 99.8% | | | | | | | | |
| (Cost $46,802,345) | | | | | | $ | 49,989,879 | |
Percentages are based on Net Assets of $50,105,596.
| * | Non-income producing security. |
| (A) | Security sold within terms of a private placement memorandum, exempt from registration under Section 144A of the Securities Act of 1933, as amended, and may be sold only to dealers in that program or other "accredited investors." The total value of such securities as of November 30, 2017 was $2,717,624 and represents 5.4% of Net Assets. |
ADR — American Depositary Receipt
Cl — Class
As of November 30, 2017, all of the Fund's investments were considered Level 1, in accordance with authoritative guidance on fair value measurements and disclosure under U.S. GAAP.
For the period ended November 30, 2017, there have been no transfers between Level 1, Level 2 and Level 3 investments.
The accompanying notes are an integral part of the financial statements.
| Schedule of Investments | November 30, 2017 |
| Global X Internet of Things ETF |
Sector Weightings (unaudited)†:
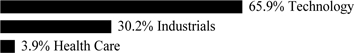
† Sector weightings percentages are based on the total market value of investments.
| | | Shares | | | Value | |
| COMMON STOCK — 99.9% | | | | | | | | |
| AUSTRIA — 6.4% | | | | | | | | |
| Technology — 6.4% | | | | | | | | |
| AMS | | | 55,740 | | | $ | 5,438,048 | |
| CANADA — 0.6% | | | | | | | | |
| Technology — 0.6% | | | | | | | | |
| Sierra Wireless * | | | 21,151 | | | | 478,414 | |
| FRANCE— 4.3% | | | | | | | | |
| Industrials — 4.3% | | | | | | | | |
| Legrand | | | 24,634 | | | | 1,849,283 | |
| Schneider Electric | | | 21,593 | | | | 1,859,148 | |
| TOTAL FRANCE | | | | | | | 3,708,431 | |
| HONG KONG — 0.4% | | | | | | | | |
| Industrials — 0.4% | | | | | | | | |
| Wasion Group Holdings | | | 659,760 | | | | 327,760 | |
| JAPAN — 0.8% | | | | | | | | |
| Industrials — 0.6% | | | | | | | | |
| Nippon Ceramic | | | 17,620 | | | | 479,450 | |
| Technology — 0.2% | | | | | | | | |
| JIG-SAW * | | | 4,226 | | | | 205,059 | |
| TOTAL JAPAN | | | | | | | 684,509 | |
| NETHERLANDS — 2.0% | | | | | | | | |
| Technology — 2.0% | | | | | | | | |
| NXP Semiconductors * | | | 15,510 | | | | 1,758,679 | |
| NORWAY— 0.6% | | | | | | | | |
| Technology — 0.6% | | | | | | | | |
| Nordic Semiconductor * | | | 107,812 | | | | 512,415 | |
| SWEDEN — 0.5% | | | | | | | | |
| Industrials — 0.5% | | | | | | | | |
| Fingerprint Cards, Cl B | | | 202,550 | | | | 416,331 | |
| SWITZERLAND — 11.0.% | | | | | | | | |
| Industrials — 2.0% | | | | | | | | |
| ABB | | | 67,152 | | | | 1,722,653 | |
| Technology — 9.0% | | | | | | | | |
| STMicroelectronics | | | 340,523 | | | | 7,730,669 | |
| TOTAL SWITZERLAND | | | | | | | 9,453,322 | |
The accompanying notes are an integral part of the financial statements.
| Schedule of Investments | November 30, 2017 |
| Global X Internet of Things ETF |
| | | Shares | | | Value | |
| COMMON STOCK — continued | | | | | | | | |
| TAIWAN — 6.8% | | | | | | | | |
| Technology — 6.8% | | | | | | | | |
| Advantech | | | 459,543 | | | $ | 3,064,233 | |
| eMemory Technology | | | 49,862 | | | | 658,310 | |
| MediaTek | | | 190,400 | | | | 2,069,427 | |
| TOTAL TAIWAN | | | | | | | 5,791,970 | |
| UNITED KINGDOM — 0.2% | | | | | | | | |
| Technology — 0.2% | | | | | | | | |
| Telit Communications | | | 83,730 | | | | 170,012 | |
| UNITED STATES — 66.3% | | | | | | | | |
| Health Care — 3.9% | | | | | | | | |
| DexCom * | | | 57,015 | | | | 3,331,386 | |
| Industrials — 22.4% | | | | | | | | |
| Ambarella * | | | 22,130 | | | | 1,200,995 | |
| Badger Meter | | | 19,188 | | | | 890,323 | |
| Belden | | | 27,903 | | | | 2,363,105 | |
| Emerson Electric | | | 28,916 | | | | 1,874,335 | |
| Honeywell International | | | 12,665 | | | | 1,975,233 | |
| Itron * | | | 25,499 | | | | 1,643,411 | |
| Johnson Controls International | | | 40,594 | | | | 1,527,958 | |
| Rockwell Automation | | | 10,582 | | | | 2,043,173 | |
| Sensata Technologies Holding * | | | 112,991 | | | | 5,643,901 | |
| | | | | | | | 19,162,434 | |
| Technology — 40.0% | | | | | | | | |
| Alarm.com Holdings * | | | 30,555 | | | | 1,252,450 | |
| Analog Devices | | | 20,884 | | | | 1,798,321 | |
| Cisco Systems | | | 53,320 | | | | 1,988,835 | |
| Cypress Semiconductor | | | 217,495 | | | | 3,482,095 | |
| Fitbit, Cl A * | | | 122,046 | | | | 837,236 | |
| Garmin | | | 99,198 | | | | 6,158,212 | |
| Impinj * | | | 13,512 | | | | 344,151 | |
| Intel | | | 49,430 | | | | 2,216,441 | |
| InterDigital | | | 22,887 | | | | 1,741,701 | |
| International Business Machines | | | 11,000 | | | | 1,693,670 | |
| NETGEAR * | | | 21,399 | | | | 1,102,049 | |
| QUALCOMM | | | 30,073 | | | | 1,995,043 | |
| Rambus * | | | 73,677 | | | | 1,090,420 | |
| Sigma Designs * | | | 42,487 | | | | 248,549 | |
| Silicon Laboratories * | | | 27,952 | | | | 2,546,427 | |
| Silver Spring Networks * | | | 34,939 | | | | 561,470 | |
| Skyworks Solutions | | | 49,373 | | | | 5,171,328 | |
| | | | | | | | 34,228,398 | |
The accompanying notes are an integral part of the financial statements.
| Schedule of Investments | November 30, 2017 |
| Global X Internet of Things ETF |
| | | Value | |
| COMMON STOCK — continued | | | | |
| TOTAL UNITED STATES | | $ | 56,722,218 | |
| TOTAL COMMON STOCK | | | | |
| (Cost $76,922,065) | | | 85,462,109 | |
| | | | | |
| TOTAL INVESTMENTS — 99.9% | | | | |
| (Cost $76,922,065) | | $ | 85,462,109 | |
Percentages are based on Net Assets of $85,520,999.
| * | Non-income producing security. |
Cl — Class
As of November 30, 2017, all of the Fund's investments were considered Level 1, in accordance with authoritative guidance on fair value measurements and disclosure under U.S. GAAP.
For the period ended November 30, 2017, there have been no transfers between Level 1, Level 2 or Level 3 investments.
The accompanying notes are an integral part of the financial statements.
| Schedule of Investments | November 30, 2017 |
| Global X Robotics & Artificial Intelligence ETF |
Sector Weightings (unaudited)†:
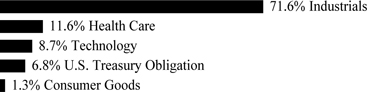
† Sector weightings percentages are based on the total market value of investments.
| | | Shares | | | Value | |
| COMMON STOCK — 97.7% | | | | | | | | |
| CANADA— 2.4% | | | | | | | | |
| Industrials — 2.4% | | | | | | | | |
| ATS Automation Tooling Systems * | | | 951,145 | | | $ | 11,842,246 | |
| Maxar Technologies | | | 374,708 | | | | 23,634,846 | |
| TOTAL CANADA | | | | | | | 35,477,092 | |
| FINLAND— 2.3% | | | | | | | | |
| Industrials — 2.3% | | | | | | | | |
| Cargotec, Cl B | | | 569,420 | | | | 32,677,761 | |
| GERMANY— 2.3% | | | | | | | | |
| Industrials — 2.3% | | | | | | | | |
| KUKA | | | 212,503 | | | | 32,719,476 | |
| ISRAEL— 1.0% | | | | | | | | |
| Health Care — 1.0% | | | | | | | | |
| Mazor Robotics ADR * | | | 244,409 | | | | 14,212,383 | |
| JAPAN— 49.2% | | | | | | | | |
| Health Care — 1.3% | | | | | | | | |
| CYBERDYNE * | | | 1,401,284 | | | | 18,620,341 | |
| Industrials — 47.9% | | | | | | | | |
| Daifuku | | | 1,245,506 | | | | 68,115,783 | |
| FANUC | | | 451,375 | | | | 112,717,701 | |
| Hirata | | | 110,531 | | | | 12,218,118 | |
| Keyence | | | 194,358 | | | | 112,736,498 | |
| Mitsubishi Electric | | | 6,169,237 | | | | 102,126,908 | |
| Omron | | | 1,207,294 | | | | 71,528,164 | |
| SMC | | | 176,163 | | | | 71,579,747 | |
| Toshiba Machine | | | 1,519,261 | | | | 10,766,042 | |
| Yaskawa Electric | | | 2,543,019 | | | | 112,487,771 | |
| | | | | | | | 674,276,732 | |
| TOTAL JAPAN | | | | | | | 692,897,073 | |
| SWITZERLAND— 8.1% | | | | | | | | |
| Health Care — 1.8% | | | | | | | | |
| Tecan Group | | | 119,782 | | | | 24,726,118 | |
| Industrials — 6.3% | | | | | | | | |
| ABB | | | 3,469,663 | | | | 89,007,394 | |
The accompanying notes are an integral part of the financial statements.
| Schedule of Investments | November 30, 2017 |
| Global X Robotics & Artificial Intelligence ETF |
| | | Shares / Face | | | | |
| | | Amount | | | Value | |
| COMMON STOCK — continued | | | | | | | | |
| TOTAL SWITZERLAND | | | | | | $ | 113,733,512 | |
| UNITED KINGDOM— 5.0% | | | | | | | | |
| Industrials — 5.0% | | | | | | | | |
| QinetiQ Group | | | 5,841,158 | | | | 17,086,854 | |
| Renishaw | | | 751,858 | | | | 54,093,798 | |
| TOTAL UNITED KINGDOM | | | | | | | 71,180,652 | |
| UNITED STATES— 27.4% | | | | | | | | |
| Consumer Goods — 1.4% | | | | | | | | |
| iRobot * | | | 282,451 | | | | 19,381,788 | |
| Health Care — 8.1% | | | | | | | | |
| Accuray * | | | 821,781 | | | | 4,232,172 | |
| Intuitive Surgical * | | | 275,914 | | | | 110,304,900 | |
| | | | | | | | 114,537,072 | |
| Industrials — 8.8% | | | | | | | | |
| Aerovironment * | | | 235,809 | | | | 10,748,174 | |
| FARO Technologies * | | | 167,535 | | | | 8,762,081 | |
| John Bean Technologies | | | 326,454 | | | | 39,092,867 | |
| Trimble Navigation * | | | 1,556,899 | | | | 65,374,189 | |
| | | | | | | | 123,977,311 | |
| Technology — 9.1% | | | | | | | | |
| Brooks Automation | | | 717,263 | | | | 17,852,676 | |
| NVIDIA | | | 554,125 | | | | 111,218,429 | |
| | | | | | | | 129,071,105 | |
| TOTAL UNITED STATES | | | | | | | 386,967,276 | |
| TOTAL COMMON STOCK | | | | | | | | |
| (Cost $1,249,624,244) | | | | | | | 1,379,865,225 | |
| | | | | | | | | |
| U.S. TREASURY OBLIGATION — 7.1% | | | | | | | | |
| United States Treasury Bill | | | | | | | | |
| 0.950%, 12/07/17(A) | | | | | | | | |
| (Cost $99,984,167) | | | 100,000,000 | | | | 99,983,979 | |
| TOTAL INVESTMENTS — 104.8% | | | | | | | | |
| (Cost $1,349,608,411) | | | | | | $ | 1,479,849,204 | |
Percentages are based on Net Assets of $1,412,589,454.
| * | Non-income producing security. |
| (A) | The rate reported on the Schedule of Investments is the effective yield at time of purchase. |
ADR — American Depositary Receipt
Cl — Class
The accompanying notes are an integral part of the financial statements.
| Schedule of Investments | November 30, 2017 |
| Global X Robotics & Artificial Intelligence ETF |
The following is a summary of the level of inputs used as of November 30, 2017, in valuing the Fund's investments carried at value:
| Investments in Securities | | Level 1 | | | Level 2 | | | Level 3 | | | Total | |
| Common Stock | | $ | 1,379,865,225 | | | $ | — | | | $ | — | | | $ | 1,379,865,225 | |
| U.S. Treasury Obligation | | | — | | | | 99,983,979 | | | | — | | | | 99,983,979 | |
| Total Investments in Securities | | $ | 1,379,865,225 | | | $ | 99,983,979 | | | $ | — | | | $ | 1,479,849,204 | |
For the period ended November 30, 2017, there have been no transfers between Level 1, Level 2 or Level 3 investments.
The accompanying notes are an integral part of the financial statements.
| Schedule of Investments | November 30, 2017 |
| Global X Health & Wellness Thematic ETF |
Sector Weightings (unaudited)†:
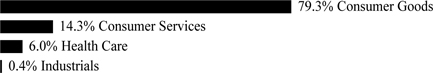
† Sector weightings percentages are based on the total market value of investments.
| | | Shares | | | Value | |
| COMMON STOCK — 99.8% | | | | | | | | |
| AUSTRALIA — 1.2% | | | | | | | | |
| Consumer Goods — 1.2% | | | | | | | | |
| Blackmores | | | 235 | | | $ | 29,907 | |
| CANADA— 3.4% | | | | | | | | |
| Consumer Goods — 3.4% | | | | | | | | |
| Gildan Activewear | | | 2,683 | | | | 85,261 | |
| CHINA— 6.0% | | | | | | | | |
| Consumer Goods — 5.7% | | | | | | | | |
| ANTA Sports Products | | | 25,571 | | | | 114,593 | |
| Li Ning * | | | 29,770 | | | | 23,137 | |
| Xtep International Holdings | | | 16,644 | | | | 6,180 | |
| | | | | | | | 143,910 | |
| Health Care — 0.3% | | | | | | | | |
| iKang Healthcare Group ADR * | | | 496 | | | | 7,261 | |
| TOTAL CHINA | | | | | | | 151,171 | |
| FINLAND — 1.7% | | | | | | | | |
| Consumer Goods — 1.7% | | | | | | | | |
| Amer Sports | | | 1,653 | | | | 43,499 | |
| FRANCE — 3.6% | | | | | | | | |
| Consumer Goods — 3.6% | | | | | | | | |
| Danone | | | 1,060 | | | | 89,635 | |
| GERMANY— 6.7% | | | | | | | | |
| Consumer Goods — 6.7% | | | | | | | | |
| adidas | | | 384 | | | | 80,217 | |
| Puma | | | 200 | | | | 89,188 | |
| TOTAL GERMANY | | | | | | | 169,405 | |
| HONG KONG — 2.5% | | | | | | | | |
| Consumer Goods — 2.5% | | | | | | | | |
| Yue Yuen Industrial Holdings | | | 17,769 | | | | 63,475 | |
| IRELAND— 2.6% | | | | | | | | |
| Consumer Goods — 2.6% | | | | | | | | |
| Glanbia^ | | | 3,481 | | | | 64,936 | |
The accompanying notes are an integral part of the financial statements.
| Schedule of Investments | November 30, 2017 |
| Global X Health & Wellness Thematic ETF |
| | | Shares | | | Value | |
| COMMON STOCK — continued | | | | | | | | |
| ITALY— 1.1% | | | | | | | | |
| Consumer Goods — 1.1% | | | | | | | | |
| Technogym (A) | | | 2,792 | | | $ | 26,849 | |
| JAPAN — 15.1% | | | | | | | | |
| Consumer Goods — 13.0% | | | | | | | | |
| ABC-Mart | | | 1,156 | | | | 63,634 | |
| Ariake Japan | | | 459 | | | | 41,755 | |
| Asics | | | 2,789 | | | | 41,272 | |
| Goldwin | | | 139 | | | | 10,185 | |
| Shimano | | | 491 | | | | 68,096 | |
| Yakult Honsha | | | 1,249 | | | | 97,773 | |
| Yonex | | | 680 | | | | 4,624 | |
| | | | | | | | 327,339 | |
| Consumer Services — 0.7% | | | | | | | | |
| Tosho | | | 334 | | | | 10,327 | |
| Xebio Holdings | | | 447 | | | | 8,257 | |
| | | | | | | | 18,584 | |
| Health Care — 1.4% | | | | | | | | |
| Tsumura | | | 988 | | | | 34,257 | |
| TOTAL JAPAN | | | | | | | 380,180 | |
| NETHERLANDS — 0.4% | | | | | | | | |
| Consumer Goods — 0.4% | | | | | | | | |
| Wessanen | | | 530 | | | | 10,677 | |
| SOUTH KOREA— 1.1% | | | | | | | | |
| Consumer Goods — 0.8% | | | | | | | | |
| Youngone | | | 609 | | | | 19,083 | |
| Consumer Services — 0.3% | | | | | | | | |
| Fila Korea | | | 112 | | | | 8,203 | |
| TOTAL SOUTH KOREA | | | | | | | 27,286 | |
| TAIWAN— 6.5% | | | | | | | | |
| Consumer Goods — 6.5% | | | | | | | | |
| Feng TAY Enterprise | | | 9,324 | | | | 39,013 | |
| Giant Manufacturing | | | 5,126 | | | | 25,635 | |
| Merida Industry | | | 4,088 | | | | 16,900 | |
| Pou Chen | | | 41,146 | | | | 49,385 | |
| Standard Foods | | | 12,775 | | | | 31,986 | |
| TOTAL TAIWAN | | | | | | | 162,919 | |
| UNITED KINGDOM — 4.1% | | | | | | | | |
| Consumer Goods — 0.2% | | | | | | | | |
| Glanbia^ | | | 210 | | | | 3,891 | |
The accompanying notes are an integral part of the financial statements.
| Schedule of Investments | November 30, 2017 |
| Global X Health & Wellness Thematic ETF |
| | | Shares | | | Value | |
| COMMON STOCK — continued | | | | | | | | |
| Consumer Services — 3.9% | | | | | | | | |
| JD Sports Fashion | | | 12,855 | | | $ | 57,388 | |
| Sports Direct International | | | 7,837 | | | | 40,154 | |
| | | | | | | | 97,542 | |
| TOTAL UNITED KINGDOM | | | | | | | 101,433 | |
| UNITED STATES — 43.8% | | | | | | | | |
| Consumer Goods — 29.8% | | | | | | | | |
| Calavo Growers | | | 245 | | | | 18,718 | |
| Cal-Maine Foods | | | 611 | | | | 30,397 | |
| Columbia Sportswear | | | 970 | | | | 68,201 | |
| Fitbit, Cl A * | | | 1,290 | | | | 8,849 | |
| Hain Celestial Group * | | | 1,444 | | | | 59,348 | |
| Herbalife * | | | 1,236 | | | | 86,693 | |
| Lululemon Athletica * | | | 1,390 | | | | 93,074 | |
| Medifast | | | 162 | | | | 11,102 | |
| Nautilus * | | | 425 | | | | 5,568 | |
| NIKE, Cl B | | | 1,303 | | | | 78,727 | |
| Nu Skin Enterprises, Cl A | | | 737 | | | | 50,050 | |
| Nutrisystem | | | 418 | | | | 21,214 | |
| Sanderson Farms | | | 317 | | | | 53,792 | |
| SunOpta * | | | 1,045 | | | | 8,256 | |
| Under Armour, Cl A * | | | 2,565 | | | | 34,089 | |
| USANA Health Sciences * | | | 342 | | | | 24,521 | |
| VF | | | 1,315 | | | | 95,943 | |
| | | | | | | | 748,542 | |
| Consumer Services — 9.3% | | | | | | | | |
| Dick's Sporting Goods | | | 1,230 | | | | 36,236 | |
| Finish Line, Cl A | | | 467 | | | | 5,039 | |
| Foot Locker | | | 997 | | | | 42,711 | |
| GNC Holdings, Cl A | | | 972 | | | | 5,424 | |
| Hibbett Sports * | | | 235 | | | | 4,688 | |
| Planet Fitness, Cl A * | | | 1,011 | | | | 32,726 | |
| Sprouts Farmers Market * | | | 1,905 | | | | 44,539 | |
| United Natural Foods * | | | 706 | | | | 33,902 | |
| Vitamin Shoppe * | | | 353 | | | | 1,324 | |
| Weight Watchers International * | | | 426 | | | | 18,774 | |
| Zumiez * | | | 409 | | | | 8,916 | |
| | | | | | | | 234,279 | |
| Health Care — 4.3% | | | | | | | | |
| DexCom * | | | 943 | | | | 55,099 | |
| Prestige Brands Holdings * | | | 739 | | | | 33,403 | |
| Tivity Health | | | 546 | | | | 20,093 | |
| | | | | | | | 108,595 | |
The accompanying notes are an integral part of the financial statements.
| Schedule of Investments | November 30, 2017 |
| Global X Health & Wellness Thematic ETF |
| | | Shares | | | Value | |
| COMMON STOCK — continued | | | | | | | | |
| Industrials — 0.4% | | | | | | | | |
| MINDBODY, Cl A * | | | 272 | | | $ | 8,867 | |
| TOTAL UNITED STATES | | | | | | | 1,100,283 | |
| TOTAL COMMON STOCK | | | | | | | | |
| (Cost $2,339,506) | | | | | | | 2,506,916 | |
| TOTAL INVESTMENTS — 99.8% | | | | | | | | |
| (Cost $2,339,506) | | | | | | $ | 2,506,916 | |
Percentages are based on Net Assets of $2,512,024.
| * | Non-income producing security. |
| ^ | Irish Security listed on the Irish Stock Exchange and London Stock Exchange. |
| (A) | Security sold within terms of a private placement memorandum, exempt from registration under Section 144A of the Securities Act of 1933, as amended, and may be sold only to dealers in that program or other “accredited investors.” The total value of such securities as of November 30, 2017 was $26,849 and represents 1.1% of Net Assets. |
ADR — American Depositary Receipt
Cl — Class
As of November 30, 2017, all of the Fund's investments were considered Level 1, in accordance with authoritative guidance on fair value measurements and disclosure under U.S. GAAP.
For the period ended November 30, 2017, there have been no transfers between Level 1, Level 2 and Level 3 investments.
The accompanying notes are an integral part of the financial statements.
| Schedule of Investments | November 30, 2017 |
| Global X Longevity Thematic ETF |
Sector Weightings (unaudited)†:
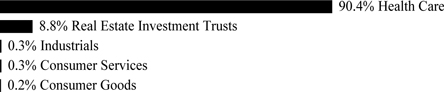
† Sector weightings percentages are based on the total market value of investments.
| | | Shares | | | Value | |
| COMMON STOCK — 99.8% | | | | | | | | |
| AUSTRALIA— 1.2% | | | | | | | | |
| Health Care — 1.2% | | | | | | | | |
| Cochlear | | | 539 | | | $ | 73,948 | |
| Regis Healthcare | | | 6,263 | | | | 17,972 | |
| TOTAL AUSTRALIA | | | | | | | 91,920 | |
| BELGIUM— 0.1% | | | | | | | | |
| Health Care — 0.1% | | | | | | | | |
| Ion Beam Applications | | | 386 | | | | 11,212 | |
| CHINA— 0.3% | | | | | | | | |
| Health Care — 0.3% | | | | | | | | |
| Luye Pharma Group | | | 32,947 | | | | 21,809 | |
| DENMARK — 7.6% | | | | | | | | |
| Health Care — 7.6% | | | | | | | | |
| Genmab * | | | 571 | | | | 112,522 | |
| GN Store Nord | | | 872 | | | | 27,494 | |
| H Lundbeck | | | 1,852 | | | | 93,554 | |
| Novo Nordisk, Cl B | | | 5,699 | | | | 294,733 | |
| William Demant Holding * | | | 2,473 | | | | 68,108 | |
| TOTAL DENMARK | | | | | | | 596,411 | |
| FRANCE — 2.4% | | | | | | | | |
| Health Care — 2.4% | | | | | | | | |
| BioMerieux | | | 1,111 | | | | 92,848 | |
| Korian | | | 667 | | | | 23,290 | |
| Orpea | | | 567 | | | | 68,451 | |
| TOTAL FRANCE | | | | | | | 184,589 | |
| GERMANY— 3.1% | | | | | | | | |
| Health Care — 3.1% | | | | | | | | |
| Fresenius Medical Care & KGaA | | | 2,455 | | | | 244,335 | |
| ITALY— 0.3% | | | | | | | | |
| Health Care — 0.3% | | | | | | | | |
| Amplifon | | | 1,625 | | | | 25,440 | |
| JAPAN— 3.5% | | | | | | | | |
| Health Care — 3.5% | | | | | | | | |
| Kissei Pharmaceutical | | | 793 | | | | 22,712 | |
The accompanying notes are an integral part of the financial statements.
| Schedule of Investments | November 30, 2017 |
| Global X Longevity Thematic ETF |
| | | Shares | | | Value | |
| COMMON STOCK — continued | | | | | | | | |
| Health Care — continued | | | | | | | | |
| Miraca Holdings | | | 452 | | | $ | 19,691 | |
| Mochida Pharmaceutical | | | 271 | | | | 19,664 | |
| Nipro | | | 1,535 | | | | 22,276 | |
| Terumo | | | 3,548 | | | | 170,575 | |
| Toho Holdings | | | 966 | | | | 20,139 | |
| TOTAL JAPAN | | | | | | | 275,057 | |
| NEW ZEALAND — 0.3% | | | | | | | | |
| Health Care — 0.3% | | | | | | | | |
| Ryman Healthcare | | | 3,334 | | | | 24,001 | |
| SOUTH KOREA— 3.1% | | | | | | | | |
| Health Care — 3.1% | | | | | | | | |
| Celltrion * | | | 1,143 | | | | 210,167 | |
| ViroMed * | | | 249 | | | | 36,060 | |
| TOTAL SOUTH KOREA | | | | | | | 246,227 | |
| SWEDEN— 0.5% | | | | | | | | |
| Health Care — 0.5% | | | | | | | | |
| Attendo (A) | | | 2,032 | | | | 21,249 | |
| Elekta, Cl B | | | 2,277 | | | | 19,071 | |
| TOTAL SWEDEN | | | | | | | 40,320 | |
| SWITZERLAND — 2.9% | | | | | | | | |
| Health Care — 2.9% | | | | | | | | |
| Sonova Holding | | | 614 | | | | 97,982 | |
| Straumann Holding | | | 148 | | | | 110,327 | |
| Ypsomed Holding | | | 107 | | | | 18,089 | |
| TOTAL SWITZERLAND | | | | | | | 226,398 | |
| TAIWAN — 0.2% | | | | | | | | |
| Health Care — 0.2% | | | | | | | | |
| OBI Pharma * | | | 2,334 | | | | 11,789 | |
| UNITED KINGDOM — 2.3% | | | | | | | | |
| Consumer Goods — 0.3% | | | | | | | | |
| McCarthy & Stone (A) | | | 8,647 | | | | 19,313 | |
| Health Care — 2.0% | | | | | | | | |
| Smith & Nephew | | | 8,154 | | | | 144,594 | |
| Vectura Group * | | | 10,410 | | | | 13,634 | |
| | | | | | | | 158,228 | |
| TOTAL UNITED KINGDOM | | | | | | | 177,541 | |
| UNITED STATES — 72.1% | | | | | | | | |
| Consumer Services — 0.3% | | | | | | | | |
| Diplomat Pharmacy * | | | 1,377 | | | | 24,648 | |
The accompanying notes are an integral part of the financial statements.
| Schedule of Investments | November 30, 2017 |
| Global X Longevity Thematic ETF |
| | | Shares | | | Value | |
| COMMON STOCK — continued | | | | | | | | |
| Health Care — 62.6% | | | | | | | | |
| AbbVie | | | 3,204 | | | $ | 310,533 | |
| ABIOMED * | | | 409 | | | | 79,690 | |
| ACADIA Pharmaceuticals * | | | 1,140 | | | | 34,485 | |
| Align Technology * | | | 753 | | | | 196,443 | |
| Alkermes * | | | 1,436 | | | | 75,088 | |
| Amedisys * | | | 389 | | | | 21,006 | |
| Amgen | | | 1,265 | | | | 222,210 | |
| Array BioPharma * | | | 2,427 | | | | 27,304 | |
| Axovant Sciences * | | | 1,025 | | | | 5,658 | |
| Becton Dickinson | | | 1,127 | | | | 257,192 | |
| BeiGene ADR * | | | 543 | | | | 43,440 | |
| Biogen Idec * | | | 767 | | | | 247,104 | |
| Bluebird Bio * | | | 242 | | | | 41,818 | |
| Blueprint Medicines * | | | 473 | | | | 35,503 | |
| Boston Scientific * | | | 8,411 | | | | 221,041 | |
| Brookdale Senior Living * | | | 1,565 | | | | 16,730 | |
| Celgene * | | | 1,649 | | | | 166,269 | |
| Clovis Oncology * | | | 377 | | | | 23,702 | |
| DaVita * | | | 1,826 | | | | 111,496 | |
| DENTSPLY SIRONA | | | 2,154 | | | | 144,340 | |
| DexCom * | | | 811 | | | | 47,387 | |
| Eagle Pharmaceuticals * | | | 234 | | | | 13,820 | |
| Edwards Lifesciences * | | | 1,979 | | | | 231,939 | |
| Ensign Group | | | 1,065 | | | | 25,848 | |
| Exact Sciences * | | | 892 | | | | 53,056 | |
| Exelixis * | | | 2,731 | | | | 73,955 | |
| FibroGen * | | | 842 | | | | 39,995 | |
| Glaukos * | | | 424 | | | | 11,350 | |
| Halozyme Therapeutics * | | | 1,629 | | | | 30,413 | |
| Incyte * | | | 1,492 | | | | 147,693 | |
| Inogen * | | | 266 | | | | 34,245 | |
| Insulet * | | | 488 | | | | 35,004 | |
| Integra LifeSciences Holdings * | | | 496 | | | | 24,116 | |
| Ionis Pharmaceuticals * | | | 1,163 | | | | 64,535 | |
| Juno Therapeutics * | | | 873 | | | | 47,683 | |
| Lexicon Pharmaceuticals * | | | 1,376 | | | | 14,063 | |
| LivaNova * | | | 400 | | | | 34,872 | |
| Medtronic | | | 2,576 | | | | 211,567 | |
| Merit Medical Systems * | | | 714 | | | | 31,023 | |
| Myriad Genetics * | | | 1,148 | | | | 39,755 | |
| Natus Medical * | | | 521 | | | | 20,866 | |
| NuVasive * | | | 282 | | | | 16,269 | |
| Puma Biotechnology * | | | 578 | | | | 61,210 | |
| Quest Diagnostics | | | 1,287 | | | | 126,718 | |
The accompanying notes are an integral part of the financial statements.
| Schedule of Investments | November 30, 2017 |
| Global X Longevity Thematic ETF |
| | | Shares | | | Value | |
| COMMON STOCK — continued | | | | | | | | |
| Health Care — continued | | | | | | | | |
| Radius Health * | | | 571 | | | $ | 16,165 | |
| Regeneron Pharmaceuticals * | | | 562 | | | | 203,365 | |
| Sage Therapeutics * | | | 282 | | | | 26,060 | |
| Seattle Genetics * | | | 1,338 | | | | 81,524 | |
| Stryker | | | 1,583 | | | | 246,948 | |
| TESARO * | | | 505 | | | | 42,723 | |
| Varian Medical Systems * | | | 876 | | | | 97,893 | |
| Vertex Pharmaceuticals * | | | 1,795 | | | | 259,002 | |
| Wright Medical Group * | | | 690 | | | | 16,774 | |
| Zimmer Biomet Holdings | | | 1,731 | | | | 202,700 | |
| | | | | | | | 4,911,588 | |
| Industrials — 0.3% | | | | | | | | |
| Integer Holdings * | | | 512 | | | | 24,806 | |
| Real Estate Investment Trusts — 8.8% | | | | | | | | |
| HCP | | | 4,394 | | | | 116,177 | |
| LTC Properties | | | 417 | | | | 19,115 | |
| National Health Investors | | | 277 | | | | 21,606 | |
| Omega Healthcare Investors | | | 1,847 | | | | 49,592 | |
| Quality Care Properties * | | | 1,060 | | | | 15,571 | |
| Sabra Health Care | | | 1,545 | | | | 29,726 | |
| Senior Housing Properties Trust | | | 2,232 | | | | 42,743 | |
| Ventas | | | 3,144 | | | | 201,248 | |
| Welltower | | | 2,828 | | | | 190,777 | |
| | | | | | | | 686,555 | |
| TOTAL UNITED STATES | | | | | | | 5,647,597 | |
| TOTAL COMMON STOCK | | | | | | | | |
| (Cost $7,334,511) | | | | | | | 7,824,646 | |
| | | | | | | | | |
| TOTAL INVESTMENTS — 99.8% | | | | | | | | |
| (Cost $7,334,511) | | | | | | $ | 7,824,646 | |
Percentages are based on Net Assets of $7,840,680.
| * | Non-income producing security. |
| (A) | Security sold within terms of a private placement memorandum, exempt from registration under Section 144A of the Securities Act of 1933, as amended, and may be sold only to dealers in that program or other "accredited investors." The total value of such securities as of November 30, 2017 was $40,562 and represents 0.5% of Net Assets. |
ADR — American Depositary Receipt
Cl — Class
As of November 30, 2017, all of the Fund's investments were considered Level 1, in accordance with authoritative guidance on fair value measurements and disclosure under U.S. GAAP.
For the period ended November 30, 2017, there have been no transfers between Level 1, Level 2 or Level 3 investments.
The accompanying notes are an integral part of the financial statements.
| Schedule of Investments | November 30, 2017 |
| Global X Millennials Thematic ETF |
Sector Weightings (unaudited)†:
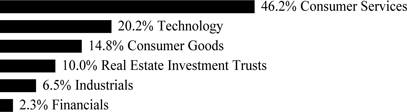
† Sector weightings percentages are based on the total market value of investments.
| | | Shares | | | Value | |
| COMMON STOCK — 99.8% | | | | | | | | |
| Consumer Goods — 14.7% | | | | | | | | |
| Carter's | | | 841 | | | $ | 91,097 | |
| Columbia Sportswear | | | 1,236 | | | | 86,903 | |
| Fitbit, Cl A * | | | 4,916 | | | | 33,724 | |
| GoPro, Cl A * | | | 3,435 | | | | 29,335 | |
| Hasbro | | | 2,204 | | | | 205,016 | |
| Lululemon Athletica * | | | 2,213 | | | | 148,182 | |
| Michael Kors Holdings * | | | 2,670 | | | | 156,035 | |
| NIKE, Cl B | | | 6,536 | | | | 394,906 | |
| Under Armour, Cl A * | | | 3,245 | | | | 43,126 | |
| VF | | | 5,156 | | | | 376,182 | |
| Wayfair, Cl A * | | | 962 | | | | 67,330 | |
| Zynga, Cl A * | | | 13,649 | | | | 55,961 | |
| | | | | | | | 1,687,797 | |
| Consumer Services — 46.1% | | | | | | | | |
| Amazon.com * | | | 331 | | | | 389,504 | |
| Avis Budget Group * | | | 1,452 | | | | 55,321 | |
| Bed Bath & Beyond | | | 2,516 | | | | 56,333 | |
| Bright Horizons Family Solutions * | | | 1,041 | | | | 92,598 | |
| CarMax * | | | 3,213 | | | | 221,408 | |
| Chegg * | | | 2,134 | | | | 32,458 | |
| Children's Place Retail Stores | | | 309 | | | | 41,066 | |
| Chipotle Mexican Grill, Cl A * | | | 502 | | | | 152,804 | |
| Costco Wholesale | | | 2,113 | | | | 389,700 | |
| Dick's Sporting Goods | | | 1,485 | | | | 43,748 | |
| DSW, Cl A | | | 1,715 | | | | 36,581 | |
| eBay * | | | 8,723 | | | | 302,426 | |
| El Pollo Loco Holdings * | | | 2,722 | | | | 28,717 | |
| Etsy * | | | 2,075 | | | | 34,155 | |
| Expedia | | | 2,246 | | | | 275,135 | |
| Francesca's Holdings * | | | 4,833 | | | | 35,861 | |
| GNC Holdings, Cl A | | | 4,115 | | | | 22,962 | |
| Groupon, Cl A * | | | 9,768 | | | | 55,092 | |
| GrubHub * | | | 1,520 | | | | 102,691 | |
The accompanying notes are an integral part of the financial statements.
| Schedule of Investments | November 30, 2017 |
| Global X Millennials Thematic ETF |
| | | Shares | | | Value | |
| COMMON STOCK — continued | | | | | | | | |
| Consumer Services — continued | | | | | | | | |
| Home Depot | | | 2,019 | | | $ | 363,056 | |
| K12 * | | | 1,912 | | | | 31,624 | |
| L Brands | | | 5,001 | | | | 280,406 | |
| Liberty Expedia Holdings, Cl A * | | | 955 | | | | 43,051 | |
| Live Nation Entertainment * | | | 3,631 | | | | 164,775 | |
| Lowe's | | | 4,073 | | | | 339,565 | |
| Netflix * | | | 1,696 | | | | 318,136 | |
| Pandora Media * | | | 4,420 | | | | 22,100 | |
| Pier 1 Imports | | | 8,068 | | | | 39,453 | |
| Planet Fitness, Cl A * | | | 1,504 | | | | 48,684 | |
| priceline.com * | | | 173 | | | | 300,970 | |
| Sprouts Farmers Market * | | | 2,381 | | | | 55,668 | |
| Starbucks | | | 5,936 | | | | 343,220 | |
| TripAdvisor * | | | 2,216 | | | | 76,718 | |
| Trivago ADR * | | | 3,060 | | | | 20,961 | |
| TrueCar * | | | 2,126 | | | | 25,916 | |
| Vitamin Shoppe * | | | 6,455 | | | | 24,206 | |
| Walt Disney | | | 3,428 | | | | 359,323 | |
| Yelp, Cl A * | | | 1,438 | | | | 64,063 | |
| | | | | | | | 5,290,455 | |
| Financials — 2.3% | | | | | | | | |
| LendingClub * | | | 7,223 | | | | 31,565 | |
| LendingTree * | | | 212 | | | | 64,013 | |
| Nelnet, Cl A | | | 644 | | | | 34,499 | |
| SLM * | | | 7,592 | | | | 87,840 | |
| Zillow Group, Cl A * | | | 1,005 | | | | 41,265 | |
| | | | | | | | 259,182 | |
| Industrials — 6.5% | | | | | | | | |
| Fiserv * | | | 2,613 | | | | 343,479 | |
| MINDBODY, Cl A * | | | 1,180 | | | | 38,468 | |
| PayPal Holdings * | | | 4,825 | | | | 365,397 | |
| | | | | | | | 747,344 | |
| Real Estate Investment Trusts — 10.0% | | | | | | | | |
| American Campus Communities | | | 2,401 | | | | 101,754 | |
| AvalonBay Communities | | | 1,836 | | | | 332,923 | |
| Camden Property Trust | | | 1,632 | | | | 148,969 | |
| Education Realty Trust | | | 1,287 | | | | 47,066 | |
| Equity Residential | | | 4,942 | | | | 330,224 | |
| UDR | | | 4,713 | | | | 185,362 | |
| | | | | | | | 1,146,298 | |
| Technology — 20.2% | | | | | | | | |
| Alphabet, Cl A * | | | 330 | | | | 341,935 | |
| Apple | | | 2,130 | | | | 366,041 | |
| Blucora * | | | 1,311 | | | | 26,941 | |
The accompanying notes are an integral part of the financial statements.
| Schedule of Investments | November 30, 2017 |
| Global X Millennials Thematic ETF |
| | | Shares | | | Value | |
| COMMON STOCK — continued | | | | | | | | |
| Technology — continued | | | | | | | | |
| Facebook, Cl A * | | | 1,925 | | | $ | 341,072 | |
| IAC * | | | 1,303 | | | | 165,833 | |
| Instructure * | | | 963 | | | | 33,464 | |
| Intuit | | | 2,278 | | | | 358,147 | |
| Match Group * | | | 1,278 | | | | 37,573 | |
| Snap, Cl A * | | | 14,291 | | | | 196,930 | |
| Square, Cl A * | | | 4,436 | | | | 173,980 | |
| Twitter * | | | 13,067 | | | | 268,919 | |
| | | | | | | | 2,310,835 | |
| TOTAL COMMON STOCK | | | | | | | | |
| (Cost $10,595,116) | | | | | | | 11,441,911 | |
| TOTAL INVESTMENTS — 99.8% | | | | | | | | |
| (Cost $10,595,116) | | | | | | $ | 11,441,911 | |
Percentages are based on Net Assets of $11,467,279.
| * | Non-income producing security. |
ADR — American Depositary Receipt
Cl — Class
As of November 30, 2017, all of the Fund's investments were considered Level 1, in accordance with authoritative guidance on fair value measurements and disclosure under U.S. GAAP.
For the period ended November 30, 2017, there have been no transfers between Level 1, Level 2 or Level 3 investments.
The accompanying notes are an integral part of the financial statements.
| Schedule of Investments | November 30, 2017 |
| Global X U.S. Infrastructure Development ETF |
Sector Weightings (unaudited)†:
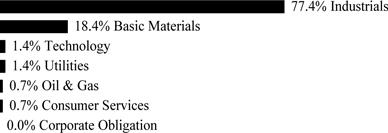
† Sector weightings percentages are based on the total market value of investments.
| | | Shares | | | Value | |
| COMMON STOCK — 99.7% | | | | | | | | |
| Basic Materials — 18.4% | | | | | | | | |
| AK Steel Holding * | | | 15,595 | | | $ | 75,948 | |
| Alcoa | | | 9,080 | | | | 376,911 | |
| Allegheny Technologies | | | 5,409 | | | | 123,163 | |
| Calgon Carbon | | | 3,515 | | | | 75,924 | |
| Century Aluminum * | | | 3,620 | | | | 47,965 | |
| Cleveland-Cliffs * | | | 11,450 | | | | 76,257 | |
| Commercial Metals | | | 5,740 | | | | 113,882 | |
| CSW Industrials * | | | 1,525 | | | | 73,352 | |
| Haynes International | | | 1,350 | | | | 43,254 | |
| Minerals Technologies | | | 1,734 | | | | 125,628 | |
| Nucor | | | 9,610 | | | | 552,575 | |
| Reliance Steel & Aluminum | | | 3,601 | | | | 283,075 | |
| RPM International | | | 6,629 | | | | 351,138 | |
| Ryerson Holding * | | | 5,254 | | | | 48,599 | |
| Steel Dynamics | | | 12,105 | | | | 466,042 | |
| United States Steel | | | 8,561 | | | | 247,584 | |
| Westlake Chemical | | | 6,404 | | | | 627,144 | |
| | | | | | | | 3,708,441 | |
| Consumer Services — 0.7% | | | | | | | | |
| Herc Holdings * | | | 1,125 | | | | 66,578 | |
| Titan Machinery * | | | 4,034 | | | | 76,646 | |
| | | | | | | | 143,224 | |
| Industrials — 77.1% | | | | | | | | |
| Acuity Brands | | | 2,198 | | | | 376,781 | |
| Advanced Drainage Systems | | | 2,309 | | | | 54,723 | |
| AECOM * | | | 7,704 | | | | 288,900 | |
| Aegion, Cl A * | | | 2,395 | | | | 66,174 | |
| Altra Industrial Motion | | | 1,500 | | | | 72,900 | |
| Anixter International * | | | 1,645 | | | | 117,617 | |
| Argan | | | 750 | | | | 44,250 | |
| Astec Industries | | | 800 | | | | 44,296 | |
| Atkore International Group * | | | 2,084 | | | | 44,348 | |
The accompanying notes are an integral part of the financial statements.
| Schedule of Investments | November 30, 2017 |
| Global X U.S. Infrastructure Development ETF |
| | | Shares | | | Value | |
| COMMON STOCK — continued | | | | | | | | |
| Industrials — continued | | | | | | | | |
| Badger Meter | | | 1,450 | | | $ | 67,280 | |
| Chicago Bridge & Iron | | | 4,971 | | | | 81,127 | |
| Columbus McKinnon | | | 2,025 | | | | 80,878 | |
| Crane | | | 2,915 | | | | 248,854 | |
| CSX | | | 12,034 | | | | 670,895 | |
| Eagle Materials | | | 2,401 | | | | 268,744 | |
| Eaton | | | 7,886 | | | | 613,373 | |
| EMCOR Group | | | 3,009 | | | | 243,037 | |
| Emerson Electric | | | 9,514 | | | | 616,697 | |
| Exponent | | | 951 | | | | 71,800 | |
| Fastenal | | | 11,238 | | | | 588,759 | |
| Fluor | | | 6,916 | | | | 334,804 | |
| Fortive | | | 10,097 | | | | 753,741 | |
| General Cable | | | 2,745 | | | | 59,017 | |
| Genesee & Wyoming, Cl A * | | | 3,045 | | | | 240,007 | |
| Global Brass & Copper Holdings | | | 1,675 | | | | 57,955 | |
| Gorman-Rupp | | | 1,720 | | | | 56,640 | |
| Granite Construction | | | 1,970 | | | | 130,749 | |
| H&E Equipment Services | | | 2,150 | | | | 79,958 | |
| HD Supply Holdings * | | | 9,994 | | | | 369,578 | |
| Hubbell, Cl B | | | 2,750 | | | | 345,923 | |
| Insteel Industries | | | 1,500 | | | | 41,325 | |
| Jacobs Engineering Group | | | 5,996 | | | | 393,517 | |
| Kansas City Southern | | | 5,354 | | | | 600,398 | |
| Lincoln Electric Holdings | | | 3,276 | | | | 298,575 | |
| Manitowoc * | | | 2,038 | | | | 81,887 | |
| Martin Marietta Materials | | | 2,425 | | | | 505,346 | |
| MasTec * | | | 4,090 | | | | 183,437 | |
| MDU Resources Group | | | 9,699 | | | | 271,087 | |
| Mueller Industries | | | 2,850 | | | | 103,740 | |
| Mueller Water Products, Cl A | | | 8,054 | | | | 100,594 | |
| MYR Group * | | | 1,450 | | | | 51,562 | |
| Norfolk Southern | | | 4,753 | | | | 658,908 | |
| Powell Industries | | | 1,450 | | | | 40,702 | |
| Quanta Services * | | | 7,179 | | | | 272,084 | |
| RBC Bearings * | | | 1,175 | | | | 156,804 | |
| Rexnord * | | | 5,134 | | | | 127,939 | |
| Rockwell Automation | | | 3,774 | | | | 728,684 | |
| SPX * | | | 2,226 | | | | 70,987 | |
| Stantec | | | 5,671 | | | | 153,684 | |
| Summit Materials, Cl A * | | | 5,340 | | | | 164,258 | |
| Team * | | | 1,651 | | | | 22,701 | |
| Tetra Tech | | | 2,845 | | | | 142,250 | |
| TimkenSteel * | | | 3,301 | | | | 49,845 | |
The accompanying notes are an integral part of the financial statements.
| Schedule of Investments | November 30, 2017 |
| Global X U.S. Infrastructure Development ETF |
| | | Shares / Face | | | | |
| | | Amount | | | Value | |
| COMMON STOCK — continued | | | | | | | | |
| Industrials — continued | | | | | | | | |
| Trimble Navigation * | | | 12,445 | | | $ | 522,566 | |
| Tutor Perini * | | | 1,875 | | | | 47,250 | |
| Union Pacific | | | 5,236 | | | | 662,354 | |
| United Rentals * | | | 4,199 | | | | 669,657 | |
| US Concrete * | | | 850 | | | | 68,722 | |
| Valmont Industries | | | 1,125 | | | | 194,400 | |
| Vulcan Materials | | | 4,340 | | | | 545,321 | |
| Wabash National | | | 3,151 | | | | 63,493 | |
| Wabtec | | | 4,421 | | | | 339,975 | |
| WESCO International * | | | 2,409 | | | | 157,910 | |
| | | | | | | | 15,581,767 | |
| Oil & Gas — 0.7% | | | | | | | | |
| MRC Global * | | | 4,734 | | | | 74,371 | |
| NOW * | | | 5,334 | | | | 55,047 | |
| | | | | | | | 129,418 | |
| Technology — 1.4% | | | | | | | | |
| Calix * | | | 7,730 | | | | 51,018 | |
| Dycom Industries * | | | 1,559 | | | | 167,390 | |
| Silver Spring Networks * | | | 4,359 | | | | 70,049 | |
| | | | | | | | 288,457 | |
| Utilities — 1.4% | | | | | | | | |
| Vectren | | | 4,115 | | | | 285,993 | |
| TOTAL COMMON STOCK | | | | | | | | |
| (Cost $18,373,542) | | | | | | | 20,137,300 | |
| | | | | | | | | |
| CORPORATE OBLIGATION — 0.0% | | | | | | | | |
| Mueller Industries | | | | | | | | |
| 6.000%, 03/01/27 (Cost $1,000) | | $ | 1,000 | | | | 1,027 | |
| TOTAL INVESTMENTS — 99.7% | | | | | | | | |
| (Cost $18,374,542) | | | | | | $ | 20,138,327 | |
Percentages are based on Net Assets of $20,203,218.
| * | Non-income producing security. |
Cl — Class
The following is a summary of the level of inputs used as of November 30, 2017, in valuing the Fund's investments carried at value:
| Investments in Securities | | Level 1 | | | Level 2 | | | Level 3 | | | Total | |
| Common Stock | | $ | 20,137,300 | | | $ | — | | | $ | — | | | $ | 20,137,300 | |
| Corporate Obligation | | | — | | | | 1,027 | | | | — | | | | 1,027 | |
| Total Investments in Securities | | $ | 20,137,300 | | | $ | 1,027 | | | $ | — | | | $ | 20,138,327 | |
For the period ended, there have been no transfers between Level 1, Level 2 or Level 3 investments.
The accompanying notes are an integral part of the financial statements.
| Schedule of Investments | November 30, 2017 |
| Global X Conscious Companies ETF |
Sector Weightings (unaudited)†:

† Sector weightings percentages are based on the total market value of investments.
| | | Shares | | | Value | |
| COMMON STOCK — 99.8% | | | | | | | | |
| CANADA — 0.7% | | | | | | | | |
| Financials — 0.7% | | | | | | | | |
| Toronto-Dominion Bank | | | 5,803 | | | $ | 330,423 | |
| UNITED STATES — 99.1% | | | | | | | | |
| Basic Materials — 2.9% | | | | | | | | |
| Air Products & Chemicals | | | 2,139 | | | | 348,743 | |
| Ecolab | | | 2,487 | | | | 338,033 | |
| Newmont Mining | | | 8,862 | | | | 327,805 | |
| Praxair | | | 2,302 | | | | 354,324 | |
| | | | | | | | 1,368,905 | |
| Consumer Goods — 15.1% | | | | | | | | |
| Campbell Soup | | | 7,133 | | | | 351,657 | |
| Clorox | | | 2,587 | | | | 360,344 | |
| Coca-Cola | | | 7,126 | | | | 326,157 | |
| Colgate-Palmolive | | | 4,580 | | | | 331,821 | |
| Dr Pepper Snapple Group | | | 3,667 | | | | 330,727 | |
| Estee Lauder, Cl A | | | 2,986 | | | | 372,742 | |
| Ford Motor | | | 26,993 | | | | 337,952 | |
| General Mills | | | 6,354 | | | | 359,383 | |
| Hasbro | | | 3,540 | | | | 329,291 | |
| Hershey | | | 3,008 | | | | 333,677 | |
| Hormel Foods | | | 10,872 | | | | 396,285 | |
| Kellogg | | | 5,378 | | | | 355,808 | |
| Kimberly-Clark | | | 2,937 | | | | 351,735 | |
| Molson Coors Brewing, Cl B | | | 3,938 | | | | 307,558 | |
| NIKE, Cl B | | | 6,159 | | | | 372,127 | |
| PepsiCo | | | 2,972 | | | | 346,297 | |
| Pool | | | 2,708 | | | | 340,233 | |
The accompanying notes are an integral part of the financial statements.
| Schedule of Investments | November 30, 2017 |
| Global X Conscious Companies ETF |
| | | Shares | | | Value | |
| COMMON STOCK — continued | | | | | | | | |
| Consumer Goods — continued | | | | | | | | |
| Procter & Gamble | | | 3,783 | | | $ | 340,432 | |
| PVH | | | 2,539 | | | | 341,622 | |
| Tupperware Brands | | | 5,389 | | | | 340,154 | |
| VF | | | 4,620 | | | | 337,075 | |
| | | | | | | | 7,263,077 | |
| Consumer Services — 16.5% | | | | | | | | |
| Alaska Air Group | | | 4,143 | | | | 286,571 | |
| Amazon.com * | | | 337 | | | | 396,564 | |
| Best Buy | | | 5,808 | | | | 346,215 | |
| Cardinal Health | | | 4,952 | | | | 293,109 | |
| CarMax * | | | 4,400 | | | | 303,204 | |
| Choice Hotels International | | | 4,869 | | | | 382,216 | |
| Copart * | | | 9,101 | | | | 392,799 | |
| Costco Wholesale | | | 2,028 | | | | 374,024 | |
| CVS Health | | | 4,329 | | | | 331,601 | |
| Darden Restaurants | | | 3,982 | | | | 335,762 | |
| Delta Air Lines | | | 6,187 | | | | 327,416 | |
| eBay * | | | 8,957 | | | | 310,539 | |
| Home Depot | | | 1,982 | | | | 356,403 | |
| Kohl's | | | 7,485 | | | | 359,055 | |
| L Brands | | | 7,406 | | | | 415,255 | |
| Lowe's | | | 4,128 | | | | 344,151 | |
| Marriott International, Cl A | | | 2,817 | | | | 357,759 | |
| Nordstrom | | | 7,907 | | | | 359,374 | |
| Omnicom Group | | | 4,640 | | | | 331,482 | |
| priceline.com * | | | 170 | | | | 295,751 | |
| Southwest Airlines | | | 5,596 | | | | 339,510 | |
| Starbucks | | | 6,063 | | | | 350,563 | |
| Walt Disney | | | 3,348 | | | | 350,937 | |
| | | | | | | | 7,940,260 | |
| Financials — 13.0% | | | | | | | | |
| Aflac | | | 3,892 | | | | 341,095 | |
| Allstate | | | 3,514 | | | | 360,747 | |
| American Express | | | 3,506 | | | | 342,571 | |
| BlackRock, Cl A | | | 695 | | | | 348,327 | |
| Capital One Financial | | | 3,677 | | | | 338,284 | |
| CBRE Group, Cl A * | | | 8,327 | | | | 361,059 | |
| Discover Financial Services | | | 4,883 | | | | 344,740 | |
| Jones Lang LaSalle | | | 2,561 | | | | 390,527 | |
| JPMorgan Chase | | | 3,261 | | | | 340,839 | |
| KeyCorp | | | 17,825 | | | | 338,319 | |
| Mastercard, Cl A | | | 2,257 | | | | 339,611 | |
| Moody's | | | 2,239 | | | | 339,925 | |
| PNC Financial Services Group | | | 2,388 | | | | 335,657 | |
The accompanying notes are an integral part of the financial statements.
| Schedule of Investments | November 30, 2017 |
| Global X Conscious Companies ETF |
| | | Shares | | | Value | |
| COMMON STOCK — continued | | | | | | | | |
| Financials — continued | | | | | | | | |
| Progressive | | | 6,712 | | | $ | 356,944 | |
| T Rowe Price Group | | | 3,410 | | | | 350,957 | |
| Travelers | | | 2,470 | | | | 334,858 | |
| US Bancorp | | | 6,071 | | | | 334,816 | |
| Visa, Cl A | | | 3,036 | | | | 341,823 | |
| | | | | | | | 6,241,099 | |
| Health Care — 11.6% | | | | | | | | |
| Abbott Laboratories | | | 5,942 | | | | 334,951 | |
| AbbVie | | | 3,589 | | | | 347,845 | |
| Amgen | | | 1,825 | | | | 320,580 | |
| Becton Dickinson | | | 1,560 | | | | 356,007 | |
| Biogen Idec * | | | 1,042 | | | | 335,701 | |
| Bristol-Myers Squibb | | | 5,170 | | | | 326,692 | |
| Celgene * | | | 2,734 | | | | 275,669 | |
| Edwards Lifesciences * | | | 2,880 | | | | 337,536 | |
| Eli Lilly | | | 3,863 | | | | 326,965 | |
| Illumina * | | | 1,561 | | | | 359,077 | |
| IQVIA Holdings * | | | 3,216 | | | | 328,064 | |
| Johnson & Johnson | | | 2,324 | | | | 323,803 | |
| Merck | | | 5,212 | | | | 288,067 | |
| Regeneron Pharmaceuticals * | | | 771 | | | | 278,994 | |
| Thermo Fisher Scientific | | | 1,693 | | | | 326,343 | |
| Varian Medical Systems * | | | 3,065 | | | | 342,514 | |
| Waters * | | | 1,754 | | | | 345,836 | |
| | | | | | | | 5,554,644 | |
| Industrials — 13.9% | | | | | | | | |
| 3M | | | 1,402 | | | | 340,882 | |
| Agilent Technologies | | | 4,889 | | | | 338,515 | |
| Automatic Data Processing | | | 2,826 | | | | 323,464 | |
| Ball | | | 7,668 | | | | 306,030 | |
| Boeing | | | 1,237 | | | | 342,401 | |
| Cummins | | | 1,845 | | | | 308,853 | |
| Danaher | | | 3,618 | | | | 341,394 | |
| FedEx | | | 1,457 | | | | 337,237 | |
| Fluor | | | 7,703 | | | | 372,902 | |
| General Electric | | | 15,030 | | | | 274,899 | |
| ManpowerGroup | | | 2,654 | | | | 342,101 | |
| Mettler-Toledo International * | | | 492 | | | | 309,571 | |
| Raytheon | | | 1,740 | | | | 332,601 | |
| Rockwell Automation | | | 1,744 | | | | 336,732 | |
| Rockwell Collins | | | 2,436 | | | | 322,307 | |
| Sonoco Products | | | 6,292 | | | | 336,685 | |
| Union Pacific | | | 2,915 | | | | 368,748 | |
| United Parcel Service, Cl B | | | 2,749 | | | | 333,866 | |
The accompanying notes are an integral part of the financial statements.
| Schedule of Investments | November 30, 2017 |
| Global X Conscious Companies ETF |
| | | Shares | | | Value | |
| COMMON STOCK — continued | | | | | | | | |
| Industrials — continued | | | | | | | | |
| Waste Management | | | 4,222 | | | $ | 347,260 | |
| WW Grainger | | | 1,659 | | | | 367,153 | |
| | | | | | | | 6,683,601 | |
| Oil & Gas — 5.0% | | | | | | | | |
| Chevron | | | 2,760 | | | | 328,412 | |
| ConocoPhillips | | | 6,454 | | | | 328,380 | |
| Devon Energy | | | 9,446 | | | | 363,954 | |
| EOG Resources | | | 3,411 | | | | 349,014 | |
| Hess | | | 7,468 | | | | 342,632 | |
| Occidental Petroleum | | | 4,999 | | | | 352,430 | |
| Schlumberger | | | 5,271 | | | | 331,282 | |
| | | | | | | | 2,396,104 | |
| Technology — 16.2% | | | | | | | | |
| Adobe Systems * | | | 1,917 | | | | 347,878 | |
| Akamai Technologies * | | | 6,339 | | | | 353,589 | |
| Alphabet, Cl A * | | | 333 | | | | 345,045 | |
| Analog Devices | | | 3,645 | | | | 313,871 | |
| Apple | | | 2,095 | | | | 360,026 | |
| Applied Materials | | | 5,837 | | | | 308,018 | |
| Autodesk * | | | 2,759 | | | | 302,662 | |
| Cisco Systems | | | 9,517 | | | | 354,984 | |
| Cognizant Technology Solutions, Cl A | | | 4,406 | | | | 318,466 | |
| Facebook, Cl A * | | | 1,915 | | | | 339,300 | |
| Intel | | | 8,038 | | | | 360,424 | |
| Intuit | | | 2,214 | | | | 348,085 | |
| KLA-Tencor | | | 3,056 | | | | 312,445 | |
| Microsoft | | | 4,174 | | | | 351,325 | |
| NVIDIA | | | 1,656 | | | | 332,376 | |
| Oracle | | | 6,584 | | | | 323,011 | |
| QUALCOMM | | | 6,065 | | | | 402,352 | |
| salesforce.com * | | | 3,336 | | | | 348,012 | |
| Teradata * | | | 10,107 | | | | 384,167 | |
| Texas Instruments | | | 3,412 | | | | 331,953 | |
| VMware, Cl A * | | | 2,751 | | | | 330,423 | |
| Workday, Cl A * | | | 3,071 | | | | 316,313 | |
| Xilinx | | | 4,596 | | | | 319,468 | |
| | | | | | | | 7,804,193 | |
| Telecommunications — 1.4% | | | | | | | | |
| AT&T | | | 9,438 | | | | 343,355 | |
| Verizon Communications | | | 6,724 | | | | 342,184 | |
| | | | | | | | 685,539 | |
| Utilities — 3.5% | | | | | | | | |
| Entergy | | | 3,828 | | | | 331,045 | |
| Exelon | | | 8,235 | | | | 343,482 | |
The accompanying notes are an integral part of the financial statements.
| Schedule of Investments | November 30, 2017 |
| Global X Conscious Companies ETF |
| | | Shares | | | Value | |
| COMMON STOCK — continued | | | | | | | | |
| Utilities — continued | | | | | | | | |
| NextEra Energy | | | 2,134 | | | $ | 337,257 | |
| Sempra Energy | | | 2,862 | | | | 346,274 | |
| WEC Energy Group | | | 4,925 | | | | 342,238 | |
| | | | | | | | 1,700,296 | |
| TOTAL UNITED STATES | | | | | | | 47,637,718 | |
| TOTAL COMMON STOCK | | | | | | | | |
| (Cost $42,880,610) | | | | | | | 47,968,141 | |
| TOTAL INVESTMENTS — 99.8% | | | | | | | | |
| (Cost $42,880,610) | | | | | | $ | 47,968,141 | |
Percentages are based on Net Assets of $48,064,733.
| * | Non-income producing security. |
Cl — Class
As of November 30, 2017, all of the Fund's investments were considered Level 1, in accordance with authoritative guidance on fair value measurements and disclosure under U.S. GAAP.
For the period ended November 30, 2017, there have been no transfers between Level 1, Level 2 or Level 3 investments.
The accompanying notes are an integral part of the financial statements.
| Schedule of Investments | November 30, 2017 |
| Global X Founder-Run Companies ETF |
Sector Weightings (unaudited)†:
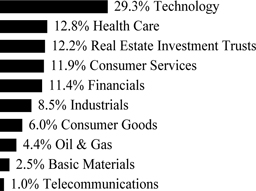
† Sector weightings percentages are based on the total market value of investments.
| | | Shares | | | Value | |
| COMMON STOCK — 99.9% | | | | | | | | |
| Basic Materials — 2.5% | | | | | | | | |
| Steel Dynamics | | | 924 | | | $ | 35,574 | |
| Westlake Chemical | | | 535 | | | | 52,393 | |
| | | | | | | | 87,967 | |
| Consumer Goods — 6.0% | | | | | | | | |
| Gentex | | | 1,610 | | | | 32,973 | |
| Hain Celestial Group * | | | 895 | | | | 36,785 | |
| National Beverage | | | 379 | | | | 41,356 | |
| Skechers U.S.A., Cl A * | | | 1,310 | | | | 45,981 | |
| Tesla * | | | 105 | | | | 32,429 | |
| Under Armour, Cl A * | | | 1,538 | | | | 20,440 | |
| | | | | | | | 209,964 | |
| Consumer Services — 11.8% | | | | | | | | |
| Amazon.com * | | | 36 | | | | 42,363 | |
| Cheesecake Factory | | | 520 | | | | 25,501 | |
| Chipotle Mexican Grill, Cl A * | | | 69 | | | | 21,003 | |
| DISH Network, Cl A * | | | 513 | | | | 25,983 | |
| GrubHub * | | | 770 | | | | 52,021 | |
| L Brands | | | 643 | | | | 36,053 | |
| Las Vegas Sands | | | 574 | | | | 39,772 | |
| Netflix * | | | 217 | | | | 40,705 | |
| Texas Roadhouse, Cl A | | | 310 | | | | 15,832 | |
| TripAdvisor * | | | 735 | | | | 25,446 | |
| Urban Outfitters * | | | 1,446 | | | | 45,000 | |
| Wynn Resorts | | | 270 | | | | 42,681 | |
| | | | | | | | 412,360 | |
| Financials — 11.4% | | | | | | | | |
| Athene Holding, Cl A * | | | 620 | | | | 29,803 | |
| BlackRock, Cl A | | | 87 | | | | 43,604 | |
| Capital One Financial | | | 413 | | | | 37,996 | |
The accompanying notes are an integral part of the financial statements.
| Schedule of Investments | November 30, 2017 |
| Global X Founder-Run Companies ETF |
| | | Shares | | | Value | |
| COMMON STOCK — continued | | | | | | | | |
| Financials — continued | | | | | | | | |
| Essent Group * | | | 894 | | | $ | 39,560 | |
| Interactive Brokers Group, Cl A | | | 955 | | | | 54,492 | |
| Intercontinental Exchange | | | 553 | | | | 39,512 | |
| MarketAxess Holdings | | | 172 | | | | 33,586 | |
| SEI Investments | | | 656 | | | | 46,156 | |
| Signature Bank NY * | | | 239 | | | | 32,810 | |
| Wintrust Financial | | | 468 | | | | 39,242 | |
| | | | | | | | 396,761 | |
| Health Care — 12.8% | | | | | | | | |
| Intercept Pharmaceuticals * | | | 295 | | | | 18,116 | |
| Ionis Pharmaceuticals * | | | 687 | | | | 38,122 | |
| Jazz Pharmaceuticals * | | | 208 | | | | 29,066 | |
| Juno Therapeutics * | | | 1,327 | | | | 72,481 | |
| Masimo * | | | 322 | | | | 28,607 | |
| Medicines * | | | 671 | | | | 19,459 | |
| MEDNAX * | | | 548 | | | | 27,285 | |
| Neurocrine Biosciences * | | | 619 | | | | 44,500 | |
| Regeneron Pharmaceuticals * | | | 85 | | | | 30,758 | |
| Seattle Genetics * | | | 484 | | | | 29,490 | |
| TESARO * | | | 224 | | | | 18,950 | |
| Ultragenyx Pharmaceutical * | | | 514 | | | | 25,952 | |
| United Therapeutics * | | | 263 | | | | 34,187 | |
| Universal Health Services, Cl B | | | 275 | | | | 29,796 | |
| | | | | | | | 446,769 | |
| Industrials — 8.5% | | | | | | | | |
| Clean Harbors * | | | 569 | | | | 30,646 | |
| CoStar Group * | | | 137 | | | | 41,781 | |
| Euronet Worldwide * | | | 400 | | | | 36,540 | |
| FedEx | | | 175 | | | | 40,506 | |
| IPG Photonics * | | | 262 | | | | 59,993 | |
| Orbital ATK | | | 336 | | | | 44,332 | |
| TransDigm Group | | | 145 | | | | 41,149 | |
| | | | | | | | 294,947 | |
| Oil & Gas — 4.4% | | | | | | | | |
| Antero Resources * | | | 1,561 | | | | 29,659 | |
| Continental Resources * | | | 780 | | | | 36,917 | |
| Laredo Petroleum * | | | 2,572 | | | | 27,495 | |
| Oasis Petroleum * | | | 2,769 | | | | 28,327 | |
| Parsley Energy, Cl A * | | | 1,110 | | | | 29,814 | |
| | | | | | | | 152,212 | |
| Real Estate Investment Trusts — 12.2% | | | | | | | | |
| Acadia Realty Trust | | | 1,159 | | | | 32,487 | |
| Alexandria Real Estate Equities | | | 299 | | | | 37,991 | |
| American Campus Communities | | | 704 | | | | 29,835 | |
The accompanying notes are an integral part of the financial statements.
| Schedule of Investments | November 30, 2017 |
| Global X Founder-Run Companies ETF |
| | | Shares | | | Value | |
| COMMON STOCK — continued | | | | | | | | |
| Real Estate Investment Trusts — continued | | | | | | | | |
| American Homes 4 Rent, Cl A | | | 1,442 | | | $ | 30,974 | |
| Apartment Investment & Management, Cl A | | | 768 | | | | 33,861 | |
| Brandywine Realty Trust | | | 1,985 | | | | 34,202 | |
| Camden Property Trust | | | 408 | | | | 37,242 | |
| DiamondRock Hospitality | | | 3,073 | | | | 34,387 | |
| GEO Group | | | 1,008 | | | | 26,752 | |
| Healthcare Trust of America, Cl A | | | 1,058 | | | | 32,364 | |
| Medical Properties Trust | | | 2,624 | | | | 35,923 | |
| Starwood Property Trust | | | 1,522 | | | | 32,997 | |
| Vornado Realty Trust | | | 347 | | | | 26,934 | |
| | | | | | | | 425,949 | |
| Technology — 29.3% | | | | | | | | |
| Akamai Technologies * | | | 543 | | | | 30,288 | |
| Alphabet, Cl A * | | | 36 | | | | 37,302 | |
| athenahealth * | | | 337 | | | | 44,784 | |
| Cavium * | | | 480 | | | | 41,030 | |
| Cerner * | | | 511 | | | | 36,123 | |
| Cognizant Technology Solutions, Cl A | | | 552 | | | | 39,899 | |
| EPAM Systems * | | | 430 | | | | 43,619 | |
| Facebook, Cl A * | | | 220 | | | | 38,980 | |
| Fortinet * | | | 848 | | | | 35,667 | |
| Medidata Solutions * | | | 506 | | | | 33,720 | |
| Monolithic Power Systems | | | 363 | | | | 42,961 | |
| NetScout Systems * | | | 878 | | | | 27,262 | |
| NVIDIA | | | 318 | | | | 63,826 | |
| Paycom Software * | | | 549 | | | | 45,018 | |
| Pegasystems | | | 287 | | | | 14,479 | |
| salesforce.com * | | | 384 | | | | 40,059 | |
| Snap, Cl A * | | | 1,466 | | | | 20,201 | |
| Square, Cl A * | | | 1,814 | | | | 71,145 | |
| SS&C Technologies Holdings | | | 903 | | | | 37,285 | |
| Twitter * | | | 2,007 | | | | 41,304 | |
| Ubiquiti Networks * | | | 642 | | | | 42,905 | |
| Ultimate Software Group * | | | 163 | | | | 34,398 | |
| Veeva Systems, Cl A * | | | 617 | | | | 37,149 | |
| VeriSign * | | | 372 | | | | 42,817 | |
| ViaSat * | | | 516 | | | | 38,308 | |
| Workday, Cl A * | | | 379 | | | | 39,037 | |
| | | | | | | | 1,019,566 | |
| Telecommunications — 1.0% | | | | | | | | |
| Zayo Group Holdings * | | | 943 | | | | 33,326 | |
The accompanying notes are an integral part of the financial statements.
| Schedule of Investments | November 30, 2017 |
| Global X Founder-Run Companies ETF |
| | | Value | |
| COMMON STOCK — continued | | | | |
| TOTAL COMMON STOCK | | | | |
| (Cost $3,297,268) | | $ | 3,479,821 | |
| TOTAL INVESTMENTS — 99.9% | | | | |
| (Cost $3,297,268) | | $ | 3,479,821 | |
Percentages are based on Net Assets of $3,482,650.
| * | Non-income producing security. |
Cl — Class
As of November 30, 2017, all of the Fund's investments were considered Level 1, in accordance with authoritative guidance on fair value measurements and disclosure under U.S. GAAP.
For the period ended November 30, 2017, there have been no transfers between Level 1, Level 2 or Level 3 investments.
The accompanying notes are an integral part of the financial statements.
| Schedule of Investments | November 30, 2017 |
| Global X Iconic U.S. Brands ETF |
Sector Weightings (unaudited)†:

† Sector weightings percentages are based on the total market value of investments.
| | | Shares | | | Value | |
| COMMON STOCK — 99.8% | | | | | | | | |
| | | | | | | | | |
| Consumer Goods — 20.0% | | | | | | | | |
| Activision Blizzard | | | 711 | | | $ | 44,366 | |
| Coca-Cola | | | 318 | | | | 14,555 | |
| Colgate-Palmolive | | | 201 | | | | 14,563 | |
| Constellation Brands, Cl A | | | 75 | | | | 16,319 | |
| Coty, Cl A | | | 2,232 | | | | 38,457 | |
| DR Horton | | | 399 | | | | 20,349 | |
| Estee Lauder, Cl A | | | 144 | | | | 17,976 | |
| Ford Motor | | | 1,335 | | | | 16,714 | |
| General Motors | | | 1,248 | | | | 53,777 | |
| Kimberly-Clark | | | 120 | | | | 14,371 | |
| Kraft Heinz | | | 168 | | | | 13,670 | |
| Lennar, Cl A | | | 270 | | | | 16,950 | |
| Lennar, Cl B | | | 5 | | | | 257 | |
| Molson Coors Brewing, Cl B | | | 480 | | | | 37,488 | |
| Mondelez International, Cl A | | | 333 | | | | 14,299 | |
| Newell Brands | | | 867 | | | | 26,851 | |
| NIKE, Cl B | | | 735 | | | | 44,409 | |
| PepsiCo | | | 123 | | | | 14,332 | |
| Procter & Gamble | | | 159 | | | | 14,308 | |
| Tesla * | | | 39 | | | | 12,045 | |
| Tyson Foods, Cl A | | | 219 | | | | 18,013 | |
| | | | | | | | 464,069 | |
| Consumer Services — 34.2% | | | | | | | | |
| Amazon.com * | | | 45 | | | | 52,954 | |
| American Airlines Group | | | 297 | | | | 14,996 | |
| Best Buy | | | 240 | | | | 14,306 | |
| CarMax * | | | 222 | | | | 15,298 | |
| Carnival | | | 213 | | | | 13,981 | |
| Charter Communications, Cl A * | | | 36 | | | | 11,744 | |
| Comcast, Cl A | | | 351 | | | | 13,176 | |
| Costco Wholesale | | | 93 | | | | 17,152 | |
The accompanying notes are an integral part of the financial statements.
| Schedule of Investments | November 30, 2017 |
| Global X Iconic U.S. Brands ETF |
| | | Shares | | | Value | |
| COMMON STOCK — continued | | | | | | | | |
| | | | | | | | | |
| Consumer Services — continued | | | | | | | | |
| CVS Health | | | 543 | | | $ | 41,594 | |
| Delta Air Lines | | | 294 | | | | 15,558 | |
| Dollar General | | | 192 | | | | 16,911 | |
| Dollar Tree * | | | 195 | | | | 20,038 | |
| Expedia | | | 300 | | | | 36,750 | |
| Home Depot | | | 279 | | | | 50,170 | |
| Kroger | | | 612 | | | | 15,826 | |
| Lowe's | | | 558 | | | | 46,521 | |
| Marriott International, Cl A | | | 435 | | | | 55,245 | |
| McDonald's | | | 93 | | | | 15,993 | |
| Netflix * | | | 84 | | | | 15,757 | |
| priceline.com * | | | 24 | | | | 41,753 | |
| Ross Stores | | | 780 | | | | 59,303 | |
| Southwest Airlines | | | 267 | | | | 16,199 | |
| Starbucks | | | 813 | | | | 47,008 | |
| Target | | | 261 | | | | 15,634 | |
| Time Warner | | | 426 | | | | 38,983 | |
| TJX | | | 201 | | | | 15,186 | |
| Twenty-First Century Fox, Cl A | | | 513 | | | | 16,385 | |
| United Continental Holdings * | | | 219 | | | | 13,867 | |
| Walgreens Boots Alliance | | | 180 | | | | 13,097 | |
| Wal-Mart Stores | | | 180 | | | | 17,501 | |
| Walt Disney | | | 141 | | | | 14,780 | |
| | | | | | | | 793,666 | |
| Financials — 15.5% | | | | | | | | |
| Allstate | | | 153 | | | | 15,707 | |
| Bank of America | | | 606 | | | | 17,071 | |
| BlackRock, Cl A | | | 33 | | | | 16,539 | |
| Capital One Financial | | | 174 | | | | 16,008 | |
| Charles Schwab | | | 1,062 | | | | 51,815 | |
| Citigroup | | | 216 | | | | 16,308 | |
| Goldman Sachs Group | | | 63 | | | | 15,602 | |
| JPMorgan Chase | | | 474 | | | | 49,542 | |
| MetLife | | | 306 | | | | 16,426 | |
| Morgan Stanley | | | 315 | | | | 16,257 | |
| Progressive | | | 306 | | | | 16,273 | |
| Prudential Financial | | | 138 | | | | 15,986 | |
| Synchrony Financial | | | 492 | | | | 17,658 | |
| US Bancorp | | | 834 | | | | 45,995 | |
| Visa, Cl A | | | 144 | | | | 16,213 | |
| Wells Fargo | | | 276 | | | | 15,586 | |
| | | | | | | | 358,986 | |
| Health Care — 10.1% | | | | | | | | |
| Abbott Laboratories | | | 297 | | | | 16,742 | |
The accompanying notes are an integral part of the financial statements.
| Schedule of Investments | November 30, 2017 |
| Global X Iconic U.S. Brands ETF |
| | | Shares | | | Value | |
| COMMON STOCK — continued | | | | | | | | |
| | | | | | | | | |
| Health Care — continued | | | | | | | | |
| AbbVie | | | 204 | | | $ | 19,772 | |
| Allergan | | | 63 | | | | 10,951 | |
| Anthem | | | 75 | | | | 17,622 | |
| Becton Dickinson | | | 72 | | | | 16,431 | |
| Bristol-Myers Squibb | | | 765 | | | | 48,340 | |
| Celgene * | | | 111 | | | | 11,192 | |
| Eli Lilly | | | 531 | | | | 44,944 | |
| Johnson & Johnson | | | 108 | | | | 15,048 | |
| Pfizer | | | 432 | | | | 15,664 | |
| UnitedHealth Group | | | 75 | | | | 17,113 | |
| | | | | | | | 233,819 | |
| Industrials — 3.6% | | | | | | | | |
| Boeing | | | 60 | | | | 16,608 | |
| Deere | | | 114 | | | | 17,084 | |
| FedEx | | | 69 | | | | 15,971 | |
| PayPal Holdings * | | | 249 | | | | 18,857 | |
| United Parcel Service, Cl B | | | 129 | | | | 15,667 | |
| | | | | | | | 84,187 | |
| Oil & Gas — 1.3% | | | | | | | | |
| Chevron | | | 132 | | | | 15,707 | |
| ExxonMobil | | | 183 | | | | 15,242 | |
| | | | | | | | 30,949 | |
| Technology — 11.6% | | | | | | | | |
| Adobe Systems * | | | 99 | | | | 17,966 | |
| Alphabet, Cl A * | | | 45 | | | | 46,628 | |
| Apple | | | 90 | | | | 15,466 | |
| Broadcom | | | 60 | | | | 16,676 | |
| Cisco Systems | | | 462 | | | | 17,233 | |
| Facebook, Cl A * | | | 258 | | | | 45,712 | |
| Intel | | | 402 | | | | 18,026 | |
| Microsoft | | | 201 | | | | 16,918 | |
| Oracle | | | 300 | | | | 14,718 | |
| salesforce.com * | | | 162 | | | | 16,900 | |
| Western Digital | | | 543 | | | | 42,821 | |
| | | | | | | | 269,064 | |
| Telecommunications — 3.5% | | | | | | | | |
| AT&T | | | 381 | | | | 13,861 | |
| Sprint * | | | 1,731 | | | | 10,369 | |
| T-Mobile US * | | | 678 | | | | 41,405 | |
| Verizon Communications | | | 303 | | | | 15,419 | |
| | | | | | | | 81,054 | |
The accompanying notes are an integral part of the financial statements.
| Schedule of Investments | November 30, 2017 |
| Global X Iconic U.S. Brands ETF |
| | | Value | |
| COMMON STOCK — continued | | | | |
| | | | | |
| TOTAL COMMON STOCK | | | | |
| (Cost $2,242,980) | | $ | 2,315,794 | |
| TOTAL INVESTMENTS — 99.8% | | | | |
| (Cost $2,242,980) | | $ | 2,315,794 | |
Percentages are based on Net Assets of $2,321,345.
| * | Non-income producing security. |
Cl — Class
As of November 30, 2017, all of the Fund's investments were considered Level 1, in accordance with authoritative guidance on fair value measurements and disclosure under U.S. GAAP.
For the period ended November 30, 2017, there have been no transfers between Level 1, Level 2 or Level 3 investments.
The accompanying notes are an integral part of the financial statements.
| STATEMENTS OF ASSETS AND LIABILITIES |
| November 30, 2017 |
| | | | | | | | | Global X Robotics | |
| | | Global X FinTech | | | Global X Internet | | | & Artificial | |
| | | ETF | | | of Things ETF | | | Intelligence ETF | |
| Assets: | | | | | | | | | | | | |
| Cost of Investments | | $ | 46,802,345 | | | $ | 76,922,065 | | | $ | 1,349,608,411 | |
| Cost of Foreign Currency | | | — | | | | — | | | | 726 | |
| Investments, at Value | | $ | 49,989,879 | | | $ | 85,462,109 | | | $ | 1,479,849,204 | |
| Foreign Currency, at Value | | | — | | | | — | | | | 1,659 | |
| Cash | | | 48,112 | | | | — | | | | — | |
| Receivable for Investment Securities Sold | | | 78,862 | | | | 156,060 | | | | 10,944,253 | |
| Receivable for Capital Shares Sold | | | — | | | | — | | | | 10,807,784 | |
| Dividend and Interest Receivable | | | 9,554 | | | | 94,758 | | | | 1,300,964 | |
| Reclaim Receivable | | | 405 | | | | 4,592 | | | | 31,454 | |
| Total Assets | | | 50,126,812 | | | | 85,717,519 | | | | 1,502,935,318 | |
| Liabilities: | | | | | | | | | | | | |
| Due to Custodian | | | — | | | | 153,982 | | | | 67,313,726 | |
| Payable for Investment Securities Purchased | | | — | | | | — | | | | 21,785,731 | |
| Due to Broker | | | — | | | | — | | | | 550,284 | |
| Payable due to Investment Adviser | | | 21,216 | | | | 42,538 | | | | 696,123 | |
| Total Liabilities | | | 21,216 | | | | 196,520 | | | | 90,345,864 | |
| Net Assets | | $ | 50,105,596 | | | $ | 85,520,999 | | | $ | 1,412,589,454 | |
| Net Assets Consist of: | | | | | | | | | | | | |
| Paid-in Capital | | $ | 46,904,655 | | | $ | 76,180,240 | | | $ | 1,289,286,865 | |
| Undistributed Net Investment Income/Accumulated Net Investment Loss | | | (14,233 | ) | | | 332,996 | | | | 97,517 | |
| Accumulated Net Realized Gain (Loss) on Investments and Foreign Currency Transactions | | | 27,609 | | | | 467,641 | | | | (7,065,131 | ) |
| Net Unrealized Appreciation on Investments | | | 3,187,534 | | | | 8,540,045 | | | | 130,240,793 | |
| Net Unrealized Appreciation on Foreign Currency Translations | | | 31 | | | | 77 | | | | 29,410 | |
| Net Assets | | $ | 50,105,596 | | | $ | 85,520,999 | | | $ | 1,412,589,454 | |
| Outstanding Shares of Beneficial Interest | | | | | | | | | | | | |
| (unlimited authorization — no par value) | | | 2,300,000 | | | | 4,250,000 | | | | 58,950,000 | |
| Net Asset Value, Offering and Redemption Price Per Share | | $ | 21.79 | | | $ | 20.12 | | | $ | 23.96 | |
The accompanying notes are an integral part of the financial statements.
| Statements of Assets and Liabilities |
| November 30, 2017 |
| | | Global X Health & | | | Global X | | | Global X | |
| | | Wellness Thematic | | | Longevity | | | Millennials | |
| | | ETF | | | Thematic ETF | | | Thematic ETF | |
| Assets: | | | | | | | | | | | | |
| Cost of Investments | | $ | 2,339,506 | | | $ | 7,334,511 | | | $ | 10,595,116 | |
| Cost of Foreign Currency | | | 15 | | | | 1 | | | | — | |
| Investments, at Value | | $ | 2,506,916 | | | $ | 7,824,646 | | | $ | 11,441,911 | |
| Foreign Currency, at Value | | | 15 | | | | — | | | | — | |
| Cash | | | 4,520 | | | | 15,310 | | | | 21,104 | |
| Dividend and Interest Receivable | | | 1,326 | | | | 2,976 | | | | 8,722 | |
| Reclaim Receivable | | | 249 | | | | 930 | | | | — | |
| Total Assets | | | 2,513,026 | | | | 7,843,862 | | | | 11,471,737 | |
| Liabilities: | | | | | | | | | | | | |
| Payable due to Investment Adviser | | | 1,002 | | | | 3,182 | | | | 4,458 | |
| Total Liabilities | | | 1,002 | | | | 3,182 | | | | 4,458 | |
| Net Assets | | $ | 2,512,024 | | | $ | 7,840,680 | | | $ | 11,467,279 | |
| Net Assets Consist of: | | | | | | | | | | | | |
| Paid-in Capital | | $ | 2,281,090 | | | $ | 7,286,437 | | | $ | 10,615,694 | |
| Undistributed Net Investment Income | | | 20,719 | | | | 15,411 | | | | 23,229 | |
| Accumulated Net Realized Gain (Loss) on Investments and Foreign Currency Transactions | | | 42,788 | | | | 48,659 | | | | (18,439 | ) |
| Net Unrealized Appreciation on Investments | | | 167,410 | | | | 490,135 | | | | 846,795 | |
| Net Unrealized Appreciation on Foreign Currency Translations | | | 17 | | | | 38 | | | | — | |
| Net Assets | | $ | 2,512,024 | | | $ | 7,840,680 | | | $ | 11,467,279 | |
| Outstanding Shares of Beneficial Interest | | | | | | | | | | | | |
| (unlimited authorization — no par value) | | | 150,000 | | | | 400,000 | | | | 600,000 | |
| Net Asset Value, Offering and Redemption Price Per Share | | $ | 16.75 | | | $ | 19.60 | | | $ | 19.11 | |
The accompanying notes are an integral part of the financial statements.
| Statements of Assets and Liabilities |
| November 30, 2017 |
| | | Global X U.S. | | | Global X | | | Global X Founder- | | | | |
| | | Infrastructure | | | Conscious | | | Run Companies | | | Global X Iconic | |
| | | Development ETF | | | Companies ETF | | | ETF | | | U.S. Brands ETF | |
| Assets: | | | | | | | | | | | | | | | | |
| Cost of Investments | | $ | 18,374,542 | | | $ | 42,880,610 | | | $ | 3,297,268 | | | $ | 2,242,980 | |
| Investments, at Value | | $ | 20,138,327 | | | $ | 47,968,141 | | | $ | 3,479,821 | | | $ | 2,315,794 | |
| Cash | | | 42,363 | | | | 17,479 | | | | 3,789 | | | | 1,945 | |
| Dividend and Interest Receivable | | | 29,574 | | | | 95,354 | | | | 629 | | | | 4,494 | |
| Reclaim Receivable | | | 89 | | | | — | | | | — | | | | — | |
| Receivable for Capital Shares Sold | | | — | | | | — | | | | 870,663 | | | | — | |
| Total Assets | | | 20,210,353 | | | | 48,080,974 | | | | 4,354,902 | | | | 2,322,233 | |
| Liabilities: | | | | | | | | | | | | | | | | |
| Payable due to Investment Adviser | | | 7,135 | | | | 16,241 | | | | 1,370 | | | | 888 | |
| Payable for Investment Securities Purchased | | | — | | | | — | | | | 870,868 | | | | — | |
| Due to Broker | | | — | | | | — | | | | 14 | | | | — | |
| Total Liabilities | | | 7,135 | | | | 16,241 | | | | 872,252 | | | | 888 | |
| Net Assets | | $ | 20,203,218 | | | $ | 48,064,733 | | | $ | 3,482,650 | | | $ | 2,321,345 | |
| Net Assets Consist of: | | | | | | | | | | | | | | | | |
| Paid-in Capital | | $ | 18,367,884 | | | $ | 43,156,616 | | | $ | 3,248,402 | | | $ | 2,244,131 | |
| Undistributed Net Investment Income | | | 71,549 | | | | 553,267 | | | | 5,657 | | | | 4,420 | |
| Accumulated Net Realized Gain (Loss) on Investments and Foreign Currency Transactions | | | — | | | | (732,681 | ) | | | 46,038 | | | | (20 | ) |
| Net Unrealized Appreciation on Investments | | | 1,763,785 | | | | 5,087,531 | | | | 182,553 | | | | 72,814 | |
| Net Assets | | $ | 20,203,218 | | | $ | 48,064,733 | | | $ | 3,482,650 | | | $ | 2,321,345 | |
| Outstanding Shares of Beneficial Interest | | | | | | | | | | | | | | | | |
| (unlimited authorization — no par value) | | | 1,250,000 | | | | 2,500,000 | | | | 200,000 | | | | 150,000 | |
| Net Asset Value, Offering and Redemption Price Per Share | | $ | 16.16 | | | $ | 19.23 | | | $ | 17.41 | | | $ | 15.48 | |
The accompanying notes are an integral part of the financial statements.
| Statements of Operations |
| November 30, 2017 |
| | | | | | | | | Global X Robotics | |
| | | Global X FinTech | | | Global X Internet | | | & Artificial | |
| | | ETF | | | of Things ETF | | | Intelligence ETF | |
| Investment Income: | | | | | | | | | | | | |
| Dividend Income | | $ | 58,186 | | | $ | 671,078 | | | $ | 2,423,232 | |
| Interest Income | | | — | | | | — | | | | 2,735 | |
| Less: Foreign Taxes Withheld | | | (1,547 | ) | | | (31,544 | ) | | | (279,686 | ) |
| Total Investment Income | | | 56,639 | | | | 639,534 | | | | 2,146,281 | |
| Supervision and Administration Fees(1) | | | 70,051 | | | | 280,104 | | | | 1,948,208 | |
| Custodian Fees | | | 91 | | | | 8,237 | | | | 41,768 | |
| Total Expenses | | | 70,142 | | | | 288,341 | | | | 1,989,976 | |
| Net Expenses | | | 70,142 | | | | 288,341 | | | | 1,989,976 | |
| Net Investment Income (Loss) | | | (13,503 | ) | | | 351,193 | | | | 156,305 | |
| Net Realized Gain on: | | | | | | | | | | | | |
| Investments (2) | | | 27,609 | | | | 468,233 | | | | 11,728,536 | |
| Foreign Currency Transactions | | | (74 | ) | | | (11,062 | ) | | | (58,787 | ) |
| Net Realized Gain on Investments and Foreign Currency Transactions | | | 27,535 | | | | 457,171 | | | | 11,669,749 | |
| Net Change in Unrealized Appreciation on: | | | | | | | | | | | | |
| Investments | | | 3,204,264 | | | | 8,438,264 | | | | 130,260,380 | |
| Foreign Currency Translations | | | 31 | | | | 77 | | | | 29,770 | |
| Net Change in Unrealized Appreciation on Investments and Foreign Currency Translations | | | 3,204,295 | | | | 8,438,341 | | | | 130,290,150 | |
| Net Realized and Unrealized Gain on Investments and Foreign Currency Transactions and Translations | | | 3,231,830 | | | | 8,895,512 | | | | 141,959,899 | |
| Net Increase in Net Assets Resulting from Operations | | $ | 3,218,327 | | | $ | 9,246,705 | | | $ | 142,116,204 | |
| (1) | The Supervision and Administration fees include fees paid by the Funds for the investment advisory services provided by the Adviser. (See Note 3 in Notes to Financial Statements.) |
| (2) | Includes realized gains/(losses) as a result of in-kind transactions. (For detail by Fund, see Note 4 in Notes to Financial Statements.) |
The accompanying notes are an integral part of the financial statements.
| Statements of Operations |
| November 30, 2017 |
| | | Global X Health & | | | Global X | | | Global X | |
| | | Wellness Thematic | | | Longevity | | | Millennials | |
| | | ETF | | | Thematic ETF | | | Thematic ETF | |
| Investment Income: | | | | | | | | | | | | |
| Dividend Income | | $ | 34,065 | | | $ | 39,677 | | | $ | 58,610 | |
| Less: Foreign Taxes Withheld | | | (2,013 | ) | | | (1,209 | ) | | | — | |
| Total Investment Income | | | 32,052 | | | | 38,468 | | | | 58,610 | |
| Supervision and Administration Fees(1) | | | 13,449 | | | | 27,136 | | | | 42,415 | |
| Custodian Fees | | | 23 | | | | 8 | | | | — | |
| Total Expenses | | | 13,472 | | | | 27,144 | | | | 42,415 | |
| Waiver of Supervision and Administration Fees | | | (2,692 | ) | | | (6,251 | ) | | | (8,858 | ) |
| Net Expenses | | | 10,780 | | | | 20,893 | | | | 33,557 | |
| Net Investment Income | | | 21,272 | | | | 17,575 | | | | 25,053 | |
| Net Realized Gain on: | | | | | | | | | | | | |
| Investments (2) | | | 42,792 | | | | 269,235 | | | | 501,828 | |
| Foreign Currency Transactions | | | (96 | ) | | | (916 | ) | | | — | |
| Net Realized Gain on Investments and Foreign Currency Transactions | | | 42,696 | | | | 268,319 | | | | 501,828 | |
| Net Change in Unrealized Appreciation on: | | | | | | | | | | | | |
| Investments | | | 215,463 | | | | 512,156 | | | | 768,703 | |
| Foreign Currency Translations | | | 67 | | | | 88 | | | | — | |
| Net Change in Unrealized Appreciation on Investments and Foreign Currency Translations | | | 215,530 | | | | 512,244 | | | | 768,703 | |
| Net Realized and Unrealized Gain on Investments and Foreign Currency Transactions and Translations | | | 258,226 | | | | 780,563 | | | | 1,270,531 | |
| Net Increase in Net Assets Resulting from Operations | | $ | 279,498 | | | $ | 798,138 | | | $ | 1,295,584 | |
| (1) | The Supervision and Administration fees include fees paid by the Funds for the investment advisory services provided by the Adviser. (See Note 3 in Notes to Financial Statements.) |
| (2) | Includes realized gains/(losses) as a result of in-kind transactions. (For detail by Fund, see Note 4 in Notes to Financial Statements.) |
The accompanying notes are an integral part of the financial statements.
| Statements of Operations |
| November 30, 2017 |
| | | Global X U.S. | | | | | | | | | | |
| | | Infrastructure | | | Global X | | | Global X Founder- | | | | |
| | | Development | | | Conscious | | | Run Companies | | | Global X Iconic | |
| | | ETF(1) | | | Companies ETF | | | ETF(2) | | | U.S. Brands ETF(3) | |
| Investment Income: | | | | | | | | | | | | | | | | |
| Dividend Income | | $ | 108,510 | | | $ | 750,826 | | | $ | 19,008 | | | $ | 5,633 | |
| Less: Foreign Taxes Withheld | | | (145 | ) | | | (1,557 | ) | | | — | | | | — | |
| Total Investment Income | | | 108,365 | | | | 749,269 | | | | 19,008 | | | | 5,633 | |
| Supervision and Administration Fees(4) | | | 45,444 | | | | 166,491 | | | | 13,351 | | | | 1,213 | |
| Custodian Fees | | | — | | | | 1 | | | | — | | | | — | |
| Total Expenses | | | 45,444 | | | | 166,492 | | | | 13,351 | | | | 1,213 | |
| Waiver of Supervision and Administration Fees | | | (8,619 | ) | | | – | | | | – | | | | – | |
| Net Expenses | | | 36,825 | | | | 166,492 | | | | 13,351 | | | | 1,213 | |
| Net Investment Income | | | 71,540 | | | | 582,777 | | | | 5,657 | | | | 4,420 | |
| Net Realized Gain on: | | | | | | | | | | | | | | | | |
| Investments (5) | | | 9 | | | | 3,166,365 | | | | 182,209 | | | | (20 | ) |
| Net Realized Gain (Loss) on Investments | | | 9 | | | | 3,166,365 | | | | 182,209 | | | | (20 | ) |
| Net Change in Unrealized Appreciation on: | | | | | | | | | | | | | | | | |
| Investments | | | 1,763,785 | | | | 4,312,446 | | | | 182,553 | | | | 72,814 | |
| Net Change in Unrealized Appreciation on Investments | | | 1,763,785 | | | | 4,312,446 | | | | 182,553 | | | | 72,814 | |
| Net Realized and Unrealized Gain on Investments | | | 1,763,794 | | | | 7,478,811 | | | | 364,762 | | | | 72,794 | |
| Net Increase in Net Assets Resulting from Operations | | $ | 1,835,334 | | | $ | 8,061,588 | | | $ | 370,419 | | | $ | 77,214 | |
| (1) | The Fund commenced operations on March 6, 2017. |
| (2) | The Fund commenced operations on February 13, 2017. |
| (3) | The Fund commenced operations on October 16, 2017. |
| (4) | The Supervision and Administration fees include fees paid by the Funds for the investment advisory services provided by the Adviser. (See Note 3 in Notes to Financial Statements.) |
| (5) | Includes realized gains/(losses) as a result of in-kind transactions. (For detail by Fund, see Note 4 in Notes to Financial Statements.) |
The accompanying notes are an integral part of the financial statements.
| Statements of Changes in Net Assets |
| | | Global X FinTech ETF | | | Global X Internet of Things ETF | |
| | | Year Ended | | | Period Ended | | | Year Ended | | | Period Ended | |
| | | November 30, | | | November 30, | | | November 30, | | | November 30, | |
| | | 2017 | | | 2016(1) | | | 2017 | | | 2016(1) | |
| Operations: | | | | | | | | | | | | |
| Net Investment Income (Loss) | | $ | (13,503 | ) | | $ | (656 | ) | | $ | 351,193 | | | $ | 14,558 | |
| Net Realized Gain (Loss) on Investments and Foreign Currency Transactions | | | 27,535 | | | | — | | | | 457,171 | | | | (380 | ) |
| Net Change in Unrealized Appreciation (Depreciation) on Investments and Foreign Currency Translations | | | 3,204,295 | | | | (16,730 | ) | | | 8,438,341 | | | | 101,781 | |
| Net Increase (Decrease) in Net Assets Resulting from Operations | | | 3,218,327 | | | | (17,386 | ) | | | 9,246,705 | | | | 115,959 | |
| Dividends and Distributions from: | | | | | | | | | | | | | | | | |
| Net Investment Income | | | — | | | | — | | | | (21,905 | ) | | | — | |
| Total Dividends and Distributions | | | — | | | | — | | | | (21,905 | ) | | | — | |
| Capital Share Transactions: | | | | | | | | | | | | | | | | |
| Issued | | | 45,396,654 | | | | 1,508,001 | | | | 72,415,469 | | | | 3,764,771 | |
| Increase in Net Assets from Capital Share Transactions | | | 45,396,654 | | | | 1,508,001 | | | | 72,415,469 | | | | 3,764,771 | |
| Total Increase in Net Assets | | | 48,614,981 | | | | 1,490,615 | | | | 81,640,269 | | | | 3,880,730 | |
| Net Assets: | | | | | | | | | | | | | | | | |
| Beginning of Period | | | 1,490,615 | | | | — | | | | 3,880,730 | | | | — | |
| End of Period | | $ | 50,105,596 | | | $ | 1,490,615 | | | $ | 85,520,999 | | | $ | 3,880,730 | |
| Undistributed Net Investment Income/Accumulated Net Investment Loss | | $ | (14,233 | ) | | $ | (656 | ) | | $ | 332,996 | | | $ | 14,770 | |
| Share Transactions: | | | | | | | | | | | | | | | | |
| Issued | | | 2,200,000 | | | | 100,000 | | | | 4,000,000 | | | | 250,000 | |
| Net Increase in Shares Outstanding from Share Transactions | | | 2,200,000 | | | | 100,000 | | | | 4,000,000 | | | | 250,000 | |
| (1) | The Fund commenced operations on September 12, 2016 |
The accompanying notes are an integral part of the financial statements.
| Statements of Changes in Net Assets |
| | | Global X Robotics & Artificial | | | Global X Health & Wellness Thematic | |
| | | Intelligence ETF | | | ETF | |
| | | Year Ended | | | Period Ended | | | Year Ended | | | Period Ended | |
| | | November 30, | | | November 30, | | | November 30, | | | November 30, | |
| | | 2017 | | | 2016(1) | | | 2017 | | | 2016(2) | |
| Operations: | | | | | | | | | | | | | | | | |
| Net Investment Income | | $ | 156,305 | | | $ | 2,222 | | | $ | 21,272 | | | $ | 7,061 | |
| Net Realized Gain (Loss) on Investments and Foreign Currency Transactions(3) | | | 11,669,749 | | | | (90 | ) | | | 42,696 | | | | (14 | ) |
| Net Change in Unrealized Appreciation (Depreciation) on Investments and Foreign Currency Translations | | | 130,290,150 | | | | (19,947 | ) | | | 215,530 | | | | (48,103 | ) |
| Net Increase (Decrease) in Net Assets Resulting from Operations | | | 142,116,204 | | | | (17,815 | ) | | | 279,498 | | | | (41,056 | ) |
| Dividends and Distributions from: | | | | | | | | | | | | | | | | |
| Net Investment Income | | | (2,133 | ) | | | — | | | | (7,508 | ) | | | — | |
| Total Dividends and Distributions | | | (2,133 | ) | | | — | | | | (7,508 | ) | | | — | |
| Capital Share Transactions: | | | | | | | | | | | | | | | | |
| Issued | | | 1,342,568,190 | | | | 2,991,286 | | | | 767,845 | | | | 1,513,245 | |
| Redeemed | | | (75,066,278 | ) | | | — | | | | — | | | | — | |
| Increase in Net Assets from Capital Share Transactions | | | 1,267,501,912 | | | | 2,991,286 | | | | 767,845 | | | | 1,513,245 | |
| Total Increase in Net Assets | | | 1,409,615,983 | | | | 2,973,471 | | | | 1,039,835 | | | | 1,472,189 | |
| Net Assets: | | | | | | | | | | | | | | | | |
| Beginning of Period | | | 2,973,471 | | | | — | | | | 1,472,189 | | | | — | |
| End of Period | | $ | 1,412,589,454 | | | $ | 2,973,471 | | | $ | 2,512,024 | | | $ | 1,472,189 | |
| Undistributed Net Investment Income | | $ | 97,517 | | | $ | 2,132 | | | $ | 20,719 | | | $ | 7,050 | |
| Share Transactions: | | | | | | | | | | | | | | | | |
| Issued | | | 62,100,000 | | | | 200,000 | | | | 50,000 | | | | 100,000 | |
| Redeemed | | | (3,350,000 | ) | | | — | | | | — | | | | — | |
| Net Increase in Shares Outstanding from Share Transactions | | | 58,750,000 | | | | 200,000 | | | | 50,000 | | | | 100,000 | |
| (1) | The Fund commenced operations on September 12, 2016 |
| (2) | The Fund commenced operations on May 9, 2016 |
| (3) | Includes realized gains/(losses) as a result of in-kind transactions. (For detail by Fund, see Note 4 in Notes to Financial Statements.) |
The accompanying notes are an integral part of the financial statements.
| Statements of Changes in Net Assets |
| | | Global X Longevity Thematic ETF | | | Global X Millennials Thematic ETF | |
| | | Year Ended | | | Period Ended | | | Year Ended | | | Period Ended | |
| | | November 30, | | | November 30, | | | November 30, | | | November 30, | |
| | | 2017 | | | 2016(1) | | | 2017 | | | 2016(2) | |
| Operations: | | | | | | | | | | | | | | | | |
| Net Investment Income | | $ | 17,575 | | | $ | 6,914 | | | $ | 25,053 | | | $ | 9,704 | |
| Net Realized Gain (Loss) on Investments and Foreign Currency Transactions(3) | | | 268,319 | | | | (486 | ) | | | 501,828 | | | | 884 | |
| Net Change in Unrealized Appreciation (Depreciation) on Investments and Foreign Currency Translations | | | 512,244 | | | | (22,071 | ) | | | 768,703 | | | | 78,092 | |
| Net Increase (Decrease) in Net Assets Resulting from Operations | | | 798,138 | | | | (15,643 | ) | | | 1,295,584 | | | | 88,680 | |
| Dividends and Distributions from: | | | | | | | | | | | | | | | | |
| Net Investment Income | | | (9,295 | ) | | | — | | | | (12,412 | ) | | | — | |
| Net Realized Gains | | | (6,832 | ) | | | — | | | | — | | | | — | |
| Total Dividends and Distributions | | | (16,127 | ) | | | — | | | | (12,412 | ) | | | — | |
| Capital Share Transactions: | | | | | | | | | | | | | | | | |
| Issued | | | 6,509,793 | | | | 1,532,246 | | | | 8,050,051 | | | | 3,807,099 | |
| Redeemed | | | (967,727 | ) | | | — | | | | (1,761,723 | ) | | | — | |
| Increase in Net Assets from Capital Share Transactions | | | 5,542,066 | | | | 1,532,246 | | | | 6,288,328 | | | | 3,807,099 | |
| Total Increase in Net Assets | | | 6,324,077 | | | | 1,516,603 | | | | 7,571,500 | | | | 3,895,779 | |
| Net Assets: | | | | | | | | | | | | | | | | |
| Beginning of Period | | | 1,516,603 | | | | — | | | | 3,895,779 | | | | — | |
| End of Period | | $ | 7,840,680 | | | $ | 1,516,603 | | | $ | 11,467,279 | | | $ | 3,895,779 | |
| Undistributed Net Investment Income | | $ | 15,411 | | | $ | 7,960 | | | $ | 23,229 | | | $ | 10,588 | |
| Share Transactions: | | | | | | | | | | | | | | | | |
| Issued | | | 350,000 | | | | 100,000 | | | | 450,000 | | | | 250,000 | |
| Redeemed | | | (50,000 | ) | | | — | | | | (100,000 | ) | | | — | |
| Net Increase in Shares Outstanding from Share Transactions | | | 300,000 | | | | 100,000 | | | | 350,000 | | | | 250,000 | |
| (1) | The Fund commenced operations on May 9, 2016 |
| (2) | The Fund commenced operations on May 4, 2016 |
| (3) | Includes realized gains/(losses) as a result of in-kind transactions. (For detail by Fund, see Note 4 in Notes to Financial Statements.) |
The accompanying notes are an integral part of the financial statements.
| Statements of Changes in Net Assets |
| | | Global X U.S. | | | | | | | |
| | | Infrastructure | | | | | | | |
| | | Development ETF | | | Global X Conscious Companies ETF | |
| | | Period Ended | | | Year Ended | | | Period Ended | |
| | | November 30, | | | November 30, | | | November 30, | |
| | | 2017(1) | | | 2017 | | | 2016(2) | |
| Operations: | | | | | | | | | | | | |
| Net Investment Income | | $ | 71,540 | | | $ | 582,777 | | | $ | 298,406 | |
| Net Realized Gain (Loss) on Investments(3) | | | 9 | | | | 3,166,365 | | | | (12,276 | ) |
| Net Change in Unrealized Appreciation on Investments | | | 1,763,785 | | | | 4,312,446 | | | | 775,085 | |
| Net Increase in Net Assets Resulting from Operations | | | 1,835,334 | | | | 8,061,588 | | | | 1,061,215 | |
| Dividends and Distributions from: | | | | | | | | | | | — | |
| Net Investment Income | | | — | | | | (328,342 | ) | | | | |
| Total Dividends and Distributions | | | — | | | | (328,342 | ) | | | — | |
| Capital Share Transactions: | | | | | | | | | | | | |
| Issued | | | 18,367,884 | | | | 23,402,689 | | | | 32,872,597 | |
| Redeemed | | | — | | | | (16,233,965 | ) | | | (771,049 | ) |
| Increase in Net Assets from Capital Share Transactions | | | 18,367,884 | | | | 7,168,724 | | | | 32,101,548 | |
| Total Increase in Net Assets | | | 20,203,218 | | | | 14,901,970 | | | | 33,162,763 | |
| Net Assets: | | | | | | | | | | | | |
| Beginning of Period | | | — | | | | 33,162,763 | | | | — | |
| End of Period | | $ | 20,203,218 | | | $ | 48,064,733 | | | $ | 33,162,763 | |
| Undistributed Net Investment Income | | $ | 71,549 | | | $ | 553,267 | | | $ | 298,832 | |
| Share Transactions: | | | | | | | | | | | | |
| Issued | | | 1,250,000 | | | | 1,300,000 | | | | 2,150,000 | |
| Redeemed | | | — | | | | (900,000 | ) | | | (50,000 | ) |
| Net Increase in Shares Outstanding from Share Transactions | | | 1,250,000 | | | | 400,000 | | | | 2,100,000 | |
| (1) | The Fund commenced operations on March 6, 2017 |
| (2) | The Fund commenced operations on July 11, 2016 |
| (3) | Includes realized gains/(losses) as a result of in-kind transactions. (For detail by Fund, see Note 4 in Notes to Financial Statements.) |
The accompanying notes are an integral part of the financial statements.
| Statements of Changes in Net Assets |
| | | Global X | | | | |
| | | Founder-Run | | | Global X Iconic | |
| | | Companies ETF | | | U.S. Brands ETF | |
| | | Period Ended | | | Period Ended | |
| | | November 30, | | | November 30, | |
| | | 2017(1) | | | 2017(2) | |
| Operations: | | | | | | | | |
| Net Investment Income | | $ | 5,657 | | | $ | 4,420 | |
| Net Realized Gain (Loss) on Investments(3) | | | 182,209 | | | | (20 | ) |
| Net Change in Unrealized Appreciation on Investments | | | 182,553 | | | | 72,814 | |
| Net Increase in Net Assets Resulting from Operations | | | 370,419 | | | | 77,214 | |
| Capital Share Transactions: | | | | | | | | |
| Issued | | | 4,692,223 | | | | 2,244,131 | |
| Redeemed | | | (1,579,992 | ) | | | — | |
| Increase in Net Assets from Capital Share Transactions | | | 3,112,231 | | | | 2,244,131 | |
| Total Increase in Net Assets | | | 3,482,650 | | | | 2,321,345 | |
| Net Assets: | | | | | | | | |
| Beginning of Period | | | — | | | | — | |
| End of Period | | $ | 3,482,650 | | | $ | 2,321,345 | |
| Undistributed Net Investment Income | | $ | 5,657 | | | $ | 4,420 | |
| Share Transactions: | | | | | | | | |
| Issued | | | 300,000 | | | | 150,000 | |
| Redeemed | | | (100,000 | ) | | | — | |
| Net Increase in Shares Outstanding from Share Transactions | | | 200,000 | | | | 150,000 | |
| (1) | The Fund commenced operations on February 13, 2017 |
| (2) | The Fund commenced operations on October 16, 2017 |
| (3) | Includes realized gains/(losses) as a result of in-kind transactions. (For detail by Fund, see Note 4 in Notes to Financial Statements.) |
The accompanying notes are an integral part of the financial statements.
Selected Per Share Data & Ratios
For a Share Outstanding Throughout the Period
| | | | | | | | | Net Realized | | | | | | | | | | | | | | | | | | | | | | | | | | | Ratio of Net | | | | |
| | | Net | | | | | | and | | | | | | | | | | | | | | | Net | | | | | | | | | | | | Investment | | | | |
| | | Asset | | | | | | Unrealized | | | | | | | | | | | | | | | Asset | | | | | | | | | Ratio of | | | Income | | | | |
| | | Value, | | | Net | | | Gain (Loss) | | | | | | Distribution | | | Distribution | | | | | | Value, | | | | | | Net Assets | | | Expenses | | | (Loss) to | | | | |
| | | Beginning | | | Investment | | | on | | | Total from | | | from Net | | | from | | | Total from | | | End of | | | Total | | | End of | | | to Average | | | Average | | | Portfolio | |
| | | of Period | | | Income | | | Investments | | | Operations | | | Investment | | | Capital | | | Distributions | | | Period | | | Return | | | Period | | | Net Assets | | | Net Assets | | | Turnover | |
| | | ($) | | | (Loss) ($)* | | | ($) | | | ($) | | | Income ($) | | | Gains ($) | | | ($) | | | ($) | | | (%)** | | | ($)(000) | | | (%) | | | (%) | | | (%)†† | |
| Global X FinTech ETF | | | | | | | | | | | | | | | | | | | | | | | | | | | | | | | | | | | | | |
| 2017 | | | 14.91 | | | | (0.03 | ) | | | 6.91 | | | | 6.88 | | | | — | | | | — | | | | — | | | | 21.79 | | | | 46.14 | | | | 50,106 | | | | 0.68 | | | | (0.13 | ) | | | 11.65 | |
| 2016(1) | | | 15.08 | | | | (0.01 | ) | | | (0.16 | ) | | | (0.17 | ) | | | — | | | | — | | | | — | | | | 14.91 | | | | (1.13 | ) | | | 1,491 | | | | 0.68 | † | | | (0.20 | )† | | | — | |
| Global X Internet of Things ETF | | | | | | | | | | | | | | | | | | | | | | | | | | | | | | | | | | | | | |
| 2017 | | | 15.52 | | | | 0.16 | | | | 4.49 | | | | 4.65 | | | | (0.05 | ) | | | — | | | | (0.05 | ) | | | 20.12 | | | | 30.04 | | | | 85,521 | | | | 0.70 | | | | 0.85 | | | | 24.90 | |
| 2016(1) | | | 15.04 | | | | 0.09 | | | | 0.39 | | | | 0.48 | | | | — | | | | — | | | | — | | | | 15.52 | | | | 3.19 | | | | 3,881 | | | | 0.68 | † | | | 2.75 | † | | | 0.39 | |
| Global X Robotics & Artificial Intelligence ETF | | | | | | | | | | | | | | | | | | | | | | | | | | | | | | | | | | | | | |
| 2017 | | | 14.87 | | | �� | 0.01 | | | | 9.09 | | | | 9.10 | | | | (0.01 | ) | | | — | | | | (0.01 | ) | | | 23.96 | | | | 61.22 | | | | 1,412,589 | | | | 0.69 | | | | 0.05 | | | | 15.29 | |
| 2016(1) | | | 14.84 | | | | 0.02 | | | | 0.01 | | | | 0.03 | | | | — | | | | — | | | | — | | | | 14.87 | | | | 0.20 | | | | 2,974 | | | | 0.68 | † | | | 0.62 | † | | | — | |
| Global X Health & Wellness Thematic ETF | | | | | | | | | | | | | | | | | | | | | | | | | | | | | | | | | | | | | |
| 2017 | | | 14.72 | | | | 0.17 | | | | 1.94 | | | | 2.11 | | | | (0.08 | ) | | | — | | | | (0.08 | ) | | | 16.75 | | | | 14.38 | | | | 2,512 | | | | 0.54 | ^ | | | 1.08 | | | | 16.73 | |
| 2016(2) | | | 15.13 | | | | 0.07 | | | | (0.48 | ) | | | (0.41 | ) | | | — | | | | — | | | | — | | | | 14.72 | | | | (2.71 | ) | | | 1,472 | | | | 0.68 | † | | | 0.82 | † | | | — | |
| Global X Longevity Thematic ETF | | | | | | | | | | | | | | | | | | | | | | | | | | | | | | | | | | | | | |
| 2017 | | | 15.17 | | | | 0.08 | | | | 4.51 | | | | 4.59 | | | | (0.09 | ) | | | (0.07 | ) | | | (0.16 | ) | | | 19.60 | | | | 30.58 | | | | 7,841 | | | | 0.52 | ^ | | | 0.44 | | | | 10.20 | |
| 2016(2) | | | 15.32 | | | | 0.07 | | | | (0.22 | ) | | | (0.15 | ) | | | — | | | | — | | | | — | | | | 15.17 | | | | (0.98 | ) | | | 1,517 | | | | 0.68 | † | | | 0.78 | † | | | 2.76 | |
| Global X Millennials Thematic ETF | | | | | | | | | | | | | | | | | | | | | | | | | | | | | | | | | | | | | |
| 2017 | | | 15.58 | | | | 0.07 | | | | 3.51 | | | | 3.58 | | | | (0.05 | ) | | | — | | | | (0.05 | ) | | | 19.11 | | | | 23.05 | | | | 11,467 | | | | 0.54 | ^ | | | 0.40 | | | | 20.97 | |
| 2016(3) | | | 14.95 | | | | 0.05 | | | | 0.58 | | | | 0.63 | | | | — | | | | — | | | | — | | | | 15.58 | | | | 4.21 | | | | 3,896 | | | | 0.68 | † | | | 0.59 | † | | | — | |
| Global X U.S. Infrastructure Development ETF | | | | | | | | | | | | | | | | | | | | | | | | | | | | | | | | | | | | | |
| 2017(4) | | | 14.98 | | | | 0.10 | | | | 1.08 | | | | 1.18 | | | | — | | | | — | | | | — | | | | 16.16 | | | | 7.88 | | | | 20,203 | | | | 0.47 | †‡ | | | 0.91 | † | | | — | |
| Global X Conscious Companies ETF | | | | | | | | | | | | | | | | | | | | | | | | | | | | | | | | | | | | | |
| 2017 | | | 15.79 | | | | 0.26 | | | | 3.33 | | | | 3.59 | | | | (0.15 | ) | | | — | | | | (0.15 | ) | | | 19.23 | | | | 22.95 | | | | 48,065 | | | | 0.43 | | | | 1.50 | | | | 41.77 | |
| 2016(5) | | | 15.09 | | | | 0.15 | | | | 0.55 | | | | 0.70 | | | | — | | | | — | | | | — | | | | 15.79 | | | | 4.64 | | | | 33,163 | | | | 0.43 | † | | | 2.57 | † | | | 37.35 | |
| Global X Founder-Run Companies ETF | | | | | | | | | | | | | | | | | | | | | | | | | | | | | | | | | | | | | |
| 2017(6) | | | 15.02 | | | | 0.04 | | | | 2.35 | | | | 2.39 | | | | — | | | | — | | | | — | | | | 17.41 | | | | 15.91 | | | | 3,483 | | | | 0.65 | † | | | 0.33 | † | | | 21.61 | |
| Global X Iconic U.S. Brands ETF | | | | | | | | | | | | | | | | | | | | | | | | | | | | | | | | | | | | | |
| 2017(7) | | | 14.96 | | | | 0.03 | | | | 0.49 | | | | 0.52 | | | | — | | | | — | | | | — | | | | 15.48 | | | | 3.48 | | | | 2,321 | | | | 0.48 | † | | | 1.74 | † | | | — | |
| * | Per share data calculated using average shares method. |
| ** | Total return is based on the change in net asset value of a share during the year or period and assumes reinvestment of dividends and distributions at net asset value. Total return is for the period indicated and periods of less than one year have not been annualized. The return shown does not reflect the deduction of taxes that a shareholder would pay on Fund distributions or the redemption of Fund shares. |
| †† | Portfolio turnover rate is for the period indicated and periods of less than one year have not been annualized. Excludes effect of in-kind transfers. |
| ^ | The Global X Health & Wellness Thematic ETF, Global X Longevity Thematic ETF, and Global X Millennials Thematic ETF ratio of Expenses to Average to Net Asset would have been 0.68% withought the waiver. |
| ‡ | The Global X U.S. Infrastucture Development ETF Ratio of Expenses to Average to Net Asset would have been 0.58 withought the waiver. |
| (1) | The Fund commenced operations on September 12, 2016. |
| (2) | The Fund commenced operations on May 9, 2016. |
| (3) | The Fund commenced operations on May 4, 2016. |
| (4) | The Fund commenced operations on March 6, 2017. |
| (5) | The Fund commenced operations on July 11, 2016. |
| (6) | The Fund commenced operations on February 13, 2017. |
| (7) | The Fund commenced operations on October 16, 2017. |
Amounts designated as “—” are either $0 or have been rounded to $0.
The accompanying notes are an integral part of the financial statements.
| Notes to Financial Statements |
| |
| November 30, 2017 |
1. ORGANIZATION
The Global X Funds (the “Trust”) is a Delaware statutory trust formed on March 6, 2008. The Trust is registered under the Investment Company Act of 1940, as amended, as an open-end management investment company. As of November 30, 2017, the Trust had ninety- six portfolios, fifty-two of which were operational. The financial statements herein and the related notes pertain to the Global X FinTech ETF, Global X Internet of Things ETF, Global X Robotics & Artificial Intelligence ETF, Global X Health & Wellness Thematic ETF, Global X Longevity Thematic ETF, Global X Millennials Thematic ETF, Global X U.S. Infrastructure Development ETF, Global X Conscious Companies ETF, Global X Founder -Run Companies ETF, and Global X Iconic U.S. Brands ETF (the “Funds”). Each Fund, other than the Global X Conscious Companies ETF, had elected non-diversified status.
The Global X Iconic U.S. Brands ETF commenced operations on October 16, 2017.
2. SIGNIFICANT ACCOUNTING POLICIES
The following is a summary of the significant accounting policies followed by the Funds.
USE OF ESTIMATES — The Funds are investment companies that apply the accounting and reporting guidance issued in Topic 946 by the U.S. Financial Accounting Standards Board. The preparation of financial statements in conformity with U.S. generally accepted accounting principles ("U.S. GAAP") requires management to make estimates and assumptions that affect the reported amounts of assets and liabilities and disclosure of contingent assets and liabilities at the date of the financial statements and the reported amounts of increases and decreases in net assets from operations during the reporting period. Actual results could materially differ from those estimates.
SECURITY VALUATION — Securities listed on a securities exchange, market or automated quotation system for which quotations are readily available (except for securities traded on NASDAQ), including securities traded over the counter, are valued at the last quoted sale price on the primary exchange or market (foreign or domestic) on which they are traded (or at approximately 4:00 pm if a security’s primary exchange is normally open at that time), or, if there is no such reported sale, at the most recent mean between the quoted bid and asked prices (absent both bid and asked prices on such exchange, the bid price may be used).
For securities traded on NASDAQ, the NASDAQ official closing price will be used. If available, debt securities are priced based upon valuations provided by independent, third-party pricing agents. Such values generally reflect the last reported sales price if the security is actively traded. The third-party pricing agents may also value debt securities at an evaluated bid price by employing methodologies that utilize actual market transactions, broker-supplied valuations, or other methodologies designed to identify the market value for such securities. Debt obligations with remaining maturities of sixty days or less may be valued at their amortized cost, which approximates market value. The prices for foreign securities are reported in local currency and converted to U.S. dollars using currency exchange rates as of reporting date. The exchange rates used by the Trust for valuation are captured as of the New York or London close each day. Prices for most securities held in the Funds are provided daily by recognized independent pricing agents. If a security price cannot be obtained from an independent, third-party pricing agent, the Funds seek to obtain a bid price from at least one independent broker.
| Notes to Financial Statements |
| |
| November 30, 2017 |
2. SIGNIFICANT ACCOUNTING POLICIES (continued)
Securities for which market prices are not “readily available” are valued in accordance with Fair Value Procedures established by the Board of Trustees (the “Board”). The Funds’ Fair Value Procedures are implemented through a Fair Value Committee (the “Committee”) designated by the Board. Some of the more common reasons that may necessitate that a security be valued using Fair Value Procedures include: the security's trading has been halted or suspended; the security has been de -listed from its primary trading exchange; the security's primary trading market is temporarily closed at a time when under normal conditions it would be open; the security has not been traded for an extended period of time; the security's primary pricing source is not able or willing to provide a price; or trading of the security is subject to local government-imposed restrictions. In addition, the Funds may fair value their securities if an event that may materially affect the value of the Funds’ securities that traded outside of the United States (a “Significant Event”) has occurred between the time of the security's last close and the time that the Funds calculate their net asset value. A Significant Event may relate to a single issuer or to an entire market sector. Events that may be Significant Events include: government actions, natural disasters, armed conflict, acts of terrorism and significant market fluctuations. If Global X Management Company LLC (the “Adviser”) becomes aware of a Significant Event that has occurred with respect to a security or group of securities after the closing of the exchange or market on which the security or securities principally trade, but before the time at which the Funds calculate net asset value, it may request that a Committee meeting be called. When a security is valued in accordance with the Fair Value Procedures, the Committee will determine the value after taking into consideration all relevant information reasonably available to the Committee. As of November 30, 2017, there were no securities priced using the Fair Value Procedures.
In accordance with the authoritative guidance on fair value measurements and disclosure under U.S. GAAP, the Funds disclose the fair value of their investments in a hierarchy that prioritizes the inputs to valuation techniques used to measure the fair value. The objective of a fair value measurement is to determine the price that would be received to sell an asset or paid to transfer a liability in an orderly transaction between market participants at the measurement date (an exit price). Accordingly, the fair value hierarchy gives the highest priority to quoted prices (unadjusted) in active markets for identical assets or liabilities (Level 1) and the lowest priority to unobservable inputs (Level 3). The three levels of the fair value hierarchy are described below:
Level 1 – Unadjusted quoted prices in active markets for identical, unrestricted assets or liabilities that the Funds have the ability to access at the measurement date;
Level 2 – Other significant observable inputs (including quoted prices in non -active markets, quoted prices for similar investments, fair value of investments for which the Funds have the ability to fully redeem tranches at net asset value as of the measurement date or within the near term, and short-term investments valued at amortized cost);
Level 3 – Significant unobservable inputs (including the Funds’ own assumptions in determining the fair value of investments and fair value of investments for which the Funds do not have the ability to fully redeem tranches at net asset value as of the measurement date or within the near term).
| Notes to Financial Statements (continued) |
| |
| November 30, 2017 |
2. SIGNIFICANT ACCOUNTING POLICIES (continued)
Investments are classified within the level of the lowest significant input considered in determining fair value. Investments classified within Level 3 whose fair value measurement considers several inputs may include Level 1 or Level 2 inputs as components of the overall fair value measurement.
For the year ended November 30, 2017 there have been no significant changes to the Funds’ fair valuation methodologies.
FEDERAL INCOME TAXES — It is each Fund’s intention to qualify, or continue to qualify, as a regulated investment company for Federal income tax purposes by complying with the appropriate provisions of Subchapter M of the Internal Revenue Code of 1986, as amended. Accordingly, no provisions for Federal income taxes have been made in the financial statements except as described below.
The Funds evaluate tax positions taken or expected to be taken in the course of preparing the Funds’ tax returns to determine whether it is "more-likely -than-not" (i.e., greater than 50 percent) that each tax position will be sustained upon examination by a taxing authority based on the technical merits of the position. Tax positions not deemed to meet the more-likely-than-not threshold are recorded as a tax benefit or expense in the current year. The Funds did not record any tax provisions in the current period; however, management’s conclusions regarding tax positions may be subject to review and adjustment at a later date based on factors including, but not limited to, examination by tax authorities (i.e., the last three tax year ends, as applicable), on-going analysis of and changes to tax laws, regulations and interpretations thereof. Any foreign tax filings that have not been made, will be filed within the prescribed period.
SECURITY TRANSACTIONS AND INVESTMENT INCOME — Security transactions are accounted for on the trade date for financial reporting purposes. Costs used in determining realized gains and losses on the sale of investment securities are based on specific identification. Dividend income is recorded on the ex-dividend date. Interest income is recognized on the accrual basis from the settlement date.
FOREIGN CURRENCY TRANSACTIONS AND TRANSLATION — The books and records of the Funds are maintained in U.S. dollars. Investment securities and other assets and liabilities denominated in a foreign currency are translated into U.S. dollars on the date of valuation. Purchases and sales of investment securities, income and expenses are translated into U.S. dollars at the relevant rates of exchange prevailing on the respective dates of such transactions. The Funds do not isolate that portion of realized or unrealized gains and losses resulting from changes in the foreign exchange rate from fluctuations arising from changes in the market prices of the securities. These gains and losses are included in net realized and unrealized gains and losses on investments on the Statement of Operations. Net realized and unrealized gains and losses on foreign currency transactions and translations represent net foreign exchange gains or losses from foreign currency spot contracts, disposition of foreign currencies, currency gains or losses realized between trade and settlement dates on securities transactions and the difference between the amount of the investment income and foreign withholding taxes recorded on the Funds’ books and the U.S. dollar equivalent amounts actually received or paid.
| Notes to Financial Statements (continued) |
| |
| November 30, 2017 |
2. SIGNIFICANT ACCOUNTING POLICIES (continued)
DIVIDENDS AND DISTRIBUTIONS TO SHAREHOLDERS — The Funds distribute their net investment income on a pro rata basis. Any net realized capital gains are distributed annually. All distributions are recorded on ex-dividend date.
CREATION UNITS — The Funds issue and redeem their shares (“Shares”) on a continuous basis at Net Asset Value (“NAV”) and only in large blocks of 50,000 Shares, referred to as “Creation Units”. Purchasers of Creation Units (“Authorized Participants”) at NAV must pay a standard creation transaction fee per transaction. The fee is a single charge and will be the same regardless of the number of Creation Units purchased by an Authorized Participant on the same day.
An Authorized Participant who holds Creation Units and wishes to redeem at NAV would also pay a standard redemption fee per transaction to Brown Brothers Harriman & Co. (“BBH”), the Funds’ custodian (“Custodian”), on the date of such redemption, regardless of the number of Creation Units redeemed that day.
If a Creation Unit is purchased or redeemed for cash, an additional variable fee may be charged. The following table discloses Creation Unit breakdown:
| | | | | | | | | Value at | | | | |
| | | Creation Unit | | | | | | November 30, | | | | |
| | | Shares | | | Creation Fee | | | 2017 | | | Redemption Fee | |
| Global X FinTech ETF* | | | 50,000 | | | $ | 500 | | | $ | 1,089,500 | | | $ | 500 | |
| Global X Internet of Things ETF* | | | 50,000 | | | | 750 | | | | 1,006,000 | | | | 750 | |
| Global X Robotics & Artificial Intelligence ETF* | | | 50,000 | | | | 750 | | | | 1,198,000 | | | | 750 | |
| Global X Health & Wellness Thematic ETF * | | | 50,000 | | | | 1,000 | | | | 837,500 | | | | 1,000 | |
| Global X Longevity Thematic ETF* | | | 50,000 | | | | 1,000 | | | | 980,000 | | | | 1,000 | |
| Global X Millennials Thematic ETF | | | 50,000 | | | | 750 | | | | 955,500 | | | | 750 | |
| Global X U.S. Infrastructure Development ETF | | | 50,000 | | | | 750 | | | | 808,000 | | | | 750 | |
| Global X Conscious Companies ETF | | | 50,000 | | | | 750 | | | | 961,500 | | | | 750 | |
| Global X Founder-Run Companies ETF | | | 50,000 | | | | 750 | | | | 870,500 | | | | 750 | |
| Global X Iconic U.S. Brands ETF | | | 50,000 | | | | 300 | | | | 774,000 | | | | 300 | |
*On March 30, 2017, Global X FinTech ETF, Global X Internet of Things ETF, Global X Robotics & Artificial Intelligence ETF, Global X Health & Wellness Thematic ETF, and Global X Longevity Thematic ETF, changed their creation/ redemption fee from: $1,000, $1,200, $1,500, $1,500, and $1,500, to $500, $750, $1,000, and $1,000, respectively.
CASH OVERDRAFT CHARGES – Per the terms of an agreement with BBH, if a Fund has a cash overdraft on a given day, it will be assessed an overdraft charge of LIBOR plus 2.00%. Cash overdraft charges are included in custodian fees on the Statement of Operations.
| Notes to Financial Statements (continued) |
| |
| November 30, 2017 |
3. RELATED PARTY TRANSACTIONS AND SERVICE PROVIDER TRANSACTIONS
The Adviser serves as the investment adviser and the administrator for the Funds. Subject to the supervision of the Board of Trustees, the Adviser is responsible for managing the investment activities of the Funds and the Funds’ business affairs and other administrative matters and provides or causes to be furnished all supervisory, administrative and other services reasonably necessary for the operation of the Funds, including certain distribution services (provided pursuant to a separate distribution services agreement), certain shareholder and distribution-related services (provided pursuant to a separate Rule 12b-1 Plan and related agreements) and investment advisory services (provided pursuant to a separate investment advisory agreement), under what is essentially an "all -in" fee structure. For its service to the Funds, under the supervision and administration agreement, each Fund pays a monthly fee to the Adviser at the annual rate below (stated as a percentage of the average daily net assets of the Fund). In addition, the Funds bear other expenses, directly and indirectly, that are not covered by the supervision and administration agreement, which may vary and affect the total expense ratios of the Funds, such as taxes, brokerage fees, commissions, acquired fund fees and other transaction expenses, interest expenses, and extraordinary expenses (such as litigation and indemnification expenses).
| | | Supervision and | |
| | | Administration Fee | |
| Global X FinTech ETF | | | 0.68 | % |
| Global X Internet of Things ETF | | | 0.68 | % |
| Global X Robotics & Artificial Intelligence ETF | | | 0.68 | % |
| Global X Health & Wellness Thematic ETF* | | | 0.68 | % |
| Global X Longevity Thematic ETF* | | | 0.68 | % |
| Global X Millennials Thematic ETF* | | | 0.68 | % |
| Global X U.S. Infrastructure Development ETF* | | | 0.58 | % |
| Global X Conscious Companies ETF | | | 0.43 | % |
| Global X Founder-Run Companies ETF | | | 0.65 | % |
| Global X Iconic U.S. Brands ETF | | | 0.48 | % |
*Pursuant to an expense limitation agreement, the Adviser has agreed to waive or reimburse fees and/or limit fund expenses to the extent necessary to assure that the operating expenses of the Global X U.S. Infrastructure Development ETF (the “Fund”) (exclusive of taxes, brokerage fees, commissions, and other transaction expenses, interest, and extraordinary expenses (such as litigation and indemnification expenses)) will not exceed 0.47% of the Fund’s average daily net assets per year until March 1, 2018. Pursuant to an expense limitation agreement, the Adviser has agreed to waive or reimburse fees and/or limit fund expenses to the extent necessary to assure that the operating expenses of the Global X Health & Wellness Thematic ETF, Global X Longevity Thematic ETF and the Global X Millennials Thematic ETF (the “Funds”) (exclusive of taxes, brokerage fees, commissions, and other transaction expenses, interest, and extraordinary expenses (such as litigation and indemnification expenses)) will not exceed 0.50% of the Funds’ average daily net assets per year until April 1, 2018. Each Fund (at a later date) may reimburse the Adviser for the fees and expenses it waived or reimbursed and/or limited pursuant to the expense limitation agreement during any of the prior three fiscal years, provided that, among other things, any reimbursement made to the Adviser does not cause Total Annual Fund Operating Expenses to exceed the maximum permitted rate during the period in which it is paid and the Board has approved such reimbursement to the Adviser. As of November 30, 2017, the amounts of waivers/reimbursements subject to recoupment for the Global X Health & Wellness Thematic ETF, Global X Longevity Thematic ETF, Global X Millennials Thematic ETF and Global X U.S. Infrastructure Development ETF were $2,692 expiring 2020, $6,251 expiring 2020, $8,858 expiring 2020 and $8,619 expiring 2020, respectively.
| Notes to Financial Statements (continued) |
| |
| November 30, 2017 |
3. RELATED PARTY TRANSACTIONS AND SERVICE PROVIDER TRANSACTIONS (concluded)
SEI Investments Global Funds Services (“SEIGFS”) serves as sub-administrator to the Funds. As sub-administrator, SEIGFS provides the Funds with the required general administrative services, including, without limitation: office space, equipment, and personnel; clerical and general back office services; bookkeeping, internal accounting and secretarial services; the calculation of NAV; and assistance with the preparation and filing of reports, registration statements, proxy statements and other materials required to be filed or furnished by the Funds under federal and state securities laws. As compensation for these services, the sub-administrator receives certain out-of-pocket costs, transaction fees and asset-based fees which are accrued daily and paid monthly by the Adviser.
SEI Investments Distribution Co. (“SIDCO”) serves as each Fund’s underwriter and distributor of Creation Units pursuant to a distribution agreement. SIDCO has no obligation to sell any specific quantity of Shares. SIDCO bears the following costs and expenses relating to the distribution of Shares: (1) the costs of processing and maintaining records of creations of Creation Units; (2) all costs of maintaining the records required of a registered broker/dealer; (3) the expenses of maintaining its registration or qualification as a dealer or broker under Federal or state laws; (4) filing fees; and (5) all other expenses incurred in connection with the distribution services as contemplated in the distribution agreement. SIDCO receives no fee from the Funds for its distribution services under the distribution agreement; rather the Adviser compensates SIDCO for certain expenses, out-of-pocket costs, and transaction fees.
BBH serves as custodian of the Funds’ assets. As custodian, BBH has agreed to (1) make receipts and disbursements of money on behalf of the Funds, (2) collect and receive all income and other payments and distributions on account of the Funds’ portfolio investments, (3) respond to correspondence from shareholders, security brokers and others relating to its duties, and (4) make periodic reports to the Funds concerning the Funds’ operations. BBH does not exercise any supervisory function over the purchase and sale of securities. BBH also serves as the Fund’s transfer agent. As transfer agent, BBH has agreed to (1) issue and redeem shares of each Fund, (2) make dividend and other distributions to shareholders of each Fund, (3) respond to correspondence by shareholders and others relating to its duties, (4) maintain shareholder accounts, and (5) make periodic reports to the Funds. As compensation for these services, BBH receives certain out-of pocket costs, transaction fees and asset-based fees which are accrued daily and paid monthly by the Adviser from its fees.
4. INVESTMENT TRANSACTIONS
For the years ended November 30, 2016 and November 30, 2017, the purchases and sales of investments in securities, excluding; in-kind transactions, long-term U.S. Government and short-term securities were, respectively:
| | | Purchases | | | Sales and Maturities | |
| Global X FinTech ETF | | $ | 1,367,739 | | | $ | 1,494,093 | |
| Global X Internet of Things ETF | | | 14,950,058 | | | | 10,548,415 | |
| Global X Robotics & Artificial Intelligence ETF | | | 48,999,298 | | | | 59,987,145 | |
| Global X Health & Wellness Thematic ETF | | | 406,801 | | | | 331,222 | |
| Global X Longevity Thematic ETF | | | 602,849 | | | | 411,175 | |
| Global X Millennials Thematic ETF | | | 1,311,261 | | | | 1,300,143 | |
| Global X U.S. Infrastructure Development ETF | | | 19,803 | | | | 29 | |
| Global X Conscious Companies ETF | | | 16,320,728 | | | | 16,385,439 | |
| Global X Founder-Run Companies ETF | | | 602,849 | | | | 587,812 | |
| Global X Iconic U.S. Brands ETF | | | — | | | | — | |
| Notes to Financial Statements (continued) |
| |
| November 30, 2017 |
4. INVESTMENT TRANSACTIONS (continued)
For the years ended November 30, 2016 and November 30, 2017, in-kind transactions associated with creations and redemptions were, respectively:
| | | | | | Sales and | | | Realized | |
| 2016 | | Purchases | | | Maturities | | | Gain/(Loss) | |
| Global X FinTech ETF | | $ | 1,507,633 | | | $ | - | | | $ | - | |
| Global X Internet of Things ETF | | | 3,557,758 | | | | - | | | | - | |
| Global X Robotics & Artificial Intelligence ETF | | | 2,991,058 | | | | - | | | | - | |
| Global X Health & Wellness Thematic ETF | | | 1,278,923 | | | | - | | | | - | |
| Global X Longevity Thematic ETF | | | 1,490,924 | | | | - | | | | - | |
| Global X Millennials Thematic ETF | | | 3,806,608 | | | | - | | | | - | |
| Global X Conscious Companies ETF | | | 32,860,364 | | | | 727,399 | | | | 47,034 | |
| | | | | | Sales and | | | Realized | |
| 2017 | | Purchases | | | Maturities | | | Gain/(Loss) | |
| Global X FinTech ETF | | $ | 45,393,262 | | | $ | - | | | $ | - | |
| Global X Internet of Things ETF | | | 68,280,878 | | | | - | | | | - | |
| Global X Robotics & Artificial Intelligence ETF | | | 1,321,223,760 | | | | 75,881,515 | | | | 18,793,667 | |
| Global X Health & Wellness Thematic ETF | | | 703,240 | | | | - | | | | - | |
| Global X Longevity Thematic ETF | | | 6,359,421 | | | | 929,928 | | | | 212,212 | |
| Global X Millennials Thematic ETF | | | 8,047,486 | | | | 1,764,759 | | | | 520,267 | |
| Global X U.S. Infrastructure Development ETF | | | 18,354,759 | | | | - | | | | - | |
| Global X Conscious Companies ETF | | | 23,377,949 | | | | 15,880,134 | | | | 3,840,956 | |
| Global X Founder-Run Companies ETF | | | 4,681,158 | | | | 1,579,943 | | | | 136,171 | |
| Global X Iconic U.S. Brands ETF | | | 2,242,999 | | | | - | | | | - | |
For the year ended November 30, 2016, there were no purchases or sales of long-term U.S. Government securities for the Funds.
5. TAX INFORMATION
The amount and character of income and capital gain distributions to be paid, if any, are determined in accordance with Federal income tax regulations, which may differ from U.S. GAAP. As a result, net investment income (loss) and net realized gain (loss) on investment transactions for a reporting period may differ significantly from distributions during such period. These book/tax differences may be temporary or permanent. To the extent these differences are permanent in nature, they are charged or credited to undistributed net investment income (loss), accumulated net realized gain (loss) or paid-in capital, as appropriate, in the period that the differences arise.
| Notes to Financial Statements (continued) |
| |
| November 30, 2017 |
5. TAX INFORMATION (continued)
The following differences, primarily attributable to foreign currency, redemptions in- kind, and reclassification of distribution, have been reclassified to/from the following accounts during the fiscal year ended November 30, 2017:
| | | | | | Undistributed Net | | | Accumulated | |
| | | | | | Investment | | | Net Realized | |
| Global X Funds | | Paid-in Capital | | | Income (Loss) | | | Gain (Loss) | |
| Global X FinTech ETF | | $ | – | | | $ | (74 | ) | | $ | 74 | |
| Global X Internet of Things ETF | | | – | | | | (11,062 | ) | | | 11,062 | |
| Global X Robotics & Artificial Intelligence ETF | | | 18,793,667 | | | | (58,787 | ) | | | (18,734,880 | ) |
| Global X Health & Wellness Thematic ETF | | | – | | | | (95 | ) | | | 95 | |
| Global X Longevity Thematic ETF | | | 212,125 | | | | (829 | ) | | | (211,296 | ) |
| Global X Millennials Thematic ETF | | | 520,267 | | | | – | | | | (520,267 | ) |
| Global X U.S. Infrastructure Development ETF | | | – | | | | 9 | | | | (9 | ) |
| Global X Conscious Companies ETF | | | 3,839,310 | | | | – | | | | (3,839,310 | ) |
| Global X Founder-Run Companies ETF | | | 136,171 | | | | – | | | | (136,171 | ) |
The tax character of dividends and distributions declared during the years or periods ended November 30, 2017 and Novmeber 30, 2016 were as follows:
| Global X | | | | | Long-Term | | | | | | | |
| Funds | | Ordinary Income | | | Capital Gain | | | Return of Capital | | | Totals | |
| | | | | | | | | | | | | |
| Global X FinTech ETF | | | | | | | | | | | | | | | | |
| 2017 | | $ | – | | | $ | – | | | $ | – | | | $ | – | |
| 2016 | | | – | | | | – | | | | – | | | | – | |
| Global X Internet of Things ETF | | | | | | | | | | | | | | | | |
| 2017 | | $ | 21,905 | | | $ | – | | | $ | – | | | $ | 21,905 | |
| 2016 | | | – | | | | – | | | | – | | | | – | |
| Global X Robotics & Artificial Intelligence ETF | | | | | | | | | | | | | | | | |
| 2017 | | $ | 2,133 | | | $ | – | | | $ | – | | | $ | 2,133 | |
| 2016 | | | – | | | | – | | | | – | | | | – | |
| Global X Health & Wellness Thematic ETF | | | | | | | | | | | | |
| 2017 | | $ | 7,508 | | | $ | – | | | $ | – | | | $ | 7,508 | |
| 2016 | | | – | | | | – | | | | – | | | | – | |
| Global X Longevity Thematic ETF | | | | | | | | | | | | | | | | |
| 2017 | | $ | 16,127 | | | $ | – | | | $ | – | | | $ | 16,127 | |
| 2016 | | | – | | | | – | | | | – | | | | – | |
| Global X Millennials Thematic ETF | | | | | | | | | | | | | | | | |
| 2017 | | $ | 12,412 | | | $ | – | | | $ | – | | | $ | 12,412 | |
| 2016 | | | – | | | | – | | | | – | | | | – | |
| Global X U.S. Infrastructure Development ETF | | | | | | | | | | | | |
| 2017 | | $ | – | | | $ | – | | | $ | – | | | $ | – | |
| Global X Conscious Companies ETF | | | | | | | | | | | | | | | | |
| 2017 | | $ | 328,342 | | | $ | – | | | $ | – | | | $ | 328,342 | |
| 2016 | | | – | | | | – | | | | – | | | | – | |
| Global X Founder-Run Companies ETF | | | | | | | | | | | | |
| 2017 | | $ | – | | | $ | – | | | $ | – | | | $ | – | |
| Global X Iconic U.S. Brands ETF | | | | | | | | | | | | | | | | |
| 2017 | | $ | – | | | $ | – | | | $ | – | | | $ | – | |
| Notes to Financial Statements (continued) |
| |
| November 30, 2017 |
5. TAX INFORMATION (continued)
As of November 30, 2017, the components of tax basis distributable earnings (accumulated losses) were as follows:
| | | Global X Funds | |
| | | | | | | | | Global X Robotics | |
| | | Global X FinTech | | | Global X Internet | | | & Artificial | |
| | | ETF | | | of Things ETF | | | Intelligence ETF | |
| Undistributed Ordinary Income | | $ | 47,894 | | | $ | 837,387 | | | $ | 97,517 | |
| Undistributed Long-Term Capital Gain | | | 15,111 | | | | 79,852 | | | | – | |
| Capital Loss Carry Forawards | | | – | | | | – | | | | (3,825,056 | ) |
| Other Temporary Differences | | | 1 | | | | (1 | ) | | | 1 | |
| Unrealized Appreciation on Investments and Foreign Currency | | | 3,137,935 | | | | 8,423,521 | | | | 127,030,128 | |
| Total Distributable Earnings | | $ | 3,200,941 | | | $ | 9,340,759 | | | $ | 123,302,589 | |
| | | Global X Funds | |
| | | Global X Health & | | | Global X | | | Global X | |
| | | Wellness Thematic | | | Longevity | | | Millennials | |
| | | ETF | | | Thematic ETF | | | Thematic ETF | |
| Undistributed Ordinary Income | | $ | 53,435 | | | $ | 67,653 | | | $ | 89,226 | |
| Undistributed Long-Term Capital Gain | | | 16,672 | | | | 14,947 | | | | 20,902 | |
| Other Temporary Differences | | | 1 | | | | – | | | | – | |
| Unrealized Appreciation on Investments and Foreign Currency | | | 160,826 | | | | 471,643 | | | | 741,457 | |
| Total Distributable Earnings | | $ | 230,934 | | | $ | 554,243 | | | $ | 851,585 | |
| | | Global X Funds | |
| | | Global X U.S. | | | Global X | | | Global X | |
| | | Infrastructure | | | Conscious | | | Founder-Run | |
| | | Development ETF | | | Companies ETF | | | Companies ETF | |
| Undistributed Ordinary Income | | $ | 71,549 | | | $ | 553,267 | | | $ | 50,519 | |
| Undistributed Long-Term Capital Gain | | | – | | | | – | | | | 1,176 | |
| Capital Loss Carry Forwards | | | – | | | | (387,669 | ) | | | – | |
| Unrealized Appreciation on Investments and Foreign Currency | | | 1,763,785 | | | | 4,742,519 | | | | 182,553 | |
| Total Distributable Earnings | | $ | 1,835,334 | | | $ | 4,908,117 | | | $ | 234,248 | |
| | | Global X Funds | | | | | | | |
| | | Global X Iconic | | | | | | | |
| | | U.S. Brands ETF | | | | | | | |
| Undistributed Ordinary Income | | $ | 4,420 | | | | | | | | | |
| Post-October Losses | | | (20 | ) | | | | | | | | |
| Unrealized Appreciation on Investments and Foreign Currency | | | 72,814 | | | | | | | | | |
| Total Distributable Earnings | | $ | 77,214 | | | | | | | | | |
| Notes to Financial Statements (continued) |
| |
| November 30, 2017 |
5. TAX INFORMATION (continued)
During the year ended November 30, 2017 the following funds utilized capital loss carryforwards to offset capital gains amounting to:
| Global X Funds | | Short-Term Loss | | | Long-Term Loss | | | Total | |
| Global X Internet of Things Thematic ETF | | $ | 592 | | | $ | - | | | $ | 592 | |
| Global X Longevity Thematic ETF | | | 1,532 | | | | - | | | | 1,532 | |
| Global X Conscious Companies ETF | | | 3,751 | | | | - | | | | 3,751 | |
For taxable years beginning after December 22, 2010, a RIC is permitted to carry forward net capitallosses to offset capital gains realized in later years, and the losses carried forward retain their originalcharacter as either long-term or short-term losses. Losses carried forward under these new provisionsare as follows:
| Global X Funds | | Short-Term Loss | | | Long-Term Loss | | | Total | |
| Global X Robotics & Artificial Intellegence ETF | | $ | (3,825,057 | ) | | $ | - | | | $ | (3,825,057 | ) |
| Global X Conscious Companies ETF | | | (48,815 | ) | | | (338,854 | ) | | | (387,669 | ) |
The Federal tax cost and aggregate gross unrealized appreciation and depreciation on investments held by the Funds at November 30, 2017, were as follows:
| | | | | | Aggregated | | | Aggregated | | | | |
| | | | | | Gross | | | Gross | | | Net | |
| | | Federal Tax | | | Unrealized | | | Unrealized | | | Unrealized | |
| Global X Funds | | Cost | | | Appreciation | | | Depreciation | | | Appreciation | |
| Global X FinTech ETF | | $ | 46,851,974 | | | $ | 3,857,314 | | | $ | (719,378 | ) | | $ | 3,137,936 | |
| Global X Internet of Things ETF | | | 77,038,666 | | | | 10,201,792 | | | | (1,778,272 | ) | | | 8,423,520 | |
| Global X Robotics & Artificial Intelligence ETF | | | 1,352,848,485 | | | | 139,481,063 | | | | (12,450,934 | ) | | | 127,030,129 | |
| Global X Health & Wellness Thematic ETF | | | 2,346,107 | | | | 337,263 | | | | (176,437 | ) | | | 160,826 | |
| Global X Longevity Thematic ETF | | | 7,353,040 | | | | 798,094 | | | | (326,450 | ) | | | 471,644 | |
| Global X Millennials Thematic ETF | | | 10,700,454 | | | | 1,162,516 | | | | (421,059 | ) | | | 741,457 | |
| Global X U.S. Infrastructure Development ETF | | | 18,374,542 | | | | 1,955,426 | | | | (191,641 | ) | | | 1,763,785 | |
| Global X Conscious Companies ETF | | | 43,225,623 | | | | 5,845,411 | | | | (1,102,893 | ) | | | 4,742,518 | |
| Global X Founder-Run Companies ETF | | | 3,297,268 | | | | 336,371 | | | | (153,818 | ) | | | 182,553 | |
| Global X Iconic U.S. Brands ETF | | | 2,242,979 | | | | 122,662 | | | | (49,847 | ) | | | 72,815 | |
The preceding differences between book and tax cost are primarily due to mark-to-market treatment of passive foreign investment companies and wash sales.
| Notes to Financial Statements (continued) |
| |
| November 30, 2017 |
6. CONCENTRATION OF RISKS (continued)
The Funds invest in securities of foreign issuers in various countries. These investments may involve certain considerations and risks not typically associated with investments in the United States as a result of, among other factors, the possibility of future political and economic developments and the level of governmental supervision and regulation of securities markets in the respective countries.
The securities markets of emerging countries are less liquid and subject to greater price volatility, and have a smaller market capitalization, than the U.S. securities markets. In certain countries, there may be fewer publicly traded securities and the market may be dominated by a few issues or sectors. Issuers and securities markets in such countries are not subject to as extensive and frequent accounting, financial and other reporting requirements or as comprehensive government regulations as are issuers and securities markets in the United States. In particular, the assets and profits appearing on the financial statements of emerging country issuers may not reflect their financial position or results of operations in the same manner as financial statements for U.S. issuers. Substantially less information may be publicly available about emerging country issuers than is available about issuers in the United States.
The Funds may be subject to taxes imposed by countries in which they invest. Such taxes are generally based on either income or gains earned or repatriated. The Funds accrue and apply such taxes to net investment income, net realized gains and net unrealized gains as income and/or capital gains are earned.
The Funds use a replication strategy. A replication strategy is an indexing strategy that involves investing in the securities of the underlying index in approximately the same proportions as in the underlying index. The Funds may utilize a representative sampling strategy with respect to their underlying indices when a replication strategy might be detrimental to their shareholders, such as when there are practical difficulties or substantial costs involved in compiling a portfolio of equity securities to follow its underlying index, or, in certain instances, when securities in the underlying index become temporarily illiquid, unavailable or less liquid, or due to legal restrictions (such as diversification requirements that apply to the Funds but not to the underlying indexes). Commodity related securities are susceptible to fluctuations in certain commodity markets. Any negative changes in commodity markets could have a substantial impact on these Funds.
A more complete description of risks is included in each Fund’s Prospectus and Statement of Additional Information.
| Notes to Financial Statements (continued) |
| |
| November 30, 2017 |
7. LOANS OF PORTFOLIO SECURITIES
The Funds may lend portfolio securities having a market value up to one-third of the Funds’ total assets. Security loans made pursuant to a securities lending agreement are required at all times to be secured by collateral equal to at least 102% for U.S. -based securities and 105% for foreign- based securities. Such collateral will be cash or securities issued or guaranteed by the U.S. Government or any agencies. Cash collateral received in connection with these loans can be invested in repurchase agreements or U.S. Treasury obligations and is accounted for in the Schedule of Investments and Statement of Assets and Liabilities. The obligation to return securities lending collateral is also recognized as a liability in the Statement of Assets and Liabilities. It is the Funds’ policy to obtain additional collateral from or return excess collateral to the borrower by the end of the next business day, following the valuation date of the securities loaned. Therefore, the value of the collateral held may be temporarily less than the value of the securities on loan. Lending securities entails a risk of loss to the Funds if and to the extent that the market values of the securities loaned were to increase and the borrower did not increase the collateral accordingly and the borrower failed to return the securities. The Funds could also experience delays and costs gaining access to the collateral. The Funds bear the risk of any deficiency in the amount of the collateral available for return to the borrower due to any loss on the collateral invested. As of November 30, 2017, the Funds had no securities on loan.
8. CONTRACTUAL OBLIGATIONS
The Funds enter into contracts in the normal course of business that contain a variety of indemnifications. The Funds’ maximum exposure under these arrangements is unknown. However, the Funds have not had prior gains or losses pursuant to these contracts. Management has reviewed the Funds’ existing contracts and expects the risk of loss to be remote.
Pursuant to the Trust’s organizational documents, the Trustees of the Trust and the Trust’s officers are indemnified against certain liabilities that may arise out of the performance of their duties.
9. REGULATORY MATTERS
In October 2016, the U.S. Securities and Exchange Commission adopted new rules and amended existing rules (together, the final rules) intended to modernize the reporting and disclosure of information by registered investment companies. In part, the final rules amend Regulation S-X and require standardized, enhanced disclosures about derivatives in investment company financial statements, as well as other amendments. As of August 1, 2017, management has implemented the amendments to Regulation S-X, which did not have a material impact on the Funds’ financial statements and related disclosures or impact the Funds’ net assets or results of operations.
10. SUBSEQUENT EVENTS
The Funds have been evaluated regarding the need for additional disclosures and/or adjustments resulting from subsequent events. Based on this evaluation, please note the additional disclosure:
On November 1, 2017, the Trust has entered into an agreement with BBH in which BBH will serve as the new securities lending agent for the Trust and each of its series. The agreement was implemented beginning January 1, 2018.
| Report of Independent Registered Public Accounting Firm |
To the Board of Trustees and Shareholders of Global X FinTech ETF, Global X Internet of Things ETF, Global X Robotics & Artificial Intelligence ETF, Global X Health & Wellness Thematic ETF, Global X Longevity Thematic ETF, Global X Millennials Thematic ETF, Global X U.S. Infrastructure Development ETF, Global X Conscious Companies ETF, Global X Founder-Run Companies ETF and Global X Iconic U.S. Brands ETF.
In our opinion, the accompanying statements of assets and liabilities, including the schedules of investments, and the related statements of operations, of changes in net assets and the financial highlights present fairly, in all material respects, the financial position of each of the ten Funds listed in the table below (ten of the funds constituting part of the series of Global X Funds, hereafter referred to as the "Funds") as of November 30, 2017, the results of each of their operations, the changes in each of their net assets and the financial highlights for the respective periods described in the table below, in conformity with accounting principles generally accepted in the United States of America.
| Global X FinTech ETF, Global X Internet of Things ETF and Global X Robotics & Artificial Intelligence ETF | Statements of operations for the year ended November 30, 2017 and the changes in net assets and the financial highlights for the year ended November 30, 2017 and for the period September 12, 2016 (commencement of operations) through November 30, 2016 |
| Global X Health & Wellness Thematic ETF and Global X Longevity Thematic ETF | Statements of operations for the year ended November 30, 2017 and the changes in net assets and the financial highlights for the year ended November 30, 2017 and for the period May 9, 2016 (commencement of operations) through November 30, 2016 |
| Global X Millennials Thematic ETF | Statements of operations for the year ended November 30, 2017 and the changes in net assets and the financial highlights for the year ended November 30, 2017 and for the period May 4, 2016 (commencement of operations) through November 30, 2016 |
| Global X U.S. Infrastructure Development ETF | Statements of operations, the changes in net assets and the financial highlights for the period March 6, 2017 (commencement of operations) through November 30, 2017 |
| Global X Conscious Companies ETF | Statement of operations for the year ended November 30, 2017 and the changes in net assets and the financial highlights for the year ended November 30, 2017 and for the period July 11, 2016 (commencement of operations) through November 30, 2016 |
| Report of Independent Registered Public Accounting Firm (continued) |
| Global X Founder-Run Companies ETF | Statements of operations, the changes in net assets and the financial highlights for the period February 13, 2017 (commencement of operations) through November 30, 2017 |
| Global X Iconic U.S. Brands ETF | Statements of operations, the changes in net assets and the financial highlights for the period October 16, 2017 (commencement of operations) through November 30, 2017 |
These financial statements and financial highlights (hereafter referred to as "financial statements") are the responsibility of the Funds’ management. Our responsibility is to express an opinion on these financial statements based on our audits. We conducted our audits of these financial statements in accordance with the standards of the Public Company Accounting Oversight Board (United States). Those standards require that we plan and perform the audit to obtain reasonable assurance about whether the financial statements are free of material misstatement. An audit includes examining, on a test basis, evidence supporting the amounts and disclosures in the financial statements, assessing the accounting principles used and significant estimates made by management, and evaluating the overall financial statement presentation. Our procedures included confirmation of securities owned as of November 30, 2017 by correspondence with the custodian and brokers; when replies were not received from brokers, we performed other auditing procedures. We believe that our audits provide a reasonable basis for our opinions.
| /s/ PricewaterhouseCoopers LLP | |
| Philadelphia, Pennsylvania | |
| January 26, 2017 | |
| Disclosure of Fund Expenses (Unaudited) |
All Exchange Traded Funds (“ETFs”) have operating expenses. As a shareholder of an ETF, your investment is affected by these ongoing costs, which include (among others) costs for ETF management, administrative services, commissions, and shareholder reports like this one. It is important for you to understand the impact of these costs on your investment returns. In addition, a shareholder is responsible for brokerage fees as a result of their investment in the Fund.
Operating expenses such as these are deducted from an ETF’s gross income and directly reduce its final investment return. These expenses are expressed as a percentage of the ETF’s average net assets; this percentage is known as the ETF’s expense ratio.
The following examples use the expense ratio and are intended to help you understand the ongoing costs (in dollars) of investing in your Fund and to compare these costs with those of other funds. The examples are based on an investment of $1,000 made at the beginning of the period shown and held for the entire period (June 1, 2017 to November 30, 2017).
The table on the next page illustrates your Fund’s costs in two ways:
Actual Fund Return. This section helps you to estimate the actual expenses that your Fund incurred over the period. The “Expenses Paid During Period” column shows the actual dollar expense cost incurred by a $1,000 investment in the Fund, and the “Ending Account Value” number is derived from deducting that expense cost from the Fund’s gross investment return.
You can use this information, together with the actual amount you invested in the Funds, to estimate the expenses you paid over that period. Simply divide your actual account value by $1,000 to arrive at a ratio (for example, an $8,600 account value divided by $1,000 = 8.6), then multiply that ratio by the number shown for your Funds under “Expenses Paid During Period.”
Hypothetical 5% Return. This section helps you compare your Fund’s costs with those of other funds. It assumes that the Funds had an annual 5% return before expenses during the year, but that the expense ratio (Column 3) for the period is unchanged. This example is useful in making comparisons because the Securities and Exchange Commission requires all funds to make this 5% calculation. You can assess your Fund’s comparative cost by comparing the hypothetical result for your Fund in the “Expenses Paid During Period” column with those that appear in the same charts in the shareholder reports for other funds.
NOTE: Because the return is set at 5% for comparison purposes — NOT your Fund’s actual return — the account values shown may not apply to your specific investment.
| Disclosure of Fund Expenses (Unaudited) (concluded) |
| | | Beginning | | | Ending | | | | | | Expenses | |
| | | Account | | | Account | | | Annualized | | | Paid | |
| | | Value | | | Value | | | Expense | | | During | |
| | | 6/1/2017 | | | 11/30/2017 | | | Ratios | | | Period(1) | |
| Global X FinTech ETF | | | | | | | | | | | | | | | | |
| Actual Fund Return | | $ | 1,000.00 | | | $ | 1,208.50 | | | | 0 .68 | % | | $ | 3.77 | |
| Hypothetical 5% Return | | | 1,000.00 | | | | 1,021.66 | | | | 0 .68 | | | | 3.45 | |
| Global X Internet of Things ETF | | | | | | | | | | | | | | | | |
| Actual Fund Return | | $ | 1,000.00 | | | $ | 1,109.20 | | | | 0 .71 | % | | $ | 3.74 | |
| Hypothetical 5% Return | | | 1,000.00 | | | | 1,021.52 | | | | 0 .71 | | | | 3.59 | |
| Global X Robotics & Artificial Intelligence ETF | | | | | | | | | | | | | | | | |
| Actual Fund Return | | $ | 1,000.00 | | | $ | 1,290.30 | | | | 0 .70 | % | | $ | 3.99 | |
| Hypothetical 5% Return | | | 1,000.00 | | | | 1,021.58 | | | | 0 .70 | | | | 3.52 | |
| Global X Health & Wellness Thematic ETF | | | | | | | | | | | | | | | | |
| Actual Fund Return | | $ | 1,000.00 | | | $ | 1,079.90 | | | | 0 .50 | % | | $ | 2.62 | |
| Hypothetical 5% Return | | | 1,000.00 | | | | 1,022.55 | | | | 0 .50 | | | | 2.54 | |
| Global X Longevity Thematic ETF | | | | | | | | | | | | | | | | |
| Actual Fund Return | | $ | 1,000.00 | | | $ | 1,098.70 | | | | 0 .50 | % | | $ | 2.63 | |
| Hypothetical 5% Return | | | 1,000.00 | | | | 1,021.66 | | | | 0 .50 | | | | 2.54 | |
| Global X Millennials Thematic ETF | | | | | | | | | | | | | | | | |
| Actual Fund Return | | $ | 1,000.00 | | | $ | 1,090.80 | | | | 0 .50 | % | | $ | 2.62 | |
| Hypothetical 5% Return | | | 1,000.00 | | | | 1,022.56 | | | | 0 .50 | | | | 2.54 | |
| Global X U.S. Infrastructure Development ETF | | | | | | | | | | | | | | | | |
| Actual Fund Return | | $ | 1,000.00 | | | $ | 1,134.00 | | | | 0 .47 | % | | $ | 2.51 | |
| Hypothetical 5% Return | | | 1,000.00 | | | | 1,022.71 | | | | 0 .47 | | | | 2.38 | |
| Global X Conscious Companies ETF | | | | | | | | | | | | | | | | |
| Actual Fund Return | | $ | 1,000.00 | | | $ | 1,109.60 | | | | 0 .43 | % | | $ | 2.27 | |
| Hypothetical 5% Return | | | 1,000.00 | | | | 1,022.92 | | | | 0 .43 | | | | 2.18 | |
| Global X Founder-Run Companies ETF | | | | | | | | | | | | | | | | |
| Actual Fund Return | | $ | 1,000.00 | | | $ | 1,121.10 | | | | 0 .65 | % | | $ | 3.46 | |
| Hypothetical 5% Return | | | 1,000.00 | | | | 1,021.81 | | | | 0 .65 | | | | 3.29 | |
| Global X Iconic U.S. Brands ETF* | | | | | | | | | | | | | | | | |
| Actual Fund Return | | $ | 1,000.00 | | | $ | 1,034.80 | | | | 0 .48 | % | | $ | 0.60 | (2) |
| Hypothetical 5% Return | | | 1,000.00 | | | | 1,022.67 | | | | 0 .48 | | | | 2.43 | |
| * | The Fund commenced operations on October 16, 2017. |
| (1) | Expenses are equal to the Fund’s annualized expense ratio multiplied by the average account value over the period, multiplied 183/365 (to reflect the one-half year period.) |
| (2) | Expenses are equal to the Fund’s annualized expense ratio multiplied by the average account value over the period, multiplied 45/365 (to reflect the period from inception to date.) |
| Approval of Investment Advisory Agreement (Unaudited) |
Section 15(c) of the Investment Company Act of 1940, as amended ("1940 Act"), requires that the board of trustees of an exchange-traded fund (“ETF”), including a majority of those trustees who are not "interested persons" of the ETF, as defined in the 1940 Act ("Independent Trustees"), consider on an initial basis and periodically thereafter (as required by the 1940 Act), at an in person meeting called for such purpose, the terms of each fund’s investment advisory agreement and whether to approve entering into, or renewing, each agreement.
At an in person quarterly Board meeting held on November 14, 2017, called for such purpose, the Board of Trustees (including the Trust’s Independent Trustees voting separately) considered and unanimously approved the continuation of (i) the Investment Advisory Agreement ("Renewal Investment Advisory Agreement") for each Fund included in this Annual Report (each, a “Renewal Fund”) and (ii) the Supervision and Administration Agreement between the Trust ("Renewal Supervision and Administration Agreement"), on behalf of each Renewal Fund, and Global X Management Company LLC ("Global X Management"). The Renewal Investment Advisory Agreement and the Renewal Supervision and Administration Agreement are referred to herein as the "Renewal Agreements."
On September 20, 2017, the Board of Trustees (including the Trust’s Independent Trustees voting separately) also initially considered and unanimously approved (i) the initial Investment Advisory Agreement (“New Investment Advisory Agreement”), for the Global X Iconic U.S. Brands ETF (the “New Fund”) and (ii) the Supervision and Administration Agreement between the Trust (“New Supervision and Administration Agreement”), on behalf the New Fund, and Global X Management. The New Advisory Agreement and the New Supervision and Administration Agreement are referred to collectively as the “New Fund Agreements.”
In advance of the Board meeting, the Board (including the Trust’s Independent Trustees) and the Independent Trustees’ independent legal counsel requested (in writing) detailed information from Global X Management in connection with their consideration of the Renewal Agreements and received and reviewed written responses from Global X Management and supporting materials relating to those requests for information. In the course of their consideration of the Renewal Agreements, the Trust’s Independent Trustees were advised by their counsel and, in addition to meeting with management of Global X Management, they met separately in executive session with their counsel.
In determining to approve the continuation of the New Fund Agreements for the New Fund, the Board considered a variety of factors, including the factors discussed in greater detail below.
NEW FUND AGREEMENTS
Nature, Extent and Quality of Services
With respect to this factor, the Board considered:
| • | the terms of the New Fund Agreements and the range of services to be provided to the New Funds in accordance with the New Fund Agreements; |
| • | Global X Management’s key personnel and the portfolio managers who would provide investment advisory services to the New Fund; |
| Approval of Investment Advisory Agreement (Unaudited) |
| • | Global X Management’s responsibilities under the New Fund Agreements to, among other things, (i) manage the investment operations of the New Fund and the composition of the New Fund’s assets, including the purchase, retention and disposition of its holdings, (ii) provide quarterly reports to the Trust’s officers and the Board and other reports as the Board deems necessary or appropriate, (iii) vote proxies, exercise consents, and exercise all other rights appertaining to securities and assets held by the New Fund, (iv) select broker-dealers to execute portfolio transactions for the New Fund when necessary, (v) assist in the preparation and filing of reports and proxy statements (if any) to the shareholders of the New Fund, and the periodic updating of the registration statement, prospectuses, statement of additional information, and other reports and documents for the New Fund that are required to be filed by the Trust with the Securities and Exchange Commission ("SEC") and other regulatory or governmental bodies, and (vi) monitor anticipated purchases and redemptions of the shares (including Creation Units) of the New Fund by shareholders and new investors; |
| • | the nature, extent and quality of all of the services (including advisory, administrative and compliance services) that would be provided by Global X Management or made available to the New Fund; and |
| • | the quality of Global X Management’s resources and personnel that would be made available to the New Fund, including Global X Management’s experience and the professional qualifications of Global X Management’s key personnel. |
Based on these considerations, the Board concluded that it was satisfied with the nature, extent and quality of the services to be provided to the New Fund by Global X Management.
Performance
The Board determined that, because the New Fund had not yet been operational for one calendar year, meaningful data relating to investment performance of the New Fund was not available and, therefore, could not be a factor in approving the New Fund Agreements.
Cost of Services and Profitability
With respect to this factor, the Board considered:
| • | Global X Management’s expected costs to provide investment management, supervision and administrative and related services to the New Fund; |
| • | The unitary fee (including the proposed investment advisory fee) ("Management Fee") that was proposed to be borne by the New Fund under the New Fund Agreements for the investment advisory, supervisory and administrative services that the New Fund requires under a unitary fee structure (including the types of fees and expenses that are not included within the unitary fee and would be borne by the New Fund); and |
| • | the expected profitability to Global X Management, if any, from all services to be provided to the New Fund and all aspects of the relationship between Global X Management and the New Fund. |
| Approval of Investment Advisory Agreement (Unaudited) |
Based on these considerations, the Board concluded that the proposed Management Fee to be paid by the New Fund to Global X Management, in light of the nature, extent and quality of the services to be provided, was reasonable and in the best interests of the New Fund’s shareholders.
Comparison of Fees and Services
With respect to this factor, the Board considered:
| • | comparative information with respect to the proposed Management Fee to be paid to Global X Management by the New Fund. In connection with this consideration, Global X Management provided the Board with comparative expense data for the New Fund, including fees and expenses paid by unaffiliated comparable specialized and/or focused exchange-traded funds, and/or other comparable registered funds; |
| • | the structure of the proposed unitary Management Fee (which includes as one component the proposed investment advisory fee for the New Fund) and the expected total expense ratios for the New Fund. In this regard, the Board took into consideration that the purpose of adopting a unitary Management Fee structure for the New Fund was to create a simple, all-inclusive fee that would provide a level of predictability with respect to the overall expense ratio (i.e., the total fees) of the New Fund and that the proposed Management Fee for the New Fund was set at a competitive level to make the New Fund viable in the marketplace; and |
| • | that, under the unified Management Fee structure, Global X Management would be responsible for most ordinary expenses of the New Fund, including the costs of various third-party services required by the New Fund, including investment advisory, administrative, audit, certain custody, portfolio accounting, legal, transfer agency and printing costs, but that the New Fund would bear other expenses not covered under the proposed all-inclusive Management Fee, such as taxes, brokerage fees, commissions, and other transaction expenses, interest expenses, and extraordinary expenses. |
Based on these considerations, the Board concluded that the services to be received and the fees to be charged under the New Fund Agreements were reasonable on a comparative basis.
Economies of Scale
With respect to this factor, the Board considered:
| • | the extent to which economies of scale would be realized as the New Fund grows and whether the proposed unitary Management Fee for the New Fund reflected these economies of scale; |
| • | the significant investment of time, personnel and other resources that Global X Management intends to make in the New Fund in order to seek to assure that the New Fund is attractive to investors; and |
| • | that the proposed unitary Management Fee would provide a high level of certainty as to the total level of expenses for the New Fund and its shareholders. |
| Approval of Investment Advisory Agreement (Unaudited) |
Based on these considerations, the Board concluded that approval of the proposed unitary Management Fee for the New Fund appropriately addressed economies of scale.
Other Benefits
In considering the New Fund Agreements, in addition to the categories discussed above, the Board considered other benefits that may be realized by Global X Management as a result of its relationships with the New Fund. As a result, the Board concluded that, in the exercise of its business judgement, all information it considered supported approval of the New Fund Agreements.
Conclusion
After full consideration of the factors above, as well as other factors that were instructive in their consideration, the Board, including all of the Trust’s Independent Trustees voting separately, concluded, in the exercise of their business judgement, that the New Fund Agreements were fair and reasonable and in the best interest of the New Fund.
In reaching this decision, the Board did not assign relative weights to the factors discussed below nor did the Board deem any one factor or group of them to be controlling in and of themselves. Each member of the Board may have afforded different weight to the various factors.
| Approval of Investment Advisory Agreement (Unaudited) |
RENEWAL AGREEMENTS
In determining to approve the continuation of the Renewal Agreements for the Renewal Funds, the Board considered a variety of factors, including the factors discussed in greater detail below.
Nature, Extent and Quality of Services
With respect to this factor, the Board considered:
| • | the terms of the Renewal Agreements and the range of services that would continue to be provided to each Renewal Fund in accordance with the Renewal Agreements; |
| • | Global X Management’s key personnel and the portfolio managers who would continue to provide investment advisory, supervision and administrative services to each Renewal Fund; |
| • | Global X Management’s responsibilities under the Renewal Agreements, among other things, to: (i) manage the investment operations of the Renewal Funds and the composition of the Renewal Funds’ assets, including the purchase, retention and disposition of their holdings, (ii) provide quarterly reports to the Trust’s officers and the Board and other reports as the Board deems necessary or appropriate, (iii) vote proxies, exercise consents, and exercise all other rights relating to securities and assets held by the Renewal Funds, (iv) select broker-dealers to execute portfolio transactions for the Renewal Funds when necessary, (v) assist in the preparation and filing of reports and proxy statements (if any) to the shareholders of the Renewal Funds, and the periodic updating of the registration statement, prospectuses, statement of additional information, and other reports and documents for the Renewal Funds that are required to be filed by the Trust with the SEC and other regulatory and governmental bodies, and (vi) monitor anticipated purchases and redemptions of the shares (including Creation Units) of the Renewal Funds by shareholders and new investors; |
| • | the nature, extent and quality of all of the services (including advisory, administrative and compliance services) that have been provided by Global X Management or made available to the Renewal Funds and the adequacy of Global X Management’s personnel resources that would continue to be made available to the Renewal Funds; and |
| • | Global X Management’s experience and the professional qualifications of Global X Management’s key personnel. |
Based on these considerations, the Board concluded that it was satisfied with the nature, extent and quality of the services provided to the Renewal Funds by Global X Management.
Performance
The Board considered the performance of each Renewal Fund. They examined the performance of the Renewal Funds for the one-year, three-year, and since-inception periods, as applicable. Also, the Board considered the total return and investments performance of the Renewal Funds relative to (i) the performance of unaffiliated comparable specialized and/or focused exchange-traded funds and other registered funds in the same classification as the Renewal Funds, which performance information is publicly available from such registered funds as well as other third party sources; and (ii) the performance of comparable registered funds and pertinent indexes. The Board considered instances of under-performance and over-performance with respect to the comparator funds. The Board also considered the Renewal Funds’ tracking against their underlying indexes in absolute terms.
| Approval of Investment Advisory Agreement (Unaudited) |
Based on these considerations and comparisons, the Board concluded that the investment performance of the Renewal Funds did not adversely affect the Board’s approval of the continuance of the Renewal Agreements.
Cost of Services and Profitability
The Board considered Global X Management’s cost to provide investment management and related services to the Renewal Funds. In this regard, the Board considered the management fee (“Management Fee”) that has been borne or expected to be borne by the Renewal Funds under the Renewal Agreements for the various investment advisory, supervisory and administrative services that the Renewal Funds require under a unitary fee structure (including the types of fees and expenses that are not included within the unitary fee and would be borne by the Renewal Funds).
In addition, the Board considered expected profitability to Global X Management, as applicable, from all services provided or expected to be provided to the Renewal Funds and all aspects of Global X Management’s relationship with the Renewal Funds. In connection with these considerations, Global X Management provided the Board with financial information regarding its operations and the services provided to the Renewal Funds and discussed with the Board its current and expected, as applicable, profitability with respect to the Renewal Funds.
Based on these considerations, the Board concluded that the Management Fee rate paid by the Renewal Funds to Global X Management, in light of the nature, extent and quality of the services provided, was reasonable and in the best interests of the Renewal Funds’ shareholders.
Comparison of Fees and Services
With respect to this factor, the Board considered:
| • | comparative information with respect to the Management Fee paid to Global X Management by the Renewal Funds. In connection with this consideration, Global X Management provided the Board with comparative expense data for the Renewal Funds, including fees and expenses paid by unaffiliated comparable specialized and/or focused exchange-traded funds and/or other comparable registered funds. The Board considered the Adviser’s detailed explanation of the fee structures of any Renewal Fund that was above the average and median for their peer groups; |
| • | the structure of the unified Management Fee (which includes as one component the investment advisory fee for the Renewal Funds) and the current total expense ratios for the Renewal Funds. In this regard, the Board took into consideration that the purpose of adopting a unitary Management Fee structure for the Renewal Funds was to create a simple, all-inclusive fee that would provide a level of predictability with respect to the overall expense ratio (i.e., the total fees) of the Renewal Funds and that the proposed Management Fee for the Renewal Funds was set at a competitive fee to make the Renewal Funds viable in the marketplace; and |
| • | that, under the unified Management Fee structure, Global X Management is responsible for most ordinary expenses of the Renewal Funds, including the costs of various third-party services required by the Renewal Funds, including investment advisory, administrative, audit, certain custody, portfolio accounting, legal, transfer agency and printing costs, but that the Renewal Funds would bear other expenses not covered under the proposed all-inclusive Management Fee, such as taxes, brokerage fees, commissions, and other transaction expenses, interest expenses, and extraordinary expenses. |
| Approval of Investment Advisory Agreement (Unaudited) |
Based on these considerations, the Board concluded that the services received and the fees charged under the Renewal Agreements were reasonable on a comparative basis.
Economies of Scale
With respect to this factor, the Board considered:
| • | the extent to which economies of scale would be realized as the Renewal Funds grow and whether the unitary Management Fee for the Renewal Funds reflected these economies of scale; |
| • | the significant investment of time, personnel and other resources that Global X Management has made and intends to continue to make in the Renewal Funds in order to seek to assure that the Renewal Funds are attractive to investors; and |
| • | that the unitary Management Fee would provide a high level of certainty as to the total level of expenses for the Renewal Funds and their shareholders. |
Based on these considerations, the Board concluded that the unitary Management Fee for the Renewal Funds appropriately addressed economies of scale.
Other Benefits
In considering the Renewal Agreements, in addition to the categories discussed above, the Board considered any other benefits realized by Global X Management as a result of its relationships with the Renewal Funds and concluded that all information it considered supported approval of the continuation of the Renewal Agreements.
Conclusion
After full consideration of the factors above, as well as other factors that were instructive in their consideration, the Board, including all of the Trust’s Independent Trustees voting separately, concluded, in the exercise of their business judgement, that the Renewal Agreements were fair and reasonable and in the best interest of each Renewal Fund.
In reaching this decision, the Board did not assign relative weights to the factors discussed below nor did the Board deem any one factor or group of them to be controlling in and of themselves. Each member of the Board may have afforded different weight to the various factors.
| Supplemental Information (Unaudited) |
Net asset value, or “NAV”, is the price per Share at which the Funds issue and redeem Shares. It is calculated in accordance with the standard formula for valuing mutual fund shares. The “Market Price” of the Funds generally is determined using the midpoint between the highest bid and the lowest offer on the stock exchange on which the Shares of the Funds are listed for trading, as of the time that the Funds’ NAV is calculated. The Funds’ Market Price may be at, above or below their NAV. The NAV of the Funds will fluctuate with changes in the market value of the Funds’ holdings. The Market Price of the Funds will fluctuate in accordance with changes in its NAV, as well as market supply and demand.
Premiums or discounts are the differences (expressed as a percentage) between the NAV and Market Price of the Funds on a given day, generally at the time NAV is calculated. A premium is the amount that the Funds are trading above the reported NAV, expressed as a percentage of the NAV. A discount is the amount that the Funds are trading below the reported NAV, expressed as a percentage of the NAV.
Further information regarding premiums and discounts is available on the Funds’ website at www.GlobalXFunds.com.
| Trustees and Officers of The Trust (unaudited) |
Set forth below are the names, addresses, year of birth, position with the Trust, term of office and length of time served, the principal occupations for the last five years, number of funds in fund complex overseen by the Trustees, and other directorships outside the fund complex of each of the persons currently serving as Trustees and Officers of the Trust.
| | | | Number of | |
| Name, | Position(s) | | Operational | |
| Address | Held | | Funds in Trust | |
| (Year of | with | Principal Occupation(s) During | Overseen by | Other Directorships Held |
| Birth) | Funds | the Past 5 Years | Trustee | by Trustees |
| Independent Trustees2 |
Sanjay Ram Bharwani 600 Lexington Avenue, 20th Floor New York, NY 10022 (1974) | Trustee (since 2008) | CEO of Risk Advisors Inc. (consulting firm) (since 2007) | 523 | None |
Scott R. Chichester1 600 Lexington Avenue, 20th Floor New York, NY 10022 (1970) | Trustee (since 2008) | CFO, AdeptPros Inc. (app development, training and consulting) (since 2012); Founder, Madison Park Advisors LLC (advisory services) (since 2011); CFO, Sterling Seal & Supply Inc. (since 2011); President & Treasurer, Bayview Acquisition Corp (2010-2012); Founder and President, DirectPay USA LLC (payroll company) (since 2006); Proprietor, Scott R. Chichester CPA (CPA firm) (since 2001) | 523 | Director of AdeptPros Inc. (since 2015); Director of Sterling Seal & Supply Inc. (since 2011); Director of Bayview Acquisition Corp. (since 2010-2012); Trustee of ARK ETF Trust (since 2014) |
Kartik Kiran Shah 600 Lexington Avenue, 20th Floor New York, NY 10022 (1977) | Trustee (since 2008) | Chief Business Officer, Oxeia Biopharmaceuticals, Inc. (since 2014); Vice President, Business Development, Cynvenio Biosystems (2012-2014); Independent Consultant, Self-Employed (non-financial services) (2011-2012) | 523 | Director of Oxeia Biopharmaceuticals, Inc. (since 2014) |
| Trustees and Officers of The Trust (unaudited) |
The Trust’s Statement of Additional Information (“SAI”) includes additional information about the Trustees and Officers. The SAI may be obtained without charge by calling 1-888-493-8631. The preceding and following charts list Trustees and Officers as of November 30, 2017:
| | | | Number of | |
| | | | Operational | |
| | | Principal Occupation(s) | Funds in Trust | Other |
| Name, Address | Position(s) Held | During | Overseen by | Directorships Held |
| (Year of Birth) | with Funds | the Past 5 Years | Trustee | by Trustees |
| Interested Trustee / Officers2 |
Bruno del Ama 600 Lexington Avenue, 20th Floor New York, NY 10022 (1976) | Trustee (since 2008), President, Chief Executive Officer (since 2008) | Chief Executive Officer, Global X Management Company (“GXMC”) (since 2008); Chief Compliance Officer, GXMC (2008-2013) | 523 | None |
Luis Berruga 600 Lexington Avenue, 20th Floor New York, NY 10022 (1977) | Chief Operating Officer, Treasurer, Principal Accounting Officer and Chief Financial Officer (since 9/2015) | Chief Financial Officer, GXMC (since 9/2015) and Chief Operating Officer (since 2/2014); Investment Banker, Jefferies (2012-2014); Regional Product Specialist, Morgan Stanley (2005 - 2012) | N/A | N/A |
Daphne Tippens Chisolm 600 Lexington Avenue, 20th Floor New York, NY 10022 (1969) | Secretary (since 2012) | General Counsel, GXMC (since 2011); Chief Compliance Officer, GXMC (1/2014 - 5/2014 and 2/2015-9/2016) | N/A | N/A |
Joe Costello 600 Lexington Avenue, 20th Floor New York, NY 10022 (1974) | Chief Compliance Officer (since 9/2016) | Chief Compliance Officer, FlexShares Funds (2011- 2015); Vice President, Northern Trust Investments (2003 - 2015) | N/A | N/A |
| Trustees and Officers of The Trust (unaudited) |
| | | | Other Directorships |
| Name, Address | Position(s) Held | Principal Occupation(s) During | Held |
| (Year of Birth) | with Funds | the Past 5 Years | by Trustees |
Lisa Whittaker4 One Freedom Valley Drive Oaks, PA 19456 (1978) | Assistant Secretary (since 2013) | Counsel at SEI Investments (since 2012); Associate Counsel and Compliance Officer at The Glendale Trust Company (2011- 2012); Associate of Drinker Biddle & Reath LLP (2006-2011) | N/A |
Eric Kleinschmidt 4 One Freedom Valley Drive Oaks, PA 19456 (1968) | Assistant Treasurer (since 2016) | Director, Fund Accounting, SEI Investments Global Funds Services (2004 to present) | N/A |
| 1 | Mr. Chichester is currently married to a sister of Mr. del Ama’s wife. While an “immediate family member” (as defined in Section 2(a)(19) of the 1940 Act) of Mr. del Ama would be considered an Interested Person, Mr. Chichester is not considered an immediate family member for this purpose. Although this fact was taken into consideration in determining whether Mr. Chichester should be considered to be an Independent Trustee for purposes of the Section 2(a)(19) of the 1940 Act, it was determined that this relationship was not one that should disqualify Mr. Chichester from serving as an Independent Trustee of the Trust. |
| 2 | Each Trustee serves until his successor is duly elected or appointed and qualified. |
| 3 | As of November 30, 2017, the Trust had ninety-six investment portfolios, fifty-two of which were operational. |
| 4 | These officers of the Trust also serve as officers of one or more mutual funds for which SEI Investments Company or an affiliate acts as investment manager, administrator or distributor. |
| Notice to Shareholders (unaudited) |
For shareholders that do not have a November 30, 2017 tax year end, this notice is for informational purposes only. For shareholders with a November 30, 2017 tax year end, please consult your tax advisor as to the pertinence of this notice. For the fiscal year ended November 30, 2017, the Funds are designating the following items with regard to distributions paid during the year.
| | | | | | | | | | | | Qualifying | | | | | | | | | | | | | | | | |
| | | | | | | | | | | | for Corporate | | | | | | | | | | | | | | | | |
| | | Long-Term | | | Ordinary | | | | | | Dividends | | | Qualifying | | | U.S. | | | Interest | | | Short Term | | | | |
| | | Capital Gain | | | Income | | | Total | | | Received | | | Dividend | | | Government | | | Related | | | Capital Gain | | | Foreign | |
| | | Distributions | | | Distributions | | | Distributions | | | Deduction(1) | | | Income(2) | | | Interest(3) | | | Dividends(4) | | | Dividends(5) | | | Tax Credit | |
| Global X FinTech ETF | | | 0.00 | % | | | 0.00 | % | | | 0.00 | % | | | 0.00 | % | | | 0.00 | % | | | 0.00 | % | | | 0.00 | % | | | 0.00 | % | | | 0.00 | % |
| Global X Internet of Things ETF | | | 0.00 | % | | | 100.00 | % | | | 100.00 | % | | | 30.06 | % | | | 40.91 | % | | | 0.00 | % | | | 0.00 | % | | | 0.00 | % | | | 0.00 | % |
| Global X Robotics & Artificial Intelligence ETF | | | 0.00 | % | | | 100.00 | % | | | 100.00 | % | | | 45.33 | % | | | 99.23 | % | | | 20.25 | % | | | 0.11 | % | | | 0.00 | % | | | 99.23 | % |
| Global X Health & Wellness Thematic ETF | | | 0.00 | % | | | 100.00 | % | | | 100.00 | % | | | 56.16 | % | | | 99.05 | % | | | 0.00 | % | | | 0.00 | % | | | 0.00 | % | | | 0.00 | % |
| Global X Longevity Thematic ETF | | | 0.00 | % | | | 100.00 | % | | | 100.00 | % | | | 30.07 | % | | | 57.95 | % | | | 0.00 | % | | | 0.00 | % | | | 100.00 | % | | | 0.00 | % |
| Global X Millennials Thematic ETF | | | 0.00 | % | | | 100.00 | % | | | 100.00 | % | | | 93.52 | % | | | 93.29 | % | | | 0.00 | % | | | 0.00 | % | | | 100.00 | % | | | 0.00 | % |
| Global X U.S. Infrastructure Development ETF | | | 0.00 | % | | | 0.00 | % | | | 0.00 | % | | | 0.00 | % | | | 0.00 | % | | | 0.00 | % | | | 0.00 | % | | | 0.00 | % | | | 0.00 | % |
| Global X Conscious Companies ETF | | | 0.00 | % | | | 100.00 | % | | | 100.00 | % | | | 100.00 | % | | | 100.00 | % | | | 0.00 | % | | | 0.00 | % | | | 0.00 | % | | | 0.00 | % |
| Global X Founder-Run Companies ETF | | | 0.00 | % | | | 0.00 | % | | | 0.00 | % | | | 0.00 | % | | | 0.00 | % | | | 0.00 | % | | | 0.00 | % | | | 0.00 | % | | | 0.00 | % |
| Global X Iconic U.S. Brands ETF | | | 0.00 | % | | | 0.00 | % | | | 0.00 | % | | | 0.00 | % | | | 0.00 | % | | | 0.00 | % | | | 0.00 | % | | | 0.00 | % | | | 0.00 | % |
| (1) | Qualifying dividends represent dividends which qualify for the corporate dividends received deduction and is reflected as a percentage of ordinary income distributions (the total of short term capital gain and net investment income distributions). |
| (2) | The percentage in this column represents the amount of "Qualifying Dividend Income" as created by the Jobs and Growth Relief Reconciliation Act of 2003 and it is reflected as a percentage of ordinary income distributions (the total of short term capital gain and net investment income distributions). It is the intention of each of the aforementioned Funds to designate the maximum amount permitted by law. |
| (3) | "U.S. Government Interest" represents the amount of interest that was derived from U.S. Government obligations and distributed during the fiscal year. Generally, interest from direct U.S. Government obligations is exempt from state income tax. However, for shareholders who are residents of California, Connecticut and New York, the statutory threshold requirements were not satisfied to permit exemption of these amounts from state income. |
| (4) | The percentage in this column represents the amount of "Qualifying Interest Income" as created by the American Jobs Creation Act of 2004 and is a percentage of net investment income that is exempt from U.S. withholding tax when paid for foreign investors. |
| (5) | The percentage of this column represents the amount of “Short Term Capital Gain Dividend’’ and is reflected as a percentage of short term capital gain distribution that is exempted from U.S. withholding tax when paid to foreign investors. |
600 Lexington Avenue, 20th Floor
New York, NY 10022
1-888-GXFund-1
(1-888-493-8631)
www.globalxfunds.com
Investment Adviser and Administrator:
Global X Management Company LLC
600 Lexington Avenue, 20th Floor
New York, NY 10022
Distributor:
SEI Investments Distribution Co.
One Freedom Valley Drive
Oaks, PA 19456
Sub-Administrator:
SEI Investments Global Funds Services
One Freedom Valley Drive
Oaks, PA 19456
Counsel for Global X Funds and the Independent Trustees:
Stradley Ronon Stevens & Young, LLP
1250 Connecticut Avenue, N.W.
Suite 500
Washington, DC 20036
Custodian and Transfer Agent:
Brown Brothers Harriman & Co.
50 Post Office Square
Boston, MA 02110
Independent Registered Public Accounting Firm:
PricewaterhouseCoopers LLP
Two Commerce Square
Suite 1800
2001 Market Street
Philadelphia, PA 19103
This information must be preceded or accompanied by a current prospectus for the Funds described.
GLX-AR-007-0200
The registrant has adopted a code of ethics that applies to the registrant’s principal executive officer, principal financial officer, comptroller or principal accounting officer, and any person who performs a similar function.
| Item 3. | Audit Committee Financial Expert. |
(a)(1) The registrant’s board of trustees has determined that the registrant has at least one audit committee financial expert serving on the audit committee.
(a)(2) The audit committee financial expert is Scott Chichester and is independent as defined in Form N-CSR Item 3(a)(2).
| Item 4. | Principal Accountant Fees and Services. |
Fees billed by Pricewaterhouse Coopers LLP in 2017 and 2016 related to the registrant.
In 2017 and 2016, Pricewaterhouse Coopers LLP billed the registrant aggregate fees for services rendered to the registrant for the last two fiscal years as follows:
| | 2017 | 2016 |
| | | All fees and
services to
the Trust
that were
pre-approved | All fees and
services to
service
affiliates that
were
pre-approved | All other
fees and
services to service
affiliates that
did not
require
pre-approval | All fees and
services to
the Trust
that were
pre-approved | All fees and
services to
service
affiliates that were
pre-approved | All other
fees and services to
service
affiliates that
did not
require
pre-approval |
| (a) | Audit Fees | $ 570,650 | $0 | $0 | $532,690 | $0 | $0 |
| (b) | Audit-Related Fees | $0 | $0 | $0 | $0 | $0 | $0 |
| (c) | Tax Fees | $ 182,990 | $0 | $0 | $201,260 | $0 | $0 |
| (d) | All Other Fees | $0 | $0 | $0 | $0 | $0 | $0 |
(e)(1) Not applicable.
(e)(2) Percentage of fees billed applicable to non-audit services pursuant to waiver of pre-approval requirement were as follows for Pricewaterhouse Coopers LLP in 2017 and 2016:
| | 2017 | 2016 |
Audit-Related Fees | 0% | 0% |
| Tax Fees | 0% | 0% |
All Other Fees | 0% | 0% |
(f) Not applicable.
(g) The aggregate non-audit fees and services billed by Pricewaterhouse Coopers LLP in 2017 and 2016 for the last two fiscal years were $0 and $0, respectively.
(h) During the past fiscal year, all non-audit services provided by registrant’s principal accountant to either registrant’s investment adviser or to any entity controlling, controlled by, or under common control with registrant’s investment adviser that provides ongoing services to registrant were pre-approved by the audit committee of registrant’s Board of Trustees. Included in the audit committee’s pre-approval was the review and consideration as to whether the provision of these non-audit services is compatible with maintaining the principal accountant’s independence.
| Item 5. | Audit Committee of Listed Registrants. |
The Registrant has a separately-designated standing Audit Committee, which is composed of the Registrant's Independent Trustees, Scott R. Chichester, Sanjay Ram Bharwani and Kartik Kiran Shah.
| Item 6. | Schedule of Investments. |
Information included in Item 1.
| Item 7. | Disclosure of Proxy Voting Policies and Procedures for Closed-End Management Investment Companies. |
Not applicable to open-end management investment companies.
| Item 8. | Portfolio Managers of Closed-End Management Investment Companies. |
Not applicable to open-end management investment companies. Effective for closed-end management investment companies for fiscal years ending on or after December 31, 2005.
| Item 9. | Purchases of Equity Securities by Closed-End Management Company and Affiliated Purchasers. |
Not applicable to open-end management investment companies.
| Item 10. | Submission of Matters to a Vote of Security Holders. |
There have been no material changes.
| Item 11. | Controls and Procedures. |
(a) The certifying officers, whose certifications are included herewith, have evaluated the registrant’s disclosure controls and procedures within 90 days of the filing date of this report. In their opinion, based on their evaluation, the registrant’s disclosure controls and procedures are adequately designed, and are operating effectively to ensure, that information required to be disclosed by the registrant in the reports it files or submits under the Securities Exchange Act of 1934 is recorded, processed, summarized and reported within the time periods specified in the Securities and Exchange Commission’s rules and forms.
(b) There were no significant changes in the registrant’s internal control over financial reporting that occurred during the last fiscal quarter of the period covered by this report that has materially affected, or is reasonably likely to materially affect, the registrant’s internal control over financial reporting.
| Item 12. | Disclosure of Securities Lending Activities for Closed-End Management Investment Companies. |
Not applicable to open-end management investment companies.
(a)(1) Code of Ethics attached hereto.
(a)(2) A separate certification for the principal executive officer and the principal financial officer of the registrant as required by Rule 30a-2(a) under the Investment Company Act of 1940, as amended (17 CFR 270.30a-2(a)), are filed herewith.
(b) Officer certifications as required by Rule 30a-2(b) under the Investment Company Act of 1940, as amended (17 CFR 270.30a-2(b)) also accompany this filing as an Exhibit.
SIGNATURES
Pursuant to the requirements of the Securities Exchange Act of 1934 and the Investment Company Act of 1940, the registrant has duly caused this report to be signed on its behalf by the undersigned, thereunto duly authorized.
| (Registrant) | | Global X Funds |
| | | |
| By (Signature and Title)* | | /s/ Luis Berruga |
| | | Luis Berruga |
| | | President |
Date: February 8, 2018
Pursuant to the requirements of the Securities Exchange Act of 1934 and the Investment Company Act of 1940, this report has been signed below by the following persons on behalf of the registrant and in the capacities and on the dates indicated.
| By (Signature and Title)* | | /s/ Luis Berruga |
| | | Luis Berruga |
| | | President |
| | | |
| Date: February 8, 2018 | | |
| | | |
| By (Signature and Title)* | | /s/ Luis Berruga |
| | | Luis Berruga |
| | | Chief Financial Officer |
Date: February 8, 2018
| * | Print the name and title of each signing officer under his or her signature. |