UNITED STATES
SECURITIES AND EXCHANGE COMMISSION
WASHINGTON, D.C. 20549
FORM N-CSR
CERTIFIED SHAREHOLDER REPORT OF REGISTERED
MANAGEMENT INVESTMENT COMPANIES
Investment Company Act file number 811-22208
Valued Advisers Trust
(Exact name of registrant as specified in charter)
Ultimus Asset Services, LLC 225 Pictoria Drive, Suite 450 Cincinnati, OH 45246
(Address of principal executive offices) (Zip code)
Capitol Services, Inc.
615 S. Dupont Hwy.
Dover, DE 19901
(Name and address of agent for service)
With a copy to:
John H. Lively, Esq.
The Law Offices of John H. Lively & Associates, Inc.
A member firm of The 1940 Act Law GroupTM
11300 Tomahawk Creek Parkway,
Suite 310
Leawood, KS 66221
Registrant’s telephone number, including area code: 513-587-3400
Date of fiscal year end: 5/31
Date of reporting period: 5/31/17
Item 1. Reports to Stockholders.
ANNUAL
REPORT
May 31, 2017
BFS Equity Fund

185 Asylum Street • City Place II • Hartford, CT 06103 • (855) 575-2430
BFS Equity Fund
Letter to Shareholders
Dear Fellow Shareholders,
This annual report covers the period June 1, 2016 through May 31, 2017 – the BFS Equity Fund’s third full fiscal year.
The BFS Equity Fund (the “Fund”) was launched on November 8, 2013, with initial funds from investors of $1.1 million. On June 1, 2016, the Fund had net assets of $23.9 million. During the course of the fiscal year, the net assets of the Fund increased 13.8% to $27.2 million, as of May 31, 2017. This growth was driven by inflows from investors into the Fund, as well as by the positive investment return achieved by the Fund over the past fiscal year. As of May 31, 2017, there were approximately 550 investors in the Fund.
The Fund achieved a total return of 13.15% for the fiscal year commencing June 1, 2016 and ending May 31, 2017. This was less than the 17.47% total return of the S&P 500® Index and the 21.16% total return of the Dow Jones Industrial Average for the same period.
This report includes a commentary from the Lead Portfolio Manager, Tim Foster, and Co-Portfolio Managers, Tom Sargent and Keith LaRose. You will also find a listing of the portfolio holdings as of May 31, 2017, as well as financial statements and detailed information about the performance and positioning of the Fund.
The past fiscal year has been somewhat of a rollercoaster ride, dominated predominantly by the U.S. presidential election, the difficulty that the Trump administration has had getting a health care bill through Congress due to disunity of the Republicans in the House and Senate, the continuing media buzz about collusion with Russia by Trump operatives, the “resistance” by Democrats in Congress, and, finally, the sense that tax reform – one of the main planks of the Trump economic growth agenda – might not pass this year. Despite these factors, the market has ignored them and forged ahead. Corporate earnings growth has been positive the last three calendar quarters and appears to be accelerating, inflation has been muted, and stock market volatility is at very low levels. Even with the recent three hikes in the Fed Funds rate, it is unlikely that medium and longer term interest rates will rise significantly in the year ahead. With the earnings yield so much higher on U.S. stocks than bonds, it is likely that the stock market will continue to attract investors.
1
In closing, it is important to reiterate our belief that our investment strategy of investing in quality growth stocks purchased with a risk-mitigating approach and positioned to provide a margin of safety in the case of economic or market weakness is effective over the longer term. We believe the Fund’s ownership of shares in quality companies with sound business models, strong brands, good balance sheets, professional management, and robust cash flow should be able to withstand market corrections, even bear markets, and perform well over the longer term.
The Portfolio Managers of the Fund and I are shareholders together with you. We thank you for the trust that you have placed in us to manage your assets.
Sincerely
Stephen L. Willcox
President and CEO
Bradley, Foster & Sargent, Inc.
2
BFS Equity Fund
Portfolio Managers’ Letter
TO OUR SHAREHOLDERS
The BFS Equity Fund the (“Fund”) completed its third full fiscal year on May 31, 2017. The Fund returned a very healthy 13.15%, but lagged the performance of the S&P 500® Index (“S&P 500”), which returned 17.47% as well as the Dow Jones Industrial Average total return of 21.16%. The Fund is not managed to mimic either index. The S&P 500 is comprised of 500 different stocks, market cap weighted, so that the largest 10-20 names really drive the performance of the entire index. Apple’s 3.73% top weighting in the index with $776 billion in market capitalization makes Transocean’s 500th place at $3.4 billion market cap immaterial. The Dow Jones Industrial Average Index is comprised of 30 stocks, weighted by their relative absolute stock prices, where Goldman Sach’s $250 stock price trumps GE’s $29 stock price.
Generally, the Fund holds approximately 35 positions with individual weightings generally varying from 2-4%. We believe having about 35 names in the portfolio provides adequate diversification. At any time, we hold up to five individual securities within each of the S&P 500’s nine defined economic sectors. If we cannot find attractive values in a sector, such as Telecom or Utilities, which tend to perform poorly in a rising interest rate environment, we may opt not to own any (and, in fact, we do not own any, as of May 31, 2017). The S&P 500 Industrials sector includes sub categories such as Automotive, Aerospace, Agriculture, Mining Equipment, and Defense. Airlines may be attractive when Automobiles are not, so, unlike Utilities, a wider array of economic influences can drive individual stock performance. We may (and do) own more names in diverse sectors like Industrials, Technology, and Consumer Discretionary. Diversification is generally thought of as a good thing – it limits the impact of losses of any one holding. It is important to realize, as well, that diversification also limits the impact of gains. For the Fund, we want to identify what we believe to be the few best companies and/or best values across the most attractive sectors of the economy and focus our attention on those names. When an unforeseen event occurs that brings into question our assessment of what constitutes a best company or best value, then we will sell and move on. We strive to minimize stock selections that don’t work out, in order to limit the damage done.
MARKET COMMENTARY
As of March of this year, the bull market entered its ninth year. The S&P 500 has more than tripled since the March 2009 bottom, rising from a low of 676 to 2412 on May 31, 2017. The market appears extended to us, both in terms of time as well as magnitude.
3
Investor complacency as measured by the VIX index “anxiety gauge” is currently near its all-time low. Additionally, bond credit spreads have narrowed to near record lows. The market’s valuation is no longer below the long term mean, but is now somewhat above it on a P/E basis, but approaching the top decile of valuation by other metrics like market cap to GDP, the Shiller CAPE, or price to replacement value. The Federal Reserve is still in a very accommodative mode, but has recently taken three “baby steps” of raising the Federal Funds rate – each by 25 basis points. Inflation bottomed in the 1% range, but is now closer to 2%. Labor markets have been robust with the unemployment rate now down to 4.3%.
Bull markets do not die of old age, but there are plenty of potential catalysts that could shift current investor optimism into a dash for the hills – global conflicts from North Korea to Syria, not to mention internal U.S. political conflicts. A new president was elected last November on a platform of deregulation and lower taxes to stimulate the U.S. economy, but will that agenda ever see the light of day? And, will it work?
Our view of the near term investment outlook is modestly cautious. We sense the market has come too far, too soon, based on optimism of what could go right with the economy as opposed to consideration of how the market would react if something goes wrong. We do not foresee anything as dire as the 50% collapse during the bear markets of 2002 and 2008. The bubble in Technology stock valuations burst in the post Y2K and post 9/11 reality driving the 2002 bottom. The implosion of the Banking, Financial, and Housing sectors in 2008 led to the great recession of the next several years. Recession and a collapse of corporate profit growth is the real enemy to the market. The red flags of recession warning are simply not in place. No spike in inventories, inflation, or real interest rates. No inverted yield curve. No major shift in the Fed’s stance on a continued accommodative policy approach. As well, there are few signs of speculative excess. No IPO frenzy. No spike in M&A activity. No influx of capital to equity mutual funds and ETFs. In fact, the average investor who fled the equity markets after the second bear market (2009) of this new millennium parked his assets in bond funds and has never looked back.
Pending doom for the market? No, but a healthy pullback? We think there is a reasonable likelihood.
INVESTMENT STRATEGY
We have let our cash creep up a little to have some dry powder on hand. In a rising market, cash acts as an anchor to performance relative to an index, because the benchmark indices carry no cash. That is a risk we are willing to take when we see some signs of exuberance as in the large Technology stocks (including: Apple, Amazon, Alphabet, Microsoft, and Facebook). Despite continuing to like these names because of
4
their favorable growth prospects, we think there is a very reasonable prospect we will add back to these positions at lower prices in the not too distant future.
Patience is paramount in the portfolio management process. It requires patience to hold some cash reserves when reinvestment alternatives appear less than compelling. New event-driven opportunities will eventually present themselves – and it pays to be selective. An even more challenging patience is embracing the contrarian point of view. For example, our purchase of Nielsen Holdings has not, as yet, played out as we expected. This is the leading company in data gathering and analysis for the CPG (consumer packaged goods) industry, as well as measuring audience composition across all forms of media from traditional television to mobile streaming. Nielsen was the leader in these fields several decades ago when I first encountered the company through case studies and Nielsen remains the leader today. In fact, the value of competitive information only becomes more valuable. Retail sales were a little squishy during the past twelve months and discretionary spending by some of the CPG companies was curtailed. The market tends to treat any kind of earnings shortfall swiftly and severely, but similarly heaps rewards when expectations are exceeded. Temporary shortfall or systemic weakness? We will need to see how future earnings play out, but in the meantime we receive a very attractive 3.6% dividend yield to keep us patient.
We purchased Quintiles this past year under a similar investment thesis – the power of information. When Quintiles, a leading provider of clinical studies for the pharmaceutical and biopharmaceutical companies, acquired IMS, the leading purveyor of sales data for the global pharma industry, the merged companies were able to create a vertical data stream – from a medical compound’s birth to loss of patent protection. The value of this data continuum can be priceless. Quintiles has produced positive returns for the Fund. Nielsen has not. It takes a lot more patience to hold a stock that is not currently working than enjoying the ride on a stock that is. More often than not, it is those out-of-favor names that will provide the best returns going forward, while expectations for today’s winners become too challenging to exceed.
INVESTMENT COMMENTARY
The dark horse wins the biggest purse. It seemed virtually inconceivable that Donald Trump could win the U.S. presidential election last year. And even more inconceivable – that the stock market would surge better than 15% in the next several months. For stock investors? So far, so good under the new administration, but that advance has been largely in anticipation of policy promises that have yet to be implemented or achieved. Corporate earnings? We have had a little help from the U.S. dollar stabilizing versus other currencies. While hardly robust with oil prices back in the mid 40’s per barrel, prices are
5
somewhat higher than a year ago and much of the energy industry is shifting back to modest profits from heavy losses. Most other sectors enjoy near record profit margins that may come under pressure should labor costs rise under near full national employment, basic material inflation kick back in, and/or interest rates rise. Is there room for the market’s multiple to expand? The P/E of the S&P 500 was higher in the late nineties, but the current S&P 500 forward P/E at 18 is already above the thirty year mean of 16-17. Consumer confidence is at an all-time high, which has correlated very closely with the stock market. It is the second derivative that drives markets, however, and we see greater prospects for a moderation of good news items or acceleration of the bad news items. Thus we see a greater likelihood of a moderate pullback than further rally in the stock markets.
We believe the time is right for some caution and some patience. The road forward will surely hold some potholes and provide some new investment opportunities.
Some sector highlights of the past twelve months follow:
Technology
The Technology sector was both our heaviest weighted at 22.1% and highest earning sector at +28.6%, but weighted slightly lower than the S&P 500 Technology sector weighting of 23.2% and total return of +33.8%. We reduced our weighting to slightly below the S&P 500 during the first quarter of 2017, believing the powerful double digit gains were unsustainable. Our top performing stocks were Apple (+55.9%), Adobe (+42.6%), Microsoft (+35.0%), Alphabet (+31.8%) and Facebook (+27.5%). Two Tech names detracted modestly from performance: Cognizant (-17.8%) and Mastercard (-6.6%).
Industrials
The Fund’s Industrials holdings at 16.0% of the portfolio were the largest sector overweighting relative to the S&P 500 Industrials weighting of 10.2%. Given the wide ranging sub components, our Industrials exposure relates to several distinctive industries. John Deere in the agricultural sector was the standout performer (+57.9%), followed by heavy equipment manufacturer Caterpillar (+30.7%). Defense stocks did well with Raytheon (+29.2%) and United Technologies (+23.5%). Our biggest disappointment was the aforementioned Nielsen Holdings. Weakness in the retail space held back discretionary spending in Nielsen’s “Buy” space, but we have confidence in the faster growing “Media” space and feel the Buy space should pick up as well. The sector return for the Fund was +16.5% versus +21.8% for the S&P 500.
6
Healthcare
Despite the governmental scrutiny on rising healthcare costs, we still see healthcare as a growth industry. The Fund is overweighted in Healthcare at 15.5% versus the S&P 500 weighting of 13.9%. The Fund is more heavily weighted towards purveyors of all things “life science” – related versus traditional pharma. Zoetis, the leading animal science spin-out from Pfizer, was our top performer (+32.4%). Abbott Labs (+18.3%), J&J (+16.9%), Danaher (+14.7%) and Thermo Fisher (+14.3%) all contributed nicely, as well, driven by medical device and diagnostic equipment sales. Swiss drug maker, Novartis, was our weakest link (-9.6%). The strength of the Swiss Franc provided a currency headwind. The Fund showed excellent relative performance at +15.7% versus the S&P 500 Healthcare sector return of +8.6%.
Financials
The Fund’s holdings in the Financials sector totaled 12.4% of the portfolio, modestly under the S&P 500 Financials sector weighting of 13.7%. Our Financial sector return was +17.5% compared to the S&P 500 Financials return of +23.1%. Financials sharply underperformed the rest of the market pre-election and then sharply outperformed the market post-election. Results were strong across the board with the exception of Wells Fargo that disclosed fraudulent marketing activity later last year, spurring our sale of the position. J.P. Morgan was the hands down winner (+29.2%) with American Express and US Bancorp returning near +20.0% each, as well.
Consumer Discretionary
The Fund’s Consumer Discretionary sector weighting at 11.2% was close to the S&P 500’s sector weighting at 12.5%. For the sector as a whole, the Fund’s performance was +5.8% versus the S&P 500 Consumer Discretionary sector’s performance of +16.9%. The Fund’s performance was severely tarnished by a single issue – Under Armour. Under Armour hit, not a speed bump, but a wall, in its revenue trajectory and the stock declined (-43.0%). Amazon helped (+37.6%), but was overwhelmed by the decline in Under Armour. Retailers Home Depot (+18.8%) and Starbucks (+17.8%) also performed well.
Energy
After reaching a low in early 2016 of about $27 per barrel, oil rallied to near $60, but has since faded back to the high $40’s over the past year. Falling oil and natural gas prices led to negative returns for both the Fund of -0.9% and the S&P 500 of -0.8%. We own three stocks in this sector: one integrated major producer, Exxon (-6.3%), one oil service, Schlumberger (-6.4%), and one natural gas, Cabot (-3.0%). Global economies will continue to run on hydrocarbon fuels for many years to come. Given all of the global uncertainties and despite low current energy prices, we intend to maintain our exposure to energy.
7
Materials
Materials is a very broad sector and one driven by the vagaries of commodities pricing. Fertilizer prices are known for their volatility and are currently well below the levels of several years ago when corn prices were near double where they are today. We purchased Mosaic (+16.9%). We like the idea of being paid a healthy dividend yield while awaiting a commodities cycle to turn. We also own Ecolab (+6.1%), which is not driven by commodity prices, rather it is more of a service company providing essential cleaning/purification services and supplies. Our sector return of +23.0% was well ahead of the S&P 500 sector return of +15.4% with a weighting in the Fund of 4.5% versus the S&P 500 weighting of 2.8%.
Consumer Staples
We like the Consumer Staple sector for the defensive characteristics it offers, but we currently see little opportunity, given stretched stock prices. The sector offers only modest growth and currently sells at a high premium value to the market. The Fund is well underweighted at 3.1% versus the S&P 500 at 9.4%. Pepsi was our top performer (+19.7%), but we have been reducing the position due to the run up in valuation.
Utilities, Telecommunications and REITS
The Fund had only a single holding across these sectors, Spirit Realty. We were attracted by Spirit’s 6.0% dividend yield as a “safe” place to park some funds while awaiting either a pullback in the broad market or at least in one or more of our favored core positions. Unfortunately, it was Spirit that suffered the pullback, declining (-26.2%) with a first quarter earnings miss and a significant downgrade in earnings forecast by management.
CLOSING COMMENTS
The stock market has treated us well for the past eight plus years. Stock valuations have nearly doubled from 9-10 P/E multiples in 2009 to now 17-18. That is above the mean of 16x of the past several decades. The economy has grown at a below average rate for the past several years, 1-2% Real GDP growth. Now consensus forecasts call for growth accelerating to 2-3%. With the post-election 15% rally, the stock market has already priced in the improvement. Inflation has remained low and interest rates have been repressed through massive quantitative easing by the Federal Reserve. If economic growth does accelerate, it would be logical for interest rates and inflation to regress upward towards their long term mean values. Generally, rising rates and rising inflation present headwinds to the stock market.
Our expectation is that asset price inflation (i.e., record high market index prices) through central bank engineering is a tailwind that will soon be extinguished. Owning high quality
8
companies that can grow their earnings in more challenging economic conditions will be the winners going forward. Our research is focused on just those candidates. We will continue to refine the portfolio, seeking out new ideas for growth and weeding out names that show signs of weakness.
We, at Bradley, Foster & Sargent, Inc., look forward to serving you through our management of the Fund. Thank you for placing your capital under our care.
| Timothy Foster | Keith LaRose | Thomas Sargent | ||
| Lead Portfolio Manager | Co-Portfolio Manager | Co-Portfolio Manager |
9
BFS Equity Fund
ANNUAL PERFORMANCE REVIEW
(UNAUDITED)
The Fund lagged the performance of both the S&P 500 as well as the Dow Jones Industrial Average for the twelve month period commencing June 1, 2016 and ending May 31, 2017. The Fund returned 13.15% versus 17.47% for the S&P 500 and 21.16% for the Dow Jones Industrial Average.
Key Detractors from Relative Results
| • | The S&P 500, being market cap weighted, as well as the Dow Jones Industrial Average being market price weighted, create benchmarks quite different from the largely unit weighted BFS Equity Fund. |
| • | Two individual stocks were key detractors for the Fund for the twelve months ending May 31, 2017: Under Armour and Spirit Realty. The declines in both stocks related to the deep malaise affecting bricks and mortar retailing in the U.S. over this period. |
| • | Although not overweighted in the Energy sector, the sharp decline in oil prices led to negative returns for our Energy sector holdings, in particular, Exxon and Schlumberger. |
Key Contributors to Relative Results
| • | On the positive side, the Fund both over weighted and outperformed the S&P 500 Healthcare sector. Top performance came from both Abbott Labs and Thermo Fisher. |
| • | Exposure to top performing large cap growth stocks like Adobe, Apple, Alphabet, Amazon and Facebook was a significant positive contributor to the Fund’s absolute return. Reducing our exposure to these names during the period to less than market weights, as valuations became richer, limited returns relative to benchmarks. |
FUND INFORMATION
May 31, 2017
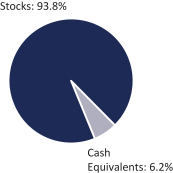
ASSET ALLOCATION
TEN LARGEST HOLDINGS (%) | FUND | |||
Chubb Ltd. | 4.0 | |||
U.S. Bancorp | 3.2 | |||
Thermo Fisher Scientific, Inc. | 3.2 | |||
Danaher Corp. | 3.1 | |||
JPMorgan Chase & Co. | 3.0 | |||
Raytheon Co. | 3.0 | |||
Automatic Data Processing, Inc. | 3.0 | |||
Exxon Mobil Corp. | 3.0 | |||
Amazon.com, Inc. | 2.9 | |||
Alphabet, Inc. — Class A | 2.9 | |||
SECTOR DIVERSIFICATION (%) | FUND | S&P 500 | ||||||
Information Technology | 22.1 | 23.2 | ||||||
Industrials | 16.0 | 10.2 | ||||||
Healthcare | 15.5 | 13.9 | ||||||
Financials | 12.4 | 13.7 | ||||||
Consumer Discretionary | 11.2 | 12.5 | ||||||
Energy | 7.3 | 6.0 | ||||||
Materials | 4.5 | 2.8 | ||||||
Consumer Staples | 3.1 | 9.4 | ||||||
Real Estate | 1.6 | 2.9 | ||||||
Telecommunication Services | 0.0 | 2.2 | ||||||
Utilities | 0.0 | 3.3 | ||||||
Cash Equivalents | 6.2 | 0.0 | ||||||
10
BFS Equity Fund
Investment Results (Unaudited)
Average Annual Total Returns(a) (For the periods ended May 31, 2017)
| One Year | Since Inception (November 8, 2013) | |||||||
BFS Equity Fund | 13.15% | 8.01% | ||||||
S&P 500® Index(b) | 17.47% | 11.40% | ||||||
Dow Jones Industrial Average®(c) | 21.16% | 11.16% | ||||||
Total annual fund operating expenses, as disclosed in the BFS Equity Fund’s (the “Fund”) prospectus dated September 28, 2016, were 1.86% of average daily net assets (1.25% after fee waivers/expense reimbursements by Bradley, Foster & Sargent, Inc. (the “Adviser”)). The Adviser has contractually agreed to waive or limit its fees and assume other expenses of the Fund until September 30, 2017, so that total annual fund operating expenses does not exceed 1.00%. This contractual arrangement may only be terminated by mutual consent of the Adviser and the Board of Trustees of the Trust, and it will automatically terminate upon the termination of the investment advisory agreement between the Fund and the Adviser. This operating expense limitation does not apply to: (i) interest, (ii) taxes, (iii) brokerage commissions, (iv) other expenditures which are capitalized in accordance with generally accepted accounting principles, (v) other extraordinary expenses not incurred in the ordinary course of the Fund’s business, (vi) dividend expense on short sales, (vii) expenses incurred under a plan of distribution under Rule 12b-1, and (viii) expenses that the Fund has incurred but did not actually pay because of an expense offset arrangement, if applicable, in any fiscal year. The operating expense limitation also excludes any “Fees and Expenses of Acquired Funds,” which are the expenses indirectly incurred by the Fund as a result of investing in money market funds or other investment companies, including Exchange-Traded Funds (“ETF”), that have their own expenses. Each waiver or reimbursement of an expense by the Adviser is subject to repayment by the Fund within three years following the date in which the expense was incurred, provided that the Fund is able to make the repayment without exceeding the expense limitation in place at the time of the waiver or reimbursement.
The performance quoted represents past performance, which does not guarantee future results. The investment return and principal value of an investment will fluctuate so that an investor’s shares, when redeemed, may be worth more or less than their original cost. The returns shown do not reflect deduction of taxes that a shareholder would pay on Fund distributions or the redemption Fund shares. The Fund’s investment objectives, risks, charges and expenses must be considered carefully before investing. Current performance of a Fund may be lower or higher than the performance quoted. Performance data current to the most recent month end may be obtained by calling (855) 575-2430.
| (a) | Average annual total returns reflect any change in price per share and assume the reinvestment of all distributions. The Fund’s returns reflect any fee reductions during the applicable periods. If such fee reductions had not occurred, the quoted performance would have been lower. Total returns for periods less than one year are not annualized. |
| (b) | The S&P 500® Index (“S&P 500”) is a widely recognized unmanaged index of equity prices and is representative of a broader market and range of securities than is found in the Fund’s portfolio. The index is an unmanaged benchmark that assumes reinvestment of all distributions and excludes the effect of taxes and fees. Individuals cannot invest directly in this index; however, an individual can invest in exchange traded funds or other investment vehicles that attempt to track the performance of a benchmark index. |
| (c) | The Dow Jones Industrial Average® is a widely recognized unmanaged index of equity prices and is representative of a narrower market and range of securities than is found in the Fund’s portfolio. The index is an unmanaged benchmark that assumes reinvestment of all distributions and excludes the effect of taxes and fees. Individuals cannot invest directly in this index; however, an individual can invest in exchange traded funds or other investment vehicles that attempt to track the performance of a benchmark index. |
The Fund’s investment objectives, strategies, risks, charges and expenses must be considered carefully before investing. The prospectus contains this and other important information about the Fund and may be obtained by calling the same number as above. Please read it carefully before investing.
The Fund is distributed by Unified Financial Securities, LLC, member FINRA/SIPC.
11
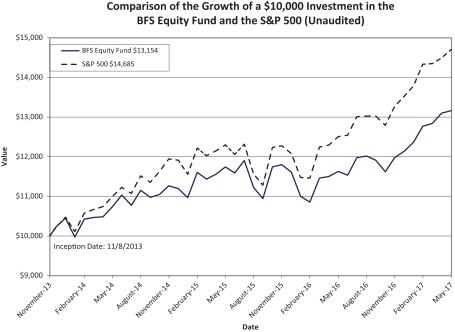
The chart above assumes an initial investment of $10,000 made on November 8, 2013 (commencement of operations) held through May 31, 2017. THE FUND’S RETURN REPRESENTS PAST PERFORMANCE AND DOES NOT GUARANTEE FUTURE RESULTS. The returns shown do not reflect deduction of taxes that a shareholder would pay on Fund distributions or the redemption of Fund shares. Investment returns and principal values will fluctuate so that your shares, when redeemed, may be worth more or less than their original purchase price.
Current performance may be lower or higher than the performance data quoted. For more information on the Fund, and to obtain performance data current to the most recent month end or to request a prospectus, please call (855) 575-2430. You should carefully consider the investment objectives, potential risks, management fees, and charges and expenses of the Fund before investing. The Fund’s prospectus contains this and other information about the Fund, and should be read carefully before investing.
The Fund is distributed by Unified Financial Securities, LLC, member FINRA/SIPC.
Availability of Portfolio Schedule (Unaudited)
The Fund files its complete schedule of portfolio holdings with the Securities and Exchange Commission (“SEC”) as of the end of the first and third quarters of each fiscal year on Form N-Q. The Fund’s Forms N-Q will be available at the SEC’s website at www.sec.gov. The Fund’s Form N-Q may be reviewed and copied at the Public Reference Room in Washington, DC. Information on the operation of the Public Reference Room may be obtained by calling (800) SEC-0330.
12
BFS Equity Fund
Schedule of Investments
May 31, 2017
| Shares | Fair Value | |||||||
| COMMON STOCKS — 93.76% | ||||||||
| Aerospace & Defense — 5.69% | ||||||||
| 5,000 | Raytheon Co. | $ | 820,050 | |||||
| 6,000 | United Technologies Corp. | 727,680 | ||||||
|
| |||||||
| 1,547,730 | ||||||||
|
| |||||||
| Banks — 3.18% | ||||||||
| 17,000 | U.S. Bancorp | 865,130 | ||||||
|
| |||||||
| Beverages — 1.72% | ||||||||
| 4,000 | PepsiCo, Inc. | 467,480 | ||||||
|
| |||||||
| Chemicals — 4.52% | ||||||||
| 5,000 | Ecolab, Inc. | 664,200 | ||||||
| 25,000 | Mosaic Co./The | 565,750 | ||||||
|
| |||||||
| 1,229,950 | ||||||||
|
| |||||||
| Communications Equipment — 2.90% | ||||||||
| 25,000 | Cisco Systems, Inc. | 788,250 | ||||||
|
| |||||||
| Consumer Finance — 2.26% | ||||||||
| 8,000 | American Express Co. | 615,520 | ||||||
|
| |||||||
| Diversified Financial Services — 3.02% | ||||||||
| 10,000 | JPMorgan Chase & Co. | 821,500 | ||||||
|
| |||||||
| Electronic Equipment, Instruments & Components — 2.47% | ||||||||
| 9,000 | Amphenol Corp. — Class A | 671,400 | ||||||
|
| |||||||
| Energy Equipment & Services — 2.30% | ||||||||
| 9,000 | Schlumberger Ltd. | 626,310 | ||||||
|
| |||||||
| Equity Real Estate Investment Trusts — 1.60% | ||||||||
| 60,000 | Spirit Realty Capital, Inc. | 433,800 | ||||||
|
| |||||||
| Food Products — 1.37% | ||||||||
| 8,000 | Mondelez International, Inc. — Class A | 372,720 | ||||||
|
| |||||||
| Health Care Equipment & Supplies — 2.02% | ||||||||
| 12,000 | Abbott Laboratories | 547,920 | ||||||
|
| |||||||
| Hotels, Restaurants & Leisure — 2.11% | ||||||||
| 9,000 | Starbucks Corp. | 572,490 | ||||||
|
| |||||||
| Industrial Conglomerates — 5.64% | ||||||||
| 10,000 | Danaher Corp. | 849,400 | ||||||
| 25,000 | General Electric Co. | 684,500 | ||||||
|
| |||||||
| 1,533,900 | ||||||||
|
| |||||||
| Insurance — 3.95% | ||||||||
| 7,500 | Chubb Ltd. | 1,073,925 | ||||||
|
| |||||||
| Internet & Catalog Retail — 2.93% | ||||||||
| 800 | Amazon.com, Inc. * | 795,696 | ||||||
|
| |||||||
See accompanying notes which are an integral part of the financial statements.
13
BFS Equity Fund
Schedule of Investments (continued)
May 31, 2017
| Shares | Fair Value | |||||||
| COMMON STOCKS — (continued) | ||||||||
| Internet Software & Services — 5.69% | ||||||||
| 800 | Alphabet, Inc. — Class A * | $ | 789,672 | |||||
| 5,000 | Facebook, Inc. — Class A * | 757,300 | ||||||
|
| |||||||
| 1,546,972 | ||||||||
|
| |||||||
| IT Services — 3.01% | ||||||||
| 8,000 | Automatic Data Processing, Inc. | 818,960 | ||||||
|
| |||||||
| Life Sciences Tools & Services — 5.72% | ||||||||
| 8,000 | Quintiles IMS Holdings, Inc. * | 691,520 | ||||||
| 5,000 | Thermo Fisher Scientific, Inc. | 863,950 | ||||||
|
| |||||||
| 1,555,470 | ||||||||
|
| |||||||
| Machinery — 5.42% | ||||||||
| 4,000 | Caterpillar, Inc. | 421,720 | ||||||
| 3,500 | Deere & Co. | 428,610 | ||||||
| 10,000 | Fortive Corp. | 624,500 | ||||||
|
| |||||||
| 1,474,830 | ||||||||
|
| |||||||
| Media — 1.99% | ||||||||
| 5,000 | Walt Disney Co./The | 539,700 | ||||||
|
| |||||||
| Oil, Gas & Consumable Fuels — 5.00% | ||||||||
| 25,000 | Cabot Oil & Gas Corp. | 554,750 | ||||||
| 10,000 | Exxon Mobil Corp. | 805,000 | ||||||
|
| |||||||
| 1,359,750 | ||||||||
|
| |||||||
| Pharmaceuticals — 4.64% | ||||||||
| 4,000 | Johnson & Johnson | 513,000 | ||||||
| 12,000 | Zoetis, Inc. | 747,360 | ||||||
|
| |||||||
| 1,260,360 | ||||||||
|
| |||||||
| Professional Services — 2.41% | ||||||||
| 17,000 | Nielsen Holdings PLC | 654,160 | ||||||
|
| |||||||
| Software — 5.18% | ||||||||
| 5,000 | Adobe Systems, Inc. * | 709,300 | ||||||
| 10,000 | Microsoft Corp. | 698,400 | ||||||
|
| |||||||
| 1,407,700 | ||||||||
|
| |||||||
| Specialty Retail — 2.26% | ||||||||
| 4,000 | Home Depot, Inc./The | 614,040 | ||||||
|
| |||||||
| Technology Hardware, Storage & Peripherals — 2.81% | ||||||||
| 5,000 | Apple, Inc. | 763,800 | ||||||
|
| |||||||
| Textiles, Apparel & Luxury Goods — 1.95% | ||||||||
| 10,000 | NIKE, Inc. | 529,900 | ||||||
|
| |||||||
Total Common Stocks (Cost $20,290,164) | 25,489,363 | |||||||
|
| |||||||
See accompanying notes which are an integral part of the financial statements.
14
BFS Equity Fund
Schedule of Investments (continued)
May 31, 2017
| Shares | Fair Value | |||||||
| MONEY MARKET SECURITIES — 6.24% | ||||||||
| 1,696,196 | Fidelity Investments Money Market Government Portfolio — Institutional Class, 0.69% (a) | $ | 1,696,196 | |||||
|
| |||||||
Total Money Market Securities (Cost $1,696,196) | 1,696,196 | |||||||
|
| |||||||
Total Investments – 100.00% (Cost $21,986,360) | 27,185,559 | |||||||
|
| |||||||
Liabilities in Excess of Other Assets – (0.00)% | (409 | ) | ||||||
|
| |||||||
NET ASSETS – 100.00% | $ | 27,185,150 | ||||||
|
| |||||||
| (a) | Rate disclosed is the seven day effective yield as of May 31, 2017. |
| * | Non-income producing security. |
The industries shown on the schedule of investments are based on the Global Industry Classification Standard, or GICS® (“GICS”). The GICS was developed by and/or is the exclusive property of MSCI, Inc. and Standard & Poor’s Financial Services LLC (“S&P”). GICS is a service mark of MSCI, Inc. and S&P and has been licensed for use by the Administrator.
See accompanying notes which are an integral part of the financial statements.
15
BFS Equity Fund
Statement of Assets and Liabilities
May 31, 2017
Assets | ||||
Investments in securities at fair value (cost $21,986,360) | $ | 27,185,559 | ||
Dividends receivable | 43,523 | |||
Prepaid expenses | 7,620 | |||
Total Assets | 27,236,702 | |||
Liabilities | ||||
Payable for fund shares redeemed | 5,451 | |||
Payable to Adviser | 7,287 | |||
Payable to Administrator | 6,783 | |||
Distribution fees accrued | 11,136 | |||
Other accrued expenses | 20,895 | |||
Total Liabilities | 51,552 | |||
Net Assets | $ | 27,185,150 | ||
Net Assets consist of: | ||||
Paid-in capital | $ | 22,226,668 | ||
Accumulated undistributed net investment income | 27,037 | |||
Accumulated net realized loss from investment transactions | (267,754 | ) | ||
Net unrealized appreciation on investments | 5,199,199 | |||
Net Assets | $ | 27,185,150 | ||
Shares outstanding (unlimited number of shares authorized, no par value) | 2,088,881 | |||
Net asset value, offering and redemption price per share | $ | 13.01 |
16
See accompanying notes which are an integral part of the financial statements.
BFS Equity Fund
Statement of Operations
For the year ended May 31, 2017
Investment Income |
| |||
Dividend income | $ | 401,688 | ||
Total investment income | 401,688 | |||
Expenses |
| |||
Investment Adviser | 188,205 | |||
Distribution (12b-1) | 62,735 | |||
Administrator | 38,000 | |||
Fund accounting | 25,000 | |||
Registration | 22,995 | |||
Transfer agent | 18,106 | |||
Audit | 17,100 | |||
Legal | 17,044 | |||
Printing | 11,722 | |||
Trustee | 6,912 | |||
Custodian | 4,247 | |||
Miscellaneous | 26,799 | |||
Total expenses | 438,865 | |||
Fees waived by Adviser | (124,587 | ) | ||
Net operating expenses | 314,278 | |||
Net investment income | 87,410 | |||
Net Realized and Change in Unrealized Gain on Investments |
| |||
Net realized gain on investment securities transactions | 545,073 | |||
Net change in unrealized appreciation of investment securities | 2,527,048 | |||
Net realized and change in unrealized gain on investments | 3,072,121 | |||
Net increase in net assets resulting from operations | $ | 3,159,531 | ||
17
See accompanying notes which are an integral part of the financial statements.
BFS Equity Fund
Statements of Changes in Net Assets
| Increase (Decrease) in Net Assets due to: | For the Year Ended May 31, 2017 | For the Year Ended May 31, 2016 | ||||||
Operations | ||||||||
Net investment income | $ | 87,410 | $ | 94,935 | ||||
Net realized gain/(loss) on investment securities transactions | 545,073 | (458,394 | ) | |||||
Net change in unrealized appreciation of investment securities | 2,527,048 | 217,958 | ||||||
Net increase (decrease) in net assets resulting from operations | 3,159,531 | (145,501 | ) | |||||
Distributions | ||||||||
From net investment income | (113,393 | ) | (69,881 | ) | ||||
Total distributions | (113,393 | ) | (69,881 | ) | ||||
Capital Transactions | ||||||||
Proceeds from shares sold | 1,862,217 | 5,178,205 | ||||||
Reinvestment of distributions | 101,818 | 62,385 | ||||||
Amount paid for shares redeemed | (1,709,170 | ) | (1,308,552 | ) | ||||
Net increase in net assets resulting from capital transactions | 254,865 | 3,932,038 | ||||||
Total Increase in Net Assets | 3,301,003 | 3,716,656 | ||||||
Net Assets |
| |||||||
Beginning of year | 23,884,147 | 20,167,491 | ||||||
End of year | $ | 27,185,150 | $ | 23,884,147 | ||||
Accumulated undistributed net investment income included in net assets at end of year | $ | 27,037 | $ | 53,020 | ||||
Share Transactions | ||||||||
Shares sold | 153,183 | 455,719 | ||||||
Shares issued in reinvestment of distributions | 8,443 | 5,364 | ||||||
Shares redeemed | (140,838 | ) | (118,087 | ) | ||||
Net increase in shares outstanding | 20,788 | 342,996 | ||||||
18
See accompanying notes which are an integral part of the financial statements.
BFS Equity Fund
Financial Highlights
(For a share outstanding during each period)
| For the Year Ended May 31, 2017 | For the Year Ended May 31, 2016 | For the Year Ended May 31, 2015 | For the Period Ended May 31, 2014(a) | |||||||||||||
Selected Per Share Data: | ||||||||||||||||
Net asset value, beginning of period | $11.55 | $11.69 | $10.73 | $10.00 | ||||||||||||
|
|
|
|
|
|
|
| |||||||||
Income from investment operations: | ||||||||||||||||
Net investment income | 0.04 | 0.04 | 0.02 | 0.04 | ||||||||||||
Net realized and unrealized gain/(loss) on investments | 1.47 | (0.15 | ) | 0.97 | 0.70 | |||||||||||
|
|
|
|
|
|
|
| |||||||||
Total from investment operations | 1.51 | (0.11 | ) | 0.99 | 0.74 | |||||||||||
|
|
|
|
|
|
|
| |||||||||
Less distributions to shareholders from: | ||||||||||||||||
Net investment income | (0.05 | ) | (0.03 | ) | (0.03 | ) | (0.01 | ) | ||||||||
|
|
|
|
|
|
|
| |||||||||
Total distributions | (0.05 | ) | (0.03 | ) | (0.03 | ) | (0.01 | ) | ||||||||
|
|
|
|
|
|
|
| |||||||||
Net asset value, end of period | $13.01 | $11.55 | $11.69 | $10.73 | ||||||||||||
|
|
|
|
|
|
|
| |||||||||
Total Return(b) | 13.15 | % | (0.91 | )% | 9.27 | % | 7.36 | %(c) | ||||||||
Ratios and Supplemental Data: | ||||||||||||||||
Net assets, end of period (000) | $27,185 | $23,884 | $20,167 | $12,745 | ||||||||||||
Ratio of net expenses to average net assets | 1.25 | % | 1.25 | % | 1.25 | % | 1.25 | %(d) | ||||||||
Ratio of expenses to average net assets before waiver and reimbursement | 1.75 | % | 1.86 | % | 2.26 | % | 3.93 | %(d) | ||||||||
Ratio of net investment income to average net assets | 0.35 | % | 0.43 | % | 0.30 | % | 0.68 | %(d) | ||||||||
Portfolio turnover rate | 47.82 | % | 49.38 | % | 51.17 | % | 46.50 | %(c) | ||||||||
| (a) | For the period November 8, 2013 (commencement of operations) to May 31, 2014. |
| (b) | Total return in the above table represents the rate that the investor would have earned or lost on an investment in the Fund, assuming reinvestment of dividends, if any. |
| (c) | Not annualized |
| (d) | Annualized |
19
See accompanying notes which are an integral part of the financial statements.
BFS Equity Fund
Notes to the Financial Statements
May 31, 2017
NOTE 1. ORGANIZATION
The BFS Equity Fund (the “Fund”) was organized as an open-end diversified series of Valued Advisers Trust (the “Trust”) on July 23, 2013 and commenced operations on November 8, 2013. The Trust is a management investment company established under the laws of Delaware by an Agreement and Declaration of Trust dated June 13, 2008 (the “Trust Agreement”). The Trust Agreement permits the Trustees to issue an unlimited number of shares of beneficial interest of separate series without par value. The Fund is one of a series of funds authorized by the Board of Trustees (the “Board”). The Fund’s investment adviser is Bradley, Foster & Sargent, Inc. (the “Adviser”). The investment objective of the Fund is long-term appreciation through growth of principal and income.
NOTE 2. SIGNIFICANT ACCOUNTING POLICIES
The Fund is an investment company and follows accounting and reporting guidance under Financial Accounting Standards Board Accounting Standards Codification (“ASC”) Topic 946, “Financial Services-Investment Companies”. The following is a summary of significant accounting policies followed by the Fund in the preparation of its financial statements. These policies are in conformity with generally accepted accounting principles in the United States of America (“GAAP”).
Estimates – The preparation of financial statements in conformity with GAAP requires management to make estimates and assumptions that affect the reported amounts of assets and liabilities and disclosure of contingent assets and liabilities at the date of the financial statements and the reported amounts of increases and decreases in net assets from operations during the reporting period. Actual results could differ from those estimates.
Securities Valuation – All investments in securities are recorded at their estimated fair value as described in Note 3.
Federal Income Taxes – The Fund makes no provision for federal income or excise tax. The Fund has qualified and intends to qualify each year as a regulated investment company (“RIC”) under subchapter M of the Internal Revenue Code of 1986, as amended, by complying with the requirements applicable to RICs and by distributing substantially all of its taxable income. The Fund also intends to distribute sufficient net investment income and net capital gains, if any, so that it will not be subject to excise tax on undistributed income and gains. If the required amount of net investment income or gains is not distributed, the Fund could incur a tax expense.
As of, and during the fiscal year ended May 31, 2017, the Fund did not have a liability for any unrecognized tax benefits. The Fund recognizes interest and penalties, if any, related to unrecognized tax benefits as income tax expense in the statement of operations. During the fiscal year ended May 31, 2017, the Fund did not incur any interest or penalties.
Expenses – Expenses incurred by the Trust that do not relate to a specific fund of the Trust are allocated to the individual funds based on each fund’s relative net assets or another appropriate basis.
Security Transactions and Related Income – The Fund follows industry practice and records security transactions on the trade date for financial reporting purposes. For financial statement and income tax purposes, the specific identification method is used for determining gains or losses.
20
BFS Equity Fund
Notes to the Financial Statements (continued)
May 31, 2017
Dividend income is recorded on the ex-dividend date and interest income is recorded on an accrual basis. Withholding taxes on foreign dividends have been provided for in accordance with the Fund’s understanding of the applicable country’s tax rules and rates.
Dividends and Distributions – The Fund intends to distribute its net investment income and net realized long-term and short-term capital gains, if any, at least annually. Dividends and distributions to shareholders, which are determined in accordance with income tax regulations, are recorded on the ex-dividend date. The treatment for financial reporting purposes of distributions made to shareholders during the period from net investment income or net realized capital gains may differ from their ultimate treatment for federal income tax purposes. These differences are caused primarily by differences in the timing of the recognition of certain components of income, expense or realized capital gain for federal income tax purposes. Where such differences are permanent in nature, they are reclassified among the components of the net assets based on their ultimate characterization for federal income tax purposes. Any such reclassifications will have no effect on net assets, results of operations or net asset values per share of the Fund.
NOTE 3. SECURITIES VALUATION AND FAIR VALUE MEASUREMENTS
Fair value is defined as the price that the Fund would receive upon selling an investment in an orderly transaction to an independent buyer in the principal or most advantageous market of the investment. GAAP establishes a three-tier hierarchy to maximize the use of observable market data and minimize the use of unobservable inputs and establish classification of fair value measurements for disclosure purposes.
Inputs refer broadly to the assumptions that market participants would use in pricing the asset or liability, including assumptions about risk, for example, the risk inherent in a particular valuation technique used to measure fair value including a pricing model and/or the risk inherent in the inputs to the valuation technique. Inputs may be observable or unobservable. Observable inputs are inputs that reflect the assumptions market participants would use in pricing the asset or liability developed based on market data obtained from sources independent of the reporting entity. Unobservable inputs are inputs that reflect the reporting entity’s own assumptions about the assumptions market participants would use in pricing the asset or liability developed based on the best information available in the circumstances.
Various inputs are used in determining the value of the Fund’s investments. These inputs are summarized in the three broad levels listed below.
| • | Level 1 – unadjusted quoted prices in active markets for identical investments and/or registered investment companies where the value per share is determined and published and is the basis for current transactions for identical assets or liabilities at the valuation date. |
| • | Level 2 – other significant observable inputs (including, but not limited to, quoted prices for an identical security in an inactive market, quoted prices for similar securities, interest rates, prepayment speeds, credit risk, etc.) |
| • | Level 3 – significant unobservable inputs (including the Fund’s own assumptions in determining fair value of investments based on the best information available) |
21
BFS Equity Fund
Notes to the Financial Statements (continued)
May 31, 2017
The inputs used to measure fair value may fall into different levels of the fair value hierarchy. In such cases, for disclosure purposes, the level in the fair value hierarchy which is reported is determined based on the lowest level input that is significant to the fair value measurement in its entirety.
Equity securities that are traded on any stock exchange are generally valued at the last quoted sale price on the security’s primary exchange. Lacking a last sale price, an exchange traded security is generally valued at its last bid price. Securities traded in the NASDAQ over-the-counter market are generally valued at the NASDAQ Official Closing Price. When using the market quotations and when the market is considered active, the security is classified as a Level 1 security. In the event that market quotations are not readily available or are considered unreliable due to market or other events, the Fund values its securities and other assets at fair value in accordance with policies established by and under the general supervision of the Board. Under these policies, the securities will be classified as Level 2 or 3 within the fair value hierarchy, depending on the inputs used.
Investments in mutual funds, including money market mutual funds, are generally priced at the ending net asset value (“NAV”) provided by the pricing service of the funds. These securities will be categorized as Level 1 securities.
In accordance with the Trust’s valuation policies, the Adviser is required to consider all appropriate factors relevant to the value of securities for which it has determined other pricing sources are not available or reliable as described above. No single standard exists for determining fair value, because fair value depends upon the circumstances of each individual case. As a general principle, the current fair value of an issue of securities being valued by the Adviser would appear to be the amount that the Fund might reasonably expect to receive for them upon their current sale. Methods that are in accordance with this principle may, for example, be based on (i) a multiple of earnings; (ii) a discount from market prices of a similar freely traded security (including a derivative security or a basket of securities traded on other markets, exchanges or among dealers); or (iii) yield to maturity with respect to debt issues, or a combination of these and other methods. Fair-value pricing is permitted if, in the Adviser’s opinion, the validity of market quotations appears to be questionable based on factors such as evidence of a thin market in the security based on a small number of quotations, a significant event occurs after the close of a market but before the Fund’s NAV calculation that may affect a security’s value, or the Adviser is aware of any other data that calls into question the reliability of market quotations.
The following is a summary of the inputs used to value the Fund’s investments as of May 31, 2017:
| Valuation Inputs | ||||||||||||||||
| Assets | Level 1 | Level 2 | Level 3 | Total | ||||||||||||
Common Stocks(a) | $ | 25,489,363 | $ | – | $ | – | $ | 25,489,363 | ||||||||
Money Market Funds | 1,696,196 | – | – | 1,696,196 | ||||||||||||
Total | $ | 27,185,559 | $ | – | $ | – | $ | 27,185,559 | ||||||||
| (a) | Refer to Schedule of Investments for sector classifications. |
22
BFS Equity Fund
Notes to the Financial Statements (continued)
May 31, 2017
The Fund did not hold any investments during the reporting period for which other significant observable inputs (Level 2) were used in determining fair value. The Fund did not hold any investments during the reporting period for which significant unobservable inputs (Level 3) were used in determining fair value; therefore, no reconciliation of Level 3 securities is included for this reporting period. The Fund did not hold any derivative instruments during the reporting period.
The Trust recognizes transfers between fair value hierarchy levels at the end of the reporting period. There were no transfers between any levels as of May 31, 2017 based on input levels assigned at May 31, 2016.
NOTE 4. FEES AND OTHER TRANSACTIONS WITH AFFILIATES AND OTHER SERVICE PROVIDERS
Under the terms of the investment advisory agreement on behalf of the Fund (the “Agreement”), the Adviser manages the Fund’s investments subject to oversight of the Board. As compensation for its services, the Fund is obligated to pay the Adviser a fee computed and accrued daily and paid monthly at an annual rate of 0.75% of the average daily net assets of the Fund. For the fiscal year ended May 31, 2017, the Adviser earned a fee of $188,205 from the Fund before the waivers described below. At May 31, 2017, the Fund owed the Adviser $7,287.
The Adviser has contractually agreed to waive or limit its fee and reimburse other expenses of the Fund, until September 30, 2017, so that the ratio of total annual operating expenses does not exceed 1.00%. This operating expense limitation does not apply to interest, taxes, brokerage commissions, other expenditures which are capitalized in accordance with GAAP, other extraordinary expenses not incurred in the ordinary course of the Fund’s business, dividend expense on short sales, expenses incurred under a plan of distribution under Rule 12b-1, and expenses that the Fund has incurred but did not actually pay because of an expense offset arrangement, if applicable, incurred by the Fund in any fiscal year. The operating expense limitation also excludes any “Fees and Expenses of Acquired Funds,” which are the expenses indirectly incurred by the Fund as a result of investing in money market funds or other investment companies, including ETFs, that have their own expenses. Each fee waiver or expense reimbursement by the Adviser is subject to repayment by the Fund within the three years following the date in which the fee waiver or expense reimbursement occurred, provided that the Fund is able to make the repayment without exceeding the expense limitation that is in effect at the time of the repayment or at the time of the fee waiver or expense reimbursement, whichever is lower. For the fiscal year ended May 31, 2017, fees and expenses totaling $124,587 were waived or reimbursed by the Adviser. The maximum amounts subject to repayment by the Fund, pursuant to the aforementioned conditions are as follows:
| Recoverable through May 31, | Amount | |||||
| 2018 | $163,520 | |||||
| 2019 | 135,629 | |||||
| 2020 | 124,587 | |||||
23
BFS Equity Fund
Notes to the Financial Statements (continued)
May 31, 2017
The Trust retains Ultimus Asset Services, LLC (the “Administrator”) to provide the Fund with administration and compliance, fund accounting, and transfer agent services, including all regulatory reporting. For the fiscal year ended May 31, 2017, The Administrator earned fees of $38,000 for administration services, $25,000 for fund accounting services and $18,106 for transfer agent services. At May 31, 2017, the Fund owed the Administrator $6,783 for such services.
The officers and one trustee of the Trust are members of management and/or employees of the Administrator. Unified Financial Securities, LLC (the “Distributor”) acts as the principal distributor of the Fund’s shares. An officer of the Trust is an officer of the Distributor and such person may be deemed to be an affiliate of the Distributor.
The Fund has adopted a Distribution Plan (the “Plan”) pursuant to Rule 12b-1 under the Investment Company Act of 1940 (the “1940 Act”). The Plan provides that the Fund will pay the Distributor and/or any registered securities dealer, financial institution or any other person (the “Recipient”) a shareholder servicing fee of 0.25% of the average daily net assets of the Fund in connection with the promotion and distribution of the Fund’s shares or the provision of personal services to shareholders, including, but not necessarily limited to, advertising, compensation to underwriters, dealers and selling personnel, the printing and mailing of prospectuses to other than current Fund shareholders, the printing and mailing of sales literature and servicing shareholder accounts (“12b-1 Expenses”). The Fund or Distributor may pay all or a portion of these fees to any recipient who renders assistance in distributing or promoting the sale of shares, or who provides certain shareholder services, pursuant to a written agreement. For the fiscal year ended May 31, 2017, 12b-1 expense incurred by the Fund was $62,735. The Fund owed $11,136 for 12b-1 fees as of May 31, 2017.
NOTE 5. PURCHASES AND SALES OF SECURITIES
For the fiscal year ended May 31, 2017, purchases and sales of investment securities, other than short-term investments and short-term U.S. government obligations, were as follows:
Purchases | Sales | |||
| $11,698,818 | $ | 12,410,166 | ||
There were no purchases or sales of long-term U.S. government obligations during the fiscal year ended May 31, 2017.
NOTE 6. BENEFICIAL OWNERSHIP
The beneficial ownership, either directly or indirectly, of more than 25% of the voting securities of a fund creates a presumption of control of a fund, under Section 2(a) (9) of the 1940 Act. At May 31, 2017, Charles Schwab & Co., Inc. (“Schwab”) owned, as record shareholder, 54% of the outstanding shares of the Fund. It is not known whether Schwab or any of the underlying beneficial owners owned or controlled more than 25% of the voting securities of the Fund.
24
BFS Equity Fund
Notes to the Financial Statements (continued)
May 31, 2017
NOTE 7. FEDERAL TAX INFORMATION
At May 31, 2017, the net unrealized appreciation (depreciation) of investments for tax purposes was as follows:
Gross Unrealized Appreciation | $ | 5,609,583 | ||
Gross Unrealized Depreciation | (428,924 | ) | ||
Net Unrealized Appreciation on Investments | $ | 5,180,659 |
At May 31, 2017, the aggregate cost of securities for federal income tax purposes was $22,004,900.
At May 31, 2017, the Fund’s most recent fiscal year end, the components of distributable earnings (accumulated losses) on a tax basis were as follows:
Undistributed ordinary income | $ | 27,037 | ||
Accumulated capital and other losses | (249,214 | ) | ||
Unrealized appreciation | 5,180,659 | |||
Total | $ | 4,958,482 |
The difference between book and tax basis appreciation was attributable primarily to the tax deferral of losses on wash sales.
The tax character of distributions paid for the fiscal years ended May 31, 2017 and May 31, 2016 were as follows:
| 2017 | 2016 | |||||||
Distributions paid from: | ||||||||
Ordinary Income | $ | 113,393 | $ | 69,881 | ||||
As of May 31, 2017, the Fund has available for federal tax purposes an unused capital loss carryforward of $249,214 short-term capital losses, respectively, with no expiration, which is available to offset against future taxable net capital gains. To the extent that these carryforwards are used to offset future gains, it is probable that the amount offset will not be distributed to shareholders.
During the fiscal year ended May 31, 2017, the Fund utilized $182,694 of its capital loss carryforward.
NOTE 8. COMMITMENTS AND CONTINGENCIES
The Fund indemnifies its officers and trustees for certain liabilities that may arise from performance of their duties to the Fund. Additionally, in the normal course of business, the Fund enters into contracts that contain a variety of representations and warranties which provide general indemnifications. The Fund’s maximum exposure under these arrangements is unknown, as this would involve future claims that may be made against the Fund that have not yet occurred.
NOTE 9. SUBSEQUENT EVENTS
Management of the Fund has evaluated the need for disclosure and/or adjustments resulting from subsequent events through the date these financials were issued. Management has determined there were no items requiring adjustment of the financial statements or additional disclosure.
25
Report of Independent Registered Public Accounting Firm
To the Shareholders of BFS Equity Fund and
Board of Trustees of Valued Advisers Trust
We have audited the accompanying statement of assets and liabilities, including the schedule of investments, of BFS Equity Fund (the “Fund”), a series of Valued Advisers Trust, as of May 31, 2017, and the related statement of operations for the year then ended, the statements of changes in net assets for each of the two years in the period then ended, and the financial highlights for each of the four periods in the period then ended. These financial statements and financial highlights are the responsibility of the Fund’s management. Our responsibility is to express an opinion on these financial statements and financial highlights based on our audits.
We conducted our audits in accordance with the standards of the Public Company Accounting Oversight Board (United States). Those standards require that we plan and perform the audit to obtain reasonable assurance about whether the financial statements and financial highlights are free of material misstatement. An audit includes examining, on a test basis, evidence supporting the amounts and disclosures in the financial statements. Our procedures included confirmation of securities owned as of May 31, 2017, by correspondence with the custodian. An audit also includes assessing the accounting principles used and significant estimates made by management, as well as evaluating the overall financial statement presentation. We believe that our audits provide a reasonable basis for our opinion.
In our opinion, the financial statements and financial highlights referred to above present fairly, in all material respects, the financial position of BFS Equity Fund as of May 31, 2017, the results of its operations for the year then ended, the changes in its net assets for each of the two years in the period then ended, and the financial highlights for each of the four periods in the period then ended, in conformity with accounting principles generally accepted in the United States of America.
COHEN & COMPANY, LTD.
Cleveland, Ohio
July 24, 2017
26
BFS Equity Fund
Summary of Fund Expenses (Unaudited)
As a shareholder of the Fund, you incur two types of costs: (1) transaction costs; and (2) ongoing costs, including management fees; and other Fund expenses. This Example is intended to help you understand your ongoing costs (in dollars) of investing in the Fund and to compare these costs with the ongoing costs of investing in other mutual funds. The Example in the table below is based on an investment of $1,000 invested at the beginning of the period, and held for the six month period from December 1, 2016 to May 31, 2017.
Actual Expenses
The first line of the table below provides information about actual account values and actual expenses. You may use the information in this line, together with the amount you invested, to estimate the expenses that you paid over the period. Simply divide your account value by $1,000 (for example, an $8,600 account value divided by $1,000 = 8.60), then multiply the result by the number in the first line under the heading “Expenses Paid During the Period” to estimate the expenses you paid on your account during this period.
Hypothetical Example for Comparison Purposes
The second line of the table below provides information about hypothetical account values and hypothetical expenses based on the Fund’s actual expense ratios and an assumed rate of return of 5% per year before expenses, which is not the Fund’s actual return. The hypothetical account values and expenses may not be used to estimate the actual ending account balance or expenses you paid for the period. You may use this information to compare the ongoing costs of investing in the Fund and other funds. To do so, compare this 5% hypothetical example with the 5% hypothetical examples that appear in the shareholder reports of other funds.
Expenses shown in the table are meant to highlight your ongoing costs only and do not reflect any transactional costs, such as sales charges (loads), or redemption fees. Therefore, the second line of the table is useful in comparing ongoing costs only, and will not help you determine the relative total costs of owning different funds.
| Beginning Account Value December 1, 2016 | Ending Account Value May 31, 2017 | Expenses Paid During the Period(a) | ||||||||||
Actual | $ | 1,000.00 | $ | 1,099.10 | $ | 6.54 | ||||||
Hypothetical(b) | $ | 1,000.00 | $ | 1,018.70 | $ | 6.29 | ||||||
| (a) | Expenses are equal to the Fund’s annualized net expense ratio of 1.25%, multiplied by the average account value over the period, multiplied by 182/365. |
| (b) | Assumes a 5% return before expenses. |
27
Additional Federal Income Tax Information (Unaudited):
The Form 1099-DIV you receive in January 2018 will show the tax status of all distributions paid to your account in calendar year 2017. Shareholders are advised to consult their own tax adviser with respect to the tax consequences of their investment in the Fund. As required by the Internal Revenue Code and/or regulations, shareholders must be notified regarding the status of qualified dividend income for individuals and the dividends received deduction for corporations.
Qualified Dividend Income: The Fund designates approximately 100%, or up to the maximum amount of such dividends allowable pursuant to the Internal Revenue Code, as qualified dividend income eligible for the reduced tax rate of 15%.
Dividends Received Deduction: Corporate shareholders are generally entitled to take the dividends received deduction on the portion of the Fund’s dividend distribution that qualifies under tax law. For the Fund’s fiscal year 2017 ordinary income dividends, 100% qualifies for the corporate dividends received deduction.
Trustees and Officers (Unaudited)
The Board of Trustees supervises the business activities of the Trust. Each Trustee serves as a trustee until termination of the Trust unless the Trustee dies, resigns, retires or is removed.
The following table provides information regarding each of the independent trustees.
| Name, Address*, Age, Position with Trust**, Term of Position with Trust | Principal Occupation During Past 5 Years and Other Directorships | Other Directorships | ||
Andrea N. Mullins, 50 Independent Trustee Since December 2013
Chairperson since March 2017 | Current: Private investor; Independent Contractor, SWM Advisors (since April 2014). | None. | ||
Ira Cohen, 58 Independent Trustee Since June 2010 | Current: Independent financial services consultant (since February 2005); Executive Vice President of Asset Management Services, Recognos Financial (since August 2015). | Trustee, Griffin Institutional Access Credit Fund (since January 2017); Trustee and Audit Committee Chairman, Griffin Institutional Real Estate Access Fund (since May 2014); Trustee, Angel Oak Funds Trust (since October 2014); Chairman (since April 2017). | ||
| * | The address for each trustee and officer is 225 Pictoria Drive, Suite 450, Cincinnati, Ohio 45246. |
| ** | As of the date of this report, the Trust consists of 13 series. |
28
The following table provides information regarding the Trustee who is considered an “interested person” of the Trust, as that term is defined under the 1940 Act. Based on the experience of the Trustee, the Trust concluded that the individual described below should serve as a Trustee.
| Name, Address*, (Age), Position with Trust**, Term of Position with Trust | Principal Occupation During Past 5 Years | Other Directorships | ||
Mark J. Seger, 55 Trustee Since March 2017 | Current: President, Managing Director, and Co-Founder, Ultimus Fund Solutions, LLC (since 1999); Treasurer and Managing Director, Ultimus Fund Distributors, LLC (since 1999); President and Managing Director, Ultimus Asset Services, LLC (since 2016); Managing Director, Unified Financial Securities, LLC (since 2016). | None. | ||
| * | The address for each trustee and officer is 225 Pictoria Drive, Suite 450, Cincinnati, Ohio 45246. |
| ** | As of the date of this report, the Trust consists of 13 series. |
The following table provides information regarding the officers of the Trust:
| Name, Address*, (Age), Position with Trust,** Term of Position with Trust | Principal Occupation During Past 5 Years | Other Directorships | ||
Bo J. Howell, 36 Principal Executive Officer and President Since March 2017 | Current: Vice President, Director of Fund Administration, Ultimus Fund Solutions, LLC (since 2014).
Previous: Counsel, Securities and Mutual Funds, Western & Southern Financial Group (2012 – 2014). | None. | ||
John C. Swhear, 56 Chief Compliance Officer and Vice President Since August 2008 | Current: Assistant Vice President and Associate Director of Fund Administration, Ultimus Fund Solutions, LLC (since April 2017); Chief Compliance Officer, Unified Financial Securities, LLC (since May 2007).
Previous: Associate Director of Compliance, Ultimus Fund Solutions, LLC (December 2015 to May 2017); Vice President of Legal Administration and Compliance, Huntington Asset Services, Inc. (n/k/a Ultimus Asset Services, LLC) (April 2007 to December 2015), Director (May 2014 to December 2015); Director, Unified Financial Securities, Inc. (n/k/a Unified Financial Securities, LLC) (May 2014 to December 2015). | None. | ||
Carol J. Highsmith, 52 Vice President Since August 2008
Secretary Since March 2014 | Current: Assistant Vice President, Ultimus Fund Solutions, LLC (since December 2015).
Previous: Employed in various positions with Huntington Asset Services, Inc. (n/k/a Ultimus Asset Services, LLC) (November 1994 to December 2015), most recently Vice President of Legal Administration (2005 to December 2015). | None. | ||
29
| Name, Address*, (Age), Position with Trust,** Term of Position with Trust | Principal Occupation During Past 5 Years | Other Directorships | ||
Matthew J. Miller, 41 Vice President Since December 2011 | Current: Assistant Vice President, Relationship Management, Ultimus Fund Solutions, LLC (since December 2015).
Previous: Employed in various positions with Huntington Asset Services, Inc. (n/k/a Ultimus Asset Services, LLC) ( July 1998 to December 2015), most recently Vice President of Relationship Management (2005 to December 2015). | None. | ||
Bryan W. Ashmus, 44 Principal Financial Officer and Treasurer Since December 2013 | Current: Vice President and Director of Financial Administration, Ultimus Fund Solutions, LLC (since December 2015).
Previous: Vice President and Manager of Financial Administration, Huntington Asset Services, Inc. (n/k/a Ultimus Asset Services, LLC) (September 2013 to December 2015); Vice President, Fund Administration, Citi Fund Services Ohio, Inc. (from May 2005 to September 2013). | None. | ||
| * | The address for each trustee and officer is 225 Pictoria Drive, Suite 450, Cincinnati, Ohio 45246. |
| ** | As of the date of this report, the Trust consists of 13 series. |
Other Information (Unaudited)
The Fund’s Statement of Additional Information (“SAI”) includes additional information about the trustees and is available without charge, upon request. You may call toll-free at (855) 575-2430 to request a copy of the SAI or to make shareholder inquiries.
30
March 9, 2017
FACTS | WHAT DOES VALUED ADVISERS TRUST DO WITH YOUR PERSONAL INFORMATION? | |
Why? | Financial companies choose how they share your personal information. Federal law gives consumers the right to limit some but not all sharing. Federal law also requires us to tell you how we collect, share, and protect your personal information. Please read this notice carefully to understand what we do. | |
What? | The types of personal information we collect and share depend on the product or service you have with us. This information can include: ◾ Social Security number ◾ account balances and account transactions ◾ account transactions, transaction or loss history and purchase history ◾ checking account information and wire transfer instructions When you are no longer our customer, we continue to share your information as described in this notice.
| |
How? | All financial companies need to share customers’ personal information to run their everyday business. In the section below, we list the reasons financial companies can share their customers’ personal information; the reasons Valued Advisers Trust chooses to share; and whether you can limit this sharing.
|
Reasons we can share your personal information | Does Valued Advisers Trust share? | |
For our everyday business purposes — such as to process your transactions, maintain your account(s), respond to court orders and legal investigations, or report to credit bureaus | Yes | |
For our marketing purposes — to offer our products and services to you | Yes | |
For joint marketing with other financial companies | No | |
For our affiliates’ everyday business purposes — information about your transactions and experiences | No | |
For our affiliates’ everyday business purposes — information about your creditworthiness | No | |
For nonaffiliates to market to you | No |
Questions? | Call 1-855-575-2430. |
31
| Who we are | ||
Who is providing this notice?
| Valued Advisers Trust
| |
What we do
| ||
| How does Valued Advisers Trust protect my personal information? | To protect your personal information from unauthorized access and use, we use security measures that comply with federal law. These measures include computer safeguards and secured files and buildings.
| |
| How does Valued Advisers Trust collect my personal information? | We collect your personal information, for example, when you ◾ open an account or deposit money ◾ buy securities from us or sell securities to us ◾ make deposits or withdrawals from your account or provide account information ◾ give us your account information ◾ make a wire transfer ◾ tell us who receives the money ◾ tell us where to send the money ◾ show your government-issued ID ◾ show your driver’s license
| |
| Why can’t I limit all sharing? | Federal law gives you the right to limit only ◾ sharing for affiliates’ everyday business purposes — information about your creditworthiness ◾ affiliates from using your information to market to you ◾ sharing for nonaffiliates to market to you
State laws and individual companies may give you additional rights to limit sharing.
| |
Definitions
| ||
| Affiliates | Companies related by common ownership or control. They can be financial and nonfinancial companies. | |
| Nonaffiliates | Companies not related by common ownership or control. They can be financial and nonfinancial companies. ◾ Valued Advisers Trust does not share your personal information with nonaffiliates so they can market to you. | |
| Joint marketing | A formal agreement between nonaffiliated financial companies that together market financial products or services to you. ◾ Valued Advisers Trust doesn’t jointly market financial products or services to you. | |
32
Proxy Voting
A description of the policies and procedures that the Fund uses to determine how to vote proxies relating to portfolio securities and information regarding how the Fund voted those proxies during the most recent twelve month period ended June 30, is available without charge upon request by (1) calling the Fund at (855) 575-2430 and (2) from Fund documents filed with the Securities and Exchange Commission (“SEC”) on the SEC’s website at www.sec.gov.
TRUSTEES
Andrea N. Mullins, Chairperson
Ira P. Cohen
Mark J. Seger
OFFICERS
Bo J. Howell, Principal Executive Officer and President
Bryan W. Ashmus, Principal Financial Officer and Treasurer
John C. Swhear, Chief Compliance Officer and Vice President
Carol J. Highsmith, Vice President and Secretary
Matthew J. Miller, Vice President
Stephen L. Preston, Anti-Money Laundering Officer
INVESTMENT ADVISER
Bradley, Foster & Sargent, Inc.
185 Asylum Street, City Place II
Hartford, CT 06103
DISTRIBUTOR
Unified Financial Securities, LLC
9465 Counselors Row, Suite 200
Indianapolis, IN 46240
INDEPENDENT REGISTERED PUBLIC ACCOUNTING FIRM
Cohen & Company, Ltd.
1350 Euclid Avenue, Suite 800
Cleveland, OH 44115
LEGAL COUNSEL
The Law Offices of John H. Lively & Associates, Inc.
A member firm of The 1940 Act Law Group TM
11300 Tomahawk Creek Parkway, Suite 310
Leawood, KS 66211
CUSTODIAN
Huntington National Bank
41 South High Street
Columbus, OH 43215
ADMINISTRATOR, TRANSFER AGENT AND FUND ACCOUNTANT
Ultimus Asset Services, LLC
225 Pictoria Drive, Suite 450
Cincinnati, OH 45246
This report is intended only for the information of shareholders or those who have received the Fund’s prospectus which contains information about the Fund’s management fee and expenses. Please read the prospectus carefully before investing.
Distributed by Unified Financial Securities, LLC
Member FINRA/SIPC
To Shareholders of the LS Opportunity Fund,
Prospector Partners, LLC (“Prospector”), based in Guilford, CT is the sub-adviser of the LS Opportunity Fund (“LSOFX” or the “Fund”). Prospector has a long/short hedge fund track record that spans 20 years with a substantially similar investment objective to LSOFX and brings its experience to our Fund in a daily liquid mutual fund format with a goal of downside protection and a consistency of returns.
The Fund aims to generate long-term capital appreciation by investing in both long and short positions within a portfolio consisting of primarily publicly-traded common stock, with less net exposure than that of the stock market in general. Through extensive research, risk management, and no leverage in the long book, the Fund strives to preserve capital while delivering solid risk adjusted returns and managing volatility. For additional information, please visit our website at www.longshortadvisors.com.
Performance
The twelve month period ended May 31, 2017 (the “Period”) was characterized by the ever-resilient stock market, the continued historically low interest rates, and the changing political landscape after Donald Trump won the US presidency. Overall, LSOFX returned +9.98% during the Period, which was better than the HFRX Equity Hedge Index (“HFRX”), which returned +5.59%. However, the S&P 500® Index (“S&P 500”) finished the Period with a return of +17.47%.
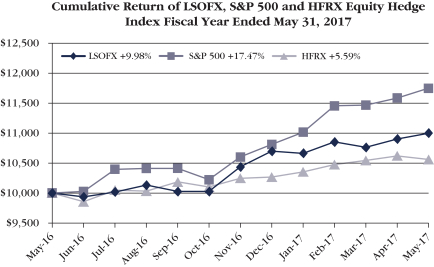
1
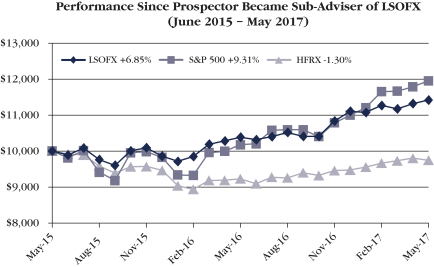
2 Year Standard Deviation
LSOFX: 6.7%
S&P 500: 11.2%
HFRX: 5.8%
Our Perspective on Short Selling
When we are evaluating investment opportunities on the short side, our process most often mirrors the one we execute when looking for long ideas. For example, on the short side we seek companies with weak balance sheets because of soft marks on their assets and/or liabilities plus high financial leverage. We aggressively utilize public, non-GAAP data to help us determine the strength or weaknesses in the balance sheet marks that financial services companies take. For insurers, we dive into statutory statements which are filed with various state insurance departments and have more fulsome disclosure. For banks we can dig into regulatory filings which contain much more granular data on loan growth. We also try to identify mediocre management teams at companies undifferentiated in their products, costs structures, and growth outlook. We also look for high expectations that are unlikely to be achieved. Then we endeavor to identify a catalyst which will cause the broader investment public to come around to our view and reset the price lower. Finally, we try hard to find these opportunities in situations where we are among the first rank of investors to reach these conclusions. We typically like to sell short average or below-average companies at above average or average prices.
Almost as important as the characteristics we are looking for in a short sale are the ones we are trying to avoid. We stay away from companies with strong balance sheets and excess capital to weather harsh conditions in the short term. We avoid top-tier, owner-oriented management teams, because they have a tendency to add
2
value through a difficult environment with their ability. We steer clear of companies who are obvious acquisition candidates or likely to attract the attention of activist investors. Existing high levels of short interest are a red flag as well, indicating to us that we are not early to the idea and susceptible to a short squeeze should subsequent data points undermine our original thesis. A high valuation is never a sufficient reason on its own for shorting a particular stock; also a rock bottom valuation often indicates that lots of bad news is already reflected in the current stock price. We also are careful to not short shares of companies that we feel are likely candidates for inclusion in various stock indices; the buying power of passive portfolios is unmatched over the last few decades. Currently we are cognizant of high tax rate payers due to the prospect of meaningful corporate tax reform.
Retailers
Retailers of all types face many well-known challenges in the shifting consumer landscape. Large format retailers, which are often the #1 customer of major consumer staples companies, face encroachment from both Amazon and the European hard discounters which have announced aggressive expansion plans in the U.S. and are known for executing private label effectively. For example recent statements from Wal-Mart suggest they believe they have significantly raised the quality of their own private-label offering, thus allowing them to use such products to build consumer loyalty and earn the higher percentage margins typically available in private label. In addition, retailers can deploy private label as a credible threat to their branded suppliers.
Meanwhile, nearly all consumer staples companies are trying to raise their own margins, largely through cost-reduction programs such as Zero Based Budgeting. Having seen the dramatic results achieved by 3G/Berkshire at Kraft-Heinz (where margins increased by approximately 1000 basis points post-acquisition), most have promised margin improvement as a means to earnings growth in what has been a disappointing volume environment the last few years.
With both sides facing existential threats, it is abundantly clear that retailers won’t sit idly by while their suppliers all raise operating margins by 10 percentage points. In our view, the retailers have started to fight back. They have taken out the stick, in order to claim their share of the cost savings.
In such a difficult environment, we increasingly favor companies that dominate their categories and thus will continue to enjoy pricing power. For instance, candy and beverages face less of a private-label threat due to the unique taste profiles that tend to build brand loyalty. In contrast, paper products are more commodity-oriented and thus less protected. In general, we believe the losers will be those companies that compete in categories with already high private-label share, as they tend to have the least brand loyalty.
3
M&A
Many of the positions in your portfolio incorporate our view on the likelihood of that company being a buyer or a seller. The prospect of a transaction is rarely the primary reason for ownership; we maintain our focus on finding attractive opportunities amongst companies with conservatively-stated balance sheets and/or undervalued franchises and situations. We are particularly attracted to investments with those attributes AND the prospect of a premium realization (we like to have more than one way to win). Therefore, the Fund includes companies with unique skill-sets (3rd party asset management, such as RenaissanceRe and Validus Holdings), dominant market position and limited growth opportunities (ProAssurance), as well as respected franchises in relatively better businesses (Selective, Hanover, Hiscox). We continue to believe that the private market value for these companies exceeds their current publicly-traded prices.
Financial Investing Outlook
We continue to have little exposure to mega-cap, highly-levered financials, and you should expect that to continue into the future. Our preference is for smaller, less-levered financial services companies.
As we previously stated in last year’s annual report, but worth repeating again is that bank sector ROE erosion has slowed. Valuations are reasonable and consistent with the low ROE’s that are currently reported. Capital levels have been built to new standards, so managements will have more freedom to allocate future capital generation to more shareholder-friendly options such as share repurchase and dividend hikes. Bankers are adjusting their business models to reduce dependence on interest rates and spread income in favor of higher fees and commissions. Having said this, at some point in the intermediate term, interest rates and the yield curve could be determined by market forces, the traditional mechanism, rather than central bankers who have pegged short rates near zero for the last decade. This could help repair some of the ROE degradation of the last seven years. The goal on the long side is to find well run banks with controlled growth and good capital management. Banks can achieve high single digit returns compounded over time.
Outlook
After an eight year post-financial crisis period of consistent underlying conditions for equity investing, things have likely shifted. Both the interest rate and regulatory cycles appear to have reached an inflection point. One thing that hasn’t changed is that the equity market continues to perform better than the underlying economy. The U.S. economy remains in a modest growth mode, although expectations are rising. Our economy’s performance remains the global leader, but domestic companies face headwinds from the strong U.S. dollar and still slower economic growth across international markets.
4
Energy prices, despite the recent rally, are still low. This should stimulate consumer spending and confidence in the long run both here and for non-oil producing countries abroad. We continue to enjoy the competitive advantage of a long-term supply of abundant cheap natural gas. Importantly, the U.S. consumer will benefit from lower energy prices and less expensive imports as a result of the strong dollar.
Interest and mortgage rates continue near historically low levels, although they have moved off the lows. Ultimately, higher rates will likely accompany better economic performance and some inflation, both of which are relative positives for equities compared to bonds. Much depends on the path and pace of interest rates’ return to normalcy.
Investment-grade corporations have solid balance sheets and are accumulating excess cash and capital. Importantly, they are also spending on new capital projects, new employees, and new acquisitions. They are emboldened by the prospect of meaningful corporate tax cuts and the possibility of an inducement to repatriate cash, of which there is more than $3 trillion. High-yield financing remains abundant and relatively inexpensive. Profit margins sit near all-time high levels.
In our estimation equity valuations remain at extended levels. We feel we are in the later stages of a bull market, although nothing is certain. Equities look most reasonable when comparing earnings yields to Treasury or even corporate bond yields. In any case, the values inherent in the Fund should attract acquirers and other investors over time. Meanwhile, we believe equities are a superior asset allocation alternative to bonds over the longer term.
Long Book
Top Positions
At Period’s end, the Fund contained 69 long positions in the portfolio representing companies with what management believes represents long-term value and favorable characteristics such as a discount to private market value, attractive free cash flow yields, and strong balance sheets. The Fund’s top 10 long positions represented approximately 29% of the portfolio and included Aflac (AFL), Berkshire Hathaway (BRK.B), Brown & Brown (BRO), PNC Financial (PNC), Microsoft (MSFT), Mondelez (MDLZ), Nestle (NESN), Renaissance RE (RNR), T. Rowe Price (TROW), and US Bancorp (USB).
Contributors
The five stocks in the long book that contributed the largest returns during the Period, from largest to smallest were: Berkshire Hathaway (BRK.B), PNC Financial (PNC), KeyCorp (KEY), Microsoft (MSFT), and Endurance Specialty (ENH).
5
Detractors
Over the entire twelve month Period, the five stocks in the long book that detracted from returns the most during the Period, from largest to smallest were: Celadon (CGI), Federated (FII), Patterson (PDCO), MetLife (MET), and Travelers (TRV).
Largest Purchases
The top purchases by dollar value in the long book for the Period were: Berkshire Hathaway (BRK.B), Brown & Brown (BRO), PNC Financial (PNC), Nestle (NESN), and Citigroup (C).
Largest Sales
The top sales by dollar value in the long book for the Period were: Berkshire Hathaway (BRK.B), Endurance Specialty (ENH), Procter & Gamble (PG), Citigroup (C), and YUM! Brands (YUM).
Short Book
Top Positions
The Fund’s short book at Period’s end contained 35 individual companies that have business model challenges, excessive valuations, and/or potential balance sheet issues. The Fund’s top 10 short positions represented approximately 17% of the portfolio.
Winning by Not Losing
Using strategies designed to protect capital during bear markets, the Fund strives to compound returns from a higher base during bull markets, thus creating the opportunity to outperform competitive offerings over a complete market cycle.
“The Secret of Wealth Creation is to Avoid Large Losses”
-John Gillespie, portfolio manager
The Case for Long/Short Equity
Long/short equity can be an effective solution for managing downside risk.
| • | Bonds: We believe the bond allocation of a traditional 60/40 blend could tread water at best given current low bond yields. As yields rise, bond prices fall which will create greater bond volatility |
| • | Stocks: Equity volatility has been subdued over the past year but will likely return to higher historical norms, making a larger allocation to long-only stocks potentially imprudent |
6
| • | Adding Long/Short Equity: The addition of a long/short equity component to a traditional 60/40 blend of stocks and bonds can potentially significantly increase an investor’s risk-adjusted returns |
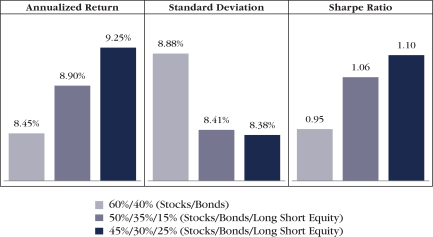
Source: Morningstar, Hedge Fund Research. Data from January 1990 thru May 2017. Blends refer to S&P 500 Total Return / Barclays U.S. Aggregate Bond Total Return / HFRI Equity Hedge (Total) Index
Thank you for your continued support and we look forward to reporting to you again following our semi-annual date of November 30, 2017.
Steadfast, we remain committed to making you money while protecting your wealth.
Long Short Advisors
Definitions
Standard Deviation is a measure of the dispersion of a set of data from its mean.
Sharpe Ratio uses standard deviation and excess return to determine reward per unit of risk.
HFRI Equity Hedge Index is compiled by Hedge Fund Research, Inc. It is comprised solely of hedge funds, and is designed to be representative of the overall composition of the hedge fund universe implementing a long/short equity strategy. The Fund’s performance is not intended to reflect the performance of the Index, which is provided for comparison purposes only. The Index is not available for direct investment.
7
Investment Results (Unaudited)
| Average Annual Total Returns(a) | ||||||||||||||||
| (For the periods ended May 31, 2017) | ||||||||||||||||
| One Year | Three Year | Five Year | Since Inception (September 30, 2010) | |||||||||||||
LS Opportunity Fund | 9.98 | % | 4.69 | % | 8.05 | % | 6.47 | % | ||||||||
S&P 500® Index(b) | 17.47 | % | 10.14 | % | 15.42 | % | 14.29 | % | ||||||||
Total annual operating expenses, as disclosed in the LS Opportunity Fund’s (the “Fund”) prospectus dated September 28, 2016, were 3.92% of average daily net assets (2.93% after fee waivers and expense reimbursements by Long Short Advisors, LLC (the “Adviser”)). The Adviser has entered into an expense limitation agreement, pursuant to which it will waive its fees and/or reimburse other expenses of the Fund until September 30, 2017, so that Total Annual Fund Operating Expenses does not exceed 1.95%. This operating expense limitation does not apply to borrowing costs such as interest and dividends on securities sold short, taxes, brokerage commissions, other expenditures which are capitalized in accordance with generally accepted accounting principles, other extraordinary expenses not incurred in the ordinary course of the Fund’s business, expenses incurred under a Rule 12b-1 plan of distribution, “acquired fund fees and expenses,” and expenses that the Fund has incurred but did not actually pay because of an expense offset arrangement. Each fee waiver or reimbursement of an expense by the Adviser is subject to repayment by the Fund within the three fiscal years following the fiscal year in which the expense was incurred, provided that the Fund is able to make the repayment without exceeding the expense limitation in place at the time of the waiver or reimbursement. This agreement may only be terminated by mutual consent of the Adviser and the Board of Trustees.
The performance quoted represents past performance, which does not guarantee future results. The investment return and principal value of an investment will fluctuate so that an investor’s shares, when redeemed, may be worth more or less than their original cost. The returns shown do not reflect deduction of taxes that a shareholder would pay on Fund distributions or the redemption of Fund shares. Prior to May 28, 2015, the Fund’s performance was attributable to a previous sub-adviser. The Fund’s investment objectives, risks, charges and expenses must be considered carefully before investing. Current performance of the Fund may be lower or higher than the performance quoted. Performance data current to the most recent month end may be obtained by calling (877) 336-6763.
(a) Average annual total returns reflect any change in price per share and assume the reinvestment of all distributions, if any. The Fund’s returns reflect any fee reductions during the applicable periods. If such fee reductions had not occurred, the quoted performance would have been lower.
8
(b) The S&P 500® Index (“Index”) is a widely recognized unmanaged index of equity prices and is representative of a broader market and range of securities than is found in the Fund’s portfolio. The Index is an unmanaged benchmark that assumes reinvestment of all distributions and excludes the effect of taxes and fees. Individuals cannot invest directly in this Index; however, an individual can invest in exchange traded funds or other investment vehicles that attempt to track the performance of a benchmark index.
The Fund’s investment objectives, risks, charges and expenses must be considered carefully before investing. The prospectus contains this and other important information about the Fund and may be obtained by calling (877) 336-6763. Please read it carefully before investing.
The Fund is distributed by Unified Financial Securities, LLC, member FINRA/SIPC.
9
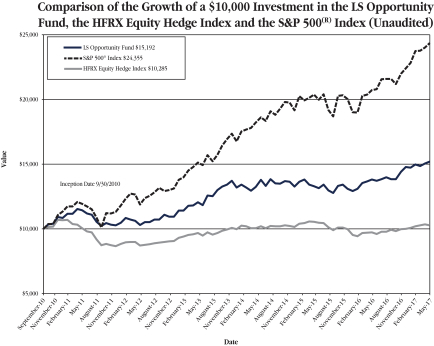
The chart above assumes an initial investment of $10,000 made on September 30, 2010 (commencement of Fund operations) and held through May 31, 2017. THE FUND’S RETURNS REPRESENT PAST PERFORMANCE AND DO NOT GUARANTEE FUTURE RESULTS. The returns shown do not reflect deduction of taxes that a shareholder would pay on the Fund’s distributions or the redemption of the Fund’s shares. Investment returns and principal values will fluctuate so that your shares, when redeemed, may be worth more or less than their original purchase price.
Current performance may be lower or higher than the performance data quoted. For more information on the Fund, and to obtain performance data current to the most recent month-end, or to request a prospectus, please call (877) 336-6763. You should carefully consider the investment objectives, potential risks, management fees, and charges and expenses of the Fund before investing. The Fund’s prospectus contains this and other information about the Fund, and should be read carefully before investing.
HFRX Equity Hedge Index is compiled by Hedge Fund Research, Inc. It is comprised solely of hedge funds, and is designed to be representative of the overall composition of the hedge fund universe implementing a long/short equity strategy. The Fund’s performance is not intended to reflect the performance of the index, which is provided for comparison purposes only. The index is not available for direct investment.
The Fund is distributed by Unified Financial Securities, LLC, member FINRA/SIPC.
10
Fund Holdings (Unaudited)
Sector Exposure (5/31/2017)
(Based on Net Assets)
| Long | Short | Gross | Net | |||||||||||||
Consumer Discretionary | 4.26 | % | -0.96 | % | 5.22 | % | 3.30 | % | ||||||||
Consumer Staples | 9.97 | % | -8.57 | % | 18.54 | % | 1.40 | % | ||||||||
Energy | 2.68 | % | 0.00 | % | 2.68 | % | 2.68 | % | ||||||||
Financials | 51.83 | % | -24.33 | % | 76.16 | % | 27.50 | % | ||||||||
Health Care | 7.53 | % | 0.00 | % | 7.53 | % | 7.53 | % | ||||||||
Industrials | 5.81 | % | -3.21 | % | 9.02 | % | 2.60 | % | ||||||||
Information Technology | 11.38 | % | 0.00 | % | 11.38 | % | 11.38 | % | ||||||||
Materials | 0.98 | % | 0.00 | % | 0.98 | % | 0.98 | % | ||||||||
Real Estate | 0.59 | % | 0.00 | % | 0.59 | % | 0.59 | % | ||||||||
Money Market Securities | 4.64 | % | 0.00 | % | 4.64 | % | 4.64 | % | ||||||||
Unclassified | 0.04 | % | 0.00 | % | 0.04 | % | 0.04 | % | ||||||||
|
|
|
|
|
|
|
| |||||||||
Total | 99.71 | % | -37.07 | % | 136.78 | % | 62.64 | % | ||||||||
|
|
|
|
|
|
|
| |||||||||
The LS Opportunity Fund seeks to generate long-term capital appreciation by investing in both long and short positions within a portfolio consisting of primarily publicly-traded common stock, with less risk than that of the stock market in general.
Availability of Portfolio Schedule (Unaudited)
The Fund files its complete schedule of portfolio holdings with the Securities and Exchange Commission (“SEC”) as of the end of the first and third quarters of each fiscal year on Form N-Q. The Fund’s Forms N-Q are available at the SEC’s website at www.sec.gov. The Forms N-Q may be reviewed and copied at the Public Reference Room in Washington DC. Information on the operation of the Public Reference Room may be obtained by calling (800) SEC-0330.
11
LS Opportunity Fund
Schedule of Investments
May 31, 2017
| Common Stocks — Long — Domestic – 80.00% | Shares | Fair Value | ||||||
Consumer Discretionary — 4.26% | ||||||||
Buffalo Wild Wings, Inc.* | 2,300 | $ | 330,510 | |||||
Darden Restaurants, Inc.(a) | 1,700 | 151,181 | ||||||
Home Depot, Inc./The(a) | 2,420 | 371,494 | ||||||
Hyatt Hotels Corp. – Class A(a)* | 2,900 | 167,330 | ||||||
Lowe’s Cos., Inc.(a) | 7,400 | 582,898 | ||||||
|
| |||||||
| 1,603,413 | ||||||||
|
| |||||||
Consumer Staples – 6.81% | ||||||||
Church & Dwight Co., Inc.(a) | 13,100 | 676,746 | ||||||
Coca-Cola Co./The(a) | 11,100 | 504,717 | ||||||
Colgate-Palmolive Co.(a) | 5,700 | 435,252 | ||||||
Mondelez International, Inc. – Class A(a) | 20,300 | 945,777 | ||||||
|
| |||||||
| 2,562,492 | ||||||||
|
| |||||||
Energy – 1.16% | ||||||||
Hess Corp.(a) | 3,300 | 151,437 | ||||||
Noble Energy, Inc.(a) | 9,900 | 284,031 | ||||||
|
| |||||||
| 435,468 | ||||||||
|
| |||||||
Financials – 44.55% | ||||||||
Aflac, Inc.(a) | 10,300 | 776,414 | ||||||
Beneficial Bancorp, Inc.(a) | 20,000 | 293,000 | ||||||
Berkshire Hathaway, Inc. – Class B(a)* | 14,060 | 2,323,837 | ||||||
Brookline Bancorp, Inc. | 16,200 | 223,560 | ||||||
Brown & Brown, Inc.(a) | 20,500 | 890,315 | ||||||
Capital Bank Financial Corp. – Class A | 6,800 | 252,280 | ||||||
Central Pacific Financial Corp.(a) | 7,000 | 211,750 | ||||||
Citigroup, Inc.(a) | 12,200 | 738,588 | ||||||
Federated Investors, Inc. – Class B(a) | 18,100 | 480,736 | ||||||
Hanover Insurance Group, Inc.(a) | 4,300 | 358,577 | ||||||
Hartford Financial Services Group, Inc./The(a) | 15,200 | 750,728 | ||||||
Invesco Ltd.(a) | 16,300 | 516,710 | ||||||
KeyCorp(a) | 42,300 | 738,981 | ||||||
Leucadia National Corp.(a) | 27,700 | 675,603 | ||||||
Marsh & McLennan Cos., Inc.(a) | 7,900 | 612,724 | ||||||
OneBeacon Insurance Group Ltd. – Class A(a) | 25,100 | 460,585 | ||||||
Oritani Financial Corp.(a) | 16,200 | 268,110 | ||||||
PJT Partners, Inc. – Class A(a) | 9,200 | 355,764 | ||||||
See accompanying notes which are an integral part of these financial statements.
12
LS Opportunity Fund
Schedule of Investments – continued
May 31, 2017
| Common Stocks — Long — Domestic – 80.00% – continued | Shares | Fair Value | ||||||
Financials – 44.55% – continued | ||||||||
PNC Financial Services Group, Inc.(a) | 13,100 | $ | 1,554,970 | |||||
Primerica, Inc.(a) | 6,500 | 469,300 | ||||||
Progressive Corp./The(a) | 17,900 | 759,497 | ||||||
Selective Insurance Group, Inc.(a) | 6,500 | 332,150 | ||||||
T. Rowe Price Group, Inc.(a) | 13,900 | 979,116 | ||||||
Torchmark Corp.(a) | 7,100 | 536,050 | ||||||
U.S. Bancorp(a) | 16,600 | 844,774 | ||||||
Unum Group | 7,900 | 355,342 | ||||||
|
| |||||||
| 16,759,461 | ||||||||
|
| |||||||
Health Care – 5.44% | ||||||||
Abbott Laboratories(a) | 8,700 | 397,242 | ||||||
Invacare Corp.(a) | 9,600 | 135,840 | ||||||
Johnson & Johnson(a) | 4,900 | 628,425 | ||||||
Merck & Co., Inc. | 5,700 | 371,127 | ||||||
Patterson Companies, Inc.(a) | 11,600 | 512,256 | ||||||
|
| |||||||
| 2,044,890 | ||||||||
|
| |||||||
Industrials – 5.81% | ||||||||
CIRCOR International, Inc.(a) | 5,600 | 360,976 | ||||||
Eaton Corp. PLC(a) | 7,200 | 557,136 | ||||||
General Dynamics Corp.(a) | 2,870 | 583,328 | ||||||
Kirby Corp.(a)* | 2,800 | 185,500 | ||||||
United Technologies Corp.(a) | 4,100 | 497,248 | ||||||
|
| |||||||
| 2,184,188 | ||||||||
|
| |||||||
Information Technology – 11.38% | ||||||||
Automatic Data Processing, Inc.(a) | 6,400 | 655,168 | ||||||
eBay, Inc.(a)* | 5,600 | 192,080 | ||||||
FLIR Systems, Inc.(a) | 15,100 | 572,139 | ||||||
Microsoft Corp.(a) | 15,500 | 1,082,520 | ||||||
Paychex, Inc.(a) | 5,500 | 325,765 | ||||||
PayPal Holdings, Inc.(a)* | 6,900 | 360,249 | ||||||
Science Applications International Corp.(a) | 6,500 | 493,935 | ||||||
VeriSign, Inc.(a)* | 2,300 | 207,368 | ||||||
Xilinx, Inc.(a) | 5,900 | 393,589 | ||||||
|
| |||||||
| 4,282,813 | ||||||||
|
| |||||||
See accompanying notes which are an integral part of these financial statements.
13
LS Opportunity Fund
Schedule of Investments – continued
May 31, 2017
| Common Stocks — Long — Domestic – 80.00% – continued | Shares | Fair Value | ||||||
Real Estate – 0.59% | ||||||||
Cousins Properties, Inc.(a) | 21,023 | $ | 179,957 | |||||
Four Corners Property Trust, Inc.(a) | 1,698 | 41,805 | ||||||
|
| |||||||
| 221,762 | ||||||||
|
| |||||||
TOTAL COMMON STOCKS — LONG — DOMESTIC |
| 30,094,487 | ||||||
|
| |||||||
Common Stocks — Long — International – 15.03% | ||||||||
Consumer Staples – 3.16% | ||||||||
Diageo PLC ADR(a) | 3,500 | 426,720 | ||||||
Nestle SA(a) | 8,900 | 760,255 | ||||||
|
| |||||||
| 1,186,975 | ||||||||
|
| |||||||
Energy – 1.52% | ||||||||
Suncor Energy, Inc.(a) | 18,200 | 569,842 | ||||||
|
| |||||||
Financials – 7.28% | ||||||||
Arch Capital Group Ltd.(a)* | 7,700 | 748,825 | ||||||
Hiscox Ltd. | 23,000 | 364,617 | ||||||
Lancashire Holdings Ltd. | 22,100 | 198,427 | ||||||
RenaissanceRe Holdings Ltd.(a) | 5,320 | 760,015 | ||||||
Validus Holdings Ltd.(a) | 12,500 | 667,500 | ||||||
|
| |||||||
| 2,739,384 | ||||||||
|
| |||||||
Health Care – 2.09% | ||||||||
GlaxoSmithKline PLC ADR | 8,800 | 389,224 | ||||||
Roche Holding AG | 1,450 | 398,336 | ||||||
|
| |||||||
| 787,560 | ||||||||
|
| |||||||
Materials – 0.98% | ||||||||
Agnico Eagle Mines Ltd.(a) | 7,600 | 367,916 | ||||||
|
| |||||||
TOTAL COMMON STOCKS — LONG — INTERNATIONAL |
| 5,651,677 | ||||||
|
| |||||||
See accompanying notes which are an integral part of these financial statements.
14
LS Opportunity Fund
Schedule of Investments – continued
May 31, 2017
| Options Purchased — Long* – 0.04% | Contracts | Fair Value | ||||||
Allstate Corp., Put @ $75, Expiring July 2017 | 44 | $ | 352 | |||||
BB&T Corp., Call @ $47, Expiring June 2017 | 40 | 80 | ||||||
BB&T Corp., Call @ $48, Expiring June 2017 | 50 | 50 | ||||||
BB&T Corp., Call @ $50, Expiring January 2018 | 20 | 460 | ||||||
Procter & Gamble Co./The, Put @ $85, Expiring January 2018 | 49 | 14,945 | ||||||
|
| |||||||
TOTAL OPTIONS PURCHASED – LONG |
| 15,887 | ||||||
|
| |||||||
| Money Market Securities – 4.64% | Shares | |||||||
Invesco Short-Term Investments Trust Treasury Portfolio – Institutional Class, 0.67%(b) | 1,744,832 | 1,744,832 | ||||||
|
| |||||||
TOTAL MONEY MARKET SECURITIES | 1,744,832 | |||||||
|
| |||||||
TOTAL INVESTMENTS – 99.71% | 37,506,883 | |||||||
|
| |||||||
Other Assets in Excess of Liabilities – 0.29% | 109,102 | |||||||
|
| |||||||
NET ASSETS – 100.00% | $ | 37,615,985 | ||||||
|
| |||||||
| (a) | All or a portion of the security is held as collateral for securities sold short. The fair value of this collateral on May 31, 2017 was $24,154,475. |
| (b) | Rate disclosed is the seven day effective yield as of May 31, 2017. |
| * | Non-income producing security. |
ADR – American Depositary Receipt
15
See accompanying notes which are an integral part of these financial statements.
LS Opportunity Fund
Schedule of Securities Sold Short
May 31, 2017
| Common Stocks — Short — Domestic — (23.76)% | Shares | Fair Value | ||||||
Consumer Discretionary — (0.96)% |
| |||||||
Bloomin’ Brands, Inc. | (18,100 | ) | $ | (362,543 | ) | |||
|
| |||||||
Consumer Staples — (8.57)% |
| |||||||
Clorox Co./The | (2,840 | ) | (385,473 | ) | ||||
Constellation Brands, Inc. – Class A | (2,540 | ) | (464,185 | ) | ||||
Kellogg Co. | (4,500 | ) | (322,200 | ) | ||||
Kimberly-Clark Corp. | (4,150 | ) | (538,379 | ) | ||||
Molson Coors Brewing Co. – Class B | (6,300 | ) | (597,177 | ) | ||||
Procter & Gamble Co./The | (5,500 | ) | (484,495 | ) | ||||
Sysco Corp. | (7,900 | ) | (431,024 | ) | ||||
|
| |||||||
| (3,222,933 | ) | |||||||
|
| |||||||
Financials — (11.02)% |
| |||||||
Affiliated Managers Group, Inc. | (2,310 | ) | (355,394 | ) | ||||
Allstate Corp. | (4,500 | ) | (388,530 | ) | ||||
American International Group, Inc. | (6,100 | ) | (388,143 | ) | ||||
Ameriprise Financial, Inc. | (4,450 | ) | (537,516 | ) | ||||
AmTrust Financial Services, Inc. | (11,800 | ) | (155,052 | ) | ||||
Community Bank System, Inc. | (6,100 | ) | (327,936 | ) | ||||
CVB Financial Corp. | (2,800 | ) | (56,840 | ) | ||||
Glacier Bancorp, Inc. | (4,900 | ) | (158,074 | ) | ||||
Horace Mann Educators Corp. | (10,000 | ) | (382,500 | ) | ||||
Legg Mason, Inc. | (12,100 | ) | (446,127 | ) | ||||
Markel Corp.* | (355 | ) | (346,924 | ) | ||||
Prudential Financial, Inc. | (3,500 | ) | (366,975 | ) | ||||
Trustmark Corp. | (7,700 | ) | (234,157 | ) | ||||
|
| |||||||
| (4,144,168 | ) | |||||||
|
| |||||||
Industrials — (3.21)% |
| |||||||
Lockheed Martin Corp. | (1,440 | ) | (404,827 | ) | ||||
PACCAR, Inc. | (2,600 | ) | (163,696 | ) | ||||
Rockwell Automation, Inc. | (2,570 | ) | (407,910 | ) | ||||
Union Pacific Corp. | (2,100 | ) | (231,630 | ) | ||||
|
| |||||||
| (1,208,063 | ) | |||||||
|
| |||||||
TOTAL COMMON STOCKS — SHORT — DOMESTIC |
| (8,937,707 | ) | |||||
|
| |||||||
16
See accompanying notes which are an integral part of these financial statements.
LS Opportunity Fund
Schedule of Securities Sold Short – continued
May 31, 2017
| Common Stocks — Short — International — (13.31)% | Shares | Fair Value | ||||||
Financials — (13.31)% |
| |||||||
Canadian Imperial Bank of Commerce | (4,500 | ) | $ | (351,315 | ) | |||
Canadian Western Bank | (9,000 | ) | (161,716 | ) | ||||
Chubb Ltd. | (4,858 | ) | (695,617 | ) | ||||
Comdirect Bank AG | (2,300 | ) | (25,178 | ) | ||||
Commonwealth Bank of Australia | (12,600 | ) | (747,125 | ) | ||||
Everest Re Group Ltd. | (3,390 | ) | (863,263 | ) | ||||
HSBC Holdings PLC ADR | (4,700 | ) | (204,403 | ) | ||||
Westpac Banking Corp. | (15,969 | ) | (362,589 | ) | ||||
Willis Towers Watson PLC | (5,456 | ) | (800,013 | ) | ||||
XL Group Ltd. | (18,200 | ) | (795,158 | ) | ||||
|
| |||||||
TOTAL COMMON STOCKS — SHORT — INTERNATIONAL |
| (5,006,377 | ) | |||||
|
| |||||||
TOTAL SECURITIES SOLD SHORT — (37.07)% |
| $ | (13,944,084 | ) | ||||
|
| |||||||
| * | Non-dividend expense producing security. |
ADR – American Depositary Receipt
The sectors shown on the schedule of investments and schedule of securities sold short are based on the Global Industry Classification Standard, or GICS® (“GICS”). The GICS was developed by and/or is the exclusive property of MSCI, Inc. and Standard & Poor’s Financial Services LLC (“S&P”). GICS is a service mark of MSCI, Inc. and S&P and has been licensed for use by the Administrator.
See accompanying notes which are an integral part of these financial statements.
17
LS Opportunity Fund
Statement of Assets and Liabilities
May 31, 2017
Assets | ||||
Investments in securities at fair value (cost $32,375,396) | $ | 37,506,883 | ||
Cash(a) | 14,114,413 | |||
Receivable for fund shares sold | 135,000 | |||
Receivable for investments sold | 157,391 | |||
Dividends receivable | 62,123 | |||
Tax reclaims receivable | 8,184 | |||
Prepaid expenses | 14,785 | |||
|
| |||
Total Assets | 51,998,779 | |||
|
| |||
Liabilities | ||||
Investment securities sold short, at fair value (proceeds $12,775,789) | 13,944,084 | |||
Payable for fund shares redeemed | 93,987 | |||
Payable for investments purchased | 199,941 | |||
Foreign currency payable to broker (proceeds $20,080) | 20,049 | |||
Dividend expense payable on short positions | 39,618 | |||
Payable to Adviser | 47,235 | |||
Payable to Administrator | 7,869 | |||
Other accrued expenses | 30,011 | |||
|
| |||
Total Liabilities | 14,382,794 | |||
|
| |||
Net Assets | $ | 37,615,985 | ||
|
| |||
Net Assets consist of: | ||||
Paid-in capital | $ | 33,320,949 | ||
Accumulated undistributed net investment loss | (154,015 | ) | ||
Accumulated undistributed net realized gain from investments | 485,565 | |||
Net unrealized appreciation on: | ||||
Investment securities and securities sold short | 3,963,192 | |||
Foreign currency | 294 | |||
|
| |||
Net Assets | $ | 37,615,985 | ||
|
| |||
Shares outstanding (unlimited number of shares authorized, no par value) | 2,798,667 | |||
|
| |||
Net asset value (“NAV”), offering and redemption price per share | $ | 13.44 | ||
|
| |||
| (a) | See Note 2 in the Notes to the Financial Statements regarding restricted cash. |
See accompanying notes which are an integral part of these financial statements.
18
LS Opportunity Fund
Statement of Operations
For the year ended May 31, 2017
Investment Income | ||||
Dividend income (net of foreign taxes withheld of $7,618) | $ | 731,606 | ||
Interest income | 13,297 | |||
|
| |||
Total investment income | 744,903 | |||
|
| |||
Expenses | ||||
Investment Adviser | 626,975 | |||
Dividend expense on securities sold short | 321,962 | |||
Fund accounting | 34,993 | |||
Administrator | 33,402 | |||
Transfer agent | 28,823 | |||
Legal | 21,839 | |||
Audit | 18,100 | |||
Custodian | 14,059 | |||
Short sale & interest expense | 12,012 | |||
Trustee | 8,374 | |||
Compliance services | 6,750 | |||
Miscellaneous | 73,319 | |||
|
| |||
Total expenses | 1,200,608 | |||
Fees waived by Adviser | (166,292 | ) | ||
|
| |||
Net operating expenses | 1,034,316 | |||
|
| |||
Net investment loss | (289,413 | ) | ||
|
| |||
Net Realized and Change in Unrealized Gain (Loss) | ||||
Net realized gain (loss) on: | ||||
Investment securities | 1,866,930 | |||
Securities sold short | (920,891 | ) | ||
Written option contracts | 14,384 | |||
Foreign currency | (5,054 | ) | ||
Change in unrealized appreciation (depreciation) on: | ||||
Investment securities | 4,171,448 | |||
Securities sold short | (1,029,986 | ) | ||
Foreign currency | 274 | |||
|
| |||
Net realized and change in unrealized gain (loss) on investment securities, securities sold short, written options and foreign currency | 4,097,105 | |||
|
| |||
Net increase in net assets resulting from operations | $ | 3,807,692 | ||
|
|
See accompanying notes which are an integral part of these financial statements.
19
LS Opportunity Fund
Statements of Changes in Net Assets
| For the Year Ended May 31, 2017 | For the Year Ended May 31, 2016 | |||||||
Increase (Decrease) in Net Assets due to: | ||||||||
Operations | ||||||||
Net investment loss | $ | (289,413 | ) | $ | (425,275 | ) | ||
Net realized gain (loss) on investment transactions, securities sold short, written options and foreign currency | 955,369 | (271,513 | ) | |||||
Net change in unrealized appreciation (depreciation) of investments, securities sold short and foreign currency | 3,141,736 | 1,169,896 | ||||||
|
|
|
| |||||
Net increase in net assets resulting from operations | 3,807,692 | 473,108 | ||||||
|
|
|
| |||||
Distributions | ||||||||
From net realized gains | — | (4,087,143 | ) | |||||
|
|
|
| |||||
Total distributions | — | (4,087,143 | ) | |||||
|
|
|
| |||||
Capital Transactions | ||||||||
Proceeds from shares sold | 23,952,785 | 3,781,205 | ||||||
Reinvestment of distributions | — | 4,014,686 | ||||||
Amount paid for shares redeemed | (15,301,930 | ) | (75,311,472 | ) | ||||
Proceeds from redemption fees(a) | 8,962 | 9,374 | ||||||
|
|
|
| |||||
Net increase (decrease) in net assets resulting from capital transactions | 8,659,817 | (67,506,207 | ) | |||||
|
|
|
| |||||
Total Increase (Decrease) in Net Assets | 12,467,509 | (71,120,242 | ) | |||||
|
|
|
| |||||
Net Assets | ||||||||
Beginning of year | 25,148,476 | 96,268,718 | ||||||
|
|
|
| |||||
End of year | $ | 37,615,985 | $ | 25,148,476 | ||||
|
|
|
| |||||
Accumulated undistributed net investment loss included in net assets at end of year | $ | (154,015 | ) | $ | (117,395 | ) | ||
|
|
|
| |||||
Share Transactions | ||||||||
Shares sold | 1,936,400 | 320,085 | ||||||
Shares issued in reinvestment of distributions | — | 338,581 | ||||||
Shares redeemed | (1,196,167 | ) | (6,270,268 | ) | ||||
|
|
|
| |||||
Net increase (decrease) in share transactions | 740,233 | (5,611,602 | ) | |||||
|
|
|
| |||||
| (a) | Prior to September 28, 2016, a redemption fee of 2% was charged on shares held less than 60 days. |
See accompanying notes which are an integral part of these financial statements.
20
LS Opportunity Fund
Financial Highlights
(For a share outstanding during each year)
| For the Year Ended May 31, 2017 | For the Year Ended May 31, 2016 | For the Year Ended May 31, 2015 | For the Year Ended May 31, 2014 | For the Year Ended May 31, 2013 | ||||||||||||||||
Selected Per Share Data: | ||||||||||||||||||||
Net asset value, beginning of year | $ | 12.22 | $ | 12.55 | $ | 12.72 | $ | 12.04 | $ | 10.29 | ||||||||||
|
|
|
|
|
|
|
|
|
| |||||||||||
Income from investment operations: | ||||||||||||||||||||
Net investment income (loss) | (0.09 | ) | (0.21 | ) | (0.42 | ) | (0.26 | )(a) | (0.24 | )(a) | ||||||||||
Net realized and unrealized gain (loss) on investments | 1.31 | 0.66 | 0.49 | 1.44 | 1.99 | |||||||||||||||
|
|
|
|
|
|
|
|
|
| |||||||||||
Total from investment operations | 1.22 | 0.45 | 0.07 | 1.18 | 1.75 | |||||||||||||||
|
|
|
|
|
|
|
|
|
| |||||||||||
Less Distributions to Shareholders: | ||||||||||||||||||||
From net realized gains | — | (0.78 | ) | (0.24 | ) | (0.50 | ) | — | ||||||||||||
|
|
|
|
|
|
|
|
|
| |||||||||||
Redemption fees | — | (b) | — | (b) | — | — | (b) | — | (b) | |||||||||||
|
|
|
|
|
|
|
|
|
| |||||||||||
Net asset value, end of year | $ | 13.44 | $ | 12.22 | $ | 12.55 | $ | 12.72 | $ | 12.04 | ||||||||||
|
|
|
|
|
|
|
|
|
| |||||||||||
Total Return(c)(d) | 9.98 | % | 3.80 | % | 0.50 | % | 9.72 | % | 17.01 | % | ||||||||||
Ratios and Supplemental Data: | ||||||||||||||||||||
Net assets, end of year (000) | $ | 37,616 | $ | 25,148 | $ | 96,269 | $ | 149,857 | $ | 37,750 | ||||||||||
Ratio of expenses to average net assets(e) | 2.88 | % | 2.93 | % | 2.51 | % | 2.49 | % | 3.12 | %(f) | ||||||||||
Ratio of expenses to average net assets before waiver and reimbursement/recoupment by Adviser(e) | 3.34 | % | 3.92 | % | 2.60 | % | 2.71 | % | 3.12 | % | ||||||||||
Ratio of net investment income (loss) to average net assets | (0.81 | )% | (1.11 | )% | (1.72 | )% | (2.04 | )% | (2.22 | )% | ||||||||||
Portfolio turnover rate | 75.09 | % | 89.54 | % | 551.53 | % | 312.34 | % | 310.57 | % | ||||||||||
| (a) | Per share net investment income (loss) has been calculated using the average shares method. |
| (b) | Amount represents less than $0.005 per share. |
| (c) | Total return in the above table represents the rate that the investor would have earned or lost on an investment in the Fund, assuming reinvestment of distributions. |
| (d) | Excludes redemption fee. |
| (e) | Includes dividend and interest expense of 0.93%, 0.98%, 0.56%, 0.54%, and 0.77% for the fiscal years ended May 31, 2017, 2016, 2015, 2014 and 2013, respectively. |
| (f) | Effective February 4, 2013, the Adviser agreed to waive fees to maintain Fund expenses at 1.95%. Prior to that date, the expense cap was 2.50%. (See Note 4. Fees and Other Transactions with Affiliates and Other Service Providers) |
See accompanying notes which are an integral part of these financial statements.
21
LS Opportunity Fund
Notes to the Financial Statements
May 31, 2017
NOTE 1. ORGANIZATION
The LS Opportunity Fund (the “Fund”) is an open-end, diversified series of Valued Advisers Trust (the “Trust”). The Trust is a management investment company established under the laws of Delaware by an Agreement and Declaration of Trust dated June 13, 2008 (the “Trust Agreement”). The Trust Agreement permits the Trustees to issue an unlimited number of shares of beneficial interest of separate series without par value. The Fund is one of a series of funds authorized by the Board of Trustees (the “Board”). The Fund’s investment adviser is Long Short Advisors, LLC (the “Adviser”). The Adviser has retained Prospector Partners, LLC (the “Sub-Adviser”) to serve as the sub-adviser to provide portfolio management and related services to the Fund. The Sub-Adviser receives a fee from the Adviser (not the Fund) for these services. The investment objective of the Fund is to generate long term capital appreciation by investing in both long and short positions within a portfolio consisting of primarily publicly-traded common stock, with less net exposure than that of the stock market in general.
NOTE 2. SIGNIFICANT ACCOUNTING POLICIES
The Fund is an investment company and follows accounting and reporting guidance under Financial Accounting Standards Board Accounting Standards Codification (“ASC”) Topic 946, “Financial Services-Investment Companies”. The following is a summary of significant accounting policies followed by the Fund in the preparation of its financial statements. These policies are in conformity with the generally accepted accounting principles in the United States of America (“GAAP”).
Estimates – The preparation of financial statements in conformity with GAAP requires management to make estimates and assumptions that affect the reported amounts of assets and liabilities and disclosure of contingent assets and liabilities at the date of the financial statements and the reported amounts of increases and decreases in net assets from operations during the reporting period. Actual results could differ from those estimates.
Securities Valuation – All investments in securities are recorded at their estimated fair value as described in Note 3.
Federal Income Taxes – The Fund makes no provision for federal income or excise tax. The Fund has qualified and intends to qualify each year as a “regulated investment company” (“RIC”) under subchapter M of the Internal Revenue Code of 1986, as amended, by complying with the requirements applicable to RICs and by distributing substantially all of its taxable income. The Fund also intends to distribute sufficient net investment income and net capital gains, if any, so that it will not be
22
LS Opportunity Fund
Notes to the Financial Statements — continued
May 31, 2017
NOTE 2. SIGNIFICANT ACCOUNTING POLICIES — continued
subject to excise tax on undistributed income and gains. If the required amount of net investment income or gains is not distributed, the Fund could incur a tax expense.
As of and during the fiscal year ended May 31, 2017, the Fund did not have a liability for any unrecognized tax benefits. The Fund recognizes interest and penalties, if any, related to unrecognized tax benefits as income tax expense in the statement of operations. During the fiscal year ended May 31, 2017, the Fund did not incur any interest or penalties.
Expenses – Expenses incurred by the Trust that do not relate to a specific fund of the Trust are allocated to the individual funds based on each fund’s relative net assets or other appropriate basis.
Security Transactions and Related Income – The Fund follows industry practice and records security transactions on the trade date for financial reporting purposes. For financial statement and income tax purposes, the specific identification method is used for determining gains or losses. Dividend income and dividend expense are recorded on the ex-dividend date and interest income is recorded on an accrual basis. Dividend income from real estate investment trusts (REITs) and distributions from limited partnerships are recognized on the ex-date. The calendar year end classification of distributions received from REITs during the fiscal year are reported subsequent to year end; accordingly, the Fund estimates the character of REIT distributions based on the most recent information available. Income or loss from Limited Partnerships is reclassified among the components of net assets upon receipt of Schedules K-1(Form 1065). Discounts and premiums on securities purchased are amortized or accreted using the effective interest method. Withholding taxes on foreign dividends have been provided for in accordance with the Fund’s understanding of the applicable country’s tax rules and rates.
Redemption Fees – Prior to September 28, 2016, the Fund charged a 2.00% redemption fee for shares redeemed within 60 days of purchase. These fees were deducted from the redemption proceeds otherwise payable to the shareholder. The Fund retained the fee charged as an increase in paid-in capital and such fees became part of the Fund’s daily NAV calculation.
Foreign Currency Translations – Foreign currency amounts are translated into U.S. dollars as follows: (i) assets and liabilities at the rate of exchange at the end of the respective period; and (ii) purchases and sales of securities and income and expenses at the rate of exchange prevailing on the dates of such transactions. The
23
LS Opportunity Fund
Notes to the Financial Statements — continued
May 31, 2017
NOTE 2. SIGNIFICANT ACCOUNTING POLICIES — continued
portion of the results of operations arising from changes in the exchange rates and the portion due to fluctuations arising from changes in the market prices of securities are not isolated. Such fluctuations are included with the net realized and unrealized gain or loss on investments.
The Fund may enter into transactions to purchase or sell foreign currencies to protect the U.S. dollar value of its underlying portfolio securities against the effect of possible adverse movements in foreign exchange rates. Principal risks associated with such transactions include the movement in value of the foreign currency relative to the U.S. dollar and the ability of the counterparty to meet its obligations. Fluctuations in the value of such forward currency transactions are recorded daily as unrealized gain or loss; realized gain or loss includes net gain or loss on transactions that have terminated by settlement or by the Fund entering into offsetting commitments. Reported net realized foreign exchange gains or losses arise from sales of foreign currencies, currency gains or losses realized between the trade and settlement dates on securities transactions, and the difference between the amounts of dividends, interest, and foreign withholding taxes recorded on the company’s books and the U.S. dollar equivalent of the amounts actually received or paid. These instruments involve market risk, credit risk, or both kinds of risks, in excess of the amount that would be recognized in the Statement of Assets and Liabilities. Risks arise from the possible inability of counterparties to meet the terms of their contracts and from movement in currency and securities values and interest rates.
Dividends and Distributions – The Fund intends to distribute its net investment income and net realized long-term and short-term capital gains, if any, at least annually. Dividends and distributions to shareholders, which are determined in accordance with income tax regulations, are recorded on the ex-dividend date. The treatment for financial reporting purposes of distributions made to shareholders during the year from net investment income or net realized capital gains may differ from their ultimate treatment for federal income tax purposes. These differences are caused primarily by differences in the timing of the recognition of certain components of income, expense or realized capital gain for federal income tax purposes. Where such differences are permanent in nature, they are reclassified among the components of net assets based on their ultimate characterization for federal income tax purposes. Any such reclassifications will have no effect on net assets,
24
LS Opportunity Fund
Notes to the Financial Statements — continued
May 31, 2017
NOTE 2. SIGNIFICANT ACCOUNTING POLICIES — continued
results of operations or net asset value per share of the Fund. For the fiscal year ended May 31, 2017, the Fund made the following reclassifications to increase (decrease) the components of net assets:
Paid-in Capital | Accumulated Undistributed Net Investment Loss | Accumulated Net Realized Gain from Investments | ||||||
$(256,421) | $ | 252,793 | $ | 3,628 | ||||
Short Sales – The Fund may make short sales as part of its overall portfolio management strategies or to offset a potential decline in value of a security. The Fund may engage in short sales with respect to various types of securities, including exchange-traded funds (ETFs). A short sale involves the sale of a security that is borrowed from a broker or other institution to complete the sale. The Fund may engage in short sales with respect to securities it owns, as well as securities that it does not own. Short sales expose the Fund to the risk that it will be required to acquire, convert or exchange securities to replace the borrowed securities (also known as “covering” the short position) at a time when the securities sold short have appreciated in value, thus resulting in a loss to the Fund. The amount of loss may exceed the proceeds received in a short sale. The Fund’s investment performance may also suffer if the Fund is required to close out a short position earlier than it had intended. The Fund must segregate assets determined to be liquid in accordance with procedures established by the Board, or otherwise cover its position in a permissible manner. The Fund will be required to pledge its liquid assets to the broker in order to secure its performance on short sales. As a result, the assets pledged may not be available to meet the Fund’s needs for immediate cash or other liquidity. In addition, the Fund may be subject to expenses related to short sales that are not typically associated with investing in securities directly, such as costs of borrowing and margin account maintenance costs associated with the Fund’s open short positions. These types of short sales expenses are sometimes referred to as the “negative cost of carry,” and will tend to cause the Fund to lose money on a short sale even in instances where the price of the underlying security sold short does not change over the duration of the short sale.
Dividend expenses on securities sold short and borrowing costs are not covered under the Adviser’s expense limitation agreement with the Fund and, therefore, these expenses will be borne by the shareholders of the Fund. The amount of restricted cash or cash equivalents held at the broker as collateral for securities sold short was $14,114,413 as of May 31, 2017.
25
LS Opportunity Fund
Notes to the Financial Statements — continued
May 31, 2017
NOTE 2. SIGNIFICANT ACCOUNTING POLICIES — continued
Purchasing Call Options – The Fund may purchase call options. As the holder of a call option, the Fund has the right to purchase the underlying security at the exercise price at any time during the option period. The Fund may enter into closing sale transactions with respect to such options, exercise them or permit them to expire. The Fund may also purchase call options on relevant stock indexes. Call options may also be purchased by the Fund for the purpose of acquiring the underlying securities for its portfolio. Utilized in this fashion, the purchase of call options enables the Fund to acquire the securities at the exercise price of the call option plus the premium paid. At times the net cost of acquiring securities in this manner may be less than the cost of acquiring the securities directly. This technique may also be useful to the Fund in purchasing a large block of securities that would be more difficult to acquire by direct market purchases. So long as it holds such a call option rather than the underlying security itself, the Fund is partially protected from any unexpected decline in the market price of the underlying security and in such event could allow the call option to expire, incurring a loss only to the extent of the premium paid for the option.
Purchasing Put Options – The Fund may purchase put options. As the holder of a put option, the Fund has the right to sell the underlying security at the exercise price at any time during the option period. The Fund may enter into closing sale transactions with respect to such options, exercise them or permit them to expire. The Fund may purchase a put option on an owned underlying security (a “protective put”) as a defensive technique to protect against an anticipated decline in the value of the security. Such hedge protection is provided only during the life of the put option when the Fund, as the holder of the put option, is able to sell the underlying security at the put exercise price regardless of any decline in the underlying security’s market price. The Fund may also purchase put options at a time when it does not own the underlying security. By purchasing put options on a security it does not own, the Fund seeks to benefit from a decline in the market price of the underlying security. If the put option is not sold when it has remaining value, and if the market price of the underlying security remains equal to or greater than the exercise price during the life of the put option, the Fund will lose its entire investment in the put option. In order for the purchase of a put option to be profitable, the market price of the underlying security must decline sufficiently below the exercise price to cover the premium and transaction costs.
Writing Options – The Fund may write covered call options on equity securities that the Fund is eligible to purchase to extend a holding period to obtain long-term capital gain treatment, to earn premium income, to assure a definite price for a security it has considered selling, or to close out options previously purchased. The
26
LS Opportunity Fund
Notes to the Financial Statements — continued
May 31, 2017
NOTE 2. SIGNIFICANT ACCOUNTING POLICIES — continued
Fund may write covered call options if, immediately thereafter, not more than 30% of its net assets would be committed to such transactions. A call option gives the holder (buyer) the right to purchase a security at a specified price (the exercise price) at any time until a certain date (the expiration date). A call option is “covered” if the Fund owns the underlying security subject to the call option at all times during the option period. When the Fund writes a covered call option, it maintains a segregated account with its Custodian, cash, or liquid portfolio securities in an amount not less than the exercise price at all times while the option is outstanding.
Forward Currency Exchange Contracts – The Fund may engage in foreign currency exchange transactions. The value of the Fund’s portfolio securities that are invested in non-U.S. dollar denominated instruments as measured in U.S. dollars may be affected favorably or unfavorably by changes in foreign currency exchange rates, and the Fund may incur costs in connection with conversions between various currencies. The Fund will conduct its foreign currency exchange transactions either on a spot (i.e., cash) basis at the spot rate prevailing in the foreign currency exchange market to purchase or sell foreign currencies. A forward foreign currency exchange contract involves an obligation to purchase or sell a specific currency at a future date, which may be any fixed number of days from the date of the contract agreed upon by the parties, at a price set at the time of the contract. These contracts are traded directly between currency traders (usually large commercial banks) and their customers. The Fund will not, however, hold foreign currency except in connection with the purchase and sale of foreign portfolio securities.
Derivative Transactions – The following tables identify the location and fair value of derivative instruments on the Statement of Assets and Liabilities as of May 31, 2017, and the effect of derivative instruments on the Statement of Operations for the fiscal year ended May 31, 2017.
As of May 31, 2017:
| Derivatives | Location of Derivatives on Statement of Assets and Liabilities | Fair Value | ||||
Equity Risk: | ||||||
Options Purchased | Investments in securities at fair value | $ | 15,887 | |||
27
LS Opportunity Fund
Notes to the Financial Statements — continued
May 31, 2017
NOTE 2. SIGNIFICANT ACCOUNTING POLICIES — continued
For the fiscal year ended May 31, 2017:
| Derivatives | Location of Gain (Loss) on Derivatives on Statement of Operations | Realized Gain (Loss) on Derivatives | Change in Unrealized Appreciation (Depreciation) on Derivatives | |||||||
Equity Risk: | ||||||||||
Options Purchased | Net realized loss on investment securities | $ | (106,660 | ) | ||||||
Options Purchased | Change in unrealized appreciation (depreciation) on investment securities | — | $ | (32,950 | ) | |||||
Options Written | Net realized loss from written option contracts | 14,384 | ||||||||
During the fiscal year ended May 31, 2017, the Fund opened 1,149 purchased option contracts and closed 1,306 purchased option contracts.
The Fund is not subject to a master netting arrangement and its policy is to not offset assets and liabilities related to its investment in derivatives.
Transactions in written options by the Fund during the fiscal year ended May 31, 2017, were as follows:
| Number of Contracts | Premiums Received | |||||||
Outstanding at May 31, 2016 | — | $ | — | |||||
Options written | 88 | 14,384 | ||||||
Options expired | (88 | ) | (14,384 | ) | ||||
|
|
|
| |||||
Outstanding at May 31, 2017 | — | $ | — | |||||
|
|
|
| |||||
NOTE 3. SECURITIES VALUATION AND FAIR VALUE MEASUREMENTS
Fair value is defined as the price that the Fund would receive upon selling an investment in an orderly transaction to an independent buyer in the principal or most advantageous market of the investment. GAAP establishes a three-tier hierarchy to maximize the use of observable market data and minimize the use of unobservable inputs and to establish classification of fair value measurements for disclosure purposes.
Inputs refer broadly to the assumptions that market participants would use in pricing the asset or liability, including assumptions about risk, for example, the risk inherent in a particular valuation technique used to measure fair value including a pricing model and/or the risk inherent in the inputs to the valuation technique. Inputs may be
28
LS Opportunity Fund
Notes to the Financial Statements — continued
May 31, 2017
NOTE 3. SECURITIES VALUATION AND FAIR VALUE MEASUREMENTS — continued
observable or unobservable. Observable inputs are inputs that reflect the assumptions market participants would use in pricing the asset or liability developed based on market data obtained from sources independent of the reporting entity. Unobservable inputs are inputs that reflect the reporting entity’s own assumptions about the assumptions market participants would use in pricing the asset or liability developed based on the best information available in the circumstances.
Various inputs are used in determining the value of the Fund’s investments. These inputs are summarized in the three broad levels listed below.
| • | Level 1 – unadjusted quoted prices in active markets for identical investments and/or registered investment companies where the value per share is determined and published and is the basis for current transactions for identical assets or liabilities at the valuation date. |
| • | Level 2 – other significant observable inputs (including, but not limited to, quoted prices for an identical security in an inactive market, quoted prices for similar securities, interest rates, prepayment speeds, credit risk, etc.) |
| • | Level 3 – significant unobservable inputs (including the Fund’s own assumptions in determining fair value of investments based on the best information available) |
The inputs used to measure fair value may fall into different levels of the fair value hierarchy. In such cases, for disclosure purposes, the level in the fair value hierarchy which is reported is determined based on the lowest level input that is significant to the fair value measurement in its entirety.
Equity securities that are traded on any stock exchange are generally valued at the last quoted sale price on the security’s primary exchange. Lacking a last sale price, an exchange traded security is generally valued at its last bid price, except in the case of a security sold short, in which case the last ask price is utilized. Securities traded in the NASDAQ over-the-counter market are generally valued at the NASDAQ Official Closing Price. When using the market quotations and when the market is considered active, the security is classified as a Level 1 security. In the event that market quotations are not readily available or are considered unreliable due to market or other events, the Fund values its securities and other assets at fair value in accordance with policies established by and under the general supervision of the Board. Under these policies, the securities will be classified as Level 2 or 3 within the fair value hierarchy, depending on the inputs used.
29
LS Opportunity Fund
Notes to the Financial Statements — continued
May 31, 2017
NOTE 3. SECURITIES VALUATION AND FAIR VALUE MEASUREMENTS — continued
Investments in mutual funds, including money market mutual funds, are generally priced at the ending net asset value (“NAV”) provided by the pricing service of the funds. These securities are categorized as Level 1 securities.
Call and put options purchased in which the Fund invests in are generally traded on an exchange and are generally valued at the last trade price as provided by a pricing service. If the last sale price is not available, the options will be valued using the last bid price. The options will generally be categorized as Level 1 securities unless the market is considered inactive. In the absence of a last bid price they will generally be categorized as Level 2 securities.
Derivative instruments in which the Fund invests in are valued by a pricing service based on the prevailing banking rates and are generally categorized as Level 2 securities.
In accordance with the Trust’s valuation policies, the Adviser is required to consider all appropriate factors relevant to the value of securities for which it has determined other pricing sources are not available or reliable as described above. No single standard exists for determining fair value, because fair value depends upon the circumstances of each individual case. As a general principle, the current fair value of an issue of securities being valued by the Adviser would appear to be the amount that the owner might reasonably expect to receive for them upon their current sale. Methods that are in accordance with this principle may, for example, be based on (i) a multiple of earnings; (ii) a discount from market prices of a similar freely traded security (including a derivative security or a basket of securities traded on other markets, exchanges or among dealers); or (iii) yield to maturity with respect to debt issues, or a combination of these and other methods. Fair value pricing is permitted if, in the Adviser’s opinion, the validity of market quotations appears to be questionable based on factors such as evidence of a thin market in the security based on a small number of quotations, a significant event occurs after the close of a market but before the Fund’s NAV calculation that may affect a security’s value, or the Adviser is aware of any other data that calls into question the reliability of market quotations. Fair value pricing may also be used in instances when the bonds in which the Fund invests may default or otherwise cease to have market quotations readily available.
30
LS Opportunity Fund
Notes to the Financial Statements — continued
May 31, 2017
NOTE 3. SECURITIES VALUATION AND FAIR VALUE MEASUREMENTS — continued
The following is a summary of the inputs used to value the Fund’s investments as of May 31, 2017:
| Valuation Inputs | ||||||||||||||||
| Assets | Level 1 | Level 2 | Level 3 | Total | ||||||||||||
Common Stocks Domestic* | $ | 30,094,487 | $ | — | $ | — | $ | 30,094,487 | ||||||||
Common Stocks International* | 5,651,677 | — | — | 5,651,677 | ||||||||||||
Options Purchased | 15,757 | 130 | — | 15,887 | ||||||||||||
Money Market Securities | 1,744,832 | — | — | 1,744,832 | ||||||||||||
Total | $ | 37,506,753 | $ | 130 | $ | — | $ | 37,506,883 | ||||||||
| * | Please refer to Schedule of Investments for sector classifications. |
| Valuation Inputs | ||||||||||||||||
| Liabilities | Level 1 | Level 2 | Level 3 | Total | ||||||||||||
Common Stocks Domestic* | $ | (8,937,707 | ) | $ | — | $ | — | $ | (8,937,707 | ) | ||||||
Common Stocks International* | (5,006,377 | ) | — | — | (5,006,377 | ) | ||||||||||
Total | $ | (13,944,084 | ) | $ | — | $ | — | $ | (13,944,084 | ) | ||||||
| * | Please refer to Schedule of Securities Sold Short for sector classifications. |
The Fund did not hold any investments during the reporting period for which significant unobservable inputs (Level 3) were used in determining fair value; therefore, no reconciliation of Level 3 securities is included for this reporting period. The Trust recognizes transfers between fair value hierarchy levels at the reporting period end. There were no transfers between any levels as of May 31, 2017 based on input levels assigned at May 31, 2016.
NOTE 4. FEES AND OTHER TRANSACTIONS WITH AFFILIATES AND OTHER SERVICE PROVIDERS
The Adviser, under the terms of the management agreement (the “Agreement”), manages the Fund’s investments. As compensation for its management services, the Fund is obligated to pay the Adviser a fee computed and accrued daily and paid monthly at an annual rate of 1.75% of the Fund’s average net assets. For the fiscal year ended May 31, 2017, the Adviser earned a fee of $626,975 from the Fund before the waivers described below.
The Adviser has contractually agreed to waive its management fee and reimburse certain Fund operating expenses, but only to the extent necessary so that the Fund’s net expenses (excluding interest, taxes, brokerage commissions, other expenditures which are capitalized in accordance with generally accepted accounting principles, other extraordinary expenses not incurred in the ordinary course of the Fund’s
31
LS Opportunity Fund
Notes to the Financial Statements — continued
May 31, 2017
NOTE 4. FEES AND OTHER TRANSACTIONS WITH AFFILIATES AND OTHER SERVICE PROVIDERS — continued
business, dividend and interest expense on short sales, expenses incurred under a Rule 12b-1 plan of distribution, “acquired fund fees and expenses” (i.e., investment companies in which the Fund may invest), and expenses that the Fund has incurred but did not actually pay because of an expense offset arrangement) do not exceed 1.95% of net assets. The contractual agreement is effective through September 30, 2017. For the fiscal year ended May 31, 2017, the Adviser waived fees of $166,292. At May 31, 2017, the Adviser was owed $47,235 from the Fund for advisory services.
The fee waiver or expense reimbursement by the Adviser with respect to the Fund is subject to repayment by the Fund within the three years following the date in which that particular fee waiver or expense reimbursement incurred, provided that the Fund is able to make the repayment without exceeding the expense limitation that is in effect at the time of the repayment or at the time of the waiver or reimbursement, whichever is lower.
The maximum amount subject to repayment by the Fund pursuant to the aforementioned conditions at May 31, 2017 was:
Amount | Recoverable through May 31, | |||
$ 148,331 | 2018 | |||
380,899 | 2019 | |||
166,292 | 2020 | |||
The Adviser has retained the Sub-Adviser to provide portfolio management and related services to the Fund. The Sub-Adviser receives a fee from the Adviser (not the Fund) for these services.
The Trust retains Ultimus Asset Services, LLC (the “Administrator”) to provide the Fund with administration, compliance, fund accounting and transfer agent services, including all regulatory reporting. For fiscal year ended May 31, 2017, the Administrator earned fees of $33,402 for administration services, $6,750 for compliance services, $34,993 for fund accounting services and $28,823 for transfer agent services. At May 31, 2017, the Fund owed the Administrator $7,869 for such services.
The officers and one trustee of the Trust are members of management and/or employees of the Administrator. Unified Financial Securities, LLC (the “Distributor”)
acts as the principal distributor of the Fund’s shares. An officer of the Trust is an officer of the Distributor and such person may be deemed to be an affiliate of the Distributor. There were no payments made to the Distributor by the Fund for the fiscal year ended May 31, 2017.
32
LS Opportunity Fund
Notes to the Financial Statements — continued
May 31, 2017
NOTE 5. INVESTMENT TRANSACTIONS
For the fiscal year ended May 31, 2017, purchases and sales of investment securities and securities sold short, other than short-term investments, were as follows:
Purchases | ||||
U.S. Government Obligations | $ | — | ||
Other | 36,445,957 | |||
Sales | ||||
U.S. Government Obligations | $ | — | ||
Other | 34,445,142 |
NOTE 6. BENEFICIAL OWNERSHIP
The beneficial ownership, either directly or indirectly, of more than 25% of the voting securities of a fund creates a presumption of control of a fund, under Section 2(a)(9) of the Investment Company Act of 1940. At May 31, 2017, National Financial Services, LLC (“NFS”) owned, as record shareholder, 54% of the outstanding shares of the Fund. It is not known whether NFS or any of the underlying beneficial owners owned or controlled more than 25% of the voting securities of the Fund.
NOTE 7. FEDERAL TAX INFORMATION
At May 31, 2017, the appreciation (depreciation) of investments for tax purposes was as follows:
| Amount | ||||
Gross Unrealized Appreciation | $ | 5,207,724 | ||
Gross Unrealized Depreciation | (315,507 | ) | ||
|
| |||
Net Unrealized Appreciation/(Depreciation) | $ | 4,892,217 | ||
|
| |||
At May 31, 2017, the aggregate cost of securities for federal income tax purposes, was $32,614,666.
The difference between book basis and tax basis unrealized appreciation is attributable primarily to the tax deferral of wash losses.
33
LS Opportunity Fund
Notes to the Financial Statements — continued
May 31, 2017
NOTE 7. FEDERAL TAX INFORMATION — continued
The tax characterization of distributions for the fiscal years ended May 31, 2017 and May 31, 2016 were as follows:
| 2017 | 2016 | |||||||
Distributions paid from: | ||||||||
Ordinary Income | $ | — | $ | 2,624,587 | ||||
Long-Term Capital Gains | — | 1,462,556 | ||||||
|
|
|
| |||||
| $ | — | $ | 4,087,143 | |||||
|
|
|
| |||||
At May 31, 2017, the components of distributable earnings (accumulated losses) on a tax basis were as follows:
Undistributed Long-Term Capital Gains | $ | 724,834 | ||
Accumulated Capital and Other Losses | (154,015 | ) | ||
Unrealized Appreciation/(Depreciation) | 3,724,217 | |||
|
| |||
| $ | 4,295,036 | |||
|
|
Certain capital losses incurred after October 31, and within the current taxable year, are deemed to arise on the first business day of the Fund’s following taxable year. For the tax year ended May 31, 2017, the Fund deferred Qualified Late Year Ordinary Losses in the amount of $146,205.
NOTE 8. COMMITMENTS AND CONTINGENCIES
The Fund indemnifies its officers and trustees for certain liabilities that may arise from their performance of their duties to the Fund. Additionally, in the normal course of business, the Fund enters into contracts that contain a variety of representations and warranties which provide general indemnifications. The Fund’s maximum exposure under these arrangements is unknown, as this would involve future claims that may be made against the Fund that have not yet occurred.
NOTE 9. SUBSEQUENT EVENT
Management of the Fund has evaluated the need for disclosures and/or adjustments resulting from subsequent events through the date these financial statements were issued. There were no items requiring adjustment of the financial statements or additional disclosure.
34
REPORT OF INDEPENDENT REGISTERED PUBLIC ACCOUNTING FIRM
To the Shareholders of LS Opportunity Fund and
Board of Trustees of Valued Advisers Trust
We have audited the accompanying statement of assets and liabilities, including the schedules of investments and securities sold short, of LS Opportunity Fund (the “Fund”), a series of Valued Advisers Trust, as of May 31, 2017, and the related statement of operations for the year then ended, the statements of changes in net assets for each of the two years in the period then ended, and the financial highlights for each of the five years in the period then ended. These financial statements and financial highlights are the responsibility of the Fund’s management. Our responsibility is to express an opinion on these financial statements and financial highlights based on our audits.
We conducted our audits in accordance with the standards of the Public Company Accounting Oversight Board (United States). Those standards require that we plan and perform the audit to obtain reasonable assurance about whether the financial statements and financial highlights are free of material misstatement. An audit includes examining, on a test basis, evidence supporting the amounts and disclosures in the financial statements. Our procedures included confirmation of securities owned as of May 31, 2017, by correspondence with the custodian and brokers or by other appropriate auditing procedures where replies from brokers or counterparties were not received. An audit also includes assessing the accounting principles used and significant estimates made by management, as well as evaluating the overall financial statement presentation. We believe that our audits provide a reasonable basis for our opinion.
In our opinion, the financial statements and financial highlights referred to above present fairly, in all material respects, the financial position of LS Opportunity Fund as of May 31, 2017, the results of its operations for the year then ended, the changes in its net assets for each of the two years in the period then ended, and the financial highlights for each of the five years in the period then ended, in conformity with accounting principles generally accepted in the United States of America.
COHEN & COMPANY, LTD.
Cleveland, Ohio
July 24, 2017
35
Summary of Fund Expenses (Unaudited)
As a shareholder of the Fund, you incur two types of costs: (1) transaction costs; and (2) ongoing costs, including management fees; and other Fund expenses. This Example is intended to help you understand your ongoing costs (in dollars) of investing in the Fund and to compare these costs with the ongoing costs of investing in other mutual funds. The Example in the table below is based on an investment of $1,000 invested at the beginning of the period, and for the entire period from December 1, 2016 to May 31, 2017.
Actual Expenses
The first line of the table provides information about actual account values and actual expenses. You may use the information in this line, together with the amount you invested, to estimate the expenses that you paid over the period. Simply divide your account value by $1,000 (for example, an $8,600 account value divided by $1,000 = 8.60), then multiply the result by the number in the first line under the heading “Expenses Paid During the Period” to estimate the expenses you paid on your account during this period.
Hypothetical Example for Comparison Purposes
The second line of the table provides information about hypothetical account values and hypothetical expenses based on the Fund’s actual expense ratios and an assumed rate of return of 5% per year before expenses, which is not the Fund’s actual return. The hypothetical account values and expenses may not be used to estimate the actual ending account balance or expenses you paid for the period. You may use this information to compare the ongoing costs of investing in the Fund and other funds. To do so, compare this 5% hypothetical example with the 5% hypothetical examples that appear in the shareholder reports of the other funds.
Expenses shown in the table are meant to highlight your ongoing costs only and do not reflect any transactional costs, such as sales charges (loads), or redemption fees. Therefore, the second line of the table is useful in comparing ongoing costs only, and will not help you determine the relative total costs of owning different funds. In addition, if these transactional costs were included, your costs would have been higher.
Beginning December 1, 2016 | Ending Account Value May 31, 2017 | Expenses Paid the Period(a) | ||||||||||
Actual | $ | 1,000.00 | $ | 1,054.10 | $ | 14.58 | ||||||
Hypothetical(b) | $ | 1,000.00 | $ | 1,010.74 | $ | 14.27 | ||||||
| (a) | Expenses are equal to the Fund’s annualized expense ratio of 2.85%, multiplied by the average account value over the period, multiplied by 182/365. |
| (b) | Assumes a 5% return before expenses. |
36
Additional Federal Income Tax Information (Unaudited):
The Form 1099-DIV you receive in January 2018 will show the tax status of all distributions paid to your account in calendar year 2017. Shareholders are advised to consult their own tax adviser with respect to the tax consequences of their investment in the Fund. As required by the Internal Revenue Code and/or regulations, shareholders must be notified regarding the status of qualified dividend income for individuals and the dividends received deduction for corporations.
37
Trustees and Officers (Unaudited)
The Board of Trustees supervises the business activities of the Trust. Each Trustee serves as a trustee until termination of the Trust unless the Trustee dies, resigns, retires or is removed.
The following table provides information regarding each of the independent trustees.
Name, Address*, (Age), | Principal Occupation During Past 5 Years | Other Directorships | ||
Andrea N. Mullins, 50 Independent Trustee Since December 2013
Chairperson since March 2017 | Current: Private investor; Independent Contractor, SWM Advisors (since April 2014). | None. | ||
Ira Cohen, 58 Independent Trustee Since June 2010 | Current: Independent financial services consultant (since February 2005); Executive Vice President of Asset Management Services, Recognos Financial (since August 2015). | Trustee, Griffin Institutional Access Credit Fund (since January 2017); Trustee and Audit Committee Chairman, Griffin Institutional Real Estate Access Fund (since May 2014); Trustee, Angel Oak Funds Trust (since October 2014); Chairman (since April 2017). | ||
| * | The address for each trustee and officer is 225 Pictoria Drive, Suite 450, Cincinnati, Ohio 45246. |
| ** | As of the date of this report, the Trust consists of 13 series. |
38
The following table provides information regarding the Trustee who is considered an “interested person” of the Trust, as that term is defined under the 1940 Act. Based on the experience of the Trustee, the Trust concluded that the individual described below should serve as a Trustee.
Name, Address*, Age, Position with Trust**, Term of Position with Trust | Principal Occupation During Past 5 Years | Other Directorships | ||
Mark J. Seger, 55 Trustee Since March 2017 | Current: President, Managing Director, and Co-Founder, Ultimus Fund Solutions, LLC (since 1999); Treasurer and Managing Director, Ultimus Fund Distributors, LLC (since 1999); President and Managing Director, Ultimus Asset Services, LLC (since 2016); Managing Director, Unified Financial Securities, LLC (since 2016). | None. |
| * | The address for each trustee and officer is 225 Pictoria Drive, Suite 450, Cincinnati, Ohio 45246. |
| ** | As of the date of this report, the Trust consists of 13 series. |
The following table provides information regarding the officers of the Trust:
Name, Address*, (Age), Position with Trust,** Term of Position with Trust | Principal Occupation During Past 5 Years | Other Directorships | ||
Bo J. Howell, 36 Principal Executive Officer and President Since March 2017 | Current: Vice President, Director of Fund Administration, Ultimus Fund Solutions, LLC (since 2014).
Previous: Counsel, Securities and Mutual Funds, Western & Southern Financial Group (2012 – 2014). | None. |
39
Name, Address*, (Age), Position with Trust,** Term of Position with Trust | Principal Occupation During Past 5 Years | Other Directorships | ||
John C. Swhear, 56 Chief Compliance Officer and Vice President Since August 2008 | Current: Assistant Vice President and Associate Director of Fund Administration, Ultimus Fund Solutions, LLC (since April 2017); Chief Compliance Officer, Unified Financial Securities, LLC (since May 2007).
Previous: Associate Director of Compliance, Ultimus Fund Solutions, LLC (December 2015 to May 2017); Vice President of Legal Administration and Compliance, Huntington Asset Services, Inc. (n/k/a Ultimus Asset Services, LLC) (April 2007 to December 2015), Director (May 2014 to December 2015); Director, Unified Financial Securities, Inc. (n/k/a Unified Financial Securities, LLC) (May 2014 to December 2015). | None. | ||
Carol J. Highsmith, 52 Vice President Since August 2008
Secretary Since March 2014 | Current: Assistant Vice President, Ultimus Fund Solutions, LLC (since December 2015).
Previous: Employed in various positions with Huntington Asset Services, Inc. (n/k/a Ultimus Asset Services, LLC) (November 1994 to December 2015), most recently Vice President of Legal Administration (2005 to December 2015). | None. | ||
Matthew J. Miller, 41 Vice President Since December 2011 | Current: Assistant Vice President, Relationship Management, Ultimus Fund Solutions, LLC (since December 2015).
Previous: Employed in various positions with Huntington Asset Services, Inc. (n/k/a Ultimus Asset Services, LLC) ( July 1998 to December 2015), most recently Vice President of Relationship Management (2005 to December 2015). | None. | ||
40
Name, Address*, (Age), Position with Trust,** Term of Position with Trust | Principal Occupation During Past 5 Years | Other Directorships | ||
Bryan W. Ashmus, 44 Principal Financial Officer and Treasurer Since December 2013 | Current: Vice President and Director of Financial Administration, Ultimus Fund Solutions, LLC (since December 2015).
Previous: Vice President and Manager of Financial Administration, Huntington Asset Services, Inc. (n/k/a Ultimus Asset Services, LLC) (September 2013 to December 2015). Vice President, Fund Administration, Citi Fund Services Ohio, Inc. (from May 2005 to September 2013). | None. | ||
| * | The address for each trustee and officer is 225 Pictoria Drive, Suite 450, Cincinnati, Ohio 45246. |
| ** | As of the date of this report, the Trust consists of 13 series. |
Other Information (Unaudited)
The Fund’s Statement of Additional Information (“SAI”) includes additional information about the trustees and is available without charge, upon request. You may call toll-free at (877) 336-6763 to request a copy of the SAI or to make shareholder inquiries.
41
Investment Advisory Agreement Renewal Approval (Unaudited)
At a meeting held on March 7-8, 2017, the Board of Trustees (the “Board”) considered the renewal of the Investment Advisory Agreement (the “LSA Agreement”) between Valued Advisers Trust (the “Trust”) and Long Short Advisors, LLC (“LSA”) with respect to the LS Opportunity Fund (the “LS Fund”). LSA provided written information to the Board to assist the Board in its considerations.
The Board discussed the contractual arrangements between LSA and the Trust for the LS Fund. They reflected upon the Board’s prior experience with LSA in managing the LS Fund, as well as their earlier discussions with LSA.
Counsel then directed the Trustees to a memorandum from his firm that summarized, among other things, the fiduciary duties and responsibilities of the Board in reviewing and approving the LSA Agreement. In assessing the factors and reaching its decision, the Board took into consideration information furnished by LSA and the Trust’s other service providers for the Board’s review and consideration throughout the year, as well as information specifically prepared or presented in connection with the renewal process, including: (i) reports regarding the services and support provided to the LS Fund by LSA; (ii) quarterly assessments of the investment performance of the LS Fund; (iii) commentary on the reasons for the performance; (iv) presentations by LSA addressing its investment philosophy, investment strategy, personnel, and operations of LSA and Prospector Partners, LLC, the LS Fund’s sub-adviser (“Prospector”); (v) compliance and audit reports concerning the LS Fund, LSA, and Prospector; (vi) disclosure information contained in the registration statement of the Trust for the LS Fund and LSA’s Form ADV; (vii) information relating to the manner in which LSA oversees Prospector; and (viii) a memorandum from counsel, that summarized the fiduciary duties and responsibilities of the Board in reviewing and approving the LSA Agreement. The Board also requested and received materials including, without limitation: (a) documents containing information about LSA, including its financial information; a description of its personnel and the services it provides to the LS Fund; information on LSA’s investment advice and performance; summaries of the LS Fund’s expenses, compliance program, current legal matters, and other general information; (b) comparative expense and performance information for other mutual funds with strategies similar to the LS Fund; and (c) the benefits to be realized by LSA from its relationship with the LS Fund. The Board did not identify any particular information that was most relevant to its consideration to approve the LSA Agreement and each Trustee may have afforded different weight to the various factors.
| 1. | The nature, extent, and quality of the services to be provided by LSA. In this regard, the Board considered LSA’s responsibilities under the LSA Agreement. The Trustees considered the services being provided by LSA to the LS Fund including its process for overseeing the sub-adviser’s portfolio management of the LS Fund, assuring compliance with the LS Fund’s investment objectives and limitations, its coordination of services for the LS Fund among the LS Fund’s service providers, and its efforts to promote the LS Fund and grow its assets. |
42
The Trustees reviewed the steps LSA takes to oversee and supervise the sub-adviser, as described in the materials provided by LSA. The Trustees considered the relationship of LSA’s associated adviser and its utilization of the infrastructure and other resources of that entity. The Trustees considered LSA’s continuity of, and commitment to retain, qualified personnel and LSA’s commitment to maintain and enhance its resources and systems, and the commitment of LSA’s personnel to finding alternatives and options that allow the LS Fund to maintain its goals. The Trustees considered LSA’s personnel, including the education and experience of LSA’s personnel. The Trustees reflected on certain of their prior experiences with LSA from an administrative perspective and opportunities for improvement in that regard, as well as improvements that had been made. After considering the foregoing information and further information in the Meeting materials provided by LSA (including LSA’s Form ADV), the Board concluded that, in light of all the facts and circumstances, the nature, extent and quality of the services provided by LSA were satisfactory and adequate for the LS Fund. |
| 2. | Investment Performance of the LS Fund and LSA. In considering the investment performance of the LS Fund, the Trustees noted that LSA did not manage any accounts directly and that it had delegated the portfolio management responsibilities of the LS Fund to a sub-adviser. Accordingly, the Trustees concluded that their consideration of this factor for LSA was less relevant in their determination of LSA’s performance of its duties than other factors. The Trustees considered the consistency of LSA’s management oversight of the LS Fund’s sub-adviser with the LS Fund’s investment objective, strategies, and limitations. The Trustees also compared the performance of the LS Fund with the performance of its benchmark index and with its Morningstar category. The Trustees noted that the LS Fund’s performance was better than the average of its Morningstar category for the one year, three year, and five year periods ended December 31, 2016. The Trustees also observed that the LS Fund had outperformed its benchmark for periods of one year and shorter, but had underperformed as compared to the benchmark for the three year and five year periods. After reviewing and discussing the investment performance of the LS Fund further, LSA’s experience in overseeing the sub-adviser to the LS Fund, the LS Fund’s historical performance, and other relevant factors, the Board concluded, in light of all the facts and circumstances, that the investment performance, and LSA’s oversight of the sub-adviser to the LS Fund was satisfactory. |
| 3. | The costs of the services to be provided and profits to be realized by LSA from its relationship with the LS Fund. In considering the costs of services to be provided and the profits to be realized by LSA from its relationship with the LS Fund, the Trustees considered: (1) LSA’s financial condition; (2) asset levels of the LS Fund; (3) the overall expenses of the LS Fund; and (4) the nature and frequency of advisory fee payments. The Trustees reviewed information provided by LSA regarding its profits associated with managing the LS Fund. The Trustees also considered the relationship of LSA’s related adviser and its |
43
utilization of the infrastructure and other resources of that entity. The Trustees also considered potential benefits for LSA in managing the LS Fund. The Trustees then compared the fees and expenses of the LS Fund (including the management fee) to other comparable mutual funds. The Trustees noted that the LS Fund’s management fee was higher than the average and median of its Morningstar category. They also noted that the LS Fund’s net expense ratio was higher than the median, but slightly lower than the average of the category. In this regard, the Trustees reflected upon their discussion with a representative of LSA earlier in the Meeting, and commented on LSA’s assertion that the firm provided a premium product in comparison to other products to which they were compared in the marketplace. The Board concluded that the fees to be paid to LSA by the LS Fund and the profits to be realized by LSA, in light of all the facts and circumstances, were fair and reasonable in relation to the nature and quality of the services provided by LSA. |
| 4. | The extent to which economies of scale would be realized as the LS Fund grows and whether advisory fee levels reflect these economies of scale for the benefit of the LS Fund’s investors. In this regard, the Board considered the LS Fund’s fee arrangements with LSA. The Board considered that while the management fee remained the same at all asset levels, the LS Fund’s shareholders had experienced benefits from the expense limitation arrangement. The Trustees noted that once the LS Fund’s expenses fell below the cap set by the arrangement, the shareholders would continue to benefit from the economies of scale under the LS Fund’s agreements with service providers other than LSA. In light of its ongoing consideration of the LS Fund’s asset levels, expectations for growth in the LS Fund, and fee levels, the Board determined that the LS Fund’s fee arrangements, in light of all the facts and circumstances, were fair and reasonable in relation to the nature and quality of the services provided by LSA. |
| 5. | Possible conflicts of interest and benefits to LSA. In considering LSA’s practices regarding conflicts of interest, the Trustees evaluated the potential for conflicts of interest and considered such matters as the experience and ability of the advisory personnel assigned to the LS Fund; the operations of LSA’s related investment adviser; and the substance and administration of LSA’s code of ethics. The Trustees also considered disclosure in the registration statement of the Trust relating to LSA’s potential conflicts of interest. The Trustees noted that LSA identified no other potential benefits (in addition to the management fee) to LSA. Based on the foregoing, the Board determined that LSA’s standards and practices relating to the identification and mitigation of potential conflicts of interest and the benefits to be realized by LSA in managing the LS Fund were satisfactory. |
After additional consideration of the factors delineated in the memorandum provided by counsel and further discussion among the Board members, the Board determined to approve the continuation of the LSA Agreement between the Trust and LSA.
44
Investment Sub-Advisory Agreement Renewal Approval (Unaudited)
At a meeting held on March 7-8, 2017, the Board of Trustees (the “Board”) considered the renewal of the Investment Sub-Advisory Agreement (the “Prospector Agreement”) between Long Short Advisors, LLC (“LSA”) and Prospector Partners, LLC (“Prospector”) with respect to the LS Opportunity Fund (the “LS Fund”). Prospector provided written information to the Board to assist the Board in its considerations.
The Board discussed the contractual arrangements between LSA and Prospector for the LS Fund. They reflected upon the Board’s prior experience with Prospector in managing the LS Fund, as well as their earlier discussions with Prospector.
Counsel then directed the Trustees to a memorandum from his firm that summarized, among other things, the fiduciary duties and responsibilities of the Board in reviewing and approving the Prospector Agreement. In assessing the factors and reaching its decision, the Board took into consideration information furnished by Prospector and the Trust’s other service providers for the Board’s review and consideration throughout the year, as well as information specifically prepared or presented in connection with the renewal process, including: (i) reports regarding the services and support provided to the LS Fund by Prospector; (ii) quarterly assessments of the investment performance of the LS Fund; (iii) commentary on the reasons for the performance; (iv) presentations by Prospector addressing its investment philosophy, investment strategy, personnel, and operations; (v) compliance and audit reports concerning the LS Fund and Prospector; (vi) disclosure information contained in the registration statement of the Trust for the LS Fund and Prospector’s Form ADV; (vii) a memorandum from counsel, that summarized the fiduciary duties and responsibilities of the Board in reviewing and approving the Prospector Agreement. The Board also requested and received various informational materials including, without limitation: (a) documents containing information about Prospector, including its financial information; a description of its personnel and the services it provides to the LS Fund; information on Prospector’s investment advice and performance; summaries of the LS Fund’s expenses, compliance program, current legal matters, and other general information; (b) comparative expense and performance information for other mutual funds with strategies similar to the LS Fund; and (c) the benefits to be realized by Prospector from its relationship with the LS Fund. The Board did not identify any particular information that was most relevant to its consideration to approve the Prospector Agreement and each Trustee may have afforded different weight to the various factors.
| 1. | The nature, extent, and quality of the services to be provided by Prospector. In this regard, the Board considered Prospector’s responsibilities under the Prospector Agreement. The Board considered the services being provided by Prospector to the LS Fund, including without limitation: the quality of its investment sub-advisory services (including research and recommendations with respect to portfolio securities), and its process for formulating investment |
45
recommendations and assuring compliance with the LS Fund’s investment objectives and limitations. The Board considered Prospector’s continuity of, and commitment to retain, qualified personnel and Prospector’s commitment to maintain its resources and systems, and Prospector’s cooperation with the Board and counsel for the LS Fund. The Board considered Prospector’s personnel, including the education and experience of the personnel and Prospector’s compliance program, policies and procedures. The Board considered the arrangements between LSA and Prospector pursuant to which it would have an on-going arrangement with respect to the Fund in which it would agree to waive, to a degree, a portion of its sub-advisory fees and commit to an exclusivity arrangement between itself and LSA with respect to managing other mutual funds with similar objectives. After considering the foregoing information and further information in the Meeting materials provided by Prospector (including its Form ADV), the Board concluded that, in light of all the facts and circumstances, the nature, extent, and quality of the services provided by Prospector were satisfactory and adequate for the LS Fund. |
| 2. | Investment Performance of the LS Fund and Prospector. In considering the investment performance of the LS Fund and Prospector, the Trustees considered the consistency of Prospector’s management of the LS Fund with the LS Fund’s investment objective, strategies, and limitations. The Trustees also compared the performance of the LS Fund with the performance of its benchmark index and with its Morningstar category. The Trustees focused on the performance since Prospector assumed its role as sub-adviser on May 28, 2015. They noted that the LS Fund’s performance was better than the average of its Morningstar category for the one year period ended December 31, 2016. The Trustees also observed that the LS Fund had outperformed its style-specific benchmark and its broad-based benchmark for periods of one year and shorter, and for the period since Prospector began managing the LS Fund. After reviewing and discussing the investment performance of the LS Fund further, Prospector’s experience sub-advising the LS Fund, the LS Fund’s performance since Prospector began managing the portfolio, and other relevant factors, the Board concluded, in light of all the facts and circumstances, that the investment performance of the LS Fund and Prospector was satisfactory. |
| 3. | The costs of the services to be provided and profits to be realized by Prospector from the relationship with the LS Fund. In this regard, the Board considered: (1) Prospector’s financial condition; (2) asset levels of the LS Fund; (3) the overall expenses of the LS Fund; and (4) the nature and frequency of sub-advisory fee payments. The Trustees reviewed information provided by Prospector regarding its profits associated with managing the LS Fund. The Board also considered potential benefits for Prospector in managing the Fund. The Board compared the fees and expenses of the Fund (including the sub-advisory fee) to other private fund accounts managed by Prospector, and determined that the fee arrangements were relatively comparable in light of the differing structures. Following this comparison and upon further consideration |
46
and discussion of the foregoing, the Board concluded that the fees to be paid to Prospector by LSA and the profits to be realized by Prospector, in light of all the facts and circumstances, were fair and reasonable in relation to the nature and quality of the services provided by Prospector. |
| 4. | The extent to which economies of scale would be realized as the Fund grows and whether advisory fee levels reflect these economies of scale for the benefit of the Fund’s investors. In this regard, the Board considered the Fund’s fee arrangements with Prospector. The Board considered that while the sub-advisory fee changed with changes in the Fund’s assets, the Fund’s shareholders did not realize any changes in their overall expenses as Prospector’s fee was paid entirely from the advisory fee paid to LSA, which was fixed. The Board considered the sub-advisory fees in light of the overall arrangement with the Fund’s investment adviser. In light of the foregoing, the Board determined that the LS Fund’s fee arrangements for Prospector, in light of all the facts and circumstances, were fair and reasonable in relation to the nature and quality of the services provided by Prospector. |
| 5. | Possible conflicts of interest and benefits to Prospector. In evaluating Prospector’s practices regarding conflicts of interest, the Trustees evaluated the potential for conflicts of interest and considered such matters as the experience and ability of the advisory personnel assigned to the LS Fund; the basis of decisions to buy or sell securities for the LS Fund and/or Prospector’s other accounts; the substance and administration of Prospector’s code of ethics and other relevant policies described in Prospector’s Form ADV, and affiliations and associations of Prospector and its principals. The Board concluded that the foregoing matters were appropriately disclosed and managed by Prospector. With respect to benefits to Prospector (in addition to the fees under the Prospector Agreement), the Board noted that Prospector would benefit from its relationship with the LS Fund as the LS Fund would provide a more diversified investor base and an alternative vehicle in which to place clients with initial investments below the minimum for its private funds. |
Following further consideration and discussion, the Board determined that Prospector’s standards and practices relating to the identification and mitigation of potential conflicts of interest were satisfactory and the benefits to be realized by Prospector from managing the LS Fund were satisfactory.
After additional consideration of the factors delineated in the memorandum provided by counsel and further discussion among the Board members, the Board determined to approve the continuation of the Prospector Agreement between LSA and Prospector.
47
March 9, 2017
FACTS | WHAT DOES VALUED ADVISERS TRUST DO WITH YOUR PERSONAL INFORMATION? | |
Why? | Financial companies choose how they share your personal information. Federal law gives consumers the right to limit some but not all sharing. Federal law also requires us to tell you how we collect, share, and protect your personal information. Please read this notice carefully to understand what we do. | |
What? | The types of personal information we collect and share depend on the product or service you have with us. This information can include: ◾ Social Security number ◾ account balances and account transactions ◾ account transactions, transaction or loss history and purchase history ◾ checking account information and wire transfer instructions When you are no longer our customer, we continue to share your information as described in this notice.
| |
How? | All financial companies need to share customers’ personal information to run their everyday business. In the section below, we list the reasons financial companies can share their customers’ personal information; the reasons Valued Advisers Trust chooses to share; and whether you can limit this sharing.
|
Reasons we can share your personal information | Does Valued Advisers Trust share? | |
For our everyday business purposes — such as to process your transactions, maintain your account(s), respond to court orders and legal investigations, or report to credit bureaus | Yes | |
For our marketing purposes — to offer our products and services to you | Yes | |
For joint marketing with other financial companies | No | |
For our affiliates’ everyday business purposes — information about your transactions and experiences | No | |
For our affiliates’ everyday business purposes — information about your creditworthiness | No | |
For nonaffiliates to market to you | No |
Questions? | Call 1-877-336-6763. |
48
Page 2 |
| Who we are | ||
Who is providing this notice?
| Valued Advisers Trust
| |
What we do
| ||
| How does Valued Advisers Trust protect my personal information? | To protect your personal information from unauthorized access and use, we use security measures that comply with federal law. These measures include computer safeguards and secured files and buildings.
| |
| How does Valued Advisers Trust collect my personal information? | We collect your personal information, for example, when you ◾ open an account or deposit money ◾ buy securities from us or sell securities to us ◾ make deposits or withdrawals from your account or provide account information ◾ give us your account information ◾ make a wire transfer ◾ tell us who receives the money ◾ tell us where to send the money ◾ show your government-issued ID ◾ show your driver’s license
| |
| Why can’t I limit all sharing? | Federal law gives you the right to limit only ◾ sharing for affiliates’ everyday business purposes — information about your creditworthiness ◾ affiliates from using your information to market to you ◾ sharing for nonaffiliates to market to you
State laws and individual companies may give you additional rights to limit sharing.
| |
Definitions
| ||
| Affiliates | Companies related by common ownership or control. They can be financial and nonfinancial companies. | |
| Nonaffiliates | Companies not related by common ownership or control. They can be financial and nonfinancial companies. ◾ Valued Advisers Trust does not share your personal information with nonaffiliates so they can market to you. | |
| Joint marketing | A formal agreement between nonaffiliated financial companies that together market financial products or services to you. ◾ Valued Advisers Trust doesn’t jointly market financial products or services to you. | |
49
PROXY VOTING
A copy of the policies and procedures that the Fund uses to determine how to vote proxies relating to securities held in the Fund’s portfolio, as well as a record of how the Fund voted any such proxies during the most recent twelve month period ended June 30, is available without charge and upon request by (1) calling the Fund at (877) 336-6763 and (2) from Fund documents filed with the Securities and Exchange Commission (“SEC”) on the SEC’s website at www.sec.gov.
TRUSTEES
Andrea N. Mullins, Chairperson
Ira P. Cohen
Mark J. Seger
OFFICERS
Bo J. Howell, Principal Executive Officer and President
Bryan W. Ashmus, Principal Financial Officer and Treasurer
John C. Swhear, Chief Compliance Officer and Vice President
Carol J. Highsmith, Vice President and Secretary
Matthew J. Miller, Vice President
Stephen L. Preston, Anti-Money Laundering Officer
INVESTMENT ADVISOR
Long Short Advisors, LLC
1818 Market Street, 33rd Floor, Suite 3323
Philadelphia, PA 19103
DISTRIBUTOR
Unified Financial Securities, LLC
9465 Counselors Row, Suite 200
Indianapolis, IN 46240
INDEPENDENT REGISTERED PUBLIC ACCOUNTING FIRM
Cohen & Company, Ltd.
1350 Euclid Avenue, Suite 800
Cleveland, OH 44115
LEGAL COUNSEL
The Law Offices of John H. Lively & Associates, Inc.,
A member firm of The 1940 Act Law GroupTM
11300 Tomahawk Creek Parkway, Suite 310
Leawood, KS 66211
CUSTODIAN
U.S. Bank, N.A.
425 Walnut St.
Cincinnati, OH 45202
ADMINISTRATOR, TRANSFER AGENT AND FUND ACCOUNTANT
Ultimus Asset Services, LLC
225 Pictoria Drive, Suite 450
Cincinnati, OH 45246
This report is intended only for the information of shareholders or those who have received the Fund’s prospectus which contains information about the Fund’s management fee and expenses. Please read the prospectus carefully before investing.
Distributed by Unified Financial Securities, LLC
Member FINRA/SIPC
Item 2. Code of Ethics.
As of the end of the period covered by this report, the registrant has adopted a code of ethics that applies to the registrant’s principal executive officer, principal financial officer, principal accounting officer or controller, or persons performing similar functions, regardless of whether these individuals are employed by the registrant or a third party. Pursuant to Item 12(a)(1), a copy of registrant’s code of ethics is filed as an exhibit to this Form N-CSR. During the period covered by this report, the code of ethics has not been amended, and the registrant has not granted any waivers, including implicit waivers, from the provisions of the code of ethics.
Item 3. Audit Committee Financial Expert.
(a)(1) The registrant’s Board of Trustees has determined that the registrant has at least one audit committee financial expert serving on its audit committee.
(a)(2) The audit committee financial expert is Andrea N. Mullins, who is “independent” for purposes of this Item 3 of Form N-CSR.
Item 4. Principal Accountant Fees and Services.
| (a) | Audit Fees |
LS Opportunity Fund: | FY 2017 | $ | 14,000 | |||||
| FY 2016 | $ | 14,000 | ||||||
BFS Equity Fund: | FY 2017 | $ | 13,000 | |||||
| FY 2016 | $ | 13,000 |
| (b) | Audit-Related Fees |
Registrant
LS Opportunity Fund: | FY 2017 | $ | 0 | |||||
| FY 2016 | $ | 0 | ||||||
BFS Equity Fund: | FY 2017 | $ | 0 | |||||
| FY 2016 | $ | 0 |
| (c) | Tax Fees |
Registrant
LS Opportunity Fund: | FY 2017 | $ | 3,000 | |||||
| FY 2016 | $ | 3,000 | ||||||
BFS Equity Fund: | FY 2017 | $ | 3,000 | |||||
| FY 2016 | $ | 3,000 |
Nature of the fees: Preparation of the 1120 RIC and Excise review
| (d) | All Other Fees |
Registrant
LS Opportunity Fund: | FY 2017 | $ | 0 | |||||
| FY 2016 | $ | 0 | ||||||
BFS Equity Fund: | FY 2017 | $ | 0 | |||||
| FY 2016 | $ | 0 |
Nature of the fees: Rule 17f-1 Examination
| (e) | (1) Audit Committee’s Pre-Approval Policies |
The Audit Committee Charter requires the Audit Committee to be responsible for the selection, retention or termination of auditors and, in connection therewith, to (i) evaluate the proposed fees and other compensation, if any, to be paid to the auditors, (ii) evaluate the independence of the auditors, (iii) pre-approve all audit services and, when appropriate, any non-audit services provided by the independent auditors to the Trust, (iv) pre-approve, when appropriate, any non-audit services provided by the independent auditors to the Trust’s investment adviser, or any entity controlling, controlled by, or under common control with the investment adviser and that provides ongoing services to the Trust if the engagement relates directly to the operations and financial reporting of the Trust, and (v) receive the auditors’ specific representations as to their independence;
| (2) | Percentages of Services Approved by the Audit Committee |
Registrant
Audit-Related Fees: | 0 | % | ||
Tax Fees: | 0 | % | ||
All Other Fees: | 0 | % |
(f) During audit of registrant’s financial statements for the most recent fiscal year, less than 50 percent of the hours expended on the principal accountant’s engagement were attributed to work performed by persons other than the principal accountant’s full-time, permanent employees.
(g) The aggregate non-audit fees billed by the registrant’s accountant for services rendered to the registrant, and rendered to the registrant’s investment adviser (not including any sub-adviser whose role is primarily portfolio management and is subcontracted with or overseen by another investment adviser), and any entity controlling, controlled by, or under common control with the adviser that provides ongoing services to the registrant:
| Registrant | Adviser | |||||||
FY 2017 | $ | 6,000 | $ | 0 | ||||
FY 2016 | $ | 6,000 | $ | 0 | ||||
(h) Not applicable. The auditor performed no services for the registrant’s investment adviser or any entity controlling, controlled by, or under common control with the investment adviser that provides ongoing services to the registrant.
Item 5. Audit Committee of Listed Companies. NOT APPLICABLE – applies to listed companies only
Item 6. Schedule of Investments. Schedules filed with Item 1.
Item 7. Disclosure of Proxy Voting Policies and Procedures for Closed-End Management Investment Companies. NOT APPLICABLE – applies to closed-end funds only
Item 8. Portfolio Managers of Closed-End Investment Companies. NOT APPLICABLE – applies to closed-end funds only
Item 9. Purchases of Equity Securities by Closed-End Management Investment Company and Affiliated Purchasers. NOT APPLICABLE – applies to closed-end funds only
Item 10. Submission of Matters to a Vote of Security Holders.
The guidelines applicable to shareholders desiring to submit recommendations for nominees to the Registrant’s board of trustees are contained in the statement of additional information of the Trust with respect to the Fund(s) for which this Form N-CSR is being filed.
Item 11. Controls and Procedures.
(a) Based on their evaluation of the registrant’s disclosure controls and procedures (as defined in Rule 30a-3(c) under the Investment Company Act of 1940, as amended (the “Act”)) as of a date within 90 days of the filing date of this report, the registrant’s principal executive officer and principal financial officer have concluded that such disclosure controls and procedures are reasonably designed and are operating effectively to ensure that material information relating to the registrant is made known to them by others within those entities, particularly during the period in which this report is being prepared, and that the information required in filings on Form N-CSR is recorded, processed, summarized, and reported on a timely basis.
(b) There were no changes in the registrant’s internal control over financial reporting (as defined in Rule 30a-3(d) under the Investment Company Act of 1940) that occurred during the second fiscal quarter of the period covered by this report that have materially affected, or are reasonably likely to materially affect, the registrant’s internal control over financial reporting.
Item 12. Exhibits.
| (a) (1) | Code is filed herewith. | |
| (2) | Certifications by the registrant’s principal executive officer and principal financial officer, pursuant to Section 302 of the Sarbanes- Oxley Act of 2002 and required by Rule 30a-2 under the Investment Company Act of 1940 are filed herewith. | |
| (3) | Not Applicable | |
| (b) | Certification pursuant to 18 U.S.C. Section 1350, as adopted pursuant to Section 906 of the Sarbanes-Oxley Act of 2002 is filed herewith. | |
Pursuant to the requirements of the Securities Exchange Act of 1934 and the Investment Company Act of 1940, the registrant has duly caused this report to be signed on its behalf by the undersigned, thereunto duly authorized.
| (Registrant) | Valued Advisers Trust |
| By | /s/ Bo J. Howell | |
| Bo J. Howell, President and Principal Executive Officer | ||
| Date | 8/03/2017 | |
Pursuant to the requirements of the Securities Exchange Act of 1934 and the Investment Company Act of 1940, this report has been signed below by the following persons on behalf of the registrant and in the capacities and on the dates indicated.
| By | /s/ Bo J. Howell | |
| Bo J. Howell, President and Principal Executive Officer | ||
| Date | 8/03/2017 | |
| By | /s/ Bryan W. Ashmus | |
| Bryan W. Ashmus, Treasurer and Principal Financial Officer | ||
| Date | 8/03/2017 | |