UNITED STATES
SECURITIES AND EXCHANGE COMMISSION
WASHINGTON, D.C. 20549
FORM N-CSR
CERTIFIED SHAREHOLDER REPORT OF REGISTERED
MANAGEMENT INVESTMENT COMPANIES
Investment Company Act file number 811-22208
Valued Advisers Trust
(Exact name of registrant as specified in charter)
| | |
| Ultimus Asset Services, LLC 225 Pictoria Drive, Suite 450 | | Cincinnati, OH 45246 |
| (Address of principal executive offices) | | (Zip code) |
Capitol Services, Inc.
615 S. Dupont Hwy.
Dover, DE 19901
(Name and address of agent for service)
With a copy to:
John H. Lively, Esq.
The Law Offices of John H. Lively & Associates, Inc.
A member firm of The 1940 Act Law GroupTM
11300 Tomahawk Creek Parkway,
Suite 310
Leawood, KS 66221
Registrant’s telephone number, including area code: 513-587-3400
Date of fiscal year end: 10/31
Date of reporting period: 10/31/17
| Item 1. | Reports to Stockholders. |
Annual Report
October 31, 2017
Fund Adviser:
Granite Investment Advisors, LLC
6 Eagle Square, 3rd Floor
Concord, New Hampshire 03301
Toll Free (603) 226-6600
MANAGEMENT’S DISCUSSION OF FUND PERFORMANCE – (Unaudited)
The Fund’s performance for the year ended October 31, 2017 was 16.50% versus the S&P 500 Total Return 23.63%.
The top performing stocks for the last year were:
|
Boeing Co. |
Citigroup |
Apple Inc. |
Berkshire Hathaway Cl. B |
General Motors |
The worst performing stocks for the last year were:
|
Schlumberger |
General Electric |
Mattel, Inc. |
Viacom Inc. – Cl. B |
Southwestern Energy Co. |
On December 15, 2017 the fund will close. We would like to take this opportunity to thank all of the shareholders for their trust and confidence placed in us.
Sincerely,
Scott B. Schermerhorn and Timothy S. Lesko
1
INVESTMENT RESULTS – (Unaudited)
| | | | | | | | | | | | |
Average Annual Total Returns*
(For the periods ended October 31, 2017) | |
| | | One Year | | | Five Year | | | Since Inception
(December 22, 2011) | |
Granite Value Fund | | | 16.50 | % | | | 7.94 | % | | | 8.89 | % |
S&P 500® Index** | | | 23.63 | % | | | 15.18 | % | | | 15.48 | % |
Russell 1000® Value Index** | | | 17.78 | % | | | 13.48 | % | | | 14.15 | % |
Total annual operating expenses, as disclosed in the Granite Value Fund (the “Fund”) prospectus dated February 28, 2017, were 2.88% of average daily net assets (1.36% after fee waivers/expense reimbursements by Granite Investment Advisors, LLC (the “Adviser”). The Adviser has contractually agreed to waive or limit its fees and to assume other expenses of the Fund until February 28, 2018, so that the Total Annual Fund Operating Expenses does not exceed 1.35%. This operating expense limitation does not apply to brokerage fees and commissions, borrowing costs (such as interest and dividend expenses on securities sold short), taxes, 12b-1 fees and extraordinary expenses and indirect expenses (such as “acquired fund fees and expenses”). Additional information pertaining to the Fund’s expense ratios as of October 31, 2017 can be found in the financial highlights.
The performance quoted represents past performance, which does not guarantee future results. The investment return and principal value of an investment will fluctuate so that an investor’s shares, when redeemed, may be worth more or less than their original cost. The returns shown do not reflect deduction of taxes that a shareholder would pay on Fund distributions or the redemption of Fund shares. Current performance of the Fund may be lower or higher than the performance quoted. The Fund’s investment objectives, risks, charges and expenses must be considered carefully before investing. Performance data current to the most recent month end may be obtained by calling 1-603-226-6600.
| * | Return figures reflect any change in price per share and assume the reinvestment of all distributions. The Fund’s returns reflect any fee reductions during the applicable period. If such fee reductions had not occurred, the quoted performance would have been lower. |
| ** | The S&P 500® Index and the Russell 1000® Value Index are widely recognized unmanaged indices of equity securities and are representative of a broader domestic equity market and range of securities than is found in the Fund’s portfolio. Individuals cannot invest directly in an index; however, an individual can invest in exchange traded funds or other investment vehicles that attempt to track the performance of a benchmark index. |
The Fund’s investment objective, strategies, risks, charges and expenses must be considered carefully before investing. The prospectus contains this and other important information about the Fund and may be obtained by calling the same number as above. Please read it carefully before investing.
The Fund is distributed by Unified Financial Securities, LLC, member FINRA/SIPC.
2
INVESTMENT RESULTS – (Unaudited)
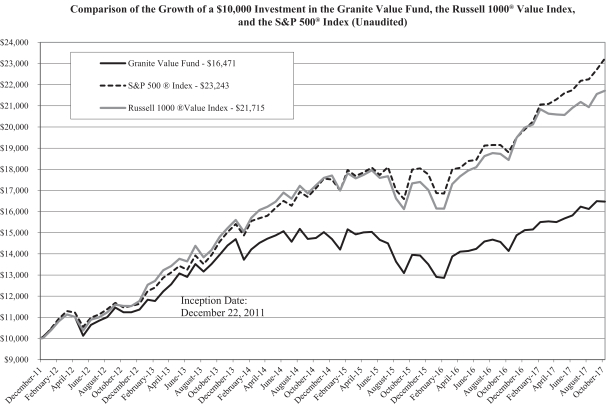
The chart above assumes an initial investment of $10,000 made on December 22, 2011 (commencement of Fund operations) and held through October 31, 2017. The S&P 500® Index and Russell 1000® Value Index are widely recognized unmanaged indices of equity securities and are representative of a broader domestic equity market and range of securities than is found in the Fund’s portfolio. Individuals cannot invest directly in an index; however, an individual can invest in exchange traded funds or other investment vehicles that attempt to track the performance of a benchmark index. THE FUND’S RETURN REPRESENTS PAST PERFORMANCE AND DOES NOT GUARANTEE FUTURE RESULTS. The returns shown do not reflect deduction of taxes that a shareholder would pay on Fund distributions or the redemption of Fund shares. Investment returns and principal values will fluctuate so that your shares, when redeemed, may be worth more or less than their original purchase price.
Current performance may be lower or higher than the performance data quoted. For more information on the Fund, and to obtain performance data current to the most recent month end or to request a prospectus, please call 1-603-226-6600. You should carefully consider the investment objectives, potential risks, management fees, and charges and expenses of the Fund before investing. The Fund’s prospectus contains this and other information about the Fund, and should be read carefully before investing.
The Fund is distributed by Unified Financial Securities, LLC, member FINRA/SIPC.
3
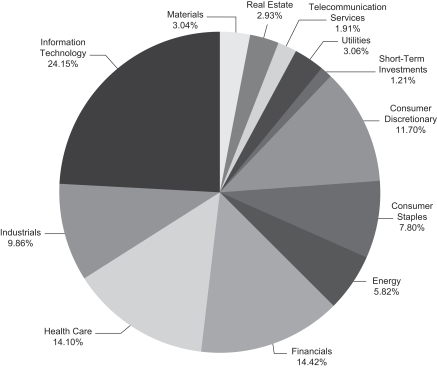
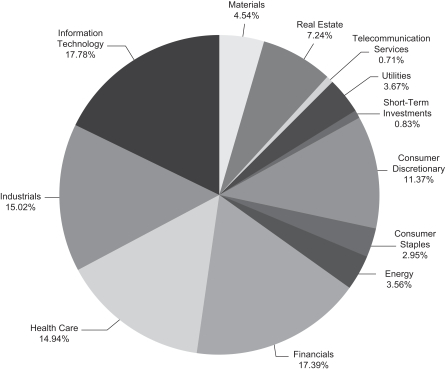
FUND HOLDINGS – (Unaudited)
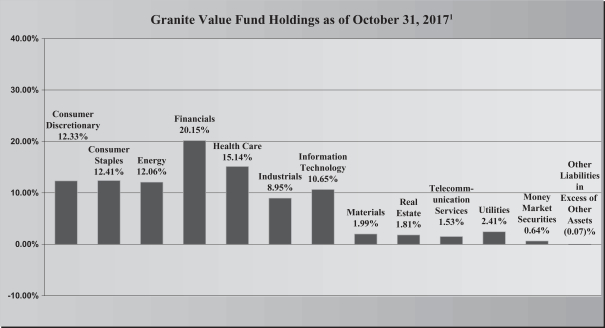
| 1 | As a percentage of net assets. |
The investment objective of the Fund is to seek long-term capital appreciation.
AVAILABILITY OF PORTFOLIO SCHEDULE – (Unaudited)
The Fund files its complete schedule of portfolio holdings with the Securities and Exchange Commission (“SEC”) for the first and third quarters of each fiscal year on Form N-Q. The Fund’s Forms N-Q are available at the SEC’s website at www.sec.gov. The Fund’s Forms N-Q may be reviewed and copied at the SEC’s Public Reference Room in Washington DC. Information on the operation of the Public Reference Room may be obtained by calling 1-800-SEC-0330.
4
GRANITE VALUE FUND
SCHEDULE OF INVESTMENTS
October 31, 2017
| | | | | | | | |
| Common Stocks – 99.43% | | Shares | | | Fair Value | |
Consumer Discretionary – 12.33% | | | | | | | | |
Carnival Corp. | | | 4,145 | | | $ | 275,187 | |
Comcast Corp., Class A | | | 7,350 | | | | 264,820 | |
General Motors Co. | | | 6,965 | | | | 299,356 | |
TJX Cos., Inc./The | | | 2,760 | | | | 192,648 | |
Viacom, Inc., Class B | | | 6,915 | | | | 166,167 | |
Whirlpool Corp. | | | 930 | | | | 152,455 | |
| | | | | | | | |
| | | | | | | 1,350,633 | |
| | | | | | | | |
Consumer Staples – 12.41% | | | | | | | | |
Coca-Cola Co./The | | | 2,365 | | | | 108,743 | |
CVS Health Corp. | | | 2,550 | | | | 174,752 | |
Danone SA ADR | | | 23,575 | | | | 387,573 | |
Unilever PLC ADR | | | 6,840 | | | | 387,486 | |
Wal-Mart Stores, Inc. | | | 3,440 | | | | 300,346 | |
| | | | | | | | |
| | | | | | | 1,358,900 | |
| | | | | | | | |
Energy – 12.06% | | | | | | | | |
Cimarex Energy Co. | | | 1,550 | | | | 181,242 | |
Royal Dutch Shell PLC ADR | | | 6,740 | | | | 440,526 | |
Schlumberger Ltd. | | | 2,755 | | | | 176,320 | |
Southwestern Energy Co. * | | | 23,020 | | | | 127,761 | |
Tenaris SA ADR | | | 7,545 | | | | 205,601 | |
Transocean Ltd. * | | | 17,975 | | | | 188,738 | |
| | | | | | | | |
| | | | | | | 1,320,188 | |
| | | | | | | | |
Financials – 20.15% | | | | | | | | |
Alleghany Corp. * | | | 605 | | | | 342,563 | |
American International Group, Inc. | | | 2,785 | | | | 179,939 | |
Bank of New York Mellon Corp./The | | | 4,260 | | | | 219,177 | |
Berkshire Hathaway, Inc., Class B * | | | 3,120 | | | | 583,253 | |
Brighthouse Financial, Inc. * | | | 3,739 | | | | 232,491 | |
Citigroup, Inc. | | | 6,155 | | | | 452,392 | |
MetLife, Inc. | | | 3,680 | | | | 197,174 | |
| | | | | | | | |
| | | | | | | 2,206,989 | |
| | | | | | | | |
Health Care – 15.14% | | | | | | | | |
Abbott Laboratories | | | 6,305 | | | | 341,920 | |
C.R. Bard, Inc. | | | 600 | | | | 196,242 | |
Gilead Sciences, Inc. | | | 3,210 | | | | 240,622 | |
Johnson & Johnson | | | 1,580 | | | | 220,268 | |
McKesson Corp. | | | 1,810 | | | | 249,563 | |
Merck & Co., Inc. | | | 3,680 | | | | 202,731 | |
UnitedHealth Group, Inc. | | | 980 | | | | 206,016 | |
| | | | | | | | |
| | | | | | | 1,657,362 | |
| | | | | | | | |
See accompanying notes which are an integral part of these financial statements.
5
GRANITE VALUE FUND
SCHEDULE OF INVESTMENTS – (continued)
October 31, 2017
| | | | | | | | |
| Common Stocks – 99.43% – continued | | Shares | | | Fair Value | |
Industrials – 8.95% | | | | | | | | |
Boeing Co./The | | | 855 | | | $ | 220,573 | |
General Electric Co. | | | 7,240 | | | | 145,958 | |
Honeywell International, Inc. | | | 2,095 | | | | 302,015 | |
United Technologies Corp. | | | 2,600 | | | | 311,376 | |
| | | | | | | | |
| | | | | | | 979,922 | |
| | | | | | | | |
Information Technology – 10.65% | | | | | | | | |
Apple, Inc. | | | 2,265 | | | | 382,876 | |
Microsoft Corp. | | | 4,185 | | | | 348,108 | |
Oracle Corp. | | | 8,550 | | | | 435,195 | |
| | | | | | | | |
| | | | | | | 1,166,179 | |
| | | | | | | | |
Materials – 1.99% | | | | | | | | |
Agrium, Inc. | | | 2,000 | | | | 217,840 | |
| | | | | | | | |
Real Estate – 1.81% | | | | | | | | |
Tanger Factory Outlet Centers, Inc. | | | 8,700 | | | | 197,925 | |
| | | | | | | | |
Telecommunication Services – 1.53% | | | | | | | | |
AT&T, Inc. | | | 4,985 | | | | 167,745 | |
| | | | | | | | |
Utilities – 2.41% | | | | | | | | |
Calpine Corp. * | | | 17,675 | | | | 264,064 | |
| | | | | | | | |
| | |
Total Common Stocks (Cost $9,032,135) | | | | | | | 10,887,747 | |
| | | | | | | | |
Money Market Securities – 0.64% | | | | | | | | |
Fidelity Money Market Government Portfolio, Institutional Class, 0.96% (a) | | | 70,667 | | | | 70,667 | |
| | | | | | | | |
Total Money Market Securities (Cost $70,667) | | | | | | | 70,667 | |
| | | | | | | | |
Total Investments – 100.07% (Cost $9,102,802) | | | | | | | 10,958,414 | |
| | | | | | | | |
Liabilities in Excess of Other Assets – (0.07)% | | | | | | | (7,769) | |
| | | | | | | | |
NET ASSETS – 100.00% | | | | | | $ | 10,950,645 | |
| | | | | | | | |
| | (a) | Rate disclosed is the seven day effective yield as of October 31, 2017. |
| | * | Non-income producing security. |
ADR – American Depositary Receipt
The sectors shown on the schedule of investments are based on Global Industry Classification Standard, or GICS® (“GICS”). The GICS was developed by and/or is the exclusive property of MSCI, Inc. and Standard & Poor’s Financial Services LLC (“S&P”). GICS is a service mark of MSCI, Inc. and S&P and has been licensed for use by the Administrator.
See accompanying notes which are an integral part of these financial statements.
6
GRANITE VALUE FUND
STATEMENT OF ASSETS AND LIABILITIES
October 31, 2017
| | | | |
Assets | | | | |
Investments in securities at fair value (cost $9,102,802) | | $ | 10,958,414 | |
Dividends receivable | | | 9,471 | |
Receivable from Adviser | | | 2,790 | |
Prepaid expenses | | | 9,812 | |
| | | | |
Total Assets | | | 10,980,487 | |
| | | | |
Liabilities | | | | |
Payable to Administrator | | | 6,875 | |
Payable to custodian | | | 600 | |
Other accrued expenses | | | 22,367 | |
| | | | |
Total Liabilities | | | 29,842 | |
| | | | |
| |
Net Assets | | $ | 10,950,645 | |
| | | | |
Net Assets consist of: | | | | |
Paid-in capital | | $ | 8,544,038 | |
Accumulated undistributed net investment income | | | 59,507 | |
Accumulated undistributed net realized gain from investments | | | 491,488 | |
Net unrealized appreciation on investments | | | 1,855,612 | |
| | | | |
| |
Net Assets | | $ | 10,950,645 | |
| | | | |
Shares outstanding (unlimited number of shares authorized, no par value) | | | 748,039 | |
| | | | |
Net asset value, offering and redemption price per share (a) | | $ | 14.64 | |
| | | | |
| (a) | The Fund charges a 2.00% redemption fee on shares redeemed in 60 days or less of purchase. Shares are redeemed at the NAV if held longer than 60 calendar days. |
See accompanying notes which are an integral part of these financial statements.
7
GRANITE VALUE FUND
STATEMENT OF OPERATIONS
For the year ended October 31, 2017
| | | | |
Investment Income | | | | |
Dividend income (net of foreign taxes withheld of $4,318) | | $ | 233,908 | |
| | | | |
Total investment income | | | 233,908 | |
| | | | |
| |
Expenses | | | | |
Investment Adviser | | | 104,309 | |
Administration | | | 37,500 | |
Fund accounting | | | 25,000 | |
Transfer agent | | | 20,022 | |
Audit and tax | | | 17,900 | |
Legal | | | 17,165 | |
Registration | | | 15,585 | |
Report printing | | | 10,155 | |
Trustee | | | 6,507 | |
Custodian | | | 3,600 | |
Miscellaneous | | | 28,413 | |
| | | | |
Total expenses | | | 286,156 | |
| | | | |
Fees waived and reimbursed by Adviser | | | (145,209 | ) |
| | | | |
Net operating expenses | | | 140,947 | |
| | | | |
Net investment income | | | 92,961 | |
| | | | |
| |
Net Realized and Unrealized Gain on Investments | | | | |
Net realized gain on investment securities transactions | | | 471,597 | |
Net change in unrealized appreciation of investment securities | | | 1,002,427 | |
| | | | |
Net realized and unrealized gain on investments | | | 1,474,024 | |
| | | | |
Net increase in net assets resulting from operations | | $ | 1,566,985 | |
| | | | |
See accompanying notes which are an integral part of these financial statements.
8
GRANITE VALUE FUND
STATEMENTS OF CHANGES IN NET ASSETS
| | | | | | | | |
| | | For the
Year Ended
October 31, 2017 | | | For the
Year Ended
October 31, 2016 | |
Increase (Decrease) in Net Assets due to: | | | | | | | | |
Operations | | | | | | | | |
Net investment income | | $ | 92,961 | | | $ | 101,076 | |
Net realized gain on investment transactions | | | 471,597 | | | | 384,642 | |
Net change in unrealized appreciation (depreciation) of investments | | | 1,002,427 | | | | (398,113 | ) |
| | | | | | | | |
Net increase in net assets resulting from operations | | | 1,566,985 | | | | 87,605 | |
| | | | | | | | |
Distributions | | | | | | | | |
From net investment income | | | (88,414 | ) | | | (53,723 | ) |
From net realized gains | | | (253,158 | ) | | | – | |
| | | | | | | | |
Total distributions | | | (341,572 | ) | | | (53,723 | ) |
| | | | | | | | |
Capital Transactions | | | | | | | | |
Proceeds from shares sold | | | 510,986 | | | | 591,824 | |
Reinvestment of distributions | | | 286,875 | | | | 44,897 | |
Amount paid for shares redeemed | | | (744,947 | ) | | | (1,719,950 | ) |
| | | | | | | | |
Net increase (decrease) in net assets resulting from capital transactions | | | 52,914 | | | | (1,083,229 | ) |
| | | | | | | | |
Total Increase (Decrease) in Net Assets | | | 1,278,327 | | | | (1,049,347 | ) |
| | | | | | | | |
Net Assets | | | | | | | | |
Beginning of year | | | 9,672,318 | | | | 10,721,665 | |
| | | | | | | | |
End of year | | $ | 10,950,645 | | | $ | 9,672,318 | |
| | | | | | | | |
Accumulated undistributed net investment income included in net assets at end of period | | $ | 59,507 | | | $ | 74,852 | |
| | | | | | | | |
Share Transactions | | | | | | | | |
Shares sold | | | 36,644 | | | | 45,877 | |
Shares issued in reinvestment of distributions | | | 21,172 | | | | 3,558 | |
Shares redeemed | | | (53,872 | ) | | | (136,304 | ) |
| | | | | | | | |
Net increase (decrease) in shares outstanding | | | 3,944 | | | | (86,869 | ) |
| | | | | | | | |
See accompanying notes which are an integral part of these financial statements.
9
GRANITE VALUE FUND
FINANCIAL HIGHLIGHTS
(For a share outstanding during each year)
| | | | | | | | | | | | | | | | | | | | |
| | | For the
Year Ended
October 31,
2017 | | | For the
Year Ended
October 31,
2016 | | | For the
Year Ended
October 31,
2015 | | | For the
Year Ended
October 31,
2014 | | | For the
Year Ended
October 31,
2013 | |
Selected Per Share Data: | | | | | | | | | | | | | | | | | | | | |
Net asset value, beginning of year | | $ | 13.00 | | | $ | 12.90 | | | $ | 14.22 | | | $ | 13.84 | | | $ | 11.24 | |
| | | | | | | | | | | | | | | | | | | | |
Investment operations: | | | | | | | | | | | | | | | | | | | | |
Net investment income | | | 0.13 | | | | 0.14 | | | | 0.05 | | | | 0.02 | | | | 0.02 | |
Net realized and unrealized gain (loss) on investments | | | 1.98 | | | | 0.03 | (a) | | | (0.80 | ) | | | 0.74 | | | | 2.68 | |
| | | | | | | | | | | | | | | | | | | | |
Total from investment operations | | | 2.11 | | | | 0.17 | | | | (0.75 | ) | | | 0.76 | | | | 2.70 | |
| | | | | | | | | | | | | | | | | | | | |
Less distributions to shareholders from: | | | | | | | | | | | | | | | | | | | | |
Net investment income | | | (0.12 | ) | | | (0.07 | ) | | | (0.03 | ) | | | (0.02 | ) | | | (0.10 | ) |
Net realized gains | | | (0.35 | ) | | | – | | | | (0.54 | ) | | | (0.36 | ) | | | – | |
| | | | | | | | | | | | | | | | | | | | |
Total distributions | | | (0.47 | ) | | | (0.07 | ) | | | (0.57 | ) | | | (0.38 | ) | | | (0.10 | ) |
| | | | | | | | | | | | | | | | | | | | |
Paid in capital from redemption fees | | | – | | | | – | | | | – | | | | – | (b) | | | – | |
| | | | | | | | | | | | | | | | | | | | |
Net asset value, end of year | | $ | 14.64 | | | $ | 13.00 | | | $ | 12.90 | | | $ | 14.22 | | | $ | 13.84 | |
| | | | | | | | | | | | | | | | | | | | |
| | | | | |
Total Return (c) | | | 16.50 | % | | | 1.30 | % | | | -5.37 | % | | | 5.65 | % | | | 24.21 | % |
Ratios and Supplemental Data: | | | | | | | | | | | | | | | | | | | | |
Net assets, end of year (000) | | $ | 10,951 | | | $ | 9,672 | | | $ | 10,722 | | | $ | 13,212 | | | $ | 10,577 | |
Ratio of net expenses to average net assets | | | 1.35 | % | | | 1.35 | % | | | 1.36 | %(d) | | | 1.35 | % | | | 1.35 | % |
Ratio of expenses to average net assets before waiver and reimbursement | | | 2.74 | % | | | 2.87 | % | | | 2.53 | % | | | 2.39 | % | | | 3.32 | % |
Ratio of net investment income to average net assets | | | 0.89 | % | | | 1.02 | % | | | 0.40 | % | | | 0.17 | % | | | 0.27 | % |
Portfolio turnover rate | | | 17 | % | | | 31 | % | | | 32 | % | | | 30 | % | | | 33 | % |
| (a) | The amount shown for a share outstanding throughout the period does not accord with the change in aggregate gains and losses in the portfolio of securities during the period because of the timing of sales and purchases of fund shares in relation to fluctuating market values during the period. |
| (b) | Resulted in less than $0.005 per share. |
| (c) | Total return in the above table represents the rate that the investor would have earned or lost on an investment in the Fund, assuming reinvestment of distributions. |
| (d) | Includes 0.01% overdraft fees. |
See accompanying notes which are an integral part of these financial statements.
10
GRANITE VALUE FUND
NOTES TO THE FINANCIAL STATEMENTS
October 31, 2017
NOTE 1. ORGANIZATION
The Granite Value Fund (the “Fund”) is an open-end diversified series of Valued Advisers Trust (the “Trust”). The Trust is a management investment company established under the laws of Delaware by an Agreement and Declaration of Trust dated June 13, 2008 (the “Trust Agreement”). The Trust Agreement permits the Board of Trustees (the “Board”) to issue an unlimited number of shares of beneficial interest of separate series without par value. The Fund is one of a series of funds authorized by the Board. The Fund commenced operations December 22, 2011. The Fund’s investment adviser is Granite Investment Advisors, LLC. (the “Adviser”). The investment objective of the Fund is to seek long-term capital appreciation. The Fund liquidated effective December 15, 2017.
NOTE 2. SIGNIFICANT ACCOUNTING POLICIES
The Fund is an investment company and follows accounting and reporting guidance under Financial Accounting Standards Board Accounting Standards Codification Topic 946, “Financial Services-Investment Companies”. The following is a summary of significant accounting policies followed by the Fund in the preparation of its financial statements. These policies are in conformity with generally accepted accounting principles in the United States of America (“GAAP”).
Estimates – The preparation of financial statements in conformity with GAAP requires management to make estimates and assumptions that affect the reported amounts of assets and liabilities and disclosure of contingent assets and liabilities at the date of the financial statements and the reported amounts of increases and decreases in net assets from operations during the reporting period. Actual results could differ from those estimates.
Securities Valuation – All investments in securities are recorded at their estimated fair value as described in Note 3.
Federal Income Taxes – The Fund makes no provision for federal income or excise tax. The Fund has qualified and intends to qualify each year as a regulated investment company (“RIC”) under subchapter M of the Internal Revenue Code of 1986, as amended, by complying with the requirements applicable to RICs and by distributing substantially all of its taxable income. The Fund also intends to distribute sufficient net investment income and net capital gains, if any, so that it will not be subject to excise tax on undistributed income and gains. If the required amount of net investment income or gains is not distributed, the Fund could incur a tax expense.
As of and during the fiscal year ended October 31, 2017, the Fund did not have a liability for any unrecognized tax benefits. The Fund recognizes interest and penalties, if any, related to unrecognized tax benefits as income tax expense in the Statement of Operations, when incurred. During the fiscal year ended October 31, 2017, the Fund did not incur any interest or penalties.
Expenses – Expenses incurred by the Trust that do not relate to a specific fund of the Trust are allocated to the individual funds based on each fund’s relative net assets or other appropriate basis (as determined by the Board).
Security Transactions and Related Income – The Fund follows industry practice and records security transactions on the trade date for financial reporting purposes. For financial statement and income tax purposes, the specific identification method is used for determining gains or losses. Dividend income is recorded on the ex-dividend date and interest income is recorded on an accrual basis. Discounts and premiums on securities purchased are accreted or amortized using the effective interest method, if applicable. Withholding taxes on foreign dividends have been provided for in accordance with the Fund’s understanding of the applicable country’s tax rules and rates.
11
GRANITE VALUE FUND
NOTES TO THE FINANCIAL STATEMENTS – (continued)
October 31, 2017
NOTE 2. SIGNIFICANT ACCOUNTING POLICIES – continued
Redemption Fees – The Fund charges a 2.00% redemption fee for shares redeemed within 60 days. These fees are deducted from the redemption proceeds otherwise payable to the shareholder. The Fund will retain the fee charged as an increase in paid-in capital and such fees become part of the Fund’s daily net asset value (“NAV”) calculation.
Dividends and Distributions – The Fund intends to distribute its net investment income and net realized long-term and short-term capital gains, if any, at least annually. Dividends and distributions to shareholders, which are determined in accordance with income tax regulations, are recorded on the ex-dividend date. The treatment for financial reporting purposes of distributions made to shareholders during the period from net investment income or net realized capital gains may differ from their ultimate treatment for federal income tax purposes. These differences are caused primarily by differences in the timing of the recognition of certain components of income, expense or realized capital gain for federal income tax purposes. Where such differences are permanent in nature, they are reclassified in the components of net assets based on their ultimate characterization for federal income tax purposes. Any such reclassifications will have no effect on net assets, results of operations or net asset values per share of the Fund. For fiscal year ended October 31, 2017, the Fund made the following reclassifications to increase (decrease) the components of net assets:
| | |
Accumulated Undistributed
Net Investment Income (loss) | | Accumulated Net Realized
Gain (Loss) from Investments |
$(19,892) | | $19,892 |
NOTE 3. SECURITIES VALUATION AND FAIR VALUE MEASUREMENTS
Fair value is defined as the price that the Fund would receive upon selling an investment in an orderly transaction to an independent buyer in the principal or most advantageous market of the investment. GAAP establishes a three-tier hierarchy to maximize the use of observable market data and minimize the use of unobservable inputs and establish classification of fair value measurements for disclosure purposes.
Inputs refer broadly to the assumptions that market participants would use in pricing the asset or liability, including assumptions about risk, for example, the risk inherent in a particular valuation technique used to measure fair value including a pricing model and/or the risk inherent in the inputs to the valuation technique. Inputs may be observable or unobservable. Observable inputs are inputs that reflect the assumptions market participants would use in pricing the asset or liability developed based on market data obtained from sources independent of the reporting entity. Unobservable inputs are inputs that reflect the reporting entity’s own assumptions about the assumptions market participants would use in pricing the asset or liability developed based on the best information available in the circumstances. Various inputs are used in determining the value of the Fund’s investments. These inputs are summarized in the three broad levels listed below.
| | • | | Level 1 – unadjusted quoted prices in active markets for identical investments and/or registered investment companies where the value per share is determined and published and is the basis for current transactions for identical assets or liabilities at the valuation date |
| | • | | Level 2 – other significant observable inputs (including, but not limited to, quoted prices for an identical security in an inactive market, quoted prices for similar securities, interest rates, prepayment speeds, credit risk, etc.) |
| | • | | Level 3 – significant unobservable inputs (including the Fund’s own assumptions in determining fair value of investments based on the best information available) |
12
GRANITE VALUE FUND
NOTES TO THE FINANCIAL STATEMENTS – (continued)
October 31, 2017
NOTE 3. SECURITIES VALUATION AND FAIR VALUE MEASUREMENTS – continued
The inputs used to measure fair value may fall into different levels of the fair value hierarchy. In such cases, for disclosure purposes, the level in the fair value hierarchy within which the fair value measurement falls in its entirety, is determined based on the lowest level input that is significant to the fair value measurement in its entirety.
Equity securities, including common stocks, that are traded on any stock exchange are generally valued at the last quoted sale price on the security’s primary exchange. Lacking a last sale price, an exchange traded security is generally valued at its last bid price. Securities traded in the NASDAQ over-the-counter market are generally valued by the pricing agent at the NASDAQ Official Closing Price. When using the market quotations and when the market is considered active, the security is classified as a Level 1 security. In the event that market quotations are not readily available or are considered unreliable due to market or other events, the Fund values its securities and other assets at fair value in accordance with policies established by and under the general supervision of the Board. Under these policies, the securities will be classified as Level 2 or 3 within the fair value hierarchy, depending on the inputs used.
Investments in mutual funds, including money market mutual funds, are generally priced at the ending NAV. These securities are categorized as Level 1 securities.
In accordance with the Trust’s valuation policies, the Adviser is required to consider all appropriate factors relevant to the value of securities for which it has determined other pricing sources are not available or reliable as described above. No single method exists for determining fair value, because fair value depends upon the circumstances of each individual case. As a general principle, the current fair value of a security being valued by the Adviser would be the amount which the Fund might reasonably expect to receive upon the current sale. Methods which are in accordance with this principle may, for example, be based on (i) a multiple of earnings; (ii) a discount from market of a similar freely traded security (including a derivative security or a basket of securities traded on other markets, exchanges or among dealers); or (iii) yield to maturity with respect to debt issues, or a combination of these and other methods. Fair value pricing is permitted if, in the Adviser’s opinion, the validity of market quotations appears to be questionable based on factors such as evidence of a thin market in the security based on a small number of quotations, a significant event occurs after the close of a market but before the Fund’s NAV calculation that may affect a security’s value, or the Adviser is aware of any other data that calls into question the reliability of market quotations.
The following is a summary of the inputs used to value the Fund’s investments as of October 31, 2017:
| | | | | | | | | | | | | | | | |
| | | Valuation Inputs | | | | |
| Assets | | Level 1 | | | Level 2 | | | Level 3 | | | Total | |
Common Stocks* | | $ | 10,887,747 | | | $ | – | | | $ | – | | | $ | 10,887,747 | |
Money Market Securities | | | 70,667 | | | | – | | | | – | | | | 70,667 | |
Total | | $ | 10,958,414 | | | $ | – | | | $ | – | | | $ | 10,958,414 | |
| * | Refer to the Schedule of Investments for sector classifications. |
The Fund did not hold any investments at the end of the reporting period in which significant unobservable inputs were used in determining fair value; therefore, no reconciliation of Level 3 securities is included for this reporting period. The Trust recognizes transfers between fair value hierarchy levels at the end of the reporting period. There were no transfers between any levels as of October 31, 2017 based on input levels assigned at October 31, 2016.
13
GRANITE VALUE FUND
NOTES TO THE FINANCIAL STATEMENTS – (continued)
October 31, 2017
NOTE 4. FEES AND OTHER TRANSACTIONS WITH AFFILIATES
Under the terms of the management agreement, on behalf of the Fund, the Adviser manages the Fund’s investments subject to oversight of the Board. As compensation for its management services, the Fund is obligated to pay the Adviser a fee computed and accrued daily and paid monthly at an annual rate of 1.00% of the average daily net assets of the Fund. For the fiscal year ended October 31, 2017, the Adviser earned a fee of $104,309 from the Fund before the reimbursement described below.
The Adviser has contractually agreed to waive its management fee and/or reimburse expenses through February 28, 2018, so that total annual fund operating expenses, excluding interest, taxes, brokerage commissions, other expenditures which are capitalized in accordance with GAAP, other extraordinary expenses not incurred in the ordinary course of the Fund’s business, dividend expense on short sales, and expenses that the Fund has incurred but did not actually pay because of an expense offset arrangement, if applicable, incurred by the Fund in any fiscal year, do not exceed 1.35% of the Fund’s average daily net assets. The operating expense limitation also excludes any fees and expenses of acquired funds.
Each fee waiver and expense reimbursement is subject to repayment by the Fund in the three fiscal years following the date the particular expense payment occurred, provided such reimbursement can be achieved without exceeding the expense limitation that was in effect at the time of the expense payment or the reimbursement. As of October 31, 2017, the Adviser may seek repayment of investment advisory fees waived and expense reimbursements in the amount of $444,003 from the Fund no later than October 31, 2020.
The Trust retains Ultimus Asset Services, LLC (the “Administrator”) to provide the Fund with administration and compliance, fund accounting, and transfer agent services, including all regulatory reporting. For the fiscal year ended October 31, 2017, the Administrator earned fees of $37,500 for administration services, $25,000 for fund accounting services and $20,022 for transfer agent services. At October 31, 2017, the Fund owed the Administrator $6,875 for such services.
The officers and one trustee of the Trust are members of management and/or employees of the Administrator. Unified Financial Securities, LLC (the “Distributor”) acts as the principal distributor of the Fund’s shares.
The Fund has adopted a 12b-1 Plan that permits the Fund to pay 0.25% of its average daily net assets to financial institutions that provide distribution and/or shareholder servicing. The 12b-1 Plan has not been activated as of October 31, 2017.
NOTE 5. PURCHASES AND SALES
For the fiscal year ended October 31, 2017, purchases and sales of investment securities, other than short-term investments and U.S. government obligations, were as follows:
| | | | |
Purchases | | $ | 1,808,517 | |
Sales | | $ | 1,892,194 | |
There were no purchases or sales of long-term U.S. government obligations during the fiscal year ended October 31, 2017.
14
GRANITE VALUE FUND
NOTES TO THE FINANCIAL STATEMENTS – (continued)
October 31, 2017
NOTE 6. BENEFICIAL OWNERSHIP
The beneficial ownership, either directly or indirectly, of more than 25% of the voting securities of a fund creates a presumption of control of a fund, under Section 2(a) (9) of the Investment Company Act of 1940. At October 31, 2017, Charles Schwab & Co., Inc. for the benefit of its customers, owned 49.23%.
NOTE 7. FEDERAL TAX INFORMATION
At October 31, 2017, the net unrealized appreciation (depreciation) of investments for tax purposes was as follows:
| | | | |
Gross appreciation | | $ | 2,353,209 | |
Gross depreciation | | | (497,603 | ) |
| | | | |
Net appreciation on investments | | $ | 1,855,606 | |
| | | | |
At October 31, 2017, the aggregate cost of securities for federal income tax purposes was $9,102,808. At October 31, 2017, the difference between book basis and tax basis unrealized appreciation (depreciation) is attributable to the tax deferral of gains on wash sales.
On November 29, 2017 the Fund paid an income distribution of $0.09006 per share, short-term capital gain of $0.005277 per share, and a long-term capital gain of $3.154998 per share to shareholders of record on November 28, 2017.
The tax characterization of distributions for the fiscal year ended October 31, 2017 and 2016, was as follows:
| | | | | | | | |
| | | 2017 | | | 2016 | |
Distributions paid from: | | | | | | | | |
Ordinary Income* | | $ | 88,341 | | | $ | 53,723 | |
Long-Term Capital Gains | | $ | 253,231 | | | $ | – | |
| | | | | | | | |
Total Distributions | | $ | 341,572 | | | $ | 53,723 | |
| | | | | | | | |
| * | Short-term capital gain distributions are treated as ordinary income for tax purposes. |
At October 31, 2017, the components of distributable earnings (accumulated losses) on a tax basis were as follows:
| | | | |
Undistributed ordinary income | | $ | 65,634 | |
Undistributed long-term capital gain | | | 487,653 | |
Accumulated capital and other losses | | | (2,286 | ) |
Net unrealized appreciation | | | 1,855,606 | |
| | | | |
| | $ | 2,406,607 | |
| | | | |
15
GRANITE VALUE FUND
NOTES TO THE FINANCIAL STATEMENTS – (continued)
October 31, 2017
NOTE 8. COMMITMENTS AND CONTINGENCIES
The Fund indemnifies its officers and trustees for certain liabilities that may arise from their performance of their duties to the Fund. Additionally, in the normal course of business, the Fund enters into contracts that contain a variety of representations and warranties which provide general indemnifications. The Fund’s maximum exposure under these arrangements is unknown, as this would involve future claims that may be made against the Fund that have not yet occurred.
NOTE 9. SUBSEQUENT EVENTS
The Board has determined to liquidate the Fund and to cease operations of the Fund due to the Adviser’s business decision that it no longer is economically feasible to continue managing the Fund because of the Fund’s small size and the difficulty encountered in attracting and maintaining assets. The Fund is no longer accepting purchase orders for its shares and it will close effective as of December 15, 2017.
16
REPORT OF INDEPENDENT
REGISTERED PUBLIC ACCOUNTING FIRM
To the Shareholders of Granite Value Fund and
Board of Trustees of Valued Advisers Trust
We have audited the accompanying statement of assets and liabilities, including the schedule of investments, of Granite Value Fund (the “Fund”), a series of Valued Advisers Trust, as of October 31, 2017, and the related statement of operations for the year then ended, the statements of changes in net assets for each of the two years in the period then ended, and the financial highlights for each of the five periods in the period then ended. These financial statements and financial highlights are the responsibility of the Fund’s management. Our responsibility is to express an opinion on these financial statements and financial highlights based on our audits.
We conducted our audits in accordance with the standards of the Public Company Accounting Oversight Board (United States). Those standards require that we plan and perform the audit to obtain reasonable assurance about whether the financial statements and financial highlights are free of material misstatement. An audit includes examining, on a test basis, evidence supporting the amounts and disclosures in the financial statements. Our procedures included confirmation of securities owned as of October 31, 2017, by correspondence with the custodian. An audit also includes assessing the accounting principles used and significant estimates made by management, as well as evaluating the overall financial statement presentation. We believe that our audits provide a reasonable basis for our opinion.
In our opinion, the financial statements and financial highlights referred to above present fairly, in all material respects, the financial position of Granite Value Fund as of October 31, 2017, the results of its operations for the year then ended, the changes in its net assets for each of the two years in the period then ended, and the financial highlights for each of the five periods in the period then ended, in conformity with accounting principles generally accepted in the United States of America.
Subsequent to October 31, 2017, the Board of Trustees of Valued Advisers Trust approved the liquidation of Granite Value Fund, as disclosed in Note 9 to the financial statements.
COHEN & COMPANY, LTD.
Cleveland, Ohio
December 27, 2017
17
SUMMARY OF FUND EXPENSES – (Unaudited)
As a shareholder of the Fund, you incur two types of costs: (1) transaction and (2) ongoing costs, including management fees, distribution and service (12b-1) fees and other Fund expenses. These Examples are intended to help you understand your ongoing costs (in dollars) of investing in the Fund and to compare these costs with the ongoing costs of investing in other mutual funds.
The Example is based on an investment of $1,000 invested at the beginning of the period and held for the entire period from May 1, 2017 through October 31, 2017.
Actual Expenses
The first line of the table below provides information about actual account values and actual expenses. You may use the information in this line, together with the amount you invested, to estimate the expenses that you paid over the period. Simply divide your account value by $1,000 (for example, an $8,600 account value divided by $1,000 = 8.60), then multiply the result by the number in the first line under the heading entitled “Expenses Paid During Period” to estimate the expenses you paid on your account during this period.
Hypothetical Example for Comparison Purposes
The second line of the table below provides information about hypothetical account values and hypothetical expenses based on the Fund’s actual expense ratio and an assumed rate of return of 5% per year before expenses, which is not the Fund’s actual return. The hypothetical account values and expenses may not be used to estimate the actual ending account balance or expenses you paid for the period. You may use this information to compare the ongoing costs of investing in the Fund and other funds. To do so, compare this 5% hypothetical example with the 5% hypothetical examples that appear in the shareholder reports of the other funds.
Please note that the expenses shown in the table are meant to highlight your ongoing costs only. Therefore, the second line of the table below is useful in comparing ongoing costs only and will not help you determine the relative costs of owning different funds.
| | | | | | | | | | | | |
| Granite Value Fund | | Beginning
Account Value May 1, 2017 | | | Ending Account Value October 31, 2017 | | | Expenses Paid
During Period* May 1, 2017 – October 31, 2017 | |
Actual | | $ | 1,000.00 | | | $ | 1,024.65 | | | $ | 6.89 | |
Hypothetical** | | $ | 1,000.00 | | | $ | 1,018.40 | | | $ | 6.87 | |
| * | Expenses are equal to the Fund’s annualized expense ratio of 1.35%, multiplied by the average account value over the period, multiplied by 184/365 (to reflect the one-half year period). |
| ** | Assumes a 5% return before expenses. |
18
TRUSTEES AND OFFICERS (Unaudited)
The Board of Trustees supervises the business activities of the Trust. Each Trustee serves as a trustee until termination of the Trust unless the Trustee dies, resigns, retires or is removed.
The following table provides information regarding each of the independent trustees.
| | | | |
Name, Address*, Age, Position with Trust**, Term
of Position with Trust | | Principal Occupation During Past 5 Years
and Other Directorships | | Other Directorships |
Andrea N. Mullins, 50 Independent Trustee Since December 2013 Chairperson since March 2017 | | Current: Private investor; Independent Contractor, SWM Wealth Management, LLC (since April 2014). | | None. |
Ira Cohen, 58 Independent Trustee Since June 2010 | | Current: Independent financial services consultant (since February 2005); Executive Vice President of Asset Management Services, Recognos Financial (since August 2015). | | Trustee, Griffin Institutional Access Credit Fund (since January 2017); Trustee and Audit Committee Chairman, Griffin Institutional Real Estate Access Fund (since May 2014); Trustee, Chairman, and Nominating and Governance Committee Chairman, Angel Oak Strategic Credit Fund (since December 2017). |
| * | The address for each trustee and officer is 225 Pictoria Drive, Suite 450, Cincinnati, Ohio 45246. |
| ** | As of the date of this report, the Trust consists of 13 series. |
The following table provides information regarding the Trustee who is considered an “interested person” of the Trust, as that term is defined under the 1940 Act. Based on the experience of the Trustee, the Trust concluded that the individual described below should serve as a Trustee.
| | | | |
Name, Address*, Age, Position with Trust**, Term
of Position with Trust | | Principal Occupation During Past 5 Years | | Other Directorships |
Mark J. Seger, 55 Trustee Since March 2017 | | Current: President, Managing Director, and Co-Founder, Ultimus Fund Solutions, LLC (since 1999); Treasurer and Managing Director, Ultimus Fund Distributors, LLC (since 1999); President and Managing Director, Ultimus Asset Services, LLC (since 2016). | | None. |
| * | The address for each trustee and officer is 225 Pictoria Drive, Suite 450, Cincinnati, Ohio 45246. |
| ** | As of the date of this report, the Trust consists of 13 series. |
19
The following table provides information regarding the officers of the Trust:
| | | | |
Name, Address*, Age, Position with Trust,**, Term
of Position with Trust | | Principal Occupation During Past 5 Years | | Other Directorships |
Bo J. Howell, 36 Principal Executive Officer and President Since March 2017 | | Current: Vice President, Director of Fund Administration, Ultimus Fund Solutions, LLC (since 2014). Previous: Counsel, Securities and Mutual Funds, Western & Southern Financial Group (2012 – 2014). | | None. |
Brandon R. Kipp, 34 Chief Compliance Officer Since October 2017 | | Current: Senior Fund Compliance Officer, Ultimus Fund Solutions, LLC (since July 2017). Previous: Assistant Vice President and Compliance Manager, UMB Fund Services, Inc. (March 2014 to July 2017); Officer and Lead Fund Administrator, UMB Fund Services, Inc. (May 2012 to March 2014). | | None. |
Carol J. Highsmith, 53 Vice President Since August 2008 Secretary Since March 2014 | | Current: Assistant Vice President, Ultimus Fund Solutions, LLC (since December 2015). Previous: Employed in various positions with Huntington Asset Services, Inc. (n/k/a Ultimus Asset Services, LLC) (November 1994 to December 2015), most recently Vice President of Legal Administration (2005 to December 2015). | | None. |
Matthew J. Miller, 41 Vice President Since December 2011 | | Current: Assistant Vice President, Relationship Management, Ultimus Fund Solutions, LLC (since December 2015). Previous: Employed in various positions with Huntington Asset Services, Inc. (n/k/a Ultimus Asset Services, LLC) (July 1998 to December 2015), most recently Vice President of Relationship Management (2005 to December 2015). | | None. |
| * | The address for each trustee and officer is 225 Pictoria Drive, Suite 450, Cincinnati, Ohio 45246. |
| ** | As of the date of this report, the Trust consists of 13 series. |
20
| | | | |
Name, Address*, Age, Position with Trust,**, Term
of Position with Trust | | Principal Occupation During Past 5 Years | | Other Directorships |
| Bryan W. Ashmus, 44 Principal Financial Officer and Treasurer Since December 2013 | | Current: Vice President and Director of Financial Administration, Ultimus Fund Solutions, LLC (since December 2015). Previous: Vice President and Manager of Financial Administration, Huntington Asset Services, Inc. (n/k/a Ultimus Asset Services, LLC) (September 2013 to December 2015); Vice President, Fund Administration, Citi Fund Services Ohio, Inc. (from May 2005 to September 2013). | | None. |
| Stephen L. Preston, 50 AML Officer since June 2017 | | Current: Chief Compliance Officer, Ultimus Fund Solutions, LLC (since June 2011); Chief Compliance Officer, Ultimus Fund Distributors, LLC (since June 2011). | | None. |
| * | The address for each trustee and officer is 225 Pictoria Drive, Suite 450, Cincinnati, Ohio 45246. |
| ** | As of the date of this report, the Trust consists of 13 series. |
OTHER INFORMATION (Unaudited)
The Fund’s Statement of Additional Information (“SAI”) includes additional information about the trustees and is available without charge, upon request. You may call toll-free at (603) 226-6600 to request a copy of the SAI or to make shareholder inquiries.
21
APPROVAL OF INVESTMENT ADVISORY AGREEMENT (Unaudited)
At a meeting held on June 8, 2017, the Board of Trustees (the “Board”) considered the renewal of the Investment Advisory Agreement (the “Granite Agreement”) between Valued Advisers Trust (the “Trust”) and Granite Investment Advisors, LLC (“Granite”) with respect to the Granite Value Fund (the “Granite Fund”). Granite provided written information to the Board to assist the Board in its considerations.
The Board discussed the contractual arrangements between Granite and the Trust for the Granite Fund. They reflected upon the Board’s prior experience with Granite in managing the Granite Fund, as well as their earlier discussions with Granite.
Counsel then directed the Trustees to a memorandum from his firm that summarized, among other things, the fiduciary duties and responsibilities of the Board in reviewing and approving the Granite Agreement. In assessing the factors and reaching its decision, the Board took into consideration information furnished by Granite and the Trust’s other service providers for the Board’s review and consideration throughout the year, as well as information specifically prepared or presented in connection with the renewal process, including: (i) reports regarding the services and support provided to the Granite Fund by Granite; (ii) quarterly assessments of the investment performance of the Granite Fund; (iii) commentary on the reasons for the performance; (iv) presentations by Granite addressing its investment philosophy, investment strategy, personnel, and operations of Granite; (v) compliance and audit reports concerning the Granite Fund and Granite; (vi) disclosure information contained in the registration statement of the Trust for the Granite Fund and Granite’s Form ADV; and (vii) a memorandum from counsel, that summarized the fiduciary duties and responsibilities of the Board in reviewing and approving the Granite Agreement. The Board also requested and received materials including, without limitation: (a) documents containing information about Granite, including its financial information; a description of its personnel and the services it provides to the Granite Fund; information on Granite’s investment advice and performance; summaries of the Granite Fund’s expenses, compliance program, current legal matters, and other general information; (b) comparative expense and performance information for other mutual funds with strategies similar to the Granite Fund; and (c) the benefits to be realized by Granite from its relationship with the Granite Fund. The Board did not identify any particular information that was most relevant to its consideration to approve the Granite Agreement and each Trustee may have afforded different weight to the various factors.
| 1. | The nature, extent, and quality of the services to be provided by Granite. In this regard, the Board considered Granite’s responsibilities under the Granite Agreement. The Trustees considered the services being provided by Granite to the Granite Fund including, without limitation: the quality of its investment advisory services (including research and recommendations with respect to portfolio securities), its process for formulating investment recommendations and assuring compliance with the Granite Fund’s investment objectives and limitations, Granite’s coordination of services for the Granite Fund among the Granite Fund’s service providers, and Granite’s efforts to promote the Granite Fund and grow its assets. The Trustees considered Granite’s continuity of, and commitment to retain, qualified personnel and Granite’s commitment to maintain its resources and systems and options that allow the Granite Fund to maintain its goals, and Granite’s continued cooperation with the Independent Trustees and Counsel for the Granite Fund. The Trustees considered Granite’s methods of operation and its personnel, including their education and experience; and Granite’s compliance program, policies, and procedures. The Trustees considered Granite’s efforts to engage an outside marketing firm. After considering the foregoing information and further information in the Meeting materials provided by Granite, the Board concluded that, in light of all the facts and circumstances, the nature, extent, and quality of the services provided by Granite to the Granite Fund were satisfactory and adequate. |
| 2. | Investment Performance of the Granite Fund and Granite. In considering the investment performance of the Granite Fund and Granite, the Trustees compared the performance, including the year-to-date, 1-year, 3-year, 5-year, and since inception annualized returns of the Granite Fund (for the periods ending March 31, 2017) with the performance of funds in the same Morningstar category, and with the performance of the Granite Fund’s benchmark. The Trustees also considered the consistency of Granite’s management of the Granite Fund with its investment objective, strategies, and limitations. The Trustees noted that the Granite Fund’s performance for all periods was below the category average and median, and was below the performance of the benchmark. The Trustees also considered the |
22
| | performance of Granite’s separate accounts that were managed in a manner similar to that of the Granite Fund and they noted that the performance was relatively comparable and that Granite’s explanations for the differences in performance were acceptable. The Trustees took into consideration discussions with a representative of Granite regarding the reasons for the performance of the Granite Fund. After reviewing and discussing the investment performance of the Granite Fund further, Granite’s experience managing the Granite Fund, the Granite Fund’s historical performance, and other relevant factors, the Board concluded, in light of all the facts and circumstances, that the investment performance of the Granite Fund and Granite was satisfactory. |
| 3. | The costs of the services to be provided and profits to be realized by Granite from the relationship with the Granite Fund. In considering the costs of services to be provided and the profits to be realized by Granite from the relationship with the Granite Fund, the Trustees considered: (1) Granite’s financial condition; (2) the asset levels of the Granite Fund; (3) the overall expenses of the Granite Fund; and (4) the nature and frequency of advisory fee payments. The Trustees reviewed information provided by Granite regarding its profits associated with managing the Granite Fund. The Trustees also considered potential benefits for Granite in managing the Granite Fund. The Trustees then compared the fees and expenses of the Granite Fund (including the management fee) to other comparable mutual funds. The Trustees noted that the Granite Fund’s management fee was higher than its peer average and median, as was the net operating expense ratio, although the Trustees noted that other funds in the peer group had higher management fees and net operating expense ratios. The Trustees discussed the difference between the fees charged to the Granite Fund as compared to the fees charged to Granite’s separately managed accounts with investment strategies and objectives similar to the Granite Fund. They acknowledged the increased resources required to manage the Granite Fund, including increased compliance and administrative costs. Based on the foregoing, the Board concluded that the fees to be paid to Granite by the Granite Fund and the profits to be realized by Granite, in light of all the facts and circumstances, were fair and reasonable in relation to the nature and quality of the services provided by Granite. |
| 4. | The extent to which economies of scale would be realized as the Granite Fund grows and whether advisory fee levels reflect these economies of scale for the benefit of the Granite Fund’s investors. In this regard, the Board considered the Granite Fund’s fee arrangements with Granite. The Board considered that while the management fee remained the same at all asset levels, the Granite Fund’s shareholders had experienced benefits from the Granite Fund’s expense limitation arrangement. The Trustees noted Granite’s representation of its current intent to keep the expense limitation arrangement in place into the near future. The Trustees also noted that once the Granite Fund’s expenses fell below the cap set by the arrangement, the Granite Fund’s shareholders would continue to benefit from the economies of scale under the Granite Fund’s agreements with service providers other than Granite. In light of its ongoing consideration of the Granite Fund’s asset levels, expectations for growth in the Granite Fund, and fee levels, the Board determined that the Granite Fund’s fee arrangements, in light of all the facts and circumstances, were fair and reasonable in relation to the nature and quality of the services provided by Granite. |
| 5. | Possible conflicts of interest and benefits to Granite. In considering Granite’s practices regarding conflicts of interest, the Trustees evaluated the potential for conflicts of interest and considered such matters as the experience and ability of the advisory personnel assigned to the Granite Fund; the basis of decisions to buy or sell securities for the Granite Fund and/or Granite’s other accounts; and the substance and administration of Granite’s Code of Ethics. The Trustees also considered disclosure in the registration statement of the Trust relating to Granite’s potential conflicts of interest. The Trustees considered Granite’s policies with respect to the use of soft dollars. The Trustees noted that Granite benefited from the Granite Fund in that it is able to utilize the Granite Fund as a vehicle into which to direct advisory clients with small account balances. The Trustees did not identify any other potential benefits (other than the management fee) that would be realized by Granite. Based on the foregoing, the Board determined that the standards and practices of Granite relating to the identification and mitigation of potential conflicts of interest and the benefits that it derives from managing the Granite Fund are acceptable. |
After additional consideration of the factors delineated in the memorandum provided by counsel and further discussion among the Board members, the Board determined to approve the continuation of the Granite Agreement between the Trust and Granite.
23
ADDITIONAL FEDERAL INCOME TAX INFORMATION – (Unaudited)
The Form 1099-DIV you receive in January 2018 will show the tax status of all distributions paid to your account in calendar year 2017. Shareholders are advised to consult their own tax adviser with respect to the tax consequences of their investment in the Fund. As required by the Internal Revenue Code and/or regulations, shareholders must be notified regarding the status of qualified dividend income for individuals and the dividends received deduction for corporations.
Qualified Dividend Income. The Fund designates approximately 100% or up to the maximum amount of such dividends allowable pursuant to the Internal Revenue Code, as qualified dividend income eligible for the reduced tax rate of 15%.
Dividends Received Deduction. Corporate shareholders are generally entitled to take the dividends received deduction on the portion of the Fund’s dividend distribution that qualifies under tax law. For the Fund’s calendar year 2017 ordinary income dividends, 100% qualifies for the corporate dividends received deduction.
For the year ended October 31, 2017, the Fund designated $253,231 as long-term capital gain distributions.
24
| | | | |
| |
FACTS | | WHAT DOES VALUED ADVISERS TRUST DO
WITH YOUR PERSONAL INFORMATION? |
| | | | |
| | |
Why? | | Financial companies choose how they share your personal information. Federal law gives consumers the right to limit some but not all sharing. Federal law also requires us to tell you how we collect, share, and protect your personal information. Please read this notice carefully to understand what we do. |
| | | | |
| | |
What? | | The types of personal information we collect and share depend on the product or service you have with us. This information can include: ◾ Social Security number ◾ account balances and account transactions ◾ account transactions, transaction or loss history and purchase history ◾ checking account information and wire transfer instructions When you are no longer our customer, we continue to share your information as described in this notice. |
| | | | |
| | |
How? | | All financial companies need to share customers’ personal information to run their everyday business. In the section below, we list the reasons financial companies can share their customers’ personal information; the reasons Valued Advisers Trust chooses to share; and whether you can limit this sharing. |
| | |
Reasons we can share your personal information | | Does Valued Advisers Trust share? |
For our everyday business purposes –
such as to process your transactions, maintain your account(s), respond to court orders and legal investigations, or report to credit bureaus | | Yes |
For our marketing purposes –
to offer our products and services to you | | Yes |
For joint marketing with other financial companies | | No |
For our affiliates’ everyday business purposes –
information about your transactions and experiences | | No |
For our affiliates’ everyday business purposes –
information about your creditworthiness | | No |
For nonaffiliates to market to you | | No |
| | | | |
Questions? | | Call 1-603-226-6600. |
25
| | |
Who we are |
| Who is providing this notice? | | Valued Advisers Trust |
What we do |
| How does Valued Advisers Trust protect my personal information? | | To protect your personal information from unauthorized access and use, we use security measures that comply with federal law. These measures include computer safeguards and secured files and buildings. |
| How does Valued Advisers Trust collect my personal information? | | We collect your personal information, for example, when you ◾ open an account or deposit money ◾ buy securities from us or sell securities to us ◾ make deposits or withdrawals from your account or provide account information ◾ give us your account information ◾ make a wire transfer ◾ tell us who receives the money ◾ tell us where to send the money ◾ show your government-issued ID ◾ show your driver’s license |
| Why can’t I limit all sharing? | | Federal law gives you the right to limit only ◾ sharing for affiliates’ everyday business purposes – information about your creditworthiness ◾ affiliates from using your information to market to you ◾ sharing for nonaffiliates to market to you State laws and individual companies may give you additional rights to limit sharing. |
Definitions | | |
| Affiliates | | Companies related by common ownership or control. They can be financial and nonfinancial companies. |
| Nonaffiliates | | Companies not related by common ownership or control. They can be financial and nonfinancial companies. ◾ Valued Advisers Trust does not share your personal information with nonaffiliates so they can market to you. |
| Joint marketing | | A formal agreement between nonaffiliated financial companies that together market financial products or services to you. ◾ Valued Advisers Trust doesn’t jointly market financial products or services to you. |
26
PROXY VOTING
A description of the policies and procedures that the Fund uses to determine how to vote proxies relating to portfolio securities and information regarding how the Fund voted those proxies is available without charge upon request by (1) calling the Fund at (603) 226-6600 and (2) from Fund documents filed with the Securities and Exchange Commission (“SEC”) on the SEC’s website at www.sec.gov.
TRUSTEES
Andrea N. Mullins, Chairperson
Ira P. Cohen
Mark J. Seger
OFFICERS
Bo J. Howell, Principal Executive Officer and President
Bryan W. Ashmus, Principal Financial Officer and Treasurer
Brandon R. Kipp, Chief Compliance Officer
Carol J. Highsmith, Vice President and Secretary
Matthew J. Miller, Vice President
Stephen L. Preston, Anti-Money Laundering Officer
INVESTMENT ADVISER
Granite Investment Advisors, LLC
6 Eagle Square, 3rd Floor
Concord, NH 03301
DISTRIBUTOR
Unified Financial Securities, LLC
9465 Counselors Row, Suite 200
Indianapolis, IN 46240
INDEPENDENT REGISTERED PUBLIC ACCOUNTING FIRM
Cohen & Company, Ltd.
1350 Euclid Avenue, Suite 800
Cleveland, OH 44115
LEGAL COUNSEL
The Law Offices of John H. Lively & Associates, Inc.
A member firm of The 1940 Act Law GroupTM
11300 Tomahawk Creek Parkway, Ste. 310
Leawood, KS 66211
CUSTODIAN
Huntington National Bank
41 South High Street
Columbus, OH 43215
ADMINISTRATOR, TRANSFER AGENT AND FUND ACCOUNTANT
Ultimus Asset Services, LLC
225 Pictoria Drive, Suite 450
Cincinnati, OH 45246
This report is intended only for the information of shareholders or those who have received the Fund’s prospectus which contains information about the Fund’s management fee and expenses. Please read the prospectus carefully before investing.
Distributed by Unified Financial Securities, LLC
Member FINRA/SIPC

SOUND MIND INVESTING FUND (SMIFX)
SMI CONSERVATIVE
ALLOCATION FUND (SMILX)
SMI DYNAMIC
ALLOCATION FUND (SMIDX)
SMI BOND FUND (SMIUX)
SMI 50/40/10 FUND (SMIRX)
|
| |
| ANNUAL REPORT |
| |
| OCTOBER 31, 2017 |
Fund Adviser:
SMI Advisory Services, LLC
411 6th Street
Columbus, IN 47201
(877) 764-3863
(877) SMI-FUND
www.smifund.com
“Steady plodding brings prosperity; hasty speculation brings poverty.” Proverbs 21:5
Dear Fellow Shareholder,
The stock market continued its uninterrupted march higher throughout the fiscal year ending October 31, 2017 with most stocks adding healthy gains. Both foreign and domestic markets were strong performers, and domestic stocks were strong across all of SMI’s risk categories.
The S&P 500 total-return index has now had 12 consecutive winning months (Nov-Oct). That’s quite rare, happening for only the second time in the past four decades. This is also just the sixth time since 1950 that more than a year has passed without at least a 5% pull-back for the S&P 500 index. This lack of volatility has been highly unusual by historical standards.
Sustained trends like this are great for SMI’s trend-following strategies, so it’s no surprise they have posted particularly strong performance of late and sport compelling year-to-date numbers as well. While market storm clouds may be rumbling in the distance, the third quarter was a reminder that cashing out of a richly-valued market while it is still rallying can mean leaving considerable gains on the table. These are heady times for stock investors. For the fiscal year ended October 31, 2017, the gain for the S&P 500 was 23.63%. Even more remarkable, SMI’s Sector Rotation strategy was up a stunning 74% in that time! While the significance of this impacts the 10% allocated to it in SMI 50/40/10 Fund, it’s clear there are strong pockets of strength even within a richly-valued market.
When investors are enjoying these types of gains, it’s tough for them to listen to the voice of reason. But the unfortunate reality of investing is that big gains don’t reduce future risk...they increase it. If stocks were risky a year ago (and they were), they are that much more so after another year of growing toward the sky.
SMI readers have heard our many cautions regarding market risk in the current environment, so I’ll keep this brief by limiting myself to just two thoughts.
First, the U.S. has experienced at least one economic recession in every decade since 1850. Some decades had more than one, but every decade has had at least one. So far, the 2010-2019 decade is the lone exception. If we make it through the next two years without a recession, it will be unique in the past 170 years.
Keep in mind that the U.S. stock market typically peaks roughly one year before economic recessions begin. By definition, then, if we see a recession within the next two years, that would imply a stock market peak sometime in the next year.
That said, there are no particularly worrisome signs of recession on the horizon. Markets love political gridlock and expanding earnings, both of which are present right now – at least partially explaining the
1
big gains of the past year. These gains could well continue. For that matter, there’s nothing magical about the “recession every decade” idea other than the fact that it demonstrates that downturns happen with a certain regularity which we’ve been able to push off lately. The current economic expansion is the third longest on record; if it lasts through the end of 2019 it will become the longest. It could happen. But it might not be smart to expect it to.
Second, we’ve emphasized that the change in central bank policy from accommodation to tightening, which took an important step forward in October when the U.S. Federal Reserve (the “Fed”) started intentionally shrinking its balance sheet, is a big deal. Not so much in its immediate impact, which is starting off quite modest (and is more than offset by the continuing stimulus from the European Central Bank and Bank of Japan). But as with QE on the expansion side, the Fed’s recent move has signaled the other central banks to start discussing their own exit strategies from this decade of propping up the economy and financial markets with central bank largesse. If all goes as these central banks have currently outlined, roughly a year from now (Fall 2018) the world will be facing a net tightening of central bank capital for the first time since the financial crisis.
It’s unfortunate that the numbers are so big that they’re barely relatable, but the net impact of this shift is that the financial markets will go from half a trillion dollars’ worth of stimulus in 2016 to a trillion dollars of tightening in 2018. That’s a $1.5 trillion-dollar swing, roughly equivalent to 2% of world GDP. Or put differently, that $1.5 trillion is roughly the size of Canada’s GDP, which is the 10th largest economy in the world. Just as that money materialized out of nothing to buy bonds through QE, it’s scheduled to evaporate, pulling that capital out of the world’s system. It would be noticed if Canada just didn’t show up economically all of a sudden. We certainly expect this significant central bank policy shift will be noticed as well.
Along that same line, courtesy of Baird Advisors’ Mary Ellen Stanek: “Collectively, the Fed, European Central Bank and Bank of Japan own one-third of the global bond market.” Astonishing.
Think ahead
Now that I’ve gone all Debby-Downer on you, what’s the point of all this? Am I telling you to sell and run for the hills? Of course not.
However, an important fact of investing is that when prospective returns are high, that’s when you want to be maximally aggressive. And when prospective returns are low, that’s the time to get more conservative. We know when these times are (roughly) based on valuations, which have a fantastic track record of projecting long-term future returns. Valuation is a lousy short-term timing signal. But it’s great at telling us what type of returns to expect over the next 7-12 years. And with current valuations ranging somewhere between “worst ever” and “only worse before the 1929 and 2000 market peaks,” we know total returns over the next decade aren’t likely to be very good. Usually that means enduring a significant bear market that knocks those valuations down to a more reasonable level. The message here isn’t to sell and run away. It’s that prospective returns are low and risk is high, so keep risk front-of-mind as these fantastic returns continue to roll in. That’s hard to do when Sector Rotation skyrockets +16.1% in a month, as it did in October. But it’s a necessary discipline if you’re going to be a successful long-term investor.
At a minimum, applying this information means sticking to your long-term plan. Just this simple step will keep you ahead of most investors, who unthinkingly get more aggressive as risk increases late in a bull market. Recent high returns entice them to allocate more and more to riskier stocks/strategies – right up
2
until the moment the market trap door swings open beneath them. At a minimum, keep yourself from following that path. Stick to your long-term plan and reallocate back to your baseline allocations at year-end. To be blunt, this is not the time to be increasing your long-term allocation to Sector Rotation!
If you want to be more proactive��than that, one approach I’ve long advocated is to gradually shift money away from more aggressive strategies (such as Sector Rotation) as bull markets get over-extended, and re-allocate it to conservative strategies (like Dynamic Asset Allocation “DAA”) that will hold up better in the next downturn. Full disclosure: this process stinks as you’re doing it, because you’re never going to get the timing perfect, which means kicking yourself month by month as the high returns continue – until the market rolls over. Then it’s sweet relief. Naturally, there will come a point in the next bear market when the losses have deepened and accelerated to the point that you want to throw up – that’s your cue to reverse the process and start gradually re-allocating more aggressively again. [Just to be clear, the process outlined in this paragraph is optional – sticking with an appropriate mix of strategy allocations and not making these types of adjustments is perfectly fine. You don’t have to do this to be successful.]
Always be aware of your surroundings
In closing, it’s worth noting that we’re working every day at SMI to figure out ways to protect your capital between now and the next market opportunity. DAA was a huge step in that direction. We continue to look for more breakthroughs along those lines. As we do, be mindful of where we are in this bull/bear market cycle. And make sure your current portfolio is such that if a major market downturn were to occur that you could handle it without it being devastating to your long-term financial progress.
Thankfully, SMI’s success isn’t based on correctly predicting the market’s future. Rather, our approach begins within the context of following God’s protective principles. A strong financial foundation, established by working to become debt-free and creating a savings reserve, provides the strength to weather unexpected setbacks. Allocating your stock/bond mix (that is, setting your risk level) in a way that balances your need for growth and your emotional fear of loss is another key step. We build portfolios based on the principle of diversification, both between and within various asset classes, knowing that performance excellence rotates. Finally, we suggest taking no more risk than is absolutely necessary in order to reach your financial destination. After all, investing isn’t about building the biggest pile of money possible – it’s about meeting your specific financial goals.
Rather than build a portfolio dependent on a particular market prediction coming true, we believe in diversifying your portfolio so it can take advantage of market opportunities while also protecting against its risks. A portfolio that doesn’t fly too high when the market is rising – but also doesn’t dive too low when it’s falling – is much easier to stick with emotionally than one with wider swings of performance. Since the primary struggle most investors face is emotional, we believe constructing portfolios that attempt to minimize these emotional swings gives SMI investors the best chance of long-term investing success.
Performance Review
The recent highs, both for the market and for several of SMI’s model portfolios, have continued month after month. Investors in most of SMI’s strategies have earned strong 12-month results that will help buffer any declines from the next market pullback. SMI has long maintained that it’s exceedingly difficult to predict what the market will do next, so staying invested with a well-diversified portfolio generally makes the most sense.
3
SMI Funds Fund Upgrading – Funds utilizing this strategy in at least part of their portfolios: SMIFX, SMILX* & SMIRX:
Fund Upgrading has posted strong absolute returns over the past year. SMIFX is up +21.55% over the past 12 months. While that trails the +23.96% of the Wilshire 5000 index and +23.63% of the S&P 500 index, it’s worth noting that large/growth stocks are weighted more heavily within those indexes than within our diversified Fund Upgrading portfolios.
Encouragingly, the relative performance of our Stock Upgrading strategy has improved lately. During the 3rd quarter of 2017, SMIFX gained +6.13%, notably better than the +4.59% and +4.48% gains of the Wilshire 5000 and S&P 500 indexes, respectively. This improved recent performance correlates with adjustments we’ve made to our upgrading process this year. Beginning around mid-2017, we’ve added some higher volatility funds to our fund universe. We’re optimistic that this change will help boost SMIFX’s relative returns in the future.
SMIRX finished the period ranked within the top 1% of Alternative Multi-Strategy funds according to Lipper, and also ranks in the top 1% of Morningstar’s Moderate Allocation Category for the 3 months ended October 31st.
Dynamic Asset Allocation (DAA) – Funds utilizing this strategy in at least part of their portfolios: SMIDX, SMILX* & SMIRX:
Our Dynamic Asset Allocation strategy (DAA) was dramatically impacted by the trend shifts around the 2016 U.S. Presidential election. In fact, October and November of 2016 were the two single worst performance months DAA has had in the past two years (since August 2015).
However, since that adjustment period ended, SMIDX has performed as well as we could have hoped, given the strong market environment. Its 2017 YTD gain (through 10/31) of +11.27% trails the U.S. stock market indices, but is comfortably ahead of the fund’s 60/40 blended benchmark gain of 10.84%. SMIDX is never more than two-thirds invested directly in stocks (though that additional third is sometimes invested in REITS), so for the fund to participate in the upside of this year’s market gains to the degree that it has is encouraging.
DAA is our most defensive strategy (apart from the all-bond SMIUX) and as such is going to have its best relative performance during declining, rather than rising, markets. It doesn’t need to match the market on the way up – as long as it stays close, its overall performance should catch up (and then some) through the completion of the full market cycle.
Being insulated against the potential of a market decline is crucial at this point in the stock-market cycle. We know markets are cyclical, and unfortunately the strong gains of recent years don’t make stocks less risky; they become more vulnerable the further valuations get stretched. As a result, we continue to encourage SMI investors to make DAA a core part of their portfolios, despite the fact that there are other options offering stronger absolute performance currently. It’s hard to favor conservative strategies like DAA right now, given returns of more aggressive strategies have been higher. But conservative strategies like DAA are absolutely the key to helping us navigate the dangerous bear market that likely lies ahead in the not-too-distant future.
*Indicates this fund does not always contain the strategy being described.
4
Sector Rotation (SR) – Funds utilizing this strategy in at least part of their portfolios: SMIRX:
We’ve run out of superlatives to describe SR’s performance. This strategy was up a stunning +19.6% in the third quarter, only to follow that up with a +16.1% gain in October. Are those facts more or less amazing than the fact that SR has gained +28.2% annualized over the past five years? We’ll let you be the judge.
The SMI newsletter launched SR as a live strategy nearly 14 years ago in November of 2003. Since then, SR investors have enjoyed annualized gains of +16.4% per year. That dwarfs the market’s +9.0% rate of return over the same period. But to really grasp the significance of those annualized numbers, it helps to translate them into actual dollars. A $25,000 initial investment that earned the market’s rate of return would have grown to a healthy $83,405 over those nearly 14 years. But that same investment made in SR would have grown to $207,899 – two-and-a-half times as much!
Compounding a high rate of return over an extended period like that can yield awesome results. The question is whether your portfolio is positioned to take advantage of this type of compounding in the future? If not, consider allocating a portion of your portfolio to SMI’s high-risk, high-reward Sector Rotation strategy.
Bond Upgrading – Funds utilizing this strategy in at least part of their portfolios: SMIUX & SMILX*:
SMIUX earned 1.77% over the year ending 10/31/17, easily beating the 0.90% total return of the Bloomberg Barclays US Aggregate Bond Index. After initially spiking higher immediately following the elections in November 2016, bond yields gradually retreated again as 2017 progressed. Remember, bond prices move in the opposite direction of yields. So the post-election yield spike hurt bond returns, while the eventual drifting back down of yields helped mend those results.
The Fed continued its quest to push short-term interest rates back toward a more historically “normal” range, hiking rates in December 2016 and following up with three more hikes in 2017. While this upward pressure on rates is challenging in terms of hurting the prices of bonds in the portfolio, it is also gradually raising the interest available on newer bonds. This helps make our short-term bond holdings gradually more attractive.
While committing a sizable portion of our portfolio to shorter-term bonds isn’t going to lead to standout returns in the current interest rate environment, it’s a reflection of the middle-of-the-road style we think is appropriate for this fund. Many SMI investors use SMIUX as their sole bond holding, so we want to keep it a relative safe haven rather than taking risks in reaching for higher returns. This helps to reduce volatility in periods of bond market upheaval, such as was experienced immediately following the election last year.
We’d like to direct your attention to the fact that the SMI Bond Fund is closing. This is primarily due to the advisor’s decision that it is no longer economically feasible to continue managing the Fund at its current small size. The Fund has struggled to attract and maintain assets. While we’re disappointed that SMIUX didn’t grow and fulfill our original vision of a thriving bond fund option within the SMI Fund family, there are two positive “silver linings” here. First, of all the SMI strategies, Bond Upgrading is one of the easiest to maintain as an individual investor. The SMI Newsletter provides ongoing instruction for those inclined to manage their bond portfolios on their own.
*Indicates this fund does not always contain the strategy being described.
5
Going Direct With the SMI Funds
Slightly over two-thirds of the assets in the SMI Funds are owned through accounts held at other organizations (Fidelity, Schwab, TD Ameritrade, etc.). That’s perfectly fine. However, there are some advantages to having your account directly with the SMI Funds rather than through a third party.
The primary advantage of a direct account is the ability to buy or sell shares of the SMI Funds without paying any transaction fees. Most third-party accounts are charged some sort of transaction fee when the SMI Funds are bought or sold. Those fees can add up — particularly if you are regularly buying or selling shares in any of the SMI Funds. When your account is held directly with the SMI Funds, you never have to pay transaction fees. To learn more about moving your account directly to the SMI Funds, visit www.smifund.com or call 1-877-SMI-FUND. We appreciate the confidence you have placed in us to be a faithful steward of your assets, as you strive to be a faithful steward of His assets.
Sincerely,

Mark Biller
Senior Portfolio Manager
The Sound Mind Investing Funds
The SMI Fund lineup, shown below, now offers investors a way to mix and match professionally managed funds to custom tailor the risk level desired for their portfolio. If you’d like assistance customizing your portfolio in this manner, please call a Stewardship Advisor at (800) 796-4975.
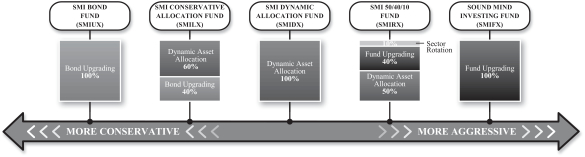
6
PERFORMANCE RESULTS – (Unaudited)
| | | | | | | | | | | | | | | | | | | | |
Average Annual Total Returns(a) (For the periods ended October 31, 2017) | |
| | | Three Months | | | Six Months | | | One Year | | | Five Year | | | Ten Year | |
Sound Mind Investing Fund | | | 5.56% | | | | 9.73% | | | | 21.55% | | | | 11.82% | | | | 4.67% | |
Wilshire 5000® Total Market Index(b) | | | 4.87% | | | | 8.86% | | | | 23.96% | | | | 15.16% | | | | 7.64% | |
S&P 500® Index(b) | | | 4.76% | | | | 9.10% | | | | 23.63% | | | | 15.18% | | | | 7.51% | |
SMI Custom Index(c) | | | 5.07% | | | | 9.03% | | | | 25.57% | | | | 13.71% | | | | 6.45% | |
Total annual operating expenses, as disclosed in the Sound Mind Investing Fund’s (“SMI Fund”) prospectus dated February 28, 2017, were 1.97% of average daily net assets, which includes acquired fund fees and expenses. All expenses are reflected in performance results. SMI Advisory Services, LLC (the “Adviser”) contractually has agreed to waive its fee and reimburse expenses to the extent necessary to maintain Total Annual Fund Operating Expenses (excluding interest, taxes, brokerage commissions, other expenses which are capitalized in accordance with generally accepted accounting principles, extraordinary expenses, dividend expense on short sales, 12b-1 fees, and acquired fund fees and expenses) at 1.50% of the SMI Fund’s average daily net assets through February 28, 2018. This expense cap may not be terminated prior to this date except by the Board of Trustees (the “Board”).
| | | | | | | | | | | | | | | | | | | | |
Average Annual Total Returns(a) (For the periods ended October 31, 2017) | |
| | | Three Months | | | Six Months | | | One Year | | | Five Year | | | Since Inception
(December 30, 2010) | |
SMI Conservative Allocation Fund | | | 1.44% | | | | 3.36% | | | | 4.84% | | | | 5.00% | | | | 4.18% | |
Wilshire 5000® Total Market Index(b) | | | 4.87% | | | | 8.86% | | | | 23.96% | | | | 15.16% | | | | 13.16% | |
Bloomberg Barclays U.S. Aggregate Bond Index(b) | | | 0.47% | | | | 1.58% | | | | 0.90% | | | | 2.04% | | | | 3.28% | |
Weighted Index(c) | | | 3.10% | | | | 5.91% | | | | 14.27% | | | | 9.87% | | | | 9.29% | |
Total annual operating expenses, as disclosed in the SMI Conservative Allocation Fund’s prospectus dated February 28, 2017, were 1.30% of average daily net assets (1.66% before fee waivers/expense reimbursements by the Adviser), which includes acquired fund fees and expenses and reflects the fee waiver/expense reimbursement discussed below. All expenses are reflected in performance results. The Adviser contractually has agreed to waive its fee and reimburse expenses to the extent necessary to maintain Total Annual Fund Operating Expenses (excluding interest, taxes, brokerage commissions, other expenses which are capitalized in accordance with generally accepted accounting principles, extraordinary expenses, dividend expense on short sales, 12b-1 fees, and acquired fund fees and expenses) at 1.15% of the SMI Conservative Allocation Fund’s average daily net assets through February 28, 2018. Each fee waiver or expense reimbursement by the Adviser is subject to repayment by the SMI Conservative Allocation Fund within the three fiscal years following the date in which the expense was incurred, provided that the SMI Conservative Allocation Fund is able to make the repayment without exceeding the expense limitation in place at the time of the fee waiver or expense reimbursement. This expense cap may not be terminated prior to this date except by the Board.
7
PERFORMANCE RESULTS – (Unaudited), (Continued)
| | | | | | | | | | | | | | | | |
Average Annual Total Returns(a) (For the periods ended October 31, 2017) | |
| | | Three Months | | | Six Months | | | One Year | | | Since Inception
(February 28, 2013) | |
SMI Dynamic Allocation Fund | | | 2.35% | | | | 4.91% | | | | 7.87% | | | | 4.79% | |
Wilshire 5000® Total Market Index(b) | | | 4.87% | | | | 8.86% | | | | 23.96% | | | | 14.19% | |
Bloomberg Barclays U.S. Aggregate Bond Index(b) | | | 0.47% | | | | 1.58% | | | | 0.90% | | | | 2.21% | |
Weighted Index(c) | | | 3.10% | | | | 5.91% | | | | 14.27% | | | | 9.39% | |
Total annual operating expenses, as disclosed in the SMI Dynamic Allocation Fund’s prospectus dated February 28, 2017, were 1.29% of average daily net assets, which includes acquired fund fees and expenses. All expenses are reflected in performance results. The Adviser contractually has agreed to waive its fee and reimburse expenses to the extent necessary to maintain Total Annual Fund Operating Expenses (excluding interest, taxes, brokerage commissions, other expenses which are capitalized in accordance with generally accepted accounting principles, extraordinary expenses, dividend expense on short sales, 12b-1 fees, and acquired fund fees and expenses) at 1.45% of the SMI Dynamic Allocation Fund’s average daily net assets through February 28, 2018. This expense cap may not be terminated prior to this date except by the Board.
| | | | | | | | | | | | | | | | |
Average Annual Total Returns(a) (For the periods ended October 31, 2017) | |
| | | Three Months | | | Six Months | | | One Year | | | Since Inception
(April 28, 2015) | |
SMI Bond Fund | | | 0.53% | | | | 1.97% | | | | 1.77% | | | | 1.13% | |
Bloomberg Barclays U.S. Aggregate Bond Index(b) | | | 0.47% | | | | 1.58% | | | | 0.90% | | | | 1.91% | |
Total annual operating expenses, as disclosed in the SMI Bond Fund’s prospectus dated February 28, 2017, were 1.05% of average daily net assets (2.42% before fee waivers/expense reimbursements by the Adviser). All expenses are reflected in performance results. The Adviser contractually has agreed to waive its fee and/or reimburse expenses to the extent necessary to maintain Total Annual Fund Operating Expenses (excluding interest, taxes, brokerage commissions, other expenses which are capitalized in accordance with generally accepted accounting principles, extraordinary expenses, dividend expense on short sales, 12b-1 fees, and acquired fund fees and expenses) at 0.85% of the SMI Bond Fund’s average daily net assets through February 28, 2018. Each fee waiver or expense reimbursement by the Adviser is subject to repayment by the SMI Bond Fund within the three fiscal years following the date in which the expense was incurred, provided that the SMI Bond Fund is able to make the repayment without exceeding the expense limitation in place at the time of the fee waiver or expense reimbursement. This expense cap may not be terminated prior to this date except by the Board.
8
PERFORMANCE RESULTS – (Unaudited), (Continued)
| | | | | | | | | | | | | | | | |
Average Annual Total Returns(a) (For the periods ended October 31, 2017) | |
| | | Three Months | | | Six Months | | | One Year | | | Since Inception
(April 29, 2015) | |
SMI 50/40/10 Fund | | | 5.92% | | | | 9.97% | | | | 17.99% | | | | 3.92% | |
Wilshire 5000® Total Market Index(b) | | | 4.87% | | | | 8.86% | | | | 23.96% | | | | 10.47% | |
Bloomberg Barclays U.S. Aggregate Bond Index(b) | | | 0.47% | | | | 1.58% | | | | 0.90% | | | | 2.02% | |
Weighted Index(c) | | | 3.10% | | | | 5.91% | | | | 14.27% | | | | 7.16% | |
Total annual operating expenses, as disclosed in the SMI 50/40/10 Fund’s prospectus dated February 28, 2017, were 1.95% of average daily net assets (2.26% before fee waivers/expense reimbursements by the Adviser). All expenses are reflected in performance results. The Adviser contractually has agreed to waive its fee and reimburse expenses to the extent necessary to maintain Total Annual Fund Operating Expenses (excluding interest, taxes, brokerage commissions, other expenses which are capitalized in accordance with generally accepted accounting principles, extraordinary expenses, dividend expense on short sales, 12b-1 fees, and acquired fund fees and expenses) at 1.45% of the SMI 50/40/10 Fund’s average daily net assets through February 28, 2018. Each fee waiver or reimbursement of an expense by the Adviser is subject to repayment by the SMI 50/40/10 Fund within the three fiscal years following the date in which the expense was incurred, provided that the SMI 50/40/10 Fund is able to make the repayment without exceeding the expense limitation in place at the time of the fee waiver or reimbursement. This expense cap may not be terminated prior to this date except by the Board.
The performance quoted represents past performance, which does not guarantee future results. The investment return and principal value of an investment will fluctuate so that an investor’s shares, when redeemed, may be worth more or less than their original cost. The returns shown do not reflect deduction of taxes that a shareholder would pay on Fund distributions or the redemption of Fund shares. Current performance of the Sound Mind Investing Fund, SMI Conservative Allocation Fund, SMI Dynamic Allocation Fund, SMI Bond Fund and SMI 50/40/10 Fund (each a “Fund” and collectively the “Funds”) may be lower or higher than the performance quoted. Performance data current to the most recent month end may be obtained by calling (877) 764-3863.
| (a) | Average annual total returns reflect any change in price per share and assume the reinvestment of all distributions. The Funds’ returns reflect any fee reductions during the applicable periods. If such fee reductions had not occurred, the quoted performance would have been lower. Total returns for periods less than 1 year are not annualized. |
| (b) | The Standard & Poor’s 500® Index (“S&P 500”), Wilshire 5000® Total Market Index (“Wilshire 5000”), Bloomberg Barclays U.S. Aggregate Bond Index, Russell 1000® Value Index, Russell 1000® Growth Index, Russell 2000® Value Index, Russell 2000® Growth Index and MSCI EAFE Index (collectively, the “Indices”) are unmanaged indices that assume reinvestment of all distributions and exclude the effect of taxes and fees. These Indices are widely recognized unmanaged indices and are representative of a broader market and range of securities than is found in each Fund’s portfolio. The returns of the Indices are not reduced by any fees or operating expenses. Individuals cannot invest directly in the Indices; however, an individual can invest in exchange traded funds or other investment vehicles that attempt to track the performance of a benchmark index. As of December 13, 2016, the Wilshire 5000 has replaced the S&P 500 as the Sound Mind Investing Fund’s primary benchmark. Given the allocation of the Sound Mind Investing Fund’s portfolio, the Adviser believes that the Wilshire 5000 provides a more accurate comparison. |
| (c) | The SMI Custom Index for the Sound Mind Investing Fund is comprised of 20% Russell 1000® Value Index, 20% Russell 1000® Growth Index, 20% Russell 2000® Value Index, 20% Russell 2000® Growth Index and 20% MSCI EAFE Index and the Weighted Index for the SMI Conservative Allocation Fund, SMI Dynamic Allocation Fund and SMI 50/40/10 Fund is comprised of 60% Wilshire 5000 and 40% Bloomberg Barclays U.S. Aggregate Bond Index. |
The Funds’ investment objectives, risks, charges and expenses must be considered carefully before investing. The prospectus contains this and other important information about the Funds and may be obtained by calling the same number as above. Please read it carefully before investing.
9
PERFORMANCE RESULTS – (Unaudited), (Continued)
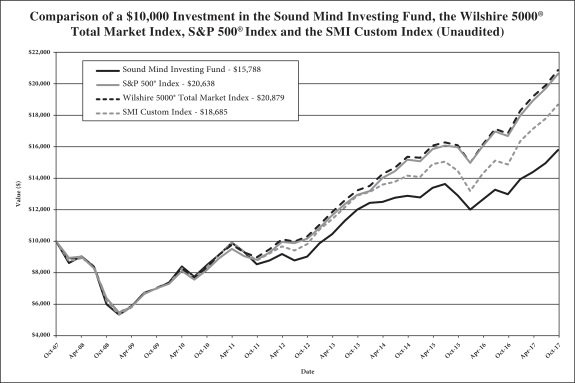
The chart above assumes an initial investment of $10,000 made on October 31, 2007 and held through October 31, 2017. THE FUND’S RETURN REPRESENTS PAST PERFORMANCE AND DOES NOT GUARANTEE FUTURE RESULTS. The returns shown do not reflect deduction of taxes that a shareholder would pay on Fund distributions or the redemption of Fund shares. Investment returns and principal values will fluctuate so that your shares, when redeemed, may be worth more or less than their original purchase price.
Current performance of the Fund may be lower or higher than the performance quoted. For more information on the Fund, and to obtain performance data current to the most recent month end or to request a prospectus, please call (877) 764-3863. You should carefully consider the investment objectives, potential risks, management fees, and charges and expenses of the Fund before investing. The Fund’s prospectus contains this and other information about the Fund, and should be read carefully before investing.
The SMI Custom Index for the Sound Mind Investing Fund is comprised of 20% Russell 1000® Value Index, 20% Russell 1000® Growth Index, 20% Russell 2000® Value Index, 20% Russell 2000® Growth Index and 20% MSCI EAFE Index.
The Fund is distributed by Unified Financial Securities, LLC, member FINRA/SIPC.
10
PERFORMANCE RESULTS – (Unaudited), (Continued)
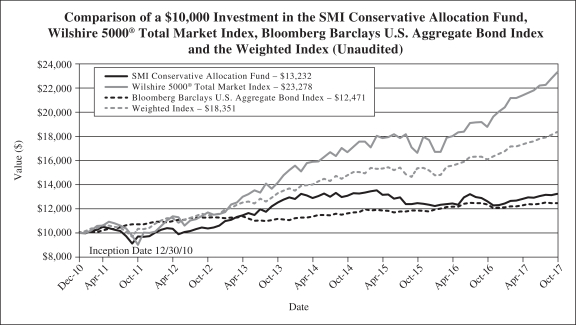
The chart above assumes an initial investment of $10,000 made on December 30, 2010 (commencement of Fund operations) and held through October 31, 2017. THE FUND’S RETURN REPRESENTS PAST PERFORMANCE AND DOES NOT GUARANTEE FUTURE RESULTS. The returns shown do not reflect deduction of taxes that a shareholder would pay on Fund distributions or the redemption of Fund shares. Investment returns and principal values will fluctuate so that your shares, when redeemed, may be worth more or less than their original purchase price.
Current performance of the Fund may be lower or higher than the performance quoted. For more information on the Fund, and to obtain performance data current to the most recent month end or to request a prospectus, please call (877) 764-3863. You should carefully consider the investment objectives, potential risks, management fees, and charges and expenses of the Fund before investing. The Fund’s prospectus contains this and other information about the Fund, and should be read carefully before investing.
The Weighted Index is comprised of 60% Wilshire 5000® Total Market Index and 40% Bloomberg Barclays U.S. Aggregate Bond Index.
The Fund is distributed by Unified Financial Securities, LLC, member FINRA/SIPC
11
PERFORMANCE RESULTS – (Unaudited), (Continued)
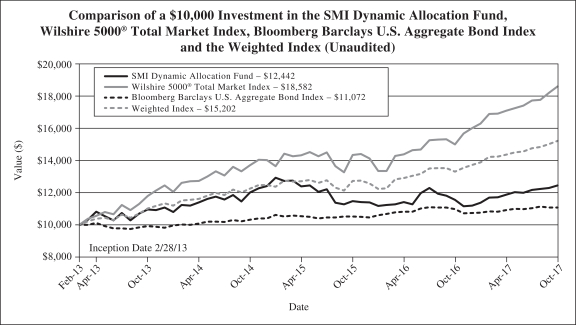
The chart above assumes an initial investment of $10,000 made on February 28, 2013 (commencement of Fund operations) and held through October 31, 2017. THE FUND’S RETURN REPRESENTS PAST PERFORMANCE AND DOES NOT GUARANTEE FUTURE RESULTS. The returns shown do not reflect deduction of taxes that a shareholder would pay on Fund distributions or the redemption of Fund shares. Investment returns and principal values will fluctuate so that your shares, when redeemed, may be worth more or less than their original purchase price.
Current performance of the Fund may be lower or higher than the performance quoted. For more information on the Fund, and to obtain performance data current to the most recent month end or to request a prospectus, please call (877) 764-3863. You should carefully consider the investment objectives, potential risks, management fees, and charges and expenses of the Fund before investing. The Fund’s prospectus contains this and other information about the Fund, and should be read carefully before investing.
The Weighted Index is comprised of 60% Wilshire 5000® Total Market Index and 40% Bloomberg Barclays U.S. Aggregate Bond Index.
The Fund is distributed by Unified Financial Securities, LLC, member FINRA/SIPC.
12
PERFORMANCE RESULTS – (Unaudited), (Continued)
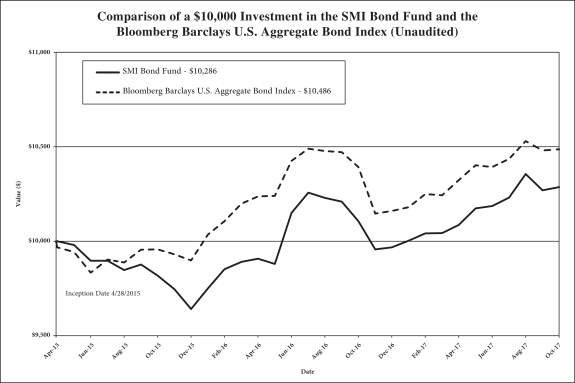
The chart above assumes an initial investment of $10,000 made on April 28, 2015 (commencement of Fund operations) and held through October 31, 2017. THE FUND’S RETURN REPRESENTS PAST PERFORMANCE AND DOES NOT GUARANTEE FUTURE RESULTS. The returns shown do not reflect deduction of taxes that a shareholder would pay on Fund distributions or the redemption of Fund shares. Investment returns and principal values will fluctuate so that your shares, when redeemed, may be worth more or less than their original purchase price.
Current performance of the Fund may be lower or higher than the performance quoted. For more information on the Fund, and to obtain performance data current to the most recent month end or to request a prospectus, please call (877) 764-3863. You should carefully consider the investment objectives, potential risks, management fees, and charges and expenses of the Fund before investing. The Fund’s prospectus contains this and other information about the Fund, and should be read carefully before investing.
The Fund is distributed by Unified Financial Securities, LLC, member FINRA/SIPC.
13
PERFORMANCE RESULTS – (Unaudited), (Continued)
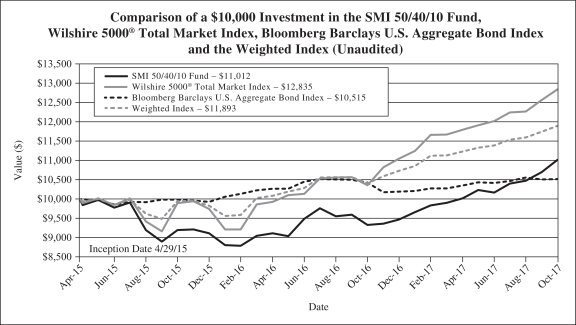
The chart above assumes an initial investment of $10,000 made on April 29, 2015 (commencement of Fund operations) and held through October 31, 2017. THE FUND’S RETURN REPRESENTS PAST PERFORMANCE AND DOES NOT GUARANTEE FUTURE RESULTS. The returns shown do not reflect deduction of taxes that a shareholder would pay on Fund distributions or the redemption of Fund shares. Investment returns and principal values will fluctuate so that your shares, when redeemed, may be worth more or less than their original purchase price.
Current performance of the Fund may be lower or higher than the performance quoted. For more information on the Fund, and to obtain performance data current to the most recent month end or to request a prospectus, please call (877) 764-3863. You should carefully consider the investment objectives, potential risks, management fees, and charges and expenses of the Fund before investing. The Fund’s prospectus contains this and other information about the Fund, and should be read carefully before investing.
The Weighted Index is comprised of 60% Wilshire 5000® Total Market Index and 40% Bloomberg Barclays U.S. Aggregate Bond Index.
The Fund is distributed by Unified Financial Securities, LLC, member FINRA/SIPC.
14
FUND HOLDINGS – (Unaudited)
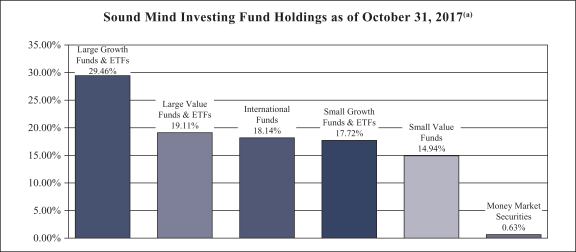
| | (a) | As a percentage of investments. |
Sound Mind Investing Fund seeks long-term capital appreciation. The Fund seeks to achieve its objective by investing in a diversified portfolio of other investment companies using a “Fund Upgrading” strategy. The fund upgrading investment strategy is a systematic investment approach that is based on the belief of the Adviser that superior returns can be obtained by constantly monitoring the performance of a wide universe of other investment companies, and standing ready to move assets into the funds deemed by the Adviser to be most attractive at the time of analysis.
15
FUND HOLDINGS – (Unaudited), (Continued)
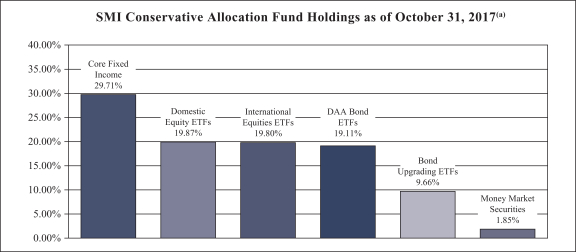
| | (a) | As a percentage of investments. |
DAA – Dynamic Asset Allocation strategy.
SMI Conservative Allocation Fund seeks total return. Total return is composed of both income and capital appreciation. The Fund invests in a portfolio of equities and fixed income securities, including securities of other investment companies that focus their investments on equity and fixed income investments. To the extent the Adviser invests the Fund’s assets in equity securities, such investments will consist of investments in other investment companies (i.e., mutual funds), exchange-traded funds (“ETFs”) and pooled investment vehicles, and the Adviser will select such portfolio holdings. The fixed income portion (if any) of the Fund will be comprised of fixed income investment companies and ETFs and individual fixed income securities. The Adviser will use its proprietary “Bond Upgrading” strategy to make all portfolio decisions with respect to investments in fixed income investment companies and ETFs. The Adviser’s “Bond Upgrading” strategy involves the use of momentum based performance indicators of the various bond categories to identify which categories may present the best investment opportunities. The Adviser scores the categories and uses the scores to make decisions on investments in the various categories.
16
FUND HOLDINGS – (Unaudited), (Continued)
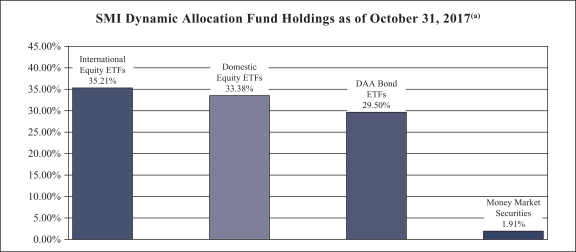
| | (a) | As a percentage of investments. |
SMI Dynamic Allocation Fund seeks total return. Total return is composed of both income and capital appreciation. The Fund uses a dynamic asset allocation investment strategy to achieve its investment objective. This is done by investing in securities from the following six asset classes – U.S. Equities, International Equities, Fixed Income Securities, Real Estate, Precious Metals, and Cash.
17
FUND HOLDINGS – (Unaudited), (Continued)
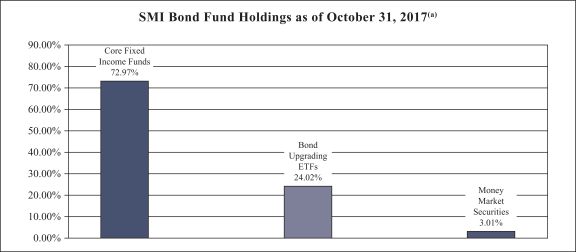
| | (a) | As a percentage of investments. |
SMI Bond Fund seeks total return. Total return is composed of both income and capital appreciation. The Fund invests at least 80% of its net assets in a portfolio of fixed income securities, including securities of other investment companies that focus their investments on fixed income investments. The Fund will be comprised of fixed income investment companies and ETFs and individual fixed income securities. The Adviser will use its proprietary “Bond Upgrading” strategy to make all portfolio decisions with respect to investments in fixed income investment companies and ETFs. The Adviser’s “Bond Upgrading” strategy involves the use of momentum based performance indicators of the various bond categories to identify which categories may present the best investment opportunities. The Adviser scores the categories and uses the scores to make decisions on investments in the various categories.
18
FUND HOLDINGS – (Unaudited), (Continued)
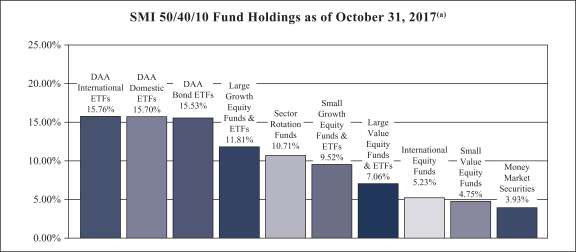
| | (a) | As a percentage of investments. |
SMI 50/40/10 Fund seeks total return. Total return is composed of both income and capital appreciation. The Adviser allocates the Fund’s assets on a 50/40/10 basis among various investment strategies as follows:
| | • | | 50% – Dynamic Asset Allocation Strategy |
| | • | | 40% – Fund Upgrading Strategy |
| | • | | 10% – Sector Rotation Strategy |
The Sector Rotation Strategy involves the Adviser selecting from a universe of mutual funds and ETFs it has compiled using proprietary methods. This universe is specifically designed by the Adviser to balance exposure to a wide variety of market sectors and industries. This universe includes both leveraged and non-leveraged funds. The Adviser ranks these funds based on their recent performance across multiple short-term performance periods, then uses an upgrading approach to invest in the top performing market sector or sectors. Once a particular sector or sectors is identified, the Adviser purchases one or more mutual funds or ETFs to gain the desired exposure to that particular sector. This portion of the Fund may be concentrated, meaning that the Fund may be invested in as few as one or two sectors at a time and potentially as few as one underlying mutual fund or ETF.
Availability of Portfolio Schedule – (Unaudited)
Each Fund files its complete schedule of portfolio holdings with the Securities and Exchange Commission (“SEC”) for the first and third quarters of each fiscal year on Form N-Q. The Funds’ Forms N-Q are available at the SEC’s website at www.sec.gov. The Funds’ Forms N-Q may be reviewed and copied at the Public Reference Room in Washington DC. Information on the operation of the Public Reference Room may be obtained by calling 1-800-SEC-0330.
19
SOUND MIND INVESTING FUND
SCHEDULE OF INVESTMENTS
October 31, 2017
| | | | | | | | |
| Mutual Funds 86.98% | | Shares | | | Fair Value | |
Aegis Value Fund, Inc. | | | 200 | | | $ | 3,288 | |
Allianz NFJ Dividend Value Fund, Institutional Class | | | 200 | | | | 3,710 | |
Allianz NFJ Small-Cap Value Fund, Institutional Class | | | 162 | | | | 4,586 | |
AllianzGI NFJ Mid-Cap Value Fund, Institutional Class | | | 321,089 | | | | 11,366,554 | |
American Century Equity Income Fund, Investor Class | | | 100 | | | | 959 | |
American Century International Discovery Fund, Institutional Class * | | | 250 | | | | 4,166 | |
AMG GW&K U.S. Small Cap Growth Fund, Institutional Class | | | 100 | | | | 561 | |
Artisan International Small Cap Fund, Investor Class | | | 150 | | | | 3,783 | |
Artisan International Value Fund, Investor Class | | | 150 | | | | 5,971 | |
Artisan Mid Cap Value Fund, Investor Class | | | 279 | | | | 6,693 | |
Artisan Small Cap Fund, Investor Class | | | 125 | | | | 4,340 | |
Baron Discovery Fund, Retail Class * | | | 262,518 | | | | 4,638,690 | |
Baron Partners Fund, Institutional Class * | | | 162,414 | | | | 8,094,729 | |
BBH Core Select Fund, Class N | | | 100 | | | | 2,318 | |
Berwyn Fund | | | 100 | | | | 3,311 | |
BlackRock International Opportunities Portfolio, Institutional Class | | | 100 | | | | 3,134 | |
Bridgeway Small-Cap Growth Fund, Class N | | | 205 | | | | 5,493 | |
Bridgeway Small-Cap Value Fund, Class N | | | 179 | | | | 4,729 | |
Buffalo Small Cap Fund, Inc. | | | 150 | | | | 2,846 | |
Champlain Small Company Fund, Institutional Class | | | 100 | | | | 2,151 | |
Columbia Acorn International, Class Z | | | 100 | | | | 4,746 | |
Columbia Acorn Select, Class Z | | | 150 | | | | 2,472 | |
Columbia Contrarian Core Fund, Class Z | | | 91 | | | | 2,397 | |
Columbia Small Cap Growth Fund I, Class Z | | | 100 | | | | 2,215 | |
Davis Opportunity Fund, Class Y | | | 100 | | | | 3,874 | |
Delaware Select Growth Fund, Institutional Class | | | 100 | | | | 4,273 | |
Delaware Small Cap Value Fund, Institutional Class | | | 100 | | | | 6,837 | |
Delaware Smid Cap Growth Fund, Institutional Class | | | 100 | | | | 2,653 | |
Delaware Value Fund, Institutional Class | | | 144 | | | | 3,019 | |
Deutsche Small Cap Value Fund, Institutional Class | | | 85 | | | | 2,387 | |
DFA International Small Cap Value Portfolio, Investor Class | | | 100 | | | | 2,351 | |
DFA International Small Company Portfolio, Institutional Class | | | 100 | | | | 2,152 | |
DFA U.S. Small Cap Value Portfolio, Institutional Class | | | 100 | | | | 3,907 | |
Dodge & Cox Stock Fund | | | 9,386 | | | | 1,893,858 | |
Dreyfus Opportunistic Small Cap Fund | | | 100 | | | | 3,814 | |
Fairholme Fund | | | 100 | | | | 1,922 | |
Fidelity Mid-Cap Stock Fund | | | 150 | | | | 5,845 | |
Fidelity OTC Portfolio | | | 90,623 | | | | 9,807,259 | |
Fidelity Select Brokerage & Investment Management Portfolio | | | 24,415 | | | | 1,950,010 | |
See accompanying notes which are an integral part of these financial statements.
20
SOUND MIND INVESTING FUND
SCHEDULE OF INVESTMENTS
October 31, 2017 – (Continued)
| | | | | | | | |
| Mutual Funds 86.98% – continued | | Shares | | | Fair Value | |
Fidelity Select Chemicals Portfolio | | | 10,862 | | | $ | 2,008,324 | |
Fidelity Select Defense and Aerospace Portfolio | | | 12,058 | | | | 1,989,257 | |
Fidelity Select Semiconductors Portfolio | | | 14,712 | | | | 1,785,000 | |
Fidelity Select Technology Portfolio | | | 11,067 | | | | 2,102,046 | |
Fidelity Small Cap Discovery Fund | | | 100 | | | | 3,218 | |
Fidelity Small Cap Stock Fund | | | 150 | | | | 3,005 | |
Fidelity Small Cap Value Fund | | | 150 | | | | 2,984 | |
Franklin Small Cap Value Fund, Advisor Class | | | 100 | | | | 6,191 | |
Hartford International Opportunities Fund/The, Class Y | | | 248 | | | | 4,539 | |
Heartland Value Fund | | | 100 | | | | 4,383 | |
Hennessy Focus Fund, Investor Class * | | | 50 | | | | 4,246 | |
Hotchkis and Wiley Mid-Cap Value Fund, Institutional Class | | | 100 | | | | 3,781 | |
Invesco American Value Fund, Class R5 | | | 100 | | | | 4,003 | |
Janus Henderson Mid Cap Value Fund, Class T | | | 200 | | | | 3,678 | |
Janus Henderson Overseas Fund, Class T | | | 100 | | | | 3,265 | |
Janus Henderson Venture Fund, Class T | | | 100 | | | | 7,914 | |
JOHCM International Select Fund, Institutional Class | | | 100 | | | | 2,249 | |
JPMorgan Disciplined Equity Fund, Institutional Class | | | 100 | | | | 2,723 | |
JPMorgan Mid Cap Value Fund, Institutional Class | | | 100 | | | | 3,988 | |
JPMorgan Small Cap Equity Fund, Select Class | | | 100 | | | | 5,869 | |
JPMorgan Small Cap Growth Fund, Class L | | | 782,768 | | | | 14,528,168 | |
Kinetics Paradigm Fund, Institutional Class * | | | 85,084 | | | | 3,860,252 | |
Kinetics Small Capital Opportunities Fund, Institutional Class * | | | 73,729 | | | | 3,583,983 | |
Longleaf Partners Fund | | | 150 | | | | 4,243 | |
Longleaf Partners International Fund | | | 100 | | | | 1,680 | |
Longleaf Partners Small-Cap Fund | | | 100 | | | | 2,945 | |
Lord Abbett Developing Growth Fund, Inc., Institutional Class * | | | 100 | | | | 2,553 | |
Mairs and Power Small Cap Fund | | | 100 | | | | 2,602 | |
Miller Opportunity Trust, Institutional Class * | | | 445,487 | | | | 10,985,716 | |
Morgan Stanley Institutional Fund, Inc. – Growth Portfolio, Institutional Class | | | 100 | | | | 4,856 | |
Morgan Stanley Institutional Fund, Inc. – International Opportunity Portfolio, Class A | | | 392,636 | | | | 8,535,905 | |
Neuberger Berman Genesis Fund, Institutional Class | | | 100 | | | | 6,351 | |
Nicholas Fund, Inc. | | | 50 | | | | 3,210 | |
Oakmark International Fund, Investor Class | | | 465,372 | | | | 13,519,058 | |
Oakmark International Small Cap Fund, Institutional Class | | | 150 | | | | 2,699 | |
Oakmark Select Fund, Institutional Class | | | 150 | | | | 7,219 | |
Oppenheimer International Small-Mid Company Fund, Class Y | | | 100 | | | | 4,837 | |
See accompanying notes which are an integral part of these financial statements.
21
SOUND MIND INVESTING FUND
SCHEDULE OF INVESTMENTS
October 31, 2017 – (Continued)
| | | | | | | | |
| Mutual Funds 86.98% – continued | | Shares | | | Fair Value | |
Oppenheimer Mid Cap Value Fund, Class Y | | | 100 | | | $ | 6,048 | |
PRIMECAP Odyssey Aggressive Growth Fund | | | 100 | | | | 4,141 | |
Principal SmallCap Growth Fund I, Institutional Class | | | 200 | | | | 2,826 | |
ProFunds Banks UltraSector ProFund, Investor Class * | | | 9,356 | | | | 465,437 | |
ProFunds Biotechnology UltraSector ProFund, Investor Class * | | | 30,819 | | | | 2,011,874 | |
ProFunds Internet UltraSector ProFund, Investor Class * | | | 34,395 | | | | 2,518,385 | |
ProFunds Semiconductor UltraSector, Investor Class * | | | 38,019 | | | | 2,380,396 | |
ProFunds Technology UltraSector Profund, Investor Class * | | | 21,717 | | | | 2,450,995 | |
Royce Low-Priced Stock Fund, Investment Class | | | 150 | | | | 1,337 | |
Royce Opportunity Fund, Investment Class | | | 1,037,117 | | | | 15,836,782 | |
Royce Premier Fund, Investment Class | | | 300 | | | | 5,586 | |
Royce Small-Cap Value Fund, Institutional Class | | | 100 | | | | 1,027 | |
Royce Special Equity Fund, Institutional Class | | | 150 | | | | 3,411 | |
T. Rowe Price Global Technology Fund | | | 130,050 | | | | 2,532,082 | |
T. Rowe Price International Discovery Fund | | | 75 | | | | 5,317 | |
T. Rowe Price Mid-Cap Growth Fund | | | 50 | | | | 4,609 | |
T. Rowe Price New Horizons Fund | | | 100 | | | | 5,559 | |
T. Rowe Price Small-Cap Value Fund | | | 100 | | | | 5,021 | |
Thornburg Value Fund, Institutional Class | | | 83,093 | | | | 5,666,928 | |
TIAA-CREF International Equity Fund, Institutional Class | | | 100 | | | | 1,324 | |
Toreador Core Fund, Institutional Class | | | 263,273 | | | | 4,657,304 | |
Touchstone Sands Capital Select Growth Fund, Class Y | | | 100 | | | | 1,785 | |
Tweedy Browne Global Value Fund | | | 150 | | | | 4,263 | |
Value Line Larger Companies Focused Fund | | | 180,669 | | | | 5,508,599 | |
Vanguard International Growth Fund, Admiral Class | | | 144,865 | | | | 13,723,071 | |
Vanguard Strategic Equity Fund, Investor Class | | | 100 | | | | 3,562 | |
Victory RS Small Cap Growth Fund, Class Y | | | 100 | | | | 8,275 | |
Virtus KAR Small-Cap Growth Fund, Institutional Class | | | 306,628 | | | | 8,042,858 | |
Wasatch Emerging Markets Small Cap Fund, Investor Class * | | | 1,000 | | | | 3,020 | |
Wasatch International Growth Fund, Investor Class | | | 150 | | | | 5,056 | |
Wasatch International Opportunities Fund, Institutional Class * | | | 1,000 | | | | 3,520 | |
William Blair Small Cap Growth Fund | | | 60,788 | | | | 2,001,748 | |
Zacks Small-Cap Core Fund, Institutional Class | | | 67,203 | | | | 2,216,348 | |
| | | | | | | | |
TOTAL MUTUAL FUNDS (Cost $150,858,724) | | | | | | | 170,963,437 | |
| | | | | | | | |
See accompanying notes which are an integral part of these financial statements.
22
SOUND MIND INVESTING FUND
SCHEDULE OF INVESTMENTS
October 31, 2017 – (Continued)
| | | | | | | | |
| Exchange-Traded Funds 12.90% | | Shares | | | Fair Value | |
Guggenheim S&P 500 Equal Weight Technology ETF | | | 78,465 | | | $ | 11,180,478 | |
iShares Global Timber & Forestry ETF | | | 32,000 | | | | 2,232,640 | |
iShares U.S. Broker-Dealers & Securities Exchanges ETF | | | 33,800 | | | | 1,959,724 | |
PowerShares Aerospace & Defense Portfolio | | | 37,600 | | | | 1,974,000 | |
SPDR Dow Jones Industrial Average ETF Trust | | | 25,205 | | | | 5,888,644 | |
SPDR S&P Biotech ETF | | | 25,300 | | | | 2,116,092 | |
| | | | | | | | |
TOTAL EXCHANGE-TRADED FUNDS (Cost $22,945,941) | | | | | | | 25,351,578 | |
| | | | | | | | |
Money Market Securities 0.63% | | | | | | | | |
Fidelity Investments Money Market Government Portfolio, Institutional Class, 0.96% (a) | | | 1,244,497 | | | | 1,244,497 | |
| | | | | | | | |
TOTAL MONEY MARKET SECURITIES (Cost $1,244,497) | | | | | | | 1,244,497 | |
| | | | | | | | |
TOTAL INVESTMENTS – 100.51% (Cost $175,049,162) | | | | | | $ | 197,559,512 | |
| | | | | | | | |
Liabilities in Excess of Other Assets – (0.51)% | | | | | | | (995,139 | ) |
| | | | | | | | |
NET ASSETS – 100.00% | | | | | | $ | 196,564,373 | |
| | | | | | | | |
| (a) | Rate disclosed is the seven day effective yield as of October 31, 2017. |
| * | Non-income producing security. |
| ETF | – Exchange-Traded Fund |
| SPDR | – Standard & Poor’s Depositary Receipts |
Small investments are occasionally retained in mutual funds that are closed to new investment, or in the manager’s opinion are at risk to close, so as to allow the Fund the flexibility to reinvest in these funds in the future.
See accompanying notes which are an integral part of these financial statements.
23
SMI CONSERVATIVE ALLOCATION FUND
SCHEDULE OF INVESTMENTS
October 31, 2017
| | | | | | | | |
| Mutual Funds – 30.09% | | Shares | | | Fair Value | |
Scout Core Plus Bond Fund, Institutional Class | | | 46,778 | | | $ | 1,484,730 | |
Vanguard Intermediate-Term Bond Index Fund, Admiral Class | | | 269,301 | | | | 3,078,113 | |
| | | | | | | | |
TOTAL MUTUAL FUNDS (Cost $4,580,699) | | | | | | | 4,562,843 | |
| | | | | | | | |
Exchange-Traded Funds – 69.31% | |
iShares 20+ Year Treasury Bond ETF | | | 11,800 | | | | 1,468,628 | |
iShares iBoxx $ Investment Grade Corporate Bond ETF | | | 12,100 | | | | 1,465,794 | |
iShares MSCI EAFE ETF | | | 43,675 | | | | 3,041,090 | |
SPDR S&P 500 ETF | | | 11,865 | | | | 3,051,085 | |
Vanguard Long-Term Corporate Bond ETF | | | 15,700 | | | | 1,483,807 | |
| | | | | | | | |
TOTAL EXCHANGE-TRADED FUNDS (Cost $9,519,864) | | | | | | | 10,510,404 | |
| | | | | | | | |
Money Market Securities – 1.87% | | | | | | | | |
Fidelity Investments Money Market Government Portfolio, Institutional Class, 0.96% (a) | | | 283,549 | | | | 283,549 | |
| | | | | | | | |
TOTAL MONEY MARKET SECURITIES (Cost $283,549) | | | | | | | 283,549 | |
| | | | | | | | |
TOTAL INVESTMENTS – 101.27% (Cost $14,384,112) | | | | | | $ | 15,356,796 | |
| | | | | | | | |
Liabilities in Excess of Other Assets – (1.27)% | | | | | | | (192,244 | ) |
| | | | | | | | |
NET ASSETS – 100.00% | | | | | | $ | 15,164,552 | |
| | | | | | | | |
| (a) | Rate disclosed is the seven day effective yield as of October 31, 2017. |
| ETF | – Exchange-Traded Fund |
| SPDR | – Standard & Poor’s Depositary Receipts |
See accompanying notes which are an integral part of these financial statements.
24
SMI DYNAMIC ALLOCATION FUND
SCHEDULE OF INVESTMENTS
October 31, 2017
| | | | | | | | |
| Exchange-Traded Funds – 98.42% | | Shares | | | Fair Value | |
iShares 20+ Year Treasury Bond ETF | | | 192,400 | | | $ | 23,946,104 | |
iShares iBoxx $ Investment Grade Corporate Bond ETF | | | 198,100 | | | | 23,997,834 | |
iShares MSCI EAFE ETF (a) | | | 822,000 | | | | 57,235,860 | |
SPDR S&P 500 ETF (a) | | | 211,000 | | | | 54,258,650 | |
| | | | | | | | |
TOTAL EXCHANGE-TRADED FUNDS (Cost $141,225,844) | | | | | | | 159,438,448 | |
| | | | | | | | |
Money Market Securities – 1.91% | | | | | | | | |
Fidelity Investments Money Market Government Portfolio, Institutional Class, 0.96% (b) | | | 3,101,310 | | | | 3,101,310 | |
| | | | | | | | |
TOTAL MONEY MARKET SECURITIES (Cost $3,101,310) | | | | | | | 3,101,310 | |
| | | | | | | | |
TOTAL INVESTMENTS – 100.33% (Cost $144,327,154) | | | | | | $ | 162,539,758 | |
| | | | | | | | |
Liabilities in Excess of Other Assets – (0.33)% | | | | | | | (537,832 | ) |
| | | | | | | | |
NET ASSETS – 100.00% | | | | | | $ | 162,001,926 | |
| | | | | | | | |
| (a) | Represents an investment greater than 25% of the Fund’s net assets. Performance of the Fund may be adversely impacted by concentrated investments in securities. The financial statements and portfolio holdings for these securities can be found at www.sec.gov. As of October 31, 2017, the percentage of net assets invested in iShares MSCI EAFE ETF and SPDR S&P 500 ETF were 35.33% and 33.49%, respectively, of the Fund. |
| (b) | Rate disclosed is the seven day effective yield as of October 31, 2017. |
| ETF | – Exchange-Traded Fund |
| SPDR | – Standard & Poor’s Depositary Receipts |
See accompanying notes which are an integral part of these financial statements.
25
SMI BOND FUND
SCHEDULE OF INVESTMENTS
October 31, 2017
| | | | | | | | |
| Mutual Funds – 74.45% | | Shares | | | Fair Value | |
Scout Core Plus Bond Fund, Institutional Class | | | 55,101 | | | $ | 1,748,899 | |
Vanguard Intermediate-Term Bond Index Fund, Admiral Class (a) | | | 306,684 | | | | 3,505,395 | |
| | | | | | | | |
TOTAL MUTUAL FUNDS (Cost $5,268,733) | | | | | | | 5,254,294 | |
| | | | | | | | |
Exchange-Traded Funds – 24.51% | | | | | | | | |
Vanguard Long-Term Corporate Bond ETF | | | 18,300 | | | | 1,729,533 | |
| | | | | | | | |
TOTAL EXCHANGE-TRADED FUNDS (Cost $1,722,757) | | | | | | | 1,729,533 | |
| | | | | | | | |
Money Market Securities – 3.07% | | | | | | | | |
Fidelity Investments Money Market Government Portfolio, Institutional Class, 0.96% (b) | | | 216,465 | | | | 216,465 | |
| | | | | | | | |
TOTAL MONEY MARKET SECURITIES (Cost $216,465) | | | | | | | 216,465 | |
| | | | | | | | |
TOTAL INVESTMENTS – 102.03% (Cost $7,207,955) | | | | | | $ | 7,200,292 | |
| | | | | | | | |
Liabilities in Excess of Other Assets – (2.03)% | | | | | | | (143,263 | ) |
| | | | | | | | |
NET ASSETS – 100.00% | | | | | | $ | 7,057,029 | |
| | | | | | | | |
| (a) | Represents an investment greater than 25% of the Fund’s net assets. Performance of the Fund may be adversely impacted by concentrated investments in securities. The financial statements and portfolio holdings for these securities can be found at www.sec.gov. As of October 31, 2017, the percentage of net assets invested in Vanguard Intermediate-Term Bond Index Fund was 49.67% of the Fund. |
| (b) | Rate disclosed is the seven day effective yield as of October 31, 2017. |
| ETF | – Exchange-Traded Fund |
See accompanying notes which are an integral part of these financial statements.
26
SMI 50/40/10 FUND
SCHEDULE OF INVESTMENTS
October 31, 2017
| | | | | | | | |
| Mutual Funds – 46.89% | | Shares | | | Fair Value | |
AllianzGI NFJ Mid-Cap Value Fund, Institutional Class | | | 7,418 | | | $ | 262,611 | |
Baron Discovery Fund, Retail Class * | | | 47,989 | | | | 847,959 | |
Baron Partners Fund, Institutional Class * | | | 13,705 | | | | 683,078 | |
Fidelity Select Chemicals Portfolio | | | 568 | | | | 105,002 | |
Fidelity Select Defense and Aerospace Portfolio | | | 632 | | | | 104,201 | |
Fidelity Select Semiconductors Portfolio | | | 865 | | | | 105,000 | |
Fidelity Select Technology Portfolio | | | 623 | | | | 118,380 | |
JPMorgan Small Cap Growth Fund, Class L | | | 51,826 | | | | 961,897 | |
Kinetics Paradigm Fund, Institutional Class * | | | 13,225 | | | | 600,012 | |
Miller Opportunity Trust, Class I * | | | 14,364 | | | | 354,205 | |
Morgan Stanley Institutional Fund, Inc. – International Opportunity Portfolio, Class A | | | 32,524 | | | | 707,070 | |
Oakmark International Fund, Investor Class | | | 16,394 | | | | 476,247 | |
Oppenheimer International Small-Mid Company Fund, Class Y | | | 100 | | | | 4,837 | |
ProFunds Banks UltraSector ProFund, Investor Class * | | | 2,127 | | | | 105,809 | |
ProFunds Basic Materials UltraSector ProFund, Investor Class | | | 1,461 | | | | 105,000 | |
ProFunds Biotechnology UltraSector ProFund, Investor Class * | | | 1,387 | | | | 90,563 | |
ProFunds Internet UltraSector ProFund, Investor Class * | | | 1,624 | | | | 118,941 | |
ProFunds Semiconductor UltraSector ProFund, Investor Class * | | | 38,930 | | | | 2,437,377 | |
ProFunds Technology UltraSector Profund, Investor Class * | | | 1,068 | | | | 120,564 | |
Royce Opportunity Fund, Investment Class | | | 53,690 | | | | 819,848 | |
T. Rowe Price Global Technology Fund | | | 5,828 | | | | 113,462 | |
Thornburg Value Fund, Class I | | | 5,845 | | | | 398,610 | |
Toreador Core Fund, Institutional Class | | | 24,057 | | | | 425,563 | |
Virtus KAR Small-Cap Growth Fund, Institutional Class | | | 9,477 | | | | 248,588 | |
Wasatch International Growth Fund, Investor Class | | | 100 | | | | 3,371 | |
| | | | | | | | |
TOTAL MUTUAL FUNDS (Cost $8,454,826) | | | | | | | 10,318,195 | |
| | | | | | | | |
Exchange Traded Funds – 52.50% | |
Guggenheim S&P 500 Equal Weight Technology ETF | | | 4,450 | | | | 634,080 | |
iShares 20+ Year Treasury Bond ETF | | | 14,200 | | | | 1,767,332 | |
iShares Global Timber & Forestry ETF | | | 1,600 | | | | 111,632 | |
iShares iBoxx $ Investment Grade Corporate Bond ETF | | | 14,600 | | | | 1,768,644 | |
iShares MSCI EAFE ETF | | | 51,540 | | | | 3,588,730 | |
SPDR S&P 500 ETF | | | 13,900 | | | | 3,574,385 | |
SPDR S&P Biotech ETF | | | 1,300 | | | | 108,732 | |
| | | | | | | | |
TOTAL EXCHANGE-TRADED FUNDS (Cost $10,330,864) | | | | | | | 11,553,535 | |
| | | | | | | | |
See accompanying notes which are an integral part of these financial statements.
27
SMI 50/40/10 FUND
SCHEDULE OF INVESTMENTS
October 31, 2017 – (Continued)
| | | | | | | | |
| Money Market Securities – 4.07% | | Shares | | | Fair Value | |
Fidelity Investments Money Market Government Portfolio, Institutional Class, 0.96% (a) | | | 895,586 | | | $ | 895,586 | |
| | | | | | | | |
TOTAL MONEY MARKET SECURITIES (Cost $895,586) | | | | | | | 895,586 | |
| | | | | | | | |
TOTAL INVESTMENTS – 103.46% (Cost $19,681,276) | | | | | | $ | 22,767,316 | |
| | | | | | | | |
Liabilities in Excess of Other Assets – (3.46)% | | | | | | | (760,545 | ) |
| | | | | | | | |
NET ASSETS – 100.00% | | | | | | $ | 22,006,771 | |
| | | | | | | | |
| (a) | Rate disclosed is the seven day effective yield as of October 31, 2017. |
| * | Non-income producing security. |
| ETF | – Exchange-Traded Fund |
| SPDR | – Standard & Poor’s Depositary Receipts |
See accompanying notes which are an integral part of these financial statements.
28
SMI FUNDS
STATEMENTS OF ASSETS AND LIABILITIES
October 31, 2017
| | | | | | | | | | | | |
| | | Sound Mind
Investing Fund | | | SMI Conservative
Allocation Fund | | | SMI Dynamic
Allocation Fund | |
Assets | | | | | | | | | | | | |
Investment in securities: | | | | | | | | | | | | |
At cost | | $ | 175,049,162 | | | $ | 14,384,112 | | | $ | 144,327,154 | |
| | | | | | | | | | | | |
At fair value | | $ | 197,559,512 | | | $ | 15,356,796 | | | $ | 162,539,758 | |
Receivable for investments sold | | | 1,776,000 | | | | — | | | | — | |
Receivable for fund shares sold | | | 95,454 | | | | 24,683 | | | | 232,955 | |
Dividends receivable | | | 5,484 | | | | 8,353 | | | | 2,399 | |
Prepaid expenses | | | 14,331 | | | | 4,060 | | | | 7,283 | |
| | | | | | | | | | | | |
Total Assets | | | 199,450,781 | | | | 15,393,892 | | | | 162,782,395 | |
| | | | | | | | | | | | |
Liabilities | | | | | | | | | | | | |
Payable for investments purchased | | | 1,785,000 | | | | 153,556 | | | | — | |
Payable for fund shares redeemed | | | 890,050 | | | | 49,640 | | | | 606,229 | |
Payable to Adviser | | | 167,622 | | | | 5,872 | | | | 136,840 | |
Payable to Administrator | | | 9,712 | | | | 1,567 | | | | 6,735 | |
Payable to trustees | | | 3,540 | | | | 1,152 | | | | 2,965 | |
Other accrued expenses | | | 30,484 | | | | 17,553 | | | | 27,700 | |
| | | | | | | | | | | | |
Total Liabilities | | | 2,886,408 | | | | 229,340 | | | | 780,469 | |
| | | | | | | | | | | | |
Net Assets | | $ | 196,564,373 | | | $ | 15,164,552 | | | $ | 162,001,926 | |
| | | | | | | | | | | | |
Net Assets consist of: | | | | | | | | | | | | |
Paid-in capital | | $ | 156,890,697 | | | $ | 14,936,212 | | | $ | 155,276,987 | |
Accumulated undistributed net investment income | | | — | | | | 105,082 | | | | 582,080 | |
Accumulated undistributed net realized gain (loss) from investment transactions | | | 17,163,326 | | | | (849,426 | ) | | | (12,069,745 | ) |
Net unrealized appreciation on investment securities | | | 22,510,350 | | | | 972,684 | | | | 18,212,604 | |
| | | | | �� | | | | | | | |
Net Assets | | $ | 196,564,373 | | | $ | 15,164,552 | | | $ | 162,001,926 | |
| | | | | | | | | | | | |
Shares outstanding (unlimited number of shares authorized, no par value) | | | 15,694,124 | | | | 1,541,136 | | | | 13,787,690 | |
| | | | | | | | | | | | |
Net asset value (“NAV”), offering and redemption price per share | | $ | 12.52 | | | $ | 9.84 | | | $ | 11.75 | |
| | | | | | | | | | | | |
See accompanying notes which are an integral part of these financial statements.
29
SMI FUNDS
STATEMENTS OF ASSETS AND LIABILITIES
October 31, 2017 – (Continued)
| | | | | | | | |
| | | SMI
Bond Fund | | | SMI
50/40/10 Fund | |
Assets | | | | | | | | |
Investment in securities: | | | | | | | | |
At cost | | $ | 7,207,955 | | | $ | 19,681,276 | |
| | | | | | | | |
At fair value | | $ | 7,200,292 | | | $ | 22,767,316 | |
Receivable for investments sold | | | — | | | | 92,880 | |
Receivable for fund shares sold | | | — | | | | 36,977 | |
Dividends receivable | | | 9,731 | | | | 97 | |
Receivable from Adviser | | | 3,244 | | | | — | |
Prepaid expenses | | | 8,370 | | | | 8,722 | |
| | | | | | | | |
Total Assets | | | 7,221,637 | | | | 22,905,992 | |
| | | | | | | | |
Liabilities | | | | | | | | |
Payable for investments purchased | | | 145,000 | | | | 857,954 | |
Payable for fund shares redeemed | | | 355 | | | | 4,009 | |
Payable for distributions to shareholders | | | 122 | | | | — | |
Payable to Adviser | | | — | | | | 16,280 | |
Payable to Administrator | | | 945 | | | | 1,833 | |
Payable to trustees | | | 1,031 | | | | 1,241 | |
Other accrued expenses | | | 17,155 | | | | 17,904 | |
| | | | | | | | |
Total Liabilities | | | 164,608 | | | | 899,221 | |
| | | | | | | | |
Net Assets | | $ | 7,057,029 | | | $ | 22,006,771 | |
| | | | | | | | |
Net Assets consist of: | | | | | | | | |
Paid-in capital | | $ | 7,059,088 | | | $ | 19,417,492 | |
Accumulated undistributed net investment income (loss) | | | 877 | | | | (82,259 | ) |
Accumulated undistributed net realized gain (loss) from investment transactions | | | 4,727 | | | | (414,502 | ) |
Net unrealized appreciation (depreciation) on investment securities | | | (7,663 | ) | | | 3,086,040 | |
| | | | | | | | |
Net Assets | | $ | 7,057,029 | | | $ | 22,006,771 | |
| | | | | | | | |
Shares outstanding (unlimited number of shares authorized, no par value) | | | 714,420 | | | | 2,015,486 | |
| | | | | | | | |
Net asset value (“NAV”), offering and redemption price per share | | $ | 9.88 | | | $ | 10.92 | |
| | | | | | | | |
See accompanying notes which are an integral part of these financial statements.
30
SMI FUNDS
STATEMENTS OF OPERATIONS
For the Year Ended October 31, 2017
| | | | | | | | | | | | |
| | | Sound Mind
Investing Fund | | | SMI Conservative
Allocation Fund | | | SMI Dynamic
Allocation Fund | |
Investment Income | | | | | | | | | | | | |
Dividend income | | $ | 1,463,630 | | | $ | 307,832 | | | $ | 2,835,966 | |
| | | | | | | | | | | | |
Total investment income | | | 1,463,630 | | | | 307,832 | | | | 2,835,966 | |
| | | | | | | | | | | | |
Expenses | | | | | | | | | | | | |
Investment Adviser | | | 1,971,157 | | | | 144,562 | | | | 1,639,954 | |
Registration | | | 26,644 | | | | 21,621 | | | | 27,674 | |
Administration | | | 47,967 | | | | 3,932 | | | | 39,661 | |
Audit and tax preparation | | | 17,900 | | | | 17,900 | | | | 17,900 | |
Legal | | | 17,450 | | | | 17,933 | | | | 19,045 | |
Transfer agent | | | 32,215 | | | | 4,213 | | | | 14,035 | |
Fund accounting | | | 26,703 | | | | 2,188 | | | | 22,077 | |
Printing | | | 23,784 | | | | 2,568 | | | | 19,996 | |
Trustee | | | 11,512 | | | | 6,198 | | | | 10,430 | |
Compliance | | | 7,875 | | | | 7,875 | | | | 7,875 | |
Custodian | | | 19,136 | | | | 3,000 | | | | 9,017 | |
Line of credit | | | 6,799 | | | | 551 | | | | 5,605 | |
Interest expense | | | 2,200 | | | | 631 | | | | 7,391 | |
Miscellaneous | | | 63,341 | | | | 12,518 | | | | 54,519 | |
| | | | | | | | | | | | |
Total expenses | | | 2,274,683 | | | | 245,690 | | | | 1,895,179 | |
Fees contractually waived and expenses reimbursed by Adviser | | | — | | | | (59,711 | ) | | | — | |
| | | | | | | | | | | | |
Net operating expenses | | | 2,274,683 | | | | 185,979 | | | | 1,895,179 | |
| | | | | | | | | | | | |
Net investment income (loss) | | | (811,053 | ) | | | 121,853 | | | | 940,787 | |
| | | | | | | | | | | | |
Net Realized and Change in Unrealized Gain (Loss) on Investments | | | | | | | | | | | | |
Long-term capital gain dividends from investment companies | | | 3,707,396 | | | | 369 | | | | — | |
Net realized gain (loss) on investment transactions | | | 17,916,976 | | | | (303,181 | ) | | | (7,171,526 | ) |
Net change in unrealized appreciation on investments | | | 17,865,419 | | | | 885,700 | | | | 18,122,234 | |
| | | | | | | | | | | | |
Net realized and change in unrealized gain on investments | | | 39,489,791 | | | | 582,888 | | | | 10,950,708 | |
| | | | | | | | | | | | |
Net increase in net assets resulting from operations | | $ | 38,678,738 | | | $ | 704,741 | | | $ | 11,891,495 | |
| | | | | | | | | | | | |
See accompanying notes which are an integral part of these financial statements.
31
SMI FUNDS
STATEMENTS OF OPERATIONS
For the Year Ended October 31, 2017 – (Continued)
| | | | | | | | |
| | | SMI
Bond Fund | | | SMI
50/40/10 Fund | |
Investment Income | | | | | | | | |
Dividend income | | $ | 152,994 | | | $ | 246,193 | |
| | | | | | | | |
Total investment income | | | 152,994 | | | | 246,193 | |
| | | | | | | | |
Expenses | | | | | | | | |
Investment Adviser | | | 51,850 | | | | 191,808 | |
Registration | | | 23,263 | | | | 24,265 | |
Administration | | | 1,638 | | | | 4,650 | |
Audit and tax preparation | | | 17,900 | | | | 17,900 | |
Legal | | | 17,399 | | | | 17,056 | |
Transfer agent | | | 1,303 | | | | 6,674 | |
Fund accounting | | | 911 | | | | 2,588 | |
Printing | | | 1,775 | | | | 2,862 | |
Trustee | | | 5,932 | | | | 6,322 | |
Compliance | | | 7,875 | | | | 7,875 | |
Custodian | | | 3,000 | | | | 3,337 | |
Line of credit | | | 271 | | | | 657 | |
Interest expense | | | 33 | | | | 597 | |
Miscellaneous | | | 10,245 | | | | 13,189 | |
| | | | | | | | |
Total expenses | | | 143,395 | | | | 299,780 | |
Fees contractually waived and expenses reimbursed by Adviser | | | (84,237 | ) | | | (20,157 | ) |
| | | | | | | | |
Net operating expenses | | | 59,158 | | | | 279,623 | |
| | | | | | | | |
Net investment income (loss) | | | 93,836 | | | | (33,430 | ) |
| | | | | | | | |
Net Realized and Change in Unrealized Gain (Loss) on Investments | | | | | | | | |
Long-term capital gain dividends from investment companies | | | 387 | | | | 85,188 | |
Net realized gain on investment transactions | | | 62,309 | | | | 349,690 | |
Net change in unrealized appreciation (depreciation) on investments | | | (61,311 | ) | | | 2,833,847 | |
| | | | | | | | |
Net realized and change in unrealized gain on investments | | | 1,385 | | | | 3,268,725 | |
| | | | | | | | |
Net increase in net assets resulting from operations | | $ | 95,221 | | | $ | 3,235,295 | |
| | | | | | | | |
See accompanying notes which are an integral part of these financial statements.
32
SOUND MIND INVESTING FUND
STATEMENTS OF CHANGES IN NET ASSETS
| | | | | | | | |
| | | For the Year
Ended
October 31, 2017 | | | For the Year
Ended
October 31, 2016 | |
Increase (Decrease) in Net Assets due to: | | | | | | | | |
Operations | | | | | | | | |
Net investment income (loss) | | $ | (811,053 | ) | | $ | 310,845 | |
Long-term capital gain dividends from investment companies | | | 3,707,396 | | | | 9,201,713 | |
Net realized gain (loss) on investment transactions | | | 17,916,976 | | | | (11,925,406 | ) |
Net change in unrealized appreciation on investments | | | 17,865,419 | | | | 2,869,366 | |
| | | | | | | | |
Net increase in net assets resulting from operations | | | 38,678,738 | | | | 456,518 | |
| | | | | | | | |
Distributions From | | | | | | | | |
Net realized gains | | | — | | | | (28,684,023 | ) |
| | | | | | | | |
Total distributions | | | — | | | | (28,684,023 | ) |
| | | | | | | | |
Capital Transactions | | | | | | | | |
Proceeds from shares sold | | | 11,847,763 | | | | 12,910,740 | |
Proceeds from redemption fees (a) | | | 649 | | | | 6,288 | |
Reinvestment of distributions | | | — | | | | 27,898,432 | |
Amount paid for shares redeemed | | | (48,640,819 | ) | | | (45,249,201 | ) |
| | | | | | | | |
Net decrease in net assets resulting from capital transactions | | | (36,792,407 | ) | | | (4,433,741 | ) |
| | | | | | | | |
Total Increase (Decrease) in Net Assets | | | 1,886,331 | | | | (32,661,246 | ) |
| | | | | | | | |
Net Assets | | | | | | | | |
Beginning of year | | | 194,678,042 | | | | 227,339,288 | |
| | | | | | | | |
End of year | | $ | 196,564,373 | | | $ | 194,678,042 | |
| | | | | | | | |
Accumulated net investment loss included in net assets at end of year | | $ | — | | | $ | (288,843 | ) |
| | | | | | | | |
Share Transactions | | | | | | | | |
Shares sold | | | 1,045,399 | | | | 1,270,281 | |
Shares issued in reinvestment of distributions | | | — | | | | 2,727,119 | |
Shares redeemed | | | (4,260,796 | ) | | | (4,414,628 | ) |
| | | | | | | | |
Net decrease in shares outstanding | | | (3,215,397 | ) | | | (417,228 | ) |
| | | | | | | | |
| (a) | Prior to February 28, 2017 the Fund charged a 2% redemption fee on shares redeemed within 60 days of purchase. |
See accompanying notes which are an integral part of these financial statements.
33
SMI CONSERVATIVE ALLOCATION FUND
STATEMENTS OF CHANGES IN NET ASSETS
| | | | | | | | |
| | | For the Year
Ended
October 31, 2017 | | | For the Year
Ended
October 31, 2016 | |
Decrease in Net Assets due to: | | | | | | | | |
Operations | | | | | | | | |
Net investment income | | $ | 121,853 | | | $ | 210,208 | |
Long-term capital gain dividends from investment companies | | | 369 | | | | 15,711 | |
Net realized gain (loss) on investment transactions | | | (303,181 | ) | | | 162,196 | |
Net change in unrealized appreciation (depreciation) on investments | | | 885,700 | | | | (145,072 | ) |
| | | | | | | | |
Net increase in net assets resulting from operations | | | 704,741 | | | | 243,043 | |
| | | | | | | | |
Distributions From | | | | | | | | |
Net investment income | | | (149,639 | ) | | | (217,790 | ) |
Net realized gains | | | — | | | | (438,679 | ) |
| | | | | | | | |
Total distributions | | | (149,639 | ) | | | (656,469 | ) |
| | | | | | | | |
Capital Transactions | | | | | | | | |
Proceeds from shares sold | | | 1,504,297 | | | | 2,198,797 | |
Proceeds from redemption fees (a) | | | 605 | | | | 1,821 | |
Reinvestment of distributions | | | 146,642 | | | | 644,375 | |
Amount paid for shares redeemed | | | (5,130,818 | ) | | | (6,545,564 | ) |
| | | | | | | | |
Net decrease in net assets resulting from capital transactions | | | (3,479,274 | ) | | | (3,700,571 | ) |
| | | | | | | | |
Total Decrease in Net Assets | | | (2,924,172 | ) | | | (4,113,997 | ) |
| | | | | | | | |
Net Assets | | | | | | | | |
Beginning of year | | | 18,088,724 | | | | 22,202,721 | |
| | | | | | | | |
End of year | | $ | 15,164,552 | | | $ | 18,088,724 | |
| | | | | | | | |
Accumulated undistributed net investment income included in net assets at end of year | | $ | 105,082 | | | $ | 92,021 | |
| | | | | | | | |
Share Transactions | | | | | | | | |
Shares sold | | | 157,086 | | | | 234,592 | |
Shares issued in reinvestment of distributions | | | 16,026 | | | | 69,512 | |
Shares redeemed | | | (541,183 | ) | | | (695,959 | ) |
| | | | | | | | |
Net decrease in shares outstanding | | | (368,071 | ) | | | (391,855 | ) |
| | | | | | | | |
| (a) | Prior to February 28, 2017 the Fund charged a 2% redemption fee on shares redeemed within 60 days of purchase. |
See accompanying notes which are an integral part of these financial statements.
34
SMI DYNAMIC ALLOCATION FUND
STATEMENTS OF CHANGES IN NET ASSETS
| | | | | | | | |
| | | For the Year
Ended
October 31, 2017 | | | For the Year
Ended
October 31, 2016 | |
Decrease in Net Assets due to: | | | | | | | | |
Operations | | | | | | | | |
Net investment income | | $ | 940,787 | | | $ | 1,496,457 | |
Long-term capital gain dividends from investment companies | | | — | | | | 28,483 | |
Net realized gain (loss) on investment transactions | | | (7,171,526 | ) | | | 3,992,962 | |
Net change in unrealized appreciation (depreciation) on investments | | | 18,122,234 | | | | (4,268,680 | ) |
| | | | | | | | |
Net increase in net assets resulting from operations | | | 11,891,495 | | | | 1,249,222 | |
| | | | | | | | |
Distributions From | | | | | | | | |
Net investment income | | | (414,783 | ) | | | (2,361,609 | ) |
| | | | | | | | |
Total distributions | | | (414,783 | ) | | | (2,361,609 | ) |
| | | | | | | | |
Capital Transactions | | | | | | | | |
Proceeds from shares sold | | | 18,896,033 | | | | 20,009,885 | |
Proceeds from redemption fees (a) | | | 1,553 | | | | 4,923 | |
Reinvestment of distributions | | | 405,068 | | | | 2,304,657 | |
Amount paid for shares redeemed | | | (49,181,394 | ) | | | (38,342,055 | ) |
| | | | | | | | |
Net decrease in net assets resulting from capital transactions | | | (29,878,740 | ) | | | (16,022,590 | ) |
| | | | | | | | |
Total Decrease in Net Assets | | | (18,402,028 | ) | | | (17,134,977 | ) |
| | | | | | | | |
Net Assets | | | | | | | | |
Beginning of year | | | 180,403,954 | | | | 197,538,931 | |
| | | | | | | | |
End of year | | $ | 162,001,926 | | | $ | 180,403,954 | |
| | | | | | | | |
Accumulated undistributed net investment income included in net assets at end of year | | $ | 582,080 | | | $ | 213,474 | |
| | | | | | | | |
Share Transactions | | | | | | | | |
Shares sold | | | 1,689,987 | | | | 1,838,944 | |
Shares issued in reinvestment of distributions | | | 38,214 | | | | 212,607 | |
Shares redeemed | | | (4,456,279 | ) | | | (3,515,353 | ) |
| | | | | | | | |
Net decrease in shares outstanding | | | (2,728,078 | ) | | | (1,463,802 | ) |
| | | | | | | | |
| (a) | Prior to February 28, 2017 the Fund charged a 2% redemption fee on shares redeemed within 60 days of purchase. |
See accompanying notes which are an integral part of these financial statements.
35
SMI BOND FUND
STATEMENTS OF CHANGES IN NET ASSETS
| | | | | | | | |
| | | For the Year
Ended
October 31, 2017 | | | For the Year
Ended
October 31, 2016 | |
Increase (Decrease) in Net Assets due to: | | | | | | | | |
Operations | | | | | | | | |
Net investment income | | $ | 93,836 | | | $ | 133,069 | |
Long-term capital gain dividends from investment companies | | | 387 | | | | 11,219 | |
Net realized gain on investment transactions | | | 62,309 | | | | 19,978 | |
Net change in unrealized appreciation (depreciation) on investments | | | (61,311 | ) | | | 96,790 | |
| | | | | | | | |
Net increase in net assets resulting from operations | | | 95,221 | | | | 261,056 | |
| | | | | | | | |
Distributions From | | | | | | | | |
Net investment income | | | (135,801 | ) | | | (152,352 | ) |
| | | | | | | | |
Total distributions | | | (135,801 | ) | | | (152,352 | ) |
| | | | | | | | |
Capital Transactions | | | | | | | | |
Proceeds from shares sold | | | 2,347,036 | | | | 3,264,713 | |
Proceeds from redemption fees (a) | | | 442 | | | | 1,930 | |
Reinvestment of distributions | | | 134,185 | | | | 150,481 | |
Amount paid for shares redeemed | | | (2,947,434 | ) | | | (2,716,700 | ) |
| | | | | | | | |
Net increase (decrease) in net assets resulting from capital transactions | | | (465,771 | ) | | | 700,424 | |
| | | | | | | | |
Total Increase (Decrease) in Net Assets | | | (506,351 | ) | | | 809,128 | |
| | | | | | | | |
Net Assets | | | | | | | | |
Beginning of year | | | 7,563,380 | | | | 6,754,252 | |
| | | | | | | | |
End of year | | $ | 7,057,029 | | | $ | 7,563,380 | |
| | | | | | | | |
Accumulated undistributed net investment income included in net assets at end of year | | $ | 877 | | | $ | — | |
| | | | | | | | |
Share Transactions | | | | | | | | |
Shares sold | | | 238,526 | | | | 334,341 | |
Shares issued in reinvestment of distributions | | | 13,730 | | | | 15,382 | |
Shares redeemed | | | (301,580 | ) | | | (274,716 | ) |
| | | | | | | | |
Net increase (decrease) in shares outstanding | | | (49,324 | ) | | | 75,007 | |
| | | | | | | | |
| (a) | Prior to February 28, 2017 the Fund charged a 2% redemption fee on shares redeemed within 60 days of purchase. |
See accompanying notes which are an integral part of these financial statements.
36
SMI 50/40/10 FUND
STATEMENTS OF CHANGES IN NET ASSETS
| | | | | | | | |
| | | For the Year
Ended
October 31, 2017 | | | For the Year
Ended
October 31, 2016 | |
Increase in Net Assets due to: | | | | | | | | |
Operations | | | | | | | | |
Net investment income (loss) | | $ | (33,430 | ) | | $ | 51,319 | |
Long-term capital gain dividends from investment companies | | | 85,188 | | | | 197,740 | |
Net realized gain (loss) on investment transactions | | | 349,690 | | | | (14,481 | ) |
Net change in unrealized appreciation on investments | | | 2,833,847 | | | | 47,753 | |
| | | | | | | | |
Net increase in net assets resulting from operations | | | 3,235,295 | | | | 282,331 | |
| | | | | | | | |
Distributions From | | | | | | | | |
Net investment income | | | (48,002 | ) | | | (91,435 | ) |
| | | | | | | | |
Total distributions | | | (48,002 | ) | | | (91,435 | ) |
| | | | | | | | |
Capital Transactions | | | | | | | | |
Proceeds from shares sold | | | 6,814,504 | | | | 7,981,856 | |
Proceeds from redemption fees (a) | | | 1,251 | | | | 310 | |
Reinvestment of distributions | | | 46,319 | | | | 89,150 | |
Amount paid for shares redeemed | | | (6,405,146 | ) | | | (3,046,187 | ) |
| | | | | | | | |
Net increase in net assets resulting from capital transactions | | | 456,928 | | | | 5,025,129 | |
| | | | | | | | |
Total Increase in Net Assets | | | 3,644,221 | | | | 5,216,025 | |
| | | | | | | | |
Net Assets | | | | | | | | |
Beginning of year | | | 18,362,550 | | | | 13,146,525 | |
| | | | | | | | |
End of year | | $ | 22,006,771 | | | $ | 18,362,550 | |
| | | | | | | | |
Accumulated net investment loss included in net assets at end of year | | $ | (82,259 | ) | | $ | (10,640 | ) |
| | | | | | | | |
Share Transactions | | | | | | | | |
Shares sold | | | 681,179 | | | | 876,455 | |
Shares issued in reinvestment of distributions | | | 4,912 | | | | 9,764 | |
Shares redeemed | | | (650,195 | ) | | | (334,897 | ) |
| | | | | | | | |
Net increase in shares outstanding | | | 35,896 | | | | 551,322 | |
| | | | | | | | |
| (a) | Prior to February 28, 2017 the Fund charged a 2% redemption fee on shares redeemed within 60 days of purchase. |
See accompanying notes which are an integral part of these financial statements.
37
SOUND MIND INVESTING FUND
FINANCIAL HIGHLIGHTS
(For a share outstanding during each year)
| | | | |
| | | Year Ended
October 31,
2017 | |
Selected Per Share Data: | | | | |
Net asset value, beginning of year | | $ | 10.30 | |
| | | | |
Income from investment operations: | | | | |
Net investment income (loss)(a) | | | (0.05 | ) |
Net realized and unrealized gain | | | 2.27 | |
| | | | |
Total from investment operations | | | 2.22 | |
| | | | |
| |
Less Distributions to Shareholders: | | | | |
From net investment income | | | — | |
From net realized gain | | | — | |
| | | | |
Total distributions | | | — | |
| | | | |
Paid in capital from redemption fees(d) | | | — | |
| | | | |
Net asset value, end of year | | $ | 12.52 | |
| | | | |
| |
Total Return(e) | | | 21.55 | % |
| |
Ratios and Supplemental Data: | | | | |
Net assets, end of year (000) | | $ | 196,564 | |
Ratio of expenses to average net assets(f) | | | 1.15 | % |
Ratio of expenses to average net assets excluding interest expense(f)(g) | | | 1.15 | % |
Ratio of net investment income (loss) to average net assets(a)(h) | | | (0.41 | )% |
Portfolio turnover rate | | | 176.40 | % |
| (a) | Recognition of net investment income by the Fund is affected by the timing of the declaration of dividends by the underlying investment companies in which the Fund invests. |
| (b) | The amount shown for a share outstanding throughout the year does not correspond with the change in aggregate gains and losses in the portfolio of securities during the year because of the timing of sales and purchases of fund shares in relation to fluctuating market values during the year. |
| (c) | Resulted in less than $0.005 per share. |
| (d) | Redemption fee resulted in less than $0.005 per share. |
| (e) | Total return represents the rate that an investor would have earned or lost on an investment in the Fund, assuming reinvestment of dividends. |
| (f) | These ratios exclude the impact of expenses of the underlying funds in which the Fund invests as represented in the Schedule of Investments. |
| (g) | These ratios do not include the effects of other expenses refunded by the underlying funds in which the Fund invests or line of credit interest expense and borrowing costs. |
| (h) | This ratio is presented net of expenses and/or expenses refunded by the underlying funds in which the Fund invests. |
See accompanying notes which are an integral part of these financial statements.
38
SOUND MIND INVESTING FUND
FINANCIAL HIGHLIGHTS
(For a share outstanding during each year) – (Continued)
| | | | | | | | | | | | | | |
Year Ended
October 31,
2016 | | | Year Ended
October 31,
2015 | | | Year Ended
October 31,
2014 | | | Year Ended
October 31,
2013 | |
| | | | | | | | | | | | | | |
| $ | 11.76 | | | $ | 13.94 | | | $ | 14.47 | | | $ | 11.36 | |
| | | | | | | | | | | | | | |
| | | | | | | | | | | | | | |
| | 0.01 | | | | (0.08 | ) | | | (0.09 | ) | | | (0.05 | ) |
| | 0.04 | (b) | | | 0.16 | | | | 1.12 | | | | 3.66 | |
| | | | | | | | | | | | | | |
| | 0.05 | | | | 0.08 | | | | 1.03 | | | | 3.61 | |
| | | | | | | | | | | | | | |
| | | |
| | | | | | | | | | | | | | |
| | — | | | | (0.07 | ) | | | (0.05 | ) | | | — | (c) |
| | (1.51 | ) | | | (2.19 | ) | | | (1.51 | ) | | | (0.50 | ) |
| | | | | | | | | | | | | | |
| | (1.51 | ) | | | (2.26 | ) | | | (1.56 | ) | | | (0.50 | ) |
| | | | | | | | | | | | | | |
| | — | | | | — | | | | — | | | | — | |
| | | | | | | | | | | | | | |
| $ | 10.30 | | | $ | 11.76 | | | $ | 13.94 | | | $ | 14.47 | |
| | | | | | | | | | | | | | |
| | | |
| | 0.55 | % | | | 0.16 | % | | | 7.38 | % | | | 33.01 | % |
| | | |
| | | | | | | | | | | | | | |
| $ | 194,678 | | | $ | 227,339 | | | $ | 282,670 | | | $ | 293,035 | |
| | 1.16 | % | | | 1.14 | % | | | 1.09 | % | | | 1.17 | % |
| | 1.15 | % | | | 1.13 | % | | | 1.11 | % | | | 1.17 | % |
| | 0.15 | % | | | (0.59 | )% | | | (0.64 | )% | | | (0.41 | )% |
| | 131.40 | % | | | 216.17 | % | | | 135.60 | % | | | 93.59 | % |
See accompanying notes which are an integral part of these financial statements.
39
SMI CONSERVATIVE ALLOCATION FUND
FINANCIAL HIGHLIGHTS
(For a share outstanding during each year)
| | | | |
| | | Year Ended
October 31,
2017 | |
Selected Per Share Data: | | | | |
Net asset value, beginning of year | | $ | 9.47 | |
| | | | |
Income from investment operations: | | | | |
Net investment income (loss)(a) | | | 0.07 | |
Net realized and unrealized gain (loss) | | | 0.38 | |
| | | | |
Total from investment operations | | | 0.45 | |
| | | | |
| |
Less Distributions to Shareholders: | | | | |
From net investment income | | | (0.08 | ) |
From net realized gain | | | — | |
| | | | |
Total distributions | | | (0.08 | ) |
| | | | |
Paid in capital from redemption fees(c) | | | — | |
| | | | |
Net asset value, end of year | | $ | 9.84 | |
| | | | |
| |
Total Return(d) | | | 4.84 | % |
| |
Ratios and Supplemental Data: | | | | |
Net assets, end of year (000) | | $ | 15,165 | |
Ratio of expenses to average net assets(e) | | | 1.16 | % |
Ratio of expenses to average net assets excluding interest expense(e)(f) | | | 1.15 | % |
Ratio of expenses to average net assets before waiver and reimbursement(e) | | | 1.53 | % |
Ratio of net investment income (loss) to average net assets(a)(g) | | | 0.76 | % |
Portfolio turnover rate | | | 207.04 | % |
| (a) | Recognition of net investment income by the Fund is affected by the timing of the declaration of dividends by the underlying investment companies in which the Fund invests. |
| (b) | The amount shown for a share outstanding throughout the year does not correspond with the change in aggregate gains and losses in the portfolio of securities during the year because of the timing of sales and purchases of fund shares in relation to fluctuating market values during the year. |
| (c) | Redemption fees resulted in less than $0.005 per share. |
| (d) | Total return represents the rate that an investor would have earned on an investment in the Fund, assuming reinvestment of dividends. |
| (e) | These ratios exclude the impact of expenses of the underlying funds in which the Fund may invest, as represented in the Schedule of Investments. |
| (f) | These ratios do not include the effects of other expenses refunded by the underlying funds in which the Fund invests or line of credit interest expense and borrowing costs. |
| (g) | This ratio is presented net of expenses and/or expenses refunded by the underlying funds in which the Fund invests. |
See accompanying notes which are an integral part of these financial statements.
40
SMI CONSERVATIVE ALLOCATION FUND
FINANCIAL HIGHLIGHTS
(For a share outstanding during each year) – (Continued)
| | | | | | | | | | | | | | |
Year Ended
October 31,
2016 | | | Year Ended
October 31,
2015 | | | Year Ended
October 31,
2014 | | | Year Ended
October 31,
2013 | |
| | | | | | | | | | | | | | |
| $ | 9.65 | | | $ | 11.52 | | | $ | 12.20 | | | $ | 10.31 | |
| | | | | | | | | | | | | | |
| | | | | | | | | | | | | | |
| | 0.10 | | | | 0.08 | | | | (0.01 | ) | | | (0.02 | ) |
| | 0.02 | (b) | | | (0.52 | ) | | | 0.54 | | | | 2.11 | |
| | | | | | | | | | | | | | |
| | 0.12 | | | | (0.44 | ) | | | 0.53 | | | | 2.09 | |
| | | | | | | | | | | | | | |
| | | |
| | | | | | | | | | | | | | |
| | (0.10 | ) | | | (0.09 | ) | | | (0.06 | ) | | | (0.03 | ) |
| | (0.20 | ) | | | (1.34 | ) | | | (1.15 | ) | | | (0.17 | ) |
| | | | | | | | | | | | | | |
| | (0.30 | ) | | | (1.43 | ) | | | (1.21 | ) | | | (0.20 | ) |
| | | | | | | | | | | | | | |
| | — | | | | — | | | | — | | | | — | |
| | | | | | | | | | | | | | |
| $ | 9.47 | | | $ | 9.65 | | | $ | 11.52 | | | $ | 12.20 | |
| | | | | | | | | | | | | | |
| | | |
| | 1.30 | % | | | (4.58 | )% | | | 4.46 | % | | | 20.56 | % |
| | | |
| | | | | | | | | | | | | | |
| $ | 18,089 | | | $ | 22,203 | | | $ | 30,606 | | | $ | 29,826 | |
| | 1.16 | % | | | 1.16 | % | | | 1.13 | % | | | 1.15 | % |
| | 1.15 | % | | | 1.15 | % | | | 1.15 | % | | | 1.15 | % |
| | 1.51 | % | | | 1.49 | % | | | 1.31 | % | | | 1.52 | % |
| | 1.06 | % | | | 0.82 | % | | | (0.17 | )% | | | (0.06 | )% |
| | 203.11 | % | | | 377.51 | % | | | 255.50 | % | | | 270.30 | % |
See accompanying notes which are an integral part of these financial statements.
41
SMI DYNAMIC ALLOCATION FUND
FINANCIAL HIGHLIGHTS
(For a share outstanding during each period)
| | | | |
| | | Year Ended
October 31,
2017 | |
Selected Per Share Data: | | | | |
Net asset value, beginning of period | | $ | 10.92 | |
| | | | |
Income from investment operations: | | | | |
Net investment income(b) | | | 0.07 | |
Net realized and unrealized gain (loss) | | | 0.79 | |
| | | | |
Total from investment operations | | | 0.86 | |
| | | | |
| |
Less Distributions to Shareholders: | | | | |
From net investment income | | | (0.03 | ) |
From net realized gains | | | — | |
| | | | |
Total distributions | | | (0.03 | ) |
| | | | |
Paid in capital from redemption fees(c) | | | — | |
| | | | |
Net asset value, end of period | | $ | 11.75 | |
| | | | |
| |
Total Return(d) | | | 7.87 | % |
| |
Ratios and Supplemental Data: | | | | |
Net assets, end of period (000) | | $ | 162,002 | |
Ratio of expenses to average net assets(f) | | | 1.16 | % |
Ratio of expenses to average net assets excluding interest expense(f)(g) | | | 1.15 | % |
Ratio of net investment income to average net assets(b)(i) | | | 0.57 | % |
Portfolio turnover rate | | | 247.10 | % |
| (a) | For the period February 28, 2013 (the date the Fund commenced operations) through October 31, 2013. |
| (b) | Recognition of net investment income by the Fund is affected by the timing of the declaration of dividends by the underlying investment companies in which the Fund invests. |
| (c) | Redemption fees resulted in less than $0.005 per share. |
| (d) | Total return represents the rate that an investor would have earned on an investment in the Fund, assuming reinvestment of dividends. |
| (f) | These ratios exclude the impact of expenses of the underlying funds in which the Fund may invest, as represented in the Schedule of Investments. |
| (g) | These ratios do not include the effects of other expenses refunded by the underlying funds in which the Fund invests or line of credit interest expense and borrowing costs. |
| (i) | This ratio is presented net of expenses of the funds in which the Fund invests. |
See accompanying notes which are an integral part of these financial statements.
42
SMI DYNAMIC ALLOCATION FUND
FINANCIAL HIGHLIGHTS
(For a share outstanding during each period) – (Continued)
| | | | | | | | | | | | | | |
Year Ended
October 31,
2016 | | | Year Ended
October 31,
2015 | | | Year Ended
October 31,
2014 | | | Period Ended
October 31,
2013(a) | |
| | | | | | | | | | | | | | |
| $ | 10.99 | | | $ | 11.81 | | | $ | 10.95 | | | $ | 10.00 | |
| | | | | | | | | | | | | | |
| | | | | | | | | | | | | | |
| | 0.09 | | | | 0.19 | | | | 0.23 | | | | 0.05 | |
| | (0.02 | ) | | | (0.69 | ) | | | 0.81 | | | | 0.90 | |
| | | | | | | | | | | | | | |
| | 0.07 | | | | (0.50 | ) | | | 1.04 | | | | 0.95 | |
| | | | | | | | | | | | | | |
| | | |
| | | | | | | | | | | | | | |
| | (0.14 | ) | | | (0.23 | ) | | | (0.18 | ) | | | — | |
| | — | | | | (0.09 | ) | | | — | | | | — | |
| | | | | | | | | | | | | | |
| | (0.14 | ) | | | (0.32 | ) | | | (0.18 | ) | | | — | |
| | | | | | | | | | | | | | |
| | — | | | | — | | | | — | | | | — | |
| | | | | | | | | | | | | | |
| $ | 10.92 | | | $ | 10.99 | | | $ | 11.81 | | | $ | 10.95 | |
| | | | | | | | | | | | | | |
| | | |
| | 0.62 | % | | | (4.52 | )% | | | 9.64 | % | | | 9.50 | %(e) |
| | | |
| | | | | | | | | | | | | | |
| $ | 180,404 | | | $ | 197,539 | | | $ | 147,003 | | | $ | 68,290 | |
| | 1.15 | % | | | 1.15 | % | | | 1.20 | % | | | 1.30 | %(h) |
| | 1.15 | % | | | 1.15 | % | | | 1.20 | % | | | 1.30 | %(h) |
| | 0.80 | % | | | 1.62 | % | | | 2.13 | % | | | 0.94 | %(h) |
| | 151.88 | % | | | 248.18 | % | | | 134.71 | % | | | 68.64 | %(e) |
See accompanying notes which are an integral part of these financial statements.
43
SMI BOND FUND
FINANCIAL HIGHLIGHTS
(For a share outstanding during each period)
| | | | | | | | | | | | |
| | | Year Ended
October 31,
2017 | | | Year Ended
October 31,
2016 | | | Period Ended
October 31,
2015(a) | |
Selected Per Share Data: | | | | | | | | | | | | |
Net asset value, beginning of period | | $ | 9.90 | | | $ | 9.81 | | | $ | 10.00 | |
| | | | | | | | | | | | |
Income from investment operations: | | | | | | | | | | | | |
Net investment income(b) | | | 0.13 | | | | 0.16 | | | | 0.01 | |
Net realized and unrealized gain (loss) | | | 0.04 | | | | 0.12 | | | | (0.19 | ) |
| | | | | | | | | | | | |
Total from investment operations | | | 0.17 | | | | 0.28 | | | | (0.18 | ) |
| | | | | | | | | | | | |
| | | |
Less Distributions to Shareholders: | | | | | | | | | | | | |
From net investment income | | | (0.19 | ) | | | (0.19 | ) | | | (0.01 | ) |
| | | | | | | | | | | | |
Total distributions | | | (0.19 | ) | | | (0.19 | ) | | | (0.01 | ) |
| | | | | | | | | | | | |
Paid in capital from redemption fees(c) | | | — | | | | — | | | | — | |
| | | | | | | | | | | | |
Net asset value, end of period | | $ | 9.88 | | | $ | 9.90 | | | $ | 9.81 | |
| | | | | | | | | | | | |
| | | |
Total Return(d) | | | 1.77 | % | | | 2.95 | % | | | (1.82 | )%(e) |
| | | |
Ratios and Supplemental Data: | | | | | | | | | | | | |
Net assets, end of period (000) | | $ | 7,057 | | | $ | 7,563 | | | $ | 6,754 | |
Ratio of expenses to average net assets(f) | | | 0.86 | % | | | 0.86 | % | | | 0.86 | %(h) |
Ratio of expenses to average net assets excluding interest expense(f)(g) | | | 0.85 | % | | | 0.85 | % | | | 0.85 | %(h) |
Ratio of expenses to average net assets before waiver and reimbursement(f) | | | 2.07 | % | | | 2.22 | % | | | 4.18 | %(h) |
Ratio of net investment income to average net assets(b)(i) | | | 1.36 | % | | | 1.70 | % | | | 0.11 | %(h) |
Portfolio turnover rate | | | 139.27 | % | | | 289.18 | % | | | 399.72 | %(e) |
| (a) | For the period April 28, 2015 (the date the Fund commenced operations) through October 31, 2015. |
| (b) | Recognition of net investment income by the Fund is affected by the timing of the declaration of dividends by the underlying investment companies in which the Fund invests. |
| (c) | Redemption fees resulted in less than $0.005 per share. |
| (d) | Total return represents the rate that an investor would have earned on an investment in the Fund, assuming reinvestment of dividends. |
| (f) | These ratios exclude the impact of expenses of the underlying funds in which the Fund may invest, as represented in the Schedule of Investments. |
| (g) | These ratios do not include the effects of line of credit interest expense and borrowing costs. |
| (i) | This ratio is presented net of expenses of the funds in which the Fund invests. |
See accompanying notes which are an integral part of these financial statements.
44
SMI 50/40/10 FUND
FINANCIAL HIGHLIGHTS
(For a share outstanding during each period)
| | | | | | | | | | | | |
| | | Year Ended
October 31,
2017 | | | Year Ended
October 31,
2016 | | | Period Ended
October 31,
2015(a) | |
Selected Per Share Data: | | | | | | | | | | | | |
Net asset value, beginning of period | | $ | 9.28 | | | $ | 9.20 | | | $ | 10.00 | |
| | | | | | | | | | | | |
Income from investment operations: | | | | | | | | | | | | |
Net investment income (loss)(b) | | | (0.01 | ) | | | 0.03 | | | | — | (c) |
Net realized and unrealized gain (loss) | | | 1.68 | | | | 0.10 | | | | (0.80 | ) |
| | | | | | | | | | | | |
Total from investment operations | | | 1.67 | | | | 0.13 | | | | (0.80 | ) |
| | | | | | | | | | | | |
| | | |
Less Distributions to Shareholders: | | | | | | | | | | | | |
From net investment income | | | (0.03 | ) | | | (0.05 | ) | | | — | |
| | | | | | | | | | | | |
Total distributions | | | (0.03 | ) | | | (0.05 | ) | | | — | |
| | | | | | | | | | | | |
Paid in capital from redemption fees(d) | | | — | | | | — | | | | — | |
| | | | | | | | | | | | |
Net asset value, end of period | | $ | 10.92 | | | $ | 9.28 | | | $ | 9.20 | |
| | | | | | | | | | | | |
| | | |
Total Return(e) | | | 17.99 | % | | | 1.44 | % | | | (8.00 | )%(f) |
| | | |
Ratios and Supplemental Data: | | | | | | | | | | | | |
Net assets, end of period (000) | | $ | 22,007 | | | $ | 18,363 | | | $ | 13,147 | |
Ratio of expenses to average net assets(g) | | | 1.46 | % | | | 1.45 | % | | | 1.45 | %(i) |
Ratio of expenses to average net assets excluding interest expense(g)(h) | | | 1.45 | % | | | 1.45 | % | | | 1.45 | %(i) |
Ratio of expenses to average net assets before waiver and reimbursement(g) | | | 1.56 | % | | | 1.76 | % | | | 2.75 | %(i) |
Ratio of net investment income (loss) to average net assets(b)(j) | | | (0.17 | )% | | | 0.30 | % | | | (0.09 | )%(i) |
Portfolio turnover rate | | | 212.36 | % | | | 146.24 | % | | | 184.30 | %(f) |
| (a) | For the period April 29, 2015 (the date the Fund commenced operations) through October 31, 2015. |
| (b) | Recognition of net investment income by the Fund is affected by the timing of the declaration of dividends by the underlying investment companies in which the Fund invests. |
| (c) | Amount is less than $0.005 per share. |
| (d) | Redemption fee resulted in less than $0.005 per share. |
| (e) | Total return represents the rate that an investor would have earned on an investment in the Fund, assuming reinvestment of dividends. |
| (g) | These ratios exclude the impact of expenses of the underlying funds in which the Fund may invest, as represented in the Schedule of Investments. |
| (h) | These ratios do not include the effects of line of credit interest expense and borrowing costs. |
| (j) | This ratio is presented net of expenses of the funds in which the Fund invests. |
See accompanying notes which are an integral part of these financial statements.
45
SMI FUNDS
NOTES TO THE FINANCIAL STATEMENTS
October 31, 2017
NOTE 1. ORGANIZATION
The Sound Mind Investing Fund (“SMI Fund”), SMI Conservative Allocation Fund, SMI Dynamic Allocation Fund, SMI Bond Fund and SMI 50/40/10 Fund (each a “Fund” and collectively, the “Funds”) are each a diversified series of Valued Advisers Trust (the “Trust”). Pursuant to a reorganization that took place on February 28, 2013, the SMI Fund and SMI Conservative Allocation Fund are the successors to the series of Unified Series Trust (the “Predecessor Funds”) with the same names. The Predecessor Funds had the same investment objectives and strategies and substantially the same investment policies as the Funds. The SMI Fund was organized on August 29, 2005, and commenced operations on December 2, 2005. The SMI Conservative Allocation Fund was organized on November 13, 2010, and commenced operations on December 30, 2010. The SMI Dynamic Allocation Fund was organized on December 11, 2012, and commenced operations on February 28, 2013. The SMI Bond Fund was organized on March 11, 2015, and commenced operations on April 28, 2015. The SMI 50/40/10 Fund was organized on March 11, 2015, and commenced operations on April 29, 2015. The Trust is a management investment company established under the laws of Delaware by an Agreement and Declaration of Trust dated June 13, 2008 (the “Trust Agreement”). The Trust Agreement permits the Trustees to issue an unlimited number of shares of beneficial interest of separate series without par value. Each Fund is one of a series of funds currently authorized by the Trustees. The investment adviser to the Funds is SMI Advisory Services, LLC (the “Adviser”). The SMI Fund seeks to provide long-term capital appreciation. The SMI Conservative Allocation Fund, SMI Dynamic Allocation Fund, SMI Bond Fund and SMI 50/40/10 Fund seek total return.
Each of the Funds is a “fund-of-funds” in which each Fund may invest in other investment companies, including exchange-traded funds. For a discussion on the strategies employed by each of the Funds, please refer to pages 4 and 5 of this report.
NOTE 2. SIGNIFICANT ACCOUNTING POLICIES
The Funds are investment companies and follow accounting and reporting guidance under Financial Accounting Standards Board Accounting Standards Codification (“ASC”) Topic 946, “Financial Services- Investment Companies”. The following is a summary of significant accounting policies followed by the Funds in the preparation of their financial statements. These policies are in conformity with the generally accepted accounting principles in the United States of America (“GAAP”).
Estimates – The preparation of financial statements in conformity with GAAP requires management to make estimates and assumptions that affect the reported amounts of assets and liabilities and disclosure of contingent assets and liabilities at the date of the financial statements and the reported amounts of increases and decreases in net assets from operations during the reporting period. Actual results could differ from those estimates.
Securities Valuations – All investments in securities are recorded at their estimated fair value as described in Note 3.
46
SMI FUNDS
NOTES TO THE FINANCIAL STATEMENTS
October 31, 2017 – (Continued)
NOTE 2. SIGNIFICANT ACCOUNTING POLICIES – (Continued)
Federal Income Taxes – The Funds make no provision for federal income or excise tax. The Funds have qualified and intend to qualify each year as regulated investment companies (“RICs”) under subchapter M of the Internal Revenue Code of 1986, as amended, by complying with the requirements applicable to RICs and by distributing substantially all of their taxable income. The Funds also intend to distribute sufficient net investment income and net capital gains, if any, so that they will not be subject to excise tax on undistributed income and gains. If the required amount of net investment income or gains is not distributed, the Funds could incur a tax expense.
As of and during the fiscal year ended October 31, 2017, the Funds did not have a liability for any unrecognized tax benefits. The Funds recognize interest and penalties, if any, related to unrecognized tax benefits as income tax expense in the Statements of Operations when incurred. During the fiscal year ended October 31, 2017, the Funds did not incur any interest or penalties.
Expenses – Expenses incurred by the Trust, or at the fund complex level, that do not relate to a specific fund are allocated to the individual funds based on each fund’s relative net assets or other appropriate basis.
Security Transactions and Related Income – The Funds follow industry practice and record security transactions on the trade date for financial reporting purposes. For financial statement and income tax purposes, the specific identification method is used for determining gains or losses. Dividend income is recorded on the ex-dividend date and interest income is recorded on an accrual basis. Short-term capital gain distributions from underlying funds are classified as dividend income for financial reporting purposes. Long-term capital gain distributions are broken out as such. The ability of issuers of debt securities held by the Funds to meet their obligations may be affected by economic and political developments in a specific country or region.
Dividends and Distributions – The Funds typically distribute substantially all of their net investment income in the form of dividends and taxable capital gains to their shareholders at least annually. These distributions, which are recorded on the ex-dividend date, are automatically reinvested in each Fund unless shareholders request cash distributions on their application or through a written request. The treatment for financial reporting purposes of distributions made to shareholders during the year from net investment income or net realized capital gains may differ from their ultimate treatment for federal income tax purposes. Where such differences are permanent in nature, they are reclassified among the components of the net assets based on their ultimate characterization for federal income tax purposes. Any such reclassifications will have no effect on net assets, results of operations or net asset values (“NAV”) per share of the Funds.
47
SMI FUNDS
NOTES TO THE FINANCIAL STATEMENTS
October 31, 2017 – (Continued)
NOTE 2. SIGNIFICANT ACCOUNTING POLICIES – (Continued)
For the fiscal year ended October 31, 2017, the Funds made the following reclassifications to increase/ (decrease) the components of net assets:
| | | | | | | | | | | | |
Fund | | Paid-in Capital | | | Accumulated
Undistributed
Net Investment
Income (Loss) | | | Accumulated
Net Realized
Gain (Loss) on Investments | |
| SMI Fund | | $ | — | | | $ | 1,099,896 | | | $ | (1,099,896 | ) |
| SMI Conservative Allocation Fund | | | — | | | | 40,847 | | | | (40,847 | ) |
| SMI Dynamic Allocation Fund | | | — | | | | (157,398 | ) | | | 157,398 | |
| SMI Bond Fund | | | — | | | | 42,842 | | | | (42,842 | ) |
| SMI 50/40/10 Fund | | | (13,480 | ) | | | 9,813 | | | | 3,667 | |
These differences are primarily due to differing treatments for items such as gains distributed from underlying investment companies, partnership adjustments and net investment losses.
NOTE 3. SECURITIES VALUATION AND FAIR VALUE MEASUREMENTS
Fair value is defined as the price that a Fund would receive upon selling an investment in an orderly transaction to an independent buyer in the principal or most advantageous market of the investment. GAAP establishes a three-tier hierarchy to maximize the use of observable market data and minimize the use of unobservable inputs and to establish classification of fair value measurements for disclosure purposes.
Inputs refer broadly to the assumptions that market participants would use in pricing the asset or liability, including assumptions about risk, for example, the risk inherent in a particular valuation technique used to measure fair value including such a pricing model and the risk inherent in the inputs to the valuation technique. Inputs may be observable or unobservable. Observable inputs are inputs that reflect the assumptions market participants would use in pricing the asset or liability developed based on market data obtained from sources independent of the reporting entity. Unobservable inputs are inputs that reflect the reporting entity’s own assumptions about the assumptions market participants would use in pricing the asset or liability developed based on the best information available in the circumstances.
Various inputs are used in determining the value of the Funds’ investments. These inputs are summarized in the three broad levels listed below.
| | • | | Level 1 – unadjusted quoted prices in active markets for identical investments and/or registered investment companies where the value per share is determined and published and is the basis for current transactions for identical assets or liabilities at the valuation date. |
| | • | | Level 2 – other significant observable inputs (including, but not limited to, quoted prices for an identical security in an inactive market, quoted prices for similar securities, interest rates, prepayment speeds, credit risk, etc.) |
48
SMI FUNDS
NOTES TO THE FINANCIAL STATEMENTS
October 31, 2017 – (Continued)
NOTE 3. SECURITIES VALUATION AND FAIR VALUE MEASUREMENTS – (Continued)
| | • | | Level 3 – significant unobservable inputs (including each Fund’s own assumptions in determining fair value of investments based on the best information available) |
The inputs used to measure fair value may fall into different levels of the fair value hierarchy. In such cases, for disclosure purposes, the level in the fair value hierarchy which is reported is determined based on the lowest level input that is significant to the fair value measurement in its entirety.
Equity securities that are traded on any stock exchange are generally valued at the last quoted sale price on the security’s primary exchange. Lacking a last sale price, an exchange traded security is generally valued at its last bid price. Securities traded in the NASDAQ over-the-counter market are generally valued at the NASDAQ Official Closing Price. When using the market quotations and when the market is considered active, the security is classified as a Level 1 security. In the event that market quotations are not readily available or are considered unreliable due to market or other events, the Fund values its securities and other assets at fair value in accordance with policies established by and under the general supervision of the Board of Trustees (the “Board”). Under these policies, the securities will be classified as Level 2 or 3 within the fair value hierarchy, depending on the inputs used.
Investments in mutual funds, including money market mutual funds, are generally priced at the ending NAV of the mutual funds. These securities are categorized as Level 1 securities. In the event that the ending NAV for a mutual fund is unavailable at the end of day pricing time, the Adviser may, in accordance with the Trust’s valuation policies, consider all appropriate factors in determining the fair value of the mutual fund. In such cases the security will generally be categorized as a Level 2 security.
In accordance with the Trust’s valuation policies, the Adviser is required to consider all appropriate factors relevant to the value of securities for which it has determined other pricing sources are not available or reliable as described above. No single standard exists for determining fair value, because fair value depends upon the circumstances of each individual case. As a general principle, the current fair value of an issue of securities being valued by the Adviser would appear to be the amount that the Fund might reasonably expect to receive for them upon their current sale. Methods that are in accordance with this principle may, for example, be based on (i) a multiple of earnings; (ii) a discount from market prices of a similar freely traded security (including a derivative security or a basket of securities traded on other markets, exchanges or among dealers); or (iii) yield to maturity with respect to debt issues, or a combination of these and other methods. Fair-value pricing is permitted if, in the Adviser’s opinion, the validity of market quotations appears to be questionable based on factors such as evidence of a thin market in the security based on a small number of quotations, a significant event occurs after the close of a market but before a Fund’s NAV calculation that may affect a security’s value, or the Adviser is aware of any other data that calls into question the reliability of market quotations. Fair-value pricing may also be used in instances when the bonds in which the Funds may invest default or otherwise cease to have market quotations readily available.
49
SMI FUNDS
NOTES TO THE FINANCIAL STATEMENTS
October 31, 2017 – (Continued)
NOTE 3. SECURITIES VALUATION AND FAIR VALUE MEASUREMENTS – (Continued)
The following is a summary of the inputs used to value the Funds’ investments as of October 31, 2017:
| | | | | | | | | | | | | | | | |
| | | Valuation Inputs | |
| SMI Fund | | Level 1 | | | Level 2 | | | Level 3 | | | Total | |
| Mutual Funds | | $ | 170,956,608 | | | $ | 6,829 | | | $ | — | | | $ | 170,963,437 | |
| Exchange-Traded Funds | | | 25,351,578 | | | | — | | | | — | | | | 25,351,578 | |
| Money Market Securities | | | 1,244,497 | | | | — | | | | — | | | | 1,244,497 | |
| Total Investments | | $ | 197,552,683 | | | $ | 6,829 | | | $ | — | | | $ | 197,559,512 | |
| | | | | | | | | | | | | | | | |
| | | Valuation Inputs | |
SMI Conservative Allocation Fund | | Level 1 | | | Level 2 | | | Level 3 | | | Total | |
| Mutual Funds | | $ | 4,562,843 | | | $ | — | | | $ | — | | | $ | 4,562,843 | |
| Exchange-Traded Funds | | | 10,510,404 | | | | — | | | | — | | | | 10,510,404 | |
| Money Market Securities | | | 283,549 | | | | — | | | | — | | | | 283,549 | |
| Total Investments | | $ | 15,356,796 | | | $ | — | | | $ | — | | | $ | 15,356,796 | |
| | | | | | | | | | | | | | | | |
| | | Valuation Inputs | |
SMI Dynamic Allocation Fund | | Level 1 | | | Level 2 | | | Level 3 | | | Total | |
| Exchange-Traded Funds | | $ | 159,438,448 | | | $ | — | | | $ | — | | | $ | 159,438,448 | |
| Money Market Securities | | | 3,101,310 | | | | — | | | | — | | | | 3,101,310 | |
| Total Investments | | $ | 162,539,758 | | | $ | — | | | $ | — | | | $ | 162,539,758 | |
| | | | | | | | | | | | | | | | |
| | | Valuation Inputs | |
| SMI Bond Fund | | Level 1 | | | Level 2 | | | Level 3 | | | Total | |
| Mutual Funds | | $ | 5,254,294 | | | $ | — | | | $ | — | | | $ | 5,254,294 | |
| Exchange-Traded Funds | | | 1,729,533 | | | | — | | | | — | | | | 1,729,533 | |
| Money Market Securities | | | 216,465 | | | | — | | | | — | | | | 216,465 | |
| Total Investments | | $ | 7,200,292 | | | $ | — | | | $ | — | | | $ | 7,200,292 | |
50
SMI FUNDS
NOTES TO THE FINANCIAL STATEMENTS
October 31, 2017 – (Continued)
NOTE 3. SECURITIES VALUATION AND FAIR VALUE MEASUREMENTS – (Continued)
| | | | | | | | | | | | | | | | |
| | | Valuation Inputs | |
| SMI 50/40/10 Fund | | Level 1 | | | Level 2 | | | Level 3 | | | Total | |
| Mutual Funds | | $ | 10,318,195 | | | $ | — | | | $ | — | | | $ | 10,318,195 | |
| Exchange-Traded Funds | | | 11,553,535 | | | | — | | | | — | | | | 11,553,535 | |
| Money Market Securities | | | 895,586 | | | | — | | | | — | | | | 895,586 | |
| Total Investments | | $ | 22,767,316 | | | $ | — | | | $ | — | | | $ | 22,767,316 | |
The Funds did not hold any investments during the reporting period for which significant unobservable inputs (Level 3) were used in determining fair value; therefore, no reconciliation of Level 3 securities is included for this reporting period.
The Trust recognizes transfers between fair value hierarchy levels at the end of the reporting period. The transfers from Level 1 to Level 2 represent securities which were valued using observable inputs of a similar asset at the end of the period that were not at the beginning of the period. The following is a summary of the transfer between Level 1 and Level 2 of the fair value hierarchy as of October 31, 2017 based on input levels assigned at October 31, 2016:
| | | | |
| | | Transfers from Level 1 to Level 2 | |
| SMI Fund | | | |
| Mutual Funds | | $ | 6,829 | |
NOTE 4. FEES AND OTHER TRANSACTIONS WITH AFFILIATES
The Adviser, under the terms of the management agreement with respect to each Fund, manages the Funds’ investments. As compensation for its management services, each Fund is obligated to pay the Adviser a fee based on each Fund’s average daily net assets as follows:
| | | | | | | | | | | | |
Fund Assets | | SMI Fund
Management Fee | | | SMI Conservative Allocation
Fund Management Fee | | | SMI Dynamic Allocation Fund Management Fee | |
| $1 – $100 million | | | 1.00% | | | | 0.90% | | | | 1.00% | |
| $100,000,001 – $250 million | | | 1.00% | | | | 0.80% | | | | 1.00% | |
| $250,000,001 – $500 million | | | 0.90% | | | | 0.70% | | | | 0.90% | |
| Over $500 million | | | 0.80% | | | | 0.60% | | | | 0.80% | |
| Management fees earned | | $ | 1,971,157 | | | $ | 144,562 | | | $ | 1,639,954 | |
Fees waived by Adviser | | | — | | | | (59,711) | | | | — | |
51
SMI FUNDS
NOTES TO THE FINANCIAL STATEMENTS
October 31, 2017 – (Continued)
NOTE 4. FEES AND OTHER TRANSACTIONS WITH AFFILIATES – (Continued)
| | |
Fund Assets | | SMI Bond Fund Management Fee |
| $1 – $99,999,999 | | 0.75% |
| $100 million – $250 million | | 0.70% |
| Over $250 million | | 0.65% |
| Management fees earned | | $ 51,850 |
| Fees waived and expenses reimbursed by Adviser | | (84,237) |
| | |
Fund Assets | | SMI 50/40/10 Fund Management Fee |
| $1 – $250 million | | 1.00% |
| $250,000,001 – $500 million | | 0.90% |
| Over $500 million | | 0.80% |
| Management fees earned | | $ 191,808 |
| Fees waived by Adviser | | (20,157) |
The Adviser contractually has agreed to waive its management fee and reimburse certain operating expenses, but only to the extent necessary so that each Fund’s total annual operating expenses (excluding interest, taxes, brokerage commissions, other expenses which are capitalized in accordance with GAAP, extraordinary expenses, dividend expense on short sales, 12b-1 fees, and acquired fund fees and expenses) do not exceed 1.50% of the Fund’s average daily net assets with respect to the SMI Fund, 1.15% with respect to the SMI Conservative Allocation Fund, 1.45% with respect to the SMI Dynamic Allocation Fund, 0.85% with respect to the SMI Bond Fund, and 1.45% with respect to the SMI 50/40/10 Fund through February 28, 2018.
Each fee waiver or expense reimbursement by the Adviser is subject to repayment by the applicable Fund within the three fiscal years following the date in which that particular waiver or expense reimbursement occurred, provided that such Fund is able to make the repayment without exceeding the expense limitation that is in effect at the repayment or at the time of the waiver or expense reimbursement, whichever is lower.
As of October 31, 2017, the Adviser may seek repayment of investment advisory fee waivers and expense reimbursements of $217,619, $259,550 and $127,212 from the SMI Conservative Allocation Fund, SMI Bond Fund and SMI 50/40/10 Fund, respectively, pursuant to the aforementioned conditions, no later than October 31, 2020.
The Trust retains Ultimus Asset Services, LLC (the “Administrator”), to provide the Funds with administration, compliance, fund accounting, and transfer agent services, including all regulatory reporting. Expenses incurred by the Funds for these services are allocated to the individual Funds based on each Fund’s relative net assets.
52
SMI FUNDS
NOTES TO THE FINANCIAL STATEMENTS
October 31, 2017 – (Continued)
NOTE 4. FEES AND OTHER TRANSACTIONS WITH AFFILIATES – (Continued)
The officers and one trustee of the Trust are members of management and/or employees of the Administrator. Unified Financial Securities, LLC (the “Distributor”) acts as the principal distributor of the Funds’ shares. For the fiscal year ended October 31, 2017, fees for administration, compliance, fund accounting, and transfer agent services, and amounts due to the Administrator at October 31, 2017 were as follows:
| | | | | | | | | | | | | | | | | | | | |
| | | SMI Fund | | | SMI Conservative Allocation Fund | | | SMI Dynamic
Allocation Fund | | | SMI Bond Fund | | | SMI 50/40/10 Fund | |
Administration expenses | | $ | 47,967 | | | $ | 3,932 | | | $ | 39,661 | | | $ | 1,638 | | | $ | 4,650 | |
Compliance expenses | | | 7,875 | | | | 7,875 | | | | 7,875 | | | | 7,875 | | | | 7,875 | |
Fund accounting expenses | | | 26,703 | | | | 2,188 | | | | 22,077 | | | | 911 | | | | 2,588 | |
Transfer agent expenses | | | 32,215 | | | | 4,213 | | | | 14,035 | | | | 1,303 | | | | 6,674 | |
Payable to Administrator | | | 9,712 | | | | 1,567 | | | | 6,735 | | | | 945 | | | | 1,833 | |
There were no payments made to the Distributor by the Funds for the fiscal year ended October 31, 2017.
NOTE 5. INVESTMENTS
For the fiscal year ended October 31, 2017, purchases and sales of investment securities, other than short- term investments were as follows:
| | | | | | | | | | | | | | | | | | | | |
| | | SMI Fund | | | SMI Conservative
Allocation Fund | | | SMI Dynamic
Allocation Fund | | | SMI Bond
Fund | | | SMI 50/40/10
Fund | |
Purchases | | | | | | | | | | | | | | | | | | | | |
U.S. Government Obligations | | $ | — | | | $ | — | | | $ | — | | | $ | — | | | $ | — | |
Other | | | 345,476,446 | | | | 32,697,927 | | | | 387,871,412 | | | | 9,603,896 | | | | 40,383,506 | |
| | | | | |
Sales | | | | | | | | | | | | | | | | | | | | |
U.S. Government Obligations | | $ | — | | | $ | — | | | $ | — | | | $ | — | | | $ | — | |
Other | | | 378,857,495 | | | | 36,121,658 | | | | 411,040,202 | | | | 10,143,766 | | | | 40,208,326 | |
NOTE 6. LINE OF CREDIT
During the fiscal year ended October 31, 2017, the Trust, on behalf of the Funds, entered into a short- term credit agreement (“Line of Credit”) with Huntington National Bank (“Huntington”), expiring on February 2, 2018. Under the terms of the Line of Credit, each of the Funds may borrow up to the lesser of 10% of a Fund’s daily market value or $5 million at an interest rate of LIBOR plus 150 basis points, 2.73778% as of October 31, 2017. The purpose of the Line of Credit is to meet temporary or emergency
53
SMI FUNDS
NOTES TO THE FINANCIAL STATEMENTS
October 31, 2017 – (Continued)
NOTE 6. LINE OF CREDIT – (Continued)
cash needs, including redemption requests that might otherwise require the untimely disposition of securities. Huntington receives an annual facility fee of 0.125% on $5 million as well as an additional annual fee of 0.125% on any unused portion of the credit facility, invoiced quarterly, for providing the Line of Credit. The Funds will not borrow money, except (a) from a bank, provided that immediately after such borrowing there is an asset coverage of 300% for all borrowings of a Fund; or (b) from a bank or other persons for temporary purposes only, provided that such temporary borrowings are in an amount not exceeding 5% of a Fund’s total assets at the time when the borrowing is made. To the extent that the Line of Credit is utilized, it will be collateralized by securities in the Funds’ portfolios.
As of October 31, 2017, the Funds had no outstanding borrowings under this Line of Credit.
| | | | | | | | | | | | | | | | | | | | |
| Fund | | Average
Daily Loan
Balance(a) | | | Weighted
Average
Interest
Rate(a) | | | Number of Days
Outstanding(b) | | | Interest
Expense
Accrued | | | Maximum
Loan
Outstanding | |
| SMI Fund | | $ | 676,522 | | | | 2.29 | % | | | 46 | | | $ | 2,200 | | | $ | 2,200,000 | |
| SMI Conservative Allocation Fund | | | 123,243 | | | | 2.49 | % | | | 74 | | | | 631 | | | | 450,000 | |
| SMI Dynamic Allocation Fund | | | 928,505 | | | | 2.48 | % | | | 107 | | | | 7,391 | | | | 5,000,000 | |
| SMI Bond Fund | | | 110,000 | | | | 2.59 | % | | | 17 | | | | 33 | | | | 300,000 | |
| SMI 50/40/10 Fund | | | 405,556 | | | | 2.21 | % | | | 27 | | | | 597 | | | | 1,150,000 | |
| (a) | Averages based on the number of days outstanding. |
| (b) | Number of Days Outstanding represents the total days during the year ended October 31, 2017, that a Fund utilized the Line of Credit. |
NOTE 7. BENEFICIAL OWNERSHIP
The beneficial ownership, either directly or indirectly, of more than 25% of the voting securities of a fund creates a presumption of control of the fund, under Section 2(a)(9) of the Investment Company Act of 1940. At October 31, 2017, National Financial Services Corporation (“NFS”) for the benefit of others, held 25%, 29%, 35% and 45% of the SMI Fund, SMI Conservative Allocation Fund, SMI Dynamic Allocation Fund and SMI Bond Fund, respectively.
54
SMI FUNDS
NOTES TO THE FINANCIAL STATEMENTS
October 31, 2017 – (Continued)
NOTE 8. FEDERAL TAX INFORMATION
At October 31, 2017, the net unrealized appreciation (depreciation) of investments for tax purposes was as follows:
| | | | | | | | | | | | | | | | | | | | |
| | | SMI Fund | | | SMI Conservative
Allocation Fund | | | SMI Dynamic
Allocation Fund | | | SMI Bond
Fund | | | SMI 50/40/10
Fund | |
Gross appreciation | | $ | 22,539,919 | | | $ | 1,007,222 | | | $ | 18,302,943 | | | $ | 7,562 | | | $ | 3,097,375 | |
Gross (depreciation) | | | (31,097 | ) | | | (34,538 | ) | | | (90,339 | ) | | | (24,968 | ) | | | (13,055 | ) |
| | | | | | | | | | | | | | | | | | | | |
Net appreciation (depreciation) on investments | | $ | 22,508,822 | | | $ | 972,684 | | | $ | 18,212,604 | | | $ | (17,406 | ) | | $ | 3,084,320 | |
| | | | | | | | | | | | | | | | | | | | |
Tax cost of investments | | $ | 175,050,690 | | | $ | 14,384,112 | | | $ | 144,327,154 | | | $ | 7,217,698 | | | $ | 19,682,996 | |
| | | | | | | | | | | | | | | | | | | | |
On November 30, 2017, the SMI Bond Fund paid an income distribution of $0.011294.
The tax characterization of distributions for the fiscal years ended October 31, 2017 and October 31, 2016, were as follows:
| | | | | | | | | | | | | | | | | | | | | | | | |
| | | SMI Fund | | | SMI Conservative
Allocation Fund | | | SMI Dynamic
Allocation Fund | |
| | | 2017 | | | 2016 | | | 2017 | | | 2016 | | | 2017 | | | 2016 | |
Distributions paid from:* | | | | | | | | | | | | | | | | | | | | | | | | |
Ordinary income | | $ | — | | | $ | — | | | $ | 149,639 | | | $ | 193,531 | | | $ | 414,783 | | | $ | 2,361,609 | |
Long-term capital gain | | | — | | | | 28,684,023 | | | | — | | | | 462,938 | | | | — | | | | — | |
| | | | | | | | | | | | | | | | | | | | | | | | |
Total taxable distributions | | $ | — | | | $ | 28,684,023 | | | $ | 149,639 | | | $ | 656,469 | | | $ | 414,783 | | | $ | 2,361,609 | |
| | | | | | | | | | | | | | | | | | | | | | | | |
| | | | | | | | | | | | | | | | |
| | | SMI Bond Fund | | | SMI 50/40/10 Fund | |
| | | 2017 | | | 2016 | | | 2017 | | | 2016 | |
Distributions paid from:* | | | | | | | | | | | | | | | | |
Ordinary income | | $ | 135,679 | | | $ | 152,057 | | | $ | 34,523 | | | $ | 69,379 | |
| | | | | | | | | | | | | | | | |
Total taxable distributions | | $ | 135,679 | | | $ | 152,057 | | | $ | 34,523 | | | $ | 69,379 | |
| | | | | | | | | | | | | | | | |
Tax return of capital | | | — | | | | 295 | | | | 13,479 | | | | 22,056 | |
| | | | | | | | | | | | | | | | |
Total distributions paid | | $ | 135,679 | | | $ | 152,352 | | | $ | 48,002 | | | $ | 91,435 | |
| | | | | | | | | | | | | | | | |
| * | For federal income tax purposes, distributions of short-term capital gains are treated as ordinary income distributions. |
55
SMI FUNDS
NOTES TO THE FINANCIAL STATEMENTS
October 31, 2017 – (Continued)
NOTE 8. FEDERAL TAX INFORMATION – (Continued)
At October 31, 2017, the Funds’ most recent fiscal year end, the components of distributable earnings (accumulated losses) on a tax basis were as follows:
| | | | | | | | | | | | |
| | | SMI Fund | | | SMI Conservative
Allocation Fund | | | SMI Dynamic
Allocation Fund | |
Accumulated undistributed ordinary income | | $ | 6,624,525 | | | $ | 105,082 | | | $ | 582,080 | |
Accumulated undistributed long-term capital gains | | | 10,540,329 | | | | — | | | | — | |
Accumulated capital and other losses | | | — | | | | (849,426 | ) | | | (12,069,745 | ) |
Unrealized appreciation (depreciation) | | | 22,508,822 | | | | 972,684 | | | | 18,212,604 | |
| | | | | | | | | | | | |
| | | |
| | $ | 39,673,676 | | | $ | 228,340 | | | $ | 6,724,939 | |
| | | | | | | | | | | | |
| | | | | | | | |
| | | SMI Bond
Fund | | | SMI 50/40/10
Fund | |
Accumulated undistributed ordinary income | | $ | 15,469 | | | $ | — | |
Distributions payable | | | (122 | ) | | | — | |
Accumulated capital and other losses | | | — | | | | (495,041 | ) |
Unrealized appreciation (depreciation) | | | (17,406 | ) | | | 3,084,320 | |
| | | | | | | | |
| | $ | (2,059 | ) | | $ | 2,589,279 | |
| | | | | | | | |
At October 31, 2017, the difference between book basis and tax basis unrealized appreciation (depreciation) is attributable to the tax deferral of losses on wash sales.
At October 31, 2017, the following Funds had net capital loss carryforwards which are available to offset future net capital gains, if any:
| | | | | | | | | | | | | | | | | | | | | | | | |
| | | SMI Conservative
Allocation Fund | | | SMI Dynamic
Allocation Fund | | | SMI 50/40/10 Fund | |
| | | Short-Term | | | Long-Term | | | Short-Term | | | Long-Term | | | Short-Term | | | Long-Term | |
Non-Expiring | | $ | 848,662 | | | $ | 764 | | | $ | 10,605,086 | | | $ | 1,464,659 | | | $ | 412,782 | | | $ | — | |
| | | | | | | | | | | | | | | | | | | | | | | | |
Capital loss carryforwards are available to offset future realized capital gains and thereby reduce further taxable gain distributions. During the fiscal year ended October 31, 2017, the SMI Fund, SMI Bond Fund and SMI 50/40/10 Fund utilized $3,359,621, $13,344 and $447,277, respectively of their capital loss carryforwards.
For the tax year ended October 31, 2017, the following Fund deferred late year ordinary losses of:
| | | | |
| | | Qualified
Late Year Ordinary
Losses | |
SMI 50/40/10 Fund | | $ | 82,259 | |
56
SMI FUNDS
NOTES TO THE FINANCIAL STATEMENTS
October 31, 2017 – (Continued)
NOTE 9. COMMITMENTS AND CONTIGENCIES
The Funds indemnify their officers and trustees for certain liabilities that may arise from performance of their duties to the Funds. Additionally, in the normal course of business, the Funds enter into contracts that contain a variety of representations and warranties which provide general indemnifications. The Funds’ maximum exposure under these arrangements is unknown, as this would involve future claims that may be made against the Funds that have not yet occurred.
NOTE 10. SUBSEQUENT EVENT
Management of the Funds has evaluated the need for disclosures resulting from subsequent events through the date these financial statements were issued, and has determined that the following event requires disclosure to shareholders.
At a meeting of the Board of Trustees on December 12, 2017, the Board approved a resolution whereby the SMI Bond Fund would close and liquidate proceeds to shareholders that remain on the date of liquidation. This liquidation is expected to occur in the first quarter of 2018. Additionally, at this meeting, the Board approved a resolution allowing for the merger of the SMI 50/40/10 and the SMI Conservative Allocation Funds. Shareholders will receive a prospectus supplement with information about the fund closure and the merger.
Management has further determined there are no other items requiring adjustment of the financial statements or additional disclosure.
57
REPORT OF INDEPENDENT REGISTERED PUBLIC ACCOUNTING FIRM
To the Shareholders of Sound Mind Investing Fund, SMI Conservative Allocation Fund, SMI Dynamic Allocation Fund, SMI Bond Fund, and SMI 50/40/10 Fund and
Board of Trustees of Valued Advisers Trust
We have audited the accompanying statements of assets and liabilities, including the schedules of investments, of Sound Mind Investing Fund, SMI Conservative Allocation Fund, SMI Dynamic Allocation Fund, SMI Bond Fund, and SMI 50/40/10 Fund (collectively referred to as the “Funds”), each a series of Valued Advisers Trust, as of October 31, 2017, and the related statements of operations for the year then ended, the statements of changes in net assets for each of the two years in the period then ended, and the financial highlights for each of the periods indicated in the period then ended. These financial statements and financial highlights are the responsibility of the Funds’ management. Our responsibility is to express an opinion on these financial statements and financial highlights based on our audits.
We conducted our audits in accordance with the standards of the Public Company Accounting Oversight Board (United States). Those standards require that we plan and perform the audit to obtain reasonable assurance about whether the financial statements and financial highlights are free of material misstatement. An audit includes examining, on a test basis, evidence supporting the amounts and disclosures in the financial statements. Our procedures included confirmation of securities owned as of October 31, 2017, by correspondence with the custodian and brokers. An audit also includes assessing the accounting principles used and significant estimates made by management, as well as evaluating the overall financial statement presentation. We believe that our audits provide a reasonable basis for our opinion.
In our opinion, the financial statements and financial highlights referred to above present fairly, in all material respects, the financial positions of Sound Mind Investing Fund, SMI Conservative Allocation Fund, SMI Dynamic Allocation Fund, SMI Bond Fund, and SMI 50/40/10 Fund as of October 31, 2017, the results of their operations for the year then ended, the changes in their net assets for each of the two years in the period then ended, and the financial highlights for each of the periods indicated in the period then ended, in conformity with accounting principles generally accepted in the United States of America.
Subsequent to October 31, 2017, the Board of Trustees of Valued Advisers Trust approved the liquidation of SMI Bond Fund, as disclosed in Note 10 to the financial statements.
COHEN & COMPANY, LTD.
Cleveland, Ohio
December 27, 2017
58
SUMMARY OF FUND EXPENSES – (Unaudited)
As a shareholder of one of the Funds, you incur two types of costs: (1) transaction costs and (2) ongoing costs, including management fees and other Fund expenses. This example is intended to help you understand your ongoing costs (in dollars) of investing in each Fund and to compare these costs with the ongoing costs of investing in other mutual funds.
Each Fund’s example is based on an investment of $1,000 invested at the beginning of the period and held for the entire period from May 1, 2017 through October 31, 2017.
Actual Expenses
The first line of the table provides information about actual account values and actual expenses. You may use the information in this line, together with the amount you invested, to estimate the expenses that you paid over the period. Simply divide your account value by $1,000 (for example, an $8,600 account value divided by $1,000 = 8.60), then multiply the result by the number in the first line under the heading “Expenses Paid During Period May 1, 2017 – October 31, 2017” to estimate the expenses you paid on your account during this period.
Hypothetical Example for Comparison Purposes
The second line of the table provides information about hypothetical account values and hypothetical expenses based on each Fund’s actual expense ratio and an assumed rate of return of 5% per year before expenses, which is not the Fund’s actual return. The hypothetical account values and expenses may not be used to estimate the actual ending account balance or expenses you paid for the period. You may use this information to compare the ongoing costs of investing in the Funds and other funds. To do so, compare this 5% hypothetical example with the 5% hypothetical examples that appear in the shareholder reports of the other funds.
Expenses shown are meant to highlight your ongoing costs only and do not reflect any transactional costs. Therefore, the second line of the table is useful in comparing ongoing costs only and will not help you determine the relative costs of owning different funds. In addition, if these transaction costs were included, your costs would have been higher.
| | | | | | | | | | | | |
SMI Fund | | Beginning
Account Value
May 1, 2017 | | | Ending
Account Value
October 31, 2017 | | | Expenses Paid
During Period
May 1, 2017 –
October 31, 2017 (a) | |
| Actual | | $ | 1,000.00 | | | $ | 1,097.30 | | | $ | 6.09 | |
| Hypothetical (b) | | $ | 1,000.00 | | | $ | 1,019.40 | | | $ | 5.87 | |
| (a) | Expenses are equal to the Fund’s annualized expense ratio of 1.15%, multiplied by the average account value over the period, multiplied by 184/365 (to reflect the partial year period). |
| (b) | Assumes a 5% return before expenses. |
59
SUMMARY OF FUND EXPENSES – (Unaudited), (Continued)
| | | | | | | | | | | | |
SMI
Conservative Allocation
Fund | | Beginning
Account Value
May 1, 2017 | | | Ending
Account Value
October 31, 2017 | | | Expenses Paid
During Period
May 1, 2017 –
October 31, 2017 (a) | |
| Actual | | $ | 1,000.00 | | | $ | 1,033.60 | | | $ | 5.94 | |
| Hypothetical (b) | | $ | 1,000.00 | | | $ | 1,019.36 | | | $ | 5.90 | |
| (a) | Expenses are equal to the Fund’s annualized expense ratio of 1.16%, multiplied by the average account value over the period, multiplied by 184/365 (to reflect the partial year period). |
| (b) | Assumes a 5% return before expenses. |
| | | | | | | | | | | | |
SMI Dynamic Allocation
Fund | | Beginning
Account Value
May 1, 2017 | | | Ending
Account Value
October 31, 2017 | | | Expenses Paid
During Period
May 1, 2017 –
October 31, 2017 (a) | |
| Actual | | $ | 1,000.00 | | | $ | 1,049.10 | | | $ | 5.96 | |
| Hypothetical (b) | | $ | 1,000.00 | | | $ | 1,019.39 | | | $ | 5.87 | |
| (a) | Expenses are equal to the Fund’s annualized expense ratio of 1.15%, multiplied by the average account value over the period, multiplied by 184/365 (to reflect the partial year period). |
| (b) | Assumes a 5% return before expenses. |
| | | | | | | | | | | | |
SMI Bond Fund | | Beginning
Account Value
May 1, 2017 | | | Ending
Account Value
October 31, 2017 | | | Expenses Paid
During Period
May 1, 2017 –
October 31, 2017 (a) | |
| Actual | | $ | 1,000.00 | | | $ | 1,019.70 | | | $ | 4.36 | |
| Hypothetical (b) | | $ | 1,000.00 | | | $ | 1,020.89 | | | $ | 4.36 | |
| (a) | Expenses are equal to the Fund’s annualized expense ratio of 0.86%, multiplied by the average account value over the period, multiplied by 184/365 (to reflect the partial year period). |
| (b) | Assumes a 5% return before expenses. |
| | | | | | | | | | | | |
SMI 50/40/10 Fund | | Beginning
Account Value
May 1, 2017 | | | Ending
Account Value
October 31, 2017 | | | Expenses Paid
During Period
May 1, 2017 –
October 31, 2017 (a) | |
| Actual | | $ | 1,000.00 | | | $ | 1,099.70 | | | $ | 7.69 | |
| Hypothetical (b) | | $ | 1,000.00 | | | $ | 1,017.88 | | | $ | 7.39 | |
| (a) | Expenses are equal to the Fund’s annualized expense ratio of 1.45%, multiplied by the average account value over the period, multiplied by 184/365 (to reflect the partial year period). |
| (b) | Assumes a 5% return before expenses. |
60
ADDITIONAL FEDERAL INCOME TAX INFORMATION
(Unaudited)
The Form 1099-DIV you receive in January 2018 will show the tax status of all distributions paid to your account in calendar year 2017. Shareholders are advised to consult their own tax adviser with respect to the tax consequences of their investment in the Fund. As required by the Internal Revenue Code and/or regulations, shareholders must be notified regarding the status of qualified dividend income for individuals and the dividends received deduction for corporations.
Qualified Dividend Income. The SMI Conservative Allocation Fund, SMI Dynamic Allocation Fund and SMI 50/40/10 Fund designates approximately 39%, 83% and 100%, respectively, or up to the maximum amount of such dividends allowable pursuant to the Internal Revenue Code, as qualified dividend income eligible for the reduced tax rate of 15%.
Dividends Received Deduction. Corporate shareholders are generally entitled to take the dividends received deduction on the portion of the Fund’s dividend distribution that qualifies under tax law. For the SMI Conservative Allocation Fund, SMI Dynamic Allocation Fund and SMI 50/40/10 Fund’s calendar year 2017 ordinary income dividends, 26%, 83% and 100%, respectively, qualifies for the corporate dividends received deduction.
61
TRUSTEES AND OFFICERS – (Unaudited)
The Board of Trustees supervises the business activities of the Trust. Each Trustee serves as a trustee until termination of the Trust unless the Trustee dies, resigns, retires or is removed.
The following table provides information regarding each of the independent trustees.
| | | | |
Name, Address*, Age,
Position with Trust**,
Term of Position with Trust | | Principal Occupation During Past 5 Years | | Other Directorships |
Andrea N. Mullins, 50
Independent Trustee
Since December 2013 Chairperson since
March 2017 | | Current: Private investor; Independent Contractor, SWM Wealth Management, LLC (since April 2014). | | None. |
Ira P. Cohen, 58 Independent Trustee Since June 2010 | | Current: Independent financial services consultant (since February 2005); Executive Vice President of Asset Management Services, Recognos Financial (since August 2015). | | Trustee, Griffin Institutional Access Credit Fund (since January 2017); Trustee and Audit Committee Chairman, Griffin Institutional Real Estate Access Fund (since May 2014); Trustee, Chairman, and Nominating and Governance Committee Chairman, Angel Oak Strategic Credit Fund (since December 2017); Trustee, Angel Oak Funds Trust (since October 2014); Chairman (since April 2017). |
| * | The address for each trustee and officer is 225 Pictoria Drive, Suite 450, Cincinnati, Ohio 45246. |
| ** | As of the date of this report, the Trust consists of 13 series. |
The following table provides information regarding the Trustee who is considered an “interested person” of the Trust, as that term is defined under the 1940 Act. Based on the experience of the Trustee, the Trust concluded that the individual described below should serve as a Trustee.
| | | | |
Name, Address*, Age,
Position with Trust**,
Term of Position with Trust | | Principal Occupation During Past 5 Years | | Other Directorships |
Mark J. Seger, 55
Trustee Since March 2017 | | Current: President, Managing Director, and Co-Founder, Ultimus Fund Solutions, LLC (since 1999); Treasurer and Managing Director, Ultimus Fund Distributors, LLC (since 1999); President and Managing Director, Ultimus Asset Services, LLC (since 2016). | | None. |
| * | The address for each trustee and officer is 225 Pictoria Drive, Suite 450, Cincinnati, Ohio 45246. |
| ** | As of the date of this report, the Trust consists of 13 series. |
62
TRUSTEES AND OFFICERS – (Unaudited), (Continued)
The following table provides information regarding the officers of the Trust:
| | | | |
Name, Address*, Age,
Position with Trust,**
Term of Position with Trust | | Principal Occupation During Past 5 Years | | Other Directorships |
Bo J. Howell, 36
Principal Executive Officer and President Since
March 2017 | | Current: Vice President, Director of Fund Administration, Ultimus Fund Solutions, LLC (since 2014). Previous: Counsel, Securities and Mutual Funds, Western & Southern Financial Group (2012 – 2014). | | None. |
Brandon R. Kipp, 34
Chief Compliance Officer Since October 2017 | | Current: Senior Fund Compliance Officer, Ultimus Fund Solutions, LLC (since July 2017). Previous: Assistant Vice President and Compliance Manager, UMB Fund Services, Inc. (March 2014 to July 2017); Officer and Lead Fund Administrator, UMB Fund Services, Inc. (May 2012 to March 2014). | | None. |
Carol J. Highsmith, 53
Vice President Since
August 2008 Secretary Since March 2014 | | Current: Assistant Vice President, Ultimus Fund Solutions, LLC (since December 2015). Previous: Employed in various positions with Huntington Asset Services, Inc. (n/k/a Ultimus Asset Services, LLC) (November 1994 to December 2015), most recently Vice President of Legal Administration (2005 to December 2015). | | None. |
Matthew J. Miller, 41
Vice President Since December 2011 | | Current: Assistant Vice President, Relationship Management, Ultimus Fund Solutions, LLC (since December 2015). Previous: Employed in various positions with Huntington Asset Services, Inc. (n/k/a Ultimus Asset Services, LLC) (July 1998 to December 2015), most recently Vice President of Relationship Management (2005 to December 2015). | | None. |
63
TRUSTEES AND OFFICERS – (Unaudited), (Continued)
| | | | |
Name, Address*, Age,
Position with Trust,**
Term of Position with Trust | | Principal Occupation During Past 5 Years | | Other Directorships |
Bryan W. Ashmus, 44
Principal Financial Officer and Treasurer Since December 2013 | | Current: Vice President and Director of Financial Administration, Ultimus Fund Solutions, LLC (since December 2015). Previous: Vice President and Manager of Financial Administration, Huntington Asset Services, Inc. (n/k/a Ultimus Asset Services, LLC) (September 2013 to December 2015); Vice President, Fund Administration, Citi Fund Services Ohio, Inc. (from May 2005 to September 2013). | | None. |
Stephen L. Preston, 50
AML Officer since
June 2017 | | Current: Chief Compliance Officer, Ultimus Fund Solutions, LLC (since June 2011); Chief Compliance Officer of Ultimus Fund Distributors, LLC (since June 2011). | | None. |
| * | The address for each trustee and officer is 225 Pictoria Drive, Suite 450, Cincinnati, Ohio 45246. |
| ** | As of the date of this report, the Trust consists of 13 series. |
OTHER INFORMATION (Unaudited)
The Fund’s Statement of Additional Information (“SAI”) includes additional information about the trustees and is available without charge, upon request. You may call toll-free at (877) 764-3863 to request a copy of the SAI or to make shareholder inquiries.
64
| | |
FACTS | | WHAT DOES VALUED ADVISERS TRUST DO
WITH YOUR PERSONAL INFORMATION? |
| | |
Why? | | Financial companies choose how they share your personal information. Federal law gives consumers the right to limit some but not all sharing. Federal law also requires us to tell you how we collect, share, and protect your personal information. Please read this notice carefully to understand what we do. |
| | |
What? | | The types of personal information we collect and share depend on the product or service you have with us. This information can include: • Social Security number • account balances and account transactions • account transactions, transaction or loss history and purchase history • checking account information and wire transfer instructions |
| | When you are no longer our customer, we continue to share your information as described in this notice. |
| | |
How? | | All financial companies need to share customers’ personal information to run their everyday business. In the section below, we list the reasons financial companies can share their customers’ personal information; the reasons Valued Advisers Trust chooses to share; and whether you can limit this sharing. |
| | |
| Reasons we can share your personal information | | Does Valued Advisers
Trust share? |
For our everyday business purposes—
such as to process your transactions, maintain your account(s), respond to court orders and legal investigations, or report to credit bureaus | | Yes |
For our marketing purposes— to offer our products and services to you | | Yes |
For joint marketing with other financial companies | | No |
For our affiliates’ everyday business purposes— information about your transactions and experiences | | No |
For our affiliates’ everyday business purposes— information about your creditworthiness | | No |
For nonaffiliates to market to you | | No |
| | |
Questions? | | Call 1-877-764-3863 |
65
| | |
Who we are |
| Who is providing this notice? | | Valued Advisers Trust |
| | |
What we do |
| | |
| How does Valued Advisers Trust protect my personal information? | | To protect your personal information from unauthorized access and use, we use security measures that comply with federal law. These measures include computer safeguards and secured files and buildings. |
| | |
| How does Valued Advisers Trust collect my personal information? | | We collect your personal information, for example, when you • open an account or deposit money • buy securities from us or sell securities to us • make deposits or withdrawals from your account or provide account information • give us your account information • make a wire transfer • tell us who receives the money • tell us where to send the money • show your government-issued ID • show your driver’s license |
| | |
| Why can’t I limit all sharing? | | Federal law gives you the right to limit only • sharing for affiliates’ everyday business purposes—information about your creditworthiness • affiliates from using your information to market to you • sharing for nonaffiliates to market to you State laws and individual companies may give you additional rights to limit sharing. |
| | |
Definitions | | |
| | |
| Affiliates | | Companies related by common ownership or control. They can be financial and nonfinancial companies. |
| | |
| Nonaffiliates | | Companies not related by common ownership or control. They can be financial and nonfinancial companies. • Valued Advisers Trust does not share your personal information with nonaffiliates so they can market to you. |
| | |
| Joint marketing | | A formal agreement between nonaffiliated financial companies that together market financial products or services to you. • Valued Advisers Trust doesn’t jointly market financial products or services to you. |
66
PROXY VOTING
A description of the policies and procedures that the Funds use to determine how to vote proxies relating to portfolio securities and information regarding how the Funds voted those proxies during the most recent twelve month period ended June 30 is available without charge upon request by (1) calling the Funds at (877) 764-3863 and (2) from Fund documents filed with the Securities and Exchange Commission (“SEC”) on the SEC’s website at www.sec.gov.
TRUSTEES
Andrea N. Mullins, Chairperson
Ira P. Cohen
Mark J. Seger
OFFICERS
Bo J. Howell, Principal Executive
Officer and President
Bryan W. Ashmus, Principal Financial
Officer and Treasurer
Brandon R. Kipp, Chief Compliance Officer
Carol J. Highsmith, Vice President and Secretary
Matthew J. Miller, Vice President
Stephen L. Preston, Anti-Money
Laundering Officer
INVESTMENT ADVISER
SMI Advisory Services, LLC
411 6th St.
Columbus, IN 47201
DISTRIBUTOR
Unified Financial Securities, LLC
9465 Counselors Row, Suite 200
Indianapolis, IN 46240
INDEPENDENT REGISTERED PUBLIC ACCOUNTING FIRM
Cohen & Company, Ltd.
1350 Euclid Avenue, Suite 800
Cleveland, OH 44115
LEGAL COUNSEL
The Law Offices of John H. Lively &
Associates, Inc.
A member firm of The 1940 Act Law GroupTM
11300 Tomahawk Creek Pkwy, Suite 310
Leawood, KS 66211
CUSTODIAN
Huntington National Bank
41 South High Street
Columbus, OH 43215
ADMINISTRATOR, TRANSFER AGENT AND FUND ACCOUNTANT
Ultimus Asset Services, LLC
225 Pictoria Drive, Suite 450
Cincinnati, OH 45246
This report is intended only for the information of shareholders or those who have received the Funds’ prospectus which contains information about each Fund’s management fee and expenses. Please read the prospectus carefully before investing.
Distributed by Unified Financial Securities, LLC
Member FINRA/SIPC
67

SOUND MIND
INVESTING FUND (SMIFX)
SMI CONSERVATIVE ALLOCATION FUND (SMILX)
SMI DYNAMIC ALLOCATION FUND (SMIDX)
SMI BOND FUND (SMIUX)
SMI 50/40/10 FUND (SMIRX)
|
| |
| ANNUAL REPORT |
| |
| OCTOBER 31, 2017 |
Fund Adviser:
SMI Advisory Services, LLC
411 6th Street
Columbus, IN 47201
(877) 764-3863
(877) SMI-Fund
www.smifund.com

Annual Report
October 31, 2017
Fund Adviser:
Kovitz Investment Group Partners, LLC
115 South LaSalle Street, 27th Floor
Chicago, IL 60603
Toll Free (888) 695-3729
MANAGEMENT DISCUSSION OF FUND PERFORMANCE – (UNAUDITED)
Kovitz Investment Group launched the Green Owl Intrinsic Value Fund (the “Fund”) with the goal of seeking long-term capital appreciation through high risk-adjusted returns. Relying on a fundamental, research-driven process, the Fund strives to build a diversified portfolio of equity investments through the purchase of competitively advantaged and financially strong companies at prices substantially less than our estimate of their intrinsic values.
As long-term investors, our research process emphasizes the appraisal of factors that we believe matter most to a business’s long-term success. These include the quality of the business, the strength of the balance sheet, the predictability of the cash flows, and the ability of the management team to allocate capital intelligently and judiciously. We believe these attributes are the most reliable predictors of a company’s ability to maximize intrinsic value on a per share basis.
Market and Performance Summary
For the fiscal year ended October 31, 2017, the Fund returned 27.02%. In comparison, our benchmark, the S&P 500 Index, gained 23.63% during the same period. Since inception on December 28, 2011, the Fund has compounded at an average annual rate of 14.03%, versus 15.34% for the S&P 500 over the same time period.
The current bull market in stocks, which began in the still dark days of the financial crisis in early 2009, has now lasted for over 8 1/2 years. But while many consider this to be getting long in the tooth, this past year has been one of the calmest stock markets on record. Volatility has been practically non-existent. In fact, the market (using the S&P 500 as a proxy) has not had a correction of more than 3% since the presidential election last fall. Historically, stocks have averaged at least one 15% correction per year and corrections of 5%-10% have been commonplace. Furthermore, with interest rates low, the economy on firm, if unspectacular, footing, and corporate profits strong, this bull market shows no signs of slowing any time soon.
However, one of the hallmarks of bull markets is that they dull investors’ senses. Bull markets breed a certain complacency that leads many to assume more risk in their portfolios. Maximizing returns becomes the priority while risk management takes a backseat. Fear of missing out replaces investment discipline. It can be tempting to forget that nasty downturns happen with some regularity, and there is never a bell rung to announce their arrival.
With the market trading at elevated levels, many investors tend to justify continued investments on a relative basis. We constantly hear that stocks are cheap when compared to low yielding bonds or that buying stocks with some kind of dividend yield is better than keeping cash reserves with little or no yield. The acronym “TINA” (there is no alternative) is sometimes used to describe the rationale for the capital flows into equities.
So what are we doing in the midst of the second longest bull market in history? Since Fund management typically acts cautiously in the application of its investment process, we are exhibiting even more caution than usual. Our bottom-up research emphasizes business quality, industry structures, growth opportunities, management skill, and corporate culture. It is further augmented by our assessment of the company’s ability to sustain earnings power over economic cycles through an understanding of its competitive advantages, business model, and management’s proficiency in the allocation of capital. If a company passes these qualitative screens, our risk management principles will only allow purchase if the shares are trading at a sufficient discount to our estimate of their worth.
We therefore use absolute, rather than relative, methods to estimate companies’ intrinsic values and we use the movement of market prices around these intrinsic value estimates to construct and manage a portfolio of high-quality businesses that have the potential to create sustained shareholder value over many years. When we can’t find investments that meet these criteria, our default option is to hold cash, which we continue to maintain at levels higher than normal. We don’t view cash sitting around earning negligible returns as an abdication of responsibility. Our primary responsibility is to protect the capital entrusted to us. Growth of that capital is an
1
important, but secondary, consideration. Cash also affords maximum flexibility as it can quickly be channeled into investment opportunities with minimal friction and transaction costs. When – not if – this long-running bull market comes to an end and bargain-hunting comes back into vogue, we’ll be happy we have it.
With the ongoing trend towards passive (index) investing and the increasing level of quantitative/algorithmic trading, a small fraction of trades today are being implemented by human beings making fundamental value judgments regarding companies and their stocks. And what should we think about the willingness of investors to turn over their capital to a process in which neither individual holdings nor portfolio construction is the subject of thoughtful analysis and decision-making, and in which buying takes place regardless of price? We’ll stick to our time-tested principles of fundamental value investing that have served us well over more than two decades. To us, it feels like it’s a better time to emphasize avoiding losses rather than seeking gains.
In the meantime, our job is to continue to identify companies that are unappreciated by the market and whose shares are undervalued. A contrarian approach – avoiding recently expensive securities and favoring recently cheap securities – may be uncomfortable in the short run, but it is a sound way to generate outperformance in the long run. Our job is to endure the emotional discomfort of deviating from the crowd, which sets the stage for our style of investing to continue to work over time. The bedrock of our philosophy is that price matters. Our clients would be poorly served if we chose to simply pile into whatever shares had appreciated the most over recent years, ignoring price, valuation, and underlying fundamentals. This is a time when paying calm, careful, and deliberate attention to the changing investment landscape can have a tremendous payoff.
Performance Attribution
Key Contributors to Relative Results
The individual positions that contributed the most to performance, on a dollar basis, during the year were: Apple (AAPL), Boeing Co. (BA), Bank of America Corp. (BAC), Berkshire Hathaway (BRKB) and JPMorgan & Co. (JPM). On a percentage basis (excluding dividends), the top performers for the year were: Boeing (+81%), Bank of America (+66%), CBRE Group (CBG, +53%), CarMax (KMX, +50%), and Citigroup (C, +50%).
On a sector basis, the Fund’s overweight stance in the Financial sector contributed significantly to results. Three of our bank holdings (JP Morgan, Bank of America, and Citigroup) were up at least 45% while Leucadia (LUK) and American Express (AXP) were also particularly strong.
Holdings in the Industrial sector also contributed meaningfully to results with Boeing, Robert Half International (RHI) and Quanta Services (PWR) the primary standouts.
The Fund’s underweight position in the Telecommunication sector also contributed to results as Telecom was the only sector with a negative return over the fiscal year.
Key Detractors to Relative Results
The individual positions that detracted the most from performance, on a dollar basis, during the year were: Walgreens Boots Alliance (WBA), Harley Davidson (HOG,) CVS Health (CVS), Schlumberger (SLB), and Haliburton (HAL). On a percentage basis (excluding dividends), the worst performers for the year were: Walgreens (-20%), Schlumberger (-18%), Harley (-17%), Haliburton (-7%), and CBS (CBS, -1%).
While the Fund’s security selection was strong in the Technology sector its underweight position detracted from results.
Cash holdings were also a drag to the Fund’s results.
2
Portfolio Activity
Portfolio activity during the year included the following:
Initiated positions in the following 5 companies: Bayer AG (DB:BAYN), Blackstone Group (BX), Cheesecake Factory (CAKE), Delta Airlines (DAL), and PPG Industries (PPG).
Increased position sizes in the following 8 companies: Alphabet (GOOG), Amerco (UHAL), Aon (AON), CBRE, CBS, Citigroup, General Motors (GM), and Harley.
Exited positions in the following 3 companies: Coca Cola (KO), CVS Health (CVS), and Kohl’s (KSS).
Decreased position sizes in the following 6 companies: Bank of America. Boeing, Jacobs Engineering (JEC), Leucadia (LUK), Quanta, and Wells Fargo (WFC)
As of October 31, 2017, the Fund’s five largest positions were: Berkshire Hathaway, Apple, Quanta, JPMorgan, and General Motors (GM).
Overall, we remain optimistic about the long-term outlook for the Fund, where the valuation of its holdings, in aggregate, is significantly lower than that of the overall market. The wide valuation disparities that characterize the current market offer significant opportunities for active management. We remain focused on the careful and patient application of our investment criteria and valuation requirements. Patience, persistence, and a long-term investment horizon are essential to long-term investment success. We encourage our shareholders to take a similar view.
Thank you for your continued support and trust in our ability to manage your investment in the Fund.
3
INVESTMENT RESULTS – (Unaudited)
Average Annual Total Returns*
(For the periods ended October 31, 2017)
| | | | | | | | | | | | |
| | | One Year | | | Five Year | | | Since Inception
(December 22, 2011) (a) | |
Green Owl Intrinsic Value Fund | | | 27.02 | % | | | 13.05 | % | | | 14.03 | % |
S&P 500® Index** | | | 23.63 | % | | | 15.18 | % | | | 15.34 | % |
Total annual operating expenses, as disclosed in the Fund’s prospectus dated September 20, 2017, were 1.42% of average daily net assets (1.12% after fee waivers/expense reimbursements by the Adviser). The Adviser contractually agreed to waive or limit its fees and to assume other expenses of the Fund until February 28, 2019, so that the Total Annual Operating Expenses do not exceed 1.10%. This operating expense limitation does not apply to interest, taxes, brokerage commissions, other expenditures which are capitalized in accordance with generally accepted accounting principles, other extraordinary expenses not incurred in the ordinary course of the Fund’s business, dividend expense on short sales, expenses incurred under a Rule 12b-1 plan of distribution, “acquired fund fees and expenses,” and expenses that the Fund has incurred but did not actually pay because of an expense offset arrangement. Additional information pertaining to the Fund’s expense ratios as of October 31, 2017 can be found in the financial highlights.
The performance quoted represents past performance, which does not guarantee future results. The investment return and principal value of an investment will fluctuate so that an investor’s shares, when redeemed, may be worth more or less than their original cost. The returns shown do not reflect deduction of taxes that a shareholder would pay on Fund distributions or the redemption of Fund shares. Current performance of the Fund may be lower or higher than the performance quoted. The Fund’s investment objectives, risks, charges and expenses must be considered carefully before investing. Performance data current to the most recent month end may be obtained by calling 1-888-695-3729.
| (a) | The Fund commenced operations on December 22, 2011. However, the Fund did not invest in long-term securities towards the investment objective until December 27, 2011. December 27, 2011 is the performance calculation inception date. |
| * | Return figures reflect any change in price per share and assume the reinvestment of all distributions. The Fund’s returns reflect any fee reductions during the applicable periods. If such fee reductions had not occurred, the quoted performance would have been lower. |
| ** | The S&P 500® Index is a widely recognized unmanaged index of equity securities and is representative of a broader domestic equity market and range of securities than is found in the Fund’s portfolio. Individuals cannot invest directly in the Index; however, an individual can invest in exchange traded funds or other investment vehicles that attempt to track the performance of a benchmark index. |
The Fund’s investment objectives, strategies, risks, charges and expenses must be considered carefully before investing. The prospectus contains this and other important information about the Fund and may be obtained by calling the same number as above. Please read it carefully before investing.
The Fund is distributed by Unified Financial Securities, LLC, member FINRA/SIPC.
4
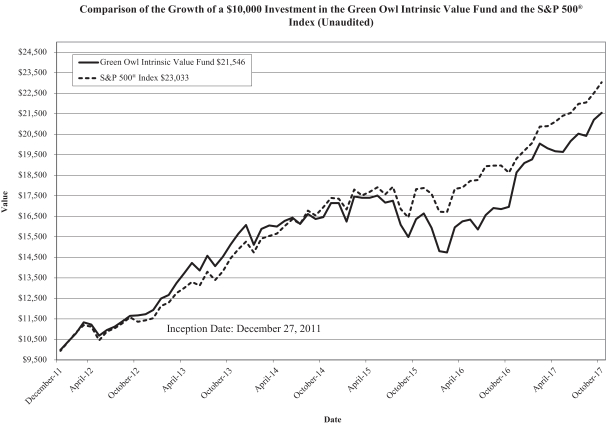
The Fund commenced operations on December 22, 2011. However, the Fund did not invest in long-term securities towards the investment objective until December 27, 2011. December 27, 2011 is the performance calculation inception date. The chart above assumes an initial investment of $10,000 made on December 28, 2011 and held through October 31, 2017. The S&P 500® Index is a widely recognized unmanaged index of equity securities and is representative of a broader domestic equity market and range of securities than is found in the Fund’s portfolio. Individuals cannot invest directly in the Index; however, an individual can invest in exchange traded funds or other investment vehicles that attempt to track the performance of a benchmark index. THE FUND’S RETURN REPRESENTS PAST PERFORMANCE AND DOES NOT GUARANTEE FUTURE RESULTS. The returns shown do not reflect deduction of taxes that a shareholder would pay on Fund distributions or the redemption of Fund shares. Investment returns and principal values will fluctuate so that your shares, when redeemed, may be worth more or less than their original purchase price.
Current performance may be lower or higher than the performance data quoted. For more information on the Fund, and to obtain performance data current to the most recent month end or to request a prospectus, please call 1-888-695-3729. You should carefully consider the investment objectives, potential risks, management fees, and charges and expenses of the Fund before investing. The Fund’s prospectus contains this and other information about the Fund, and should be read carefully before investing.
The Fund is distributed by Unified Financial Securities, LLC, member FINRA/SIPC.
5
FUND HOLDINGS – (Unaudited)
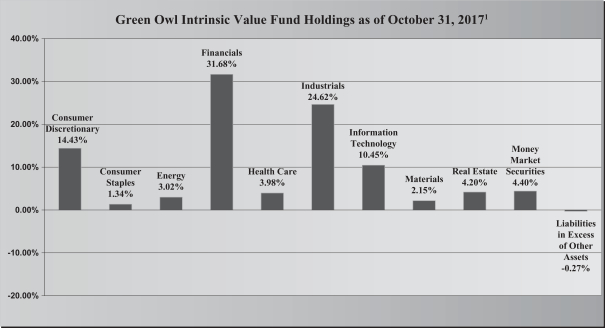
| 1 | As a percentage of net assets. |
The investment objective of the Green Owl Intrinsic Value Fund is long-term capital appreciation.
Availability of Portfolio Schedule – (Unaudited)
The Fund files its complete schedule of portfolio holdings with the Securities and Exchange Commission (“SEC”) for the first and third quarters of each fiscal year on Form N-Q. The Fund’s Forms N-Q are available at the SEC’s website at www.sec.gov. The Fund’s Forms N-Q may be reviewed and copied at the SEC’s Public Reference Room in Washington DC. Information on the operation of the Public Reference Room may be obtained by calling 1-800-SEC-0330.
6
GREEN OWL INTRINSIC VALUE FUND
SCHEDULE OF INVESTMENTS
October 31, 2017
| | | | | | | | |
| Common Stocks – 95.87% | | Shares | | | Fair Value | |
Consumer Discretionary – 14.43% | | | | | | | | |
CarMax, Inc. * | | | 33,240 | | | $ | 2,496,324 | |
CBS Corp., Class B | | | 42,830 | | | | 2,403,620 | |
Cheesecake Factory, Inc./The | | | 19,675 | | | | 880,259 | |
General Motors Co. | | | 78,600 | | | | 3,378,228 | |
Harley-Davidson, Inc. | | | 31,690 | | | | 1,500,205 | |
Walt Disney Co./The | | | 12,100 | | | | 1,183,501 | |
| | | | | | | | |
| | | | | | | 11,842,137 | |
| | | | | | | | |
Consumer Staples – 1.34% | | | | | | | | |
Walgreens Boots Alliance, Inc. | | | 16,575 | | | | 1,098,425 | |
| | | | | | | | |
Energy – 3.02% | | | | | | | | |
Halliburton Co. | | | 38,200 | | | | 1,632,668 | |
Schlumberger Ltd. | | | 8,895 | | | | 569,280 | |
TechnipFMC PLC * | | | 10,000 | | | | 273,900 | |
| | | | | | | | |
| | | | | | | 2,475,848 | |
| | | | | | | | |
Financials – 31.68% | | | | | | | | |
American Express Co. | | | 30,610 | | | | 2,923,867 | |
Aon PLC | | | 18,900 | | | | 2,710,827 | |
Bank of America Corp. | | | 120,175 | | | | 3,291,593 | |
Bank of New York Mellon Corp./The | | | 26,675 | | | | 1,372,429 | |
Berkshire Hathaway, Inc., Class B * | | | 28,815 | | | | 5,386,676 | |
Blackstone Group L.P./The (a) | | | 49,830 | | | | 1,658,841 | |
Citigroup, Inc. | | | 30,000 | | | | 2,205,000 | |
JPMorgan Chase & Co. | | | 36,230 | | | | 3,645,100 | |
Leucadia National Corp. | | | 59,647 | | | | 1,509,069 | |
Wells Fargo & Co. | | | 23,136 | | | | 1,298,855 | |
| | | | | | | | |
| | | | | | | 26,002,257 | |
| | | | | | | | |
Health Care – 3.98% | | | | | | | | |
Bayer AG | | | 11,000 | | | | 1,431,367 | |
McKesson Corp. | | | 13,300 | | | | 1,833,804 | |
| | | | | | | | |
| | | | | | | 3,265,171 | |
| | | | | | | | |
Industrials – 24.62% | | | | | | | | |
AMERCO | | | 6,297 | | | | 2,472,454 | |
American Airlines Group, Inc. | | | 40,640 | | | | 1,902,765 | |
Boeing Co./The | | | 12,190 | | | | 3,144,776 | |
Delta Air Lines, Inc. | | | 27,000 | | | | 1,350,810 | |
Jacobs Engineering Group, Inc. | | | 36,724 | | | | 2,137,704 | |
Quanta Services, Inc. * | | | 104,955 | | | | 3,959,952 | |
Robert Half International, Inc. | | | 35,218 | | | | 1,823,236 | |
See accompanying notes which are an integral part of these financial statements.
7
GREEN OWL INTRINSIC VALUE FUND
SCHEDULE OF INVESTMENTS – (continued)
October 31, 2017
| | | | | | | | |
| Common Stocks – 95.87% – continued | | Shares | | | Fair Value | |
Industrials – 24.62% – continued | | | | | | | | |
United Parcel Service, Inc., Class B | | | 11,520 | | | $ | 1,353,946 | |
Valmont Industries, Inc. | | | 12,953 | | | | 2,058,232 | |
| | | | | | | | |
| | | | | | | 20,203,875 | |
| | | | | | | | |
Information Technology – 10.45% | | | | | | | | |
Alphabet, Inc., Class A * | | | 773 | | | | 798,540 | |
Alphabet, Inc., Class C * | | | 2,753 | | | | 2,798,810 | |
Apple, Inc. | | | 29,430 | | | | 4,974,847 | |
| | | | | | | | |
| | | | | | | 8,572,197 | |
| | | | | | | | |
Materials – 2.15% | | | | | | | | |
PPG Industries, Inc. | | | 15,195 | | | | 1,766,267 | |
| | | | | | | | |
Real Estate – 4.20% | | | | | | | | |
CBRE Group, Inc., Class A * | | | 71,450 | | | | 2,809,414 | |
Howard Hughes Corp/The * | | | 5,000 | | | | 638,150 | |
| | | | | | | | |
| | | | | | | 3,447,564 | |
| | | | | | | | |
| | |
TOTAL COMMON STOCKS (Cost $52,417,383) | | | | | | | 78,673,741 | |
| | | | | | | | |
| | |
MONEY MARKET SECURITIES – 4.40% | | | | | | | | |
Federated Treasury Obligations Fund – Service Shares, 0.66% (b) | | | 3,613,989 | | | | 3,613,989 | |
| | | | | | | | |
TOTAL MONEY MARKET SECURITIES (Cost $3,613,989) | | | | | | | 3,613,989 | |
| | | | | | | | |
TOTAL INVESTMENTS – 100.27% (Cost $56,031,372) | | | | | | | 82,287,730 | |
| | | | | | | | |
Liabilities in Excess of Other Assets – (0.27)% | | | | | | | (219,728 | ) |
| | | | | | | | |
NET ASSETS – 100.00% | | | | | | $ | 82,068,002 | |
| | | | | | | | |
| | (a) | Master Limited Partnership |
| | (b) | Rate disclosed is the seven day effective yield as of October 31, 2017. |
| | * | Non-income producing security. |
The sectors shown on the schedule of investments are based on Global Industry Classification Standard, or GICS® (“GICS”). The GICS was developed by and/or is the exclusive property of MSCI, Inc. and Standard & Poor Financial Services LLC (“S&P”). GICS is a service mark of MSCI, Inc. and S&P and has been licensed for use by Ultimus Asset Services, LLC.
See accompanying notes which are an integral part of these financial statements.
8
GREEN OWL INTRINSIC VALUE FUND
STATEMENT OF ASSETS AND LIABILITIES
October 31, 2017
| | | | |
Assets | | | | |
Investments in securities at fair value (cost $56,031,372) | | $ | 82,287,730 | |
Receivable for fund shares sold | | | 100 | |
Dividends receivable | | | 52,023 | |
Tax reclaims receivable | | | 3,936 | |
Prepaid expenses | | | 14,694 | |
| | | | |
Total Assets | | | 82,358,483 | |
| | | | |
| |
Liabilities | | | | |
Payable for fund shares redeemed | | | 16,736 | |
Payable for investments purchased | | | 182,339 | |
Payable to Adviser | | | 56,250 | |
Payable to Administrator | | | 9,526 | |
Other accrued expenses | | | 25,630 | |
| | | | |
Total Liabilities | | | 290,481 | |
| | | | |
| |
Net Assets | | $ | 82,068,002 | |
| | | | |
Net Assets consist of: | | | | |
Paid-in capital | | $ | 54,182,315 | |
Accumulated undistributed net investment income | | | 101,530 | |
Accumulated undistributed net realized gain from investments | | | 1,527,561 | |
Net unrealized appreciation on: | | | | |
Investments | | | 26,256,358 | |
Foreign currency translations | | | 238 | |
| | | | |
| |
Net Assets | | $ | 82,068,002 | |
| | | | |
Shares outstanding
(unlimited number of shares authorized, no par value) | | | 4,299,250 | |
| | | | |
Net asset value, offering and redemption price per share | | $ | 19.09 | |
| | | | |
See accompanying notes which are an integral part of these financial statements.
9
GREEN OWL INTRINSIC VALUE FUND
STATEMENT OF OPERATIONS
For the year ended October 31, 2017
| | | | |
Investment Income | | | | |
Dividend income (net of foreign taxes withheld of $4,864) | | $ | 966,366 | |
| | | | |
Total investment income | | | 966,366 | |
| | | | |
| |
Expenses | | | | |
Investment Adviser | | | 730,295 | |
Administration | | | 58,225 | |
Fund accounting | | | 29,092 | |
Transfer agent | | | 22,634 | |
Audit | | | 17,900 | |
Legal | | | 16,449 | |
Custodian | | | 11,597 | |
Trustee | | | 8,365 | |
Line of credit | | | 2,516 | |
Miscellaneous | | | 65,823 | |
| | | | |
Total expenses | | | 962,896 | |
| | | | |
Fees waived by Adviser | | | (156,094 | ) |
| | | | |
Net operating expenses | | | 806,802 | |
| | | | |
Net investment income | | | 159,564 | |
| | | | |
|
Net Realized and Unrealized Gain (Loss) on Investments | |
Net realized gain (loss) on: | |
Investment securities transactions | | | 1,687,767 | |
Written option transactions | | | 26,762 | |
Foreign currency translations | | | (8 | ) |
Change in unrealized appreciation (depreciation) on: | |
Investment securities | | | 14,994,349 | |
Written option contracts | | | (43,179 | ) |
Foreign currency translations | | | 238 | |
| | | | |
Net realized and unrealized gain on investments | | | 16,665,929 | |
| | | | |
Net increase in net assets resulting from operations | | $ | 16,825,493 | |
| | | | |
See accompanying notes which are an integral part of these financial statements.
10
GREEN OWL INTRINSIC VALUE FUND
STATEMENTS OF CHANGES IN NET ASSETS
| | | | | | | | |
| | | For the
Year Ended
October 31, 2017 | | | For the
Year Ended
October 31, 2016 | |
Increase (Decrease) in Net Assets due to: | | | | | | | | |
Operations | | | | | | | | |
Net investment income | | $ | 159,564 | | | $ | 237,809 | |
Net realized gain (loss) on investment transactions, written options and foreign currency | | | 1,714,521 | | | | (168,473 | ) |
Net change in unrealized appreciation of investments, written options and foreign currency | | | 14,951,408 | | | | 1,956,875 | |
| | | | | | | | |
Net increase in net assets resulting from operations | | | 16,825,493 | | | | 2,026,211 | |
| | | | | | | | |
Distributions | | | | | | | | |
From net investment income | | | (230,271 | ) | | | (241,645 | ) |
From net realized gains | | | – | | | | (934,988 | ) |
| | | | | | | | |
Total distributions | | | (230,271 | ) | | | (1,176,633 | ) |
| | | | | | | | |
Capital Transactions | | | | | | | | |
Proceeds from shares sold | | | 14,125,089 | | | | 7,328,721 | |
Reinvestment of distributions | | | 217,018 | | | | 1,113,919 | |
Amount paid for shares redeemed | | | (10,136,585 | ) | | | (7,343,220 | ) |
| | | | | | | | |
Net increase in net assets resulting from capital transactions | | | 4,205,522 | | | | 1,099,420 | |
| | | | | | | | |
Total Increase in Net Assets | | | 20,800,744 | | | | 1,948,998 | |
| | | | | | | | |
Net Assets | | | | | | | | |
Beginning of year | | | 61,267,258 | | | | 59,318,260 | |
| | | | | | | | |
End of year | | $ | 82,068,002 | | | $ | 61,267,258 | |
| | | | | | | | |
Accumulated undistributed net investment income | | $ | 101,530 | | | $ | 173,161 | |
| | | | | | | | |
Share Transactions | | | | | | | | |
Shares sold | | | 807,820 | | | | 512,880 | |
Shares issued in reinvestment of distributions | | | 12,699 | | | | 76,663 | |
Shares redeemed | | | (584,986 | ) | | | (524,224 | ) |
| | | | | | | | |
Net increase in shares outstanding | | | 235,533 | | | | 65,319 | |
| | | | | | | | |
See accompanying notes which are an integral part of these financial statements.
11
GREEN OWL INTRINSIC VALUE FUND
FINANCIAL HIGHLIGHTS
(For a share outstanding during each year)
| | | | | | | | | | | | | | | | | | | | |
| | | For the
Year Ended
October 31, 2017 | | | For the
Year Ended
October 31, 2016 | | | For the
Year Ended
October 31, 2015 | | | For the
Year Ended
October 31, 2014 | | | For the
Year Ended
October 31, 2013 | |
Selected Per Share Data: | | | | | | | | | | | | | | | | | | | | |
Net asset value, beginning of year | | $ | 15.08 | | | $ | 14.84 | | | $ | 15.72 | | | $ | 14.99 | | | $ | 11.67 | |
| | | | | | | | | | | | | | | | | | | | |
Investment operations: | | | | | | | | | | | | | | | | | | | | |
Net investment income | | | 0.04 | | | | 0.06 | | | | 0.08 | | | | 0.19 | | | | 0.02 | |
Net realized and unrealized gain (loss) on investments | | | 4.03 | | | | 0.47 | | | | (0.16 | ) | | | 1.11 | | | | 3.41 | |
| | | | | | | | | | | | | | | | | | | | |
Total from investment operations | | | 4.07 | | | | 0.53 | | | | (0.08 | ) | | | 1.30 | | | | 3.43 | |
| | | | | | | | | | | | | | | | | | | | |
Less distributions to shareholders from: | | | | | | | | | | | | | | | | | | | | |
Net investment income | | | (0.06 | ) | | | (0.06 | ) | | | (0.20 | ) | | | (0.03 | ) | | | (0.05 | ) |
Net realized gains | | | – | | | | (0.23 | ) | | | (0.60 | ) | | | (0.54 | ) | | | (0.06 | ) |
| | | | | | | | | | | | | | | | | | | | |
Total distributions | | | (0.06 | ) | | | (0.29 | ) | | | (0.80 | ) | | | (0.57 | ) | | | (0.11 | ) |
| | | | | | | | | | | | | | | | | | | | |
Net asset value, end of year | | $ | 19.09 | | | $ | 15.08 | | | $ | 14.84 | | | $ | 15.72 | | | $ | 14.99 | |
| | | | | | | | | | | | | | | | | | | | |
| | | | | |
Total Return (a) | | | 27.02 | % | | | 3.65 | % | | | (0.60 | )% | | | 8.86 | % | | | 29.59 | % |
Ratios and Supplemental Data: | | | | | | | | | | | | | | | | | | | | |
Net assets, end of year (000) | | $ | 82,068 | | | $ | 61,267 | | | $ | 59,318 | | | $ | 60,581 | | | $ | 47,129 | |
Ratio of net expenses to average net assets | | | 1.10 | % | | | 1.10 | % | | | 1.10 | % | | | 1.11 | %(b) | | | 1.40 | % |
Ratio of expenses to average net assets before waiver and reimbursement | | | 1.32 | % | | | 1.40 | % | | | 1.37 | % | | | 1.38 | % | | | 1.52 | % |
Ratio of net investment income to average net assets | | | 0.22 | % | | | 0.41 | % | | | 0.49 | % | | | 1.30 | % | | | 0.14 | % |
Portfolio turnover rate | | | 17 | % | | | 21 | % | | | 33 | % | | | 35 | % | | | 20 | % |
| (a) | Total return represents the rate that the investor would have earned or lost on an investment in the Fund, assuming reinvestment of distributions. |
| (b) | Includes line of credit interest expense of 0.01%. |
See accompanying notes which are an integral part of these financial statements.
12
GREEN OWL INTRINSIC VALUE FUND
NOTES TO THE FINANCIAL STATEMENTS
October 31, 2017
NOTE 1. ORGANIZATION
The Green Owl Intrinsic Value Fund (the “Fund”) is an open-end diversified series of Valued Advisers Trust (the “Trust”). The Trust is a management investment company established under the laws of Delaware by an Agreement and Declaration of Trust dated June 13, 2008 (the “Trust Agreement”). The Trust Agreement permits the Board of Trustees (the “Board”) to issue an unlimited number of shares of beneficial interest of separate series without par value. The Fund is one of a series of funds authorized by the Board. The Fund commenced operations on December 22, 2011. The Fund’s investment adviser is Kovitz Investment Group Partners, LLC (the “Adviser”). The investment objective of the Fund is to provide long-term capital appreciation.
NOTE 2. SIGNIFICANT ACCOUNTING POLICIES
The Fund is an investment company and follows accounting and reporting guidance under Financial Accounting Standards Board Accounting Standards Codification (“ASC”) Topic 946, “Financial Services-Investment Companies”. The following is a summary of significant accounting policies followed by the Fund in the preparation of its financial statements. These polices are in conformity with generally accepted accounting principles in the United States of America (“GAAP”).
Estimates – The preparation of financial statements in conformity with GAAP requires management to make estimates and assumptions that affect the reported amounts of assets and liabilities and disclosure of contingent assets and liabilities at the date of the financial statements and the reported amounts of increases and decreases in net assets from operations during the reporting period. Actual results could differ from those estimates.
Securities Valuation – All investments in securities are recorded at their estimated fair value as described in Note 3.
Foreign Currency Translation – The accounting records of the Fund are maintained in U.S. dollars. Foreign currency amounts are translated into U.S. dollars at the current rate of exchange each business day to determine the value of investments, and other assets and liabilities. Purchases and sales of foreign securities, and income and expenses, are translated at the prevailing rate of exchange on the respective date of these transactions. The Fund does not isolate that portion of the results of operations resulting from changes in foreign exchange rates on investments from fluctuation arising from changes in market prices of securities held. These fluctuations are included with the unrealized gain or loss from investments. Reported net realized foreign exchange gains or losses arise from sales of foreign currencies, currency gains or losses realized between the trade and settlement dates on securities transactions, and the difference between the amounts of dividends, interest, and foreign withholding taxes recorded on the Fund’s books and the U.S. dollar equivalent of the amounts actually received or paid. Net unrealized foreign exchange gains and losses arise from changes in the fair values of assets and liabilities, other than investments in securities at period end, resulting from changes in exchange rates.
Federal Income Taxes – The Fund makes no provision for federal income or excise tax. The Fund has qualified and intends to qualify each year as a regulated investment company (“RIC”) under subchapter M of the Internal Revenue Code of 1986, as amended, by complying with the requirements applicable to RICs and by distributing substantially all of its taxable income. The Fund also intends to distribute sufficient net investment income and net capital gains, if any, so that it will not be subject to excise tax on undistributed income and gains. If the required amount of net investment income or gains is not distributed, the Fund could incur a tax expense.
As of and during the year ended October 31, 2017, the Fund did not have a liability for any unrecognized tax benefits. The Fund recognizes interest and penalties, if any, related to unrecognized tax benefits as income tax
13
GREEN OWL INTRINSIC VALUE FUND
NOTES TO THE FINANCIAL STATEMENTS – (continued)
October 31, 2017
NOTE 2. SIGNIFICANT ACCOUNTING POLICIES – continued
expense on the statement of operations. The Fund is subject to examination by U.S. federal tax authorities for the last three tax years and the current tax year. During the period, the Fund did not incur any interest or penalties.
Expenses – Expenses incurred by the Trust that do not relate to a specific fund of the Trust are allocated to the individual funds based on each fund’s relative net assets or other appropriate basis (using procedures approved by the Board).
Security Transactions and Related Income – The Fund follows industry practice and records security transactions on the trade date for financial reporting purposes. The specific identification method is used for determining gains or losses for financial statements and income tax purposes. Dividend income is recorded on the ex-dividend date and interest income is recorded on an accrual basis. Discounts and premiums on securities purchased are amortized or accreted using the effective interest method. Withholding taxes on foreign dividends have been provided for in accordance with the Fund’s understanding of the applicable country’s tax rules and rates.
Dividends and Distributions – The Fund intends to distribute substantially all of its net investment income, net realized long-term capital gains and its net realized short-term capital gains, if any, to its shareholders on at least an annual basis. Dividends to shareholders, which are determined in accordance with income tax regulations, are recorded on the ex-dividend date. The treatment for financial reporting purposes of distributions made to shareholders during the year from net investment income or net realized capital gains may differ from their ultimate treatment for federal income tax purposes. These differences are caused primarily by differences in the timing of the recognition of certain components of income, expense or realized capital gain for federal income tax purposes. Where such differences are permanent in nature, they are reclassified in the components of net assets based on their ultimate characterization for federal income tax purposes. Any such reclassifications will have no effect on net assets, results of operations or net asset values per share of the Fund. For fiscal year ended October 31, 2017, the Fund made the following reclassifications to increase (decrease) the components of net assets:
| | | | |
Accumulated Undistributed
Net Investment Income (loss) | | Accumulated Net Realized
Gain (Loss) from Investments | | Paid in Capital |
$(924) | | $10 | | $914 |
Written Options – The Fund may write covered call options on equity securities or futures contracts that the Fund is eligible to purchase to extend a holding period to obtain long-term capital gain treatment, to earn premium income, to assure a definite price for a security it has considered selling, or to close out options previously purchased. The Fund may write covered call options if, immediately thereafter, not more than 30% of its net assets would be committed to such transactions. A call option gives the holder (buyer) the right to purchase a security or futures contract at a specified price (the exercise price) at any time until a certain date (the expiration date). A call option is “covered” if the Fund owns the underlying security subject to the call option at all times during the option period, or to the extent that some or all of the risk of the option has been offset by another option. When the Fund writes a covered call option, it maintains a segregated position within its account with its Custodian or as otherwise required by the rules of the exchange the underlying security, of cash or liquid portfolio securities in an amount not less than the exercise price at all times while the option is outstanding. See Note 4 for additional disclosures.
14
GREEN OWL INTRINSIC VALUE FUND
NOTES TO THE FINANCIAL STATEMENTS – (continued)
October 31, 2017
NOTE 2. SIGNIFICANT ACCOUNTING POLICIES – continued
The Fund will receive a premium from writing a call option, which increases the Fund’s return in the event the option expires unexercised or is closed out at a profit. The amount of the premium will reflect, among other things, the relationship of the market price of the underlying security to the exercise price of the option and the remaining term of the option. However, there is no assurance that a closing transaction can be effected at a favorable price. During the option period, the covered call writer has, in return for the premium received, given up the opportunity for capital appreciation above the exercise price should the market price of the underlying security increase, but has retained the risk of loss should the price of the underlying security decline.
The Fund may write put options on equity securities and futures contracts that the Fund is eligible to purchase to earn premium income or to assure a definite price for a security if it is considering acquiring the security at a lower price than the current market price or to close out options previously purchased. The Fund may not write a put option if, immediately thereafter, more than 25% of its net assets would be committed to such transactions. A put option gives the holder of the option the right to sell, and the writer has the obligation to buy, the underlying security at the exercise price at any time during the option period. The operation of put options in other respects is substantially identical to that of call options. When the Fund writes a put option, it maintains a segregated position within its account with the Custodian of cash or liquid portfolio securities in an amount not less than the exercise price at all times while the put option is outstanding.
The Fund will receive a premium from writing a put option, which increases the Fund’s return in the event the option expires unexercised or is closed out at a profit. The amount of the premium will reflect, among other things, the relationship of the market price of the underlying security to the exercise price of the option and the remaining term of the option. The risks involved in writing put options include the risk that a closing transaction cannot be effected at a favorable price and the possibility that the price of the underlying security may fall below the exercise price, in which case the Fund may be required to purchase the underlying security at a higher price than the market price of the security at the time the option is exercised, resulting in a potential capital loss unless the security subsequently appreciates in value. During the year ended October 31, 2017, the Fund utilized covered call options to extend the holding period to obtain long-term capital gain treatment and to take advantage of the option premium to garner a higher exit price than would have been available by immediately selling the stock.
NOTE 3. SECURITIES VALUATION AND FAIR VALUE MEASUREMENTS
Fair value is defined as the price that the Fund would receive upon selling an investment in an orderly transaction to an independent buyer in the principal or most advantageous market of the investment. GAAP establishes a three-tier hierarchy to maximize the use of observable market data and minimize the use of unobservable inputs and to establish classification of fair value measurements for disclosure purposes.
Inputs refer broadly to the assumptions that market participants would use in pricing the asset or liability, including assumptions about risk (the risk inherent in a particular valuation technique used to measure fair value including items such as a pricing model and/or the risk inherent in the inputs to the valuation technique). Inputs may be observable or unobservable. Observable inputs are inputs that reflect the assumptions market participants would use in pricing the asset or liability developed based on market data obtained from sources independent of the reporting entity. Unobservable inputs are inputs that reflect the reporting entity’s own assumptions about the assumptions market participants would use in pricing the asset or liability developed based on the best
15
GREEN OWL INTRINSIC VALUE FUND
NOTES TO THE FINANCIAL STATEMENTS – (continued)
October 31, 2017
NOTE 3. SECURITIES VALUATION AND FAIR VALUE MEASUREMENTS – continued
information available in the circumstances. Various inputs are used in determining the value of the Fund’s investments. These inputs are summarized in the three broad levels listed below.
| | • | | Level 1 – unadjusted quoted prices in active markets for identical investments and/or registered investment companies where the value per share is determined and published and is the basis for current transactions for identical assets or liabilities at the valuation date |
| | • | | Level 2 – other significant observable inputs (including, but not limited to, quoted prices for an identical security in an inactive market, quoted prices for similar securities, interest rates, prepayment speeds, credit risk, etc.) |
| | • | | Level 3 – significant unobservable inputs (including the Fund’s own assumptions in determining fair value of investments based on the best information available) |
The inputs used to measure fair value may fall into different levels of the fair value hierarchy. In such cases, for disclosure purposes, the level in the fair value hierarchy within which the fair value measurement falls in its entirety, is determined based on the lowest level input that is significant to the fair value measurement in its entirety.
Equity securities, including common stocks, that are traded on any stock exchange are generally valued at the last quoted sale price on the security’s primary exchange. Lacking a last sale price, an exchange traded security is generally valued at its last bid price. Securities traded in the NASDAQ over-the-counter market are generally valued by the pricing agent at the NASDAQ Official Closing Price. When using the market quotations and when the market is considered active, the security is classified as a Level 1 security. In the event that market quotations are not readily available or are considered unreliable due to market or other events, the Fund values its securities and other assets at fair value in accordance with policies established by and under the general supervision of the Board. Under these policies, the securities will be classified as Level 2 or 3 within the fair value hierarchy, depending on the inputs used.
Investments in open-end mutual funds, including money market mutual funds, are generally priced at the ending net asset value (“NAV”). These securities are categorized as Level 1 securities.
Written option contracts in which the Fund invests are generally traded on an exchange. The options in which the Fund invests are generally valued at the last trade price as provided by a pricing service. If the last sale price is not available, the options will be valued at the mean of the last bid and ask prices. The options will generally be categorized as Level 1 securities. If the Fund decides that a price provided by the pricing service does not accurately reflect the fair value of the securities, when prices are not readily available from a pricing service, or when restricted or illiquid securities are being valued, securities are valued at fair value as determined by the Adviser, in conformity with policies adopted by and subject to review of the Board. These securities will generally be categorized as Level 2 or 3 securities.
In accordance with the Trust’s valuation policies, the Adviser is required to consider all appropriate factors relevant to the value of securities for which it has determined other pricing sources are not available or reliable as described above. No single method exists for determining fair value, because fair value depends upon the circumstances of each individual case. As a general principle, the current fair value of a security being valued by the Adviser would be the amount which the Fund might reasonably expect to receive upon the current sale. Methods which are in accordance with this principle may, for example, be based on (i) a multiple of earnings;
16
GREEN OWL INTRINSIC VALUE FUND
NOTES TO THE FINANCIAL STATEMENTS – (continued)
October 31, 2017
NOTE 3. SECURITIES VALUATION AND FAIR VALUE MEASUREMENTS – continued
(ii) a discount from market of a similar freely traded security (including a derivative security or a basket of securities traded on other markets, exchanges or among dealers); or (iii) yield to maturity with respect to debt issues, or a combination of these and other methods. Fair value pricing is permitted if, in the Adviser’s opinion, the validity of market quotations appears to be questionable based on factors such as evidence of a thin market in the security based on a small number of quotations, a significant event occurs after the close of a market but before the Fund’s NAV calculation that may affect a security’s value, or the Adviser is aware of any other data that calls into question the reliability of market quotations.
The following is a summary of the inputs used to value the Fund’s investments as of October 31, 2017:
| | | | | | | | | | | | | | | | |
| | | Valuation Inputs | |
Assets | | Level 1 | | | Level 2 | | | Level 3 | | | Total | |
Common Stocks* | | $ | 78,673,741 | | | $ | – | | | $ | – | | | $ | 78,673,741 | |
Money Market Securities | | | 3,613,989 | | | | – | | | | – | | | | 3,613,989 | |
| | | | | | | | | | | | | | | | |
Total | | $ | 82,287,730 | | | $ | – | | | $ | – | | | $ | 82,287,730 | |
| | | | | | | | | | | | | | | | |
| *Refer | to the Schedule of Investments for sector classifications. |
The Fund did not hold any investments at the end of the reporting period in which significant unobservable inputs were used in determining fair value; therefore, no reconciliation of Level 3 securities is included for this reporting period. The Trust recognizes transfers between fair value hierarchy levels at the end of the reporting period. There were no transfers between any levels as of October 31, 2017 based on input levels assigned at October 31, 2016.
NOTE 4. DERIVATIVE TRANSACTIONS
Call options written are presented separately on the Statement of Operations under net realized gain on written option transactions and change in unrealized depreciation on written option contracts, respectively. There were no written option contracts held at October 31, 2017. The average monthly market value of written option contracts outstanding during the fiscal year ended October 31, 2017 was $(1,163).
For the year ended October 31, 2017 :
| | | | | | |
| Derivatives | | Location of Gain (Loss) on
Derivatives on Statement of Operations | | Change in
Unrealized
Appreciation
(Depreciation)
on Derivatives | |
Equity Risk: | | | | | | |
Written Call Options | | Net change in unrealized depreciation on written option contracts | | $ | (43,179 | ) |
Equity Risk: | | | | | | |
Written Call Options | | Net realized gain on written option transactions | | $ | 26,762 | |
17
GREEN OWL INTRINSIC VALUE FUND
NOTES TO THE FINANCIAL STATEMENTS – (continued)
October 31, 2017
NOTE 5. ADVISER FEES AND OTHER TRANSACTIONS
Under the terms of the management agreement, on behalf of the Fund, the Adviser manages the Fund’s investments subject to approval by the Board. As compensation for its management services, the Fund is obligated to pay the Adviser a fee computed and accrued daily and paid monthly at an annual rate of 1.00% of the average daily net assets of the Fund. For the year ended October 31, 2017, the Adviser earned a fee of $730,295 from the Fund before the reimbursement described below. At October 31, 2017, the Fund owed the Adviser $56,250.
The Adviser has contractually agreed to waive its management fee and/or reimburse expenses so that total annual fund operating expenses, excluding interest, taxes, brokerage commissions, other expenditures which are capitalized in accordance with GAAP, other extraordinary expenses not incurred in the ordinary course of the Fund’s business, dividend expense on short sales, and expenses that the Fund has incurred but did not actually pay because of an expense offset arrangement, if applicable, incurred by the Fund in any fiscal year, do not exceed 1.10% of the Fund’s average daily net assets through February 28, 2019. The operating expense limitation also excludes any fees and expenses of acquired funds.
Each fee waiver and expense reimbursement is subject to repayment by the Fund in the three years following the date the particular expense payment occurred, provided such reimbursement can be achieved without exceeding the expense limitation that was in effect at the time of the expense payment or the reimbursement. As of October 31, 2017, the Adviser may seek repayment of investment advisory fees waived and expense reimbursements in the amount of $492,088 from the Fund no later than October 31, 2020.
The Trust retains Ultimus Asset Services, LLC (“the Administrator”), to provide the Fund with administration, fund accounting and transfer agent services, including all regulatory reporting. For the year ended October 31, 2017, the Administrator earned fees of $58,225, $29,092 and $22,634 for administration, accounting and transfer agent services, respectively. At October 31, 2017, the Administrator was owed $9,526 from the Fund for these services.
The officers and one trustee of the Trust are members of management and/or employees of the Administrator. Unified Financial Securities, LLC (the “Distributor”) acts as the principal distributor of the Fund’s shares.
There were no payments made by the Fund to the Distributor during the year ended October 31, 2017.
During the year ended October 31, 2017, the Fund paid $5,229 to Kovitz Securities, LLC, an affiliate of the Adviser, on the execution of purchases and sales of the Fund’s portfolio investments.
NOTE 6. LINE OF CREDIT
The Fund participates in a short-term credit agreement (“Line of Credit”) with Huntington National Bank (“HNB”) expiring on September 5, 2018. Under the terms of the agreement, the Fund may borrow the lesser of $1,000,000 or 5% of the Fund’s daily market value at an interest rate of LIBOR plus 150 basis points. The purpose of the agreement is to meet temporary or emergency cash needs, including redemption requests that might otherwise require the untimely disposition of securities. HNB receives an annual facility fee of 0.125% on $1 million, subject to a minimum fee of $1,250, as well as an additional annual fee of 0.125% on any unused portion of the credit facility, invoiced quarterly, for providing the Line of Credit. As of and for the fiscal year ended October 31, 2017, the Fund had no outstanding borrowings under this Line of Credit.
18
GREEN OWL INTRINSIC VALUE FUND
NOTES TO THE FINANCIAL STATEMENTS – (continued)
October 31, 2017
NOTE 7. PURCHASES AND SALES
For the year ended October 31, 2017, purchases and sales of investment securities, other than short-term investments, were as follows:
| | | | |
Purchases | | $ | 13,944,502 | |
Sales | | $ | 11,353,120 | |
There were no purchases or sales of long-term U.S. government obligations during the fiscal year ended October 31, 2017.
NOTE 8. BENEFICIAL OWNERSHIP
The beneficial ownership, either directly or indirectly, of more than 25% of the voting securities of a fund creates a presumption of control of a fund, under Section 2(a) (9) of the Investment Company Act of 1940. At October 31, 2017, there were no beneficial owners, either directly or indirectly, of more than 25% percent of the Fund.
NOTE 9. FEDERAL TAX INFORMATION
At October 31, 2017, the net unrealized appreciation (depreciation) of investments, including written options and change in unrealized appreciation on foreign currency, for tax purposes were as follows:
| | | | |
Gross Appreciation | | $ | 26,742,757 | |
Gross (Depreciation) | | | (486,161 | ) |
| | | | |
Net Appreciation on Investments | | $ | 26,256,596 | |
| | | | |
At October 31, 2017, the aggregate cost of securities for federal income tax purposes was $56,031,372.
On December 13, 2017, the Fund paid an income distribution of $0.038528 per share and a long-term capital gain distribution of $0.354739 per share to shareholders of record on December 12, 2017.
The tax characterization of distributions for the fiscal year ended October 31, 2017 and 2016 were as follows:
| | | | | | | | |
| | | 2017 | | | 2016 | |
Distributions paid from: | | | | | | | | |
Ordinary Income* | | $ | 230,271 | | | $ | 241,647 | |
Long-Term Capital Gains | | | – | | | | 934,986 | |
| | | | | | | | |
Total Distributions | | $ | 230,271 | | | $ | 1,176,633 | |
| | | | | | | | |
| * | Short term capital gain distributions are treated as ordinary income for tax purposes. |
19
GREEN OWL INTRINSIC VALUE FUND
NOTES TO THE FINANCIAL STATEMENTS – (continued)
October 31, 2017
NOTE 9. FEDERAL TAX INFORMATION – continued
At October 31, 2017, the components of distributable earnings on a tax basis were as follows:
| | | | |
Undistributed ordinary income | | $ | 103,799 | |
Undistributed long-term capital gains | | | 1,527,561 | |
Net unrealized appreciation (depreciation) | | | 26,256,596 | |
Accumulated capital and other losses | | | (2,269 | ) |
| | | | |
| | $ | 27,885,687 | |
| | | | |
During the fiscal year ended October 31, 2017, the Fund utilized short-term capital loss carryforwards in the amount of $186,968.
NOTE 10. COMMITMENTS AND CONTINGENCIES
The Fund indemnifies its officers and trustees for certain liabilities that may arise from their performance of their duties to the Fund. Additionally, in the normal course of business, the Fund enters into contracts that contain a variety of representations and warranties which provide general indemnifications. The Fund’s maximum exposure under these arrangements is unknown, as this would involve future claims that may be made against the Fund that have not yet occurred.
NOTE 11. SUBSEQUENT EVENTS
Management of the Fund has evaluated the need for disclosures and/or adjustments resulting from subsequent events through the date these financial statements were issued. There were no items requiring adjustment of financial statements or additional disclosure.
20
REPORT OF INDEPENDENT
REGISTERED PUBLIC ACCOUNTING FIRM
To the Shareholders of Green Owl Intrinsic Value Fund and
Board of Trustees of Valued Advisers Trust
We have audited the accompanying statement of assets and liabilities, including the schedule of investments, of Green Owl Intrinsic Value Fund (the “Fund”), a series of Valued Advisers Trust, as of October 31, 2017, and the related statement of operations for the year then ended, the statements of changes in net assets for each of the two years in the period then ended, and the financial highlights for each of the five years in the period then ended. These financial statements and financial highlights are the responsibility of the Fund’s management. Our responsibility is to express an opinion on these financial statements and financial highlights based on our audits.
We conducted our audits in accordance with the standards of the Public Company Accounting Oversight Board (United States). Those standards require that we plan and perform the audit to obtain reasonable assurance about whether the financial statements and financial highlights are free of material misstatement. An audit includes examining, on a test basis, evidence supporting the amounts and disclosures in the financial statements. Our procedures included confirmation of securities owned as of October 31, 2017, by correspondence with the custodian and brokers. An audit also includes assessing the accounting principles used and significant estimates made by management, as well as evaluating the overall financial statement presentation. We believe that our audits provide a reasonable basis for our opinion.
In our opinion, the financial statements and financial highlights referred to above present fairly, in all material respects, the financial position of Green Owl Intrinsic Value Fund as of October 31, 2017, the results of its operations for the year then ended, the changes in its net assets for each of the two years in the period then ended, and the financial highlights for each of the five years in the period then ended, in conformity with accounting principles generally accepted in the United States of America.
COHEN & COMPANY, LTD.
Cleveland, Ohio
December 27, 2017
21
SUMMARY OF FUND EXPENSES – (Unaudited)
As a shareholder of the Fund, you incur ongoing costs, including management fees and other Fund expenses. This example is intended to help you understand your ongoing costs (in dollars) of investing in the Fund and to compare these costs with the ongoing costs of investing in other mutual funds.
The example is based on an investment of $1,000 invested at the beginning and held for the entire period from May 1, 2017 to October 31, 2017.
Actual Expenses
The first line of the table below provides information about actual account values and actual expenses. You may use the information in this line, together with the amount you invested, to estimate the expenses that you paid over the period. Simply divide your account value by $1,000 (for example, an $8,600 account value divided by $1,000 = 8.6), then multiply the result by the number in the first line under the heading entitled “Expenses Paid During Period” to estimate the expenses you paid on your account during this period.
Hypothetical Example for Comparison Purposes
The second line of the table below provides information about hypothetical account values and hypothetical expenses based on the Fund’s actual expense ratio and an assumed rate of return of 5% per year before expenses, which is not the Fund’s actual return. The hypothetical account values and expenses may not be used to estimate the actual ending account balance or expenses you paid for the period. You may use this information to compare the ongoing costs of investing in the Fund and other funds. To do so, compare this 5% hypothetical example with the 5% hypothetical examples that appear in the shareholder reports of the other funds.
Please note that the expenses shown in the table are meant to highlight your ongoing costs only. Therefore, the second line of the table below is useful in comparing ongoing costs only and will not help you determine the relative costs of owning different funds.
| | | | | | | | | | | | |
| Green Owl Intrinsic Value Fund | | Beginning
Account Value May 1, 2017 | | | Ending Account Value October 31, 2017 | | | Expenses Paid
During Period* May 1, 2017 –
October 31, 2017 | |
Actual | | $ | 1,000.00 | | | $ | 1,095.20 | | | $ | 5.83 | |
Hypothetical** | | $ | 1,000.00 | | | $ | 1,019.64 | | | $ | 5.62 | |
| * | Expenses are equal to the Fund’s annualized expense ratio of 1.10%, multiplied by the average account value over the period, multiplied by 184/365 (to reflect the one-half year period). |
| ** | Assumes a 5% return before expenses. |
22
TRUSTEES AND OFFICERS (Unaudited)
The Board of Trustees supervises the business activities of the Trust. Each Trustee serves as a trustee until termination of the Trust unless the Trustee dies, resigns, retires or is removed.
The following table provides information regarding each of the independent trustees.
| | | | |
Name, Address*, Age,
Position with Trust**, Term
of Position with Trust | | Principal Occupation During Past 5 Years
and Other Directorships | | Other Directorships |
Andrea N. Mullins, 50 Independent Trustee Since December 2013 Chairperson since March 2017 | | Current: Private investor; Independent Contractor, SWM Wealth Management, LLC (since April 2014). | | None. |
Ira Cohen, 58 Independent Trustee Since June 2010 | | Current: Independent financial services consultant (since February 2005); Executive Vice President of Asset Management Services, Recognos Financial (since August 2015). | | Trustee, Griffin Institutional Access Credit Fund (since January 2017); Trustee and Audit Committee Chairman, Griffin Institutional Real Estate Access Fund (since May 2014); Trustee, Chairman, and Nominating and Governance Committee Chairman, Angel Oak Strategic Credit Fund (since December 2017). |
| * | The address for each trustee and officer is 225 Pictoria Drive, Suite 450, Cincinnati, Ohio 45246. |
| ** | As of the date of this report, the Trust consists of 13 series. |
The following table provides information regarding the Trustee who is considered an “interested person” of the Trust, as that term is defined under the 1940 Act. Based on the experience of the Trustee, the Trust concluded that the individual described below should serve as a Trustee.
| | | | |
Name, Address*, Age,
Position with Trust**, Term
of Position with Trust | | Principal Occupation During Past 5 Years | | Other Directorships |
Mark J. Seger, 55 Trustee Since March 2017 | | Current: President, Managing Director, and Co-Founder, Ultimus Fund Solutions, LLC (since 1999); Treasurer and Managing Director, Ultimus Fund Distributors, LLC (since 1999); President and Managing Director, Ultimus Asset Services, LLC (since 2016). | | None. |
| * | The address for each trustee and officer is 225 Pictoria Drive, Suite 450, Cincinnati, Ohio 45246. |
| ** | As of the date of this report, the Trust consists of 13 series. |
23
The following table provides information regarding the officers of the Trust:
| | | | |
Name, Address*, Age,
Position with Trust**, Term
of Position with Trust | | Principal Occupation During Past 5 Years | | Other Directorships |
Bo J. Howell, 36 Principal Executive Officer and President Since March 2017 | | Current: Vice President, Director of Fund Administration, Ultimus Fund Solutions, LLC (since 2014). Previous: Counsel, Securities and Mutual Funds, Western & Southern Financial Group (2012 – 2014). | | None. |
Brandon R. Kipp, 34 Chief Compliance Officer Since October 2017 | | Current: Senior Fund Compliance Officer, Ultimus Fund Solutions, LLC (since July 2017). Previous: Assistant Vice President and Compliance Manager, UMB Fund Services, Inc. (March 2014 to July 2017); Officer and Lead Fund Administrator, UMB Fund Services, Inc. (May 2012 to March 2014). | | None. |
Carol J. Highsmith, 52 Vice President Since August 2008 Secretary Since March 2014 | | Current: Assistant Vice President, Ultimus Fund Solutions, LLC (since December 2015). Previous: Employed in various positions with Huntington Asset Services, Inc. (n/k/a Ultimus Asset Services, LLC) (November 1994 to December 2015), most recently Vice President of Legal Administration (2005 to December 2015). | | None. |
Matthew J. Miller, 41 Vice President Since December 2011 | | Current: Assistant Vice President, Relationship Management, Ultimus Fund Solutions, LLC (since December 2015). Previous: Employed in various positions with Huntington Asset Services, Inc. (n/k/a Ultimus Asset Services, LLC) (July 1998 to December 2015), most recently Vice President of Relationship Management (2005 to December 2015). | | None. |
| * | The address for each trustee and officer is 225 Pictoria Drive, Suite 450, Cincinnati, Ohio 45246. |
| ** | As of the date of this report, the Trust consists of 13 series. |
24
| | | | |
Name, Address*, Age,
Position with Trust**, Term
of Position with Trust | | Principal Occupation During Past 5 Years | | Other Directorships |
Bryan W. Ashmus, 44 Principal Financial Officer and Treasurer Since December 2013 | | Current: Vice President and Director of Financial Administration, Ultimus Fund Solutions, LLC (since December 2015). Previous: Vice President and Manager of Financial Administration, Huntington Asset Services, Inc. (n/k/a Ultimus Asset Services, LLC) (September 2013 to December 2015); Vice President, Fund Administration, Citi Fund Services Ohio, Inc. (from May 2005 to September 2013). | | None. |
Stephen L. Preston, 50 AML Officer since June 2017 | | Current: Chief Compliance Officer, Ultimus Fund Solutions, LLC (since June 2011); Chief Compliance Officer of Ultimus Fund Distributors, LLC (since June 2011). | | None. |
| * | The address for each trustee and officer is 225 Pictoria Drive, Suite 450, Cincinnati, Ohio 45246. |
| ** | As of the date of this report, the Trust consists of 13 series. |
OTHER INFORMATION (Unaudited)
The Fund’s Statement of Additional Information (“SAI”) includes additional information about the trustees and is available without charge, upon request. You may call toll-free at (888) 695-3729 to request a copy of the SAI or to make shareholder inquiries.
25
OTHER FEDERAL INCOME TAX INFORMATION (Unaudited)
The Form 1099-DIV you receive in January 2018 will show the tax status of all distributions paid to your account in calendar year 2017. Shareholders are advised to consult their own tax adviser with respect to the tax consequences of their investment in the Fund. As required by the Internal Revenue Code and/or regulations, shareholders must be notified regarding the status of qualified dividend income for individuals and the dividends received deduction for corporations.
Qualified Dividend Income. The Fund designates approximately 100% or up to the maximum amount of such dividends allowable pursuant to the Internal Revenue Code, as qualified dividend income eligible for the reduced tax rate of 15%.
Dividends Received Deduction. Corporate shareholders are generally entitled to take the dividends received deduction on the portion of the Fund’s dividend distribution that qualifies under tax law. For the Fund’s calendar year 2017 ordinary income dividends, 100% qualifies for the corporate dividends received deduction.
For the year ended October 31, 2017, the Fund did not designate any long-term capital gain distributions.
26
INVESTMENT ADVISORY AGREEMENT RENEWAL (Unaudited)
Kovitz Investment Group Partners, LLC (“Kovitz”) is an indirect wholly-owned subsidiary of Focus Financial Partners, LLC (“Focus”). Effective July 3, 2017, an investor group led by Stone Point Capital and KKR acquired a majority ownership interest in Focus, which resulted in a change of control of Kovitz. The change of control of Kovitz in turn resulted in the termination of the Investment Advisory Agreement between Kovitz and Valued Advisers Trust (the “Trust”). At an in-person meeting held on June 8, 2017 the Board of Trustees (the “Board”) considered the approval of a new Investment Advisory Agreement (the “New Agreement”) between the Trust and Kovitz with respect to the Green Owl Intrinsic Value Fund (the “Green Owl Fund”). Kovitz provided written information to the Board to assist the Board in its considerations.
The Board discussed the existing arrangements between Kovitz and the Trust with respect to the Green Owl Fund. The Board reviewed a memorandum from Trust counsel and addressed to the trustees that summarized, among other things, the fiduciary duties and responsibilities of the Board in reviewing and approving the New Agreement. The Trustees relied in part on their past experience with Kovitz in managing the Green Owl Fund, due to the fact that the personnel and management of Kovitz is expected to remain the same as that currently in place and that no changes are expected as a result of the change of control. They also considered that the New Agreement is identical to the prior agreement (except for the date of effectiveness). They reflected upon their experience with Kovitz, including the information furnished for the Board’s review and consideration in the past at regular Board meetings, as well as information specifically prepared and/or presented in connection with the current approval process, including information presented at the meeting.
The Board requested and was provided with information and reports relevant to the consideration of the approval of the New Agreement, including: (i) reports regarding the services and support provided to the Green Owl Fund and its shareholders by Kovitz; (ii) quarterly assessments of the investment performance of the Green Owl Fund by personnel of Kovitz; (iii) commentary on the reasons for the performance; (iv) presentations by Kovitz addressing its investment philosophy, investment strategy, personnel and operations; (v) compliance and audit reports concerning the Green Owl Fund and Kovitz; (vi) disclosure information contained in the registration statement of the Trust and the Form ADV of Kovitz; and (vii) a memorandum from counsel, that summarized the fiduciary duties and responsibilities of the Board in reviewing and approving the New Agreement, including the material factors set forth above and the types of information included in each factor that should be considered by the Board in order to make an informed decision. The Board also requested and received various informational materials including, without limitation: (a) documents containing information about Kovitz, including financial information, a description of personnel and the services provided to the Green Owl Fund, information on investment advice, performance, summaries of Green Owl Fund expenses, compliance program, current legal matters, and other general information; (b) comparative expense and performance information for other mutual funds with strategies similar to the Green Owl Fund and composite performance of other accounts managed by Kovitz; (c) the anticipated effect of size on the Green Owl Fund’s performance and expenses; and (d) conflicts of interest and benefits to be realized by Kovitz from its relationship with the Green Owl Fund. In considering the foregoing, the Board also considered the impact, if any, that the change of control of Kovitz would have on the ability of Kovitz to continue to provide a similar level and quality of services to the Green Owl Fund and its shareholders as had previously been provided. The Board did not identify any particular information that was most relevant to its consideration to approve the New Agreement and each Trustee may have afforded different weight to the various factors.
| 1. | The nature, extent, and quality of the services to be provided by Kovitz. In this regard, the Board considered responsibilities that Kovitz would have under the New Agreement. The Trustees considered the services proposed to be provided by Kovitz to the Green Owl Fund and their experience with Kovitz in providing similar services, including without limitation: the quality of advisory services (including research and recommendations with respect to portfolio securities), the process for formulating investment recommendations and assuring compliance with the Green Owl Fund’s investment objectives and limitations, the coordination of services for the Green Owl Fund among the Green Owl Fund’s service |
27
INVESTMENT ADVISORY AGREEMENT RENEWAL (Unaudited) (continued)
| | providers, and efforts to promote the Green Owl Fund and grow its assets. The Trustees considered Kovitz’s continuity of, and commitment to retain, qualified personnel, Kovitz’s commitment to maintain its resources and systems, and Kovitz’s cooperation with the Board and Counsel for the Green Owl Fund. The Trustees considered Kovitz’s personnel, including the education and experience of the personnel and Kovitz’s compliance program, policies and procedures. The Trustees specifically acknowledged the fact that the personnel associated with the day-to-day management of the Green Owl Fund is not anticipated to change. After considering the foregoing information and further information in the meeting materials provided by Kovitz, the Board concluded that, in light of all the facts and circumstances, the nature, extent, and quality of the services proposed to be provided by Kovitz will be satisfactory and adequate for the Green Owl Fund. |
| 2. | Investment Performance of the Green Owl Fund and Kovitz. In considering the investment performance of the Green Owl Fund and Kovitz, the Trustees compared the performance of the Green Owl Fund with the performance of funds in a peer group with similar objectives managed by other investment advisers, as well as with aggregated Morningstar category data. The Trustees also considered the consistency of Kovitz’s management of the Green Owl Fund with its investment objective, strategies, and limitations. When comparing the performance of the Green Owl Fund to that of other funds in the peer group, the Trustees noted that the Green Owl Fund’s performance for the 1-year, 3-year and 5-year periods ended March 31, 2017 was above the average and median of the group. When considering the performance of the Green Owl Fund’s Morningstar category, the Trustees noted that the Green Owl Fund’s performance was higher than the average and median for the 1-year period, slightly below the average and median for the 3-year period, comparable to the average and median for the 5-year period, and above the average and median for the period since inception of the Green Owl Fund. The Trustees also considered the performance of Kovitz’s separate accounts that were managed in a manner similar to that of the Green Owl Fund and they noted that the performance was very comparable and that any differences were reasonable in light of the circumstances. After reviewing and discussing the investment performance of the Green Owl Fund further, Kovitz’s experience managing the Green Owl Fund, the Green Owl Fund’s historical performance, and other relevant factors, the Board concluded, in light of all the facts and circumstances, that the investment performance of the Green Owl Fund and Kovitz was satisfactory. |
| 3. | The costs of the services to be provided and profits to be realized by Kovitz from the relationship with the Green Owl Fund. In considering the costs of services to be provided and the profits to be realized by Kovitz from the relationship with the Green Owl Fund, the Trustees considered: (1) Kovitz’s financial condition; (2) the asset levels of the Green Owl Fund; (3) the overall expenses of the Green Owl Fund; and (4) the nature and frequency of advisory fee payments. The Trustees reviewed information provided by Kovitz regarding its profits associated with managing the Green Owl Fund. The Trustees also considered potential benefits for Kovitz in managing the Green Owl Fund. The Trustees then compared the fees and expenses of the Green Owl Fund (including the management fee) to other comparable mutual funds. First, the Trustees compared the fees and expenses of the Green Owl Fund to those of other funds included in a custom peer group of funds with similar strategy and objective. The Trustees noted that the Green Owl Fund’s management fee was the highest in its peer group and the net expense ratio was higher than the average and median. The Trustees then considered the fees and expenses of the Green Owl Fund as compared to other funds in its Morningstar category. They noted that the management fee was higher than the average and median of the category. They also noted that the net expense ratio was closer to the average and median of the category, although still higher. The Trustees acknowledged the commitment of Kovitz to continue to limit the expenses of the Green Owl Fund under the same terms going forward. The Trustees considered the services provided to the Green Owl Fund in light of the advisory fees and the peer group fee data and concluded that the fee was within an acceptable range. The Trustees noted that the management fee was generally less than what Kovitz charges to its separate account clients who had investment strategies and objectives similar to the Green Owl Fund. Based on the foregoing, the Board concluded that the fees to be paid to Kovitz by the Green Owl Fund and the profits to be realized by Kovitz, in light of all the facts and |
28
INVESTMENT ADVISORY AGREEMENT RENEWAL (Unaudited) (continued)
| | circumstances, were fair and reasonable in relation to the nature and quality of the services to be provided by Kovitz. |
| 4. | The extent to which economies of scale would be realized as the Green Owl Fund grows and whether advisory fee levels reflect these economies of scale for the benefit of the Green Owl Fund’s investors. In this regard, the Board considered the Green Owl Fund’s proposed fee arrangements with Kovitz, noting that the proposed fees are the same as the current fees paid to Kovitz. The Board considered that while the management fee remained the same at all asset levels, the Green Owl Fund’s shareholders experienced benefits from the Green Owl Fund’s expense limitation arrangement. The Trustees noted that once the Green Owl Fund’s expenses fell below the cap set by the arrangement, the Green Owl Fund’s shareholders would continue to benefit from the economies of scale under the Green Owl Fund’s agreements with service providers other than Kovitz. In light of its ongoing consideration of the Green Owl Fund’s asset levels, expectations for growth in the Green Owl Fund, and fee levels, the Board determined that the Green Owl Fund’s fee arrangements, in light of all the facts and circumstances, were fair and reasonable in relation to the nature and quality of the services to be provided by Kovitz. |
| 5. | Possible conflicts of interest and benefits to Kovitz. In considering Kovitz’s practices regarding conflicts of interest, the Trustees evaluated the potential for conflicts of interest and considered such matters as the experience and ability of the advisory personnel assigned to the Green Owl Fund; the basis of decisions to buy or sell securities for the Green Owl Fund and/or Kovitz’s other accounts; and the substance and administration of Kovitz’s code of ethics. The Trustees also considered disclosure in the registration statement of the Trust relating to potential conflicts of interest. The Trustees noted that Kovitz does not utilize soft dollars. The Trustees noted that Kovitz benefits from the Green Owl Fund in that it is able to utilize the Green Owl Fund as a vehicle into which to direct advisory clients with small account balances. The Trustees also noted that Kovitz executes trades for the Green Owl Fund through its affiliated broker dealer and that it is able to benefit from certain hardware, software, administrative and reporting tools that its affiliated broker dealer receives. The Trustees did not identify any other potential benefits (other than the management fee) that would inure to Kovitz. Based on the foregoing, the Board determined that the standards and practices of Kovitz relating to the identification and mitigation of potential conflicts of interest and the benefits that it derives from managing the Green Owl Fund are acceptable. |
After additional consideration of the factors delineated in the memorandum provided by counsel and further discussion among the Board members, the Board determined to approve the New Agreement between the Trust and Kovitz.
29
PROXY VOTING RESULTS (Unaudited)
The Adviser is an indirect wholly-owned subsidiary of Focus Financial Partners, LLC (“Focus”), a Delaware limited liability company that is a strategic and financial investor in independently-managed wealth management firms. Effective July 3, 2017, an investor group led by Stone Point Capital and KKR acquired a majority ownership interest in Focus, which resulted in a change of control of the Adviser. On September 14, 2017, a special meeting of shareholders of the Fund was held for the purpose of approving a new investment advisory agreement. Below are the voting results from the special meeting:
| | | | | | | | | | |
| For | | | Against | | | Abstain | |
| | 2,228,986 | | | | 3,146 | | | | — | |
30
| | | | |
| |
FACTS | | WHAT DOES VALUED ADVISERS TRUST DO
WITH YOUR PERSONAL INFORMATION? |
| | | | |
| | |
Why? | | Financial companies choose how they share your personal information. Federal law gives consumers the right to limit some but not all sharing. Federal law also requires us to tell you how we collect, share, and protect your personal information. Please read this notice carefully to understand what we do. |
| | | | |
| | |
What? | | The types of personal information we collect and share depend on the product or service you have with us. This information can include: ◾ Social Security number ◾ account balances and account transactions ◾ account transactions, transaction or loss history and purchase history ◾ checking account information and wire transfer instructions When you are no longer our customer, we continue to share your information as described in this notice. |
| | | | |
| | |
How? | | All financial companies need to share customers’ personal information to run their everyday business. In the section below, we list the reasons financial companies can share their customers’ personal information; the reasons Valued Advisers Trust chooses to share; and whether you can limit this sharing. |
| | |
Reasons we can share your personal information | | Does Valued Advisers Trust share? |
For our everyday business purposes –
such as to process your transactions, maintain your account(s), respond to court orders and legal investigations, or report to credit bureaus | | Yes |
For our marketing purposes –
to offer our products and services to you | | Yes |
For joint marketing with other financial companies | | No |
For our affiliates’ everyday business purposes –
information about your transactions and experiences | | No |
For our affiliates’ everyday business purposes –
information about your creditworthiness | | No |
For nonaffiliates to market to you | | No |
| | | | |
Questions? | | Call 1-888-695-3729. |
| | |
Who we are |
Who is providing this notice? | | Valued Advisers Trust |
What we do |
How does Valued Advisers Trust protect my personal information? | | To protect your personal information from unauthorized access and use, we use security measures that comply with federal law. These measures include computer safeguards and secured files and buildings. |
| How does Valued Advisers Trust collect my personal information? | | We collect your personal information, for example, when you ◾ open an account or deposit money ◾ buy securities from us or sell securities to us ◾ make deposits or withdrawals from your account or provide account information ◾ give us your account information ◾ make a wire transfer ◾ tell us who receives the money ◾ tell us where to send the money ◾ show your government-issued ID ◾ show your driver’s license |
| Why can’t I limit all sharing? | | Federal law gives you the right to limit only ◾ sharing for affiliates’ everyday business purposes – information about your creditworthiness ◾ affiliates from using your information to market to you ◾ sharing for nonaffiliates to market to you State laws and individual companies may give you additional rights to limit sharing. |
Definitions | | |
| Affiliates | | Companies related by common ownership or control. They can be financial and nonfinancial companies. |
| Nonaffiliates | | Companies not related by common ownership or control. They can be financial and nonfinancial companies. ◾ Valued Advisers Trust does not share your personal information with nonaffiliates so they can market to you. |
| Joint marketing | | A formal agreement between nonaffiliated financial companies that together market financial products or services to you. ◾ Valued Advisers Trust doesn’t jointly market financial products or services to you. |
PROXY VOTING
A description of the policies and procedures that the Fund uses to determine how to vote proxies relating to portfolio securities and information regarding how the Fund voted those proxies is available without charge upon request by (1) calling the Fund at (888) 695-3729 and (2) from Fund documents filed with the Securities and Exchange Commission (“SEC”) on the SEC’s website at www.sec.gov.
TRUSTEES
Andrea N. Mullins, Chairperson
Ira P. Cohen
Mark J. Seger
OFFICERS
Bo J. Howell, Principal Executive Officer and President
Bryan W. Ashmus, Principal Financial Officer and Treasurer
Brandon R. Kipp, Chief Compliance Officer
Carol J. Highsmith, Vice President and Secretary
Matthew J. Miller, Vice President
Stephen L. Preston, Anti-Money Laundering Officer
INVESTMENT ADVISER
Kovitz Investment Group Partners, LLC
115 South LaSalle Street, 27th Floor
Chicago, IL 60603
DISTRIBUTOR
Unified Financial Securities, LLC
9465 Counselors Row, Suite 200
Indianapolis, IN 46240
INDEPENDENT REGISTERED PUBLIC ACCOUNTING FIRM
Cohen & Company, Ltd.
1350 Euclid Avenue, Suite 800
Cleveland, OH 44115
LEGAL COUNSEL
The Law Offices of John H. Lively & Associates, Inc.
A member firm of The 1940 Act Law GroupTM
11300 Tomahawk Creek Parkway, Ste. 310
Leawood, KS 66211
CUSTODIAN
Huntington National Bank
41 South High Street
Columbus, OH 43215
ADMINISTRATOR, TRANSFER AGENT AND FUND ACCOUNTANT
Ultimus Asset Services, LLC
225 Pictoria Drive, Suite 450
Cincinnati, OH 45246
This report is intended only for the information of shareholders or those who have received the Fund’s prospectus which contains information about the Fund’s management fee and expenses. Please read the prospectus carefully before investing.
Distributed by Unified Financial Securities, LLC
Member FINRA/SIPC
| | |
Annual Report October 31, 2017 |
Foundry Partners Fundamental Small Cap Value Fund
Fund Adviser:
Foundry Partners, LLC
510 First Avenue North, Suite 409
Minneapolis, MN 55403
(800) 247-1014
Market Overview and Fund Performance
The Foundry Partners Fundamental Small Cap Value Fund (the “Fund”) returned 22.01% (Institutional Class) during the 12-month period ended October 31, 2017. The Fund’s benchmark, the Russell 2000® Value Index(a) (“Russell 2000”), returned 24.81% for the same period.
Market Review
The U.S. equity markets posted strong returns for the year as investors fled to stocks as it became literally the only game in town. The returns are especially impressive given the wall of worry investors easily scaled including: an upset in the Presidential election, a lack of follow through on Trump’s campaign promises (lower taxes, fiscal stimulus and less regulation), geopolitical stress from North Korea, and the Federal Reserve raising rates and shrinking its balance sheet. The markets’ grind higher was fueled by the economy pushing out a lack luster but steady 2% growth. This consistent growth since the 2008 recession equates to the lowest post-recession growth rate in history. The old adage of “slow and steady wins the race” is certainly applicable in today’s market. For the year, small caps edged out mid cap and large cap and growth trumped value.
Portfolio Review
For the year the Fund underperformed its benchmark. The largest detractors to performance were cash, Health Care, Information Technology, and Financials. Offsetting a portion of this weakness was Energy, Consumer Staples, Materials and Utilities.
Our underweight in the Energy Sector was a large contributor to alpha for the Fund as it was one of the worst performing sectors in the Index. Higher than expected oil inventory levels and the inability for OPEC to cooperate on output quotas weighed upon energy prices. The decision to remain underweight this group has proved positive for the Fund over the past several years. While we continue to scour the universe for names, we have yet to add; waiting for valuations to bottom and fundamentals to heal as the industry works off nearly a decade of excess capacity build. The Materials Sector was another bright area for the Fund. The potential for fiscal stimulus and renewed confidence in the economy combined with lower energy costs was a tailwind for this space. Three of our specialty chemical companies climbed double digits on the back of this tailwind with Kraton up +91%, Olin Corp. up +71%, and Cabot up +19%. Owens-Illinois, a manufacturer of glass containers, also benefited as it climbed +24%. Our silver companies did not fare as well as Coeur Mining fell -32% and Pan American Silver posted a small gain of +2%. Our overweight in Industrials was a positive for the Fund. Many of our holdings posted strong returns with Barnes up +65%; Park-Ohio up +50%; and Hyster-Yale jumping +37%. Brinks Co. was the strongest performer gaining +94%. The company initiated several restructuring initiatives that spurred a turnaround in its U.S. business.
Healthcare was our worst performing sector on a relative basis as the Biotechnology and Pharmaceutical companies rallied. In the small cap space many of these companies do not make money, making it impossible for us to invest in them given our process. For the year Biotechnology was up +67% and Pharmaceuticals was up +31%! Those big numbers account for all, and then some, of our underperformance in the sector. Cash was the largest drag on the
Annual Report
1
Market Overview and Fund Performance (Continued)
Fund as we have held approximately 5% in cash as the market continued to move higher. In the small cap space it has been over 600 days since we have had a 10% correction! This is the 5th longest stretch out of 52 total periods in the Russell 2000’s history. Although it is not completely unchartered waters, it is certainly a rare occurrence. We continue to believe that valuations are getting extended and like most bubbles they can certainly last longer than many investors think. However, our prudence has served us well over the years as we look to preserve capital when the markets fall. We have steadily reduced the number of positions in the Fund by concentrating on companies with the highest quality given our fundamental work. This combined with our cash position should serve us well when the market eventually corrects and will allow us to quickly position the Fund for the next leg higher.
As volatility increases, we believe that stock picking will become an increasingly important factor in outperformance. This bodes well for our contrarian, fundamental value-driven process, as we continue to focus our efforts on building the Portfolio one stock at a time. We believe this disciplined, value-based approach - together with our conscious decision to avoid chasing overvalued stocks when they rally - has been the key to our success over the past decade.
The Fund’s performance quoted is past performance and does not guarantee future results. The investment return and principal value of an investment in the Fund will fluctuate so that an investor’s shares, when redeemed, may be worth more or less than their original cost. Current performance of the Fund may be lower or higher than the performance quoted. Performance data current to the most recent month end may be obtained by calling 1-800-247-1014. Information provided with respect to the Fund’s Portfolio Holdings, Sector Weightings and Number of Holdings are as of October 31, 2017 and are subject to change at any time.
| (a) | The Russell 2000® Value Index is a widely recognized unmanaged index of equity prices and is representative of a broader market and range of securities than is found in the Fund’s portfolio. The Russell 2000® Value Index measures the performance of the small-cap value segment of the U.S. equity universe. It includes those Russell 2000 companies with lower price-to-book ratios and lower forecasted growth values. Individuals cannot invest directly in an index; however, an individual can invest in exchange traded funds (“ETFs”) or other investment vehicles that attempt to track the performance of a benchmark index. |
Value stocks may remain undervalued for extended periods of time and the market may not recognize the intrinsic value of these securities.
Micro cap and small cap investing involves greater risk not associated with investing in more established companies, such as greater price volatility, business risk, less liquidity and increased competitive threat.
The opinions expressed are those of the investment management team and are subject to change without notice, as are statements of financial market trends, which are based on current conditions. Under no circumstances does the information contained within represent a recommendation to buy, hold or sell any security and it should not be assumed that the companies discussed were, or will prove to be, profitable. Current and future holdings are subject to risk.
Annual Report
2
Investment Results (Unaudited)
| | | | | | |
Average Annual Total Returns(a)
As of October 31, 2017 |
| | | | |
| | | Investor
Class | | Institutional
Class | | Russell 2000®
Value Index(b) |
| One Year | | 21.68% | | 22.01% | | 24.81% |
| Three Year | | 9.69% | | 9.97% | | 9.67% |
| Five Year | | 14.45% | | 14.70% | | 13.58% |
| Ten Year | | 7.85% | | 8.03% | | 7.04% |
| Since Inception (8/22/07) | | N/A | | 8.23% | | 6.96% |
| Since Inception (12/31/03) | | 10.76% | | N/A | | 8.44% |
| | | |
| | | Expense Ratios(c) | | |
| | | | |
| | | Investor
Class | | Institutional
Class | | |
| | | 1.44% | | 1.19% | | |
The investment return and principal value of an investment will fluctuate so that an investor’s shares, when redeemed, may be worth more or less than their original cost. The returns shown do not reflect deduction of taxes that a shareholder would pay on Foundry Partners Fundamental Small Cap Value Fund (the “Fund”) distributions or the redemption of Fund shares. THE FUND’S RETURNS REPRESENT PAST PERFORMANCE AND DO NOT PREDICT FUTURE RESULTS. The returns shown are net of all recurring expenses. Current performance of the Fund may be lower or higher than the performance quoted. For more information on the Fund, and to obtain performance data current to the most recent month end, or to request a prospectus, please call 1-800-247-1014.
You should carefully consider the investment objectives, potential risk, management fees, and charges and expenses of the Fund before investing. The Fund’s prospectus contains this and other information about the Fund, and should be read carefully before investing.
| (a) | Average annual total returns reflect any change in price per share and assume the reinvestment of all distributions. The Fund’s returns reflect any fee reductions during the applicable periods. If such fee reductions had not occurred, the quoted performance would have been lower. |
| (b) | The Russell 2000® Value Index (“Index”) is an unmanaged benchmark that assumes reinvestment of all distributions and excludes the effect of taxes and fees. The Index is a widely recognized, unmanaged index of equity prices and is representative of a broader market and range of securities than are found in the Fund’s portfolio. Individuals cannot invest directly in the Index; however, an individual can invest in ETFs or other investment vehicles that attempt to track the performance of a benchmark index. |
| (c) | The expense ratios are from the Fund’s prospectus dated February 28, 2017. Foundry Partners, LLC (the “Adviser”) has contractually agreed to waive its management fee and/or reimburse certain operating expenses through February 28, 2018, but only to the extent necessary so that the Fund’s net expenses, excluding brokerage fees and commissions, borrowing costs (such as interest expense and dividend expense on securities sold short), taxes, distribution and service (12b-1) fees, extraordinary expenses and indirect expenses (such as fees and expenses of acquired funds), does not exceed 1.25% of the Fund’s average daily net assets. Information pertaining to the Fund’s expense ratios as of October 31, 2017 can be found on the financial highlights. |
The Fund is distributed by Unified Financial Securities, LLC, member FINRA/SIPC.
Annual Report
3
Investment Results (Unaudited) (Continued)
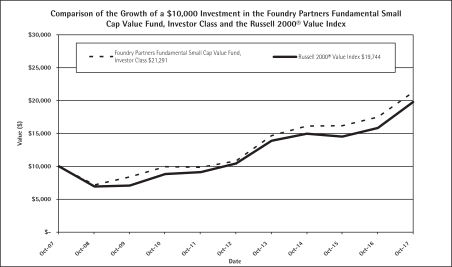
The chart above assumes an initial investment of $10,000 made on October 31, 2007 and held through October 31, 2017. THE FUND’S RETURN REPRESENTS PAST PERFORMANCE AND DOES NOT PREDICT FUTURE RESULTS. Investment returns and principal values will fluctuate so that Fund shares, when redeemed, may be worth more or less than their original purchase price. Current performance may be lower or higher than the performance data quoted.
For more information on the Fund, and to obtain performance data current to the most recent month end, or to request a prospectus, please call 1-800-247-1014. You should carefully consider the investment objectives, potential risk, management fees, and charges and expenses of the Fund before investing. The Fund’s prospectus contains important information about the Fund’s investment objectives, potential risks, management fees, charges and expenses, and other information and should be read carefully before investing.
The Fund is distributed by Unified Financial Securities, Inc., member FINRA/SIPC.
Annual Report
4
Fund Holdings (Unaudited)
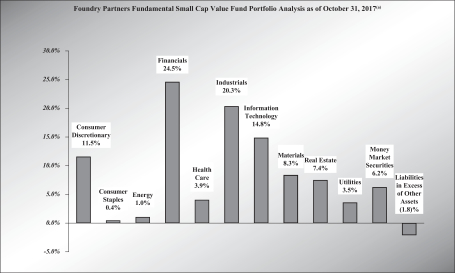
| (a) | As a percent of net assets. |
Availability of Portfolio Schedule (Unaudited)
The Fund files its complete schedule of Investments with the Securities and Exchange Commission (“SEC”) for the first and third quarters of each fiscal year on Form N-Q, which is available on the SEC’s web site at www.sec.gov. The Fund’s Form N-Q may be reviewed and copied at the SEC’s Public Reference Room in Washington, DC. Information on the operation of the Public Reference Room may be obtained by calling 1-800-SEC-0330.
Annual Report
5
|
| Foundry Partners Fundamental Small Cap Value Fund |
Schedule of Investments
October 31, 2017
| | | | | | | | | | | | |
| Shares | | | | | Fair Value | | | | |
| | Common Stocks — 95.61% | | | | | | | | |
| | Consumer Discretionary — 11.46% | | | | | | | | |
| | 31,264 | | | Aaron’s, Inc. | | $ | 1,150,515 | | | | | |
| | 55,218 | | | Adtalem Global Education, Inc. * | | | 2,040,305 | | | | | |
| | 148,506 | | | American Axle & Manufacturing Holdings, Inc. * | | | 2,641,922 | | | | | |
| | 28,322 | | | Big Lots, Inc. | | | 1,453,202 | | | | | |
| | 130,758 | | | Bloomin’ Brands, Inc. | | | 2,324,877 | | | | | |
| | 55,730 | | | Cooper Tire & Rubber Co. | | | 1,827,944 | | | | | |
| | 12,065 | | | Helen of Troy Ltd. * | | | 1,120,838 | | | | | |
| | 24,374 | | | John Wiley & Sons, Inc., Class A | | | 1,332,039 | | | | | |
| | 124,589 | | | KB Home | | | 3,417,476 | | | | | |
| | 39,302 | | | M/I Homes, Inc. * | | | 1,312,687 | | | | | |
| | 52,792 | | | Meredith Corp. | | | 2,797,976 | | | | | |
| | 27,488 | | | Movado Group, Inc. | | | 761,418 | | | | | |
| | | | | 22,181,199 | | | | | |
| | Consumer Staples — 0.44% | | | | | | | | |
| | 34,796 | | | SpartanNash Co. | | | 854,242 | | | | | |
| | Energy — 0.98% | | | | | | | | |
| | 40,559 | | | Aegean Marine Petroleum Network, Inc. | | | 182,516 | | | | | |
| | 40,374 | | | Alliance Resource Partners LP | | | 795,368 | | | | | |
| | 182,284 | | | Denbury Resources, Inc. * | | | 224,209 | | | | | |
| | 317,480 | | | Gran Tierra Energy, Inc. * | | | 688,932 | | | | | |
| | | | | 1,891,025 | | | | | |
| | Financials — 24.55% | | | | | | | | |
| | 69,656 | | | AllianceBernstein Holding LP | | | 1,800,608 | | | | | |
| | 42,105 | | | Apollo Commercial Real Estate Finance, Inc. | | | 760,837 | | | | | |
| | 40,726 | | | Aspen Insurance Holdings Ltd. | | | 1,747,145 | | | | | |
| | 131,027 | | | Associated Banc-Corp. | | | 3,314,983 | | | | | |
| | 16,499 | | | Chemical Financial Corp. | | | 869,332 | | | | | |
| | 43,861 | | | Donnelley Financial Solutions, Inc. * | | | 943,012 | | | | | |
| | 96,295 | | | F.N.B. Corp. | | | 1,299,020 | | | | | |
| | 98,593 | | | First Midwest Bancorp, Inc. | | | 2,276,512 | | | | | |
| | 217,730 | | | Fulton Financial Corp. | | | 3,962,686 | | | | | |
| | | | | | | | | | | | |
| Shares | | | | | Fair Value | | | | |
| | Common Stocks — (continued) | | | | | | | | |
| | Financials — (continued) | | | | | | | | |
| | 80,515 | | | Hancock Holding Co. | | $ | 3,925,106 | | | | | |
| | 21,360 | | | Hanover Insurance Group, Inc. | | | 2,101,397 | | | | | |
| | 70,536 | | | International Bancshares Corp. | | | 2,863,762 | | | | | |
| | 25,241 | | | Nelnet, Inc., Class A | | | 1,477,608 | | | | | |
| | 215,408 | | | Old National Bancorp | | | 3,920,426 | | | | | |
| | 25,240 | | | Prosperity Bancshares, Inc. | | | 1,660,287 | | | | | |
| | 155,496 | | | TCF Financial Corp. | | | 2,833,137 | | | | | |
| | 103,014 | | | Umpqua Holdings Corp. | | | 2,107,666 | | | | | |
| | 122,150 | | | Washington Federal, Inc. | | | 4,250,820 | | | | | |
| | 35,065 | | | WesBanco, Inc. | | | 1,416,626 | | | | | |
| | 48,916 | | | Wintrust Financial Corp. | | | 3,976,382 | | | | | |
| | | | | 47,507,352 | | | | | |
| | Health Care — 3.92% | | | | | | | | |
| | 11,349 | | | Almost Family, Inc. * | | | 502,193 | | | | | |
| | 16,983 | | | Charles River Laboratories International, Inc. * | | | 1,974,953 | | | | | |
| | 9,690 | | | Integra LifeSciences Holdings Corp. * | | | 453,298 | | | | | |
| | 63,717 | | | Owens & Minor, Inc. | | | 1,565,527 | | | | | |
| | 53,349 | | | Quality Systems, Inc. * | | | 750,620 | | | | | |
| | 122,133 | | | Select Medical Holdings Corp. * | | | 2,338,847 | | | | | |
| | | | | 7,585,438 | | | | | |
| | Industrials — 20.28% | | | | | | | | |
| | 69,890 | | | AAR Corp. | | | 2,718,022 | | | | | |
| | 63,349 | | | Aegion Corp. * | | | 1,475,398 | | | | | |
| | 136,026 | | | Aircastle Ltd. | | | 3,163,965 | | | | | |
| | 48,666 | | | Barnes Group, Inc. | | | 3,167,670 | | | | | |
| | 11,485 | | | Brink’s Co./The | | | 874,009 | | | | | |
| | 33,576 | | | Crane Co. | | | 2,790,837 | | | | | |
| | 33,678 | | | EMCOR Group, Inc. | | | 2,711,416 | | | | | |
| | 33,732 | | | EnerSys | | | 2,339,989 | | | | | |
| | 44,624 | | | Generac Holdings, Inc. * | | | 2,324,464 | | | | | |
| | 57,066 | | | Global Brass & Copper Holdings, Inc. | | | 1,997,310 | | | | | |
| | 50,575 | | | Hillenbrand, Inc. | | | 2,000,241 | | | | | |
| | 21,935 | | | Hyster-Yale Materials Handling, Inc., Class A | | | 1,721,678 | | | | | |
| | 49,339 | | | Korn/Ferry International | | | 2,063,850 | | | | | |
| | 25,971 | | | Matthews International Corp., Class A | | | 1,632,277 | | | | | |
See accompanying notes which are an integral part of these financial statements.
Annual Report
6
|
| Foundry Partners Fundamental Small Cap Value Fund |
Schedule of Investments (Continued)
October 31, 2017
| | | | | | | | | | | | |
| Shares | | | | | Fair Value | | | | |
| | Common Stocks — (continued) | | | | | | | | |
| | Industrials — (continued) | | | | | | | | |
| | 40,752 | | | Navigant Consulting, Inc. * | | $ | 705,417 | | | | | |
| | 14,861 | | | Park-Ohio Holdings Corp. | | | 700,696 | | | | | |
| | 31,161 | | | Regal-Beloit Corp. | | | 2,528,715 | | | | | |
| | 80,573 | | | Tutor Perini Corp. * | | | 2,272,159 | | | | | |
| | 18,268 | | | Universal Forest Products, Inc. | | | 2,062,457 | | | | | |
| | | | | 39,250,570 | | | | | |
| | Information Technology — 14.82% | | | | | | | | |
| | 57,926 | | | AVX Corp. | | | 1,091,326 | | | | | |
| | 29,499 | | | Belden, Inc. | | | 2,357,265 | | | | | |
| | 124,690 | | | Celestica, Inc. * | | | 1,253,134 | | | | | |
| | 29,524 | | | ChipMOS Technology, Inc. ADR | | | 590,480 | | | | | |
| | 45,923 | | | Convergys Corp. | | | 1,181,599 | | | | | |
| | 38,983 | | | CSG Systems International, Inc. | | | 1,650,540 | | | | | |
| | 37,613 | | | Itron, Inc. * | | | 2,939,456 | | | | | |
| | 57,029 | | | IXYS Corp. * | | | 1,408,616 | | | | | |
| | 65,025 | | | Kulicke & Soffa Industries, Inc. * | | | 1,472,816 | | | | | |
| | 13,763 | | | NETGEAR, Inc. * | | | 642,044 | | | | | |
| | 48,676 | | | Plantronics, Inc. | | | 2,207,943 | | | | | |
| | 97,051 | | | Sanmina Corp. * | | | 3,175,994 | | | | | |
| | 20,397 | | | ScanSource, Inc. * | | | 876,051 | | | | | |
| | 22,075 | | | Science Applications International Corp. | | | 1,618,980 | | | | | |
| | 24,034 | | | Sykes Enterprises, Inc. * | | | 695,544 | | | | | |
| | 23,037 | | | Tech Data Corp. * | | | 2,137,142 | | | | | |
| | 152,286 | | | Vishay Intertechnology, Inc. | | | 3,388,363 | | | | | |
| | | | | 28,687,293 | | | | | |
| | Materials — 8.26% | | | | | | | | |
| | 30,128 | | | A Schulman, Inc. | | | 1,184,030 | | | | | |
| | 36,910 | | | Cabot Corp. | | | 2,250,034 | | | | | |
| | 134,781 | | | Coeur Mining, Inc. * | | | 1,022,988 | | | | | |
| | 51,388 | | | Domtar Corp. | | | 2,431,680 | | | | | |
| | 43,425 | | | Kraton Corp. * | | | 2,129,128 | | | | | |
| | 59,606 | | | Mercer International, Inc. | | | 876,208 | | | | | |
| | 125,191 | | | Owens-Illinois, Inc. * | | | 2,990,813 | | | | | |
| | 91,083 | | | Pan American Silver Corp. | | | 1,487,385 | | | | | |
| | 20,346 | | | Stepan Co. | | | 1,624,832 | | | | | |
| | | | | 15,997,098 | | | | | |
| | | | | | | | | | | | |
| Shares | | | | | Fair Value | | | | |
| | Common Stocks — (continued) | | | | | | | | |
| | Real Estate — 7.43% | | | | | | | | |
| | 202,358 | | | Ashford Hospitality Trust, Inc. | | $ | 1,422,577 | | | | | |
| | 192,673 | | | Brandywine Realty Trust | | | 3,369,851 | | | | | |
| | 61,546 | | | GEO Group, Inc./The | | | 1,597,119 | | | | | |
| | 26,651 | | | Hospitality Properties Trust | | | 761,686 | | | | | |
| | 198,758 | | | Lexington Realty Trust | | | 2,011,431 | | | | | |
| | 95,991 | | | Mack-Cali Realty Corp. | | | 2,185,715 | | | | | |
| | 136,385 | | | Medical Properties Trust, Inc. | | | 1,804,374 | | | | | |
| | 50,722 | | | Select Income REIT | | | 1,225,444 | | | | | |
| | | | | 14,378,197 | | | | | |
| | Utilities — 3.47% | | | | | | | | |
| | 34,902 | | | ALLETE, Inc. | | | 2,734,572 | | | | | |
| | 18,921 | | | IDACORP, Inc. | | | 1,741,300 | | | | | |
| | 46,886 | | | Portland General Electric Co. | | | 2,238,338 | | | | | |
| | | | | 6,714,210 | | | | | |
| Total Common Stocks
(Cost $150,286,410) | | | 185,046,624 | | | | | |
| | Money Market Funds — 6.17% | | | | | | | | |
| | 11,932,254 | | | Federated Government Obligations Fund, Institutional Class, 0.92% (a) | | | 11,932,254 | | | | | |
| Total Money Market Funds
(Cost $11,932,254) | | | 11,932,254 | | | | | |
| Total Investments
(Cost $162,218,664) — 101.78% | | | 196,978,878 | | | | | |
| Liabilities in Excess of
Other Assets — (1.78)% | | | (3,436,046 | ) | | | | |
| | Net Assets — 100.00% | | $ | 193,542,832 | | | | | |
| (a) | Rate disclosed is the seven day effective yield as of October 31, 2017. |
| * | Non-income producing security. |
ADR — American Depositary Receipt
The sectors shown on the schedule investments are based on Global Industry Classification Standard, or GICS® (“GICS”). The GICS was developed by and/or is the exclusive property of MSCI, Inc. and Standard & Poor’s Financial Services LLC (“S&P”). GICS is a service mark of MSCI, Inc. and S&P and has been licensed for use by the Administrator.
See accompanying notes which are an integral part of these financial statements.
Annual Report
7
| | |
Foundry Partners Fundamental Small Cap Value Fund |
Statement of Assets and Liabilities
October 31, 2017
| | | | |
| Assets: | | | | |
Investments in securities, at cost | | $ | 162,218,664 | |
| | | | | |
Investments in securities, at fair value | | | 196,978,878 | |
Dividends receivable | | | 58,542 | |
Receivable for investments sold | | | 16,547 | |
Receivable for fund shares sold | | | 148,028 | |
Prepaid expenses | | | 14,636 | |
Total assets | | | 197,216,631 | |
| Liabilities: | | | | |
Payable for investments purchased | | | 3,244,720 | |
Payable for shares redeemed | | | 227,462 | |
Payable to Adviser | | | 139,704 | |
Payable to Administrator | | | 18,962 | |
Accrued 12b-1 fees | | | 8,900 | |
Other accrued expenses | | | 34,051 | |
Total liabilities | | | 3,673,799 | |
Net Assets | | $ | 193,542,832 | |
| | | | | |
| Net Assets consist of: | | | | |
Paid in capital | | $ | 152,969,785 | |
Accumulated undistributed net investment income | | | 280,258 | |
Accumulated undistributed net realized gain on investments | | | 5,532,575 | |
Net unrealized appreciation on investments | | | 34,760,214 | |
Net Assets | | $ | 193,542,832 | |
| | | | | |
| Investor Class: | | | | |
Net Assets | | $ | 41,785,781 | |
Shares outstanding | | | 1,718,217 | |
Net asset value, offering and redemption price per share | | $ | 24.32 | |
| | | | | |
| Institutional Class: | | | | |
Net Assets | | $ | 151,757,051 | |
Shares outstanding | | | 6,204,970 | |
Net asset value, offering and redemption price per share | | $ | 24.46 | |
| | | | | |
See accompanying notes which are an integral part of these financial statements.
Annual Report
8
| | |
Foundry Partners Fundamental Small Cap Value Fund |
Statement of Operations
Year Ended October 31, 2017
| | | | |
| Investment Income: | | | | |
Dividend income | | $ | 2,668,273 | |
Foreign dividend taxes withheld | | | (8,131 | ) |
Total investment income | | | 2,660,142 | |
| Expenses: | | | | |
Investment Adviser | | | 1,445,604 | |
Administration | | | 227,546 | |
Distribution (12b-1) Investor Class | | | 106,698 | |
Registration | | | 54,163 | |
Custodian | | | 31,256 | |
Printing | | | 30,894 | |
Audit and tax preparation | | | 19,565 | |
Legal | | | 18,783 | |
Trustee | | | 9,191 | |
Miscellaneous | | | 50,175 | |
Net operating expenses | | | 1,993,875 | |
Net investment income | | | 666,267 | |
| Realized & Change in Unrealized Gain on Investments | | | | |
Net realized gain on investment transactions | | | 5,897,086 | |
Change in unrealized appreciation on investments | | | 24,884,360 | |
Net realized and change in unrealized gain on investments | | | 30,781,446 | |
Net increase in net assets resulting from operations | | $ | 31,447,713 | |
| | | | | |
See accompanying notes which are an integral part of these financial statements.
Annual Report
9
| | |
Foundry Partners Fundamental Small Cap Value Fund |
Statements of Changes in Net Assets
| | | | | | | | |
| | | Year Ended
October 31,
2017 | | | Year Ended
October 31,
2016 | |
| Increase (Decrease) in Net Assets due to: | | | | | | | | |
| Operations: | | | | | | | | |
Net investment income | | $ | 666,267 | | | $ | 1,320,906 | |
Net realized gain on investment transactions | | | 5,897,086 | | | | 3,102,550 | |
Change in unrealized appreciation on investments | | | 24,884,360 | | | | 5,898,041 | |
Net increase in net assets resulting from operations | | | 31,447,713 | | | | 10,321,497 | |
| Distributions: | | | | | | | | |
Net investment income: | | | | | | | | |
Class A (a) | | | — | | | | (48,014 | ) |
Investor Class (b) | | | (239,835 | ) | | | (718,238 | ) |
Institutional Class | | | (848,537 | ) | | | (1,145,978 | ) |
Realized gains: | | | | | | | | |
Class A (a) | | | — | | | | (384,616 | ) |
Investor Class (b) | | | (870,786 | ) | | | (5,875,018 | ) |
Institutional Class | | | (2,123,643 | ) | | | (7,745,108 | ) |
Total distributions | | | (4,082,801 | ) | | | (15,916,972 | ) |
| Capital Transactions—Class A: (a) | | | | | | | | |
Proceeds from shares sold | | | — | | | | 1,430,843 | |
Reinvestment of distributions | | | — | | | | 423,710 | |
Shares redeemed in connection with class consolidation | | | — | | | | (2,502,231 | ) |
Amount paid for shares redeemed | | | — | | | | (2,603,135 | ) |
Total Capital Transactions—Class A | | | — | | | | (3,250,813 | ) |
| Capital Transactions—Investor Class: (b) | | | | | | | | |
Proceeds from shares sold | | | 7,499,554 | | | | 5,660,241 | |
Shares issued in connection with class consolidation | | | — | | | | 2,502,231 | |
Reinvestment of distributions | | | 1,094,341 | | | | 6,521,846 | |
Amount paid for shares redeemed | | | (12,676,422 | ) | | | (30,670,094 | ) |
Proceeds from redemption fees (c) | | | — | | | | 1,838 | |
Total Capital Transactions—Investor Class | | | (4,082,527 | ) | | | (15,983,938 | ) |
| Capital Transactions—Institutional Class: | | | | | | | | |
Proceeds from shares sold | | | 54,010,989 | | | | 28,241,114 | |
Reinvestment of distributions | | | 2,800,611 | | | | 8,579,713 | |
Amount paid for shares redeemed | | | (23,401,744 | ) | | | (25,850,060 | ) |
Total Capital Transactions—Institutional Class | | | 33,409,856 | | | | 10,970,767 | |
Net change resulting from capital transactions | | | 29,327,329 | | | | (8,263,984 | ) |
Total Increase (Decrease) in Net Assets | | | 56,692,241 | | | | (13,859,459 | ) |
| Net Assets: | | | | | | | | |
Beginning of year | | | 136,850,591 | | | | 150,710,050 | |
End of year | | $ | 193,542,832 | | | $ | 136,850,591 | |
| | | | | | | | | |
Accumulated undistributed net investment income included in net assets at end of year | | $ | 280,258 | | | $ | 612,474 | |
See accompanying notes which are an integral part of these financial statements.
Annual Report
10
| | | | | | | | |
| | | Year Ended
October 31,
2017 | | | Year Ended
October 31,
2016 | |
| Share Transactions—Class A: (a) | | | | | | | | |
Shares sold | | | — | | | | 77,514 | |
Shares issued in reinvestment of distributions | | | — | | | | 23,141 | |
Shares redeemed in connection with class consolidation | | | — | | | | (121,309 | ) |
Shares redeemed | | | — | | | | (145,598 | ) |
Total Share Transactions—Class A | | | — | | | | (166,252 | ) |
| Share Transactions—Investor Class: (b) | | | | | | | | |
Shares sold | | | 325,986 | | | | 298,860 | |
Shares issued in connection with class consolidation | | | — | | | | 120,985 | |
Shares issued in reinvestment of distributions | | | 47,292 | | | | 355,220 | |
Shares redeemed | | | (551,826 | ) | | | (1,686,897 | ) |
Total Share Transactions—Investor Class | | | (178,548 | ) | | | (911,832 | ) |
| Share Transactions—Institutional Class: | | | | | | | | |
Shares sold | | | 2,339,947 | | | | 1,537,354 | |
Shares issued in reinvestment of distributions | | | 120,612 | | | | 465,783 | |
Shares redeemed | | | (1,011,806 | ) | | | (1,290,602 | ) |
Total Share Transactions—Institutional Class | | | 1,448,753 | | | | 712,535 | |
| (a) | Effective August 29, 2016, Class A was consolidated into Investor Class. |
| (b) | Retail Class was renamed Investor Class on August 29, 2016. |
| (c) | Prior to August 30, 2016, a redemption fee of 1.00% was charged on shares held less than 60 days. |
See accompanying notes which are an integral part of these financial statements.
Annual Report
11
| | |
Foundry Partners Fundamental Small Cap Value Fund |
Financial Highlights
(For a share outstanding throughout each year ended October 31)
| | | | | | | | | | | | | | | | | | | | | | | | | | | | |
| | | Net Asset
Value,
beginning
of year | | | Net
investment
income (loss) | | | Net realized
and unrealized
gain (loss) on
investments | | | Total from
investment
operations | | | Distributions
from net
investment
income | | | Distributions
from net
realized gain
on investment
transactions | | | Total
distributions | |
| Investor Class | |
| 2013 | | $ | 17.86 | | | | 0.17 | | | | 6.08 | | | | 6.25 | | | | (0.08 | ) | | | (0.16 | ) | | | (0.24 | ) |
| 2014 | | $ | 23.87 | | | | 0.15 | | | | 2.13 | | | | 2.28 | | | | (0.16 | ) | | | (2.36 | ) | | | (2.52 | ) |
| 2015 | | $ | 23.63 | | | | 0.19 | | | | (0.11 | ) | | | 0.08 | | | | (0.18 | ) | | | (2.12 | ) | | | (2.30 | ) |
| 2016 | | $ | 21.41 | | | | 0.16 | | | | 1.32 | | | | 1.48 | | | | (0.26 | ) | | | (2.14 | ) | | | (2.40 | ) |
| 2017 | | $ | 20.49 | | | | 0.05 | | | | 4.37 | | | | 4.42 | | | | (0.13 | ) | | | (0.46 | ) | | | (0.59 | ) |
| Institutional Class | |
| 2013 | | $ | 17.92 | | | | 0.20 | | | | 6.10 | | | | 6.30 | | | | (0.08 | ) | | | (0.16 | ) | | | (0.24 | ) |
| 2014 | | $ | 23.98 | | | | 0.20 | (e) | | | 2.14 | | | | 2.34 | | | | (0.22 | ) | | | (2.36 | ) | | | (2.58 | ) |
| 2015 | | $ | 23.74 | | | | 0.26 | | | | (0.12 | ) | | | 0.14 | | | | (0.24 | ) | | | (2.12 | ) | | | (2.36 | ) |
| 2016 | | $ | 21.52 | | | | 0.25 | | | | 1.29 | | | | 1.54 | | | | (0.32 | ) | | | (2.14 | ) | | | (2.46 | ) |
| 2017 | | $ | 20.60 | | | | 0.11 | | | | 4.39 | | | | 4.50 | | | | (0.18 | ) | | | (0.46 | ) | | | (0.64 | ) |
| (a) | Total return represents the rate the investor would have earned or lost on an investment in the Fund, assuming reinvestment of dividends, and excludes any sales charge and redemptions that were changed by the Fund prior to August 30, 2016. |
| (b) | Portfolio turnover is calculated on the basis of the Fund as a whole without distinguishing among the classes of shares. |
| (c) | Amount is less than $0.005. |
| (d) | The expense ratios shown include overdraft fees charged to the Fund. Without these overdraft fees, the expense ratios would be 1.25% for Investor Class and 1.00% for Institutional Class. |
| (e) | Per share amount has been calculated using the average shares method. |
See accompanying notes which are an integral part of these financial statements.
Annual Report
12
| | | | | | | | | | | | | | | | | | | | | | | | | | | | | | |
Paid in
capital from
redemption
fees | | | Net Asset
Value, end
of year | | | Total
return(a) | | | Net Assets,
end of
year
(000 omitted) | | | Ratio of net
expenses
to average
net assets | | | Ratio of expenses
(prior to
reimbursements)
to average
net assets | | | Ratio of net
investment
income (loss)
to average
net assets | | | Portfolio
turnover
rate(b) | |
| | | | | | | | | | | | | | | | | | | | | | | | | | | | | | |
| | — | (c) | | $ | 23.87 | | | | 35.38 | % | | $ | 63,976 | | | | 1.26 | %(d) | | | 1.53 | % | | | 0.72 | % | | | 28.28 | % |
| | — | (c) | | $ | 23.63 | | | | 9.89 | % | | $ | 64,020 | | | | 1.25 | % | | | 1.37 | % | | | 0.63 | % | | | 36.66 | % |
| | — | (c) | | $ | 21.41 | | | | 0.21 | % | | $ | 60,134 | | | | 1.37 | % | | | 1.41 | % | | | 0.87 | % | | | 43.59 | % |
| | — | (c) | | $ | 20.49 | | | | 8.23 | % | | $ | 38,864 | | | | 1.43 | % | | | 1.43 | % | | | 0.84 | % | | | 12.85 | % |
| | — | | | $ | 24.32 | | | | 21.68 | % | | $ | 41,786 | | | | 1.36 | % | | | 1.36 | % | | | 0.22 | % | | | 28.16 | % |
| | | | | | | | | | | | | | | | | | | | | | | | | | | | | | |
| | — | | | $ | 23.98 | | | | 35.55 | % | | $ | 14,689 | | | | 1.01 | %(d) | | | 1.27 | % | | | 0.95 | % | | | 28.28 | % |
| | — | | | $ | 23.74 | | | | 10.12 | % | | $ | 82,086 | | | | 1.00 | % | | | 1.12 | % | | | 0.85 | % | | | 36.66 | % |
| | — | | | $ | 21.52 | | | | 0.46 | % | | $ | 87,023 | | | | 1.12 | % | | | 1.16 | % | | | 1.12 | % | | | 43.59 | % |
| | — | | | $ | 20.60 | | | | 8.50 | % | | $ | 97,987 | | | | 1.18 | % | | | 1.18 | % | | | 1.05 | % | | | 12.85 | % |
| | — | | | $ | 24.46 | | | | 22.01 | % | | $ | 151,757 | | | | 1.11 | % | | | 1.11 | % | | | 0.45 | % | | | 28.16 | % |
See accompanying notes which are an integral part of these financial statements.
Annual Report
13
| | |
| Foundry Partners Fundamental Small Cap Value Fund |
Notes to the Financial Statements
October 31, 2017
Note 1. Organization
The Foundry Partners Fundamental Small Cap Value Fund (the “Fund”) is an open-end diversified series of Valued Advisers Trust (the “Trust”). The Trust is a management investment company established under the laws of Delaware by an Agreement and Declaration of Trust dated June 13, 2008 (the “Trust Agreement”). The Trust Agreement permits the Board of Trustees (the “Board”) to issue an unlimited number of shares of beneficial interest of separate series without par value. The Fund is one of a series of funds authorized by the Board. The Fund’s investment adviser is Foundry Partners, LLC (the “Adviser”). The investment objective of the Fund is long-term capital appreciation.
The Fund currently offers Investor Class shares (Retail Class was renamed Investor Class on August 29, 2016) and Institutional Class shares. Effective on the close of business on August 29, 2016, Class A shares were converted into Investor Class shares.
Note 2. Significant Accounting Policies
The Fund is an investment company and follows accounting and reporting guidance under Financial Accounting Standards Board Accounting Standards Codification Topic 946, “Financial Services-Investment Companies”. The following is a summary of significant accounting policies followed by the Fund in the preparation of its financial statements. These policies are in conformity with generally accepted accounting principles in the United States of America (“GAAP”).
Estimates—The preparation of financial statements in conformity with GAAP requires management to make estimates and assumptions that affect the reported amounts of assets and liabilities and disclosure of contingent assets and liabilities at the date of the financial statements and the reported amounts of increases and decreases in net assets from operations during the reporting period. Actual results could differ from those estimates.
Securities Valuation—All investments in securities are recorded at their estimated fair value as described in Note 3.
Federal Income Taxes—The Fund makes no provision for federal income or excise tax. The Fund has qualified and intends to qualify each year as a regulated investment company (“RIC”) under subchapter M of the Internal Revenue Code of 1986, as amended, by complying with the requirements applicable to RICs and by distributing substantially all of its taxable income. The Fund also intends to distribute sufficient net investment income and net capital gains, if any, so that it will not be subject to excise tax on undistributed income and gains. If the required amount of net investment income or gains is not distributed, the Fund could incur a tax expense.
As of and during the fiscal year ended October 31, 2017, the Fund did not have a liability for any unrecognized tax benefits. The Fund recognizes interest and penalties, if any, related to unrecognized tax benefits as income tax expense in the statement of operations as incurred. During the fiscal year ended October 31, 2017 the Fund did not incur any interest or penalties.
Annual Report
14
Expenses—Expenses incurred by the Trust that do not relate to a specific fund of the Trust are allocated to the individual funds based on each fund’s relative net assets or other appropriate basis (as determined by the Board). Expenses attributable to any class are borne by that class. Income, realized gains and losses, unrealized appreciation and depreciation, and expenses are allocated to each class based on the net assets in relation to the relative net assets of the Fund.
Security Transactions and Related Income—The Fund follows industry practice and records security transactions on the trade date for financial reporting purposes. For financial statement and income tax purposes, the specific identification method is used for determining gains or losses. Dividend income is recorded on the ex-dividend date and interest income is recorded on an accrual basis. Discounts and premiums on securities purchased are accreted or amortized using the effective interest method, if applicable. Withholding taxes on foreign dividends have been provided for in accordance with the Fund’s understanding of the applicable country’s tax rules and rates.
The Fund holds Real Estate Investment Trusts (“REITs”) which pay dividends to their shareholders based upon available funds from operations. It is possible for these dividends to exceed the REIT’s underlying taxable earnings and profits resulting in the excess portion of such dividends being designated as a return of capital. Distributions received from REITs that represent a return of capital or capital gains are recorded as a reduction of the cost of the REITs or as a realized gain, respectively.
Dividends and Distributions—Distributions to shareholders, which are determined in accordance with income tax regulations, are recorded on the ex-dividend date. The Fund intends to distribute substantially all of its net investment income on at least an annual basis. The Fund intends to distribute its net realized long-term capital gains and its net realized short-term capital gains, if any, at least once a year. The treatment for financial reporting purposes of distributions made to shareholders during the year from net investment income or net realized capital gains may differ from their ultimate treatment for federal income tax purposes. These differences are caused primarily by differences in the timing of the recognition of certain components of income, expense or realized capital gain for federal income tax purposes. Where such differences are permanent in nature, they are reclassified in the components of the net assets based on their ultimate characterization for federal income tax purposes. Any such reclassifications will have no effect on net assets, results of operations or net asset values per share of the Fund.
For the fiscal year ended October 31, 2017, the Fund made the following reclassifications to increase/(decrease) the components of net assets:
| | | | | | | | |
Paid-in
Capital | | Accumulated
Undistributed Net
Investment Income | | | Accumulated Net
Realized Gain on
Investments | |
$ — | | $ | 89,889 | | | $ | (89,889 | ) |
These differences are primarily due to differing treatments for dividend distributions.
Annual Report
15
| | |
| Foundry Partners Fundamental Small Cap Value Fund |
Notes to the Financial Statements
October 31, 2017
Note 3. Securities Valuation And Fair Value Measurements
Fair value is defined as the price that the Fund would receive upon selling an investment in a timely transaction to an independent buyer in the principal or most advantageous market of the investment. GAAP establishes a three-tier hierarchy to maximize the use of observable market data and minimize the use of unobservable inputs and establish classification of fair value measurements for disclosure purposes.
Inputs refer broadly to the assumptions that market participants would use in pricing the asset or liability, including assumptions about risk (the risk inherent in a particular valuation technique used to measure fair value including such a pricing model and/or the risk inherent in the inputs to the valuation technique). Inputs may be observable or unobservable. Observable inputs are inputs that reflect the assumptions market participants would use in pricing the asset or liability developed based on market data obtained from sources independent of the reporting entity. Unobservable inputs are inputs that reflect the reporting entity’s own assumptions about the assumptions market participants would use in pricing the asset or liability developed based on the best information available in the circumstances.
Various inputs are used in determining the value of the Fund’s investments. These inputs are summarized in the three broad levels listed below.
| • | | Level 1—unadjusted quoted prices in active markets for identical investments and/or registered investment companies where the value per share is determined and published and is the basis for current transactions for identical assets or liabilities at the valuation date. |
| • | | Level 2—other significant observable inputs (including, but not limited to, quoted prices for an identical security in an inactive market, quoted prices for similar securities, interest rates, prepayment speeds, credit risk, etc.). |
| • | | Level 3—significant unobservable inputs (including the Fund’s own assumptions in determining fair value of investments based on the best information available). |
The inputs used to measure fair value may fall into different levels of the fair value hierarchy. In such cases, for disclosure purposes, the level in the fair value hierarchy which is reported is determined based on the lowest level input that is significant to the fair value measurement in its entirety.
Equity securities that are traded on any stock exchange are generally valued at the last quoted sale price on the security’s primary exchange. Lacking a last sale price, an exchange traded security is generally valued at its last bid price. Securities traded in the NASDAQ over-the counter market are generally valued at the NASDAQ Official Closing Price. When using the market quotations and when the market is considered active, the security is classified as a Level 1 security. In the event that market quotations are not readily available or are considered unreliable due to market or other events, the Fund values its securities and other assets at fair
Annual Report
16
value in accordance with policies established by and under the general supervision of the Board. Under these policies, the securities will be classified as Level 2 or 3 within the fair value hierarchy, depending on the inputs used.
Investments in mutual funds, including money market mutual funds, are generally priced at the ending net asset value (“NAV”). These securities are categorized as Level 1 securities.
In accordance with the Trust’s valuation policies, the Adviser is required to consider all appropriate factors relevant to the value of securities for which it has determined other pricing sources are not available or reliable as described above. No single method exists for determining fair value, because fair value depends upon the circumstances of each individual case. As a general principle, the current fair value of a security being valued by the Adviser would be the amount that the Fund might reasonably expect to receive upon the current sale. Methods that are in accordance with this principle may, example, be based on (i) a multiple of earnings; (ii) a discount from market of a similar freely traded security (including a derivative security or a basket of securities traded on other markets, exchanges or among dealers); or (iii) yield to maturity with respect to debt issues, or a combination of these and other methods. Fair-value pricing is permitted if, in the Adviser’s opinion, the validity of market quotations appears to be questionable based on factors such as evidence of a thin market in the security based on a small number of quotations, a significant event occurs after the close of a market but before a Fund’s NAV calculation that may affect a security’s value, or the Adviser is aware of any other data that calls into question the reliability of market quotations.
The following is a summary of the inputs used to value the Fund’s investments as of October 31, 2017:
| | | | | | | | | | | | | | | | |
| | | Valuation Inputs | | | | |
| Assets | | Level 1 | | | Level 2 | | | Level 3 | | | Total | |
Common Stocks * | | $ | 185,046,624 | | | $ | — | | | $ | — | | | $ | 185,046,624 | |
Money Market Funds | | | 11,932,254 | | | | — | | | | — | | | | 11,932,254 | |
| | | | | | | | | | | | | | | | |
Total | | $ | 196,978,878 | | | $ | — | | | $ | — | | | $ | 196,978,878 | |
| * | Refer to Schedule of Investments for sector classifications. |
The Fund did not hold any investments at the end of the reporting period for which other significant observable inputs (Level 2) were used in determining fair value. The Fund did not hold any investments during the reporting period for which significant unobservable inputs (Level 3) were used in determining fair value; therefore, no reconciliation of Level 3 securities is included for this reporting period. The Fund did not hold any derivative instruments during the reporting period.
Annual Report
17
| | |
| Foundry Partners Fundamental Small Cap Value Fund |
Notes to the Financial Statements
October 31, 2017
The Trust recognizes transfers between fair value hierarchy levels at the end of the reporting period. Transfers from Level 2 to Level 1 represent securities which were valued using observable inputs of a similar asset at the beginning of the period but not at October 31, 2017. The following is a summary of the transfer between Level 1 and Level 2 of the fair value hierarchy as of October 31, 2017 based on input levels assigned at October 31, 2016:
| | | | |
| | | Transfers from
Level 2 to Level 1 | |
Common Stocks | | $ | 590,480 | |
Note 4. Fees And Other Transactions With Affiliates And Other Service Providers
Under the terms of the management agreement between the Trust and the Adviser for the Fund, the Adviser manages the Fund’s investments subject to oversight of the Board. As compensation for its management services, the Fund is obligated to pay the Adviser a fee computed and accrued daily and paid monthly at an annual rate of 0.85% of the average daily net assets of the Fund. For the fiscal year ended October 31, 2017, the Adviser earned a fee of $1,445,604 from the Fund. At October 31, 2017, the Fund owed the Adviser $139,704.
The Adviser has contractually agreed to waive its management fee and/or reimburse certain operating expenses, but only to the extent necessary so that the Fund’s net expenses, excluding brokerage fees and commissions, borrowing costs (such as interest expense and dividends on securities sold short), taxes, distribution and service (12b-1) fees, extraordinary expenses, and any indirect expenses (such as fees and expenses of acquired funds), do not exceed an annual rate of 1.25% of the average daily net assets of the Fund.
Each fee waiver or expense reimbursement by the Adviser is subject to repayment by the Fund within the three fiscal years following the date in which the fee waiver or expense reimbursement occurred, provided that the Fund is able to make the repayment without exceeding the expense limitation that is in effect at the time of the repayment or at the time of the fee waiver or expense reimbursement. As of October 31, 2017, the Adviser has made no previous waivers that may be recouped. The contractual agreement is in effect through February 28, 2018. The expense cap may not be terminated prior to this date except by the Board. For the fiscal year ended October 31, 2017, the Adviser did not waive any fees from the Fund.
The Trust retains Ultimus Asset Services, LLC (the “Administrator”), to provide the Fund with administration and compliance, fund accounting and transfer agent services, including all regulatory reporting. For the fiscal year ended October 31, 2017, the Administrator earned fees of $227,546 for administrative services. At October 31, 2017, the Administrator was owed $18,962 for administrative services.
Annual Report
18
The officers and one trustee of the Trust are members of management and/or employees of the Administrator. Unified Financial Securities, LLC (the “Distributor” or “Unified”) acts as the principal distributor of the Fund’s shares.
The Fund has adopted a Distribution Plan (the “Plan”) pursuant to Rule 12b-1 under the Investment Company Act of 1940 as amended (the “1940 Act”). The Plan provides that the Fund will pay the Distributor or any registered securities dealer, financial institution or any other person (a “Recipient”) a fee aggregating at a rate of 0.25% of the average daily net assets of the Investor Class shares in connection with the promotion and distribution of the Fund’s shares or the provision of personal services to shareholders, including, but not necessarily limited to, advertising, compensation to underwriters, dealers and selling personnel; the printing and mailing of prospectuses to other than current Fund shareholders; the printing and mailing of sales literature; and servicing shareholder accounts. The Fund or the Adviser may pay all or a portion of these fees to any Recipient who renders assistance in distributing or promoting the sale of shares, or who provides certain shareholder services, pursuant to a written agreement. The Plan is a compensation plan, which means that compensation is paid regardless of 12b-1 expenses actually incurred. It is anticipated that the Plan will benefit shareholders because an effective sales program typically is necessary in order for the Fund to reach and maintain a sufficient size to achieve efficiently its investment objectives and to realize economies of scale. For the fiscal year ended October 31, 2017, Investor Class shares 12b-1 expense incurred by the Fund was $106,698. The Fund owed $8,900 for Investor Class shares 12b-1 fees as of October 31, 2017.
Note 5. Purchases And Sales Of Securities
For the fiscal year ended October 31, 2017, purchases and sales of investment securities, other than short-term investments were as follows:
| | | | |
| | | Amount | |
Purchases | | | | |
U.S. Government Obligations | | $ | — | |
Other | | | 69,412,156 | |
Sales | | | | |
U.S. Government Obligations | | $ | — | |
Other | | | 45,177,057 | |
Note 6. Beneficial Ownership
The beneficial ownership, either directly or indirectly, of more than 25% of the voting securities of a fund creates a presumption of control of the fund, under Section 2(a) (9) of the 1940 Act. At October 31, 2017, Charles Schwab & Co. (“Schwab”) owned, as record shareholder for the beneficial owners of such shares, 71% of the outstanding shares of the Fund.
Annual Report
19
| | |
| Foundry Partners Fundamental Small Cap Value Fund |
Notes to the Financial Statements
October 31, 2017
Note 7. Federal Income Taxes
At October 31, 2017, the net unrealized appreciation (depreciation) of investments for tax purposes was as follows:
| | | | |
Gross Unrealized Appreciation | | $ | 37,954,687 | |
Gross Unrealized Depreciation | | | (3,739,167 | ) |
Net Unrealized Appreciation on Investments | | $ | 34,215,520 | |
At October 31, 2017, the aggregate cost of securities for federal income tax purposes was $162,763,358.
At October 31, 2017, the difference between book basis and tax basis unrealized appreciation (depreciation) is attributable to the tax deferral of losses on wash sales and partnership basis adjustments.
On December 26, 2017, the Fund paid an income distribution of $0.081757 and $0.143778 for Investor Class and Institutional Class, respectively. The Fund also paid long-term capital gain distribution of $0.725742 per share to shareholders of record.
At October 31, 2017, the Fund’s most recent fiscal year end, the components of distributable earnings (accumulated losses) on a tax basis were as follows:
| | | | | | | | | | | | | | |
Undistributed
Ordinary Income | | | Undistributed
Long-Term
Capital Gains | | | Unrealized
Appreciation/
(Depreciation) | | | Total
Accumulated
Earnings/
(Defecit) | |
| $ | 599,530 | | | $ | 5,757,997 | | | $ | 34,215,520 | | | $ | 40,573,047 | |
The tax character of distributions paid from the Fund for the fiscal year ended October 31, 2017 was as follows:
| | | | | | | | | | | | | | | | | | |
| Distributions Paid From* | | | | | | | | | | |
Ordinary
Income | | | Net
Long-Term
Capital Gains | | | Total
Taxable
Distributions | | | Tax Return
of Capital | | | Total
Distributions
Paid | |
| $ | 1,283,296 | | | $ | 2,799,505 | | | $ | 4,082,801 | | | $ | — | | | $ | 4,082,801 | |
Annual Report
20
The tax character of distributions paid from the Fund for the fiscal year ended October 31, 2016 was as follows:
| | | | | | | | | | | | | | | | | | |
| Distributions Paid From* | | | | | | | | | | |
Ordinary
Income | | | Net
Long-Term
Capital Gains | | | Total
Taxable
Distributions | | | Tax Return
of Capital | | | Total
Distributions
Paid | |
| $ | 1,884,915 | | | $ | 14,032,057 | | | $ | 15,916,972 | | | $ | — | | | $ | 15,916,972 | |
| * | The tax character of distributions paid may differ from the character of distributions shown on the statements of changes in net assets due to short-term capital gains being treated as ordinary income and reclassification of distributions for tax purposes. |
Note 8. Commitments And Contingencies
The Fund indemnifies its officers and trustees for certain liabilities that may arise from performance of their duties to the Fund. Additionally, in the normal course of business, the Fund enters into contracts that contain a variety of representations and warranties which provide general indemnifications. The Fund’s maximum exposure under these arrangements is unknown, as this would involve future claims that may be made against the Fund that have not yet occurred.
Note 9. Subsequent Events
Management of the Fund has evaluated the need for disclosures and/or adjustments resulting from subsequent events through the date these financial statements were issued. Based upon this evaluation, management has determined there were no items requiring adjustment of the financial statements or additional disclosure.
Annual Report
21
| | |
| Report of Independent Registered Public Accounting Firm |
To the Shareholders of Foundry Partners Fundamental Small Cap Value Fund and
Board of Trustees of Valued Advisers Trust
We have audited the accompanying statement of assets and liabilities, including the schedule of investments, of Foundry Partners Fundamental Small Cap Value Fund (the “Fund”), a series of Valued Advisers Trust, as of October 31, 2017, and the related statement of operations for the year then ended, the statements of changes in net assets for each of the two years in the period then ended, and the financial highlights for each of the five years in the period then ended. These financial statements and financial highlights are the responsibility of the Fund’s management. Our responsibility is to express an opinion on these financial statements and financial highlights based on our audits.
We conducted our audits in accordance with the standards of the Public Company Accounting Oversight Board (United States). Those standards require that we plan and perform the audit to obtain reasonable assurance about whether the financial statements and financial highlights are free of material misstatement. An audit includes examining, on a test basis, evidence supporting the amounts and disclosures in the financial statements. Our procedures included confirmation of securities owned as of October 31, 2017, by correspondence with the custodian and brokers. An audit also includes assessing the accounting principles used and significant estimates made by management, as well as evaluating the overall financial statement presentation. We believe that our audits provide a reasonable basis for our opinion.
In our opinion, the financial statements and financial highlights referred to above present fairly, in all material respects, the financial position of Foundry Partners Fundamental Small Cap Value Fund as of October 31, 2017, the results of its operations for the year then ended, the changes in its net assets for each of the two years in the period then ended, and the financial highlights for each of the five years in the period then ended, in conformity with accounting principles generally accepted in the United States of America.
COHEN & COMPANY, LTD.
Cleveland, Ohio
December 27, 2017
Annual Report
22
Summary of Fund Expenses (Unaudited)
As a shareholder of the Fund, you incur two types of costs: (1) transaction and (2) ongoing costs, including management fees, distribution and service (12b-1) fees and other Fund expenses. These Examples are intended to help you understand your ongoing costs (in dollars) of investing in the Fund and to compare these costs with the ongoing costs of investing in other mutual funds.
The Example is based on an investment of $1,000 invested at the beginning of the period and held for the entire period from May 1, 2017 through October 31, 2017.
Actual Expenses
The first line of the table for each class provides information about actual account values and actual expenses. You may use the information on these lines, together with the amount you invested, to estimate the expenses that you paid over the period. Simply divide your account value by $1,000 (for example, an $8,600 account value divided by $1,000 = 8.60), then multiply the result by the number in the first line under the heading entitled “Expenses Paid During the Period” to estimate the expenses you paid on your account during this period.
Hypothetical Example for Comparison Purposes
The second line of the table for each class provides information about hypothetical account values and hypothetical expenses based on the Fund’s actual expense ratios and an assumed rate of return of 5% per year before expenses, which is not the Fund’s actual return. The hypothetical account values and expenses may not be used to estimate the actual ending account balances or expenses you paid for the period. You may use this information to compare the ongoing costs of investing in the Fund and other funds. To do so, compare this 5% hypothetical example with the 5% hypothetical examples that appear in the shareholder reports of the other funds.
Expenses shown in the table are meant to highlight your ongoing costs only and do not reflect any transactional costs. Therefore, the second line of the table for each class is useful in comparing ongoing costs only, and will not help you determine the relative total costs of owning different funds. In addition, if these transaction costs were included, your costs would have been higher.
| | | | | | | | | | | | | | | | | | | | |
| | | | | | Beginning
Account
Value,
May 1, 2017 | | | Ending
Account Value,
October 31, 2017 | | | Expenses
Paid
During the
Period (a) | | | Annualized
Expense
Ratio | |
|
Foundry Partners Fundamental Small Cap Value Fund | |
Investor Class | | | Actual | | | $ | 1,000.00 | | | $ | 1,043.80 | | | $ | 6.90 | | | | 1.34 | % |
| | | | Hypothetical | (b) | | $ | 1,000.00 | | | $ | 1,018.45 | | | $ | 6.82 | | | | 1.34 | % |
Institutional Class | | | Actual | | | $ | 1,000.00 | | | $ | 1,045.30 | | | $ | 5.64 | | | | 1.09 | % |
| | | | Hypothetical (b) | | | $ | 1,000.00 | | | $ | 1,019.69 | | | $ | 5.57 | | | | 1.09 | % |
| (a) | Expenses are equal to the Fund’s annualized expense ratios, multiplied by the average account value over the period, multiplied by 184/365 (to reflect the one-half year period). |
| (b) | Hypothetical assumes 5% annual return before expenses. |
Annual Report
23
Additional Federal Income Tax Information (Unaudited)
The Form 1099-DIV you receive in January 2018 will show the tax status of all distributions paid to your account in calendar year 2017. Shareholders are advised to consult their own tax adviser with respect to the tax consequences of their investment in the Fund. As required by the Internal Revenue Code and/or regulations, shareholders must be notified regarding the status of qualified dividend income for individuals and the dividends received deduction for corporations.
Qualified Dividend Income. The Fund designates approximately 100% or up to the maximum amount of such dividends allowable pursuant to the Internal Revenue Code, as qualified dividend income eligible for the reduced tax rate of 15%.
Dividends Received Deduction. Corporate shareholders are generally entitled to take the dividends received deduction on the portion of the Fund’s dividend distribution that qualifies under tax law. For the Fund’s calendar year 2017 ordinary income dividends, 100% qualifies for the corporate dividends received deduction.
For the year ended October 31, 2017, the Fund designated $2,799,506 as 20% long-term capital gain distributions.
Annual Report
24
Trustees and Officers (Unaudited)
The Board of Trustees supervises the business activities of the Trust. Each Trustee serves as a trustee until termination of the Trust unless the Trustee dies, resigns, retires or is removed.
The following table provides information regarding each of the independent trustees.
| | | | |
Name, Address*, Age,
Position with Trust**,
Term of Position with Trust | | Principal Occupation During Past 5 Years
and Other Directorships | | Other Directorships |
Andrea N. Mullins, 50 Independent Trustee Since December 2013 Chairperson since March 2017 | | Current: Private investor; Independent Contractor, SWM Wealth Management, LLC (since April 2014). | | None. |
Ira Cohen, 58 Independent Trustee Since June 2010 | | Current: Independent financial services consultant (since February 2005); Executive Vice President of Asset Management Services, Recognos Financial (since August 2015). | | Trustee, Griffin Institutional Access Credit Fund (since January 2017); Trustee and Audit Committee Chairman, Griffin Institutional Real Estate Access Fund (since May 2014); Trustee, Chairman, and Nominating and Governance Committee Chairman, Angel Oak Strategic Credit Fund (since December 2017); Trustee, Angel Oak Funds Trust (since October 2014); Chairman (since April 2017). |
| * | The address for each trustee and officer is 225 Pictoria Drive, Suite 450, Cincinnati, Ohio 45246. |
| ** | As of the date of this report, the Trust consists of 13 series. |
Annual Report
25
Trustees and Officers (Unaudited) (Continued)
The following table provides information regarding the Trustee who is considered an “interested person” of the Trust, as that term is defined under the 1940 Act. Based on the experience of the Trustee, the Trust concluded that the individual described below should serve as a Trustee.
| | | | |
Name, Address*, Age,
Position with Trust**,
Term of Position with Trust | | Principal Occupation During Past 5 Years | | Other Directorships |
Mark J. Seger, 55 Trustee Since March 2017 | | Current: President, Managing Director, and Co-Founder, Ultimus Fund Solutions, LLC (since 1999); Treasurer and Managing Director, Ultimus Fund Distributors, LLC (since 1999); President and Managing Director, Ultimus Asset Services, LLC (since 2016). | | None. |
| * | The address for each trustee and officer is 225 Pictoria Drive, Suite 450, Cincinnati, Ohio 45246. |
| ** | As of the date of this report, the Trust consists of 13 series. |
The following table provides information regarding the officers of the Trust:
| | | | |
Name, Address*, Age,
Position with Trust,**
Term of Position with Trust | | Principal Occupation During Past 5 Years | | Other Directorships |
Bo J. Howell, 36 Principal Executive Officer and President Since March 2017 | | Current: Vice President, Director of Fund Administration, Ultimus Fund Solutions, LLC (since 2014). Previous: Counsel, Securities and Mutual Funds, Western & Southern Financial Group (2012 – 2014). | | None. |
Brandon R. Kipp, 34 Chief Compliance Officer Since October 2017 | | Current: Senior Fund Compliance Officer, Ultimus Fund Solutions, LLC (since July 2017). Previous: Assistant Vice President and Compliance Manager, UMB Fund Services, Inc. (March 2014 to July 2017); Officer and Lead Fund Administrator, UMB Fund Services, Inc. (May 2012 to March 2014). | | None. |
Carol J. Highsmith, 53 Vice President Since August 2008 Secretary Since March 2014 | | Current: Assistant Vice President, Ultimus Fund Solutions, LLC (since December 2015). Previous: Employed in various positions with Huntington Asset Services, Inc. (n/k/a Ultimus Asset Services, LLC) (November 1994 to December 2015), most recently Vice President of Legal Administration (2005 to December 2015). | | None. |
Annual Report
26
| | | | |
Name, Address*, Age,
Position with Trust,**
Term of Position with Trust | | Principal Occupation During Past 5 Years | | Other Directorships |
Matthew J. Miller, 41 Vice President Since December 2011 | | Current: Assistant Vice President, Relationship Management, Ultimus Fund Solutions, LLC (since December 2015). Previous: Employed in various positions with Huntington Asset Services, Inc. (n/k/a Ultimus Asset Services, LLC) (July 1998 to December 2015), most recently Vice President of Relationship Management (2005 to December 2015). | | None. |
| Bryan W. Ashmus, 44 Principal Financial Officer and Treasurer Since December 2013 | | Current: Vice President and Director of Financial Administration, Ultimus Fund Solutions, LLC (since December 2015). Previous: Vice President and Manager of Financial Administration, Huntington Asset Services, Inc. (n/k/a Ultimus Asset Services, LLC) (September 2013 to December 2015); Vice President, Fund Administration, Citi Fund Services Ohio, Inc. (from May 2005 to September 2013). | | None. |
| Stephen L. Preston, 50 AML Officer since June 2017 | | Current: Chief Compliance Officer, Ultimus Fund Solutions, LLC (since June 2011); Chief Compliance Officer of Ultimus Fund Distributors, LLC (since June 2011). | | None. |
| * | The address for each trustee and officer is 225 Pictoria Drive, Suite 450, Cincinnati, Ohio 45246. |
| ** | As of the date of this report, the Trust consists of 13 series. |
Other Information (Unaudited)
The Fund’s Statement of Additional Information (“SAI”) includes additional information about the trustees and is available without charge, upon request. You may call toll-free at (800) 247-1014 to request a copy of the SAI or to make shareholder inquiries.
Annual Report
27
Valued Advisers Trust Privacy Policy
| | | | |
| | |
FACTS | | WHAT DOES VALUED ADVISERS TRUST DO WITH YOUR PERSONAL INFORMATION? |
| | | | |
| | |
Why? | | Financial companies choose how they share your personal information. Federal law gives consumers the right to limit some but not all sharing. Federal law also requires us to tell you how we collect, share, and protect your personal information. Please read this notice carefully to understand what we do. |
| | | | |
| | |
What? | | The types of personal information we collect and share depend on the product or service you have with us. This information can include: ◾ Social Security number ◾ account balances and account transactions ◾ account transactions, transaction or loss history and purchase history ◾ checking account information and wire transfer instructions When you are no longer our customer, we continue to share your information as described in this notice. |
| | | | |
| | |
How? | | All financial companies need to share customers’ personal information to run their everyday business. In the section below, we list the reasons financial companies can share their customers’ personal information; the reasons Valued Advisers Trust chooses to share; and whether you can limit this sharing. |
| | |
Reasons we can share your personal information | | Does Valued Advisers Trust share? |
For our everyday business purposes—
such as to process your transactions, maintain your account(s), respond to court orders and legal investigations, or report to credit bureaus | | Yes |
For our marketing purposes— to offer our products and services to you | | Yes |
For joint marketing with other financial companies | | No |
For our affiliates’ everyday business purposes— information about your transactions and experiences | | No |
For our affiliates’ everyday business purposes— information about your creditworthiness | | No |
For nonaffiliates to market to you | | No |
| | | | |
Questions? | | Call 1-800-247-1014. |
| | |
Who we are | | |
Who is providing this notice? | | Valued Advisers Trust |
| | |
What we do |
| How does Valued Advisers Trust protect my personal information? | | To protect your personal information from unauthorized access and use, we use security measures that comply with federal law. These measures include computer safeguards and secured files and buildings. |
| How does Valued Advisers Trust collect my personal information? | | We collect your personal information, for example, when you ◾ open an account or deposit money ◾ buy securities from us or sell securities to us ◾ make deposits or withdrawals from your account or provide account information ◾ give us your account information ◾ make a wire transfer ◾ tell us who receives the money ◾ tell us where to send the money ◾ show your government-issued ID ◾ show your driver’s license |
| Why can’t I limit all sharing? | | Federal law gives you the right to limit only ◾ sharing for affiliates’ everyday business purposes—information about your creditworthiness ◾ affiliates from using your information to market to you ◾ sharing for nonaffiliates to market to you State laws and individual companies may give you additional rights to limit sharing. |
Definitions | | |
| Affiliates | | Companies related by common ownership or control. They can be financial and nonfinancial companies. |
| Nonaffiliates | | Companies not related by common ownership or control. They can be financial and nonfinancial companies. ◾ Valued Advisers Trust does not share your personal information with nonaffiliates so they can market to you. |
| Joint marketing | | A formal agreement between nonaffiliated financial companies that together market financial products or services to you. ◾ Valued Advisers Trust doesn’t jointly market financial products or services to you. |
PROXY VOTING
A description of the policies and procedures that the Fund uses to determine how to vote proxies relating to portfolio securities and information regarding how the Fund voted those proxies during the most recent twelve month period ended June 30, is available without charge upon request by (1) calling the Fund at (800) 247-1014 and (2) from Fund documents filed with the Securities and Exchange Commission (“SEC”) on the SEC’s website at www.sec.gov.
TRUSTEES
Andrea N. Mullins, Chairperson
Ira P. Cohen
Mark J. Seger
OFFICERS
Bo J. Howell, Principal Executive Officer and President
Bryan W. Ashmus, Principal Financial Officer and Treasurer
Brandon R. Kipp, Chief Compliance Officer
Carol J. Highsmith, Vice President and Secretary
Matthew J. Miller, Vice President
Stephen L. Preston, Anti-Money Laundering Officer
INVESTMENT ADVISER
Foundry Partners, LLC
510 First Avenue North, Suite 409
Minneapolis, MN 55403
DISTRIBUTOR
Unified Financial Securities, LLC
9465 Counselors Row, Suite 200
Indianapolis, IN 46240
INDEPENDENT REGISTERED PUBLIC ACCOUNTING FIRM
Cohen & Company, Ltd.
1350 Euclid Avenue, Suite 800
Cleveland, OH 44115
LEGAL COUNSEL
The Law Offices of John H. Lively & Associates, Inc.
A member firm of The 1940 Act Law Group TM
11300 Tomahawk Creek Parkway, Suite 310
Leawood, KS 66211
CUSTODIAN
Huntington National Bank
41 South High Street
Columbus, OH 43215
ADMINISTRATOR, TRANSFER AGENT AND FUND ACCOUNTANT
Ultimus Asset Services, LLC
225 Pictoria Drive, Suite 450
Cincinnati, OH 45246
This report is intended only for the information of shareholders or those who have received the Fund’s prospectus which contains information about the Fund’s management fee and expenses. Please read the prospectus carefully before investing.
Distributed by Unified Financial Securities, LLC
Member FINRA/SIPC

DANA LARGE CAP EQUITY FUND
DANA SMALL CAP EQUITY FUND
Annual Report
October 31, 2017
Dana Investment Advisors, Inc.
20700 Swenson Drive, Suite 400
Waukesha, WI 53186
(855) 280-9648
www.danafunds.com
Dear Fellow Shareholders,
We are once again pleased to offer you this annual report for the Dana Large Cap Equity Fund and Dana Small Cap Equity Fund for the 12-month period ended October 31, 2017. This eventful 12-month period provided very strong returns for investors. During this time period, the Dana Large Cap Equity Fund (Institutional Class) returned 30.11%, and the Dana Small Cap Equity Fund (Institutional Class) rose 23.08%. The overall market returns were also strong as the S&P 500® Index (“S&P 500”) returned 23.63%, and the Russell 2000® Index (“Russell 2000”) provided a return of 27.85% during the trailing 12-months. The Dana Small Cap Equity Fund just marked the end of its second fiscal year with assets under management doubling from $10 million to approximately $20 million during the last 12 months. The Dana Large Cap Equity Fund experienced more moderate growth, ending the fiscal year at $175 million in assets. We are grateful for our long-term shareholders and happy to see you rewarded for your patience.
As the equity markets continue to reach new highs, we continue to look for companies with good relative earnings, cash flow growth, balance sheet strength, and attractive valuation relative to peers. It is typical that companies exhibiting these characteristics will be rewarded over the long-term regardless of market conditions. We know our shareholders have many investment options to choose from, and we thank you for your continued support of Dana Funds.
Economic and Market Recap:
The fiscal year started with a volatile market reaction to the U.S. presidential election. A pronounced drop in the futures market on Trump’s election victory was quickly followed by a sharp rally that continued for the next month. Equity trading volumes in the days following the election reflected a repositioning based on a surprise election result. On December 14, 2016, the Federal Open Market Committee raised the Federal Reserve (“Fed”) funds rate by 25 basis points – this was only the second time since 2006 that the Fed increased the federal funds rate. While the market paused on this hike, the upswing in equities had only just begun, and positive inflows into equities sustained upward market momentum through the end of this fiscal period.
Economic fundamentals are supporting the equity markets. Real GDP growth has hit 3% the last two quarters. More importantly, for the first time since the financial crisis, the global economy experienced a synchronized upturn with both developed and developing countries growing on a year-over-year basis. U.S. corporations, particularly large ones with overseas exposure, benefitted from the improvement in international markets and a weaker dollar. Corporate earnings growth as measured by the S&P 500 constituents turned from negative to positive in the latter part of 2016 and continued to grow through 2017. Mid-cap and small-cap companies lagged large caps in both earnings growth and stock performance in 2017, in part due to reduced benefits from a declining U.S. dollar. Earnings expectations for these smaller market capitalization companies are forecasted to improve in 2018. With GDP improving, unemployment below 5%, inflation tame, and corporate earnings rising, the Fed raised rates by 25 basis points in March and June, respectively. In addition, the Fed announced its intent to begin to trim its balance sheet in October 2017.
Investors have taken the Fed’s actions as well as several other risks on the horizon in stride. Severe hurricanes in Texas, Florida, and Puerto Rico cost lives. They dislocated people, destroyed
1
commercial and residential properties and damaged supply chains. In the short term, consumption and GDP may rise as construction and replacement demand for all sorts of items take hold. Longer term, there is a cost in terms of growth. Many key domestic fiscal policies, health care and tax reform to name two, are still being debated. Lastly, geopolitical tension between the U.S. and North Korea remains heightened.
Large Cap Fund Performance:
The Dana Large Cap Equity Fund outperformed the S&P 500 by 6.5% during the trailing twelve months ended October 31, 2017. Stock selection was a key driver of outperformance as growth indices broadly outperformed value indices. The Dana investment process focuses on companies that trade at attractive relative valuations yet exhibit consistent growth and profitability.
Several of the Dana Large Cap Equity Fund’s information technology holdings contributed to returns. Lam Research Corporation (LRCX), a semiconductor equipment company, was the largest contributor to the Fund’s return. CDW Corporation (CDW), Activision Blizzard, Inc. (ATVI), and Broadcom Limited (AVGO) also performed well. Recent purchase Intel Corporation (INTC) reported better-than-expected third quarter earnings, and the stock price rallied on this news. Investors have been concerned over Intel’s slowing PC business, yet its newer businesses – cloud servers and mobile products – combined with better cost controls are beginning to deliver. Several Consumer Discretionary holdings experienced rebounds from the prior year, demonstrating that patience can indeed be a virtue. These include Royal Caribbean Cruises Ltd. (RCL) and Lear Corporation (LEA). Lowe’s Companies, Inc. (LOW) and Newell Brands, Inc. (NWL), on the other hand, are experiencing declining fundamentals and disappointing earnings. We sold these positions. Industrial holdings, Boeing Company (BA) and Owens Corning (OC) contributed significantly to returns during the fiscal period. Many stocks in Consumer Staples lagged stocks in other, more growth-oriented sectors. The Fund’s holdings in Altria Group, Inc. (MO), Kimberly-Clark Corporation (KMB), Dr. Pepper Snapple Group, Inc. (DPS), and Ingredion, Inc. (INGR) were weak as a result.
The Fund’s collective holdings have displayed consistent positive earnings growth. Overall, the Dana Large Cap Equity Fund holdings have seen positive earnings revisions to expected future income and revenue projections. We believe the Fund is well-positioned for the current and near-term environment.
Small Cap Fund Performance
The Dana Small Cap Equity Fund lagged the Russell 2000 over the last twelve months. Despite strong absolute returns of over 20%, the ride was anything but smooth during this time period. It started off with Donald Trump winning the U.S. Presidential election. The rhetoric of his campaign led many to believe that small cap stocks would be the biggest beneficiary of his election, and the market reacted sharply in the weeks following his victory with the Russell 2000 returning 11.16% in November. Despite the unbridled enthusiasm at the end of 2016, small caps struggled in the first half of 2017 in comparison to their large cap counterparts. Small caps, due to the lack of international exposure, did not see the same earnings recovery catalyst that propelled large cap stocks for most of the year. However, we are seeing signs of improvement. Overall index volatility has trended lower since the election, so low that some commentators are declaring it a sign of
2
complacency and negative sentiment. This element hides a greater degree of volatility on the individual security level, in both the Russell 2000 and the S&P 500, creating both headaches and opportunities for investors.
Strong stock selection led to nine out of eleven GICS sectors contributing positive returns, and four of our holdings generated returns in excess of 100% over the last twelve months: Coherent, Inc. (COHR), MKS Instruments, Inc. (MKSI), Supernus Pharmaceuticals, Inc. (SUPN), and Marriott Vacations Worldwide Corporation (VAC) led the gainers. On a sector level, energy and health care companies were laggards as volatility punished companies with deteriorating visibility regarding 2017 earnings. Interestingly, factors inherent in our process, namely quality and relative valuation, attributed negative performance to the fund in 4 distinct periods – immediately after the 2016 election, February, June, and August. Normally we expect periods where low-quality stocks rally to be offset by gains in higher quality companies. The latest fiscal year was unbalanced in that regard.
We believe the Dana Small Cap Equity Fund is well positioned regardless of market direction at this time. We continue to focus on companies that are trading at discounts relative to peers, have positive earnings and cash flow generation, and are positioned as leaders in their industries. Our experience has shown that a portfolio of fundamentally strong companies will be rewarded over time, and we believe that the patient investor will reap those benefits.
Respectfully Submitted,

Mark R. Mirsberger, CPA
Chief Executive Officer – Dana Investment Advisors, Inc.

Duane Roberts, CFA
Portfolio Manager and Director of Equities – Dana Investment Advisors, Inc.
3
Investment Results (Unaudited)
Average Annual Total Returns(a) as of October 31, 2017
| | | | | | | | | | | | | | | | | | | | |
| | | One
Year | | | Three
Year | | | Five
Year | | | Since
Inception
(3/1/10) | | | Since
Inception
(10/29/13) | |
Dana Large Cap Equity Fund | | | | | | | | | | | | | |
Institutional Class | | | 30.11% | | | | 9.95% | | | | N/A | | | | N/A | | | | 11.64% | |
Investor Class (formerly, Class N) | | | 29.72% | | | | 9.65% | | | | 14.13% | | | | 14.24% | | | | N/A | |
S&P 500® Index(b) | | | 23.63% | | | | 10.77% | | | | 15.18% | | | | 13.89% | | | | 12.10% | |
| | | | | | | Expense Ratios(c) | | | | | |
| | | | | | Institutional
Class | | | | | | Investor
Class | | | | |
Gross | | | | | | | 0.91% | | | | | | | | 1.16% | | | | | |
With Applicable Waivers | | | | | | | 0.73% | | | | | | | | 0.98% | | | | | |
The performance quoted represents past performance, which does not guarantee future results. The investment return and principal value of an investment will fluctuate so that an investor’s shares, when redeemed, may be worth more or less than their original cost. The returns shown do not reflect deduction of taxes that a shareholder would pay on Dana Large Cap Equity Fund (the “Large Cap Fund”) distributions or the redemption of Large Cap Fund shares. Current performance of the Large Cap Fund may be lower or higher than the performance quoted. The Large Cap Fund’s investment objectives, risks, charges and expenses must be considered carefully before investing. Performance data current to the most recent month end may be obtained by calling 1-855-280-9648.
(a) Average annual total returns reflect any change in price per share and assume the reinvestment of all distributions. The Large Cap Fund’s returns reflect any fee reductions during the applicable period. If such reductions had not occurred, the quoted performance would have been lower.
(b) The S&P 500® Index (“Index”) is a widely recognized unmanaged index of equity securities and is representative of a broader domestic equity market and range of securities than is found in the Large Cap Fund’s portfolio. Individuals cannot invest directly in the Index; however, an individual can invest in exchange traded funds or other investment vehicles that attempt to track the performance of a benchmark index.
(c) The expense ratios are from the Large Cap Fund’s prospectus dated February 28, 2017. Dana Investment Advisors, Inc. (the “Adviser”) has contractually agreed to reimburse or limit its fees and to assume other expenses of the Large Cap Fund until February 28, 2018, so that total annual fund operating expenses does not exceed 0.73% of the Large Cap Fund’s average daily net assets. This operating expense limitation does not apply to brokerage fees and commissions, borrowing costs (such as interest and dividend expenses on securities sold short), taxes, extraordinary expenses, fees and expenses paid under a distribution plan adopted pursuant to Rule 12b-1, fees and expenses paid under a shareholder services plan, and indirect expenses (such as “Acquired Funds Fees and Expenses”). Each fee waiver or expense reimbursement by the Adviser is subject to repayment by the Large Cap Fund within three fiscal years following the date in which the expense was incurred, provided that the Large Cap Fund is able to make the repayment without exceeding the expense limitation in place at the time of waiver or reimbursement. This agreement may only be terminated by mutual consent of the Adviser and the Board of Trustees. Additional information pertaining to the Large Cap Fund’s expense ratios as of October 31, 2017 can be found on the financial highlights.
The Large Cap Fund’s investment objectives, strategies, risks, charges and expenses must be considered carefully before investing. The prospectus contains this and other important information about the Large Cap Fund and may be obtained by calling the same number as above. Please read it carefully before investing.
The Large Cap Fund is distributed by Unified Financial Securities, LLC, member FINRA/SIPC.
4
Investment Results (Unaudited)
Average Annual Total Return(a) as of October 31, 2017
| | | | | | | | |
| | | One
Year | | | Since
Inception
(11/3/15) | |
Dana Small Cap Equity Fund | | | | | |
Institutional Class | | | 23.08% | | | | 7.08% | |
Investor Class | | | 22.73% | | | | 6.78% | |
Russell 2000® Index(b) | | | 27.85% | | | | 13.96% | |
| | | Expense Ratios(c) | |
| | | Institutional
Class | | | Investor
Class | |
Gross | | | 4.23% | | | | 4.48% | |
With Applicable Waivers | | | 0.95% | | | | 1.20% | |
The performance quoted represents past performance, which does not guarantee future results. The investment return and principal value of an investment will fluctuate so that an investor’s shares, when redeemed, may be worth more or less than their original cost. The returns shown do not reflect deduction of taxes that a shareholder would pay on Dana Small Cap Equity Fund (the “Small Cap Fund”) distributions or the redemption of Small Cap Fund shares. Current performance of the Small Cap Fund may be lower or higher than the performance quoted. The Small Cap Fund’s investment objectives, risks, charges and expenses must be considered carefully before investing. Performance data current to the most recent month end may be obtained by calling 1-855-280-9648.
(a) Average annual returns reflect any change in price per share and assume the reinvestment of all distributions. The Small Cap Fund’s returns reflect any fee reductions during the applicable period. If such reductions had not occurred, the quoted performance would have been lower.
(b) The Russell 2000® Index (“Russell Index”) is a widely recognized unmanaged index of equity securities and is representative of a broader domestic equity market and range of securities than are found in the Small Cap Fund’s portfolio. Individuals can not invest directly in the Russell Index; however, an individual can invest in ETFs or other investment vehicles that attempt to track the performance of a benchmark index.
(c) The expense ratios are from the Small Cap Fund’s prospectus dated February 28, 2017. The Adviser has contractually agreed to reimburse or limit its fees and to assume other expenses of the Small Cap Fund until February 28, 2018, so that total annual fund operating expenses does not exceed 0.95% of the Small Cap Fund’s average daily net assets. This operating expense limitation does not apply to brokerage fees and commissions, borrowing costs (such as interest and dividend expenses on securities sold short), taxes, extraordinary expenses, fees and expenses paid under a distribution plan adopted pursuant to Rule 12b-1, fees and expenses paid under a shareholder services plan, and indirect expenses (such as “Acquired Funds Fees and Expenses”). Each fee waiver or expense reimbursement by the Adviser is subject to repayment by the Small Cap Fund within three fiscal years following the date in which the expense was incurred, provided that the Small Cap Fund is able to make the repayment without exceeding the expense limitation in place at the time of waiver or reimbursement. This agreement may only be terminated by mutual consent of the Adviser and the Board of Trustees. Additional information pertaining to the Small Cap Fund’s expense ratios as of October 31, 2017 can be found on the financial highlights.
The Small Cap Fund’s investment objectives, strategies, risks, charges and expenses must be considered carefully before investing. The prospectus contains this and other important information about the Small Cap Fund and may be obtained by calling the same number as above. Please read it carefully before investing.
The Small Cap Fund is distributed by Unified Financial Securities, LLC, member FINRA/SIPC.
5
Comparison of Growth of $10,000 Investment in the Dana Large Cap Equity Fund, Investor Class (formerly, Class N) and the S&P 500® Index (Unaudited)
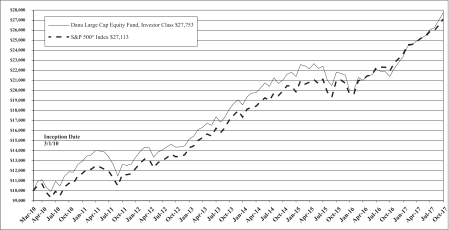
The chart above assumes an initial investment of $10,000 made on March 1, 2010 (commencement of Investor Class operations) held through October 31, 2017. THE FUND’S RETURN REPRESENTS PAST PERFORMANCE AND DOES NOT GUARANTEE FUTURE RESULTS. The returns shown do not reflect deduction of taxes that a shareholder would pay on Fund distributions or the redemption of Fund shares. Investment returns and principal values will fluctuate so that your shares, when redeemed, may be worth more or less than their original purchase price.
Current performance may be lower or higher than the performance data quoted. For more information on the Fund, and to obtain performance data current to the most recent month end or to request a prospectus, please call 1-855-280-9648. You should carefully consider the investment objectives, potential risks, management fees, and charges and expenses of the Fund before investing. The Fund’s prospectus contains this and other information about the Fund, and should be read carefully before investing.
The Fund is distributed by Unified Financial Securities, LLC, member FINRA/SIPC.
6
Comparison of Growth of $10,000 Investment in the Dana Small Cap Equity Fund, Investor Class and the Russell 2000® Index (Unaudited)
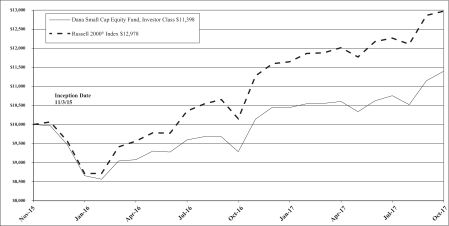
The chart above assumes an initial investment of $10,000 made on November 3, 2015 (commencement of Investor Class operations) held through October 31, 2017. THE FUND’S RETURN REPRESENTS PAST PERFORMANCE AND DOES NOT GUARANTEE FUTURE RESULTS. The returns shown do not reflect deduction of taxes that a shareholder would pay on Fund distributions or the redemption of Fund shares. Investment returns and principal values will fluctuate so that your shares, when redeemed, may be worth more or less than their original purchase price.
Current performance may be lower or higher than the performance data quoted. For more information on the Fund, and to obtain performance data current to the most recent month end or to request a prospectus, please call 1-855-280-9648. You should carefully consider the investment objectives, potential risks, management fees, and charges and expenses of the Fund before investing. The Fund’s prospectus contains this and other information about the Fund, and should be read carefully before investing.
The Fund is distributed by Unified Financial Securities, LLC, member FINRA/SIPC.
7
Portfolio Illustration (Unaudited)
October 31, 2017
The following chart gives a visual breakdown of the Large Cap Fund by sector weighting as a percentage of the fair value of portfolio investments.
8
Portfolio Illustration (Unaudited)
October 31, 2017
The following chart gives a visual breakdown of the Small Cap Fund by sector weighting as a percentage of the fair value of portfolio investments.
Availability of Portfolio Schedules (Unaudited)
The Large Cap Fund and the Small Cap Fund (each a “Fund” and collectively the “Funds”) file their complete schedule of portfolio holdings with the Securities and Exchange Commission (“SEC”) for the first and third quarters of each fiscal year on Form N-Q. The Funds’ Form N-Q is available at the SEC’s website at www.sec.gov. The Funds’ Form N-Q may be reviewed and copied at the Public Reference Room in Washington DC. Information on the operation of the Public Reference Room may be obtained by calling 1-800-SEC-0330.
9
Dana Large Cap Equity Fund
Schedule of Investments
October 31, 2017
| | | | | | | | |
| Shares | | | | | Fair Value | |
| | Common Stocks – 98.46% | | | | |
| | |
| | | | Consumer Discretionary – 11.65% | | | | |
| | 54,000 | | | CBS Corp., Class B | | $ | 3,030,480 | |
| | 85,000 | | | Comcast Corp., Class A | | | 3,062,550 | |
| | 89,200 | | | D.R. Horton, Inc. | | | 3,943,532 | |
| | 19,800 | | | Lear Corp. | | | 3,476,682 | |
| | 26,200 | | | PVH Corp. | | | 3,322,422 | |
| | 29,000 | | | Royal Caribbean Cruises Ltd. | | | 3,589,330 | |
| | | | | | | | |
| | | | | | | 20,424,996 | |
| | | | | | | | |
| | |
| | | | Consumer Staples – 7.78% | | | | |
| | 31,000 | | | Dr. Pepper Snapple Group, Inc. | | | 2,655,460 | |
| | 22,400 | | | Ingredion, Inc. | | | 2,807,840 | |
| | 24,000 | | | Kimberly-Clark Corp. | | | 2,700,240 | |
| | 24,600 | | | Philip Morris International, Inc. | | | 2,574,144 | |
| | 52,000 | | | Sysco Corp. | | | 2,892,240 | |
| | | | | | | | |
| | | | | | | 13,629,924 | |
| | | | | | | | |
| | |
| | | | Energy – 5.80% | | | | |
| | 23,000 | | | Chevron Corp. | | | 2,665,470 | |
| | 30,000 | | | Exxon Mobil Corp. | | | 2,500,500 | |
| | 56,000 | | | Halliburton Co. | | | 2,393,440 | |
| | 33,000 | | | Valero Energy Corp. | | | 2,603,370 | |
| | | | | | | | |
| | | | | | | 10,162,780 | |
| | | | | | | | |
| | |
| | | | Financials – 14.38% | | | | |
| | 133,000 | | | Bank of America Corp. | | | 3,642,870 | |
| | 21,000 | | | Chubb Ltd. | | | 3,167,220 | |
| | 15,000 | | | Citigroup, Inc. | | | 1,102,500 | |
| | 92,000 | | | Citizens Financial Group, Inc. | | | 3,496,920 | |
| | 24,000 | | | Comerica, Inc. | | | 1,885,680 | |
| | 29,000 | | | JPMorgan Chase & Co. | | | 2,917,690 | |
| | 66,000 | | | Morgan Stanley | | | 3,300,000 | |
| | 30,000 | | | Prudential Financial, Inc. | | | 3,313,800 | |
| | 110,000 | | | Starwood Property Trust, Inc. | | | 2,366,100 | |
| | | | | | | | |
| | | | | | | 25,192,780 | |
| | | | | | | | |
| | |
| | | | Health Care – 14.06% | | | | |
| | 41,000 | | | AbbVie, Inc. | | | 3,700,250 | |
| | 18,000 | | | Amgen, Inc. | | | 3,153,960 | |
| | 56,000 | | | Baxter International, Inc. | | | 3,610,320 | |
| | 25,600 | | | Johnson & Johnson | | | 3,568,896 | |
| | 92,600 | | | Pfizer, Inc. | | | 3,246,556 | |
| | 23,600 | | | Stryker Corp. | | | 3,654,932 | |
| | 17,600 | | | UnitedHealth Group, Inc. | | | 3,699,872 | |
| | | | | | | | |
| | | | | | | 24,634,786 | |
| | | | | | | | |
See accompanying notes which are an integral part of these financial statements.
10
Dana Large Cap Equity Fund
Schedule of Investments (continued)
October 31, 2017
| | | | | | | | |
| Shares | | | | | Fair Value | |
| | Common Stocks – (continued) | | | | |
| | |
| | | | Industrials – 9.82% | | | | |
| | 43,000 | | | Alaska Air Group, Inc. | | $ | 2,839,290 | |
| | 14,000 | | | Boeing Co./The | | | 3,611,720 | |
| | 24,000 | | | Honeywell International, Inc. | | | 3,459,840 | |
| | 44,200 | | | Owens Corning | | | 3,654,898 | |
| | 22,600 | | | Stanley Black & Decker, Inc. | | | 3,651,030 | |
| | | | | | | | |
| | | | | | | 17,216,778 | |
| | | | | | | | |
| | |
| | | | Information Technology – 24.07% | | | | |
| | 3,500 | | | Alphabet, Inc., Class A * | | | 3,615,640 | |
| | 24,200 | | | Apple, Inc. | | | 4,090,768 | |
| | 13,000 | | | Broadcom Ltd. | | | 3,430,830 | |
| | 38,000 | | | Broadridge Financial Solutions, Inc. | | | 3,264,960 | |
| | 50,000 | | | CDW Corp. | | | 3,500,000 | |
| | 1,000 | | | Cisco Systems, Inc. | | | 34,150 | |
| | 100,000 | | | Corning, Inc. | | | 3,131,000 | |
| | 17,900 | | | Facebook, Inc., Class A * | | | 3,223,074 | |
| | 85,000 | | | Intel Corp. | | | 3,866,650 | |
| | 120,000 | | | Juniper Networks, Inc. | | | 2,979,600 | |
| | 19,000 | | | Lam Research Corp. | | | 3,962,830 | |
| | 23,000 | | | MasterCard, Inc., Class A | | | 3,421,710 | |
| | 44,000 | | | Microsoft Corp. | | | 3,659,920 | |
| | | | | | | | |
| | | | | | | 42,181,132 | |
| | | | | | | | |
| | |
| | | | Materials – 3.02% | | | | |
| | 300 | | | Albemarle Corp. | | | 42,267 | |
| | 25,000 | | | Avery Dennison Corp. | | | 2,654,250 | |
| | 22,400 | | | Packaging Corp. of America | | | 2,604,448 | |
| | | | | | | | |
| | | | | | | 5,300,965 | |
| | | | | | | | |
| | |
| | | | Real Estate – 2.92% | | | | |
| | 19,000 | | | American Tower Corp., Class A | | | 2,729,730 | |
| | 37,000 | | | Prologis, Inc. | | | 2,389,460 | |
| | | | | | | | |
| | | | | | | 5,119,190 | |
| | | | | | | | |
| | |
| | | | Telecommunication Services – 1.91% | | | | |
| | 47,000 | | | AT&T, Inc. | | | 1,581,550 | |
| | 29,400 | | | T-Mobile US, Inc. * | | | 1,757,238 | |
| | | | | | | | |
| | | | | | | 3,338,788 | |
| | | | | | | | |
| | |
| | | | Utilities – 3.05% | | | | |
| | 87,000 | | | CenterPoint Energy, Inc. | | | 2,573,460 | |
| | 69,000 | | | Exelon Corp. | | | 2,774,490 | |
| | | | | | | | |
| | | | | | | 5,347,950 | |
| | | | | | | | |
| | | | Total Common Stocks (Cost $140,677,624) | | | 172,550,069 | |
| | | | | | | | |
See accompanying notes which are an integral part of these financial statements.
11
Dana Large Cap Equity Fund
Schedule of Investments (continued)
October 31, 2017
| | | | | | | | |
| Shares | | | | | Fair Value | |
| | Short-Term Investments – 1.21% | | | | |
| | |
| | 2,116,603 | | | Federated Government Obligations Fund, Institutional Class, 0.92% (a) | | $ | 2,116,603 | |
| | | | | | | | |
| | | | Total Short-Term Investments (Cost $2,116,603) | | | 2,116,603 | |
| | | | | | | | |
| | |
| | | | Total Investments – 99.67% (Cost $142,794,227) | | | 174,666,672 | |
| | | | | | | | |
| | |
| | | | Other Assets in Excess of Liabilities – 0.33% | | | 581,465 | |
| | | | | | | | |
| | |
| | | | NET ASSETS – 100.00% | | $ | 175,248,137 | |
| | | | | | | | |
| (a) | | Rate disclosed is the seven day effective yield as of October 31, 2017. |
| * | | Non-income producing security. |
The sectors shown on the schedule of investments are based on Global Industry Classification Standard, or GICS® (“GICS”). The GICS was developed by and/or is the exclusive property of MSCI, Inc. and Standard & Poor’s Financial Services LLC (“S&P”). GICS is a service mark of MSCI, Inc. and S&P and has been licensed for use by the Administrator.
See accompanying notes which are an integral part of these financial statements.
12
Dana Small Cap Equity Fund
Schedule of Investments
October 31, 2017
| | | | | | | | |
| Shares | | | | | Fair Value | |
| | Common Stocks – 98.42% | | | | |
| | |
| | | | Consumer Discretionary – 11.28% | | | | |
| | 5,000 | | | Big Lots, Inc. | | $ | 256,550 | |
| | 4,900 | | | Columbia Sportswear Co. | | | 305,662 | |
| | 17,461 | | | Gray Television, Inc. * | | | 271,868 | |
| | 2,770 | | | LCI Industries | | | 342,926 | |
| | 2,262 | | | Lithia Motors, Inc., Class A | | | 256,013 | |
| | 9,308 | | | Marcus Corp./The | | | 252,712 | |
| | 2,424 | | | Marriott Vacations Worldwide Corp. | | | 319,047 | |
| | 5,156 | | | TopBuild Corp. * | | | 340,244 | |
| | | | | | | | |
| | | | | | | 2,345,022 | |
| | | | | | | | |
| | |
| | | | Consumer Staples – 2.93% | | | | |
| | 10,951 | | | Blue Buffalo Pet Products, Inc. * | | | 316,812 | |
| | 7,671 | | | Central Garden & Pet Co. * | | | 292,879 | |
| | | | | | | | |
| | | | | | | 609,691 | |
| | | | | | | | |
| | |
| | | | Energy – 3.53% | | | | |
| | 22,135 | | | Callon Petroleum Co. * | | | 245,477 | |
| | 8,455 | | | Matador Resources Co. * | | | 224,480 | |
| | 10,839 | | | RPC, Inc. | | | 263,496 | |
| | | | | | | | |
| | | | | | | 733,453 | |
| | | | | | | | |
| | |
| | | | Financials – 17.26% | | | | |
| | 9,929 | | | Berkshire Hills Bancorp, Inc. | | | 380,281 | |
| | 13,199 | | | CenterState Bank Corp. | | | 351,621 | |
| | 8,254 | | | First Merchants Corp. | | | 354,922 | |
| | 14,469 | | | Home BancShares, Inc. | | | 325,263 | |
| | 8,316 | | | James River Group Holdings Ltd. | | | 351,933 | |
| | 4,293 | | | Primerica, Inc. | | | 379,931 | |
| | 8,242 | | | Renasant Corp. | | | 341,219 | |
| | 14,204 | | | Sterling Bancorp | | | 355,810 | |
| | 7,075 | | | Stifel Financial Corp. | | | 375,187 | |
| | 6,668 | | | Western Alliance Bancorp * | | | 372,074 | |
| | | | | | | | |
| | | | | | | 3,588,241 | |
| | | | | | | | |
| | |
| | | | Health Care – 14.83% | | | | |
| | 7,281 | | | AMN Healthcare Services, Inc. * | | | 319,636 | |
| | 5,828 | | | ANI Pharmaceuticals, Inc. * | | | 338,490 | |
| | 10,425 | | | BioTelemetry, Inc. * | | | 302,846 | |
| | 15,725 | | | HMS Holdings Corp. * | | | 302,549 | |
| | 2,307 | | | Ligand Pharmaceuticals, Inc., Class B * | | | 335,323 | |
| | 2,991 | | | Masimo Corp. * | | | 262,490 | |
| | 8,809 | | | Natus Medical, Inc. * | | | 373,502 | |
| | 5,375 | | | Prestige Brands Holdings, Inc. * | | | 252,088 | |
See accompanying notes which are an integral part of these financial statements.
13
Dana Small Cap Equity Fund
Schedule of Investments (continued)
October 31, 2017
| | | | | | | | |
| Shares | | | | | Fair Value | |
| | Common Stocks – (continued) | | | | |
| | |
| | | | Health Care – 14.83% (continued) | | | | |
| | 25,595 | | | Sucampo Pharmaceuticals, Inc., Class A * | | $ | 255,950 | |
| | 8,147 | | | Supernus Pharmaceuticals, Inc. * | | | 338,915 | |
| | | | | | | | |
| | | | | | | 3,081,789 | |
| | | | | | | | |
| | |
| | | | Industrials – 14.91% | | | | |
| | 11,651 | | | Air Transport Services Group, Inc. * | | | 281,954 | |
| | 6,417 | | | Apogee Enterprises, Inc. | | | 306,283 | |
| | 7,400 | | | Comfort Systems USA, Inc. | | | 327,820 | |
| | 5,586 | | | Lydall, Inc. * | | | 322,871 | |
| | 6,359 | | | MasTec, Inc. * | | | 276,935 | |
| | 4,884 | | | On Assignment, Inc. * | | | 298,999 | |
| | 3,623 | | | Patrick Industries, Inc. * | | | 336,939 | |
| | 6,857 | | | SkyWest, Inc. | | | 322,965 | |
| | 6,430 | | | Tetra Tech, Inc. | | | 316,678 | |
| | 8,855 | | | TriNet Group, Inc. * | | | 307,446 | |
| | | | | | | | |
| | | | | | | 3,098,890 | |
| | | | | | | | |
| | |
| | | | Information Technology – 17.65% | | | | |
| | 4,122 | | | Advanced Energy Industries, Inc. * | | | 349,216 | |
| | 6,699 | | | BroadSoft, Inc. * | | | 367,440 | |
| | 10,911 | | | Ciena Corp. * | | | 232,077 | |
| | 1,393 | | | Coherent, Inc. * | | | 365,955 | |
| | 3,252 | | | Euronet Worldwide, Inc. * | | | 314,273 | |
| | 14,036 | | | Kulicke & Soffa Industries, Inc. * | | | 317,915 | |
| | 3,903 | | | MKS Instruments, Inc. | | | 424,061 | |
| | 32,628 | | | Oclaro, Inc. * | | | 269,834 | |
| | 2,358 | | | Rogers Corp. * | | | 358,605 | |
| | 21,775 | | | TTM Technologies, Inc. * | | | 343,610 | |
| | 13,489 | | | Web.com Group, Inc. * | | | 325,085 | |
| | | | | | | | |
| | | | | | | 3,668,071 | |
| | | | | | | | |
| | |
| | | | Materials – 4.50% | | | | |
| | 14,449 | | | Ferro Corp. * | | | 344,175 | |
| | 6,976 | | | PolyOne Corp. | | | 321,384 | |
| | 3,392 | | | Stepan Co. | | | 270,885 | |
| | | | | | | | |
| | | | | | | 936,444 | |
| | | | | | | | |
| | |
| | | | Real Estate – 7.19% | | | | |
| | 21,488 | | | Armada Hoffler Properties, Inc. | | | 306,634 | |
| | 2,631 | | | CoreSite Realty Corp. | | | 291,383 | |
| | 18,054 | | | Monmouth Real Estate Investment Corp., Class A | | | 307,640 | |
| | 15,738 | | | Preferred Apartment Communities, Inc. | | | 312,399 | |
| | 10,100 | | | STAG Industrial, Inc. | | | 275,730 | |
| | | | | | | | |
| | | | | | | 1,493,786 | |
| | | | | | | | |
See accompanying notes which are an integral part of these financial statements.
14
Dana Small Cap Equity Fund
Schedule of Investments (continued)
October 31, 2017
| | | | | | | | |
| Shares | | | | | Fair Value | |
| | Common Stocks – (continued) | | | | |
| | |
| | | | Telecommunication Services – 0.70% | | | | |
| | 7,606 | | | Consolidated Communications Holdings, Inc. | | $ | 145,807 | |
| | | | | | | | |
| | |
| | | | Utilities – 3.64% | | | | |
| | 4,824 | | | Chesapeake Utilities Corp. | | | 388,573 | |
| | 4,480 | | | Southwest Gas Corp. | | | 369,107 | |
| | | | | | | | |
| | | | | | | 757,680 | |
| | | | | | | | |
| | | | Total Common Stocks (Cost $17,155,470) | | | 20,458,874 | |
| | | | | | | | |
| |
| | Short-Term Investments – 0.83% | | | | |
| | |
| | 171,273 | | | Federated Government Obligations Fund, Institutional Class, 0.92% (a) | | | 171,273 | |
| | | | | | | | |
| | | | Total Short-Term Investments (Cost $171,273) | | | 171,273 | |
| | | | | | | | |
| | |
| | | | Total Investments – 99.25% (Cost $17,326,743) | | | 20,630,147 | |
| | | | | | | | |
| | |
| | | | Other Assets in Excess of Liabilities – 0.75% | | | 156,908 | |
| | | | | | | | |
| | |
| | | | NET ASSETS – 100.00% | | $ | 20,787,055 | |
| | | | | | | | |
| (a) | | Rate disclosed is the seven day effective yield as of October 31, 2017. |
| * | | Non-income producing security. |
The sectors shown on the schedule of investments are based on Global Industry Classification Standard, or GICS® (“GICS”). The GICS was developed by and/or is the exclusive property of MSCI, Inc. and Standard & Poor’s Financial Services LLC (“S&P”). GICS is a service mark of MSCI, Inc. and S&P and has been licensed for use by the Administrator.
See accompanying notes which are an integral part of these financial statements.
15
Dana Funds
Statements of Assets and Liabilities
October 31, 2017
| | | | | | | | |
| | | Dana Large Cap
Equity Fund | | | Dana Small Cap
Equity Fund | |
Assets | | | | | | | | |
Investments in securities at fair value (cost $142,794,227 and $17,326,743) | | $ | 174,666,672 | | | $ | 20,630,147 | |
Receivable for fund shares sold | | | 1,286,287 | | | | 160,922 | |
Dividends receivable | | | 115,569 | | | | 5,132 | |
Receivable from Adviser | | | — | | | | 251 | |
Prepaid expenses | | | 22,845 | | | | 21,544 | |
Total Assets | | | 176,091,373 | | | | 20,817,996 | |
Liabilities | | | | | | | | |
Payable for fund shares redeemed | | | 291,567 | | | | 4,349 | |
Payable for investments purchased | | | 422,539 | | | | — | |
Payable to Adviser | | | 79,249 | | | | — | |
Payable for Distribution Fees | | | 8,644 | | | | 1,424 | |
Payable to Administrator | | | 15,297 | | | | 7,192 | |
Other accrued expenses | | | 25,940 | | | | 17,976 | |
Total Liabilities | | | 843,236 | | | | 30,941 | |
Net Assets | | $ | 175,248,137 | | | $ | 20,787,055 | |
Net Assets consist of: | | | | | | | | |
Paid-in capital | | $ | 136,832,110 | | | $ | 17,722,313 | |
Accumulated undistributed net investment income (loss) | | | 186,203 | | | | (25,143 | ) |
Accumulated undistributed net realized gain (loss) from investment transactions | | | 6,357,379 | | | | (213,519 | ) |
Net unrealized appreciation on investments | | | 31,872,445 | | | | 3,303,404 | |
Net Assets | | $ | 175,248,137 | | | $ | 20,787,055 | |
Institutional Class: | | | | | | | | |
Net Assets | | $ | 134,290,838 | | | $ | 14,010,880 | |
Shares outstanding (unlimited number of shares authorized, no par value) | | | 5,930,358 | | | | 1,225,643 | |
Net asset value (“NAV”), offering and redemption price per share | | $ | 22.64 | | | $ | 11.43 | |
Investor Class: (a) | | | | | | | | |
Net Assets | | $ | 40,957,299 | | | $ | 6,776,175 | |
Shares outstanding (unlimited number of shares authorized, no par value) | | | 1,808,842 | | | | 595,457 | |
Net asset value (“NAV”), offering and redemption price per share | | $ | 22.64 | | | $ | 11.38 | |
| (a) | | Effective October 13, 2017, the outstanding Class A shares of the Dana Large Cap Equity Fund were exchanged for Class N shares of the Dana Large Cap Equity Fund and immediately following the class exchange Class N shares were re-designated as Investor Class shares. |
See accompanying notes which are an integral part of these financial statements.
16
Dana Funds
Statements of Operations
For the year ended October 31, 2017
| | | | | | | | |
| | | Dana Large Cap
Equity Fund | | | Dana Small Cap
Equity Fund | |
Investment Income | | | | | | | | |
Dividend income | | $ | 3,291,136 | | | $ | 151,178 | |
Total investment income | | | 3,291,136 | | | | 151,178 | |
Expenses | | | | | | | | |
Investment Adviser | | | 1,039,462 | | | | 126,457 | |
Distribution (12b-1): | | | | | | | | |
Class A (a) | | | 3,335 | | | | — | |
Investor Class (a) | | | 90,441 | | | | 14,090 | |
Administration | | | 82,388 | | | | 38,000 | |
Registration | | | 51,239 | | | | 37,505 | |
Fund accounting | | | 47,263 | | | | 30,000 | |
Transfer agent | | | 29,542 | | | | 22,725 | |
Audit and tax preparation | | | 18,900 | | | | 18,400 | |
Legal | | | 16,589 | | | | 17,332 | |
Insurance | | | 20,635 | | | | 3,323 | |
Custodian | | | 19,616 | | | | 4,325 | |
Interest | | | 18,386 | | | | 7 | |
Printing | | | 14,876 | | | | 3,077 | |
Trustee | | | 6,259 | | | | 4,508 | |
Pricing | | | 2,207 | | | | 2,449 | |
Miscellaneous | | | 12,996 | | | | 12,526 | |
Total expenses | | | 1,474,134 | | | | 334,724 | |
Fees contractually waived and expenses reimbursed by Adviser | | | (277,301 | ) | | | (170,116 | ) |
Net operating expenses | | | 1,196,833 | | | | 164,608 | |
Net investment income (loss) | | | 2,094,303 | | | | (13,430 | ) |
Net Realized and Change in Unrealized Gain on Investments | | | | | |
Net realized gain on investment securities transactions | | | 13,094,901 | | | | 63,928 | |
Net change in unrealized appreciation of investment securities | | | 25,349,579 | | | | 2,944,021 | |
Net realized and change in unrealized gain on investments | | | 38,444,480 | | | | 3,007,949 | |
Net increase in net assets resulting from operations | | $ | 40,538,783 | | | $ | 2,994,519 | |
| (a) | | Effective October 13, 2017, the outstanding Class A shares of the Dana Large Cap Equity Fund were exchanged for Class N shares of the Dana Large Cap Equity Fund and immediately following the class exchange Class N shares were re-designated as Investor Class shares. |
17
See accompanying notes which are an integral part of these financial statements.
Dana Funds
Statements of Changes in Net Assets
| | | | | | | | | | | | | | | | |
| | | Dana Large Cap Equity Fund | | | Dana Small Cap Equity Fund | |
| | | For the Year
Ended
October 31, 2017 | | | For the Year
Ended
October 31, 2016 | | | For the Year
Ended
October 31, 2017 | | | For the Period
Ended
October 31, 2016(c) | |
Increase in Net Assets due to:
Operations: | | | | | | | | | | | | | |
Net investment income (loss) | | $ | 2,094,303 | | | $ | 2,470,203 | | | $ | (13,430 | ) | | $ | 2,901 | |
Net realized gain (loss) on investment transactions | | | 13,094,901 | | | | (5,226,176 | ) | | | 63,928 | | | | (277,656 | ) |
Net change in unrealized appreciation of investments | | | 25,349,579 | | | | 323,264 | | | | 2,944,021 | | | | 359,383 | |
Net increase (decrease) in net assets resulting from operations | | | 40,538,783 | | | | (2,432,709 | ) | | | 2,994,519 | | | | 84,628 | |
Distributions From: | | | | | | | | | | | | | | | | |
Net investment income: | | | | | | | | | | | | | | | | |
Class A (a) | | | (18,088 | ) | | | (13,120 | ) | | | | | | | | |
Institutional Class | | | (1,652,850 | ) | | | (1,966,634 | ) | | | (12,219 | ) | | | (4,145 | ) |
Investor Class (a) | | | (466,217 | ) | | | (394,154 | ) | | | (3,424 | ) | | | (587 | ) |
Total distributions | | | (2,137,155 | ) | | | (2,373,908 | ) | | | (15,643 | ) | | | (4,732 | ) |
Capital Transactions – Class A: (a) | | | | | | | | | | | | | |
Proceeds from shares sold | | | 88,095 | | | | 414,562 | | | | | | | | | |
Shares redeemed in connection with class consolidation | | | (1,435,747 | ) | | | — | | | | | | | | | |
Reinvestment of distributions | | | 16,810 | | | | 12,358 | | | | | | | | | |
Amount paid for shares redeemed | | | (331,496 | ) | | | (1,684,118 | ) | | | | | | | | |
Proceeds from redemption fees (b) | | | — | | | | 42 | | | | | | | | | |
Total Class A | | | (1,662,338 | ) | | | (1,257,156 | ) | | | | | | | | |
| (a) | | Effective October 13, 2017, the outstanding Class A shares of the Dana Large Cap Equity Fund were exchanged for Class N shares of the Dana Large Cap Equity Fund and immediately following the class exchange Class N shares were re-designated as Investor Class shares. |
| (b) | | Prior to February 28, 2017, the Funds charged a 2.00% redemption fee on shares redeemed within 60 days of purchase. |
| (c) | | For the period November 3, 2015 (commencement of operations) through October 31, 2016. |
See accompanying notes which are an integral part of these financial statements.
18
Dana Funds
Statements of Changes in Net Assets (continued)
| | | | | | | | | | | | | | | | |
| | | Dana Large Cap Equity Fund | | | Dana Small Cap Equity Fund | |
| | | For the Year
Ended
October 31, 2017 | | | For the Year
Ended
October 31, 2016 | | | For the Year
Ended
October 31, 2017 | | | For the Period
Ended
October 31, 2016(c) | |
Capital Transactions – Institutional Class: | | | | | | | | | |
Proceeds from shares sold | | $ | 43,190,437 | | | $ | 74,899,806 | | | $ | 6,663,858 | | | $ | 6,935,349 | |
Reinvestment of distributions | | | 163,064 | | | | 170,023 | | | | 11,845 | | | | 2,967 | |
Amount paid for shares redeemed | | | (76,805,815 | ) | | | (50,570,426 | ) | | | (1,194,695 | ) | | | (427,018 | ) |
Proceeds from redemption fees (b) | | | 4,007 | | | | 13,598 | | | | — | | | | 1,840 | |
Total Institutional Class | | | (33,448,307 | ) | | | 24,513,001 | | | | 5,481,008 | | | | 6,513,138 | |
Capital Transactions – Investor Class: (a) | | | | | | | | | |
Proceeds from shares sold | | | 1,374,972 | | | | 2,351,765 | | | | 2,501,527 | | | | 4,289,510 | |
Shares issued in connection with class consolidation | | | 1,435,747 | | | | — | | | | — | | | | — | |
Reinvestment of distributions | | | 459,195 | | | | 386,214 | | | | 3,424 | | | | 587 | |
Amount paid for shares redeemed | | | (3,707,148 | ) | | | (6,016,995 | ) | | | (356,670 | ) | | | (704,373 | ) |
Proceeds from redemption fees (b) | | | — | | | | 261 | | | | — | | | | 132 | |
Total Investor Class | | | (437,234 | ) | | | (3,278,755 | ) | | | 2,148,281 | | | | 3,585,856 | |
Net increase (decrease) in net assets resulting from capital transactions | | | (35,547,879 | ) | | | 19,977,090 | | | | 7,629,289 | | | | 10,098,994 | |
Total Increase in Net Assets | | | 2,853,749 | | | | 15,170,473 | | | | 10,608,165 | | | | 10,178,890 | |
Net Assets | | | | | | | | | | | | | | | | |
Beginning of period | | | 172,394,388 | | | | 157,223,915 | | | | 10,178,890 | | | | — | |
End of period | | $ | 175,248,137 | | | $ | 172,394,388 | | | $ | 20,787,055 | | | $ | 10,178,890 | |
Accumulated net investment income (loss) included in net assets at end of period | | $ | 186,203 | | | $ | 229,055 | | | $ | (25,143 | ) | | $ | — | |
| (a) | | Effective October 13, 2017, the outstanding Class A shares of the Dana Large Cap Equity Fund were exchanged for Class N shares of the Dana Large Cap Equity Fund and immediately following the class exchange Class N shares were re-designated as Investor Class shares. |
| (b) | | Prior to February 28, 2017, the Funds charged a 2.00% redemption fee on shares redeemed within 60 days of purchase. |
| (c) | | For the period November 3, 2015 (commencement of operations) through October 31, 2016. |
See accompanying notes which are an integral part of these financial statements.
19
Dana Funds
Statements of Changes in Net Assets (continued)
| | | | | | | | | | | | | | | | |
| | | Dana Large Cap Equity Fund | | | Dana Small Cap Equity Fund | |
| | | For the Year
Ended
October 31, 2017 | | | For the Year
Ended
October 31, 2016 | | | For the Year
Ended
October 31, 2017 | | | For the Period
Ended
October 31, 2016(c) | |
Share Transactions – Class A: (a) | | | | | | | | | | | | | |
Shares sold | | | 4,307 | | | | 22,982 | | | | | | | | | |
Shares redeemed in connection with class consolidation | | | (64,455 | ) | | | — | | | | | | | | | |
Shares issued in reinvestment of distributions | | | 835 | | | | 699 | | | | | | | | | |
Shares redeemed | | | (16,663 | ) | | | (93,562 | ) | | | | | | | | |
Total Class A | | | (75,976 | ) | | | (69,881 | ) | | | | | | | | |
Share Transactions – Institutional Class: | | | | | |
Shares sold | | | 2,049,462 | | | | 4,226,099 | | | | 628,613 | | | | 754,430 | |
Shares issued in reinvestment of distributions | | | 8,132 | | | | 9,607 | | | | 1,113 | | | | 313 | |
Shares redeemed | | | (3,965,578 | ) | | | (2,854,088 | ) | | | (110,673 | ) | | | (48,153 | ) |
Total Institutional Class | | | (1,907,984 | ) | | | 1,381,618 | | | | 519,053 | | | | 706,590 | |
Share Transactions – Investor Class: (a) | | | | | |
Shares sold | | | 66,528 | | | | 134,234 | | | | 240,680 | | | | 465,806 | |
Shares issued in connection with class consolidation | | | 64,333 | | | | — | | | | — | | | | — | |
Shares issued in reinvestment of distributions | | | 22,704 | | | | 21,807 | | | | 323 | | | | 61 | |
Shares redeemed | | | (184,163 | ) | | | (341,774 | ) | | | (33,941 | ) | | | (77,472 | ) |
Total Investor Class | | | (30,598 | ) | | | (185,733 | ) | | | 207,062 | | | | 388,395 | |
| (a) | | Effective October 13, 2017, the outstanding Class A shares of the Dana Large Cap Equity Fund were exchanged for Class N shares of the Dana Large Cap Equity Fund and immediately following the class exchange Class N shares were re-designated as Investor Class shares. |
| (c) | | For the period November 3, 2015 (commencement of operations) through October 31, 2016. |
See accompanying notes which are an integral part of these financial statements.
20
Dana Large Cap Equity Fund – Institutional Class
Financial Highlights
Selected data for a share outstanding throughout each period.
| | | | | | | | | | | | | | | | | | | | |
| | | Years Ended October 31, | | | Period
Ended
October 31,
2013(a) | |
| | | 2017 | | | 2016 | | | 2015 | | | 2014 | | |
Net asset value, at beginning of period | | | $17.67 | | | | $18.22 | | | | $18.52 | | | | $17.19 | | | | $17.14 | |
| | | | | | | | | | | | | | | | | | | | |
| | | | | |
Income from investment operations: | | | | | | | | | | | | | | | | | | | | |
| | | | | |
Net investment income | | | 0.32 | | | | 0.26 | (b) | | | 0.19 | | | | 0.26 | | | | — | (b)(c) |
| | | | | |
Net realized and unrealized gain (loss) on investments | | | 4.96 | | | | (0.56 | ) | | | 0.52 | (d) | | | 2.44 | | | | 0.05 | |
| | | | | | | | | | | | | | | | | | | | |
| | | | | |
Total from investment operations | | | 5.28 | | | | (0.30 | ) | | | 0.71 | | | | 2.70 | | | | 0.05 | |
| | | | | | | | | | | | | | | | | | | | |
| | | | | |
Distributions from: | | | | | | | | | | | | | | | | | | | | |
| | | | | |
Net investment income | | | (0.31 | ) | | | (0.25 | ) | | | (0.19 | ) | | | (0.25 | ) | | | — | |
| | | | | |
Net realized gain | | | — | | | | — | | | | (0.83 | ) | | | (1.12 | ) | | | — | |
| | | | | | | | | | | | | | | | | | | | |
| | | | | |
Total from distributions | | | (0.31 | ) | | | (0.25 | ) | | | (1.02 | ) | | | (1.37 | ) | | | — | |
| | | | | | | | | | | | | | | | | | | | |
| | | | | |
Redemption fees | | | — | (c) | | | — | (c) | | | 0.01 | | | | — | | | | — | |
| | | | | |
Net asset value, at end of period | | | $22.64 | | | | $17.67 | | | | $18.22 | | | | $18.52 | | | | $17.19 | |
| | | | | | | | | | | | | | | | | | | | |
| | | | | |
Total Return (e) | | | 30.11 | % | | | (1.66 | )% | | | 3.89 | % | | | 16.60 | % | | | 0.29 | %(f) |
| | | | | | | | | | | | | | | | | | | | |
Ratios/Supplemental Data: | | | | | | | | | | | | | | | | | | | | |
| | | | | |
Net assets at end of period (thousands) | | | $134,291 | | | | $138,540 | | | | $117,663 | | | | $6,919 | | | | $273 | |
| | | | | |
Before waiver: | | | | | | | | | | | | | | | | | | | | |
| | | | | |
Ratio of expenses to average net assets | | | 0.92 | % | | | 0.91 | % | | | 1.00 | % | | | 1.68 | % | | | 1.53 | %(g) |
| | | | | |
After waiver: | | | | | | | | | | | | | | | | | | | | |
| | | | | |
Ratio of expenses to average net assets | | | 0.74 | %(h) | | | 0.73 | % | | | 0.73 | % | | | 0.73 | % | | | 0.73 | %(g) |
| | | | | |
Ratio of net investment income to
average net assets | | | 1.48 | % | | | 1.45 | % | | | 1.25 | % | | | 1.34 | % | | | 0.49 | %(g) |
| | | | | |
Portfolio turnover (i) | | | 50 | % | | | 69 | % | | | 45 | % | | | 57 | % | | | 70 | %(f) |
| (a) | | The Dana Large Cap Equity Fund’s Institutional Class commenced operations on October 29, 2013. |
| (b) | | Per share net investment income has been determined on the basis of average shares outstanding during the period. |
| (c) | | The amount is less than $0.005 per share. |
| (d) | | The amount shown for a share outstanding throughout the period does not accord with the change in aggregate gains and losses in the portfolio of securities during the period because of the timing of sales and purchases of fund shares in relation to fluctuating market values during the period. |
| (e) | | Total return represents the rate that the investor would have earned or lost on an investment in the Fund, assuming reinvestment of distributions. |
| (h) | | This ratio includes the impact of overdraft fees. If this cost had been excluded, the ratio of expenses to average net assets would have been 0.73% for the fiscal year ended October 31, 2017. |
| (i) | | Portfolio turnover is calculated on the basis on the Fund as a whole without distinguishing among the classes of shares. |
See accompanying notes which are an integral part of these financial statements.
21
Dana Large Cap Equity Fund – Investor Class (formerly Class N)
Financial Highlights
Selected data for a share outstanding throughout each year.
| | | | | | | | | | | | | | | | | | | | |
| | | | | | Years Ended October 31, | |
| | | 2017 | | | 2016 | | | 2015 | | | 2014 | | | 2013 | |
Net asset value, at
beginning of year | | $ | 17.68 | | | $ | 18.23 | | | $ | 18.54 | | | $ | 17.19 | | | $ | 13.88 | |
| | | | | | | | | | | | | | | | | | | | |
| | | | | |
Income from investment operations: | | | | | | | | | | | | | | | | | | | | |
| | | | | |
Net investment income | | | 0.24 | | | | 0.22 | (a) | | | 0.18 | | | | 0.19 | | | | 0.21 | (a) |
| | | | | |
Net realized and unrealized gain (loss) on investments | | | 4.98 | | | | (0.57 | ) | | | 0.49 | (b) | | | 2.46 | | | | 3.40 | |
| | | | | | | | | | | | | | | | | | | | |
| | | | | |
Total from investment operations | | | 5.22 | | | | (0.35 | ) | | | 0.67 | | | | 2.65 | | | | 3.61 | |
| | | | | | | | | | | | | | | | | | | | |
| | | | | |
Distributions from: | | | | | | | | | | | | | | | | | | | | |
| | | | | |
Net investment income | | | (0.26 | ) | | | (0.20 | ) | | | (0.15 | ) | | | (0.18 | ) | | | (0.22 | ) |
| | | | | |
Net realized gain | | | — | | | | — | | | | (0.83 | ) | | | (1.12 | ) | | | (0.08 | ) |
| | | | | | | | | | | | | | | | | | | | |
| | | | | |
Total from distributions | | | (0.26 | ) | | | (0.20 | ) | | | (0.98 | ) | | | (1.30 | ) | | | (0.30 | ) |
| | | | | | | | | | | | | | | | | | | | |
| | | | | |
Redemption fees | | | — | | | | — | (c) | | | — | (c) | | | — | (c) | | | — | (c) |
| | | | | |
Net asset value, at
end of year | | $ | 22.64 | | | $ | 17.68 | | | $ | 18.23 | | | $ | 18.54 | | | $ | 17.19 | |
| | | | | | | | | | | | | | | | | | | | |
| | | | | |
Total Return (d) | | | 29.72 | % | | | (1.91 | )% | | | 3.61 | % | | | 16.23 | % | | | 26.35 | % |
| | | | | | | | | | | | | | | | | | | | |
Ratios/Supplemental Data: | | | | | | | | | | | | | | | | | | | | |
| | | | | |
Net assets at end of year (thousands) | | $ | 40,957 | | | $ | 32,514 | | | $ | 36,909 | | | $ | 29,197 | | | $ | 18,306 | |
| | | | | |
Before waiver | | | | | | | | | | | | | | | | | | | | |
| | | | | |
Ratio of expenses to average net assets | | | 1.17 | % | | | 1.16 | % | | | 1.25 | % | | | 1.93 | % | | | 1.99 | % |
| | | | | |
After waiver | | | | | | | | | | | | | | | | | | | | |
| | | | | |
Ratio of expenses to average net assets | | | 0.99 | %(e) | | | 0.98 | % | | | 0.98 | % | | | 0.98 | % | | | 0.98 | % |
| | | | | |
Ratio of net investment income to average net assets | | | 1.20 | % | | | 1.22 | % | | | 1.00 | % | | | 1.09 | % | | | 1.33 | % |
| | | | | |
Portfolio turnover (f) | | | 50 | % | | | 69 | % | | | 45 | % | | | 57 | % | | | 70 | % |
| (a) | | Per share net investment income has been determined on the basis of average shares outstanding during the year. |
| (b) | | The amount shown for a share outstanding throughout the year does not accord with the change in aggregate gains and losses in the portfolio of securities during the year because of the timing of sales and purchases of fund shares in relation to fluctuating market values during the year. |
| (c) | | The amount is less than $0.005 per share. |
| (d) | | Total return represents the rate that the investor would have earned or lost on an investment in the Fund, assuming reinvestment of distributions. |
| (e) | | This ratio includes the impact of overdraft fees. If this cost had been excluded, the ratio of expenses to average net assets would have been 0.98% for the fiscal year ended October 31, 2017. |
| (f) | | Portfolio turnover is calculated on the basis on the Fund as a whole without distinguishing among the classes of shares. |
See accompanying notes which are an integral part of these financial statements.
22
Dana Small Cap Equity Fund – Institutional Class
Financial Highlights
Selected data for a share outstanding throughout each period.
| | | | | | | | |
| | | Year
Ended
October 31,
2017 | | | Period
Ended
October 31,
2016(a) | |
Net asset value, at beginning of period | | | $9.30 | | | | $10.00 | |
| | | | | | | | |
| | |
Income from investment operations: | | | | | | | | |
| | |
Net investment income | | | — | (b) | | | 0.01 | |
| | |
Net realized and unrealized gain (loss) on investments | | | 2.14 | | | | (0.70 | )(c) |
| | | | | | | | |
| | |
Total from investment operations | | | 2.14 | | | | (0.69 | ) |
| | | | | | | | |
| | |
Distributions from: | | | | | | | | |
| | |
Net investment income | | | (0.01 | ) | | | (0.01 | ) |
| | | | | | | | |
| | |
Total from distributions | | | (0.01 | ) | | | (0.01 | ) |
| | | | | | | | |
| | |
Redemption fees | | | — | | | | — | (b) |
| | |
Net asset value, at end of period | | | $11.43 | | | | $9.30 | |
| | | | | | | | |
| | |
Total Return (d) | | | 23.08 | % | | | (6.87 | )%(e) |
| | | | | | | | |
Ratios/Supplemental Data: | | | | | | | | |
| | |
Net assets at end of period (thousands) | | | $14,011 | | | | $6,575 | |
| | |
Before waiver: | | | | | | | | |
| | |
Ratio of expenses to average net assets | | | 2.02 | % | | | 4.11 | %(f) |
| | |
After waiver: | | | | | | | | |
| | |
Ratio of expenses to average net assets | | | 0.95 | % | | | 0.95 | %(f) |
| | |
Ratio of net investment income to average net assets | | | — | % | | | 0.12 | %(f) |
| | |
Portfolio turnover (g) | | | 58 | % | | | 54 | %(e) |
| (a) | | For the period November 3, 2015 (commencement of operations) through October 31, 2016. |
| (b) | | The amount is less than $0.005 per share. |
| (c) | | The amount shown for a share outstanding throughout the period does not accord with the change in aggregate gains and losses in the portfolio of securities during the period because of the timing of sales and purchases of fund shares in relation to fluctuating market values during the period. |
| (d) | | Total return represents the rate that the investor would have earned or lost on an investment in the Fund, assuming reinvestment of distributions. |
| (g) | | Portfolio turnover is calculated on the basis on the Fund as a whole without distinguishing among the classes of shares. |
See accompanying notes which are an integral part of these financial statements.
23
Dana Small Cap Equity Fund – Investor Class
Financial Highlights
Selected data for a share outstanding throughout each period.
| | | | | | | | |
| | | Year
Ended
October 31,
2017 | | | Period
Ended
October 31,
2016(a) | |
Net asset value, at beginning of period | | | $9.28 | | | | $10.00 | |
| | | | | | | | |
| | |
Income from investment operations: | | | | | | | | |
| | |
Net investment income (loss) | | | (0.02 | ) | | | — | (b) |
| | |
Net realized and unrealized gain (loss) on investments | | | 2.13 | | | | (0.71 | )(c) |
| | | | | | | | |
| | |
Total from investment operations | | | 2.11 | | | | (0.71 | ) |
| | | | | | | | |
| | |
Distributions from: | | | | | | | | |
| | |
Net investment income | | | (0.01 | ) | | | (0.01 | ) |
| | | | | | | | |
| | |
Total from distributions | | | (0.01 | ) | | | (0.01 | ) |
| | | | | | | | |
| | |
Redemption fees | | | — | | | | — | (b) |
| | |
Net asset value, at end of period | | | $11.38 | | | | $9.28 | |
| | | | | | | | |
| | |
Total Return (d) | | | 22.73 | % | | | (7.13 | )%(e) |
| | | | | | | | |
Ratios/Supplemental Data: | | | | | | | | |
| | |
Net assets at end of period (thousands) | | | $6,776 | | | | $3,604 | |
| | |
Before waiver: | | | | | | | | |
| | |
Ratio of expenses to average net assets | | | 2.27 | % | | | 4.53 | %(f) |
| | |
After waiver: | | | | | | | | |
| | |
Ratio of expenses to average net assets | | | 1.20 | % | | | 1.20 | %(f) |
| | |
Ratio of net investment loss to average net assets | | | (0.25 | )% | | | (0.10 | )%(f) |
| | |
Portfolio turnover (g) | | | 58 | % | | | 54 | %(e) |
| (a) | | For the period November 3, 2015 (commencement of operations) through October 31, 2016. |
| (b) | | The amount is less than $0.005 per share. |
| (c) | | The amount shown for a share outstanding throughout the period does not accord with the change in aggregate gains and losses in the portfolio of securities during the period because of the timing of sales and purchases of fund shares in relation to fluctuating market values during the period. |
| (d) | | Total return represents the rate that the investor would have earned or lost on an investment in the Fund, assuming reinvestment of distributions. |
| (g) | | Portfolio turnover is calculated on the basis on the Fund as a whole without distinguishing among the classes of shares. |
See accompanying notes which are an integral part of these financial statements.
24
Dana Funds
Notes to the Financial Statements
October 31, 2017
NOTE 1. ORGANIZATION
The Dana Large Cap Equity Fund (the “Large Cap Fund”) and the Dana Small Cap Equity Fund (the “Small Cap Fund”) (each a “Fund” and collectively, the “Funds”) are each an open-end diversified series of Valued Advisers Trust (the “Trust”). The Trust is a management investment company established under the laws of Delaware by an Agreement and Declaration of Trust dated June 13, 2008 (the “Trust Agreement”). The Trust Agreement permits the Board of Trustees (“Board”) to issue an unlimited number of shares of beneficial interest of separate series without par value. Each Fund is one of a series of funds currently authorized by the Board. The investment adviser to the Funds is Dana Investment Advisors, Inc. (the “Adviser”). Each Fund seeks long-term growth of capital.
The Large Cap Fund and Small Cap Fund currently offer Investor Class shares and Institutional Class shares. Effective on the close of business on October 13, 2017, Class A shares were consolidated into Class N shares of the Large Cap Fund which was subsequently re-designated Investor Class shares. Each share represents an equal proportionate interest in the assets and liabilities belonging to the Fund and is entitled to such dividends and distributions out of income belonging to the Fund as declared by the Board. Prior to February 28, 2017, all share classes imposed a 2.00% redemption fee on shares redeemed within 60 days of purchase.
NOTE 2. SIGNIFICANT ACCOUNTING POLICIES
The Funds are investment companies and follow accounting and reporting guidance under Financial Accounting Standards Board Accounting Standards Codification (“ASC”) Topic 946, “Financial Services-Investment Companies”. The following is a summary of significant accounting policies followed by the Funds in the preparation of their financial statements. These policies are in conformity with the generally accepted accounting principles in the United States of America (“GAAP”).
Estimates – The preparation of financial statements in conformity with GAAP requires management to make estimates and assumptions that affect the reported amounts of assets and liabilities and disclosure of contingent assets and liabilities at the date of the financial statements and the reported amounts of increases and decreases in net assets from operations during the reporting period. Actual results could differ from those estimates.
Securities Valuation – All investments in securities are recorded at their estimated fair value as described in Note 3.
Federal Income Taxes – The Funds make no provision for federal income or excise tax. Each Fund has qualified and intends to qualify each year as a regulated investment company (“RIC”) under subchapter M of the Internal Revenue Code of 1986, as amended, by complying with the requirements applicable to RICs and by distributing substantially all of its taxable income. Each Fund also intends to distribute sufficient net investment income and net capital gains, if any, so that it will not be subject to excise tax on undistributed income and gains. If the required amount of net investment income or gains is not distributed, the Fund could incur a tax expense.
25
Dana Funds
Notes to the Financial Statements (continued)
October 31, 2017
For the fiscal year ended October 31, 2017, the Funds did not have a liability for any unrecognized tax benefits. The Funds recognize interest and penalties, if any, related to unrecognized tax benefits as income tax expense on the statements of operations when incurred. During the period, the Funds did not incur any interest or penalties.
Expenses – Expenses incurred by the Trust that do not relate to a specific fund of the Trust are allocated to the individual funds based on each fund’s relative net assets or other appropriate basis. Expenses attributable to any class are borne by that class. Income, realized gains and losses, unrealized appreciation and depreciation, and expenses are allocated to each class based on the net assets in relation to the relative net assets of the Fund.
Security Transactions and Related Income – The Funds follow industry practice and record security transactions on the trade date for financial reporting purposes. The specific identification method is used for determining gains or losses for financial statement and income tax purposes. Dividend income is recorded on the ex-dividend date and interest income is recorded on an accrual basis. Discounts and premiums on securities purchased are accreted or amortized using the effective interest method, if applicable. Withholding taxes on foreign dividends have been provided for in accordance with the Funds’ understanding of the applicable country’s tax rules and rates.
Dividends and Distributions – Distributions to shareholders, which are determined in accordance with income tax regulations, are recorded on the ex-dividend date. The Funds intend to distribute substantially all of their net investment income quarterly. The Funds intend to distribute their net realized long-term and short-term capital gains, if any, annually. The treatment for financial reporting purposes of distributions made to shareholders during the year from net investment income or net realized capital gains may differ from their ultimate treatment for federal income tax purposes. These differences are caused primarily by differences in the timing of the recognition of certain components of income, expense or realized capital gain for federal income tax purposes. Where such differences are permanent in nature, they are reclassified in the components of the net assets based on their ultimate characterization for federal income tax purposes. Any such reclassifications will have no effect on net assets, results of operations or net asset value (“NAV”) per share of the Funds. For the fiscal year ended October 31, 2017, the Fund made the following reclassifications to increase (decrease) the components of net assets:
| | | | | | | | | | |
| | | Paid-in Capital | | Accumulated Undistributed Net Investment Income | | | Accumulated Net Realized Loss from Investments | |
Small Cap Fund | | $(4,139) | | $ | 3,930 | | | $ | 209 | |
NOTE 3. SECURITIES VALUATION AND FAIR VALUE MEASUREMENTS
Fair value is defined as the price that a Fund would receive upon selling an investment in a timely transaction to an independent buyer in the principal or most advantageous market of the investment. GAAP establishes a three-tier hierarchy to maximize the use of observable market data and minimize the use of unobservable inputs and to establish classification of fair value measurements for disclosure purposes.
26
Dana Funds
Notes to the Financial Statements (continued)
October 31, 2017
Inputs refer broadly to the assumptions that market participants would use in pricing the asset or liability, including assumptions about risk (the risk inherent in a particular valuation technique used to measure fair value including such a pricing model and/or the risk inherent in the inputs to the valuation technique). Inputs may be observable or unobservable. Observable inputs are inputs that reflect the assumptions market participants would use in pricing the asset or liability developed based on market data obtained and available from sources independent of the reporting entity. Unobservable inputs are inputs that reflect the reporting entity’s own assumptions about the assumptions market participants would use in pricing the asset or liability developed based on the best information available in the circumstances.
Various inputs are used in determining the value of the Funds’ investments. These inputs are summarized in the three broad levels listed below.
| | • | | Level 1 – unadjusted quoted prices in active markets for identical investments and/or registered investment companies where the value per share is determined and published and is the basis for current transactions for identical assets or liabilities at the valuation date |
| | • | | Level 2 – other significant observable inputs (including, but not limited to, quoted prices for an identical security in an inactive market, quoted prices for similar securities, interest rates, prepayment speeds, credit risk, etc.) |
| | • | | Level 3 – significant unobservable inputs (including the Funds’ own assumptions in determining fair value of investments based on the best information available) |
The inputs used to measure fair value may fall into different levels of the fair value hierarchy. In such cases, for disclosure purposes, the level in the fair value hierarchy which is reported, is determined based on the lowest level input that is significant to the fair value measurement in its entirety.
Equity securities that are traded on any stock exchange are generally valued at the last quoted sale price on the security’s primary exchange. Lacking a last sale price, an exchange traded security is generally valued at its last bid price. Securities traded in the NASDAQ over-the-counter market are generally valued at the NASDAQ Official Closing Price. When using the market quotations and when the market is considered active, the security is classified as a Level 1 security. In the event that market quotations are not readily available or are considered unreliable due to market or other events, the Fund values its securities and other assets at fair value in accordance with policies established by and under the general supervision of the Board. Under these policies, the securities will be classified as Level 2 or 3 within the fair value hierarchy, depending on the inputs used.
Investments in mutual funds, including money market mutual funds, are generally priced at the ending NAV. These securities are categorized as Level 1 securities.
In accordance with the Trust’s valuation policies, the Adviser is required to consider all appropriate factors relevant to the value of securities for which it has determined other pricing sources are not available or reliable as described above. No single method exists for determining fair value, because fair value depends upon the circumstances of each individual case. As a general principle, the current fair value of a security being valued by the Adviser would be the amount that the Fund might reasonably expect to receive upon the current sale.
27
Dana Funds
Notes to the Financial Statements (continued)
October 31, 2017
Methods that are in accordance with this principle may, for example, be based on (i) a multiple of earnings; (ii) a discount from market prices of a similar freely traded security (including a derivative security or a basket of securities traded on other markets, exchanges or among dealers); or (iii) yield to maturity with respect to debt issues, or a combination of these and other methods. Fair-value pricing is permitted if, in the Adviser’s opinion, the validity of market quotations appears to be questionable based on factors such as evidence of a thin market in the security based on a small number of quotations, a significant event occurs after the close of a market but before a Fund’s NAV calculation that may affect a security’s value, or the Adviser is aware of any other data that calls into question the reliability of market quotations.
The following is a summary of the inputs used to value the Funds’ investments as of October 31, 2017:
| | | | | | | | | | | | | | | | |
| Large Cap Fund | | Valuation Inputs | | | | |
| Assets | | Level 1 | | | Level 2 | | | Level 3 | | | Total | |
Common Stocks* | | $ | 172,550,069 | | | $ | – | | | $ | – | | | $ | 172,550,069 | |
Short-Term Investments | | | 2,116,603 | | | | – | | | | – | | | | 2,116,603 | |
Total | | $ | 174,666,672 | | | $ | – | | | $ | – | | | $ | 174,666,672 | |
| | | | | | | | | | | | | | | | |
| Small Cap Fund | | Valuation Inputs | | | | |
| Assets | | Level 1 | | | Level 2 | | | Level 3 | | | Total | |
Common Stocks* | | $ | 20,458,874 | | | $ | – | | | $ | – | | | $ | 20,458,874 | |
Short-Term Investments | | | 171,273 | | | | – | | | | – | | | | 171,273 | |
Total | | $ | 20,630,147 | | | $ | – | | | $ | – | | | $ | 20,630,147 | |
| * | | Refer to Schedule of Investments for sector classifications. |
The Funds did not hold any investments at the end of the reporting period for which other significant observable inputs (Level 2) were used in determining fair value. The Funds did not hold any investments during the reporting period for which significant unobservable inputs (Level 3) were used in determining fair value; therefore, no reconciliation of Level 3 securities is included for this reporting period. The Funds did not hold any derivative instruments during the reporting period.
The Trust recognizes transfers between fair value hierarchy levels at the end of the reporting period. There were no transfers between any levels as of October 31, 2017 based on input levels assigned at October 31, 2016.
NOTE 4. FEES AND OTHER TRANSACTIONS WITH AFFILIATES
The Adviser, under the terms of the management agreement for each Fund, manages the Funds’ investments subject to oversight of the Board. As compensation for its management services, the Funds are obligated to pay the Adviser a fee computed and accrued daily and paid monthly at an annual rate of 0.70% and 0.80% of the average daily net assets of the Large Cap Fund and the Small Cap Fund, respectively. For the fiscal year ended October 31, 2017, the Adviser earned fees of $1,039,462 from the Large Cap Fund and $126,457 from the Small Cap Fund before the waivers
28
Dana Funds
Notes to the Financial Statements (continued)
October 31, 2017
described below. At October 31, 2017, the Large Cap Fund owed the Adviser $79,249 and the Adviser owed the Small Cap Fund $251.
The Adviser has contractually agreed to waive its management fee and/or reimburse certain operating expenses through February 28, 2018, but only to the extent necessary so that the Funds’ net expenses, excluding brokerage fees and commissions, borrowing costs (such as interest and dividend expenses on securities sold short), taxes, extraordinary expenses, fees and expenses paid under a distribution plan adopted pursuant to Rule 12b-1, fees and expenses paid under a shareholder services plan, and indirect expenses (such as “acquired funds fees and expenses”) do not exceed 0.73% for Institutional Class and Investor Class for the Large Cap Fund and do not exceed 0.95% for the Institutional Class and Investor Class for the Small Cap Fund.
Each fee waiver or expense reimbursement by the Adviser is subject to repayment by the applicable Fund within the three fiscal years following the date in which the fee waiver or expense reimbursement occurred, provided that the Fund is able to make the repayment without exceeding the expense limitation that is in effect at the time of the repayment or at the time of the fee waiver or expense reimbursement, whichever is lower. The contractual agreement is in effect through February 28, 2018. The expense cap may not be terminated prior to this date except by the Board. For the fiscal year ended October 31, 2017, the Adviser waived fees of $277,301 from the Large Cap Fund and $170,116 from the Small Cap Fund. As of October 31, 2017, the Adviser may seek repayment of investment advisory fee waivers and expense reimbursements of $858,754 and $323,924 from the Large Cap Fund and Small Cap Fund, respectively, pursuant to the aforementioned conditions, no later than October 31, 2020.
The Trust retains Ultimus Asset Services, LLC (the “Administrator”), to provide the Funds with administration, compliance, fund accounting, and transfer agent services, including all regulatory reporting. Expenses incurred by the Funds for these services are allocated to the individual Funds based on each Fund’s relative net assets.
The officers and one trustee of the Trust are members of management and/or employees of the Administrator. Unified Financial Securities, LLC (the “Distributor”) acts as the principal distributor of the Funds’ shares. For the fiscal year ended October 31, 2017, fees for administration and compliance, fund accounting, and transfer agent services, and amounts due to the Administrator at October 31, 2017 were as follows:
| | | | | | | | |
| | | Large Cap
Fund | | | Small Cap
Fund | |
Administration | | $ | 82,388 | | | $ | 38,000 | |
Fund accounting | | | 47,263 | | | | 30,000 | |
Transfer agent | | | 29,542 | | | | 22,725 | |
Payable to Administrator | | | 15,297 | | | | 7,192 | |
The Trust, with respect to each Fund, has adopted a Distribution Plan (the “Plan”) pursuant to Rule 12b-1 under the Investment Company Act of 1940 (the “1940 Act”). The Plan provides that the Funds will pay the Distributor and any registered securities dealer, financial institution or any other person (a “Recipient”) a shareholder servicing fee aggregating at a rate of 0.25% of the average
29
Dana Funds
Notes to the Financial Statements (continued)
October 31, 2017
daily net assets for the Investor Class shares in connection with the promotion and distribution of the Funds’ shares or the provision of personal services to shareholders, including, but not necessarily limited to, advertising, compensation to underwriters, dealers and selling personnel, the printing and mailing of prospectuses to other than current Fund shareholders, the printing and mailing of sales literature and servicing shareholder accounts. The Funds, or the Adviser, may pay all, or a portion, of these fees to any Recipient who renders assistance in distributing or promoting the sale of shares, or who provides certain shareholder services, pursuant to a written agreement. The Plan is a compensation plan, which means that compensation is paid regardless of 12b-1 expenses actually incurred. It is anticipated that the Plan will benefit shareholders because an effective sales program typically is necessary in order for the Fund to reach and maintain a sufficient size to achieve efficiently its investment objectives and to realize economies of scale. For the fiscal year ended October 31, 2017, Investor Class and Class A shares 12b-1 expense incurred by the Large Cap Fund was $90,441 and $3,335, respectively and Investor Class shares 12b-1 expense incurred by the Small Cap Fund was $14,090. The Large Cap Fund owed $8,483 and $161 for Investor Class and Class A shares for 12b-1 fees, respectively, as of October 31, 2017 and the Small Cap Fund owed $1,424 for Investor Class shares 12b-1 fees as of October 31, 2017.
During the fiscal year ended October 31, 2017, there were no commissions earned on sales of Class A shares of the Large Cap Fund.
NOTE 5. PURCHASES AND SALES OF SECURITIES
For the fiscal year ended October 31, 2017, purchases and sales of investment securities, other than short-term investments were as follows:
| | | | | | | | |
| | | Large Cap
Fund | | | Small Cap
Fund | |
Purchases | | | | | | | | |
U.S. Government Obligations | | $ | – | | | $ | – | |
Other | | | 73,662,511 | | | | 16,330,991 | |
Sales | | | | | | | | |
U.S. Government Obligations | | $ | – | | | $ | – | |
Other | | | 110,394,210 | | | | 8,979,537 | |
NOTE 6. BENEFICIAL OWNERSHIP
The beneficial ownership, either directly or indirectly, of more than 25% of the voting securities of a fund creates a presumption of control of a fund, under Section 2(a)(9) of the 1940 Act. At October 31, 2017, Charles Schwab & Co., Inc. (“Schwab”) owned, as record shareholder for the beneficial owners of such shares, 59% and 63% of the outstanding shares of the Large Cap Fund and Small Cap Fund, respectively.
30
Dana Funds
Notes to the Financial Statements (continued)
October 31, 2017
NOTE 7. FEDERAL TAX INFORMATION
At October 31, 2017, the net unrealized appreciation (depreciation) of investments for tax purposes was as follows:
| | | | | | | | |
| | | Large Cap
Fund | | | Small Cap
Fund | |
Gross Unrealized Appreciation | | $ | 34,098,866 | | | $ | 3,604,146 | |
Gross Unrealized Depreciation | | | (2,234,302 | ) | | | (308,628 | ) |
Net Unrealized Appreciation | | $ | 31,864,564 | | | $ | 3,295,518 | |
At October 31, 2017, the aggregate cost of securities for federal income tax purposes was $142,802,108 for the Large Cap Fund and $17,334,629 for the Small Cap Fund.
At October 31, 2017, the difference between book basis and tax basis unrealized appreciation for the Large Cap Fund and Small Cap Fund was attributable primarily to the tax deferral of losses on wash sales and the return of capital adjustments from real estate investment trusts.
On December 27, 2017, the Large Cap Fund paid income distributions of $0.088886 and $0.073258 for Institutional Class and Investor Class, respectively. The Large Cap Fund also paid long-term capital gain distribution of $0.737613 per share to shareholders of record.
On December 27, 2017, the Small Cap Fund paid an income distribution of $0.003301 for Institutional Class.
At October 31, 2017, the Funds’ most recent fiscal year end, the components of distributable earnings (accumulated losses) on a tax basis was as follows:
| | | | | | | | |
| | | Large Cap
Fund | | | Small Cap
Fund | |
Undistributed Ordinary Income | | $ | 186,203 | | | $ | – | |
Undistributed Long-Term Capital Gains | | | 6,365,260 | | | | — | |
Accumulated Capital and Other Losses | | | – | | | | (230,776 | ) |
Unrealized Appreciation (Depreciation) | | | 31,864,564 | | | | 3,295,518 | |
Total Accumulated Earnings (Deficit) | | $ | 38,416,027 | | | $ | 3,064,742 | |
The tax character of distributions for the fiscal years ended October 31, 2017 and October 31, 2016 were as follows:
| | | | | | | | | | | | | | | | |
| | | Large Cap
Fund | | | Small Cap
Fund | |
| | | 2017 | | | 2016 | | | 2017 | | | 2016 | |
Distributions paid from: | | | | | | | | | | | | | | | | |
Ordinary Income | | $ | 2,137,155 | | | $ | 2,373,908 | | | $ | 11,650 | | | $ | 2,906 | |
Return of Capital | | | — | | | | – | | | | 3,993 | | | | 1,826 | |
| | | $ | 2,137,155 | | | $ | 2,373,908 | | | $ | 15,643 | | | $ | 4,732 | |
31
Dana Funds
Notes to the Financial Statements (continued)
October 31, 2017
As of October 31, 2017, the Small Cap Fund had available for tax purposes unused capital loss carryforwards of $203,266 of short-term capital losses with no expiration, which is available to offset against future taxable net capital gains. To the extent that these carryforwards are used to offset future gains, it is probable that the amount offset will not be distributed to shareholders.
During the fiscal year ended October 31, 2017, the Large Cap Fund and the Small Cap Fund utilized short-term capital loss carryforwards in the amount of $6,777,950 and $62,524, respectively.
For the tax year ended October 31, 2017, the Small Cap Fund deferred Qualified Late Year Ordinary losses of $27,510.
NOTE 8. COMMITMENTS AND CONTIGENCIES
The Funds indemnify their officers and trustees for certain liabilities that may arise from performance of their duties to the Funds. Additionally, in the normal course of business, the Funds enter into contracts that contain a variety of representations and warranties which provide general indemnifications. The Funds’ maximum exposure under these arrangements is unknown, as this would involve future claims that may be made against the Funds that have not yet occurred.
NOTE 9. SUBSEQUENT EVENTS
Management of the Funds has evaluated the need for disclosures and/or adjustments resulting from subsequent events through the date these financial statements were issued. Management has determined there were no items requiring adjustment of the financial statements or additional disclosure.
32
Report of Independent Registered Public Accounting Firm
To the Shareholders of Dana Funds and
Board of Trustees of Valued Advisers Trust
We have audited the accompanying statements of assets and liabilities, including the schedules of investments, of the Dana Funds, comprising Dana Large Cap Equity Fund and Dana Small Cap Equity Fund (the “Funds”), each a series of Valued Advisers Trust, as of October 31, 2017, and the related statements of operations for the year then ended, the statements of changes in net assets for each of the two years in the period then ended, and the financial highlights for each of the five periods in the period then ended for Dana Large Cap Equity Fund, and the related statements of operations for the year then ended, the statements of changes in net assets for each of the two periods in the period then ended, and the financial highlights for each of the two periods in the period then ended for Dana Small Cap Equity Fund. These financial statements and financial highlights are the responsibility of the Funds’ management. Our responsibility is to express an opinion on these financial statements and financial highlights based on our audits.
We conducted our audits in accordance with the standards of the Public Company Accounting Oversight Board (United States). Those standards require that we plan and perform the audit to obtain reasonable assurance about whether the financial statements and financial highlights are free of material misstatement. An audit includes examining, on a test basis, evidence supporting the amounts and disclosures in the financial statements. Our procedures included confirmation of securities owned as of October 31, 2017, by correspondence with the custodian and brokers. An audit also includes assessing the accounting principles used and significant estimates made by management, as well as evaluating the overall financial statement presentation. We believe that our audits provide a reasonable basis for our opinion.
In our opinion, the financial statements and financial highlights referred to above present fairly, in all material respects, the financial position of each of the Funds constituting Dana Funds as of October 31, 2017, the results of their operations for the year then ended, the changes in their net assets for each of the two years or periods in the period then ended, and the financial highlights for each of the periods presented, in conformity with accounting principles generally accepted in the United States of America.
COHEN & COMPANY, LTD.
Cleveland, Ohio
December 27, 2017
33
Summary of Fund Expenses (Unaudited)
As a shareholder of one of the Funds, you incur two types of costs: (1) transaction costs and (2) ongoing costs, including management fees; and other Fund expenses. These examples are intended to help you understand your ongoing costs (in dollars) of investing in each Fund and to compare these costs with the ongoing costs of investing in other mutual funds. Each Fund’s example is based on an investment of $1,000 invested at the beginning of the period and held for the entire period from May 1, 2017 through October 31, 2017.
Actual Expenses
The first line of the table for each class provides information about actual account values and actual expenses. You may use the information in these lines, together with the amount you invested, to estimate the expenses that you paid over the period. Simply divide your account value by $1,000 (for example, an $8,600 account value divided by $1,000 = 8.60), then multiply the result by the number in the first line under the heading “Expenses Paid During Period” to estimate the expenses you paid on your account during this period.
Hypothetical Example for Comparison Purposes
The second line of the table for each class provides information about hypothetical account values and hypothetical expenses based on each Fund’s actual expense ratios and an assumed rate of return of 5% per year before expenses, which is not the Fund’s actual return. The hypothetical account values and expenses may not be used to estimate the actual ending account balances or expenses you paid for the period. You may use this information to compare the ongoing costs of investing in the Funds and other funds. To do so, compare this 5% hypothetical example with the 5% hypothetical examples that appear in the shareholder reports of the other funds.
Expenses shown in the table are meant to highlight your ongoing costs only and do not reflect any transactional costs. Therefore, the second line of the table for each class is useful in comparing ongoing costs only and will not help you determine the relative total costs of owning different funds. In addition, if transaction costs were included, your costs would have been higher.
34
Summary of Fund Expenses (Unaudited) (continued)
| | | | | | | | | | | | | | | | | | | | |
| | | | | | Beginning
Account
Value,
May 1, 2017 | | | Ending Account
Value,
October 31, 2017 | | | Expenses
Paid
During
Period(a) | | | Annualized
Expense
Ratio | |
Dana Large Cap Equity Fund | | | | | | | | | | | | | |
Institutional Class | | | Actual | | | $ | 1,000.00 | | | $ | 1,115.00 | | | $ | 3.89 | | | | 0.73 | % |
| | | | | | | | | | | | | | | | | | | | |
| | | Hypothetical | (b) | | $ | 1,000.00 | | | $ | 1,021.52 | | | $ | 3.72 | | | | 0.73 | % |
| | | | | | | | | | | | | | | | | | | | |
Investor Class | | | Actual | | | $ | 1,000.00 | | | $ | 1,113.60 | | | $ | 5.22 | | | | 0.98 | % |
| | | | | | | | | | | | | | | | | | | | |
| | | Hypothetical | (b) | | $ | 1,000.00 | | | $ | 1,020.26 | | | $ | 4.99 | | | | 0.98 | % |
| | | | | |
| | | | | | Beginning
Account
Value,
May 1, 2017 | | | Ending Account
Value,
October 31, 2017 | | | Expenses
Paid
During
Period(a) | | | Annualized
Expense
Ratio | |
Dana Small Cap Equity Fund | | | | | | | | | | | | | | | | | |
Institutional Class | | | Actual | | | $ | 1,000.00 | | | $ | 1,075.30 | | | $ | 4.94 | | | | 0.95 | % |
| | | | | | | | | | | | | | | | | | | | |
| | | Hypothetical | (b) | | $ | 1,000.00 | | | $ | 1,020.42 | | | $ | 4.84 | | | | 0.95 | % |
| | | | | | | | | | | | | | | | | | | | |
Investor Class | | | Actual | | | $ | 1,000.00 | | | $ | 1,074.60 | | | $ | 6.24 | | | | 1.20 | % |
| | | | | | | | | | | | | | | | | | | | |
| | | Hypothetical | (b) | | $ | 1,000.00 | | | $ | 1,019.16 | | | $ | 6.11 | | | | 1.20 | % |
| (a) | | Expenses are equal to the Fund’s annualized expense ratios, multiplied by the average account value over the period, multiplied by 184/365 (to reflect the one-half year period). The annualized expense ratios reflect reimbursement of expenses by the Fund’s investment adviser for the period beginning May 1, 2017 to October 31, 2017. The “Financial Highlights” tables in the Fund’s financial statements, included in this report, also show the gross expense ratios, without such reimbursements. |
| (b) | | Hypothetical assumes 5% annual return before expenses. |
35
Additional Federal Income Tax Information (Unaudited)
The Form 1099-DIV you receive in January 2018 will show the tax status of all distributions paid to your account in calendar year 2017. Shareholders are advised to consult their own tax adviser with respect to the tax consequences of their investment in a Fund. As required by the Internal Revenue Code and/or regulations, shareholders must be notified regarding the status of qualified dividend income for individuals and the dividends received deduction for corporations.
Qualified Dividend Income. The Large Cap Fund and Small Cap Fund designates approximately 100% and 100%, respectively, or up to the maximum amount of such dividends allowable pursuant to the Internal Revenue Code, as qualified dividend income eligible for the reduced tax rate of 15%.
Dividends Received Deduction. Corporate shareholders are generally entitled to take the dividends received deduction on the portion of the Fund’s dividend distribution that qualifies under tax law. For the Large Cap Fund’s and Small Cap Fund’s calendar year 2017 ordinary income dividends, 100% and 100%, respectively, qualifies for the corporate dividends received deduction.
Trustees and Officers (Unaudited)
The Board of Trustees supervises the business activities of the Trust. Each Trustee serves as a trustee until termination of the Trust unless the Trustee dies, resigns, retires or is removed.
The following table provides information regarding each of the independent trustees.
| | | | |
Name, Address*, Age,
Position with Trust**,
Term of Position with Trust | | Principal Occupation
During Past 5 Years
and Other Directorships | | Other Directorships |
Andrea N. Mullins, 50
Independent Trustee
Since December 2013 Chairperson
since March 2017 | | Current: Private investor; Independent Contractor, SWM Wealth Management, LLC (since April 2014). | | None. |
Ira P. Cohen, 58
Independent Trustee
Since June 2010 | | Current: Independent financial services consultant (since February 2005); Executive Vice President of Asset Management Services, Recognos Financial (since August 2015). | | Trustee, Griffin Institutional Access Credit Fund (since January 2017); Trustee and Audit Committee Chairman, Griffin Institutional Real Estate Access Fund (since May 2014); Trustee, Chairman, and Nominating and Governance Committee Chairman, Angel Oak Strategic Credit Fund (since December 2017); Trustee, Angel Oak Funds Trust (since October 2014); Chairman (since April 2017). |
| * | | The address for each trustee and officer is 225 Pictoria Drive, Suite 450, Cincinnati, Ohio 45246. |
| ** | | As of the date of this report, the Trust consists of 13 series. |
36
The following table provides information regarding the Trustee who is considered an “interested person” of the Trust, as that term is defined under the 1940 Act. Based on the experience of the Trustee, the Trust concluded that the individual described below should serve as a Trustee.
| | | | |
Name, Address*, Age,
Position with Trust**,
Term of Position with Trust | | Principal Occupation
During Past 5 Years | | Other Directorships |
Mark J. Seger, 55 Trustee Since March 2017 | | Current: President, Managing Director, and Co-Founder, Ultimus Fund Solutions, LLC (since 1999); Treasurer and Managing Director, Ultimus Fund Distributors, LLC (since 1999); President and Managing Director, Ultimus Asset Services, LLC (since 2016). | | None. |
| * | | The address for each trustee and officer is 225 Pictoria Drive, Suite 450, Cincinnati, Ohio 45246. |
| ** | | As of the date of this report, the Trust consists of 13 series. |
The following table provides information regarding the officers of the Trust:
| | | | |
Name, Address*, Age,
Position with Trust,**
Term of Position with Trust | | Principal Occupation
During Past 5 Years | | Other Directorships |
Bo J. Howell, 36 Principal Executive Officer and President Since March 2017 | | Current: Vice President, Director of Fund Administration, Ultimus Fund Solutions, LLC (since 2014). Previous: Counsel, Securities and Mutual Funds, Western & Southern Financial Group (2012 – 2014). | | None. |
Brandon R. Kipp, 34 Chief Compliance
Officer Since October 2017 | | Current: Senior Fund Compliance Officer, Ultimus Fund Solutions, LLC (since July 2017). Previous: Assistant Vice President and Compliance Manager, UMB Fund Services, Inc. (March 2014 to July 2017); Officer and Lead Fund Administrator, UMB Fund Services, Inc. (May 2012 to March 2014). | | None. |
Carol J. Highsmith, 53
Vice President Since
August 2008 Secretary Since March 2014 | | Current: Assistant Vice President, Ultimus Fund Solutions, LLC (since December 2015). Previous: Employed in various positions with Huntington Asset Services, Inc. (n/k/a Ultimus Asset Services, LLC) (November 1994 to December 2015), most recently Vice President of Legal Administration (2005 to December 2015). | | None. |
Matthew J. Miller, 41 Vice President Since
December 2011 | | Current: Assistant Vice President, Relationship Management, Ultimus Fund Solutions, LLC (since December 2015). Previous: Employed in various positions with Huntington Asset Services, Inc. (n/k/a Ultimus Asset Services, LLC) (July 1998 to December 2015), most recently Vice President of Relationship Management (2005 to December 2015). | | None. |
37
Trustees and Officers (Unaudited) (continued)
| | | | |
Name, Address*, Age,
Position with Trust,**
Term of Position with Trust | | Principal Occupation
During Past 5 Years | | Other Directorships |
| Bryan W. Ashmus, 44 Principal Financial Officer and Treasurer Since December 2013 | | Current: Vice President and Director of Financial Administration, Ultimus Fund Solutions, LLC (since December 2015). Previous: Vice President and Manager of Financial Administration, Huntington Asset Services, Inc. (n/k/a Ultimus Asset Services, LLC) (September 2013 to December 2015); Vice President, Fund Administration, Citi Fund Services Ohio, Inc. (from May 2005 to September 2013). | | None. |
Stephen L. Preston, 50
AML Officer since June 2017 | | Current: Chief Compliance Officer, Ultimus Fund Solutions, LLC (since June 2011); Chief Compliance Officer of Ultimus Fund Distributors, LLC (since June 2011). | | None. |
| * | | The address for each trustee and officer is 225 Pictoria Drive, Suite 450, Cincinnati, Ohio 45246. |
| ** | | As of the date of this report, the Trust consists of 13 series. |
Other Information (Unaudited)
The Funds’ Statement of Additional Information (“SAI”) includes additional information about the trustees and is available without charge, upon request. You may call toll-free at (855) 280-9648 to request a copy of the SAI or to make shareholder inquiries.
38
Investment Advisory Agreement Renewal (Unaudited)
At a meeting held on June 8, 2017, the Board of Trustees (the “Board”) considered the renewal of the Investment Advisory Agreements (the “Dana Agreements”) between Valued Advisers Trust (the “Trust”) and Dana Investment Advisors, Inc. (“Dana”) with respect to the Dana Large Cap Equity Fund (the “Large Cap Fund”) and the Dana Small Cap Equity Fund (the “Small Cap Fund”) (collectively, the “Dana Funds”). Dana provided written information to the Board to assist the Board in its considerations.
The Board discussed the contractual arrangements between Dana and the Trust for the Dana Funds. They reflected upon the Board’s prior experience with Dana in managing the Dana Funds, as well as their earlier discussions with Dana.
Counsel then directed the Trustees to a memorandum from his firm that summarized, among other things, the fiduciary duties and responsibilities of the Board in reviewing and approving the Dana Agreements. In assessing the factors and reaching its decision, the Board took into consideration information furnished by Dana and the Trust’s other service providers for the Board’s review and consideration throughout the year, as well as information specifically prepared or presented in connection with the renewal process, including: (i) reports regarding the services and support provided to the Dana Funds by Dana; (ii) quarterly assessments of the investment performance of the Dana Funds; (iii) commentary on the reasons for the performance; (iv) presentations by Dana addressing its investment philosophy, investment strategy, personnel, and operations of Dana; (v) compliance and audit reports concerning the Dana Funds and Dana; (vi) disclosure information contained in the registration statement of the Trust for the Dana Funds and Dana’s Form ADV; and (vii) a memorandum from counsel, that summarized the fiduciary duties and responsibilities of the Board in reviewing and approving the Dana Agreements. The Board also requested and received materials including, without limitation: (a) documents containing information about Dana, including its financial information; a description of its personnel and the services it provides to the Dana Funds; information on Dana’s investment advice and performance; summaries of the Dana Funds’ expenses, compliance program, current legal matters, and other general information; (b) comparative expense and performance information for other mutual funds with strategies similar to the Dana Funds; and (c) the benefits to be realized by Dana from its relationship with the Dana Funds. The Board did not identify any particular information that was most relevant to its consideration to approve the Dana Agreements and each Trustee may have afforded different weight to the various factors.
| 1. | | The nature, extent, and quality of the services to be provided by Dana. In this regard, the Board considered Dana’s responsibilities under the Dana Agreements. The Trustees considered the services being provided by Dana to the Dana Funds including, without limitation: the quality of its investment advisory services (including research and recommendations with respect to portfolio securities), its process for formulating investment recommendations and assuring compliance with the Dana Funds’ investment objectives and limitations, its coordination of services for the Dana Funds among their service providers, and its efforts to promote the Dana Funds and grow their assets. The Trustees considered Dana’s continuity of, and commitment to retain, qualified personnel and Dana’s commitment to maintain and enhance its resources and systems, the commitment of Dana’s personnel to finding alternatives and options that allow the Dana Funds to maintain their goals, and Dana’s continued cooperation with the Independent Trustees and Counsel for the Dana Funds. The Trustees considered Dana’s personnel, including their education and experience. After considering the foregoing information and further information in the Meeting materials provided by Dana, the Board |
39
Investment Advisory Agreement Renewal (Unaudited) (continued)
| | concluded that, in light of all the facts and circumstances, the nature, extent, and quality of the services provided by Dana were satisfactory and adequate for the Dana Funds. |
| 2. | | Investment Performance of the Dana Funds and Dana. In this regard, the Trustees compared the performance of each of the Dana Funds with the performance of funds with similar objectives managed by other investment advisers, with aggregated peer group data, as well as with the performance of each of the Dana Funds’ benchmark. The Trustees also considered the consistency of Dana’s management of the Dana Funds with their investment objectives, strategies, and limitations. The Trustees noted that, as of March 31, 2017, the Large Cap Fund’s performance was close to, but below its peer group average for the 1-year and 3-year periods. The Trustees noted that the Large Cap Fund’s performance was above that of its benchmark for the year-to-date period, but below the benchmark for the 1-year, 3-year, and 5-year periods. When compared to other funds in its Morningstar category, the Trustees observed that the Large Cap Fund’s performance was below the average and median for the 1-year, 3-year, and 5-year periods, but above the average and median for the period since inception of the Large Cap Fund. The Trustees also considered the performance of Dana’s separate accounts that were managed in a manner similar to that of the Large Cap Fund and they noted that the performance was relatively comparable. The Trustees considered the performance of the Small Cap Fund, and observed that, as of March 31, 2017, the Small Cap Fund underperformed as compared to the average and median of its peer group for the 1-year period. As compared to its benchmark, the Trustees noted that the Small Cap Fund underperformed for the 1-year and year-to-date periods. They also noted that the Small Cap Fund’s performance was below the average and median of its Morningstar category for the 1-year and since inception periods. The Trustees also considered the performance of Dana’s separate accounts that were managed in a manner similar to that of the Small Cap Fund and they noted that the performance was relatively comparable. The Trustees took into consideration discussions with representatives of Dana regarding the reasons for the performance of each of the Dana Funds. After reviewing and discussing these and other relevant factors, the Board concluded, in light of all the facts and circumstances, that the investment performance of the Dana Funds and Dana was satisfactory. |
| 3. | | The costs of the services to be provided and profits to be realized by Dana from the relationship with the Dana Funds. In this regard, the Trustees considered: (1) Dana’s financial condition; (2) the asset level of the Dana Funds; (3) the overall expenses of each of the Dana Funds; and (4) the nature and frequency of management fee payments. The Trustees reviewed information provided by Dana regarding its profits associated with managing each of the Dana Funds, noting that Dana is currently waiving a portion of its management fee for its services rendered to each of the Dana Funds. The Trustees also considered potential benefits for Dana in managing the Dana Funds. The Trustees then compared the fees and expenses of the Dana Funds (including the management fee) to other comparable mutual funds. The Trustees noted that the Large Cap Fund’s management fee was slightly above the average and equal to the median of its peer group and above the average and median of its Morningstar category. The Trustees also noted that the Large Cap Fund’s net expense ratio was lower than that of the peer group average and median and below the average and comparable to the median of its Morningstar category, because of Dana’s contractual commitment to limit the expenses of the Large Cap Fund. With respect to the Small Cap Fund, the Trustees noted that the management fee was below the average and median of its peer group and comparable to the average and median of its Morningstar category. They also noted that the Small Cap |
40
Investment Advisory Agreement Renewal (Unaudited) (continued)
| | Fund’s expense ratio was below the average and median of its peer group and below the average and median of its Morningstar category. The Board noted that the fees that Dana assesses for separate account clients that have strategies similar to that of each of the Dana Funds, respectively, could be comparable or lower and they expressed the view that the reasons for such differences were acceptable and reasonable. Based on the foregoing, the Board concluded that the fees to be paid to Dana by each of the Dana Funds and the profits to be realized by Dana, in light of all the facts and circumstances, were fair and reasonable in relation to the nature and quality of the services provided by Dana. |
| 4. | | The extent to which economies of scale would be realized as the Dana Funds grow and whether advisory fee levels reflect these economies of scale for the benefit of the Dana Funds’ investors. In this regard, the Board considered the Dana Funds’ fee arrangements with Dana. The Board considered that while the management fee remained the same at all asset levels, the shareholders experienced benefits from each of the Dana Funds’ expense limitation arrangements. The Trustees noted that once the expenses fell below the cap set by each arrangement, the shareholders would continue to benefit from economies of scale under the Dana Funds’ arrangements with other service providers to the Dana Funds, and the Trustees attributed this benefit, in part, to the direct and indirect efforts of Dana at the inception of each of the Dana Funds to ensure that a cost structure was in place that was beneficial for the Dana Funds as they grew. In light of its ongoing consideration of the Dana Funds’ asset levels, expectations for growth in the Dana Funds, and fee levels, the Board determined that the Dana Funds’ fee arrangements, in light of all the facts and circumstances, were fair and reasonable in relation to the nature and quality of the services provided by Dana. |
| 5. | | Possible conflicts of interest and benefits to Dana. In this regard, the Trustees evaluated the potential for conflicts of interest and considered such matters as the experience and ability of the advisory personnel assigned to the Dana Funds; the basis of decisions to buy or sell securities for the Dana Funds and the substance and administration of Dana’s code of ethics. The Trustees also considered disclosure in the registration statement of the Trust relating to Dana’s potential conflicts of interest. The Trustees noted that Dana may utilize soft dollars and the Trustees noted Dana’s policies and processes for managing the conflicts of interest that could arise from soft dollar arrangements. The Trustees noted other potential benefits to Dana, including the fact that the Dana Funds provide an attractive vehicle for smaller accounts, which may increase the total assets under management by Dana and provide marginal cost efficiency. Based on the foregoing, the Board determined that the standards and practices of Dana relating to the identification and mitigation of potential conflicts of interest and the benefits to be realized by Dana in managing the Dana Funds were satisfactory. |
After additional consideration of the factors delineated in the memorandum provided by counsel and further discussion among the Board members, the Board determined to approve the continuation of the Dana Agreements between the Trust and Dana.
41
| | |
FACTS | | WHAT DOES VALUED ADVISERS TRUST DO WITH YOUR PERSONAL INFORMATION? |
| | |
| Why? | | Financial companies choose how they share your personal information. Federal law gives consumers the right to limit some but not all sharing. Federal law also requires us to tell you how we collect, share, and protect your personal information. Please read this notice carefully to understand what we do. |
| | |
| What? | | The types of personal information we collect and share depend on the product or service you have with us. This information can include: ◾ Social Security number ◾ account balances and account transactions ◾ account transactions, transaction or loss history and purchase history ◾ checking account information and wire transfer instructions When you are no longer our customer, we continue to share your information as described in this notice. |
| | |
| How? | | All financial companies need to share customers’ personal information to run their everyday business. In the section below, we list the reasons financial companies can share their customers’ personal information; the reasons Valued Advisers Trust chooses to share; and whether you can limit this sharing. |
| | |
| Reasons we can share your personal information | | Does Valued Advisers
Trust share? |
For our everyday business purposes — such as to process your transactions, maintain your account(s), respond to court orders and legal investigations, or report to credit bureaus | | Yes |
For our marketing purposes — to offer our products and services to you | | Yes |
| For joint marketing with other financial companies | | No |
For our affiliates’ everyday business purposes — information about your transactions and experiences | | No |
For our affiliates’ everyday business purposes — information about your creditworthiness | | No |
| For nonaffiliates to market to you | | No |
| | |
| Questions? | | Call 1-855-280-9648. |
42
| | |
| Who we are | | |
| Who is providing this notice? | | Valued Advisers Trust |
| What we do | | |
| How does Valued Advisers Trust protect my personal information? | | To protect your personal information from unauthorized access and use, we use security measures that comply with federal law. These measures include computer safeguards and secured files and buildings. |
| How does Valued Advisers Trust collect my personal information? | | We collect your personal information, for example, when you ◾ open an account or deposit money ◾ buy securities from us or sell securities to us ◾ make deposits or withdrawals from your account or provide account information ◾ give us your account information ◾ make a wire transfer ◾ tell us who receives the money ◾ tell us where to send the money ◾ show your government-issued ID ◾ show your driver’s license |
| Why can’t I limit all sharing? | | Federal law gives you the right to limit only ◾ sharing for affiliates’ everyday business purposes — information about your creditworthiness ◾ affiliates from using your information to market to you ◾ sharing for nonaffiliates to market to you State laws and individual companies may give you additional rights to limit sharing. |
| Definitions | | |
| Affiliates | | Companies related by common ownership or control. They can be financial and nonfinancial companies. |
| Nonaffiliates | | Companies not related by common ownership or control. They can be financial and nonfinancial companies. ◾ Valued Advisers Trust does not share your personal information with nonaffiliates so they can market to you. |
| Joint marketing | | A formal agreement between nonaffiliated financial companies that together market financial products or services to you. ◾ Valued Advisers Trust doesn’t jointly market financial products or services to you. |
43
PROXY VOTING
A description of the policies and procedures that each Fund uses to determine how to vote proxies relating to portfolio securities and information regarding how each Fund voted those proxies during the most recent twelve month period ended June 30, is available without charge upon request by (1) calling the Funds at (855) 280-9648 and (2) from Fund documents filed with the Securities and Exchange Commission (“SEC”) on the SEC’s website at www.sec.gov.
TRUSTEES
Andrea N. Mullins, Chairperson
Ira P. Cohen
Mark J. Seger
OFFICERS
Bo J. Howell, Principal Executive Officer and President
Bryan W. Ashmus, Principal Financial Officer and Treasurer
Brandon R. Kipp, Chief Compliance Officer
Carol J. Highsmith, Vice President and Secretary
Matthew J. Miller, Vice President
Stephen L. Preston, Anti-Money Laundering Officer
INVESTMENT ADVISER
Dana Investment Advisors, Inc.
20700 Swenson Drive, Suite 400
Waukesha, WI 53186
DISTRIBUTOR
Unified Financial Securities, LLC
9465 Counselors Row, Suite 200
Indianapolis, IN 46240
INDEPENDENT REGISTERED PUBLIC ACCOUNTING FIRM
Cohen & Company, Ltd.
1350 Euclid Avenue, Suite 800
Cleveland, OH 44115
LEGAL COUNSEL
The Law Offices of John H. Lively & Associates, Inc.,
A member firm of The 1940 Act Law GroupTM
11300 Tomahawk Creek Parkway, Suite 310
Leawood, KS 66211
CUSTODIAN
Huntington National Bank
41 S. High St.
Columbus, OH 43215
ADMINISTRATOR, TRANSFER AGENT AND FUND ACCOUNTANT
Ultimus Asset Services, LLC
225 Pictoria Drive, Suite 450
Cincinnati, OH 45246
This report is intended only for the information of shareholders or those who have received the Funds’ prospectus which contains information about each Fund’s management fee and expenses. Please read the prospectus carefully before investing.
Distributed by Unified Financial Securities, LLC
Member FINRA/SIPC
As of the end of the period covered by this report, the registrant has adopted a code of ethics that applies to the registrant’s principal executive officer, principal financial officer, principal accounting officer or controller, or persons performing similar functions, regardless of whether these individuals are employed by the registrant or a third party. Pursuant to Item 12(a)(1), a copy of registrant’s code of ethics is filed as an exhibit to this Form N-CSR. During the period covered by this report, the code of ethics has not been amended, and the registrant has not granted any waivers, including implicit waivers, from the provisions of the code of ethics.
| Item 3. | Audit Committee Financial Expert. |
(a)(1) The registrant’s Board of Trustees has determined that the registrant has at least one audit committee financial expert serving on its audit committee.
(a)(2) The audit committee financial expert is Andrea N. Mullins, who is “independent” for purposes of this Item 3 of Form N-CSR.
| Item 4. | Principal Accountant Fees and Services. |
| | | | | | | | |
Granite Value Fund: | | | FY 2017 | | | $ | 13,000 | |
| | | FY 2016 | | | $ | 13,800 | |
| | |
Sound Mind Investing Funds: | | | FY 2017 | | | $ | 65,000 | |
| | | FY 2016 | | | $ | 69,000 | |
| | |
Green Owl Intrinsic Value Fund: | | | FY 2017 | | | $ | 13,000 | |
| | | FY 2016 | | | $ | 13,800 | |
| | |
Foundry Partners Fundamental Small Cap Value Fund: | | | FY 2017 | | | $ | 13,500 | |
| | | FY 2016 | | | $ | 14,800 | |
| | |
Dana Funds: | | | FY 2017 | | | $ | 27,500 | |
| | | FY 2016 | | | $ | 29,100 | |
| | | | | | | | |
Granite Value Fund: | | | FY 2017 | | | $ | 0 | |
| | | FY 2016 | | | $ | 0 | |
| | |
Sound Mind Investing Funds: | | | FY 2017 | | | $ | 0 | |
| | | FY 2016 | | | $ | 0 | |
| | |
Green Owl Intrinsic Value Fund: | | | FY 2017 | | | $ | 0 | |
| | | FY 2016 | | | $ | 0 | |
| | |
Foundry Partners Fundamental Small Cap Value Fund: | | | FY 2017 | | | $ | 0 | |
| | | FY 2016 | | | $ | 0 | |
| | |
Dana Funds: | | | FY 2017 | | | $ | 0 | |
| | | FY 2016 | | | $ | 0 | |
-2-
| | | | | | | | |
Granite Value Fund: | | | FY 2017 | | | $ | 3,000 | |
| | | FY 2016 | | | $ | 3,000 | |
| | |
Sound Mind Investing Funds: | | | FY 2017 | | | $ | 15,000 | |
| | | FY 2016 | | | $ | 15,000 | |
| | |
Green Owl Intrinsic Value Fund: | | | FY 2017 | | | $ | 3,000 | |
| | | FY 2016 | | | $ | 3,000 | |
| | |
Foundry Partners Fundamental Small Cap Value Fund: | | | FY 2017 | | | $ | 3,000 | |
| | | FY 2016 | | | $ | 3,000 | |
| | |
Dana Funds: | | | FY 2017 | | | $ | 6,000 | |
| | | FY 2015 | | | $ | 6,000 | |
Nature of the fees: Preparation of the 1120 RIC and Excise review
| | | | | | | | |
Granite Value Fund: | | | FY 2017 | | | $ | 0 | |
| | | FY 2016 | | | $ | 0 | |
| | |
Sound Mind Investing Funds: | | | FY 2017 | | | $ | 0 | |
| | | FY 2016 | | | $ | 0 | |
| | |
Green Owl Intrinsic Value Fund: | | | FY 2017 | | | $ | 0 | |
| | | FY 2016 | | | $ | 0 | |
| | |
Foundry Partners Fundamental Small Cap Value Fund: | | | FY 2017 | | | $ | 0 | |
| | | FY 2016 | | | $ | 0 | |
| | |
Dana Funds: | | | FY 2017 | | | $ | 0 | |
| | | FY 2016 | | | $ | 0 | |
(e) | (1) | Audit Committee’s Pre-Approval Policies |
The Audit Committee Charter requires the Audit Committee to be responsible for the selection, retention or termination of auditors and, in connection therewith, to (i) evaluate the proposed fees and other compensation, if any, to be paid to the auditors, (ii) evaluate the independence of the auditors, (iii) pre-approve all audit services and, when appropriate, any non-audit services provided by the independent auditors to the Trust, (iv) pre-approve, when appropriate, any non-audit services provided by the independent auditors to the Trust’s investment adviser, or any entity controlling, controlled by, or under common control with the investment adviser and that provides ongoing services to the Trust if the engagement relates directly to the operations and financial reporting of the Trust, and (v) receive the auditors’ specific representations as to their independence;
-3-
| | (2) | Percentages of Services Approved by the Audit Committee |
| | | | |
| | | Registrant | |
Audit-Related Fees: | | | 0 | % |
Tax Fees: | | | 100 | % |
All Other Fees: | | | 0 | % |
(f) During audit of registrant’s financial statements for the most recent fiscal year, less than 50 percent of the hours expended on the principal accountant’s engagement were attributed to work performed by persons other than the principal accountant’s full-time, permanent employees.
(g) The aggregate non-audit fees billed by the registrant’s accountant for services rendered to the registrant, and rendered to the registrant’s investment adviser (not including any sub-adviser whose role is primarily portfolio management and is subcontracted with or overseen by another investment adviser), and any entity controlling, controlled by, or under common control with the adviser that provides ongoing services to the registrant:
| | | | | | | | |
| | | Registrant | | | Adviser | |
FY 2017 | | $ | 30,000 | | | $ | 0 | |
FY 2016 | | $ | 30,000 | | | $ | 0 | |
(h) Not applicable. The auditor performed no services for the registrant’s investment adviser or any entity controlling, controlled by, or under common control with the investment adviser that provides ongoing services to the registrant.
| Item 5. | Audit Committee of Listed Companies. NOT APPLICABLE – applies to listed companies only |
| Item 6. | Schedule of Investments. Schedules filed with Item 1. |
| Item 7. | Disclosure of Proxy Voting Policies and Procedures for Closed-End Management Investment Companies. NOT APPLICABLE – applies to closed-end funds only |
| Item 8. | Portfolio Managers of Closed-End Investment Companies. NOT APPLICABLE – applies to closed-end funds only |
| Item 9. | Purchases of Equity Securities by Closed-End Management Investment Company and Affiliated Purchasers. NOT APPLICABLE – applies to closed-end funds only |
| Item 10. | Submission of Matters to a Vote of Security Holders. |
The guidelines applicable to shareholders desiring to submit recommendations for nominees to the Registrant’s board of trustees are contained in the statement of additional information of the Trust with respect to the Fund(s) for which this Form N-CSR is being filed.
| Item 11. | Controls and Procedures. |
(a) Based on their evaluation of the registrant’s disclosure controls and procedures (as defined in Rule 30a-3(c) under the Investment Company Act of 1940, as amended (the “Act”)) as of a date within 90 days of the filing date of this report, the registrant’s principal executive officer and principal financial officer
-4-
have concluded that such disclosure controls and procedures are reasonably designed and are operating effectively to ensure that material information relating to the registrant is made known to them by others within those entities, particularly during the period in which this report is being prepared, and that the information required in filings on Form N-CSR is recorded, processed, summarized, and reported on a timely basis.
(b) There were no changes in the registrant’s internal control over financial reporting (as defined in Rule 30a-3(d) under the Investment Company Act of 1940) that occurred during the second fiscal quarter of the period covered by this report that have materially affected, or are reasonably likely to materially affect, the registrant’s internal control over financial reporting.
| Item 12. | Disclosure of Securities Lending Activities for Closed-End Management Investment Companies. |
Not applicable
(a)(1) Code is filed herewith.
| | (2) | Certifications by the registrant’s principal executive officer and principal financial officer, pursuant to Section 302 of the Sarbanes- Oxley Act of 2002 and required by Rule 30a-2 under the Investment Company Act of 1940 are filed herewith. |
(b) Certification pursuant to 18 U.S.C. Section 1350, as adopted pursuant to Section 906 of the Sarbanes-Oxley Act of 2002 is filed herewith.
-5-
Pursuant to the requirements of the Securities Exchange Act of 1934 and the Investment Company Act of 1940, the registrant has duly caused this report to be signed on its behalf by the undersigned, thereunto duly authorized.
(Registrant) Valued Advisers Trust
| | |
| By |
| /s/ Bo J. Howell |
| Bo J. Howell, President and Principal Executive Officer |
Date 1/4/2018 |
Pursuant to the requirements of the Securities Exchange Act of 1934 and the Investment Company Act of 1940, this report has been signed below by the following persons on behalf of the registrant and in the capacities and on the dates indicated.
| | |
| By |
| /s/ Bo J. Howell |
| Bo J. Howell, President and Principal Executive Officer |
Date 1/4/2018 |
| | |
| By |
| /s/ Bryan W. Ashmus |
| Bryan W. Ashmus, Treasurer and Principal Financial Officer |
Date 1/4/2018 |
-6-