UNITED STATES
SECURITIES AND EXCHANGE COMMISSION
WASHINGTON, D.C. 20549
FORM N-CSR
CERTIFIED SHAREHOLDER REPORT OF REGISTERED
MANAGEMENT INVESTMENT COMPANIES
Investment Company Act file number 811-22208
Valued Advisers Trust
(Exact name of registrant as specified in charter)
| | |
| Ultimus Asset Services, LLC 225 Pictoria Drive, Suite 450 | | Cincinnati, OH 45246 |
| (Address of principal executive offices) | | (Zip code) |
Capitol Services, Inc.
615 S. Dupont Hwy.
Dover, DE 19901
(Name and address of agent for service)
With a copy to:
John H. Lively, Esq.
The Law Offices of John H. Lively & Associates, Inc.
A member firm of The 1940 Act Law GroupTM
11300 Tomahawk Creek Parkway,
Suite 310
Leawood, KS 66221
Registrant’s telephone number, including area code: 513-587-3400
Date of fiscal year end: 10/31
Date of reporting period: 10/31/16
Item 1. Reports to Stockholders.

Annual Report
October 31, 2016
Fund Adviser:
Granite Investment Advisors, Inc.
6 Eagle Square, 3rd Floor
Concord, New Hampshire 03301
Toll Free (888) 442-9893
MANAGEMENT’S DISCUSSION OF FUND PERFORMANCE – (Unaudited)
Our fiscal year ended October 31, 2016 has been a satisfactory one in terms of performance. So far it has been a tale of two years. During the last months of 2015, we saw continued weakness, but the fund dramatically improved in 2016. While it is still early in the recovery, it seems that the value investment discipline is making a comeback. Since 2010, value has struggled and trailed its growth counterpart for much of that time period. As of the end of October, the Granite Value Fund was up 1.30% versus the S&P 500, which was up 4.51%.
As we discussed in last year’s letter, much of the market’s positive performance in 2015 could be attributed to only a few stocks, whereas the rest of the market was flat to negative. Beginning in 2016, this began to change. Some of yesterday’s darlings are now lagging, while many of the companies that were left behind have begun a broad based rally. Why? The first reason is valuation. We believe that markets always reflect valuation over the long-term. From time to time, stock valuations may be influenced by popular sentiment, which can lead to distortions. While the market can get caught up in short-term euphoria, in the long-term stocks will almost always represent their intrinsic value. Looking back again at 2015, only 20 stocks in the S&P 500 exhibited gains and became rather expensive, whereas the remaining 480 companies were negative on average. I’m happy to report that so far in 2016, the market has started to focus again on traditional valuation metrics, which has benefited many of the attractively valued companies in the Granite Value Fund.
Below please find part of our quarterly letter that we sent to clients at the end of September. In this letter we discussed equity valuations, ongoing global issues, economic “well-being” indicators, and the potential implications of the presidential election on the stock market. While this was written before the election, much of the information is still pertinent to our views on the markets moving forward.
Climbing the Wall of Worry
There is an old saying in the investment industry that “Markets Climb a Wall of Worry”, meaning in some cases markets continue to rise even though headline news seems to be filled with uncertainty. Most would agree that this has been the case since we emerged from the Financial Crisis. We’ve been having many discussions amongst ourselves and other investors that this seems to be the most “unhappy” bull market that any of us can remember. Instead of focusing upon the positives investors and the media seem to be waiting for the next shoe to drop. Our assessment is more positive than consensus and our belief is much of the pessimism has to do with recency bias given the 2008 Financial Crisis.
To quote the late Sir John Templeton who was credited with bringing global investing to the main stream, “Bull markets are born on pessimism; grow on skepticism, mature on optimism and die of euphoria”. His last point on dying on euphoria rings especially true to us. In the past whether it was 2008 or the end of the Tech Bubble in 1999 usually mass euphoria or people believing its different this time usually precedes any type of severe market reaction. As we have written about in the past prior to the Tech Bubble bursting in 1999, there was wide spread euphoria that traditional businesses such as retailers, manufacturing and even value investing as a discipline were outdated and destined to fail as new technology leaders would displace them. Similarly, just before the Financial Crisis, US residential real estate was considered an infallible asset class. Investors and others were clearly euphoric during both of these periods. With this as a backdrop where are we now?
In our opinion stock markets are still growing on “skepticism”. Why? It’s pretty clear that we are nowhere near a euphoric stage and let alone not even close to optimism. The worries are the usual suspects, Chinese implosion, Europe slipping back into recession, and weakness in the United States economy. Add to this list uncertainty about the US future policies given leadership changes that will occur in 2017, the Zika virus and Brexit.
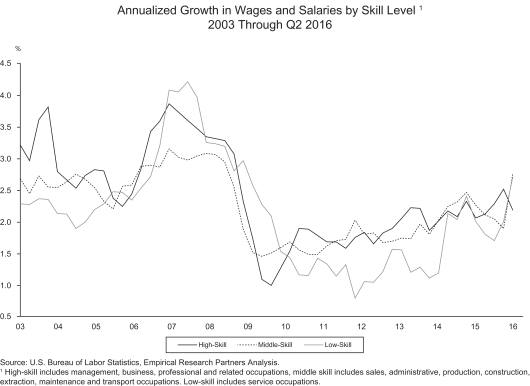
In looking at valuation of the US equity markets it’s pretty hard to see any euphoria. The overall market as judged by the S&P 500 is roughly in range of historical norms trading as 16.5 times next year’s earnings. While not cheap it’s not expensive either. One can argue that with earnings projected to increase 13% in 2017 this number maybe too optimistic. However, given the Energy sector which is a reasonably large component is emerging from one of its worst cyclical downturns gives us some confidence that 2017’s expected earnings growth is reasonable. Another important driver is something we wrote about last year, namely for the first time
1
since the depths of the financial crisis wages for middle and lower income people in the United States is finally growing after years of stagnation. See exhibit 1 below. Historically these two cohorts spend much of what they earn so this should provide a tail wind to US economic growth. With a reasonably valued market along with a tailwind for the US economy we remain constructive on equities.
Running the risk of touching the political “third rail” we find the current election process one of the strangest in recent memory. As it seems to be affecting investor sentiment we’d like to share our thoughts. The whole thing seems to have decayed from who are the best and brightest to run our great country into my candidate is not as bad as yours, therefore you should vote for them. In the past, voters seemed to have some real excitement and enthusiasm for their candidate of choice, not so it seems in this cycle. Regardless of whether you are a Democrat or Republican, rarely have we heard any side articulating how their candidate is the best possible choice to be the commander and chief of the United States. Instead most of the arguments center around if the opposition gets elected it will be a major negative for our country. It begs the question if our current election process is truly pushing qualified candidates away for whatever reason? Is the current dual party process broken to the point that qualified candidates simply have no interest in participating? What does seem clear to most is that neither party had been able to put forward a candidate that their party can overwhelmingly embrace. Instead of focusing on issues that truly impact our country and economy the process and/or debates seem to focus on political mud-slinging and character assassinations. As a reference point entitlement spending has grown at a roughly nine percent rate per year since the 1960’s.
Our view on the entire process regarding the implications for investors is twofold. Markets over time have been a somewhat efficient mechanism of discounting people’s views and expectations. As such, given current polls seem to be quite close and going back and forth depending upon the day and/or comments made, one should expect the markets are discounting roughly the same odds of either getting elected. Regardless of the outcome while there may be some short term volatility it’s hard to argue that markets would be totally surprised by either outcome. In addition, given the checks and balances in Washington it’s not as if either candidate can have a major effect on the direction of the country in the short term.
2
We continue to be constructive on equites going forward as valuations seem reasonable, but not cheap, the global economy seems to be on the upswing and interest rates remain favorable. Additionally, with the risk of touching the proverbial third rail (politics) our belief is so far the market has concluded that the new administration in Washington will be more pro-business than the one its replacing which in turn should increase the overall growth rate of the economy. All of this should be a positive for equites as any pick-up in economic activity should act as a tail wind.
Best Performers
Our best performer in this past fiscal year was Mattel, which was up over 35% (including dividends). Over the years, Mattel and Hasbro have gone back and forth dominating the toy industry. They both have strong brands with widespread appeal. Mattel had recently stumbled with its Barbie franchise and was under pressure. However, management announced plans to restructure the company. Their strategies seemed logical and likely to get the company back on track. Additionally, management pledged to preserve the dividend, which was yielding over 7% at the time. Overall, we liked the company, its business restructuring plans, and the dividend yield. We felt the risk reward tradeoff was quite favorable and chose to invest.
Johnson and Johnson (JNJ) was our second best contributor in this past fiscal year. Similar to Mattel, we view JNJ as a very valuable company with great brands. They have had some issues with their pediatric over-the-counter products, which cast a negative cloud over the company. Additionally, their pharmaceutical division’s growth rate being questioned by analysts on Wall Street. Both of these factors provided an investment opportunity. When we invested in JNJ it had a dividend yield above 3%.
A third great performer in the Granite Value Fund has been Wal-Mart, which underperformed in the previous year. Bearish investors were concerned that the company had lost its way and could not compete with the likes of Amazon. We believe that Walmart has been and continues to be one of the best managed retailers in the world. It is true that ecommerce and Amazon have been a headwind. However, given Wal-Mart’s significant investments in ecommerce and infrastructure, as well as the company’s vast distribution capabilities, we believe that they can compete with Amazon.
Worst Performers
Our worst performing stocks in the past fiscal year were McKesson and Gilead Sciences. Both companies have been short-term victims of the presidential election. Drug price inflation and fears of future price controls by the Clinton administration put heavy pressure on both McKesson and Gilead Sciences. Both parties mentioned the need to do something about drug price inflation that has been occurring. McKesson as the largest drug distributor would clearly be negatively impacted if any type of governmental price controls were instituted. However we believe the possibility of price controls are minimal in the United States. We remain positive on the group due to demographics. It has been shown that there exists a direct correlation between age and drug usage. Given Baby Boomers are just entering retirement age we expect this to be a tailwind for drug consumption. Gilead Sciences was singled out by Hilary Clinton in August for the six-figure pricing of their Hepatitis C drug. While this might seem quite egregious, the campaign did not mention that this is a list price. Very few patients pay this high cost because their insurance carriers are able to negotiate more favorable discounts. Despite high pricing, Gilead Science’s Hepatitis C drug is the only known cure for the disease. While expensive in the short-term, the drug actually saves patients and insurance companies a lot of money in the long-term. Rather than keep patients with Hepatitis C on intermittent doses of interferon – a drug used to combat the disease – patients are now able to be cured completely.
3
As always, we thank you for the trust you place in the Granite Value Fund and will do our best to earn it every day. If you have any questions or comments, please do not hesitate to call.
Sincerely,

Scott B. Schermerhorn
Managing Principal and Chief Investment Officer
4
INVESTMENT RESULTS – (Unaudited)
| | | | | | | | |
Average Annual Total Returns* (For the periods ended October 31, 2016) | |
| | | One Year | | | Since Inception
(December 22, 2011) | |
Granite Value Fund | | | 1.30 | % | | | 7.39 | % |
S&P 500® Index** | | | 4.51 | % | | | 13.87 | % |
Russell 1000® Value Index** | | | 6.37 | % | | | 13.41 | % |
Total annual operating expenses, as disclosed in the Fund’s prospectus dated February 29, 2016, were 2.53% of average daily net assets (1.36% after fee waivers/expense reimbursements by Granite Investment Advisors, Inc. (the “Adviser”)). The Adviser has contractually agreed to waive or limit its fees and to assume other expenses of the Fund until February 28, 2017, so that the Total Annual Fund Operating Expenses does not exceed 1.35%. This operating expense limitation does not apply to brokerage fees and commissions, borrowing costs (such as interest and dividend expenses on securities sold short), taxes, 12b-1 fees; extraordinary expenses and indirect expenses (such as “acquired fund fees and expenses”). Additional information pertaining to the Fund’s expense ratios as of October 31, 2016 can be found in the financial highlights.
The performance quoted represents past performance, which does not guarantee future results. The investment return and principal value of an investment will fluctuate so that an investor’s shares, when redeemed, may be worth more or less than their original cost. The returns shown do not reflect deduction of taxes that a shareholder would pay on Fund distributions or the redemption of Fund shares. Current performance of the Fund may be lower or higher than the performance quoted. The Fund’s investment objectives, risks, charges and expenses must be considered carefully before investing. Performance data current to the most recent month end may be obtained by calling 1-888-442-9893.
| * | Return figures reflect any change in price per share and assume the reinvestment of all distributions. The Fund’s returns reflect any fee reductions during the applicable periods. If such fee reductions had not occurred, the quoted performance would have been lower. |
| ** | The S&P 500® Index and the Russell 1000® Value Index are widely recognized unmanaged indices of equity securities and are representative of a broader domestic equity market and range of securities than is found in the Fund’s portfolio. Individuals cannot invest directly in an Index; however, an individual can invest in exchange traded funds or other investment vehicles that attempt to track the performance of a benchmark index. |
The Fund’s investment objective, strategies, risks, charges and expenses must be considered carefully before investing. The prospectus contains this and other important information about the Fund and may be obtained by calling the same number as above. Please read it carefully before investing.
The Fund is distributed by Unified Financial Securities, LLC, member FINRA/SIPC.
5
INVESTMENT RESULTS – (Unaudited)
Comparison of the Growth of a $10,000 Investment in the Granite Value Fund, the S&P 500® Index, and the Russell 1000® Value Index (Unaudited)
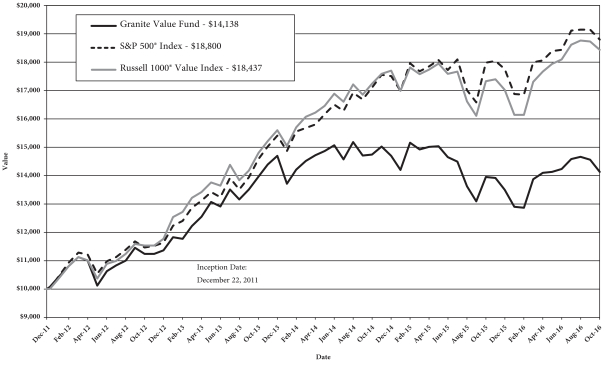
The chart above assumes an initial investment of $10,000 made on December 22, 2011 (commencement of Fund operations) and held through October 31, 2016. The S&P 500® Index and Russell 1000® Value Index are widely recognized unmanaged indices of equity securities and are representative of a broader domestic equity market and range of securities than is found in the Fund’s portfolio. Individuals cannot invest directly in an Index; however, an individual can invest in exchange traded funds or other investment vehicles that attempt to track the performance of a benchmark index. THE FUND’S RETURN REPRESENTS PAST PERFORMANCE AND DOES NOT GUARANTEE FUTURE RESULTS. The returns shown do not reflect deduction of taxes that a shareholder would pay on Fund distributions or the redemption of Fund shares. Investment returns and principal values will fluctuate so that your shares, when redeemed, may be worth more or less than their original purchase price.
Current performance may be lower or higher than the performance data quoted. For more information on the Fund, and to obtain performance data current to the most recent month end or to request a prospectus, please call 1-888-442-9893. You should carefully consider the investment objectives, potential risks, management fees, and charges and expenses of the Fund before investing. The Fund’s prospectus contains this and other information about the Fund, and should be read carefully before investing.
The Fund is distributed by Unified Financial Securities, LLC, member FINRA/SIPC.
6
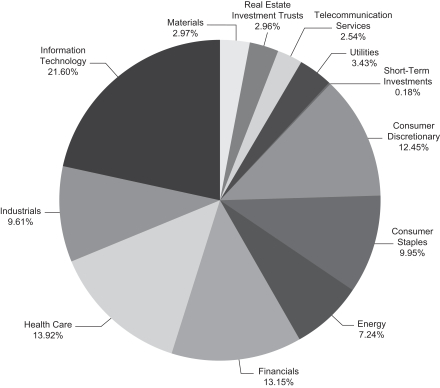
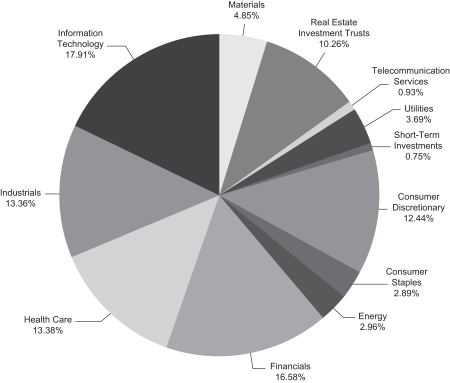
FUND HOLDINGS – (Unaudited)
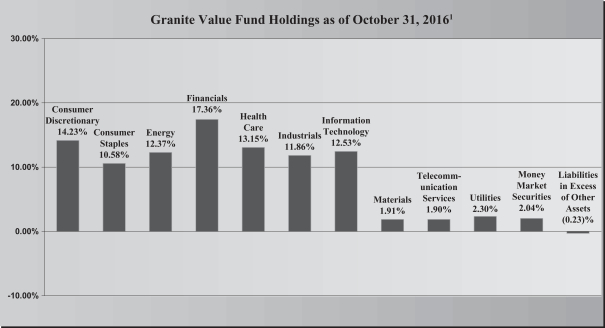
| 1 | As a percentage of net assets. |
The investment objective of the Granite Value Fund is to seek long-term capital appreciation.
Availability of Portfolio Schedule – (Unaudited)
The Fund files its complete schedule of portfolio holdings with the Securities and Exchange Commission (“SEC”) for the first and third quarters of each fiscal year on Form N-Q. The Fund’s Forms N-Q are available at the SEC’s website at www.sec.gov. The Fund’s Forms N-Q may be reviewed and copied at the SEC’s Public Reference Room in Washington DC. Information on the operation of the Public Reference Room may be obtained by calling 1-800-SEC-0330.
7
GRANITE VALUE FUND
SCHEDULE OF INVESTMENTS
October 31, 2016
| | | | | | | | |
| Common Stocks – 98.19% | | Shares | | | Fair Value | |
Consumer Discretionary – 14.23% | | | | | | | | |
Carnival Corp. | | | 4,145 | | | $ | 203,519 | |
Comcast Corp., Class A | | | 3,675 | | | | 227,188 | |
General Motors Co. | | | 11,315 | | | | 357,554 | |
Mattel, Inc. | | | 6,615 | | | | 208,571 | |
TJX Cos., Inc./The | | | 3,260 | | | | 240,425 | |
Whirlpool Corp. | | | 930 | | | | 139,333 | |
| | | | | | | | |
| | | | | | | 1,376,590 | |
| | | | | | | | |
Consumer Staples – 10.58% | | | | | | | | |
Coca-Cola Co./The | | | 7,000 | | | | 296,800 | |
Danone SA ADR | | | 14,435 | | | | 200,791 | |
Unilever PLC ADR | | | 6,840 | | | | 285,023 | |
Wal-Mart Stores, Inc. | | | 3,440 | | | | 240,869 | |
| | | | | | | | |
| | | | | | | 1,023,483 | |
| | | | | | | | |
Energy – 12.37% | | | | | | | | |
Cimarex Energy Co. | | | 1,550 | | | | 200,151 | |
Royal Dutch Shell PLC ADR | | | 6,740 | | | | 352,569 | |
Schlumberger Ltd. | | | 2,755 | | | | 215,524 | |
Southwestern Energy Co. * | | | 20,735 | | | | 215,437 | |
Tenaris SA ADR | | | 7,545 | | | | 212,769 | |
| | | | | | | | |
| | | | | | | 1,196,450 | |
| | | | | | | | |
Financials – 17.36% | | | | | | | | |
Alleghany Corp. * | | | 605 | | | | 312,307 | |
American International Group, Inc. | | | 6,125 | | | | 377,912 | |
Berkshire Hathaway, Inc., Class B * | | | 3,320 | | | | 479,076 | |
Citigroup, Inc. | | | 6,855 | | | | 336,923 | |
MetLife, Inc. | | | 3,680 | | | | 172,813 | |
| | | | | | | | |
| | | | | | | 1,679,031 | |
| | | | | | | | |
Health Care – 13.15% | | | | | | | | |
C.R. Bard, Inc. | | | 860 | | | | 186,345 | |
Gilead Sciences, Inc. | | | 3,210 | | | | 236,352 | |
Johnson & Johnson | | | 1,580 | | | | 183,264 | |
McKesson Corp. | | | 1,810 | | | | 230,178 | |
Merck & Co., Inc. | | | 3,680 | | | | 216,090 | |
UnitedHealth Group, Inc. | | | 1,555 | | | | 219,768 | |
| | | | | | | | |
| | | | | | | 1,271,997 | |
| | | | | | | | |
See accompanying notes which are an integral part of these financial statements.
8
GRANITE VALUE FUND
SCHEDULE OF INVESTMENTS – (continued)
October 31, 2016
| | | | | | | | |
| Common Stocks – 98.19% – continued | | Shares | | | Fair Value | |
Industrials – 11.86% | | | | | | | | |
Boeing Co./The | | | 1,485 | | | $ | 211,509 | |
Caterpillar, Inc. | | | 2,755 | | | | 229,932 | |
General Electric Co. | | | 7,240 | | | | 210,684 | |
Honeywell International, Inc. | | | 2,095 | | | | 229,780 | |
United Technologies Corp. | | | 2,600 | | | | 265,720 | |
| | | | | | | | |
| | | | | | | 1,147,625 | |
| | | | | | | | |
Information Technology – 12.53% | | | | | | | | |
Apple, Inc. | | | 2,575 | | | | 292,365 | |
Corning, Inc. | | | 9,770 | | | | 221,877 | |
Microsoft Corp. | | | 4,185 | | | | 250,765 | |
Oracle Corp. | | | 6,380 | | | | 245,120 | |
Western Union Co./The | | | 10,040 | | | | 201,503 | |
| | | | | | | | |
| | | | | | | 1,211,630 | |
| | | | | | | | |
Materials – 1.91% | | | | | | | | |
AdvanSix, Inc. * | | | 83 | | | | 1,325 | |
Agrium, Inc. | | | 2,000 | | | | 183,640 | |
| | | | | | | | |
| | | | | | | 184,965 | |
| | | | | | | | |
Telecommunication Services – 1.90% | | | | | | | | |
AT&T, Inc. | | | 4,985 | | | | 183,398 | |
| | | | | | | | |
Utilities – 2.30% | | | | | | | | |
Calpine Corp. * | | | 18,675 | | | | 222,232 | |
| | | | | | | | |
| | |
Total Common Stocks (Cost $8,644,216) | | | | | | | 9,497,401 | |
| | | | | | | | |
Money Market Securities – 2.04% | | | | | | | | |
Fidelity Money Market Government Portfolio, Institutional Class, 0.32% (a) | | | 197,042 | | | | 197,042 | |
| | | | | | | | |
Total Money Market Securities (Cost $197,042) | | | | | | | 197,042 | |
| | | | | | | | |
Total Investments – 100.23% (Cost $8,841,258) | | | | | | | 9,694,443 | |
| | | | | | | | |
Liabilities in Excess of Other Assets – (0.23)% | | | | | | | (22,125) | |
| | | | | | | | |
NET ASSETS – 100.00% | | | | | | $ | 9,672,318 | |
| | | | | | | | |
| | (a) | Rate disclosed is the seven day effective yield as of October 31, 2016. |
| | * | Non-income producing security. |
ADR – American Depositary Receipt
The sectors shown on the schedule of investments are based on Global Industry Classification Standard, or GICS® (“GICS”). The GICS was developed by and/or is the exclusive property of MSCI, Inc. and Standard & Poor Financial Services LLC (“S&P”). GICS is a service mark of MSCI, Inc. and S&P and has been licensed for use by Ultimus Asset Services, LLC.
See accompanying notes which are an integral part of these financial statements.
9
GRANITE VALUE FUND
STATEMENT OF ASSETS AND LIABILITIES
October 31, 2016
| | | | |
Assets | | | | |
Investments in securities at fair value (cost $8,841,258) | | $ | 9,694,443 | |
Receivable for investments sold | | | 204,672 | |
Dividends receivable | | | 7,175 | |
Receivable from Adviser | | | 2,738 | |
Prepaid expenses | | | 5,577 | |
| | | | |
Total Assets | | | 9,914,605 | |
| | | | |
Liabilities | | | | |
Payable for investments purchased | | | 202,304 | |
Payable to administrator, fund accountant, and transfer agent | | | 13,759 | |
Payable to trustees | | | 31 | |
Other accrued expenses | | | 26,193 | |
| | | | |
Total Liabilities | | | 242,287 | |
| | | | |
| |
Net Assets | | $ | 9,672,318 | |
| | | | |
Net Assets consist of: | | | | |
Paid-in capital | | $ | 8,491,124 | |
Accumulated undistributed net investment income | | | 74,852 | |
Accumulated undistributed net realized gain from investments | | | 253,157 | |
Net unrealized appreciation on investments | | | 853,185 | |
| | | | |
| |
Net Assets | | $ | 9,672,318 | |
| | | | |
Shares outstanding (unlimited number of shares authorized, no par value) | | | 744,095 | |
| | | | |
Net asset value (“NAV”) and offering price per share | | $ | 13.00 | |
| | | | |
Redemption price per share (NAV * 98%) (a) | | $ | 12.74 | |
| | | | |
| (a) | The Fund charges a 2.00% redemption fee on shares redeemed in 60 days or less of purchase. Shares are redeemed at the NAV if held longer than 60 calendar days. |
See accompanying notes which are an integral part of these financial statements.
10
GRANITE VALUE FUND
STATEMENT OF OPERATIONS
For the year ended October 31, 2016
| | | | |
Investment Income | |
Dividend income (net of foreign taxes withheld of $571) | | $ | 234,824 | |
| | | | |
Total investment income | | | 234,824 | |
| | | | |
|
Expenses | |
Investment Adviser | | | 98,873 | |
Administration | | | 37,500 | |
Fund accounting | | | 25,000 | |
Transfer agent | | | 20,056 | |
Registration | | | 17,999 | |
Audit | | | 16,800 | |
Legal | | | 15,176 | |
Report printing | | | 10,501 | |
Trustee | | | 4,807 | |
Custodian | | | 3,894 | |
Miscellaneous | | | 33,808 | |
| | | | |
Total expenses | | | 284,414 | |
| | | | |
Fees waived and expenses reimbursed by Adviser | | | (150,666 | ) |
| | | | |
Net operating expenses | | | 133,748 | |
| | | | |
Net investment income | | | 101,076 | |
| | | | |
|
Net Realized and Unrealized Gain (Loss) on Investments | |
Net realized gain on investment securities transactions | | | 384,642 | |
Net change in unrealized appreciation/depreciation of investment securities | | | (398,113 | ) |
| | | | |
Net realized and unrealized loss on investments | | | (13,471 | ) |
| | | | |
Net increase in net assets resulting from operations | | $ | 87,605 | |
| | | | |
See accompanying notes which are an integral part of these financial statements.
11
GRANITE VALUE FUND
STATEMENTS OF CHANGES IN NET ASSETS
| | | | | | | | |
| | | For the
Year Ended
October 31, 2016 | | | For the
Year Ended
October 31, 2015 | |
Increase (Decrease) in Net Assets due to: | | | | | | | | |
Operations | | | | | | | | |
Net investment income | | $ | 101,076 | | | $ | 50,264 | |
Net realized gain (loss) on investment securities transactions | | | 384,642 | | | | (130,519 | ) |
Net change in unrealized appreciation/depreciation of investment securities | | | (398,113 | ) | | | (573,813 | ) |
| | | | | | | | |
Net increase (decrease) in net assets resulting from operations | | | 87,605 | | | | (654,068 | ) |
| | | | | | | | |
Distributions | | | | | | | | |
From net investment income | | | (53,723 | ) | | | (31,319 | ) |
From net realized gains | | | – | | | | (484,050 | ) |
| | | | | | | | |
Total distributions | | | (53,723 | ) | | | (515,369 | ) |
| | | | | | | | |
Capital Transactions | | | | | | | | |
Proceeds from shares sold | | | 591,824 | | | | 1,720,031 | |
Reinvestment of distributions | | | 44,897 | | | | 446,979 | |
Amount paid for shares redeemed | | | (1,719,950 | ) | | | (3,488,076 | ) |
| | | | | | | | |
Net decrease in net assets resulting from capital transactions | | | (1,083,229 | ) | | | (1,321,066 | ) |
| | | | | | | | |
Total Decrease in Net Assets | | | (1,049,347 | ) | | | (2,490,503 | ) |
| | | | | | | | |
Net Assets | | | | | | | | |
Beginning of year | | | 10,721,665 | | | | 13,212,168 | |
| | | | | | | | |
End of year | | $ | 9,672,318 | | | $ | 10,721,665 | |
| | | | | | | | |
Accumulated undistributed net investment income | | $ | 74,852 | | | $ | 31,636 | |
| | | | | | | | |
Share Transactions | | | | | | | | |
Shares sold | | | 45,877 | | | | 125,135 | |
Shares issued in reinvestment of distributions | | | 3,558 | | | | 33,607 | |
Shares redeemed | | | (136,304 | ) | | | (257,087 | ) |
| | | | | | | | |
Net decrease in shares outstanding | | | (86,869 | ) | | | (98,345 | ) |
| | | | | | | | |
See accompanying notes which are an integral part of these financial statements.
12
GRANITE VALUE FUND
FINANCIAL HIGHLIGHTS
(For a share outstanding during each period)
| | | | | | | | | | | | | | | | | | | | |
| | | For the
Year Ended
October 31,
2016 | | | For the
Year Ended
October 31,
2015 | | | For the
Year Ended
October 31,
2014 | | | For the
Year Ended
October 31,
2013 | | | For the
Period Ended
October 31,
2012 (a) | |
Selected Per Share Data: | | | | | | | | | | | | | | | | | | | | |
Net asset value, beginning of year | | $ | 12.90 | | | $ | 14.22 | | | $ | 13.84 | | | $ | 11.24 | | | $ | 10.00 | |
| | | | | | | | | | | | | | | | | | | | |
Investment operations: | | | | | | | | | | | | | | | | | | | | |
Net investment income | | | 0.14 | | | | 0.05 | | | | 0.02 | | | | 0.02 | | | | 0.05 | (b) |
Net realized and unrealized gain (loss) on investments | | | 0.03 | (c) | | | (0.80 | ) | | | 0.74 | | | | 2.68 | | | | 1.19 | |
| | | | | | | | | | | | | | | | | | | | |
Total from investment operations | | | 0.17 | | | | (0.75 | ) | | | 0.76 | | | | 2.70 | | | | 1.24 | |
| | | | | | | | | | | | | | | | | | | | |
Less distributions to shareholders from: | | | | | | | | | | | | | | | | | | | | |
Net investment income | | | (0.07 | ) | | | (0.03 | ) | | | (0.02 | ) | | | (0.10 | ) | | | – | |
Net realized gains | | | – | | | | (0.54 | ) | | | (0.36 | ) | | | – | | | | – | |
| | | | | | | | | | | | | | | | | | | | |
Total distributions | | | (0.07 | ) | | | (0.57 | ) | | | (0.38 | ) | | | (0.10 | ) | | | – | |
| | | | | | | | | | | | | | | | | | | | |
Paid in capital from redemption fees | | | – | | | | – | | | | – | (d) | | | – | | | | – | (d) |
| | | | | | | | | | | | | | | | | | | | |
Net asset value, end of year | | $ | 13.00 | | | $ | 12.90 | | | $ | 14.22 | | | $ | 13.84 | | | $ | 11.24 | |
| | | | | | | | | | | | | | | | | | | | |
| | | | | |
Total Return (e) | | | 1.30 | % | | | -5.37 | % | | | 5.65 | % | | | 24.21 | % | | | 12.40 | %(f) |
Ratios and Supplemental Data: | | | | | | | | | | | | | | | | | | | | |
Net assets, end of year (000) | | $ | 9,672 | | | $ | 10,722 | | | $ | 13,212 | | | $ | 10,577 | | | $ | 4,750 | |
Ratio of net expenses to average net assets | | | 1.35 | % | | | 1.36 | %(h) | | | 1.35 | % | | | 1.35 | % | | | 1.35 | %(g) |
Ratio of expenses to average net assets before waiver and reimbursement | | | 2.87 | % | | | 2.53 | % | | | 2.39 | % | | | 3.32 | % | | | 8.11 | %(g) |
Ratio of net investment income to average net assets | | | 1.02 | % | | | 0.40 | % | | | 0.17 | % | | | 0.27 | % | | | 0.55 | %(g) |
Portfolio turnover rate | | | 31 | % | | | 32 | % | | | 30 | % | | | 33 | % | | | 20 | %(f) |
| (a) | For the period December 22, 2011 (commencement of operations) to October 31, 2012. |
| (b) | Calculated using the average shares method. |
| (c) | The amount shown for a share outstanding throughout the period does not accord with the change in aggregate gains and losses in the portfolio of securities during the period because of the timing of sales and purchases of fund shares in relation to fluctuating market values during the period. |
| (d) | Resulted in less than $0.005 per share. |
| (e) | Total return in the above table represents the rate that an investor would have earned or lost on an investment in the Fund, assuming reinvestment of distributions. |
| (h) | Includes 0.01% overdraft fees. |
See accompanying notes which are an integral part of these financial statements.
13
GRANITE VALUE FUND
NOTES TO THE FINANCIAL STATEMENTS
October 31, 2016
NOTE 1. ORGANIZATION
The Granite Value Fund (the “Fund”) is an open-end diversified series of the Valued Advisers Trust (the “Trust”). The Trust is a management investment company established under the laws of Delaware by an Agreement and Declaration of Trust dated June 13, 2008 (the “Trust Agreement”). The Trust Agreement permits the Board of Trustees (the “Board”) to issue an unlimited number of shares of beneficial interest of separate series without par value. The Fund is one of a series of funds authorized by the Board. The Fund commenced operations December 22, 2011. The Fund’s investment adviser is Granite Investment Advisors, Inc. (the “Adviser”). The investment objective of the Fund is to seek long-term capital appreciation.
NOTE 2. SIGNIFICANT ACCOUNTING POLICIES
The Fund is an investment company and follows accounting and reporting guidance under Financial Accounting Standards Board Accounting Standards Codification (“ASC”) Topic 946, “Financial Services-Investment Companies”. The following is a summary of significant accounting policies followed by the Fund in the preparation of its financial statements. These policies are in conformity with generally accepted accounting principles in the United States of America (“GAAP”).
Estimates – The preparation of financial statements in conformity with GAAP requires management to make estimates and assumptions that affect the reported amounts of assets and liabilities and disclosure of contingent assets and liabilities at the date of the financial statements and the reported amounts of increases and decreases in net assets from operations during the reporting period. Actual results could differ from those estimates.
Securities Valuation – All investments in securities are recorded at their estimated fair value as described in Note 3.
Federal Income Taxes – The Fund makes no provision for federal income or excise tax. The Fund has qualified and intends to qualify each year as a regulated investment company (“RIC”) under subchapter M of the Internal Revenue Code of 1986, as amended, by complying with the requirements applicable to RICs and by distributing substantially all of its taxable income. The Fund also intends to distribute sufficient net investment income and net capital gains, if any, so that it will not be subject to excise tax on undistributed income and gains. If the required amount of net investment income or gains is not distributed, the Fund could incur a tax expense.
As of and during the year ended October 31, 2016, the Fund did not have a liability for any unrecognized tax benefits. The Fund recognizes interest and penalties, if any, related to unrecognized tax benefits as income tax expense in the statement of operations. The Fund is subject to examination by U.S. federal tax authorities for the last three tax year ends and the interim tax period since then.
Expenses – Expenses incurred by the Trust that do not relate to a specific fund of the Trust are allocated to the individual funds based on each fund’s relative net assets or other appropriate basis (using procedures approved by the Board).
Security Transactions and Related Income – The Fund follows industry practice and records security transactions on the trade date for financial reporting purposes. The specific identification method is used for determining gains or losses for financial statements and income tax purposes. Dividend income is recorded on the ex-dividend date and interest income is recorded on an accrual basis. Discounts and premiums on securities purchased are amortized or accreted using the effective interest method. Withholding taxes on foreign dividends have been provided for in accordance with the Fund’s understanding of the applicable country’s tax rules and rates.
14
GRANITE VALUE FUND
NOTES TO THE FINANCIAL STATEMENTS – (continued)
October 31, 2016
NOTE 2. SIGNIFICANT ACCOUNTING POLICIES – continued
Redemption Fees – The Fund charges a 2.00% redemption fee for shares redeemed within 60 days of purchase. These fees are deducted from the redemption proceeds otherwise payable to the shareholder. The Fund will retain the fee charged as an increase in paid-in capital and such fees become part of the Fund’s daily NAV calculation.
Dividends and Distributions – The Fund intends to distribute substantially all of its net investment income, net realized long-term capital gains and its net realized short-term capital gains, if any, to its shareholders on at least an annual basis. Dividends to shareholders, which are determined in accordance with income tax regulations, are recorded on the ex-dividend date. The treatment for financial reporting purposes of distributions made to shareholders during the year from net investment income or net realized capital gains may differ from their ultimate treatment for federal income tax purposes. These differences are caused primarily by differences in the timing of the recognition of certain components of income, expense or realized capital gain for federal income tax purposes. Where such differences are permanent in nature, they are reclassified in the components of net assets based on their ultimate characterization for federal income tax purposes. Any such reclassifications will have no effect on net assets, results of operations or net asset values per share of the Fund. For fiscal year ended October 31, 2016, the Fund made the following reclassifications to increase (decrease) the components of net assets:
| | | | |
Accumulated Undistributed
Net Investment Income (loss) | | Accumulated Net Realized
Gain (Loss) from Investments | |
$(4,137) | | $ | 4,137 | |
NOTE 3. SECURITIES VALUATION AND FAIR VALUE MEASUREMENTS
Fair value is defined as the price that the Fund would receive upon selling an investment in a orderly transaction to an independent buyer in the principal or most advantageous market of the investment. GAAP established a three-tier hierarchy to maximize the use of observable market data and minimize the use of unobservable inputs and to establish classification of fair value measurements for disclosure purposes.
Inputs refer broadly to the assumptions that market participants would use in pricing the asset or liability, including assumptions about risk (the risk inherent in a particular valuation technique used to measure fair value including items such as a pricing model and/or the risk inherent in the inputs to the valuation technique). Inputs may be observable or unobservable. Observable inputs are inputs that reflect the assumptions market participants would use in pricing the asset or liability developed based on market data obtained from sources independent of the reporting entity. Unobservable inputs are inputs that reflect the reporting entity’s own assumptions about the assumptions market participants would use in pricing the asset or liability developed based on the best information available in the circumstances. Various inputs are used in determining the value of the Fund’s investments. These inputs are summarized in the three broad levels listed below.
| | • | | Level 1 – unadjusted quoted prices in active markets for identical investments and/or registered investment companies where the value per share is determined and published and is the basis for current transactions for identical assets or liabilities at the valuation date |
| | • | | Level 2 – other significant observable inputs (including, but not limited to, quoted prices for an identical security in an inactive market, quoted prices for similar securities, interest rates, prepayment speeds, credit risk, etc.) |
| | • | | Level 3 – significant unobservable inputs (including the Fund’s own assumptions in determining fair value of investments based on the best information available) |
15
GRANITE VALUE FUND
NOTES TO THE FINANCIAL STATEMENTS – (continued)
October 31, 2016
NOTE 3. SECURITIES VALUATION AND FAIR VALUE MEASUREMENTS – continued
The inputs used to measure fair value may fall into different levels of the fair value hierarchy. In such cases, for disclosure purposes, the level in the fair value hierarchy within which the fair value measurement falls in its entirety, is determined based on the lowest level input that is significant to the fair value measurement in its entirety.
Equity securities, including common stocks, that are traded on any stock exchange are generally valued at the last quoted sale price on the security’s primary exchange. Lacking a last sale price, an exchange traded security is generally valued at its last bid price. Securities that are traded on any stock exchange are generally valued by the pricing agent at the last quoted sale price. Lacking a last sale price, an exchange traded security is generally valued by the pricing agent at its last bid price. Securities traded in the NASDAQ over-the-counter market are generally valued by the pricing agent at the NASDAQ Official Closing Price.
When using the market quotations or close prices provided by the pricing agent and when the market is considered active, the security will be classified as a Level 1 security. Sometimes, an equity security owned by the Fund will be valued by the pricing agent with factors other than market quotations or when the market is considered inactive. When this happens, the security will be classified as a Level 2 security. When market quotations are not readily available, when the Adviser determines that the market quotation or the price provided by the pricing agent does not accurately reflect the current fair value, or when restricted or illiquid securities are being valued, such securities are valued as determined in good faith by the Adviser, in conformity with policies adopted by and subject to review by the Board. These will generally be categorized as Level 3 securities.
Investments in open-end mutual funds, including money market mutual funds, are generally priced at the ending net asset value (NAV) provided by the service agent of the funds. These securities will be categorized as Level 1 securities.
In accordance with the Trust’s valuation policies, the Adviser is required to consider all appropriate factors relevant to the value of securities for which it has determined other pricing sources are not available or reliable as described above. No single standard exists for determining fair value, because fair value depends upon the circumstances of each individual case. As a general principle, the current fair value of an issue of securities being valued by the Adviser would be the amount which the Fund might reasonably expect to receive for them upon their current sale. Methods which are in accordance with this principle may, for example, be based on (i) a multiple of earnings; (ii) a discount from market of a similar freely traded security (including a derivative security or a basket of securities traded on other markets, exchanges or among dealers); or (iii) yield to maturity with respect to debt issues, or a combination of these and other methods. Fair value pricing is permitted if, in the Adviser’s opinion, the validity of market quotations appears to be questionable based on factors such as evidence of a thin market in the security based on a small number of quotations, a significant event occurs after the close of a market but before a Fund’s NAV calculation that may affect a security’s value, or the Adviser is aware of any other data that calls into question the reliability of market quotations. The following is a summary of the inputs used to value the Fund’s investments as of October 31, 2016:
| | | | | | | | | | | | | | | | |
| | | Valuation Inputs | |
| Assets | | Level 1 | | | Level 2 | | | Level 3 | | | Total | |
Common Stocks* | | $ | 9,497,401 | | | $ | – | | | $ | – | | | $ | 9,497,401 | |
Money Market Securities | | | 197,042 | | | | – | | | | – | | | | 197,042 | |
Total | | $ | 9,694,443 | | | $ | – | | | $ | – | | | $ | 9,694,443 | |
| * | Refer to the Schedule of Investments for industry classifications. |
16
GRANITE VALUE FUND
NOTES TO THE FINANCIAL STATEMENTS – (continued)
October 31, 2016
NOTE 3. SECURITIES VALUATION AND FAIR VALUE MEASUREMENTS – continued
The Fund did not hold any investments during the reporting period in which significant unobservable inputs were used in determining fair value; therefore, no reconciliation of Level 3 securities is included for this reporting period. The Trust recognizes transfers between fair value hierarchy levels at the reporting period end. There were no transfers between any levels as of October 31, 2016 and the previous reporting period end.
NOTE 4. FEES AND OTHER TRANSACTIONS WITH AFFILIATES
Under the terms of the management agreement, on behalf of the Fund (the “Agreement”), the Adviser manages the Fund’s investments subject to approval of the Board. As compensation for its management services, the Fund is obligated to pay the Adviser a fee computed and accrued daily and paid monthly at an annual rate of 1.00% of the average daily net assets of the Fund. For the year ended October 31, 2016, the Adviser earned a fee of $98,873 from the Fund before the reimbursement described below.
The Adviser has contractually agreed to waive its management fee and/or reimburse expenses through February 28, 2017, so that total annual fund operating expenses, excluding interest, taxes, brokerage commissions, other expenditures which are capitalized in accordance with GAAP, other extraordinary expenses not incurred in the ordinary course of the Fund’s business, dividend expense on short sales, and expenses that the Fund has incurred but did not actually pay because of an expense offset arrangement, if applicable, incurred by the Fund in any fiscal year, do not exceed 1.35% of the Fund’s average daily net assets. The operating expense limitation also excludes any fees and expenses of acquired funds.
For the year ended October 31, 2016, fees and expenses totaling $150,666 were waived or reimbursed by the Adviser. Each fee waiver or expense reimbursement by the Adviser with respect to the Fund is subject to repayment by the Fund within the three fiscal years following the fiscal year in which that particular fee waiver or expense reimbursement occurred, provided that the Fund is able to make the repayment without exceeding the expense limitation in effect at the time of the fee waiver or expense reimbursement and any expense limitation in place at the time of repayment.
The amounts subject to repayment by the Fund pursuant to the aforementioned conditions are as follows:
| | | | |
Amount | | Recoverable through
October 31, | |
$ 129,076 | | | 2017 | |
148,128 | | | 2018 | |
150,666 | | | 2019 | |
The Trust retains Ultimus Asset Services, LLC (“Ultimus”), formerly Huntington Asset Services, Inc. (“HASI”) to provide the Fund with administration, fund accounting, transfer agent and compliance services, including all regulatory reporting. For the period ended October 31, 2016, Ultimus earned fees of $37,500, $25,000 and $20,056 for administration, fund accounting and transfer agent services, respectively. At October 31, 2016, the Fund owed Ultimus $13,759 for such services.
The officers and one trustee of the Trust are members of management and/or employees of Ultimus. Unified Financial Securities, LLC (the “Distributor”), acts as the principal distributor of the Fund’s shares. Effective at the close of business on December 31, 2015, Ultimus Fund Solutions, LLC, acquired HASI and the Distributor from Huntington Bancshares, Inc. (“HBI”). Prior to January 1, 2106, HASI and the Distributor were under common control by HBI.
17
GRANITE VALUE FUND
NOTES TO THE FINANCIAL STATEMENTS – (continued)
October 31, 2016
NOTE 4. FEES AND OTHER TRANSACTIONS WITH AFFILIATES – continued
There were no payments made by the Fund to the Distributor during the year ended October 31, 2016. A trustee and certain officers of the Trust are officers of the Distributor and each such person may be deemed to be an affiliate of the Distributor.
The Fund has adopted a 12b-1 Plan that permits the Fund to pay 0.25% of its average daily net assets to financial institutions that provide distribution and/or shareholder servicing. The 12b-1 Plan has not been activated as of October 31, 2016.
NOTE 5. PURCHASES AND SALES
For the year ended October 31, 2016, purchases and sales of investment securities, other than short-term investments and short-term U.S. government obligations, were as follows:
| | | | |
Purchases | | | | |
U.S. Government Obligations | | $ | – | |
Other | | | 3,090,410 | |
Sales | | | | |
U.S. Government Obligations | | $ | – | |
Other | | | 4,091,287 | |
NOTE 6. BENEFICIAL OWNERSHIP
The beneficial ownership, either directly or indirectly, of more than 25% of the voting securities of a fund creates a presumption of control of a fund, under Section 2(a) (9) of the Investment Company Act of 1940. At October 31, 2016, Charles Schwab & Co., Inc. for the benefit of its customers, owned 50.58%. The Trust does not know whether Charles Schwab & Co., Inc. or any of the underlying beneficial owners controlled more than 25% of the voting securities of the Fund.
NOTE 7. FEDERAL TAX INFORMATION
At October 31, 2016, the net unrealized appreciation (depreciation) of investments for tax purposes was as follows:
| | | | |
Gross appreciation | | $ | 1,236,789 | |
Gross depreciation | | | (371,664 | ) |
| | | | |
Net appreciation on investments | | $ | 865,125 | |
| | | | |
At October 31, 2016, the aggregate cost of securities, excluding U.S. government obligations, for federal income tax purposes was $8,829,318 for the Fund.
On December 14, 2016 the Fund paid an income distribution of $0.120847 per share and a long term capital gain of $0.346023 per share to shareholders of record on December 13, 2016.
18
GRANITE VALUE FUND
NOTES TO THE FINANCIAL STATEMENTS – (continued)
October 31, 2016
NOTE 7. FEDERAL TAX INFORMATION – continued
The tax characterization of distributions for the fiscal years ended October 31, 2016 and 2015, was as follows:
| | | | | | | | |
| Distributions paid from: | | 2016 | | | 2015 | |
Ordinary Income* | | $ | 53,723 | | | $ | 31,319 | |
Long-Term Capital Gains | | $ | — | | | $ | 484,050 | |
| | | | | | | | |
Total Distributions | | $ | 53,723 | | | $ | 515,369 | |
| | | | | | | | |
| * | Short term capital gain distributions are treated as ordinary income for tax purposes. |
At October 31, 2016, the components of distributable earnings (accumulated losses) on a tax basis were as follows:
| | | | |
Undistributed ordinary income | | $ | 65,446 | |
Undistributed long-term capital gain | | | 253,158 | |
Accumulated capital and other losses | | | (2,535 | ) |
Net unrealized appreciation (depreciation) | | | 865,125 | |
| | | | |
| | $ | 1,181,194 | |
| | | | |
NOTE 8. COMMITMENTS AND CONTINGENCIES
The Fund indemnifies its officers and trustees for certain liabilities that may arise from their performance of their duties to the Fund. Additionally, in the normal course of business, the Fund enters into contracts that contain a variety of representations and warranties which provide general indemnifications. The Fund’s maximum exposure under these arrangements is unknown, as this would involve future claims that may be made against the Fund that have not yet occurred.
NOTE 9. SUBSEQUENT EVENTS
Management of the Fund has evaluated the need for disclosures and/or adjustments resulting from subsequent events through the date these financial statements were issued. There were no items requiring adjustment of the financial statements or additional disclosure.
19
REPORT OF INDEPENDENT REGISTERED PUBLIC ACCOUNTING FIRM
To the Shareholders of Granite Value Fund and
Board of Trustees of Valued Advisers Trust
We have audited the accompanying statement of assets and liabilities, including the schedule of investments, of Granite Value Fund (the “Fund”), a series of Valued Advisers Trust, as of October 31, 2016, and the related statement of operations for the year then ended, the statements of changes in net assets for each of the two years in the period then ended, and the financial highlights for each of the five periods in the period then ended. These financial statements and financial highlights are the responsibility of the Fund’s management. Our responsibility is to express an opinion on these financial statements and financial highlights based on our audits.
We conducted our audits in accordance with the standards of the Public Company Accounting Oversight Board (United States). Those standards require that we plan and perform the audit to obtain reasonable assurance about whether the financial statements and financial highlights are free of material misstatement. An audit includes examining, on a test basis, evidence supporting the amounts and disclosures in the financial statements. Our procedures included confirmation of securities owned as of October 31, 2016, by correspondence with the custodian and brokers. An audit also includes assessing the accounting principles used and significant estimates made by management, as well as evaluating the overall financial statement presentation. We believe that our audits provide a reasonable basis for our opinion.
In our opinion, the financial statements and financial highlights referred to above present fairly, in all material respects, the financial position of Granite Value Fund as of October 31, 2016, the results of its operations for the year then ended, the changes in its net assets for each of the two years in the period then ended, and the financial highlights for each of the five periods in the period then ended, in conformity with accounting principles generally accepted in the United States of America.
COHEN & COMPANY, LTD.
Cleveland, Ohio
December 23, 2016
20
SUMMARY OF FUND EXPENSES (Unaudited)
As a shareholder of the Fund, you incur two types of costs: (1) transaction costs, such as short-term redemption fees; and (2) ongoing costs, including management fees and other Fund expenses. This Example is intended to help you understand your ongoing costs (in dollars) of investing in the Fund and to compare these costs with the ongoing costs of investing in other mutual funds. The example is based on an investment of $1,000 invested at the beginning and held for the six month period, May 1, 2016 to October 31, 2016.
Actual Expenses
The first line of the table below provides information about actual account values and actual expenses. You may use the information in this line, together with the amount you invested, to estimate the expenses that you paid over the period. Simply divide your account value by $1,000 (for example, an $8,600 account value divided by $1,000 = $8.60), then multiply the result by the number in the first line under the heading entitled “Expenses Paid During the Period” to estimate the expenses you paid on your account during this period.
Hypothetical Example for Comparison Purposes
The second line of the table below provides information about hypothetical account values and hypothetical expenses based on the Fund’s actual expense ratio and an assumed rate of return of 5% per year before expenses, which is not the Fund’s actual return. The hypothetical account values and expenses may not be used to estimate the actual ending account balance or expenses you paid for the period. You may use this information to compare the ongoing costs of investing in the Fund and other funds. To do so, compare this 5% hypothetical example with the 5% hypothetical examples that appear in the shareholder reports of the other funds.
Please note that the expenses shown in the table are meant to highlight your ongoing costs only. Therefore, the second line of the table below is useful in comparing ongoing costs only and will not help you determine the relative costs of owning different funds.
| | | | | | | | | | | | |
| Granite Value Fund | | Beginning
Account Value May 1, 2016 | | | Ending Account Value October 31, 2016 | | | Expenses Paid
During Period* May 1, 2016 – October 31, 2016 | |
Actual | | $ | 1,000.00 | | | $ | 994.36 | | | $ | 6.75 | |
Hypothetical** | | $ | 1,000.00 | | | $ | 1,018.34 | | | $ | 6.86 | |
| * | Expenses are equal to the Fund’s annualized expense ratio of 1.35%, multiplied by the average account value over the period, multiplied by 184/366 (to reflect the one-half year period). |
| ** | Assumes a 5% return before expenses. |
21
TRUSTEES AND OFFICERS (Unaudited)
The Board of Trustees supervises the business activities of the Trust. Each Trustee serves as a trustee until termination of the Trust unless the Trustee dies, resigns, retires or is removed.
The following tables provide information regarding the Trustees and Officers.
The following table provides information regarding each of the Independent Trustees.
| | | | |
Name, Address*, (Age),
Position with Trust**, Term
of Position with Trust | | Principal Occupation During Past 5 Years | | Other Directorships |
Ira Cohen, 57, Independent Trustee, June 2010 to present. | | Current: Independent financial services consultant since February 2005; Executive Vice President of Asset Management Services, Recognos Financial, since August 2015. | | Trustee and Audit Committee Chairman, Griffin Institutional Real Estate Access Fund, since May 2014. Trustee, Angel Oak Funds Trust, since October 2014. |
Andrea N. Mullins, 49, Independent Trustee, December 2013 to present. | | Current: Private investor; Independent Contractor, Seabridge Wealth Management, LLC, since April 2014. | | None. |
| * | The address for each trustee and officer is 225 Pictoria Drive, Suite 450, Cincinnati, OH 45246. |
| ** | As of the date of this report, the Trust consists of 14 series. |
The following table provides information regarding the Trustee who is considered an “interested person” of the Trust, as that term is defined under the 1940 Act. Based on the experience of the Trustee, the Trust concluded that the individual described below is qualified to serve as a Trustee.
| | | | |
Name, Address*, (Age),
Position with Trust**, Term
of Position with Trust | | Principal Occupation During Past 5 Years | | Other Directorships |
R. Jeffrey Young, 52, Trustee and Chairman, June 2010 to present. | | Current: Vice President and Director of Relationship Management, Ultimus Fund Solutions, LLC (since December 2015); President, Unified Financial Securities, LLC (since July 2015). Previous: President, Huntington Asset Services, Inc. (n/k/a Ultimus Asset Services, LLC) (April 2015 to December 2015), Director (May 2014 to December 2015), Senior Vice President (January 2010 to April 2015); Director, Unified Financial Securities, Inc. (n/k/a Unified Financial Securities, LLC) (May 2014 to December 2015); Chief Executive Officer, Huntington Funds (February 2010 to March 2015); Chief Executive Officer, Huntington Strategy Shares (November 2010 to March 2015); President and Chief Executive Officer, Dreman Contrarian Funds (March 2011 to February 2013). | | Trustee and Chairman, Capitol Series Trust, since September 2013. |
| * | The address for each trustee and officer is 225 Pictoria Drive, Suite 450, Cincinnati, OH 45246. |
| ** | As of the date of this report, the Trust consists of 14 series. |
22
The following table provides information regarding the Officers of the Trust:
| | | | |
Name, Address*, (Age),
Position with Trust,** Term
of Position with Trust | | Principal Occupation During Past 5 Years | | Other Directorships |
R. Jeffrey Young, 52, Trustee and Chairman, June 2010 to present; Principal Executive Officer and President, Valued Advisers Trust since February 2010. | | Current: Vice President and Director of Relationship Management, Ultimus Fund Solutions, LLC (since December 2015); President, Unified Financial Securities, LLC (since July 2015). Previous: President, Huntington Asset Services, Inc. (n/k/a Ultimus Asset Services, LLC) (April 2015 to December 2015), Director (May 2014 to December 2015), Senior Vice President (January 2010 to April 2015); Director, Unified Financial Securities, Inc. (n/k/a Unified Financial Securities, LLC) (May 2014 to December 2015); Chief Executive Officer, Huntington Funds (February 2010 to March 2015); Chief Executive Officer, Huntington Strategy Shares (November 2010 to March 2015); President and Chief Executive Officer, Dreman Contrarian Funds (March 2011 to February 2013). | | Trustee and Chairman, Capitol Series Trust, since September 2013. |
John C. Swhear, 55, Chief Compliance Officer, AML Officer and Vice President, August 2008 to present. | | Current: Assistant Vice President and Associate Director of Compliance, Ultimus Fund Solutions, LLC (since December 2015); Chief Compliance Officer, Unified Financial Securities, LLC (since May 2007); Chief Compliance Officer and AML Officer, Capitol Series Trust (since September 2013); Vice President Unified Series Trust (since January 2016). Previous: Vice President of Legal Administration and Compliance, Huntington Asset Services, Inc. (n/k/a Ultimus Asset Services, LLC) (April 2007 to December 2015), Director (May 2014 to December 2015); Director, Unified Financial Securities, Inc. (n/k/a Unified Financial Securities, LLC) (May 2014 to December 2015); President , Unified Series Trust (March 2012 to January 2016), Senior Vice President (May 2007 to March 2012); Secretary , Huntington Funds (April 2010 to February 2012). | | None. |
Carol J. Highsmith, 52, Vice President, August 2008 to present; Secretary, March 2014 to present | | Current: Assistant Vice President, Ultimus Fund Solutions, LLC (since December 2015). Previous: Secretary, Cross Shore Discovery Fund (May 2014 to February 2016); Employed in various positions with Huntington Asset Services, Inc. (n/k/a Ultimus Asset Services, LLC) (November 1994 to December 2015), most recently Vice President of Legal Administration (2005 to December 2015). | | None. |
23
| | | | |
Name, Address*, (Age),
Position with Trust,** Term
of Position with Trust | | Principal Occupation During Past 5 Years | | Other Directorships |
Matthew J. Miller, 40, Vice President, December 2011 to present. | | Current: Assistant Vice President, Relationship Management, Ultimus Fund Solutions, LLC (since December 2015); President and Chief Executive Officer, Capitol Series Trust (since September 2013). Previous: Employed in various positions with Huntington Asset Services, Inc. (n/k/a Ultimus Asset Services, LLC) (since July 1998), most recently Vice President of Relationship Management (2005 to December 2015); Vice President, Huntington Funds (February 2010 to April 2015). | | None. |
Bryan W. Ashmus, 43, Principal Financial Officer and Treasurer, December 2013 to present. | | Current: Vice President and Director of Financial Administration, Ultimus Fund Solutions, LLC (since December 2015); Chief Financial Officer and Treasurer, Cross Shore Discovery Fund (since June 2016). Previous: Vice President and Manager of Financial Administration, Huntington Asset Services, Inc. (n/k/a Ultimus Asset Services, LLC) (September 2013 to December 2015); Chief Financial Officer and Treasurer, Huntington Strategy Shares and Huntington Funds Trust (November 2013 to April 2016); Vice President, Fund Administration, Citi Fund Services Ohio, Inc. (from May 2005 to September 2013). | | None. |
| * | The address for each trustee and officer is 225 Pictoria Drive, Suite 450, Cincinnati, OH 45246. |
| ** | As of the date of this report, the Trust consists of 14 series. |
OTHER INFORMATION (Unaudited)
The Fund’s Statement of Additional Information (“SAI”) includes additional information about the trustees and is available without charge, upon request. You may call toll-free at (888) 442-9893 to request a copy of the SAI or to make shareholder inquiries.
24
APPROVAL OF INVESTMENT ADVISORY AGREEMENT (Unaudited)
At a meeting held on September 7-8, 2016, the Board of Trustees (the “Board”) considered the renewal of the Investment Advisory Agreement (the “Agreement”) between Valued Advisers Trust (the “Trust”) and Granite Investment Advisors, Inc. (“Granite”) with respect to the Granite Value Fund (the “Fund”). Granite provided written information to the Board to assist the Board in its considerations.
Trust counsel reminded the Trustees of their fiduciary duties and responsibilities as summarized in the memorandum from his firm, including the factors to be considered, and the application of those factors to the Agreement. In assessing the factors, the Board took into consideration information furnished by Granite and Trust management for the Board’s review and consideration throughout the year, as well as information specifically prepared or presented in connection with the annual renewal process, including: (i) reports regarding the services and support provided to the Fund and its shareholders by Granite; (ii) quarterly assessments of the investment performance of the Fund by personnel of Granite; (iii) commentary on the reasons for the Fund’s performance; (iv) presentations by Granite addressing Granite’s investment philosophy, investment strategy, personnel, and operations; (v) compliance and audit reports concerning the Fund and Granite; (vi) disclosure information contained in the registration statement for the Fund and the Form ADV of Granite; and (vii) a memorandum from counsel, that summarized the fiduciary duties and responsibilities of the Board in reviewing and approving the Agreement. The Board also requested and received various informational materials including, without limitation: (i) documents containing information about Granite, including its financial information, a description of personnel and the services it provides to the Fund; information on Granite’s investment advice and performance; summaries of the Fund’s expenses, compliance program, current legal matters, and other general information; (ii) comparative expense and performance information for other mutual funds with strategies similar to the Fund; and (iii) the benefits to be realized by Granite from its relationship with the Fund. The Board did not identify any particular information that was most relevant to its consideration of the Agreement and each Trustee may have afforded different weight to the various factors.
| 1. | The nature, extent, and quality of the services to be provided by Granite. In this regard, the Board considered Granite’s responsibilities under the Agreement. The Trustees considered the services being provided by Granite to the Fund including, without limitation: the quality of its investment advisory services (including research and recommendations with respect to portfolio securities), its process for formulating investment recommendations and assuring compliance with the Fund’s investment objectives and limitations, Granite’s coordination of services for the Fund among the fund’s service providers, and Granite’s efforts to promote the Fund and grow its assets. The Trustees considered Granite’s continuity of, and commitment to retain, qualified personnel and Granite’s commitment to maintain its resources and systems and options that allow the Fund to maintain its goals, and Granite’s continued cooperation with the Independent Trustees and counsel for the Fund. The Trustees considered Granite’s methods of operation and its personnel, including their education and experience; and Granite’s compliance program, policies, and procedures. The Trustees considered Granite’s intent to add to its business development resources. After considering the foregoing information and further information in the meeting materials provided by Granite (including Granite’s Form ADV), the Board concluded that, in light of all the facts and circumstances, the nature, extent, and quality of the services provided by Granite to the Fund were satisfactory and adequate. |
| 2. | Investment Performance of the Fund and Granite. In considering the investment performance of the Fund and Granite, the Trustees compared the performance, including the year-to-date, 1-year, 3-year and since inception annualized returns of the Fund (for the periods ending June 30, 2016) with the performance of funds in the Morningstar Large Cap Value category. The Trustees also considered the consistency of Granite’s management of the Fund with its investment objective, strategies, and limitations. The Trustees noted that the Fund’s performance for the year-to-date and since inception periods was above the category average, and the performance over the 1-year and 3-year periods was below the average of its Morningstar category. The Trustees also considered the performance of Granite’s separate accounts that were managed in a manner similar to that of the Fund and they noted that the performance was relatively comparable and that |
25
| | Granite’s explanations for the differences in performance were acceptable. After reviewing and discussing the investment performance of the Fund further, Granite’s experience managing the Fund, the Fund’s historical performance, and other relevant factors, the Board concluded, in light of all the facts and circumstances, that the investment performance of the Fund and Granite was satisfactory. |
| 3. | The costs of the services to be provided and profits to be realized by Granite from the relationship with the Fund. In considering the costs of services to be provided and the profits to be realized by Granite from the relationship with the Fund, the Trustees considered: (1) Granite’s financial condition; (2) the asset levels of the Fund; (3) the overall expenses of the Fund; and (4) the nature and frequency of advisory fee payments. The Trustees reviewed information provided by Granite regarding its profits associated with managing the Fund. The Trustees also considered potential benefits for Granite in managing the Fund. The Trustees then compared the fees and expenses of the Fund (including the management fee) to other comparable mutual funds. The Trustees noted that the Fund’s management fee was higher than its peer average and median, as was the net operating expense ratio, although the Trustees noted that other funds in the peer group had higher management fees and net operating expense ratios. The Trustees discussed the difference between the fees charged to the Fund as compared to the fees charged to Granite’s separately managed accounts with investment strategies and objectives similar to the Fund. They acknowledged the increased resources required to manage the Fund, including increased compliance and administrative costs. Based on the foregoing, the Board concluded that the fees to be paid to Granite by the Fund and the profits to be realized by Granite, in light of all the facts and circumstances, were fair and reasonable in relation to the nature and quality of the services provided by Granite. |
| 4. | The extent to which economies of scale would be realized as the Fund grows and whether advisory fee levels reflect these economies of scale for the benefit of the Fund’s investors. In this regard, the Board considered the Fund’s fee arrangements with Granite. The Board considered that while the management fee remained the same at all asset levels, the Fund’s shareholders had experienced benefits from the Fund’s expense limitation arrangement. The Trustees noted Granite’s representation of its current intent to keep the expense limitation arrangement in place into the foreseeable future. The Trustees also noted that once the Fund’s expenses fell below the cap set by the arrangement, the Fund’s shareholders would continue to benefit from the economies of scale under the Fund’s agreements with service providers other than Granite. In light of its ongoing consideration of the Fund’s asset levels, expectations for growth in the Fund, and fee levels, the Board determined that the Fund’s fee arrangements, in light of all the facts and circumstances, were fair and reasonable in relation to the nature and quality of the services provided by Granite. |
| 5. | Possible conflicts of interest and benefits to Granite. In considering Granite’s practices regarding conflicts of interest, the Trustees evaluated the potential for conflicts of interest and considered such matters as the experience and ability of the advisory personnel assigned to the Fund; the basis of decisions to buy or sell securities for the Fund and/or Granite’s other accounts; and the substance and administration of Granite’s Code of Ethics. The Trustees also considered disclosure in the registration statement of the Trust relating to Granite’s potential conflicts of interest. The Trustees considered Granite’s policies with respect to the use of soft dollars. The Trustees noted that Granite benefited from the Fund in that it is able to utilize the Fund as a vehicle into which to direct advisory clients with small account balances. The Trustees did not identify any other potential benefits (other than the management fee) that would be realized by Granite. Based on the foregoing, the Board determined that the standards and practices of Granite relating to the identification and mitigation of potential conflicts of interest and the benefits that it derives from managing the Fund are acceptable. |
After additional consideration of the factors delineated in the memorandum provided by counsel and further discussion among the Board members, the Board determined to approve the continuation of the Agreement between the Trust and Granite.
26
OTHER FEDERAL INCOME TAX INFORMATION (Unaudited)
The Form 1099-DIV you receive in January 2017 will show the tax status of all distributions paid to your account in calendar year 2016. Shareholders are advised to consult their own tax adviser with respect to the tax consequences of their investment in the Fund. As required by the Internal Revenue Code and/or regulations, shareholders must be notified regarding the status of qualified dividend income for individuals and the dividends received deduction for corporations.
Qualified Dividend Income. The Fund designates approximately 100% or up to the maximum amount of such dividends allowable pursuant to the Internal Revenue Code, as qualified dividend income eligible for the reduced tax rate of 15%.
Dividends Received Deduction. Corporate shareholders are generally entitled to take the dividends received deduction on the portion of the Fund’s dividend distribution that qualifies under tax law. For the Fund’s calendar year 2016 ordinary income dividends, 100% qualifies for the corporate dividends received deduction.
For the year ended October 31, 2016, the Fund did not designate any long-term capital gain distributions.
27
VALUED ADVISERS TRUST
PRIVACY POLICY
The following is a description of the policies of the Valued Advisers Trust (the “Trust”) regarding disclosure of nonpublic personal information that shareholders provide to a series of the Trust (each, a “Fund”) or that the Fund collects from other sources. In the event that a shareholder holds shares of a Fund through a broker-dealer or other financial intermediary, the privacy policy of the financial intermediary would govern how shareholder nonpublic personal information would be shared with nonaffiliated third parties.
Categories of Information A Fund May Collect. A Fund may collect the following nonpublic personal information about its shareholders:
| • | | Information the Fund receives from a shareholder on applications or other forms, correspondence, or conversations (such as the shareholder’s name, address, phone number, social security number, and date of birth); and |
| • | | Information about the shareholder’s transactions with the Fund, its affiliates, or others (such as the shareholder’s account number and balance, payment history, cost basis information, and other financial information). |
Categories of Information A Fund May Disclose. A Fund may not disclose any nonpublic personal information about its current or former shareholders to unaffiliated third parties, except as required or permitted by law. A Fund is permitted by law to disclose all of the information it collects, as described above, to its service providers (such as the Fund’s custodian, administrator, transfer agent, accountant and legal counsel) to process shareholder transactions and otherwise provide services to the shareholder.
Confidentiality and Security. Each Fund shall restrict access to shareholder nonpublic personal information to those persons who require such information to provide products or services to the shareholder. Each Fund shall maintain physical, electronic, and procedural safeguards that comply with federal standards to guard shareholder nonpublic personal information.
Disposal of Information. The Funds, through their transfer agent, have taken steps to reasonably ensure that the privacy of a shareholder’s nonpublic personal information is maintained at all times, including in connection with the disposal of information that is no longer required to be maintained by the Funds. Such steps shall include, whenever possible, shredding paper documents and records prior to disposal, requiring off-site storage vendors to shred documents maintained in such locations prior to disposal, and erasing and/or obliterating any data contained on electronic media in such a manner that the information can no longer be read or reconstructed.
28
PROXY VOTING (Unaudited)
A description of the policies and procedures that the Fund uses to determine how to vote proxies relating to portfolio securities and information regarding how the Fund voted those proxies is available without charge upon request by (1) calling the Fund at (888) 442-9893 and (2) from Fund documents filed with the Securities and Exchange Commission (“SEC”) on the SEC’s website at www.sec.gov.
TRUSTEES
R. Jeffrey Young, Chairman
Ira P. Cohen
Andrea N. Mullins
OFFICERS
R. Jeffrey Young, Principal Executive Officer and President
John C. Swhear, Chief Compliance Officer, AML Officer and Vice President
Carol J. Highsmith, Vice President and Secretary
Matthew J. Miller, Vice President
Bryan W. Ashmus, Principal Financial Officer and Treasurer
INVESTMENT ADVISER
Granite Investment Advisors, Inc.
6 Eagle Square, 3rd Floor
Concord, NH 03301
DISTRIBUTOR
Unified Financial Securities, LLC
9465 Counselors Row, Suite 200
Indianapolis, IN 46240
INDEPENDENT REGISTERED PUBLIC ACCOUNTING FIRM
Cohen & Company, Ltd.
1350 Euclid Avenue, Suite 800
Cleveland, OH 44115
LEGAL COUNSEL
The Law Offices of John H. Lively & Associates, Inc.
A member firm of The 1940 Act Law GroupTM
11300 Tomahawk Creek Parkway, Ste. 310
Leawood, KS 66211
CUSTODIAN
Huntington National Bank
41 South High Street
Columbus, OH 43215
ADMINISTRATOR, TRANSFER AGENT AND FUND ACCOUNTANT
Ultimus Asset Services, LLC
225 Pictoria Drive, Suite 450
Cincinnati, OH 45246
This report is intended only for the information of shareholders or those who have received the Fund’s prospectus which contains information about the Fund’s management fee and expenses. Please read the prospectus carefully before investing.
Distributed by Unified Financial Securities, LLC
Member FINRA/SIPC

SOUND MIND INVESTING FUND (SMIFX)
SMI CONSERVATIVE
ALLOCATION FUND (SMILX)
SMI DYNAMIC
ALLOCATION FUND (SMIDX)
SMI BOND FUND (SMIUX)
SMI 50/40/10 FUND (SMIRX)
|
| |
| ANNUAL REPORT |
| |
| OCTOBER 31, 2016 |
Fund Adviser:
SMI Advisory Services, LLC
P.O. BOX 547
Columbus, IN 47202
Toll Free (877) SMI-FUND
www.smifund.com
“We have two kinds of forecasters: Those who don’t know, and those who don’t know they don’t know.”
– John Kenneth Galbraith
Dear Fellow Shareholder,
Donald Trump’s recent victory was historic for many reasons. Hopefully investors will remember it as the day they finally gave up on listening to the “experts.”
After all, the vast majority of election forecasters got this year’s presidential race wrong. After statistician Nate Silver correctly called all 50 states during President Obama’s re-election in 2012, many people came to believe that election outcomes can be accurately predicted. But almost none of the polls or experts called this one correctly.
Nor did they accurately foresee the investment implications of a Trump win. A few weeks before Election Day, Liz Ann Sonders, Chief Investment Strategist for Charles Schwab, pondered how the market might react to the election. Her conclusion: “The most unsettling [result] would likely be a ‘Brexit’-type situation, where polls suggest a clear Clinton win, but we wake up and find Trump has won.”
Of course, that’s exactly what happened. As Trump’s chances of victory shifted throughout the night from unlikely to possible to inevitable, Sonders appeared to be spot on. More than unsettled, Dow futures fell hard, losing nearly 800 points. However, by the time the market opened the next day, stocks had recovered almost that entire decline, and the Dow was up nearly 1.5% by the end of the day.
Investors can learn a valuable lesson from this experience. Once and for all, declare your investment portfolio to be a prediction-free zone.
That’s not to say we should invest blindly with no regard to the conditions around us. There are times to be more conservative or aggressive than others. But first and foremost, we need to recognize our limitations. Time and time again, the prediction model has failed investors. Yet most investors tend to lick their wounds and turn right around looking for a better expert to believe the next time.
At SMI, our approach begins within the context of following God’s protective principles. A strong financial foundation, built by getting debt-free and creating a savings reserve, provides the strength to weather unexpected setbacks. Allocating your stock/bond mix (that is, setting your risk level) in a way that balances your need for growth and your emotional fear of loss is another key step. We build portfolios based on the principle of diversification, both between and within various asset classes, knowing that performance excellence rotates. Finally, we suggest taking no more risk than is absolutely necessary in order to reach your financial goals. After all, investing isn’t about building the biggest pile of money possible, it’s about meeting your specific financial goals.
1
Rather than build a portfolio dependent on a particular market prediction coming true, we believe in diversifying your portfolios in an effort to take advantage of market opportunities while also attempting to protect against its risks. A portfolio that doesn’t fly too high when the market is rising – but also doesn’t dive too low when it’s falling – is much easier for investors to stick with emotionally than one with wider swings of performance. Since the primary struggle most investors face is emotional, we believe constructing portfolios that attempt to minimize these emotional swings gives SMI investors the best chance of long-term investing success.
Performance Review
The 12 months ended October 31, 2016 was a difficult period for trend-following strategies. Like all momentum-based strategies, SMI’s investment approaches tend to thrive when current market trends persist. Ideally, these trends persist for extended periods of time, allowing our portfolios to get positioned in whatever type of investment is working and then ride the trend higher. Unfortunately, when the market is rapidly changing direction and pivoting between extreme ups and downs, there are no persisting trends to take advantage of.
The first of the stock market’s pair of 10% corrections ended in September of 2015. Any time the market experiences a significant decline like that, SMI’s portfolios are going to begin to tilt conservatively. This positioning hurt our performance in November and December of 2015, as the market rebounded strongly from the earlier correction. Unfortunately, just as that stronger performance was starting to impact the holdings of SMI’s portfolios, the second market correction hit in January and February. That correction lasted just long enough to whipsaw our portfolios again. The roughly two-month swings from recovery to another correction to another recovery meant our portfolios spent the first half of the reporting period chasing trends that would quickly reverse. Thankfully, this type of market behavior has historically been the exception rather than the rule, or trend-following wouldn’t work as a long-term approach.
The third quarter of 2016 started on the heels of a summer bombshell: The surprising result of the June 23 Brexit vote to leave the EU briefly stunned investors and roiled global markets. But the U.S. stock market quickly shook off any lasting impact and surged to new highs as the third quarter unfolded. It was a surprisingly swift pivot back to greater risk-taking, as foreign and smaller stocks took over the leadership position from their larger-stock counterparts.
Despite all the fear and uncertainty that has surrounded the market over the past year and a half (including a pair of separate 10% market corrections), the most profitable path for SMI investors has been to tune out the noise and stick with their long-term plans.
It’s interesting to note that while Dynamic Asset Allocation and Stock Upgrading moved out of synch with each other through much of 2016 (DAA had a great second quarter and weak third quarter, while Stock Upgrading was the opposite), they both had similar year-to-date returns through the first 10 months of 2016. They are complementary strategies, which is the point of pairing them in portfolios (as we do in the 50-40-10 portfolio) – to diversify your overall portfolio so ideally there’s always something performing well, regardless of what the market is doing.
2
SMI Funds
Dynamic Asset Allocation (“DAA”) – Funds utilizing this strategy in at least part of their portfolios: SMIDX, SMILX* & SMIRX:
DAA served us wonderfully as a stock market buffer during the first six weeks of 2016, a period when the Wilshire 5000 Index (“Wilshire 5000”) lost -11.0%. It also performed well in the second quarter of the year, while invested primarily in the traditionally less-aggressive asset classes of gold, bonds, and real estate. However, that conservative posture meant lower returns through the third quarter and October, during which it posted a small loss at a time when the stock market started gaining again. When the market shifts from favoring conservative assets (such as bonds and gold) to more aggressive ones (like stocks), it usually takes DAA some time to respond to those changes.
Stock Upgrading – Funds utilizing this strategy in at least part of their portfolios: SMIFX, SMILX* & SMIRX:
In the third quarter, foreign and smaller stocks reversed the trend of the last several years and began outperforming large company stocks. This is somewhat surprising, given that large stocks usually dominate the latter stages of bull markets. This trend has only accelerated in the week following the election and is definitely something we’ll be watching closely.
Whether the trend of small-company stocks outperforming large-company stocks will last is unknown, but it’s a very helpful development for Upgrading. That’s because SMI always diversifies among stock types, owning significant amounts of smaller-company stocks as well as foreign holdings. This has hurt Upgrading’s performance relative to the broad-market indexes like the S&P 500® Index and Wilshire 5000, which are dominated by the returns of large stocks. But having been involved in Upgrading for decades, we know that performance can swing quickly between these groups. So we maintain our diversification, knowing that eventually what has been out of favor and hurting our relative performance will likely swing back the other way eventually and help us make up that relative performance gap.
It’s also worth noting that SMIFX has posted a healthy 8.76% annualized return over the last five years. Few would have predicted that back in 2011, or even as recently as a year ago when the market was just starting to recover from its first correction in four years – especially if they’d known a second correction was coming just a few months later! It’s a good reminder that the market is full of surprises, but tends to reward those who patiently and consistently endure its short-term gyrations in pursuit of its long-term rewards.
Bond Upgrading – Funds utilizing this strategy in at least part of their portfolios: SMIUX & SMILX*:
After posting strong gains during the first half of 2016, the bond market cooled during the third quarter. The Fed continued its game of “will they or won’t they?” in terms of raising rates, but ultimately held them steady. The 10-year Treasury yield started 2016 at 2.27%, fell all the way to 1.37% by mid-year, then started climbing again. It rose from 1.60% to 1.84% in October alone, and soared another 0.40% in the week following the election.
*Indicates this fund does not always contain the strategy being described.
3
SMI’s bond returns were hurt a bit in late 2015 by our portfolio’s inclusion of longer-term bonds at a time when interest rates were increasing. For most of 2016, though, our Bond Upgrading process kept us running slightly ahead of a very strong bond market. Through the first nine months of 2016, SMIUX led the Barclay’s Capital U.S. Aggregate Bond Index by a 5.90% to 5.80% margin. Longer-term corporate bonds gave back some of their gains as interest rates rose in October 2016, causing SMIUX’s one-year performance through 10/31/2016 to trail the index (although SMIUX had recaptured the one-year performance edge as of this letter’s writing in mid-November).
Going Direct With the SMI Funds
Slightly over two-thirds of the assets in the SMI Funds are owned through accounts held at other organizations (Fidelity, Schwab, TD Ameritrade, etc.). That’s perfectly fine. However, there are some advantages to having your account directly with the SMI Funds rather than through a third party.
The primary advantage of a direct account is the ability to buy or sell shares of the SMI Funds without paying any transaction fees. Most third-party accounts are charged some sort of transaction fee when the SMI Funds are bought or sold. Those fees can add up – particularly if you are regularly buying or selling shares in any of the SMI Funds. When your account is held directly with the SMI Funds, you never have to pay transaction fees. Additionally, in accounts held directly with the SMI Funds, the typical 2% redemption fee on shares sold within 60 days of purchase is waived if you are transferring money from one SMI Fund to another. To learn more about moving your account directly to the SMI Funds, visit www.smifund.com or call 1-877-SMI-FUND.
We appreciate the confidence you have placed in us to be a faithful steward of your assets, as you strive to be a faithful steward of His assets.
Sincerely,

Mark Biller
Senior Portfolio Manager
The Sound Mind Investing Funds
The SMI Fund lineup, shown below, now offers investors a way to mix and match professionally managed funds to custom tailor the risk level desired for their portfolio. If you’d like assistance customizing your portfolio in this manner, please call a Stewardship Advisor at (800) 796-4975.
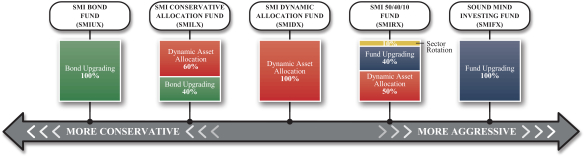
4
PERFORMANCE RESULTS – (Unaudited)
| | | | | | | | | | | | | | | | | | | | |
Average Annual Total Returns(a) (For the periods ended October 31, 2016) | |
| | | Three Months | | | Six Months | | | One Year | | | Five Year | | | Ten Year | |
Sound Mind Investing Fund | | | -2.18% | | | | 2.69% | | | | 0.55% | | | | 8.76% | | | | 5.22% | |
Wilshire 5000® Total Market Index(b) | | | -1.68% | | | | 4.35% | | | | 4.63% | | | | 13.36% | | | | 6.84% | |
S&P 500® Index(b) | | | -1.67% | | | | 4.06% | | | | 4.51% | | | | 13.57% | | | | 6.70% | |
SMI Custom Index(c) | | | -1.63% | | | | 4.05% | | | | 2.78% | | | | 11.09% | | | | 5.48% | |
Total annual operating expenses, as disclosed in the Sound Mind Investing Fund’s (“SMI Fund”) prospectus dated February 29, 2016, were 2.03% of average daily net assets, which includes acquired fund fees and expenses. All expenses are reflected in performance results. The SMI Fund’s investment adviser contractually has agreed to waive its fee and reimburse expenses to the extent necessary to maintain Total Annual Fund Operating Expenses (excluding interest, taxes, brokerage commissions, other expenses which are capitalized in accordance with generally accepted accounting principles, extraordinary expenses, dividend expense on short sales, 12b-1 fees, and acquired fund fees and expenses) at 1.50% of the SMI Fund’s average daily net assets through February 28, 2017. This expense cap may not be terminated prior to this date except by the Board of Trustees (the “Board”).
| | | | | | | | | | | | | | | | | | | | |
Average Annual Total Returns(a) (For the periods ended October 31, 2016) | |
| | | Three Months | | | Six Months | | | One Year | | | Five Year | | | Since Inception
(December 30, 2010) | |
SMI Conservative Allocation Fund | | | -4.34% | | | | 1.50% | | | | 1.30% | | | | 5.41% | | | | 4.07% | |
Wilshire 5000® Total Market Index(b) | | | -1.68% | | | | 4.35% | | | | 4.63% | | | | 13.36% | | | | 11.40% | |
Bloomberg Barclays U.S. Aggregate Bond Index(b) | | | -0.94% | | | | 1.51% | | | | 4.37% | | | | 2.90% | | | | 3.70% | |
Weighted Index(c) | | | -1.38% | | | | 3.22% | | | | 4.66% | | | | 9.22% | | | | 8.46% | |
Total annual operating expenses, as disclosed in the SMI Conservative Allocation Fund’s prospectus dated February 29, 2016, were 1.55% of average daily net assets (1.89% before fee waivers/expense reimbursements by the SMI Advisory Services, LLC (the “Adviser”)), which includes acquired fund fees and expenses and reflects the fee waiver/expense reimbursement discussed below. All expenses are reflected in performance results. The SMI Conservative Allocation Fund’s investment adviser contractually has agreed to waive its fee and reimburse expenses to the extent necessary to maintain Total Annual Fund Operating Expenses (excluding interest, taxes, brokerage commissions, other expenses which are capitalized in accordance with generally accepted accounting principles, extraordinary expenses, dividend expense on short sales, 12b-1 fees, and acquired fund fees and expenses) at 1.15% of the SMI Conservative Allocation Fund’s average daily net assets through February 28, 2017. Each fee waiver or expense reimbursement by the SMI Conservative Allocation Fund’s investment advisor is subject to repayment by the SMI Conservative Allocation Fund within the three fiscal years following the fiscal year in which the expense was incurred, provided that the SMI Conservative Allocation Fund’s is able to make the repayment without exceeding the expense limitation in place at the time of the fee waiver or expense reimbursement. The Adviser is also entitled to recoupment related to fees waived and expenses reimbursed with respect to the predecessor fund (Sound Mind Investing Balanced Fund). This expense cap may not be terminated prior to this date except by the Board.
5
PERFORMANCE RESULTS – (Unaudited), (Continued)
| | | | | | | | | | | | | | | | |
Average Annual Total Returns(a) (For the periods ended October 31, 2016) | |
| | | Three Months | | | Six Months | | | One Year | | | Since Inception
(February 28, 2013) | |
SMI Dynamic Allocation Fund | | | -6.02% | | | | 1.20% | | | | 0.62% | | | | 3.97% | |
Wilshire 5000® Total Market Index(b) | | | -1.68% | | | | 4.35% | | | | 4.63% | | | | 11.67% | |
Bloomberg Barclays U.S. Aggregate Bond Index(b) | | | -0.94% | | | | 1.51% | | | | 4.37% | | | | 2.56% | |
Weighted Index(c) | | | -1.38% | | | | 3.22% | | | | 4.66% | | | | 8.09% | |
Total annual operating expenses, as disclosed in the SMI Dynamic Allocation Fund’s prospectus dated February 29, 2016, were 1.38% of average daily net assets, which includes acquired fund fees and expenses. All expenses are reflected in performance results. The SMI Dynamic Allocation Fund’s investment adviser contractually has agreed to waive its fee and reimburse expenses to the extent necessary to maintain Total Annual Fund Operating Expenses (excluding interest, taxes, brokerage commissions, other expenses which are capitalized in accordance with generally accepted accounting principles, extraordinary expenses, dividend expense on short sales, 12b-1 fees, and acquired fund fees and expenses) at 1.45% of the SMI Dynamic Allocation Fund’s average daily net assets through February 28, 2017. This expense cap may not be terminated prior to this date except by the Board.
| | | | | | | | | | | | | | | | |
Average Annual Total Returns(a) (For the periods ended October 31, 2016) | |
| | | Three Months | | | Six Months | | | One Year | | | Since Inception
(April 28, 2015) | |
SMI Bond Fund | | | -1.46% | | | | 2.02% | | | | 2.95% | | | | 0.71% | |
Bloomberg Barclays U.S. Aggregate Bond Index(b) | | | -0.94% | | | | 1.51% | | | | 4.37% | | | | 2.58% | |
Total annual operating expenses, as disclosed in the SMI Bond Fund’s prospectus dated February 29, 2016, were 1.15% of average daily net assets (4.48% before fee waivers/expense reimbursements by the Adviser). All expenses are reflected in performance results. The SMI Bond Fund’s investment adviser contractually has agreed to waive its fee and/or reimburse expenses to the extent necessary to maintain Total Annual Fund Operating Expenses (excluding interest, taxes, brokerage commissions, other expenses which are capitalized in accordance with generally accepted accounting principles, extraordinary expenses, dividend expense on short sales, 12b-1 fees, and acquired fund fees and expenses) at 0.85% of the SMI Bond Fund’s average daily net assets through February 28, 2017. Each fee waiver or expense reimbursement by the Adviser is subject to repayment by the SMI Bond Fund within the three fiscal years following the fiscal year in which the expense was incurred, provided that the SMI Bond Fund is able to make the repayment without exceeding the expense limitation in place at the time of the fee waiver or expense reimbursement. This expense cap may not be terminated prior to this date except by the Board.
6
PERFORMANCE RESULTS – (Unaudited), (Continued)
| | | | | | | | | | | | | | | | |
Average Annual Total Returns(a) (For the periods ended October 31, 2016) | |
| | | Three Months | | | Six Months | | | One Year | | | Since Inception
(April 29, 2015) | |
SMI 50/40/10 Fund | | | -4.43% | | | | 2.43% | | | | 1.44% | | | | -4.48% | |
Wilshire 5000® Total Market Index(b) | | | -1.68% | | | | 4.35% | | | | 4.63% | | | | 2.34% | |
Bloomberg Barclays U.S. Aggregate Bond Index(b) | | | -0.94% | | | | 1.51% | | | | 4.37% | | | | 2.77% | |
Weighted Index(c) | | | -1.38% | | | | 3.22% | | | | 4.66% | | | | 2.69% | |
Total annual operating expenses, as disclosed in the SMI 50/40/10 Fund’s prospectus dated February 29, 2016, were 2.11% of average daily net assets (3.41% before fee waivers/expense reimbursements by the Adviser). All expenses are reflected in performance results. The SMI 50/40/10 Fund’s investment adviser contractually has agreed to waive its fee and reimburse expenses to the extent necessary to maintain Total Annual Fund Operating Expenses (excluding interest, taxes, brokerage commissions, other expenses which are capitalized in accordance with generally accepted accounting principles, extraordinary expenses, dividend expense on short sales, 12b-1 fees, and acquired fund fees and expenses) at 1.45% of the SMI 50/40/10 Fund’s average daily net assets through February 28, 2017. Each waiver or reimbursement of an expense by the Adviser is subject to repayment by the SMI 50/40/10 Fund within the three fiscal years following the fiscal year in which the expense was incurred, provided that the SMI 50/40/10 Fund is able to make the repayment without exceeding the expense limitation in place at the time of the waiver or reimbursement. This expense cap may not be terminated prior to this date except by the Board.
The performance quoted represents past performance, which does not guarantee future results. The investment return and principal value of an investment will fluctuate so that an investor’s shares, when redeemed, may be worth more or less than their original cost. The returns shown do not reflect deduction of taxes that a shareholder would pay on Fund distributions or the redemption of Fund shares. Current performance of the Sound Mind Investing Fund, SMI Conservative Allocation Fund, SMI Dynamic Allocation Fund, SMI Bond Fund and SMI 50/40/10 Fund (each a “Fund” and collectively the “Funds”) may be lower or higher than the performance quoted. Performance data current to the most recent month end may be obtained by calling (877) 764-3863.
| (a) | Average annual total returns reflect any change in price per share and assume the reinvestment of all distributions. The Funds’ returns reflect any fee reductions during the applicable periods. If such fee reductions had not occurred, the quoted performance would have been lower. Total returns for periods less than 1 year are not annualized. |
| (b) | The Standard & Poor’s 500® Index (“S&P 500”), Wilshire 5000® Total Market Index (“Wilshire 5000”), Bloomberg Barclays U.S. Aggregate Bond Index, Russell 1000® Value Index, Russell 1000® Growth Index, Russell 2000® Value Index, Russell 2000® Growth Index and MSCI EAFE Index (collectively, the “Indices”) are unmanaged indices that assume reinvestment of all distributions and exclude the effect of taxes and fees. These Indices are widely recognized unmanaged indices and are representative of a broader market and range of securities than is found in each Fund’s portfolio. The returns of the Indices are not reduced by any fees or operating expenses. Individuals cannot invest directly in the Indices; however, an individual can invest in exchange traded funds or other investment vehicles that attempt to track the performance of a benchmark index. As of December 13, 2016, The Wilshire 5000 has replaced the S&P 500 as the Sound Mind Investing Fund’s primary benchmark. Given the allocation of the Sound Mind Investing Fund’s portfolio, the Adviser believes that the Wilshire 5000 provides a more accurate comparison. |
| (c) | The SMI Custom Index for the Sound Mind Investing Fund is comprised of 20% Russell 1000® Value Index, 20% Russell 1000® Growth Index, 20% Russell 2000® Value Index, 20% Russell 2000® Growth Index and 20% MSCI EAFE Index and the Weighted Index for the SMI Conservative Allocation Fund, SMI Dynamic Allocation Fund and SMI 50/40/10 Fund is comprised of 60% Wilshire 5000® Total Market Index and 40% Bloomberg Barclays U.S. Aggregate Bond Index. |
The Funds’ investment objectives, risks, charges and expenses must be considered carefully before investing. The prospectus contains this and other important information about the Funds and may be obtained by calling the same number as above. Please read it carefully before investing.
7
PERFORMANCE RESULTS – (Unaudited), (Continued)
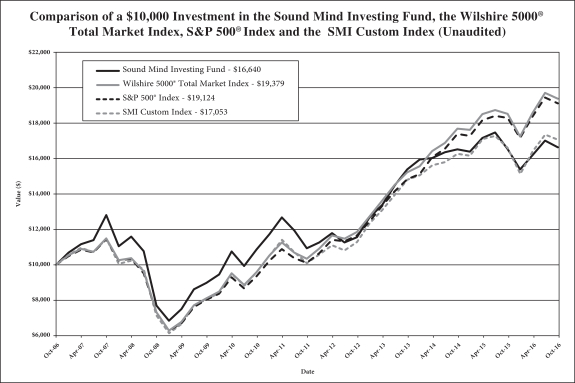
The chart above assumes an initial investment of $10,000 made on October 31, 2006 and held through October 31, 2016. THE FUND’S RETURN REPRESENTS PAST PERFORMANCE AND DOES NOT GUARANTEE FUTURE RESULTS. The returns shown do not reflect deduction of taxes that a shareholder would pay on Fund distributions or the redemption of Fund shares. Investment returns and principal values will fluctuate so that your shares, when redeemed, may be worth more or less than their original purchase price.
Current performance of the Fund may be lower or higher than the performance quoted. For more information on the Fund, and to obtain performance data current to the most recent month end or to request a prospectus, please call (877) 764-3863. You should carefully consider the investment objectives, potential risks, management fees, and charges and expenses of the Fund before investing. The Fund’s prospectus contains this and other information about the Fund, and should be read carefully before investing.
The SMI Custom Index is comprised of 20% Russell 1000® Value Index, 20% Russell 1000® Growth Index, 20% Russell 2000® Value Index, 20% Russell 2000® Growth Index and 20% MSCI EAFE Index.
The Fund is distributed by Unified Financial Securities, LLC, member FINRA/SIPC.
8
PERFORMANCE RESULTS – (Unaudited), (Continued)
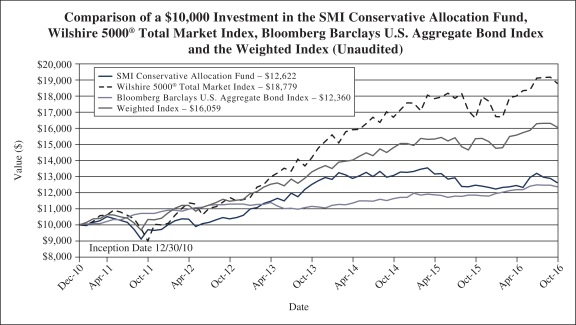
The chart above assumes an initial investment of $10,000 made on December 30, 2010 (commencement of Fund operations) and held through October 31, 2016. THE FUND’S RETURN REPRESENTS PAST PERFORMANCE AND DOES NOT GUARANTEE FUTURE RESULTS. The returns shown do not reflect deduction of taxes that a shareholder would pay on Fund distributions or the redemption of Fund shares. Investment returns and principal values will fluctuate so that your shares, when redeemed, may be worth more or less than their original purchase price.
Current performance of the Fund may be lower or higher than the performance quoted. For more information on the Fund, and to obtain performance data current to the most recent month end or to request a prospectus, please call (877) 764-3863. You should carefully consider the investment objectives, potential risks, management fees, and charges and expenses of the Fund before investing. The Fund’s prospectus contains this and other information about the Fund, and should be read carefully before investing.
The Weighted Index is comprised of 60% Wilshire 5000® Total Market Index and 40% Bloomberg Barclays U.S. Aggregate Bond Index.
The Fund is distributed by Unified Financial Securities, LLC, member FINRA/SIPC
9
PERFORMANCE RESULTS – (Unaudited), (Continued)
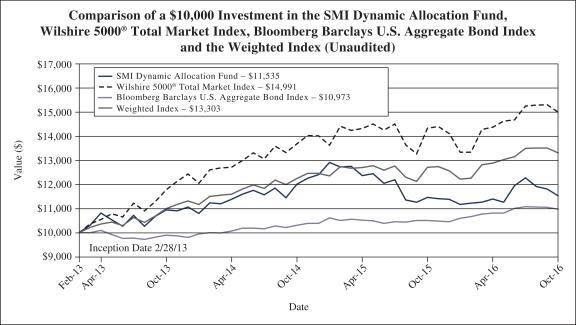
The chart above assumes an initial investment of $10,000 made on February 28, 2013 (commencement of Fund operations) and held through October 31, 2016. THE FUND’S RETURN REPRESENTS PAST PERFORMANCE AND DOES NOT GUARANTEE FUTURE RESULTS. The returns shown do not reflect deduction of taxes that a shareholder would pay on Fund distributions or the redemption of Fund shares. Investment returns and principal values will fluctuate so that your shares, when redeemed, may be worth more or less than their original purchase price.
Current performance of the Fund may be lower or higher than the performance quoted. For more information on the Fund, and to obtain performance data current to the most recent month end or to request a prospectus, please call (877) 764-3863. You should carefully consider the investment objectives, potential risks, management fees, and charges and expenses of the Fund before investing. The Fund’s prospectus contains this and other information about the Fund, and should be read carefully before investing.
The Weighted Index is comprised of 60% Wilshire 5000® Total Market Index and 40% Bloomberg Barclays U.S. Aggregate Bond Index.
The Fund is distributed by Unified Financial Securities, LLC, member FINRA/SIPC.
10
PERFORMANCE RESULTS – (Unaudited), (Continued)
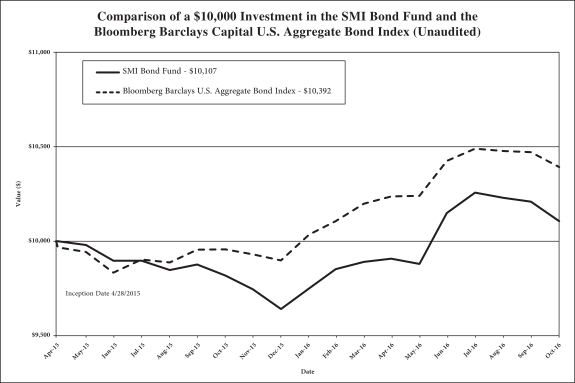
The chart above assumes an initial investment of $10,000 made on April 28, 2015 (commencement of Fund operations) and held through October 31, 2016. THE FUND’S RETURN REPRESENTS PAST PERFORMANCE AND DOES NOT GUARANTEE FUTURE RESULTS. The returns shown do not reflect deduction of taxes that a shareholder would pay on Fund distributions or the redemption of Fund shares. Investment returns and principal values will fluctuate so that your shares, when redeemed, may be worth more or less than their original purchase price.
Current performance of the Fund may be lower or higher than the performance quoted. For more information on the Fund, and to obtain performance data current to the most recent month end or to request a prospectus, please call (877) 764-3863. You should carefully consider the investment objectives, potential risks, management fees, and charges and expenses of the Fund before investing. The Fund’s prospectus contains this and other information about the Fund, and should be read carefully before investing.
The Fund is distributed by Unified Financial Securities, LLC, member FINRA/SIPC.
11
PERFORMANCE RESULTS – (Unaudited), (Continued)
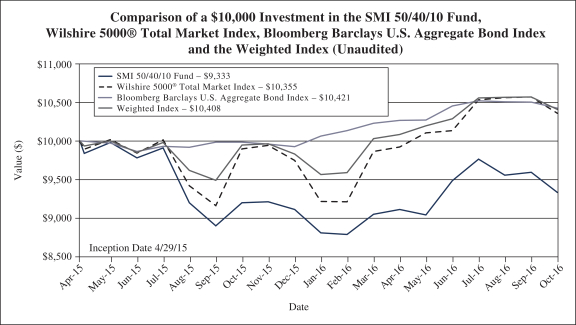
The chart above assumes an initial investment of $10,000 made on April 29, 2015 (commencement of Fund operations) and held through October 31, 2016. THE FUND’S RETURN REPRESENTS PAST PERFORMANCE AND DOES NOT GUARANTEE FUTURE RESULTS. The returns shown do not reflect deduction of taxes that a shareholder would pay on Fund distributions or the redemption of Fund shares. Investment returns and principal values will fluctuate so that your shares, when redeemed, may be worth more or less than their original purchase price.
Current performance of the Fund may be lower or higher than the performance quoted. For more information on the Fund, and to obtain performance data current to the most recent month end or to request a prospectus, please call (877) 764-3863. You should carefully consider the investment objectives, potential risks, management fees, and charges and expenses of the Fund before investing. The Fund’s prospectus contains this and other information about the Fund, and should be read carefully before investing.
The Weighted Index is comprised of 60% Wilshire 5000® Total Market Index and 40% Bloomberg Barclays U.S. Aggregate Bond Index.
The Fund is distributed by Unified Financial Securities, LLC, member FINRA/SIPC.
12
FUND HOLDINGS – (Unaudited)
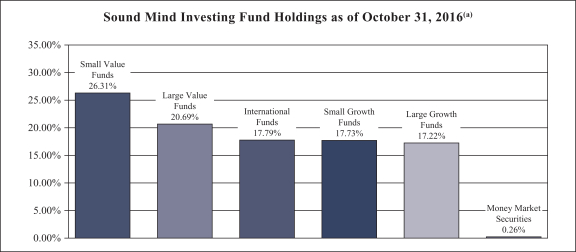
| | (a) | As a percentage of investments. |
Sound Mind Investing Fund seeks long-term capital appreciation. The Fund seeks to achieve its objective by investing in a diversified portfolio of other investment companies using a “fund upgrading” strategy. The fund upgrading investment strategy is a systematic investment approach that is based on the belief of the Adviser that superior returns can be obtained by constantly monitoring the performance of a wide universe of other investment companies, and standing ready to move assets into the funds deemed by the adviser to be most attractive at the time of analysis.
13
FUND HOLDINGS – (Unaudited), (Continued)
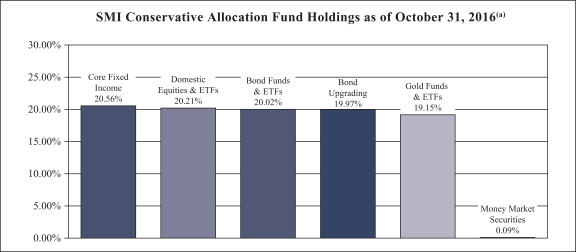
| | (a) | As a percentage of investments. |
SMI Conservative Allocation Fund seeks total return. Total return is composed of both income and capital appreciation. The Fund invests in a portfolio of equities and fixed income securities, including securities of other investment companies that focus their investments on equity and fixed income investments. To the extent the Adviser invests the Fund’s assets in equity securities, such investments will consist of investments in other investment companies (i.e., mutual funds), exchange traded funds (“ETFs”) and pooled investment vehicles, and the Adviser will select such portfolio holdings. The fixed income portion (if any) of the Fund will be comprised of fixed income investment companies and ETFs and individual fixed income securities. The Adviser will use its proprietary “Bond Upgrading” strategy to make all portfolio decisions with respect to investments in fixed income investment companies and ETFs. The Adviser’s “Bond Upgrading” strategy involves the use of momentum based performance indicators of the various bond categories to identify which categories may present the best investment opportunities. The Adviser scores the categories and uses the scores to make decisions on investments in the various categories.
14
FUND HOLDINGS – (Unaudited), (Continued)
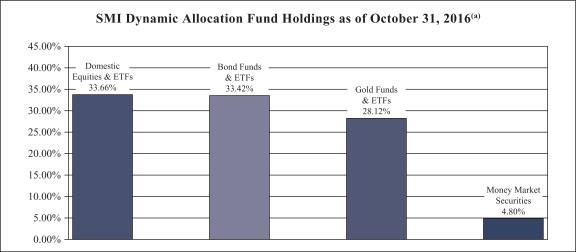
| | (a) | As a percentage of investments. |
SMI Dynamic Allocation Fund seeks total return. Total return is composed of both income and capital appreciation. The Fund uses a dynamic asset allocation investment strategy to achieve its investment objective. This is done by investing in securities from the following six asset classes – U.S. Equities, International Equities, Fixed Income Securities, Real Estate, Precious Metals, and Cash.
15
FUND HOLDINGS – (Unaudited), (Continued)
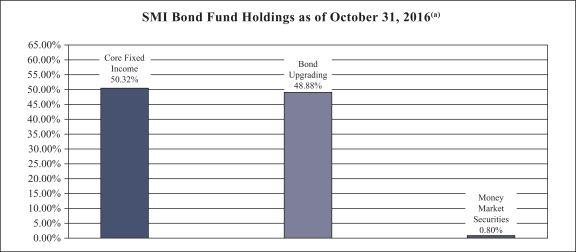
| | (a) | As a percentage of investments. |
SMI Bond Fund seeks total return. Total return is composed of both income and capital appreciation. The Fund invests at least 80% of its net assets in a portfolio of fixed income securities, including securities of other investment companies that focus their investments on fixed income investments. The Fund will be comprised of fixed income investment companies and ETFs and individual fixed income securities. The Adviser will use its proprietary “Bond Upgrading” strategy to make all portfolio decisions with respect to investments in fixed income investment companies and ETFs. The Adviser’s “Bond Upgrading” strategy involves the use of momentum based performance indicators of the various bond categories to identify which categories may present the best investment opportunities. The Adviser scores the categories and uses the scores to make decisions on investments in the various categories.
16
FUND HOLDINGS – (Unaudited), (Continued)
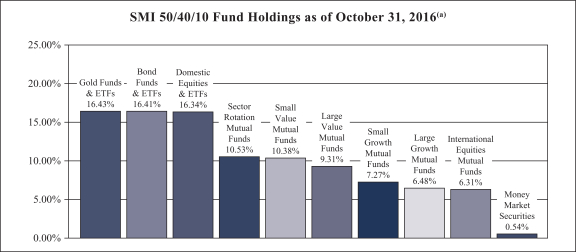
| | (a) | As a percentage of investments. |
SMI 50/40/10 Fund seeks total return. Total return is composed of both income and capital appreciation. The Adviser allocates the Fund’s assets on a 50/40/10 basis among various investment strategies as follows:
| | • | | 50% – Dynamic Asset Allocation Strategy |
| | • | | 40% – Fund Upgrading Strategy |
| | • | | 10% – Sector Rotation Strategy |
The Sector Rotation Strategy involves the Adviser selecting from a universe of mutual funds and ETFs it has compiled using proprietary methods. This universe is specifically designed by the Adviser to balance exposure to a wide variety of market sectors and industries. This universe includes both leveraged and non-leveraged funds. The Adviser ranks these funds based on their recent performance across multiple short-term performance periods, then uses an upgrading approach to invest in the top performing market sector or sectors. Once a particular sector or sectors is identified, the Adviser purchases one or more mutual funds or ETFs to gain the desired exposure to that particular sector. This portion of the Fund may be concentrated, meaning that the Fund may be invested in as few as one or two sectors at a time and potentially as few as one underlying mutual fund or ETF.
Availability of Portfolio Schedule – (Unaudited)
Each Fund files its complete schedule of portfolio holdings with the Securities and Exchange Commission (“SEC”) for the first and third quarters of each fiscal year on Form N-Q. The Funds’ Forms N-Q are available at the SEC’s website at www.sec.gov. The Funds’ Forms N-Q may be reviewed and copied at the Public Reference Room in Washington DC. Information on the operation of the Public Reference Room may be obtained by calling 1-800-SEC-0330.
17
SOUND MIND INVESTING FUND
SCHEDULE OF INVESTMENTS
October 31, 2016
| | | | | | | | |
| Mutual Funds 77.15% | | Shares | | | Fair Value | |
Mutual Funds Greater Than 1% of The Sound
Mind Investing Fund’s Net Assets – 76.50% | | | | | | | | |
Aegis Value Fund, Inc. (a) | | | 274,471 | | | $ | 4,117,067 | |
American Century Equity Income Fund – Investor Class | | | 745,954 | | | | 6,616,612 | |
Artisan Value Fund – Advisor Class (a) | | | 961,013 | | | | 12,320,185 | |
Champlain Mid Cap Fund – Institutional Class (a) | | | 766,433 | | | | 11,557,810 | |
Davis Opportunity Fund – Class Y | | | 149,323 | | | | 4,681,270 | |
Driehaus Micro Cap Growth Fund (a) | | | 635,332 | | | | 7,293,611 | |
Fidelity OTC Portfolio | | | 80,217 | | | | 6,747,070 | |
Hodges Fund – Retail Class (a) | | | 187,117 | | | | 7,774,702 | |
Jensen Quality Growth Fund – Institutional Class | | | 81,831 | | | | 3,215,139 | |
Kinetics Paradigm Fund – Institutional Class | | | 120,520 | | | | 4,298,950 | |
Longleaf Partners Fund | | | 270,236 | | | | 6,874,806 | |
Longleaf Partners International Fund (a) | | | 930,494 | | | | 12,840,813 | |
Longleaf Partners Small-Cap Fund | | | 164,695 | | | | 5,075,914 | |
Loomis Sayles Growth Fund – Class Y | | | 738,829 | | | | 9,124,534 | |
Mairs and Power Small Cap Fund (a) | | | 189,024 | | | | 4,118,829 | |
Manning & Napier International Series Fund – Institutional Class (a) | | | 638,589 | | | | 6,519,991 | |
Oppenheimer International Small-Mid Company Fund – Class Y | | | 215,197 | | | | 8,106,488 | |
PRIMECAP Odyssey Growth Fund | | | 195,581 | | | | 5,456,701 | |
Royce Opportunity Fund – Investor Class | | | 461,579 | | | | 5,414,321 | |
Towle Deep Value Fund (a) | | | 171,906 | | | | 2,822,701 | |
Virtus Small-Cap Sustainable Growth Fund – Institutional Class (a) | | | 357,325 | | | | 6,832,049 | |
Wasatch International Opportunities Fund – Institutional Class (a) | | | 2,272,904 | | | | 7,114,188 | |
| | | | | | | | |
TOTAL MUTUAL FUNDS GREATER THAN 1% OF THE SOUND
MIND INVESTING FUND’S NET ASSETS (Cost $146,987,803) | | | | 148,923,751 | |
| | | | | | | | |
Mutual Funds Less Than 1% of The Sound
Mind Investing Fund’s Net Assets – 0.65% (b) | | | | | | | | |
Allianz NFJ Dividend Value Fund – Institutional Class | | | 200 | | | | 3,198 | |
Allianz NFJ Small-Cap Value Fund – Institutional Class | | | 162 | | | | 3,825 | |
American Century International Discovery Fund – Institutional Class | | | 250 | | | | 3,189 | |
AMG GW&K U.S. Small Cap Growth Fund – Institutional Class | | | 100 | | | | 427 | |
Artisan International Small Cap Fund – Investor Class | | | 150 | | | | 3,277 | |
Artisan International Value Fund – Investor Class | | | 150 | | | | 4,933 | |
Artisan Mid Cap Value Fund – Investor Class | | | 279 | | | | 5,878 | |
Artisan Small Cap Fund – Investor Class | | | 250 | | | | 7,012 | |
BBH Core Select Fund – Class N | | | 100 | | | | 2,115 | |
Berwyn Fund | | | 100 | | | | 2,978 | |
See accompanying notes which are an integral part of these financial statements.
18
SOUND MIND INVESTING FUND
SCHEDULE OF INVESTMENTS
October 31, 2016 – (Continued)
| | | | | | | | |
| Mutual Funds 77.15% – continued | | Shares | | | Fair Value | |
Mutual Funds Less Than 1% of The Sound
Mind Investing Fund’s Net Assets – 0.65% (b) – continued | | | | | | | | |
BlackRock International Opportunities Portfolio – Institutional Class | | | 100 | | | $ | 3,256 | |
Bridgeway Small-Cap Growth Fund – Class N | | | 205 | | | | 4,218 | |
Bridgeway Small-Cap Value Fund – Class N | | | 179 | | | | 3,814 | |
Buffalo Small Cap Fund, Inc. | | | 150 | | | | 2,655 | |
Champlain Small Company Fund – Institutional Class | | | 53,677 | | | | 981,750 | |
Columbia Acorn International – Class Z | | | 100 | | | | 3,954 | |
Columbia Acorn Select – Class Z | | | 150 | | | | 2,205 | |
Columbia Funds Series Trust I Contrarian Core Fund – Class Z | | | 91 | | | | 2,012 | |
Columbia Small Cap Growth Fund I – Class Z | | | 100 | | | | 1,757 | |
Delaware Select Growth Fund – Institutional Class | | | 100 | | | | 4,028 | |
Delaware Small Cap Value Fund – Institutional Class | | | 100 | | | | 5,486 | |
Delaware Smid Cap Growth Fund – Institutional Class | | | 100 | | | | 3,078 | |
Delaware Value Fund – Institutional Class | | | 144 | | | | 2,719 | |
Deutsche Small Cap Value Fund – Institutional Class | | | 85 | | | | 1,923 | |
DFA International Small Cap Value Portfolio – Investor Class | | | 100 | | | | 1,931 | |
DFA International Small Company Portfolio – Institutional Class | | | 100 | | | | 1,778 | |
DFA U.S. Small Cap Value Portfolio – Institutional Class | | | 100 | | | | 3,275 | |
Dreyfus Opportunistic Small Cap Fund | | | 100 | | | | 2,882 | |
Fairholme Fund | | | 100 | | | | 1,879 | |
Fidelity Mid-Cap Stock Fund | | | 150 | | | | 5,067 | |
Fidelity Small Cap Discovery Fund | | | 100 | | | | 2,770 | |
Fidelity Small Cap Stock Fund | | | 150 | | | | 2,597 | |
Fidelity Small Cap Value Fund | | | 150 | | | | 2,535 | |
Franklin Small Cap Value Fund – Advisor Class | | | 100 | | | | 5,379 | |
Hartford International Opportunities Fund/The – Class Y | | | 248 | | | | 3,730 | |
Heartland Value Fund | | | 100 | | | | 3,699 | |
Hennessy Focus Fund – Investor Class | | | 100 | | | | 7,063 | |
Hotchkis and Wiley Mid-Cap Value Fund – Institutional Class | | | 100 | | | | 3,214 | |
Invesco American Value Fund – Class R5 | | | 100 | | | | 3,530 | |
Janus Overseas Fund – Class T | | | 100 | | | | 2,641 | |
Janus Venture Fund – Class T | | | 100 | | | | 6,287 | |
JOHCM International Select Fund – Institutional Class | | | 100 | | | | 1,932 | |
JPMorgan Disciplined Equity Fund – Institutional Class | | | 100 | | | | 2,238 | |
JPMorgan Mid Cap Value Fund – Institutional Class | | | 100 | | | | 3,647 | |
JPMorgan Small Cap Equity Fund – Select Class | | | 226 | | | | 10,964 | |
Legg Mason Opportunity Trust – Institutional Class * | | | 100 | | | | 1,887 | |
See accompanying notes which are an integral part of these financial statements.
19
SOUND MIND INVESTING FUND
SCHEDULE OF INVESTMENTS
October 31, 2016 – (Continued)
| | | | | | | | |
| Mutual Funds 77.15% – continued | | Shares | | | Fair Value | |
Mutual Funds Less Than 1% of The Sound
Mind Investing Fund’s Net Assets – 0.65% (b) – continued | | | | | | | | |
Lord Abbett Developing Growth Fund, Inc. – Institutional Class | | | 100 | | | $ | 1,988 | |
Morgan Stanley Institutional Fund, Inc. –Growth Portfolio – Institutional Class | | | 100 | | | | 3,915 | |
Neuberger Berman Genesis Fund – Institutional Class | | | 100 | | | | 5,463 | |
Nicholas Fund, Inc. | | | 50 | | | | 3,031 | |
Oakmark International Fund – Institutional Class | | | 150 | | | | 3,318 | |
Oakmark International Small Cap Fund – Institutional Class | | | 150 | | | | 2,174 | |
Oakmark Select Fund – Institutional Class | | | 150 | | | | 6,142 | |
Oppenheimer Mid Cap Value Fund – Class Y | | | 100 | | | | 5,052 | |
Perkins Mid Cap Value Fund – Class T | | | 200 | | | | 3,386 | |
PRIMECAP Odyssey Aggressive Growth Fund | | | 100 | | | | 3,378 | |
Principal SmallCap Growth Fund I – Institutional Class | | | 200 | | | | 2,226 | |
Royce Low-Priced Stock Fund – Investment Class | | | 150 | | | | 1,196 | |
Royce Premier Fund – Investment Class | | | 300 | | | | 4,731 | |
Royce Small-Cap Value Fund – Institutional Class | | | 100 | | | | 908 | |
Royce Special Equity Fund – Investment Class | | | 100 | | | | 2,030 | |
Royce Special Equity Fund – Institutional Class | | | 150 | | | | 3,024 | |
T. Rowe Price International Discovery Fund | | | 150 | | | | 8,359 | |
T. Rowe Price Mid-Cap Growth Fund | | | 100 | | | | 7,473 | |
T. Rowe Price New Horizons Fund | | | 100 | | | | 4,400 | |
T. Rowe Price Small-Cap Value Fund | | | 100 | | | | 4,059 | |
Third Avenue Value Fund – Institutional Class | | | 335 | | | | 17,171 | |
Thornburg Value Fund – Institutional Class | | | 100 | | | | 5,461 | |
TIAA-CREF International Equity Fund – Institutional Class | | | 100 | | | | 1,059 | |
Touchstone Sands Capital Select Growth Fund – Class Y | | | 100 | | | | 1,614 | |
Tweedy Browne Global Value Fund | | | 150 | | | | 3,777 | |
Vanguard Strategic Equity Fund – Investor Class | | | 100 | | | | 2,943 | |
Victory RS Small Cap Growth Fund – Class Y | | | 100 | | | | 6,245 | |
Wasatch Emerging Markets Small Cap Fund | | | 1,000 | | | | 2,620 | |
Wasatch International Growth Fund – Investor Class | | | 150 | | | | 4,542 | |
| | | | | | | | |
TOTAL MUTUAL FUNDS LESS THAN 1% OF THE SOUND
MIND INVESTING FUND’S NET ASSETS (Cost $1,249,853) | | | | 1,262,297 | |
| | | | | | | | |
TOTAL MUTUAL FUNDS (Cost $148,237,656) | | | | | | | 150,186,048 | |
| | | | | | | | |
See accompanying notes which are an integral part of these financial statements.
20
SOUND MIND INVESTING FUND
SCHEDULE OF INVESTMENTS
October 31, 2016 – (Continued)
| | | | | | | | |
| Exchange-Traded Funds 22.64% | | Shares | | | Fair Value | |
PowerShares High Yield Equity Dividend Achievers Portfolio (a) | | | 1,275,500 | | | $ | 19,795,760 | |
PowerShares S&P 500 High Dividend Low Volatility Portfolio | | | 383,500 | | | | 14,461,785 | |
WisdomTree SmallCap Dividend ETF | | | 136,000 | | | | 9,812,400 | |
| | | | | | | | |
TOTAL EXCHANGE-TRADED FUNDS (Cost $41,373,406) | | | | | | | 44,069,945 | |
| | | | | | | | |
Money Market Securities 0.25% | | | | | | | | |
Fidelity Investments Government Money Market Portfolio – Institutional Class, 0.31% (c) | | | 496,793 | | | | 496,793 | |
| | | | | | | | |
TOTAL MONEY MARKET SECURITIES (Cost $496,793) | | | | | | | 496,793 | |
| | | | | | | | |
TOTAL INVESTMENTS – 100.04% (Cost $190,107,855) | | | | | | $ | 194,752,786 | |
| | | | | | | | |
Liabilities in Excess of Other Assets – (0.04)% | | | | | | | (74,744 | ) |
| | | | | | | | |
NET ASSETS – 100.00% | | | | | | $ | 194,678,042 | |
| | | | | | | | |
| (a) | In accordance with the Investment Company Act of 1940, as amended (the “1940 Act”) an issuer of any investment company security purchased or acquired by a registered investment company shall not be obligated to redeem such security in an amount exceeding 1 per centum of such issuer’s total outstanding shares during any period of less than thirty days. As of October 31, 2016, the fair value, based on readily available market values and calculated based on the total assets, of such securities held by the Fund was $36,557,559 or 18.78% of net assets. |
| (b) | Small investments are occasionally retained in mutual funds that are closed to new investment, or in the manager’s opinion are at risk to close, so as to allow the Fund the flexibility to reinvest in these funds in the future. |
| (c) | Rate disclosed is the seven day effective yield as of October 31, 2016. |
| * | Non-income producing security. |
| ETF | – Exchange-Traded Fund |
See accompanying notes which are an integral part of these financial statements.
21
SMI CONSERVATIVE ALLOCATION FUND
SCHEDULE OF INVESTMENTS
October 31, 2016
| | | | | | | | |
| Exchange-Traded Funds – 59.04% | | Shares | | | Fair Value | |
iShares 20+ Year Treasury Bond ETF | | | 14,250 | | | $ | 1,870,313 | |
iShares iBoxx $ Investment Grade Corporate Bond ETF | | | 14,300 | | | | 1,730,014 | |
PowerShares DB Gold Fund ETF * | | | 83,400 | | | | 3,444,420 | |
SPDR S&P 500 ETF | | | 17,100 | | | | 3,634,605 | |
| | | | | | | | |
TOTAL EXCHANGE-TRADED FUNDS (Cost $10,643,714) | | | | | | | 10,679,352 | |
| | | | | | | | |
Mutual Funds – 40.31% | | | | | | | | |
Scout Core Plus Bond Fund – Institutional Class | | | 56,889 | | | | 1,867,093 | |
Scout Unconstrained Bond Fund – Institutional Class | | | 232,535 | | | | 2,741,587 | |
Vanguard High-Yield Corporate Fund – Admiral Class | | | 145,051 | | | | 850,000 | |
Vanguard Intermediate-Term Bond Index Fund – Admiral Class | | | 78,284 | | | | 917,493 | |
Vanguard Short-Term Bond Index Fund – Admiral Class | | | 86,730 | | | | 915,000 | |
| | | | | | | | |
TOTAL MUTUAL FUNDS (Cost $7,239,827) | | | | | | | 7,291,173 | |
| | | | | | | | |
Money Market Securities – 0.09% | | | | | | | | |
Fidelity Investment Government Money Market Portfolio – Institutional Class, 0.31% (a) | | | 16,281 | | | | 16,281 | |
| | | | | | | | |
TOTAL MONEY MARKET SECURITIES (Cost $16,281) | | | | | | | 16,281 | |
| | | | | | | | |
TOTAL INVESTMENTS – 99.44% (Cost $17,899,822) | | | | | | $ | 17,986,806 | |
| | | | | | | | |
Other Assets in Excess of Liabilities – 0.56% | | | | | | | 101,918 | |
| | | | | | | | |
NET ASSETS – 100.00% | | | | | | $ | 18,088,724 | |
| | | | | | | | |
| (a) | Rate disclosed is the seven day effective yield as of October 31, 2016. |
| * | Non-income producing security. |
| ETF | – Exchange-Traded Fund |
| SPDR | – Standard & Poor’s Depositary Receipts |
See accompanying notes which are an integral part of these financial statements.
22
SMI DYNAMIC ALLOCATION FUND
SCHEDULE OF INVESTMENTS
October 31, 2016
| | | | | | | | |
| Exchange-Traded Funds – 92.13% | | Shares | | | Fair Value | |
iShares 20+ Year Treasury Bond ETF | | | 226,700 | | | $ | 29,754,375 | |
iShares iBoxx $ Investment Grade Corporate Bond ETF | | | 252,200 | | | | 30,511,156 | |
PowerShares DB Gold Fund ETF (a)* | | | 1,093,000 | | | | 45,140,900 | |
SPDR S&P 500 ETF (a) | | | 285,800 | | | | 60,746,790 | |
Vanguard Intermediate-Term Bond ETF | | | 600 | | | | 51,990 | |
| | | | | | | | |
TOTAL EXCHANGE-TRADED FUNDS (Cost $166,224,719) | | | | | | | 166,205,211 | |
| | | | | | | | |
Mutual Funds – 3.11% | | | | | | | | |
First Eagle Gold Fund – Institutional Class* | | | 305,216 | | | | 5,609,878 | |
| | | | | | | | |
TOTAL MUTUAL FUNDS (Cost $5,500,000) | | | | | | | 5,609,878 | |
| | | | | | | | |
Money Market Securities – 4.80% | | | | | | | | |
Fidelity Investments Government Money Market Portfolio – Institutional Class, 0.31% (b) | | | 8,666,906 | | | | 8,666,906 | |
| | | | | | | | |
TOTAL MONEY MARKET SECURITIES (Cost $8,666,906) | | | | | | | 8,666,906 | |
| | | | | | | | |
TOTAL INVESTMENTS – 100.04% (Cost $180,391,625) | | | | | | $ | 180,481,995 | |
| | | | | | | | |
Liabilities in Excess of Other Assets – (0.04)% | | | | | | | (78,041 | ) |
| | | | | | | | |
NET ASSETS – 100.00% | | | | | | $ | 180,403,954 | |
| | | | | | | | |
| (a) | Represents an investment greater than 25% of the Fund’s net assets. Performance of the Fund may be adversely impacted by concentrated investments in securities. The financial statements and portfolio holdings for these securities can be found at www.sec.gov. As of October 31, 2016, the percentage of net assets invested in PowerShares DB Gold Fund ETF and SPDR S&P 500 ETF were 25% and 34%, respectively, of the Fund. |
| (b) | Rate disclosed is the seven day effective yield as of October 31, 2016. |
| * | Non-income producing security. |
| ETF | – Exchange-Traded Fund |
| SPDR | – Standard & Poor’s Depositary Receipts |
See accompanying notes which are an integral part of these financial statements.
23
SMI BOND FUND
SCHEDULE OF INVESTMENTS
October 31, 2016
| | | | | | | | |
| Mutual Funds – 100.03% | | Shares | | | Fair Value | |
| | | | | | | | |
Scout Core Plus Bond Fund – Institutional Class (a) | | | 60,348 | | | $ | 1,980,627 | |
Scout Unconstrained Bond Fund – Institutional Class (a) | | | 247,492 | | | | 2,917,932 | |
Vanguard High-Yield Corporate Fund – Admiral Class | | | 138,225 | | | | 810,000 | |
Vanguard Intermediate-Term Bond Index Fund – Admiral Class | | | 76,108 | | | | 891,983 | |
Vanguard Short-Term Bond Index Fund – Admiral Class | | | 91,469 | | | | 965,000 | |
| | | | | | | | |
TOTAL MUTUAL FUNDS (Cost $7,511,894) | | | | | | | 7,565,542 | |
| | | | | | | | |
Money Market Securities – 0.81% | | | | | | | | |
Fidelity Investments Government Money Market Portfolio – Institutional Class, 0.31% (b) | | | 61,259 | | | | 61,259 | |
| | | | | | | | |
TOTAL MONEY MARKET SECURITIES (Cost $61,259) | | | | | | | 61,259 | |
| | | | | | | | |
TOTAL INVESTMENTS – 100.84% (Cost $7,573,153) | | | | | | $ | 7,626,801 | |
| | | | | | | | |
Liabilities in Excess of Other Assets – (0.84)% | | | | | | | (63,421 | ) |
| | | | | | | | |
NET ASSETS – 100.00% | | | | | | $ | 7,563,380 | |
| | | | | | | | |
| (a) | Represents an investment greater than 25% of the Fund’s net assets. Performance of the Fund may be adversely impacted by concentrated investments in securities. The financial statements and portfolio holdings for these securities can be found at www.sec.gov. As of October 31, 2016, the percentage of net assets invested in Scout Core Plus Bond Fund and Scout Unconstrained Bond Fund were 26% and 39%, respectively, of the Fund. |
| (b) | Rate disclosed is the seven day effective yield as of October 31, 2016. |
See accompanying notes which are an integral part of these financial statements.
24
SMI 50/40/10 FUND
SCHEDULE OF INVESTMENTS
October 31, 2016
| | | | | | | | |
| Exchange-Traded Funds – 57.65% | | Shares | | | Fair Value | |
iShares 20+ Year Treasury Bond ETF | | | 11,725 | | | $ | 1,538,906 | |
iShares iBoxx $ Investment Grade Corporate Bond ETF | | | 12,560 | | | | 1,519,509 | |
PowerShares DB Gold Fund ETF * | | | 74,130 | | | | 3,061,569 | |
PowerShares High Yield Equity Dividend Achievers Portfolio | | | 49,100 | | | | 762,032 | |
PowerShares S&P 500 High Dividend Low Volatility Portfolio | | | 17,500 | | | | 659,925 | |
SPDR S&P 500 ETF | | | 14,325 | | | | 3,044,779 | |
| | | | | | | | |
TOTAL EXCHANGE-TRADED FUNDS (Cost $10,437,894) | | | | 10,586,720 | |
| | | | | | | | |
Mutual Funds – 43.27% | | | | | | | | |
Aegis Value Fund, Inc. | | | 61,625 | | | | 924,382 | |
American Century Equity Income Fund – Investor Class | | | 46,934 | | | | 416,309 | |
Artisan Value Fund – Advisor Class | | | 51,298 | | | | 657,636 | |
Fidelity OTC Portfolio | | | 5,556 | | | | 467,309 | |
Fidelity Select Semiconductors Portfolio | | | 15,116 | | | | 1,363,047 | |
Hodges Fund – Retail Class | | | 4,565 | | | | 189,672 | |
Longleaf Partners International Fund | | | 57,118 | | | | 788,232 | |
Loomis Sayles Growth Fund – Class Y | | | 59,918 | | | | 739,986 | |
Manning & Napier International Series Fund – Institutional Class | | | 37,364 | | | | 381,484 | |
Oppenheimer International Small-Mid Company Fund – Class Y | | | 100 | | | | 3,767 | |
PRIMECAP Odyssey Aggressive Growth Fund | | | 16,916 | | | | 571,412 | |
ProFunds Semiconductor UltraSector – Investor Class (a) | | | 16,829 | | | | 598,429 | |
Towle Deep Value Fund | | | 15,074 | | | | 247,512 | |
Virtus Small-Cap Sustainable Growth Fund – Institutional Class | | | 31,042 | | | | 593,528 | |
Wasatch International Growth Fund – Investor Class * | | | 100 | | | | 3,028 | |
| | | | | | | | |
TOTAL MUTUAL FUNDS (Cost $7,842,366) | | | | 7,945,733 | |
| | | | | | | | |
Money Market Securities – 0.55% | | | | | | | | |
Fidelity Investments Government Money Market Portfolio – Institutional Class, 0.31% (b) | | | 100,076 | | | | 100,076 | |
| | | | | | | | |
TOTAL MONEY MARKET SECURITIES (Cost $100,076) | | | | 100,076 | |
| | | | | | | | |
TOTAL INVESTMENTS – 101.47% (Cost $18,380,336) | | | $ | 18,632,529 | |
| | | | | | | | |
Liabilities in Excess of Other Assets – (1.47)% | | | | (269,979 | ) |
| | | | | | | | |
NET ASSETS – 100.00% | | | $ | 18,362,550 | |
| | | | | | | | |
See accompanying notes which are an integral part of these financial statements.
25
SMI 50/40/10 FUND
SCHEDULE OF INVESTMENTS
October 31, 2016 – (Continued)
| (a) | In accordance with the 1940 Act an issuer of any investment company security purchased or acquired by a registered investment company shall not be obligated to redeem such security in an amount exceeding 1 per centum of such issuer’s total outstanding shares during any period of less than thirty days. As of October 31, 2016, the fair value, based on readily available market values and calculated based on the total assets, of such securities held by the Fund was $257,095 or 1.40% of net assets. |
| (b) | Rate disclosed is the seven day effective yield as of October 31, 2016. |
| * | Non-income producing security. |
| ETF | – Exchange-Traded Fund |
| SPDR | – Standard & Poor’s Depositary Receipts |
See accompanying notes which are an integral part of these financial statements.
26
SMI FUNDS
STATEMENTS OF ASSETS AND LIABILITIES
October 31, 2016
| | | | | | | | | | | | |
| | | Sound Mind
Investing Fund | | | SMI Conservative
Allocation Fund | | | SMI Dynamic
Allocation Fund | |
Assets | | | | | | | | | | | | |
Investment in securities: | | | | | | | | | | | | |
At cost | | $ | 190,107,855 | | | $ | 17,899,822 | | | $ | 180,391,625 | |
| | | | | | | | | | | | |
At fair value | | $ | 194,752,786 | | | $ | 17,986,806 | | | $ | 180,481,995 | |
Cash | | | — | | | | 1,354 | | | | — | |
Receivable for investments sold | | | 1,049,944 | | | | 2,694,409 | | | | — | |
Receivable for fund shares sold | | | 97,357 | | | | 4,950 | | | | 98,104 | |
Dividend receivable | | | 508 | | | | 3,781 | | | | 2,444 | |
Prepaid expenses | | | 37,166 | | | | 6,769 | | | | 28,077 | |
| | | | | | | | | | | | |
Total Assets | | | 195,937,761 | | | | 20,698,069 | | | | 180,610,620 | |
| | | | | | | | | | | | |
Liabilities | | | | | | | | | | | | |
Payable for investments purchased | | | 900,000 | | | | 2,565,000 | | | | — | |
Payable for fund shares redeemed | | | 148,662 | | | | 12,020 | | | | 17,500 | |
Payable to Adviser | | | 168,311 | | | | 10,154 | | | | 154,158 | |
Payable to administrator, fund accountant, and transfer agent | | | 9,093 | | | | 979 | | | | 6,937 | |
Payable to trustees | | | 787 | | | | 232 | | | | 720 | |
Other accrued expenses | | | 32,866 | | | | 20,960 | | | | 27,351 | |
| | | | | | | | | | | | |
Total Liabilities | | | 1,259,719 | | | | 2,609,345 | | | | 206,666 | |
| | | | | | | | | | | | |
Net Assets | | $ | 194,678,042 | | | $ | 18,088,724 | | | $ | 180,403,954 | |
| | | | | | | | | | | | |
Net Assets consist of: | | | | | | | | | | | | |
Paid-in capital | | $ | 193,683,104 | | | $ | 18,415,486 | | | $ | 185,155,727 | |
Accumulated undistributed net investment income (loss) | | | (288,843 | ) | | | 92,021 | | | | 213,474 | |
Accumulated undistributed net realized gain (loss) from investment transactions | | | (3,361,150 | ) | | | (505,767 | ) | | | (5,055,617 | ) |
Net unrealized appreciation on investment securities | | | 4,644,931 | | | | 86,984 | | | | 90,370 | |
| | | | | | | | | | | | |
Net Assets | | $ | 194,678,042 | | | $ | 18,088,724 | | | $ | 180,403,954 | |
| | | | | | | | | | | | |
Shares outstanding (unlimited number of shares authorized, no par value) | | | 18,909,521 | | | | 1,909,207 | | | | 16,515,768 | |
| | | | | | | | | | | | |
Net asset value (“NAV”) and offering price per share | | $ | 10.30 | | | $ | 9.47 | | | $ | 10.92 | |
| | | | | | | | | | | | |
Redemption price per share (NAV * 98%) (a) | | $ | 10.09 | | | $ | 9.28 | | | $ | 10.70 | |
| | | | | | | | | | | | |
| (a) | The Funds charge a 2% redemption fee on shares redeemed within 60 days of purchase. Shares are redeemed at the NAV if held longer than 60 days. |
See accompanying notes which are an integral part of these financial statements.
27
SMI FUNDS
STATEMENTS OF ASSETS AND LIABILITIES
October 31, 2016 – (Continued)
| | | | | | | | |
| | | SMI
Bond Fund | | | SMI
50/40/10 Fund | |
Assets | | | | | | | | |
Investment in securities: | | | | | | | | |
At cost | | $ | 7,573,153 | | | $ | 18,380,336 | |
| | | | | | | | |
At fair value | | $ | 7,626,801 | | | $ | 18,632,529 | |
Cash | | | 1,364 | | | | — | |
Receivable for investments sold | | | 2,689,163 | | | | — | |
Receivable for fund shares sold | | | 712 | | | | 970 | |
Dividend receivable | | | 3,883 | | | | 81 | |
Receivable from Adviser | | | 3,141 | | | | — | |
Prepaid expenses | | | 11,213 | | | | 12,916 | |
| | | | | | | | |
Total Assets | | | 10,336,277 | | | | 18,646,496 | |
| | | | | | | | |
Liabilities | | | | | | | | |
Payable for investments purchased | | | 2,685,000 | | | | — | |
Payable for fund shares redeemed | | | 66,867 | | | | 248,837 | |
Payable for distributions to shareholders | | | 82 | | | | — | |
Payable to Adviser | | | — | | | | 12,445 | |
Payable to administrator, fund accountant, and transfer agent | | | 370 | | | | 1,009 | |
Payable to trustees | | | 190 | | | | 229 | |
Other accrued expenses | | | 20,388 | | | | 21,426 | |
| | | | | | | | |
Total Liabilities | | | 2,772,897 | | | | 283,946 | |
| | | | | | | | |
Net Assets | | $ | 7,563,380 | | | $ | 18,362,550 | |
| | | | | | | | |
Net Assets consist of: | | | | | | | | |
Paid-in capital | | $ | 7,524,859 | | | $ | 18,974,044 | |
Accumulated undistributed net investment income (loss) | | | — | | | | (10,640 | ) |
Accumulated undistributed net realized gain (loss) from investment transactions | | | (15,127 | ) | | | (853,047 | ) |
Net unrealized appreciation on investment securities | | | 53,648 | | | | 252,193 | |
| | | | | | | | |
Net Assets | | $ | 7,563,380 | | | $ | 18,362,550 | |
| | | | | | | | |
Shares outstanding (unlimited number of shares authorized, no par value) | | | 763,744 | | | | 1,979,590 | |
| | | | | | | | |
Net asset value (“NAV”) and offering price per share | | $ | 9.90 | | | $ | 9.28 | |
| | | | | | | | |
Redemption price per share (NAV * 98%) (a) | | $ | 9.70 | | | $ | 9.09 | |
| | | | | | | | |
| (a) | The Funds charge a 2% redemption fee on shares redeemed within 60 days of purchase. Shares are redeemed at the NAV if held longer than 60 days. |
See accompanying notes which are an integral part of these financial statements.
28
SMI FUNDS
STATEMENTS OF OPERATIONS
For the Year Ended October 31, 2016
| | | | | | | | | | | | |
| | | Sound Mind
Investing Fund | | | SMI Conservative
Allocation Fund | | | SMI Dynamic
Allocation Fund | |
Investment Income | | | | | | | | | | | | |
Dividend income | | $ | 2,709,254 | | | $ | 438,731 | | | $ | 3,653,398 | |
| | | | | | | | | | | | |
Total investment income | | | 2,709,254 | | | | 438,731 | | | | 3,653,398 | |
| | | | | | | | | | | | |
Expenses | | | | | | | | | | | | |
Investment Adviser | | | 2,071,995 | | | | 177,909 | | | | 1,875,182 | |
Administration | | | 47,344 | | | | 4,555 | | | | 43,162 | |
Fund accounting | | | 27,048 | | | | 2,602 | | | | 24,656 | |
Transfer agent | | | 35,512 | | | | 4,510 | | | | 15,315 | |
Custodian | | | 17,033 | | | | 4,121 | | | | 9,972 | |
Chief Compliance Officer | | | 10,800 | | | | 10,800 | | | | 10,800 | |
Trustee | | | 9,328 | | | | 5,472 | | | | 8,932 | |
Legal | | | 19,209 | | | | 18,037 | | | | 19,093 | |
Audit | | | 16,800 | | | | 16,800 | | | | 16,800 | |
Printing | | | 32,795 | | | | 3,430 | | | | 27,704 | |
Registration | | | 30,941 | | | | 28,553 | | | | 42,365 | |
Miscellaneous | | | 72,292 | | | | 19,738 | | | | 54,918 | |
Line of credit | | | 7,259 | | | | 735 | | | | 6,776 | |
Interest expense | | | 53 | | | | 649 | | | | 1,266 | |
| | | | | | | | | | | | |
Total expenses | | | 2,398,409 | | | | 297,911 | | | | 2,156,941 | |
Fees waived by Adviser | | | — | | | | (69,388 | ) | | | — | |
| | | | | | | | | | | | |
Net operating expenses | | | 2,398,409 | | | | 228,523 | | | | 2,156,941 | |
| | | | | | | | | | | | |
Net investment income | | | 310,845 | | | | 210,208 | | | | 1,496,457 | |
| | | | | | | | | | | | |
Net Realized and Unrealized Gain (Loss) on Investments | | | | | | | | | | | | |
Long term capital gain dividends from investment companies | | | 9,201,713 | | | | 15,711 | | | | 28,483 | |
Net realized gain (loss) on investment transactions | | | (11,925,406 | ) | | | 162,196 | | | | 3,992,962 | |
Net change in unrealized appreciation (depreciation) on investments | | | 2,869,366 | | | | (145,072 | ) | | | (4,268,680 | ) |
| | | | | | | | | | | | |
Net realized and unrealized gain (loss) on investments | | | 145,673 | | | | 32,835 | | | | (247,235 | ) |
| | | | | | | | | | | | |
Net increase in net assets resulting from operations | | $ | 456,518 | | | $ | 243,043 | | | $ | 1,249,222 | |
| | | | | | | | | | | | |
See accompanying notes which are an integral part of these financial statements.
29
SMI FUNDS
STATEMENTS OF OPERATIONS
For the Year Ended October 31, 2016 – (Continued)
| | | | | | | | |
| | | SMI
Bond Fund | | | SMI
50/40/10 Fund | |
Investment Income | | | | | | | | |
Dividend income | | $ | 200,085 | | | $ | 296,612 | |
| | | | | | | | |
Total investment income | | | 200,085 | | | | 296,612 | |
| | | | | | | | |
Expenses | | | | | | | | |
Investment Adviser | | | 58,715 | | | | 168,695 | |
Administration | | | 1,819 | | | | 3,857 | |
Fund accounting | | | 1,037 | | | | 2,200 | |
Transfer agent | | | 1,205 | | | | 5,289 | |
Custodian | | | 2,795 | | | | 2,982 | |
Chief Compliance Officer | | | 10,800 | | | | 10,800 | |
Trustee | | | 5,258 | | | | 5,435 | |
Legal | | | 17,872 | | | | 18,416 | |
Audit | | | 13,800 | | | | 13,800 | |
Printing | | | 2,535 | | | | 3,740 | |
Registration | | | 21,813 | | | | 23,326 | |
Offering | | | 19,988 | | | | 20,047 | |
Miscellaneous | | | 15,304 | | | | 18,321 | |
Line of credit | | | 248 | | | | 477 | |
Interest expense | | | 205 | | | | 85 | |
| | | | | | | | |
Total expenses | | | 173,394 | | | | 297,470 | |
Fees waived by Adviser | | | (104,545 | ) | | | (52,177 | ) |
Fees waived by the Administrator | | | (1,833 | ) | | | — | |
| | | | | | | | |
Net operating expenses | | | 67,016 | | | | 245,293 | |
| | | | | | | | |
Net investment income | | | 133,069 | | | | 51,319 | |
| | | | | | | | |
Net Realized and Unrealized Gain (Loss) on Investments | | | | | | | | |
Long term capital gain dividends from investment companies | | | 11,219 | | | | 197,740 | |
Net realized gain (loss) on investment transactions | | | 19,978 | | | | (14,481 | ) |
Net change in unrealized appreciation (depreciation) on investments | | | 96,790 | | | | 47,753 | |
| | | | | | | | |
Net realized and unrealized gain (loss) on investments | | | 127,987 | | | | 231,012 | |
| | | | | | | | |
Net increase in net assets resulting from operations | | $ | 261,056 | | | $ | 282,331 | |
| | | | | | | | |
See accompanying notes which are an integral part of these financial statements.
30
SOUND MIND INVESTING FUND
STATEMENTS OF CHANGES IN NET ASSETS
| | | | | | | | |
| | | Year Ended
October 31, 2016 | | | Year Ended
October 31, 2015 | |
Decrease in Net Assets due to: | | | | | | | | |
Operations | | | | | | | | |
Net investment income (loss) | | $ | 310,845 | | | $ | (1,516,121 | ) |
Long term capital gain dividends from investment companies | | | 9,201,713 | | | | 12,375,953 | |
Net realized gain (loss) on investment transactions | | | (11,925,406 | ) | | | 18,464,087 | |
Net change in unrealized appreciation (depreciation) on investments | | | 2,869,366 | | | | (27,522,080 | ) |
| | | | | | | | |
Net increase in net assets resulting from operations | | | 456,518 | | | | 1,801,839 | |
| | | | | | | | |
Distributions From: | | | | | | | | |
Net investment income | | | — | | | | (1,347,114 | ) |
Net realized gains | | | (28,684,023 | ) | | | (43,665,598 | ) |
| | | | | | | | |
Total distributions | | | (28,684,023 | ) | | | (45,012,712 | ) |
| | | | | | | | |
Capital Transactions | | | | | | | | |
Proceeds from shares sold | | | 12,910,740 | | | | 20,805,833 | |
Proceeds from redemption fees (a) | | | 6,288 | | | | 8,051 | |
Reinvestment of distributions | | | 27,898,432 | | | | 44,074,918 | |
Amount paid for shares redeemed | | | (45,249,201 | ) | | | (77,008,628 | ) |
| | | | | | | | |
Net decrease in net assets resulting from capital transactions | | | (4,433,741 | ) | | | (12,119,826 | ) |
| | | | | | | | |
Total Decrease in Net Assets | | | (32,661,246 | ) | | | (55,330,699 | ) |
| | | | | | | | |
Net Assets | | | | | | | | |
Beginning of year | | | 227,339,288 | | | | 282,669,987 | |
| | | | | | | | |
End of year | | $ | 194,678,042 | | | $ | 227,339,288 | |
| | | | | | | | |
Accumulated net investment loss included in net assets at end of year | | $ | (288,843 | ) | | $ | (1,333,296 | ) |
| | | | | | | | |
Share Transactions | | | | | | | | |
Shares sold | | | 1,270,281 | | | | 1,669,832 | |
Shares issued in reinvestment of distributions | | | 2,727,119 | | | | 3,648,586 | |
Shares redeemed | | | (4,414,628 | ) | | | (6,270,705 | ) |
| | | | | | | | |
Net decrease in shares outstanding | | | (417,228 | ) | | | (952,287 | ) |
| | | | | | | | |
| (a) | The Fund charges a 2% redemption fee on shares redeemed within 60 days of purchase. Shares are redeemed at the NAV if held longer than 60 days. |
See accompanying notes which are an integral part of these financial statements.
31
SMI CONSERVATIVE ALLOCATION FUND
STATEMENTS OF CHANGES IN NET ASSETS
| | | | | | | | |
| | | Year Ended
October 31, 2016 | | | Year Ended
October 31, 2015 | |
Decrease in Net Assets due to: | | | | | | | | |
Operations | | | | | | | | |
Net investment income | | $ | 210,208 | | | $ | 221,588 | |
Long term capital gain dividends from investment companies | | | 15,711 | | | | 711,659 | |
Net realized gain (loss) on investment transactions and swap contracts | | | 162,196 | | | | (763,305 | ) |
Net change in unrealized appreciation (depreciation) on investments and swap contracts | | | (145,072 | ) | | | (1,236,357 | ) |
| | | | | | | | |
Net decrease in net assets resulting from operations | | | 243,043 | | | | (1,066,415 | ) |
| | | | | | | | |
Distributions From: | | | | | | | | |
Net investment income | | | (217,790 | ) | | | (234,212 | ) |
Net realized gains | | | (438,679 | ) | | | (3,459,165 | ) |
| | | | | | | | |
Total distributions | | | (656,469 | ) | | | (3,693,377 | ) |
| | | | | | | | |
Capital Transactions | | | | | | | | |
Proceeds from shares sold | | | 2,198,797 | | | | 6,964,005 | |
Proceeds from redemption fees (a) | | | 1,821 | | | | 2,295 | |
Reinvestment of distributions | | | 644,375 | | | | 3,636,441 | |
Amount paid for shares redeemed | | | (6,545,564 | ) | | | (14,246,135 | ) |
| | | | | | | | |
Net decrease in net assets resulting from capital transactions | | | (3,700,571 | ) | | | (3,643,394 | ) |
| | | | | | | | |
Total Decrease in Net Assets | | | (4,113,997 | ) | | | (8,403,186 | ) |
| | | | | | | | |
Net Assets | | | | | | | | |
Beginning of year | | | 22,202,721 | | | | 30,605,907 | |
| | | | | | | | |
End of year | | $ | 18,088,724 | | | $ | 22,202,721 | |
| | | | | | | | |
Accumulated net investment income included in net assets at end of period | | $ | 92,021 | | | $ | 76,248 | |
| | | | | | | | |
Share Transactions | | | | | | | | |
Shares sold | | | 234,592 | | | | 676,358 | |
Shares issued in reinvestment of distributions | | | 69,512 | | | | 353,052 | |
Shares redeemed | | | (695,959 | ) | | | (1,385,789 | ) |
| | | | | | | | |
Net decrease in shares outstanding | | | (391,855 | ) | | | (356,379 | ) |
| | | | | | | | |
| (a) | The Fund charges a 2% redemption fee on shares redeemed within 60 days of purchase. Shares are redeemed at the NAV if held longer than 60 days. |
See accompanying notes which are an integral part of these financial statements.
32
SMI DYNAMIC ALLOCATION FUND
STATEMENTS OF CHANGES IN NET ASSETS
| | | | | | | | |
| | | Year Ended
October 31, 2016 | | | Year Ended
October 31, 2015 | |
Increase (Decrease) in Net Assets due to: | | | | | | | | |
Operations | | | | | | | | |
Net investment income | | $ | 1,496,457 | | | $ | 3,105,038 | |
Long term capital gain dividends from investment companies | | | 28,483 | | | | 3,376 | |
Net realized gain (loss) on investment transactions | | | 3,992,962 | | | | (9,671,547 | ) |
Net change in unrealized appreciation (depreciation) on investments | | | (4,268,680 | ) | | | (5,577,797 | ) |
| | | | | | | | |
Net decrease in net assets resulting from operations | | | 1,249,222 | | | | (12,140,930 | ) |
| | | | | | | | |
Distributions From: | | | | | | | | |
Net investment income | | | (2,361,609 | ) | | | (3,044,696 | ) |
Net realized gains | | | — | | | | (1,173,745 | ) |
| | | | | | | | |
Total distributions | | | (2,361,609 | ) | | | (4,218,441 | ) |
| | | | | | | | |
Capital Transactions | | | | | | | | |
Proceeds from shares sold | | | 20,009,885 | | | | 97,034,317 | |
Proceeds from redemption fees (a) | | | 4,923 | | | | 8,043 | |
Reinvestment of distributions | | | 2,304,657 | | | | 4,160,062 | |
Amount paid for shares redeemed | | | (38,342,055 | ) | | | (34,306,667 | ) |
| | | | | | | | |
Net increase (decrease) in net assets resulting from capital transactions | | | (16,022,590 | ) | | | 66,895,755 | |
| | | | | | | | |
Total Increase (Decrease) in Net Assets | | | (17,134,977 | ) | | | 50,536,384 | |
| | | | | | | | |
Net Assets | | | | | | | | |
Beginning of year | | | 197,538,931 | | | | 147,002,547 | |
| | | | | | | | |
End of year | | $ | 180,403,954 | | | $ | 197,538,931 | |
| | | | | | | | |
Accumulated net investment income included in net assets at end of year | | $ | 213,474 | | | $ | 1,049,699 | |
| | | | | | | | |
Share Transactions | | | | | | | | |
Shares sold | | | 1,838,944 | | | | 8,126,323 | |
Shares issued in reinvestment of distributions | | | 212,607 | | | | 346,672 | |
Shares redeemed | | | (3,515,353 | ) | | | (2,940,748 | ) |
| | | | | | | | |
Net increase (decrease) in shares outstanding | | | (1,463,802 | ) | | | 5,532,247 | |
| | | | | | | | |
| (a) | The Fund charges a 2% redemption fee on shares redeemed within 60 days of purchase. Shares are redeemed at the NAV if held longer than 60 days. |
See accompanying notes which are an integral part of these financial statements.
33
SMI BOND FUND
STATEMENTS OF CHANGES IN NET ASSETS
| | | | | | | | |
| | | Year Ended
October 31, 2016 | | | For the Period
Ended
October 31, 2015 (a) | |
Increase (Decrease) in Net Assets due to: | | | | | | | | |
Operations | | | | | | | | |
Net investment income | | $ | 133,069 | | | $ | 2,420 | |
Long term capital gain dividends from investment companies | | | 11,219 | | | | — | |
Net realized gain (loss) on investment transactions | | | 19,978 | | | | (27,336 | ) |
Net change in unrealized appreciation (depreciation) on investments | | | 96,790 | | | | (43,142 | ) |
| | | | | | | | |
Net increase (decrease) in net assets resulting from operations | | | 261,056 | | | | (68,058 | ) |
| | | | | | | | |
Distributions From: | | | | | | | | |
Net investment income | | | (152,352 | ) | | | (2,960 | ) |
| | | | | | | | |
Total distributions | | | (152,352 | ) | | | (2,960 | ) |
| | | | | | | | |
Capital Transactions | | | | | | | | |
Proceeds from shares sold | | | 3,264,713 | | | | 7,595,456 | |
Proceeds from redemption fees (b) | | | 1,930 | | | | 676 | |
Reinvestment of distributions | | | 150,481 | | | | 2,894 | |
Amount paid for shares redeemed | | | (2,716,700 | ) | | | (773,756 | ) |
| | | | | | | | |
Net increase in net assets resulting from capital transactions | | | 700,424 | | | | 6,825,270 | |
| | | | | | | | |
Total Increase in Net Assets | | | 809,128 | | | | 6,754,252 | |
| | | | | | | | |
Net Assets | | | | | | | | |
Beginning of period | | | 6,754,252 | | | | — | |
| | | | | | | | |
End of period | | $ | 7,563,380 | | | $ | 6,754,252 | |
| | | | | | | | |
Accumulated net investment income (loss) included in net assets at end of period | | $ | — | | | $ | — | |
| | | | | | | | |
Share Transactions | | | | | | | | |
Shares sold | | | 334,341 | | | | 766,917 | |
Shares issued in reinvestment of distributions | | | 15,382 | | | | 293 | |
Shares redeemed | | | (274,716 | ) | | | (78,473 | ) |
| | | | | | | | |
Net increase in shares outstanding | | | 75,007 | | | | 688,737 | |
| | | | | | | | |
| (a) | For the period April 28, 2015 (commencement of operations) through October 31, 2015. |
| (b) | The Fund charges a 2% redemption fee on shares redeemed within 60 days of purchase. Shares are redeemed at the NAV if held longer than 60 days. |
See accompanying notes which are an integral part of these financial statements.
34
SMI 50/40/10 FUND
STATEMENTS OF CHANGES IN NET ASSETS
| | | | | | | | |
| | | Year Ended
October 31, 2016 | | | For the Period
Ended
October 31, 2015 (a) | |
Increase (Decrease) in Net Assets due to: | | | | | | | | |
Operations | | | | | | | | |
Net investment income (loss) | | $ | 51,319 | | | $ | (4,088 | ) |
Long term capital gain dividends from investment companies | | | 197,740 | | | | — | |
Net realized (loss) on investment transactions | | | (14,481 | ) | | | (1,024,798 | ) |
Net change in unrealized appreciation on investments | | | 47,753 | | | | 204,440 | |
| | | | | | | | |
Net decrease in net assets resulting from operations | | | 282,331 | | | | (824,446 | ) |
| | | | | | | | |
Distributions From: | | | | | | | | |
Net investment income | | | (91,435 | ) | | | — | |
| | | | | | | | |
Total distributions | | | (91,435 | ) | | | — | |
| | | | | | | | |
Capital Transactions | | | | | | | | |
Proceeds from shares sold | | | 7,981,856 | | | | 14,865,557 | |
Proceeds from redemption fees (b) | | | 310 | | | | 16 | |
Reinvestment of distributions | | | 89,150 | | | | — | |
Amount paid for shares redeemed | | | (3,046,187 | ) | | | (894,602 | ) |
| | | | | | | | |
Net increase in net assets resulting from capital transactions | | | 5,025,129 | | | | 13,970,971 | |
| | | | | | | | |
Total Increase in Net Assets | | | 5,216,025 | | | | 13,146,525 | |
| | | | | | | | |
Net Assets | | | | | | | | |
Beginning of period | | | 13,146,525 | | | | — | |
| | | | | | | | |
End of period | | $ | 18,362,550 | | | $ | 13,146,525 | |
| | | | | | | | |
Accumulated net investment loss included in net assets at end of period | | $ | (10,640 | ) | | $ | (4,088 | ) |
| | | | | | | | |
Share Transactions | | | | | | | | |
Shares sold | | | 876,455 | | | | 1,522,749 | |
Shares issued in reinvestment of distributions | | | 9,764 | | | | — | |
Shares redeemed | | | (334,897 | ) | | | (94,481 | ) |
| | | | | | | | |
Net increase in shares outstanding | | | 551,322 | | | | 1,428,268 | |
| | | | | | | | |
| (a) | For the period April 29, 2015 (commencement of operations) through October 31, 2015. |
| (b) | The Fund charges a 2% redemption fee on shares redeemed within 60 days of purchase. Shares are redeemed at the NAV if held longer than 60 days. |
See accompanying notes which are an integral part of these financial statements.
35
SOUND MIND INVESTING FUND
FINANCIAL HIGHLIGHTS
(For a share outstanding during each year)
| | | | |
| | | Year Ended
October 31,
2016 | |
Selected Per Share Data: | | | | |
Net asset value, beginning of year | | $ | 11.76 | |
| | | | |
Income from investment operations: | | | | |
Net investment income (loss)(a) | | | 0.01 | |
Net realized and unrealized gain | | | 0.04 | (b) |
| | | | |
Total from investment operations | | | 0.05 | |
| | | | |
| |
Less Distributions to Shareholders: | | | | |
From net investment income | | | — | |
From net realized gain | | | (1.51 | ) |
| | | | |
Total distributions | | | (1.51 | ) |
| | | | |
Paid in capital from redemption fees(d) | | | — | |
| | | | |
Net asset value, end of year | | $ | 10.30 | |
| | | | |
| |
Total Return(e) | | | 0.55 | % |
| |
Ratios and Supplemental Data: | | | | |
Net assets, end of year (000) | | $ | 194,678 | |
Ratio of expenses to average net assets(f)(g) | | | 1.15 | % |
Ratio of net investment income (loss) to average net assets(a)(h) | | | 0.15 | % |
Portfolio turnover rate | | | 131.40 | % |
| (a) | Recognition of net investment income by the Fund is affected by the timing of the declaration of dividends by the underlying investment companies in which the Fund invests. |
| (b) | The amount shown for a share outstanding throughout the year does not accord with the change in aggregate gains and losses in the portfolio of securities during the year because of the timing of sales and purchases of fund shares in relation to fluctuating market values during the year. |
| (c) | Resulted in less than $0.005 per share. |
| (d) | Redemption fee resulted in less than $0.005 per share. |
| (e) | Total return in the above table represents the rate that an investor would have earned or lost on an investment in the Fund, assuming reinvestment of dividends. |
| (f) | These ratios exclude the impact of expenses of the underlying funds in which the Fund invests as represented in the Schedule of Investments. |
| (g) | These ratios do not include the effects of other expenses refunded by the underlying funds in which the Fund invests or line of credit interest expense and borrowing costs. If these refunds and borrowing costs had been included, the ratio of expenses to average net assets would have been 1.16%, 1.14%, 1.09%, 1.17%, and 1.15% for the years ended October 31, 2016, October 31, 2015, October 31, 2014, October 31, 2013, and October 31, 2012, respectively. |
| (h) | This ratio is presented net of expenses and/or expenses refunded by the underlying funds in which the Fund invests. |
See accompanying notes which are an integral part of these financial statements.
36
SOUND MIND INVESTING FUND
FINANCIAL HIGHLIGHTS
(For a share outstanding during each year) – (Continued)
| | | | | | | | | | | | | | |
Year Ended
October 31,
2015 | | | Year Ended
October 31,
2014 | | | Year Ended
October 31,
2013 | | | Year Ended
October 31,
2012 | |
| | | | | | | | | | | | | | |
| $ | 13.94 | | | $ | 14.47 | | | $ | 11.36 | | | $ | 10.74 | |
| | | | | | | | | | | | | | |
| | | | | | | | | | | | | | |
| | (0.08 | ) | | | (0.09 | ) | | | (0.05 | ) | | | — | |
| | 0.16 | | | | 1.12 | | | | 3.66 | | | | 0.62 | |
| | | | | | | | | | | | | | |
| | 0.08 | | | | 1.03 | | | | 3.61 | | | | 0.62 | |
| | | | | | | | | | | | | | |
| | | |
| | | | | | | | | | | | | | |
| | (0.07 | ) | | | (0.05 | ) | | | — | (c) | | | — | |
| | (2.19 | ) | | | (1.51 | ) | | | (0.50 | ) | | | — | |
| | | | | | | | | | | | | | |
| | (2.26 | ) | | | (1.56 | ) | | | (0.50 | ) | | | — | |
| | | | | | | | | | | | | | |
| | — | | | | — | | | | — | | | | — | |
| | | | | | | | | | | | | | |
| $ | 11.76 | | | $ | 13.94 | | | $ | 14.47 | | | $ | 11.36 | |
| | | | | | | | | | | | | | |
| | | |
| | 0.16 | % | | | 7.38 | % | | | 33.01 | % | | | 5.77 | % |
| | | |
| | | | | | | | | | | | | | |
| $ | 227,339 | | | $ | 282,670 | | | $ | 293,035 | | | $ | 272,092 | |
| | 1.13 | % | | | 1.11 | % | | | 1.17 | % | | | 1.15 | % |
| | (0.59 | )% | | | (0.64 | )% | | | (0.41 | )% | | | 0.00 | % |
| | 216.17 | % | | | 135.60 | % | | | 93.59 | % | | | 187.39 | % |
See accompanying notes which are an integral part of these financial statements.
37
SMI CONSERVATIVE ALLOCATION FUND
FINANCIAL HIGHLIGHTS
(For a share outstanding during each year)
| | | | |
| | | Year Ended
October 31,
2016 | |
Selected Per Share Data: | | | | |
Net asset value, beginning of year | | $ | 9.65 | |
| | | | |
Income from investment operations: | | | | |
Net investment income (loss)(a) | | | 0.10 | |
Net realized and unrealized gain (loss) | | | 0.02 | (b) |
| | | | |
Total from investment operations | | | 0.12 | |
| | | | |
| |
Less Distributions to Shareholders: | | | | |
From net investment income | | | (0.10 | ) |
From net realized gain | | | (0.20 | ) |
| | | | |
Total distributions | | | (0.30 | ) |
| | | | |
Paid in capital from redemption fees(c) | | | — | |
| | | | |
Net asset value, end of year | | $ | 9.47 | |
| | | | |
| |
Total Return(d) | | | 1.30 | % |
| |
Ratios and Supplemental Data: | | | | |
Net assets, end of year (000) | | $ | 18,089 | |
Ratio of expenses to average net assets(e) | | | 1.15 | %(f) |
Ratio of expenses to average net assets before waiver and reimbursement(e) | | | 1.51 | % |
Ratio of net investment income (loss) to average net assets(a)(g) | | | 1.06 | % |
Portfolio turnover rate | | | 203.11 | % |
| (a) | Recognition of net investment income by the Fund is affected by the timing of the declaration of dividends by the underlying investment companies in which the Fund invests. |
| (b) | The amount shown for a share outstanding throughout the year does not accord with the change in aggregate gains and losses in the portfolio of securities during the year because of the timing of sales and purchases of fund shares in relation to fluctuating market values during the year. |
| (c) | Redemption fees resulted in less than $0.005 per share. |
| (d) | Total return in the above table represents the rate that an investor would have earned on an investment in the Fund, assuming reinvestment of dividends. |
| (e) | These ratios exclude the impact of expenses of the underlying funds in which the Fund may invest, as represented in the Schedule of Investments. |
| (f) | These ratios do not include the effects of other expenses refunded by the underlying funds in which the Fund invests or line of credit interest expense and borrowing costs. If these refunds and borrowing costs had been included, the ratio of expenses to average net assets would have been 1.16%, 1.16%, 1.13%, and 1.14% for the years ended October 31, 2016, October 31, 2015, October 31, 2014 and October 31, 2012 , respectively. |
| (g) | This ratio is presented net of expenses and/or expenses refunded by the underlying funds in which the Fund invests. |
See accompanying notes which are an integral part of these financial statements.
38
SMI CONSERVATIVE ALLOCATION FUND
FINANCIAL HIGHLIGHTS
(For a share outstanding during each year) – (Continued)
| | | | | | | | | | | | | | |
Year Ended
October 31,
2015 | | | Year Ended
October 31,
2014 | | | Year Ended
October 31,
2013 | | | Year Ended
October 31,
2012 | |
| | | | | | | | | | | | | | |
| $ | 11.52 | | | $ | 12.20 | | | $ | 10.31 | | | $ | 9.70 | |
| | | | | | | | | | | | | | |
| | | | | | | | | | | | | | |
| | 0.08 | | | | (0.01 | ) | | | (0.02 | ) | | | 0.03 | |
| | (0.52 | ) | | | 0.54 | | | | 2.11 | | | | 0.63 | |
| | | | | | | | | | | | | | |
| | (0.44 | ) | | | 0.53 | | | | 2.09 | | | | 0.66 | |
| | | | | | | | | | | | | | |
| | | |
| | | | | | | | | | | | | | |
| | (0.09 | ) | | | (0.06 | ) | | | (0.03 | ) | | | (0.05 | ) |
| | (1.34 | ) | | | (1.15 | ) | | | (0.17 | ) | | | — | |
| | | | | | | | | | | | | | |
| | (1.43 | ) | | | (1.21 | ) | | | (0.20 | ) | | | (0.05 | ) |
| | | | | | | | | | | | | | |
| | — | | | | — | | | | — | | | | — | |
| | | | | | | | | | | | | | |
| $ | 9.65 | | | $ | 11.52 | | | $ | 12.20 | | | $ | 10.31 | |
| | | | | | | | | | | | | | |
| | | |
| | (4.58 | )% | | | 4.46 | % | | | 20.56 | % | | | 6.89 | % |
| | | |
| | | | | | | | | | | | | | |
| $ | 22,203 | | | $ | 30,606 | | | $ | 29,826 | | | $ | 37,258 | |
| | 1.15 | %(g) | | | 1.15 | %(f) | | | 1.15 | % | | | 1.15 | %(f) |
| | 1.49 | % | | | 1.31 | % | | | 1.52 | % | | | 1.49 | % |
| | 0.82 | % | | | (0.17 | )% | | | (0.06 | )% | | | 0.29 | % |
| | 377.51 | % | | | 255.50 | % | | | 270.30 | % | | | 349.33 | % |
See accompanying notes which are an integral part of these financial statements.
39
SMI DYNAMIC ALLOCATION FUND
FINANCIAL HIGHLIGHTS
(For a share outstanding during each period)
| | | | |
| | | Year Ended
October 31,
2016 | |
Selected Per Share Data: | | | | |
Net asset value, beginning of period | | $ | 10.99 | |
| | | | |
Income from investment operations: | | | | |
Net investment income(b) | | | 0.09 | |
Net realized and unrealized gain (loss) | | | (0.02 | ) |
| | | | |
Total from investment operations | | | 0.07 | |
| | | | |
| |
Less Distributions to Shareholders: | | | | |
From net investment income | | | (0.14 | ) |
From net realized gains | | | — | |
| | | | |
Total distributions | | | (0.14 | ) |
| | | | |
Paid in capital from redemption fees(c) | | | — | |
| | | | |
Net asset value, end of period | | $ | 10.92 | |
| | | | |
| |
Total Return(d) | | | 0.62 | % |
| |
Ratios and Supplemental Data: | | | | |
Net assets, end of period (000) | | $ | 180,404 | |
Ratio of expenses to average net assets(f) | | | 1.15 | % |
Ratio of net investment income to average net assets(b)(h) | | | 0.80 | % |
Portfolio turnover rate | | | 151.88 | % |
| (a) | For the period February 28, 2013 (the date the Fund commenced operations) through October 31, 2013. |
| (b) | Recognition of net investment income by the Fund is affected by the timing of the declaration of dividends by the underlying investment companies in which the Fund invests. |
| (c) | Redemption fees resulted in less than $0.005 per share. |
| (d) | Total return in the above table represents the rate that an investor would have earned on an investment in the Fund, assuming reinvestment of dividends. |
| (f) | These ratios exclude the impact of expenses of the underlying funds in which the Fund may invest, as represented in the Schedule of Investments. |
| (h) | This ratio is presented net of expenses of the funds in which the Fund invests. |
See accompanying notes which are an integral part of these financial statements.
40
SMI DYNAMIC ALLOCATION FUND
FINANCIAL HIGHLIGHTS
(For a share outstanding during each period) – (Continued)
| | | | | | | | | | |
Year Ended
October 31,
2015 | | | Year Ended
October 31,
2014 | | | Period Ended
October 31,
2013(a) | |
| | | | | | | | | | |
| $ | 11.81 | | | $ | 10.95 | | | $ | 10.00 | |
| | | | | | | | | | |
| | | | | | | | | | |
| | 0.19 | | | | 0.23 | | | | 0.05 | |
| | (0.69 | ) | | | 0.81 | | | | 0.90 | |
| | | | | | | | | | |
| | (0.50 | ) | | | 1.04 | | | | 0.95 | |
| | | | | | | | | | |
| | |
| | | | | | | | | | |
| | (0.23 | ) | | | (0.18 | ) | | | — | |
| | (0.09 | ) | | | — | | | | — | |
| | | | | | | | | | |
| | (0.32 | ) | | | (0.18 | ) | | | — | |
| | | | | | | | | | |
| | — | | | | — | | | | — | |
| | | | | | | | | | |
| $ | 10.99 | | | $ | 11.81 | | | $ | 10.95 | |
| | | | | | | | | | |
| | |
| | (4.52 | )% | | | 9.64 | % | | | 9.50 | %(e) |
| | |
| | | | | | | | | | |
| $ | 197,539 | | | $ | 147,003 | | | $ | 68,290 | |
| | 1.15 | % | | | 1.20 | % | | | 1.30 | %(g) |
| | 1.62 | % | | | 2.13 | % | | | 0.94 | %(g) |
| | 248.18 | % | | | 134.71 | % | | | 68.64 | %(e) |
See accompanying notes which are an integral part of these financial statements.
41
SMI BOND FUND
FINANCIAL HIGHLIGHTS
(For a share outstanding during each period)
| | | | | | | | |
| | | Year Ended
October 31,
2016 | | | Period Ended
October 31,
2015(a) | |
Selected Per Share Data: | | | | | | | | |
Net asset value, beginning of period | | $ | 9.81 | | | $ | 10.00 | |
| | | | | | | | |
Income from investment operations: | | | | | | | | |
Net investment income(b) | | | 0.16 | | | | 0.01 | |
Net realized and unrealized gain (loss) | | | 0.12 | | | | (0.19 | ) |
| | | | | | | | |
Total from investment operations | | | 0.28 | | | | (0.18 | ) |
| | | | | | | | |
| | |
Less Distributions to Shareholders: | | | | | | | | |
From net investment income | | | (0.19 | ) | | | (0.01 | ) |
| | | | | | | | |
Total distributions | | | (0.19 | ) | | | (0.01 | ) |
| | | | | | | | |
Paid in capital from redemption fees(c) | | | — | | | | — | |
| | | | | | | | |
Net asset value, end of period | | $ | 9.90 | | | $ | 9.81 | |
| | | | | | | | |
| | |
Total Return(d) | | | 2.95 | % | | | (1.82 | )%(e) |
| | |
Ratios and Supplemental Data: | | | | | | | | |
Net assets, end of period (000) | | $ | 7,563 | | | $ | 6,754 | |
Ratio of expenses to average net assets(f)(g) | | | 0.85 | % | | | 0.85 | %(h) |
Ratio of expenses to average net assets before waiver and reimbursement(f) | | | 2.22 | % | | | 4.18 | %(h) |
Ratio of net investment income to average net assets(b)(i) | | | 1.70 | % | | | 0.11 | %(h) |
Portfolio turnover rate | | | 289.18 | % | | | 399.72 | %(e) |
| (a) | For the period April 28, 2015 (the date the Fund commenced operations) through October 31, 2015. |
| (b) | Recognition of net investment income by the Fund is affected by the timing of the declaration of dividends by the underlying investment companies in which the Fund invests. |
| (c) | Redemption fees resulted in less than $0.005 per share. |
| (d) | Total return in the above table represents the rate that an investor would have earned on an investment in the Fund, assuming reinvestment of dividends. |
| (f) | These ratios exclude the impact of expenses of the underlying funds in which the Fund may invest, as represented in the Schedule of Investments. |
| (g) | These ratios do not include the effects of line of credit interest expense and borrowing costs. If these borrowing costs had been included, the ratio of expenses to average net assets would have been 0.86% and 0.86% for the periods ended October 31, 2016 and October 31, 2015, respectively. |
| (i) | This ratio is presented net of expenses of the funds in which the Fund invests. |
See accompanying notes which are an integral part of these financial statements.
42
SMI 50/40/10 FUND
FINANCIAL HIGHLIGHTS
(For a share outstanding during each period)
| | | | | | | | |
| | | Year Ended
October 31,
2016 | | | Period Ended
October 31,
2015(a) | |
Selected Per Share Data: | | | | | | | | |
Net asset value, beginning of period | | $ | 9.20 | | | $ | 10.00 | |
| | | | | | | | |
Income from investment operations: | | | | | | | | |
Net investment income (loss)(b) | | | 0.03 | | | | — | (c) |
Net realized and unrealized gain (loss) | | | 0.10 | | | | (0.80 | ) |
| | | | | | | | |
Total from investment operations | | | 0.13 | | | | (0.80 | ) |
| | | | | | | | |
| | |
Less Distributions to Shareholders: | | | | | | | | |
From net investment income | | | (0.05 | ) | | | — | |
| | | | | | | | |
Total distributions | | | (0.05 | ) | | | — | |
| | | | | | | | |
Paid in capital from redemption fees(d) | | | — | | | | — | |
| | | | | | | | |
Net asset value, end of period | | $ | 9.28 | | | $ | 9.20 | |
| | | | | | | | |
| | |
Total Return(e) | | | 1.44 | % | | | (8.00 | )%(f) |
| | |
Ratios and Supplemental Data: | | | | | | | | |
Net assets, end of period (000) | | $ | 18,363 | | | $ | 13,147 | |
Ratio of expenses to average net assets(g) | | | 1.45 | % | | | 1.45 | %(h) |
Ratio of expenses to average net assets before waiver and reimbursement(g) | | | 1.76 | % | | | 2.75 | %(h) |
Ratio of net investment income (loss) to average net assets(b)(i) | | | 0.30 | % | | | (0.09 | )%(h) |
Portfolio turnover rate | | | 146.24 | % | | | 184.30 | %(f) |
| (a) | For the period April 29, 2015 (the date the Fund commenced operations) through October 31, 2015. |
| (b) | Recognition of net investment income by the Fund is affected by the timing of the declaration of dividends by the underlying investment companies in which the Fund invests. |
| (c) | Amount is less than $0.005 per share. |
| (d) | Redemption fee resulted in less than $0.005 per share. |
| (e) | Total return in the above table represents the rate that an investor would have earned on an investment in the Fund, assuming reinvestment of dividends. |
| (g) | These ratios exclude the impact of expenses of the underlying funds in which the Fund may invest, as represented in the Schedule of Investments. |
| (i) | This ratio is presented net of expenses of the funds in which the Fund invests. |
See accompanying notes which are an integral part of these financial statements.
43
SMI FUNDS
NOTES TO THE FINANCIAL STATEMENTS
October 31, 2016
NOTE 1. ORGANIZATION
The Sound Mind Investing Fund (“SMI Fund”), SMI Conservative Allocation Fund, SMI Dynamic Allocation Fund, SMI Bond Fund and SMI 50/40/10 Fund (each a “Fund” and collectively, the “Funds”) are each a diversified series of The Valued Advisers Trust (the “Trust”). Pursuant to a reorganization that took place on February 28, 2013, the SMI Fund and SMI Conservative Allocation Fund are the successors to the series of the Unified Series Trust (the “Predecessor Funds”) with the same names. The Predecessor Funds had the same investment objectives and strategies and substantially the same investment policies as the Funds. The SMI Fund was organized on August 29, 2005, and commenced operations on December 2, 2005. The SMI Conservative Allocation Fund was organized on November 13, 2010, and commenced operations on December 30, 2010. The SMI Dynamic Allocation Fund was organized on December 11, 2012, and commenced operations on February 28, 2013. The SMI Bond Fund was organized on March 11, 2015, and commenced operations on April 28, 2015. The SMI 50/40/10 Fund was organized on March 11, 2015, and commenced operations on April 29, 2015. The Trust is a management investment company established under the laws of Delaware by an Agreement and Declaration of Trust dated June 13, 2008 (the “Trust Agreement”). The Trust Agreement permits the Trustees to issue an unlimited number of shares of beneficial interest of separate series without par value. Each Fund is one of a series of funds currently authorized by the Trustees. The investment adviser to the Funds is SMI Advisory Services, LLC (the “Adviser”). The SMI Fund seeks to provide long-term capital appreciation. The SMI Conservative Allocation Fund, SMI Dynamic Allocation Fund, SMI Bond Fund and SMI 50/40/10 Fund seek total return.
NOTE 2. SIGNIFICANT ACCOUNTING POLICIES
The Funds are investment companies and follow accounting and reporting guidance under Financial Accounting Standards Board Accounting Standards Codification (“ASC”) Topic 946, “Financial Services-Investment Companies”. The following is a summary of significant accounting policies followed by the Funds in the preparation of their financial statements. These policies are in conformity with the generally accepted accounting principles in the United States of America (“GAAP”).
Securities Valuations – All investments in securities are recorded at their estimated fair value as described in Note 3.
Federal Income Taxes – The Funds make no provision for federal income or excise tax. The Funds have qualified and intend to qualify each year as regulated investment companies (“RICs”) under subchapter M of the Internal Revenue Code of 1986, as amended, by complying with the requirements applicable to RICs and by distributing substantially all of their taxable income. The Funds also intend to distribute sufficient net investment income and net capital gains, if any, so that they will not be subject to excise tax on undistributed income and gains. If the required amount of net investment income or gains is not distributed, the Funds could incur a tax expense.
44
SMI FUNDS
NOTES TO THE FINANCIAL STATEMENTS
October 31, 2016 – (Continued)
NOTE 2. SIGNIFICANT ACCOUNTING POLICIES – (Continued)
As of and during the fiscal year ended October 31, 2016, the Funds did not have a liability for any unrecognized tax benefits. The Funds recognize interest and penalties, if any, related to unrecognized tax benefits as income tax expense in the Statements of Operations. During the fiscal year ended October 31, 2016, the Funds did not incur any interest or penalties.
Expenses – Expenses incurred by the Trust, or at the fund complex level, that do not relate to a specific fund are allocated to the individual funds based on each fund’s relative net assets or other appropriate basis.
Security Transactions and Related Income – The Funds follow industry practice and record security transactions on the trade date for financial reporting purposes. For financial statement and income tax purposes, the specific identification method is used for determining gains or losses. Dividend income is recorded on the ex-dividend date and interest income is recorded on an accrual basis. Short-term capital gain distributions from underlying funds are classified as dividend income for financial reporting purposes. Long-term capital gain distributions are broken out as such. The ability of issuers of debt securities held by the Funds to meet their obligations may be affected by economic and political developments in a specific country or region.
Dividends and Distributions – The Funds typically distribute substantially all of their net investment income in the form of dividends and taxable capital gains to their shareholders at least annually. These distributions, which are recorded on the ex-dividend date, are automatically reinvested in each Fund unless shareholders request cash distributions on their application or through a written request. The treatment for financial reporting purposes of distributions made to shareholders during the year from net investment income or net realized capital gains may differ from their ultimate treatment for federal income tax purposes. Where such differences are permanent in nature, they are reclassified in the components of the net assets based on their ultimate characterization for federal income tax purposes. Any such reclassifications will have no effect on net assets, results of operations or net asset values (“NAV”) per share of the Funds.
For the fiscal year ended October 31, 2016, the Funds made the following reclassifications to increase/(decrease) the components of net assets:
| | | | | | | | | | | | | | | |
Fund | | Paid-in Capital | | Accumulated
Undistributed
Net Investment
Income (Loss) | | Accumulated
Net Realized
Gain (Loss)
on Investments |
| SMI Fund | | | | $(96,398 | ) | | | | $733,608 | | | | | $(637,210 | ) |
| SMI Conservative Allocation Fund | | | | — | | | | | 23,355 | | | | | (23,355 | ) |
| SMI Dynamic Allocation Fund | | | | — | | | | | 28,927 | | | | | (28,927 | ) |
| SMI Bond Fund | | | | (295 | ) | | | | 19,283 | | | | | (18,988 | ) |
| SMI 50/40/10 Fund | | | | (22,056 | ) | | | | 33,564 | | | | | (11,508 | ) |
45
SMI FUNDS
NOTES TO THE FINANCIAL STATEMENTS
October 31, 2016 – (Continued)
NOTE 2. SIGNIFICANT ACCOUNTING POLICIES – (Continued)
Swap Contracts – The SMI Conservative Allocation Fund, SMI Dynamic Allocation Fund, SMI Bond Fund and SMI 50/40/10 Fund may invest in open-end mutual funds and ETFs (“Underlying Funds”) that invests in credit default swap contracts. A credit default swap involves a protection buyer and a protection seller. The Underlying Funds may be either a protection buyer or seller. The protection buyer makes periodic premium payments to the protection seller during the swap term in exchange for the protection seller agreeing to make certain defined payments to the protection buyer in the event that certain defined credit events occur with respect to a particular security, issuer, or basket of securities. The “notional amount” of the swap agreement is the agreed upon amount or value of the underlying asset used for calculating the obligations that the parties to a swap agreement have agreed to exchange. An Underlying Fund’s obligation under a swap agreement will be accrued daily (offset against amounts owed to the Underlying Funds) and any accrued but unpaid net amounts owed to a swap counterparty may be collateralized by designating liquid assets on the Underlying Fund’s books and records. The credit default swaps are marked to market daily based upon quotes received from a pricing agent and any change in value is recorded in unrealized appreciation/depreciation. Periodic payments paid or received are recorded in realized gain/loss. Any premium paid or received by the Underlying Funds upon entering into a credit default swap contract is recorded as an asset or liability and amortized daily as a component of realized gain (loss) on the Statements of Operations of the Underlying Fund. Payments made or received as a result of a credit event or termination of the contract are recognized, net of a proportional amount of the upfront payment, as realized gains/losses. In addition to bearing the risk that the credit event will occur as a protection seller, the Underlying Funds could be exposed to market risk due to unfavorable changes in interest rates or in the price of the underlying security or index, the possibility that an Underlying Fund may be unable to close out its position at the same time or at the same price as if it had purchased comparable publicly traded securities, or that the counterparty may default on its obligation to perform. During the year ended October 31, 2016, the Funds did not have any direct investments in credit default swap contracts.
NOTE 3. SECURITIES VALUATION AND FAIR VALUE MEASUREMENTS
Fair value is defined as the price that a Fund would receive upon selling an investment in an orderly transaction to an independent buyer in the principal or most advantageous market of the investment. GAAP establishes a three-tier hierarchy to maximize the use of observable market data and minimize the use of unobservable inputs and to establish classification of fair value measurements for disclosure purposes.
Inputs refer broadly to the assumptions that market participants would use in pricing the asset or liability, including assumptions about risk, for example, the risk inherent in a particular valuation technique used to measure fair value including such a pricing model and the risk inherent in the inputs to the valuation technique. Inputs may be observable or unobservable. Observable inputs are inputs that reflect the assumptions market participants would use in pricing the asset or liability developed based on market data obtained from sources independent of the reporting entity. Unobservable inputs are inputs that reflect the reporting entity’s own assumptions about the assumptions market participants would use in pricing the asset or liability developed based on the best information available in the circumstances.
46
SMI FUNDS
NOTES TO THE FINANCIAL STATEMENTS
October 31, 2016 – (Continued)
NOTE 3. SECURITIES VALUATION AND FAIR VALUE MEASUREMENTS – (Continued)
Various inputs are used in determining the value of the Funds’ investments. These inputs are summarized in the three broad levels listed below.
| | • | | Level 1 – unadjusted quoted prices in active markets for identical investments and/or registered investment companies where the value per share is determined and published and is the basis for current transactions for identical assets or liabilities at the valuation date. |
| | • | | Level 2 – other significant observable inputs (including, but not limited to, quoted prices for an identical security in an inactive market, quoted prices for similar securities, interest rates, prepayment speeds, credit risk, etc.) |
| | • | | Level 3 – significant unobservable inputs (including each Fund’s own assumptions in determining fair value of investments based on the best information available) |
The inputs used to measure fair value may fall into different levels of the fair value hierarchy. In such cases, for disclosure purposes, the level in the fair value hierarchy which is reported is determined based on the lowest level input that is significant to the fair value measurement in its entirety.
Equity securities that are traded on any stock exchange are generally valued at the last quoted sale price on the security’s primary exchange. Lacking a last sale price, an exchange traded security is generally valued at its last bid price. Securities traded in the NASDAQ over-the-counter market are generally valued at the NASDAQ Official Closing Price. When using the market quotations and when the market is considered active, the security is classified as a Level 1 security. In the event that market quotations are not readily available or are considered unreliable due to market or other events, the Fund values its securities and other assets at fair value in accordance with policies established by and under the general supervision of the Board of Trustees (the “Board”). Under these policies, the securities will be classified as Level 2 or 3 within the fair value hierarchy, depending on the inputs used.
Investments in mutual funds, including money market mutual funds, are generally priced at the ending NAV provided by the pricing agent of the funds. These securities are categorized as Level 1 securities. In the event that the ending NAV for a mutual fund is unavailable at the end of night pricing time, the Adviser may, in accordance with the Trust’s valuation policies, consider all appropriate factors in determining the fair value of the mutual fund. In such cases the security will generally be categorized as a Level 2 security.
In accordance with the Trust’s valuation policies, the Adviser is required to consider all appropriate factors relevant to the value of securities for which it has determined other pricing sources are not available or
reliable as described above. No single standard exists for determining fair value, because fair value depends upon the circumstances of each individual case. As a general principle, the current fair value of an issue of securities being valued by the Adviser would appear to be the amount that the owner might reasonably expect to receive for them upon their current sale. Methods that are in accordance with this principle may, for example, be based on (i) a multiple of earnings; (ii) a discount from market prices of a
47
SMI FUNDS
NOTES TO THE FINANCIAL STATEMENTS
October 31, 2016 – (Continued)
NOTE 3. SECURITIES VALUATION AND FAIR VALUE MEASUREMENTS – (Continued)
similar freely traded security (including a derivative security or a basket of securities traded on other markets, exchanges or among dealers); or (iii) yield to maturity with respect to debt issues, or a combination of these and other methods. Fair-value pricing is permitted if, in the Adviser’s opinion, the validity of market quotations appears to be questionable based on factors such as evidence of a thin market in the security based on a small number of quotations, a significant event occurs after the close of a market but before a Fund’s NAV calculation that may affect a security’s value, or the Adviser is aware of any other data that calls into question the reliability of market quotations. Fair-value pricing may also be used in instances when the bonds the Funds may invest in default or otherwise cease to have market quotations readily available.
The following is a summary of the inputs used to value the Funds’ investments as of October 31, 2016:
| | | | | | | | | | | | | | | | |
| | | Valuation Inputs | |
| SMI Fund | | Level 1 | | | Level 2 | | | Level 3 | | | Total | |
Mutual Funds – greater
than 1% of net assets | | $ | 148,923,751 | | | $ | — | | | $ | — | | | $ | 148,923,751 | |
Mutual Funds – less
than 1% of net assets | | | 1,262,297 | | | | — | | | | — | | | | 1,262,297 | |
| Exchange-Traded Funds | | | 44,069,945 | | | | — | | | | — | | | | 44,069,945 | |
| Money Market Securities | | | 496,793 | | | | — | | | | — | | | | 496,793 | |
| Total Investments | | $ | 194,752,786 | | | $ | — | | | $ | — | | | $ | 194,752,786 | |
| | | | | | | | | | | | | | | | |
| | | Valuation Inputs | |
SMI Conservative Allocation Fund | | Level 1 | | | Level 2 | | | Level 3 | | | Total | |
| Exchange-Traded Funds | | $ | 10,679,352 | | | $ | — | | | $ | — | | | $ | 10,679,352 | |
| Mutual Funds | | | 7,291,173 | | | | — | | | | — | | | | 7,291,173 | |
| Money Market Securities | | | 16,281 | | | | — | | | | — | | | | 16,281 | |
| Total Investments | | $ | 17,986,806 | | | $ | — | | | $ | — | | | $ | 17,986,806 | |
48
SMI FUNDS
NOTES TO THE FINANCIAL STATEMENTS
October 31, 2016 – (Continued)
NOTE 3. SECURITIES VALUATION AND FAIR VALUE MEASUREMENTS – (Continued)
| | | | | | | | | | | | | | | | |
| | | Valuation Inputs | |
SMI Dynamic Allocation Fund | | Level 1 | | | Level 2 | | | Level 3 | | | Total | |
| Exchange-Traded Funds | | $ | 166,205,211 | | | $ | — | | | $ | — | | | $ | 166,205,211 | |
| Mutual Funds | | | 5,609,878 | | | | — | | | | — | | | | 5,609,878 | |
| Money Market Securities | | | 8,666,906 | | | | — | | | | — | | | | 8,666,906 | |
| Total Investments | | $ | 180,481,995 | | | $ | — | | | $ | — | | | $ | 180,481,995 | |
| | | | | | | | | | | | | | | | |
| | | Valuation Inputs | |
| SMI Bond Fund | | Level 1 | | | Level 2 | | | Level 3 | | | Total | |
| Mutual Funds | | $ | 7,565,542 | | | $ | — | | | $ | — | | | $ | 7,565,542 | |
| Money Market Securities | | | 61,259 | | | | — | | | | — | | | | 61,259 | |
| Total Investments | | $ | 7,626,801 | | | $ | — | | | $ | — | | | $ | 7,626,801 | |
| | | | | | | | | | | | | | | | |
| | | Valuation Inputs | |
| SMI 50/40/10 Fund | | Level 1 | | | Level 2 | | | Level 3 | | | Total | |
| Exchange-Traded Funds | | $ | 10,586,720 | | | $ | — | | | $ | — | | | $ | 10,586,720 | |
| Mutual Funds | | | 7,945,733 | | | | — | | | | — | | | | 7,945,733 | |
| Money Market Securities | | | 100,076 | | | | — | | | | — | | | | 100,076 | |
| Total Investments | | $ | 18,632,529 | | | $ | — | | | $ | — | | | $ | 18,632,529 | |
The Funds did not hold any investments during the reporting period for which other significant unobservable inputs (Level 2) were used in determining fair value. The Funds did not hold any investments during the reporting period for which significant unobservable inputs (Level 3) were used in determining fair value; therefore, no reconciliation of Level 3 securities is included for this reporting period.
The Trust recognizes transfers between fair value hierarchy levels at the end of the reporting period. The transfers from Level 1 to Level 2 represent securities which were fair valued at the end of the period that were not at the beginning of the period. Transfers from Level 2 to Level 1 represent securities which were fair valued at the beginning of the period but not at October 31, 2016. There were no transfers between Level 1 and Level 2 of the fair value hierarchy for the fiscal year ended October 31, 2016.
49
SMI FUNDS
NOTES TO THE FINANCIAL STATEMENTS
October 31, 2016 – (Continued)
NOTE 4. DERIVATIVE TRANSACTIONS
The SMI Conservative Allocation Fund, SMI Dynamic Allocation Fund, SMI Bond Fund and SMI 50/40/10 Fund may obtain exposure to the fixed income market by investing in Underlying Funds which invest in credit default swap (“CDX”) contracts. These Underlying Funds may use CDX contracts as an additional avenue by which to bring value to the Underlying Funds. These Underlying Funds may use CDX contracts as an alternative to buying, selling, or holding certain securities in the fixed income market. The use of CDX contracts may provide a less expensive, more expedient, or more specifically focused way to invest than traditional fixed income securities would. These Underlying Funds may enter into single name CDX agreements to gain exposure to a particular company when it is more economically attractive to do so rather than purchasing traditional bonds. These Underlying Funds may also invest in CDX index products and options thereon that allow these Underlying Funds to gain broad market exposure but with less company-specific risk than single name CDX agreements.
These Underlying Funds enter into CDX contracts to gain exposure or to mitigate specific forms of credit risk. Swaps expose these Underlying Funds to counterparty risk (described below). An Underlying Fund could also suffer losses with respect to a swap agreement if the Underlying Fund is unable to terminate the agreement or reduce its exposure through offsetting transactions.
Many of the markets in which these Underlying Funds participate in credit default transactions are “over the counter” or “interdealer” markets. The participants in these markets are typically not subject to credit evaluation and regulatory oversight as are members of “exchange based markets”. When an Underlying Fund invests in CDX contracts, it is assuming a credit risk with regard to parties with whom it trades and also bears the risk of settlement default. These risks may differ materially from those associated with transactions effected on an exchange, which generally are backed by clearing organization guarantees, daily marking-to-market and settlement, and segregation and minimum capital requirements applicable to intermediaries. Transactions entered into directly between two counterparties generally do not benefit from such protections. This exposes these Underlying Funds to the risk that the counterparty will not settle a transaction in accordance with its terms and conditions because of a dispute over the terms of the contract (whether or not bona fide) or because of a credit or liquidity problem, thus causing these Underlying Funds to suffer a loss. To mitigate counterparty risk, these Underlying Funds will sometimes require the counterparty to post collateral to the Underlying Funds’ custodian to cover the exposure.
These Underlying Funds may also invest in credit default swap index products and in options on credit default swap index products. These instruments are designed to track segments of the credit default swap market and provide investors with exposure to specific “baskets” of issuers of bonds or loans. In general, the value of the credit default swap market provides investors with exposure to specific “baskets” of issuers of bonds or loans. In general, the value of the credit default swap index product will go up or down in response to changes in the perceived credit risk and default experience of the basket of issuers, instead of the exchange of the stream of payments for the payment of the notional amount (if a credit event occurs) that is the substance of a single name credit default swap. Such investments are subject to liquidity risks as well as counterparty and other risks associated with investments in credit default swaps discussed above.
50
SMI FUNDS
NOTES TO THE FINANCIAL STATEMENTS
October 31, 2016 – (Continued)
NOTE 5. FEES AND OTHER TRANSACTIONS WITH AFFILIATES
The Adviser, under the terms of the management agreement with respect to each Fund (each an “Agreement”), manages the Funds’ investments. As compensation for its management services, each Fund is obligated to pay the Adviser a fee based on each Fund’s average daily net assets as follows:
| | | | | | | | | | | | | | | |
Fund Assets | | SMI Fund
Management Fee | | SMI Conservative Allocation
Fund Management Fee | | SMI Dynamic Allocation
Fund Management Fee |
| $1 – $100 million | | | | 1.00% | | | | | 0.90% | | | | | 1.00% | |
| $100,000,001 – $250 million | | | | 1.00% | | | | | 0.80% | | | | | 1.00% | |
| $250,000,001 to $500 million | | | | 0.90% | | | | | 0.70% | | | | | 0.90% | |
| Over $500 million | | | | 0.80% | | | | | 0.60% | | | | | 0.80% | |
| Management fees earned | | | | $ 2,071,995 | | | | | $ 177,909 | | | | | $ 1,875,182 | |
Fees waived by Adviser | | | | — | | | | | (69,388) | | | | | — | |
| | |
Fund Assets | | SMI Bond Fund Management Fee |
| $1 – $99,999,999 | | 0.75% |
| $100 million to $250 million | | 0.70% |
| Over $250 million | | 0.65% |
| Management fees earned | | $ 58,715 |
| Fees waived by Adviser | | (104,545) |
| | |
Fund Assets | | SMI 50/40/10 Fund Management Fee |
| $1 – $250 million | | 1.00% |
| $250,000,001 to $500 million | | 0.90% |
| Over $500 million | | 0.80% |
| Management fees earned | | $ 168,695 |
| Fees waived by Adviser | | (52,177) |
The Adviser contractually has agreed to waive its management fee and reimburse certain operating expenses, but only to the extent necessary so that each Fund’s total annual operating expenses (excluding interest, taxes, brokerage commissions, other expenses which are capitalized in accordance with GAAP, extraordinary expenses, dividend expense on short sales, 12b-1 fees, and acquired fund fees and expenses) do not exceed 1.50% of the Fund’s average daily net assets with respect to the SMI Fund, 1.15% with respect to the SMI Conservative Allocation Fund, 1.45% with respect to the SMI Dynamic Allocation Fund, 0.85% with respect to the SMI Bond Fund, and 1.45% with respect to the SMI 50/40/10 Fund through February 28, 2017.
51
SMI FUNDS
NOTES TO THE FINANCIAL STATEMENTS
October 31, 2016 – (Continued)
NOTE 5. FEES AND OTHER TRANSACTIONS WITH AFFILIATES – (Continued)
Each fee waiver or expense reimbursement by the Adviser is subject to repayment by the applicable Fund within the three fiscal years following the fiscal year in which the fee waiver or expense reimbursement occurred, provided that such Fund is able to make the repayment without exceeding the expense limitation that is in effect at the time of the repayment or at the time of the fee waiver or expense reimbursement.
The amount subject to recoupment by the SMI Conservative Allocation Fund, SMI Bond Fund and SMI 50/40/10 Fund, pursuant to the aforementioned conditions, at October 31, 2016 is as follows:
| | | | | | | | | | | | |
Recoverable through
October 31, | | SMI Conservative
Allocation Fund | | | SMI Bond Fund | | | SMI 50/40/10 Fund | |
| 2017 | | $ | 50,773 | | | $ | — | | | $ | — | |
| 2018 | | | 88,520 | | | | 70,768 | | | | 54,878 | |
| 2019 | | | 69,388 | | | | 104,545 | | | | 52,177 | |
The Trust retains Ultimus Asset Services, LLC (“Ultimus”), formerly Huntington Asset Services, Inc. (“HASI”), to provide the Funds with administrative, accounting, transfer agent and compliance services including all regulatory reporting. Ultimus contractually agreed to waive 100% of its administration, fund accounting and transfer agency fees (excluding out-of-pocket expenses) for the SMI Bond Fund through April 30, 2016. Expenses incurred by the Funds for these services are allocated to the individual Funds based on each Fund’s relative net assets.
The officers and one trustee of the Trust are members of management and employees of Ultimus. Unified Financial Securities, LLC, (the “Distributor”) acts as the principal distributor of the Funds’ Shares. Effective at the close of business on December 31, 2015, Ultimus Fund Solutions, LLC, acquired HASI and the Distributor from Huntington Bancshares, Inc. (“HBI”). Prior to January 1, 2016, HASI and the Distributor were under common control by HBI. For the fiscal year ended October 31, 2016, fees for administrative, transfer agent, and fund accounting services, and reimbursement of out-of-pocket expenses amounts due to Ultimus at October 31, 2016, net of any waivers, were as follows:
| | | | | | | | | | | | | | | | | | | | |
| | | SMI Fund | | | SMI Conservative
Allocation Fund | | | SMI Dynamic
Allocation Fund | | | SMI Bond
Fund | | | SMI 50/40/10
Fund | |
Administration expenses | | $ | 47,344 | | | $ | 4,555 | | | $ | 43,162 | | | $ | 980 | | | $ | 3,857 | |
Transfer agent expenses | | | 35,512 | | | | 4,510 | | | | 15,315 | | | | 689 | | | | 5,289 | |
Fund accounting expenses | | | 27,048 | | | | 2,602 | | | | 24,656 | | | | 559 | | | | 2,200 | |
Payable to Ultimus | | | 9,093 | | | | 979 | | | | 6,937 | | | | 370 | | | | 1,009 | |
There were no payments made to the Distributor by the Funds for the fiscal year ended October 31, 2016. Certain officers of the Trust are officers of the Distributor and each such person may be deemed to be an affiliate of the Distributor.
52
SMI FUNDS
NOTES TO THE FINANCIAL STATEMENTS
October 31, 2016 – (Continued)
NOTE 6. INVESTMENTS
For the fiscal year ended October 31, 2016, purchases and sales of investment securities, other than short-term investments and short-term U.S. government obligations were as follows:
| | | | | | | | | | | | | | | | | | | | |
| | | SMI Fund | | | SMI Conservative
Allocation Fund | | | SMI Dynamic
Allocation Fund | | | SMI Bond
Fund | | | SMI 50/40/10
Fund | |
Purchases | | | | | | | | | | | | | | | | | | | | |
U.S. Government Obligations | | $ | — | | | $ | — | | | $ | — | | | $ | — | | | $ | — | |
Other | | | 271,934,704 | | | | 38,389,687 | | | | 259,511,776 | | | | 23,059,852 | | | | 29,039,328 | |
| | | | | |
Sales | | | | | | | | | | | | | | | | | | | | |
U.S. Government Obligations | | $ | — | | | $ | — | | | $ | — | | | $ | — | | | $ | — | |
Other | | | 294,347,991 | | | | 42,233,792 | | | | 278,747,754 | | | | 22,287,429 | | | | 23,480,728 | |
NOTE 7. LINE OF CREDIT
During the fiscal year ended October 31, 2016, the Trust, on behalf of the Funds, entered into in a short-term credit agreement (“Line of Credit”) with Huntington National Bank (“Huntington”), expiring on February 5, 2017. Under the terms of the agreement, each of the Funds may borrow up to the lesser of 10% of a Fund’s daily market value or $5 million at an interest rate of LIBOR plus 150 basis points. The purpose of the agreement is to meet temporary or emergency cash needs, including redemption requests that might otherwise require the untimely disposition of securities. Huntington receives an annual facility fee of 0.125% on $5 million as well as an additional annual fee of 0.125% on any unused portion of the credit facility, invoiced quarterly, for providing the Line of Credit. The Funds will not borrow money, except (a) from a bank, provided that immediately after such borrowing there is an asset coverage of 300% for all borrowings of a Fund; or (b) from a bank or other persons for temporary purposes only, provided that such temporary borrowings are in an amount not exceeding 5% of a Fund’s total assets at the time when the borrowing is made. This limitation does not preclude a Fund from entering into reverse repurchase transactions, provided that the Fund has asset coverage of 300% for all borrowings and repurchase commitments of the Fund pursuant to reverse repurchase transactions. To the extent that the line of credit is utilized, it will be collateralized by securities in the Funds’ portfolios.
53
SMI FUNDS
NOTES TO THE FINANCIAL STATEMENTS
October 31, 2016 – (Continued)
NOTE 7. LINE OF CREDIT – (Continued)
As of October 31, 2016, the Funds had no outstanding borrowings under this Line of Credit.
| | | | | | | | | | | | | | | | | | | | |
| Fund | | Average
Daily Loan
Balance(a) | | | Weighted
Average
Interest
Rate(a) | | | Number of Days
Outstanding(b) | | | Interest
Expense
Accrued | | | Maximum
Loan
Outstanding | |
| Sound Mind Investing Fund | | $ | 829,167 | | | | 2.00 | % | | | 6 | | | $ | 53 | | | $ | 3,500,000 | |
| SMI Conservative Allocation Fund | | | 154,250 | | | | 1.87 | % | | | 60 | | | | 649 | | | | 750,000 | |
| SMI Dynamic Allocation Fund | | | 632,875 | | | | 1.80 | % | | | 40 | | | | 1,266 | | | | 2,150,000 | |
| SMI Bond Fund | | | 123,400 | | | | 2.00 | % | | | 25 | | | | 205 | | | | 400,000 | |
| SMI 50/40/10 Fund | | | 221,429 | | | | 1.97 | % | | | 7 | | | | 85 | | | | 450,000 | |
| (a) | Averages based on the number of days outstanding. |
| (b) | Number of Days Outstanding represents the total days during the fiscal year ended October 31, 2016, that a Fund utilized the Line of Credit. |
NOTE 8. ESTIMATES
The preparation of financial statements in conformity with GAAP requires management to make estimates and assumptions that affect the reported amounts of assets and liabilities and disclosure of contingent assets and liabilities at the date of the financial statements and the reported amounts of increases and decreases in net assets from operations during the reporting period. Actual results could differ from those estimates.
NOTE 9. BENEFICIAL OWNERSHIP
The beneficial ownership, either directly or indirectly, of more than 25% of the voting securities of a fund creates a presumption of control of the fund, under Section 2(a)(9) of the Investment Company Act of 1940. At October 31, 2016, National Financial Services Corporation (“NFS”) for the benefit of others, held 25%, 29%, 37% and 49% of the SMI Fund, SMI Conservative Allocation Fund, SMI Dynamic Allocation Fund and SMI Bond Fund, respectively. It is not known whether NFS or any of the underlying beneficial owners owned or controlled 25% or more of the voting securities of the Funds.
54
SMI FUNDS
NOTES TO THE FINANCIAL STATEMENTS
October 31, 2016 – (Continued)
NOTE 10. FEDERAL TAX INFORMATION
At October 31, 2016, the net unrealized appreciation (depreciation) of investments for tax purposes was as follows:
| | | | | | | | | | | | | | | | | | | | |
| | | SMI Fund | | | SMI Conserative
Allocation Fund | | | SMI Dynamic
Allocation Fund | | | SMI Bond
Fund | | | SMI 50/40/10
Fund | |
Gross appreciation | | $ | 6,632,175 | | | $ | 260,922 | | | $ | 2,645,331 | | | $ | 51,865 | | | $ | 455,382 | |
Gross (depreciation) | | | (1,988,772 | ) | | | (174,518 | ) | | | (2,560,218 | ) | | | — | | | | (203,189 | ) |
| | | | | | | | | | | | | | | | | | | | |
Net appreciation (depreciation) on investments | | $ | 4,643,403 | | | $ | 86,404 | | | $ | 85,113 | | | $ | 51,865 | | | $ | 252,193 | |
| | | | | | | | | | | | | | | | | | | | |
Tax cost of investments | | $ | 190,109,383 | | | $ | 17,900,402 | | | $ | 180,396,882 | | | $ | 7,574,936 | | | $ | 18,380,336 | |
| | | | | | | | | | | | | | | | | | | | |
The tax characterization of distributions for the fiscal years ended October 31, 2016 and October 31, 2015, were as follows:
| | | | | | | | | | | | | | | | | | | | | | | | |
| | | SMI Fund | | | SMI Conservative
Allocation Fund | | | SMI Dynamic
Allocation Fund | |
| | | 2016 | | | 2015 | | | 2016 | | | 2015 | | | 2016 | | | 2015 | |
Distributions paid from:* | | | | | | | | | | | | | | | | | | | | | | | | |
Ordinary income | | $ | — | | | $ | 1,347,114 | | | $ | 193,531 | | | $ | 285,314 | | | $ | 2,361,609 | | | $ | 3,044,706 | |
Long-term capital gain | | | 28,684,023 | | | | 43,665,598 | | | | 462,938 | | | | 3,408,064 | | | | — | | | | 1,173,735 | |
| | | | | | | | | | | | | | | | | | | | | | | | |
Total taxable distributions | | $ | 28,684,023 | | | $ | 45,012,712 | | | $ | 656,469 | | | $ | 3,693,378 | | | $ | 2,361,609 | | | $ | 4,218,441 | |
| | | | | | | | | | | | | | | | | | | | | | | | |
| | | | | | | | | | | | | | | | |
| | | SMI Bond Fund | | | SMI 50/40/10 Fund | |
| | | 2016 | | | 2015 | | | 2016 | | | 2015 | |
Distributions paid from:* | | | | | | | | | | | | | | | | |
Ordinary income | | $ | 152,057 | | | $ | 2,420 | | | $ | 69,379 | | | $ | — | |
| | | | | | | | | | | | | | | | |
Total taxable distributions | | $ | 152,057 | | | $ | 2,420 | | | $ | 69,379 | | | $ | — | |
| | | | | | | | | | | | | | | | |
Tax return of capital | | | 295 | | | | 540 | | | | 22,056 | | | | — | |
| | | | | | | | | | | | | | | | |
Total distributions paid | | $ | 152,352 | | | $ | 2,960 | | | $ | 91,435 | | | $ | — | |
| | | | | | | | | | | | | | | | |
SMI Bond Fund: On November 30, 2016, the SMI Bond Fund paid an income distribution of $0.003225 per share, to shareholders of record on November 29, 2016.
| * | For federal income tax purposes, distributions of short-term capital gains are treated as ordinary income distributions. |
55
SMI FUNDS
NOTES TO THE FINANCIAL STATEMENTS
October 31, 2016 – (Continued)
NOTE 10. FEDERAL TAX INFORMATION – (Continued)
At October 31, 2016, the Funds’ most recent fiscal year end, the components of distributable earnings (accumulated losses) on a tax basis were as follows:
| | | | | | | | | | | | |
| | | SMI Fund | | | SMI Conservative
Allocation Fund | | | SMI Dynamic
Allocation Fund | |
Accumulated undistributed ordinary income | | $ | — | | | $ | 92,021 | | | $ | 213,474 | |
Accumulated undistributed long-term capital gains | | | — | | | | — | | | | — | |
Accumulated capital and other losses | | | (3,648,465 | ) | | | (505,187 | ) | | | (5,050,360 | ) |
Unrealized appreciation (depreciation) | | | 4,643,403 | | | | 86,404 | | | | 85,113 | |
| | | | | | | | | | | | |
| | | |
| | $ | 994,938 | | | $ | (326,762 | ) | | $ | (4,751,773 | ) |
| | | | | | | | | | | | |
| | | | | | | | |
| | | SMI Bond
Fund | | | SMI 50/40/10
Fund | |
Accumulated capital and other losses | | $ | (13,344 | ) | | $ | (863,687 | ) |
Unrealized appreciation (depreciation) | | | 51,865 | | | | 252,193 | |
| | | | | | | | |
| | $ | 38,521 | | | $ | (611,494 | ) |
| | | | | | | | |
At October 31, 2016, the difference between book basis and tax basis unrealized appreciation (depreciation) is attributable to the tax deferral of losses on wash sales.
As of October 31, 2016, the following funds had net capital loss carryforwards which are available to offset future net capital gains, if any:
| | | | | | | | | | | | | | | | | | | | | | | | |
| | | SMI Fund | | | SMI Conservative
Allocation Fund | | | SMI Dynamic
Allocation Fund | |
| | | Short-Term | | | Long-Term | | | Short-Term | | | Long-Term | | | Short-Term | | | Long-Term | |
Non-Expiring | | $ | 3,359,622 | | | $ | — | | | $ | 505,187 | | | $ | — | | | $ | 4,626,459 | | | $ | 423,901 | |
| | | | | | | | | | | | | | | | | | | | | | | | |
| | $ | 3,359,622 | | | $ | — | | | $ | 505,187 | | | $ | — | | | $ | 4,626,459 | | | $ | 423,901 | |
| | | | | | | | | | | | | | | | | | | | | | | | |
| | | | | | | | | | | | | | | | |
| | | SMI Bond Fund | | | SMI 50/40/10 Fund | |
| | | Short-Term | | | Long-Term | | | Short-Term | | | Long-Term | |
Non-Expiring | | $ | 13,344 | | | $ | — | | | $ | 853,046 | | | $ | — | |
| | | | | | | | | | | | | | | | |
| | $ | 13,344 | | | $ | — | | | $ | 853,046 | | | $ | — | |
| | | | | | | | | | | | | | | | |
For the tax year ended October 31, 2016, the following funds deferred late year ordinary losses of:
| | | | |
| | | Qualified
Late Year Ordinary
Losses | |
SMI Fund | | $ | 288,843 | |
SMI 50/40/10 Fund | | | 10,640 | |
56
SMI FUNDS
NOTES TO THE FINANCIAL STATEMENTS
October 31, 2016 – (Continued)
NOTE 11. COMMITMENTS AND CONTIGENCIES
The Funds indemnify their officers and trustees for certain liabilities that may arise from performance of their duties to the Funds. Additionally, in the normal course of business, the Funds enter into contracts that contain a variety of representations and warranties which provide general indemnifications. The Funds’ maximum exposure under these arrangements is unknown, as this would involve future claims that may be made against the Funds that have not yet occurred.
NOTE 12. SUBSEQUENT EVENT
Management of the Funds has evaluated the need for disclosures resulting from subsequent events through the date these financial statements were issued. Based upon this evaluation, management has determined there were no items requiring adjustment of the financial statements or additional disclosure.
57
REPORT OF INDEPENDENT REGISTERED
PUBLIC ACCOUNTING FIRM
To the Shareholders of Sound Mind Investing Fund, SMI Conservative Allocation Fund, SMI Dynamic Allocation Fund, SMI Bond Fund, and SMI 50/40/10 Fund and Board of Trustees of Valued Advisers Trust
We have audited the accompanying statements of assets and liabilities, including the schedules of investments, of Sound Mind Investing Fund, SMI Conservative Allocation Fund, SMI Dynamic Allocation Fund, SMI Bond Fund, and SMI 50/40/10 Fund (collectively referred to as the “Funds”), each a series of Valued Advisers Trust, as of October 31, 2016, and the related statements of operations for the year then ended, the statements of changes in net assets for each of the two periods in the period then ended, and the financial highlights for each of the periods indicated in the period then ended. These financial statements and financial highlights are the responsibility of the Funds’ management. Our responsibility is to express an opinion on these financial statements and financial highlights based on our audits.
We conducted our audits in accordance with the standards of the Public Company Accounting Oversight Board (United States). Those standards require that we plan and perform the audit to obtain reasonable assurance about whether the financial statements and financial highlights are free of material misstatement. An audit includes examining, on a test basis, evidence supporting the amounts and disclosures in the financial statements. Our procedures included confirmation of securities owned as of October 31, 2016 by correspondence with the custodian and brokers. An audit also includes assessing the accounting principles used and significant estimates made by management, as well as evaluating the overall financial statement presentation. We believe that our audits provide a reasonable basis for our opinion.
In our opinion, the financial statements and financial highlights referred to above present fairly, in all material respects, the financial positions of Sound Mind Investing Fund, SMI Conservative Allocation Fund, SMI Dynamic Allocation Fund, SMI Bond Fund, and SMI 50/40/10 Fund as of October 31, 2016, the results of their operations for the year then ended, the changes in their net assets for each of the two periods in the period then ended, and their financial highlights for each of the periods indicated in the period then ended, in conformity with accounting principles generally accepted in the United States of America.
COHEN & COMPANY, LTD.
Cleveland, Ohio
December 23, 2016
58
SUMMARY OF FUND EXPENSES – (Unaudited)
As a shareholder of one of the Funds, you incur two types of costs: (1) transaction costs (such as short-term redemption fees); and (2) ongoing costs, including management fees and other Fund expenses. This example is intended to help you understand your ongoing costs (in dollars) of investing in the Funds and to compare these costs with the ongoing costs of investing in other mutual funds.
Each Fund’s example is based on an investment of $1,000 invested at the beginning of the period and held for the entire period from May 1, 2016 through October 31, 2016.
Actual Expenses
The first line of the table provides information about actual account values and actual expenses. You may use the information in this line, together with the amount you invested, to estimate the expenses that you paid over the period. Simply divide your account value by $1,000 (for example, an $8,600 account value divided by $1,000 = 8.60), then multiply the result by the number in the first line under the heading “Expenses Paid During Period” to estimate the expenses you paid on your account during this period.
Hypothetical Example for Comparison Purposes
The second line of the table provides information about hypothetical account values and hypothetical expenses based on each Fund’s actual expense ratio and an assumed rate of return of 5% per year before expenses, which is not the Fund’s actual return. The hypothetical account values and expenses may not be used to estimate the actual ending account balance or expenses you paid for the period. You may use this information to compare the ongoing costs of investing in the Funds and other funds. To do so, compare this 5% hypothetical example with the 5% hypothetical examples that appear in the shareholder reports of the other funds.
Expenses shown are meant to highlight your ongoing costs only and do not reflect any transactional costs such as the fee imposed on short-term redemptions. Therefore, the second line of the table is useful in comparing ongoing costs only and will not help you determine the relative costs of owning different funds. In addition, if these transaction costs were included, your costs would have been higher.
| | | | | | | | | | | | |
Sound Mind
Investing Fund | | Beginning
Account Value
May 1, 2016 | | | Ending
Account Value
October 31, 2016 | | | Expenses Paid
During Period (a) | |
Actual | | $ | 1,000.00 | | | $ | 1,026.90 | | | $ | 5.89 | |
Hypothetical (b) | | $ | 1,000.00 | | | $ | 1,019.33 | | | $ | 5.86 | |
| (a) | Expenses are equal to the Fund’s annualized expense ratio of 1.16%, multiplied by the average account value over the period, multiplied by 184/366 (to reflect the partial year period). |
| (b) | Assumes a 5% return before expenses. |
59
SUMMARY OF FUND EXPENSES – (Unaudited), (Continued)
| | | | | | | | | | | | |
SMI
Conservative Allocation
Fund | | Beginning
Account Value
May 1, 2016 | | | Ending
Account Value
October 31, 2016 | | | Expenses Paid
During Period (a) | |
Actual | | $ | 1,000.00 | | | $ | 1,015.00 | | | $ | 5.85 | |
Hypothetical (b) | | $ | 1,000.00 | | | $ | 1,019.33 | | | $ | 5.87 | |
| (a) | Expenses are equal to the Fund’s annualized expense ratio of 1.16%, multiplied by the average account value over the period, multiplied by 184/366 (to reflect the partial year period). |
| (b) | Assumes a 5% return before expenses. |
| | | | | | | | | | | | |
SMI
Dynamic Allocation
Fund | | Beginning
Account Value
May 1, 2016 | | | Ending
Account Value
October 31, 2016 | | | Expenses Paid
During Period (a) | |
Actual | | $ | 1,000.00 | | | $ | 1,012.00 | | | $ | 5.77 | |
Hypothetical (b) | | $ | 1,000.00 | | | $ | 1,019.40 | | | $ | 5.80 | |
| (a) | Expenses are equal to the Fund’s annualized expense ratio of 1.14%, multiplied by the average account value over the period, multiplied by 184/366 (to reflect the partial year period). |
| (b) | Assumes a 5% return before expenses. |
| | | | | | | | | | | | |
SMI Bond
Fund | | Beginning
Account Value
May 1, 2016 | | | Ending
Account Value
October 31, 2016 | | | Expenses Paid
During Period (a) | |
Actual | | $ | 1,000.00 | | | $ | 1,020.20 | | | $ | 4.36 | |
Hypothetical (b) | | $ | 1,000.00 | | | $ | 1,020.82 | | | $ | 4.36 | |
| (a) | Expenses are equal to the Fund’s annualized expense ratio of 0.86%, multiplied by the average account value over the period, multiplied by 184/366 (to reflect the partial year period). |
| (b) | Assumes a 5% return before expenses. |
| | | | | | | | | | | | |
SMI
50/40/10
Fund | | Beginning
Account Value
May 1, 2016 | | | Ending
Account Value
October 31, 2016 | | | Expenses Paid
During Period (a) | |
Actual | | $ | 1,000.00 | | | $ | 1,024.30 | | | $ | 7.36 | |
Hypothetical (b) | | $ | 1,000.00 | | | $ | 1,017.87 | | | $ | 7.34 | |
| (a) | Expenses are equal to the Fund’s annualized expense ratio of 1.45%, multiplied by the average account value over the period, multiplied by 184/366 (to reflect the partial year period). |
| (b) | Assumes a 5% return before expenses. |
60
ADDITIONAL FEDERAL INCOME TAX INFORMATION
(Unaudited)
The Form 1099-DIV you receive in January 2017 will show the tax status of all distributions paid to your account in calendar year 2016. Shareholders are advised to consult their own tax adviser with respect to the tax consequences of their investment in a Fund. As required by the Internal Revenue Code and/or regulations, shareholders must be notified regarding the status of qualified dividend income for individuals and the dividends received deduction for corporations.
Qualified Dividend Income. The SMI Conservative Allocation Fund, SMI Dynamic Allocation Fund and SMI 50/40/10 Fund designates approximately 27%, 56% and 100%, respectively, or up to the maximum amount of such dividends allowable pursuant to the Internal Revenue Code, as qualified dividend income eligible for the reduced tax rate of 15%.
Dividends Received Deduction. Corporate shareholders are generally entitled to take the dividends received deduction on the portion of the Fund’s dividend distribution that qualifies under tax law. For the SMI Conservative Allocation, SMI Dynamic Allocation and SMI 50/40/10 Fund’s calendar year 2016 ordinary income dividends, 40%, 42% and 100%, respectively, qualifies for the corporate dividends received deduction.
For the year ended October 31, 2016, the SMI Fund and SMI Conservative Allocation Fund designated $28,685,304, $462,938, respectively, as 20% long-term capital gain distributions.
61
TRUSTEES AND OFFICERS (Unaudited)
The Board of Trustees supervises the business activities of the Trust. Each Trustee serves as a trustee until termination of the Trust unless the Trustee dies, resigns, retires or is removed.
The following table provides information regarding each of the Independent Trustees.
| | | | |
Name, Address*, (Age),
Position with Trust**,
Term of Position with Trust | | Principal Occupation
During Past 5 Years | | Other Directorships |
Ira Cohen, 57,
Independent Trustee,
June 2010 to present. | | Current: Independent financial services consultant since February 2005; Executive Vice President of Asset Management Services, Recognos Financial (since August 2015). | | Trustee and Audit Committee Chairman, Griffin Institutional Real Estate Access Fund, since May 2014. Trustee, Angel Oak Funds Trust, since October 2014. |
| Andrea N. Mullins, 49, Independent Trustee, December 2013 to present. | | Current: Private investor; Independent Contractor, Seabridge Wealth Management, LLC (since April 2014). | | None. |
| * | The address for each trustee and officer is 225 Pictoria Drive, Suite 450, Cincinnati, OH 45246. |
| ** | As of the date of this report, the Trust consists of 14 series. |
The following table provides information regarding the Trustee who is considered an “interested person” of the Trust, as that term is defined under the 1940 Act. Based on the experience of the Trustee, the Trust concluded that the individual described below is qualified to serve as a Trustee.
| | | | |
Name, Address*, (Age),
Position with Trust**,
Term of Position with Trust | | Principal Occupation
During Past 5 Years | | Other
Directorships |
R. Jeffrey Young, 52,
Trustee and Chairman,
June 2010 to present. | | Current: Vice President and Director of Relationship Management, Ultimus Fund Solutions, LLC (since December 2015); President, Unified Financial Securities, LLC (since July 2015). Previous: President, Huntington Asset Services, Inc. (n/k/a Ultimus Asset Services, LLC) (April 2015 to December 2015), Director (May 2014 to December 2015), Senior Vice President (January 2010 to April 2015); Director, Unified Financial Securities, Inc. (n/k/a Unified Financial Securities, LLC) (May 2014 to December 2015); Chief Executive Officer, Huntington Funds (February 2010 to March 2015); Chief Executive Officer, Huntington Strategy Shares (November 2010 to March 2015); President and Chief Executive Officer, Dreman Contrarian Funds (March 2011 to February 2013). | | Trustee and Chairman, Capitol Series Trust, since September 2013. |
| * | The address for each trustee and officer is 225 Pictoria Drive, Suite 450, Cincinnati, OH 45246. |
| ** | As of the date of this report, the Trust consists of 14 series. |
62
TRUSTEES AND OFFICERS – (Unaudited), (Continued)
The following table provides information regarding the Officers of the Trust:
| | | | |
Name, Address*, (Age),
Position with Trust,**
Term of Position with Trust | | Principal Occupation
During Past 5 Years | | Other Directorships |
R. Jeffrey Young, 52,
Trustee and Chairman,
June 2010 to present;
Principal Executive Officer and President, Valued Advisers Trust since February 2010. | | Current: Vice President and Director of Relationship Management, Ultimus Fund Solutions, LLC (since December 2015); President, Unified Financial Securities, LLC (since July 2015). Previous: President, Huntington Asset Services, Inc. (n/k/a Ultimus Asset Services, LLC) (April 2015 to December 2015), Director (May 2014 to December 2015), Senior Vice President (January 2010 to April 2015); Director, Unified Financial Securities, Inc. (n/k/a Unified Financial Securities, LLC) (May 2014 to December 2015); Chief Executive Officer, Huntington Funds (February 2010 to March 2015); Chief Executive Officer, Huntington Strategy Shares (November 2010 to March 2015); President and Chief Executive Officer, Dreman Contrarian Funds (March 2011 to February 2013). | | Trustee and Chairman, Capitol Series Trust, since September 2013. |
John C. Swhear, 55,
Chief Compliance Officer,
AML Officer and Vice President, August 2008 to present. | | Current: Vice President, Unified Series Trust (since January 2016); Assistant Vice President and Associate Director of Compliance, Ultimus Fund Solutions, LLC (since December 2015); Chief Compliance Officer, Unified Financial Securities, LLC (since May 2007); Chief Compliance Officer and AML Officer, Capitol Series Trust (since September 2013). Previous: Vice President of Legal Administration and Compliance, Huntington Asset Services, Inc. (n/k/a Ultimus Asset Services, LLC) (April 2007 to December 2015), Director (May 2014 to December 2015); Director, Unified Financial Securities, Inc. (n/k/a Unified Financial Securities, LLC) (May 2014 to December 2015); President , Unified Series Trust (March 2012 to January 2016), Senior Vice President (May 2007 to March 2012); Secretary , Huntington Funds (April 2010 to February 2012). | | None. |
63
TRUSTEES AND OFFICERS – (Unaudited), (Continued)
| | | | |
Name, Address*, (Age),
Position with Trust,**
Term of Position with Trust | | Principal Occupation
During Past 5 Years | | Other Directorships |
Carol J. Highsmith, 52,
Vice President, August 2008 to present; Secretary,
March 2014 to present | | Current: Assistant Vice President, Ultimus Fund Solutions, LLC (since December 2015). Previous: Secretary, Cross Shore Discovery Fund (May 2014 to February 2016); Employed in various positions with Huntington Asset Services, Inc. (n/k/a Ultimus Asset Services, LLC) (November 1994 to December 2015), most recently Vice President of Legal Administration (2005 to December 2015). | | None. |
Matthew J. Miller, 40,
Vice President, December 2011 to present. | | Current: Assistant Vice President, Relationship Management, Ultimus Fund Solutions, LLC (since December 2015); President and Chief Executive Officer, Capitol Series Trust (since September 2013). Previous: Employed in various positions with Huntington Asset Services, Inc. (n/k/a Ultimus Asset Services, LLC) (since July 1998), most recently Vice President of Relationship Management (2005 to December 2015); Vice President, Huntington Funds (February 2010 to April 2015). | | None. |
Bryan W. Ashmus, 43,
Principal Financial Officer and Treasurer, December 2013 to present. | | Current: Vice President and Director of Financial Administration, Ultimus Fund Solutions, LLC (since December 2015); Chief Financial Officer and Treasurer, Cross Shore Discovery Fund (since June 2016). Previous: Vice President and Manager of Financial Administration, Huntington Asset Services, Inc. (n/k/a Ultimus Asset Services, LLC) (September 2013 to December 2015); Chief Financial Officer and Treasurer, Huntington Strategy Shares and Huntington Funds Trust (November 2013 to April 2016); Vice President, Fund Administration, Citi Fund Services Ohio, Inc. (from May 2005 to September 2013). | | None. |
| * | The address for each trustee and officer is 225 Pictoria Drive, Suite 450, Cincinnati, OH 45246. |
| ** | As of the date of this report, the Trust consists of 14 series. |
64
OTHER INFORMATION
The Funds’ Statement of Additional Information (“SAI”) includes additional information about the trustees and is available without charge, upon request. You may call toll-free at (877) 764-3863 to request a copy of the SAI or to make shareholder inquiries.
65
VALUED ADVISERS TRUST
PRIVACY POLICY
The following is a description of the policies of the Valued Advisers Trust (the “Trust”) regarding disclosure of nonpublic personal information that shareholders provide to a series of the Trust (each, a “Fund”) or that each Fund collects from other sources. In the event that a shareholder holds shares of a Fund through a broker-dealer or other financial intermediary, the privacy policy of the financial intermediary would govern how shareholder nonpublic personal information would be shared with nonaffiliated third parties.
Categories of Information a Fund May Collect. A Fund may collect the following nonpublic personal information about its shareholders:
| | • | | Information each Fund receives from a shareholder on applications or other forms, correspondence, or conversations (such as the shareholder’s name, address, phone number, social security number, and date of birth); and |
| | • | | Information about the shareholder’s transactions with each Fund, its affiliates, or others (such as the shareholder’s account number and balance, payment history, cost basis information, and other financial information). |
Categories of Information a Fund May Disclose. A Fund may not disclose any nonpublic personal information about its current or former shareholders to unaffiliated third parties, except as required or permitted by law. A Fund is permitted by law to disclose all of the information it collects, as described above, to its service providers (such as the Fund’s custodian, administrator, transfer agent, accountant and legal counsel) to process shareholder transactions and otherwise provide services to the shareholder.
Confidentiality and Security. Each Fund shall restrict access to shareholder nonpublic personal information to those persons who require such information to provide products or services to the shareholder. Each Fund shall maintain physical, electronic, and procedural safeguards that comply with federal standards to guard shareholder nonpublic personal information.
Disposal of Information. The Funds, through their transfer agent, have taken steps to reasonably ensure that the privacy of a shareholder’s nonpublic personal information is maintained at all times, including in connection with the disposal of information that is no longer required to be maintained by the Funds. Such steps shall include, whenever possible, shredding paper documents and records prior to disposal, requiring off-site storage vendors to shred documents maintained in such locations prior to disposal, and erasing and/or obliterating any data contained on electronic media in such a manner that the information can no longer be read or reconstructed.
66
PROXY VOTING
A description of the policies and procedures that the Funds use to determine how to vote proxies relating to portfolio securities and information regarding how the Funds voted those proxies during the most recent twelve month period ended June 30 is available without charge upon request by (1) calling the Funds at (877) 764-3863 and (2) from Fund documents filed with the Securities and Exchange Commission (“SEC”) on the SEC’s website at www.sec.gov.
TRUSTEES
R. Jeffrey Young, Chairman
Ira P. Cohen
Andrea N. Mullins
OFFICERS
R. Jeffrey Young, Principal Executive
Officer and President
Bryan W. Ashmus, Principal Financial
Officer and Treasurer
John C. Swhear, Chief Compliance Officer,
AML Officer and Vice President
Carol J. Highsmith, Vice President and Secretary
Matthew J. Miller, Vice President
INVESTMENT ADVISER
SMI Advisory Services, LLC
P.O. Box 547
Columbus, IN 47202
DISTRIBUTOR
Unified Financial Securities, LLC
9465 Counselors Row, Suite 200
Indianapolis, IN 46240
INDEPENDENT REGISTERED PUBLIC ACCOUNTING FIRM
Cohen & Company, Ltd.
1350 Euclid Avenue, Suite 800
Cleveland, OH 44115
LEGAL COUNSEL
The Law Offices of John H. Lively &
Associates, Inc.
A member firm of The 1940 Act Law GroupTM
11300 Tomahawk Creek Pkwy, Suite 310
Leawood, KS 66211
CUSTODIAN
Huntington National Bank
41 South High Street
Columbus, OH 43215
ADMINISTRATOR, TRANSFER AGENT AND FUND ACCOUNTANT
Ultimus Asset Services, LLC
225 Pictoria Drive Suite 450
Cincinnati, OH 45246
This report is intended only for the information of shareholders or those who have received the Funds’ prospectus which contains information about each Fund’s management fee and expenses. Please read the prospectus carefully before investing.
Distributed by Unified Financial Securities, LLC
Member FINRA/SIPC
67

SOUND MIND
INVESTING FUND (SMIFX)
SMI CONSERVATIVE ALLOCATION FUND (SMILX)
SMI DYNAMIC ALLOCATION FUND (SMIDX)
SMI BOND FUND (SMIUX)
SMI 50/40/10 FUND (SMIRX)
|
| |
| ANNUAL REPORT |
| |
| OCTOBER 31, 2016 |
Fund Adviser:
SMI Advisory Services, LLC
P.O. BOX 547
Columbus, IN 47202
Toll Free (877) SMI-Fund
www.smifund.com

Annual Report
October 31, 2016
Fund Adviser:
Kovitz Investment Group Partners, LLC
115 South LaSalle Street, 27th Floor
Chicago, IL 60603
Toll Free (888) 695-3729
MANAGEMENT’S DISCUSSION OF FUND PERFORMANCE – (Unaudited)
Kovitz Investment Group, LLC launched the Green Owl Intrinsic Value Fund (the “Fund”) with the goal of seeking long-term capital appreciation through high risk-adjusted returns. Relying on a fundamental, research-driven process, the Fund strives to build a diversified portfolio of equity investments through the purchase of competitively advantaged and financially strong companies at prices substantially less than our estimate of their intrinsic values.
As long-term investors, our research process emphasizes the appraisal of factors that we believe matter most to a business’s long-term success. These include the quality of the business, the strength of the balance sheet, the predictability of the cash flows, and the ability of the management team to allocate capital intelligently and judiciously. We believe these attributes are the most reliable predictors of a company’s ability to maximize intrinsic value on a per share basis.
Broadly speaking, our strategy is to own a relatively concentrated portfolio of the very best ideas we can find – essentially, stocks we believe to be undervalued with enduring competitive advantages that can generate sustainable free cash flow and have strong balance sheets. We are agnostic as to the timing, but believe that our disciplined approach to security selection along with the patience to ride out, and take advantage of, market volatility will ultimately lead to more than satisfactory results.
Overall, we remain optimistic about the long-term outlook for the Fund, where the valuation of its holdings, in aggregate, is significantly lower than that of the overall market. The wide valuation disparities that characterize the current market offer significant opportunities for active management. We believe that patience, persistence, and a long-term investment horizon are essential to long-term investment success. We encourage our shareholders to take a similar view.
Market and Performance Summary
For the fiscal year ending October 31, 2016, the Fund returned 3.65%. In comparison, our benchmark, the S&P 500 Index, gained 4.51% during the same period. Since inception on December 28, 2011, the Fund has compounded at a rate of 11.53% annually, versus 14.00% annually for the S&P 500.
While slightly underperforming our benchmark for the year, we began to see a shift in investor sentiment towards the latter half of the fiscal year. Up until this time, the combination of modest U.S. economic growth and low interest rates caused investors to search for yield in the equity markets to the exclusion of almost any other attribute. As a consequence, stocks perceived as defensive (e.g. Consumer Staples/Utilities) with “bond-like” characteristics (i.e. attractive dividend yields) outperformed most any business with even a whiff of cyclicality. As history has shown, whenever investors clamor for certain stocks with certain attractive near-term prospects to the exclusion of price, the euphoria eventually outstrips the reality. Over the summer, we urged caution and suggested that there’s danger in thinking you’re defensively positioned when you overpay. While correctly assessing the range of a company’s future growth prospects is essential for any investor to be successful, we think the price paid for that prospective growth is the more important driver of long-term performance. Said differently, at one price, a potential investment may offer substantial investment merit. At a higher price, the same investment may offer only heartache.
As the year progressed and interest rates started to move higher (unthinkable only a few months before), excitement over supposed safe stocks appeared to wane. What had been the best performing sectors became the weakest while supposedly riskier cyclical sectors became some of the best performing. To us, this turn in performance came down to the fact that valuation – what a business sells for in relation to its intrinsic value – finally was relevant again. In other words, more cheaply valued stocks finally did better than more richly valued ones. At long-last, valuation parameters mattered and acted as a catalyst for price movement just like it has done for most of our investing careers.
1
We have long argued that stock price movements over the last few years were not driven by the valuation of the underlying businesses and did not necessarily mirror the fundamentals or economic prospects of the underlying businesses. Price momentum, where expensive stocks continued to get more expensive and cheap stocks seemed to get ever cheaper, played a bigger role in determining stock price movements than valuation. Investors had also appeared to focus way too much on how much the company decided to pay out to shareholders in the form of a dividend. A dividend payment is just a capital allocation decision. We believe the intrinsic value of a company’s stock should be based solely on the amount of cash it generates, not on whether management chooses to allocate a larger or smaller portion of that cash towards a dividend. We have felt that this type of investment landscape was unsustainable and we may now be at an inflection point where math and economics will finally trump momentum and the chase for yield.
In the meantime, our job is to continue to identify companies that are unappreciated by the market and whose shares are undervalued. A contrarian approach – avoiding recently expensive securities and favoring recently cheap securities – may be uncomfortable in the short run, but it can be a sound way to generate outperformance in the long run. Our job is to endure the emotional discomfort of deviating from the crowd, which we believe sets the stage for our style of investing to continue to work over time. The bedrock of our philosophy is that price matters. Our clients would be poorly served if we chose to simply pile into whatever shares had appreciated the most over recent years, ignoring price, valuation, and underlying fundamentals. We believe this is a time when paying calm, careful, and deliberate attention to the changing investment landscape can have a tremendous payoff.
Performance Attribution
Key Contributors to Relative Results
The individual positions that contributed the most to performance during the year were: Quanta Services (PWR), Jacobs Engineering Group (JEC), CBS (CBS), Halliburton (HAL), and AON (AON).
The Fund’s holdings in the Industrial sector (up 21% compared to up 7% for the S&P 500 sector) contributed significantly to results. Quanta (up 43%) and Jacobs Engineering (up 29%) were particularly strong.
The Fund’s average underweight position in the Healthcare sector (1% versus 15%) contributed to results as Healthcare was one of three sectors with negative returns over the fiscal year.
Key Detractors to Relative Results
The individual positions that detracted the most from performance during the year were: Bed Bath & Beyond (BBBY), McKesson (MCK), Noble (NE), CarMax (KMX), and CVS Health (CVS).
The Fund’s average overweight position (19% versus 13% for the S&P 500) and holdings in the Consumer Discretionary sector (down 3% versus down 2%) detracted from results. Bed Bath & Beyond (down 14%) was particularly weak.
The Fund’s average underweight position (10% versus 21% for the S&P 500) and holdings in the Information Technology sector (up 8% versus up 11%) detracted from results.
Portfolio Activity
Portfolio activity during the year included the following:
Initiated positions in the following 4 companies; AMERCO (UHAL), Robert Half International (RHI), McKesson, and CBRE Group (CBG).
2
Increased position sizes in the following 8 companies; American Airlines Group (AAL), American Express (AXP), Apple (AAPL), Bank of America (BAC), CBS Corp., CVS Health, Harley-Davidson (HOG), and Leucadia National (LUK).
Exited positions in the following 7 companies; Accenture (ACN), American International Group (AIG), Baker Hughes (BHI), Bed Bath & Beyond, Corning (GLW), Viacom (VIA.B), Wal-Mart Stores (WMT).
Decreased position sizes in the following 2 companies; Bank of New York Mellon (BK), Jacobs Engineering Group.
As of October 31, 2016, our five largest positions were Quanta Services, Berkshire Hathaway (BRKB), Apple, Bank of America, and JPMorgan Chase (JPM).
We remain focused on the careful and patient application of our investment criteria and valuation requirements. We are more concerned with the risk of suffering a permanent loss of capital than about the risk of missing opportunities, especially those that are short-term in nature. Our bottom-up research emphasizes business quality, industry structures, growth opportunities, management skill and corporate culture. It is further augmented by our assessment of the company’s ability to sustain earnings power over the long haul through an understanding of its competitive advantages, business model and management’s proficiency in the allocation of capital. We use absolute, rather than relative, methods to estimate companies’ intrinsic values and we use the movement of market prices around these intrinsic value estimates to construct and manage a portfolio of high-quality businesses that have the potential to create sustained shareholder value over many years.
Thank you for your continued support and trust in our ability to manage your investment in the Fund.
Kovitz Investment Group Partners, LLC
3
INVESTMENT RESULTS – (Unaudited)
Average Annual Total Returns*
(For the periods ended October 31, 2016)
| | | | | | | | |
| | | One Year | | | Since Inception
(December 22, 2011) (a) | |
Green Owl Intrinsic Value Fund | | | 3.65 | % | | | 11.53 | % |
S&P 500® Index** | | | 4.51 | % | | | 13.68 | % |
Total annual operating expenses, as disclosed in the Fund’s prospectus dated February 29, 2016, were 1.37% of average daily net assets (1.10% after fee waivers/expense reimbursements by Kovitz Investment Group Partners, LLC (the “Adviser”). Effective January 1, 2016, the Adviser contractually agreed to waive or limit its fees and to assume other expenses of the Fund until February 28, 2018, so that the Total Annual Operating Expenses do not exceed 1.10%. This operating expense limitation does not apply to interest, taxes, brokerage commissions, other expenditures which are capitalized in accordance with generally accepted accounting principles, other extraordinary expenses not incurred in the ordinary course of the Fund’s business, dividend expense on short sales, expenses incurred under a Rule 12b-1 plan of distribution, “acquired fund fees and expenses,” and expenses that the Fund has incurred but did not actually pay because of an expense offset arrangement. Additional information pertaining to the Fund’s expense ratios as of October 31, 2016 can be found in the financial highlights.
The performance quoted represents past performance, which does not guarantee future results. The investment return and principal value of an investment will fluctuate so that an investor’s shares, when redeemed, may be worth more or less than their original cost. The returns shown do not reflect the deduction of taxes that a shareholder would pay on Fund distributions or the redemption of Fund shares. Current performance of the Fund may be lower or higher than the performance quoted. The Fund’s investment objectives, risks, charges and expenses must be considered carefully before investing. Performance data current to the most recent month end may be obtained by calling 1-888-695-3729.
| (a) | The Fund commenced operations on December 22, 2011. However, the Fund did not invest in long-term securities towards the investment objective until December 28, 2011. December 28, 2011 is the performance calculation inception date. |
| * | Return figures reflect any change in price per share and assume the reinvestment of all distributions. The Fund’s returns reflect any fee reductions during the applicable periods. If such fee reductions had not occurred, the quoted performance would have been lower. |
| ** | The S&P 500® Index is a widely recognized unmanaged index of equity securities and is representative of a broader domestic equity market and range of securities than is found in the Fund’s portfolio. Individuals cannot invest directly in the Index; however, an individual can invest in exchange traded funds or other investment vehicles that attempt to track the performance of a benchmark index. |
The Fund’s investment objectives, strategies, risks, charges and expenses must be considered carefully before investing. The prospectus contains this and other important information about the Fund and may be obtained by calling the same number as above. Please read it carefully before investing.
The Fund is distributed by Unified Financial Securities, LLC, member FINRA/SIPC.
4
Comparison of the Growth of a $10,000 Investment in the Green Owl Intrinsic Value
Fund and the S&P 500® Index (Unaudited)
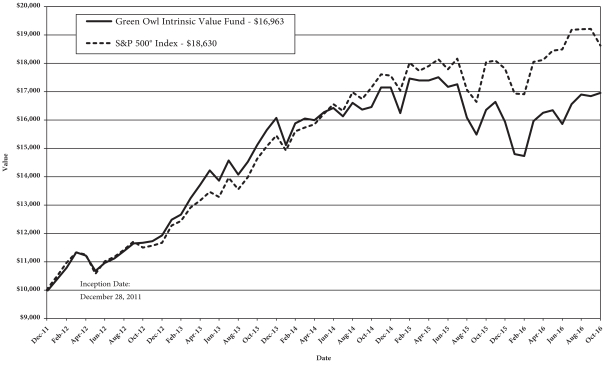
The Fund commenced operations on December 22, 2011. However, the Fund did not invest in long-term securities towards the investment objective until December 28, 2011. December 28, 2011 is the performance calculation inception date. The chart above assumes an initial investment of $10,000 made on December 28, 2011 and held through October 31, 2016. The S&P 500® Index is a widely recognized unmanaged index of equity securities and is representative of a broader domestic equity market and range of securities than is found in the Fund’s portfolio. Individuals cannot invest directly in the Index; however, an individual can invest in exchange traded funds or other investment vehicles that attempt to track the performance of a benchmark index. THE FUND’S RETURN REPRESENTS PAST PERFORMANCE AND DOES NOT GUARANTEE FUTURE RESULTS. The returns shown do not reflect deduction of taxes that a shareholder would pay on Fund distributions or the redemption of Fund shares. Investment returns and principal values will fluctuate so that your shares, when redeemed, may be worth more or less than their original purchase price.
Current performance may be lower or higher than the performance data quoted. For more information on the Fund, and to obtain performance data current to the most recent month end or to request a prospectus, please call 1-888-695-3729. You should carefully consider the investment objectives, potential risks, management fees, and charges and expenses of the Fund before investing. The Fund’s prospectus contains this and other information about the Fund, and should be read carefully before investing.
The Fund is distributed by Unified Financial Securities, LLC, member FINRA.
5
FUND HOLDINGS – (Unaudited)
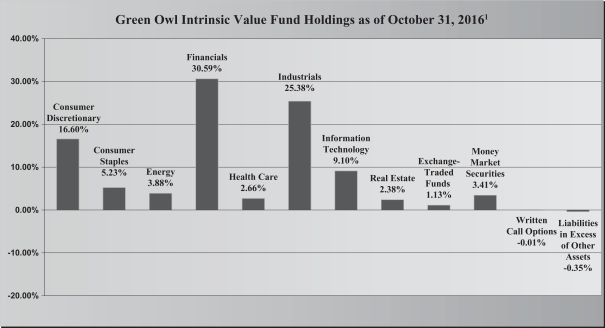
| 1As | a percentage of net assets. |
The investment objective of the Green Owl Intrinsic Value Fund is long-term capital appreciation.
AVAILABILITY OF PORTFOLIO SCHEDULE – (Unaudited)
The Fund files its complete schedule of portfolio holdings with the Securities and Exchange Commission (“SEC”) for the first and third quarters of each fiscal year on Form N-Q. The Fund’s Forms N-Q are available at the SEC’s website at www.sec.gov. The Fund’s Forms N-Q may be reviewed and copied at the SEC’s Public Reference Room in Washington DC. Information on the operation of the Public Reference Room may be obtained by calling 1-800-SEC-0330.
6
GREEN OWL INTRINSIC VALUE FUND
SCHEDULE OF INVESTMENTS
October 31, 2016
| | | | | | | | |
| Common Stocks – 95.82% | | Shares | | | Fair Value | |
| | | | | | | | |
| | | | | | | | |
Consumer Discretionary – 16.60% | | | | | | | | |
CarMax, Inc. * | | | 30,240 | | | $ | 1,510,186 | |
CBS Corp., Class B | | | 36,230 | | | | 2,051,343 | |
General Motors Co. | | | 70,600 | | | | 2,230,960 | |
Harley-Davidson, Inc. | | | 26,535 | | | | 1,513,026 | |
Kohl’s Corp. | | | 39,900 | | | | 1,745,625 | |
Walt Disney Co./The | | | 12,100 | | | | 1,121,549 | |
| | | | | | | | |
| | | | | | | 10,172,689 | |
| | | | | | | | |
Consumer Staples – 5.23% | | | | | | | | |
Coca-Cola Co./The | | | 12,470 | | | | 528,728 | |
CVS Health Corp. | | | 20,895 | | | | 1,757,269 | |
Walgreens Boots Alliance, Inc. | | | 11,075 | | | | 916,235 | |
| | | | | | | | |
| | | | | | | 3,202,232 | |
| | | | | | | | |
Energy – 3.88% | | | | | | | | |
Halliburton Co. | | | 38,200 | | | | 1,757,200 | |
Schlumberger Ltd. | | | 7,895 | | | | 617,626 | |
| | | | | | | | |
| | | | | | | 2,374,826 | |
| | | | | | | | |
Financials – 30.59% | | | | | | | | |
American Express Co. | | | 30,610 | | | | 2,033,116 | |
Aon PLC | | | 15,900 | | | | 1,762,197 | |
Bank of America Corp. | | | 172,175 | | | | 2,840,887 | |
Bank of New York Mellon Corp./The | | | 26,675 | | | | 1,154,227 | |
Berkshire Hathaway, Inc., Class B * | | | 28,815 | | | | 4,158,004 | |
Citigroup, Inc. | | | 26,400 | | | | 1,297,560 | |
JPMorgan Chase & Co. | | | 36,230 | | | | 2,509,290 | |
Leucadia National Corp. | | | 80,485 | | | | 1,502,655 | |
Wells Fargo & Co. | | | 32,255 | | | | 1,484,052 | |
| | | | | | | | |
| | | | | | | 18,741,988 | |
| | | | | | | | |
Health Care – 2.66% | | | | | | | | |
McKesson Corp. | | | 12,800 | | | | 1,627,776 | |
| | | | | | | | |
Industrials – 25.38% | | | | | | | | |
AMERCO | | | 2,810 | | | | 905,916 | |
American Airlines Group, Inc. (a) | | | 36,640 | | | | 1,487,584 | |
Boeing Co./The | | | 15,190 | | | | 2,163,512 | |
Jacobs Engineering Group, Inc. * | | | 47,724 | | | | 2,461,604 | |
Quanta Services, Inc. * | | | 153,955 | | | | 4,426,206 | |
Robert Half International, Inc. | | | 32,218 | | | | 1,205,598 | |
United Parcel Service, Inc., Class B | | | 11,520 | | | | 1,241,395 | |
Valmont Industries, Inc. | | | 12,953 | | | | 1,657,336 | |
| | | | | | | | |
| | | | | | | 15,549,151 | |
| | | | | | | | |
See accompanying notes which are an integral part of these financial statements.
7
GREEN OWL INTRINSIC VALUE FUND
SCHEDULE OF INVESTMENTS – (continued)
October 31, 2016
| | | | | | | | |
| Common Stocks – 95.82% – continued | | Shares | | | Fair Value | |
| | | | | | | | |
Information Technology – 9.10% | | | | | | | | |
Alphabet, Inc., Class A * | | | 773 | | | $ | 626,053 | |
Alphabet, Inc., Class C * | | | 2,053 | | | | 1,610,661 | |
Apple, Inc. | | | 29,430 | | | | 3,341,482 | |
| | | | | | | | |
| | | | | | | 5,578,196 | |
| | | | | | | | |
Real Estate – 2.38% | | | | | | | | |
CBRE Group, Inc., Class A * | | | 56,750 | | | | 1,461,880 | |
| | | | | | | | |
| | |
Total Common Stocks (Cost $47,403,972) | | | | | | | 58,708,738 | |
| | | | | | | | |
| | |
Exchange-Traded Funds – 1.13% | | | | | | | | |
VanEck Vectors Oil Services ETF | | | 24,635 | | | | 691,504 | |
| | | | | | | | |
| | |
Total Exchange-Traded Funds (Cost $734,261) | | | | | | | 691,504 | |
| | | | | | | | |
| | |
Money Market Securities – 3.41% | | | | | | | | |
Federated Treasury Obligations Fund – Service Shares, 0.01% (b) | | | 2,085,616 | | | | 2,085,616 | |
| | | | | | | | |
Total Money Market Securities (Cost $2,085,616) | | | | | | | 2,085,616 | |
| | | | | | | | |
Total Investments – 100.36% (Cost $50,223,849) | | | | | | | 61,485,858 | |
| | | | | | | | |
Total Written Call Options (Premiums Received $46,179) – (0.01)% | | | | | | | (3,000 | ) |
| | | | | | | | |
Liabilities in Excess of Other Assets – (0.35)% | | | | | | | (215,600 | ) |
| | | | | | | | |
NET ASSETS – 100.00% | | | | | | $ | 61,267,258 | |
| | | | | | | | |
| | (a) | All or a portion of this security is held as collateral for written call options. |
| | (b) | Rate disclosed is the seven day effective yield as of October 31, 2016. |
| | * | Non-income producing security. |
The sectors shown on the schedule of investments are based on Global Industry Classification Standard, or GICS® (“GICS”). The GICS was developed by and/or is the exclusive property of MSCI, Inc. and Standard & Poor Financial Services LLC (“S&P”). GICS is a service mark of MSCI, Inc. and S&P and has been licensed for use by Ultimus Asset Services, LLC.
See accompanying notes which are an integral part of these financial statements.
8
GREEN OWL INTRINSIC VALUE FUND
SCHEDULE OF WRITTEN OPTIONS
October 31, 2016
| | | | | | | | |
| Written Call Options – (0.01)% | | Outstanding
Contracts | | | Fair Value | |
American Airlines Group, Inc./ January 2017/ Strike $50.00 (a) | | | (150 | ) | | $ | (3,000 | ) |
| | | | | | | | |
| Total Written Call Options (Premiums Received $46,179) – (0.01)% | | | | | | $ | (3,000 | ) |
| | | | | | | | |
| | (a) | The call contract has a multiplier of 100 shares. |
See accompanying notes which are an integral part of these financial statements.
9
GREEN OWL INTRINSIC VALUE FUND
STATEMENT OF ASSETS AND LIABILITIES
October 31, 2016
| | | | |
Assets | | | | |
Investments in securities at fair value (cost $50,223,849) | | $ | 61,485,858 | |
Receivable for fund shares sold | | | 20,670 | |
Receivable for investments sold | | | 470,243 | |
Dividends receivable | | | 30,669 | |
Prepaid expenses | | | 20,410 | |
| | | | |
Total Assets | | | 62,027,850 | |
| | | | |
| |
Liabilities | | | | |
Written options, at fair value (premium received $46,179) | | | 3,000 | |
Payable for fund shares redeemed | | | 10,021 | |
Payable for investments purchased | | | 670,499 | |
Payable to Adviser | | | 37,433 | |
Payable to administrator, fund accountant, and transfer agent | | | 7,787 | |
Payable to trustees | | | 34 | |
Other accrued expenses | | | 31,818 | |
| | | | |
Total Liabilities | | | 760,592 | |
| | | | |
| |
Net Assets | | $ | 61,267,258 | |
| | | | |
| |
Net Assets consist of: | | | | |
Paid-in capital | | $ | 49,975,879 | |
Accumulated undistributed net investment income | | | 173,161 | |
Accumulated undistributed net realized loss from investments | | | (186,970 | ) |
Net unrealized appreciation on: | | | | |
Investment securities | | | 11,262,009 | |
Written options | | | 43,179 | |
| | | | |
| |
Net Assets | | $ | 61,267,258 | |
| | | | |
Shares outstanding
(unlimited number of shares authorized, no par value) | | | 4,063,717 | |
| | | | |
Net asset value, offering and redemption price per share | | $ | 15.08 | |
| | | | |
See accompanying notes which are an integral part of these financial statements.
10
GREEN OWL INTRINSIC VALUE FUND
STATEMENT OF OPERATIONS
For the year ended October 31, 2016
| | | | |
Investment Income | | | | |
Dividend income | | $ | 875,440 | |
| | | | |
Total investment income | | | 875,440 | |
| | | | |
| |
Expenses | | | | |
Investment Adviser | | | 577,767 | |
Administration | | | 46,050 | |
Fund accounting | | | 25,085 | |
Transfer agent | | | 22,572 | |
Custodian | | | 10,061 | |
Trustee | | | 5,786 | |
Line of credit | | | 2,332 | |
Miscellaneous | | | 121,688 | |
| | | | |
Total expenses | | | 811,341 | |
| | | | |
Fees waived by Adviser | | | (173,710 | ) |
| | | | |
Net operating expenses | | | 637,631 | |
| | | | |
Net investment income | | | 237,809 | |
| | | | |
| |
Net Realized and Unrealized Gain (Loss) on Investments | | | | |
Net realized loss on investment securities transactions | | | (168,473 | ) |
Net change in unrealized appreciation of investment securities | | | 1,878,875 | |
Net change in unrealized appreciation/depreciation of written options | | | 78,000 | |
| | | | |
Net realized and unrealized gain on investments | | | 1,788,402 | |
| | | | |
Net increase in net assets resulting from operations | | $ | 2,026,211 | |
| | | | |
See accompanying notes which are an integral part of these financial statements.
11
GREEN OWL INTRINSIC VALUE FUND
STATEMENTS OF CHANGES IN NET ASSETS
| | | | | | | | |
| | | For the
Year Ended
October 31, 2016 | | | For the
Year Ended
October 31, 2015 | |
Increase (Decrease) in Net Assets due to: | | | | | | | | |
Operations | | | | | | | | |
Net investment income | | $ | 237,809 | | | $ | 302,919 | |
Net realized gain (loss) on investment transactions | | | (168,473 | ) | | | 968,969 | |
Net change in unrealized appreciation/depreciation of investments and written options | | | 1,956,875 | | | | (1,647,258 | ) |
| | | | | | | | |
Net increase (decrease) in net assets resulting from operations | | | 2,026,211 | | | | (375,370 | ) |
| | | | | | | | |
| | |
Distributions | | | | | | | | |
From net investment income | | | (241,645 | ) | | | (764,929 | ) |
From net realized gains | | | (934,988 | ) | | | (2,314,248 | ) |
| | | | | | | | |
Total distributions | | | (1,176,633 | ) | | | (3,079,177 | ) |
| | | | | | | | |
| | |
Capital Transactions | | | | | | | | |
Proceeds from shares sold | | | 7,328,721 | | | | 10,031,283 | |
Reinvestment of distributions | | | 1,113,919 | | | | 2,937,926 | |
Amount paid for shares redeemed | | | (7,343,220 | ) | | | (10,777,672 | ) |
| | | | | | | | |
Net increase in net assets resulting from capital transactions | | | 1,099,420 | | | | 2,191,537 | |
| | | | | | | | |
Total Increase (Decrease) in Net Assets | | | 1,948,998 | | | | (1,263,010 | ) |
| | | | | | | | |
Net Assets | | | | | | | | |
Beginning of year | | | 59,318,260 | | | | 60,581,270 | |
| | | | | | | | |
End of year | | $ | 61,267,258 | | | $ | 59,318,260 | |
| | | | | | | | |
Accumulated undistributed net investment income included in net assets at end of year | | $ | 173,161 | | | $ | 176,997 | |
| | | | | | | | |
| | |
Share Transactions | | | | | | | | |
Shares sold | | | 512,880 | | | | 654,165 | |
Shares issued in reinvestment of distributions | | | 76,663 | | | | 194,051 | |
Shares redeemed | | | (524,224 | ) | | | (703,988 | ) |
| | | | | | | | |
Net increase in shares outstanding | | | 65,319 | | | | 144,228 | |
| | | | | | | | |
See accompanying notes which are an integral part of these financial statements.
12
GREEN OWL INTRINSIC VALUE FUND
FINANCIAL HIGHLIGHTS
(For a share outstanding during each period)
| | | | | | | | | | | | | | | | | | | | |
| | | For the
Year Ended
October 31,
2016 | | | For the
Year Ended
October 31,
2015 | | | For the
Year Ended
October 31,
2014 | | | For the
Year Ended
October 31,
2013 | | | For the
Period Ended
October 31,
2012 (a) | |
Selected Per Share Data: | | | | | | | | | | | | | | | | | | | | |
Net asset value, beginning of period | | $ | 14.84 | | | $ | 15.72 | | | $ | 14.99 | | | $ | 11.67 | | | $ | 10.00 | |
| | | | | | | | | | | | | | | | | | | | |
Investment operations: | | | | | | | | | | | | | | | | | | | | |
Net investment income | | | 0.06 | | | | 0.08 | | | | 0.19 | | | | 0.02 | | | | 0.02 | |
Net realized and unrealized gain (loss) on investments | | | 0.47 | | | | (0.16 | ) | | | 1.11 | | | | 3.41 | | | | 1.65 | |
| | | | | | | | | | | | | | | | | | | | |
Total from investment operations | | | 0.53 | | | | (0.08 | ) | | | 1.30 | | | | 3.43 | | | | 1.67 | |
| | | | | | | | | | | | | | | | | | | | |
Less distributions to shareholders from: | | | | | | | | | | | | | | | | | | | | |
Net investment income | | | (0.06 | ) | | | (0.20 | ) | | | (0.03 | ) | | | (0.05 | ) | | | — | |
Net realized gains | | | (0.23 | ) | | | (0.60 | ) | | | (0.54 | ) | | | (0.06 | ) | | | — | |
| | | | | | | | | | | | | | | | | | | | |
Total distributions | | | (0.29 | ) | | | (0.80 | ) | | | (0.57 | ) | | | (0.11 | ) | | | — | |
| | | | | | | | | | | | | | | | | | | | |
Net asset value, end of period | | $ | 15.08 | | | $ | 14.84 | | | $ | 15.72 | | | $ | 14.99 | | | $ | 11.67 | |
| | | | | | | | | | | | | | | | | | | | |
| | | | | |
Total Return (b) | | | 3.65 | % | | | (0.60 | )% | | | 8.86 | % | | | 29.59 | % | | | 16.70 | %(c) |
| | | | | |
Ratios and Supplemental Data: | | | | | | | | | | | | | | | | | | | | |
Net assets, end of period (000) | | $ | 61,267 | | | $ | 59,318 | | | $ | 60,581 | | | $ | 47,129 | | | $ | 24,756 | |
Ratio of net expenses to average net assets | | | 1.10 | % | | | 1.10 | % | | | 1.11 | %(e) | | | 1.40 | % | | | 1.41 | %(d)(e) |
Ratio of expenses to average net assets before waiver and reimbursement | | | 1.40 | % | | | 1.37 | % | | | 1.38 | % | | | 1.52 | % | | | 2.11 | %(d) |
Ratio of net investment income to average net assets | | | 0.41 | % | | | 0.49 | % | | | 1.30 | % | | | 0.14 | % | | | 0.26 | %(d) |
Portfolio turnover rate | | | 21 | % | | | 33 | % | | | 35 | % | | | 20 | % | | | 11 | %(c) |
| (a) | For the period December 22, 2011 (commencement of operations) to October 31, 2012. |
| (b) | Total return in the above table represents the rate that an investor would have earned or lost on an investment in the Fund, assuming reinvestment of distributions. |
| (e) | Includes line of credit interest expense of 0.01%. |
See accompanying notes which are an integral part of these financial statements.
13
GREEN OWL INTRINSIC VALUE FUND
NOTES TO THE FINANCIAL STATEMENTS
October 31, 2016
NOTE 1. ORGANIZATION
The Green Owl Intrinsic Value Fund (the “Fund”) is an open-end diversified series of Valued Advisers Trust (the “Trust”). The Trust is a management investment company established under the laws of Delaware by an Agreement and Declaration of Trust dated June 13, 2008 (the “Trust Agreement”). The Trust Agreement permits the Board of Trustees (the “Board”) to issue an unlimited number of shares of beneficial interest of separate series without par value. The Fund is one of a series of funds authorized by the Board. The Fund’s investment adviser is Kovitz Investment Group Partners, LLC (the “Adviser”). The investment objective of the Fund is to provide long-term capital appreciation.
NOTE 2. SIGNIFICANT ACCOUNTING POLICIES
The Fund is an investment company and follows accounting and reporting guidance under Financial Accounting Standards Board Accounting Standards Codification (“ASC”) Topic 946, “Financial Services-Investment Companies”. The following is a summary of significant accounting policies followed by the Fund in the preparation of its financial statements. These polices are in conformity with generally accepted accounting principles in the United States of America (“GAAP”).
Estimates – The preparation of financial statements in conformity with GAAP requires management to make estimates and assumptions that affect the reported amounts of assets and liabilities and disclosure of contingent assets and liabilities at the date of the financial statements and the reported amounts of increases and decreases in net assets from operations during the reporting period. Actual results could differ from those estimates.
Securities Valuation – All investments in securities are recorded at their estimated fair value as described in Note 3.
Federal Income Taxes – The Fund makes no provision for federal income or excise tax. The Fund has qualified and intends to qualify each year as a regulated investment company (“RIC”) under subchapter M of the Internal Revenue Code of 1986, as amended, by complying with the requirements applicable to RICs and by distributing substantially all of its taxable income. The Fund also intends to distribute sufficient net investment income and net capital gains, if any, so that it will not be subject to excise tax on undistributed income and gains. If the required amount of net investment income or gains is not distributed, the Fund could incur a tax expense.
As of and during the year ended October 31, 2016, the Fund did not have a liability for any unrecognized tax benefits. The Fund recognizes interest and penalties, if any, related to unrecognized tax benefits as income tax expense on the statement of operations. The Fund is subject to examination by U.S. federal tax authorities for the last three tax years and the interim tax period since then. During the period, the Fund did not incur any interest or penalties.
Expenses – Expenses incurred by the Trust that do not relate to a specific fund of the Trust are allocated to the individual funds based on each fund’s relative net assets or other appropriate basis (using procedures approved by the Board).
Security Transactions and Related Income – The Fund follows industry practice and records security transactions on the trade date for financial reporting purposes. The specific identification method is used for determining gains or losses for financial statements and income tax purposes. Dividend income is recorded on the ex-dividend
14
GREEN OWL INTRINSIC VALUE FUND
NOTES TO THE FINANCIAL STATEMENTS – (continued)
October 31, 2016
NOTE 2. SIGNIFICANT ACCOUNTING POLICIES – continued
date and interest income is recorded on an accrual basis. Discounts and premiums on securities purchased are amortized or accreted using the effective interest method.
Dividends and Distributions – The Fund intends to distribute substantially all of its net investment income, net realized long-term capital gains and its net realized short-term capital gains, if any, to its shareholders on at least an annual basis. Dividends to shareholders, which are determined in accordance with income tax regulations, are recorded on the ex-dividend date. The treatment for financial reporting purposes of distributions made to shareholders during the year from net investment income or net realized capital gains may differ from their ultimate treatment for federal income tax purposes. These differences are caused primarily by differences in the timing of the recognition of certain components of income, expense or realized capital gain for federal income tax purposes. Where such differences are permanent in nature, they are reclassified in the components of net assets based on their ultimate characterization for federal income tax purposes. Any such reclassifications will have no effect on net assets, results of operations or net asset values per share of the Fund. There were no such material reclassifications made as of October 31, 2016.
Written Options – The Fund may write covered call options on equity securities or futures contracts that the Fund is eligible to purchase to extend a holding period to obtain long-term capital gain treatment, to earn premium income, to assure a definite price for a security it has considered selling, or to close out options previously purchased. The Fund may write covered call options if, immediately thereafter, not more than 30% of its net assets would be committed to such transactions. A call option gives the holder (buyer) the right to purchase a security or futures contract at a specified price (the exercise price) at any time until a certain date (the expiration date). A call option is “covered” if the Fund owns the underlying security subject to the call option at all times during the option period, or to the extent that some or all of the risk of the option has been offset by another option. When the Fund writes a covered call option, it maintains a segregated position within its account with its Custodian or as otherwise required by the rules of the exchange of the underlying security, cash or liquid portfolio securities in an amount not less than the exercise price at all times while the option is outstanding. See Note 4 for additional disclosures.
The Fund will receive a premium from writing a call option, which increases the Fund’s return in the event the option expires unexercised or is closed out at a profit. The amount of the premium will reflect, among other things, the relationship of the market price of the underlying security to the exercise price of the option and the remaining term of the option. However, there is no assurance that a closing transaction can be effected at a favorable price. During the option period, the covered call writer has, in return for the premium received, given up the opportunity for capital appreciation above the exercise price should the market price of the underlying security increase, but has retained the risk of loss should the price of the underlying security decline.
The Fund may write put options on equity securities and futures contracts that the Fund is eligible to purchase to earn premium income or to assure a definite price for a security if it is considering acquiring the security at a lower price than the current market price or to close out options previously purchased. The Fund may not write a put option if, immediately thereafter, more than 25% of its net assets would be committed to such transactions. A put option gives the holder of the option the right to sell, and the writer has the obligation to buy, the underlying security at the exercise price at any time during the option period. The operation of put options in other respects is substantially identical to that of call options. When the Fund writes a put option, it maintains a segregated position within its account with the Custodian of cash or liquid portfolio securities in an amount not less than the exercise price at all times while the put option is outstanding.
15
GREEN OWL INTRINSIC VALUE FUND
NOTES TO THE FINANCIAL STATEMENTS – (continued)
October 31, 2016
NOTE 2. SIGNIFICANT ACCOUNTING POLICIES – continued
The Fund will receive a premium from writing a put option, which increases the Fund’s return in the event the option expires unexercised or is closed out at a profit. The amount of the premium will reflect, among other things, the relationship of the market price of the underlying security to the exercise price of the option and the remaining term of the option. The risks involved in writing put options include the risk that a closing transaction cannot be effected at a favorable price and the possibility that the price of the underlying security may fall below the exercise price, in which case the Fund may be required to purchase the underlying security at a higher price than the market price of the security at the time the option is exercised, resulting in a potential capital loss unless the security subsequently appreciates in value. During the year ended October 31, 2016, the Fund utilized covered call options to extend the holding period to obtain long-term capital gain treatment and to take advantage of the option premium to garner a higher exit price than would have been available by immediately selling the stock.
NOTE 3. SECURITIES VALUATION AND FAIR VALUE MEASUREMENTS
Fair value is defined as the price that the Fund would receive upon selling an investment in an orderly transaction to an independent buyer in the principal or most advantageous market of the investment. GAAP established a three-tier hierarchy to maximize the use of observable market data and minimize the use of unobservable inputs and to establish classification of fair value measurements for disclosure purposes.
Inputs refer broadly to the assumptions that market participants would use in pricing the asset or liability, including assumptions about risk (the risk inherent in a particular valuation technique used to measure fair value including items such as a pricing model and/or the risk inherent in the inputs to the valuation technique). Inputs may be observable or unobservable. Observable inputs are inputs that reflect the assumptions market participants would use in pricing the asset or liability developed based on market data obtained from sources independent of the reporting entity. Unobservable inputs are inputs that reflect the reporting entity’s own assumptions about the assumptions market participants would use in pricing the asset or liability developed based on the best information available in the circumstances. Various inputs are used in determining the value of the Fund’s investments. These inputs are summarized in the three broad levels listed below.
| | • | | Level 1 – unadjusted quoted prices in active markets for identical investments and/or registered investment companies where the value per share is determined and published and is the basis for current transactions for identical assets or liabilities at the valuation date |
| | • | | Level 2 – other significant observable inputs (including, but not limited to, quoted prices for an identical security in an inactive market, quoted prices for similar securities, interest rates, prepayment speeds, credit risk, etc.) |
| | • | | Level 3 – significant unobservable inputs (including the Fund’s own assumptions in determining fair value of investments based on the best information available) |
The inputs used to measure fair value may fall into different levels of the fair value hierarchy. In such cases, for disclosure purposes, the level in the fair value hierarchy within which the fair value measurement falls in its entirety, is determined based on the lowest level input that is significant to the fair value measurement in its entirety.
Equity securities, including common stocks and exchange-traded funds, that are traded on any stock exchange are generally valued at the last quoted sale price on the security’s primary exchange. Lacking a last sale price, an
16
GREEN OWL INTRINSIC VALUE FUND
NOTES TO THE FINANCIAL STATEMENTS – (continued)
October 31, 2016
NOTE 3. SECURITIES VALUATION AND FAIR VALUE MEASUREMENTS – continued
exchange-traded security is generally valued at its last bid price. Securities traded in the NASDAQ over-the-counter market are generally valued at the NASDAQ Official Closing Price. When using the market quotations and when the market is considered active, the security is classified as a Level 1 security. In the event that market quotations are not readily available or are considered unreliable due to market or other events, the Fund values its securities and other assets at fair value in accordance with policies established by and under the general supervision of the Board. Under these policies, the securities will be classified as Level 2 or 3 within the fair value hierarchy, depending on the inputs used.
Investments in open-end mutual funds, including money market mutual funds, are generally priced at the ending net asset value (“NAV”) provided by the service agent of the funds. These securities are categorized as Level 1 securities.
Written option contracts in which the Fund invests are generally traded on an exchange. The options in which the Fund invests are generally valued at the last trade price as provided by a pricing service. If the last sale price is not available, the options will be valued at the mean of the last bid and ask prices. The options will generally be categorized as Level 1 securities. If the Fund decides that a price provided by the pricing service does not accurately reflect the fair value of the securities, when prices are not readily available from a pricing service, or when restricted or illiquid securities are being valued, securities are valued at fair value as determined by the Adviser, in conformity with policies adopted by and subject to review of the Board. These securities will generally be categorized as Level 3 securities.
In accordance with the Trust’s valuation policies, the Adviser is required to consider all appropriate factors relevant to the value of securities for which it has determined other pricing sources are not available or reliable as described above. No single standard exists for determining fair value, because fair value depends upon the circumstances of each individual case. As a general principle, the current fair value of an issue of securities being valued by the Adviser would be the amount which the Fund might reasonably expect to receive for them upon their current sale. Methods which are in accordance with this principle may, for example, be based on (i) a multiple of earnings; (ii) a discount from market of a similar freely traded security (including a derivative security or a basket of securities traded on other markets, exchanges or among dealers); or (iii) yield to maturity with respect to debt issues, or a combination of these and other methods. Fair value pricing is permitted if, in the Adviser’s opinion, the validity of market quotations appears to be questionable based on factors such as evidence of a thin market in the security based on a small number of quotations, a significant event occurs after the close of a market but before a Fund’s NAV calculation that may affect a security’s value, or the Adviser is aware of any other data that calls into question the reliability of market quotations.
The following is a summary of the inputs used to value the Fund’s investments as of October 31, 2016:
| | | | | | | | | | | | | | | | |
| | | Valuation Inputs | |
| Assets | | Level 1 | | | Level 2 | | | Level 3 | | | Total | |
Common Stocks* | | $ | 58,708,738 | | | $ | – | | | $ | – | | | $ | 58,708,738 | |
Exchange-Traded Funds | | | 691,504 | | | | – | | | | – | | | | 691,504 | |
Money Market Securities | | | 2,085,616 | | | | – | | | | – | | | | 2,085,616 | |
Total | | $ | 61,485,858 | | | $ | – | | | $ | – | | | $ | 61,485,858 | |
| * | Refer to the Schedule of Investments for industry classifications. |
17
GREEN OWL INTRINSIC VALUE FUND
NOTES TO THE FINANCIAL STATEMENTS – (continued)
October 31, 2016
NOTE 3. SECURITIES VALUATION AND FAIR VALUE MEASUREMENTS – continued
| | | | | | | | | | | | | | | | |
| | | Valuation Inputs | |
| Liabilities | | Level 1 | | | Level 2 | | | Level 3 | | | Total | |
Written Options | | $ | (3,000 | ) | | $ | – | | | $ | – | | | $ | (3,000 | ) |
Total | | $ | (3,000 | ) | | $ | – | | | $ | – | | | $ | (3,000 | ) |
The Fund did not hold any investments during the reporting period in which significant unobservable inputs were used in determining fair value; therefore, no reconciliation of Level 3 securities is included for this reporting period. The Trust recognizes transfers between fair value hierarchy levels at the reporting period end. There were no transfers between any levels for the year ended October 31, 2016 and the previous reporting period end.
NOTE 4. DERIVATIVE TRANSACTIONS
Call options written are presented separately on the Statement of Assets and Liabilities as a liability at fair value and on the Statement of Operations under net realized loss on written option transactions and change in unrealized depreciation on written option contracts, respectively. The option positions held at year end are representative of the volume for the year.
At October 31, 2016:
| | | | | | |
| Derivatives | | Location of Derivatives on
Statement of Assets & Liabilities | | | |
Equity Risk: | | | | | | |
Written Call Options | | Written options, at fair value | | $ | (3,000 | ) |
Equity Risk: | | | | | | |
Written Call Options | | Net unrealized appreciation/depreciation on written options | | $ | 43,179 | |
For the year ended October 31, 2016:
| | | | | | | | |
| Derivatives | | Location of Gain (Loss) on Derivatives on Statement of Operations | | | Change in
Unrealized
Appreciation
(Depreciation)
on Derivatives | |
Equity Risk: | | | | | | | | |
Written Call Options | |
| Net change in unrealized appreciation/depreciation on
written options |
| | $ | 78,000 | |
18
GREEN OWL INTRINSIC VALUE FUND
NOTES TO THE FINANCIAL STATEMENTS – (continued)
October 31, 2016
NOTE 4. DERIVATIVE TRANSACTIONS – continued
Transactions in written options by the Fund during the year ended October 31, 2016, were as follows:
| | | | | | | | |
| | | Number of
Contracts | | | Premiums
Received | |
Options outstanding at October 31, 2015 | | | (150 | ) | | $ | 46,179 | |
Options written | | | – | | | | – | |
Options exercised | | | – | | | | – | |
Options closed | | | – | | | | – | |
| | | | | | | | |
Options outstanding at October 31, 2016 | | | (150 | ) | | $ | 46,179 | |
| | | | | | | | |
NOTE 5. ADVISER FEES AND OTHER TRANSACTIONS
Under the terms of the management agreement, on behalf of the Fund (the “Agreement”), the Adviser manages the Fund’s investments subject to approval by the Board. As compensation for its management services, the Fund is obligated to pay the Adviser a fee computed and accrued daily and paid monthly at an annual rate of 1.00% of the average daily net assets of the Fund. For the year ended October 31, 2016, the Adviser earned a fee of $577,767 from the Fund before the reimbursement described below. At October 31, 2016, the Fund owed the Adviser $37,433.
Prior to January 1, 2016, the Fund’s investment adviser was Kovitz Investment Group, LLC (“KIG”). On January 1, 2016, Focus Financial Partners, LLC (“Focus”) acquired substantially all of the assets of KIG, which concurrently sold substantially all of its assets to the Adviser, an indirect wholly-owned subsidiary of Focus.
The Adviser has contractually agreed to waive its management fee and/or reimburse expenses so that total fund operating expenses, excluding interest, taxes, brokerage commissions, other expenditures which are capitalized in accordance with GAAP, other extraordinary expenses not incurred in the ordinary course of the Fund’s business, dividend expense on short sales, and expenses that the Fund has incurred but did not actually pay because of an expense offset arrangement, if applicable, incurred by the Fund in any fiscal year, do not exceed 1.10% of the Fund’s average daily net assets through February 28, 2018. The operating expense limitation also excludes any fees and expenses of acquired funds.
For the year ended October 31, 2016, fees totaling $173,710 were waived by the Adviser. Each fee waiver or expense reimbursement by the Adviser with respect to the Fund is subject to repayment by the Fund within the three fiscal years following the fiscal year in which that particular fee waiver or expense reimbursement occurred, provided that the Fund is able to make the repayment without exceeding the expense limitation in effect at the time of the fee waiver or expense reimbursement and any expense limitation in place at the time of repayment.
The amounts subject to repayment by the Fund pursuant to the aforementioned conditions are as follows:
| | | | |
Amount | | Recoverable through
October 31, | |
$ 150,715 | | | 2017 | |
162,284 | | | 2018 | |
173,710 | | | 2019 | |
19
GREEN OWL INTRINSIC VALUE FUND
NOTES TO THE FINANCIAL STATEMENTS – (continued)
October 31, 2016
NOTE 5. ADVISER FEES AND OTHER TRANSACTIONS – continued
The Trust retains Ultimus Asset Services, LLC (“Ultimus”), formerly Huntington Asset Services, Inc. (“HASI”) to provide the Fund with administration, fund accounting, transfer agent and compliance services, including all regulatory reporting. For the year ended October 31, 2016, Ultimus earned fees of $46,050, $25,085 and $22,572 for administration, accounting and transfer agent services, respectively. At October 31, 2016, Ultimus was owed $7,787 from the Fund for these services.
The officers and one trustee of the Trust are members of management and employees of Ultimus. Unified Financial Securities, LLC (the “Distributor”), acts as the principal distributor of the Fund’s shares.
Effective at the close of business on December 31, 2015, Ultimus Fund Solutions, LLC, acquired HASI and the Distributor from Huntington Bancshares, Inc. (“HBI”). Prior to January 1, 2016, HASI and the Distributor were under common control by HBI.
There were no payments made by the Fund to the Distributor during the year ended October 31, 2016. A trustee and certain officers of the Trust are officers of the Distributor and each such person may be deemed to be an affiliate of the Distributor.
During the year ended October 31, 2016, the Fund paid $5,857 to Kovitz Securities, LLC, an affiliate of the Adviser, on the execution of purchases and sales of the Fund’s portfolio investments.
NOTE 6. LINE OF CREDIT
The Fund participates in a short-term credit agreement (“Line of Credit”) with Huntington expiring on September 6, 2017. Under the terms of the agreement, the Fund may borrow the lesser of $1,000,000 or 5% of the Fund’s daily market value at an interest rate of LIBOR plus 150 basis points. The purpose of the agreement is to meet temporary or emergency cash needs, including redemption requests that might otherwise require the untimely disposition of securities. As of October 31, 2016, the Fund had no outstanding borrowings under this Line of Credit.
| | | | | | | | | | | | |
Average
Daily
Loan
Balance | | Weighted
Average
Interest
Rate | | | Number of
Days
Outstanding* | | | Interest
Expense
Incurred** | |
$ 31,287 | | | 1.92 | % | | | 1 | | | $ | 2 | |
| * | Number of Days Outstanding represents the total days during the year ended October 31, 2016 that the Fund utilized the Line of Credit. |
| ** | Amount shown represents interest incurred on outstanding Line of Credit during the year ended October 31, 2016. |
20
GREEN OWL INTRINSIC VALUE FUND
NOTES TO THE FINANCIAL STATEMENTS – (continued)
October 31, 2016
NOTE 7. PURCHASES AND SALES
For the year ended October 31, 2016, purchases and sales of investment securities, other than short-term investments and short-term U.S. government obligations, were as follows:
| | | | |
Purchases | | | | |
U.S. Government Obligations | | $ | – | |
Other | | | 11,730,629 | |
Sales | | | | |
U.S. Government Obligations | | $ | – | |
Other | | | 11,856,039 | |
NOTE 8. BENEFICIAL OWNERSHIP
The beneficial ownership, either directly or indirectly, of more than 25% of the voting securities of a fund creates a presumption of control of a fund, under Section 2(a) (9) of the Investment Company Act of 1940. At October 31, 2016, there were no beneficial owners, either directly or indirectly, of more than 25% percent of the Fund.
NOTE 9. FEDERAL TAX INFORMATION
At October 31, 2016, the net unrealized appreciation (depreciation) of investments, including written options, for tax purposes was as follows:
| | | | |
Gross Appreciation | | $ | 12,378,315 | |
Gross (Depreciation) | | | (1,073,127 | ) |
| | | | |
Net Appreciation on Investments | | $ | 11,305,188 | |
| | | | |
At October 31, 2016, the aggregate cost of securities for federal income tax purposes was $50,223,849 and premiums received for written options was $46,197 for the Fund.
On December 14, 2016 the Fund paid an income distribution of $0.057884 per share to shareholders of record on December 13, 2016.
The tax characterization of distributions for the fiscal year ended October 31, 2016 and 2015 was as follows:
| | | | | | | | |
| | | 2016 | | | 2015 | |
Distributions paid from: | | | | | | | | |
Ordinary Income* | | $ | 241,647 | | | $ | 764,929 | |
Long Term Capital Gains | | | 934,986 | | | | 2,314,248 | |
| | | | | | | | |
Total Distributions | | $ | 1,176,633 | | | $ | 3,079,177 | |
| | | | | | | | |
| * | Short term capital gain distributions are treated as ordinary income for tax purposes. |
21
GREEN OWL INTRINSIC VALUE FUND
NOTES TO THE FINANCIAL STATEMENTS – (continued)
October 31, 2016
NOTE 9. FEDERAL TAX INFORMATION – continued
At October 31, 2016, the components of distributable earnings on a tax basis were as follows:
| | | | |
Undistributed ordinary income | | $ | 175,676 | |
Undistributed long term capital gains | | | – | |
Net unrealized appreciation (depreciation) | | | 11,305,188 | |
Accumulated capital and other losses | | | (189,485 | ) |
| | | | |
| | $ | 11,291,376 | |
| | | | |
As of October 31, 2016, the Fund had short-term capital loss carryforwards available to offset future gains and not subject to expiration in the amount of $186,968.
NOTE 10. COMMITMENTS AND CONTINGENCIES
The Fund indemnifies its officers and trustees for certain liabilities that may arise from their performance of their duties to the Fund. Additionally, in the normal course of business, the Fund enters into contracts that contain a variety of representations and warranties which provide general indemnifications. The Fund’s maximum exposure under these arrangements is unknown, as this would involve future claims that may be made against the Fund that have not yet occurred.
NOTE 11. SUBSEQUENT EVENTS
Management of the Fund has evaluated the need for disclosures and/or adjustments resulting from subsequent events through the date these financial statements were issued. There were no items requiring adjustment of financial statements or additional disclosure.
22
REPORT OF INDEPENDENT REGISTERED PUBLIC ACCOUNTING FIRM
To the Shareholders of Green Owl Intrinsic Value Fund and
Board of Trustees of Valued Advisers Trust
We have audited the accompanying statement of assets and liabilities, including the schedule of investments and schedule of written options, of Green Owl Intrinsic Value Fund (the “Fund”), a series of Valued Advisers Trust, as of October 31, 2016, and the related statement of operations for the year then ended, the statements of changes in net assets for each of the two years in the period then ended, and the financial highlights for each of the five periods in the period then ended. These financial statements and financial highlights are the responsibility of the Fund’s management. Our responsibility is to express an opinion on these financial statements and financial highlights based on our audits.
We conducted our audits in accordance with the standards of the Public Company Accounting Oversight Board (United States). Those standards require that we plan and perform the audit to obtain reasonable assurance about whether the financial statements and financial highlights are free of material misstatement. An audit includes examining, on a test basis, evidence supporting the amounts and disclosures in the financial statements. Our procedures included confirmation of securities owned as of October 31, 2016, by correspondence with the custodian and brokers. An audit also includes assessing the accounting principles used and significant estimates made by management, as well as evaluating the overall financial statement presentation. We believe that our audits provide a reasonable basis for our opinion.
In our opinion, the financial statements and financial highlights referred to above present fairly, in all material respects, the financial position of Green Owl Intrinsic Value Fund as of October 31, 2016, the results of its operations for the year then ended, the changes in its net assets for each of the two years in the period then ended, and the financial highlights for each of the five periods in the period then ended, in conformity with accounting principles generally accepted in the United States of America.
COHEN & COMPANY, LTD.
Cleveland, Ohio
December 23, 2016
23
SUMMARY OF FUND EXPENSES (Unaudited)
As a shareholder of the Fund, you incur ongoing costs, including management fees and other Fund expenses. This example is intended to help you understand your ongoing costs (in dollars) of investing in the Fund and to compare these costs with the ongoing costs of investing in other mutual funds.
The example is based on an investment of $1,000 invested at the beginning and held for the entire period from May 1, 2016 to October 31, 2016.
Actual Expenses
The first line of the table below provides information about actual account values and actual expenses. You may use the information in this line, together with the amount you invested, to estimate the expenses that you paid over the period. Simply divide your account value by $1,000 (for example, an $8,600 account value divided by $1,000 = $8.60), then multiply the result by the number in the first line under the heading entitled “Expenses Paid During Period” to estimate the expenses you paid on your account during this period.
Hypothetical Example for Comparison Purposes
The second line of the table below provides information about hypothetical account values and hypothetical expenses based on the Fund’s actual expense ratio and an assumed rate of return of 5% per year before expenses, which is not the Fund’s actual return. The hypothetical account values and expenses may not be used to estimate the actual ending account balance or expenses you paid for the period. You may use this information to compare the ongoing costs of investing in the Fund and other funds. To do so, compare this 5% hypothetical example with the 5% hypothetical examples that appear in the shareholder reports of the other funds.
Please note that the expenses shown in the table are meant to highlight your ongoing costs only. Therefore, the second line of the table below is useful in comparing ongoing costs only and will not help you determine the relative costs of owning different funds.
| | | | | | | | | | | | |
| Green Owl Intrinsic Value Fund | | Beginning
Account Value May 1, 2016 | | | Ending Account Value October 31, 2016 | | | Expenses Paid
During Period* May 1, 2016 –
October 31, 2016 | |
Actual | | $ | 1,000.00 | | | $ | 1,043.60 | | | $ | 5.67 | |
Hypothetical** | | $ | 1,000.00 | | | $ | 1,019.59 | | | $ | 5.60 | |
| * | Expenses are equal to the Fund’s annualized expense ratio of 1.10%, multiplied by the average account value over the period, multiplied by 184/366 (to reflect the one-half year period). |
| ** | Assumes a 5% return before expenses. |
24
TRUSTEES AND OFFICERS (Unaudited)
The Board of Trustees supervises the business activities of the Trust. Each Trustee serves as a trustee until termination of the Trust unless the Trustee dies, resigns, retires or is removed.
The following tables provide information regarding the Trustees and Officers.
The following table provides information regarding each of the Independent Trustees.
| | | | |
Name, Address*, (Age),
Position with Trust**, Term of Position with Trust | | Principal Occupation During Past 5 Years | | Other Directorships |
Ira Cohen, 57, Independent Trustee, June 2010 to present. | | Current: Independent financial services consultant since February 2005; Executive Vice President of Asset Management Services, Recognos Financial, since August 2015. | | Trustee and Audit Committee Chairman, Griffin Institutional Real Estate Access Fund, since May 2014. Trustee, Angel Oak Funds Trust, since October 2014. |
Andrea N. Mullins, 49, Independent Trustee, December 2013 to present. | | Current: Private investor; Independent Contractor, Seabridge Wealth Management, LLC, since April 2014. | | None. |
| * | The address for each trustee and officer is 225 Pictoria Drive, Suite 450, Cincinnati, OH 45246. |
| ** | As of the date of this report, the Trust consists of 14 series. |
The following table provides information regarding the Trustee who is considered an “interested person” of the Trust, as that term is defined under the 1940 Act. Based on the experience of the Trustee, the Trust concluded that the individual described below is qualified to serve as a Trustee.
| | | | |
Name, Address*, (Age),
Position with Trust**, Term of Position with Trust | | Principal Occupation During Past 5 Years | | Other Directorships |
R. Jeffrey Young, 52, Trustee and Chairman, June 2010 to present. | | Current: Vice President and Director of Relationship Management, Ultimus Fund Solutions, LLC (since December 2015); President, Unified Financial Securities, LLC (since July 2015). Previous: President, Huntington Asset Services, Inc. (n/k/a Ultimus Asset Services, LLC) (April 2015 to December 2015), Director (May 2014 to December 2015), Senior Vice President (January 2010 to April 2015); Director, Unified Financial Securities, Inc. (n/k/a Unified Financial Securities, LLC) (May 2014 to December 2015); Chief Executive Officer, Huntington Funds (February 2010 to March 2015); Chief Executive Officer, Huntington Strategy Shares (November 2010 to March 2015); President and Chief Executive Officer, Dreman Contrarian Funds (March 2011 to February 2013). | | Trustee and Chairman, Capitol Series Trust, since September 2013. |
| * | The address for each trustee and officer is 225 Pictoria Drive, Suite 450, Cincinnati, OH 45246. |
| ** | As of the date of this report, the Trust consists of 14 series. |
25
The following table provides information regarding the Officers of the Trust:
| | | | |
Name, Address*, (Age),
Position with Trust,** Term of Position with Trust | | Principal Occupation During Past 5 Years | | Other Directorships |
R. Jeffrey Young, 52, Trustee and Chairman, June 2010 to present; Principal Executive Officer and President, Valued Advisers Trust since February 2010. | | Current: Vice President and Director of Relationship Management, Ultimus Fund Solutions, LLC (since December 2015); President, Unified Financial Securities, LLC (since July 2015). Previous: President, Huntington Asset Services, Inc. (n/k/a Ultimus Asset Services, LLC) (April 2015 to December 2015), Director (May 2014 to December 2015), Senior Vice President (January 2010 to April 2015); Director, Unified Financial Securities, Inc. (n/k/a Unified Financial Securities, LLC) (May 2014 to December 2015); Chief Executive Officer, Huntington Funds (February 2010 to March 2015); Chief Executive Officer, Huntington Strategy Shares (November 2010 to March 2015); President and Chief Executive Officer, Dreman Contrarian Funds (March 2011 to February 2013). | | Trustee and Chairman, Capitol Series Trust, since September 2013. |
John C. Swhear, 55, Chief Compliance Officer, AML Officer and Vice President, August 2008 to present. | | Current: Assistant Vice President and Associate Director of Compliance, Ultimus Fund Solutions, LLC (since December 2015); Chief Compliance Officer, Unified Financial Securities, LLC (since May 2007); Chief Compliance Officer and AML Officer, Capitol Series Trust (since September 2013); Vice President, Unified Series Trust (since January 2016). Previous: Vice President of Legal Administration and Compliance, Huntington Asset Services, Inc. (n/k/a Ultimus Asset Services, LLC) (April 2007 to December 2015), Director (May 2014 to December 2015); Director, Unified Financial Securities, Inc. (n/k/a Unified Financial Securities, LLC) (May 2014 to December 2015); President , Unified Series Trust (March 2012 to January 2016), Senior Vice President (May 2007 to March 2012); Secretary , Huntington Funds (April 2010 to February 2012). | | None. |
26
| | | | |
Name, Address*, (Age),
Position with Trust,** Term of Position with Trust | | Principal Occupation During Past 5 Years | | Other Directorships |
Carol J. Highsmith, 52, Vice President, August 2008 to present; Secretary, March 2014 to present | | Current: Assistant Vice President, Ultimus Fund Solutions, LLC (since December 2015). Previous: Secretary, Cross Shore Discovery Fund (May 2014 to February 2016); Employed in various positions with Huntington Asset Services, Inc. (n/k/a Ultimus Asset Services, LLC) (November 1994 to December 2015), most recently Vice President of Legal Administration (2005 to December 2015). | | None. |
Matthew J. Miller, 40, Vice President, December 2011 to present. | | Current: Assistant Vice President, Relationship Management, Ultimus Fund Solutions, LLC (since December 2015); President and Chief Executive Officer, Capitol Series Trust (since September 2013). Previous: Employed in various positions with Huntington Asset Services, Inc. (n/k/a Ultimus Asset Services, LLC) (since July 1998), most recently Vice President of Relationship Management (2005 to December 2015); Vice President, Huntington Funds (February 2010 to April 2015). | | None. |
Bryan W. Ashmus, 43, Principal Financial Officer and Treasurer, December 2013 to present. | | Current: Vice President and Director of Financial Administration, Ultimus Fund Solutions, LLC (since December 2015); Chief Financial Officer and Treasurer, Cross Shore Discovery Fund (since June 2016). Previous: Vice President and Manager of Financial Administration, Huntington Asset Services, Inc. (n/k/a Ultimus Asset Services, LLC) (September 2013 to December 2015); Chief Financial Officer and Treasurer, Huntington Strategy Shares and Huntington Funds Trust (November 2013 to April 2016); Vice President, Fund Administration, Citi Fund Services Ohio, Inc. (from May 2005 to September 2013). | | None. |
| * | The address for each trustee and officer is 225 Pictoria Drive, Suite 450, Cincinnati, OH 45246. |
| ** | As of the date of this report, the Trust consists of 14 series. |
OTHER INFORMATION (Unaudited)
The Fund’s Statement of Additional Information (“SAI”) includes additional information about the trustees and is available without charge, upon request. You may call toll-free at (888) 695-3729 to request a copy of the SAI or to make shareholder inquiries.
27
OTHER FEDERAL INCOME TAX INFORMATION (Unaudited)
The Form 1099-DIV you receive in January 2017 will show the tax status of all distributions paid to your account in calendar year 2016. Shareholders are advised to consult their own tax adviser with respect to the tax consequences of their investment in the Fund. As required by the Internal Revenue Code and/or regulations, shareholders must be notified regarding the status of qualified dividend income for individuals and the dividends received deduction for corporations.
Qualified Dividend Income. The Fund designates approximately 100% or up to the maximum amount of such dividends allowable pursuant to the Internal Revenue Code, as qualified dividend income eligible for the reduced tax rate of 15%.
Dividends Received Deduction. Corporate shareholders are generally entitled to take the dividends received deduction on the portion of the Fund’s dividend distribution that qualifies under tax law. For the Fund’s calendar year 2016 ordinary income dividends, 100% qualifies for the corporate dividends received deduction.
For the year ended October 31, 2016, the Fund designated $934,986 as long-term capital gain distributions.
28
VALUED ADVISERS TRUST
PRIVACY POLICY
The following is a description of the policies of the Valued Advisers Trust (the “Trust”) regarding disclosure of nonpublic personal information that shareholders provide to a series of the Trust (each, a “Fund”) or that the Fund collects from other sources. In the event that a shareholder hold shares of a Fund through a broker-dealer or other financial intermediary, the privacy policy of the financial intermediary would govern how shareholder nonpublic personal information would be shared with nonaffiliated third parties.
Categories of Information a Fund May Collect. A Fund may collect the following nonpublic personal information about its shareholders:
| | • | | Information the Fund receives from a shareholder on applications or other forms, correspondence, or conversations (such as the shareholder’s name, address, phone number, social security number, and date of birth); and |
| | • | | Information about the shareholder’s transactions with the Fund, its affiliates, or others (such as the shareholder’s account number and balance, payment history, cost basis information, and other financial information). |
Categories of Information a Fund May Disclose. A Fund may not disclose any nonpublic personal information about its current or former shareholders to unaffiliated third parties, except as required or permitted by law. A Fund is permitted by law to disclose all of the information it collects, as described above, to its service providers (such as the Fund’s custodian, administrator, transfer agent, accountant and legal counsel) to process shareholder transactions and otherwise provide services to the shareholder.
Confidentiality and Security. Each Fund shall restrict access to shareholder nonpublic personal information to those persons who require such information to provide products or services to the shareholder. Each Fund shall maintain physical, electronic, and procedural safeguards that comply with federal standards to guard shareholder nonpublic personal information.
Disposal of Information. The Funds, through their transfer agent, have taken steps to reasonably ensure that the privacy of a shareholder’s nonpublic personal information is maintained at all times, including in connection with the disposal of information that is no longer required to be maintained by the Funds. Such steps shall include, whenever possible, shredding paper documents and records prior to disposal, requiring off-site storage vendors to shred documents maintained in such locations prior to disposal, and erasing and/or obliterating any data contained on electronic media in such a manner that the information can no longer be read or reconstructed.
29
PROXY VOTING (Unaudited)
A description of the policies and procedures that the Fund uses to determine how to vote proxies relating to portfolio securities and information regarding how the Fund voted those proxies is available without charge upon request by (1) calling the Fund at (888) 695-3729 and (2) from Fund documents filed with the Securities and Exchange Commission (“SEC”) on the SEC’s website at www.sec.gov.
TRUSTEES
R. Jeffrey Young, Chairman
Ira P. Cohen
Andrea N. Mullins
OFFICERS
R. Jeffrey Young, Principal Executive Officer and President
John C. Swhear, Chief Compliance Officer, AML Officer and Vice President
Carol J. Highsmith, Vice President and Secretary
Matthew J. Miller, Vice President
Bryan W. Ashmus, Principal Financial Officer and Treasurer
INVESTMENT ADVISER
Kovitz Investment Group Partners, LLC
115 South LaSalle Street, 27th Floor
Chicago, IL 60603
DISTRIBUTOR
Unified Financial Securities, LLC
9465 Counselors Row, Suite 200
Indianapolis, IN 46240
INDEPENDENT REGISTERED PUBLIC ACCOUNTING FIRM
Cohen & Company, Ltd.
1350 Euclid Avenue, Suite 800
Cleveland, OH 44115
LEGAL COUNSEL
The Law Offices of John H. Lively & Associates, Inc.
A member firm of The 1940 Act Law GroupTM
11300 Tomahawk Creek Parkway, Ste. 310
Leawood, KS 66211
CUSTODIAN
Huntington National Bank
41 South High Street
Columbus, OH 43215
ADMINISTRATOR, TRANSFER AGENT AND FUND ACCOUNTANT
Ultimus Asset Services, LLC
225 Pictoria Drive, Suite 450
Cincinnati, OH 45246
This report is intended only for the information of shareholders or those who have received the Fund’s prospectus which contains information about the Fund’s management fee and expenses. Please read the prospectus carefully before investing.
Distributed by Unified Financial Securities, LLC
Member FINRA/SIPC
| | |
Annual Report October 31, 2016 |
Foundry Partners Fundamental Small Cap Value Fund
(Formerly the Dreman Contrarian Small Cap Value Fund)
Fund Adviser:
Foundry Partners, LLC
510 First Avenue North, Suite 409
Minneapolis, MN 55403

Market Overview and Fund
Performance
The Foundry Partners Fundamental Small Cap Value Fund (the “Fund”) returned 8.50% (Institutional Class) during the 12-month period ended October 31, 2016. The Fund’s benchmark, the Russell 2000® Value Index (a) (“Russell 2000”), returned 8.81% for the same period.
Performance Attribution
For the year, the Fund’s performance was highlighted by strong stock selection in the Financials, Materials, Health Care, Consumer Discretionary and Information Technology Sectors. Stock selection in Real Estate Investment Trust (“REIT”), Industrials, and Consumer Staples Sectors combined with our underweight in Utilities weighed upon performance.
The Material Sector was the best performing Sector in the Index and the Portfolio during the year given the strong move in Precious Metals names due to the sustained momentum in gold and silver prices. The stage for a rally in gold and silver prices was set during the first quarter of 2016 as investors grew more concerned over global growth and the implications from unprecedented monetary stimulus; reversing a four year declining trend. Coeur Mining climbed +314% and Pan American Silver rose +114%.
Our underweight in Energy versus the benchmark and hesitancy to add to our energy holdings proved to be beneficial for the Portfolio as Energy was the worst performing Sector in the Index. Oil prices were volatile over the course of the year, falling below $30 a barrel during the first quarter of 2016 only to rebound back to $50 in the second quarter and remain range bound in the mid-$40s throughout the remainder of the year. We are still cautious about the group as a whole despite more compelling valuations and what seems to be a healthy rebound of oil prices. Deteriorating company fundamentals and extended balance sheets, particularly in small cap companies, require oil prices remain at much higher levels in order for several of these smaller cap companies to survive. It traditionally has taken more than two years for an industry to work off the oversupply of product following a prolonged period of excess capacity build and even then the consolidators tend to be the larger, better balance sheet players. We remain underweight in this space.
The dearth of organic growth investment ideas combined with cheap financing due to ultra-low interest rates and healthy balance sheets created a fertile ground for M&A activity over the past year and as a result the Fund had its fair share of takeouts. Two of our banks, FirstMerit (+17.9%) and First Niagara Financial (+1.5%), and one of our reinsurance companies, Endurance Specialty Holdings (+49.1%), were acquired by peers as consolidation within both industries continues to take hold. Several of our technology names were also bid away by strategic acquirers. Chipmos Technologies (+31.2%), Lexmark (+27.4%), QLogic (+25.7%) and Ingram Micro (+25.3%) were all taken out at healthy premiums.
On the negative side, the REITs space proved to be a challenging area for the Fund as several of our names lagged the market due to specific end market issues. GEO Group, a REIT that owns and operates federal and state prisons, fell -16.8% as the Department of Justice’s recommendation to reduce the use of “for profit prisons” by the federal Government weighed on
Annual Report
1
Market Overview and Fund Performance (Continued)
shares. CBL & Associates, a mall REIT, fell -19.3% as concerns linger over the potential for retail store rationalization due to slower shopping trends and the competitive threat from online retailers. This sentiment also capped performance for our other mall owner, Pennsylvania REIT, which declined -9.8% on the year. RAIT Financial, a mortgage REIT that focuses on commercial real estate, fell nearly -28.9% after announcing a dividend cut.
Outlook and Positioning
Our investment outlook for small cap equities remains muted given the recent run in performance following the unexpected conclusion to the 2016 presidential election in the U.S. With the S&P 500® Index (a) trading at approximately 18 times 2016 and the Russell 2000 trading north of 25 times estimates (excluding negative earning companies), the market for new investment opportunities is sparse.
Earnings growth and interest rates remain the key drivers for the market moving forward. While we continue to believe rates will climb higher in the coming quarters, especially short-term rates, we do not see a major spike at the long end of the curve in the near future. The relative strength of the U.S. economy and the turmoil in many parts of the emerging markets leaves the U.S. in a relatively strong position to attract capital and hence keep our rates low; albeit higher than the most recent lows reached in 2016.
As contrarians, we are attracted to stocks in turmoil and in particular during periods of market stress. Our experience has shown that once we are comfortable with the fundamental value of a stock, buying when others are fearful pays off over time. There will always exist opportunities to unearth companies or sectors that have declined in price despite minimal deterioration in the fundamentals. While the recent rally in equities causes us to pause and become more selective on new ideas, we are always on the lookout to take advantage of any pullbacks and market dislocations to reposition the portfolio into newly created value opportunities.
The Fund’s performance quoted is past performance and does not guarantee future results. The investment return and principal value of an investment in the Fund will fluctuate so that an investor’s shares, when redeemed, may be worth more or less than their original cost. Current performance of the Fund may be lower or higher than the performance quoted. Performance data current to the most recent month end may be obtained by calling 1-800-247-1014. Information provided with respect to the Fund’s Portfolio Holdings, Sector Weightings and Number of Holdings are as of October 31, 2016 and are subject to change at any time.
You should carefully consider the investment objectives, potential risks, management fees, and charges and expenses of the Fund before investing. The Fund’s prospectus contains this and other information about the Fund, and should be read and considered carefully before investing. You may obtain a current copy of the Fund’s prospectus by calling 1-800-247-1014 or by visiting the Fund’s website at www.foundrypartnersllc.com. Past performance is no guarantee of future results. The investment return and principal value of an investment in the Fund will fluctuate so that an investor’s shares, when redeemed, may be worth more or less than their original cost.
Annual Report
2
The Fund is distributed by Unified Financial Securities, LLC, member FINRA/SIPC.
Value stocks may remain undervalued for extended periods of time and the market may not recognize the intrinsic value of these securities.
Micro cap and small cap investing involves greater risk not associated with investing in more established companies, such as greater price volatility, business risk, less liquidity and increased competitive threat.
| (a) | The Russell 2000® Value Index is a widely recognized unmanaged index of equity prices and is representative of a broader market and range of securities than is found in the Fund’s portfolio. The Russell 2000® Value Index measures the performance of the small-cap value segment of the U.S. equity universe. It includes those Russell 2000 companies with lower price-to-book ratios and lower forecasted growth values. The S&P 500® Index is widely recognized unmanaged index of equity securities and is representative of a broader domestic equity market and range of securities than is found in the Fund’s portfolio. Individuals cannot invest directly in an index; however, an individual can invest in exchange traded funds or other investment vehicles that attempt to track the performance of a benchmark index. |
The opinions expressed are those of the investment management team and are subject to change without notice, as are statements of financial market trends, which are based on current conditions. Under no circumstances does the information contained within represent a recommendation to buy, hold or sell any security and it should not be assumed that the companies discussed were, or will prove to be, profitable. Current and future holdings are subject to risk.
This material has been prepared for investors and investment professionals,
including broker-dealers and investment advisers.
Annual Report
3
Investment Results – (Unaudited)
| | | | | | |
Average Annual Total Returns(a)
As of October 31, 2016 |
| | | | |
| | | Investor
Class | | Institutional
Class | | Russell 2000®
Value Index(b) |
| One Year | | 8.23% | | 8.50% | | 8.81% |
| Three Year | | 6.03% | | 6.28% | | 4.47% |
| Five Year | | 12.15% | | 12.38% | | 11.63% |
| Ten Year | | 6.97% | | N/A | | 4.91% |
| Since Inception (8/22/07) | | N/A | | 6.82% | | 5.17% |
| Since Inception (12/31/03) | | 9.95% | | N/A | | 7.26% |
| | | |
| | | Expense Ratios(c) | | |
| | | | |
| | | Investor
Class | | Institutional
Class | | |
| | | 1.45% | | 1.20% | | |
The investment return and principal value of an investment will fluctuate so that an investor’s shares, when redeemed, may be worth more or less than their original cost. The returns shown do not reflect deduction of taxes that a shareholder would pay on Foundry Partners Fundamental Small Cap Value Fund (formerly the Dreman Contrarian Small Cap Value Fund) (the “Fund”) distributions or the redemption of Fund shares. THE FUND’S RETURNS REPRESENT PAST PERFORMANCE AND DO NOT PREDICT FUTURE RESULTS. The returns shown are net of all recurring expenses. Current performance of the Fund may be lower or higher than the performance quoted. For more information on the Fund, and to obtain performance data current to the most recent month end, or to request a prospectus, please call 1-800-247-1014.
You should carefully consider the investment objectives, potential risk, management fees, and charges and expenses of the Fund before investing. The Fund’s prospectus contains this and other information about the Fund, and should be read carefully before investing.
| (a) | The total return figures set forth above include all waivers of fees for various periods since inception. Without such fee waivers, the total returns would have been lower. Total return figures reflect any change in price per share and assume reinvestment of all distributions. Prior to June 21, 2016, the Fund’s performance was attributable to the previous adviser (Dreman Value Management LLC). |
| (b) | The Russell 2000® Value Index (“Index”) is an unmanaged benchmark that assumes reinvestment of all distributions and excludes the effect of taxes and fees. The Index is a widely recognized unmanaged index of equity prices and is representative of a broader market and range of securities than are found in the Fund’s portfolio. Individuals cannot invest directly in the Index; however, an individual can invest in ETFs or other investment vehicles that attempt to track the performance of a benchmark index. |
| (c) | The expense ratios are from the Fund’s prospectus dated August 30, 2016. Foundry Partners, LLC (the “Adviser”) has contractually agreed to waive its management fee and/or reimburse certain operating expenses through February 28, 2018, but only to the extent necessary so that the Fund’s net expenses, excluding brokerage fees and commissions, borrowing costs (such as interest expense and dividend expense on securities sold short), taxes, distribution and service (12b-1) fees, extraordinary expenses and indirect expenses (such as fees and expenses of acquired funds), does not exceed 1.25%. Information pertaining to the Fund’s expense ratios as of October 31, 2016 can be found in the financial highlights. |
The Fund is distributed by Unified Financial Securities, LLC, member FINRA/SIPC.
Annual Report
4
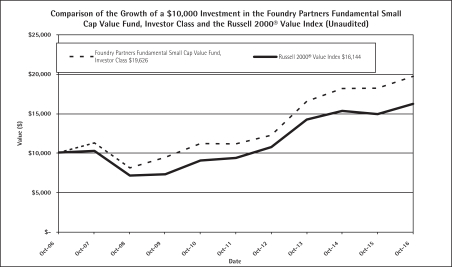
The chart above assumes an initial investment of $10,000 made on October 31, 2006 and held through October 31, 2016. THE FUND’S RETURN REPRESENTS PAST PERFORMANCE AND DOES NOT PREDICT FUTURE RESULTS. Investment returns and principal values will fluctuate so that Fund shares, when redeemed, may be worth more or less than their original purchase price. Current performance may be lower or higher than the performance data quoted.
For more information on the Foundry Partners Fundamental Small Cap Value Fund Investor Class, and to obtain performance data current to the most recent month end, or to request a prospectus, please call 1-800-247-1014. You should carefully consider the investment objectives, potential risk, management fees, and charges and expenses of the Fund before investing. The Fund’s prospectus contains important information about the Fund’s investment objectives, potential risks, management fees, charges and expenses, and other information and should be read carefully before investing.
The Fund is distributed by Unified Financial Securities, Inc., member FINRA/SIPC.
Annual Report
5
| | |
Fund Holdings – (Unaudited) | | |
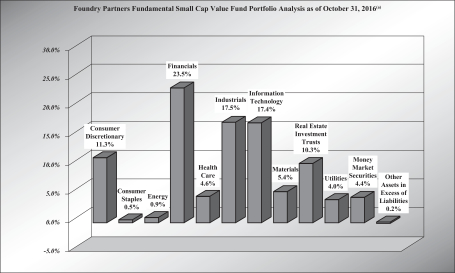
| (a) | As a percent of net assets. |
Availability of Portfolio Schedule – (Unaudited)
The Fund files its complete schedule of portfolio holdings with the Securities and Exchange Commission (“SEC”) for the first and third quarters of each fiscal year on Form N-Q, which is available on the SEC’s web site at www.sec.gov. The Fund’s Form N-Q may be reviewed and copied at the SEC’s Public Reference Room in Washington, DC. Information on the operation of the Public Reference Room may be obtained by calling 1-800-SEC-0330.
Annual Report
6
| | |
| Foundry Partners Fundamental Small Cap Value Fund | | October 31, 2016 |
Portfolio of Investments
| | | | | | | | | | | | |
| Shares | | | | | Fair Value | | | | |
| | | | | | | | | | | | |
| Common Stocks — 95.4% | | | | | | | | |
| Consumer Discretionary — 11.3% | | | | | | | | |
| | 38,624 | | | Aaron’s, Inc. | | $ | 954,399 | | | | | |
| | 129,825 | | | American Axle & Manufacturing Holdings, Inc. * | | | 2,326,464 | | | | | |
| | 23,009 | | | Big 5 Sporting Goods Corp. | | | 356,640 | | | | | |
| | 19,985 | | | Big Lots, Inc. | | | 867,349 | | | | | |
| | 41,788 | | | Bloomin’ Brands, Inc. | | | 722,932 | | | | | |
| | 27,635 | | | Brinker International, Inc. | | | 1,360,747 | | | | | |
| | 38,226 | | | Cooper Tire & Rubber Co. | | | 1,404,806 | | | | | |
| | 36,732 | | | DeVry Education Group, Inc. | | | 833,816 | | | | | |
| | 24,540 | | | Finish Line, Inc./The, Class A | | | 483,193 | | | | | |
| | 8,083 | | | Helen of Troy Ltd. * | | | 658,765 | | | | | |
| | 16,319 | | | John Wiley & Sons, Inc., Class A | | | 842,060 | | | | | |
| | 87,970 | | | KB Home | | | 1,279,084 | | | | | |
| | 17,345 | | | Matthews International Corp., Class A | | | 1,038,966 | | | | | |
| | 37,011 | | | Meredith Corp. | | | 1,678,449 | | | | | |
| | 18,420 | | | Movado Group, Inc. | | | 406,161 | | | | | |
| | 29,965 | | | Rent-A-Center, Inc. | | | 302,347 | | | | | |
| | | | | 15,516,178 | | | | | |
| Consumer Staples — 0.5% | | | | | | | | |
| | 23,280 | | | SpartanNash Co. | | | 651,840 | | | | | |
| Energy — 0.9% | | | | | | | | |
| | 28,375 | | | Aegean Marine Petroleum Network, Inc. | | | 244,025 | | | | | |
| | 130,390 | | | Denbury Resources, Inc. * | | | 311,632 | | | | | |
| | 212,450 | | | Gran Tierra Energy, Inc. * | | | 618,230 | | | | | |
| | | | | 1,173,887 | | | | | |
| Financials — 23.5% | | | | | | | | |
| | 32,948 | | | Allied World Assurance Co. Holdings AG | | | 1,416,105 | | | | | |
| | 36,396 | | | Aspen Insurance Holdings Ltd. | | | 1,756,107 | | | | | |
| | 109,230 | | | Associated Banc-Corp. | | | 2,217,369 | | | | | |
| | 12,378 | | | Chemical Financial Corp. | | | 531,635 | | | | | |
| | 21,102 | | | Clifton Bancorp, Inc. | | | 322,650 | | | | | |
| | 29,020 | | | Donnelley Financial Solutions, Inc. * | | | 622,479 | | | | | |
| | 18,264 | | | Endurance Specialty Holdings Ltd. | | | 1,679,375 | | | | | |
| | 83,264 | | | F.N.B. Corp. | | | 1,088,260 | | | | | |
| | 66,010 | | | First Midwest Bancorp, Inc. | | | 1,274,653 | | | | | |
| | 161,000 | | | Fulton Financial Corp. | | | 2,398,900 | | | | | |
| | 73,235 | | | Hancock Holding Co. | | | 2,457,034 | | | | | |
| | 18,470 | | | Hanover Insurance Group, Inc. | | | 1,407,229 | | | | | |
| | | | | | | | | | | | |
| Shares | | | | | Fair Value | | | | |
| | | | | | | | | | | | |
| Common Stocks — (continued) | | | | | | | | |
| Financials — (continued) | | | | | | | | |
| | 47,114 | | | International Bancshares Corp. | | $ | 1,453,467 | | | | | |
| | 71,749 | | | Janus Capital Group, Inc. | | | 919,822 | | | | | |
| | 16,913 | | | Nelnet, Inc., Class A | | | 662,651 | | | | | |
| | 147,780 | | | Old National Bancorp | | | 2,172,366 | | | | | |
| | 22,958 | | | Prosperity Bancshares, Inc. | | | 1,273,480 | | | | | |
| | 106,667 | | | TCF Financial Corp. | | | 1,525,338 | | | | | |
| | 89,073 | | | Umpqua Holdings Corp. | | | 1,361,035 | | | | | |
| | 25,460 | | | Waddell & Reed Financial, Inc., Class A | | | 400,231 | | | | | |
| | 90,320 | | | Washington Federal, Inc. | | | 2,461,220 | | | | | |
| | 13,460 | | | WesBanco, Inc. | | | 442,969 | | | | | |
| | 42,296 | | | Wintrust Financial Corp. | | | 2,281,869 | | | | | |
| | | | | 32,126,244 | | | | | |
| Health Care — 4.6% | | | | | | | | |
| | 7,528 | | | Almost Family, Inc. * | | | 295,474 | | | | | |
| | 11,052 | | | Charles River Laboratories International, Inc. * | | | 838,626 | | | | | |
| | 30,399 | | | Hill-Rom Holdings, Inc. | | | 1,684,409 | | | | | |
| | 3,255 | | | Integra LifeSciences Holdings Corp. * | | | 258,805 | | | | | |
| | 38,037 | | | Owens & Minor, Inc. | | | 1,234,301 | | | | | |
| | 115,094 | | | Select Medical Holdings Corp. * | | | 1,496,222 | | | | | |
| | 20,617 | | | Triple-S Management Corp., Class B * | | | 426,360 | | | | | |
| | | | | 6,234,197 | | | | | |
| Industrials — 17.5% | | | | | | | | |
| | 49,146 | | | AAR Corp. | | | 1,581,027 | | | | | |
| | 42,412 | | | Aegion Corp. * | | | 785,046 | | | | | |
| | 93,484 | | | Aircastle Ltd. | | | 1,921,096 | | | | | |
| | 58,727 | | | Barnes Group, Inc. | | | 2,339,684 | | | | | |
| | 38,415 | | | Brink’s Co./The | | | 1,519,313 | | | | | |
| | 33,242 | | | Crane Co. | | | 2,260,788 | | | | | |
| | 29,120 | | | EMCOR Group, Inc. | | | 1,760,595 | | | | | |
| | 24,215 | | | EnerSys | | | 1,577,123 | | | | | |
| | 38,196 | | | Global Brass & Copper Holdings, Inc. | | | 1,096,225 | | | | | |
| | 33,857 | | | Hillenbrand, Inc. | | | 1,027,560 | | | | | |
| | 14,695 | | | Hyster-Yale Materials Handling, Inc., Class A | | | 855,396 | | | | | |
| | 13,821 | | | LSC Communications, Inc. | | | 335,021 | | | | | |
| | 27,270 | | | Navigant Consulting, Inc. * | | | 638,118 | | | | | |
| | 9,899 | | | Park-Ohio Holdings, Corp. | | | 316,273 | | | | | |
| | 25,880 | | | Regal-Beloit Corp. | | | 1,529,508 | | | | | |
| | 36,858 | | | RR Donnelley & Sons Co. | | | 654,229 | | | | | |
| | 43,347 | | | Triumph Group, Inc. | | | 1,027,324 | | | | | |
| | 87,585 | | | Tutor Perini Corp. * | | | 1,668,494 | | | | | |
| | 12,440 | | | Universal Forest Products, Inc. | | | 1,069,716 | | | | | |
| | | | | 23,962,536 | | | | | |
See accompanying notes which are an integral part of these financial statements.
Annual Report
7
| | |
| Foundry Partners Fundamental Small Cap Value Fund | | October 31, 2016 |
| | |
Portfolio of Investments (Continued) |
| | | | | | | | | | | | |
| Shares | | | | | Fair Value | | | | |
| | | | | | | | | | | | |
| Common Stocks — (continued) | | | | | | | | |
| Information Technology — 17.4% | | | | | | | | |
| | 38,760 | | | AVX Corp. | | $ | 543,415 | | | | | |
| | 99,105 | | | Brocade Communications Systems, Inc. | | | 1,050,513 | | | | | |
| | 83,456 | | | Celestica, Inc. * | | | 988,954 | | | | | |
| | 20,150 | | | ChipMOS Technology, Inc. ADR * | | | 359,348 | | | | | |
| | 25,350 | | | CSG Systems International, Inc. | | | 964,061 | | | | | |
| | 28,230 | | | Diodes, Inc. * | | | 584,643 | | | | | |
| | 57,200 | | | Ingram Micro, Inc., Class A | | | 2,127,840 | | | | | |
| | 30,702 | | | Itron, Inc. * | | | 1,654,838 | | | | | |
| | 38,143 | | | IXYS Corp. | | | 404,316 | | | | | |
| | 43,505 | | | Kulicke & Soffa Industries, Inc. * | | | 576,006 | | | | | |
| | 43,880 | | | Lexmark International, Inc., Class A | | | 1,741,597 | | | | | |
| | 47,905 | | | Mentor Graphics Corp. | | | 1,384,455 | | | | | |
| | 45,625 | | | Microsemi Corp. * | | | 1,922,181 | | | | | |
| | 9,314 | | | NETGEAR, Inc. * | | | 470,357 | | | | | |
| | 33,380 | | | Plantronics, Inc. | | | 1,726,080 | | | | | |
| | 66,572 | | | Sanmina Corp. * | | | 1,840,716 | | | | | |
| | 13,495 | | | ScanSource, Inc. * | | | 472,325 | | | | | |
| | 15,287 | | | Science Applications International Corp. | | | 1,053,427 | | | | | |
| | 16,063 | | | Sykes Enterprises, Inc. * | | | 429,525 | | | | | |
| | 18,563 | | | Tech Data Corp. * | | | 1,429,722 | | | | | |
| | 150,505 | | | Vishay Intertechnology, Inc. | | | 2,122,120 | | | | | |
| | | | | 23,846,439 | | | | | |
| Materials — 5.4% | | | | | | | | |
| | 29,961 | | | A Schulman, Inc. | | | 861,379 | | | | | |
| | 27,944 | | | Cabot Corp. | | | 1,457,000 | | | | | |
| | 83,298 | | | Coeur Mining, Inc. * | | | 931,272 | | | | | |
| | 39,647 | | | Mercer International, Inc. | | | 313,211 | | | | | |
| | 47,715 | | | Olin Corp. | | | 1,046,390 | | | | | |
| | 40,670 | | | Owens-Illinois, Inc. * | | | 784,931 | | | | | |
| | 61,712 | | | Pan American Silver Corp. | | | 989,243 | | | | | |
| | 13,532 | | | Stepan Co. | | | 961,178 | | | | | |
| | | | | 7,344,604 | | | | | |
| Real Estate Investment Trusts — 10.3% | | | | | | | | |
| | 28,171 | | | Apollo Commercial Real Estate Finance, Inc. | | | 476,653 | | | | | |
| | 43,022 | | | Ashford Hospitality Prime, Inc. | | | 557,565 | | | | | |
| | 135,431 | | | Ashford Hospitality Trust, Inc. | | | 786,854 | | | | | |
| | 130,910 | | | Brandywine Realty Trust | | | 2,029,105 | | | | | |
| | 95,314 | | | CBL & Associates Properties, Inc. | | | 1,019,860 | | | | | |
| | 49,604 | | | GEO Group, Inc./The | | | 1,188,512 | | | | | |
| | | | | | | | | | | | |
| Shares | | | | | Fair Value | | | | |
| | | | | | | | | | | | |
| Common Stocks — (continued) | | | | | | | | |
| Real Estate Investment Trusts —
(continued) | | | | | | | | |
| | 35,254 | | | Hospitality Properties Trust | | $ | 964,549 | | | | | |
| | 64,948 | | | Mack-Cali Realty Corp. | | | 1,667,865 | | | | | |
| | 145,678 | | | Medical Properties Trust, Inc. | | | 2,030,751 | | | | | |
| | 78,127 | | | New Residential Investment Corp. | | | 1,090,653 | | | | | |
| | 79,597 | | | Pennsylvania Real Estate Investment Trust | | | 1,552,937 | | | | | |
| | 254,550 | | | RAIT Financial Trust | | | 776,378 | | | | | |
| | | | | 14,141,682 | | | | | |
| Utilities — 4.0% | | | | | | | | |
| | 33,593 | | | ALLETE, Inc. | | | 2,058,915 | | | | | |
| | 21,691 | | | IDACORP, Inc. | | | 1,700,357 | | | | | |
| | 40,541 | | | Portland General Electric Co. | | | 1,769,209 | | | | | |
| | | | | 5,528,481 | | | | | |
| Total Common Stocks
(Cost $120,650,234) | | | 130,526,088 | | | | | |
| Money Market Securities — 4.4% | | | | | | | | |
| | 5,991,732 | | | Federated Government Obligations Fund, Institutional Class, 0.27% (a) | | | 5,991,732 | | | | | |
| Total Money Market Securities
(Cost $5,991,732) | | | 5,991,732 | | | | | |
| Total Investments
(Cost $126,641,966) — 99.8% | | | 136,517,820 | | | | | |
| Other Assets in Excess of
Liabilities — 0.2% | | | 332,771 | | | | | |
| Net Assets — 100.0% | | $ | 136,850,591 | | | | | |
| (a) | Rate disclosed is the seven day effective yield as of October 31, 2016. |
| * | Non-income producing security. |
ADR — American Depositary Receipt
The sectors shown on the portfolio of investments are based on Global Industry Classification Standard, or GICS® (“GICS”). The GICS was developed by and/or is the exclusive property of MSCI, Inc. and Standard & Poor Financial Services LLC (“S&P”). GICS is a service mark of MSCI, Inc. and S&P and has been licensed for use by Ultimus Asset Services, LLC.
See accompanying notes which are an integral part of these financial statements.
Annual Report
8
Statement of Assets and Liabilities
October 31, 2016
| | | | |
| Assets: | | | | |
Investments in securities, at cost | | $ | 126,641,966 | |
| | | | | |
Investments in securities, at fair value | | | 136,517,820 | |
Cash | | | 79,910 | |
Dividends receivable | | | 73,156 | |
Receivable for investments sold | | | 176,546 | |
Receivable for fund shares sold | | | 165,377 | |
Prepaid expenses | | | 35,813 | |
Total assets | | | 137,048,622 | |
| Liabilities: | | | | |
Payable for shares redeemed | | | 38,883 | |
Payable to Adviser | | | 98,845 | |
Payable to administrator | | | 18,962 | |
Accrued 12b-1 fees | | | 8,292 | |
Payable to trustee | | | 191 | |
Other accrued expenses | | | 32,858 | |
Total liabilities | | | 198,031 | |
Net Assets | | $ | 136,850,591 | |
| | | | | |
| Net Assets consist of: | | | | |
Paid in capital | | $ | 123,642,456 | |
Accumulated undistributed net investment income | | | 612,474 | |
Accumulated undistributed net realized gain on investments | | | 2,719,807 | |
Net unrealized appreciation on investments | | | 9,875,854 | |
Net Assets | | $ | 136,850,591 | |
| | | | | |
| Net Assets (unlimited number of shares authorized) | | | | |
| Investor Class: (a) | | | | |
Net Assets | | $ | 38,864,020 | |
Shares outstanding | | | 1,896,765 | |
Net asset value, offering and redemption price per share | | $ | 20.49 | |
| | | | | |
| Institutional Class: | | | | |
Net Assets | | $ | 97,986,571 | |
Shares outstanding | | | 4,756,217 | |
Net asset value, offering and redemption price per share | | $ | 20.60 | |
| | | | | |
| (a) | Retail Class was renamed Investor Class on August 29, 2016. |
See accompanying notes which are an integral part of these financial statements.
Annual Report
9
Statement of Operations
Year Ended October 31, 2016
| | | | |
| Investment Income: | | | | |
Dividend income | | $ | 3,028,001 | |
Dividend income from affiliated securities | | | 145 | |
Foreign dividend taxes withheld | | | (797 | ) |
Total investment income | | | 3,027,349 | |
| Expenses: | | | | |
Investment Adviser | | | 1,144,200 | |
Administration | | | 226,790 | |
Distribution/12b-1: | | | | |
Class A (a) | | | 6,139 | |
Investor Class (b) | | | 108,499 | |
Registration | | | 62,079 | |
Custodian | | | 26,950 | |
Printing | | | 23,946 | |
Audit | | | 17,800 | |
Legal | | | 16,894 | |
Trustee | | | 7,352 | |
Miscellaneous | | | 65,794 | |
Net operating expenses | | | 1,706,443 | |
Net investment income | | | 1,320,906 | |
| Realized & Change in Unrealized Gain on Investments | | | | |
Net realized gain on investment securities | | | 3,102,550 | |
Change in unrealized appreciation on investment securities | | | 5,898,041 | |
Net realized and change in unrealized gain on investment securities | | | 9,000,591 | |
Net increase in net assets resulting from operations | | $ | 10,321,497 | |
| | | | | |
| (a) | Effective August 29, 2016, Class A was consolidated to Investor Class. |
| (b) | Retail Class was renamed Investor Class on August 29, 2016. |
See accompanying notes which are an integral part of these financial statements.
Annual Report
10
[THIS PAGE INTENTIONALLY LEFT BLANK]
Statements of Changes in Net Assets
| | | | | | | | |
| | | Year Ended
October 31,
2016 | | | Year Ended
October 31,
2015 | |
| Increase (Decrease) in Net Assets due to: | | | | | | | | |
| Operations: | | | | | | | | |
Net investment income | | $ | 1,320,906 | | | $ | 1,528,058 | |
Net realized gain on investment securities | | | 3,102,550 | | | | 14,531,505 | |
Change in unrealized appreciation (depreciation) on investment securities | | | 5,898,041 | | | | (15,576,288 | ) |
Net increase in net assets resulting from operations | | | 10,321,497 | | | | 483,275 | |
| Distributions: | | | | | | | | |
Net investment income: | | | | | | | | |
Class A(a) | | | (48,014 | ) | | | (24,971 | ) |
Investor Class(b) | | | (718,238 | ) | | | (498,693 | ) |
Institutional Class | | | (1,145,978 | ) | | | (815,183 | ) |
Realized gains: | | | | | | | | |
Class A(a) | | | (384,616 | ) | | | (310,960 | ) |
Investor Class(b) | | | (5,875,018 | ) | | | (5,763,778 | ) |
Institutional Class | | | (7,745,108 | ) | | | (7,217,978 | ) |
Total distributions | | | (15,916,972 | ) | | | (14,631,563 | ) |
| Capital Transactions—Class A: (a) | | | | | | | | |
Proceeds from shares sold | | | 1,430,843 | | | | 1,016,533 | |
Reinvestment of distributions | | | 423,710 | | | | 331,469 | |
Shares redeemed in connection with class consolidation | | | (2,502,231 | ) | | | — | |
Amount paid for shares redeemed | | | (2,603,135 | ) | | | (545,748 | ) |
Total Class A | | | (3,250,813 | ) | | | 802,254 | |
| Capital Transactions—Investor Class: (b) | | | | | | | | |
Proceeds from shares sold | | | 5,660,241 | | | | 12,838,383 | |
Shares issued in connection with class consolidation | | | 2,502,231 | | | | — | |
Reinvestment of distributions | | | 6,521,846 | | | | 6,187,695 | |
Amount paid for shares redeemed | | | (30,670,094 | ) | | | (16,810,930 | ) |
Proceeds from redemption fees (c) | | | 1,838 | | | | 500 | |
Total Investor Class | | | (15,983,938 | ) | | | 2,215,648 | |
| Capital Transactions—Institutional Class: | | | | | | | | |
Proceeds from shares sold | | | 28,241,114 | | | | 17,300,097 | |
Reinvestment of distributions | | | 8,579,713 | | | | 7,245,776 | |
Amount paid for shares redeemed | | | (25,850,060 | ) | | | (11,889,014 | ) |
Total Institutional Class | | | 10,970,767 | | | | 12,656,859 | |
Net change resulting from capital transactions | | | (8,263,984 | ) | | | 15,674,761 | |
Total Increase (Decrease) in Net Assets | | | (13,859,459 | ) | | | 1,526,473 | |
| Net Assets: | | | | | | | | |
Beginning of year | | | 150,710,050 | | | | 149,183,577 | |
End of year | | $ | 136,850,591 | | | $ | 150,710,050 | |
| | | | | | | | | |
Accumulated net investment income included in net assets at end of year | | $ | 612,474 | | | $ | 1,050,701 | |
See accompanying notes which are an integral part of these financial statements.
Annual Report
12
| | | | | | | | |
| | | Year Ended
October 31,
2016 | | | Year Ended
October 31,
2015 | |
| Share Transactions—Class A: (a) | | | | | | | | |
Shares sold | | | 77,514 | | | | 45,674 | |
Shares issued in reinvestment of distributions | | | 23,141 | | | | 15,275 | |
Shares redeemed in connection with class consolidation | | | (121,309 | ) | | | — | |
Shares redeemed | | | (145,598 | ) | | | (25,241 | ) |
Total Class A | | | (166,252 | ) | | | 35,708 | |
| Share Transactions—Investor Class: (b) | | | | | | | | |
Shares sold | | | 298,860 | | | | 590,308 | |
Shares issued in connection with class consolidation | | | 120,985 | | | | — | |
Shares issued in reinvestment of distributions | | | 355,220 | | | | 284,492 | |
Shares redeemed | | | (1,686,897 | ) | | | (775,888 | ) |
Total Investor Class | | | (911,832 | ) | | | 98,912 | |
| Share Transactions—Institutional Class: | | | | | | | | |
Shares sold | | | 1,537,354 | | | | 784,994 | |
Shares issued in reinvestment of distributions | | | 465,783 | | | | 332,223 | |
Shares redeemed | | | (1,290,602 | ) | | | (531,356 | ) |
Total Institutional Class | | | 712,535 | | | | 585,861 | |
| (a) | Effective August 29, 2016, Class A was consolidated to Investor Class. |
| (b) | Retail Class was renamed Investor Class on August 29, 2016. |
| (c) | Prior to August 30, 2016, a redemption fee of 1.00% was charged on shares held less than 60 days. |
See accompanying notes which are an integral part of these financial statements.
Annual Report
13
(For a share outstanding throughout each year ended October 31)
| | | | | | | | | | | | | | | | | | | | | | | | | | | | |
| | | Net Asset
Value,
beginning
of year | | | Net
investment
income (loss) | | | Net realized
and unrealized
gain (loss) on
investments | | | Total from
investment
operations | | | Distributions
from net
investment
income | | | Distributions
from net
realized gain
on investment
transactions | | | Total
distributions | |
| FOUNDRY PARTNERS FUNDAMENTAL SMALL CAP VALUE FUND | |
| Investor Class (formerly Retail Class) | |
| 2012 | | $ | 18.11 | | | | 0.11 | | | | 1.47 | | | | 1.58 | | | | (0.17 | ) | | | (1.66 | ) | | | (1.83 | ) |
| 2013 | | $ | 17.86 | | | | 0.17 | | | | 6.08 | | | | 6.25 | | | | (0.08 | ) | | | (0.16 | ) | | | (0.24 | ) |
| 2014 | | $ | 23.87 | | | | 0.15 | | | | 2.13 | | | | 2.28 | | | | (0.16 | ) | | | (2.36 | ) | | | (2.52 | ) |
| 2015 | | $ | 23.63 | | | | 0.19 | | | | (0.11 | ) | | | 0.08 | | | | (0.18 | ) | | | (2.12 | ) | | | (2.30 | ) |
| 2016 | | $ | 21.41 | | | | 0.16 | | | | 1.32 | | | | 1.48 | | | | (0.26 | ) | | | (2.14 | ) | | | (2.40 | ) |
| Institutional Class | |
| 2012 | | $ | 18.19 | | | | 0.14 | | | | 1.48 | | | | 1.62 | | | | (0.23 | ) | | | (1.66 | ) | | | (1.89 | ) |
| 2013 | | $ | 17.92 | | | | 0.20 | | | | 6.10 | | | | 6.30 | | | | (0.08 | ) | | | (0.16 | ) | | | (0.24 | ) |
| 2014 | | $ | 23.98 | | | | 0.20 | (e) | | | 2.14 | | | | 2.34 | | | | (0.22 | ) | | | (2.36 | ) | | | (2.58 | ) |
| 2015 | | $ | 23.74 | | | | 0.26 | | | | (0.12 | ) | | | 0.14 | | | | (0.24 | ) | | | (2.12 | ) | | | (2.36 | ) |
| 2016 | | $ | 21.52 | | | | 0.25 | | | | 1.29 | | | | 1.54 | | | | (0.32 | ) | | | (2.14 | ) | | | (2.46 | ) |
| (a) | Total return represents the rate the investor would have earned or lost on an investment in the Fund, assuming reinvestment of dividends, and excludes any sales charges and redemption fees. |
| (b) | Portfolio turnover is calculated on the basis of the Fund as a whole without distinguishing among the classes of shares. |
| (c) | Amount is less than $0.005. |
| (d) | The expense ratios shown include overdraft fees charged to the Fund. Without these overdraft fees, the expense ratios would be 1.25% for Investor Class and 1.00% for Institutional Class. |
| (e) | Per share amount has been calculated using the average shares method. |
See accompanying notes which are an integral part of these financial statements.
Annual Report
14
| | | | | | | | | | | | | | | | | | | | | | | | | | | | | | | | | | |
Paid in
capital from
redemption
fees | | | Net Asset
Value, end
of year | | | Total
return(a) | | | Net Assets,
end of
year
(000 omitted) | | | Ratio of net
expenses
to average
net assets | | | Ratio of expenses
(prior to
reimbursements)
to average
net assets | | | Ratio of net
investment
income
(loss) to
average
net assets | | | Ratio of net
investment
income (loss)
to average net
assets before
waiver &
reimbursement
by Adviser | | | Portfolio
turnover
rate(b) | |
| | | | | | | | | | | | | | | | | | | | | | | | | | | | | | | | | | |
| | | | | | | | | | | | | | | | | | | | | | | | | | | | | | | | | | |
| | — | (c) | | $ | 17.86 | | | | 9.93 | % | | $ | 69,992 | | | | 1.25 | % | | | 1.74 | % | | | 0.56 | % | | | 0.06 | % | | | 30.19 | % |
| | — | (c) | | $ | 23.87 | | | | 35.38 | % | | $ | 63,976 | | | | 1.26 | %(d) | | | 1.53 | % | | | 0.72 | % | | | 0.45 | % | | | 28.28 | % |
| | — | (c) | | $ | 23.63 | | | | 9.89 | % | | $ | 64,020 | | | | 1.25 | % | | | 1.37 | % | | | 0.63 | % | | | 0.51 | % | | | 36.66 | % |
| | — | (c) | | $ | 21.41 | | | | 0.21 | % | | $ | 60,134 | | | | 1.37 | % | | | 1.41 | % | | | 0.87 | % | | | 0.83 | % | | | 43.59 | % |
| | — | (c) | | $ | 20.49 | | | | 8.23 | % | | $ | 38,864 | | | | 1.43 | % | | | 1.43 | % | | | 0.84 | % | | | 0.84 | % | | | 12.85 | % |
| | | | | | | | | | | | | | | | | | | | | | | | | | | | | | | | | | |
| | — | | | $ | 17.92 | | | | 10.14 | % | | $ | 13,185 | | | | 1.00 | % | | | 1.49 | % | | | 0.80 | % | | | 0.30 | % | | | 30.19 | % |
| | — | | | $ | 23.98 | | | | 35.55 | % | | $ | 14,689 | | | | 1.01 | %(d) | | | 1.27 | % | | | 0.95 | % | | | 0.68 | % | | | 28.28 | % |
| | — | | | $ | 23.74 | | | | 10.12 | % | | $ | 82,086 | | | | 1.00 | % | | | 1.12 | % | | | 0.85 | % | | | 0.73 | % | | | 36.66 | % |
| | — | | | $ | 21.52 | | | | 0.46 | % | | $ | 87,023 | | | | 1.12 | % | | | 1.16 | % | | | 1.12 | % | | | 1.08 | % | | | 43.59 | % |
| | — | | | $ | 20.60 | | | | 8.50 | % | | $ | 97,987 | | | | 1.18 | % | | | 1.18 | % | | | 1.05 | % | | | 1.05 | % | | | 12.85 | % |
See accompanying notes which are an integral part of these financial statements.
Annual Report
15
Notes to the Financial Statements
October 31, 2016
Note 1. Organization
The Foundry Partners Fundamental Small Cap Value Fund (the “Fund”) (formerly the Dreman Contrarian Small Cap Value Fund) is an open-end diversified series of the Valued Advisers Trust (the “Trust”). The Trust is a management investment company established under the laws of Delaware by an Agreement and Declaration of Trust dated June 13, 2008 (the “Trust Agreement”). The Trust Agreement permits the Board of Trustees (the “Board”) to issue an unlimited number of shares of beneficial interest of separate series without par value. The Fund is one of a series of funds authorized by the Board. The Fund’s investment adviser is Foundry Partners, LLC (the “Adviser”). Prior to June 21, 2016, Dreman Value Management, LLC served as the investment adviser to the Fund. The investment objective of the Fund is long-term capital appreciation.
The Fund currently offers Investor Class shares (Retail Class was renamed Investor Class on August 29, 2016) and Institutional Class shares. Effective on the close of business on August 29, 2016, Class A shares were consolidated into Investor Class shares.
Note 2. Significant Accounting Policies
The Fund is an investment company and follows accounting and reporting guidance under Financial Accounting Standards Board Accounting Standards Codification (“ASC”) Topic 946, “Financial Services-Investment Companies”. The following is a summary of significant accounting policies followed by the Fund in the preparation of its financial statements. These policies are in conformity with the generally accepted accounting principles in the United States of America (“GAAP”).
Estimates—The preparation of financial statements in conformity with GAAP requires management to make estimates and assumptions that affect the reported amounts of assets and liabilities and disclosure of contingent assets and liabilities at the date of the financial statements and the reported amounts of increases and decreases in net assets from operations during the reporting period. Actual results could differ from those estimates.
Securities Valuation—All investments in securities are recorded at their estimated fair value as described in Note 3.
Federal Income Taxes—The Fund makes no provision for federal income or excise tax. The Fund has qualified and intends to qualify each year as a regulated investment company (“RIC”) under subchapter M of the Internal Revenue Code of 1986, as amended, by complying with the requirements applicable to RICs and by distributing substantially all of its taxable income. The Fund also intends to distribute sufficient net investment income and net capital gains, if any, so that it will not be subject to excise tax on undistributed income and gains. If the required amount of net investment income or gains is not distributed, the Fund could incur a tax expense.
Annual Report
16
As of and during the fiscal year ended October 31, 2016, the Fund did not have a liability for any unrecognized tax benefits. The Fund recognizes interest and penalties, if any, related to unrecognized tax benefits as income tax expense in the statement of operations. During the fiscal year ended October 31, 2016 the fund did not incur any interest or penalties.
Expenses—Expenses incurred by the Trust that do not relate to a specific fund of the Trust are allocated to the individual funds based on each fund’s relative net assets or other appropriate basis (as determined by the Board). Expenses attributable to any class are borne by that class. Income, realized gains and losses, unrealized appreciation and depreciation, and expenses are allocated to each class based on the net assets in relation to the relative net assets of the Fund.
Security Transactions and Related Income—The Fund follows industry practice and records security transactions on the trade date for financial reporting purposes. The specific identification method is used for determining gains or losses for financial statement and income tax purposes. Dividend income is recorded on the ex-dividend date and interest income is recorded on an accrual basis. Discounts and premiums on securities purchased are accreted or amortized using the effective interest method, if applicable. Withholding taxes on foreign dividends have been provided for in accordance with the Fund’s understanding of the applicable country’s tax rules and rates.
The Fund holds REITs which pay dividends to their shareholders based upon available funds from operations. It is possible for these dividends to exceed the REIT’s underlying taxable earnings and profits resulting in the excess portion of such dividends being designated as a return of capital. Distributions received from REITs that represent a return of capital or capital gains are recorded as a reduction of the cost of the REITs or as a realized gain, respectively.
Dividends and Distributions—Distributions to shareholders, which are determined in accordance with income tax regulations, are recorded on the ex-dividend date. The Fund intends to distribute substantially all of its net investment income on at least an annual basis. The Fund intends to distribute its net realized long-term capital gains and its net realized short-term capital gains, if any, at least once a year. The treatment for financial reporting purposes of distributions made to shareholders during the year from net investment income or net realized capital gains may differ from their ultimate treatment for federal income tax purposes. These differences are caused primarily by differences in the timing of the recognition of certain components of income, expense or realized capital gain for federal income tax purposes. Where such differences are permanent in nature, they are reclassified in the components of the net assets based on their ultimate characterization for federal income tax purposes. Any such reclassifications will have no effect on net assets, results of operations or net asset values per share of the Fund.
For the fiscal year ended October 31, 2016, the Fund made the following reclassifications to increase/(decrease) the components of net assets:
| | | | | | | | |
Paid-in
Capital | | Accumulated
Undistributed Net
Investment Income | | | Accumulated Net
Realized Gain on
Investments | |
$ — | | $ | 153,097 | | | $ | (153,097 | ) |
Annual Report
17
Notes to the Financial Statements (Continued)
Note 3. Securities Valuation And Fair Value Measurements
Fair value is defined as the price that the Fund would receive upon selling an investment in a timely transaction to an independent buyer in the principal or most advantageous market of the investment. GAAP establishes a three-tier hierarchy to maximize the use of observable market data and minimize the use of unobservable inputs and to establish classification of fair value measurements for disclosure purposes.
Inputs refer broadly to the assumptions that market participants would use in pricing the asset or liability, including assumptions about risk (the risk inherent in a particular valuation technique used to measure fair value including such a pricing model and/or the risk inherent in the inputs to the valuation technique). Inputs may be observable or unobservable. Observable inputs are inputs that reflect the assumptions market participants would use in pricing the asset or liability developed based on market data obtained from sources independent of the reporting entity. Unobservable inputs are inputs that reflect the reporting entity’s own assumptions about the assumptions market participants would use in pricing the asset or liability developed based on the best information available in the circumstances.
Various inputs are used in determining the value of the Fund’s investments. These inputs are summarized in the three broad levels listed below.
| • | | Level 1—unadjusted quoted prices in active markets for identical investments and/or registered investment companies where the value per share is determined and published and is the basis for current transactions for identical assets or liabilities at the valuation date. |
| • | | Level 2—other significant observable inputs (including, but not limited to, quoted prices for an identical security in an inactive market, quoted prices for similar securities, interest rates, prepayment speeds, credit risk, etc.). |
| • | | Level 3—significant unobservable inputs (including the Fund’s own assumptions in determining fair value of investments based on the best information available). |
The inputs used to measure fair value may fall into different levels of the fair value hierarchy. In such cases, for disclosure purposes, the level in the fair value hierarchy which is reported is determined based on the lowest level input that is significant to the fair value measurement in its entirety.
Equity securities that are traded on any stock exchange are generally valued at the last quoted sale price on the security’s primary exchange. Lacking a last sale price, an exchange traded security is generally valued at its last bid price. Securities traded in the NASDAQ over-the-counter market are generally valued at the NASDAQ Official Closing Price. When using the market quotations and when the market is considered active, the security is classified as a Level 1 security. In the event that market quotations are not readily available or are considered unreliable due to market or other events, the Fund values its securities and other assets at fair value in accordance with policies established by and under the general supervision of the Board. Under these policies, the securities will be classified as Level 2 or 3 within the fair value hierarchy, depending on the inputs used.
Annual Report
18
Investments in mutual funds, including money market mutual funds, are generally priced at the ending net asset value (“NAV”) provided by the pricing agent of the Fund. These securities are categorized as Level 1 securities.
In accordance with the Trust’s valuation policies, the Adviser is required to consider all appropriate factors relevant to the value of securities for which it has determined other pricing sources are not available or reliable as described above. No single standard exists for determining fair value, because fair value depends upon the circumstances of each individual case. As a general principle, the current fair value of an issue of securities being valued by the Adviser would appear to be the amount that the owner might reasonably expect to receive for them upon their current sale. Methods that are in accordance with this principle may, for example, be based on (i) a multiple of earnings; (ii) a discount from market of a similar freely traded security (including a derivative security or a basket of securities traded on other markets, exchanges or among dealers); or (iii) yield to maturity with respect to debt issues, or a combination of these and other methods. Fair-value pricing is permitted if, in the Adviser’s opinion, the validity of market quotations appears to be questionable based on factors such as evidence of a thin market in the security based on a small number of quotations, a significant event occurs after the close of a market but before a Fund’s NAV calculation that may affect a security’s value, or the Adviser is aware of any other data that calls into question the reliability of market quotations.
The following is a summary of the inputs used to value the Fund’s investments as of October 31, 2016:
| | | | | | | | | | | | | | | | |
| | | | | | Valuation Inputs | | | | | | | |
| Assets | | Level 1 | | | Level 2 | | | Level 3 | | | Total | |
Common Stocks* | | $ | 130,166,740 | | | $ | 359,348 | | | $ | — | | | $ | 130,526,088 | |
Money Market Securities | | | 5,991,732 | | | | — | | | | — | | | | 5,991,732 | |
| | | | | | | | | | | | | | | | |
Total | | $ | 136,158,472 | | | $ | 359,348 | | | $ | — | | | $ | 136,517,820 | |
| * | Refer to Portfolio of Investments for industry classifications. |
The Fund did not hold any investments during the reporting period for which significant unobservable inputs (Level 3) were used in determining fair value; therefore, no reconciliation of Level 3 securities is included for this reporting period. The Fund did not hold any derivative instruments during the reporting period.
The Trust recognizes transfers between fair value hierarchy levels at the end of the reporting period. The transfers from Level 1 to Level 2 represent securities which were fair valued at the end of the period that were not at the beginning of the period. Transfers from Level 2 to Level 1 represent securities which were fair valued at the beginning of the period but not at October 31, 2016. The following is a summary of the transfers between Level 1 and Level 2 of the fair value hierarchy for the fiscal year ended October 31, 2016:
| | | | | | | | |
| | | Transfers from
Level 1 to Level 2 | | | Transfers from
Level 2 to Level 1 | |
Common Stocks | | $ | 359,348 | | | $ | — | |
Annual Report
19
Notes to the Financial Statements (Continued)
Note 4. Fees And Other Transactions With Affiliates And Other Service Providers
Under the terms of the management agreement between the Trust and the Adviser (the “Agreement”) for the Fund, the Adviser manages the Fund’s investments subject to oversight of the Board. As compensation for its management services, the Fund is obligated to pay the Adviser a fee computed and accrued daily and paid monthly at an annual rate of 0.85% of the average daily net assets of the Fund. For the fiscal year ended October 31, 2016, the Adviser and Dreman Value Management, LLC earned fees of $1,144,200 from the Fund. At October 31, 2016, the Fund owed $98,845 to the Adviser.
The Adviser has contractually agreed to waive its management fee and/or reimburse certain operating expenses, but only to the extent necessary so that the Fund’s net expenses, excluding brokerage fees and commissions, borrowing costs (such as interest expense and dividends on securities sold short), taxes, distribution and service (12b-1) fees, extraordinary expenses, and any indirect expenses (such as fees and expenses of acquired funds), do not exceed 1.25% of the net assets of the Fund.
Each fee waiver or expense reimbursement by the Adviser is subject to repayment by the Fund within the three fiscal years following the fiscal year in which the fee waiver or expense incurred, provided that the Fund is able to make the recoupment without exceeding the expense limitation that is in effect at the time of the recoupment or at the time of the fee waiver or expense reimbursement. As of October 31, 2016, the Adviser currently has made no previous reimbursements that may be recouped. The contractual agreement is in effect through February 28, 2018. The expense cap may not be terminated prior to this date except by the Board. For the fiscal year ended October 31, 2016, the Adviser did not waive any fees from the Fund.
The Trust retains Ultimus Asset Services, LLC (“Ultimus”), formerly Huntington Asset Services, Inc. (“HASI”), to provide the Fund with administrative, accounting, transfer agent and compliance services, including all regulatory reporting. For the fiscal year ended October 31, 2016, Ultimus earned fees of $226,790 for administrative services. At October 31, 2016, Ultimus was owed $18,962 for administrative services.
The officers and one Trustee of the Trust are members of management and/or employees of Ultimus. Unified Financial Securities, LLC (the “Distributor” or “Unified”) acts as the principal distributor of the Fund’s shares. Effective at the close of business on December 31, 2015, Ultimus Fund Solutions, LLC acquired HASI and the Distributor from Huntington Bancshares, Inc. (“HBI”). Prior to January 1, 2016, HASI and the Distributor were under common control by HBI.
The Fund has adopted a Distribution Plan (the “Plan”) pursuant to Rule 12b-1 under the Investment Company Act of 1940 as amended (the “1940 Act”). The Plan provides that the Fund will pay the Distributor or any registered securities dealer, financial institution or any other person (a “Recipient”) a fee aggregating at a rate of: 0.25% of the average daily net assets of the Investor Class shares (and prior to August 29, 2016, the Class A shares) in connection with the promotion and distribution of the Fund’s shares or the provision of personal services to shareholders, including, but not necessarily limited to, advertising, compensation to underwriters, dealers and selling personnel; the printing and mailing of prospectuses to other than current Fund
Annual Report
20
shareholders; the printing and mailing of sales literature; and servicing shareholder accounts. The Fund or the Adviser may pay all or a portion of these fees to any Recipient who renders assistance in distributing or promoting the sale of shares, or who provides certain shareholder services, pursuant to a written agreement. The Plan is a compensation plan, which means that compensation is paid regardless of 12b-1 expenses actually incurred. It is anticipated that the Plan will benefit shareholders because an effective sales program typically is necessary in order for the Fund to reach and maintain a sufficient size to achieve efficiently its investment objectives and to realize economies of scale. For the fiscal year ended October 31, 2016 (through August 29, 2016 for Class A shares), Class A shares 12b-1 expense incurred by the Fund was $6,139 and Investor Class shares 12b-1 expense incurred by the Fund was $108,499. The Fund owed $8,292 for Investor Class shares 12b-1 fees as of October 31, 2016.
Through the period ended August 29, 2016 (conclusion of operations for Class A shares), the Distributor received $2,868 from commissions earned on sales of Class A shares, of which $2,750 was re-allowed to intermediaries of the Fund. Certain officers of the Trust are officers of the Distributor and each such person may be deemed to be an affiliate of the Distributor.
The Fund may invest in certain affiliated money market funds which were managed by a formerly affiliated party of the Distributor. Income distributions earned from investments in this money market fund are recorded as dividend income from affiliates in the accompanying financial statements. A summary of the Fund’s investment in such affiliated money market funds is presented in the table below:
| | | | | | | | | | | | | | | | | | | | |
| Affiliated Fund | | 10/31/15
Fair Value | | | Purchases | | | Sales | | | 10/31/16
Fair Value | | | Income | |
Huntington Money Market Fund, Institutional Shares | | $ | 9,266,949 | | | $ | 365,372 | | | $ | (9,632,321 | ) | | $ | — | | | $ | 145 | |
Note 5. Purchases And Sales Of Securities
For the fiscal year ended October 31, 2016, purchases and sales of investment securities, other than short-term investments and short-term U.S. government obligations were as follows:
| | | | |
| | | Amount | |
Purchases | | | | |
U.S. Government Obligations | | $ | — | |
Other | | | 16,816,645 | |
Sales | | | | |
U.S. Government Obligations | | $ | — | |
Other | | | 36,555,502 | |
Note 6. Beneficial Ownership
The beneficial ownership, either directly or indirectly, of more than 25% of the voting securities of a fund creates a presumption of control of the fund, under Section 2(a)(9) of the 1940 Act. At October 31, 2016, Charles Schwab & Co., Inc. (“Schwab”) owned, as record shareholder, 50% of the outstanding shares of the Fund. It is not known whether Schwab or any of the underlying beneficial owners owned or controlled 25% or more of the voting securities of the Fund.
Annual Report
21
Notes to the Financial Statements (Continued)
Note 7. Federal Income Taxes
At October 31, 2016, the net unrealized appreciation (depreciation) of investments for tax purposes was as follows:
| | | | |
Gross Unrealized Appreciation | | $ | 18,394,016 | |
Gross Unrealized (Depreciation) | | $ | (8,960,007 | ) |
Net Unrealized Appreciation on Investments | | $ | 9,434,009 | |
At October 31, 2016, the difference between book basis and tax basis unrealized appreciation (depreciation) is attributable to the tax deferral of losses on wash sales and mark-to-market adjustments on passive foreign investment companies.
At October 31, 2016, the aggregate cost of securities for federal income tax purposes was $127,083,811 for the Fund.
At October 31, 2016, the Fund’s most recent fiscal year end, the components of distributable earnings (accumulated losses) on a tax basis were as follows:
| | | | | | | | | | | | | | | | |
| Fund | | Undistributed
Ordinary Income | | | Undistributed
Long-Term
Capital Gains | | | Unrealized
Appreciation/
(Depreciation)* | | | Total
Accumulated
Earnings/
(Defecit) | |
Foundry Partners Fundamental Small Cap Value Fund | | $ | 1,109,071 | | | $ | 2,665,055 | | | $ | 9,434,009 | | | $ | 13,208,135 | |
| * | The difference between book basis and tax basis unrealized appreciation (depreciation) is attributable to the tax deferral of losses on wash sales and mark-to-market adjustments on passive foreign investment companies. |
The tax character of distributions paid for the fiscal year ended October 31, 2016 was as follows:
| | | | | | | | | | | | | | | | | | | | |
| | | Distributions Paid From* | | | | | | | | | | |
| Fund | | Ordinary
Income | | | Net
Long-Term
Capital Gains | | | Total
Taxable
Distributions | | | Tax Return
of Capital | | | Total
Distributions
Paid | |
Foundry Partners Fundamental Small Cap Value Fund | | $ | 1,884,915 | | | $ | 14,032,057 | | | $ | 15,916,972 | | | $ | — | | | $ | 15,916,972 | |
The tax character of distributions paid for the fiscal year ended October 31, 2015 was as follows:
| | | | | | | | | | | | | | | | | | | | |
| | | Distributions Paid From* | | | | | | | | | | |
| Fund | | Ordinary
Income | | | Net
Long-Term
Capital Gains | | | Total
Taxable
Distributions | | | Tax Return
of Capital | | | Total
Distributions
Paid | |
Foundry Partners Fundamental Small Cap Value Fund | | $ | 4,167,704 | | | $ | 10,463,859 | | | $ | 14,631,563 | | | $ | — | | | $ | 14,631,563 | |
| * | The tax character of distributions paid may differ from the character of distributions shown on the statements of changes in net assets due to short-term capital gains being treated as ordinary income for tax purposes. |
Annual Report
22
Note 8. Commitments And Contingencies
The Fund indemnifies its officers and trustees for certain liabilities that may arise from performance of their duties to the Fund. Additionally, in the normal course of business, the Fund enters into contracts that contain a variety of representations and warranties which provide general indemnifications. The Fund’s maximum exposure under these arrangements is unknown, as this would involve future claims that may be made against the Fund that have not yet occurred.
Note 9. Subsequent Events
Management of the Fund has evaluated the need for disclosures and/or adjustments resulting from subsequent events through the date these financial statements were issued. Based upon this evaluation, management has determined there were no items requiring adjustment of the financial statements or additional disclosure.
Note 10. Proxy Voting Results (Unaudited)
On August 15, 2016, a special meeting of the shareholders of the Fund was held at the offices of the Trust for the purpose of approving a new investment advisory agreement between Foundry Partners, LLC and the Trust on behalf of the Fund and to transact such other business as may properly come before the special meeting and any postponement or adjournment thereof.
Below are the voting results for the Fund from the special meeting:
| | | | | | | | | | | | |
| | | For | | | Against | | | Abstain | |
To approve a new investment advisory agreement between Foundry Partners, LLC and the Trust on behalf of the Fund | | | 4,303,694 | | | | 13,928 | | | | 25,389 | |
| | | | | | | | | | | | |
| | | For | | | Against | | | Abstain | |
To transact such other business as may properly come before the special meeting and any postponement or adjournment thereof | | | 3,886,121 | | | | 435,968 | | | | 20,922 | |
Annual Report
23
Report of Independent Registered Public Accounting Firm
To the Shareholders of Foundry Partners Fundamental Small Cap Value Fund and
Board of Trustees of Valued Advisers Trust
We have audited the accompanying statement of assets and liabilities, including the portfolio of investments, of Foundry Partners Fundamental Small Cap Value Fund, formerly known as Dreman Contrarian Small Cap Value Fund (the “Fund”), a series of Valued Advisers Trust, as of October 31, 2016, and the related statement of operations for the year then ended, the statements of changes in net assets for each of the two years in the period then ended, and the financial highlights for each of the five years in the period then ended. These financial statements and financial highlights are the responsibility of the Fund’s management. Our responsibility is to express an opinion on these financial statements and financial highlights based on our audits.
We conducted our audits in accordance with the standards of the Public Company Accounting Oversight Board (United States). Those standards require that we plan and perform the audit to obtain reasonable assurance about whether the financial statements and financial highlights are free of material misstatement. An audit includes examining, on a test basis, evidence supporting the amounts and disclosures in the financial statements. Our procedures included confirmation of securities owned as of October 31, 2016, by correspondence with the custodian and brokers. An audit also includes assessing the accounting principles used and significant estimates made by management, as well as evaluating the overall financial statement presentation. We believe that our audits provide a reasonable basis for our opinion.
In our opinion, the financial statements and financial highlights referred to above present fairly, in all material respects, the financial position of Foundry Partners Fundamental Small Cap Value Fund as of October 31, 2016, the results of its operations for the year then ended, the changes in its net assets for each of the two years in the period then ended, and the financial highlights for each of the five years in the period then ended, in conformity with accounting principles generally accepted in the United States of America.
COHEN & COMPANY, LTD.
Cleveland, Ohio
December 23, 2016
Annual Report
24
Summary of Fund Expenses – (Unaudited)
As a shareholder of the Fund, you incur two types of costs: (1) transaction costs and (2) ongoing costs, including management fees, distribution and service (12b-1) fees and other Fund expenses. These Examples are intended to help you understand your ongoing costs (in dollars) of investing in the Fund and to compare these costs with the ongoing costs of investing in other mutual funds.
The Example is based on an investment of $1,000 invested at the beginning of the period and held for the entire period from May 1, 2016 through October 31, 2016.
Actual Expenses
The first line of the table for each class provides information about actual account values and actual expenses. You may use the information on these lines, together with the amount you invested, to estimate the expenses that you paid over the period. Simply divide your account value by $1,000 (for example, an $8,600 account value divided by $1,000 = 8.60), then multiply the result by the number in the first line under the heading entitled “Expenses Paid During Period” to estimate the expenses you paid on your account during this period.
Hypothetical Example for Comparison Purposes
The second line of the table for each class provides information about hypothetical account values and hypothetical expenses based on the Fund’s actual expense ratios and an assumed rate of return of 5% per year before expenses, which is not the Fund’s actual return. The hypothetical account values and expenses may not be used to estimate the actual ending account balances or expenses you paid for the period. You may use this information to compare the ongoing costs of investing in the Fund and other funds. To do so, compare this 5% hypothetical example with the 5% hypothetical examples that appear in the shareholder reports of the other funds.
Expenses shown in the table are meant to highlight your ongoing costs only and do not reflect any transactional costs, such as the fee imposed on short-term redemptions. Therefore, the second line of the table for each class is useful in comparing ongoing costs only, and will not help you determine the relative total costs of owning different funds. In addition, if these transaction costs were included, your costs would have been higher.
| | | | | | | | | | | | | | | | | | | | |
| | | | | | Beginning
Account
Value,
May 1, 2016 | | | Ending
Account Value,
October 31, 2016 | | | Expenses
Paid
During
Period (a) | | | Annualized
Expense
Ratio | |
|
Foundry Partners Fundamental Small Cap Value Fund | |
Investor Shares | | | Actual | | | $ | 1,000.00 | | | $ | 1,068.30 | | | $ | 7.28 | | | | 1.40 | % |
| | | | Hypothetical | (b) | | $ | 1,000.00 | | | $ | 1,018.10 | | | $ | 7.10 | | | | 1.40 | % |
Institutional Shares | | | Actual | | | $ | 1,000.00 | | | $ | 1,069.60 | | | $ | 5.96 | | | | 1.15 | % |
| | | | Hypothetical (b) | | | $ | 1,000.00 | | | $ | 1,019.38 | | | $ | 5.81 | | | | 1.15 | % |
| (a) | Expenses are equal to the Fund’s annualized expense ratios, multiplied by the average account value over the period, multiplied by 184/366 (to reflect the one-half year period). The annualized expense ratios reflect reimbursement of expenses by the Fund’s investment adviser for the period beginning May 1, 2016 through October 31, 2016. The “Financial Highlights” tables in the Fund’s financial statements, included in this report, also show the gross expense ratios, without such reimbursements. |
| (b) | Hypothetical assumes 5% annual return before expenses. |
Annual Report
25
Additional Federal Income Tax Information (Unaudited)
The Form 1099-DIV you receive in January 2017 will show the tax status of all distributions paid to your account in calendar year 2016. Shareholders are advised to consult their own tax adviser with respect to the tax consequences of their investment in the Fund. As required by the Internal Revenue Code and/or regulations, shareholders must be notified regarding the status of qualified dividend income for individuals and the dividends received deduction for corporations.
Qualified Dividend Income. The Fund designates approximately 100% or up to the maximum amount of such dividends allowable pursuant to the Internal Revenue Code, as qualified dividend income eligible for the reduced tax rate of 15%.
Dividends Received Deduction. Corporate shareholders are generally entitled to take the dividends received deduction on the portion of the Fund’s dividend distribution that qualifies under tax law. For the Fund’s calendar year 2016 ordinary income dividends, 100% qualifies for the corporate dividends received deduction.
For the year ended October 31, 2016, the Fund designated $14,032,057 as 20% long-term capital gain distributions.
Annual Report
26
Trustees and Officers (Unaudited)
The Board of Trustees supervises the business activities of the Trust. Each Trustee serves as a trustee until termination of the Trust unless the Trustee dies, resigns, retires or is removed.
The following table provides information regarding each of the Independent Trustees.
| | | | |
Name, Address*, (Age),
Position with Trust**,
Term of Position with Trust | | Principal Occupation During Past 5 Years | | Other Directorships |
Ira Cohen, 57,
Independent Trustee, June 2010 to present. | | Current: Independent financial services consultant since February 2005; Executive Vice President of Asset Management Services, Recognos Financial (since August 2015). | | Trustee and Audit Committee Chairman, Griffin Institutional Real Estate Access Fund, since May 2014. Trustee, Angel Oak Funds Trust, since October 2014. |
| Andrea N. Mullins, 49, Independent Trustee, December 2013 to present. | | Current: Private investor; Independent Contractor, Seabridge Wealth Management, LLC (since April 2014). | | None. |
| * | The address for each trustee and officer is 225 Pictoria Drive, Suite 450, Cincinnati, OH 45246. |
| ** | As of the date of this report, the Trust consists of 14 series. |
The following table provides information regarding the Trustee who is considered an “interested person” of the Trust, as that term is defined under the 1940 Act. Based on the experience of the Trustee, the Trust concluded that the individual described below is qualified to serve as a Trustee.
| | | | |
Name, Address*, (Age),
Position with Trust**,
Term of Position with Trust | | Principal Occupation During Past 5 Years | | Other Directorships |
R. Jeffrey Young, 52,
Trustee and Chairman, June 2010 to present. | | Current: Vice President and Director of Relationship Management, Ultimus Fund Solutions, LLC (since December 2015); President, Unified Financial Securities, LLC (since July 2015). Previous: President, Huntington Asset Services, Inc. (n/k/a Ultimus Asset Services, LLC) (April 2015 to December 2015), Director (May 2014 to December 2015), Senior Vice President (January 2010 to April 2015); Director, Unified Financial Securities, Inc. (n/k/a Unified Financial Securities, LLC) (May 2014 to December 2015); Chief Executive Officer, Huntington Funds (February 2010 to March 2015); Chief Executive Officer, Huntington Strategy Shares (November 2010 to March 2015); President and Chief Executive Officer, Dreman Contrarian Funds (March 2011 to February 2013). | | Trustee and Chairman, Capitol Series Trust, since September 2013. |
| * | The address for each trustee and officer is 225 Pictoria Drive, Suite 450, Cincinnati, OH 45246. |
| ** | As of the date of this report, the Trust consists of 14 series. |
Annual Report
27
Trustees and Officers (Unaudited) (Continued)
The following table provides information regarding the Officers of the Trust:
| | | | |
Name, Address*, (Age),
Position with Trust**,
Term of Position with Trust | | Principal Occupation During Past 5 Years | | Other Directorships |
| R. Jeffrey Young, 52, Trustee and Chairman, June 2010 to present; Principal Executive Officer and President, Valued Advisers Trust since February 2010. | | Current: Vice President and Director of Relationship Management, Ultimus Fund Solutions, LLC (since December 2015); President, Unified Financial Securities, LLC (since July 2015). Previous: President, Huntington Asset Services, Inc. (n/k/a Ultimus Asset Services, LLC) (April 2015 to December 2015), Director (May 2014 to December 2015), Senior Vice President (January 2010 to April 2015); Director, Unified Financial Securities, Inc. (n/k/a Unified Financial Securities, LLC) (May 2014 to December 2015); Chief Executive Officer, Huntington Funds (February 2010 to March 2015); Chief Executive Officer, Huntington Strategy Shares (November 2010 to March 2015); President and Chief Executive Officer, Dreman Contrarian Funds (March 2011 to February 2013). | | Trustee and Chairman, Capitol Series Trust, since September 2013. |
John C. Swhear, 55,
Chief Compliance Officer, AML Officer and Vice President, August 2008 to present. | | Current: Vice President, Unified Series Trust (since January 2016); Assistant Vice President and Associate Director of Compliance, Ultimus Fund Solutions, LLC (since December 2015); Chief Compliance Officer, Unified Financial Securities, LLC (since May 2007); Chief Compliance Officer and AML Officer, Capitol Series Trust (since September 2013). Previous: Vice President of Legal Administration and Compliance, Huntington Asset Services, Inc. (n/k/a Ultimus Asset Services, LLC) (April 2007 to December 2015), Director (May 2014 to December 2015); Director, Unified Financial Securities, Inc. (n/k/a Unified Financial Securities, LLC) (May 2014 to December 2015); President, Unified Series Trust (March 2012 to January 2016), Senior Vice President (May 2007 to March 2012); Secretary, Huntington Funds (April 2010 to February 2012). | | None. |
Carol J. Highsmith, 52,
Vice President, August 2008 to present; Secretary, March 2014 to present. | | Current: Assistant Vice President, Ultimus Fund Solutions, LLC (since December 2015). Previous: Secretary, Cross Shore Discovery Fund (May 2014 to February 2016); Employed in various positions with Huntington Asset Services, Inc. (n/k/a Ultimus Asset Services, LLC) (November 1994 to December 2015), most recently Vice President of Legal Administration (2005 to December 2015). | | None. |
Annual Report
28
| | | | |
Name, Address*, (Age),
Position with Trust**,
Term of Position with Trust | | Principal Occupation During Past 5 Years | | Other Directorships |
Matthew J. Miller, 40,
Vice President, December 2011 to present. | | Current: Assistant Vice President, Relationship Management, Ultimus Fund Solutions, LLC (since December 2015); President and Chief Executive Officer, Capitol Series Trust (since September 2013). Previous: Employed in various positions with Huntington Asset Services, Inc. (n/k/a Ultimus Asset Services, LLC) (since July 1998), most recently Vice President of Relationship Management (2005 to December 2015); Vice President, Huntington Funds (February 2010 to April 2015). | | None. |
| Bryan W. Ashmus, 43, Principal Financial Officer and Treasurer, December 2013 to present. | | Current: Vice President and Director of Financial Administration, Ultimus Fund Solutions, LLC (since December 2015); Chief Financial Officer and Treasurer, Cross Shore Discovery Fund (since June 2016). Previous: Vice President and Manager of Financial Administration, Huntington Asset Services, Inc.
(n/k/a Ultimus Asset Services, LLC) (September 2013 to December 2015); Chief Financial Officer and Treasurer, Huntington Strategy Shares and Huntington Funds Trust (November 2013 to April 2016); Vice President, Fund Administration, Citi Fund Services Ohio, Inc. (from May 2005 to September 2013). | | None. |
| * | The address for each trustee and officer is 225 Pictoria Drive, Suite 450, Cincinnati, OH 45246. |
| ** | As of the date of this report, the Trust consists of 14 series. |
OTHER INFORMATION
The Fund’s Statement of Additional Information (“SAI”) includes additional information about the trustees and is available without charge, upon request. You may call toll-free at (800) 247-1014 to request a copy of the SAI or to make shareholder inquiries.
Annual Report
29
Investment Advisory Agreement Approval (Unaudited)
At a meeting held on June 7-8, 2016, the Board of Trustees (the “Board”) considered the approval of the Investment Advisory Agreement (the “Agreement”) between Foundry Partners, LLC (“Foundry”) and Valued Advisers Trust (the “Trust”) with respect to the Foundry Partners Fundamental Small Cap Value Fund (the “Fund”). Foundry provided written information to the Board to assist the Board in its considerations.
The Board discussed the existing arrangements between Dreman Value Management, LLC (“Dreman”) (the current adviser to the Fund) and the Trust for the Fund, as well as the anticipated arrangements once Foundry assumes responsibilities as investment adviser. Counsel discussed with the Trustees the types of information and factors that the Board should consider in order to make an informed decision regarding the approval of the Agreement.
The Trustees expressed the view that, although they were considering the Agreement with Foundry, they believed they should take into account their prior experience with the portfolio managers who managed the Fund and would be managing the Fund – that is, they noted that Messrs. Roach and Tufano are joining Foundry as portfolio managers specifically responsible for managing the Fund. The Trustees reflected upon their experience with the portfolio managers, including the information furnished for the Board’s review and consideration at previous Board meetings, as well as information specifically prepared or presented at the June meeting. The Board noted that one of the portfolio managers of the Fund, David Dreman, would not be transitioning to Foundry, and they expressed the view that this should not diminish the level of services provided to the Fund, especially in light of the perceived additional support that would be provided by Foundry and the general view that Messrs. Roach and Tufano had been primarily responsible for the day-to-day management of the Fund recently.
The Board noted that it had recently conducted an annual review and renewal of the investment advisory agreement between the Trust and Dreman with respect to the Fund at its quarterly meeting held on December 8 and 9, 2015. In this regard, counsel noted that the responses to the prior Dreman 15c request were similar in light of the nature of the transaction (i.e., it is a team lift out). In addition to the comparative information provided at this December meeting, the Board requested and received information and reports relevant to the consideration of the approval of the Agreement, including: (i) proposals regarding the services and support that Foundry would provide to the Fund and its shareholders; (ii) presentations by Foundry addressing its investment philosophy, investment strategy, personnel, operations, and compliance program; (vi) disclosure information contained in Foundry’s Form ADV; and (vii) a memorandum from counsel, that summarized the fiduciary duties and responsibilities of the Board in reviewing and approving the Agreement, including the material factors and the types of information included in each factor that should be considered by the Board in order to make an informed decision. The Board also requested and received various informational materials including, without limitation: (i) documents containing information about Foundry, such as its financial condition, personnel and services, investment performance, estimated Fund expenses, compliance program, legal matters, and other general information; (ii) comparative expense and performance information for other mutual funds with strategies similar to the Fund and
Annual Report
30
performance of other accounts to be managed by Foundry similar to the Fund; (iii) the anticipated effect of size on the Fund’s performance and expenses; and (iv) conflicts of interest and benefits to be realized by Foundry from its relationship with the Fund. In considering the foregoing, the Board also considered the ability of Foundry to continue to provide a similar level and quality of services to the Fund as previously provided by Dreman. The Trustees observed that certain portfolio and trading personnel of Dreman, including two of the portfolio managers responsible for managing the Fund, would continue in similar capacities with Foundry. The Trustees further noted that Foundry represented that no significant changes to the Fund’s management or operations were anticipated. Accordingly, the Trustees expressed the view that their previous experiences with Dreman were relevant to their consideration of each of the factors described below. The Board did not identify any particular factor that was most relevant to its consideration to approve the Agreement and each Trustee may have afforded different weight to the various factors.
| 1. | The nature, extent, and quality of the services to be provided by Foundry. In this regard, the Board considered responsibilities that Foundry would have under the Agreement. The Trustees considered the services to be provided by Foundry to the Fund and the Trustees’ experience with Dreman in providing similar services, including without limitation: the quality of advisory services (including research and recommendations on portfolio securities), the process for formulating investment recommendations and assuring compliance with the Fund’s investment objectives and limitations, the coordination of services for the Fund among its service providers, and efforts to promote the Fund and grow its assets. The Trustees further considered Dreman’s prior continuity of, and commitment to retain, qualified personnel and the fact that Foundry appeared to have this same level of commitment, Dreman’s past and Foundry’s anticipated commitment to maintain appropriate resources and systems, and Dreman’s past and Foundry’s anticipated cooperation with the Board, Trust management, and counsel. The Trustees considered the education and experience of Foundry personnel and Foundry’s compliance program, as well as the education and experience of the two portfolio managers who would be transitioning from Dreman to Foundry. The Trustees specifically acknowledged the fact that most of the personnel associated with the day-to-day management of the Fund at Dreman would remain intact at Foundry. After considering the foregoing information and further information in the meeting materials provided by Dreman and Foundry, the Board concluded that, in light of all the facts and circumstances, the nature, extent, and quality of the services proposed by Foundry will be satisfactory and adequate for the Fund. |
| 2. | Investment Performance of the Fund and Foundry. In considering the investment performance of the Fund, the Trustees compared the performance of the Fund to the performance of funds with similar objectives managed by other investment advisers, as well as with aggregated peer group data. The Trustees also considered the consistency of the portfolio managers’ management of the Fund with its investment objective, strategies, and limitations. The Trustees further considered the performance of other clients managed by |
Annual Report
31
Investment Advisory Agreement Approval (Unaudited) (Continued)
| | the portfolio managers that are moving from Dreman to Foundry. After reviewing and discussing the investment performance of the Fund, the experience of the portfolio managers in managing the Fund, the Fund’s and Foundry’s historical performance, and other relevant factors, the Board concluded, in light of all the facts and circumstances, that the investment performance of the Fund and its portfolio managers was and should continue to be satisfactory. |
| 3. | The costs of the services to be provided and profits to be realized by Foundry from the relationship with the Fund. In considering the costs of services to be provided and the profits to be realized by Foundry from the relationship with the Fund, the Trustees considered: (1) Foundry’s financial condition; (2) the current and projected asset levels of the Fund; (3) the overall expenses of the Fund; and (4) the nature and frequency of advisory fee payments. The Trustees reviewed information provided by Foundry regarding its expected profits associated with managing the Fund. The Trustees also considered potential benefits for Foundry in managing the Fund. The Trustees then compared the fees and expenses of the Fund (including the management fee) to other comparable mutual funds. The Trustees noted that the Fund’s management fee and net expense ratio is below the average and median for funds of similar size and class structure in the Fund’s Morningstar category. The Board also reviewed the Fund’s management fee and net expense ratio relative to certain select peers identified by Foundry as competitive funds, noting that the Fund’s management fee is below the peer group’s average and median, but the Fund’s net expense ratio is slightly above the peer group average and median. The Trustees acknowledged the commitment of Foundry to continue to limit the expenses of the Fund going forward at levels that were currently in place. Based on the foregoing, the Board concluded that the fees to be paid to Foundry by the Fund and the anticipated profits to be realized by Foundry, in light of all the facts and circumstances, are fair and reasonable in relation to the nature and quality of the services to be provided by Foundry. |
| 4. | The extent to which economies of scale would be realized as the Fund grows and whether advisory fee levels reflect these economies of scale for the benefit of the Fund’s investors. In this regard, the Board considered the Fund’s proposed fee arrangements with Foundry, noting that the proposed management fee is the same as the current fee paid to Dreman. The Board considered that while the management fee remained the same at all asset levels, the Fund’s shareholders could experience benefits from the Fund’s expense limitation arrangement. The Trustees noted that the Fund, at its current asset levels, was operating right at the capping level of the expense limitation arrangement. The Trustees expressed the view that the expense limitation arrangements were more beneficial than breakpoints in an advisory fee structure in that the expense limitation arrangement provided substantially similar benefits as breakpoints without the Fund having to achieve high asset levels and it provided an element of assurance that the overall fees of the Fund would remain no higher than the cap in the event assets of the Fund were to decline. The Trustees noted that once the Fund’s expenses fell below the expense limit, the Fund’s shareholders would continue to |
Annual Report
32
| | benefit from the economies of scale under the Fund’s agreements with service providers other than Foundry – the Trustees expressed the view that this weighed favorably on the assessment of economies of scale as Foundry determined to continue to manage the Fund in the Trust as a result of this structure rather than seek to reorganize the Fund to another service provider. In light of its ongoing consideration of the Fund’s current and expected asset levels and fee levels, the Board determined that the Fund’s fee arrangements, in light of all the facts and circumstances, are fair and reasonable, economies of scale are and would continue to be realized in light of all of the arrangements that would be in place with Foundry serving as the investment adviser to the Fund. |
| 5. | Possible conflicts of interest and benefits to Foundry. In considering Foundry’s mitigation of conflicts of interest, the Trustees evaluated the potential for conflicts of interest and considered such matters as the experience and ability of the advisory personnel to be assigned to the Fund; the basis of decisions to buy or sell securities for the Fund and Foundry’s other accounts (including the use of soft dollars); and the substance and anticipated administration of Foundry’s code of ethics. The Trustees also considered disclosure in the registration statement of the Trust relating to potential conflicts of interest. In addition to the fees associated with managing the Fund and the potential for using soft dollars, the Trustees noted Foundry’s potential benefit of the publicity associated with managing a public mutual fund and promoting the brand of Foundry. Based on the foregoing, the Board determined that the standards and practices of Foundry relating to the identification and mitigation of potential conflicts of interest and the benefits that it derives from managing the Fund are acceptable. |
After additional consideration of the factors delineated in the memorandum provided by counsel and further discussion among the Board members, the Board determined to approve the Agreement between the Trust and Foundry.
Annual Report
33
Valued Advisers Trust
PRIVACY POLICY
The following is a description of the policies of the Valued Advisers Trust (the “Trust”) regarding disclosure of nonpublic personal information that shareholders provide to a series of the Trust (each, a “Fund”) or that the Fund collects from other sources. In the event that a shareholder holds shares of a Fund through a broker-dealer or other financial intermediary, the privacy policy of the financial intermediary would govern how shareholder nonpublic personal information would be shared with nonaffiliated third parties.
Categories of Information a Fund May Collect. A Fund may collect the following nonpublic personal information about its shareholders:
| • | | Information the Fund receives from a shareholder on applications or other forms, correspondence, or conversations (such as the shareholder’s name, address, phone number, social security number, and date of birth); and |
| • | | Information about the shareholder’s transactions with the Fund, its affiliates, or others (such as the shareholder’s account number and balance, payment history, cost basis information, and other financial information). |
Categories of Information a Fund May Disclose. A Fund may not disclose any nonpublic personal information about its current or former shareholders to unaffiliated third parties, except as required or permitted by law. A Fund is permitted by law to disclose all of the information it collects, as described above, to its service providers (such as the Fund’s custodian, administrator, transfer agent, accountant and legal counsel) to process shareholder transactions and otherwise provide services to the shareholder.
Confidentiality and Security. Each Fund shall restrict access to shareholder nonpublic personal information to those persons who require such information to provide products or services to the shareholder. Each Fund shall maintain physical, electronic, and procedural safeguards that comply with federal standards to guard shareholder nonpublic personal information.
Disposal of Information. The Funds, through their transfer agent, have taken steps to reasonably ensure that the privacy of a shareholder’s nonpublic personal information is maintained at all times, including in connection with the disposal of information that is no longer required to be maintained by the Funds. Such steps shall include, whenever possible, shredding paper documents and records prior to disposal, requiring off-site storage vendors to shred documents maintained in such locations prior to disposal, and erasing and/or obliterating any data contained on electronic media in such a manner that the information can no longer be read or reconstructed.
Annual Report
34
PROXY VOTING
A description of the policies and procedures that the Fund uses to determine how to vote proxies relating to portfolio securities and information regarding how the Fund voted those proxies during the most recent twelve month period ended June 30, is available without charge upon request by (1) calling the Fund at (800) 247-1014 and (2) from Fund documents filed with the Securities and Exchange Commission (“SEC”) on the SEC’s website at www.sec.gov.
TRUSTEES
R. Jeffrey Young, Chairman
Ira P. Cohen
Andrea N. Mullins
OFFICERS
R. Jeffrey Young, Principal Executive Officer and President
Bryan W. Ashmus, Principal Financial Officer and Treasurer
John C. Swhear, Chief Compliance Officer, AML Officer and Vice-President
Carol J. Highsmith, Vice President and Secretary
Matthew J. Miller, Vice President
INVESTMENT ADVISER
Foundry Partners, LLC
510 First Avenue North, Suite 409
Minneapolis, MN 55403
DISTRIBUTOR
Unified Financial Securities, LLC
9465 Counselors Row, Suite 200
Indianapolis, IN 46240
INDEPENDENT REGISTERED PUBLIC ACCOUNTING FIRM
Cohen & Company, Ltd.
1350 Euclid Avenue, Suite 800
Cleveland, OH 44115
LEGAL COUNSEL
The Law Offices of John H. Lively & Associates, Inc.
A member firm of The 1940 Act Law Group TM
11300 Tomahawk Creek Parkway, Suite 310
Leawood, KS 66211
CUSTODIAN
Huntington National Bank
41 South High Street
Columbus, OH 43215
ADMINISTRATOR, TRANSFER AGENT AND FUND ACCOUNTANT
Ultimus Asset Services, LLC
225 Pictoria Drive, Suite 450
Cincinnati, OH 45246
This report is intended only for the information of shareholders or those who have received the Fund’s prospectus which contains information about the Fund’s management fee and expenses. Please read the prospectus carefully before investing.
Distributed by Unified Financial Securities, LLC
Member FINRA/SIPC

DANA LARGE CAP EQUITY FUND
DANA SMALL CAP EQUITY FUND
Annual Report
October 31, 2016
Dana Investment Advisors, Inc.
20700 Swenson Drive, Suite 400
Waukesha, WI 53186
(855) 280-9648
www.danafunds.com
Dear Fellow Shareholders,
We are once again pleased to offer you this annual report for the Dana Funds (Dana Large Cap Equity Fund and Dana Small Cap Equity Fund) for the 12-month period ended October 31, 2016. In the last 12 months, we expanded our offerings with the Dana Small Cap Equity Fund (the “Small Cap Fund”) and hit a new high mark for assets in the Dana Large Cap Equity Fund (the “Large Cap Fund”). This proved to be a challenging year in the markets as the Large Cap Fund (Institutional Class) returned -1.66% for the year ended October 31, 2016 and the Small Cap Fund (Institutional Class) returned -6.87% for the period from November 3, 2015 (inception date) through October 31, 2016. Investors grappled with several macro-oriented factors including interest rate policies domestically and abroad, China’s variable growth prospects, and a particularly contentious U.S. election year. At the beginning of the Funds’ fiscal year, we saw returns accrue to a narrow group of large, high valuation stocks. At Dana Investment Advisors, we are determined not to overpay for growth and the Funds were underweighted with respect to companies trading at higher valuations. More recently, low-quality stocks (i.e. low return on equity and highly leveraged balance sheets) have garnered investor attention. Our investment analysis emphasizes company fundamentals and yielded holdings with good relative earnings and cash flow growth (despite an earnings recession), balance sheet strength, and attractive valuations relative to peers. The Large Cap and Small Cap Funds’ holdings have outperformed their respective benchmarks in terms of actual earnings growth, and we believe both are well positioned to benefit as investor interest and focus returns to improving fundamentals. We know our shareholders have many investment options to choose from, and we wish to thank you for your support.
Economic and Market Recap:
The market gave up some ground in the final two months of 2015, after performing quite strong in October 2015. The first six weeks of 2016 saw even more pronounced declines, with mounting concerns regarding China’s slowing growth, a potential rate hike in the U.S., and the adoption of negative interest rates in Japan. By February 11th, the S&P 500® Index (“S&P 500”) was down -11.4%, and indexes covering mid-cap, small-cap and international stocks were down even more. Fed Chair Janet Yellen’s congressional testimony in February helped to stabilize markets, and Jamie Dimon’s announcement of his purchase of JP Morgan Chase & Co. stock marked the beginning of a rebound in stocks. Bonds rallied as well. Interest rate sensitive stocks performed well, with utilities delivering double-digit returns in the first quarter. However, earnings revisions continued to be negative and market valuations remained high compared to historical valuations.
Markets moved sideways for most of the second quarter of this year. Economic data was positive, but lackluster. Earnings growth continued to be negative year-over-year, although earnings reports began to exceed their much lowered expectations. The quarter ended with a bang, delivered from overseas, when the U.K voted to leave the EU (European Union) in a referendum on June 23rd. This surprising “Brexit” vote caused stocks to slide for two days. A rebound in U.S. stocks on the final three days of the quarter reversed almost all of the decline, and the S&P 500 and the Russell 2000® Indexes and the Large Cap and Small Cap Funds finished in positive territory.
The rebound continued in early summer, and the strength in July outweighed the waning period of August and September, resulting in another positive return for both Funds and their respective benchmarks. Small-cap stocks handily outperformed large-cap stocks and investors gained confidence in the earnings outlook. In fact, third quarter earnings reports might tip into positive territory, ending an approximately 18 month period of an earnings recession. Once again,
1
expectations for an interest rate hike reappeared. However at this point the Fed remains reluctant to act in the midst of an extremely heated election period. Stocks rallied in the last bit of September only to correct in October, the last month of the Funds’ fiscal year.
Dana Large Cap Equity Fund Performance:
The Large Cap Fund lagged the S&P 500 during the twelve months ended October 31, 2016. The Fund experienced two headwinds during this time period. Initially the Fund lagged as a small number of large, high valuation growth stocks had a pronounced impact on the Index. Our process of focusing on companies with growth at relatively attractive valuations led to an underweight in these stocks. Second, lower quality stocks, many with no earnings and poor balance sheets rallied. While we expect corporate earnings to improve, the degree to which these low-quality names rebounded seems excessive and risky to us.
In terms of sectors, Fund holdings within Energy, Real Estate (a new sector, added in August) and Utilities performed well. Weakest performance was seen in Consumer Staples, Consumer Discretionary and Materials stocks. We saw strong double-digit returns in a number of holdings. Spectra Energy, a pipeline company, recovered with stable to improving oil prices and then received an offer to be bought by Canadian company, Enbridge. The stock moved up significantly on this announcement. Information Technology stocks in general were up strongly and holdings such as Lam Research Corporation, a semiconductor equipment maker, Electronic Arts Inc., and Broadridge Financial Solutions, Inc. were some of the top performing holdings in the Fund. Weakness in Consumer companies detracted from returns for the year. Royal Caribbean Cruises, LLC, a leading performer in our prior fiscal year, disappointed this year as earnings results came in below expectations. Retailers including Macy’s Inc., Dollar General Corporation and Lowe’s failed to meet expectations, too. Campbell Soup Company guided earnings and revenue lower recently as some of their organic offerings met with greater competition.
Fund collective holdings have displayed consistent positive earnings growth despite six quarters of earnings declines for the S&P 500. Overall, the Large Cap Fund holdings have seen positive earnings revisions to expected future income and revenue projections. We believe this positions the Fund well for an environment that becomes more focused on fundamentals.
Dana Small Cap Equity Fund Performance:
The Small Cap Fund lagged its benchmark for the period November 3, 2015 through October 31, 2016. Toward the end of last year and into the early months of 2016, corporate earnings downgrades were significant. While the Fund’s holdings performed better than the Index in terms of earnings beats (earnings matching or beating expectations), those companies that failed to exceed expectations were severely punished in the marketplace. The Fund held several stocks in the Healthcare sector that reacted well to better earnings and upward revisions. Emergent BioSolutions, Inc. and Globus Medical, Inc. were strong in the latter part of 2015 and AMN Healthcare Services, Inc. and VCA, Inc. rose strongly in the first quarter of 2016 after delivering strong earnings and revenue growth. Information Technology holdings lagged in the early months of the fiscal year. Blackhawk Network Holding, Inc. was weak as was Federal Signal Corporation after lowering guidance for the first quarter and year.
During the second and third quarters of 2016, small cap stocks gained momentum, led by a strong recovery in low-quality stocks. The Small Cap Fund delivered positive performance in these quarters,
2
but did not keep up with the Russell 2000® Index. Indeed by the third quarter, companies with no earnings delivered double-digit returns on average. Likewise, companies within high beta, high price-to-earnings, high debt-to-capital and low ROE (Return on Equity) quintiles outperformed. The Fund holdings did not participate to the same extent in this type of rally as our process is focused on identifying and selecting strong companies with strong fundamentals and balance sheets as well as attractive relative valuations. During this timeframe, Healthcare holdings continued to perform well. Also Industrial holdings such as Dycom Industries benefited from telecom/cable capex growth and Patrick Industries, Inc. experienced solid growth in mobile homes and recreational vehicles in the second quarter. Materials holdings added value in the third quarter. Chemtura jumped nearly 25% when management agreed to a takeover offer by Lanxess and Berry Plastics Group, Inc. delivered a double-digit return after reporting another stronger than expected quarter. Consumer Discretionary stocks, Sonic Corp. and Express, Inc., disappointed investors with poor same-store-sales results in the second quarter and Financial holdings were weak in the third quarter.
Our analysis shows that the Small Cap Fund holdings are trading at attractive relative valuations versus its benchmark and are performing well in terms of actual earnings and cash flow generation. Our focus remains on company fundamentals, and we believe patient investors will be rewarded in time.
Post-Election Note:
At this writing the long-awaited election results are in. President-elect Trump and a Republican Congress will take hold of the reins in the New Year. This has been a contentious time for U.S. citizens, a time that revealed some deep-seated divisions amongst people. Issues of economic disparity, values, race, and gender were on display for the world to see. At this juncture, the stock market seems positively disposed to the potential benefits of tax cuts and fiscal spending on infrastructure, while the yield curve is rising in anticipation of rising inflation and debt. Given the high levels of uncertainty, we remain laser-focused on building the best portfolio for our shareholders, buying stocks with better earnings and cash flow generation versus the market, at more attractive valuations versus peers.
Respectfully submitted,

Mark R. Mirsberger, CPA
Chief Executive Officer – Dana Investment Advisors, Inc.

Duane Roberts, CFA
Portfolio Manager and Director of Equities – Dana Investment Advisors, Inc.
3
Investment Results (Unaudited)
Average Annual Total Returns(a) as of October 31, 2016
| | | | | | | | | | | | | | | | | | | | | | | | |
| | | One Year | | | Three Year | | | Five Year | | | Since Inception (3/1/10) | | | Since Inception (7/28/10) | | | Since Inception (10/29/13) | |
Dana Large Cap Equity Fund | | | | | | | | | | | | | | | | | |
Class A with Load | | | (6.83)% | | | | 3.90% | | | | 9.86% | | | | N/A | | | | 10.23% | | | | N/A | |
Class A without Load | | | (1.91)% | | | | 5.69% | | | | 10.99% | | | | N/A | | | | 11.14% | | | | N/A | |
Class N | | | (1.91)% | | | | 5.71% | | | | 11.11% | | | | 12.08% | | | | N/A | | | | N/A | |
Institutional Class | | | (1.66)% | | | | 6.01% | | | | N/A | | | | N/A | | | | N/A | | | | 6.10% | |
S&P 500® Index(b) | | | 4.51% | | | | 8.84% | | | | 13.57% | | | | 12.50% | | | | 13.39% | | | | 8.51% | |
| | | | | | | Expense Ratios(c) | | | | | | | | | |
| | | | | | Class A | | | Class N | | | Institutional Class | | | | | | | |
Gross | | | | | | | 1.25% | | | | 1.25% | | | | 1.00% | | | | | | | | | |
With Applicable Waivers | | | | | | | 0.98% | | | | 0.98% | | | | 0.73% | | | | | | | | | |
The performance quoted represents past performance, which does not guarantee future results. The investment return and principal value of an investment will fluctuate so that an investor’s shares, when redeemed, may be worth more or less than their original cost. The returns shown do not reflect deduction of taxes that a shareholder would pay on Dana Large Cap Equity Fund (the “Large Cap Fund”) distributions or the redemption of Large Cap Fund shares. Current performance of the Large Cap Fund may be lower or higher than the performance quoted. The Large Cap Fund’s investment objectives, risks, charges and expenses must be considered carefully before investing. Performance data current to the most recent month end may be obtained by calling 1-855-280-9648.
(a) Average annual total returns reflect any change in price per share and assume the reinvestment of all distributions. The Large Cap Fund’s returns reflect any fee reductions during the applicable period. If such reductions had not occurred, the quoted performance would have been lower. Returns figures for Class A with load include the maximum 5.00% sales charge.
(b) The S&P 500® Index (“Index”) is widely recognized unmanaged index of equity securities and is representative of a broader domestic equity market and range of securities than is found in the Large Cap Fund’s portfolio. Individuals cannot invest directly in the Index; however, an individual can invest in exchange traded funds or other investment vehicles that attempt to track the performance of a benchmark index.
(c) The expense ratios are from the Large Cap Fund’s prospectus dated February 29, 2016. The Dana Investment Advisors, Inc. (the “Adviser”) has contractually agreed to reimburse or limit its fees and to assume other expenses of the Large Cap Fund until February 28, 2017, so that total annual fund operating expenses does not exceed 0.73%. This operating expense limitation does not apply to brokerage fees and commissions, borrowing costs (such as interest and dividend expenses on securities sold short), taxes, extraordinary expenses, fees and expenses paid under a distribution plan adopted pursuant to Rule 12b-1, fees and expenses paid under a shareholder services plan, and indirect expenses (such as “Acquired Funds Fees and Expenses”). Each fee waiver or reimbursement of an expense by the Adviser is subject to repayment by the Large Cap Fund within three years following the fiscal year in which the fee waiver or expense reimbursement occurred, provided that the Large Cap Fund is able to make the repayment without exceeding the expense limitation in place at the time of the fee waiver or expense reimbursement. This agreement may only be terminated by mutual consent of the Adviser and the Board of Trustees. Additional information pertaining to the Large Cap Fund’s expense ratios as of October 31, 2016 can be found in the financial highlights.
The Large Cap Fund’s investment objectives, strategies, risks, charges and expenses must be considered carefully before investing. The prospectus contains this and other important information about the Large Cap Fund and may be obtained by calling the same number as above. Please read it carefully before investing.
The Large Cap Fund is distributed by Unified Financial Securities, LLC, member FINRA/SIPC.
4
Investment Results (Unaudited)
Total Return(a) as of October 31, 2016
| | | | | | | | |
| | | Since Inception (11/3/15) | | | | |
Dana Small Cap Equity Fund | | | | | |
Institutional Class | | | (6.87)% | | | | | |
Investor Class | | | (7.13)% | | | | | |
Russell 2000® Index(b) | | | 1.51% | | | | | |
| | | Expense Ratios(c) | |
| | | Institutional Class | | | Investor Class | |
Gross | | | 2.49% | | | | 2.74% | |
With Applicable Waivers | | | 0.95% | | | | 1.20% | |
The performance quoted represents past performance, which does not guarantee future results. The investment return and principal value of an investment will fluctuate so that an investor’s shares, when redeemed, may be worth more or less than their original cost. The returns shown do not reflect deduction of taxes that a shareholder would pay on Dana Small Cap Equity Fund (the “Small Cap Fund”) distributions or the redemption of Small Cap Fund shares. Current performance of the Small Cap Fund may be lower or higher than the performance quoted. The Small Cap Fund’s investment objectives, risks, charges and expenses must be considered carefully before investing. Performance data current to the most recent month end may be obtained by calling 1-855-280-9648.
(a) Return figures reflect any change in price per share and assume the reinvestment of all distributions. The Small Cap Fund’s returns reflect any fee reductions during the applicable period. If such reductions had not occurred, the quoted performance would have been lower.
(b) The Russell 2000® Index (“Russell Index”) is a widely recognized unmanaged index of equity securities and is representative of a broader domestic equity market and range of securities than are found in the Small Cap Fund’s portfolio. Individuals can not invest directly in the Russell Index; however, an individual can invest in ETFs or other investment vehicles that attempt to track the performance of a benchmark index.
(c) The expense ratios are from the Small Cap Fund’s prospectus dated February 29, 2016. The Adviser has contractually agreed to waive or limit its fees and to reimburse other expenses of the Small Cap Fund until February 28, 2017, so that total annual fund operating expenses does not exceed 0.95%. This operating expense limitation does not apply to brokerage fees and commissions, borrowing costs (such as interest and dividend expenses on securities sold short), taxes, extraordinary expenses, fees and expenses paid under a distribution plan adopted pursuant to Rule 12b-1, fees and expenses paid under a shareholder services plan, and indirect expenses (such as “Acquired Funds Fees and Expenses”). Each fee waiver or reimbursement of an expense by the Adviser is subject to repayment by the Small Cap Fund within three years following the fiscal year in which the fee waiver or expense reimbursement occurred, provided that the Small Cap Fund is able to make the repayment without exceeding the expense limitation in place at the time of the fee waiver or expense reimbursement. This agreement may only be terminated by mutual consent of the Adviser and the Board of Trustees. Additional information pertaining to the Small Cap Fund’s expense ratios as of October 31, 2016 can be found in the financial highlights.
The Small Cap Fund’s investment objectives, strategies, risks, charges and expenses must be considered carefully before investing. The prospectus contains this and other important information about the Small Cap Fund and may be obtained by calling the same number as above. Please read it carefully before investing.
The Small Cap Fund is distributed by Unified Financial Securities, LLC, member FINRA/SIPC.
5
Comparison of Growth of $10,000 Investment in the Dana Large Cap Equity Fund, Class N and the S&P 500® Index (Unaudited)
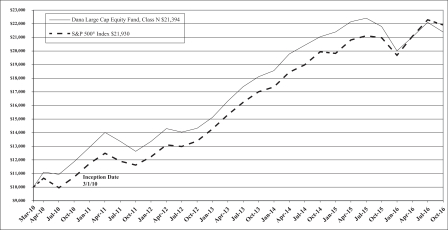
The chart above assumes an initial investment of $10,000 made on March 1, 2010 (commencement of Class N operations) held through October 31, 2016. THE FUND’S RETURN REPRESENTS PAST PERFORMANCE AND DOES NOT GUARANTEE FUTURE RESULTS. The returns shown do not reflect deduction of taxes that a shareholder would pay on Fund distributions or the redemption of Fund shares. Investment returns and principal values will fluctuate so that your shares, when redeemed, may be worth more or less than their original purchase price.
Current performance may be lower or higher than the performance data quoted. For more information on the Fund, and to obtain performance data current to the most recent month end or to request a prospectus, please call 1-855-280-9648. You should carefully consider the investment objectives, potential risks, management fees, and charges and expenses of the Fund before investing. The Fund’s prospectus contains this and other information about the Fund, and should be read carefully before investing.
The Fund is distributed by Unified Financial Securities, LLC, member FINRA/SIPC.
6
Comparison of Growth of $10,000 Investment in the Dana Small Cap Equity Fund, Investor Class and the Russell 2000® Index (Unaudited)
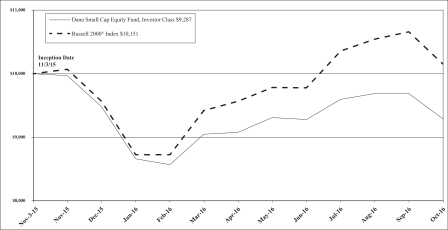
The chart above assumes an initial investment of $10,000 made on November 3, 2015 (commencement of Investor Class operations) held through October 31, 2016. THE FUND’S RETURN REPRESENTS PAST PERFORMANCE AND DOES NOT GUARANTEE FUTURE RESULTS. The returns shown do not reflect deduction of taxes that a shareholder would pay on Fund distributions or the redemption of Fund shares. Investment returns and principal values will fluctuate so that your shares, when redeemed, may be worth more or less than their original purchase price.
Current performance may be lower or higher than the performance data quoted. For more information on the Fund, and to obtain performance data current to the most recent month end or to request a prospectus, please call 1-855-280-9648. You should carefully consider the investment objectives, potential risks, management fees, and charges and expenses of the Fund before investing. The Fund’s prospectus contains this and other information about the Fund, and should be read carefully before investing.
The Fund is distributed by Unified Financial Securities, LLC, member FINRA/SIPC.
7
Portfolio Illustration (Unaudited)
October 31, 2016
The following chart gives a visual breakdown of the Large Cap Fund by sector weighting as a percentage of the fair value of portfolio investments.
8
Portfolio Illustration (Unaudited)
October 31, 2016
The following chart gives a visual breakdown of the Small Cap Fund by sector weighting as a percentage of the fair value of portfolio investments.
Availability of Portfolio Schedule – (Unaudited)
The Large Cap Fund and the Small Cap Fund (each a “Fund” and collectively the “Funds”) file their complete schedule of portfolio holdings with the Securities and Exchange Commission (“SEC”) for the first and third quarters of each fiscal year on Form N-Q. The Funds’ Form N-Q is available at the SEC’s website at www.sec.gov. The Funds’ Form N-Q may be reviewed and copied at the Public Reference Room in Washington DC. Information on the operation of the Public Reference Room may be obtained by calling 1-800-SEC-0330.
9
Dana Large Cap Equity Fund
Schedule of Investments
October 31, 2016
| | | | | | | | |
| Shares | | | | | Fair Value | |
| | Common Stocks – 99.09% | | | | |
| | |
| | | | Consumer Discretionary – 12.36% | | | | |
| | 54,000 | | | Comcast Corp., Class A | | $ | 3,338,280 | |
| | 123,600 | | | D.R. Horton, Inc. | | | 3,563,388 | |
| | 29,000 | | | Lear Corp. | | | 3,560,620 | |
| | 51,900 | | | Lowe’s Companies, Inc. | | | 3,459,135 | |
| | 70,700 | | | Newell Brands, Inc. | | | 3,395,014 | |
| | 52,000 | | | Royal Caribbean Cruises Ltd. | | | 3,997,240 | |
| | | | | | | | |
| | | | | | | 21,313,677 | |
| | | | | | | | |
| | |
| | | | Consumer Staples – 9.88% | | | | |
| | 56,000 | | | Altria Group, Inc. | | | 3,702,720 | |
| | 39,000 | | | Dr. Pepper Snapple Group, Inc. | | | 3,423,810 | |
| | 25,000 | | | Ingredion, Inc. | | | 3,279,250 | |
| | 28,000 | | | Kimberly-Clark Corp. | | | 3,203,480 | |
| | 71,000 | | | Sysco Corp. | | | 3,416,520 | |
| | | | | | | | |
| | | | | | | 17,025,780 | |
| | | | | | | | |
| | |
| | | | Energy – 7.19% | | | | |
| | 31,000 | | | Chevron Corp. | | | 3,247,250 | |
| | 37,000 | | | Exxon Mobil Corp. | | | 3,082,840 | |
| | 38,000 | | | Schlumberger Ltd. | | | 2,972,740 | |
| | 74,000 | | | Spectra Energy Corp. | | | 3,093,940 | |
| | | | | | | | |
| | | | | | | 12,396,770 | |
| | | | | | | | |
| | |
| | | | Financials – 13.05% | | | | |
| | 32,000 | | | Ameriprise Financial, Inc. | | | 2,828,480 | |
| | 160,000 | | | Bank of America Corp. | | | 2,640,000 | |
| | 28,000 | | | Chubb Ltd. | | | 3,556,000 | |
| | 60,000 | | | Discover Financial Services | | | 3,379,800 | |
| | 52,000 | | | JPMorgan Chase & Co. | | | 3,601,520 | |
| | 45,000 | | | Nasdaq, Inc. | | | 2,878,650 | |
| | 80,000 | | | SunTrust Banks, Inc. | | | 3,618,400 | |
| | | | | | | | |
| | | | | | | 22,502,850 | |
| | | | | | | | |
| | |
| | | | Health Care – 13.82% | | | | |
| | 59,000 | | | AbbVie, Inc. | | | 3,291,020 | |
| | 21,800 | | | Amgen, Inc. | | | 3,077,288 | |
| | 30,600 | | | Johnson & Johnson | | | 3,549,294 | |
| | 107,000 | | | Pfizer, Inc. | | | 3,392,970 | |
| | 51,000 | | | STERIS PLC | | | 3,407,820 | |
| | 31,000 | | | Stryker Corp. | | | 3,575,850 | |
| | 25,000 | | | UnitedHealth Group, Inc. | | | 3,533,250 | |
| | | | | | | | |
| | | | | | | 23,827,492 | |
| | | | | | | | |
See accompanying notes which are an integral part of these financial statements.
10
Dana Large Cap Equity Fund
Schedule of Investments (continued)
October 31, 2016
| | | | | | | | |
| Shares | | | | | Fair Value | |
| | Common Stocks – (continued) | | | | |
| | |
| | | | Industrials – 9.54% | | | | |
| | 45,800 | | | Alaska Air Group, Inc. | | $ | 3,307,676 | |
| | 28,000 | | | Boeing Co./The | | | 3,988,040 | |
| | 30,000 | | | Honeywell International, Inc. | | | 3,290,400 | |
| | 52,400 | | | Owens Corning | | | 2,556,072 | |
| | 29,000 | | | Stanley Black & Decker, Inc. | | | 3,301,360 | |
| | | | | | | | |
| | | | | | | 16,443,548 | |
| | | | | | | | |
| | |
| | | | Information Technology – 21.44% | | | | |
| | 86,000 | | | Activision Blizzard, Inc. | | | 3,712,620 | |
| | 4,600 | | | Alphabet, Inc., Class A * | | | 3,725,540 | |
| | 34,000 | | | Apple, Inc. | | | 3,860,360 | |
| | 22,000 | | | Broadcom Ltd. | | | 3,746,160 | |
| | 55,000 | | | Broadridge Financial Solutions, Inc. | | | 3,556,300 | |
| | 80,000 | | | CDW Corp. | | | 3,592,800 | |
| | 123,000 | | | Cisco Systems, Inc. | | | 3,773,640 | |
| | 28,000 | | | Facebook, Inc., Class A * | | | 3,667,720 | |
| | 36,000 | | | Lam Research Corp. | | | 3,486,960 | |
| | 64,000 | | | Microsoft Corp. | | | 3,834,880 | |
| | | | | | | | |
| | | | | | | 36,956,980 | |
| | | | | | | | |
| | |
| | | | Materials – 2.95% | | | | |
| | 1,200 | | | AdvanSix, Inc. * | | | 19,152 | |
| | 30,000 | | | Albemarle Corp. | | | 2,506,500 | |
| | 31,000 | | | Packaging Corporation of America | | | 2,557,500 | |
| | | | | | | | |
| | | | | | | 5,083,152 | |
| | | | | | | | |
| | |
| | | | Real Estate Investment Trusts – 2.94% | | | | |
| | 64,000 | | | Omega Healthcare Investors, Inc. | | | 2,037,120 | |
| | 58,000 | | | Prologis, Inc. | | | 3,025,280 | |
| | | | | | | | |
| | | | | | | 5,062,400 | |
| | | | | | | | |
| | |
| | | | Telecommunication Services – 2.52% | | | | |
| | 58,000 | | | AT&T, Inc. | | | 2,133,820 | |
| | 46,000 | | | Verizon Communications, Inc. | | | 2,212,600 | |
| | | | | | | | |
| | | | | | | 4,346,420 | |
| | | | | | | | |
| | |
| | | | Utilities – 3.40% | | | | |
| | 68,000 | | | CMS Energy Corp. | | | 2,866,200 | |
| | 88,000 | | | Exelon Corp. | | | 2,998,160 | |
| | | | | | | | |
| | | | | | | 5,864,360 | |
| | | | | | | | |
| | | | Total Common Stocks (Cost $164,300,563) | | | 170,823,429 | |
| | | | | | | | |
See accompanying notes which are an integral part of these financial statements.
11
Dana Large Cap Equity Fund
Schedule of Investments (continued)
October 31, 2016
| | | | | | | | |
| Shares | | | | | Fair Value | |
| | Short-Term Investments – 0.17% | | | | |
| | |
| | 302,763 | | | Federated Government Obligations Fund, Institutional Class, 0.27% (a) | | $ | 302,763 | |
| | | | | | | | |
| | | | Total Short-Term Investments (Cost $302,763) | | | 302,763 | |
| | | | | | | | |
| | | | Total Investments – 99.26% (Cost $164,603,326) | | | 171,126,192 | |
| | | | | | | | |
| | | | Other Assets in Excess of Liabilities – 0.74% | | | 1,268,196 | |
| | | | | | | | |
| | | | NET ASSETS – 100.00% | | $ | 172,394,388 | |
| | | | | | | | |
| (a) | | Rate disclosed is the seven day effective yield as of October 31, 2016. |
| * | | Non-income producing security. |
The sectors shown on the schedule of investments are based on Global Industry Classification Standard, or GICS® (“GICS”). The GICS was developed by and/or is the exclusive property of MSCI, Inc. and Standard & Poor Financial Services LLC (“S&P”). GICS is a service mark of MSCI, Inc. and S&P and has been licensed for use by Ultimus Asset Services, LLC.
See accompanying notes which are an integral part of these financial statements.
12
Dana Small Cap Equity Fund
Schedule of Investments
October 31, 2016
| | | | | | | | |
| Shares | | | | | Fair Value | |
| | Common Stocks – 99.34% | | | | |
| | |
| | | | Consumer Discretionary – 12.46% | | | | |
| | 9,467 | | | American Axle & Manufacturing Holdings, Inc. * | | $ | 169,649 | |
| | 3,050 | | | Columbia Sportswear Co. | | | 172,752 | |
| | 1,756 | | | Drew Industries, Inc. | | | 157,250 | |
| | 4,957 | | | Ethan Allen Interiors, Inc. | | | 152,180 | |
| | 2,269 | | | Marriott Vacations Worldwide Corp. | | | 144,263 | |
| | 5,898 | | | Sinclair Broadcast Group, Inc., Class A | | | 148,040 | |
| | 5,320 | | | Sonic Corp. | | | 121,881 | |
| | 1,266 | | | Vail Resorts, Inc. | | | 201,851 | |
| | | | | | | | |
| | | | | | | 1,267,866 | |
| | | | | | | | |
| | |
| | | | Consumer Staples – 2.89% | | | | |
| | 10,631 | | | Amplify Snack Brands, Inc. * | | | 154,043 | |
| | 1,238 | | | Casey’s General Stores, Inc. | | | 139,882 | |
| | | | | | | | |
| | | | | | | 293,925 | |
| | | | | | | | |
| | |
| | | | Energy – 2.97% | | | | |
| | 4,476 | | | Carrizo Oil & Gas, Inc. * | | | 151,423 | |
| | 8,507 | | | Matrix Service Co. * | | | 150,574 | |
| | | | | | | | |
| | | | | | | 301,997 | |
| | | | | | | | |
| | |
| | | | Financials – 16.59% | | | | |
| | 5,095 | | | Bank of the Ozarks, Inc. | | | 188,311 | |
| | 10,281 | | | CenterState Banks, Inc. | | | 192,049 | |
| | 6,859 | | | First Merchants Corp. | | | 193,081 | |
| | 9,183 | | | Home BancShares, Inc. | | | 197,526 | |
| | 4,866 | | | James River Group Holdings Ltd. | | | 183,156 | |
| | 3,528 | | | Pinnacle Financial Partners, Inc. | | | 182,045 | |
| | 3,338 | | | Primerica, Inc. | | | 182,589 | |
| | 5,525 | | | Renasant Corp. | | | 186,414 | |
| | 4,921 | | | Western Alliance Bancorp * | | | 183,849 | |
| | | | | | | | |
| | | | | | | 1,689,020 | |
| | | | | | | | |
| | |
| | | | Health Care – 13.39% | | | | |
| | 4,785 | | | AMN Healthcare Services, Inc. * | | | 156,948 | |
| | 2,709 | | | ANI Pharmaceuticals, Inc. * | | | 161,727 | |
| | 2,313 | | | Aptevo Therapeutics, Inc. * | | | 5,112 | |
| | 7,806 | | | DepoMed, Inc. * | | | 174,542 | |
| | 1,307 | | | Ligand Pharmaceuticals, Inc., Class B * | | | 125,119 | |
| | 2,898 | | | Masimo Corp. * | | | 159,390 | |
| | 3,861 | | | Natus Medical, Inc. * | | | 151,930 | |
| | 2,460 | | | NuVasive, Inc. * | | | 146,936 | |
See accompanying notes which are an integral part of these financial statements.
13
Dana Small Cap Equity Fund
Schedule of Investments (continued)
October 31, 2016
| | | | | | | | |
| Shares | | | | | Fair Value | |
| | Common Stocks – (continued) | | | | |
| | |
| | | | Health Care – 13.39% (continued) | | | | |
| | 6,929 | | | Supernus Pharmaceuticals, Inc. * | | $ | 137,194 | |
| | 2,351 | | | VCA, Inc. * | | | 144,492 | |
| | | | | | | | |
| | | | | | | 1,363,390 | |
| | | | | | | | |
| | |
| | | | Industrials – 13.37% | | | | |
| | 3,125 | | | Apogee Enterprises, Inc. | | | 127,344 | |
| | 3,319 | | | Astronics Corp. * | | | 122,869 | |
| | 498 | | | Astronics Corp., Class B * | | | 18,420 | |
| | 5,718 | | | Comfort Systems USA, Inc. | | | 164,964 | |
| | 1,699 | | | Dycom Industries, Inc. * | | | 130,704 | |
| | 5,941 | | | Echo Global Logistics, Inc. * | | | 125,949 | |
| | 2,884 | | | Hawaiian Holdings, Inc. * | | | 129,852 | |
| | 2,975 | | | Lydall, Inc. * | | | 139,081 | |
| | 11,023 | | | Mueller Water Products, Inc. | | | 135,803 | |
| | 4,113 | | | On Assignment, Inc. * | | | 141,528 | |
| | 2,166 | | | Patrick Industries, Inc. * | | | 124,220 | |
| | | | | | | | |
| | | | | | | 1,360,734 | |
| | | | | | | | |
| | |
| | | | Information Technology – 17.92% | | | | |
| | 6,128 | | | ARRIS International PLC * | | | 170,236 | |
| | 8,425 | | | Ciena Corp. * | | | 163,277 | |
| | 1,635 | | | Coherent, Inc. * | | | 170,236 | |
| | 5,884 | | | Convergys Corp. | | | 171,813 | |
| | 2,135 | | | Euronet Worldwide, Inc. * | | | 169,839 | |
| | 4,190 | | | Fabrinet * | | | 159,052 | |
| | 3,121 | | | Gigamon, Inc. * | | | 172,591 | |
| | 2,871 | | | Manhattan Associates, Inc. * | | | 145,387 | |
| | 3,502 | | | MKS Instruments, Inc. | | | 176,676 | |
| | 9,865 | | | Rudolph Technologies, Inc. * | | | 178,557 | |
| | 3,999 | | | Synchronoss Technologies, Inc. * | | | 146,803 | |
| | | | | | | | |
| | | | | | | 1,824,467 | |
| | | | | | | | |
| | |
| | | | Materials – 4.85% | | | | |
| | 3,733 | | | Berry Plastics Group, Inc. * | | | 163,319 | |
| | 5,266 | | | Chemtura Corp. * | | | 172,725 | |
| | 1,974 | | | Neenah Paper, Inc. | | | 157,723 | |
| | | | | | | | |
| | | | | | | 493,767 | |
| | | | | | | | |
| | |
| | | | Real Estate Investment Trusts – 10.27% | | | | |
| | 11,920 | | | Armada Hoffler Properties, Inc. | | | 160,086 | |
| | 10,609 | | | Colony Capital, Inc., Class A | | | 201,677 | |
| | 2,192 | | | CoreSite Realty Corp. | | | 161,638 | |
| | 1,738 | | | Life Storage, Inc. | | | 140,170 | |
See accompanying notes which are an integral part of these financial statements.
14
Dana Small Cap Equity Fund
Schedule of Investments (continued)
October 31, 2016
| | | | | | | | |
| Shares | | | | | Fair Value | |
| | Common Stocks – (continued) | | | | |
| | |
| | | | Real Estate Investment Trusts – 10.27% (continued) | | | | |
| | 3,713 | | | LTC Properties, Inc. | | $ | 186,058 | |
| | 15,034 | | | Summit Hotel Properties, Inc. | | | 195,292 | |
| | | | | | | | |
| | | | | | | 1,044,921 | |
| | | | | | | | |
| | |
| | | | Telecommunications – 0.93% | | | | |
| | 5,663 | | | Inteliquent, Inc. | | | 95,082 | |
| | | | | | | | |
| | |
| | | | Utilities – 3.70% | | | | |
| | 1,939 | | | Chesapeake Utilities Corp. | | | 124,193 | |
| | 3,841 | | | PNM Resources, Inc. | | | 126,177 | |
| | 1,738 | | | Southwest Gas Corp. | | | 125,936 | |
| | | | | | | | |
| | | | | | | 376,306 | |
| | | | | | | | |
| | | | Total Common Stocks (Cost $9,752,092) | | | 10,111,475 | |
| | | | | | | | |
| |
| | Short-Term Investments – 0.75% | | | | |
| | |
| | 76,302 | | | Federated Government Obligations Fund, Institutional Class, 0.27% (a) | | | 76,302 | |
| | | | | | | | |
| | | | Total Short-Term Investments (Cost $76,302) | | | 76,302 | |
| | | | | | | | |
| | | | Total Investments – 100.09% (Cost $9,828,394) | | | 10,187,777 | |
| | | | | | | | |
| | | | Liabilities in Excess of Other Assets – (0.09)% | | | (8,887 | ) |
| | | | | | | | |
| | | | NET ASSETS – 100.00% | | $ | 10,178,890 | |
| | | | | | | | |
| (a) | | Rate disclosed is the seven day effective yield as of October 31, 2016. |
| * | | Non-income producing security. |
The sectors shown on the schedule of investments are based on Global Industry Classification Standard, or GICS® (“GICS”). The GICS was developed by and/or is the exclusive property of MSCI, Inc. and Standard & Poor Financial Services LLC (“S&P”). GICS is a service mark of MSCI, Inc. and S&P and has been licensed for use by Ultimus Asset Services, LLC.
See accompanying notes which are an integral part of these financial statements.
15
Dana Funds
Statements of Assets and Liabilities
October 31, 2016
| | | | | | | | |
| | | Dana Large Cap
Equity Fund | | | Dana Small Cap
Equity Fund | |
Assets | | | | | | | | |
Investments in securities at fair value (cost $164,603,326 and $9,828,394) | | $ | 171,126,192 | | | $ | 10,187,777 | |
Receivable for fund shares sold | | | 108,531 | | | | 10,042 | |
Receivable for investments sold | | | 1,250,952 | | | | — | |
Dividends receivable | | | 157,510 | | | | 1,410 | |
Receivable from Adviser | | | — | | | | 9,509 | |
Prepaid expenses | | | 43,409 | | | | 24,472 | |
Total Assets | | | 172,686,594 | | | | 10,233,210 | |
Liabilities | | | | | | | | |
Payable for fund shares redeemed | | | 155,400 | | | | 27,711 | |
Payable to Adviser | | | 80,456 | | | | — | |
Payable for Distribution Fees | | | 7,282 | | | | 797 | |
Payable to administrator, fund accountant, and transfer agent | | | 15,422 | | | | 3,923 | |
Payable to trustees | | | 2,032 | | | | 988 | |
Other accrued expenses | | | 31,614 | | | | 20,901 | |
Total Liabilities | | | 292,206 | | | | 54,320 | |
Net Assets | | $ | 172,394,388 | | | $ | 10,178,890 | |
Net Assets consist of: | | | | | | | | |
Paid-in capital | | $ | 172,379,989 | | | $ | 10,097,163 | |
Accumulated undistributed net investment income | | | 229,055 | | | | — | |
Accumulated undistributed net realized loss from investment transactions | | | (6,737,522 | ) | | | (277,656 | ) |
Net unrealized appreciation on investments | | | 6,522,866 | | | | 359,383 | |
Net Assets | | $ | 172,394,388 | | | $ | 10,178,890 | |
See accompanying notes which are an integral part of these financial statements.
16
Dana Funds
Statements of Assets and Liabilities (continued)
October 31, 2016
| | | | | | | | |
| | | Dana Large Cap
Equity Fund | | | Dana Small Cap
Equity Fund | |
Class N: | | | | | | | | |
Net Assets | | $ | 32,514,266 | | | | | |
Shares outstanding (unlimited number of shares authorized, no par value) | | | 1,839,440 | | | | | |
Net asset value ("NAV") and offering price per share | | $ | 17.68 | | | | | |
Redemption price per share (NAV * 98%) (a) | | $ | 17.33 | | | | | |
Class A: | | | | | | | | |
Net Assets | | $ | 1,340,461 | | | | | |
Shares outstanding (unlimited number of shares authorized, no par value) | | | 75,976 | | | | | |
Net asset value ("NAV") per share | | $ | 17.64 | | | | | |
Offering price per share (NAV/0.95) (b) | | $ | 18.57 | | | | | |
Redemption price per share (NAV * 98%) (a) | | $ | 17.29 | | | | | |
Institutional Class: | | | | | | | | |
Net Assets | | $ | 138,539,661 | | | $ | 6,574,752 | |
Shares outstanding (unlimited number of shares authorized, no par value) | | | 7,838,342 | | | | 706,590 | |
Net asset value ("NAV") and offering price per share | | $ | 17.67 | | | $ | 9.30 | |
Redemption price per share (NAV * 98%) (a) | | $ | 17.32 | | | $ | 9.11 | |
Investor Class: | | | | | | | | |
Net Assets | | | | | | $ | 3,604,138 | |
Shares outstanding (unlimited number of shares authorized, no par value) | | | | | | | 388,395 | |
Net asset value ("NAV") and offering price per share | | | | | | $ | 9.28 | |
Redemption price per share (NAV * 98%) (a) | | | | | | $ | 9.09 | |
| (a) | | The Fund charges a 2.00% redemption fee on shares redeemed within 60 days of purchase. |
| (b) | | Class A shares impose a maximum 5.00% sales charge on purchases. |
See accompanying notes which are an integral part of these financial statements.
17
Dana Funds
Statements of Operations
For the year ended October 31, 2016
| | | | | | | | |
| | | Dana Large Cap
Equity Fund | | | Dana Small Cap
Equity Fund(a) | |
Investment Income | | | | | | | | |
Dividend income (net of foreign taxes withheld of $1,881 and $—) | | $ | 3,842,480 | | | $ | 73,529 | |
Total investment income | | | 3,842,480 | | | | 73,529 | |
Expenses | | | | | | | | |
Investment Adviser | | | 1,230,213 | | | | 54,449 | |
Distribution (12b-1): | | | | | | | | |
Class N | | | 86,481 | | | | — | |
Class A | | | 3,379 | | | | — | |
Investor Class | | | — | | | | 5,711 | |
Administration | | | 94,386 | | | | 37,500 | |
Fund accounting | | | 51,913 | | | | 30,000 | |
Transfer agent | | | 29,419 | | | | 23,093 | |
Legal | | | 20,972 | | | | 16,208 | |
Registration | | | 59,570 | | | | 10,927 | |
Custodian | | | 21,639 | | | | 15,989 | |
Audit | | | 17,000 | | | | 16,500 | |
Trustee | | | 7,992 | | | | 5,170 | |
Insurance | | | 17,219 | | | | 46 | |
Pricing | | | 2,330 | | | | 2,315 | |
Printing | | | 14,530 | | | | 1,140 | |
Offering | | | — | | | | 48,112 | |
Organizational | | | — | | | | 8,750 | |
Miscellaneous | | | 28,515 | | | | 14,587 | |
Total expenses | | | 1,685,558 | | | | 290,497 | |
Fees contractually waived and reimbursed by Adviser | | | (313,281 | ) | | | (153,808 | ) |
Fees waived voluntarily by Administrator | | | — | | | | (66,061 | ) |
Net operating expenses | | | 1,372,277 | | | | 70,628 | |
Net investment income | | | 2,470,203 | | | | 2,901 | |
Net Realized and Change in Unrealized Gain (Loss) on Investments | | | | | | | | |
Net realized loss on investment securities transactions | | | (5,226,176 | ) | | | (277,656 | ) |
Net change in unrealized appreciation of investment securities | | | 323,264 | | | | 359,383 | |
Net realized and change in unrealized gain (loss) on investments | | | (4,902,912 | ) | | | 81,727 | |
Net increase (decrease) in net assets resulting from operations | | $ | (2,432,709 | ) | | $ | 84,628 | |
| (a) | | For the period November 3, 2015 (commencement of operations) through October 31, 2016. |
See accompanying notes which are an integral part of these financial statements.
18
Dana Funds
Statements of Changes in Net Assets
| | | | | | | | | | | | |
| | | Dana Large Cap Equity Fund | | | Dana Small Cap Equity Fund | |
| | | For the Year Ended
October 31, 2016 | | | For the Year Ended
October 31, 2015 | | | For the Period Ended
October 31, 2016(a) | |
Increase in Net Assets due to:
Operations | | | | | | | | | |
Net investment income | | $ | 2,470,203 | | | $ | 1,145,661 | | | $ | 2,901 | |
Net realized loss on investment transactions | | | (5,226,176 | ) | | | (1,513,521 | ) | | | (277,656 | ) |
Net change in unrealized appreciation of investments | | | 323,264 | | | | 918,692 | | | | 359,383 | |
Net increase (decrease) in net assets resulting from operations | | | (2,432,709 | ) | | | 550,832 | | | | 84,628 | |
Distributions From: | | | | | | | | | | | | |
Net investment income: | | | | | | | | | | | | |
Class N | | | (394,154 | ) | | | (310,826 | ) | | | | |
Class A | | | (13,120 | ) | | | (12,606 | ) | | | | |
Institutional Class | | | (1,966,634 | ) | | | (702,819 | ) | | | (4,145 | ) |
Investor Class | | | | | | | | | | | (587 | ) |
Realized gains: | | | | | | | | | | | | |
Class N | | | — | | | | (1,380,628 | ) | | | | |
Class A | | | — | | | | (47,055 | ) | | | | |
Institutional Class | | | — | | | | (936,609 | ) | | | | |
Total distributions | | | (2,373,908 | ) | | | (3,390,543 | ) | | | (4,732 | ) |
Capital Transactions – Class N: | | | | | | | | | |
Proceeds from shares sold | | | 2,351,765 | | | | 22,909,588 | | | | | |
Reinvestment of distributions | | | 386,214 | | | | 1,276,366 | | | | | |
Amount paid for shares redeemed | | | (6,016,995 | ) | | | (15,880,730 | ) | | | | |
Proceeds from redemption fees (b) | | | 261 | | | | 162 | | | | | |
Total Class N | | | (3,278,755 | ) | | | 8,305,386 | | | | | |
Capital Transactions – Class A: | | | | | | | | | |
Proceeds from shares sold | | | 414,562 | | | | 1,685,300 | | | | | |
Reinvestment of distributions | | | 12,358 | | | | 58,595 | | | | | |
Amount paid for shares redeemed | | | (1,684,118 | ) | | | (152,311 | ) | | | | |
Proceeds from redemption fees (b) | | | 42 | | | | 652 | | | | | |
Total Class A | | | (1,257,156 | ) | | | 1,592,236 | | | | | |
(a) For the period November 3, 2015 (commencement of operations) through October 31, 2016. (b) The Funds charge a 2.00% redemption fee on shares redeemed within 60 days of purchase. | |
See accompanying notes which are an integral part of these financial statements.
19
Dana Funds
Statements of Changes in Net Assets (continued)
| | | | | | | | | | | | |
| | | Dana Large Cap Equity Fund | | | Dana Small Cap Equity Fund | |
| | | For the Year Ended
October 31, 2016 | | | For the Year Ended
October 31, 2015 | | | For the Period Ended
October 31, 2016(a) | |
Capital Transactions – Institutional Class: | | | | | | | | | |
Proceeds from shares sold | | $ | 74,899,806 | | | $ | 127,938,610 | | | $ | 6,935,349 | |
Reinvestment of distributions | | | 170,023 | | | | 195,472 | | | | 2,967 | |
Amount paid for shares redeemed | | | (50,570,426 | ) | | | (15,194,601 | ) | | | (427,018 | ) |
Proceeds from redemption fees (b) | | | 13,598 | | | | 63,483 | | | | 1,840 | |
Total Institutional Class | | | 24,513,001 | | | | 113,002,964 | | | | 6,513,138 | |
Capital Transactions – Investor Class: | | | | | | | | | |
Proceeds from shares sold | | | | | | | | | | | 4,289,510 | |
Reinvestment of distributions | | | | | | | | | | | 587 | |
Amount paid for shares redeemed | | | | | | | | | | | (704,373 | ) |
Proceeds from redemption fees (b) | | | | | | | | | | | 132 | |
Total Investor Class | | | | | | | | 3,585,856 | |
Net increase in net assets resulting from capital transactions | | | 19,977,090 | | | | 122,900,586 | | | | 10,098,994 | |
Total Increase in Net Assets | | | 15,170,473 | | | | 120,060,875 | | | | 10,178,890 | |
Net Assets | | | | | | | | | | | | |
Beginning of period | | | 157,223,915 | | | | 37,163,040 | | | | — | |
End of period | | $ | 172,394,388 | | | $ | 157,223,915 | | | $ | 10,178,890 | |
Accumulated net investment income included in net assets at end of period | | $ | 229,055 | | | $ | 139,697 | | | $ | — | |
(a) For the period November 3, 2015 (commencement of operations) through October 31, 2016. (b) The Funds charge a 2.00% redemption fee on shares redeemed within 60 days of purchase. | |
See accompanying notes which are an integral part of these financial statements.
20
Dana Funds
Statements of Changes in Net Assets (continued)
| | | | | | | | | | | | |
| | | Dana Large Cap Equity Fund | | | Dana Small Cap Equity Fund | |
| | | For the Year Ended
October 31, 2016 | | | For the Year Ended
October 31, 2015 | | | For the Period Ended
October 31, 2016(a) | |
Share Transactions – Class N: | | | | | | | | | |
Shares sold | | | 134,234 | | | | 1,222,207 | | | | | |
Shares issued in reinvestment of distributions | | | 21,807 | | | | 69,257 | | | | | |
Shares redeemed | | | (341,774 | ) | | | (840,885 | ) | | | | |
Total Class N | | | (185,733 | ) | | | 450,579 | | | | | |
Share Transactions – Class A: | | | | | | | | | |
Shares sold | | | 22,982 | | | | 94,497 | | | | | |
Shares issued in reinvestment of distributions | | | 699 | | | | 3,192 | | | | | |
Shares redeemed | | | (93,562 | ) | | | (8,399 | ) | | | | |
Total Class A | | | (69,881 | ) | | | 89,290 | | | | | |
Share Transactions – Institutional Class: | | | | | | | | | |
Shares sold | | | 4,226,099 | | | | 6,906,834 | | | | 754,430 | |
Shares issued in reinvestment of distributions | | | 9,607 | | | | 10,643 | | | | 313 | |
Shares redeemed | | | (2,854,088 | ) | | | (834,286 | ) | | | (48,153 | ) |
Total Institutional Class | | | 1,381,618 | | | | 6,083,191 | | | | 706,590 | |
Share Transactions – Investor Class: | | | | | | | | | |
Shares sold | | | | | | | | | | | 465,806 | |
Shares issued in reinvestment of distributions | | | | | | | | | | | 61 | |
Shares redeemed | | | | | | | | | | | (77,472 | ) |
Total Investor Class | | | | | | | | 388,395 | |
| (a) | | For the period November 3, 2015 (commencement of operations) through October 31, 2016. |
21
See accompanying notes which are an integral part of these financial statements.
Dana Large Cap Equity Fund – Class N
Financial Highlights
Selected data for a share outstanding throughout each year.
| | | | | | | | | | | | | | | | | | | | |
| | | | | | Years Ended October 31, | |
| | | 2016 | | | 2015 | | | 2014 | | | 2013 | | | 2012 | |
Net asset value, at
beginning of year | | | $18.23 | | | | $18.54 | | | | $17.19 | | | | $13.88 | | | | $12.50 | |
| | | | | | | | | | | | | | | | | | | | |
| | | | | |
Income from investment operations: | | | | | | | | | | | | | | | | | | | | |
| | | | | |
Net investment income (loss) | | | 0.22 | (a) | | | 0.18 | | | | 0.19 | | | | 0.21 | (a) | | | 0.14 | (a) |
| | | | | |
Net realized and unrealized gain (loss) on investments | | | (0.57 | ) | | | 0.49 | (b) | | | 2.46 | | | | 3.40 | | | | 1.51 | |
| | | | | | | | | | | | | | | | | | | | |
| | | | | |
Total from investment operations | | | (0.35 | ) | | | 0.67 | | | | 2.65 | | | | 3.61 | | | | 1.65 | |
| | | | | | | | | | | | | | | | | | | | |
| | | | | |
Distributions from: | | | | | | | | | | | | | | | | | | | | |
| | | | | |
Net investment income | | | (0.20 | ) | | | (0.15 | ) | | | (0.18 | ) | | | (0.22 | ) | | | (0.14 | ) |
| | | | | |
Net realized gain | | | — | | | | (0.83 | ) | | | (1.12 | ) | | | (0.08 | ) | | | (0.13 | ) |
| | | | | | | | | | | | | | | | | | | | |
| | | | | |
Total from distributions | | | (0.20 | ) | | | (0.98 | ) | | | (1.30 | ) | | | (0.30 | ) | | | (0.27 | ) |
| | | | | | | | | | | | | | | | | | | | |
| | | | | |
Redemption fees (c) | | | — | | | | — | | | | — | | | | — | | | | — | |
| | | | | |
Net asset value, at
end of year | | | $17.68 | | | | $18.23 | | | | $18.54 | | | | $17.19 | | | | $13.88 | |
| | | | | | | | | | | | | | | | | | | | |
| | | | | |
Total Return (d) | | | (1.91 | )% | | | 3.61 | % | | | 16.23 | % | | | 26.35 | % | | | 13.44 | % |
| | | | | | | | | | | | | | | | | | | | |
Ratios/Supplemental Data: | | | | | | | | | | | | | | | | | | | | |
| | | | | |
Net assets at end of year (thousands) | | | $32,514 | | | | $36,909 | | | | $29,197 | | | | $18,306 | | | | $12,819 | |
| | | | | |
Before waiver | | | | | | | | | | | | | | | | | | | | |
| | | | | |
Ratio of expenses to average net assets | | | 1.16 | % | | | 1.25 | % | | | 1.93 | % | | | 1.99 | % | | | 2.30 | % |
| | | | | |
After waiver | | | | | | | | | | | | | | | | | | | | |
| | | | | |
Ratio of expenses to average net assets | | | 0.98 | % | | | 0.98 | % | | | 0.98 | % | | | 0.98 | % | | | 1.50 | % |
| | | | | |
Ratio of net investment income (loss) to average net assets | | | 1.22 | % | | | 1.00 | % | | | 1.09 | % | | | 1.33 | % | | | 1.04 | % |
| | | | | |
Portfolio turnover (e) | | | 69 | % | | | 45 | % | | | 57 | % | | | 70 | % | | | 54 | % |
| (a) | | Per share net investment income has been determined on the basis of average shares outstanding during the year. |
| (b) | | The amount shown for a share outstanding throughout the year does not accord with the change in aggregate gains and losses in the portfolio of securities during the year because of the timing of sales and purchases of fund shares in relation to fluctuating market values during the year. |
| (c) | | The amount is less than $0.005 per share. |
| (d) | | Total return in the above table represents the rate that the investor would have earned or lost on an investment in the Fund, assuming reinvestment of distributions. |
| (e) | | Portfolio turnover is calculated on the basis of the Fund as a whole without distinguishing among the classes of shares. |
See accompanying notes which are an integral part of these financial statements.
22
Dana Large Cap Equity Fund – Class A
Financial Highlights
Selected data for a share outstanding throughout each year.
| | | | | | | | | | | | | | | | | | | | |
| | | | | | Years Ended October 31, | |
| | | 2016 | | | 2015 | | | 2014 | | | 2013 | | | 2012 | |
Net asset value, at
beginning of year | | | $18.18 | | | | $18.51 | | | | $17.17 | | | | $13.92 | | | | $12.52 | |
| | | | | | | | | | | | | | | | | | | | |
| | | | | |
Income from investment operations: | | | | | | | | | | | | | | | | | | | | |
| | | | | |
Net investment income (loss) | | | 0.23 | (a) | | | 0.16 | | | | 0.20 | | | | 0.13 | (a) | | | 0.14 | (a) |
| | | | | |
Net realized and unrealized gain (loss) on investments | | | (0.58 | ) | | | 0.50 | (b) | | | 2.44 | | | | 3.39 | | | | 1.52 | |
| | | | | | | | | | | | | | | | | | | | |
| | | | | |
Total from investment operations | | | (0.35 | ) | | | 0.66 | | | | 2.64 | | | | 3.52 | | | | 1.66 | |
| | | | | | | | | | | | | | | | | | | | |
| | | | | |
Distributions from: | | | | | | | | | | | | | | | | | | | | |
| | | | | |
Net investment income | | | (0.19 | ) | | | (0.16 | ) | | | (0.18 | ) | | | (0.19 | ) | | | (0.13 | ) |
| | | | | |
Net realized gain | | | — | | | | (0.83 | ) | | | (1.12 | ) | | | (0.08 | ) | | | (0.13 | ) |
| | | | | | | | | | | | | | | | | | | | |
| | | | | |
Total from distributions | | | (0.19 | ) | | | (0.99 | ) | | | (1.30 | ) | | | (0.27 | ) | | | (0.26 | ) |
| | | | | | | | | | | | | | | | | | | | |
| | | | | |
Redemption fees (c) | | | — | | | | — | | | | — | | | | — | | | | — | |
| | | | | |
Net asset value, at
end of year | | | $17.64 | | | | $18.18 | | | | $18.51 | | | | $17.17 | | | | $13.92 | |
| | | | | | | | | | | | | | | | | | | | |
| | | | | |
Total Return (d) | | | (1.91 | )% | | | 3.54 | % | | | 16.24 | % | | | 25.67 | % | | | 13.54 | % |
| | | | | | | | | | | | | | | | | | | | |
Ratios/Supplemental Data: | | | | | | | | | | | | | | | | | | | | |
| | | | | |
Net assets at end of year (thousands) | | | $1,340 | | | | $2,652 | | | | $1,047 | | | | $799 | | | | $678 | |
| | | | | |
Before waiver: | | | | | | | | | | | | | | | | | | | | |
| | | | | |
Ratio of expenses to average net assets | | | 1.16 | % | | | 1.25 | % | | | 1.93 | % | | | 1.98 | % | | | 2.27 | % |
| | | | | |
After waiver: | | | | | | | | | | | | | | | | | | | | |
| | | | | |
Ratio of expenses to average net assets | | | 0.98 | % | | | 0.98 | % | | | 0.98 | % | | | 1.49 | % | | | 1.50 | % |
| | | | | |
Ratio of net investment income (loss) to
average net assets | | | 1.29 | % | | | 1.00 | % | | | 1.09 | % | | | 0.84 | % | | | 1.00 | % |
| | | | | |
Portfolio turnover (e) | | | 69 | % | | | 45 | % | | | 57 | % | | | 70 | % | | | 54 | % |
| (a) | | Per share net investment income has been determined on the basis of average shares outstanding during the year. |
| (b) | | The amount shown for a share outstanding throughout the year does not accord with the change in aggregate gains and losses in the portfolio of securities during the year because of the timing of sales and purchases of fund shares in relation to fluctuating market values during the year. |
| (c) | | The amount is less than $0.005 per share. |
| (d) | | Total return in the above table represents the rate that the investor would have earned or lost on an investment in the Fund, assuming reinvestment of distributions and excludes the maximum sales charge. |
| (e) | | Portfolio turnover is calculated on the basis of the Fund as a whole without distinguishing among the classes of shares. |
See accompanying notes which are an integral part of these financial statements.
23
Dana Large Cap Equity Fund – Institutional Class
Financial Highlights
Selected data for a share outstanding throughout each period.
| | | | | | | | | | | | | | | | |
| | | Years Ended October 31, | | | Period
Ended
October 31,
2013(a) | |
| | | 2016 | | | 2015 | | | 2014 | | |
Net asset value, at
beginning of period | | | $18.22 | | | | $18.52 | | | | $17.19 | | | | $17.14 | |
| | | | | | | | | | | | | | | | |
| | | | |
Income from investment operations: | | | | | | | | | | | | | | | | |
| | | | |
Net investment income (loss) | | | 0.26 | (b) | | | 0.19 | | | | 0.26 | | | | — | (b)(c) |
| | | | |
Net realized and unrealized gain (loss) on investments | | | (0.56 | ) | | | 0.52 | (d) | | | 2.44 | | | | 0.05 | |
| | | | | | | | | | | | | | | | |
| | | | |
Total from investment operations | | | (0.30 | ) | | | 0.71 | | | | 2.70 | | | | 0.05 | |
| | | | | | | | | | | | | | | | |
| | | | |
Distributions from: | | | | | | | | | | | | | | | | |
| | | | |
Net investment income | | | (0.25 | ) | | | (0.19 | ) | | | (0.25 | ) | | | — | |
| | | | |
Net realized gain | | | — | | | | (0.83 | ) | | | (1.12 | ) | | | — | |
| | | | | | | | | | | | | | | | |
| | | | |
Total from distributions | | | (0.25 | ) | | | (1.02 | ) | | | (1.37 | ) | | | — | |
| | | | | | | | | | | | | | | | |
| | | | |
Redemption fees | | | — | (c) | | | 0.01 | | | | — | | | | — | |
| | | | |
Net asset value, at
end of period | | | $17.67 | | | | $18.22 | | | | $18.52 | | | | $17.19 | |
| | | | | | | | | | | | | | | | |
| | | | |
Total Return (e) | | | (1.66 | )% | | | 3.89 | % | | | 16.60 | % | | | 0.29 | %(f) |
| | | | | | | | | | | | | | | | |
Ratios/Supplemental Data: | | | | | | | | | | | | | | | | |
| | | | |
Net assets at end of period (thousands) | | | $138,540 | | | | $117,663 | | | | $6,919 | | | | $273 | |
| | | | |
Before waiver: | | | | | | | | | | | | | | | | |
| | | | |
Ratio of expenses to average net assets | | | 0.91 | % | | | 1.00 | % | | | 1.68 | % | | | 1.53 | %(g) |
| | | | |
After waiver: | | | | | | | | | | | | | | | | |
| | | | |
Ratio of expenses to average net assets | | | 0.73 | % | | | 0.73 | % | | | 0.73 | % | | | 0.73 | %(g) |
| | | | |
Ratio of net investment income (loss) to
average net assets | | | 1.45 | % | | | 1.25 | % | | | 1.34 | % | | | 0.49 | %(g) |
| | | | |
Portfolio turnover (h) | | | 69 | % | | | 45 | % | | | 57 | % | | | 70 | %(f) |
| (a) | | The Dana Large Cap Equity Fund's Institutional Class commenced operations on October 29, 2013. |
| (b) | | Per share net investment income has been determined on the basis of average shares outstanding during the period. |
| (c) | | The amount is less than $0.005 per share. |
| (d) | | The amount shown for a share outstanding throughout the period does not accord with the change in aggregate gains and losses in the portfolio of securities during the period because of the timing of sales and purchases of fund shares in relation to fluctuating market values during the period. |
| (e) | | Total return in the above table represents the rate that the investor would have earned or lost on an investment in the Fund, assuming reinvestment of distributions. |
| (h) | | Portfolio turnover is calculated on the basis of the Fund as a whole without distinguishing among the classes of shares. |
See accompanying notes which are an integral part of these financial statements.
24
Dana Small Cap Equity Fund – Institutional Class
Financial Highlights
Selected data for a share outstanding throughout the period.
| | | | |
| | | Period
Ended
October 31,
2016(a) | |
Net asset value, at beginning of period | | | $10.00 | |
| | | | |
| |
Income from investment operations: | | | | |
| |
Net investment income (loss) | | | 0.01 | |
| |
Net realized and unrealized gain (loss) on investments | | | (0.70 | )(b) |
| | | | |
| |
Total from investment operations | | | (0.69 | ) |
| | | | |
| |
Distributions from: | | | | |
| |
Net investment income | | | (0.01 | ) |
| | | | |
| |
Total from distributions | | | (0.01 | ) |
| | | | |
| |
Redemption fees (c) | | | — | |
| |
Net asset value, at end of period | | | $9.30 | |
| | | | |
| |
Total Return (d) | | | (6.87 | )%(e) |
| | | | |
Ratios/Supplemental Data: | | | | |
| |
Net assets at end of period (thousands) | | | $6,575 | |
| |
Before waiver: | | | | |
| |
Ratio of expenses to average net assets | | | 4.11 | %(f) |
| |
After waiver: | | | | |
| |
Ratio of expenses to average net assets | | | 0.95 | %(f) |
| |
Ratio of net investment income (loss) to average net assets | | | 0.12 | %(f) |
| |
Portfolio turnover (g) | | | 54 | %(e) |
| (a) | | For the period November 3, 2015 (commencement of operations) through October 31, 2016. |
| (b) | | The amount shown for a share outstanding throughout the period does not accord with the change in aggregate gains and losses in the portfolio of securities during the period because of the timing of sales and purchases of fund shares in relation to fluctuating market values during the period. |
| (c) | | The amount is less than $0.005 per share. |
| (d) | | Total return in the above table represents the rate that the investor would have earned or lost on an investment in the Fund, assuming reinvestment of distributions. |
| (g) | | Portfolio turnover is calculated on the basis of the Fund as a whole without distinguishing among the classes of shares. |
See accompanying notes which are an integral part of these financial statements.
25
Dana Small Cap Equity Fund – Investor Class
Financial Highlights
Selected data for a share outstanding throughout the period.
| | | | |
| | | Period
Ended
October 31,
2016(a) | |
Net asset value, at beginning of period | | | $10.00 | |
| | | | |
| |
Income from investment operations: | | | | |
| |
Net investment income (loss) | | | — | (b) |
| |
Net realized and unrealized gain (loss) on investments | | | (0.71 | )(c) |
| | | | |
| |
Total from investment operations | | | (0.71 | ) |
| | | | |
| |
Distributions from: | | | | |
| |
Net investment income | | | (0.01 | ) |
| | | | |
| |
Total from distributions | | | (0.01 | ) |
| | | | |
| |
Redemption fees (b) | | | — | |
| |
Net asset value, at end of period | | | $9.28 | |
| | | | |
| |
Total Return (d) | | | (7.13 | )%(e) |
| | | | |
Ratios/Supplemental Data: | | | | |
| |
Net assets at end of period (thousands) | | | $3,604 | |
| |
Before waiver: | | | | |
| |
Ratio of expenses to average net assets | | | 4.53 | %(f) |
| |
After waiver: | | | | |
| |
Ratio of expenses to average net assets | | | 1.20 | %(f) |
| |
Ratio of net investment income (loss) to average net assets | | | (0.10 | )%(f) |
| |
Portfolio turnover (g) | | | 54 | %(e) |
| (a) | | For the period November 3, 2015 (commencement of operations) through October 31,2016. |
| (b) | | The amount is less than $0.005 per share. |
| (c) | | The amount shown for a share outstanding throughout the period does not accord with the change in aggregate gains and losses in the portfolio of securities during the period because of the timing of sales and purchases of fund shares in relation to fluctuating market values during the period. |
| (d) | | Total return in the above table represents the rate that the investor would have earned or lost on an investment in the Fund, assuming reinvestment of distributions. |
| (g) | | Portfolio turnover is calculated on the basis of the Fund as a whole without distinguishing among the classes of shares. |
See accompanying notes which are an integral part of these financial statements.
26
Dana Funds
Notes to the Financial Statements
October 31, 2016
NOTE 1. ORGANIZATION
The Dana Large Cap Equity Fund (the “Large Cap Fund”) and the Dana Small Cap Equity Fund (the “Small Cap Fund”) (each a “Fund” and collectively, the “Funds”) are each an open-end diversified series of the Valued Advisers Trust (the “Trust”). The Trust is a management investment company established under the laws of Delaware by an Agreement and Declaration of Trust dated June 13, 2008 (the “Trust Agreement”). The Trust Agreement permits the Board of Trustees (“Board”) to issue an unlimited number of shares of beneficial interest of separate series without par value. Each Fund is one of a series of funds currently authorized by the Board. The investment adviser to the Funds is Dana Investment Advisors, Inc. (the “Adviser”). Each Fund seeks long-term growth of capital.
The Large Cap Fund currently offers Class N shares, Class A shares, and Institutional Class shares, and the Small Cap Fund currently offers Investor Class shares and Institutional Class shares. Each share represents an equal proportionate interest in the assets and liabilities belonging to the Fund and is entitled to such dividends and distributions out of income belonging to the Fund as declared by the Board. Class A currently has a maximum sales charge on purchases of 5.00% as a percentage of the original purchase price. All share classes impose a 2.00% redemption fee on shares redeemed within 60 days of purchase.
NOTE 2. SIGNIFICANT ACCOUNTING POLICIES
The Funds are investment companies and follow accounting and reporting guidance under Financial Accounting Standards Board Accounting Standards Codification (“ASC”) Topic 946, “Financial Services-Investment Companies”. The following is a summary of significant accounting policies followed by the Funds in the preparation of their financial statements. These policies are in conformity with the generally accepted accounting principles in the United States of America (“GAAP”).
Estimates – The preparation of financial statements in conformity with GAAP requires management to make estimates and assumptions that affect the reported amounts of assets and liabilities and disclosure of contingent assets and liabilities at the date of the financial statements and the reported amounts of increases and decreases in net assets from operations during the reporting period. Actual results could differ from those estimates.
Securities Valuation – All investments in securities are recorded at their estimated fair value as described in Note 3.
Federal Income Taxes – The Funds make no provision for federal income or excise tax. Each Fund has qualified and intend to qualify each year as a regulated investment company (“RIC”) under subchapter M of the Internal Revenue Code of 1986, as amended, by complying with the requirements applicable to RICs and by distributing substantially all of its taxable income. Each Fund also intends to distribute sufficient net investment income and net capital gains, if any, so that it will not be subject to excise tax on undistributed income and gains. If the required amount of net investment income or gains is not distributed, a Fund could incur a tax expense.
Organization and Offering costs – The Small Cap Fund incurred offering costs of $48,112, which were capitalized and expensed over 12 months on a straight-line basis. No unamortized costs
27
Dana Funds
Notes to the Financial Statements (continued)
October 31, 2016
remained as of October 31, 2016. Expenses incurred by the Small Cap Equity in connection with the organization were expensed as incurred. Subsequent to its formation, the Fund incurred organizational costs of $8,750 for the period ended October 31, 2016.
For the period ended October 31, 2016, the Funds did not have a liability for any unrecognized tax benefits. The Funds recognize interest and penalties, if any, related to unrecognized tax benefits as income tax expense on the statements of operations. During the period, the Funds did not incur any interest or penalties.
Expenses – Expenses incurred by the Trust that do not relate to a specific fund of the Trust are allocated to the individual funds based on each fund’s relative net assets or other appropriate basis. Expenses attributable to any class are borne by that class. Income, realized gains and losses, unrealized appreciation and depreciation, and expenses are allocated to each class based on the net assets in relation to the relative net assets of the Fund.
Security Transactions and Related Income – The Funds follow industry practice and record security transactions on the trade date for financial reporting purposes. The specific identification method is used for determining gains or losses for financial statement and income tax purposes. Dividend income is recorded on the ex-dividend date and interest income is recorded on an accrual basis. Discounts and premiums on securities purchased are accreted or amortized using the effective interest method, if applicable. Withholding taxes on foreign dividends have been provided for in accordance with the Funds’ understanding of the applicable country’s tax rules and rates.
Dividends and Distributions – Distributions to shareholders, which are determined in accordance with income tax regulations, are recorded on the ex-dividend date. The Funds intend to distribute substantially all of their net investment income quarterly. The Funds intend to distribute their net realized long-term and short-term capital gains, if any, annually. The treatment for financial reporting purposes of distributions made to shareholders during the year from net investment income or net realized capital gains may differ from their ultimate treatment for federal income tax purposes. These differences are caused primarily by differences in the timing of the recognition of certain components of income, expense or realized capital gain for federal income tax purposes. Where such differences are permanent in nature, they are reclassified in the components of the net assets based on their ultimate characterization for federal income tax purposes. Any such reclassifications will have no effect on net assets, results of operations or NAV per share of the Funds. For the period ended October 31, 2016, the Funds made the following reclassifications to increase (decrease) the components of net assets:
| | | | | | | | | | |
| | | Paid-in Capital | | Accumulated Undistributed
Net Investment Income | | | Accumulated Net Realized
Loss from Investments | |
Large Cap Fund | | $ – | | $ | (6,937 | ) | | $ | 6,937 | |
Small Cap Fund | | (1,831) | | | 1,831 | | | | – | |
NOTE 3. SECURITIES VALUATION AND FAIR VALUE MEASUREMENTS
Fair value is defined as the price that a Fund would receive upon selling an investment in a timely transaction to an independent buyer in the principal or most advantageous market of the
28
Dana Funds
Notes to the Financial Statements (continued)
October 31, 2016
investment. GAAP establishes a three-tier hierarchy to maximize the use of observable market data and minimize the use of unobservable inputs and to establish classification of fair value measurements for disclosure purposes.
Inputs refer broadly to the assumptions that market participants would use in pricing the asset or liability, including assumptions about risk (the risk inherent in a particular valuation technique used to measure fair value including such a pricing model and/or the risk inherent in the inputs to the valuation technique). Inputs may be observable or unobservable. Observable inputs are inputs that reflect the assumptions market participants would use in pricing the asset or liability developed based on market data obtained and available from sources independent of the reporting entity. Unobservable inputs are inputs that reflect the reporting entity’s own assumptions about the assumptions market participants would use in pricing the asset or liability developed based on the best information available in the circumstances.
Various inputs are used in determining the value of the Funds’ investments. These inputs are summarized in the three broad levels listed below.
| | • | | Level 1 – unadjusted quoted prices in active markets for identical investments and/or registered investment companies where the value per share is determined and published and is the basis for current transactions for identical assets or liabilities at the valuation date |
| | • | | Level 2 – other significant observable inputs (including, but not limited to, quoted prices for an identical security in an inactive market, quoted prices for similar securities, interest rates, prepayment speeds, credit risk, etc.) |
| | • | | Level 3 – significant unobservable inputs (including the Funds’ own assumptions in determining fair value of investments based on the best information available) |
The inputs used to measure fair value may fall into different levels of the fair value hierarchy. In such cases, for disclosure purposes, the level in the fair value hierarchy which is reported, is determined based on the lowest level input that is significant to the fair value measurement in its entirety.
Equity securities that are traded on any stock exchange are generally valued at the last quoted sale price on the security’s primary exchange. Lacking a last sale price, an exchange traded security is generally valued at its last bid price. Securities traded in the NASDAQ over-the-counter market are generally valued at the NASDAQ Official Closing Price. When using the market quotations and when the market is considered active, the security is classified as a Level 1 security. In the event that market quotations are not readily available or are considered unreliable due to market or other events, a Fund values its securities and other assets at fair value in accordance with policies established by and under the general supervision of the Board of Trustees (the “Board”). Under these policies, the securities will be classified as Level 2 or 3 within the fair value hierarchy, depending on the inputs used.
Investments in mutual funds, including money market mutual funds, are generally priced at the ending Net Asset Value (“NAV”) provided by the pricing agent of the funds. These securities are categorized as Level 1 securities.
29
Dana Funds
Notes to the Financial Statements (continued)
October 31, 2016
In accordance with the Trust’s valuation policies, the Adviser is required to consider all appropriate factors relevant to the value of securities for which it has determined other pricing sources are not available or reliable as described above. No single standard exists for determining fair value, because fair value depends upon the circumstances of each individual case. As a general principle, the current fair value of an issue of securities being valued by the Adviser would appear to be the amount that the owner might reasonably expect to receive for them upon their current sale. Methods that are in accordance with this principle may, for example, be based on (i) a multiple of earnings; (ii) a discount from market prices of a similar freely traded security (including a derivative security or a basket of securities traded on other markets, exchanges or among dealers); or (iii) yield to maturity with respect to debt issues, or a combination of these and other methods. Fair-value pricing is permitted if, in the Adviser’s opinion, the validity of market quotations appears to be questionable based on factors such as evidence of a thin market in the security based on a small number of quotations, a significant event occurs after the close of a market but before a Fund’s NAV calculation that may affect a security’s value, or the Adviser is aware of any other data that calls into question the reliability of market quotations.
The following is a summary of the inputs used to value the Funds’ investments as of October 31, 2016:
| | | | | | | | | | | | | | | | |
| Large Cap Fund | | Valuation Inputs | | | | |
| Assets | | Level 1 | | | Level 2 | | | Level 3 | | | Total | |
Common Stocks* | | $ | 170,823,429 | | | $ | – | | | $ | – | | | $ | 170,823,429 | |
Short-Term Investments | | | 302,763 | | | | – | | | | – | | | | 302,763 | |
Total | | $ | 171,126,192 | | | $ | – | | | $ | – | | | $ | 171,126,192 | |
| | | | | | | | | | | | | | | | |
| Small Cap Fund | | Valuation Inputs | | | | |
| Assets | | Level 1 | | | Level 2 | | | Level 3 | | | Total | |
Common Stocks* | | $ | 10,111,475 | | | $ | – | | | $ | – | | | $ | 10,111,475 | |
Short-Term Investments | | | 76,302 | | | | – | | | | – | | | | 76,302 | |
Total | | $ | 10,187,777 | | | $ | – | | | $ | – | | | $ | 10,187,777 | |
| * | | Refer to Schedule of Investments for industry classifications. |
The Funds did not hold any investments during the reporting period for which other significant observable inputs (Level 2) were used in determining fair value. The Funds did not hold any investments during the reporting period for which significant unobservable inputs (Level 3) were used in determining fair value; therefore, no reconciliation of Level 3 securities is included for this reporting period. The Funds did not hold any derivative instruments during the reporting period.
The Trust recognizes transfers between fair value hierarchy levels at the end of the reporting period. There were no transfers between any levels during the period ended October 31, 2016.
NOTE 4. FEES AND OTHER TRANSACTIONS WITH AFFILIATES
The Adviser, under the terms of the management agreement for each Fund (each an “Agreement”), manages the Funds’ investments subject to oversight of the Board. As compensation for its
30
Dana Funds
Notes to the Financial Statements (continued)
October 31, 2016
management services, the Funds are obligated to pay the Adviser a fee computed and accrued daily and paid monthly at an annual rate of 0.70% and 0.80% of the average daily net assets of the Large Cap Fund and the Small Cap Fund, respectively. For the period ended October 31, 2016, the Adviser earned fees of $1,230,213 from the Large Cap Fund and $54,449 from the Small Cap Fund before the waivers described below. At October 31, 2016, the Large Cap Fund owed the Adviser $80,456 and the Adviser owed the Small Cap Fund $9,509.
The Adviser has contractually agreed to waive its management fee and/or reimburse certain operating expenses through February 28, 2017, but only to the extent necessary so that the Funds’ net expenses, excluding brokerage fees and commissions, borrowing costs (such as interest and dividend expenses on securities sold short), taxes, extraordinary expenses, fees and expenses paid under a distribution plan adopted pursuant to Rule 12b-1, fees and expenses paid under a shareholder services plan, and indirect expenses (such as “acquired funds fees and expenses”) do not exceed 0.73% for Class N, Class A and Institutional Class shares for the Large Cap Fund and do not exceed 0.95% for the Investor Class and Institutional Class for the Small Cap Fund.
Each fee waiver or reimbursement of an expense by the Adviser is subject to repayment by the applicable Fund within the three fiscal years following the fiscal year in which the fee waiver or expense reimbursement occurred, provided that the Fund is able to make the repayment without exceeding the expense limitation that is in effect at the time of the recoupment or at the time of the fee waiver or expense reimbursement. The contractual agreement for each Fund is in effect through February 28, 2017. The expense cap for a Fund may not be terminated prior to this date except by the Board. For the period ended October 31, 2016, the Adviser waived fees of $313,281 from the Large Cap Fund and $153,808 from the Small Cap Fund.
The amounts subject to repayment by the Funds, pursuant to the aforementioned conditions are as follows:
| | | | |
| Large Cap Fund | |
| Amount | | Recoverable through
October 31, | |
| $239,324 | | | 2017 | |
| $268,172 | | | 2018 | |
| $313,281 | | | 2019 | |
| | | | |
| Small Cap Fund | |
| Amount | | Recoverable through
October 31, | |
| $153,808 | | | 2019 | |
The Trust retains Ultimus Asset Services, LLC (“Ultimus”), formerly Huntington Asset Services, Inc. (“HASI”), to provide the Funds with administrative, accounting, shareholder and compliance services, including all regulatory reporting. The Trust also retains Ultimus to act as each Fund’s transfer agent and to provide fund accounting services.
Expenses incurred by the Funds for these services are allocated to the individual Funds based on each Fund’s relative net assets. In addition, the Administrator, voluntarily agreed to waive a portion of its fees, or reimburse, $66,061 of administrative, fund accounting and transfer agency expenses of the Small Cap Fund during the period ended October 31, 2016. The officers and one Trustee of the Trust are members of management and/or employees of Ultimus. Unified Financial Securities, LLC (the “Distributor”) acts as the principal distributor of the Funds’ shares. Effective at the close of business on December 31, 2015, Ultimus acquired HASI and the Distributor from Huntington
31
Dana Funds
Notes to the Financial Statements (continued)
October 31, 2016
Bancshares, Inc. (“HBI”). Prior to January 1, 2016, the Custodian, HASI and the Distributor were under common control by HBI. For the period ended October 31, 2016, fees for administrative and compliance services, transfer agent services, fund accounting services and reimbursement of out-of-pocket expenses, net of any waivers, were as follows:
| | | | | | | | |
| | | Large Cap
Fund | | | Small Cap
Fund | |
Administration | | $ | 94,386 | | | $ | 11,250 | |
Fund accounting | | | 51,913 | | | | 7,500 | |
Transfer agent | | | 29,419 | | | | 5,782 | |
Payable to Ultimus | | | 15,422 | | | | 3,923 | |
Each Fund has adopted a Distribution Plan (the “Plan”) pursuant to Rule 12b-1 under the Investment Company Act of 1940 (the “1940 Act”). The Plan provides that each Fund will pay the Distributor or any registered securities dealer, financial institution or any other person (a “Recipient”) a shareholder servicing fee aggregating at a rate of 0.25% of the average daily net assets for each of the Class N, Class A and Investor Class shares in connection with the promotion and distribution of the Funds’ shares or the provision of personal services to shareholders, including, but not necessarily limited to, advertising, compensation to underwriters, dealers and selling personnel, the printing and mailing of prospectuses to other than current Fund shareholders, the printing and mailing of sales literature and servicing shareholder accounts. The Funds or the Adviser may pay all or a portion of these fees to any Recipient who renders assistance in distributing or promoting the sale of shares, or who provides certain shareholder services, pursuant to a written agreement. The Plan is a compensation plan, which means that compensation is paid regardless of 12b-1 expenses actually incurred. It is anticipated that the Plan will benefit shareholders because an effective sales program typically is necessary in order for a Fund to reach and maintain a sufficient size to achieve efficiently its investment objectives and to realize economies of scale. For the period ended October 31, 2016, Class N shares 12b-1 and Class A shares 12b-1 expense incurred by the Large Cap Fund was $86,481 and $3,379, respectively and Investor Class shares 12b-1 expense incurred by the Small Cap Fund was $5,711. The Large Cap Fund owed $6,997 for Class N shares and $285 for Class A shares 12b-1 fees as of October 31, 2016 and the Small Cap Fund owed $797 for Investor Class shares 12b-1 fees as of October 31, 2016.
During the period ended October 31, 2016, the Distributor received $1,550 from commissions earned on sales of Class A shares of the Large Cap Fund, of which $1,549 was re-allowed to intermediaries. Certain officers of the Trust are officers of the Distributor and each such person may be deemed to be an affiliate of the Distributor.
NOTE 5. PURCHASES AND SALES OF SECURITIES
For the period ended October 31, 2016, purchases and sales of investment securities, other than short-term investments and short-term U.S. government obligations were as follows:
| | | | | | | | |
| | | Large Cap
Fund | | | Small Cap
Fund | |
Purchases | | | | | | | | |
U.S. Government Obligations | | $ | – | | | $ | – | |
Other | | | 140,098,847 | | | | 13,885,232 | |
Sales | | | | | | | | |
U.S. Government Obligations | | $ | – | | | $ | – | |
Other | | | 119,045,768 | | | | 3,850,279 | |
32
Dana Funds
Notes to the Financial Statements (continued)
October 31, 2016
NOTE 6. BENEFICIAL OWNERSHIP
The beneficial ownership, either directly or indirectly, of more than 25% of the voting securities of a fund creates a presumption of control of a fund, under Section 2(a)(9) of the 1940 Act. At October 31, 2016, there were no beneficial owners, either directly or indirectly, of more than 25% of the Large Cap Fund. At October 31, 2016, Charles Schwab & Co., Inc. (“Schwab”) owned, as record shareholder, 65% of the outstanding shares of the Small Cap Fund. It is not known whether Schwab or any of the underlying beneficial owners owned or controlled 25% or more of the voting securities of the Small Cap Fund.
NOTE 7. FEDERAL TAX INFORMATION
At October 31, 2016, the net unrealized appreciation (depreciation) of investments for tax purposes was as follows:
| | | | | | | | |
| | | Large Cap
Fund | | | Small Cap
Fund | |
Gross Unrealized Appreciation | | $ | 10,951,063 | | | $ | 770,875 | |
Gross Unrealized Depreciation | | | (4,436,078 | ) | | | (423,784 | ) |
Net Unrealized Appreciation | | $ | 6,514,985 | | | $ | 347,091 | |
At October 31, 2016, the aggregate cost of securities for federal income tax purposes was $164,611,207 for Large Cap Fund and $9,840,686 for Small Cap Fund.
At October 31, 2016, the difference between book basis and tax basis unrealized appreciation for the Large Cap Fund was attributable primarily to the tax deferral of losses on wash sales and the return of capital adjustments from real estate investment trusts.
At October 31, 2016, the Funds’ most recent fiscal period end, the components of distributable earnings (accumulated losses) on a tax basis was as follows:
| | | | | | | | |
| | | Large Cap
Fund | | | Small Cap
Fund | |
Undistributed Ordinary Income | | $ | 229,055 | | | $ | – | |
Accumulated Capital and Other Losses | | | (6,729,641 | ) | | | (265,364 | ) |
Unrealized Appreciation (Depreciation)(a) | | | 6,514,985 | | | | 347,091 | |
Total Accumulated Earnings (Deficit) | | $ | 14,399 | | | $ | 81,727 | |
| (a) | | The difference between book basis and tax basis unrealized appreciation (depreciation) is attributable to the tax deferral of losses on wash sales and income from certain investments. |
33
Dana Funds
Notes to the Financial Statements (continued)
October 31, 2016
The tax character of distributions for the fiscal period ended October 31, 2016 and October 31, 2015 were as follows:
| | | | | | | | | | | | |
| | | Large Cap
Fund | | | Small Cap
Fund | |
| | | 2016 | | | 2015 | | | 2016 | |
Distributions paid from: | | | | | | | | | | | | |
Ordinary Income | | $ | 2,373,908 | | | $ | 1,351,560 | | | $ | 2,906 | |
Net Long-Term Capital Gains | | | – | | | | 2,038,983 | | | | – | |
Return of Capital | | | – | | | | – | | | | 1,826 | |
| | | $ | 2,373,908 | | | $ | 3,390,543 | | | $ | 4,732 | |
As of October 31, 2016, the Large Cap Fund and Small Cap Fund have available for tax purposes unused capital loss carryforwards of $6,729,641 and $265,364, respectively, of short-term capital losses with no expiration, which is available to offset against future taxable net capital gains. To the extent that these carryforwards are used to offset future gains, it is probable that the amount offset will not be distributed to shareholders.
NOTE 8. COMMITMENTS AND CONTINGENCIES
The Funds indemnify their officers and trustees for certain liabilities that may arise from performance of their duties to the Funds. Additionally, in the normal course of business, the Funds enter into contracts that contain a variety of representations and warranties which provide general indemnifications. The Funds’ maximum exposure under these arrangements is unknown, as this would involve future claims that may be made against the Funds that have not yet occurred.
NOTE 9. SUBSEQUENT EVENTS
Management of the Funds has evaluated the need for disclosures and/or adjustments resulting from subsequent events through the date these financial statements were issued. Management has determined there were no items requiring adjustment of the financial statements or additional disclosure.
34
Report of Independent Registered Public Accounting Firm
To the Shareholders of Dana Large Cap Equity Fund and Dana Small Cap Equity Fund and Board of Trustees of Valued Advisers Trust
We have audited the accompanying statements of assets and liabilities, including the schedules of investments, of Dana Large Cap Equity Fund and Dana Small Cap Equity Fund (the “Funds”), each a series of Valued Advisers Trust, as of October 31, 2016, and the related statement of operations for the year then ended, the statements of changes in net assets for each of the two years in the period then ended, and the financial highlights for each of the five years in the period then ended for Dana Large Cap Equity Fund, and the statements of operations and changes in net assets and financial highlights for the period November 3, 2015 (commencement of operations) through October 31, 2016 for Dana Small Cap Equity Fund. These financial statements and financial highlights are the responsibility of the Funds’ management. Our responsibility is to express an opinion on these financial statements and financial highlights based on our audits.
We conducted our audits in accordance with the standards of the Public Company Accounting Oversight Board (United States). Those standards require that we plan and perform the audits to obtain reasonable assurance about whether the financial statements and financial highlights are free of material misstatement. An audit includes examining, on a test basis, evidence supporting the amounts and disclosures in the financial statements. Our procedures included confirmation of securities owned as of October 31, 2016, by correspondence with the custodian and brokers. An audit also includes assessing the accounting principles used and significant estimates made by management, as well as evaluating the overall financial statement presentation. We believe that our audits provide a reasonable basis for our opinion.
In our opinion, the financial statements and financial highlights referred to above present fairly, in all material respects, the financial position of Dana Large Cap Equity Fund and Dana Small Cap Equity Fund as of October 31, 2016, the results of their operations, the changes in their net assets, and the financial highlights for each of the periods presented, in conformity with accounting principles generally accepted in the United States of America.
COHEN & COMPANY, LTD.
Cleveland, Ohio
December 23, 2016
35
Summary of Fund Expenses – (Unaudited)
As a shareholder of one of the Funds, you incur two types of costs: (1) transaction costs, including sales charges (loads) on purchases and short-term redemption fees and (2) ongoing costs, including management fees; and other Fund expenses. These examples are intended to help you understand your ongoing costs (in dollars) of investing in each Fund and to compare these costs with the ongoing costs of investing in other mutual funds. Each Fund’s example is based on an investment of $1,000 invested at the beginning of the period and held for the entire period from May 1, 2016 through October 31, 2016.
Actual Expenses
The first line of the table for each class provides information about actual account values and actual expenses. You may use the information in these lines, together with the amount you invested, to estimate the expenses that you paid over the period. Simply divide your account value by $1,000 (for example, an $8,600 account value divided by $1,000 = 8.60), then multiply the result by the number in the first line under the heading “Expenses Paid During Period” to estimate the expenses you paid on your account during this period.
Hypothetical Example for Comparison Purposes
The second line of the table for each class provides information about hypothetical account values and hypothetical expenses based on each Fund’s actual expense ratios and an assumed rate of return of 5% per year before expenses, which is not the Fund’s actual return. The hypothetical account values and expenses may not be used to estimate the actual ending account balances or expenses you paid for the period. You may use this information to compare the ongoing costs of investing in the Funds and other funds. To do so, compare this 5% hypothetical example with the 5% hypothetical examples that appear in the shareholder reports of the other funds.
Expenses shown in the table are meant to highlight your ongoing costs only and do not reflect any transactional costs such as the fee imposed on sales charges and short-term redemptions. Therefore, the second line of the table for each class is useful in comparing ongoing costs only and will not help you determine the relative total costs of owning different funds. In addition, if transaction costs were included, your costs would have been higher.
36
Summary of Fund Expenses – (Unaudited) (continued)
| | | | | | | | | | | | | | | | | | | | |
| | | | | | Beginning
Account
Value,
May 1, 2016 | | | Ending Account
Value,
October 31, 2016 | | | Expenses
Paid
During
Period(a) | | | Annualized
Expense
Ratio | |
Dana Large Cap Equity Fund | | | | | | | | | | | | | |
Class N | | | Actual | | | $ | 1,000.00 | | | $ | 1,017.80 | | | $ | 4.97 | | | | 0.98 | % |
| | | | | | | | | | | | | | | | | | | | |
| | | Hypothetical | (b) | | $ | 1,000.00 | | | $ | 1,020.21 | | | $ | 4.98 | | | | 0.98 | % |
| | | | | | | | | | | | | | | | | | | | |
Class A | | | Actual | | | $ | 1,000.00 | | | $ | 1,017.30 | | | $ | 4.97 | | | | 0.98 | % |
| | | | | | | | | | | | | | | | | | | | |
| | | Hypothetical | (b) | | $ | 1,000.00 | | | $ | 1,020.21 | | | $ | 4.97 | | | | 0.98 | % |
| | | | | | | | | | | | | | | | | | | | |
Institutional Class | | | Actual | | | $ | 1,000.00 | | | $ | 1,018.60 | | | $ | 3.70 | | | | 0.73 | % |
| | | | | | | | | | | | | | | | | | | | |
| | | Hypothetical | (b) | | $ | 1,000.00 | | | $ | 1,021.47 | | | $ | 3.71 | | | | 0.73 | % |
| | | | | |
| | | | | | Beginning
Account
Value,
May 1, 2016 | | | Ending Account
Value,
October 31, 2016 | | | Expenses
Paid
During
Period(a) | | | Annualized
Expense
Ratio | |
Dana Small Cap Equity Fund | | | | | | | | | | | | | | | | | |
Institutional Class | | | Actual | | | $ | 1,000.00 | | | $ | 1,023.50 | | | $ | 4.83 | | | | 0.95 | % |
| | | | | | | | | | | | | | | | | | | | |
| | | Hypothetical | (b) | | $ | 1,000.00 | | | $ | 1,020.36 | | | $ | 4.82 | | | | 0.95 | % |
| | | | | | | | | | | | | | | | | | | | |
Investor Class | | | Actual | | | $ | 1,000.00 | | | $ | 1,023.20 | | | $ | 6.10 | | | | 1.20 | % |
| | | | | | | | | | | | | | | | | | | | |
| | | Hypothetical | (b) | | $ | 1,000.00 | | | $ | 1,019.10 | | | $ | 6.09 | | | | 1.20 | % |
| (a) | | Expenses are equal to a Fund’s annualized expense ratios, multiplied by the average account value over the period, multiplied by 184/366 (to reflect the one-half year period). The annualized expense ratios reflect reimbursement of expenses by the Fund’s investment adviser for the period May 1, 2016 to October 31, 2016. The “Financial Highlights” tables in the Fund’s financial statements, included in this report, also show the gross expense ratios, without such reimbursements. |
| (b) | | Hypothetical assumes 5% annual return before expenses. |
37
Additional Federal Income Tax Information (Unaudited)
The Form 1099-DIV you receive in January 2017 will show the tax status of all distributions paid to your account in calendar year 2016. Shareholders are advised to consult their own tax adviser with respect to the tax consequences of their investment in a Fund. As required by the Internal Revenue Code and/or regulations, shareholders must be notified regarding the status of qualified dividend income for individuals and the dividends received deduction for corporations.
Qualified Dividend Income. The Large Cap Fund and Small Cap Fund designate approximately 100% and 100%, respectively, or up to the maximum amount of such dividends allowable pursuant to the Internal Revenue Code, as qualified dividend income eligible for the reduced tax rate of 15%.
Dividends Received Deduction. Corporate shareholders are generally entitled to take the dividends received deduction on the portion of a Fund’s dividend distribution that qualifies under tax law. For the Large Cap Fund’s and Small Cap Fund’s calendar year 2016 ordinary income dividends, 100% and 100%, respectively, qualifies for the corporate dividends received deduction.
38
Trustees and Officers (Unaudited)
The Board of Trustees supervises the business activities of the Trust. Each Trustee serves as a trustee until termination of the Trust unless the Trustee dies, resigns, retires or is removed.
The following table provides information regarding each of the Independent Trustees.
| | | | |
Name, Address*, (Age),
Position with Trust**,
Term of Position with Trust | | Principal Occupation
During Past 5 Years | | Other Directorships |
Ira Cohen, 57,
Independent Trustee,
June 2010 to present. | | Current: Independent financial services consultant since February 2005; Executive Vice President of Asset Management Services, Recognos Financial (since August 2015). | | Trustee and Audit Committee Chairman, Griffin Institutional Real Estate Access Fund, since May 2014. Trustee, Angel Oak Funds Trust, since October 2014. |
Andrea N. Mullins, 49, Independent Trustee,
December 2013 to present. | | Current: Private investor; Independent Contractor, Seabridge Wealth Management, LLC (since April 2014). | | None. |
| * | | The address for each trustee and officer is 225 Pictoria Drive, Suite 450, Cincinnati, OH 45246. |
| ** | | As of the date of this report, the Trust consists of 14 series. |
The following table provides information regarding the Trustee who is considered an “interested person” of the Trust, as that term is defined under the 1940 Act. Based on the experience of the Trustee, the Trust concluded that the individual described below is qualified to serve as a Trustee.
| | | | |
Name, Address*, (Age),
Position with Trust**,
Term of Position with Trust | | Principal Occupation
During Past 5 Years | | Other Directorships |
R. Jeffrey Young, 52,
Trustee and Chairman,
June 2010 to present. | | Current: Vice President and Director of Relationship Management, Ultimus Fund Solutions, LLC (since December 2015); President, Unified Financial Securities, LLC (since July 2015). Previous: President, Huntington Asset Services, Inc. (n/k/a Ultimus Asset Services, LLC) (April 2015 to December 2015), Director (May 2014 to December 2015), Senior Vice President (January 2010 to April 2015); Director, Unified Financial Securities, Inc. (n/k/a Unified Financial Securities, LLC) (May 2014 to December 2015); Chief Executive Officer, Huntington Funds (February 2010 to March 2015); Chief Executive Officer, Huntington Strategy Shares (November 2010 to March 2015); President and Chief Executive Officer, Dreman Contrarian Funds (March 2011 to February 2013). | | Trustee and Chairman, Capitol Series Trust, since September 2013. |
| * | | The address for each trustee and officer is 225 Pictoria Drive, Suite 450, Cincinnati, OH 45246. |
| ** | | As of the date of this report, the Trust consists of 14 series. |
39
Trustees and Officers (Unaudited) (continued)
The following table provides information regarding the Officers of the Trust:
| | | | |
Name, Address*, (Age),
Position with Trust,**
Term of Position with Trust | | Principal Occupation
During Past 5 Years | | Other Directorships |
R. Jeffrey Young, 52,
Trustee and Chairman,
June 2010 to present; Principal Executive Officer and President, Valued Advisers Trust since February 2010. | | Current: Vice President and Director of Relationship Management, Ultimus Fund Solutions, LLC (since December 2015); President, Unified Financial Securities, LLC (since July 2015). Previous: President, Huntington Asset Services, Inc. (n/k/a Ultimus Asset Services, LLC) (April 2015 to December 2015), Director (May 2014 to December 2015), Senior Vice President (January 2010 to April 2015); Director, Unified Financial Securities, Inc. (n/k/a Unified Financial Securities, LLC) (May 2014 to December 2015); Chief Executive Officer, Huntington Funds (February 2010 to March 2015); Chief Executive Officer, Huntington Strategy Shares (November 2010 to March 2015); President and Chief Executive Officer, Dreman Contrarian Funds (March 2011 to February 2013). | | Trustee and Chairman, Capitol Series Trust, since September 2013. |
John C. Swhear, 55,
Chief Compliance Officer,
AML Officer and Vice President, August 2008 to present. | | Current: Vice President, Unified Series Trust (since January 2016); Assistant Vice President and Associate Director of Compliance, Ultimus Fund Solutions, LLC (since December 2015); Chief Compliance Officer, Unified Financial Securities, LLC (since May 2007); Chief Compliance Officer and AML Officer, Capitol Series Trust (since September 2013). Previous: Vice President of Legal Administration and Compliance, Huntington Asset Services, Inc. (n/k/a Ultimus Asset Services, LLC) (April 2007 to December 2015), Director (May 2014 to December 2015); Director, Unified Financial Securities, Inc. (n/k/a Unified Financial Securities, LLC) (May 2014 to December 2015); President , Unified Series Trust (March 2012 to January 2016), Senior Vice President (May 2007 to March 2012); Secretary , Huntington Funds (April 2010 to February 2012). | | None. |
Carol J. Highsmith, 52,
Vice President, August 2008 to present; Secretary, March 2014 to present | | Current: Assistant Vice President, Ultimus Fund Solutions, LLC (since December 2015). Previous: Secretary, Cross Shore Discovery Fund (May 2014 to February 2016); Employed in various positions with Huntington Asset Services, Inc. (n/k/a Ultimus Asset Services, LLC) (November 1994 to December 2015), most recently Vice President of Legal Administration (2005 to December 2015). | | None. |
40
Trustees and Officers (Unaudited) (continued)
| | | | |
Name, Address*, (Age),
Position with Trust,**
Term of Position with Trust | | Principal Occupation
During Past 5 Years | | Other Directorships |
Matthew J. Miller, 40,
Vice President, December 2011 to present. | | Current: Assistant Vice President, Relationship Management, Ultimus Fund Solutions, LLC (since December 2015); President and Chief Executive Officer, Capitol Series Trust (since September 2013). Previous: Employed in various positions with Huntington Asset Services, Inc. (n/k/a Ultimus Asset Services, LLC) (since July 1998), most recently Vice President of Relationship Management (2005 to December 2015); Vice President, Huntington Funds (February 2010 to April 2015). | | None. |
Bryan W. Ashmus, 43,
Principal Financial Officer and Treasurer, December 2013 to present. | | Current: Vice President and Director of Financial Administration, Ultimus Fund Solutions, LLC (since December 2015); Chief Financial Officer and Treasurer, Cross Shore Discovery Fund (since June 2016). Previous: Vice President and Manager of Financial Administration, Huntington Asset Services, Inc. (n/k/a Ultimus Asset Services, LLC) (September 2013 to December 2015); Chief Financial Officer and Treasurer, Huntington Strategy Shares and Huntington Funds Trust (November 2013 to April 2016); Vice President, Fund Administration, Citi Fund Services Ohio, Inc. (from May 2005 to September 2013). | | None. |
| * | | The address for each trustee and officer is 225 Pictoria Drive, Suite 450, Cincinnati, OH 45246. |
| ** | | As of the date of this report, the Trust consists of 14 series. |
Other Information
The Funds’ Statement of Additional Information (“SAI”) includes additional information about the trustees and is available without charge, upon request. You may call toll-free at (855) 280-9648 to request a copy of the SAI or to make shareholder inquiries.
41
Investment Advisory Agreement Approval (Unaudited)
At a meeting held on June 7-8, 2016, the Board of Trustees (the “Board”) considered the renewal of the Investment Advisory Agreement (the “Agreement”) between Valued Advisers Trust (the “Trust”) and Dana Investment Advisors, Inc. (“Dana”) with respect to the Dana Large Cap Equity Fund (the “Fund”). Dana provided written information to the Board to assist the Board in its considerations.
The Board discussed the specific contractual arrangements between Dana and the Trust with respect to the Fund. Trust counsel reminded the Trustees of their fiduciary duties and responsibilities as summarized in the memorandum from his firm, including the factors to be considered, and the application of those factors to Dana. In assessing the factors and reaching its decision, the Board took into consideration information furnished by Dana and the Trust’s other service providers for the Board’s review and consideration throughout the year at regular Board meetings, as well as information specifically prepared or presented in connection with the annual renewal process, including information presented at this meeting. The Board requested and was provided with, and reflected on, information and reports relevant to the annual renewal of the Agreement, including: (i) reports regarding the services and support provided to the Fund by Dana; (ii) quarterly assessments of the investment performance of the Fund by personnel of Dana; (iii) commentary on the reasons for the performance; (iv) presentations by Dana addressing its investment philosophy, investment strategy, personnel, and operations; (v) compliance and audit reports concerning the Fund and Dana; (vi) disclosure information contained in the Trust’s registration statement and Dana’s Form ADV; and (vii) a memorandum from counsel, that summarized the fiduciary duties and responsibilities of the Board in reviewing and approving the Agreement, including the material factors to be considered and the types of information with respect to each factor that should be considered by the Board in order to make an informed decision. The Board also requested and received various informational materials including, without limitation: (i) documents containing information about Dana, including its financial information, personnel and services provided to the Fund; information on investment advice, performance, summaries of Fund expenses, compliance program, current legal matters, and other general information; (ii) comparative expense and performance information for other mutual funds with strategies similar to the Fund; and (iii) benefits to be realized by Dana from its relationship with the Fund. The Board did not identify any particular information that was most relevant to its consideration to approve the Agreement and each Trustee may have afforded different weight to the various factors.
| 1. | | The nature, extent, and quality of the services to be provided by Dana. In this regard, the Board considered Dana’s responsibilities under the Agreement. The Trustees considered the services being provided by Dana to the Fund including, without limitation: the quality of its investment advisory services (including research and recommendations with respect to portfolio securities), its process for formulating investment recommendations and assuring compliance with the Fund’s investment objectives and limitations, its coordination of services for the Fund among its service providers, and its efforts to promote the Fund and grow its assets. The Trustees considered Dana’s continuity of, and commitment to retain, qualified personnel and Dana’s commitment to maintain and enhance its resources and systems, the commitment of Dana’s personnel to finding alternatives and options that allow the Fund to maintain its goals, and Dana’s continued cooperation with the Independent Trustees and counsel for the Fund. The Trustees considered Dana’s personnel, including their education and experience. After considering the foregoing information and further information in the meeting materials provided by Dana, the Board concluded that, in light of all the facts and circumstances, the nature, extent, and quality of the services provided by Dana were satisfactory and adequate for the Fund. |
42
Investment Advisory Agreement Approval (Unaudited) (continued)
| 2. | | Investment Performance of the Fund and Dana. In this regard, the Trustees compared the performance of the Fund with the performance of funds with similar objectives managed by other investment advisers, with aggregated peer group data, as well as with the performance of the Fund’s benchmark. The Trustees also considered the consistency of Dana’s management of the Fund with its investment objectives, strategies, and limitations. The Trustees noted that, as of March 31, 2016, the Fund’s performance was above that of its peer group average for the three-year and five-year periods, but that it was below its peer group average for the one-year and the most recent three month periods. The Trustees noted that the Fund’s performance was relatively comparable to that of its benchmark. The Trustees also considered the performance of Dana’s separate accounts that were managed in a manner similar to that of the Fund and they noted that the performance was relatively comparable. After reviewing and discussing these and other relevant factors, the Board concluded, in light of all the facts and circumstances, that the investment performance of the Fund and Dana was satisfactory. |
| 3. | | The costs of the services to be provided and profits to be realized by Dana from the relationship with the Fund. In this regard, the Trustees considered: (1) Dana’s financial condition; (2) the asset level of the Fund; (3) the overall expenses of the Fund; and (4) the nature and frequency of management fee payments. The Trustees reviewed information provided by Dana regarding its profits associated with managing the Fund, noting that Dana is currently waiving a portion of its management fee for its services rendered to the Fund. The Trustees also considered potential benefits for Dana in managing the Fund. The Trustees then compared the fees and expenses of the Fund (including the management fee) to other comparable mutual funds. The Trustees noted that the Fund’s management fee was below that of the average and median management fee of the peer category. The Trustees also noted that the Fund’s net expense ratio was lower than that of the peer category average and median, because of Dana’s contractual commitment to limit the expenses of the Fund. The Board noted that the fees that Dana assesses for separate account clients that have strategies similar to that of the Fund could be comparable or lower and they expressed the view that the reasons for such differences were acceptable and reasonable. Based on the foregoing, the Board concluded that the fees to be paid to Dana by the Fund and the profits to be realized by Dana, in light of all the facts and circumstances, were fair and reasonable in relation to the nature and quality of the services provided by Dana. |
| 4. | | The extent to which economies of scale would be realized as the Fund grows and whether advisory fee levels reflect these economies of scale for the benefit of the Fund’s investors. In this regard, the Board considered the Fund’s fee arrangements with Dana. The Board considered that while the management fee remained the same at all asset levels, the Fund’s shareholders experienced benefits from the Fund’s expense limitation arrangement. The Trustees noted that once the Fund’s expenses fell below the cap set by the arrangement, the shareholders would continue to benefit from economies of scale under the Fund’s arrangements with other service providers to the Fund, and the Trustees attributed this benefit, in part, to the direct and indirect efforts of Dana at the inception of the Fund to ensure that a cost structure was in place that was beneficial for the Fund as it grew. In light of its ongoing consideration of the Fund’s asset levels, expectations for growth in the Fund, and fee levels, the Board determined that the Fund’s fee arrangements, in light of all the facts and circumstances, were fair and reasonable in relation to the nature and quality of the services provided by Dana. |
43
Investment Advisory Agreement Approval (Unaudited) (continued)
| 5. | | Possible conflicts of interest and benefits to Dana. In this regard, the Trustees evaluated the potential for conflicts of interest and considered such matters as the experience and ability of the advisory personnel assigned to the Fund; the basis of decisions to buy or sell securities for the Fund and the substance and administration of Dana’s code of ethics. The Trustees also considered disclosure in the registration statement of the Trust relating to Dana’s potential conflicts of interest. The Trustees noted that Dana may utilize soft dollars and the Trustees noted Dana’s policies and processes for managing the conflicts of interest that could arise from soft dollar arrangements. The Trustees noted other potential benefits to Dana, including the fact that the Fund provides an attractive vehicle for smaller accounts, which may increase the total assets under management by Dana and provide marginal cost efficiency. Based on the foregoing, the Board determined that the standards and practices of Dana relating to the identification and mitigation of potential conflicts of interest and the benefits to be realized by Dana in managing the Fund were satisfactory. |
After additional consideration of the factors delineated in the memorandum provided by counsel and further discussion among the Board members, the Board determined to approve the continuation of the Agreement between the Trust and Dana.
44
VALUED ADVISERS TRUST
PRIVACY POLICY
The following is a description of the policies of the Valued Advisers Trust (the “Trust”) regarding disclosure of nonpublic personal information that shareholders provide to a series of the Trust (each, a “Fund”) or that the Fund collects from other sources. In the event that a shareholder hold shares of a Fund through a broker-dealer or other financial intermediary, the privacy policy of the financial intermediary would govern how shareholder nonpublic personal information would be shared with nonaffiliated third parties.
Categories of Information a Fund May Collect. A Fund may collect the following nonpublic personal information about its shareholders:
| | • | | Information the Fund receives from a shareholder on applications or other forms, correspondence, or conversations (such as the shareholder’s name, address, phone number, social security number, and date of birth); and |
| | • | | Information about the shareholder’s transactions with the Fund, its affiliates, or others (such as the shareholder’s account number and balance, payment history, cost basis information, and other financial information). |
Categories of Information a Fund May Disclose. A Fund may not disclose any nonpublic personal information about its current or former shareholders to unaffiliated third parties, except as required or permitted by law. A Fund is permitted by law to disclose all of the information it collects, as described above, to its service providers (such as the Fund’s custodian, administrator, transfer agent, accountant and legal counsel) to process shareholder transactions and otherwise provide services to the shareholder.
Confidentiality and Security. Each Fund shall restrict access to shareholder nonpublic personal information to those persons who require such information to provide products or services to the shareholder. Each Fund shall maintain physical, electronic, and procedural safeguards that comply with federal standards to guard shareholder nonpublic personal information.
Disposal of Information. The Funds, through their transfer agent, have taken steps to reasonably ensure that the privacy of a shareholder’s nonpublic personal information is maintained at all times, including in connection with the disposal of information that is no longer required to be maintained by the Funds. Such steps shall include, whenever possible, shredding paper documents and records prior to disposal, requiring off-site storage vendors to shred documents maintained in such locations prior to disposal, and erasing and/or obliterating any data contained on electronic media in such a manner that the information can no longer be read or reconstructed.
45
PROXY VOTING
A description of the policies and procedures that each Fund uses to determine how to vote proxies relating to portfolio securities and information regarding how each Fund voted those proxies during the most recent twelve month period ended June 30, is available without charge upon request by (1) calling the Funds at (855) 280-9648 and (2) from Fund documents filed with the Securities and Exchange Commission (“SEC”) on the SEC’s website at www.sec.gov.
TRUSTEES
R. Jeffrey Young, Chairman
Ira Cohen
Andrea N. Mullins
OFFICERS
R. Jeffrey Young, Principal Executive Officer and President
Bryan W. Ashmus, Principal Financial Officer and Treasurer
John C. Swhear, Chief Compliance Officer, AML Officer and Vice-President
Carol J. Highsmith, Vice President and Secretary
Matthew J. Miller, Vice President
INVESTMENT ADVISER
Dana Investment Advisors, Inc.
20700 Swenson Drive, suite 400
Waukesha, WI 53186
DISTRIBUTOR
Unified Financial Securities, LLC
2465 Counselors Row, Suite 200
Indianapolis, IN 46240
INDEPENDENT REGISTERED PUBLIC ACCOUNTING FIRM
Cohen & Company, Ltd.
1350 Euclid Avenue, Suite 800
Cleveland, OH 44115
LEGAL COUNSEL
The Law Offices of John H. Lively & Associates, Inc.,
A member firm of The 1940 Act Law GroupTM
11300 Tomahawk Creek Parkway, Suite 310
Leawood, KS 66211
CUSTODIAN
Huntington National Bank
41 S. High St.
Columbus, OH 43215
ADMINISTRATOR, TRANSFER AGENT AND FUND ACCOUNTANT
Ultimus Asset Services, LLC
225 Pictoria Drive, Suite 450
Cincinnati, OH 45246
This report is intended only for the information of shareholders or those who have received the Funds’ prospectus which contains information about the Funds’ management fee and expenses. Please read the prospectus carefully before investing.
Distributed by Unified Financial Securities, LLC
Member FINRA/SIPC
Item 2. Code of Ethics.
As of the end of the period covered by this report, the registrant has adopted a code of ethics that applies to the registrant’s principal executive officer, principal financial officer, principal accounting officer or controller, or persons performing similar functions, regardless of whether these individuals are employed by the registrant or a third party. Pursuant to Item 12(a)(1), a copy of registrant’s code of ethics is filed as an exhibit to this Form N-CSR. During the period covered by this report, the code of ethics has not been amended, and the registrant has not granted any waivers, including implicit waivers, from the provisions of the code of ethics.
Item 3. Audit Committee Financial Expert.
(a)(1) The registrant’s Board of Trustees has determined that the registrant has at least one audit committee financial expert serving on its audit committee.
(a)(2) The audit committee financial expert is Andrea N. Mullins, who is “independent” for purposes of this Item 3 of Form N-CSR.
Item 4. Principal Accountant Fees and Services.
| | | | | | | | |
Granite Value Fund: | | | FY 2016 | | | $ | 13,800 | |
| | | FY 2015 | | | $ | 13,000 | |
Sound Mind Investing Funds: | | | FY 2016 | | | $ | 69,000 | |
| | | FY 2015 | | | $ | 68,000 | |
Green Owl Intrinsic Value Fund: | | | FY 2016 | | | $ | 13,800 | |
| | | FY 2015 | | | $ | 13,000 | |
Foundry Partners Fundamental Small Cap Value Fund: | | | FY 2016 | | | $ | 14,800 | |
| | | FY 2015 | | | $ | 14,000 | |
Dana Funds: | | | FY 2016 | | | $ | 29,100 | |
| | | FY 2015 | | | $ | 14,000 | |
| | | | | | |
| Granite Value Fund: | | FY 2016 | | $ | 0 | |
| | FY 2015 | | $ | 0 | |
| Sound Mind Investing Funds: | | FY 2016 | | $ | 0 | |
| | FY 2015 | | $ | 0 | |
| Green Owl Intrinsic Value Fund: | | FY 2016 | | $ | 0 | |
| | FY 2015 | | $ | 0 | |
| Foundry Partners Fundamental Small Cap Value Fund: | | FY 2016 | | $ | 0 | |
| | FY 2015 | | $ | 0 | |
| Dana Funds: | | FY 2016 | | $ | 0 | |
| | FY 2015 | | $ | 0 | |
-2-
| | | | | | | | |
Granite Value Fund: | | | FY 2016 | | | $ | 3,000 | |
| | | FY 2015 | | | $ | 2,500 | |
Sound Mind Investing Funds: | | | FY 2016 | | | $ | 15,000 | |
| | | FY 2015 | | | $ | 13,325 | |
Green Owl Intrinsic Value Fund: | | | FY 2016 | | | $ | 3,000 | |
| | | FY 2015 | | | $ | 2,500 | |
Foundry Partners Fundamental Small Cap Value Fund: | | | FY 2016 | | | $ | 3,000 | |
| | | FY 2015 | | | $ | 2,500 | |
Dana Funds: | | | FY 2016 | | | $ | 6,000 | |
| | | FY 2015 | | | $ | 2,500 | |
Nature of the fees: Preparation of the 1120 RIC and Excise review
| | | | | | | | |
| | |
Granite Value Fund: | | | FY 2016 | | | $ | 0 | |
| | | FY 2015 | | | $ | 0 | |
Sound Mind Investing Funds: | | | FY 2016 | | | $ | 0 | |
| | | FY 2015 | | | $ | 0 | |
Green Owl Intrinsic Value Fund: | | | FY 2016 | | | $ | 0 | |
| | | FY 2015 | | | $ | 0 | |
Foundry Partners Fundamental Small Cap Value Fund: | | | FY 2016 | | | $ | 0 | |
| | | FY 2015 | | | $ | 0 | |
Dana Funds: | | | FY 2016 | | | $ | 0 | |
| | | FY 2015 | | | $ | 0 | |
| | | | |
| (e) | | (1) | | Audit Committee’s Pre-Approval Policies |
| | |
| | | | The Audit Committee Charter requires the Audit Committee to be responsible for the selection, retention or termination of auditors and, in connection therewith, to (i) evaluate the proposed fees and other compensation, if any, to be paid to the auditors, (ii) evaluate the independence of the auditors, (iii) pre-approve all audit services and, when appropriate, any non-audit services provided by the independent auditors to the Trust, (iv) pre-approve, when appropriate, any non-audit services provided by the independent auditors to the Trust’s investment adviser, or any entity controlling, controlled by, or under common control with the investment adviser and that provides ongoing services to the Trust if the engagement relates directly to the operations and financial reporting of the Trust, and (v) receive the auditors’ specific representations as to their independence; |
-3-
| | | | |
| | |
| | (2) | | Percentages of Services Approved by the Audit Committee |
| | | | |
| | | Registrant | |
Audit-Related Fees: | | | 0 | % |
Tax Fees: | | | 0 | % |
All Other Fees: | | | 0 | % |
(f) During audit of registrant’s financial statements for the most recent fiscal year, less than 50 percent of the hours expended on the principal accountant’s engagement were attributed to work performed by persons other than the principal accountant’s full-time, permanent employees.
(g) The aggregate non-audit fees billed by the registrant’s accountant for services rendered to the registrant, and rendered to the registrant’s investment adviser (not including any sub-adviser whose role is primarily portfolio management and is subcontracted with or overseen by another investment adviser), and any entity controlling, controlled by, or under common control with the adviser that provides ongoing services to the registrant:
| | | | | | | | |
| | | Registrant | | | Adviser | |
FY 2016 | | $ | 0 | | | $ | 0 | |
FY 2015 | | $ | 0 | | | $ | 0 | |
(h) Not applicable. The auditor performed no services for the registrant’s investment adviser or any entity controlling, controlled by, or under common control with the investment adviser that provides ongoing services to the registrant.
Item 5. Audit Committee of Listed Companies. NOT APPLICABLE – applies to listed companies only
Item 6. Schedule of Investments. Schedules filed with Item 1.
Item 7. Disclosure of Proxy Voting Policies and Procedures for Closed-End Management Investment Companies. NOT APPLICABLE – applies to closed-end funds only
Item 8. Portfolio Managers of Closed-End Investment Companies. NOT APPLICABLE – applies to closed-end funds only
Item 9. Purchases of Equity Securities by Closed-End Management Investment Company and Affiliated Purchasers. NOT APPLICABLE – applies to closed-end funds only
Item 10. Submission of Matters to a Vote of Security Holders.
The guidelines applicable to shareholders desiring to submit recommendations for nominees to the Registrant’s board of trustees are contained in the statement of additional information of the Trust with respect to the Fund(s) for which this Form N-CSR is being filed.
Item 11. Controls and Procedures.
(a) Based on their evaluation of the registrant’s disclosure controls and procedures (as defined in Rule 30a-3(c) under the Investment Company Act of 1940, as amended (the “Act”)) as of a date within 90 days of the filing date of this report, the registrant’s principal executive officer and principal financial officer
-4-
have concluded that such disclosure controls and procedures are reasonably designed and are operating effectively to ensure that material information relating to the registrant is made known to them by others within those entities, particularly during the period in which this report is being prepared, and that the information required in filings on Form N-CSR is recorded, processed, summarized, and reported on a timely basis.
(b) There were no changes in the registrant’s internal control over financial reporting (as defined in Rule 30a-3(d) under the Investment Company Act of 1940) that occurred during the second fiscal quarter of the period covered by this report that have materially affected, or are reasonably likely to materially affect, the registrant’s internal control over financial reporting.
Item 12. Exhibits.
| | | | |
| (a) | | (1) | | Code is filed herewith. |
| | |
| | (2) | | Certifications by the registrant’s principal executive officer and principal financial officer, pursuant to Section 302 of the Sarbanes- Oxley Act of 2002 and required by Rule 30a-2 under the Investment Company Act of 1940 are filed herewith. |
| | |
| | (3) | | Not Applicable |
| | |
| (b) | | | | Certification pursuant to 18 U.S.C. Section 1350, as adopted pursuant to Section 906 of the Sarbanes-Oxley Act of 2002 is filed herewith. |
-5-
Pursuant to the requirements of the Securities Exchange Act of 1934 and the Investment Company Act of 1940, the registrant has duly caused this report to be signed on its behalf by the undersigned, thereunto duly authorized.
| | |
| (Registrant) | | Valued Advisers Trust |
| | |
| |
| By | | /s/ R. Jeffrey Young |
| | R. Jeffrey Young, President and Principal Executive Officer |
| |
| Date | | 12/28/16 |
Pursuant to the requirements of the Securities Exchange Act of 1934 and the Investment Company Act of 1940, this report has been signed below by the following persons on behalf of the registrant and in the capacities and on the dates indicated.
| | |
| By | | /s/ R. Jeffrey Young |
| | R. Jeffrey Young, President and Principal Executive Officer |
| |
| Date | | 12/28/16 |
| |
| By | | /s/ Bryan W. Ashmus |
| | Bryan W. Ashmus, Treasurer and Principal Financial Officer |
| |
| Date | | 12/28/16 |
-6-