UNITED STATES
SECURITIES AND EXCHANGE COMMISSION
WASHINGTON, D.C. 20549
FORM N-CSR
CERTIFIED SHAREHOLDER REPORT OF REGISTERED
MANAGEMENT INVESTMENT COMPANIES
Investment Company Act file number 811-22208
Valued Advisers Trust
(Exact name of registrant as specified in charter)
| | | | |
| Huntington Asset Services, Inc. | | 2960 N. Meridian Street, Suite 300 | | Indianapolis, IN 46208 |
| (Address of principal executive offices) | | (Zip code) |
Capitol Services, Inc.
615 S. Dupont Hwy.
Dover, DE 19901
(Name and address of agent for service)
With a copy to:
John H. Lively, Esq.
The Law Offices of John H. Lively & Associates, Inc.
A member firm of The 1940 Act Law GroupTM
11300 Tomahawk Creek Parkway,
Suite 310
Leawood, KS 66221
Registrant’s telephone number, including area code: 317-917-7000
Date of fiscal year end: 10/31
Date of reporting period: 10/31/15
| Item 1. | Reports to Stockholders. |

Annual Report
October 31, 2015
Fund Adviser:
Granite Investment Advisors, Inc.
6 Eagle Square, 3rd Floor
Concord, New Hampshire 03301
Toll Free (888) 442-9893
DISCUSSION – (Unaudited)
Our fiscal year ended October 31, 2015 has been an unsatisfactory year for our performance. This is my responsibility as the Chief Investment Officer, and one which I take very seriously. The buck stops here. As of the end of October, we were down 5.37% in the Granite Value Fund versus the S&P 500®, which was up 5.20% and the Russell 1000® Value, which was up 0.5%.
As we have stated in past, because we run a concentrated portfolio, there will be times when we deviate from the indices: both up and down. Closer examination reveals three other periods where we underperformed by a similar magnitude and one where we underperformed more than we did this year. Following those periods, we outperformed the market and made up for lost ground. While we cannot guarantee results, we are confident in our disciplined investment process and our ability to bounce back.
What is becoming clearer over time is that since 2010, active managers as a group have underperformed their benchmark indices. It has been even more difficult for value managers because a handful of growth stocks – primarily in the technology and biotechnology industries – have been leading markets higher. Given the lofty valuations in these areas, these are stocks that value managers rarely consider purchasing. Overall, it has been a momentum, not value driven-market. To make matters worse, the market has become very narrow. This means that a handful of names have distorted the returns of the overall indexes. According to an article in USA Today entitled, “Where’s the Breadth,” the top ten stocks in the S&P 500® have been responsible for 100% of the gains so far this year. So far more than half of the stocks in the S&P 500 are negative or down. The recent market performance has become so concentrated that Wall Street has titled some of the group as FANG (Facebook, Amazon¸ Netflix and Google). Just as with the technology and biotechnology sectors, these names carry extremely lofty valuations: 50, 346, 579 and 26 times this year’s earnings respectively.
Does any of this sound familiar? To us this feels similar to, but not identical to, the “dot com” bubble of the late 1990s. It has often been said that crises are never the same, but they do often rhyme. During the “dot com” bubble, a handful of very expensive companies (primarily in the technology sector) were driving the market. Valuations and earnings growth did not matter to investors as long as the companies were growing revenues. Active managers were having a very hard time keeping up and value investing was thought of as your father’s Oldsmobile. In addition, we were under tremendous pressure to change our style to reflect the new reality and chase these technology growth stocks. Did we change? No. We stuck to our time-tested value style, which rewarded our clients handsomely from 2000 through the financial crisis of 2008/2009.
Best Performers
Our best performer was Excelis for this past fiscal year. We invested in this defense company because it possessed many of the attributes we look for in a value investment: attractively valued, profitable, and well managed with a stable business model. Additionally, they were in the process of restructuring their business to increase profitably. Unbeknownst to us, Harris Corporation saw the same attractiveness we did and purchased the entire company shortly after we invested in Excelis.
AIG was our second best performer for the year and we believe there is more upside to come. We invested in the company while the U.S. Treasury Department still held its stake. We believe that this is a very valuable global brand with the new management team doing a good job cleaning up sins from the prior management team. As this new team process moves forward we believe that profitability and the stock price will follow – so far we have been right. Given how long government examiners were involved with the company, we were quite surprised to have the opportunity to buy AIG at a substantial discount to book value. Book value is a measure of an entity’s assets minus its liabilities, so given the regulatory oversight and scrutiny the company was under, we had no reason to believe that book value was inaccurate. Since we made our investment, management has done a good job getting the company back on track. Additionally, we now have activist investors attempting to accelerate its transformation to maximize shareholder value. Stay tuned.
1
United Healthcare was our third best performer for this past fiscal year. The Affordable Care Act has proven to be a terrific tailwind for the entire industry for two reasons. First, as people did not have health insurance available to them in the past, demand for healthcare has gone up. Secondly, the ACA’s name is misleading. It’s not affordable, but rather just the opposite as it has become more expensive per person. Why? It seems that in an attempt to get the bill passed, Washington needed to offer some incentives to the Healthcare industry/lobby to ensure their support. For example, the government gave up some of their negotiating power on drug pricing. In short, the Affordable Care Act is not very affordable. While this is a negative for taxpayers it’s been great for UNH.
Worst Performers
Our worst performing stocks Ultra Petroleum, Southwestern Energy and Unit Corporation respectively all have one thing in common: they are energy related. Given the group depends on the price of oil to generate returns, the individual companies often move directly with the commodity. As such, I want to share our thoughts about the group overall, as opposed to dealing with company specific issues.
Are we Early or Wrong with our Energy Holdings?
In a recent meeting I was asked this question by a client with many years of investment experience. Clearly, having any energy exposure for the past year or so has been the wrong call. My response to her question was, “if we see supply come down in response to low prices, we are early. If not, we are wrong and will take corrective measures.” The good news is that we are now seeing non-OPEC supply come down. The bad news is that given the above mentioned concerns regarding China, investors fear that lower demand from China may offset any supply declines. We continue to believe that supply is the key factor to focus on, not demand. Why? Unlike other commodities, oil is consumed on a regular basis and is therefore less economically sensitive. Think of oil as the razor blade of commodities with many of the others being the razors – one gets consumed regularly and the others last a lot longer – this is one of the reasons we prefer oil. Exhibit 1 shows how stable demand has been for oil over a long period of time.
Exhibit 1
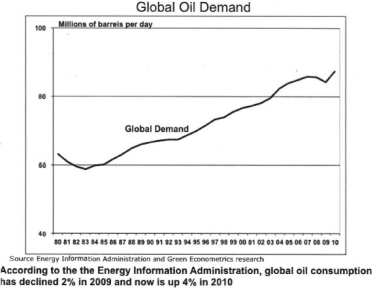
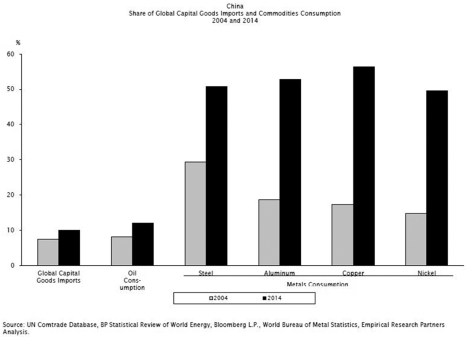
While Exhibit 1 does not illustrate 2010-2015, demand has continued to steadily rise, proving this has been a long-term trend. If we were to look at the same graph for other commodities, such as copper or steel, we would get a very different picture. This stability in demand is one of the reasons we favor oil over other commodities. As can be seen in Exhibit 2, over the last ten years China’s demand for all commodities has risen as a percentage of global demand.
2
Exhibit 2
Reflections on the Previous Year
Clearly, we made mistakes this year, which are reflected in our performance. So what lessons did we learn? We need to be more disciplined in adhering to a timeline of milestones for our companies to meet in order to warrant our continued patience. As value investors, we believe that we can identify profitable companies selling at attractive prices, with economic moats and margins of safety. It is impossible to predict when other investors will see this value and bid up the stock. While we wait for other investors to acknowledge that a company is undervalued, we must remain diligent and make sure that our investment thesis remains intact and sound in nature. We will not change our long-term focus, but we will be more vigilant about cutting ties with any holding that deviates from our investment thesis.
Our research analysts are revisiting our investment thesis for each of our holdings to make sure nothing has changed. If it has, we will do a complete review. However, we firmly believe that the combination of our investment philosophy and process will continue to add value over longer periods of time. In addition, we believe many of the companies that we still own are great businesses and very attractively priced.
We remain very constructive on equities because valuations are still reasonable, the global economy is improving, and stocks look cheap compared to other asset classes. In recent weeks, there has been much concern on Wall Street that emerging markets are slowing and Europe may be sliding back into a recession. It would not surprise us if emerging economies were in fact slowing, given the run they have had. However, we are not convinced that this is necessarily a bad thing, as economic growth, especially in emerging markets, is never linear, no matter how much investors would like it to be. Trying to identify trends based upon short-term economic data is difficult at best. As for a European “double-dip,” the warning signs that usually proceed a recession are simply not present: growing inflation, rising inventories, declining employment, and inverting yield curves. Presently, the opposites of these precursors are happening. We believe these concerns about Europe are the same ones we hear every year, just noise. However, we will continue to evaluate the data.
3
One item that could become a real concern is instability in the Middle East. It seems that the political situation is getting worse every day with no end in sight. As such we have been quite surprised that oil has stayed as low as it has as a supply disruption gets more likely by the day.
As always, we thank you for the trust you place in the Granite Value Fund and will do our best to earn it every day. If you have any questions or comments, please do not hesitate to call.
Sincerely,

Scott B. Schermerhorn
Managing Principal and Chief Investment Officer
4
INVESTMENT RESULTS – (Unaudited)
| | | | | | | | |
Total Returns* (For the periods ended October 31, 2015) | |
| | | | | | Average Annual Returns | |
| | | One Year | | | Since Inception
(December 22, 2011) | |
Granite Value Fund | | | -5.37 | % | | | 9.01 | % |
S&P 500® Index** | | | 5.20 | % | | | 16.67 | % |
Russell 1000® Value Index** | | | 0.53 | % | | | 15.63 | % |
Total annual operating expenses, as disclosed in the Fund’s prospectus dated February 28, 2015, were 2.39% of average daily net assets (1.35% after fee waivers/expense reimbursements by the Adviser). The Adviser has contractually agreed to waive or limit its fees and to assume other expenses of the Fund until February 29, 2016, so that the Total Annual Fund Operating Expenses does not exceed 1.35%. This operating expense limitation does not apply to brokerage fees and commissions, borrowing costs (such as interest and dividend expenses on securities sold short), taxes, 12b-1 fees; extraordinary expenses and indirect expenses (such as “acquired fund fees and expenses”). Additional information pertaining to the Fund’s expense ratios as of October 31, 2015 can be found in the financial highlights.
The performance quoted represents past performance, which does not guarantee future results. The investment return and principal value of an investment will fluctuate so that an investor’s shares, when redeemed, may be worth more or less than their original cost. The returns shown do not reflect deduction of taxes that a shareholder would pay on Fund distributions or the redemption of Fund shares. Current performance of the Fund may be lower or higher than the performance quoted. The Fund’s investment objectives, risks, charges and expenses must be considered carefully before investing. Performance data current to the most recent month end may be obtained by calling 1-888-442-9893.
| * | Return figures reflect any change in price per share and assume the reinvestment of all distributions. |
| ** | The S&P 500® Index and the Russell 1000® Value Index are widely recognized unmanaged indices of equity securities and are representative of a broader domestic equity market and range of securities than is found in the Fund’s portfolio. Individuals cannot invest directly in an Index; however, an individual can invest in exchange traded funds or other investment vehicles that attempt to track the performance of a benchmark index. |
The Fund’s investment objective, strategies, risks, charges and expenses must be considered carefully before investing. The prospectus contains this and other important information about the Fund and may be obtained by calling the same number as above. Please read it carefully before investing.
The Fund is distributed by Unified Financial Securities, Inc., member FINRA.
5
INVESTMENT RESULTS – (Unaudited)
Comparison of the Growth of a $10,000 Investment in the Granite Value Fund,
the Russell 1000® Value Index, and the S&P 500® Index (Unaudited)
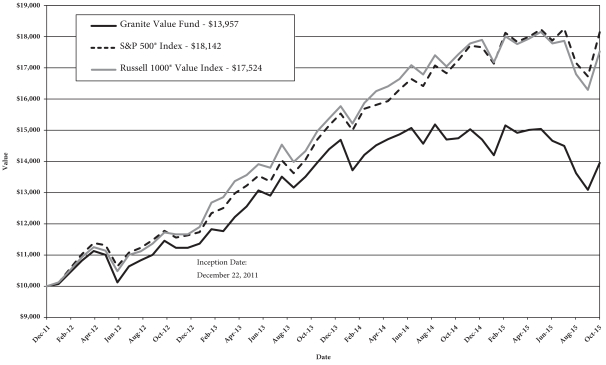
The chart above assumes an initial investment of $10,000 made on December 22, 2011 (commencement of Fund operations) and held through October 31, 2015. The S&P 500® Index and Russell 1000® Value Index are widely recognized unmanaged indices of equity securities and are representative of a broader domestic equity market and range of securities than is found in the Fund’s portfolio. Individuals cannot invest directly in an Index; however, an individual can invest in exchange traded funds or other investment vehicles that attempt to track the performance of a benchmark index. THE FUND’S RETURN REPRESENTS PAST PERFORMANCE AND DOES NOT GUARANTEE FUTURE RESULTS. The returns shown do not reflect deduction of taxes that a shareholder would pay on Fund distributions or the redemption of Fund shares. Investment returns and principal values will fluctuate so that your shares, when redeemed, may be worth more or less than their original purchase price.
Current performance may be lower or higher than the performance data quoted. For more information on the Fund, and to obtain performance data current to the most recent month end or to request a prospectus, please call 1-888-442-9893. You should carefully consider the investment objectives, potential risks, management fees, and charges and expenses of the Fund before investing. The Fund’s prospectus contains this and other information about the Fund, and should be read carefully before investing.
The Fund is distributed by Unified Financial Securities, Inc., member FINRA.
6
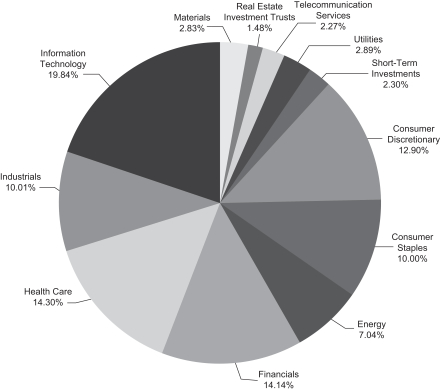
FUND HOLDINGS – (Unaudited)
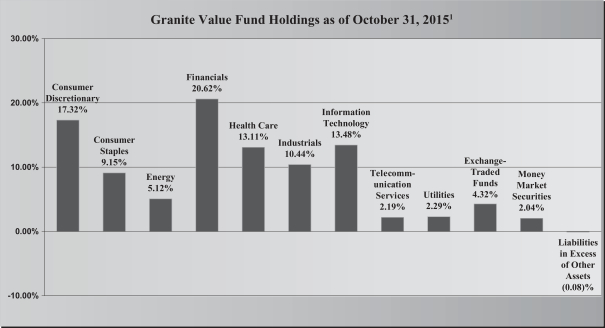
| 1 | As a percentage of net assets. |
The investment objective of the Granite Value Fund is to seek long-term capital appreciation.
Availability of Portfolio Schedule – (Unaudited)
The Fund files its complete schedule of portfolio holdings with the Securities and Exchange Commission (“SEC”) for the first and third quarters of each fiscal year on Form N-Q. The Fund’s Forms N-Q is available at the SEC’s website at www.sec.gov. The Fund’s Forms N-Q may be reviewed and copied at the SEC’s Public Reference Room in Washington DC. Information on the operation of the Public Reference Room may be obtained by calling 1-800-SEC-0330.
Summary of Fund’s Expenses – (Unaudited)
As a shareholder of the Fund, you incur two types of costs: (1) transaction costs, such as short-term redemption fees; and (2) ongoing costs, including management fees and other Fund expenses. This Example is intended to help you understand your ongoing costs (in dollars) of investing in the Fund and to compare these costs with the ongoing costs of investing in other mutual funds. The example is based on an investment of $1,000 invested at the beginning and held for the six month period, May 1, 2015 to October 31, 2015.
Actual Expenses
The first line of the table below provides information about actual account values and actual expenses. You may use the information in this line, together with the amount you invested, to estimate the expenses that you paid over the period. Simply divide your account value by $1,000 (for example, an $8,600 account value divided by $1,000 = $8.60), then multiply the result by the number in the first line under the heading entitled “Expenses Paid During the Period” to estimate the expenses you paid on your account during this period.
7
Hypothetical Example for Comparison Purposes
The second line of the table below provides information about hypothetical account values and hypothetical expenses based on the Fund’s actual expense ratio and an assumed rate of return of 5% per year before expenses, which is not the Fund’s actual return. The hypothetical account values and expenses may not be used to estimate the actual ending account balance or expenses you paid for the period. You may use this information to compare the ongoing costs of investing in the Fund and other funds. To do so, compare this 5% hypothetical example with the 5% hypothetical examples that appear in the shareholder reports of the other funds.
Please note that the expenses shown in the table are meant to highlight your ongoing costs only. Therefore, the second line of the table below is useful in comparing ongoing costs only and will not help you determine the relative costs of owning different funds.
| | | | | | | | | | | | |
| Granite Value Fund | | Beginning
Account Value May 1, 2015 | | | Ending Account Value October 31, 2015 | | | Expenses Paid
During Period* May 1, 2015 – October 31, 2015 | |
Actual* | | $ | 1,000.00 | | | $ | 957.56 | | | $ | 6.70 | |
Hypothetical** | | $ | 1,000.00 | | | $ | 1,018.36 | | | $ | 6.91 | |
| * | Expenses are equal to the Fund’s annualized expense ratio of 1.36%, multiplied by the average account value over the period, multiplied by 184/365 (to reflect the one-half year period). |
| ** | Assumes a 5% return before expenses. |
8
GRANITE VALUE FUND
SCHEDULE OF INVESTMENTS
October 31, 2015
| | | | | | | | |
| Common Stocks – 93.72% | | Shares | | | Fair Value | |
| | | | | | | | |
Consumer Discretionary – 17.32% | | | | | | | | |
Bed Bath & Beyond, Inc. * | | | 4,650 | | | $ | 277,280 | |
Comcast Corp. – Class A | | | 5,000 | | | | 313,100 | |
Foot Locker, Inc. | | | 2,275 | | | | 154,131 | |
General Motors Co. | | | 12,595 | | | | 439,691 | |
Mattel, Inc. | | | 10,435 | | | | 256,492 | |
Starz * | | | 5,305 | | | | 177,771 | |
Whirlpool Corp. | | | 1,490 | | | | 238,609 | |
| | | | | | | | |
| | | | | | | 1,857,074 | |
| | | | | | | | |
Consumer Staples – 9.15% | | | | | | | | |
Coca-Cola Co./The | | | 8,450 | | | | 357,858 | |
Unilever PLC ADR | | | 9,240 | | | | 410,718 | |
Wal-Mart Stores, Inc. | | | 3,710 | | | | 212,360 | |
| | | | | | | | |
| | | | | | | 980,936 | |
| | | | | | | | |
Energy – 5.12% | | | | | | | | |
Cimarex Energy Co. | | | 1,185 | | | | 139,901 | |
Exxon Mobil Corp. | | | 4,940 | | | | 408,736 | |
| | | | | | | | |
| | | | | | | 548,637 | |
| | | | | | | | |
Financials – 20.62% | | | | | | | | |
Alleghany Corp. * | | | 700 | | | | 347,389 | |
American Express Co. | | | 4,430 | | | | 324,542 | |
American International Group, Inc. | | | 7,075 | | | | 446,149 | |
Berkshire Hathaway, Inc. – Class B * | | | 3,655 | | | | 497,153 | |
Citigroup, Inc. | | | 7,090 | | | | 376,975 | |
MetLife, Inc. | | | 4,335 | | | | 218,397 | |
| | | | | | | | |
| | | | | | | 2,210,605 | |
| | | | | | | | |
Health Care – 13.11% | | | | | | | | |
Baxalta Inc. | | | 5,190 | | | | 178,847 | |
C.R. Bard, Inc. | | | 1,125 | | | | 209,644 | |
Gilead Sciences, Inc. | | | 2,270 | | | | 245,455 | |
Johnson & Johnson | | | 3,490 | | | | 352,595 | |
Merck & Co., Inc. | | | 4,000 | | | | 218,640 | |
UnitedHealth Group, Inc. | | | 1,700 | | | | 200,226 | |
| | | | | | | | |
| | | | | | | 1,405,407 | |
| | | | | | | | |
Industrials – 10.44% | | | | | | | | |
Boeing Co./The | | | 2,280 | | | | 337,600 | |
General Electric Co. | | | 7,715 | | | | 223,118 | |
Honeywell International, Inc. | | | 2,550 | | | | 263,364 | |
United Technologies Corp. | | | 3,000 | | | | 295,230 | |
| | | | | | | | |
| | | | | | | 1,119,312 | |
| | | | | | | | |
See accompanying notes which are an integral part of these financial statements.
9
GRANITE VALUE FUND
SCHEDULE OF INVESTMENTS – (continued)
October 31, 2015
| | | | | | | | |
| Common Stocks – 93.72% – continued | | Shares | | | Fair Value | |
| | | | | | | | |
Information Technology – 13.48% | | | | | | | | |
Apple, Inc. | | | 3,130 | | | $ | 374,035 | |
Corning, Inc. | | | 10,930 | | | | 203,298 | |
Microsoft Corp. | | | 6,495 | | | | 341,897 | |
Oracle Corp. | | | 5,585 | | | | 216,921 | |
Western Union Co./The | | | 16,070 | | | | 309,348 | |
| | | | | | | | |
| | | | | | | 1,445,499 | |
| | | | | | | | |
Telecommunication Services – 2.19% | | | | | | | | |
AT&T, Inc. | | | 7,000 | | | | 234,570 | |
| | | | | | | | |
| | |
Utilities – 2.29% | | | | | | | | |
Calpine Corp. * | | | 15,875 | | | | 246,221 | |
| | | | | | | | |
| | |
Total Common Stocks (Cost $8,822,030) | | | | | | | 10,048,261 | |
| | | | | | | | |
Exchange-Traded Funds – 4.32% | | | | | | | | |
SPDR S&P Oil & Gas Exploration & Production ETF | | | 12,500 | | | | 463,500 | |
| | | | | | | | |
Total Exchange-Traded Funds (Cost $438,433) | | | | | | | 463,500 | |
| | | | | | | | |
Money Market Securities – 2.04% | | | | | | | | |
Fidelity Institutional Money Market Funds – Prime Money Market Portfolio – Institutional Class, 0.14% (a) | | | 218,269 | | | | 218,269 | |
| | | | | | | | |
Total Money Market Securities (Cost $218,269) | | | | | | | 218,269 | |
| | | | | | | | |
Total Investments – 100.08% (Cost $9,478,732) | | | | | | $ | 10,730,030 | |
| | | | | | | | |
Liabilities in Excess of Other Assets – (0.08)% | | | | | | | (8,365) | |
| | | | | | | | |
NET ASSETS – 100.00% | | | | | | $ | 10,721,665 | |
| | | | | | | | |
| | (a) | Rate disclosed is the seven day yield as of October 31, 2015. |
| | * | Non-income producing security. |
ADR – American Depositary Receipt
The sectors shown on the schedule of investments are based on the Global Industry Classification Standard, or GICS® (“GICS”). The GICS was developed by and/or is the exclusive property of MSCI, Inc. and Standard & Poor Financial Services LLC (“S&P”). GICS is a service mark of MSCI, Inc. and S&P and has been licensed for use by Huntington Asset Services, Inc.
See accompanying notes which are an integral part of these financial statements.
10
GRANITE VALUE FUND
STATEMENT OF ASSETS AND LIABILITIES
October 31, 2015
| | | | |
Assets | | | | |
Investments in securities at fair value (cost $9,478,732) | | $ | 10,730,030 | |
Dividends receivable | | | 9,367 | |
Receivable from Adviser | | | 8,592 | |
Prepaid expenses | | | 3,487 | |
| | | | |
Total Assets | | | 10,751,476 | |
| | | | |
Liabilities | | | | |
Payable to administrator, fund accountant, and transfer agent | | | 8,676 | |
Payable to custodian | | | 223 | |
Other accrued expenses | | | 20,912 | |
| | | | |
Total Liabilities | | | 29,811 | |
| | | | |
| |
Net Assets | | $ | 10,721,665 | |
| | | | |
Net Assets consist of: | | | | |
Paid-in capital | | $ | 9,574,353 | |
Accumulated undistributed net investment income | | | 31,636 | |
Accumulated undistributed net realized loss from investments | | | (135,622 | ) |
Net unrealized appreciation on investments | | | 1,251,298 | |
| | | | |
| |
Net Assets | | $ | 10,721,665 | |
| | | | |
Shares outstanding
(unlimited number of shares authorized, no par value) | | | 830,964 | |
| | | | |
Net asset value (“NAV”) and offering price per share | | $ | 12.90 | |
| | | | |
Redemption price per share (NAV * 98%) (a) | | $ | 12.64 | |
| | | | |
| (a) | The Fund charges a 2.00% redemption fee on shares redeemed in 60 days or less of purchase. Shares are redeemed at the NAV if held longer than 60 calendar days. |
See accompanying notes which are an integral part of these financial statements.
11
GRANITE VALUE FUND
STATEMENT OF OPERATIONS
For the year ended October 31, 2015
| | | | |
Investment Income | | | | |
Dividend income | | $ | 220,835 | |
| | | | |
Total investment income | | | 220,835 | |
| | | | |
| |
Expenses | | | | |
Investment Adviser | | | 125,895 | |
Administration | | | 40,500 | |
Fund accounting | | | 25,000 | |
Transfer agent | | | 39,637 | |
Legal | | | 22,801 | |
Registration | | | 15,469 | |
Custodian | | | 3,600 | |
Audit | | | 15,500 | |
Report printing | | | 14,756 | |
Miscellaneous | | | 14,837 | |
Overdraft | | | 704 | |
| | | | |
Total expenses | | | 318,699 | |
| | | | |
Fees waived and reimbursed by Adviser | | | (148,128 | ) |
| | | | |
Net operating expenses | | | 170,571 | |
| | | | |
Net investment income | | | 50,264 | |
| | | | |
| |
Net Realized and Unrealized Loss on Investments | | | | |
Net realized loss on investment securities transactions | | | (130,519 | ) |
Net change in unrealized appreciation of investment securities | | | (573,813 | ) |
| | | | |
Net realized and unrealized loss on investments | | | (704,332 | ) |
| | | | |
Net decrease in net assets resulting from operations | | $ | (654,068 | ) |
| | | | |
See accompanying notes which are an integral part of these financial statements.
12
GRANITE VALUE FUND
STATEMENTS OF CHANGES IN NET ASSETS
| | | | | | | | |
| | | For the
Year Ended
October 31, 2015 | | | For the
Year Ended
October 31, 2014 | |
Increase (Decrease) in Net Assets due to: | | | | | | | | |
Operations | | | | | | | | |
Net investment income | | $ | 50,264 | | | $ | 20,639 | |
Net realized gain (loss) on investment securities transactions | | | (130,519 | ) | | | 490,691 | |
Net change in unrealized appreciation (depreciation) of investment securities | | | (573,813 | ) | | | 169,429 | |
| | | | | | | | |
Net increase (decrease) in net assets resulting from operations | | | (654,068 | ) | | | 680,759 | |
| | | | | | | | |
Distributions | | | | | | | | |
From net investment income | | | (31,319 | ) | | | (17,290 | ) |
From net realized gains | | | (484,050 | ) | | | (287,895 | ) |
| | | | | | | | |
Total distributions | | | (515,369 | ) | | | (305,185 | ) |
| | | | | | | | |
Capital Transactions | | | | | | | | |
Proceeds from shares sold | | | 1,720,031 | | | | 2,872,894 | |
Proceeds from redemption fees (a) | | | – | | | | 141 | |
Reinvestment of distributions | | | 446,979 | | | | 261,021 | |
Amount paid for shares redeemed | | | (3,488,076 | ) | | | (874,557 | ) |
| | | | | | | | |
Net increase (decrease) in net assets resulting from capital transactions | | | (1,321,066 | ) | | | 2,259,499 | |
| | | | | | | | |
Total Increase (Decrease) in Net Assets | | | (2,490,503 | ) | | | 2,635,073 | |
| | | | | | | | |
Net Assets | | | | | | | | |
Beginning of year | | | 13,212,168 | | | | 10,577,095 | |
| | | | | | | | |
End of year | | $ | 10,721,665 | | | $ | 13,212,168 | |
| | | | | | | | |
Accumulated undistributed net investment income | | $ | 31,636 | | | $ | 12,691 | |
| | | | | | | | |
Share Transactions | | | | | | | | |
Shares sold | | | 125,135 | | | | 207,718 | |
Shares issued in reinvestment of distributions | | | 33,607 | | | | 19,067 | |
Shares redeemed | | | (257,087 | ) | | | (61,652 | ) |
| | | | | | | | |
Net increase (decrease) in shares | | | (98,345 | ) | | | 165,133 | |
| | | | | | | | |
| (a) | The Fund charges a 2.00% redemption fee on shares redeemed in 60 days or less of purchase. Shares are redeemed at the NAV if held longer than 60 calendar days. |
See accompanying notes which are an integral part of these financial statements.
13
GRANITE VALUE FUND
FINANCIAL HIGHLIGHTS
(For a share outstanding during each period)
| | | | | | | | | | | | | | | | |
| | | For the
Year Ended
October 31,
2015 | | | For the
Year Ended
October 31,
2014 | | | For the
Year Ended
October 31,
2013 | | | For the
Period Ended
October 31,
2012 (a) | |
Selected Per Share Data: | | | | | | | | | | | | | | | | |
Net asset value, beginning of period | | $ | 14.22 | | | $ | 13.84 | | | $ | 11.24 | | | $ | 10.00 | |
| | | | | | | | | | | | | | | | |
Investment operations: | | | | | | | | | | | | | | | | |
Net investment income | | | 0.05 | | | | 0.02 | | | | 0.02 | | | | 0.05 | (b) |
Net realized and unrealized gain (loss) on investments | | | (0.80 | ) | | | 0.74 | | | | 2.68 | | | | 1.19 | |
| | | | | | | | | | | | | | | | |
Total from investment operations | | | (0.75 | ) | | | 0.76 | | | | 2.70 | | | | 1.24 | |
| | | | | | | | | | | | | | | | |
Less distributions to shareholders from: | | | | | | | | | | | | | | | | |
Net investment income | | | (0.03 | ) | | | (0.02 | ) | | | (0.10 | ) | | | – | |
Net realized gains | | | (0.54 | ) | | | (0.36 | ) | | | – | | | | – | |
| | | | | | | | | | | | | | | | |
Total distributions | | | (0.57 | ) | | | (0.38 | ) | | | (0.10 | ) | | | – | |
| | | | | | | | | | | | | | | | |
Paid in capital from redemption fees | | | – | | | | – | (c) | | | – | | | | – | (c) |
| | | | | | | | | | | | | | | | |
Net asset value, end of period | | $ | 12.90 | | | $ | 14.22 | | | $ | 13.84 | | | $ | 11.24 | |
| | | | | | | | | | | | | | | | |
| | | | |
Total Return (d) | | | -5.37 | % | | | 5.65 | % | | | 24.21 | % | | | 12.40 | %(e) |
Ratios and Supplemental Data: | | | | | | | | | | | | | | | | |
Net assets, end of period (000) | | $ | 10,722 | | | $ | 13,212 | | | $ | 10,577 | | | $ | 4,750 | |
Ratio of net expenses to average net assets | | | 1.36 | %(g) | | | 1.35 | % | | | 1.35 | % | | | 1.35 | %(f) |
Ratio of expenses to average net assets before waiver and reimbursement | | | 2.53 | % | | | 2.39 | % | | | 3.32 | % | | | 8.11 | %(f) |
Ratio of net investment income to average net assets | | | 0.40 | % | | | 0.17 | % | | | 0.27 | % | | | 0.55 | %(f) |
Portfolio turnover rate | | | 32 | % | | | 30 | % | | | 33 | % | | | 20 | %(e) |
| (a) | For the period December 22, 2011 (commencement of operations) to October 31, 2012. |
| (b) | Calculated using the average shares method. |
| (c) | Resulted in less than $0.005 per share. |
| (d) | Total return in the above table represents the rate that the investor would have earned or lost on an investment in the Fund, assuming reinvestment of distributions. |
| (g) | Includes 0.01% overdraft fees. |
See accompanying notes which are an integral part of these financial statements.
14
GRANITE VALUE FUND
NOTES TO THE FINANCIAL STATEMENTS
October 31, 2015
NOTE 1. ORGANIZATION
The Granite Value Fund (the “Fund”) is an open-end diversified series of the Valued Advisers Trust (the “Trust”). The Trust is a management investment company established under the laws of Delaware by an Agreement and Declaration of Trust dated June 13, 2008 (the “Trust Agreement”). The Trust Agreement permits the Trust to issue an unlimited number of shares of beneficial interest of separate series without par value. The Fund is one of a series of funds authorized by the Board of Trustees (the “Board”). The Fund commenced operations December 22, 2011. The Fund’s investment adviser is Granite Investment Advisors, Inc. (the “Adviser”). The investment objective of the Fund is to seek long-term capital appreciation.
NOTE 2. SIGNIFICANT ACCOUNTING POLICIES
The Fund is an investment company and follows accounting and reporting guidance under Financial Accounting Standards Board (“FASB”) Accounting Standards Codification (“ASC”) Topic 946, “Financial Services – Investment Companies”. The following is a summary of significant accounting policies followed by the Fund in the preparation of its financial statements. These policies are in conformity with generally accepted accounting principles in the United States of America (“GAAP”).
Securities Valuation – All investments in securities are recorded at their estimated fair value as described in Note 3.
Federal Income Taxes – The Fund makes no provision for federal income or excise tax. The Fund intends to qualify each year as a regulated investment company (“RIC”) under subchapter M of the Internal Revenue Code of 1986, as amended, by complying with the requirements applicable to RICs and by distributing substantially all of its taxable income. The Fund also intends to distribute sufficient net investment income and net capital gains, if any, so that it will not be subject to excise tax on undistributed income and gains. If the required amount of net investment income or gains is not distributed, the Fund could incur a tax expense.
As of and during the year ended October 31, 2015, the Fund did not have a liability for any unrecognized tax benefits. The Fund recognizes interest and penalties, if any, related to unrecognized tax benefits as income tax expense in the statement of operations. The Fund is subject to examination by U.S. federal tax authorities for the last three tax year ends and the interim tax period since then.
Expenses – Expenses incurred by the Trust that do not relate to a specific fund of the Trust are allocated to the individual funds based on each fund’s relative net assets or other appropriate basis.
Security Transactions and Related Income – The Fund follows industry practice and records security transactions on the trade date for financial reporting purposes. The specific identification method is used for determining gains or losses for financial statements and income tax purposes. Dividend income is recorded on the ex-dividend date and interest income is recorded on an accrual basis. Discounts and premiums on securities purchased are amortized or accreted using the effective interest method. Withholding taxes on foreign dividends have been provided for in accordance with the Fund’s understanding of the applicable country’s tax rules and rates. The ability of issuers of debt securities held by the Fund to meet their obligations may be affected by economic and political developments in a specific country or region.
Redemption Fees – The Fund charges a 2.00% redemption fee for shares redeemed within 60 days. These fees are deducted from the redemption proceeds otherwise payable to the shareholder. The Fund will retain the fee charged as an increase in paid-in capital and such fees become part of the Fund’s daily NAV calculation.
15
GRANITE VALUE FUND
NOTES TO THE FINANCIAL STATEMENTS – (continued)
October 31, 2015
NOTE 2. SIGNIFICANT ACCOUNTING POLICIES – continued
Dividends and Distributions – The Fund intends to distribute substantially all of its net investment income, net realized long-term capital gains and its net realized short-term capital gains, if any, to its shareholders on at least an annual basis. Dividends to shareholders, which are determined in accordance with income tax regulations, are recorded on the ex-dividend date. The treatment for financial reporting purposes of distributions made to shareholders during the year from net investment income or net realized capital gains may differ from their ultimate treatment for federal income tax purposes. These differences are caused primarily by differences in the timing of the recognition of certain components of income, expense or realized capital gain for federal income tax purposes. Where such differences are permanent in nature, they are reclassified among the components of net assets based on their ultimate characterization for federal income tax purposes. Any such reclassifications have no effect on net assets, results of operations or net asset values per share of the Fund. There were no such reclassifications made as of October 31, 2015.
NOTE 3. SECURITIES VALUATION AND FAIR VALUE MEASUREMENTS
Fair value is defined as the price that a Fund would receive upon selling an investment in a orderly transaction to an independent buyer in the principal or most advantageous market of the investment. GAAP established a three-tier hierarchy to maximize the use of observable market data and minimize the use of unobservable inputs and to establish classification of fair value measurements for disclosure purposes.
Inputs refer broadly to the assumptions that market participants would use in pricing the asset or liability, including assumptions about risk, (ex., the risk inherent in a particular valuation technique used to measure fair value including items such as a pricing model and/or the risk inherent in the inputs to the valuation technique). Inputs may be observable or unobservable. Observable inputs are inputs that reflect the assumptions market participants would use in pricing the asset or liability developed based on market data obtained from sources independent of the reporting entity. Unobservable inputs are inputs that reflect the reporting entity’s own assumptions about the assumptions market participants would use in pricing the asset or liability developed based on the best information available in the circumstances.
Various inputs are used in determining the value of the Fund’s investments. These inputs are summarized in the three broad levels listed below.
| | • | | Level 1 – unadjusted quoted prices in active markets for identical investments and/or registered investment companies where the value per share is determined and published and is the basis for current transactions for identical assets or liabilities at the valuation date |
| | • | | Level 2 – other significant observable inputs (including, but not limited to, quoted prices for an identical security in an inactive market, quoted prices for similar securities, interest rates, prepayment speeds, credit risk, etc.) |
| | • | | Level 3 – significant unobservable inputs (including the Fund’s own assumptions in determining fair value of investments based on the best information available) |
The inputs used to measure fair value may fall into different levels of the fair value hierarchy. In such cases, for disclosure purposes, the level in the fair value hierarchy within which the fair value measurement falls in its entirety, is determined based on the lowest level input that is significant to the fair value measurement in its entirety.
16
GRANITE VALUE FUND
NOTES TO THE FINANCIAL STATEMENTS – (continued)
October 31, 2015
NOTE 3. SECURITIES VALUATION AND FAIR VALUE MEASUREMENTS – continued
Equity securities, including common stocks and exchange-traded funds, are generally valued by using market quotations, furnished by a pricing service. Securities that are traded on any stock exchange are generally valued at the last quoted sale price. Lacking a last sale price, an exchange traded security is generally valued at its last bid price. Securities traded in the NASDAQ over-the-counter market are generally valued at the NASDAQ Official Closing Price. When using the market quotations or close prices provided by the pricing service and when the market is considered active, the security is classified as a Level 1 security. Sometimes, an equity security owned by the Fund will be valued by the pricing service with factors other than market quotations or when the market is considered inactive. When this happens, the security is classified as a Level 2 security. When market quotations are not readily available, when the Adviser determines that the market quotation or the price provided by the pricing service does not accurately reflect the current fair value, or when restricted or illiquid securities are being valued, such securities are valued as determined in good faith by the Adviser, in conformity with guidelines adopted by and subject to review by the Board. These securities may be categorized as Level 3 securities.
Investments in open-end mutual funds, including money market mutual funds, are generally priced at the ending net asset value (NAV) provided by the service agent of the funds. These securities will be categorized as Level 1 securities.
In accordance with the Trust’s good faith pricing guidelines, the Adviser is required to consider all appropriate factors relevant to the value of securities for which it has determined other pricing sources are not available or reliable as described above. No single standard exists for determining fair value, because fair value depends upon the circumstances of each individual case. As a general principle, the current fair value of an issue of securities being valued by the Adviser would appear to be the amount which the owner might reasonably expect to receive for them upon their current sale. Methods which are in accordance with this principle may, for example, be based on (i) a multiple of earnings; (ii) a discount from market of a similar freely traded security (including a derivative security or a basket of securities traded on other markets, exchanges or among dealers); or (iii) yield to maturity with respect to debt issues, or a combination of these and other methods. Good faith pricing is permitted if, in the Adviser’s opinion, the validity of market quotations appears to be questionable based on factors such as evidence of a thin market in the security based on a small number of quotations, a significant event occurs after the close of a market but before a Fund’s NAV calculation that may affect a security’s value, or the Adviser is aware of any other data that calls into question the reliability of market quotations.
The following is a summary of the inputs used to value the Fund’s investments as of October 31, 2015:
| | | | | | | | | | | | | | | | |
| | | Valuation Inputs | |
| Assets | | Level 1 | | | Level 2 | | | Level 3 | | | Total | |
Common Stocks* | | $ | 10,048,261 | | | $ | – | | | $ | – | | | $ | 10,048,261 | |
Exchange-Traded Funds | | $ | 463,500 | | | | – | | | | – | | | $ | 463,500 | |
Money Market Securities | | $ | 218,269 | | | | – | | | | – | | | $ | 218,269 | |
Total | | $ | 10,730,030 | | | $ | – | | | $ | – | | | $ | 10,730,030 | |
| * | Refer to the Schedule of Investments for industry classifications. |
17
GRANITE VALUE FUND
NOTES TO THE FINANCIAL STATEMENTS – (continued)
October 31, 2015
NOTE 3. SECURITIES VALUATION AND FAIR VALUE MEASUREMENTS – continued
The Fund did not hold any investments at any time during the reporting period in which significant unobservable inputs were used in determining fair value; therefore, no reconciliation of Level 3 securities is included for this reporting period. The Trust recognizes transfers between fair value hierarchy levels at the reporting period end. There were no transfers between any levels as of October 31, 2015 and the previous reporting period end.
NOTE 4. FEES AND OTHER TRANSACTIONS WITH AFFILIATES
Under the terms of the management agreement, on behalf of the Fund (the “Agreement”), the Adviser manages the Fund’s investments subject to approval of the Board. As compensation for its management services, the Fund is obligated to pay the Adviser a fee computed and accrued daily and paid monthly at an annual rate of 1.00% of the average daily net assets of the Fund. For the year ended October 31, 2015, the Adviser earned a fee of $125,895 from the Fund before the reimbursement described below.
The Adviser has contractually agreed to waive its management fee and/or reimburse expenses through February 29, 2016, so that total annual fund operating expenses, excluding interest, taxes, brokerage commissions, other expenditures which are capitalized in accordance with GAAP, other extraordinary expenses not incurred in the ordinary course of the Fund’s business, dividend expense on short sales, expense incurred under a plan of distribution adopted pursuant to Rule 12b-1 under the 1940 Act, and expenses that the Fund has incurred but did not actually pay because of an expense offset arrangement, if applicable, incurred by the Fund in any fiscal year, do not exceed 1.35% of the Fund’s average daily net assets. The operating expense limitation also excludes any fees and expenses of acquired funds. For the year ended October 31, 2015, expenses totaling $148,128 were waived or reimbursed by the Adviser and are subject to potential recoupment by the Adviser until October 31, 2018. At October 31, 2015, the Adviser owed the Fund $8,592.
The amounts subject to repayment by the Fund pursuant to the aforementioned conditions are as follows:
| | |
Amount | | Recoverable through
October 31, |
$150,231 | | 2016 |
129,076 | | 2017 |
148,128 | | 2018 |
The Trust retains Huntington Asset Services, Inc. (“HASI”) to manage the Fund’s business affairs and provide the Fund with administration services, including all regulatory reporting and necessary office equipment and personnel. For the year ended October 31, 2015, HASI earned fees of $40,500 for administration and compliance services provided to the Fund. At October 31, 2015, HASI was owed $3,125 from the Fund for administration services. Certain officers and one Trustee of the Trust are members of management and/or employees of HASI. HASI is a wholly-owned subsidiary of Huntington Bancshares, Inc., the parent company of Unified Financial Securities, Inc. (the “Distributor”), the principal underwriter of the Fund’s shares, and Huntington National Bank, the custodian of the Fund’s assets (the “Custodian”). For the year ended October 31, 2015, the Custodian earned fees of $3,600 for custody services provided to the Fund. At October 31, 2015, the Custodian was owed $223 from the Fund for custody services. There were no payments made by the Fund to the Distributor during the year ended October 31, 2015. An officer and Trustee of the Trust is an officer of the Distributor and such person may be deemed to be an affiliate of the Distributor.
The Trust also retains HASI to act as the Fund’s transfer agent and to provide fund accounting services. For the year ended October 31, 2015, HASI earned fees of $39,637 for transfer agent services to the Fund. At
18
GRANITE VALUE FUND
NOTES TO THE FINANCIAL STATEMENTS – (continued)
October 31, 2015
NOTE 4. FEES AND OTHER TRANSACTIONS WITH AFFILIATES – continued
October 31, 2015, the Fund owed HASI $3,467 for transfer agent services. For the year ended October 31, 2015, HASI earned fees of $25,000 from the Fund for fund accounting services. At October 31, 2015, HASI was owed $2,084 from the Fund for fund accounting services.
The Fund has adopted a 12b-1 Plan that permits the Fund to pay 0.25% of its average daily net assets to financial institutions that provide distribution and/or shareholder servicing. The 12b-1 Plan has not been activated as of October 31, 2015.
NOTE 5. INVESTMENTS
For the year ended October 31, 2015, purchases and sales of investment securities, other than short-term investments and short-term U.S. government obligations, were as follows:
| | | | |
Purchases | | | | |
U.S. Government Obligations | | $ | – | |
Other | | | 3,896,444 | |
Sales | | | | |
U.S. Government Obligations | | $ | – | |
Other | | | 5,742,203 | |
NOTE 6. ESTIMATES
The preparation of financial statements in conformity with GAAP requires management to make estimates and assumptions that affect the reported amounts of assets and liabilities and disclosure of contingent assets and liabilities at the date of the financial statements and the reported amounts of increases and decreases in net assets from operations during the reporting period. Actual results could differ from those estimates.
NOTE 7. BENEFICIAL OWNERSHIP
The beneficial ownership, either directly or indirectly, of 25% or more of the voting securities of a fund creates a presumption of control of a fund, under Section 2(a) (9) of the Investment Company Act of 1940. At October 31, 2015, Charles Schwab & Co., Inc. for the benefit of its customers, owned 49.31%. The Trust does not know whether Charles Schwab & Co., Inc. or any of the underlying beneficial owners controlled 25% or more of the voting securities of the Fund.
NOTE 8. FEDERAL TAX INFORMATION
At October 31, 2015, the net unrealized appreciation (depreciation) of investments for tax purposes was as follows:
| | | | |
Gross Appreciation | | $ | 1,542,648 | |
Gross (Depreciation) | | | (291,350 | ) |
| | | | |
Net Appreciation (Depreciation) on Investments | | $ | 1,251,298 | |
| | | | |
19
GRANITE VALUE FUND
NOTES TO THE FINANCIAL STATEMENTS – (continued)
October 31, 2015
NOTE 8. FEDERAL TAX INFORMATION – continued
At October 31, 2015, the aggregate cost of securities for federal income tax purposes was $9,478,732 for the Fund.
On December 16, 2015, the Fund paid an income distribution of $0.065806 per share to shareholders of record on December 15, 2015.
The tax characterization of distributions for the fiscal years ended October 31, 2015 and 2014, was as follows:
| | | | | | | | |
| Distributions paid from: | | 2015 | | | 2014 | |
Ordinary Income* | | $ | 31,319 | | | $ | 164,135 | |
Long-Term Capital Gains | | $ | 484,050 | | | $ | 141,050 | |
| | | | | | | | |
Total Distributions | | $ | 515,369 | | | $ | 305,185 | |
| | | | | | | | |
| * | Short term capital gain distributions are treated as ordinary income for tax purposes. |
At October 31, 2015, the components of distributable earnings (accumulated losses) on a tax basis were as follows:
| | | | |
Undistributed ordinary income | | $ | 34,420 | |
Undistributed long-term capital gain | | | – | |
Accumulated capital and other losses | | | (138,406 | ) |
Net unrealized appreciation (depreciation) | | | 1,251,298 | |
| | | | |
| | $ | 1,147,312 | |
| | | | |
At October 31, 2015, for federal income tax purposes, the Fund had long-term capital loss carryforwards available to offset future gains and not subject to expiration in the amount of $135,621.
NOTE 9. COMMITMENTS AND CONTINGENCIES
The Fund indemnifies its officers and trustees for certain liabilities that may arise from their performance of their duties to the Fund. Additionally, in the normal course of business, the Fund enters into contracts that contain a variety of representations and warranties which provide general indemnifications. The Fund’s maximum exposure under these arrangements is unknown, as this would involve future claims that may be made against the Fund that have not yet occurred.
NOTE 10. SUBSEQUENT EVENTS
Management of the Fund has evaluated the need for disclosures resulting from subsequent events through the date these financial statements were issued. Subsequent to the period end, on November 13, 2015, Huntington Bancshares Inc. entered in an agreement to sell Huntington Asset Services, Inc. and Unified Financial Services, Inc. to Ultimus Fund Solutions, LLC. The sale is expected to close by the end of December 2015, subject to customary closing conditions. Management has determined that there were no additional items requiring additional disclosure.
20
REPORT OF INDEPENDENT REGISTERED PUBLIC ACCOUNTING FIRM
To the Shareholders of Granite Value Fund and
Board of Trustees of Valued Advisers Trust
We have audited the accompanying statement of assets and liabilities, including the schedule of investments, of Granite Value Fund (the “Fund”), a series of Valued Advisers Trust, as of October 31, 2015, and the related statement of operations for the year then ended, the statements of changes in net assets for each of the two years in the period then ended, and the financial highlights for each of the four periods in the period then ended. These financial statements and financial highlights are the responsibility of the Fund’s management. Our responsibility is to express an opinion on these financial statements and financial highlights based on our audits.
We conducted our audits in accordance with the standards of the Public Company Accounting Oversight Board (United States). Those standards require that we plan and perform the audit to obtain reasonable assurance about whether the financial statements and financial highlights are free of material misstatement. An audit includes examining, on a test basis, evidence supporting the amounts and disclosures in the financial statements. Our procedures included confirmation of securities owned as of October 31, 2015, by correspondence with the custodian. An audit also includes assessing the accounting principles used and significant estimates made by management, as well as evaluating the overall financial statement presentation. We believe that our audits provide a reasonable basis for our opinion.
In our opinion, the financial statements and financial highlights referred to above present fairly, in all material respects, the financial position of the Granite Value Fund as of October 31, 2015, the results of its operations for the year then ended, the changes in its net assets for each of the two years in the period then ended, and the financial highlights for each of the four periods in the period then ended, in conformity with accounting principles generally accepted in the United States of America.
COHEN FUND AUDIT SERVICES, LTD.
Cleveland, Ohio
December 23, 2015
21
ADDITIONAL FEDERAL INCOME TAX INFORMATION (Unaudited)
The Form 1099-DIV you receive in January 2016 will show the tax status of all distributions paid to your account in calendar year 2015. Shareholders are advised to consult their own tax adviser with respect to the tax consequences of their investment in the Fund. As required by the Internal Revenue Code and/or regulations, shareholders must be notified regarding the status of qualified dividend income for individuals and the dividends received deduction for corporations.
Qualified Dividend Income. The Fund designates approximately 100% or up to the maximum amount of such dividends allowable pursuant to the Internal Revenue Code, as qualified dividend income eligible for the reduced tax rate of 15%.
Dividends Received Deduction. Corporate shareholders are generally entitled to take the dividends received deduction on the portion of the Fund’s dividend distribution that qualifies under tax law. For the Fund’s calendar year 2015 ordinary income dividends, 100% qualifies for the corporate dividends received deduction.
For the year ended October 31, 2015, the Fund designated $484,050 as long-term capital gain distributions.
22
TRUSTEES AND OFFICERS (Unaudited)
The Board of Trustees supervises the business activities of the Trust. Each Trustee serves as a trustee until termination of the Trust unless the Trustee dies, resigns, retires or is removed.
The following tables provide information regarding the Trustees and Officers.
The following table provides information regarding each of the Independent Trustees.
| | | | |
Name, Address*, (Age),
Position with Trust**, Term
of Position with Trust | | Principal Occupation During Past 5 Years | | Other Directorships |
Ira Cohen, 56,
Independent Trustee, June 2010 to present. | | Independent financial services consultant since February 2005; Executive Vice President of Asset Management Services, Recognos Financial, since August 2015. | | Trustee and Audit Committee Chairman, Griffin Institutional Access Real Estate Fund, since May 2014. Trustee, Angel Oak Funds Trust, since October 2014 |
| Andrea N. Mullins, 48, Independent Trustee, December 2013 to present. | | Private investor; Independent Contractor, Seabridge Wealth Management, LLC, since April 2014; Principal Financial Officer and Treasurer, Eagle Family of Funds (mutual fund family) and Vice President, Eagle Asset Management, Inc. (investment adviser) each from 2004 to 2010. | | None. |
| * | The address for each trustee and officer is 2960 N. Meridian St., Suite 300, Indianapolis, IN 46208. |
| ** | As of the date of this report, the Trust consists of 14 series. |
The following table provides information regarding the Trustee who is considered an “interested person” of the Trust, as that term is defined under the 1940 Act. Based on the experience of the Trustee, the Trust concluded that the individual described below should serve as a Trustee.
| | | | |
Name, Address*, (Age),
Position with Trust**, Term
of Position with Trust | | Principal Occupation During Past 5 Years | | Other Directorships |
| R. Jeffrey Young, 51, Trustee and Chairman, June 2010 to present. | | Principal Executive Officer and President, Valued Advisers Trust since February 2010; President, Huntington Asset Services, Inc., since April 2015; Director since May 2014; Senior Vice President January 2010 to April 2015; President, Unified Financial Securities, Inc. since July 2015; Director since May 2014; Chief Executive Officer, Huntington Funds, February 2010 to March 2015; Chief Executive Officer, Huntington Strategy Shares, November 2010 to March 2015; President and Chief Executive Officer, Dreman Contrarian Funds, March 2011 to February 2013; Trustee, Valued Advisers Trust, August 2008 to January 2010; and Managing Director and Chief Operating Officer of Professional Planning Consultants, from 2007 to 2010. | | Trustee and Chairman, Capitol Series Trust, since September 2013. |
| * | The address for each trustee and officer is 2960 N. Meridian St., Suite 300, Indianapolis, IN 46208. |
| ** | As of the date of this report, the Trust consists of 14 series. |
23
The following table provides information regarding the Officers of the Trust:
| | | | |
Name, Address*, (Age),
Position with Trust,**
Term of Position with Trust | | Principal Occupation During Past 5 Years | | Other Directorships |
| R. Jeffrey Young, 51, Trustee and Chairman, June 2010 to present; Principal Executive Officer and President, Valued Advisers Trust since February 2010; | | President, Huntington Asset Services, Inc., since April 2015; Director since May 2014; Senior Vice President January 2010 to April 2015; President, Unified Financial Securities, Inc. since July 2015; Director since May 2014; Chief Executive Officer, Huntington Funds, February 2010 to March 2015; Chief Executive Officer, Huntington Strategy Shares, November 2010 to March 2015; President and Chief Executive Officer, Dreman Contrarian Funds, March 2011 to February 2013; Trustee, Valued Advisers Trust, August 2008 to January 2010; and Managing Director and Chief Operating Officer of Professional Planning Consultants, from 2007 to 2010. | | Trustee and Chairman, Capitol Series Trust, since September 2013. |
| John C. Swhear, 54, Chief Compliance Officer, AML Officer and Vice President, August 2008 to present. | | Vice President of Legal Administration and Compliance for Huntington Asset Services, Inc., the Trust’s administrator, since April 2007 and Director since May 2014; Chief Compliance Officer of Unified Financial Securities, Inc., the Trust’s distributor, since May 2007 and Director since May 2014; President of the Unified Series Trust since March 2012, and Senior Vice President from May 2007 to March 2012; Chief Compliance Officer and AML Officer, Capitol Series Trust, since September 2013; Secretary of Huntington Funds from April 2010 to February 2012; President and Chief Executive Officer of Dreman Contrarian Funds from March 2010 to March 2011. | | None. |
| Carol J. Highsmith, 50, Vice President, August 2008 to present; Secretary, March 2014 to present | | Employed in various positions with Huntington Asset Services, Inc., the Trust’s administrator, since November 1994; currently Vice President of Legal Administration; Secretary, Cross Shore Discovery Fund since May 2014. | | None. |
| Matthew J. Miller, 39, Vice President, December 2011 to present. | | Employed in various positions with Huntington Asset Services, Inc., the Trust’s administrator, since July 1998; currently Vice President of Relationship Management; Vice President, Huntington Funds, since February 2010; President and Chief Executive Officer, Capitol Series Trust, since September 2013. | | None. |
24
| | | | |
Name, Address*, (Age),
Position with Trust,**
Term of Position with Trust | | Principal Occupation During Past 5 Years | | Other Directorships |
| Bryan W. Ashmus, 42, Principal Financial Officer and Treasurer, December 2013 to present. | | Vice President, Financial Administration, Huntington Asset Services, Inc., the Trust’s administrator, since September 2013; Chief Financial Officer and Treasurer, The Huntington Strategy Shares and The Huntington Funds, since November 2013; Vice President, Fund Administration, Citi Fund Services Ohio, Inc., from 2005 to 2013. | | None. |
| * | The address for each trustee and officer is 2960 N. Meridian St., Suite 300, Indianapolis, IN 46208. |
| ** | As of the date of this report, the Trust consists of 14 series. |
25
MANAGEMENT AGREEMENT RENEWALS (Unaudited)
At a meeting held on September 9-10, 2015, the Board of Trustees (the “Board”) considered the renewal of the Investment Advisory Agreement (the “Agreement”) between the Trust and Granite Investment Advisers, Inc. (the “Adviser” or “Granite”) with respect to the Granite Value Fund (the “Fund”). Counsel noted that the 1940 Act requires the approval of the investment advisory agreement between the Trust and its investment adviser by the Board, including a majority of the Independent Trustees. The Board discussed the arrangements between the Adviser and the Trust with respect to the Fund.
Counsel discussed with the Board the types of information and factors that should be considered by the Board in order to make an informed decision regarding renewal of the Agreement, including the following material factors: (i) the nature, extent, and quality of the services to be provided by Granite; (ii) the investment performance of the Fund; (iii) the costs of the services to be provided and anticipated profits to be realized by Granite from the relationship with the Fund; (iv) the extent to which economies of scale would be realized if the Fund grows and whether advisory fee levels reflect those economies of scale for the benefit of the Fund’s investors; and (v) Granite’s practices regarding possible conflicts of interest and potential benefits derived from its relationship with the Fund (generally, these factors are referred to in these minutes as the “Factors”).
In assessing the Factors and reaching its decision, the Board took into consideration information furnished for the Board’s review and consideration throughout the year at regular Board meetings, as well as information specifically requested and prepared and/or presented in connection with the annual renewal process, including information presented at the Meeting. The Board requested, was provided with, and reflected on, information and reports relevant to the annual renewal of the Agreement, including (i) reports regarding the services and support provided to the Fund and its shareholders by Granite; (ii) quarterly assessments of the investment performance of the Fund by personnel of Granite; (iii) commentary on the reasons for the performance; (iv) presentations by Granite addressing investment philosophy, investment strategy, personnel and operations of Granite; (v) compliance and audit reports concerning the Fund and Granite; (vi) disclosure information contained in the registration statement of the Trust with respect to the Fund and the Form ADV of Granite; and (vii) a memorandum from Counsel, that summarized the fiduciary duties and responsibilities of the Board in reviewing and approving the Agreement, including the material Factors set forth above and the types of information included in each Factor that should be considered by the Board in order to make an informed decision. The Board also requested and received various informational materials including, without limitation: (i) documents containing information about Granite, including financial information, a description of personnel and the managerial services provided to the Fund, information on investment advice, performance, summaries of Fund expenses, compliance program, current legal matters, and other general information; (ii) comparative expense and performance information for other mutual funds with strategies similar to those historically utilized by the Fund, as well as for separate accounts managed by Granite; and (iii) benefits to be realized by Granite from its relationship with the Fund. The Board did not identify any particular information that was most relevant to its consideration to approve the Agreement and each Trustee may have afforded different weight to the various Factors.
| 1. | The nature, extent, and quality of the services to be provided by the Adviser. In this regard, the Board considered the Adviser’s responsibilities under the Agreement. The Trustees considered the services being provided by Granite to the Fund including, without limitation: the quality of its investment advisory services (including research and recommendations with respect to portfolio securities), its process for formulating investment recommendations and assuring compliance with the Fund’s investment objectives and limitations, its coordination of services for the Fund among the Fund’s service providers, and its efforts to promote the Fund and grow its assets. The Trustees considered Granite’s continuity of, and commitment to retain, qualified personnel and Granite’s commitment to maintain its resources and systems and options that allow the Fund to maintain its goals, and Granite’s continued cooperation with the Independent Trustees and Counsel for the Fund. The Trustees considered Granite’s personnel, including the education and experience |
26
MANAGEMENT AGREEMENT RENEWALS (Unaudited)
| | of Granite’s personnel. After considering the foregoing information and further information in the Meeting materials provided by Granite (including Granite’s Form ADV), the Board concluded that, in light of all the facts and circumstances, the nature, extent, and quality of the services provided by Granite were satisfactory and adequate for the Fund. |
| 2. | Investment Performance of the Fund and the Adviser. In considering the investment performance of the Fund and the Adviser, the Trustees compared the short-term performance, including the year-to-date, one month, three month, and 1-year cumulative return and since inception annualized returns of the Fund (for the periods ending June 30, 2015) with the performance of funds with similar objectives managed by other investment advisers, as well as with aggregated peer group data. The Trustees also considered the consistency of Granite’s management of the Fund with its investment objective, strategies, and limitations. The Trustees noted that while the Fund’s performance since inception was above average, the performance over the shorter timeframes was below the average of its peer group. The Trustees also considered the performance of Granite’s separate accounts that were managed in a manner similar to that of the Fund and they noted that the performance was comparable. After reviewing and discussing the investment performance of the Fund further, Granite’s experience managing the Fund, the Fund’s historical performance, and other relevant factors, the Board concluded, in light of all the facts and circumstances, that the investment performance of the Fund and Granite was satisfactory. |
| 3. | The costs of the services to be provided and profits to be realized by the Adviser from the relationship with the Fund. In considering the costs of services to be provided and the profits to be realized by the Adviser from the relationship with the Fund, the Trustees considered: (1) Granite’s financial condition; (2) the asset levels of the Fund; (3) the overall expenses of the Fund; and (4) the nature and frequency of advisory fee payments. The Trustees reviewed information provided by Granite regarding its profits associated with managing the Fund. The Trustees also considered potential benefits for Granite in managing the Fund. The Trustees then compared the fees and expenses of the Fund (including the management fee) to other comparable mutual funds. The Trustees noted that the Fund’s management fee was higher than its peer average and median, although the net expense ratio was slightly below the peer average and slightly above the peer median as a result of Granite’s contractual commitment to limit the expenses of the Fund. The Trustees discussed the difference between the fees charged to the Fund as compared to the fees charged to Granite’s separately managed accounts with investment strategies and objectives similar to the Fund. They acknowledged the increased resources required to manage the Fund, including increased compliance and administrative costs. Based on the foregoing, the Board concluded that the fees to be paid to Granite by the Fund and the profits to be realized by Granite, in light of all the facts and circumstances, were fair and reasonable in relation to the nature and quality of the services provided by Granite. |
| 4. | The extent to which economies of scale would be realized as the Fund grows and whether advisory fee levels reflect these economies of scale for the benefit of the Fund’s investors. In this regard, the Board considered the Fund’s fee arrangements with the Adviser. The Board considered that while the management fee remained the same at all asset levels, the Fund’s shareholders had experienced benefits from the Fund’s expense limitation arrangement. The Trustees noted Granite’s representation that it intended to keep this arrangement in place even after the expiration of the current term of the arrangement. The Trustees noted that once the Fund’s expenses fell below the cap set by the arrangement, the Fund’s shareholders would continue to benefit from the economies of scale under the Fund’s agreements with service providers other than Granite. In light of its ongoing consideration of the Fund’s asset levels, expectations for growth in the Fund, and fee levels, the Board determined that the Fund’s fee arrangements, in light of all the facts and circumstances, were fair and reasonable in relation to the nature and quality of the services provided by Granite. |
27
MANAGEMENT AGREEMENT RENEWALS (Unaudited)
| 5. | Possible conflicts of interest and benefits to the Adviser. In considering the Adviser’s practices regarding conflicts of interest, the Trustees evaluated the potential for conflicts of interest and considered such matters as the experience and ability of the advisory personnel assigned to the Fund; the basis of decisions to buy or sell securities for the Fund and/or Granite’s other accounts; and the substance and administration of Granite’s code of ethics. The Trustees also considered disclosure in the registration statement of the Trust relating to Granite’s potential conflicts of interest. The Trustees considered Granite’s policies with respect to the use of soft dollars. The Trustees noted that Granite benefited from the Fund in that it is able to utilize the Fund as a vehicle into which to direct advisory clients with small account balances. The Trustees did not identify any other potential benefits (other than the management fee) that would be realized by Granite. Based on the foregoing, the Board determined that the standards and practices of Granite relating to the identification and mitigation of potential conflicts of interest and the benefits that it derives from managing the Fund are acceptable. |
After additional consideration of the factors delineated in the memorandum provided by Counsel and further discussion among the Board, the Board determined to approve the continuation of the Agreement between the Trust and Granite.
28
OTHER INFORMATION
The Fund’s Statement of Additional Information (“SAI”) includes additional information about the trustees and is available without charge, upon request. You may call toll-free at (888) 442-9893 to request a copy of the SAI or to make shareholder inquiries.
PROXY VOTING
A description of the policies and procedures that the Fund uses to determine how to vote proxies relating to portfolio securities and information regarding how the Fund voted those proxies is available without charge upon request by (1) calling the Fund at (888) 442-9893 and (2) from Fund documents filed with the Securities and Exchange Commission (“SEC”) on the SEC’s website at www.sec.gov.
TRUSTEES
R. Jeffrey Young, Chairman
Ira Cohen
Andrea N. Mullins
OFFICERS
R. Jeffrey Young, Principal Executive Officer and President
John C. Swhear, Chief Compliance Officer, AML Officer and Vice President
Carol J. Highsmith, Vice President and Secretary
Matthew J. Miller, Vice President
Bryan W. Ashmus, Principal Financial Officer and Treasurer
INVESTMENT ADVISER
Granite Investment Advisors
6 Eagle Square, 3rd Floor
Concord, NH 03301
DISTRIBUTOR
Unified Financial Securities, Inc.
2960 North Meridian Street, Suite 300
Indianapolis, IN 46208
INDEPENDENT REGISTERED PUBLIC ACCOUNTING FIRM
Cohen Fund Audit Services Ltd.
1350 Euclid Avenue, Suite 800
Cleveland, OH 44115
LEGAL COUNSEL
The Law Offices of John H. Lively & Associates, Inc.
A member firm of The 1940 Act Law GroupTM
11300 Tomahawk Creek Parkway, Ste. 310
Leawood, KS 66211
CUSTODIAN
Huntington National Bank
41 South High Street
Columbus, OH 43215
ADMINISTRATOR, TRANSFER AGENT AND FUND ACCOUNTANT
Huntington Asset Services, Inc.
2960 North Meridian Street, Suite 300
Indianapolis, IN 46208
This report is intended only for the information of shareholders or those who have received the Fund’s prospectus which contains information about the Fund’s management fee and expenses. Please read the prospectus carefully before investing.
Distributed by Unified Financial Securities, Inc.
Member FINRA/SIPC
29
VALUED ADVISERS TRUST
PRIVACY POLICY
The following is a description of the policies of the Valued Advisers Trust (the “Trust”) regarding disclosure of nonpublic personal information that shareholders provide to a series of the Trust (each, a “Fund”) or that the Fund collects from other sources. In the event that a shareholder holds shares of a Fund through a broker-dealer or other financial intermediary, the privacy policy of the financial intermediary would govern how shareholder nonpublic personal information would be shared with nonaffiliated third parties.
Categories of Information A Fund May Collect. A Fund may collect the following nonpublic personal information about its shareholders:
| | • | | Information the Fund receives from a shareholder on applications or other forms, correspondence, or conversations (such as the shareholder’s name, address, phone number, social security number, and date of birth); and |
| | • | | Information about the shareholder’s transactions with the Fund, its affiliates, or others (such as the shareholder’s account number and balance, payment history, cost basis information, and other financial information). |
Categories of Information A Fund May Disclose. A Fund may not disclose any nonpublic personal information about its current or former shareholders to unaffiliated third parties, except as required or permitted by law. A Fund is permitted by law to disclose all of the information it collects, as described above, to its service providers (such as the Fund’s custodian, administrator, transfer agent, accountant and legal counsel) to process shareholder transactions and otherwise provide services to the shareholder.
Confidentiality and Security. Each Fund shall restrict access to shareholder nonpublic personal information to those persons who require such information to provide products or services to the shareholder. Each Fund shall maintain physical, electronic, and procedural safeguards that comply with federal standards to guard shareholder nonpublic personal information.
Disposal of Information. The Funds, through their transfer agent, have taken steps to reasonably ensure that the privacy of a shareholder’s nonpublic personal information is maintained at all times, including in connection with the disposal of information that is no longer required to be maintained by the Funds. Such steps shall include, whenever possible, shredding paper documents and records prior to disposal, requiring off-site storage vendors to shred documents maintained in such locations prior to disposal, and erasing and/or obliterating any data contained on electronic media in such a manner that the information can no longer be read or reconstructed.
30

SOUND MIND INVESTING FUND
SMI CONSERVATIVE
ALLOCATION FUND
SMI DYNAMIC
ALLOCATION FUND
SMI BOND FUND
SMI 50/40/10 FUND
|
| |
| ANNUAL REPORT |
| |
| OCTOBER 31, 2015 |
Fund Advisor:
SMI Advisory Services, LLC
11135 Baker Hollow Road
Columbus, IN 47201
Toll Free (877) SMI-FUND
www.smifund.com
Dear Fellow Shareholder,
Late last year, we presented you with an opportunity to join us in a matching giving campaign to help Christians who had been displaced by the Islamic State in Iraq and Syria.
Our stated goal was $25,000 in donations, which would trigger our maximum matching gift of $50,000. Internally, our sights were set a little higher, hoping that you might donate $50,000, to be matched with our $50,000, for a total of $100,000.
But once again, we were blown away by the generosity of the SMI family! Your contributions totaled $80,875, which when matched with our $50,000, brought the total amount raised to a whopping $130,875!
That money has been used to provide for basic material needs and trauma counseling for our persecuted brothers and sisters, in addition to training pastors and staff in trauma counseling. So much damage has been done to the innocent, but your faithful generosity is helping to heal some of those wounds.
Well done! Thank you to all who participated and gave – we really appreciate being able to partner together in this worthy effort!
Year in Review
Life is full of surprises, some of them unpleasant. This fact should not catch us off guard. Thousands of years ago, the writer of Proverbs warned us that “The wealth of the rich is their fortified city; they imagine it an unscalable wall” (Proverbs 18:11). While we like to think that wealth protects us and controls our environment, the events of the past year drive home the reality that much lies beyond our control. Thankfully, we know that “God has not given us a spirit of fear, but a spirit of power, of love and a sound mind (2 Timothy 1:7)!”
Speaking of “surprises,” the first half of 2015 was noteworthy for the unusual lack of volatility – the S&P 500® Index (“S&P 500”) traded in one of the narrowest ranges ever recorded. But, as often seems to happen, what followed made up for that lack of excitement, and then some.
Heading into August, it had been four years since the stock market’s last 10% “correction” (retreat from a previous high). Given that market corrections have historically occurred roughly once a year, on average, it’s easy to say the market was simply overdue. But when the major stock indexes opened down 6%-8% on the morning of August 24, it was difficult for anyone to easily dismiss what was happening.
The damage was swift and sudden – and mercifully brief. Investors couldn’t know it at the time, of course, but the correction would end within two weeks. Stocks rallied a bit in September (before retesting the
1
correction lows at the end of the month). The correction was so rapid that investors who weren’t tuned in to the short-term gyrations of the market might not have even realized anything significant had occurred. And the market swiftly recovered the bulk of its losses with strong gains in October.
SMI Funds Strategy Analysis
Dynamic Asset Allocation (“DAA”) (SMIDX, as well as SMILX & SMIRX):
Historically, market corrections have often lasted long enough for DAA to actually profit from them, but our original research also showed that is not always the case. Because DAA is a trend-following system, it takes a little time for the strategy to transition to the asset classes newly in favor when the broader trends shift. This year has been a bit frustrating, as the lack of sustained trends has meant more churn among the DAA asset classes than usual. On multiple occasions, DAA has positioned itself based on a recent market trend, only to have the market change direction and move counter to the way the portfolio was positioned.
August’s swift correction was a perfect example of this. Entering August, the stock market was only 2% below its all-time high, so naturally DAA was invested in both US stocks (SPY) and also International stocks (EFA). Given those equity positions and how abrupt the market correction was, we’re fortunate that DAA was able to limit our losses at all. Adding insult to injury, following the losses of August and September, the system then reduced our stock market exposure just as the market was set to rally in October.
We’ve known from the outset that DAA is going to produce some frustration from time to time. But it is vital to note that while it’s going to get some of these short-term moves wrong, as long as it does what it’s supposed to do and it catches the big trends correctly, those who stick with it are likely to be pleased with it overall.
To drive that point home, it may be helpful to briefly review the “big picture” of what DAA has done during the few years that it has been active. It kept us exposed to stocks during 2013 and 2014 and produced double-digit gains both years. This year, when the stock market looked particularly vulnerable to significant declines, and in fact delivered the market’s first 10% correction in four years, DAA quickly got us completely out of stocks. Remember the original goal of the DAA strategy: Solid upside during rising markets, and reasonably fast protective action as downside risk increases.
DAA won’t always handle every market wiggle perfectly. But in spite of these known characteristics, we still believe that DAA is a great option for those who want the ability to gain stock-market exposure, while doing so in a way that attempts to protect against major losses.
Stock Upgrading (SMIFX, as well as SMIRX):
While Stock Upgrading managed a small gain over the past 12 months, it lagged the performance of the broadly watched S&P 500 (full details are available in the performance report that follows this letter). This isn’t particularly surprising, given that the market’s rise has been driven by an increasingly narrow group of large stocks. The broad indexes tell the story: the large-stock S&P 500 was up 5.20% over the last year, the small-stock Russell 2000® Index was up just 0.34%, and the international-stock EAFE index was actually negative at -0.07%. With more than half of our Stock Upgrading portfolio allocated to small and foreign stocks, its results predictably lagged the performance of the large-stock indexes.
2
Bond Upgrading (SMIUX, as well as SMILX):
In hindsight, the timing of the SMI Bond Fund’s launch in late April was unfortunate. Interest rates fell sharply in late 2014 and early 2015, which meant that the original positioning of this trend-following bond portfolio was toward the longer-term bonds that had benefitted from those declining rates. Unfortunately, rates rose sharply right away in May and June, and the fund experienced losses initially without having benefitted from the earlier gains. (Bond prices move the opposite direction of interest rates, so when rates rise, bond prices fall, causing losses.)
Some may wonder why they should hold bonds at all, given the widely-held belief that interest rates have entered a long-term rising pattern that could result in poor bond returns for years. The simplest reason is there is still a vast difference between the volatility of stocks and that of bonds. While bonds may not provide the exceptional returns they offered during the past 30 years of mostly declining interest rates, they still play an important role in diversifying a stock-heavy portfolio. Consider that during 2008, the S&P 500 fell 37%. In contrast, the worst loss for the Barclays Aggregate Bond Index during any 12-month period of the past 30 years was a mere 3.67%.
While stocks have historically been the best vehicle to generate superior long-term gains, they are simply too volatile to be appropriate for 100% of most investors’ portfolios. With low interest rates eliminating most traditional savings products as a viable option, bonds continue to have a role to play for many investors, in spite of the likelihood of rising interest rates. We believe that our Bond Upgrading approach will provide the flexibility and direction needed to successfully navigate a higher-rate environment by shifting between various types and maturities of bonds as conditions dictate.
Performance data for all five funds can be found in the enclosed annual report. For performance information current through the most recent month-end, visit our website at www.smifund.com.
50/40/10:
This oddly titled fund (SMI 50/40/10 Fund) refers to the specific blend of SMI strategies – 50% DAA, 40% Fund Upgrading and 10% Sector Rotation (SR). Our research has shown that this combination of strategies has worked synergistically in the past to boost returns while simultaneously reducing risk, which we believe is a great combination. It accomplished this by adding the high upside of SR and the volatility-dampening properties of DAA to an Upgrading base.
In the first quarter of 2015, we saw the benefits of blending these strategies, as SR fell while DAA and Upgrading rose. During the second quarter, we again saw the benefits, although in a different way – SR’s strong gain helped offset an unusually weak quarter by DAA. And in the third quarter, it was the more traditional “down market” result that we might expect: DAA losing less than the market, Upgrading with losses close to the market’s loss, and SR turning in larger losses.
The performance of the three strategies will vary significantly at times, but a portfolio diversified among them strives to smooth the ride along the way.
Going Direct With the SMI Funds
Slightly over two-thirds of the assets in the SMI Funds are owned through accounts held at other organizations (Fidelity, Schwab, TD Ameritrade, etc.). That’s perfectly fine. However, there are some advantages to having your account directly with the SMI Funds rather than through a third party.
3
The primary advantage of a direct account is the ability to buy or sell shares of the SMI Funds without paying any transaction fees. Most third-party accounts are charged some sort of transaction fee when the SMI Funds are bought or sold. Those fees can add up – particularly if you are regularly buying or selling shares in any of the SMI Funds. When your account is held directly with the SMI Funds, you never have to pay transaction fees. Additionally, in accounts held directly with the SMI Funds, the typical 2% redemption fee on shares sold within 60 days of purchase is waived if you are transferring money from one SMI Fund to another. To learn more about moving your account directly to the SMI Funds, visit www.smifund.com or call 1-877-SMI-FUND.
We appreciate the confidence you have placed in us to be a faithful steward of your assets, as you strive to be a faithful steward of His assets.
Sincerely,

Mark Biller
Senior Portfolio Manager
The Sound Mind Investing Funds
The SMI Fund lineup, shown below, now offers investors a way to mix and match professionally managed funds to custom tailor the risk level desired for their portfolio. If you’d like assistance customizing your portfolio in this manner, please call a Stewardship Advisor at (800) 796-4975.
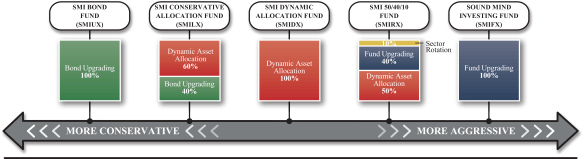
4
PERFORMANCE RESULTS – (Unaudited)
| | | | | | | | | | | | | | | | | | | | |
Total Return* (For the periods ended October 31, 2015) | |
| | | | | | | | | | | | Average Annual | |
| | | Three Months | | | Six Months | | | One Year | | | Five Year | | | Since Inception
(December 2, 2005) | |
Sound Mind Investing Fund | | | -5.31% | | | | -3.61% | | | | 0.16% | | | | 8.75% | | | | 6.14% | |
S&P 500® Index** | | | -0.63% | | | | 0.77% | | | | 5.20% | | | | 14.33% | | | | 7.38% | |
Wilshire 5000 Index** | | | -1.18% | | | | 0.05% | | | | 4.70% | | | | 14.05% | | | | 7.50% | |
Total annual operating expense, as disclosed in the Fund’s prospectus dated February 28, 2015, were 2.03% of average daily net assets, which includes acquired fund fees and expenses. The Fund’s advisor contractually has agreed to waive its fee and/or reimburse expenses to the extent necessary to maintain Total Annual Fund Operating Expenses (excluding interest, taxes, brokerage commissions, other expenses which are capitalized in accordance with generally accepted accounting principles, extraordinary expenses, dividend expense on short sales, 12b-1 fees, and acquired fund fees and expenses) at 1.50% of the Fund’s average daily net assets through February 29, 2016. This expense cap may not be terminated prior to this date except by the Board of Trustees.
| | | | | | | | | | | | | | | | |
Total Return* (For the periods ended October 31, 2015) | |
| | | | | | | | | | | | Average Annual | |
| | | Three Months | | | Six Months | | | One Year | | | Since Inception
(December 30, 2010) | |
SMI Conservative Allocation Fund | | | -3.60% | | | | -5.30% | | | | -4.58% | | | | 4.65% | |
Wilshire 5000 Index** | | | -1.18% | | | | 0.05% | | | | 4.70% | | | | 12.82% | |
Barclays Capital U.S. Aggregate Bond Index** | | | 0.55% | | | | -0.10% | | | | 1.96% | | | | 3.54% | |
Custom Benchmark*** | | | -0.36% | | | | 0.13% | | | | 3.82% | | | | 9.23% | |
Total annual operating expense, as disclosed in the Fund’s prospectus dated February 28, 2015, were 1.77% of average daily net assets (1.93% before fee waivers/expense reimbursements by the Advisor), which includes acquired fund fees and expenses and reflects the fee waiver/expense reimbursement discussed below. All expenses are reflected in performance results. The Fund’s advisor contractually has agreed to waive its fee and/or reimburse expenses to the extent necessary to maintain Total Annual Fund Operating Expenses (excluding interest, taxes, brokerage commissions, other expenses which are capitalized in accordance with generally accepted accounting principles, extraordinary expenses, dividend expense on short sales, 12b-1 fees, and acquired fund fees and expenses) at 1.15% of the Fund’s average daily net assets through February 29, 2016. Each waiver or reimbursement of an expense by the Advisor is subject to repayment by the Fund within the three fiscal years following the fiscal year in which the expense was incurred, provided that the Fund is able to make the repayment without exceeding the expense limitation in place at the time of the waiver or reimbursement. The Advisor is also entitled to recoupment related to fees waived and/or expenses reimbursed with respect to the Predecessor Fund. This expense cap may not be terminated prior to this date except by the Board of Trustees.
5
PERFORMANCE RESULTS – (Unaudited), (Continued)
| | | | | | | | | | | | | | | | |
Total Return* (For the periods ended October 31, 2015) | |
| | | | | | | | | | | | Average Annual | |
| | | Three Months | | | Six Months | | | One Year | | | Since Inception
(February 28, 2013) | |
SMI Dynamic Allocation Fund | | | -5.99% | | | | -7.34% | | | | -4.52% | | | | 5.25% | |
Wilshire 5000 Index** | | | -1.18% | | | | 0.05% | | | | 4.70% | | | | 14.50% | |
Barclays Capital U.S. Aggregate Bond Index** | | | 0.55% | | | | -0.10% | | | | 1.96% | | | | 1.92% | |
Custom Benchmark*** | | | -0.36% | | | | 0.13% | | | | 3.82% | | | | 9.46% | |
Total annual operating expense, as disclosed in the Fund’s prospectus dated February 28, 2015, were 1.44% of average daily net assets, which includes acquired fund fees and expenses. All expenses are reflected in performance results. The Fund’s advisor contractually has agreed to waive its fee and/or reimburse expenses to the extent necessary to maintain Total Annual Fund Operating Expenses (excluding interest, taxes, brokerage commissions, other expenses which are capitalized in accordance with generally accepted accounting principles, extraordinary expenses, dividend expense on short sales, 12b-1 fees, and acquired fund fees and expenses) at 1.45% of the Fund’s average daily net assets through February 29, 2016. This expense cap may not be terminated prior to this date except by the Board of Trustees.
| | | | | | | | | | | | |
Total Return* (For the periods ended October 31, 2015) | |
| | | Three Months | | | Six Months | | | Since Inception
(April 28, 2015) | |
SMI Bond Fund | | | -0.80% | | | | -1.82% | | | | -1.82% | |
Barclays Capital U.S. Aggregate Bond Index** | | | 0.55% | | | | -0.10% | | | | -0.67% | |
Total annual operating expense, as disclosed in the Fund’s prospectus dated April 27, 2015, were 1.21% of average daily net assets (1.75% before fee waivers/expense reimbursements by the Advisor). The Advisor has contractually has agreed to waive its fee and/or reimburse expenses to the extent necessary to maintain Total Annual Fund Operating Expenses (excluding interest, taxes, brokerage commissions, other expenses which are capitalized in accordance with generally accepted accounting principles, extraordinary expenses, dividend expense on short sales, 12b-1 fees, and acquired fund fees and expenses) at 0.85% of the Fund’s average daily net assets through February 28, 2017. Each waiver or reimbursement of an expense by the Advisor is subject to repayment by the Fund within the three fiscal years following the fiscal year in which the expense was incurred, provided that the Fund is able to make the repayment without exceeding the expense limitation in place at the time of the waiver or reimbursement. This expense cap may not be terminated prior to this date except by the Board of Trustees.
6
PERFORMANCE RESULTS – (Unaudited), (Continued)
| | | | | | | | | | | | |
Total Return* (For the periods ended October 31, 2015) | |
| | | Three Months | | | Six Months | | | Since Inception
(April 29, 2015) | |
SMI 50/40/10 Fund | | | -7.16% | | | | -6.50% | | | | -8.00% | |
Wilshire 5000 Index** | | | -1.18% | | | | 0.05% | | | | -1.44% | |
Barclays Capital U.S. Aggregate Bond Index** | | | 0.55% | | | | -0.10% | | | | -0.43% | |
Custom Benchmark*** | | | -0.36% | | | | 0.13% | | | | -0.91% | |
Total annual operating expense, as disclosed in the Fund’s prospectus dated April 27, 2015, were 2.01% of average daily net assets (2.21% before fee waivers/expense reimbursements by the Advisor). The Advisor has contractually has agreed to waive its fee and/or reimburse expenses to the extent necessary to maintain Total Annual Fund Operating Expenses (excluding interest, taxes, brokerage commissions, other expenses which are capitalized in accordance with generally accepted accounting principles, extraordinary expenses, dividend expense on short sales, 12b-1 fees, and acquired fund fees and expenses) at 1.45% of the Fund’s average daily net assets through February 28, 2017. Each waiver or reimbursement of an expense by the Advisor is subject to repayment by the Fund within the three fiscal years following the fiscal year in which the expense was incurred, provided that the Fund is able to make the repayment without exceeding the expense limitation in place at the time of the waiver or reimbursement. This expense cap may not be terminated prior to this date except by the Board of Trustees.
The performance quoted represents past performance, which does not guarantee future results. The investment return and principal value of an investment will fluctuate so that an investor’s shares, when redeemed, may be worth more or less than their original cost. The returns shown do not reflect deduction of taxes that a shareholder would pay on Fund distributions or the redemption of Fund shares. Current performance of the Funds may be lower or higher than the performance quoted. Performance data current to the most recent month end may be obtained by calling 1-877-764-3863.
| * | Return figures reflect any change in price per share and assume the reinvestment of all distributions. |
| ** | The Standard & Poor’s 500® Index, Wilshire 5000 Index and Barclays Capital U.S. Aggregate Bond Index are unmanaged indices that assume reinvestment of all distributions and exclude the effect of taxes and fees. The Standard & Poor’s 500® Index, Wilshire 5000 Index and Barclays Capital U.S. Aggregate Bond Index are widely recognized unmanaged indices and are representative of a broader market and range of securities than is found in each Fund’s portfolio. The returns of the indices are not reduced by any fees or operating expenses. Individuals cannot invest directly in the Indices; however, an individual can invest in exchange traded funds or other investment vehicles that attempt to track the performance of a benchmark index. |
| *** | The Custom Benchmark for the SMI Conservative Allocation Fund, SMI Dynamic Allocation Fund and SMI 50/40/10 Fund is comprised of 60% Wilshire 5000 Index and 40% Barclays Capital U.S. Aggregate Bond Index. |
The Funds’ investment objectives, risks, charges and expenses must be considered carefully before investing. The prospectus contains this and other important information about the Funds and may be obtained by calling the same number as above. Please read it carefully before investing.
7
PERFORMANCE RESULTS – (Unaudited), (Continued)
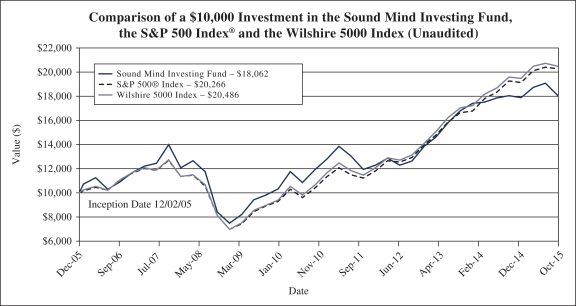
The chart above assumes an initial investment of $10,000 made on December 2, 2005 (commencement of Fund operations) and held through October 31, 2015. THE FUND’S RETURN REPRESENTS PAST PERFORMANCE AND DOES NOT GUARANTEE FUTURE RESULTS. The returns shown do not reflect deduction of taxes that a shareholder would pay on Fund distributions or the redemption of Fund shares. Investment returns and principal values will fluctuate so that your shares, when redeemed, may be worth more or less than their original purchase price.
Current performance of the Fund may be lower or higher than the performance quoted. For more information on the Fund, and to obtain performance data current to the most recent month end or to request a prospectus, please call 1-877-764-3863. You should carefully consider the investment objectives, potential risks, management fees, and charges and expenses of the Fund before investing. The Fund’s prospectus contains this and other information about the Fund, and should be read carefully before investing.
The Fund is distributed by Unified Financial Securities, Inc., member FINRA.
8
PERFORMANCE RESULTS – (Unaudited), (Continued)
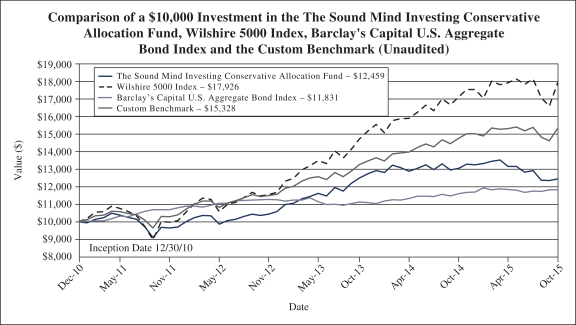
The chart above assumes an initial investment of $10,000 made on December 30, 2010 (commencement of Fund operations) and held through October 31, 2015. THE FUND’S RETURN REPRESENTS PAST PERFORMANCE AND DOES NOT GUARANTEE FUTURE RESULTS. The returns shown do not reflect deduction of taxes that a shareholder would pay on Fund distributions or the redemption of Fund shares. Investment returns and principal values will fluctuate so that your shares, when redeemed, may be worth more or less than their original purchase price.
Current performance of the Fund may be lower or higher than the performance quoted. For more information on the Fund, and to obtain performance data current to the most recent month end or to request a prospectus, please call 1-877-764-3863. You should carefully consider the investment objectives, potential risks, management fees, and charges and expenses of the Fund before investing. The Fund’s prospectus contains this and other information about the Fund, and should be read carefully before investing.
The Custom Benchmark is comprised of 60% Wilshire 5000 Index and 40% Barclays Capital U.S. Aggregate Bond Index.
The Fund is distributed by Unified Financial Securities, Inc., member FINRA.
9
PERFORMANCE RESULTS – (Unaudited), (Continued)
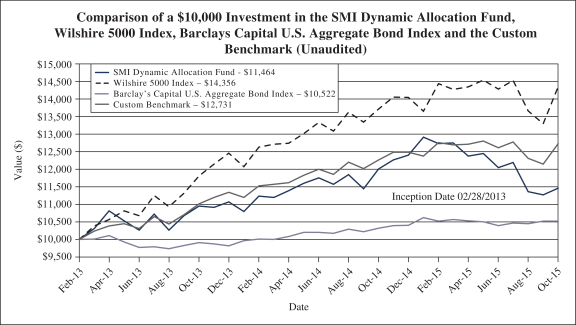
The chart above assumes an initial investment of $10,000 made on February 28, 2013 (commencement of Fund operations) and held through October 31, 2015. THE FUND’S RETURN REPRESENTS PAST PERFORMANCE AND DOES NOT GUARANTEE FUTURE RESULTS. The returns shown do not reflect deduction of taxes that a shareholder would pay on Fund distributions or the redemption of Fund shares. Investment returns and principal values will fluctuate so that your shares, when redeemed, may be worth more or less than their original purchase price.
Current performance of the Fund may be lower or higher than the performance quoted. For more information on the Fund, and to obtain performance data current to the most recent month end or to request a prospectus, please call 1-877-764-3863. You should carefully consider the investment objectives, potential risks, management fees, and charges and expenses of the Fund before investing. The Fund’s prospectus contains this and other information about the Fund, and should be read carefully before investing.
The Custom Benchmark is comprised of 60% Wilshire 5000 Index and 40% Barclays Capital U.S. Aggregate Bond Index.
The Fund is distributed by Unified Financial Securities, Inc., member FINRA.
10
PERFORMANCE RESULTS – (Unaudited), (Continued)
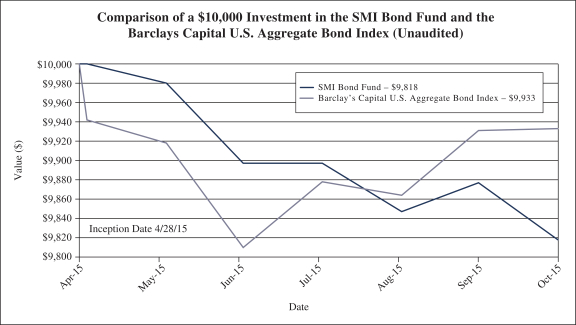
The chart above assumes an initial investment of $10,000 made on April 28, 2015 (commencement of Fund operations) and held through October 31, 2015. THE FUND’S RETURN REPRESENTS PAST PERFORMANCE AND DOES NOT GUARANTEE FUTURE RESULTS. The returns shown do not reflect deduction of taxes that a shareholder would pay on Fund distributions or the redemption of Fund shares. Investment returns and principal values will fluctuate so that your shares, when redeemed, may be worth more or less than their original purchase price.
Current performance of the Fund may be lower or higher than the performance quoted. For more information on the Fund, and to obtain performance data current to the most recent month end or to request a prospectus, please call 1-877-764-3863. You should carefully consider the investment objectives, potential risks, management fees, and charges and expenses of the Fund before investing. The Fund’s prospectus contains this and other information about the Fund, and should be read carefully before investing.
The Fund is distributed by Unified Financial Securities, Inc., member FINRA.
11
PERFORMANCE RESULTS – (Unaudited), (Continued)
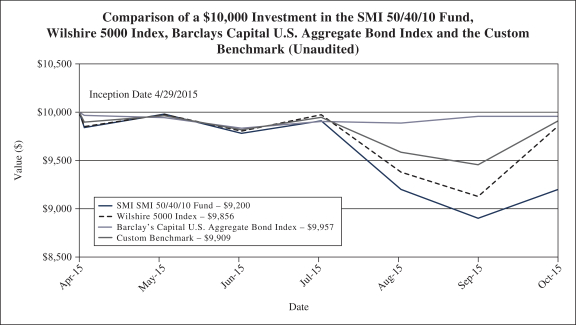
The chart above assumes an initial investment of $10,000 made on April 29, 2015 (commencement of Fund operations) and held through October 31, 2015. THE FUND’S RETURN REPRESENTS PAST PERFORMANCE AND DOES NOT GUARANTEE FUTURE RESULTS. The returns shown do not reflect deduction of taxes that a shareholder would pay on Fund distributions or the redemption of Fund shares. Investment returns and principal values will fluctuate so that your shares, when redeemed, may be worth more or less than their original purchase price.
Current performance of the Fund may be lower or higher than the performance quoted. For more information on the Fund, and to obtain performance data current to the most recent month end or to request a prospectus, please call 1-877-764-3863. You should carefully consider the investment objectives, potential risks, management fees, and charges and expenses of the Fund before investing. The Fund’s prospectus contains this and other information about the Fund, and should be read carefully before investing.
The Custom Benchmark is comprised of 60% Wilshire 5000 Index and 40% Barclays Capital U.S. Aggregate Bond Index.
The Fund is distributed by Unified Financial Securities, Inc., member FINRA.
12
FUND HOLDINGS – (Unaudited)
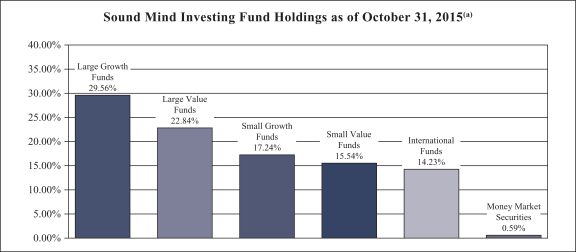
| | (a) | As a percentage of investments. |
Sound Mind Investing Fund seeks long term capital appreciation. The Fund seeks to achieve its objective by investing in a diversified portfolio of other investment companies using a “fund upgrading” strategy. The fund upgrading investment strategy is a systematic investment approach that is based on the belief of the Fund’s advisor, SMI Advisory Services, LLC, (“The Advisor”), that superior returns can be obtained by constantly monitoring the performance of a wide universe of other investment companies, and standing ready to move assets into the funds deemed by the advisor to be most attractive at the time of analysis.
13
FUND HOLDINGS – (Unaudited), (Continued)
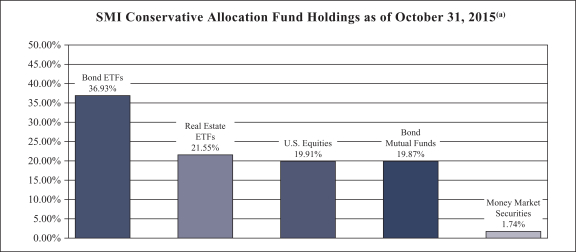
| | (a) | As a percentage of investments. |
SMI Conservative Allocation Fund seeks total return. Total return is composed of both income and capital appreciation. The Fund invests in a portfolio of equities and fixed income securities, including securities of other investment companies that focus their investments on equity and fixed income investments. To the extent the Advisor invests the Fund’s assets in equity securities, such investments will consist of investments in other investment companies (i.e., mutual funds), exchange traded funds (“ETFs”) and pooled investment vehicles, and the Advisor will select such portfolio holdings. The fixed income portion (if any) of the Fund will be comprised of fixed income investment companies and ETFs and individual fixed income securities. The Advisor will use its proprietary “Bond Upgrading” strategy to make all portfolio decisions with respect to investments in fixed income investment companies and ETFs. The Advisor’s “Bond Upgrading” strategy involves the use of momentum based performance indicators of the various bond categories to identify which categories may present the best investment opportunities. The Advisor scores the categories and uses the scores to make decisions on investments in the various categories.
14
FUND HOLDINGS – (Unaudited), (Continued)
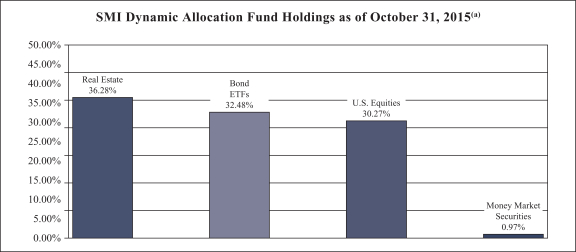
| | (a) | As a percentage of investments. |
SMI Dynamic Allocation Fund seeks total return. Total return is composed of both income and capital appreciation. The Fund uses a dynamic asset allocation investment strategy to achieve its investment objective. This is done by investing in securities from the following six asset classes – U.S. Equities, International Equities, Fixed Income Securities, Real Estate, Precious Metals, and Cash.
15
FUND HOLDINGS – (Unaudited), (Continued)

| | (a) | As a percentage of investments. |
SMI Bond Fund seeks total return. Total return is composed of both income and capital appreciation. The Fund invests at least 80% of its net assets in a portfolio of fixed income securities, including securities of other investment companies that focus their investments on fixed income investments. The Fund will be comprised of fixed income investment companies and ETFs and individual fixed income securities. The Advisor will use its proprietary “Bond Upgrading” strategy to make all portfolio decisions with respect to investments in fixed income investment companies and ETFs. The Advisor’s “Bond Upgrading” strategy involves the use of momentum based performance indicators of the various bond categories to identify which categories may present the best investment opportunities. The Advisor scores the categories and uses the scores to make decisions on investments in the various categories.
16
FUND HOLDINGS – (Unaudited), (Continued)
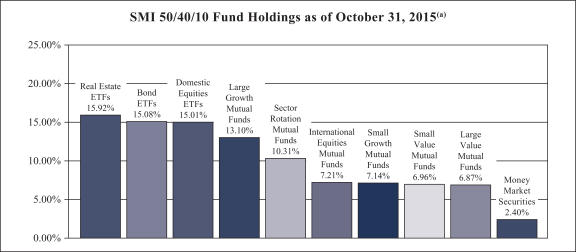
| | (a) | As a percentage of investments. |
SMI 50/40/10 Fund seeks total return. Total return is composed of both income and capital appreciation. The Fund’s advisor, allocates the Fund’s assets on a 50/40/10 basis among various investment strategies as follows:
| | • | | 50% – Dynamic Asset Allocation Strategy |
| | • | | 40% – Fund Upgrading Strategy |
| | • | | 10% – Sector Rotation Strategy |
The Sector Rotation Strategy involves the Advisor selecting from a universe of mutual funds and ETFs it has compiled using proprietary methods. This universe is specifically designed by the Advisor to balance exposure to a wide variety of market sectors and industries. This universe includes both leveraged and non-leveraged funds. The Advisor ranks these funds based on their recent performance across multiple short-term performance periods, then uses an upgrading approach to invest in the top performing market sector or sectors. Once a particular sector or sectors is identified, the Advisor purchases one or more mutual funds or ETFs to gain the desired exposure to that particular sector. This portion of the Fund may be concentrated, meaning that the Fund may be invested in as few as one or two sectors at a time and potentially as few as one underlying mutual fund or ETF.
Availability of Portfolio Schedule – (Unaudited)
Each Fund files its complete schedule of portfolio holdings with the Securities and Exchange Commission (“SEC”) for the first and third quarters of each fiscal year on Form N-Q. The Funds’ Forms N-Q are available at the SEC’s website at www.sec.gov. The Funds’ Forms N-Q may be reviewed and copied at the Public Reference Room in Washington DC. Information on the operation of the Public Reference Room may be obtained by calling 1-800-SEC-0330.
17
SUMMARY OF FUNDS’ EXPENSES – (Unaudited)
As a shareholder of one of the Funds, you incur two types of costs: (1) transaction costs (such as short-term redemption fees); and (2) ongoing costs, including management fees and other Fund expenses. This example is intended to help you understand your ongoing costs (in dollars) of investing in the Funds and to compare these costs with the ongoing costs of investing in other mutual funds.
Each Fund’s example is based on an investment of $1,000 invested at the beginning of the period and held for the entire period (May 1, 2015 through October 31, 2015).
Actual Expenses
The first line of the table provides information about actual account values and actual expenses. You may use the information in this line, together with the amount you invested, to estimate the expenses that you paid over the period. Simply divide your account value by $1,000 (for example, an $8,600 account value divided by $1,000 = 8.60), then multiply the result by the number in the first line under the heading “Expenses Paid During Period” to estimate the expenses you paid on your account during this period.
Hypothetical Example for Comparison Purposes
The second line of the table provides information about hypothetical account values and hypothetical expenses based on the Funds’ actual expense ratio and an assumed rate of return of 5% per year before expenses, which is not the Funds’ actual return. The hypothetical account values and expenses may not be used to estimate the actual ending account balance or expenses you paid for the period. You may use this information to compare the ongoing costs of investing in the Funds and other funds. To do so, compare this 5% hypothetical example with the 5% hypothetical examples that appear in the shareholder reports of the other funds.
Expenses shown are meant to highlight your ongoing costs only and do not reflect any transactional costs such as the fee imposed on short-term redemptions. Therefore, the second line of the table is useful in comparing ongoing costs only and will not help you determine the relative costs of owning different funds. If incurred, the short-term redemption fee imposed by the Funds would increase your expenses.
| | | | | | | | | | | | |
Sound Mind
Investing Fund | | Beginning
Account Value
May 1, 2015 | | | Ending
Account Value
October 31, 2015 | | | Expenses Paid
During Period
May 1, 2015 –
October 31, 2015 (a) | |
| Actual | | $ | 1,000.00 | | | $ | 963.90 | | | $ | 5.67 | |
| Hypothetical (b) | | $ | 1,000.00 | | | $ | 1,019.43 | | | $ | 5.83 | |
| (a) | Expenses are equal to the Fund’s annualized expense ratio of 1.14%, multiplied by the average account value over the period, multiplied by 184/365 (to reflect the partial year period). |
| (b) | Assumes a 5% return before expenses. |
18
SUMMARY OF FUNDS’ EXPENSES – (Unaudited), (Continued)
| | | | | | | | | | | | |
SMI
Conservative Allocation
Fund | | Beginning
Account Value
May 1, 2015 | | | Ending
Account Value
October 31, 2015 | | | Expenses Paid
During Period
May 1, 2015 –
October 31, 2015 (a) | |
| Actual | | $ | 1,000.00 | | | $ | 947.00 | | | $ | 5.71 | |
| Hypothetical (b) | | $ | 1,000.00 | | | $ | 1,019.35 | | | $ | 5.92 | |
| (a) | Expenses are equal to the Fund’s annualized expense ratio of 1.16%, multiplied by the average account value over the period, multiplied by 184/365 (to reflect the partial year period). |
| (b) | Assumes a 5% return before expenses. |
| | | | | | | | | | | | |
SMI
Dynamic Allocation
Fund | | Beginning
Account Value
May 1, 2015 | | | Ending
Account Value
October 31, 2015 | | | Expenses Paid
During Period
May 1, 2015 –
October 31, 2015 (a) | |
| Actual | | $ | 1,000.00 | | | $ | 926.60 | | | $ | 5.64 | |
| Hypothetical (b) | | $ | 1,000.00 | | | $ | 1,019.35 | | | $ | 5.92 | |
| (a) | Expenses are equal to the Fund’s annualized expense ratio of 1.16%, multiplied by the average account value over the period, multiplied by 184/365 (to reflect the partial year period). |
| (b) | Assumes a 5% return before expenses. |
| | | | | | | | | | | | |
SMI Bond
Fund | | Beginning
Account Value
May 1, 2015 | | | Ending
Account Value
October 31, 2015 | | | Expenses Paid
During Period
May 1, 2015 –
October 31, 2015 (a) | |
| Actual | | $ | 1,000.00 | | | $ | 981.80 | | | $ | 4.30 | |
| Hypothetical (b) | | $ | 1,000.00 | | | $ | 1,020.87 | | | $ | 4.38 | |
| (a) | Expenses are equal to the Fund’s annualized expense ratio of 0.86%, multiplied by the average account value over the period, multiplied by 184/365 (to reflect the partial year period). |
| (b) | Assumes a 5% return before expenses. |
| | | | | | | | | | | | |
SMI 50/40/10 Fund | | Beginning
Account Value
May 1, 2015 | | | Ending
Account Value
October 31, 2015 | | | Expenses Paid
During Period
May 1, 2015 –
October 31, 2015 (a) | |
| Actual | | $ | 1,000.00 | | | $ | 935.00 | | | $ | 7.08 | |
| Hypothetical (b) | | $ | 1,000.00 | | | $ | 1,017.88 | | | $ | 7.39 | |
| (a) | Expenses are equal to the Fund’s annualized expense ratio of 1.45%, multiplied by the average account value over the period, multiplied by 184/365 (to reflect the partial year period). |
| (b) | Assumes a 5% return before expenses. |
19
SOUND MIND INVESTING FUND
SCHEDULE OF INVESTMENTS
October 31, 2015
| | | | | | | | |
| Mutual Funds – 94.48% | | Shares | | | Fair Value | |
Mutual Funds Greater Than 1% of The Sound
Mind Investing Fund’s Net Assets – 91.34% | | | | | | | | |
AllianceBernstein Large Cap Growth Fund – Advisor Class | | | 281,571 | | | $ | 12,397,564 | |
AlphaOne Micro Cap Equity Fund – Institutional Class (a) | | | 283,720 | | | | 3,481,250 | |
AQR Large Cap Defensive Style Fund – Class N | | | 180,718 | | | | 2,795,709 | |
Clipper Fund (a) | | | 142,359 | | | | 15,052,999 | |
Fidelity Small Cap Value Fund | | | 581,070 | | | | 10,238,461 | |
Hartford Growth Opportunities Fund/The – Class Y | | | 201,766 | | | | 8,207,856 | |
Hennessy Cornerstone Mid Cap 30 Fund – Institutional Class (a) | | | 564,892 | | | | 11,608,537 | |
Hennessy Focus Fund – Investor Class | | | 36,146 | | | | 2,647,353 | |
Janus Forty Fund – Institutional Class | | | 469,208 | | | | 16,178,279 | |
JPMorgan Growth Advantage Fund – Select Class | | | 238,213 | | | | 3,773,287 | |
Lazard Global Listed Infrastructure Portfolio – Institutional Class | | | 870,678 | | | | 12,520,347 | |
Lazard US Equity Concentrated Portfolio – Institutional Class (a) | | | 953,266 | | | | 13,707,965 | |
Legg Mason Opportunity Trust – Institutional Class * | | | 511,941 | | | | 11,011,843 | |
MainStay US Equity Opportunities Fund – Institutional Class | | | 713,140 | | | | 6,418,259 | |
Nationwide Geneva Small Cap Growth Fund – Institutional Service Class (a) | | | 138,276 | | | | 6,315,070 | |
Loomis Sayles Growth Fund – Class Y | | | 248,849 | | | | 2,881,677 | |
Nicholas Fund, Inc. | | | 50,666 | | | | 3,359,690 | |
Nuveen Small Cap Value Fund – Institutional Class (a) | | | 172,019 | | | | 3,548,754 | |
Oppenheimer International Small Company Fund – Class Y | | | 317,120 | | | | 11,574,889 | |
Polen Growth Fund – Institutional Class (a) | | | 493,280 | | | | 10,151,709 | |
Principal SmallCap Fund – Institutional Class (a) | | | 306,985 | | | | 6,695,346 | |
T. Rowe Price Mid-Cap Growth Fund | | | 65,758 | | | | 5,334,299 | |
TCW Select Equities Fund – Institutional Class (b) | | | 464,280 | | | | 13,710,188 | |
Thornburg Value Fund – Class I | | | 55,941 | | | | 2,996,745 | |
Value Line Small Cap Opportunities Fund – Investor Class | | | 68,579 | | | | 3,374,081 | |
Victory Sycamore Established Value Fund – Class I | | | 91,040 | | | | 3,237,371 | |
Wasatch International Growth Fund | | | 151,856 | | | | 4,434,205 | |
| | | | | | | | |
TOTAL MUTUAL FUNDS GREATER THAN 1% OF THE SOUND
MIND INVESTING FUND’S NET ASSETS (Cost $205,829,044) | | | | 207,653,733 | |
| | | | | | | | |
Mutual Funds Less Than 1% of The Sound
Mind Investing Fund’s Net Assets – 3.14% (c) | | | | | | | | |
Allianz NFJ Dividend Value Fund – Institutional Class | | | 200 | | | | 3,182 | |
Allianz NFJ Small-Cap Value Fund – Institutional Class | | | 162 | | | | 4,336 | |
American Century International Discovery Fund – Institutional Class | | | 250 | | | | 3,229 | |
Artisan International Small Cap Fund – Investor Class | | | 150 | | | | 3,731 | |
See accompanying notes which are an integral part of these financial statements.
20
SOUND MIND INVESTING FUND
SCHEDULE OF INVESTMENTS
October 31, 2015 – (Continued)
| | | | | | | | |
| Mutual Funds – 94.48% – continued | | Shares | | | Fair Value | |
Mutual Funds Less Than 1% of The Sound
Mind Investing Fund’s Net Assets – 3.14% (c) – continued | | | | | | | | |
Artisan International Value Fund – Investor Class | | | 150 | | | $ | 5,236 | |
Artisan Mid Cap Value Fund – Investor Class | | | 200 | | | | 4,668 | |
Artisan Small Cap Fund – Investor Class | | | 250 | | | | 7,430 | |
Artisan Small Cap Value Fund – Investor Class | | | 150 | | | | 1,929 | |
Aston/TAMRO Small Cap Fund – Institutional Class | | | 100 | | | | 1,930 | |
BBH Core Select Fund – Class N | | | 100 | | | | 2,279 | |
Berwyn Fund | | | 100 | | | | 2,884 | |
BlackRock International Opportunities Portfolio – Institutional Class | | | 100 | | | | 3,292 | |
Bridgeway Small-Cap Growth Fund – Class N | | | 205 | | | | 4,226 | |
Bridgeway Small-Cap Value Fund – Class N | | | 179 | | | | 3,887 | |
Buffalo Small Cap Fund, Inc. | | | 150 | | | | 4,525 | |
Columbia Acorn International – Class Z | | | 100 | | | | 4,134 | |
Columbia Acorn Select – Class Z | | | 150 | | | | 3,156 | |
Columbia Small Cap Growth Fund I – Class Z | | | 100 | | | | 2,732 | |
Columbia Value and Restructuring Fund – Class Z | | | 50 | | | | 2,333 | |
Davis Opportunity Fund – Class Y | | | 100 | | | | 3,434 | |
Delaware Select Growth Fund – Institutional Class | | | 100 | | | | 5,035 | |
Delaware Small Cap Value Fund – Institutional Class | | | 100 | | | | 5,410 | |
Delaware Smid Cap Growth Fund – Institutional Class | | | 45,217 | | | | 1,558,171 | |
Delaware Value Fund – Institutional Class | | | 144 | | | | 2,617 | |
Deutsche Small Cap Value Fund – Institutional Class | | | 85 | | | | 2,126 | |
DFA International Small Cap Value Portfolio – Investor Class | | | 100 | | | | 1,944 | |
DFA International Small Company Portfolio – Institutional Class | | | 100 | | | | 1,778 | |
DFA US Small Cap Value Portfolio – Institutional Class | | | 100 | | | | 3,308 | |
Dreyfus Opportunistic Small Cap Fund | | | 100 | | | | 2,992 | |
Driehaus Micro Cap Growth Fund | | | 68,027 | | | | 770,748 | |
Fairholme Fund | | | 100 | | | | 3,532 | |
Federated International Small-Mid Company Fund – Institutional Class | | | 22,037 | | | | 879,264 | |
Fidelity Mid-Cap Stock Fund | | | 150 | | | | 5,371 | |
Fidelity Small Cap Discovery Fund | | | 100 | | | | 2,822 | |
Fidelity Small Cap Stock Fund | | | 150 | | | | 2,783 | |
Franklin Small Cap Value Fund – Advisor Class | | | 100 | | | | 5,390 | |
Hartford International Opportunities Fund/The – Class Y | | | 248 | | | | 3,916 | |
Heartland Value Fund | | | 100 | | | | 3,864 | |
Hennessy Focus Fund – Investor Class | | | 100 | | | | 7,194 | |
Hotchkis and Wiley Mid-Cap Value Fund – Institutional Class | | | 100 | | | | 3,786 | |
Invesco American Value Fund – Class R5 | | | 100 | | | | 3,807 | |
See accompanying notes which are an integral part of these financial statements.
21
SOUND MIND INVESTING FUND
SCHEDULE OF INVESTMENTS
October 31, 2015 – (Continued)
| | | | | | | | |
| Mutual Funds – 94.48% – continued | | Shares | | | Fair Value | |
Mutual Funds Less Than 1% of The Sound
Mind Investing Fund’s Net Assets – 3.14% (c) – continued | | | | | �� | | | |
Janus Overseas Fund – Class T | | | 100 | | | $ | 2,984 | |
Janus Venture Fund – Class T | | | 100 | | | | 6,482 | |
JOHCM International Select Fund – Class I | | | 100 | | | | 1,820 | |
JPMorgan Disciplined Equity Fund – Institutional Class | | | 100 | | | | 2,340 | |
JPMorgan Mid Cap Value Fund – Institutional Class | | | 100 | | | | 3,693 | |
JPMorgan Small Cap Equity Fund – Select Class | | | 226 | | | | 10,887 | |
Longleaf Partners Fund | | | 150 | | | | 3,940 | |
Longleaf Partners International Fund | | | 100 | | | | 1,352 | |
Longleaf Partners Small-Cap Fund | | | 100 | | | | 2,869 | |
Lord Abbett Developing Growth Fund, Inc. – Institutional Class | | | 100 | | | | 2,335 | |
Morgan Stanley Institutional Fund, Inc. – Growth Portfolio – Institutional Class | | | 100 | | | | 4,180 | |
Neuberger Berman Genesis Fund – Institutional Class | | | 100 | | | | 5,838 | |
Oakmark International Fund – Institutional Class | | | 150 | | | | 3,531 | |
Oakmark International Small Cap Fund – Institutional Class | | | 150 | | | | 2,315 | |
Oakmark Select Fund – Institutional Class | | | 150 | | | | 6,019 | |
Oppenheimer Mid Cap Value Fund – Class Y | | | 100 | | | | 4,759 | |
Perkins Mid Cap Value Fund – Class T | | | 200 | | | | 3,934 | |
PRIMECAP Odyssey Aggressive Growth Fund | | | 100 | | | | 3,327 | |
Principal SmallCap Growth Fund – Institutional Class | | | 200 | | | | 2,398 | |
Royce Low-Priced Stock Fund – Investment Class | | | 150 | | | | 1,314 | |
Royce Opportunity Fund – Investor Class | | | 151 | | | | 1,836 | |
Royce Premier Fund – Investment Class | | | 300 | | | | 5,601 | |
Royce Small-Cap Value Fund – Institutional Class | | | 100 | | | | 1,105 | |
Royce Special Equity Fund – Investment Class | | | 100 | | | | 2,120 | |
Royce Special Equity Fund – Institutional Class | | | 150 | | | | 3,162 | |
RS Small Cap Growth Fund – Class Y | | | 10,532 | | | | 725,355 | |
T. Rowe Price International Discovery Fund | | | 150 | | | | 8,340 | |
T. Rowe Price New Horizons Fund | | | 100 | | | | 4,619 | |
T. Rowe Price Small-Cap Value Fund | | | 100 | | | | 4,607 | |
Third Avenue Value Fund – Institutional Class | | | 335 | | | | 18,220 | |
Thornburg International Value Fund – Class I | | | 48,000 | | | | 1,420,800 | |
TIAA-CREF International Equity Fund – Institutional Class | | | 100 | | | | 1,097 | |
Touchstone Sands Capital Select Growth Fund – Class Y | | | 100 | | | | 1,877 | |
Tweedy Browne Global Value Fund | | | 150 | | | | 3,954 | |
Vanguard Strategic Equity Fund – Investor Class | | | 100 | | | | 3,253 | |
See accompanying notes which are an integral part of these financial statements.
22
SOUND MIND INVESTING FUND
SCHEDULE OF INVESTMENTS
October 31, 2015 – (Continued)
| | | | | | | | |
| Mutual Funds – 94.48% – continued | | Shares | | | Fair Value | |
Mutual Funds Less Than 1% of The Sound
Mind Investing Fund’s Net Assets – 3.14% (c) – continued | | | | | | | | |
Virtus Foreign Opportunities Fund – Class I | | | 51,295 | | | $ | 1,498,327 | |
Wasatch Emerging Markets Small Cap Fund | | | 1,000 | | | | 2,500 | |
| | | | | | | | |
TOTAL MUTUAL FUNDS LESS THAN 1% OF THE SOUND
MIND INVESTING FUND’S NET ASSETS (Cost $7,377,848) | | | | 7,131,501 | |
| | | | | | | | |
TOTAL MUTUAL FUNDS (Cost $213,206,892) | | | | | | | 214,785,234 | |
| | | | | | | | |
Exchange-Traded Funds 5.09% | | | | | | | | |
PowerShares High Yield Equity Dividend Achievers Portfolio (a) | | | 846,200 | | | | 11,576,016 | |
| | | | | | | | |
TOTAL EXCHANGE-TRADED FUNDS (Cost $11,378,793) | | | | | | | 11,576,016 | |
| | | | | | | | |
Money Market Securities 0.59% | | | | | | | | |
Fidelity Institutional Money Market Portfolio – Institutional Class, 0.16% (d) | | | 1,338,996 | | | | 1,338,996 | |
| | | | | | | | |
TOTAL MONEY MARKET SECURITIES (Cost $1,338,996) | | | | | | | 1,338,996 | |
| | | | | | | | |
TOTAL INVESTMENTS – 100.16% (Cost $225,924,681) | | | | | | $ | 227,700,246 | |
| | | | | | | | |
Liabilities in Excess of Other Assets – (0.16)% | | | | | | | (360,958 | ) |
| | | | | | | | |
TOTAL NET ASSETS – 100.00% | | | | | | $ | 227,339,288 | |
| | | | | | | | |
| (a) | A portion of this security may be deemed illiquid due to the Investment Company Act of 1940 provision stating that no issuer of any investment company security purchased or acquired by a registered investment company shall be obligated to redeem such security in an amount exceeding 1 per centum of such issuer’s total outstanding shares during any period of less than thirty days. As of October 31, 2015, the fair value of illiquid securities held by the Fund was $26,360,360 or 11.60% of net assets. |
| (b) | Security is fair valued by Advisor. |
| (c) | Small investments are occasionally retained in mutual funds that are closed to new investment, or in the manager’s opinion are at risk to close, so as to allow the Fund the flexibility to reinvest in these funds in the future. |
| (d) | Rate disclosed is the seven day yield as of October 31, 2015. |
| * | Non-income producing security. |
See accompanying notes which are an integral part of these financial statements.
23
SMI CONSERVATIVE ALLOCATION FUND
SCHEDULE OF INVESTMENTS
October 31, 2015
| | | | | | | | |
| Mutual Funds – 19.91% | | Shares | | | Fair Value | |
Scout Core Plus Bond Fund – Institutional Class | | | 68,114 | | | $ | 2,211,662 | |
Vanguard Intermediate-Term Bond Index Fund-Admiral Class | | | 192,821 | | | | 2,207,803 | |
| | | | | | | | |
TOTAL MUTUAL FUNDS (Cost $4,450,000) | | | | | | | 4,419,465 | |
| | | | | | | | |
Exchange-Traded Funds – 78.54% | | | | | | | | |
iShares 20+ Year Treasury Bond ETF (a) | | | 50,400 | | | | 6,188,112 | |
iShares iBoxx $ Investment Grade Corporate Bond ETF | | | 8,400 | | | | 977,928 | |
SPDR S&P 500 ETF Trust | | | 21,300 | | | | 4,428,909 | |
Vanguard Intermediate-Term Bond ETF | | | 6,800 | | | | 576,028 | |
Vanguard REIT ETF | | | 60,000 | | | | 4,793,400 | |
Vanguard Short-Term Bond ETF | | | 5,900 | | | | 473,416 | |
| | | | | | | | |
TOTAL EXCHANGE-TRADED FUNDS (Cost $17,175,209) | | | | | | | 17,437,793 | |
| | | | | | | | |
| | | Principal
Amount | | | | |
Asset-Backed Securities – 0.00% | | | | | | | | |
Northwest Airlines Pass Through Trust,
Series 2007-1, Class A, 7.03%, 11/1/2019 | | $ | 17 | | | | 20 | |
US Airways Pass Through Trust,
Series 2011-1, Class A, 7.13%, 10/22/2023 | | | 3 | | | | 4 | |
| | | | | | | | |
TOTAL ASSET-BACKED SECURITIES (Cost $17) | | | | | | | 24 | |
| | | | | | | | |
| | | Shares | | | | |
Money Market Securities – 1.74% | | | | | | | | |
Fidelity Institutional Money Market Portfolio – Institutional Class, 0.16% (b) | | | 386,597 | | | | 386,597 | |
| | | | | | | | |
TOTAL MONEY MARKET SECURITIES (Cost $386,597) | | | | | | | 386,597 | |
| | | | | | | | |
TOTAL INVESTMENTS – 100.19% (Cost $22,011,823) | | | | | | $ | 22,243,879 | |
| | | | | | | | |
Liabilities in Excess of Other Assets – (0.19)% | | | | | | | (41,158 | ) |
| | | | | | | | |
NET ASSETS – 100.00% | | | | | | $ | 22,202,721 | |
| | | | | | | | |
| (a) | For a schedule of the Fund’s holdings please refer to the Fund’s most recent semi-annual or annual report filed at www.sec.gov. |
| (b) | Rate disclosed is the seven day yield as of October 31, 2015. |
| ETF | – Exchange-Traded Fund |
| SPDR | – Standard & Poor’s Depositary Receipts |
See accompanying notes which are an integral part of these financial statements.
24
SMI DYNAMIC ALLOCATION FUND
SCHEDULE OF INVESTMENTS
October 31, 2015
| | | | | | | | |
| Exchange-Traded Funds – 97.16% | | Shares | | | Fair Value | |
Consumer Discretionary Select Sector SPDR Fund | | | 47,900 | | | $ | 3,878,463 | |
iShares 20+ Year Treasury Bond ETF | | | 256,200 | | | | 31,456,236 | |
iShares iBoxx $ Investment Grade Corporate Bond ETF | | | 138,600 | | | | 16,135,812 | |
SPDR S&P 500 ETF Trust (a) | | | 263,500 | | | | 54,789,555 | |
Vanguard Intermediate-Term Bond ETF | | | 90,800 | | | | 7,691,668 | |
Vanguard REIT ETF (a) | | | 880,100 | | | | 70,311,189 | |
Vanguard Short-Term Bond ETF | | | 95,400 | | | | 7,654,896 | |
| | | | | | | | |
TOTAL EXCHANGE-TRADED FUNDS (Cost $187,558,769) | | | | | | | 191,917,819 | |
| | | | | | | | |
Money Market Securities – 0.95% | | | | | | | | |
Fidelity Institutional Money Market Portfolio – Institutional Class, 0.16% (b) | | | 1,879,476 | | | | 1,879,476 | |
| | | | | | | | |
TOTAL MONEY MARKET SECURITIES (Cost $1,879,476) | | | | | | | 1,879,476 | |
| | | | | | | | |
TOTAL INVESTMENTS – 98.11% (Cost $189,438,245) | | | | | | $ | 193,797,295 | |
| | | | | | | | |
Other Assets in Excess of Liabilities – 1.89% | | | | | | | 3,741,636 | |
| | | | | | | | |
NET ASSETS – 100.00% | | | | | | $ | 197,538,931 | |
| | | | | | | | |
| (a) | For a schedule of each Fund’s holdings please refer to each Fund’s most recent semi-annual or annual report filed at www.sec.gov. |
| (b) | Rate disclosed is the seven day yield as of October 31, 2015. |
| ETF | – Exchange-Traded Fund |
| REIT | – Real Estate Investment Trust |
| SPDR | – Standard & Poor’s Depositary Receipts |
See accompanying notes which are an integral part of these financial statements.
25
SMI BOND FUND
SCHEDULE OF INVESTMENTS
October 31, 2015
| | | | | | | | |
| Exchange-Traded Funds – 49.45% | | Shares | | | Fair Value | |
iShares 20+ Year Treasury Bond ETF (a) | | | 27,200 | | | $ | 3,339,616 | |
| | | | | | | | |
TOTAL EXCHANGE-TRADED FUNDS (Cost $3,369,771) | | | | | | | 3,339,616 | |
| | | | | | | | |
Mutual Funds – 49.68% | | | | | | | | |
Vanguard Intermediate-Term Bond Index Fund – Admiral Class | | | 146,640 | | | | 1,679,023 | |
| | | | | | | | |
Scout Core Plus Bond Fund – Institutional Class | | | 51,638 | | | | 1,676,698 | |
| | | | | | | | |
TOTAL MUTUAL FUNDS (Cost $3,368,708) | | | | | | | 3,355,721 | |
| | | | | | | | |
Money Market Securities – 0.29% | | | | | | | | |
Fidelity Institutional Money Market Portfolio – Institutional Class, 0.16% (b) | | | 19,573 | | | | 19,573 | |
| | | | | | | | |
TOTAL MONEY MARKET SECURITIES (Cost $19,573) | | | | | | | 19,573 | |
| | | | | | | | |
TOTAL INVESTMENTS – 99.42% (Cost $6,758,052) | | | | | | $ | 6,714,910 | |
| | | | | | | | |
Other Assets in Excess of Liabilities – 0.58% | | | | | | | 39,342 | |
| | | | | | | | |
NET ASSETS – 100.00% | | | | | | $ | 6,754,252 | |
| | | | | | | | |
| (a) | For a schedule of the Fund’s holdings please refer to the Fund’s most recent semi-annual or annual report filed at www.sec.gov. |
| (b) | Rate disclosed is the seven day yield as of October 31, 2015. |
| ETF | – Exchange-Traded Fund |
See accompanying notes which are an integral part of these financial statements.
26
SMI 50/40/10 FUND
SCHEDULE OF INVESTMENTS
October 31, 2015
| | | | | | | | |
| Exchange-Traded Funds – 50.08% | | Shares | | | Fair Value | |
iShares 20+ Year Treasury Bond ETF | | | 8,300 | | | $ | 1,019,074 | |
iShares iBoxx $ Investment Grade Corporate Bond ETF | | | 4,300 | | | | 500,606 | |
PowerShares High Yield Equity Dividend Achievers Portfolio | | | 34,000 | | | | 465,120 | |
SPDR S&P 500 ETF Trust | | | 9,600 | | | | 1,996,128 | |
Vanguard Intermediate-Term Bond ETF | | | 2,900 | | | | 245,659 | |
Vanguard REIT ETF | | | 26,500 | | | | 2,117,085 | |
Vanguard Short-Term Bond ETF | | | 3,000 | | | | 240,720 | |
| | | | | | | | |
TOTAL EXCHANGE-TRADED FUNDS (Cost $6,443,736) | | | | | | | 6,584,392 | |
| | | | | | | | |
Mutual Funds – 48.67% | | | | | | | | |
Federated International Small-Mid Company Fund – Institutional Class | | | 5,567 | | | | 222,140 | |
Fidelity Select Retailing Portfolio | | | 12,901 | | | | 1,370,846 | |
Lazard Global Listed Infrastructure Portfolio– Institutional Class | | | 37,189 | | | | 534,774 | |
Lazard US Equity Concentrated Portfolio– Institutional Class | | | 31,746 | | | | 456,508 | |
MainStay US Equity Opportunities Fund – Institutional Class | | | 50,885 | | | | 457,965 | |
Nationwide Geneva Small Cap Growth Fund– Institutional Service Class | | | 11,251 | | | | 513,823 | |
Loomis Sayles Growth Fund – Class Y | | | 88,873 | | | | 1,029,150 | |
Oppenheimer International Small Company Fund – Class Y | | | 5,545 | | | | 202,391 | |
Polen Growth Fund – Institutional Class | | | 34,651 | | | | 713,112 | |
Value Line Small Cap Opportunities Fund – Investor Class | | | 8,866 | | | | 436,199 | |
Victory Sycamore Established Value Fund – Institutional Class | | | 12,961 | | | | 460,876 | |
| | | | | | | | |
TOTAL MUTUAL FUNDS (Cost $6,334,000) | | | | | | | 6,397,784 | |
| | | | | | | | |
Money Market Securities – 2.43% | | | | | | | | |
Fidelity Institutional Money Market Portfolio – Institutional Class, 0.16% (a) | | | 319,406 | | | | 319,406 | |
| | | | | | | | |
TOTAL MONEY MARKET SECURITIES (Cost $319,406) | | | | | | | 319,406 | |
| | | | | | | | |
TOTAL INVESTMENTS – 101.18% (Cost $13,097,142) | | | | | | $ | 13,301,582 | |
| | | | | | | | |
Liabilities in Excess of Other Assets – (1.18)% | | | | | | | (155,057 | ) |
| | | | | | | | |
NET ASSETS – 100.00% | | | | | | $ | 13,146,525 | |
| | | | | | | | |
| (a) | Rate disclosed is the seven day yield as of October 31, 2015. |
| ETF | – Exchange-Traded Fund |
| REIT | – Real Estate Investment Trust |
| SPDR | – Standard & Poor’s Depositary Receipts |
See accompanying notes which are an integral part of these financial statements.
27
SMI FUNDS
STATEMENTS OF ASSETS AND LIABILITIES
October 31, 2015
| | | | | | | | | | | | |
| | | Sound Mind
Investing Fund | | | SMI Conservative
Allocation Fund | | | SMI Dynamic
Allocation Fund | |
Assets | | | | | | | | | | | | |
Investment in securities: | | | | | | | | | | | | |
At cost | | $ | 225,924,681 | | | $ | 22,011,823 | | | $ | 189,438,245 | |
| | | | | | | | | | | | |
At fair value | | $ | 227,700,246 | | | $ | 22,243,879 | | | $ | 193,797,295 | |
Cash | | | — | | | | 2,191 | | | | — | |
Receivable for investments sold | | | 6,062,133 | | | | 4,427,582 | | | | 62,834,346 | |
Receivable for fund shares sold | | | 68,907 | | | | 50 | | | | 58,613 | |
Dividend and interest receivable | | | 656 | | | | 56 | | | | 360 | |
Prepaid expenses | | | 18,013 | | | | 9,619 | | | | 17,829 | |
| | | | | | | | | | | | |
Total Assets | | | 233,849,955 | | | | 26,683,377 | | | | 256,708,443 | |
| | | | | | | | | | | | |
Liabilities | | | | | | | | | | | | |
Payable for investments purchased | | | 6,050,000 | | | | 4,448,473 | | | | 58,913,870 | |
Payable for fund shares redeemed | | | 225,020 | | | | — | | | | 46,401 | |
Payable to Advisor | | | 190,160 | | | | 2,764 | | | | 167,234 | |
Payable to administrator, fund accountant, and
transfer agent | | | 12,816 | | | | 2,218 | | | | 9,143 | |
Payable to custodian | | | 1,981 | | | | 531 | | | | 962 | |
Payable to trustees | | | 136 | | | | 65 | | | | 118 | |
Other accrued expenses | | | 30,554 | | | | 26,605 | | | | 31,784 | |
| | | | | | | | | | | | |
Total Liabilities | | | 6,510,667 | | | | 4,480,656 | | | | 59,169,512 | |
| | | | | | | | | | | | |
Net Assets | | $ | 227,339,288 | | | $ | 22,202,721 | | | $ | 197,538,931 | |
| | | | | | | | | | | | |
Net Assets consist of: | | | | | | | | | | | | |
Paid-in capital | | $ | 198,213,243 | | | $ | 22,116,057 | | | $ | 201,178,317 | |
Accumulated undistributed net investment income (loss) | | | (1,333,296 | ) | | | 76,248 | | | | 1,049,699 | |
Accumulated undistributed net realized gain (loss) from investment transactions | | | 28,683,776 | | | | (221,640 | ) | | | (9,048,135 | ) |
Net unrealized appreciation on investment securities | | | 1,775,565 | | | | 232,056 | | | | 4,359,050 | |
| | | | | | | | | | | | |
Net Assets | | $ | 227,339,288 | | | $ | 22,202,721 | | | $ | 197,538,931 | |
| | | | | | | | | | | | |
Shares outstanding (unlimited number of shares authorized, no par value) | | | 19,326,749 | | | | 2,301,062 | | | | 17,979,570 | |
| | | | | | | | | | | | |
Net asset value (“NAV”) and offering price per share | | $ | 11.76 | | | $ | 9.65 | | | $ | 10.99 | |
| | | | | | | | | | | | |
Redemption price per share (NAV * 98%) (a) | | $ | 11.52 | | | $ | 9.46 | | | $ | 10.77 | |
| | | | | | | | | | | | |
| (a) | The Funds charge a 2% redemption fee on shares redeemed within 60 days of purchase. Shares are redeemed at the NAV if held longer than 60 days. |
See accompanying notes which are an integral part of these financial statements.
28
SMI FUNDS
STATEMENTS OF ASSETS AND LIABILITIES
October 31, 2015 – (Continued)
| | | | | | | | |
| | | SMI
Bond Fund | | | SMI
50/40/10 Fund | |
Assets | | | | | | | | |
Investment in securities: | | | | | | | | |
At cost | | $ | 6,758,052 | | | $ | 13,097,142 | |
| | | | | | | | |
At fair value | | $ | 6,714,910 | | | $ | 13,301,582 | |
Cash | | | 242 | | | | — | |
Receivable for investments sold | | | 1,433,362 | | | | 1,916,922 | |
Receivable for fund shares sold | | | 32,000 | | | | 14,150 | |
Dividend and interest receivable | | | 15 | | | | 85 | |
Receivable from Advisor | | | 3,427 | | | | — | |
Deferred offering cost | | | 19,988 | | | | 20,047 | |
Prepaid expenses | | | 6,700 | | | | 7,605 | |
| | | | | | | | |
Total Assets | | | 8,210,644 | | | | 15,260,391 | |
| | | | | | | | |
Liabilities | | | | | | | | |
Payable for investments purchased | | | 1,433,000 | | | | 2,082,921 | |
Payable for fund shares redeemed | | | 85 | | | | — | |
Payable for distributions to shareholders | | | 10 | | | | — | |
Payable to Advisor | | | — | | | | 6,877 | |
Payable to administrator, fund accountant, and transfer agent | | | 1,030 | | | | 963 | |
Payable to custodian | | | 455 | | | | 567 | |
Payable to trustees | | | 8 | | | | 15 | |
Other accrued expenses | | | 21,804 | | | | 22,523 | |
| | | | | | | | |
Total Liabilities | | | 1,456,392 | | | | 2,113,866 | |
| | | | | | | | |
Net Assets | | $ | 6,754,252 | | | $ | 13,146,525 | |
| | | | | | | | |
Net Assets consist of: | | | | | | | | |
Paid-in capital | | $ | 6,824,730 | | | $ | 13,970,971 | |
Accumulated undistributed net investment loss | | | — | | | | (4,088 | ) |
Accumulated undistributed net realized loss from investment transactions | | | (27,336 | ) | | | (1,024,798 | ) |
Net unrealized appreciation (depreciation) on investment securities | | | (43,142 | ) | | | 204,440 | |
| | | | | | | | |
Net Assets | | $ | 6,754,252 | | | $ | 13,146,525 | |
| | | | | | | | |
Shares outstanding (unlimited number of shares authorized, no par value) | | | 688,737 | | | | 1,428,268 | |
| | | | | | | | |
Net asset value (“NAV”) and offering price per share | | $ | 9.81 | | | $ | 9.20 | |
| | | | | | | | |
Redemption price per share (NAV * 98%) (a) | | $ | 9.61 | | | $ | 9.02 | |
| | | | | | | | |
| (a) | The Funds charge a 2% redemption fee on shares redeemed within 60 days of purchase. Shares are redeemed at the NAV if held longer than 60 days. |
See accompanying notes which are an integral part of these financial statements.
29
SMI FUNDS
STATEMENTS OF OPERATIONS
For the year ended October 31, 2015
| | | | | | | | | | | | |
| | | Sound Mind
Investing Fund | | | SMI Conservative
Allocation Fund | | | SMI Dynamic
Allocation Fund | |
Investment Income | | | | | | | | | | | | |
Dividend income | | $ | 1,398,354 | | | $ | 394,223 | | | $ | 5,314,660 | |
Interest income | | | — | | | | 141,236 | | | | — | |
| | | | | | | | | | | | |
Total investment income | | | 1,398,354 | | | | 535,459 | | | | 5,314,660 | |
| | | | | | | | | | | | |
Expenses | | | | | | | | | | | | |
Investment Advisor | | | 2,550,393 | | | | 243,296 | | | | 1,919,501 | |
Administration | | | 66,762 | | | | 6,981 | | | | 48,566 | |
Fund accounting | | | 36,041 | | | | 3,772 | | | | 26,534 | |
Transfer agent | | | 64,309 | | | | 19,427 | | | | 39,575 | |
Custodian | | | 26,328 | | | | 9,567 | | | | 11,677 | |
Chief Compliance Officer | | | 10,800 | | | | 10,762 | | | | 10,800 | |
Trustee | | | 8,692 | | | | 5,479 | | | | 7,750 | |
Legal | | | 26,402 | | | | 21,484 | | | | 25,564 | |
Audit | | | 16,325 | | | | 18,450 | | | | 15,500 | |
Printing | | | 42,263 | | | | 14,046 | | | | 35,361 | |
Registration | | | 27,219 | | | | 22,908 | | | | 47,725 | |
Miscellaneous | | | 36,326 | | | | 25,477 | | | | 16,632 | |
Line of credit | | | 5,121 | | | | 539 | | | | 4,086 | |
Interest expense | | | 3,261 | | | | 1,082 | | | | 351 | |
| | | | | | | | | | | | |
Total expenses | | | 2,920,242 | | | | 403,270 | | | | 2,209,622 | |
Fees waived by Advisor | | | — | | | | (88,520 | ) | | | — | |
Other expense reductions (a) | | | (5,767 | ) | | | (879 | ) | | | — | |
| | | | | | | | | | | | |
Net operating expenses | | | 2,914,475 | | | | 313,871 | | | | 2,209,622 | |
| | | | | | | | | | | | |
Net investment income (loss) | | | (1,516,121 | ) | | | 221,588 | | | | 3,105,038 | |
| | | | | | | | | | | | |
Net Realized and Unrealized Gain (Loss) on Investments | | | | | | | | | | | | |
Long term capital gain dividends from investment companies | | | 12,375,953 | | | | 711,659 | | | | 3,376 | |
Net realized gain (loss) on investment securities transactions | | | 18,464,087 | | | | (785,524 | ) | | | (9,671,547 | ) |
Net realized gain on swap contracts | | | — | | | | 22,219 | | | | — | |
Net change in unrealized appreciation of investment securities | | | (27,522,080 | ) | | | (1,231,640 | ) | | | (5,577,797 | ) |
Net change in unrealized depreciation on swap contracts | | | — | | | | (4,717 | ) | | | — | |
| | | | | | | | | | | | |
Net realized and unrealized gain (loss) on investments | | | 3,317,960 | | | | (1,288,003 | ) | | | (15,245,968 | ) |
| | | | | | | | | | | | |
Net increase (decrease) in net assets resulting from operations | | $ | 1,801,839 | | | $ | (1,066,415 | ) | | $ | (12,140,930 | ) |
| | | | | | | | | | | | |
| (a) | Certain funds in which the Fund invests refund a portion of the distribution fee charged. |
See accompanying notes which are an integral part of these financial statements.
30
SMI FUNDS
STATEMENTS OF OPERATIONS
For the period ended October 31, 2015 – (Continued)
| | | | | | | | |
| | | SMI Bond
Fund (a) | | | SMI
50/40/10
Fund (b) | |
Investment Income | | | | | | | | |
Dividend income | | $ | 21,007 | | | $ | 60,726 | |
| | | | | | | | |
Total investment income | | | 21,007 | | | | 60,726 | |
| | | | | | | | |
Expenses | | | | | | | | |
Investment Advisor | | | 16,180 | | | | 44,599 | |
Administration | | | 450 | | | | 931 | |
Fund accounting | | | 262 | | | | 542 | |
Transfer agent | | | 4,573 | | | | 5,758 | |
Custodian | | | 1,710 | | | | 2,578 | |
Chief Compliance Officer | | | 5,400 | | | | 5,400 | |
Trustee | | | 2,275 | | | | 2,310 | |
Legal | | | 7,886 | | | | 7,893 | |
Audit | | | 18,500 | | | | 18,500 | |
Printing | | | 850 | | | | 981 | |
Registration | | | 3,619 | | | | 3,965 | |
Miscellaneous | | | 3,007 | | | | 3,496 | |
Offering | | | 16,767 | | | | 16,708 | |
Organizational | | | 8,750 | | | | 8,750 | |
Line of credit | | | 55 | | | | 102 | |
Interest expense | | | 36 | | | | — | |
| | | | | | | | |
Total expenses | | | 90,320 | | | | 122,513 | |
Fees waived and reimbursed by Advisor | | | (70,768 | ) | | | (54,878 | ) |
Fees waived by the administrator | | | (965 | ) | | | (2,821 | ) |
| | | | | | | | |
Net operating expenses | | | 18,587 | | | | 64,814 | |
| | | | | | | | |
Net investment income (loss) | | | 2,420 | | | | (4,088 | ) |
| | | | | | | | |
Net Realized and Unrealized Loss on Investments | | | | | | | | |
Net realized loss on investment securities transactions | | | (27,336 | ) | | | (1,024,798 | ) |
Net change in unrealized appreciation (depreciation) of investment securities | | | (43,142 | ) | | | 204,440 | |
| | | | | | | | |
Net realized and unrealized loss on investments | | | (70,478 | ) | | | (820,358 | ) |
| | | | | | | | |
Net decrease in net assets resulting from operations | | $ | (68,058 | ) | | $ | (824,446 | ) |
| | | | | | | | |
| (a) | For the period April 28, 2015 (commencement of operations) through October 31, 2015. |
| (b) | For the period April 29, 2015 (commencement of operations) through October 31, 2015. |
See accompanying notes which are an integral part of these financial statements.
31
SOUND MIND INVESTING FUND
STATEMENTS OF CHANGES IN NET ASSETS
| | | | | | | | |
| | | Year ended
October 31, 2015 | | | Year ended
October 31, 2014 | |
Decrease in Net Assets due to: | | | | | | | | |
Operations | | | | | | | | |
Net investment loss | | $ | (1,516,121 | ) | | $ | (1,892,841 | ) |
Long term capital gain dividends from investment companies | | | 12,375,953 | | | | 7,771,975 | |
Net realized gain on investment transactions | | | 18,464,087 | | | | 39,721,511 | |
Net change in unrealized depreciation on investments | | | (27,522,080 | ) | | | (24,395,804 | ) |
| | | | | | | | |
Net increase in net assets resulting from operations | | | 1,801,839 | | | | 21,204,841 | |
| | | | | | | | |
Distributions | | | | | | | | |
From net investment income | | | (1,347,114 | ) | | | (985,095 | ) |
From net realized gains | | | (43,665,598 | ) | | | (30,426,944 | ) |
| | | | | | | | |
Total distributions | | | (45,012,712 | ) | | | (31,412,039 | ) |
| | | | | | | | |
Capital Transactions | | | | | | | | |
Proceeds from shares sold | | | 20,805,833 | | | | 34,893,201 | |
Proceeds from redemption fees (a) | | | 8,051 | | | | 7,583 | |
Reinvestment of distributions | | | 44,074,918 | | | | 30,865,319 | |
Amount paid for shares redeemed | | | (77,008,628 | ) | | | (65,924,252 | ) |
| | | | | | | | |
Net decrease in net assets resulting from capital transactions | | | (12,119,826 | ) | | | (158,149 | ) |
| | | | | | | | |
Total Decrease in Net Assets | | | (55,330,699 | ) | | | (10,365,347 | ) |
| | | | | | | | |
Net Assets | | | | | | | | |
Beginning of year | | | 282,669,987 | | | | 293,035,334 | |
| | | | | | | | |
End of year | | $ | 227,339,288 | | | $ | 282,669,987 | |
| | | | | | | | |
Accumulated net investment loss included in net assets at end of year | | $ | (1,333,296 | ) | | $ | (1,097,028 | ) |
| | | | | | | | |
Share Transactions | | | | | | | | |
Shares sold | | | 1,669,832 | | | | 2,502,218 | |
Shares issued in reinvestment of distributions | | | 3,648,586 | | | | 2,266,176 | |
Shares redeemed | | | (6,270,705 | ) | | | (4,741,258 | ) |
| | | | | | | | |
Net increase (decrease) in shares outstanding | | | (952,287 | ) | | | 27,136 | |
| | | | | | | | |
| (a) | The Fund charges a 2% redemption fee on shares redeemed within 60 days of purchase. Shares are redeemed at the NAV if held longer than 60 days. |
See accompanying notes which are an integral part of these financial statements.
32
SMI CONSERVATIVE ALLOCATION FUND
STATEMENTS OF CHANGES IN NET ASSETS
| | | | | | | | |
| | | Year ended
October 31, 2015 | | | Year ended
October 31, 2014 | |
Increase (Decrease) in Net Assets due to: | | | | | | | | |
Operations | | | | | | | | |
Net investment income (loss) | | $ | 221,588 | | | $ | (52,865 | ) |
Long term capital gain dividends from investment companies | | | 711,659 | | | | 481,460 | |
Net realized gain (loss) on investment transactions and swap contracts | | | (763,305 | ) | | | 3,137,249 | |
Net change in unrealized (depreciation) on investments and swap contracts | | | (1,236,357 | ) | | | (2,219,765 | ) |
| | | | | | | | |
Net increase (decrease) in net assets resulting from operations | | | (1,066,415 | ) | | | 1,346,079 | |
| | | | | | | | |
Distributions | | | | | | | | |
From net investment income | | | (234,212 | ) | | | (139,586 | ) |
From net realized gains | | | (3,459,165 | ) | | | (2,841,565 | ) |
| | | | | | | | |
Total distributions | | | (3,693,377 | ) | | | (2,981,151 | ) |
| | | | | | | | |
Capital Transactions | | | | | | | | |
Proceeds from shares sold | | | 6,964,005 | | | | 8,927,185 | |
Proceeds from redemption fees (a) | | | 2,295 | | | | 1,026 | |
Reinvestment of distributions | | | 3,636,441 | | | | 2,960,793 | |
Amount paid for shares redeemed | | | (14,246,135 | ) | | | (9,473,927 | ) |
| | | | | | | | |
Net increase (decrease) in net assets resulting from capital transactions | | | (3,643,394 | ) | | | 2,415,077 | |
| | | | | | | | |
Total Increase (Decrease) in Net Assets | | | (8,403,186 | ) | | | 780,005 | |
| | | | | | | | |
Net Assets | | | | | | | | |
Beginning of year | | | 30,605,907 | | | | 29,825,902 | |
| | | | | | | | |
End of year | | $ | 22,202,721 | | | $ | 30,605,907 | |
| | | | | | | | |
Accumulated undistributed net investment income (loss) included in net assets at end of year | | $ | 76,248 | | | $ | (73,987 | ) |
| | | | | | | | |
Share Transactions | | | | | | | | |
Shares sold | | | 676,358 | | | | 771,701 | |
Shares issued in reinvestment of distributions | | | 353,052 | | | | 260,404 | |
Shares redeemed | | | (1,385,789 | ) | | | (818,915 | ) |
| | | | | | | | |
Net increase (decrease) in shares outstanding | | | (356,379 | ) | | | 213,190 | |
| | | | | | | | |
| (a) | The Fund charges a 2% redemption fee on shares redeemed within 60 days of purchase. Shares are redeemed at the NAV if held longer than 60 days. |
See accompanying notes which are an integral part of these financial statements.
33
SMI DYNAMIC ALLOCATION FUND
STATEMENTS OF CHANGES IN NET ASSETS
| | | | | | | | |
| | | Year ended
October 31, 2015 | | | Year ended
October 31, 2014 | |
Increase (Decrease) in Net Assets due to: | | | | | | | | |
Operations | | | | | | | | |
Net investment income | | $ | 3,105,038 | | | $ | 2,265,111 | |
Long term capital gain dividends from investment companies | | | 3,376 | | | | 1,422 | |
Net realized gain (loss) on investment transactions | | | (9,671,547 | ) | | | 3,206,693 | |
Net change in unrealized appreciation (depreciation) on investments | | | (5,577,797 | ) | | | 5,271,786 | |
| | | | | | | | |
Net increase (decrease) in net assets resulting from operations | | | (12,140,930 | ) | | | 10,745,012 | |
| | | | | | | | |
Distributions | | | | | | | | |
From net investment income | | | (3,044,696 | ) | | | (1,285,357 | ) |
From net realized gains | | | (1,173,745 | ) | | | — | |
| | | | | | | | |
Total distributions | | | (4,218,441 | ) | | | (1,285,357 | ) |
| | | | | | | | |
Capital Transactions | | | | | | | | |
Proceeds from shares sold | | | 97,034,317 | | | | 80,949,324 | |
Proceeds from redemption fees (a) | | | 8,043 | | | | 769 | |
Reinvestment of distributions | | | 4,160,062 | | | | 1,264,696 | |
Amount paid for shares redeemed | | | (34,306,667 | ) | | | (12,961,554 | ) |
| | | | | | | | |
Net increase in net assets resulting from capital transactions | | | 66,895,755 | | | | 69,253,235 | |
| | | | | | | | |
Total Increase in Net Assets | | | 50,536,384 | | | | 78,712,890 | |
| | | | | | | | |
Net Assets | | | | | | | | |
Beginning of year | | | 147,002,547 | | | | 68,289,657 | |
| | | | | | | | |
End of year | | $ | 197,538,931 | | | $ | 147,002,547 | |
| | | | | | | | |
Accumulated undistributed net investment income included in net assets at end of year | | $ | 1,049,699 | | | $ | 1,630,012 | |
| | | | | | | | |
Share Transactions | | | | | | | | |
Shares sold | | | 8,126,323 | | | | 7,252,340 | |
Shares issued in reinvestment of distributions | | | 346,672 | | | | 116,348 | |
Shares redeemed | | | (2,940,748 | ) | | | (1,155,506 | ) |
| | | | | | | | |
Net increase in shares outstanding | | | 5,532,247 | | | | 6,213,182 | |
| | | | | | | | |
| (a) | The Fund charges a 2% redemption fee on shares redeemed within 60 days of purchase. Shares are redeemed at the NAV if held longer than 60 days. |
See accompanying notes which are an integral part of these financial statements.
34
SMI BOND FUND
STATEMENT OF CHANGES IN NET ASSETS
| | | | |
| | | For the period
ended
October 31, 2015 (a) | |
Increase (Decrease) in Net Assets due to: | | | | |
Operations | | | | |
Net investment income | | $ | 2,420 | |
Net realized loss on investment transactions | | | (27,336 | ) |
Net change in unrealized depreciation on investments | | | (43,142 | ) |
| | | | |
Net decrease in net assets resulting from operations | | | (68,058 | ) |
| | | | |
Distributions | | | | |
From net investment income | | | (2,960 | ) |
| | | | |
Total distributions | | | (2,960 | ) |
| | | | |
Capital Transactions | | | | |
Proceeds from shares sold | | | 7,595,456 | |
Proceeds from redemption fees (b) | | | 676 | |
Reinvestment of distributions | | | 2,894 | |
Amount paid for shares redeemed | | | (773,756 | ) |
| | | | |
Net increase in net assets resulting from capital transactions | | | 6,825,270 | |
| | | | |
Total Increase in Net Assets | | | 6,754,252 | |
| | | | |
Net Assets | | | | |
Beginning of period | | | — | |
| | | | |
End of period | | $ | 6,754,252 | |
| | | | |
Accumulated net investment income (loss) included in net assets at end of period | | $ | — | |
| | | | |
Share Transactions | | | | |
Shares sold | | | 766,917 | |
Shares issued in reinvestment of distributions | | | 293 | |
Shares redeemed | | | (78,473 | ) |
| | | | |
Net increase in shares outstanding | | | 688,737 | |
| | | | |
| (a) | For the period April 28, 2015 (commencement of operations) through October 31, 2015. |
| (b) | The Fund charges a 2% redemption fee on shares redeemed within 60 days of purchase. Shares are redeemed at the NAV if held longer than 60 days. |
See accompanying notes which are an integral part of these financial statements.
35
SMI 50/40/10 FUND
STATEMENT OF CHANGES IN NET ASSETS
| | | | |
| | | For the period
ended
October 31, 2015 (a) | |
Increase (Decrease) in Net Assets due to: | | | | |
Operations | | | | |
Net investment loss | | $ | (4,088 | ) |
Net realized loss on investment transactions | | | (1,024,798 | ) |
Net change in unrealized appreciation on investments | | | 204,440 | |
| | | | |
Net decrease in net assets resulting from operations | | | (824,446 | ) |
| | | | |
Capital Transactions | | | | |
Proceeds from shares sold | | | 14,865,557 | |
Proceeds from redemption fees (b) | | | 16 | |
Amount paid for shares redeemed | | | (894,602 | ) |
| | | | |
Net increase in net assets resulting from capital transactions | | | 13,970,971 | |
| | | | |
Total Increase in Net Assets | | | 13,146,525 | |
| | | | |
Net Assets | | | | |
Beginning of period | | | — | |
| | | | |
End of period | | $ | 13,146,525 | |
| | | | |
Accumulated net investment loss included in net assets at end of period | | $ | (4,088 | ) |
| | | | |
Share Transactions | | | | |
Shares sold | | | 1,522,749 | |
Shares redeemed | | | (94,481 | ) |
| | | | |
Net increase in shares outstanding | | | 1,428,268 | |
| | | | |
| (a) | For the period April 29, 2015 (commencement of operations) through October 31, 2015. |
| (b) | The Fund charges a 2% redemption fee on shares redeemed within 60 days of purchase. Shares are redeemed at the NAV if held longer than 60 days. |
See accompanying notes which are an integral part of these financial statements.
36
This page intentionally left blank.
37
SOUND MIND INVESTING FUND
FINANCIAL HIGHLIGHTS
(For a share outstanding during each year)
| | | | |
| | | Year ended
October 31,
2015 | |
Selected Per Share Data: | | | | |
Net asset value, beginning of year | | $ | 13.94 | |
| | | | |
Income from investment operations: | | | | |
Net investment income (loss)(a) | | | (0.08 | ) |
Net realized and unrealized gain | | | 0.16 | |
| | | | |
Total from investment operations | | | 0.08 | |
| | | | |
| |
Less Distributions to Shareholders: | | | | |
From net investment income | | | (0.07 | ) |
From net realized gain | | | (2.19 | ) |
| | | | |
Total distributions | | | (2.26 | ) |
| | | | |
Paid in capital from redemption fees(c) | | | — | |
| | | | |
Net asset value, end of year | | $ | 11.76 | |
| | | | |
| |
Total Return(d) | | | 0.16 | % |
| |
Ratios and Supplemental Data: | | | | |
Net assets, end of year (000) | | $ | 227,339 | |
Ratio of expenses to average net assets(e) | | | 1.13 | %(f) |
Ratio of net investment income (loss) to average net assets(a)(g) | | | (0.59 | )% |
Portfolio turnover rate | | | 216.17 | % |
| (a) | Recognition of the net investment income by the Fund is affected by the timing of the declaration of dividends by the underlying investment companies in which the Fund invests. |
| (b) | Resulted in less than $0.005 per share. |
| (c) | Redemption fee resulted in less than $0.005 per share. |
| (d) | Total return in the above table represents the rate that the investor would have earned or lost on an investment in the Fund, assuming reinvestment of dividends. |
| (e) | These ratios exclude the impact of expenses of the underlying funds in which the Fund invests as represented in the Schedule of Investments. |
| (f) | This ratio does not include the effects of other expenses refunded by the underlying funds in which the Fund invests or line of credit interest expense and borrowing costs. If these refunds and borrowing costs had been included, the ratio of expenses to average net assets would have been 1.14%, 1.09%, 1.17%, 1.15% and 1.14% for the years ended October 31, 2015, October 31, 2014, October 31, 2013, October 31, 2012 and October 31, 2011, respectively. |
| (g) | This ratio is presented net of the other expenses refunded by the underlying funds in which the Fund invests. |
| (h) | Portfolio turnover rate excludes $21,405,392 of purchases, which is the book value of securities acquired at the time of merger with SMI Managed Volatility Fund. |
See accompanying notes which are an integral part of these financial statements.
38
SOUND MIND INVESTING FUND
FINANCIAL HIGHLIGHTS
(For a share outstanding during each year) – (Continued)
| | | | | | | | | | | | | | |
Year ended
October 31, 2014 | | | Year ended
October 31, 2013 | | | Year ended
October 31, 2012 | | | Year ended
October 31, 2011 | |
| | | | | | | | | | | | | | |
| $ | 14.47 | | | $ | 11.36 | | | $ | 10.74 | | | $ | 10.71 | |
| | | | | | | | | | | | | | |
| | | | | | | | | | | | | | |
| | (0.09 | ) | | | (0.05 | ) | | | — | | | | 0.02 | |
| | 1.12 | | | | 3.66 | | | | 0.62 | | | | 0.04 | |
| | | | | | | | | | | | | | |
| | 1.03 | | | | 3.61 | | | | 0.62 | | | | 0.06 | |
| | | | | | | | | | | | | | |
| | | |
| | | | | | | | | | | | | | |
| | (0.05 | ) | | | — | (b) | | | — | | | | (0.03 | ) |
| | (1.51 | ) | | | (0.50 | ) | | | — | | | | — | |
| | | | | | | | | | | | | | |
| | (1.56 | ) | | | (0.50 | ) | | | — | | | | (0.03 | ) |
| | | | | | | | | | | | | | |
| | — | | | | — | | | | — | | | | — | |
| | | | | | | | | | | | | | |
| $ | 13.94 | | | $ | 14.47 | | | $ | 11.36 | | | $ | 10.74 | |
| | | | | | | | | | | | | | |
| | | |
| | 7.38 | % | | | 33.01 | % | | | 5.77 | % | | | 0.50 | % |
| | | |
| | | | | | | | | | | | | | |
| $ | 282,670 | | | $ | 293,035 | | | $ | 272,092 | | | $ | 288,727 | |
| | 1.11 | %(f) | | | 1.17 | %(f) | | | 1.15 | %(f) | | | 1.15 | %(f) |
| | (0.64 | )% | | | (0.41 | )% | | | 0.00 | % | | | 0.13 | % |
| | 135.60 | % | | | 93.59 | % | | | 187.39 | % | | | 165.12 | %(h) |
See accompanying notes which are an integral part of these financial statements.
39
SMI CONSERVATIVE ALLOCATION FUND
FINANCIAL HIGHLIGHTS
(For a share outstanding during each period)
| | | | |
| | | Year ended
October 31,
2015 | |
Selected Per Share Data: | | | | |
Net asset value, beginning of period | | $ | 11.52 | |
| | | | |
Income from investment operations: | | | | |
Net investment income (loss)(b) | | | 0.08 | |
Net realized and unrealized gain (loss) | | | (0.52 | ) |
| | | | |
Total from investment operations | | | (0.44 | ) |
| | | | |
| |
Less Distributions to Shareholders: | | | | |
From net investment income | | | (0.09 | ) |
From net realized gain | | | (1.34 | ) |
| | | | |
Total distributions | | | (1.43 | ) |
| | | | |
Paid in capital from redemption fees | | | — | (c) |
| | | | |
Net asset value, end of period | | $ | 9.65 | |
| | | | |
| |
Total Return(d) | | | (4.58 | )% |
| |
Ratios and Supplemental Data: | | | | |
Net assets, end of period (000) | | $ | 22,203 | |
Ratio of expenses to average net assets(f) | | | 1.15 | %(g) |
Ratio of expenses to average net assets before waiver and reimbursement(f) | | | 1.49 | % |
Ratio of net investment income (loss) to average net assets(b)(f)(i) | | | 0.82 | % |
Portfolio turnover rate | | | 377.51 | % |
| (a) | For the period December 30, 2010 (the date the Fund commenced operations) through October 31, 2011. |
| (b) | Recognition of net investment income by the Fund is affected by the timing of the declaration of dividends by the underlying investment companies in which the Fund invests. |
| (c) | Redemption fees resulted in less than $0.005 per share. |
| (d) | Total return in the above table represents the rate that the investor would have earned on an investment in the Fund, assuming reinvestment of dividends. |
| (f) | These ratios exclude the impact of expenses of the underlying funds in which the Fund may invest, as represented in the Schedule of Investments. |
| (g) | This ratio does not include the effects of other expenses refunded by the underlying funds in which the Fund invests or line of credit interest expense and borrowing costs. If these refunds and borrowing costs had been included, the ratio of expenses to average net assets would have been 1.16%, 1.13%, 1.14%, and 1.14% for the periods ended October 31, 2015, October 31, 2014, October 31, 2012 and October 31, 2011, respectively. |
| (i) | This ratio is presented net of the other expenses refunded by the underlying funds in which the Fund invests. |
See accompanying notes which are an integral part of these financial statements.
40
SMI CONSERVATIVE ALLOCATION FUND
FINANCIAL HIGHLIGHTS
(For a share outstanding during each period) – (Continued)
| | | | | | | | | | | | | | |
Year ended
October 31, 2014 | | | Year ended
October 31, 2013 | | | Year ended
October 31, 2012 | | | Period ended October 31, 2011(a) | |
| | | | | | | | | | | | | | |
| $ | 12.20 | | | $ | 10.31 | | | $ | 9.70 | | | $ | 10.00 | |
| | | | | | | | | | | | | | |
| | | | | | | | | | | | | | |
| | (0.01 | ) | | | (0.02 | ) | | | 0.03 | | | | (0.01 | ) |
| | 0.54 | | | | 2.11 | | | | 0.63 | | | | (0.30 | ) |
| | | | | | | | | | | | | | |
| | 0.53 | | | | 2.09 | | | | 0.66 | | | | (0.31 | ) |
| | | | | | | | | | | | | | |
| | | |
| | | | | | | | | | | | | | |
| | (0.06 | ) | | | (0.03 | ) | | | (0.05 | ) | | | — | |
| | (1.15 | ) | | | (0.17 | ) | | | — | | | | — | |
| | | | | | | | | | | | | | |
| | (1.21 | ) | | | (0.20 | ) | | | (0.05 | ) | | | — | |
| | | | | | | | | | | | | | |
| | — | (c) | | | — | (c) | | | — | (c) | | | 0.01 | |
| | | | | | | | | | | | | | |
| $ | 11.52 | | | $ | 12.20 | | | $ | 10.31 | | | $ | 9.70 | |
| | | | | | | | | | | | | | |
| | | |
| | 4.46 | % | | | 20.56 | % | | | 6.89 | % | | | (3.00 | )%(e) |
| | | |
| | | | | | | | | | | | | | |
| $ | 30,606 | | | $ | 29,826 | | | $ | 37,258 | | | $ | 34,830 | |
| | 1.15 | %(g) | | | 1.15 | % | | | 1.15 | %(g) | | | 1.15 | %(g)(h) |
| | 1.31 | % | | | 1.52 | % | | | 1.49 | % | | | 1.80 | %(h) |
| | (0.17 | )% | | | (0.06 | )% | | | 0.29 | % | | | (0.17 | )%(h) |
| | 255.50 | % | | | 270.30 | % | | | 349.33 | % | | | 276.04 | %(e) |
See accompanying notes which are an integral part of these financial statements.
41
SMI DYNAMIC ALLOCATION FUND
FINANCIAL HIGHLIGHTS
(For a share outstanding during each period)
| | | | | | | | | | | | |
| | | Year ended
October 31,
2015 | | | Year ended
October 31,
2014 | | | Period ended
October 31,
2013(a) | |
Selected Per Share Data: | | | | | | | | | | | | |
Net asset value, beginning of period | | $ | 11.81 | | | $ | 10.95 | | | $ | 10.00 | |
| | | | | | | | | | | | |
Income from investment operations: | | | | | | | | | | | | |
Net investment income (loss)(b) | | | 0.19 | | | | 0.23 | | | | 0.05 | |
Net realized and unrealized gain (loss) | | | (0.69 | ) | | | 0.81 | | | | 0.90 | |
| | | | | | | | | | | | |
Total from investment operations | | | (0.50 | ) | | | 1.04 | | | | 0.95 | |
| | | | | | | | | | | | |
| | | |
Less Distributions to Shareholders: | | | | | | | | | | | | |
From net investment income | | | (0.23 | ) | | | (0.18 | ) | | | — | |
From net realized gains | | | (0.09 | ) | | | — | | | | — | |
| | | | | | | | | | | | |
Total distributions | | | (0.32 | ) | | | (0.18 | ) | | | — | |
| | | | | | | | | | | | |
Paid in capital from redemption fees(c) | | | — | | | | — | | | | — | |
| | | | | | | | | | | | |
Net asset value, end of period | | $ | 10.99 | | | $ | 11.81 | | | $ | 10.95 | |
| | | | | | | | | | | | |
| | | |
Total Return(d) | | | (4.52 | )% | | | 9.64 | % | | | 9.50 | %(e) |
| | | |
Ratios and Supplemental Data: | | | | | | | | | | | | |
Net assets, end of period (000) | | $ | 197,539 | | | $ | 147,003 | | | $ | 68,290 | |
Ratio of expenses to average net assets(f) | | | 1.15 | % | | | 1.20 | % | | | 1.30 | %(g) |
Ratio of net investment income (loss) to average net assets(b)(f) | | | 1.62 | % | | | 2.13 | % | | | 0.94 | %(g) |
Portfolio turnover rate | | | 248.18 | % | | | 134.71 | % | | | 68.64 | %(e) |
| (a) | For the period February 28, 2013 (the date the Fund commenced operations) through October 31, 2013. |
| (b) | Recognition of net investment income by the Fund is affected by the timing of the declaration of dividends by the underlying investment companies in which the Fund invests. |
| (c) | Redemption fees resulted in less than $0.005 per share. |
| (d) | Total return in the above table represents the rate that the investor would have earned on an investment in the Fund, assuming reinvestment of dividends. |
| (f) | These ratios exclude the impact of expenses of the underlying funds in which the Fund may invest, as represented in the Schedule of Investments. |
See accompanying notes which are an integral part of these financial statements.
42
SMI BOND FUND
FINANCIAL HIGHLIGHTS
(For a share outstanding during the period)
| | | | |
| | | Period ended
October 31,
2015(a) | |
Selected Per Share Data: | | | | |
Net asset value, beginning of period | | $ | 10.00 | |
| | | | |
Income from investment operations: | | | | |
Net investment income (loss)(b) | | | 0.01 | |
Net realized and unrealized gain (loss) | | | (0.19 | ) |
| | | | |
Total from investment operations | | | (0.18 | ) |
| | | | |
| |
Less Distributions to Shareholders: | | | | |
From net investment income | | | (0.01 | ) |
| | | | |
Total distributions | | | (0.01 | ) |
| | | | |
Paid in capital from redemption fees(c) | | | — | |
| | | | |
Net asset value, end of period | | $ | 9.81 | |
| | | | |
| |
Total Return(d) | | | (1.82 | )%(e) |
| |
Ratios and Supplemental Data: | | | | |
Net assets, end of period (000) | | $ | 6,754 | |
Ratio of expenses to average net assets(f) | | | 0.85 | %(g)(h) |
Ratio of expenses to average net assets before waiver and reimbursement(f) | | | 4.18 | %(h) |
Ratio of net investment income (loss) to average net assets(b)(f) | | | 0.11 | %(h) |
Portfolio turnover rate | | | 399.72 | %(e) |
| (a) | For the period April 28, 2015 (the date the Fund commenced operations) through October 31, 2015. |
| (b) | Recognition of net investment income by the Fund is affected by the timing of the declaration of dividends by the underlying investment companies in which the Fund invests. |
| (c) | Amount is less than $0.005 per share. |
| (d) | Total return in the above table represents the rate that the investor would have earned on an investment in the Fund, assuming reinvestment of dividends. |
| (f) | These ratios exclude the impact of expenses of the underlying funds in which the Fund may invest, as represented in the Schedule of Investments. |
| (g) | This ratio does not include the effects of line of credit interest expense and borrowing costs. If these borrowing costs had been included, the ratio of expenses to average net assets would have been 0.86% for the period ended October 31, 2015. |
See accompanying notes which are an integral part of these financial statements.
43
SMI 50/40/10 FUND
FINANCIAL HIGHLIGHTS
(For a share outstanding during the period)
| | | | |
| | | Period ended
October 31,
2015(a) | |
Selected Per Share Data: | | | | |
Net asset value, beginning of period | | $ | 10.00 | |
| | | | |
Income from investment operations: | | | | |
Net investment income (loss)(b) | | | — | (c) |
Net realized and unrealized gain (loss) | | | (0.80 | ) |
| | | | |
Total from investment operations | | | (0.80 | ) |
| | | | |
Paid in capital from redemption fees(d) | | | — | |
| | | | |
Net asset value, end of period | | $ | 9.20 | |
| | | | |
| |
Total Return(e) | | | (8.00 | )%(f) |
| |
Ratios and Supplemental Data: | | | | |
Net assets, end of period (000) | | $ | 13,147 | |
Ratio of expenses to average net assets(f) | | | 1.45 | %(h) |
Ratio of expenses to average net assets before waiver and reimbursement(g) | | | 2.75 | %(h) |
Ratio of net investment income (loss) to average net assets(b)(g) | | | (0.09 | )%(h) |
Portfolio turnover rate | | | 184.30 | %(f) |
| (a) | For the period April 29, 2015 (the date the Fund commenced operations) through October 31, 2015. |
| (b) | Recognition of net investment income by the Fund is affected by the timing of the declaration of dividends by the underlying investment companies in which the Fund invests. |
| (c) | Amount is less than $0.005 per share. |
| (d) | Redemption fee resulted in less than $0.005 per share. |
| (e) | Total return in the above table represents the rate that the investor would have earned on an investment in the Fund, assuming reinvestment of dividends. |
| (g) | These ratios exclude the impact of expenses of the underlying funds in which the Fund may invest, as represented in the Schedule of Investments. |
See accompanying notes which are an integral part of these financial statements.
44
SMI FUNDS
NOTES TO THE FINANCIAL STATEMENTS
October 31, 2015
NOTE 1. ORGANIZATION
The Sound Mind Investing Fund (“SMI Fund”), SMI Conservative Allocation Fund (formerly the Sound Mind Investing Balanced Fund), SMI Dynamic Allocation Fund, SMI Bond Fund and SMI 50/40/10 Fund (each a “Fund” and collectively, the “Funds”) are each a diversified series of The Valued Advisers Trust (the “Trust”). Pursuant to a reorganization that took place on February 28, 2013, the SMI Fund and SMI Conservative Allocation Fund are the successors to the series of the Unified Series Trust (the “Predecessor Funds”) with the same names. The Predecessor Funds had the same investment objectives and strategies and substantially the same investment policies as the Funds. The SMI Fund was organized on August 29, 2005, and commenced operations on December 2, 2005. The SMI Conservative Allocation Fund was organized on November 13, 2010, and commenced operations on December 30, 2010. The SMI Dynamic Allocation Fund was organized on December 11, 2012, and commenced operations on February 28, 2013. The SMI Bond Fund was organized on March 11, 2015, and commenced operations on April 28, 2015. The SMI 50/40/10 Fund was organized on March 11, 2015, and commenced operations on April 29, 2015. The Trust is a management investment company established under the laws of Delaware by an Agreement and Declaration of Trust dated June 13, 2008 (the “Trust Agreement”). The Trust Agreement permits the Trustees to issue an unlimited number of shares of beneficial interest of separate series without par value. Each Fund is one of a series of funds currently authorized by the Trustees. The investment advisor to the Funds is SMI Advisory Services, LLC (the “Advisor”). Scout Investments, Inc., (the “Subadvisor”) through its Reams Asset Management division, is the subadvisor for the fixed income portion of the SMI Conservative Allocation Fund and SMI Bond Fund and subadvisor for the fixed income investments (other than ETFs and other investment companies that invest primarily in fixed income securities) and cash investments for the SMI Dynamic Allocation Fund and SMI 50/40/10 Fund. The SMI Fund seeks to provide long-term capital appreciation. The SMI Conservative Allocation Fund, SMI Dynamic Allocation Fund, SMI Bond Fund and SMI 50/40/10 Fund seek total return.
NOTE 2. SIGNIFICANT ACCOUNTING POLICIES
The Funds are investment companies and follow accounting and reporting guidance under Financial Accounting Standards Board (“FASB”) Accounting Standards Codification (“ASC”) Topic 946, “Financial Services-Investment Companies”. The following is a summary of significant accounting policies followed by the Funds in the preparation of their financial statements. These policies are in conformity with the generally accepted accounting principles in the United States of America (“GAAP”).
Securities Valuations – All investments in securities are recorded at their estimated fair value as described in Note 3.
Federal Income Taxes – The Funds make no provision for federal income or excise tax. The Funds intend to qualify each year as regulated investment companies (“RICs”) under subchapter M of the Internal Revenue Code of 1986, as amended, by complying with the requirements applicable to RICs and by distributing substantially all of their taxable income. The Funds also intend to distribute sufficient net
45
SMI FUNDS
NOTES TO THE FINANCIAL STATEMENTS
October 31, 2015 – (Continued)
NOTE 2. SIGNIFICANT ACCOUNTING POLICIES – (Continued)
investment income and net capital gains, if any, so that they will not be subject to excise tax on undistributed income and gains. If the required amount of net investment income or gains is not distributed, the Funds could incur a tax expense.
As of and during the fiscal year ended October 31, 2015, the Funds did not have a liability for any unrecognized tax benefits. The Funds recognize interest and penalties, if any, related to unrecognized tax benefits as income tax expense in the Statement of Operations. During the fiscal year ended October 31, 2015, the Funds did not incur any interest or penalties. Management of the Funds has reviewed tax positions taken in tax years that remain subject to examination by all major tax jurisdictions, including federal (i.e., the last three tax year ends (since inception for the SMI Bond Fund and SMI 50/40/10 Fund), including the most recent fiscal year end which has yet to be filed). Management believes that there is no tax liability resulting from unrecognized tax benefits related to uncertain tax positions taken.
Expenses – Expenses incurred by the Trust, or at the fund complex level, that do not relate to a specific fund are allocated to the individual funds based on each fund’s relative net assets or other appropriate basis.
Security Transactions and Related Income – The Funds follow industry practice and record security transactions on the trade date for financial reporting purposes. For financial statement and income tax purposes, the specific identification method is used for determining gains or losses. Dividend income is recorded on the ex-dividend date and interest income is recorded on an accrual basis. Short-term capital gain distributions from underlying funds are classified as dividend income for financial reporting purposes. Long-term capital gain distributions are broken out as such. Discounts and premiums on securities purchased are amortized or accreted using the effective interest method. The ability of issuers of debt securities held by the Funds to meet their obligations may be affected by economic and political developments in a specific country or region.
Dividends and Distributions – The Funds typically distribute substantially all of their net investment income in the form of dividends and taxable capital gains to their shareholders at least annually. These distributions, which are recorded on the ex-dividend date, are automatically reinvested in each Fund unless shareholders request cash distributions on their application or through a written request. The treatment for financial reporting purposes of distributions made to shareholders during the year from net investment income or net realized capital gains may differ from their ultimate treatment for federal income tax purposes. Where such differences are permanent in nature, they are reclassified in the components of the net assets based on their ultimate characterization for federal income tax purposes. Any such reclassifications will have no effect on net assets, results of operations or net asset values per share of the Funds. For the year ended October 31, 2015, the Funds made the following reclassifications to increase/(decrease) the components of net assets:
46
SMI FUNDS
NOTES TO THE FINANCIAL STATEMENTS
October 31, 2015 – (Continued)
NOTE 2. SIGNIFICANT ACCOUNTING POLICIES – (Continued)
| | | | | | | | | | | | |
Fund | | Paid in Capital | | | Accumulated
Undistributed
Net Investment
Income (Loss) | | | Accumulated
Net Realized
Gain (Loss)
on Investments | |
SMI Fund | | $ | (463,902 | ) | | $ | 2,626,967 | | | $ | (2,163,065 | ) |
SMI Conservative Allocation Fund | | | 5,722 | | | | 162,859 | | | | (168,581 | ) |
SMI Dynamic Allocation Fund | | | — | | | | (640,655 | ) | | | 640,655 | |
SMI Bond Fund | | | (540 | ) | | | 540 | | | | — | |
Swap Contracts – The SMI Conservative Allocation Fund, SMI Dynamic Allocation Fund, SMI Bond Fund and SMI 50/40/10 Fund may enter into credit default swap contracts. A credit default swap involves a protection buyer and a protection seller. The Funds may be either a protection buyer or seller. The protection buyer makes periodic premium payments to the protection seller during the swap term in exchange for the protection seller agreeing to make certain defined payments to the protection buyer in the event that certain defined credit events occur with respect to a particular security, issuer, or basket of securities. The “notional amount” of the swap agreement is the agreed upon amount or value of the underlying asset used for calculating the obligations that the parties to a swap agreement have agreed to exchange. The Funds’ obligation under a swap agreement will be accrued daily (offset against amounts owed to the Funds) and any accrued but unpaid net amounts owed to a swap counterparty may be collateralized by designating liquid assets on the Fund’s books and records. The credit default swaps are marked to market daily based upon quotes received from a pricing service and any change in value is recorded in unrealized appreciation/depreciation. Periodic payments paid or received are recorded in realized gain/loss. Any premium paid or received by the Funds upon entering into a credit default swap contract is recorded as an asset or liability and amortized daily as a component of realized gain (loss) on the Statements of Operations. Payments made or received as a result of a credit event or termination of the contract are recognized, net of a proportional amount of the upfront payment, as realized gains/losses. In addition to bearing the risk that the credit event will occur as a protection seller, the Funds could be exposed to market risk due to unfavorable changes in interest rates or in the price of the underlying security or index, the possibility that the Funds may be unable to close out its position at the same time or at the same price as if it had purchased comparable publicly traded securities, or that the counterparty may default on its obligation to perform. Please see Note 4 for information on swap agreement activity during the fiscal period ended October 31, 2015.
NOTE 3. SECURITIES VALUATION AND FAIR VALUE MEASUREMENTS
Fair value is defined as the price that a Fund would receive upon selling an investment in an orderly transaction to an independent buyer in the principal or most advantageous market of the investment. GAAP establishes a three-tier hierarchy to maximize the use of observable market data and minimize the use of unobservable inputs and to establish classification of fair value measurements for disclosure purposes.
47
SMI FUNDS
NOTES TO THE FINANCIAL STATEMENTS
October 31, 2015 – (Continued)
NOTE 3. SECURITIES VALUATION AND FAIR VALUE MEASUREMENTS – (Continued)
Inputs refer broadly to the assumptions that market participants would use in pricing the asset or liability, including assumptions about risk, for example, the risk inherent in a particular valuation technique used to measure fair value including such a pricing model and/or the risk inherent in the inputs to the valuation technique. Inputs may be observable or unobservable. Observable inputs are inputs that reflect the assumptions market participants would use in pricing the asset or liability developed based on market data obtained from sources independent of the reporting entity. Unobservable inputs are inputs that reflect the reporting entity’s own assumptions about the assumptions market participants would use in pricing the asset or liability developed based on the best information available in the circumstances.
Various inputs are used in determining the value of the Funds’ investments. These inputs are summarized in the three broad levels listed below.
| | • | | Level 1 – unadjusted quoted prices in active markets for identical investments and/or registered investment companies where the value per share is determined and published and is the basis for current transactions for identical assets or liabilities at the valuation date |
| | • | | Level 2 – other significant observable inputs (including, but not limited to, quoted prices for an identical security in an inactive market, quoted prices for similar securities, interest rates, prepayment speeds, credit risk, etc.) |
| | • | | Level 3 – significant unobservable inputs (including each Fund’s own assumptions in determining fair value of investments based on the best information available) |
The inputs used to measure fair value may fall into different levels of the fair value hierarchy. In such cases, for disclosure purposes, the level in the fair value hierarchy within which the fair value measurement falls in its entirety, is determined based on the lowest level input that is significant to the fair value measurement in its entirety.
Equity securities, including exchange-traded funds, are generally valued by using market quotations, but may be valued on the basis of prices furnished by a pricing service when the Advisor believes such prices more accurately reflect the fair value of such securities. Securities that are traded on any stock exchange are generally valued by the pricing service at the last quoted sale price. Lacking a last sale price, an exchange traded security is generally valued by the pricing service at its last bid price. Securities traded in the NASDAQ over-the-counter market are generally valued by the pricing service at the NASDAQ Official Closing Price.
When using the market quotations or close prices provided by the pricing service and when the market is considered active, the security will be classified as a Level 1 security. Sometimes, an equity security owned by the Funds will be valued by the pricing service with factors other than market quotations or when the market is considered inactive. When this happens, the security will be classified as a Level 2 security. When market quotations are not readily available, when the Advisor determines that the market quotation or the price provided by the pricing service does not accurately reflect the current fair value, or when
48
SMI FUNDS
NOTES TO THE FINANCIAL STATEMENTS
October 31, 2015 – (Continued)
NOTE 3. SECURITIES VALUATION AND FAIR VALUE MEASUREMENTS – (Continued)
restricted or illiquid securities are being valued, such securities are valued as determined in good faith by the Advisor, in conformity with guidelines adopted by and subject to review by the Board of Trustees (“Board”). These securities will generally be categorized as Level 3 securities.
Investments in mutual funds, including money market mutual funds, are generally priced at the ending net asset value (“NAV”) provided by the service agent of the funds. These securities will be categorized as Level 1 securities. In the event that the ending NAV for a mutual fund is unavailable at the end of night pricing time, the Advisor may, in accordance with the Trust’s good faith pricing guidelines, consider all appropriate factors in determining the fair value of the mutual fund. In such cases the security will generally be categorized as a Level 2 security.
Derivative instruments that the Funds invest in, such as swap agreements, are generally traded over-the-counter. The credit default swaps the SMI Conservative Allocation Fund, SMI Dynamic Allocation Fund, SMI Bond Fund and SMI 50/40/10 Fund invests in will generally be valued at the mean of bid and ask prices provided by a major credit default swap pricing provider and will generally be classified as Level 2 securities.
Fixed income securities, including asset-backed securities, when valued using market quotations in an active market, will be categorized as Level 1 securities. However, they may be valued on the basis of prices furnished by a pricing service when the Advisor believes such prices more accurately reflect the fair value of such securities. A pricing service uses various inputs and techniques, which include broker-dealer quotations, live trading levels, recently executed transactions in securities of the issuer or comparable issuers, and option adjusted spread models that include base curve and spread curve inputs. Adjustments to individual bonds can be applied to recognize trading differences compared to other bonds issued by the same issuer. The broker-dealer quotations received are supported by credit analysis of the issuer that takes into consideration credit quality assessments, daily trading activity, and the activity of the underlying equities, listed bonds and sector-specific trends. Data used to establish quotes for asset-backed securities includes analysis of cash flows, pre-payment speeds, default rates, delinquency assumptions, and assumptions regarding collateral and loss. To the extent that these inputs are observable, the fixed income securities are categorized as Level 2 securities. If the Advisor decides that a price provided by the pricing service does not accurately reflect the fair value of the securities, when prices are not readily available from a pricing service, or when restricted or illiquid securities are being valued, securities are valued at fair value as determined in good faith by the Advisor, in conformity with guidelines adopted by and subject to review of the Board. These securities may be categorized as Level 3 securities.
Short-term investments in fixed income securities, (those with maturities of less than 60 days when acquired, or which subsequently are within 60 days of maturity), may be valued by using the amortized cost method of valuation, which the Board has determined represents fair value. These securities will be classified as Level 2 securities.
In accordance with the Trust’s good faith pricing guidelines, the Advisor is required to consider all appropriate factors relevant to the value of securities for which it has determined other pricing sources are not available or reliable as described above. No single standard exists for determining fair value, because
fair value depends upon the circumstances of each individual case. As a general principle, the current fair
49
SMI FUNDS
NOTES TO THE FINANCIAL STATEMENTS
October 31, 2015 – (Continued)
NOTE 3. SECURITIES VALUATION AND FAIR VALUE MEASUREMENTS – (Continued)
value of an issue of securities being valued by the Advisor would appear to be the amount which the owner
might reasonably expect to receive for them upon their current sale. Methods which are in accordance with this principle may, for example, be based on (i) a multiple of earnings; (ii) a discount from market of a similar freely traded security (including a derivative security or a basket of securities traded on other markets, exchanges or among dealers); or (iii) yield to maturity with respect to debt issues, or a combination of these and other methods. Good faith pricing is permitted if, in the Advisor’s opinion, the validity of market quotations appears to be questionable based on factors such as evidence of a thin market in the security based on a small number of quotations, a significant event occurs after the close of a market but before a Fund’s NAV calculation that may affect a security’s value, or the Advisor is aware of any other data that calls into question the reliability of market quotations. Good faith pricing may also be used in instances when the bonds the Funds’ invest in may default or otherwise cease to have market quotations readily available.
The following is a summary of the inputs used to value the Funds’ investments as of October 31, 2015:
| | | | | | | | | | | | | | | | |
| | | Valuation Inputs | |
| SMI Fund | | Level 1 – Quoted Prices in Active Markets | | | Level 2 – Other Significant Observable
Inputs | | | Level 3 – Significant Unobservable
Inputs | | | Total | |
Mutual Funds – greater
than 1% of net assets | | $ | 193,943,545 | | | $ | 13,710,188 | | | $ | — | | | $ | 207,653,733 | |
Mutual Funds – less
than 1% of net assets | | | 7,131,501 | | | | — | | | | — | | | | 7,131,501 | |
| Exchange-Traded Funds | | | 11,576,016 | | | | — | | | | — | | | | 11,576,016 | |
| Money Market Securities | | | 1,338,996 | | | | — | | | | — | | | | 1,338,996 | |
| Total Investments | | $ | 213,990,058 | | | $ | 13,710,188 | | | $ | — | | | $ | 227,700,246 | |
| | | | | | | | | | | | | | | | |
| | | Valuation Inputs | |
SMI Conservative
Allocation Fund | | Level 1 – Quoted Prices in Active Markets | | | Level 2 – Other Significant Observable
Inputs | | | Level 3 – Significant Unobservable
Inputs | | | Total | |
| Asset-Backed Securities | | $ | — | | | $ | 24 | | | $ | — | | | $ | 24 | |
| Mutual Funds | | | 4,419,465 | | | | — | | | | — | | | | 4,419,465 | |
| Exchange-Traded Funds | | | 17,437,793 | | | | — | | | | — | | | | 17,437,793 | |
| Money Market Securities | | | 386,597 | | | | — | | | | — | | | | 386,597 | |
| Total Investments | | $ | 22,243,855 | | | $ | 24 | | | $ | — | | | $ | 22,243,879 | |
50
SMI FUNDS
NOTES TO THE FINANCIAL STATEMENTS
October 31, 2015 – (Continued)
NOTE 3. SECURITIES VALUATION AND FAIR VALUE MEASUREMENTS – (Continued)
| | | | | | | | | | | | | | | | |
| | | Valuation Inputs | |
SMI Dynamic
Allocation Fund | | Level 1 – Quoted Prices in Active Markets | | | Level 2 – Other Significant Observable
Inputs | | | Level 3 – Significant Unobservable
Inputs | | | Total | |
| Exchange-Traded Funds | | $ | 191,917,819 | | | $ | — | | | $ | — | | | $ | 191,917,819 | |
| Money Market Securities | | | 1,879,476 | | | | — | | | | — | | | | 1,879,476 | |
| Total Investments | | $ | 193,797,295 | | | $ | — | | | $ | — | | | $ | 193,797,295 | |
| | | | | | | | | | | | | | | | |
| | | Valuation Inputs | |
| SMI Bond Fund | | Level 1 – Quoted Prices in Active Markets | | | Level 2 – Other Significant Observable
Inputs | | | Level 3 – Significant Unobservable
Inputs | | | Total | |
| Exchange-Traded Funds | | $ | 3,339,616 | | | $ | — | | | $ | — | | | $ | 3,339,616 | |
| Mutual Funds | | | 3,355,721 | | | | — | | | | — | | | | 3,355,721 | |
| Money Market Securities | | | 19,573 | | | | — | | | | — | | | | 19,573 | |
| Total Investments | | $ | 6,714,910 | | | $ | — | | | $ | — | | | $ | 6,714,910 | |
| | | | | | | | | | | | | | | | |
| | | Valuation Inputs | |
| SMI 50/40/10 Fund | | Level 1 – Quoted Prices in Active Markets | | | Level 2 – Other Significant Observable
Inputs | | | Level 3 – Significant Unobservable
Inputs | | | Total | |
| Exchange-Traded Funds | | $ | 6,584,392 | | | $ | — | | | $ | — | | | $ | 6,584,392 | |
| Mutual Funds | | | 6,397,784 | | | | — | | | | — | | | | 6,397,784 | |
| Money Market Securities | | | 319,406 | | | | — | | | | — | | | | 319,406 | |
| Total Investments | | $ | 13,301,582 | | | $ | — | | | $ | — | | | $ | 13,301,582 | |
The Funds did not hold any investments at any time during the reporting period in which significant unobservable inputs were used in determining fair value; therefore, no reconciliation of Level 3 securities is included for this reporting period. During the fiscal year ended October 31, 2015, there were no transfers between levels. The Trust recognizes transfers between fair value hierarchy levels at the end of the reporting period.
51
SMI FUNDS
NOTES TO THE FINANCIAL STATEMENTS
October 31, 2015 – (Continued)
NOTE 4. DERIVATIVE TRANSACTIONS
The SMI Conservative Allocation Fund, SMI Dynamic Allocation Fund, SMI Bond Fund and SMI 50/40/10 Fund may obtain exposure to the fixed income market by investing in credit default swap (“CDX”) contracts. These Funds may use CDX contracts as an additional avenue in which to bring value to the Funds. These Funds may use CDX contracts as an alternative to buying, selling, or holding certain securities in the fixed income market. The use of CDX contracts may provide a less expensive, more expedient, or more specifically focused way to invest than traditional fixed income securities would. These Funds may enter into single name CDX agreements to gain exposure to a particular company when it is more economically attractive to do so rather than purchasing traditional bonds. These Funds may also invest in CDX index products and options thereon that allow these Funds to gain broad market exposure but with less company-specific risk than single name CDX agreements.
These Funds enter into CDX contracts to gain exposure or to mitigate specific forms of credit risk. Swaps expose these Funds to counterparty risk (described below). These Funds could also suffer losses with respect to a swap agreement if these Funds are unable to terminate the agreement or reduce its exposure through offsetting transactions.
Many of the markets in which these Funds participate in credit default transactions are “over the counter” or “interdealer” markets. The participants in these markets are typically not subject to credit evaluation and regulatory oversight as are members of “exchange based markets”. When these Funds invest in CDX contracts, it is assuming a credit risk with regard to parties with whom it trades and also bears the risk of settlement default. These risks may differ materially from those associated with transactions effected on an exchange, which generally are backed by clearing organization guarantees, daily marking-to-market and settlement, and segregation and minimum capital requirements applicable to intermediaries. Transactions entered into directly between two counterparties generally do not benefit from such protections. This exposes these Funds to the risk that the counterparty will not settle a transaction in accordance with its terms and conditions because of a dispute over the terms of the contract (whether or not bona fide) or because of a credit or liquidity problem, thus causing these Funds to suffer a loss. To mitigate counterparty risk, these Funds will sometimes require the counterparty to post collateral to the Funds’ custodian to cover the exposure.
These Funds may also invest in credit default swap index products and in options on credit default swap index products. These instruments are designed to track segments of the credit default swap market and provide investors with exposure to specific “baskets” of issuers of bonds or loans. In general, the value of the credit default swap market provides investors with exposure to specific “baskets” of issuers of bonds or loans. In general, the value of the credit default swap index product will go up or down in response to changes in the perceived credit risk and default experience of the basket of issuers, instead of the exchange of the stream of payments for the payment of the notional amount (if a credit event occurs) that is the substance of a single name credit default swap. Such investments are subject to liquidity risks as well as counterparty and other risks associated with investments in credit default swaps discussed above.
52
SMI FUNDS
NOTES TO THE FINANCIAL STATEMENTS
October 31, 2015 – (Continued)
NOTE 4. DERIVATIVE TRANSACTIONS – (Continued)
The effect of trading in credit default swap contracts is reflected on the Statements of Operations under net realized gain on swap contracts and net change in unrealized appreciation on swap contracts.
For the year ended October 31, 2015:
| | | | | | | | | | |
Derivatives – Credit
Risk | | Location of Gain (Loss) on
Derivatives on Statements of
Operations | | Realized Gain (Loss)
on Derivatives | | | Change in
Unrealized
Appreciation
(Depreciation)
on Derivatives | |
SMI Conservative
Allocation Fund: | | | | | | | | |
| Credit Default Swap Agreements | | Net realized and unrealized gain (loss) on swap contracts | | $ | 22,219 | | | $ | (4,717 | ) |
The SMI Conservative Allocation Fund purchased a total notional value of swap agreements of $1,918,300 during the year ended October 31, 2015. The total notional value of terminated swap agreements was $2,088,300. The SMI Conservative Allocation Fund utilized credit derivative instruments in conjunction with investment securities in an effort to achieve its investment objective for the year ended October 31, 2015.
As of October 31, 2015, the SMI Conservative Allocation Fund had no segregated cash collateral for outstanding swap contracts.
NOTE 5. FEES AND OTHER TRANSACTIONS WITH AFFILIATES
The Advisor, under the terms of the management agreement with respect to each Fund (each an “Agreement”), manages the Funds’ investments. As compensation for its management services, each Fund is obligated to pay the Advisor a fee based on each Fund’s average daily net assets as follows:
| | | | | | | | | | | | |
Fund Assets | | SMI Fund
Management Fee | | | SMI Conservative Allocation
Fund Management Fee | | | SMI Dynamic Allocation
Fund Management Fee | |
| $1 – $100 million | | | 1.00% | | | | 0.90% | | | | 1.00% | |
| $100,000,001 – $250 million | | | 1.00% | | | | 0.80% | | | | 1.00% | |
| $250,000,001 to $500 million | | | 0.90% | | | | 0.70% | | | | 0.90% | |
| Over $500 million | | | 0.80% | | | | 0.60% | | | | 0.80% | |
| Management fees earned | | $ | 2,550,393 | | | $ | 243,296 | | | $ | 1,919,501 | |
Fees waived and expenses reimbursed by Adviser | | | — | | | | (88,520 | ) | | | — | |
53
SMI FUNDS
NOTES TO THE FINANCIAL STATEMENTS
October 31, 2015 – (Continued)
NOTE 5. FEES AND OTHER TRANSACTIONS WITH AFFILIATES – (Continued)
| | |
Fund Assets | | SMI Bond Fund Management Fee |
| $1 – $99,999,999 | | 0.75% |
| $100 million to $250 million | | 0.70% |
| Over $250 million | | 0.65% |
| Management fees earned | | $ 16,180 |
| Fees waived and expenses reimbursed by Adviser | | (70,768) |
| | |
Fund Assets | | SMI 50/40/10 Fund Management Fee |
| $1 – $250 million | | 1.00% |
| $250,000,001 to $500 million | | 0.90% |
| Over $500 million | | 0.80% |
| Management fees earned | | $ 44,599 |
| Fees waived and expenses reimbursed by Adviser | | (54,878) |
The Advisor contractually has agreed to waive its management fee and/or reimburse certain operating expenses, but only to the extent necessary so that each Fund’s total annual operating expenses (excluding interest, taxes, brokerage commissions, other expenses which are capitalized in accordance with GAAP, extraordinary expenses, dividend expense on short sales, 12b-1 fees, and acquired fund fees and expenses) do not exceed 1.50% of the Fund’s average daily net assets with respect to the SMI Fund, 1.15% with respect to the SMI Conservative Allocation Fund, 1.45% with respect to the SMI Dynamic Allocation Fund, 0.85% with respect to the SMI Bond Fund, and 1.45% with respect to the SMI 50/40/10 Fund. The contractual arrangement for the SMI Fund, SMI Conservative Allocation Fund and SMI Dynamic Allocation Fund is in place through February 29, 2016, and for the SMI Bond Fund and SMI 50/40/10 Fund is in place through February 28, 2017. Each waiver or reimbursement by the Advisor is subject to repayment by the applicable Fund within the three fiscal years following the fiscal year in which the particular expense or reimbursement was incurred; provided that such Fund is able to make the repayment without exceeding the applicable expense limitation.
The amount subject to repayment by the SMI Conservative Allocation Fund, SMI Bond Fund and SMI 50/40/10 Fund, pursuant to the aforementioned conditions, at October 31, 2015 is as follows:
| | | | | | | | | | | | |
Recoverable through
October 31, | | SMI Conservative
Allocation Fund | | | SMI Bond Fund | | | SMI 50/40/10 Fund | |
| 2016 | | $ | 116,168 | | | $ | — | | | $ | — | |
| 2017 | | | 50,773 | | | | — | | | | — | |
| 2018 | | | 88,520 | | | | 70,768 | | | | 54,878 | |
54
SMI FUNDS
NOTES TO THE FINANCIAL STATEMENTS
October 31, 2015 – (Continued)
NOTE 5. FEES AND OTHER TRANSACTIONS WITH AFFILIATES – (Continued)
The Trust retains Huntington Asset Services, Inc. (“HASI”) to manage the Funds’ business affairs and to provide the Funds with administrative services, including all regulatory reporting and necessary office equipment and personnel. The Trust also retains HASI to act as each Fund’s transfer agent and to provide fund accounting services. HASI contractually agreed to waive 100% of its administration, fund accounting and transfer agency fees (excluding out-of-pocket expenses) for the SMI Bond Fund through April 30, 2016 and for the SMI 50/40/10 Fund through October 31, 2015. Expenses incurred by the Funds for these expenses are allocated to the individual Funds based on each Fund’s relative net assets. Certain officers of the Trust are members of management and/or employees of HASI. HASI operates as a wholly-owned subsidiary of Huntington Bancshares, Inc., the parent company of the principal underwriter of the Funds and Huntington National Bank, the custodian of the Funds’ investments (the “Custodian”). A Trustee of the Trust is a member of management of the Custodian. For the fiscal year ended October 31, 2015, net of fees for administrative, transfer agent, and fund accounting services, reimbursement of out-of-pocket expenses, and Custodian expenses and the amounts due to HASI and the Custodian at October 31, 2015, were as follows:
| | | | | | | | | | | | | | | | | | | | |
| | | SMI Fund | | | SMI Conservative
Allocation Fund | | | SMI Dynamic
Allocation Fund | | | SMI Bond
Fund | | | SMI 50/40/10
Fund | |
Administration expenses | | $ | 66,762 | | | $ | 6,981 | | | $ | 48,566 | | | $ | — | | | $ | — | |
Transfer agent expenses | | | 64,309 | | | | 19,427 | | | | 39,575 | | | | 4,320 | | | | 4,410 | |
Fund accounting expenses | | | 36,041 | | | | 3,772 | | | | 26,534 | | | | — | | | | — | |
Custodian expenses | | | 26,328 | | | | 9,567 | | | | 11,677 | | | | 1,710 | | | | 2,578 | |
Payable to HASI | | | 12,816 | | | | 2,218 | | | | 9,143 | | | | 1,030 | | | | 963 | |
Payable to Custodian | | | 1,981 | | | | 531 | | | | 962 | | | | 455 | | | | 567 | |
Unified Financial Securities, Inc. (the “Distributor”) acts as the principal underwriter of the Funds’ shares. There were no payments made to the Distributor by the SMI Fund, SMI Conservative Allocation Fund, SMI Dynamic Allocation Fund, SMI Bond Fund or SMI 50/40/10 Fund for fiscal year ended October 31, 2015. The Distributor, HASI, and the Custodian are controlled by Huntington Bancshares, Inc. A Trustee of the Trust is a member of management of Huntington National Bank, a subsidiary of Huntington Bancshares, Inc. (the parent of the Distributor), and certain officers and a trustee of the Trust are officers of the Distributor and such persons may be deemed to be affiliates of the Distributor.
55
SMI FUNDS
NOTES TO THE FINANCIAL STATEMENTS
October 31, 2015 – (Continued)
NOTE 6. INVESTMENTS
For the fiscal year ended October 31, 2015, purchases and sales of investment securities, other than short-term investments and short-term U.S. government obligations were as follows:
| | | | | | | | | | | | | | | | | | | | |
| | | SMI Fund | | | SMI Conservative
Allocation Fund | | | SMI Dynamic
Allocation Fund | | | SMI Bond
Fund | | | SMI 50/40/10
Fund | |
Purchases | | | | | | | | | | | | | | | | | | | | |
U.S. Government Obligations | | $ | — | | | $ | 6,033,204 | | | $ | — | | | $ | — | | | $ | — | |
Other | | | 549,181,115 | | | | 92,972,087 | | | | 526,279,330 | | | | 22,678,765 | | | | 28,941,580 | |
| | | | | |
Sales | | | | | | | | | | | | | | | | | | | | |
U.S. Government Obligations | | $ | — | | | $ | 12,018,392 | | | $ | — | | | $ | — | | | $ | — | |
Other | | | 593,849,203 | | | | 92,635,089 | | | | 465,880,120 | | | | 15,912,952 | | | | 15,139,058 | |
NOTE 7. LINE OF CREDIT
During the year ended October 31, 2015, the Trust, on behalf of the Funds, entered into in a short-term credit agreement (“Line of Credit”) with Huntington National Bank (“Huntington”), an affiliate of HASI, expiring on February 5, 2016. Under the terms of the agreement, the Funds may borrow up to $5 million at an interest rate of LIBOR plus 150 basis points. The purpose of the agreement is to meet temporary or emergency cash needs, including redemption requests that might otherwise require the untimely disposition of securities. Huntington receives an annual facility fee of 0.125% on $5 million as well as an additional annual fee of 0.125% on any unused portion of the credit facility, invoiced quarterly, for providing the Line of Credit. The Funds will not borrow money, except (a) from a bank, provided that immediately after such borrowing there is an asset coverage of 300% for all borrowings of a Fund; or (b) from a bank or other persons for temporary purposes only, provided that such temporary borrowings are in an amount not exceeding 5% of a Fund’s total assets at the time when the borrowing is made. This limitation does not preclude a Fund from entering into reverse repurchase transactions, provided that the Fund has asset coverage of 300% for all borrowings and repurchase commitments of the Fund pursuant to reverse repurchase transactions. To the extent that the line of credit is utilized, it will be collateralized by securities in the Funds’ portfolios.
56
SMI FUNDS
NOTES TO THE FINANCIAL STATEMENTS
October 31, 2015 – (Continued)
NOTE 7. LINE OF CREDIT – (Continued)
As of October 31, 2015, the Funds had no outstanding borrowings under this Line of Credit.
| | | | | | | | | | | | | | | | | | | | |
| Fund | | Average
Daily Loan
Balance | | | Weighted
Average
Interest
Rate | | | Number of Days
Outstanding* | | | Interest Expense
Incurred | | | Maximum
Loan
Outstanding | |
| SMI Fund | | $ | 1,478,723 | | | | 1.68 | % | | | 47 | | | $ | 3,261 | | | $ | 2,300,000 | |
| SMI Conservative Allocation Fund | | | 574,419 | | | | 1.68 | % | | | 43 | | | | 1,082 | | | | 3,600,000 | |
| SMI Dynamic Allocation Fund | | | 542,727 | | | | 1.68 | % | | | 22 | | | | 351 | | | | 1,375,000 | |
| SMI Bond Fund | | | 175,556 | | | | 1.69 | % | | | 9 | | | | 36 | | | | 400,000 | |
| * | Number of Days Outstanding represents the total days during the year ended October 31, 2015, that a Fund utilized the Line of Credit. |
NOTE 8. ESTIMATES
The preparation of financial statements in conformity with GAAP requires management to make estimates and assumptions that affect the reported amounts of assets and liabilities and disclosure of contingent assets and liabilities at the date of the financial statements and the reported amounts of increases and decreases in net assets from operations during the reporting period. Actual results could differ from those estimates.
NOTE 9. BENEFICIAL OWNERSHIP
The beneficial ownership, either directly or indirectly, more than of 25% or more of the voting securities of a fund creates a presumption of control of the fund, under Section 2(a)(9) of the Investment Company Act of 1940. At October 31, 2015, National Financial Services Corporation (“NFS”) for the benefit of others, held 29% and 35% of the SMI Conservative Allocation Fund and SMI Dynamic Allocation Fund, respectively. It is not known whether NFS or any of the underlying beneficial owners owned or controlled 25% or more of the voting securities of the Funds.
57
SMI FUNDS
NOTES TO THE FINANCIAL STATEMENTS
October 31, 2015 – (Continued)
NOTE 10. FEDERAL TAX INFORMATION
At October 31, 2015, the net unrealized appreciation (depreciation) of investments for tax purposes was as follows:
| | | | | | | | | | | | | | | | | | | | |
| | | SMI Fund | | | SMI Conservative
Allocation Fund | | | SMI Dynamic
Allocation Fund | | | SMI Bond
Fund | | | SMI 50/40/10
Fund | |
Gross Appreciation | | $ | 4,142,217 | | | $ | — | | | $ | — | | | $ | — | | | $ | — | |
Gross (Depreciation) | | | (2,368,180 | ) | | | (428,263 | ) | | | (1,390,304 | ) | | | (43,156 | ) | | | (93,878 | ) |
| | | | | | | | | | | | | | | | | | | | |
Net Appreciation (Depreciation) on Investments | | $ | 1,774,037 | | | $ | (428,263 | ) | | $ | (1,390,304 | ) | | $ | (43,156 | ) | | $ | (93,878 | ) |
| | | | | | | | | | | | | | | | | | | | |
At October 31, 2015, the aggregate cost of securities for federal income tax purposes was $225,926,209, $22,672,142, $195,187,599, $6,758,066 and $13,395,460 for the SMI Fund, SMI Conservative Allocation Fund, SMI Dynamic Allocation Fund, SMI Bond Fund, and the SMI 50/40/10 Fund, respectively.
The tax characterization of distributions for the fiscal year ended October 31, 2015, was as follows:
| | | | | | | | | | | | | | | | | | | | | | | | |
| | | SMI Fund | | | SMI Conservative
Allocation Fund | | | SMI Dynamic
Allocation Fund | |
| | | 2015 | | | 2014 | | | 2015 | | | 2014 | | | 2015 | | | 2014 | |
Distributions paid from:* | | | | | | | | | | | | | | | | | | | | | | | | |
Ordinary Income | | $ | 1,347,114 | | | $ | 17,659,948 | | | $ | 285,314 | | | $ | 1,850,608 | | | $ | 3,044,706 | | | $ | 1,285,357 | |
Long-term Capital Gain | | | 43,665,598 | | | | 13,752,091 | | | | 3,408,064 | | | | 1,130,543 | | | | 1,173,735 | | | | — | |
| | | | | | | | | | | | | | | | | | | | | | | | |
Total Taxable Distributions | | $ | 45,012,712 | | | $ | 31,412,039 | | | $ | 3,693,378 | | | $ | 2,981,151 | | | $ | 4,218,441 | | | $ | 1,285,357 | |
| | | | | | | | | | | | | | | | | | | | | | | | |
| | | | | | | | |
| | | SMI Bond Fund | | | SMI 50/40/10 Fund | |
| | | 2015 | | | 2015 | |
Distributions paid from:* | | | | | | | | |
Ordinary Income | | $ | 2,420 | | | $ | — | |
Long-term Capital Gain | | | — | | | | — | |
| | | | | | | | |
Total Taxable Distributions | | $ | 2,420 | | | $ | — | |
| | | | | | | | |
Tax Return of Capital | | | 540 | | | | — | |
| | | | | | | | |
Total Distributions Paid | | $ | 2,960 | | | $ | — | |
| | | | | | | | |
| * | For federal income tax purposes, distributions of short-term capital gains are treated as ordinary income distributions. |
58
SMI FUNDS
NOTES TO THE FINANCIAL STATEMENTS
October 31, 2015 – (Continued)
NOTE 10. FEDERAL TAX INFORMATION – (Continued)
As of October 31, 2015, the SMI Dynamic Allocation Fund, the SMI Bond Fund and the SMI 50/40/10 Fund has available for tax purposes unused capital loss carryforwards of $3,298,781, $27,322 and $726,480 respectively of short-term capital losses with no expiration, which is available to offset against future taxable net capital gains. To the extent that these carryforwards are used to offset future gains, it is probable that the amount offset will not be distributed to shareholders.
At October 31, 2015, the Funds’ most recent fiscal year end, the components of distributable earnings (accumulated losses) on a tax basis were as follows:
| | | | | | | | | | | | |
| | | SMI Fund | | | SMI Conservative
Allocation Fund | | | SMI Dynamic
Allocation Fund | |
Accumulated undistributed ordinary income | | $ | — | | | $ | 76,249 | | | $ | 1,049,699 | |
Accumulated undistributed long-term capital gains | | | 28,685,304 | | | | 438,678 | | | | — | |
Accumulated capital and other losses | | | (1,333,296 | ) | | | — | | | | (3,298,781 | ) |
Unrealized appreciation (depreciation) | | | 1,774,037 | | | | (428,263 | ) | | | (1,390,304 | ) |
| | | | | | | | | | | | |
| | $ | 29,126,045 | | | $ | 86,664 | | | $ | (3,639,386 | ) |
| | | | | | | | | | | | |
| | | | | | | | |
| | | SMI Bond
Fund | | | SMI 50/40/10
Fund | |
Accumulated undistributed ordinary income | | $ | — | | | $ | — | |
Accumulated undistributed long-term capital gains | | | — | | | | — | |
Accumulated capital and other losses | | | (27,322 | ) | | | (730,568 | ) |
Unrealized appreciation (depreciation) | | | (43,156 | ) | | | (93,878 | ) |
| | | | | | | | |
| | $ | (70,478 | ) | | $ | (824,446 | ) |
| | | | | | | | |
At October 31, 2015, the difference between book basis and tax basis unrealized appreciation (depreciation) is attributable to the tax deferral of losses on wash sales.
For the tax year ended October 31, 2015, the following funds deferred late year ordinary losses of:
| | | | |
| | | Qualified
Late Year Ordinary
Losses | |
SMI Fund | | $ | 1,333,296 | |
SMI 50/40/10 Fund | | | 4,088 | |
59
SMI FUNDS
NOTES TO THE FINANCIAL STATEMENTS
October 31, 2015 – (Continued)
NOTE 11. COMMITMENTS AND CONTINGENCIES
The Funds indemnify its officers and trustees for certain liabilities that may arise from performance of their duties to the Funds. Additionally, in the normal course of business, the Funds enter into contracts that contain a variety of representations and warranties which provide general indemnifications. The Funds’ maximum exposure under these arrangements is unknown, as this would involve future claims that may be made against the Funds that have not yet occurred.
NOTE 12. SUBSEQUENT EVENT
Management of the Funds has evaluated the need for disclosures resulting from subsequent events through the date these financial statements were issued. Subsequent to the period end, on November 13, 2015, Huntington Bancshares Inc. entered in an agreement to sell Huntington Asset Services, Inc. and Unified Financial Services, Inc. to Ultimus Fund Solutions, LLC. The sale is expected to close by the end of December 2015, subject to customary closing conditions. Also subsequent to period end, on November 3, 2015, the Subadvisor, through its Reams Asset Management division, notified the Board of the Trust of its intent to resign as subadviser to certain of the SMI Funds. The Board accepted the Subadvisor’s resignation, effective December 8, 2015. Upon the termination of the Subadvisor agreement certain investment and derivative transactions will no longer be made by the Funds, such as direct fixed income debt instruments and swap contracts. Management has determined that there were no additional items requiring additional disclosure.
60
REPORT OF INDEPENDENT REGISTERED
PUBLIC ACCOUNTING FIRM
To the Shareholders of Sound Mind Investing Fund, SMI Conservative Allocation Fund, SMI Dynamic Allocation Fund, SMI Bond Fund, and SMI 50/40/10 Fund and
Board of Trustees of Valued Advisers Trust
We have audited the accompanying statements of assets and liabilities, including the schedules of investments, of Sound Mind Investing Fund, SMI Conservative Allocation Fund (formerly Sound Mind Investing Balanced Fund), SMI Dynamic Allocation Fund, SMI Bond Fund, and SMI 50/40/10 Fund (collectively referred to as the “Funds”), each a series of Valued Advisers Trust, as of October 31, 2015, and the related statements of operations for the year then ended, the statements of changes in net assets for each of the two years in the period then ended, and the financial highlights for each of the five periods in the period then ended for Sound Mind Investing Fund and SMI Conservative Allocation Fund, the statement of operations for the year then ended, the statements of changes in net assets for each of the two years in the period then ended, and the financial highlights for each of the three periods in the period then ended for SMI Dynamic Allocation Fund, and the statements of operations and changes in net assets and financial highlights for the period April 28, 2015 (commencement of operations for the SMI Bond Fund) and April 29, 2015 (commencement of operations for SMI 50/40/10 Fund) through October 31, 2015. These financial statements and financial highlights are the responsibility of the Funds’ management. Our responsibility is to express an opinion on these financial statements and financial highlights based on our audits.
We conducted our audits in accordance with the standards of the Public Company Accounting Oversight Board (United States). Those standards require that we plan and perform the audit to obtain reasonable assurance about whether the financial statements and financial highlights are free of material misstatement. An audit includes examining, on a test basis, evidence supporting the amounts and disclosures in the financial statements. Our procedures included confirmation of securities owned as of October 31, 2015, by correspondence with the custodian and brokers. An audit also includes assessing the accounting principles used and significant estimates made by management, as well as evaluating the overall financial statement presentation. We believe that our audits provide a reasonable basis for our opinion.
In our opinion, the financial statements and financial highlights referred to above present fairly, in all material respects, the financial position of Sound Mind Investing Fund, SMI Conservative Allocation Fund, SMI Dynamic Allocation Fund, SMI Bond Fund, and SMI 50/40/10 Fund as of October 31, 2015, the results of their operations for the period then ended, and the changes in their net assets and their financial highlights for each of the periods presented, in conformity with accounting principles generally accepted in the United States of America.

COHEN FUND AUDIT SERVICES, LTD.
Cleveland, Ohio
December 23, 2015
61
ADDITIONAL FEDERAL INCOME TAX INFORMATION
(Unaudited)
The Form 1099-DIV you receive in January 2016 will show the tax status of all distributions paid to your account in calendar year 2015. Shareholders are advised to consult their own tax advisor with respect to the tax consequences of their investment in the Fund. As required by the Internal Revenue Code and/or regulations, shareholders must be notified regarding the status of qualified dividend income for individuals and the dividends received deduction for corporations.
Qualified Dividend Income. The SMI Fund, SMI Conservative Allocation Fund and SMI Dynamic Allocation Fund designates approximately 48%, 45% and 88%, respectively, or up to the maximum amount of such dividends allowable pursuant to the Internal Revenue Code, as qualified dividend income eligible for the reduced tax rate of 15%.
Dividends Received Deduction. Corporate shareholders are generally entitled to take the dividends received deduction on the portion of the Fund’s dividend distribution that qualifies under tax law. For the SMI Fund, SMI Conservative Allocation Fund and SMI Dynamic Allocation Fund’s calendar year 2015 ordinary income dividends, 38%, 80% and 51%, respectively, qualifies for the corporate dividends received deduction.
For the year ended October 31, 2015, the SMI Fund, SMI Conservative Allocation Fund and SMI Dynamic Allocation Fund designated $43,665,598, $3,408,064 and $1,173,735, respectively, as long-term capital gain distributions.
62
TRUSTEES AND OFFICERS (Unaudited)
The Board of Trustees supervises the business activities of the Trust. Each Trustee serves as a trustee until termination of the Trust unless the Trustee dies, resigns, retires or is removed.
The following tables provide information regarding the Trustees and Officers.
The following table provides information regarding each of the Independent Trustees.
| | | | |
Name, Address*, (Age),
Position with Trust**,
Term of Position with Trust | | Principal Occupation
During Past 5 Years | | Other Directorships |
Ira Cohen, 56, Independent Trustee, June 2010 to present. | | Independent financial services consultant since February 2005; Executive Vice President of Asset Management Services, Recognos Financial, since August 2015. | | Trustee and Audit Committee Chairman, Griffin Institutional Access Real Estate Fund, since May 2014. Trustee, Angel Oak Funds Trust, since October 2014 |
| Andrea N. Mullins, 48, Independent Trustee, December 2013 to present. | | Private investor; Independent Contractor, Seabridge Wealth Management, LLC, since April 2014; Principal Financial Officer and Treasurer, Eagle Family of Funds (mutual fund family) and Vice President, Eagle Asset Management, Inc. (investment advisor) each from 2004 to 2010. | | None. |
| * | The address for each trustee and officer is 2960 N. Meridian St., Suite 300, Indianapolis, IN 46208. |
| ** | As of the date of this report, the Trust consists of 14 series. |
The following table provides information regarding the Trustee who is considered an “interested person” of the Trust, as that term is defined under the 1940 Act. Based on the experience of the Trustee, the Trust concluded that the individual described below should serve as a Trustee.
| | | | |
Name, Address*, (Age),
Position with Trust**,
Term of Position with Trust | | Principal Occupation
During Past 5 Years | | Other
Directorships |
R. Jeffrey Young, 51, Trustee and Chairman, June 2010 to present. | | Principal Executive Officer and President, Valued Advisers Trust since February 2010; President, Huntington Asset Services, Inc., since April 2015; Director since May 2014; Senior Vice President January 2010 to April 2015; President, Unified Financial Securities, Inc. since July 2015; Director since May 2014; Chief Executive Officer, Huntington Funds, February 2010 to March 2015; Chief Executive Officer, Huntington Strategy Shares, November 2010 to March 2015; President and Chief Executive Officer, Dreman Contrarian Funds, March 2011 to February 2013; Trustee, Valued Advisers Trust, August 2008 to January 2010; and Managing Director and Chief Operating Officer of Professional Planning Consultants, from 2007 to 2010. | | Trustee and Chairman, Capitol Series Trust, since September 2013. |
| * | The address for each trustee and officer is 2960 N. Meridian St., Suite 300, Indianapolis, IN 46208. |
| ** | As of the date of this report, the Trust consists of 14 series. |
63
TRUSTEES AND OFFICERS – (Unaudited), (Continued)
The following table provides information regarding the Officers of the Trust:
| | | | |
Name, Address*, (Age),
Position with Trust,**
Term of Position with Trust | | Principal Occupation
During Past 5 Years | | Other Directorships |
R. Jeffrey Young, 51, Trustee and Chairman, June 2010 to present; Principal Executive Officer and President, Valued Advisers Trust since February 2010; | | President, Huntington Asset Services, Inc., since April 2015; Director since May 2014; Senior Vice President January 2010 to April 2015; President, Unified Financial Securities, Inc. since July 2015; Director since May 2014; Chief Executive Officer, Huntington Funds, February 2010 to March 2015; Chief Executive Officer, Huntington Strategy Shares, November 2010 to March 2015; President and Chief Executive Officer, Dreman Contrarian Funds, March 2011 to February 2013; Trustee, Valued Advisers Trust, August 2008 to January 2010; and Managing Director and Chief Operating Officer of Professional Planning Consultants, from 2007 to 2010. | | Trustee and Chairman, Capitol Series Trust, since September 2013. |
John C. Swhear, 54, Chief Compliance Officer, AML Officer and Vice President, August 2008 to present. | | Vice President of Legal Administration and Compliance for Huntington Asset Services, Inc., the Trust’s administrator, since April 2007 and Director since May 2014; Chief Compliance Officer of Unified Financial Securities, Inc., the Trust’s distributor, since May 2007 and Director since May 2014; President of the Unified Series Trust since March 2012, and Senior Vice President from May 2007 to March 2012; Chief Compliance Officer and AML Officer, Capitol Series Trust, since September 2013; Secretary of Huntington Funds from April 2010 to February 2012; President and Chief Executive Officer of Dreman Contrarian Funds from March 2010 to March 2011. | | None. |
64
TRUSTEES AND OFFICERS – (Unaudited), (Continued)
| | | | |
Name, Address*, (Age),
Position with Trust,**
Term of Position with Trust | | Principal Occupation
During Past 5 Years | | Other Directorships |
Carol J. Highsmith, 50, Vice President, August 2008 to present; Secretary, March 2014 to present | | Employed in various positions with Huntington Asset Services, Inc., the Trust’s administrator, since November 1994; currently Vice President of Legal Administration; Secretary, Cross Shore Discovery Fund since May 2014. | | None. |
Matthew J. Miller, 39, Vice President, December 2011 to present. | | Employed in various positions with Huntington Asset Services, Inc., the Trust’s administrator, since July 1998; currently Vice President of Relationship Management; Vice President, Huntington Funds, since February 2010; President and Chief Executive Officer, Capitol Series Trust, since September 2013. | | None. |
| Bryan W. Ashmus, 42, Principal Financial Officer and Treasurer, December 2013 to present. | | Vice President, Financial Administration, Huntington Asset Services, Inc., the Trust’s administrator, since September 2013; Chief Financial Officer and Treasurer, The Huntington Strategy Shares and The Huntington Funds, since November 2013; Vice President, Fund Administration, Citi Fund Services Ohio, Inc., from 2005 to 2013. | | None. |
| * | The address for each trustee and officer is 2960 N. Meridian St., Suite 300, Indianapolis, IN 46208. |
| ** | As of the date of this report, the Trust consists of 14 series. |
65
OTHER INFORMATION
The Funds’ Statement of Additional Information (“SAI”) includes additional information about the trustees and is available without charge, upon request. You may call toll-free at (877) 764-3863 to request a copy of the SAI or to make shareholder inquiries.
PROXY VOTING
A description of the policies and procedures that the Funds use to determine how to vote proxies relating to portfolio securities and information regarding how the Funds voted those proxies during the most recent twelve month period ended June 30 is available without charge upon request by (1) calling the Funds at (877) 764-3863 and (2) from Fund documents filed with the Securities and Exchange Commission (“SEC”) on the SEC’s website at www.sec.gov.
TRUSTEES
R. Jeffrey Young, Chairman
Ira Cohen
Andrea N. Mullins
OFFICERS
R. Jeffrey Young, Principal Executive
Officer and President
Bryan W. Ashmus, Principal Financial
Officer and Treasurer
John C. Swhear, Chief Compliance Officer,
AML Officer and Vice-President
Carol J. Highsmith, Vice President and Secretary
Matthew J. Miller, Vice President
INVESTMENT ADVISOR
SMI Advisory Services, LLC
11135 Baker Hollow Road
Columbus, IN 47201
DISTRIBUTOR
Unified Financial Securities, Inc.
2960 North Meridian Street, Suite 300
Indianapolis, IN 46208
INDEPENDENT REGISTERED PUBLIC ACCOUNTING FIRM
Cohen Fund Audit Services Ltd.
1350 Euclid Avenue, Suite 800
Cleveland, OH 44115
LEGAL COUNSEL
The Law Offices of John H. Lively &
Associates, Inc.
A member firm of The 1940 Act Law GroupTM
11300 Tomahawk Creek Pkwy, Suite 310
Leawood, KS 66211
CUSTODIAN
Huntington National Bank
41 South High Street
Columbus, OH 43215
ADMINISTRATOR, TRANSFER AGENT AND FUND ACCOUNTANT
Huntington Asset Services, Inc.
2960 North Meridian Street, Suite 300
Indianapolis, IN 46208
This report is intended only for the information of shareholders or those who have received the Funds prospectus which contains information about the Funds management fee and expenses. Please read the prospectus carefully before investing.
Distributed by Unified Financial Securities, Inc.
Member FINRA/SIPC
66
VALUED ADVISERS TRUST
PRIVACY POLICY
The following is a description of the policies of the Valued Advisers Trust (the “Trust”) regarding disclosure of nonpublic personal information that shareholders provide to a series of the Trust (each, a “Fund”) or that each Fund collects from other sources. In the event that a shareholder holds shares of a Fund through a broker-dealer or other financial intermediary, the privacy policy of the financial intermediary would govern how shareholder nonpublic personal information would be shared with nonaffiliated third parties.
Categories of Information a Fund May Collect. A Fund may collect the following nonpublic personal information about its shareholders:
| | • | | Information each Fund receives from a shareholder on applications or other forms, correspondence, or conversations (such as the shareholder’s name, address, phone number, social security number, and date of birth); and |
| | • | | Information about the shareholder’s transactions with each Fund, its affiliates, or others (such as the shareholder’s account number and balance, payment history, cost basis information, and other financial information). |
Categories of Information a Fund May Disclose. A Fund may not disclose any nonpublic personal information about its current or former shareholders to unaffiliated third parties, except as required or permitted by law. A Fund is permitted by law to disclose all of the information it collects, as described above, to its service providers (such as the Fund’s custodian, administrator, transfer agent, accountant and legal counsel) to process shareholder transactions and otherwise provide services to the shareholder.
Confidentiality and Security. Each Fund shall restrict access to shareholder nonpublic personal information to those persons who require such information to provide products or services to the shareholder. Each Fund shall maintain physical, electronic, and procedural safeguards that comply with federal standards to guard shareholder nonpublic personal information.
Disposal of Information. The Funds, through their transfer agent, have taken steps to reasonably ensure that the privacy of a shareholder’s nonpublic personal information is maintained at all times, including in connection with the disposal of information that is no longer required to be maintained by the Funds. Such steps shall include, whenever possible, shredding paper documents and records prior to disposal, requiring off-site storage vendors to shred documents maintained in such locations prior to disposal, and erasing and/or obliterating any data contained on electronic media in such a manner that the information can no longer be read or reconstructed.
67

SOUND MIND
INVESTING FUND
SMI CONSERVATIVE ALLOCATION FUND
SMI DYNAMIC ALLOCATION FUND
SMI BOND FUND
SMI 50/40/10 FUND
|
| |
| ANNUAL REPORT |
| |
| OCTOBER 31, 2015 |
Fund Advisor:
SMI Advisory Services, LLC
11135 Baker Hollow Road
Columbus, IN 47201
Toll Free (877) SMI-Fund
www.smifund.com

Annual Report
October 31, 2015
Fund Adviser:
Kovitz Investment Group, LLC
115 South LaSalle Street, 27th Floor
Chicago, IL 60603
Toll Free (888) 695-3729
MANAGEMENT’S DISCUSSION OF FUND PERFORMANCE (Unaudited)
Kovitz Investment Group launched the Green Owl Intrinsic Value Fund (the “Fund”) with the goal of seeking long-term capital appreciation. Relying on a fundamental, research-driven process, the Fund strives to build a diversified portfolio of equity investments through the purchase of competitively advantaged and financially strong companies at prices substantially less than our estimate of their intrinsic values.
As long-term investors, our research process emphasizes the appraisal of factors that we believe matter most to a business’s long-term success. These include the quality of the business, the strength of the balance sheet, the predictability of the cash flows, and the ability of the management team to allocate capital intelligently and judiciously. We believe these attributes are the most reliable predictors of a company’s ability to maximize intrinsic value on a per share basis.
Market and Performance Summary
For the fiscal year ending October 31, 2015, the Fund lost 0.60%. In comparison, our benchmark, the S&P 500® Index, gained 5.20% during the same period. Since inception on December 28, 2011, the Fund has returned at a rate of 13.66% annually, versus 16.22% annually for the S&P 500®.
It’s always easier for management of the Fund to report to you that we’ve had a year of strong outperformance. But this wasn’t the case in the latest fiscal year. On the contrary, we lagged the S&P 500® by 5.8 percentage points – a significant margin of underperformance.
It’s important to understand that it is inevitable that we will underperform the market from time to time. This is simply part of the game if your goal is to return money at high rates over many years and to achieve long-term outperformance. After all, to beat the index, you cannot own the index. In the short term, our divergence from the index sometimes works to our disadvantage. But in the long term, we believe this divergence will prove to be a considerable advantage.
Broadly speaking, our strategy is to own a relatively concentrated portfolio of the very best ideas we can find – essentially, undervalued stocks of companies with enduring competitive advantages that can generate sustainable free cash flow and have strong balance sheets. We can’t predict when the upside will come, but believe that our disciplined approach to security selection along with the patience to endure these periods of underperformance will ultimately lead to more than satisfactory results.
One reason why most investors do so badly over the long term is that it requires psychological discipline to stick with the program. Thankfully (for us), the nature of the stock market is ultimately to shift money from impatient investors to patient investors.
Quantitatively, paying a low price for a company relative to the cash flows generated skews the odds in the investor’s favor over a long period of time, and produces a margin of safety if future results are worse than hoped for. Qualitatively (and counter-intuitively), the reason our investment strategy tends to work is because not everyone can handle that it doesn’t work all of the time. The emotional discomfort of deviating from the crowd is large. And sets the stage for our style of investing to continue to work over time.
Performance Attribution
The individual positions that contributed the most to performance during the year were Target (TGT), Walgreen Boots Alliance (WBA), Boeing (BA), Alphabet (formerly known as Google, GOOGL & GOOG), and Accenture (ACN).
The individual positions that detracted the most from performance during the year were Ocwen Financial (OCN), Quanta Services (PWR), Ensco (ESV), Wal-Mart Stores (WMT), and Viacom (VIAB).
1
On a sector basis, the combination of sector weighting and security selection in the Energy, Materials, and Information Technology sectors benefitted the Fund the most during the year. The combination of the sector weighting and security selection in the Financials, Consumer Discretionary, and Industrials sectors detracted from the Fund’s performance the most.
Portfolio Activity
Portfolio activity during the year included the following:
| | • | | Initiated positions in the following 11 companies; American Airlines (AAL), Aon PLC (AON), Baker Hughes (BHI), CBS (CBS), FMC Technologies (FTI), Haliburton (HAL), Harley Davidson (HOG), Jacobs Engineering (JEC), Precision Castparts (PCP), Quanta Services (PWR), and Schlumberger (SLB). |
| | • | | Increased position sizes in the following 5 companies; Boeing, General Motors (GM), Jacobs, Quanta, and Valmont Industries (VMI). |
| | • | | Exited positions in the following 8 companies; Abbott Laboratories (ABT), Coach (COH), DirecTV (DTV) (acquired), Expeditors International of Washington (EXPD), National Oilwell Varco (NOV), Ocwen, Precision Castparts (acquired), Target. |
| | • | | Decreased position sizes in the following 7 companies; Accenture, American International Group (AIG), Carmax (KMX), CVS Health (CVS), Kohl’s (KSS) Walgreens Boots Alliance, Walt Disney (DIS). |
As of October 31, 2015, our five largest positions were Berkshire Hathaway (BRKB), Quanta, Jacobs, Apple (AAPL), and Boeing.
We remain focused on the careful and patient application of our investment criteria and valuation requirements. We are more concerned with the risk of suffering a permanent loss of capital than about the risk of missing opportunities, especially those that are short-term in nature. Our bottom-up research emphasizes business quality, industry structures, growth opportunities, management skill and corporate culture. It is further augmented by our assessment of the company’s ability to sustain earnings power over the long haul through an understanding of its competitive advantages, business model and management’s proficiency in the allocation of capital. We use absolute, rather than relative, methods to estimate companies’ intrinsic values and we use the movement of market prices around these intrinsic value estimates to construct and manage a portfolio of high-quality businesses that have the potential to create sustained shareholder value over many years.
Thank you for your continued support and trust in our ability to manage your investment in the Fund.
Kovitz Investment Group, LLC
2
INVESTMENT RESULTS – (Unaudited)
Total Returns*
(For the periods ended October 31, 2015)
| | | | | | | | |
| | | | | | Average Annual
Returns | |
| | | One Year | | | Since Inception
(December 22, 2011) (a) | |
Green Owl Intrinsic Value Fund | | | -0.60 | % | | | 13.66 | % |
S&P 500® Index** | | | 5.20 | % | | | 16.22 | % |
Total annual operating expenses, as disclosed in the Fund’s prospectus dated February 28, 2015, were 1.38% of average daily net assets (1.11% after fee waivers/expense reimbursements by the adviser). Effective March 1, 2015, the adviser contractually agreed to waive or limit its fees and to assume other expenses of the Fund until February 28, 2017, so that the Total Annual Operating Expenses do not exceed 1.10%. This operating expense limitation does not apply to interest, taxes, brokerage commissions, other expenditures which are capitalized in accordance with generally accepted accounting principles, other extraordinary expenses not incurred in the ordinary course of the Fund’s business, dividend expense on short sales, expenses incurred under a Rule 12b-1 plan of distribution, “acquired fund fees and expenses,” and expenses that the Fund has incurred but did not actually pay because of an expense offset arrangement. Additional information pertaining to the Fund’s expense ratios as of October 31, 2015 can be found in the financial highlights.
The performance quoted represents past performance, which does not guarantee future results. The investment return and principal value of an investment will fluctuate so that an investor’s shares, when redeemed, may be worth more or less than their original cost. The returns shown do not reflect deduction of taxes that a shareholder would pay on Fund distributions or the redemption of Fund shares. Current performance of the Fund may be lower or higher than the performance quoted. The Fund’s investment objectives, risks, charges and expenses must be considered carefully before investing. Performance data current to the most recent month end may be obtained by calling 1-888-695-3729.
| (a) | The Fund commenced operations on December 22, 2011. However, the Fund did not invest in long-term securities towards the investment objective until December 28, 2011. December 28, 2011 is the performance calculation inception date. |
| * | Return figures reflect any change in price per share and assume the reinvestment of all distributions. |
| ** | The S&P 500® Index is a widely recognized unmanaged index of equity securities and is representative of a broader domestic equity market and range of securities than is found in the Fund’s portfolio. Individuals cannot invest directly in the Index; however, an individual can invest in exchange traded funds or other investment vehicles that attempt to track the performance of a benchmark index. |
The Fund’s investment objectives, strategies, risks, charges and expenses must be considered carefully before investing. The prospectus contains this and other important information about the Fund and may be obtained by calling the same number as above. Please read it carefully before investing.
The Fund is distributed by Unified Financial Securities, Inc., member FINRA.
3
Comparison of the Growth of a $10,000 Investment in the Green Owl Intrinsic Value
Fund and the S&P 500® Index (Unaudited)
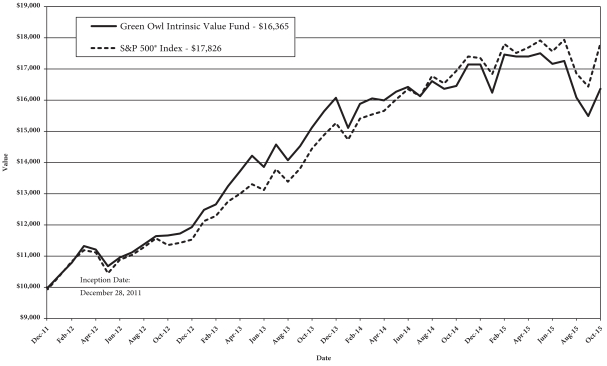
The Fund commenced operations on December 22, 2011. However, the Fund did not invest in long-term securities towards the investment objective until December 28, 2011. December 28, 2011 is the performance calculation inception date. The chart above assumes an initial investment of $10,000 made on December 28, 2011 and held through October 31, 2015. The S&P 500® Index is a widely recognized unmanaged index of equity securities and is representative of a broader domestic equity market and range of securities than is found in the Fund’s portfolio. Individuals cannot invest directly in the Index; however, an individual can invest in exchange traded funds or other investment vehicles that attempt to track the performance of a benchmark index. THE FUND’S RETURN REPRESENTS PAST PERFORMANCE AND DOES NOT GUARANTEE FUTURE RESULTS. The returns shown do not reflect deduction of taxes that a shareholder would pay on Fund distributions or the redemption of Fund shares. Investment returns and principal values will fluctuate so that your shares, when redeemed, may be worth more or less than their original purchase price.
Current performance may be lower or higher than the performance data quoted. For more information on the Fund, and to obtain performance data current to the most recent month end or to request a prospectus, please call 1-888-695-3729. You should carefully consider the investment objectives, potential risks, management fees, and charges and expenses of the Fund before investing. The Fund’s prospectus contains this and other information about the Fund, and should be read carefully before investing.
The Fund is distributed by Unified Financial Securities, Inc., member FINRA.
4
FUND HOLDINGS – (Unaudited)
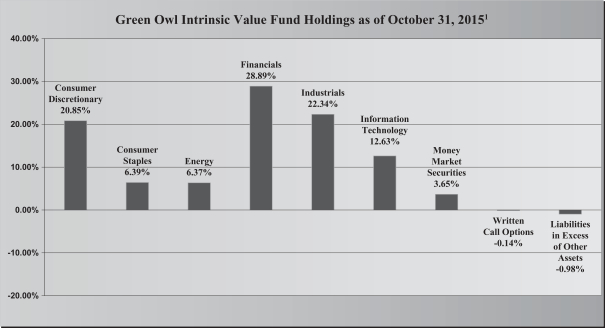
| 1As | a percentage of net assets. |
The investment objective of the Green Owl Intrinsic Value Fund is long-term capital appreciation.
Availability of Portfolio Schedule – (Unaudited)
The Fund files its complete schedule of portfolio holdings with the Securities and Exchange Commission (“SEC”) for the first and third quarters of each fiscal year on Form N-Q. The Fund’s Forms N-Q are available at the SEC’s website at www.sec.gov. The Fund’s Forms N-Q may be reviewed and copied at the SEC’s Public Reference Room in Washington DC. Information on the operation of the Public Reference Room may be obtained by calling 1-800-SEC-0330.
Summary of Fund’s Expenses – (Unaudited)
As a shareholder of the Fund, you incur ongoing costs, including management fees and other Fund expenses. This example is intended to help you understand your ongoing costs (in dollars) of investing in the Fund and to compare these costs with the ongoing costs of investing in other mutual funds.
The example is based on an investment of $1,000 invested at the beginning and held for the entire period from May 1, 2015 to October 31, 2015.
Actual Expenses
The first line of the table below provides information about actual account values and actual expenses. You may use the information in this line, together with the amount you invested, to estimate the expenses that you paid over the period. Simply divide your account value by $1,000 (for example, an $8,600 account value divided by $1,000 = $8.60), then multiply the result by the number in the first line under the heading entitled “Expenses Paid During the Period” to estimate the expenses you paid on your account during this period.
5
Hypothetical Example for Comparison Purposes
The second line of the table below provides information about hypothetical account values and hypothetical expenses based on the Fund’s actual expense ratio and an assumed rate of return of 5% per year before expenses, which is not the Fund’s actual return. The hypothetical account values and expenses may not be used to estimate the actual ending account balance or expenses you paid for the period. You may use this information to compare the ongoing costs of investing in the Fund and other funds. To do so, compare this 5% hypothetical example with the 5% hypothetical examples that appear in the shareholder reports of the other funds.
Please note that the expenses shown in the table are meant to highlight your ongoing costs only. Therefore, the second line of the table below is useful in comparing ongoing costs only and will not help you determine the relative costs of owning different funds.
| | | | | | | | | | | | |
Green Owl Intrinsic Value Fund | | Beginning
Account Value May 1, 2015 | | | Ending Account Value October 31, 2015 | | | Expenses Paid
During Period* May 1, 2015 –
October 31, 2015 | |
Actual | | $ | 1,000.00 | | | $ | 940.40 | | | $ | 5.42 | |
Hypothetical** | | $ | 1,000.00 | | | $ | 1,019.62 | | | $ | 5.64 | |
| * | Expenses are equal to the Fund’s annualized expense ratio of 1.11%, multiplied by the average account value over the period, multiplied by 184/365 (to reflect the one-half year period). |
| ** | Assumes a 5% return before expenses. |
6
GREEN OWL INTRINSIC VALUE FUND
SCHEDULE OF INVESTMENTS
October 31, 2015
| | | | | | | | |
| Common Stocks – 97.47% | | Shares | | | Fair Value | |
| | | | | | | | |
| | | | | | | | |
Consumer Discretionary – 20.85% | |
Bed Bath & Beyond, Inc. * | | | 34,125 | | | $ | 2,034,874 | |
CarMax, Inc. * | | | 28,240 | | | | 1,666,442 | |
CBS Corp. – Class B | | | 33,230 | | | | 1,545,860 | |
General Motors Co. | | | 70,600 | | | | 2,464,646 | |
Harley-Davidson, Inc. | | | 15,210 | | | | 752,135 | |
Kohl’s Corp. | | | 39,900 | | | | 1,840,188 | |
Viacom, Inc. – Class B | | | 13,876 | | | | 684,226 | |
Walt Disney Co./The | | | 12,100 | | | | 1,376,254 | |
| | | | | | | | |
| | | | | | | 12,364,625 | |
| | | | | | | | |
Consumer Staples – 6.39% | |
Coca-Cola Co./The | | | 16,195 | | | | 685,858 | |
CVS Health Corp. | | | 11,735 | | | | 1,159,183 | |
Walgreens Boots Alliance, Inc. | | | 8,075 | | | | 683,791 | |
Wal-Mart Stores, Inc. | | | 22,050 | | | | 1,262,142 | |
| | | | | | | | |
| | | | | | | 3,790,974 | |
| | | | | | | | |
Energy – 6.37% | | | | | | | | |
Baker Hughes, Inc. | | | 13,800 | | | | 726,984 | |
FMC Technologies, Inc. * | | | 17,430 | | | | 589,657 | |
Halliburton Co. | | | 36,000 | | | | 1,381,680 | |
Noble Corp. PLC | | | 34,300 | | | | 462,021 | |
Schlumberger Ltd. | | | 7,895 | | | | 617,073 | |
| | | | | | | | |
| | | | | | | 3,777,415 | |
| | | | | | | | |
Financials – 28.89% | |
American Express Co. | | | 12,415 | | | | 909,523 | |
American International Group, Inc. | | | 14,630 | | | | 922,568 | |
Aon PLC | | | 12,500 | | | | 1,166,375 | |
Bank of America Corp. | | | 121,600 | | | | 2,040,448 | |
Bank of New York Mellon Corp./The | | | 40,175 | | | | 1,673,289 | |
Berkshire Hathaway, Inc. – Class B * | | | 28,815 | | | | 3,919,416 | |
Citigroup, Inc. | | | 26,400 | | | | 1,403,688 | |
JPMorgan Chase & Co. | | | 36,230 | | | | 2,327,778 | |
Leucadia National Corp. | | | 51,485 | | | | 1,030,215 | |
Wells Fargo & Co. | | | 32,255 | | | | 1,746,286 | |
| | | | | | | | |
| | | | | | | 17,139,586 | |
| | | | | | | | |
Industrials – 22.34% | |
American Airlines Group, Inc. (a) | | | 18,815 | | | | 869,629 | |
Boeing Co./The | | | 19,690 | | | | 2,915,498 | |
Jacobs Engineering Group, Inc. * | | | 79,141 | | | | 3,176,720 | |
Quanta Services, Inc. * | | | 183,955 | | | | 3,699,335 | |
United Parcel Service, Inc. – Class B | | | 11,520 | | | | 1,186,790 | |
See accompanying notes which are an integral part of these financial statements.
7
GREEN OWL INTRINSIC VALUE FUND
SCHEDULE OF INVESTMENTS – (continued)
October 31, 2015
| | | | | | | | |
| Common Stocks – 97.47% – continued | | Shares | | | Fair Value | |
| | | | | | | | |
Industrials – 22.34% – continued | | | | | | | | |
Valmont Industries, Inc. | | | 12,953 | | | $ | 1,404,623 | |
| | | | | | | | |
| | | | | | | 13,252,595 | |
| | | | | | | | |
Information Technology – 12.63% | |
Accenture PLC – Class A | | | 11,025 | | | | 1,181,880 | |
Alphabet, Inc. – Class A * | | | 1,073 | | | | 791,219 | |
Alphabet, Inc. – Class C * | | | 2,053 | | | | 1,459,293 | |
Apple, Inc. | | | 26,120 | | | | 3,121,340 | |
Corning, Inc. | | | 50,340 | | | | 936,324 | |
| | | | | | | | |
| | | | | | | 7,490,056 | |
| | | | | | | | |
| | |
Total Common Stocks (Cost $48,432,117) | | | | | | | 57,815,251 | |
| | | | | | | | |
| | | | | | | | |
| | |
Money Market Securities – 3.65% | | | | | | | | |
Federated Treasury Obligations Fund – Service Shares, 0.01% (b) | | | 2,167,221 | | | | 2,167,221 | |
| | | | | | | | |
Total Money Market Securities (Cost $2,167,221) | | | | | | | 2,167,221 | |
| | | | | | | | |
Total Investments – 101.12% (Cost $50,599,338) | | | | | | $ | 59,982,472 | |
| | | | | | | | |
| Total Written Call Options (Premium Received $46,179) – (0.14)% | | | | | | | (81,000 | ) |
| | | | | | | | |
| Liabilities in Excess of Other Assets – (0.98)% | | | | | | | (583,212 | ) |
| | | | | | | | |
| NET ASSETS – 100.00% | | | | | | $ | 59,318,260 | |
| | | | | | | | |
| | (a) | All or a portion of this security is held as collateral for written call options. |
| | (b) | Rate disclosed is the seven day yield as of October 31, 2015. |
| | * | Non-income producing security. |
The sectors shown on the schedule of investments are based on the Global Industry Classification Standard, or GICS® (“GICS”). The GICS was developed by and/or is the exclusive property of MSCI, Inc. and Standard & Poor Financial Services LLC (“S&P”). GICS is a service mark of MSCI, Inc. and S&P and has been licensed for use by Huntington Asset Services, Inc.
See accompanying notes which are an integral part of these financial statements.
8
GREEN OWL INTRINSIC VALUE FUND
SCHEDULE OF WRITTEN OPTIONS
October 31, 2015
| | | | | | | | |
| Written Call Options – (0.14)% | | Outstanding
Contracts | | | Fair Value | |
American Airlines Group, Inc./ January 2017/ Strike $50.00 (a) | | | (150 | ) | | $ | (81,000 | ) |
| | | | | | | | |
| Total Written Call Options (Premiums Received $46,179) – (0.14)% | | | | | | $ | (81,000 | ) |
| | | | | | | | |
| | (a) | The call contract has a multiplier of 100 shares. |
See accompanying notes which are an integral part of these financial statements.
9
GREEN OWL INTRINSIC VALUE FUND
STATEMENT OF ASSETS AND LIABILITIES
October 31, 2015
| | | | |
Assets | | | | |
Investments in securities at fair value (cost $50,599,338) | | $ | 59,982,472 | |
Receivable for fund shares sold | | | 15,715 | |
Dividends receivable | | | 52,830 | |
Prepaid expenses | | | 15,673 | |
| | | | |
Total Assets | | | 60,066,690 | |
| | | | |
| |
Liabilities | | | | |
Options written, at fair value (premiums received $46,179) | | | 81,000 | |
Payable for fund shares redeemed | | | 2,713 | |
Payable for investments purchased | | | 596,409 | |
Payable to Adviser | | | 35,111 | |
Payable to administrator, fund accountant, and transfer agent | | | 9,223 | |
Payable to custodian | | | 642 | |
Payable to trustees | | | 191 | |
Other accrued expenses | | | 23,141 | |
| | | | |
Total Liabilities | | | 748,430 | |
| | | | |
| |
Net Assets | | $ | 59,318,260 | |
| | | | |
Net Assets consist of: | | | | |
Paid-in capital | | $ | 48,876,459 | |
Accumulated undistributed net investment income | | | 176,997 | |
Accumulated undistributed net realized gain from investments and written option contracts | | | 916,491 | |
Net unrealized appreciation (depreciation) on: | | | | |
Investment securities | | | 9,383,134 | |
Written option contracts | | | (34,821 | ) |
| | | | |
| |
Net Assets | | $ | 59,318,260 | |
| | | | |
Shares outstanding
(unlimited number of shares authorized, no par value) | | | 3,998,398 | |
| | | | |
Net asset value, offering and redemption price per share | | $ | 14.84 | |
| | | | |
See accompanying notes which are an integral part of these financial statements.
10
GREEN OWL INTRINSIC VALUE FUND
STATEMENT OF OPERATIONS
For the year ended October 31, 2015
| | | | |
Investment Income | | | | |
Dividend income | | $ | 990,202 | |
| | | | |
Total investment income | | | 990,202 | |
| | | | |
| |
Expenses | | | | |
Investment Adviser | | | 622,176 | |
Administration | | | 52,635 | |
Fund accounting | | | 25,375 | |
Transfer agent | | | 38,318 | |
Custodian | | | 10,378 | |
Trustee | | | 5,616 | |
Miscellaneous | | | 92,154 | |
Line of credit | | | 1,421 | |
Interest expense | | | 1,494 | |
| | | | |
Total expenses | | | 849,567 | |
| | | | |
Fees waived and reimbursed by Adviser | | | (162,284 | ) |
| | | | |
Net operating expenses | | | 687,283 | |
| | | | |
Net investment income | | | 302,919 | |
| | | | |
|
Net Realized and Unrealized Gain (Loss) on Investments | |
Net realized gain on investment securities transactions | | | 1,002,754 | |
Net realized loss on written option transactions | | | (33,785 | ) |
Net change in unrealized appreciation of investment securities | | | (1,612,437 | ) |
Net change in unrealized depreciation of written option contracts | | | (34,821 | ) |
| | | | |
Net realized and unrealized loss on investments | | | (678,289 | ) |
| | | | |
Net decrease in net assets resulting from operations | | $ | (375,370 | ) |
| | | | |
See accompanying notes which are an integral part of these financial statements.
11
GREEN OWL INTRINSIC VALUE FUND
STATEMENTS OF CHANGES IN NET ASSETS
| | | | | | | | |
| | | For the
Year Ended
October 31, 2015 | | | For the
Year Ended
October 31, 2014 | |
Increase (Decrease) in Net Assets due to: | | | | | | | | |
Operations | | | | | | | | |
Net investment income | | $ | 302,919 | | | $ | 716,657 | |
Net realized gain on investment securities transactions and written option contracts | | | 968,969 | | | | 2,261,772 | |
Net change in unrealized appreciation of investment securities transactions and written option contracts | | | (1,647,258 | ) | | | 1,452,087 | |
| | | | | | | | |
Net increase (decrease) in net assets resulting from operations | | | (375,370 | ) | | | 4,430,516 | |
| | | | | | | | |
Distributions | | | | | | | | |
From net investment income | | | (764,929 | ) | | | (84,105 | ) |
From net realized gains | | | (2,314,248 | ) | | | (1,708,485 | ) |
| | | | | | | | |
Total distributions | | | (3,079,177 | ) | | | (1,792,590 | ) |
| | | | | | | | |
Capital Transactions | | | | | | | | |
Proceeds from shares sold | | | 10,031,283 | | | | 15,055,561 | |
Reinvestment of distributions | | | 2,937,926 | | | | 1,696,716 | |
Amount paid for shares redeemed | | | (10,777,672 | ) | | | (5,937,474 | ) |
| | | | | | | | |
Net increase in net assets resulting from capital transactions | | | 2,191,537 | | | | 10,814,803 | |
| | | | | | | | |
Total Increase (Decrease) in Net Assets | | | (1,263,010 | ) | | | 13,452,729 | |
| | | | | | | | |
Net Assets | | | | | | | | |
Beginning of year | | | 60,581,270 | | | | 47,128,541 | |
| | | | | | | | |
End of year | | $ | 59,318,260 | | | $ | 60,581,270 | |
| | | | | | | | |
Accumulated undistributed net investment income | | $ | 176,997 | | | $ | 639,007 | |
| | | | | | | | |
Share Transactions | | | | | | | | |
Shares sold | | | 654,165 | | | | 983,233 | |
Shares issued in reinvestment of distributions | | | 194,051 | | | | 114,954 | |
Shares redeemed | | | (703,988 | ) | | | (387,209 | ) |
| | | | | | | | |
Net increase in shares | | | 144,228 | | | | 710,978 | |
| | | | | | | | |
See accompanying notes which are an integral part of these financial statements.
12
GREEN OWL INTRINSIC VALUE FUND
FINANCIAL HIGHLIGHTS
(For a share outstanding during each period)
| | | | | | | | | | | | | | | | |
| | | For the
Year Ended
October 31, 2015 | | | For the
Year Ended
October 31, 2014 | | | For the
Year Ended
October 31, 2013 | | | For the
Period Ended
October 31, 2012(a) | |
Selected Per Share Data: | | | | | | | | | | | | | | | | |
Net asset value, beginning of period | | $ | 15.72 | | | $ | 14.99 | | | $ | 11.67 | | | $ | 10.00 | |
| | | | | | | | | | | | | | | | |
Income from investment operations: | | | | | | | | | | | | | | | | |
Net investment income | | | 0.08 | | | | 0.19 | | | | 0.02 | | | | 0.02 | |
Net realized and unrealized gain (loss) on investments | | | (0.16 | ) | | | 1.11 | | | | 3.41 | | | | 1.65 | |
| | | | | | | | | | | | | | | | |
Total from investment operations | | | (0.08 | ) | | | 1.30 | | | | 3.43 | | | | 1.67 | |
| | | | | | | | | | | | | | | | |
Less distributions to shareholders from: | | | | | | | | | | | | | | | | |
Net investment income | | | (0.20 | ) | | | (0.03 | ) | | | (0.05 | ) | | | – | |
Net realized gains | | | (0.60 | ) | | | (0.54 | ) | | | (0.06 | ) | | | – | |
| | | | | | | | | | | | | | | | |
Total distributions | | | (0.80 | ) | | | (0.57 | ) | | | (0.11 | ) | | | – | |
| | | | | | | | | | | | | | | | |
Net asset value, end of period | | $ | 14.84 | | | $ | 15.72 | | | $ | 14.99 | | | $ | 11.67 | |
| | | | | | | | | | | | | | | | |
| | | | |
Total Return (b) | | | (0.60 | )% | | | 8.86 | % | | | 29.59 | % | | | 16.70 | %(c) |
Ratios and Supplemental Data: | | | | | | | | | | | | | | | | |
Net assets, end of period (000) | | $ | 59,318 | | | $ | 60,581 | | | $ | 47,129 | | | $ | 24,756 | |
Ratio of net expenses to average net assets | | | 1.10 | %(e) | | | 1.11 | %(e) | | | 1.40 | %(e) | | | 1.41 | %(d)(e) |
Ratio of expenses to average net assets before waiver and reimbursement | | | 1.37 | %(e) | | | 1.38 | %(e) | | | 1.52 | %(e) | | | 2.11 | %(d)(e) |
Ratio of net investment income to average net assets | | | 0.49 | % | | | 1.30 | % | | | 0.14 | % | | | 0.26 | %(d) |
Portfolio turnover rate | | | 33 | % | | | 35 | % | | | 20 | % | | | 11 | %(c) |
| (a) | For the period December 22, 2011 (commencement of operations) to October 31, 2012. |
| (b) | Total return in the above table represents the rate that the investor would have earned or lost on an investment in the Fund, assuming reinvestment of distributions. |
| (e) | Includes 0.01%, less than 0.005%, 0.01% and less than 0.005% for line of credit fees for 2012, 2013, 2014 and 2015, respectively. |
See accompanying notes which are an integral part of these financial statements.
13
GREEN OWL INTRINSIC VALUE FUND
NOTES TO THE FINANCIAL STATEMENTS
October 31, 2015
NOTE 1. ORGANIZATION
The Green Owl Intrinsic Value Fund (the “Fund”) is an open-end diversified series of the Valued Advisers Trust (the “Trust”). The Trust is a management investment company established under the laws of Delaware by an Agreement and Declaration of Trust dated June 13, 2008 (the “Trust Agreement”). The Trust Agreement permits the Board of Trustees (the “Board”) to issue an unlimited number of shares of beneficial interest of separate series without par value. The Fund is one of a series of funds authorized by the Board. The Fund’s investment adviser is Kovitz Investment Group, LLC (the “Adviser”). The investment objective of the Fund is to provide long-term capital appreciation.
NOTE 2. SIGNIFICANT ACCOUNTING POLICIES
The Fund is an investment company and follows accounting and reporting guidance under Financial Accounting Standards Board (“FASB”) Accounting Standards Codification (“ASC”) Topic 946, “Financial Services-Investment Companies”. The following is a summary of significant accounting policies followed by the Fund in the preparation of its financial statements. These polices are in conformity with generally accepted accounting principles in the United States of America (“GAAP”).
Securities Valuation – All investments in securities are recorded at their estimated fair value as described in Note 3.
Federal Income Taxes – The Fund makes no provision for federal income or excise tax. The Fund intends to qualify each year as a regulated investment company (“RIC”) under subchapter M of the Internal Revenue Code of 1986, as amended, by complying with the requirements applicable to RICs and by distributing substantially all of its taxable income. The Fund also intends to distribute sufficient net investment income and net capital gains, if any, so that it will not be subject to excise tax on undistributed income and gains. If the required amount of net investment income or gains is not distributed, the Fund could incur a tax expense.
As of and during the year ended October 31, 2015, the Fund did not have a liability for any unrecognized tax benefits. The Fund recognizes interest and penalties, if any, related to unrecognized tax benefits as income tax expense in the statement of operations. The Fund is subject to examination by U.S. federal tax authorities for the last three tax year ends and the interim tax period since then.
Expenses – Expenses incurred by the Trust that do not relate to a specific fund of the Trust are allocated to the individual funds based on each fund’s relative net assets or other appropriate basis.
Security Transactions and Related Income – The Fund follows industry practice and records security transactions on the trade date for financial reporting purposes. The specific identification method is used for determining gains or losses for financial statements and income tax purposes. Dividend income is recorded on the ex-dividend date and interest income is recorded on an accrual basis. Discounts and premiums on securities purchased are amortized or accreted using the effective interest method. Withholding taxes on foreign dividends have been provided for in accordance with the Fund’s understanding of the applicable country’s tax rules and rates. The ability of issuers of debt securities held by the Fund to meet their obligations may be affected by economic and political developments in a specific country or region.
Dividends and Distributions – The Fund intends to distribute substantially all of its net investment income, net realized long-term capital gains and its net realized short-term capital gains, if any, to its shareholders on at least an annual basis. Dividends to shareholders, which are determined in accordance with income tax regulations, are
14
GREEN OWL INTRINSIC VALUE FUND
NOTES TO THE FINANCIAL STATEMENTS – (continued)
October 31, 2015
NOTE 2. SIGNIFICANT ACCOUNTING POLICIES – continued
recorded on the ex-dividend date. The treatment for financial reporting purposes of distributions made to shareholders during the year from net investment income or net realized capital gains may differ from their ultimate treatment for federal income tax purposes. These differences are caused primarily by differences in the timing of the recognition of certain components of income, expense or realized capital gain for federal income tax purposes. Where such differences are permanent in nature, they are reclassified in the components of net assets based on their ultimate characterization for federal income tax purposes. Any such reclassifications will have no effect on net assets, results of operations or net asset values per share of the Fund. There were no such reclassifications made as of October 31, 2015.
Writing Options – The Fund may write covered call options on equity securities or futures contracts that the Fund is eligible to purchase to extend a holding period to obtain long-term capital gain treatment, to earn premium income, to assure a definite price for a security it has considered selling, or to close out options previously purchased. The Fund may write covered call options if, immediately thereafter, not more than 30% of its net assets would be committed to such transactions. A call option gives the holder (buyer) the right to purchase a security or futures contract at a specified price (the exercise price) at any time until a certain date (the expiration date). A call option is “covered” if the Fund owns the underlying security subject to the call option at all times during the option period, or to the extent that some or all of the risk of the option has been offset by another option. When the Fund writes a covered call option, it maintains a segregated position within its account with its Custodian or as otherwise required by the rules of the exchange the underlying security, cash or liquid portfolio securities in an amount not less than the exercise price at all times while the option is outstanding. See Note 4 for additional disclosures.
The Fund will receive a premium from writing a call option, which increases the Fund’s return in the event the option expires unexercised or is closed out at a profit. The amount of the premium will reflect, among other things, the relationship of the market price of the underlying security to the exercise price of the option and the remaining term of the option. However, there is no assurance that a closing transaction can be affected at a favorable price. During the option period, the covered call writer has, in return for the premium received, given up the opportunity for capital appreciation above the exercise price should the market price of the underlying security increase, but has retained the risk of loss should the price of the underlying security decline.
The Fund may write put options on equity securities and futures contracts that the Fund is eligible to purchase to earn premium income or to assure a definite price for a security if it is considering acquiring the security at a lower price than the current market price or to close out options previously purchased. The Fund may not write a put option if, immediately thereafter, more than 25% of its net assets would be committed to such transactions. A put option gives the holder of the option the right to sell, and the writer has the obligation to buy, the underlying security at the exercise price at any time during the option period. The operation of put options in other respects is substantially identical to that of call options. When the Fund writes a put option, it maintains a segregated position within its account with the Custodian of cash or liquid portfolio securities in an amount not less than the exercise price at all times while the put option is outstanding.
The Fund will receive a premium from writing a put option, which increases the Fund’s return in the event the option expires unexercised or is closed out at a profit. The amount of the premium will reflect, among other things, the relationship of the market price of the underlying security to the exercise price of the option and the remaining term of the option. The risks involved in writing put options include the risk that a closing transaction cannot be effected at a favorable price and the possibility that the price of the underlying security may fall below the exercise price, in which case the Fund may be required to purchase the underlying security at a higher price
15
GREEN OWL INTRINSIC VALUE FUND
NOTES TO THE FINANCIAL STATEMENTS – (continued)
October 31, 2015
NOTE 2. SIGNIFICANT ACCOUNTING POLICIES – continued
than the market price of the security at the time the option is exercised, resulting in a potential capital loss unless the security subsequently appreciates in value. During the fiscal year ended October 31, 2015, the Fund utilized covered call options to extend the holding period to obtain long-term capital gain treatment and to take advantage of the option premium to garner a higher exit price than would have been available by immediately selling the stock.
NOTE 3. SECURITIES VALUATION AND FAIR VALUE MEASUREMENTS
Fair value is defined as the price that a Fund would receive upon selling an investment in an orderly transaction to an independent buyer in the principal or most advantageous market of the investment. GAAP established a three-tier hierarchy to maximize the use of observable market data and minimize the use of unobservable inputs and to establish classification of fair value measurements for disclosure purposes.
Inputs refer broadly to the assumptions that market participants would use in pricing the asset or liability, including assumptions about risk; for example, the risk inherent in a particular valuation technique used to measure fair value including items such as a pricing model and/or the risk inherent in the inputs to the valuation technique. Inputs may be observable or unobservable. Observable inputs are inputs that reflect the assumptions market participants would use in pricing the asset or liability developed based on market data obtained from sources independent of the reporting entity. Unobservable inputs are inputs that reflect the reporting entity’s own assumptions about the assumptions market participants would use in pricing the asset or liability developed based on the best information available in the circumstances.
Various inputs are used in determining the value of the Fund’s investments. These inputs are summarized in the three broad levels listed below.
| | • | | Level 1 – unadjusted quoted prices in active markets for identical investments and/or registered investment companies where the value per share is determined and published and is the basis for current transactions for identical assets or liabilities at the valuation date |
| | • | | Level 2 – other significant observable inputs (including, but not limited to, quoted prices for an identical security in an inactive market, quoted prices for similar securities, interest rates, prepayment speeds, credit risk, etc.) |
| | • | | Level 3 – significant unobservable inputs (including the Fund’s own assumptions in determining fair value of investments based on the best information available) |
The inputs used to measure fair value may fall into different levels of the fair value hierarchy. In such cases, for disclosure purposes, the level in the fair value hierarchy within which the fair value measurement falls in its entirety, is determined based on the lowest level input that is significant to the fair value measurement in its entirety.
Equity securities, including common stocks, are generally valued by using market quotations, but may be valued on the basis of prices furnished by a pricing service when the Adviser believes such prices more accurately reflect the fair value of such securities. Securities that are traded on any stock exchange are generally valued by the pricing service at the last quoted sale price. Lacking a last sale price, an exchange traded security is generally valued by the pricing service at its last bid price. Securities traded in the NASDAQ over-the-counter market are generally valued by the pricing service at the NASDAQ Official Closing Price. When using the market
16
GREEN OWL INTRINSIC VALUE FUND
NOTES TO THE FINANCIAL STATEMENTS – (continued)
October 31, 2015
NOTE 3. SECURITIES VALUATION AND FAIR VALUE MEASUREMENTS – continued
quotations or close prices provided by the pricing service and when the market is considered active, the security will be classified as a Level 1 security. Sometimes, an equity security owned by the Fund will be valued by the pricing service with factors other than market quotations or when the market is considered inactive. When this happens, the security will be classified as a Level 2 security. When market quotations are not readily available, when the Adviser determines that the market quotation or the price provided by the pricing service does not accurately reflect the current fair value, or when restricted or illiquid securities are being valued, such securities are valued as determined in good faith by the Adviser, in conformity with guidelines adopted by and subject to review by the Board. These will generally be categorized as Level 3 securities.
Investments in open-end mutual funds, including money market mutual funds, are generally priced at the ending net asset value (NAV) provided by the service agent of the funds. These securities are categorized as Level 1 securities.
Written option contracts that the Fund invests in are generally traded on an exchange. The options in which the Fund invests are generally valued at the last trade price as provided by a pricing service. If the last sale price is not available, the options will be valued at the mean of the last bid and ask prices. The options will generally be categorized as Level 1 securities. If the Fund decides that a price provided by the pricing service does not accurately reflect the fair value of the securities, when prices are not readily available from a pricing service, or when restricted or illiquid securities are being valued, securities are valued at fair value as determined in good faith by the Adviser, in conformity with guidelines adopted by and subject to review of the Board. These securities will generally be categorized as Level 3 securities.
In accordance with the Trust’s good faith pricing guidelines, the Adviser is required to consider all appropriate factors relevant to the value of securities for which it has determined other pricing sources are not available or reliable as described above. No single standard exists for determining fair value, because fair value depends upon the circumstances of each individual case. As a general principle, the current fair value of an issue of securities being valued by the Adviser would appear to be the amount which the owner might reasonably expect to receive for them upon their current sale. Methods which are in accordance with this principle may, for example, be based on (i) a multiple of earnings; (ii) a discount from market of a similar freely traded security (including a derivative security or a basket of securities traded on other markets, exchanges or among dealers); or (iii) yield to maturity with respect to debt issues, or a combination of these and other methods. Good faith pricing is permitted if, in the Adviser’s opinion, the validity of market quotations appears to be questionable based on factors such as evidence of a thin market in the security based on a small number of quotations, a significant event occurs after the close of a market but before a Fund’s NAV calculation that may affect a security’s value, or the Adviser is aware of any other data that calls into question the reliability of market quotations.
The following is a summary of the inputs used to value the Fund’s investments as of October 31, 2015:
| | | | | | | | | | | | | | | | |
| | | Valuation Inputs | |
| Assets | | Level 1 | | | Level 2 | | | Level 3 | | | Total | |
Common Stocks* | | $ | 57,815,251 | | | $ | – | | | $ | – | | | $ | 57,815,251 | |
Money Market Securities | | | 2,167,221 | | | | – | | | | – | | | | 2,167,221 | |
Total | | $ | 59,982,472 | | | $ | – | | | $ | – | | | $ | 59,982,472 | |
* Refer to the Schedule of Investments for industry classifications.
17
GREEN OWL INTRINSIC VALUE FUND
NOTES TO THE FINANCIAL STATEMENTS – (continued)
October 31, 2015
NOTE 3. SECURITIES VALUATION AND FAIR VALUE MEASUREMENTS – continued
| | | | | | | | | | | | | | | | |
| | | Valuation Inputs | |
| Liabilities | | Level 1 | | | Level 2 | | | Level 3 | | | Total | |
Written Options Contracts | | $ | (81,000 | ) | | $ | – | | | $ | – | | | $ | (81,000 | ) |
Total | | $ | (81,000 | ) | | $ | – | | | $ | – | | | $ | (81,000 | ) |
The Fund did not hold any investments at any time during the reporting period in which significant unobservable inputs were used in determining fair value; therefore, no reconciliation of Level 3 securities is included for this reporting period. The Trust recognizes transfers between fair value hierarchy levels at the reporting period end. There were no transfers between any levels for the fiscal year ended October 31, 2015 and the previous reporting period end.
NOTE 4. DERIVATIVE TRANSACTIONS
Call options written are presented separately on the Statement of Assets and Liabilities as a liability at fair value and on the Statement of Operations under net realized loss on written option transactions and change in unrealized depreciation on written option contracts, respectively.
At October 31, 2015 :
| | | | | | |
| Derivatives | | Location of Derivatives on
Statement of Assets & Liabilities | | | |
Equity Risk: | | | | | | |
Written Call Options | | Options written, at fair value | | $ | (81,000 | ) |
Equity Risk: | | | | | | |
Written Call Options | | Net unrealized appreciation (depreciation) on written option contracts | | $ | (34,821 | ) |
For the fiscal year ended October 31, 2015 :
| | | | | | | | | | |
| Derivatives | | Location of Gain (Loss) on
Derivatives on Statement of Operations | | Realized Gain
(Loss) on
Derivatives | | | Change in
Unrealized
Appreciation
(Depreciation)
on Derivatives | |
Equity Risk: | | | | | | | | | | |
Written Call Options | | Net realized and unrealized loss on written option contracts | | $ | (33,785 | ) | | $ | (34,821 | ) |
18
GREEN OWL INTRINSIC VALUE FUND
NOTES TO THE FINANCIAL STATEMENTS – (continued)
October 31, 2015
NOTE 4. DERIVATIVE TRANSACTIONS – continued
Transactions in written options by the Fund during the fiscal year ended October 31, 2015, were as follows:
| | | | | | | | |
| | | Number of
Contracts | | | Premiums
Received | |
Options outstanding at October 31, 2014 | | | – | | | $ | – | |
Options written | | | 948 | | | | 315,720 | |
Options exercised | | | (132 | ) | | | (23,012 | ) |
Options closed | | | (666 | ) | | | (246,529 | ) |
| | | | | | | | |
Options outstanding at October 31, 2015 | | | 150 | | | $ | 46,179 | |
| | | | | | | | |
NOTE 5. ADVISER FEES AND OTHER TRANSACTIONS
Under the terms of the management agreement, on behalf of the Fund (the “Agreement”), the Adviser manages the Fund’s investments subject to approval by the Board. As compensation for its management services, the Fund is obligated to pay the Adviser a fee computed and accrued daily and paid monthly at an annual rate of 1.00% of the average daily net assets of the Fund. For the fiscal year ended October 31, 2015, the Adviser earned a fee of $622,176 from the Fund before the reimbursement described below. At October 31, 2015, the Fund owed the Adviser $35,111.
The Adviser has contractually agreed to waive its management fee and/or reimburse expenses so that total annual fund operating expenses, excluding interest, taxes, brokerage commissions, other expenditures which are capitalized in accordance with GAAP, other extraordinary expenses not incurred in the ordinary course of the Fund’s business, dividend expense on short sales, expense incurred under a plan of distribution adopted pursuant to Rule 12b-1 under the 1940 Act, and expenses that the Fund has incurred but did not actually pay because of an expense offset arrangement, if applicable, incurred by the Fund in any fiscal year, do not exceed 1.10% of the Fund’s average daily net assets through February 28, 2017. The operating expense limitation also excludes any fees and expenses of acquired funds.
For the fiscal year ended October 31, 2015, expenses totaling $162,284 were waived or reimbursed by the Adviser. Each waiver or reimbursement by the Adviser with respect to the Fund is subject to repayment by the Fund within the three fiscal years following the fiscal year in which that particular waiver or reimbursement occurred, provided that the Fund is able to make the repayment without exceeding the expense limitation in effect at the time of the waiver and any expense limitation in place at the time of repayment.
The amounts subject to repayment by the Fund pursuant to the aforementioned conditions are as follows:
| | | | |
Amount | | Recoverable through
October 31, | |
$ 40,437 | | | 2016 | |
150,715 | | | 2017 | |
162,284 | | | 2018 | |
The Trust retains Huntington Asset Services, Inc. (“HASI”) to manage the Fund’s business affairs and provide the Fund with administration services, including all regulatory reporting and necessary office equipment and personnel. For the fiscal year ended October 31, 2015, HASI earned fees of $52,635 for administration and compliance services provided to the Fund. At October 31, 2015, HASI was owed $3,754 from the Fund for administration services.
19
GREEN OWL INTRINSIC VALUE FUND
NOTES TO THE FINANCIAL STATEMENTS – (continued)
October 31, 2015
NOTE 5. ADVISER FEES AND OTHER TRANSACTIONS – continued
Certain officers and one Trustee of the Trust are members of management and/or employees of HASI. HASI is a wholly-owned subsidiary of Huntington Bancshares, Inc., the parent company of Unified Financial Securities, Inc. (the “Distributor”), the principal underwriter of the Fund’s shares, and Huntington National Bank (“Huntington”), the custodian of the Fund’s assets (the “Custodian”). For the fiscal year ended October 31, 2015, the Custodian earned fees of $10,378 for custody services provided to the Fund. At October 31, 2015, the Custodian was owed $642 from the Fund for custody services. There were no payments made by the Fund to the Distributor during the fiscal year ended October 31, 2015. An officer and Trustee of the Trust is an officer of the Distributor and such person may be deemed to be an affiliate of the Distributor.
The Trust also retains HASI to act as the Fund’s transfer agent and to provide fund accounting services. For the fiscal year ended October 31, 2015, HASI earned fees of $38,318 for transfer agent services to the Fund. At October 31, 2015, the Fund owed HASI $3,471 for transfer agent services. For the fiscal year ended October 31, 2015, HASI earned fees of $25,375 from the Fund for fund accounting services. At October 31, 2015, HASI was owed $1,998 from the Fund for fund accounting services.
During the fiscal year ended October 31, 2015, the Fund paid $10,543 to Kovitz Securities, LLC, an affiliate of the Adviser, on the execution of purchases and sales of the Fund’s portfolio investments.
NOTE 6. LINE OF CREDIT
The Fund participates in a short-term credit agreement (“Line of Credit”) with Huntington expiring on September 7, 2016. Under the terms of the agreement, the Fund may borrow the lesser of $1,000,000 or 5% of the Fund’s daily market value at an interest rate of LIBOR plus 150 basis points. Any borrowings under the Line of Credit are collateralized by securities in the Fund’s portfolio. The purpose of the agreement is to meet temporary or emergency cash needs, including redemption requests that might otherwise require the untimely disposition of securities. As of October 31, 2015, the Fund had no outstanding borrowings under this Line of Credit. For the year ended October 31, 2015, the annual fee and unused interest expense were $1,421 and $1,494, respectively.
| | | | | | | | | | | | | | | | |
Average
Daily
Loan
Balance | | Weighted
Average
Interest
Rate | | | Number of
Days
Outstanding* | | | Interest
Expense
Incurred** | | | Maximum
Loan
Outstanding | |
$ 367,368 | | | 1.69 | % | | | 22 | | | $ | 379 | | | $ | 1,000,000 | |
| * | Number of Days Outstanding represents the total days during the fiscal year ended October 31, 2015 that the Fund utilized the Line of Credit. |
| ** | Amount shown represents interest incurred on outstanding Line of Credit during the fiscal year ended October 31, 2015. |
20
GREEN OWL INTRINSIC VALUE FUND
NOTES TO THE FINANCIAL STATEMENTS – (continued)
October 31, 2015
NOTE 7. INVESTMENTS
For the fiscal year ended October 31, 2015, purchases and sales of investment securities, other than short-term investments and short-term U.S. government obligations, were as follows:
| | | | |
Purchases | | | | |
U.S. Government Obligations | | $ | – | |
Other | | | 22,122,966 | |
Sales | | | | |
U.S. Government Obligations | | $ | – | |
Other | | | 19,762,861 | |
NOTE 8. ESTIMATES
The preparation of financial statements in conformity with GAAP requires management to make estimates and assumptions that affect the reported amounts of assets and liabilities and disclosure of contingent assets and liabilities at the date of the financial statements and the reported amounts of increases and decreases in net assets from operations during the reporting period. Actual results could differ from those estimates.
NOTE 9. BENEFICIAL OWNERSHIP
The beneficial ownership, either directly or indirectly, of 25% or more of the voting securities of a fund creates a presumption of control of a fund, under Section 2(a) (9) of the Investment Company Act of 1940. At October 31, 2015, Charles Schwab & Co., Inc., for the benefit of its customers, owned 33.58% of the Fund. It is not known whether Charles Schwab & Co., Inc. or any of the underlying beneficial owners owned or controlled 25% or more of the voting securities of the Fund.
NOTE 10. FEDERAL TAX INFORMATION
At October 31, 2015, the net unrealized appreciation (depreciation) of investments, including written options, for tax purposes was as follows:
| | | | |
Gross Appreciation | | $ | 12,259,284 | |
Gross (Depreciation) | | | (2,929,465 | ) |
| | | | |
Net Appreciation (Depreciation) on Investments | | $ | 9,329,819 | |
| | | | |
At October 31, 2015, the aggregate cost of securities for federal income tax purposes was $50,617,832, and premiums received for written options was $46,197 for the Fund.
On December 16, 2015, the Fund paid an income distribution of $0.059739 and a long-term capital gain distribution of $0.231146 per share to shareholders of record on December 15, 2015.
21
GREEN OWL INTRINSIC VALUE FUND
NOTES TO THE FINANCIAL STATEMENTS – (continued)
October 31, 2015
NOTE 10. FEDERAL TAX INFORMATION – continued
The tax characterization of distributions for the fiscal years ended October 31, 2015 and 2014 was as follows:
| | | | | | | | |
| | | 2015 | | | 2014 | |
Distributions paid from: | | | | | | | | |
Ordinary Income* | | $ | 764,929 | | | $ | 150,409 | |
Long Term Capital Gains | | | 2,314,248 | | | | 1,642,181 | |
| | | | | | | | |
Total Distributions | | $ | 3,079,177 | | | $ | 1,792,590 | |
| | | | | | | | |
| * | Short term capital gain distributions are treated as ordinary income for tax purposes. |
At October 31, 2015, the components of distributable earnings on a tax basis were as follows:
| | | | |
Undistributed ordinary income | | $ | 179,762 | |
Undistributed long term capital gains | | | 934,985 | |
Net unrealized appreciation (depreciation) | | | 9,329,819 | |
Accumulated capital and other losses | | | (2,765 | ) |
| | | | |
| | $ | 10,441,801 | |
| | | | |
As of October 31, 2015, the difference between book basis and tax basis unrealized appreciation/(depreciation) is primarily attributable to wash sales.
NOTE 11. COMMITMENTS AND CONTINGENCIES
The Fund indemnifies its officers and trustees for certain liabilities that may arise from their performance of their duties to the Fund. Additionally, in the normal course of business, the Fund enters into contracts that contain a variety of representations and warranties which provide general indemnifications. The Fund’s maximum exposure under these arrangements is unknown, as this would involve future claims that may be made against the Fund that have not yet occurred.
NOTE 12. SUBSEQUENT EVENTS
Management of the Fund has evaluated the need for disclosures resulting from subsequent events through the date these financial statements were issued. Subsequent to the period end, on November 13, 2015, Huntington Bancshares Inc. entered in an agreement to sell Huntington Asset Services, Inc. and Unified Financial Services, Inc. to Ultimus Fund Solutions, LLC. The sale is expected to close by the end of December 2015, subject to customary closing conditions. At a meeting of the Board of Trustees (the “Board”) of the Valued Advisers Trust (the “Trust”) held on December 8-9, 2015, the Trustees approved a new investment advisory agreement between Kovitz Investment Group Partners, LLC (“KIG Partners”), a wholly-owned subsidiary of Focus Financial Partners, LLC and the Trust on behalf of the Fund, subject to shareholder approval. At the same meeting, the Board also approved an interim investment advisory agreement with KIG Partners to take effect on or about January 1, 2016. A special meeting of shareholders to consider this proposal is expected to occur on or about March 16, 2016. Management has determined that there were no additional items requiring additional disclosure.
22
REPORT OF INDEPENDENT REGISTERED PUBLIC ACCOUNTING FIRM
To the Shareholders of Green Owl Intrinsic Value Fund and
Board of Trustees of Valued Advisers Trust
We have audited the accompanying statement of assets and liabilities, including the schedules of investments and written options, of Green Owl Intrinsic Value Fund (the “Fund”), a series of Valued Advisers Trust, as of October 31, 2015, and the related statement of operations for the year then ended, the statements of changes in net assets for each of the two years in the period then ended, and the financial highlights for each of the four periods in the period then ended. These financial statements and financial highlights are the responsibility of the Fund’s management. Our responsibility is to express an opinion on these financial statements and financial highlights based on our audits.
We conducted our audits in accordance with the standards of the Public Company Accounting Oversight Board (United States). Those standards require that we plan and perform the audits to obtain reasonable assurance about whether the financial statements and financial highlights are free of material misstatement. An audit includes examining, on a test basis, evidence supporting the amounts and disclosures in the financial statements. Our procedures included confirmation of securities owned as of October 31, 2015, by correspondence with the custodian and brokers. An audit also includes assessing the accounting principles used and significant estimates made by management, as well as evaluating the overall financial statement presentation. We believe that our audits provide a reasonable basis for our opinion.
In our opinion, the financial statements and financial highlights referred to above present fairly, in all material respects, the financial position of Green Owl Intrinsic Value Fund as of October 31, 2015, the results of its operations for the year then ended, the changes in its net assets for each of the two years in the period then ended, and the financial highlights for each of the four periods in the period then ended, in conformity with accounting principles generally accepted in the United States of America.
COHEN FUND AUDIT SERVICES, LTD.
Cleveland, Ohio
December 23, 2015
23
TRUSTEES AND OFFICERS (Unaudited)
The Board of Trustees supervises the business activities of the Trust. Each Trustee serves as a trustee until termination of the Trust unless the Trustee dies, resigns, retires or is removed.
The following tables provide information regarding the Trustees and Officers.
The following table provides information regarding each of the Independent Trustees.
| | | | |
Name, Address*, (Age),
Position with Trust**, Term
of Position with Trust | | Principal Occupation During Past 5 Years | | Other Directorships |
Ira Cohen, 56, Independent Trustee, June 2010 to present. | | Independent financial services consultant since February 2005; Executive Vice President of Asset Management Services, Recognos Financial, since August 2015. | | Trustee and Audit Committee Chairman, Griffin Institutional Access Real Estate Fund, since May 2014. Trustee, Angel Oak Funds Trust, since October 2014 |
Andrea N. Mullins, 48, Independent Trustee, December 2013 to present. | | Private investor; Independent Contractor, Seabridge Wealth Management, LLC, since April 2014; Principal Financial Officer and Treasurer, Eagle Family of Funds (mutual fund family) and Vice President, Eagle Asset Management, Inc. (investment adviser) each from 2004 to 2010. | | None. |
| * | The address for each trustee and officer is 2960 N. Meridian St., Suite 300, Indianapolis, IN 46208. |
| ** | As of the date of this report, the Trust consists of 14 series. |
The following table provides information regarding the Trustee who is considered an “interested person” of the Trust, as that term is defined under the 1940 Act. Based on the experience of the Trustee, the Trust concluded that the individual described below should serve as a Trustee.
| | | | |
Name, Address*, (Age),
Position with Trust**, Term
of Position with Trust | | Principal Occupation During Past 5 Years | | Other Directorships |
R. Jeffrey Young, 51, Trustee and Chairman, June 2010 to present. | | Principal Executive Officer and President, Valued Advisers Trust since February 2010; President, Huntington Asset Services, Inc., since April 2015; Director since May 2014; Senior Vice President January 2010 to April 2015; President, Unified Financial Securities, Inc. since July 2015; Director since May 2014; Chief Executive Officer, Huntington Funds, February 2010 to March 2015; Chief Executive Officer, Huntington Strategy Shares, November 2010 to March 2015; President and Chief Executive Officer, Dreman Contrarian Funds, March 2011 to February 2013; Trustee, Valued Advisers Trust, August 2008 to January 2010; and Managing Director and Chief Operating Officer of Professional Planning Consultants, from 2007 to 2010. | | Trustee and Chairman, Capitol Series Trust, since September 2013. |
| * | The address for each trustee and officer is 2960 N. Meridian St., Suite 300, Indianapolis, IN 46208. |
** As of the date of this report, the Trust consists of 14 series.
24
The following table provides information regarding the Officers of the Trust:
| | | | |
Name, Address*, (Age),
Position with Trust,** Term
of Position with Trust | | Principal Occupation During Past 5 Years | | Other Directorships |
| R. Jeffrey Young, 51, Trustee and Chairman, June 2010 to present; Principal Executive Officer and President, Valued Advisers Trust since February 2010; | | President, Huntington Asset Services, Inc., since April 2015; Director since May 2014; Senior Vice President January 2010 to April 2015; President, Unified Financial Securities, Inc. since July 2015; Director since May 2014; Chief Executive Officer, Huntington Funds, February 2010 to March 2015; Chief Executive Officer, Huntington Strategy Shares, November 2010 to March 2015; President and Chief Executive Officer, Dreman Contrarian Funds, March 2011 to February 2013; Trustee, Valued Advisers Trust, August 2008 to January 2010; and Managing Director and Chief Operating Officer of Professional Planning Consultants, from 2007 to 2010. | | Trustee and Chairman, Capitol Series Trust, since September 2013. |
| John C. Swhear, 54, Chief Compliance Officer, AML Officer and Vice President, August 2008 to present. | | Vice President of Legal Administration and Compliance for Huntington Asset Services, Inc., the Trust’s administrator, since April 2007 and Director since May 2014; Chief Compliance Officer of Unified Financial Securities, Inc., the Trust’s distributor, since May 2007 and Director since May 2014; President of the Unified Series Trust since March 2012, and Senior Vice President from May 2007 to March 2012; Chief Compliance Officer and AML Officer, Capitol Series Trust, since September 2013; Secretary of Huntington Funds from April 2010 to February 2012; President and Chief Executive Officer of Dreman Contrarian Funds from March 2010 to March 2011. | | None. |
| Carol J. Highsmith, 50, Vice President, August 2008 to present; Secretary, March 2014 to present | | Employed in various positions with Huntington Asset Services, Inc., the Trust’s administrator, since November 1994; currently Vice President of Legal Administration; Secretary, Cross Shore Discovery Fund since May 2014. | | None. |
| Matthew J. Miller, 39, Vice President, December 2011 to present. | | Employed in various positions with Huntington Asset Services, Inc., the Trust’s administrator, since July 1998; currently Vice President of Relationship Management; Vice President, Huntington Funds, since February 2010; President and Chief Executive Officer, Capitol Series Trust, since September 2013. | | None. |
| Bryan W. Ashmus, 42, Principal Financial Officer and Treasurer, December 2013 to present. | | Vice President, Financial Administration, Huntington Asset Services, Inc., the Trust’s administrator, since September 2013; Chief Financial Officer and Treasurer, The Huntington Strategy Shares and The Huntington Funds, since November 2013; Vice President, Fund Administration, Citi Fund Services Ohio, Inc., from 2005 to 2013. | | None. |
| * | The address for each trustee and officer is 2960 N. Meridian St., Suite 300, Indianapolis, IN 46208. |
| ** | As of the date of this report, the Trust consists of 14 series. |
25
MANAGEMENT AGREEMENT RENEWALS (Unaudited)
At a meeting held on June 2-3, 2015, the Board of Trustees (the “Board”) considered the renewal of the Investment Advisory Agreement (the “Agreement”) between the Trust and Kovitz Investment Group, LLC (the “Adviser” or “Kovitz”) with respect to the Green Owl Intrinsic Value Fund (the “Green Owl Fund”). Counsel noted that the 1940 Act requires the approval of the investment advisory agreement between the Trust and its investment adviser by the Board, including a majority of the Independent Trustees. The Board discussed the specific contractual arrangements between Kovitz and the Trust with respect to the Green Owl Fund. Counsel reminded the Trustees of their fiduciary duties and responsibilities as summarized in the memorandum from his firm, including the factors (the “Factors”) to be considered, and the application of those Factors to Kovitz. In assessing these Factors and reaching its decisions, the Board took into consideration information furnished for the Board’s review and consideration throughout the year at regular Board meetings, as well as information specifically prepared and/or presented in connection with the annual renewal process, including information presented at the Meeting. The Board requested and was provided with, and reflected on, information and reports relevant to the annual renewal of the Agreement, including: (i) reports regarding the services and support provided to the Green Owl Fund and its shareholders by Kovitz; (ii) quarterly assessments of the investment performance of the Green Owl Fund by personnel of Kovitz; (iii) commentary on the reasons for the performance; (iv) presentations by Kovitz addressing Kovitz’s investment philosophy, investment strategy, personnel and operations; (v) compliance and audit reports concerning the Green Owl Fund and Kovitz; (vi) disclosure information contained in the registration statement of the Trust and the Form ADV of Kovitz; and (vii) a memorandum from Counsel, that summarized the fiduciary duties and responsibilities of the Board in reviewing and approving the Agreement, including the material Factors set forth above and the types of information with respect to each Factor that should be considered by the Board in order to make an informed decision. The Board also requested and received various informational materials including, without limitation: (i) documents containing information about Kovitz, including financial information, a description of personnel and the services provided to the Green Owl Fund, information on investment advice, performance, summaries of Green Owl Fund expenses, compliance program, current legal matters, and other general information; (ii) comparative expense and performance information for other mutual funds with strategies similar to the Green Owl Fund; and (iii) benefits to be realized by Kovitz from its relationship with the Green Owl Fund. The Board did not identify any particular information that was most relevant to its consideration to approve the Agreement and each Trustee may have afforded different weight to the various Factors.
| 1. | The nature, extent, and quality of the services to be provided by the Adviser. In this regard, the Board considered Kovitz’s responsibilities under the Agreement. The Trustees considered the services being provided by Kovitz to the Green Owl Fund including, without limitation: the quality of its investment advisory services (including research and recommendations with respect to portfolio securities), its process for formulating investment recommendations and assuring compliance with the Green Owl Fund’s investment objectives and limitations, its coordination of services for the Green Owl Fund among the Green Owl Fund’s service providers, and its efforts to promote the Green Owl Fund and grow its assets. The Trustees considered Kovitz’s continuity of, and commitment to retain, qualified personnel and Kovitz’s commitment to maintain its resources and systems and options that allow the Green Owl Fund to maintain its goals, and Kovitz’s continued cooperation with the Independent Trustees and Counsel for the Green Owl Fund. The Trustees considered Kovitz’s personnel, including the education and experience of Kovitz’s personnel. After considering the foregoing information and further information in the Meeting materials provided by Kovitz (including Kovitz’s Form ADV), the Board concluded that, in light of all the facts and circumstances, the nature, extent, and quality of the services provided by Kovitz were satisfactory and adequate for the Green Owl Fund. |
| 2. | Investment Performance of the Green Owl Fund and the Adviser. In considering the investment performance of the Green Owl Fund and Kovitz, the Trustees compared the performance of the Green Owl Fund with the performance of funds with similar objectives managed by other investment advisers, as well |
26
| | as with aggregated peer group data. The Trustees also considered the consistency of Kovitz’s management of the Green Owl Fund with its investment objective, strategies, and limitations. The Trustees noted that the Green Owl Fund’s performance for the one-year period ending March 31, 2015 was below average, but that for the since inception period, the Green Owl Fund’s performance was well above average. The Trustees also considered the performance of Kovitz’s separate accounts that were managed in a manner similar to that of the Green Owl Fund and they noted that the performance was very comparable and that any differences were reasonable in light of the circumstances. After reviewing and discussing the investment performance of the Green Owl Fund further, Kovitz’s experience managing the Green Owl Fund, the Green Owl Fund’s historical performance, and other relevant factors, the Board concluded, in light of all the facts and circumstances, that the investment performance of the Green Owl Fund and Kovitz was satisfactory. |
| 3. | The costs of the services to be provided and profits to be realized by the Adviser from the relationship with the Green Owl Fund. In considering the costs of services to be provided and the profits to be realized by Kovitz from the relationship with the Green Owl Fund, the Trustees considered: (1) Kovitz’s financial condition; (2) the asset levels of the Green Owl Fund; (3) the overall expenses of the Green Owl Fund; and (4) the nature and frequency of advisory fee payments. The Trustees reviewed information provided by Kovitz regarding its profits associated with managing the Green Owl Fund. The Trustees also considered potential benefits for Kovitz in managing the Green Owl Fund. The Trustees then compared the fees and expenses of the Green Owl Fund (including the management fee) to other comparable mutual funds. The Trustees noted that the Green Owl Fund’s management fee was among the highest in its peer group (and it was higher than its peer average and median), although the net expense ratios were below the peer average and median as a result of Kovitz’s contractual commitment to limit the expenses of the Green Owl Fund. The Trustees considered the services provided to the Green Owl Fund in light of the advisory fees and the peer group fee data and concluded that the fee was within an acceptable range. The Trustees noted that the management fee was generally less than what Kovitz charges to its separate account clients who had investment strategies and objectives similar to the Green Owl Fund. Based on the foregoing, the Board concluded that the fees to be paid to Kovitz by the Green Owl Fund and the profits to be realized by the Green Owl Fund, in light of all the facts and circumstances, were fair and reasonable in relation to the nature and quality of the services provided by Kovitz. |
| 4. | The extent to which economies of scale would be realized as the Green Owl Fund grows and whether advisory fee levels reflect these economies of scale for the benefit of the Green Owl Fund’s investors. In this regard, the Board considered the Green Owl Fund’s fee arrangements with Kovitz. The Board considered that while the management fee remained the same at all asset levels, the Green Owl Fund’s shareholders experienced benefits from the Green Owl Fund’s expense limitation arrangement. The Trustees noted that once the Green Owl Fund’s expenses fell below the cap set by the arrangement, the Green Owl Fund’s shareholders would continue to benefit from the economies of scale under the Green Owl Fund’s agreements with service providers other than Kovitz. In light of its ongoing consideration of the Green Owl Fund’s asset levels, expectations for growth in the Green Owl Fund, and fee levels, the Board determined that the Green Owl Fund’s fee arrangements, in light of all the facts and circumstances, were fair and reasonable in relation to the nature and quality of the services provided by Kovitz. |
| 5. | Possible conflicts of interest and benefits to the Adviser. In considering Kovitz’s practices regarding conflicts of interest, the Trustees evaluated the potential for conflicts of interest and considered such matters as the experience and ability of the advisory personnel assigned to the Green Owl Fund; the basis of decisions to buy or sell securities for the Green Owl Fund and/or Kovitz’s other accounts; and the substance and administration of Kovitz’s code of ethics. The Trustees also considered disclosure in the registration statement of the Trust relating to Kovitz’s potential conflicts of interest. The Trustees noted that Kovitz does not utilize soft dollars. The Trustees noted that Kovitz benefited from the Green Owl Fund in that it is able to utilize the Green Owl Fund as a vehicle into which to direct advisory clients with small account balances. The Trustees also noted that Kovitz executes trades for the Green Owl Fund through its affiliated broker dealer and that it is able to benefit from certain hardware, software, administrative and reporting tools that |
27
| | its affiliated broker dealer receives. The Trustees discussed the representation by Kovitz that the affiliated broker dealer lowered its commission rates for certain institutional clients, including the Green Owl Fund. The Trustees did not identify any other potential benefits (other than the management fee) that would inure to Kovitz. Based on the foregoing, the Board determined that the standards and practices of Kovitz relating to the identification and mitigation of potential conflicts of interest and the benefits that it derives from managing the Green Owl Fund are acceptable. |
After additional consideration of the factors delineated in the memorandum provided by Counsel and further discussion among the Board, the Board determined to approve the continuation of the Agreement between the Trust and the Adviser.
28
OTHER FEDERAL INCOME TAX INFORMATION (Unaudited)
The Form 1099-DIV you receive in January 2016 will show the tax status of all distributions paid to your account in calendar year 2015. Shareholders are advised to consult their own tax adviser with respect to the tax consequences of their investment in the Fund. As required by the Internal Revenue Code and/or regulations, shareholders must be notified regarding the status of qualified dividend income for individuals and the dividends received deduction for corporations.
Qualified Dividend Income. The Fund designates approximately 100% or up to the maximum amount of such dividends allowable pursuant to the Internal Revenue Code, as qualified dividend income eligible for the reduced tax rate of 15%.
Dividends Received Deduction. Corporate shareholders are generally entitled to take the dividends received deduction on the portion of the Fund’s dividend distribution that qualifies under tax law. For the Fund’s calendar year 2015 ordinary income dividends, 100% qualifies for the corporate dividends received deduction.
For the year ended October 31, 2015, the Fund designated $2,314,248 as long-term capital gain distributions.
29
OTHER INFORMATION
The Fund’s Statement of Additional Information (“SAI”) includes additional information about the trustees and is available without charge, upon request. You may call toll-free at (888) 695-3729 to request a copy of the SAI or to make shareholder inquiries.
PROXY VOTING
A description of the policies and procedures that the Fund uses to determine how to vote proxies relating to portfolio securities and information regarding how the Fund voted those proxies is available without charge upon request by (1) calling the Fund at (888) 695-3729 and (2) from Fund documents filed with the Securities and Exchange Commission (“SEC”) on the SEC’s website at www.sec.gov.
TRUSTEES
R. Jeffrey Young, Chairman
Ira Cohen
Andrea N. Mullins
OFFICERS
R. Jeffrey Young, Principal Executive Officer and President
John C. Swhear, Chief Compliance Officer, AML Officer and Vice President
Carol J. Highsmith, Vice President and Secretary
Matthew J. Miller, Vice President
Bryan W. Ashmus, Principal Financial Officer and Treasurer
INVESTMENT ADVISER
Kovitz Investment Group, LLC
115 South LaSalle Street, 27th Floor
Chicago, IL 60603
DISTRIBUTOR
Unified Financial Securities, Inc.
2960 North Meridian Street, Suite 300
Indianapolis, IN 46208
INDEPENDENT REGISTERED PUBLIC ACCOUNTING FIRM
Cohen Fund Audit Services Ltd.
1350 Euclid Avenue, Suite 800
Cleveland, OH 44115
LEGAL COUNSEL
The Law Offices of John H. Lively & Associates, Inc.
A member firm of The 1940 Act Law GroupTM
11300 Tomahawk Creek Parkway, Ste. 310
Leawood, KS 66211
CUSTODIAN
Huntington National Bank
41 South High Street
Columbus, OH 43215
ADMINISTRATOR, TRANSFER AGENT AND FUND ACCOUNTANT
Huntington Asset Services, Inc.
2960 North Meridian Street, Suite 300
Indianapolis, IN 46208
This report is intended only for the information of shareholders or those who have received the Fund’s prospectus which contains information about the Fund’s management fee and expenses. Please read the prospectus carefully before investing.
Distributed by Unified Financial Securities, Inc.
Member FINRA/SIPC
30
PRIVACY POLICY
The following is a description of the Fund’s policies regarding disclosure of nonpublic personal information that you provide to the Fund or that the Fund collects from other sources. In the event that you hold shares of the Fund through a broker-dealer or other financial intermediary, the privacy policy of your financial intermediary would govern how your nonpublic personal information would be shared with nonaffiliated third parties.
Categories of Information the Fund Collects. The Fund collects the following nonpublic personal information about you:
| | • | | Information the Fund receives from you on applications or other forms, correspondence, or conversations (such as your name, address, phone number, social security number, and date of birth); and |
| | • | | Information about your transactions with the Fund, its affiliates, or others (such as your account number and balance, payment history, cost basis information, and other financial information). |
Categories of Information the Fund Discloses. The Fund does not disclose any nonpublic personal information about its current or former shareholders to unaffiliated third parties, except as required or permitted by law. The Fund is permitted by law to disclose all of the information it collects, as described above, to service providers (such as the Fund’s custodian, administrator, transfer agent, accountant and legal counsel) to process your transactions and otherwise provide services to you.
Confidentiality and Security. The Fund restricts access to your nonpublic personal information to those persons who require such information to provide products or services to you. The Fund maintains physical, electronic, and procedural safeguards that comply with federal standards to guard your nonpublic personal information.
Disposal of Information. The Fund, through its transfer agent, has taken steps to reasonably ensure that the privacy of your nonpublic personal information is maintained at all times, including in connection with the disposal of information that is no longer required to be maintained by the Fund. Such steps shall include, whenever possible, shredding paper documents and records prior to disposal, requiring off-site storage vendors to shred documents maintained in such locations prior to disposal, and erasing and/or obliterating any data contained on electronic media in such a manner that the information can no longer be read or reconstructed.
BRC
Large Cap
Focus Equity Fund
Annual Report
October 31, 2015
Fund Adviser:
BRC Investment Management LLC
8400 East Prentice Avenue, Suite 1401
Greenwood Village, Colorado 80111
Toll Free (877) 272-1214
MANAGEMENT’S DISCUSSION OF FUND PERFORMANCE
The investment strategy of the BRC Large Cap Focus Equity Fund (the “Fund”) is based on our belief that future investor expectations are strongly influenced by the opinions, forecasts and announcements of perceived market experts, including Wall Street analysts and company management. By incorporating a combination of proprietary behavioral valuation techniques, we seek to invest in companies that are likely to be the beneficiaries of future favorable earnings announcements and upward earnings estimate revisions. Regardless of market conditions, so long as the predictive abilities of the quantitative models remain strong and investors continue to react to industry experts, the management team expects this investment strategy to provide above average returns over a typical 3-5 year investment cycle.
For the year ending October 31, 2015, the management team was satisfied with the overall predictive abilities of the quantitative model and the implementation of the investment process. As the period ended, the Fund held 33 U.S. large cap equity positions representing those securities that were highly ranked by our quantitative models and were evaluated and approved by our fundamental analysts.
Despite this good predictive ability of the models, successful implementation of the process and strong performance through June, the Fund experienced significantly weaker performance in the July through October period. The magnitude of underperformance was not outside a range of what the management team would expect given our historical alpha and tracking error. The underperformance was primarily attributable to the following factors:
| • | | Outperformance of Large Cap Stocks – The fundamental factor environment has produced significant headwinds for our strategy over the past four months, and in particular, the continued strength of large capitalization stocks relative to smaller stocks has resulted in cap-weighted benchmark returns being strongly skewed toward the returns of stocks with the largest market caps. Based on our sector-neutralized market capitalization factor model, the smallest quintile has underperformed the largest quintile by -8.8% since July 1. Since our behavioral models are agnostic to market capitalization, we tend to track the performance of the average stock in a universe rather than cap-weighted benchmarks. We estimate that nearly all of our underperformance over the past four months is attributable to this capitalization effect. |
| • | | Stock Specific Effects in the Consumer Discretionary and Technology Sectors – The Consumer Discretionary sector delivered the worst relative returns in 3Q, declining -8.8% versus a benchmark sector return of -3.4%. Underperforming Consumer Discretionary stocks included Hanesbrands (down 6.8%), Lear (down 5.9%), and Mohawk Industries (down 8.0%). Lam Research (down 19.3%) and Synopsys (down 8.8%) led to relative underperformance in the Information Technology sector. |
During the month of October, underperforming Technology stocks included Skyworks Solutions (down 8.5%) and Intel (down 1.8%), not owning Microsoft (up 18.9%) and Alphabet (Google) (up approximately 16% depending on share class) also contributed to negative alpha for the month. The Consumer Discretionary sector also underperformed in October, rising 3.7% versus a benchmark return of 8.2%. Darden Restaurants was the biggest underperformer in this sector, declining 8.2%; not owning Amazon (up 22.3%) also hurt relative sector performance.
For the 12-month period ending October 31, 2015 the Fund’s rate of return was 6.95% versus the S&P 500® Index return of 5.20%.
The Adviser has proprietary tools for tracking and monitoring risk factors. The risk management process assesses the risks embedded in the strategy on an on-going basis. Some of the factors we focus on include; value factors (Price to Book, Price to Earnings, Price to Sales, Price to Cash Flow etc.); medium-term and short-term momentum; market capitalization; beta; and volatility, among others. The Adviser also monitors the levels and trends of fundamental factor exposures, economic sector exposures, and the composition and magnitude of residual risk versus various benchmarks and indices. For the reporting period, this risk management process resulted in even sector and style exposures.
1
On behalf of the management team, I would like to thank you for your continued support. You have our commitment to the consistent application of our investment process and to a proprietary research agenda that will drive our ongoing effort to add value for our clients.
John R. Riddle, CFA
Managing Principal and Chief Investment Officer
2
INVESTMENT RESULTS – (Unaudited)
| | | | | | | | |
Total Returns* (For the periods ended October 31, 2015) | |
| | | | | | Average Annual Returns | |
| | | One Year | | | Since Inception
(December 21, 2012) | |
BRC Large Cap Focus Equity Fund - Institutional Class | | | 6.95 | % | | | 16.03 | % |
S&P 500® Index** | | | 5.20 | % | | | 15.96 | % |
Total annual operating expenses, as disclosed in the Fund’s prospectus dated February 28, 2015, were 2.03% of net assets for the Institutional Class (0.55% after fee waivers/expense reimbursements by the Adviser). The Adviser has contractually agreed to waive or limit its fees and to assume other expenses of the Fund until February 28, 2018, so that the Total Annual Fund Operating Expenses does not exceed 0.55%. This operating expense limitation does not apply to interest, taxes, brokerage commissions, other expenditures which are capitalized in accordance with generally accepted accounting principles, other extraordinary expenses not incurred in the ordinary course of the Fund’s business, dividend expense on short sales, expenses incurred under a Rule 12b-1 plan of distribution, “acquired fund fees and expenses,” and expenses that the Fund has incurred but did not actually pay because of an expense offset arrangement. Additional information pertaining to the Fund’s expense ratios as of October 31, 2015, can be found in the financial highlights.
The performance quoted represents past performance, which does not guarantee future results. The investment return and principal value of an investment will fluctuate so that an investor’s shares, when redeemed, may be worth more or less than their original cost. The returns shown do not reflect deduction of taxes that a shareholder would pay on Fund distributions or the redemption of Fund shares. Current performance of the Fund may be lower or higher than the performance quoted. The Fund’s investment objectives, risks, charges and expenses must be considered carefully before investing. Performance data current to the most recent month end may be obtained by calling (877) 272-1214.
| * | Return figures reflect any change in price per share and assume the reinvestment of all distributions. |
| ** | The S&P 500® Index is a widely recognized unmanaged index of equity securities and is representative of a broader domestic equity market and range of securities than is found in the Fund’s portfolio. Individuals cannot invest directly in an Index; however, an individual can invest in exchange traded funds or other investment vehicles that attempt to track the performance of a benchmark index. |
The Fund’s investment objectives, strategies, risks, charges and expenses must be considered carefully before investing. The prospectus contains this and other important information about the Fund and may be obtained by calling the same number as above. Please read it carefully before investing.
The Fund is distributed by Unified Financial Securities, Inc., member FINRA.
3
INVESTMENT RESULTS – (Unaudited)
Comparison of the Growth of a $100,000 Investment in the BRC Large Cap Focus Equity Fund - Institutional Class and the S&P 500® Index (Unaudited)
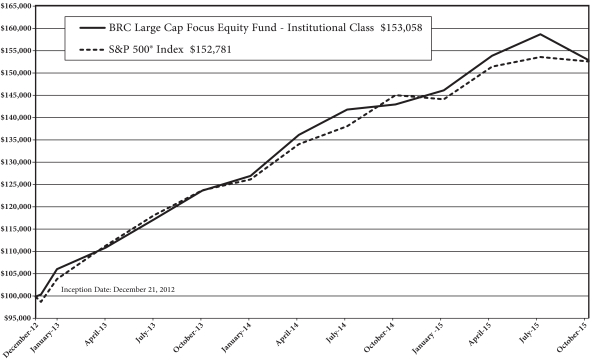
The chart above assumes an initial investment of $100,000 made on December 21, 2012 (commencement of Institutional Class operations) and held through October 31, 2015. The S&P 500® Index is a widely recognized unmanaged index of equity securities and is representative of a broader domestic equity market and range of securities than is found in the Fund’s portfolio. Individuals cannot invest directly in an Index; however, an individual can invest in exchange traded funds or other investment vehicles that attempt to track the performance of a benchmark index. THE FUND’S RETURN REPRESENTS PAST PERFORMANCE AND DOES NOT GUARANTEE FUTURE RESULTS. The returns shown do not reflect deduction of taxes that a shareholder would pay on Fund distributions or the redemption of Fund shares. Investment returns and principal values will fluctuate so that your shares, when redeemed, may be worth more or less than their original purchase price.
Current performance may be lower or higher than the performance data quoted. For more information on the Fund, and to obtain performance data current to the most recent month end or to request a prospectus, please call (877) 272-1214. You should carefully consider the investment objectives, potential risks, management fees, and charges and expenses of the Fund before investing. The Fund’s prospectus contains this and other information about the Fund, and should be read carefully before investing.
The Fund is distributed by Unified Financial Securities, Inc., member FINRA.
4
FUND HOLDINGS – (Unaudited)
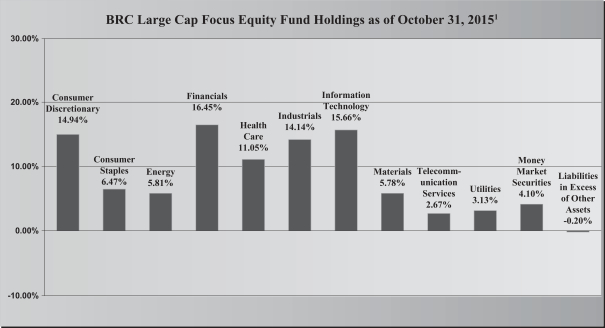
| 1 | As a percentage of net assets. |
The investment objective of the BRC Large Cap Focus Equity Fund is to seek long-term capital appreciation that will exceed the S&P 500® Index over a three-to-five year time horizon.
AVAILABILITY OF PORTFOLIO SCHEDULE – (Unaudited)
The Fund files its complete schedule of portfolio holdings with the Securities and Exchange Commission (“SEC”) for the first and third quarters of each fiscal year on Form N-Q. The Fund’s Forms N-Q is available at the SEC’s website at www.sec.gov. The Fund’s Forms N-Q may be reviewed and copied at the SEC’s Public Reference Room in Washington DC. Information on the operation of the Public Reference Room may be obtained by calling 1-800-SEC-0330.
5
SUMMARY OF FUND’S EXPENSES – (Unaudited)
As a shareholder of the Fund, you incur ongoing costs, including management fees and other Fund expenses. This Example is intended to help you understand your ongoing costs (in dollars) of investing in the Fund and to compare these costs with the ongoing costs of investing in other mutual funds. The example is based on an investment of $1,000 invested at the beginning and held for the entire period from May 1, 2015 to October 31, 2015.
Actual Expenses
The first line of the table below provides information about actual account values and actual expenses. You may use the information in this line, together with the amount you invested, to estimate the expenses that you paid over the period. Simply divide your account value by $1,000 (for example, an $8,600 account value divided by $1,000 = $8.60), then multiply the result by the number in the first line under the heading entitled “Expenses Paid During the Period” to estimate the expenses you paid on your account during this period.
Hypothetical Example for Comparison Purposes
The second line of the table below provides information about hypothetical account values and hypothetical expenses based on the Fund’s actual expense ratio and an assumed rate of return of 5% per year before expenses, which is not the Fund’s actual return. The hypothetical account values and expenses may not be used to estimate the actual ending account balance or expenses you paid for the period. You may use this information to compare the ongoing costs of investing in the Fund and other funds. To do so, compare this 5% hypothetical example with the 5% hypothetical examples that appear in the shareholder reports of the other funds.
Please note that the expenses shown in the table are meant to highlight your ongoing costs only. Therefore, the second line of the table below is useful in comparing ongoing costs only and will not help you determine the relative costs of owning different funds.
| | | | | | | | | | | | |
BRC Large Cap Focus Equity Fund – Institutional Class | | Beginning
Account Value May 1, 2015 | | | Ending Account Value October 31, 2015 | | | Expenses Paid
During Period
May 1, 2015 – October 31, 2015 | |
Actual* | | $ | 1,000.00 | | | $ | 993.70 | | | $ | 2.76 | |
Hypothetical** | | $ | 1,000.00 | | | $ | 1,022.43 | | | $ | 2.80 | |
| * | Expenses are equal to the Fund’s annualized expense ratio of 0.55%, multiplied by the average account value over the period, multiplied by 184/365. |
| ** | Assumes a 5% return before expenses. |
6
BRC LARGE CAP FOCUS EQUITY FUND
SCHEDULE OF INVESTMENTS
October 31, 2015
| | | | | | | | |
| Common Stocks – 96.10% | | Shares | | | Fair Value | |
| | | | | | | | |
Consumer Discretionary – 14.94% | | | | | | | | |
Comcast Corp. – Class A | | | 10,400 | | | $ | 651,248 | |
Home Depot, Inc./The | | | 5,803 | | | | 717,483 | |
L Brands, Inc. | | | 6,500 | | | | 623,870 | |
Mohawk Industries, Inc. * | | | 3,203 | | | | 626,186 | |
Wyndham Worldwide Corp. | | | 8,189 | | | | 666,175 | |
| | | | | | | | |
| | | | | | | 3,284,962 | |
| | | | | | | | |
Consumer Staples – 6.47% | | | | | | | | |
Constellation Brands, Inc. – Class A | | | 5,588 | | | | 753,262 | |
Kroger Co./The | | | 17,710 | | | | 669,438 | |
| | | | | | | | |
| | | | | | | 1,422,700 | |
| | | | | | | | |
Energy – 5.81% | | | | | | | | |
Devon Energy Corp. | | | 14,850 | | | | 622,660 | |
Marathon Petroleum Corp. | | | 12,639 | | | | 654,700 | |
| | | | | | | | |
| | | | | | | 1,277,360 | |
| | | | | | | | |
Financials – 16.45% | | | | | | | | |
CBRE Group, Inc. * | | | 18,077 | | | | 673,911 | |
NASDAQ OMX Group, Inc./The | | | 10,700 | | | | 619,423 | |
Progressive Corp./The | | | 19,700 | | | | 652,661 | |
Santander Consumer USA Holdings Inc * | | | 26,910 | | | | 484,649 | |
SunTrust Banks, Inc. | | | 14,980 | | | | 621,970 | |
Synchrony Financial * | | | 18,335 | | | | 563,985 | |
| | | | | | | | |
| | | | | | | 3,616,599 | |
| | | | | | | | |
Health Care – 11.05% | | | | | | | | |
Amgen, Inc. | | | 3,610 | | | | 571,030 | |
Gilead Sciences, Inc. | | | 5,825 | | | | 629,857 | |
Laboratory Corp. of America Holdings * | | | 5,309 | | | | 651,627 | |
Stryker Corp. | | | 6,040 | | | | 577,545 | |
| | | | | | | | |
| | | | | | | 2,430,059 | |
| | | | | | | | |
Industrials – 14.14% | | | | | | | | |
Cintas Corp. | | | 7,888 | | | | 734,294 | |
Expeditors International of Washington, Inc. | | | 14,530 | | | | 723,449 | |
General Dynamics Corp. | | | 4,105 | | | | 609,921 | |
PACCAR, Inc. | | | 8,555 | | | | 450,421 | |
Trinity Industries, Inc. | | | 21,774 | | | | 589,422 | |
| | | | | | | | |
| | | | | | | 3,107,507 | |
| | | | | | | | |
See accompanying notes which are an integral part of these financial statements.
7
BRC LARGE CAP FOCUS EQUITY FUND
SCHEDULE OF INVESTMENTS – (continued)
October 31, 2015
| | | | | | | | |
| Common Stocks – 96.10% – continued | | Shares | | | Fair Value | |
| | | | | | | | |
Information Technology – 15.66% | | | | | | | | |
Accenture PLC – Class A | | | 6,663 | | | $ | 714,274 | |
Apple, Inc. | | | 5,417 | | | | 647,331 | |
Fiserv, Inc. * | | | 7,953 | | | | 767,544 | |
Intel Corp. | | | 18,600 | | | | 629,796 | |
Synopsys, Inc. * | | | 13,690 | | | | 684,226 | |
| | | | | | | | |
| | | | | | | 3,443,171 | |
| | | | | | | | |
Materials – 5.78% | | | | | | | | |
Air Products & Chemicals, Inc. | | | 4,363 | | | | 606,370 | |
PPG Industries, Inc. | | | 6,370 | | | | 664,136 | |
| | | | | | | | |
| | | | | | | 1,270,506 | |
| | | | | | | | |
Telecommunication Services – 2.67% | | | | | | | | |
Verizon Communications, Inc. | | | 12,510 | | | | 586,469 | |
| | | | | | | | |
Utilities – 3.13% | | | | | | | | |
CMS Energy Corp. | | | 19,087 | | | | 688,468 | |
| | | | | | | | |
| |
Total Common Stocks (Cost $19,958,583) | | | | 21,127,801 | |
| | | | | | | | |
Money Market Securities – 4.10% | |
Fidelity Institutional Money Market Portfolio – Institutional shares, 0.16% (a) | | | 902,055 | | | | 902,055 | |
| | | | | | | | |
Total Money Market Securities (Cost $902,055) | | | | | | | 902,055 | |
| | | | | | | | |
Total Investments – 100.20% (Cost $20,860,638) | | | | | | | 22,029,856 | |
| | | | | | | | |
Liabilities in Excess of Other Assets – (0.20)% | | | | | | | (44,720 | ) |
| | | | | | | | |
| NET ASSETS – 100.00% | | | | | | $ | 21,985,136 | |
| | | | | | | | |
| | (a) | Rate disclosed is the seven day yield as of October 31, 2015. |
| | * | Non-income producing security. |
The sectors shown on the schedule of investments are based on the Global Industry Classification Standard, or GICS® (“GICS”). The GICS was developed by and/or is the exclusive property of MSCI, Inc. and Standard & Poor Financial Services LLC (“S&P”). GICS is a service mark of MSCI, Inc. and S&P and has been licensed for use by Huntington Asset Services, Inc.
See accompanying notes which are an integral part of these financial statements.
8
BRC LARGE CAP FOCUS EQUITY FUND
STATEMENT OF ASSETS AND LIABILITIES
October 31, 2015
| | | | |
Assets | | | | |
Investments in securities at fair value (cost $20,860,638) | | $ | 22,029,856 | |
Receivable for fund shares sold | | | 25,000 | |
Receivable for investments sold | | | 576,181 | |
Dividends receivable | | | 25,879 | |
Receivable from Adviser | | | 8,691 | |
Prepaid expenses | | | 3,980 | |
| | | | |
Total Assets | | | 22,669,587 | |
| | | | |
Liabilities | | | | |
Payable for investments purchased | | | 653,860 | |
Payable to administrator, fund accountant, and transfer agent | | | 8,523 | |
Payable to custodian | | | 877 | |
Payable to trustees | | | 182 | |
Other accrued expenses | | | 21,009 | |
| | | | |
Total Liabilities | | | 684,451 | |
| | | | |
| |
Net Assets | | $ | 21,985,136 | |
| | | | |
Net Assets consist of: | | | | |
Paid-in capital | | $ | 19,708,336 | |
Accumulated undistributed net investment income | | | 111,100 | |
Accumulated undistributed net realized gain from investment transactions | | | 996,482 | |
Net unrealized appreciation on investments | | | 1,169,218 | |
| | | | |
| |
Net Assets | | $ | 21,985,136 | |
| | | | |
Institutional Class: | | | | |
Shares outstanding (unlimited number of shares authorized, no par value) | | | 1,551,813 | |
| | | | |
Net asset value, offering and redemption price per share | | $ | 14.17 | |
| | | | |
See accompanying notes which are an integral part of these financial statements.
9
BRC LARGE CAP FOCUS EQUITY FUND
STATEMENT OF OPERATIONS
For the year ended October 31, 2015
| | | | |
Investment Income | | | | |
Dividend income | | $ | 256,570 | |
| | | | |
Total investment income | | | 256,570 | |
| | | | |
Expenses | | | | |
Investment Adviser | | | 88,716 | |
Administration | | | 40,500 | |
Fund accounting | | | 25,000 | |
Transfer agent | | | 36,844 | |
Legal | | | 16,090 | |
Registration | | | 25,035 | |
Custodian | | | 10,184 | |
Audit | | | 16,000 | |
Trustee | | | 4,994 | |
Pricing | | | 2,255 | |
Report printing | | | 17,743 | |
Miscellaneous | | | 8,245 | |
| | | | |
Total expenses | | | 291,606 | |
| | | | |
Fees waived and reimbursed by Adviser | | | (187,701 | ) |
| | �� | | |
Net operating expenses | | | 103,905 | |
| | | | |
Net investment income | | | 152,665 | |
| | | | |
| |
Net Realized and Unrealized Gain on Investments | | | | |
Net realized gain on investment securities transactions | | | 988,555 | |
Net change in unrealized appreciation of investment securities | | | (7,613 | ) |
| | | | |
Net realized and unrealized gain on investments | | | 980,942 | |
| | | | |
Net increase in net assets resulting from operations | | $ | 1,133,607 | |
| | | | |
See accompanying notes which are an integral part of these financial statements.
10
BRC LARGE CAP FOCUS EQUITY FUND
STATEMENTS OF CHANGES IN NET ASSETS
| | | | | | | | |
| | | For the
Year Ended
October 31, 2015 | | | For the
Year Ended
October 31, 2014 | |
Increase in Net Assets due to: | | | | | | | | |
Operations | | | | | | | | |
Net investment income | | $ | 152,665 | | | $ | 113,370 | |
Net realized gain on investment securities transactions | | | 988,555 | | | | 1,010,366 | |
Net change in unrealized appreciation of investment securities | | | (7,613 | ) | | | 402,177 | |
| | | | | | | | |
Net increase in net assets resulting from operations | | | 1,133,607 | | | | 1,525,913 | |
| | | | | | | | |
Distributions | | | | | | | | |
From net investment income | | | (123,164 | ) | | | (55,395 | ) |
From net realized gains | | | (1,011,562 | ) | | | (242 | ) |
| | | | | | | | |
Total distributions | | | (1,134,726 | ) | | | (55,637 | ) |
| | | | | | | | |
Capital Transactions – Institutional Class | | | | | | | | |
Proceeds from shares sold | | | 7,750,302 | | | | 8,031,528 | |
Reinvestment of distributions | | | 823,845 | | | | 54,011 | |
Amount paid for shares redeemed | | | (2,711,888 | ) | | | (1,543,486 | ) |
| | | | | | | | |
Net increase in net assets resulting from capital transactions | | | 5,862,259 | | | | 6,542,053 | |
| | | | | | | | |
Total Increase in Net Assets | | | 5,861,140 | | | | 8,012,329 | |
| | | | | | | | |
Net Assets | | | | | | | | |
Beginning of year | | | 16,123,996 | | | | 8,111,667 | |
| | | | | | | | |
End of year | | $ | 21,985,136 | | | $ | 16,123,996 | |
| | | | | | | | |
Accumulated undistributed net investment income | | $ | 111,100 | | | $ | 90,722 | |
| | | | | | | | |
Share Transactions – Institutional Class | | | | | | | | |
Shares sold | | | 549,368 | | | | 586,219 | |
Shares issued in reinvestment of distributions | | | 59,742 | | | | 4,152 | |
Shares redeemed | | | (190,932 | ) | | | (111,818 | ) |
| | | | | | | | |
Net increase in shares | | | 418,178 | | | | 478,553 | |
| | | | | | | | |
See accompanying notes which are an integral part of these financial statements.
11
BRC LARGE CAP FOCUS EQUITY FUND
FINANCIAL HIGHLIGHTS – INSTITUTIONAL CLASS
(For a share outstanding during each period)
| | | | | | | | | | | | |
| | | For the
Year Ended
October 31, 2015 | | | For the
Year Ended
October 31, 2014 | | | For the
Period Ended
October 31, 2013 (a) | |
Selected Per Share Data: | | | | | | | | | | | | |
Net asset value, beginning of period | | $ | 14.22 | | | $ | 12.38 | | | $ | 10.00 | |
| | | | | | | | | | | | |
Investment Operations: | | | | | | | | | | | | |
Net investment income | | | 0.11 | | | | 0.11 | | | | 0.05 | |
Net realized and unrealized gain on investments | | | 0.85 | | | | 1.81 | | | | 2.33 | |
| | | | | | | | | | | | |
Total from investment operations | | | 0.96 | | | | 1.92 | | | | 2.38 | |
| | | | | | | | | | | | |
Less distributions to shareholders from: | | | | | | | | | | | | |
Net investment income | | | (0.11 | ) | | | (0.08 | ) | | | – | |
Net realized gains | | | (0.90 | ) | | | – | (b) | | | – | |
| | | | | | | | | | | | |
Total distributions | | | (1.01 | ) | | | (0.08 | ) | | | – | |
| | | | | | | | | | | | |
Net asset value, end of period | | $ | 14.17 | | | $ | 14.22 | | | $ | 12.38 | |
| | | | | | | | | | | | |
| | | |
Total Return (c) | | | 6.95 | % | | | 15.60 | % | | | 23.80 | %(d) |
Ratios and Supplemental Data: | | | | | | | | | | | | |
Net assets, end of period (000) | | $ | 21,985 | | | $ | 16,124 | | | $ | 8,112 | |
Ratio of net expenses to average net assets | | | 0.55 | % | | | 0.55 | % | | | 0.56 | %(e) |
Ratio of expenses to average net assets before waiver and reimbursement | | | 1.54 | % | | | 2.03 | % | | | 6.49 | %(e) |
Ratio of net investment income to average net assets | | | 0.81 | % | | | 0.90 | % | | | 0.98 | %(e) |
Portfolio turnover rate | | | 232 | % | | | 192 | % | | | 154 | %(d) |
| (a) | For the period December 21, 2012 (commencement of operations) to October 31, 2013. |
| (b) | Amount is less than $0.005. |
| (c) | Total return in the above table represents the rate that the investor would have earned or lost on an investment in the Fund, assuming reinvestment of distributions. |
See accompanying notes which are an integral part of these financial statements.
12
BRC LARGE CAP FOCUS EQUITY FUND
NOTES TO THE FINANCIAL STATEMENTS
October 31, 2015
NOTE 1. ORGANIZATION
The BRC Large Cap Focus Equity Fund (the “Fund”) is an open-end diversified series of the Valued Advisers Trust (the “Trust”). The Trust is a management investment company established under the laws of Delaware by an Agreement and Declaration of Trust dated June 13, 2008 (the “Trust Agreement”). The Trust Agreement permits the Trust to issue an unlimited number of shares of beneficial interest of separate series without par value. The Fund is one of a series of funds authorized by the Board of Trustees (the “Board”). The Fund commenced operations December 21, 2012. The Fund’s investment adviser is BRC Investment Management LLC. (the “Adviser”). The investment objective of the Fund is to seek long-term capital appreciation that will exceed the S&P 500® Index over a three-to five-year time horizon.
The Fund is authorized to offer two classes of shares: Institutional Class and Advisor Class. Each share represents an equal proportionate interest in the assets and liabilities belonging to the Fund and is entitled to such dividends and distributions out of income belonging to the applicable class as are declared by the Trustees. Expenses attributable to any class are borne by that class. Income, expenses, and realized and unrealized gains/losses are allocated to the respective classes on the basis of relative daily net assets. On matters that affect the Fund as a whole, each class has the same voting and other rights and preferences as any other class. On matters that affect only one class, only shareholders of that class may vote. Each class votes separately on matters affecting only that class, or on matters expressly required to be voted on separately by state or federal law. Shares of each class of a series have the same voting and other rights and preferences as the other classes and series of the Trust for matters that affect the Trust as a whole. As of October 31, 2015, the Fund only offers the Institutional Class of shares. The Fund may offer additional classes of shares in the future.
NOTE 2. SIGNIFICANT ACCOUNTING POLICIES
The Fund is an investment company and follows accounting and reporting guidance under Financial Accounting Standards Board (“FASB”) Accounting Standards Codification (“ASC”) Topic 946, “Financial Services-Investment Companies”. The following is a summary of significant accounting policies followed by the Fund in the preparation of its financial statements. These policies are in conformity with generally accepted accounting principles in the United States of America (“GAAP”).
Securities Valuation – All investments in securities are recorded at their estimated fair value as described in Note 3.
Federal Income Taxes – The Fund makes no provision for federal income or excise tax. The Fund intends to qualify each year as a regulated investment company (“RIC”) under subchapter M of the Internal Revenue Code of 1986, as amended, by complying with the requirements applicable to RICs and by distributing substantially all of its taxable income. The Fund also intends to distribute sufficient net investment income and net capital gains, if any, so that it will not be subject to excise tax on undistributed income and gains. If the required amount of net investment income or gains is not distributed, the Fund could incur a tax expense.
As of and during the year ended October 31, 2015, the Fund did not have a liability for any unrecognized tax benefits. The Fund recognizes interest and penalties, if any, related to unrecognized tax benefits as income tax expense in the Statement of Operations. During the year, the Fund did not incur any interest or penalties. The Fund is subject to examination by U.S. federal tax authorities for all tax years since inception.
Expenses – Expenses incurred by the Trust that do not relate to a specific fund of the Trust are allocated to the individual funds based on each fund’s relative net assets or other appropriate basis.
13
BRC LARGE CAP FOCUS EQUITY FUND
NOTES TO THE FINANCIAL STATEMENTS – (continued)
October 31, 2015
NOTE 2. SIGNIFICANT ACCOUNTING POLICIES – continued
Security Transactions and Related Income – The Fund follows industry practice and records security transactions on the trade date for financial reporting purposes. The specific identification accounting method is used for determining gains or losses for financial statements and income tax purposes. Dividend income is recorded on the ex-dividend date and interest income is recorded on an accrual basis. Discounts and premiums on securities purchased are amortized or accreted using the effective interest method. Withholding taxes on foreign dividends, if any, have been provided for in accordance with the Fund’s understanding of the applicable country’s tax rules and rates. The ability of issuers of debt securities held by the Fund to meet their obligations may be affected by economic and political developments in a specific country or region.
Dividends and Distributions – The Fund intends to distribute substantially all of its net investment income, net realized long-term capital gains and its net realized short-term capital gains, if any, to its shareholders on at least an annual basis. Dividends to shareholders, which are determined in accordance with income tax regulations, are recorded on the ex-dividend date. The treatment for financial reporting purposes of distributions made to shareholders during the year from net investment income or net realized capital gains may differ from their ultimate treatment for federal income tax purposes. These differences are caused primarily by differences in the timing of the recognition of certain components of income, expense or realized capital gain for federal income tax purposes. Where such differences are permanent in nature, they are reclassified among the components of net assets based on their ultimate characterization for federal income tax purposes. Any such reclassifications have no effect on net assets, results of operations or net asset values per share of the Fund. For the fiscal year ended October 31, 2015, the Fund made the following reclassifications to increase (decrease) the components of net assets:
| | | | |
Paid in Capital | | Accumulated
Undistributed Net
Investment Income | | Accumulated Net
Realized Gain from
Investments |
$– | | $(9,123) | | $9,123 |
NOTE 3. SECURITIES VALUATION AND FAIR VALUE MEASUREMENTS
Fair value is defined as the price that a Fund would receive upon selling an investment in a orderly transaction to an independent buyer in the principal or most advantageous market of the investment. GAAP established a three-tier hierarchy to maximize the use of observable market data and minimize the use of unobservable inputs and to establish classification of fair value measurements for disclosure purposes.
Inputs refer broadly to the assumptions that market participants would use in pricing the asset or liability, including assumptions about risk, (ex., the risk inherent in a particular valuation technique used to measure fair value including items such as a pricing model and/or the risk inherent in the inputs to the valuation technique). Inputs may be observable or unobservable. Observable inputs are inputs that reflect the assumptions market participants would use in pricing the asset or liability developed based on market data obtained from sources independent of the reporting entity. Unobservable inputs are inputs that reflect the reporting entity’s own assumptions about the assumptions market participants would use in pricing the asset or liability developed based on the best information available in the circumstances.
14
BRC LARGE CAP FOCUS EQUITY FUND
NOTES TO THE FINANCIAL STATEMENTS – (continued)
October 31, 2015
NOTE 3. SECURITIES VALUATION AND FAIR VALUE MEASUREMENTS – continued
Various inputs are used in determining the value of the Fund’s investments. These inputs are summarized in the three broad levels listed below.
| | • | | Level 1 – unadjusted quoted prices in active markets for identical investments and/or registered investment companies where the value per share is determined and published and is the basis for current transactions for identical assets or liabilities at the valuation date |
| | • | | Level 2 – other significant observable inputs (including, but not limited to, quoted prices for an identical security in an inactive market, quoted prices for similar securities, interest rates, prepayment speeds, credit risk, etc.) |
| | • | | Level 3 – significant unobservable inputs (including the Fund’s own assumptions in determining fair value of investments based on the best information available) |
The inputs used to measure fair value may fall into different levels of the fair value hierarchy. In such cases, for disclosure purposes, the level in the fair value hierarchy within which the fair value measurement falls in its entirety, is determined based on the lowest level input that is significant to the fair value measurement in its entirety.
Equity securities, including common stocks, are generally valued by using market quotations, furnished by a pricing service. Securities that are traded on any stock exchange are generally valued at the last quoted sale price. Lacking a last sale price, an exchange traded security is generally valued at its last bid price. Securities traded in the NASDAQ over-the-counter market are generally valued at the NASDAQ Official Closing Price. When using the market quotations or close prices provided by the pricing service and when the market is considered active, the security is classified as a Level 1 security. Sometimes, an equity security owned by the Fund will be valued by the pricing service with factors other than market quotations or when the market is considered inactive. When this happens, the security is classified as a Level 2 security. When market quotations are not readily available, when the Fund determines that the market quotation or the price provided by the pricing service does not accurately reflect the current fair value, or when restricted or illiquid securities are being valued, such securities are valued as determined in good faith by the Fund, in conformity with guidelines adopted by and subject to review by the Board. These securities are generally categorized as Level 3 securities.
Investments in open-end mutual funds, including money market mutual funds, are generally priced at the ending net asset value (NAV) provided by the service agent of the funds. These securities will be categorized as Level 1 securities.
In accordance with the Trust’s good faith pricing guidelines, the Adviser is required to consider all appropriate factors relevant to the value of securities for which it has determined other pricing sources are not available or reliable as described above. No single standard exists for determining fair value, because fair value depends upon the circumstances of each individual case. As a general principle, the current fair value of an issue of securities being valued by the Adviser would appear to be the amount which the owner might reasonably expect to receive for them upon their current sale. Methods which are in accordance with this principle may, for example, be based on (i) a multiple of earnings; (ii) a discount from market of a similar freely traded security (including a derivative security or a basket of securities traded on other markets, exchanges or among dealers); or (iii) yield to maturity with respect to debt issues, or a combination of these and other methods. Good faith pricing is permitted if, in the Adviser’s opinion, the validity of market quotations appears to be questionable based on factors such as evidence of a thin market in the security based on a small number of quotations, a significant event occurs after the close
15
BRC LARGE CAP FOCUS EQUITY FUND
NOTES TO THE FINANCIAL STATEMENTS – (continued)
October 31, 2015
NOTE 3. SECURITIES VALUATION AND FAIR VALUE MEASUREMENTS – continued
of a market but before a Fund’s NAV calculation that may affect a security’s value, or the Adviser is aware of any other data that calls into question the reliability of market quotations. Good faith pricing may also be used in instances when the bonds the Fund invests in may default or otherwise cease to have market quotations readily available. Any fair value pricing done outside the Fund’s approved pricing methods must be approved by the Pricing Committee of the Board.
The following is a summary of the inputs used to value the Fund’s investments as of October 31, 2015:
| | | | | | | | | | | | | | | | |
| | | Valuation Inputs | |
| Assets | | Level 1 | | | Level 2 | | | Level 3 | | | Total | |
Common Stocks* | | $ | 21,127,801 | | | $ | – | | | $ | – | | | $ | 21,127,801 | |
Money Market Securities | | | 902,055 | | | | – | | | | – | | | | 902,055 | |
Total | | $ | 22,029,856 | | | $ | – | | | $ | – | | | $ | 22,029,856 | |
| * | Refer to the Schedule of Investments for industry classifications. |
The Fund did not hold any investments at any time during the reporting period in which significant unobservable inputs were used in determining fair value; therefore, no reconciliation of Level 3 securities is included for this reporting period. The Trust recognizes transfers between fair value hierarchy levels at the reporting period end. There were no transfers between any Levels as of October 31, 2015 and the previous reporting period end.
NOTE 4. ADVISER FEES AND OTHER TRANSACTIONS
Under the terms of the management agreement, on behalf of the Fund (the “Agreement”), the Adviser manages the Fund’s investments subject to approval of the Trustees. As compensation for its management services, the Fund is obligated to pay the Adviser a fee computed and accrued daily and paid monthly at an annual rate of 0.47% of the average daily net assets of the Fund. For the year ended October 31, 2015, the Adviser earned a fee of $88,716 from the Fund before the reimbursement described below.
The Adviser has contractually agreed to waive its management fee and/or reimburse expenses through February 28, 2018, so that total annual fund operating expenses, excluding interest, taxes, brokerage commissions, other expenditures which are capitalized in accordance with GAAP, other extraordinary expenses not incurred in the ordinary course of the Fund’s business, dividend expense on short sales, 12b-1 expenses, and expenses that the Fund has incurred but did not actually pay because of an expense offset arrangement, if applicable, incurred by the Fund in any fiscal year, do not exceed 0.55% of the Fund’s average daily net assets. The operating expense limitation also excludes any fees and expenses of acquired funds. For the year ended October 31, 2015, expenses totaling $187,701 were waived or reimbursed by the Adviser and may be subject to potential recoupment by the Adviser until October 31, 2018. At October 31, 2015, the Adviser owed the Fund $8,691.
16
BRC LARGE CAP FOCUS EQUITY FUND
NOTES TO THE FINANCIAL STATEMENTS – (continued)
October 31, 2015
NOTE 4. ADVISER FEES AND OTHER TRANSACTIONS – continued
The amount subject to repayment by the Fund pursuant to the aforementioned conditions are as follows:
| | |
Amount | | October 31, |
$198,220 | | 2016 |
185,217 | | 2017 |
187,701 | | 2018 |
The Trust retains Huntington Asset Services, Inc. (“HASI”) to manage the Fund’s business affairs and provide the Fund with administration services, including all regulatory reporting and necessary office equipment and personnel. For the year ended October 31, 2015, HASI earned fees of $40,500 for administration and compliance services provided to the Fund. At October 31, 2015, HASI was owed $3,125 from the Fund for administration services. Certain officers and trustees of the Trust are members of management and/or employees of HASI. HASI is a wholly-owned subsidiary of Huntington Bancshares, Inc., the parent company of Unified Financial Securities, Inc. (the “Distributor”), the principal underwriter of the Fund’s shares, and Huntington National Bank, the custodian of the Fund’s assets (the “Custodian”). For the year ended up October 31, 2015, the Custodian earned fees of $10,184 for custody services provided to the Fund. At October 31, 2015, the Custodian was owed $877 from the Fund for custody services. There were no payments made by the Fund to the Distributor during the year ended October 31, 2015. An officer and Trustee of the Trust is an officer of the Distributor and such person may be deemed to be an affiliate of the Distributor.
The Trust also retains HASI to act as the Fund’s transfer agent and to provide transfer agent and fund accounting services. For the year ended October 31, 2015, HASI earned fees of $36,844 for transfer agent services to the Fund. At October 31, 2015, the Fund owed HASI $3,315 for transfer agent services. For the year ended October 31, 2015, HASI earned fees of $25,000 from the Fund for fund accounting services. At October 31, 2015, HASI was owed $2,083 from the Fund for fund accounting services.
NOTE 5. PURCHASES AND SALES
For the year ended October 31, 2015, purchases and sales of investment securities, other than short-term investments and short-term U.S. government obligations, were as follows:
| | | | |
Purchases | | | | |
U.S. Government Obligations | | $ | – | |
Other | | | 47,162,772 | |
Sales | | | | |
U.S. Government Obligations | | $ | – | |
Other | | | 42,683,028 | |
NOTE 6. ESTIMATES
The preparation of financial statements in conformity with GAAP requires management to make estimates and assumptions that affect the reported amounts of assets and liabilities and disclosure of contingent assets and liabilities at the date of the financial statements and the reported amounts of increases and decreases in net assets from operations during the reporting period. Actual results could differ from those estimates.
17
BRC LARGE CAP FOCUS EQUITY FUND
NOTES TO THE FINANCIAL STATEMENTS – (continued)
October 31, 2015
NOTE 7. BENEFICIAL OWNERSHIP
The beneficial ownership, either directly or indirectly, of 25% or more of the voting securities of a fund creates a presumption of control of a fund, under Section 2(a) (9) of the Investment Company Act of 1940. At October 31, 2015, Charles Schwab & Co., Inc. for the benefit of its customers, owned 50.29% and Band & Co. owned 31.88%. It is not known whether Charles Schwab & Co., Band & Co., or any of the underlying beneficial owners controlled 25% or more of the voting securities of the Fund.
NOTE 8. FEDERAL TAX INFORMATION
At October 31, 2015, the net unrealized appreciation (depreciation) of investments for tax purposes was as follows:
| | | | |
Gross Appreciation | | $ | 1,608,596 | |
Gross (Depreciation) | | | (442,289 | ) |
| | | | |
Net Appreciation (Depreciation) on Investments | | $ | 1,166,307 | |
| | | | |
At October 31, 2015, the aggregate cost of securities for federal income tax purposes was $20,863,549 for the Fund.
The tax characterization of distributions for the fiscal years ended October 31, 2015 and 2014 was as follows:
| | | | | | | | |
| | | 2015 | | | 2014 | |
Distributions paid from: | | | | | | | | |
Ordinary income* | | $ | 600,944 | | | $ | 55,637 | |
Long-Term Capital Gain | | | 533,783 | | | | – | |
| | | | | | | | |
| | $ | 1,134,727 | | | $ | 55,637 | |
| | | | | | | | |
| * | Short-term capital gain distributions are treated as ordinary income for tax purposes. |
At October 31, 2015, the components of distributable earnings (accumulated losses) on a tax basis were as follows:
| | | | |
Undistributed ordinary income | | $ | 446,341 | |
Undistributed long-term capital gains | | | 664,152 | |
Net unrealized appreciation (depreciation) | | | 1,166,307 | |
| | | | |
| | $ | 2,276,800 | |
| | | | |
At October 31, 2015, the difference between book basis and tax basis unrealized appreciation (depreciation) is primarily attributable to wash sales.
At October 31, 2015, for federal income tax purposes, the Fund has no capital loss carryforwards.
18
BRC LARGE CAP FOCUS EQUITY FUND
NOTES TO THE FINANCIAL STATEMENTS – (continued)
October 31, 2015
NOTE 9. COMMITMENTS AND CONTINGENCIES
The Fund indemnifies its officers and trustees for certain liabilities that may arise from the performance of their duties to the Fund. Additionally, in the normal course of business, the Fund enters into contracts that contain a variety of representations and warranties which provide general indemnifications. The Fund’s maximum exposure under these arrangements is unknown, as this would involve future claims that may be made against the Fund that have not yet occurred.
NOTE 10. SUBSEQUENT EVENTS
Management of the Fund has evaluated the need for disclosures resulting from subsequent events through the date these financial statements were issued. Subsequent to the period end, on November 13, 2015, Huntington Bancshares Inc. entered in an agreement to sell Huntington Asset Services, Inc. and Unified Financial Services, Inc. to Ultimus Fund Solutions, LLC. The sale is expected to close by the end of December 2015, subject to customary closing conditions. Management has determined that there were no additional items requiring additional disclosure.
19
REPORT OF INDEPENDENT REGISTERED PUBLIC ACCOUNTING FIRM
To the Shareholders of BRC Large Cap Focus Equity Fund and
Board of Trustees of Valued Advisers Trust
We have audited the accompanying statement of assets and liabilities, including the schedule of investments, of BRC Large Cap Focus Equity Fund (the “Fund”), a series of Valued Advisers Trust, as of October 31, 2015, and the related statement of operations for the year then ended, the statements of changes in net assets for each of the two years in the period then ended, and the financial highlights for each of the three periods in the period then ended. These financial statements and financial highlights are the responsibility of the Fund’s management. Our responsibility is to express an opinion on these financial statements and financial highlights based on our audits.
We conducted our audits in accordance with the standards of the Public Company Accounting Oversight Board (United States). Those standards require that we plan and perform the audits to obtain reasonable assurance about whether the financial statements and financial highlights are free of material misstatement. An audit includes examining, on a test basis, evidence supporting the amounts and disclosures in the financial statements. Our procedures included confirmation of securities owned as of October 31, 2015, by correspondence with the custodian and brokers or by other appropriate auditing procedures where replies from brokers were not received. An audit also includes assessing the accounting principles used and significant estimates made by management, as well as evaluating the overall financial statement presentation. We believe that our audits provide a reasonable basis for our opinion.
In our opinion, the financial statements and financial highlights referred to above present fairly, in all material respects, the financial position of BRC Large Cap Focus Equity Fund as of October 31, 2015, the results of its operations for the year then ended, the changes in its net assets for each of the two years in the period then ended, and the financial highlights for each of the three periods in the period then ended, in conformity with accounting principles generally accepted in the United States of America.
COHEN FUND AUDIT SERVICES, LTD.
Cleveland, Ohio
December 23, 2015
20
ADDITIONAL FEDERAL INCOME TAX INFORMATION (Unaudited)
The Form 1099-DIV you receive in January 2016 will show the tax status of all distributions paid to your account in calendar year 2015. Shareholders are advised to consult their own tax adviser with respect to the tax consequences of their investment in the Fund. As required by the Internal Revenue Code and/or regulations, shareholders must be notified regarding the status of qualified dividend income for individuals and the dividends received deduction for corporations.
Qualified Dividend Income. The Fund designates approximately 6.44% or up to the maximum amount of such dividends allowable pursuant to the Internal Revenue Code, as qualified dividend income eligible for the reduced tax rate of 15%.
Dividends Received Deduction. Corporate shareholders are generally entitled to take the dividends received deduction on the portion of the Fund’s dividend distribution that qualifies under tax law. For the Fund’s calendar year 2015 ordinary income dividends, 5.29% qualifies for the corporate dividends received deduction.
For the year ended October 31, 2015, the Fund designated $533,783 as long-term capital gain distributions.
21
TRUSTEES AND OFFICERS (Unaudited)
The Board of Trustees supervises the business activities of the Trust. Each Trustee serves as a trustee until termination of the Trust unless the Trustee dies, resigns, retires or is removed.
The following tables provide information regarding the Trustees and Officers.
The following table provides information regarding each of the Independent Trustees.
| | | | |
Name, Address*, (Age), Position with Trust**, Term of Position with Trust | | Principal Occupation
During Past 5 Years | | Other Directorships |
Ira Cohen, 56, Independent Trustee, June 2010 to present. | | Independent financial services consultant since February 2005; Executive Vice President of Asset Management Services, Recognos Financial, since August 2015. | | Trustee and Audit Committee Chairman, Griffin Institutional Access Real Estate Fund, since May 2014. Trustee, Angel Oak Funds Trust, since October 2014 |
Andrea N. Mullins, 48, Independent Trustee, December 2013 to present. | | Private investor; Independent Contractor, Seabridge Wealth Management, LLC, since April 2014; Principal Financial Officer and Treasurer, Eagle Family of Funds (mutual fund family) and Vice President, Eagle Asset Management, Inc. (investment adviser) each from 2004 to 2010. | | None. |
| * | The address for each trustee and officer is 2960 N. Meridian St., Suite 300, Indianapolis, IN 46208. |
| ** | As of the date of this report, the Trust consists of 14 series. |
22
The following table provides information regarding the Trustee who is considered an “interested person” of the Trust, as that term is defined under the 1940 Act. Based on the experience of the Trustee, the Trust concluded that the individual described below should serve as a Trustee.
| | | | |
Name, Address*, (Age), Position with Trust**, Term of Position with Trust | | Principal Occupation
During Past 5 Years | | Other Directorships |
R. Jeffrey Young, 51, Trustee and Chairman, June 2010 to present. | | Principal Executive Officer and President, Valued Advisers Trust since February 2010; President, Huntington Asset Services, Inc., since April 2015; Director since May 2014; Senior Vice President January 2010 to April 2015; President, Unified Financial Securities, Inc. since July 2015; Director since May 2014; Chief Executive Officer, Huntington Funds, February 2010 to March 2015; Chief Executive Officer, Huntington Strategy Shares, November 2010 to March 2015; President and Chief Executive Officer, Dreman Contrarian Funds, March 2011 to February 2013; Trustee, Valued Advisers Trust, August 2008 to January 2010; and Managing Director and Chief Operating Officer of Professional Planning Consultants, from 2007 to 2010. | | Trustee and Chairman, Capitol Series Trust, since September 2013. |
| * | The address for each trustee and officer is 2960 N. Meridian St., Suite 300, Indianapolis, IN 46208. |
| ** | As of the date of this report, the Trust consists of 14 series. |
23
The following table provides information regarding the Officers of the Trust:
| | | | |
Name, Address*, (Age), Position with Trust,** Term of Position with Trust | | Principal Occupation
During Past 5 Years | | Other Directorships |
R. Jeffrey Young, 51, Trustee and Chairman, June 2010 to present; Principal Executive Officer and President, Valued Advisers Trust since February 2010; | | President, Huntington Asset Services, Inc., since April 2015; Director since May 2014; Senior Vice President January 2010 to April 2015; President, Unified Financial Securities, Inc. since July 2015; Director since May 2014; Chief Executive Officer, Huntington Funds, February 2010 to March 2015; Chief Executive Officer, Huntington Strategy Shares, November 2010 to March 2015; President and Chief Executive Officer, Dreman Contrarian Funds, March 2011 to February 2013; Trustee, Valued Advisers Trust, August 2008 to January 2010; and Managing Director and Chief Operating Officer of Professional Planning Consultants, from 2007 to 2010. | | Trustee and Chairman, Capitol Series Trust, since September 2013. |
John C. Swhear, 54, Chief Compliance Officer, AML Officer and Vice President, August 2008 to present. | | Vice President of Legal Administration and Compliance for Huntington Asset Services, Inc., the Trust’s administrator, since April 2007 and Director since May 2014; Chief Compliance Officer of Unified Financial Securities, Inc., the Trust’s distributor, since May 2007 and Director since May 2014; President of the Unified Series Trust since March 2012, and Senior Vice President from May 2007 to March 2012; Chief Compliance Officer and AML Officer, Capitol Series Trust, since September 2013; Secretary of Huntington Funds from April 2010 to February 2012; President and Chief Executive Officer of Dreman Contrarian Funds from March 2010 to March 2011. | | None. |
24
| | | | |
Name, Address*, (Age), Position with Trust,** Term of Position with Trust | | Principal Occupation
During Past 5 Years | | Other Directorships |
Carol J. Highsmith, 50, Vice President, August 2008 to present; Secretary, March 2014 to present | | Employed in various positions with Huntington Asset Services, Inc., the Trust’s administrator, since November 1994; currently Vice President of Legal Administration; Secretary, Cross Shore Discovery Fund since May 2014. | | None. |
Matthew J. Miller, 39, Vice President, December 2011 to present. | | Employed in various positions with Huntington Asset Services, Inc., the Trust’s administrator, since July 1998; currently Vice President of Relationship Management; Vice President, Huntington Funds, since February 2010; President and Chief Executive Officer, Capitol Series Trust, since September 2013. | | None. |
Bryan W. Ashmus, 42, Principal Financial Officer and Treasurer, December 2013 to present. | | Vice President, Financial Administration, Huntington Asset Services, Inc., the Trust’s administrator, since September 2013; Chief Financial Officer and Treasurer, The Huntington Strategy Shares and The Huntington Funds, since November 2013; Vice President, Fund Administration, Citi Fund Services Ohio, Inc., from 2005 to 2013. | | None. |
| * | The address for each trustee and officer is 2960 N. Meridian St., Suite 300, Indianapolis, IN 46208. |
| ** | As of the date of this report, the Trust consists of 14 series. |
25
MANAGEMENT AGREEMENT RENEWALS (Unaudited)
At a meeting held on September 9-10, 2015, the Board of Trustees (the “Board”) considered the renewal of the Investment Advisory Agreements (the “Agreements”) between the Trust and BRC Investment Management, Inc. (the “Adviser” or “BRC”) with respect to each of the BRC Large Cap Focus Equity Fund and the BRC Mid Cap Diversified Equity Fund (collectively, the “BRC Funds”). Counsel noted that the 1940 Act requires the approval of the investment advisory agreement between the Trust and its investment adviser by the Board, including a majority of the Independent Trustees. The Board discussed the arrangements between the Adviser and the Trust with respect to the BRC Funds.
The Board then considered the proposed renewal of the Agreements between the Trust and BRC with respect to the BRC Funds. The Board discussed the contractual arrangements between BRC and the Trust with respect to the BRC Funds. Counsel reminded the Trustees of their fiduciary duties and responsibilities as summarized in the memorandum from his firm, including the Factors to be considered, and the application of those Factors to BRC. In assessing these Factors and reaching its decisions, the Board took into consideration information furnished for the Board’s review and consideration throughout the year at regular Board meetings, as well as information specifically prepared and/or presented in connection with the annual renewal process, including information presented at the Meeting. The Board acknowledged that much of the information provided related to the BRC Large Cap Focus Equity Fund only, because the BRC Mid Cap Diversified Equity Fund has not yet commenced operations. The Board requested and was provided with, and reflected on, information and reports relevant to the annual renewal of the Agreements, including: (i) reports regarding the services and support provided to the BRC Funds and its shareholders by BRC; (ii) quarterly assessments of the investment performance of the BRC Funds by personnel of BRC; (iii) commentary on the reasons for the performance; (iv) presentations by BRC addressing BRC’s investment philosophy, investment strategy, personnel and operations; (v) compliance and audit reports concerning the BRC Funds and BRC; (vi) disclosure information contained in the registration statement of the Trust and the Form ADV of BRC; and (vii) a memorandum from Counsel, that summarized the fiduciary duties and responsibilities of the Board in reviewing and approving the Agreements, including the material Factors set forth above and the types of information included in each Factor that should be considered by the Board in order to make an informed decision. The Board also requested and received various informational materials including, without limitation: (i) documents containing information about BRC, including financial information, a description of personnel and the services provided to the BRC Funds, information on investment advice, performance, summaries of BRC Funds’ expenses, compliance program, current legal matters, and other general information; (ii) comparative expense and performance information for other mutual funds with strategies similar to the BRC Funds, as well as for separate accounts managed by BRC; and (iii) benefits to be realized by BRC from its relationship with the BRC Funds. The Board did not identify any particular information that was most relevant to its consideration to approve the Agreements and each Trustee may have afforded different weight to the various Factors.
BRC Large Cap Focus Equity Fund
| 1. | The nature, extent, and quality of the services to be provided by the Adviser. In this regard, the Board considered the Adviser’s responsibilities under the Agreement. The Board reviewed the services being provided by BRC to the BRC Large Cap Focus Equity Fund including, without limitation: BRC’s procedures for formulating investment recommendations and assuring compliance with the BRC Large Cap Focus Equity Fund’s investment objectives and limitations; its anticipated coordination of services for the BRC Large Cap Focus Equity Fund among the BRC Large Cap Focus Equity Fund’s service providers, and its efforts to promote the BRC Large Cap Focus Equity Fund, grow its assets, and assist in the distribution of the BRC Large Cap Focus Equity Fund shares. The Board considered: BRC’s staffing, personnel, and methods of operating; the education and experience of BRC’s personnel; and BRC’s compliance program, policies, and procedures. The Trustees also discussed BRC’s continued cooperation with the Independent Trustees and Counsel for the BRC Large Cap Focus Equity Fund. After reviewing the foregoing and further information from BRC (including BRC’s Form ADV), the Board concluded that, in light of all the facts and |
26
| | circumstances, the quality, extent, and nature of the services provided by BRC were satisfactory and adequate for the BRC Large Cap Focus Equity Fund. |
| 2. | Investment Performance of the BRC Large Cap Focus Equity Fund and the Adviser. In evaluating the investment performance of the BRC Large Cap Focus Equity Fund and the Adviser, the Trustees compared the short-term performance, including the year-to-date, one month, three month, and 1-year cumulative return and since inception annualized returns of the BRC Large Cap Focus Equity Fund (for the periods ending June 30, 2015) with the performance of funds with similar objectives managed by other investment advisers, as well as with aggregated peer group data. The Trustees also considered the consistency of BRC’s management of the BRC Large Cap Focus Equity Fund with its investment objective, strategies, and limitations. The Trustees noted that the BRC Large Cap Focus Equity Fund’s performance was above the median and the average of its peers for most periods presented. It was also noted that the BRC Large Cap Focus Equity Fund outperformed its benchmark for the year to date period. The Board also considered the performance of BRC’s separate accounts that were managed in a manner similar to that of the BRC Large Cap Focus Equity Fund and they noted that the performance was very comparable. Following further discussion regarding the performance of the BRC Large Cap Focus Equity Fund, BRC’s experience managing the BRC Large Cap Focus Equity Fund, the BRC Large Cap Focus Equity Fund’s historical performance, and other relevant factors, the Board concluded, in light of all the facts and circumstances, that the investment performance of the BRC Large Cap Focus Equity Fund and BRC was satisfactory. |
| 3. | The costs of the services to be provided and profits to be realized by the Adviser from the relationship with the BRC Large Cap Focus Equity Fund. In considering the costs of services to be provided and the profits to be realized by the Adviser from the relationship with the BRC Large Cap Focus Equity Fund, the Trustees considered: (1) BRC’s financial condition; (2) the asset levels of the BRC Large Cap Focus Equity Fund; (3) the overall expenses of the BRC Large Cap Focus Equity Fund; and (4) the nature and frequency of advisory fee payments. The Trustees reviewed information provided by BRC regarding its profits associated with managing the BRC Large Cap Focus Equity Fund. The Trustees also considered potential benefits for BRC in managing the BRC Large Cap Focus Equity Fund. The Trustees compared the fees and expenses of the BRC Large Cap Focus Equity Fund (including the management fee) to other comparable mutual funds. The Trustees noted that the BRC Large Cap Focus Equity Fund’s management fee was lower than the average and median of its peer group, and that the advisory fee paid by the BRC Large Cap Focus Equity Fund was lower than the fee paid by BRC’s separate account clients at the current asset level of the BRC Large Cap Focus Equity Fund. The Trustees also noted that, in light of the contractual Expense Limitation Agreement the BRC Large Cap Focus Equity Fund’s anticipated expense ratio is lower than the average and median of its peer group. Based on the foregoing, the Board concluded that the fees to be paid to BRC by the BRC Large Cap Focus Equity Fund and the profits to be realized by the BRC Large Cap Focus Equity Fund, in light of all the facts and circumstances, were fair and reasonable in relation to the nature and quality of the services provided by BRC. |
| 4. | The extent to which economies of scale would be realized as the BRC Large Cap Focus Equity Fund grows and whether advisory fee levels reflect these economies of scale for the benefit of the BRC Large Cap Focus Equity Fund’s investors. In this regard, the Board considered the BRC Large Cap Focus Equity Fund’s fee arrangements with the Adviser. The Board noted that the management fee remained the same as asset levels increased, although it also noted that the shareholders of the BRC Large Cap Focus Equity Fund had experienced benefits from the Expense Limitation Agreement. The Board also noted that the BRC Large Cap Focus Equity Fund would benefit from economies of scale under its agreements with service providers other than BRC. Based on its ongoing consideration of the BRC Large Cap Focus Equity Fund’s asset levels, expectations for growth, and fee levels, the Board determined that the BRC Large Cap Focus Equity Fund’s fee arrangements with BRC were fair and reasonable in relation to the nature and quality of the services provided by BRC. |
27
| 5. | Possible conflicts of interest and benefits to the Adviser. In considering the Adviser’s practices regarding conflicts of interest, the Trustees evaluated the potential for conflicts of interest and considered such matters as the experience and ability of the advisory personnel assigned to the BRC Large Cap Focus Equity Fund; the basis of decisions to buy or sell securities for the BRC Large Cap Focus Equity Fund and/or BRC’s other accounts; and the substance and administration of BRC’s code of ethics. The Trustees also considered disclosure in the registration statement of the Trust relating to BRC’s potential conflicts of interest. The Trustees discussed BRC’s practices with regard to soft dollars. The Trustees noted that BRC benefited from the BRC Large Cap Focus Equity Fund in that it is able to utilize the BRC Large Cap Focus Equity Fund as a vehicle into which to direct defined contribution plans. The Trustees did not identify any other potential benefits (other than the management fee) that would be realized by BRC. Based on the foregoing, the Board determined that the standards and practices of BRC relating to the identification and mitigation of potential conflicts of interest and the benefits that it derives from managing the BRC Large Cap Focus Equity Fund are acceptable. |
BRC Mid-Cap Diversified Equity Fund
| 1. | The nature, extent, and quality of the services to be provided by the Adviser. In this regard, the Board acknowledged that the BRC Mid Cap Diversified Equity Fund had not commenced operations. They considered responsibilities that BRC has under the Agreement. The Trustees considered the services to be provided by BRC to the BRC Mid Cap Diversified Equity Fund, including without limitation: BRC’s procedures for formulating investment recommendations and assuring compliance with the BRC Mid Cap Diversified Equity Fund’s investment objectives and limitations; the efforts of BRC during the BRC Mid Cap Diversified Equity Fund’s start-up phase, its anticipated coordination of services for the BRC Mid Cap Diversified Equity Fund among the BRC Mid Cap Diversified Equity Fund’s service providers, and its anticipated efforts to promote the BRC Mid Cap Diversified Equity Fund and grow its assets. The Trustees considered BRC’s continuity of, and commitment to retain, qualified personnel and BRC’s commitment to maintain and enhance its resources and systems, and BRC’s cooperation with the Board and Counsel for the BRC Mid Cap Diversified Equity Fund. The Trustees acknowledged their reliance, in part, on their experience with BRC in its management of another series of the Trust. The Trustees considered BRC’s personnel, including the education and experience of BRC’s personnel and BRC’s compliance program, policies and procedures. After considering the foregoing information and further information in the Meeting materials provided by BRC (including BRC’s Form ADV), the Board concluded that, in light of all the facts and circumstances, the nature, extent, and quality of the services to be provided by BRC will be satisfactory and adequate for the BRC Mid Cap Diversified Equity Fund. |
| 2. | Investment Performance of the BRC Mid Cap Diversified Equity Fund and the Adviser. The Board noted that while the BRC Mid Cap Diversified Equity Fund had not commenced operations and thus did not have investment performance information to review, the Board could consider the investment performance of the Adviser in managing accounts similar to the manner in which the BRC Mid Cap Diversified Equity Fund would be managed. The Board reviewed performance history of BRC’s mid cap diversified strategy and observed that the strategy has consistently outperformed its benchmark for the year to date, 3 year, 5 year, and since inception periods ended June 30, 2015, and has underperformed for the 1 year period. After reviewing the performance, the Board concluded, in light of the foregoing factors, that the investment performance of BRC was satisfactory. |
| 3. | The costs of the services to be provided and profits to be realized by the Adviser from the relationship with the BRC Mid Cap Diversified Equity Fund. In this regard, the Board considered: the financial condition of BRC and the level of commitment to the BRC Mid Cap Diversified Equity Fund and BRC by the principals of BRC; the projected asset levels of the BRC Mid Cap Diversified Equity Fund; BRC’s payment of startup costs for the BRC Mid Cap Diversified Equity Fund; and the overall anticipated expenses of the BRC Mid Cap Diversified Equity Fund, including the expected nature and frequency of advisory fee payments. The Board also considered potential benefits for BRC in managing the BRC Mid Cap Diversified Equity Fund. |
28
| | The Board compared the expected fees and expenses of the BRC Mid Cap Diversified Equity Fund (including the management fee) to other funds comparable to the BRC Mid Cap Diversified Equity Fund in terms of the type of fund, the style of investment management, the anticipated size of the BRC Mid Cap Diversified Equity Fund and the nature of the investment strategy and markets invested in, among other factors. The Board determined that the management fee is less than the average and median of its anticipated peer group, and that, in light of the contractual Expense Limitation Agreement the BRC Mid Cap Diversified Equity Fund’s anticipated expense ratio was the lowest of its peer group. Following this comparison and upon further consideration and discussion of the foregoing, the Board concluded that the fees to be paid to BRC by the BRC Mid Cap Diversified Equity Fund were fair and reasonable. |
| 4. | The extent to which economies of scale would be realized as the BRC Mid Cap Diversified Equity Fund grows and whether advisory fee levels reflect these economies of scale for the benefit of the BRC Mid Cap Diversified Equity Fund’s investors. In this regard, the Board considered the BRC Mid Cap Diversified Equity Fund’s fee arrangements with BRC. The Board noted that the management fee would stay the same as asset levels increased, although it also noted that the shareholders of the BRC Mid Cap Diversified Equity Fund would benefit from the Expense Limitation Agreement. The Board also noted that the BRC Mid Cap Diversified Equity Fund would benefit from economies of scale under the Trust’s agreements with service providers other than BRC. Following further discussion of the BRC Mid Cap Diversified Equity Fund’s projected asset levels, expectations for growth, and levels of fees, the Board determined that the BRC Mid Cap Diversified Equity Fund’s fee arrangements with BRC were fair and reasonable in relation to the nature and quality of the services to be provided by BRC. |
| 5. | Possible conflicts of interest and benefits to the Adviser. In evaluating the possibility for conflicts of interest, the Board considered such matters as: the experience and ability of the advisory personnel assigned to the BRC Mid Cap Diversified Equity Fund; the basis of decisions to buy or sell securities for the BRC Mid Cap Diversified Equity Fund and/or BRC’s other accounts; the substance and administration of BRC’s code of ethics and other relevant policies described in BRC’s Form ADV. With respect to benefits to BRC (in addition to the fees under the Agreement), the Board noted that BRC would benefit from its relationship with the BRC Mid Cap Diversified Equity Fund as the BRC Mid Cap Diversified Equity Fund would provide the ability to market BRC’s mid cap strategy in a mutual fund format, which is more suitable for defined contribution retirement plans than the products currently offered. The Board noted that BRC would also benefit from the use of soft dollars with respect to the BRC Mid Cap Diversified Equity Fund. Following further consideration and discussion, the Board indicated that BRC’s standards and practices relating to the identification and mitigation of potential conflicts of interest were satisfactory and the anticipated benefits to be realized by BRC from managing the BRC Mid Cap Diversified Equity Fund were acceptable. |
After additional consideration of the factors delineated in the memorandum provided by Counsel and further discussion among the Board, the Board determined to approve the continuation of the Agreements between the Trust and the Adviser.
29
OTHER INFORMATION
The Fund’s Statement of Additional Information (“SAI”) includes additional information about the trustees and is available without charge, upon request. You may call toll-free at (877) 272-1214 to request a copy of the SAI or to make shareholder inquiries.
PROXY VOTING
A description of the policies and procedures that the Fund uses to determine how to vote proxies relating to portfolio securities and information regarding how the Fund voted those proxies is available without charge upon request by (1) calling the Fund at (877) 272-1214 and (2) from Fund documents filed with the Securities and Exchange Commission (“SEC”) on the SEC’s website at www.sec.gov.
TRUSTEES
R. Jeffrey Young, Chairman
Ira Cohen
Andrea N. Mullins
OFFICERS
| R. | Jeffrey Young, Principal Executive Officer and President |
| John | C. Swhear, Chief Compliance Officer, AML Officer and Vice President |
| Carol | J. Highsmith, Vice President and Secretary |
| Matthew | J. Miller, Vice President |
| Bryan | W. Ashmus, Principal Financial Officer and Treasurer |
INVESTMENT ADVISER
BRC Investment Management LLC
8400 East Prentice Avenue, Suite 1401
Greenwood Village, Colorado 80111
DISTRIBUTOR
Unified Financial Securities, Inc.
2960 North Meridian Street, Suite 300
Indianapolis, IN 46208
INDEPENDENT REGISTERED PUBLIC ACCOUNTING FIRM
Cohen Fund Audit Services Ltd.
1350 Euclid Avenue, Suite 800
Cleveland, OH 44115
LEGAL COUNSEL
The Law Offices of John H. Lively & Associates, Inc.
A member firm of The 1940 Act Law GroupTM
11300 Tomahawk Creek Parkway, Ste. 310
Leawood, KS 66211
CUSTODIAN
Huntington National Bank
41 South High Street
Columbus, OH 43215
ADMINISTRATOR, TRANSFER AGENT AND FUND ACCOUNTANT
Huntington Asset Services, Inc.
2960 North Meridian Street, Suite 300
Indianapolis, IN 46208
This report is intended only for the information of shareholders or those who have received the Fund’s prospectus which contains information about the Fund’s management fee and expenses. Please read the prospectus carefully before investing.
Distributed by Unified Financial Securities, Inc.
Member FINRA/SIPC
30
PRIVACY POLICY
The following is a description of the Fund’s policies regarding disclosure of nonpublic personal information that you provide to the Fund or that the Fund collects from other sources. In the event that you hold shares of the Fund through a broker-dealer or other financial intermediary, the privacy policy of your financial intermediary would govern how your nonpublic personal information would be shared with nonaffiliated third parties.
Categories of Information the Fund Collects. The Fund collects the following nonpublic personal information about you:
| • | | Information the Fund receives from you on applications or other forms, correspondence, or conversations (such as your name, address, phone number, social security number, and date of birth); and |
| • | | Information about your transactions with the Fund, its affiliates, or others (such as your account number and balance, payment history, cost basis information, and other financial information). |
Categories of Information the Fund Discloses. The Fund does not disclose any nonpublic personal information about its current or former shareholders to unaffiliated third parties, except as required or permitted by law. The Fund is permitted by law to disclose all of the information it collects, as described above, to service providers (such as the Fund’s custodian, administrator, transfer agent, accountant and legal counsel) to process your transactions and otherwise provide services to you.
Confidentiality and Security. The Fund restricts access to your nonpublic personal information to those persons who require such information to provide products or services to you. The Fund maintains physical, electronic, and procedural safeguards that comply with federal standards to guard your nonpublic personal information.
Disposal of Information. The Fund, through its transfer agent, has taken steps to reasonably ensure that the privacy of your nonpublic personal information is maintained at all times, including in connection with the disposal of information that is no longer required to be maintained by the Fund. Such steps shall include, whenever possible, shredding paper documents and records prior to disposal, requiring off-site storage vendors to shred documents maintained in such locations prior to disposal, and erasing and/or obliterating any data contained on electronic media in such a manner that the information can no longer be read or reconstructed.
31
|
Annual Report October 31, 2015 |
Dreman Contrarian Small Cap Value Fund
Fund Adviser:
Dreman Value Management, LLC
1515 North Flagler Drive, Suite 920
West Palm Beach, FL 33401
Toll Free: (800) 247-1014

| | |
Dreman Contrarian Small Cap Value Fund |
Market Overview and Fund Performance
The Dreman Contrarian Small Cap Value Fund (the “Fund”) returned 0.46% (Institutional Class) during the 12-month period ended October 31, 2015. The Fund’s benchmark, the Russell 2000® Value Index(a), returned -2.88% for the same period.
Performance Attribution
For the year, the Fund’s performance was highlighted by strong stock selection in the Industrials, Consumer Discretionary, Financials, Information Technology, Consumer Staples, and Utilities sectors. Stock selection in the Energy and Materials sectors weighed on performance.
Brinks Company was the best performing Industrials stock for the year. The secure logistics and security solutions company was up 49.8% as the company continued to grow organically despite significant currency headwinds, especially in Venezuela. In addition, the company’s margins have been steadily rising as management has implemented several strategic initiatives to improve profitability.
Universal Forest Products, a supplier of building materials for residential and commercial construction and manufactured housing, was also a strong performer jumping 47.6%. The company has posted strong earnings fueled by a recovery in the housing markets coupled with new product introductions that reduce the company’s sensitivity to lumber prices.
Offsetting some of these gains was Tutor Perini dropping 40.1% for the year. The company has seen several project delays which have led to investor concerns over the timing of cash payments. However, as of the period end, we continue to hold the stock given that company continues to build its backlog across all segments. We remain overweight the Industrials Sector.
Household Durable Company, Helen of Troy, gained 60.4% as lower oil prices fueled margin gains. Helen of Troy owns several well-known personal care and household brands including, Honeywell, Braun, Vicks, Revlon, and Dr. Scholls, among others. Given the stock’s strong performance, we opportunistically took profits. The portfolio’s Auto Component stocks also performed well for the year as Cooper Tire and American Axle posted gains of 31.3% and 14.6%, respectively. Cooper Tire posted strong revenue growth in North America coupled with higher margins as falling oil process reduced raw material costs. American Axle, a leading provider of vehicle driveline systems to light tucks, has seen increased demand for pickup trucks and SUVs, fueling stronger revenue growth over the past year. We are currently slightly underweight the Consumer Discretionary Sector.
On the negative side, Energy was the largest loser for the year. The collapse of oil in the fourth quarter of 2014 from $91 to $53 pushed all of our energy holdings lower. Unfortunately, oil has continued to languish despite Exploration and Production companies slashing capex spending and shutting in well production. We believe an opportunity within Energy is beginning to emerge as many companies are down over 50%; however, we are still cautious in calling the bottom as oil prices appear to be range bound. We believe it may take several more quarters for the capex cuts and well shut-ins to begin impacting oil prices. Needless to say, our value instincts are on high alert and we continue to closely monitor the stocks within the Energy sector, though for now, we remain underweight.
Outlook and Positioning
Our investment outlook for equities remains positive, though somewhat muted due to uncertainties about the outlook for China, the interest rate environment and the rise in tensions in the Middle East. We are also concerned with the rise in U.S. business inventories, which helped the U.S. print a strong second quarter
Annual Report
1
GDP number, but eventually have to be worked off. With the S&P 500® Index(a) trading at approximately 17 times 2015 earnings and 15.6 times 2016 estimates, the market is trading in its historic valuation range.
Earnings growth and interest rates remain the key drivers for the market looking forward. While we continue to believe rates will move higher in the coming quarters, especially short-term rates, we do not see a major spike in rates at longer maturities in the near future. The relative strength of the U.S. economy, the lack of inflation as measured by the Consumer Price Index and the turmoil in many parts of the emerging markets, leaves the U.S. in a relatively strong position to attract capital and hence keep our rates low.
As much as we dislike the recent volatility in the market, the recent decline has created more interesting opportunities than we have seen in some time. As contrarians, we are attracted to stocks in turmoil. Our experience has shown that, once we are comfortable with the fundamental value of a stock, buying when others are fearful pays off over time. Across every sector, we are finding companies that have declined in price by 20%, 30% or even 40% despite minimal deterioration in the company’s fundamentals. Because of this, we expect to take advantage of the recent pullback to reposition the portfolio into newly created value opportunities.
The Fund’s performance quoted is past performance and does not guarantee future results. The investment return and principal value of an investment in the Fund will fluctuate so that an investor’s shares, when redeemed, may be worth more or less than their original cost. Current performance of the Fund may be lower or higher than the performance quoted. Performance data current to the most recent month end may be obtained by calling 1-800-247-1014. Information provided with respect to the Fund’s Portfolio Holdings, Sector Weightings and Number of Holdings are as of October 31, 2015 and are subject to change at any time.
You should carefully consider the investment objectives, potential risks, management fees, and charges and expenses of the Fund before investing. The Fund’s prospectus contains this and other information about the Fund, and should be read and considered carefully before investing. You may obtain a current copy of the Fund’s prospectus by calling 1-800-247-1014 or by visiting http://www.dremancontrarianfunds.com. Past performance is no guarantee of future results. The investment return and principal value of an investment in the Fund will fluctuate so that an investor’s shares, when redeemed, may be worth more or less than their original cost.
The Fund is distributed by Unified Financial Securities, Inc., 2960 North Meridian Street, Suite 300, Indianapolis, IN 46208 (Member FINRA).
Value stocks may remain undervalued for extended periods of time and the market may not recognize the intrinsic value of these securities.
Micro cap and small cap investing involves greater risk not associated with investing in more established companies, such as greater price volatility, business risk, less liquidity and increased competitive threat.
| (a) | The Russell 2000® Value Index is a widely recognized unmanaged index of equity prices and is representative of a broader market and range of securities than is found in the Fund’s portfolio. The Russell 2000® Value Index measures the performance of small-cap value segment of the U.S. equity universe. It includes those Russell 2000 companies with lower price-to-book ratios and lower forecasted growth values. The S&P 500® Index is widely recognized unmanaged index of equity securities and is representative of a broader domestic equity market and range of securities than is found in the Fund’s portfolio. Individuals cannot invest directly in an index; however, an individual can invest in exchange traded funds or other investment vehicles that attempt to track the performance of a benchmark index. |
Annual Report
2
The opinions expressed are those of the investment management team and are subject to change without notice, as are statements of financial market trends, which are based on current conditions. Under no circumstances does the information contained within represent a recommendation to buy, hold or sell any security and it should not be assumed that the companies discussed were, or will prove to be, profitable. Current and future holdings are subject to risk.
This material has been prepared for investors and investment professionals,
including broker-dealers and investment advisers.
Annual Report
3
| | |
Investment Results – (Unaudited) | | |
| | | | | | | | | | | | | | | | | | | | |
Total Returns*
As of October 31, 2015 | |
| | | | | | |
| | | Class A with
Load | | | Class A without
Load | | | Retail
Class | | | Institutional
Class | | | Russell 2000®
Value Index(a) | |
One Year | | | -5.53 | % | | | 0.24 | % | | | 0.21 | % | | | 0.46 | % | | | -2.88 | % |
Three Year | | | 12.06 | % | | | 14.30 | % | | | 14.24 | % | | | 14.46 | % | | | 11.65 | % |
Five Year | | | 8.98 | % | | | 10.29 | % | | | 10.24 | % | | | 10.46 | % | | | 10.53 | % |
Ten Year | | | N/A | | | | N/A | | | | 8.97 | % | | | N/A | | | | 6.19 | % |
Since Inception (11/20/09) | | | 10.06 | % | | | 11.16 | % | | | N/A | | | | N/A | | | | 12.13 | % |
Since Inception (8/22/07) | | | N/A | | | | N/A | | | | N/A | | | | 6.62 | % | | | 4.89 | % |
Since Inception (12/31/03) | | | N/A | | | | N/A | | | | 10.09 | % | | | N/A | | | | 6.98 | % |
| | | | |
| | | | | | Expense Ratios(b) | | | | |
| | | | | | |
| | | | | | Class A | | | Retail
Class | | | Institutional
Class | | | | |
| | | | | | | | 1.41 | % | | | 1.41 | % | | | 1.16 | % | | | | |
The investment return and principal value of an investment will fluctuate so that an investor’s shares, when redeemed, may be worth more or less than their original cost. The returns shown do not reflect deduction of taxes that a shareholder would pay on Fund distributions or the redemption of Fund shares. THE FUND’S RETURNS REPRESENT PAST PERFORMANCE AND DO NOT PREDICT FUTURE RESULTS. The returns shown are net of all recurring expenses. Current performance of the Fund may be lower or higher than the performance quoted. For more information on the Fund, and to obtain performance data current to the most recent month end, or to request a prospectus or summary prospectus, please call 1-800-247-1014.
You should carefully consider the investment objectives, potential risk, management fees, and charges and expenses of the Fund before investing. The Fund’s prospectus and summary prospectus contains this and other information about the Fund, and should be read carefully before investing.
| * | The total return figures set forth above include all waivers of fees for various periods since inception. Without such fee waivers, the total returns would have been lower. Total return figures reflect any change in price per share and assume reinvestment of all distributions. Total returns for periods less than 1 year are not annualized. |
| (a) | The Russell 2000® Value Index (“Index”) is an unmanaged benchmark that assumes reinvestment of all distributions and excludes the effect of taxes and fees. The Index is a widely recognized unmanaged index of equity prices and is representative of a broader market and range of securities than are found in the Fund’s portfolio. Individuals cannot invest directly in the Index; however, an individual can invest in ETFs or other investment vehicles that attempt to track the performance of a benchmark index. |
| (b) | The expense ratios are from the Fund’s prospectus dated February 28, 2015. The Adviser has contractually agreed to waive its management fee and/or reimburse certain operating expenses through February 29, 2016, but only to the extent necessary so that the Fund’s net expenses, excluding brokerage fees and commissions, borrowing costs (such as interest expense and dividend expense on securities sold short), taxes, extraordinary expenses, 12b-1 fees (Class A and Retail Class), and indirect expenses (such as fees and expenses of acquired funds), do not exceed 1.25%. Information pertaining to the Fund’s expense ratios as of October 31, 2015 can be found on the financial highlights. |
The Fund is distributed by Unified Financial Securities, Inc., member FINRA.
Annual Report
4
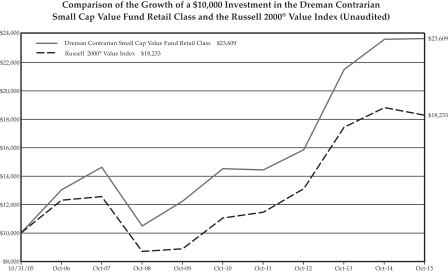
The chart above assumes an initial investment of $10,000 made on October 31, 2005 and held through October 31, 2015. THE FUND’S RETURN REPRESENTS PAST PERFORMANCE AND DOES NOT PREDICT FUTURE RESULTS. Investment returns and principal values will fluctuate so that Fund shares, when redeemed, may be worth more or less than their original purchase price. Current performance may be lower or higher than the performance data quoted.
For more information on the Dreman Contrarian Small Cap Value Fund Retail Class, and to obtain performance data current to the most recent month end, or to request a prospectus or summary prospectus, please call 1-800-247-1014. You should carefully consider the investment objectives, potential risk, management fees, and charges and expenses of the Fund before investing. The Fund’s prospectus and summary prospectus contains important information about the Fund’s investment objectives, potential risks, management fees, charges and expenses, and other information and should be read carefully before investing.
The Fund is distributed by Unified Financial Securities, Inc., member FINRA.
Annual Report
5
| | |
Fund Holdings – (Unaudited) | | |
| (a) | As a percent of net assets. |
Availability of Portfolio Schedule – (Unaudited)
The Fund files its complete schedule of portfolio holdings with the Securities and Exchange Commission (“SEC”) for the first and third quarters of each fiscal year on Form N-Q, which is available on the SEC’s web site at www.sec.gov. The Fund’s Form N-Q may be reviewed and copied at the SEC’s Public Reference Room in Washington, DC. Information on the operation of the Public Reference Room may be obtained by calling 1-800-SEC-0330.
Annual Report
6
| | |
Summary of Fund’s Expenses – (Unaudited) |
As a shareholder of the Fund, you incur two types of costs: (1) transaction costs, including sales charges (loads) on purchases and short-term redemption fees and (2) ongoing costs, including management fees, distribution and service (12b-1) fees and other Fund expenses. These Examples are intended to help you understand your ongoing costs (in dollars) of investing in the Fund and to compare these costs with the ongoing costs of investing in other mutual funds.
The Example is based on an investment of $1,000 invested at the beginning of the period and held for the entire period (May 1, 2015 through October 31, 2015).
Actual Expenses
The first line of the table for each class provide information about actual account values and actual expenses. You may use the information in these lines, together with the amount you invested, to estimate the expenses that you paid over the period. Simply divide your account value by $1,000 (for example, an $8,600 account value divided by $1,000 = 8.60), then multiply the result by the number in the first line under the heading entitled “Expenses Paid During Period” to estimate the expenses you paid on your account during this period.
Hypothetical Example for Comparison Purposes
The second line of the table for each class provides information about hypothetical account values and hypothetical expenses based on the Fund’s actual expense ratios and an assumed rate of return of 5% per year before expenses, which is not the Fund’s actual return. The hypothetical account values and expenses may not be used to estimate the actual ending account balances or expenses you paid for the period. You may use this information to compare the ongoing costs of investing in the Fund and other funds. To do so, compare this 5% hypothetical example with the 5% hypothetical examples that appear in the shareholder reports of the other funds.
Expenses shown in the table are meant to highlight your ongoing costs only and do not reflect any transactional costs, such as the fee imposed on short-term redemptions. Therefore, the second line of the table for each class is useful in comparing ongoing costs only, and will not help you determine the relative total costs of owning different funds. In addition, if transaction costs were included, your costs would have been higher.
| | | | | | | | | | | | | | | | | | | | |
| | | | | | Beginning
Account
Value,
May 1, 2015 | | | Ending
Account Value,
October 31, 2015 | | | Expenses
Paid
During
Period (a) | | | Annualized
Expense
Ratio | |
| | | |
Dreman Contrarian Small Cap Value Fund | | | | | | | | | | | | | |
Class A Shares | | | Actual | | | $ | 1,000.00 | | | $ | 961.30 | | | $ | 7.06 | | | | 1.43 | % |
| | | | Hypothetical | (b) | | $ | 1,000.00 | | | $ | 1,018.01 | | | $ | 7.26 | | | | 1.43 | % |
Retail Shares | | | Actual | | | $ | 1,000.00 | | | $ | 961.00 | | | $ | 7.06 | | | | 1.43 | % |
| | | | Hypothetical | (b) | | $ | 1,000.00 | | | $ | 1,018.01 | | | $ | 7.26 | | | | 1.43 | % |
Institutional Shares | | | Actual | | | $ | 1,000.00 | | | $ | 962.40 | | | $ | 5.82 | | | | 1.18 | % |
| | | | Hypothetical | (b) | | $ | 1,000.00 | | | $ | 1,019.27 | | | $ | 5.99 | | | | 1.18 | % |
| (a) | Expenses are equal to the Fund’s annualized expense ratios, multiplied by the average account value over the period, multiplied by 184/365 (to reflect the one-half year period). The annualized expense ratios reflect reimbursement of expenses by the Fund’s Adviser for the period beginning May 1, 2015 through October 31, 2015. The “Financial Highlights” tables in the Fund’s financial statements, included in the report, also show the gross expense ratios, without such reimbursements. |
| (b) | Hypothetical assumes 5% annual return before expenses. |
Annual Report
7
| | |
| | |
| Dreman Contrarian Small Cap Value Fund | | October 31, 2015 |
| | | | | | | | | | |
| Shares | | | | | Fair Value | | | |
| | | | | | | | | | |
| Common Stocks — 93.9% | | | | | | |
| Consumer Discretionary — 8.9% | | | | | | |
| | 21,655 | | | Aaron’s, Inc. | | $ | 534,229 | | | |
| | 107,175 | | | American Axle & Manufacturing Holdings, Inc. * | | | 2,374,998 | | | |
| | 31,689 | | | Big 5 Sporting Goods Corp. | | | 289,954 | | | |
| | 18,955 | | | Big Lots, Inc. | | | 873,826 | | | |
| | 26,205 | | | Brinker International, Inc. | | | 1,192,590 | | | |
| | 36,236 | | | Cooper Tire & Rubber Co. | | | 1,514,302 | | | |
| | 24,221 | | | DeVry Education Group, Inc. | | | 570,647 | | | |
| | 7,673 | | | Helen of Troy Ltd. * | | | 761,238 | | | |
| | 15,469 | | | John Wiley & Sons, Inc., Class A | | | 809,493 | | | |
| | 83,280 | | | KB Home | | | 1,090,968 | | | |
| | 16,455 | | | Matthews International Corp., Class A | | | 949,947 | | | |
| | 35,061 | | | Meredith Corp. | | | 1,648,568 | | | |
| | 28,385 | | | Rent-A-Center, Inc. | | | 522,000 | | | |
| | 22,150 | | | TravelCenters of America LLC * | | | 255,168 | | | |
| | | | | | | | 13,387,928 | | | |
| Consumer Staples — 0.4% | | | | | | |
| | 22,060 | | | SpartanNash Co. | | | 615,474 | | | |
| Energy — 1.6% | | | | | | |
| | 44,830 | | | Atwood Oceanics, Inc. | | | 741,937 | | | |
| | 169,080 | | | Bellatrix Exploration Ltd. * | | | 277,291 | | | |
| | 123,420 | | | Denbury Resources, Inc. | | | 436,907 | | | |
| | 201,090 | | | Gran Tierra Energy, Inc. * | | | 482,616 | | | |
| | 91,990 | | | Ultra Petroleum Corp. * | | | 504,105 | | | |
| | | | | 2,442,856 | | | |
| Financials — 25.5% | | | | | | |
| | 35,568 | | | Allied World Assurance Co. Holdings AG | | | 1,293,253 | | | |
| | 34,486 | | | Aspen Insurance Holdings Ltd. | | | 1,676,364 | | | |
| | 156,680 | | | Associated Banc-Corp. | | | 3,030,191 | | | |
| | 17,359 | | | Chemical Financial Corp. | | | 588,991 | | | |
| | 88,059 | | | Clifton Bancorp, Inc. | | | 1,283,900 | | | |
| | 34,438 | | | Endurance Specialty Holdings Ltd. | | | 2,174,071 | | | |
| | 62,510 | | | First Midwest Bancorp, Inc. | | | 1,113,928 | | | |
| | 207,659 | | | First Niagara Financial Group, Inc. | | | 2,149,271 | | | |
| | 113,304 | | | FirstMerit Corp. | | | 2,128,982 | | | |
| | 176,720 | | | Fulton Financial Corp. | | | 2,371,582 | | | |
| | 69,345 | | | Hancock Holding Co. | | | 1,913,922 | | | |
| | 25,030 | | | Hanover Insurance Group, Inc. | | | 2,108,778 | | | |
| | 44,624 | | | International Bancshares Corp. | | | 1,202,617 | | | |
| | 67,929 | | | Janus Capital Group, Inc. | | | 1,054,937 | | | |
| | | | | | | | | | |
| Shares | | | | | Fair Value | | | |
| | | | | | | | | | |
| Common Stocks — (Continued) | | | | | | |
| Financials — (Continued) | | | | | | |
| | 16,043 | | | Nelnet, Inc., Class A | | $ | 574,019 | | | |
| | 139,880 | | | Old National Bancorp | | | 1,958,320 | | | |
| | 51,145 | | | Prospect Capital Corp. (a) | | | 374,893 | | | |
| | 22,528 | | | Prosperity Bancshares, Inc. | | | 1,157,489 | | | |
| | 58,330 | | | Symetra Financial Corp. | | | 1,850,811 | | | |
| | 100,987 | | | TCF Financial Corp. | | | 1,554,190 | | | |
| | 44,030 | | | Umpqua Holdings Corp. | | | 735,301 | | | |
| | 24,140 | | | Waddell & Reed Financial, Inc., Class A | | | 891,732 | | | |
| | 96,910 | | | Washington Federal, Inc. | | | 2,416,935 | | | |
| | 12,780 | | | WesBanco, Inc. | | | 417,267 | | | |
| | 46,996 | | | Wintrust Financial Corp. | | | 2,372,828 | | | |
| | | | | 38,394,572 | | | |
| Health Care — 4.9% | | | | | | |
| | 10,562 | | | Charles River Laboratories International, Inc. * | | | 689,065 | | | |
| | 32,769 | | | Hill-Rom Holdings, Inc. | | | 1,726,599 | | | |
| | 14,195 | | | Integra LifeSciences Holdings Corp. * | | | 845,596 | | | |
| | 49,177 | | | Owens & Minor, Inc. | | | 1,762,995 | | | |
| | 150,550 | | | Select Medical Holdings Corp. | | | 1,701,215 | | | |
| | 31,227 | | | Triple-S Management Corp., Class B * | | | 642,964 | | | |
| | | | | 7,368,434 | | | |
| Industrials — 17.2% | | | | | | |
| | 59,376 | | | AAR Corp. | | | 1,347,241 | | | |
| | 50,695 | | | ABM Industries, Inc. | | | 1,439,738 | | | |
| | 40,172 | | | Aegion Corp. * | | | 774,918 | | | |
| | 101,024 | | | Aircastle Ltd. | | | 2,289,204 | | | |
| | 63,677 | | | Barnes Group, Inc. | | | 2,393,618 | | | |
| | 21,059 | | | Brady Corp., Class A | | | 479,092 | | | |
| | 36,385 | | | Brink’s Co./The | | | 1,127,207 | | | |
| | 31,502 | | | Crane Co. | | | 1,658,265 | | | |
| | 27,590 | | | EMCOR Group, Inc. | | | 1,332,045 | | | |
| | 22,955 | | | EnerSys | | | 1,400,025 | | | |
| | 36,206 | | | Global Brass & Copper Holdings, Inc. | | | 814,273 | | | |
| | 32,077 | | | Hillenbrand, Inc. | | | 951,725 | | | |
| | 13,945 | | | Hyster-Yale Materials Handling, Inc., Class A | | | 816,061 | | | |
| | 25,850 | | | Navigant Consulting, Inc. * | | | 444,620 | | | |
| | 13,415 | | | Orbital ATK, Inc. | | | 1,148,592 | | | |
| | 24,530 | | | Regal-Beloit Corp. | | | 1,564,769 | | | |
| | 106,744 | | | R.R. Donnelley & Sons Co. | | | 1,800,771 | | | |
| | 29,920 | | | Triumph Group, Inc. | | | 1,393,674 | | | |
| | 82,925 | | | Tutor Perini Corp. * | | | 1,391,482 | | | |
| | 18,780 | | | Universal Forest Products, Inc. | | | 1,363,991 | | | |
| | | | | 25,931,311 | | | |
See accompanying notes which are an integral part of these financial statements.
Annual Report
8
| | |
| | |
| Dreman Contrarian Small Cap Value Fund | | October 31, 2015 |
| | |
| Portfolio of Investments (Continued) |
| | | | | | | | | | |
| Shares | | | | | Fair Value | | | |
| | | | | | | | | | |
| Common Stocks — (Continued) | | | | | | |
| Information Technology — 16.4% | | | | | | |
| | 21,663 | | | ARRIS Group, Inc. * | | $ | 612,196 | | | |
| | 36,710 | | | AVX Corp. | | | 495,585 | | | |
| | 48,335 | | | Brocade Communications Systems, Inc. | | | 503,651 | | | |
| | 79,016 | | | Celestica, Inc. * | | | 886,560 | | | |
| | 20,429 | | | ChipMOS Technologies (Bermuda) Ltd. | | | 362,206 | | | |
| | 32,790 | | | CSG Systems International, Inc. | | | 1,099,121 | | | |
| | 26,750 | | | Diodes, Inc. * | | | 612,575 | | | |
| | 6,220 | | | DST Systems, Inc. | | | 759,773 | | | |
| | 58,410 | | | Ingram Micro, Inc., Class A | | | 1,739,450 | | | |
| | 29,092 | | | Itron, Inc. * | | | 1,068,549 | | | |
| | 36,153 | | | IXYS Corp. | | | 450,466 | | | |
| | 66,345 | | | Kulicke & Soffa Industries, Inc. * | | | 703,257 | | | |
| | 41,820 | | | Lexmark International, Inc., Class A | | | 1,358,732 | | | |
| | 68,270 | | | Mentor Graphics Corp. | | | 1,856,944 | | | |
| | 54,595 | | | Microsemi Corp. * | | | 1,965,966 | | | |
| | 15,230 | | | NETGEAR, Inc. * | | | 630,522 | | | |
| | 31,640 | | | Plantronics, Inc. | | | 1,696,537 | | | |
| | 98,067 | | | QLogic Corp. * | | | 1,216,031 | | | |
| | 63,042 | | | Sanmina Corp. * | | | 1,303,078 | | | |
| | 19,920 | | | Science Applications International Corp. | | | 913,531 | | | |
| | 37,483 | | | Sykes Enterprises, Inc. * | | | 1,087,007 | | | |
| | 26,923 | | | Tech Data Corp. * | | | 1,959,725 | | | |
| | 142,445 | | | Vishay Intertechnology, Inc. | | | 1,509,917 | | | |
| | | | | 24,791,379 | | | |
| Materials — 4.1% | | | | | | |
| | 21,325 | | | A Schulman, Inc. | | | 765,354 | | | |
| | 48,084 | | | Cabot Corp. | | | 1,728,139 | | | |
| | 110,836 | | | Coeur Mining, Inc. * | | | 299,257 | | | |
| | 45,445 | | | Olin Corp. | | | 871,635 | | | |
| | 38,520 | | | Owens-Illinois, Inc. * | | | 830,106 | | | |
| | 58,452 | | | Pan American Silver Corp. | | | 442,482 | | | |
| | 24,950 | | | Stepan Co. | | | 1,320,604 | | | |
| | | | | 6,257,577 | | | |
| Real Estate Investment Trusts — 10.8% | | | | | | |
| | 64,695 | | | Apollo Residential Mortgage, Inc. | | | 832,625 | | | |
| | 40,752 | | | Ashford Hospitality Prime, Inc. | | | 599,054 | | | |
| | 128,191 | | | Ashford Hospitality Trust, Inc. | | | 881,954 | | | |
| | 144,450 | | | Brandywine Realty Trust | | | 1,950,075 | | | |
| | 90,244 | | | CBL & Associates Properties, Inc. | | | 1,315,758 | | | |
| | 46,964 | | | GEO Group, Inc./The | | | 1,515,528 | | | |
| | 35,224 | | | Hospitality Properties Trust | | | 945,412 | | | |
| | | | | | | | | | |
| Shares | | | | | Fair Value | | | |
| Common Stocks — (Continued) | | | | | | |
| Real Estate Investment Trusts —
(Continued) | | | | | | |
| | 103,418 | | | Mack-Cali Realty Corp. | | $ | 2,250,376 | | | |
| | 137,898 | | | Medical Properties Trust, Inc. | | | 1,558,247 | | | |
| | 103,777 | | | New Residential Investment Corp. | | | 1,258,815 | | | |
| | 86,467 | | | Pennsylvania Real Estate Investment Trust | | | 1,943,778 | | | |
| | 240,900 | | | RAIT Financial Trust | | | 1,168,365 | | | |
| | | | | 16,219,987 | | | |
| Utilities — 4.1% | | | | | | |
| | 36,066 | | | ALLETE, Inc. | | | 1,810,874 | | | |
| | 32,268 | | | IDACORP, Inc. | | | 2,157,116 | | | |
| | 58,378 | | | Portland General Electric Co. | | | 2,164,656 | | | |
| | | | | 6,132,646 | | | |
| Total Common Stocks
(Cost $137,564,351) | | | 141,542,164 | | | |
| Money Market Securities — 6.2% | | | | | | |
| | 9,266,949 | | | Huntington Money Market Fund, Institutional Shares, 0.01% (b) (c) | | | 9,266,949 | | | |
| Total Money Market Securities
(Cost $9,266,949) | | | 9,266,949 | | | |
| Total Investments
(Cost $146,831,300) — 100.1% | | | 150,809,113 | | | |
| Liabilities in Excess of Other
Assets — (0.1)% | | | (99,063) | | | |
| Net Assets — 100.0% | | $ | 150,710,050 | | | |
| (a) | Business Development Company |
| (b) | Rate disclosed is the seven day yield as of October 31, 2015. |
| * | Non-income producing security. |
The sectors shown on the portfolio of investments are based on the Global Industry Classification Standard, or GICS® (“GICS”). The GICS was developed by and/or is the exclusive property of MSCI, Inc. and Standard & Poor Financial Services LLC (“S&P”). GICS is a service mark of MSCI, Inc. and S&P and has been licensed for use by Huntington Asset Services, Inc.
See accompanying notes which are an integral part of these financial statements.
Annual Report
9
October 31, 2015
October 31, 2015
| | | | |
| Assets: | | | | |
Investments in securities, at cost | | $ | 137,564,351 | |
Investments in affiliated securities, at cost | | | 9,266,949 | |
| | | | | |
Investments in securities, at fair value | | | 141,542,164 | |
Investments in affiliated securities, at value | | | 9,266,949 | |
Dividends receivable | | | 48,875 | |
Receivable for fund shares sold | | | 29,563 | |
Prepaid expenses | | | 20,174 | |
Total assets | | | 150,907,725 | |
| Liabilities: | | | | |
Payable for shares redeemed | | | 25,358 | |
Payable to Adviser | | | 107,067 | |
Payable to administrator | | | 21,263 | |
Payable to custodian | | | 3,599 | |
Accrued 12b-1 fees | | | 13,291 | |
Payable to trustees | | | 1,814 | |
Other accrued expenses | | | 25,283 | |
Total liabilities | | | 197,675 | |
Net Assets | | $ | 150,710,050 | |
| | | | | |
| Net Assets consist of: | | | | |
Paid in capital | | $ | 131,906,440 | |
Accumulated undistributed net investment income | | | 1,050,701 | |
Accumulated undistributed net realized gain on investments | | | 13,775,096 | |
Net unrealized appreciation on investments | | | 3,977,813 | |
Net Assets | | $ | 150,710,050 | |
| | | | | |
| Net Assets (unlimited number of shares authorized) | | | | |
| Class A: | | | | |
Net Assets | | $ | 3,552,337 | |
Shares outstanding | | | 166,252 | |
Net asset value and redemption price per share | | $ | 21.37 | |
| | | | | |
Offering price per share (NAV/0.9425) (a) | | $ | 22.67 | |
| | | | | |
| Retail Class: | | | | |
Net Assets | | $ | 60,134,419 | |
Shares outstanding | | | 2,808,597 | |
Net asset value and offering price per share | | $ | 21.41 | |
| | | | | |
Redemption price per share (NAV * 0.99) (b) | | $ | 21.20 | |
| | | | | |
| Institutional Class: | | | | |
Net Assets | | $ | 87,023,294 | |
Shares outstanding | | | 4,043,682 | |
Net asset value, offering and redemption price per share | | $ | 21.52 | |
| | | | | |
| (a) | Class A shares impose a maximum 5.75% sales charge on purchases. |
| (b) | A redemption fee of 1.00% is charged on shares held less than 60 days. |
See accompanying notes which are an integral part of these financial statements.
Annual Report
10
Statement of Assets and Liabilities
Statement of Operations
Year Ended October 31, 2015
| | | | |
| Investment Income: | | | | |
Dividend income | | $ | 3,382,570 | |
Dividend income from affiliated securities | | | 1,892 | |
Foreign dividend taxes withheld | | | (2,656 | ) |
Total investment income | | | 3,381,806 | |
| Expenses: | | | | |
Investment Adviser | | | 1,286,733 | |
Distribution/12b-1: | | | | |
Class A | | | 8,989 | |
Retail Class | | | 156,151 | |
Administration | | | 256,669 | |
Legal | | | 19,312 | |
Registration | | | 61,957 | |
Printing | | | 45,707 | |
Audit | | | 16,500 | |
Custodian | | | 42,017 | |
Trustee | | | 7,519 | |
Miscellaneous | | | 19,708 | |
Total expenses | | | 1,921,262 | |
Fees waived by Adviser | | | (67,514 | ) |
Net operating expenses | | | 1,853,748 | |
Net investment income | | | 1,528,058 | |
| Realized & Unrealized Gain/(Loss) on Investments | | | | |
Net realized gain on investment securities | | | 14,531,505 | |
Change in unrealized appreciation on investment securities | | | (15,576,288 | ) |
Net realized and unrealized gain/(loss) on investment securities | | | (1,044,783 | ) |
Net increase in net assets resulting from operations | | $ | 483,275 | |
| | | | | |
Stat
See accompanying notes which are an integral part of these financial statements.
Annual Report
11
Statements of Changes in Net Assets
| | | | | | | | |
| | | Year Ended
October 31,
2015 | | | Year Ended
October 31,
2014 | |
| Increase (Decrease) in Net Assets due to: | | | | | | | | |
| Operations: | | | | | | | | |
Net investment income | | $ | 1,528,058 | | | $ | 987,341 | |
Net realized gain on investment securities | | | 14,531,505 | | | | 13,426,386 | |
Change in unrealized appreciation (depreciation) on investment securities | | | (15,576,288 | ) | | | (3,032,602 | ) |
Net increase in net assets resulting from operations | | | 483,275 | | | | 11,381,125 | |
Distributions From: Net investment income: | | | | | | | | |
Class A | | | (24,971 | ) | | | (33,863 | ) |
Retail Class | | | (498,693 | ) | | | (418,477 | ) |
Institutional Class | | | (815,183 | ) | | | (468,029 | ) |
Realized gain: | | | | | | | | |
Class A | | | (310,960 | ) | | | (490,209 | ) |
Retail Class | | | (5,763,778 | ) | | | (6,225,188 | ) |
Institutional Class | | | (7,217,978 | ) | | | (5,063,473 | ) |
Total distributions | | | (14,631,563 | ) | | | (12,699,239 | ) |
| Capital Transactions—Class A: | | | | | | | | |
Proceeds from shares sold | | | 1,016,533 | | | | 1,212,976 | |
Reinvestment of distributions | | | 331,469 | | | | 487,467 | |
Amount paid for shares redeemed | | | (545,748 | ) | | | (3,654,017 | ) |
Total Class A | | | 802,254 | | | | (1,953,574 | ) |
| Capital Transactions—Retail Class: | | | | | | | | |
Proceeds from shares sold | | | 12,838,383 | | | | 11,652,873 | |
Reinvestment of distributions | | | 6,187,695 | | | | 6,532,454 | |
Amount paid for shares redeemed | | | (16,810,930 | ) | | | (17,461,939 | ) |
Proceeds from redemption fees (a) | | | 500 | | | | 1,182 | |
Total Retail Class | | | 2,215,648 | | | | 724,570 | |
| Capital Transactions—Institutional Class: | | | | | | | | |
Proceeds from shares sold | | | 17,300,097 | | | | 72,236,519 | |
Reinvestment of distributions | | | 7,245,776 | | | | 4,944,506 | |
Amount paid for shares redeemed | | | (11,889,014 | ) | | | (9,221,455 | ) |
Total Institutional Class | | | 12,656,859 | | | | 67,959,570 | |
Net change resulting from capital transactions | | | 15,674,761 | | | | 66,730,566 | |
Total Increase in Net Assets | | | 1,526,473 | | | | 65,412,452 | |
Net Assets: | | | | | | | | |
Beginning of year | | | 149,183,577 | | | | 83,771,125 | |
End of year | | $ | 150,710,050 | | | $ | 149,183,577 | |
| | | | | | | | | |
Accumulated net investment income included in net assets at end of year | | $ | 1,050,701 | | | $ | 582,452 | |
See accompanying notes which are an integral part of these financial statements.
Annual Report
12
| | | | | | | | |
| | | Year Ended
October 31,
2015 | | | Year Ended
October 31,
2014 | |
| Share Transactions—Class A: | | | | | | | | |
Shares sold | | $ | 45,674 | | | $ | 51,197 | |
Shares issued in reinvestment of distributions | | | 15,275 | | | | 21,371 | |
Shares redeemed | | | (25,241 | ) | | | (156,427 | ) |
Total Class A | | | 35,708 | | | | (83,859 | ) |
| Share Transactions—Retail Class: | | | | | | | | |
Shares sold | | | 590,308 | | | | 500,748 | |
Shares issued in reinvestment of distributions | | | 284,492 | | | | 285,759 | |
Shares redeemed | | | (775,888 | ) | | | (757,263 | ) |
Total Retail Class | | | 98,912 | | | | 29,244 | |
| Share Transactions—Institutional Class: | | | | | | | | |
Shares sold | | | 784,994 | | | | 3,029,137 | |
Shares issued in reinvestment of distributions | | | 332,223 | | | | 215,619 | |
Shares redeemed | | | (531,356 | ) | | | (399,425 | ) |
Total Institutional Class | | | 585,861 | | | | 2,845,331 | |
| (a) | A redemption fee of 1.00% is charged on shares held less than 60 days. |
See accompanying notes which are an integral part of these financial statements.
Annual Report
13
(For a share outstanding throughout each year ended October 31)
| | | | | | | | | | | | | | | | | | | | | | | | | | | | |
| | | Net Asset
Value,
beginning
of year | | | Net
investment
income (loss) | | | Net realized
and unrealized
gain (loss) on
investments | | | Total from
investment
operations | | | Distributions
from net
investment
income | | | Distributions
from net
realized gain
on investment
transactions | | | Total
distributions | |
| Class A | |
| 2011 | | $ | 18.30 | | | | 0.10 | | | | (0.22 | ) | | | (0.12 | ) | | | (0.13 | ) | | | — | | | | (0.13 | ) |
| 2012 | | $ | 18.07 | | | | 0.11 | | | | 1.47 | | | | 1.58 | | | | (0.19 | ) | | | (1.66 | ) | | | (1.85 | ) |
| 2013 | | $ | 17.80 | | | | 0.12 | | | | 6.14 | | | | 6.26 | | | | (0.08 | ) | | | (0.16 | ) | | | (0.24 | ) |
| 2014 | | $ | 23.82 | | | | 0.15 | (d) | | | 2.12 | | | | 2.27 | | | | (0.16 | ) | | | (2.36 | ) | | | (2.52 | ) |
| 2015 | | $ | 23.57 | | | | 0.19 | | | | (0.10 | ) | | | 0.09 | | | | (0.17 | ) | | | (2.12 | ) | | | (2.29 | ) |
| Retail Class | |
| 2011 | | $ | 18.35 | | | | 0.11 | | | | (0.22 | ) | | | (0.11 | ) | | | (0.13 | ) | | | — | | | | (0.13 | ) |
| 2012 | | $ | 18.11 | | | | 0.11 | | | | 1.47 | | | | 1.58 | | | | (0.17 | ) | | | (1.66 | ) | | | (1.83 | ) |
| 2013 | | $ | 17.86 | | | | 0.17 | | | | 6.08 | | | | 6.25 | | | | (0.08 | ) | | | (0.16 | ) | | | (0.24 | ) |
| 2014 | | $ | 23.87 | | | | 0.15 | | | | 2.13 | | | | 2.28 | | | | (0.16 | ) | | | (2.36 | ) | | | (2.52 | ) |
| 2015 | | $ | 23.63 | | | | 0.19 | | | | (0.11 | ) | | | 0.08 | | | | (0.18 | ) | | | (2.12 | ) | | | (2.30 | ) |
| Institutional Class | |
| 2011 | | $ | 18.40 | | | | 0.31 | | | | (0.38 | ) | | | (0.07 | ) | | | (0.14 | ) | | | — | | | | (0.14 | ) |
| 2012 | | $ | 18.19 | | | | 0.14 | | | | 1.48 | | | | 1.62 | | | | (0.23 | ) | | | (1.66 | ) | | | (1.89 | ) |
| 2013 | | $ | 17.92 | | | | 0.20 | | | | 6.10 | | | | 6.30 | | | | (0.08 | ) | | | (0.16 | ) | | | (0.24 | ) |
| 2014 | | $ | 23.98 | | | | 0.20 | (d) | | | 2.14 | | | | 2.34 | | | | (0.22 | ) | | | (2.36 | ) | | | (2.58 | ) |
| 2015 | | $ | 23.74 | | | | 0.26 | | | | (0.12 | ) | | | 0.14 | | | | (0.24 | ) | | | (2.12 | ) | | | (2.36 | ) |
| (a) | Total return represents the rate the investor would have earned or lost on an investment in the Fund, assuming reinvestment of dividends, and excludes any sales charges and redemption fees. |
| (b) | Portfolio turnover is calculated on the basis of the Fund as a whole without distinguishing among the classes of shares. |
| (c) | The expense ratios shown include overdraft fees charged to the Fund. Without these overdraft fees, the expense ratios would be 1.25% for Class A and Retail Class and 1.00% for Institutional Class. |
| (d) | Per share amount has been calculated using the average shares method. |
| (e) | Amount is less than $0.005. |
See accompanying notes which are an integral part of these financial statements.
Annual Report
14
| | | | | | | | | | | | | | | | | | | | | | | | | | | | | | | | | | |
Paid in
capital from
redemption
fees | | | Net Asset
Value, end
of year | | | Total
return(a) | | | Net Assets,
end of year
(000 omitted) | | | Ratio of net
expenses
to average
net assets | | | Ratio of expenses
(prior to
reimbursements)
to average net assets | | | Ratio of net
investment
income
(loss) to
average
net assets | | | Ratio of net
investment
income (loss)
to average net
assets before
waiver &
reimbursement
by Adviser | | | Portfolio
turnover
rate(b) | |
| | | | | | | | | | | | | | | | | | | | | | | | | | | | | | | | | | |
| | 0.02 | | | $ | 18.07 | | | | (0.60 | )% | | $ | 1,935 | | | | 1.25 | % | | | 1.49 | % | | | 0.46 | % | | | 0.22 | % | | | 44.08 | % |
| | — | | | $ | 17.80 | | | | 9.92 | % | | $ | 3,180 | | | | 1.25 | % | | | 1.75 | % | | | 0.55 | % | | | 0.05 | % | | | 30.19 | % |
| | — | | | $ | 23.82 | | | | 35.56 | % | | $ | 5,106 | | | | 1.26 | %(c) | | | 1.51 | % | | | 0.65 | % | | | 0.40 | % | | | 28.28 | % |
| | — | | | $ | 23.57 | | | | 9.89 | % | | $ | 3,077 | | | | 1.25 | % | | | 1.37 | % | | | 0.63 | % | | | 0.51 | % | | | 36.66 | % |
| | — | | | $ | 21.37 | | | | 0.24 | % | | $ | 3,552 | | | | 1.37 | % | | | 1.41 | % | | | 0.87 | % | | | 0.83 | % | | | 43.59 | % |
| | | | | | | | | | | | | | | | | | | | | | | | | | | | | | | | | | |
| | — | (e) | | $ | 18.11 | | | | (0.66 | )% | | $ | 82,840 | | | | 1.25 | % | | | 1.51 | % | | | 0.57 | % | | | 0.32 | % | | | 44.08 | % |
| | — | (e) | | $ | 17.86 | | | | 9.93 | % | | $ | 69,992 | | | | 1.25 | % | | | 1.74 | % | | | 0.56 | % | | | 0.06 | % | | | 30.19 | % |
| | — | (e) | | $ | 23.87 | | | | 35.38 | % | | $ | 63,976 | | | | 1.26 | %(c) | | | 1.53 | % | | | 0.72 | % | | | 0.45 | % | | | 28.28 | % |
| | — | (e) | | $ | 23.63 | | | | 9.89 | % | | $ | 64,020 | | | | 1.25 | % | | | 1.37 | % | | | 0.63 | % | | | 0.51 | % | | | 36.66 | % |
| | — | (e) | | $ | 21.41 | | | | 0.21 | % | | $ | 60,134 | | | | 1.37 | % | | | 1.41 | % | | | 0.87 | % | | | 0.83 | % | | | 43.59 | % |
| | | | | | | | | | | | | | | | | | | | | | | | | | | | | | | | | | |
| | — | | | $ | 18.19 | | | | (0.44 | )% | | $ | 11,472 | | | | 1.00 | % | | | 1.26 | % | | | 0.85 | % | | | 0.59 | % | | | 44.08 | % |
| | — | | | $ | 17.92 | | | | 10.14 | % | | $ | 13,185 | | | | 1.00 | % | | | 1.49 | % | | | 0.80 | % | | | 0.30 | % | | | 30.19 | % |
| | — | | | $ | 23.98 | | | | 35.55 | % | | $ | 14,689 | | | | 1.01 | %(c) | | | 1.27 | % | | | 0.95 | % | | | 0.68 | % | | | 28.28 | % |
| | — | | | $ | 23.74 | | | | 10.12 | % | | $ | 82,086 | | | | 1.00 | % | | | 1.12 | % | | | 0.85 | % | | | 0.73 | % | | | 36.66 | % |
| | — | | | $ | 21.52 | | | | 0.46 | % | | $ | 87,023 | | | | 1.12 | % | | | 1.16 | % | | | 1.12 | % | | | 1.08 | % | | | 43.59 | % |
See accompanying notes which are an integral part of these financial statements.
Annual Report
15
Notes to the Financial Statements
October 31, 2015
Note 1. Organization
The Dreman Contrarian Small Cap Value Fund (the “Fund”) is an open-end diversified series of the Valued Advisers Trust (the “Trust”). The Trust is a management investment company established under the laws of Delaware by an Agreement and Declaration of Trust dated June 13, 2008 (the “Trust Agreement”). The Trust Agreement permits the Board of Trustees (the “Board”) to issue an unlimited number of shares of beneficial interest of separate series without par value. The Fund is one of a series of funds authorized by the Board. The Fund’s investment adviser is Dreman Value Management, LLC (the “Adviser”). The investment objective of the Fund is long-term capital appreciation.
The Fund currently offers Class A shares, Retail Class shares, and Institutional Class shares. Class A shares are offered with a front-end sales charge. The Retail Class shares impose a 1% redemption fee on all shares redeemed within 60 days of purchase. Institutional Class shares do not have a sales charge.
Note 2. Significant Accounting Policies
The Fund is an investment company and follows accounting and reporting guidance under Financial Accounting Standards Board (“FASB”) Accounting Standards Codification (“ASC”) Topic 946, “Financial Services-Investment Companies”. The following is a summary of significant accounting policies followed by the Fund in the preparation of its financial statements. These policies are in conformity with the generally accepted accounting principles in the United States of America (“GAAP”).
Estimates—The preparation of financial statements in conformity with GAAP requires management to make estimates and assumptions that affect the reported amounts of assets and liabilities and disclosure of contingent assets and liabilities at the date of the financial statements and the reported amounts of increases and decreases in net assets from operations during the reporting period. Actual results could differ from those estimates.
Securities Valuation—All investments in securities are recorded at their estimated fair value as described in Note 3.
Federal Income Taxes—The Fund makes no provision for federal income or excise tax. The Fund intends to qualify each year as a regulated investment company (“RIC”) under subchapter M of the Internal Revenue Code of 1986, as amended, by complying with the requirements applicable to RICs and by distributing substantially all of its taxable income. The Fund also intends to distribute sufficient net investment income and net capital gains, if any, so that it will not be subject to excise tax on undistributed income and gains. If the required amount of net investment income or gains is not distributed, the Fund could incur a tax expense.
For the fiscal year ended October 31, 2015, the Fund did not have a liability for any unrecognized tax benefits. The Fund recognizes interest and penalties, if any, related to unrecognized tax benefits as income tax expense in the statement of operations. The Fund is subject to
Annual Report
16
examination by U.S. federal tax authorities for the last three tax year ends and the interim tax period since then.
Expenses—Expenses incurred by the Trust that do not relate to a specific fund of the Trust are allocated to the individual funds based on each fund’s relative net assets or other appropriate basis (as determined by the Board). Expenses attributable to any class are borne by that class. Income, realized gains and losses, unrealized appreciation and depreciation, and expenses are allocated to each class based on the net assets in relation to the relative net assets of the Fund.
Security Transactions and Related Income—The Fund follows industry practice and records security transactions on the trade date for financial reporting purposes. The specific identification method is used for determining gains or losses for financial statement and income tax purposes. Dividend income is recorded on the ex-dividend date and interest income is recorded on an accrual basis. Discounts and premiums on securities purchased are accreted or amortized using the effective interest method. Withholding taxes on foreign dividends have been provided for in accordance with the Fund’s understanding of the applicable country’s tax rules and rates.
Dividends and Distributions—Distributions to shareholders, which are determined in accordance with income tax regulations, are recorded on the ex-dividend date. The Fund intends to distribute substantially all of its net investment income on, at least, an annual basis. The Fund intends to distribute its net realized long-term capital gains and its net realized short-term capital gains, if any, at least once a year. The treatment for financial reporting purposes of distributions made to shareholders during the year from net investment income or net realized capital gains may differ from their ultimate treatment for federal income tax purposes. These differences are caused primarily by differences in the timing of the recognition of certain components of income, expense or realized capital gain for federal income tax purposes. Where such differences are permanent in nature, they are reclassified in the components of the net assets based on their ultimate characterization for federal income tax purposes. Any such reclassifications will have no effect on net assets, results of operations or net asset values per share of the Fund.
For the year ended October 31, 2015, the Fund made the following reclassifications to increase/(decrease) the components of net assets:
| | | | | | | | |
| Paid-in Capital | | Accumulated
Undistributed Net
Investment Income | | | Accumulated Net
Realized Gain on Investments | |
$– | | $ | 279,038 | | | $ | (279,038 | ) |
Note 3. Securities Valuation And Fair Value Measurements
Fair value is defined as the price that a Fund would receive upon selling an investment in a timely transaction to an independent buyer in the principal or most advantageous market of the investment. GAAP establishes a three-tier hierarchy to maximize the use of observable market data and minimize the use of unobservable inputs and to establish classification of fair value measurements for disclosure purposes.
Annual Report
17
Notes to the Financial Statements (Continued)
Inputs refer broadly to the assumptions that market participants would use in pricing the asset or liability, including assumptions about risk (the risk inherent in a particular valuation technique used to measure fair value including such a pricing model and/or the risk inherent in the inputs to the valuation technique). Inputs may be observable or unobservable. Observable inputs are inputs that reflect the assumptions market participants would use in pricing the asset or liability
developed based on market data obtained from sources independent of the reporting entity. Unobservable inputs are inputs that reflect the reporting entity’s own assumptions about the assumptions market participants would use in pricing the asset or liability developed based on the best information available in the circumstances.
Various inputs are used in determining the value of the Fund’s investments. These inputs are summarized in the three broad levels listed below.
| • | | Level 1—unadjusted quoted prices in active markets for identical investments and/or registered investment companies where the value per share is determined and published and is the basis for current transactions for identical assets or liabilities at the valuation date. |
| • | | Level 2—other significant observable inputs (including, but not limited to, quoted prices for an identical security in an inactive market, quoted prices for similar securities, interest rates, prepayment speeds, credit risk, etc.). |
| • | | Level 3—significant unobservable inputs (including the Fund’s own assumptions in determining fair value of investments based on the best information available). |
The inputs used to measure fair value may fall into different levels of the fair value hierarchy. In such cases, for disclosure purposes, the level in the fair value hierarchy within which the fair value measurement falls in its entirety, is determined based, on the lowest level input that is significant to the fair value measurement in its entirety.
Equity securities, including common stocks, exchanged-traded funds and real estate investment trusts, are generally valued by using market quotations, but may be valued on the basis of prices furnished by a pricing service when the Adviser believes such prices more accurately reflect the fair value of such securities. Securities traded in the NASDAQ over-the-counter market are generally valued by a pricing service at the NASDAQ Official Closing Price.
When using the market quotations or close prices provided by a pricing service and when the market is considered active, the security is classified as a Level 1 security. Sometimes, an equity security owned by the Fund will be valued by the pricing service with factors other than market quotations or when the market is considered inactive. When this happens, the security is classified as a Level 2 security. When market quotations are not readily available, when the Adviser determines that the market quotation or the price provided by the pricing service does not accurately reflect the current fair value, or when restricted or illiquid securities are being valued, such securities are valued as determined in good faith by the Adviser, in conformity with guidelines adopted by and subject to review by the Board. These securities are generally categorized as Level 3 securities.
Annual Report
18
Investments in mutual funds, including money market mutual funds, are generally priced at the ending NAV provided by the service agent of the funds. These securities are categorized as Level 1 securities.
Short-term investments in fixed income securities, (those with maturities of less than 60 days when acquired, or which subsequently are within 60 days of maturity), are valued by using the amortized cost method of valuation, which the Board has determined represents fair value. These securities are classified as Level 2 securities.
In accordance with the Trust’s good faith pricing guidelines, the Adviser is required to consider all appropriate factors relevant to the value of securities for which it has determined other pricing sources are not available or reliable as described above. No single standard exists for determining fair value, because fair value depends upon the circumstances of each individual case. As a general principle, the current fair value of an issue of securities being valued by the Adviser would appear to be the amount which the owner might reasonably expect to receive for them upon their current sale. Methods which are in accordance with this principle may, for example, be based on (i) a multiple of earnings; (ii) a discount from market of a similar freely traded security (including a derivative security or a basket of securities traded on other markets, exchanges or among dealers); or (iii) yield to maturity with respect to debt issues, or a combination of these and other methods. Good faith pricing is permitted if, in the Adviser’s opinion, the validity of market quotations appears to be questionable based on factors such as evidence of a thin market in the security based on a small number of quotations, a significant event occurs after the close of a market but before a Fund’s NAV calculation that may affect a security’s value, or the Adviser is aware of any other data that calls into question the reliability of market quotations. Good faith pricing may also be used in instances when the bonds the Fund invests in may default or otherwise cease to have market quotations readily available.
The following is a summary of the inputs used to value the Fund’s investments as of October 31, 2015:
| | | | | | | | | | | | | | | | |
| | | | | | Valuation Inputs | | | | | | | |
| Assets | | Level 1 | | | Level 2 | | | Level 3 | | | Total | |
Common Stocks* | | $ | 141,542,164 | | | $ | — | | | $ | — | | | $ | 141,542,164 | |
Money Market Securities | | | 9,266,949 | | | | — | | | | — | | | | 9,266,949 | |
| | | | | | | | | | | | | | | | |
Total | | $ | 150,809,113 | | | $ | — | | | $ | — | | | $ | 150,809,113 | |
| * | Refer to Schedule of Investments for industry classifications. |
The Fund did not hold any investments at any time during the reporting period in which other significant observable inputs (Level 2) were used in determining fair value. The Fund did not hold any investments at any time during the reporting period in which significant unobservable inputs were used in determining fair value; therefore, no reconciliation of Level 3 securities is included for this reporting period.
The Trust recognizes transfers between fair value hierarchy levels at the reporting period end. There were no transfers between any levels as of October 31, 2015.
Annual Report
19
Notes to the Financial Statements (Continued)
Note 4. Fees And Other Transactions With Affiliates And Other Service Providers
Under the terms of the management agreement between the Trust and the Adviser (the “Agreement”) for the Fund, the Adviser manages the Fund’s investments subject to oversight of the Board. As compensation for its management services, the Fund is obligated to pay the Adviser a fee computed and accrued daily and paid monthly at an annual rate of 0.85% of the average daily net assets of the Fund. For the fiscal year ended October 31, 2015, the Adviser earned fees of $1,286,733 from the Fund before the waivers described below. At October 31, 2015, the Fund owed $107,067 to the Adviser.
The Adviser has contractually agreed to waive its management fee and/or reimburse certain operating expenses, but only to the extent necessary so that the Fund’s net expenses, excluding brokerage fees and commissions, borrowing costs (such as interest expense and dividends on securities sold short), taxes distribution and service (12b-1) fees, extraordinary expenses, and any indirect expenses (such as fees and expenses of acquired funds), do not exceed 1.25% (1.00% prior to March 1, 2015) of the net assets of the Fund. Each waiver or reimbursement of an expense by the Adviser is subject to repayment by the Fund within the three fiscal years following the fiscal year in which the expense was incurred, provided that the Fund is able to make the repayment without exceeding the expense limitation which was in place at the time of the waiver. The contractual agreement is in effect through February 29, 2016. The expense cap may not be terminated prior to this date except by the Board. For the fiscal year ended October 31, 2015, the Adviser waived fees of $67,514 from the Fund. This amount is subject to potential recoupment by the Adviser through October 31, 2018.
The amounts subject to repayment by the Fund, pursuant to the aforementioned conditions are as follows:
| | | | | | |
| Amount | | | | Recoverable
through
October 31, | |
| $215,534 | | | | | 2016 | |
| $166,367 | | | | | 2017 | |
| $67,514 | | | | | 2018 | |
The Trust retains Huntington Asset Services, Inc. (“HASI”) to manage the Fund’s business affairs and to provide the Fund with administrative services, including all regulatory, reporting and necessary office equipment and personnel. The Trust also retains HASI to act as the Fund’s transfer agent and to provide the Fund with fund accounting services. For the fiscal year ended October 31, 2015, HASI earned fees of $256,669 for administrative services. At October 31, 2015, HASI was owed $21,263 for administrative services.
Certain officers and one Trustee of the Trust are members of management and/or employees of HASI. HASI operates as a wholly-owned subsidiary of Huntington Bancshares, Inc., the parent company of the Unified Financial Securities, Inc. (the “Distributor” or “Unified”), the principal underwriter of the Fund’s shares, and Huntington National Bank, the custodian of the Fund’s
Annual Report
20
assets (the “Custodian”). For the fiscal year ended October 31, 2015, the Custodian earned fees $42,017 for custody services. At October 31, 2015, the Custodian was owed $3,599 for custody services.
The Fund has adopted a Distribution Plan (the “Plan”) pursuant to Rule 12b-1 under the 1940 Act. The Plan provides that the Fund will pay the Distributor and/or any registered securities dealer, financial institution or any other person (a “Recipient”) a shareholder servicing fee aggregating up to: 0.25% of the average daily net assets of the Class A shares and Retail Class shares in connection with the promotion and distribution of the Fund’s shares or the provision of personal services to shareholders, including, but not necessarily limited to, advertising, compensation to underwriters, dealers and selling personnel, the printing and mailing of prospectuses to other than current Fund shareholders, the printing and mailing of sales literature and servicing shareholder accounts. The Fund or the Distributor may pay all or a portion of these fees to any Recipient who renders assistance in distributing or promoting the sale of shares, or who provides certain shareholder services, pursuant to a written agreement. The Plan is a compensation plan, which means that compensation is paid regardless of 12b-1 expenses actually incurred. It is anticipated that the Plan will benefit shareholders because an effective sales program typically is necessary in order for the Fund to reach and maintain a sufficient size to achieve efficiently its investment objectives and to realize economies of scale. For the fiscal year ended October 31, 2015, Class A shares 12b-1 expense incurred by the Fund was $8,989 and Retail Class shares 12b-1 expense incurred by the Fund was $156,151. The Fund owed $754 for Class A shares and $12,537 for Retail Class shares 12b-1 fees as of October 31, 2015.
During the year ended October 31, 2015, the Distributor received $2,678 from commissions earned on sales of Class A shares, of which $2,544 was re-allowed to intermediaries of the Fund. A trustee of the Trust is an officer of the Distributor and such person may be deemed to be an affiliate of the Distributor.
The Fund may invest in certain affiliated money market funds which are managed by an affiliated party of the Distributor. Income distributions earned from investments in this Fund are recorded as dividend income from affiliates in the accompanying financial statements. A summary of the Fund’s investment in such affiliated money market funds is presented in the table below:
| | | | | | | | | | | | | | | | | | | | |
| Affiliated Fund | | 10/31/14
Fair Value | | | Purchases | | | Sales | | | 10/31/15
Fair Value | | | Income | |
Huntington Money Market Fund, Institutional Shares | | $ | 9,101,828 | | | $ | 40,576,381 | | | $ | (40,411,260 | ) | | $ | 9,266,949 | | | $ | 1,892 | |
Annual Report
21
Notes to the Financial Statements (Continued)
Note 5. Purchases And Sales Of Securities
For the fiscal year ended October 31, 2015, purchases and sales of investment securities, other than short-term investments and short-term U.S. government obligations were as follows:
| | | | |
| | | Amount | |
Purchases | | | | |
U.S. Government Obligations | | $ | — | |
Other | | | 65,473,498 | |
Sales | | | | |
U.S. Government Obligations | | $ | — | |
Other | | | 62,351,777 | |
Note 6. Beneficial Ownership
The beneficial ownership, either directly or indirectly, of more than 25% of the voting securities of a fund creates a presumption of control of the fund, under Section 2(a) (9) of the Investment Company Act of 1940. At October 31, 2015, Charles Schwab & Co. (“Schwab”) owned, as record shareholder, 41% of the outstanding shares of the Fund. It is not known whether Schwab or any of the underlying beneficial owners owned or controlled 25% or more of the voting securities of the Fund.
Note 7. Federal Income Taxes
At October 31, 2015, the net unrealized appreciation (depreciation) of investments for tax purposes was as follows:
| | | | |
Gross Unrealized Appreciation | | $ | 15,933,024 | |
Gross Unrealized (Depreciation) | | | (12,646,604 | ) |
Net Unrealized Appreciation on Investments* | | $ | 3,286,420 | |
At October 31, 2015, the aggregate cost of securities for federal income tax purposes was $147,522,693 for the Fund.
At October 31, 2015, the Fund’s most recent fiscal year end, the components of distributable earnings (accumulated losses) on a tax basis were as follows:
| | | | | | | | | | | | | | | | |
| Fund | | Undistributed
Ordinary Income | | | Undistributed
Long-Term
Capital Gains | | | Unrealized
Appreciation/
(Depreciation)* | | | Total
Accumulated
Earnings/
(Deficit) | |
Small Cap Value Fund | | $ | 1,515,104 | | | $ | 14,002,086 | | | $ | 3,286,420 | | | $ | 18,803,610 | |
| * | The difference between book basis and tax basis unrealized appreciation (depreciation) is attributable to the tax deferral of losses on wash sales and mark-to-market adjustments on passive foreign investment companies. |
Annual Report
22
The tax character of distributions paid for the fiscal period ended October 31, 2015 was as follows:
| | | | | | | | | | | | | | | | | | | | |
| | | Distributions Paid From* | | | | | | | | | | |
| Fund | | Ordinary
Income | | | Net Long-Term
Capital Gains | | | Total
Taxable
Distributions | | | Tax Return
of Capital | | | Total
Distributions
Paid | |
Small Cap Value Fund | | $ | 4,167,704 | | | $ | 10,463,859 | | | $ | 14,631,563 | | | $ | — | | | $ | 14,631,563 | |
| * | The tax character of distributions paid may differ from the character of distributions shown on the statements of changes in net assets due to short-term capital gains being treated as ordinary income for tax purposes. |
The tax character of distributions paid for the prior fiscal period ended October 31, 2014 was as follows:
| | | | | | | | | | | | | | | | | | | | |
| | | Distributions Paid From* | | | | | | | | | | |
| Fund | | Ordinary
Income | | | Net
Long Term
Capital Gains | | | Total
Taxable
Distributions | | | Tax Return
of Capital | | | Total
Distributions
Paid | |
Small Cap Value Fund | | $ | 1,629,931 | | | $ | 11,069,308 | | | $ | 12,699,239 | | | $ | — | | | $ | 12,699,239 | |
| * | The tax character of distributions paid may differ from the character of distributions shown on the statements of changes in net assets due to short-term capital gains being treated as ordinary income for tax purposes. |
Note 8. Commitments And Contingencies
The Fund indemnifies its officers and trustees for certain liabilities that may arise from performance of their duties to the Fund. Additionally, in the normal course of business, the Fund enters into contracts that contain a variety of representations and warranties which provide general indemnifications. The Fund’s maximum exposure under these arrangements is unknown, as this would involve future claims that may be made against the Fund that have not yet occurred.
Note 9. Subsequent Events
Management of the Fund has evaluated the need for disclosure and/or adjustments resulting from subsequent events through the date these financials were issued. Subsequent to the period end, on November 13, 2015, Huntington Bancshares Inc. entered in an agreement to sell Huntington Asset Services, Inc. and Unified Financial Services, Inc. to Ultimus Fund Solutions, LLC. The sale is expected to close by the end of December 2015, subject to customary closing conditions. Management has determined that there were no additional items requiring additional disclosure.
Annual Report
23
REPORT OF INDEPENDENT REGISTERED PUBLIC ACCOUNTING FIRM
To the Shareholders of Dreman Contrarian Small Cap Value Fund and
Board of Trustees of Valued Advisers Trust
We have audited the accompanying statement of assets and liabilities, including the portfolio of investments, of Dreman Contrarian Small Cap Value Fund (the “Fund”), a series of Valued Advisers Trust, as of October 31, 2015, and the related statement of operations for the year then ended, the statements of changes in net assets for each of the two years in the period then ended, and the financial highlights for each of the five years in the period then ended. These financial statements and financial highlights are the responsibility of the Fund’s management. Our responsibility is to express an opinion on these financial statements and financial highlights based on our audits.
We conducted our audits in accordance with the standards of the Public Company Accounting Oversight Board (United States). Those standards require that we plan and perform the audits to obtain reasonable assurance about whether the financial statements and financial highlights are free of material misstatement. An audit includes examining, on a test basis, evidence supporting the amounts and disclosures in the financial statements. Our procedures included confirmation of securities owned as of October 31, 2015, by correspondence with the Fund’s custodian. An audit also includes assessing the accounting principles used and significant estimates made by management, as well as evaluating the overall financial statement presentation. We believe that our audits provide a reasonable basis for our opinion.
In our opinion, the financial statements and financial highlights referred to above present fairly, in all material respects, the financial position of Dreman Contrarian Small Cap Value Fund as of October 31, 2015, the results of its operations for the year then ended, the changes in its net assets for each of the two years in the period then ended, and the financial highlights for each of the five years in the period then ended, in conformity with accounting principles generally accepted in the United States of America.

COHEN FUND AUDIT SERVICES, LTD.
Cleveland, Ohio
December 23, 2015
Annual Report
24
Other Federal Income Tax Information (Unaudited)
The Form 1099-DIV you receive in January 2016 will show the tax status of all distributions paid to your account in calendar year 2015. Shareholders are advised to consult their own tax adviser with respect to the tax consequences of their investment in the Fund. As required by the Internal Revenue Code and/or regulations, shareholders must be notified regarding the status of qualified dividend income for individuals and the dividends received deduction for corporations.
Qualified Dividend Income. The Fund designates approximately 55% or up to the maximum amount of such dividends allowable pursuant to the Internal Revenue Code, as qualified dividend income eligible for the reduced tax rate of 15%.
Dividends Received Deduction. Corporate shareholders are generally entitled to take the dividends received deduction on the portion of the Fund’s dividend distribution that qualifies under tax law. For the Fund’s calendar year 2015 ordinary income dividends, 55% qualifies for the corporate dividends received deduction.
For the year ended October 31, 2015, the Fund designated $10,463,859 as long-term capital gain distributions.
Annual Report
25
| | |
Trustees and Officers (Unaudited) | | |
The Board of Trustees supervises the business activities of the Trust. Each Trustee serves as a trustee until termination of the Trust unless the Trustee dies, resigns, retires or is removed.
The following tables provide information regarding the Trustees and Officers.
The following table provides information regarding each of the Independent Trustees.
| | | | |
Name, Address*, (Age), Position with Trust**, Term of Position with
Trust | | Principal Occupation During Past 5 Years | | Other Directorships |
Ira Cohen, 56,
Independent Trustee,
June 2010 to present. | | Independent financial services consultant since February 2005; Executive Vice President of Asset Management Services, Recognos Financial, since August 2015. | | Trustee and Audit Committee Chairman, Griffin Institutional Access Real Estate Fund, since May 2014. Trustee, Angel Oak Funds Trust, since October 2014 |
Andrea N. Mullins, 48,
Independent Trustee,
December 2013 to present. | | Private investor; Independent Contractor, Seabridge Wealth Management, LLC, since April 2014; Principal Financial Officer and Treasurer, Eagle Family of Funds (mutual fund family) and Vice President, Eagle Asset Management, Inc. (investment adviser) each from 2004 to 2010. | | None. |
| * | The address for each trustee and officer is 2960 N. Meridian St., Suite 300, Indianapolis, IN 46208. |
| ** | As of the date of this report, the Trust consists of 14 series. |
The following table provides information regarding the Trustee who is considered an “interested person” of the Trust, as that term is defined under the 1940 Act. Based on the experience of the Trustee, the Trust concluded that the individual described below should serve as a Trustee.
| | | | |
Name, Address*, (Age), Position with Trust**, Term of Position with
Trust | | Principal Occupation During Past 5 Years | | Other Directorships |
R. Jeffrey Young, 51,
Trustee and Chairman,
June 2010 to present. | | Principal Executive Officer and President, Valued Advisers Trust since February 2010; President, Huntington Asset Services, Inc., since April 2015; Director since May 2014; Senior Vice President January 2010 to April 2015; President, Unified Financial Securities, Inc. since July 2015; Director since May 2014; Chief Executive Officer, Huntington Funds, February 2010 to March 2015; Chief Executive Officer, Huntington Strategy Shares, November 2010 to March 2015; President and Chief Executive Officer, Dreman Contrarian Funds, March 2011 to February 2013; Trustee, Valued Advisers Trust, August 2008 to January 2010; and Managing Director and Chief Operating Officer of Professional Planning Consultants, from 2007 to 2010. | | Trustee and Chairman, Capitol Series Trust, since September 2013. |
| * | The address for each trustee and officer is 2960 N. Meridian St., Suite 300, Indianapolis, IN 46208. |
| ** | As of the date of this report, the Trust consists of 14 series. |
Annual Report
26
The following table provides information regarding the Officers of the Trust:
| | | | |
Name, Address*, (Age), Position with Trust,** Term of Position with
Trust | | Principal Occupation During Past 5 Years | | Other Directorships |
R. Jeffrey Young, 51,
Trustee and Chairman,
June 2010 to present; Principal Executive Officer and President, Valued Advisers Trust since February 2010; | | President, Huntington Asset Services, Inc., since April 2015; Director since May 2014; Senior Vice President January 2010 to April 2015; President, Unified Financial Securities, Inc. since July 2015; Director since May 2014; Chief Executive Officer, Huntington Funds, February 2010 to March 2015; Chief Executive Officer, Huntington Strategy Shares, November 2010 to March 2015; President and Chief Executive Officer, Dreman Contrarian Funds, March 2011 to February 2013; Trustee, Valued Advisers Trust, August 2008 to January 2010; and Managing Director and Chief Operating Officer of Professional Planning Consultants, from 2007 to 2010. | | Trustee and Chairman, Capitol Series Trust, since September 2013. |
John C. Swhear, 54,
Chief Compliance Officer, AML Officer and Vice President,
August 2008 to present. | | Vice President of Legal Administration and Compliance for Huntington Asset Services, Inc., the Trust’s administrator, since April 2007 and Director since May 2014; Chief Compliance Officer of Unified Financial Securities, Inc., the Trust’s distributor, since May 2007 and Director since May 2014; President of the Unified Series Trust since March 2012, and Senior Vice President from May 2007 to March 2012; Chief Compliance Officer and AML Officer, Capitol Series Trust, since September 2013; Secretary of Huntington Funds from April 2010 to February 2012; President and Chief Executive Officer of Dreman Contrarian Funds from March 2010 to March 2011. | | None. |
Carol J. Highsmith, 50,
Vice President,
August 2008 to present; Secretary, March 2014 to present | | Employed in various positions with Huntington Asset Services, Inc., the Trust’s administrator, since November 1994; currently Vice President of Legal Administration; Secretary, Cross Shore Discovery Fund since May 2014. | | None. |
Matthew J. Miller, 39,
Vice President,
December 2011 to present. | | Employed in various positions with Huntington Asset Services, Inc., the Trust’s administrator, since July 1998; currently Vice President of Relationship Management; Vice President, Huntington Funds, since February 2010; President and Chief Executive Officer, Capitol Series Trust, since September 2013. | | None. |
Annual Report
27
| | |
Trustees and Officers (Unaudited) (Continued) | | |
| | | | |
Name, Address*, (Age), Position with Trust,** Term of Position with
Trust | | Principal Occupation During Past 5 Years | | Other Directorships |
Bryan W. Ashmus, 42,
Principal Financial Officer and Treasurer,
December 2013 to present. | | Vice President, Financial Administration, Huntington Asset Services, Inc., the Trust’s administrator, since September 2013; Chief Financial Officer and Treasurer, The Huntington Strategy Shares and The Huntington Funds, since November 2013; Vice President, Fund Administration, Citi Fund Services Ohio, Inc., from 2005 to 2013. | | None. |
| | | | | |
| * | The address for each trustee and officer is 2960 N. Meridian St., Suite 300, Indianapolis, IN 46208. |
| ** | As of the date of this report, the Trust consists of 14 series. |
OTHER INFORMATION
The Fund’s Statement of Additional Information (“SAI”) includes additional information about the trustees and is available without charge, upon request. You may call toll-free at (800) 247-1014 to request a copy of the SAI or to make shareholder inquiries.
Annual Report
28
PRIVACY POLICY
The following is a description of the policies of the Valued Advisers Trust (the “Trust”) regarding disclosure of nonpublic personal information that shareholders provide to a series of the Trust (each, a “Fund”) or that the Fund collects from other sources. In the event that a shareholder holds shares of a Fund through a broker-dealer or other financial intermediary, the privacy policy of the financial intermediary would govern how shareholder nonpublic personal information would be shared with nonaffiliated third parties.
Categories of Information a Fund May Collect.
A Fund may collect the following nonpublic personal information about its shareholders:
| • | | Information the Fund receives from a shareholder on applications or other forms, correspondence, or conversations (such as the shareholder’s name, address, phone number, social security number, and date of birth); and |
| • | | Information about the shareholder’s transactions with the Fund, its affiliates, or others (such as the shareholder’s account number and balance, payment history, cost basis information, and other financial information). |
Categories of Information a Fund May Disclose.
A Fund may not disclose any nonpublic personal information about its current or former shareholders to unaffiliated third parties, except as required or permitted by law. A Fund is permitted by law to disclose all of the information it collects, as described above, to its service providers (such as the Fund’s custodian, administrator, transfer agent, accountant and legal counsel) to process shareholder transactions and otherwise provide services to the shareholder.
Confidentiality and Security.
Each Fund shall restrict access to shareholder nonpublic personal information to those persons who require such information to provide products or services to the shareholder. Each Fund shall maintain physical, electronic, and procedural safeguards that comply with federal standards to guard shareholder nonpublic personal information.
Disposal of Information.
The Funds, through their transfer agent, have taken steps to reasonably ensure that the privacy of a shareholder’s nonpublic personal information is maintained at all times, including in connection with the disposal of information that is no longer required to be maintained by the Funds. Such steps shall include, whenever possible, shredding paper documents and records prior to disposal, requiring off-site storage vendors to shred documents maintained in such locations prior to disposal, and erasing and/or obliterating any data contained on electronic media in such a manner that the information can no longer be read or reconstructed.
Annual Report
29
PROXY VOTING
A description of the policies and procedures that the Fund uses to determine how to vote proxies relating to portfolio securities and information regarding how the Fund voted those proxies during the most recent twelve month period ended June 30, is available without charge upon request by (1) calling the Fund at (800) 247-1014 and (2) from Fund documents filed with the Securities and Exchange Commission (“SEC”) on the SEC’s website at www.sec.gov.
TRUSTEES
R. Jeffrey Young, Chairman
Ira Cohen
Andrea N. Mullins
OFFICERS
R. Jeffrey Young, Principal Executive Officer and President
Bryan W. Ashmus, Principal Financial Officer and Treasurer
John C. Swhear, Chief Compliance Officer, AML Officer and Vice-President
Carol J. Highsmith, Vice President and Secretary
Matthew J. Miller, Vice President
INVESTMENT ADVISER
Dreman Value Management, LLC
1515 North Flagler Drive, Suite 920
West Palm Beach, FL 33401
DISTRIBUTOR
Unified Financial Securities, Inc.
2960 North Meridian Street, Suite 300
Indianapolis, IN 46208
INDEPENDENT REGISTERED PUBLIC ACCOUNTING FIRM
Cohen Fund Audit Services, Ltd.
1350 Euclid Avenue, Suite 800
Cleveland, OH 44115
LEGAL COUNSEL
The Law Offices of John H. Lively & Associates, Inc.
A member firm of The 1940 Act Law Group TM
11300 Tomahawk Creek Parkway, Suite 310
Leawood, KS 66211
CUSTODIAN
Huntington National Bank
41 South High Street
Columbus, OH 43215
ADMINISTRATOR, TRANSFER AGENT AND FUND ACCOUNTANT
Huntington Asset Services, Inc.
2960 North Meridian Street, Suite 300
Indianapolis, IN 46208
This report is intended only for the information of shareholders or those who have received the Fund’s prospectus which contains information about the Fund’s management fee and expenses. Please read the prospectus carefully before investing.
Distributed by Unified Financial Securities, Inc.

DANA LARGE CAP EQUITY FUND
Annual Report
October 31, 2015
Dana Investment Advisors, Inc.
15800 Bluemound Rd., Suite 250
Brookfield, WI 53005
(855) 280-9648
www.danafunds.com
Dear Fellow Shareholders,
We are once again happy to offer you this annual report for the Dana Large Cap Equity Fund (the “Fund”) for the 12-month period ended October 31, 2015. During the last 12 months, the Fund has celebrated its five-year anniversary and assets under management have more than quadrupled. In the 2015 fiscal year the S&P 500® Index (“S&P 500”) reached new all-time highs, followed by a strong pullback in August and September. Despite these fluctuations in market performance, the Fund’s Institutional class provided a positive return of 3.89% to shareholders during this time period. Volatile market periods can be difficult times for shareholders to ‘stay the course’ and not give in to the daily rhetoric of market pundits. During these periods, our process and discipline guides our efforts and we never waver from our goal of building the best portfolio that we believe will maximize the long term returns for our shareholders. We know you have many investment options to choose from and we thank you for having the confidence to choose Dana.
Market Recap:
The economic recovery in the U.S. continues with intermittent quarters of negligible growth. Similar to last year, the U.S. economy delivered a weaker first quarter GDP number (+0.6%) before rebounding to +3.9% growth in the second quarter, and the third quarter advance estimate sits at +1.5%. The S&P 500 returned +5.20% over the last year following a strong +17.3% return in the prior year. These positive returns occurred despite an earnings per share decline of -5.5% in index holdings. Global equity market gains were more muted, with the MSCI EAFE Index for developed markets returning -0.07%, and the MSCI Emerging Markets Index declining -14.53% over the same period. In the U.S., the unemployment rate continues to decline while consumer confidence improves. Strength in the automotive and housing sectors has been notable. Across both oceans, Europe and Japan struggle to invigorate developed economies beset by fiscal, demographic and monetary issues. Infrastructure investment in China has markedly slowed, and the government is attempting to manage a difficult pivot to a consumption-driven economy. With this backdrop, it seems as though the U.S. market remains in a position of relative strength.
The S&P 500 experienced a correction beginning in mid-August, declining -12.3% from its all-time high in the second quarter. A precursor to this decline was China’s decision to devalue its currency, which sparked dual concerns of a stronger dollar and a weaker than expected Chinese economy. The former has created an earnings drag for U.S.-based companies during the last few quarters, while the latter pressures the industrial and commodities complex. The third quarter earnings season appears to have allayed some concerns as 74.0% of S&P 500 companies have beaten consensus estimates to date, but few would argue that these headwinds have abated. In particular, a Federal Reserve rate hike in December may fuel further dollar strength. Persistently low commodity prices are an additional concern for export-driven economies in Brazil, Russia, Canada and the Middle East.
A common complaint regarding the sustainability of the current bull market centers on market valuation. Over the last 30 years, the S&P 500 has experienced three corrections of over 20%. In 1987 and 2000, both the market P/E ratio and bond yields were higher than they are currently. The 1987 and 2000 peaks represented elevated equity market valuations relative to both history and bond alternatives. In 2007, the S&P 500 traded at 17.0x earnings, similar to the current period,
1
while the earnings yield exceeded the 10-year bond yield by only 3.0% – well below the 5.7% earnings yield advantage over bond yields in the current markets. A sustained low interest rate and low inflation environment can support a higher P/E ratio, but only if economic growth remains resilient.
Fund Performance:
U.S. large cap equities performed relatively well during the 12 months from October 31, 2014 to October 31, 2015, though below the high returns of the prior five and a half years. U.S. equities peaked in May, declining slightly over the next three months before suffering a 10.4% loss over 4 trading days in August. A strong October recovered most of the August drop. Within the U.S. equity market, large-cap indexes did notably better than mid-cap and small-cap counterparts. Growth outperformed value in all market cap ranges, but especially among large cap stocks where the S&P 500® Growth Index posted a total return of +9.23% for the year ending October 31, 2015, compared to the S&P 500® Value Index return of +0.81%. The S&P 500 was propelled by a very narrow group of large, high-growth (and mostly high-valuation) companies, led by Amazon and Netflix (both doubling in market value over the Fund’s fiscal year), with sizeable contributions from Google, Apple and Facebook.
The concentration of better performance in large, high-valuation growth companies hurt relative performance due to the Fund’s value-tilted, equally weighted (within sectors) investment process. Our weakest sector was Financials, where we were hurt by poor performance from our insurance names and being underweight to the large multinational banks. Our strongest sector was Consumer Staples, where every one of our year-end holdings delivered double-digit returns to the Fund during the fiscal year.
The Fund enjoyed exceptional performance in several holdings, led by Royal Caribbean Cruises, Reynolds American, and CDW Corporation. Royal Caribbean continues to show strong and growing tourist demand, while low oil prices have been a boon on the cost side. Reynolds American, a midyear addition to the Fund, completed its merger with Lorillard and continues to impress investors with double-digit earnings and revenue growth. CDW Corporation is consistently exceeding analyst expectations, and several partnerships and new market opportunities bode well for continued success.
There were many weak spots in the broad market that were masked by index performance skewed towards mega-cap growth companies. Within the Fund, many of our weakest performers were mid-year additions whose returns partially reflected a downward market. The biggest drag on the Fund was Qorvo, Inc., a semiconductor company whose stock was hit hard during the third quarter on concerns of an economic slowdown in China and potential weakness in Apple iPhone sales. Our second greatest detractor, International Paper, was buffeted by commodity prices, with falling containerboard pricing in particular leading to declining revenue in 2015 and 2016. Paccar Inc. fell on weak demand for large trucks.
Because of the dynamic nature of the markets in the past year, with several macro headwinds, we experienced a high level of turnover during the Fund’s fiscal year. Portfolio managers were proactive in making changes in the portfolio as conditions warranted. Fortunately for taxable
2
clients, we were able to generate a positive total return, yet realize a net taxable loss. Many of our sales were responses to commodity price movements, either directly or indirectly. Housing was a common thread for several of our new additions (D.R. Horton, Lowe’s, Stanley Works). While we continue to seek revenue growth, the recent purchase of Alphabet as an example, we remain true to our relative value legacy. We believe the portfolio is positioned well for a modestly growing economy and the current market environment, where investors are bidding up hard-to-find revenue growth, but where our overall portfolio valuation will provide some defensive characteristics.
Respectively Submitted,

Mark R. Mirsberger, CPA
Chief Executive Officer – Dana Investment Advisors, Inc.

Duane Roberts, CFA
Portfolio Manager and Director of Equities – Dana Investment Advisors, Inc.
3
Investment Results (Unaudited)
Total Returns(a) as of October 31, 2015
| | | | | | | | | | | | | | | | | | | | | | | | |
| | | One
Year | | | Three
Year | | | Five
Year | | | Since
Inception
(3/1/10) | | | Since
Inception
(7/28/10) | | | Since
Inception
(10/29/13) | |
Dana Large Cap Equity Fund | | | | | | | | | | | | | | | | | | | | | |
Class A with Load | | | (1.62)% | | | | 12.85% | | | | 11.66% | | | | N/A | | | | 12.69% | | | | N/A | |
Class A without Load | | | 3.54% | | | | 14.79% | | | | 12.80% | | | | N/A | | | | 13.80% | | | | N/A | |
Class N | | | 3.61% | | | | 15.02% | | | | 12.93% | | | | 14.74% | | | | N/A | | | | N/A | |
Institutional Class | | | 3.89% | | | | N/A | | | | N/A | | | | N/A | | | | N/A | | | | 10.18% | |
S&P 500® Index(b) | | | 5.20% | | | | 16.20% | | | | 14.33% | | | | 14.17% | | | | 15.00% | | | | 10.86% | |
| | | | | | | Expense Ratios(c) | | | | | | | | | |
| | | | | | Class A | | | Class N | | | Institutional
Class | | | | | | | |
Gross | | | | | | | 1.93% | | | | 1.93% | | | | 1.68% | | | | | | | | | |
With Applicable Waivers | | | | | | | 0.98% | | | | 0.98% | | | | 0.73% | | | | | | | | | |
The performance quoted represents past performance, which does not guarantee future results. The investment return and principal value of an investment will fluctuate so that an investor’s shares, when redeemed, may be worth more or less than their original cost. The returns shown do not reflect deduction of taxes that a shareholder would pay on Fund distributions or the redemption of Fund shares. Current performance of the Fund may be lower or higher than the performance quoted. The Fund's investment objectives, risks, charges and expenses must be considered carefully before investing. Performance data current to the most recent month end may be obtained by calling 1-855-280-9648.
(a) Return figures reflect any change in price per share and assume the reinvestment of all distributions. Returns for periods greater than 1 year are annualized.
(b) The S&P 500® Index ("Index") is widely recognized unmanaged index of equity securities and is representative of a broader domestic equity market and range of securities than is found in the Fund's portfolio. Individuals cannot invest directly in the Index; however, an individual can invest in exchange traded funds or other investment vehicles that attempt to track the performance of a benchmark index.
(c) The expense ratios are from the Fund's prospectus dated February 28, 2015. The Adviser has contractually agreed to waive or limit its fees and to assume other expenses of the Fund until February 28, 2017, so that total annual fund operating expenses does not exceed 0.73%. This operating expense limitation does not apply to brokerage fees and commissions, borrowing costs (such as interest and dividend expenses on securities sold short), taxes, extraordinary expenses, fees and expenses paid under a distribution plan adopted pursuant to Rule 12b-1, fees and expenses paid under a shareholder services plan, and indirect expenses (such as “Acquired Funds Fees and Expenses”). Each waiver or reimbursement of an expense by the Adviser is subject to repayment by the Fund within three years following the fiscal year in which the expense was incurred, provided that the Fund is able to make the repayment without exceeding the expense limitation in place at the time of waiver or reimbursement. This agreement may only be terminated by mutual consent of the Adviser and the Board of Trustees. The amounts subject to potential recoupment by the Adviser prior to the reorganization as a series of the Valued Advisers Trust are not subject to recoupment. Additional information pertaining to the Fund's expense ratios as of October 31, 2015 can be found on the financial highlights.
The Fund's investment objectives, strategies, risks, charges and expenses must be considered carefully before investing. The prospectus contains this and other important information about the Fund and may be obtained by calling the same number as above. Please read it carefully before investing.
The Fund is distributed by Unified Financial Securities, Inc., member FINRA.
4
Comparison of Growth of $10,000 Investment in the Dana Large Cap Equity Fund, Class N and the S&P 500® Index (Unaudited)
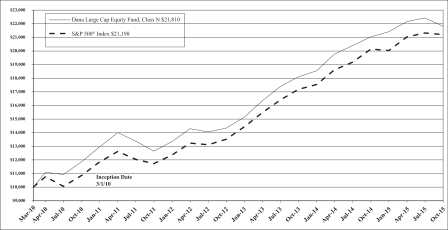
The chart above assumes an initial investment of $10,000 made on March 1, 2010 (commencement of Class N operations) held through October 31, 2015. THE FUND’S RETURN REPRESENTS PAST PERFORMANCE AND DOES NOT GUARANTEE FUTURE RESULTS. The returns shown do not reflect deduction of taxes that a shareholder would pay on Fund distributions or the redemption of Fund shares. Investment returns and principal values will fluctuate so that your shares, when redeemed, may be worth more or less than their original purchase price.
Current performance may be lower or higher than the performance data quoted. For more information on the Fund, and to obtain performance data current to the most recent month end or to request a prospectus, please call 1-855-280-9648. You should carefully consider the investment objectives, potential risks, management fees, and charges and expenses of the Fund before investing. The Fund’s prospectus contains this and other information about the Fund, and should be read carefully before investing.
The Fund is distributed by Unified Financial Securities, Inc., member FINRA.
5
Portfolio Illustration (Unaudited)
October 31, 2015
The following chart gives a visual breakdown of the Fund by the industry sectors as a percentage of the fair value of portfolio investments.
Availability of Portfolio Schedule – (Unaudited)
The Fund files its complete schedule of portfolio holdings with the Securities and Exchange Commission (“SEC”) for the first and third quarters of each fiscal year on Form N-Q. The Fund’s Forms N-Q are available at the SEC’s website at www.sec.gov. The Fund’s Forms N-Q may be reviewed and copied at the Public Reference Room in Washington DC. Information on the operation of the Public Reference Room may be obtained by calling 1-800-SEC-0330.
6
Summary of Fund’s Expenses – (Unaudited)
As a shareholder of the Fund, you incur two types of costs: (1) transaction costs, including sales charges (loads) on purchases and short-term redemption fees and (2) ongoing costs, including management fees, distribution and service (12b-1) fees, and other Fund expenses. These examples are intended to help you understand your ongoing costs (in dollars) of investing in the Fund and to compare these costs with the ongoing costs of investing in other mutual funds.
The Example is based on an investment of $1,000 invested at the beginning of the period and held for the entire period (May 1, 2015 through October 31, 2015).
Actual Expenses
The first line of the table for each class provides information about actual account values and actual expenses. You may use the information in these lines, together with the amount you invested, to estimate the expenses that you paid over the period. Simply divide your account value by $1,000 (for example, an $8,600 account value divided by $1,000 = 8.60), then multiply the result by the number in the first line under the heading “Expenses Paid During Period” to estimate the expenses you paid on your account during this period.
Hypothetical Example for Comparison Purposes
The second line of the table for each class provides information about hypothetical account values and hypothetical expenses based on the Fund’s actual expense ratios and an assumed rate of return of 5% per year before expenses, which is not the Fund’s actual return. The hypothetical account values and expenses may not be used to estimate the actual ending account balances or expenses you paid for the period. You may use this information to compare the ongoing costs of investing in the Fund and other funds. To do so, compare this 5% hypothetical example with the 5% hypothetical examples that appear in the shareholder reports of the other funds.
Expenses shown in the table are meant to highlight your ongoing costs only and do not reflect any transactional costs such as the fee imposed on sales charges and short-term redemptions. Therefore, the second line of the table for each class is useful in comparing ongoing costs only and will not help you determine the relative total costs of owning different funds. In addition, if transaction costs were included, your costs would have been higher.
7
Summary of Fund’s Expenses – (Unaudited) (continued)
| | | | | | | | | | | | | | | | | | |
| | | | | Beginning
Account
Value,
May 1, 2015 | | | Ending
Account
Value,
October 31, 2015 | | | Expenses
Paid
During
Period(a) | | | Annualized
Expense
Ratio | |
Dana Large Cap Equity Fund | | | | | | | | | | | | | | | | |
Class A | | Actual | | $ | 1,000.00 | | | $ | 983.90 | | | $ | 4.90 | | | | 0.98 | % |
| | | | | | | | | | | | | | | | | | |
| | Hypothetical(b) | | $ | 1,000.00 | | | $ | 1,020.27 | | | $ | 4.99 | | | | 0.98 | % |
| | | | | | | | | | | | | | | | | | |
Class N | | Actual | | $ | 1,000.00 | | | $ | 984.10 | | | $ | 4.90 | | | | 0.98 | % |
| | | | | | | | | | | | | | | | | | |
| | Hypothetical(b) | | $ | 1,000.00 | | | $ | 1,020.27 | | | $ | 4.99 | | | | 0.98 | % |
| | | | | | | | | | | | | | | | | | |
Institutional Class | | Actual | | $ | 1,000.00 | | | $ | 985.40 | | | $ | 3.65 | | | | 0.73 | % |
| | | | | | | | | | | | | | | | | | |
| | Hypothetical(b) | | $ | 1,000.00 | | | $ | 1,021.53 | | | $ | 3.72 | | | | 0.73 | % |
| (a) | | Expenses are equal to the Fund’s annualized expense ratios, multiplied by the average account value over the period, multiplied by 184/365 (to reflect the one-half year period). The annualized expense ratios reflect reimbursement of expenses by the Fund’s Adviser for the period beginning May 1, 2015 to October 31, 2015. The “Financial Highlights” tables in the Fund’s financial statements, included in the report, also show the gross expense ratios, without such reimbursements. |
| (b) | | Hypothetical assumes 5% annual return before expenses. |
8
Schedule of Investments
October 31, 2015
| | | | | | | | |
| Shares | | | | | Fair Value | |
| | Common Stocks – 98.50% | |
| | |
| | | | Consumer Discretionary – 13.01% | | | | |
| | 46,000 | | | Comcast Corp. – Class A | | $ | 2,880,520 | |
| | 92,000 | | | D.R. Horton, Inc. | | | 2,708,480 | |
| | 39,000 | | | Lowe’s Companies, Inc. | | | 2,879,370 | |
| | 46,000 | | | Macy’s, Inc. | | | 2,345,080 | |
| | 57,000 | | | Magna International, Inc. | | | 3,005,610 | |
| | 36,000 | | | Royal Caribbean Cruises Ltd. | | | 3,540,600 | |
| | 40,000 | | | Target Corp. | | | 3,087,200 | |
| | | | | | | | |
| | | | | | | 20,446,860 | |
| | | | | | | | |
| | |
| | | | Consumer Staples – 10.08% | | | | |
| | 31,000 | | | CVS Health Corp. | | | 3,062,180 | |
| | 36,000 | | | Dr. Pepper Snapple Group, Inc. | | | 3,217,320 | |
| | 26,000 | | | Kimberly-Clark Corp. | | | 3,112,460 | |
| | 84,000 | | | Kroger Co./The | | | 3,175,200 | |
| | 68,000 | | | Reynolds American, Inc. | | | 3,285,760 | |
| | | | | | | | |
| | | | | | | 15,852,920 | |
| | | | | | | | |
| | |
| | | | Energy – 7.10% | | | | |
| | 30,000 | | | Chevron Corp. | | | 2,726,400 | |
| | 36,000 | | | Exxon Mobil Corp. | | | 2,978,640 | |
| | 33,000 | | | Schlumberger Ltd. | | | 2,579,280 | |
| | 22,000 | | | Tesoro Corp. | | | 2,352,460 | |
| | 8,000 | | | Valero Energy Corp. | | | 527,360 | |
| | | | | | | | |
| | | | | | | 11,164,140 | |
| | | | | | | | |
| | |
| | | | Financials – 14.26% | | | | |
| | 23,000 | | | Ameriprise Financial, Inc. | | | 2,653,280 | |
| | 53,000 | | | Citigroup, Inc. | | | 2,818,010 | |
| | 15,000 | | | Goldman Sachs Group, Inc./The | | | 2,812,500 | |
| | 59,000 | | | Hartford Financial Services Group, Inc./The | | | 2,729,340 | |
| | 30,000 | | | PNC Financial Services Group, Inc. | | | 2,707,800 | |
| | 55,000 | | | Principal Financial Group, Inc. | | | 2,758,800 | |
| | 70,000 | | | SunTrust Banks, Inc. | | | 2,906,400 | |
| | 56,000 | | | Wells Fargo & Co. | | | 3,031,840 | |
| | | | | | | | |
| | | | | | | 22,417,970 | |
| | | | | | | | |
| | |
| | | | Health Care – 14.42% | | | | |
| | 50,000 | | | AbbVie, Inc. | | | 2,977,500 | |
| | 28,500 | | | Aetna, Inc. | | | 3,271,230 | |
| | 18,000 | | | Amgen, Inc. | | | 2,847,240 | |
| | 28,000 | | | Gilead Sciences, Inc. | | | 3,027,640 | |
| | 38,000 | | | HCA Holdings, Inc. * | | | 2,614,020 | |
| | 29,400 | | | Johnson & Johnson | | | 2,970,282 | |
| | 13,000 | | | McKesson Corp. | | | 2,324,400 | |
| | 78,000 | | | Pfizer, Inc. | | | 2,637,960 | |
| | | | | | | | |
| | | | | | | 22,670,272 | |
| | | | | | | | |
| | |
| | | | Industrials – 10.09% | | | | |
| | 42,000 | | | Alaska Air Group, Inc. | | | 3,202,500 | |
| | 22,600 | | | Boeing Co./The | | | 3,346,382 | |
See accompanying notes which are an integral part of these financial statements.
9
Schedule of Investments (continued)
October 31, 2015
| | | | | | | | |
| Shares | | | | | Fair Value | |
| | Common Stocks – (continued) | |
| | |
| | | | Industrials – 10.09% (continued) | | | | |
| | 22,200 | | | General Dynamics Corp. | | $ | 3,298,476 | |
| | 54,000 | | | PACCAR, Inc. | | | 2,843,100 | |
| | 30,000 | | | Stanley Black & Decker, Inc. | | | 3,179,400 | |
| | | | | | | | |
| | | | | | | 15,869,858 | |
| | | | | | | | |
| | |
| | | | Information Technology – 19.99% | | | | |
| | 50,000 | | | Activision Blizzard, Inc. | | | 1,738,000 | |
| | 4,400 | | | Alphabet, Inc. – Class A * | | | 3,244,516 | |
| | 56,000 | | | Amdocs Ltd. | | | 3,335,920 | |
| | 28,000 | | | Apple, Inc. | | | 3,346,000 | |
| | 47,000 | | | Broadridge Financial Solutions, Inc. | | | 2,800,260 | |
| | 80,000 | | | CDW Corp. | | | 3,575,200 | |
| | 105,000 | | | Cisco Systems, Inc. | | | 3,029,250 | |
| | 40,000 | | | Lam Research Corp. | | | 3,063,600 | |
| | 60,000 | | | Microsoft Corp. | | | 3,158,400 | |
| | 38,000 | | | Qorvo, Inc. * | | | 1,669,340 | |
| | 32,000 | | | Skyworks Solutions, Inc. | | | 2,471,680 | |
| | | | | | | | |
| | | | | | | 31,432,166 | |
| | | | | | | | |
| | |
| | | | Materials – 2.85% | | | | |
| | 25,000 | | | Lyondellbasell Industries NV – Class A | | | 2,322,750 | |
| | 44,000 | | | Sealed Air Corp. | | | 2,161,280 | |
| | | | | | | | |
| | | | | | | 4,484,030 | |
| | | | | | | | |
| | |
| | | | Real Estate Investment Trusts – 1.49% | | | | |
| | 68,000 | | | Omega Healthcare Investors, Inc. | | | 2,347,360 | |
| | | | | | | | |
| | |
| | | | Telecommunication Services – 2.29% | | | | |
| | 54,000 | | | AT&T, Inc. | | | 1,809,540 | |
| | 38,000 | | | Verizon Communications, Inc. | | | 1,781,440 | |
| | | | | | | | |
| | | | | | | 3,590,980 | |
| | | | | | | | |
| | |
| | | | Utilities – 2.92% | | | | |
| | 63,000 | | | CMS Energy Corp. | | | 2,272,410 | |
| | 65,000 | | | Xcel Energy, Inc. | | | 2,315,950 | |
| | | | | | | | |
| | | | | | | 4,588,360 | |
| | | | | | | | |
| | | | Total Common Stocks (Cost $148,665,314) | | | 154,864,916 | |
| | | | | | | | |
|
| | Short-Term Investments – 2.32% | |
| | |
| | 3,652,855 | | | Fidelity Institutional Money Market Portfolio – Institutional Class, 0.16% (a) | | | 3,652,855 | |
| | | | | | | | |
| | | | Total Short-Term Investments (Cost $3,652,855) | | | 3,652,855 | |
| | | | | | | | |
| | | | Total Investments – 100.82% (Cost $152,318,169) | | | 158,517,771 | |
| | | | | | | | |
| | | | Liabilities in Excess of Other Assets – (0.82)% | | | (1,293,856 | ) |
| | | | | | | | |
| | | | NET ASSETS – 100.00% | | $ | 157,223,915 | |
| | | | | | | | |
| (a) | | Rate disclosed is the seven day yield as of October 31, 2015. |
| * | | Non-income producing security. |
The sectors shown on the schedule of investments are based on the Global Industry Classification Standard, or GICS® (“GICS”). The GICS was developed by and/or is the exclusive property of MSCI, Inc. and Standard & Poor Financial Services LLC (“S&P”). GICS is a service mark of MSCI, Inc. and S&P and has been licensed for use by Huntington Asset Services, Inc.
See accompanying notes which are an integral part of these financial statements.
10
Statement of Assets and Liabilities
October 31, 2015
| | | | |
Assets | | | | |
Investments in securities at fair value (cost $152,318,169) | | $ | 158,517,771 | |
Receivable for fund shares sold | | | 173,931 | |
Dividends receivable | | | 175,326 | |
Prepaid expenses | | | 30,550 | |
Total Assets | | | 158,897,578 | |
Liabilities | | | | |
Payable for fund shares redeemed | | | 78,270 | |
Payable for investments purchased | | | 1,466,554 | |
Payable to Adviser | | | 63,999 | |
Payable for Distribution Fees | | | 8,240 | |
Payable to administrator, fund accountant, and transfer agent | | | 16,570 | |
Payable to custodian | | | 1,751 | |
Payable to trustees | | | 1,974 | |
Other accrued expenses | | | 36,305 | |
Total Liabilities | | | 1,673,663 | |
Net Assets | | $ | 157,223,915 | |
Net Assets consist of: | | | | |
Paid-in capital | | $ | 152,402,899 | |
Accumulated undistributed net investment income | | | 139,697 | |
Accumulated undistributed net realized loss from investment transactions | | | (1,518,283 | ) |
Net unrealized appreciation on investments | | | 6,199,602 | |
Net Assets | | $ | 157,223,915 | |
Class N: | | | | |
Net Assets | | $ | 36,909,498 | |
Shares outstanding | | | 2,025,173 | |
Net asset value (“NAV”) and offering price per share | | $ | 18.23 | |
Minimum redemption price per share (NAV * 98%) (a) | | $ | 17.87 | |
Class A: | | | | |
Net Assets | | $ | 2,651,702 | |
Shares outstanding | | | 145,857 | |
Net asset value (“NAV”) per share | | $ | 18.18 | |
Maximum offering price per share (NAV/0.95) (b) | | $ | 19.14 | |
Minimum redemption price per share (NAV * 98%) (a) | | $ | 17.82 | |
Institutional Class: | | | | |
Net Assets | | $ | 117,662,715 | |
Shares outstanding | | | 6,456,724 | |
Net asset value (“NAV”) and offering price per share | | $ | 18.22 | |
Minimum redemption price per share (NAV * 98%) (a) | | $ | 17.86 | |
| (a) | | The Fund charges a 2.00% redemption fee on shares redeemed within 60 days of purchase. Shares held longer than 60 days are redeemed at NAV. |
| (b) | | Class A shares impose a maximum 5.00% sales charge on purchases. |
11
The accompanying notes which are an integral part of these financial statements.
Statement of Operations
For the year ended October 31, 2015
| | | | |
Investment Income | | | | |
Dividend income (net of foreign taxes withheld of $4,554) | | $ | 1,968,524 | |
Total investment income | | | 1,968,524 | |
Expenses | | | | |
Investment Adviser | | | 694,299 | |
Distribution (12b-1): | | | | |
Class N | | | 92,933 | |
Class A | | | 3,407 | |
Administration | | | 63,395 | |
Fund accounting | | | 41,116 | |
Transfer agent | | | 47,441 | |
Legal | | | 16,802 | |
Registration | | | 47,240 | |
Custodian | | | 22,161 | |
Audit | | | 16,500 | |
Trustee | | | 7,251 | |
Insurance | | | 2,134 | |
Pricing | | | 2,399 | |
Report printing | | | 15,220 | |
24f-2 | | | 9,841 | |
Miscellaneous | | | 8,896 | |
Total expenses | | | 1,091,035 | |
Fees contractually waived by Adviser | | | (268,172 | ) |
Net operating expenses | | | 822,863 | |
Net investment income | | | 1,145,661 | |
Net Realized and Unrealized Gain (Loss) on Investments | | | | |
Net realized loss on investment securities transactions | | | (1,513,521 | ) |
Net change in unrealized appreciation of investment securities | | | 918,692 | |
Net realized and unrealized loss on investments | | | (594,829 | ) |
Net increase in net assets resulting from operations | | $ | 550,832 | |
12
The accompanying notes which are an integral part of these financial statements.
Statements of Changes in Net Assets
| | | | | | | | |
| | | For the Year Ended October 31, 2015 | | | For the Year Ended October 31, 2014 | |
Increase in Net Assets due to: Operations: | | | | | | | | |
Net investment income | | $ | 1,145,661 | | | $ | 281,982 | |
Net realized gain (loss) on investment securities transactions | | | (1,513,521 | ) | | | 2,361,426 | |
Net change in unrealized appreciation of investments securities | | | 918,692 | | | | 1,169,791 | |
Net increase in net assets resulting from operations | | | 550,832 | | | | 3,813,199 | |
Distributions From: | | | | | | | | |
Net investment income: | | | | | | | | |
Class N | | | (310,826 | ) | | | (229,577 | ) |
Class A | | | (12,606 | ) | | | (10,075 | ) |
Institutional Class | | | (702,819 | ) | | | (22,020 | ) |
Realized gains: | | | | | | | | |
Class N | �� | | (1,380,628 | ) | | | (1,221,280 | ) |
Class A | | | (47,055 | ) | | | (55,136 | ) |
Institutional Class | | | (936,609 | ) | | | (17,698 | ) |
Total distributions | | | (3,390,543 | ) | | | (1,555,786 | ) |
Capital Transactions – Class N: | | | | | | | | |
Proceeds from shares sold | | | 22,909,588 | | | | 11,857,787 | |
Reinvestment of distributions | | | 1,276,366 | | | | 1,343,916 | |
Amount paid for shares redeemed | | | (15,880,730 | ) | | | (4,169,188 | ) |
Proceeds from redemption fees (a) | | | 162 | | | | 225 | |
Total Class N | | | 8,305,386 | | | | 9,032,740 | |
Capital Transactions – Class A: | | | | | | | | |
Proceeds from shares sold | | | 1,685,300 | | | | 124,623 | |
Reinvestment of distributions | | | 58,595 | | | | 65,169 | |
Amount paid for shares redeemed | | | (152,311 | ) | | | (20,233 | ) |
Proceeds from redemption fees (a) | | | 652 | | | | — | |
Total Class A | | | 1,592,236 | | | | 169,559 | |
Capital Transactions – Institutional Class: | | | | | | | | |
Proceeds from shares sold | | | 127,938,610 | | | | 7,689,531 | |
Reinvestment of distributions | | | 195,472 | | | | 34,586 | |
Amount paid for shares redeemed | | | (15,194,601 | ) | | | (1,398,420 | ) |
Proceeds from redemption fees (a) | | | 63,483 | | | | — | |
Total Institutional Class | | | 113,002,964 | | | | 6,325,697 | |
Net increase in net assets resulting from capital transactions | | | 122,900,586 | | | | 15,527,996 | |
Total Increase in Net Assets | | | 120,060,875 | | | | 17,785,409 | |
| (a) | | The Fund charges a 2.00% redemption fee on shares redeemed within 60 days of purchase. |
13
The accompanying notes which are an integral part of these financial statements.
Statements of Changes in Net Assets (continued)
| | | | | | | | |
| | | For the Year Ended October 31, 2015 | | | For the Year Ended October 31, 2014 | |
Net Assets: | | | | | | | | |
Beginning of year | | | 37,163,040 | | | | 19,377,631 | |
End of year | | $ | 157,223,915 | | | $ | 37,163,040 | |
Accumulated net investment income included in net assets at end of year | | $ | 139,697 | | | $ | 22,258 | |
Share Transactions – Class N: | | | | | | | | |
Shares sold | | | 1,222,207 | | | | 664,835 | |
Shares issued in reinvestment of distributions | | | 69,257 | | | | 80,043 | |
Shares redeemed | | | (840,885 | ) | | | (235,215 | ) |
Total Class N | | | 450,579 | | | | 509,663 | |
Share Transactions – Class A: | | | | | | | | |
Shares sold | | | 94,497 | | | | 7,269 | |
Shares issued in reinvestment of distributions | | | 3,192 | | | | 3,889 | |
Shares redeemed | | | (8,399 | ) | | | (1,149 | ) |
Total Class A | | | 89,290 | | | | 10,009 | |
Share Transactions – Institutional Class: | | | | | | | | |
Shares sold | | | 6,906,834 | | | | 430,805 | |
Shares issued in reinvestment of distributions | | | 10,643 | | | | 1,994 | |
Shares redeemed | | | (834,286 | ) | | | (75,128 | ) |
Total Institutional Class | | | 6,083,191 | | | | 357,671 | |
14
The accompanying notes which are an integral part of these financial statements.
Dana Large Cap Equity Fund – Class N
Financial Highlights
Selected data for a share outstanding throughout each year.
| | | | | | | | | | | | | | | | | | | | |
| | | Years Ended October 31, | |
| | | 2015 | | | 2014 | | | 2013 | | | 2012 | | | 2011 | |
Net asset value, at
beginning of year | | | $18.54 | | | | $17.19 | | | | $13.88 | | | | $12.50 | | | | $11.83 | |
| | | | | | | | | | | | | | | | | | | | |
| | | | | |
Income from investment operations: | | | | | | | | | | | | | | | | | | | | |
| | | | | |
Net investment income (loss) | | | 0.18 | | | | 0.19 | | | | 0.21 | (a) | | | 0.14 | (a) | | | 0.09 | (a) |
| | | | | |
Net realized and unrealized gain (loss) on investments | | | 0.49 | (b) | | | 2.46 | | | | 3.40 | | | | 1.51 | | | | 0.67 | |
| | | | | | | | | | | | | | | | | | | | |
| | | | | |
Total from investment operations | | | 0.67 | | | | 2.65 | | | | 3.61 | | | | 1.65 | | | | 0.76 | |
| | | | | | | | | | | | | | | | | | | | |
| | | | | |
Distributions from: | | | | | | | | | | | | | | | | | | | | |
| | | | | |
Net investment income | | | (0.15 | ) | | | (0.18 | ) | | | (0.22 | ) | | | (0.14 | ) | | | (0.09 | ) |
| | | | | |
Net realized gain | | | (0.83 | ) | | | (1.12 | ) | | | (0.08 | ) | | | (0.13 | ) | | | — | |
| | | | | | | | | | | | | | | | | | | | |
| | | | | |
Total from distributions | | | (0.98 | ) | | | (1.30 | ) | | | (0.30 | ) | | | (0.27 | ) | | | (0.09 | ) |
| | | | | | | | | | | | | | | | | | | | |
| | | | | |
Redemption fees (c) | | | — | | | | — | | | | — | | | | — | | | | — | |
| | | | | |
Net asset value, at
end of year | | | $18.23 | | | | $18.54 | | | | $17.19 | | | | $13.88 | | | | $12.50 | |
| | | | | | | | | | | | | | | | | | | | |
| | | | | |
Total Return (d) | | | 3.61 | % | | | 16.23 | % | | | 26.35 | % | | | 13.44 | % | | | 6.40 | % |
| | | | | | | | | | | | | | | | | | | | |
Ratios/Supplemental Data: | | | | | | | | | | | | | | | | | | | | |
Net assets at end of year (thousands) | | | $36,909 | | | | $29,197 | | | | $18,306 | | | | $12,819 | | | | $8,961 | |
| | | | | |
Before waiver | | | | | | | | | | | | | | | | | | | | |
| | | | | |
Ratio of expenses to average net assets | | | 1.25 | % | | | 1.93 | % | | | 1.99 | % | | | 2.30 | % | | | 3.50 | % |
| | | | | |
Ratio of net investment income (loss) to average net assets | | | 0.73 | % | | | 0.15 | % | | | 0.32 | % | | | 0.24 | % | | | (1.28 | )% |
| | | | | |
After waiver | | | | | | | | | | | | | | | | | | | | |
| | | | | |
Ratio of expenses to average net assets | | | 0.98 | % | | | 0.98 | % | | | 0.98 | % | | | 1.50 | % | | | 1.50 | % |
| | | | | |
Ratio of net investment income (loss) to average net assets | | | 1.00 | % | | | 1.09 | % | | | 1.33 | % | | | 1.04 | % | | | 0.72 | % |
| | | | | |
Portfolio turnover (e) | | | 45 | % | | | 57 | % | | | 70 | % | | | 54 | % | | | 53 | % |
| (a) | | Per share net investment income has been determined on the basis of average shares outstanding during the year. |
| (b) | | The amount shown for a share outstanding throughout the year does not accord with the change in aggregate gains and losses in the portfolio of securities during the year because of the timing of sales and purchases of fund shares in relation to fluctuating market values during the year. |
| (c) | | The amount is less than $0.005 per share. |
| (d) | | Total return in the above table represents the rate that the investor would have earned or lost on an investment in the Fund, assuming reinvestment of distributions. |
| (e) | | Portfolio turnover is calculated on the basis on the Fund as a whole without distinguishing among the classes of shares. |
15
See accompanying notes which are an integral part of these financial statements.
Dana Large Cap Equity Fund – Class A
Financial Highlights
Selected data for a share outstanding throughout each year.
| | | | | | | | | | | | | | | | | | | | |
| | | Years Ended October 31, | |
| | | 2015 | | | 2014 | | | 2013 | | | 2012 | | | 2011 | |
Net asset value, at
beginning of year | | | $18.51 | | | | $17.17 | | | | $13.92 | | | | $12.52 | | | | $11.84 | |
| | | | | | | | | | | | | | | | | | | | |
| | | | | |
Income from investment operations: | | | | | | | | | | | | | | | | | | | | |
| | | | | |
Net investment income (loss) | | | 0.16 | | | | 0.20 | | | | 0.13 | (a) | | | 0.14 | (a) | | | 0.08 | (a) |
| | | | | |
Net realized and unrealized gain (loss) on investments | | | 0.50 | (b) | | | 2.44 | | | | 3.39 | | | | 1.52 | | | | 0.67 | |
| | | | | | | | | | | | | | | | | | | | |
| | | | | |
Total from investment operations | | | 0.66 | | | | 2.64 | | | | 3.52 | | | | 1.66 | | | | 0.75 | |
| | | | | | | | | | | | | | | | | | | | |
| | | | | |
Distributions from: | | | | | | | | | | | | | | | | | | | | |
| | | | | |
Net investment income | | | (0.16 | ) | | | (0.18 | ) | | | (0.19 | ) | | | (0.13 | ) | | | (0.07 | ) |
| | | | | |
Net realized gain | | | (0.83 | ) | | | (1.12 | ) | | | (0.08 | ) | | | (0.13 | ) | | | — | |
| | | | | | | | | | | | | | | | | | | | |
| | | | | |
Total from distributions | | | (0.99 | ) | | | (1.30 | ) | | | (0.27 | ) | | | (0.26 | ) | | | (0.07 | ) |
| | | | | | | | | | | | | | | | | | | | |
| | | | | |
Redemption fees (c) | | | — | | | | — | | | | — | | | | — | | | | — | |
| | | | | |
Net asset value, at
end of year | | | $18.18 | | | | $18.51 | | | | $17.17 | | | | $13.92 | | | | $12.52 | |
| | | | | | | | | | | | | | | | | | | | |
| | | | | |
Total Return (d) | | | 3.54 | % | | | 16.24 | % | | | 25.67 | % | | | 13.54 | % | | | 6.36 | % |
| | | | | | | | | | | | | | | | | | | | |
Ratios/Supplemental Data: | | | | | | | | | | | | | | | | | | | | |
Net assets at end of year (thousands) | | | $2,652 | | | | $1,047 | | | | $799 | | | | $678 | | | | $301 | |
| | | | | |
Before waiver: | | | | | | | | | | | | | | | | | | | | |
| | | | | |
Ratio of expenses to average net assets | | | 1.25 | % | | | 1.93 | % | | | 1.98 | % | | | 2.27 | % | | | 3.11 | % |
| | | | | |
Ratio of net investment income (loss) to
average net assets | | | 0.73 | % | | | 0.15 | % | | | 0.35 | % | | | 0.22 | % | | | (0.95 | )% |
| | | | | |
After waiver: | | | | | | | | | | | | | | | | | | | | |
| | | | | |
Ratio of expenses to average net assets | | | 0.98 | % | | | 0.98 | % | | | 1.49 | % | | | 1.50 | % | | | 1.50 | % |
| | | | | |
Ratio of net investment income (loss) to
average net assets | | | 1.00 | % | | | 1.09 | % | | | 0.84 | % | | | 1.00 | % | | | 0.66 | % |
| | | | | |
Portfolio turnover (e) | | | 45 | % | | | 57 | % | | | 70 | % | | | 54 | % | | | 53 | % |
| (a) | | Per share net investment income has been determined on the basis of average shares outstanding during the year. |
| (b) | | The amount shown for a share outstanding throughout the year does not accord with the change in aggregate gains and losses in the portfolio of securities during the year because of the timing of sales and purchases of fund shares in relation to fluctuating market values during the year. |
| (c) | | The amount is less than $0.005 per share. |
| (d) | | Total return in the above table represents the rate that the investor would have earned or lost on an investment in the Fund, assuming reinvestment of distributions. |
| (e) | | Portfolio turnover is calculated on the basis on the Fund as a whole without distinguishing among the classes of shares. |
16
See accompanying notes which are an integral part of these financial statements.
Dana Large Cap Equity Fund - Institutional Class
Financial Highlights
Selected data for a share outstanding throughout each period.
| | | | | | | | | | | | |
| | | Years Ended October 31, | | | Period
Ended
October 31,
2013(a) | |
| | | 2015 | | | 2014 | | |
Net asset value, at beginning of period | | | $18.52 | | | | $17.19 | | | | $17.14 | |
| | | | | | | | | | | | |
| | | |
Income from investment operations: | | | | | | | | | | | | |
| | | |
Net investment income (loss) | | | 0.19 | | | | 0.26 | | | | — | (b)(c) |
| | | |
Net realized and unrealized gain (loss) on investments | | | 0.52 | (d) | | | 2.44 | | | | 0.05 | |
| | | | | | | | | | | | |
| | | |
Total from investment operations | | | 0.71 | | | | 2.70 | | | | 0.05 | |
| | | | | | | | | | | | |
| | | |
Distributions from: | | | | | | | | | | | | |
| | | |
Net investment income | | | (0.19 | ) | | | (0.25 | ) | | | — | |
| | | |
Net realized gain | | | (0.83 | ) | | | (1.12 | ) | | | — | |
| | | | | | | | | | | | |
| | | |
Total from distributions | | | (1.02 | ) | | | (1.37 | ) | | | — | |
| | | | | | | | | | | | |
| | | |
Redemption fees | | | 0.01 | | | | — | | | | — | |
| | | |
Net asset value, at end of period | | | $18.22 | | | | $18.52 | | | | $17.19 | |
| | | | | | | | | | | | |
| | | |
Total Return (e) | | | 3.89 | % | | | 16.60 | % | | | 0.29 | %(f) |
| | | | | | | | | | | | |
Ratios/Supplemental Data: | | | | | | | | | | | | |
| | | |
Net assets at end of period (thousands) | | | $117,663 | | | | $6,919 | | | | $273 | |
| | | |
Before waiver: | | | | | | | | | | | | |
| | | |
Ratio of expenses to average net assets | | | 1.00 | % | | | 1.68 | % | | | 1.53 | %(g) |
| | | |
Ratio of net investment income (loss) to average net assets | | | 0.98 | % | | | 0.40 | % | | | (0.31 | )%(g) |
| | | |
After waiver: | | | | | | | | | | | | |
| | | |
Ratio of expenses to average net assets | | | 0.73 | % | | | 0.73 | % | | | 0.73 | %(g) |
| | | |
Ratio of net investment income (loss) to average net assets | | | 1.25 | % | | | 1.34 | % | | | 0.49 | %(g) |
| | | |
Portfolio turnover (h) | | | 45 | % | | | 57 | % | | | 70 | %(f) |
| (a) | | The Dana Large Cap Equity Fund Institutional Class commenced operations on October 29, 2013. |
| (b) | | Per share net investment income has been determined on the basis of average shares outstanding during the period. |
| (c) | | The amount is less than $0.005 per share. |
| (d) | | The amount shown for a share outstanding throughout the period does not accord with the change in aggregate gains and losses in the portfolio of securities during the period because of the timing of sales and purchases of fund shares in relation to fluctuating market values during the period. |
| (e) | | Total return in the above table represents the rate that the investor would have earned or lost on an investment in the Fund, assuming reinvestment of distributions, and is not annualized for periods of less than one year. |
| (h) | | Portfolio turnover is calculated on the basis on the Fund as a whole without distinguishing among the classes of shares. |
17
See accompanying notes which are an integral part of these financial statements.
Notes to the Financial Statements
October 31, 2015
NOTE 1. ORGANIZATION
The Dana Large Cap Equity Fund (the “Fund”) is an open-end diversified series of the Valued Advisers Trust (the “Trust”). The Trust is a management investment company established under the laws of Delaware by an Agreement and Declaration of Trust dated June 13, 2008 (the “Trust Agreement”). The Trust Agreement permits the Board of Trustees (“Board”) to issue an unlimited number of shares of beneficial interest of separate series without par value. The Fund is one of a series of funds currently authorized by the Board. The Fund’s investment adviser is Dana Investment Advisors, Inc. (the “Adviser”). The Fund seeks long-term growth of capital.
The Fund currently offers Class N shares, Class A shares, and Institutional Class shares. Each share represents an equal proportionate interest in the assets and liabilities belonging to the Fund and is entitled to such dividends and distributions out of income belonging to the Fund as declared by the Board. Class A currently has a maximum sales charge on purchases of 5.00% as a percentage of the original purchase price. All three share classes impose a 2.00% redemption fee on shares redeemed within 60 days of purchase.
NOTE 2. SIGNIFICANT ACCOUNTING POLICIES
The Fund is an investment company and follows accounting and reporting guidance under Financial Accounting Standards Board (“FASB”) Accounting Standards Codification (“ASC”) Topic 946, “Financial Services-Investment Companies”. The following is a summary of significant accounting policies followed by the Fund in the preparation of its financial statements. These policies are in conformity with the generally accepted accounting principles in the United States of America (“GAAP”).
Estimates – The preparation of financial statements in conformity with GAAP requires management to make estimates and assumptions that affect the reported amounts of assets and liabilities and disclosure of contingent assets and liabilities at the date of the financial statements and the reported amounts of increases and decreases in net assets from operations during the reporting period. Actual results could differ from those estimates.
Securities Valuation – All investments in securities are recorded at their estimated fair value as described in Note 3.
Federal Income Taxes – The Fund makes no provision for federal income or excise tax. The Fund intends to qualify each year as a regulated investment company (“RIC”) under subchapter M of the Internal Revenue Code of 1986, as amended, by complying with the requirements applicable to RICs and by distributing substantially all of its taxable income. The Fund also intends to distribute sufficient net investment income and net capital gains, if any, so that it will not be subject to excise tax on undistributed income and gains. If the required amount of net investment income or gains is not distributed, the Fund could incur a tax expense.
For the fiscal year ended October 31, 2015, the Fund did not have a liability for any unrecognized tax benefits. The Fund recognizes interest and penalties, if any, related to unrecognized tax benefits as income tax expense in the statement of operations. The Fund is subject to examination by U.S. federal tax authorities for the last three tax year ends and the interim tax period since then.
18
Notes to the Financial Statements (continued)
October 31, 2015
Expenses – Expenses incurred by the Trust that do not relate to a specific fund of the Trust are allocated to the individual funds based on each fund’s relative net assets or other appropriate basis. Expenses attributable to any class are borne by that class. Income, realized gains and losses, unrealized appreciation and depreciation, and expenses are allocated to each class based on the net assets in relation to the relative net assets of the Fund.
Security Transactions and Related Income – The Fund follows industry practice and records security transactions on the trade date for financial reporting purposes. The specific identification method is used for determining gains or losses for financial statement and income tax purposes. Dividend income is recorded on the ex-dividend date and interest income is recorded on an accrual basis. Discounts and premiums on securities purchased are accreted or amortized using the effective interest method. Withholding taxes on foreign dividends have been provided for in accordance with the Fund’s understanding of the applicable country’s tax rules and rates.
Dividends and Distributions – Distributions to shareholders, which are determined in accordance with income tax regulations, are recorded on the ex-dividend date. The Fund intends to distribute substantially all of its net investment income on a quarterly basis. The Fund intends to distribute its net realized long-term and short-term capital gains, if any, on an annual basis. The treatment for financial reporting purposes of distributions made to shareholders during the year from net investment income or net realized capital gains may differ from their ultimate treatment for federal income tax purposes. These differences are caused primarily by differences in the timing of the recognition of certain components of income, expense or realized capital gain for federal income tax purposes. Where such differences are permanent in nature, they are reclassified in the components of the net assets based on their ultimate characterization for federal income tax purposes. Any such reclassifications will have no effect on net assets, results of operations or net asset values per share of the Fund. For the fiscal year ended October 31, 2015, the Fund made the following reclassifications to increase (decrease) the components of net assets:
| | | | |
| Paid in Capital | | Accumulated Undistributed
Net Investment Income | | Accumulated Net Realized Loss from Investments |
$– | | $(1,971) | | $1,971 |
NOTE 3. SECURITIES VALUATION AND FAIR VALUE MEASUREMENTS
Fair value is defined as the price that a Fund would receive upon selling an investment in a timely transaction to an independent buyer in the principal or most advantageous market of the investment. GAAP establishes a three-tier hierarchy to maximize the use of observable market data and minimize the use of unobservable inputs and to establish classification of fair value measurements for disclosure purposes.
Inputs refer broadly to the assumptions that market participants would use in pricing the asset or liability, including assumptions about risk (the risk inherent in a particular valuation technique used to measure fair value including such a pricing model and/or the risk inherent in the inputs to the valuation technique). Inputs may be observable or unobservable. Observable inputs are inputs that reflect the assumptions market participants would use in pricing the asset or liability developed based on market data obtained from sources independent of the reporting entity. Unobservable inputs are inputs that reflect the reporting entity’s own assumptions about the assumptions market
19
Notes to the Financial Statements (continued)
October 31, 2015
participants would use in pricing the asset or liability developed based on the best information available in the circumstances.
Various inputs are used in determining the value of the Fund’s investments. These inputs are summarized in the three broad levels listed below.
| | • | | Level 1 – unadjusted quoted prices in active markets for identical investments and/or registered investment companies where the value per share is determined and published and is the basis for current transactions for identical assets or liabilities at the valuation date |
| | • | | Level 2 – other significant observable inputs (including, but not limited to, quoted prices for an identical security in an inactive market, quoted prices for similar securities, interest rates, prepayment speeds, credit risk, etc.) |
| | • | | Level 3 – significant unobservable inputs (including the Fund’s own assumptions in determining fair value of investments based on the best information available) |
The inputs used to measure fair value may fall into different levels of the fair value hierarchy. In such cases, for disclosure purposes, the level in the fair value hierarchy within which the fair value measurement falls in its entirety, is determined based, on the lowest level input that is significant to the fair value measurement in its entirety.
Equity securities, including common stocks, exchanged-traded funds and real estate investment trusts, are generally valued by using market quotations, but may be valued on the basis of prices furnished by a pricing service when the Adviser believes such prices more accurately reflect the fair value of such securities. Securities traded in the NASDAQ over-the-counter market are generally valued by a pricing service at the NASDAQ official closing price. Lacking a last sale price, an exchange security is generally valued by the pricing service at its last bid price.
When using the market quotations or close prices provided by a pricing service and when the market is considered active, the security is classified as a Level 1 security. Sometimes, an equity security owned by the Fund will be valued by the pricing service with factors other than market quotations or when the market is considered inactive. When this happens, the security is classified as a Level 2 security. When market quotations are not readily available, when the Adviser determines that the market quotation or the price provided by the pricing service does not accurately reflect the current fair value, or when restricted or illiquid securities are being valued, such securities are valued as determined in good faith by the Adviser, in conformity with guidelines adopted by and subject to review by the Board. These securities are generally categorized as Level 3 securities.
Investments in mutual funds, including money market mutual funds, are generally priced at the ending NAV provided by the service agent of the funds. These securities are categorized as Level 1 securities.
Short-term investments in fixed income securities, (those with maturities of less than 60 days when acquired, or which subsequently are within 60 days of maturity), are valued by using the amortized cost method of valuation, which the Board has determined represents fair value. These securities are classified as Level 2 securities.
20
Notes to the Financial Statements (continued)
October 31, 2015
In accordance with the Trust’s good faith pricing guidelines, the Adviser is required to consider all appropriate factors relevant to the value of securities for which it has determined other pricing sources are not available or reliable as described above. No single standard exists for determining fair value, because fair value depends upon the circumstances of each individual case. As a general principle, the current fair value of an issue of securities being valued by the Adviser would appear to be the amount which the owner might reasonably expect to receive for them upon their current sale. Methods which are in accordance with this principle may, for example, be based on (i) a multiple of earnings; (ii) a discount from market of a similar freely traded security (including a derivative security or a basket of securities traded on other markets, exchanges or among dealers); or (iii) yield to maturity with respect to debt issues, or a combination of these and other methods. Good faith pricing is permitted if, in the Adviser’s opinion, the validity of market quotations appears to be questionable based on factors such as evidence of a thin market in the security based on a small number of quotations, a significant event occurs after the close of a market but before a Fund’s NAV calculation that may affect a security’s value, or the Adviser is aware of any other data that calls into question the reliability of market quotations. Good faith pricing may also be used in instances when the bonds the Fund invests in may default or otherwise cease to have market quotations readily available.
The following is a summary of the inputs used to value the Fund’s investments as of October 31, 2015:
| | | | | | | | | | | | | | | | |
| | | Valuation Inputs | | | | |
| Assets | | Level 1 | | | Level 2 | | | Level 3 | | | Total | |
Common Stocks* | | $ | 154,864,916 | | | $ | – | | | $ | – | | | $ | 154,864,916 | |
Short-Term Investments | | | 3,652,855 | | | | – | | | | – | | | | 3,652,855 | |
Total | | $ | 158,517,771 | | | $ | – | | | $ | – | | | $ | 158,517,771 | |
| * | | Refer to Schedule of Investments for industry classifications. |
The Fund did not hold any investments at any time during the reporting period in which other significant observable inputs (Level 2) were used in determining fair value. The Fund did not hold any investments at any time during the reporting period in which significant unobservable inputs were used in determining fair value; therefore, no reconciliation of Level 3 securities is included for this reporting period.
The Trust recognizes transfers between fair value hierarchy levels at the reporting period end. There were no transfers between any levels as of October 31, 2015 and the previous reporting period end.
NOTE 4. FEES AND OTHER TRANSACTIONS WITH AFFILIATES
Under the terms of the management agreement between the Trust and the Adviser (the “Agreement”) for the Fund, the Adviser manages the Fund’s investments subject to oversight of the Board. As compensation for its management services, the Fund is obligated to pay the Adviser a fee computed and accrued daily and paid monthly at an annual rate of 0.70% of the average daily net assets of the Fund. For the fiscal year ended October 31, 2015, the Adviser earned fees of $694,299 from the Fund before the waivers described below. At October 31, 2015, the Fund owed the Adviser $63,999.
21
Notes to the Financial Statements (continued)
October 31, 2015
The Adviser has contractually agreed to waive its management fee and/or reimburse certain operating expenses through February 28, 2017, but only to the extent necessary so that the Fund’s net expenses, excluding brokerage fees and commissions, borrowing costs (such as interest and dividend expenses on securities sold short), taxes, extraordinary expenses, fees and expenses paid under a distribution plan adopted pursuant to Rule 12b-1, fees and expenses paid under a shareholder services plan, and indirect expenses (such as “acquired funds fees and expenses”) do not exceed 0.73% for Class N, Class A and Institutional shares.
Each waiver or reimbursement of an expense by the Adviser is subject to repayment by the Fund within the three fiscal years following the fiscal year in which the expense was incurred, provided that the Fund is able to make the repayment without exceeding the expense limitation. The contractual agreement is in effect through February 28, 2017. The expense cap may not be terminated prior to this date except by the Board. For the fiscal year ended October 31, 2015, the Adviser waived fees of $268,172 from the Fund.
The amounts subject to repayment by the Fund, pursuant to the aforementioned conditions are as follows:
| | | | |
| Amount | | Recoverable through
October 31, | |
| $ 2,189 | | | 2016 | |
| 239,324 | | | 2017 | |
| 268,172 | | | 2018 | |
The Trust retains Huntington Asset Services, Inc. (“HASI”) to manage the Fund’s business affairs and to provide the Fund with administrative services, including all regulatory, reporting and necessary office equipment and personnel. For the fiscal year ended October 31, 2015, HASI earned fees of $63,395 from the Fund for administrative and compliance services provided to the Fund. At October 31, 2015, HASI was owed $7,842 from the Fund for administrative and compliance services. The Trust also retains HASI to act as the Fund’s transfer agent and to provide the Fund with fund accounting services. For the fiscal year ended October 31, 2015, HASI earned fees of $47,441 for transfer agent services and reimbursement for out-of-pocket expenses incurred in providing transfer agent services to the Fund. At October 31, 2015, HASI was owed $4,336 for transfer agent services and out-of-pocket expenses. For the fiscal year ended October 31, 2015, HASI earned fees of $41,116 from the Fund for fund accounting services. At October 31, 2015, HASI was owed $4,392 from the Fund for fund accounting services.
Certain officers and one Trustee of the Trust are members of management and/or employees of HASI. HASI operates as a wholly-owned subsidiary of Huntington Bancshares, Inc., the parent company of the Unified Financial Securities, Inc. (the “Distributor” or “Unified”), the principal underwriter of the Fund’s shares, and Huntington National Bank, the custodian of the Fund’s assets (the “Custodian”). For the fiscal year ended October 31, 2015, the Custodian earned fees $22,161 for custody services. At October 31, 2015, the Custodian was owed $1,751 for custody services.
The Fund has adopted a Distribution Plan (the “Plan”) pursuant to Rule 12b-1 under the 1940 Act. The Plan provides that the Fund will pay the Distributor and/or any registered securities dealer, financial institution or any other person (a “Recipient”) a shareholder servicing fee aggregating up
22
Notes to the Financial Statements (continued)
October 31, 2015
to 0.25% of the average daily net assets of the Class N and Class A shares in connection with the promotion and distribution of the Fund’s shares or the provision of personal services to shareholders, including, but not necessarily limited to, advertising, compensation to underwriters, dealers and selling personnel, the printing and mailing of prospectuses to other than current Fund shareholders, the printing and mailing of sales literature and servicing shareholder accounts. The Fund or the Adviser may pay all or a portion of these fees to any Recipient who renders assistance in distributing or promoting the sale of shares, or who provides certain shareholder services, pursuant to a written agreement. The Plan is a compensation plan, which means that compensation is paid regardless of 12b-1 expenses actually incurred. It is anticipated that the Plan will benefit shareholders because an effective sales program typically is necessary in order for the Fund to reach and maintain a sufficient size to achieve efficiently its investment objectives and to realize economies of scale. For the fiscal year ended October 31, 2015, Class N shares 12b-1 expense incurred by the Fund was $92,933 and Class A shares 12b-1 expense incurred by the Fund was $3,407. The Fund owed $7,692 for Class N shares and $548 for Class A shares 12b-1 fees as of October 31, 2015.
During the fiscal year ended October 31, 2015, the Distributor received $9,936 from commissions earned on sales of Class A shares, of which $9,936 was re-allowed to intermediaries of the Fund. An officer of the Trust is an officer of the Distributor and such person may be deemed to be an affiliate of the Distributor.
NOTE 5. PURCHASES AND SALES OF SECURITIES
For the fiscal year ended October 31, 2015, purchases and sales of investment securities, other than short-term investments and short-term U.S. government obligations were as follows:
| | | | |
| | | Amount | |
Purchases | | | | |
U.S. Government Obligations | | $ | – | |
Other | | | 163,337,073 | |
Sales | | | | |
U.S. Government Obligations | | $ | – | |
Other | | | 43,965,105 | |
NOTE 6. BENEFICIAL OWNERSHIP
The beneficial ownership, either directly or indirectly, of more than 25% of the voting securities of a fund creates a presumption of control of a fund, under Section 2(a)(9) of the Investment Company Act of 1940. At October 31, 2015, there were no beneficial owners, either directly or indirectly, of more than 25% of the Fund.
NOTE 7. FEDERAL TAX INFORMATION
At October 31, 2015, the net unrealized appreciation (depreciation) of investments for tax purposes was as follows:
| | | | |
Gross Unrealized Appreciation | | $ | 11,057,668 | |
Gross Unrealized Depreciation | | | (4,851,876 | ) |
Net Unrealized Appreciation | | $ | 6,205,792 | |
23
Notes to the Financial Statements (continued)
October 31, 2015
At October 31, 2015, the aggregate cost of securities for federal income tax purposes was $152,311,979 for the Fund.
At October 31, 2015, the difference between book basis and tax basis unrealized appreciation was attributable primarily to the tax deferral of losses on wash sales and the return of capital adjustments from real estate investment trusts.
At October 31, 2015, the Fund’s most recent fiscal year end, the components of distributable earnings (accumulated losses) on a tax basis was as follows:
| | | | |
Undistributed Ordinary Income | | $ | 128,745 | |
Accumulated Capital and Other Losses | | | (1,513,521 | ) |
Unrealized Appreciation (Depreciation)(a) | | | 6,205,792 | |
Total Accumulated Earnings (Deficit) | | $ | 4,821,016 | |
| (a) | | The difference between book basis and tax basis unrealized appreciation (depreciation) is attributable to the tax deferral of losses on wash sales and income from certain investments. |
The tax character of distributions for the fiscal years ended October 31, 2015 and October 31, 2014 was as follows:
| | | | | | | | |
| | | 2015 | | | 2014 | |
Distributions paid from: | | | | | | | | |
Ordinary Income | | $ | 1,351,560 | | | $ | 468,041 | |
Net Long-Term Capital Gains | | | 2,038,983 | | | | 1,087,745 | |
| | | $ | 3,390,543 | | | $ | 1,555,786 | |
As of October 31, 2015, the Fund has available for tax purposes an unused capital loss carryforwards of $1,513,521 of short-term capital losses with no expiration, which is available to offset against future taxable net capital gains. To the extent that these carryforwards are used to offset future gains, it is probable that the amount offset will not be distributed to shareholders.
NOTE 8. COMMITMENTS AND CONTINGENCIES
The Fund indemnifies its officers and trustees for certain liabilities that may arise from performance of their duties to the Fund. Additionally, in the normal course of business, the Fund enters into contracts that contain a variety of representations and warranties which provide general indemnifications. The Fund’s maximum exposure under these arrangements is unknown, as this would involve future claims that may be made against the Fund that have not yet occurred.
NOTE 9. SUBSEQUENT EVENTS
Management of the Fund has evaluated the need for disclosures and/or adjustments resulting from subsequent events through the date these financial statements were issued. Subsequent to the period end, on November 13, 2015, Huntington Bancshares Inc. entered in an agreement to sell Huntington Asset Services, Inc. and Unified Financial Services, Inc. to Ultimus Fund Solutions, LLC. The sale is expected to close by the end of December 2015, subject to customary closing conditions. Management has determined that there were no additional items requiring additional disclosure.
24
Report of Independent Registered Public Accounting Firm
To the Shareholders of Dana Large Cap Equity Fund and
Board of Trustees of Valued Advisers Trust
We have audited the accompanying statement of assets and liabilities, including the schedule of investments, of Dana Large Cap Equity Fund (the “Fund”), a series of Valued Advisors Trust, as of October 31, 2015, and the related statement of operations for the year then ended, the statements of changes in net assets for each of the two years in the period then ended, and the financial highlights for each of the three periods in the period then ended. These financial statements and financial highlights are the responsibility of the Fund’s management. Our responsibility is to express an opinion on these financial statements and financial highlights based on our audits. The Fund’s financial highlights for the periods ended on or prior to October 31, 2012, were audited by other auditors whose report dated December 19, 2012, expressed an unqualified opinion on those financial highlights.
We conducted our audits in accordance with the standards of the Public Company Accounting Oversight Board (United States). Those standards require that we plan and perform the audits to obtain reasonable assurance about whether the financial statements and financial highlights are free of material misstatement. An audit includes examining, on a test basis, evidence supporting the amounts and disclosures in the financial statements. Our procedures included confirmation of securities owned as of October 31, 2015, by correspondence with the custodian and brokers. An audit also includes assessing the accounting principles used and significant estimates made by management, as well as evaluating the overall financial statement presentation. We believe that our audits provide a reasonable basis for our opinion.
In our opinion, the financial statements and financial highlights referred to above present fairly, in all material respects, the financial position of Dana Large Cap Equity Fund as of October 31, 2015, the results of its operations for the year then ended, the changes in its net assets for each of the two years in the period then ended, and the financial highlights for each of the three periods in the period then ended, in conformity with accounting principles generally accepted in the United States of America.

COHEN FUND AUDIT SERVICES, LTD.
Cleveland, Ohio
December 23, 2015
25
Additional Federal Income Tax Information (Unaudited)
The Form 1099-DIV you receive in January 2016 will show the tax status of all distributions paid to your account in calendar year 2015. Shareholders are advised to consult their own tax adviser with respect to the tax consequences of their investment in the Fund. As required by the Internal Revenue Code and/or regulations, shareholders must be notified regarding the status of qualified dividend income for individuals and the dividends received deduction for corporations.
Qualified Dividend Income. The Fund designates approximately 92% or up to the maximum amount of such dividends allowable pursuant to the Internal Revenue Code, as qualified dividend income eligible for the reduced tax rate of 15%.
Dividends Received Deduction. Corporate shareholders are generally entitled to take the dividends received deduction on the portion of the Fund’s dividend distribution that qualifies under tax law. For the Fund’s calendar year 2015 ordinary income dividends, 93% qualifies for the corporate dividends received deduction.
For the year ended October 31, 2015, the Fund designated $2,038,983 as long-term capital gain distributions.
26
Trustees and Officers (Unaudited)
The Board of Trustees supervises the business activities of the Trust. Each Trustee serves as a trustee until termination of the Trust unless the Trustee dies, resigns, retires or is removed.
The following tables provide information regarding the Trustees and Officers.
The following table provides information regarding each of the Independent Trustees.
| | | | |
Name, Address*, (Age),
Position with Trust**,
Term of Position with Trust | | Principal Occupation During Past 5 Years | | Other Directorships |
Ira Cohen, 56,
Independent Trustee,
June 2010 to present. | | Independent financial services consultant since February 2005; Executive Vice President of Asset Management Services, Recognos Financial, since August 2015. | | Trustee and Audit Committee Chairman, Griffin Institutional Access Real Estate Fund, since May 2014. Trustee, Angel Oak Funds Trust, since October 2014 |
Andrea N. Mullins, 48,
Independent Trustee,
December 2013 to present. | | Private investor; Independent Contractor, Seabridge Wealth Management, LLC, since April 2014; Principal Financial Officer and Treasurer, Eagle Family of Funds (mutual fund family) and Vice President, Eagle Asset Management, Inc. (investment adviser) each from 2004 to 2010. | | None. |
| * | | The address for each trustee and officer is 2960 N. Meridian St., Suite 300, Indianapolis, IN 46208. |
| ** | | As of the date of this report, the Trust consists of 14 series. |
The following table provides information regarding the Trustee who is considered an “interested person” of the Trust, as that term is defined under the 1940 Act. Based on the experience of the Trustee, the Trust concluded that the individual described below should serve as a Trustee.
| | | | |
Name, Address*, (Age),
Position with Trust**,
Term of Position with Trust | | Principal Occupation During Past 5 Years | | Other Directorships |
R. Jeffrey Young, 51,
Trustee and Chairman,
June 2010 to present. | | Principal Executive Officer and President, Valued Advisers Trust since February 2010; President, Huntington Asset Services, Inc., since April 2015; Director since May 2014; Senior Vice President January 2010 to April 2015; President, Unified Financial Securities, Inc. since July 2015; Director since May 2014; Chief Executive Officer, Huntington Funds, February 2010 to March 2015; Chief Executive Officer, Huntington Strategy Shares, November 2010 to March 2015; President and Chief Executive Officer, Dreman Contrarian Funds, March 2011 to February 2013; Trustee, Valued Advisers Trust, August 2008 to January 2010; and Managing Director and Chief Operating Officer of Professional Planning Consultants, from 2007 to 2010. | | Trustee and Chairman, Capitol Series Trust, since September 2013. |
| * | | The address for each trustee and officer is 2960 N. Meridian St., Suite 300, Indianapolis, IN 46208. |
| ** | | As of the date of this report, the Trust consists of 14 series. |
27
Trustees and Officers (Unaudited) (continued)
The following table provides information regarding the Officers of the Trust:
| | | | |
Name, Address*, (Age),
Position with Trust,**
Term of Position with Trust | | Principal Occupation During Past 5 Years | | Other Directorships |
R. Jeffrey Young, 51,
Trustee and Chairman,
June 2010 to present; Principal Executive Officer and President, Valued Advisers Trust since February 2010; | | President, Huntington Asset Services, Inc., since April 2015; Director since May 2014; Senior Vice President January 2010 to April 2015; President, Unified Financial Securities, Inc. since July 2015; Director since May 2014; Chief Executive Officer, Huntington Funds, February 2010 to March 2015; Chief Executive Officer, Huntington Strategy Shares, November 2010 to March 2015; President and Chief Executive Officer, Dreman Contrarian Funds, March 2011 to February 2013; Trustee, Valued Advisers Trust, August 2008 to January 2010; and Managing Director and Chief Operating Officer of Professional Planning Consultants, from 2007 to 2010. | | Trustee and Chairman, Capitol Series Trust, since September 2013. |
John C. Swhear, 54,
Chief Compliance Officer, AML Officer and Vice President, August 2008 to present. | | Vice President of Legal Administration and Compliance for Huntington Asset Services, Inc., the Trust’s administrator, since April 2007 and Director since May 2014; Chief Compliance Officer of Unified Financial Securities, Inc., the Trust’s distributor, since May 2007 and Director since May 2014; President of the Unified Series Trust since March 2012, and Senior Vice President from May 2007 to March 2012; Chief Compliance Officer and AML Officer, Capitol Series Trust, since September 2013; Secretary of Huntington Funds from April 2010 to February 2012; President and Chief Executive Officer of Dreman Contrarian Funds from March 2010 to March 2011. | | None. |
Carol J. Highsmith, 50,
Vice President,
August 2008 to present; Secretary, March 2014 to present | | Employed in various positions with Huntington Asset Services, Inc., the Trust’s administrator, since November 1994; currently Vice President of Legal Administration; Secretary, Cross Shore Discovery Fund since May 2014. | | None. |
Matthew J. Miller, 39,
Vice President,
December 2011 to present. | | Employed in various positions with Huntington Asset Services, Inc., the Trust’s administrator, since July 1998; currently Vice President of Relationship Management; Vice President, Huntington Funds, since February 2010; President and Chief Executive Officer, Capitol Series Trust, since September 2013. | | None. |
Bryan W. Ashmus, 42,
Principal Financial Officer
and Treasurer,
December 2013 to present. | | Vice President, Financial Administration, Huntington Asset Services, Inc., the Trust’s administrator, since September 2013; Chief Financial Officer and Treasurer, The Huntington Strategy Shares and The Huntington Funds, since November 2013; Vice President, Fund Administration, Citi Fund Services Ohio, Inc., from 2005 to 2013. | | None. |
| * | | The address for each trustee and officer is 2960 N. Meridian St., Suite 300, Indianapolis, IN 46208. |
| ** | | As of the date of this report, the Trust consists of 14 series. |
Other Information
The Fund’s Statement of Additional Information (“SAI”) includes additional information about the trustees and is available without charge, upon request. You may call toll-free at (855) 280-9648 to request a copy of the SAI or to make shareholder inquiries.
28
Investment Advisory Agreement Approval (Unaudited)
At a meeting held on June 2-3, 2015, the Board of Trustees (the “Board”) considered the renewal of the Investment Advisory Agreement (the “Agreement”) between the Trust and Dana Investment Advisers, Inc. (the “Adviser” or “Dana”) on behalf of the Dana Large Cap Equity Fund (the “Dana Fund”). Counsel noted that the 1940 Act requires the approval of the Agreement between the Trust and the Adviser by a majority of the Independent Trustees. Counsel again reminded the Trustees of their fiduciary duties and responsibilities as summarized in the memorandum from his firm, including the factors (the “Factors”) to be considered, and the application of those Factors to Dana. In assessing these Factors and reaching its decisions, the Board took into consideration information furnished for the Board’s review and consideration throughout the year at regular Board meetings, as well as information specifically prepared and/or presented in connection with the annual renewal process, including information presented at the Meeting. The Board requested and was provided with, and reflected on, information and reports relevant to the annual renewal of the Agreement, including: (i) reports regarding the services and support provided to the Dana Fund and its shareholders by Dana; (ii) quarterly assessments of the investment performance of the Dana Fund by personnel of Dana; (iii) commentary on the reasons for the performance; (iv) presentations by Dana addressing Dana’s investment philosophy, investment strategy, personnel and operations; (v) compliance and audit reports concerning the Dana Fund and Dana; (vi) disclosure information contained in the registration statement of the Trust and the Form ADV of Dana; and (vii) a memorandum from Counsel, that summarized the fiduciary duties and responsibilities of the Board in reviewing and approving the Agreement, including the material Factors set forth above and the types of information with respect to each Factor that should be considered by the Board in order to make an informed decision. The Board also requested and received various informational materials including, without limitation: (i) documents containing information about Dana, including financial information, a description of personnel and the services provided to the Dana Fund, information on investment advice, performance, summaries of Dana Fund expenses, compliance program, current legal matters, and other general information; (ii) comparative expense and performance information for other mutual funds with strategies similar to the Dana Fund; and (iii) benefits to be realized by Dana from its relationship with the Dana Fund. The Board did not identify any particular information that was most relevant to its consideration to approve the Agreement and each Trustee may have afforded different weight to the various Factors.
| 1. | | The nature, extent, and quality of the services to be provided by the Adviser. In this regard, the Board considered Dana’s responsibilities under the Advisory Agreement. The Trustees considered the services being provided by Dana to the Dana Fund including, without limitation: the quality of its investment advisory services (including research and recommendations with respect to portfolio securities), its process for formulating investment recommendations and assuring compliance with the Dana Fund’s investment objectives and limitations, its coordination of services for the Dana Fund among the Dana Fund’s service providers, and its efforts to promote the Dana Fund and grow its assets. The Trustees considered Dana’s continuity of, and commitment to retain, qualified personnel and Dana’s commitment to maintain and enhance its resources and systems, the commitment of Dana’s personnel to finding alternatives and options that allow the Dana Fund to maintain its goals, and Dana’s continued cooperation with the Independent Trustees and Counsel for the Dana Fund. The Trustees considered Dana’s personnel, including the education and experience of |
29
Investment Advisory Agreement Approval (Unaudited) (continued)
| | Dana’s personnel. After considering the foregoing information and further information in the Meeting materials provided by Dana (including Dana’s Form ADV), the Board concluded that, in light of all the facts and circumstances, the nature, extent, and quality of the services provided by Dana were satisfactory and adequate for the Dana Fund. |
| 2. | | Investment Performance of the Dana Fund and the Adviser. In considering the investment performance of the Dana Fund and Dana, the Trustees compared the performance of the Dana Fund with the performance of funds with similar objectives managed by other investment advisers, with aggregated peer group data, as well as with the performance of the Dana Fund’s benchmark. The Trustees also considered the consistency of Dana’s management of the Dana Fund with its investment objectives, strategies, and limitations. The Trustees noted that the Dana Fund’s performance was above that of its peer group for all periods presented, including the year-to-date, one month, three month, one year, and since inception periods ended March 31. The Trustees also considered the performance of Dana’s separate accounts that were managed in a manner similar to that of the Dana Fund and they noted that the performance was very comparable. After reviewing and discussing the investment performance of the Dana Fund further, Dana’s experience managing the Dana Fund, the Dana Fund’s historical performance, and other relevant factors, the Board concluded, in light of all the facts and circumstances, that the investment performance of the Dana Fund and Dana was satisfactory. |
| 3. | | The costs of the services to be provided and profits to be realized by the Adviser from the relationship with the Dana Fund. In considering the costs of services to be provided and the profits to be realized by Dana from the relationship with the Dana Fund, the Trustees considered: (1) Dana’s financial condition; (2) the asset level of the Dana Fund; (3) the overall expenses of the Dana Fund; and (4) the nature and frequency of advisory fee payments. The Trustees reviewed information provided by Dana regarding its profits associated with managing the Dana Fund, noting that Dana is currently waiving its management fee and reimbursing a portion of the Dana Fund’s expenses. The Trustees also considered potential benefits for Dana in managing the Dana Fund. The Trustees then compared the fees and expenses of the Dana Fund (including the management fee) to other comparable mutual funds. The Trustees noted that the Dana Fund’s management fee is below the average and median fees of peers in its category. The Trustees also noted that the Dana Fund’s net expense ratio was lower than that of the peer average and median, as a result of Dana’s contractual commitment to limit the expenses of the Dana Fund. The Board noted that the fees that Dana assesses for separate account clients that have strategies similar to that of the Fund could generally be lower and they noted that the reason for such differences was acceptable and reasonable. Based on the foregoing, the Board concluded that the fees to be paid to Dana by the Dana Fund and the profits to be realized by Dana, in light of all the facts and circumstances, were fair and reasonable in relation to the nature and quality of the services provided by Dana. |
| 4. | | The extent to which economies of scale would be realized as the Dana Fund grows and whether advisory fee levels reflect these economies of scale for the benefit of the Dana Fund’s investors. In this regard, the Board considered the Dana Fund’s fee arrangements with Dana. The Board considered that while the management fee remained the same at all asset levels, the Dana Fund’s shareholders experienced benefits from the Dana Fund’s expense limitation arrangement. The Trustees noted that once the Dana Fund’s expenses fell below the cap set by the arrangement, the Dana Fund’s shareholders would continue to benefit from the economies |
30
Investment Advisory Agreement Approval (Unaudited) (continued)
| | of scale under the Trust’s agreement with service providers other than Dana. In light of its ongoing consideration of the Dana Fund’s asset levels, expectations for growth in the Dana Fund, and fee levels, the Board determined that the Dana Fund’s fee arrangements, in light of all the facts and circumstances, were fair and reasonable in relation to the nature and quality of the services provided by Dana. |
| 5. | | Possible conflicts of interest and benefits to the Adviser. In considering Dana’s practices regarding conflicts of interest, the Trustees evaluated the potential for conflicts of interest and considered such matters as the experience and ability of the advisory personnel assigned to the Dana Fund; the basis of decisions to buy or sell securities for the Dana Fund and/or Dana’s other accounts; and the substance and administration of Dana’s code of ethics. The Trustees also considered disclosure in the registration statement of the Trust relating to Dana’s potential conflicts of interest. The Trustees noted that Dana may utilize soft dollars and the Trustees noted Dana’s policies and processes for managing the conflicts of interest that could arise from soft dollar arrangements. The Trustees noted other potential benefits to Dana, including the fact that the Dana Fund provides an attractive vehicle for smaller accounts, which may increase the total assets under management by Dana and provide marginal cost efficiency. Based on the foregoing, the Board determined that the standards and practices of Dana relating to the identification and mitigation of potential conflicts of interest and the benefits to be realized by Dana in managing the Dana Fund were satisfactory. |
After additional consideration of the factors delineated in the memorandum provided by Counsel and further discussion among the Board, the Board determined to approve the continuation of the Agreement between the Trust and the Adviser.
31
VALUED ADVISERS TRUST
PRIVACY POLICY
The following is a description of the policies of the Valued Advisers Trust (the “Trust”) regarding disclosure of nonpublic personal information that shareholders provide to a series of the Trust (each, a “Fund”) or that the Fund collects from other sources. In the event that a shareholder hold shares of a Fund through a broker-dealer or other financial intermediary, the privacy policy of the financial intermediary would govern how shareholder nonpublic personal information would be shared with nonaffiliated third parties.
Categories of Information a Fund May Collect. A Fund may collect the following nonpublic personal information about its shareholders:
| | • | | Information the Fund receives from a shareholder on applications or other forms, correspondence, or conversations (such as the shareholder’s name, address, phone number, social security number, and date of birth); and |
| | • | | Information about the shareholder’s transactions with the Fund, its affiliates, or others (such as the shareholder’s account number and balance, payment history, cost basis information, and other financial information). |
Categories of Information a Fund May Disclose. A Fund may not disclose any nonpublic personal information about its current or former shareholders to unaffiliated third parties, except as required or permitted by law. A Fund is permitted by law to disclose all of the information it collects, as described above, to its service providers (such as the Fund’s custodian, administrator, transfer agent, accountant and legal counsel) to process shareholder transactions and otherwise provide services to the shareholder.
Confidentiality and Security. Each Fund shall restrict access to shareholder nonpublic personal information to those persons who require such information to provide products or services to the shareholder. Each Fund shall maintain physical, electronic, and procedural safeguards that comply with federal standards to guard shareholder nonpublic personal information.
Disposal of Information. The Funds, through their transfer agent, have taken steps to reasonably ensure that the privacy of a shareholder’s nonpublic personal information is maintained at all times, including in connection with the disposal of information that is no longer required to be maintained by the Funds. Such steps shall include, whenever possible, shredding paper documents and records prior to disposal, requiring off-site storage vendors to shred documents maintained in such locations prior to disposal, and erasing and/or obliterating any data contained on electronic media in such a manner that the information can no longer be read or reconstructed.
32
PROXY VOTING
A description of the policies and procedures that the Fund uses to determine how to vote proxies relating to portfolio securities and information regarding how the Fund voted those proxies during the most recent twelve month period ended June 30, is available without charge upon request by (1) calling the Fund at (855) 280-9648 and (2) from Fund documents filed with the Securities and Exchange Commission (“SEC”) on the SEC’s website at www.sec.gov.
TRUSTEES
R. Jeffrey Young, Chairman
Ira Cohen
Andrea N. Mullins
OFFICERS
R. Jeffrey Young, Principal Executive Officer and President
Bryan W. Ashmus, Principal Financial Officer and Treasurer
John C. Swhear, Chief Compliance Officer, AML Officer and Vice-President
Carol J. Highsmith, Vice President and Secretary
Matthew J. Miller, Vice President
INVESTMENT ADVISER
Dana Investment Advisors, Inc.
15800 Bluemound Rd., Suite 250
Brookfield, WI 53005
DISTRIBUTOR
Unified Financial Securities, Inc.
2960 North Meridian Street, Suite 300
Indianapolis, IN 46208
INDEPENDENT REGISTERED PUBLIC ACCOUNTING FIRM
Cohen Fund Audit Services, Ltd.
1350 Euclid Avenue, Suite 800
Cleveland, OH 44115
LEGAL COUNSEL
The Law Offices of John H. Lively & Associates, Inc.,
A member firm of The 1940 Act Law GroupTM
11300 Tomahawk Creek Parkway, Suite 310
Leawood, KS 66211
CUSTODIAN
Huntington National Bank
41 S. High St.
Columbus, OH 43215
ADMINISTRATOR, TRANSFER AGENT AND FUND ACCOUNTANT
Huntington Asset Services, Inc.
2960 North Meridian Street, Suite 300
Indianapolis, IN 46208
This report is intended only for the information of shareholders or those who have received the Fund’s prospectus which contains information about the Fund’s management fee and expenses. Please read the prospectus carefully before investing.
Distributed by Unified Financial Securities, Inc.
Member FINRA/SIPC
As of the end of the period covered by this report, the registrant has adopted a code of ethics that applies to the registrant’s principal executive officer, principal financial officer, principal accounting officer or controller, or persons performing similar functions, regardless of whether these individuals are employed by the registrant or a third party. Pursuant to Item 12(a)(1), a copy of registrant’s code of ethics is filed as an exhibit to this Form N-CSR. During the period covered by this report, the code of ethics has not been amended, and the registrant has not granted any waivers, including implicit waivers, from the provisions of the code of ethics.
| Item 3. | Audit Committee Financial Expert. |
(a)(1) The registrant’s Board of Trustees has determined that the registrant has at least one audit committee financial expert serving on its audit committee.
(a)(2) The audit committee financial expert is Andrea N. Mullins, who is “independent” for purposes of this Item 3 of Form N-CSR.
| Item 4. | Principal Accountant Fees and Services. |
| | | | | | |
| Granite Value Fund: | | FY 2015 | | $ | 13,000 | |
| | FY 2014 | | $ | 12,500 | |
| Sound Mind Investing Funds: | | FY 2015 | | $ | 68,000 | |
| | FY 2014 | | $ | 40,500 | |
| Green Owl Intrinsic Value Fund: | | FY 2015 | | $ | 13,000 | |
| | FY 2014 | | $ | 12,500 | |
| BRC Large Cap Focus Equity Fund: | | FY 2015 | | $ | 13,500 | |
| | FY 2014 | | $ | 12,500 | |
| Dreman Contrarian Small Cap Value Fund: | | FY 2015 | | $ | 14,000 | |
| | FY 2014 | | $ | 13,500 | |
| Dana Large Cap Equity Fund: | | FY 2015 | | $ | 14,000 | |
| | FY 2014 | | $ | 13,500 | |
| | | | | | |
Registrant | | | | | |
| Granite Value Fund: | | FY 2015 | | $ | 0 | |
| | FY 2014 | | $ | 0 | |
| Sound Mind Investing Funds: | | FY 2015 | | $ | 0 | |
| | FY 2014 | | $ | 0 | |
| Green Owl Intrinsic Value Fund: | | FY 2015 | | $ | 0 | |
| | FY 2014 | | $ | 0 | |
| BRC Large Cap Focus Equity Fund: | | FY 2015 | | $ | 0 | |
| | FY 2014 | | $ | 0 | |
| Dreman Contrarian Small Cap Value Fund: | | FY 2015 | | $ | 0 | |
| | FY 2014 | | $ | 0 | |
| Dana Large Cap Equity Fund: | | FY 2015 | | $ | 0 | |
| | FY 2014 | | $ | 0 | |
-2-
| | | | | | |
Registrant | | | | | |
| Granite Value Fund: | | FY 2015 | | $ | 2,500 | |
| | FY 2014 | | $ | 2,500 | |
| Sound Mind Investing Funds: | | FY 2015 | | $ | 13,325 | |
| | FY 2014 | | $ | 7,500 | |
| Green Owl Intrinsic Value Fund: | | FY 2015 | | $ | 2,500 | |
| | FY 2014 | | $ | 2,500 | |
| BRC Large Cap Focus Equity Fund: | | FY 2015 | | $ | 2,500 | |
| | FY 2014 | | $ | 2,500 | |
| Dreman Contrarian Small Cap Value Fund: | | FY 2015 | | $ | 2,500 | |
| | FY 2014 | | $ | 2,500 | |
| Dana Large Cap Equity Fund: | | FY 2015 | | $ | 2,500 | |
| | FY 2014 | | $ | 2,500 | |
Nature of the fees: Preparation of the 1120 RIC and Excise review
-3-
| | | | | | | | |
Registrant | | | | | | |
Granite Value Fund: | | | FY 2015 | | | $ | �� 0 | |
| | | FY 2014 | | | $ | 0 | |
Sound Mind Investing Funds: | | | FY 2015 | | | $ | 0 | |
| | | FY 2014 | | | $ | 0 | |
Green Owl Intrinsic Value Fund: | | | FY 2015 | | | $ | 0 | |
| | | FY 2014 | | | $ | 0 | |
BRC Large Cap Focus Equity Fund: | | | FY 2015 | | | $ | 0 | |
| | | FY 2014 | | | $ | 0 | |
Dreman Contrarian Small Cap Value Fund: | | | FY 2015 | | | $ | 0 | |
| | | FY 2014 | | | $ | 0 | |
Dana Large Cap Equity Fund : | | | FY 2015 | | | $ | 0 | |
| | | FY 2014 | | | $ | 0 | |
| (e) | (1) Audit Committee’s Pre-Approval Policies |
The Audit Committee Charter requires the Audit Committee to be responsible for the selection, retention or termination of auditors and, in connection therewith, to (i) evaluate the proposed fees and other compensation, if any, to be paid to the auditors, (ii) evaluate the independence of the auditors, (iii) pre-approve all audit services and, when appropriate, any non-audit services provided by the independent auditors to the Trust, (iv) pre-approve, when appropriate, any non-audit services provided by the independent auditors to the Trust’s investment adviser, or any entity controlling, controlled by, or under common control with the investment adviser and that provides ongoing services to the Trust if the engagement relates directly to the operations and financial reporting of the Trust, and (v) receive the auditors’ specific representations as to their independence;
| | (2) | Percentages of Services Approved by the Audit Committee |
| | |
Registrant | | |
| Audit-Related Fees: | | 0% |
| Tax Fees: | | 0% |
| All Other Fees: | | 0% |
(f) During audit of registrant’s financial statements for the most recent fiscal year, less than 50 percent of the hours expended on the principal accountant’s engagement were attributed to work performed by persons other than the principal accountant’s full-time, permanent employees.
-4-
(g) The aggregate non-audit fees billed by the registrant’s accountant for services rendered to the registrant, and rendered to the registrant’s investment adviser (not including any sub-adviser whose role is primarily portfolio management and is subcontracted with or overseen by another investment adviser), and any entity controlling, controlled by, or under common control with the adviser that provides ongoing services to the registrant:
| | | | | | | | |
| | | Registrant | | | Adviser | |
| FY 2015 | | $ | 0 | | | $ | 0 | |
| FY 2014 | | $ | 0 | | | $ | 0 | |
(h) Not applicable. The auditor performed no services for the registrant’s investment adviser or any entity controlling, controlled by, or under common control with the investment adviser that provides ongoing services to the registrant.
Item 5. Audit Committee of Listed Companies. NOT APPLICABLE – applies to listed companies only
Item 6. Schedule of Investments. Schedules filed with Item 1.
Item 7. Disclosure of Proxy Voting Policies and Procedures for Closed-End Management Investment Companies. NOT APPLICABLE – applies to closed-end funds only
Item 8. Portfolio Managers of Closed-End Investment Companies. NOT APPLICABLE – applies to closed-end funds only
Item 9. Purchases of Equity Securities by Closed-End Management Investment Company and Affiliated Purchasers. NOT APPLICABLE – applies to closed-end funds only
Item 10. Submission of Matters to a Vote of Security Holders.
The guidelines applicable to shareholders desiring to submit recommendations for nominees to the Registrant’s board of trustees are contained in the statement of additional information of the Trust with respect to the Fund(s) for which this Form N-CSR is being filed.
Item 11. Controls and Procedures.
(a) Based on their evaluation of the registrant’s disclosure controls and procedures (as defined in Rule 30a-3(c) under the Investment Company Act of 1940, as amended (the “Act”)) as of a date within 90 days of the filing date of this report, the registrant’s principal executive officer and principal financial officer have concluded that such disclosure controls and procedures are reasonably designed and are operating effectively to ensure that material information relating to the registrant is made known to them by others within those entities, particularly during the period in which this report is being prepared, and that the information required in filings on Form N-CSR is recorded, processed, summarized, and reported on a timely basis.
(b) There were no changes in the registrant’s internal control over financial reporting (as defined in Rule 30a-3(d) under the Investment Company Act of 1940) that occurred during the second fiscal quarter of the period covered by this report that have materially affected, or are reasonably likely to materially affect, the registrant’s internal control over financial reporting.
-5-
Item 12. Exhibits.
| (a) (1) | Code is filed herewith. |
| | (2) | Certifications by the registrant’s principal executive officer and principal financial officer, pursuant to Section 302 of the Sarbanes- Oxley Act of 2002 and required by Rule 30a-2 under the Investment Company Act of 1940 are filed herewith. |
| (b) | Certification pursuant to 18 U.S.C. Section 1350, as adopted pursuant to Section 906 of the Sarbanes-Oxley Act of 2002 is filed herewith. |
-6-
Pursuant to the requirements of the Securities Exchange Act of 1934 and the Investment Company Act of 1940, the registrant has duly caused this report to be signed on its behalf by the undersigned, thereunto duly authorized.
| | |
| (Registrant) Valued Advisers Trust |
| |
| By | | |
| * | | /s/ R. Jeffrey Young |
| | R. Jeffrey Young, President and Principal Executive Officer |
| |
| Date | | 12/23/2015 |
Pursuant to the requirements of the Securities Exchange Act of 1934 and the Investment Company Act of 1940, this report has been signed below by the following persons on behalf of the registrant and in the capacities and on the dates indicated.
| | |
| By | | |
| * | | /s/ R. Jeffrey Young |
| | R. Jeffrey Young, President and Principal Executive Officer |
|
| Date 12/23/2015 |
| |
| By | | |
| * | | /s/ Bryan W. Ashmus |
| | Bryan W. Ashmus, Treasurer and Principal Financial Officer |
| |
| Date | | 12/23/2015 |
-7-