UNITED STATES
SECURITIES AND EXCHANGE COMMISSION
WASHINGTON, D.C. 20549
FORM N-CSR
CERTIFIED SHAREHOLDER REPORT OF REGISTERED
MANAGEMENT INVESTMENT COMPANIES
Investment Company Act file number 811-22208
Valued Advisers Trust
(Exact name of registrant as specified in charter)
Huntington Asset Services, Inc. 2960 N. Meridian Street, Suite 300 Indianapolis, IN 46208
(Address of principal executive offices) (Zip code)
Capitol Services, Inc.
615 S. Dupont Hwy.
Dover, DE 19901
(Name and address of agent for service)
With a copy to:
John H. Lively, Esq.
The Law Offices of John H. Lively & Associates, Inc.
A member firm of The 1940 Act Law GroupTM
11300 Tomahawk Creek Parkway,
Suite 310
Leawood, KS 66221
Registrant’s telephone number, including area code: 317-917-7000
Date of fiscal year end: 5/31
Date of reporting period: 5/31/15
Item 1. Reports to Stockholders.
ANNUAL REPORT
May 31, 2015
BFS Equity Fund

185 Asylum Street — City Place II — Hartford, CT 06103 — (855) 575-2430
Letter to Shareholders
Dear Fellow Shareholders,
This annual report covers the period June 1, 2014 through May 31, 2015 – the BFS Equity Fund’s (the “Fund”) first full fiscal year.
The Fund was launched on November 8, 2013, with initial funds from investors of $1.1 million. On June 1, 2014, the Fund had net assets of $12.7 million. During the course of the last fiscal year, the net assets increased 59% to $20.2 million as of May 31, 2015. This growth was driven by both robust inflows from investors into the Fund, as well as by the positive investment returns achieved over the past fiscal year.
Despite a plethora of global economic and geo-political challenges, the U.S. stock market climbed the proverbial “wall of worry,” as it churned ahead during the period under review. The Fund achieved a total return of 9.3% for the year ending May 31, 2015. This was less than the 11.8% total return of the S&P 500® Index (“S&P 500) and the 10.3% total return of the Dow Jones Industrial Average (“Dow Jones”). However, during the second half of our fiscal year – the six-month period from December 1, 2014 through May 31, 2015, the Fund outperformed the S&P 500 by 1.2% and the Dow Jones by 1.9%.
This report includes a commentary from the Lead Portfolio Manager, Tim Foster, and Co-Portfolio Managers, Tom Sargent and Keith LaRose. You will also find a listing of the portfolio holdings as of May 31, 2015, as well as financial statements and detailed information about the performance and positioning of the Fund.
With energy and commodity prices gyrating and interest rates poised to increase later this year, which will probably bring to an end the 30-year bull market in bonds, we view the stock market over the next year with somewhat more caution than a year ago. The bull market in the U.S. stock market, which commenced in March, 2009, has entered its seventh year, and equity valuations, while not unreasonable, are not undervalued as they were several years ago. Other potential headwinds involve geo-political tensions in many parts of the globe. Russia’s annexation of Crimea, aggression in Ukraine, and the recent sale of sophisticated SAM missiles to Iran are examples of a belligerent foreign policy. Another cause for investor anxiety is the raging cauldron in the Middle East – nuclear weapons within Iran’s reach, the gains of ISIS, and the re-emergence of Al-Qaeda. Finally, the strong U.S. dollar and lower profits from the energy sector are holding back earnings growth for many U.S. companies, and stock market gains over the longer term are based on higher earnings.
1
On the other hand, the U.S. economy continues its moderate growth. Real GDP in the U.S. grew at an annualized 2.7% for the four quarters ending in March 2015. For the twelve months ending May 31, 2015, the U.S. economy created an average of 250,000 new jobs each month. Inflation continues to register at below 2%. Finally, the economies in Europe and Japan are showing signs of renewed growth. Taking all these factors into account, we remain cautiously optimistic that the U.S. stock market may continue to track modestly higher for the remainder of 2015.
In closing, it is important to reiterate our belief that our investment strategy of investing in quality growth stocks purchased with a risk-mitigating approach and positioned to provide a margin of safety in the case of economic or market weakness is effective over the longer term. Thirty-six of the forty-three companies that the Fund owned as of May 31, 2015 pay dividends, and a considerable number are so-called “dividend aristocrats” – companies which have increased their dividend payouts annually for the past 25 years. We believe the Fund’s ownership of shares in quality companies with strong brands, good balance sheets, professional management, and robust cash flow should be able to withstand market corrections, even bear markets, and perform well over the longer term.
The Portfolio Managers of the Fund and I are shareholders together with you. We thank you for the trust that you have placed in us to manage your assets.
Sincerely,
Robert H. Bradley
President and CEO
Bradley, Foster & Sargent, Inc.
2
Portfolio Managers’ Letter
TO OUR SHAREHOLDERS
May 31st, 2015 marked the end of the first full fiscal year for the BFS Equity Fund (the “Fund”). On an absolute basis, the Fund returned 9.3% for the twelve month period ending May 31, 2015. We view this as a reasonable return on shareholders’ investment (both yours and ours) as it approximates the 10% average annual return for the equity markets over the past several decades. The S&P 500® Index (“S&P 500”) over the same twelve month period returned 11.8% and The Dow Jones Industrial Average (“Dow Jones”) returned 10.3%. Relative to the two benchmarks, the Fund trailed the S&P 500 by 2.5 percentage points and the Dow Jones Industrial Average by 1.0 percentage point.
MARKET COMMENTARY
This past March, the U.S. equity markets rolled into the seventh year of recovery since the market bottom in March of 2009. As recovery cycles go, this places the current recovery just a little longer in duration than the mean of the past several business cycles. With market gains of just over 300% from the bottom, the magnitude of the recovery now exceeds the average as well. Does this imply the end of the recovery may be imminent? Not at all! Recoveries do not end by duration and magnitude alone. The fundamental underpinnings of the equity market remain positive, including positive real GDP growth, an accommodative Federal Reserve, low inflation and low interest rates. However, in the course of tripling over the past six years, stock valuations are now somewhat above average, corporate profit margins are now at record levels and most global economies are being fueled by unprecedented central bank quantitative easing programs. The final chapter of how quantitative easing eventually unwinds and the resulting impact on global economies and equity markets has yet to be written.
From an investment perspective, it would be fair to conclude that this economic and market cycle is well underway and perhaps entering a transitional crossroads as the Federal Reserve now contemplates its first interest rate hike in many years. The central bank driven liquidity that benefitted all equities over the past six years may have hit the high water mark. Healthy equity returns going forward may prove more challenging. Quarter over quarter, real GDP growth ranged from a robust 5.0% in the third quarter of 2014 to a contraction of 0.7% in the first quarter of 2015. Who would have thought a year ago that oil prices
3
would plummet from over $100 per barrel to less than $50; that due to record harvests, corn and soybean prices would tumble by a third; but that gold prices would remain relatively stable near $1,200 per ounce? Also, the U.S. dollar became the lowest risk option amidst global uncertainty and appreciated strongly versus almost every other global currency. A rising U.S. dollar and tumbling commodity prices forced a major recalculation of U.S. corporate earnings potential and shook the market with a very brief 9.9% correction last October. For the most part, however, the market just ground its way higher with generally low volatility.
INVESTMENT STRATEGY
In structuring the composition of the Fund, we strive to be proactive, building our exposure to those sectors and companies we view as potential beneficiaries of change; whether it is the growing tailwinds of improving pricing power or the diminishing headwinds of de-regulation or deflation. These investment themes often take time to play out; thus, when evaluating the attractiveness of a particular holding, we often have a three to five-year time horizon. Our stock selection process is to choose among the many high-quality businesses we have identified through our bottom-up research process and to use a longer investment time horizon as a competitive advantage in our favor. Two strategies emerge from the time-is-in-our-favor camp. One is seeking to identify changes the market has not yet priced in, and two is to take advantage of sell-offs the market may provide when both institutional and individual investors may overreact to a short term negative event. Top down macro-economic views do play a role with respect to both our sector and security selection, but our purchase and sale decisions are driven to a greater extent by our analysis of the absolute and relative attractiveness of each company. For instance, best-of-breed or industry leaders are highly sought after candidates for inclusion in the Fund, ideally if valuations provide a margin for error in terms of a discount to intrinsic value or, at a minimum, a discount relative to comparable companies. Investment risks and opportunities are analyzed company-by-company and, for each holding, we seek to judge whether all the key factors are incorporated into the company’s stock price. As such, we endeavor to deliver attractive risk-adjusted results over a full market cycle by utilizing a disciplined approach targeting results which should compare favorably to benchmarks, as well as peer managers, but avoids reaching for that elusive top decile performance that can invite bottom decile rankings as well.
4
INVESTMENT COMMENTARY
For the year ended May 31, 2015, the S&P 500 remained in a fairly narrow rising trend channel capping the 12 months with a gain of 11.8%. For the same period, the Fund had a total return of 9.3%. For the S&P 500, there was a very brief pullback of 9.9% beginning mid-September through mid-October that occurred so quickly few investors had time to react. Rapid swings in currency, commodities and interest rates were each contributing catalysts to the correction, but the volatility of each has since abated in 2015. As the economic, monetary and valuation underpinnings of the market remained solid over the period, our outlook and fully invested portfolio positioning remained consistent as well. At the end of our first full fiscal year, the Fund had positions in 43 companies and was well diversified with sector exposures reasonably close to those of the S&P 500.
Having launched the Fund in November 2013, already five years into the recovery cycle, our generally positive view was tempered with some caution. You only get to launch a fund once and our mid-recovery cycle starting point, we believed, better supported a more cautious approach than buying the high fliers and hoping they continued to soar. Looking forward to the upcoming year, we maintain our caution given the higher market valuations. Our economic outlook remains skewed toward improving real GDP growth and, eventually, higher interest rates.
Technology
The Technology sector was our heaviest weighted sector at 20.0%, as well as the heaviest weighted sector of the S&P 500, also at 20.0%. Our top performing stocks were Apple (+46.6%) and Cognizant (+45.1%), followed by Adobe (+22.5%). We continue to like the prospects for Google, but for the period, Google was our worst Tech performer with a decline of 4.6%. Our Tech selections performed 3.5 percentage points better than the S&P 500.
Healthcare
At a 15.4% weighting, Healthcare was our second largest sector exposure. Our Healthcare selections, although contributing to our returns, fell shy of the S&P 500 Healthcare sector returns by 8.5%. Our holdings include a conservative range of large global pharmaceutical companies, scientific instrument companies, animal health businesses, and bio-technology businesses. Biotechnology names became stock market darlings. Zoetis was our best
5
contributor (+63.4%), followed by Celgene (+49.6%), and Gilead Sciences (+38.3%). Every holding in the sector contributed positively to performance.
Industrials
Compared to the S&P 500 Industrial sector weighting of 10.2%, Industrials were our largest relative sector bet at 13.6%. Unfortunately, both commodity price swings, as well as a much stronger dollar conspired such that the Fund’s Industrial sector’s contribution to total return was 3.8%, a little shy of the 5.3% return for the S&P 500 Industrial sector. Railroads, which had been outstanding performers last year, gave up some gains and Union Pacific, Kansas City Southern and Genesee & Wyoming all declined. After many years of trailing the market, the ongoing transformation of GE from a financial titan to an energy and infrastructure powerhouse led to a gain of 11.9%.
Financials
The S&P 500 Financial sector had a total return of 12.3%. The Fund’s Financial sector return was 5.0%. Our holdings were purposefully weighted toward larger financial institutions that we view as inexpensive, resilient and beneficiaries of both higher interest rates and improved economic growth. In our opinion, these large financial institutions are healthy and well-capitalized. We believe that they are poised to deliver attractive total returns over a longer-term time horizon through earnings growth distributed to shareholders by means of share buybacks and increased dividends. Continued progress on reduced regulatory pressure as well as loan growth will be necessary to unleash this potential. Our positions in HSBC Holdings Plc and Bank of America both detracted from our performance in the sector and the stocks were sold. J.P. Morgan Chase, Wells Fargo and State Street were healthy contributors. American Express stumbled earlier this year with the announcement of the loss of the co-branded Costco partnership. We continue to hold the stock, now selling at its lowest relative P/E multiple in many years. Although our Financial sector positions underperformed the S&P 500 Financial sector benchmark, we believe that with stronger U.S. economic growth, higher interest rates, and tapering regulatory pressure, our portfolio choices will produce solid long-term results going forward.
Consumer Staples and Discretionary
The Consumer Discretionary sector provided the Fund’s best relative performance of 30.9% versus 18.0% for the S&P 500 Consumer Discretionary sector. The Fund’s Consumer Staples holdings also outperformed the S&P 500
6
Consumer Staples sector. Well known consumer franchises like Starbucks, Home Depot, Nike and Walt Disney each provided handsome double digit returns. Lesser known by its corporate moniker, Jarden, but well recognized by its many leading consumer brands in sporting goods, camping gear and kitchen appliances, Jarden contributed a healthy 15.5%, as well. The more defensive Consumer Staples sector offered somewhat modest single digit returns, but consolidation in the beverage industry resulted in Constellation Brands being the top performing Consumer Staples position (+40.5%).
Energy
During a period in which oil prices collapsed by more than 50%, it is little wonder that the Energy sector was the worst performing sector for the Fund (-16.7%), as well as for the S&P 500 (-15.4%). There was only a single positive energy stock contributor to the Energy sector returns during the review period. Initiating a positon after a sharp correction, our purchase of Core Labs returned 8.7% for the holding period. The stocks of the companies most negatively impacted by the collapse in oil prices were the shale-centric and fast growing exploration and production companies: Continental Resources (-42.7%) and EOG Resources (-15.6%). We narrowed our exposures at the end of the period under review, bringing our energy weighting at the end of the period to 7.4% of Fund assets – below the S&P 500 benchmark of 8.0%. The Fund is currently narrowly focused on three energy names: EOG, Core Labs and Schlumberger.
7
CLOSING COMMENTS
This bull market has been underway for more than 6 years and we believe it is likely we are now in the later innings of this recovery cycle. There are two critical elements that will continue to drive our investment strategies going forward: the quality of the companies we seek to include in the Fund, as well as valuation. Staying disciplined about not paying too much for even a great company often limits our exposure to those new technologies that gain headlines and lots of investor attention. It also limits our potential for capital loss when the cycle shifts to a correction phase. We currently see few imbalances that would lead us to believe near term economic growth is threatened or that the Federal Reserve is likely to significantly raise interest rates any time soon. We do, however, continue to shape our portfolio to preserve capital in times of economic adversity and create wealth in more buoyant times.
We, at Bradley, Foster & Sargent, Inc., look forward to serving you through our management of the Fund. Thank you for placing your capital under our care.
| | | | |
| Timothy Foster | | Keith LaRose | | Thomas Sargent |
| Lead Portfolio Manager | | Co-Portfolio Manager | | Co-Portfolio Manager |
8
ANNUAL PERFORMANCE REVIEW
(UNAUDITED)
The Fund underperformed the S&P 500 Index and the Dow Jones Industrial Average for the year ended May 31, 2015, returning 9.3% versus 11.8% for the S&P 500 and 10.3% for the Dow Jones Industrial Average.
Key Detractors from Relative Results
| | • | | Healthcare, one of the larger sectors in the S&P 500, as well as for the Fund at 15.4%, generated very attractive returns of 18.8% for the Fund, but below the S&P 500 Healthcare sector return of 27.3%. Three stalwarts of the pharmaceutical industry trailed the S&P 500 substantially with only modest contributions from Johnson & Johnson (+1.5%), Pfizer (+4.5%) and Merck (+8.5%). |
| | • | | Financials proved vexing for our stock selections. While we were underweighted the S&P 500 Financial sector at 13.3% versus 16.2%, our returns trailed at 5.0% versus 12.3% for the S&P 500. Our three primary detractors were: American Express (-11.8%), HSBC Holdings (-7.0%) and US Bancorp (-2.1%). |
Key Contributors to Relative Results
| | • | | On the positive side, the Fund was overweighted in the Consumer Discretionary sector at 12.9% versus 12.5% for the S&P 500 Consumer Discretionary sector. This helped power relative returns of 30.9% versus 18.0% for the S&P 500. Four stocks each returned better than 30%: Starbucks (+43.9%), Home Depot (+41.8%), Nike (+33.7%) and Walt Disney (+33.0%). |
| | • | | Technology, the largest Fund and S&P 500 sector at 20.0%, also contributed solid returns. Apple (+46.6%) and Cognizant (+45.1%) were the standout performers, with 20+% returns also coming from Adobe, MasterCard and Amphenol. |
FUND INFORMATION
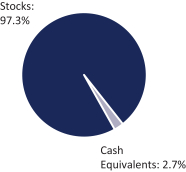
ASSET ALLOCATION
(as a percentage of total investments)
| | | | |
TEN LARGEST HOLDINGS (%) | | FUND | |
Walt Disney | | | 3.8 | |
Apple | | | 3.8 | |
Google – Class A | | | 3.2 | |
Danaher | | | 3.0 | |
Microsoft | | | 2.8 | |
Schlumberger | | | 2.7 | |
Thermo Fisher Scientific | | | 2.6 | |
Wells Fargo | | | 2.5 | |
Zoetis | | | 2.5 | |
JP Morgan Chase | | | 2.5 | |
| | | | | | | | |
SECTOR DIVERSIFICATION (%) | | FUND | | | S&P 500 | |
Technology | | | 20.0 | | | | 20.0 | |
Healthcare | | | 15.4 | | | | 15.1 | |
Industrial | | | 13.6 | | | | 10.2 | |
Financials | | | 13.3 | | | | 16.2 | |
Consumer Discretionary | | | 12.9 | | | | 12.5 | |
Consumer Staples | | | 10.8 | | | | 9.5 | |
Energy | | | 7.4 | | | | 8.0 | |
Materials | | | 3.9 | | | | 3.2 | |
Telecommunication Services | | | 0.0 | | | | 2.3 | |
Utilities | | | 0.0 | | | | 3.0 | |
9
Investment Results (Unaudited)
Total Returns* (For the periods ended May 31, 2015)
| | | | | | | | |
| | | | | | Annualized | |
| | | One Year | | | Since Inception
(November 8, 2013) | |
BFS Equity Fund | | | 9.27% | | | | 10.77% | |
S&P 500® Index** | | | 11.81% | | | | 15.10% | |
Dow Jones Industrial Average®*** | | | 10.27% | | | | 12.34% | |
Total annual operating expenses, as disclosed in the Fund’s prospectus dated September 30, 2014, were 3.94% of average daily net assets (1.26% after fee waivers/expense reimbursements by the Adviser). The Adviser has contractually agreed to waive or limit its fees and assume other expenses of the Fund until September 30, 2015, so that total annual fund operating expenses do not exceed 1.00%. This contractual arrangement may only be terminated by mutual consent of the Adviser and the Board of Trustees of the Trust, and it will automatically terminate upon the termination of the investment advisory agreement between the Fund and the Adviser. This operating expense limitation does not apply to: (i) interest, (ii) taxes, (iii) brokerage commissions, (iv) other expenditures which are capitalized in accordance with generally accepted accounting principles, (v) other extraordinary expenses not incurred in the ordinary course of the Fund’s business, (vi) dividend expense on short sales, (vii) expenses incurred under a plan of distribution under Rule 12b-1, and (viii) expenses that the Fund has incurred but did not actually pay because of an expense offset arrangement, if applicable, in any fiscal year. The operating expense limitation also excludes any “Fees and Expenses of Acquired Funds,” which are the expenses indirectly incurred by the Fund as a result of investing in money market funds or other investment companies, including ETFs, that have their own expenses. The Adviser may be entitled to the reimbursement of any fees waived or expenses reimbursed pursuant to the agreement provided overall expenses fall below the limitations set forth above. The Adviser may recoup the sum of all fees previously waived or expenses reimbursed during any of the previous three years, less any reimbursement previously paid, provided total expenses do not exceed the limitation in place at the time of such waived fees or reimbursed expenses.
The performance quoted represents past performance, which does not guarantee future results. The investment return and principal value of an investment will fluctuate so that an investor’s shares, when redeemed, may be worth more or less than their original cost. The returns shown do not reflect deduction of taxes that a shareholder would pay on Fund distributions or the redemption of Fund shares. The Fund’s investment objectives, risks, charges and expenses must be considered carefully before investing. Current performance of a Fund may be lower or higher than the performance quoted. Performance data current to the most recent month end may be obtained by calling (855) 575-2430.
10
* Return figures reflect any change in price per share and assume the reinvestment of all distributions. The Fund’s returns reflect any fee reductions during the applicable periods. If such fee reductions had not occurred, the quoted performance would have been lower.
** The S&P 500® Index is a widely recognized unmanaged index of equity prices and is representative of a broader market and range of securities than is found in the Fund’s portfolio. The Index is an unmanaged benchmark that assumes reinvestment of all distributions and excludes the effect of taxes and fees. Individuals cannot invest directly in this Index; however, an individual can invest in exchange traded funds or other investment vehicles that attempt to track the performance of a benchmark index.
*** The Dow Jones Industrial Average® is a widely recognized unmanaged index of equity prices and is representative of a narrower market and range of securities than is found in the Fund’s portfolio. The Index is an unmanaged benchmark that assumes reinvestment of all distributions and excludes the effect of taxes and fees. Individuals cannot invest directly in this Index; however, an individual can invest in exchange traded funds or other investment vehicles that attempt to track the performance of a benchmark index.
The Fund’s investment objectives, strategies, risks, charges and expenses must be considered carefully before investing. The prospectus contains this and other important information about the Fund and may be obtained by calling the same number as above. Please read it carefully before investing.
The Fund is distributed by Unified Financial Securities, Inc., member FINRA.
11
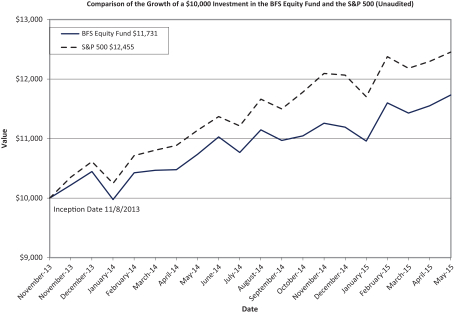
The chart above assumes an initial investment of $10,000 made on November 8, 2013 (commencement of operations) held through May 31, 2015. THE FUND’S RETURN REPRESENTS PAST PERFORMANCE AND DOES NOT GUARANTEE FUTURE RESULTS. The returns shown do not reflect deduction of taxes that a shareholder would pay on Fund distributions or the redemption of Fund shares. Investment returns and principal values will fluctuate so that your shares, when redeemed, may be worth more or less than their original purchase price.
Current performance may be lower or higher than the performance data quoted. For more information on the Fund, and to obtain performance data current to the most recent month end or to request a prospectus, please call (855) 575-2430. You should carefully consider the investment objectives, potential risks, management fees, and charges and expenses of the Fund before investing. The Fund’s prospectus contains this and other information about the Fund, and should be read carefully before investing.
The Fund is distributed by Unified Financial Securities, Inc., member FINRA.
AVAILABILITY OF PORTFOLIO SCHEDULE (Unaudited)
The Fund files its complete schedule of portfolio holdings with the Securities and Exchange Commission (“SEC”) for the first and third quarters of each fiscal year on Form N-Q. The Fund’s Forms N-Q are available at the SEC’s website at www.sec.gov. The Fund’s Form N-Q may be reviewed and copied at the Public Reference Room in Washington, DC. Information on the operation of the Public Reference Room may be obtained by calling (800) SEC-0330.
12
SUMMARY OF FUND’S EXPENSES (Unaudited)
As a shareholder of the Fund, you incur two types of costs: (1) transaction costs; and (2) ongoing costs, including management fees; and other Fund expenses. This Example is intended to help you understand your ongoing costs (in dollars) of investing in the Fund and to compare these costs with the ongoing costs of investing in other mutual funds. The Example is based on an investment of $1,000 invested at the beginning of the period, and held for the six month period, December 1, 2014 to May 31, 2015.
Actual Expenses
The first line of the table below provides information about actual account values and actual expenses. You may use the information in this line, together with the amount you invested, to estimate the expenses that you paid over the period. Simply divide your account value by $1,000 (for example, an $8,600 account value divided by $1,000 = 8.60), then multiply the result by the number in the first line under the heading “Expenses Paid During the Period Ended May 31, 2015” to estimate the expenses you paid on your account during this period.
Hypothetical Example for Comparison Purposes
The second line of the table below provides information about hypothetical account values and hypothetical expenses based on the Fund’s actual expense ratios and an assumed rate of return of 5% per year before expenses, which is not the Fund’s actual return. The hypothetical account values and expenses may not be used to estimate the actual ending account balance or expenses you paid for the period. You may use this information to compare the ongoing costs of investing in the Fund and other funds. To do so, compare this 5% hypothetical example with the 5% hypothetical examples that appear in the shareholder reports of other funds.
Please note that the expenses shown in the table are meant to highlight your ongoing costs only and do not reflect any transactional costs, such as sales charges (loads), or redemption fees. Therefore, the second line of the table is useful in comparing ongoing costs only, and will not help you determine the relative total costs of owning different funds. In addition, if these transactional costs were included, your costs would have been higher.
| | | | | | | | | | | | |
| | | Beginning
Account
Value | | | Ending
Account
Value | | | Expenses
Paid During the Period Ended | |
| BFS Equity Fund | | December 1, 2014 | | | May 31, 2015 | | | May 31, 2015* | |
Actual | | $ | 1,000.00 | | | $ | 1,042.20 | | | $ | 6.36 | |
Hypothetical ** (5% return before expenses) | | $ | 1,000.00 | | | $ | 1,018.70 | | | $ | 6.29 | |
| * | | Expenses are equal to the Fund’s annualized expense ratio of 1.25%, multiplied by the average account value over the period, multiplied by 182/365. |
| ** | | Assumes a 5% return before expenses. |
13
Schedule of Investments
May 31, 2015
| | | | | | | | |
| Shares | | | | | Fair Value | |
| | COMMON STOCKS – 97.34% | |
| | |
| | | | Aerospace & Defense 2.03% | | | | |
| | 3,500 | | | United Technologies Corp. | | $ | 410,095 | |
| | | | | | | | |
| | |
| | | | Beverages 3.48% | | | | |
| | 3,500 | | | Constellation Brands, Inc. – Class A | | | 412,615 | |
| | 3,000 | | | PepsiCo, Inc. | | | 289,290 | |
| | | | | | | | |
| | | | | | | 701,905 | |
| | | | | | | | |
| | | | Biotechnology 3.65% | | | | |
| | 3,000 | | | Celgene Corp.* | | | 343,320 | |
| | 3,500 | | | Gilead Sciences, Inc.* | | | 392,945 | |
| | | | | | | | |
| | | | | | | 736,265 | |
| | | | | | | | |
| | | | Chemicals 1.98% | | | | |
| | 7,000 | | | FMC Corp. | | | 400,190 | |
| | | | | | | | |
| | |
| | | | Commercial Banks 8.86% | | | | |
| | 11,000 | | | East West Bancorp, Inc. | | | 471,900 | |
| | 3,500 | | | M&T Bank Corp. | | | 423,080 | |
| | 9,000 | | | U.S. Bancorp | | | 387,990 | |
| | 9,000 | | | Wells Fargo & Co. | | | 503,640 | |
| | | | | | | | |
| | | | | | | 1,786,610 | |
| | | | | | | | |
| | | | Computers & Peripherals 3.75% | | | | |
| | 5,800 | | | Apple, Inc. | | | 755,624 | |
| | | | | | | | |
| | |
| | | | Consumer Finance 1.98% | | | | |
| | 5,000 | | | American Express Co. | | | 398,600 | |
| | | | | | | | |
| | |
| | | | Diversified Financial Services 2.45% | | | | |
| | 7,500 | | | JPMorgan Chase & Co. | | | 493,350 | |
| | | | | | | | |
| | |
| | | | Electronic Equipment, Instruments & Components 2.12% | | | | |
| | 7,500 | | | Amphenol Corp. – Class A | | | 427,875 | |
| | | | | | | | |
| | |
| | | | Energy Equipment & Services 5.03% | | | | |
| | 4,000 | | | Core Laboratories N.V. | | | 469,920 | |
| | 6,000 | | | Schlumberger Ltd. | | | 544,620 | |
| | | | | | | | |
| | | | | | | 1,014,540 | |
| | | | | | | | |
| | | | Food & Staples Retailing 3.30% | | | | |
| | 1,800 | | | Costco Wholesale Corp. | | | 256,662 | |
| | 4,000 | | | CVS Health Corp. | | | 409,520 | |
| | | | | | | | |
| | | | | | | 666,182 | |
| | | | | | | | |
| | | | Food Products 1.92% | | | | |
| | 5,000 | | | Nestle SA ADR | | | 387,200 | |
| | | | | | | | |
| | |
| | | | Hotels, Restaurants & Leisure 2.27% | | | | |
| | 8,800 | | | Starbucks Corp. | | | 457,248 | |
| | | | | | | | |
14
See accompanying notes which are an integral part of these financial statements.
Schedule of Investments (continued)
May 31, 2015
| | | | | | | | |
| Shares | | | | | Fair Value | |
| | COMMON STOCKS – (continued) | |
| | |
| | | | Household Durables 2.37% | | | | |
| | 9,000 | | | Jarden Corp.* | | $ | 477,540 | |
| | | | | | | | |
| | |
| | | | Household Products 2.08% | | | | |
| | 5,000 | | | Church & Dwight Co., Inc. | | | 419,850 | |
| | | | | | | | |
| | |
| | | | Industrial Conglomerates 5.30% | | | | |
| | 7,000 | | | Danaher Corp. | | | 604,240 | |
| | 17,000 | | | General Electric Co. | | | 463,590 | |
| | | | | | | | |
| | | | | | | 1,067,830 | |
| | | | | | | | |
| | | | Internet Software & Services 3.24% | | | | |
| | 1,200 | | | Google, Inc. – Class A* | | | 654,384 | |
| | | | | | | | |
| | |
| | | | IT Services 4.31% | | | | |
| | 7,000 | | | Cognizant Technology Solutions Corp. – Class A* | | | 453,040 | |
| | 4,500 | | | MasterCard, Inc. – Class A | | | 415,170 | |
| | | | | | | | |
| | | | | | | 868,210 | |
| | | | | | | | |
| | |
| | | | Life Sciences Tools & Services 2.57% | | | | |
| | 4,000 | | | Thermo Fisher Scientific, Inc. | | | 518,520 | |
| | | | | | | | |
| | |
| | | | Media 3.83% | | | | |
| | 7,000 | | | Walt Disney Co./The | | | 772,590 | |
| | | | | | | | |
| | |
| | | | Metals & Mining 1.91% | | | | |
| | 12,000 | | | Agnico-Eagle Mines Ltd. | | | 386,040 | |
| | | | | | | | |
| | |
| | | | Oil, Gas & Consumable Fuels 2.42% | | | | |
| | 5,500 | | | EOG Resources, Inc. | | | 487,795 | |
| | | | | | | | |
| | |
| | | | Pharmaceuticals 9.16% | | | | |
| | 4,500 | | | Johnson & Johnson | | | 450,630 | |
| | 8,000 | | | Merck & Co., Inc. | | | 487,120 | |
| | 4,000 | | | Novartis AG ADR | | | 410,920 | |
| | 10,000 | | | Zoetis, Inc. | | | 497,700 | |
| | | | | | | | |
| | | | | | | 1,846,370 | |
| | | | | | | | |
| | | | Professional Services 2.23% | | | | |
| | 10,000 | | | Nielsen NV | | | 449,900 | |
| | | | | | | | |
| | |
| | | | Road & Rail 2.00% | | | | |
| | 4,000 | | | Union Pacific Corp. | | | 403,640 | |
| | | | | | | | |
| | |
| | | | Software 6.56% | | | | |
| | 4,000 | | | Adobe Systems, Inc.* | | | 316,360 | |
| | 5,000 | | | ANSYS, Inc.* | | | 445,000 | |
| | 12,000 | | | Microsoft Corp. | | | 562,320 | |
| | | | | | | | |
| | | | | | | 1,323,680 | |
| | | | | | | | |
15
See accompanying notes which are an integral part of these financial statements.
Schedule of Investments (continued)
May 31, 2015
| | | | | | | | |
| Shares | | | | | Fair Value | |
| | COMMON STOCKS – (continued) | |
| | |
| | | | Specialty Retail 2.21% | | | | |
| | 4,000 | | | Home Depot, Inc./The | | $ | 445,680 | |
| | | | | | | | |
| | |
| | | | Textiles, Apparel & Luxury Goods 2.27% | | | | |
| | 4,500 | | | NIKE, Inc. | | | 457,515 | |
| | | | | | | | |
| | |
| | | | Trading Companies & Distributors 2.06% | | | | |
| | 10,000 | | | Fastenal Co. | | | 415,100 | |
| | | | | | | | |
| | | | Total Common Stocks (Cost $17,176,135) | | | 19,630,328 | |
| | | | | | | | |
| | |
| | | | Money Market Securities 2.67% | | | | |
| | 539,546 | | | Fidelity Institutional Money Market Funds – Prime Money Market Portfolio, 0.10%(a) | | | 539,546 | |
| | | | | | | | |
| | | | Total Money Market Securities (Cost $539,546) | | | 539,546 | |
| | | | | | | | |
| | | | | | | | |
| | | | Total Investments 100.01% (Cost $17,715,681) | | | 20,169,874 | |
| | | | | | | | |
| | | | Liabilities in Excess of Other Assets (0.01)% | | | (2,383 | ) |
| | | | | | | | |
| | | | NET ASSETS 100.00% | | $ | 20,167,491 | |
| | | | | | | | |
| (a) | | Rate disclosed is the seven day yield as of May 31, 2015. |
| * | | Non-income producing security. |
| ADR | | – American Depositary Receipt |
16
See accompanying notes which are an integral part of these financial statements.
Statement of Assets and Liabilities
May 31, 2015
| | | | |
Assets | | | | |
Investments in securities at fair value (cost $17,715,681) | | $ | 20,169,874 | |
Dividends receivable | | | 21,994 | |
Tax reclaims receivable | | | 2,127 | |
Receivable from Adviser | | | 57 | |
Prepaid expenses | | | 7,269 | |
Total Assets | | | 20,201,321 | |
Liabilities | | | | |
Payable to administrator, fund accountant, and transfer agent | | | 8,612 | |
Payable to custodian | | | 700 | |
Payable to trustees | | | 223 | |
Distribution fees accrued | | | 4,264 | |
Other accrued expenses | | | 20,031 | |
Total Liabilities | | | 33,830 | |
Net Assets | | $ | 20,167,491 | |
Net Assets consist of: | | | | |
Paid-in capital | | $ | 18,039,765 | |
Accumulated undistributed net investment income | | | 29,496 | |
Accumulated net realized loss from investment transactions | | | (355,963 | ) |
Net unrealized appreciation on investments | | | 2,454,193 | |
Net Assets | | $ | 20,167,491 | |
Shares outstanding (unlimited number of shares authorized, no par value) | | | 1,725,097 | |
Net asset value, offering and redemption price per share | | $ | 11.69 | |
17
See accompanying notes which are an integral part of these financial statements.
Statement of Operations
For the year ended May 31, 2015
| | | | |
Investment Income | | | | |
Dividend income (net of foreign taxes withheld of $7,697) | | $ | 252,445 | |
Total investment income | | | 252,445 | |
Expenses | | | | |
Investment Adviser | | | 121,718 | |
Distribution (12b-1) | | | 40,573 | |
Administration | | | 38,000 | |
Fund accounting | | | 25,000 | |
Transfer agent | | | 36,752 | |
Legal | | | 16,486 | |
Registration | | | 18,886 | |
Custodian | | | 3,792 | |
Audit | | | 14,525 | |
Trustee | | | 5,378 | |
Report printing | | | 17,975 | |
Offering costs | | | 19,185 | |
Miscellaneous | | | 8,369 | |
Total expenses | | | 366,639 | |
Fees waived and reimbursed by Adviser | | | (163,520 | ) |
Net operating expenses | | | 203,119 | |
Net investment income | | | 49,326 | |
Net Realized and Unrealized Gain/(Loss) on Investments | | | | |
Net realized loss on investment securities transactions and foreign currency translations | | | (179,137 | ) |
Net change in unrealized appreciation of investment securities | | | 1,676,273 | |
Net realized and unrealized gain on investments | | | 1,497,136 | |
Net increase in net assets resulting from operations | | $ | 1,546,462 | |
18
See accompanying notes which are an integral part of these financial statements.
Statements of Changes in Net Assets
| | | | | | | | |
| Increase in Net Assets due to: | | For the Year Ended
May 31, 2015 | | | For the Period Ended
May 31, 2014(a) | |
Operations | | | | | | | | |
Net investment income | | $ | 49,326 | | | $ | 37,215 | |
Net realized loss on investment transactions and foreign currency translations | | | (179,137 | ) | | | (178,580 | ) |
Net change in unrealized appreciation of investments | | | 1,676,273 | | | | 777,920 | |
Net increase in net assets resulting from operations | | | 1,546,462 | | | | 636,555 | |
Distributions | | | | | | | | |
From net investment income | | | (50,367 | ) | | | (4,924 | ) |
Total distributions | | | (50,367 | ) | | | (4,924 | ) |
Capital Transactions | | | | | | | | |
Proceeds from shares sold | | | 6,774,960 | | | | 12,239,160 | |
Reinvestment of distributions | | | 31,188 | | | | 2,913 | |
Amount paid for shares redeemed | | | (879,815 | ) | | | (128,641 | ) |
Net increase in net assets resulting from capital transactions | | | 5,926,333 | | | | 12,113,432 | |
Total Increase in Net Assets | | | 7,422,428 | | | | 12,745,063 | |
Net Assets | | | | | | | | |
Beginning of period | | | 12,745,063 | | | | – | |
End of period | | $ | 20,167,491 | | | $ | 12,745,063 | |
Accumulated undistributed net investment income included in net assets at end of period | | $ | 29,496 | | | $ | 32,183 | |
Share Transactions | | | | | | | | |
Shares sold | | | 613,346 | | | | 1,200,263 | |
Issued in reinvestment of distributions | | | 2,772 | | | | 280 | |
Redeemed | | | (79,058 | ) | | | (12,506 | ) |
Net increase in share transactions | | | 537,060 | | | | 1,188,037 | |
| (a) | | For the period November 8, 2013 (commencement of operations) to May 31, 2014. |
19
See accompanying notes which are an integral part of these financial statements.
Financial Highlights
(For a share outstanding during each period)
| | | | | | | | |
| | | For the Year Ended
May 31, 2015 | | | For the Period Ended
May 31, 2014(a) | |
Selected Per Share Data: | | | | | | | | |
Net asset value, beginning of period | | | $10.73 | | | | $10.00 | |
| | | | | | | | |
| | |
Income from investment operations: | | | | | | | | |
| | |
Net investment income | | | 0.02 | | | | 0.04 | |
| | |
Net realized and unrealized gain on investments | | | 0.97 | | | | 0.70 | |
| | | | | | | | |
| | |
Total from investment operations | | | 0.99 | | | | 0.74 | |
| | | | | | | | |
| | |
Less distributions to shareholders from: | | | | | | | | |
| | |
Net investment income | | | (0.03 | ) | | | (0.01 | ) |
| | | | | | | | |
| | |
Total distributions | | | (0.03 | ) | | | (0.01 | ) |
| | | | | | | | |
Net asset value, end of period | | | $11.69 | | | | $10.73 | |
| | | | | | | | |
| | |
Total Return(b) | | | 9.27 | % | | | 7.36 | %(c) |
| | | | | | | | |
Ratios and Supplemental Data: | | | | | | | | |
Net assets, end of period (000) | | | $20,167 | | | | $12,745 | |
| | |
Ratio of expenses to average net assets | | | 1.25 | % | | | 1.25 | %(d) |
| | |
Ratio of expenses to average net assets before waiver and reimbursement | | | 2.26 | % | | | 3.93 | %(d) |
| | |
Ratio of net investment income to average net assets | | | 0.30 | % | | | 0.68 | %(d) |
| | |
Ratio of net investment loss to average net assets before waiver and reimbursement | | | (0.71 | )% | | | (2.00 | )%(d) |
| | |
Portfolio turnover rate | | | 51.17 | % | | | 46.50 | %(c) |
| (a) | | For the period November 8, 2013 (commencement of operations) to May 31, 2014. |
| (b) | | Total return in the above table represents the rate that the investor would have earned or lost on an investment in the Fund, assuming reinvestment of dividends, if any. |
20
See accompanying notes which are an integral part of these financial statements.
Notes to the Financial Statements
May 31, 2015
NOTE 1 – ORGANIZATION
The BFS Equity Fund (the “Fund”) was organized as an open-end diversified series of the Valued Advisers Trust (the “Trust”) on July 23, 2013 and commenced operations on November 8, 2013. The Trust is a management investment company established under the laws of Delaware by an Agreement and Declaration of Trust dated June 13, 2008 (the “Trust Agreement”). The Trust Agreement permits the Trustees to issue an unlimited number of shares of beneficial interest of separate series without par value. The Fund is one of a series of funds authorized by the Board of Trustees (the “Board”). The Fund’s investment adviser is Bradley, Foster & Sargent, Inc. (the “Adviser”). The investment objective of the Fund is long-term appreciation through growth of principal and income.
NOTE 2 – SIGNIFICANT ACCOUNTING POLICIES
The Fund is an investment company and follows accounting and reporting guidance under Financial Accounting Standards Board (“FASB”) Accounting Standards Codification (“ASC”) Topic 946, “Financial Services-Investment Companies”. The following is a summary of significant accounting policies followed by the Fund in the preparation of its financial statements. These policies are in conformity with generally accepted accounting principles in the United States of America (“GAAP”).
Securities Valuation – All investments in securities are recorded at their estimated fair value as described in Note 3.
Federal Income Taxes – The Fund makes no provision for federal income or excise tax. The Fund intends to qualify each year as a regulated investment company (“RIC”) under subchapter M of the Internal Revenue Code of 1986, as amended, by complying with the requirements applicable to RICs and by distributing substantially all of its taxable income. The Fund also intends to distribute sufficient net investment income and net capital gains, if any, so that it will not be subject to excise tax on undistributed income and gains. If the required amount of net investment income or gains is not distributed, the Fund could incur a tax expense.
For the fiscal year ended May 31, 2015, the Fund did not have a liability for any unrecognized tax benefits. The Fund recognizes interest and penalties, if any, related to unrecognized tax benefits as income tax expense in the statement of operations. During the year, the Fund did not incur any interest or penalties. The Fund is subject to examination by U.S. federal tax authorities for all tax years since inception.
Expenses – Expenses incurred by the Trust that do not relate to a specific fund of the Trust are allocated to the individual funds based on each fund’s relative net assets or another appropriate basis.
Security Transactions and Related Income – The Fund follows industry practice and records security transactions on the trade date for financial reporting purposes. The Fund has chosen specific identification as its tax lot identification method for all securities transactions. Interest income is recorded on an accrual basis and dividend income is recorded on the ex-dividend date except in the case of foreign securities, in which case dividends are generally recorded as soon as such information becomes available. Discounts and premiums on securities purchased are accreted
21
Notes to the Financial Statements (continued)
May 31, 2015
or amortized using the effective interest method. The ability of issuers of debt securities held by the Fund to meet their obligations may be affected by economic and political developments in a specific country or region. Withholding taxes on foreign dividends have been provided for in accordance with the Fund’s understanding of the applicable country’s tax rules and rates.
Dividends and Distributions – The Fund intends to distribute its net realized long term and short term capital gains, if any, at least annually. Dividends to shareholders, which are determined in accordance with income tax regulations, are recorded on the ex-dividend date. The treatment for financial reporting purposes of distributions made to shareholders during the period from net investment income or net realized capital gains may differ from their ultimate treatment for federal income tax purposes. These differences are caused primarily by differences in the timing of the recognition of certain components of income, expense or realized capital gain for federal income tax purposes. Where such differences are permanent in nature, they are reclassified in the components of the net assets based on their ultimate characterization for federal income tax purposes. Any such reclassifications will have no effect on net assets, results of operations or net asset values per share of the Fund. For the fiscal year ended May 31, 2015, the Fund made the following reclassifications of net assets:
| | | | |
| Paid-in Capital | | Accumulated
Undistributed Net
Investment Income | | Accumulated Net
Realized Gain/(Loss)
on Investments |
$– | | $(1,646) | | $1,646 |
NOTE 3. Securities Valuation and Fair Value Measurements
Fair value is defined as the price that a Fund would receive upon selling an investment in an orderly transaction to an independent buyer in the principal or most advantageous market of the investment. GAAP establishes a three-tier hierarchy to maximize the use of observable market data and minimize the use of unobservable inputs and establish classification of fair value measurements for disclosure purposes.
Inputs refer broadly to the assumptions that market participants would use in pricing the asset or liability, including assumptions about risk, for example, the risk inherent in a particular valuation technique used to measure fair value including a pricing model and/or the risk inherent in the inputs to the valuation technique. Inputs may be observable or unobservable. Observable inputs are inputs that reflect the assumptions market participants would use in pricing the asset or liability developed based on market data obtained from sources independent of the reporting entity. Unobservable inputs are inputs that reflect the reporting entity’s own assumptions about the assumptions market participants would use in pricing the asset or liability developed based on the best information available in the circumstances.
Various inputs are used in determining the value of the Fund’s investments. These inputs are summarized in the three broad levels listed below.
| | • | | Level 1 – quoted prices in active markets for identical securities |
| | • | | Level 2 – other significant observable inputs (including, but not limited to, quoted prices for an identical security in an inactive market, quoted prices for similar securities, interest rates, prepayment speeds, credit risk, etc.) |
22
Notes to the Financial Statements (continued)
May 31, 2015
| | • | | Level 3 – significant unobservable inputs (including the Fund’s own assumptions in determining fair value of investments based on the best information available) |
The inputs used to measure fair value may fall into different levels of the fair value hierarchy. In such cases, for disclosure purposes, the level in the fair value hierarchy within which the fair value measurement falls in its entirety, is determined based on the lowest level input that is significant to the fair value measurement in its entirety.
Equity securities, including common stocks, are generally valued by using market quotations, but may be valued on the basis of prices furnished by a pricing service when the Adviser believes such prices more accurately reflect the fair value of such securities. Securities that are traded on any stock exchange are generally valued by the pricing service at the last quoted sale price. Lacking a last sale price, an exchange traded security is generally valued by the pricing service at its last bid price. Securities traded in the NASDAQ over-the-counter market are generally valued by the pricing service at the NASDAQ Official Closing Price.
When using the market quotations or close prices provided by the pricing service and when the market is considered active, the security will be classified as a Level 1 security. Sometimes, an equity security owned by the Fund will be valued by the pricing service with factors other than market quotations or when the market is considered inactive. When this happens, the security will be classified as a Level 2 security. When market quotations are not readily available, when the Adviser determines that the market quotation or the price provided by the pricing service does not accurately reflect the current fair value, or when restricted or illiquid securities are being valued, such securities are valued as determined in good faith, in conformity with guidelines adopted by and subject to review by the Board. These securities will generally be categorized as Level 3 securities.
Investments in mutual funds, including money market mutual funds, are generally priced at the ending net asset value (“NAV”) provided by the service agent of the funds. These securities will be categorized as Level 1 securities.
In accordance with the Trust’s good faith pricing guidelines, the Fund, with support from the Adviser, is required to consider all appropriate factors relevant to the value of securities for which it has determined other pricing sources are not available or reliable as described above. No single standard exists for determining fair value, because fair value depends upon the circumstances of each individual case. As a general principle, the current fair value of an issue of securities being valued would appear to be the amount which the owner might reasonably expect to receive for them upon their current sale. Methods which are in accordance with this principle may, for example, be based on (i) a multiple of earnings; (ii) a discount from market of a similar freely traded security (including a derivative security or a basket of securities traded on other markets, exchanges or among dealers); or (iii) yield to maturity with respect to debt issues, or a combination of these and other methods. Good faith pricing is permitted if, in the management’s opinion, the validity of market quotations appears to be questionable based on factors such as evidence of a thin market in the security based on a small number of quotations, a significant event occurs after the close of a market but before a Fund’s NAV calculation that may affect a security’s value, or the Fund is aware of any other data that calls into question the reliability of market quotations.
23
Notes to the Financial Statements (continued)
May 31, 2015
The following is a summary of the inputs used to value the Fund’s investments as of May 31, 2015:
| | | | | | | | | | | | | | | | |
| | | Valuation Inputs | | | | |
| Assets | | Level 1
Quoted Prices in
Active Markets | | | Level 2
Other Significant
Observable Inputs | | | Level 3
Significant
Unobservable Inputs | | | Total | |
Common Stocks* | | $ | 19,630,328 | | | $ | – | | | $ | – | | | $ | 19,630,328 | |
Money Market Securities | | | 539,546 | | | | – | | | | – | | | | 539,546 | |
Total | | $ | 20,169,874 | | | $ | – | | | $ | – | | | $ | 20,169,874 | |
| * | | Refer to Schedule of Investments for industry classifications. |
The Fund did not hold any investments at any time during the reporting period in which other significant observable inputs (Level 2) were used in determining fair value. The Fund did not hold any assets at any time during the reporting period in which significant unobservable inputs were used in determining fair value; therefore, no reconciliation of Level 3 securities is included for this reporting period. The Fund did not hold any derivative instruments during the reporting period.
The Trust recognizes transfers between fair value hierarchy levels at the end of the reporting period. There were no transfers between any levels during the year ended May 31, 2015 and the previous reporting period end.
NOTE 4 – FEES AND OTHER TRANSACTIONS WITH AFFILIATES AND OTHER SERVICE PROVIDERS
Under the terms of the investment advisory agreement, on behalf of the Fund (the “Agreement”), the Adviser manages the Fund’s investments subject to oversight of the Board. As compensation for its services, the Fund is obligated to pay the Adviser a fee computed and accrued daily and paid monthly at an annual rate of 0.75% of the average daily net assets of the Fund. For the fiscal year ended May 31, 2015, the Adviser earned a fee of $121,718 from the Fund before the waivers described below. At May 31, 2015, the Adviser owed $57 to the Fund, including fee waivers and expense reimbursements.
The Adviser has contractually agreed to waive or limit its fee and reimburse certain Fund operating expenses, until September 30, 2015, so that the ratio of total annual operating expenses does not exceed 1.00%. This operating expense limitation does not apply to interest, taxes, brokerage commissions, other expenditures which are capitalized in accordance with GAAP, other extraordinary expenses not incurred in the ordinary course of the Fund’s business, dividend expense on short sales, expenses incurred under a plan of distribution under Rule 12b-1, and expenses that the Fund has incurred but did not actually pay because of an expense offset arrangement, if applicable, incurred by the Fund in any fiscal year. The operating expense limitation also excludes any “Fees and Expenses of Acquired Funds” which are the expenses indirectly incurred by the Fund as a result of investing in money market funds or other investment companies, including ETFs, that have their own expenses. The Adviser may be entitled to recoup the sum of all fees previously waived or expenses reimbursed during any of the previous three years, less any reimbursement previously paid, provided total expenses do not exceed the limitation set forth above. For the fiscal
24
Notes to the Financial Statements (continued)
May 31, 2015
year ended May 31, 2015, expenses totaling $163,520 were waived or reimbursed by the Adviser. The amounts subject to repayment by the Fund, pursuant to the aforementioned conditions are as follows:
| | | | |
| Amount | | Recoverable through
May 31, | |
| $146,030 | | | 2017 | |
| $163,520 | | | 2018 | |
The Trust retains Huntington Asset Services, Inc. (“HASI”) to manage the Fund’s business affairs and provide the Fund with administrative services, including all regulatory reporting and necessary office equipment and personnel. For the fiscal year ended May 31, 2015, HASI earned fees of $38,000 for administrative and compliance services provided to the Fund. At May 31, 2015, HASI was owed $3,167 from the Fund for administrative and compliance services. Certain officers of the Trust are members of management and/or employees of HASI. HASI is a wholly-owned subsidiary of Huntington Bancshares, Inc., the parent company of Unified Financial Securities, Inc. (the “Distributor”) and Huntington National Bank, the custodian of the Fund’s investments (the “Custodian”). For the fiscal year ended May 31, 2015, the Custodian earned fees of $3,792 for custody services provided to the Fund. At May 31, 2015, the Custodian was owed $700 from the Fund for custody services.
The Trust also retains HASI to act as the Fund’s transfer agent and to provide fund accounting services. For the fiscal year ended May 31, 2015, HASI earned fees of $36,752 for transfer agent services and reimbursement for out-of-pocket expenses incurred in providing transfer agent services to the Fund. At May 31, 2015, the Fund owed HASI $3,362 for transfer agent services and out-of-pocket expenses. For the fiscal year ended May 31, 2015, HASI earned fees of $25,000 from the Fund for fund accounting services. At May 31, 2015, HASI was owed $2,083 from the Fund for fund accounting services.
The Fund has adopted a Distribution Plan pursuant to Rule 12b-1 under the 1940 Act (the “Plan”). The Plan provides that the Fund will pay the Distributor and/or any registered securities dealer, financial institution or any other person (the “Recipient”) a shareholder servicing fee of 0.25% of the average daily net assets of the Fund in connection with the promotion and distribution of the Fund’s shares or the provision of personal services to shareholders, including, but not necessarily limited to, advertising, compensation to underwriters, dealers and selling personnel, the printing and mailing of prospectuses to other than current Fund shareholders, the printing and mailing of sales literature and servicing shareholder accounts (“12b-1 Expenses”). The Fund or Distributor may pay all or a portion of these fees to any recipient who renders assistance in distributing or promoting the sale of shares, or who provides certain shareholder services, pursuant to a written agreement. For the fiscal year ended May 31, 2015, 12b-1 expense incurred by the Fund was $40,573. The Fund owed $4,264 for 12b-1 fees as of May 31, 2015.
Unified Financial Securities, Inc. acts as the principal distributor of the Fund’s shares. A trustee and an officer of the Trust is an officer of the Distributor and such person may be deemed to be an affiliate of the Distributor.
25
Notes to the Financial Statements (continued)
May 31, 2015
NOTE 5 – PURCHASES AND SALES OF SECURITIES
For the fiscal year ended May 31, 2015, purchases and sales of investment securities, other than short-term investments and short-term U.S. government obligations, were as follows:
| | | | | | |
Purchases | | | Sales | |
| $ | 13,962,204 | | | $ | 8,109,327 | |
There were no purchases or sales of long-term U.S. government obligations during the fiscal year ended May 31, 2015.
NOTE 6 – ESTIMATES
The preparation of financial statements in conformity with GAAP requires management to make estimates and assumptions that affect the reported amounts of assets and liabilities and disclosure of contingent assets and liabilities at the date of the financial statements and the reported amounts of increases and decreases in net assets from operations during the reporting period. Actual results could differ from those estimates.
NOTE 7 – BENEFICIAL OWNERSHIP
The beneficial ownership, either directly or indirectly, of 25% or more of the voting securities of a fund creates a presumption of control of a fund, under Section 2(a) (9) of the Investment Company Act of 1940. At May 31, 2015, Charles Schwab & Co. (“Schwab”) owned, as record shareholder, 57% of the outstanding shares of the Fund. It is not known whether Schwab or any of the underlying beneficial owners owned or controlled 25% or more of the voting securities of the Fund.
NOTE 8 – FEDERAL TAX INFORMATION
At May 31, 2015, the net unrealized appreciation (depreciation) of investments for tax purposes was as follows:
| | | | |
Gross Unrealized Appreciation | | $ | 2,493,559 | |
Gross Unrealized (Depreciation) | | | (84,123 | ) |
Net Unrealized Appreciation on Investments | | $ | 2,409,436 | |
At May 31, 2015, the aggregate cost of securities for tax purposes was $17,760,438 for the Fund.
At May 31, 2015, the Fund’s most recent fiscal year end, the components of distributable earnings (accumulated losses) on a tax basis were as follows:
| | | | |
Undistributed ordinary income | | $ | 29,496 | |
Undistributed long-term capital gains | | | – | |
Accumulated capital and other losses | | | (311,206 | ) |
Unrealized appreciation on investments | | | 2,409,436 | |
Total | | $ | 2,127,726 | |
The difference between book and tax basis appreciation was attributable primarily to the tax deferral of losses on wash sales in the amount of $44,757.
26
Notes to the Financial Statements (continued)
May 31, 2015
The tax character of distributions paid for the fiscal periods ended May 31, 2015 and May 31, 2014 were as follows:
| | | | | | | | |
| | | 2015 | | | 2014 | |
Distributions paid from: | | | | | | | | |
Ordinary Income | | $ | 50,367 | | | $ | 4,924 | |
As of May 31, 2015, the Fund has available for tax purposes an unused capital loss carryforward of $177,167 of short-term capital losses with no expiration, which is available to offset against future taxable net capital gains. To the extent that these carryforwards are used to offset future gains, it is probable that the amount offset will not be distributed to shareholders.
Certain capital losses incurred after October 31, and within the current taxable year, are deemed to arise on the first business day of the Fund’s following taxable year. For the tax year ended May 31, 2015, the Fund deferred post October capital losses in the amount of $134,039.
NOTE 9 – COMMITMENTS AND CONTINGENCIES
The Fund indemnifies its officers and trustees for certain liabilities that may arise from performance of their duties to the Fund. Additionally, in the normal course of business, the Fund enters into contracts that contain a variety of representations and warranties which provide general indemnifications. The Fund’s maximum exposure under these arrangements is unknown, as this would involve future claims that may be made against the Fund that have not yet occurred.
NOTE 10 – SUBSEQUENT EVENTS
Management of the Fund has evaluated the need for disclosures and/or adjustments resulting from subsequent events through the date these financial statements were issued. There were no items requiring adjustment of the financial statements or additional disclosures.
27
Report of Independent Registered Public Accounting Firm
To the Shareholders of BFS Equity Fund and
Board of Trustees of Valued Advisers Trust
We have audited the accompanying statement of assets and liabilities, including the schedule of investments, of BFS Equity Fund (the “Fund”), a series of Valued Advisers Trust, as of May 31, 2015, and the related statement of operations for the year then ended, the statements of changes in net assets and financial highlights for each of the two periods in the period then ended. These financial statements and financial highlights are the responsibility of the Fund’s management. Our responsibility is to express an opinion on these financial statements and financial highlights based on our audits.
We conducted our audits in accordance with the standards of the Public Company Accounting Oversight Board (United States). Those standards require that we plan and perform the audit to obtain reasonable assurance about whether the financial statements and financial highlights are free of material misstatement. An audit includes examining, on a test basis, evidence supporting the amounts and disclosures in the financial statements. Our procedures included confirmation of securities owned as of May 31, 2015, by correspondence with the custodian. An audit also includes assessing the accounting principles used and significant estimates made by management, as well as evaluating the overall financial statement presentation. We believe that our audits provide a reasonable basis for our opinion.
In our opinion, the financial statements and financial highlights referred to above present fairly, in all material respects, the financial position of BFS Equity Fund as of May 31, 2015, the results of its operations for the year then ended, the statements of changes in net assets and financial highlights for each of the two periods in the period then ended, in conformity with accounting principles generally accepted in the United States of America.

COHEN FUND AUDIT SERVICES, LTD.
Cleveland, Ohio
July 27, 2015
28
Additional Federal Income Tax Information (Unaudited):
The Form 1099-DIV you receive in January 2016 will show the tax status of all distributions paid to your account in calendar year 2015. Shareholders are advised to consult their own tax adviser with respect to the tax consequences of their investment in the Fund. As required by the Internal Revenue Code and/or regulations, shareholders must be notified regarding the status of qualified dividend income for individuals and the dividends received deduction for corporations.
Qualified Dividend Income: For the fiscal year ended May 31, 2015, the Fund designates 100%, or up to the maximum amount of such dividends allowable pursuant to the Internal Revenue Code, as qualified dividend income eligible for the reduced tax rate of 15%.
Dividends Received Deduction: Corporate shareholders are generally entitled to take the dividends received deduction on the portion of the Fund’s dividend distribution that qualifies under tax law. For the Fund’s fiscal year 2015 ordinary income dividends, 100% qualifies for the corporate dividends received deduction.
For the fiscal year ended March 31, 2015, the Fund designated $0 as long-term capital gain distributions.
29
The following table provides information regarding each of the Independent Trustees.
| | | | |
Name, Address*, (Age),
Position with Trust**, Term
of Position with Trust | | Principal Occupation During Past 5 Years | | Other Directorships |
| | |
| Ira Cohen, 56, Independent Trustee, June 2010 to present. | | Independent financial services consultant (Feb. 2005 – present). | | Trustee and Audit Committee Chairman, Griffin Institutional Access Real Estate Fund since May 2014. Trustee for the Angel Oak Funds Trust since October 2014. |
| | |
| Andrea N. Mullins, 48, Independent Trustee, December 2013 to present. | | Private investor; Independent Contractor, Seabridge Wealth Management, LLC, since April 2014; Principal Financial Officer and Treasurer, Eagle Family of Funds (mutual fund family) and Vice President, Eagle Asset Management, Inc. (investment adviser) each from 2004 to 2010. | | None. |
| * | | The address for each trustee and officer is 2960 N. Meridian St., Suite 300, Indianapolis, IN 46208. |
| ** | | As of the date of this report, the Trust consists of 14 series. |
The following table provides information regarding the Trustee who is considered an “interested person” of the Trust, as that term is defined under the 1940 Act. Based on the experience of the Trustee, the Trust concluded that the individual described below is qualified to serve as a Trustee.
| | | | |
Name, Address*, (Age),
Position with Trust**, Term
of Position with Trust | | Principal Occupation During Past 5 Years | | Other Directorships |
| | |
| R. Jeffrey Young, 50, Trustee and Chairman, June 2010 to present; Principal Executive Officer and President, Valued Advisers Trust since February 2010. | | President of Huntington Asset Services since April 2015, Senior Vice President, since January 2010 and Director since May 2014; Director, Unified Financial Securities since May 2014; Chief Executive Officer, Huntington Funds from February 2010 to March 2015; Chief Executive Officer, The Huntington Strategy Shares from November 2010 to March 2015; President and Chief Executive Officer, Dreman Contrarian Funds March 2011 to February 2013; Trustee, Valued Advisers Trust, August 2008 to January 2010; and Managing Director and Chief Operating Officer of Professional Planning Consultants 2007 to 2010. | | Trustee and Chairman, Capitol Series Trust, since September 2013. |
| * | | The address for each trustee and officer is 2960 N. Meridian St., Suite 300, Indianapolis, IN 46208. |
| ** | | As of the date of this report, the Trust consists of 14 series. |
30
The following table provides information regarding the Officers of the Trust:
| | | | |
Name, Address*, (Age),
Position with Trust,** Term
of Position with Trust | | Principal Occupation During Past 5 Years | | Other Directorships |
| | |
| R. Jeffrey Young, 50, Trustee and Chairman, June 2010 to present; Principal Executive Officer and President, Valued Advisers Trust since February 2010. | | President of Huntington Asset Services since April 2015, Senior Vice President, since January 2010 and Director since May 2014; Director, Unified Financial Securities, since May 2014; Chief Executive Officer, Huntington Funds from February 2010 to March 2015; Chief Executive Officer, The Huntington Strategy Shares from November 2010 to March 2015; President and Chief Executive Officer, Dreman Contrarian Funds March 2011 to February 2013; Trustee, Valued Advisers Trust, August 2008 to January 2010; and Managing Director and Chief Operating Officer of Professional Planning Consultants 2007 to 2010. | | Trustee and Chairman, Capitol Series Trust, since September 2013. |
| | |
| John C. Swhear, 54, Chief Compliance Officer, AML Officer and Vice President, August 2008 to present. | | Vice President of Legal Administration and Compliance, Huntington Asset Services, Inc., the Trust’s administrator, since April 2007 and Director since May 2014; Chief Compliance Officer, Unified Financial Securities, Inc., the Trust’s distributor, since May 2007 and Director since May 2014; President, Unified Series Trust, since March 2012, and Senior Vice President from May 2007 to March 2012; Chief Compliance Officer and AML Officer, Capitol Series Trust, since September 2013; Secretary, Huntington Funds, from April 2010 to February 2012; and President and Chief Executive Officer, Dreman Contrarian Funds, from March 2010 to March 2011. | | None. |
| | |
| Carol J. Highsmith, 50, Vice President, August 2008 to present; Secretary, March 2014 to present | | Employed in various positions with Huntington Asset Services, Inc., the Trust’s administrator, since November of 1994; currently Vice President of Legal Administration; Secretary, Cross Shore Discovery Fund since May 2014. | | None. |
| | |
| Matthew J. Miller, 39, Vice President, December 2011 to present. | | Employed in various positions with Huntington Asset Services, Inc., the Trust’s administrator, since July of 1998; currently Vice President of Relationship Management; Vice President, Huntington Funds, since February 2010; President and Chief Executive Officer, Capitol Series Trust, since September 2013. | | None. |
| | |
| Bryan W. Ashmus, 42, Principal Financial Officer and Treasurer, December 2013 to present. | | Vice President, Fund Administration, Huntington Asset Services, Inc., the Trust’s administrator, since September 2013; Chief Financial Officer and Treasurer, The Huntington Strategy Shares and The Huntington Funds, since November 2013; Vice President, Fund Administration, Citi Fund Services Ohio, Inc., from 2005 to 2013. | | None. |
| * | | The address for each trustee and officer is 2960 N. Meridian St., Suite 300, Indianapolis, IN 46208. |
| ** | | As of the date of this report, the Trust consists of 14 series. |
31
OTHER INFORMATION
The Fund’s Statement of Additional Information (“SAI”) includes additional information about the trustees and is available without charge, upon request. You may call toll-free at (855) 575-2430 to request a copy of the SAI or to make shareholder inquiries.
32
VALUED ADVISERS TRUST
PRIVACY POLICY
The following is a description of the policies of the Valued Advisers Trust (the “Trust”) regarding disclosure of nonpublic personal information that shareholders provide to a series of the Trust (each, a “Fund”) or that the Fund collects from other sources. In the event that a shareholder holds shares of a Fund through a broker-dealer or other financial intermediary, the privacy policy of the financial intermediary would govern how shareholder nonpublic personal information would be shared with nonaffiliated third parties.
Categories of Information a Fund May Collect. A Fund may collect the following nonpublic personal information about its shareholders:
| | • | | Information the Fund receives from a shareholder on applications or other forms, correspondence, or conversations (such as the shareholder’s name, address, phone number, social security number, and date of birth); and |
| | • | | Information about the shareholder’s transactions with the Fund, its affiliates, or others (such as the shareholder’s account number and balance, payment history, cost basis information, and other financial information). |
Categories of Information a Fund May Disclose. A Fund may not disclose any nonpublic personal information about its current or former shareholders to unaffiliated third parties, except as required or permitted by law. A Fund is permitted by law to disclose all of the information it collects, as described above, to its service providers (such as the Fund’s custodian, administrator, transfer agent, accountant and legal counsel) to process shareholder transactions and otherwise provide services to the shareholder.
Confidentiality and Security. Each Fund shall restrict access to shareholder nonpublic personal information to those persons who require such information to provide products or services to the shareholder. Each Fund shall maintain physical, electronic, and procedural safeguards that comply with federal standards to guard shareholder nonpublic personal information.
Disposal of Information. The Funds, through their transfer agent, have taken steps to reasonably ensure that the privacy of a shareholder’s nonpublic personal information is maintained at all times, including in connection with the disposal of information that is no longer required to be maintained by the Funds. Such steps shall include, whenever possible, shredding paper documents and records prior to disposal, requiring off-site storage vendors to shred documents maintained in such locations prior to disposal, and erasing and/or obliterating any data contained on electronic media in such a manner that the information can no longer be read or reconstructed.
33
PROXY VOTING
A description of the policies and procedures that the Fund uses to determine how to vote proxies relating to portfolio securities and information regarding how the Fund voted those proxies during the most recent twelve month period ended June 30, will be available without charge upon request by (1) calling the Fund at (855) 575-2430 and (2) from Fund documents filed with the Securities and Exchange Commission (“SEC”) on the SEC’s website at www.sec.gov.
TRUSTEES
R. Jeffrey Young, Chairman
Ira Cohen
Andrea N. Mullins
OFFICERS
R. Jeffrey Young, Principal Executive Officer and President
Bryan W. Ashmus, Principal Financial Officer and Treasurer
John C. Swhear, Chief Compliance Officer, AML Officer and Vice-President
Carol J. Highsmith, Vice President and Secretary
Matthew J. Miller, Vice President
INVESTMENT ADVISER
Bradley, Foster & Sargent
185 Asylum Street, City Place II
Hartford, Connecticut 06103
DISTRIBUTOR
Unified Financial Securities, Inc.
2960 North Meridian Street, Suite 300
Indianapolis, IN 46208
INDEPENDENT REGISTERED PUBLIC ACCOUNTING FIRM
Cohen Fund Audit Services, Ltd.
1350 Euclid Avenue, Suite 800
Cleveland, OH 44115
LEGAL COUNSEL
The Law Offices of John H. Lively & Associates, Inc.
A member firm of The 1940 Act Law Group TM
11300 Tomahawk Creek Parkway, Suite 310
Leawood, KS 66211
CUSTODIAN
Huntington National Bank
41 South High Street
Columbus, OH 43215
ADMINISTRATOR, TRANSFER AGENT AND FUND ACCOUNTANT
Huntington Asset Services, Inc.
2960 North Meridian Street, Suite 300
Indianapolis, IN 46208
This report is intended only for the information of shareholders or those who have received the Fund’s prospectus which contains information about the Fund’s management fee and expenses. Please read the prospectus carefully before investing.
Distributed by Unified Financial Securities, Inc.
Member FINRA/SIPC
ANNUAL REPORT
May 31, 2015

CLOUD CAPITAL FUNDS
Cloud Capital Strategic All Cap Fund
Fund Adviser:
Cloud Capital LLC
P.O. Box 451179
Grove, OK 74345
Toll Free (877) 670-2227
| | |
Management’s Discussion of Fund Performance |
We welcome and thank all new and existing shareholders of the Cloud Capital Strategic All Cap Fund.
In the fiscal year ended on May 31, 2015, the Cloud Capital Strategic Large Cap Fund (the “Large Cap Fund”) absorbed the Cloud Capital Strategic Mid Cap Fund (the “Mid Cap Fund”) and was rebranded and restructured as the Cloud Capital Strategic All Cap Fund (the “All Cap Fund”). The All Cap Fund gained 7.99% during the trailing twelve months, trailing the Russell 3000 Index by 3.87%. The Energy sector’s negative performance due to the drop in oil prices was responsible for much of the lag against the benchmark’s performance.
The U.S. market has extended its bull run for over seven years now, setting new historical highs regularly over the past year, despite slow growth in the overall economy. While portfolios grow, we at Cloud Capital LLC (“Cloud Capital”) can’t help but remember the beginning of 2007, when disparities between the stock market and the economy were growing and were largely ignored. While we want to continue to enjoy the fruits of the market rally as long as possible, it is also important to us to have our shareholders’ assets in a position of safety when the rally concludes.
In the All Cap Fund, the sector selections within the portfolio were within 30 bps above or below the benchmark in seven of ten GICS Sectors. Of the remaining three, the All Cap Fund outperformed in Industrials, while falling short in Technology and the aforementioned Energy.
Although the market appears to be resuming historical cyclical growth, the truth is the aftereffects of continued stimulus that has flowed into the market over the past several years are still unclear. The core strategy of the All Cap Fund, which has historically outperformed the benchmark 70% of the time over rolling one-year periods, would benefit greatly from a return to the good old days. However, we are vigilant for unforeseen consequences of artificially driving the markets through stimulus, and especially the effects of withdrawing that support, as will have to eventually happen.
Again, we thank our shareholders for their continued confidence in Cloud Capital, and with another fiscal year behind us, we look forward to many more years of serving them.
Sincerely,
Randy Cloud
Cloud Capital LLC, President
Annual Report
1
| | |
Investment Results – (Unaudited) | | |
| | | | | | | | | | | | |
Total Returns (a)
(For the periods ended May 31, 2015) | |
| | | |
| | | | | | Average Annual Returns | |
| | | | |
| | | One Year | | | Three Year | | | Since Inception
(June 29, 2011) | |
Cloud Capital Strategic All Cap Fund - Institutional Class | | | 7.99 | % | | | 18.18 | % | | | 12.70 | % |
S&P 500® Index (b) | | | 11.81 | % | | | 19.67 | % | | | 15.62 | % |
Russell 3000 Index (b) (c) | | | 11.86 | % | | | 19.92 | % | | | 15.39 | % |
Total annual operating expenses, as disclosed in the Fund’s prospectus dated January 20, 2015, were 1.51% of average daily net assets. (1.01% after fee waivers/expense reimbursements by Cloud Capital LLC (the “Adviser”)). Beginning February 1, 2014, The Adviser has contractually agreed to waive its management fee in its entirety. This waiver is not subject to recoupment and will continue through September 30, 2016. Additionally, the Adviser has contractually agreed to waive or limit its fees and to assume other expenses of the Fund through September 30, 2016, so that Total Annual Fund Operating Exepnses do not exceed 1.40%. This operating expense limitation does not apply to brokerage fees and commissions, borrowing costs (such as interest and dividend expenses on securities sold short), taxes, extraordinary expenses, fees and expenses paid under a distribution plan adopted pursuant to Rule 12b-1, and indirect expenses (such as “Acquired Fund Fees and Expenses”). The Adviser may be entitled to reimbursement of any fees waived or expenses reimbursed prior to February 1, 2014, pursuant to the agreement provided overall expenses fall below the limitations set forth above. The Adviser may recoup the sum of all fees previously waived or expenses reimbursed during any of the previous three years, less any reimbursement previously paid, provided total expenses do not exceed the limitation set forth above. This agreement may only be terminated by mutual consent of the Adviser and the Board of Trustees.
The performance quoted represents past performance, which does not guarantee future results. The investment return and principal value of an investment will fluctuate so that an investor’s shares, when redeemed, may be worth more or less than their original cost. The returns shown do not reflect deduction of taxes that a shareholder would pay on Fund distributions or the redemption of Fund shares. The Fund’s investment objectives, risks, charges and expenses must be considered carefully before investing. Current performance may be lower or higher than the performance quoted. Performance data current to the most recent month end may be obtained by calling (877) 670-2227.
| (a) | Return figures reflect any change in price per share and assume the reinvestment of all distributions. |
| (b) | The S&P 500® Index and the Russell 3000® Index are unmanaged indices that assume reinvestment of all distributions and exclude the effect of taxes and fees. These indices are widely recognized unmanaged indices of equity prices. Individuals cannot invest directly in these indices; however, an individual can invest in exchange-traded funds or other investment vehicles that attempt to track the performance of a benchmark index. |
| (c) | Effective January 19, 2015, the Fund (formerly known as the Cloud Capital Strategic Large Cap Fund) adopted a new investment objective and strategy. The Trust has designated the Russell 3000 Index as the Fund’s primary benchmark index as it is more representative of the Fund’s investment objective and strategy. |
The Fund’s investment objectives, risks, charges and expenses must be considered carefully before investing. The prospectus contains this and other important information about the investment company and may be obtained by calling (877) 670-2227. Please read it carefully before investing.
The Fund is distributed by Unified Financial Securities, Inc., Member FINRA.
Annual Report
2
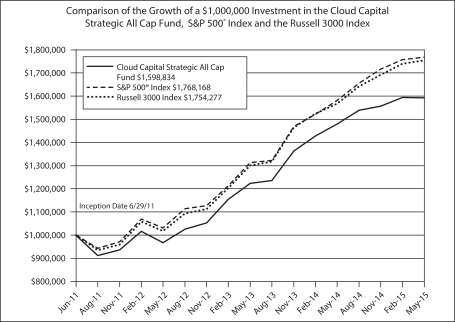
The chart above assumes an initial investment of $1,000,000 made on June 29, 2011 (commencement of Fund operations) and held through May 31, 2015. THE FUND’S RETURNS REPRESENT PAST PERFORMANCE AND DO NOT GUARANTEE FUTURE RESULTS. The returns shown do not reflect deduction of taxes that a shareholder would pay on the Fund’s distributions or the redemption of the Fund’s shares. Investment returns and principal values will fluctuate so that your shares, when redeemed, may be worth more or less than their original purchase price.
Current performance may be lower or higher than the performance data quoted. For more information on the Fund, and to obtain performance data current to the most recent month-end, or to request a prospectus, please call (877) 670-2227. You should carefully consider the investment objectives, potential risks, management fees, and charges and expenses of the Fund before investing. The Fund’s prospectus contains this and other information about the Fund, and should be read carefully before investing.
The Fund is distributed by Unified Financial Securities, Inc., member FINRA.
Annual Report
3
| | |
Fund Holdings – (Unaudited) | | |
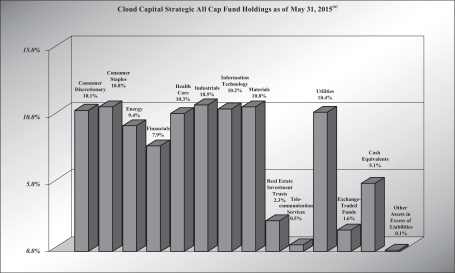
| (a) | As a percent of net assets. |
The investment objective of the Cloud Capital Strategic All Cap Fund is long-term capital appreciation.
Availability of Portfolio Schedule – (Unaudited)
The Fund files its complete schedule of portfolio holdings with the Securities and Exchange Commission (“SEC”) for the first and third quarters of each fiscal year on Form N-Q, which is available on the SEC’s web site at www.sec.gov. The Fund’s Form N-Q may be reviewed and copied at the SEC’s Public Reference Room in Washington, DC. Information on the operation of the Public Reference Room may be obtained by calling 1-800-SEC-0330.
Annual Report
4
| | |
About the Fund’s Expenses – (Unaudited) |
As a shareholder of the Fund, you incur two types of costs: (1) transaction costs (such as short-term redemption fees); and (2) ongoing costs, including management fees; and other Fund expenses. This Example is intended to help you understand your ongoing costs (in dollars) of investing in the Fund and to compare these costs with the ongoing costs of investing in other mutual funds. The Example is based on an investment of $1,000 invested at the beginning of the period, and held for the entire period from December 1, 2014 to May 31, 2015.
Actual Expenses
The first line of the table provides information about actual account values and actual expenses. You may use the information in this line, together with the amount you invested, to estimate the expenses that you paid over the period. Simply divide your account value by $1,000 (for example, an $8,600 account value divided by $1,000 = 8.60), then multiply the result by the number in the first line under the heading “Expenses Paid During the Period Ended May 31, 2015” to estimate the expenses you paid on your account during this period.
Hypothetical Example for Comparison Purposes
The second line of the table provides information about hypothetical account values and hypothetical expenses based on the Fund’s actual expense ratios and an assumed rate of return of 5% per year before expenses, which is not the Fund’s actual return. The hypothetical account values and expenses may not be used to estimate the actual ending account balance or expenses you paid for the period. You may use this information to compare the ongoing costs of investing in the Fund and other funds. To do so, compare this 5% hypothetical example with the 5% hypothetical examples that appear in the shareholder reports of the other funds.
Please note that the expenses shown in the table are meant to highlight your ongoing costs only and do not reflect any transactional costs, such as sales charges (loads), redemption fees, or exchange fees. Therefore, the second line of the table is useful in comparing ongoing costs only, and will not help you determine the relative total costs of owning different funds. In addition, if these transactional costs were included, your costs would have been higher.
| | | | | | | | | | |
| | | Beginning
Account
Value December 1, 2014 | | Ending Account Value May 31, 2015 | | | Expenses
Paid
During the Period
Ended May 31, 2015(a) | |
| | |
Cloud Capital Strategic All Cap Fund – Institutional Class | | | | | | | | |
Actual | | $1,000.00 | | $ | 1,025.70 | | | $ | 7.42 | |
Hypothetical (b) | | $1,000.00 | | $ | 1,017.60 | | | $ | 7.39 | |
| (a) | Expenses are equal to the Fund’s annualized expense ratio of 1.47%, multiplied by the average account value over the period, multiplied by 182/365. |
| (b) | Assumes a 5% return before expenses. |
Annual Report
5
| | |
| | |
| Cloud Capital Strategic All Cap Fund | | May 31, 2015 |
| | | | | | | | | | |
| Shares | | | | | Fair Value | | | |
| Common Stocks — 93.13% | | | | | | |
| Consumer Discretionary — 9.90% | | | | | | |
| | 506 | | | Aaron’s, Inc. | | $ | 17,739 | | | |
| | 137 | | | Advance Auto Parts, Inc. | | | 20,936 | | | |
| | 4,911 | | | Aeropostale, Inc. * | | | 9,283 | | | |
| | 42 | | | Amazon.com, Inc. * | | | 17,817 | | | |
| | 287 | | | AMC Networks, Inc. - Class A * | | | 22,523 | | | |
| | 1,550 | | | American Eagle Outfitters, Inc. | | | 25,373 | | | |
| | 424 | | | ANN, Inc. * | | | 19,816 | | | |
| | 584 | | | Apollo Group, Inc. - Class A * | | | 9,677 | | | |
| | 1,009 | | | Ascena Retail Group, Inc. * | | | 14,911 | | | |
| | 247 | | | AutoNation, Inc. * | | | 15,435 | | | |
| | 27 | | | AutoZone, Inc. * | | | 17,931 | | | |
| | 817 | | | Barnes & Noble, Inc. * | | | 19,209 | | | |
| | 229 | | | Bed Bath & Beyond, Inc. * | | | 16,297 | | | |
| | 500 | | | Best Buy Co., Inc. | | | 17,342 | | | |
| | 393 | | | Big Lots, Inc. | | | 17,234 | | | |
| | 358 | | | Bob Evans Farms, Inc. | | | 16,434 | | | |
| | 214 | | | BorgWarner, Inc. | | | 12,875 | | | |
| | 351 | | | Brinker International, Inc. | | | 19,345 | | | |
| | 284 | | | Cabela’s, Inc. - Class A * | | | 14,498 | | | |
| | 840 | | | Cablevision Systems Corp. | | | 20,580 | | | |
| | 317 | | | CarMax, Inc. * | | | 22,515 | | | |
| | 369 | | | Carnival Corp. | | | 17,077 | | | |
| | 250 | | | Carter’s, Inc. | | | 25,854 | | | |
| | 236 | | | CBS Corp. - Class B | | | 14,564 | | | |
| | 86 | | | CDK Global, Inc. | | | 4,600 | | | |
| | 276 | | | CEB, Inc. | | | 23,338 | | | |
| | 385 | | | Cheesecake Factory, Inc./The | | | 19,843 | | | |
| | 1,056 | | | Chico’s FAS, Inc. | | | 17,545 | | | |
| | 24 | | | Chipotle Mexican Grill, Inc. * | | | 14,878 | | | |
| | 536 | | | Cinemark Holdings, Inc. | | | 21,715 | | | |
| | 362 | | | Coach, Inc. | | | 12,806 | | | |
| | 273 | | | Comcast Corp. - Class A | | | 15,950 | | | |
| | 518 | | | CST Brands, Inc. | | | 20,602 | | | |
| | 606 | | | D.R. Horton, Inc. | | | 15,832 | | | |
| | 296 | | | Darden Restaurants, Inc. | | | 19,390 | | | |
| | 214 | | | Deckers Outdoor Corp. * | | | 14,600 | | | |
| | 210 | | | Delphi Automotive PLC | | | 18,302 | | | |
| | 397 | | | DeVry Education Group, Inc. | | | 12,637 | | | |
| | 397 | | | Dick’s Sporting Goods, Inc. | | | 21,338 | | | |
| | 3 | | | Dillard’s, Inc. - Class A | | | 348 | | | |
| | 167 | | | DIRECTV - Class A * | | | 15,192 | | | |
| | 181 | | | Discovery Communications, Inc. - Class A * | | | 6,159 | | | |
| | 181 | | | Discovery Communications, Inc. - Class C * | | | 5,684 | | | |
| | 229 | | | Dollar General Corp. | | | 16,594 | | | |
| | | | | | | | | | |
| Shares | | | | | Fair Value | | | |
| Common Stocks — (Continued) | | | | | | |
| Consumer Discretionary — (Continued) | | | | | | |
| | 258 | | | Dollar Tree, Inc. * | | $ | 19,348 | | | |
| | 252 | | | Domino’s Pizza, Inc. | | | 27,427 | | | |
| | 696 | | | DreamWorks Animation SKG, Inc. - Class A * | | | 18,748 | | | |
| | 181 | | | Expedia, Inc. | | | 19,380 | | | |
| | 207 | | | Family Dollar Stores, Inc. | | | 16,028 | | | |
| | 354 | | | Foot Locker, Inc. | | | 22,393 | | | |
| | 855 | | | Ford Motor Co. | | | 12,971 | | | |
| | 132 | | | Fossil Group, Inc. * | | | 9,354 | | | |
| | 362 | | | GameStop Corp. - Class A | | | 15,715 | | | |
| | 496 | | | Gannett Co., Inc. | | | 17,766 | | | |
| | 341 | | | Gap, Inc./The | | | 13,056 | | | |
| | 241 | | | Garmin Ltd. | | | 10,972 | | | |
| | 402 | | | General Motors Co. | | | 14,452 | | | |
| | 1,227 | | | Gentex Corp. | | | 21,073 | | | |
| | 168 | | | Genuine Parts Co. | | | 15,228 | | | |
| | 524 | | | Goodyear Tire & Rubber Co./The | | | 16,680 | | | |
| | 21 | | | Graham Holdings Co. | | | 22,657 | | | |
| | 676 | | | Guess?, Inc. | | | 11,854 | | | |
| | 433 | | | H & R Block, Inc. | | | 13,724 | | | |
| | 807 | | | Hanesbrands, Inc. | | | 25,710 | | | |
| | 207 | | | Harley-Davidson, Inc. | | | 11,070 | | | |
| | 137 | | | Harman International Industries, Inc. | | | 16,560 | | | |
| | 277 | | | Hasbro, Inc. | | | 19,984 | | | |
| | 178 | | | Home Depot, Inc./The | | | 19,867 | | | |
| | 360 | | | HSN, Inc. | | | 24,167 | | | |
| | 166 | | | International Game Technology PLC * | | | 2,997 | | | |
| | 543 | | | International Speedway Corp. - Class A | | | 20,234 | | | |
| | 728 | | | Interpublic Group of Cos., Inc./The | | | 14,864 | | | |
| | 446 | | | Jarden Corp. * | | | 23,658 | | | |
| | 259 | | | John Wiley & Sons, Inc. - Class A | | | 15,007 | | | |
| | 288 | | | Johnson Controls, Inc. | | | 15,000 | | | |
| | 1,025 | | | KB Home | | | 15,145 | | | |
| | 272 | | | Kohl’s Corp. | | | 17,815 | | | |
| | 254 | | | L Brands, Inc. | | | 22,005 | | | |
| | 432 | | | Leggett & Platt, Inc. | | | 20,443 | | | |
| | 343 | | | Lennar Corp. - Class A | | | 15,971 | | | |
| | 367 | | | Life Time Fitness, Inc. * | | | 26,399 | | | |
| | 662 | | | LKQ Corp. * | | | 18,922 | | | |
| | 311 | | | Lowe’s Companies, Inc. | | | 21,771 | | | |
| | 250 | | | Macy’s, Inc. | | | 16,730 | | | |
| | 228 | | | Marriott International, Inc. - Class A | | | 17,775 | | | |
| | 375 | | | Mattel, Inc. | | | 9,683 | | | |
| | 439 | | | Matthews International Corp. - Class A | | | 21,778 | | | |
| | 142 | | | McDonalds Corp. | | | 13,657 | | | |
| | 622 | | | MDC Holdings, Inc. | | | 17,397 | | | |
See accompanying notes which are an integral part of these financial statements.
Annual Report
6
| | |
| | |
| Cloud Capital Strategic All Cap Fund | | May 31, 2015 |
| | |
| Schedule of Investments (Continued) |
| | | | | | | | | | |
| Shares | | | | | Fair Value | | | |
| Common Stocks — (Continued) | | | | | | |
| Consumer Discretionary — (Continued) | | | | | | |
| | 403 | | | Meredith Corp. | | $ | 21,276 | | | |
| | 155 | | | Michael Kors Holdings Ltd. * | | | 7,195 | | | |
| | 228 | | | Mohawk Industries, Inc. * | | | 42,496 | | | |
| | 32 | | | Netflix, Inc. * | | | 20,161 | | | |
| | 1,150 | | | New York Times Co./The - Class A | | | 15,986 | | | |
| | 463 | | | Newell Rubbermaid, Inc. | | | 18,294 | | | |
| | 811 | | | News Corp. - Class A * | | | 12,282 | | | |
| | 189 | | | NIKE, Inc. - Class B | | | 19,190 | | | |
| | 211 | | | Nordstrom, Inc. | | | 15,334 | | | |
| | 15 | | | NVR, Inc. * | | | 20,946 | | | |
| | 3,062 | | | Office Depot, Inc. * | | | 28,384 | | | |
| | 206 | | | Omnicom Group, Inc. | | | 15,336 | | | |
| | 92 | | | O’Reilly Automotive, Inc. * | | | 20,258 | | | |
| | 117 | | | Panera Bread Co. - Class A * | | | 21,352 | | | |
| | 135 | | | Polaris Industries, Inc. | | | 19,367 | | | |
| | 12 | | | Priceline Group, Inc. * | | | 14,634 | | | |
| | 727 | | | Pulte Group, Inc. | | | 13,952 | | | |
| | 121 | | | PVH Corp. | | | 12,704 | | | |
| | 92 | | | Ralph Lauren Corp. | | | 12,046 | | | |
| | 1,252 | | | Regis Corp. * | | | 20,238 | | | |
| | 60 | | | Remy International, Inc. | | | 1,325 | | | |
| | 618 | | | Rent-A-Center, Inc. | | | 18,690 | | | |
| | 210 | | | Ross Stores, Inc. | | | 20,312 | | | |
| | 532 | | | Scholastic Corp. | | | 23,659 | | | |
| | 1,558 | | | Scientific Games Corp. - Class A * | | | 23,718 | | | |
| | 178 | | | Scripps Networks Interactive, Inc. - Class A | | | 11,911 | | | |
| | 877 | | | Service Corporation International | | | 25,482 | | | |
| | 160 | | | Signet Jewelers Ltd. | | | 20,665 | | | |
| | 431 | | | Sotheby’s | | | 19,341 | | | |
| | 1,299 | | | Staples, Inc. | | | 21,392 | | | |
| | 379 | | | Starbucks Corp. | | | 19,691 | | | |
| | 183 | | | Starwood Hotels & Resorts Worldwide, Inc. | | | 15,108 | | | |
| | 315 | | | Strayer Education, Inc. * | | | 14,446 | | | |
| | 247 | | | Target Corp. | | | 19,562 | | | |
| | 302 | | | Tempur Sealy International, Inc. * | | | 17,998 | | | |
| | 306 | | | Thor Industries, Inc. | | | 18,681 | | | |
| | 145 | | | Tiffany & Co. | | | 13,559 | | | |
| | 102 | | | Time Warner Cable, Inc. - Class A | | | 18,378 | | | |
| | 206 | | | Time Warner, Inc. | | | 17,390 | | | |
| | 259 | | | TJX Cos., Inc./The | | | 16,693 | | | |
| | 484 | | | Toll Brothers, Inc. * | | | 17,511 | | | |
| | 272 | | | Tractor Supply Co. | | | 23,728 | | | |
| | 136 | | | TripAdvisor, Inc. * | | | 10,376 | | | |
| | 219 | | | Tupperware Brands Corp. | | | 14,424 | | | |
| | 403 | | | Twenty-First Century Fox, Inc. | | | 13,547 | | | |
| | | | | | | | | | |
| Shares | | | | | Fair Value | | | |
| Common Stocks — (Continued) | | | | | | |
| Consumer Discretionary — (Continued) | | | | | | |
| | 297 | | | Under Armour, Inc. - Class A * | | $ | 23,314 | | | |
| | 412 | | | Urban Outfitters, Inc. * | | | 14,153 | | | |
| | 62 | | | Vectrus, Inc. * | | | 1,561 | | | |
| | 231 | | | VF Corp. | | | 16,278 | | | |
| | 165 | | | Viacom, Inc. - Class B | | | 11,035 | | | |
| | 277 | | | Vista Outdoor, Inc. * | | | 12,767 | | | |
| | 171 | | | Walt Disney Co./The | | | 18,899 | | | |
| | 2,079 | | | Wendy’s Co./The | | | 23,367 | | | |
| | 104 | | | Whirlpool Corp. | | | 19,203 | | | |
| | 230 | | | Williams-Sonoma, Inc. | | | 18,088 | | | |
| | 197 | | | Wyndham Worldwide Corp. | | | 16,753 | | | |
| | 75 | | | Wynn Resorts Ltd. | | | 7,557 | | | |
| | 182 | | | Yum! Brands, Inc. | | | 16,365 | | | |
| | | | | 2,514,411 | | | |
| Consumer Staples — 10.74% | | | | | | |
| | 913 | | | Altria Group, Inc. | | | 46,735 | | | |
| | 842 | | | Archer-Daniels-Midland Co. | | | 44,481 | | | |
| | 2,548 | | | Avon Products, Inc. | | | 17,125 | | | |
| | 391 | | | Brown-Forman Corp. - Class B | | | 36,902 | | | |
| | 830 | | | Campbell Soup Co. | | | 40,101 | | | |
| | 1,180 | | | Church & Dwight Co., Inc. | | | 99,080 | | | |
| | 419 | | | Clorox Co./The | | | 45,100 | | | |
| | 924 | | | Coca-Cola Co./The | | | 37,845 | | | |
| | 823 | | | Coca-Cola Enterprises, Inc. | | | 36,404 | | | |
| | 548 | | | Colgate-Palmolive Co. | | | 36,622 | | | |
| | 1,220 | | | ConAgra Foods, Inc. | | | 47,109 | | | |
| | 434 | | | Constellation Brands, Inc. - Class A | | | 51,183 | | | |
| | 333 | | | Costco Wholesale Corp. | | | 47,516 | | | |
| | 488 | | | CVS Health Corp. | | | 49,922 | | | |
| | 4,617 | | | Dean Foods Co. | | | 85,054 | | | |
| | 639 | | | Dr. Pepper Snapple Group, Inc. | | | 48,951 | | | |
| | 682 | | | Energizer Holdings, Inc. | | | 96,642 | | | |
| | 491 | | | Estee Lauder Cos., Inc./The - Class A | | | 42,900 | | | |
| | 4,016 | | | Flowers Foods, Inc. | | | 90,205 | | | |
| | 698 | | | General Mills, Inc. | | | 39,215 | | | |
| | 378 | | | Hershey Co./The | | | 35,144 | | | |
| | 769 | | | Hormel Foods Corp. | | | 43,987 | | | |
| | 1,074 | | | Ingredion, Inc. | | | 88,052 | | | |
| | 354 | | | JM Smucker Co./The | | | 41,928 | | | |
| | 569 | | | Kellogg Co. | | | 35,744 | | | |
| | 658 | | | Keurig Green Mountain, Inc. | | | 56,714 | | | |
| | 340 | | | Kimberly-Clark Corp. | | | 36,965 | | | |
| | 681 | | | Kraft Foods Group, Inc. | | | 57,540 | | | |
| | 787 | | | Kroger Co./The | | | 57,294 | | | |
| | 881 | | | Lancaster Colony Corp. | | | 78,649 | | | |
| | 599 | | | Lorillard, Inc. | | | 43,425 | | | |
| | 523 | | | McCormick & Co., Inc. | | | 41,070 | | | |
See accompanying notes which are an integral part of these financial statements.
Annual Report
7
| | |
| | |
| Cloud Capital Strategic All Cap Fund | | May 31, 2015 |
| | |
| Schedule of Investments (Continued) |
| | | | | | | | | | |
| Shares | | | | | Fair Value | | | |
| Common Stocks — (Continued) | | | | | | |
| Consumer Staples — (Continued) | | | | | | |
| | 418 | | | Mead Johnson Nutrition Co. | | $ | 40,628 | | | |
| | 518 | | | Molson Coors Brewing Co. - Class B | | | 38,039 | | | |
| | 1,001 | | | Mondelez International, Inc. - Class A | | | 41,614 | | | |
| | 520 | | | Monster Beverage Corp. * | | | 66,166 | | | |
| | 430 | | | PepsiCo, Inc. | | | 41,510 | | | |
| | 432 | | | Philip Morris International, Inc. | | | 35,849 | | | |
| | 1,582 | | | Post Holdings, Inc. * | | | 68,433 | | | |
| | 477 | | | Procter & Gamble Co. | | | 37,377 | | | |
| | 631 | | | Reynolds American, Inc. | | | 48,397 | | | |
| | 10,242 | | | SUPERVALU, Inc. * | | | 90,440 | | | |
| | 1,029 | | | Sysco Corp. | | | 38,224 | | | |
| | 2,938 | | | Tootsie Roll Industries, Inc. | | | 90,316 | | | |
| | 1,028 | | | Tyson Foods, Inc. - Class A | | | 43,619 | | | |
| | 1,249 | | | United Natural Foods, Inc. * | | | 83,750 | | | |
| | 1,476 | | | Universal Corp. | | | 76,010 | | | |
| | 499 | | | Walgreens Boots Alliance, Inc. | | | 42,813 | | | |
| | 495 | | | Wal-Mart Stores, Inc. | | | 36,784 | | | |
| | 2,427 | | | WhiteWave Food Co. * | | | 116,553 | | | |
| | 888 | | | Whole Foods Market, Inc. | | | 36,623 | | | |
| | | | | 2,728,749 | | | |
| Energy — 9.43% | | | | | | |
| | 23,517 | | | Alpha Natural Resources, Inc. * | | | 11,690 | | | |
| | 380 | | | Anadarko Petroleum Corp. | | | 31,739 | | | |
| | 420 | | | Apache Corp. | | | 25,114 | | | |
| | 23,525 | | | Arch Coal, Inc. * | | | 11,527 | | | |
| | 1,660 | | | Atwood Oceanics, Inc. | | | 51,067 | | | |
| | 575 | | | Baker Hughes, Inc. | | | 37,076 | | | |
| | 3,056 | | | Bill Barrett Corp. * | | | 26,983 | | | |
| | 1,183 | | | Cabot Oil & Gas Corp. | | | 40,170 | | | |
| | 161 | | | California Resources Corp. | | | 1,261 | | | |
| | 630 | | | Cameron International Corp. * | | | 32,327 | | | |
| | 637 | | | CARBO Ceramics, Inc. | | | 27,164 | | | |
| | 1,362 | | | Chesapeake Energy Corp. | | | 19,219 | | | |
| | 326 | | | Chevron Corp. | | | 33,606 | | | |
| | 621 | | | Cimarex Energy Co. | | | 71,744 | | | |
| | 504 | | | ConocoPhillips | | | 32,063 | | | |
| | 899 | | | Consol Energy, Inc. | | | 25,025 | | | |
| | 2,324 | | | Denbury Resources, Inc. | | | 17,130 | | | |
| | 528 | | | Devon Energy Corp. | | | 34,420 | | | |
| | 873 | | | Diamond Offshore Drilling, Inc. | | | 26,496 | | | |
| | 1,374 | | | Dresser-Rand Group, Inc. * | | | 116,203 | | | |
| | 813 | | | Dril-Quip, Inc. * | | | 61,438 | | | |
| | 956 | | | Energen Corp. | | | 66,157 | | | |
| | 795 | | | Ensco PLC - Class A | | | 18,685 | | | |
| | | | | | | | | | |
| Shares | | | | | Fair Value | | | |
| Common Stocks — (Continued) | | | | | | |
| Energy — (Continued) | | | | | | |
| | 362 | | | EOG Resources, Inc. | | $ | 32,091 | | | |
| | 377 | | | EQT Corp. | | | 32,103 | | | |
| | 406 | | | Exxon Mobil Corp. | | | 34,575 | | | |
| | 690 | | | FMC Technologies, Inc. * | | | 28,838 | | | |
| | 607 | | | Halliburton Co. | | | 27,572 | | | |
| | 3,383 | | | Helix Energy Solutions Group, Inc. * | | | 53,008 | | | |
| | 366 | | | Helmerich & Payne, Inc. | | | 26,711 | | | |
| | 429 | | | Hess Corp. | | | 28,989 | | | |
| | 1,874 | | | HollyFrontier Corp. | | | 78,067 | | | |
| | 1,216 | | | Kinder Morgan, Inc. | | | 50,448 | | | |
| | 1,065 | | | Marathon Oil Corp. | | | 28,963 | | | |
| | 477 | | | Marathon Petroleum Corp. | | | 49,315 | | | |
| | 640 | | | Murphy Oil Corp. | | | 27,821 | | | |
| | 1,515 | | | Nabors Industries Ltd. | | | 22,351 | | | |
| | 540 | | | National Oilwell Varco, Inc. | | | 26,556 | | | |
| | 970 | | | Newfield Exploration Co. * | | | 36,685 | | | |
| | 1,299 | | | Noble Corp. PLC | | | 21,757 | | | |
| | 539 | | | Noble Energy, Inc. | | | 23,590 | | | |
| | 409 | | | Occidental Petroleum Corp. | | | 31,945 | | | |
| | 1,141 | | | Oceaneering International, Inc. | | | 57,949 | | | |
| | 1,345 | | | Oil States International, Inc. * | | | 54,976 | | | |
| | 394 | | | Paragon Offshore PLC | | | 654 | | | |
| | 2,543 | | | Patterson-UTI Energy, Inc. | | | 51,365 | | | |
| | 2,524 | | | Peabody Energy Corp. | | | 8,531 | | | |
| | 493 | | | Phillips 66 | | | 38,980 | | | |
| | 180 | | | Pioneer Natural Resources Co. | | | 26,596 | | | |
| | 1,241 | | | QEP Resources, Inc. | | | 23,361 | | | |
| | 465 | | | Range Resources Corp. | | | 25,758 | | | |
| | 1,612 | | | Rosetta Resources, Inc. * | | | 37,660 | | | |
| | 1,273 | | | Rowan Cos. PLC | | | 27,336 | | | |
| | 390 | | | Schlumberger Ltd. | | | 35,392 | | | |
| | 93 | | | Seventy Seven Energy, Inc. * | | | 549 | | | |
| | 1,055 | | | SM Energy Co. | | | 55,176 | | | |
| | 871 | | | Southwestern Energy Co. * | | | 22,434 | | | |
| | 1,019 | | | Spectra Energy Corp. | | | 35,848 | | | |
| | 2,432 | | | Superior Energy Services, Inc. | | | 56,159 | | | |
| | 707 | | | Tesoro Corp. | | | 62,600 | | | |
| | 1,614 | | | Tidewater, Inc. | | | 39,617 | | | |
| | 1,019 | | | Transocean Ltd. | | | 19,215 | | | |
| | 1,279 | | | Unit Corp. * | | | 40,317 | | | |
| | 766 | | | Valero Energy Corp. | | | 45,394 | | | |
| | 735 | | | Williams Cos., Inc./The | | | 37,549 | | | |
| | 1,803 | | | World Fuel Services Corp. | | | 90,204 | | | |
| | 1,785 | | | WPX Energy, Inc. * | | | 23,008 | | | |
| | | | | 2,396,317 | | | |
| Financials — 7.87% | | | | | | |
| | 140 | | | ACE Ltd. | | | 14,862 | | | |
| | 78 | | | Affiliated Managers Group, Inc. * | | | 17,409 | | | |
See accompanying notes which are an integral part of these financial statements.
Annual Report
8
| | |
| | |
| Cloud Capital Strategic All Cap Fund | | May 31, 2015 |
| | |
| Schedule of Investments (Continued) |
| | | | | | | | | | |
| Shares | | | | | Fair Value | | | |
| Common Stocks — (Continued) | | | | | | |
| Financials — (Continued) | | | | | | |
| | 231 | | | Aflac, Inc. | | $ | 14,386 | | | |
| | 193 | | | Alexander & Baldwin, Inc. | | | 7,934 | | | |
| | 36 | | | Alleghany Corp. * | | | 17,165 | | | |
| | 245 | | | Allstate Corp./The | | | 16,491 | | | |
| | 155 | | | American Express Co. | | | 12,319 | | | |
| | 271 | | | American Financial Group, Inc. | | | 17,211 | | | |
| | 265 | | | American International Group, Inc. | | | 15,559 | | | |
| | 125 | | | Ameriprise Financial, Inc. | | | 15,562 | | | |
| | 162 | | | Aon PLC | | | 16,369 | | | |
| | 2,061 | | | Apollo Investment Corp. | | | 16,178 | | | |
| | 350 | | | Arthur J Gallagher & Co. | | | 16,949 | | | |
| | 345 | | | Aspen Insurance Holdings Ltd. | | | 15,991 | | | |
| | 883 | | | Associated Banc-Corp. | | | 16,753 | | | |
| | 217 | | | Assurant, Inc. | | | 14,305 | | | |
| | 1,169 | | | Astoria Financial Corp. | | | 15,321 | | | |
| | 647 | | | BancorpSouth, Inc. | | | 15,642 | | | |
| | 930 | | | Bank of America Corp. | | | 15,340 | | | |
| | 275 | | | Bank of Hawaii Corp. | | | 17,258 | | | |
| | 408 | | | Bank of New York Mellon Corp./The | | | 17,692 | | | |
| | 381 | | | BB&T Corp. | | | 15,053 | | | |
| | 114 | | | Berkshire Hathaway, Inc. - Class B * | | | 16,287 | | | |
| | 47 | | | BlackRock, Inc. | | | 17,316 | | | |
| | 515 | | | Brown & Brown, Inc. | | | 16,669 | | | |
| | 180 | | | Capital One Financial Corp. | | | 15,077 | | | |
| | 609 | | | Cathay General Bancorp | | | 18,399 | | | |
| | 310 | | | CBOE Holdings, Inc. | | | 18,141 | | | |
| | 474 | | | CBRE Group, Inc. * | | | 18,121 | | | |
| | 532 | | | Charles Schwab Corp./The | | | 16,825 | | | |
| | 157 | | | Chubb Corp./The | | | 15,329 | | | |
| | 307 | | | Cincinnati Financial Corp. | | | 15,515 | | | |
| | 299 | | | Citigroup, Inc. | | | 16,183 | | | |
| | 210 | | | City National Corp. | | | 19,337 | | | |
| | 208 | | | CME Group, Inc. | | | 19,570 | | | |
| | 289 | | | Comerica, Inc. | | | 14,156 | | | |
| | 361 | | | Commerce Bancshares, Inc. | | | 16,107 | | | |
| | 281 | | | Crown Castle International Corp. | | | 22,890 | | | |
| | 203 | | | Cullen/Frost Bankers, Inc. | | | 14,896 | | | |
| | 237 | | | Discover Financial Services | | | 13,814 | | | |
| | 660 | | | E*Trade Financial Corp. * | | | 19,456 | | | |
| | 453 | | | East West Bancorp, Inc. | | | 19,424 | | | |
| | 433 | | | Eaton Vance Corp. | | | 17,577 | | | |
| | 50 | | | Everest Re Group Ltd. | | | 9,047 | | | |
| | 540 | | | Federated Investors, Inc. - Class B | | | 18,790 | | | |
| | 974 | | | Fidelity National Financial, Inc. - Class A | | | 36,971 | | | |
| | 334 | | | Fidelity National Financial, Inc. * | | | 5,129 | | | |
| | | | | | | | | | |
| Shares | | | | | Fair Value | | | |
| Common Stocks — (Continued) | | | | | | |
| Financials — (Continued) | | | | | | |
| | 686 | | | Fifth Third Bancorp. | | $ | 13,895 | | | |
| | 561 | | | First American Financial Corp. | | | 20,050 | | | |
| | 1,322 | | | First Horizon National Corp. | | | 19,511 | | | |
| | 1,842 | | | First Niagara Financial Group, Inc. | | | 16,410 | | | |
| | 816 | | | FirstMerit Corp. | | | 16,019 | | | |
| | 257 | | | Franklin Resources, Inc. | | | 13,073 | | | |
| | 1,292 | | | Fulton Financial Corp. | | | 16,362 | | | |
| | 822 | | | Genworth Financial, Inc. - Class A * | | | 6,528 | | | |
| | 87 | | | Goldman Sachs Group, Inc./The | | | 17,936 | | | |
| | 341 | | | Greenhill & Co., Inc. | | | 13,262 | | | |
| | 458 | | | Hancock Holding Co. | | | 13,330 | | | |
| | 253 | | | Hanover Insurance Group, Inc. | | | 18,017 | | | |
| | 409 | | | Hartford Financial Services Group, Inc. | | | 16,815 | | | |
| | 335 | | | HCC Insurance Holdings, Inc. | | | 19,131 | | | |
| | 1,462 | | | Hudson City Bancorp, Inc. | | | 13,913 | | | |
| | 73 | | | Intercontinental Exchange Group, Inc. | | | 17,332 | | | |
| | 611 | | | International Bancshares Corp. | | | 15,943 | | | |
| | 390 | | | Invesco Ltd. | | | 15,530 | | | |
| | 911 | | | Iron Mountain, Inc. | | | 33,235 | | | |
| | 1,311 | | | Janus Capital Group, Inc. | | | 23,787 | | | |
| | 126 | | | Jones Lang LaSalle, Inc. | | | 21,878 | | | |
| | 257 | | | JPMorgan Chase & Co. | | | 16,926 | | | |
| | 438 | | | Kemper Corp. | | | 15,688 | | | |
| | 1,020 | | | KeyCorp | | | 14,869 | | | |
| | 288 | | | Legg Mason, Inc. | | | 15,375 | | | |
| | 553 | | | Leucadia National Corp. | | | 13,620 | | | |
| | 282 | | | Lincoln National Corp. | | | 16,049 | | | |
| | 333 | | | Loews Corp. | | | 13,352 | | | |
| | 119 | | | M&T Bank Corp. | | | 14,354 | | | |
| | 283 | | | Marsh & McLennan Cos., Inc. | | | 16,508 | | | |
| | 175 | | | McGraw Hill Financial, Inc. | | | 18,146 | | | |
| | 350 | | | Mercury General Corp. | | | 19,462 | | | |
| | 263 | | | MetLife, Inc. | | | 13,726 | | | |
| | 168 | | | Moody’s Corp. | | | 18,169 | | | |
| | 449 | | | Morgan Stanley | | | 17,142 | | | |
| | 349 | | | MSCI, Inc. - Class A | | | 21,640 | | | |
| | 385 | | | NASDAQ OMX Group, Inc./The | | | 19,915 | | | |
| | 1,043 | | | New York Community Bancorp, Inc. | | | 18,497 | | | |
| | 228 | | | Northern Trust Corp. | | | 17,019 | | | |
| | 956 | | | Old Republic International Corp. | | | 14,772 | | | |
| | 1,009 | | | People’s United Financial, Inc. | | | 15,700 | | | |
See accompanying notes which are an integral part of these financial statements.
Annual Report
9
| | |
| | |
| Cloud Capital Strategic All Cap Fund | | May 31, 2015 |
| | |
| Schedule of Investments (Continued) |
| | | | | | | | | | |
| Shares | | | | | Fair Value | | | |
| Common Stocks — (Continued) | | | | | | |
| Financials — (Continued) | | | | | | |
| | 167 | | | PNC Financial Services Group, Inc. | | $ | 15,946 | | | |
| | 332 | | | Primerica, Inc. | | | 14,703 | | | |
| | 299 | | | Principal Financial Group, Inc. | | | 15,455 | | | |
| | 578 | | | Progressive Corp./The | | | 15,802 | | | |
| | 259 | | | Prosperity Bancshares, Inc. | | | 13,863 | | | |
| | 166 | | | Prudential Financial, Inc. | | | 14,007 | | | |
| | 315 | | | Raymond James Financial, Inc. | | | 18,332 | | | |
| | 1,366 | | | Regions Financial Corp. | | | 13,785 | | | |
| | 201 | | | Reinsurance Group of America, Inc. | | | 18,781 | | | |
| | 485 | | | SEI Investments Co. | | | 23,207 | | | |
| | 127 | | | Signature Bank * | | | 17,773 | | | |
| | 1,660 | | | SLM Corp. * | | | 17,036 | | | |
| | 252 | | | StanCorp Financial Group, Inc. | | | 18,675 | | | |
| | 214 | | | State Street Corp. | | | 16,687 | | | |
| | 364 | | | SunTrust Banks, Inc. | | | 15,518 | | | |
| | 133 | | | SVB Financial Group * | | | 17,960 | | | |
| | 642 | | | Synovus Financial Corp. | | | 18,645 | | | |
| | 183 | | | T. Rowe Price Group, Inc. | | | 14,766 | | | |
| | 968 | | | TCF Financial Corp. | | | 15,230 | | | |
| | 267 | | | Torchmark Corp. | | | 15,239 | | | |
| | 153 | | | Travelers Cos., Inc./The | | | 15,467 | | | |
| | 657 | | | Trustmark Corp. | | | 15,662 | | | |
| | 344 | | | U.S. Bancorp | | | 14,831 | | | |
| | 416 | | | Unum Group | | | 14,532 | | | |
| | 70 | | | Urban Edge Properties | | | 1,504 | | | |
| | 1,620 | | | Valley National Bancorp | | | 15,846 | | | |
| | 351 | | | W.R. Berkley Corp. | | | 17,219 | | | |
| | 262 | | | Waddell & Reed Financial, Inc. - Class A | | | 12,527 | | | |
| | 705 | | | Washington Federal, Inc. | | | 15,574 | | | |
| | 513 | | | Webster Financial Corp. | | | 19,438 | | | |
| | 280 | | | Wells Fargo & Co. | | | 15,677 | | | |
| | 288 | | | Westamerica Bancorp | | | 13,169 | | | |
| | 448 | | | XL Group PLC | | | 16,893 | | | |
| | 487 | | | Zions Bancorp. | | | 14,071 | | | |
| | | | | 1,999,481 | | | |
| Health Care — 10.34% | | | | | | |
| | 497 | | | Abbott Laboratories | | | 24,136 | | | |
| | 370 | | | AbbVie, Inc. | | | 24,634 | | | |
| | 200 | | | Actavis PLC * | | | 61,275 | | | |
| | 247 | | | Aetna, Inc. | | | 29,129 | | | |
| | 335 | | | Agilent Technologies, Inc. | | | 13,819 | | | |
| | 122 | | | Alexion Pharmaceuticals, Inc. * | | | 20,007 | | | |
| | 2,202 | | | Allscripts Healthcare Solutions, Inc. * | | | 30,982 | | | |
| | 274 | | | AmerisourceBergen Corp. | | | 30,817 | | | |
| | 170 | | | Amgen, Inc. | | | 26,534 | | | |
| | | | | | | | | | |
| Shares | | | | | Fair Value | | | |
| Common Stocks — (Continued) | | | | | | |
| Health Care — (Continued) | | | | | | |
| | 190 | | | Anthem, Inc. | | $ | 31,810 | | | |
| | 275 | | | Baxter International, Inc. | | | 18,321 | | | |
| | 206 | | | Becton, Dickinson and Co. | | | 28,909 | | | |
| | 64 | | | Biogen Idec, Inc. * | | | 25,492 | | | |
| | 273 | | | Bio-Rad Laboratories, Inc. - Class A * | | | 39,407 | | | |
| | 369 | | | Bio-Techne Corp. | | | 37,373 | | | |
| | 1,559 | | | Boston Scientific Corp. * | | | 28,476 | | | |
| | 425 | | | Bristol-Myers Squibb Co. | | | 27,482 | | | |
| | 144 | | | C.R. Bard, Inc. | | | 24,568 | | | |
| | 292 | | | Cardinal Health, Inc. | | | 25,729 | | | |
| | 246 | | | Celgene Corp. * | | | 28,126 | | | |
| | 371 | | | Cerner Corp. * | | | 24,941 | | | |
| | 613 | | | Charles River Laboratories International, Inc. * | | | 44,379 | | | |
| | 219 | | | CIGNA Corp. | | | 30,813 | | | |
| | 757 | | | Community Health Systems, Inc. * | | | 41,865 | | | |
| | 247 | | | Cooper Cos., Inc./The | | | 44,808 | | | |
| | 280 | | | DaVita, Inc. * | | | 23,494 | | | |
| | 414 | | | DENTSPLY International, Inc. | | | 21,525 | | | |
| | 239 | | | Edwards LifeSciences Corp. * | | | 31,274 | | | |
| | 337 | | | Eli Lilly & Co. | | | 26,625 | | | |
| | 479 | | | Endo International PLC * | | | 40,106 | | | |
| | 285 | | | Express Scripts Holding Co. * | | | 24,871 | | | |
| | 246 | | | Gilead Sciences, Inc. * | | | 27,655 | | | |
| | 42 | | | Halyard Health, Inc. * | | | 1,731 | | | |
| | 823 | | | Health Net, Inc. * | | | 51,218 | | | |
| | 279 | | | Henry Schein, Inc. * | | | 39,560 | | | |
| | 834 | | | Hill-Rom Holdings, Inc. | | | 43,006 | | | |
| | 1,721 | | | HMS Holdings Corp. * | | | 29,329 | | | |
| | 1,306 | | | Hologic, Inc. * | | | 46,712 | | | |
| | 384 | | | Hospira, Inc. * | | | 33,973 | | | |
| | 161 | | | Humana, Inc. | | | 34,643 | | | |
| | 250 | | | IDEXX Laboratories, Inc. * | | | 33,881 | | | |
| | 49 | | | Intuitive Surgical, Inc. * | | | 24,129 | | | |
| | 196 | | | Johnson & Johnson | | | 19,666 | | | |
| | 297 | | | Laboratory Corp. of America Holdings * | | | 35,075 | | | |
| | 513 | | | LifePoint Hospitals, Inc. * | | | 38,592 | | | |
| | 429 | | | Mallinckrodt PLC * | | | 55,547 | | | |
| | 1,410 | | | Masimo Corp. * | | | 49,494 | | | |
| | 108 | | | McKesson Corp. | | | 25,594 | | | |
| | 560 | | | Mednax, Inc. * | | | 39,837 | | | |
| | 533 | | | Medtronic PLC | | | 40,704 | | | |
| | 348 | | | Merck & Co., Inc. | | | 21,197 | | | |
| | 134 | | | Mettler-Toledo International, Inc. * | | | 43,356 | | | |
| | 387 | | | Mylan NV * | | | 28,074 | | | |
| | 511 | | | Omnicare, Inc. | | | 48,706 | | | |
| | 975 | | | Owens & Minor, Inc. | | | 32,475 | | | |
| | 512 | | | Patterson Cos., Inc. | | | 24,491 | | | |
See accompanying notes which are an integral part of these financial statements.
Annual Report
10
| | |
| | |
| Cloud Capital Strategic All Cap Fund | | May 31, 2015 |
| | |
| Schedule of Investments (Continued) |
| | | | | | | | | | |
| Shares | | | | | Fair Value | | | |
| Common Stocks — (Continued) | | | | | | |
| Health Care — (Continued) | | | | | | |
| | 423 | | | PerkinElmer, Inc. | | $ | 22,314 | | | |
| | 138 | | | Perrigo Co. PLC | | | 26,265 | | | |
| | 679 | | | Pfizer, Inc. | | | 23,596 | | | |
| | 342 | | | Quest Diagnostics, Inc. | | | 25,747 | | | |
| | 65 | | | Regeneron Pharmaceuticals, Inc. * | | | 33,371 | | | |
| | 636 | | | ResMed, Inc. | | | 37,405 | | | |
| | 300 | | | St. Jude Medical, Inc. | | | 22,160 | | | |
| | 645 | | | STERIS Corp. | | | 43,074 | | | |
| | 237 | | | Stryker Corp. | | | 22,809 | | | |
| | 318 | | | Teleflex, Inc. | | | 40,997 | | | |
| | 417 | | | Tenet Healthcare Corp. * | | | 22,159 | | | |
| | 165 | | | Thermo Fisher Scientific, Inc. | | | 21,453 | | | |
| | 980 | | | Thoratec Corp. * | | | 44,487 | | | |
| | 380 | | | United Therapeutics Corp. * | | | 69,876 | | | |
| | 256 | | | UnitedHealth Group, Inc. | | | 30,774 | | | |
| | 364 | | | Universal Health Services, Inc. - Class B | | | 47,147 | | | |
| | 238 | | | Varian Medical Systems, Inc. * | | | 20,606 | | | |
| | 930 | | | VCA, Inc. * | | | 48,783 | | | |
| | 818 | | | Vertex Pharmaceuticals, Inc. * | | | 104,980 | | | |
| | 186 | | | Waters Corp. * | | | 24,791 | | | |
| | 433 | | | WellCare Health Plans, Inc. * | | | 37,068 | | | |
| | 188 | | | Zimmer Holdings, Inc. | | | 21,482 | | | |
| | 668 | | | Zoetis, Inc. | | | 33,269 | | | |
| | | | | 2,624,985 | | | |
| Industrials — 10.63% | | | | | | |
| | 161 | | | 3M Co. | | | 25,537 | | | |
| | 142 | | | Acuity Brands, Inc. | | | 25,039 | | | |
| | 673 | | | ADT Corp./The | | | 24,536 | | | |
| | 739 | | | AECOM Technology Corp. * | | | 24,423 | | | |
| | 342 | | | AGCO Corp. | | | 17,354 | | | |
| | 395 | | | Alaska Air Group, Inc. | | | 25,524 | | | |
| | 396 | | | Allegion PLC | | | 24,723 | | | |
| | 778 | | | AMETEK, Inc. | | | 41,851 | | | |
| | 987 | | | Avery Dennison Corp. | | | 61,077 | | | |
| | 197 | | | B/E Aerospace, Inc. | | | 11,303 | | | |
| | 173 | | | Boeing Co./The | | | 24,265 | | | |
| | 683 | | | Brink’s Co./The | | | 21,813 | | | |
| | 215 | | | Carlisle Cos., Inc. | | | 21,313 | | | |
| | 218 | | | Caterpillar, Inc. | | | 18,636 | | | |
| | 366 | | | CH Robinson Worldwide, Inc. | | | 22,619 | | | |
| | 366 | | | Cintas Corp. | | | 31,519 | | | |
| | 321 | | | CLARCOR, Inc. | | | 19,770 | | | |
| | 298 | | | Clean Harbors, Inc. * | | | 16,766 | | | |
| | 386 | | | Con-way, Inc. | | | 15,610 | | | |
| | | | | | | | | | |
| Shares | | | | | Fair Value | | | |
| Common Stocks — (Continued) | | | | | | |
| Industrials — (Continued) | | | | | | |
| | 514 | | | Copart, Inc. * | | $ | 17,778 | | | |
| | 256 | | | Crane Co. | | | 15,510 | | | |
| | 753 | | | CSX Corp. | | | 25,679 | | | |
| | 147 | | | Cummins, Inc. | | | 19,959 | | | |
| | 284 | | | Danaher Corp. | | | 24,541 | | | |
| | 260 | | | Deere & Co. | | | 24,379 | | | |
| | 680 | | | Delta Air Lines, Inc. | | | 29,166 | | | |
| | 330 | | | Deluxe Corp. | | | 21,084 | | | |
| | 451 | | | Donaldson Co., Inc. | | | 16,096 | | | |
| | 259 | | | Dover Corp. | | | 19,513 | | | |
| | 219 | | | Dun & Bradstreet Corp. | | | 28,060 | | | |
| | 310 | | | Eaton Corp. PLC | | | 22,160 | | | |
| | 345 | | | Emerson Electric Co. | | | 20,789 | | | |
| | 324 | | | Equifax, Inc. | | | 32,496 | | | |
| | 157 | | | Esterline Technologies Corp. * | | | 17,010 | | | |
| | 515 | | | Expeditors International of Washington, Inc. | | | 23,609 | | | |
| | 474 | | | Fastenal Co. | | | 19,657 | | | |
| | 157 | | | FedEx Corp. | | | 27,113 | | | |
| | 300 | | | Flowserve Corp. | | | 16,480 | | | |
| | 299 | | | Fluor Corp. | | | 16,837 | | | |
| | 482 | | | Fortune Brands Home & Security, Inc. | | | 22,121 | | | |
| | 506 | | | FTI Consulting, Inc. * | | | 19,904 | | | |
| | 292 | | | GATX Corp. | | | 16,260 | | | |
| | 765 | | | General Cable Corp. | | | 14,447 | | | |
| | 195 | | | General Dynamics Corp. | | | 27,338 | | | |
| | 884 | | | General Electric Co. | | | 24,104 | | | |
| | 179 | | | Genesee & Wyoming, Inc. - Class A * | | | 14,772 | | | |
| | 247 | | | Graco, Inc. | | | 17,934 | | | |
| | 535 | | | Granite Construction, Inc. | | | 19,166 | | | |
| | 710 | | | Harsco Corp. | | | 11,438 | | | |
| | 603 | | | Herman Miller, Inc. | | | 16,692 | | | |
| | 492 | | | HNI Corp. | | | 23,868 | | | |
| | 247 | | | Honeywell International, Inc. | | | 25,704 | | | |
| | 153 | | | Hubbell, Inc. - Class B | | | 16,541 | | | |
| | 190 | | | Huntington Ingalls Industries, Inc. | | | 23,587 | | | |
| | 237 | | | IDEX Corp. | | | 18,283 | | | |
| | 264 | | | Illinois Tool Works, Inc. | | | 24,747 | | | |
| | 370 | | | Ingersoll-Rand PLC | | | 25,470 | | | |
| | 405 | | | ITT Corp. | | | 17,298 | | | |
| | 419 | | | Jacobs Engineering Group, Inc. * | | | 18,108 | | | |
| | 246 | | | JB Hunt Transport Services, Inc. | | | 20,634 | | | |
| | 380 | | | Joy Global, Inc. | | | 14,809 | | | |
| | 218 | | | Kansas City Southern | | | 19,741 | | | |
| | 719 | | | KBR, Inc. | | | 13,771 | | | |
| | 403 | | | Kennametal, Inc. | | | 14,516 | | | |
| | 167 | | | Keysight Technologies, Inc. * | | | 5,485 | | | |
See accompanying notes which are an integral part of these financial statements.
Annual Report
11
| | |
| | |
| Cloud Capital Strategic All Cap Fund | | May 31, 2015 |
| | |
| Schedule of Investments (Continued) |
| | | | | | | | | | |
| Shares | | | | | Fair Value | | | |
| Common Stocks — (Continued) | | | | | | |
| Industrials — (Continued) | | | | | | |
| | 159 | | | Kirby Corp. * | | $ | 12,226 | | | |
| | 98 | | | KLX, Inc. * | | | 4,308 | | | |
| | 187 | | | L-3 Communications Holdings, Inc. | | | 22,032 | | | |
| | 289 | | | Landstar System, Inc. | | | 18,879 | | | |
| | 211 | | | Lennox International, Inc. | | | 23,755 | | | |
| | 266 | | | Lincoln Electric Holdings, Inc. | | | 17,886 | | | |
| | 144 | | | Lockheed Martin Corp. | | | 27,096 | | | |
| | 222 | | | ManpowerGroup | | | 18,769 | | | |
| | 1,072 | | | Masco Corp. | | | 29,022 | | | |
| | 764 | | | Matson, Inc. | | | 30,775 | | | |
| | 333 | | | MSA Safety, Inc. | | | 14,869 | | | |
| | 207 | | | MSC Industrial Direct Co., Inc. -
Class A | | | 14,358 | | | |
| | 495 | | | Nielsen NV | | | 22,257 | | | |
| | 226 | | | Nordson Corp. | | | 18,284 | | | |
| | 227 | | | Norfolk Southern Corp. | | | 20,912 | | | |
| | 192 | | | Northrop Grumman Corp. | | | 30,565 | | | |
| | 138 | | | Orbital ATK, Inc. | | | 10,595 | | | |
| | 346 | | | Oshkosh Corp. | | | 17,377 | | | |
| | 369 | | | PACCAR, Inc. | | | 23,472 | | | |
| | 275 | | | Pall Corp. | | | 34,191 | | | |
| | 182 | | | Parker Hannifin Corp. | | | 21,939 | | | |
| | 310 | | | Pentair PLC | | | 19,828 | | | |
| | 840 | | | Pitney Bowes, Inc. | | | 18,345 | | | |
| | 86 | | | Precision Castparts Corp. | | | 18,304 | | | |
| | 671 | | | Quanta Services, Inc. * | | | 19,687 | | | |
| | 1,196 | | | R.R. Donnelley & Sons Co. | | | 22,935 | | | |
| | 244 | | | Raytheon Co. | | | 25,160 | | | |
| | 237 | | | Regal-Beloit Corp. | | | 18,547 | | | |
| | 628 | | | Republic Services, Inc. | | | 25,310 | | | |
| | 486 | | | Robert Half International, Inc. | | | 27,391 | | | |
| | 183 | | | Rockwell Automation, Inc. | | | 22,463 | | | |
| | 290 | | | Rockwell Collins, Inc. | | | 27,616 | | | |
| | 917 | | | Rollins, Inc. | | | 22,753 | | | |
| | 157 | | | Roper Industries, Inc. | | | 27,465 | | | |
| | 264 | | | Ryder System, Inc. | | | 24,228 | | | |
| | 196 | | | Snap-on, Inc. | | | 30,533 | | | |
| | 869 | | | Southwest Airlines Co. | | | 32,211 | | | |
| | 174 | | | SPX Corp. | | | 12,939 | | | |
| | 265 | | | Stanley Black & Decker, Inc. | | | 27,113 | | | |
| | 194 | | | Stericycle, Inc. * | | | 26,606 | | | |
| | 484 | | | Terex Corp. | | | 11,973 | | | |
| | 576 | | | Textron, Inc. | | | 26,032 | | | |
| | 283 | | | Timken Co. | | | 11,053 | | | |
| | 172 | | | Towers Watson & Co. - Class A | | | 23,784 | | | |
| | 444 | | | Trinity Industries, Inc. | | | 13,319 | | | |
| | 262 | | | Triumph Group, Inc. | | | 17,462 | | | |
| | 505 | | | Tyco International PLC | | | 20,395 | | | |
| | 233 | | | Union Pacific Corp. | | | 23,471 | | | |
| | | | | | | | | | |
| Shares | | | | | Fair Value | | | |
| Common Stocks — (Continued) | | | | | | |
| Industrials — (Continued) | | | | | | |
| | 228 | | | United Parcel Service, Inc. - Class B | | $ | 22,612 | | | |
| | 178 | | | United Rentals, Inc. * | | | 15,831 | | | |
| | 199 | | | United Technologies Corp. | | | 23,270 | | | |
| | 1,932 | | | UTi Worldwide, Inc. * | | | 18,590 | | | |
| | 117 | | | Valmont Industries, Inc. | | | 14,604 | | | |
| | 90 | | | W.W. Grainger, Inc. | | | 21,600 | | | |
| | 226 | | | Wabtec Corp. | | | 22,712 | | | |
| | 438 | | | Waste Connections, Inc. | | | 21,257 | | | |
| | 531 | | | Waste Management, Inc. | | | 26,363 | | | |
| | 186 | | | Watsco, Inc. | | | 23,370 | | | |
| | 701 | | | Werner Enterprises, Inc. | | | 19,300 | | | |
| | 384 | | | Woodward, Inc. | | | 19,583 | | | |
| | 597 | | | Xylem, Inc. | | | 21,816 | | | |
| | | | | 2,699,730 | | | |
| Information Technology — 10.28% | | | | | | |
| | 305 | | | 3D Systems Corp. * | | | 6,673 | | | |
| | 248 | | | Accenture PLC - Class A | | | 23,815 | | | |
| | 867 | | | ACI Worldwide, Inc. * | | | 20,649 | | | |
| | 749 | | | Acxiom Corp. * | | | 12,404 | | | |
| | 271 | | | Adobe Systems, Inc. * | | | 21,461 | | | |
| | 740 | | | ADTRAN, Inc. | | | 12,738 | | | |
| | 508 | | | Advent Software, Inc. | | | 22,219 | | | |
| | 331 | | | Akamai Technologies, Inc. * | | | 25,281 | | | |
| | 179 | | | Alliance Data Systems Corp. * | | | 53,493 | | | |
| | 586 | | | Altera Corp. | | | 28,622 | | | |
| | 421 | | | Amphenol Corp. - Class A | | | 23,999 | | | |
| | 373 | | | Analog Devices, Inc. | | | 25,377 | | | |
| | 212 | | | ANSYS, Inc. * | | | 18,891 | | | |
| | 441 | | | AOL, Inc. * | | | 22,040 | | | |
| | 222 | | | Apple, Inc. | | | 28,935 | | | |
| | 906 | | | Applied Materials, Inc. | | | 18,238 | | | |
| | 266 | | | Arrow Electronics, Inc. * | | | 16,177 | | | |
| | 1,704 | | | Atmel Corp. | | | 15,112 | | | |
| | 357 | | | Autodesk, Inc. * | | | 19,325 | | | |
| | 261 | | | Automatic Data Processing, Inc. | | | 22,328 | | | |
| | 372 | | | Avnet, Inc. | | | 16,390 | | | |
| | 526 | | | Broadcom Corp. - Class A | | | 29,913 | | | |
| | 404 | | | Broadridge Financial Solutions, Inc. | | | 21,907 | | | |
| | 703 | | | CA, Inc. | | | 21,417 | | | |
| | 957 | | | Cadence Design Systems, Inc. * | | | 18,941 | | | |
| | 720 | | | Ciena Corp. * | | | 17,361 | | | |
| | 838 | | | Cisco Systems, Inc. | | | 24,551 | | | |
| | 306 | | | Citrix Systems, Inc. * | | | 19,903 | | | |
| | 413 | | | Cognizant Technology Solutions
Corp. - Class A * | | | 26,701 | | | |
| | 328 | | | CommVault Systems, Inc. * | | | 14,559 | | | |
See accompanying notes which are an integral part of these financial statements.
Annual Report
12
| | |
| | |
| Cloud Capital Strategic All Cap Fund | | May 31, 2015 |
| | |
| Schedule of Investments (Continued) |
| | | | | | | | | | |
| Shares | | | | | Fair Value | | | |
| Common Stocks — (Continued) | | | | | | |
| Information Technology — (Continued) | | | | | | |
| | 319 | | | Computer Sciences Corp. | | $ | 21,916 | | | |
| | 771 | | | Convergys Corp. | | | 19,135 | | | |
| | 538 | | | CoreLogic, Inc. * | | | 20,955 | | | |
| | 958 | | | Corning, Inc. | | | 20,038 | | | |
| | 250 | | | Covisint Corp. * | | | 672 | | | |
| | 321 | | | Cree, Inc. * | | | 9,714 | | | |
| | 1,525 | | | Cypress Semiconductor Corp. | | | 20,935 | | | |
| | 429 | | | Diebold, Inc. | | | 14,659 | | | |
| | 178 | | | DST Systems, Inc. | | | 21,119 | | | |
| | 404 | | | eBay, Inc. * | | | 24,813 | | | |
| | 547 | | | Electronic Arts, Inc. * | | | 34,322 | | | |
| | 765 | | | EMC Corp. | | | 20,157 | | | |
| | 79 | | | Equinix, Inc. | | | 21,146 | | | |
| | 178 | | | F5 Networks, Inc. * | | | 22,400 | | | |
| | 275 | | | Facebook, Inc. - Class A * | | | 21,804 | | | |
| | 141 | | | Factset Research Systems, Inc. | | | 23,248 | | | |
| | 268 | | | Fair Isaac Corp. | | | 23,551 | | | |
| | 1,009 | | | Fairchild Semiconductor International, Inc. * | | | 20,106 | | | |
| | 376 | | | Fidelity National Information Services, Inc. | | | 23,566 | | | |
| | 291 | | | First Solar, Inc. * | | | 14,487 | | | |
| | 334 | | | Fiserv, Inc. * | | | 26,736 | | | |
| | 558 | | | FLIR Systems, Inc. | | | 17,055 | | | |
| | 232 | | | Gartner, Inc. * | | | 20,267 | | | |
| | 230 | | | Global Payments, Inc. | | | 24,030 | | | |
| | 36 | | | Google, Inc. - Class A * | | | 19,475 | | | |
| | 382 | | | Harris Corp. | | | 30,288 | | | |
| | 582 | | | Hewlett-Packard Co. | | | 19,429 | | | |
| | 440 | | | Informatica Corp. * | | | 21,298 | | | |
| | 575 | | | Ingram Micro, Inc. - Class A * | | | 15,408 | | | |
| | 1,115 | | | Integrated Device Technology, Inc. * | | | 26,369 | | | |
| | 678 | | | Intel Corp. | | | 23,370 | | | |
| | 349 | | | InterDigital, Inc. | | | 20,472 | | | |
| | 112 | | | International Business Machines Corp. | | | 19,049 | | | |
| | 1,110 | | | Intersil Corp. - Class A | | | 14,988 | | | |
| | 254 | | | Intuit, Inc. | | | 26,462 | | | |
| | 397 | | | Itron, Inc. * | | | 14,264 | | | |
| | 1,020 | | | Jabil Circuit, Inc. | | | 25,054 | | | |
| | 276 | | | Jack Henry & Associates, Inc. | | | 17,962 | | | |
| | 809 | | | Juniper Networks, Inc. | | | 22,495 | | | |
| | 366 | | | KLA-Tencor Corp. | | | 21,812 | | | |
| | 304 | | | Lam Research Corp. | | | 25,000 | | | |
| | 362 | | | Lexmark International, Inc. - Class A | | | 16,660 | | | |
| | 436 | | | Linear Technology Corp. | | | 20,863 | | | |
| | 571 | | | ManTech International Corp. - Class A | | | 16,260 | | | |
| | | | | | | | | | |
| Shares | | | | | Fair Value | | | |
| Common Stocks — (Continued) | | | | | | |
| Information Technology — (Continued) | | | | | | |
| | 268 | | | MasterCard, Inc. - Class A | | $ | 24,718 | | | |
| | 766 | | | Mentor Graphics Corp. | | | 19,991 | | | |
| | 414 | | | Microchip Technology, Inc. | | | 20,331 | | | |
| | 626 | | | Micron Technology, Inc. * | | | 17,476 | | | |
| | 490 | | | Microsoft Corp. | | | 22,944 | | | |
| | 2,596 | | | Monster Worldwide, Inc. * | | | 15,758 | | | |
| | 304 | | | Motorola Solutions, Inc. | | | 17,952 | | | |
| | 525 | | | National Instruments Corp. | | | 15,713 | | | |
| | 484 | | | NCR Corp. * | | | 14,541 | | | |
| | 555 | | | NetApp, Inc. | | | 18,551 | | | |
| | 666 | | | NeuStar, Inc. - Class A * | | | 18,203 | | | |
| | 1,042 | | | NVIDIA Corp. | | | 23,057 | | | |
| | 475 | | | Oracle Corp. | | | 20,655 | | | |
| | 499 | | | Paychex, Inc. | | | 24,680 | | | |
| | 350 | | | Plantronics, Inc. | | | 19,329 | | | |
| | 1,289 | | | Polycom, Inc. * | | | 17,361 | | | |
| | 432 | | | PTC, Inc. * | | | 17,830 | | | |
| | 407 | | | Qorvo, Inc. * | | | 33,439 | | | |
| | 258 | | | QUALCOMM, Inc. | | | 17,993 | | | |
| | 436 | | | Rackspace Hosting, Inc. * | | | 17,467 | | | |
| | 380 | | | Red Hat, Inc. * | | | 29,327 | | | |
| | 667 | | | Rovi Corp. * | | | 11,178 | | | |
| | 346 | | | Salesforce.com, Inc. * | | | 25,186 | | | |
| | 198 | | | SanDisk Corp. | | | 13,521 | | | |
| | 366 | | | Seagate Technology PLC | | | 20,375 | | | |
| | 594 | | | Semtech Corp. * | | | 12,694 | | | |
| | 334 | | | Silicon Laboratories, Inc. * | | | 18,526 | | | |
| | 340 | | | Skyworks Solutions, Inc. | | | 37,209 | | | |
| | 399 | | | SolarWinds, Inc. * | | | 18,946 | | | |
| | 249 | | | Solera Holdings, Inc. | | | 12,270 | | | |
| | 738 | | | SunEdison, Inc. * | | | 22,111 | | | |
| | 941 | | | Symantec Corp. | | | 23,179 | | | |
| | 414 | | | Synopsys, Inc. * | | | 20,640 | | | |
| | 327 | | | TE Connectivity Ltd. | | | 22,568 | | | |
| | 263 | | | Tech Data Corp. * | | | 16,596 | | | |
| | 452 | | | Teradata Corp. * | | | 17,615 | | | |
| | 426 | | | Texas Instruments, Inc. | | | 23,811 | | | |
| | 664 | | | Total System Services, Inc. | | | 27,355 | | | |
| | 422 | | | Trimble Navigation Ltd. * | | | 9,891 | | | |
| | 442 | | | VeriFone Systems, Inc. * | | | 16,869 | | | |
| | 388 | | | VeriSign, Inc. * | | | 24,510 | | | |
| | 381 | | | Visa, Inc. - Class A | | | 26,135 | | | |
| | 1,074 | | | Vishay Intertechnology, Inc. | | | 13,988 | | | |
| | 220 | | | Western Digital Corp. | | | 21,456 | | | |
| | 1,263 | | | Western Union Co./The | | | 27,725 | | | |
| | 156 | | | WEX, Inc. * | | | 17,699 | | | |
| | 1,600 | | | Xerox Corp. | | | 18,267 | | | |
| | 431 | | | Xilinx, Inc. | | | 20,444 | | | |
| | 1,577 | | | Yahoo!, Inc. * | | | 67,729 | | | |
| | 206 | | | Zebra Technologies Corp. - Class A * | | | 22,608 | | | |
| | | | | 2,611,646 | | | |
See accompanying notes which are an integral part of these financial statements.
Annual Report
13
| | |
| | |
| Cloud Capital Strategic All Cap Fund | | May 31, 2015 |
| | |
| Schedule of Investments (Continued) |
| | | | | | | | | | |
| Shares | | | | | Fair Value | | | |
| Common Stocks — (Continued) | | | | | | |
| Materials — 10.75% | | | | | | |
| | 381 | | | Air Products & Chemicals, Inc. | | $ | 55,947 | | | |
| | 459 | | | Airgas, Inc. | | | 46,823 | | | |
| | 588 | | | Albemarle Corp. | | | 35,369 | | | |
| | 3,405 | | | Alcoa, Inc. | | | 42,563 | | | |
| | 1,178 | | | Allegheny Technologies, Inc. | | | 38,276 | | | |
| | 629 | | | AptarGroup, Inc. | | | 40,136 | | | |
| | 388 | | | Ashland, Inc. | | | 49,391 | | | |
| | 805 | | | Ball Corp. | | | 57,177 | | | |
| | 1,207 | | | Bemis Co., Inc. | | | 55,453 | | | |
| | 687 | | | Cabot Corp. | | | 28,503 | | | |
| | 658 | | | Carpenter Technology Corp. | | | 26,879 | | | |
| | 203 | | | CF Industries Holdings, Inc. | | | 63,980 | | | |
| | 3,492 | | | Cliffs Natural Resources, Inc. | | | 18,541 | | | |
| | 2,299 | | | Commercial Metals Co. | | | 36,944 | | | |
| | 448 | | | Compass Minerals International, Inc. | | | 38,621 | | | |
| | 820 | | | Cytec Industries, Inc. | | | 49,610 | | | |
| | 978 | | | Domtar Corp. | | | 42,248 | | | |
| | 958 | | | Dow Chemical Co./The | | | 49,906 | | | |
| | 437 | | | Eagle Materials, Inc. | | | 36,462 | | | |
| | 563 | | | Eastman Chemical Co. | | | 43,246 | | | |
| | 455 | | | Ecolab, Inc. | | | 52,202 | | | |
| | 726 | | | EI du Pont de Nemours & Co. | | | 51,581 | | | |
| | 649 | | | FMC Corp. | | | 37,086 | | | |
| | 1,489 | | | Freeport-McMoRan Copper & Gold, Inc. - Class B | | | 29,268 | | | |
| | 787 | | | Greif, Inc. - Class A | | | 30,049 | | | |
| | 486 | | | International Flavors & Fragrances, Inc. | | | 57,822 | | | |
| | 1,021 | | | International Paper Co. | | | 52,904 | | | |
| | 2,325 | | | Intrepid Potash, Inc. * | | | 27,022 | | | |
| | 2,783 | | | Louisiana-Pacific Corp. * | | | 50,345 | | | |
| | 506 | | | Lyondellbasell Industries NV - Class A | | | 51,109 | | | |
| | 316 | | | Martin Marietta Materials, Inc. | | | 47,043 | | | |
| | 1,139 | | | MeadWestvaco Corp. | | | 57,542 | | | |
| | 658 | | | Minerals Technologies, Inc. | | | 44,267 | | | |
| | 410 | | | Monsanto Co. | | | 48,006 | | | |
| | 992 | | | Mosaic Co./The | | | 45,495 | | | |
| | 109 | | | NewMarket Corp. | | | 50,069 | | | |
| | 2,090 | | | Newmont Mining Corp. | | | 56,932 | | | |
| | 970 | | | Nucor Corp. | | | 45,872 | | | |
| | 1,519 | | | Olin Corp. | | | 44,412 | | | |
| | 1,444 | | | Owens-Illinois, Inc. * | | | 34,511 | | | |
| | 601 | | | Packaging Corp. of America | | | 41,557 | | | |
| | 242 | | | PPG Industries, Inc. | | | 55,361 | | | |
| | 372 | | | Praxair, Inc. | | | 45,724 | | | |
| | | | | | | | | | |
| Shares | | | | | Fair Value | | | |
| Common Stocks — (Continued) | | | | | | |
| Materials — (Continued) | | | | | | |
| | 58 | | | Rayonier Advanced Materials, Inc. | | $ | 951 | | | |
| | 575 | | | Reliance Steel & Aluminum Co. | | | 36,685 | | | |
| | 808 | | | Rock-Tenn Co. - Class A | | | 52,625 | | | |
| | 603 | | | Royal Gold, Inc. | | | 39,085 | | | |
| | 925 | | | RPM International, Inc. | | | 46,272 | | | |
| | 759 | | | Scotts Miracle-Gro Co./The - Class A | | | 46,491 | | | |
| | 1,448 | | | Sealed Air Corp. | | | 70,518 | | | |
| | 776 | | | Sensient Technologies Corp. | | | 52,503 | | | |
| | 241 | | | Sherwin-Williams Co./The | | | 69,525 | | | |
| | 489 | | | Sigma-Aldrich Corp. | | | 68,101 | | | |
| | 843 | | | Silgan Holdings, Inc. | | | 45,821 | | | |
| | 972 | | | Sonoco Products Co. | | | 43,780 | | | |
| | 2,327 | | | Steel Dynamics, Inc. | | | 50,762 | | | |
| | 141 | | | TimkenSteel Corp. | | | 4,204 | | | |
| | 1,983 | | | United States Steel Corp. | | | 48,381 | | | |
| | 544 | | | Valspar Corp. | | | 45,442 | | | |
| | 20 | | | Veritiv Corp. * | | | 829 | | | |
| | 763 | | | Vulcan Materials Co. | | | 68,659 | | | |
| | 990 | | | Worthington Industries, Inc. | | | 26,948 | | | |
| | | | | 2,729,836 | | | |
| Real Estate Investment Trusts — 2.31% | | | | | | |
| | 104 | | | Alexandria Real Estate Equities, Inc. | | | 9,688 | | | |
| | 211 | | | American Campus Communities, Inc. | | | 8,235 | | | |
| | 165 | | | American Tower Corp. - Class A | | | 15,334 | | | |
| | 465 | | | Apartment Investment & Management Co. - Class A | | | 17,646 | | | |
| | 106 | | | AvalonBay Communities, Inc. | | | 17,730 | | | |
| | 376 | | | BioMed Realty Trust, Inc. | | | 7,674 | | | |
| | 130 | | | Boston Properties, Inc. | | | 16,942 | | | |
| | 116 | | | Camden Property Trust | | | 8,670 | | | |
| | 446 | | | Communications Sales & Leasing, Inc. | | | 11,621 | | | |
| | 288 | | | Corporate Office Properties Trust | | | 7,382 | | | |
| | 503 | | | Corrections Corp. of America | | | 17,695 | | | |
| | 457 | | | Duke Realty Corp. | | | 8,948 | | | |
| | 347 | | | Equity One, Inc. | | | 8,594 | | | |
| | 241 | | | Equity Residential | | | 17,918 | | | |
| | 90 | | | Essex Property Trust, Inc. | | | 19,987 | | | |
| | 153 | | | Extra Space Storage, Inc. | | | 10,687 | | | |
| | 67 | | | Federal Realty Investment Trust | | | 9,021 | | | |
See accompanying notes which are an integral part of these financial statements.
Annual Report
14
| | |
| | |
| Cloud Capital Strategic All Cap Fund | | May 31, 2015 |
| | |
| Schedule of Investments (Continued) |
| | | | | | | | | | |
| Shares | | | | | Fair Value | | | |
| Common Stocks — (Continued) | | | | | | |
| Real Estate Investment Trusts —
(Continued) | | | | | | |
| | 641 | | | General Growth Properties, Inc. | | $ | 18,159 | | | |
| | 372 | | | HCP, Inc. | | | 14,405 | | | |
| | 243 | | | Health Care REIT, Inc. | | | 17,053 | | | |
| | 196 | | | Highwoods Properties, Inc. | | | 8,204 | | | |
| | 133 | | | Home Properties, Inc. | | | 9,887 | | | |
| | 284 | | | Hospitality Properties Trust | | | 8,575 | | | |
| | 671 | | | Host Hotels & Resorts, Inc. | | | 13,361 | | | |
| | 131 | | | Kilroy Realty Corp. | | | 9,014 | | | |
| | 652 | | | Kimco Realty Corp. | | | 15,622 | | | |
| | 367 | | | Lamar Advertising Co. - Class A | | | 22,257 | | | |
| | 218 | | | Liberty Property Trust | | | 7,633 | | | |
| | 223 | | | Macerich Co./The | | | 18,280 | | | |
| | 367 | | | Mack-Cali Realty Corp. | | | 6,196 | | | |
| | 223 | | | National Retail Properties, Inc. | | | 8,369 | | | |
| | 233 | | | Omega Healthcare Investors, Inc. | | | 8,400 | | | |
| | 338 | | | Plum Creek Timber Co., Inc. | | | 13,958 | | | |
| | 201 | | | Potlatch Corp. | | | 7,308 | | | |
| | 362 | | | ProLogis, Inc. | | | 14,346 | | | |
| | 87 | | | Public Storage, Inc. | | | 16,849 | | | |
| | 174 | | | Rayonier, Inc. | | | 4,495 | | | |
| | 186 | | | Realty Income Corp. | | | 8,489 | | | |
| | 148 | | | Regency Centers Corp. | | | 9,323 | | | |
| | 356 | | | Senior Housing Properties Trust | | | 7,116 | | | |
| | 90 | | | Simon Property Group, Inc. | | | 16,322 | | | |
| | 72 | | | SL Green Realty Corp. | | | 8,517 | | | |
| | 228 | | | Taubman Centers, Inc. | | | 16,905 | | | |
| | 293 | | | UDR, Inc. | | | 9,528 | | | |
| | 239 | | | Ventas, Inc. | | | 15,905 | | | |
| | 140 | | | Vornado Realty Trust | | | 13,954 | | | |
| | 253 | | | Weingarten Realty Investors | | | 8,535 | | | |
| | 478 | | | Weyerhaeuser Co. | | | 15,561 | | | |
| | | | | 586,298 | | | |
| Telecommunication Services — 0.53% | | | | | | |
| | 604 | | | AT&T, Inc. | | | 20,867 | | | |
| | 575 | | | CenturyLink, Inc. | | | 19,105 | | | |
| | 3,708 | | | Frontier Communications Corp. | | | 19,098 | | | |
| | 136 | | | Level 3 Communications, Inc. * | | | 7,534 | | | |
| | 2,214 | | | Sprint Corp. * | | | 10,296 | | | |
| | 308 | | | Telephone & Data Systems, Inc. | | | 9,133 | | | |
| | 605 | | | T-Mobile US, Inc. * | | | 23,509 | | | |
| | 425 | | | Verizon Communications, Inc. | | | 21,009 | | | |
| | | | | | | | | | |
| Shares | | | | | Fair Value | | | |
| Common Stocks — (Continued) | | | | | | |
| Telecommunication Services —
(Continued) | | | | | | |
| | 411 | | | Windstream Holdings, Inc. | | $ | 3,344 | | | |
| | | | | 133,895 | | | |
| Utilities — 10.35% | | | | | | |
| | 3,145 | | | AES Corp./The | | | 42,772 | | | |
| | 854 | | | AGL Resources, Inc. | | | 43,022 | | | |
| | 1,162 | | | Alliant Energy Corp. | | | 71,250 | | | |
| | 1,196 | | | Ameren Corp. | | | 48,132 | | | |
| | 870 | | | American Electric Power Co., Inc. | | | 48,972 | | | |
| | 2,629 | | | Aqua America, Inc. | | | 69,207 | | | |
| | 1,305 | | | Atmos Energy Corp. | | | 70,470 | | | |
| | 1,128 | | | Black Hills Corp. | | | 53,894 | | | |
| | 1,893 | | | CenterPoint Energy, Inc. | | | 38,566 | | | |
| | 1,299 | | | Cleco Corp. | | | 70,476 | | | |
| | 1,540 | | | CMS Energy Corp. | | | 52,566 | | | |
| | 833 | | | Consolidated Edison, Inc. | | | 51,495 | | | |
| | 667 | | | Dominion Resources, Inc. - Class A | | | 47,068 | | | |
| | 616 | | | DTE Energy Co. | | | 48,792 | | | |
| | 651 | | | Duke Energy Corp. | | | 49,326 | | | |
| | 826 | | | Edison International | | | 50,237 | | | |
| | 589 | | | Entergy Corp. | | | 45,071 | | | |
| | 1,011 | | | Eversource Energy | | | 49,804 | | | |
| | 1,270 | | | Exelon Corp. | | | 42,948 | | | |
| | 1,326 | | | FirstEnergy Corp. | | | 47,298 | | | |
| | 2,664 | | | Great Plains Energy, Inc. | | | 69,459 | | | |
| | 2,793 | | | Hawaiian Electric Industries, Inc. | | | 85,284 | | | |
| | 1,212 | | | IDACORP, Inc. | | | 72,079 | | | |
| | 787 | | | Integrys Energy Group, Inc. | | | 56,614 | | | |
| | 2,003 | | | MDU Resources Group, Inc. | | | 41,949 | | | |
| | 878 | | | National Fuel Gas Co. | | | 56,419 | | | |
| | 471 | | | NextEra Energy, Inc. | | | 48,157 | | | |
| | 1,224 | | | NiSource, Inc. | | | 57,728 | | | |
| | 1,250 | | | NRG Energy, Inc. | | | 31,494 | | | |
| | 1,825 | | | OGE Energy Corp. | | | 57,480 | | | |
| | 3 | | | ONE Gas, Inc. | | | 111 | | | |
| | 746 | | | Oneok, Inc. | | | 31,262 | | | |
| | 1,718 | | | Pepco Holdings, Inc. | | | 46,804 | | | |
| | 993 | | | PG&E Corp. | | | 53,090 | | | |
| | 848 | | | Pinnacle West Capital Corp. | | | 51,643 | | | |
| | 2,360 | | | PNM Resources, Inc. | | | 62,762 | | | |
| | 1,376 | | | PPL Corp. | | | 47,759 | | | |
| | 1,214 | | | Public Service Enterprise Group, Inc. | | | 51,770 | | | |
| | 2,849 | | | Questar Corp. | | | 64,681 | | | |
| | 912 | | | SCANA Corp. | | | 48,504 | | | |
| | 451 | | | Sempra Energy | | | 48,432 | | | |
| | 1,053 | | | Southern Co. | | | 46,013 | | | |
| | 2,642 | | | TECO Energy, Inc. | | | 49,801 | | | |
| | 2,072 | | | UGI Corp. | | | 77,481 | | | |
See accompanying notes which are an integral part of these financial statements.
Annual Report
15
| | |
| | |
| Cloud Capital Strategic All Cap Fund | | May 31, 2015 |
| | |
| Schedule of Investments (Continued) |
| | | | | | | | | | |
Shares/
Principal
Amount | | | | | Fair Value | | | |
| Common Stocks — (Continued) | | | | | | |
| Utilities — (Continued) | | | | | | |
| | 1,669 | | | Vectren Corp. | | $ | 71,061 | | | |
| | 1,865 | | | Westar Energy, Inc. | | | 68,379 | | | |
| | 1,599 | | | WGL Holdings, Inc. | | | 92,010 | | | |
| | 1,004 | | | Wisconsin Energy Corp. | | | 48,471 | | | |
| | 1,502 | | | Xcel Energy, Inc. | | | 51,133 | | | |
| | | | | 2,629,196 | | | |
| Total Common Stocks
(Cost $20,877,262) | | | 23,654,544 | | | |
| Exchange-Traded Funds — 1.64% | | | | | | |
| | 1,600 | | | ProShares UltraPro MidCap400 Fund | | | 105,232 | | | |
| | 4,400 | | | ProShares UltraPro S&P 500 Fund | | | 311,564 | | | |
| Total Exchange-Traded Funds
(Cost $362,370) | | | 416,796 | | | |
| Rights — 0.00% | | | | | | |
| Consumer Staples — 0.00% | | | | | | |
| | 1,104 | | | Safeway, Inc. (Property Development Centers)* (a) | | | — | | | |
| | 1,104 | | | Safeway, Inc. (Casa Ley)* (a) | | | — | | | |
| Total Rights (Cost $—) | | | — | | | |
| Cash Equivalents — 5.10% | | | | | | |
| | 141,883 | | | FOLIOfn Investment Cash Account, 0.01% (b) | | | 141,883 | | | |
| | 1,152,658 | | | FOLIOfn Investment Sweep Account, 0.01% (b) | | | 1,152,658 | | | |
| Total Cash Equivalents
(Cost $1,294,541) | | | 1,294,541 | | | |
| Total Investments — 99.87%
(Cost $22,534,173) | | | 25,365,881 | | | |
| Other Assets in Excess of
Liabilities — 0.13% | | | 32,467 | | | |
| Net Assets — 100.00% | | $ | 25,398,348 | | | |
| (a) | Securities have been deemed illiquid and represent 0.00% of the Fund’s net assets. |
| (b) | Rate disclosed is the seven day yield as of May 31, 2015. |
| * | Non-income producing security. |
See accompanying notes which are an integral part of these financial statements.
Annual Report
16
Statement of Assets and Liabilities
May 31, 2015
| | | | |
| Assets: | | | | |
Investments in securities | | | | |
At cost | | $ | 22,534,173 | |
| | | | | |
At fair value | | $ | 25,365,881 | |
Cash | | | 2,969 | |
Receivable for fund shares sold | | | 2,234 | |
Interest and dividends receivable | | | 39,479 | |
Tax reclaims receivable | | | 31 | |
Prepaid expenses | | | 22,337 | |
Total assets | | | 25,432,931 | |
| Liabilities: | | | | |
Payable to Adviser | | | 955 | |
Payable for investments purchased | | | 1,965 | |
Payable for fund shares redeemed | | | 1,814 | |
Payable to administrator, fund accountant and transfer agent | | | 7,631 | |
Payable for administrative servicing fees - Institutional Class | | | 1,985 | |
Other accrued expenses | | | 20,233 | |
Total Liabilities | | | 34,583 | |
Net Assets | | $ | 25,398,348 | |
| | | | | |
| Net Assets consist of: | | | | |
Paid in capital | | $ | 22,745,799 | |
Accumulated net investment income | | | 7,235 | |
Accumulated net realized loss from investment transactions | | | (186,394 | ) |
Net unrealized appreciation on investments | | | 2,831,708 | |
Net Assets | | $ | 25,398,348 | |
| | | | | |
| Institutional Class: | | | | |
Shares Outstanding (unlimited number of shares authorized, no par value) | | | 2,922,448 | |
Net Asset Value, Offering and Redemption Price Per Share: | | $ | 8.69 | |
| | | | | |
See accompanying notes which are an integral part of these financial statements.
Annual Report
17
Statement of Operations
For the Year Ended May 31, 2015
| | | | |
| Investment Income | | | | |
Dividend income (net of foreign taxes withheld of $131) | | $ | 396,135 | |
Interest income | | | 156 | |
Total investment income | | | 396,291 | |
| Expenses | | | | |
Investment Adviser | | | 111,881 | |
Administrative servicing - Institutional Class | | | 25,880 | |
Administration | | | 39,304 | |
Fund accounting | | | 24,837 | |
Transfer agent | | | 34,874 | |
Custodian | | | 8,418 | |
Legal | | | 51,863 | |
Registration | | | 19,356 | |
Audit | | | 9,497 | |
Pricing | | | 16,646 | |
Trustee | | | 6,709 | |
Report printing | | | 27,043 | |
Miscellaneous | | | 8,004 | |
Line of credit | | | 5,286 | |
Total expenses | | | 389,598 | |
Recoupment of prior expenses waived/reimbursed by Adviser | | | 7,955 | |
Fees contractually waived by Adviser | | | (111,881 | ) |
Fees voluntarily waived by the Administrator | | | (2,783 | ) |
Net operating expenses | | | 282,889 | |
Net investment income | | | 113,402 | |
| Net Realized and Unrealized Gain/(Loss) on Investments | | | | |
Net realized gain on investment transactions | | | 2,550,662 | |
Net change in unrealized appreciation of investments | | | (953,519 | ) |
Net realized and unrealized gain on investments | | | 1,597,143 | |
Net increase in net assets resulting from operations | | $ | 1,710,545 | |
| | | | | |
See accompanying notes which are an integral part of these financial statements.
Annual Report
18
Statements of Changes in Net Assets
| | | | | | | | |
| | | For the Year Ended
May 31,
2015 | | | For the Year Ended
May 31,
2014 | |
| Increase (Decrease) in Net Assets due to: | | | | | | | | |
| Operations: | | | | | | | | |
Net investment income | | $ | 113,402 | | | $ | 224,083 | |
Net realized gain on investment transactions | | | 2,550,662 | | | | 10,781,671 | |
Net change in unrealized appreciation of investments | | | (953,519 | ) | | | (3,658,396 | ) |
Net increase in net assets resulting from operations | | | 1,710,545 | | | | 7,347,358 | |
| Distributions: | | | | | | | | |
From net investment income: | | | | | | | | |
Institutional Class | | | (193,052 | ) | | | (196,571 | ) |
From net realized gain: | | | | | | | | |
Institutional Class | | | (9,091,051 | ) | | | (4,113,598 | ) |
Total distributions | | | (9,284,103 | ) | | | (4,310,169 | ) |
| Capital Transactions—Institutional Class: | | | | | | | | |
Proceeds from shares sold | | | 11,015,838 | | | | 4,351,185 | |
Shares issued in connection with merger (a) | | | 10,333,009 | | | | — | |
Reinvestment of distributions | | | 6,464,866 | | | | 2,286,184 | |
Amount paid for shares redeemed | | | (19,229,951 | ) | | | (32,032,685 | ) |
Net change resulting from capital transactions | | | 8,583,762 | | | | (25,395,316 | ) |
Total Increase (Decrease) in Net Assets | | | 1,010,204 | | | | (22,358,127 | ) |
Net Assets: | | | | | | | | |
Beginning of year | | | 24,388,144 | | | | 46,746,271 | |
End of year | | $ | 25,398,348 | | | $ | 24,388,144 | |
| | | | | | | | | |
Accumulated net investment income included in net assets at end of year | | $ | 7,235 | | | $ | 96,333 | |
| Share Transactions—Institutional Class: | | | | | | | | |
Shares sold | | | 935,892 | | | | 248,756 | |
Shares issued in connection with merger (a) | | | 1,239,011 | | | | — | |
Shares issued in reinvestment of distributions | | | 789,361 | | | | 135,598 | |
Shares redeemed | | | (1,356,593 | ) | | | (1,819,777 | ) |
Total Institutional Class | | | 1,607,671 | | | | (1,435,423 | ) |
| (a) | See Note 1 to the Notes to Financial Statements. |
See accompanying notes which are an integral part of these financial statements.
Annual Report
19
(For a share outstanding during each period)
| | | | | | | | | | | | | | | | |
| | | For the
Year Ended
May 31,
2015 | | | For the
Year Ended
May 31,
2014 | | | For the
Year Ended
May 31,
2013 | | | For the
Period Ended
May 31,
2012(a) | |
| Institutional Class: | | | | | | | | | | | | | | | | |
| Selected Per Share Data: | | | | | | | | | | | | | | | | |
Net asset value, beginning of period | | $ | 18.55 | | | $ | 17.00 | | | $ | 14.46 | | | $ | 15.00 | |
Income from investment operations: | | | | | | | | | | | | | | | | |
Net investment income | | | 0.06 | (b) | | | 0.13 | | | | 0.13 | | | | 0.07 | |
Net realized and unrealized gain (loss) on investments | | | 0.77 | | | | 3.22 | | | | 3.54 | | | | (0.54 | ) |
Total from investment operations | | | 0.83 | | | | 3.35 | | | | 3.67 | | | | (0.47 | ) |
Less distributions to shareholders: | | | | | | | | | | | | | | | | |
From net investment income | | | (0.22 | ) | | | (0.08 | ) | | | (0.14 | ) | | | (0.04 | ) |
From net realized gains | | | (10.47 | ) | | | (1.72 | ) | | | (0.99 | ) | | | (0.03 | ) |
Total distributions | | | (10.69 | ) | | | (1.80 | ) | | | (1.13 | ) | | | (0.07 | ) |
Net asset value, end of period | | $ | 8.69 | | | $ | 18.55 | | | $ | 17.00 | | | $ | 14.46 | |
| | | | | | | | | | | | | | | | | |
| Total Return(c) | | | 7.99 | % | | | 20.81 | % | | | 26.51 | % | | | (3.12 | )%(d) |
| | | | |
| Ratios and Supplemental Data: | | | | | | | | | | | | | | | | |
Net assets, end of period (000) | | $ | 25,398 | | | $ | 24,388 | | | $ | 46,746 | | | $ | 38,550 | |
Ratio of expenses to average net assets | | | 1.26 | %(e) | | | 1.23 | % | | | 1.40 | % | | | 1.40 | %(f) |
Ratio of expenses to average net assets before waiver and recoupment | | | 1.74 | % | | | 1.15 | % | | | 1.27 | % | | | 1.90 | %(f) |
Ratio of net investment income to average net assets | | | 0.51 | % | | | 0.57 | % | | | 0.78 | % | | | 0.53 | %(f) |
Ratio of net investment income to average net assets before waiver and recoupment | | | 0.03 | % | | | 0.65 | % | | | 0.91 | % | | | 0.03 | %(f) |
Portfolio turnover rate | | | 61.71 | % | | | 90.14 | % | | | 72.66 | % | | | 163.38 | %(d) |
| (a) | For the period June 29, 2011 (commencement of operations) to May 31, 2012. |
| (b) | Net investment income per share is based on average shares outstanding during the year. |
| (c) | Total return in the above table represents the rate that the investor would have earned or lost on an investment in the Fund, assuming reinvestment of dividends. |
| (e) | Includes recoupment of previously waived fees of 0.04%. |
See accompanying notes which are an integral part of these financial statements.
Annual Report
20
Notes to the Financial Statements
May 31, 2015
Note 1. Organization
The Cloud Capital Strategic All Cap Fund (the “Fund”) (formerly the Cloud Capital Strategic Large Cap Fund) was organized as open-end diversified series of the Valued Advisers Trust (the “Trust”). The Trust is a management investment company established under the laws of Delaware by an Agreement and Declaration of Trust dated June 13, 2008 (the “Trust Agreement”). The Trust Agreement permits the Trustees to issue an unlimited number of shares of beneficial interest of separate series without par value. The Fund is one of a series of funds authorized by the Board of Trustees (the “Board”). The Fund offers two share classes, Class A Shares and Institutional Class Shares. The Fund’s Class A Shares have not yet commenced operations. The Fund’s Institutional Class Shares commenced operations on June 29, 2011. The Fund’s investment adviser is Cloud Capital LLC (the “Adviser”). The investment objective of the Fund is long-term capital appreciation.
As of the close of business on January 16, 2015, the Fund acquired all the assets and assumed all of the liabilities of the Cloud Capital Strategic Mid Cap Fund (the “Mid Cap Fund”) pursuant to an agreement and plan of reorganization approved by the Board on November 19, 2014. The reorganization qualified as a tax-free reorganization for federal income tax purposes with no gain or loss recognized to the funds or their shareholders.
The acquisition was accomplished by a tax-free exchange of 899,233 Institutional Class shares of the Mid Cap Fund (valued at $10,333,009) for 1,239,011 Institutional Class Shares of the Fund outstanding on January 16, 2015. For financial reporting purposes, assets received and shares issued by the Fund were recorded at fair value; however, the identified cost of the investments received from the Mid Cap Fund was carried forward to align ongoing reporting of the Fund’s realized and unrealized gains and losses with amounts distributable to shareholders for tax purposes. The aggregate net assets of the Fund immediately before the acquisition were $13,682,729. The aggregate net assets of the Mid Cap Fund at January 16, 2015 of $10,333,009, including $555,302 of unrealized appreciation, were combined with those of the Fund, resulting in combined aggregate net assets of $24,015,738.
Assuming the acquisition had been completed on June 1, 2014, the beginning of the annual reporting period of the Fund, the Fund’s pro forma results of operation for the year ended May 31, 2015, are as follows:
| | | | |
Net investment income | | $ | 85,147 | |
Net realized and unrealized gains on investments | | | 2,558,259 | |
Net increase in net assets resulting from operations | | $ | 2,643,406 | |
Because the combined investment portfolios have been managed as a single integrated portfolio since the acquisition was completed, it is not practicable to separate the amounts of revenue and earnings of the Mid Cap Fund that have been included in the Fund’s statement of operations since January 16, 2015.
Annual Report
21
Notes to the Financial Statements (Continued)
The Fund’s prospectus provides a description of the investment objective, policies and strategies, along with information on the classes of shares currently being offered.
Note 2. Significant Accounting Policies
The Fund is an investment company and follows accounting and reporting guidance under Financial Accounting Standards Board (“FASB”) Accounting Standards Codification (“ASC”) Topic 946, “Financial Services-Investment Companies”. The following is a summary of significant accounting policies followed by the Fund in the preparation of its financial statements. These policies are in conformity with generally accepted accounting principles in the United States of America (“GAAP”).
Securities Valuation—All investments in securities are recorded at their estimated fair value as described in Note 3.
Federal Income Taxes—The Fund makes no provision for federal income or excise tax. The Fund intends to qualify each year as a regulated investment company (“RIC”) under subchapter M of the Internal Revenue Code of 1986, as amended, by complying with the requirements applicable to RICs and by distributing substantially all of its taxable income. The Fund also intends to distribute sufficient net investment income and net capital gains, if any, so that it will not be subject to excise tax on undistributed income and gains. If the required amount of net investment income or gains is not distributed, the Fund could incur a tax expense.
For the fiscal year ended May 31, 2015, the Fund did not have a liability for any unrecognized tax benefits. The Fund recognizes interest and penalties, if any, related to unrecognized tax benefits as income tax expense in the statement of operations. During the year, the Fund did not incur any interest or penalties. The Fund is subject to examination by U.S. federal tax authorities for the last three year ends, including the most recent fiscal year end which has yet to be filed.
Expenses—Expenses incurred by the Trust that do not relate to a specific fund of the Trust are allocated to the individual funds based on each Fund’s relative net assets or another appropriate basis.
Security Transactions and Related Income—The Fund follows industry practice and records security transactions on the trade date for financial reporting purposes. The specific identification method is used for determining gains or losses for financial statements and income tax purposes. Dividend income is recorded on the ex-dividend date and interest income is recorded on an accrual basis. Discounts and premiums on securities purchased are accreted or amortized using the effective interest method. Withholding taxes on foreign dividends have been provided for in accordance with the Fund’s understanding of the applicable country’s tax rules and rates. The ability of issuers of debt securities held by the Fund to meet their obligations may be affected by economic and political developments in a specific country or region.
Dividends and Distributions—The Fund intends to distribute substantially all of its net investment income, if any, as dividends to its shareholders on at least an annual basis. The Fund intends to distribute its net realized long-term capital gains and its net realized short-term capital gains, if any, at least once a year. Dividends to shareholders, which are determined in
Annual Report
22
accordance with income tax regulations, are recorded on the ex-dividend date. The treatment for financial reporting purposes of distributions made to shareholders during the period from net investment income or net realized capital gains may differ from their ultimate treatment for federal income tax purposes. These differences are caused primarily by differences in the timing of the recognition of certain components of income, expense or realized capital gains for federal income tax purposes. Where such differences are permanent in nature, they are reclassified among the components of the net assets based on their ultimate characterization for federal income tax purposes. Any such reclassifications will have no effects on net assets, results of operations or net asset values per share of the Fund.
For the year ended May 31, 2015, the Fund made the following reclassifications to increase (decrease) the components of net assets:
| | | | |
| Paid in Capital | | Accumulated Net
Investment Income
(Loss) | | Accumulated Net
Realized Gain
(Loss) |
$460,273 | | $(9,448) | | $(450,825) |
Note 3. Securities Valuation and Fair Value Measurements
Fair value is defined as the price that a Fund would receive upon selling an investment in an orderly transaction to an independent buyer in the principal or most advantageous market of the investment. GAAP establish a three-tier hierarchy to maximize the use of observable market data and minimize the use of unobservable inputs and to establish classification of fair value measurements for disclosure purposes.
Inputs refer broadly to the assumptions that market participants would use in pricing the asset or liability, including assumptions about risk (the risk inherent in a particular valuation technique used to measure fair value such as pricing model and/or the risk inherent in the inputs to the valuation technique). Inputs may be observable or unobservable. Observable inputs are inputs that reflect the assumptions market participants would use in pricing the asset or liability developed based on market data obtained from sources independent of the reporting entity. Unobservable inputs are inputs that reflect the reporting entity’s own assumptions about the assumptions market participants would use in pricing the asset or liability developed based on the best information available in the circumstances.
Various inputs are used in determining the value of the Fund’s investments. These inputs are summarized in the three broad levels listed below.
| • | | Level 1—quoted prices in active markets for identical securities |
| • | | Level 2—other significant observable inputs (including, but not limited to, quoted prices for an identical security in an inactive market, quoted prices for similar securities, interest rates, prepayment speeds, credit risk, etc.) |
| • | | Level 3—significant unobservable inputs (including the Fund’s own assumptions in determining fair value of investments based on the best information available) |
Annual Report
23
Notes to the Financial Statements (Continued)
The inputs used to measure fair value may fall into different levels of the fair value hierarchy. In such cases, for disclosure purposes, the level in the fair value hierarchy within which the fair value measurement falls in its entirety, is determined based on the lowest level input that is significant to the fair value measurement in its entirety.
Equity securities, including common stock, exchange traded funds and real estate investment trusts, are generally valued by using market quotations, but may be valued on the basis of prices furnished by a pricing service when the Fund believes such prices more accurately reflect the fair value of such securities. Securities that are traded on any stock exchange are generally valued by the pricing service at the last quoted sale price. Lacking a last sale price, an exchange traded security is generally valued by the pricing service at its last bid price. Securities traded in the NASDAQ over-the-counter market are generally valued by the pricing service at the NASDAQ Official Closing Price. When using the market quotations or close prices provided by the pricing service and when the market is considered active, the security will be classified as a Level 1 security. Sometimes, an equity security owned by the Fund will be valued by the pricing service with factors other than market quotations or when the market is considered inactive. When this happens, the security will be classified as a Level 2 security. When market quotations are not readily available, when the Fund determines that the market quotation or the price provided by the pricing service does not accurately reflect the current fair value, or when certain restricted or illiquid securities are being valued, such securities are valued as determined in good faith, in conformity with guidelines adopted by and subject to review by the Board. These securities will generally be categorized as Level 3 securities.
In accordance with the Trust’s good faith pricing guidelines, the Fund, with support from the Adviser, is required to consider all appropriate factors relevant to the value of securities for which it has determined other pricing sources are not available or reliable as described above. No single standard exists for determining fair value, because fair value depends upon the circumstances of each individual case. As a general principle, the current fair value of an issue of securities being valued would appear to be the amount which the owner might reasonably expect to receive for them upon their current sale. Methods which are in accordance with this principle may, for example, be based on (i) a multiple of earnings; (ii) a discount from market of a similar freely traded security (including a derivative security or a basket of securities traded on other markets, exchanges or among dealers); or (iii) yield to maturity with respect to debt issues, or a combination of these and other methods. Good faith pricing is permitted if, in management’s opinion, the validity of market quotations appears to be questionable based on factors such as evidence of a thin market in the security based on a small number of quotations, a significant event occurs after the close of a market but before a Fund’s NAV calculation that may affect a security’s value, or the Fund is aware of any other data that calls into question the reliability of market quotations. Good faith pricing may also be used in instances when the bonds the Fund invests in may default or otherwise cease to have market quotations readily available.
Annual Report
24
The following is a summary of the inputs used to value the Fund’s investments as of May 31, 2015:
| | | | | | | | | | | | | | | | |
| | | Valuation Inputs | | | | |
| | | Level 1
Quoted Prices
in Active
Markets | | | Level 2
Other Significant
Observable
Inputs | | | Level 3
Significant
Unobservable
Inputs | | | Total | |
Common Stocks* | | $ | 23,654,544 | | | $ | — | | | $ | — | | | $ | 23,654,544 | |
Exchange-Traded Funds | | | 416,796 | | | | — | | | | — | | | | 416,796 | |
Cash Equivalents | | | 1,294,541 | | | | — | | | | — | | | | 1,294,541 | |
Rights | | | — | | | | — | | | | — | | | | — | |
| | | | | | | | | | | | | | | | |
Total | | $ | 25,365,881 | | | $ | — | | | $ | — | | | $ | 25,365,881 | |
| * | Please refer to Schedule of Investments for industry classifications. |
The Fund did not hold any investments at any time during the reporting period in which significant unobservable inputs were used in determining fair value; therefore, no reconciliation of Level 3 securities is included for this reporting period. The Fund did not hold any derivative instruments during the reporting period.
The Trust recognizes transfers between fair value hierarchy levels at the end of the reporting period. There were no transfers between any levels as of May 31, 2015 and the previous reporting period end.
Note 4. Fees and Other Transactions with Affiliates and Other Service Providers
Under the terms of the investment advisory agreement, on behalf of the Fund (the “Agreement”), the Adviser manages the Fund’s investments subject to oversight of the Board. As compensation for its management services, the Fund is obligated to pay the Adviser a fee computed and accrued daily and paid monthly at an annual rate of 0.50% of the average daily net assets of the Fund. For the year ended May 31, 2015, the Adviser earned fees of $111,881 from the Fund before the waivers and recoupment described below. At May 31, 2015, the Fund owed the Adviser $955.
The Adviser has contractually agreed to waive its advisory fee and/or reimburse certain Fund operating expenses, but only to the extent necessary so that the Fund’s net expenses, excluding brokerage fees and commissions, borrowing costs (such as interest and dividend expenses on securities sold short), taxes, distribution and service (12b-1) fees, extraordinary expenses and indirect expenses (such as fees and expenses of acquired funds) does not exceed 1.40% of the net assets of the Fund. On February 1, 2014, the agreement was amended and the Adviser contractually agreed to waive, in their entirety, its advisory fees effective February 1, 2014, through September 30, 2016. This contractual arrangement may only be terminated by mutual consent of the Adviser and the Board, and it will automatically terminate upon the termination of the investment advisory agreement between the Fund and the Adviser. The Adviser shall not be entitled to reimbursement for any advisory fees waived for the Fund for the period February 1, 2014, through September 30, 2016. Other than advisory fees waived from February 1, 2014, through September 30, 2016, each waiver or reimbursement of an expense by the Adviser is subject to repayment by the Fund within the three fiscal years following the fiscal
Annual Report
25
Notes to the Financial Statements (Continued)
year in which the particular expense was incurred, provided that the Fund is able to make the repayment without exceeding the applicable expense limitation. For the year ended May 31, 2015, expenses totaling $111,881 were waived or reimbursed by the Adviser. This amount is not subject to potential recoupment by the Adviser. At a special meeting of the shareholders held on January 19, shareholders of the Fund approved a proposal to allow the Advisor to recoup reimbursements provided to the Mid Cap Fund prior to the merger. the Adviser recouped $7,955 during the period January 17, 2015, through May 31, 2015, which had previously been waived in the Mid Cap Fund.
The amounts subject to repayment by the Fund, pursuant to the aforementioned conditions are as follows:
| | | | |
| Amount | | Recoverable
through
May 31, | |
$46,393 | | | 2016 | |
The Trust retains Huntington Asset Services, Inc. (“HASI”) to manage the Fund’s business affairs and provide the Fund with administrative and Chief Compliance Officer services, including all regulatory reporting and necessary office equipment and personnel. For the year ended May 31, 2015, HASI earned fees of $39,304 for administrative and compliance services provided to the Fund. For the year ended May 31, 2015, administrative expenses totaling $2,783 were voluntarily waived by HASI. At May 31, 2015, HASI was owed $2,442 from the Fund for administrative and compliance services.
The Trust also retains HASI to act as the Fund’s transfer agent and to provide fund accounting services. For the year ended May 31, 2015, HASI earned fees of $34,874 for transfer agent services and reimbursement for out-of-pocket expenses incurred in providing transfer agent services. At May 31, 2015, HASI was owed $3,106 from the Fund for transfer agent services and out-of-pocket expenses. For the year ended May 31, 2015, HASI earned fees of $24,837 from the Fund for fund accounting services. At May 31, 2015, HASI was owed $2,083 from the Fund for fund accounting services.
Certain officers and a trustee of the Trust are members of management and/or employees of HASI. HASI is a wholly-owned subsidiary of Huntington Bancshares, Inc., the parent company of Unified Financial Securities, Inc. (the “Distributor”).
The Fund has adopted a Distribution Plan (the “Plan”) pursuant to Rule 12b-1 under the 1940 Act. The Plan provides that the Fund will pay the Distributor and/or any registered securities dealer, financial institution or any other person (the “Recipient”) a fee of 0.40% of the average daily net assets of the Class A Shares of the Fund in connection with the promotion and distribution of the Fund’s shares or the provision of personal services to shareholders, including, but not necessarily limited to, advertising, compensation to underwriters, dealers and selling personnel, the printing and mailing of prospectuses to other than current Fund shareholders, the printing and mailing of sales literature and servicing shareholder accounts.
Annual Report
26
The Fund or Distributor may pay all or a portion of these fees to any Recipient who renders assistance in distributing or promoting the sale of shares, or who provides certain shareholder services, pursuant to a written agreement. The Plan is a compensation plan, which means that compensation is provided regardless of 12b-1 expenses actually incurred. It is anticipated that the Plan will benefit shareholders because an effective sales program typically is necessary in order for the Fund to reach and maintain a sufficient size to achieve efficiently its investment objectives and to realize economies of scale. There were no 12b-1 fees for the year ended May 31, 2015, as the Class A Shares of the Fund have yet to commence operations.
The Fund may pay certain financial intermediaries that provide certain administrative services to shareholders who invest in the Institutional Class shares of the Fund, including record keeping and sub-accounting shareholder accounts. The Fund is authorized to pay up to 0.25% of the average daily net assets of the Fund’s Institutional Class shares. The payments may also be made to certain financial intermediaries in connection with client account maintenance support, statement preparation and transaction processing. The types of payments under this category include, among others, payment of ticket charges per purchase or exchange order placed by a financial intermediary, payment of networking or other recordkeeping fees, or one-time payments for ancillary services such as setting up the Fund on a financial intermediary’s trading systems. For the year ended May 31, 2015, the Fund incurred administrative servicing fees of $25,880. At May 31, 2015, the Fund owed $1,985 in administrative servicing fees.
The Distributor acts as the principal distributor of the Fund’s shares. A trustee and an officer of the Trust is an officer of the Distributor and such person may be deemed to be an affiliate of the Distributor. For the year ended May 31, 2015, there were no sales charges or CDSC fees deducted from the proceeds of sales, and redemption of capital shares, as the Fund’s Class A shares have not yet commenced.
Note 5. Purchases and Sales of Securities
For the year ended May 31, 2015, purchases and sales of investment securities, other than short-term investments and short-term U.S. government obligations, were as follows:
| | | | |
| Purchases | | Sales | |
$13,129,014 | | $ | 24,563,733 | |
There were no purchases or sales of long-term U.S. Government obligations during the year ended May 31, 2015.
Note 6. Line of Credit
On December 2, 2014, the Trust, on behalf of the Fund, entered into in a short-term credit agreement (“Line of Credit”) with Huntington National Bank (“Huntington”), an affiliate of HASI, expiring on December 5, 2015. Under the terms of the agreement, the Funds may borrow up to $3 million at an interest rate of LIBOR plus 150 basis points. Any borrowings under the Line of Credit are collateralized by securities in the Fund’s portfolio. The purpose of the agreement is to meet temporary or emergency cash needs, including redemption requests that might otherwise
Annual Report
27
Notes to the Financial Statements (Continued)
require the untimely disposition of securities. Huntington receives an annual facility fee of 0.125% on $3 million as well as an additional annual fee of 0.125% on any unused portion of the credit facility, invoiced quarterly, for providing the Line of Credit. The Funds will not borrow money, except (a) from a bank, provided that immediately after such borrowing there is an asset coverage of 300% for all borrowings of a Fund; or (b) from a bank or other persons for temporary purposes only, provided that such temporary borrowings are in an amount not exceeding 10% of a Fund’s total assets at the time when the borrowing is made. This limitation does not preclude a Fund from entering into reverse repurchase transactions, provided that the Fund has asset coverage of 300% for all borrowings and repurchase commitments of the Fund pursuant to reverse repurchase transactions. For the year ended May 31, 2015, the Fund had no borrowings under this Line of Credit.
Note 7. Estimates
The preparation of financial statements in conformity with GAAP requires management to make estimates and assumptions that affect the reported amounts of assets and liabilities and disclosure of contingent assets and liabilities at the date of the financial statements and the reported amounts of increases and decreases in net assets from operations during the reporting period. Actual results could differ from those estimates.
Note 8. Beneficial Ownership
The beneficial ownership, either directly or indirectly, of 25% or more of the voting securities of a fund creates a presumption of control of a fund, under Section 2(a)(9) of the Investment Company Act of 1940. At May 31, 2015, TD Ameritrade Trust Company (“TD Ameritrade”) owned, as record shareholder 72% of the outstanding shares of the Fund. It is not known whether TD Ameritrade or any of the underlying beneficial owners owned or controlled 25% or more of the voting securities of the Fund.
Note 9. Federal Tax Information
At May 31, 2015, the net unrealized appreciation (depreciation) of investments for tax purposes was as follows:
| | | | | | |
Tax Cost of
Securities | | Unrealized
Appreciation | | Unrealized
Depreciation | | Net Unrealized
Appreciation
(Depreciation) |
$23,133,046 | | $3,504,211 | | ($1,271,376) | | $2,232,835 |
The difference between book basis and tax basis unrealized appreciation was attributable primarily to the tax deferral of losses on wash sales.
The tax characterization of distributions paid for the year ended May 31, 2015 was as follows:
| | | | |
| Ordinary Income* | | Long-Term
Capital Gain | | Total Distributions |
$1,065,158 | | $8,218,945 | | $9,284,103 |
Annual Report
28
The tax characterization of distributions paid for the fiscal period ended May 31, 2014 was as follows:
| | | | |
| Ordinary Income* | | Long-Term
Capital Gain | | Total Distributions |
$370,177 | | $3,939,992 | | $4,310,169 |
| * | Short-term capital gains distributions are treated as ordinary income for tax purposes. |
At May 31, 2015, the components of distributable earnings (accumulated losses) on a tax basis were as follows:
| | | | | | | | |
Undistributed
Ordinary
Income | | Undistributed
Long-Term
Capital Gains | | Accumulated
Capital and
Other Losses | | Unrealized
Appreciation
(Depreciation) | | Total
Accumulated
Earnings (Loss) |
$189,617 | | $241,831 | | $(11,734) | | $2,232,835 | | $2,652,549 |
Note 10. Commitments and Contingencies
The Fund indemnifies its officers and trustees for certain liabilities that may arise from performance of their duties to the Fund. Additionally, in the normal course of business, the Fund enters into contracts that contain a variety of representations and warranties which provide general indemnifications. The Fund’s maximum exposure under these arrangements is unknown, as this would involve future claims that may be made against the Fund that have not yet occurred.
Note 11. Subsequent Events
Management of the Fund has evaluated the need for disclosures and/or adjustments resulting from subsequent events through the date these financial statements were issued. There were no items requiring adjustment the financial statements or additional disclosures.
Note 12. Proxy Voting Results (Unaudited)
On January 14, 2015, a special meeting of the shareholders of the Fund was held at the offices of the Trust to approve the ability of the Adviser to seek reimbursement of fees waived for, and/or expenses reimbursed to the Cloud Capital Strategic Mid Cap Fund from the Fund following the reorganization of the Cloud Capital Strategic Mid Cap Fund into the Fund.
Below are the voting results from this special meeting of the Fund:
| | | | |
| For | | Against | | Abstain |
900,726 | | — | | — |
Annual Report
29
| | |
Report of Independent Registered Public Accounting Firm |
To the Shareholders of Cloud Capital Strategic All Cap Fund and
Board of Trustees of Valued Advisers Trust
We have audited the accompanying statement of assets and liabilities, including the schedule of investments, of Cloud Capital Strategic All Cap Fund (the “Fund,” formerly known as Cloud Capital Strategic Large Cap Fund), a series of Valued Advisers Trust, as of May 31, 2015, and the related statement of operations for the year then ended, the statements of changes in net assets for each of the two years in the period then ended, and the financial highlights for each of the four periods in the period then ended. These financial statements and financial highlights are the responsibility of the Fund’s management. Our responsibility is to express an opinion on these financial statements and financial highlights based on our audits.
We conducted our audits in accordance with the standards of the Public Company Accounting Oversight Board (United States). Those standards require that we plan and perform the audit to obtain reasonable assurance about whether the financial statements and financial highlights are free of material misstatement. An audit includes examining, on a test basis, evidence supporting the amounts and disclosures in the financial statements. Our procedures included confirmation of securities owned as of May 31, 2015, by correspondence with the custodian and brokers. An audit also includes assessing the accounting principles used and significant estimates made by management, as well as evaluating the overall financial statement presentation. We believe that our audits provide a reasonable basis for our opinion.
In our opinion, the financial statements and financial highlights referred to above present fairly, in all material respects, the financial position of Cloud Capital Strategic All Cap Fund as of May 31, 2015, the results of its operations for the year then ended, the changes in its net assets for each of the two years in the period then ended, and the financial highlights for each of the four periods in the period then ended, in conformity with accounting principles generally accepted in the United States of America.

COHEN FUND AUDIT SERVICES, LTD.
Cleveland, Ohio
July 27, 2015
Annual Report
30
| | |
Additional Federal Income Tax Information (Unaudited) | | |
The Form 1099-DIV you receive in January 2016 will show the tax status of all distributions paid to your account in calendar year 2015. Shareholders are advised to consult their own tax adviser with respect to the tax consequences of their investment in the Fund. As required by the Internal Revenue Code and/or regulations, shareholders must be notified regarding the status of qualified dividend income for individuals and the dividends received deduction for corporations.
Qualified Dividend Income: For the fiscal year ended May 31, 2015, the Fund designates 66.37%, or up to the maximum amount of such dividends allowable pursuant to the Internal Revenue Code, as qualified dividend income eligible for the reduced tax rate of 15%.
Dividends Received Deduction: Corporate shareholders are generally entitled to take the dividends received deduction on the portion of the Fund’s dividend distribution that qualifies under tax law. For the Fund’s fiscal year 2015 ordinary income dividends, 69.46% for the corporate dividends received deduction.
For the fiscal year ended May 31, 2015, the Fund designated $8,218,945 as long-term capital gain distributions.
Annual Report
31
The following table provides information regarding each of the Independent Trustees.
| | | | |
Name, Address*, (Age),
Position with Trust**,
Term of Position with Trust | | Principal Occupation During Past 5 Years | | Other Directorships |
Ira Cohen, 56,
Independent Trustee, June 2010 to present. | | Independent financial services consultant (Feb. 2005–present). | | Trustee and Audit Committee Chairman, Griffin Institutional Access Real Estate Fund since May 2014. Trustee for the Angel Oak Funds Trust since October 2014. |
| Andrea N. Mullins, 48, Independent Trustee, December 2013 to present. | | Private investor; Independent Contractor, Seabridge Wealth Management, LLC, since April 2014; Principal Financial Officer and Treasurer, Eagle Family of Funds (mutual fund family) and Vice President, Eagle Asset Management, Inc. (investment adviser) each from 2004 to 2010. | | None. |
| * | The address for each trustee and officer is 2960 N. Meridian St., Suite 300, Indianapolis, IN 46208. |
| ** | As of the date of this report, the Trust consists of 14 series. |
The following table provides information regarding the Trustee who is considered an “interested person” of the Trust, as that term is defined under the 1940 Act. Based on the experience of the Trustee, the Trust concluded that the individual described below is qualified to serve as a Trustee.
| | | | |
Name, Address*, (Age),
Position with Trust**,
Term of Position with Trust | | Principal Occupation During Past 5 Years | | Other Directorships |
R. Jeffrey Young, 50,
Trustee and Chairman, June 2010 to present; Principal Executive Officer and President, Valued Advisers Trust since February 2010. | | President of Huntington Asset Services since April 2015, Senior Vice President, since January 2010 and Director since May 2014; Director, Unified Financial Securities since May 2014; Chief Executive Officer, Huntington Funds from February 2010 to March 2015; Chief Executive Officer, The Huntington Strategy Shares from November 2010 to March 2015; President and Chief Executive Officer, Dreman Contrarian Funds March 2011 to February 2013; Trustee, Valued Advisers Trust, August 2008 to January 2010; and Managing Director and Chief Operating Officer of Professional Planning Consultants 2007 to 2010. | | Trustee and Chairman, Capitol Series Trust, since September 2013. |
| * | The address for each trustee and officer is 2960 N. Meridian St., Suite 300, Indianapolis, IN 46208. |
| ** | As of the date of this report, the Trust consists of 14 series. |
Annual Report
32
The following table provides information regarding the Officers of the Trust:
| | | | |
Name, Address*, (Age),
Position with Trust,**
Term of Position with Trust | | Principal Occupation During Past 5 Years | | Other Directorships |
R. Jeffrey Young, 50,
Trustee and Chairman, June 2010 to present; Principal Executive Officer and President, Valued Advisers Trust since February 2010. | | President of Huntington Asset Services since April 2015, Senior Vice President, since January 2010 and Director since May 2014; Director, Unified Financial Securities, since May 2014; Chief Executive Officer, Huntington Funds from February 2010 to March 2015; Chief Executive Officer, The Huntington Strategy Shares from November 2010 to March 2015; President and Chief Executive Officer, Dreman Contrarian Funds March 2011 to February 2013; Trustee, Valued Advisers Trust, August 2008 to January 2010; and Managing Director and Chief Operating Officer of Professional Planning Consultants 2007 to 2010. | | Trustee and Chairman, Capitol Series Trust, since September 2013. |
John C. Swhear, 54,
Chief Compliance Officer, AML Officer and Vice President, August 2008 to present. | | Vice President of Legal Administration and Compliance, Huntington Asset Services, Inc., the Trust’s administrator, since April 2007 and Director since May 2014; Chief Compliance Officer, Unified Financial Securities, Inc., the Trust’s distributor, since May 2007 and Director since May 2014; President, Unified Series Trust, since March 2012, and Senior Vice President from May 2007 to March 2012; Chief Compliance Officer and AML Officer, Capitol Series Trust, since September 2013; Secretary, Huntington Funds, from April 2010 to February 2012; and President and Chief Executive Officer, Dreman Contrarian Funds, from March 2010 to March 2011. | | None. |
Carol J. Highsmith, 50,
Vice President, August 2008 to present; Secretary, March 2014 to present | | Employed in various positions with Huntington Asset Services, Inc., the Trust’s administrator, since November of 1994; currently Vice President of Legal Administration; Secretary, Cross Shore Discovery Fund since May 2014. | | None. |
Matthew J. Miller, 39,
Vice President, December 2011 to present. | | Employed in various positions with Huntington Asset Services, Inc., the Trust’s administrator, since July of 1998; currently Vice President of Relationship Management; Vice President, Huntington Funds, since February 2010; President and Chief Executive Officer, Capitol Series Trust, since September 2013. | | None. |
Annual Report
33
| | | | |
Name, Address*, (Age),
Position with Trust,**
Term of Position with Trust | | Principal Occupation During Past 5 Years | | Other Directorships |
| Bryan W. Ashmus, 42, Principal Financial Officer and Treasurer, December 2013 to present. | | Vice President, Fund Administration, Huntington Asset Services, Inc., the Trust’s administrator, since September 2013; Chief Financial Officer and Treasurer, The Huntington Strategy Shares and The Huntington Funds, since November 2013; Vice President, Fund Administration, Citi Fund Services Ohio, Inc., from 2005 to 2013. | | None. |
| * | The address for each trustee and officer is 2960 N. Meridian St., Suite 300, Indianapolis, IN 46208. |
| ** | As of the date of this report, the Trust consists of 14 series. |
OTHER INFORMATION
The Fund’s Statement of Additional Information (“SAI”) includes additional information about the trustees and is available without charge, upon request. You may call toll-free at (877) 670-2227 to request a copy of the SAI or to make shareholder inquiries.
Annual Report
34
Management Renewal Agreement (Unaudited)
At a meeting held on March 10-11, 2015, the Board of Trustees (the “Board”) considered the renewal of the Investment Advisory Agreement (the “Investment Advisory Agreement”) between the Trust and Cloud Capital LLC (the “Cloud” or “Adviser”) with respect to the Cloud Capital Strategic All Cap Fund (the “Fund”).
The Trustees then considered the proposed renewal of the Investment Advisory Agreement between the Trust and Cloud with respect to the Fund. Counsel directed the Trustees to a memorandum that summarized, among other things, the fiduciary duties and responsibilities of the Board in reviewing and approving the Investment Advisory Agreement. The Board then discussed the contractual arrangements between the Trust and Cloud with respect to the Fund. They reflected upon the Board’s prior experience with Cloud in managing the Fund, as well as their earlier discussion with Mr. Cloud.
Counsel discussed with the Trustees the types of information and factors that should be considered by the Board in order to make an informed decision regarding the approval of the renewal of the Investment Advisory Agreement, including the following material factors: (i) the nature, extent, and quality of the services to be provided by Cloud; (ii) the investment performance of the Fund; (iii) the costs of the services to be provided and anticipated profits to be realized by Cloud from the relationship with the Fund; (iv) the extent to which economies of scale would be realized if the Fund grows and whether advisory fee levels reflect those economies of scale for the benefit of the Fund’s investors; and (v) Cloud’s practices regarding possible conflicts of interest and potential benefits derived from its relationship with the Fund.
In assessing the factors and reaching its decision, the Board took into consideration information furnished for the Board’s review and consideration throughout the year at regular Board meetings, as well as information specifically requested and prepared and/or presented in connection with the annual renewal process, including information presented at the Meeting. The Board requested, was provided with, and reflected on, information and reports relevant to the annual renewal of the Investment Advisory Agreement, including (i) reports regarding the services and support provided to the Fund and its shareholders by Cloud; (ii) quarterly assessments of the investment performance of the Fund by personnel of Cloud; (iii) commentary on the reasons for the performance; (iv) presentations by Cloud addressing investment philosophy, investment strategy, personnel and operations of Cloud; (v) compliance and audit reports concerning the Fund and Cloud; (vi) disclosure information contained in the registration statement of the Trust with respect to the Fund and the Form ADV of Cloud; and (vii) a memorandum from Counsel, that summarized the fiduciary duties and responsibilities of the Board in reviewing and approving the Investment Advisory Agreement, including the material Factors set forth above and the types of information included in each factor that should be considered by the Board in order to make an informed decision. The Board also requested and received various informational materials including, without limitation: (i) documents containing information about Cloud, including financial information, a description of personnel and the managerial services provided to the Fund, information on investment advice, performance, summaries of Fund expenses, compliance program, current legal matters, and
Annual Report
35
Management Renewal Agreement
(Unaudited) (Continued)
other general information; (ii) comparative expense and performance information for other mutual funds with strategies similar to the Fund historically utilized by the Fund, as well as for separate accounts managed by Cloud; and (iii) benefits to be realized by Cloud from its relationship with the Fund. The Board did not identify any particular information that was most relevant to its consideration to approve the Agreement and each Trustee may have afforded different weight to the various factors.
| 1. | The nature, extent, and quality of the services to be provided by the Adviser. In this regard, the Board considered Cloud’s responsibilities under the Advisory Agreement. The Trustees considered the services being provided by Cloud to the Fund including, without limitation: the quality of its investment advisory services (including research and recommendations with respect to portfolio securities), its process for formulating investment recommendations and assuring compliance with the Fund’s investment objectives and limitations, its coordination of services for the Fund among the Fund’s service providers, and its efforts to promote the Fund and grow its assets. The Trustees considered Cloud’s continuity of, and commitment to retain, qualified personnel and Cloud’s commitment to maintain and enhance its resources and systems, the commitment of Cloud’s personnel to finding alternatives and options that allow the Fund to maintain its goals, and Cloud’s continued cooperation with the Independent Trustees and Counsel for the Fund. The Trustees considered Cloud’s personnel, including the education and experience of Cloud’s personnel. After considering the foregoing information and further information in the Meeting materials provided by Cloud (including Cloud’s Form ADV), the Board concluded that, in light of all the facts and circumstances, the nature, extent, and quality of the services provided by Cloud were satisfactory and adequate for the Fund. |
| 2. | Investment Performance of the Fund and the Adviser. In considering the investment performance of the Fund and Cloud, the Trustees compared the performance of the Fund with the performance of funds with similar objectives managed by other investment advisers, with aggregated peer group data, as well as with the performance of the Fund’s benchmark. The Trustees also considered the consistency of Cloud’s management of the Fund with its investment objectives, strategies, and limitations. The Trustees noted that the Fund’s performance was comparable to that of the peer group average for all periods. They also noted that the Fund’s performance generally trailed the benchmark for all periods except the short-term (less than one year). After reviewing and discussing the investment performance of the Fund further, Cloud’s experience managing the Fund, the Fund’s historical performance, and other relevant factors, the Board concluded, in light of all the facts and circumstances, that the investment performance of the Fund and Cloud was satisfactory. |
| 3. | The costs of the services to be provided and profits to be realized by the Adviser from the relationship with the Fund. In considering the costs of services to be provided and the profits to be realized by Cloud from the relationship with the Fund, the Trustees considered: (1) Cloud’s financial condition; (2) the asset level of the Fund; (3) the overall expenses of the Fund; and (4) the nature and frequency of advisory fee payments. The Trustees reviewed information provided by Cloud regarding its profits associated with managing the |
Annual Report
36
| | Fund. The Trustees also considered potential benefits for Cloud in managing the Fund. The Trustees then compared the fees and expenses of the Fund (including the management fee) to other comparable mutual funds. The Trustees recalled that, due to a management fee reduction and revisions to the expense limitation arrangements for the Fund, Cloud receives no management fee from the Fund. The Trustees noted that the Fund’s management fee was well below the average and median fees of peers in its category and one of the lowest in its category. The Trustees also noted that Fund’s net expense ratio was slightly higher than that of the peer average, but slightly lower than the median expense ratio, as a result of Cloud’s contractual commitment to limit the expenses of the Fund. Based on the foregoing, the Board concluded that the fees to be paid to Cloud by the Fund and the profits to be realized by Cloud, in light of all the facts and circumstances, were fair and reasonable in relation to the nature and quality of the services provided by Cloud. |
| 4. | The extent to which economies of scale would be realized as the Fund grows and whether advisory fee levels reflect these economies of scale for the benefit of the Fund’s investors. In this regard, the Board considered the Fund’s fee arrangements with Cloud. The Board considered that while the management fee remained the same at all asset levels, the Fund’s shareholders had experienced benefits from the Fund’s expense limitation arrangement and from a reduction in the management fee. They also noted Cloud’s agreement to revise the expense limitation arrangements for the Fund, which effectively eliminated the management fee. The Trustees noted that once the Fund’s expenses fell below the cap set by the arrangement, the Fund’s shareholders would continue to benefit from the economies of scale under the Trust’s agreement with service providers other than Cloud. In light of its ongoing consideration of the Fund’s asset levels, expectations for growth in the Fund, and fee levels, the Board determined that the Fund’s fee arrangements, in light of all the facts and circumstances, were fair and reasonable in relation to the nature and quality of the services provided by Cloud. |
| 5. | Possible conflicts of interest and benefits to the Adviser. In considering Cloud’s practices regarding conflicts of interest, the Trustees evaluated the potential for conflicts of interest and considered such matters as the experience and ability of the advisory personnel assigned to the Fund; the basis of decisions to buy or sell securities for the Fund and/or Cloud’s other accounts; and the substance and administration of Cloud’s code of ethics. The Trustees also considered disclosure in the registration statement of the Trust relating to Cloud’s potential conflicts of interest. The Trustees noted that Cloud does not utilize soft dollars. The Trustees noted other potential benefits to Cloud, such as the ability to market their services in new channels (other than direct separate accounts) and some benefit from press exposure. Based on the foregoing, the Board determined that the standards and practices of Cloud relating to the identification and mitigation of potential conflicts of interest and the benefits to be realized by Cloud in managing the Fund were satisfactory. |
After additional consideration of the factors delineated in the memorandum provided by Counsel and further discussion among the Board, the Board determined to approve the continuation of the Investment Advisory Agreement between the Trust and the Adviser.
Annual Report
37
PRIVACY POLICY
The following is a description of the policies of the Valued Advisers Trust (the “Trust”) regarding disclosure of nonpublic personal information that shareholders provide to a series of the Trust (each, a “Fund”) or that the Fund collects from other sources. In the event that a shareholder holds shares of a Fund through a broker-dealer or other financial intermediary, the privacy policy of the financial intermediary would govern how shareholder nonpublic personal information would be shared with nonaffiliated third parties.
Categories of Information a Fund May Collect.
A Fund may collect the following nonpublic personal information about its shareholders:
| • | | Information the Fund receives from a shareholder on applications or other forms, correspondence, or conversations (such as the shareholder’s name, address, phone number, social security number, and date of birth); and |
| • | | Information about the shareholder’s transactions with the Fund, its affiliates, or others (such as the shareholder’s account number and balance, payment history, cost basis information, and other financial information). |
Categories of Information a Fund May Disclose.
A Fund may not disclose any nonpublic personal information about its current or former shareholders to unaffiliated third parties, except as required or permitted by law. A Fund is permitted by law to disclose all of the information it collects, as described above, to its service providers (such as the Fund’s custodian, administrator, transfer agent, accountant and legal counsel) to process shareholder transactions and otherwise provide services to the shareholder.
Confidentiality and Security.
Each Fund shall restrict access to shareholder nonpublic personal information to those persons who require such information to provide products or services to the shareholder. Each Fund shall maintain physical, electronic, and procedural safeguards that comply with federal standards to guard shareholder nonpublic personal information.
Disposal of Information.
The Funds, through their transfer agent, have taken steps to reasonably ensure that the privacy of a shareholder’s nonpublic personal information is maintained at all times, including in connection with the disposal of information that is no longer required to be maintained by the Funds. Such steps shall include, whenever possible, shredding paper documents and records prior to disposal, requiring off-site storage vendors to shred documents maintained in such locations prior to disposal, and erasing and/or obliterating any data contained on electronic media in such a manner that the information can no longer be read or reconstructed.
Annual Report
38
PROXY VOTING
A description of the policies and procedures that the Fund uses to determine how to vote proxies relating to portfolio securities and information regarding how the Fund voted those proxies during the most recent twelve month period ended June 30, is available without charge upon request by (1) calling the Fund at (877) 670-2227 and (2) from Fund documents filed with the Securities and Exchange Commission (“SEC”) on the SEC’s website at www.sec.gov.
TRUSTEES
R. Jeffrey Young, Chairman
Ira Cohen
Andrea N. Mullins
OFFICERS
R. Jeffrey Young, Principal Executive Officer and President
Bryan W. Ashmus, Principal Financial Officer and Treasurer
John C. Swhear, Chief Compliance Officer, AML Officer and Vice-President
Carol J. Highsmith, Vice President and Secretary
Matthew J. Miller, Vice President
INVESTMENT ADVISER
Cloud Capital LLC
5314 South Yale, Suite 606
Tulsa, OK 74135
DISTRIBUTOR
Unified Financial Securities, Inc.
2960 North Meridian Street, Suite 300
Indianapolis, IN 46208
INDEPENDENT REGISTERED PUBLIC ACCOUNTING FIRM
Cohen Fund Audit Services, Ltd.
1350 Euclid Avenue, Suite 800
Cleveland, OH 44115
LEGAL COUNSEL
The Law Offices of John H. Lively & Associates, Inc.
A member firm of The 1940 Act Law Group TM
11300 Tomahawk Creek Parkway, Suite 310
Leawood, KS 66211
CUSTODIAN
FOLIOfn Investments, Inc.
8180 Greensboro Drive
8th Floor
McLean, VA 22102
ADMINISTRATOR, TRANSFER AGENT
AND FUND ACCOUNTANT
Huntington Asset Services, Inc.
2960 North Meridian Street, Suite 300
Indianapolis, IN 46208
This report is intended only for the information of shareholders or those who have received the Fund’s prospectus which contains information about the Fund’s management fee and expenses. Please read the prospectus carefully before investing.
Distributed by Unified Financial Securities, Inc.
Member FINRA/SIPC
To Shareholders of the LS Opportunity Fund,
Long Short Advisors, LLC (LSA, the “Advisor”) launched the LS Opportunity Fund (LSOFX, the “Fund”) on September 30, 2010 to offer access to a long/short equity strategy in a 1940 Act mutual fund structure. Prospector Partners, LLC, the Fund’s “Sub-Advisor”, has been operating a traditional long/short equity hedge fund with a similar investment objective since 1997 and assumed investment responsibilities for the Fund at the end of May 2015. John Gillespie, Kevin O’Brien, and Jason Kish are the Fund’s co-Portfolio Managers. The Fund aims to identify compelling long/short investment opportunities through a bottom-up stock selection process based upon in-depth analysis of business and financial fundamentals. Through extensive research, implementation of risk management, diversification, and no use of leverage on the long side, the Fund strives to do what a successful investment manager should do – preserve capital while delivering long-term capital appreciation and managing volatility. For additional information, please visit our website at www.longshortadvisors.com.
Market Review
Our fiscal year ending May 31, 2015 (the “Period”) straddles the end of 2014 and beginning of 2015. The twelve month period was characterized by lower gasoline prices, lower interest rates, rising wages, and a labor market back over its pre-recession levels create a powerful backdrop for the US consumer. Consumer free cash flow is reaching the highest level in nearly 20 years. A stronger U.S. consumer translates into a bullish outlook for the consumer discretionary sector. However, the widely feared equity market correction and rising interest rates have not yet materialized, leaving the S&P 500® Index (“S&P 500”) near all-time highs at the end of the Period. Overall, the S&P 500 finished the Period with a cumulative total return of 11.8%, while the HFRI Equity Hedge Index (HFRI) returned 5.2%.
Management Discussion of Fund Performance
Overall, the Fund gained 0.50% during the Period. The contributors and detractors highlighted below were the main factors in the Fund’s performance.
Contributors
Three stocks from the long portfolio each earned more than 100 basis points of return during the Period. These positions InterMune (ITMN), Celgene (CELG), and HCA Holdings (HCA) are also all within the healthcare sector. Two securities in the short book also provided outsized contribution to performance, Carbo Ceramics (CRR) and Green Mountain Coffee (GMCR).
1
Detractors
Over the entire twelve month Period, the Fund did not lose more than 61 basis points on any individual long position. A few of the underperformers included US Silica (USI), BioDelivery Sciences (BDSI), Golar LNG (GLNG), and Acceleron Pharma (XLRN). In the short book, Kraft Foods (KRFT/KHC), Post Holdings (POST), and Panera Bread (PNRA) were the biggest detractors during the Period.
About Prospector Partners LLC (Management Changes)
Prospector Partners LLC has been selected by Long Short Advisors to become the new sub-advisor of the Fund. Prospector was approved as the interim Sub-Advisor at a special meeting of the Board of Trustees in April 2015 and has been managing the assets of the Fund since May 28, 2015. Prospector will continue as the interim Sub-Advisor until shareholders vote in September 2015 to approve them on a permanent basis.
Prospector Partners has an 18-year long/short equity hedge fund track record and will manage the Fund with substantially similar longs and shorts as the hedge fund and with substantially similar net exposure. Prospector Partners’ strategy brings a wealth of experience with a goal of downside protection and a consistency of returns.
At Period’s end, the Fund’s top 10 long positions represented approximately 25.6% of the long book and included Aflac (AFL), Arch Capital (ACGL), Automatic Data (ADP), Berkshire Hathaway (BRK.B), Chubb (CHB), Endurance (ENH), Hess (HES), Leucadia (LUK), McDonalds (MCD), and Patterson (PDCO).
Also at Period’s end, the Fund’s short book is populated by shares of twenty individual companies that have business model challenges, excessive valuations, and/or aggressive accounting practices.
Thank you for your continued support and we look forward to reporting to you again following our semi-annual date of November 30, 2015.
Sincerely,
Long Short Advisors, LLC
2
Why might investors need a long short equity mutual fund allocation?
| | • | | Strategy of Downside Protection: In an effort to provide downside protection in an increasingly volatile world where equity markets are near all-time highs and bond yields are near all-time lows |
| | • | | Enhancing Risk/Return: An allocation to long/short equity can allow for continued upside market capture while seeking to dampen inevitable downside equity volatility, and without the interest rate risk associated with bonds |
| | • | | Liquid Alternative Advantages: Alternative mutual funds offer daily liquidity, full quarterly portfolio transparency, no performance fees, limited leverage and lower minimum investments |
Investors may be overlooking the benefits of adding long/short equity to a portfolio, with some giving up on the allocation altogether. It’s hard to blame them, as the S&P 500 has returned almost 21% annualized since the recession low point on March 9, 2009. Our belief is that these types of returns are almost certainly unsustainable, and that long/short equity strategies will again showcase their ability to generate equity-like returns while protecting capital during down markets. Graph 1 below compares the rolling twelve month return of the HFRI Equity Hedge (Total) Index relative to the S&P 500, pictorially showing the rotating nature of investing:
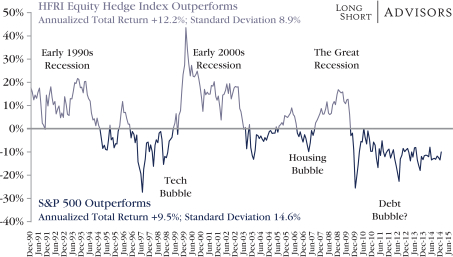
Source: Long Short Advisors, Hedge Fund Research
Represents comparative performance of the HFRI Equity Hedge Index versus the S&P 500. Investors cannot invest directly in an index; however, an individual can invest in exchange traded funds or other investment vehicles that attempt to track the performance of a benchmark index. Past performance does not guarantee future results.
3
| | ¡ | | Long/short equity hedge funds have outperformed the S&P 500 on a rolling twelve month basis almost 51% of the time, but one can readily see in the previous chart that the most significant periods of underperformance have been amidst ‘bubble’ markets. |
| | ¡ | | Using strategies to protect capital during bear markets, long/short equity funds strive to compound returns from a higher base during bull markets, thus creating the opportunity to outperform over a complete market cycle. |
“The Secret of Wealth Creation is to Avoid Large Losses”
-John Gillespie, portfolio manager
Long/short equity mutual funds as an alternative to hedge funds
At this point in the evolution of the liquid alternative space, investors are starting to compare 3+ year performance numbers of alternative mutual funds to those of traditional hedge funds, and most are discovering that daily liquidity does not have to come at the expense of performance.
| | • | | The data could not be more supportive for these investors, as the Fund has outperformed the HFRI Equity Hedge (Total) Index since the inception of the Fund on September 30, 2010. In addition, the Morningstar Long/Short Equity Category also has a lower annual return than the Fund since inception. |
| | | | | | | | | | | | | | | | |
| | | October 2010 - May 2015 | |
| | | Annual
Return | | | Standard
Deviation | | | Beta vs.
S&P 500 | | | Correlation
vs. S&P 500 | |
HFRI Equity Hedge (Total) Index | | | 5.17 | % | | | 7.0 | % | | | 0.57 | | | | 0.90 | |
Morningstar Long/Short Equity Category | | | 4.64 | % | | | 5.8 | % | | | 0.50 | | | | 0.98 | |
LS Opportunity Fund (LSOFX) | | | 5.94 | % | | | 8.6 | % | | | 0.57 | | | | 0.74 | |
Source: Long Short Advisors, Hedge Fund Research, Morningstar
| | • | | Thus, the Fund can serve as a daily liquid replacement or complement to a private long/short equity hedge fund with the additional benefits of a low $5,000 minimum investment, quarterly holdings transparency, no incentive fees, and minimal leverage. |
Thank you for choosing the LS Opportunity Fund as a place to invest your assets alongside ours. We appreciate your trust in us to help manage and grow your capital.
4
Please refer to the Fund’s prospectus for a full description of the investment strategy and for more information about the Fund. You may obtain a current copy of the Fund’s prospectus by calling (877) 336-6763, or visiting our website at www.longshortadvisors.com and clicking on the ‘Fund Information’ tab.
For additional questions or to discuss this report in more detail, please contact us at (215) 399-9409, or via email at info@longshortadvisors.com
“Don’t time the market, invest in it”
The views and opinions expressed in management’s discussion of Fund performance are those of the advisor and sub-advisor as of the end of the period. These views and opinions are subject to change at any time based on factors such as market and economic conditions. These views and opinions may not be relied upon as investment advice or recommendations, or as an offer for a particular security. The information is not a complete analysis of every aspect of any market, country, industry, security or the Fund. Statements of fact are from sources considered reliable, but neither the advisor nor the sub-advisor makes any representation or warranty as to their completeness or accuracy. Although historical performance is no guarantee of future results, these insights may help you understand our investment management philosophy.
The S&P 500 Index is a widely recognized, unmanaged index of equity prices and is representative of a broader market and range of securities than is found in the Fund’s portfolio. The Index is an unmanaged benchmark that assumes reinvestment of all distributions and excludes the effect of taxes and fees. Individuals cannot invest directly in this Index; however, an individual can invest in exchange traded funds or other investment vehicles that attempt to track the performance of a benchmark index. HFRI Equity Hedge Index is compiled by Hedge Fund Research, Inc. It is comprised solely of hedge funds, and is designed to be representative of the overall composition of the hedge fund universe implementing a long/short equity strategy. The Funds’ performance is not intended to reflect the performance of the Index, which is provided for comparison purposes only. The Index is not available for direct investment. HFRX Equity Hedge Index is compiled by Hedge Fund Research, Inc. It is comprised solely of hedge funds, and is designed to be representative of the overall composition of the hedge fund universe implementing a long/short equity strategy. For inclusion in the HFRX indices a hedge fund must meet the HFRI criteria, but also be open to new transparent investment, have at least $50 million assets under management and have at least a 24 month track record. The Funds’ performance is not intended to reflect the performance of the Index, which is provided for comparison purposes only. The Index is not available for direct investment. Standard Deviation is a measure of the dispersion of a set of data from its mean. Alpha is a measure of performance on a risk adjusted basis. Beta is a measure of the volatility of a portfolio relative to the overall market. Correlation is a statistical measure of how two securities move in relation to each other. Sharpe Ratio uses standard deviation and excess return to determine reward per unit of risk.
5
Investment Results – (Unaudited)
| | | | | | | | | | | | |
Total Returns* | |
(For the periods ended May 31, 2015) | |
| | | |
| | | | | | Average Annual Returns | |
| | | One Year | | | Three Year | | | Since Inception
(September 30, 2010) | |
LS Opportunity Fund | | | 0.50 | % | | | 8.86 | % | | | 6.31 | % |
S&P 500® Index** | | | 11.81 | % | | | 19.67 | % | | | 16.40 | % |
Total annual operating expenses, as disclosed in the Fund’s prospectus dated September 30, 2014, were 2.71% of average daily net assets (2.49% after fee waivers and expense reimbursements by the Adviser.) Long Short Advisors, LLC (the “Adviser”) contractually has agreed to waive or limit its fees and to assume other expenses of the Fund until September 30, 2015, so that the ratio of total annual operating expenses does not exceed 1.95%. This operating expense limitation does not apply to interest, taxes, brokerage commissions, other expenditures which are capitalized in accordance with generally accepted accounting principles, other extraordinary expenses not incurred in the ordinary course of the Fund’s business, dividend expense on short sales, expenses incurred under a Rule 12b-1 plan of distribution, “acquired fund fees and expenses,” and expenses that the Fund has incurred but did not actually pay because of an expense offset arrangement. The Adviser may be entitled to the reimbursement of any fees waived or expenses reimbursed pursuant to the agreement provided overall expenses fall below the limitations set forth above. The Adviser may recoup the sum of all fees previously waived or expenses reimbursed during any of the previous three years, less any reimbursement previously paid, provided total expenses do not exceed the limitation set forth above. This agreement may only be terminated by mutual consent of the Adviser and the Board of Trustees.
The performance quoted represents past performance, which does not guarantee future results. The investment return and principal value of an investment will fluctuate so that an investor’s shares, when redeemed, may be worth more or less than their original cost. The returns shown do not reflect deduction of taxes that a shareholder would pay on Fund distributions or the redemption of Fund shares. The Fund’s investment objectives, risks, charges and expenses must be considered carefully before investing. Current performance of the Fund may be lower or higher than the performance quoted. Performance data current to the most recent month end may be obtained by calling (877) 336-6763.
* Return figures reflect any change in price per share and assume the reinvestment of all distributions, if any.
** The S&P 500® Index is a widely recognized unmanaged index of equity prices and is representative of a broader market and range of securities than is found in the Fund’s portfolio. The Index is an unmanaged benchmark that assumes reinvestment of all distributions and excludes the effect of taxes and fees. Individuals cannot invest directly in this Index; however, an individual can invest in exchange traded funds or other investment vehicles that attempt to track the performance of a benchmark index.
6
The Fund’s investment objectives, risks, charges and expenses must be considered carefully before investing. The prospectus contains this and other important information about the investment company and may be obtained by calling (877) 336-6763. Please read it carefully before investing.
The Fund is distributed by Unified Financial Securities, Inc., Member FINRA.
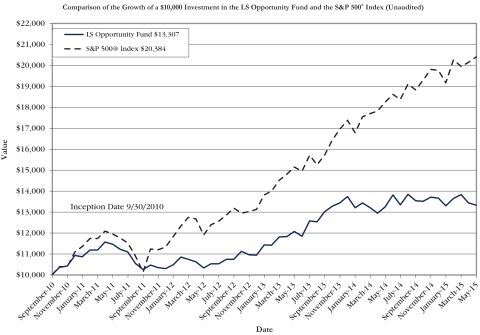
The chart above assumes an initial investment of $10,000 made on September 30, 2010 (commencement of Fund operations) and held through May 31, 2015. THE FUND’S RETURNS REPRESENT PAST PERFORMANCE AND DO NOT GUARANTEE FUTURE RESULTS. The returns shown do not reflect deduction of taxes that a shareholder would pay on the Fund’s distributions or the redemption of the Fund’s shares. Investment returns and principal values will fluctuate so that your shares, when redeemed, may be worth more or less than their original purchase price.
Current performance may be lower or higher than the performance data quoted. For more information on the Fund, and to obtain performance data current to the most recent month-end, or to request a prospectus, please call (877) 336-6763. You should carefully consider the investment objectives, potential risks, management fees, and charges and expenses of the Fund before investing. The Fund’s prospectus contains this and other information about the Fund, and should be read carefully before investing.
The Fund is distributed by Unified Financial Securities, Inc., member FINRA
7
Fund Holdings – (Unaudited)
Sector Exposure (5/31/2015)
(Based on Net Assets)
| | | | | | | | | | | | | | | | |
| | | Long | | | Short | | | Gross | | | Net | |
Consumer Discretionary | | | 7.77 | % | | | -1.46 | % | | | 9.23 | % | | | 6.31 | % |
Consumer Staples | | | 9.34 | % | | | -1.96 | % | | | 11.30 | % | | | 7.38 | % |
Energy | | | 2.97 | % | | | -0.98 | % | | | 3.95 | % | | | 1.99 | % |
Financials | | | 37.26 | % | | | -18.59 | % | | | 55.85 | % | | | 18.67 | % |
Health Care | | | 6.96 | % | | | 0.00 | % | | | 6.96 | % | | | 6.96 | % |
Industrials | | | 2.45 | % | | | 0.00 | % | | | 2.45 | % | | | 2.45 | % |
Information Technology | | | 11.28 | % | | | 0.00 | % | | | 11.28 | % | | | 11.28 | % |
Materials | | | 0.99 | % | | | 0.00 | % | | | 0.99 | % | | | 0.99 | % |
Real Estate Investment Trusts | | | 0.96 | % | | | 0.00 | % | | | 0.96 | % | | | 0.96 | % |
Unclassified | | | 0.99 | % | | | 0.00 | % | | | 0.99 | % | | | 0.99 | % |
| | | | | | | | | | | | | | | | |
Total | | | 80.97 | % | | | -22.99 | % | | | 103.96 | % | | | 57.98 | % |
| | | | | | | | | | | | | | | | |
The LS Opportunity Fund (“Fund”) seeks to generate long term capital appreciation by investing in both long and short positions within a portfolio consisting of primarily publicly-traded common stock, with less risk than that of the stock market in general.
Availability of Portfolio Schedule – (Unaudited)
The Fund files its complete schedule of portfolio holdings with the Securities and Exchange Commission (“SEC”) for the first and third quarters of each fiscal year on Form N-Q. The Fund’s Forms N-Q are available at the SEC’s website at www.sec.gov. The Forms N-Q may be reviewed and copied at the Public Reference Room in Washington DC. Information on the operation of the Public Reference Room may be obtained by calling 1-800-SEC-0330.
About The Fund’s Expenses – (Unaudited)
As a shareholder of the Fund, you incur two types of costs: (1) transaction costs (such as short-term redemption fees); and (2) ongoing costs, including management fees; and other Fund expenses. This Example is intended to help you understand your ongoing costs (in dollars) of investing in the Fund and to compare these costs with the ongoing costs of investing in other mutual funds. The Example is based on an investment of $1,000 invested at the beginning of the period, and held for the entire period from December 1, 2014 to May 31, 2015.
8
Actual Expenses
The first line of the table provides information about actual account values and actual expenses. You may use the information in this line, together with the amount you invested, to estimate the expenses that you paid over the period. Simply divide your account value by $1,000 (for example, an $8,600 account value divided by $1,000 = 8.60), then multiply the result by the number in the first line under the heading “Expenses Paid During the Period Ended May 31, 2015” to estimate the expenses you paid on your account during this period.
Hypothetical Example for Comparison Purposes
The second line of the table provides information about hypothetical account values and hypothetical expenses based on the Fund’s actual expense ratios and an assumed rate of return of 5% per year before expenses, which is not the Fund’s actual return. The hypothetical account values and expenses may not be used to estimate the actual ending account balance or expenses you paid for the period. You may use this information to compare the ongoing costs of investing in the Fund and other funds. To do so, compare this 5% hypothetical example with the 5% hypothetical examples that appear in the shareholder reports of the other funds.
Please note that the expenses shown in the table are meant to highlight your ongoing costs only and do not reflect any transactional costs, such as sales charges (loads), redemption fees, or exchange fees. Therefore, the second line of the table is useful in comparing ongoing costs only, and will not help you determine the relative total costs of owning different funds. In addition, if these transactional costs were included, your costs would have been higher.
| | | | | | | | | | | | |
LS Opportunity
Fund | | Beginning
Account Value December 1, 2014 | | | Ending Account Value May 31, 2015 | | | Expenses Paid During the Period Ended May 31, 2015* | |
Actual | | $ | 1,000.00 | | | $ | 971.40 | | | $ | 12.93 | |
Hypothetical ** | | $ | 1,000.00 | | | $ | 1,011.82 | | | $ | 13.19 | |
| * | Expenses are equal to the Fund’s annualized expense ratio of 2.63%, multiplied by the average account value over the period, multiplied by 182/365. |
| ** | Assumes a 5% return before expenses. |
9
LS Opportunity Fund
Schedule of Investments
May 31, 2015
| | | | | | | | |
| Common Stocks – Long – Domestic – 72.61% | | Shares | | | Fair Value | |
Consumer Discretionary – 7.77% | | | | | | | | |
Darden Restaurants, Inc. | | | 14,600 | | | $ | 956,884 | |
Home Depot, Inc./The | | | 16,900 | | | | 1,882,998 | |
McDonald’s Corp. | | | 28,900 | | | | 2,772,377 | |
Yum! Brands, Inc. | | | 20,700 | | | | 1,865,277 | |
| | | | | | | | |
| | | | | | | 7,477,536 | |
| | | | | | | | |
Consumer Staples – 7.88% | | | | | | | | |
Church & Dwight Co., Inc. | | | 16,900 | | | | 1,419,093 | |
Coca-Cola Co./The | | | 23,100 | | | | 946,176 | |
Colgate-Palmolive Co. | | | 21,100 | | | | 1,409,269 | |
Mondelez International, Inc. – Class A | | | 23,700 | | | | 985,683 | |
PepsiCo, Inc. | | | 14,800 | | | | 1,427,164 | |
Procter & Gamble Co./The | | | 17,900 | | | | 1,403,181 | |
| | | | | | | | |
| | | | | | | 7,590,566 | |
| | | | | | | | |
Energy – 2.97% | | | | | | | | |
Hess Corp. | | | 28,300 | | | | 1,910,816 | |
Murphy Oil Corp. | | | 21,900 | | | | 951,774 | |
| | | | | | | | |
| | | | | | | 2,862,590 | |
| | | | | | | | |
Financials – 31.35% | | | | | | | | |
Aflac, Inc. | | | 30,400 | | | | 1,891,488 | |
Berkshire Hathaway, Inc. – Class B* | | | 32,800 | | | | 4,690,400 | |
Central Pacific Financial Corp. | | | 40,300 | | | | 943,826 | |
Chubb Corp./The | | | 38,700 | | | | 3,773,250 | |
Citigroup, Inc. | | | 17,300 | | | | 935,584 | |
Franklin Resources, Inc. | | | 36,900 | | | | 1,878,579 | |
Invesco Ltd. | | | 23,500 | | | | 936,005 | |
JPMorgan Chase & Co. | | | 7,100 | | | | 467,038 | |
Legg Mason, Inc. | | | 35,200 | | | | 1,878,272 | |
Leucadia National Corp. | | | 77,000 | | | | 1,896,510 | |
Marsh & McLennan Cos., Inc. | | | 16,100 | | | | 937,503 | |
Oritani Financial Corp. | | | 64,300 | | | | 946,496 | |
PNC Financial Services Group, Inc./The | | | 14,900 | | | | 1,425,781 | |
ProAssurance Corp. | | | 32,000 | | | | 1,445,760 | |
Progressive Corp./The | | | 52,300 | | | | 1,429,882 | |
Safety Insurance Group, Inc. | | | 16,800 | | | | 937,440 | |
StanCorp Financial Group, Inc. | | | 12,700 | | | | 942,594 | |
State Street Corp. | | | 12,100 | | | | 942,953 | |
See accompanying notes which are an integral part of these financial statements.
10
LS Opportunity Fund
Schedule of Investments – continued
May 31, 2015
| | | | | | | | |
| Common Stocks – Long – Domestic – 72.61% – continued | | Shares | | | Fair Value | |
Financials – 31.35% – continued | | | | | | | | |
T. Rowe Price Group, Inc. | | | 11,700 | | | $ | 944,073 | |
U.S. Bancorp | | | 21,700 | | | | 935,487 | |
| | | | | | | | |
| | | | | | | 30,178,921 | |
| | | | | | | | |
Health Care – 6.96% | | | | | | | | |
Abbott Laboratories | | | 19,400 | | | | 942,840 | |
Invacare Corp. | | | 22,400 | | | | 486,752 | |
Johnson & Johnson | | | 18,800 | | | | 1,882,632 | |
Merck & Co., Inc. | | | 24,000 | | | | 1,461,360 | |
Patterson Cos., Inc. | | | 40,200 | | | | 1,923,168 | |
| | | | | | | | |
| | | | | | | 6,696,752 | |
| | | | | | | | |
Industrials – 2.45% | | | | | | | | |
Lockheed Martin Corp. | | | 5,000 | | | | 941,000 | |
Northrop Grumman Corp. | | | 8,900 | | | | 1,416,702 | |
| | | | | | | | |
| | | | | | | 2,357,702 | |
| | | | | | | | |
Information Technology – 11.28% | | | | | | | | |
Automatic Data Processing, Inc. | | | 22,100 | | | | 1,889,771 | |
eBay, Inc.* | | | 16,000 | | | | 981,760 | |
EMC Corp. | | | 35,600 | | | | 937,704 | |
FLIR Systems, Inc. | | | 30,600 | | | | 934,830 | |
Microsoft Corp. | | | 39,900 | | | | 1,869,714 | |
Paychex, Inc. | | | 19,100 | | | | 943,731 | |
Science Applications International Corp. | | | 26,900 | | | | 1,425,700 | |
VeriSign, Inc.* | | | 14,700 | | | | 928,893 | |
Xilinx, Inc. | | | 19,900 | | | | 943,658 | |
| | | | | | | | |
| | | | | | | 10,855,761 | |
| | | | | | | | |
Materials – 0.99% | | | | | | | | |
Newmont Mining Corp. | | | 35,100 | | | | 956,124 | |
| | | | | | | | |
Real Estate Investment Trusts – 0.96% | | | | | | | | |
Parkway Properties, Inc. | | | 54,000 | | | | 928,260 | |
| | | | | | | | |
TOTAL COMMON STOCKS – LONG – DOMESTIC
(Cost $70,264,422) | | | | | | | 69,904,212 | |
| | | | | | | | |
See accompanying notes which are an integral part of these financial statements.
11
LS Opportunity Fund
Schedule of Investments – continued
May 31, 2015
| | | | | | | | |
| Common Stocks – Long – International – 7.37% | | Shares | | | Fair Value | |
Consumer Staples – 1.46% | | | | | | | | |
Diageo PLC ADR | | | 12,700 | | | $ | 1,409,192 | |
| | | | | | | | |
Financials – 5.91% | | | | | | | | |
Arch Capital Group Ltd.* | | | 37,100 | | | | 2,370,319 | |
Endurance Specialty Holdings Ltd. | | | 31,200 | | | | 1,896,336 | |
XL Group PLC | | | 37,700 | | | | 1,420,536 | |
| | | | | | | | |
| | | | | | | 5,687,191 | |
| | | | | | | | |
TOTAL COMMON STOCKS – LONG – INTERNATIONAL (Cost $7,138,660) | | | | | | | 7,096,383 | |
| | | | | | | | |
Exchange-Traded Funds – Long – 0.99% | | | | | | | | |
SPDR Gold Shares* | | | 8,300 | | | | 947,030 | |
| | | | | | | | |
TOTAL EXCHANGE-TRADED FUNDS – LONG
(Cost $946,691) | | | | | | | 947,030 | |
| | | | | | | | |
TOTAL INVESTMENTS – LONG – 80.97%
(Cost $78,349,773) | | | | | | | 77,947,625 | |
| | | | | | | | |
TOTAL SECURITIES SOLD SHORT – (22.99)%
(Cost $22,187,688) | | | | | | | (22,133,006 | ) |
| | | | | | | | |
Other Assets in Excess of Liabilities – 42.02% | | | | | | | 40,454,099 | |
| | | | | | | | |
TOTAL NET ASSETS – 100.00% | | | | | | $ | 96,268,718 | |
| | | | | | | | |
| * | Non-income producing security. |
| ADR | – American Depositary Receipt |
See accompanying notes which are an integral part of these financial statements.
12
LS Opportunity Fund
Schedule of Securities Sold Short
May 31, 2015
| | | | | | | | |
| Common Stocks – Short – Domestic – (21.03)% | | Shares | | | Fair Value | |
Consumer Discretionary – (1.46)% | | | | | | | | |
Brinker International, Inc. | | | (25,400 | ) | | $ | (1,401,572 | ) |
| | | | | | | | |
Consumer Staples – (1.96)% | | | | | | | | |
Kellogg Co. | | | (30,000 | ) | | | (1,883,100 | ) |
| | | | | | | | |
Energy – (0.98)% | | | | | | | | |
Chevron Corp. | | | (9,200 | ) | | | (947,600 | ) |
| | | | | | | | |
Financials – (16.63)% | | | | | | | | |
Alleghany Corp.* | | | (2,900 | ) | | | (1,378,515 | ) |
Ameriprise Financial, Inc. | | | (7,500 | ) | | | (934,425 | ) |
Amtrust Financial Services, Inc. | | | (15,600 | ) | | | (938,808 | ) |
Arthur J Gallagher & Co. | | | (19,400 | ) | | | (939,930 | ) |
Bank of New York Mellon Corp./The | | | (21,600 | ) | | | (936,576 | ) |
Cincinnati Financial Corp. | | | (18,600 | ) | | | (940,788 | ) |
Eaton Vance Corp. | | | (23,300 | ) | | | (945,980 | ) |
Hartford Financial Services Group, Inc. | | | (22,900 | ) | | | (941,419 | ) |
Horace Mann Educators Corp. | | | (27,200 | ) | | | (936,224 | ) |
Markel Corp.* | | | (1,900 | ) | | | (1,468,244 | ) |
Prosperity Bancshares, Inc. | | | (17,700 | ) | | | (948,189 | ) |
Prudential Financial, Inc. | | | (11,200 | ) | | | (947,632 | ) |
Travelers Cos., Inc./The | | | (18,600 | ) | | | (1,880,832 | ) |
Trustmark Corp. | | | (39,000 | ) | | | (930,150 | ) |
Unum Group | | | (27,000 | ) | | | (943,920 | ) |
| | | | | | | | |
| | | | | | | (16,011,632 | ) |
| | | | | | | | |
TOTAL COMMON STOCKS – SHORT – DOMESTIC
(Proceeds Received $20,288,090) | | | | | | | (20,243,904 | ) |
| | | | | | | | |
Common Stocks – Short – International – (1.96)% | | | | | | | | |
Financials – (1.96)% | | | | | | | | |
Everest Re Group Ltd. | | | (5,200 | ) | | | (943,852 | ) |
HSBC Holdings PLC ADR | | | (19,900 | ) | | | (945,250 | ) |
| | | | | | | | |
TOTAL COMMON STOCKS – SHORT – INTERNATIONAL (Proceeds Received $1,899,598) | | | | | | | (1,889,102 | ) |
| | | | | | | | |
TOTAL SECURITIES SOLD SHORT – (22.99)%
(Proceeds Received $22,187,688) | | | | | | $ | (22,133,006 | ) |
| | | | | | | | |
| * | Non-dividend expense producing security. |
| ADR | – American Depositary Receipt |
See accompanying notes which are an integral part of these financial statements.
13
LS Opportunity Fund
Statement of Assets and Liabilities
May 31, 2015
| | | | |
Assets | | | | |
Investments in securities at fair value (cost $78,349,773) | | $ | 77,947,625 | |
Cash(a) | | | 52,807,912 | |
Foreign currencies, at fair value (Cost $5,401) | | | 4,721 | |
Receivable for fund shares sold | | | 1,734 | |
Receivable for investments sold | | | 97,338,450 | |
Dividends receivable | | | 53,695 | |
Prepaid expenses | | | 17,427 | |
| | | | |
Total Assets | | | 228,171,564 | |
| | | | |
Liabilities | | | | |
Investment securities sold short at fair value (proceeds $22,187,688) | | | 22,133,006 | |
Payable for fund shares redeemed | | | 1,265,627 | |
Payable for investments purchased | | | 108,274,249 | |
Dividend expense payable on short postions | | | 3,551 | |
Payable to Adviser | | | 165,954 | |
Payable to administrator, fund accountant, and transfer agent | | | 19,863 | |
Other accrued expenses | | | 40,596 | |
| | | | |
Total Liabilities | | | 131,902,846 | |
| | | | |
| |
Net Assets | | $ | 96,268,718 | |
| | | | |
| |
Net Assets consist of: | | | | |
Paid-in capital | | $ | 92,651,488 | |
Accumulated undistributed net investment loss | | | (9,702 | ) |
Accumulated undistributed net realized gain | | | 3,975,078 | |
Net unrealized depreciation on: | | | | |
Investment securities and securities sold short | | | (347,466 | ) |
Foreign currency | | | (680 | ) |
| | | | |
Net Assets | | $ | 96,268,718 | |
| | | | |
Shares outstanding (unlimited number of shares authorized, no par value) | | | 7,670,036 | |
| | | | |
Net asset value (“NAV”) and offering price per share | | $ | 12.55 | |
| | | | |
Redemption price per share (NAV * 98%)(b) | | $ | 12.30 | |
| | | | |
| (a) | See Note 2 in the Notes to Financial Statements regarding restricted cash. |
| (b) | The Fund charges a 2.00% redemption fee on shares redeemed in 60 days or less of purchase. Shares are redeemed at the NAV if held longer than 60 calendar days. |
See accompanying notes which are an integral part of these financial statements.
14
LS Opportunity Fund
Statement of Operations
For the year ended May 31, 2015
| | | | |
Investment Income | | | | |
Dividend income (net of foreign taxes withheld of $6,823) | | $ | 1,370,770 | |
| | | | |
Total investment income | | | 1,370,770 | |
| | | | |
Expenses | | | | |
Investment Adviser | | | 3,023,471 | |
Administration | | | 133,320 | |
Fund accounting | | | 80,091 | |
Transfer agent | | | 65,107 | |
Legal | | | 18,075 | |
Audit | | | 17,500 | |
Trustee | | | 5,557 | |
Compliance services | | | 3,000 | |
Miscellaneous | | | 168,448 | |
Other – short sale & interest expense | | | 361,089 | |
Dividend expense on securities sold short | | | 606,856 | |
| | | | |
Total expenses | | | 4,482,514 | |
| | | | |
Fees waived by Adviser | | | (148,331 | ) |
| | | | |
Net expenses | | | 4,334,183 | |
| | | | |
Net investment loss | | | (2,963,413 | ) |
| | | | |
Net Realized and Unrealized Gain | | | | |
Net realized gain (loss) on: | | | | |
Investment securities | | | 26,171,462 | |
Securities sold short | | | (12,219,792 | ) |
Written options | | | 45,027 | |
Foreign currency | | | 862 | |
Change in unrealized appreciation (depreciation) on: | | | | |
Investment securities | | | (10,220,553 | ) |
Securities sold short | | | 732,779 | |
Foreign currency | | | (880 | ) |
| | | | |
Net realized and unrealized gain on investments, short securities, options, foreign currency and foreign currency contracts | | | 4,508,905 | |
| | | | |
Net increase in net assets resulting from operations | | $ | 1,545,492 | |
| | | | |
See accompanying notes which are an integral part of these financial statements.
15
LS Opportunity Fund
Statements of Changes in Net Assets
| | | | | | | | |
| | | For the Year
Ended
May 31, 2015 | | | For the Year
Ended
May 31, 2014 | |
Increase (Decrease) in Net Assets due to: | | | | | | | | |
Operations | | | | | | | | |
Net investment loss | | $ | (2,963,413 | ) | | $ | (1,516,827 | ) |
Net realized gain on investment securities, short securities, written options, and foreign currency | | | 13,997,559 | | | | 3,707,847 | |
Net change in unrealized appreciation (depreciation) of investment securities, short securities, and foreign currency | | | (9,488,654 | ) | | | 3,635,817 | |
| | | | | | | | |
Net increase in net assets resulting from operations | | | 1,545,492 | | | | 5,826,837 | |
| | | | | | | | |
Distributions From: | | | | | | | | |
From net realized gains | | | (3,344,132 | ) | | | (2,801,219 | ) |
| | | | | | | | |
Total distributions | | | (3,344,132 | ) | | | (2,801,219 | ) |
| | | | | | | | |
Capital Transactions | | | | | | | | |
Proceeds from shares sold | | | 100,954,218 | | | | 131,422,391 | |
Reinvestment of distributions | | | 3,259,260 | | | | 2,649,446 | |
Amount paid for shares redeemed | | | (156,003,469 | ) | | | (25,002,470 | ) |
Proceeds from redemption fees(a) | | | — | | | | 12,468 | |
| | | | | | | | |
Net increase (decrease) in net assets resulting from capital transactions | | | (51,789,991 | ) | | | 109,081,835 | |
| | | | | | | | |
Total Increase (Decrease) in Net Assets | | | (53,588,631 | ) | | | 112,107,453 | |
| | | | | | | | |
Net Assets | | | | | | | | |
Beginning of period | | | 149,857,349 | | | | 37,749,896 | |
| | | | | | | | |
End of period | | $ | 96,268,718 | | | $ | 149,857,349 | |
| | | | | | | | |
Accumulated undistributed net investment loss | | $ | (9,702 | ) | | $ | (795,391 | ) |
| | | | | | | | |
Share Transactions | | | | | | | | |
Shares sold | | | 7,821,644 | | | | 10,409,801 | |
Shares issued in reinvestment of distributions | | | 253,639 | | | | 205,383 | |
Shares redeemed | | | (12,187,993 | ) | | | (1,967,082 | ) |
| | | | | | | | |
Net increase (decrease) in share transactions | | | (4,112,710 | ) | | | 8,648,102 | |
| | | | | | | | |
| (a) | The Fund charges a 2% redemption fee on shares redeemed in 60 days or less of purchase. Shares are redeemed at the NAV if held longer than 60 calendar days. |
See accompanying notes which are an integral part of these financial statements.
16
LS Opportunity Fund
Financial Highlights
(For a share outstanding during each period)
| | | | | | | | | | | | | | | | | | | | |
| | | For the Fiscal
Year Ended
May 31, 2015 | | | For the Fiscal
Year Ended
May 31, 2014 | | | For the Fiscal
Year Ended
May 31, 2013 | | | For the Fiscal
Year Ended
May 31, 2012 | | | For the
Period Ended
May 31, 2011(a) | |
Selected Per Share Data: | | | | | | | | | | | | | | | | | | | | |
Net asset value, beginning of period | | $ | 12.72 | | | $ | 12.04 | | | $ | 10.29 | | | $ | 11.45 | | | $ | 10.00 | |
| | | | | | | | | | | | | | | | | | | | |
Income from investment operations: | | | | | | | | | | | | | | | | | | | | |
Net investment income (loss) | | | (0.42 | ) | | | (0.26 | )(b) | | | (0.24 | )(b) | | | (0.23 | )(b) | | | (0.17 | )(b) |
Net realized and unrealized gain (loss) on investments | | | 0.49 | | | | 1.44 | | | | 1.99 | | | | (0.91 | ) | | | 1.62 | |
| | | | | | | | | | | | | | | | | | | | |
Total from investment operations | | | 0.07 | | | | 1.18 | | | | 1.75 | | | | (1.14 | ) | | | 1.45 | |
| | | | | | | | | | | | | | | | | | | | |
Less Distributions to Shareholders: | | | | | | | | | | | | | | | | | | | | |
From net realized gains | | | (0.24 | ) | | | (0.50 | ) | | | — | | | | (0.02 | ) | | | — | |
| | | | | | | | | | | | | | | | | | | | |
Redemption fees | | | — | | | | — | (c) | | | — | (c) | | | — | (c) | | | — | (c) |
| | | | | | | | | | | | | | | | | | | | |
Net asset value, end of period | | $ | 12.55 | | | $ | 12.72 | | | $ | 12.04 | | | $ | 10.29 | | | $ | 11.45 | |
| | | | | | | | | | | | | | | | | | | | |
Total Return(d)(e) | | | 0.50 | % | | | 9.72 | % | | | 17.01 | % | | | (9.92 | )% | | | 14.50 | %(f) |
Ratios and Supplemental Data: | | | | | | | | | | | | | | | | | | | | |
Net assets, end of period (000) | | $ | 96,269 | | | $ | 149,857 | | | $ | 37,750 | | | $ | 48,864 | | | $ | 20,375 | |
Ratio of expenses to average net assets(g) | | | 2.51 | % | | | 2.49 | % | | | 3.12 | %(h) | | | 3.16 | % | | | 2.99 | %(i) |
Ratio of expenses to average net assets before waiver and reimbursement/recoupment by Adviser(g) | | | 2.60 | % | | | 2.71 | % | | | 3.12 | % | | | 3.06 | % | | | 4.25 | %(i) |
Ratio of net investment loss to average net assets | | | (1.72 | )% | | | (2.04 | )% | | | (2.22 | )% | | | (2.19 | )% | | | (2.25 | )%(i) |
Portfolio turnover rate | | | 551.53 | % | | | 312.34 | % | | | 310.57 | % | | | 444.62 | % | | | 199.48 | %(f) |
| (a) | For the period September 30, 2010 (Commencement of Operations) through May 31, 2011. |
| (b) | Per share net investment loss has been calculated using the average shares method. |
| (c) | Amount represents less than $0.005 per share. |
| (d) | Total return in the above table represents the rate that the investor would have earned or lost on an investment in the Fund, assuming reinvestment of dividends. |
| (e) | Excludes redemption fee. |
| (g) | Includes dividend and interest expense of 0.56%, 0.54%, 0.77%, 0.66% and 0.49% for periods ended May 31, 2015, 2014, 2013, 2012 and 2011, respectively. |
| (h) | Effective February 4, 2013, the Adviser agreed to waive fees to maintain Fund expenses at 1.95%. Prior to that date, the expense cap was 2.50%. (See Note 4. Fees and Other Transactions with Affiliates and Other Service Providers) |
See accompanying notes which are an integral part of these financial statements.
17
LS Opportunity Fund
Notes to the Financial Statements
May 31, 2015
NOTE 1. ORGANIZATION
The LS Opportunity Fund (the “Fund”) is an open-end, diversified series of the Valued Advisers Trust (the “Trust”). The Trust is a management investment company established under the laws of Delaware by an Agreement and Declaration of Trust dated June 13, 2008 (the “Trust Agreement”). The Trust Agreement permits the Trustees to issue an unlimited number of shares of beneficial interest of separate series without par value. The Fund is one of a series of funds authorized by the Board of Trustees (the “Board”). The Fund’s investment adviser is Long Short Advisors, LLC (the “Adviser”). Effective April 28, 2015, the Board appointed Prospector Partners, LLC (the “Sub-Adviser”) to serve as the interim sub-adviser to provide portfolio management and related services to the Fund. Prior to April 28, 2015, Independence Capital Asset Partners, LLC (the “Previous Sub-Adviser”) served as sub-adviser to the Fund. The Sub-Adviser receives a fee from the Adviser (not the Fund) for these services. The investment objective of the Fund is to generate long term capital appreciation by investing in both long and short positions within a portfolio consisting of primarily publicly-traded common stock, with less risk than that of the stock market in general.
NOTE 2. SIGNIFICANT ACCOUNTING POLICIES
The Fund is an investment company and follows accounting and reporting guidance under Financial Accounting Standards Board (“FASB”) Accounting Standards Codification (“ASC”) Topic 946, “Financial Services-Investment Companies”. The following is a summary of significant accounting policies followed by the Fund in the preparation of its financial statements. These policies are in conformity with the generally accepted accounting principles in the United States of America (“GAAP”).
Securities Valuation – All investments in securities are recorded at their estimated fair value as described in Note 3.
Federal Income Taxes – The Fund makes no provision for federal income or excise tax. The Fund intends to qualify each year as a “regulated investment company” (“RIC”) under subchapter M of the Internal Revenue Code of 1986, as amended, by complying with the requirements applicable to RICs and by distributing substantially all of its taxable income. The Fund also intends to distribute sufficient net investment income and net capital gains, if any, so that it will not be subject to excise tax on undistributed income and gains. If the required amount of net investment income or gains is not distributed, the Fund could incur a tax expense.
As of and during the fiscal year ended May 31, 2015, the Fund did not have a liability for any unrecognized tax benefits. The Fund recognizes interest and penalties, if
18
LS Opportunity Fund
Notes to the Financial Statements – continued
May 31, 2015
NOTE 2. SIGNIFICANT ACCOUNTING POLICIES – continued
any, related to unrecognized tax benefits as income tax expense in the Statement of Operations. During the year, the Fund did not incur any interest or penalties. The Fund is subject to examination by U.S. federal tax authorities for the last four year ends, including the most recent fiscal year end which has yet to be filed.
Expenses – Expenses incurred by the Trust that do not relate to a specific fund of the Trust are allocated to the individual funds based on each fund’s relative net assets or other appropriate basis.
Security Transactions and Related Income – The Fund follows industry practice and records security transactions on the trade date for financial reporting purposes. The specific identification method is used for determining gains or losses for financial statements and income tax purposes. Dividend income and dividend expense are recorded on the ex-dividend date and interest income is recorded on an accrual basis. Dividend income from Real Estate Investment Trusts (REITS) and distributions from Limited Partnerships are recognized on the ex-date. The calendar year end classification of distributions received from REITS during the fiscal year are reported subsequent to year end; accordingly, the Fund estimates the character of REIT distributions based on the most recent information available. Income or loss from Limited Partnerships is reclassified among the components of net assets upon receipt of Schedules K-1(Form 1065). Discounts and premiums on securities purchased are amortized or accreted using the effective interest method. Withholding taxes on foreign dividends have been provided for in accordance with the Fund’s understanding of the applicable country’s tax rules and rates.
Redemption Fees – The Fund charges a 2.00% redemption fee for shares redeemed within 60 days. These fees are deducted from the redemption proceeds otherwise payable to the shareholder. The Fund will retain the fee charged as an increase in paid-in capital and such fees become part of the Fund’s daily NAV calculation.
Foreign Currency Translations – Foreign currency amounts are translated into U.S. dollars as follows: (i) assets and liabilities at the rate of exchange at the end of the respective period; and (ii) purchases and sales of securities and income and expenses at the rate of exchange prevailing on the dates of such transactions. The portion of the results of operations arising from changes in the exchange rates and the portion due to fluctuations arising from changes in the market prices of securities are not isolated. Such fluctuations are included with the net realized and unrealized gain or loss on investments.
The Fund may enter into transactions to purchase or sell foreign currencies to protect the U.S. dollar value of its underlying portfolio securities against the effect of
19
LS Opportunity Fund
Notes to the Financial Statements – continued
May 31, 2015
NOTE 2. SIGNIFICANT ACCOUNTING POLICIES – continued
possible adverse movements in foreign exchange rates. Principal risks associated with such transactions include the movement in value of the foreign currency relative to the U.S. dollar and the ability of the counterparty to perform. Fluctuations in the value of such forward currency transactions are recorded daily as unrealized gain or loss; realized gain or loss includes net gain or loss on transactions that have terminated by settlement or by a fund entering into offsetting commitments. Reported net realized foreign exchange gains or losses arise from sales of foreign currencies, currency gains or losses realized between the trade and settlement dates on securities transactions, and the difference between the amounts of dividends, interest, and foreign withholding taxes recorded on the company’s books and the U.S. dollar equivalent of the amounts actually received or paid. These instruments involve market risk, credit risk, or both kinds of risks, in excess of the amount that would be recognized in the Statement of Assets and Liabilities. Risks arise from the possible inability of counterparties to meet the terms of their contracts and from movement in currency and securities values and interest rates.
Dividends and Distributions – The Fund intends to distribute substantially all of its net investment income, net realized long-term capital gains and its net realized short-term capital gains, if any, to its shareholders on at least an annual basis. Dividends to shareholders, which are determined in accordance with income tax regulations, are recorded on the ex-dividend date. The treatment for financial reporting purposes of distributions made to shareholders during the year from net investment income or net realized capital gains may differ from their ultimate treatment for federal income tax purposes. These differences are caused primarily by differences in the timing of the recognition of certain components of income, expense or realized capital gain for federal income tax purposes. Where such differences are permanent in nature, they are reclassified among the components of net assets based on their ultimate characterization for federal income tax purposes. Any such reclassifications will have no effect on net assets, results of operations or net asset value per share of the Fund. For the fiscal year ended May 31, 2015, the Fund made the following reclassifications to increase (decrease) the components of net assets:
| | | | | | | | |
Paid-in Capital | | Accumulated
Undistributed Net
Investment Loss | | | Accumulated
Undistributed
Net Realized
Gain | |
$3,801,374 | | $ | 3,749,102 | | | $ | (7,550,476 | ) |
Short Sales – The Fund may make short sales as part of its overall portfolio management strategies or to offset a potential decline in value of a security. The
20
LS Opportunity Fund
Notes to the Financial Statements – continued
May 31, 2015
NOTE 2. SIGNIFICANT ACCOUNTING POLICIES – continued
Fund may engage in short sales with respect to various types of securities, including Exchange-Traded Funds (ETFs). A short sale involves the sale of a security that is borrowed from a broker or other institution to complete the sale. The Fund may engage in short sales with respect to securities it owns, as well as securities that it does not own. Short sales expose the Fund to the risk that it will be required to acquire, convert or exchange securities to replace the borrowed securities (also known as “covering” the short position) at a time when the securities sold short have appreciated in value, thus resulting in a loss to the Fund. The amount of loss may exceed the proceeds received in a short sale. The Fund’s investment performance may also suffer if the Fund is required to close out a short position earlier than it had intended. The Fund must segregate assets determined to be liquid in accordance with procedures established by the Board, or otherwise cover its position in a permissible manner. The Fund will be required to pledge its liquid assets to the broker in order to secure its performance on short sales. As a result, the assets pledged may not be available to meet the Fund’s needs for immediate cash or other liquidity. In addition, the Fund may be subject to expenses related to short sales that are not typically associated with investing in securities directly, such as costs of borrowing and margin account maintenance costs associated with the Fund’s open short positions. These types of short sales expenses are sometimes referred to as the “negative cost of carry,” and will tend to cause the Fund to lose money on a short sale even in instances where the price of the underlying security sold short does not change over the duration of the short sale.
Dividend expenses on securities sold short and borrowing costs are not covered under the Adviser’s expense limitation agreement with the Fund and, therefore, these expenses will be borne by the shareholders of the Fund. The amount of restricted cash held as collateral for securities sold short was $30,000,000 as of May 31, 2015.
Purchasing Call Options – The Fund may purchase call options. As the holder of a call option, the Fund has the right to purchase the underlying security at the exercise price at any time during the option period. The Fund may enter into closing sale transactions with respect to such options, exercise them or permit them to expire. The Fund may also purchase call options on relevant stock indexes. Call options may also be purchased by the Fund for the purpose of acquiring the underlying securities for its portfolio. Utilized in this fashion, the purchase of call options enables the Fund to acquire the securities at the exercise price of the call option plus the premium paid. At times the net cost of acquiring securities in this manner may be less than the cost of acquiring the securities directly. This technique may also be useful to the Fund in purchasing a large block of securities that would be
21
LS Opportunity Fund
Notes to the Financial Statements – continued
May 31, 2015
NOTE 2. SIGNIFICANT ACCOUNTING POLICIES – continued
more difficult to acquire by direct market purchases. So long as it holds such a call option rather than the underlying security itself, the Fund is partially protected from any unexpected decline in the market price of the underlying security and in such event could allow the call option to expire, incurring a loss only to the extent of the premium paid for the option.
Purchasing Put Options – The Fund may purchase put options. As the holder of a put option, the Fund has the right to sell the underlying security at the exercise price at any time during the option period. The Fund may enter into closing sale transactions with respect to such options, exercise them or permit them to expire. The Fund may purchase a put option on an owned underlying security (a “protective put”) as a defensive technique to protect against an anticipated decline in the value of the security. Such hedge protection is provided only during the life of the put option when the Fund, as the holder of the put option, is able to sell the underlying security at the put exercise price regardless of any decline in the underlying security’s market price. The Fund may also purchase put options at a time when it does not own the underlying security. By purchasing put options on a security it does not own, the Fund seeks to benefit from a decline in the market price of the underlying security. If the put option is not sold when it has remaining value, and if the market price of the underlying security remains equal to or greater than the exercise price during the life of the put option, the Fund will lose its entire investment in the put option. In order for the purchase of a put option to be profitable, the market price of the underlying security must decline sufficiently below the exercise price to cover the premium and transaction costs, unless the put option is sold in a closing sale transaction.
Writing Options – The Fund may write covered call options on equity securities or futures contracts that the Fund is eligible to purchase to extend a holding period to obtain long-term capital gain treatment, to earn premium income, to assure a definite price for a security it has considered selling, or to close out options previously purchased. The Fund may write covered call options if, immediately thereafter, not more than 30% of its net assets would be committed to such transactions. A call option gives the holder (buyer) the right to purchase a security or futures contract at a specified price (the exercise price) at any time until a certain date (the expiration date). A call option is “covered” if the Fund owns the underlying security subject to the call option at all times during the option period. When the Fund writes a covered call option, it maintains a segregated account with its Custodian, cash or liquid portfolio securities in an amount not less than the exercise price at all times while the option is outstanding.
22
LS Opportunity Fund
Notes to the Financial Statements – continued
May 31, 2015
NOTE 2. SIGNIFICANT ACCOUNTING POLICIES – continued
Forward Currency Exchange Contracts – The Fund may engage in foreign currency exchange transactions. The value of the Fund’s portfolio securities that are invested in non-U.S. dollar denominated instruments as measured in U.S. dollars may be affected favorably or unfavorably by changes in foreign currency exchange rates, and the Fund may incur costs in connection with conversions between various currencies. The Fund will conduct its foreign currency exchange transactions either on a spot (i.e., cash) basis at the spot rate prevailing in the foreign currency exchange market, or through forward contracts to purchase or sell foreign currencies. A forward foreign currency exchange contract involves an obligation to purchase or sell a specific currency at a future date, which may be any fixed number of days from the date of the contract agreed upon by the parties, at a price set at the time of the contract. These contracts are traded directly between currency traders (usually large commercial banks) and their customers. The Fund will not, however, hold foreign currency except in connection with the purchase and sale of foreign portfolio securities.
Derivative Transactions – The following table identifies the effect of derivative instruments on the Statement of Operations for the fiscal year ended May 31, 2015. As of May 31, 2015, there were no open derivative positions.
| | | | | | | | | | | | | | | | | | |
| Derivatives | | Location of Gain (Loss) on
Derivatives on Statements
of Operations | | Contracts
Opened | | | Contracts
Closed | | | Realized
Gain
(Loss) on
Derivatives | | | Change in
Unrealized
Appreciation
(Depreciation) on
Derivatives | |
Equity Risk: | | | | | | | | | | | | | | | | | | |
Call Options Purchased | | Net realized and unrealized gain (loss) on investment securities | | | 64 | | | | 64 | | | $ | (14,756 | ) | | $ | — | |
Equity Risk: | | | | | | | | | | | | | | | | | | |
Call Options Written | | Net realized and unrealized gain (loss) on written options | | | 206 | | | | 206 | | | | 26,370 | | | | — | |
Equity Risk: | | | | | | | | | | | | | | | | | | |
Put Options Purchased | | Net realized and unrealized gain (loss) on investment securities | | | 206 | | | | 206 | | | | (98,943 | ) | | | — | |
Equity Risk: | | | | | | | | | | | | | | | | | | |
Put Options Written | | Net realized and unrealized gain (loss) on written options | | | 206 | | | | 206 | | | | 18,657 | | | | — | |
23
LS Opportunity Fund
Notes to the Financial Statements – continued
May 31, 2015
NOTE 2. SIGNIFICANT ACCOUNTING POLICIES – continued
Transactions in options written during the fiscal year ended May 31, 2015 were as follows:
| | | | | | | | |
| | | Number of
Contracts | | | Premiums
Received | |
Written options outstanding at May 31, 2014 | | | — | | | $ | — | |
Options written | | | 412 | | | | 45,027 | |
Options expired | | | (412 | ) | | | (45,027 | ) |
| | | | | | | | |
Written options outstanding at May 31, 2015 | | | — | | | $ | — | |
| | | | | | | | |
The Fund is not subject to a master netting arrangement and its policy is to not offset assets and liabilities related to its investment in derivatives.
NOTE 3. SECURITIES VALUATION AND FAIR VALUE MEASUREMENTS
Fair value is defined as the price that a Fund would receive upon selling an investment in an orderly transaction to an independent buyer in the principal or most advantageous market of the investment. GAAP establishes a three-tier hierarchy to maximize the use of observable market data and minimize the use of unobservable inputs and to establish classification of fair value measurements for disclosure purposes.
Inputs refer broadly to the assumptions that market participants would use in pricing the asset or liability, including assumptions about risk (the risk inherent in a particular valuation technique used to measure fair value such as pricing model and/or the risk inherent in the inputs to the valuation technique). Inputs may be observable or unobservable. Observable inputs are inputs that reflect the assumptions market participants would use in pricing the asset or liability developed based on market data obtained from sources independent of the reporting entity. Unobservable inputs are inputs that reflect the reporting entity’s own assumptions about the assumptions market participants would use in pricing the asset or liability developed based on the best information available in the circumstances.
Various inputs are used in determining the value of the Fund’s investments. These inputs are summarized in the three broad levels listed below.
| | • | | Level 1 – quoted prices in active markets for identical securities |
| | • | | Level 2 – other significant observable inputs (including, but not limited to, quoted prices for an identical security in an inactive market, quoted prices for similar securities, interest rates, prepayment speeds, credit risk, etc.) |
24
LS Opportunity Fund
Notes to the Financial Statements – continued
May 31, 2015
NOTE 3. SECURITIES VALUATION AND FAIR VALUE MEASUREMENTS – continued
| | • | | Level 3 – significant unobservable inputs (including the Fund’s own assumptions in determining fair value of investments based on the best information available) |
The inputs used to measure fair value may fall into different levels of the fair value hierarchy. In such cases, for disclosure purposes, the level in the fair value hierarchy within which the fair value measurement falls in its entirety, is determined based on the lowest level input that is significant to the fair value measurement in its entirety.
Equity securities, including common stock, exchange traded funds, real estate investment trusts, and american depositary receipts are generally valued by using market quotations, furnished by a pricing service. Securities that are traded on any stock exchange are generally valued at the last quoted sale price. Lacking a last sale price, an exchange traded security is generally valued at its last bid price. Securities traded in the NASDAQ over-the-counter market are generally valued at the NASDAQ Official Closing Price.
When using the market quotations or close prices provided by the pricing service and when the market is considered active, the security is classified as a Level 1 security. Sometimes, an equity security owned by the Fund will be valued by the pricing service with factors other than market quotations or when the market is considered inactive. When this happens, the security is classified as a Level 2 security. When market quotations are not readily available, when the Adviser determines that the market quotation or the price provided by the pricing service does not accurately reflect the current fair value, or when restricted or illiquid securities are being valued, such securities are valued as determined in good faith, in conformity with guidelines adopted by and subject to review by the Board. These securities will generally be categorized as Level 3 securities.
Investments in mutual funds, including money market mutual funds, are generally priced at the ending net asset value (“NAV”) provided by the service agent of the funds. These securities are categorized as Level 1 securities.
Call and put options that the Fund invests in are generally traded on an exchange and are generally valued at the last trade price as provided by a pricing service. If the last sale price is not available, the options will be valued using the last bid price. The options will generally be categorized as Level 1 securities.
25
LS Opportunity Fund
Notes to the Financial Statements – continued
May 31, 2015
NOTE 3. SECURITIES VALUATION AND FAIR VALUE MEASUREMENTS – continued
Derivative instruments the Fund invests in, such as forward currency exchange contracts, are valued by a pricing service at the interpolated rates based on the prevailing banking rates and are generally categorized as Level 2 securities.
In accordance with the Trust’s good faith pricing guidelines, the Fund, with support from the Adviser, is required to consider all appropriate factors relevant to the value of securities for which it has determined other pricing sources are not available or reliable as described above. No single standard exists for determining fair value, because fair value depends upon the circumstances of each individual case. As a general principle, the current fair value of an issue of securities being valued would appear to be the amount which the owner might reasonably expect to receive for them upon their current sale. Methods which are in accordance with this principle may, for example, be based on (i) a multiple of earnings; (ii) a discount from market of a similar freely traded security (including a derivative security or a basket of securities traded on other markets, exchanges or among dealers); or (iii) yield to maturity with respect to debt issues, or a combination of these and other methods. Good faith pricing is permitted if, in the management’s opinion, the validity of market quotations appears to be questionable based on factors such as evidence of a thin market in the security based on a small number of quotations, a significant event occurs after the close of a market but before a Fund’s NAV calculation that may affect a security’s value, or the Fund is aware of any other data that calls into question the reliability of market quotations. Good faith pricing may also be used in instances when the bonds the Fund invests in may default or otherwise cease to have market quotations readily available.
The following is a summary of the inputs used to value the Fund’s investments as of May 31, 2015:
| | | | | | | | | | | | | | | | |
| | | Valuation Inputs | |
| Assets | | Level 1 — Quoted
Prices in Active
Markets | | | Level 2 — Other
Significant
Observable
Inputs | | | Level 3 —
Significant
Unobservable
Inputs | | | Total | |
Common Stocks* | | $ | 77,000,595 | | | $ | — | | | $ | — | | | $ | 77,000,595 | |
Exchange-Traded Funds | | | 947,030 | | | | — | | | | — | | | | 947,030 | |
Total | | $ | 77,947,625 | | | $ | — | | | $ | — | | | $ | 77,947,625 | |
| * | Please refer to Schedule of Investments for industry classifications. |
26
LS Opportunity Fund
Notes to the Financial Statements – continued
May 31, 2015
NOTE 3. SECURITIES VALUATION AND FAIR VALUE MEASUREMENTS – continued
| | | | | | | | | | | | | | | | |
| | | Valuation Inputs | |
| Liabilities | | Level 1 — Quoted
Prices in Active
Markets | | | Level 2 — Other
Significant
Observable
Inputs | | | Level 3 —
Significant
Unobservable
Inputs | | | Total | |
Common Stocks* | | $ | (22,133,006 | ) | | $ | — | | | $ | — | | | $ | (22,133,006 | ) |
Total | | $ | (22,133,006 | ) | | $ | — | | | $ | — | | | $ | (22,133,006 | ) |
| * | Please refer to Schedule of Securities Sold Short for industry classifications. |
The Fund did not hold any investments at any time during the reporting period in which significant unobservable inputs were used in determining fair value; therefore, no reconciliation of Level 3 securities is included for this reporting period. The Trust recognizes transfers between fair value hierarchy levels at the reporting period end. There were no transfers between any Levels for the fiscal year ended May 31, 2015.
NOTE 4. FEES AND OTHER TRANSACTIONS WITH AFFILIATES AND OTHER SERVICE PROVIDERS
The Adviser, under the terms of the management agreement (the “Agreement”), manages the Fund’s investments. As compensation for its management services, the Fund is obligated to pay the Adviser a fee computed and accrued daily and paid monthly at an annual rate of 1.75% of the Fund’s average net assets. For the fiscal year ended May 31, 2015, the Adviser earned a fee of $3,023,471 from the Fund before the waivers described below.
The Adviser has contractually agreed to waive its management fee and/or reimburse certain Fund operating expenses, but only to the extent necessary so that the Fund’s net expenses (excluding interest, taxes, brokerage commissions, other expenditures which are capitalized in accordance with generally accepted accounting principles, other extraordinary expenses not incurred in the ordinary course of the Fund’s business, dividend expense on short sales, expenses incurred under a Rule 12b-1 plan of distribution, “acquired fund fees and expenses” (i.e., investment companies in which the Fund may invest), and expenses that the Fund has incurred but did not actually pay because of an expense offset arrangement) do not exceed 1.95% of net assets. This expense limitation arrangement also does not include the expense of other investment companies in which the Fund may invest. The contractual agreement is effective through September 30, 2015. For the fiscal year ended May 31, 2015, the Adviser waived fees of $148,331. At May 31, 2015, the Adviser was owed $165,954 from the Fund for advisory services. The waiver and/or reimbursement by
27
LS Opportunity Fund
Notes to the Financial Statements – continued
May 31, 2015
NOTE 4. FEES AND OTHER TRANSACTIONS WITH AFFILIATES AND OTHER SERVICE PROVIDERS – continued
the Adviser with respect to the Fund is subject to repayment by the Fund within the three fiscal years following the fiscal year in which that particular waiver and/or reimbursement occurred, provided that the Fund is able to make the repayment without exceeding the expense limitations described above.
The amount subject to repayment by the Fund pursuant to the aforementioned conditions at May 31, 2015 was:
| | |
Amount | | Recoverable through
May 31, |
$159,710 | | 2017 |
148,331 | | 2018 |
The Adviser has retained the Sub-Adviser to provide portfolio management and related services to the Fund. The Sub-Adviser receives a fee from the Adviser (not the Fund) for these services. The Trust retains Huntington Asset Services, Inc. (“HASI”), to manage the Fund’s business affairs and to provide the Fund with administrative services, including all regulatory reporting and necessary office equipment and personnel. For the fiscal year ended May 31, 2015, HASI earned fees of $133,320 for administrative services provided to the Fund. At May 31, 2015, the Fund owed HASI $8,951 for administrative services. Certain officers of the Trust are members of management and/or employees of HASI. A trustee of the Trust is a member of management of HASI. HASI operates as a wholly-owned subsidiary of Huntington Bancshares, Inc., the parent company of Unified Financial Securities, Inc. (the “Distributor”).
The Trust retains HASI to act as the Fund’s transfer agent and to provide fund accounting services. For the fiscal year ended May 31, 2015, HASI earned fees of $65,107 from the Fund for transfer agent services. For the fiscal year ended May 31, 2015, HASI earned fees of $80,091 from the Fund for fund accounting services. At May 31, 2015, the Fund owed HASI $5,397 for transfer agent services and $5,515 for fund accounting services.
The Distributor acts as the principal distributor of the Fund’s shares. There were no payments made to the Distributor by the Fund for the fiscal year ended May 31, 2015. A trustee and an officer of the Trust is an officer of the Distributor and such person may be deemed to be an affiliate of the Distributor.
28
LS Opportunity Fund
Notes to the Financial Statements – continued
May 31, 2015
NOTE 5. INVESTMENT TRANSACTIONS
For the fiscal year ended May 31, 2015, purchases and sales of investment securities, other than short-term investments, were as follows:
| | | | |
Purchases | | | | |
U.S. Government Obligations | | $ | — | |
Other | | | 807,626,383 | |
Sales | | | | |
U.S. Government Obligations | | $ | — | |
Other | | | 887,836,222 | |
NOTE 6. ESTIMATES
The preparation of financial statements in conformity with GAAP requires management to make estimates and assumptions that affect the reported amounts of assets and liabilities and disclosure of contingent assets and liabilities at the date of the financial statements and the reported amounts of increases and decreases in net assets from operations during the reporting period. Actual results could differ from those estimates.
NOTE 7. BENEFICIAL OWNERSHIP
The beneficial ownership, either directly or indirectly, of 25% or more of the voting securities of a fund creates a presumption of control of a fund, under Section 2(a)(9) of the Investment Company Act of 1940. At May 31, 2015, National Financial Services, Inc. (“NFS”) owned, as record shareholder, 79% of the outstanding shares of the Fund. It is not known whether NFS or any of the underlying beneficial owners owned or controlled 25% or more of the voting securities of the Fund.
NOTE 8. FEDERAL TAX INFORMATION
At May 31, 2015, the appreciation (depreciation) of investments, net of proceeds for investment securities sold short, for tax purposes was as follows:
| | | | |
| | | Amount | |
Gross Unrealized Appreciation | | $ | 195,314 | |
Gross Unrealized Depreciation | | | (566,512 | ) |
| | | | |
Net Unrealized Depreciation | | $ | (371,198 | ) |
| | | | |
29
LS Opportunity Fund
Notes to the Financial Statements – continued
May 31, 2015
NOTE 8. FEDERAL TAX INFORMATION – continued
At May 31, 2015, the aggregate cost of securities, net of proceeds for investment securities sold short, for federal income tax purposes, was $56,185,817.
The tax characterization of distributions for the fiscal years ended May 31, 2015 and May 31, 2014, were as follows:
| | | | | | | | |
| | | 2015 | | | 2014 | |
Distributions paid from: | | | | | | | | |
Long-term Capital Gain | | $ | 3,344,132 | | | $ | 2,801,219 | |
| | | | | | | | |
| | $ | 3,344,132 | | | $ | 2,801,219 | |
| | | | | | | | |
At May 31, 2015, the components of distributable earnings (accumulated losses) on a tax basis were as follows:
| | | | |
Undistributed Ordinary Income | | $ | 2,549,871 | |
Undistributed long-term capital gains | | | 1,448,940 | |
Accumulated capital and other losses | | | (9,702 | ) |
Unrealized appreciation/(depreciation) | | | (371,879 | ) |
| | | | |
| | $ | 3,617,230 | |
| | | | |
The difference between book basis and tax basis unrealized appreciation is primarily attributable to the tax deferral of wash losses.
NOTE 9. DISTRIBUTIONS TO SHAREHOLDERS
On July 10, 2015, the Fund paid the following distributions to shareholders of record on July 9, 2015.
| | | | |
Distribution Type | | Per Share | |
Short-Term Capital Gain | | $ | 0.477221 | |
Long-Term Capital Gain | | $ | 0.271177 | |
30
LS Opportunity Fund
Notes to the Financial Statements – continued
May 31, 2015
NOTE 10. COMMITMENTS AND CONTINGENCIES
The Fund indemnifies its officers and trustees for certain liabilities that may arise from their performance of their duties to the Fund. Additionally, in the normal course of business, the Fund enters into contracts that contain a variety of representations and warranties which provide general indemnifications. The Fund’s maximum exposure under these arrangements is unknown, as this would involve future claims that may be made against the Fund that have not yet occurred.
NOTE 11. SUBSEQUENT EVENT
Management of the Fund has evaluated the need for disclosures and/or adjustments resulting from subsequent events through the date these financial statements were issued. The Adviser and the Board were informed of certain portfolio management changes expected to occur within the Previous Sub-Adviser to the Fund that would impact the ongoing management of the Fund. As such, the Board terminated the previous sub-advisory agreement on April 23, 2015 and that termination became effective on May 28, 2015. At a special meeting held on April 28, 2015, the Board met to approve an interim sub-advisory agreement with Prospector Partners so that it may provide sub-advisory services to the Fund. The Sub-Advisor commenced providing services to the Fund on an interim basis on May 28, 2015. At its June 30, 2015 meeting, the Board, including by separate vote of a majority of the Independent Trustees, reviewed and approved the new sub-advisory agreement between the Sub-Adviser and the Adviser, subject to shareholder approval. Shareholders are expected to vote on this proposal at a special meeting to occur on, or about, September 17, 2015. Shareholders will also be asked to vote on a proposal to implement a multi-manager arrangement whereby the Adviser, under certain circumstances, would be able to hire and replace sub-advisers for the Fund without obtaining shareholder approval.
31
REPORT OF INDEPENDENT REGISTERED PUBLIC ACCOUNTING FIRM
To the Shareholders of LS Opportunity Fund and
Board of Trustees of Valued Advisers Trust
We have audited the accompanying statement of assets and liabilities, including the schedules of investments and securities sold short, of LS Opportunity Fund (the “Fund”), a series of Valued Advisers Trust, as of May 31, 2015, and the related statement of operations for the year then ended, the statements of changes in net assets for each of the two years in the period then ended, and the financial highlights for each of the four years in the period then ended. These financial statements and financial highlights are the responsibility of the Fund’s management. Our responsibility is to express an opinion on these financial statements and financial highlights based on our audits. The financial highlights for the period ended May 31, 2011, were audited by other auditors whose report dated July 22, 2011, expressed an unqualified opinion on those financial highlights.
We conducted our audits in accordance with the standards of the Public Company Accounting Oversight Board (United States). Those standards require that we plan and perform the audit to obtain reasonable assurance about whether the financial statements and financial highlights are free of material misstatement. An audit includes examining, on a test basis, evidence supporting the amounts and disclosures in the financial statements. Our procedures included confirmation of securities owned as of May 31, 2015, by correspondence with the custodian and brokers. An audit also includes assessing the accounting principles used and significant estimates made by management, as well as evaluating the overall financial statement presentation. We believe that our audits provide a reasonable basis for our opinion.
In our opinion, the financial statements and financial highlights referred to above present fairly, in all material respects, the financial position of LS Opportunity Fund as of May 31, 2015, the results of its operations for the year then ended, the changes in its net assets for each of the two years in the period then ended, and the financial highlights for each of the four years in the period then ended, in conformity with accounting principles generally accepted in the United States of America.

COHEN FUND AUDIT SERVICES, LTD.
Cleveland, Ohio
July 28, 2015
32
Additional Federal Income Tax Information (Unaudited):
The Form 1099-DIV you receive in January 2016 will show the tax status of all distributions paid to your account in calendar year 2015. Shareholders are advised to consult their own tax adviser with respect to the tax consequences of their investment in the Fund. As required by the Internal Revenue Code and/or regulations, shareholders must be notified regarding the status of qualified dividend income for individuals and the dividends received deduction for corporations.
Qualified Dividend Income: For the fiscal year ended May 31, 2015, the Fund designates 0%, or up to the maximum amount of such dividends allowable pursuant to the Internal Revenue Code, as qualified dividend income eligible for the reduced tax rate of 15%.
Dividends Received Deduction: Corporate shareholders are generally entitled to take the dividends received deduction on the portion of the Fund’s dividend distribution that qualifies under tax law. For the Fund’s fiscal year 2015 ordinary income dividends, 0% for the corporate dividends received deduction.
For the fiscal year ended May 31, 2015, the Fund designated $5,159,265 as long-term capital gain distributions.
33
The following table provides information regarding each of the Independent Trustees.
| | | | |
Name, Address*, (Age),
Position with Trust**, Term
of Position with Trust | | Principal Occupation During Past 5 Years | | Other Directorships |
| | |
Ira Cohen, 56, Independent Trustee, June 2010 to present. | | Independent financial services consultant (Feb. 2005 – present). | | Trustee and Audit Committee Chairman, Griffin Institutional Access Real Estate Fund since May 2014. Trustee for the Angel Oak Funds Trust since October 2014. |
| | |
| Andrea N. Mullins, 48, Independent Trustee, December 2013 to present. | | Private investor; Independent Contractor, Seabridge Wealth Management, LLC, since April 2014; Principal Financial Officer and Treasurer, Eagle Family of Funds (mutual fund family) and Vice President, Eagle Asset Management, Inc. (investment adviser) each from 2004 to 2010. | | None. |
| * | The address for each trustee and officer is 2960 N. Meridian St., Suite 300, Indianapolis, IN 46208. |
| ** | As of the date of this report, the Trust consists of 14 series. |
The following table provides information regarding the Trustee who is considered an “interested person” of the Trust, as that term is defined under the 1940 Act. Based on the experience of the Trustee, the Trust concluded that the individual described below is qualified to serve as a Trustee.
| | | | |
Name, Address*, (Age),
Position with Trust**, Term
of Position with Trust | | Principal Occupation During Past 5 Years | | Other Directorships |
| | |
R. Jeffrey Young, 50, Trustee and Chairman, June 2010 to present; Principal Executive Officer and President, Valued Advisers Trust since February 2010. | | President of Huntington Asset Services since April 2015, Senior Vice President, since January 2010 and Director since May 2014; Director, Unified Financial Securities since May 2014; Chief Executive Officer, Huntington Funds from February 2010 to March 2015; Chief Executive Officer, The Huntington Strategy Shares from November 2010 to March 2015; President and Chief Executive Officer, Dreman Contrarian Funds March 2011 to February 2013; Trustee, Valued Advisers Trust, August 2008 to January 2010; and Managing Director and Chief Operating Officer of Professional Planning Consultants 2007 to 2010. | | Trustee and Chairman, Capitol Series Trust, since September 2013. |
| * | The address for each trustee and officer is 2960 N. Meridian St., Suite 300, Indianapolis, IN 46208. |
| ** | As of the date of this report, the Trust consists of 14 series. |
34
The following table provides information regarding the Officers of the Trust:
| | | | |
Name, Address*, (Age),
Position with Trust,** Term
of Position with Trust | | Principal Occupation During Past 5 Years | | Other Directorships |
| | |
| R. Jeffrey Young, 50, Trustee and Chairman, June 2010 to present; Principal Executive Officer and President, Valued Advisers Trust since February 2010. | | President of Huntington Asset Services since April 2015, Senior Vice President, since January 2010 and Director since May 2014; Director, Unified Financial Securities, since May 2014; Chief Executive Officer, Huntington Funds from February 2010 to March 2015; Chief Executive Officer, The Huntington Strategy Shares from November 2010 to March 2015; President and Chief Executive Officer, Dreman Contrarian Funds March 2011 to February 2013; Trustee, Valued Advisers Trust, August 2008 to January 2010; and Managing Director and Chief Operating Officer of Professional Planning Consultants 2007 to 2010. | | Trustee and Chairman, Capitol Series Trust, since September 2013. |
| | |
John C. Swhear, 54,
Chief Compliance Officer, AML Officer and Vice President, August 2008 to present. | | Vice President of Legal Administration and Compliance, Huntington Asset Services, Inc., the Trust’s administrator, since April 2007 and Director since May 2014; Chief Compliance Officer, Unified Financial Securities, Inc., the Trust’s distributor, since May 2007 and Director since May 2014; President, Unified Series Trust, since March 2012, and Senior Vice President from May 2007 to March 2012; Chief Compliance Officer and AML Officer, Capitol Series Trust, since September 2013; Secretary, Huntington Funds, from April 2010 to February 2012; and President and Chief Executive Officer, Dreman Contrarian Funds, from March 2010 to March 2011. | | None. |
| | |
Carol J. Highsmith, 50,
Vice President, August 2008 to present; Secretary, March 2014 to present | | Employed in various positions with Huntington Asset Services, Inc., the Trust’s administrator, since November of 1994; currently Vice President of Legal Administration; Secretary, Cross Shore Discovery Fund since May 2014. | | None. |
| | |
Matthew J. Miller, 39,
Vice President, December 2011 to present. | | Employed in various positions with Huntington Asset Services, Inc., the Trust’s administrator, since July of 1998; currently Vice President of Relationship Management; Vice President, Huntington Funds, since February 2010; President and Chief Executive Officer, Capitol Series Trust, since September 2013. | | None. |
| | |
| Bryan W. Ashmus, 42, Principal Financial Officer and Treasurer, December 2013 to present. | | Vice President, Fund Administration, Huntington Asset Services, Inc., the Trust’s administrator, since September 2013; Chief Financial Officer and Treasurer, The Huntington Strategy Shares and The Huntington Funds, since November 2013; Vice President, Fund Administration, Citi Fund Services Ohio, Inc., from 2005 to 2013. | | None. |
| * | The address for each trustee and officer is 2960 N. Meridian St., Suite 300, Indianapolis, IN 46208. |
| ** | As of the date of this report, the Trust consists of 14 series. |
35
OTHER INFORMATION
The Fund’s Statement of Additional Information (“SAI”) includes additional information about the trustees and is available without charge, upon request. You may call toll-free at (877) 336-6763 to request a copy of the SAI or to make shareholder inquiries.
36
Continuation of Investment Advisory Agreement and Sub-Advisory Agreement Relating to the LS Opportunity Fund (Unaudited)
At a meeting held on March 10-11, 2015, the Board of Trustees (the “Board”) considered the renewal of the Investment Advisory Agreement (the “Advisory Agreement”) between the Trust and Long Short Advisors, LLC (“LSA” or “Adviser”) on behalf of the LS Opportunity Fund (the “Fund” or “LS Fund”) and the renewal of the Investment Sub-Advisory Agreement (the “Sub-Advisory Agreement”) between the Adviser and Independence Capital Asset Partners, LLC (“ICAP” or “Sub-Adviser”) on behalf of the Fund. Counsel noted that the 1940 Act requires the approval of the investment advisory agreement between the Trust and its investment adviser by the Board, including a majority of the Independent Trustees. The Board then specifically discussed the arrangements between the Adviser and the Trust with respect to the Fund.
Counsel directed the Trustees to a memorandum that summarized, among other things, the fiduciary duties and responsibilities of the Board in reviewing and approving the agreements. A copy of this memorandum was circulated to the Trustees in advance of the meeting. Counsel discussed with the Trustees the types of information and factors that should be considered by the Board in order to make an informed decision regarding the approval of the renewal of the Advisory Agreement and Sub-Advisory Agreement, including the following material factors: (i) the nature, extent, and quality of the services provided by the Adviser, including its oversight of ICAP; (ii) the investment performance of the Fund; (iii) the costs of the services to be provided and anticipated profits to be realized by the Adviser from the relationship with the Fund; (iv) the extent to which economies of scale would be realized if the Fund grows and whether advisory fee levels reflect those economies of scale for the benefit of the Fund’s investors; and (v) the Adviser’s practices regarding possible conflicts of interest and potential benefits derived from its relationship with the Fund. He pointed out that the Board’s duties with respect to the Sub-Advisory Agreement are the same as those with respect to the Advisory Agreement. The Board discussed the contractual arrangements between the Trust and LSA, and between LSA and ICAP with respect to the Fund.
Advisory Agreement
With respect to the proposed renewal of the Advisory Agreement, Counsel discussed with the Trustees the factors that should be considered by the Board in order to make an informed decision regarding the renewal of the Advisory Agreement, including a review of the factors as applicable to LSA. In assessing these factors and reaching its decisions, the Board took into consideration information furnished for the Board’s review and consideration throughout the year at regular Board meetings, as well as information specifically requested and prepared and/or presented in connection with the annual renewal process, including information presented at the Meeting. The Board was provided with information and reports
37
relevant to the annual renewal of the Advisory Agreement, including: (i) reports regarding the services and support provided to the LS Fund and its shareholders by LSA; (ii) quarterly assessments of the investment performance of the LS Fund by personnel of LSA; (iii) commentary on the reasons for the performance; (iv) presentations by LSA addressing investment philosophy, investment strategy, personnel and operations of ICAP; (v) compliance and audit reports concerning the LS Fund and LSA and the oversight by LSA of similar reports concerning ICAP; (vi) disclosure information contained in the registration statement of the Trust with respect to the LS Fund and the Form ADV of LSA; (vii) information relating to the manner in which LSA oversees ICAP; and (viii) a memorandum from Counsel, that summarized the fiduciary duties and responsibilities of the Board in reviewing and approving the Advisory Agreement, including the material factors set forth above and the types of information included in each factor that should be considered by the Board in order to make an informed decision. The Board also requested and received various informational materials including, without limitation: (i) documents containing information about LSA, including financial information, a description of personnel and the managerial services provided to the LS Fund, information on investment advice, performance, summaries of LS Fund expenses, compliance program, current legal matters, and other general information; (ii) comparative expense and performance information for other mutual funds with strategies similar to the LS Fund; and (iii) benefits to be realized by LSA from its relationship with the LS Fund. The Board did not identify any particular information that was most relevant to its consideration to approve the Advisory Agreement and each Trustee may have afforded different weight to the various factors. In deciding whether to approve the Agreement, the Trustees considered:
| 1. | The nature, extent, and quality of the services to be provided by the Adviser. In this regard, the Board considered LSA’s responsibilities under the Advisory Agreement. The Trustees considered the services being provided by LSA to the Fund including its process for overseeing the sub-adviser’s portfolio management of the Fund, assuring compliance with the Fund’s investment objectives and limitations, its coordination of services for the Fund among the Fund’s service providers, and its efforts to promote the Fund and grow its assets. The Trustees reviewed the steps LSA takes to oversee and supervise the sub-adviser, as described in the materials provided by LSA. The Trustees noted that LSA had recently added a chief operating officer who has been beneficial to the operations of LSA and of the Fund. The Trustees also considered the relationship of LSA’s affiliate and its utilization of the infrastructure and other resources of its affiliate. The Trustees considered LSA’s continuity of, and commitment to retain, qualified personnel and LSA’s commitment to maintain and enhance its resources and systems, the commitment of LSA’s personnel to finding alternatives and options that allow the Fund to maintain its goals, and LSA’s continued cooperation with the Board and Counsel for the Fund. The Trustees considered LSA’s personnel, including the education and experience of LSA’s personnel. After considering the foregoing information and further information |
38
| | in the Meeting materials provided by LSA (including LSA’s Form ADV), the Board concluded that, in light of all the facts and circumstances, the nature, extent, and quality of the services provided by LSA were satisfactory and adequate for the Fund. |
| 2. | Investment Performance of the Fund and the Adviser. In considering the investment performance of the Fund, the Trustees noted that LSA did not manage any accounts directly and that it had delegated the portfolio management responsibilities of the Fund to a sub-adviser. Accordingly, the Trustees concluded that their consideration of this factor for LSA was less relevant in their determination of LSA’s performance of its duties than other factors. The Trustees considered the consistency of LSA’s management oversight of the Fund’s sub-adviser with the Fund’s investment objective, strategies, and limitations. The Trustees also compared the short-term performance of the Fund with the performance of its benchmark index, a style specific index and comparable funds with similar objectives managed by other investment advisers. The Trustees noted that the Fund’s performance, in the period since the Fund’s inception, was better than that of its style-specific benchmark, but that the Fund had underperformed as compared to its broad-based market index. The Trustees also observed that the Fund had outperformed the average and median of peers in the Fund’s category for the period since inception, although the Fund’s performance was lower than the average and median for periods of one year and less. After reviewing and discussing the investment performance of the Fund further, LSA’s experience in overseeing the sub-adviser to the Fund, the Fund’s historical performance, and other relevant factors, the Board concluded, in light of all the facts and circumstances, that the investment performance of the Fund was satisfactory. |
| 3. | The costs of the services to be provided and profits to be realized by the Adviser from the relationship with the Fund. In considering the costs of services to be provided and the profits to be realized by LSA from the relationship with the Fund, the Trustees considered: (1) LSA’s financial condition; (2) asset levels of the Fund; (3) the overall expenses of the Fund; and (4) the nature and frequency of advisory fee payments. The Trustees reviewed information provided by LSA regarding its profits associated with managing the Fund. The Trustees also considered the relationship of LSA’s affiliate and its utilization of the infrastructure and other resources of its affiliate. The Trustees also considered potential benefits for LSA in managing the Fund. The Trustees then compared the fees and expenses of the Fund (including the management fee) to other comparable mutual funds. The Trustees noted that the Fund’s management fee was the highest in its peer group and the net expense ratio was also among the highest in its peer group. In this regard, the Trustees reflected upon their discussion with representatives of LSA earlier in the Meeting, and commented on LSA’s assertion that the firm provided a premium product in comparison to other products in the marketplace. The Board concluded that |
39
| | the fees to be paid to LSA by the Fund and the profits to be realized by the Fund, in light of all the facts and circumstances, were fair and reasonable in relation to the nature and quality of the services provided by LSA. |
| 4. | The extent to which economies of scale would be realized as the Fund grows and whether advisory fee levels reflect these economies of scale for the benefit of the Fund’s investors. In this regard, the Board considered the Fund’s fee arrangements with LSA. The Board considered that while the management fee remained the same at all asset levels, the Fund’s shareholders had experienced benefits from the Fund’s expense limitation arrangement. The Trustees noted that once the Fund’s expenses fell below the cap set by the arrangement, the Fund’s shareholders would continue to benefit from the economies of scale under the Fund’s agreements with service providers other than LSA. In light of its ongoing consideration of the Fund’s asset levels, expectations for growth in the Fund, and fee levels, the Board determined that the Fund’s fee arrangements, in light of all the facts and circumstances, were fair and reasonable in relation to the nature and quality of the services provided by LSA. |
| 5. | Possible conflicts of interest and benefits to the Adviser. In considering LSA’s practices regarding conflicts of interest, the Trustees evaluated the potential for conflicts of interest and considered such matters as the experience and ability of the advisory personnel assigned to the Fund; the operations of LSA’s investment advisory affiliate; and the substance and administration of LSA’s code of ethics. The Trustees also considered disclosure in the registration statement of the Trust relating to LSA’s potential conflicts of interest. The Trustees noted other potential benefits (in addition to the management fee) to LSA, such as the ability to offer the Fund as an investment option for the smaller clients of LSA’s affiliate. Based on the foregoing, the Board determined that LSA’s standards and practices relating to the identification and mitigation of potential conflicts of interest and the benefits to be realized by LSA in managing the Fund were satisfactory. |
After additional consideration of the factors delineated in the memorandum provided by Counsel and further discussion among the Board, the Board determined to approve the continuation of the Advisory Agreement between the Trust and the Adviser.
Sub-Advisory Agreement
The Board then specifically discussed the proposed renewal of the Sub-Advisory Agreement between LSA and ICAP with respect to the LS Fund. Counsel again referenced the memorandum from Counsel that summarized, among other things, the fiduciary duties and responsibilities of the Board in reviewing and approving the renewal of the Sub-Advisory Agreement. Counsel reminded the Trustees of the types of information and factors that should be considered by the Board in order to make
40
an informed decision regarding the approval of the renewal of the Sub-Advisory Agreement, including a review of the Factors as applicable to ICAP.
In assessing these factors and reaching its decisions, the Board took into consideration information furnished for the Board’s review and consideration throughout the year at regular Board meetings, as well as information specifically requested and prepared and/or presented in connection with the annual renewal process, including information presented at the Meeting. The Board was provided with information and reports relevant to the annual renewal of the Sub-Advisory Agreement, including: (i) reports regarding the services provided to the LS Fund and its shareholders by ICAP; (ii) compliance and audit reports concerning the LS Fund and ICAP; (iii) disclosure information contained in the registration statement of the Trust with respect to the LS Fund and the Form ADV of ICAP; and (iv) a memorandum from Counsel, that summarized the fiduciary duties and responsibilities of the Board in reviewing and approving the Sub-Advisory Agreement, including the material factors set forth above and the types of information included in each factor that should be considered by the Board in order to make an informed decision. The Board also requested and received various informational materials including, without limitation: (i) documents containing information about ICAP, including financial information, a description of personnel and the services provided to the LS Fund, information on investment advice, performance, summaries of LS Fund expenses, compliance program, current legal matters, and other general information; (ii) comparative expense and performance information for other mutual funds with strategies similar to the LS Fund; (iii) the anticipated effect of size on the LS Fund’s performance and expenses; and (iv) benefits to be realized by ICAP from its relationship with the LS Fund. The Board did not identify any particular information that was most relevant to its consideration to approve the Sub-Advisory Agreement and each Trustee may have afforded different weight to the various factors. In deciding whether to approve the Agreement, the Trustees considered:
| 1. | The nature, extent, and quality of the services to be provided by the Sub-Adviser. In this regard, the Board considered ICAP’s responsibilities under the Sub-Advisory Agreement. The Trustees considered the services being provided by ICAP to the LS Fund, including, without limitation: the quality of its investment sub-advisory services (including research and recommendations with respect to portfolio securities), its process for formulating investment recommendations and assuring compliance with the Fund’s investment objectives and limitations. The Trustees considered ICAP’s continuity of, and commitment to retain, qualified personnel and ICAP’s commitment to maintain and enhance its resources and systems, the commitment of ICAP’s personnel. The Trustees considered ICAP’s personnel, including the education and experience of ICAP’s personnel. After considering the foregoing information and further information in the Meeting materials provided by ICAP (including ICAP’s Form ADV), the Board concluded that, in light of all the facts and circumstances, the nature, extent, and quality of the services provided by ICAP were satisfactory and adequate for the Fund. |
41
| 2. | Investment Performance of the Fund and the Sub-Adviser. In considering the investment performance of the Fund and ICAP, the Trustees compared the short-term performance of the Fund with the performance of funds with similar objectives managed by other investment advisers, as well as with aggregated peer group data and with its benchmarks. The Trustees also considered the consistency of ICAP’s management of the Fund with its investment objective, strategies, and limitations. The Trustees considered the performance of other accounts managed by ICAP. The Trustees noted that the Fund Fund’s performance, in the period since the Fund’s inception, was better than that of its style-specific benchmark, but that the Fund had underperformed as compared to its broad-based market index. The Trustees also observed that the Fund had outperformed the average and median of peers in the Fund’s category for the period since inception, although the Fund’s performance was lower than the average and median for periods of one year and less. The Trustees considered that the performance of the Fund was less than that of ICAP’s composite of other accounts that were managed in a manner similar to the Fund. After reviewing and discussing the investment performance of the Fund further, ICAP’s experience sub-advising the Fund, the Fund’s historical performance, and other relevant factors, the Board concluded, in light of all the facts and circumstances, that the investment performance of the Fund and ICAP was satisfactory. |
| 3. | The costs of the services to be provided and profits to be realized by the Sub-Adviser from the relationship with the Fund. In considering the costs of services to be provided and the profits to be realized by ICAP from the relationship with the Fund, the Trustees considered: (1) ICAP’s financial condition; (2) the asset levels of the Fund; (3) the overall expenses of the Fund; and (4) the nature and frequency of sub-advisory fee payments. The Trustees reviewed information provided by ICAP regarding its profits associated with managing the Fund. The Trustees also considered potential benefits for ICAP in managing the Fund. The Trustees then compared the fees and expenses of the Fund (including the sub-advisory fee) to other accounts managed by ICAP. The Trustees noted that the sub-advisory fee was lower than any other accounts with similar objectives and strategies managed by ICAP. Based on the foregoing, the Board concluded that the fees to be paid to ICAP by the Fund’s adviser and the profits to be realized by ICAP, in light of all the facts and circumstances, were fair and reasonable in relation to the nature and quality of the services provided by ICAP. |
| 4. | The extent to which economies of scale would be realized as the Fund grows and whether sub-advisory fee levels reflect these economies of scale for the benefit of the Fund’s investors. In this regard, the Board considered the Fund’s fee arrangements with ICAP. The Board considered that while the sub-advisory fee changed with changes in the Fund’s assets, the Fund’s shareholders did not realize any changes in their overall expenses as ICAP’s fee was paid entirely |
42
| | from the advisory fee paid to the investment adviser, which was fixed. The Board considered the sub-advisory fees in light of the overall arrangement with the Fund’s investment adviser. In light of the foregoing, the Board determined that the Fund’s fee arrangements for ICAP, in light of all the facts and circumstances, were fair and reasonable in relation to the nature and quality of the services provided by ICAP. |
| 5. | Possible conflicts of interest and benefits to the Sub-Adviser. In considering ICAP’s practices regarding conflicts of interest, the Trustees evaluated the potential for conflicts of interest and considered such matters as the experience and ability of the advisory personnel assigned to the Fund; the basis of decisions to buy or sell securities for the Fund and/or ICAP’s other accounts; and the substance and administration of ICAP’s code of ethics. The Trustees also considered disclosure in the registration statement of the Trust relating to ICAP’s potential conflicts of interest. The Trustees noted that ICAP may utilize soft dollars and the Trustees noted ICAP’s policies and processes for managing the conflicts of interest that could arise from soft dollar arrangements. The Trustees noted another potential benefit (in addition to the sub-advisory fee) to ICAP, which is the ability to generate a public performance record for potential clients that utilize hedge funds as well as mutual funds. Based on the foregoing, the Board determined that the standards and practices of ICAP relating to the identification and mitigation of potential conflicts of interest and the benefits to be realized by ICAP in managing the Fund were satisfactory. |
After additional consideration of the factors delineated in the memorandum provided by Counsel and further discussion among the Board, the Board determined to approve the continuation of the Sub-Advisory Agreement between the Adviser and the Sub-Adviser.
43
VALUED ADVISERS TRUST
PRIVACY POLICY
The following is a description of the policies of the Valued Advisers Trust (the “Trust”) regarding disclosure of nonpublic personal information that shareholders provide to a series of the Trust (each, a “Fund”) or that the Fund collects from other sources. In the event that a shareholder hold shares of a Fund through a broker-dealer or other financial intermediary, the privacy policy of the financial intermediary would govern how shareholder nonpublic personal information would be shared with nonaffiliated third parties.
Categories of Information a Fund May Collect. A Fund may collect the following nonpublic personal information about its shareholders:
| | • | | Information the Fund receives from a shareholder on applications or other forms, correspondence, or conversations (such as the shareholder’s name, address, phone number, social security number, and date of birth); and |
| | • | | Information about the shareholder’s transactions with the Fund, its affiliates, or others (such as the shareholder’s account number and balance, payment history, cost basis information, and other financial information). |
Categories of Information a Fund May Disclose. A Fund may not disclose any nonpublic personal information about its current or former shareholders to unaffiliated third parties, except as required or permitted by law. A Fund is permitted by law to disclose all of the information it collects, as described above, to its service providers (such as the Fund’s custodian, administrator, transfer agent, accountant and legal counsel) to process shareholder transactions and otherwise provide services to the shareholder.
Confidentiality and Security. Each Fund shall restrict access to shareholder nonpublic personal information to those persons who require such information to provide products or services to the shareholder. Each Fund shall maintain physical, electronic, and procedural safeguards that comply with federal standards to guard shareholder nonpublic personal information.
Disposal of Information. The Funds, through their transfer agent, have taken steps to reasonably ensure that the privacy of a shareholder’s nonpublic personal information is maintained at all times, including in connection with the disposal of information that is no longer required to be maintained by the Funds. Such steps shall include, whenever possible, shredding paper documents and records prior to disposal, requiring off-site storage vendors to shred documents maintained in such locations prior to disposal, and erasing and/or obliterating any data contained on electronic media in such a manner that the information can no longer be read or reconstructed.
44
PROXY VOTING
A copy of the policies and procedures of the Fund uses to determine how to vote proxies relating to securities held in the Fund’s portfolio, as well as a record of how the Fund voted any such proxies during the most recent 12-month period ended June 30, is available without charge and upon request by calling the Fund at (877) 336-6763. This information is also available from the EDGAR database on the SEC’s website at www.sec.gov.
TRUSTEES
R. Jeffrey Young, Chairman
Ira Cohen
Andrea Mullins
OFFICERS
R. Jeffrey Young, Principal Executive Officer and President
Bryan W. Ashmus, Principal Financial Officer and Treasurer
John C. Swhear, Chief Compliance Officer, AML Officer and Vice President
Carol J. Highsmith, Vice President and Secretary
Matthew J. Miller, Vice President
INVESTMENT ADVISOR
Long Short Advisors, LLC
1818 Market Street, 33rd Floor, Suite 3323
Philadelphia, PA 19103
DISTRIBUTOR
Unified Financial Securities, Inc.
2960 North Meridian Street, Suite 300
Indianapolis, IN 46208
INDEPENDENT REGISTERED PUBLIC ACCOUNTING FIRM
Cohen Fund Audit Services, Ltd.
1350 Euclid Avenue, Suite 800
Cleveland, OH 44115
LEGAL COUNSEL
The Law Offices of John H. Lively & Associates, Inc.,
A member firm of The 1940 Act Law GroupTM
11300 Tomahawk Creek Parkway, Suite 310
Leawood, KS 66211
CUSTODIAN
Citibank, N.A.
388 Greenwich Street
New York, NY 10013
ADMINISTRATOR, TRANSFER AGENT AND FUND ACCOUNTANT
Huntington Asset Services, Inc.
2960 North Meridian Street, Suite 300
Indianapolis, IN 46208
This report is intended only for the information of shareholders or those who have received the Fund’s prospectus which contains information about the Fund’s management fee and expenses. Please read the prospectus carefully before investing.
Distributed by Unified Financial Securities, Inc.
Member FINRA/SIPC
Item 2. Code of Ethics.
As of the end of the period covered by this report, the registrant has adopted a code of ethics that applies to the registrant’s principal executive officer, principal financial officer, principal accounting officer or controller, or persons performing similar functions, regardless of whether these individuals are employed by the registrant or a third party. Pursuant to Item 12(a)(1), a copy of registrant’s code of ethics is filed as an exhibit to this Form N-CSR. During the period covered by this report, the code of ethics has not been amended, and the registrant has not granted any waivers, including implicit waivers, from the provisions of the code of ethics.
Item 3. Audit Committee Financial Expert.
(a)(1) The registrant’s Board of Trustees has determined that the registrant has at least one audit committee financial expert serving on its audit committee.
(a)(2) The audit committee financial expert is Andrea N. Mullins, who is “independent” for purposes of this Item 3 of Form N-CSR.
Item 4. Principal Accountant Fees and Services.
| | | | | | | | |
LS Opportunity Fund: | | | FY 2015 | | | $ | 14,000 | |
| | | FY 2014 | | | $ | 13,500 | |
| | |
BFS Equity Fund: | | | FY 2015 | | | $ | 13,000 | |
| | | FY 2014 | | | $ | 12,500 | |
| | |
Cloud Capital Funds: | | | FY 2015 | | | $ | 13,500 | |
| | | FY 2014 | | | $ | 25,000 | |
Registrant
| | | | | | | | |
LS Opportunity Fund: | | | FY 2015 | | | $ | 0 | |
| | | FY 2014 | | | $ | 0 | |
| | |
BFS Equity Fund: | | | FY 2015 | | | $ | 0 | |
| | | FY 2014 | | | $ | 0 | |
| | |
Cloud Capital Funds: | | | FY 2015 | | | $ | 0 | |
| | | FY 2014 | | | $ | 0 | |
Registrant
| | | | | | | | |
LS Opportunity Fund: | | | FY 2015 | | | $ | 5,000 | |
| | | FY 2014 | | | $ | 2,500 | |
| | |
BFS Equity Fund: | | | FY 2015 | | | $ | 2,500 | |
| | | FY 2014 | | | $ | 2,500 | |
| | |
Cloud Capital Funds: | | | FY 2015 | | | $ | 2,500 | |
| | | FY 2014 | | | $ | 5,000 | |
Nature of the fees: Preparation of the 1120 RIC and Excise review
Registrant
| | | | | | | | |
LS Opportunity Fund: | | | FY 2015 | | | $ | 0 | |
| | | FY 2014 | | | $ | 0 | |
| | |
BFS Equity Fund: | | | FY 2015 | | | $ | 0 | |
| | | FY 2014 | | | $ | 0 | |
| | |
Cloud Capital Funds: | | | FY 2015 | | | $ | 19,400 | |
| | | FY 2014 | | | $ | 20,000 | |
Nature of the fees: Rule 17f-1 Examination
| | | | |
(e) | | (1) | | Audit Committee’s Pre-Approval Policies |
| | |
| | | | The Audit Committee Charter requires the Audit Committee to be responsible for the selection, retention or termination of auditors and, in connection therewith, to (i) evaluate the proposed fees and other compensation, if any, to be paid to the auditors, (ii) evaluate the independence of the auditors, (iii) pre-approve all audit services and, when appropriate, any non-audit services provided by the independent auditors to the Trust, (iv) pre-approve, when appropriate, any non-audit services provided by the independent auditors to the Trust’s investment adviser, or any entity controlling, controlled by, or under common control with the investment adviser and that provides ongoing services to the Trust if the engagement relates directly to the operations and financial reporting of the Trust, and (v) receive the auditors’ specific representations as to their independence; |
| | |
| | (2) | | Percentages of Services Approved by the Audit Committee |
Registrant
| | | | |
Audit-Related Fees: | | | 0 | % |
Tax Fees: | | | 0 | % |
All Other Fees: | | | 0 | % |
(f) During audit of registrant’s financial statements for the most recent fiscal year, less than 50 percent of the hours expended on the principal accountant’s engagement were attributed to work performed by persons other than the principal accountant’s full-time, permanent employees.
(g) The aggregate non-audit fees billed by the registrant’s accountant for services rendered to the registrant, and rendered to the registrant’s investment adviser (not including any sub-adviser whose role is primarily portfolio management and is subcontracted with or overseen by another investment adviser), and any entity controlling, controlled by, or under common control with the adviser that provides ongoing services to the registrant:
| | | | | | | | |
| | | Registrant | | | Adviser | |
FY 2015 | | $ | 0 | | | $ | 0 | |
FY 2014 | | $ | 0 | | | $ | 0 | |
(h) Not applicable. The auditor performed no services for the registrant’s investment adviser or any entity controlling, controlled by, or under common control with the investment adviser that provides ongoing services to the registrant.
Item 5. Audit Committee of Listed Companies. NOT APPLICABLE – applies to listed companies only
Item 6. Schedule of Investments. Schedules filed with Item 1.
Item 7. Disclosure of Proxy Voting Policies and Procedures for Closed-End Management Investment Companies.
NOT APPLICABLE – applies to closed-end funds only
Item 8. Portfolio Managers of Closed-End Investment Companies. NOT APPLICABLE – applies to closed-end funds only
Item 9. Purchases of Equity Securities by Closed-End Management Investment Company and Affiliated Purchasers.
NOT APPLICABLE – applies to closed-end funds only
Item 10. Submission of Matters to a Vote of Security Holders.
The guidelines applicable to shareholders desiring to submit recommendations for nominees to the Registrant’s board of trustees are contained in the statement of additional information of the Trust with respect to the Fund(s) for which this Form N-CSR is being filed.
Item 11. Controls and Procedures.
(a) Based on their evaluation of the registrant’s disclosure controls and procedures (as defined in Rule 30a-3(c) under the Investment Company Act of 1940, as amended (the “Act”)) as of a date within 90 days of the filing date of this report, the registrant’s principal executive officer and principal financial officer have concluded that such disclosure controls and procedures are reasonably designed and are operating effectively to ensure that material information relating to the registrant is made known to them by others within those entities, particularly during the period in which this report is being prepared, and that the information required in filings on Form N-CSR is recorded, processed, summarized, and reported on a timely basis.
(b) There were no changes in the registrant’s internal control over financial reporting (as defined in Rule 30a-3(d) under the Investment Company Act of 1940) that occurred during the second fiscal quarter of the period covered by this report that have materially affected, or are reasonably likely to materially affect, the registrant’s internal control over financial reporting.
Item 12. Exhibits.
| (a) (1) | Code is filed herewith. |
| (2) | Certifications by the registrant’s principal executive officer and principal financial officer, pursuant to Section 302 of the Sarbanes- Oxley Act of 2002 and required by Rule 30a-2 under the Investment Company Act of 1940 are filed herewith. |
| (b) | Certification pursuant to 18 U.S.C. Section 1350, as adopted pursuant to Section 906 of the Sarbanes-Oxley Act of 2002 is filed herewith. |
Pursuant to the requirements of the Securities Exchange Act of 1934 and the Investment Company Act of 1940, the registrant has duly caused this report to be signed on its behalf by the undersigned, thereunto duly authorized.
| | |
| (Registrant) | | Valued Advisers Trust |
| |
| By | | /s/ R. Jeffrey Young |
| | R. Jeffrey Young, President and Principal Executive Officer |
| |
| Date | | 8/05/2015 |
Pursuant to the requirements of the Securities Exchange Act of 1934 and the Investment Company Act of 1940, this report has been signed below by the following persons on behalf of the registrant and in the capacities and on the dates indicated.
| | |
| By | | /s/ R. Jeffrey Young |
| | R. Jeffrey Young, President and Principal Executive Officer |
| |
| Date | | 8/05/2015 |
| |
| By | | /s/ Bryan W. Ashmus |
| | Bryan W. Ashmus, Treasurer and Principal Financial Officer |
| |
| Date | | 8/05/2015 |