UNITED STATES
SECURITIES AND EXCHANGE COMMISSION
WASHINGTON, D.C. 20549
FORM N-CSR
CERTIFIED SHAREHOLDER REPORT OF REGISTERED
MANAGEMENT INVESTMENT COMPANIES
Investment Company Act file number 811-22208
Valued Advisers Trust
(Exact name of registrant as specified in charter)
| | |
Huntington Asset Services, Inc. 2960 N. Meridian Street, Suite 300 | | Indianapolis, IN 46208 |
| (Address of principal executive offices) | | (Zip code) |
Capitol Services, Inc.
615 S. Dupont Hwy.
Dover, DE 19901
(Name and address of agent for service)
With a copy to:
John H. Lively, Esq.
The Law Offices of John H. Lively & Associates, Inc.
A member firm of The 1940 Act Law Group
11300 Tomahawk Creek Parkway,
Suite 310
Leawood, KS 66221
Registrant’s telephone number, including area code: 317-917-7000
Date of fiscal year end: 5/31
Date of reporting period: 5/31/14
Item 1. Reports to Stockholders.
ANNUAL REPORT
May 31, 2014
BFS Equity Fund

185 Asylum Street — City Place II — Hartford, CT 06103 — (855) 575-2430
Letter to Shareholders
Dear Fellow Shareholders,
Welcome to the first annual report of the BFS Equity Fund (the “Fund”). The report covers the period from the launch of the Fund on November 8, 2013 through May 31, 2014 – the end of the Fund’s fiscal year. Thus the report covers a period of slightly less than seven months.
On the day of the launch on November 8, 2013, approximately $1.1 million was invested in the Fund, and over the subsequent period covered by this report, investors added more than $11 million to the Fund. With the positive investment performance of the Fund during the period under review, the BFS Equity Fund completed its fiscal year on May 31, 2014 with assets of $12.7 million.
This report includes a commentary from the Lead Portfolio Manager – Keith LaRose – and Co-Portfolio Managers, Tom Sargent and Tim Foster. You will also find a listing of the portfolio holdings as of May 31, 2014, financial statements and detailed information about the performance and positioning of the BFS Equity Fund.
The Fund’s launch took place during the 5th year of this bull market, which commenced on March 6, 2009 with the S&P 500® Index (“S&P 500”)1 bottoming at 666.79. At the inception of the Fund, the price of the S&P 500 had climbed 165.6% to close at 1770.61 on November 8, 2013. While not negative on the prospects of the U.S. economy or on the stock market at the time of the Fund’s launch, the Fund’s Portfolio Managers were naturally somewhat cautious in initiating stock positions in many stocks near their all-time highs. Accordingly, the Fund during its initial phase was positioned somewhat defensively in order to weather a potential pullback in the market.
In fact, there was a mild correction in the early part of 2014. As some shareholders may remember, the price of the S&P 500, having gained 4.39% from the date of the Fund’s launch through the end of 2013, sold off from January 15, 2014 through the first several days of February. The price of the S&P 500 dropped 5.76% during this period so that as of the close of the market on February 3, 2014, the price of the S&P 500 was lower than on the date of the Fund’s inception.
It was largely during this period when the market was whipsawing +/- 5% that the Fund’s managers were constructing the portfolio. The process was also complicated by the harsh winter which caused U.S. GDP to decline 2.9% during the first quarter, thereby negatively impacting the shares of many stocks. The
1
end result of our investment strategy is the Fund’s portfolio of 50 quality growth stocks purchased with a risk-mitigating approach and positioned to provide a margin of safety in the case of economic or market weakness. More than 85% of the Fund’s companies pay dividends, and a considerable number are so-called “dividend aristocrats” – companies which have increased their dividend payouts annually for the past 25 years. While the total return of the Fund has lagged the S&P 500 and the Dow Jones Industrial Average2 from its launch through May 31, 2014, we, at Bradley, Foster & Sargent, believe the Fund’s ownership of shares in these quality companies with strong brands and robust cash flow should be able to withstand market corrections, even bear markets and perform well over the long-term.
The Portfolio Managers of the BFS Equity Fund and I are shareholders together with you, and we appreciate the trust that you have placed in us to manage your assets. Kindly contact us via email through our website – www.bfsinvest.com or www.bfsfunds.com – or by telephone at 860-527-8050 with any questions or concerns about the Fund that are not addressed in this report.
Sincerely,
Robert H. Bradley
President and CEO
Bradley, Foster & Sargent, Inc.
| 1 | | The S&P 500® Index is a widely recognized unmanaged index of equity prices and is representative of a broader market and range of securities than is found in the Fund’s portfolio. The Index is an unmanaged benchmark that assumes reinvestment of all distributions and excludes the effect of taxes and fees. Individuals cannot invest directly in this Index; however, an individual can invest in exchange traded funds or other investment vehicles that attempt to track the performance of a benchmark index. |
| 2 | | The Dow Jones Industrial Average® is a widely recognized unmanaged index of equity prices and is representative of a narrower market and range of securities than is found in the Fund’s portfolio. The Index is an unmanaged benchmark that assumes reinvestment of all distributions and excludes the effect of taxes and fees. Individuals cannot invest directly in this Index; however, an individual can invest in exchange traded funds or other investment vehicles that attempt to track the performance of a benchmark index. |
2
Portfolio Managers’ Letter
TO OUR SHAREHOLDERS
The BFS Equity Fund (the “Fund”) had a total return of 7.4% for the period November 8, 2013 through May 31, 2014, the close of our first fiscal year. This compared to a total return of 11.4% for the S&P 500® Index (“S&P 500”) and 8.7% for the Dow Jones Industrial Average for the same period. At our fiscal year-end, the Fund had net assets of $12.7 million with a cash position of 3.5%.
MARKET COMMENTARY
The U.S. equity markets were strong during the fourth quarter of 2013 with the S&P 500 up 10.5%. For the full calendar year of 2013, the S&P 500 was up 32.4%, the best year since 1997. During the fourth quarter of 2013, when the Fund was launched, economic activity appeared to be accelerating, and this caused the yield on the U.S. 10-Year Treasury Note to climb from approximately 2.5% at the beginning of the quarter to 3.0% by year-end. However, the economy failed to shift into a higher gear, as the cold weather hampered growth and international geopolitical concerns during the first quarter of 2014 worried investors. In fact, GDP in the U.S. during the first quarter declined 2.9%. This caused U.S. interest rates to fall once again, confounding many investors. The poor weather and geopolitical difficulties in the first quarter of 2014 caused a brief, sharp sell-off in the U.S. equity markets in the second half of January and early February, with the S&P 500 falling 5.8% during this period. Despite the weak economy, we remained optimistic about the long-term prospects for corporate earnings growth, and we continued to maintain the view that moderate economic growth combined with low interest rates is a positive investment backdrop. During this period of uncertainty, we remained focused on the longer-term horizon which enabled us to establish numerous high quality positions at reasonable valuations. Since the inception of the Fund in November 2013, we have been of the opinion that the long awaited normalization process for U.S. interest rates is underway and that the Federal Reserve will bring its quantitative easing program to an end during the fourth quarter of 2014. Accordingly, we have held a strong preference for companies that benefit from economic expansion and rising interest rates.
INVESTMENT STRATEGY
Our investment strategy is to seek to buy shares in high-quality businesses identified through our bottom-up research process. We do not acquire shares for short-term speculative trading. When evaluating the attractiveness of a
3
particular holding, we have a three to five year time horizon. Although our top-down macro-economic views play a role with respect to both sector and security selection, our decisions are driven to a greater extent by our analysis of the absolute and relative attractiveness of each company. Our equity investment process has two main principles: identifying quality companies and investing in the stocks of these companies at favorable valuations, which often happens after an event or a change of circumstances. We are keenly focused on making solid intermediate and long-term judgments, as opposed to rotating toward the flavor of the moment in an attempt to achieve short-term results. Investment risks and opportunities are analyzed company-by-company, and for each holding, we seek to judge whether all the key factors are incorporated into the company’s stock price. As such, we will endeavor to deliver attractive risk-adjusted results over a full market cycle as opposed to a boom and bust pattern of performance.
INVESTMENT COMMENTARY
During the 6+ month period under review, the U.S. stock market remained in a relatively narrow trading range between the close of the S&P 500 on February 3, 2014 of 1742 and the high of 1924 on the closing day of our fiscal year, May 31, 2014. With the S&P 500 trading at approximately 16 times 2014 estimated earnings (roughly in line with its 40-year historical average), we had ample opportunity to deploy capital at reasonable prices into the shares of quality businesses that were already familiar to us. At the end of the fiscal year, the Fund had positions in 50 holdings and was well diversified. Based on our bottom-up security selection, the Fund is moderately overweight in several areas of the market including Industrials (15.0% of the Fund compared to 10.5% for the S&P 500) and Health Care (15.6% of the Fund compared to 13.3% for the S&P 500).
Energy
In the Energy sector, the Fund has significant investments (9.1% of Fund assets). The Fund’s holdings in the Energy sector were up 17.0% for the period November 8, 2013 through May 31, 2014, compared to an increase of 12.4% of the S&P 500 Energy sector for the same period. The Energy sector is benefiting from the energy revolution taking place in the United States. The remarkable technology of horizontal drilling has ushered in an energy boom in the U.S. by opening up new opportunities for expanded production from domestic oil and gas shale plays. EOG Resources and Continental Resources, both of which focus primarily on oil exploration and production, were our big winners – up 25.3% and 24.7% respectively. Both EOG and Continental are benefiting from strong oil
4
production and reserve growth from key shale plays in the Bakken and the South Central Oklahoma Oil Preserve. Both companies have valuable acreage positions in these two highly prolific shale formations in the United States with a drilling inventory that should last for years.
Financials
The Fund has substantial holdings in the Financials sector (15.1% of Fund assets). While the Fund’s holdings were up 2.7% for the period under review, they underperformed the S&P 500 Financials sector by 7.7%. Our holdings were purposefully weighted toward larger financial institutions that we view as inexpensive. In our opinion, they are healthy and well-capitalized, and we believe that they are poised to deliver attractive total returns over a longer-term time horizon through earnings growth, return of capital through share buybacks, and increased dividends. However, reduced regulatory pressure and loan growth are necessary to unleash this potential. This clearly did not materialize during our partial fiscal year. Wells Fargo was our best performer in the Financials sector, up 20.3%, followed by American Express, up 11.7%, and M&T Bank Corp., up 9.6%. This was not enough to offset the negative performance from Bank of America, down 9.9%, State Street down 8.6% and Goldman Sachs, down 8.2%. Although our Financials sector positions, in aggregate, underperformed its S&P 500 Financials sector benchmark, we believe that with strong U.S. economic growth, higher interest rates, and less regulation, our portfolio choices will produce solid long-term results.
CLOSING COMMENTS
2013 was a terrific year for the U.S. stock market. The stock market, which was undervalued at the start of 2013, is now, we believe, closer to fair value. Accordingly, our outlook for the market in 2014 is more modest. Yet we believe that the BFS Equity Fund is well positioned in its holdings to take advantage of the promising long-term performance from these fine businesses with outstanding management teams. We believe these top-in-class companies will deliver solid long-term risk adjusted results for our investors. We will continue to keep our eye on the long-term horizon, avoid short-term noise, and remain opportunistic with respect to capital deployment. We, at Bradley, Foster & Sargent, Inc., look forward to serving you through our management of the BFS Equity Fund. We welcome you and thank you for placing your capital under our care.
| | | | |
| Keith LaRose | | Timothy Foster | | Thomas Sargent |
| Lead Portfolio Manager | | Co-Portfolio Manager | | Co-Portfolio Manager |
5
ANNUAL PERFORMANCE REVIEW
(Unaudited)
The Fund underperformed the S&P 500 by 4.0% and the Dow Jones Industrial Average by 1.4% for the period November 8, 2013 through May 31, 2014.
Key Detractors from Relative Results
| | • | | Relative returns from holdings in the Financials sector (up 2.7% compared to up 10.4% for the S&P 500 Financials sector) detracted from results. Bank of America (down 9.9%), State Street (down 8.6%) and Goldman Sachs (down 8.2% until time of sale) as well as JP Morgan (up 6.2% but less than the S&P 500 Financials sector benchmark) produced underperformance in this sector. |
| | • | | The Fund’s overweight position and holdings in the Industrial Sector (up 7.0% compared with up 11.7% for the S&P 500 Industrial sector) detracted from results. Kansas City Southern (down 15.7% until time of sale) was the biggest negative in the Fund in this sector. |
Key Contributors to Relative Results
| | • | | The Fund’s holdings in the Energy sector (up 17.0% compared with up 12.4% for the S&P 500 Energy sector) helped results. EOG (up 25.3%) and CLR (up 24.7%) were the strongest contributors for the Fund in this sector. |
| | • | | Strong returns for the Fund’s holdings in the Materials sector (up 24.1% compared with the S&P 500 Materials sector up 14.4%) aided results. Westlake Chemical (up 40.2%) was a notable contributor. |
FUND INFORMATION (Unaudited)
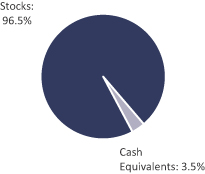
ASSET ALLOCATION
(As a percentage of total investments)
| | | | |
TEN LARGEST HOLDINGS (%) | | FUND | |
Danaher | | | 4.6 | |
Walt Disney | | | 4.0 | |
JPMorgan Chase | | | 3.7 | |
United Technologies | | | 3.7 | |
Microsoft | | | 3.2 | |
Wells Fargo | | | 3.2 | |
Johnson & Johnson | | | 3.2 | |
Google – Class A | | | 3.0 | |
Home Depot | | | 2.8 | |
EOG Resources | | | 2.7 | |
| | | | | | | | |
SECTOR DIVERSIFICATION (%) | | FUND | | | S&P 500 | |
Health Care | | | 15.6 | | | | 13.3 | |
Financials | | | 15.1 | | | | 16.1 | |
Industrial | | | 15.0 | | | | 10.5 | |
Consumer Discretionary | | | 13.6 | | | | 11.9 | |
Consumer Staples | | | 11.7 | | | | 9.5 | |
Technology | | | 11.4 | | | | 18.9 | |
Energy | | | 9.1 | | | | 10.8 | |
Materials | | | 3.8 | | | | 3.5 | |
Telecommunication Services | | | 1.2 | | | | 2.4 | |
Utilities | | | 0.0 | | | | 3.1 | |
Cash Equivalents | | | 3.5 | | | | 0.0 | |
6
Investment Results (Unaudited)
Total Returns* (For the period ended May 31, 2014)
| | | | |
| | | Since Inception (November 8, 2013) | |
BFS Equity Fund | | | 7.36% | |
S&P 500® Index** | | | 11.39% | |
Dow Jones Industrial Average®*** | | | 8.73% | |
The performance quoted represents past performance, which does not guarantee future results. The investment return and principal value of an investment will fluctuate so that an investor’s shares, when redeemed, may be worth more or less than their original cost. The returns shown do not reflect deduction of taxes that a shareholder would pay on Fund distributions or the redemption of Fund shares. The Fund’s investment objectives, risks, charges and expenses must be considered carefully before investing. Current performance of a Fund may be lower or higher than the performance quoted.
* Return figures reflect any change in price per share and assume the reinvestment of all distributions.
** The S&P 500® Index is a widely recognized unmanaged index of equity prices and is representative of a broader market and range of securities than is found in the Fund’s portfolio. The Index is an unmanaged benchmark that assumes reinvestment of all distributions and excludes the effect of taxes and fees. Individuals cannot invest directly in this Index; however, an individual can invest in exchange traded funds or other investment vehicles that attempt to track the performance of a benchmark index.
*** The Dow Jones Industrial Average® is a widely recognized unmanaged index of equity prices and is representative of a narrower market and range of securities than is found in the Fund’s portfolio. The Index is an unmanaged benchmark that assumes reinvestment of all distributions and excludes the effect of taxes and fees. Individuals cannot invest directly in this Index; however, an individual can invest in exchange traded funds or other investment vehicles that attempt to track the performance of a benchmark index.
AVAILABILITY OF PORTFOLIO SCHEDULE (Unaudited)
The Fund files its complete schedule of portfolio holdings with the Securities and Exchange Commission (“SEC”) for the first and third quarters of each fiscal year on Form N-Q. The Fund’s Forms N-Q will be available at the SEC’s website at www.sec.gov. The Fund’s Form N-Q may be reviewed and copied at the Public Reference Room in Washington, DC. Information on the operation of the Public Reference Room may be obtained by calling 1-800-SEC-0330.
SUMMARY OF FUND’S EXPENSES (Unaudited)
As a shareholder of the Fund, you incur two types of costs: (1) transaction costs; and (2) ongoing costs, including management fees; and other Fund expenses. This Example is intended to help you understand your ongoing costs (in dollars) of investing in the Fund and to compare these costs with the ongoing costs of investing in other mutual funds. The Example is based on an investment of $1,000 invested at the beginning of the period, and held for the six month period, December 1, 2013 to May 31, 2014.
Actual Expenses
The first line of the table below provides information about actual account values and actual expenses. You may use the information in this line, together with the amount you invested, to estimate the expenses that you paid over the period. Simply divide your account value by $1,000 (for example, an $8,600 account value divided by $1,000 = 8.60), then multiply the result by the number in the first line under the heading entitled
7
“Expenses Paid During the Period Ended May 31, 2014” to estimate the expenses you paid on your account during this period.
Hypothetical Example for Comparison Purposes
The second line of the table below provides information about hypothetical account values and hypothetical expenses based on the Fund’s actual expense ratios and an assumed rate of return of 5% per year before expenses, which is not the Fund’s actual return. The hypothetical account values and expenses may not be used to estimate the actual ending account balance or expenses you paid for the period. You may use this information to compare the ongoing costs of investing in the Fund and other funds. To do so, compare this 5% hypothetical example with the 5% hypothetical examples that appear in the shareholder reports of other funds.
Please note that the expenses shown in the table are meant to highlight your ongoing costs only and do not reflect any transactional costs, such as sales charges (loads), or redemption fees. Therefore, the second line of the table is useful in comparing ongoing costs only, and will not help you determine the relative total costs of owning different funds. In addition, if these transactional costs were included, your costs would have been higher.
| | | | | | | | | | | | |
| | | Beginning
Account
Value | | | Ending
Account
Value | | | Expenses
Paid During
the Period Ended | |
| | | | | | May 31, 2014 | | | May 31, 2014* | |
| BFS Equity Fund | | | | | | | | | | | | |
Actual | | $ | 1,000.00 | | | $ | 1,050.50 | | | $ | 6.39 | |
Hypothetical ** (5% return before expenses) | | $ | 1,000.00 | | | $ | 1,018.70 | | | $ | 6.29 | |
| * | | Expenses are equal to the Fund’s annualized expense ratio of 1.25%, multiplied by the average account value over the period, multiplied by 182/365. |
| ** | | Assumes a 5% return before expenses. |
8
Schedule of Investments
May 31, 2014
| | | | | | | | |
| Shares | | | | | Fair Value | |
| | COMMON STOCKS – 96.35% | |
| | |
| | | | Aerospace & Defense 3.65% | | | | |
| | 4,000 | | | United Technologies Corp. | | $ | 464,880 | |
| | | | | | | | |
| | |
| | | | Beverages 3.60% | | | | |
| | 2,300 | | | Constellation Brands, Inc. – Class A* | | | 193,499 | |
| | 3,000 | | | PepsiCo, Inc. | | | 264,990 | |
| | | | | | | | |
| | | | | | | 458,489 | |
| | | | | | | | |
| | | | Biotechnology 1.72% | | | | |
| | 475 | | | Celgene Corp.* | | | 72,689 | |
| | 1,800 | | | Gilead Sciences, Inc.* | | | 146,178 | |
| | | | | | | | |
| | | | | | | 218,867 | |
| | | | | | | | |
| | | | Capital Markets 1.18% | | | | |
| | 2,300 | | | State Street Corp. | | | 150,121 | |
| | | | | | | | |
| | |
| | | | Chemicals 3.76% | | | | |
| | 1,500 | | | Monsanto Co. | | | 182,775 | |
| | 900 | | | Praxair, Inc. | | | 119,016 | |
| | 2,200 | | | Westlake Chemical Corp. | | | 177,870 | |
| | | | | | | | |
| | | | | | | 479,661 | |
| | | | | | | | |
| | | | Commercial Banks 5.57% | | | | |
| | 2,500 | | | M&T Bank Corp. | | | 303,425 | |
| | 8,000 | | | Wells Fargo & Co. | | | 406,240 | |
| | | | | | | | |
| | | | | | | 709,665 | |
| | | | | | | | |
| | | | Computers & Peripherals 2.23% | | | | |
| | 450 | | | Apple, Inc. | | | 284,850 | |
| | | | | | | | |
| | |
| | | | Consumer Finance 2.51% | | | | |
| | 3,500 | | | American Express Co. | | | 320,250 | |
| | | | | | | | |
| | |
| | | | Diversified Financial Services 4.85% | | | | |
| | 10,000 | | | Bank of America Corp. | | | 151,400 | |
| | 8,400 | | | JPMorgan Chase & Co. | | | 466,788 | |
| | | | | | | | |
| | | | | | | 618,188 | |
| | | | | | | | |
| | | | Diversified Telecommunication 1.18% | | | | |
| | 3,000 | | | Verizon Communications, Inc. | | | 149,880 | |
| | | | | | | | |
| | |
| | | | Electronic Equipment, Instruments & Components 1.73% | | | | |
| | 2,300 | | | Amphenol Corp. – Class A | | | 220,340 | |
| | | | | | | | |
| | |
| | | | Food & Staples Retailing 3.05% | | | | |
| | 1,800 | | | Costco Wholesale Corp. | | | 208,836 | |
| | 2,500 | | | Walgreen Co. | | | 179,775 | |
| | | | | | | | |
| | | | | | | 388,611 | |
| | | | | | | | |
See accompanying notes which are an integral part of these financial statements.
9
Schedule of Investments (continued)
May 31, 2014
| | | | | | | | |
| Shares | | | | | Fair Value | |
| | COMMON STOCKS – (continued) | |
| | |
| | | | Food Products 2.47% | | | | |
| | 4,000 | | | Nestle SA ADR | | $ | 314,300 | |
| | | | | | | | |
| | |
| | | | Health Care Equipment & Supplies 1.66% | | | | |
| | 2,900 | | | Covidien PLC | | | 212,019 | |
| | | | | | | | |
| | |
| | | | Hotels, Restaurants & Leisure 3.89% | | | | |
| | 2,000 | | | McDonalds Corp. | | | 202,860 | |
| | 4,000 | | | Starbucks Corp. | | | 292,960 | |
| | | | | | | | |
| | | | | | | 495,820 | |
| | | | | | | | |
| | | | Household Products 2.55% | | | | |
| | 2,500 | | | Colgate-Palmolive Co. | | | 171,000 | |
| | 1,900 | | | Procter & Gamble Co. | | | 153,501 | |
| | | | | | | | |
| | | | | | | 324,501 | |
| | | | | | | | |
| | | | Industrial Conglomerates 5.46% | | | | |
| | 7,500 | | | Danaher Corp. | | | 588,225 | |
| | 4,000 | | | General Electric Co. | | | 107,160 | |
| | | | | | | | |
| | | | | | | 695,385 | |
| | | | | | | | |
| | | | Internet Software & Services 2.96% | | | | |
| | 660 | | | Google, Inc. – Class A* | | | 377,289 | |
| | | | | | | | |
| | |
| | | | Life Sciences Tools & Services 2.29% | | | | |
| | 2,500 | | | Thermo Fisher Scientific, Inc. | | | 292,275 | |
| | | | | | | | |
| | |
| | | | Machinery 1.43% | | | | |
| | 2,000 | | | Deere & Co. | | | 182,340 | |
| | | | | | | | |
| | |
| | | | Media 3.95% | | | | |
| | 6,000 | | | Walt Disney Co./The | | | 504,060 | |
| | | | | | | | |
| | |
| | | | Oil, Gas & Consumable Fuels 9.06% | | | | |
| | 1,700 | | | Continental Resources, Inc.* | | | 238,612 | |
| | 3,200 | | | EOG Resources, Inc. | | | 338,560 | |
| | 1,400 | | | Exxon Mobil Corp. | | | 140,742 | |
| | 3,000 | | | Occidental Petroleum Corp. | | | 299,070 | |
| | 5,000 | | | Plains GP Holdings LP(a) | | | 138,000 | |
| | | | | | | | |
| | | | | | | 1,154,984 | |
| | | | | | | | |
| | | | Pharmaceuticals 9.90% | | | | |
| | 4,000 | | | Johnson & Johnson | | | 405,840 | |
| | 4,000 | | | Merck & Co., Inc. | | | 231,440 | |
| | 2,600 | | | Novartis AG ADR | | | 234,156 | |
| | 8,000 | | | Pfizer, Inc. | | | 237,040 | |
| | 5,000 | | | Zoetis, Inc. | | | 153,500 | |
| | | | | | | | |
| | | | | | | 1,261,976 | |
| | | | | | | | |
See accompanying notes which are an integral part of these financial statements.
10
Schedule of Investments (continued)
May 31, 2014
| | | | | | | | |
| Shares | | | | | Fair Value | |
| | COMMON STOCKS – (continued) | |
| | |
| | | | Professional Services 1.89% | | | | |
| | 5,000 | | | Nielsen NV | | $ | 241,300 | |
| | | | | | | | |
| | |
| | | | Real Estate Investment Trust 1.00% | | | | |
| | 2,000 | | | WP Carey, Inc. | | | 127,280 | |
| | | | | | | | |
| | |
| | | | Road & Rail 1.04% | | | | |
| | 2,200 | | | Canadian National Railway Co. | | | 133,276 | |
| | | | | | | | |
| | |
| | | | Software 4.48% | | | | |
| | 2,500 | | | Adobe Systems, Inc.* | | | 161,350 | |
| | 10,000 | | | Microsoft Corp. | | | 409,400 | |
| | | | | | | | |
| | | | | | | 570,750 | |
| | | | | | | | |
| | | | Specialty Retail 2.83% | | | | |
| | 4,500 | | | Home Depot, Inc./The | | | 361,035 | |
| | | | | | | | |
| | |
| | | | Textiles, Apparel & Luxury Goods 2.93% | | | | |
| | 2,500 | | | Luxottica Group SpA ADR | | | 142,475 | |
| | 3,000 | | | NIKE, Inc. | | | 230,730 | |
| | | | | | | | |
| | | | | | | 373,205 | |
| | | | | | | | |
| | | | Tobacco 1.53% | | | | |
| | 2,000 | | | Genesee & Wyoming, Inc. – Class A* | | | 194,700 | |
| | | | | | | | |
| | | | Total Common Stocks (Cost $11,502,377) | | | 12,280,297 | |
| | | | | | | | |
| | |
| | | | Money Market Securities 3.52% | | | | |
| | 448,023 | | | Fidelity Institutional Money Market Funds – Prime Money Market Portfolio, 0.06%(b) | | | 448,023 | |
| | | | | | | | |
| | | | Total Money Market Securities (Cost $448,023) | | | 448,023 | |
| | | | | | | | |
| | | | Total Investments 99.87% (Cost $11,950,400) | | | 12,728,320 | |
| | | | | | | | |
| | | | Other Assets in Excess of Liabilities 0.13% | | | 16,743 | |
| | | | | | | | |
| | | | TOTAL NET ASSETS 100.00% | | $ | 12,745,063 | |
| | | | | | | | |
| (a) | | Master Limited Partnership. |
| (b) | | Rate disclosed is the seven day yield as of May 31, 2014. |
| * | | Non-income producing security. |
| ADR | | – American Depositary Receipt |
See accompanying notes which are an integral part of these financial statements.
11
Statement of Assets and Liabilities
May 31, 2014
| | | | |
Assets | | | | |
Investments in securities at fair value (cost $11,950,400) | | $ | 12,728,320 | |
Cash | | | 1,776 | |
Receivable for fund shares sold | | | 4,303 | |
Dividends receivable | | | 17,152 | |
Tax reclaims receivable | | | 4,454 | |
Receivable from Adviser | | | 16,165 | |
Deferred offering costs | | | 19,185 | |
Prepaid expenses | | | 1,873 | |
Total Assets | | | 12,793,228 | |
Liabilities | | | | |
Payable to administrator, fund accountant, and transfer agent | | | 17,096 | |
Payable to custodian | | | 1,198 | |
Distribution fees accrued | | | 2,629 | |
Other accrued expenses | | | 27,242 | |
Total Liabilities | | | 48,165 | |
Net Assets | | $ | 12,745,063 | |
Net Assets consist of: | | | | |
Paid-in capital | | $ | 12,113,432 | |
Accumulated undistributed net investment income | | | 32,183 | |
Accumulated net realized loss from investments | | | (178,472 | ) |
Net unrealized appreciation on investments | | | 777,920 | |
Net Assets | | $ | 12,745,063 | |
Shares outstanding (unlimited number of shares authorized, no par value) | | | 1,188,037 | |
Net asset value, offering and redemption price per share | | $ | 10.73 | |
12
See accompanying notes which are an integral part of these financial statements.
Statement of Operations
For the period ended May 31, 2014(a)
| | | | |
Investment Income | | | | |
Dividend income (net of foreign taxes withheld of $908) | | $ | 105,282 | |
Total investment income | | | 105,282 | |
Expenses | | | | |
Investment Adviser | | | 40,611 | |
Distribution (12b-1) | | | 13,537 | |
Administration | | | 21,486 | |
Fund accounting | | | 14,097 | |
Transfer agent | | | 28,825 | |
Legal | | | 13,711 | |
Custodian | | | 8,354 | |
Audit | | | 16,500 | |
Trustee | | | 1,649 | |
Offering costs | | | 24,580 | |
Organizational costs | | | 8,750 | |
Miscellaneous | | | 11,708 | |
Report Printing | | | 7,160 | |
24f-2 | | | 1,529 | |
Pricing | | | 1,272 | |
Registration | | | 328 | |
Total expenses | | | 214,097 | |
Fees waived and reimbursed by Adviser | | | (146,030 | ) |
Net operating expenses | | | 68,067 | |
Net investment income | | | 37,215 | |
Net Realized and Unrealized Gains/(Losses) on Investments | | | | |
Net realized loss on investment securities transactions | | | (178,580 | ) |
Net change in unrealized appreciation on investment securities | | | 777,920 | |
Net realized and unrealized gain on investments | | | 599,340 | |
Net increase in net assets resulting from operations | | $ | 636,555 | |
| (a) | | For the period November 8, 2013 (commencement of operations) to May 31, 2014. |
13
See accompanying notes which are an integral part of these financial statements.
Statement of Changes in Net Assets
| | | | |
| Increase in Net Assets due to: | | For the Period Ended May 31, 2014(a) | |
Operations | | | | |
Net investment income | | $ | 37,215 | |
Net realized loss on investment securities transactions | | | (178,580 | ) |
Net change in unrealized appreciation on investment securities | | | 777,920 | |
Net increase in net assets resulting from operations | | | 636,555 | |
Distributions From | | | | |
Net investment income | | | (4,924 | ) |
Total distributions | | | (4,924 | ) |
Capital Transactions | | | | |
Proceeds from shares sold | | | 12,239,160 | |
Reinvestment of distributions | | | 2,913 | |
Amount paid for shares redeemed | | | (128,641 | ) |
Net increase in net assets resulting from capital transactions | | | 12,113,432 | |
Total Increase in Net Assets | | | 12,745,063 | |
Net Assets | | | | |
Beginning of period | | | – | |
End of period | | $ | 12,745,063 | |
Accumulated undistributed net investment income | | $ | 32,183 | |
Share Transactions | | | | |
Sold | | | 1,200,263 | |
Issued in reinvestment of distributions | | | 280 | |
Redeemed | | | (12,506 | ) |
Net increase in share transactions | | | 1,188,037 | |
| (a) | | For the period November 8, 2013 (commencement of operations) to May 31, 2014. |
14
See accompanying notes which are an integral part of these financial statements.
Financial Highlights
(For a share outstanding during the period)
| | | | |
| | | For the Period Ended
May 31, 2014(a) | |
Selected Per Share Data: | |
Net asset value, beginning of period | | | $10.00 | |
| | | | |
| |
Income from investment operations: | | | | |
| |
Net investment income | | | 0.04 | |
| |
Net realized and unrealized gain on investments | | | 0.70 | |
| | | | |
| |
Total from investment operations | | | 0.74 | |
| | | | |
| |
Less distributions to shareholders from: | | | | |
| |
From investment income | | | (0.01 | ) |
| | | | |
| |
Total distributions | | | (0.01 | ) |
| | | | |
Net asset value, end of period | | | $10.73 | |
| | | | |
| |
Total Return(b) | | | 7.36 | %(c) |
| | | | |
Ratios and Supplemental Data: | |
Net assets, end of period (000) | | | $12,745 | |
| |
Ratio of expenses to average net assets | | | 1.25 | %(d) |
| |
Ratio of expenses to average net assets before waiver | | | 3.93 | %(d) |
| |
Ratio of net investment income to average net assets | | | 0.68 | %(d) |
| |
Ratio of net investment loss to average net assets before waiver | | | (2.00 | )%(d) |
| |
Portfolio turnover rate | | | 46.50 | %(c) |
| (a) | | For the period November 8, 2013 (commencement of operations) to May 31, 2014. |
| (b) | | Total return in the above table represents the rate that the investor would have earned or lost on an investment in the Fund, assuming reinvestment of dividends, if any. |
15
See accompanying notes which are an integral part of these financial statements.
Notes to the Financial Statements
May 31, 2014
NOTE 1 – ORGANIZATION
The BFS Equity Fund (the “Fund”) was organized as an open-end diversified series of the Valued Advisers Trust (the “Trust”) on July 23, 2013 and commenced operations on November 8, 2013. The Trust is a management investment company established under the laws of Delaware by an Agreement and Declaration of Trust dated June 13, 2008 (the “Trust Agreement”). The Trust Agreement permits the Trustees to issue an unlimited number of shares of beneficial interest of separate series without par value. The Fund is one of a series of funds authorized by the Board of Trustees (the “Board”). The Fund’s investment adviser is Bradley, Foster & Sargent, Inc. (the “Adviser”). The investment objective of the Fund is long-term appreciation through growth of principal and income.
NOTE 2 – SIGNIFICANT ACCOUNTING POLICIES
The following is a summary of significant accounting policies followed by the Fund in the preparation of its financial statements. These policies are in conformity with the generally accepted accounting principles in the United States of America (“GAAP”).
Securities Valuation – All investments in securities are recorded at their estimated fair value as described in Note 3.
Federal Income Taxes – The Fund makes no provision for federal income or excise tax. The Fund intends to qualify each year as a regulated investment company (“RIC”) under subchapter M of the Internal Revenue Code of 1986, as amended, by complying with the requirements applicable to RICs and by distributing substantially all of its taxable income. The Fund also intends to distribute sufficient net investment income and net capital gains, if any, so that it will not be subject to excise tax on undistributed income and gains. If the required amount of net investment income or gains is not distributed, the Fund could incur a tax expense.
As of, and during the period ended May 31, 2014, the Fund did not have a liability for any unrecognized tax benefits. The Fund recognizes interest and penalties, if any, related to unrecognized tax benefits as income tax expense in the statement of operations. During the year, the Fund did not incur any interest or penalties. The Fund is subject to examination by U.S. federal tax authorities for all tax years since inception.
Expenses – Expenses incurred by the Trust that do not relate to a specific fund of the Trust are allocated to the individual funds based on each fund’s relative net assets or another appropriate basis (as determined by the Board).
Security Transactions and Related Income - The Fund follows industry practice and records security transactions on the trade date for financial reporting purposes. The Fund has chosen high cost as its standing (default) tax lot identification method for all shareholders. Interest income is recorded on an accrual basis and dividend income is recorded on the ex-dividend date except in the case of foreign securities, in which case dividends are generally recorded as soon as such information becomes available. Discounts and premiums on securities purchased are accreted or amortized using the effective interest method. The ability of issuers of debt securities held by the Fund to meet their obligations may be affected by economic and political developments in a specific country or region. Withholding taxes on foreign dividends have been provided for in accordance with the Fund’s understanding of the applicable country’s tax rules and rates.
16
Notes to the Financial Statements (continued)
May 31, 2014
Dividends and Distributions – The Fund intends to distribute its net realized long term and short term capital gains, if any, at least once a year. Dividends to shareholders, which are determined in accordance with income tax regulations, are recorded on the ex-dividend date. The treatment for financial reporting purposes of distributions made to shareholders during the period from net investment income or net realized capital gains may differ from their ultimate treatment for federal income tax purposes. These differences are caused primarily by differences in the timing of the recognition of certain components of income, expense or realized capital gain for federal income tax purposes. Where such differences are permanent in nature, they are reclassified in the components of the net assets based on their ultimate characterization for federal income tax purposes. Any such reclassifications will have no effect on net assets, results of operations or net asset values per share of the Fund. For the period ended May 31, 2014, the Fund made the following reclassifications of net assets.
| | | | |
| Paid-in Capital | | Accumulated Undistributed Net Investment Income | | Accumulated Net Realized Gain/(Loss) on Investments |
$– | | $(108) | | $108 |
NOTE 3 – SECURITIES VALUATION AND FAIR VALUE MEASUREMENTS
Fair value is defined as the price that a Fund would receive upon selling an investment in an orderly transaction to an independent buyer in the principal or most advantageous market of the investment. Accounting principles generally accepted in the United States of America (“GAAP”) have established a three-tier hierarchy to maximize the use of observable market data and minimize the use of unobservable inputs and establish classification of fair value measurements for disclosure purposes.
Inputs refer broadly to the assumptions that market participants would use in pricing the asset or liability, including assumptions about risk, for example, the risk inherent in a particular valuation technique used to measure fair value including a pricing model and/or the risk inherent in the inputs to the valuation technique. Inputs may be observable or unobservable. Observable inputs are inputs that reflect the assumptions market participants would use in pricing the asset or liability developed based on market data obtained from sources independent of the reporting entity. Unobservable inputs are inputs that reflect the reporting entity’s own assumptions about the assumptions market participants would use in pricing the asset or liability developed based on the best information available in the circumstances.
Various inputs are used in determining the value of the Fund’s investments. These inputs are summarized in the three broad levels listed below.
| | • | | Level 1 – quoted prices in active markets for identical securities |
| | • | | Level 2 – other significant observable inputs (including, but not limited to, quoted prices for an identical security in an inactive market, quoted prices for similar securities, interest rates, prepayment speeds, credit risk, etc.) |
| | • | | Level 3 – significant unobservable inputs (including the Fund’s own assumptions in determining fair value of investments based on the best information available) |
17
Notes to the Financial Statements (continued)
May 31, 2014
The inputs used to measure fair value may fall into different levels of the fair value hierarchy. In such cases, for disclosure purposes, the level in the fair value hierarchy within which the fair value measurement falls in its entirety, is determined based on the lowest level input that is significant to the fair value measurement in its entirety.
Equity securities, including common stocks, are generally valued by using market quotations, but may be valued on the basis of prices furnished by a pricing service when the Adviser believes such prices more accurately reflect the fair value of such securities. Securities that are traded on any stock exchange are generally valued by the pricing service at the last quoted sale price. Lacking a last sale price, an exchange traded security is generally valued by the pricing service at its last bid price. Securities traded in the NASDAQ over-the-counter market are generally valued by the pricing service at the NASDAQ Official Closing Price.
When using the market quotations or close prices provided by the pricing service and when the market is considered active, the security will be classified as a Level 1 security. Sometimes, an equity security owned by the Fund will be valued by the pricing service with factors other than market quotations or when the market is considered inactive. When this happens, the security will be classified as a Level 2 security. When market quotations are not readily available, when the Adviser determines that the market quotation or the price provided by the pricing service does not accurately reflect the current fair value, or when restricted or illiquid securities are being valued, such securities are valued as determined in good faith by the Adviser, in conformity with guidelines adopted by and subject to review by the Board. These securities will generally be categorized as Level 3 securities.
Investments in mutual funds, including money market mutual funds, are generally priced at the ending net asset value (“NAV”) provided by the service agent of the funds. These securities will be categorized as Level 1 securities.
In accordance with the Trust’s good faith pricing guidelines, the Adviser is required to consider all appropriate factors relevant to the value of securities for which it has determined other pricing sources are not available or reliable as described above. No single standard exists for determining fair value, because fair value depends upon the circumstances of each individual case. As a general principle, the current fair value of an issue of securities being valued by the Adviser would appear to be the amount which the owner might reasonably expect to receive for them upon their current sale. Methods which are in accordance with this principle may, for example, be based on (i) a multiple of earnings; (ii) a discount from market of a similar freely traded security (including a derivative security or a basket of securities traded on other markets, exchanges or among dealers); or (iii) yield to maturity with respect to debt issues, or a combination of these and other methods. Good faith pricing is permitted if, in the Adviser’s opinion, the validity of market quotations appears to be questionable based on factors such as evidence of a thin market in the security based on a small number of quotations, a significant event occurs after the close of a market but before a Fund’s NAV calculation that may affect a security’s value, or the Adviser is aware of any other data that calls into question the reliability of market quotations. Good faith pricing may also be used in instances when the bonds the Fund invests in may default or otherwise cease to have market quotations readily available.
18
Notes to Financial Statements (continued)
May 31, 2014
The following is a summary of the inputs used to value the Fund’s investments as of May 31, 2014:
| | | | | | | | | | | | | | | | |
| | | Valuation Inputs | | | | |
| Assets | | Level 1 Quoted Prices in
Active Markets | | | Level 2 Other Significant Observable Inputs | | | Level 3 Significant Unobservable Inputs | | | Total | |
Common Stocks* | | $ | 12,280,297 | | | $ | – | | | $ | – | | | $ | 12,280,297 | |
Money Market Securities | | | 448,023 | | | | – | | | | – | | | | 448,023 | |
Total | | $ | 12,728,320 | | | $ | – | | | $ | – | | | $ | 12,728,320 | |
| * | | Refer to Schedule of Investments for industry classifications. |
The Fund did not hold any investments at any time during the reporting period in which other significant observable inputs (Level 2) were used in determining fair value. The Fund did not hold any assets at any time during the reporting period in which significant unobservable inputs were used in determining fair value; therefore, no reconciliation of Level 3 securities is included for this reporting period.
The Trust recognizes transfers between fair value hierarchy levels at the end of the reporting period. There were no transfers between any levels during the period ended May 31, 2014.
NOTE 4 – FEES AND OTHER TRANSACTIONS WITH AFFILIATES
Under the terms of the investment advisory agreement, on behalf of the Fund (the “Agreement”), the Adviser manages the Fund’s investments subject to oversight of the Board. As compensation for its services, the Fund is obligated to pay the Adviser a fee computed and accrued daily and paid monthly at an annual rate of 0.75% of the average daily net assets of the Fund. For the period ended May 31, 2014, the Adviser earned a fee of $40,611 from the Fund before the waivers described below. At May 31, 2014, the Adviser owed $16,165 to the Fund, including fee waivers and expense reimbursements.
The Adviser has contractually agreed to waive or limit its fee and reimburse certain Fund operating expenses, until September 30, 2015, so that the ratio of total annual operating expenses does not exceed 1.00%. This operating expense limitation does not apply to interest, taxes, brokerage commissions, other expenditures which are capitalized in accordance with generally accepted accounting principles, other extraordinary expenses not incurred in the ordinary course of the Fund’s business, dividend expense on short sales, expenses incurred under a plan of distribution under Rule 12b-1, and expenses that the Fund has incurred but did not actually pay because of an expense offset arrangement, if applicable, incurred by the Fund in any fiscal year. The operating expense limitation also excludes any “Fees and Expenses of Acquired Funds” which are the expenses indirectly incurred by the Fund as a result of investing in money market funds or other investment companies, including ETFs, that have their own expenses. The Adviser may be entitled to recoup the sum of all fees previously waived or expenses reimbursed during any of the previous three (3) years, less any reimbursement previously paid, provided total expenses do not exceed the limitation set forth above. For the period November 8, 2013 (commencement of operations) through May 31, 2014, expenses totaling $146,030 were waived or reimbursed by the Adviser and may be subject to potential recoupment by the Adviser until May 31, 2017.
19
Notes to Financial Statements (continued)
May 31, 2014
The Trust retains Huntington Asset Services, Inc. (“HASI”) to manage the Fund’s business affairs and provide the Fund with administrative services, including all regulatory reporting and necessary office equipment and personnel. For the period ended May 31, 2014, HASI earned fees of $21,486 for administrative and compliance services provided to the Fund. At May 31, 2014, HASI was owed $6,333 from the Fund for administrative and compliance services. Certain officers of the Trust are members of management and/or employees of HASI. HASI is a wholly-owned subsidiary of Huntington Bancshares, Inc., the parent company of Unified Financial Securities, Inc. (the “Distributor”) and Huntington National Bank, the custodian of the Fund’s investments (the “Custodian”). For the period ended May 31, 2014, the Custodian earned fees of $8,354 for custody services provided to the Fund. At May 31, 2014, the Custodian was owed $1,198 from the Fund for custody services.
The Trust also retains HASI to act as the Fund’s transfer agent and to provide fund accounting services. For the period ended May 31, 2014, HASI earned fees of $28,825 for transfer agent services and reimbursement for out-of-pocket expenses incurred in providing transfer agent services to the Fund. At May 31, 2014, the Fund owed HASI $6,596 for transfer agent services and out-of-pocket expenses. For the period ended May 31, 2014, HASI earned fees of $14,097 from the Fund for fund accounting services. At May 31, 2014, HASI was owed $4,167 from the Fund for fund accounting services.
The Fund has adopted a Distribution Plan pursuant to Rule 12b-1 under the 1940 Act (the “Plan”). The Plan provides that the Fund will pay the Distributor and/or any registered securities dealer, financial institution or any other person (the “Recipient”) a shareholder servicing fee of 0.25% of the average daily net assets of the Fund in connection with the promotion and distribution of the Fund’s shares or the provision of personal services to shareholders, including, but not necessarily limited to, advertising, compensation to underwriters, dealers and selling personnel, the printing and mailing of prospectuses to other than current Fund shareholders, the printing and mailing of sales literature and servicing shareholder accounts (“12b-1 Expenses”). The Fund or Distributor may pay all or a portion of these fees to any recipient who renders assistance in distributing or promoting the sale of shares, or who provides certain shareholder services, pursuant to a written agreement. The Plan is a compensation plan, which means that the Plan will benefit shareholders because an effective sales program typically is necessary in order for the Fund to reach and maintain a sufficient size to achieve efficiently its investment objectives and to realize economies of scale. For the period ended May 31, 2014, 12b-1 expense incurred by the Fund was $13,537. The Fund owed $2,629 for 12b-1 fees as of May 31, 2014.
Unified Financial Securities, Inc. acts as the principal distributor of the Fund’s shares. An officer of the Trust is an officer of the Distributor and such person may be deemed to be an affiliate of the Distributor.
NOTE 5 – INVESTMENTS
For the period ended May 31, 2014, purchases and sales of investment securities, other than short-term investments and short-term U.S. government obligations, were as follows:
| | | | | | | | |
| | | Purchases | | | Sales | |
| | $ | 16,375,740 | | | $ | 4,694,780 | |
There were no purchases or sales of long-term U.S. government obligations during the period ended May 31, 2014.
20
Notes to Financial Statements (continued)
May 31, 2014
NOTE 6 – ESTIMATES
The preparation of financial statements in conformity with GAAP requires management to make estimates and assumptions that affect the reported amounts of assets and liabilities and disclosure of contingent assets and liabilities at the date of the financial statements and the reported amounts of increases and decreases in net assets from operations during the reporting period. Actual results could differ from those estimates.
NOTE 7 – BENEFICIAL OWNERSHIP
The beneficial ownership, either directly or indirectly, of 25% or more of the voting securities of a fund creates a presumption of control of a fund, under Section 2(a) (9) of the Investment Company Act of 1940. At May 31, 2014, Charles Schwab & Co. (“Schwab”) owned, as record shareholder, 51% of the outstanding shares of the Fund. It is not known whether Schwab or any of the underlying beneficial owners owned or controlled 25% or more of the voting securities of the Fund. As a result, Schwab may be deemed to control the Fund.
NOTE 8 – FEDERAL TAX INFORMATION
At May 31, 2014, the net unrealized appreciation (depreciation) of investments for tax purposes was as follows:
| | | | |
Gross Unrealized Appreciation | | $ | 840,103 | |
Gross Unrealized (Depreciation) | | | (85,158 | ) |
Net Unrealized Appreciation | | $ | 754,945 | |
At May 31, 2014, the aggregate cost of securities for federal income tax purposes was $11,973,375 for the Fund.
At May 31, 2014, the Fund’s most recent fiscal year end, the components of distributable earnings (accumulated losses) on a tax basis were as follows:
| | | | |
Undistributed ordinary income | | $ | 30,704 | |
Undistributed long-term capital gains | | | – | |
Accumulated capital and other losses | | | (154,018 | ) |
Unrealized Appreciation | | | 754,945 | |
| | | $ | 631,631 | |
The difference between book and tax basis appreciation was attributable primarily to the tax deferral of losses on wash sales in the amount of $22,975.
The tax character of distributions paid for the fiscal period ended May 31, 2014 was as follows:
| | | | |
| | | 2014 | |
Distributions paid from: | | | | |
Ordinary Income | | $ | 4,924 | |
| | | $ | 4,924 | |
Certain capital losses incurred after October 31, and within the current taxable year, are deemed to arise on the first business day of the Fund’s following taxable year. For the tax year ended May 31, 2014, the Fund deferred post October capital losses in the amount of $154,018.
21
Notes to Financial Statements (continued)
May 31, 2014
NOTE 9 – COMMITMENTS AND CONTINGENCIES
The Fund indemnifies its officers and trustees for certain liabilities that may arise from performance of their duties to the Fund. Additionally, in the normal course of business, the Fund enters into contracts that contain a variety of representations and warranties which provide general indemnifications. The Fund’s maximum exposure under these arrangements is unknown, as this would involve future claims that may be made against the Fund that have not yet occurred.
NOTE 10 – SUBSEQUENT EVENTS
Management of the Fund has evaluated the need for disclosures and/or adjustments resulting from subsequent events through the date these financial statements were issued. There were no items requiring adjustment of financial statements or additional disclosure.
22
Report of Independent Registered Public Accounting Firm
To the Shareholders of BFS Equity Fund and
Board of Trustees of Valued Advisers Trust
We have audited the accompanying statement of assets and liabilities, including the schedule of investments, of BFS Equity Fund (the “Fund”), a series of Valued Advisers Trust, as of May 31, 2014, and the related statements of operations and changes in net assets, and the financial highlights for the period November 8, 2013 (commencement of operations) through May 31, 2014. These financial statements and financial highlights are the responsibility of the Fund’s management. Our responsibility is to express an opinion on these financial statements and financial highlights based on our audit.
We conducted our audit in accordance with the standards of the Public Company Accounting Oversight Board (United States). Those standards require that we plan and perform the audit to obtain reasonable assurance about whether the financial statements and financial highlights are free of material misstatement. An audit includes examining, on a test basis, evidence supporting the amounts and disclosures in the financial statements. Our procedures included confirmation of securities owned as of May 31, 2014 by correspondence with the custodian. An audit also includes assessing the accounting principles used and significant estimates made by management, as well as evaluating the overall financial statement presentation. We believe that our audit provides a reasonable basis for our opinion.
In our opinion, the financial statements and financial highlights referred to above present fairly, in all material respects, the financial position of the BFS Equity Fund as of May 31, 2014, the results of its operations, the changes in its net assets, and its financial highlights for the period November 8, 2013 (commencement of operations) through May 31, 2014, in conformity with accounting principles generally accepted in the United States of America.

COHEN FUND AUDIT SERVICES, LTD.
Cleveland, Ohio
July 29, 2014
23
Additional Federal Income Tax Information (Unaudited):
Qualified Dividend Income: For the period ended May 31, 2014, the Fund designates 100% of the dividends distributed during the fiscal year as amounts which can be taken into account as a dividend for the purpose of the maximum tax rate under section 1(h)(11) of the Internal Revenue Code.
Dividends Received Deduction: For the period ended May 31, 2014, the Fund designates 100% of the dividends distributed during the fiscal year as qualifying for the dividends-received deduction for corporate shareholders.
The Funds will notify shareholders in January 2015 of amounts for use in preparing 2014 income tax returns.
24
The following table provides information regarding each of the Independent Trustees.
| | | | |
Name, Address*, (Age),
Position with Trust**, Term
of Position with Trust | | Principal Occupation During Past 5 Years | | Other Directorships |
| | |
| Ira Cohen, 55, Independent Trustee, June 2010 to present. | | Independent financial services consultant, since February 2005. | | Trustee, Griffin Institutional Access Real Estate Fund, since June 2014. |
| | |
| Andrea N. Mullins, 47, Independent Trustee, December 2013 to present. | | Private investor; Independent Contractor, Seabridge Wealth Management, LLC, since April 2014; Principal Financial Officer and Treasurer, Eagle Family of Funds (mutual fund family) and Vice President, Eagle Asset Management, Inc. (investment adviser), each from 2004 to 2010. | | None. |
| * | | The address for each trustee and officer is 2960 N. Meridian St., Suite 300, Indianapolis, IN 46208. |
| ** | | As of the date of this SAI, the Trust consists of 14 series. |
The following table provides information regarding the Trustee who is considered an “interested person” of the Trust, as that term is defined under the 1940 Act. Based on the experience of the Trustee, the Trust concluded that the individual described below should serve as a Trustee.
| | | | |
Name, Address*, (Age),
Position with Trust**, Term
of Position with Trust | | Principal Occupation During Past 5 Years | | Other Directorships |
| | |
| R. Jeffrey Young, 49, Trustee and Chairman, June 2010 to present. | | Senior Vice President, Huntington Asset Services, Inc., the Trust’s administrator, since January 2010, Director since May 2014; Chief Executive Officer, Huntington Funds, since February 2010; Chief Executive Officer, Huntington Strategy Shares, since November 2010; Director, Unified Financial Securities, Inc., the Trust’s distributor, since May 2014; President and Chief Executive Officer, Dreman Contrarian Funds, from March 2011 to February 2013; Trustee, Valued Advisers Trust, from August 2008 to January 2010; and Managing Director and Chief Operating Officer of Professional Planning Consultants, from 2007 to 2010. | | Trustee, Capitol Series Trust, since September 2013. |
| * | | The address for each trustee and officer is 2960 N. Meridian St., Suite 300, Indianapolis, IN 46208. |
| ** | | As of the date of this SAI, the Trust consists of 14 series. |
25
The following table provides information regarding the Officers of the Trust:
| | | | |
Name, Address*, (Age),
Position with Trust,** Term
of Position with Trust | | Principal Occupation During Past 5 Years | | Other Directorships |
| | |
| R. Jeffrey Young, 49, Trustee and Chairman, June 2010 to present; Principal Executive Officer and President, Valued Advisers Trust since February 2010; | | Senior Vice President, Huntington Asset Services, Inc., the Trust’s administrator, since January 2010, Director since May 2014; Chief Executive Officer, Huntington Funds, since February 2010; Chief Executive Officer, Huntington Strategy Shares, since November 2010; Director, Unified Financial Securities, Inc., the Trust’s distributor, since May 2014; President and Chief Executive Officer, Dreman Contrarian Funds, from March 2011 to February 2013; Trustee, Valued Advisers Trust, from August 2008 to January 2010; and Managing Director and Chief Operating Officer, Professional Planning Consultants, from 2007 to 2010. | | Trustee, Capitol Series Trust, since September 2013. |
| | |
| John C. Swhear, 53, Chief Compliance Officer, AML Officer and Vice President, August 2008 to present. | | Vice President of Legal Administration and Compliance, Huntington Asset Services, Inc., the Trust’s administrator, since April 2007, Director since May 2014; Chief Compliance Officer, Unified Financial Securities, Inc., the Trust’s distributor, since May 2007, Director since May 2014; President, Unified Series Trust, since March 2012, and Senior Vice President from May 2007 to March 2012; Chief Compliance Officer and AML Officer, Capitol Series Trust, since September 2013; Secretary, Huntington Funds, from April 2010 to February 2012; President and Chief Executive Officer, Dreman Contrarian Funds, from March 2010 to March 2011, and Vice President and Acting Chief Executive Officer, from 2007 to March 2010. | | None. |
| | |
| Carol J. Highsmith, 49, Vice President, August 2008 to present; Secretary, March 2014 to present | | Employed in various positions with Huntington Asset Services, Inc., the Trust’s administrator, since November of 1994; currently Vice President of Legal Administration. | | None. |
| | |
| Matthew J. Miller, 38, Vice President, December 2011 to present. | | Employed in various positions with Huntington Asset Services, Inc., the Trust’s administrator, since July of 1998; currently Vice President of Relationship Management; Vice President, Huntington Funds, since February 2010; President and Chief Executive Officer, Capitol Series Trust, since September 2013. | | None. |
| | |
| Bryan W. Ashmus, 41, Principal Financial Officer and Treasurer, December 2013 to present. | | Vice President, Financial Administration, Huntington Asset Services, Inc., the Trust’s administrator, since September 2013; Chief Financial Officer and Treasurer, Huntington Strategy Shares and Huntington Funds, since November 2013; Vice President, Treasurer Services, Citi Fund Services Ohio, Inc., from 2005 to 2013. | | None. |
| * | | The address for each trustee and officer is 2960 N. Meridian St., Suite 300, Indianapolis, IN 46208. |
| ** | | As of the date of this SAI, the Trust consists of 14 series. |
26
VALUED ADVISERS TRUST
PRIVACY POLICY
The following is a description of the policies of the Valued Advisers Trust (the “Trust”) regarding disclosure of nonpublic personal information that shareholders provide to a series of the Trust (each, a “Fund”) or that the Fund collects from other sources. In the event that a shareholder holds shares of a Fund through a broker-dealer or other financial intermediary, the privacy policy of the financial intermediary would govern how shareholder nonpublic personal information would be shared with nonaffiliated third parties.
Categories of Information a Fund May Collect. A Fund may collect the following nonpublic personal information about its shareholders:
| | • | | Information the Fund receives from a shareholder on applications or other forms, correspondence, or conversations (such as the shareholder’s name, address, phone number, social security number, and date of birth); and |
| | • | | Information about the shareholder’s transactions with the Fund, its affiliates, or others (such as the shareholder’s account number and balance, payment history, cost basis information, and other financial information). |
Categories of Information a Fund May Disclose. A Fund may not disclose any nonpublic personal information about its current or former shareholders to unaffiliated third parties, except as required or permitted by law. A Fund is permitted by law to disclose all of the information it collects, as described above, to its service providers (such as the Fund’s custodian, administrator, transfer agent, accountant and legal counsel) to process shareholder transactions and otherwise provide services to the shareholder.
Confidentiality and Security. Each Fund shall restrict access to shareholder nonpublic personal information to those persons who require such information to provide products or services to the shareholder. Each Fund shall maintain physical, electronic, and procedural safeguards that comply with federal standards to guard shareholder nonpublic personal information.
Disposal of Information. The Funds, through their transfer agent, have taken steps to reasonably ensure that the privacy of a shareholder’s nonpublic personal information is maintained at all times, including in connection with the disposal of information that is no longer required to be maintained by the Funds. Such steps shall include, whenever possible, shredding paper documents and records prior to disposal, requiring off-site storage vendors to shred documents maintained in such locations prior to disposal, and erasing and/or obliterating any data contained on electronic media in such a manner that the information can no longer be read or reconstructed.
27
OTHER INFORMATION
The Fund’s Statement of Additional Information (“SAI”) includes additional information about the trustees and is available without charge, upon request. You may call toll-free at (855) 575-2430 to request a copy of the SAI or to make shareholder inquiries.
28
Proxy Voting
A description of the policies and procedures that the Fund uses to determine how to vote proxies relating to portfolio securities and information regarding how the Fund voted those proxies during the most recent twelve month period ended June 30, will be available without charge upon request by (1) calling the Fund at (855) 575-2430 and (2) from Fund documents filed with the Securities and Exchange Commission (“SEC”) on the SEC’s website at www.sec.gov.
TRUSTEES
R. Jeffrey Young, Chairman
Ira Cohen
Andrea N. Mullins
OFFICERS
R. Jeffrey Young, Principal Executive Officer and President
Bryan W. Ashmus, Principal Financial Officer and Treasurer
John C. Swhear, Chief Compliance Officer, AML Officer and Vice-President
Carol J. Highsmith, Vice President and Secretary
Matthew J. Miller, Vice President
INVESTMENT ADVISER
Bradley, Foster & Sargent, Inc.
185 Asylum Street, City Place II
Hartford, Connecticut 06103
DISTRIBUTOR
Unified Financial Securities, Inc.
2960 North Meridian Street, Suite 300
Indianapolis, IN 46208
INDEPENDENT REGISTERED PUBLIC ACCOUNTING FIRM
Cohen Fund Audit Services, Ltd.
1350 Euclid Avenue, Suite 800
Cleveland, OH 44115
LEGAL COUNSEL
The Law Offices of John H. Lively & Associates, Inc.
A member firm of The 1940 Act Law Group TM
11300 Tomahawk Creek Parkway, Suite 310
Leawood, KS 66211
CUSTODIAN
Huntington National Bank
41 South High Street
Columbus, OH 43215
ADMINISTRATOR, TRANSFER AGENT AND FUND ACCOUNTANT
Huntington Asset Services, Inc.
2960 North Meridian Street, Suite 300
Indianapolis, IN 46208
This report is intended only for the information of shareholders or those who have received the Fund’s prospectus which contains information about the Fund’s management fee and expenses. Please read the prospectus carefully before investing.
Distributed by Unified Financial Securities, Inc.
Member FINRA/SIPC
ANNUAL REPORT
May 31, 2014

CLOUD CAPITAL FUNDS
Cloud Capital Strategic Large Cap Fund
Cloud Capital Strategic Mid Cap Fund
Fund Adviser:
Cloud Capital LLC
5314 South Yale, Suite 606
Tulsa, OK 74135
Toll Free (877) 670-2227
Management’s Discussion of Fund Performance
We welcome and thank all new and existing shareholders of the Cloud Capital mutual funds.
In the fiscal year ended May 31, 2014, both the Cloud Capital Strategic Large Cap Fund (the “Large Cap Fund”) and the Cloud Capital Strategic Mid Cap Fund (the “Mid Cap Fund”) (each a “Fund” and, collectively the “Funds”) experienced strong growth. The Large Cap Fund gained 20.8%, ahead of S&P 500® Index total return by 0.4% and ahead of its peer group by 1.7%. The Mid Cap Fund gained 16.7% for the year, short of the S&P MidCap 400® Index total return by 1.4%. The expenses of operating the Mid Cap Fund were responsible for much of the lag against the benchmark’s performance.
The Funds endured a terrible start, opening into a 20% market correction, but have largely managed to overcome that. The Large Cap Fund is within 20 bps of its benchmark over the last two years, and ranks in the top quartile of the Large Blend peer group for the trailing twelve months. The Mid Cap Fund has been slower to recover, but is beginning to catch up to its benchmark and peer group.
The U.S. market has extended its bull run for over five years now, setting new historical highs regularly over the past year, despite slow growth in the overall economy. While portfolios grow, we at Cloud Capital LLC (“Cloud Capital”) can’t help but remember the beginning of 2007, when disparities between the stock market and the economy were growing and were largely ignored. While we want to continue to enjoy the fruits of the market rally as long as possible, it is also important to us to have our shareholders’ assets in a position of safety when the rally concludes.
The Funds are now operating at a lower gross expense ratio with the waiver of a management fee, which should bolster performance even more going forward.
In the Large Cap Fund, the stock selections within the portfolio were very successful over the past year, with the Large Cap Fund outperforming the benchmark in all ten GICS Sectors. The sector-neutral approach employed in the Fund also enhanced performance, winning seven of ten sectors versus the benchmark.
During that same period, the Mid Cap Fund found greater success in the sector-neutral strategy, with eight of ten GICS sectors besting the benchmark allocation. All ten sectors gained at least 13.8% over the fiscal year, led by the Health Care sector with 25.3%. Cash drag had a greater effect on the Mid Cap Fund than the Large Cap Fund during this period, and hindered performance against the index, which doesn’t have to concern itself with liquidity or operating expenses.
Although the market appears to be resuming historical cyclical growth, the truth is the after-effects of continued stimulus that have flowed into the market over the past
1
several years are still unclear. The core strategy of the Funds, which has historically outperformed the benchmark 76% of the time over rolling one-year periods, would benefit greatly from a return to the good old days. However, we are vigilant for unforeseen consequences of artificially driving the markets through stimulus, and especially the effects of withdrawing that support, as will have to eventually happen.
Again, we thank our shareholders for their continued confidence in Cloud Capital LLC, and with another fiscal year behind us, we look forward to many more years of serving them.
Sincerely,
Randy Cloud
Cloud Capital LLC, President
2
Cloud Capital Strategic Large Cap Fund
Investment Results – (Unaudited)
Total Returns *
(For the periods ended May 31, 2014)
| | | | | | | | |
| | | | | | Average Annual
Returns | |
| | | One Year | | | Since Inception
(June 29, 2011) | |
Cloud Capital Strategic Large Cap Fund –Institutional Class | | | 20.81 | % | | | 14.35 | % |
S&P 500® Index** | | | 20.45 | % | | | 16.96 | % |
Total annual operating expenses, as disclosed in the Fund’s prospectus dated February 26, 2014, were 1.41% of average daily net assets (0.91% after fee waivers/expense reimbursements by Cloud Capital LLC (the Adviser)). The Adviser has contractually agreed to waive or limit its fees and to assume other expenses of the Large Cap Fund effective February 1, 2014 through September 30, 2015, so that Total Annual Fund Operating Expenses does not exceed 1.40%. This operating expense limitation does not apply to brokerage fees and commissions, borrowing costs (such as interest and dividend expenses on securities sold short), taxes, extraordinary expenses, fees and expenses paid under a distribution plan adopted pursuant to Rule 12b-1, and indirect expenses (such as “Acquired Fund Fees and Expenses”). The Adviser shall not be entitled to reimbursement for any advisory fees waived for the period February 1, 2014 through September 30, 2015. However, for the periods prior to this, the Adviser may be entitled to the reimbursement of any fees waived or expenses reimbursed pursuant to prior expense limitation agreements provided overall expenses fall below the limitations set forth above. The Adviser may recoup the sum of all fees previously waived or expenses reimbursed during any of the previous three (3) years, less any reimbursement previously paid, provided total expenses do not exceed the limitation set forth above. This agreement may only be terminated by mutual consent of the Adviser and the Board of Trustees.
The performance quoted represents past performance, which does not guarantee future results. The investment return and principal value of an investment will fluctuate so that an investor’s shares, when redeemed, may be worth more or less than their original cost. The returns shown do not reflect deduction of taxes that a shareholder would pay on Fund distributions or the redemption of Fund shares. The Fund’s investment objectives, risks, charges and expenses must be considered carefully before investing. Current performance of a Fund may be lower or higher than the performance quoted. Performance data current to the most recent month end may be obtained by calling 1-877-670-2227.
* Return figures reflect any change in price per share and assume the reinvestment of all distributions.
** The S&P 500® Index is a widely recognized unmanaged index of equity prices and is representative of a broader market and range of securities than is found in the Fund’s portfolio. The Index is an unmanaged benchmark that assumes reinvestment of all distributions and excludes the effect of taxes and fees. Individuals cannot invest directly in this Index; however, an individual can invest in exchange traded funds or other investment vehicles that attempt to track the performance of a benchmark index.
The Fund’s investment objectives, risks, charges and expenses must be considered carefully before investing. The prospectus contains this and other important information about the investment company and may be obtained by calling 1-877-670-2227. Please read it carefully before investing.
The Fund is distributed by Unified Financial Securities, Inc., Member FINRA.
3
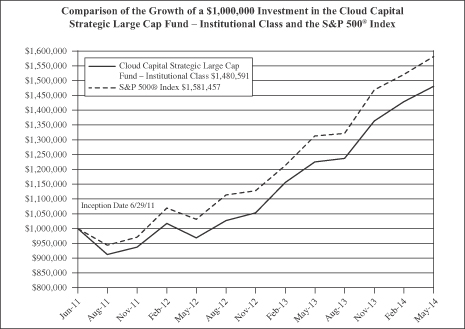
The chart above assumes an initial investment of $1,000,000 made on June 29, 2011 (commencement of Fund operations) and held through May 31, 2014. THE FUND’S RETURNS REPRESENT PAST PERFORMANCE AND DO NOT GUARANTEE FUTURE RESULTS. The returns shown do not reflect deduction of taxes that a shareholder would pay on the Fund’s distributions or the redemption of the Fund’s shares. Investment returns and principal values will fluctuate so that your shares, when redeemed, may be worth more or less than their original purchase price.
Current performance may be lower or higher than the performance data quoted. For more information on the Fund, and to obtain performance data current to the most recent month-end, or to request a prospectus, please call 1-877-670-2227. You should carefully consider the investment objectives, potential risks, management fees, and charges and expenses of the Fund before investing. The Fund’s prospectus contains this and other information about the Fund, and should be read carefully before investing.
The Fund is distributed by Unified Financial Securities, Inc., member FINRA.
4
Cloud Capital Strategic Mid Cap Fund
Investment Results – (Unaudited)
Total Returns *
(For the periods ended May 31, 2014)
| | | | | | | | |
| | | | | | Average Annual
Returns | |
| | | One Year | | | Since Inception
(June 29, 2011) | |
Cloud Capital Strategic Mid Cap Fund – Institutional Class | | | 16.66 | % | | | 11.77 | % |
S&P MidCap 400® Index** | | | 18.04 | % | | | 14.64 | % |
Total annual operating expenses, as disclosed in the Fund’s prospectus dated February 26, 2014, were 1.92% of average daily net assets (1.82% after fee waiver/expense reimbursement by Cloud Capital LLC (the “Adviser”)). The Adviser has contractually agreed to waive or limit its fees and to assume other expenses of the Mid Cap Fund effective February 1, 2014 through September 30, 2015, so that Total Annual Fund Operating Expenses does not exceed 1.90%. This operating expense limitation does not apply to brokerage fees and commissions, borrowing costs (such as interest and dividend expenses on securities sold short), taxes, extraordinary expenses, fees and expenses paid under a distribution plan adopted pursuant to Rule 12b-1, and indirect expenses (such as “Acquired Fund Fees and Expenses”). The Adviser shall not be entitled to reimbursement for any advisory fees waived for the period February 1, 2014 through September 30, 2015. However, for periods prior to this, the Adviser may be entitled to the reimbursement of any fees waived or expenses reimbursed pursuant to prior expense limitation agreements provided overall expenses fall below the limitations set forth above. The Adviser may recoup the sum of all fees previously waived or expenses reimbursed during any of the previous three (3) years, less any reimbursement previously paid, provided total expenses do not exceed the limitation set forth above. This agreement may only be terminated by mutual consent of the Adviser and the Board of Trustees.
The performance quoted represents past performance, which does not guarantee future results. The investment return and principal value of an investment will fluctuate so that an investor’s shares, when redeemed, may be worth more or less than their original cost. The returns shown do not reflect deduction of taxes that a shareholder would pay on Fund distributions or the redemption of Fund shares. The Fund’s investment objectives, risks, charges and expenses must be considered carefully before investing. Current performance of a Fund may be lower or higher than the performance quoted. Performance data current to the most recent month end may be obtained by calling 1-877-670-2227.
* Return figures reflect any change in price per share and assume the reinvestment of all distributions.
** The S&P MidCap 400® Index is a widely recognized unmanaged index of equity prices and is representative of a broader market and range of securities than is found in the Fund’s portfolio. The Index is an unmanaged benchmark that assumes reinvestment of all distributions and excludes the effect of taxes and fees. Individuals cannot invest directly in this Index; however, an individual can invest in exchange traded funds or other investment vehicles that attempt to track the performance of a benchmark index.
The Fund’s investment objectives, risks, charges and expenses must be considered carefully before investing. The prospectus contains this and other important information about the investment company and may be obtained by calling 1-877-670-2227. Please read it carefully before investing.
The Fund is distributed by Unified Financial Securities, Inc., Member FINRA.
5
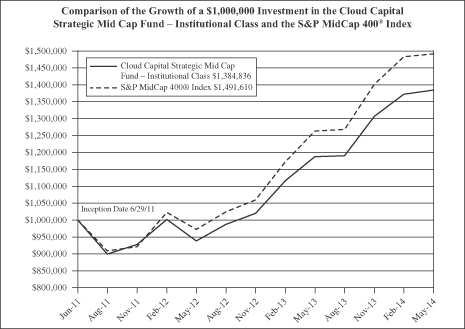
The chart above assumes an initial investment of $1,000,000 made on June 29, 2011 (commencement of Fund operations) and held through May 31, 2014. THE FUND’S RETURNS REPRESENT PAST PERFORMANCE AND DO NOT GUARANTEE FUTURE RESULTS. The returns shown do not reflect deduction of taxes that a shareholder would pay on the Fund’s distributions or the redemption of the Fund’s shares. Investment returns and principal values will fluctuate so that your shares, when redeemed, may be worth more or less than their original purchase price.
Current performance may be lower or higher than the performance data quoted. For more information on the Fund, and to obtain performance data current to the most recent month-end, or to request a prospectus, please call 1-877-670-2227. You should carefully consider the investment objectives, potential risks, management fees, and charges and expenses of the Fund before investing. The Fund’s prospectus contains this and other information about the Fund, and should be read carefully before investing.
The Fund is distributed by Unified Financial Securities, Inc., member FINRA.
6
FUND HOLDINGS – (Unaudited)
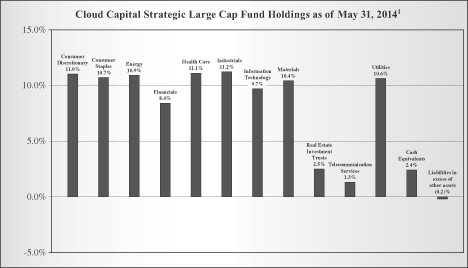
1 As a percent of net assets.
The investment objective of the Cloud Capital Strategic Large Cap Fund is to consistently deliver excess returns relative to the S&P 500® Index over three- to five-year time horizons.
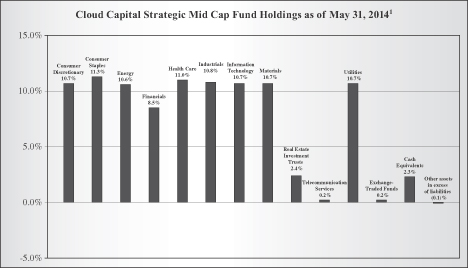
1 As a percent of net assets.
The investment objective of the Cloud Capital Strategic Mid Cap Fund is to consistently deliver excess returns relative to the S&P MidCap 400® Index over three- to five-year time horizons.
7
AVAILABILITY OF PORTFOLIO SCHEDULE – (Unaudited)
The Funds file its complete schedule of portfolio holdings with the Securities and Exchange Commission (“SEC”) for the first and third quarters of each fiscal year on Form N-Q. The Funds’ Forms N-Q are available at the SEC’s website at www.sec.gov. The Forms N-Q may be reviewed and copied at the Public Reference Room in Washington, DC. Information on the operation of the Public Reference Room may be obtained by calling 1-800-SEC-0330.
ABOUT THE FUNDS’ EXPENSES – (Unaudited)
As a shareholder of the Funds, you incur two types of costs: (1) transaction costs (such as short-term redemption fees); and (2) ongoing costs, including management fees; and other Fund expenses. This Example is intended to help you understand your ongoing costs (in dollars) of investing in the Funds and to compare these costs with the ongoing costs of investing in other mutual funds. The Example is based on an investment of $1,000 invested at the beginning of the period, and held for the entire period from December 1, 2013 to May 31, 2014.
Actual Expenses
The first line of the table below provides information about actual account values and actual expenses. You may use the information in this line, together with the amount you invested, to estimate the expenses that you paid over the period. Simply divide your account value by $1,000 (for example, an $8,600 account value divided by $1,000 = 8.60), then multiply the result by the number in the first line under the heading entitled “Expenses Paid During Period” to estimate the expenses you paid on your account during this period.
Hypothetical Example for Comparison Purposes
The second line of the table below provides information about hypothetical account values and hypothetical expenses based on the Funds’ actual expense ratios and an assumed rate of return of 5% per year before expenses, which is not the Funds’ actual return. The hypothetical account values and expenses may not be used to estimate the actual ending account balance or expenses you paid for the period. You may use this information to compare the ongoing costs of investing in the Fund and other funds. To do so, compare this 5% hypothetical example with the 5% hypothetical examples that appear in the shareholder reports of the other funds.
8
ABOUT THE FUNDS’ EXPENSES – (Unaudited) (continued)
Please note that the expenses shown in the table are meant to highlight your ongoing costs only and do not reflect any transactional costs, such as sales charges (loads), redemption fees, or exchange fees. Therefore, the second line of the table is useful in comparing ongoing costs only, and will not help you determine the relative total costs of owning different funds. In addition, if these transactional costs were included, your costs would have been higher.
| | | | | | | | | | | | |
Cloud Capital Strategic Large Cap Fund –
Institutional Class | | Beginning
Account Value December 1, 2013 | | | Ending Account Value May 31, 2014 | | | Expenses Paid During the Period Ended May 31, 2014* | |
Actual | | $ | 1,000.00 | | | $ | 1,085.50 | | | $ | 5.08 | |
Hypothetical ** | | $ | 1,000.00 | | | $ | 1,020.06 | | | $ | 4.92 | |
* Expenses are equal to the Cloud Capital Strategic Large Cap Fund’s annualized expense ratio of 0.98%, multiplied by the average account value over the period, multiplied by 182/365.
** Assumes a 5% return before expenses.
| | | | | | | | | | | | |
Cloud Capital Strategic
Mid Cap Fund –
Institutional Class | | Beginning
Account Value December 1, 2013 | | | Ending Account Value May 31, 2014 | | | Expenses Paid During the Period Ended May 31, 2014* | |
Actual | | $ | 1,000.00 | | | $ | 1,059.60 | | | $ | 7.19 | |
Hypothetical ** | | $ | 1,000.00 | | | $ | 1,017.95 | | | $ | 7.04 | |
* Expenses are equal to the Cloud Capital Strategic Mid Cap Fund’s annualized expense ratio of 1.40%, multiplied by the average account value over the period, multiplied by 182/365.
** Assumes a 5% return before expenses.
9
Cloud Capital Strategic Large Cap Fund
Schedule of Investments
May 31, 2014
| | | | | | | | |
| Shares | | | | | Fair Value | |
| Common Stocks – 97.66% | | | | |
| |
| Consumer Discretionary – 10.94% | | | | |
| | 104 | | | Amazon.com, Inc. * | | $ | 32,426 | |
| | 591 | | | AutoNation, Inc. * | | | 33,794 | |
| | 59 | | | AutoZone, Inc. * | | | 31,226 | |
| | 501 | | | Bed Bath & Beyond, Inc. * | | | 30,505 | |
| | 1,196 | | | Best Buy Co., Inc. | | | 33,069 | |
| | 512 | | | BorgWarner, Inc. | | | 32,191 | |
| | 1,889 | | | Cablevision Systems Corp. | | | 33,295 | |
| | 722 | | | CarMax, Inc. * | | | 31,975 | |
| | 784 | | | Carnival Corp. | | | 31,401 | |
| | 540 | | | CBS Corp. - Class B | | | 32,214 | |
| | 64 | | | Chipotle Mexican Grill, Inc. * | | | 34,785 | |
| | 692 | | | Coach, Inc. | | | 28,174 | |
| | 604 | | | Comcast Corp. - Class A | | | 31,514 | |
| | 1,392 | | | D.R. Horton, Inc. | | | 32,954 | |
| | 629 | | | Darden Restaurants, Inc. | | | 31,525 | |
| | 471 | | | Delphi Automotive PLC | | | 32,511 | |
| | 407 | | | DIRECTV - Class A * | | | 33,584 | |
| | 411 | | | Discovery Communications, Inc. - Class A * | | | 31,654 | |
| | 550 | | | Dollar General Corp. * | | | 29,600 | |
| | 600 | | | Dollar Tree, Inc. * | | | 31,817 | |
| | 441 | | | Expedia, Inc. | | | 32,343 | |
| | 532 | | | Family Dollar Stores, Inc. | | | 31,158 | |
| | 1,947 | | | Ford Motor Co. | | | 32,017 | |
| | 290 | | | Fossil Group, Inc. * | | | 30,429 | |
| | 779 | | | GameStop Corp. - Class A | | | 29,476 | |
| | 1,158 | | | Gannett Co., Inc. | | | 32,178 | |
| | 794 | | | Gap, Inc./The | | | 32,721 | |
| | 524 | | | Garmin Ltd. | | | 30,885 | |
| | 920 | | | General Motors Co. | | | 31,797 | |
| | 365 | | | Genuine Parts Co. | | | 31,482 | |
| | 1,255 | | | Goodyear Tire & Rubber Co./The | | | 33,090 | |
| | 47 | | | Graham Holdings Co. | | | 31,720 | |
| | 1,117 | | | H & R Block, Inc. | | | 33,270 | |
| | 426 | | | Harley-Davidson, Inc. | | | 30,383 | |
See accompanying notes which are an integral part of these financial statements.
10
Cloud Capital Strategic Large Cap Fund
Schedule of Investments – (continued)
May 31, 2014
| | | | | | | | |
| Shares | | | | | Fair Value | |
| Consumer Discretionary – (continued) | | | | |
| | 293 | | | Harman International Industries, Inc. | | $ | 30,826 | |
| | 575 | | | Hasbro, Inc. | | | 30,869 | |
| | 392 | | | Home Depot, Inc./The | | | 31,449 | |
| | 2,553 | | | International Game Technology | | | 32,037 | |
| | 1,837 | | | Interpublic Group of Cos., Inc./The | | | 35,132 | |
| | 710 | | | Johnson Controls, Inc. | | | 34,339 | |
| | 572 | | | Kohl’s Corp. | | | 31,144 | |
| | 577 | | | L Brands, Inc. | | | 33,143 | |
| | 955 | | | Leggett & Platt, Inc. | | | 32,400 | |
| | 814 | | | Lennar Corp. - Class A | | | 33,272 | |
| | 679 | | | Lowe’s Companies, Inc. | | | 31,973 | |
| | 542 | | | Macy’s, Inc. | | | 32,441 | |
| | 546 | | | Marriott International, Inc. - Class A | | | 33,641 | |
| | 806 | | | Mattel, Inc. | | | 31,295 | |
| | 310 | | | McDonalds Corp. | | | 31,397 | |
| | 345 | | | Michael Kors Holdings Ltd. * | | | 32,559 | |
| | 209 | | | Mohawk Industries, Inc. * | | | 28,386 | |
| | 99 | | | Netflix, Inc. * | | | 41,394 | |
| | 1,042 | | | Newell Rubbermaid, Inc. | | | 30,506 | |
| | 1,830 | | | News Corp. - Class A * | | | 31,219 | |
| | 430 | | | NIKE, Inc. - Class B | | | 33,044 | |
| | 510 | | | Nordstrom, Inc. | | | 34,724 | |
| | 463 | | | Omnicom Group, Inc. | | | 32,917 | |
| | 209 | | | O’Reilly Automotive, Inc. * | | | 30,963 | |
| | 466 | | | PetSmart, Inc. | | | 26,798 | |
| | 27 | | | Priceline.com, Inc. * | | | 34,746 | |
| | 1,714 | | | Pulte Group, Inc. | | | 33,519 | |
| | 251 | | | PVH Corp. | | | 33,027 | |
| | 207 | | | Ralph Lauren Corp. | | | 31,822 | |
| | 459 | | | Ross Stores, Inc. | | | 31,395 | |
| | 421 | | | Scripps Networks Interactive, Inc. - Class A | | | 32,222 | |
| | 2,518 | | | Staples, Inc. | | | 28,331 | |
| | 447 | | | Starbucks Corp. | | | 32,715 | |
| | 414 | | | Starwood Hotels & Resorts Worldwide, Inc. | | | 33,070 | |
| | 508 | | | Target Corp. | | | 28,817 | |
| | 356 | | | Tiffany & Co. | | | 35,425 | |
See accompanying notes which are an integral part of these financial statements.
11
Cloud Capital Strategic Large Cap Fund
Schedule of Investments – (continued)
May 31, 2014
| | | | | | | | |
| Shares | | | | | Fair Value | |
| Consumer Discretionary – (continued) | | | | |
| | 222 | | | Time Warner Cable, Inc. - Class A | | $ | 31,397 | |
| | 487 | | | Time Warner, Inc. | | | 34,007 | |
| | 534 | | | TJX Cos., Inc./The | | | 29,054 | |
| | 394 | | | TripAdvisor, Inc. * | | | 38,323 | |
| | 982 | | | Twenty-First Century Fox, Inc. | | | 34,775 | |
| | 874 | | | Urban Outfitters, Inc. * | | | 29,298 | |
| | 512 | | | VF Corp. | | | 32,277 | |
| | 375 | | | Viacom, Inc. - Class B | | | 32,036 | |
| | 395 | | | Walt Disney Co./The | | | 33,216 | |
| | 206 | | | Whirlpool Corp. | | | 29,526 | |
| | 440 | | | Wyndham Worldwide Corp. | | | 32,511 | |
| | 156 | | | Wynn Resorts Ltd. | | | 33,515 | |
| | 409 | | | Yum! Brands, Inc. | | | 31,644 | |
| | | | | | | | |
| | | | 2,667,699 | |
| | | | | | | | |
| Consumer Staples – 10.72% | | | | |
| | 1,632 | | | Altria Group, Inc. | | | 67,840 | |
| | 1,510 | | | Archer-Daniels-Midland Co. | | | 67,882 | |
| | 4,328 | | | Avon Products, Inc. | | | 61,846 | |
| | 734 | | | Brown-Forman Corp. - Class B | | | 67,977 | |
| | 1,442 | | | Campbell Soup Co. | | | 66,200 | |
| | 722 | | | Clorox Co./The | | | 64,670 | |
| | 1,606 | | | Coca-Cola Co./The | | | 65,693 | |
| | 1,446 | | | Coca-Cola Enterprises, Inc. | | | 65,994 | |
| | 973 | | | Colgate-Palmolive Co. | | | 66,548 | |
| | 2,145 | | | ConAgra Foods, Inc. | | | 69,291 | |
| | 822 | | | Constellation Brands, Inc. - Class A * | | | 69,193 | |
| | 567 | | | Costco Wholesale Corp. | | | 65,742 | |
| | 900 | | | CVS Caremark Corp. | | | 70,507 | |
| | 1,190 | | | Dr. Pepper Snapple Group, Inc. | | | 68,673 | |
| | 899 | | | Estee Lauder Cos., Inc./The - Class A | | | 68,918 | |
| | 1,243 | | | General Mills, Inc. | | | 68,282 | |
| | 681 | | | Hershey Co./The | | | 66,246 | |
| | 1,380 | | | Hormel Foods Corp. | | | 67,925 | |
| | 677 | | | JM Smucker Co./The | | | 69,501 | |
| | 979 | | | Kellogg Co. | | | 67,533 | |
See accompanying notes which are an integral part of these financial statements.
12
Cloud Capital Strategic Large Cap Fund
Schedule of Investments – (continued)
May 31, 2014
| | | | | | | | |
| Shares | | | | | Fair Value | |
| Consumer Staples – (continued) | | | | |
| | 585 | | | Kimberly-Clark Corp. | | $ | 65,740 | |
| | 1,153 | | | Kraft Foods Group, Inc. | | | 68,542 | |
| | 1,441 | | | Kroger Co./The | | | 68,794 | |
| | 1,112 | | | Lorillard, Inc. | | | 69,118 | |
| | 917 | | | McCormick & Co., Inc. | | | 66,318 | |
| | 743 | | | Mead Johnson Nutrition Co. | | | 66,519 | |
| | 1,096 | | | Molson Coors Brewing Co. - Class B | | | 72,027 | |
| | 1,844 | | | Mondelez International, Inc. - Class A | | | 69,381 | |
| | 991 | | | Monster Beverage Corp. * | | | 68,734 | |
| | 765 | | | PepsiCo, Inc. | | | 67,564 | |
| | 768 | | | Philip Morris International, Inc. | | | 68,022 | |
| | 799 | | | Procter & Gamble Co. | | | 64,575 | |
| | 1,160 | | | Reynolds American, Inc. | | | 69,181 | |
| | 1,924 | | | Safeway, Inc. | | | 66,055 | |
| | 1,815 | | | Sysco Corp. | | | 68,118 | |
| | 1,556 | | | Tyson Foods, Inc. - Class A | | | 66,073 | |
| | 980 | | | Walgreen Co. | | | 70,471 | |
| | 820 | | | Wal-Mart Stores, Inc. | | | 62,930 | |
| | 1,329 | | | Whole Foods Market, Inc. | | | 50,820 | |
| | | | | | | | |
| | | | | | | 2,615,443 | |
| | | | | | | | |
| | Energy – 10.87% | | | | |
| | 599 | | | Anadarko Petroleum Corp. | | | 61,634 | |
| | 685 | | | Apache Corp. | | | 63,856 | |
| | 861 | | | Baker Hughes, Inc. | | | 60,720 | |
| | 1,529 | | | Cabot Oil & Gas Corp. | | | 55,417 | |
| | 922 | | | Cameron International Corp. * | | | 58,987 | |
| | 2,063 | | | Chesapeake Energy Corp. | | | 59,248 | |
| | 472 | | | Chevron Corp. | | | 57,901 | |
| | 797 | | | ConocoPhillips | | | 63,681 | |
| | 1,349 | | | Consol Energy, Inc. | | | 59,584 | |
| | 3,549 | | | Denbury Resources, Inc. | | | 59,939 | |
| | 846 | | | Devon Energy Corp. | | | 62,507 | |
| | 1,107 | | | Diamond Offshore Drilling, Inc. | | | 56,530 | |
| | 1,187 | | | Ensco PLC - Class A | | | 62,513 | |
| | 605 | | | EOG Resources, Inc. | | | 64,039 | |
See accompanying notes which are an integral part of these financial statements.
13
Cloud Capital Strategic Large Cap Fund
Schedule of Investments – (continued)
May 31, 2014
| | | | | | | | |
| Shares | | | | | Fair Value | |
| | Energy – (continued) | | | | |
| | 549 | | | EQT Corp. | | $ | 58,638 | |
| | 583 | | | Exxon Mobil Corp. | | | 58,591 | |
| | 1,042 | | | FMC Technologies, Inc. * | | | 60,472 | |
| | 947 | | | Halliburton Co. | | | 61,197 | |
| | 549 | | | Helmerich & Payne, Inc. | | | 60,412 | |
| | 660 | | | Hess Corp. | | | 60,266 | |
| | 1,817 | | | Kinder Morgan, Inc. | | | 60,657 | |
| | 1,617 | | | Marathon Oil Corp. | | | 59,272 | |
| | 633 | | | Marathon Petroleum Corp. | | | 56,619 | |
| | 929 | | | Murphy Oil Corp. | | | 57,274 | |
| | 2,376 | | | Nabors Industries Ltd. | | | 62,316 | |
| | 760 | | | National Oilwell Varco, Inc. | | | 62,208 | |
| | 1,853 | | | Newfield Exploration Co. * | | | 67,606 | |
| | 1,965 | | | Noble Corp. PLC | | | 61,806 | |
| | 820 | | | Noble Energy, Inc. | | | 59,065 | |
| | 614 | | | Occidental Petroleum Corp. | | | 61,164 | |
| | 3,190 | | | Peabody Energy Corp. | | | 51,551 | |
| | 701 | | | Phillips 66 | | | 59,448 | |
| | 306 | | | Pioneer Natural Resources Co. | | | 64,219 | |
| | 1,917 | | | QEP Resources, Inc. | | | 61,242 | |
| | 654 | | | Range Resources Corp. | | | 60,803 | |
| | 1,924 | | | Rowan Cos. PLC | | | 59,576 | |
| | 582 | | | Schlumberger Ltd. | | | 60,518 | |
| | 1,245 | | | Southwestern Energy Co. * | | | 56,621 | |
| | 1,492 | | | Spectra Energy Corp. | | | 60,541 | |
| | 1,061 | | | Tesoro Corp. | | | 59,606 | |
| | 1,394 | | | Transocean Ltd. | | | 59,229 | |
| | 1,027 | | | Valero Energy Corp. | | | 57,575 | |
| | 1,407 | | | Williams Cos., Inc./The | | | 66,062 | |
| | 2,829 | | | WPX Energy, Inc. * | | | 59,916 | |
| | | | | | | | |
| | | | | | | 2,651,026 | |
| | | | | | | | |
| | Financials – 8.36% | | | | |
| | 319 | | | ACE Ltd. | | | 33,053 | |
| | 514 | | | Aflac, Inc. | | | 31,487 | |
| | 564 | | | Allstate Corp./The | | | 32,832 | |
See accompanying notes which are an integral part of these financial statements.
14
Cloud Capital Strategic Large Cap Fund
Schedule of Investments – (continued)
May 31, 2014
| | | | | | | | |
| Shares | | | | | Fair Value | |
| | Financials – (continued) | | | | |
| | 369 | | | American Express Co. | | $ | 33,726 | |
| | 614 | | | American International Group, Inc. | | | 33,226 | |
| | 295 | | | Ameriprise Financial, Inc. | | | 33,256 | |
| | 383 | | | Aon PLC | | | 34,443 | |
| | 481 | | | Assurant, Inc. | | | 32,613 | |
| | 2,135 | | | Bank of America Corp. | | | 32,326 | |
| | 963 | | | Bank of New York Mellon Corp./The | | | 33,280 | |
| | 867 | | | BB&T Corp. | | | 32,874 | |
| | 253 | | | Berkshire Hathaway, Inc. - Class B * | | | 32,425 | |
| | 108 | | | BlackRock, Inc. | | | 33,070 | |
| | 438 | | | Capital One Financial Corp. | | | 34,528 | |
| | 1,223 | | | CBRE Group, Inc. * | | | 36,483 | |
| | 1,224 | | | Charles Schwab Corp./The | | | 30,862 | |
| | 352 | | | Chubb Corp./The | | | 32,595 | |
| | 666 | | | Cincinnati Financial Corp. | | | 32,660 | |
| | 673 | | | Citigroup, Inc. | | | 32,016 | |
| | 459 | | | CME Group, Inc. | | | 33,060 | |
| | 680 | | | Comerica, Inc. | | | 32,642 | |
| | 582 | | | Discover Financial Services | | | 34,425 | |
| | 1,473 | | | E*Trade Financial Corp. * | | | 30,010 | |
| | 1,589 | | | Fifth Third Bancorp. | | | 32,877 | |
| | 624 | | | Franklin Resources, Inc. | | | 34,467 | |
| | 1,858 | | | Genworth Financial, Inc. - Class A * | | | 31,565 | |
| | 204 | | | Goldman Sachs Group, Inc./The | | | 32,571 | |
| | 921 | | | Hartford Financial Services Group, Inc. | | | 31,927 | |
| | 3,298 | | | Hudson City Bancorp, Inc. | | | 32,226 | |
| | 161 | | | Intercontinental Exchange Group, Inc. | | | 31,596 | |
| | 921 | | | Invesco Ltd. | | | 33,786 | |
| | 583 | | | JPMorgan Chase & Co. | | | 32,390 | |
| | 2,383 | | | KeyCorp | | | 32,626 | |
| | 691 | | | Legg Mason, Inc. | | | 33,743 | |
| | 1,272 | | | Leucadia National Corp. | | | 32,625 | |
| | 673 | | | Lincoln National Corp. | | | 32,256 | |
| | 741 | | | Loews Corp. | | | 31,945 | |
| | 267 | | | M&T Bank Corp. | | | 32,434 | |
| | 664 | | | Marsh & McLennan Cos., Inc. | | | 33,389 | |
See accompanying notes which are an integral part of these financial statements.
15
Cloud Capital Strategic Large Cap Fund
Schedule of Investments – (continued)
May 31, 2014
| | | | | | | | |
| Shares | | | | | Fair Value | |
| | Financials – (continued) | | | | |
| | 434 | | | McGraw Hill Financial, Inc. | | $ | 35,498 | |
| | 624 | | | MetLife, Inc. | | | 31,779 | |
| | 411 | | | Moody’s Corp. | | | 35,194 | |
| | 1,068 | | | Morgan Stanley | | | 32,964 | |
| | 885 | | | NASDAQ OMX Group, Inc./The | | | 33,532 | |
| | 1,274 | | | Navient Corp. * | | | 20,125 | |
| | 539 | | | Northern Trust Corp. | | | 32,526 | |
| | 2,277 | | | People’s United Financial, Inc. | | | 32,724 | |
| | 388 | | | PNC Financial Services Group, Inc. | | | 33,050 | |
| | 692 | | | Principal Financial Group, Inc. | | | 32,384 | |
| | 1,343 | | | Progressive Corp./The | | | 33,612 | |
| | 399 | | | Prudential Financial, Inc. | | | 32,813 | |
| | 3,194 | | | Regions Financial Corp. | | | 32,549 | |
| | 1,274 | | | SLM Corp. | | | 10,967 | |
| | 501 | | | State Street Corp. | | | 32,669 | |
| | 851 | | | SunTrust Banks, Inc. | | | 32,597 | |
| | 398 | | | T. Rowe Price Group, Inc. | | | 32,448 | |
| | 406 | | | Torchmark Corp. | | | 32,893 | |
| | 355 | | | Travelers Cos., Inc./The | | | 33,152 | |
| | 802 | | | U.S. Bancorp | | | 33,840 | |
| | 981 | | | Unum Group | | | 33,250 | |
| | 656 | | | Wells Fargo & Co. | | | 33,289 | |
| | 1,027 | | | XL Group PLC | | | 33,352 | |
| | 1,117 | | | Zions Bancorp. | | | 31,946 | |
| | | | | | | | |
| | | | | | | 2,039,468 | |
| | | | | | | | |
| | Health Care – 11.07% | | | | |
| | 1,248 | | | Abbott Laboratories | | | 49,933 | |
| | 935 | | | AbbVie, Inc. | | | 50,790 | |
| | 233 | | | Actavis PLC * | | | 49,363 | |
| | 660 | | | Aetna, Inc. | | | 51,186 | |
| | 894 | | | Agilent Technologies, Inc. | | | 50,929 | |
| | 301 | | | Alexion Pharmaceuticals, Inc. * | | | 50,007 | |
| | 289 | | | Allergan, Inc. | | | 48,445 | |
| | 741 | | | AmerisourceBergen Corp. | | | 54,250 | |
| | 428 | | | Amgen, Inc. | | | 49,655 | |
See accompanying notes which are an integral part of these financial statements.
16
Cloud Capital Strategic Large Cap Fund
Schedule of Investments – (continued)
May 31, 2014
| | | | | | | | |
| Shares | | | | | Fair Value | |
| | Health Care – (continued) | | | | |
| | 654 | | | Baxter International, Inc. | | $ | 48,679 | |
| | 427 | | | Becton, Dickinson and Co. | | | 50,227 | |
| | 167 | | | Biogen Idec, Inc. * | | | 53,177 | |
| | 3,800 | | | Boston Scientific Corp. * | | | 48,758 | |
| | 968 | | | Bristol-Myers Squibb Co. | | | 48,134 | |
| | 350 | | | C.R. Bard, Inc. | | | 51,760 | |
| | 690 | | | Cardinal Health, Inc. | | | 48,725 | |
| | 1,234 | | | CareFusion Corp. * | | | 52,975 | |
| | 329 | | | Celgene Corp. * | | | 50,361 | |
| | 943 | | | Cerner Corp. * | | | 50,957 | |
| | 603 | | | CIGNA Corp. | | | 54,097 | |
| | 682 | | | Covidien PLC | | | 49,849 | |
| | 687 | | | DaVita, Inc. * | | | 48,503 | |
| | 1,078 | | | DENTSPLY International, Inc. | | | 50,985 | |
| | 586 | | | Edwards LifeSciences Corp. * | | | 47,545 | |
| | 808 | | | Eli Lilly & Co. | | | 48,393 | |
| | 720 | | | Express Scripts Holding Co. * | | | 51,473 | |
| | 518 | | | Forest Laboratories, Inc. * | | | 49,127 | |
| | 628 | | | Gilead Sciences, Inc. * | | | 51,011 | |
| | 1,021 | | | Hospira, Inc. * | | | 50,212 | |
| | 430 | | | Humana, Inc. | | | 53,552 | |
| | 132 | | | Intuitive Surgical, Inc. * | | | 48,749 | |
| | 473 | | | Johnson & Johnson | | | 48,030 | |
| | 483 | | | Laboratory Corp. of America Holdings * | | | 49,537 | |
| | 284 | | | McKesson Corp. | | | 53,937 | |
| | 816 | | | Medtronic, Inc. | | | 49,772 | |
| | 817 | | | Merck & Co., Inc. | | | 47,249 | |
| | 949 | | | Mylan, Inc. * | | | 47,278 | |
| | 1,168 | | | Patterson Companies, Inc. | | | 45,741 | |
| | 1,143 | | | PerkinElmer, Inc. | | | 51,389 | |
| | 329 | | | Perrigo Co. PLC | | | 45,458 | |
| | 1,503 | | | Pfizer, Inc. | | | 44,531 | |
| | 857 | | | Quest Diagnostics, Inc. | | | 51,309 | |
| | 161 | | | Regeneron Pharmaceuticals, Inc. * | | | 49,374 | |
| | 758 | | | St. Jude Medical, Inc. | | | 49,192 | |
| | 617 | | | Stryker Corp. | | | 52,096 | |
See accompanying notes which are an integral part of these financial statements.
17
Cloud Capital Strategic Large Cap Fund
Schedule of Investments – (continued)
May 31, 2014
| | | | | | | | |
| Shares | | | | | Fair Value | |
| | Health Care – (continued) | | | | |
| | 1,049 | | | Tenet Healthcare Corp. * | | $ | 49,308 | |
| | 419 | | | Thermo Fisher Scientific, Inc. | | | 49,001 | |
| | 629 | | | UnitedHealth Group, Inc. | | | 50,111 | |
| | 599 | | | Varian Medical Systems, Inc. * | | | 49,419 | |
| | 709 | | | Vertex Pharmaceuticals, Inc. * | | | 51,248 | |
| | 485 | | | Waters Corp. * | | | 48,584 | |
| | 471 | | | WellPoint, Inc. | | | 51,052 | |
| | 490 | | | Zimmer Holdings, Inc. | | | 51,176 | |
| | 1,746 | | | Zoetis, Inc. | | | 53,615 | |
| | | | | | | | |
| | | | | | | 2,700,214 | |
| | | | | | | | |
| | Industrials – 11.22% | | | | |
| | 290 | | | 3M Co. | | | 41,336 | |
| | 1,284 | | | ADT Corp./The | | | 41,335 | |
| | 814 | | | Allegion PLC | | | 42,649 | |
| | 779 | | | AMETEK, Inc. | | | 41,341 | |
| | 1,727 | | | Avery Dennison Corp. | | | 87,538 | |
| | 312 | | | Boeing Co./The | | | 42,215 | |
| | 380 | | | Caterpillar, Inc. | | | 38,875 | |
| | 679 | | | CH Robinson Worldwide, Inc. | | | 40,658 | |
| | 688 | | | Cintas Corp. | | | 42,718 | |
| | 1,424 | | | CSX Corp. | | | 41,870 | |
| | 266 | | | Cummins, Inc. | | | 40,739 | |
| | 544 | | | Danaher Corp. | | | 42,656 | |
| | 430 | | | Deere & Co. | | | 39,183 | |
| | 1,262 | | | Delta Air Lines, Inc. | | | 50,365 | |
| | 468 | | | Dover Corp. | | | 40,843 | |
| | 372 | | | Dun & Bradstreet Corp. | | | 38,435 | |
| | 562 | | | Eaton Corp. PLC | | | 41,438 | |
| | 592 | | | Emerson Electric Co. | | | 39,531 | |
| | 574 | | | Equifax, Inc. | | | 40,653 | |
| | 986 | | | Expeditors International of Washington, Inc. | | | 44,851 | |
| | 815 | | | Fastenal Co. | | | 39,707 | |
| | 296 | | | FedEx Corp. | | | 42,741 | |
| | 557 | | | Flowserve Corp. | | | 41,097 | |
| | 539 | | | Fluor Corp. | | | 40,484 | |
See accompanying notes which are an integral part of these financial statements.
18
Cloud Capital Strategic Large Cap Fund
Schedule of Investments – (continued)
May 31, 2014
| | | | | | | | |
| Shares | | | | | Fair Value | |
| | Industrials – (continued) | | | | |
| | 373 | | | General Dynamics Corp. | | $ | 44,050 | |
| | 1,502 | | | General Electric Co. | | | 40,230 | |
| | 437 | | | Honeywell International, Inc. | | | 40,723 | |
| | 473 | | | Illinois Tool Works, Inc. | | | 40,912 | |
| | 683 | | | Ingersoll-Rand PLC | | | 40,875 | |
| | 1,439 | | | Iron Mountain, Inc. | | | 44,818 | |
| | 707 | | | Jacobs Engineering Group, Inc. * | | | 38,915 | |
| | 669 | | | Joy Global, Inc. | | | 38,230 | |
| | 400 | | | Kansas City Southern | | | 43,004 | |
| | 349 | | | L-3 Communications Holdings, Inc. | | | 42,238 | |
| | 248 | | | Lockheed Martin Corp. | | | 40,568 | |
| | 1,997 | | | Masco Corp. | | | 42,530 | |
| | 855 | | | Nielsen NV | | | 41,278 | |
| | 426 | | | Norfolk Southern Corp. | | | 42,911 | |
| | 334 | | | Northrop Grumman Corp. | | | 40,618 | |
| | 636 | | | PACCAR, Inc. | | | 40,310 | |
| | 481 | | | Pall Corp. | | | 40,784 | |
| | 320 | | | Parker Hannifin Corp. | | | 40,032 | |
| | 545 | | | Pentair Ltd. | | | 40,699 | |
| | 1,512 | | | Pitney Bowes, Inc. | | | 41,779 | |
| | 158 | | | Precision Castparts Corp. | | | 39,999 | |
| | 1,161 | | | Quanta Services, Inc. * | | | 39,424 | |
| | 421 | | | Raytheon Co. | | | 41,066 | |
| | 1,148 | | | Republic Services, Inc. | | | 40,622 | |
| | 918 | | | Robert Half International, Inc. | | | 41,855 | |
| | 346 | | | Rockwell Automation, Inc. | | | 41,909 | |
| | 523 | | | Rockwell Collins, Inc. | | | 41,299 | |
| | 291 | | | Roper Industries, Inc. | | | 41,190 | |
| | 496 | | | Ryder System, Inc. | | | 43,012 | |
| | 348 | | | Snap-on, Inc. | | | 40,786 | |
| | 1,660 | | | Southwest Airlines Co. | | | 43,918 | |
| | 475 | | | Stanley Black & Decker, Inc. | | | 41,494 | |
| | 348 | | | Stericycle, Inc. * | | | 39,835 | |
| | 1,008 | | | Textron, Inc. | | | 39,545 | |
| | 991 | | | Tyco International Ltd. | | | 43,252 | |
| | 212 | | | Union Pacific Corp. | | | 42,167 | |
See accompanying notes which are an integral part of these financial statements.
19
Cloud Capital Strategic Large Cap Fund
Schedule of Investments – (continued)
May 31, 2014
| | | | | | | | |
| Shares | | | | | Fair Value | |
| | Industrials – (continued) | | | | |
| | 409 | | | United Parcel Service, Inc. - Class B | | $ | 42,491 | |
| | 341 | | | United Technologies Corp. | | | 39,589 | |
| | 162 | | | W.W. Grainger, Inc. | | | 41,928 | |
| | 913 | | | Waste Management, Inc. | | | 40,806 | |
| | 1,091 | | | Xylem, Inc. | | | 40,711 | |
| | | | | | | | |
| | | | | | | 2,735,660 | |
| | | | | | | | |
| | Information Technology – 9.71% | | | | |
| | 456 | | | Accenture PLC - Class A | | | 37,157 | |
| | 579 | | | Adobe Systems, Inc. * | | | 37,348 | |
| | 686 | | | Akamai Technologies, Inc. * | | | 37,277 | |
| | 149 | | | Alliance Data Systems Corp. * | | | 38,097 | |
| | 1,100 | | | Altera Corp. | | | 36,450 | |
| | 376 | | | Amphenol Corp. - Class A | | | 36,056 | |
| | 708 | | | Analog Devices, Inc. | | | 37,095 | |
| | 61 | | | Apple, Inc. | | | 38,627 | |
| | 1,901 | | | Applied Materials, Inc. | | | 38,377 | |
| | 757 | | | Autodesk, Inc. * | | | 39,624 | |
| | 469 | | | Automatic Data Processing, Inc. | | | 37,382 | |
| | 1,186 | | | Broadcom Corp. - Class A | | | 37,784 | |
| | 1,207 | | | CA, Inc. | | | 34,622 | |
| | 1,562 | | | Cisco Systems, Inc. | | | 38,468 | |
| | 614 | | | Citrix Systems, Inc. * | | | 38,032 | |
| | 742 | | | Cognizant Technology Solutions Corp. - Class A * | | | 36,065 | |
| | 610 | | | Computer Sciences Corp. | | | 38,388 | |
| | 1,723 | | | Corning, Inc. | | | 36,707 | |
| | 688 | | | eBay, Inc. * | | | 34,888 | |
| | 1,270 | | | Electronic Arts, Inc. * | | | 44,616 | |
| | 1,399 | | | EMC Corp. | | | 37,154 | |
| | 339 | | | F5 Networks, Inc. * | | | 36,802 | |
| | 545 | | | Facebook, Inc. - Class A * | | | 34,500 | |
| | 676 | | | Fidelity National Information Services, Inc. | | | 36,628 | |
| | 537 | | | First Solar, Inc. * | | | 33,181 | |
| | 602 | | | Fiserv, Inc. * | | | 36,205 | |
| | 1,052 | | | FLIR Systems, Inc. | | | 36,713 | |
| | 67 | | | Google, Inc. - Class A * | | | 38,203 | |
See accompanying notes which are an integral part of these financial statements.
20
Cloud Capital Strategic Large Cap Fund
Schedule of Investments – (continued)
May 31, 2014
| | | | | | | | |
| Shares | | | | | Fair Value | |
| | Information Technology – (continued) | | | | |
| | 488 | | | Harris Corp. | | $ | 37,705 | |
| | 1,087 | | | Hewlett-Packard Co. | | | 36,429 | |
| | 1,347 | | | Intel Corp. | | | 36,795 | |
| | 182 | | | International Business Machines Corp. | | | 33,582 | |
| | 471 | | | Intuit, Inc. | | | 37,345 | |
| | 2,083 | | | Jabil Circuit, Inc. | | | 39,211 | |
| | 1,464 | | | Juniper Networks, Inc. * | | | 35,819 | |
| | 556 | | | KLA-Tencor Corp. | | | 36,459 | |
| | 619 | | | Lam Research Corp. * | | | 38,376 | |
| | 809 | | | Linear Technology Corp. | | | 37,344 | |
| | 494 | | | MasterCard, Inc. - Class A | | | 37,748 | |
| | 759 | | | Microchip Technology, Inc. | | | 36,120 | |
| | 1,390 | | | Micron Technology, Inc. * | | | 39,740 | |
| | 881 | | | Microsoft Corp. | | | 36,086 | |
| | 566 | | | Motorola Solutions, Inc. | | | 38,156 | |
| | 1,013 | | | NetApp, Inc. | | | 37,491 | |
| | 1,917 | | | NVIDIA Corp. | | | 36,415 | |
| | 884 | | | Oracle Corp. | | | 37,153 | |
| | 880 | | | Paychex, Inc. | | | 36,180 | |
| | 455 | | | QUALCOMM, Inc. | | | 36,615 | |
| | 741 | | | Red Hat, Inc. * | | | 37,127 | |
| | 706 | | | Salesforce.com, Inc. * | | | 37,140 | |
| | 423 | | | SanDisk Corp. | | | 40,921 | |
| | 659 | | | Seagate Technology PLC | | | 35,385 | |
| | 1,777 | | | Symantec Corp. | | | 39,070 | |
| | 608 | | | TE Connectivity Ltd. | | | 36,123 | |
| | 794 | | | Teradata Corp. * | | | 33,329 | |
| | 781 | | | Texas Instruments, Inc. | | | 36,677 | |
| | 1,148 | | | Total System Services, Inc. | | | 34,730 | |
| | 764 | | | VeriSign, Inc. * | | | 38,282 | |
| | 175 | | | Visa, Inc. - Class A | | | 37,677 | |
| | 400 | | | Western Digital Corp. | | | 35,151 | |
| | 2,273 | | | Western Union Co./The | | | 36,756 | |
| | 3,014 | | | Xerox Corp. | | | 37,229 | |
| | 760 | | | Xilinx, Inc. | | | 35,697 | |
See accompanying notes which are an integral part of these financial statements.
21
Cloud Capital Strategic Large Cap Fund
Schedule of Investments – (continued)
May 31, 2014
| | | | | | | | |
| Shares | | | | | Fair Value | |
| | Information Technology – (continued) | | | | |
| | 992 | | | Yahoo!, Inc. * | | $ | 34,357 | |
| | | | | |
| | | | | | | 2,368,866 | |
| | | | | |
| | Materials – 10.42% | | | | |
| | 718 | | | Air Products & Chemicals, Inc. | | | 86,134 | |
| | 787 | | | Airgas, Inc. | | | 83,704 | |
| | 6,219 | | | Alcoa, Inc. | | | 84,640 | |
| | 2,033 | | | Allegheny Technologies, Inc. | | | 83,511 | |
| | 1,486 | | | Ball Corp. | | | 89,725 | |
| | 2,069 | | | Bemis Co., Inc. | | | 85,693 | |
| | 342 | | | CF Industries Holdings, Inc. | | | 83,115 | |
| | 4,759 | | | Cliffs Natural Resources, Inc. | | | 74,615 | |
| | 1,718 | | | Dow Chemical Co./The | | | 89,566 | |
| | 965 | | | Eastman Chemical Co. | | | 85,192 | |
| | 801 | | | Ecolab, Inc. | | | 87,412 | |
| | 1,240 | | | EI du Pont de Nemours & Co. | | | 85,951 | |
| | 1,093 | | | FMC Corp. | | | 83,663 | |
| | 2,473 | | | Freeport-McMoRan Copper & Gold, Inc. - Class B | | | 84,210 | |
| | 860 | | | International Flavors & Fragrances, Inc. | | | 85,332 | |
| | 1,770 | | | International Paper Co. | | | 84,312 | |
| | 917 | | | Lyondellbasell Industries NV - Class A | | | 91,335 | |
| | 2,184 | | | MeadWestvaco Corp. | | | 88,628 | |
| | 755 | | | Monsanto Co. | | | 92,028 | |
| | 1,674 | | | Mosaic Co./The | | | 83,674 | |
| | 3,368 | | | Newmont Mining Corp. | | | 77,092 | |
| | 1,633 | | | Nucor Corp. | | | 82,692 | |
| | 2,667 | | | Owens-Illinois, Inc. * | | | 88,636 | |
| | 433 | | | PPG Industries, Inc. | | | 87,301 | |
| | 649 | | | Praxair, Inc. | | | 85,772 | |
| | 2,425 | | | Sealed Air Corp. | | | 79,839 | |
| | 419 | | | Sherwin-Williams Co./The | | | 85,680 | |
| | 874 | | | Sigma-Aldrich Corp. | | | 86,113 | |
| | 3,279 | | | United States Steel Corp. | | | 75,556 | |
| | 1,313 | | | Vulcan Materials Co. | | | 80,059 | |
| | | | | | | | |
| | | | | | | 2,541,180 | |
| | | | | | | | |
See accompanying notes which are an integral part of these financial statements.
22
Cloud Capital Strategic Large Cap Fund
Schedule of Investments – (continued)
May 31, 2014
| | | | | | | | |
| Shares | | | | | Fair Value | |
| | Real Estate Investment Trusts – 2.45% | | | | |
| | 385 | | | American Tower Corp. - Class A | | $ | 34,509 | |
| | 1,047 | | | Apartment Investment & Management Co. - Class A | | | 32,973 | |
| | 235 | | | AvalonBay Communities, Inc. | | | 33,357 | |
| | 274 | | | Boston Properties, Inc. | | | 33,125 | |
| | 542 | | | Equity Residential | | | 33,498 | |
| | 1,460 | | | General Growth Properties, Inc. | | | 34,801 | |
| | 786 | | | HCP, Inc. | | | 32,795 | |
| | 519 | | | Health Care REIT, Inc. | | | 32,818 | |
| | 1,532 | | | Host Hotels & Resorts, Inc. | | | 33,806 | |
| | 1,418 | | | Kimco Realty Corp. | | | 32,490 | |
| | 501 | | | Macerich Co./The | | | 33,068 | |
| | 743 | | | Plum Creek Timber Co., Inc. | | | 33,500 | |
| | 797 | | | ProLogis, Inc. | | | 33,070 | |
| | 185 | | | Public Storage, Inc. | | | 31,953 | |
| | 186 | | | Simon Property Group, Inc. | | | 30,916 | |
| | 488 | | | Ventas, Inc. | | | 32,610 | |
| | 316 | | | Vornado Realty Trust | | | 33,880 | |
| | 93 | | | Washington Prime Group, Inc. * | | | 1,847 | |
| | 1,072 | | | Weyerhaeuser Co. | | | 33,696 | |
| | | | | | | | |
| | | | | | | 598,712 | |
| | | | | | | | |
| | Telecommunication Services – 1.27% | | | | |
| | 1,033 | | | AT&T, Inc. | | | 36,626 | |
| | 1,032 | | | CenturyLink, Inc. | | | 38,861 | |
| | 497 | | | Crown Castle International Corp. | | | 38,140 | |
| | 6,057 | | | Frontier Communications Corp. | | | 35,069 | |
| | 4,338 | | | Sprint Corp. * | | | 41,427 | |
| | 1,225 | | | T-Mobile US, Inc. * | | | 42,063 | |
| | 775 | | | Verizon Communications, Inc. | | | 38,706 | |
| | 3,932 | | | Windstream Holdings, Inc. | | | 37,625 | |
| | | | | | | | |
| | | | | | | 308,517 | |
| | | | | | | | |
| Utilities – 10.63% | | | | |
| | 5,924 | | | AES Corp./The | | | 83,535 | |
| | 1,571 | | | AGL Resources, Inc. | | | 83,840 | |
| | 2,040 | | | Ameren Corp. | | | 80,261 | |
See accompanying notes which are an integral part of these financial statements.
23
Cloud Capital Strategic Large Cap Fund
Schedule of Investments – (continued)
May 31, 2014
| | | | | | | | |
| Shares | | | | | Fair Value | |
| | Utilities – (continued) | | | | |
| | 1,556 | | | American Electric Power Co., Inc. | | $ | 83,028 | |
| | 3,411 | | | CenterPoint Energy, Inc. | | | 82,266 | |
| | 2,818 | | | CMS Energy Corp. | | | 83,845 | |
| | 1,449 | | | Consolidated Edison, Inc. | | | 79,730 | |
| | 1,153 | | | Dominion Resources, Inc. - Class A | | | 79,499 | |
| | 1,081 | | | DTE Energy Co. | | | 82,287 | |
| | 1,129 | | | Duke Energy Corp. | | | 80,280 | |
| | 1,505 | | | Edison International | | | 82,968 | |
| | 1,146 | | | Entergy Corp. | | | 86,425 | |
| | 2,430 | | | Exelon Corp. | | | 89,488 | |
| | 2,514 | | | FirstEnergy Corp. | | | 85,009 | |
| | 1,380 | | | Integrys Energy Group, Inc. | | | 80,049 | |
| | 846 | | | NextEra Energy, Inc. | | | 82,333 | |
| | 2,350 | | | NiSource, Inc. | | | 87,816 | |
| | 1,791 | | | Northeast Utilities | | | 81,297 | |
| | 2,591 | | | NRG Energy, Inc. | | | 92,359 | |
| | 1,353 | | | Oneok, Inc. | | | 87,228 | |
| | 3,155 | | | Pepco Holdings, Inc. | | | 87,402 | |
| | 1,853 | | | PG&E Corp. | | | 84,982 | |
| | 1,501 | | | Pinnacle West Capital Corp. | | | 83,204 | |
| | 2,530 | | | PPL Corp. | | | 88,768 | |
| | 2,088 | | | Public Service Enterprise Group, Inc. | | | 81,346 | |
| | 1,588 | | | SCANA Corp. | | | 82,555 | |
| | 855 | | | Sempra Energy | | | 85,776 | |
| | 1,843 | | | Southern Co. | | | 80,697 | |
| | 4,752 | | | TECO Energy, Inc. | | | 82,059 | |
| | 1,747 | | | Wisconsin Energy Corp. | | | 79,527 | |
| | 2,660 | | | Xcel Energy, Inc. | | | 81,824 | |
| | | | | | | | |
| | | | 2,591,683 | |
| | | | | | | | |
| |
| TOTAL COMMON STOCKS (Cost $20,588,543) | | | 23,818,468 | |
| | | | | | | | |
See accompanying notes which are an integral part of these financial statements.
24
Cloud Capital Strategic Large Cap Fund
Schedule of Investments – (continued)
May 31, 2014
| | | | | | | | |
| Shares | | | | | Fair Value | |
| Cash Equivalents – 2.36% | | | | |
| | 574,179 | | | FOLIOfn Investment Sweep Account, 0.010% (a) | | $ | 574,179 | |
| | | | | | | | |
| |
| TOTAL CASH EQUIVALENTS (Cost $574,179) | | | 574,179 | |
| | | | | | | | |
| |
| TOTAL INVESTMENTS
(Cost $21,162,722) – 100.02% | | | 24,392,647 | |
| | | | | | | | |
| |
| Liabilities in Excess of Other Assets – (0.02)% | | | (4,503 | ) |
| | | | | | | | |
| |
| TOTAL NET ASSETS – 100.00% | | $ | 24,388,144 | |
| | | | | | | | |
| (a) | Rate disclosed is the seven day yield as of May 31, 2014. |
| * | Non-income producing security. |
See accompanying notes which are an integral part of these financial statements.
25
Cloud Capital Strategic Mid Cap Fund
Schedule of Investments
May 31, 2014
| | | | | | | | |
| Shares | | | | | Fair Value | |
| | | | | | | | |
| | Common Stocks – 97.63% | | | | |
| |
| | Consumer Discretionary – 10.66% | | | | |
| | 1,369 | | | Aaron’s, Inc. | | $ | 44,968 | |
| | 333 | | | Advance Auto Parts, Inc. | | | 41,309 | |
| | 8,050 | | | Aeropostale, Inc. * | | | 31,476 | |
| | 614 | | | AMC Networks, Inc. - Class A * | | | 38,014 | |
| | 3,516 | | | American Eagle Outfitters, Inc. | | | 37,723 | |
| | 1,036 | | | ANN, Inc. * | | | 40,250 | |
| | 1,419 | | | Apollo Group, Inc. - Class A * | | | 38,017 | |
| | 2,350 | | | Ascena Retail Group, Inc. * | | | 39,228 | |
| | 631 | | | Bally Technologies, Inc. * | | | 37,215 | |
| | 2,429 | | | Barnes & Noble, Inc. * | | | 44,069 | |
| | 1,035 | | | Big Lots, Inc. * | | | 43,928 | |
| | 856 | | | Bob Evans Farms, Inc. | | | 38,228 | |
| | 816 | | | Brinker International, Inc. | | | 40,509 | |
| | 619 | | | Cabela’s, Inc. - Class A * | | | 37,924 | |
| | 551 | | | Carter’s, Inc. | | | 39,753 | |
| | 893 | | | Cheesecake Factory, Inc./The | | | 40,978 | |
| | 2,555 | | | Chico’s FAS, Inc. | | | 38,739 | |
| | 1,352 | | | Cinemark Holdings, Inc. | | | 42,614 | |
| | 1,244 | | | CST Brands, Inc. | | | 41,142 | |
| | 498 | | | Deckers Outdoor Corp. * | | | 38,485 | |
| | 890 | | | DeVry Education Group, Inc. | | | 37,568 | |
| | 761 | | | Dick’s Sporting Goods, Inc. | | | 33,832 | |
| | 3 | | | Dillard’s, Inc. - Class A | | | 338 | |
| | 558 | | | Domino’s Pizza, Inc. | | | 40,423 | |
| | 1,720 | | | DreamWorks Animation SKG, Inc. - Class A * | | | 48,300 | |
| | 873 | �� | | Foot Locker, Inc. | | | 42,069 | |
| | 1,381 | | | Gentex Corp. | | | 39,926 | |
| | 1,504 | | | Guess?, Inc. | | | 38,347 | |
| | 492 | | | Hanesbrands, Inc. | | | 41,712 | |
| | 703 | | | HSN, Inc. | | | 39,106 | |
| | 1,278 | | | International Speedway Corp. - Class A | | | 39,718 | |
| | 704 | | | Jarden Corp. * | | | 39,839 | |
| | 625 | | | John Wiley & Sons, Inc. - Class A | | | 34,210 | |
| | 2,431 | | | KB Home | | | 40,059 | |
See accompanying notes which are an integral part of these financial statements.
26
Cloud Capital Strategic Mid Cap Fund
Schedule of Investments – (continued)
May 31, 2014
| | | | | | | | |
| Shares | | | | | Fair Value | |
| | | | | | | | |
| Consumer Discretionary – (continued) | | | | |
| | 806 | | | Lamar Advertising Co. | | $ | 39,747 | |
| | 834 | | | Life Time Fitness, Inc. * | | | 44,343 | |
| | 1,401 | | | LKQ Corp. * | | | 38,866 | |
| | 998 | | | Matthews International Corp. - Class A | | | 40,932 | |
| | 1,460 | | | MDC Holdings, Inc. | | | 41,782 | |
| | 919 | | | Meredith Corp. | | | 41,319 | |
| | 300 | | | Mohawk Industries, Inc. * | | | 40,645 | |
| | 2,500 | | | New York Times Co./The - Class A | | | 37,154 | |
| | 37 | | | NVR, Inc. * | | | 41,418 | |
| | 9,832 | | | Office Depot, Inc. * | | | 50,340 | |
| | 261 | | | Panera Bread Co. - Class A * | | | 40,070 | |
| | 303 | | | Polaris Industries, Inc. | | | 39,045 | |
| | 3,136 | | | Regis Corp. | | | 43,158 | |
| | 1,388 | | | Rent-A-Center, Inc. | | | 38,814 | |
| | 1,253 | | | Scholastic Corp. | | | 39,936 | |
| | 3,428 | | | Scientific Games Corp. - Class A * | | | 30,682 | |
| | 2,111 | | | Service Corporation International | | | 42,264 | |
| | 403 | | | Signet Jewelers Ltd. | | | 42,738 | |
| | 972 | | | Sotheby’s | | | 38,362 | |
| | 957 | | | Strayer Education, Inc. * | | | 52,269 | |
| | 809 | | | Tempur Sealy International, Inc. * | | | 44,459 | |
| | 662 | | | Thor Industries, Inc. | | | 39,732 | |
| | 1,166 | | | Toll Brothers, Inc. * | | | 42,239 | |
| | 600 | | | Tractor Supply Co. | | | 39,039 | |
| | 478 | | | Tupperware Brands Corp. | | | 40,020 | |
| | 833 | | | Under Armour, Inc. - Class A * | | | 42,318 | |
| | 4,855 | | | Wendy’s Co./The | | | 39,809 | |
| | 576 | | | Williams-Sonoma, Inc. | | | 38,555 | |
| | | | | | | | |
| | | | 2,460,071 | |
| | | | | | | | |
| Consumer Staples – 11.27% | | | | |
| | 2,479 | | | Church & Dwight Co., Inc. | | | 171,594 | |
| | 10,905 | | | Dean Foods Co. | | | 189,533 | |
| | 1,532 | | | Energizer Holdings, Inc. | | | 177,765 | |
| | 8,491 | | | Flowers Foods, Inc. | | | 177,028 | |
| | 4,845 | | | Hillshire Brands Co. | | | 258,151 | |
See accompanying notes which are an integral part of these financial statements.
27
Cloud Capital Strategic Mid Cap Fund
Schedule of Investments – (continued)
May 31, 2014
| | | | | | | | |
| Shares | | | | | Fair Value | |
| | | | | | | | |
| Consumer Staples – (continued) | | | | |
| | 2,518 | | | Ingredion, Inc. | | $ | 191,733 | |
| | 1,862 | | | Keurig Green Mountain, Inc. | | | 209,949 | |
| | 1,820 | | | Lancaster Colony Corp. | | | 162,508 | |
| | 3,306 | | | Post Holdings, Inc. * | | | 165,200 | |
| | 24,259 | �� | | SUPERVALU, Inc. * | | | 181,213 | |
| | 6,123 | | | Tootsie Roll Industries, Inc. | | | 178,175 | |
| | 2,539 | | | United Natural Foods, Inc. * | | | 171,186 | |
| | 3,203 | | | Universal Corp. | | | 171,531 | |
| | 6,215 | | | WhiteWave Food Co. - Class A * | | | 195,709 | |
| | | | | | | | |
| | | | 2,601,275 | |
| | | | | | | | |
| Energy – 10.65% | | | | |
| | 28,667 | | | Alpha Natural Resources, Inc. * | | | 96,893 | |
| | 27,425 | | | Arch Coal, Inc. | | | 97,634 | |
| | 2,525 | | | Atwood Oceanics, Inc. * | | | 124,626 | |
| | 5,232 | | | Bill Barrett Corp. * | | | 130,803 | |
| | 915 | | | CARBO Ceramics, Inc. | | | 125,817 | |
| | 1,037 | | | Cimarex Energy Co. | | | 133,918 | |
| | 2,053 | | | Dresser-Rand Group, Inc. * | | | 125,621 | |
| | 1,108 | | | Dril-Quip, Inc. * | | | 113,230 | |
| | 1,584 | | | Energen Corp. | | | 135,218 | |
| | 5,202 | | | Helix Energy Solutions Group, Inc. * | | | 121,620 | |
| | 2,323 | | | HollyFrontier Corp. | | | 114,410 | |
| | 1,705 | | | Oceaneering International, Inc. | | | 122,862 | |
| | 1,287 | | | Oil States International, Inc. * | | | 138,474 | |
| | 3,880 | | | Patterson-UTI Energy, Inc. | | | 128,393 | |
| | 2,616 | | | Rosetta Resources, Inc. * | | | 123,315 | |
| | 1,609 | | | SM Energy Co. | | | 121,964 | |
| | 3,842 | | | Superior Energy Services, Inc. | | | 127,519 | |
| | 2,476 | | | Tidewater, Inc. | | | 129,067 | |
| | 1,881 | | | Unit Corp. * | | | 119,498 | |
| | 2,766 | | | World Fuel Services Corp. | | | 128,217 | |
| | | | | | | | |
| | | | 2,459,099 | |
| | | | | | | | |
| Financials – 8.52% | | | | |
| | 176 | | | Affiliated Managers Group, Inc. * | | | 33,283 | |
See accompanying notes which are an integral part of these financial statements.
28
Cloud Capital Strategic Mid Cap Fund
Schedule of Investments – (continued)
May 31, 2014
| | | | | | | | |
| Shares | | | | | Fair Value | |
| | | | | | | | |
| Financials – (continued) | | | | |
| | 412 | | | Alexander & Baldwin, Inc. | | $ | 15,609 | |
| | 85 | | | Alleghany Corp. * | | | 35,765 | |
| | 595 | | | American Financial Group, Inc. | | | 34,722 | |
| | 4,303 | | | Apollo Investment Corp. | | | 36,056 | |
| | 773 | | | Arthur J Gallagher & Co. | | | 35,436 | |
| | 761 | | | Aspen Insurance Holdings Ltd. | | | 34,948 | |
| | 1,979 | | | Associated Banc-Corp. | | | 34,099 | |
| | 2,591 | | | Astoria Financial Corp. | | | 33,110 | |
| | 1,490 | | | BancorpSouth, Inc. | | | 35,016 | |
| | 622 | | | Bank of Hawaii Corp. | | | 34,689 | |
| | 1,165 | | | Brown & Brown, Inc. | | | 35,158 | |
| | 1,469 | | | Cathay General Bancorp | | | 35,309 | |
| | 649 | | | CBOE Holdings, Inc. | | | 32,890 | |
| | 477 | | | City National Corp. | | | 33,942 | |
| | 793 | | | Commerce Bancshares, Inc. | | | 34,430 | |
| | 451 | | | Cullen/Frost Bankers, Inc. | | | 33,731 | |
| | 1,001 | | | East West Bancorp, Inc. | | | 33,527 | |
| | 971 | | | Eaton Vance Corp. | | | 36,089 | |
| | 109 | | | Everest Re Group Ltd. | | | 17,394 | |
| | 1,221 | | | Federated Investors, Inc. - Class B | | | 34,516 | |
| | 2,180 | | | Fidelity National Financial, Inc. - Class A | | | 72,690 | |
| | 1,310 | | | First American Financial Corp. | | | 36,700 | |
| | 3,013 | | | First Horizon National Corp. | | | 34,528 | |
| | 3,890 | | | First Niagara Financial Group, Inc. | | | 33,497 | |
| | 1,794 | | | FirstMerit Corp. | | | 33,501 | |
| | 2,818 | | | Fulton Financial Corp. | | | 33,673 | |
| | 690 | | | Greenhill & Co., Inc. | | | 34,305 | |
| | 1,025 | | | Hancock Holding Co. | | | 34,614 | |
| | 587 | | | Hanover Insurance Group, Inc. | | | 35,250 | |
| | 752 | | | HCC Insurance Holdings, Inc. | | | 35,319 | |
| | 1,517 | | | International Bancshares Corp. | | | 36,565 | |
| | 2,876 | | | Janus Capital Group, Inc. | | | 33,586 | |
| | 300 | | | Jones Lang LaSalle, Inc. | | | 36,331 | |
| | 885 | | | Kemper Corp. | | | 30,918 | |
| | 723 | | | Mercury General Corp. | | | 34,106 | |
| | 848 | | | MSCI, Inc. - Class A * | | | 36,595 | |
See accompanying notes which are an integral part of these financial statements.
29
Cloud Capital Strategic Mid Cap Fund
Schedule of Investments – (continued)
May 31, 2014
| | | | | | | | |
| Shares | | | | | Fair Value | |
| | | | | | | | |
| Financials – (continued) | | | | |
| | 2,261 | | | New York Community Bancorp, Inc. | | $ | 34,554 | |
| | 2,102 | | | Old Republic International Corp. | | | 35,952 | |
| | 757 | | | Primerica, Inc. | | | 34,076 | |
| | 587 | | | Prosperity Bancshares, Inc. | | | 34,106 | |
| | 683 | | | Protective Life Corp. | | | 35,710 | |
| | 698 | | | Raymond James Financial, Inc. | | | 33,799 | |
| | 457 | | | Reinsurance Group of America, Inc. | | | 35,687 | |
| | 1,077 | | | SEI Investments Co. | | | 35,457 | |
| | 291 | | | Signature Bank * | | | 33,748 | |
| | 570 | | | StanCorp Financial Group, Inc. | | | 34,247 | |
| | 322 | | | SVB Financial Group * | | | 33,937 | |
| | 1,538 | | | Synovus Financial Corp. | | | 35,474 | |
| | 2,200 | | | TCF Financial Corp. | | | 34,951 | |
| | 1,506 | | | Trustmark Corp. | | | 34,873 | |
| | 3,443 | | | Valley National Bancorp | | | 33,365 | |
| | 516 | | | Waddell & Reed Financial, Inc. - Class A | | | 31,138 | |
| | 1,607 | | | Washington Federal, Inc. | | | 33,469 | |
| | 1,162 | | | Webster Financial Corp. | | | 34,766 | |
| | 637 | | | Westamerica Bancorp | | | 31,181 | |
| | 782 | | | WR Berkley Corp. | | | 34,861 | |
| | | | | | | | |
| | | | 1,967,248 | |
| | | | | | | | |
| Health Care – 11.05% | | | | |
| | 5,143 | | | Allscripts Healthcare Solutions, Inc. * | | | 75,809 | |
| | 643 | | | Bio-Rad Laboratories, Inc. - Class A * | | | 77,578 | |
| | 1,441 | | | Charles River Laboratories International, Inc. * | | | 77,221 | |
| | 2,043 | | | Community Health Systems, Inc. * | | | 85,316 | |
| | 591 | | | Cooper Cos., Inc./The | | | 76,229 | |
| | 887 | | | Covance, Inc. * | | | 74,381 | |
| | 1,253 | | | Endo International PLC * | | | 88,458 | |
| | 2,283 | | | Health Net, Inc. * | | | 91,279 | |
| | 687 | | | Henry Schein, Inc. * | | | 82,194 | |
| | 2,114 | | | Hill-Rom Holdings, Inc. | | | 83,924 | |
| | 4,821 | | | HMS Holdings Corp. * | | | 90,626 | |
| | 3,738 | | | Hologic, Inc. * | | | 91,346 | |
| | 615 | | | IDEXX Laboratories, Inc. * | | | 79,023 | |
See accompanying notes which are an integral part of these financial statements.
30
Cloud Capital Strategic Mid Cap Fund
Schedule of Investments – (continued)
May 31, 2014
| | | | | | | | |
| Shares | | | | | Fair Value | |
| | | | | | | | |
| Health Care – (continued) | | | | |
| | 1,391 | | | LifePoint Hospitals, Inc. * | | $ | 85,189 | |
| | 1,112 | | | Mallinckrodt PLC * | | | 86,498 | |
| | 2,934 | | | Masimo Corp. * | | | 72,284 | |
| | 1,324 | | | Mednax, Inc. * | | | 76,310 | |
| | 339 | | | Mettler-Toledo International, Inc. * | | | 83,102 | |
| | 1,333 | | | Omnicare, Inc. | | | 84,691 | |
| | 2,313 | | | Owens & Minor, Inc. | | | 80,212 | |
| | 1,573 | | | ResMed, Inc. | | | 78,755 | |
| | 720 | | | Salix Pharmaceuticals Ltd. * | | | 82,119 | |
| | 1,616 | | | STERIS Corp. | | | 86,476 | |
| | 864 | | | Techne Corp. | | | 75,884 | |
| | 767 | | | Teleflex, Inc. | | | 81,778 | |
| | 2,400 | | | Thoratec Corp. * | | | 79,477 | |
| | 813 | | | United Therapeutics Corp. * | | | 77,867 | |
| | 985 | | | Universal Health Services, Inc. - Class B | | | 88,263 | |
| | 2,554 | | | VCA Antech, Inc. * | | | 85,938 | |
| | 1,168 | | | Vertex Pharmaceuticals, Inc. * | | | 84,407 | |
| | 1,150 | | | WellCare Health Plans, Inc. * | | | 89,034 | |
| | | | | | | | |
| | | | 2,551,668 | |
| | | | | | | | |
| Industrials – 10.82% | | | | |
| | 309 | | | Acuity Brands, Inc. | | | 38,827 | |
| | 1,192 | | | AECOM Technology Corp. * | | | 38,310 | |
| | 685 | | | AGCO Corp. | | | 36,952 | |
| | 407 | | | Alaska Air Group, Inc. | | | 40,089 | |
| | 260 | | | Alliant Techsystems, Inc. | | | 32,830 | |
| | 734 | | | AMETEK, Inc. | | | 38,975 | |
| | 441 | | | BE Aerospace, Inc. * | | | 42,630 | |
| | 1,532 | | | Brink’s Co./The | | | 40,906 | |
| | 467 | | | Carlisle Cos., Inc. | | | 39,598 | |
| | 657 | | | CLARCOR, Inc. | | | 38,437 | |
| | 646 | | | Clean Harbors, Inc. * | | | 39,490 | |
| | 904 | | | Con-way, Inc. | | | 41,781 | |
| | 1,066 | | | Copart, Inc. * | | | 37,925 | |
| | 594 | | | Corporate Executive Board Co./The | | | 40,515 | |
| | 529 | | | Crane Co. | | | 39,238 | |
See accompanying notes which are an integral part of these financial statements.
31
Cloud Capital Strategic Mid Cap Fund
Schedule of Investments – (continued)
May 31, 2014
| | | | | | | | |
| Shares | | | | | Fair Value | |
| | | | | | | | |
| Industrials – (continued) | | | | |
| | 710 | | | Deluxe Corp. | | $ | 39,802 | |
| | 909 | | | Donaldson Co., Inc. | | | 37,010 | |
| | 353 | | | Esterline Technologies Corp. * | | | 39,366 | |
| | 2,074 | | | Exelis, Inc. | | | 35,421 | |
| | 959 | | | Fortune Brands Home & Security, Inc. | | | 38,328 | |
| | 1,137 | | | FTI Consulting, Inc. * | | | 36,703 | |
| | 589 | | | GATX Corp. | | | 38,808 | |
| | 1,522 | | | General Cable Corp. | | | 38,821 | |
| | 396 | | | Genesee & Wyoming, Inc. - Class A * | | | 38,565 | |
| | 527 | | | Graco, Inc. | | | 38,493 | |
| | 1,064 | | | Granite Construction, Inc. | | | 37,794 | |
| | 1,617 | | | Harsco Corp. | | | 43,633 | |
| | 1,252 | | | Herman Miller, Inc. | | | 39,157 | |
| | 1,087 | | | HNI Corp. | | | 40,692 | |
| | 327 | | | Hubbell, Inc. - Class B | | | 38,273 | |
| | 375 | | | Huntington Ingalls Industries, Inc. | | | 37,418 | |
| | 519 | | | IDEX Corp. | | | 39,789 | |
| | 887 | | | ITT Corp. | | | 38,749 | |
| | 504 | | | JB Hunt Transport Services, Inc. | | | 39,153 | |
| | 1,527 | | | KBR, Inc. | | | 37,086 | |
| | 840 | | | Kennametal, Inc. | | | 37,836 | |
| | 382 | | | Kirby Corp. * | | | 42,235 | |
| | 608 | | | Landstar System, Inc. | | | 39,491 | |
| | 459 | | | Lennox International, Inc. | | | 39,010 | |
| | 580 | | | Lincoln Electric Holdings, Inc. | | | 38,091 | |
| | 476 | | | ManpowerGroup | | | 39,023 | |
| | 1,618 | | | Matson, Inc. | | | 39,752 | |
| | 724 | | | MSA Safety, Inc. | | | 39,586 | |
| | 428 | | | MSC Industrial Direct Co., Inc. - Class A | | | 39,359 | |
| | 515 | | | Nordson Corp. | | | 41,984 | |
| | 699 | | | Oshkosh Corp. | | | 37,770 | |
| | 2,221 | | | R.R. Donnelley & Sons Co. | | | 35,176 | |
| | 518 | | | Regal-Beloit Corp. | | | 39,505 | |
| | 1,280 | | | Rollins, Inc. | | | 39,261 | |
| | 376 | | | SPX Corp. | | | 39,308 | |
| | 897 | | | Terex Corp. | | | 34,496 | |
See accompanying notes which are an integral part of these financial statements.
32
Cloud Capital Strategic Mid Cap Fund
Schedule of Investments – (continued)
May 31, 2014
| | | | | | | | |
| Shares | | | | | Fair Value | |
| | | | | | | | |
| Industrials – (continued) | | | | |
| | 607 | | | Timken Co. | | $ | 39,003 | |
| | 343 | | | Towers Watson & Co. - Class A | | | 38,602 | |
| | 500 | | | Trinity Industries, Inc. | | | 43,285 | |
| | 599 | | | Triumph Group, Inc. | | | 41,484 | |
| | 409 | | | United Rentals, Inc. * | | | 41,314 | |
| | 817 | | | URS Corp. | | | 36,753 | |
| | 3,896 | | | UTi Worldwide, Inc. | | | 37,989 | |
| | 257 | | | Valmont Industries, Inc. | | | 39,758 | |
| | 517 | | | Wabtec Corp. | | | 40,708 | |
| | 928 | | | Waste Connections, Inc. | | | 42,306 | |
| | 380 | | | Watsco, Inc. | | | 38,190 | |
| | 1,504 | | | Werner Enterprises, Inc. | | | 39,710 | |
| | 860 | | | Woodward, Inc. | | | 38,433 | |
| | | | | | | | |
| | | | 2,498,982 | |
| | | | | | | | |
| Information Technology – 10.70% | | | | |
| | 750 | | | 3D Systems Corp. * | | | 38,005 | |
| | 629 | | | ACI Worldwide, Inc. * | | | 34,184 | |
| | 1,255 | | | Acxiom Corp. * | | | 28,528 | |
| | 1,602 | | | ADTRAN, Inc. | | | 35,952 | |
| | 1,268 | | | Advent Software, Inc. | | | 38,361 | |
| | 148 | | | Alliance Data Systems Corp. * | | | 37,861 | |
| | 465 | | | ANSYS, Inc. * | | | 34,118 | |
| | 844 | | | AOL, Inc. * | | | 30,637 | |
| | 627 | | | Arrow Electronics, Inc. * | | | 36,187 | |
| | 4,550 | | | Atmel Corp. * | | | 38,132 | |
| | 830 | | | Avnet, Inc. | | | 36,148 | |
| | 942 | | | Broadridge Financial Solutions, Inc. | | | 38,660 | |
| | 2,293 | | | Cadence Design Systems, Inc. * | | | 38,262 | |
| | 1,795 | | | Ciena Corp. * | | | 34,818 | |
| | 757 | | | CommVault Systems, Inc. * | | | 37,019 | |
| | 3,434 | | | Compuware Corp. | | | 34,001 | |
| | 467 | | | Concur Technologies, Inc. * | | | 39,859 | |
| | 1,669 | | | Convergys Corp. | | | 36,423 | |
| | 1,462 | | | Conversant, Inc. * | | | 34,474 | |
| | 1,297 | | | CoreLogic, Inc. * | | | 37,007 | |
See accompanying notes which are an integral part of these financial statements.
33
Cloud Capital Strategic Mid Cap Fund
Schedule of Investments – (continued)
May 31, 2014
| | | | | | | | |
| Shares | | | | | Fair Value | |
| | | | | | | | |
| Information Technology – (continued) | | | | |
| | 751 | | | Cree, Inc. * | | $ | 36,128 | |
| | 3,684 | | | Cypress Semiconductor Corp. | | | 37,757 | |
| | 953 | | | Diebold, Inc. | | | 35,772 | |
| | 387 | | | DST Systems, Inc. | | | 35,296 | |
| | 192 | | | Equinix, Inc. * | | | 38,120 | |
| | 337 | | | Factset Research Systems, Inc. | | | 36,108 | |
| | 622 | | | Fair Isaac Corp. | | | 36,614 | |
| | 2,835 | | | Fairchild Semiconductor International, Inc. * | | | 41,593 | |
| | 521 | | | Gartner, Inc. * | | | 37,041 | |
| | 545 | | | Global Payments, Inc. | | | 37,375 | |
| | 1,018 | | | Informatica Corp. * | | | 37,266 | |
| | 1,324 | | | Ingram Micro, Inc. - Class A * | | | 36,764 | |
| | 3,057 | | | Integrated Device Technology, Inc. * | | | 40,664 | |
| | 1,034 | | | InterDigital, Inc. | | | 39,293 | |
| | 1,379 | | | International Rectifier Corp. * | | | 36,978 | |
| | 2,905 | | | Intersil Corp. - Class A | | | 40,877 | |
| | 940 | | | Itron, Inc. * | | | 36,140 | |
| | 651 | | | Jack Henry & Associates, Inc. | | | 37,759 | |
| | 824 | | | Lexmark International, Inc. - Class A | | | 35,903 | |
| | 1,210 | | | ManTech International Corp. - Class A | | | 35,694 | |
| | 1,732 | | | Mentor Graphics Corp. | | | 36,706 | |
| | 689 | | | MICROS Systems, Inc. * | | | 36,822 | |
| | 5,416 | | | Monster Worldwide, Inc. * | | | 30,656 | |
| | 1,318 | | | National Instruments Corp. | | | 37,754 | |
| | 1,161 | | | NCR Corp. * | | | 37,923 | |
| | 1,395 | | | NeuStar, Inc. - Class A * | | | 39,088 | |
| | 835 | | | Plantronics, Inc. | | | 37,872 | |
| | 2,857 | | | Polycom, Inc. * | | | 36,425 | |
| | 1,016 | | | PTC, Inc. * | | | 37,401 | |
| | 1,243 | | | Rackspace Hosting, Inc. * | | | 45,344 | |
| | 4,081 | | | RF Micro Devices, Inc. * | | | 38,399 | |
| | 1,801 | | | Riverbed Technology, Inc. * | | | 36,602 | |
| | 1,615 | | | Rovi Corp. * | | | 39,026 | |
| | 1,486 | | | Semtech Corp. * | | | 38,539 | |
| | 821 | | | Silicon Laboratories, Inc. * | | | 37,030 | |
| | 856 | | | Skyworks Solutions, Inc. | | | 37,088 | |
See accompanying notes which are an integral part of these financial statements.
34
Cloud Capital Strategic Mid Cap Fund
Schedule of Investments – (continued)
May 31, 2014
| | | | | | | | |
| Shares | | | | | Fair Value | |
| | | | | | | | |
| Information Technology – (continued) | | | | |
| | 912 | | | SolarWinds, Inc. * | | $ | 35,662 | |
| | 555 | | | Solera Holdings, Inc. | | | 36,239 | |
| | 1,882 | | | SunEdison, Inc. * | | | 37,055 | |
| | 959 | | | Synopsys, Inc. * | | | 36,901 | |
| | 570 | | | Tech Data Corp. * | | | 33,950 | |
| | 1,822 | | | TIBCO Software, Inc. * | | | 39,184 | |
| | 927 | | | Trimble Navigation Ltd. * | | | 33,448 | |
| | 1,091 | | | VeriFone Systems, Inc. * | | | 35,812 | |
| | 2,501 | | | Vishay Intertechnology, Inc. | | | 37,316 | |
| | 377 | | | WEX, Inc. * | | | 36,332 | |
| | 521 | | | Zebra Technologies Corp. - Class A * | | | 38,742 | |
| | | | | | | | |
| | | | 2,471,094 | |
| | | | | | | | |
| Materials – 10.67% | | | | |
| | 1,262 | | | Albemarle Corp. | | | 87,298 | |
| | 1,260 | | | AptarGroup, Inc. | | | 83,875 | |
| | 878 | | | Ashland, Inc. | | | 90,464 | |
| | 1,482 | | | Cabot Corp. | | | 83,781 | |
| | 1,344 | | | Carpenter Technology Corp. | | | 83,983 | |
| | 4,428 | | | Commercial Metals Co. | | | 78,605 | |
| | 930 | | | Compass Minerals International, Inc. | | | 86,473 | |
| | 885 | | | Cytec Industries, Inc. | | | 87,916 | |
| | 883 | | | Domtar Corp. | | | 80,216 | |
| | 1,025 | | | Eagle Materials, Inc. | | | 89,129 | |
| | 1,560 | | | Greif, Inc. - Class A | | | 85,231 | |
| | 5,183 | | | Intrepid Potash, Inc. * | | | 84,015 | |
| | 5,173 | | | Louisiana-Pacific Corp. * | | | 73,456 | |
| | 683 | | | Martin Marietta Materials, Inc. | | | 83,847 | |
| | 1,408 | | | Minerals Technologies, Inc. | | | 87,272 | |
| | 227 | | | NewMarket Corp. | | | 88,785 | |
| | 3,021 | | | Olin Corp. | | | 82,317 | |
| | 1,276 | | | Packaging Corp. of America | | | 88,269 | |
| | 1,196 | | | Reliance Steel & Aluminum Co. | | | 86,086 | |
| | 880 | | | Rock-Tenn Co. - Class A | | | 88,928 | |
| | 1,293 | | | Royal Gold, Inc. | | | 81,103 | |
| | 2,003 | | | RPM International, Inc. | | | 86,249 | |
See accompanying notes which are an integral part of these financial statements.
35
Cloud Capital Strategic Mid Cap Fund
Schedule of Investments – (continued)
May 31, 2014
| | | | | | | | |
| Shares | | | | | Fair Value | |
| | | | | | | | |
| Materials – (continued) | | | | |
| | 1,377 | | | Scotts Miracle-Gro Co./The - Class A | | $ | 82,535 | |
| | 1,566 | | | Sensient Technologies Corp. | | | 85,841 | |
| | 1,690 | | | Silgan Holdings, Inc. | | | 82,539 | |
| | 2,000 | | | Sonoco Products Co. | | | 84,488 | |
| | 4,665 | | | Steel Dynamics, Inc. | | | 80,559 | |
| | 1,158 | | | Valspar Corp. | | | 86,469 | |
| | 2,301 | | | Worthington Industries, Inc. | | | 92,748 | |
| | | | | | | | |
| | | | 2,462,477 | |
| | | | | | | | |
| Real Estate Investment Trusts – 2.38% | | | | |
| | 235 | | | Alexandria Real Estate Equities, Inc. | | | 17,861 | |
| | 449 | | | American Campus Communities, Inc. | | | 17,423 | |
| | 826 | | | BioMed Realty Trust, Inc. | | | 17,930 | |
| | 252 | | | Camden Property Trust | | | 17,678 | |
| | 652 | | | Corporate Office Properties Trust | | | 17,964 | |
| | 1,054 | | | Corrections Corp. of America | | | 34,301 | |
| | 996 | | | Duke Realty Corp. | | | 17,635 | |
| | 765 | | | Equity One, Inc. | | | 17,562 | |
| | 199 | | | Essex Property Trust, Inc. | | | 35,998 | |
| | 332 | | | Extra Space Storage, Inc. | | | 17,396 | |
| | 147 | | | Federal Realty Investment Trust | | | 17,574 | |
| | 425 | | | Highwoods Properties, Inc. | | | 17,246 | |
| | 285 | | | Home Properties, Inc. | | | 17,696 | |
| | 590 | | | Hospitality Properties Trust | | | 17,119 | |
| | 290 | | | Kilroy Realty Corp. | | | 17,590 | |
| | 462 | | | Liberty Property Trust * | | | 17,897 | |
| | 849 | | | Mack-Cali Realty Corp. | | | 18,463 | |
| | 508 | | | National Retail Properties, Inc. | | | 17,772 | |
| | 498 | | | Omega Healthcare Investors, Inc. | | | 18,366 | |
| | 455 | | | Potlatch Corp. | | | 18,288 | |
| | 386 | | | Rayonier, Inc. | | | 18,383 | |
| | 399 | | | Realty Income Corp. | | | 17,270 | |
| | 328 | | | Regency Centers Corp. | | | 17,515 | |
| | 742 | | | Senior Housing Properties Trust | | | 17,799 | |
| | 166 | | | SL Green Realty Corp. | | | 18,167 | |
| | 474 | | | Taubman Centers, Inc. | | | 35,492 | |
See accompanying notes which are an integral part of these financial statements.
36
Cloud Capital Strategic Mid Cap Fund
Schedule of Investments – (continued)
May 31, 2014
| | | | | | | | |
| Shares | | | | | Fair Value | |
| | | | | | | | |
| Real Estate Investment Trusts – (continued) | | | | |
| | 670 | | | UDR, Inc. | | $ | 18,452 | |
| | 552 | | | Weingarten Realty Investors | | | 17,557 | |
| | | | | | | | |
| | | | 550,394 | |
| | | | | | | | |
| Telecommunication Services – 0.16% | | | | |
| | 637 | | | Telephone & Data Systems, Inc. | | | 17,641 | |
| | 559 | | | TW Telecom, Inc. * | | | 18,322 | |
| | | | | | | | |
| | | | 35,963 | |
| | | | | | | | |
| Utilities – 10.75% | | | | |
| | 2,533 | | | Alliant Energy Corp. | | | 147,653 | |
| | 5,775 | | | Aqua America, Inc. | | | 146,569 | |
| | 2,868 | | | Atmos Energy Corp. | | | 143,711 | |
| | 2,535 | | | Black Hills Corp. | | | 146,220 | |
| | 2,832 | | | Cleco Corp. | | | 147,344 | |
| | 5,452 | | | Great Plains Energy, Inc. | | | 138,742 | |
| | 5,982 | | | Hawaiian Electric Industries, Inc. | | | 143,864 | |
| | 2,617 | | | IDACORP, Inc. | | | 143,508 | |
| | 4,120 | | | MDU Resources Group, Inc. | | | 139,570 | |
| | 1,989 | | | National Fuel Gas Co. | | | 149,172 | |
| | 3,964 | | | OGE Energy Corp. | | | 145,589 | |
| | 3 | | | ONE Gas, Inc. | | | 92 | |
| | 10 | | | Oneok, Inc. | | | 645 | |
| | 5,289 | | | PNM Resources, Inc. | | | 150,516 | |
| | 6,079 | | | Questar Corp. | | | 146,318 | |
| | 3,111 | | | UGI Corp. | | | 151,427 | |
| | 3,592 | | | Vectren Corp. | | | 143,258 | |
| | 4,067 | | | Westar Energy, Inc. | | | 146,609 | |
| | 3,716 | | | WGL Holdings, Inc. | | | 150,683 | |
| | | | | | | | |
| | | | 2,481,490 | |
| | | | | | | | |
| |
| TOTAL COMMON STOCKS (Cost $18,658,014) | | | 22,539,761 | |
| | | | | | | | |
See accompanying notes which are an integral part of these financial statements.
37
Cloud Capital Strategic Mid Cap Fund
Schedule of Investments – (continued)
May 31, 2014
| | | | | | | | |
| Shares | | | | | Fair Value | |
| | | | | | | | |
| Exchange-Traded Funds – 0.21% | | | | |
| | 1,000 | | | Guggenheim Russell MidCap Equal Weight ETF | | $ | 49,200 | |
| | | | | | | | |
| |
| TOTAL EXCHANGE-TRADED FUNDS
(Cost $43,901) | | | 49,200 | |
| | | | | | | | |
| |
| Cash Equivalents – 2.25% | | | | |
| | 520,261 | | | FOLIOfn Investment Sweep Account, 0.010% (a) | | | 520,261 | |
| | | | | | | | |
| |
| TOTAL CASH EQUIVALENTS (Cost $520,261) | | | 520,261 | |
| | | | | | | | |
| |
| TOTAL INVESTMENTS
(Cost $19,222,176) – 100.09% | | | 23,109,222 | |
| | | | | | | | |
| |
| Liabilities in Excess of Other Assets – (0.09)% | | | (20,847 | ) |
| | | | | | | | |
| |
| TOTAL NET ASSETS – 100.00% | | $ | 23,088,375 | |
| | | | | | | | |
| (a) | Rate disclosed is the seven day yield as of May 31, 2014. |
| * | Non-income producing security. |
See accompanying notes which are an integral part of these financial statements.
38
Cloud Capital Funds
Statements of Assets and Liabilities
May 31, 2014
| | | | | | | | |
| | | Cloud Capital
Strategic Large Cap
Fund | | | Cloud Capital
Strategic Mid Cap
Fund | |
Assets: | | | | | | | | |
Investments in securities | | | | | | | | |
At cost | | $ | 21,162,722 | | | $ | 19,222,176 | |
| | | | | | | | |
At fair value | | $ | 24,392,647 | | | $ | 23,109,222 | |
Receivable for investments sold | | | 1,045 | | | | — | |
Receivable for fund shares sold | | | 56 | | | | 56 | |
Dividends receivable | | | 46,304 | | | | 30,913 | |
Tax reclaims receivable | | | 209 | | | | — | |
Prepaid expenses | | | 10,791 | | | | 9,615 | |
| | | | | | | | |
Total assets | | | 24,451,052 | | | | 23,149,806 | |
| | | | | | | | |
| | |
Liabilities: | | | | | | | | |
Cash overdraft | | | 60 | | | | 60 | |
Payable to Adviser | | | — | | | | 5,210 | |
Payable for investments purchased | | | 2,534 | | | | 1,071 | |
Payable for fund shares redeemed | | | 10,691 | | | | 7,999 | |
Payable to administrator, fund accountant and transfer agent | | | 15,821 | | | | 15,727 | |
Payable to custodian | | | 1,712 | | | | 1,359 | |
Administrative servicing fees – Institutional Class | | | 1,813 | | | | 2,298 | |
Other accrued expenses | | | 30,277 | | | | 27,707 | |
| | | | | | | | |
Total Liabilities | | | 62,908 | | | | 61,431 | |
| | | | | | | | |
Net Assets | | $ | 24,388,144 | | | $ | 23,088,375 | |
| | | | | | | | |
| | |
Net Assets consist of: | | | | | | | | |
Paid in capital | | $ | 14,257,066 | | | $ | 18,519,398 | |
Accumulated net investment income (loss) | | | 96,333 | | | | (13,128 | ) |
Accumulated net realized gain from investment transactions | | | 6,804,820 | | | | 695,059 | |
Net unrealized appreciation on investments | | | 3,229,925 | | | | 3,887,046 | |
| | | | | | | | |
Net Assets | | $ | 24,388,144 | | | $ | 23,088,375 | |
| | | | | | | | |
| | |
Institutional Class: | | | | | | | | |
Shares Outstanding (unlimited number of shares authorized, no par value) | | | 1,314,777 | | | | 1,347,063 | |
| | | | | | | | |
Net Asset Value, Offering and Redemption Per Share: | | $ | 18.55 | | | $ | 17.14 | |
| | | | | | | | |
See accompanying notes which are an integral part of these financial statements.
39
Cloud Capital Funds
Statements of Operations
For the year ended May 31, 2014
| | | | | | | | |
| | | Cloud Capital
Strategic Large Cap
Fund | | | Cloud Capital
Strategic Mid Cap
Fund | |
Investment Income | | | | | | | | |
Dividend income (net of foreign taxes withheld of $272 and $46) | | $ | 703,906 | | | $ | 352,852 | |
Interest income | | | 255 | | | | 148 | |
| | | | | | | | |
Total Investment Income | | | 704,161 | | | | 353,000 | |
| | | | | | | | |
| | |
Expenses | | | | | | | | |
Investment Adviser | | | 196,052 | | | | 124,737 | |
Administrative servicing – Institutional Class | | | 36,809 | | | | 14,725 | |
Administration | | | 38,996 | | | | 38,996 | |
Transfer agent | | | 35,331 | | | | 33,504 | |
Fund accounting | | | 25,000 | | | | 25,000 | |
Audit | | | 27,000 | | | | 27,000 | |
Legal | | | 16,243 | | | | 16,242 | |
Registration | | | 16,333 | | | | 13,515 | |
Pricing | | | 12,815 | | | | 10,377 | |
Custodian | | | 16,964 | | | | 12,662 | |
Report Printing | | | 16,643 | | | | 16,428 | |
Trustee | | | 4,732 | | | | 4,732 | |
Insurance | | | 2,393 | | | | 2,393 | |
Miscellaneous | | | 4,843 | | | | 3,854 | |
| | | | | | | | |
Total Expenses | | | 450,154 | | | | 344,165 | |
| | | | | | | | |
Recoupment of prior expenses waived/reimbursed by Adviser | | | 76,941 | | | | 43,773 | |
Fees contractually waived by Adviser | | | (47,017 | ) | | | (38,806 | ) |
| | | | | | | | |
Net operating expenses | | | 480,078 | | | | 349,132 | |
| | | | | | | | |
Net investment income | | | 224,083 | | | | 3,868 | |
| | | | | | | | |
| | |
Realized & Unrealized Gain (Loss) on Investments | | | | | | | | |
Net realized gain on investment transactions | | | 10,781,671 | | | | 4,137,279 | |
Change in unrealized appreciation/depreciation of investments | | | (3,658,396 | ) | | | (345,846 | ) |
| | | | | | | | |
Net realized and unrealized gain on investments | | | 7,123,275 | | | | 4,483,125 | |
| | | | | | | | |
Net increase in net assets resulting from operations | | $ | 7,347,358 | | | $ | 3,795,301 | |
| | | | | | | | |
See accompanying notes which are an integral part of these financial statements.
40
Cloud Capital Funds
Statements of Changes in Net Assets
| | | | | | | | | | | | | | | | |
| | | Cloud Capital Strategic
Large Cap Fund | | | Cloud Capital Strategic
Mid Cap Fund | |
| | | Year Ended
May 31, 2014 | | | Year Ended
May 31, 2013 | | | Year Ended
May 31, 2014 | | | Year Ended
May 31, 2013 | |
Increase (Decrease) in Net Assets due to: | | | | | | | | | | | | | | | | |
Operations: | | | | | | | | | | | | | | | | |
Net investment income | | $ | 224,083 | | | $ | 328,546 | | | $ | 3,868 | | | $ | 86,569 | |
Net realized gain on investment transactions | | | 10,781,671 | | | | 2,678,233 | | | | 4,137,279 | | | | 1,538,431 | |
Net change in unrealized appreciation (depreciation) of investments | | | (3,658,396 | ) | | | 6,924,578 | | | | (345,846 | ) | | | 3,856,153 | |
| | | | | | | | | | | | | | | | |
Net increase in net assets resulting from operations | | | 7,347,358 | | | | 9,931,357 | | | | 3,795,301 | | | | 5,481,153 | |
| | | | | | | | | | | | | | | | |
Distributions: | | | | | | | | | | | | | | | | |
From net investment income: | | | | | | | | | | | | | | | | |
Institutional Class | | | (196,571 | ) | | | (353,411 | ) | | | (20,150 | ) | | | (115,431 | ) |
From net realized gain: | | | | | | | | | | | | | | | | |
Institutional Class | | | (4,113,598 | ) | | | (2,534,055 | ) | | | (2,918,858 | ) | | | (1,143,207 | ) |
| | | | | | | | | | | | | | | | |
Total distributions | | | (4,310,169 | ) | | | (2,887,466 | ) | | | (2,939,008 | ) | | | (1,258,638 | ) |
| | | | | | | | | | | | | | | | |
Capital Transactions – Institutional Class: | | | | | | | | | | | | | | | | |
Proceeds from shares sold | | | 4,351,185 | | | | 8,582,938 | | | | 3,135,630 | | | | 6,740,470 | |
Reinvestment of distributions | | | 2,286,184 | | | | 1,499,196 | | | | 1,078,540 | | | | 491,612 | |
Amount paid for shares redeemed | | | (32,032,685 | ) | | | (8,930,053 | ) | | | (8,526,690 | ) | | | (5,428,385 | ) |
| | | | | | | | | | | | | | | | |
Net change resulting from capital transactions | | | (25,395,316 | ) | | | 1,152,081 | | | | (4,312,520 | ) | | | 1,803,697 | |
| | | | | | | | | | | | | | | | |
Total Increase (Decrease) in Net Assets | | | (22,358,127 | ) | | | 8,195,972 | | | | (3,456,227 | ) | | | 6,026,212 | |
| | | | | | | | | | | | | | | | |
Net Assets: | | | | | | | | | | | | | | | | |
Beginning of year | | | 46,746,271 | | | | 38,550,299 | | | | 26,544,602 | | | | 20,518,390 | |
| | | | | | | | | | | | | | | | |
End of year | | $ | 24,388,144 | | | $ | 46,746,271 | | | $ | 23,088,375 | | | $ | 26,544,602 | |
| | | | | | | | | | | | | | | | |
Accumulated net investment income (loss) | | $ | 96,333 | | | $ | 74,370 | | | $ | (13,128 | ) | | $ | 1,092 | |
| | | | | | | | | | | | | | | | |
Share Transactions – Institutional Class: | | | | | | | | | | | | | | | | |
Shares sold | | | 248,756 | | | | 550,718 | | | | 187,815 | | | | 445,826 | |
Shares issued in reinvestment of distributions | | | 135,598 | | | | 100,685 | | | | 67,493 | | | | 33,788 | |
Shares redeemed | | | (1,819,777 | ) | | | (567,724 | ) | | | (504,017 | ) | | | (354,925 | ) |
| | | | | | | | | | | | | | | | |
Total Institutional Class | | | (1,435,423 | ) | | | 83,679 | | | | (248,709 | ) | | | 124,689 | |
| | | | | | | | | | | | | | | | |
See accompanying notes which are an integral part of these financial statements.
41
Cloud Capital Strategic Large Cap Fund
Financial Highlights
(For a share outstanding during each period)
| | | | | | | | | | | | |
| | | For the
year ended
May 31, 2014 | | | For the
year ended
May 31, 2013 | | | For the
period ended
May 31, 2012 (a) | |
Institutional Class: | | | | | | | | | | | | |
Selected Per Share Data: | | | | | | | | | | | | |
Net asset value, beginning of period | | $ | 17.00 | | | $ | 14.46 | | | $ | 15.00 | |
| | | | | | | | | | | | |
Income from investment operations: | | | | | | | | | | | | |
Net investment income | | | 0.13 | | | | 0.13 | | | | 0.07 | |
Net realized and unrealized gain (loss) on investments | | | 3.22 | | | | 3.54 | | | | (0.54 | ) |
| | | | | | | | | | | | |
Total from investment operations | | | 3.35 | | | | 3.67 | | | | (0.47 | ) |
| | | | | | | | | | | | |
| | | |
Less distributions to shareholders: | | | | | | | | | | | | |
From net investment income | | | (0.08 | ) | | | (0.14 | ) | | | (0.04 | ) |
From net realized gains | | | (1.72 | ) | | | (0.99 | ) | | | (0.03 | ) |
| | | | | | | | | | | | |
Total distributions | | | (1.80 | ) | | | (1.13 | ) | | | (0.07 | ) |
| | | | | | | | | | | | |
Net asset value, end of period | | $ | 18.55 | | | $ | 17.00 | | | $ | 14.46 | |
| | | | | | | | | | | | |
| | | |
Total Return (b) | | | 20.81 | % | | | 26.51 | % | | | (3.12 | )% (c) |
| | | |
Ratios and Supplemental Data: | | | | | | | | | | | | |
Net assets, end of period (000) | | $ | 24,388 | | | $ | 46,746 | | | $ | 38,550 | |
Ratio of expenses to average net assets | | | 1.23 | % | | | 1.40 | % | | | 1.40 | % (d) |
Ratio of expenses to average net assets before waiver and recoupment | | | 1.15 | % | | | 1.27 | % | | | 1.90 | % (d) |
Ratio of net investment income to average net assets | | | 0.57 | % | | | 0.78 | % | | | 0.53 | % (d) |
Ratio of net investment income to average net assets before waiver and recoupment | | | 0.65 | % | | | 0.91 | % | | | 0.03 | % (d) |
Portfolio turnover rate | | | 90.14 | % | | | 72.66 | % | | | 163.38 | % (c) |
| (a) | For the period June 29, 2011 (commencement of operations) to May 31, 2012. |
| (b) | Total return in the above table represents the rate that the investor would have earned or lost on an investment in the Fund, assuming reinvestment of dividends. |
See accompanying notes which are an integral part of these financial statements.
42
Cloud Capital Strategic Mid Cap Fund
Financial Highlights
(For a share outstanding during each period)
| | | | | | | | | | | | |
| | | For the
year ended
May 31, 2014 | | | For the
year ended
May 31, 2013 | | | For the
period ended
May 31, 2012 (a) | |
Institutional Class: | | | | | | | | | | | | |
Selected Per Share Data: | | | | | | | | | | | | |
Net asset value, beginning of period | | $ | 16.63 | | | $ | 13.95 | | | $ | 15.00 | |
| | | | | | | | | | | | |
Income from investment operations: | | | | | | | | | | | | |
Net investment income (loss) | | | – | (b) | | | 0.06 | | | | – | (b) |
Net realized and unrealized gain (loss) on investments | | | 2.61 | | | | 3.50 | | | | (0.92 | ) |
| | | | | | | | | | | | |
Total from investment operations | | | 2.61 | | | | 3.56 | | | | (0.92 | ) |
| | | | | | | | | | | | |
Less distributions to shareholders: | | | | | | | | | | | | |
From net investment income | | | (0.01 | ) | | | (0.08 | ) | | | (0.01 | ) |
From net realized gains | | | (2.09 | ) | | | (0.80 | ) | | | (0.12 | ) |
| | | | | | | | | | | | |
Total distributions | | | (2.10 | ) | | | (0.88 | ) | | | (0.13 | ) |
| | | | | | | | | | | | |
Net asset value, end of period | | $ | 17.14 | | | $ | 16.63 | | | $ | 13.95 | |
| | | | | | | | | | | | |
| | | |
Total Return (c) | | | 16.66 | % | | | 26.46 | % | | | (6.13 | )% (d) |
| | | |
Ratios and Supplemental Data: | | | | | | | | | | | | |
Net assets, end of period (000) | | $ | 23,088 | | | $ | 26,545 | | | $ | 20,518 | |
Ratio of expenses to average net assets | | | 1.40 | % | | | 1.40 | % | | | 1.40 | % (e) |
Ratio of expenses to average net assets before waiver and recoupment | | | 1.38 | % | | | 1.60 | % | | | 2.18 | % (e) |
Ratio of net investment income (loss) to average net assets | | | 0.02 | % | | | 0.38 | % | | | – | % (e) |
Ratio of net investment (loss) to average net assets before waiver and recoupment | | | 0.04 | % | | | 0.18 | % | | | (0.78 | )% (e) |
Portfolio turnover rate | | | 55.27 | % | | | 85.71 | % | | | 178.49 | % (d) |
| (a) | For the period June 29, 2011 (commencement of operations) to May 31, 2012. |
| (b) | Amount is less than $0.005 per share. |
| (c) | Total return in the above table represents the rate that the investor would have earned or lost on an investment in the Fund, assuming reinvestment of dividends. |
See accompanying notes which are an integral part of these financial statements.
43
Cloud Capital Funds
Notes to the Financial Statements
May 31, 2014
NOTE 1. ORGANIZATION
The Cloud Capital Strategic Large Cap Fund (the “Large Cap Fund”) and the Cloud Capital Strategic Mid Cap Fund (the “Mid Cap Fund”) (each a “Fund” and, collectively the “Funds”) were organized as open-end diversified series of the Valued Advisers Trust (the “Trust”). The Trust is a management investment company established under the laws of Delaware by an Agreement and Declaration of Trust dated June 13, 2008 (the “Trust Agreement”). The Trust Agreement permits the Trustees to issue an unlimited number of shares of beneficial interest of separate series without par value. The Funds are two of a series of funds authorized by the Board of Trustees (the “Board”). The Funds each offer two share classes, Class A Shares and Institutional Class Shares. The Funds’ Class A Shares have not yet commenced operations. The Funds’ Institutional Class Shares commenced operations on June 29, 2011. The Funds’ investment adviser is Cloud Capital LLC (the “Adviser”). The investment objective of the Large Cap Fund is to consistently deliver excess returns relative to the S&P 500® Index over three- to five-year time horizons. The investment objective of the Mid Cap Fund is to consistently deliver excess returns relative to the S&P Mid Cap 400® Index over three- to five-year time horizons.
Each Fund’s prospectus provides a description of the investment objective, policies and strategies, along with information on the classes of shares currently being offered.
NOTE 2. SIGNIFICANT ACCOUNTING POLICIES
The following is a summary of significant accounting policies consistently followed by each Fund in the preparation of its financial statements.
Securities Valuation – All investments in securities are recorded at their estimated fair value as described in Note 3.
Federal Income Taxes – The Funds make no provision for federal income or excise tax. Each Fund intends to qualify each year as a regulated investment company (“RIC”) under subchapter M of the Internal Revenue Code of 1986, as amended, by complying with the requirements applicable to RICs and by distributing substantially all of its taxable income. Each Fund also intends to distribute sufficient net investment income and net capital gains, if any, so that it will not be subject to excise tax on undistributed income and gains. If the required amount of net investment income or gains is not distributed, the Funds could incur a tax expense.
As of and during the year ended May 31, 2014, the Funds did not have a liability for any unrecognized tax benefits. The Funds recognize interest and penalties, if any,
44
Cloud Capital Funds
Notes to the Financial Statements - (continued)
May 31, 2014
NOTE 2. SIGNIFICANT ACCOUNTING POLICIES - (continued)
related to unrecognized tax benefits as income tax expense in the statements of operations. During the year, the Funds did not incur any interest or penalties. The Funds are subject to examination by U.S. federal tax authorities for all tax years since inception.
Expenses – Expenses incurred by the Trust that do not relate to a specific fund of the Trust are allocated to the individual funds based on each Fund’s relative net assets or another appropriate basis (as determined by the Board).
Security Transactions and Related Income – The Funds follow industry practice and record security transactions on the trade date for financial reporting purposes. The first in, first out (“FIFO”) method is used for determining gains or losses for financial statements and income tax purposes. Dividend income is recorded on the ex-dividend date and interest income is recorded on an accrual basis. Discounts and premiums on securities purchased are accreted or amortized using the effective interest method. Withholding taxes on foreign dividends have been provided for in accordance with the Funds’ understanding of the applicable country’s tax rules and rates. The ability of issuers of debt securities held by the Funds to meet their obligations may be affected by economic and political developments in a specific country or region.
Dividends and Distributions – Each Fund intends to distribute substantially all of its net investment income, if any, as dividends to its shareholders on at least an annual basis. Each Fund intends to distribute its net realized long-term capital gains and its net realized short-term capital gains, if any, at least once a year. Dividends to shareholders, which are determined in accordance with income tax regulations, are recorded on the ex-dividend date. The treatment for financial reporting purposes of distributions made to shareholders during the period from net investment income or net realized capital gains may differ from their ultimate treatment for federal income tax purposes. These differences are caused primarily by differences in the timing of the recognition of certain components of income, expense or realized capital gains for federal income tax purposes. Where such differences are permanent in nature, they are reclassified in the components of the net assets based on their ultimate characterization for federal income tax purposes. Any such reclassifications will have no effect on net assets, results of operations or net asset values per share of the Funds.
45
Cloud Capital Funds
Notes to the Financial Statements - (continued)
May 31, 2014
NOTE 2. SIGNIFICANT ACCOUNTING POLICIES - (continued)
For the year ended May 31, 2014, the Funds made the following reclassifications to increase (decrease) the components of net assets:
| | | | | | | | | | | | |
| Fund | | Paid in Capital | | | Accumulated Net
Investment Income (Loss) | | | Accumulated Net
Realized Gain
(Loss) | |
Large Cap Fund | | $ | (10 | ) | | $ | (5,549 | ) | | $ | 5,559 | |
Mid Cap Fund | | | (136 | ) | | | 2,062 | | | | (1,926 | ) |
NOTE 3. SECURITIES VALUATION AND FAIR VALUE MEASUREMENTS
Fair value is defined as the price that a Fund would receive upon selling an investment in an orderly transaction to an independent buyer in the principal or most advantageous market of the investment. Generally Accepted Accounting Principles in the United States of America (“GAAP”) establish a three-tier hierarchy to maximize the use of observable market data and minimize the use of unobservable inputs and to establish classification of fair value measurements for disclosure purposes.
Inputs refer broadly to the assumptions that market participants would use in pricing the asset or liability, including assumptions about risk (the risk inherent in a particular valuation technique used to measure fair value such as pricing model and/or the risk inherent in the inputs to the valuation technique). Inputs may be observable or unobservable. Observable inputs are inputs that reflect the assumptions market participants would use in pricing the asset or liability developed based on market data obtained from sources independent of the reporting entity. Unobservable inputs are inputs that reflect the reporting entity’s own assumptions about the assumptions market participants would use in pricing the asset or liability developed based on the best information available in the circumstances.
Various inputs are used in determining the value of each Fund’s investments. These inputs are summarized in the three broad levels listed below.
| | • | | Level 1 – quoted prices in active markets for identical securities |
| | • | | Level 2 – other significant observable inputs (including, but not limited to, quoted prices for an identical security in an inactive market, quoted prices for similar securities, interest rates, prepayment speeds, credit risk, etc.) |
| | • | | Level 3 – significant unobservable inputs (including the Funds’ own assumptions in determining fair value of investments based on the best information available) |
46
Cloud Capital Funds
Notes to the Financial Statements - (continued)
May 31, 2014
NOTE 3. SECURITIES VALUATION AND FAIR VALUE MEASUREMENTS - (continued)
The inputs used to measure fair value may fall into different levels of the fair value hierarchy. In such cases, for disclosure purposes, the level in the fair value hierarchy within which the fair value measurement falls in its entirety, is determined based on the lowest level input that is significant to the fair value measurement in its entirety.
Equity securities, including common stock and exchange-traded funds, are generally valued by using market quotations, but may be valued on the basis of prices furnished by a pricing service when the Fund believes such prices more accurately reflect the fair value of such securities. Securities that are traded on any stock exchange are generally valued by the pricing service at the last quoted sale price. Lacking a last sale price, an exchange traded security is generally valued by the pricing service at its last bid price. Securities traded in the NASDAQ over-the-counter market are generally valued by the pricing service at the NASDAQ Official Closing Price. When using the market quotations or close prices provided by the pricing service and when the market is considered active, the security will be classified as a Level 1 security. Sometimes, an equity security owned by the Fund will be valued by the pricing service with factors other than market quotations or when the market is considered inactive. When this happens, the security will be classified as a Level 2 security. When market quotations are not readily available, when the Fund determines that the market quotation or the price provided by the pricing service does not accurately reflect the current fair value, or when certain restricted or illiquid securities are being valued, such securities are valued as determined in good faith by the Adviser, in conformity with guidelines adopted by and subject to review by the Board. These securities will be categorized as Level 3 securities.
In accordance with the Trust’s good faith pricing guidelines, each Adviser is required to consider all appropriate factors relevant to the value of securities for which it has determined other pricing sources are not available or reliable as described above. No single standard exists for determining fair value, because fair value depends upon the circumstances of each individual case. As a general principle, the current fair value of an issue of securities being valued by the Adviser would appear to be the amount which the owner might reasonably expect to receive for them upon their current sale. Methods which are in accordance with this principle may, for example, be based on (i) a multiple of earnings; (ii) a discount from market of a similar freely traded security (including a derivative security or a basket of securities traded on other markets, exchanges or among dealers); or (iii) yield to maturity with respect to debt issues, or a combination of these and other methods. Good faith pricing is permitted if, in the Adviser’s opinion, the validity of market quotations appears to be questionable based
47
Cloud Capital Funds
Notes to the Financial Statements - (continued)
May 31, 2014
NOTE 3. SECURITIES VALUATION AND FAIR VALUE MEASUREMENTS - (continued)
on factors such as evidence of a thin market in the security based on a small number of quotations, a significant event occurs after the close of a market but before a Fund’s NAV calculation that may affect a security’s value, or the Adviser is aware of any other data that calls into question the reliability of market quotations. Good faith pricing may also be used in instances when the bonds the Fund invests in may default or otherwise cease to have market quotations readily available. Any fair valuation pricing done outside the Fund’s approved pricing methods must be approved by the Pricing Committee of the Board.
The following is a summary of the inputs used to value the Funds’ investments as of May 31, 2014.
| | | | | | | | | | | | | | | | |
| | | Valuation Inputs | |
| Large Cap Fund | | Level 1 Quoted
Prices in Active
Markets | | | Level 2 Other
Significant
Observable Inputs | | | Level 3
Significant
Unobservable
Inputs | | | Total | |
Common Stocks * | | $ | 23,818,468 | | | $ | – | | | $ | – | | | $ | 23,818,468 | |
Cash Equivalents | | | 574,179 | | | | – | | | | – | | | | 574,179 | |
Total | | | 24,392,647 | | | | – | | | | – | | | | 24,392,647 | |
| Mid Cap Fund | | | | | | | | | | | | |
Common Stocks * | | | 22,539,761 | | | | – | | | | – | | | | 22,539,761 | |
Exchange-Traded Funds | | | 49,200 | | | | – | | | | – | | | | 49,200 | |
Cash Equivalents | | | 520,261 | | | | – | | | | – | | | | 520,261 | |
Total | | | 23,109,222 | | | | – | | | | – | | | | 23,109,222 | |
| * | Refer to Schedule of Investments for industry classifications. |
The Funds did not hold any investments at any time during the reporting period in which significant unobservable inputs were used in determining fair value; therefore, no reconciliation of Level 3 securities is included for this reporting period. The Funds did not hold any derivative instruments during the reporting period.
The Trust recognizes transfers between fair value hierarchy levels at the end of the reporting period. There were no transfers between any levels as of May 31, 2014, and the previous reporting period end.
48
Cloud Capital Funds
Notes to the Financial Statements - (continued)
May 31, 2014
NOTE 4. ADVISER FEES AND OTHER TRANSACTIONS
Under the terms of the management agreement, on behalf of the Funds (the “Agreement”), the Adviser manages each Fund’s investments subject to oversight of the Trustees. As compensation for its management services, each Fund is obligated to pay the Adviser a fee, computed and accrued daily and paid monthly, at an annual rate of 0.50% of the average daily net assets of the Fund. For the year ended May 31, 2014, the Adviser earned fees of $196,052 from the Large Cap Fund and $124,737 from the Mid Cap Fund before the waivers and recoupment described below. At May 31, 2014, the Mid Cap Fund owed the Adviser $5,210 for the excess of management fees earned over expenses waived and recouped during the period.
The Adviser has contractually agreed to waive its management fee and/or reimburse certain Fund operating expenses, but only to the extent necessary so that each Fund’s net expenses, excluding brokerage fees and commissions, borrowing costs (such as interest and dividend expenses on securities sold short), taxes, distribution and service (12b-1) fees, extraordinary expenses and indirect expenses (such as fees and expenses of acquired funds) does not exceed 1.40% of the net assets of each Fund. On February 1, 2014, the agreement was amended and the Adviser has contractually agreed to waive, in their entirety, its advisory fees effective February 1, 2014 through September 30, 2015 for each fund. This contractual arrangement may only be terminated by mutual consent of the Adviser and the Board, and it will automatically terminate upon the termination of the investment advisory agreement between the Fund and the Adviser. The Adviser shall not be entitled to reimbursement for any advisory fees waived for the Funds for the period February 1, 2014 through September 30, 2015. Other than advisory fees waived from February 1, 2014 through September 30, 2015, each waiver or reimbursement of an expense by the Adviser is subject to repayment by a Fund within the three fiscal years following the fiscal year in which the particular expense was incurred, provided that the Fund is able to make the repayment without exceeding the applicable expense limitation. For the period ended February 1, 2014 through May 31, 2014, the Adviser waived fees of $47,017 from the Large Cap Fund and $38,806 from the Mid Cap Fund. These amounts are not subject to potential recoupment by the Adviser. For the year ended May 31, 2014, the Adviser previously recouped waived fees of $76,941 from the Large Cap Fund and $43,773 from the Mid Cap Fund.
The amounts subject to repayment by the Funds, pursuant to the aforementioned conditions are as follows:
| | | | | | | | |
| Fund | | Amount | | | Recoverable through
May 31, | |
Mid Cap Fund | | $ | 98,472 | | | | 2015 | |
| | | 46,393 | | | | 2016 | |
49
Cloud Capital Funds
Notes to the Financial Statements - (continued)
May 31, 2014
NOTE 4. ADVISER FEES AND OTHER TRANSACTIONS - (continued)
The Trust retains Huntington Asset Services, Inc. (“HASI”) to manage each Fund’s business affairs and provide each Fund with administrative and Chief Compliance services, including all regulatory reporting and necessary office equipment and personnel. For the year ended May 31, 2014, HASI earned fees of $38,996 for the Large Cap Fund and $38,996 for the Mid Cap Fund. At May 31, 2014, HASI was owed $6,500 from the Large Cap Fund and $6,500 from the Mid Cap Fund for administrative services.
The Trust also retains HASI to act as the Fund’s transfer agent and to provide fund accounting services. For the year ended May 31, 2014, HASI earned fees of $35,331 for the Large Cap Fund and $33,504 for the Mid Cap Fund for transfer agent services and reimbursement for out-of-pocket expenses incurred in providing transfer agent services. At May 31, 2014, HASI was owed $5,154 from the Large Cap Fund and $5,060 from the Mid Cap Fund for transfer agent services and out-of-pocket expenses.
For the year ended May 31, 2014, HASI earned fees of $25,000 from the Large Cap Fund and $25,000 from the Mid Cap Fund for fund accounting services. At May 31, 2014, HASI was owed $4,167 from the Large Cap Fund and $4,167 from the Mid Cap Fund for fund accounting services.
Certain officers of the Trust are members of management and/or employees of HASI. HASI is a wholly-owned subsidiary of Huntington Bancshares, Inc., the parent company of Unified Financial Securities, Inc. (the “Distributor”).
The Funds have adopted a Distribution Plan (the “Plan”) pursuant to Rule 12b-1 under the 1940 Act. The Plan provides that the Funds will pay the Distributor and/or any registered securities dealer, financial institution or any other person (the “Recipient”) a fee up to 0.40% of the average daily net assets of the Class A Shares of each Fund in connection with the promotion and distribution of the Fund’s shares or the provision of personal services to shareholders, including, but not necessarily limited to, advertising, compensation to underwriters, dealers and selling personnel, the printing and mailing of prospectuses to other than current Fund shareholders, the printing and mailing of sales literature and servicing shareholder accounts. The Funds or Adviser may pay all or a portion of these fees to any Recipient who renders assistance in distributing or promoting the sale of shares, or who provides certain shareholder services, pursuant to a written agreement. The Plan is a compensation plan, which means that compensation is provided regardless of 12b-1 expenses actually incurred. It is anticipated that the Plan will benefit shareholders because an effective sales program typically is necessary in order for the Funds to reach and maintain a sufficient size to achieve efficiently its
50
Cloud Capital Funds
Notes to the Financial Statements - (continued)
May 31, 2014
NOTE 4. ADVISER FEES AND OTHER TRANSACTIONS - (continued)
investment objectives and to realize economies of scale. There were no 12b-1 fees for the year ended May 31, 2014, as the Class A Shares of each Fund have yet to commence operations.
The Funds may pay certain financial intermediaries that provide certain administrative services to shareholders who invest in the Institutional Class shares of the Funds, including record keeping and sub-accounting shareholder accounts. Each Fund is authorized to pay up to 0.25% of the average daily net assets of each Fund’s Institutional Class shares. The payments may also be made to certain financial intermediaries in connection with client account maintenance support, statement preparation and transaction processing. The types of payments under this category include, among others, payment of ticket charges per purchase or exchange order placed by a financial intermediary, payment of networking or other recordkeeping fees, or one-time payments for ancillary services such as setting up the Funds on a financial intermediary’s trading systems. For the year ended May 31, 2014, the Large Cap Fund and Mid Cap Fund incurred administrative servicing fees of $36,809 and $14,725, respectively. At May 31, 2014, the Large Cap Fund and Mid Cap Fund owed $1,813 and $2,298 in administrative servicing fees, respectively.
The Distributor acts as the principal distributor of the Funds’ shares. An officer of the Trust is an officer of the Distributor and such person may be deemed to be an affiliate of the Distributor. For the year ended May 31, 2014, there were no sales charges or CDSC fees deducted from the proceeds of sales, and redemption of capital shares, as the Funds’ Class A shares have not yet commenced.
NOTE 5. PURCHASES AND SALES OF SECURITIES
For the year ended May 31, 2014, purchases and sales of investment securities, other than short-term investments and short-term U.S. government obligations, were as follows:
| | | | | | | | |
| Fund | | Purchases | | | Sales | |
Large Cap Fund | | $ | 33,156,522 | | | $ | 61,350,347 | |
Mid Cap Fund | | | 12,920,419 | | | | 19,154,770 | |
There were no purchases or sales of long-term U.S. Government obligations during the period.
NOTE 6. ESTIMATES
The preparation of financial statements in conformity with GAAP requires management to make estimates and assumptions that affect the reported amounts of
51
Cloud Capital Funds
Notes to the Financial Statements - (continued)
May 31, 2014
NOTE 6. ESTIMATES - (continued)
assets and liabilities and disclosure of contingent assets and liabilities at the date of the financial statements and the reported amounts of increases and decreases in net assets from operations during the reporting period. Actual results could differ from those estimates.
NOTE 7. BENEFICIAL OWNERSHIP
The beneficial ownership, either directly or indirectly, of 25% or more of the voting securities of a fund creates a presumption of control of a fund, under Section 2(a)(9) of the Investment Company Act of 1940. At May 31, 2014, FOLIOfn Investments, Inc. (“FOLIOfn”) and TD Ameritrade Trust Company (“TD Ameritrade”) owned, as record shareholder, 49% and 43%, respectively, of the outstanding shares of the Large Cap Fund. At May 31, 2014, FOLIOfn Investments, Inc. (“FOLIOfn”) and TD Ameritrade Trust Company (“TD Ameritrade”) owned, as record shareholder, 32% and 33%, respectively, of the outstanding shares of the Mid Cap Fund. It is not known whether FOLIOfn, or TD Ameritrade or any of the underlying beneficial owners owned or controlled 25% or more of the voting securities of the Funds. As a result, FOLIOfn and TD Ameritrade may be deemed to control the Funds.
NOTE 8. FEDERAL TAX INFORMATION
At May 31, 2014, the net unrealized appreciation (depreciation) of investments for tax purposes was as follows:
| | | | | | | | | | | | | | | | |
| Fund | | Tax Cost of
Securities | | | Unrealized
Appreciation | | | Unrealized
Depreciation | | | Net Unrealized
Appreciation
(Depreciation) | |
Large Cap Fund | | $ | 21,393,909 | | | $ | 3,223,735 | | | $ | (224,997 | ) | | $ | 2,998,738 | |
Mid Cap Fund | | | 19,994,070 | | | | 3,558,489 | | | | (443,337 | ) | | | 3,115,152 | |
The difference between book basis and tax basis unrealized appreciation was attributable primarily to the tax deferral of losses on wash sales of $231,187 for the Large Cap Fund and $771,894 for the Mid Cap Fund.
The tax characterization of distributions paid for the year ended May 31, 2014 was as follows:
| | | | | | | | | | | | |
| Fund | | Ordinary
Income* | | | Long-Term
Capital Gain | | | Total
Distributions | |
Large Cap Fund | | $ | 370,177 | | | $ | 3,939,992 | | | $ | 4,310,169 | |
Mid Cap Fund | | | 241,270 | | | | 2,697,738 | | | | 2,939,008 | |
52
Cloud Capital Funds
Notes to the Financial Statements - (continued)
May 31, 2014
NOTE 8. FEDERAL TAX INFORMATION - (continued)
The tax characterization of distributions paid for the fiscal period ended May 31, 2013 was as follows:
| | | | | | | | | | | | |
| Fund | | Ordinary
Income* | | | Long-Term
Capital Gain | | | Total
Distributions | |
Large Cap Fund | | $ | 2,686,027 | | | $ | 201,439 | | | $ | 2,887,466 | |
Mid Cap Fund | | | 1,156,729 | | | | 101,909 | | | | 1,258,638 | |
| * | Short-term capital gains distributions are treated as ordinary income for tax purposes. |
At May 31, 2014, the components of distributable earnings (accumulated losses) on a tax basis were as follows:
| | | | | | | | | | | | | | | | | | | | |
| Fund | | Undistributed
Ordinary
Income | | | Undistributed
Long-Term
Capital Gains | | | Accumulated
Capital and
Other Losses | | | Unrealized
Appreciation
(Depreciation) | | | Total
Accumulated
Earnings (Loss) | |
Large Cap Fund | | $ | 768,373 | | | $ | 6,370,367 | | | $ | (6,400 | ) | | $ | 2,998,738 | | | $ | 10,131,078 | |
Mid Cap Fund | | | 294,714 | | | | 1,172,238 | | | | (13,128 | ) | | | 3,115,152 | | | | 4,568,976 | |
As of May 31, 2014, the Mid Cap Fund had $6,728 in Qualified Late Year Ordinary Losses.
NOTE 9. COMMITMENTS AND CONTINGENCIES
Each Fund indemnifies its officers and trustees for certain liabilities that may arise from performance of their duties to the Funds. Additionally, in the normal course of business, the Funds enter into contracts that contain a variety of representations and warranties which provide general indemnifications. The Funds’ maximum exposure under these arrangements is unknown, as this would involve future claims that may be made against the Funds that have not yet occurred.
NOTE 10. SUBSEQUENT EVENTS
Management of the Funds has evaluated the need for disclosures and/or adjustments resulting from subsequent events through the date these financial statements were issued. There were no items requiring adjustment of financial statements or additional disclosure.
53
REPORT OF INDEPENDENT REGISTERED PUBLIC ACCOUNTING FIRM
To the Shareholders of Cloud Capital Funds and
Board of Trustees of Valued Advisers Trust
We have audited the accompanying statements of assets and liabilities, including the schedules of investments, of Cloud Capital Funds (the “Funds”), comprising Cloud Capital Strategic Large Cap Fund and Cloud Capital Strategic Mid Cap Fund, each a series of the Valued Advisers Trust, as of May 31, 2014, and the related statements of operations for the year then ended, the statements of changes in net assets for each of the two years in the period then ended, and the financial highlights for each of the three periods in the period then ended. These financial statements and financial highlights are the responsibility of the Funds’ management. Our responsibility is to express an opinion on these financial statements and financial highlights based on our audits.
We conducted our audits in accordance with the standards of the Public Company Accounting Oversight Board (United States). Those standards require that we plan and perform the audit to obtain reasonable assurance about whether the financial statements and financial highlights are free of material misstatement. An audit includes examining, on a test basis, evidence supporting the amounts and disclosures in the financial statements. Our procedures included confirmation of securities owned as of May 31, 2014, by correspondence with the custodian and brokers. An audit also includes assessing the accounting principles used and significant estimates made by management, as well as evaluating the overall financial statement presentation. We believe that our audits provide a reasonable basis for our opinion.
In our opinion, the financial statements and financial highlights referred to above present fairly, in all material respects, the financial position of each of the Funds constituting Cloud Capital Funds as of May 31, 2014, the results of their operations for the year then ended, the changes in their net assets for each of the two years in the period then ended, and the financial highlights for each of the three periods in the period then ended, in conformity with accounting principles generally accepted in the United States of America.

COHEN FUND AUDIT SERVICES, LTD.
Cleveland, Ohio
July 29, 2014
54
Additional Federal Income Tax Information (Unaudited):
Qualified Dividend Income: For the year ended May 31, 2014, the Cloud Capital Strategic Large Cap Fund and the Cloud Capital Strategic Mid Cap Fund each designate 47.74% and 53.71%, respectively, of the dividends distributed during the fiscal year as amounts which can be taken into account as a dividend for the purposes of the maximum tax rate under section 1(h)(11) of the Internal Revenue Code.
Dividends Received Deduction: For the year ended May 31, 2014, the Cloud Capital Strategic Large Cap Fund and the Cloud Capital Strategic Mid Cap Fund each designate 51.37% and 56.40%, respectively, of the dividends distributed during the fiscal year as qualifying for the dividends-received deduction for corporate shareholders.
Long-Term Capital Gains: For the year ended May 31, 2014, the Cloud Capital Strategic Large Cap Fund and the Cloud Capital Strategic Mid Cap Fund hereby designates as a capital gain dividend with respect to the taxable year ending May 31, 2014, $3,939,992 and $2,697,738, respectively, or, subsequently determined to be different, the net capital gain of such year.
The Funds will notify shareholders in January 2015 of amounts for use in preparing 2014 income tax returns.
55
The following table provides information regarding each of the Independent Trustees.
| | | | |
Name, Address*, (Age),
Position with Trust**, Term
of Position with Trust | | Principal Occupation During Past 5 Years | | Other Directorships |
| Ira Cohen, 55, Independent Trustee, June 2010 to present. | | Independent financial services consultant, since February 2005. | | Trustee, Griffin Institutional Access Real Estate Fund, since June 2014. |
| Andrea N. Mullins, 47, Independent Trustee, December 2013 to present. | | Private investor; Independent Contractor, Seabridge Wealth Management, LLC, since April 2014; Principal Financial Officer and Treasurer, Eagle Family of Funds (mutual fund family) and Vice President, Eagle Asset Management, Inc. (investment adviser) each from 2004 to 2010. | | None. |
| * | The address for each trustee and officer is 2960 N. Meridian St., Suite 300, Indianapolis, IN 46208. |
| ** | As of the date of this SAI, the Trust consists of 14 series. |
56
The following table provides information regarding the Trustee who is considered an “interested person” of the Trust, as that term is defined under the 1940 Act. Based on the experience of the Trustee, the Trust concluded that the individual described below should serve as a Trustee.
| | | | |
Name, Address*, (Age),
Position with Trust**, Term
of Position with Trust | | Principal Occupation During Past 5 Years | | Other Directorships |
| R. Jeffrey Young, 49, Trustee and Chairman, June 2010 to present. | | Senior Vice President, Huntington Asset Services, Inc., the Trust’s administrator, since January 2010, Director since May 2014; Chief Executive Officer, Huntington Funds, since February 2010; Chief Executive Officer, Huntington Strategy Shares, since November 2010; Director, Unified Financial Securities, Inc., the Trust’s distributor, since May 2014; President and Chief Executive Officer, Dreman Contrarian Funds, from March 2011 to February 2013; Trustee, Valued Advisers Trust, from August 2008 to January 2010; and Managing Director and Chief Operating Officer of Professional Planning Consultants, from 2007 to 2010. | | Trustee, Capitol Series Trust, since September 2013. |
| * | The address for each trustee and officer is 2960 N. Meridian St., Suite 300, Indianapolis, IN 46208. |
| ** | As of the date of this SAI, the Trust consists of 14 series. |
57
The following table provides information regarding the Officers of the Trust:
| | | | |
Name, Address*, (Age),
Position with Trust,**
Term of Position with
Trust | | Principal Occupation During Past 5 Years | | Other Directorships |
| R. Jeffrey Young, 49, Trustee and Chairman, June 2010 to present; Principal Executive Officer and President, Valued Advisers Trust since February 2010; | | Senior Vice President, Huntington Asset Services, Inc., the Trust’s administrator, since January 2010, Director since May 2014; Chief Executive Officer, Huntington Funds, since February 2010; Chief Executive Officer, Huntington Strategy Shares, since November 2010; Director, Unified Financial Securities, Inc., the Trust’s distributor, since May 2014; President and Chief Executive Officer, Dreman Contrarian Funds, from March 2011 to February 2013; Trustee, Valued Advisers Trust, from August 2008 to January 2010; and Managing Director and Chief Operating Officer, Professional Planning Consultants, from 2007 to 2010. | | Trustee, Capitol Series Trust, since September 2013. |
| John C. Swhear, 53, Chief Compliance Officer, AML Officer and Vice President, August 2008 to present. | | Vice President of Legal Administration and Compliance, Huntington Asset Services, Inc., the Trust’s administrator, since April 2007, Director since May 2014; Chief Compliance Officer, Unified Financial Securities, Inc., the Trust’s distributor, since May 2007, Director since May 2014; President, Unified Series Trust, since March 2012, and Senior Vice President from May 2007 to March 2012; Chief Compliance Officer and AML Officer, Capitol Series Trust, since September 2013; Secretary, Huntington Funds, from April 2010 to February 2012; President and Chief Executive Officer, Dreman Contrarian Funds, from March 2010 to March 2011, and Vice President and Acting Chief Executive Officer, from 2007 to March 2010. | | None. |
| Carol J. Highsmith, 49, Vice President, August 2008 to present; Secretary, March 2014 to present | | Employed in various positions with Huntington Asset Services, Inc., the Trust’s administrator, since November of 1994; currently Vice President of Legal Administration. | | None. |
58
| | | | |
Name, Address*, (Age),
Position with Trust,**
Term of Position with
Trust | | Principal Occupation During Past 5 Years | | Other Directorships |
| Matthew J. Miller, 38, Vice President, December 2011 to present. | | Employed in various positions with Huntington Asset Services, Inc., the Trust’s administrator, since July of 1998; currently Vice President of Relationship Management; Vice President, Huntington Funds, since February 2010; President and Chief Executive Officer, Capitol Series Trust, since September 2013. | | None. |
| Bryan W. Ashmus, 41, Principal Financial Officer and Treasurer, December 2013 to present. | | Vice President, Financial Administration, Huntington Asset Services, Inc., the Trust’s administrator, since September 2013; Chief Financial Officer and Treasurer, Huntington Strategy Shares and Huntington Funds, since November 2013; Vice President, Treasurer Services, Citi Fund Services Ohio, Inc., from 2005 to 2013. | | None. |
| * | The address for each trustee and officer is 2960 N. Meridian St., Suite 300, Indianapolis, IN 46208. |
| ** | As of the date of this SAI, the Trust consists of 14 series. |
OTHER INFORMATION
The Funds’ Statement of Additional Information (“SAI”) includes additional information about the trustees and is available without charge, upon request. You may call toll-free at (877) 670-2227 to request a copy of the SAI or to make shareholder inquiries.
59
Management Renewal Agreement – (Unaudited)
At a meeting held on March 11-12, 2014, the Board of Trustees (the “Board”) considered the renewal of the Investment Advisory Agreements (the “Advisory Agreements”) between the Trust and Cloud Capital LLC (the “Cloud” or “Adviser”) with respect to the Cloud Capital Strategic Large Cap Fund and the Cloud Capital Strategic Mid Cap Fund (each a “Fund” and together the “Funds”).
Counsel noted that the 1940 Act requires the approval of the investment advisory agreement between the Trust and its investment adviser by the Board, including a majority of the Independent Trustees. The Board reviewed a memorandum from Counsel, and addressed to the Trustees that summarized, among other things, the fiduciary duties and responsibilities of the Board in reviewing and approving the renewal of the Advisory Agreements. A copy of this memorandum was circulated to the Trustees in advance of the meeting. Counsel discussed with the Trustees the types of information and factors that should be considered by the Board in order to make an informed decision regarding the approval of the renewal of the Advisory Agreements, including the factors as applicable to Cloud as follows: (i) the nature, extent, and quality of the services provided by the Adviser; (ii) the investment performance of the Funds; (iii) the costs of the services to be provided and anticipated profits to be realized by the Adviser from the relationship with the Funds; (iv) the extent to which economies of scale would be realized if the Funds grow and whether advisory fee levels reflect those economies of scale for the benefit of the Funds’ investors; and (v) the Adviser’s practices regarding possible conflicts of interest and potential benefits derived from its relationship with the Funds.
The Trustees then considered the proposed renewal of the Advisory Agreements between the Trust and Cloud with respect to the Funds. The Board then discussed the contractual arrangements between the Trust and Cloud with respect to the Funds. They reflected upon the presentation from a representative of Cloud, as well as the Board’s prior experience with Cloud in managing the Funds. Counsel discussed with the Trustees the fact that there currently is no management fee being paid by the Funds. Counsel also noted that the use of a non-bank custodian is a bit unusual, but makes sense given the adviser’s strategy. The Board acknowledged that the Funds’ auditors must do special securities counts throughout the year, which causes the audit fee to be somewhat higher than it otherwise would be.
Counsel further discussed with the Trustees the types of information and factors that should be considered by the Board in order to make an informed decision regarding the renewal of the Advisory Agreements, as discussed earlier in the Meeting, as well as the application of those factors to Cloud.
In assessing the factors and reaching its decisions, the Board took into consideration information furnished for the Board’s review and consideration throughout the year at regular Board meetings, as well as information specifically requested and prepared and/or presented in connection with the annual renewal process, including information
60
presented at the Meeting. The Board was provided with information and reports relevant to the annual renewal of the Advisory Agreements, including (i) reports regarding the services and support provided to the Funds and their shareholders by Cloud; (ii) quarterly assessments of the investment performance of the Funds by personnel of Cloud; (iii) commentary on the reasons for the performance; (iv) presentations by Cloud addressing investment philosophy, investment strategy, personnel and operations of Cloud; (v) compliance and audit reports concerning the Funds and Cloud; (vi) disclosure information contained in the registration statement of the Trust with respect to the Funds and the Form ADV of Cloud; and (vii) a memorandum from Counsel, that summarized the fiduciary duties and responsibilities of the Board in reviewing and approving the Advisory Agreements, including the material Factors set forth above and the types of information included in each factor that should be considered by the Board in order to make an informed decision. The Board also requested and received various informational materials including, without limitation: (i) documents containing information about Cloud, including financial information, a description of personnel and the managerial services provided to the Funds, information on investment advice, performance, summaries of Fund expenses, compliance program, current legal matters, and other general information; (ii) comparative expense and performance information for other mutual funds with strategies similar to the Funds; and (iii) benefits to be realized by Cloud from its relationship with the Funds. The Board did not identify any particular information that was most relevant to its consideration to approve the Agreement and each Trustee may have afforded different weight to the various factors.
| 1. | The nature, extent, and quality of the services to be provided by the Adviser. In this regard, the Board considered Cloud’s responsibilities under the Advisory Agreements. The Trustees considered the services being provided by Cloud to the Funds including, without limitation: the quality of its investment advisory services (including research and recommendations with respect to portfolio securities), its process for formulating investment recommendations and assuring compliance with the Funds’ investment objectives and limitations, its coordination of services for the Funds among the Funds’ service providers, and its efforts to promote the Funds and grow their assets. The Trustees considered the fact that Cloud had hired a new marketing associate who is marketing toward retirement plans, noting that the individual was trying to get assets into the firm, not just into the Funds. The Trustees considered Cloud’s continuity of, and commitment to retain, qualified personnel and Cloud’s commitment to maintain and enhance its resources and systems, the commitment of Cloud’s personnel to finding alternatives and options that allow the Funds to maintain their goals, and Cloud’s continued cooperation with the Independent Trustees and Counsel for the Funds. The Trustees considered Cloud’s personnel, including the education and experience of Cloud’s personnel. After considering the foregoing information and further information in the Meeting materials provided by Cloud (including Cloud’s Form ADV), the Board concluded that, in light of all the facts and circumstances, the nature, extent, and quality of the services provided by Cloud were satisfactory and adequate for the Funds. |
61
| 2. | Investment Performance of the Funds and the Adviser. In considering the investment performance of the Funds and Cloud, the Trustees compared the short-term performance of the Funds with the performance of funds with similar objectives managed by other investment advisers, as well as with aggregated peer group data. The Trustees considered the performance of other accounts managed by Cloud that have investment objective and strategies similar to the Funds, as well as with the performance of the relevant benchmarks for each of the Funds. The Trustees also considered the consistency of Cloud’s management of the Funds with their respective investment objectives, strategies, and limitations. The Trustees noted that each Fund’s performance, in the periods since each Fund’s inception, was better than some of its peers and worse than others, but generally comparable to most of its peers. More specifically, the Trustees observed that the Cloud Capital Strategic Mid Cap Fund (the “Cloud Mid Cap Fund”) performed comparably to the average and median performance of the peers in its category in the short-term, one-year, and since inception periods. With respect to the Cloud Capital Strategic Large Cap Fund (the “Cloud Large Cap Fund”), the Trustees observed that this Fund generally performed comparably to the average and median performance of its peer category in the short-term and one-year periods, and had outperformed the Fund’s peer group during the since inception period. After reviewing and discussing the investment performance of the Funds further, Cloud’s experience managing the Funds, each Fund’s historical performance, and other relevant factors, the Board concluded, in light of all the facts and circumstances, that the investment performance of the Funds and Cloud was satisfactory. |
| 3. | The costs of the services to be provided and profits to be realized by the Adviser from the relationship with the Funds. In considering the costs of services to be provided and the profits to be realized by Cloud from the relationship with the Funds, the Trustees considered: (1) Cloud’s financial condition; (2) the asset levels of the Funds; (3) the overall expenses of each of the Funds; and (4) the nature and frequency of advisory fee payments. The Trustees reviewed information provided by Cloud regarding its profits associated with managing the Funds. The Trustees also considered potential benefits for Cloud in managing the Funds. The Trustees then compared the fees and expenses of the Funds (including the management fee) to other comparable mutual funds. The Trustees recalled that Cloud, at its own initiative, had reduced the management fee from 1.00% to 0.50% for each Fund. They also noted that Cloud had proposed, and the Board had approved, revisions to the expense limitation arrangements for the Funds, which resulted in Cloud receiving no management fee from either Fund. The Trustees observed that this proposal by Cloud was made based on the fact that virtually all shareholders in the Funds are also Cloud clients, and Cloud wished to avoid duplication of fees. The Trustees noted that the Cloud Mid Cap Fund’s management fee was well below the average and median fees of peers in its category and one of the lowest in its category. With respect to the Cloud Large Cap Fund, the Trustees observed that the fee was also |
62
| | below the average and median fees of peers in its category. The Trustees also noted that the Large Cap Fund’s net expense ratio was slightly higher than those of the peer average and median expense ratios, and the Mid Cap Fund’s net expense ratio was comparable to the median and somewhat lower than the average of its peer group, as a result of Cloud’s contractual commitment to limit the expenses of the Funds. Based on the foregoing, the Board concluded that the fees to be paid to Cloud by the Funds and the profits to be realized by Cloud, in light of all the facts and circumstances, were fair and reasonable in relation to the nature and quality of the services provided by Cloud. |
| 4. | The extent to which economies of scale would be realized as the Funds grow and whether advisory fee levels reflect these economies of scale for the benefit of the Funds’ investors. In this regard, the Board considered each Fund’s fee arrangements with Cloud. The Board considered that while the management fee remained the same at all asset levels, each Fund’s shareholders had experienced benefits from each Fund’s expense limitation arrangement. The Trustees discussed Cloud’s recent reduction in its management fees for each of the Funds and Cloud’s previous representation that the reduction was proposed at a fixed level that would allow the Funds to avoid the hurdle of having to gather large levels of assets in order to realize economies of scale in the management fee. They also noted Cloud’s agreement to revise the expense limitation arrangements for the Funds, which effectively eliminated the management fee with respect to both Funds. The Trustees noted that once each Fund’s expenses fell below the cap set by the arrangement, the Funds’ shareholders would continue to benefit from the economies of scale under the Trust’s agreement with service providers other than Cloud. In light of its ongoing consideration of each Fund’s asset levels, expectations for growth in each Fund, and fee levels, the Board determined that each Fund’s fee arrangements, in light of all the facts and circumstances, were fair and reasonable in relation to the nature and quality of the services provided by Cloud. |
| 5. | Possible conflicts of interest and benefits to the Adviser. In considering Cloud’s practices regarding conflicts of interest, the Trustees evaluated the potential for conflicts of interest and considered such matters as the experience and ability of the advisory personnel assigned to the Funds; the basis of decisions to buy or sell securities for the Funds and/or Cloud’s other accounts; and the substance and administration of Cloud’s code of ethics. The Trustees also considered disclosure in the registration statement of the Trust relating to Cloud’s potential conflicts of interest. The Trustees noted that Cloud does not utilize soft dollars. The Trustees noted other potential benefits (in addition to the management fee) to Cloud, such as the ability to market their services in new channels (other than direct separate accounts) and some benefit from press exposure. Based on the foregoing, the Board determined that the standards and practices of Cloud relating to the identification and mitigation of potential conflicts of interest and the benefits to be realized by Cloud in managing the Funds were satisfactory. |
63
After additional consideration of the factors delineated in the memorandum provided by Counsel and further discussion among the Board, the Board determined to approve the continuation of the Advisory Agreements between the Trust and the Adviser.
64
VALUED ADVISERS TRUST
PRIVACY POLICY
The following is a description of the policies of the Valued Advisers Trust (the “Trust”) regarding disclosure of nonpublic personal information that shareholders provide to a series of the Trust (each, a “Fund”) or that the Fund collects from other sources. In the event that a shareholder holds shares of a Fund through a broker-dealer or other financial intermediary, the privacy policy of the financial intermediary would govern how shareholder nonpublic personal information would be shared with nonaffiliated third parties.
Categories of Information A Fund May Collect. A Fund may collect the following nonpublic personal information about its shareholders:
| | • | | Information the Fund receives from a shareholder on applications or other forms, correspondence, or conversations (such as the shareholder’s name, address, phone number, social security number, and date of birth); and |
| | • | | Information about the shareholder’s transactions with the Fund, its affiliates, or others (such as the shareholder’s account number and balance, payment history, cost basis information, and other financial information). |
Categories of Information A Fund May Disclose. A Fund may not disclose any nonpublic personal information about its current or former shareholders to unaffiliated third parties, except as required or permitted by law. A Fund is permitted by law to disclose all of the information it collects, as described above, to its service providers (such as the Fund’s custodian, administrator, transfer agent, accountant and legal counsel) to process shareholder transactions and otherwise provide services to the shareholder.
Confidentiality and Security. Each Fund shall restrict access to shareholder nonpublic personal information to those persons who require such information to provide products or services to the shareholder. Each Fund shall maintain physical, electronic, and procedural safeguards that comply with federal standards to guard shareholder nonpublic personal information.
Disposal of Information. The Funds, through their transfer agent, have taken steps to reasonably ensure that the privacy of a shareholder’s nonpublic personal information is maintained at all times, including in connection with the disposal of information that is no longer required to be maintained by the Funds. Such steps shall include, whenever possible, shredding paper documents and records prior to disposal, requiring off-site storage vendors to shred documents maintained in such locations prior to disposal, and erasing and/or obliterating any data contained on electronic media in such a manner that the information can no longer be read or reconstructed.
65
PROXY VOTING
A description of the policies and procedures that the Funds use to determine how to vote proxies relating to portfolio securities and information regarding how each Fund voted those proxies during the most recent twelve month period ended May 31, is available without charge upon request by (1) calling the Funds at (877) 670-2227 and (2) from Funds documents filed with the Securities and Exchange Commission (“SEC”) on the SEC’s website at www.sec.gov.
TRUSTEES
R. Jeffrey Young, Chairman
Ira Cohen
Andrea N. Mullins
OFFICERS
R. Jeffrey Young, Principal Executive Officer and President
Bryan W. Ashmus, Principal Financial Officer and Treasurer
John C. Swhear, Chief Compliance Officer, AML Officer and Vice-President
Carol J. Highsmith, Vice President and Secretary
Matthew J. Miller, Vice President
INVESTMENT ADVISER
Cloud Capital LLC
5314 South Yale, Suite 606
Tulsa, OK 74135
DISTRIBUTOR
Unified Financial Securities, Inc.
2960 North Meridian Street, Suite 300
Indianapolis, IN 46208
INDEPENDENT REGISTERED PUBLIC ACCOUNTING FIRM
Cohen Fund Audit Services, Ltd.
1350 Euclid Avenue, Suite 800
Cleveland, OH 44115
LEGAL COUNSEL
The Law Offices of John H. Lively & Associates, Inc.
A member firm of The 1940 Act Law Group TM
11300 Tomahawk Creek Parkway, Suite 310
Leawood, KS 66211
CUSTODIAN
FOLIOfn Investments, Inc.
8180 Greensboro Drive
8th Floor
McLean, VA 22102
ADMINISTRATOR, TRANSFER AGENT AND FUND ACCOUNTANT
Huntington Asset Services, Inc.
2960 North Meridian Street, Suite 300
Indianapolis, IN 46208
This report is intended only for the information of shareholders or those who have received the Funds’ prospectus which contains information about the Funds’ management fee and expenses. Please read the prospectus carefully before investing.
Distributed by Unified Financial Securities, Inc.
Member FINRA/SIPC
To Shareholders of the LS Opportunity Fund,
Long Short Advisors, LLC (LSA, the “Advisor”) launched the LS Opportunity Fund (LSOFX, the “Fund”) on September 30, 2010 to offer access to Independence Capital Asset Partners’ (ICAP, the “Sub-Advisor”) $700 million long/short equity strategy in a 1940 Act mutual fund structure. While the Fund was established in 2010, the investment team at ICAP has been operating a traditional hedge fund with a similar investment objective since 2004. The Fund aims to identify compelling long/short investment opportunities through a bottom-up stock selection process based on in-depth analysis of business and financial fundamentals. Through extensive research, implementation of risk management, diversification, and limited use of leverage, the Fund strives to do what a successful investment manager should do – preserve capital while delivering above-market returns and managing volatility. For additional information, please visit our website at www.longshortadvisors.com.
Market Review
Our fiscal year ending May 31, 2014 (the “Period”) straddles the end of 2013 and beginning of 2014. 2013 was characterized by investor’s increasing comfort with the U.S. Federal Reserve’s tapering strategy, which led to another strong double digit gain for the S&P 500. However, 2014 has thus far seen an increase in equity market volatility. But despite the continued calls by an increasing number of bull market skeptics, the widely feared equity market correction never quite panned out, leaving the S&P 500 yet again at a new all-time high at the end of the Period. Overall, the S&P 500 finished the Period with a cumulative total return of 20.5%, while the HFRX Equity Hedge Index (HFRX) returned just 4.0%.
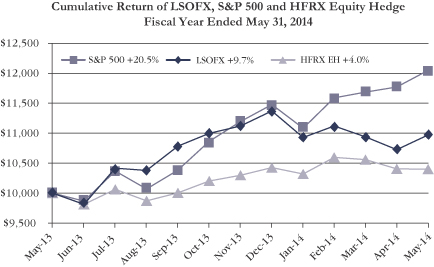
1
Management Discussion of Fund Performance
We are pleased to report that the Fund outperformed the HFRX during the Period and kept pace with the S&P 500 for most of the year. From May 31, 2013 through year end 2013, despite maintaining just ~60% average net exposure, the Fund and the S&P performed in lockstep to the upside. However, despite our strong start to the Period, the Fund’s relative performance trailed the S&P 500 during the last few months of our fiscal year.
We believe the stock prices of companies we owned became temporarily dislocated from fundamentals in early 2014. During these past few months, investors once again shunned risk and chased yield on fears that the Fed would leave rates lower for longer, leading to broad gains in dividend paying stocks at the expense of more growth focused sectors such as technology, healthcare, consumer discretionary and financials.
With the strong rise in the prices of our stocks in 2013, we began preparing for the rotation out of growth. We had already begun repositioning the portfolio by the end of 2013, side-stepping potentially even higher volatility in early 2014. With the downdraft in growth oriented stocks dampened, this allowed us to take advantage of the early 2014 volatility and accelerate our opportunistic shift to some of our deeply researched new ideas, which have already generated positive attribution in the two months subsequent to our fiscal year end.
Contributors
Half a dozen stocks across a broad market spectrum each earned more than 100 basis points of return during the Period. These included positions within the healthcare (Gilead Sciences – GILD, Endo International - ENDP), energy (Schlumberger – SLB), industrials (Alliant Techsystems - ATK) and transportation (American Airlines – AAL, Delta Air Lines – DAL) sectors.
Of particular note, none of these positions were amongst the Fund’s top 10 holdings as we entered the Period, signifying the broad repositioning of the portfolio amidst the continued ascension of the equity markets to all-time record levels. To put the current bull market in perspective, the S&P 500 cumulative total return between the March 9, 2009 recession low and May 31, 2014 was 218%, equating to an annualized return of almost 25%! Throughout the Period, the investment team reduced or eliminated a number of very successful long-term investments to make room for a number of new ideas, many of which have since become new success stories in their own rights.
Detractors
As mentioned above, the Fund gave back a portion of its solid calendar year 2013 gains over the course of January through May 2014. However, over the entire
2
twelve month Period, the Fund did not lose more than 35 basis points on any individual position, with one exception: Ocwen Financial (OCN), which was the top performer in the fiscal year that ended May 31, 2013, contributing over 400 basis points to the Fund’s 17% total return.
Management Outlook
Over ICAP’s almost ten year history running the long/short equity investment strategy utilized by the Fund, understanding company fundamentals, taking a long-term view, and having the patience to see successes unfold have been key hallmarks to our success. Thus, short-term price dislocations from fundamental values are not without precedent and often result in more attractive investment opportunities.
| | • | | ICAP’s long/short equity hedge fund strategy has experienced ten calendar quarters of negative net returns over its almost ten year history |
| | • | | ICAP’s ensuing twelve month return following a negative quarter was positive in nine of these ten instances, with an average net return of 12.9% |
| | • | | Relative to the HFRX Equity Hedge Index, an index of comparable U.S. long/short equity hedge funds, ICAP outperformed by an average of 8.8% in each of the ensuing twelve month periods |
| | • | | Relative to the S&P 500, ICAP trailed by an average of just 1.0% in each of the ensuing twelve month periods despite average net exposure of 55% |
While our investment process is not immune from short-term volatility, we remain confident in our fundamental analysis and individual stock selection on both the long and short sides of our portfolio. Where we have seen stock price dislocations before, it has historically provided incremental investment opportunities. Rather than remaining idle and waiting for the market to ‘come back to us’, we have proactively utilized the recent market dislocation to reposition the Fund into deeply researched investments that have suddenly become much more attractive. Given the two months of recent performance of the Fund subsequent to our fiscal year ended May 31, 2014, we look forward to updating you on our progress relative to the historical rebounds discussed above.
At Period’s end, the Fund’s top 10 long positions represented approximately 29.1% of the long book and included Aetna (AET), Chicago Bridge & Iron (CBI), Google (GOOGL), HCA Holdings (HCA), Intermune (ITMN), Las Vegas Sands (LVS), North Star Realty (NRF), Occidental Petroleum (OXY), Schlumberger (SLB), and Williams Companies (WMB). Our long positions remain broadly diversified across nine sectors and twenty-eight industry groups.
3
Also at Period’s end, the Fund’s short book is populated by shares of forty eight individual companies that have business model challenges, excessive valuations, and/or aggressive accounting practices. The short book is similarly diversified across eight sectors and twenty-five industry groups.
Thank you for your continued support and we look forward to reporting to you again following our semi-annual date of November 30, 2014.
Sincerely,
Jim Hillary, Chris Hillary
Co-Portfolio Managers, LS Opportunity Fund
4
How do investors use long short equity mutual funds?
Through discussions with a broad cross-section of investors, it appears that there are three ways in which investors are using long/short equity mutual funds:
| | 1. | As a long-only equity substitute with the US stock market continuing to mark new all-time highs |
| | 2. | As a core, long-term addition to a traditional 60/40 blend of stocks and bonds |
| | 3. | As a daily liquid complement to an existing long/short equity hedge fund allocation |
Long/short equity mutual funds as a long-only equity substitute:
Fundamental long/short equity funds typically have a primary goal of delivering equity like returns over a market cycle with reduced volatility (lower beta and standard deviation than the overall equity market), making them a very logical substitute for long-only equity funds, especially for investors who fear a potential market correction at current stock market highs.
| | • | | Per Table 1 below, long/short equity hedge funds have outperformed the overall equity market over the past 25 years, and have done so with 55% lower beta and 40% lower standard deviation than the S&P 500. |
Table 1
| | | | | | | | | | | | | | | | | | | | | | | | | | | | |
| | | January 1990 – May 2014 | |
| | | Annual
Return | | | Standard
Deviation | | | Beta vs.
S&P 500 | | | Alpha vs.
S&P 500 | | | Correlation vs.
S&P 500 | | | Sharpe
Ratio | | | Max
Drawdown | |
S&P 500 | | | 9.5 | % | | | 14.8 | % | | | 1.00 | | | | 0.0 | % | | | 1.00 | | | | 0.64 | | | | -51.0 | % |
HFRI Equity Hedge (Total) Index | | | 12.6 | % | | | 9.0 | % | | | 0.45 | | | | 8.0 | % | | | 0.73 | | | | 1.39 | | | | -30.6 | % |
60% S&P 500/40% Barclays Agg | | | 8.6 | % | | | 9.2 | % | | | 0.61 | | | | 2.5 | % | | | 0.99 | | | | 0.94 | | | | -30.8 | % |
45% SP500/30% Agg/25% HFRI EH | | | 9.6 | % | | | 8.6 | % | | | 0.57 | | | | 3.8 | % | | | 0.95 | | | | 1.12 | | | | -30.6 | % |
Source: Long Short Advisors, Hedge Fund Research
| | • | | More recently, investors may be overlooking the benefits of adding long/short equity to a portfolio, with some giving up on the allocation altogether. It’s hard to blame them, as the S&P 500 has returned almost 25% annualized since the recession low point on March 9, 2009. Our belief |
5
| | is that these types of returns are almost certainly unsustainable, and that long/short equity strategies will again showcase their ability to generate equity-like returns while protecting capital during down markets. Graph 1 below compares the rolling twelve month return of the HFRI Equity Hedge (Total) Index relative to the S&P 500, pictorially showing the rotating nature of investing: |
Graph 1
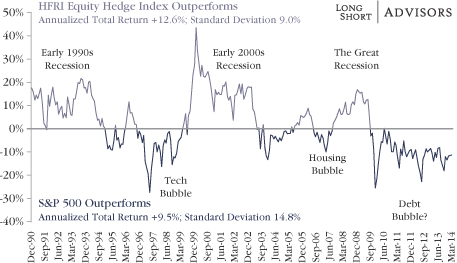
Source: Long Short Advisors, Hedge Fund Research
| | • | | Long/short equity hedge funds have outperformed the S&P 500 on a rolling twelve month basis almost 53% of the time, but one can readily see that the most significant periods of underperformance have been amidst ‘bubble’ markets. |
| | • | | By protecting capital during bear markets, long/short equity funds are able to compound returns from a higher base during bull markets, thus creating the opportunity to outperform over a complete market cycle. |
Long/short equity mutual funds as an addition to a traditional 60/40 blend:
While historical data supports long/short equity funds as a viable substitute to long-only equity funds, the above argument assumes investors have a truly long-term investment horizon over a complete market cycle (bull and bear periods). It would be naïve to expect this to be the case, and we are sensitive to the unfortunate emotional reaction of a typical investor around market extremes.
6
| | • | | For example, Table 2 below shows 2013 as a snapshot in time relative to the 25 year historical data shown in Table 1 above: |
Table 2
| | | | | | | | | | | | | | | | | | | | | | | | | | | | |
| | | Calendar Year 2013 | |
| | | Annual
Return | | | Standard
Deviation | | | Beta vs.
S&P 500 | | | Alpha vs.
S&P 500 | | | Correlation vs.
S&P 500 | | | Sharpe
Ratio | | | Max
Drawdown | |
S&P 500 | | | 32.3 | % | | | 8.5 | % | | | 1.00 | | | | 0.0 | % | | | 1.00 | | | | 3.81 | | | | -2.9 | % |
HFRI Equity Hedge (Total) Index | | | 14.2 | % | | | 4.9 | % | | | 0.52 | | | | -1.5 | % | | | 0.90 | | | | 2.89 | | | | -1.6 | % |
60% S&P 500/40% Barclays U.S. Aggregate | | | 17.5 | % | | | 5.6 | % | | | 0.65 | | | | -2.2 | % | | | 0.98 | | | | 3.10 | | | | -1.9 | % |
45% SP500/30% Agg/25% HFRI EH | | | 16.7 | % | | | 5.4 | % | | | 0.62 | | | | -2.0 | % | | | 0.98 | | | | 3.12 | | | | -1.7 | % |
40% SP500/40% Agg/20% HFRI EH | | | 14.1 | % | | | 4.9 | % | | | 0.55 | | | | -2.5 | % | | | 0.96 | | | | 2.89 | | | | -1.5 | % |
Source: Long Short Advisors, Hedge Fund Research
| | • | | Relative to a traditional 60/40 blend of stocks and bonds, this table tells a similar story as before. |
| | • | | By allocating a proportional share of both equity and debt to long/short equity in a 45/30/25 blend, an investor would have realized a similar absolute return as a 60/40 blend, but with lower overall risk. |
| | • | | However, given the dramatic 32% total return of the S&P 500 in 2013, had investors simply allocated 20% to long/short equity from their long-only equity allocation in a 40/40/20 blend, both absolute and risk-adjusted returns would have suffered. |
| | • | | This scenario for an advisor may have resulted in some contentious end of year meetings with clients. |
| | • | | As most of you know all too well, clients want stock returns in equity bull markets, but bond returns in equity bear markets, all while requiring that their advisor invest for the long-term and not try to time the market. |
| | • | | Thus, for investors and advisors alike that are accustomed to a traditional 60/40 blend of stocks and bonds, but are weary of equity markets at all- |
7
| | time highs and bond yields near all-time lows, a 45/30/25 blend of stocks, bonds and long/short equity could make the most sense. |
Long/short equity mutual funds as a daily liquid complement to hedge funds:
The last category of investors is those that already utilize long/short equity strategies, but have invested historically in private hedge funds. At this point in the evolution of the liquid alternative space, these investors are starting to compare 3+ year performance numbers of alternative mutual funds to those of traditional hedge funds, and most are discovering that daily liquidity does not have to come at the expense of performance.
| | • | | The data could not be more supportive for these investors, as the Morningstar Long/Short Equity Category has an identical return to the HFRI Equity Hedge (Total) Index since the inception of LSOFX on September 30, 2010. |
| | • | | Taking it one step further, LSOFX has outperformed them both over this time frame. |
Table 3
| | | | | | | | | | | | | | | | | | | | |
| | | October 2010 – May 2014 | |
| | | Annual
Return | | | Standard
Deviation | | | Beta vs.
S&P 500 | | | Correlation vs.
S&P 500 | | | Sharpe
Ratio | |
HFRI Equity Hedge (Total) Index | | | 5.6 | % | | | 7.6 | % | | | 0.59 | | | | 0.92 | | | | 0.73 | |
Morningstar Long/Short Equity Category | | | 5.6 | % | | | 6.1 | % | | | 0.51 | | | | 0.98 | | | | 0.92 | |
LS Opportunity Fund (LSOFX) | | | 7.9 | % | | | 8.6 | % | | | 0.55 | | | | 0.75 | | | | 0.92 | |
Source: Long Short Advisors, Hedge Fund Research, Morningstar
| | • | | Thus, LSOFX can serve as a daily liquid complement to a private long/short equity hedge fund with the additional benefits of a low $5,000 minimum investment, quarterly holdings transparency, no incentive fees, and minimal leverage. |
Thank you for choosing the LS Opportunity Fund as a place to invest your assets alongside ours. We appreciate your trust in us to help manage and grow your capital.
Please refer to the Fund’s prospectus for a full description of the investment strategy and for more information about the Fund. You may obtain a current copy of the Fund’s prospectus by calling 1-877-366-6763, or visiting our website at www.longshortadvisors.com and clicking on the ‘Fund Information’ tab.
8
For additional questions or to discuss this report in more detail, please contact us at 215-399-9409, or via email at info@longshortadvisors.com
“Don’t time the market, invest in it”
The views and opinions expressed in management’s discussion of Fund performance are those of the advisor and sub-advisor as of the end of the period. These views and opinions are subject to change at any time based on factors such as market and economic conditions. These views and opinions may not be relied upon as investment advice or recommendations, or as an offer for a particular security. The information is not a complete analysis of every aspect of any market, country, industry, security or the Fund. Statements of fact are from sources considered reliable, but neither the advisor nor the sub-advisor makes any representation or warranty as to their completeness or accuracy. Although historical performance is no guarantee of future results, these insights may help you understand our investment management philosophy.
The S&P 500 Index® is a widely recognized, unmanaged index of equity prices and is representative of a broader market and range of securities than is found in the Fund’s portfolio. The Index is an unmanaged benchmark that assumes reinvestment of all distributions and excludes the effect of taxes and fees. Individuals cannot invest directly in this Index; however, an individual can invest in exchange traded funds or other investment vehicles that attempt to track the performance of a benchmark index. HFRI Equity Hedge Index is compiled by Hedge Fund Research, Inc. It is comprised solely of hedge funds, and is designed to be representative of the overall composition of the hedge fund universe implementing a long/short equity strategy. The Fund’s performance is not intended to reflect the performance of the Index, which is provided for comparison purposes only. The Index is not available for direct investment. HFRX Equity Hedge Index is compiled by Hedge Fund Research, Inc. It is comprised solely of hedge funds, and is designed to be representative of the overall composition of the hedge fund universe implementing a long/short equity strategy. For inclusion in the HFRX indices a hedge fund must meet the HFRI criteria, but also be open to new transparent investment, have at least $50 million assets under management and have at least a 24 month track record. The Fund’s performance is not intended to reflect the performance of the Index, which is provided for comparison purposes only. The Index is not available for direct investment. Standard Deviation is a measure of the dispersion of a set of data from its mean. Alpha is a measure of performance on a risk adjusted basis. Beta is a measure of the volatility of a portfolio relative to the overall market. Correlation is a statistical measure of how two securities move in relation to each other. Sharpe Ratio uses standard deviation and excess return to determine reward per unit of risk.
9
Investment Results – (Unaudited)
| | | | | | | | | | | | |
Total Returns* | |
(For the periods ended May 31, 2014) | |
| | | |
| | | | | | Average Annual Returns | |
| | | One Year | | | Three Year | | | Since Inception
(September 30, 2010) | |
LS Opportunity Fund | | | 9.72 | % | | | 4.96 | % | | | 7.95 | % |
S&P 500® Index** | | | 20.45 | % | | | 15.15 | % | | | 17.69 | % |
Total annual operating expenses, as disclosed in the Fund’s supplement to the prospectus dated September 30, 2013, were 3.13% of average daily net assets (2.73% after fee waivers and expense reimbursements by the Adviser.) Long Short Advisors, LLC (the “Adviser”) contractually has agreed to waive or limit its fees and to assume other expenses of the Fund until September 30, 2014, so that the ratio of total annual operating expenses does not exceed 1.95%. This operating expense limitation does not apply to interest, taxes, brokerage commissions, other expenditures which are capitalized in accordance with generally accepted accounting principles, other extraordinary expenses not incurred in the ordinary course of the Fund’s business, dividend expense on short sales, expenses incurred under a Rule 12b-1 plan of distribution, “acquired fund fees and expenses,” and expenses that the Fund has incurred but did not actually pay because of an expense offset arrangement.
The performance quoted represents past performance, which does not guarantee future results. The investment return and principal value of an investment will fluctuate so that an investor’s shares, when redeemed, may be worth more or less than their original cost. The returns shown do not reflect deduction of taxes that a shareholder would pay on Fund distributions or the redemption of Fund shares. The Fund’s investment objectives, risks, charges and expenses must be considered carefully before investing. Current performance of the Fund may be lower or higher than the performance quoted. Performance data current to the most recent month end may be obtained by calling 1-877-336-6763.
* Return figures reflect any change in price per share and assume the reinvestment of all distributions, if any.
** The S&P 500® Index is a widely recognized unmanaged index of equity prices and is representative of a broader market and range of securities than is found in the Fund’s portfolio. The Index is an unmanaged benchmark that assumes reinvestment of all distributions and excludes the effect of taxes and fees. Individuals cannot invest directly in this Index; however, an individual can invest in exchange traded funds or other investment vehicles that attempt to track the performance of a benchmark index.
The Fund’s investment objectives, risks, charges and expenses must be considered carefully before investing. The prospectus contains this and other important information about the investment company and may be obtained by calling 1-877-336-6763. Please read it carefully before investing.
The Fund is distributed by Unified Financial Securities, Inc., Member FINRA.
10
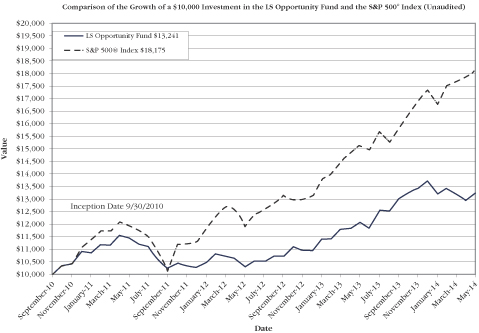
The chart above assumes an initial investment of $10,000 made on September 30, 2010 (commencement of Fund operations) and held through May 31, 2014. THE FUND’S RETURNS REPRESENT PAST PERFORMANCE AND DO NOT GUARANTEE FUTURE RESULTS. The returns shown do not reflect deduction of taxes that a shareholder would pay on the Fund’s distributions or the redemption of the Fund’s shares. Investment returns and principal values will fluctuate so that your shares, when redeemed, may be worth more or less than their original purchase price.
Current performance may be lower or higher than the performance data quoted. For more information on the Fund, and to obtain performance data current to the most recent month-end, or to request a prospectus, please call 1-877-336-6763. You should carefully consider the investment objectives, potential risks, management fees, and charges and expenses of the Fund before investing. The Fund’s prospectus contains this and other information about the Fund, and should be read carefully before investing.
The Fund is distributed by Unified Financial Securities, Inc., member FINRA.
11
Fund Holdings – (Unaudited)
Sector Exposure (5/31/2014)
(Based on Net Assets)
| | | | | | | | | | | | | | | | |
| | | Long | | | Short | | | Gross | | | Net | |
Consumer Discretionary | | | 14.16 | % | | | -4.19 | % | | | 18.35 | % | | | 9.97 | % |
Consumer Staples | | | 3.65 | % | | | -0.18 | % | | | 3.83 | % | | | 3.47 | % |
Energy | | | 16.89 | % | | | -2.23 | % | | | 19.12 | % | | | 14.66 | % |
Financials | | | 4.16 | % | | | -1.89 | % | | | 6.05 | % | | | 2.27 | % |
Health Care | | | 19.14 | % | | | -3.70 | % | | | 22.84 | % | | | 15.44 | % |
Industrials | | | 7.44 | % | | | -2.32 | % | | | 9.76 | % | | | 5.12 | % |
Information Technology | | | 15.76 | % | | | -3.57 | % | | | 19.33 | % | | | 12.19 | % |
Materials | | | 7.81 | % | | | -0.93 | % | | | 8.74 | % | | | 6.88 | % |
Real Estate Investment Trusts | | | 4.71 | % | | | 0.00 | % | | | 4.71 | % | | | 4.71 | % |
Telecommunication Services | | | 1.26 | % | | | 0.00 | % | | | 1.26 | % | | | 1.26 | % |
Unclassified | | | 0.00 | % | | | -9.35 | % | | | 9.35 | % | | | -9.35 | % |
| | | | | | | | | | | | | | | | |
Total | | | 94.98 | % | | | -28.36 | % | | | 123.34 | % | | | 66.62 | % |
| | | | | | | | | | | | | | | | |
The LS Opportunity Fund (“Fund”) seeks to generate long term capital appreciation by investing in both long and short positions within a portfolio consisting of primarily publicly-traded common stock, with less risk than that of the stock market in general.
Availability of Portfolio Schedule – (Unaudited)
The Fund files its complete schedule of portfolio holdings with the Securities and Exchange Commission (“SEC”) for the first and third quarters of each fiscal year on Form N-Q. The Fund’s Forms N-Q are available at the SEC’s website at www.sec.gov. The Forms N-Q may be reviewed and copied at the Public Reference Room in Washington DC. Information on the operation of the Public Reference Room may be obtained by calling 1-800-SEC-0330.
About The Fund’s Expenses – (Unaudited)
As a shareholder of the Fund, you incur two types of costs: (1) transaction costs (such as short-term redemption fees); and (2) ongoing costs, including management fees; and other Fund expenses. This Example is intended to help you understand your ongoing costs (in dollars) of investing in the Fund and to compare these costs with the ongoing costs of investing in other mutual funds. The Example is based on an investment of $1,000 invested at the beginning of the period, and held for the entire period from December 1, 2013 to May 31, 2014.
Actual Expenses
The first line of the table below provides information about actual account values and actual expenses. You may use the information in this line, together with the
12
amount you invested, to estimate the expenses that you paid over the period. Simply divide your account value by $1,000 (for example, an $8,600 account value divided by $1,000 = 8.60), then multiply the result by the number in the first line under the heading entitled “Expenses Paid During the Period” to estimate the expenses you paid on your account during this period.
Hypothetical Example for Comparison Purposes
The second line of the table below provides information about hypothetical account values and hypothetical expenses based on the Fund’s actual expense ratios and an assumed rate of return of 5% per year before expenses, which is not the Fund’s actual return. The hypothetical account values and expenses may not be used to estimate the actual ending account balance or expenses you paid for the period. You may use this information to compare the ongoing costs of investing in the Fund and other funds. To do so, compare this 5% hypothetical example with the 5% hypothetical examples that appear in the shareholder reports of the other funds.
Please note that the expenses shown in the table are meant to highlight your ongoing costs only and do not reflect any transactional costs, such as sales charges (loads), redemption fees, or exchange fees. Therefore, the second line of the table is useful in comparing ongoing costs only, and will not help you determine the relative total costs of owning different funds. In addition, if these transactional costs were included, your costs would have been higher.
| | | | | | | | | | | | |
LS Opportunity
Fund | | Beginning
Account Value December 1, 2013 | | | Ending Account Value May 31, 2014 | | | Expenses Paid During the Period Ended May 31, 2014* | |
Actual | | $ | 1,000.00 | | | $ | 986.60 | | | $ | 11.86 | |
Hypothetical ** | | $ | 1,000.00 | | | $ | 1,013.00 | | | $ | 12.01 | |
| * | Expenses are equal to the Fund’s annualized expense ratio of 2.39%, multiplied by the average account value over the period, multiplied by 182/365. |
| ** | Assumes a 5% return before expenses. |
13
LS Opportunity Fund
Schedule of Investments
May 31, 2014
| | | | | | | | |
| Common Stocks – Long – Domestic – 83.81% | | Shares | | | Fair Value | |
Consumer Discretionary – 12.32% | | | | | | | | |
Comcast Corp. – Class A | | | 57,968 | | | $ | 3,025,930 | |
Dillard’s, Inc. – Class A | | | 11,391 | | | | 1,284,335 | |
Las Vegas Sands Corp.(a) | | | 43,648 | | | | 3,339,945 | |
Mohawk Industries, Inc.(a)* | | | 11,812 | | | | 1,602,416 | |
Tempur Sealy International, Inc.* | | | 49,086 | | | | 2,697,767 | |
Tenneco, Inc.* | | | 35,043 | | | | 2,233,991 | |
Tribune Co.* | | | 32,243 | | | | 2,553,646 | |
Walt Disney Co. / The(a) | | | 20,536 | | | | 1,725,229 | |
| | | | | | | | |
| | | | | | | 18,463,259 | |
| | | | | | | | |
Consumer Staples – 3.65% | | | | | | | | |
Diamond Foods, Inc.* | | | 20,014 | | | | 639,447 | |
Keurig Green Mountain, Inc. | | | 2,312 | | | | 260,747 | |
Rite Aid Corp.* | | | 226,917 | | | | 1,897,026 | |
WhiteWave Food Co. – Class A(a)* | | | 85,021 | | | | 2,677,311 | |
| | | | | | | | |
| | | | | | | 5,474,531 | |
| | | | | | | | |
Energy – 15.02% | | | | | | | | |
Anadarko Petroleum Corp. | | | 13,532 | | | | 1,391,902 | |
Cabot Oil & Gas Corp. | | | 16,925 | | | | 613,362 | |
FMC Technologies, Inc.* | | | 26,027 | | | | 1,511,128 | |
Hess Corp.(a) | | | 32,061 | | | | 2,927,169 | |
Occidental Petroleum Corp.(a) | | | 34,204 | | | | 3,409,797 | |
Phillips 66 | | | 16,844 | | | | 1,428,203 | |
Pioneer Natural Resources Co.(a) | | | 12,384 | | | | 2,602,621 | |
Schlumberger Ltd.(a) | | | 45,297 | | | | 4,712,700 | |
Williams Cos., Inc. / The(a) | | | 83,249 | | | | 3,909,373 | |
| | | | | | | | |
| | | | | | | 22,506,255 | |
| | | | | | | | |
Financials – 4.16% | | | | | | | | |
Ally Financial, Inc.(a)* | | | 94,046 | | | | 2,215,724 | |
American International Group, Inc. | | | 53,567 | | | | 2,896,368 | |
Ocwen Financial Corp.* | | | 32,159 | | | | 1,127,816 | |
| | | | | | | | |
| | | | | | | 6,239,908 | |
| | | | | | | | |
Health Care – 18.43% | | | | | | | | |
Aetna, Inc.(a) | | | 49,491 | | | | 3,838,027 | |
Celgene Corp.(a)* | | | 16,214 | | | | 2,481,229 | |
DaVita, Inc.* | | | 45,742 | | | | 3,228,928 | |
See accompanying notes which are an integral part of these financial statements.
14
LS Opportunity Fund
Schedule of Investments – continued
May 31, 2014
| | | | | | | | |
| Common Stocks – Long – Domestic – 83.81% – continued | | Shares | | | Fair Value | |
Health Care – 18.43% – continued | | | | | | | | |
Gilead Sciences, Inc.* | | | 34,730 | | | $ | 2,820,423 | |
HCA Holdings, Inc.(a)* | | | 96,476 | | | | 5,112,263 | |
Hologic, Inc.(a)* | | | 84,719 | | | | 2,070,532 | |
Humana, Inc. | | | 19,021 | | | | 2,367,354 | |
Impax Laboratories, Inc.* | | | 39,410 | | | | 1,094,022 | |
InterMune, Inc.* | | | 88,127 | | | | 3,491,592 | |
Ophthotech Corp.* | | | 27,275 | | | | 1,110,093 | |
| | | | | | | | |
| | | | | | | 27,614,463 | |
| | | | | | | | |
Industrials – 4.29% | | | | | | | | |
American Airlines Group, Inc.(a)* | | | 74,520 | | | | 2,992,723 | |
Delta Air Lines, Inc.(a) | | | 67,488 | | | | 2,693,446 | |
Xylem, Inc. | | | 19,736 | | | | 736,153 | |
| | | | | | | | |
| | | | | | | 6,422,322 | |
| | | | | | | | |
Information Technology – 13.73% | | | | | | | | |
Adobe Systems, Inc.* | | | 28,340 | | | | 1,829,064 | |
Aspen Technology, Inc.* | | | 26,496 | | | | 1,139,063 | |
Autodesk, Inc.* | | | 28,340 | | | | 1,484,166 | |
Equinix, Inc.(a)* | | | 13,727 | | | | 2,728,241 | |
Google, Inc. – Class A(a)* | | | 6,722 | | | | 3,842,631 | |
Micron Technology, Inc.* | | | 81,941 | | | | 2,342,693 | |
Microsoft Corp. | | | 63,365 | | | | 2,594,163 | |
QUALCOMM, Inc.(a) | | | 20,072 | | | | 1,614,792 | |
SunEdison, Inc.(a)* | | | 151,932 | | | | 2,991,541 | |
| | | | | | | | |
| | | | | | | 20,566,354 | |
| | | | | | | | |
Materials – 6.24% | | | | | | | | |
Air Products & Chemicals, Inc. | | | 12,622 | | | | 1,514,262 | |
Monsanto Co.(a) | | | 25,879 | | | | 3,153,356 | |
U.S. Silica Holdings, Inc. | | | 38,832 | | | | 1,963,734 | |
W.R. Grace & Co.(a)* | | | 29,556 | | | | 2,721,516 | |
| | | | | | | | |
| | | | | | | 9,352,868 | |
| | | | | | | | |
Real Estate Investment Trusts – 4.71% | | | | | | | | |
Gaming and Leisure Properties, Inc. | | | 17,709 | | | | 594,314 | |
NorthStar Realty Finance Corp.(a) | | | 305,469 | | | | 5,055,512 | |
See accompanying notes which are an integral part of these financial statements.
15
LS Opportunity Fund
Schedule of Investments – continued
May 31, 2014
| | | | | | | | |
| Common Stocks – Long – Domestic – 83.81% – continued | | Shares | | | Fair Value | |
Real Estate Investment Trusts – 4.71% – continued | | | | | | | | |
Ryman Hospitality Properties, Inc. | | | 30,657 | | | $ | 1,414,207 | |
| | | | | | | | |
| | | | | | | 7,064,033 | |
| | | | | | | | |
Telecommunication Services – 1.26% | | | | | | | | |
TW Telecom, Inc.* | | | 57,624 | | | | 1,889,491 | |
| | | | | | | | |
TOTAL COMMON STOCKS – LONG – DOMESTIC (Cost $116,686,163) | | | | | | | 125,593,484 | |
| | | | | | | | |
Common Stocks – Long – International – 11.17% | | | | | | | | |
Consumer Discretionary – 1.84% | | | | | | | | |
Liberty Global PLC – Class A(a)* | | | 61,297 | | | | 2,759,591 | |
| | | | | | | | |
Energy – 1.87% | | | | | | | | |
GasLog Ltd. | | | 53,780 | | | | 1,255,763 | |
GasLog Partners LP* | | | 58,055 | | | | 1,539,619 | |
| | | | | | | | |
| | | | | | | 2,795,382 | |
| | | | | | | | |
Health Care – 0.71% | | | | | | | | |
ICON PLC* | | | 25,141 | | | | 1,062,710 | |
| | | | | | | | |
Industrials – 3.15% | | | | | | | | |
Chicago Bridge & Iron Co. NV(a) | | | 58,026 | | | | 4,723,316 | |
| | | | | | | | |
Information Technology – 2.03% | | | | | | | | |
Baidu, Inc.* | | | 18,301 | | | | 3,037,966 | |
| | | | | | | | |
Materials – 1.57% | | | | | | | | |
Constellium NV – Class A* | | | 81,000 | | | | 2,360,340 | |
| | | | | | | | |
TOTAL COMMON STOCKS – LONG – INTERNATIONAL (Cost $15,828,221) | | | | | | | 16,739,305 | |
| | | | | | | | |
TOTAL INVESTMENTS – LONG – 94.98% (Cost $132,514,384) | | | | | | | 142,332,789 | |
| | | | | | | | |
TOTAL SECURITIES SOLD SHORT – (28.36)%
(Proceeds Received $41,828,790) | | | | | | | (42,506,887 | ) |
| | | | | | | | |
Other Assets in Excess of Liabilities – 33.38% | | | | | | | 50,031,447 | |
| | | | | | | | |
TOTAL NET ASSETS – 100.00% | | | | | | $ | 149,857,349 | |
| | | | | | | | |
| (a) | All or a portion of the security is held as collateral for securities sold short. The total fair value of this collateral on May 31, 2014 was $51,262,567. |
| * | Non-income producing security. |
See accompanying notes which are an integral part of these financial statements.
16
LS Opportunity Fund
Schedule of Securities Sold Short
May 31, 2014
| | | | | | | | |
| Common Stocks – Short – Domestic – (17.36)% | | Shares | | | Fair Value | |
Consumer Discretionary – (3.88)% | | | | | | | | |
Amazon.com, Inc. | | | (1,075 | ) | | $ | (335,992 | ) |
Barnes & Noble, Inc. | | | (10,325 | ) | | | (187,295 | ) |
Bed Bath & Beyond, Inc. | | | (5,106 | ) | | | (310,700 | ) |
Cabela’s, Inc. – Class A | | | (13,356 | ) | | | (817,788 | ) |
CarMax, Inc. | | | (5,320 | ) | | | (235,729 | ) |
Dollar Tree, Inc. | | | (6,305 | ) | | | (334,354 | ) |
Family Dollar Stores, Inc. | | | (6,305 | ) | | | (369,473 | ) |
Meredith Corp. | | | (5,170 | ) | | | (232,443 | ) |
Panera Bread Co. – Class A | | | (9,344 | ) | | | (1,435,332 | ) |
Shutterfly, Inc. | | | (15,125 | ) | | | (622,242 | ) |
Starbucks Corp. | | | (6,524 | ) | | | (477,818 | ) |
TJX Cos., Inc. / The | | | (8,479 | ) | | | (461,682 | ) |
| | | | | | | | |
| | | | | | | (5,820,848 | ) |
| | | | | | | | |
Consumer Staples – (0.18)% | | | | | | | | |
Annie’s, Inc. | | | (3,671 | ) | | | (120,115 | ) |
Sprouts Farmers Market, Inc. | | | (5,665 | ) | | | (153,521 | ) |
| | | | | | | | |
| | | | | | | (273,636 | ) |
| | | | | | | | |
Energy – (1.91)% | | | | | | | | |
Alpha Natural Resources, Inc. | | | (94,976 | ) | | | (321,019 | ) |
Arch Coal, Inc. | | | (85,698 | ) | | | (305,085 | ) |
Exxon Mobil Corp. | | | (18,826 | ) | | | (1,892,578 | ) |
SM Energy Co. | | | (4,551 | ) | | | (345,011 | ) |
| | | | | | | | |
| | | | | | | (2,863,693 | ) |
| | | | | | | | |
Financials – (1.89)% | | | | | | | | |
Berkshire Hathaway, Inc. – Class B | | | (8,565 | ) | | | (1,099,232 | ) |
Citigroup, Inc. | | | (18,234 | ) | | | (867,391 | ) |
MetLife, Inc. | | | (12,172 | ) | | | (619,920 | ) |
Progressive Corp. / The | | | (9,957 | ) | | | (249,224 | ) |
| | | | | | | | |
| | | | | | | (2,835,767 | ) |
| | | | | | | | |
Health Care – (3.70)% | | | | | | | | |
Bristol-Myers Squibb Co. | | | (7,268 | ) | | | (361,510 | ) |
Cerner Corp. | | | (13,340 | ) | | | (721,027 | ) |
Covance, Inc. | | | (7,452 | ) | | | (624,925 | ) |
Eli Lilly & Co. | | | (10,570 | ) | | | (632,720 | ) |
Intuitive Surgical, Inc. | | | (1,072 | ) | | | (396,361 | ) |
See accompanying notes which are an integral part of these financial statements.
17
LS Opportunity Fund
Schedule of Securities Sold Short – continued
May 31, 2014
| | | | | | | | |
| Common Stocks – Short – Domestic – (17.36)% – continued | | Shares | | | Fair Value | |
Health Care – (3.70)% – continued | | | | | | | | |
Myriad Genetics, Inc. | | | (26,156 | ) | | $ | (867,333 | ) |
UnitedHealth Group, Inc. | | | (15,317 | ) | | | (1,219,693 | ) |
Varian Medical Systems, Inc. | | | (8,692 | ) | | | (716,655 | ) |
| | | | | | | | |
| | | | | | | (5,540,224 | ) |
| | | | | | | | |
Industrials – (2.32)% | | | | | | | | |
Caterpillar, Inc. | | | (10,191 | ) | | | (1,041,826 | ) |
Fluor Corp. | | | (12,172 | ) | | | (913,874 | ) |
JetBlue Airways Corp. | | | (24,002 | ) | | | (231,859 | ) |
Joy Global, Inc. | | | (17,705 | ) | | | (1,011,841 | ) |
USG Corp. | | | (9,092 | ) | | | (272,578 | ) |
| | | | | | | | |
| | | | | | | (3,471,978 | ) |
| | | | | | | | |
Information Technology – (2.55)% | | | | | | | | |
Cardtronics, Inc. | | | (4,505 | ) | | | (130,555 | ) |
International Business Machines Corp. | | | (10,236 | ) | | | (1,887,109 | ) |
ManTech International Corp. – Class A | | | (2,534 | ) | | | (74,728 | ) |
Twitter, Inc. | | | (6,448 | ) | | | (209,173 | ) |
Western Union Co. / The | | | (20,680 | ) | | | (334,396 | ) |
Yelp, Inc. | | | (6,448 | ) | | | (426,535 | ) |
Zillow, Inc. – Class A | | | (6,448 | ) | | | (760,993 | ) |
| | | | | | | | |
| | | | | | | (3,823,489 | ) |
| | | | | | | | |
Materials – (0.93)% | | | | | | | | |
Airgas, Inc. | | | (10,838 | ) | | | (1,152,296 | ) |
Walter Energy, Inc. | | | (49,512 | ) | | | (241,619 | ) |
| | | | | | | | |
| | | | | | | (1,393,915 | ) |
| | | | | | | | |
TOTAL COMMON STOCKS – SHORT – DOMESTIC
(Proceeds Received $26,031,886) | | | | | | | (26,023,550 | ) |
| | | | | | | | |
Common Stocks – Short – International – (1.65)% | | | | | | | | |
Consumer Discretionary – (0.31)% | | | | | | | | |
Melco Crown Entertainment Ltd. | | | (13,548 | ) | | | (467,000 | ) |
| | | | | | | | |
Energy – (0.32)% | | | | | | | | |
Transocean Ltd. | | | (11,329 | ) | | | (481,369 | ) |
| | | | | | | | |
See accompanying notes which are an integral part of these financial statements.
18
LS Opportunity Fund
Schedule of Securities Sold Short – continued
May 31, 2014
| | | | | | | | |
| Common Stocks – Short – International – (1.65)% – continued | | Shares | | | Fair Value | |
Information Technology – (1.02)% | | | | | | | | |
Accenture PLC – Class A | | | (13,635 | ) | | $ | (1,110,571 | ) |
Vistaprint NV | | | (10,367 | ) | | | (414,887 | ) |
| | | | | | | | |
| | | | | | | (1,525,458 | ) |
| | | | | | | | |
TOTAL COMMON STOCKS – SHORT – INTERNATIONAL (Proceeds Received $2,383,744) | | | | | | | (2,473,827 | ) |
| | | | | | | | |
Exchange-Traded Funds – Short – (9.35)% | | | | | | | | |
Consumer Discretionary Select Sector SPDR Fund | | | (13,874 | ) | | | (911,106 | ) |
Financial Select Sector SPDR Fund | | | (72,972 | ) | | | (1,626,546 | ) |
Health Care Select Sector SPDR Fund | | | (16,664 | ) | | | (996,174 | ) |
Industrial Select Sector SPDR Fund | | | (17,734 | ) | | | (958,523 | ) |
Powershares QQQ Trust, Series 1 | | | (39,837 | ) | | | (3,637,516 | ) |
SPDR S&P 500 ETF Trust | | | (30,523 | ) | | | (5,879,645 | ) |
| | | | | | | | |
TOTAL EXCHANGE-TRADED FUNDS – SHORT
(Proceeds Received $13,413,160) | | | | | | | (14,009,510 | ) |
| | | | | | | | |
TOTAL SECURITIES SOLD SHORT – (28.36)%
(Proceeds Received $41,828,790) | | | | | | $ | (42,506,887 | ) |
| | | | | | | | |
See accompanying notes which are an integral part of these financial statements.
19
LS Opportunity Fund
Statement of Assets and Liabilities
May 31, 2014
| | | | |
Assets | | | | |
Investments in securities at fair value (cost $132,514,384) | | $ | 142,332,789 | |
Cash(a) | | | 50,315,541 | |
Foreign currencies, at value (cost $4,875) | | | 5,075 | |
Receivable for fund shares sold | | | 550,952 | |
Receivable for investments sold | | | 4,947,632 | |
Dividends receivable | | | 37,683 | |
Tax reclaims receivable | | | 2,401 | |
Prepaid expenses | | | 24,018 | |
| | | | |
Total Assets | | | 198,216,091 | |
| | | | |
Liabilities | | | | |
Investment securities sold short, at fair value (proceeds $41,828,790) | | | 42,506,887 | |
Payable for fund shares redeemed | | | 147,383 | |
Payable for investments purchased | | | 5,439,321 | |
Dividend expense payable on short positions | | | 28,239 | |
Payable to Adviser | | | 173,760 | |
Payable to administrator, fund accountant, and transfer agent | | | 19,082 | |
Other accrued expenses | | | 44,070 | |
| | | | |
Total Liabilities | | | 48,358,742 | |
| | | | |
| |
Net Assets | | $ | 149,857,349 | |
| | | | |
| |
Net Assets consist of: | | | | |
Paid-in capital | | $ | 140,640,105 | |
Accumulated undistributed net investment (loss) | | | (795,391 | ) |
Accumulated undistributed net realized gain | | | 872,127 | |
Net unrealized appreciation on: | | | | |
Investment securities and securities sold short | | | 9,140,308 | |
Foreign currency | | | 200 | |
| | | | |
Net Assets | | $ | 149,857,349 | |
| | | | |
Shares outstanding (unlimited number of shares authorized, no par value) | | | 11,782,746 | |
| | | | |
Net asset value (“NAV”) and offering price per share | | $ | 12.72 | |
| | | | |
Redemption price per share (NAV * 98%)(b) | | $ | 12.47 | |
| | | | |
| (a) | See Note 2 in the Notes to Financial Statements regarding restricted cash. |
| (b) | The Fund charges a 2.00% redemption fee on shares redeemed in 60 days or less of purchase. Share are redeemed at the NAV if held longer than 60 calendar days. |
See accompanying notes which are an integral part of these financial statements.
20
LS Opportunity Fund
Statement of Operations
For the year ended May 31, 2014
| | | | |
Investment Income | | | | |
Dividend income (net of foreign taxes withheld of $1,393) | | $ | 340,151 | |
| | | | |
Total investment income | | | 340,151 | |
| | | | |
Expenses | | | | |
Investment Adviser | | | 1,298,813 | |
Administration | | | 66,793 | |
Fund accounting | | | 46,726 | |
Transfer agent | | | 49,879 | |
Legal | | | 19,029 | |
Audit | | | 15,000 | |
Trustee | | | 6,051 | |
Compliance services | | | 3,535 | |
Miscellaneous | | | 107,100 | |
Other – short sale & interest expense | | | 87,348 | |
Dividend expense on securities sold short | | | 316,414 | |
| | | | |
Total expenses | | | 2,016,688 | |
| | | | |
Fees waived by Adviser | | | (159,710 | ) |
| | | | |
Net expenses | | | 1,856,978 | |
| | | | |
Net investment loss | | | (1,516,827 | ) |
| | | | |
Net Realized and Unrealized Gain | | | | |
Net realized gain (loss) on: | | | | |
Investment securities | | | 7,696,984 | |
Securities sold short | | | (3,980,319 | ) |
Written options | | | (10,008 | ) |
Foreign currency | | | 1,538 | |
Forward currency exchange contracts | | | (348 | ) |
Change in unrealized appreciation/(depreciation) on: | | | | |
Investment securities | | | 3,474,921 | |
Securities sold short | | | 160,403 | |
Foreign currency | | | 269 | |
Forward currency exchange contracts | | | 224 | |
| | | | |
Net realized and unrealized gain on investments, securities sold short, written options, foreign currency and foreign currency contracts | | | 7,343,664 | |
| | | | |
Net increase in net assets resulting from operations | | $ | 5,826,837 | |
| | | | |
See accompanying notes which are an integral part of these financial statements.
21
LS Opportunity Fund
Statements of Changes in Net Assets
| | | | | | | | |
| | | For the Year
Ended
May 31, 2014 | | | For the Year
Ended
May 31, 2013 | |
Increase (Decrease) in Net Assets due to: | | | | | | | | |
Operations | | | | | | | | |
Net investment loss | | $ | (1,516,827 | ) | | $ | (975,767 | ) |
Net realized gain on investment securities, short securities, written options, foreign currency and foreign currency exchange contracts | | | 3,707,847 | | | | 4,555,796 | |
Net change in unrealized appreciation on investment securities, short securities, foreign currency and foreign currency exchange contracts | | | 3,635,817 | | | | 3,068,036 | |
| | | | | | | | |
Net increase in net assets resulting from operations | | | 5,826,837 | | | | 6,648,065 | |
| | | | | | | | |
Distributions From: | | | | | | | | |
Net realized gains | | | (2,801,219 | ) | | | — | |
| | | | | | | | |
Total distributions | | | (2,801,219 | ) | | | — | |
| | | | | | | | |
Capital Transactions | | | | | | | | |
Proceeds from shares sold | | | 131,422,391 | | | | 6,410,364 | |
Reinvestment of distributions | | | 2,649,446 | | | | — | |
Amount paid for shares redeemed | | | (25,002,470 | ) | | | (24,173,841 | ) |
Proceeds from redemption fees(a) | | | 12,468 | | | | 1,289 | |
| | | | | | | | |
Net increase (decrease) in net assets resulting from capital transactions | | | 109,081,835 | | | | (17,762,188 | ) |
| | | | | | | | |
Total Increase (Decrease) in Net Assets | | | 112,107,453 | | | | (11,114,123 | ) |
| | | | | | | | |
Net Assets | | | | | | | | |
Beginning of period | | | 37,749,896 | | | | 48,864,019 | |
| | | | | | | | |
End of period | | $ | 149,857,349 | | | $ | 37,749,896 | |
| | | | | | | | |
Accumulated undistributed net investment loss | | $ | (795,391 | ) | | $ | (264,567 | ) |
| | | | | | | | |
Share Transactions | | | | | | | | |
Shares sold | | | 10,409,801 | | | | 596,033 | |
Shares issued in reinvestment of distributions | | | 205,383 | | | | — | |
Shares redeemed | | | (1,967,082 | ) | | | (2,209,670 | ) |
| | | | | | | | |
Net increase (decrease) in share transactions | | | 8,648,102 | | | | (1,613,637 | ) |
| | | | | | | | |
| (a) | The Fund charges a 2% redemption fee on shares redeemed within 60 days of purchase. Share are redeemed at the NAV if held longer than 60 days. |
See accompanying notes which are an integral part of these financial statements.
22
LS Opportunity Fund
Financial Highlights
(For a share outstanding during each period)
| | | | | | | | | | | | | | | | |
| | | For the Fiscal
Year Ended
May 31, 2014 | | | For the Fiscal
Year Ended
May 31, 2013 | | | For the Fiscal
Year Ended
May 31, 2012 | | | For the
Period Ended
May 31, 2011(a) | |
Selected Per Share Data: | | | | | | | | | | | | | | | | |
Net asset value, beginning of period | | $ | 12.04 | | | $ | 10.29 | | | $ | 11.45 | | | $ | 10.00 | |
| | | | | | | | | | | | | | | | |
Income from investment operations: | | | | | | | | | | | | | | | | |
Net investment income (loss)(b) | | | (0.26 | ) | | | (0.24 | ) | | | (0.23 | ) | | | (0.17 | ) |
Net realized and unrealized gain (loss) on investments | | | 1.44 | | | | 1.99 | | | | (0.91 | ) | | | 1.62 | |
| | | | | | | | | | | | | | | | |
Total from investment operations | | | 1.18 | | | | 1.75 | | | | (1.14 | ) | | | 1.45 | |
| | | | | | | | | | | | | | | | |
Less Distributions to Shareholders: | | | | | | | | | | | | | |
From net realized gains | | | (0.50 | ) | | | — | | | | (0.02 | ) | | | — | |
| | | | | | | | | | | | | | | | |
Redemption fees(c) | | | — | | | | — | | | | — | | | | — | |
| | | | | | | | | | | | | | | | |
Net asset value, end of period | | $ | 12.72 | | | $ | 12.04 | | | $ | 10.29 | | | $ | 11.45 | |
| | | | | | | | | | | | | | | | |
Total Return(d)(e) | | | 9.72 | % | | | 17.01 | % | | | (9.92 | )% | | | 14.50 | %(f) |
Ratios and Supplemental Data: | | | | | | | | | | | | | | | | |
Net assets, end of period (000) | | $ | 149,857 | | | $ | 37,750 | | | $ | 48,864 | | | $ | 20,375 | |
Ratio of expenses to average net assets(g) | | | 2.49 | % | | | 3.12 | %(h) | | | 3.16 | % | | | 2.99 | %(i) |
Ratio of expenses to average net assets before waiver and reimbursement/recoupment by Adviser(g) | | | 2.71 | % | | | 3.12 | % | | | 3.06 | % | | | 4.25 | %(i) |
Ratio of net investment loss to average net assets | | | (2.04 | )% | | | (2.22 | )% | | | (2.19 | )% | | | (2.25 | )%(i) |
Portfolio turnover rate | | | 312.34 | % | | | 310.57 | % | | | 444.62 | % | | | 199.48 | %(f) |
| (a) | For the period September 30, 2010 (Commencement of Operations) through May 31, 2011. |
| (b) | Per share net investment loss has been calculated using the average shares method. |
| (c) | Amount represents less than $0.005 per share. |
| (d) | Total return in the above table represents the rate that the investor would have earned or lost on an investment in the Fund, assuming reinvestment of dividends. |
| (e) | Excludes redemption fee. |
| (g) | Includes dividend and interest expense of 0.54%, 0.77%, 0.66% and 0.49% for periods ended May 31, 2014, 2013, 2012 and 2011, respectively. |
| (h) | Effective February 4, 2013, the Adviser agreed to waive fees to maintain certain Fund expenses at 1.95%. Prior to that date, the expense cap was 2.50%. (See Note 5. Adviser Fees and Other Transactions) |
See accompanying notes which are an integral part of these financial statements.
23
LS Opportunity Fund
Notes to the Financial Statements
May 31, 2014
NOTE 1. ORGANIZATION
The LS Opportunity Fund (the “Fund”) is an open-end, diversified series of the Valued Advisers Trust (the “Trust”). The Trust is a management investment company established under the laws of Delaware by an Agreement and Declaration of Trust dated June 13, 2008 (the “Trust Agreement”). The Trust Agreement permits the Trustees to issue an unlimited number of shares of beneficial interest of separate series without par value. The Fund is one of a series of funds authorized by the Board of Trustees (the “Board”). The Fund’s investment adviser is Long Short Advisors, LLC (the “Adviser”). The Adviser has retained Independence Capital Asset Partners, LLC (the “Sub-Adviser”) to serve as sub-adviser to provide portfolio management and related services to the Fund. The Sub-Adviser receives a fee from the Adviser (not the Fund) for these services. The investment objective of the Fund is to generate long term capital appreciation by investing in both long and short positions within a portfolio consisting of primarily publicly-traded common stock, with less risk than that of the stock market in general.
NOTE 2. SIGNIFICANT ACCOUNTING POLICIES
The following is a summary of significant accounting policies followed by the Fund in the preparation of its financial statements.
Securities Valuation – All investments in securities are recorded at their estimated fair value as described in Note 3.
Federal Income Taxes – The Fund makes no provision for federal income or excise tax. The Fund intends to qualify each year as a “regulated investment company” (“RIC”) under subchapter M of the Internal Revenue Code of 1986, as amended, by complying with the requirements applicable to RICs and by distributing substantially all of its taxable income. The Fund also intends to distribute sufficient net investment income and net capital gains, if any, so that it will not be subject to excise tax on undistributed income and gains. If the required amount of net investment income or gains is not distributed, the Fund could incur a tax expense.
As of and during the fiscal year ended May 31, 2014, the Fund did not have a liability for any unrecognized tax benefits. The Fund recognizes interest and penalties, if any, related to unrecognized tax benefits as income tax expense in the Statement of Operations. During the year, the Fund did not incur any interest or penalties. The Fund is subject to examination by U.S. federal tax authorities for all tax years since inception.
24
LS Opportunity Fund
Notes to the Financial Statements – continued
May 31, 2014
NOTE 2. SIGNIFICANT ACCOUNTING POLICIES – continued
Expenses – Expenses incurred by the Trust that do not relate to a specific fund of the Trust are allocated to the individual funds based on each fund’s relative net assets or other appropriate basis (as determined by the Board).
Security Transactions and Related Income – The Fund follows industry practice and records security transactions on the trade date for financial reporting purposes. The Last In, First Out method is used for determining gains or losses for financial statements and income tax purposes. Dividend income and dividend expense are recorded on the ex-dividend date and interest income is recorded on an accrual basis. Distributions from Limited Partnerships are recognized on the ex-date. Income or loss from Limited Partnerships is reclassified in the components of net assets upon receipt of Schedules K-1 (Form 1065). Discounts and premiums on securities purchased are amortized or accreted using the effective interest method. Withholding taxes on foreign dividends have been provided for in accordance with the Fund’s understanding of the applicable country’s tax rules and rates.
Redemption Fees – The Fund charges a 2.00% redemption fee for shares redeemed within 60 days. These fees are deducted from the redemption proceeds otherwise payable to the shareholder. The Fund will retain the fee charged as an increase in paid-in capital and such fees become part of the Fund’s daily NAV calculation.
Foreign Currency Translations – Foreign currency amounts are translated into U.S. dollars as follows: (i) assets and liabilities at the rate of exchange at the end of the respective period; and (ii) purchases and sales of securities and income and expenses at the rate of exchange prevailing on the dates of such transactions. The portion of the results of operations arising from changes in the exchange rates and the portion due to fluctuations arising from changes in the market prices of securities are not isolated. Such fluctuations are included with the net realized and unrealized gain or loss on investments.
The Fund may enter into transactions to purchase or sell foreign currencies to protect the U.S. dollar value of its underlying portfolio securities against the effect of possible adverse movements in foreign exchange rates. Principal risks associated with such transactions include the movement in value of the foreign currency relative to the U.S. dollar and the ability of the counterparty to perform. Fluctuations in the value of such forward currency transactions are recorded daily as unrealized gain or loss; realized gain or loss includes net gain or loss on transactions that have terminated by settlement or by a fund entering into offsetting commitments. Reported net realized foreign exchange gains or losses arise from sales of foreign currencies, currency gains or losses realized between the trade and settlement dates
25
LS Opportunity Fund
Notes to the Financial Statements – continued
May 31, 2014
NOTE 2. SIGNIFICANT ACCOUNTING POLICIES – continued
on securities transactions, and the difference between the amounts of dividends, interest, and foreign withholding taxes recorded on the company’s books and the U.S. dollar equivalent of the amounts actually received or paid. These instruments involve market risk, credit risk, or both kinds of risks, in excess of the amount that would be recognized in the Statement of Assets and Liabilities. Risks arise from the possible inability of counterparties to meet the terms of their contracts and from movement in currency and securities values and interest rates.
Dividends and Distributions – The Fund intends to distribute substantially all of its net investment income, net realized long-term capital gains and its net realized short-term capital gains, if any, to its shareholders on at least an annual basis. Dividends to shareholders, which are determined in accordance with income tax regulations, are recorded on the ex-dividend date. The treatment for financial reporting purposes of distributions made to shareholders during the year from net investment income or net realized capital gains may differ from their ultimate treatment for federal income tax purposes. These differences are caused primarily by differences in the timing of the recognition of certain components of income, expense or realized capital gain for federal income tax purposes. Where such differences are permanent in nature, they are reclassified in the components of net assets based on their ultimate characterization for federal income tax purposes. Any such reclassifications will have no effect on net assets, results of operations or net asset value per share of the Fund. For the year ended May 31, 2014, the Fund made the following reclassifications to increase (decrease) the components of net assets:
| | | | | | | | | | | | |
| | | Paid in Capital | | | Accumulated Undistributed
Net Investment Loss | | | Accumulated Net Realized
Gain from Investments | |
| | $ | (470,624 | ) | | $ | 986,003 | | | $ | (515,379 | ) |
Short Sales – The Fund may make short sales as part of its overall portfolio management strategies or to offset a potential decline in value of a security. The Fund may engage in short sales with respect to various types of securities, including Exchange Traded Funds (ETFs). A short sale involves the sale of a security that is borrowed from a broker or other institution to complete the sale. The Fund may engage in short sales with respect to securities it owns, as well as securities that it does not own. Short sales expose the Fund to the risk that it will be required to acquire, convert or exchange securities to replace the borrowed securities (also known as “covering” the short position) at a time when the securities sold short have appreciated in value, thus resulting in a loss to the Fund. The Fund’s investment performance may also suffer if the Fund is required to close out a short position earlier than it had intended. The Fund must segregate assets determined to
26
LS Opportunity Fund
Notes to the Financial Statements – continued
May 31, 2014
NOTE 2. SIGNIFICANT ACCOUNTING POLICIES – continued
be liquid in accordance with procedures established by the Board, or otherwise cover its position in a permissible manner. The Fund will be required to pledge its liquid assets to the broker in order to secure its performance on short sales. As a result, the assets pledged may not be available to meet the Fund’s needs for immediate cash or other liquidity. In addition, the Fund may be subject to expenses related to short sales that are not typically associated with investing in securities directly, such as costs of borrowing and margin account maintenance costs associated with the Fund’s open short positions. These types of short sales expenses are sometimes referred to as the “negative cost of carry,” and will tend to cause the Fund to lose money on a short sale even in instances where the price of the underlying security sold short does not change over the duration of the short sale. Dividend expenses on securities sold short and borrowing costs are not covered under the Adviser’s expense limitation agreement with the Fund and, therefore, these expenses will be borne by the shareholders of the Fund. The amount of restricted cash held at the broker as collateral for securities sold short was $32,284,781 as of May 31, 2014.
Purchasing Call Options – The Fund may purchase call options. As the holder of a call option, the Fund has the right to purchase the underlying security at the exercise price at any time during the option period. The Fund may enter into closing sale transactions with respect to such options, exercise them or permit them to expire. The Fund may also purchase call options on relevant stock indexes. Call options may also be purchased by the Fund for the purpose of acquiring the underlying securities for its portfolio. Utilized in this fashion, the purchase of call options enables the Fund to acquire the securities at the exercise price of the call option plus the premium paid. At times the net cost of acquiring securities in this manner may be less than the cost of acquiring the securities directly. This technique may also be useful to the Fund in purchasing a large block of securities that would be more difficult to acquire by direct market purchases. So long as it holds such a call option rather than the underlying security itself, the Fund is partially protected from any unexpected decline in the market price of the underlying security and in such event could allow the call option to expire, incurring a loss only to the extent of the premium paid for the option. See Note 4 for additional disclosures.
Purchasing Put Options – The Fund may purchase put options. As the holder of a put option, the Fund has the right to sell the underlying security at the exercise price at any time during the option period. The Fund may enter into closing sale transactions with respect to such options, exercise them or permit them to expire. The Fund may purchase a put option on an underlying security (a “protective put”) owned as a defensive technique to protect against an anticipated decline in the value of the security. Such hedge protection is provided only during the life of the
27
LS Opportunity Fund
Notes to the Financial Statements – continued
May 31, 2014
NOTE 2. SIGNIFICANT ACCOUNTING POLICIES – continued
put option when the Fund, as the holder of the put option, is able to sell the underlying security at the put exercise price regardless of any decline in the underlying security’s market price. The Fund may also purchase put options at a time when it does not own the underlying security. By purchasing put options on a security it does not own, the Fund seeks to benefit from a decline in the market price of the underlying security. If the put option is not sold when it has remaining value, and if the market price of the underlying security remains equal to or greater than the exercise price during the life of the put option, the Fund will lose its entire investment in the put option. In order for the purchase of a put option to be profitable, the market price of the underlying security must decline sufficiently below the exercise price to cover the premium and transaction costs, unless the put option is sold in a closing sale transaction. See Note 4 for additional disclosures.
Writing Options – The Fund may write covered call options on equity securities or futures contracts that the Fund is eligible to purchase to extend a holding period to obtain long-term capital gain treatment, to earn premium income, to assure a definite price for a security it has considered selling, or to close out options previously purchased. The Fund may write covered call options if, immediately thereafter, not more than 30% of its net assets would be committed to such transactions. A call option gives the holder (buyer) the right to purchase a security or futures contract at a specified price (the exercise price) at any time until a certain date (the expiration date). A call option is “covered” if the Fund owns the underlying security subject to the call option at all times during the option period. When the Fund writes a covered call option, it maintains a segregated account with its Custodian, cash or liquid portfolio securities in an amount not less than the exercise price at all times while the option is outstanding. See Note 4 for additional disclosures.
Forward Currency Exchange Contracts – The Fund may engage in foreign currency exchange transactions. The value of the Fund’s portfolio securities that are invested in non-U.S. dollar denominated instruments as measured in U.S. dollars may be affected favorably or unfavorably by changes in foreign currency exchange rates, and the Fund may incur costs in connection with conversions between various currencies. The Fund will conduct its foreign currency exchange transactions either on a spot (i.e., cash) basis at the spot rate prevailing in the foreign currency exchange market, or through forward contracts to purchase or sell foreign currencies. A forward foreign currency exchange contract involves an obligation to purchase or sell a specific currency at a future date, which may be any fixed number of days from the date of the contract agreed upon by the parties, at a price set at the time of the contract. These contracts are traded directly between currency traders (usually large commercial banks) and their customers. The Fund will not,
28
LS Opportunity Fund
Notes to the Financial Statements – continued
May 31, 2014
NOTE 2. SIGNIFICANT ACCOUNTING POLICIES – continued
however, hold foreign currency except in connection with the purchase and sale of foreign portfolio securities. The Fund has engaged in foreign currency exchange transactions for the purpose of hedging as a defensive measure. See Note 4 for additional disclosures.
NOTE 3. SECURITIES VALUATION AND FAIR VALUE MEASUREMENTS
Fair value is defined as the price that a Fund would receive upon selling an investment in an orderly transaction to an independent buyer in the principal or most advantageous market of the investment. Generally Accepted Accounting Principles (“GAAP”) establishes a three-tier hierarchy to maximize the use of observable market data and minimize the use of unobservable inputs and to establish classification of fair value measurements for disclosure purposes.
Inputs refer broadly to the assumptions that market participants would use in pricing the asset or liability, including assumptions about risk (the risk inherent in a particular valuation technique used to measure fair value such as pricing model and/or the risk inherent in the inputs to the valuation technique). Inputs may be observable or unobservable. Observable inputs are inputs that reflect the assumptions market participants would use in pricing the asset or liability developed based on market data obtained from sources independent of the reporting entity. Unobservable inputs are inputs that reflect the reporting entity’s own assumptions about the assumptions market participants would use in pricing the asset or liability developed based on the best information available in the circumstances.
Various inputs are used in determining the value of the Fund’s investments. These inputs are summarized in the three broad levels listed below.
| | • | | Level 1 – quoted prices in active markets for identical securities |
| | • | | Level 2 – other significant observable inputs (including, but not limited to, quoted prices for an identical security in an inactive market, quoted prices for similar securities, interest rates, prepayment speeds, credit risk, etc.) |
| | • | | Level 3 – significant unobservable inputs (including the Fund’s own assumptions in determining fair value of investments based on the best information available) |
The inputs used to measure fair value may fall into different levels of the fair value hierarchy. In such cases, for disclosure purposes, the level in the fair value
29
LS Opportunity Fund
Notes to the Financial Statements – continued
May 31, 2014
NOTE 3. SECURITIES VALUATION AND FAIR VALUE MEASUREMENTS – continued
hierarchy within which the fair value measurement falls in its entirety, is determined based on the lowest level input that is significant to the fair value measurement in its entirety.
Equity securities, including common stock, exchange traded funds, real estate investment trusts, and american depositary receipts are generally valued by using market quotations, furnished by a pricing service. Securities that are traded on any stock exchange are generally valued at the last quoted sale price. Lacking a last sale price, an exchange traded security is generally valued at its last bid price. Securities traded in the NASDAQ over-the-counter market are generally valued at the NASDAQ Official Closing Price.
When using the market quotations or close prices provided by the pricing service and when the market is considered active, the security is classified as a Level 1 security. Sometimes, an equity security owned by the Fund will be valued by the pricing service with factors other than market quotations or when the market is considered inactive. When this happens, the security is classified as a Level 2 security. When market quotations are not readily available, when the Adviser determines that the market quotation or the price provided by the pricing service does not accurately reflect the current fair value, or when restricted or illiquid securities are being valued, such securities are valued as determined in good faith by the Adviser, in conformity with guidelines adopted by and subject to review by the Board. These securities are categorized as Level 3 securities.
Investments in mutual funds, including money market mutual funds, are generally priced at the ending net asset value (“NAV”) provided by the service agent of the funds. These securities are categorized as Level 1 securities.
Call and put options that the Fund invests in are generally traded on an exchange and are generally valued at the last trade price as provided by a pricing service. If the last sale price is not available, the options will be valued using the last bid price. The options will generally be categorized as Level 1 securities.
Derivative instruments the Fund invests in, such as forward currency exchange contracts, are valued by a pricing service at the interpolated rates based on the prevailing banking rates and are generally categorized as Level 2 securities.
In accordance with the Trust’s good faith pricing guidelines, the Adviser is required to consider all appropriate factors relevant to the value of securities for which it has determined other pricing sources are not available or reliable as described above.
30
LS Opportunity Fund
Notes to the Financial Statements – continued
May 31, 2014
NOTE 3. SECURITIES VALUATION AND FAIR VALUE MEASUREMENTS – continued
No single standard exists for determining fair value, because fair value depends upon the circumstances of each individual case. As a general principle, the current fair value of an issue of securities being valued by the Adviser would appear to be the amount which the owner might reasonably expect to receive for them upon their current sale. Methods which are in accordance with this principle may, for example, be based on (i) a multiple of earnings; (ii) a discount from market of a similar freely traded security (including a derivative security or a basket of securities traded on other markets, exchanges or among dealers); or (iii) yield to maturity with respect to debt issues, or a combination of these and other methods. Good faith pricing is permitted if, in the Adviser’s opinion, the validity of market quotations appears to be questionable based on factors such as evidence of a thin market in the security based on a small number of quotations, a significant event occurs after the close of a market but before a Fund’s NAV calculation that may affect a security’s value, or the Adviser is aware of any other data that calls into question the reliability of market quotations. Good faith pricing may also be used in instances when the bonds the Fund invests in may default or otherwise cease to have market quotations readily available.
The following is a summary of the inputs used to value the Fund’s investments as of May 31, 2014:
| | | | | | | | | | | | | | | | |
| | | Valuation Inputs | |
| Assets | | Level 1 – Quoted
Prices in Active
Markets | | | Level 2 – Other
Significant
Observable
Inputs | | | Level 3 –
Significant
Unobservable
Inputs | | | Total | |
Common Stocks* | | $ | 142,332,789 | | | $ | — | | | $ | — | | | $ | 142,332,789 | |
Total | | $ | 142,332,789 | | | $ | — | | | $ | — | | | $ | 142,332,789 | |
| * | Refer to Schedule of Investments for industry classifications |
| | | | | | | | | | | | | | | | |
| | | Valuation Inputs | |
| Liabilities | | Level 1 – Quoted
Prices in Active
Markets | | | Level 2 – Other Significant Observable Inputs | | | Level 3 –
Significant
Unobservable
Inputs | | | Total | |
Common Stocks* | | $ | (28,497,377 | ) | | $ | — | | | $ | — | | | $ | (28,497,377 | ) |
Exchange Traded Funds | | | (14,009,510 | ) | | | — | | | | — | | | | (14,009,510 | ) |
Total | | $ | (42,506,887 | ) | | $ | — | | | $ | — | | | $ | (42,506,887 | ) |
| * | Refer to Schedule of Securities Sold Short for industry classifications. |
31
LS Opportunity Fund
Notes to the Financial Statements – continued
May 31, 2014
NOTE 3. SECURITIES VALUATION AND FAIR VALUE MEASUREMENTS – continued
The Fund did not hold any investments at any time during the reporting period in which significant unobservable inputs were used in determining fair value; therefore, no reconciliation of Level 3 securities is included for this reporting period. The Trust recognizes transfers between fair value hierarchy levels at the reporting period end. There were no transfers between any Levels for the year ended May 31, 2014.
NOTE 4. DERIVATIVE TRANSACTIONS
Long and short forward currency contracts are represented on the Statement of Assets and Liabilities under investments in securities at value, cash held at broker and receivable for forward currency contracts, respectively and on the Statement of Operations under net realized gain (loss) on investment securities and change in unrealized appreciation (depreciation) on options and forward currency exchange contracts respectively. The Fund bought and sold forward currency contracts during the year ended May 31, 2014, but did not hold any as of May 31, 2014.
For the fiscal year ended May 31, 2014:
| | | | | | | | | | | | | | | | | | |
| Derivatives | | Location of Gain (Loss) on
Derivatives on Statements
of Operations | | Contracts
Opened | | | Contracts
Closed | | | Realized
Gain
(Loss) on
Derivatives | | | Change in
Unrealized
Appreciation
(Depreciation) on
Derivatives | |
Foreign Exchange Risk: | | | | | | | | | | | | | | | | | | |
Long Forward Currency Exchange Contracts | | Net realized and unrealized gain (loss) on Forward Currency Exchange Contracts | | | — | | | | 3 | | | $ | 7,725 | | | $ | 9,059 | |
Foreign Exchange Risk: | | | | | | | | | | | | | | | | | | |
Short Forward Currency Exchange Contracts | | Net realized and unrealized gain (loss) on Forward Currency Exchange Contracts | | | 2 | | | | 5 | | | | (8,073 | ) | | | (8,835 | ) |
Foreign Exchange Risk: | | | | | | | | | | | | | | | | | | |
Long Spot Forward Currency | | Net realized and unrealized gain (loss) on Foreign Currency Exchange Contracts | | | 3 | | | | 3 | | | | 453 | | | | — | |
Equity Risk: | | | | | | | | | | | | | | | | | | |
Call Options Purchased | | Net realized and unrealized gain (loss) on investment securities | | | 47 | | | | 47 | | | | (7,310 | ) | | | — | |
32
LS Opportunity Fund
Notes to the Financial Statements – continued
May 31, 2014
NOTE 4. DERIVATIVE TRANSACTIONS – continued
| | | | | | | | | | | | | | | | | | |
| Derivatives | | Location of Gain (Loss) on
Derivatives on Statements
of Operations | | Contracts
Opened | | | Contracts
Closed | | | Realized
Gain
(Loss) on
Derivatives | | | Change in
Unrealized
Appreciation
(Depreciation) on
Derivatives | |
Equity Risk: | | | | | | | | | | | | | | | | | | |
Call Options Written | | Net realized and unrealized gain (loss) on options | | | 26 | | | | 26 | | | $ | 12,697 | | | $ | — | |
Equity Risk: | | | | | | | | | | | | | | | | | | |
Put Options Purchased | | Net realized and unrealized gain (loss) on investment securities | | | 148 | | | | 148 | | | | 7,418 | | | | — | |
Equity Risk: | | | | | | | | | | | | | | | | | | |
Put Options Written | | Net realized and unrealized gain (loss) on options | | | 79 | | | | 79 | | | | (22,705 | ) | | | — | |
Transactions in options written during the fiscal year ended May 31, 2014 were as follows:
| | | | | | | | |
| | | Number of
Contracts | | | Premiums
Received | |
Written options outstanding at May 31, 2013 | | | — | | | $ | — | |
Options written | | | 105 | | | | 24,419 | |
Written options terminated in closing purchase transactions | | | (105 | ) | | | (24,419 | ) |
| | | | | | | | |
Written options outstanding at May 31, 2014 | | | — | | | $ | — | |
| | | | | | | | |
The Fund is not subject to a master netting arrangements and its policy is to not offset assets and liabilities related to its investment in derivatives.
NOTE 5. ADVISER FEES AND OTHER TRANSACTIONS
The Adviser, under the terms of the management agreement (the “Agreement”), manages the Fund’s investments. As compensation for its management services, the Fund is obligated to pay the Adviser a fee computed and accrued daily and paid monthly at an annual rate of 1.75% of the Fund’s average net assets. For the fiscal year ended May 31, 2014, the Adviser earned a fee of $1,298,813 from the Fund before the reimbursement described below.
The Adviser has contractually agreed to waive its management fee and/or reimburse certain Fund operating expenses (excluding interest, taxes, brokerage commissions, other expenditures which are capitalized in accordance with generally accepted
33
LS Opportunity Fund
Notes to the Financial Statements – continued
May 31, 2014
NOTE 5. ADVISER FEES AND OTHER TRANSACTIONS – continued
accounting principles, other extraordinary expenses not incurred in the ordinary course of the Fund’s business, dividend expense on short sales, and expenses that the Fund has incurred but did not actually pay because of an expense offset arrangement) so that total expenses do not exceed 1.95% of net assets through September 30, 2014. For the fiscal year ended May 31, 2014, the Adviser waived fees of $159,710. At May 31, 2014, the Adviser was owed $173,760 from the Fund for advisory services. The waiver and/or reimbursement by the Adviser with respect to the Fund is subject to repayment by the Fund within the three fiscal years following the fiscal year in which that particular waiver and/or reimbursement occurred, provided that the Fund is able to make the repayment without exceeding the expense limitations described above. The amount subject to repayment by the Fund pursuant to the aforementioned conditions at May 31, 2014 was:
| | |
Amount | | Recoverable through
May 31, |
$159,710 | | 2017 |
The Adviser has retained the Sub-Adviser to provide portfolio management and related services to the Fund. The Sub-Adviser receives a fee from the Adviser (not the Fund) for these services. The Trust retains Huntington Asset Services, Inc. (“HASI”), to manage the Fund’s business affairs and to provide the Fund with administrative services, including all regulatory reporting and necessary office equipment and personnel. For the fiscal year ended May 31, 2014, HASI earned fees of $66,793 for administrative services provided to the Fund. At May 31, 2014, the Fund owed HASI $9,521 for administrative services. Certain officers of the Trust are members of management and/or employees of HASI. A trustee of the Trust is a member of management of HASI. HASI operates as a wholly-owned subsidiary of Huntington Bancshares, Inc., the parent company of Unified Financial Securities, Inc. (the “Distributor”).
The Trust retains HASI to provide the Fund with compliance services. For the fiscal year ended May 31, 2014, HASI earned fees of $3,535 for compliance services provided to the Fund. At May 31, 2014, the Fund owed HASI $250 for compliance services.
The Trust retains HASI to act as the Fund’s transfer agent and to provide fund accounting services. For the fiscal year ended May 31, 2014, HASI earned fees of $49,879 from the Fund for transfer agent services. For the fiscal year ended May 31, 2014, HASI earned fees of $46,726 from the Fund for fund accounting services. At May 31, 2014, the Fund owed HASI $4,303 for transfer agent services and $5,258 for fund accounting services.
34
LS Opportunity Fund
Notes to the Financial Statements – continued
May 31, 2014
NOTE 5. ADVISER FEES AND OTHER TRANSACTIONS – continued
The Distributor acts as the principal distributor of the Fund’s shares. There were no payments made to the Distributor by the Fund for the fiscal year ended May 31, 2014. An officer of the Trust is an officer of the Distributor and such person may be deemed to be an affiliate of the Distributor.
NOTE 6. INVESTMENT TRANSACTIONS
For the fiscal year ended May 31, 2014, purchases and sales of investment securities, other than short-term investments, were as follows:
| | | | |
Purchases | | | | |
U.S. Government Obligations | | $ | — | |
Other | | | 299,499,251 | |
Sales | | | | |
U.S. Government Obligations | | $ | — | |
Other | | | 203,637,384 | |
NOTE 7. ESTIMATES
The preparation of financial statements in conformity with GAAP requires management to make estimates and assumptions that affect the reported amounts of assets and liabilities and disclosure of contingent assets and liabilities at the date of the financial statements and the reported amounts of increases and decreases in net assets from operations during the reporting period. Actual results could differ from those estimates.
NOTE 8. BENEFICIAL OWNERSHIP
The beneficial ownership, either directly or indirectly, of 25% or more of the voting securities of a fund creates a presumption of control of a fund, under Section 2(a)(9) of the Investment Company Act of 1940. At May 31, 2014, National Financial Services, Inc. (“NFS”) owned, as record shareholder, 52% of the outstanding shares of the Fund. It is not known whether NFS or any of the underlying beneficial owners owned or controlled 25% or more of the voting securities of the Fund.
35
LS Opportunity Fund
Notes to the Financial Statements – continued
May 31, 2014
NOTE 9. FEDERAL TAX INFORMATION
At May 31, 2014, the appreciation (depreciation) of investments, net of proceeds for investment securities sold short, for tax purposes was as follows:
| | | | |
| | | Amount | |
Gross Unrealized Appreciation | | $ | 9,716,059 | |
Gross Unrealized (Depreciation) | | | (1,883,983 | ) |
| | | | |
Net Unrealized Appreciation | | $ | 7,832,076 | |
| | | | |
At May 31, 2014, the aggregate cost of securities, net of proceeds for investment securities sold short, for federal income tax purposes, was $91,993,826.
The tax characterization of distributions for the fiscal years ended May 31, 2014 and 2013 was as follows:
| | | | | | | | |
| | | 2014 | | | 2013 | |
Distributions paid from: | | | | | | | | |
Long Term Capital Gains | | $ | 2,801,219 | | | $ | — | |
| | | | | | | | |
| | $ | 2,801,219 | | | $ | — | |
| | | | | | | | |
At May 31, 2014, the components of distributable earnings (accumulated losses) on a tax basis were as follows:
| | | | |
Undistributed long-term capital gains | | $ | 2,462,863 | |
Accumulated capital and other losses | | | (1,077,895 | ) |
Unrealized appreciation/depreciation | | | 7,832,276 | |
| | | | |
| | $ | 9,217,244 | |
| | | | |
The difference between book basis and tax basis unrealized appreciation is attributable to the tax deferral of wash losses.
Certain capital losses incurred after October 31, and within the current taxable year, are deemed to arise on the first business day of the Fund’s following taxable year. For the tax year ended May 31, 2014, the Fund deferred post October capital losses in the amount of $282,505 and $784,742 in Qualified Late Year Ordinary Losses.
36
LS Opportunity Fund
Notes to the Financial Statements – continued
May 31, 2014
NOTE 10. COMMITMENTS AND CONTINGENCIES
The Fund indemnifies its officers and trustees for certain liabilities that may arise from their performance of their duties to the Fund. Additionally, in the normal course of business, the Fund enters into contracts that contain a variety of representations and warranties which provide general indemnifications. The Fund’s maximum exposure under these arrangements is unknown, as this would involve future claims that may be made against the Fund that have not yet occurred.
NOTE 11. SUBSEQUENT EVENT
Management of the Fund has evaluated the need for disclosures and/or adjustments resulting from subsequent events through the date these financial statements were issued. There were no items requiring adjustment of financial statements or additional disclosure.
37
REPORT OF INDEPENDENT REGISTERED PUBLIC ACCOUNTING FIRM
To the Shareholders of LS Opportunity Fund and
Board of Trustees of Valued Advisers Trust
We have audited the accompanying statement of assets and liabilities, including the schedules of investments and securities sold short, of LS Opportunity Fund (the “Fund”), a series of the Valued Advisers Trust, as of May 31, 2014, and the related statement of operations for the year then ended, the statements of changes in net assets for each of the two years in the period then ended, and the financial highlights for each of the three years in the period then ended. These financial statements and financial highlights are the responsibility of the Fund’s management. Our responsibility is to express an opinion on these financial statements and financial highlights based on our audits. The financial highlights for the period ended May 31, 2011, were audited by other auditors whose report dated July 22, 2011, expressed an unqualified opinion on those financial highlights.
We conducted our audits in accordance with the standards of the Public Company Accounting Oversight Board (United States). Those standards require that we plan and perform the audit to obtain reasonable assurance about whether the financial statements and financial highlights are free of material misstatement. An audit includes examining, on a test basis, evidence supporting the amounts and disclosures in the financial statements. Our procedures included confirmation of securities owned as of May 31, 2014, by correspondence with the custodian and brokers or by other appropriate auditing procedures where replies from brokers were not received. An audit also includes assessing the accounting principles used and significant estimates made by management, as well as evaluating the overall financial statement presentation. We believe that our audits provide a reasonable basis for our opinion.
In our opinion, the financial statements and financial highlights referred to above present fairly, in all material respects, the financial position of LS Opportunity Fund as of May 31, 2014, the results of its operations for the year then ended, the changes in its net assets for each of the two years in the period then ended, and the financial highlights for each of the three years in the period then ended, in conformity with accounting principles generally accepted in the United States of America.

COHEN FUND AUDIT SERVICES, LTD.
Cleveland, Ohio
July 29, 2014
38
ADDITIONAL FEDERAL INCOME TAX INFORMATION (Unaudited)
Qualified Dividend Income: For the year ended May 31, 2014, the LS Opportunity Fund designates 100% of the dividends distributed during the fiscal year as amounts which can be taken into account as a dividend for the purpose of the maximum tax rate under section 1(h)(11) of the Internal Revenue Code.
Dividends Received Deduction: For the year ended May 31, 2014, the LS Opportunity Fund designates 100% of the dividends distributed during the fiscal year as qualifying for the dividends-received deduction for corporate shareholders.
Long-Term Capital Gains: For the year ended May 31, 2014, the LS Opportunity Fund hereby designates as a capital gain dividend with respect to the taxable year ending March 31, 2014, $2,801,219, or, subsequently determined to be different, the net capital gain of such year. The Funds will notify shareholders in January 2015 of amounts for use in preparing 2014 income tax returns.
39
TRUSTEES AND OFFICERS (Unaudited)
The Board of Trustees supervises the business activities of the Trust. Each Trustee serves as a trustee until termination of the Trust unless the Trustee dies, resigns, retires or is removed.
The following tables provide information regarding the Trustees and Officers.
The following table provides information regarding each of the Independent Trustees.
| | | | |
Name, Address*, (Age),
Position with Trust**, Term
of Position with Trust | | Principal Occupation During
Past 5 Years | | Other Directorships |
Ira Cohen, 55, Independent Trustee, June 2010 to present. | | Independent financial services consultant, since February 2005. | | Trustee, Griffin Institutional Access Real Estate Fund, since June 2014. |
Andrea N. Mullins, 47,
Independent Trustee, December 2013 to present. | | Private investor; Independent Contractor, Seabridge Wealth Management, LLC, since April 2014; Principal Financial Officer and Treasurer, Eagle Family of Funds (mutual fund family) and Vice President, Eagle Asset Management, Inc. (investment adviser) each from 2004 to 2010. | | None. |
| * | The address for each trustee and officer is 2960 N. Meridian St., Suite 300, Indianapolis, IN 46208. |
| ** | As of the date of this SAI, the Trust consists of 14 series. |
40
The following table provides information regarding the Trustee who is considered an “interested person” of the Trust, as that term is defined under the 1940 Act. Based on the experience of the Trustee, the Trust concluded that the individual described below should serve as a Trustee.
| | | | |
Name, Address*, (Age),
Position with Trust**, Term
of Position with Trust | | Principal Occupation During
Past 5 Years | | Other Directorships |
R. Jeffrey Young, 49, Trustee and Chairman, June 2010 to present. | | Senior Vice President, Huntington Asset Services, Inc., the Trust’s administrator, since January 2010, Director since May 2014; Chief Executive Officer, Huntington Funds, since February 2010; Chief Executive Officer, Huntington Strategy Shares, since November 2010; Director, Unified Financial Securities, Inc., the Trust’s distributor, since May 2014; President and Chief Executive Officer, Dreman Contrarian Funds, from March 2011 to February 2013; Trustee, Valued Advisers Trust, from August 2008 to January 2010; and Managing Director and Chief Operating Officer of Professional Planning Consultants, from 2007 to 2010. | | Trustee, Capitol Series Trust, since September 2013. |
| * | The address for each trustee and officer is 2960 N. Meridian St., Suite 300, Indianapolis, IN 46208. |
| ** | As of the date of this SAI, the Trust consists of 14 series. |
41
The following table provides information regarding the Officers of the Trust:
| | | | |
Name, Address*, (Age),
Position with Trust,** Term
of Position with Trust | | Principal Occupation During
Past 5 Years | | Other Directorships |
R. Jeffrey Young, 49, Trustee and Chairman, June 2010 to present; Principal Executive Officer and President, Valued Advisers Trust since February 2010; | | Senior Vice President, Huntington Asset Services, Inc., the Trust’s administrator, since January 2010, Director since May 2014; Chief Executive Officer, Huntington Funds, since February 2010; Chief Executive Officer, Huntington Strategy Shares, since November 2010; Director, Unified Financial Securities, Inc., the Trust’s distributor, since May 2014; President and Chief Executive Officer, Dreman Contrarian Funds, from March 2011 to February 2013; Trustee, Valued Advisers Trust, from August 2008 to January 2010; and Managing Director and Chief Operating Officer, Professional Planning Consultants, from 2007 to 2010. | | Trustee, Capitol Series Trust, since September 2013. |
42
| | | | |
Name, Address*, (Age),
Position with Trust,** Term
of Position with Trust | | Principal Occupation During
Past 5 Years | | Other Directorships |
John C. Swhear, 53, Chief Compliance Officer, AML Officer and Vice President, August 2008 to present. | | Vice President of Legal Administration and Compliance, Huntington Asset Services, Inc., the Trust’s administrator, since April 2007, Director since May 2014; Chief Compliance Officer, Unified Financial Securities, Inc., the Trust’s distributor, since May 2007, Director since May 2014; President, Unified Series Trust, since March 2012, and Senior Vice President from May 2007 to March 2012; Chief Compliance Officer and AML Officer, Capitol Series Trust, since September 2013; Secretary, Huntington Funds, from April 2010 to February 2012; President and Chief Executive Officer, Dreman Contrarian Funds, from March 2010 to March 2011, and Vice President and Acting Chief Executive Officer, from 2007 to March 2010. | | None. |
Carol J. Highsmith, 49, Vice President, August 2008 to present; Secretary, March 2014 to present | | Employed in various positions with Huntington Asset Services, Inc., the Trust’s administrator, since November of 1994; currently Vice President of Legal Administration. | | None. |
43
| | | | |
Name, Address*, (Age),
Position with Trust,** Term
of Position with Trust | | Principal Occupation During
Past 5 Years | | Other Directorships |
Matthew J. Miller, 38, Vice President, December 2011 to present. | | Employed in various positions with Huntington Asset Services, Inc., the Trust’s administrator, since July of 1998; currently Vice President of Relationship Management; Vice President, Huntington Funds, since February 2010; President and Chief Executive Officer, Capitol Series Trust, since September 2013. | | None. |
Bryan W. Ashmus, 41, Principal Financial Officer and Treasurer, December 2013 to present. | | Vice President, Financial Administration, Huntington Asset Services, Inc., the Trust’s administrator, since September 2013; Treasurer, Huntington Strategy Shares and Huntington Funds, since November 2013; Vice President, Treasurer Services, Citi Fund Services Ohio, Inc., from 2005 to 2013. | | None. |
| * | The address for each trustee and officer is 2960 N. Meridian St., Suite 300, Indianapolis, IN 46208. |
| ** | As of the date of this SAI, the Trust consists of 14 series. |
OTHER INFORMATION
The Fund’s Statement of Additional Information (“SAI”) includes additional information about the trustees and is available without charge, upon request. You may call toll-free at (877) 336-6763 to request a copy of the SAI or to make shareholder inquiries.
44
Continuation of Investment Advisory Agreement and Sub-Advisory Agreement Relating to the LS Opportunity Fund
At a meeting held on March 11-12, 2014, the Board of Trustees (the “Board”) considered the renewal of the Investment Advisory Agreement (the “Advisory Agreement”) between the Trust and Long Short Advisors, LLC (“LSA” or “Adviser”) on behalf of the LS Opportunity Fund (the “Fund”) and the renewal of the Investment Sub-Advisory Agreement (the “Sub-Advisory Agreement”) between the Adviser and Independence Capital Asset Partners, LLC (“ICAP” or “Sub-Adviser”) on behalf of the Fund. Counsel noted that the 1940 Act requires the approval of the investment advisory agreement between the Trust and its investment advisor by the Board, including a majority of the Independent Trustees. The Board then specifically discussed the arrangements between the Adviser and the Trust with respect to the Fund.
The discussion then turned toward the proposed renewal of the Advisory Agreement and the Sub-Advisory Agreement for the Fund. Counsel directed the Trustees to a memorandum from his firm that summarized, among other things, the fiduciary duties and responsibilities of the Board in reviewing and approving the agreements. A copy of this memorandum was circulated to the Trustees in advance of the meeting. Counsel discussed with the Trustees the types of information and factors that should be considered by the Board in order to make an informed decision regarding the approval of the renewal of the Advisory Agreement and Sub-Advisory Agreement, including the following material factors: (i) the nature, extent, and quality of the services provided by the Adviser, including its oversight of ICAP; (ii) the investment performance of the Fund; (iii) the costs of the services to be provided and anticipated profits to be realized by the Adviser from the relationship with the Fund; (iv) the extent to which economies of scale would be realized if the Fund grows and whether advisory fee levels reflect those economies of scale for the benefit of the Fund’s investors; and (v) the Adviser’s practices regarding possible conflicts of interest and potential benefits derived from its relationship with the Fund. He pointed out that the Board’s duties with respect to the Sub-Advisory Agreement are the same as those with respect to the Advisory Agreement. The Board discussed the contractual arrangements between the Trust and LSA, and between LSA and ICAP with respect to the Fund.
Advisory Agreement
With respect to the proposed renewal of the Advisory Agreement, Counsel discussed with the Trustees the factors that should be considered by the Board in order to make an informed decision regarding the renewal of the Advisory Agreement, including a review of the factors as applicable to LSA. In assessing these factors and reaching its decisions, the Board took into consideration information furnished for the Board’s review and consideration throughout the year at regular Board meetings, as well as information specifically requested and prepared and/or presented in connection with the annual renewal process, including information
45
presented at the Meeting. The Board was provided with information and reports relevant to the annual renewal of the Advisory Agreement, including: (i) reports regarding the services and support provided to the Fund and its shareholders by LSA; (ii) quarterly assessments of the investment performance of the Fund by personnel of LSA; (iii) commentary on the reasons for the performance; (iv) presentations by LSA addressing investment philosophy, investment strategy, personnel and operations of ICAP; (v) compliance and audit reports concerning the Fund and LSA and the oversight by LSA of similar reports concerning ICAP; (vi) disclosure information contained in the registration statement of the Trust with respect to the Fund and the Form ADV of LSA; (vii) information relating to the manner in which LSA oversees ICAP; and (viii) a memorandum from Counsel, that summarized the fiduciary duties and responsibilities of the Board in reviewing and approving the Advisory Agreement, including the material factors set forth above and the types of information included in each factor that should be considered by the Board in order to make an informed decision. The Board also requested and received various informational materials including, without limitation: (i) documents containing information about LSA, including financial information, a description of personnel and the managerial services provided to the Fund, information on investment advice, performance, summaries of Fund expenses, compliance program, current legal matters, and other general information; (ii) comparative expense and performance information for other mutual funds with strategies similar to the Fund; and (iii) benefits to be realized by LSA from its relationship with the Fund. The Board did not identify any particular information that was most relevant to its consideration to approve the Advisory Agreement and each Trustee may have afforded different weight to the various factors.
| 1. | The nature, extent, and quality of the services to be provided by the Adviser. In this regard, the Board considered LSA’s responsibilities under the Advisory Agreement. The Trustees considered the services being provided by LSA to the Fund including its process for overseeing the sub-adviser’s portfolio management of the Fund, assuring compliance with the Fund’s investment objectives and limitations, its coordination of services for the Fund among the Fund’s service providers, and its efforts to promote the Fund and grow its assets. The Trustees reviewed the steps LSA takes to oversee and supervise the sub-adviser, as described in the materials provided by LSA. They also noted that LSA has engaged outside experts to enhance and augment its internal compliance program. The Trustees noted that LSA had recently added a product specialist/development employee who has begun to focus 100% of his time on raising assets and marketing the Fund. The Trustees also considered the relationship of LSA’s affiliate and its utilization of the infrastructure and other resources of its affiliate. The Trustees considered LSA’s continuity of, and commitment to retain, qualified personnel and LSA’s commitment to maintain and enhance its resources and systems, the commitment of LSA’s personnel to finding alternatives and options that allow the Fund to maintain its goals, and LSA’s continued cooperation with the Board and Counsel for the Fund. The Trustees |
46
| | considered LSA’s personnel, including the education and experience of LSA’s personnel. After considering the foregoing information and further information in the Meeting materials provided by LSA (including LSA’s Form ADV), the Board concluded that, in light of all the facts and circumstances, the nature, extent, and quality of the services provided by LSA were satisfactory and adequate for the Fund. |
| 2. | Investment Performance of the Fund and the Adviser. In considering the investment performance of the Fund, the Trustees compared the short-term performance of the Fund with the performance of funds with similar objectives managed by other investment advisers, as well as with aggregated peer group data. The Trustees noted that LSA did not manage any accounts directly and that it had delegated the portfolio management responsibilities of the Fund to a sub-adviser. Accordingly, the Trustees concluded that their consideration of this factor for LSA was less relevant in their determination of LSA’s performance of its duties than other factors. The Trustees also considered the consistency of LSA’s management oversight of the Fund’s sub-adviser with the Fund’s investment objective, strategies, and limitations. The Trustees also compared the short-term performance of the Fund with the performance of its benchmark index, a style specific index and comparable funds with similar objectives managed by other investment advisers. The Trustees noted that the Fund’s performance, in the periods since the Fund’s inception, was generally better than that of its style-specific benchmark, but that the Fund had underperformed its broad-based market index. The Trustees also observed that the Fund had outperformed the average and median of peers in the Fund’s category. After reviewing and discussing the investment performance of the Fund further, LSA’s experience in overseeing the sub-adviser to the Fund, the Fund’s historical performance, and other relevant factors, the Board concluded, in light of all the facts and circumstances, that the investment performance of the Fund was satisfactory. |
| 3. | The costs of the services to be provided and profits to be realized by the Adviser from the relationship with the Fund. In considering the costs of services to be provided and the profits to be realized by LSA from the relationship with the Fund, the Trustees considered: (1) LSA’s financial condition; (2) asset levels of the Fund; (3) the overall expenses of the Fund; and (4) the nature and frequency of advisory fee payments. The Trustees reviewed information provided by LSA regarding its profits associated with managing the Fund. The Trustees also considered the relationship of LSA’s affiliate and its utilization of the infrastructure and other resources of its affiliate. The Trustees also considered potential benefits for LSA in managing the Fund. The Trustees then compared the fees and expenses of the Fund (including the management fee) to other comparable mutual funds. The Trustees noted that the Fund’s management fee was among the highest in its peer group and the net expense ratios were also among the highest in its peer group. In this regard, the Trustees |
47
| | reflected upon their discussion with representatives of LSA earlier in the Meeting, and commented on LSA’s assertion that the firm provided a premium product in comparison to other products in the marketplace. Nonetheless, the Board concluded that the fees to be paid to LSA by the Fund and the profits to be realized by the Fund, in light of all the facts and circumstances, were fair and reasonable in relation to the nature and quality of the services provided by LSA. |
| 4. | The extent to which economies of scale would be realized as the Fund grows and whether advisory fee levels reflect these economies of scale for the benefit of the Fund’s investors. In this regard, the Board considered the Fund’s fee arrangements with LSA. The Board considered that while the management fee remained the same at all asset levels, the Fund’s shareholders had experienced benefits from the Fund’s expense limitation arrangement. The Trustees noted that once the Fund’s expenses fell below the cap set by the arrangement, the Fund’s shareholders would continue to benefit from the economies of scale under the Fund’s agreements with service providers other than LSA. In light of its ongoing consideration of the Fund’s asset levels, expectations for growth in the Fund, and fee levels, the Board determined that the Fund’s fee arrangements, in light of all the facts and circumstances, were fair and reasonable in relation to the nature and quality of the services provided by LSA. |
| 5. | Possible conflicts of interest and benefits to the Adviser. In considering LSA’s practices regarding conflicts of interest, the Trustees evaluated the potential for conflicts of interest and considered such matters as the experience and ability of the advisory personnel assigned to the Fund; the operations of LSA’s investment advisory affiliate; and the substance and administration of LSA’s code of ethics. The Trustees also considered disclosure in the registration statement of the Trust relating to LSA’s potential conflicts of interest. The Trustees noted other potential benefits (in addition to the management fee) to LSA, such as the ability to market their services in new channels (other than direct separate accounts). Based on the foregoing, the Board determined that LSA’s standards and practices relating to the identification and mitigation of potential conflicts of interest and the benefits to be realized by LSA in managing the Fund were satisfactory. |
After additional consideration of the factors delineated in the memorandum provided by Counsel and further discussion among the Board, the Board determined to approve the continuation of the Advisory Agreement between the Trust and the Adviser.
Sub-Advisory Agreement
| 1. | The nature, extent, and quality of the services to be provided by the Sub-Adviser. In this regard, the Board considered ICAP’s responsibilities under the Sub-Advisory Agreement. The Trustees considered the services being provided |
48
| | by ICAP to the LS Fund, (including, without limitation: the quality of its investment sub-advisory services (including research and recommendations with respect to portfolio securities), its process for formulating investment recommendations and assuring compliance with the Fund’s investment objectives and limitations. The Trustees considered ICAP’s continuity of, and commitment to retain, qualified personnel and ICAP’s commitment to maintain and enhance its resources and systems, the commitment of ICAP’s personnel. The Trustees considered ICAP’s personnel, including the education and experience of ICAP’s personnel. After considering the foregoing information and further information in the Meeting materials provided by ICAP (including ICAP’s Form ADV), the Board concluded that, in light of all the facts and circumstances, the nature, extent, and quality of the services provided by ICAP were satisfactory and adequate for the Fund. |
| 2. | Investment Performance of the Fund and the Sub-Adviser. In considering the investment performance of the Fund and ICAP, the Trustees compared the short-term performance of the Fund with the performance of funds with similar objectives managed by other investment advisers, as well as with aggregated peer group data and with its benchmarks. The Trustees also considered the consistency of ICAP’s management of the Fund with its investment objective, strategies, and limitations. The Trustees considered the performance of other accounts managed by ICAP. The Trustees noted that the Fund’s performance, in the periods since the Fund’s inception, was generally better than that of its style-specific benchmark, but that the Fund had underperformed its broad-based market index. The Trustees also observed that the Fund had outperformed the average and median of peers in the Fund’s category. The Trustees considered that the performance of the Fund slightly exceeded that of ICAP’s composite of other accounts that were managed in a manner similar to the Fund. After reviewing and discussing the investment performance of the Fund further, ICAP’s experience sub-advising the Fund, the Fund’s historical performance, and other relevant factors, the Board concluded, in light of all the facts and circumstances, that the investment performance of the Fund and ICAP was satisfactory. |
| 3. | The costs of the services to be provided and profits to be realized by the Sub-Adviser from the relationship with the Fund. In considering the costs of services to be provided and the profits to be realized by ICAP from the relationship with the Fund, the Trustees considered: (1) ICAP’s financial condition; (2) the asset levels of the Fund; (3) the overall expenses of the Fund; and (4) the nature and frequency of sub-advisory fee payments. The Trustees reviewed information provided by ICAP regarding its profits associated with managing the Fund. The Trustees also considered potential benefits for ICAP in managing the Fund. The Trustees then compared the fees and expenses of the Fund (including the sub-advisory fee) to other accounts managed by ICAP. The Trustees noted that the sub-advisory fee was lower than any other accounts |
49
| | with similar objectives and strategies managed by ICAP. Based on the foregoing, the Board concluded that the fees to be paid to ICAP by the Fund’s adviser and the profits to be realized by ICAP, in light of all the facts and circumstances, were fair and reasonable in relation to the nature and quality of the services provided by ICAP. |
| 4. | The extent to which economies of scale would be realized as the Fund grows and whether sub-advisory fee levels reflect these economies of scale for the benefit of the Fund’s investors. In this regard, the Board considered the Fund’s fee arrangements with ICAP. The Board considered that while the sub-advisory fee changed with changes in the Fund’s assets, the Fund’s shareholders did not realize any changes in their overall expenses as ICAP’s fee was paid entirely from the advisory fee paid to the investment adviser, which was fixed. The Board considered the sub-advisory fees in light of the overall arrangement with the Fund’s investment adviser. In light of the foregoing, the Board determined that the Fund’s fee arrangements for ICAP, in light of all the facts and circumstances, were fair and reasonable in relation to the nature and quality of the services provided by ICAP. |
| 5. | Possible conflicts of interest and benefits to the Sub-Adviser. In considering ICAP’s practices regarding conflicts of interest, the Trustees evaluated the potential for conflicts of interest and considered such matters as the experience and ability of the advisory personnel assigned to the Fund; the basis of decisions to buy or sell securities for the Fund and/or ICAP’s other accounts; and the substance and administration of ICAP’s code of ethics. The Trustees also considered disclosure in the registration statement of the Trust relating to ICAP’s potential conflicts of interest. The Trustees noted that ICAP may utilize soft dollars and the Trustees noted ICAP’s policies and processes for managing the conflicts of interest that could arise from soft dollar arrangements. The Trustees noted another potential benefit (in addition to the sub-advisory fee) to ICAP, which is the ability to generate a public performance record for potential clients that utilize hedge funds as well as mutual funds. Based on the foregoing, the Board determined that the standards and practices of ICAP relating to the identification and mitigation of potential conflicts of interest and the benefits to be realized by ICAP in managing the Fund were satisfactory. |
After additional consideration of the factors delineated in the memorandum provided by Counsel and further discussion among the Board, the Board determined to approve the continuation of the Sub-Advisory Agreement between the Adviser and the Sub-Adviser.
50
VALUED ADVISERS TRUST
PRIVACY POLICY
The following is a description of the policies of the Valued Advisers Trust (the “Trust”) regarding disclosure of nonpublic personal information that shareholders provide to a series of the Trust (each, a “Fund”) or that the Fund collects from other sources. In the event that a shareholder hold shares of a Fund through a broker-dealer or other financial intermediary, the privacy policy of the financial intermediary would govern how shareholder nonpublic personal information would be shared with nonaffiliated third parties.
Categories of Information A Fund May Collect. A Fund may collect the following nonpublic personal information about its shareholders:
| | • | | Information the Fund receives from a shareholder on applications or other forms, correspondence, or conversations (such as the shareholder’s name, address, phone number, social security number, and date of birth); and |
| | • | | Information about the shareholder’s transactions with the Fund, its affiliates, or others (such as the shareholder’s account number and balance, payment history, cost basis information, and other financial information). |
Categories of Information A Fund May Disclose. A Fund may not disclose any nonpublic personal information about its current or former shareholders to unaffiliated third parties, except as required or permitted by law. A Fund is permitted by law to disclose all of the information it collects, as described above, to its service providers (such as the Fund’s custodian, administrator, transfer agent, accountant and legal counsel) to process shareholder transactions and otherwise provide services to the shareholder.
Confidentiality and Security. Each Fund shall restrict access to shareholder nonpublic personal information to those persons who require such information to provide products or services to the shareholder. Each Fund shall maintain physical, electronic, and procedural safeguards that comply with federal standards to guard shareholder nonpublic personal information.
Disposal of Information. The Funds, through their transfer agent, have taken steps to reasonably ensure that the privacy of a shareholder’s nonpublic personal information is maintained at all times, including in connection with the disposal of information that is no longer required to be maintained by the Funds. Such steps shall include, whenever possible, shredding paper documents and records prior to disposal, requiring off-site storage vendors to shred documents maintained in such locations prior to disposal, and erasing and/or obliterating any data contained on electronic media in such a manner that the information can no longer be read or reconstructed.
51
PROXY VOTING
A description of the policies and procedures that the Fund uses to determine how to vote proxies relating to portfolio securities and information regarding how the Fund voted those proxies during the most recent twelve month period ended June 30, is available without charge upon request by (1) calling the Fund at (877) 336-6763 and (2) from Fund documents filed with the Securities and Exchange Commission (“SEC”) on the SEC’s website at www.sec.gov.
TRUSTEES
R. Jeffrey Young, Chairman
Ira Cohen
Andrea Mullins
OFFICERS
R. Jeffrey Young, Principal Executive Officer and President
Bryan W. Ashmus, Principal Financial Officer and Treasurer
John C. Swhear, Chief Compliance Officer, AML Officer and Vice-President
Carol J. Highsmith, Vice President and Secretary
Matthew J. Miller, Vice President
INVESTMENT ADVISOR
Long Short Advisors, LLC
1818 Market Street, 33rd Floor, Suite 3323
Philadelphia, PA 19103
DISTRIBUTOR
Unified Financial Securities, Inc.
2960 North Meridian Street, Suite 300
Indianapolis, IN 46208
INDEPENDENT REGISTERED PUBLIC ACCOUNTING FIRM
Cohen Fund Audit Services, Ltd.
1350 Euclid Avenue, Suite 800
Cleveland, OH 44115
LEGAL COUNSEL
The Law Offices of John H. Lively & Associates, Inc.,
A member firm of The 1940 Act Law GroupTM
11300 Tomahawk Creek Parkway, Suite 310
Leawood, KS 66211
CUSTODIAN
Citibank, N.A.
388 Greenwich Street
New York, NY 10013
ADMINISTRATOR, TRANSFER AGENT AND FUND ACCOUNTANT
Huntington Asset Services, Inc.
2960 North Meridian Street, Suite 300
Indianapolis, IN 46208
This report is intended only for the information of shareholders or those who have received the Fund’s prospectus which contains information about the Fund’s management fee and expenses. Please read the prospectus carefully before investing.
Distributed by Unified Financial Securities, Inc.
Member FINRA/SIPC
Item 2. Code of Ethics.
As of the end of the period covered by this report, the registrant has adopted a code of ethics that applies to the registrant’s principal executive officer, principal financial officer, principal accounting officer or controller, or persons performing similar functions, regardless of whether these individuals are employed by the registrant or a third party. Pursuant to Item 12(a)(1), a copy of registrant’s code of ethics is filed as an exhibit to this Form N-CSR. During the period covered by this report, the code of ethics has not been amended, and the registrant has not granted any waivers, including implicit waivers, from the provisions of the code of ethics.
Item 3. Audit Committee Financial Expert.
(a)(1) The registrant’s Board of Trustees has determined that the registrant has at least one audit committee financial expert serving on its audit committee.
(a)(2) The audit committee financial expert is Andrea N. Mullins, who is “independent” for purposes of this Item 3 of the Form N-CSR.
Item 4. Principal Accountant Fees and Services.
| | | | | | | | |
The LS Opportunity Fund: | | | FY 2014 | | | $ | 13,500 | |
| | | FY 2013 | | | $ | 12,500 | |
| | |
The BFS Equity Fund: | | | FY 2014 | | | $ | 12,500 | |
| | |
The Cloud Capital Funds: | | | FY 2014 | | | $ | 25,000 | |
| | | FY 2013 | | | $ | 26,000 | |
| | | | | | | | |
Registrant | |
The LS Opportunity Fund: | | | FY 2014 | | | $ | 0 | |
| | | FY 2013 | | | $ | 0 | |
| | |
The BFS Equity Fund: | | | FY 2014 | | | $ | 0 | |
| | |
The Cloud Capital Funds: | | | FY 2014 | | | $ | 0 | |
| | | FY 2013 | | | $ | 0 | |
| | | | | | | | |
Registrant | |
The LS Opportunity Fund: | | | FY 2014 | | | $ | 2,500 | |
| | | FY 2013 | | | $ | 2,500 | |
| | |
The BFS Equity Fund: | | | FY 2014 | | | $ | 2,500 | |
| | |
The Cloud Capital Funds: | | | FY 2014 | | | $ | 5,000 | |
| | | FY 2013 | | | $ | 5,000 | |
-2-
Nature of the fees: Preparation of the 1120 RIC and Excise review
| | | | | | | | |
Registrant | |
The LS Opportunity Fund: | | | FY 2014 | | | $ | 0 | |
| | | FY 2013 | | | $ | 0 | |
| | |
The BFS Equity Fund: | | | FY 2014 | | | $ | 0 | |
| | |
The Cloud Capital Funds: | | | FY 2014 | | | $ | 20,000 | |
| | | FY 2013 | | | $ | 20,000 | |
Nature of the fees: Rule 17f-1 Examination
(e) (1) Audit Committee’s Pre-Approval Policies
The Audit Committee Charter requires the Audit Committee to be responsible for the selection, retention or termination of auditors and, in connection therewith, to (i) evaluate the proposed fees and other compensation, if any, to be paid to the auditors, (ii) evaluate the independence of the auditors, (iii) pre-approve all audit services and, when appropriate, any non-audit services provided by the independent auditors to the Trust, (iv) pre-approve, when appropriate, any non-audit services provided by the independent auditors to the Trust’s investment adviser, or any entity controlling, controlled by, or under common control with the investment adviser and that provides ongoing services to the Trust if the engagement relates directly to the operations and financial reporting of the Trust, and (v) receive the auditors’ specific representations as to their independence;
| (2) | Percentages of Services Approved by the Audit Committee |
| | | | |
Registrant | |
Audit-Related Fees: | | | 0 | % |
Tax Fees: | | | 0 | % |
All Other Fees: | | | 0 | % |
(f) During audit of registrant’s financial statements for the most recent fiscal year, less than 50 percent of the hours expended on the principal accountant’s engagement were attributed to work performed by persons other than the principal accountant’s full-time, permanent employees.
(g) The aggregate non-audit fees billed by the registrant’s accountant for services rendered to the registrant, and rendered to the registrant’s investment adviser (not including any sub-adviser whose role is primarily portfolio management and is subcontracted with or overseen by another investment adviser), and any entity controlling, controlled by, or under common control with the adviser that provides ongoing services to the registrant:
| | | | | | | | |
| | | Registrant | | | Adviser | |
FY 2014 | | $ | 0 | | | $ | 0 | |
FY 2013 | | $ | 0 | | | $ | 0 | |
-3-
(h) Not applicable. The auditor performed no services for the registrant’s investment adviser or any entity controlling, controlled by, or under common control with the investment adviser that provides ongoing services to the registrant.
Item 5. Audit Committee of Listed Companies. NOT APPLICABLE – applies to listed companies only
Item 6. Schedule of Investments. Schedule filed with Item 1.
Item 7. Disclosure of Proxy Voting Policies and Procedures for Closed-End Management Investment Companies. NOT APPLICABLE – applies to closed-end funds only
Item 8. Portfolio Managers of Closed-End Investment Companies. NOT APPLICABLE – applies to closed-end funds only
Item 9. Purchases of Equity Securities by Closed-End Management Investment Company and Affiliated Purchasers. NOT APPLICABLE – applies to closed-end funds only
Item 10. Submission of Matters to a Vote of Security Holders.
The guidelines applicable to shareholders desiring to submit recommendations for nominees to the Registrant’s board of trustees are contained in the statement of additional information of the Trust with respect to the Fund(s) for which this Form N-CSR is being filed.
Item 11. Controls and Procedures.
(a) Based on their evaluation of the registrant’s disclosure controls and procedures (as defined in Rule 30a-3(c) under the Investment Company Act of 1940, as amended (the “Act”)) as of a date within 90 days of the filing date of this report, the registrant’s principal executive officer and principal financial officer have concluded that such disclosure controls and procedures are reasonably designed and are operating effectively to ensure that material information relating to the registrant is made known to them by others within those entities, particularly during the period in which this report is being prepared, and that the information required in filings on Form N-CSR is recorded, processed, summarized, and reported on a timely basis.
(b) There were no changes in the registrant’s internal control over financial reporting (as defined in Rule 30a-3(d) under the Investment Company Act of 1940) that occurred during the second fiscal quarter of the period covered by this report that have materially affected, or are reasonably likely to materially affect, the registrant’s internal control over financial reporting.
Item 12. Exhibits.
(a) (1) Code is filed herewith.
| | (2) | Certifications by the registrant’s principal executive officer and principal financial officer, pursuant to Section 302 of the Sarbanes- Oxley Act of 2002 and required by Rule 30a-2under the Investment Company Act of 1940 are filed herewith. |
-4-
| (b) | Certification pursuant to 18 U.S.C. Section 1350, as adopted pursuant to Section 906 of the Sarbanes-Oxley Act of 2002 is filed herewith. |
-5-
Pursuant to the requirements of the Securities Exchange Act of 1934 and the Investment Company Act of 1940, the registrant has duly caused this report to be signed on its behalf by the undersigned, thereunto duly authorized.
(Registrant) Valued Advisers Trust
| | |
By | | |
* /s/ R. Jeffrey Young | | |
R. Jeffrey Young, President and Principal Executive Officer |
Date 7/31/2014
Pursuant to the requirements of the Securities Exchange Act of 1934 and the Investment Company Act of 1940, this report has been signed below by the following persons on behalf of the registrant and in the capacities and on the dates indicated.
| | |
By | | |
* /s/ R. Jeffrey Young | | |
R. Jeffrey Young, President and Principal Executive Officer |
|
| Date 7/31/2014 |
| |
By | | |
* /s/ Bryan W. Ashmus | | |
Bryan W. Ashmus, Treasurer and Principal Financial Officer |
|
| Date 7/31/2014 |
-6-