UNITED STATES
SECURITIES AND EXCHANGE COMMISSION
WASHINGTON, D.C. 20549
FORM N-CSR
CERTIFIED SHAREHOLDER REPORT OF REGISTERED MANAGEMENT
INVESTMENT COMPANIES
Investment Company Act file number 811-22208
Valued Advisers Trust
(Exact name of registrant as specified in charter)
Huntington Asset Services, Inc. 2960 N. Meridian Street, Suite 300 | Indianapolis, IN 46208 | |
| (Address of principal executive offices) | (Zip code) |
Capitol Services, Inc.
615 S. Dupont Hwy.
Dover, DE 19901
(Name and address of agent for service)
With a copy to:
John H. Lively, Esq.
The Law Offices of John H. Lively & Associates, Inc.
A member firm of The 1940 Act Law GroupTM
11300 Tomahawk Creek Parkway,
Suite 310
Leawood, KS 66221
Registrant’s telephone number, including area code: 317-917-7000
Date of fiscal year end: 10/31
Date of reporting period: 10/31/14
| Item 1. | Reports to Stockholders. |
BRC
Large Cap
Focus Equity Fund
Annual Report
October 31, 2014
Fund Adviser:
BRC Investment Management LLC
8400 East Prentice Avenue, Suite 1401
Greenwood Village, Colorado 80111
Toll Free (877) 272-1214
MANAGEMENT’S DISCUSSION OF FUND PERFORMANCE – (Unaudited)
The investment strategy of the BRC Large Cap Focus Equity Fund (the “Fund”) is based on our belief that future investor expectations are strongly influenced by the opinions, forecasts and announcements of perceived market experts, including Wall Street analysts and company management. By incorporating a combination of proprietary behavioral valuation techniques, we seek to invest in companies that are likely to be the beneficiaries of future favorable earnings announcements and upward earnings estimate revisions. Regardless of market conditions, so long as the predictive abilities of the quantitative models remain strong and investors continue to react to industry experts, the management team expects this investment strategy to provide above average returns over a typical 3-5 year investment cycle.
For the year ending October 31, 2014, the management team was satisfied with the overall predictive abilities of the quantitative model and the implementation of the investment process. As the period ended, the Fund held 33 U.S. large cap equity positions representing those securities that were highly ranked by our quantitative models and were evaluated and selected by our fundamental equity analysts.
Despite this good predictive ability of the models, successful implementation of the process and strong performance through August, the Fund experienced significantly weaker performance in September and October. The magnitude of underperformance was not outside a range of what the management team of the Adviser would expect given our historical alpha and tracking error. The underperformance was primarily attributable to the following four factors:
| • | Outperformance of Large Cap Stocks – During the month of September the largest capitalization quintile of our large cap investment universe outperformed the smallest cap quintile by 3.8%. When the largest capitalization companies outperform the breadth of our universe by such a large margin it is very difficult for this strategy to beat a cap-weighted benchmark. |
| • | Negative Returns to Momentum – In three sectors (Energy, Materials and Diversified Financials), returns to medium-term momentum were significantly negative in October. Although we do not explicitly incorporate price change in our process, our performance has historically lagged when negative momentum stocks perform well. |
| • | Relatively Low Predictive Ability of Analyst Behavior Models – Our process depends on our ability to predict the future behavior of sell-side security analysts. During October, our efforts to accurately predict future positive estimate changes were significantly below normal. |
| • | Stock Specific Effects in the Energy and Materials Sectors – The factors noted above expressed themselves in the poor performance of several specific holdings. These stocks, which had provided very strong returns earlier in the year, declined sharply as investors sought to realize profits. |
For the 12-month period ending October 31, 2014, the Fund’s return was 15.60% versus the S&P 500 Index return of 17.27%.
The Adviser has proprietary tools for tacking and monitoring risk factors. Using analytical tools that are distinct from those of portfolio management, the risk management process assesses the risks embedded in the strategy on an on-going basis. Some of the factors we focus on include; value factors (Price to Book, Price to Earnings, Price to Sales, Price to Cash Flow, etc.); medium-term and short-term momentum; market capitalization; beta; and volatility, among others. The Adviser also monitors the levels and trends of fundamental factor exposures, economic sector exposures, and the composition and magnitude of residual risk versus various benchmarks and indices. For the reporting period, this risk management process resulted in stable sector and style exposures.
On behalf of the management team of the Adviser, I would like to thank you for your continued support. You have our commitment to the consistent application of our investment process and to a proprietary research agenda that will drive our ongoing effort to add value for our clients.
John R. Riddle, CFA
Managing Principal and Chief Investment Officer
1
INVESTMENT RESULTS – (Unaudited)
| Total Returns* (for the periods ended October 31, 2014) | ||||||||
| One Year | Since Inception (December 21, 2012) | |||||||
BRC Large Cap Focus Equity Fund - Institutional Class | 15.60 | % | 21.21 | % | ||||
S&P 500 Index®** | 17.27 | % | 22.18 | % | ||||
Total annual operating expenses, as disclosed in the Fund’s prospectus were 6.44% of net assets for the Institutional Class (0.55% after fee waivers/expense reimbursements by the Adviser based on an expense limitation that was put into effect on October 6, 2014). The Adviser has contractually agreed to waive or limit its fees and to assume other expenses of the Fund until February 28, 2018, so that the Total Annual Fund Operating Expenses does not exceed 0.55%. This operating expense limitation does not apply to interest, taxes, brokerage commissions, other expenditures which are capitalized in accordance with generally accepted accounting principles, other extraordinary expenses not incurred in the ordinary course of the Fund’s business, dividend expense on short sales, expenses incurred under a Rule 12b-1 plan of distribution, “acquired fund fees and expenses,” and expenses that the Fund has incurred but did not actually pay because of an expense offset arrangement.
The performance quoted represents past performance, which does not guarantee future results. The investment return and principal value of an investment will fluctuate so that an investor’s shares, when redeemed, may be worth more or less than their original cost. The returns shown do not reflect deduction of taxes that a shareholder would pay on Fund distributions or the redemption of Fund shares. Current performance of the Fund may be lower or higher than the performance quoted. Performance data current to the most recent month end may be obtained by calling (877) 272-1214.
| * | Return figures reflect any change in price per share and assume the reinvestment of all distributions. |
| ** | The S&P 500® Index is a widely recognized unmanaged index of equity securities and is representative of a broader domestic equity market and range of securities than is found in the Fund’s portfolio. Individuals cannot invest directly in an Index; however, an individual can invest in exchange traded funds or other investment vehicles that attempt to track the performance of a benchmark index. |
The Fund’s investment objectives, strategies, risks, charges and expenses must be considered carefully before investing. The prospectus contains this and other important information about the Fund and may be obtained by calling the same number as above. Please read it carefully before investing.
The Fund is distributed by Unified Financial Securities, Inc., member FINRA.
2
INVESTMENT RESULTS – (Unaudited)
Comparison of the Growth of a $10,000 Investment in the BRC Large Cap Focus Equity Fund - Institutional Class and the S&P 500® Index (Unaudited)
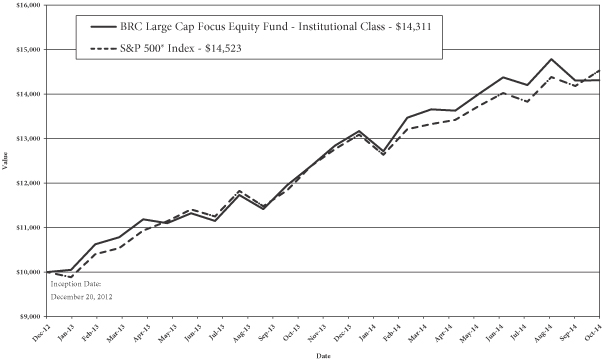
The chart above assumes an initial investment of $10,000 made on December 21, 2012 (commencement of Institutional Class operations) and held through October 31, 2014. The S&P 500® Index is a widely recognized unmanaged index of equity securities and is representative of a broader domestic equity market and range of securities than is found in the Fund’s portfolio. Individuals cannot invest directly in an Index; however, an individual can invest in exchange traded funds or other investment vehicles that attempt to track the performance of a benchmark index. THE FUND’S RETURN REPRESENTS PAST PERFORMANCE AND DOES NOT GUARANTEE FUTURE RESULTS. The returns shown do not reflect deduction of taxes that a shareholder would pay on Fund distributions or the redemption of Fund shares. Investment returns and principal values will fluctuate so that your shares, when redeemed, may be worth more or less than their original purchase price.
Current performance may be lower or higher than the performance data quoted. For more information on the Fund, and to obtain performance data current to the most recent month end or to request a prospectus, please call (877) 272-1214. You should carefully consider the investment objectives, potential risks, management fees, and charges and expenses of the Fund before investing. The Fund’s prospectus contains this and other information about the Fund, and should be read carefully before investing.
The Fund is distributed by Unified Financial Securities, Inc., member FINRA.
3
FUND HOLDINGS – (Unaudited)
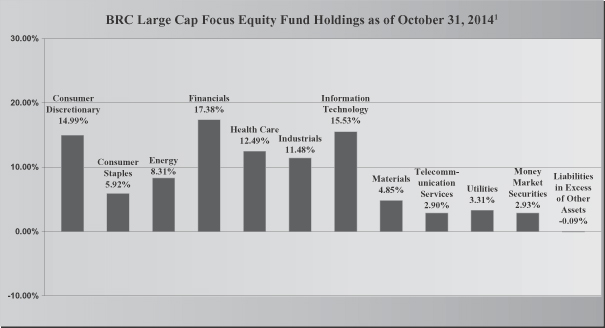
| 1 | As a percentage of net assets. |
The investment objective of the BRC Large Cap Focus Equity Fund is to seek long-term capital appreciation that will exceed the S&P 500® Index over a three-to-five year time horizon.
Availability of Portfolio Schedule – (Unaudited)
The Fund files its complete schedule of portfolio holdings with the Securities and Exchange Commission (“SEC”) for the first and third quarters of each fiscal year on Form N-Q. The Fund’s Forms N-Q are available at the SEC’s website at www.sec.gov. The Fund’s Forms N-Q may be reviewed and copied at the SEC’s Public Reference Room in Washington DC. Information on the operation of the Public Reference Room may be obtained by calling 1-800-SEC-0330.
4
SUMMARY OF FUND’S EXPENSES – (Unaudited)
As a shareholder of the Fund, you incur two types of costs: (1) transaction costs, such as short-term redemption fees; and (2) ongoing costs, including management fees and other Fund expenses. This Example is intended to help you understand your ongoing costs (in dollars) of investing in the Fund and to compare these costs with the ongoing costs of investing in other mutual funds. The example is based on an investment of $1,000 invested at the beginning and held for the entire period from May 1, 2014 to October 31, 2014.
Actual Expenses
The first line of the table below provides information about actual account values and actual expenses. You may use the information in this line, together with the amount you invested, to estimate the expenses that you paid over the period. Simply divide your account value by $1,000 (for example, an $8,600 account value divided by $1,000 = $8.60), then multiply the result by the number in the first line under the heading entitled “Expenses Paid During the Period” to estimate the expenses you paid on your account during this period.
Hypothetical Example for Comparison Purposes
The second line of the table below provides information about hypothetical account values and hypothetical expenses based on the Fund’s actual expense ratio and an assumed rate of return of 5% per year before expenses, which is not the Fund’s actual return. The hypothetical account values and expenses may not be used to estimate the actual ending account balance or expenses you paid for the period. You may use this information to compare the ongoing costs of investing in the Fund and other funds. To do so, compare this 5% hypothetical example with the 5% hypothetical examples that appear in the shareholder reports of the other funds.
Please note that the expenses shown in the table are meant to highlight your ongoing costs only. Therefore, the second line of the table below is useful in comparing ongoing costs only and will not help you determine the relative costs of owning different funds.
BRC Large Cap Focus Equity Fund – Institutional Class | Beginning Account Value May 1, 2014 | Ending Account Value October 31, 2014 | Expenses Paid October 31, 2014 | |||||||||
Actual* | $ | 1,000.00 | $ | 1,050.20 | $ | 2.84 | ||||||
Hypothetical** | $ | 1,000.00 | $ | 1,022.43 | $ | 2.80 | ||||||
| * | Expenses are equal to the Fund’s annualized expense ratio of 0.55%, multiplied by the average account value over the period, multiplied by 184/365. |
| ** | Assumes a 5% return before expenses. |
5
BRC LARGE CAP FOCUS EQUITY FUND
SCHEDULE OF INVESTMENTS
October 31, 2014
| COMMON STOCKS – 97.16% | Shares | Fair Value | ||||||
Consumer Discretionary – 14.99% |
| |||||||
Foot Locker, Inc. | 8,540 | $ | 478,325 | |||||
Gannett Co., Inc. | 14,350 | 452,025 | ||||||
Hanesbrands, Inc. | 4,427 | 467,536 | ||||||
Jarden Corp. * | 7,825 | 509,329 | ||||||
Walt Disney Co./The | 5,577 | 509,626 | ||||||
|
| |||||||
| 2,416,841 | ||||||||
|
| |||||||
Consumer Staples – 5.92% | ||||||||
Constellation Brands, Inc. – Class A * | 5,420 | 496,147 | ||||||
Kroger Co./The | 8,240 | 459,050 | ||||||
|
| |||||||
| 955,197 | ||||||||
|
| |||||||
Energy – 8.31% |
| |||||||
FMC Technologies, Inc. * | 8,456 | 473,874 | ||||||
Helmerich & Payne, Inc. | 4,165 | 361,605 | ||||||
Marathon Petroleum Corp. | 5,552 | 504,677 | ||||||
|
| |||||||
| 1,340,156 | ||||||||
|
| |||||||
Financials – 17.38% |
| |||||||
Goldman Sachs Group, Inc./The | 2,522 | 479,155 | ||||||
Jones Lang LaSalle, Inc. | 3,487 | 471,477 | ||||||
Lincoln National Corp. | 8,749 | 479,095 | ||||||
Prudential Financial, Inc. | 4,828 | 427,471 | ||||||
SunTrust Banks, Inc. | 12,100 | 473,594 | ||||||
Travelers Cos., Inc./The | 4,680 | 471,744 | ||||||
|
| |||||||
| 2,802,536 | ||||||||
|
| |||||||
Health Care – 12.49% |
| |||||||
Aetna, Inc. | 6,100 | 503,311 | ||||||
Amgen, Inc. | 3,486 | 565,360 | ||||||
Biogen Idec, Inc. * | 1,481 | 475,520 | ||||||
Laboratory Corp. of America Holdings * | 4,300 | 469,947 | ||||||
|
| |||||||
| 2,014,138 | ||||||||
|
| |||||||
Industrials – 11.48% |
| |||||||
Boeing Co./The | 3,704 | 462,667 | ||||||
Caterpillar, Inc. | 4,252 | 431,195 | ||||||
FedEx Corp. | 2,858 | 478,429 | ||||||
Snap-on, Inc. | 3,618 | 478,083 | ||||||
|
| |||||||
| 1,850,374 | ||||||||
|
| |||||||
See accompanying notes which are an integral part of these financial statements.
6
BRC LARGE CAP FOCUS EQUITY FUND
SCHEDULE OF INVESTMENTS – (continued)
October 31, 2014
| COMMON STOCKS – 97.16%– continued | Shares | Fair Value | ||||||
Information Technology – 15.53% |
| |||||||
Apple, Inc. | 4,372 | $ | 472,176 | |||||
Avago Technologies Ltd. | 6,250 | 539,063 | ||||||
Electronic Arts, Inc. * | 11,787 | 482,913 | ||||||
FleetCor Technologies, Inc. * | 3,590 | 540,510 | ||||||
Global Payments, Inc. | 5,839 | 470,040 | ||||||
|
| |||||||
| 2,504,702 | ||||||||
|
| |||||||
Materials – 4.85% |
| |||||||
Lyondellbasell Industries NV – Class A | 4,444 | 407,204 | ||||||
Westlake Chemical Corp. | 5,312 | 374,762 | ||||||
|
| |||||||
| 781,966 | ||||||||
|
| |||||||
Telecommunication Services – 2.90% |
| |||||||
Verizon Communications, Inc. | 9,289 | 466,772 | ||||||
|
| |||||||
Utilities – 3.31% |
| |||||||
Edison International | 8,540 | 534,433 | ||||||
|
| |||||||
TOTAL COMMON STOCKS (Cost $14,490,284) |
| 15,667,115 | ||||||
|
| |||||||
MONEY MARKET SECURITIES – 2.93% |
| |||||||
Fidelity Institutional Money Market Portfolio – Institutional shares, 0.08% (a) | 472,131 | 472,131 | ||||||
|
| |||||||
TOTAL MONEY MARKET SECURITIES (Cost $472,131) | 472,131 | |||||||
|
| |||||||
TOTAL INVESTMENTS – 100.09% (Cost $14,962,415) | 16,139,246 | |||||||
|
| |||||||
| Liabilities in Excess of Other Assets – (0.09)% | (15,250) | |||||||
|
| |||||||
| TOTAL NET ASSETS – 100.00% | $ | 16,123,996 | ||||||
|
| |||||||
| (a) | Rate disclosed is the seven day yield as of October 31, 2014. |
| * | Non-income producing security. |
See accompanying notes which are an integral part of these financial statements.
7
BRC LARGE CAP FOCUS EQUITY FUND
STATEMENT OF ASSETS AND LIABILITIES
October 31, 2014
Assets | ||||
Investments in securities at fair value (cost $14,962,415) | $ | 16,139,246 | ||
Receivable for investments sold | 1,844,259 | |||
Dividends receivable | 9,401 | |||
Receivable from Adviser | 10,980 | |||
Prepaid expenses | 2,497 | |||
|
| |||
Total Assets | 18,006,383 | |||
|
| |||
Liabilities | ||||
Payable for investments purchased | 1,853,138 | |||
Payable to administrator, fund accountant, and transfer agent | 8,370 | |||
Payable to custodian | 617 | |||
Payable to trustees | 117 | |||
Other accrued expenses | 20,145 | |||
|
| |||
Total Liabilities | 1,882,387 | |||
|
| |||
Net Assets | $ | 16,123,996 | ||
|
| |||
Net Assets consist of: | ||||
Paid-in capital | $ | 13,846,077 | ||
Accumulated undistributed net investment income | 90,722 | |||
Accumulated undistributed net realized gain from investment transactions | 1,010,366 | |||
Net unrealized appreciation on investments | 1,176,831 | |||
|
| |||
Net Assets | $ | 16,123,996 | ||
|
| |||
Institutional Class: | ||||
Shares outstanding (unlimited number of shares authorized, no par value) | 1,133,635 | |||
|
| |||
Net asset value, offering and redemption price per share | $ | 14.22 | ||
|
| |||
See accompanying notes which are an integral part of these financial statements.
8
BRC LARGE CAP FOCUS EQUITY FUND
STATEMENT OF OPERATIONS
For the year ended October 31, 2014
Investment Income | ||||
Dividend income | $ | 182,297 | ||
|
| |||
Total investment income | 182,297 | |||
|
| |||
Expenses | ||||
Investment Adviser | 58,884 | |||
Administration | 37,501 | |||
Fund accounting | 24,999 | |||
Transfer agent | 40,359 | |||
Custodian | 7,147 | |||
Trustee | 6,086 | |||
Pricing | 2,338 | |||
Legal | 16,766 | |||
Registration | 22,754 | |||
Audit | 14,500 | |||
Offering costs | 6,169 | |||
Miscellaneous | 16,641 | |||
|
| |||
Total expenses | 254,144 | |||
|
| |||
Fees waived and reimbursed by Adviser | (185,217 | ) | ||
|
| |||
Net operating expenses | 68,927 | |||
|
| |||
Net investment income | 113,370 | |||
|
| |||
Net Realized and Unrealized Gains on Investments | ||||
Net realized gains on investment securities transactions | 1,010,366 | |||
Net change in unrealized appreciation of investment securities | 402,177 | |||
|
| |||
Net realized and unrealized gains on investments | 1,412,543 | |||
|
| |||
Net increase in net assets resulting from operations | $ | 1,525,913 | ||
|
| |||
See accompanying notes which are an integral part of these financial statements.
9
BRC LARGE CAP FOCUS EQUITY FUND
STATEMENTS OF CHANGES IN NET ASSETS
| For the Year Ended October 31, 2014 | For the Period Ended October 31, 2013 (a) | |||||||
Increase in Net Assets due to: | ||||||||
Operations | ||||||||
Net investment income | $ | 113,370 | $ | 32,747 | ||||
Net realized gains on investment transactions | 1,010,366 | 242 | ||||||
Net change in unrealized appreciation of investments | 402,177 | 774,654 | ||||||
|
|
|
| |||||
Net increase in net assets resulting from operations | 1,525,913 | 807,643 | ||||||
|
|
|
| |||||
Distributions | ||||||||
Net investment income – Institutional Class | (55,395 | ) | – | |||||
Net realized gains – Institutional Class | (242 | ) | – | |||||
|
|
|
| |||||
Total distributions | (55,637 | ) | – | |||||
|
|
|
| |||||
Capital Transactions – Institutional Class | ||||||||
Proceeds from shares sold | 8,031,528 | 7,316,024 | ||||||
Reinvestment of distributions | 54,011 | – | ||||||
Amount paid for shares redeemed | (1,543,486 | ) | (12,000 | ) | ||||
|
|
|
| |||||
Net increase in net assets resulting from capital transactions | 6,542,053 | 7,304,024 | ||||||
|
|
|
| |||||
Total Increase in Net Assets | 8,012,329 | 8,111,667 | ||||||
|
|
|
| |||||
Net Assets | ||||||||
Beginning of period | 8,111,667 | – | ||||||
|
|
|
| |||||
End of period | $ | 16,123,996 | $ | 8,111,667 | ||||
|
|
|
| |||||
Accumulated undistributed net investment income | $ | 90,722 | $ | 32,747 | ||||
|
|
|
| |||||
Share Transactions – Institutional Class | ||||||||
Shares sold | 586,219 | 656,072 | ||||||
Shares issued in reinvestment of distributions | 4,152 | – | ||||||
Shares redeemed | (111,818 | ) | (990 | ) | ||||
|
|
|
| |||||
Net increase in shares | 478,553 | 655,082 | ||||||
|
|
|
| |||||
| (a) | For the period December 21, 2012 (commencement of operations) to October 31, 2013. |
See accompanying notes which are an integral part of these financial statements.
10
BRC LARGE CAP FOCUS EQUITY FUND
FINANCIAL HIGHLIGHTS – INSTITUTIONAL CLASS
(For a share outstanding during the period)
| For the Year Ended October 31, 2014 | For the Period Ended October 31, 2013 (a) | |||||||
Selected Per Share Data: | ||||||||
Net asset value, beginning of period | $ | 12.38 | $ | 10.00 | ||||
|
|
|
| |||||
Investment Operations: | ||||||||
Net investment income | 0.11 | 0.05 | ||||||
Net realized and unrealized gain on investments | 1.81 | 2.33 | ||||||
|
|
|
| |||||
Total from investment operations | 1.92 | 2.38 | ||||||
|
|
|
| |||||
Less distributions to shareholders from: | ||||||||
Net investment income | (0.08 | ) | – | |||||
Net realized gains | – | (b) | – | |||||
|
|
|
| |||||
Total distributions | (0.08 | ) | – | |||||
|
|
|
| |||||
Net asset value, end of period | $ | 14.22 | $ | 12.38 | ||||
|
|
|
| |||||
Total Return (c) | 15.60 | % | 23.80 | %(d) | ||||
Ratios and Supplemental Data: | ||||||||
Net assets, end of period (000) | $ | 16,124 | $ | 8,112 | ||||
Ratio of net expenses to average net assets | 0.55 | % | 0.56 | %(e) | ||||
Ratio of expenses to average net assets before waiver and reimbursement | 2.03 | % | 6.49 | %(e) | ||||
Ratio of net investment income to average net assets | 0.90 | % | 0.98 | %(e) | ||||
Portfolio turnover rate | 192 | % | 154 | %(d) | ||||
| (a) | For the period December 21, 2012 (commencement of operations) to October 31, 2013. |
| (b) | Amount is less than $0.005. |
| (c) | Total return in the above table represents the rate that the investor would have earned or lost on an investment in the Fund, assuming reinvestment of distributions. |
| (d) | Not annualized. |
| (e) | Annualized. |
See accompanying notes which are an integral part of these financial statements.
11
BRC LARGE CAP FOCUS EQUITY FUND
NOTES TO THE FINANCIAL STATEMENTS
October 31, 2014
NOTE 1. ORGANIZATION
The BRC Large Cap Focus Equity Fund (the “Fund”) is an open-end diversified series of the Valued Advisers Trust (the “Trust”). The Trust is a management investment company established under the laws of Delaware by an Agreement and Declaration of Trust dated June 13, 2008 (the “Trust Agreement”). The Trust Agreement permits the Trust to issue an unlimited number of shares of beneficial interest of separate series without par value. The Fund is one of a series of funds authorized by the Board of Trustees (the “Board”). The Fund commenced operations December 21, 2012. The Fund’s investment adviser is BRC Investment Management LLC. (the “Adviser”). The investment objective of the Fund is to seek long-term capital appreciation that will exceed the S&P 500® Index over a three-to five-year time horizon.
The Fund is authorized to offer two classes of shares: Institutional Class and Advisor Class. Each share represents an equal proportionate interest in the assets and liabilities belonging to the Fund and is entitled to such dividends and distributions out of income belonging to the applicable class as are declared by the Trustees. Expenses attributable to any class are borne by that class. Income, expenses, and realized and unrealized gains/losses are allocated to the respective classes on the basis of relative daily net assets. On matters that affect the Fund as a whole, each class has the same voting and other rights and preferences as any other class. On matters that affect only one class, only shareholders of that class may vote. Each class votes separately on matters affecting only that class, or on matters expressly required to be voted on separately by state or federal law. Shares of each class of a series have the same voting and other rights and preferences as the other classes and series of the Trust for matters that affect the Trust as a whole. As of October 31, 2014, only Institutional Class shares have commenced operations. The Fund may offer additional classes of shares, including the Advisor class, in the future.
NOTE 2. SIGNIFICANT ACCOUNTING POLICIES
The following is a summary of significant accounting policies followed by the Fund in the preparation of its financial statements. These policies are in conformity with generally accepted accounting principles in the United States of America (“GAAP”).
Securities Valuation – All investments in securities are recorded at their estimated fair value as described in Note 3.
Federal Income Taxes – The Fund makes no provision for federal income or excise tax. The Fund intends to qualify each year as a regulated investment company (“RIC”) under subchapter M of the Internal Revenue Code of 1986, as amended, by complying with the requirements applicable to RICs and by distributing substantially all of its taxable income. The Fund also intends to distribute sufficient net investment income and net capital gains, if any, so that it will not be subject to excise tax on undistributed income and gains. If the required amount of net investment income or gains is not distributed, the Fund could incur a tax expense.
As of, and during the year ended, October 31, 2014, the Fund did not have a liability for any unrecognized tax benefits. The Fund recognizes interest and penalties, if any, related to unrecognized tax benefits as income tax expense in the Statement of Operations. During the year, the Fund did not incur any interest or penalties. The Fund is subject to examination by U.S. federal tax authorities for all tax years since inception.
12
BRC LARGE CAP FOCUS EQUITY FUND
NOTES TO THE FINANCIAL STATEMENTS – (continued)
October 31, 2014
NOTE 2. SIGNIFICANT ACCOUNTING POLICIES – continued
Expenses – Expenses incurred by the Trust that do not relate to a specific fund of the Trust are allocated to the individual funds based on each fund’s relative net assets or other appropriate basis (using procedures approved by the Board of Trustees).
Security Transactions and Related Income – The Fund follows industry practice and records security transactions on the trade date for financial reporting purposes. The first in, first out accounting method is used for determining gains or losses for financial statements and income tax purposes. Dividend income is recorded on the ex-dividend date and interest income is recorded on an accrual basis. Discounts and premiums on securities purchased are amortized or accreted using the effective interest method. Withholding taxes on foreign dividends, if any, have been provided for in accordance with the Fund’s understanding of the applicable country’s tax rules and rates. The ability of issuers of debt securities held by the Fund to meet their obligations may be affected by economic and political developments in a specific country or region.
Dividends and Distributions – The Fund intends to distribute substantially all of its net investment income, net realized long-term capital gains and its net realized short-term capital gains, if any, to its shareholders on at least an annual basis. Dividends to shareholders, which are determined in accordance with income tax regulations, are recorded on the ex-dividend date. The treatment for financial reporting purposes of distributions made to shareholders during the year from net investment income or net realized capital gains may differ from their ultimate treatment for federal income tax purposes. These differences are caused primarily by differences in the timing of the recognition of certain components of income, expense or realized capital gain for federal income tax purposes. Where such differences are permanent in nature, they are reclassified among the components of net assets based on their ultimate characterization for federal income tax purposes. Any such reclassifications have no effect on net assets, results of operations or net asset values per share of the Fund. There were no such material reclassifications made as of October 31, 2014.
NOTE 3. SECURITIES VALUATION AND FAIR VALUE MEASUREMENTS
Fair value is defined as the price that a Fund would receive upon selling an investment in a orderly transaction to an independent buyer in the principal or most advantageous market of the investment. GAAP established a three-tier hierarchy to maximize the use of observable market data and minimize the use of unobservable inputs and to establish classification of fair value measurements for disclosure purposes.
Inputs refer broadly to the assumptions that market participants would use in pricing the asset or liability, including assumptions about risk (ex., the risk inherent in a particular valuation technique used to measure fair value including items such as a pricing model and/or the risk inherent in the inputs to the valuation technique). Inputs may be observable or unobservable. Observable inputs are inputs that reflect the assumptions market participants would use in pricing the asset or liability developed based on market data obtained from sources independent of the reporting entity. Unobservable inputs are inputs that reflect the reporting entity’s own assumptions about the assumptions market participants would use in pricing the asset or liability developed based on the best information available in the circumstances.
Various inputs are used in determining the value of the Fund’s investments. These inputs are summarized in the three broad levels listed below.
| • | Level 1 – quoted prices in active markets for identical securities |
13
BRC LARGE CAP FOCUS EQUITY FUND
NOTES TO THE FINANCIAL STATEMENTS – (continued)
October 31, 2014
NOTE 3. SECURITIES VALUATION AND FAIR VALUE MEASUREMENTS – continued
| • | Level 2 – other significant observable inputs (including, but not limited to, quoted prices for an identical security in an inactive market, quoted prices for similar securities, interest rates, prepayment speeds, credit risk, etc.) |
| • | Level 3 – significant unobservable inputs (including the Fund’s own assumptions in determining fair value of investments based on the best information available) |
The inputs used to measure fair value may fall into different levels of the fair value hierarchy. In such cases, for disclosure purposes, the level in the fair value hierarchy within which the fair value measurement falls in its entirety, is determined based on the lowest level input that is significant to the fair value measurement in its entirety.
Equity securities, including common stocks, are generally valued by using market quotations, furnished by a pricing service. Securities that are traded on any stock exchange are generally valued at the last quoted sale price. Lacking a last sale price, an exchange traded security is generally valued at its last bid price. Securities traded in the NASDAQ over-the-counter market are generally valued at the NASDAQ Official Closing Price. When using the market quotations or close prices provided by the pricing service and when the market is considered active, the security is classified as a Level 1 security. Sometimes, an equity security owned by the Fund will be valued by the pricing service with factors other than market quotations or when the market is considered inactive. When this happens, the security is classified as a Level 2 security. When market quotations are not readily available, when the Fund determines that the market quotation or the price provided by the pricing service does not accurately reflect the current fair value, or when restricted or illiquid securities are being valued, such securities are valued as determined in good faith by the Fund, in conformity with guidelines adopted by and subject to review by the Board. These securities are generally categorized as Level 3 securities.
Investments in open-end mutual funds, including money market mutual funds, are generally priced at the ending net asset value (NAV) provided by the service agent of the funds. These securities will be categorized as Level 1 securities.
In accordance with the Trust’s good faith pricing guidelines, the Fund is required to consider all appropriate factors relevant to the value of securities for which it has determined other pricing sources are not available or reliable as described above. No single standard exists for determining fair value, because fair value depends upon the circumstances of each individual case. As a general principle, the current fair value of an issue of securities being valued by the Fund would appear to be the amount which the owner might reasonably expect to receive for them upon their current sale. Methods which are in accordance with this principle may, for example, be based on (i) a multiple of earnings; (ii) a discount from market of a similar freely traded security (including a derivative security or a basket of securities traded on other markets, exchanges or among dealers); or (iii) yield to maturity with respect to debt issues, or a combination of these and other methods. Good faith pricing is permitted if, in the Fund’s opinion, the validity of market quotations appears to be questionable based on factors such as evidence of a thin market in the security based on a small number of quotations, a significant event occurs after the close of a market but before a Fund’s NAV calculation that may affect a security’s value, or the Fund is aware of any other data that calls into question the reliability of market quotations. Good faith pricing may also be used in instances when the bonds the Fund invests in may default or otherwise cease to have market quotations readily available. Any fair value pricing done outside the Fund’s approved pricing methods must be approved by the Pricing Committee of the Board.
14
BRC LARGE CAP FOCUS EQUITY FUND
NOTES TO THE FINANCIAL STATEMENTS – (continued)
October 31, 2014
NOTE 3. SECURITIES VALUATION AND FAIR VALUE MEASUREMENTS – continued
The following is a summary of the inputs used to value the Fund’s investments as of October 31, 2014:
| Valuation Inputs | ||||||||||||||||
| Assets | Level 1 – Quoted Prices in | Level 2 – Other | Level 3 – Significant | Total | ||||||||||||
Common Stocks* | $ | 15,667,115 | $ | – | $ | – | $ | 15,667,115 | ||||||||
Money Market Securities | 472,131 | – | – | 472,131 | ||||||||||||
Total | $ | 16,139,246 | $ | – | $ | – | $ | 16,139,246 | ||||||||
| * | Refer to the Schedule of Investments for industry classifications. |
The Fund did not hold any investments at any time during the reporting period in which significant unobservable inputs were used in determining fair value; therefore, no reconciliation of Level 3 securities is included for this reporting period. The Fund recognizes transfers between fair value hierarchy levels at the reporting period end. There were no transfers between any Levels for the year ended October 31, 2014 and the previous measurement period.
NOTE 4. ADVISER FEES AND OTHER TRANSACTIONS
Under the terms of the management agreement, on behalf of the Fund (the “Agreement”), the Adviser manages the Fund’s investments subject to approval of the Trustees. As compensation for its management services, the Fund is obligated to pay the Adviser a fee computed and accrued daily and paid monthly at an annual rate of 0.47% of the average daily net assets of the Fund. For the year ended October 31, 2014, the Adviser earned a fee of $58,884 from the Fund before the reimbursement described below.
The Adviser has contractually agreed to waive its management fee and/or reimburse expenses through February 28, 2018, so that total annual fund operating expenses, excluding interest, taxes, brokerage commissions, other expenditures which are capitalized in accordance with GAAP, other extraordinary expenses not incurred in the ordinary course of the Fund’s business, dividend expense on short sales, 12b-1 expenses, and expenses that the Fund has incurred but did not actually pay because of an expense offset arrangement, if applicable, incurred by the Fund in any fiscal year, do not exceed 0.55% of the Fund’s average daily net assets. The operating expense limitation also excludes any fees and expenses of acquired funds. For the year ended October 31, 2014, expenses totaling $185,217 were waived or reimbursed by the Adviser and may be subject to potential recoupment by the Adviser until October 31, 2017. At October 31, 2014, the Adviser owed the Fund $10,980.
The amount subject to repayment by the Fund pursuant to the aforementioned conditions are as follows:
Amount | Recoverable through October 31, | |
$198,220 | 2016 | |
185,217 | 2017 |
15
BRC LARGE CAP FOCUS EQUITY FUND
NOTES TO THE FINANCIAL STATEMENTS – (continued)
October 31, 2014
NOTE 4. ADVISER FEES AND OTHER TRANSACTIONS – continued
The Trust retains Huntington Asset Services, Inc. (“HASI”) to manage the Fund’s business affairs and provide the Fund with administrative services, including all regulatory reporting and necessary office equipment and personnel. For the year ended October 31, 2014, HASI earned fees of $37,501 for administrative services provided to the Fund. At October 31, 2014, HASI was owed $3,125 from the Fund for administrative services. Certain officers and trustees of the Trust are members of management and/or employees of HASI. HASI is a wholly-owned subsidiary of Huntington Bancshares, Inc., the parent company of Unified Financial Securities, Inc. (the “Distributor”) and Huntington National Bank, the custodian of the Fund’s investments (the “Custodian”). For the year ended October 31, 2014, the Custodian earned fees of $7,147 for custody services provided to the Fund. At October 31, 2014, the Custodian was owed $617 from the Fund for custody services.
The Trust also retains HASI to act as the Fund’s transfer agent and to provide transfer agent and fund accounting services. For the year ended October 31, 2014, HASI earned fees of $40,359 for transfer agent services to the Fund. At October 31, 2014, the Fund owed HASI $3,163 for transfer agent services. For the year ended October 31, 2014, HASI earned fees of $24,999 from the Fund for fund accounting services. At October 31, 2014, HASI was owed $2,082 from the Fund for fund accounting services.
Unified Financial Securities, Inc. acts as the principal underwriter of the Fund’s shares. There were no payments made by the Fund to the Distributor during the year ended October 31, 2014. An officer of the Trust is also an officer of the Distributor.
NOTE 5. PURCHASES AND SALES
For the year ended October 31, 2014, purchases and sales of investment securities, other than short-term investments and short-term U.S. government obligations, were as follows:
Purchases | ||||
U.S. Government Obligations | $ | – | ||
Other | 29,913,120 | |||
Sales | ||||
U.S. Government Obligations | $ | – | ||
Other | 23,676,813 |
NOTE 6. ESTIMATES
The preparation of financial statements in conformity with GAAP requires management to make estimates and assumptions that affect the reported amounts of assets and liabilities and disclosure of contingent assets and liabilities at the date of the financial statements and the reported amounts of increases and decreases in net assets from operations during the reporting period. Actual results could differ from those estimates.
NOTE 7. BENEFICIAL OWNERSHIP
The beneficial ownership, either directly or indirectly, of 25% or more of the voting securities of a fund creates a presumption of control of a fund, under Section 2(a) (9) of the Investment Company Act of 1940. At October 31, 2014, Charles Schwab & Co., Inc. for the benefit of its customers, owned 50.58% and Band & Co. owned 26.69%. It is not known whether Charles Schwab & Co., Band & Co., or any of the underlying beneficial owners controlled 25% or more of the voting securities of the Fund.
16
BRC LARGE CAP FOCUS EQUITY FUND
NOTES TO THE FINANCIAL STATEMENTS – (continued)
October 31, 2014
NOTE 8. FEDERAL TAX INFORMATION
At October 31, 2014, the net unrealized appreciation (depreciation) of investments for tax purposes was as follows:
Gross Appreciation | $ | 1,217,343 | ||
Gross (Depreciation) | (41,707 | ) | ||
|
| |||
Net Appreciation (Depreciation) on Investments | $ | 1,175,636 | ||
|
|
At October 31, 2014, the aggregate cost of securities for federal income tax purposes was $14,963,610 for the Fund.
The tax characterization of distributions for the fiscal year ended October 31, 2014 was as follows:
| 2014 | ||||
Distributions paid from: | ||||
Ordinary income* | $ | 55,637 | ||
Long-Term Capital Gain | – | |||
|
| |||
| $ | 55,637 | |||
|
| |||
| * | Short-term capital gain distributions are treated as ordinary income for tax purposes. |
At October 31, 2014, the components of distributable earnings (accumulated losses) on a tax basis were as follows:
Undistributed ordinary income | $ | 568,501 | ||
Undistributed long-term capital gains | 533,782 | |||
Net unrealized appreciation (depreciation) | 1,175,636 | |||
|
| |||
| $ | 2,277,919 | |||
|
|
At October 31, 2014, the difference between book basis and tax basis unrealized appreciation (depreciation) is primarily attributable to the tax deferral of losses on wash sales in the amount of $1,195.
At October 31, 2014, for federal income tax purposes, the Fund has no capital loss carryforwards.
NOTE 9. COMMITMENTS AND CONTINGENCIES
The Fund indemnifies its officers and trustees for certain liabilities that may arise from the performance of their duties to the Fund. Additionally, in the normal course of business, the Fund enters into contracts that contain a variety of representations and warranties which provide general indemnifications. The Fund’s maximum exposure under these arrangements is unknown, as this would involve future claims that may be made against the Fund that have not yet occurred.
NOTE 10. SUBSEQUENT EVENTS
Management of the Fund has evaluated the need for disclosures and/or adjustments resulting from subsequent events through the date these financial statements were issued. A special meeting of the shareholders of the Trust
17
BRC LARGE CAP FOCUS EQUITY FUND
NOTES TO THE FINANCIAL STATEMENTS – (continued)
October 31, 2014
NOTE 10. SUBSEQUENT EVENTS – continued
was held on December 19, 2014, for the purpose of electing the Board of Trustees, the results of the meeting can be can be found in the Proxy Voting Results Note (below).
NOTE 11. PROXY VOTING RESULTS (Unaudited)
On December 19, 2014 a special meeting of the shareholders of the Trust was held at the offices of the Trust for the purpose of electing each nominee to the Board of Trustees.
Below are the voting results for all funds from the special meeting of the Trust:
| To elect each nominee to the Board of Trustees: | ||||||||||||
| For | Against | Abstain | ||||||||||
| Ira Cohen | 280,591,916 | 20,930,930 | – | |||||||||
| Andrea N. Mullins | 296,332,857 | 5,189,989 | – | |||||||||
| R. Jeffrey Young | 280,517,160 | 21,005,685 | – | |||||||||
18
REPORT OF INDEPENDENT REGISTERED PUBLIC ACCOUNTING FIRM
To the Shareholders of BRC Large Cap Focus Equity Fund and
Board of Trustees of Valued Advisers Trust
We have audited the accompanying statement of assets and liabilities, including the schedule of investments, of BRC Large Cap Focus Equity Fund (the “Fund”), a series of Valued Advisers Trust, as of October 31, 2014, and the related statement of operations for the year then ended, and the statements of changes in net assets and the financial highlights for each of the two periods in the period then ended. These financial statements and financial highlights are the responsibility of the Fund’s management. Our responsibility is to express an opinion on these financial statements and financial highlights based on our audits.
We conducted our audits in accordance with the standards of the Public Company Accounting Oversight Board (United States). Those standards require that we plan and perform the audit to obtain reasonable assurance about whether the financial statements and financial highlights are free of material misstatement. An audit includes examining, on a test basis, evidence supporting the amounts and disclosures in the financial statements. Our procedures included confirmation of securities owned as of October 31, 2014, by correspondence with the custodian and brokers. An audit also includes assessing the accounting principles used and significant estimates made by management, as well as evaluating the overall financial statement presentation. We believe that our audits provide a reasonable basis for our opinion.
In our opinion, the financial statements and financial highlights referred to above present fairly, in all material respects, the financial position of BRC Large Cap Focus Equity Fund as of October 31, 2014, the results of its operations for the year then ended, and the changes in its net assets and financial highlights for each of the two periods in the period then ended, in conformity with accounting principles generally accepted in the United States of America.

COHEN FUND AUDIT SERVICES, LTD.
Cleveland, Ohio
December 23, 2014
19
TRUSTEES AND OFFICERS (Unaudited)
The Board of Trustees supervises the business activities of the Trust. Each Trustee serves as a trustee until termination of the Trust unless the Trustee dies, resigns, retires or is removed. The following tables provide information regarding the Trustees and Officers.
The following table provides information regarding each of the Independent Trustees.
Name, Address*, (Age), Position with Trust**, Term of Position with Trust | Principal Occupation During Past 5 Years | Other Directorships | ||
Andrea N. Mullins, 47, Independent Trustee, December 2013 to present. | Private investor; Independent Contractor, Seabridge Wealth Management, LLC, since April 2014; Principal Financial Officer, Treasurer, and Secretary, Eagle Family of Funds (mutual fund family) and Vice President, Eagle Asset Management, Inc. (investment adviser) each from 2004 to 2010. | None. | ||
Ira Cohen, 55, Independent Trustee, June 2010 to present. | Independent financial services consultant (Feb. 2005 – present). | Trustee and Audit Committee Chairman, Griffin Institutional Access Real Estate Fund since May 2014. Trustee for the Angel Oak Funds Trust since October 2014. |
| * | The address for each trustee and officer is 2960 N. Meridian St., Suite 300, Indianapolis, IN 46208. |
| ** | As of the date of this SAI, the Trust consists of 14 series. |
20
The following table provides information regarding the Trustee who is considered an “interested person” of the Trust, as that term is defined under the 1940 Act. Based on the experience of the Trustee, the Trust concluded that the individual described below should serve as a Trustee.
Name, Address*, (Age), Position with Trust**, Term of Position with Trust | Principal Occupation During Past 5 Years | Other Directorships | ||
R. Jeffrey Young, 50, Trustee and Chairman, June 2010 to present; Principal Executive Officer and President, Valued Advisers Trust February 2010 to present. | Senior Vice President, Huntington Asset Services, Inc., the Trust’s administrator, since January 2010, Director since May 2014; Director, Unified Financial Securities, Inc., the Trust’s distributor, since May 2014; Chief Executive Officer, Huntington Funds since February 2010; Chief Executive Officer, Huntington Strategy Shares since November 2010; President and Chief Executive Officer, Dreman Contrarian Funds, March 2011 to February 2013; Trustee, Valued Advisers Trust, August 2008 to January 2010; and Managing Director of WealthStone, from 2007 to 2010. | Trustee and Chairman, Capitol Series Trust, since September 2013. |
| * | The address for each trustee and officer is 2960 N. Meridian St., Suite 300, Indianapolis, IN 46208. |
| ** | As of the date of this SAI, the Trust consists of 14 series. |
21
The following table provides information regarding the Officers of the Trust:
Name, Address*, (Age), Position with Trust,** Term of Position with Trust | Principal Occupation During Past 5 Years | Other Directorships | ||
R. Jeffrey Young, 50, Trustee and Chairman, June 2010 to present; Principal Executive Officer and President, Valued Advisers Trust February 2010 to present. | Senior Vice President, Huntington Asset Services, Inc., the Trust’s administrator, since January 2010, Director since May 2014; Director, Unified Financial Securities, Inc., the Trust’s distributor, since May 2014; Chief Executive Officer, Huntington Funds since February 2010; Chief Executive Officer, Huntington Strategy Shares since November 2010; President and Chief Executive Officer, Dreman Contrarian Funds March 2011 to February 2013; Trustee, Valued Advisers Trust, August 2008 to January 2010; and Managing Director of WealthStone, from 2007 to 2010. | Trustee and Chairman, Capitol Series Trust, since September 2013. | ||
John C. Swhear, 53, Chief Compliance Officer, AML Officer and Vice President, August 2008 to present. | Vice President of Legal Administration and Compliance, Huntington Asset Services, Inc., the Trust’s administrator, since April 2007, Director since May 2014; Chief Compliance Officer, Unified Financial Securities, Inc., the Trust’s distributor, since May 2007, Director since May 2014; President, Unified Series Trust since March 2012, Senior Vice President from May 2007 to March 2012; Chief Compliance Officer and AML Officer, Capitol Series Trust, since September 2013; Secretary, Huntington Funds from April 2010 to February 2012; President and Chief Executive Officer, Dreman Contrarian Funds from March 2010 to March 2011, Vice President and Acting Chief Executive Officer, 2007 to March 2010. | None. |
22
Name, Address*, (Age), Position with Trust,** Term of Position with Trust | Principal Occupation During Past 5 Years | Other Directorships | ||
Carol J. Highsmith, 50, Vice President, August 2008 to present; Secretary, March 2014 to present. | Employed in various positions with Huntington Asset Services, Inc., the Trust’s administrator, since November of 1994; currently Vice President of Legal Administration; Secretary, Cross Shore Discovery Fund since May 2014. | None. | ||
Matthew J. Miller, 38, Vice President, December 2011 to present. | Employed in various positions with Huntington Asset Services, Inc., the Trust’s administrator, since July of 1998; currently Vice President of Relationship Management; Vice President, Huntington Funds since February 2010; President and Chief Executive Officer, Capitol Series Trust, since September 2013. | None. | ||
Bryan W. Ashmus, 41, Principal Financial Officer and Treasurer, December 2013 to present. | Vice President, Financial Administration, Huntington Asset Services, Inc., the Trust’s administrator, since September 2013; Chief Financial Officer and Treasurer, Huntington Strategy Shares and Huntington Funds, since November 2013; Vice President, Treasurer Services, Citi Fund Services Ohio, Inc., from 2005 to 2013. | None. |
| * | The address for each trustee and officer is 2960 N. Meridian St., Suite 300, Indianapolis, IN 46208. |
| ** | As of the date of this SAI, the Trust consists of 14 series. |
23
MANAGEMENT AGREEMENT RENEWAL (Unaudited)
At a meeting held on September 16, 2014, the Board of Trustees (the “Board”) considered the renewal of the Investment Advisory Agreement (the “Agreement”) between the Trust and BRC Investment Management, Inc. (the “Adviser” or “BRC”) with respect to the BRC Large Cap Focus Equity Fund (the “Fund”). Counsel noted that the 1940 Act requires the approval of the investment advisory agreement between the Trust and its investment adviser by the Board, including a majority of the Independent Trustees. The Board discussed the arrangements between the Adviser and the Trust with respect to the Fund.
Counsel discussed with the Trustees the types of information and factors that should be considered by the Board in order to make an informed decision regarding the approval of the Agreement, including the following material factors: (i) the nature, extent, and quality of the services to be provided by BRC; (ii) the investment performance of the Fund; (iii) the costs of the services to be provided and anticipated profits to be realized by BRC from the relationship with the Fund; (iv) the extent to which economies of scale would be realized if the Fund grows and whether advisory fee levels reflect those economies of scale for the benefit of the Fund’s investors; and (v) BRC’s practices regarding possible conflicts of interest and potential benefits derived from its relationship with the Fund.
In assessing the factors and reaching its decision, the Board took into consideration information furnished for the Board’s review and consideration throughout the year at regular Board meetings, as well as information specifically requested and prepared and/or presented in connection with the annual renewal process, including information presented at the meeting. The Board was provided with, and reflected on, information and reports relevant to the annual renewal of the Agreement, including (i) reports regarding the services and support provided to the Fund and its shareholders by BRC; (ii) quarterly assessments of the investment performance of the Fund by personnel of BRC; (iii) commentary on the reasons for the performance; (iv) presentations by BRC addressing investment philosophy, investment strategy, personnel and operations of BRC; (v) compliance and audit reports concerning the Fund and BRC; (vi) disclosure information contained in the registration statement of the Trust with respect to the Fund and the Form ADV of BRC; and (vii) a memorandum from Counsel, that summarized the fiduciary duties and responsibilities of the Board in reviewing and approving the Agreement, including the material factors set forth above and the types of information included in each factor that should be considered by the Board in order to make an informed decision. The Board also requested and received various informational materials including, without limitation: (i) documents containing information about BRC, including financial information, a description of personnel and the managerial services provided to the Fund, information on investment advice, performance, summaries of Fund expenses, compliance program, current legal matters, and other general information; (ii) comparative expense and performance information for other mutual funds with strategies similar to the Fund, as well as for separate accounts managed by BRC; and (iii) benefits to be realized by BRC from its relationship with the Fund. The Board did not identify any particular information that was most relevant to its consideration to approve the Agreement and each Trustee may have afforded different weight to the various factors.
| 1. | The nature, extent, and quality of the services to be provided by the Adviser. In this regard, the Board considered the Adviser’s responsibilities under the Advisory Agreement. The Board reviewed the services being provided by BRC to the Fund including, without limitation: BRC’s procedures for formulating investment recommendations and assuring compliance with the Fund’s investment objectives and limitations; its anticipated coordination of services for the Fund among the Fund’s service providers, and its efforts to promote the Fund, grow its assets, and assist in the distribution of the Fund shares. The Board considered: BRC’s staffing, personnel, and methods of operating; the education and experience of BRC’s personnel; and BRC’s compliance program, policies, and procedures. The Trustees also discussed BRC’s continued cooperation with the Independent Trustees and Counsel for the Fund. After reviewing the foregoing and further information from BRC (including BRC’s Form ADV), the Board concluded that, in light of all the facts and circumstances, the quality, extent, and nature of the services provided by BRC were satisfactory and adequate for the Fund. |
24
| 2. | Investment Performance of the Fund and the Adviser. In evaluating the investment performance of the Fund and the Adviser, the Trustees compared the short-term performance, including the year-to-date, one month, three month, and 1-year cumulative return and since inception annualized returns of the Fund (for the periods ending July 31, 2014) with the performance of funds with similar objectives managed by other investment advisers, as well as with aggregated peer group data. The Trustees also considered the consistency of BRC’s management of the Fund with its investment objective, strategies, and limitations. The Trustees noted that the Fund’s performance was above the median and the average of its peers for all periods presented. It was also noted that the Fund outperformed its benchmark for all periods presented. The Board also considered the performance of BRC’s separate accounts that were managed in a manner similar to that of the Fund and they noted that the performance was very comparable. Following further discussion regarding the performance of the Fund, BRC’s experience managing the Fund, the Fund’s historical performance, and other relevant factors, the Board concluded, in light of all the facts and circumstances, that the investment performance of the Fund and BRC was satisfactory. |
| 3. | The costs of the services to be provided and profits to be realized by the Adviser from the relationship with the Fund. In considering the costs of services to be provided and the profits to be realized by the Adviser from the relationship with the Fund, the Trustees considered: (1) BRC’s financial condition; (2) the asset levels of the Fund; (3) the overall expenses of the Fund; and (4) the nature and frequency of advisory fee payments. The Trustees reviewed information provided by BRC regarding its profits associated with managing the Fund. The Trustees also considered potential benefits for BRC in managing the Fund. The Trustees compared the fees and expenses of the Fund (including the management fee) to other comparable mutual funds. The Trustees noted that the Fund’s management fee was among the lowest in its peer group, and it was lower than its peer average and median. They also discussed the fact that BRC had, during the initial two-year term of the Advisory Agreement, voluntarily proposed an amendment to the Fund’s management agreement to lower the advisory fee. The Trustees also noted that the advisory fee paid by the Fund was lower than the fee paid by BRC’s separate account clients at the current asset level of the Fund. Based on the foregoing, the Board concluded that the fees to be paid to BRC by the Fund and the profits to be realized by the Fund, in light of all the facts and circumstances, were fair and reasonable in relation to the nature and quality of the services provided by BRC. |
| 4. | The extent to which economies of scale would be realized as the Fund grows and whether advisory fee levels reflect these economies of scale for the benefit of the Fund’s investors. In this regard, the Board considered the Fund’s fee arrangements with the Adviser. The Board noted that the management fee remained the same as asset levels increased, although it also noted that the shareholders of the Fund had experienced benefits from the Expense Limitation Agreement. The Board noted that the Adviser had voluntarily proposed to the Trust to lower its advisory fee during the initial two-year term of the Advisory Agreement. The Trustees also noted BRC’s willingness to extend the Expense Limitation Agreement for an additional two years. The Board also noted that the Fund would benefit from economies of scale under its agreements with service providers other than BRC. Based on its ongoing consideration of the Fund’s asset levels, expectations for growth, and fee levels, the Board determined that the Fund’s fee arrangements with BRC were fair and reasonable in relation to the nature and quality of the services provided by BRC. |
| 5. | Possible conflicts of interest and benefits to the Adviser. In considering the Adviser’s practices regarding conflicts of interest, the Trustees evaluated the potential for conflicts of interest and considered such matters as the experience and ability of the advisory personnel assigned to the Fund; the basis of decisions to buy or sell securities for the Fund and/or BRC’s other accounts; and the substance and administration of BRC’s code of ethics. The Trustees also considered disclosure in the registration statement of the Trust relating to BRC’s potential conflicts of interest. The Trustees discussed BRC’s practices with regard to soft dollars. The Trustees noted that BRC benefited from the Fund in that it is able to utilize the Fund as a vehicle into which to direct defined contribution plans. The Trustees did not identify any other potential benefits (other than the management fee) that would be realized by BRC. Based on the foregoing, the Board determined |
25
| that the standards and practices of BRC relating to the identification and mitigation of potential conflicts of interest and the benefits that it derives from managing the Fund are acceptable. |
After additional consideration of the factors delineated in the memorandum provided by Counsel and further discussion among the Board, the Board determined to approve the continuation of the Agreement between the Trust and the Adviser.
26
OTHER FEDERAL INCOME TAX INFORMATION (Unaudited)
The Form 1099-DIV you receive in January 2015 will show the tax status of all distributions paid to your account in calendar year 2014. Shareholders are advised to consult their own tax adviser with respect to the tax consequences of their investment in the Fund. As required by the Internal Revenue Code and/or regulations, shareholders must be notified regarding the status of qualified dividend income for individuals and the dividends received deduction for corporations.
Qualified Dividend Income. For the Fund’s fiscal year 2014 the Fund designates approximately 29.73% or up to the maximum amount of such dividends allowable pursuant to the Internal Revenue Code, as qualified dividend income eligible for the reduced tax rate of 15%.
Dividends Received Deduction. Corporate shareholders are generally entitled to take the dividends received deduction on the portion of the Fund’s dividend distribution that qualifies under tax law. For the Fund’s fiscal year 2014 ordinary income dividends, 29.32% qualifies for the corporate dividends received deduction.
For the year ended October 31, 2014, the Fund designated $242 as short-term capital gain distributions.
27
OTHER INFORMATION
The Fund’s Statement of Additional Information (“SAI”) includes additional information about the trustees and is available without charge, upon request. You may call toll-free at (877) 272-1214 to request a copy of the SAI or to make shareholder inquiries.
PROXY VOTING
A description of the policies and procedures that the Fund uses to determine how to vote proxies relating to portfolio securities and information regarding how the Fund voted those proxies is available without charge upon request by (1) calling the Fund at (877) 272-1214 and (2) from Fund documents filed with the Securities and Exchange Commission (“SEC”) on the SEC’s website at www.sec.gov.
TRUSTEES
R. Jeffrey Young, Chairman
Ira Cohen
Andrea N. Mullins
OFFICERS
| R. | Jeffrey Young, Principal Executive Officer and President |
| John | C. Swhear, Chief Compliance Officer, AML Officer and Vice President |
| Carol | J. Highsmith, Vice President and Secretary |
| Matthew | J. Miller, Vice President |
| Bryan | W. Ashmus, Principal Financial Officer and Treasurer |
INVESTMENT ADVISER
BRC Investment Management LLC
8400 East Prentice Avenue, Suite 1401
Greenwood Village, Colorado 80111
DISTRIBUTOR
Unified Financial Securities, Inc.
2960 North Meridian Street, Suite 300
Indianapolis, IN 46208
INDEPENDENT REGISTERED PUBLIC ACCOUNTING FIRM
Cohen Fund Audit Services Ltd.
1350 Euclid Avenue, Suite 800
Cleveland, OH 44115
LEGAL COUNSEL
The Law Offices of John H. Lively & Associates, Inc.
A member firm of The 1940 Act Law GroupTM
11300 Tomahawk Creek Parkway, Ste. 310
Leawood, KS 66211
CUSTODIAN
Huntington National Bank
41 South High Street
Columbus, OH 43215
ADMINISTRATOR, TRANSFER AGENT AND FUND ACCOUNTANT
Huntington Asset Services, Inc.
2960 North Meridian Street, Suite 300
Indianapolis, IN 46208
This report is intended only for the information of shareholders or those who have received the Fund’s prospectus which contains information about the Fund’s management fee and expenses. Please read the prospectus carefully before investing.
Distributed by Unified Financial Securities, Inc.
Member FINRA/SIPC
28
PRIVACY POLICY
The following is a description of the Fund’s policies regarding disclosure of nonpublic personal information that you provide to the Fund or that the Fund collects from other sources. In the event that you hold shares of the Fund through a broker-dealer or other financial intermediary, the privacy policy of your financial intermediary would govern how your nonpublic personal information would be shared with nonaffiliated third parties.
Categories of Information the Fund Collects. The Fund collects the following nonpublic personal information about you:
| • | Information the Fund receives from you on applications or other forms, correspondence, or conversations (such as your name, address, phone number, social security number, and date of birth); and |
| • | Information about your transactions with the Fund, its affiliates, or others (such as your account number and balance, payment history, cost basis information, and other financial information). |
Categories of Information the Fund Discloses. The Fund does not disclose any nonpublic personal information about its current or former shareholders to unaffiliated third parties, except as required or permitted by law. The Fund is permitted by law to disclose all of the information it collects, as described above, to service providers (such as the Fund’s custodian, administrator, transfer agent, accountant and legal counsel) to process your transactions and otherwise provide services to you.
Confidentiality and Security. The Fund restricts access to your nonpublic personal information to those persons who require such information to provide products or services to you. The Fund maintains physical, electronic, and procedural safeguards that comply with federal standards to guard your nonpublic personal information.
Disposal of Information. The Fund, through its transfer agent, has taken steps to reasonably ensure that the privacy of your nonpublic personal information is maintained at all times, including in connection with the disposal of information that is no longer required to be maintained by the Fund. Such steps shall include, whenever possible, shredding paper documents and records prior to disposal, requiring off-site storage vendors to shred documents maintained in such locations prior to disposal, and erasing and/or obliterating any data contained on electronic media in such a manner that the information can no longer be read or reconstructed.
29
Annual Report
October 31, 2014
Fund Adviser:
Granite Investment Advisors, Inc.
11 South Main Street, Suite 501
Concord, New Hampshire 03301
Toll Free (888) 442-9893
DISCUSSION – (Unaudited)
Our fiscal year ended October 31, 2014 has been an unsatisfactory year for our performance. This is my responsibility as the Chief Investment Officer, and one which I take very seriously. The buck stops here. As of the end of October, we were up 5.7% in the Granite Value Fund versus the S&P 500 which was up 17.3% and the Russell 1000 Value which was up 16.5%. On the year, against the Dow Jones Industrial Average we look a little better, as it was up 14.5%. Our performance gap has closed somewhat in October, but still exists. While we are trailing these indices, we are closer to the Russell 2000 (a small/mid cap index), which is up 8.1% through the end of October. It is our responsibility to you, our client, to look into periods of both underperformance and over performance to see what we can learn from them. How much can be attributed to great research? Or errors in our research conclusions? Was our timing off? Or was it simply luck (good or bad)?
As we have stated in past, because we run a concentrated portfolio, there will be times when we deviate from the indices: both up and down. However, if you look at our long-term track record net of fees, we are still ahead of the S&P 500. Closer examination reveals three other periods where we underperformed by a similar magnitude and one where we underperformed more than we did this year. Following those periods, we outperformed the market and made up for lost ground. While we cannot guarantee results, we are confident in our disciplined investment process and our ability to bounce back.
In the fall of 1984, Warren Buffett gave a lecture at Columbia Business School titled, “The Superinvestors of Graham-and-Doddsville.” In this speech, he chronicled the investment performance of Benjamin Graham’s (the grandfather of value investing) former students. Included in this group were Warren Buffett, Charlie Munger, Bill Ruane, and six others. It was no surprise to learn that they all had fantastic long-term track records. What was surprising was to learn that they all underperformed their benchmarks 30-40% of the time during their careers. One reason for this is that if you want to beat the indices, your holdings must differ from them. However, by deviating from the indices, performance is almost guaranteed to be different: sometimes you will outperform and other times you will underperform. Like these well-known investors, we attempt to beat the market over time by differentiating ourselves from the indices. Therefore, some aspects of our shortfall this year can be attributed to the natural path of our investment process and philosophy.
Upon closer inspection, some of our issues were self-inflicted: we made mistakes in our research process. Three companies had a significant negative impact on our performance: Coach, Tesco, and Weight Watchers. While each company is different, we made a similar mistake with all three: we believed that their issues were cyclical (tied to the economy), when in fact they were secular (competitive and/or industry trends that are longer lasting). While we still believe all three companies are great businesses, it will take longer for these companies to fix their issues than we originally estimated.
Tesco is a great example: it has long been viewed as one of the best and largest retailers in the world, second only to Wal-Mart. Our research showed Tesco to have many of the attributes and indications that have led to successful investment outcomes in the past: an attractive valuation, high profitability, a high dividend to compensate investors for their patience, a historically stable business, dominant market share, strong international growth, and innovation in a stodgy industry (through its delivery and online ordering options). We also believed that we had a large margin of safety: our analysis concluded that Tesco’s real estate holdings were worth more than the entire company’s valuation. Our belief at the time was that the hardships Tesco faced had more to do with the overall British and European economies. We knew Tesco was under some pressure in the U.K. from discounters, but assumed that the company could maintain its dominant market share. We also believed that like the U.S. consumer, the U.K. consumer would move away from discounters when their confidence and their country’s economy improved. Another comforting sign was that Berkshire Hathaway was, and still is, one of Tesco’s largest shareholders. Given our long term focus, we tried to remain as patient as possible. However, once Tesco began to exhibit significant market share losses, we began to look into another scenario: what would happen if management cut prices to match the discounters? Our research indicated that if they did indeed slash prices, the company would no longer be able to sustain its sizeable dividend. Therefore, we sold our position. We still believe that Tesco will have its day in the sun. However, until new management finalizes and communicates a new, concrete strategy and addresses other significant operational issues, the stock
1
is not an investable idea. While it resulted in a loss, our average sale price was 32% higher than where the stock currently trades; we avoided further losses by exiting our position before additional price deterioration.
Apple is a great example of why having a long-term focus is important. It has been our second best performer this calendar year and is up more than 25%. Conversely, it was one of our worst performers last year: in 2013, the market was up more than 30%, whereas Apple was up only 5%. After reassessing our initial investment thesis last year, we determined that the company remained an innovative powerhouse, with an incredibly valuable brand, and that it was still trading at a very attractive price. Therefore, we decided to hold our position, and it paid off this year.
As value investors, we are constantly faced with challenging decisions. There are times where we have to admit that we are wrong and cut our losses, as was the case with Tesco. On the contrary, there are times where we must have the courage to remain steadfast in our initial beliefs, even when the market does not agree with us. Apple is a prime example.
Clearly we made mistakes this year, which are reflected in our performance. So what lessons did we learn? We need to be more disciplined in creating a timeline with milestones for our companies to meet in order to warrant our continued patience. As value investors, we believe that we can identify profitable companies selling at attractive prices, with economic moats and margins of safety. It is impossible to predict when other investors will see this value and bid up the stock. While we wait for other investors to acknowledge that a company is undervalued, we must remain diligent and make sure that our investment thesis remains intact and sound in nature. We will not change our long-term focus, but we will be more vigilant about cutting ties with any holding that deviates from our investment thesis.
Our research analysts are revisiting our investment thesis for each of our holdings to make sure nothing has changed. If it has, we will do a complete review. However, we firmly believe that the combination of our investment philosophy and process will continue to add value over longer periods of time. In addition, we believe many of the companies that we still own are great businesses and very attractively priced. This combination has led to outperformance in the past and we believe will continue to do so in the future.
We remain very constructive on equities because valuations are still reasonable, the global economy is improving, and stocks look cheap compared to other asset classes. In recent weeks, there has been much concern on Wall Street that emerging markets are slowing and Europe may be sliding back into a recession. It would not surprise us if emerging economies were in fact slowing, given the run they have had. However, we are not convinced that this is necessarily a bad thing, as economic growth, especially in emerging markets, is never linear, no matter how much investors would like it to be. Trying to identify trends based upon short-term economic data is difficult at best. As for a European “double-dip,” the warning signs that usually proceed a recession are simply not present: growing inflation, rising inventories, declining employment, and inverting yield curves. Presently, the opposites of these precursors are happening. We believe these concerns about Europe are the same ones we hear every year, just noise. However, we will continue to evaluate the data.
One item that could become a real concern is the potential spread of the Ebola virus. The obvious concern is its impact on human health. The less obvious concern is its impact is on the economy. What if due to Ebola concerns, people chose to remain confined in their homes? Imagine the impact on travel, restaurants, retail, and other areas of the economy. Think of the reaction of U.S. citizens after 9/11, and then put it on a global scale for a much longer period of time. This clearly has the potential to be quite serious. However, other than the African countries where it originated, there have only been two confirmed cases that originated in the U.S. and one in Spain. We will continue to monitor the situation closely. So far, concerns around this issue seem to be ahead of reality, which might be creating buying opportunities for long-term investors. For instance, many travel related industries have already sold off.
As always, we thank you for the trust you place in the Granite Value Fund and will do our best to earn it every day. If you have any questions or comments, please do not hesitate to call.
Best regards,
Scott B. Schermerhorn
2
INVESTMENT RESULTS – (Unaudited)
Total Returns* (For the periods ended October 31, 2014) | ||||||||
| Average Annual Returns | ||||||||
| One Year | Since Inception (December 22, 2011) | |||||||
Granite Value Fund | 5.65 | % | 14.54 | % | ||||
S&P 500® Index** | 17.27 | % | 20.97 | % | ||||
Russell 1000® Value Index** | 16.46 | % | 21.42 | % | ||||
Total annual operating expenses, as disclosed in the Fund’s prospectus dated February 28, 2014, were 3.32% of average daily net assets (1.35% after fee waivers/expense reimbursements by the adviser). The adviser has contractually agreed to waive or limit its fees and to assume other expenses of the Fund until February 28, 2015, so that the Total Annual Fund Operating Expenses does not exceed 1.35%. This operating expense limitation does not apply to interest, taxes, brokerage commissions, other expenditures which are capitalized in accordance with generally accepted accounting principles, other extraordinary expenses not incurred in the ordinary course of the Fund’s business, dividend expense on short sales, expenses incurred under a Rule 12b-1 plan of distribution, “acquired fund fees and expenses,” and expenses that the Fund has incurred but did not actually pay because of an expense offset arrangement.
The performance quoted represents past performance, which does not guarantee future results. The investment return and principal value of an investment will fluctuate so that an investor’s shares, when redeemed, may be worth more or less than their original cost. The returns shown do not reflect deduction of taxes that a shareholder would pay on Fund distributions or the redemption of Fund shares. Current performance of the Fund may be lower or higher than the performance quoted. The Fund’s investment objectives, risks, charges and expenses must be considered carefully before investing. Performance data current to the most recent month end may be obtained by calling 1-888-442-9893.
| * | Return figures reflect any change in price per share and assume the reinvestment of all distributions. |
| ** | The S&P 500® Index and the Russell 1000® Value Index are widely recognized unmanaged indices of equity securities and are representative of a broader domestic equity market and range of securities than is found in the Fund’s portfolio. Individuals cannot invest directly in an Index; however, an individual can invest in exchange traded funds or other investment vehicles that attempt to track the performance of a benchmark index. |
The Fund’s investment objectives, strategies, risks, charges and expenses must be considered carefully before investing. The prospectus contains this and other important information about the Fund and may be obtained by calling the same number as above. Please read it carefully before investing.
The Fund is distributed by Unified Financial Securities, Inc., member FINRA.
3
Comparison of the Growth of a $10,000 Investment in the Granite Value Fund,
the Russell 1000® Value Index, and the S&P 500® Index (Unaudited)
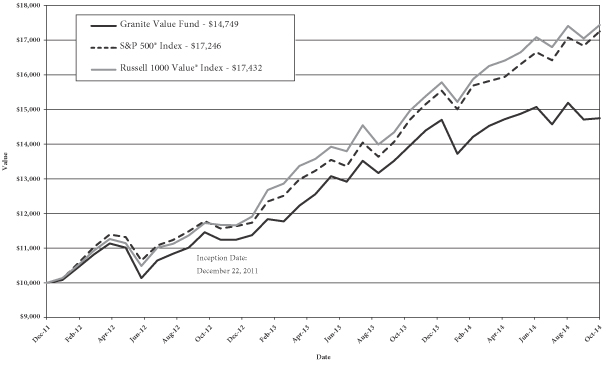
The chart above assumes an initial investment of $10,000 made on December 22, 2011 (commencement of Fund operations) and held through October 31, 2014. The S&P 500® Index and Russell 1000® Value Index are widely recognized unmanaged indices of equity securities and are representative of a broader domestic equity market and range of securities than is found in the Fund’s portfolio. Individuals cannot invest directly in an Index; however, an individual can invest in exchange traded funds or other investment vehicles that attempt to track the performance of a benchmark index. THE FUND’S RETURN REPRESENTS PAST PERFORMANCE AND DOES NOT GUARANTEE FUTURE RESULTS. The returns shown do not reflect deduction of taxes that a shareholder would pay on Fund distributions or the redemption of Fund shares. Investment returns and principal values will fluctuate so that your shares, when redeemed, may be worth more or less than their original purchase price.
Current performance may be lower or higher than the performance data quoted. For more information on the Fund, and to obtain performance data current to the most recent month end or to request a prospectus, please call 1-888-442-9893. You should carefully consider the investment objectives, potential risks, management fees, and charges and expenses of the Fund before investing. The Fund’s prospectus contains this and other information about the Fund, and should be read carefully before investing.
The Fund is distributed by Unified Financial Securities, Inc., member FINRA.
4
FUND HOLDINGS – (Unaudited)
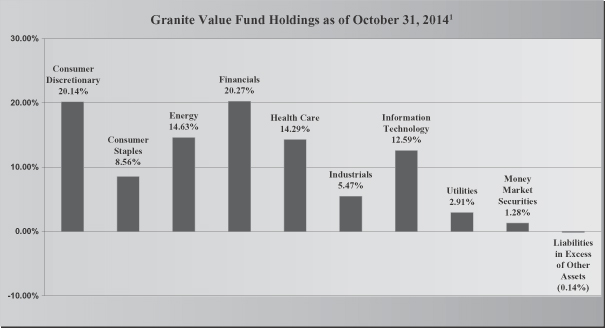
| 1 | As a percentage of net assets. |
The investment objective of the Granite Value Fund is to seek long-term capital appreciation.
Availability of Portfolio Schedule – (Unaudited)
The Fund files its complete schedule of portfolio holdings with the Securities and Exchange Commission (“SEC”) for the first and third quarters of each fiscal year on Form N-Q. The Fund’s Forms N-Q are available at the SEC’s website at www.sec.gov. The Fund’s Forms N-Q may be reviewed and copied at the SEC’s Public Reference Room in Washington DC. Information on the operation of the Public Reference Room may be obtained by calling 1-800-SEC-0330.
Summary of Fund’s Expenses – (Unaudited)
As a shareholder of the Fund, you incur two types of costs: (1) transaction costs, such as short-term redemption fees; and (2) ongoing costs, including management fees and other Fund expenses. This Example is intended to help you understand your ongoing costs (in dollars) of investing in the Fund and to compare these costs with the ongoing costs of investing in other mutual funds. The example is based on an investment of $1,000 invested at the beginning and held for the six month period, May 1, 2014 to October 31, 2014.
5
Actual Expenses
The first line of the table below provides information about actual account values and actual expenses. You may use the information in this line, together with the amount you invested, to estimate the expenses that you paid over the period. Simply divide your account value by $1,000 (for example, an $8,600 account value divided by $1,000 = $8.60), then multiply the result by the number in the first line under the heading entitled “Expenses Paid During the Period” to estimate the expenses you paid on your account during this period.
Hypothetical Example for Comparison Purposes
The second line of the table below provides information about hypothetical account values and hypothetical expenses based on the Fund’s actual expense ratio and an assumed rate of return of 5% per year before expenses, which is not the Fund’s actual return. The hypothetical account values and expenses may not be used to estimate the actual ending account balance or expenses you paid for the period. You may use this information to compare the ongoing costs of investing in the Fund and other funds. To do so, compare this 5% hypothetical example with the 5% hypothetical examples that appear in the shareholder reports of the other funds.
Please note that the expenses shown in the table are meant to highlight your ongoing costs only. Therefore, the second line of the table below is useful in comparing ongoing costs only and will not help you determine the relative costs of owning different funds.
| Granite Value Fund | Beginning May 1, 2014 | Ending Account Value October 31, 2014 | Expenses Paid May 1, 2014 – | |||||||||
Actual* | $ | 1,000.00 | $ | 1,002.10 | $ | 6.81 | ||||||
Hypothetical** | $ | 1,000.00 | $ | 1,018.40 | $ | 6.87 | ||||||
| * | Expenses are equal to the Fund’s annualized expense ratio of 1.35%, multiplied by the average account value over the period, multiplied by 184/365 (to reflect the one-half year period). |
| ** | Assumes a 5% return before expenses. |
6
GRANITE VALUE FUND
SCHEDULE OF INVESTMENTS
October 31, 2014
| COMMON STOCKS – 98.86% | Shares | Fair Value | ||||||
Consumer Discretionary – 20.14% | ||||||||
Bed Bath & Beyond, Inc. * | 6,150 | $ | 414,141 | |||||
Comcast Corp. – Class A | 7,000 | 387,450 | ||||||
Foot Locker, Inc. | 5,450 | 305,255 | ||||||
General Motors Co. | 16,890 | 530,346 | ||||||
News Corp. – Class A * | 21,830 | 337,928 | ||||||
Starz * | 10,105 | 312,245 | ||||||
Whirlpool Corp. | 2,170 | 373,348 | ||||||
|
| |||||||
| 2,660,713 | ||||||||
|
| |||||||
Consumer Staples – 8.56% | ||||||||
Coca-Cola Co./The | 9,150 | 383,202 | ||||||
Unilever PLC ADR | 10,590 | 426,036 | ||||||
Wal-Mart Stores, Inc. | 4,210 | 321,097 | ||||||
|
| |||||||
| 1,130,335 | ||||||||
|
| |||||||
Energy – 14.63% | ||||||||
Apache Corp. | 4,065 | 313,818 | ||||||
Exxon Mobil Corp. | 5,440 | 526,102 | ||||||
Southwestern Energy Co. * | 12,340 | 401,173 | ||||||
Ultra Petroleum Corp. * | 17,255 | 393,414 | ||||||
Unit Corp. * | 6,175 | 298,994 | ||||||
|
| |||||||
| 1,933,501 | ||||||||
|
| |||||||
Financials – 20.27% | ||||||||
Alleghany Corp. * | 925 | 410,959 | ||||||
American Express Co. | 4,030 | 362,498 | ||||||
American International Group, Inc. | 9,730 | 521,236 | ||||||
Berkshire Hathaway, Inc. – Class B * | 4,055 | 568,349 | ||||||
Citigroup, Inc. | 8,390 | 449,117 | ||||||
Franklin Resources, Inc. | 6,575 | 365,636 | ||||||
|
| |||||||
| 2,677,795 | ||||||||
|
| |||||||
Health Care – 14.29% | ||||||||
Baxter International, Inc. | 5,190 | 364,027 | ||||||
C.R. Bard, Inc. | 2,230 | 365,653 | ||||||
Johnson & Johnson | 3,890 | 419,264 | ||||||
Sanofi ADR | 7,395 | 341,945 | ||||||
UnitedHealth Group, Inc. | 4,185 | 397,617 | ||||||
|
| |||||||
| 1,888,506 | ||||||||
|
| |||||||
See accompanying notes which are an integral part of these financial statements.
7
GRANITE VALUE FUND
SCHEDULE OF INVESTMENTS – (continued)
October 31, 2014
| COMMON STOCKS – 98.86% – continued | Shares | Fair Value | ||||||
Industrials – 5.47% | ||||||||
Boeing Co./The | 2,830 | $ | 353,495 | |||||
Cummins, Inc. | 2,525 | 369,104 | ||||||
|
| |||||||
| 722,599 | ||||||||
|
| |||||||
Information Technology – 12.59% | ||||||||
Apple, Inc. | 4,360 | 470,880 | ||||||
Microsoft Corp. | 9,295 | 436,400 | ||||||
QUALCOMM, Inc. | 5,035 | 395,298 | ||||||
Western Union Co./The | 21,270 | 360,739 | ||||||
|
| |||||||
| 1,663,317 | ||||||||
|
| |||||||
Utilities – 2.91% | ||||||||
Calpine Corp. * | 16,875 | 385,087 | ||||||
|
| |||||||
TOTAL COMMON STOCKS (Cost $11,236,742) | 13,061,853 | |||||||
|
| |||||||
MONEY MARKET SECURITIES – 1.28% | ||||||||
Fidelity Institutional Money Market Funds – Prime Money Market Portfolio – Institutional Class, 0.06% (a) | 168,290 | 168,290 | ||||||
|
| |||||||
TOTAL MONEY MARKET SECURITIES (Cost $168,290) | 168,290 | |||||||
|
| |||||||
TOTAL INVESTMENTS – 100.14% (Cost $11,405,032) | $ | 13,230,143 | ||||||
|
| |||||||
Liabilities in Excess of Other Assets – (0.14)% | (17,975) | |||||||
|
| |||||||
TOTAL NET ASSETS – 100.00% | $ | 13,212,168 | ||||||
|
| |||||||
| (a) | Rate disclosed is the seven day yield as of October 31, 2014. |
| * | Non-income producing security. |
ADR – American Depositary Receipt
See accompanying notes which are an integral part of these financial statements.
8
GRANITE VALUE FUND
STATEMENT OF ASSETS AND LIABILITIES
October 31, 2014
Assets | ||||
Investments in securities at fair value (cost $11,405,032) | $ | 13,230,143 | ||
Receivable for fund shares sold | 3,750 | |||
Dividends receivable | 2,161 | |||
Receivable from Adviser | 1,974 | |||
Prepaid expenses | 2,020 | |||
|
| |||
Total Assets | 13,240,048 | |||
|
| |||
Liabilities | ||||
Payable to administrator, fund accountant, and transfer agent | 8,284 | |||
Payable to custodian | 300 | |||
Payable to trustees | 266 | |||
Other accrued expenses | 19,030 | |||
|
| |||
Total Liabilities | 27,880 | |||
|
| |||
Net Assets | $ | 13,212,168 | ||
|
| |||
Net Assets consist of: | ||||
Paid-in capital | $ | 10,895,419 | ||
Accumulated undistributed net investment income | 12,691 | |||
Accumulated undistributed net realized gain from investments | 478,947 | |||
Net unrealized appreciation on investments | 1,825,111 | |||
|
| |||
Net Assets | $ | 13,212,168 | ||
|
| |||
Shares outstanding | 929,309 | |||
|
| |||
Net asset value (“NAV”) and offering price per share | $ | 14.22 | ||
|
| |||
Redemption price per share (NAV * 98%) (a) | $ | 13.94 | ||
|
| |||
| (a) | The Fund charges a 2.00% redemption fee on shares redeemed in 60 days or less of purchase. Shares are redeemed at the NAV if held longer than 60 calendar days. |
See accompanying notes which are an integral part of these financial statements.
9
GRANITE VALUE FUND
STATEMENT OF OPERATIONS
For the year ended October 31, 2014
Investment Income | ||||
Dividend income (net of foreign taxes withheld of $3,910) | $ | 187,776 | ||
|
| |||
Total investment income | 187,776 | |||
|
| |||
Expenses | ||||
Investment Adviser | 123,801 | |||
Administration | 37,500 | |||
Fund accounting | 25,000 | |||
Transfer agent | 38,158 | |||
Legal | 13,845 | |||
Registration | 14,320 | |||
Custodian | 3,074 | |||
Audit | 15,000 | |||
Trustee | 6,419 | |||
Pricing | 2,009 | |||
Miscellaneous | 17,087 | |||
|
| |||
Total expenses | 296,213 | |||
|
| |||
Fees waived and reimbursed by Adviser | (129,076 | ) | ||
|
| |||
Net operating expenses | 167,137 | |||
|
| |||
Net investment income | 20,639 | |||
|
| |||
Net Realized and Unrealized Gain on Investments | ||||
Net realized gain on investment securities transactions | 490,691 | |||
Net change in unrealized appreciation of investment securities | 169,429 | |||
|
| |||
Net realized and unrealized gain on investments | 660,120 | |||
|
| |||
Net increase in net assets resulting from operations | $ | 680,759 | ||
|
| |||
See accompanying notes which are an integral part of these financial statements.
10
GRANITE VALUE FUND
STATEMENTS OF CHANGES IN NET ASSETS
| For the Year Ended October 31, 2014 | For the Year Ended October 31, 2013 | |||||||
Increase in Net Assets due to: | ||||||||
Operations | ||||||||
Net investment income | $ | 20,639 | $ | 20,979 | ||||
Net realized gain on investment transactions | 490,691 | 307,429 | ||||||
Net change in unrealized appreciation of investments | 169,429 | 1,365,378 | ||||||
|
|
|
| |||||
Net increase in net assets resulting from operations | 680,759 | 1,693,786 | ||||||
|
|
|
| |||||
Distributions | ||||||||
From net investment income | (17,290 | ) | (48,544 | ) | ||||
From net realized gains | (287,895 | ) | – | |||||
|
|
|
| |||||
Total distributions | (305,185 | ) | (48,544 | ) | ||||
|
|
|
| |||||
Capital Transactions | ||||||||
Proceeds from shares sold | 2,872,894 | 5,330,630 | ||||||
Proceeds from redemption fees (a) | 141 | – | ||||||
Reinvestment of distributions | 261,021 | 46,272 | ||||||
Amount paid for shares redeemed | (874,557 | ) | (1,194,939 | ) | ||||
|
|
|
| |||||
Net increase in net assets resulting from capital transactions | 2,259,499 | 4,181,963 | ||||||
|
|
|
| |||||
Total Increase in Net Assets | 2,635,073 | 5,827,205 | ||||||
|
|
|
| |||||
Net Assets | ||||||||
Beginning of period | 10,577,095 | 4,749,890 | ||||||
|
|
|
| |||||
End of period | $ | 13,212,168 | $ | 10,577,095 | ||||
|
|
|
| |||||
Accumulated undistributed net investment income included in net assets at end of period | $ | 12,691 | $ | 9,342 | ||||
|
|
|
| |||||
Share Transactions | ||||||||
Shares sold | 207,718 | 435,459 | ||||||
Shares issued in reinvestment of distributions | 19,067 | 4,120 | ||||||
Shares redeemed | (61,652 | ) | (97,956 | ) | ||||
|
|
|
| |||||
Net increase in shares outstanding | 165,133 | 341,623 | ||||||
|
|
|
| |||||
| (a) | The Fund charges a 2% redemption fee on shares redeemed in 60 days or less of purchase. Shares are redeemed at the NAV if held longer than 60 calendar days. |
See accompanying notes which are an integral part of these financial statements.
11
GRANITE VALUE FUND
FINANCIAL HIGHLIGHTS
(For a share outstanding during each period)
| For the Year Ended October 31, 2014 | For the Year Ended October 31, 2013 | For the Period Ended October 31, 2012 (a) | ||||||||||
Selected Per Share Data: | ||||||||||||
Net asset value, beginning of period | $ | 13.84 | $ | 11.24 | $ | 10.00 | ||||||
|
|
|
|
|
| |||||||
Income from investment operations: | ||||||||||||
Net investment income | 0.02 | 0.02 | 0.05 | (b) | ||||||||
Net realized and unrealized gain on investments | 0.74 | 2.68 | 1.19 | |||||||||
|
|
|
|
|
| |||||||
Total income from investment operations | 0.76 | 2.70 | 1.24 | |||||||||
|
|
|
|
|
| |||||||
Less distributions to shareholders: | ||||||||||||
Net investment income | (0.02 | ) | (0.10 | ) | – | |||||||
Net realized gains | (0.36 | ) | – | – | ||||||||
|
|
|
|
|
| |||||||
Total distributions | (0.38 | ) | (0.10 | ) | – | |||||||
|
|
|
|
|
| |||||||
Paid in capital from redemption fees | – | (c) | – | – | (c) | |||||||
|
|
|
|
|
| |||||||
Net asset value, end of period | $ | 14.22 | $ | 13.84 | $ | 11.24 | ||||||
|
|
|
|
|
| |||||||
Total Return (d) | 5.65 | % | 24.21 | % | 12.40 | %(e) | ||||||
Ratios and Supplemental Data: | ||||||||||||
Net assets, end of period (000) | $ | 13,212 | $ | 10,577 | $ | 4,750 | ||||||
Ratio of net expenses to average net assets | 1.35 | % | 1.35 | % | 1.35 | %(f) | ||||||
Ratio of expenses to average net assets before waiver and reimbursement | 2.39 | % | 3.32 | % | 8.11 | %(f) | ||||||
Ratio of net investment income to average net assets | 0.17 | % | 0.27 | % | 0.55 | %(f) | ||||||
Portfolio turnover rate | 30 | % | 33 | % | 20 | %(e) | ||||||
| (a) | For the period December 22, 2011 (commencement of operations) to October 31, 2012. |
| (b) | Calculated using the average shares method. |
| (c) | Resulted in less than $0.005 per share. |
| (d) | Total return in the above table represents the rate that the investor would have earned or lost on an investment in the Fund, assuming reinvestment of distributions. |
| (e) | Not annualized. |
| (f) | Annualized. |
See accompanying notes which are an integral part of these financial statements.
12
GRANITE VALUE FUND
NOTES TO THE FINANCIAL STATEMENTS
October 31, 2014
NOTE 1. ORGANIZATION
The Granite Value Fund (the “Fund”) is an open-end diversified series of the Valued Advisers Trust (the “Trust”). The Trust is a management investment company established under the laws of Delaware by an Agreement and Declaration of Trust dated June 13, 2008 (the “Trust Agreement”). The Trust Agreement permits the Trust to issue an unlimited number of shares of beneficial interest of separate series without par value. The Fund is one of a series of funds authorized by the Board of Trustees (the “Board”). The Fund commenced operations December 22, 2011. The Fund’s investment adviser is Granite Investment Advisors, Inc. (the “Adviser”). The investment objective of the Fund is to provide long-term capital appreciation.
NOTE 2. SIGNIFICANT ACCOUNTING POLICIES
The following is a summary of significant accounting policies followed by the Fund in the preparation of its financial statements. These policies are in conformity with generally accepted accounting principles in the United States of America (“GAAP”).
Securities Valuation – All investments in securities are recorded at their estimated fair value as described in Note 3.
Federal Income Taxes – The Fund makes no provision for federal income or excise tax. The Fund intends to qualify each year as a regulated investment company (“RIC”) under subchapter M of the Internal Revenue Code of 1986, as amended, by complying with the requirements applicable to RICs and by distributing substantially all of its taxable income. The Fund also intends to distribute sufficient net investment income and net capital gains, if any, so that it will not be subject to excise tax on undistributed income and gains. If the required amount of net investment income or gains is not distributed, the Fund could incur a tax expense.
As of and during the year ended October 31, 2014, the Fund did not have a liability for any unrecognized tax benefits. The Fund recognizes interest and penalties, if any, related to unrecognized tax benefits as income tax expense in the Statement of Operations. During the period, the Fund did not incur any interest or penalties. The Fund is subject to examination by U.S. federal tax authorities for all tax years since inception.
Expenses – Expenses incurred by the Trust that do not relate to a specific fund of the Trust are allocated to the individual funds based on each fund’s relative net assets or other appropriate basis.
Security Transactions and Related Income – The Fund follows industry practice and records security transactions on the trade date for financial reporting purposes. The First In, First Out method is used for determining gains or losses for financial statements and income tax purposes. Dividend income is recorded on the ex-dividend date and interest income is recorded on an accrual basis. Discounts and premiums on securities purchased are amortized or accreted using the effective interest method. Withholding taxes on foreign dividends have been provided for in accordance with the Fund’s understanding of the applicable country’s tax rules and rates. The ability of issuers of debt securities held by the Fund to meet their obligations may be affected by economic and political developments in a specific country or region.
Redemption Fees – The Fund charges a 2.00% redemption fee for shares redeemed within 60 days. These fees are deducted from the redemption proceeds otherwise payable to the shareholder. The Fund will retain the fee charged as an increase in paid-in capital and such fees become part of the Fund’s daily NAV calculation.
13
GRANITE VALUE FUND
NOTES TO THE FINANCIAL STATEMENTS – (continued)
October 31, 2014
NOTE 2. SIGNIFICANT ACCOUNTING POLICIES – continued
Dividends and Distributions – The Fund intends to distribute substantially all of its net investment income, net realized long-term capital gains and its net realized short-term capital gains, if any, to its shareholders on at least an annual basis. Dividends to shareholders, which are determined in accordance with income tax regulations, are recorded on the ex-dividend date. The treatment for financial reporting purposes of distributions made to shareholders during the year from net investment income or net realized capital gains may differ from their ultimate treatment for federal income tax purposes. These differences are caused primarily by differences in the timing of the recognition of certain components of income, expense or realized capital gain for federal income tax purposes. Where such differences are permanent in nature, they are reclassified among the components of net assets based on their ultimate characterization for federal income tax purposes. Any such reclassifications have no effect on net assets, results of operations or net asset values per share of the Fund. There were no such material reclassifications made as of October 31, 2014.
NOTE 3. SECURITIES VALUATION AND FAIR VALUE MEASUREMENTS
Fair value is defined as the price that a Fund would receive upon selling an investment in a orderly transaction to an independent buyer in the principal or most advantageous market of the investment. GAAP established a three-tier hierarchy to maximize the use of observable market data and minimize the use of unobservable inputs and to establish classification of fair value measurements for disclosure purposes.
Inputs refer broadly to the assumptions that market participants would use in pricing the asset or liability, including assumptions about risk, (ex., the risk inherent in a particular valuation technique used to measure fair value including items such as a pricing model and/or the risk inherent in the inputs to the valuation technique). Inputs may be observable or unobservable. Observable inputs are inputs that reflect the assumptions market participants would use in pricing the asset or liability developed based on market data obtained from sources independent of the reporting entity. Unobservable inputs are inputs that reflect the reporting entity’s own assumptions about the assumptions market participants would use in pricing the asset or liability developed based on the best information available in the circumstances.
Various inputs are used in determining the value of the Fund’s investments. These inputs are summarized in the three broad levels listed below.
| • | Level 1 – quoted prices in active markets for identical securities |
| • | Level 2 – other significant observable inputs (including, but not limited to, quoted prices for an identical security in an inactive market, quoted prices for similar securities, interest rates, prepayment speeds, credit risk, etc.) |
| • | Level 3 – significant unobservable inputs (including the Fund’s own assumptions in determining fair value of investments based on the best information available) |
The inputs used to measure fair value may fall into different levels of the fair value hierarchy. In such cases, for disclosure purposes, the level in the fair value hierarchy within which the fair value measurement falls in its entirety, is determined based on the lowest level input that is significant to the fair value measurement in its entirety.
Equity securities, including common stocks, are generally valued by using market quotations, furnished by a pricing service. Securities that are traded on any stock exchange are generally valued at the last quoted sale price.
14
GRANITE VALUE FUND
NOTES TO THE FINANCIAL STATEMENTS – (continued)
October 31, 2014
NOTE 3. SECURITIES VALUATION AND FAIR VALUE MEASUREMENTS – continued
Lacking a last sale price, an exchange traded security is generally valued at its last bid price. Securities traded in the NASDAQ over-the-counter market are generally valued at the NASDAQ Official Closing Price. When using the market quotations or close prices provided by the pricing service and when the market is considered active, the security is classified as a Level 1 security. Sometimes, an equity security owned by the Fund will be valued by the pricing service with factors other than market quotations or when the market is considered inactive. When this happens, the security is classified as a Level 2 security. When market quotations are not readily available, when the Fund determines that the market quotation or the price provided by the pricing service does not accurately reflect the current fair value, or when restricted or illiquid securities are being valued, such securities are valued as determined in good faith by the Fund, in conformity with guidelines adopted by and subject to review by the Board. These securities may be categorized as Level 3 securities.
Investments in open-end mutual funds, including money market mutual funds, are generally priced at the ending net asset value (NAV) provided by the service agent of the funds. These securities will be categorized as Level 1 securities.
In accordance with the Trust’s good faith pricing guidelines, the Fund is required to consider all appropriate factors relevant to the value of securities for which it has determined other pricing sources are not available or reliable as described above. No single standard exists for determining fair value, because fair value depends upon the circumstances of each individual case. As a general principle, the current fair value of an issue of securities being valued by the Fund would appear to be the amount which the owner might reasonably expect to receive for them upon their current sale. Methods which are in accordance with this principle may, for example, be based on (i) a multiple of earnings; (ii) a discount from market of a similar freely traded security (including a derivative security or a basket of securities traded on other markets, exchanges or among dealers); or (iii) yield to maturity with respect to debt issues, or a combination of these and other methods. Good faith pricing is permitted if, in the Fund’s opinion, the validity of market quotations appears to be questionable based on factors such as evidence of a thin market in the security based on a small number of quotations, a significant event occurs after the close of a market but before a Fund’s NAV calculation that may affect a security’s value, or the Fund is aware of any other data that calls into question the reliability of market quotations. Good faith pricing may also be used in instances when the bonds the Fund invests in may default or otherwise cease to have market quotations readily available. Any fair value pricing done outside the Fund’s approved pricing methods must be approved by the Pricing Committee of the Board.
The following is a summary of the inputs used to value the Fund’s investments as of October 31, 2014:
| Valuation Inputs | ||||||||||||||||
| Assets | Level 1 – Quoted Prices in Active Markets | Level 2 – Other Significant Observable Inputs | Level 3 – Significant Unobservable Inputs | Total | ||||||||||||
Common Stocks* | $ | 13,061,853 | $ | – | $ | – | $ | 13,061,853 | ||||||||
Money Market Securities | 168,290 | – | – | 168,290 | ||||||||||||
Total | $ | 13,230,143 | $ | – | $ | – | $ | 13,230,143 | ||||||||
* Refer to the Schedule of Investments for industry classifications.
15
GRANITE VALUE FUND
NOTES TO THE FINANCIAL STATEMENTS – (continued)
October 31, 2014
NOTE 3. SECURITIES VALUATION AND FAIR VALUE MEASUREMENTS – continued
The Fund did not hold any investments at any time during the reporting period in which significant unobservable inputs were used in determining fair value; therefore, no reconciliation of Level 3 securities is included for this reporting period. The Trust recognizes transfers between fair value hierarchy levels at the reporting period end. There were no transfers between any Levels for the period ended October 31, 2014 compared to the previous measurement period.
NOTE 4. FEES AND OTHER TRANSACTIONS WITH AFFILIATES
Under the terms of the management agreement, on behalf of the Fund (the “Agreement”), the Adviser manages the Fund’s investments subject to approval of the Trustees. As compensation for its management services, the Granite Value Fund is obligated to pay the Adviser a fee computed and accrued daily and paid monthly at an annual rate of 1.00% of the average daily net assets of the Fund. For the year ended October 31, 2014, the Adviser earned a fee of $123,801 from the Fund before the reimbursement described below.
The Adviser has contractually agreed to waive its management fee and/or reimburse expenses through February 28, 2015, so that total annual fund operating expenses, excluding interest, taxes, brokerage commissions, other expenditures which are capitalized in accordance with GAAP, other extraordinary expenses not incurred in the ordinary course of the Fund’s business, dividend expense on short sales, and expenses that the Fund has incurred but did not actually pay because of an expense offset arrangement, if applicable, incurred by the Fund in any fiscal year, do not exceed 1.35% of the Fund’s average daily net assets. The operating expense limitation also excludes any fees and expenses of acquired funds. For the year ended October 31, 2014, expenses totaling $129,076 were waived or reimbursed by the Adviser and are subject to potential recoupment by the Adviser until October 31, 2017. At October 31, 2014, the Adviser owed the Fund $1,974.
The amount subject to repayment by the Fund pursuant to the aforementioned conditions are as follows:
Amount | Recoverable through October 31, | |
$171,698 | 2015 | |
150,231 | 2016 | |
129,076 | 2017 |
The Trust retains Huntington Asset Services, Inc. (“HASI”) to manage the Fund’s business affairs and provide the Fund with administrative services, including all regulatory reporting and necessary office equipment and personnel. For the year ended October 31, 2014, HASI earned fees of $37,500 for administrative services provided to the Fund. At October 31, 2014, HASI was owed $3,125 from the Fund for administrative services. Certain officers and one Trustee of the Trust are members of management and/or employees of HASI. HASI is a wholly-owned subsidiary of Huntington Bancshares, Inc., the parent company of Unified Financial Securities, Inc. (the “Distributor”) and Huntington National Bank, the custodian of the Fund’s investments (the “Custodian”). For the year ended October 31, 2014, the Custodian earned fees of $3,074 for custody services provided to the Fund. At October 31, 2014, the Custodian was owed $300 from the Fund for custody services.
The Trust also retains HASI to act as the Fund’s transfer agent and to provide fund accounting services. For the year ended October 31, 2014, HASI earned fees of $38,158 for transfer agent services to the Fund. At October 31, 2014, the Fund owed HASI $3,076 for transfer agent services. For the year ended October 31, 2014, HASI earned fees of $25,000 from the Fund for fund accounting services. At October 31, 2014, HASI was owed $2,083 from the Fund for fund accounting services.
16
GRANITE VALUE FUND
NOTES TO THE FINANCIAL STATEMENTS – (continued)
October 31, 2014
NOTE 4. FEES AND OTHER TRANSACTIONS WITH AFFILIATES – continued
Unified Financial Securities, Inc. acts as the principal underwriter of the Fund’s shares. There were no payments made by the Fund to the Distributor during the year ended October 31, 2014. An officer of the Trust is an officer of the Distributor and such person may be deemed to be an affiliate of the Distributor.
The Fund has adopted a 12b-1 Plan that permits the Fund to pay 0.25% of its average daily net assets to financial institutions that provide distribution and/or shareholder servicing. The Plan has not been activated as of October 31, 2014.
NOTE 5. INVESTMENTS
For the year ended October 31, 2014, purchases and sales of investment securities, other than short-term investments and short-term U.S. government obligations, were as follows:
Purchases | ||||
U.S. Government Obligations | $ | – | ||
Other | 5,596,420 | |||
Sales | ||||
U.S. Government Obligations | $ | – | ||
Other | 3,612,575 |
NOTE 6. ESTIMATES
The preparation of financial statements in conformity with GAAP requires management to make estimates and assumptions that affect the reported amounts of assets and liabilities and disclosure of contingent assets and liabilities at the date of the financial statements and the reported amounts of increases and decreases in net assets from operations during the reporting period. Actual results could differ from those estimates.
NOTE 7. BENEFICIAL OWNERSHIP
The beneficial ownership, either directly or indirectly, of 25% or more of the voting securities of a fund creates a presumption of control of a fund, under Section 2(a) (9) of the Investment Company Act of 1940. At October 31, 2014, Charles Schwab & Co., Inc. for the benefit of its customers, owned 57.44%. The Trust does not know whether Charles Schwab & Co. or any of the underlying beneficial owners controlled 25% or more of the voting securities of the Fund.
NOTE 8. FEDERAL TAX INFORMATION
At October 31, 2014, the net unrealized appreciation (depreciation) of investments for tax purposes was as follows:
Gross Appreciation | $ | 1,962,301 | ||
Gross (Depreciation) | (142,291 | ) | ||
|
| |||
Net Appreciation (Depreciation) on Investments | $ | 1,820,010 | ||
|
|
At October 31, 2014, the aggregate cost of securities, excluding U.S. government obligations, for federal income tax purposes was $11,410,133 for the Fund.
17
GRANITE VALUE FUND
NOTES TO THE FINANCIAL STATEMENTS – (continued)
October 31, 2014
NOTE 8. FEDERAL TAX INFORMATION – continued
On December 17, 2014, the Fund paid an income distribution of $0.034827 per share and a long-term capital gain distribution of $0.538277 per share to shareholders of record.
The tax characterization of distributions for the fiscal years ended October 31, 2014 and 2013 was as follows:
| Distributions paid from: | 2014 | 2013 | ||||||
Ordinary Income* | $ | 164,135 | $ | 48,544 | ||||
Long-Term Capital Gains | $ | 141,050 | $ | – | ||||
|
|
|
| |||||
Total Distributions | $ | 305,185 | $ | 48,544 | ||||
|
|
|
| |||||
| * | Short term capital gain distributions are treated as ordinary income for tax purposes. |
At October 31, 2014, the components of distributable earnings (accumulated losses) on a tax basis were as follows:
Undistributed ordinary income | $ | 15,725 | ||
Undistributed long-term capital gain | 484,049 | |||
Accumulated capital and other losses | (3,035 | ) | ||
Net unrealized appreciation (depreciation) | 1,820,010 | |||
|
| |||
| $ | 2,316,749 | |||
|
|
At October 31, 2014, the difference between book basis and tax basis unrealized appreciation (depreciation) is primarily attributable to the tax deferral of losses on wash sales in the amount of $5,101.
At October 31, 2014, for federal income tax purposes, the Fund has no capital loss carryforwards.
NOTE 9. COMMITMENTS AND CONTINGENCIES
The Fund indemnifies its officers and trustees for certain liabilities that may arise from their performance of their duties to the Fund. Additionally, in the normal course of business, the Fund enters into contracts that contain a variety of representations and warranties which provide general indemnifications. The Fund’s maximum exposure under these arrangements is unknown, as this would involve future claims that may be made against the Fund that have not yet occurred.
NOTE 10. SUBSEQUENT EVENTS
Management of the Fund has evaluated the need for disclosures and/or adjustments resulting from subsequent events through the date these financial statements were issued. A special meeting of the shareholders of the Trust was held on December 19, 2014, for the purpose of electing the Board of Trustees, the results of the meeting can be found in the Proxy Voting Results Note (below).
NOTE 11. PROXY VOTING RESULTS (Unaudited)
On December 19, 2014 a special meeting of the shareholders of the Trust was held at the offices of the Trust for the purpose of electing each nominee to the Board of Trustees.
18
GRANITE VALUE FUND
NOTES TO THE FINANCIAL STATEMENTS – (continued)
October 31, 2014
NOTE 11. PROXY VOTING RESULTS (Unaudited) – continued
Below are the voting results for all funds from the special meeting of the Trust:
To elect each nominee to the Board of Trustees:
| For | Against | Abstain | ||||||||||
Ira Cohen | 280,591,916 | 20,930,930 | – | |||||||||
Andrea N. Mullins | 296,332,857 | 5,189,989 | – | |||||||||
R. Jeffrey Young | 280,517,160 | 21,005,685 | – | |||||||||
19
REPORT OF INDEPENDENT REGISTERED PUBLIC ACCOUNTING FIRM
To the Shareholders of Granite Value Fund and
Board of Trustees of Valued Advisers Trust
We have audited the accompanying statement of assets and liabilities, including the schedule of investments, of Granite Value Fund (the “Fund”), a series of Valued Advisers Trust, as of October 31, 2014, and the related statement of operations for the year then ended, the statements of changes in net assets for each of the two years in the period then ended, and the financial highlights for each of the three periods in the period then ended. These financial statements and financial highlights are the responsibility of the Fund’s management. Our responsibility is to express an opinion on these financial statements and financial highlights based on our audits.
We conducted our audits in accordance with the standards of the Public Company Accounting Oversight Board (United States). Those standards require that we plan and perform the audit to obtain reasonable assurance about whether the financial statements and financial highlights are free of material misstatement. An audit includes examining, on a test basis, evidence supporting the amounts and disclosures in the financial statements. Our procedures included confirmation of securities owned as of October 31, 2014, by correspondence with the custodian. An audit also includes assessing the accounting principles used and significant estimates made by management, as well as evaluating the overall financial statement presentation. We believe that our audits provide a reasonable basis for our opinion.
In our opinion, the financial statements and financial highlights referred to above present fairly, in all material respects, the financial position of the Granite Value Fund as of October 31, 2014, the results of its operations for the year then ended, the changes in its net assets for each of the two years in the period then ended, and the financial highlights for each of the three periods in the period then ended, in conformity with accounting principles generally accepted in the United States of America.

COHEN FUND AUDIT SERVICES, LTD.
Cleveland, Ohio
December 23, 2014
20
TRUSTEES AND OFFICERS (Unaudited)
The Board of Trustees supervises the business activities of the Trust. Each Trustee serves as a trustee until termination of the Trust unless the Trustee dies, resigns, retires or is removed. The following tables provide information regarding the Trustees and Officers.
The following table provides information regarding each of the Independent Trustees.
Name, Address*, (Age), Position with Trust**, Term of Position with Trust | Principal Occupation During Past 5 Years | Other Directorships | ||
Andrea N. Mullins, 47, Independent Trustee, December 2013 to present. | Private investor; Independent Contractor, Seabridge Wealth Management, LLC, since April 2014; Principal Financial Officer, Treasurer, and Secretary, Eagle Family of Funds (mutual fund family) and Vice President, Eagle Asset Management, Inc. (investment adviser) each from 2004 to 2010. | None. | ||
Ira Cohen, 55, Independent Trustee, June 2010 to present. | Independent financial services consultant (Feb. 2005 - present). | Trustee and Audit Committee Chairman, Griffin Institutional Access Real Estate Fund since May 2014. Trustee for the Angel Oak Funds Trust since October 2014. |
| * | The address for each trustee and officer is 2960 N. Meridian St., Suite 300, Indianapolis, IN 46208. |
| ** | As of the date of this SAI, the Trust consists of 14 series. |
The following table provides information regarding the Trustee who is considered an “interested person” of the Trust, as that term is defined under the 1940 Act. Based on the experience of the Trustee, the Trust concluded that the individual described below should serve as a Trustee.
Name, Address*, (Age), Position with Trust**, Term of Position with Trust | Principal Occupation During Past 5 Years | Other Directorships | ||
R. Jeffrey Young, 50, Trustee and Chairman, June 2010 to present; Principal Executive Officer and President, Valued Advisers Trust February 2010 to present. | Senior Vice President, Huntington Asset Services, Inc., the Trust’s administrator, since January 2010, Director since May 2014; Director, Unified Financial Securities, Inc., the Trust’s distributor, since May 2014; Chief Executive Officer, Huntington Funds since February 2010; Chief Executive Officer, Huntington Strategy Shares since November 2010; President and Chief Executive Officer, Dreman Contrarian Funds, March 2011 to February 2013; Trustee, Valued Advisers Trust, August 2008 to January 2010; and Managing Director of WealthStone, from 2007 to 2010. | Trustee and Chairman, Capitol Series Trust, since September 2013. |
| * | The address for each trustee and officer is 2960 N. Meridian St., Suite 300, Indianapolis, IN 46208. |
| ** | As of the date of this SAI, the Trust consists of 14 series. |
21
The following table provides information regarding the Officers of the Trust:
Name, Address*, (Age), Position with Trust,** Term of Position with Trust | Principal Occupation During Past 5 Years | Other Directorships | ||
R. Jeffrey Young, 50, Trustee and Chairman, June 2010 to present; Principal Executive Officer and President, Valued Advisers Trust February 2010 to present. | Senior Vice President, Huntington Asset Services, Inc., the Trust’s administrator, since January 2010, Director since May 2014; Director, Unified Financial Securities, Inc., the Trust’s distributor, since May 2014; Chief Executive Officer, Huntington Funds since February 2010; Chief Executive Officer, Huntington Strategy Shares since November 2010; President and Chief Executive Officer, Dreman Contrarian Funds March 2011 to February 2013; Trustee, Valued Advisers Trust, August 2008 to January 2010; and Managing Director of WealthStone, from 2007 to 2010. | Trustee and Chairman, Capitol Series Trust, since September 2013. | ||
John C. Swhear, 53, Chief Compliance Officer, AML Officer and Vice President, August 2008 to present. | Vice President of Legal Administration and Compliance, Huntington Asset Services, Inc., the Trust’s administrator, since April 2007, Director since May 2014; Chief Compliance Officer, Unified Financial Securities, Inc., the Trust’s distributor, since May 2007, Director since May 2014; President, Unified Series Trust since March 2012, Senior Vice President from May 2007 to March 2012; Chief Compliance Officer and AML Officer, Capitol Series Trust, since September 2013; Secretary, Huntington Funds from April 2010 to February 2012; President and Chief Executive Officer, Dreman Contrarian Funds from March 2010 to March 2011, Vice President and Acting Chief Executive Officer, 2007 to March 2010. | None. | ||
Carol J. Highsmith, 50, Vice President, August 2008 to present; Secretary, March 2014 to present. | Employed in various positions with Huntington Asset Services, Inc., the Trust’s administrator, since November of 1994; currently Vice President of Legal Administration; Secretary, Cross Shore Discovery Fund since May 2014. | None. | ||
Matthew J. Miller, 38, Vice President, December 2011 to present. | Employed in various positions with Huntington Asset Services, Inc., the Trust’s administrator, since July of 1998; currently Vice President of Relationship Management; Vice President, Huntington Funds since February 2010; President and Chief Executive Officer, Capitol Series Trust, since September 2013. | None. |
22
Name, Address*, (Age), Position with Trust,** Term of Position with Trust | Principal Occupation During Past 5 Years | Other Directorships | ||
Bryan W. Ashmus, 41, Principal Financial Officer and Treasurer, December 2013 to present. | Vice President, Financial Administration, Huntington Asset Services, Inc., the Trust’s administrator, since September 2013; Chief Financial Officer and Treasurer, Huntington Strategy Shares and Huntington Funds, since November 2013; Vice President, Treasurer Services, Citi Fund Services Ohio, Inc., from 2005 to 2013. | None. |
| * | The address for each trustee and officer is 2960 N. Meridian St., Suite 300, Indianapolis, IN 46208. |
| ** | As of the date of this SAI, the Trust consists of 14 series. |
23
MANAGEMENT AGREEMENT RENEWALS (Unaudited)
At a meeting held on September 16, 2014, the Board of Trustees (the “Board”) considered the renewal of the Investment Advisory Agreement (the “Agreement”) between the Trust and Granite Investment Advisers, Inc. (the “Adviser” or “Granite”) with respect to the Granite Value Fund (the “Fund”). Counsel noted that the 1940 Act requires the approval of the investment advisory agreement between the Trust and its investment adviser by the Board, including a majority of the Independent Trustees. The Board discussed the arrangements between the Adviser and the Trust with respect to the Fund. Counsel discussed with the Trustees the types of information and factors that should be considered by the Board in order to make an informed decision regarding the approval of the renewal of the Agreement, including the following material factors: (i) the nature, extent, and quality of the services provided by the Adviser; (ii) the investment performance of the Fund; (iii) the costs of the services to be provided and profits to be realized by the Adviser from the relationship with the Fund; (iv) the extent to which economies of scale would be realized if the Fund grows and whether advisory fee levels reflect those economies of scale for the benefit of the Fund’s investors; and (v) the Adviser’s practices regarding possible conflicts of interest.
Counsel reminded the Trustees of their fiduciary duties and responsibilities as summarized in the memorandum from his firm, including the factors to be considered, and the application of those factors to the Adviser. In assessing these factors and reaching its decisions, the Board took into consideration information furnished for the Board’s review and consideration throughout the year at regular Board meetings, as well as information specifically prepared and/or presented in connection with the annual renewal process, including information presented at the meeting. The Board requested and was provided with, and reflected on, information and reports relevant to the annual renewal of the Agreement, including: (i) reports regarding the services and support provided to the Fund and its shareholders by the Granite; (ii) quarterly assessments of the investment performance of the Fund by personnel of Granite; (iii) commentary on the reasons for the performance; (iv) presentations by Granite addressing Granite’s investment philosophy, investment strategy, personnel and operations; (v) compliance and audit reports concerning the Fund and Granite; (vi) disclosure information contained in the registration statement of the Trust and the Form ADV of Granite; and (vii) a memorandum from Counsel, that summarized the fiduciary duties and responsibilities of the Board in reviewing and approving the Agreement, including the material factors set forth above and the types of information included in each factor that should be considered by the Board in order to make an informed decision. The Board also requested and received various informational materials including, without limitation: (i) documents containing information about Granite, including financial information, a description of personnel and the services provided to the Fund, information on investment advice, performance, summaries of Fund expenses, compliance program, current legal matters, and other general information; (ii) comparative expense and performance information for other mutual funds with strategies similar to the Fund; and (iii) benefits to be realized by Granite from its relationship with the Fund. The Board did not identify any particular information that was most relevant to its consideration to approve the Agreement and each Trustee may have afforded different weight to the various factors.
| 1. | The nature, extent, and quality of the services to be provided by the Adviser. In this regard, the Board considered the Adviser’s responsibilities under the Advisory Agreement. The Trustees considered the services being provided by Granite to the Fund including, without limitation: the quality of its investment advisory services (including research and recommendations with respect to portfolio securities), its process for formulating investment recommendations and assuring compliance with the Fund’s investment objectives and limitations, its coordination of services for the Fund among the Fund’s service providers, and its efforts to promote the Fund and grow its assets. The Trustees considered Granite’s continuity of, and commitment to retain, qualified personnel and Granite’s commitment to maintain its resources and systems and options that allow the Fund to maintain its goals, and Granite’s continued cooperation with the Independent Trustees and Counsel for the Fund. The Trustees considered Granite’s personnel, including the education and experience of Granite’s personnel. After considering the foregoing information and further information in the Meeting materials provided by Granite (including Granite’s Form ADV), the Board concluded that, in light of all the facts and circumstances, the nature, extent, and quality of the services provided by Granite were satisfactory and adequate for the Fund. |
24
MANAGEMENT AGREEMENT RENEWALS (Unaudited)
| 2. | Investment Performance of the Fund and the Adviser. In considering the investment performance of the Fund and the Adviser, the Trustees compared the short-term performance, including the year-to-date, one month, three month, and 1-year cumulative return and since inception annualized returns of the Fund (for the periods ending July 31, 2014) with the performance of funds with similar objectives managed by other investment advisers, as well as with aggregated peer group data. The Trustees also considered the consistency of Granite’s management of the Fund with its investment objective, strategies, and limitations. The Trustees noted that while the Fund’s performance since inception was above average, the performance over the shorter timeframes was below the average of its peer group. The Trustees also considered the performance of Granite’s separate accounts that were managed in a manner similar to that of the Fund and they noted that the performance was very comparable. After reviewing and discussing the investment performance of the Fund further, Granite’s experience managing the Fund, the Fund’s historical performance, and other relevant factors, the Board concluded, in light of all the facts and circumstances, that the investment performance of the Fund and Granite, while below average, was satisfactory in light of the Fund’s relatively brief existence. |
| 3. | The costs of the services to be provided and profits to be realized by the Adviser from the relationship with the Fund. In considering the costs of services to be provided and the profits to be realized by the Adviser from the relationship with the Fund, the Trustees considered: (1) Granite’s financial condition; (2) the asset levels of the Fund; (3) the overall estimated fees and expenses of the Fund for the coming year; and (4) the nature and frequency of advisory fee payments. The Trustees reviewed information provided by Granite regarding its profits associated with managing the Fund. The Trustees also considered potential benefits for Granite in managing the Fund. The Trustees then compared the fees and expenses of the Fund (including the management fee) to other comparable mutual funds. The Trustees noted that the Fund’s management fee was among the highest in its peer group (and it was higher than its peer average and median), although the net expense ratios were only slightly above the peer average and median and could generally be viewed as comparable to that of the peers as a result of Granite’s contractual commitment to limit the expenses of the Fund. The Trustees noted that the management fee was structured differently that the fees that it charges to its separate account clients who had investment strategies and objectives similar to the Fund and that the breakpoint structure in place for separate accounts could result in higher or lower fees to the client than that of the Fund based on assets – the Trustees considered the Adviser’s rationale for this different fee structure. Based on the foregoing, the Board concluded that the fees to be paid to Granite by the Fund and the profits to be realized by the Fund, in light of all the facts and circumstances, were fair and reasonable in relation to the nature and quality of the services provided by Granite. |
| 4. | The extent to which economies of scale would be realized as the Fund grows and whether advisory fee levels reflect these economies of scale for the benefit of the Fund’s investors. In this regard, the Board considered the Fund’s fee arrangements with the Adviser. The Board considered that while the management fee remained the same at all asset levels, the Fund’s shareholders had experienced benefits from the Fund’s expense limitation arrangement. The Trustees noted Granite’s representation that it intended to keep this arrangement in place even after the expiration of the current term of the arrangement. The Trustees noted that once the Fund’s expenses fell below the cap set by the arrangement, the Fund’s shareholders would continue to benefit from the economies of scale under the Fund’s agreements with service providers other than Granite. In light of its ongoing consideration of the Fund’s asset levels, expectations for growth in the Fund, and fee levels, the Board determined that the Fund’s fee arrangements, in light of all the facts and circumstances, were fair and reasonable in relation to the nature and quality of the services provided by Granite. |
| 5. | Possible conflicts of interest and benefits to the Adviser. In considering the Adviser’s practices regarding conflicts of interest, the Trustees evaluated the potential for conflicts of interest and considered such matters as the experience and ability of the advisory personnel assigned to the Fund; the basis of decisions |
25
MANAGEMENT AGREEMENT RENEWALS (Unaudited)
| to buy or sell securities for the Fund and/or Granite’s other accounts; and the substance and administration of Granite’s code of ethics. The Trustees also considered disclosure in the registration statement of the Trust relating to Granite’s potential conflicts of interest. The Trustees considered Granite’s policies with respect to the use of soft dollars. The Trustees noted that Granite benefited from the Fund in that it is able to utilize the Fund as a vehicle into which to direct advisory clients with small account balances. The Trustees did not identify any other potential benefits (other than the management fee) that would be realized by Granite. Based on the foregoing, the Board determined that the standards and practices of Granite relating to the identification and mitigation of potential conflicts of interest and the benefits that it derives from managing the Fund are acceptable. |
After additional consideration of the factors delineated in the memorandum provided by Counsel and further discussion among the Board, the Board determined to approve the continuation of the Agreement between the Trust and the Adviser.
26
OTHER FEDERAL INCOME TAX INFORMATION (Unaudited)
The Form 1099-DIV you receive in January 2015 will show the tax status of all distributions paid to your account in calendar year 2014. Shareholders are advised to consult their own tax adviser with respect to the tax consequences of their investment in the Fund. As required by the Internal Revenue Code and/or regulations, shareholders must be notified regarding the status of qualified dividend income for individuals and the dividends received deduction for corporations.
Qualified Dividend Income. For the Fund’s fiscal year 2014 the Fund designates approximately 69.23% or up to the maximum amount of such dividends allowable pursuant to the Internal Revenue Code, as qualified dividend income eligible for the reduced tax rate of 15%.
Dividends Received Deduction. Corporate shareholders are generally entitled to take the dividends received deduction on the portion of the Fund’s dividend distribution that qualifies under tax law. For the Fund’s fiscal year 2014 ordinary income dividends, 76.37% qualifies for the corporate dividends received deduction.
For the year ended October 31, 2014, the Fund designated $146,844 as short-term capital gain distributions.
For the year ended October 31, 2014, the Fund designated $141,050 as long-term capital gain distributions.
27
OTHER INFORMATION
The Fund’s Statement of Additional Information (“SAI”) includes additional information about the trustees and is available without charge, upon request. You may call toll-free at (888) 442-9893 to request a copy of the SAI or to make shareholder inquiries.
PROXY VOTING
A description of the policies and procedures that the Fund uses to determine how to vote proxies relating to portfolio securities and information regarding how the Fund voted those proxies is available without charge upon request by (1) calling the Fund at (888) 442-9893 and (2) from Fund documents filed with the Securities and Exchange Commission (“SEC”) on the SEC’s website at www.sec.gov.
TRUSTEES
R. Jeffrey Young, Chairman
Ira Cohen
Andrea N. Mullins
OFFICERS
R. Jeffrey Young, Principal Executive Officer and President
John C. Swhear, Chief Compliance Officer, AML Officer and Vice President
Carol J. Highsmith, Vice President and Secretary
Matthew J. Miller, Vice President
Bryan W. Ashmus, Principal Financial Officer and Treasurer
INVESTMENT ADVISER
Granite Investment Advisors
11 South Main Street, Suite 501
Concord, NH 03301
DISTRIBUTOR
Unified Financial Securities, Inc.
2960 North Meridian Street, Suite 300
Indianapolis, IN 46208
INDEPENDENT REGISTERED
PUBLIC ACCOUNTING FIRM
Cohen Fund Audit Services Ltd.
1350 Euclid Avenue, Suite 800
Cleveland, OH 44115
LEGAL COUNSEL
The Law Offices of John H. Lively & Associates, Inc.
A member firm of The 1940 Act Law GroupTM
11300 Tomahawk Creek Parkway, Ste. 310
Leawood, KS 66211
CUSTODIAN
Huntington National Bank
41 South High Street
Columbus, OH 43215
ADMINISTRATOR, TRANSFER AGENT AND FUND ACCOUNTANT
Huntington Asset Services, Inc.
2960 North Meridian Street, Suite 300
Indianapolis, IN 46208
This report is intended only for the information of shareholders or those who have received the Fund’s prospectus which contains information about the Fund’s management fee and expenses. Please read the prospectus carefully before investing.
Distributed by Unified Financial Securities, Inc.
Member FINRA/SIPC
28
PRIVACY POLICY
The following is a description of the Fund’s policies regarding disclosure of nonpublic personal information that you provide to the Fund or that the Fund collects from other sources. In the event that you hold shares of the Fund through a broker-dealer or other financial intermediary, the privacy policy of your financial intermediary would govern how your nonpublic personal information would be shared with nonaffiliated third parties.
Categories of Information the Fund Collects. The Fund collects the following nonpublic personal information about you:
| • | Information the Fund receives from you on applications or other forms, correspondence, or conversations (such as your name, address, phone number, social security number, and date of birth); and |
| • | Information about your transactions with the Fund, its affiliates, or others (such as your account number and balance, payment history, cost basis information, and other financial information). |
Categories of Information the Fund Discloses. The Fund does not disclose any nonpublic personal information about its current or former shareholders to unaffiliated third parties, except as required or permitted by law. The Fund is permitted by law to disclose all of the information it collects, as described above, to service providers (such as the Fund’s custodian, administrator, transfer agent, accountant and legal counsel) to process your transactions and otherwise provide services to you.
Confidentiality and Security. The Fund restricts access to your nonpublic personal information to those persons who require such information to provide products or services to you. The Fund maintains physical, electronic, and procedural safeguards that comply with federal standards to guard your nonpublic personal information.
Disposal of Information. The Fund, through its transfer agent, has taken steps to reasonably ensure that the privacy of your nonpublic personal information is maintained at all times, including in connection with the disposal of information that is no longer required to be maintained by the Fund. Such steps shall include, whenever possible, shredding paper documents and records prior to disposal, requiring off-site storage vendors to shred documents maintained in such locations prior to disposal, and erasing and/or obliterating any data contained on electronic media in such a manner that the information can no longer be read or reconstructed.
29

Annual Report
October 31, 2014
Fund Adviser:
Kovitz Investment Group, LLC
115 South LaSalle Street, 27th Floor
Chicago, IL 60603
Toll Free (888) 695-3729
MANAGEMENT’S DISCUSSION OF FUND PERFORMANCE – FISCAL YEAR-END OCTOBER 31, 2014 – (Unaudited)
Performance
Kovitz Investment Group launched the Green Owl Intrinsic Value Fund (the Fund) with the goal of seeking long-term capital appreciation through high risk-adjusted returns. Relying on a fundamental, research-driven process, the Fund strives to build a diversified portfolio of equity investments through the purchase of competitively advantaged and financially strong companies at prices substantially less than our estimate of their intrinsic values.
For the fiscal year ending October 31, 2014, the Fund returned 8.86%. In comparison, our benchmark, the S&P 500® Index, gained 17.27% during the same period. Since inception on December 28, 2011, the Fund has returned 64.64% on a cumulative basis (19.14% on annualized basis) vs. 69.45% (20.35% annualized) for the S&P 500 over the same time period.
While reasonable on an absolute basis, the Fund’s performance significantly lagged behind that of its benchmark on a relative basis. Notwithstanding some poor outcomes this year on certain individual positions, we believe our process for selecting securities remains sound. It is our focus on the process – buying businesses we understand well, that possess durable competitive advantages, strong balance sheets and solid cash flow generation, and are trading at a significant discount to our estimate of intrinsic value – that we believe will serve our investors well.
In fact, we believe that not obsessing about our performance relative to our benchmark over short periods is the cornerstone of how we plan to outperform over longer time periods. Short-term stock gains and losses are fleeting while long-term price appreciation is driven by company fundamentals and the multiple applied to those fundamentals. We feel very strongly that our portfolio companies share strong fundamentals and are content to wait patiently for the market to place more appropriate multiples on their strong and growing free cash flows.
Keep in mind that we are in the business of finding value, not chasing performance, and to do as well as our benchmark has this year would have required us to take on more risk than we think is prudent. We will not chase returns by buying shares of highly priced social media stocks, early-stage biotechnology companies, utilities (yes, even utilities are expensive!), or other hot growth stories with poor fundamentals and uncertain prospects. “Fear of Missing Out” is not an emotion we possess. We are more concerned with the risk of suffering a permanent loss of capital than about the risk of missing opportunities, especially those that are short-term in nature. We are very grateful for a client base that shares our focus on the long-term, thus allowing us to deviate from a benchmark over short time periods. It is a very meaningful advantage.
Attribution
Our underperformance for the fiscal year was primarily attributed to poor stock selection in the Consumer Discretionary and Financial sectors, led by declines in Coach (COH), General Motors (GM) and Ocwen Financial (OCN). Also contributing to the underperformance for the year was a lack of significant exposure to the Healthcare and Utilities sectors, which were two of the best performing sectors in a period that saw all ten S&P sectors rising. Our performance was also hurt by having an average cash balance of approximately 5% during the fiscal year. With most stocks in our investment universe trading near fair value, we have found it difficult to deploy cash in a disciplined manner. A large cash position can be a negative drag in a rising market, but can become a significant source of strength when the market experiences any dislocation.
Performance was aided in the period by strong stock selection in the Consumer Staples sector and lack of significant exposure to the Energy sector.
The individual equity holdings which had the most significant positive contributions to the Fund’s absolute performance during the period were Apple (AAPL), Berkshire Hathaway (BRKB), CVS Health (CVS), Walt
1
Disney (DIS), and Wells Fargo (WFC). On the flip side, those stocks which most detracted from our absolute performance included Ocwen, Coach, Ensco (ESV), General Motors, and Viacom (VIAB).
Portfolio Activity
During the year we:
| • | Initiated positions in the following 8 companies: CBS (CBS), Citigroup (C), Ensco, National Oilwell Varco (NOV), Ocwen, Trinity Industries (TRN), Valmont Industries (VMI), and Viacom. |
| • | Increased position sizes in the following 11 companies; American International Group (AIG), Bank of America (BAC), Bed Bath & Beyond (BBBY), Boeing (BA), Coach, General Motors, Google (GOOG), JP Morgan Chase (JPM), Leucadia National (LUK), Target (TGT), and United Parcel Service (UPS). |
| • | Exited positions in the following 11 companies; DirecTV (DTV), Franklin Resources (BEN), Goldman Sachs (GS), Hertz Global Holdings (HTZ), International Business Machines (IBM), Johnson & Johnson (JNJ), Robert Half (RHI), Sysco (SYY), Trinity, Vodafone (VOD), and Weight Watchers (WTW). |
| • | Decreased position sizes in the following 3 companies; Abbott (ABT), Apple, and CVS. |
As of October 31, 2014, our five largest positions were Berkshire Hathaway, JP Morgan, Apple, Boeing, and Bed Bath & Beyond.
We remain focused on our core investment disciplines: price consciousness, strict adherence to our business fundamentals framework, and remaining unemotional regardless of the market environment.
Thank you for your continued support and trust in our ability to manage your investment in the Fund.
2
INVESTMENT RESULTS – (Unaudited)
Total Returns*
(For the periods ended October 31, 2014)
| Average Annual Returns | ||||||||
| One Year | Since Inception (December 22, 2011) (a) | |||||||
Green Owl Intrinsic Value Fund | 8.86 | % | 19.14 | % | ||||
S&P 500® Index** | 17.27 | % | 20.35 | % | ||||
Total annual operating expenses, as disclosed in the Fund’s prospectus dated February 28, 2014, were 1.54% of average daily net assets (1.12% after fee waivers/expense reimbursements by the adviser). Effective November 1, 2013, the adviser contractually agreed to waive or limit its fees and to assume other expenses of the Fund until February 28, 2017, so that the Total Annual Operating Expenses do not exceed 1.10%. This operating expense limitation does not apply to interest, taxes, brokerage commissions, other expenditures which are capitalized in accordance with generally accepted accounting principles, other extraordinary expenses not incurred in the ordinary course of the Fund’s business, dividend expense on short sales, expenses incurred under a Rule 12b-1 plan of distribution, “acquired fund fees and expenses,” and expenses that the Fund has incurred but did not actually pay because of an expense offset arrangement.
The performance quoted represents past performance, which does not guarantee future results. The investment return and principal value of an investment will fluctuate so that an investor’s shares, when redeemed, may be worth more or less than their original cost. The returns shown do not reflect deduction of taxes that a shareholder would pay on Fund distributions or the redemption of Fund shares. Current performance of the Fund may be lower or higher than the performance quoted. The Fund’s investment objectives, risks, charges and expenses must be considered carefully before investing. Performance data current to the most recent month end may be obtained by calling 1-888-695-3729.
| (a) | The Fund commenced operations on December 22, 2011. However, the Fund did not invest in long-term securities towards the investment objective until December 28, 2011. December 28, 2011 is the performance calculation inception date. |
| * | Return figures reflect any change in price per share and assume the reinvestment of all distributions. |
| ** | The S&P 500® Index is a widely recognized unmanaged index of equity securities and is representative of a broader domestic equity market and range of securities than is found in the Fund’s portfolio. Individuals cannot invest directly in the Index; however, an individual can invest in exchange traded funds or other investment vehicles that attempt to track the performance of a benchmark index. |
The Fund’s investment objectives, strategies, risks, charges and expenses must be considered carefully before investing. The prospectus contains this and other important information about the Fund and may be obtained by calling the same number as above. Please read it carefully before investing.
The Fund is distributed by Unified Financial Securities, Inc., member FINRA.
3
Comparison of the Growth of a $10,000 Investment in the Green Owl Intrinsic Value
Fund and the S&P 500® Index (Unaudited)
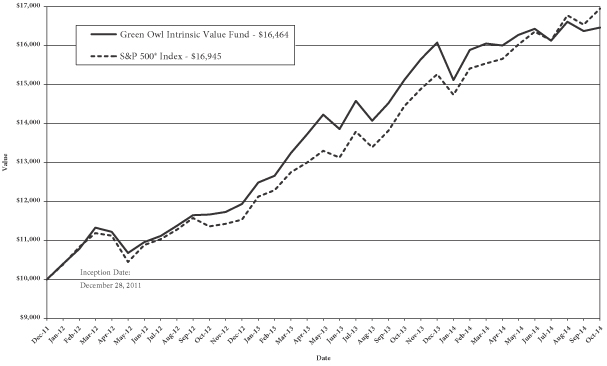
The Fund commenced operations on December 22, 2011. However, the Fund did not invest in long-term securities towards the investment objective until December 28, 2011. December 28, 2011 is the performance calculation inception date. The chart above assumes an initial investment of $10,000 made on December 28, 2011 and held through October 31, 2014. The S&P 500® Index is a widely recognized unmanaged index of equity securities and is representative of a broader domestic equity market and range of securities than is found in the Fund’s portfolio. Individuals cannot invest directly in the Index; however, an individual can invest in exchange traded funds or other investment vehicles that attempt to track the performance of a benchmark index. THE FUND’S RETURN REPRESENTS PAST PERFORMANCE AND DOES NOT GUARANTEE FUTURE RESULTS. The returns shown do not reflect deduction of taxes that a shareholder would pay on Fund distributions or the redemption of Fund shares. Investment returns and principal values will fluctuate so that your shares, when redeemed, may be worth more or less than their original purchase price.
Current performance may be lower or higher than the performance data quoted. For more information on the Fund, and to obtain performance data current to the most recent month end or to request a prospectus, please call 1-888-695-3729. You should carefully consider the investment objectives, potential risks, management fees, and charges and expenses of the Fund before investing. The Fund’s prospectus contains this and other information about the Fund, and should be read carefully before investing.
The Fund is distributed by Unified Financial Securities, Inc., member FINRA.
4
FUND HOLDINGS – (Unaudited)
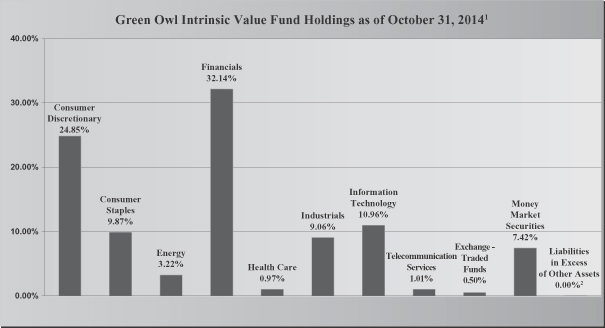
| 1As | a percentage of net assets. |
| 2Rounds | to less than 0.005%. |
The investment objective of the Green Owl Intrinsic Value Fund is long-term capital appreciation.
Availability of Portfolio Schedule – (Unaudited)
The Fund files its complete schedule of portfolio holdings with the Securities and Exchange Commission (“SEC”) for the first and third quarters of each fiscal year on Form N-Q. The Fund’s Forms N-Q are available at the SEC’s website at www.sec.gov. The Fund’s Forms N-Q may be reviewed and copied at the SEC’s Public Reference Room in Washington DC. Information on the operation of the Public Reference Room may be obtained by calling 1-800-SEC-0330.
Summary of Fund’s Expenses – (Unaudited)
As a shareholder of the Fund, you incur ongoing costs, including management fees and other Fund expenses. This example is intended to help you understand your ongoing costs (in dollars) of investing in the Fund and to compare these costs with the ongoing costs of investing in other mutual funds.
The example is based on an investment of $1,000 invested at the beginning and held for the entire period from May 1, 2014 to October 31, 2014.
5
Actual Expenses
The first line of the table below provides information about actual account values and actual expenses. You may use the information in this line, together with the amount you invested, to estimate the expenses that you paid over the period. Simply divide your account value by $1,000 (for example, an $8,600 account value divided by $1,000 = $8.60), then multiply the result by the number in the first line under the heading entitled “Expenses Paid During the Period” to estimate the expenses you paid on your account during this period.
Hypothetical Example for Comparison Purposes
The second line of the table below provides information about hypothetical account values and hypothetical expenses based on the Fund’s actual expense ratio and an assumed rate of return of 5% per year before expenses, which is not the Fund’s actual return. The hypothetical account values and expenses may not be used to estimate the actual ending account balance or expenses you paid for the period. You may use this information to compare the ongoing costs of investing in the Fund and other funds. To do so, compare this 5% hypothetical example with the 5% hypothetical examples that appear in the shareholder reports of the other funds.
Please note that the expenses shown in the table are meant to highlight your ongoing costs only. Therefore, the second line of the table below is useful in comparing ongoing costs only and will not help you determine the relative costs of owning different funds.
Green Owl Intrinsic Value Fund | Beginning May 1, 2014 | Ending Account Value October 31, 2014 | Expenses Paid May 1, 2014 – | |||||||||
Actual | $ | 1,000.00 | $ | 1,028.80 | $ | 5.63 | ||||||
Hypothetical** | $ | 1,000.00 | $ | 1,019.66 | $ | 5.60 | ||||||
| * | Expenses are equal to the Fund’s annualized expense ratio of 1.10%, multiplied by the average account value over the period, multiplied by 184/365 (to reflect the one-half year period). |
| ** | Assumes a 5% return before expenses. |
6
GREEN OWL INTRINSIC VALUE FUND
SCHEDULE OF INVESTMENTS
October 31, 2014
| Common Stocks – 92.08% | Shares | Fair Value | ||||||
Consumer Discretionary – 24.85% |
| |||||||
Bed Bath & Beyond, Inc. * | 34,125 | $ | 2,297,977 | |||||
CarMax, Inc. * | 30,240 | 1,690,718 | ||||||
CBS Corp. – Class B | 20,500 | 1,111,510 | ||||||
Coach, Inc. | 36,405 | 1,251,604 | ||||||
General Motors Co. | 70,600 | 2,216,840 | ||||||
Kohl’s Corp. | 37,500 | 2,033,250 | ||||||
Target Corp. | 34,465 | 2,130,626 | ||||||
Viacom, Inc. – Class B | 9,951 | 723,239 | ||||||
Walt Disney Co./The | 17,505 | 1,599,607 | ||||||
|
| |||||||
| 15,055,371 | ||||||||
|
| |||||||
Consumer Staples – 9.87% |
| |||||||
Coca-Cola Co./The | 28,170 | 1,179,760 | ||||||
CVS Caremark Corp. | 14,140 | 1,213,353 | ||||||
Walgreen Co. | 27,815 | 1,786,279 | ||||||
Wal-Mart Stores, Inc. | 23,565 | 1,797,303 | ||||||
|
| |||||||
| 5,976,695 | ||||||||
|
| |||||||
Energy – 3.22% |
| |||||||
Ensco PLC – Class A | 7,000 | 284,130 | ||||||
National Oilwell Varco, Inc. | 16,650 | 1,209,456 | ||||||
Transocean Ltd. | 15,350 | 457,891 | ||||||
|
| |||||||
| 1,951,477 | ||||||||
|
| |||||||
Financials – 32.14% |
| |||||||
American Express Co. | 10,815 | 972,809 | ||||||
American International Group, Inc. | 39,250 | 2,102,622 | ||||||
Bank of America Corp. | 121,600 | 2,086,656 | ||||||
Bank of New York Mellon Corp./The | 52,360 | 2,027,379 | ||||||
Berkshire Hathaway, Inc. – Class B * | 28,815 | 4,038,710 | ||||||
Citigroup, Inc. | 24,000 | 1,284,720 | ||||||
JPMorgan Chase & Co. | 41,230 | 2,493,590 | ||||||
Leucadia National Corp. | 51,485 | 1,224,313 | ||||||
Ocwen Financial Corp. * | 55,710 | 1,312,528 | ||||||
Wells Fargo & Co. | 36,350 | 1,929,822 | ||||||
|
| |||||||
| 19,473,149 | ||||||||
|
| |||||||
Health Care – 0.97% |
| |||||||
Abbott Laboratories | 13,430 | 585,414 | ||||||
|
| |||||||
Industrials – 9.06% |
| |||||||
Boeing Co./The | 19,690 | 2,459,478 | ||||||
Expeditors International of Washington, Inc. | 25,605 | 1,092,309 | ||||||
United Parcel Service, Inc. – Class B | 9,420 | 988,252 | ||||||
See accompanying notes which are an integral part of these financial statements.
7
GREEN OWL INTRINSIC VALUE FUND
SCHEDULE OF INVESTMENTS – (continued)
October 31, 2014
| Common Stocks – 92.08% – continued | Shares | Fair Value | ||||||
Valmont Industries, Inc. | 6,980 | $ | 950,467 | |||||
|
| |||||||
| 5,490,506 | ||||||||
|
| |||||||
Information Technology – 10.96% |
| |||||||
Accenture PLC – Class A | 18,315 | 1,485,713 | ||||||
Apple, Inc. | 22,820 | 2,464,560 | ||||||
Corning, Inc. | 59,340 | 1,212,316 | ||||||
Google, Inc. – Class A * | 1,073 | 609,325 | ||||||
Google, Inc. – Class C * | 1,548 | 865,456 | ||||||
|
| |||||||
| 6,637,370 | ||||||||
|
| |||||||
Telecommunication Services – 1.01% | ||||||||
Verizon Communications, Inc. | 12,233 | 614,708 | ||||||
|
| |||||||
TOTAL COMMON STOCKS (Cost $44,791,801) | 55,784,690 | |||||||
|
| |||||||
EXCHANGE-TRADED FUNDS – 0.50% iShares U.S. Oil Equipment & Services ETF | 5,000 | 303,150 | ||||||
|
| |||||||
TOTAL EXCHANGE-TRADED FUNDS (Cost $300,468) | 303,150 | |||||||
|
| |||||||
MONEY MARKET SECURITIES – 7.42% | ||||||||
Federated Treasury Obligations Fund – Service Shares, 0.01% (a) | 4,496,330 | 4,496,330 | ||||||
|
| |||||||
TOTAL MONEY MARKET SECURITIES (Cost $4,496,330) | 4,496,330 | |||||||
|
| |||||||
TOTAL INVESTMENTS – 100.00% (Cost $49,588,599) | $ | 60,584,170 | ||||||
|
| |||||||
| Liabilities in Excess of Other Assets – (0.00)% | (2,900 | ) | ||||||
|
| |||||||
| TOTAL NET ASSETS – 100.00% | $ | 60,581,270 | ||||||
|
| |||||||
| (a) | Rate disclosed is the seven day yield as of October 31, 2014. |
| * | Non-income producing security. |
See accompanying notes which are an integral part of these financial statements.
8
GREEN OWL INTRINSIC VALUE FUND
STATEMENT OF ASSETS AND LIABILITIES
October 31, 2014
Assets | ||||
Investments in securities at fair value (cost $49,588,599) | $ | 60,584,170 | ||
Receivable for fund shares sold | 42 | |||
Dividends receivable | 47,450 | |||
Prepaid expenses | 17,028 | |||
|
| |||
Total Assets | 60,648,690 | |||
|
| |||
Liabilities | ||||
Payable to Adviser | 34,346 | |||
Payable to administrator, fund accountant, and transfer agent | 9,302 | |||
Payable to custodian | 807 | |||
Payable to trustees | 105 | |||
Other accrued expenses | 22,860 | |||
|
| |||
Total Liabilities | 67,420 | |||
|
| |||
Net Assets | $ | 60,581,270 | ||
|
| |||
Net Assets consist of: | ||||
Paid-in capital | $ | 46,684,922 | ||
Accumulated undistributed net investment income | 639,007 | |||
Accumulated undistributed net realized gain from investments | 2,261,770 | |||
Net unrealized appreciation on investments | 10,995,571 | |||
|
| |||
Net Assets | $ | 60,581,270 | ||
|
| |||
Shares outstanding | 3,854,170 | |||
|
| |||
Net asset value, offering and redemption price per share | $ | 15.72 | ||
|
| |||
See accompanying notes which are an integral part of these financial statements.
9
GREEN OWL INTRINSIC VALUE FUND
STATEMENT OF OPERATIONS
For the year ended October 31, 2014
Investment Income | ||||
Dividend income (net of foreign taxes withheld of $259) | $ | 1,325,711 | ||
|
| |||
Total investment income | 1,325,711 | |||
|
| |||
Expenses | ||||
Investment Adviser | 550,767 | |||
Administration | 43,925 | |||
Fund accounting | 25,000 | |||
Transfer agent | 39,653 | |||
Legal | 17,249 | |||
Custodian | 9,086 | |||
Audit | 15,000 | |||
Trustee | 6,441 | |||
Line of credit | 2,801 | |||
Miscellaneous | 49,847 | |||
|
| |||
Total expenses | 759,769 | |||
|
| |||
Fees waived and reimbursed by Adviser | (150,715 | ) | ||
|
| |||
Net operating expenses | 609,054 | |||
|
| |||
Net investment income | 716,657 | |||
|
| |||
Net Realized and Unrealized Gain on Investments |
| |||
Net realized gain on investment securities transactions | 2,219,451 | |||
Net realized gain on option transactions | 42,321 | |||
Net change in unrealized appreciation of investment securities | 1,480,378 | |||
Net change in unrealized depreciation of option contracts | (28,291 | ) | ||
|
| |||
Net realized and unrealized gain on investments | 3,713,859 | |||
|
| |||
Net increase in net assets resulting from operations | $ | 4,430,516 | ||
|
| |||
See accompanying notes which are an integral part of these financial statements.
10
GREEN OWL INTRINSIC VALUE FUND
STATEMENTS OF CHANGES IN NET ASSETS
| For the Year Ended October 31, 2014 | For the Year Ended October 31, 2013 | |||||||
Increase in Net Assets due to: | ||||||||
Operations | ||||||||
Net investment income | $ | 716,657 | $ | 48,093 | ||||
Net realized gain on investment securities transactions and option contracts | 2,261,772 | 1,708,484 | ||||||
Net change in unrealized appreciation of investment securities and option contracts | 1,452,087 | 7,163,572 | ||||||
|
|
|
| |||||
Net increase in net assets resulting from operations | 4,430,516 | 8,920,149 | ||||||
|
|
|
| |||||
Distributions | ||||||||
From net investment income | (84,105 | ) | (104,736 | ) | ||||
From net realized gains | (1,708,485 | ) | (132,334 | ) | ||||
|
|
|
| |||||
Total distributions | (1,792,590 | ) | (237,070 | ) | ||||
|
|
|
| |||||
Capital Transactions | ||||||||
Proceeds from shares sold | 15,055,561 | 18,027,338 | ||||||
Reinvestment of distributions | 1,696,716 | 233,845 | ||||||
Amount paid for shares redeemed | (5,937,474 | ) | (4,571,936 | ) | ||||
|
|
|
| |||||
Net increase in net assets resulting from capital transactions | 10,814,803 | 13,689,247 | ||||||
|
|
|
| |||||
Total Increase in Net Assets | 13,452,729 | 22,372,326 | ||||||
|
|
|
| |||||
Net Assets | ||||||||
Beginning of period | 47,128,541 | 24,756,215 | ||||||
|
|
|
| |||||
End of period | $ | 60,581,270 | $ | 47,128,541 | ||||
|
|
|
| |||||
Accumulated undistributed net investment income included in net assets at end of period | $ | 639,007 | $ | 6,460 | ||||
|
|
|
| |||||
Share Transactions | ||||||||
Shares sold | 983,233 | 1,334,642 | ||||||
Shares issued in reinvestment of distributions | 114,954 | 19,868 | ||||||
Shares redeemed | (387,209 | ) | (333,405 | ) | ||||
|
|
|
| |||||
Net increase in shares | 710,978 | 1,021,105 | ||||||
|
|
|
| |||||
See accompanying notes which are an integral part of these financial statements.
11
GREEN OWL INTRINSIC VALUE FUND
FINANCIAL HIGHLIGHTS
(For a share outstanding during each period)
| For the Year Ended October 31, 2014 | For the Year Ended October 31, 2013 | For the Period Ended October 31, 2012(a) | ||||||||||
Selected Per Share Data: | ||||||||||||
Net asset value, beginning of period | $ | 14.99 | $ | 11.67 | $ | 10.00 | ||||||
|
|
|
|
|
| |||||||
Income from investment operations: | ||||||||||||
Net investment income | 0.19 | 0.02 | 0.02 | |||||||||
Net realized and unrealized gain on investments | 1.11 | 3.41 | 1.65 | |||||||||
|
|
|
|
|
| |||||||
Total from investment operations | 1.30 | 3.43 | 1.67 | |||||||||
|
|
|
|
|
| |||||||
Less distributions to shareholders from: | ||||||||||||
Net investment income | (0.03 | ) | (0.05 | ) | – | |||||||
Net realized gains | (0.54 | ) | (0.06 | ) | – | |||||||
|
|
|
|
|
| |||||||
Total distributions | (0.57 | ) | (0.11 | ) | – | |||||||
|
|
|
|
|
| |||||||
Net asset value, end of period | $ | 15.72 | $ | 14.99 | $ | 11.67 | ||||||
|
|
|
|
|
| |||||||
Total Return (b) | 8.86 | % | 29.59 | % | 16.70 | %(c) | ||||||
Ratios and Supplemental Data: | ||||||||||||
Net assets, end of period (000) | $ | 60,581 | $ | 47,129 | $ | 24,756 | ||||||
Ratio of net expenses to average net assets | 1.11 | %(e) | 1.40 | %(e) | 1.41 | %(d)(e) | ||||||
Ratio of expenses to average net assets before waiver and reimbursement | 1.38 | %(e) | 1.52 | %(e) | 2.11 | %(d)(e) | ||||||
Ratio of net investment income to average net assets | 1.30 | % | 0.14 | % | 0.26 | %(d) | ||||||
Portfolio turnover rate | 35 | % | 20 | % | 11 | %(c) | ||||||
| (a) | For the period December 22, 2011 (commencement of operations) to October 31, 2012. |
| (b) | Total return in the above table represents the rate that the investor would have earned or lost on an investment in the Fund, assuming reinvestment of distributions. |
| (c) | Not annualized. |
| (d) | Annualized |
| (e) | Includes 0.01%, less than 0.005% and 0.01% for line of credit fees for 2012, 2013 and 2014, respectively. |
See accompanying notes which are an integral part of these financial statements.
12
GREEN OWL INTRINSIC VALUE FUND
NOTES TO THE FINANCIAL STATEMENTS
October 31, 2014
NOTE 1. ORGANIZATION
The Green Owl Intrinsic Value Fund (the “Fund”) is an open-end diversified series of the Valued Advisers Trust (the “Trust”). The Trust is a management investment company established under the laws of Delaware by an Agreement and Declaration of Trust dated June 13, 2008 (the “Trust Agreement”). The Trust Agreement permits the Trustees to issue an unlimited number of shares of beneficial interest of separate series without par value. The Fund is one of a series of funds authorized by the Trustees. The Fund’s investment adviser is Kovitz Investment Group, LLC (the “Adviser”). The investment objective of the Fund is to provide long-term capital appreciation.
NOTE 2. SIGNIFICANT ACCOUNTING POLICIES
The following is a summary of significant accounting policies followed by the Fund in the preparation of its financial statements. These polices are in conformity with generally accepted accounting principles in the United States of America (“GAAP”).
Securities Valuation – All investments in securities are recorded at their estimated fair value as described in Note 3.
Federal Income Taxes – The Fund makes no provision for federal income or excise tax. The Fund intends to qualify each year as a regulated investment company (“RIC”) under subchapter M of the Internal Revenue Code of 1986, as amended, by complying with the requirements applicable to RICs and by distributing substantially all of its taxable income. The Fund also intends to distribute sufficient net investment income and net capital gains, if any, so that it will not be subject to excise tax on undistributed income and gains. If the required amount of net investment income or gains is not distributed, the Fund could incur a tax expense.
As of and during the fiscal year ended, October 31, 2014, the Fund did not have a liability for any unrecognized tax benefits. The Fund recognizes interest and penalties, if any, related to unrecognized tax benefits as income tax expense in the Statement of Operations. During the year, the Fund did not incur any interest or penalties. The Fund is subject to examination by U.S. federal tax authorities for all tax years since inception.
Expenses – Expenses incurred by the Trust that do not relate to a specific fund of the Trust are allocated to the individual funds based on each fund’s relative net assets or other appropriate basis (as determined by the Board of Trustees).
Security Transactions and Related Income – The Fund follows industry practice and records security transactions on the trade date for financial reporting purposes. The specific identification method is used for determining gains or losses for financial statements and income tax purposes. Dividend income is recorded on the ex-dividend date and interest income is recorded on an accrual basis. Discounts and premiums on securities purchased are amortized or accreted using the effective interest method. Withholding taxes on foreign dividends have been provided for in accordance with the Fund’s understanding of the applicable country’s tax rules and rates. The ability of issuers of debt securities held by the Fund to meet their obligations may be affected by economic and political developments in a specific country or region.
Dividends and Distributions – The Fund intends to distribute substantially all of its net investment income, net realized long-term capital gains and its net realized short-term capital gains, if any, to its shareholders on at least an annual basis. Dividends to shareholders, which are determined in accordance with income tax regulations, are recorded on the ex-dividend date. The treatment for financial reporting purposes of distributions made to
13
GREEN OWL INTRINSIC VALUE FUND
NOTES TO THE FINANCIAL STATEMENTS – (continued)
October 31, 2014
NOTE 2. SIGNIFICANT ACCOUNTING POLICIES – continued
shareholders during the year from net investment income or net realized capital gains may differ from their ultimate treatment for federal income tax purposes. These differences are caused primarily by differences in the timing of the recognition of certain components of income, expense or realized capital gain for federal income tax purposes. Where such differences are permanent in nature, they are reclassified among the components of net assets based on their ultimate characterization for federal income tax purposes. Any such reclassifications will have no effect on net assets, results of operations or net asset values per share of the Fund. For the fiscal year ended October 31, 2014, the Fund made the following reclassifications to increase (decrease) the components of net assets:
| Paid in Capital | Accumulated Undistributed Net Investment Loss | Accumulated Net Realized Gain from Investments | |||||||||||
| $ | – | $ | (5) | $ | 5 | ||||||||
Writing Options – The Fund may write covered call options on equity securities or futures contracts that the Fund is eligible to purchase to extend a holding period to obtain long-term capital gain treatment, to earn premium income, to assure a definite price for a security it has considered selling, or to close out options previously purchased. The Fund may write covered call options if, immediately thereafter, not more than 30% of its net assets would be committed to such transactions. A call option gives the holder (buyer) the right to purchase a security or futures contract at a specified price (the exercise price) at any time until a certain date (the expiration date). A call option is “covered” if the Fund owns the underlying security subject to the call option at all times during the option period, or to the extent that some or all of the risk of the option has been offset by another option. When the Fund writes a covered call option, it maintains a segregated position within its account with its Custodian or as otherwise required by the rules of the exchange the underlying security, cash or liquid portfolio securities in an amount not less than the exercise price at all times while the option is outstanding. See Note 4 for additional disclosures.
The Fund will receive a premium from writing a call option, which increases the Fund’s return in the event the option expires unexercised or is closed out at a profit. The amount of the premium will reflect, among other things, the relationship of the market price of the underlying security to the exercise price of the option and the remaining term of the option. However, there is no assurance that a closing transaction can be affected at a favorable price. During the option period, the covered call writer has, in return for the premium received, given up the opportunity for capital appreciation above the exercise price should the market price of the underlying security increase, but has retained the risk of loss should the price of the underlying security decline.
The Fund may write put options on equity securities and futures contracts that the Fund is eligible to purchase to earn premium income or to assure a definite price for a security if it is considering acquiring the security at a lower price than the current market price or to close out options previously purchased. The Fund may not write a put option if, immediately thereafter, more than 25% of its net assets would be committed to such transactions. A put option gives the holder of the option the right to sell, and the writer has the obligation to buy, the underlying security at the exercise price at any time during the option period. The operation of put options in other respects is substantially identical to that of call options. When the Fund writes a put option, it maintains a segregated position within its account with the Custodian of cash or liquid portfolio securities in an amount not less than the exercise price at all times while the put option is outstanding.
14
GREEN OWL INTRINSIC VALUE FUND
NOTES TO THE FINANCIAL STATEMENTS – (continued)
October 31, 2014
NOTE 2. SIGNIFICANT ACCOUNTING POLICIES – continued
The Fund will receive a premium from writing a put option, which increases the Fund’s return in the event the option expires unexercised or is closed out at a profit. The amount of the premium will reflect, among other things, the relationship of the market price of the underlying security to the exercise price of the option and the remaining term of the option. The risks involved in writing put options include the risk that a closing transaction cannot be effected at a favorable price and the possibility that the price of the underlying security may fall below the exercise price, in which case the Fund may be required to purchase the underlying security at a higher price than the market price of the security at the time the option is exercised, resulting in a potential capital loss unless the security subsequently appreciates in value. During the fiscal year ended October 31, 2014, the Fund utilized covered call options to extend the holding period to obtain long-term capital gain treatment and to take advantage of the option premium to garner a higher exit price than would have been available by immediately selling the stock.
NOTE 3. SECURITIES VALUATION AND FAIR VALUE MEASUREMENTS
Fair value is defined as the price that a Fund would receive upon selling an investment in an orderly transaction to an independent buyer in the principal or most advantageous market of the investment. GAAP established a three-tier hierarchy to maximize the use of observable market data and minimize the use of unobservable inputs and to establish classification of fair value measurements for disclosure purposes.
Inputs refer broadly to the assumptions that market participants would use in pricing the asset or liability, including assumptions about risk; for example, the risk inherent in a particular valuation technique used to measure fair value including items such as a pricing model and/or the risk inherent in the inputs to the valuation technique. Inputs may be observable or unobservable. Observable inputs are inputs that reflect the assumptions market participants would use in pricing the asset or liability developed based on market data obtained from sources independent of the reporting entity. Unobservable inputs are inputs that reflect the reporting entity’s own assumptions about the assumptions market participants would use in pricing the asset or liability developed based on the best information available in the circumstances.
Various inputs are used in determining the value of the Fund’s investments. These inputs are summarized in the three broad levels listed below.
| • | Level 1 – quoted prices in active markets for identical securities |
| • | Level 2 – other significant observable inputs (including, but not limited to, quoted prices for an identical security in an inactive market, quoted prices for similar securities, interest rates, prepayment speeds, credit risk, etc.) |
| • | Level 3 – significant unobservable inputs (including the Fund’s own assumptions in determining fair value of investments based on the best information available) |
The inputs used to measure fair value may fall into different levels of the fair value hierarchy. In such cases, for disclosure purposes, the level in the fair value hierarchy within which the fair value measurement falls in its entirety, is determined based on the lowest level input that is significant to the fair value measurement in its entirety.
Equity securities, including common stocks, are generally valued by using market quotations, but may be valued on the basis of prices furnished by a pricing service when the Fund believes such prices more accurately reflect
15
GREEN OWL INTRINSIC VALUE FUND
NOTES TO THE FINANCIAL STATEMENTS – (continued)
October 31, 2014
NOTE 3. SECURITIES VALUATION AND FAIR VALUE MEASUREMENTS – continued
the fair value of such securities. Securities that are traded on any stock exchange are generally valued by the pricing service at the last quoted sale price. Lacking a last sale price, an exchange traded security is generally valued by the pricing service at its last bid price. Securities traded in the NASDAQ over-the-counter market are generally valued by the pricing service at the NASDAQ Official Closing Price. When using the market quotations or close prices provided by the pricing service and when the market is considered active, the security will be classified as a Level 1 security. Sometimes, an equity security owned by the Fund will be valued by the pricing service with factors other than market quotations or when the market is considered inactive. When this happens, the security will be classified as a Level 2 security. When market quotations are not readily available, when the Fund determines that the market quotation or the price provided by the pricing service does not accurately reflect the current fair value, or when restricted or illiquid securities are being valued, such securities are valued as determined in good faith by the Fund, in conformity with guidelines adopted by and subject to review by the Board. These will generally be categorized as Level 3 securities.
Investments in open-end mutual funds, including money market mutual funds, are generally priced at the ending net asset value (NAV) provided by the service agent of the funds. These securities are categorized as Level 1 securities.
Written option contracts that the Fund invests in are generally traded on an exchange. The options in which the Fund invests are generally valued at the last trade price as provided by a pricing service. If the last sale price is not available, the options will be valued at the mean of the last bid and ask prices. The options will generally be categorized as Level 1 securities. If the Fund decides that a price provided by the pricing service does not accurately reflect the fair value of the securities, when prices are not readily available from a pricing service, or when restricted or illiquid securities are being valued, securities are valued at fair value as determined in good faith by the Fund, in conformity with guidelines adopted by and subject to review of the Board. These securities will generally be categorized as Level 3 securities.
Short-term investments in fixed income securities, (those with maturities of less than 60 days when acquired, or which subsequently are within 60 days of maturity), are valued by using the amortized cost method of valuation, which the Board has determined represents fair value. These securities will be classified as Level 2 securities.
In accordance with the Trust’s good faith pricing guidelines, the Fund is required to consider all appropriate factors relevant to the value of securities for which it has determined other pricing sources are not available or reliable as described above. No single standard exists for determining fair value, because fair value depends upon the circumstances of each individual case. As a general principle, the current fair value of an issue of securities being valued by the Fund would appear to be the amount which the owner might reasonably expect to receive for them upon their current sale. Methods which are in accordance with this principle may, for example, be based on (i) a multiple of earnings; (ii) a discount from market of a similar freely traded security (including a derivative security or a basket of securities traded on other markets, exchanges or among dealers); or (iii) yield to maturity with respect to debt issues, or a combination of these and other methods. Good faith pricing is permitted if, in the Fund’s opinion, the validity of market quotations appears to be questionable based on factors such as evidence of a thin market in the security based on a small number of quotations, a significant event occurs after the close of a market but before a Fund’s NAV calculation that may affect a security’s value, or the Fund is aware of any other data that calls into question the reliability of market quotations. Good faith pricing may also be used in instances when the bonds the Fund invests in may default or otherwise cease to have market quotations readily available. Any fair value pricing done outside the Fund’s approved pricing methods must be approved by the Pricing Committee of the Board.
16
GREEN OWL INTRINSIC VALUE FUND
NOTES TO THE FINANCIAL STATEMENTS – (continued)
October 31, 2014
NOTE 3. SECURITIES VALUATION AND FAIR VALUE MEASUREMENTS – continued
The following is a summary of the inputs used to value the Fund’s investments as of October 31, 2014:
Valuation Inputs | ||||||||||||||||
| Assets | Level 1 – Quoted Prices in Active Markets | Level 2 – Other Significant Observable Inputs | Level 3 – Significant Unobservable Inputs | Total | ||||||||||||
Common Stocks* | $ | 55,784,690 | $ | – | $ | – | $ | 55,784,690 | ||||||||
Exchange-Traded Funds | 303,150 | – | – | 303,150 | ||||||||||||
Money Market Securities | 4,496,330 | – | – | 4,496,330 | ||||||||||||
Total | $ | 60,584,170 | $ | – | $ | – | $ | 60,584,170 | ||||||||
* Refer to the Schedule of Investments for industry classifications.
The Fund did not hold any investments at any time during the reporting period in which significant unobservable inputs were used in determining fair value; therefore, no reconciliation of Level 3 securities is included for this reporting period. The Trust recognizes transfers between fair value hierarchy levels at the reporting period end. There were no transfers between any Levels for the fiscal year ended October 31, 2014.
NOTE 4. DERIVATIVE TRANSACTIONS
Call options written are presented separately on the Statement of Assets and Liabilities as a liability at fair value and on the Statement of Operations under net realized gain on option transactions and change in unrealized depreciation on option contracts, respectively. As of October 31, 2014, there were no open written call options outstanding.
For the fiscal year ended October 31, 2014 :
| Derivatives | Location of Gain (Loss) on Derivatives on Statement of Operations | Realized Gain (Loss) on Derivatives | Change in Unrealized Appreciation (Depreciation) on Derivatives | |||||||
Equity Risk: | ||||||||||
Written Call Options | Net realized and unrealized gain/loss on option contracts | $ | 42,321 | $ | (28,291) | |||||
Transactions in written options by the Fund during the fiscal year ended October 31, 2014, were as follows:
| Number of Contracts | Premiums Received | |||||||
Options outstanding at October 31, 2013 | 122 | $ | 42,321 | |||||
Options expired | (122 | ) | (42,321 | ) | ||||
|
|
|
| |||||
Options outstanding at October 31, 2014 | – | $ | – | |||||
|
|
|
| |||||
17
GREEN OWL INTRINSIC VALUE FUND
NOTES TO THE FINANCIAL STATEMENTS – (continued)
October 31, 2014
NOTE 5. ADVISER FEES AND OTHER TRANSACTIONS
Under the terms of the management agreement, on behalf of the Fund (the “Agreement”), the Adviser manages the Fund’s investments subject to approval by the Trustees. As compensation for its management services, the Fund is obligated to pay the Adviser a fee computed and accrued daily and paid monthly at an annual rate of 1.00% of the average daily net assets of the Fund. For the fiscal year ended October 31, 2014, the Adviser earned a fee of $550,767 from the Fund before the reimbursement described below. At October 31, 2014, the Fund owed the Adviser $34,346.
Effective November 1, 2013, the Adviser has contractually agreed to waive its management fee and/or reimburse expenses so that total annual fund operating expenses, excluding interest, taxes, brokerage commissions, other expenditures which are capitalized in accordance with GAAP, other extraordinary expenses not incurred in the ordinary course of the Fund’s business, dividend expense on short sales, and expenses that the Fund has incurred but did not actually pay because of an expense offset arrangement, if applicable, incurred by the Fund in any fiscal year, do not exceed 1.10% of the Fund’s average daily net assets through February 28, 2017. The operating expense limitation also excludes any fees and expenses of acquired funds.
For the fiscal year ended October 31, 2014, expenses totaling $150,715 were waived or reimbursed by the Adviser. Each waiver or reimbursement by the Adviser with respect to the Fund is subject to repayment by the Fund within the three fiscal years following the fiscal year in which that particular waiver or reimbursement occurred, provided that the Fund is able to make the repayment without exceeding the expense limitation in effect at the time of the waiver and any expense limitation in place at the time of repayment.
The amounts subject to repayment by the Fund pursuant to the aforementioned conditions are as follows:
Amount | Recoverable through October 31, | |||
$ 115,029 | 2015 | |||
40,437 | 2016 | |||
150,715 | 2017 | |||
The Trust retains Huntington Asset Services, Inc. (“HASI”) to manage the Fund’s business affairs and provide the Fund with administrative services, including all regulatory reporting and necessary office equipment and personnel. For the fiscal year ended October 31, 2014, HASI earned fees of $43,925 for administrative services provided to the Fund. At October 31, 2014, HASI was owed $4,018 from the Fund for administrative services. Certain officers and one Trustee of the Trust are members of management and/or employees of HASI. HASI is a wholly-owned subsidiary of Huntington Bancshares, Inc., the parent company of Unified Financial Securities, Inc. (the “Distributor”) and Huntington National Bank (“Huntington”), the custodian of the Fund’s investments (the “Custodian”). For the fiscal year ended October 31, 2014, the Custodian earned fees of $9,086 for custody services provided to the Fund. At October 31, 2014, the Custodian was owed $807 from the Fund for custody services.
The Trust also retains HASI to act as the Fund’s transfer agent and to provide fund accounting services. For the fiscal year ended October 31, 2014, HASI earned fees of $39,653 for transfer agent services to the Fund. At October 31, 2014, the Fund owed HASI $3,201 for transfer agent services. For the fiscal year ended October 31, 2014, HASI earned fees of $25,000 from the Fund for fund accounting services. At October 31, 2014, HASI was owed $2,083 from the Fund for fund accounting services.
18
GREEN OWL INTRINSIC VALUE FUND
NOTES TO THE FINANCIAL STATEMENTS – (continued)
October 31, 2014
NOTE 5. ADVISER FEES AND OTHER TRANSACTIONS – continued
During the fiscal year ended October 31, 2014, the Fund paid $8,178 to Kovitz Securities, LLC, an affiliate of the Adviser, on the execution of purchases and sales of the Fund’s portfolio investments.
Unified Financial Securities, Inc. (the “Distributor”) acts as the principal underwriter of the Fund’s shares. There were no payments made by the Fund to the Distributor during the fiscal year ended October 31, 2014. An officer of the Trust is an officer of the Distributor and such person may be deemed to be an affiliate of the Distributor.
NOTE 6. LINE OF CREDIT
The Fund participates in a short-term committed credit agreement (“Line of Credit”) with Huntington, expiring on September 11, 2015. Under the terms of the agreement, the Fund may borrow the lesser of $1,000,000 or 5% of the Fund’s daily market value at an interest rate of LIBOR plus 150 basis points. The purpose of the agreement is to meet temporary or emergency cash needs, including redemption requests that might otherwise require the untimely disposition of securities. As of October 31, 2014, the Fund had no outstanding borrowings under this Line of Credit.
Average Daily Loan Balance | Weighted Rate | Number of Days Outstanding* | Interest Expense Incurred | Maximum Loan Outstanding | ||||||||||||
$ 370,674 | 1.67 | % | 5 | $ | 69 | $ | 370,674 | |||||||||
| * | Number of Days Outstanding represents the total days during the fiscal year ended October 31, 2014 that the Fund utilized the Line of Credit. |
NOTE 7. INVESTMENTS
For the fiscal year ended October 31, 2014, purchases and sales of investment securities, other than short-term investments and short-term U.S. government obligations, were as follows:
Purchases | ||||
U.S. Government Obligations | $ | – | ||
Other | 24,547,707 | |||
Sales | ||||
U.S. Government Obligations | $ | – | ||
Other | 18,620,278 |
NOTE 8. ESTIMATES
The preparation of financial statements in conformity with GAAP requires management to make estimates and assumptions that affect the reported amounts of assets and liabilities and disclosure of contingent assets and liabilities at the date of the financial statements and the reported amounts of increases and decreases in net assets from operations during the reporting period. Actual results could differ from those estimates.
NOTE 9. BENEFICIAL OWNERSHIP
The beneficial ownership, either directly or indirectly, of 25% or more of the voting securities of a fund creates a presumption of control of a fund, under Section 2(a) (9) of the Investment Company Act of 1940. At October 31,
19
GREEN OWL INTRINSIC VALUE FUND
NOTES TO THE FINANCIAL STATEMENTS – (continued)
October 31, 2014
2014, Charles Schwab & Co., Inc., for the benefit of its customers, owned 38.41% of the Fund. It is not known whether Charles Schwab or any of the underlying beneficial owners owned or controlled 25% or more of the voting securities of the Fund.
NOTE 10. FEDERAL TAX INFORMATION
At October 31, 2014, the net unrealized appreciation (depreciation) on investments for tax purposes was as follows:
Gross Appreciation | $ | 12,082,816 | ||
Gross (Depreciation) | (1,139,718 | ) | ||
|
| |||
Net Unrealized Appreciation (Depreciation) on Investments | $ | 10,943,098 | ||
|
|
At October 31, 2014, the aggregate cost of securities for federal income tax purposes was $49,641,072.
On December 17, 2014, the Fund paid an income distribution of $0.199132 and a long-term capital gain distribution of $0.602462 per share to shareholders of record.
The tax characterization of distributions for the fiscal years ended October 31, 2014 and 2013 was as follows:
| 2014 | 2013 | |||||||
Distributions paid from: | ||||||||
Ordinary Income* | $ | 150,409 | $ | 237,070 | ||||
Long Term Capital Gains | 1,642,181 | – | ||||||
|
|
|
| |||||
Total Distributions | $ | 1,792,590 | $ | 237,070 | ||||
|
|
|
| |||||
| * | Short term capital gain distributions are treated as ordinary income for tax purposes. |
At October 31, 2014, the components of distributable earnings on a tax basis were as follows:
Undistributed ordinary income | $ | 642,020 | ||
Undistributed long term capital gains | 2,314,243 | |||
Net unrealized appreciation (depreciation) | 10,943,098 | |||
Accumulated capital and other losses | (3,013 | ) | ||
|
| |||
| $ | 13,896,348 | |||
|
|
As of October 31, 2014, the difference between book basis and tax basis unrealized appreciation/(depreciation) is primarily attributable to wash sales.
NOTE 11. COMMITMENTS AND CONTINGENCIES
The Fund indemnifies its officers and trustees for certain liabilities that may arise from their performance of their duties to the Fund. Additionally, in the normal course of business, the Fund enters into contracts that contain a variety of representations and warranties which provide general indemnifications. The Fund’s maximum exposure under these arrangements is unknown, as this would involve future claims that may be made against the Fund that have not yet occurred.
20
GREEN OWL INTRINSIC VALUE FUND
NOTES TO THE FINANCIAL STATEMENTS – (continued)
October 31, 2014
NOTE 12. SUBSEQUENT EVENTS
Management of the Fund has evaluated the need for disclosures and/or adjustments resulting from subsequent events through the date these financial statements were issued. A special meeting of the shareholders of the Trust was held on December 19, 2014, for the purpose of electing the Board of Trustees, the results of the meeting can be found in the Proxy Voting Results Note (below).
NOTE 13. PROXY VOTING RESULTS (Unaudited)
On December 19, 2014 a special meeting of the shareholders of the Trust was held at the offices of the Trust for the purpose of electing each nominee to the Board of Trustees.
Below are the voting results for all funds from the special meeting of the Trust:
| To elect each nominee to the Board of Trustees: | ||||||||||||
| For | Against | Abstain | ||||||||||
| Ira Cohen | 280,591,916 | 20,930,930 | — | |||||||||
| Andrea N. Mullins | 296,332,857 | 5,189,989 | — | |||||||||
| R. Jeffrey Young | 280,517,160 | 21,005,685 | — | |||||||||
21
REPORT OF INDEPENDENT REGISTERED PUBLIC ACCOUNTING FIRM
To the Shareholders of Green Owl Intrinsic Value Fund and
Board of Trustees of Valued Advisers Trust
We have audited the accompanying statement of assets and liabilities, including the schedule of investments, of Green Owl Intrinsic Value Fund (the “Fund”), a series of Valued Advisers Trust, as of October 31, 2014, and the related statement of operations for the year then ended, the statements of changes in net assets for each of the two years in the period then ended, and the financial highlights for each of the three periods in the period then ended. These financial statements and financial highlights are the responsibility of the Fund’s management. Our responsibility is to express an opinion on these financial statements and financial highlights based on our audits.
We conducted our audits in accordance with the standards of the Public Company Accounting Oversight Board (United States). Those standards require that we plan and perform the audit to obtain reasonable assurance about whether the financial statements and financial highlights are free of material misstatement. An audit includes examining, on a test basis, evidence supporting the amounts and disclosures in the financial statements. Our procedures included confirmation of securities owned as of October 31, 2014, by correspondence with the custodian. An audit also includes assessing the accounting principles used and significant estimates made by management, as well as evaluating the overall financial statement presentation. We believe that our audits provide a reasonable basis for our opinion.
In our opinion, the financial statements and financial highlights referred to above present fairly, in all material respects, the financial position of Green Owl Intrinsic Value Fund as of October 31, 2014, the results of its operations for the year then ended, the changes in its net assets for each of the two years in the period then ended, and the financial highlights for each of the three periods in the period then ended, in conformity with accounting principles generally accepted in the United States of America.

COHEN FUND AUDIT SERVICES, LTD.
Cleveland, Ohio
December 23, 2014
22
TRUSTEES AND OFFICERS (Unaudited)
The Board of Trustees supervises the business activities of the Trust. Each Trustee serves as a trustee until termination of the Trust unless the Trustee dies, resigns, retires or is removed.
The following tables provide information regarding the Trustees and Officers.
The following table provides information regarding each of the Independent Trustees.
| Name, Address*, (Age), Position with Trust**, Term of Position with Trust | Principal Occupation During Past 5 Years | Other Directorships | ||
Ira Cohen, 55, Independent Trustee, June 2010 to present. | Independent financial services consultant, since February 2005. | Trustee and Audit Committee Chairman, Griffin Institutional Access Real Estate Fund, since May 2014; Trustee for Angel Oak Funds Trust, since October 2014. | ||
Andrea N. Mullins, 47, Independent Trustee, December 2013 to present. | Private investor; Independent Contractor, Seabridge Wealth Management, LLC, since April 2014; Principal Financial Officer, Treasurer, and Secretary Eagle Family of Funds (mutual fund family) and Vice President, Eagle Asset Management, Inc. (investment adviser) each from 2004 to 2010. | None. |
| * | The address for each trustee and officer is 2960 N. Meridian St., Suite 300, Indianapolis, IN 46208. |
| ** | As of the date of this SAI, the Trust consists of 14 series. |
The following table provides information regarding the Trustee who is considered an “interested person” of the Trust, as that term is defined under the 1940 Act. Based on the experience of the Trustee, the Trust concluded that the individual described below should serve as a Trustee.
| Name, Address*, (Age), Position with Trust**, Term of Position with Trust | Principal Occupation During Past 5 Years | Other Directorships | ||
R. Jeffrey Young, 50, Trustee and Chairman, June 2010 to present; Principal Executive Officer and President, Valued Advisers Trust February 2010 to present. | Senior Vice President, Huntington Asset Services, Inc., the Trust’s administrator, since January 2010, Director since May 2014; Chief Executive Officer, Huntington Funds, since February 2010; Chief Executive Officer, Huntington Strategy Shares, since November 2010; Director, Unified Financial Securities, Inc., the Trust’s distributor, since May 2014; President and Chief Executive Officer, Dreman Contrarian Funds, from March 2011 to February 2013; Trustee, Valued Advisers Trust, from August 2008 to January 2010; and Managing Director of WealthStone, from 2007 to 2010. | Trustee and Chairman, Capitol Series Trust, since September 2013. |
| * | The address for each trustee and officer is 2960 N. Meridian St., Suite 300, Indianapolis, IN 46208. |
| ** | As of the date of this SAI, the Trust consists of 14 series. |
23
The following table provides information regarding the Officers of the Trust:
| Name, Address*, (Age), Position with Trust,** Term of Position with Trust | Principal Occupation During Past 5 Years | Other Directorships | ||
| R. Jeffrey Young, 50, Trustee and Chairman, June 2010 to present; Principal Executive Officer and President, Valued Advisers Trust February 2010 to present. | Senior Vice President, Huntington Asset Services, Inc., the Trust’s administrator, since January 2010, Director since May 2014; Chief Executive Officer, Huntington Funds, since February 2010; Chief Executive Officer, Huntington Strategy Shares, since November 2010; Director, Unified Financial Securities, Inc., the Trust’s distributor, since May 2014; President and Chief Executive Officer, Dreman Contrarian Funds, from March 2011 to February 2013; Trustee, Valued Advisers Trust, from August 2008 to January 2010; and Managing Director of WealthStone, from 2007 to 2010. | Trustee and Chairman, Capitol Series Trust, since September 2013. | ||
| John C. Swhear, 53, Chief Compliance Officer, AML Officer and Vice President, August 2008 to present. | Vice President of Legal Administration and Compliance, Huntington Asset Services, Inc., the Trust’s administrator, since April 2007, Director since May 2014; Chief Compliance Officer, Unified Financial Securities, Inc., the Trust’s distributor, since May 2007, Director since May 2014; President, Unified Series Trust, since March 2012, and Senior Vice President from May 2007 to March 2012; Chief Compliance Officer and AML Officer, Capitol Series Trust, since September 2013; Secretary, Huntington Funds, from April 2010 to February 2012; President and Chief Executive Officer, Dreman Contrarian Funds, from March 2010 to March 2011, and Vice President and Acting Chief Executive Officer, from 2007 to March 2010. | None. | ||
| Carol J. Highsmith, 50, Vice President, August 2008 to present; Secretary, March 2014 to present | Employed in various positions with Huntington Asset Services, Inc., the Trust’s administrator, since November of 1994; currently Vice President of Legal Administration; Secretary, Cross Shore Discovery Fund Since May 2014. | None. | ||
| Matthew J. Miller, 38, Vice President, December 2011 to present. | Employed in various positions with Huntington Asset Services, Inc., the Trust’s administrator, since July of 1998; currently Vice President of Relationship Management; Vice President, Huntington Funds, since February 2010; President and Chief Executive Officer, Capitol Series Trust, since September 2013. | None. | ||
| Bryan W. Ashmus, 41, Principal Financial Officer and Treasurer, December 2013 to present. | Vice President, Financial Administration, Huntington Asset Services, Inc., the Trust’s administrator, since September 2013; Chief Financial Officer and Treasurer, Huntington Strategy Shares and Huntington Funds, since November 2013; Vice President, Treasurer Services, Citi Fund Services Ohio, Inc., from 2005 to 2013. | None. |
| * | The address for each trustee and officer is 2960 N. Meridian St., Suite 300, Indianapolis, IN 46208. |
| ** | As of the date of this SAI, the Trust consists of 14 series. |
24
OTHER INFORMATION
The Fund’s Statement of Additional Information (“SAI”) includes additional information about the trustees and is available without charge, upon request. You may call toll-free at (888) 695-3729 to request a copy of the SAI or to make shareholder inquiries.
25
BOARD CONSIDERATIONS IN CONTINUING THE ADVISORY AGREEMENT
At an in-person meeting held on June 3-4, 2014 the Board of Trustees (the “Board”) of the Trust considered the approval of the continuation of the Advisory Agreement (the “Agreement”) between the Trust and Kovitz Investment Group, LLC (the “Adviser” or “Kovitz”) on behalf of the Green Owl Intrinsic Value Fund (the “Fund”). Kovitz provided written information to the Board to assist the Board in its considerations.
Counsel discussed with the Trustees the types of information and factors that should be considered by the Board in order to make an informed decision regarding the approval of the Agreement, including the following material factors: (i) the nature, extent, and quality of the services to be provided by Kovitz; (ii) the investment performance of the Fund; (iii) the costs of the services to be provided and anticipated profits to be realized by Kovitz from the relationship with the Fund; (iv) the extent to which economies of scale would be realized if the Fund grows and whether advisory fee levels reflect those economies of scale for the benefit of the Fund’s investors; and (v) Kovitz’s practices regarding possible conflicts of interest and potential benefits derived from its relationship with the Fund (generally, these factors are referred to as the “Factors”).
In assessing the Factors and reaching its decision, the Board took into consideration information furnished for the Board’s review and consideration throughout the year at regular Board meetings, as well as information specifically requested and prepared and/or presented in connection with the annual renewal process, including information presented at the Meeting. The Board was provided with information and reports relevant to the annual renewal of the Agreement, including (i) reports regarding the services and support provided to the Fund and its shareholders by Kovitz; (ii) quarterly assessments of the investment performance of the Fund by personnel of Kovitz; (iii) commentary on the reasons for the performance; (iv) presentations by Kovitz addressing investment philosophy, investment strategy, personnel and operations of Kovitz; (v) compliance and audit reports concerning the Fund and Kovitz; (vi) disclosure information contained in the registration statement of the Trust with respect to the Fund and the Form ADV of Kovitz; and (vii) a memorandum from Counsel, that summarized the fiduciary duties and responsibilities of the Board in reviewing and approving the Agreement, including the material Factors set forth above and the types of information included in each Factor that should be considered by the Board in order to make an informed decision. The Board also requested and received various informational materials including, without limitation: (i) documents containing information about Kovitz, including financial information, a description of personnel and the managerial services provided to the Fund, information on investment advice, performance, summaries of Fund expenses, compliance program, current legal matters, and other general information; (ii) comparative expense and performance information for other mutual funds with strategies similar to the Fund, as well as for separate accounts managed by Kovitz; and (iii) benefits to be realized by Kovitz from its relationship with the Fund. The Board did not identify any particular information that was most relevant to its consideration to approve the Agreement and each Trustee may have afforded different weight to the various Factors.
| 1. | The nature, extent, and quality of the services to be provided by the Adviser. In this regard, the Board considered Kovitz’s responsibilities under the Agreement. The Trustees considered the services being provided by Kovitz to the Fund including, without limitation: the quality of its investment advisory services (including research and recommendations with respect to portfolio securities), its process for formulating investment recommendations and assuring compliance with the Fund’s investment objectives and limitations, its coordination of services for the Fund among the Fund’s service providers, and its efforts to promote the Fund and grow its assets. The Trustees considered Kovitz’s continuity of, and commitment to retain, qualified personnel and Kovitz’s commitment to maintain its resources and systems and options that allow the Fund to maintain its goals, and Kovitz’s continued cooperation with the Independent Trustees and Counsel for the Fund. The Trustees considered Kovitz’s personnel, including the education and experience of Kovitz’s personnel. After considering the foregoing information and further information in the Meeting materials provided by Kovitz (including Kovitz’s Form ADV), the Board concluded that, in light of all the facts and circumstances, the nature, extent, and quality of the services provided by Kovitz were satisfactory and adequate for the Fund. |
26
| 2. | Investment Performance of the Fund and the Adviser. In considering the investment performance of the Fund and Kovitz, the Trustees compared the short-term performance, including the 1-year cumulative return and since inception annualized returns of the Fund with the performance of funds with similar objectives managed by other investment advisers, as well as with aggregated peer group data. The Trustees also considered the consistency of Kovitz’s management of the Fund with its investment objective, strategies, and limitations. The Trustees noted that the Fund’s performance in the year-to-date and one month periods (for the periods ending April 30, 2014) reviewed was below average, but that for the 3 month, one year, and since inception periods, the Fund’s performance was above average. The Trustees also considered the performance of Kovitz’s separate accounts that were managed in a manner similar to that of the Fund and they noted that the performance was very comparable. After reviewing and discussing the investment performance of the Fund further, Kovitz’s experience managing the Fund, the Fund’s historical performance, and other relevant factors, the Board concluded, in light of all the facts and circumstances, that the investment performance of the Fund and Kovitz was satisfactory. |
| 3. | The costs of the services to be provided and profits to be realized by the Adviser from the relationship with the Fund. In considering the costs of services to be provided and the profits to be realized by Kovitz from the relationship with the Fund, the Trustees considered: (1) Kovitz’s financial condition; (2) the asset levels of the Fund; (3) the overall expenses of the Fund; and (4) the nature and frequency of advisory fee payments. The Trustees reviewed information provided by Kovitz regarding its profits associated with managing the Fund. The Trustees also considered potential benefits for Kovitz in managing the Fund. The Trustees then compared the fees and expenses of the Fund (including the management fee) to other comparable mutual funds. The Trustees noted that the Fund’s management fee was among the highest in its peer group (and it was higher than its peer average and median), although the net expense ratios were only slightly above the peer average and median and could generally be viewed as comparable to that of the peers as a result of Kovitz’s contractual commitment to limit the expenses of the Fund. The Trustees noted that the management fee was generally less than what Kovitz charges to its separate account clients who had investment strategies and objectives similar to the Fund. Based on the foregoing, the Board concluded that the fees to be paid to Kovitz by the Fund and the profits to be realized by the Fund, in light of all the facts and circumstances, were fair and reasonable in relation to the nature and quality of the services provided by Kovitz. |
| 4. | The extent to which economies of scale would be realized as the Fund grows and whether advisory fee levels reflect these economies of scale for the benefit of the Fund’s investors. In this regard, the Board considered the Fund’s fee arrangements with Kovitz. The Board considered that while the management fee remained the same at all asset levels, the Fund’s shareholders had experienced benefits from the Fund’s expense limitation arrangement. The Trustees noted Kovitz’s representation that it intended to keep this arrangement in place even after the expiration of the current term of the arrangement. The Trustees noted that once the Fund’s expenses fell below the cap set by the arrangement, the Fund’s shareholders would continue to benefit from the economies of scale under the Fund’s agreements with service providers other than Kovitz. In light of its ongoing consideration of the Fund’s asset levels, expectations for growth in the Fund, and fee levels, the Board determined that the Fund’s fee arrangements, in light of all the facts and circumstances, were fair and reasonable in relation to the nature and quality of the services provided by Kovitz. |
| 5. | Possible conflicts of interest and benefits to the Adviser. In considering Kovitz’s practices regarding conflicts of interest, the Trustees evaluated the potential for conflicts of interest and considered such matters as the experience and ability of the advisory personnel assigned to the Fund; the basis of decisions to buy or sell securities for the Fund and/or Kovitz’s other accounts; and the substance and administration of Kovitz’s code of ethics. The Trustees also considered disclosure in the registration statement of the Trust relating to Kovitz’s potential conflicts of interest. The Trustees noted that Kovitz does not utilize soft dollars. The Trustees noted that Kovitz benefited from the Fund in that it is able to utilize the Fund as a vehicle into which to direct advisory clients with small account balances. The Trustees also noted that Kovitz executes |
27
| trades for the Fund through its affiliated broker dealer and that it is able to benefit from certain hardware, software, administrative and reporting tools that its affiliated broker dealer receives. The Trustees did not identify any other potential benefits (other than the management fee) that would inure to Kovitz. Based on the foregoing, the Board determined that the standards and practices of Kovitz relating to the identification and mitigation of potential conflicts of interest and the benefits that it derives from managing the Fund are acceptable. |
After additional consideration of the Factors delineated in the memorandum provided by Counsel and further discussion among the Board, the Board approved the Agreement between the Adviser and the Trust with respect to the Fund.
28
OTHER FEDERAL INCOME TAX INFORMATION (Unaudited)
The Form 1099-DIV you receive in January 2015 will show the tax status of all distributions paid to your account in calendar year 2014. Shareholders are advised to consult their own tax adviser with respect to the tax consequences of their investment in the Fund. As required by the Internal Revenue Code and/or regulations, shareholders must be notified regarding the status of qualified dividend income for individuals and the dividends received deduction for corporations.
Qualified Dividend Income. The Fund designates approximately 100% or up to the maximum amount of such dividends allowable pursuant to the Internal Revenue Code, as qualified dividend income eligible for the reduced tax rate of 15%.
Dividends Received Deduction. Corporate shareholders are generally entitled to take the dividends received deduction on the portion of the Fund’s dividend distribution that qualifies under tax law. For the Fund’s fiscal year 2014 ordinary income dividends, 100% qualifies for the corporate dividends received deduction.
For the year ended October 31, 2014, the Fund designated $1,642,181 as long-term capital gain distributions and $66,299 as short-term capital gain distributions.
29
PROXY VOTING
A description of the policies and procedures that the Fund uses to determine how to vote proxies relating to portfolio securities and information regarding how the Fund voted those proxies is available without charge upon request by (1) calling the Fund at (888) 695-3729 and (2) from Fund documents filed with the Securities and Exchange Commission (“SEC”) on the SEC’s website at www.sec.gov.
TRUSTEES
R. Jeffrey Young, Chairman
Ira Cohen
Andrea N. Mullins
OFFICERS
R. Jeffrey Young, Principal Executive Officer and President
John C. Swhear, Chief Compliance Officer, AML Officer and Vice President
Carol J. Highsmith, Vice President and Secretary
Matthew J. Miller, Vice President
Bryan W. Ashmus, Principal Financial Officer and Treasurer
INVESTMENT ADVISER
Kovitz Investment Group, LLC
115 South LaSalle Street, 27th Floor
Chicago, IL 60603
DISTRIBUTOR
Unified Financial Securities, Inc.
2960 North Meridian Street, Suite 300
Indianapolis, IN 46208
INDEPENDENT REGISTERED PUBLIC ACCOUNTING FIRM
Cohen Fund Audit Services Ltd.
1350 Euclid Avenue, Suite 800
Cleveland, OH 44115
LEGAL COUNSEL
The Law Offices of John H. Lively & Associates, Inc.
A member firm of The 1940 Act Law GroupTM
11300 Tomahawk Creek Parkway, Ste. 310
Leawood, KS 66211
CUSTODIAN
Huntington National Bank
41 South High Street
Columbus, OH 43215
ADMINISTRATOR, TRANSFER AGENT AND FUND ACCOUNTANT
Huntington Asset Services, Inc.
2960 North Meridian Street, Suite 300
Indianapolis, IN 46208
This report is intended only for the information of shareholders or those who have received the Fund’s prospectus which contains information about the Fund’s management fee and expenses. Please read the prospectus carefully before investing.
Distributed by Unified Financial Securities, Inc.
Member FINRA/SIPC
30
PRIVACY POLICY
The following is a description of the Fund’s policies regarding disclosure of nonpublic personal information that you provide to the Fund or that the Fund collects from other sources. In the event that you hold shares of the Fund through a broker-dealer or other financial intermediary, the privacy policy of your financial intermediary would govern how your nonpublic personal information would be shared with nonaffiliated third parties.
Categories of Information the Fund Collects. The Fund collects the following nonpublic personal information about you:
| • | Information the Fund receives from you on applications or other forms, correspondence, or conversations (such as your name, address, phone number, social security number, and date of birth); and |
| • | Information about your transactions with the Fund, its affiliates, or others (such as your account number and balance, payment history, cost basis information, and other financial information). |
Categories of Information the Fund Discloses. The Fund does not disclose any nonpublic personal information about its current or former shareholders to unaffiliated third parties, except as required or permitted by law. The Fund is permitted by law to disclose all of the information it collects, as described above, to service providers (such as the Fund’s custodian, administrator, transfer agent, accountant and legal counsel) to process your transactions and otherwise provide services to you.
Confidentiality and Security. The Fund restricts access to your nonpublic personal information to those persons who require such information to provide products or services to you. The Fund maintains physical, electronic, and procedural safeguards that comply with federal standards to guard your nonpublic personal information.
Disposal of Information. The Fund, through its transfer agent, has taken steps to reasonably ensure that the privacy of your nonpublic personal information is maintained at all times, including in connection with the disposal of information that is no longer required to be maintained by the Fund. Such steps shall include, whenever possible, shredding paper documents and records prior to disposal, requiring off-site storage vendors to shred documents maintained in such locations prior to disposal, and erasing and/or obliterating any data contained on electronic media in such a manner that the information can no longer be read or reconstructed.
Annual Report
October 31, 2014
|
Dreman Contrarian Small Cap Value Fund
Fund Adviser:
Dreman Value Management, LLC
Harborside Financial Center, Plaza 10
Suite 800 Jersey City, NJ 07311
Toll Free: (800) 247-1014

Dreman Contrarian Small Cap Value Fund |
Management’s Discussion of Fund Performance
Market Overview and Fund Performance
The Dreman Contrarian Small Cap Value Fund (the “Fund”) returned 10.12% (Institutional Class) during the 12-month period ended October 31, 2014. The Fund’s benchmark, the Russell 2000® Value Index1, returned 7.89% for the same period. The Small Cap market posted 8 straight quarters of positive returns before dropping in the third quarter of 2014. Continued improvements in the economy, namely stronger GDP growth and better employment data, pushed the markets to record highs.
Performance Attribution
For the year, the Fund’s performance was highlighted by strong stock selection in Information Technology, Industrials, Consumer Discretionary, Health Care, Energy, and Consumer Staples. Financials and Materials weighed on performance.
In Information Technology, contract manufacturer Sanmina Corporation was up 72.2% on robust earnings fueled by strong performance in its multimedia segment. The company is also seeing better volumes in its components, products and services, which is driving gross margins higher. Set top box manufacturer ARRIS Group was also a strong contributor to performance, up 42.3% for the year. The company has benefited from the global video and broadband spending cycle as providers upgrade their networks. Brocade Communications jumped 34.8% during the year on better demand for the company’s products and improving margins. QLogic Corporation offset some of these gains, declining 4.4%. The company acquired Broadcom’s 10GB (Gigabit) Ethernet business to offset the structural decline in its fiber channel business. This positioned QLogic in the higher-growth cloud and big data market. The stock remains attractively valued at 11.2x next-twelve-month earnings and has a strong balance sheet with $277 million in cash. We remain holders of the stock and believe much of the bad news regarding its product shift is reflected in the price. Vishay Intertechnology, a manufacturer of discrete semiconductors and passive electronic components, was up 11.4% on strong earnings and the initiation of a $0.06 quarterly dividend. The company, which was added to the Fund in the fourth quarter of 2013, generates substantial free cash flow and has over $5.00 of net cash on the balance sheet. In addition, the company is growing organically and through targeted acquisitions. We continue to find attractive investment opportunities in the Information Technology sector and maintain our overweight position.
Trinity Industries, Inc. was the best performing Industrials stock for the year. The diversified industrial company was up 42.5% as it reported better than expected orders for its railcar division. In addition, the company’s energy equipment segment is also producing good results driven by strong demand for tank storage containers. Unfortunately, the strong move up in the stock price pushed Trinity’s market capitalization over the $5 billion mark and, sticking to our disciplined small cap value process, we sold the position. Our Aerospace and Defense stocks continued to perform well, led by Esterline Technologies Corp. and Curtiss-Wright Corp., up 46.1% and 40.2%, respectively. On the down side, Brink’s Company detracted from performance, losing 32.2%. Brink’s international operations remain strong; however, the company continues to experience unfavorable trends in its North American business. We continue to hold the stock in the Fund. Although we have lowered our exposure to the Industrials sector, we remain overweight versus the benchmark.
On the negative side, our position in the precious metal miner Coeur Mining (-69.7%) weighed on performance. Gold and silver prices fell sharply from their peaks and the earnings estimates for mining stocks followed suit. We have maintained our position in Coeur Mining, but will not add additional exposure until there is a sign that the stocks have bottomed. Offsetting some of this weakness was Steel Dynamics, up 31.0% for the year. The carbon steel producer and metals recycler is experiencing strong demand for their rail and infrastructure products coupled with improving operating margins due to their efficiently run mills. We were forced to sell our position as the strong returns in the stock price pushed its market cap above $5 billion.
The Fund’s bank stocks were relative underperformers for the year after a strong showing in 2013. First Niagara Financial Group, an upstate New York Bank, fell 29.7%. The company has struggled generating higher fee income, and as a result earnings have been weaker than expected. Management continues to execute on its investment plan to bring in new technology and new people. These initiatives should help to drive revenue growth and push return on assets to the 1.15% - 1.20% level (from the current 0.65% - 0.75% level) by 2017. We continue to hold First Niagara
Annual Report
1
Dreman Contrarian Small Cap Value Fund (Continued) |
in the Fund. The banks were not all bad news as Laredo, Texas based International Bancshares moved up 26.8% on strong earnings. As of the end of the fiscal year, we remain slightly underweight the Bank industry as well as the Financial sector.
Outlook and Positioning
Volatility has been on the rise recently due to a Russian invasion of Ukraine, the uprising of ISIS in the Middle East, and slower growth in the Eurozone. We currently see attractive opportunities in the Information Technology, Financial and Industrial Sectors. The Energy sector is starting to look more attractive given the strong sell off in oil prices. We remain patient, however, and have resisted adding to our positions due to the large increase in oil drilling in the United States. We believe that stock picking will continue to become an increasingly important factor in outperformance with the rise in volatility. This bodes well for our contrarian, value-driven process, as we continue to focus our efforts on building the portfolio one stock at a time. We believe this disciplined, value-based approach—together with our conscious decision to avoid chasing overvalued stocks when they rally—has been the key to our success over the past decade.
The Fund’s performance quoted is past performance and does not guarantee future results. The investment return and principal value of an investment in the Fund will fluctuate so that an investor’s shares, when redeemed, may be worth more or less than their original cost. Current performance of the Fund may be lower or higher than the performance quoted. Performance data current to the most recent month end may be obtained by calling 1-800-247-1014. Information provided with respect to the Fund’s Portfolio Holdings, Sector Weightings and Number of Holdings are as of October 31, 2014 and are subject to change at any time.
You should carefully consider the investment objectives, potential risks, management fees, and charges and expenses of the Fund before investing. The Fund’s prospectus contains this and other information about the Fund, and should be read and considered carefully before investing. You may obtain a current copy of the Fund’s prospectus by calling 1-800-247-1014 or by visiting www.dreman.com/products/. Past performance is no guarantee of future results. The investment return and principal value of an investment in the Fund will fluctuate so that an investor’s shares, when redeemed, may be worth more or less than their original cost. The fund is distributed by Unified Financial Securities, Inc., 2960 North Meridian Street, Suite 300, Indianapolis, IN 46208. (Member FINRA)
Value stocks may remain undervalued for extended periods of time and the market may not recognize the intrinsic value of these securities.
Micro cap and small cap investing involves greater risk not associated with investing in more established companies, such as greater price volatility, business risk, less liquidity and increased competitive threat.
Investments in real estate investment trusts (“REITs”) and real-estate related securities involve special risks, such as limited liquidity and interest rate risks and may be more volatile than other securities. In addition, the value of REITs and other real estate-related investments is sensitive to changes in real estate values, extended vacancies of properties and other environmental and economic factors.
| 1 | The Russell 2000® Value Index is a widely recognized unmanaged index of equity prices and is representative of a broader market and range of securities than is found in the Fund’s portfolio. The Russell 2000® Value Index measures the performance of those Russell 2000® companies with lower price-to-book ratios and lower forecasted growth values. “Frank Russell Company (FRC) is the source and owner of the Russell Index data contained or reflected in this material and all trademarks and copyrights related thereto. The presentation may contain confidential information and unauthorized use, disclosure, copying, dissemination or redistribution is strictly prohibited. This is a Dreman Value Management presentation of the Russell Index data. Frank Russell Company is not responsible for the formatting or configuration of this material or for any inaccuracy in Dreman Value Management’s presentation thereof.” |
The opinions expressed are those of the investment management team and are subject to change without notice, as are statements of financial market trends, which are based on current conditions. Under no circumstances does the information contained within represent a recommendation to buy, hold or sell any security and it should not be assumed that the companies discussed were or will prove to be profitable. Current and future holdings are subject to risk. For more information please contact rfi@dreman.com.
© 2014 Dreman Value Management, L.L.C. All rights reserved.
This material has been prepared for investors and investment professionals, including broker-dealers and investment advisers.
Annual Report
2
| Total Returns* (unaudited) As of October 31, 2014 | ||||||||||||||||||||
| Class A with Load | Class A without Load | Retail Class | Institutional Class | Russell 2000® Value Index1 | ||||||||||||||||
One Year | 3.58 | % | 9.89 | % | 9.89 | % | 10.12 | % | 7.89 | % | ||||||||||
Three Year | 15.57 | % | 17.87 | % | 17.82 | % | 18.02 | % | 17.94 | % | ||||||||||
Five Year | N/A | N/A | 14.02 | % | 14.44 | % | 16.15 | % | ||||||||||||
Ten Year | N/A | N/A | 10.45 | % | N/A | 7.81 | % | |||||||||||||
Since Inception (11/20/09) | 12.15 | % | 13.51 | % | N/A | N/A | 15.43 | % | ||||||||||||
Since Inception (8/22/07) | N/A | N/A | N/A | 7.50 | % | 6.02 | % | |||||||||||||
Since Inception (12/31/03) | N/A | N/A | 11.05 | % | N/A | 7.94 | % | |||||||||||||
| Expense Ratios2 | ||||||||||||||||||||
Gross | 1.57 | % | 1.57 | % | 1.32 | % | ||||||||||||||
With Applicable Waivers | 1.29 | % | 1.29 | % | 1.04 | % | ||||||||||||||
The investment return and principal value of an investment will fluctuate so that an investor’s shares, when redeemed, may be worth more or less than their original cost. The returns shown do not reflect deduction of taxes that a shareholder would pay on Fund distributions or the redemption of Fund shares. THE FUND’S RETURNS REPRESENT PAST PERFORMANCE AND DO NOT PREDICT FUTURE RESULTS. The returns shown are net of all recurring expenses. Current performance of the Fund may be lower or higher than the performance quoted. For more information on the Fund, and to obtain performance data current to the most recent month end, or to request a prospectus or summary prospectus, please call 1-800-247-1014.
You should carefully consider the investment objectives, potential risk, management fees, and charges and expenses of the Fund before investing. The Fund’s prospectus and summary prospectus contains this and other information about the Fund, and should be read carefully before investing.
| * | The total return figures set forth above include all waivers of fees for various periods since inception. Without such fee waivers, the total returns would have been lower. Total return figures reflect any change in price per share and assume reinvestment of all distributions. Total returns for periods greater than 1 year are annualized. |
| 1 | The Russell 2000® Value Index (“Index”) is an unmanaged benchmark that assumes reinvestment of all distributions and excludes the effect of taxes and fees. The Index is a widely recognized unmanaged index of equity prices and is representative of a broader market and range of securities than are found in the Fund’s portfolio. Individuals cannot invest directly in the Index; however, an individual can invest in ETFs or other investment vehicles that attempt to track the performance of a benchmark index. |
| 2 | The expense ratios are from the Fund’s prospectus dated February 28, 2014. The Adviser has contractually agreed to waive its management fee and/or reimburse certain operating expenses through February 28, 2015, but only to the extent necessary so that the Fund’s net expenses, excluding brokerage fees and commissions, borrowing costs (such as (a) interest expense and (b) dividends on securities sold short), taxes, extraordinary expenses, 12b-1 fees (Class A and Retail Class), and any indirect expenses (such as fees and expenses of acquired funds), do not exceed 1.00%. Information pertaining to the Fund’s expense ratios as of October 31, 2014 can be found on the financial highlights. |
The Fund is distributed by Unified Financial Securities, Inc., member FINRA.
Annual Report
3
Dreman Contrarian Small Cap Value Fund (Continued) |
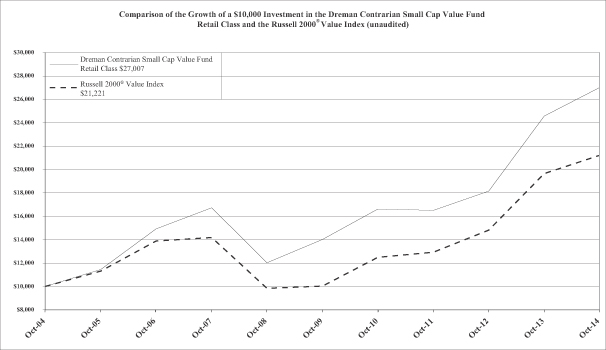
The chart above assumes an initial investment of $10,000 made on October 31, 2004 and held through October 31, 2014. THE FUND’S RETURN REPRESENTS PAST PERFORMANCE AND DOES NOT PREDICT FUTURE RESULTS. Investment returns and principal values will fluctuate so that Fund shares, when redeemed, may be worth more or less than their original purchase price. Current performance may be lower or higher than the performance data quoted.
For more information on the Dreman Contrarian Small Cap Value Fund Retail Class, and to obtain performance data current to the most recent month end, or to request a prospectus or summary prospectus, please call 1-800-247-1014. You should carefully consider the investment objectives, potential risk, management fees, and charges and expenses of the Fund before investing. The Fund’s prospectus and summary prospectus contains important information about the Fund’s investment objectives, potential risks, management fees, charges and expenses, and other information and should be read carefully before investing.
The Fund is distributed by Unified Financial Securities, Inc., member FINRA.
Annual Report
4
Fund Holdings (Unaudited) |
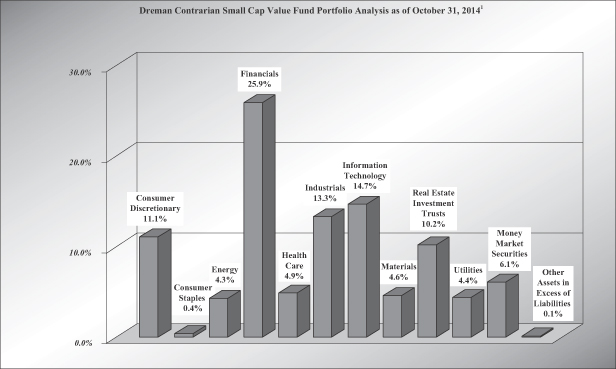
| 1 | As a percent of net assets. |
Availability of Portfolio Schedule – (Unaudited)
The Fund files its complete schedule of portfolio holdings with the Securities and Exchange Commission (“SEC”) for the first and third quarters of each fiscal year on Form N-Q, which is available on the SEC’s web site at www.sec.gov. The Fund’s Form N-Q may be reviewed and copied at the SEC’s Public Reference Room in Washington, DC. Information on the operation of the Public Reference Room may be obtained by calling 1-800-SEC-0330.
Annual Report
5
Summary of Fund’s Expenses – (Unaudited) |
As a shareholder of the Fund, you incur two types of costs: (1) transaction costs (such as short-term redemption fees) and (2) ongoing costs, including management fees and other Fund expenses. This Example is intended to help you understand your ongoing costs (in dollars) of investing in the Fund and to compare these costs with the ongoing costs of investing in other mutual funds.
The Fund’s Example is based on an investment of $1,000 invested at the beginning of the period and held for the entire period (May 1, 2014 through October 31, 2014).
Actual Expenses
The first line of the table provide information about actual account values and actual expenses. You may use the information in this line, together with the amount you invested, to estimate the expenses that you paid over the period. Simply divide your account value by $1,000 (for example, an $8,600 account value divided by $1,000 = 8.60), then multiply the result by the number in the first line under the heading entitled “Expenses Paid During Period” to estimate the expenses you paid on your account during this period.
Hypothetical Example for Comparison Purposes
The second line of the table provides information about hypothetical account values and hypothetical expenses based on the Fund’s actual expense ratios and an assumed rate of return of 5% per year before expenses, which is not the Fund’s actual return. The hypothetical account values and expenses may not be used to estimate the actual ending account balances or expenses you paid for the period. You may use this information to compare the ongoing costs of investing in the Fund and other funds. To do so, compare this 5% hypothetical example with the 5% hypothetical examples that appear in the shareholder reports of the other funds.
Expenses shown in the table are meant to highlight your ongoing costs only and do not reflect any transactional costs, such as the fee imposed on short-term redemptions. Therefore, the second line of the table are useful in comparing ongoing costs only, and will not help you determine the relative total costs of owning different funds. If incurred, the short-term redemption fee imposed by the Fund would increase your expenses.
| Beginning Account Value, May 1, 2014 | Ending Account Value, October 31, 2014 | Expenses Paid During Period (1) | Annualized Expense Ratio | |||||||||||||||||
Dreman Contrarian Small Cap Value Fund |
| |||||||||||||||||||
Class A Shares | Actual | $ | 1,000.00 | $ | 1,019.90 | $ | 6.36 | 1.25 | % | |||||||||||
| Hypothetical | (2) | $ | 1,000.00 | $ | 1,018.90 | $ | 6.36 | 1.25 | % | |||||||||||
Retail Shares | Actual | $ | 1,000.00 | $ | 1,019.90 | $ | 6.36 | 1.25 | % | |||||||||||
| Hypothetical | (2) | $ | 1,000.00 | $ | 1,018.90 | $ | 6.36 | 1.25 | % | |||||||||||
Institutional Shares | Actual | $ | 1,000.00 | $ | 1,021.10 | $ | 5.09 | 1.00 | % | |||||||||||
| Hypothetical | (2) | $ | 1,000.00 | $ | 1,020.16 | $ | 5.09 | 1.00 | % | |||||||||||
| (1) | Expenses are equal to the Fund’s annualized expense ratios, multiplied by the average account value over the period, multiplied by 184/365 (to reflect the one-half year period). The annualized expense ratios reflect reimbursement of expenses by the Fund’s Adviser for the period beginning May 1, 2014 to October 31, 2014. The “Financial Highlights” tables in the Fund’s financial statements, included in the report, also show the gross expense ratios, without such reimbursements. |
| (2) | Hypothetical assumes 5% annual return before expenses. |
Annual Report
6
| Dreman Contrarian Small Cap Value Fund | October 31, 2014 |
| Schedule of Investments |
| Shares | Fair Value | |||||||||
| Common Stocks — 93.8% | |||||||||
| Consumer Discretionary — 11.1% | |||||||||
| 56,315 | Aaron’s, Inc. | $ | 1,394,359 | |||||||
| 107,155 | American Axle & Manufacturing Holdings, Inc. * | 2,071,306 | ||||||||
| 13,855 | Big Lots, Inc. | 632,481 | ||||||||
| 38,625 | Brinker International, Inc. | 2,071,845 | ||||||||
| 39,180 | Cooper Tire & Rubber Co. | 1,261,988 | ||||||||
| 26,810 | CST Brands, Inc. | 1,025,483 | ||||||||
| 79,730 | CTC Media, Inc. | 507,083 | ||||||||
| 22,983 | Helen of Troy Ltd. * | 1,421,499 | ||||||||
| 23,137 | Hillenbrand, Inc. | 770,231 | ||||||||
| 15,639 | John Wiley & Sons, Inc., Class A | 913,161 | ||||||||
| 45,280 | KB Home | 712,707 | ||||||||
| 29,970 | Life Time Fitness, Inc. * | 1,671,427 | ||||||||
| 11,575 | Matthews International Corp., Class A | 533,376 | ||||||||
| 31,694 | Meredith Corp. | 1,652,525 | ||||||||
| 16,639,471 | ||||||||||
| Consumer Staples — 0.4% | |||||||||
| 23,700 | SpartanNash Co. | 531,117 | ||||||||
| Energy — 4.3% | |||||||||
| 35,730 | Atwood Oceanics, Inc. * | 1,452,424 | ||||||||
| 148,970 | Bellatrix Exploration Ltd. * | 692,711 | ||||||||
| 66,180 | Energy XXI Bermuda Ltd. | 508,924 | ||||||||
| 178,120 | Gran Tierra Energy, Inc. * | 812,227 | ||||||||
| 74,290 | Ultra Petroleum Corp. * | 1,693,812 | ||||||||
| 25,135 | Unit Corp. * | 1,217,037 | ||||||||
| 6,377,135 | ||||||||||
| Financials — 25.9% | |||||||||
| 46,128 | Allied World Assurance Co. Holdings AG | 1,752,864 | ||||||||
| 34,835 | Aspen Insurance Holdings Ltd. | 1,519,851 | ||||||||
| 109,590 | Associated Banc-Corp. | 2,060,292 | ||||||||
| 60,425 | BancorpSouth, Inc. | 1,391,588 | ||||||||
| 71,657 | Blue Hills Bancorp, Inc. * | 955,188 | ||||||||
| 10,189 | Chemical Financial Corp. | 303,428 | ||||||||
| 64,700 | Clifton Bancorp, Inc. | 842,394 | ||||||||
| 26,335 | Endurance Specialty Holdings Ltd. | 1,526,113 | ||||||||
| 22,673 | Federated Investors, Inc., Class B | 708,985 | ||||||||
| 130,060 | First Horizon National Corp. | 1,672,572 | ||||||||
| 36,570 | First Midwest Bancorp, Inc. | 614,010 | ||||||||
| 170,229 | First Niagara Financial Group, Inc. | 1,275,015 | ||||||||
| 80,644 | FirstMerit Corp. | 1,479,817 | ||||||||
| 118,780 | Fulton Financial Corp. | 1,411,106 | ||||||||
| 48,985 | Hancock Holding Co. | 1,723,782 | ||||||||
| 35,570 | Hanover Insurance Group, Inc. | 2,381,056 | ||||||||
| 67,110 | Home Loan Servicing Solutions Ltd. | 1,289,183 | ||||||||
| 9,355 | Independent Bank Corp. | 381,684 | ||||||||
| 17,729 | International Bancshares Corp. | 502,972 | ||||||||
| 47,715 | Janus Capital Group, Inc. | 715,248 | ||||||||
| 10,165 | Lakeland Financial Corp. | 421,238 | ||||||||
| 25,850 | Montpelier Re Holdings Ltd. | 856,669 | ||||||||
| 15,770 | NBT Bancorp, Inc. | 404,974 | ||||||||
| 11,822 | Nelnet, Inc., Class A | 562,609 | ||||||||
| 15,567 | Platinum Underwriters Holdings Ltd. | 974,961 | ||||||||
| 48,325 | Prospect Capital Corp. | 462,954 | ||||||||
| 20,438 | Prosperity Bancshares, Inc. | 1,234,251 | ||||||||
| Shares | Fair Value | |||||||||
| Common Stocks — (Continued) | |||||||||
| Financials — (Continued) | |||||||||
| 35,958 | Protective Life Corp. | $ | 2,505,553 | |||||||
| 44,185 | Symetra Financial Corp. | 1,047,185 | ||||||||
| 47,097 | TCF Financial Corp. | 727,649 | ||||||||
| 35,990 | Umpqua Holdings Corp. | 633,424 | ||||||||
| 67,810 | Washington Federal, Inc. | 1,480,292 | ||||||||
| 31,660 | Webster Financial Corp. | 992,224 | ||||||||
| 9,030 | WesBanco, Inc. | 311,174 | ||||||||
| 32,946 | Wintrust Financial Corp. | 1,526,059 | ||||||||
| 38,648,364 | ||||||||||
| Health Care — 4.9% | |||||||||
| 18,662 | Charles River Laboratories International, Inc. * | 1,178,692 | ||||||||
| 38,810 | Hill-Rom Holdings, Inc. | 1,726,269 | ||||||||
| 20,405 | Integra LifeSciences Holdings Corp. * | 1,042,900 | ||||||||
| 41,007 | Owens & Minor, Inc. | 1,366,353 | ||||||||
| 105,310 | Select Medical Holdings Corp. | 1,518,570 | ||||||||
| 22,233 | Triple-S Management Corp., Class B * | 492,239 | ||||||||
| 7,325,023 | ||||||||||
| Industrials — 13.3% | |||||||||
| 44,496 | AAR Corp. | 1,179,144 | ||||||||
| 35,525 | ABM Industries, Inc. | 981,911 | ||||||||
| 31,152 | Aegion Corp. * | 570,705 | ||||||||
| 103,184 | Aircastle Ltd. | 1,968,751 | ||||||||
| 13,275 | Alliant Techsystems, Inc. | 1,552,644 | ||||||||
| 44,962 | Barnes Group, Inc. | 1,643,811 | ||||||||
| 23,339 | Brady Corp., Class A | 556,402 | ||||||||
| 52,735 | Brink’s Co./The | 1,107,435 | ||||||||
| 22,582 | Crane Co. | 1,407,988 | ||||||||
| 19,370 | EMCOR Group, Inc. | 854,798 | ||||||||
| 16,415 | EnerSys | 1,030,862 | ||||||||
| 10,002 | Esterline Technologies Corp. * | 1,171,334 | ||||||||
| 34,270 | Global Brass & Copper Holdings, Inc. | 479,780 | ||||||||
| 10,013 | Hyster-Yale Materials Handling, Inc., Class A | 785,920 | ||||||||
| 6,040 | LB Foster Co., Class A | 326,704 | ||||||||
| 23,250 | Owens Corning | 745,395 | ||||||||
| 20,880 | Ryder System, Inc. | 1,847,254 | ||||||||
| 58,045 | Tutor Perini Corp. * | 1,625,840 | ||||||||
| 19,836,678 | ||||||||||
| Information Technology — 14.7% | |||||||||
| 36,933 | ARRIS Group, Inc. * | 1,108,729 | ||||||||
| 155,809 | Brocade Communications Systems, Inc. | 1,671,831 | ||||||||
| 55,316 | Celestica, Inc. * | 607,370 | ||||||||
| 23,000 | CSG Systems International, Inc. | 609,730 | ||||||||
| 16,130 | DST Systems, Inc. | 1,554,125 | ||||||||
| 57,800 | Ingram Micro, Inc., Class A * | 1,551,352 | ||||||||
| 6,711 | Integrated Silicon Solution, Inc. | 91,135 | ||||||||
| 21,112 | Itron, Inc. * | 821,890 | ||||||||
| 4,530 | IXYS Corp. | 52,865 | ||||||||
| 124,819 | Kulicke & Soffa Industries, Inc. * | 1,799,890 | ||||||||
| 73,790 | Mentor Graphics Corp. | 1,563,610 | ||||||||
| 78,275 | Microsemi Corp. * | 2,040,629 | ||||||||
| 36,460 | Plantronics, Inc. | 1,891,180 | ||||||||
| 130,985 | QLogic Corp. * | 1,546,933 | ||||||||
See accompanying notes which are an integral part of these financial statements.
Annual Report
7
| Dreman Contrarian Small Cap Value Fund | (Continued) |
| Shares | Fair Value | |||||||||
| Common Stocks — (Continued) | |||||||||
| Information Technology — (Continued) | |||||||||
| 44,142 | Sanmina Corp. * | $ | 1,106,640 | |||||||
| 20,580 | Science Applications International Corp. | 1,006,568 | ||||||||
| 20,573 | Sykes Enterprises, Inc. * | 443,142 | ||||||||
| 14,327 | Tech Data Corp. * | 855,608 | ||||||||
| 121,765 | Vishay Intertechnology, Inc. | 1,645,045 | ||||||||
| 21,968,272 | ||||||||||
| Materials — 4.6% | |||||||||
| 14,985 | A. Schulman, Inc. | 530,619 | ||||||||
| 28,154 | Cabot Corp. | 1,307,190 | ||||||||
| 96,906 | Coeur Mining, Inc. * | 358,552 | ||||||||
| 19,137 | Koppers Holdings, Inc. | 755,529 | ||||||||
| 43,355 | Olin Corp. | 1,050,925 | ||||||||
| 48,472 | Pan American Silver Corp. | 447,397 | ||||||||
| 46,310 | Rayonier Advanced Materials, Inc. | 1,321,224 | ||||||||
| 28,276 | Worthington Industries, Inc. | 1,092,867 | ||||||||
| 6,864,303 | ||||||||||
| Real Estate Investment Trusts — 10.2% | |||||||||
| 45,390 | Apollo Residential Mortgage, Inc. | 757,105 | ||||||||
| 25,022 | Ashford Hospitality Prime, Inc. | 433,631 | ||||||||
| 89,691 | Ashford Hospitality Trust, Inc. | 1,013,508 | ||||||||
| 43,029 | Associated Estates Realty Corp. | 840,356 | ||||||||
| 101,050 | Brandywine Realty Trust | 1,559,201 | ||||||||
| 65,865 | CBL & Associates Properties, Inc. | 1,259,997 | ||||||||
| 34,009 | Geo Group, Inc./The | 1,358,319 | ||||||||
| 53,114 | Hospitality Properties Trust | 1,572,706 | ||||||||
| 55,660 | Mack-Cali Realty Corp. | 1,042,512 | ||||||||
| 111,947 | New Residential Investment Corp. | 1,385,904 | ||||||||
| 36,480 | Omega Healthcare Investors, Inc. | 1,392,077 | ||||||||
| 61,275 | Pennsylvania Real Estate Investment Trust | 1,313,123 | ||||||||
| 169,066 | RAIT Financial Trust | 1,239,254 | ||||||||
| 15,167,693 | ||||||||||
| Utilities — 4.4% | |||||||||
| 50,690 | Hawaiian Electric Industries, Inc. | 1,427,430 | ||||||||
| 31,850 | IDACORP, Inc. | 2,013,875 | ||||||||
| 51,711 | Portland General Electric Co. | 1,882,798 | ||||||||
| 64,080 | TECO Energy, Inc. | 1,256,609 | ||||||||
| 6,580,712 | ||||||||||
| Total Common Stocks(Cost $120,384,667) | 139,938,768 | ||||||||
| Money Market Securities — 6.1% | |||||||||
| 9,101,828 | Huntington Money Market Fund, Institutional Shares, 0.010% (a) (b) | 9,101,828 | ||||||||
| Total Money Market Securities(Cost $9,101,828) | 9,101,828 | ||||||||
| Total Investments | 149,040,596 | ||||||||
| Other Assets in Excess of Liabilities — 0.1% | 142,981 | ||||||||
| Net Assets — 100.0% | $ | 149,183,577 | |||||||
| (a) | Rate disclosed is the seven day yield as of October 31, 2014. |
| (b) | Affiliated fund. |
| * | Non-income producing security. |
See accompanying notes which are an integral part of these financial statements.
Annual Report
8
Statement of Assets and Liabilities
October 31, 2014
| Dreman Contrarian Small Cap Value Fund | ||||
| Assets: | ||||
Investments in securities, at cost | $ | 120,384,667 | ||
Investments in affiliated securities, at cost | 9,101,828 | |||
Investments in securities, at fair value | 139,938,768 | |||
Investments in affiliated securities, at fair value | 9,101,828 | |||
Dividends receivable | 88,703 | |||
Receivable for investments sold | 370,717 | |||
Receivable for fund shares sold | 42,585 | |||
Prepaid expenses | 19,907 | |||
Total assets | 149,562,508 | |||
| Liabilities: | ||||
Payable for investments purchased | 142,711 | |||
Payable for shares redeemed | 111,081 | |||
Payable to administrator | 15,978 | |||
Payable to custodian | 1,576 | |||
Payable to Adviser | 77,966 | |||
Accrued 12b-1 fees | 13,550 | |||
Other accrued expenses | 16,069 | |||
Total liabilities | 378,931 | |||
Net Assets | $ | 149,183,577 | ||
| Net Assets consist of: | ||||
Paid in capital | $ | 116,231,679 | ||
Accumulated undistributed net investment income | 582,452 | |||
Accumulated undistributed net realized gain on investments | 12,815,345 | |||
Net unrealized appreciation | 19,554,101 | |||
Net Assets | $ | 149,183,577 | ||
| Net Assets (unlimited number of shares authorized) | ||||
| Class A: | ||||
Net Assets | $ | 3,076,928 | ||
Shares outstanding | 130,544 | |||
Net asset value and redemption price per share | $ | 23.57 | ||
Offering price per share (NAV/0.9425) (a) | $ | 25.01 | ||
| Retail Class: | ||||
Net Assets | $ | 64,020,441 | ||
Shares outstanding | 2,709,685 | |||
Net asset value and offering price per share | $ | 23.63 | ||
Redemption price per share (NAV * 0.99) (b) | $ | 23.39 | ||
| Institutional Class: | ||||
Net Assets | $ | 82,086,208 | ||
Shares outstanding | 3,457,821 | |||
Net asset value, offering and redemption price per share | $ | 23.74 | ||
| (a) | Class A shares impose a maximum 5.75% sales charge on purchases. |
| (b) | A redemption fee of 1.00% is charged on shares held less than 60 days. |
See accompanying notes which are an integral part of these financial statements.
Annual Report
9
Statement of Operations
Year Ended October 31, 2014
| Dreman Contrarian Small Cap Value Fund | ||||
| Investment Income: | ||||
Dividend income | $ | 2,492,612 | ||
Dividend income from affiliated securities | 505 | |||
Foreign dividend taxes withheld | (4,506 | ) | ||
Total investment income | 2,488,611 | |||
| Expenses: | ||||
Investment Adviser | 1,132,936 | |||
Distribution/12b-1: | ||||
Class A | 11,048 | |||
Retail Class | 155,599 | |||
Administration | 184,278 | |||
Legal | 15,484 | |||
Registration | 63,367 | |||
Printing | 26,745 | |||
Audit | 16,000 | |||
Custodian | 35,898 | |||
Trustee | 5,380 | |||
Miscellaneous | 20,902 | |||
Total expenses | 1,667,637 | |||
Fees waived by Adviser | (166,367 | ) | ||
Net operating expenses | 1,501,270 | |||
Net investment income | 987,341 | |||
| Realized & Unrealized Gain/(Loss) on Investments | ||||
Net realized gain on investment securities | 13,426,386 | |||
Change in unrealized depreciation on investment securities | (3,032,602 | ) | ||
Net realized and unrealized gain/(loss) on investments | 10,393,784 | |||
Net increase in net assets resulting from operations | $ | 11,381,125 | ||
See accompanying notes which are an integral part of these financial statements.
Annual Report
10
Statements of Changes in Net Assets
Dreman Contrarian Small Cap Value Fund | ||||||||
| Year Ended October 31, 2014 | Year Ended October 31, 2013 | |||||||
| Increase (Decrease) in Net Assets due to: | ||||||||
| Operations: | ||||||||
Net investment income | $ | 987,341 | $ | 607,096 | ||||
Net realized gain on investment securities | 13,426,386 | 12,164,654 | ||||||
Change in unrealized appreciation (depreciation) on investment securities | (3,032,602 | ) | 11,804,804 | |||||
Net increase in net assets resulting from operations | 11,381,125 | 24,576,554 | ||||||
| Distributions: | ||||||||
From net investment income, Class A | (33,863 | ) | (16,349 | ) | ||||
From net investment income, Retail Class | (418,477 | ) | (292,834 | ) | ||||
From net investment income, Institutional Class | (468,029 | ) | (55,644 | ) | ||||
From realized gain, Class A | (490,209 | ) | (33,363 | ) | ||||
From realized gain, Retail Class | (6,225,188 | ) | (597,247 | ) | ||||
From realized gain, Institutional Class | (5,063,473 | ) | (113,488 | ) | ||||
Total distributions | (12,699,239 | ) | (1,108,925 | ) | ||||
| Capital Transactions—Class A: | ||||||||
Proceeds from shares sold | 1,212,976 | 1,779,662 | ||||||
Reinvestment of distributions | 487,467 | 48,434 | ||||||
Amount paid for shares redeemed | (3,654,017 | ) | (1,184,391 | ) | ||||
Total Class A | (1,953,574 | ) | 643,705 | |||||
| Capital Transactions—Retail Class: | ||||||||
Proceeds from shares sold | 11,652,873 | 9,514,704 | ||||||
Reinvestment of distributions | 6,532,454 | 871,077 | ||||||
Amount paid for shares redeemed | (17,461,939 | ) | (34,677,105 | ) | ||||
Proceeds from redemption fees (a) | 1,182 | 616 | ||||||
Total Retail Class | 724,570 | (24,290,708 | ) | |||||
| Capital Transactions—Institutional Class: | ||||||||
Proceeds from shares sold | 72,236,519 | 6,044,510 | ||||||
Reinvestment of distributions | 4,944,506 | 111,665 | ||||||
Amount paid for shares redeemed | (9,221,455 | ) | (8,563,303 | ) | ||||
Total Institutional Class | 67,959,570 | (2,407,128 | ) | |||||
Net change resulting from capital transactions | 66,730,566 | (26,054,131 | ) | |||||
Total Increase (Decrease) in Net Assets | 65,412,452 | (2,586,502 | ) | |||||
Net Assets: | ||||||||
Beginning of year | 83,771,125 | 86,357,627 | ||||||
End of year | $ | 149,183,577 | $ | 83,771,125 | ||||
Accumulated net investment income included in net assets at end of year | $ | 582,452 | $ | 525,709 | ||||
| Share Transactions—Class A: | ||||||||
Shares sold | 51,197 | 92,723 | ||||||
Shares issued in reinvestment of distributions | 21,371 | 2,644 | ||||||
Shares redeemed | (156,427 | ) | (59,581 | ) | ||||
Total Class A | (83,859 | ) | 35,786 | |||||
| Share Transactions—Retail Class: | ||||||||
Shares sold | 500,748 | 476,871 | ||||||
Shares issued in reinvestment of distributions | 285,759 | 47,419 | ||||||
Shares redeemed | (757,263 | ) | (1,763,072 | ) | ||||
Total Retail Class | 29,244 | (1,238,782 | ) | |||||
| Share Transactions—Institutional Class: | ||||||||
Shares sold | 3,029,137 | 280,658 | ||||||
Shares issued in reinvestment of distributions | 215,619 | 6,056 | ||||||
Shares redeemed | (399,425 | ) | (409,909 | ) | ||||
Total Institutional Class | 2,845,331 | (123,195 | ) | |||||
| (a) | A redemption fee of 1.00% is charged on shares held less than 60 days. |
See accompanying notes which are an integral part of these financial statements.
Annual Report
11
Financial Highlights
(For a share outstanding throughout each period ended October 31)
| Net Asset Value, beginning of period | Net investment income (loss) | Net realized and unrealized gain (loss) on investments | Total from investment operations | Distributions from net investment income | Distributions | Total distributions | ||||||||||||||||||||||
| DREMAN CONTRARIAN SMALL CAP VALUE FUND | ||||||||||||||||||||||||||||
| Class A Shares | ||||||||||||||||||||||||||||
| 2010(b) | $ | 16.04 | 0.10 | (c) | 2.30 | 2.40 | (0.14 | ) | — | (0.14 | ) | |||||||||||||||||
| 2011 | $ | 18.30 | 0.10 | (0.22 | ) | (0.12 | ) | (0.13 | ) | — | (0.13 | ) | ||||||||||||||||
| 2012 | $ | 18.07 | 0.11 | 1.47 | 1.58 | (0.19 | ) | (1.66 | ) | (1.85 | ) | |||||||||||||||||
| 2013 | $ | 17.80 | 0.12 | 6.14 | 6.26 | (0.08 | ) | (0.16 | ) | (0.24 | ) | |||||||||||||||||
| 2014 | $ | 23.82 | 0.15 | (c) | 2.12 | 2.27 | (0.16 | ) | (2.36 | ) | (2.52 | ) | ||||||||||||||||
| Retail Class | ||||||||||||||||||||||||||||
| 2010 | $ | 15.59 | 0.09 | 2.80 | 2.89 | (0.13 | ) | — | (0.13 | ) | ||||||||||||||||||
| 2011 | $ | 18.35 | 0.11 | (0.22 | ) | (0.11 | ) | (0.13 | ) | — | (0.13 | ) | ||||||||||||||||
| 2012 | $ | 18.11 | 0.11 | 1.47 | 1.58 | (0.17 | ) | (1.66 | ) | (1.83 | ) | |||||||||||||||||
| 2013 | $ | 17.86 | 0.17 | 6.08 | 6.25 | (0.08 | ) | (0.16 | ) | (0.24 | ) | |||||||||||||||||
| 2014 | $ | 23.87 | 0.15 | 2.13 | 2.28 | (0.16 | ) | (2.36 | ) | (2.52 | ) | |||||||||||||||||
| Institutional Class | ||||||||||||||||||||||||||||
| 2010 | $ | 15.47 | 0.14 | 2.93 | 3.07 | (0.14 | ) | — | (0.14 | ) | ||||||||||||||||||
| 2011 | $ | 18.40 | 0.31 | (0.38 | ) | (0.07 | ) | (0.14 | ) | — | (0.14 | ) | ||||||||||||||||
| 2012 | $ | 18.19 | 0.14 | 1.48 | 1.62 | (0.23 | ) | (1.66 | ) | (1.89 | ) | |||||||||||||||||
| 2013 | $ | 17.92 | 0.20 | 6.10 | 6.30 | (0.08 | ) | (0.16 | ) | (0.24 | ) | |||||||||||||||||
| 2014 | $ | 23.98 | 0.20 | (c) | 2.14 | 2.34 | (0.22 | ) | (2.36 | ) | (2.58 | ) | ||||||||||||||||
| (a) | Total return represents the rate the investor would have earned or lost on an investment in the Fund, assuming reinvestment of dividends, and excludes any sales charges and redemption fees. |
| (b) | For the period November 20, 2009 (commencement of operations) to October 31, 2010. |
| (c) | Per share amount has been calculated using the average shares method. |
| (d) | Not Annualized. |
| (e) | Annualized. |
| (f) | The expense ratios shown include overdraft fees charged to the Fund. Without these overdraft fees, the expense ratios would be 1.25% for Class A and Retail Class and 1.00% for Institutional Class. |
| (g) | Amount is less than $0.005. |
See accompanying notes which are an integral part of these financial statements.
Annual Report
12
| Paid in capital from redemption fees | Net Asset Value, end of period | Total return(a) | Net Assets, end of period (000 omitted) | Ratio of net expenses to average net assets | Ratio of expenses net assets | Ratio of net investment income (loss) to average net assets | Ratio of net investment income (loss) to average net assets before waiver & reimbursement by advisor | Portfolio turnover rate | ||||||||||||||||||||||||||
| — | $ | 18.30 | 15.00 | %(d) | $ | 275 | 1.25 | %(e) | 1.59 | %(e) | 0.62 | %(e) | 0.28 | %(e) | 35.75 | %(d) | ||||||||||||||||||
| 0.02 | $ | 18.07 | (0.60 | )% | $ | 1,935 | 1.25 | % | 1.49 | % | 0.46 | % | 0.22 | % | 44.08 | % | ||||||||||||||||||
| — | $ | 17.80 | 9.92 | % | $ | 3,180 | 1.25 | % | 1.75 | % | 0.55 | % | 0.05 | % | 30.19 | % | ||||||||||||||||||
| — | $ | 23.82 | 35.56 | % | $ | 5,106 | 1.26 | %(f) | 1.51 | % | 0.65 | % | 0.40 | % | 28.28 | % | ||||||||||||||||||
| — | $ | 23.57 | 9.89 | % | $ | 3,077 | 1.25 | % | 1.37 | % | 0.63 | % | 0.51 | % | 36.66 | % | ||||||||||||||||||
| — | (g) | $ | 18.35 | 18.61 | % | $ | 105,796 | 1.25 | % | 1.58 | % | 0.53 | % | 0.20 | % | 35.75 | % | |||||||||||||||||
| — | (g) | $ | 18.11 | (0.66 | )% | $ | 82,840 | 1.25 | % | 1.51 | % | 0.57 | % | 0.32 | % | 44.08 | % | |||||||||||||||||
| — | (g) | $ | 17.86 | 9.93 | % | $ | 69,992 | 1.25 | % | 1.74 | % | 0.56 | % | 0.06 | % | 30.19 | % | |||||||||||||||||
| — | (g) | $ | 23.87 | 35.38 | % | $ | 63,976 | 1.26 | %(f) | 1.53 | % | 0.72 | % | 0.45 | % | 28.28 | % | |||||||||||||||||
| — | (g) | $ | 23.63 | 9.89 | % | $ | 64,020 | 1.25 | % | 1.37 | % | 0.63 | % | 0.51 | % | 36.66 | % | |||||||||||||||||
| — | $ | 18.40 | 19.90 | % | $ | 19,300 | 1.00 | % | 1.34 | % | 0.79 | % | 0.45 | % | 35.75 | % | ||||||||||||||||||
| — | $ | 18.19 | (0.44 | )% | $ | 11,472 | 1.00 | % | 1.26 | % | 0.85 | % | 0.59 | % | 44.08 | % | ||||||||||||||||||
| — | $ | 17.92 | 10.14 | % | $ | 13,185 | 1.00 | % | 1.49 | % | 0.80 | % | 0.30 | % | 30.19 | % | ||||||||||||||||||
| — | $ | 23.98 | 35.55 | % | $ | 14,689 | 1.01 | %(f) | 1.27 | % | 0.95 | % | 0.68 | % | 28.28 | % | ||||||||||||||||||
| — | $ | 23.74 | 10.12 | % | $ | 82,086 | 1.00 | % | 1.12 | % | 0.85 | % | 0.73 | % | 36.66 | % | ||||||||||||||||||
Annual Report
13
Notes to the Financial Statements
October 31, 2014
Note 1. Organization
The Dreman Contrarian Small Cap Value Fund (the “Fund”) is an open-end diversified series of the Valued Advisers Trust (the “Trust”). The Trust is a management investment company established under the laws of Delaware by an Agreement and Declaration of Trust dated June 13, 2008 (the “Trust Agreement”). The Trust Agreement permits the Board of Trustees (the “Board”) to issue an unlimited number of shares of beneficial interest of separate series without par value. The Fund is one of a series of funds authorized by the Board. The Fund’s investment adviser is Dreman Value Management, LLC (the “Adviser”). The investment objective of the Fund is long-term capital appreciation.
The Fund currently offers Class A shares, Retail Class shares, and Institutional Class shares. Class A shares are offered with a front-end sales charge. The Retail Class shares impose a 1% redemption fee on all shares redeemed within 60 days of purchase. Institutional Class shares do not have sales charges on original purchases.
The Fund was reorganized on February 28, 2013 from a series of Dreman Contrarian Funds, an unaffiliated registered investment company, to a series of the Trust. On February 8, 2013, shareholders voted to reorganize the Fund into the Trust.
Note 2. Significant Accounting Policies
The Fund is an investment company and follows accounting and reporting guidance under Financial Accounting Standards Board (“FASB”) Accounting Standards Codification (“ASC”) Topic 946, “Financial Services-Investment Companies”. The following is a summary of significant accounting policies followed by the Fund in the preparation of its financial statements. These policies are in conformity with the generally accepted accounting principles in the United States of America (“GAAP”).
Estimates—The preparation of financial statements in conformity with GAAP requires management to make estimates and assumptions that affect the reported amounts of assets and liabilities and disclosure of contingent assets and liabilities at the date of the financial statements and the reported amounts of increases and decreases in net assets from operations during the reporting period. Actual results could differ from those estimates.
Securities Valuation—All investments in securities are recorded at their estimated fair value as described in Note 3.
Federal Income Taxes—The Fund makes no provision for federal income or excise tax. The Fund intends to qualify each year as a regulated investment company (“RIC”) under subchapter M of the Internal Revenue Code of 1986, as amended, by complying with the requirements applicable to RICs and by distributing substantially all of its taxable income. The Fund also intends to distribute sufficient net investment income and net capital gains, if any, so that it will not be subject to excise tax on undistributed income and gains. If the required amount of net investment income or gains is not distributed, the Fund could incur a tax expense.
For the fiscal year ended October 31, 2014, the Fund did not have a liability for any unrecognized tax benefits. The Fund recognizes interest and penalties, if any, related to unrecognized tax benefits as income tax expense in the statement of operations. The Fund is subject to examination by U.S. federal tax authorities for the last three tax year ends and the interim tax period since then.
Expenses—Expenses incurred by the Trust that do not relate to a specific fund of the Trust are allocated to the individual funds based on each fund’s relative net assets or other appropriate basis (as determined by the Board). Expenses attributable to any class are borne by that class. Income, realized gains and losses, unrealized appreciation and depreciation, and expenses are allocated to each class based on the net assets in relation to the relative net assets of the Fund.
Security Transactions and Related Income—The Fund follows industry practice and records security transactions on the trade date for financial reporting purposes. The specific identification method is used for determining gains or losses for financial statement and income tax purposes. Dividend income is recorded on the ex-dividend date and interest income is recorded on an accrual basis. Discounts and premiums on securities purchased are accreted or amortized using the effective interest method. Withholding taxes on foreign dividends have been provided for in accordance with the Fund’s understanding of the applicable country’s tax rules and rates.
Dividends and Distributions—Distributions to shareholders, which are determined in accordance with income tax regulations, are recorded on the ex-dividend date. The Fund intends to distribute substantially all of its net investment income on, at least, an annual basis. The Fund intends to distribute its net realized long-term capital gains and its net realized short-term capital gains, if any, at least once a year. The treatment for financial reporting purposes of distributions made to shareholders during the year from net investment income or net realized capital gains may differ from their ultimate treatment for federal income tax purposes. These differences are caused primarily by differences in the timing of the recognition of certain components of income, expense or realized capital gain for federal income tax purposes. Where such differences are permanent in nature, they are reclassified in the components of the net assets based on their ultimate characterization for federal income tax purposes. Any such reclassifications will have no effect on net assets, results of operations or net asset values per share of the Fund. For the year ended October 31, 2014, the Fund made the following reclassifications to increase/(decrease) the components of net assets:
| Paid in Capital | Accumulated Undistributed Net Investment Income | Accumulated Net Realized Gain on Investments | ||||||
$— | ($ | 10,299 | ) | $ | 10,299 | |||
Annual Report
14
Note 3. Securities Valuation and Fair Value Measurements
Fair value is defined as the price that a Fund would receive upon selling an investment in a timely transaction to an independent buyer in the principal or most advantageous market of the investment. GAAP establishes a three-tier hierarchy to maximize the use of observable market data and minimize the use of unobservable inputs and to establish classification of fair value measurements for disclosure purposes.
Inputs refer broadly to the assumptions that market participants would use in pricing the asset or liability, including assumptions about risk (the risk inherent in a particular valuation technique used to measure fair value including such a pricing model and/or the risk inherent in the inputs to the valuation technique). Inputs may be observable or unobservable. Observable inputs are inputs that reflect the assumptions market participants would use in pricing the asset or liability developed based on market data obtained from sources independent of the reporting entity. Unobservable inputs are inputs that reflect the reporting entity’s own assumptions about the assumptions market participants would use in pricing the asset or liability developed based on the best information available in the circumstances.
Various inputs are used in determining the value of the Fund’s investments. These inputs are summarized in the three broad levels listed below.
| • | Level 1—quoted prices in active markets for identical securities |
| • | Level 2—other significant observable inputs (including, but not limited to, quoted prices for an identical security in an inactive market, quoted prices for similar securities, interest rates, prepayment speeds, credit risk, etc.) |
| • | Level 3—significant unobservable inputs (including the Fund’s own assumptions in determining fair value of investments based on the best information available) |
The inputs used to measure fair value may fall into different levels of the fair value hierarchy. In such cases, for disclosure purposes, the level in the fair value hierarchy within which the fair value measurement falls in its entirety, is determined based, on the lowest level input that is significant to the fair value measurement in its entirety.
Equity securities, including common stocks, exchanged-traded funds and real estate investment trusts, are generally valued by using market quotations, but may be valued on the basis of prices furnished by a pricing service when the Adviser believes such prices more accurately reflect the fair value of such securities. Securities traded in the NASDAQ over-the-counter market are generally valued by a pricing service at the NASDAQ Official Closing Price.
When using the market quotations or close prices provided by a pricing service and when the market is considered active, the security is classified as a Level 1 security. Sometimes, an equity security owned by the Fund will be valued by the pricing service with factors other than market quotations or when the market is considered inactive. When this happens, the security is classified as a Level 2 security. When market quotations are not readily available, when the Adviser determines that the market quotation or the price provided by the pricing service does not accurately reflect the current fair value, or when restricted or illiquid securities are being valued, such securities are valued as determined in good faith by the Adviser, in conformity with guidelines adopted by and subject to review by the Board. These securities are generally categorized as Level 3 securities.
Investments in mutual funds, including money market mutual funds, are generally priced at the ending NAV provided by the service agent of the funds. These securities are categorized as Level 1 securities.
Short-term investments in fixed income securities, (those with maturities of less than 60 days when acquired, or which subsequently are within 60 days of maturity), are valued by using the amortized cost method of valuation, which the Board has determined represents fair value. These securities are classified as Level 2 securities.
In accordance with the Trust’s good faith pricing guidelines, the Adviser is required to consider all appropriate factors relevant to the value of securities for which it has determined other pricing sources are not available or reliable as described above. No single standard exists for determining fair value, because fair value depends upon the circumstances of each individual case. As a general principle, the current fair value of an issue of securities being valued by the Adviser would appear to be the amount which the owner might reasonably expect to receive for them upon their current sale. Methods which are in accordance with this principle may, for example, be based on (i) a multiple of earnings; (ii) a discount from market of a similar freely traded security (including a derivative security or a basket of securities traded on other markets, exchanges or among dealers); or (iii) yield to maturity with respect to debt issues, or a combination of these and other methods. Good faith pricing is permitted if, in the Adviser’s opinion, the validity of market quotations appears to be questionable based on factors such as evidence of a thin market in the security based on a small number of quotations, a significant event occurs after the close of a market but before a Fund’s NAV calculation that may affect a security’s value, or the Adviser is aware of any other data that calls into question the reliability of market quotations. Good faith pricing may also be used in instances when the bonds the Fund invests in may default or otherwise cease to have market quotations readily available.
Annual Report
15
Notes to the Financial Statements (Continued)
The following is a summary of the inputs used to value the Fund’s investments as of October 31, 2014:
| Valuation Inputs | ||||||||||||||||
| Assets | Level 1 Quoted Prices in Active Markets | Level 2 Other Significant Observable Inputs | Level 3 Significant Unobservable Inputs | Total | ||||||||||||
Common Stocks* | $ | 139,938,768 | $ | — | $ | — | $ | 139,938,768 | ||||||||
Money Market Securities | 9,101,828 | — | — | 9,101,828 | ||||||||||||
|
|
|
|
|
|
|
| |||||||||
Total | $ | 149,040,596 | $ | — | $ | — | $ | 149,040,596 | ||||||||
| * | Refer to Schedule of Investments for industry classifications. |
The Fund did not hold any investments at any time during the reporting period in which other significant observable inputs (Level 2) were used in determining fair value. The Fund did not hold any investments at any time during the reporting period in which significant unobservable inputs were used in determining fair value; therefore, no reconciliation of Level 3 securities is included for this reporting period.
The Trust recognizes transfers between fair value hierarchy levels at the reporting period end. There were no transfers between any levels as of October 31, 2014.
Note 4. Fees and Other Transactions with Affiliates
Under the terms of the management agreement between the Trust and the Adviser (the “Agreement”) for the Fund, the Adviser manages the Fund’s investments subject to oversight of the Board. As compensation for its management services, the Fund is obligated to pay the Adviser a fee computed and accrued daily and paid monthly at an annual rate of 0.85% of the average daily net assets of the Fund. For the fiscal year ended October 31, 2014, the Adviser earned fees of $1,132,936 from the Fund before the waivers described below. At October 31, 2014, the Fund owed $77,966 to the Adviser.
The Adviser has contractually agreed to waive its management fee and/or reimburse certain operating expenses, but only to the extent necessary so that the Fund’s net expenses, excluding brokerage fees and commissions, borrowing costs (such as (a) interest expense and (b) dividends on securities sold short), taxes, extraordinary expenses, 12b-1 fees (if applicable), and any indirect expenses (such as fees and expenses of acquired funds), do not exceed 1.00%. Each waiver or reimbursement of an expense by the Adviser is subject to repayment by the Fund within the three fiscal years following the fiscal year in which the expense was incurred, provided that the Fund is able to make the repayment without exceeding the expense limitation. The contractual agreement is in effect through February 28, 2015. The expense cap may not be terminated prior to this date except by the Board. For the fiscal year ended October 31, 2014, the Adviser waived fees of $166,367 from the Fund. This amount is subject to potential recoupment by the Adviser through October 31, 2017.
The amounts subject to repayment by the Fund, pursuant to the aforementioned conditions are as follows:
| Amount | Recoverable through October 31, | |||||
| $459,430 | 2015 | |||||
| $215,534 | 2016 | |||||
| $166,367 | 2017 | |||||
The Trust retains Huntington Asset Services, Inc. (“HASI”) to manage the Fund’s business affairs and to provide the Fund with administrative services, including all regulatory, reporting and necessary office equipment and personnel. The Trust also retains HASI to act as the Fund’s transfer agent and to provide the Fund with fund accounting services. For the fiscal year ended October 31, 2014, HASI earned fees of $184,278 for administrative services. At October 31, 2014, HASI was owed $15,978 for administrative services.
Certain officers and one Trustee of the Trust are members of management and/or employees of HASI. HASI operates as a wholly-owned subsidiary of Huntington Bancshares, Inc., the parent company of the Unified Financial Securities, Inc. (the “Distributor”) and Huntington National Bank, the custodian of the Fund’s investments (the “Custodian”). For the fiscal year ended October 31, 2014, the Custodian earned fees $35,898 for custody services. At October 31, 2014, the Custodian was owed $1,576 for custody services.
The Fund has adopted a Distribution Plan (the “Plan”) pursuant to Rule 12b-1 under the 1940 Act. The Plan provides that the Fund will pay the Distributor and/or any registered securities dealer, financial institution or any other person (a “Recipient”) a shareholder servicing fee aggregating up to: 0.25% of the average daily net assets of the Class A shares and 0.25% of the average daily net assets of the Retail Class shares in connection with the promotion and distribution of the Fund’s shares or the provision of personal services to shareholders, including, but not necessarily limited to, advertising, compensation to underwriters, dealers and selling personnel, the printing and mailing of prospectuses to other than current Fund shareholders, the printing and mailing of sales literature and servicing shareholder accounts. The Fund or the Adviser may pay all or a portion of these fees to any Recipient who renders assistance in distributing or promoting the sale of shares, or who provides certain shareholder services, pursuant to a written agreement. The Plan is a compensation plan, which means that compensation is paid regardless of 12b-1 expenses actually incurred. It is anticipated that the Plan will benefit shareholders because an effective sales program typically is necessary in order for the
Annual Report
16
Fund to reach and maintain a sufficient size to achieve efficiently its investment objectives and to realize economies of scale. For the fiscal year ended October 31, 2014, Class A shares 12b-1 expense incurred by the Fund was $11,048 and Retail Class shares 12b-1 expense incurred by the Fund was $155,599. The Fund owed $621 for Class A shares and $12,929 for Retail Class shares 12b-1 fees as of October 31, 2014.
Unified Financial Securities, Inc. (“Unified”) acts as the principal distributor of the Fund’s shares. During the year ended October 31, 2014, the Distributor received $1,666 from commissions earned on sales of Class A shares, of which $1,625 was re-allowed to intermediaries of the Fund. An officer of the Trust is an officer of the Distributor and such person may be deemed to be an affiliate of the Distributor.
The Fund may invest in certain affiliated money market funds which are managed by an affiliated party of the Distributor. Income distributions earned from investments in this Fund are recorded as dividend income from affiliates in the accompanying financial statements. A summary of the Fund’s investment in such affiliated money market funds is presented in the table below:
| Affiliated Fund | 10/31/13 Fair Value | Purchases | Sales | 10/31/14 Fair Value | Income | |||||||||||||||
Huntington Money Market Fund, Trust Shares | $ | 778,785 | $ | 46,954,190 | $ | (38,631,147 | ) | $ | 9,101,828 | $ | 505 | |||||||||
Note 5. Purchases and Sales of Securities
For the fiscal year ended October 31, 2014, purchases and sales of investment securities, other than short-term investments and short-term U.S. government obligations were as follows:
| Purchases | Sales | |||
$93,539,432 | $ | 46,486,569 | ||
There were no purchases or sales of long-term U.S. government obligations during the fiscal year.
Note 6. Beneficial Ownership
The beneficial ownership, either directly or indirectly, of more than 25% of the voting securities of a fund creates a presumption of control of the fund, under Section 2(a)(9) of the Investment Company Act of 1940. At October 31, 2014, Charles Schwab & Co. (“Schwab”) owned, as record shareholder, 39% of the outstanding shares of the Fund. It is not known whether Schwab or any other underlying beneficial
owners owned or controlled 25% or more of the voting securities of the Fund.
Note 7. Federal Income Taxes
At October 31, 2014, the net unrealized appreciation (depreciation) of investments for tax purposes was as follows:
Gross Unrealized Appreciation | $ | 24,868,189 | ||
Gross Unrealized (Depreciation) | (6,061,464 | ) | ||
Net Unrealized Appreciation on Investments | $ | 18,806,725 |
At October 31, 2014, the difference between book basis and tax basis unrealized appreciation (depreciation) is attributable to the tax deferral of losses on wash sales, mark-to-market adjustments on passive foreign investment companies, return of capital from real estate investment trusts and income from certain investments.
At October 31, 2014, the aggregate cost of securities for federal income tax purposes was $130,233,871 for the Fund.
As of October 31, 2014, the Fund’s most recent fiscal year end, the components of distributable earnings (accumulated losses) on a tax basis were as follows:
| Fund | Undistributed Ordinary Income | Undistributed Long-Term Capital Gains | Unrealized Appreciation/ | Total Accumulated Earnings/ (Defecit) | ||||||||||||
Small Cap Value Fund | $ | 3,693,263 | $ | 10,451,910 | $ | 18,806,725 | $ | 32,951,898 | ||||||||
| * | The difference between book basis and tax basis unrealized appreciation (depreciation) is attributable to the tax deferral of losses on wash sales, mark-to-market adjustments on passive foreign investment companies, return of capital from real estate investment trusts and income from certain investments. |
The tax character of distributions paid for the fiscal period ended October 31, 2014 was as follows:
| Distributions Paid From* | ||||||||||||||||||||
| Fund | Ordinary Income | Net Long Term Capital Gains | Total Taxable Distributions | Tax Return of Capital | Total Distributions Paid | |||||||||||||||
Small Cap Value Fund | $ | 1,629,931 | $ | 11,069,308 | $ | 12,699,239 | $ | — | $ | 12,699,239 | ||||||||||
| * | The tax character of distributions paid may differ from the character of distributions shown on the statements of changes in net assets due to short-term capital gains being treated as ordinary income for tax purposes. |
Annual Report
17
Notes to the Financial Statements (Continued)
The tax character of distributions paid for the prior fiscal period ended October 31, 2013 was as follows:
| Distributions Paid From* | ||||||||||||||||||||
| Fund | Ordinary Income | Net Long Term Capital Gains | Total Taxable Distributions | Tax Return of Capital | Total Distributions Paid | |||||||||||||||
Small Cap Value Fund | $ | 652,447 | $ | 456,478 | $ | 1,108,925 | $ | — | $ | 1,108,925 | ||||||||||
| * | The tax character of distributions paid may differ from the character of distributions shown on the statements of changes in net assets due to short-term capital gains being treated as ordinary income for tax purposes. |
Note 8. Commitments and Contingencies
The Fund indemnifies its officers and trustees for certain liabilities that may arise from performance of their duties to the Fund. Additionally, in the normal course of business, the Fund enters into contracts that contain a variety of representations and warranties which provide general indemnifications. The Fund’s maximum exposure under these arrangements is unknown, as this would involve future claims that may be made against the Fund that have not yet occurred.
Note 9. Subsequent Events
Management of the Fund has evaluated the need for disclosure and/or adjustments resulting from subsequent events through the date these financials were issued. Effective March 1, 2015, The Adviser has contractually agreed to waive its management fee and/or reimburse certain operating expenses, but only to the extent necessary so that the Fund’s net expenses, excluding brokerage fees and commissions, borrowing costs (such as (a) interest expense and (b) dividends on securities sold short), taxes, extraordinary expenses, 12b-1 fees (if applicable), and any indirect expenses (such as fees and expenses of acquired funds), do not exceed 1.25%. Each waiver or reimbursement of an expense by the Adviser is subject to repayment by the Fund within the three fiscal years following the fiscal year in which the expense was incurred, provided that the Fund is able to make the repayment without exceeding the expense limitation. The contractual agreement is in effect through February 28, 2016. A special meeting of the shareholders of the Trust was held on December 19, 2014, for the purpose of electing the Board of Trustees, the results of the meeting can be found in the Proxy Voting Results Note (below).
Note 10. Proxy Voting Results (Unaudited)
On December 19, 2014 a special meeting of the shareholders of the Trust was held at the offices of the Trust for the purpose of electing each nominee to the Board of Trustees.
Below are the voting results for all funds from the special meeting of the Trust:
To elect each nominee to the Board of Trustees:
| For | Against | Abstain | ||||||||||
Ira Cohen | 280,591,916 | 20,930,930 | — | |||||||||
Andrea N. Mullins | 296,332,857 | 5,189,989 | — | |||||||||
R. Jeffrey Young | 280,517,160 | 21,005,685 | — | |||||||||
Annual Report
18
Report of Independent Registered Public Accounting Firm
To the Shareholders of
Dreman Contrarian Small Cap Value Fund
and Board of Trustees of Valued Advisers Trust
We have audited the accompanying statement of assets and liabilities, including the schedule of investments, of Dreman Contrarian Small Cap Value Fund (the “Fund”), a series of Valued Advisers Trust, as of October 31, 2014, and the related statement of operations for the year then ended, the statements of changes in net assets for each of the two years in the period then ended, and the financial highlights for each of the five periods in the period then ended. These financial statements and financial highlights are the responsibility of the Fund’s management. Our responsibility is to express an opinion on these financial statements and financial highlights based on our audits.
We conducted our audits in accordance with the standards of the Public Company Accounting Oversight Board (United States). Those standards require that we plan and perform the audit to obtain reasonable assurance about whether the financial statements and financial highlights are free of material misstatement. An audit includes examining, on a test basis, evidence supporting the amounts and disclosures in the financial statements. Our procedures included confirmation of securities owned as of October 31, 2014, by correspondence with the custodian and brokers, or by other appropriate auditing procedures where replies from the brokers were not received. An audit also includes assessing the accounting principles used and significant estimates made by management, as well as evaluating the overall financial statement presentation. We believe that our audits provides a reasonable basis for our opinion.
In our opinion, the financial statements and financial highlights referred to above present fairly, in all material respects, the financial position of Dreman Contrarian Small Cap Value Fund as of October 31, 2014, the results of its operations for the year then ended, the changes in its net assets for each of the two years in the period then ended, and the financial highlights for each of the five periods in the period then ended, in conformity with accounting principles generally accepted in the United States of America.

COHEN FUND AUDIT SERVICES, LTD.
Cleveland, Ohio
December 23, 2014
Annual Report
19
Other Federal Income Tax Information (Unaudited)
The Form 1099-DIV you receive in January 2015 will show the tax status of all distributions paid to your account in calendar year 2014. Shareholders are advised to consult their own tax adviser with respect to the tax consequences of their investment in the Fund. As required by the Internal Revenue Code and/or regulations, shareholders must be notified regarding the status of qualified dividend income for individuals and the dividends received deduction for corporations.
Qualified Dividend Income. The Fund designates approximately 67% or up to the maximum amount of such dividends allowable pursuant to the Internal Revenue Code, as qualified dividend income eligible for the reduced tax rate of 15%.
Dividends Received Deduction. Corporate shareholders are generally entitled to take the dividends received deduction on the portion of the Fund’s dividend distribution that qualifies under tax law. For the Fund’s fiscal year 2014 ordinary income dividends, 67% qualifies for the corporate dividends received deduction.
For the year ended October 31, 2014, the Fund designated $11,069,308 as long-term capital gain distributions and $685,653 as short-term capital gain distributions.
Annual Report
20
Trustees and Officers (Unaudited)
The Board of Trustees supervises the business activities of the Trust. Each Trustee serves as a trustee until termination of the Trust unless the Trustee dies, resigns, retires or is removed.
The following tables provide information regarding the Trustees and Officers.
The following table provides information regarding each of the Independent Trustees.
| Name, Address*, (Age), Position with Trust**, Term of Position with Trust | Principal Occupation During Past 5 Years | Other Directorships | ||
Ira Cohen, 55, Independent Trustee, June 2010 to present. | Independent financial services consultant, since February 2005. | Trustee and Audit Committee Chairman, Griffin Institutional Access Real Estate Fund, since May 2014; Trustee for Angel Oak Funds Trust, since October 2014. | ||
| Andrea N. Mullins, 47, Independent Trustee, December 2013 to present. | Private investor; Independent Contractor, Seabridge Wealth Management, LLC, since April 2014; Principal Financial Officer, Treasurer and Secretary, Eagle Family of Funds (mutual fund family) and Vice President, Eagle Asset Management, Inc. (investment adviser) each from 2004 to 2010. | None. |
| * | The address for each trustee and officer is 2960 N. Meridian St., Suite 300, Indianapolis, IN 46208. |
| ** | As of the date of this report, the Trust consists of 14 series. |
The following table provides information regarding the Trustee who is considered an “interested person” of the Trust, as that term is defined under the 1940 Act. Based on the experience of the Trustee, the Trust concluded that the individual described below should serve as a Trustee.
| Name, Address*, (Age), Position with Trust**, Term of Position with Trust | Principal Occupation During Past 5 Years | Other Directorships | ||
| R. Jeffrey Young, 50, Trustee and Chairman, June 2010 to present; Principal Executive Officer and President, Valued Advisers Trust, February 2010 to present. | Senior Vice President, Huntington Asset Services, Inc. since January 2010 and Director since May 2014; Director, Unified Financial Securities since May 2014; Chief Executive Officer, Huntington Funds since February 2010; Chief Executive Officer, The Huntington Strategy Shares since November 2010; President and Chief Executive Officer, Dreman Contrarian Funds, from March 2011 to February 2013; Trustee, Valued Advisers Trust, from August 2008 to January 2010; and Managing Director of WealthStone, from 2007 to 2010. | Trustee and Chairman, Capitol Series Trust, since September 2013. |
| * | The address for each trustee and officer is 2960 N. Meridian St., Suite 300, Indianapolis, IN 46208. |
| ** | As of the date of this report, the Trust consists of 14 series. |
Annual Report
21
Trustees and Officers (Unaudited) (Continued)
The following table provides information regarding the Officers of the Trust:
| Name, Address*, (Age), Position with Trust,** Term of Position with Trust | Principal Occupation During Past 5 Years | Other Directorships | ||
| R. Jeffrey Young, 50, Trustee and Chairman, June 2010 to present; Principal Executive Officer and President, Valued Advisers Trust, February 2010 to present. | Senior Vice President, Huntington Asset Services, Inc., since January 2010 and Director since May 2014; Director, Unified Securities, since May 2014; Chief Executive Officer, Huntington Funds, since February 2010; Chief Executive Officer, The Huntington Strategy Shares, since November 2010; President and Chief Executive Officer, Dreman Contrarian Funds, from March 2011 to February 2013; Trustee, Valued Advisers Trust, from August 2008 to January 2010; and Managing Director of WealthStone, from 2007 to 2010. | Trustee and Chairman, Capitol Series Trust, since September 2013. | ||
| John C. Swhear, 53, Chief Compliance Officer, AML Officer and Vice President, August 2008 to present. | Vice President of Legal Administration and Compliance for Huntington Asset Services, Inc., the Trust’s administrator, since April 2007 and Director since May 2014; Chief Compliance Officer of Unified Financial Securities, Inc., the Trust’s distributor, since May 2007 and Director since May 2014; President, Unified Series Trust, since March 2012, and Senior Vice President from May 2007 to March 2012; Chief Compliance Officer and AML Officer, Capitol Series Trust, since September 2013; Secretary, Huntington Funds, from April 2010 to February 2012; President and Chief Executive Officer, Dreman Contrarian Funds, from March 2010 to March 2011, and Vice President and Acting Chief Executive Officer, from 2007 to March 2010. | None. | ||
| Carol J. Highsmith, 50, Vice President, August 2008 to present; Secretary, March 2014 to present | Employed in various positions with Huntington Asset Services, Inc., the Trust’s administrator, since November 1994; currently Vice President of Legal Administration; Secretary, Cross Shore Discovery Fund since May 2014. | None. | ||
| Matthew J. Miller, 38, Vice President, December 2011 to present. | Employed in various positions with Huntington Asset Services, Inc., the Trust’s administrator, since July 1998; currently Vice President of Relationship Management; Vice President, Huntington Funds, since February 2010; President and Chief Executive Officer, Capitol Series Trust, since September 2013. | None. | ||
| Bryan W. Ashmus, 41, Treasurer and Principal Financial Officer, December 2013 to present. | Vice President, Financial Administration, Huntington Asset Services, Inc., the Trust’s administrator, since September 2013; Chief Financial Officer and Treasurer, The Huntington Strategy Shares and The Huntington Funds, since November 2013; Vice President, Treasurer Services, Citi Fund Services Ohio, Inc., from May 2005 to September 2013. | None. |
| * | The address for each trustee and officer is 2960 N. Meridian St., Suite 300, Indianapolis, IN 46208. |
| ** | As of the date of this report, the Trust consists of 14 series. |
OTHER INFORMATION
The Fund’s Statement of Additional Information (“SAI”) includes additional information about the trustees and is available without charge, upon request. You may call toll-free at (800) 247-1014 to request a copy of the SAI or to make shareholder inquiries.
Annual Report
22
Valued Advisers Trust
PRIVACY POLICY
The following is a description of the policies of the Valued Advisers Trust (the “Trust”) regarding disclosure of nonpublic personal information that shareholders provide to a series of the Trust (each, a “Fund”) or that the Fund collects from other sources. In the event that a shareholder holds shares of a Fund through a broker-dealer or other financial intermediary, the privacy policy of the financial intermediary would govern how shareholder nonpublic personal information would be shared with nonaffiliated third parties.
Categories of Information A Fund May Collect.
A Fund may collect the following nonpublic personal information about its shareholders:
| • | Information the Fund receives from a shareholder on applications or other forms, correspondence, or conversations (such as the shareholder’s name, address, phone number, social security number, and date of birth); and |
| • | Information about the shareholder’s transactions with the Fund, its affiliates, or others (such as the shareholder’s account number and balance, payment history, cost basis information, and other financial information). |
Categories of Information A Fund May Disclose.
A Fund may not disclose any nonpublic personal information about its current or former shareholders to unaffiliated third parties, except as required or permitted by law. A Fund is permitted by law to disclose all of the information it collects, as described above, to its service providers (such as the Fund’s custodian, administrator, transfer agent, accountant and legal counsel) to process shareholder transactions and otherwise provide services to the shareholder.
Confidentiality and Security.
Each Fund shall restrict access to shareholder nonpublic personal information to those persons who require such information to provide products or services to the shareholder. Each Fund shall maintain physical, electronic, and procedural safeguards that comply with federal standards to guard shareholder nonpublic personal information.
Disposal of Information.
The Funds, through their transfer agent, have taken steps to reasonably ensure that the privacy of a shareholder’s nonpublic personal information is maintained at all times, including in connection with the disposal of information that is no longer required to be maintained by the Funds. Such steps shall include, whenever possible, shredding paper documents and records prior to disposal, requiring off-site storage vendors to shred documents maintained in such locations prior to disposal, and erasing and/or obliterating any data contained on electronic media in such a manner that the information can no longer be read or reconstructed.
Annual Report
23
PROXY VOTING
A description of the policies and procedures that each Fund uses to determine how to vote proxies relating to portfolio securities and information regarding how the Funds voted those proxies during the recent twelve month period ended June 30 are available without charge upon request by (1) calling the Funds at (800) 247-1014 or (2) from Fund documents filed with the Commission on the Commission’s website at www.sec.gov.
TRUSTEES
R. Jeffrey Young, Chairman
Ira Cohen
Andrea Mullins
OFFICERS
R. Jeffrey Young, Principal Executive Officer and President
Bryan W. Ashmus, Principal Financial Officer and Treasurer
John C. Swhear, Chief Compliance Officer, AML Officer and Vice-President
Carol J. Highsmith, Vice President and Secretary
Matthew J. Miller, Vice President
INVESTMENT ADVISER
Dreman Value Management, LLC
Harborside Financial Center
Plaza 10, Suite 800
Jersey City, NJ 07311
DISTRIBUTOR
Unified Financial Securities, Inc.
2960 North Meridian Street, Suite 300
Indianapolis, IN 46208
INDEPENDENT REGISTERED PUBLIC ACCOUNTING FIRM
Cohen Fund Audit Services, Ltd.
1350 Euclid Avenue, Suite 800
Cleveland, OH 44115
LEGAL COUNSEL
The Law Offices of John H. Lively & Associates, Inc.
A member firm of The 1940 Act Law GroupTM
11300 Tomahawk Creek Parkway, Suite 310
Leawood, KS 66211
CUSTODIAN
Huntington National Bank
41 S. High St.
Columbus, OH 43215
ADMINISTRATOR, TRANSFER AGENT
AND FUND ACCOUNTANT
Huntington Asset Services, Inc.
2960 North Meridian Street, Suite 300
Indianapolis, IN 46208
This report is intended only for the information of shareholders or those who have received the Fund’s prospectus which contains information about the Fund’s management fee and expenses. Please read the prospectus carefully before investing.
Distributed by Unified Financial Securities, Inc.
Member FINRA/SIPC

SOUND MIND INVESTING FUND
SOUND MIND INVESTING
BALANCED FUND
SMI DYNAMIC
ALLOCATION FUND
| ANNUAL REPORT |
| OCTOBER 31, 2014 |
Fund Adviser:
SMI Advisory Services, LLC
11135 Baker Hollow Road
Columbus, IN 47201
Toll Free (877) SMI-FUND
www.smifund.com
Dear Fellow Shareholder,
Investors encounter many obstacles along the journey to investing success. At first, some of those obstacles are knowledge-oriented. How do I even get started? What investments are appropriate for me? How do I combine these investment types? Where should I open an account?
In time, most investors settle on some type of strategy and figure out the answers to these initial questions. At that point, while there is always more to know, the battle largely shifts from the knowledge realm to the psychological realm. It is one thing to have a plan – but quite another to implement it faithfully in the face of all the emotional trauma the markets can inflict! It is in this arena of the mind that the relentless barrage of the 24/7 news cycle tries to wreak havoc. This past year was no exception: poor first-quarter growth gave way to a summer of bloodshed in the Ukraine and the Middle East (among other places), which finally settled down just in time to focus on the contentious election season. Mix in healthy doses of income inequality, supposedly unsustainable stock market valuations, the end of the Federal Reserve’s QE program, etc. and it was enough to keep investors on edge throughout the year.
It’s not that these risks aren’t real, but long-time investors know there are always risks threatening the markets. Those who wait for “low-risk” opportunities to invest usually never get around to actually investing – a common condition these past six years as many have been unable to move past their fears. In our opinion, the best way to conquer this ever-present uncertainty is to create a plan you can live with and then stick to that plan.
SMI Advisory Services exists to help the Christian community implement objective investment strategies, and in so doing, experience the joy of providing well for their families (1 Timothy 5:8) as well as generously supporting God’s work (2 Corinthians 8:7). This year, we have a special opportunity to present to you along these lines.
Help Iraqi Christians In Need
This summer, the world was horrified to watch the brutal advance of the Islamic State (IS, or ISIS) across Syria and Iraq. The tales of murder, rape, and abuse of every kind seem almost too horrible to be possible, and yet they are real. Over the past few months, SMI Advisory Services, (“SMIAS”), has coordinated with the Global Aid Network (GAiN, the aid and relief arm of Campus Crusade for Christ International) to bring you a relief opportunity designed to help these Christian brothers and sisters.
Our goal is to encourage shareholders of the SMI Funds to get involved in tangibly alleviating this suffering. SMIAS is currently running a matching campaign during which it will match shareholder contributions to GAiN for this cause on a 2-for-1 basis, up to a total SMIAS match of $50,000. For every
1
dollar given, SMIAS will donate two more dollars, up to the $50,000 matching amount. Your $10 contribution becomes $30… your $100 contribution instantly becomes $300.
Hebrews 11 is widely recognized by many believers as a sort of “Hall of Fame” of the Christian faith. The author describes the walk of many of the heroes – Abraham, Isaac, Jacob, Joseph, Moses, and so on. Consider the verses toward the end of that chapter:
Others were tortured and refused to be released, so that they might gain a better resurrection. Some faced jeers and flogging, while still others were chained and put in prison. They were stoned, they were sawed in two; they were put to death by the sword. They went about in sheepskins and goatskins, destitute, persecuted and mistreated – the world was not worthy of them. They wandered in deserts and mountains, and in caves and holes in the ground.
It’s striking how similar this passage about the heroes of our faith mirrors the news reports we’ve heard coming out of Iraq since this summer. We have the opportunity to stand with these dear brothers and sisters who are suffering for no other reason than they are part of our family. This effort is a great chance to tangibly let them know we haven’t forgotten them and are standing with them.
If you’d like to give, go to the campaign page on GAiN’s website (https://give.cru.org/0677162_4894). Any contributions received between now and February 28 will count toward the matching effort.
Of course, we need to hold up these persecuted brothers and sisters in prayer. But your giving can also make a difference – especially when stretched by this matching campaign. Thanks for your generosity.
SMI Funds Year in Review
Dynamic Allocation Fund (SMIDX)
The SMI Dynamic Allocation Fund experienced its first real test in September-October. The S&P 500® Index (“S&P 500”) fell 9.8% from its high on September 19 to its low on October 15, with foreign and small-company stocks down significantly more. While hindsight allows us to now shrug this off as “just a correction,” investors were definitely getting nervous by the time it ended. As you likely know, mutual funds are only priced once at the end of each day, so the SMI Funds don’t have intra-day highs and lows to compare precisely with this record. But it’s worth noting that the SMI Dynamic Allocation Fund barely budged during this three week correction in the stock market, closing on September 19 with an NAV of $11.36 and on October 15 at $11.35. That’s the kind of stability SMI investors have been hoping the Dynamic Allocation strategy will provide in times of stock market stress.
For the twelve months ended October 31, 2014, SMIDX gained 9.64%. This is lower than the stock market’s gain of 16.15% (as measured by the Wilshire 5000), but better than the bond market’s gain of 4.14% (as measured by the Barclays Capital US Bond Index). With large US stocks performing so well, the Wilshire 5000 is a tough comparison for the Dynamic Allocation strategy. But this strategy wasn’t designed to outperform during periods when the stock market is strong. On the contrary, its strengths are expected to be evident when stocks are weak. Over the course of a full market cycle, its defensive properties should have plenty of opportunities to impress.
Lastly, it’s worth noting the pivotal event at the end of August when the Dynamic Allocation strategy called for us to exit foreign stocks and move into bonds. At the time, this was an emotionally difficult trade to execute, given that stocks still seemed pretty healthy (at least on the surface) and bonds –specifically the
2
long-term bonds we were buying –seemed at risk due to potentially rising interest rates. But the market’s slide in late September and early October confirmed the wisdom of following the system: as foreign stocks corrected significantly, bonds held up well.
The SMI Fund (SMIFX) and SMI Balanced Fund (SMILX)
The stock market continued to strongly favor large-company U.S. stocks during the year ended October 31, 2014. Given that the most widely followed market indexes (S&P 500, Wilshire 5000, Dow Jones Industrial Average) are dominated by large-company stocks, the indexes looked great throughout most of the year, with the S&P 500 hitting an all-time high as late as September 18 before falling back.
Alas, for foreign and small-company stocks it was a completely different story. While the large-cap S&P 500 Index gained an impressive 17.27% for the 12-months ended October 31, the small-cap Russell 2000 Index was up less than half as much, at 8.06%. That’s a striking disparity. Foreign stocks (as measured by the FTSE All-World ex US Index) exacerbated this spread by gaining only 0.45%.
Given that both the SMI Fund and SMI Balanced Fund maintain diversified portfolios with allocations to large, small, and foreign stocks, the performance of these funds is going to compare poorly to the large-company dominated stock market indexes any time large-company stocks dominate by such a wide margin. The SMI Fund gained 7.38% in the 12-months ended October 31, while the SMI Balanced Fund gained 4.46%. The Wilshire 5000 Index gained 16.15% and the Barclays Capital U.S. Aggregate Bond Index gained 4.14%.
Upgrading and Dynamic Asset Allocation Are Complementary Strategies
The introduction of the SMI Dynamic Allocation Fund last year has caused some shareholders to wonder which of the two strategies they should choose. Rather than making an either-or decision between the two, we feel the best answer for many investors is to pursue both. The two strategies tend to be complementary, as Upgrading will typically perform better during rising markets while Dynamic Asset Allocation’s strength is preserving wealth during falling markets. Therefore, owning both within a portfolio provides an additional degree of diversification. Each investor will need to determine the ideal balance between these two approaches: more aggressive investors might prefer to combine the Sound Mind Investing Fund (SMIFX) and the SMI Dynamic Allocation Fund (SMIDX), while more conservative investors, perhaps those nearing or already in retirement, might favor a combination of the SMI Balanced (SMILX) and Dynamic Allocation (SMIDX) Funds.
Going Direct With the SMI Funds
Slightly over two-thirds of the assets in the SMI Funds are owned through accounts held at other organizations (Fidelity, Schwab, TD Ameritrade, etc.). That’s perfectly fine. However, there are some advantages to having your account directly with the SMI Funds rather than through a third party.
The primary advantage of a direct account is the ability to buy or sell shares of the SMI Funds without paying any transaction fees. Most third-party accounts are charged some sort of transaction fee when the SMI Funds are bought or sold. Those fees can add up – particularly if you are regularly buying or selling shares in any of the SMI Funds. When your account is held directly with the SMI Funds, you never have to pay transaction fees. Additionally, in accounts held directly with the SMI Funds, the typical 2% redemption fee on shares sold within 60 days of purchase is waived if you are transferring money from one SMI Fund to another. To learn more about moving your account directly to the SMI Funds, visit www.smifund.com or call 1-877-SMI-FUND.
3
We appreciate the confidence you have placed in us to be a faithful steward of your assets, as you strive to be a faithful steward of His assets.
Sincerely,

Mark Biller
Senior Portfolio Manager
The Sound Mind Investing Funds
4
PERFORMANCE RESULTS – (Unaudited)
Total Return* (For the periods ended October 31, 2014) | ||||||||||||||||||||
| Average Annual | ||||||||||||||||||||
| Three Months | Six Months | One Year | Five Year | Since Inception (December 2, 2005) | ||||||||||||||||
Sound Mind Investing Fund | 1.01% | 3.03% | 7.38% | 12.96% | 6.84% | |||||||||||||||
S&P 500® Index** | 5.05% | 8.22% | 17.27% | 16.69% | 7.63% | |||||||||||||||
Wilshire 5000 Index** | 4.78% | 7.66% | 16.15% | 16.87% | 7.82% | |||||||||||||||
Gross Expenses: 2.18% (as stated in the most recent prospectus dated February 28, 2014). Net Expenses: 2.18% (as stated in the most recent prospectus dated February 28, 2014), which includes acquired fund fees and expenses and reflects the fee waiver/expense reimbursement discussed. All expenses are reflected in performance results. The Adviser contractually has agreed to waive its fee and/or reimburse expenses to the extent necessary to maintain Total Annual Fund Operating Expenses (excluding interest, taxes, brokerage commissions, other expenses which are capitalized in accordance with generally accepted accounting principles, extraordinary expenses, dividend expense on short sales, 12b-1 fees, and acquired fund fees and expenses) at 1.50% of the Fund’s average daily net assets through February 28, 2015. Each waiver or reimbursement of an expense by the Adviser is subject to repayment by the Fund within the three fiscal years in which the expense was incurred, provided that the Fund is able to make the repayment without exceeding the expense limitation. This expense cap may not be terminated prior to this date except by the Board of Trustees. The Adviser is also entitled to recoupment related to fees waived and/or expenses reimbursed with respect to the Predecessor Fund.
Total Return* (For the periods ended October 31, 2014) | ||||||||||||||||
| Average Annual | ||||||||||||||||
| Three Months | Six Months | One Year | Since Inception (December 30, 2010) | |||||||||||||
Sound Mind Investing Balanced Fund | 0.52% | 1.32% | 4.46% | 7.20% | ||||||||||||
S&P 500® Index** | 5.05% | 8.22% | 17.27% | 15.48% | ||||||||||||
Wilshire 5000 Index** | 4.78% | 7.66% | 16.15% | 15.04% | ||||||||||||
Barclays Capital U.S. Aggregate Bond Index** | 1.40% | 2.35% | 4.14% | 3.95% | ||||||||||||
Custom Benchmark*** | 3.43% | 5.53% | 11.30% | 10.68% | ||||||||||||
Gross Expenses: 2.20% (as stated in the most recent prospectus dated February 28, 2014). Net Expenses: 1.15% (as stated in the most recent prospectus dated February 28, 2014), which includes acquired fund fees and expenses and reflects the fee waiver/expense reimbursement discussed below. All expenses are reflected in performance results. The Adviser contractually has agreed to waive its fee and/or reimburse expenses to the extent necessary to maintain Total Annual Fund Operating Expenses (excluding interest, taxes, brokerage commissions, other expenses which are capitalized in accordance with generally accepted accounting principles, extraordinary expenses, dividend expense on short sales, 12b-1 fees, and acquired fund fees and expenses) at 1.15% of the Fund’s average daily net assets through February 28, 2015. Each waiver or reimbursement of an expense by the Adviser is subject to repayment by the Fund within the three fiscal years in which the expense was incurred, provided that the Fund is able to make the repayment without exceeding the expense limitation. This expense cap may not be terminated prior to this date except by the Board of Trustees. The Adviser is also entitled to recoupment related to fees waived and/or expenses reimbursed with respect to the Predecessor Fund.
5
PERFORMANCE RESULTS – (Unaudited), (Continued)
Total Return* (For the periods ended October 31, 2014) | ||||||||||||||||
| Average Annual | ||||||||||||||||
| Three Months | Six Months | One Year | Since Inception (February 28, 2013) | |||||||||||||
SMI Dynamic Allocation Fund | 3.78% | 5.45% | 9.64% | 11.56% | ||||||||||||
Wilshire 5000 Index** | 4.78% | 7.66% | 16.15% | 20.79% | ||||||||||||
Barclays Capital U.S. Aggregate Bond Index** | 1.40% | 2.35% | 4.14% | 1.90% | ||||||||||||
Custom Benchmark*** | 3.43% | 5.53% | 11.30% | 12.98% | ||||||||||||
Gross Expenses: 1.66% (as stated in the most recent prospectus dated February 28, 2014). Net Expenses: 1.66% (as stated in the most recent prospectus dated February 28, 2014), which includes acquired fund fees and expenses and reflects the fee waiver/expense reimbursement discussed below. All expenses are reflected in performance results. The Adviser contractually has agreed to waive its fee and/or reimburse expenses to the extent necessary to maintain Total Annual Fund Operating Expenses (excluding interest, taxes, brokerage commissions, other expenses which are capitalized in accordance with generally accepted accounting principles, extraordinary expenses, dividend expense on short sales, 12b-1 fees, and acquired fund fees and expenses) at 1.45% of the Fund’s average daily net assets through February 28, 2015. Each waiver or reimbursement of an expense by the Adviser is subject to repayment by the Fund within the three fiscal years in which the expense was incurred, provided that the Fund is able to make the repayment without exceeding the expense limitation. This expense cap may not be terminated prior to this date except by the Board of Trustees. The Adviser is also entitled to recoupment related to fees waived and/or expenses reimbursed with respect to the Predecessor Fund.
The performance quoted represents past performance, which does not guarantee future results. The investment return and principal value of an investment will fluctuate so that an investor’s shares, when redeemed, may be worth more or less than their original cost. The returns shown do not reflect deduction of taxes that a shareholder would pay on Fund distributions or the redemption of Fund shares. Current performance of the Funds may be lower or higher than the performance quoted. Performance data current to the most recent month end may be obtained by calling 1-877-764-3863.
| * | Return figures reflect any change in price per share and assume the reinvestment of all distributions. |
| ** | The Standard & Poor’s 500® Index, Wilshire 5000 Index and Barclays Capital U.S. Aggregate Bond Index are unmanaged indices that assume reinvestment of all distributions and exclude the effect of taxes and fees. The Standard & Poor’s 500® Index, Wilshire 5000 Index and Barclays Capital U.S. Aggregate Bond Index are widely recognized unmanaged indices and are representative of a broader market and range of securities than is found in each Fund’s portfolio. The returns of the indices are not reduced by any fees or operating expenses. Individuals cannot invest directly in the Indices; however, an individual can invest in exchange traded funds or other investment vehicles that attempt to track the performance of a benchmark index. |
| *** | The Custom Benchmark for the Sound Mind Investing Balanced Fund and SMI Dynamic Allocation Fund is comprised of 60% Wilshire 5000 Index and 40% Barclays Capital U.S. Aggregate Bond Index. |
The Funds’ investment objectives, risks, charges and expenses must be considered carefully before investing. The prospectus contains this and other important information about the Funds and may be obtained by calling the same number as above. Please read it carefully before investing.
6
PERFORMANCE RESULTS – (Unaudited), (Continued)
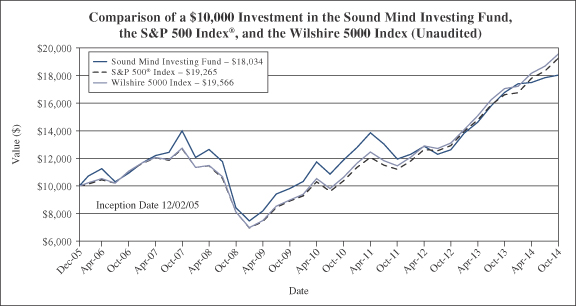
The chart above assumes an initial investment of $10,000 made on December 2, 2005 (commencement of Fund operations) and held through October 31, 2014. THE FUND’S RETURN REPRESENTS PAST PERFORMANCE AND DOES NOT GUARANTEE FUTURE RESULTS. The returns shown do not reflect deduction of taxes that a shareholder would pay on Fund distributions or the redemption of Fund shares. Investment returns and principal values will fluctuate so that your shares, when redeemed, may be worth more or less than their original purchase price.
Current performance of the Fund may be lower or higher than the performance quoted. For more information on the Fund, and to obtain performance data current to the most recent month end or to request a prospectus, please call 1-877-764-3863. You should carefully consider the investment objectives, potential risks, management fees, and charges and expenses of the Fund before investing. The Fund’s prospectus contains this and other information about the Fund, and should be read carefully before investing.
The Fund is distributed by Unified Financial Securities, Inc., member FINRA.
7
PERFORMANCE RESULTS – (Unaudited), (Continued)
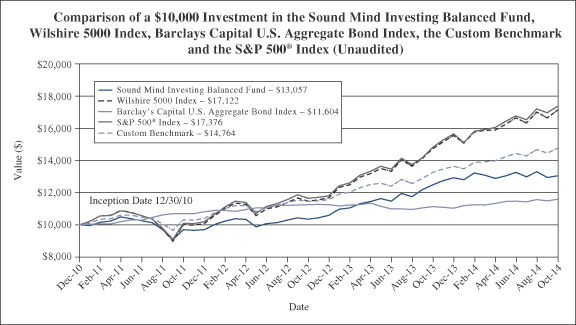
The chart above assumes an initial investment of $10,000 made on December 30, 2010 (commencement of Fund operations) and held through October 31, 2014. THE FUND’S RETURN REPRESENTS PAST PERFORMANCE AND DOES NOT GUARANTEE FUTURE RESULTS. The returns shown do not reflect deduction of taxes that a shareholder would pay on Fund distributions or the redemption of Fund shares. Investment returns and principal values will fluctuate so that your shares, when redeemed, may be worth more or less than their original purchase price.
Current performance of the Fund may be lower or higher than the performance quoted. For more information on the Fund, and to obtain performance data current to the most recent month end or to request a prospectus, please call 1-877-764-3863. You should carefully consider the investment objectives, potential risks, management fees, and charges and expenses of the Fund before investing. The Fund’s prospectus contains this and other information about the Fund, and should be read carefully before investing.
The Custom Benchmark is comprised of 60% Wilshire 5000 Index and 40% Barclays Capital U.S. Aggregate Bond Index.
The Fund is distributed by Unified Financial Securities, Inc., member FINRA.
8
PERFORMANCE RESULTS – (Unaudited), (Continued)
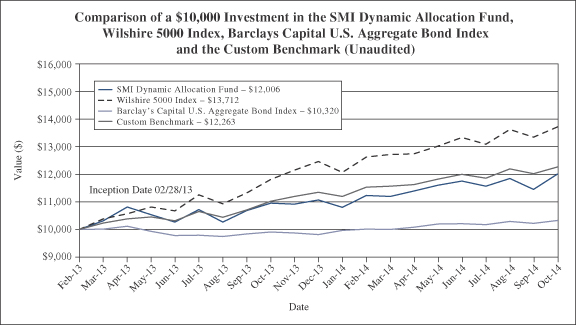
The chart above assumes an initial investment of $10,000 made on February 28, 2013 (commencement of Fund operations) and held through October 31, 2014. THE FUND’S RETURN REPRESENTS PAST PERFORMANCE AND DOES NOT GUARANTEE FUTURE RESULTS. The returns shown do not reflect deduction of taxes that a shareholder would pay on Fund distributions or the redemption of Fund shares. Investment returns and principal values will fluctuate so that your shares, when redeemed, may be worth more or less than their original purchase price.
Current performance of the Fund may be lower or higher than the performance quoted. For more information on the Fund, and to obtain performance data current to the most recent month end or to request a prospectus, please call 1-877-764-3863. You should carefully consider the investment objectives, potential risks, management fees, and charges and expenses of the Fund before investing. The Fund’s prospectus contains this and other information about the Fund, and should be read carefully before investing.
The Custom Benchmark is comprised of 60% Wilshire 5000 Index and 40% Barclays Capital U.S. Aggregate Bond Index.
The Fund is distributed by Unified Financial Securities, Inc., member FINRA.
9
FUND HOLDINGS – (Unaudited)
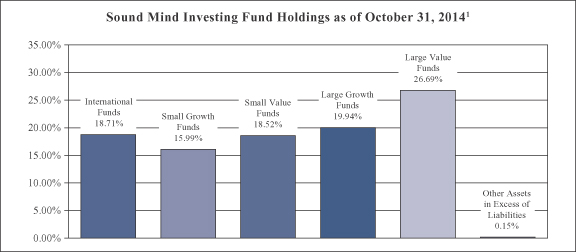
| 1 | As a percentage of net assets. |
Sound Mind Investing Fund seeks long term capital appreciation. The Fund seeks to achieve its objective by investing in a diversified portfolio of other investment companies using a “fund upgrading” strategy. The fund upgrading investment strategy is a systematic investment approach that is based on the belief of the Fund’s adviser, SMI Advisory Services, LLC, that superior returns can be obtained by constantly monitoring the performance of a wide universe of other investment companies, and standing ready to move assets into the funds deemed by the Adviser to be most attractive at the time of analysis.
10
FUND HOLDINGS – (Unaudited), (Continued)
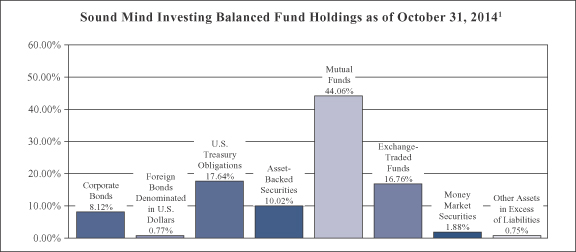
| 1 | As a percentage of net assets. |
Sound Mind Investing Balanced Fund seeks total return. Total return is composed of both income and capital appreciation. The Fund seeks to achieve its objective by investing in a diversified portfolio of equities and fixed income securities. The Fund’s Adviser determines how the Fund’s assets will be allocated between equity and fixed income securities. Under normal circumstances the Fund will target an approximate mix of 60% equity securities and 40% fixed income securities and derivatives. The Adviser periodically rebalances the Fund’s asset allocation in response to market conditions and to ensure an appropriate mix of elements in the Fund.
11
FUND HOLDINGS – (Unaudited), (Continued)
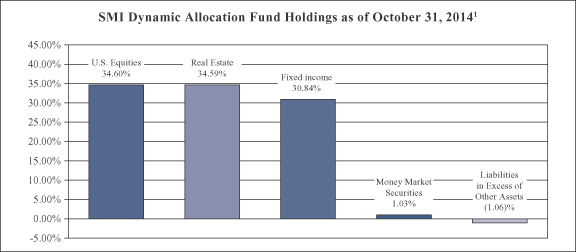
| 1 | As a percentage of net assets. |
SMI Dynamic Allocation Fund seeks total return. Total return is composed of both income and capital appreciation. The Fund uses a dynamic asset allocation investment strategy to achieve its investment objective. This is done by investing in securities from the following six asset classes – U.S. Equities, International Equities, Fixed Income Securities, Real Estate, Precious Metals, and Cash.
Availability of Portfolio Schedule – (Unaudited)
Each Fund files its complete schedule of portfolio holdings with the Securities and Exchange Commission (“SEC”) for the first and third quarters of each fiscal year on Form N-Q. The Funds’ Forms N-Q are available at the SEC’s website at www.sec.gov. The Funds’ Forms N-Q may be reviewed and copied at the Public Reference Room in Washington DC. Information on the operation of the Public Reference Room may be obtained by calling 1-800-SEC-0330.
12
SUMMARY OF FUNDS’ EXPENSES – (Unaudited)
As a shareholder of one of the Funds, you incur two types of costs: (1) transaction costs (such as short-term redemption fees); and (2) ongoing costs, including management fees and other Fund expenses. This example is intended to help you understand your ongoing costs (in dollars) of investing in the Funds and to compare these costs with the ongoing costs of investing in other mutual funds.
Each Fund’s example is based on an investment of $1,000 invested at the beginning of the period and held for the entire period (May 1, 2014 through October 31, 2014).
Actual Expenses
The first line of the table below provides information about actual account values and actual expenses. You may use the information in this line, together with the amount you invested, to estimate the expenses that you paid over the period. Simply divide your account value by $1,000 (for example, an $8,600 account value divided by $1,000 = 8.60), then multiply the result by the number in the first line under the heading entitled “Expenses Paid During Period” to estimate the expenses you paid on your account during this period.
Hypothetical Example for Comparison Purposes
The second line of the table below provides information about hypothetical account values and hypothetical expenses based on the Funds’ actual expense ratio and an assumed rate of return of 5% per year before expenses, which is not the Funds’ actual return. The hypothetical account values and expenses may not be used to estimate the actual ending account balance or expenses you paid for the period. You may use this information to compare the ongoing costs of investing in the Funds and other funds. To do so, compare this 5% hypothetical example with the 5% hypothetical examples that appear in the shareholder reports of the other funds.
Expenses shown are meant to highlight your ongoing costs only and do not reflect any transactional costs such as the fee imposed on short-term redemptions. Therefore, the second line of the table below is useful in comparing ongoing costs only and will not help you determine the relative costs of owning different funds. If incurred, the short-term redemption fee imposed by the Funds would increase your expenses.
Sound Mind Investing Fund | Beginning Account Value May 1, 2014 | Ending Account Value October 31, 2014 | Expenses Paid During Period May 1, 2014 – October 31, 2014* | |||||||||
| Actual | $ | 1,000.00 | $ | 1,030.30 | $ | 5.56 | ||||||
| Hypothetical ** | $ | 1,000.00 | $ | 1,019.73 | $ | 5.53 | ||||||
| * | Expenses are equal to the Fund’s annualized expense ratio of 1.09%, multiplied by the average account value over the period, multiplied by 184/365 (to reflect the partial year period). |
| ** | Assumes a 5% return before expenses. |
13
SUMMARY OF FUNDS’ EXPENSES – (Unaudited), (Continued)
Sound Mind Investing | Beginning Account Value May 1, 2014 | Ending Account Value October 31, 2014 | Expenses Paid During Period May 1, 2014 – October 31, 2014* | |||||||||
| Actual | $ | 1,000.00 | $ | 1,013.20 | $ | 5.76 | ||||||
| Hypothetical ** | $ | 1,000.00 | $ | 1,019.48 | $ | 5.78 | ||||||
| * | Expenses are equal to the Fund’s annualized expense ratio of 1.13%, multiplied by the average account value over the period, multiplied by 184/365 (to reflect the partial year period). |
| ** | Assumes a 5% return before expenses. |
SMI Dynamic Allocation Fund | Beginning Account Value May 1, 2014 | Ending Account Value October 31, 2014 | Expenses Paid During Period May 1, 2014 – October 31, 2014* | |||||||||
| Actual | $ | 1,000.00 | $ | 1,054.50 | $ | 6.25 | ||||||
| Hypothetical ** | $ | 1,000.00 | $ | 1,019.12 | $ | 6.14 | ||||||
| * | Expenses are equal to the Fund’s annualized expense ratio of 1.21%, multiplied by the average account value over the period, multiplied by 184/365 (to reflect the partial year period). |
| ** | Assumes a 5% return before expenses. |
14
SOUND MIND INVESTING FUND
SCHEDULE OF INVESTMENTS
October 31, 2014
| Mutual Funds – 81.27% | Shares | Fair Value | ||||||
Mutual Funds Greater Than 1% of Sound | ||||||||
AllianceBernstein Large-Cap Growth Fund – Advisor Class | 149,665 | $ | 6,681,067 | |||||
Ariel Fund – Investor Class | 102,099 | 8,075,037 | ||||||
Baron Partners Fund – Institutional Class * | 220,941 | 8,073,192 | ||||||
Delaware Value Fund – Institutional Class | 368,268 | 6,588,306 | ||||||
ClearBridge Aggressive Growth Fund – Institutional Class | 15,845 | 3,526,280 | ||||||
Dodge & Cox International Stock Fund | 345,265 | 15,326,313 | ||||||
Fidelity Mid Cap Value Fund | 580,064 | 14,408,780 | ||||||
Fidelity Value Discovery Fund | 173,636 | 4,160,315 | ||||||
GE Institutional Premier Growth Equity Fund – Investment Class (a) | 322,373 | 5,000,000 | ||||||
Goldman Sachs Growth Opportunity Fund – Institutional Class | 132,629 | 4,396,656 | ||||||
Hodges Fund – Retail Class (a) | 290,986 | 11,511,420 | ||||||
Janus Contrarian Fund – Class T | 614,013 | 14,195,979 | ||||||
JPMorgan Disciplined Equity Fund – Institutional Class | 263,793 | 6,539,423 | ||||||
Legg Mason Opportunity Trust – Institutional Class (a) | 1,144,241 | 22,942,025 | ||||||
Marsico Focus Fund (a) | 583,135 | 13,213,835 | ||||||
Morgan Stanley Institutional Fund, Inc. – Growth Portfolio –Institutional Class | 149,303 | 6,154,261 | ||||||
Nicholas Fund, Inc. | 62,859 | 4,269,380 | ||||||
Oakmark Select Fund – Institutional Class | 338,405 | 15,397,434 | ||||||
Oppenheimer International Small Co. Fund – Class Y | 501,816 | 16,223,702 | ||||||
PRIMECAP Odyssey Aggressive Growth Fund | 507,659 | 16,859,365 | ||||||
Third Avenue Value Fund – Institutional Class | 130,638 | 7,797,790 | ||||||
Virtus Emerging Markets Opportunities Fund – Class I | 769,363 | 8,086,009 | ||||||
Wasatch Emerging Markets Small Cap Fund | 1,225,255 | 3,344,946 | ||||||
|
| |||||||
TOTAL MUTUAL FUNDS GREATER THAN 1% OF SOUND |
| 222,771,515 | ||||||
|
| |||||||
Mutual Funds Less Than 1% of Sound | ||||||||
AllianzGI NFJ Dividend Value Fund – Institutional Class | 200 | 3,416 | ||||||
AllianzGI NFJ Small-Cap Value Fund – Institutional Class | 162 | 5,865 | ||||||
American Century International Discovery Fund – Institutional Class | 250 | 3,129 | ||||||
Artisan International Small Cap Fund – Investor Class | 150 | 3,665 | ||||||
Artisan International Value Fund – Investor Class | 150 | 5,476 | ||||||
Artisan Mid Cap Value Fund – Investor Class | 200 | 5,434 | ||||||
Artisan Small Cap Fund – Investor Class * | 250 | 7,137 | ||||||
See accompanying notes which are an integral part of these financial statements.
15
SOUND MIND INVESTING FUND
SCHEDULE OF INVESTMENTS
October 31, 2014 – (Continued)
| Mutual Funds – 81.27% – continued | Shares | Fair Value | ||||||
Mutual Funds Less Than 1% of Sound | ||||||||
Artisan Small Cap Value Fund – Investor Class | 150 | $ | 2,601 | |||||
Aston TAMRO Small Cap Fund – Institutional Class | 100 | 2,276 | ||||||
Aston/Fairpointe Mid Cap Fund – Class I | 19,756 | 943,170 | ||||||
BBH Core Select Fund – Class N | 100 | 2,252 | ||||||
Berwyn Fund | 100 | 3,836 | ||||||
BlackRock International Opportunities Portfolio – Institutional Class | 100 | 3,815 | ||||||
Bridgeway Small Cap Growth Fund – Class N | 205 | 3,879 | ||||||
Bridgeway Small Cap Value Fund – Class N | 179 | 3,995 | ||||||
Buffalo Small Cap Fund, Inc. | 150 | 5,154 | ||||||
Columbia Acorn International – Class Z | 100 | 4,544 | ||||||
Columbia Acorn Select – Class Z | 150 | 3,839 | ||||||
Columbia Small Cap Growth I Fund – Class Z | 100 | 2,982 | ||||||
Columbia Value and Restructuring Fund – Class Z | 50 | 2,688 | ||||||
Davis Opportunity Fund – Class Y | 100 | 3,716 | ||||||
Delaware Select Growth Fund – Institutional Class | 100 | 5,492 | ||||||
Delaware Small Cap Value Fund – Institutional Class | 100 | 5,738 | ||||||
Delaware SMID Cap Growth Fund – Institutional Class | 100 | 3,581 | ||||||
Deutsche Small Cap Value Fund – Institutional Class | 85 | 2,389 | ||||||
DFA International Small Cap Value Portfolio – Investor Class | 100 | 1,955 | ||||||
DFA International Small Company Portfolio – Institutional Class | 100 | 1,824 | ||||||
DFA U.S. Small Cap Value Portfolio | 100 | 3,582 | ||||||
Domini Social Equity Fund – Institutional Class | 60,329 | 1,783,311 | ||||||
Dreyfus Opportunistic Small Cap Fund | 100 | 3,455 | ||||||
Fairholme Fund | 100 | 3,753 | ||||||
Federated MDT Stock Trust – Institutional Class | 44,848 | 1,340,957 | ||||||
Fidelity International Capital Appreciation Fund | 119,203 | 2,052,684 | ||||||
Fidelity Mid-Cap Stock Fund | 150 | 5,830 | ||||||
Fidelity Small Cap Discovery Fund | 100 | 3,073 | ||||||
Fidelity Small Cap Stock Fund | 150 | 2,990 | ||||||
Fidelity Small Cap Value Fund – Institutional Class | 150 | 2,757 | ||||||
Franklin Small Cap Value Fund – Advisor Class | 100 | 6,125 | ||||||
Hartford International Opportunities Fund/The – Class Y | 248 | 4,371 | ||||||
Heartland Value Fund | 100 | 4,794 | ||||||
Hotchkis and Wiley Mid-Cap Value Fund – Institutional Class | 100 | 4,373 | ||||||
Hennessy Focus Fund * | 100 | 6,946 | ||||||
Invesco American Value Fund – Institutional Class | 100 | 4,244 | ||||||
See accompanying notes which are an integral part of these financial statements.
16
SOUND MIND INVESTING FUND
SCHEDULE OF INVESTMENTS
October 31, 2014 – (Continued)
| Mutual Funds – 81.27% – continued | Shares | Fair Value | ||||||
Mutual Funds Less Than 1% of Sound | ||||||||
Janus Overseas Fund – Class T | 100 | $ | 3,481 | |||||
Janus Venture Fund – Class T | 100 | 6,852 | ||||||
JPMorgan Mid Cap Value Fund – Institutional Class | 100 | 3,858 | ||||||
JPMorgan Small Cap Equity Fund – Class S | 226 | 11,707 | ||||||
Longleaf Partners Fund | 150 | 5,291 | ||||||
Longleaf Partners International Fund | 100 | 1,655 | ||||||
Longleaf Partners Small-Cap Fund | 100 | 3,639 | ||||||
Lord Abbett Developing Growth Fund, Inc. – Institutional Class | 100 | 2,888 | ||||||
Morgan Stanley Institutional Fund, Inc. – International Small Cap Portfolio – Institutional Class | 36 | 470 | ||||||
Neuberger Berman Genesis Fund – Institutional Class | 100 | 6,120 | ||||||
Oakmark International Fund – Institutional Class | 150 | 3,708 | ||||||
Oakmark International Small Cap Fund – Institutional Class | 150 | 2,424 | ||||||
Oppenheimer Small and Mid Cap Value Fund – Class Y | 100 | 4,788 | ||||||
Perkins Mid Cap Value Fund – Class T | 200 | 5,004 | ||||||
Principal SmallCap Growth Fund I – Institutional Class | 200 | 2,810 | ||||||
Royce Low-Priced Stock Fund – Investment Class | 150 | 2,013 | ||||||
Royce Opportunity Fund – Investor Class | 151 | 2,272 | ||||||
Royce Premier Fund – Investor Class | 300 | 6,666 | ||||||
Royce Special Equity Fund – Investor Class | 100 | 2,497 | ||||||
Royce Special Equity Fund – Institutional Class | 150 | 3,729 | ||||||
Royce Value Fund – Institutional Class | 100 | 1,371 | ||||||
Sterling Capital Special Opportunities Fund | 23,417 | 559,905 | ||||||
T. Rowe Price International Discovery Fund | 150 | 8,416 | ||||||
T. Rowe Price New Horizons Fund | 100 | 4,799 | ||||||
T. Rowe Price Small-Cap Value Fund | 100 | 4,981 | ||||||
TIAA-CREF International Equity Fund – Institutional Class | 100 | 1,081 | ||||||
Touchstone Sands Capital Select Growth Fund – Class Y | 100 | 1,917 | ||||||
Tweedy Browne Global Value Fund | 150 | 4,038 | ||||||
Vanguard Strategic Equity Fund – Investor Class | 100 | 3,308 | ||||||
Wasatch International Growth Fund | 150 | 4,091 | ||||||
|
| |||||||
TOTAL MUTUAL FUNDS LESS THAN 1% OF SOUND |
| 6,952,872 | ||||||
|
| |||||||
TOTAL MUTUAL FUNDS (Cost $202,953,411) |
| 229,724,387 | ||||||
|
| |||||||
See accompanying notes which are an integral part of these financial statements.
17
SOUND MIND INVESTING FUND
SCHEDULE OF INVESTMENTS
October 31, 2014 – (Continued)
| Exchange-Traded Funds – 18.58% | Shares | Fair Value | ||||||
Consumer Staples Select Sector SPDR Fund | 96,600 | $ | 4,512,186 | |||||
iShares S&P 100 ETF | 66,250 | 5,945,937 | ||||||
iShares S&P 500 Growth ETF | 46,200 | 5,072,298 | ||||||
iShares Select Dividend ETF | 75,250 | 5,880,787 | ||||||
iShares Transportation Average ETF | 95,504 | 14,965,477 | ||||||
Powershares QQQ Trust Series 1 | 159,125 | 16,135,275 | ||||||
|
| |||||||
TOTAL EXCHANGE-TRADED FUNDS (Cost $49,985,291) |
| 52,511,960 | ||||||
|
| |||||||
TOTAL INVESTMENTS – 99.85% (Cost $252,938,702) |
| $ | 282,236,347 | |||||
|
| |||||||
Other Assets in Excess of Liabilities – 0.15% |
| 433,640 | ||||||
|
| |||||||
TOTAL NET ASSETS – 100.00% |
| $ | 282,669,987 | |||||
|
| |||||||
| (a) | A portion of this security may be deemed illiquid due to the Investment Company Act of 1940 provision stating that no issuer of any investment company security purchased or acquired by a registered investment company shall be obligated to redeem such security in an amount exceeding 1 per centum of such issuer’s total outstanding shares during any period of less than thirty days. As of October 31, 2014, the fair value of illiquid securities held by the Fund was $11,007,377 or 3.89% of net assets. |
| (b) | Small investments are occasionally retained in mutual funds that are closed to new investment, or in the manager’s opinion are at risk to close, so as to allow the Fund the flexibility to reinvest in these funds in the future. |
| ETF | – Exchange-Traded Fund |
| SPDR | – Standard & Poor’s Depositary Receipts |
| * | Non-income producing security. |
See accompanying notes which are an integral part of these financial statements.
18
SOUND MIND INVESTING BALANCED FUND
SCHEDULE OF INVESTMENTS
October 31, 2014
| Corporate Bonds – 8.12% | Principal Amount | Fair Value | ||||||
Ally Financial, Inc., 3.125%, 1/15/2016 | $ | 25,000 | $ | 25,438 | ||||
Ally Financial, Inc., 5.500%, 2/15/2017 | 55,000 | 58,641 | ||||||
American Honda Finance Corp., 1.125%, 10/7/2016 | 80,000 | 79,886 | ||||||
American International Group, Inc., 5.050%, 10/1/2015 | 70,000 | 72,795 | ||||||
American International Group, Inc., 6.400%, 12/15/2020 | 50,000 | 59,785 | ||||||
Bank of America Corp., 4.500%, 4/1/2015 | 200,000 | 203,252 | ||||||
Bank of America Corp., 1.500%, 10/9/2015 | 160,000 | 161,196 | ||||||
Branch Banking & Trust Co., 1.350%, 10/1/2017 | 45,000 | 44,918 | ||||||
Burlington Northern Santa Fe LLC, 3.400%, 9/1/2024 | 70,000 | 70,427 | ||||||
Citigroup, Inc., 1.350%, 3/10/2017 | 55,000 | 55,030 | ||||||
Daimler Finance North America LLC, 1.250%, 1/11/2016 (a) | 90,000 | 90,507 | ||||||
Entergy Texas, Inc., 3.600%, 6/1/2015 | 55,000 | 56,024 | ||||||
Ford Motor Credit Co. LLC, 3.875%, 1/15/2015 | 100,000 | 100,633 | ||||||
Ford Motor Credit Co. LLC, 3.984%, 6/15/2016 (a) | 65,000 | 67,953 | ||||||
Ford Motor Credit Co. LLC, 4.250%, 2/3/2017 | 90,000 | 95,331 | ||||||
Ford Motor Credit Co. LLC, 5.000%, 5/15/2018 | 140,000 | 153,317 | ||||||
Ford Motor Credit Co. LLC, 4.375%, 8/6/2023 | 55,000 | 58,450 | ||||||
General Electric Capital Corp., 1.000%, 12/11/2015 | 90,000 | 90,493 | ||||||
General Electric Capital Corp., 1.000%, 1/8/2016 | 90,000 | 90,484 | ||||||
General Electric Capital Corp., 1.250%, 5/15/2017 | 85,000 | 85,268 | ||||||
Goldman Sachs Group, Inc./The, 3.700%, 8/1/2015 | 45,000 | 46,011 | ||||||
Goldman Sachs Group, Inc./The, 1.600%, 11/23/2015 | 85,000 | 85,691 | ||||||
Goldman Sachs Group, Inc./The, 1.433%, 4/30/2018 (b) | 85,000 | 86,362 | ||||||
Hartford Financial Services Group, Inc., 5.500%, 10/15/2016 | 60,000 | 65,032 | ||||||
Hartford Financial Services Group, Inc., 5.375%, 3/15/2017 | 65,000 | 70,983 | ||||||
JPMorgan Chase & Co., 0.855%, 2/26/2016 (b) | 75,000 | 75,271 | ||||||
JPMorgan Chase & Co., 3.250%, 9/23/2022 | 55,000 | 55,170 | ||||||
Liberty Mutual Group, Inc., 6.700%, 8/15/2016 (a) | 25,000 | 27,411 | ||||||
Manufacturers & Traders Trust Co., 1.400%, 7/25/2017 | 55,000 | 55,116 | ||||||
Morgan Stanley, 1.485%, 2/25/2016 (b) | 40,000 | 40,508 | ||||||
Verizon Communications, Inc., 1.350%, 6/9/2017 | 100,000 | 99,877 | ||||||
Wells Fargo & Co., 1.400%, 9/8/2017 | 60,000 | 60,027 | ||||||
|
| |||||||
TOTAL CORPORATE BONDS (Cost $2,429,154) |
| 2,487,287 | ||||||
|
| |||||||
See accompanying notes which are an integral part of these financial statements.
19
SOUND MIND INVESTING BALANCED FUND
SCHEDULE OF INVESTMENTS
October 31, 2014 – (Continued)
| Foreign Bonds Denominated in U.S. Dollars – 0.77% | Principal Amount | Fair Value | ||||||
ING Bank NV, 3.750%, 3/7/2017 (a) | $ | 165,000 | $ | 173,895 | ||||
Petrobras Global Finance BV, 2.371%, 1/15/2019 (b) | 35,000 | 35,012 | ||||||
Petroleos Mexicanos, 3.500%, 7/18/2018 | 25,000 | 25,938 | ||||||
|
| |||||||
TOTAL FOREIGN BONDS DENOMINATED |
| 234,845 | ||||||
|
| |||||||
U.S. Treasury Obligations – 17.64% | ||||||||
U.S. Treasury Note, 0.250%, 3/31/2015 | 705,000 | 705,441 | ||||||
U.S. Treasury Note, 0.250%, 5/31/2015 | 715,000 | 715,558 | ||||||
U.S. Treasury Note, 0.250%, 9/30/2015 | 2,375,000 | 2,377,784 | ||||||
U.S. Treasury Note, 1.500%, 1/31/2019 | 715,000 | 716,341 | ||||||
U.S. Treasury Note, 1.625%, 6/30/2019 | 415,000 | 416,329 | ||||||
U.S. Treasury Note, 2.500%, 5/15/2024 | 460,000 | 467,439 | ||||||
|
| |||||||
TOTAL U.S. TREASURY OBLIGATIONS (Cost $5,383,030) |
| 5,398,892 | ||||||
|
| |||||||
Asset-Backed Securities – 10.02% | ||||||||
American Airlines Pass Through Trust, | 23,011 | 24,708 | ||||||
Banc of America Merrill Lynch Commercial Mortgage, Inc., | 62,912 | 66,792 | ||||||
Banc of America Merrill Lynch Commercial Mortgage, Inc., | 54,388 | 55,838 | ||||||
Burlington Northern and Santa Fe Railway Co. Pass Through Trust, Series 2004-1, 4.575%, 1/15/2021 | 56,914 | 60,996 | ||||||
Burlington Northern and Santa Fe Railway Co. Pass Through Trust, Series 2001-2, 6.462%, 1/15/2021 | 22,103 | 24,765 | ||||||
Burlington Northern and Santa Fe Railway Co. Pass Through Trust, Series 2005-4, 4.967%, 4/1/2023 | 16,901 | 18,299 | ||||||
Citigroup Commercial Mortgage Trust, Series 2012-GC8, Class A1, 0.685%, 9/10/2045 | 30,675 | 30,678 | ||||||
Commercial Mortgage Pass Through Certificates, | 22,291 | 22,218 | ||||||
Commercial Mortgage Trust, Series 2007-GC9, Class A7, 5.444%, 3/10/2039 | 30,000 | 32,314 | ||||||
Commercial Mortgage Trust, Series 2005-CD1, Class A4, 5.400%, 7/15/2044 (b) | 33,215 | 33,984 | ||||||
Countrywide Asset-Backed Certificates, | 11,866 | 11,606 | ||||||
See accompanying notes which are an integral part of these financial statements.
20
SOUND MIND INVESTING BALANCED FUND
SCHEDULE OF INVESTMENTS
October 31, 2014 – (Continued)
| Asset-Backed Securities – 10.02% – continued | Principal Amount | Fair Value | ||||||
Credit Suisse First Boston Mortgage Securities Corp., | $ | 305 | $ | 305 | ||||
Credit Suisse Mortgage Capital Certificates, | 11,277 | 11,701 | ||||||
Delta Air Lines Pass Through Trust, Series 2007-1, Class A, 6.821%, 8/10/2022 | 28,307 | 32,694 | ||||||
Fannie Mae, Pool #465468, 3.330%, 7/1/2020 | 47,126 | 49,744 | ||||||
Fannie Mae, Pool #466284, 3.330%, 10/1/2020 | 89,150 | 94,885 | ||||||
Fannie Mae, Pool #466319, 3.230%, 11/1/2020 | 88,668 | 93,879 | ||||||
Fannie Mae, Pool #AM2182, 2.160%, 1/1/2023 | 149,708 | 146,258 | ||||||
Fannie Mae, Pool #AA4328, 4.000%, 4/1/2024 | 33,074 | 35,349 | ||||||
Fannie Mae, Pool #AB2822, 2.500%, 3/1/2026 | 27,814 | 28,390 | ||||||
Fannie Mae, Pool #AM1671, 2.100%, 12/1/2027 | 54,235 | 52,263 | ||||||
Fannie Mae, Pool #MA1604, 2.000%, 7/1/2028 | 50,172 | 49,382 | ||||||
Fannie Mae, Pool #464398, 5.970%, 1/1/2040 | 18,955 | 23,091 | ||||||
Fannie Mae, Pool #464400, 5.970%, 1/1/2040 | 14,216 | 17,318 | ||||||
Fannie Mae, Pool #466890, 5.100%, 12/1/2040 | 23,808 | 27,106 | ||||||
Fannie Mae REMICS, Series 2013-M14, Class A, 4.000%, 2/25/2033 | 93,789 | 93,782 | ||||||
Fannie Mae-Aces, Series 2013-M5, Class ASQ2, 0.595%, 8/25/2015 | 107,995 | 108,062 | ||||||
Fannie Mae-Aces, Series 2014-M2, Class ASQ2, 0.478%, 9/25/2015 | 100,902 | 100,897 | ||||||
Fannie Mae-Aces, Series 2014-M9, Class ASQ2, 1.462%, 4/25/2017 | 125,000 | 126,123 | ||||||
Fannie Mae-Aces, Series 2014-M5, Class ASQ1, 0.986%, 3/25/2019 | 108,173 | 107,945 | ||||||
Fannie Mae-Aces, Series 2014-M1, Class A1, 2.325%, 7/25/2023 (b) | 69,664 | 70,768 | ||||||
Freddie Mac REMICS, Series 3609, Class LA, 4.000%, 12/15/2024 | 44,455 | 46,540 | ||||||
Freddie Mac REMICS, Series 3873, Class DG, 3.000%, 7/15/2027 | 10,535 | 10,782 | ||||||
Ginnie Mae I, Pool #AB2583, 2.140%, 8/15/2023 | 83,469 | 82,990 | ||||||
Ginnie Mae I, Pool #AD0091, 2.730%, 6/15/2032 | 221,765 | 220,071 | ||||||
GS Mortgage Securities Corp. II, Series 2012-GCJ9, Class A1, 0.662%, 11/10/2045 | 34,384 | 34,243 | ||||||
GS Mortgage Securities Trust, Series 2007-GG10, Class A4, 5.797%, 8/10/2045 (b) | 90,344 | 98,867 | ||||||
Hertz Vehicle Financing LLC, Series 2011-1A, Class A1, 2.200%, 3/25/2016 (a) | 91,667 | 92,014 | ||||||
Hertz Vehicle Financing LLC, Series 2013-1A, Class A1, 1.120%, 8/25/2017 (a) | 90,000 | 90,111 | ||||||
Home Equity Loan Trust, Series 2003-HS3, Class A2A, 0.432%, 8/25/2033 (b) | 8,542 | 8,012 | ||||||
Home Equity Mortgage Trust, Series 2006-1, Class A2, 5.800%, 5/25/2036 | 26,287 | 22,401 | ||||||
See accompanying notes which are an integral part of these financial statements.
21
SOUND MIND INVESTING BALANCED FUND
SCHEDULE OF INVESTMENTS
October 31, 2014 – (Continued)
| Asset-Backed Securities – 10.02% – continued | Principal Amount | Fair Value | ||||||
JPMBB Commercial Mortgage Securities Trust, | $ | 108,719 | $ | 109,356 | ||||
JPMorgan Chase Commercial Mortgage Securities Trust, | 26,060 | 26,074 | ||||||
Mid-State Trust, Series 11, Class A1, 4.864%, 7/15/2038 | 15,400 | 16,508 | ||||||
Morgan Stanley Bank of America Merrill Lynch Trust, | 28,032 | 27,913 | ||||||
MSCC Heloc Trust, Series 2007-1, Class A, 0.252%, 12/25/2031 (b) | 62,554 | 59,208 | ||||||
Northwest Airlines Pass Through Trust, | 41,066 | 46,815 | ||||||
Structured Asset Securities Corp. Mortgage Loan Trust, | 14,176 | 13,832 | ||||||
Structured Asset Securities Corp. Mortgage Loan Trust, | 56,847 | 38,306 | ||||||
U.S. Airways Pass Through Trust, Series 2011-1, Class A, 7.125%, 10/22/2023 | 24,456 | 28,247 | ||||||
U.S. Airways Pass Through Trust, Series 2012-1, Class A, 5.900%, 10/1/2024 | 44,716 | 49,523 | ||||||
UBS-Barclays Commercial Mortgage Trust, Series 2012-C3, 0.726%, 8/10/2049 | 42,843 | 42,538 | ||||||
Union Pacific Railroad Co. 2003 Pass Through Trust, Series 03-1, 4.698%, 1/2/2024 | 9,421 | 10,308 | ||||||
Union Pacific Railroad Co. 2004 Pass Through Trust, Series 04-1, 5.404%, 7/2/2025 | 59,336 | 64,103 | ||||||
Union Pacific Railroad Co. 2005 Pass Through Trust, Series 05-1, 5.082%, 1/2/2029 | 44,000 | 48,846 | ||||||
Union Pacific Railroad Co. 2006 Pass Through Trust, Series 06-1, 5.866%, 7/2/2030 | 26,690 | 31,914 | ||||||
Wells Fargo Commercial Mortgage Trust, Series 2012-LC5, Class A1, 0.687%, 10/15/2045 | 55,575 | 55,542 | ||||||
WF-RBS Commercial Mortgage Trust, Series 2012-C10, Class A1, 0.734%, 12/15/2045 | 38,571 | 38,554 | ||||||
|
| |||||||
TOTAL ASSET-BACKED SECURITIES (Cost $2,983,898) |
| 3,065,758 | ||||||
|
| |||||||
| Mutual Funds – 44.06% | Shares | |||||||
AllianceBernstein Large-Cap Growth Fund – Advisor Class | 1,965 | 87,732 | ||||||
American Century International Discovery Fund | 100 | 1,252 | ||||||
See accompanying notes which are an integral part of these financial statements.
22
SOUND MIND INVESTING BALANCED FUND
SCHEDULE OF INVESTMENTS
October 31, 2014 – (Continued)
| Mutual Funds – 44.06% – continued | Shares | Fair Value | ||||||
Ariel Fund – Investor Class | 2,008 | $ | 158,840 | |||||
Dodge & Cox International Stock Fund | 19,580 | 869,143 | ||||||
Fidelity International Capital Appreciation Fund | 19,719 | 339,565 | ||||||
Fidelity International Small Cap Fund | 100 | 2,533 | ||||||
Fidelity Mid Cap Value Fund | 36,789 | 913,837 | ||||||
Goldman Sachs Growth Opportunity Fund – Institutional Class | 17,370 | 575,828 | ||||||
Hodges Fund | 16,949 | 670,511 | ||||||
Janus Contrarian Fund – Class T | 42,663 | 986,363 | ||||||
Legg Mason Opportunity Trust – Institutional Class | 73,863 | 1,480,956 | ||||||
Longleaf Partners Small-Cap Fund | 89 | 3,221 | ||||||
Lord Abbett Developing Growth Fund, Inc. – Institutional Class | 100 | 2,888 | ||||||
Marsico Focus Fund | 47,866 | 1,084,640 | ||||||
Morgan Stanley Institutional Fund – Growth Portfolio | 22,440 | 924,970 | ||||||
Nicholas Fund, Inc. | 6,247 | 424,296 | ||||||
Oakmark International Fund – Institutional Class | 100 | 2,472 | ||||||
Oakmark Select Fund | 29,077 | 1,322,998 | ||||||
Oppenheimer International Small Co. Fund – Class Y | 29,988 | 969,527 | ||||||
PRIMECAP Odyssey Aggressive Growth Fund | 34,713 | 1,152,816 | ||||||
Scout Unconstrained Bond Fund – Institutional Class | 29,586 | 339,645 | ||||||
Third Avenue Value Fund – Institutional Class | 13,758 | 821,228 | ||||||
Wasatch Emerging Markets Small Cap Fund | 128,393 | 350,512 | ||||||
|
| |||||||
TOTAL MUTUAL FUNDS (Cost $12,399,751) |
| 13,485,773 | ||||||
|
| |||||||
Exchange-Traded Funds – 16.76% | ||||||||
iShares S&P 100 ETF | 12,650 | 1,135,338 | ||||||
iShares S&P 500 Growth ETF | 5,800 | 636,782 | ||||||
iShares Select Dividend ETF | 8,700 | 679,905 | ||||||
iShares Transportation Average ETF | 7,900 | 1,237,930 | ||||||
Powershares QQQ Trust Series 1 | 14,200 | 1,439,880 | ||||||
|
| |||||||
TOTAL EXCHANGE-TRADED FUNDS (Cost $4,918,274) |
| 5,129,835 | ||||||
|
| |||||||
Money Market Securities – 1.88% |
| |||||||
Fidelity Institutional Money Market Portfolio – Institutional Class, 0.08% (c) | 573,853 | 573,853 | ||||||
|
| |||||||
TOTAL MONEY MARKET SECURITIES (Cost $573,853) |
| 573,853 | ||||||
|
| |||||||
TOTAL INVESTMENTS – 99.25% (Cost $28,912,547) | $ | 30,376,243 | ||||||
|
| |||||||
Other Assets in Excess of Liabilities – 0.75% | 229,664 | |||||||
|
| |||||||
TOTAL NET ASSETS – 100.00% | $ | 30,605,907 | ||||||
|
| |||||||
See accompanying notes which are an integral part of these financial statements.
23
SOUND MIND INVESTING BALANCED FUND
SCHEDULE OF INVESTMENTS
October 31, 2014 – (Continued)
| (a) | Security exempt from registration under Rule 144A or Section 4(2) of the Securities Act of 1933. The security may be resold in transactions exempt from registration, normally to qualified institutional buyers. |
| (b) | Variable or Floating Rate Security. Rate disclosed is as of October 31, 2014. |
| (c) | Rate disclosed is the seven day yield as of October 31, 2014. |
| ETF | – Exchange-Traded Fund |
Centrally Cleared Swaps – Buy | Name | Acquisition Date | Maturity Date | Implied Credit Spread at October 31, 2014 (e) | Notional Amount (f) | Appreciation/ (Depreciation) | ||||||||||||||||
CDX North America High Yield Credit Default Swap Index | Markit CDX. NA. HY. 23 | 10/15/2014 | 12/20/2019 | 3.44 | % | $ | 170,000 | $ | 4,717 | |||||||||||||
|
|
|
| |||||||||||||||||||
(Markit CDX. NA. HY. 23) contract to pay a premium equal to 5% of the notional amount. | ||||||||||||||||||||||
| (d) | When a credit event occurs as defined under the terms of the swap contract, the Fund as a buyer of credit protection will either (i) receive a net amount equal to the par value of the defaulted reference entity and deliver the reference entity or (ii) receive a net amount equal to the par value of the defaulted reference entity less its recovery value. |
| (e) | Implied credit spread, represented in absolute terms, utilized in determining the market value of the credit default swap contracts as of period will serve as an indicator of the payment/performance risk and represent the likelihood of risk of default for the credit derivative. The implied credit spread of a referenced entity reflects the cost of buying/selling protection and may include upfront payments required to be made to enter into the contract. Generally, wider credit spreads represent a perceived deterioration of the referenced entity’s credit soundness and a greater likelihood or risk of default or other credit event occurring as defined under the terms of the swap contract. |
| (f) | The notional amount represents the maximum potential the Fund may receive as a buyer of credit protection if a credit event occurs, as defined under the terms of the swap contract, for each security included in the CDX North America Investment Grade Index. |
See accompanying notes which are an integral part of these financial statements.
24
SMI DYNAMIC ALLOCATION FUND
SCHEDULE OF INVESTMENTS
October 31, 2014
| Shares | Fair Value | |||||||
| Exchange-Traded Funds – 98.40% | ||||||||
Health Care Select Sector SPDR Fund | 41,500 | $ | 2,791,705 | |||||
iShares 20+ Year Treasury Bond ETF | 192,600 | 22,967,550 | ||||||
iShares U.S. Technology ETF | 25,020 | 2,542,783 | ||||||
SPDR S&P 500 ETF Trust (a) | 213,830 | 43,120,958 | ||||||
Vanguard Long-Term Bond ETF | 18,200 | 1,667,484 | ||||||
Vanguard Long-Term Corporate Bond ETF | 227,000 | 20,711,480 | ||||||
Vanguard REIT ETF (a) | 643,730 | 50,848,233 | ||||||
|
| |||||||
TOTAL EXCHANGE-TRADED FUNDS (Cost $134,851,686) |
| 144,650,193 | ||||||
|
| |||||||
Mutual Funds – 1.63% | ||||||||
Fidelity Select Electronics Portfolio | 2,418 | 193,217 | ||||||
ProFunds Biotechnology UltraSector ProFund – Investor Class | 30,675 | 2,210,123 | ||||||
|
| |||||||
TOTAL MUTUAL FUNDS (Cost $2,265,000) |
| 2,403,340 | ||||||
|
| |||||||
Money Market Securities – 1.03% |
| |||||||
Fidelity Institutional Money Market Portfolio – Institutional Class, 0.08% (b) | 1,511,294 | 1,511,294 | ||||||
|
| |||||||
TOTAL MONEY MARKET SECURITIES (Cost $1,511,294) | 1,511,294 | |||||||
|
| |||||||
TOTAL INVESTMENTS – 101.06% (Cost $138,627,980) | $ | 148,564,827 | ||||||
|
| |||||||
Liabilities in Excess of Other Assets – (1.06)% | (1,562,280 | ) | ||||||
|
| |||||||
TOTAL NET ASSETS – 100.00% | $ | 147,002,547 | ||||||
|
| |||||||
| (a) | For a schedule of each Fund’s holdings please refer to each Fund’s most recent semi-annual or annual report filed at www.sec.gov. |
| (b) | Rate disclosed is the seven day yield as of October 31, 2014. |
| ETF | – Exchange-Traded Fund |
| REIT | – Real Estate Investment Trust |
| SPDR | – Standard & Poor’s Depositary Receipts |
See accompanying notes which are an integral part of these financial statements.
25
THE SOUND MIND INVESTING FUNDS
STATEMENTS OF ASSETS AND LIABILITIES
October 31, 2014
| Sound Mind Investing Fund | Sound Mind Investing Balanced Fund | SMI Dynamic Allocation Fund | ||||||||||
Assets | ||||||||||||
Investment in securities: | ||||||||||||
At cost | $ | 252,938,702 | $ | 28,912,547 | $ | 138,627,980 | ||||||
|
|
|
|
|
| |||||||
At fair value | $ | 282,236,347 | $ | 30,376,243 | $ | 148,564,827 | ||||||
Receivable for investments sold | 6,958,021 | 349,274 | — | |||||||||
Receivable for fund shares sold | 63,222 | 300 | 162,764 | |||||||||
Dividend and interest receivable | 252 | 40,435 | 87 | |||||||||
Receivable for variation margin on swap contracts | — | 428 | — | |||||||||
Segregated cash collateral for outstanding swap contracts | — | 9,282 | — | |||||||||
Prepaid expenses | 12,102 | 1,670 | 16,732 | |||||||||
|
|
|
|
|
| |||||||
Total Assets | 289,269,944 | 30,777,632 | 148,744,410 | |||||||||
|
|
|
|
|
| |||||||
Liabilities | ||||||||||||
Cash overdraft | 1,271,262 | 141,534 | — | |||||||||
Payable for investments purchased | 5,000,000 | — | 1,281,367 | |||||||||
Payable for fund shares redeemed | 67,894 | 1,325 | 321,499 | |||||||||
Payable to Adviser | 228,579 | 18,596 | 116,966 | |||||||||
Payable to administrator, fund accountant, and transfer agent | 18,659 | 3,571 | 8,233 | |||||||||
Payable to custodian | 1,241 | 406 | 863 | |||||||||
Other accrued expenses | 12,322 | 6,293 | 12,935 | |||||||||
|
|
|
|
|
| |||||||
Total Liabilities | 6,599,957 | 171,725 | 1,741,863 | |||||||||
|
|
|
|
|
| |||||||
Net Assets | $ | 282,669,987 | $ | 30,605,907 | $ | 147,002,547 | ||||||
|
|
|
|
|
| |||||||
Net Assets consist of: | ||||||||||||
Paid-in capital | $ | 210,796,971 | $ | 25,753,729 | $ | 134,282,562 | ||||||
Accumulated undistributed net investment income (loss) | (1,097,028 | ) | (73,987 | ) | 1,630,012 | |||||||
Accumulated undistributed net realized gain from investment transactions | 43,672,399 | 3,457,752 | 1,153,126 | |||||||||
Net unrealized appreciation on: | ||||||||||||
Investment securities | 29,297,645 | 1,463,696 | 9,936,847 | |||||||||
Swap contracts | — | 4,717 | — | |||||||||
|
|
|
|
|
| |||||||
Net Assets | $ | 282,669,987 | $ | 30,605,907 | $ | 147,002,547 | ||||||
|
|
|
|
|
| |||||||
Shares outstanding (unlimited number of shares authorized, no par value) | 20,279,036 | 2,657,441 | 12,447,323 | |||||||||
|
|
|
|
|
| |||||||
Net asset value (“NAV”) and offering price per share | $ | 13.94 | $ | 11.52 | $ | 11.81 | ||||||
|
|
|
|
|
| |||||||
Redemption price per share (NAV * 98%) (a) | $ | 13.66 | $ | 11.29 | $ | 11.57 | ||||||
|
|
|
|
|
| |||||||
| (a) | The Funds charge a 2% redemption fee on shares redeemed within 60 days of purchase. Shares are redeemed at the NAV if held longer than 60 days. |
See accompanying notes which are an integral part of these financial statements.
26
THE SOUND MIND INVESTING FUNDS
STATEMENTS OF OPERATIONS
For the year ended October 31, 2014
| Sound Mind Investing Fund | Sound Mind Investing Balanced Fund | SMI Dynamic Allocation Fund | ||||||||||
Investment Income | ||||||||||||
Dividend income | $ | 1,347,857 | $ | 93,689 | $ | 3,544,073 | ||||||
Interest income | — | 213,842 | — | |||||||||
|
|
|
|
|
| |||||||
Total investment income | 1,347,857 | 307,531 | 3,544,073 | |||||||||
|
|
|
|
|
| |||||||
Expenses | ||||||||||||
Investment Adviser | 2,918,225 | 285,825 | 1,061,946 | |||||||||
Administration | 100,873 | 9,066 | 37,204 | |||||||||
Fund accounting | 53,011 | 2,688 | 17,957 | |||||||||
Transfer agent | 63,901 | 15,790 | 30,675 | |||||||||
Legal | 12,671 | 15,233 | 18,805 | |||||||||
Registration | 31,434 | 22,895 | 42,475 | |||||||||
Custodian | 19,234 | 7,189 | 7,467 | |||||||||
Audit | 15,001 | 18,050 | 15,599 | |||||||||
Trustee | 6,205 | 5,142 | 4,847 | |||||||||
CCO | 8,912 | 8,950 | 7,433 | |||||||||
Miscellaneous | 56,858 | 25,530 | 34,554 | |||||||||
|
|
|
|
|
| |||||||
Total expenses | 3,286,325 | 416,358 | 1,278,962 | |||||||||
Fees waived by Adviser | — | (50,773 | ) | — | ||||||||
Other expense reductions (a) | (45,627 | ) | (5,189 | ) | — | |||||||
|
|
|
|
|
| |||||||
Net operating expenses | 3,240,698 | 360,396 | 1,278,962 | |||||||||
|
|
|
|
|
| |||||||
Net investment income (loss) | (1,892,841 | ) | (52,865 | ) | 2,265,111 | |||||||
|
|
|
|
|
| |||||||
Net Realized and Unrealized Gain on Investments and Swap Contracts | ||||||||||||
Long term capital gain dividends from investment companies | $ | 7,771,975 | $ | 481,460 | $ | 1,422 | ||||||
Net realized gain on investment transactions | 39,721,511 | 3,128,126 | 3,206,693 | |||||||||
Net realized gain on swap contracts | — | 9,123 | — | |||||||||
Net change in unrealized appreciation (depreciation) on investments | (24,395,804 | ) | (2,224,482 | ) | 5,271,786 | |||||||
Net change in unrealized appreciation on swap contracts | — | 4,717 | — | |||||||||
|
|
|
|
|
| |||||||
Net realized and unrealized gain on investments and swap contracts | 23,097,682 | 1,398,944 | 8,479,901 | |||||||||
|
|
|
|
|
| |||||||
Net increase in net assets resulting from operations | $ | 21,204,841 | $ | 1,346,079 | $ | 10,745,012 | ||||||
|
|
|
|
|
| |||||||
| (a) | Certain funds in which the Fund invests refund a portion of the distribution fee charged. |
See accompanying notes which are an integral part of these financial statements.
27
SOUND MIND INVESTING FUND
STATEMENTS OF CHANGES IN NET ASSETS
| Year Ended October 31, 2014 | Year Ended October 31, 2013 | |||||||
Increase (Decrease) in Net Assets due to: | ||||||||
Operations | ||||||||
Net investment loss | $ | (1,892,841 | ) | $ | (1,093,921 | ) | ||
Long term capital gain dividends from investment companies | 7,771,975 | 2,086,102 | ||||||
Net realized gain on investment transactions | 39,721,511 | 29,446,203 | ||||||
Net change in unrealized appreciation (depreciation) on investments | (24,395,804 | ) | 46,265,588 | |||||
|
|
|
| |||||
Net increase in net assets resulting from operations | 21,204,841 | 76,703,972 | ||||||
|
|
|
| |||||
Distributions | ||||||||
From net investment income | (985,095 | ) | (8,906 | ) | ||||
From net realized gains | (30,426,944 | ) | (11,101,278 | ) | ||||
|
|
|
| |||||
Total distributions | (31,412,039 | ) | (11,110,184 | ) | ||||
|
|
|
| |||||
Capital Transactions | ||||||||
Proceeds from shares sold | 34,893,201 | 28,410,260 | ||||||
Proceeds from redemption fees (a) | 7,583 | 3,705 | ||||||
Reinvestment of distributions | 30,865,319 | 10,902,326 | ||||||
Amount paid for shares redeemed | (65,924,252 | ) | (83,966,360 | ) | ||||
|
|
|
| |||||
Net decrease in net assets resulting from capital transactions | (158,149 | ) | (44,650,069 | ) | ||||
|
|
|
| |||||
Total Increase (Decrease) in Net Assets | (10,365,347 | ) | 20,943,719 | |||||
|
|
|
| |||||
Net Assets | ||||||||
Beginning of year | 293,035,334 | 272,091,615 | ||||||
|
|
|
| |||||
End of year | $ | 282,669,987 | $ | 293,035,334 | ||||
|
|
|
| |||||
Accumulated net investment loss | $ | (1,097,028 | ) | $ | (1,093,921 | ) | ||
|
|
|
| |||||
Share Transactions | ||||||||
Shares sold | 2,502,218 | 2,233,548 | ||||||
Shares issued in reinvestment of distributions | 2,266,176 | 968,235 | ||||||
Shares redeemed | (4,741,258 | ) | (6,893,624 | ) | ||||
|
|
|
| |||||
Net increase (decrease) in shares outstanding | 27,136 | (3,691,841 | ) | |||||
|
|
|
| |||||
| (a) | The Fund charges a 2% redemption fee on shares redeemed within 60 days of purchase. Shares are redeemed at the NAV if held longer than 60 days. |
See accompanying notes which are an integral part of these financial statements.
28
SOUND MIND INVESTING BALANCED FUND
STATEMENTS OF CHANGES IN NET ASSETS
| Year Ended October 31, 2014 | Year Ended October 31, 2013 | |||||||
Increase (Decrease) in Net Assets due to: | ||||||||
Operations | ||||||||
Net investment loss | $ | (52,865 | ) | $ | (18,965 | ) | ||
Long term capital gain dividends from investment companies | 481,460 | 136,250 | ||||||
Net realized gain on investment transactions and swap contracts | 3,137,249 | 2,823,594 | ||||||
Net change in unrealized appreciation (depreciation) on investments and swap contracts | (2,219,765 | ) | 2,910,633 | |||||
|
|
|
| |||||
Net increase in net assets resulting from operations | 1,346,079 | 5,851,512 | ||||||
|
|
|
| |||||
Distributions | ||||||||
From net investment income | (139,586 | ) | (87,797 | ) | ||||
From net realized gains | (2,841,565 | ) | (576,661 | ) | ||||
|
|
|
| |||||
Total distributions | (2,981,151 | ) | (664,458 | ) | ||||
|
|
|
| |||||
Capital Transactions | ||||||||
Proceeds from shares sold | 8,927,185 | 8,796,270 | ||||||
Proceeds from redemption fees (a) | 1,026 | 5,091 | ||||||
Reinvestment of distributions | 2,960,793 | 660,917 | ||||||
Amount paid for shares redeemed | (9,473,927 | ) | (22,081,663 | ) | ||||
|
|
|
| |||||
Net increase (decrease) in net assets resulting from capital transactions | 2,415,077 | (12,619,385 | ) | |||||
|
|
|
| |||||
Total Increase (Decrease) in Net Assets | 780,005 | (7,432,331 | ) | |||||
|
|
|
| |||||
Net Assets | ||||||||
Beginning of year | 29,825,902 | 37,258,233 | ||||||
|
|
|
| |||||
End of year | $ | 30,605,907 | $ | 29,825,902 | ||||
|
|
|
| |||||
Accumulated net investment loss | $ | (73,987 | ) | $ | (47,530 | ) | ||
|
|
|
| |||||
Share Transactions | ||||||||
Shares sold | 771,701 | 800,432 | ||||||
Shares issued in reinvestment of distributions | 260,404 | 63,919 | ||||||
Shares redeemed | (818,915 | ) | (2,034,213 | ) | ||||
|
|
|
| |||||
Net increase (decrease) in shares outstanding | 213,190 | (1,169,862 | ) | |||||
|
|
|
| |||||
| (a) | The Fund charges a 2% redemption fee on shares redeemed within 60 days of purchase. Shares are redeemed at the NAV if held longer than 60 days. |
See accompanying notes which are an integral part of these financial statements.
29
SMI DYNAMIC ALLOCATION FUND
STATEMENTS OF CHANGES IN NET ASSETS
| Year Ended October 31, 2014 | Period Ended October 31, 2013 (a) | |||||||
Increase in Net Assets due to: | ||||||||
Operations | ||||||||
Net investment income | $ | 2,265,111 | $ | 311,274 | ||||
Long term capital gain dividends from investment companies | 1,422 | — | ||||||
Net realized gain (loss) on investment transactions | 3,206,693 | (1,716,005 | ) | |||||
Net change in unrealized appreciation on investments | 5,271,786 | 4,665,061 | ||||||
|
|
|
| |||||
Net increase in net assets resulting from operations | 10,745,012 | 3,260,330 | ||||||
|
|
|
| |||||
Distributions | ||||||||
From net investment income | (1,285,357 | ) | — | |||||
|
|
|
| |||||
Total distributions | (1,285,357 | ) | — | |||||
|
|
|
| |||||
Capital Transactions | ||||||||
Proceeds from shares sold | 80,949,324 | 72,307,252 | ||||||
Proceeds from redemption fees (b) | 769 | 985 | ||||||
Reinvestment of distributions | 1,264,696 | — | ||||||
Amount paid for shares redeemed | (12,961,554 | ) | (7,278,910 | ) | ||||
|
|
|
| |||||
Net increase in net assets resulting from capital transactions | 69,253,235 | 65,029,327 | ||||||
|
|
|
| |||||
Total Increase in Net Assets | 78,712,890 | 68,289,657 | ||||||
|
|
|
| |||||
Net Assets | ||||||||
Beginning of period | 68,289,657 | — | ||||||
|
|
|
| |||||
End of period | $ | 147,002,547 | $ | 68,289,657 | ||||
|
|
|
| |||||
Accumulated net investment income | $ | 1,630,012 | $ | 311,274 | ||||
|
|
|
| |||||
Share Transactions | ||||||||
Shares sold | 7,252,340 | 6,916,492 | ||||||
Shares issued in reinvestment of distributions | 116,348 | — | ||||||
Shares redeemed | (1,155,506 | ) | (682,351 | ) | ||||
|
|
|
| |||||
Net increase in shares outstanding | 6,213,182 | 6,234,141 | ||||||
|
|
|
| |||||
| (a) | For the period February 28, 2013 (commencement of operations) through October 31, 2013. |
| (b) | The Fund charges a 2% redemption fee on shares redeemed within 60 days of purchase. Shares are redeemed at the NAV if held longer than 60 days. |
See accompanying notes which are an integral part of these financial statements.
30
This page intentionally left blank.
31
SOUND MIND INVESTING FUND
FINANCIAL HIGHLIGHTS
(For a share outstanding during each year)
| Year Ended October 31, 2014 | ||||
Selected Per Share Data: | ||||
Net asset value, beginning of year | $ | 14.47 | ||
|
| |||
Income from investment operations: | ||||
Net investment income (loss)(a) | (0.09 | ) | ||
Net realized and unrealized gain | 1.12 | |||
|
| |||
Total from investment operations | 1.03 | |||
|
| |||
Less Distributions to Shareholders: | ||||
From net investment income | (0.05 | ) | ||
From net realized gain | (1.51 | ) | ||
|
| |||
Total distributions | (1.56 | ) | ||
|
| |||
Paid in capital from redemption fees(c) | — | |||
|
| |||
Net asset value, end of year | $ | 13.94 | ||
|
| |||
Total Return(d) | 7.38 | % | ||
Ratios and Supplemental Data: | ||||
Net assets, end of year (000) | $ | 282,670 | ||
Ratio of expenses to average net assets(e)(f) | 1.11 | % | ||
Ratio of net investment income (loss) to average net assets(a)(g) | (0.64 | )% | ||
Portfolio turnover rate | 135.60 | % | ||
| (a) | Recognition of the net investment income by the Fund is affected by the timing of the declaration of dividends by the underlying investment companies in which the Fund invests. |
| (b) | Resulted in less than $0.005 per share. |
| (c) | Redemption fee resulted in less than $0.005 per share. |
| (d) | Total return in the above table represents the rate that the investor would have earned or lost on an investment in the Fund, assuming reinvestment of dividends. |
| (e) | These ratios exclude the impact of expenses of the underlying funds in which the Fund invests as represented in the Schedule of Investments. |
| (f) | This ratio does not include the effects of other expenses refunded by the underlying funds in which the Fund invests. If these refunds had been included, the ratio of expenses to average net assets would have been 1.09%, 1.17%, 1.15%, 1.14%, and 1.21% for the years ended October 31, 2014, October 31, 2013, October 31, 2012, October 31, 2011, and October 31, 2010, respectively. |
| (g) | This ratio is presented net of the other expenses refunded by the underlying funds in which the Fund invests. |
| (h) | Portfolio turnover rate excludes $21,405,392 of purchases, which is the book value of securities acquired at the time of merger with SMI Managed Volatility Fund. |
See accompanying notes which are an integral part of these financial statements.
32
SOUND MIND INVESTING FUND
FINANCIAL HIGHLIGHTS
(For a share outstanding during each year) – (Continued)
Year Ended | Year Ended October 31, 2012 | Year Ended October 31, 2011 | Year Ended October 31, 2010 | |||||||||||
| $ | 11.36 | $ | 10.74 | $ | 10.71 | $ | 8.84 | |||||||
|
|
|
|
|
|
|
| |||||||
| (0.05 | ) | — | 0.02 | (0.04 | ) | |||||||||
| 3.66 | 0.62 | 0.04 | 1.91 | |||||||||||
|
|
|
|
|
|
|
| |||||||
| 3.61 | 0.62 | 0.06 | 1.87 | |||||||||||
|
|
|
|
|
|
|
| |||||||
| — | (b) | — | (0.03 | ) | — | |||||||||
| (0.50 | ) | — | — | — | ||||||||||
|
|
|
|
|
|
|
| |||||||
| (0.50 | ) | — | (0.03 | ) | — | |||||||||
|
|
|
|
|
|
|
| |||||||
| — | — | — | — | |||||||||||
|
|
|
|
|
|
|
| |||||||
| $ | 14.47 | $ | 11.36 | $ | 10.74 | $ | 10.71 | |||||||
|
|
|
|
|
|
|
| |||||||
| 33.01 | % | 5.77 | % | 0.50 | % | 21.15 | % | |||||||
| $ | 293,035 | $ | 272,092 | $ | 288,727 | $ | 283,892 | |||||||
| 1.17 | % | 1.15 | % | 1.15 | % | 1.22 | % | |||||||
| (0.41 | )% | 0.00 | % | 0.13 | % | (0.41 | )% | |||||||
| 93.59 | % | 187.39 | % | 165.12 | %(h) | 95.29 | % | |||||||
See accompanying notes which are an integral part of these financial statements.
33
SOUND MIND INVESTING BALANCED FUND
FINANCIAL HIGHLIGHTS
(For a share outstanding during each period)
| Year Ended October 31, 2014 | ||||
Selected Per Share Data: | ||||
Net asset value, beginning of period | $ | 12.20 | ||
|
| |||
Income from investment operations: | ||||
Net investment income (loss)(b) | (0.01 | ) | ||
Net realized and unrealized gain (loss) | 0.54 | |||
|
| |||
Total from investment operations | 0.53 | |||
|
| |||
Less Distributions to Shareholders: | ||||
From net investment income | (0.06 | ) | ||
From net realized gain | (1.15 | ) | ||
|
| |||
Total distributions | (1.21 | ) | ||
|
| |||
Paid in capital from redemption fees | — | (c) | ||
|
| |||
Net asset value, end of period | $ | 11.52 | ||
|
| |||
Total Return(d) | 4.46 | % | ||
Ratios and Supplemental Data: | ||||
Net assets, end of period (000) | $ | 30,606 | ||
Ratio of expenses to average net assets(f) | 1.15 | %(g) | ||
Ratio of expenses to average net assets before waiver and reimbursement(f) | 1.31 | % | ||
Ratio of net investment income (loss) to average net assets(b)(f)(i) | (0.17 | )% | ||
Portfolio turnover rate | 255.50 | % | ||
| (a) | For the period December 30, 2010 (the date the Fund commenced operations) through October 31, 2011. |
| (b) | Recognition of net investment income by the Fund is affected by the timing of the declaration of dividends by the underlying investment companies in which the Fund invests. |
| (c) | Redemption fees resulted in less than $0.005 per share. |
| (d) | Total return in the above table represents the rate that the investor would have earned on an investment in the Fund, assuming reinvestment of dividends. |
| (e) | Not annualized. |
| (f) | These ratios exclude the impact of expenses of the underlying funds in which the Fund may invest, as represented in the Schedule of Investments. |
| (g) | This ratio does not include the effects of other expenses refunded by the underlying funds in which the Fund invests. If these refunds had been included, the ratio of expenses to average net assets would have been 1.13%, 1.14% and 1.14% for the periods ended October 31, 2014, October 31, 2012 and October 31, 2011, respectively. |
| (h) | Annualized. |
| (i) | This ratio is presented net of the other expenses refunded by the underlying funds in which the Fund invests. |
See accompanying notes which are an integral part of these financial statements.
34
SOUND MIND INVESTING BALANCED FUND
FINANCIAL HIGHLIGHTS
(For a share outstanding during each period) – (Continued)
Year Ended | Year Ended October 31, 2012 | Period Ended October 31, 2011(a) | ||||||||
| $ | 10.31 | $ | 9.70 | $ | 10.00 | |||||
|
|
|
|
|
| |||||
| (0.02 | ) | 0.03 | (0.01 | ) | ||||||
| 2.11 | 0.63 | (0.30 | ) | |||||||
|
|
|
|
|
| |||||
| 2.09 | 0.66 | (0.31 | ) | |||||||
|
|
|
|
|
| |||||
| (0.03 | ) | (0.05 | ) | — | ||||||
| (0.17 | ) | — | — | |||||||
|
|
|
|
|
| |||||
| (0.20 | ) | (0.05 | ) | — | ||||||
|
|
|
|
|
| |||||
| — | (c) | — | (c) | 0.01 | ||||||
|
|
|
|
|
| |||||
| $ | 12.20 | $ | 10.31 | $ | 9.70 | |||||
|
|
|
|
|
| |||||
| 20.56 | % | 6.89 | % | -3.00 | %(e) | |||||
| $ | 29,826 | $ | 37,258 | $ | 34,830 | |||||
| 1.15 | % | 1.15 | %(g) | 1.15 | %(g)(h) | |||||
| 1.52 | % | 1.49 | % | 1.80 | %(h) | |||||
| (0.06 | )% | 0.29 | % | (0.17 | )%(h) | |||||
| 270.30 | % | 349.33 | % | 276.04 | %(e) | |||||
See accompanying notes which are an integral part of these financial statements.
35
SMI DYNAMIC ALLOCATION FUND
FINANCIAL HIGHLIGHTS
(For a share outstanding during each period)
| Year Ended October 31, 2014 | Period Ended October 31, 2013(a) | |||||||
Selected Per Share Data: | ||||||||
Net asset value, beginning of period | $ | 10.95 | $ | 10.00 | ||||
|
|
|
| |||||
Income from investment operations: | ||||||||
Net investment income (loss)(b) | 0.23 | 0.05 | ||||||
Net realized and unrealized gain (loss) | 0.81 | 0.90 | ||||||
|
|
|
| |||||
Total from investment operations | 1.04 | 0.95 | ||||||
|
|
|
| |||||
Less Distributions to Shareholders: | ||||||||
From net investment income | (0.18 | ) | — | |||||
|
|
|
| |||||
Total distributions | (0.18 | ) | — | |||||
|
|
|
| |||||
Paid in capital from redemption fees(c) | — | — | ||||||
|
|
|
| |||||
Net asset value, end of period | $ | 11.81 | $ | 10.95 | ||||
|
|
|
| |||||
Total Return(d) | 9.64 | % | 9.50 | %(e) | ||||
Ratios and Supplemental Data: | ||||||||
Net assets, end of period (000) | $ | 147,003 | $ | 68,290 | ||||
Ratio of expenses to average net assets(f) | 1.20 | % | 1.30 | %(g) | ||||
Ratio of net investment income (loss) to average net assets(b)(f) | 2.13 | % | 0.94 | %(g) | ||||
Portfolio turnover rate | 134.71 | % | 68.64 | %(e) | ||||
| (a) | For the period February 28, 2013 (the date the Fund commenced operations) through October 31, 2013. |
| (b) | Recognition of net investment income by the Fund is affected by the timing of the declaration of dividends by the underlying investment companies in which the Fund invests. |
| (c) | Redemption fees resulted in less than $0.005 per share. |
| (d) | Total return in the above table represents the rate that the investor would have earned on an investment in the Fund, assuming reinvestment of dividends. |
| (e) | Not annualized. |
| (f) | These ratios exclude the impact of expenses of the underlying funds in which the Fund may invest, as represented in the Schedule of Investments. |
| (g) | Annualized. |
See accompanying notes which are an integral part of these financial statements.
36
THE SOUND MIND INVESTING FUNDS
NOTES TO THE FINANCIAL STATEMENTS
October 31, 2014
NOTE 1. ORGANIZATION
The Sound Mind Investing Fund (“SMI Fund”), Sound Mind Investing Balanced Fund (“SMI Balanced Fund”), and SMI Dynamic Allocation Fund (each a “Fund” and collectively, the “Funds”) are each a diversified series of The Valued Advisers Trust (the “Trust”). Pursuant to a reorganization that took place on February 28, 2013, the SMI Fund and SMI Balanced Fund are the successors to the series of the Unified Series Trust (the “Predecessor Funds”) with the same names. The Predecessor Funds had the same investment objectives and strategies and substantially the same investment policies as the Funds. The SMI Fund was organized on August 29, 2005 and commenced operations on December 2, 2005. The SMI Balanced Fund was organized on November 13, 2010 and commenced operations on December 30, 2010. The SMI Dynamic Allocation Fund was organized on December 11, 2012 and commenced operations on February 28, 2013. The Trust is a management investment company established under the laws of Delaware by an Agreement and Declaration of Trust dated June 13, 2008 (the “Trust Agreement”). The Trust Agreement permits the Trustees to issue an unlimited number of shares of beneficial interest of separate series without par value. Each Fund is one of a series of funds currently authorized by the Trustees. The investment adviser to the Funds is SMI Advisory Services, LLC (the “Adviser”). Scout Investments, Inc., (the “Subadviser”) through its REAMS Asset Management division, is the subadviser for the fixed income portion of the SMI Balanced Fund and subadviser for the fixed income investments (other than ETFs and other investment companies that invest primarily in fixed income securities) and cash investments for the SMI Dynamic Allocation Fund. The SMI Fund seeks to provide long-term capital appreciation. The SMI Balanced Fund seeks total return. The SMI Dynamic Allocation Fund seeks total return.
NOTE 2. SIGNIFICANT ACCOUNTING POLICIES
The Funds are investment companies and follow accounting and reporting guidance under Financial Accounting Standards Board (“FASB”) Accounting Standards Codification (“ASC”) Topic 946, “Financial Services-Investment Companies”. The following is a summary of significant accounting policies followed by the Funds in the preparation of their financial statements. These policies are in conformity with generally accepted accounting principles in the United States of America (“GAAP”).
Securities Valuations – All investments in securities are recorded at their estimated fair value as described in Note 3.
Federal Income Taxes – The Funds make no provision for federal income or excise tax. The Funds intend to qualify each year as regulated investment companies (“RICs”) under subchapter M of the Internal Revenue Code of 1986, as amended, by complying with the requirements applicable to RICs and by distributing substantially all of their taxable income. The Funds also intend to distribute sufficient net investment income and net capital gains, if any, so that they will not be subject to excise tax on undistributed income and gains. If the required amount of net investment income or gains is not distributed, the Funds could incur a tax expense.
37
THE SOUND MIND INVESTING FUNDS
NOTES TO THE FINANCIAL STATEMENTS
October 31, 2014 – (Continued)
NOTE 2. SIGNIFICANT ACCOUNTING POLICIES – (Continued)
As of, and during the fiscal year ended October 31, 2014, the Funds did not have a liability for any unrecognized tax benefits. The Funds recognize interest and penalties, if any, related to unrecognized tax benefits as income tax expense in the statement of operations. During the year, the Funds did not incur any interest or penalties. Management of the Funds has reviewed tax positions taken in tax years that remain subject to examination by all major tax jurisdictions, including federal (i.e., the last three tax year ends and the interim tax period since then, as applicable). Management believes that there is no tax liability resulting from unrecognized tax benefits related to uncertain tax positions taken.
Expenses – Expenses incurred by the Trust that do not relate to a specific fund of the Trust are allocated to the individual funds based on each fund’s relative net assets or other appropriate basis (as determined by the Board).
Security Transactions and Related Income – The Funds follow industry practice and record security transactions on the trade date for financial reporting purposes. For financial statement and income tax purposes, the specific identification method is used for determining gains or losses on mutual funds and exchange-traded funds while the first in, first out method is used for determining gains or losses on all other security types. Dividend income is recorded on the ex-dividend date and interest income is recorded on an accrual basis. Short-term capital gain distributions from underlying funds are classified as dividend income for financial reporting purposes. Long-term capital gain distributions are broken out as such. Discounts and premiums on securities purchased are amortized or accreted using the effective interest method. The ability of issuers of debt securities held by the Funds to meet their obligations may be affected by economic and political developments in a specific country or region.
Dividends and Distributions – The Funds typically distribute substantially all of their net investment income in the form of dividends and taxable capital gains to their shareholders at least annually. These distributions, which are recorded on the ex-dividend date, are automatically reinvested in each Fund unless shareholders request cash distributions on their application or through a written request. The treatment for financial reporting purposes of distributions made to shareholders during the year from net investment income or net realized capital gains may differ from their ultimate treatment for federal income tax purposes. Where such differences are permanent in nature, they are reclassified in the components of the net assets based on their ultimate characterization for federal income tax purposes. Any such reclassifications will have no effect on net assets, results of operations or net asset values per share of the Fund.
38
THE SOUND MIND INVESTING FUNDS
NOTES TO THE FINANCIAL STATEMENTS
October 31, 2014 – (Continued)
NOTE 2. SIGNIFICANT ACCOUNTING POLICIES – (Continued)
For the year ended October 31, 2014, the Funds made the following reclassifications to increase/(decrease) the components of net assets:
Fund | Paid in | Accumulated | Accumulated | |||||||||
SMI Fund | $ | (3,483 | ) | $ | 2,874,829 | $ | (2,871,346 | ) | ||||
SMI Balanced Fund | (5,722 | ) | 165,994 | (160,272 | ) | |||||||
SMI Dynamic Allocation Fund | — | 338,984 | (338,984 | ) | ||||||||
Swap Contracts – The SMI Balanced Fund may enter into credit default swap contracts. A credit default swap involves a protection buyer and a protection seller. The Fund may be either a protection buyer or seller. The protection buyer makes periodic premium payments to the protection seller during the swap term in exchange for the protection seller agreeing to make certain defined payments to the protection buyer in the event that certain defined credit events occur with respect to a particular security, issuer, or basket of securities. The “notional amount” of the swap agreement is the agreed upon amount or value of the underlying asset used for calculating the obligations that the parties to a swap agreement have agreed to exchange. The Fund’s obligation under a swap agreement will be accrued daily (offset against amounts owed to the Fund) and any accrued but unpaid net amounts owed to a swap counterparty may be collateralized by designating liquid assets on the Fund’s books and records. The credit default swaps are marked to market daily based upon quotes received from a pricing service and any change in value is recorded in unrealized appreciation/depreciation. Periodic payments paid or received are recorded in realized gain/loss. Any premium paid or received by the Fund upon entering into a credit default swap contract is recorded as an asset or liability and amortized daily as a component of realized gain (loss) on the Statement of Operations. Payments made or received as a result of a credit event or termination of the contract are recognized, net of a proportional amount of the upfront payment, as realized gains/losses. In addition to bearing the risk that the credit event will occur as a protection seller, the Fund could be exposed to market risk due to unfavorable changes in interest rates or in the price of the underlying security or index, the possibility that the Fund may be unable to close out its position at the same time or at the same price as if it had purchased comparable publicly traded securities, or that the counterparty may default on its obligation to perform. Please see Note 4 for information on swap agreement activity during the fiscal year ended October 31, 2014.
NOTE 3. SECURITIES VALUATION AND FAIR VALUE MEASUREMENTS
Fair value is defined as the price that a Fund would receive upon selling an investment in an orderly transaction to an independent buyer in the principal or most advantageous market of the investment. GAAP establishes a three-tier hierarchy to maximize the use of observable market data and minimize the use of unobservable inputs and to establish classification of fair value measurements for disclosure purposes.
39
THE SOUND MIND INVESTING FUNDS
NOTES TO THE FINANCIAL STATEMENTS
October 31, 2014 – (Continued)
NOTE 3. SECURITIES VALUATION AND FAIR VALUE MEASUREMENTS – (Continued)
Inputs refer broadly to the assumptions that market participants would use in pricing the asset or liability, including assumptions about risk, for example, the risk inherent in a particular valuation technique used to measure fair value including such a pricing model and/or the risk inherent in the inputs to the valuation technique. Inputs may be observable or unobservable. Observable inputs are inputs that reflect the assumptions market participants would use in pricing the asset or liability developed based on market data obtained from sources independent of the reporting entity. Unobservable inputs are inputs that reflect the reporting entity’s own assumptions about the assumptions market participants would use in pricing the asset or liability developed based on the best information available in the circumstances.
Various inputs are used in determining the value of the Funds’ investments. These inputs are summarized in the three broad levels listed below.
| • | Level 1 – quoted prices in active markets for identical securities |
| • | Level 2 – other significant observable inputs (including, but not limited to, quoted prices for an identical security in an inactive market, quoted prices for similar securities, interest rates, prepayment speeds, credit risk, etc.) |
| • | Level 3 – significant unobservable inputs (including each Fund’s own assumptions in determining fair value of investments based on the best information available) |
The inputs used to measure fair value may fall into different levels of the fair value hierarchy. In such cases, for disclosure purposes, the level in the fair value hierarchy within which the fair value measurement falls in its entirety, is determined based on the lowest level input that is significant to the fair value measurement in its entirety.
Equity securities, including exchange-traded funds, are generally valued by using market quotations, but may be valued on the basis of prices furnished by a pricing service when the Adviser believes such prices more accurately reflect the fair value of such securities. Securities that are traded on any stock exchange are generally valued by the pricing service at the last quoted sale price. Lacking a last sale price, an exchange traded security is generally valued by the pricing service at its last bid price. Securities traded in the NASDAQ over-the-counter market are generally valued by the pricing service at the NASDAQ Official Closing Price.
When using the market quotations or close prices provided by the pricing service and when the market is considered active, the security will be classified as a Level 1 security. Sometimes, an equity security owned by the Funds will be valued by the pricing service with factors other than market quotations or when the market is considered inactive. When this happens, the security will be classified as a Level 2 security. When market quotations are not readily available, when the Adviser determines that the market quotation or the price provided by the pricing service does not accurately reflect the current fair value, or when
40
THE SOUND MIND INVESTING FUNDS
NOTES TO THE FINANCIAL STATEMENTS
October 31, 2014 – (Continued)
NOTE 3. SECURITIES VALUATION AND FAIR VALUE MEASUREMENTS – (Continued)
restricted or illiquid securities are being valued, such securities are valued as determined in good faith by the Adviser, in conformity with guidelines adopted by and subject to review by the Board. These securities will generally be categorized as Level 3 securities.
Investments in mutual funds, including money market mutual funds, are generally priced at the ending net asset value (“NAV”) provided by the service agent of the funds. These securities will be categorized as Level 1 securities.
Derivative instruments that the Funds invest in, such as swap agreements, are generally traded over-the-counter. The credit default swaps the SMI Balanced Fund invests in will generally be valued at the mean of bid and ask prices provided by a major credit default swap pricing provider and will generally be classified as Level 2 securities.
Fixed income securities, including corporate bonds, foreign bonds denominated in U.S. dollars, U.S. treasury obligations and asset-backed securities, when valued using market quotations in an active market, will be categorized as Level 1 securities. However, they may be valued on the basis of prices furnished by a pricing service when the Adviser believes such prices more accurately reflect the fair value of such securities. A pricing service uses various inputs and techniques, which include broker-dealer quotations, live trading levels, recently executed transactions in securities of the issuer or comparable issuers, and option adjusted spread models that include base curve and spread curve inputs. Adjustments to individual bonds can be applied to recognize trading differences compared to other bonds issued by the same issuer. The broker-dealer quotations received are supported by credit analysis of the issuer that takes into consideration credit quality assessments, daily trading activity, and the activity of the underlying equities, listed bonds and sector-specific trends. Data used to establish quotes for asset-backed securities includes analysis of cash flows, pre-payment speeds, default rates, delinquency assumptions, and assumptions regarding collateral and loss. To the extent that these inputs are observable, the fixed income securities are categorized as Level 2 securities. If the Adviser decides that a price provided by the pricing service does not accurately reflect the fair value of the securities, when prices are not readily available from a pricing service, or when restricted or illiquid securities are being valued, securities are valued at fair value as determined in good faith by the Adviser, in conformity with guidelines adopted by and subject to review of the Board. These securities may be categorized as Level 3 securities.
Short-term investments in fixed income securities, (those with maturities of less than 60 days when acquired, or which subsequently are within 60 days of maturity), are valued by using the amortized cost method of valuation, which the Board has determined will represent fair value. These securities will be classified as Level 2 securities.
41
THE SOUND MIND INVESTING FUNDS
NOTES TO THE FINANCIAL STATEMENTS
October 31, 2014 – (Continued)
NOTE 3. SECURITIES VALUATION AND FAIR VALUE MEASUREMENTS – (Continued)
In accordance with the Trust’s good faith pricing guidelines, the Adviser is required to consider all appropriate factors relevant to the value of securities for which it has determined other pricing sources are not available or reliable as described above. No single standard exists for determining fair value, because fair value depends upon the circumstances of each individual case. As a general principle, the current fair value of an issue of securities being valued by the Adviser would appear to be the amount which the owner might reasonably expect to receive for them upon their current sale. Methods which are in accordance with this principle may, for example, be based on (i) a multiple of earnings; (ii) a discount from market of a similar freely traded security (including a derivative security or a basket of securities traded on other markets, exchanges or among dealers); or (iii) yield to maturity with respect to debt issues, or a combination of these and other methods. Good faith pricing is permitted if, in the Adviser’s opinion, the validity of market quotations appears to be questionable based on factors such as evidence of a thin market in the security based on a small number of quotations, a significant event occurs after the close of a market but before a Fund’s NAV calculation that may affect a security’s value, or the Adviser is aware of any other data that calls into question the reliability of market quotations. Good faith pricing may also be used in instances when the bonds the Funds’ invest in may default or otherwise cease to have market quotations readily available.
The following is a summary of the inputs used to value the Funds’ investments as of October 31, 2014:
| Valuation Inputs | ||||||||||||||||
| SMI Fund | Level 1 – Quoted Prices in Active Markets | Level 2 – Other Significant Observable Inputs | Level 3 – Significant Unobservable Inputs | Total | ||||||||||||
| Mutual Funds – greater than 1% of net assets | $ | 222,771,515 | $ | — | $ | — | $ | 222,771,515 | ||||||||
| Mutual Funds – less than 1% of net assets | 6,952,872 | — | — | 6,952,872 | ||||||||||||
| Exchange-Traded Funds | 52,511,960 | — | — | 52,511,960 | ||||||||||||
| Total | $ | 282,236,347 | $ | — | $ | — | $ | 282,236,347 | ||||||||
42
THE SOUND MIND INVESTING FUNDS
NOTES TO THE FINANCIAL STATEMENTS
October 31, 2014 – (Continued)
NOTE 3. SECURITIES VALUATION AND FAIR VALUE MEASUREMENTS – (Continued)
| Valuation Inputs | ||||||||||||||||
| SMI Balanced Fund | Level 1 – Quoted Prices in Active Markets | Level 2 – Other Significant Observable Inputs | Level 3 – Significant Unobservable Inputs | Total | ||||||||||||
| Corporate Bonds | $ | — | $ | 2,487,287 | $ | — | $ | 2,487,287 | ||||||||
| Foreign Bonds Denominated in U.S. Dollars | — | 234,845 | — | 234,845 | ||||||||||||
| U.S. Treasury Obligations | — | 5,398,892 | — | 5,398,892 | ||||||||||||
| Asset-Backed Securities | — | 3,065,758 | — | 3,065,758 | ||||||||||||
| Mutual Funds | 13,485,773 | — | — | 13,485,773 | ||||||||||||
| Exchange-Traded Funds | 5,129,835 | — | — | 5,129,835 | ||||||||||||
| Money Market Securities | 573,853 | — | — | 573,853 | ||||||||||||
| Total Investment Securities | $ | 19,189,461 | $ | 11,186,782 | $ | — | $ | 30,376,243 | ||||||||
| Other Financial Instruments* | — | 4,717 | — | 4,717 | ||||||||||||
| Total Investments | $ | 19,189,461 | $ | 11,191,499 | $ | — | $ | 30,380,960 | ||||||||
* Credit Default Swaps (reflects net appreciation as of October 31, 2014) – See Note 4 for additional information related to these instruments.
| Valuation Inputs | ||||||||||||||||
| SMI Dynamic Allocation Fund | Level 1 – Quoted Prices in Active Markets | Level 2 – Other Significant Observable Inputs | Level 3 – Significant Unobservable Inputs | Total | ||||||||||||
| Exchange-Traded Funds | $ | 144,650,193 | $ | — | $ | — | $ | 144,650,193 | ||||||||
| Mutual Funds | 2,403,340 | — | — | 2,403,340 | ||||||||||||
| Money Market Securities | 1,511,294 | — | — | 1,511,294 | ||||||||||||
| Total | $ | 148,564,827 | $ | — | $ | — | $ | 148,564,827 | ||||||||
43
THE SOUND MIND INVESTING FUNDS
NOTES TO THE FINANCIAL STATEMENTS
October 31, 2014 – (Continued)
NOTE 3. SECURITIES VALUATION AND FAIR VALUE MEASUREMENTS – (Continued)
The Funds did not hold any investments at any time during the reporting period in which significant unobservable inputs were used in determining fair value; therefore, no reconciliation of Level 3 securities is included for this reporting period. During the fiscal year ended October 31, 2014, there were no transfers between levels. The Trust recognizes transfers between fair value hierarchy levels at the end of the reporting period.
NOTE 4. DERIVATIVE TRANSACTIONS
The SMI Balanced Fund may obtain exposure to the fixed income market by investing in credit default swap (“CDX”) contracts. The Fund used CDX contracts as an additional avenue in which to bring value to the Fund. The Fund may use CDX contracts as an alternative to buying, selling, or holding certain securities in the fixed income market. The use of CDX contracts may provide a less expensive, more expedient, or more specifically focused way to invest than traditional fixed income securities would. The Fund may enter into single name CDX agreements to gain exposure to a particular company when it is more economically attractive to do so rather than purchasing traditional bonds. The Fund may also invest in CDX index products and options thereon that allow the Fund to gain broad market exposure but with less company-specific risk than single name CDX agreements.
The SMI Balanced Fund enters into CDX contracts to gain exposure or to mitigate specific forms of credit risk. Swaps expose the Fund to counterparty risk (described below). The Fund could also suffer losses with respect to a swap agreement if the Fund is unable to terminate the agreement or reduce its exposure through offsetting transactions.
Many of the markets in which the SMI Balanced Fund participates in credit default transactions are “over the counter” or “interdealer” markets. The participants in these markets are typically not subject to credit evaluation and regulatory oversight as are members of “exchange based markets”. When the Fund invests in CDX contracts, it is assuming a credit risk with regard to parties with whom it trades and also bears the risk of settlement default. These risks may differ materially from those associated with transactions effected on an exchange, which generally are backed by clearing organization guarantees, daily marking-to-market and settlement, and segregation and minimum capital requirements applicable to intermediaries. Transactions entered into directly between two counterparties generally do not benefit from such protections. This exposes the Fund to the risk that the counterparty will not settle a transaction in accordance with its terms and conditions because of a dispute over the terms of the contract (whether or not bona fide) or because of a credit or liquidity problem, thus causing the Fund to suffer a loss. To mitigate counterparty risk, the Fund will sometimes require the counterparty to post collateral to the Fund’s custodian to cover the exposure.
44
THE SOUND MIND INVESTING FUNDS
NOTES TO THE FINANCIAL STATEMENTS
October 31, 2014 – (Continued)
NOTE 4. DERIVATIVE TRANSACTIONS – (Continued)
The SMI Balanced Fund may also invest in credit default swap index products and in options on credit default swap index products. These instruments are designed to track segments of the credit default swap market and provide investors with exposure to specific “baskets” of issuers of bonds or loans. In general, the value of the credit default swap market provides investors with exposure to specific “baskets” of issuers of bonds or loans. In general, the value of the credit default swap index product will go up or down in response to changes in the perceived credit risk and default experience of the basket of issuers, instead of the exchange of the stream of payments for the payment of the notional amount (if a credit event occurs) that is the substance of a single name credit default swap. Such investments are subject to liquidity risks as well as counterparty and other risks associated with investments in credit default swaps discussed above.
The effect of trading in credit default swap contracts is reflected on the Statements of Operations under net realized gain on swap contracts and net change in unrealized appreciation on swap contracts.
| Derivatives – Credit Risk | Location of Derivatives on Statements of Assets & Liabilities | |||||
| Credit Default Swap Agreements | Receivable for variation margin on swap contracts | $ | 428 | |||
For the fiscal year ended October 31, 2014:
| Derivatives | Location of Gain (Loss) on Derivatives on Statements of Operations | Realized Gain (Loss) on Derivatives | Change in Unrealized Appreciation (Depreciation) on Derivatives | |||||||
Credit Risk: Credit Default Swap Agreements | Net realized and unrealized gain (loss) on swap contracts | $ | 9,123 | $ | 4,717 | |||||
The Fund purchased a total notional value of swap agreements of $2,383,400 during the fiscal year ended October 31, 2014. The total notional value of terminated swap agreements was $2,213,400. The Fund utilized credit derivative instruments in conjunction with investment securities in an effort to achieve its investment objective for the fiscal year ended October 31, 2014.
As of October 31, 2014, the Fund segregated cash collateral for outstanding swap contracts in the amount of $9,282.
As of October 31, 2014, the fair value of swap contracts in the Fund was $11,940.
45
THE SOUND MIND INVESTING FUNDS
NOTES TO THE FINANCIAL STATEMENTS
October 31, 2014 – (Continued)
NOTE 4. DERIVATIVE TRANSACTIONS – (Continued)
Balance Sheet Offsetting Information
The following table provides a summary of offsetting financial liabilities and derivatives and the effect of derivative instruments on the Statements of Assets and Liabilities as of October 31, 2014.
| Gross Amounts Not Offset in Statements of Assets and Liabilities | ||||||||||||||||||||||
| Gross Amounts of Recognized Assets | Gross Amounts Offset in Statements of Assets and Liabilities | Net Amounts of Assets Presented in Statements of Assets and Liabilities | Financial Instruments | Cash Collateral | Net Amount (not less than 0) | |||||||||||||||||
| Credit Default Swap Agreements | $ 428 | $ | — | $ | 428 | $ | — | $ | (428 | ) | $ | — | ||||||||||
NOTE 5. FEES AND OTHER TRANSACTIONS WITH AFFILIATES
The Adviser, under the terms of the management agreement with respect to each Fund (each an “Agreement”), manages the Funds’ investments. As compensation for its management services, each Fund is obligated to pay the Adviser a fee based on each Fund’s average daily net assets as follows:
Fund Assets | SMI Fund | SMI Balanced Fund | SMI Dynamic Allocation | |||
| $1 – $100 million | 1.00% | 0.90% | 1.00% | |||
| $100,000,001 – $250 million | 1.00% | 0.80% | 1.00% | |||
| $250,000,001 to $500 million | 0.90% | 0.70% | 0.90% | |||
| Over $500 million | 0.80% | 0.60% | 0.80% | |||
| Management fees earned | $ 2,918,225 | $ 285,825 | $ 1,061,946 | |||
| Fees waived and expenses reimbursed | $ — | $ (50,773) | $ — |
46
THE SOUND MIND INVESTING FUNDS
NOTES TO THE FINANCIAL STATEMENTS
October 31, 2014 – (Continued)
NOTE 5. FEES AND OTHER TRANSACTIONS WITH AFFILIATES – (Continued)
The Adviser contractually has agreed to waive its management fee and/or reimburse certain operating expenses, but only to the extent necessary so that each Fund’s total annual operating expenses (excluding interest, taxes, brokerage commissions, other expenses which are capitalized in accordance with GAAP, extraordinary expenses, dividend expense on short sales, 12b-1 fees, and acquired fund fees and expenses) do not exceed 1.50% of the Fund’s average daily net assets with respect to the SMI Fund, 1.15% with respect to the SMI Balanced Fund, and 1.45% with respect to the SMI Dynamic Allocation Fund. The contractual arrangement for each Fund is in place through February 28, 2015. Each waiver or reimbursement by the Adviser is subject to repayment by the applicable Fund within the three fiscal years following the fiscal year in which the particular expense or reimbursement was incurred; provided that such Fund is able to make the repayment without exceeding the applicable expense limitation.
The amount subject to repayment by the SMI Balanced Fund, pursuant to the aforementioned conditions, at October 31, 2014 is as follows:
| Amount | Recoverable through | |||||
| $ | 131,773 | 2015 | ||||
| 116,168 | 2016 | |||||
| 50,773 | 2017 | |||||
The Trust retains Huntington Asset Services, Inc. (“HASI”) to manage the Funds’ business affairs and to provide the Funds with administrative services, including all regulatory reporting and necessary office equipment and personnel. The Trust also retains HASI to act as each Fund’s transfer agent and to provide fund accounting services. Expenses incurred by the Funds for these expenses are allocated to the individual Funds based on each Fund’s relative net assets. Certain officers of the Trust are members of management and/or employees of HASI. HASI operates as a wholly-owned subsidiary of Huntington Bancshares, Inc., the parent company of the principal distributor of the Funds and Huntington National Bank, the custodian of the Funds’ investments (the “Custodian”). A Trustee of the Trust is a member of management of the Custodian. For the fiscal year ended October 31, 2014, fees for administrative, transfer agent, and fund accounting services, reimbursement of out-of-pocket expenses, and Custodian expenses and the amounts due to HASI and the Custodian at October 31, 2014 were as follows:
| SMI Fund | SMI Balanced Fund | SMI Dynamic Allocation Fund | ||||||||||
Administration expenses | $ | 100,873 | $ | 9,066 | $ | 37,204 | ||||||
Transfer agent expenses | 63,901 | 15,790 | 30,675 | |||||||||
Fund accounting expenses | 53,011 | 2,688 | 17,957 | |||||||||
Custodian expenses | 19,234 | 7,189 | 7,467 | |||||||||
Payable to HASI | 18,659 | 3,571 | 8,233 | |||||||||
Payable to Custodian | 1,241 | 406 | 863 | |||||||||
47
THE SOUND MIND INVESTING FUNDS
NOTES TO THE FINANCIAL STATEMENTS
October 31, 2014 – (Continued)
NOTE 5. FEES AND OTHER TRANSACTIONS WITH AFFILIATES – (Continued)
Unified Financial Securities, Inc. (the “Distributor”) acts as the principal distributor of the Funds. There were no payments made to the Distributor by the SMI Fund, the SMI Balanced Fund, or the SMI Dynamic Allocation Fund for fiscal year ended October 31, 2014. The Distributor, HASI, and the Custodian are controlled by Huntington Bancshares, Inc. A Trustee of the Trust is a member of management of Huntington National Bank, a subsidiary of Huntington Bancshares, Inc. (the parent of the Distributor), and certain officers of the Trust are officers of the Distributor and such persons may be deemed to be affiliates of the Distributor.
NOTE 6. INVESTMENTS
For the fiscal year ended October 31, 2014, purchases and sales of investment securities, other than short-term investments and short-term U.S. government obligations were as follows:
| SMI Fund | SMI Balanced Fund | SMI Dynamic Allocation Fund | ||||||||||
Purchases | ||||||||||||
U.S. Government Obligations | $ | — | $ | 42,423,854 | $ | — | ||||||
Other | 401,831,549 | 36,173,854 | 208,144,094 | |||||||||
Sales | ||||||||||||
U.S. Government Obligations | $ | — | $ | 40,324,035 | $ | — | ||||||
Other | 424,165,003 | 37,977,409 | 136,910,269 | |||||||||
NOTE 7. RESTRICTED SECURITIES
Restricted securities are securities that may only be resold upon registration under federal securities laws or in transactions exempt from such registration. In some cases, the issuer of restricted securities has agreed to register such securities for resale, at the issuer’s expense, either upon demand by the Funds or in connection with another registered offering of the securities. Many restricted securities may be resold in the secondary market in transactions exempt from registration. Such restricted securities may be determined to be liquid. The Board of Trustees and management of the SMI Balanced Fund consider the restricted securities shown below to be liquid. The Fund will not incur any registration costs upon such resale. The Fund’s restricted securities are valued at the price provided by dealers in the secondary market or, if no market prices are available, at the fair value as determined by the Trust’s Pricing Committee. At October 31, 2014, the SMI Balanced Fund held restricted securities representing 1.85% of net assets, as listed below:
48
THE SOUND MIND INVESTING FUNDS
NOTES TO THE FINANCIAL STATEMENTS
October 31, 2014 – (Continued)
NOTE 7. RESTRICTED SECURITIES – (Continued)
| Issuer Description | Acquisition Date | Principal Amount | Amortized Cost | Fair Value | ||||||||||||
| Credit Suisse Mortgage Capital Certificates, Series 2009-12R, Class 41A1, 5.219%, 3/27/2037 | 6/13/2011 | $ | 11,277 | $ | 11,280 | $ | 11,701 | |||||||||
| Daimler Finance North America LLC, 1.250%, 1/11/2016 | 1/9/2013 | 90,000 | 89,955 | 90,507 | ||||||||||||
| Ford Motor Credit Co. LLC, 3.984%, 6/15/2016 | (a) | 65,000 | 65,032 | 67,953 | ||||||||||||
| Hertz Vehicle Financing LLC, Series 2011-1A, Class A1, 2.200%, 3/25/2016 | (b) | 91,667 | 91,880 | 92,014 | ||||||||||||
| Hertz Vehicle Financing LLC, Series 2013-1A, Class A1, 1.120%, 8/25/2017 | 1/18/2013 | 90,000 | 89,996 | 90,111 | ||||||||||||
| ING Bank NV, 3.750%, 3/7/2017 | (c) | 165,000 | 164,675 | 173,895 | ||||||||||||
| Liberty Mutual Group, Inc. 6.700%, 8/15/2016 | 1/19/2012 | 25,000 | 25,975 | 27,411 | ||||||||||||
| Structured Asset Securities Corp. Mortgage Loan Trust, 2005-S7,Class A2, 0.452%, 12/25/2035 | (d) | 14,176 | 10,261 | 13,832 | ||||||||||||
| $ | 567,424 | |||||||||||||||
| (a) | Purchased on various dates beginning 6/17/2011. |
| (b) | Purchased on various dates beginning 6/13/2011. |
| (c) | Purchased on various dates beginning 3/1/2012. |
| (d) | Purchased on various dates beginning 6/22/2011. |
NOTE 8. ESTIMATES
The preparation of financial statements in conformity with GAAP requires management to make estimates and assumptions that affect the reported amounts of assets and liabilities and disclosure of contingent assets and liabilities at the date of the financial statements and the reported amounts of increases and decreases in net assets from operations during the reporting period. Actual results could differ from those estimates.
49
THE SOUND MIND INVESTING FUNDS
NOTES TO THE FINANCIAL STATEMENTS
October 31, 2014 – (Continued)
NOTE 9. BENEFICIAL OWNERSHIP
The beneficial ownership, either directly or indirectly, more than of 25% or more of the voting securities of a fund creates a presumption of control of the fund, under Section 2(a)(9) of the Investment Company Act of 1940. At October 31, 2014, National Financial Services Corporation (“NFS”) for the benefit of others, held 26%, 33% and 31% of the SMI Fund, SMI Balanced Fund and the SMI Dynamic Allocation Fund, respectively. It is not known whether NFS, or any of the underlying beneficial owners, owned or controlled 25% or more of the voting securities of the Funds. As a result, NFS may be deemed to control the SMI Fund, SMI Balanced Fund and the SMI Dynamic Allocation Fund.
NOTE 10. FEDERAL TAX INFORMATION
At October 31, 2014, the net unrealized appreciation (depreciation) of investments for tax purposes was as follows:
| SMI Fund | SMI Balanced Fund | SMI Dynamic Allocation Fund | ||||||||||
Gross Appreciation | $ | 29,923,322 | $ | 1,536,034 | $ | 10,201,422 | ||||||
Gross (Depreciation) | (629,443 | ) | (73,752 | ) | (285,185 | ) | ||||||
|
|
|
|
|
| |||||||
Net Appreciation (Depreciaton) on Investments | $ | 29,293,879 | $ | 1,462,282 | $ | 9,916,237 | ||||||
|
|
|
|
|
| |||||||
At October 31, 2014, the aggregate cost of securities for federal income tax purposes was $252,942,468, $28,913,961 and $138,648,590 for the SMI Fund, SMI Balanced Fund and SMI Dynamic Allocation Fund respectively.
The tax characterization of distributions for the fiscal years ended October 31, 2014 and October 31, 2013, was as follows:
| SMI Fund | ||||||||
| 2014 | 2013 | |||||||
Distributions paid from: | ||||||||
Ordinary Income | $ | 17,659,948 | $ | 8,906 | ||||
Long-term Capital Gain | 13,752,091 | 11,101,278 | ||||||
|
|
|
| |||||
| $ | 31,412,039 | $ | 11,110,184 | |||||
|
|
|
| |||||
50
THE SOUND MIND INVESTING FUNDS
NOTES TO THE FINANCIAL STATEMENTS
October 31, 2014 – (Continued)
NOTE 10. FEDERAL TAX INFORMATION – (Continued)
The tax characterization of distributions for the fiscal years ended October 31, 2014 and October 31, 2013, was as follows:
| SMI Balanced Fund | ||||||||
| 2014 | 2013 | |||||||
Distributions paid from: | ||||||||
Ordinary Income | $ | 1,850,608 | $ | 322,336 | ||||
Long-term Capital Gain | 1,130,543 | 342,122 | ||||||
|
|
|
| |||||
| $ | 2,981,151 | $ | 664,458 | |||||
|
|
|
| |||||
The tax characterization of distributions for the fiscal years ended October 31, 2014 and October 31, 2013, was as follows:
| SMI Dynamic Allocation Fund | ||||||||
| 2014 | 2013 | |||||||
Distributions paid from: | ||||||||
Ordinary Income | $ | 1,285,357 | $ | — | ||||
Long-term Capital Gain | — | — | ||||||
|
|
|
| |||||
| $ | 1,285,357 | $ | — | |||||
|
|
|
| |||||
At October 31, 2014, the components of distributable earnings (accumulated losses) on a tax basis were as follows:
| SMI Fund | SMI Balanced Fund | SMI Dynamic Allocation Fund | ||||||||||
Accumulated undistributed ordinary income | $ | 1,347,440 | $ | 64,793 | $ | 1,630,013 | ||||||
Accumulated undistributed long-term capital gains | 43,676,165 | 3,408,063 | 1,173,735 | |||||||||
Accumulated capital and other losses | (2,444,468 | ) | (82,960 | ) | — | |||||||
Unrealized appreciation (depreciation) | 29,293,879 | 1,462,282 | 9,916,237 | |||||||||
|
|
|
|
|
| |||||||
| $ | 71,873,016 | $ | 4,852,178 | $ | 12,719,985 | |||||||
|
|
|
|
|
| |||||||
At October 31, 2014, the difference between book basis and tax basis unrealized appreciation is attributable to the tax deferral of losses on wash sales in the amount of $3,767, $1,414 and $20,610 for the SMI Fund, SMI Balanced Fund, and SMI Dynamic Allocation Fund, respectively.
51
THE SOUND MIND INVESTING FUNDS
NOTES TO THE FINANCIAL STATEMENTS
October 31, 2014 – (Continued)
NOTE 10. FEDERAL TAX INFORMATION – (Continued)
As of October 31, 2014, accumulated capital and other losses consist of:
| Qualified Late Year Ordinary Losses | ||||
SMI Fund | $ | 2,444,468 | ||
SMI Balanced Fund | 82,960 | |||
NOTE 11. COMMITMENTS AND CONTIGENCIES
The Funds indemnify their officers and trustees for certain liabilities that may arise from performance of their duties to the Funds. Additionally, in the normal course of business, the Funds enter into contracts that contain a variety of representations and warranties which provide general indemnifications. The Funds’ maximum exposure under these arrangements is unknown, as this would involve future claims that may be made against the Funds that have not yet occurred.
NOTE 12. SUBSEQUENT EVENT
Management of the Funds has evaluated the need for disclosures and/or adjustments resulting from subsequent events through the date these financial statements were issued. On or around December 31, 2014 it is expected the SMI Balanced Fund will file with the Securities and Exchange Commission a proposal to change the Fund’s name and investment objective. A special meeting of the shareholders of the Trust was held on December 19, 2014, for the purpose of electing the Board of Trustees, the results of the meeting can be found in the Proxy Voting Results Note (below).
NOTE 13. PROXY VOTING RESULTS (Unaudited)
On December 19, 2014 a special meeting of the shareholders of the Trust was held at the offices of the Trust for the purpose of electing each nominee to the Board of Trustees.
Below are the voting results for all funds from the special meeting of the Trust:
To elect each nominee to the Board of Trustees:
| For | Against | Abstain | ||||||||||
Ira Cohen | 280,591,916 | 20,930,930 | — | |||||||||
Andrea N. Mullins | 296,332,857 | 5,189,989 | — | |||||||||
R. Jeffrey Young | 280,517,160 | 21,005,685 | — | |||||||||
52
REPORT OF INDEPENDENT REGISTERED
PUBLIC ACCOUNTING FIRM
To the Shareholders of The Sound Mind Investing Funds and
Board of Trustees of Valued Advisers Trust
We have audited the accompanying statements of assets and liabilities, including the schedules of investments, of The Sound Mind Investing Funds, comprising Sound Mind Investing Fund, Sound Mind Investing Balanced Fund, and SMI Dynamic Allocation Fund (the “Funds”), each a series of Valued Advisers Trust, as of October 31, 2014, and the related statement of operations for the year then ended, the statements of changes in net assets for each of the two years in the period then ended, and the financial highlights for each of the five years in the period then ended for Sound Mind Investing Fund, the statement of operations for the year then ended, the statements of changes in net assets for each of the two years in the period then ended, and the financial highlights for each of the four periods in the period then ended for Sound Mind Investing Balanced Fund, and the statement of operations for the year then ended and the statements of changes in net assets and the financial highlights for each of the two periods in the period then ended for SMI Dynamic Allocation Fund. These financial statements and financial highlights are the responsibility of the Funds’ management. Our responsibility is to express an opinion on these financial statements and financial highlights based on our audits.
We conducted our audits in accordance with the standards of the Public Company Accounting Oversight Board (United States). Those standards require that we plan and perform the audit to obtain reasonable assurance about whether the financial statements and financial highlights are free of material misstatement. An audit includes examining, on a test basis, evidence supporting the amounts and disclosures in the financial statements. Our procedures included confirmation of securities owned as of October 31, 2014, by correspondence with the custodian and brokers. An audit also includes assessing the accounting principles used and significant estimates made by management, as well as evaluating the overall financial statement presentation. We believe that our audits provide a reasonable basis for our opinion.
In our opinion, the financial statements and financial highlights referred to above present fairly, in all material respects, the financial position of each of the Funds constituting The Sound Mind Investing Funds as of October 31, 2014, the results of their operations for the year then ended, and the changes in their net assets and their financial highlights for each of the periods presented, in conformity with accounting principles generally accepted in the United States of America.

COHEN FUND AUDIT SERVICES, LTD.
Cleveland, Ohio
December 26, 2014
53
ADDITIONAL FEDERAL INCOME TAX INFORMATION – (Unaudited)
The Form 1099-DIV you receive in January 2015 will show the tax status of all distributions paid to your account in calendar year 2014. Shareholders are advised to consult their own tax adviser with respect to the tax consequences of their investment in the Fund. As required by the Internal Revenue Code and/or regulations, shareholders must be notified regarding the status of qualified dividend income for individuals and the dividends received deduction for corporations.
Qualified Dividend Income. The SMI Fund, SMI Balanced Fund and SMI Dynamic Allocation Fund designate approximately 4%, 94% and 77% respectively or up to the maximum amount of such dividends allowable pursuant to the Internal Revenue Code, as qualified dividend income eligible for the reduced tax rate of 15%.
Dividends Received Deduction. Corporate shareholders are generally entitled to take the dividends received deduction on the portion of the Fund’s dividend distribution that qualifies under tax law. For the SMI Fund’s, SMI Balanced Fund’s and SMI Dynamic Allocation Fund’s fiscal year 2014 ordinary income dividends, 2%, 55% and 32% respectively, qualifies for the corporate dividends received deduction.
For the year ended October 31, 2014, the SMI Fund designated $13,752,091 as long-term capital gain distributions and $16,674,842 as short-term capital gain distributions. For the year ended October 31, 2014, the SMI Balanced Fund designated $1,130,543 as long-term capital gain distributions and $1,711,136 as short-term capital gain distributions.
54
TRUSTEES AND OFFICERS – (Unaudited)
The following table provides information regarding each of the Independent Trustees.
| Name, Address*, (Age), Position with Trust**, Term of Position with Trust | Principal Occupation During Past 5 Years | Other Directorships | ||
| Ira Cohen, 55, Independent Trustee, June 2010 to present. | Independent financial services consultant, since February 2005. | Trustee and Audit Committee Chairman, Griffin Institutional Access Real Estate Fund, since May 2014; Trustee for Angel Oak Funds Trust, since October 2014. | ||
| Andrea N. Mullins, 47, Independent Trustee, December 2013 to present. | Private investor; Independent Contractor, Seabridge Wealth Management, LLC, since April 2014; Principal Financial Officer, Treasurer and Secretary, Eagle Family of Funds (mutual fund family) and Vice President, Eagle Asset Management, Inc. (investment adviser) each from 2004 to 2010. | None. |
| * | The address for each trustee and officer is 2960 N. Meridian St., Suite 300, Indianapolis, IN 46208. |
| ** | As of the date of this report, the Trust consists of 14 series. |
The following table provides information regarding the Trustee who is considered an “interested person” of the Trust, as that term is defined under the 1940 Act. Based on the experience of the Trustee, the Trust concluded that the individual described below should serve as a Trustee.
Name, Address*, (Age), Term of Position with Trust | Principal Occupation During Past 5 Years | Other Directorships | ||
| R. Jeffrey Young, 50, Trustee and Chairman, June 2010 to present; Principal Executive Officer and President, Valued Advisers Trust, February 2010 to present. | Senior Vice President, Huntington Asset Services, Inc. since January 2010 and Director since May 2014; Director, Unified Financial Securities since May 2014; Chief Executive Officer, Huntington Funds since February 2010; Chief Executive Officer, The Huntington Strategy Shares since November 2010; Trustee and Chairman, Capitol Series Trust, since September 2013; President and Chief Executive Officer, Dreman Contrarian Funds, from March 2011 to February 2013; Trustee, Valued Advisers Trust, from August 2008 to January 2010; and Managing Director of WealthStone, from 2007 to 2010. | Trustee and Chairman, Capitol Series Trust, since September 2013. |
| * | The address for each trustee and officer is 2960 N. Meridian St., Suite 300, Indianapolis, IN 46208. |
| ** | As of the date of this report, the Trust consists of 14 series. |
55
TRUSTEES AND OFFICERS – (Unaudited), (Continued)
The following table provides information regarding the Officers of the Trust:
| Name, Address*, (Age), Position with Trust,** Term of Position with Trust | Principal Occupation During Past 5 Years | Other Directorships | ||
| R. Jeffrey Young, 50, Trustee and Chairman, June 2010 to present; Principal Executive Officer and President, Valued Advisers, February 2010 to present. | Senior Vice President, Huntington Asset Services, Inc., since January 2010 and Director since May 2014; Director, Unified Securities, since May 2014; Chief Executive Officer, Huntington Funds, since February 2010; Chief Executive Officer, The Huntington Strategy Shares, since November 2010; Trustee and Chairman, Capitol Series Trust, since September 2013; President and Chief Executive Officer, Dreman Contrarian Funds, from March 2011 to February 2013; Trustee, Valued Advisers Trust, from August 2008 to January 2010; and Managing Director of WealthStone, from 2007 to 2010. | Trustee and Chairman, Capitol Series Trust, since September 2013. | ||
| John C. Swhear, 53, Chief Compliance Officer, AML Officer and Vice President, August 2008 to present. | Vice President of Legal Administration and Compliance for Huntington Asset Services, Inc., the Trust’s administrator, since April 2007 and Director since May 2014; Chief Compliance Officer of Unified Financial Securities, Inc., the Trust’s distributor, since May 2007 and Director since May 2014; President, Unified Series Trust, since March 2012, and Senior Vice President from May 2007 to March 2012; Chief Compliance Officer and AML Officer, Capitol Series Trust, since September 2013; Secretary, Huntington Funds, from April 2010 to February 2012; President and Chief Executive Officer, Dreman Contrarian Funds, from March 2010 to March 2011, and Vice President and Acting Chief Executive Officer, from 2007 to March 2010. | None. | ||
| Carol J. Highsmith, 50, Vice President, August 2008 to present; Secretary, March 2014 to present | Employed in various positions with Huntington Asset Services, Inc., the Trust’s administrator, since November 1994; currently Vice President of Legal Administration; Secretary, Cross Shore Discovery Fund since May 2014. | None. | ||
| Matthew J. Miller, 38, Vice President, December 2011 to present. | Employed in various positions with Huntington Asset Services, Inc., the Trust’s administrator, since July 1998; currently Vice President of Relationship Management; Vice President, Huntington Funds, since February 2010; President and Chief Executive Officer, Capitol Series Trust, since September 2013. | None. |
56
TRUSTEES AND OFFICERS – (Unaudited), (Continued)
| Name, Address*, (Age), Position with Trust,** Term of Position with Trust | Principal Occupation During Past 5 Years | Other Directorships | ||
| Bryan W. Ashmus, 41, Treasurer and Principal Financial Officer, December 2013 to present. | Vice President, Financial Administration, Huntington Asset Services, Inc., the Trust’s administrator, since September 2013; Chief Financial Officer and Treasurer, The Huntington Strategy Shares and The Huntington Funds, since November 2013; Vice President, Treasurer Services, Citi Fund Services Ohio, Inc., from May 2005 to September 2013. | None. |
| * | The address for each trustee and officer is 2960 N. Meridian St., Suite 300, Indianapolis, IN 46208. |
| ** | As of the date of this report, the Trust consists of 14 series. |
OTHER INFORMATION
The Funds’ Statement of Additional Information (“SAI”) includes additional information about the trustees and is available without charge, upon request. You may call toll-free at (877) 764-3863 to request a copy of the SAI or to make shareholder inquiries.
57
VALUED ADVISERS TRUST
PRIVACY POLICY
The following is a description of the policies of the Valued Advisers Trust (the “Trust”) regarding disclosure of nonpublic personal information that shareholders provide to a series of the Trust (each, a “Fund”) or that the Fund collects from other sources. In the event that a shareholder holds shares of a Fund through a broker-dealer or other financial intermediary, the privacy policy of the financial intermediary would govern how shareholder nonpublic personal information would be shared with nonaffiliated third parties.
Categories of Information A Fund May Collect. A Fund may collect the following nonpublic personal information about its shareholders:
| • | Information the Fund receives from a shareholder on applications or other forms, correspondence, or conversations (such as the shareholder’s name, address, phone number, social security number, and date of birth); and |
| • | Information about the shareholder’s transactions with the Fund, its affiliates, or others (such as the shareholder’s account number and balance, payment history, cost basis information, and other financial information). |
Categories of Information A Fund May Disclose. A Fund may not disclose any nonpublic personal information about its current or former shareholders to unaffiliated third parties, except as required or permitted by law. A Fund is permitted by law to disclose all of the information it collects, as described above, to its service providers (such as the Fund’s custodian, administrator, transfer agent, accountant and legal counsel) to process shareholder transactions and otherwise provide services to the shareholder.
Confidentiality and Security. Each Fund shall restrict access to shareholder nonpublic personal information to those persons who require such information to provide products or services to the shareholder. Each Fund shall maintain physical, electronic, and procedural safeguards that comply with federal standards to guard shareholder nonpublic personal information.
Disposal of Information. The Funds, through their transfer agent, have taken steps to reasonably ensure that the privacy of a shareholder’s nonpublic personal information is maintained at all times, including in connection with the disposal of information that is no longer required to be maintained by the Funds. Such steps shall include, whenever possible, shredding paper documents and records prior to disposal, requiring off-site storage vendors to shred documents maintained in such locations prior to disposal, and erasing and/or obliterating any data contained on electronic media in such a manner that the information can no longer be read or reconstructed.
58
PROXY VOTING
A description of the policies and procedures that the Funds use to determine how to vote proxies relating to portfolio securities and information regarding how the Funds voted those proxies during the most recent twelve month period ended June 30 is available without charge upon request by (1) calling the Funds at (877) 764-3863 and (2) from the Fund’s documents filed with the Securities and Exchange Commission (“SEC”) on the SEC’s website at www.sec.gov.
TRUSTEES
R. Jeffrey Young, Chairman
Ira Cohen
Andrea N. Mullins
OFFICERS
R. Jeffrey Young, Principal Executive Officer and President
Bryan W. Ashmus, Principal Financial Officer and Treasurer
John C. Swhear, Chief Compliance Officer, AML Officer and Vice-President
Carol J. Highsmith, Vice President and Secretary
Matthew J. Miller, Vice President
INVESTMENT ADVISOR
SMI Advisory Services, LLC
11135 Baker Hollow Road
Columbus, IN 47201
DISTRIBUTOR
Unified Financial Securities, Inc.
2960 North Meridian Street, Suite 300
Indianapolis, IN 46208
INDEPENDENT REGISTERED PUBLIC ACCOUNTING FIRM
Cohen Fund Audit Services Ltd.
1350 Euclid Avenue, Suite 800
Cleveland, OH 44115
LEGAL COUNSEL
The Law Offices of John H. Lively & Associates, Inc.,
A member firm of The 1940 Act Law GroupTM
11300 Tomahawk Creek Pkwy, Suite 310
Leawood, KS 66211
CUSTODIAN
Huntington National Bank
41 South High Street
Columbus, OH 43125
ADMINISTRATOR, TRANSFER AGENT AND FUND ACCOUNTANT
Huntington Asset Services, Inc.
2960 North Meridian Street, Suite 300
Indianapolis, IN 46208
This report is intended only for the information of shareholders or those who have received the Funds prospectus which contains information about the Funds management fee and expenses. Please read the prospectus carefully before investing.
Distributed by Unified Financial Securities, Inc.
Member FINRA/SIPC
59

SOUND MIND
INVESTING FUND
SOUND MIND INVESTING
BALANCED FUND
SMI DYNAMIC ALLOCATION FUND
| ANNUAL REPORT |
| October 31, 2014 |
Fund Adviser:
SMI Advisory Services, LLC
11135 Baker Hollow Road
Columbus, IN 47201
Toll Free (877) SMI-Fund
www.smifund.com

DANA LARGE CAP EQUITY FUND
Annual Report
October 31, 2014
Dana Investment Advisors, Inc.
15800 Bluemound Rd., Suite 250
Brookfield, WI 53005
(855) 280-9648
www.danafunds.com
Dear Fellow Shareholders:
We are pleased to present our 2014 annual report and portfolio review. The 2014 fiscal year has been an exciting time for shareholders of the Dana Large Cap Equity Fund (the “Fund”). Growth has been a key theme in the last year as the number of shares outstanding has grown by 78%, Fund assets have grown by over 90%, and the Fund’s Class N Shares have provided investors with a return of over 16%. Although these accomplishments are rewarding, we remained focused on the future. We believe the Fund is favorably positioned within its current distribution channels and are excited by new channels that have been established in the past 12 months. Our portfolio managers are aware of current events, but avoid getting tied up with the daily market emotions and focus their efforts on building a portfolio of fundamentally sound stocks that we believe will benefit shareholders over time regardless of market direction. We sincerely appreciate your continued support and value the trust that you have shown in allowing us the privilege to manage your assets. We welcome your comments and questions and you may reach us via email at DanaFunds@danainvestment.com.
Market Recap:
The economic recovery in the U.S., in contrast to other geographic regions, has continued over the last 12 months, and stock market gains reflect this dichotomy. The S&P 500® Index (“S&P 500”) returned 17% over the last year, while earnings per share grew 12%. Global equity market gains were more muted, with the MSCI World Index returning 9% over the same period, and the MSCI Emerging Markets Index returning just 1%. After a weather-affected first quarter GDP of -2.1%, the U.S. economy delivered +4.6% GDP growth in the second quarter, and the third quarter advance estimate sits at +3.5%. The unemployment rate continues to decline while manufacturing activity and consumer confidence increase. The economy has yet to embark on a robust expansionary phase, but the current trend is clearly upward. Across both oceans, the story is very different. Europe and Japan struggle to invigorate developed economies beset by fiscal, demographic and monetary issues. Meanwhile, China’s aggressive growth of the last decade, underpinned by infrastructure investment, is slowing as the economy deals with a flagging property market and attempts a shift to a more consumer-driven GDP.
The S&P 500 experienced a year of low volatility. The largest correction occurred from late September through mid-October, totaling -7.5%, before ending October at all-time highs. Concerns about the end of QE and rising interest rates, a weak European economy, falling crude prices and ebola – along with liquidity issues in certain corners of the market – ostensibly drove the decline. The latter two concerns, while notable for their novelty, have since been rationalized, while the former concerns have reflected the status quo for some time. A solid third quarter earnings season, 77.0% of S&P 500 companies have beaten consensus estimates to date, appears to have refocused investors on the fundamentals as the market tests new highs. Similar to last year, however, above trend equity returns have some investors questioning the sustainability of the current bull market.
We believe that several factors suggest there is further upside. Three prior bear markets, 1987-1988, 2000-2002, and 2007-2009 are instructive. In 1987, the S&P 500 traded at 21.0x earnings compared to 17.5x earnings at current year-end. Perhaps more importantly, the 10-year US Treasury offered a higher total yield than the equity market, while the current 10-year US Treasury of 2.3% is well below the current 7.6% equity market yield inclusive of dividends. In 2000, the S&P
1
500 traded at 28.0x earnings, and again the 10-year US Treasury offered a higher total yield than the equity market. The 1987 and 2000 peaks represented elevated equity market valuations relative to both history and bond alternatives, valuations of which there is little evidence of today. In 2007, the S&P 500 traded at 17.0x earnings, similar to the current period, while the equity market yield exceeded the 10-year US Treasury yield by 3.0%, well below the 5.3% difference of the current period. The 2007 peak, however, was notable not so much for excessive valuation, but for excessive and unsustainable earnings. For example, financial sector earnings, spurred on by the housing-driven credit bubble, comprised 27% of S&P 500 earnings at the 2007 peak, but declined to 10% of S&P earnings at the 2009 trough. For a number of reasons, we see little sign of a similar earnings bubble today.
In the absence of valuation or earnings bubbles, it is difficult to argue for a sustained period of equity market underperformance. With that said, more temporary corrections are always a possibility. Risks that could drive such a correction do not differ materially from a year ago. An overheated property market remains a threat to China’s financial system, European and Japanese economic recoveries are uncertain, geopolitical risks are ever-present, and the Fed appears committed to eventually raising interest rates. As we emphasized in this space last year, however, markets are ultimately driven by earnings, dividends, risk appetites and liquidity. Dana’s investment process, which adheres to specific risk controls, focuses Dana’s portfolio managers on the fundamentals, reducing the probability of being distracted by often sensationalized headline risk. Security selection has been the key value-add to our historical outperformance, since inception, and this stock-specific focus remains at the core of our investment process.
Performance:
Performance for U.S. large cap equities continued a five-plus year run during the twelve-month period ended October 31, 2014. The beginning of the Fund’s fiscal year saw many high-valuation momentum darlings leading the market. Our relative-value security selection tends to avoid such stocks, yet we were able to keep pace with the market. In March the Fund experienced its best month of relative performance, as many of the high-flyers gave back liberal portions of their prior gains. Near the end of the year, fear briefly gripped the market. Performance in the broad market was much weaker than reflected by the S&P 500, which was buoyed by heavily weighted mega-cap stocks that investors sought out as safe havens. While our portfolios did well versus the broad market, this period of September and early October was our weakest period of performance against the cap-weighted S&P 500.
With such a strong market during the Fund’s fiscal year period (November 1, 2013 to October 31, 2014), we were blessed with many strong performers. The top three contributors in declining order of Fund performance were Skyworks Solutions, Delta Air Lines and Hanesbrands. Skyworks Solutions, Inc. led the Fund, thanks to spectacular revenue and earnings growth driven by demand for its chips in a growing array of products providing mobile network access (led by smart phones, and the iPhone 6 in particular). Last year’s top Fund performer, Delta Air Lines, Inc., continued to perform on all key operational and financial metrics and its stock price was richly rewarded. Hanesbrands, Inc., the clothing manufacturer, has shown remarkable growth in earnings and revenue. Organic growth has been strong, and the impact of last year’s acquisition of Maidenform has exceeded expectations. Hanesbrands acquired French apparel maker DBApparel in September, and should provide the company opportunities to capitalize on geographic and product synergies.
2
Our largest detractor from performance during the period was a short-term holding that never reached a full-size position. GNC Holdings, Inc., a retailer of health and wellness products, reported earnings $0.02 below expectations in February of 2014, with revenue and forward guidance also shy of consensus estimates. With declining margin and estimate trends, and visibility of earnings muddled by promotional activity, we liquidated the stock in March before significant subsequent declines. Our next biggest detractor, SM Energy Company, also delivered poor earnings news in February, and was liquidated from the portfolio in March. Trinity Industries Inc. claimed third spot on our detractors list at the end of the period, as declining oil prices were perceived as a negative for the company.
During the period we sold several names due to disappointing news (e.g., GNC Holdings and SM Energy, mentioned previously), a couple due to positive M&A activity (Covidien PLC and Lorillard, Inc.), and others the result of strong performance pushing valuations to less-attractive realms (e.g., Alliance Data Systems Corporation and Wyndham Worldwide Corporation). New positions in the Fund covered a variety of sectors and themes, with an emphasis on visible growth and U.S. revenue. Examples include retailer Kroger Company, IT solutions distributor CDW Corporation, and our leading performer for the period, Skyworks Solutions. We believe these and other changes position the Fund well for the coming year, but as always we continue to look for opportunities to upgrade portfolio holdings.
These are exciting times for shareholders of the Dana Large Cap Equity Fund and we appreciate your continued confidence.
Respectfully submitted,

Mark R. Mirsberger, CPA
Chief Executive Officer – Dana Investment Advisors, Inc.

Duane Roberts, CFA
Fund Manager and Director of Equities – Dana Investment Advisors, Inc.
3
Investment Results (Unaudited)
Total Returns* as of October 31, 2014
| One Year | Three Year | Since Inception (3/1/10) | Since Inception (7/28/10) | Since Inception (10/29/13) | ||||||||||||||||
Dana Large Cap Equity Fund |
| |||||||||||||||||||
Class A with Load | 10.45% | 16.36% | N/A | 14.96% | N/A | |||||||||||||||
Class A without Load | 16.24% | 18.37% | N/A | 16.36% | N/A | |||||||||||||||
Class N | 16.23% | 18.55% | 17.27% | N/A | N/A | |||||||||||||||
Institutional Class | 16.60% | N/A | N/A | N/A | 16.79% | |||||||||||||||
S&P 500® Index1 | 17.27% | 19.77% | 16.18% | 17.43% | 16.77% | |||||||||||||||
| Expense Ratios2 | ||||||||||||||||||||
| Class A | Class N |
| Institutional Class |
| ||||||||||||||||
Gross | 2.19% | 2.19% | 1.94% | |||||||||||||||||
With Applicable Waivers | 0.98% | 0.98% | 0.73% | |||||||||||||||||
The performance quoted represents past performance, which does not guarantee future results. The investment return and principal value of an investment will fluctuate so that an investor’s shares, when redeemed, may be worth more or less than their original cost. The returns shown do not reflect deduction of taxes that a shareholder would pay on Fund distributions or the redemption of Fund shares. Current performance of the Fund may be lower or higher than the performance quoted. The Fund’s investment objectives, risks, charges and expenses must be considered carefully before investing. Performance data current to the most recent month end may be obtained by calling 1-855-280-9648.
* Return figures reflect any change in price per share and assume the reinvestment of all distributions. Returns for periods greater than 1 year are annualized.
1 The S&P 500® Index (“Index”) is widely recognized unmanaged index of equity securities and is representative of a broader domestic equity market and range of securities than is found in the Fund’s portfolio. Individuals cannot invest directly in the Index; however, an individual can invest in exchange traded funds or other investment vehicles that attempt to track the performance of a benchmark index.
2 The expense ratios are from the Fund’s prospectus dated February 28, 2014. The Adviser has contractually agreed to waive its management fee and/or reimburse certain operating expenses through February 28, 2017, but only to the extent necessary so that the Fund’s net expenses, excluding brokerage fees and commissions, borrowing costs (such as (a) interest expense and (b) dividends on securities sold short), taxes, extraordinary expenses, 12b-1 fees (if applicable), and any indirect expenses (such as fees and expenses of acquired funds), do not exceed 0.73%. Additional information pertaining to the Fund’s expense ratios as of October 31, 2014 can be found on the financial highlights.
The Fund’s investment objectives, strategies, risks, charges and expenses must be considered carefully before investing. The prospectus contains this and other important information about the Fund and may be obtained by calling the same number as above. Please read it carefully before investing.
The Fund is distributed by Unified Financial Securities, Inc., member FINRA.
4
Comparison of the Growth of a $10,000 Investment in the Dana Large Cap Equity Fund, Class N and the S&P 500® Index (unaudited)
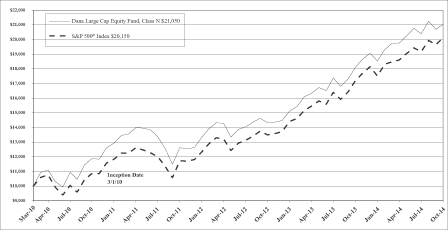
The chart above assumes an initial investment of $10,000 made on March 1, 2010 (commencement of Class N operations) held through October 31, 2014. THE FUND’S RETURN REPRESENTS PAST PERFORMANCE AND DOES NOT GUARANTEE FUTURE RESULTS. The returns shown do not reflect deduction of taxes that a shareholder would pay on Fund distributions or the redemption of Fund shares. Investment returns and principal values will fluctuate so that your shares, when redeemed, may be worth more or less than their original purchase price.
Current performance may be lower or higher than the performance data quoted. For more information on the Fund, and to obtain performance data current to the most recent month end or to request a prospectus, please call 1-855-280-9648. You should carefully consider the investment objectives, potential risks, management fees, and charges and expenses of the Fund before investing. The Fund’s prospectus contains this and other information about the Fund, and should be read carefully before investing.
The Fund is distributed by Unified Financial Securities, Inc., member FINRA.
5
Portfolio Illustration (Unaudited)
October 31, 2014
The following chart gives a visual breakdown of the Fund by the industry sectors the underlying securities represent as a percentage of the portfolio of investments.
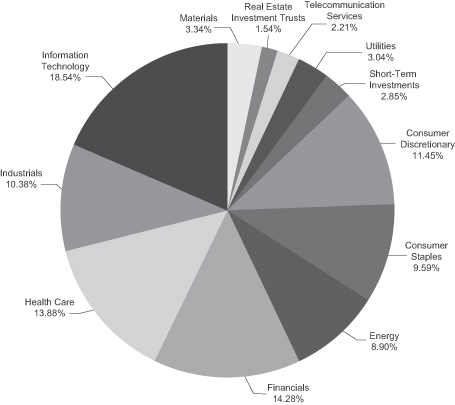
Availability of Portfolio Schedule (Unaudited)
The Fund files its complete schedule of portfolio holdings with the Securities and Exchange Commission (“SEC”) for the first and third quarters of each fiscal year on Form N-Q. The Fund’s Forms N-Q are available at the SEC’s website at www.sec.gov. The Fund’s Forms N-Q may be reviewed and copied at the Public Reference Room in Washington DC. Information on the operation of the Public Reference Room may be obtained by calling 1-800-SEC-0330.
6
Summary of Fund’s Expenses (Unaudited)
As a shareholder of the Fund, you may incur two types of costs: (1) transaction costs, including sales charges (loads) on purchases and short-term redemption fees and (2) ongoing costs, including management fees, distribution and service (12b-1) fees, and other Fund expenses. These examples are intended to help you understand your ongoing costs (in dollars) of investing in the Fund and to compare these costs with the ongoing costs of investing in other mutual funds.
Each Fund’s example is based on an investment of $1,000 invested at the beginning of the period and held for the entire period (May 1, 2014 through October 31, 2014).
Actual Expenses
The first line of the table below provides information about actual account values and actual expenses. You may use the information in this line, together with the amount you invested, to estimate the expenses that you paid over the period. Simply divide your account value by $1,000 (for example, an $8,600 account value divided by $1,000 = 8.60), then multiply the result by the number in the first line under the heading entitled “Expenses Paid During Period” to estimate the expenses you paid on your account during this period.
Hypothetical Example for Comparison Purposes
The second line of the table below provides information about hypothetical account values and hypothetical expenses based on the Fund’s actual expense ratio and an assumed rate of return of 5% per year before expenses, which is not the Fund’s actual return. The hypothetical account values and expenses may not be used to estimate the actual ending account balance or expenses you paid for the period. You may use this information to compare the ongoing costs of investing in the Fund and other funds. To do so, compare this 5% hypothetical example with the 5% hypothetical examples that appear in the shareholder reports of the other funds.
Expenses shown are meant to highlight your ongoing costs only and do not reflect any transactional costs such as the fee imposed on sales charges and short-term redemptions. Therefore, the second line of the table below is useful in comparing ongoing costs only and will not help you determine the relative costs of owning different funds. If incurred, the short-term redemption fee imposed by the Fund would increase your expenses.
7
Summary of Fund’s Expenses (Unaudited) (continued)
| Beginning Account Value, May 1, 2014 | Ending Account Value, October 31, 2014 | Expenses Paid During Period(1) | Annualized Expense Ratio | |||||||||||||||
Dana Large Cap Equity Fund | ||||||||||||||||||
Class A | Actual | $ | 1,000.00 | $ | 1,064.90 | $ | 5.11 | 0.98 | % | |||||||||
| Hypothetical(2) | $ | 1,000.00 | $ | 1,020.26 | $ | 5.00 | 0.98 | % | ||||||||||
Class N | Actual | $ | 1,000.00 | $ | 1,064.30 | $ | 5.11 | 0.98 | % | |||||||||
| Hypothetical(2) | $ | 1,000.00 | $ | 1,020.26 | $ | 5.00 | 0.98 | % | ||||||||||
Institutional Class | Actual | $ | 1,000.00 | $ | 1,066.20 | $ | 3.81 | 0.73 | % | |||||||||
| Hypothetical(2) | $ | 1,000.00 | $ | 1,021.52 | $ | 3.73 | 0.73 | % | ||||||||||
| (1) | Expenses are equal to the Fund’s annualized expense ratios, multiplied by the average account value over the period, multiplied by 184/365 (to reflect the one-half year period). The annualized expense ratios reflect reimbursement of expenses by the Fund’s Adviser for the period beginning May 1, 2014 to October 31, 2014. The “Financial Highlights” tables in the Fund’s financial statements, included in the report, also show the gross expense ratios, without such reimbursements. |
| (2) | Hypothetical assumes 5% annual return before expenses. |
8
Schedule of Investments
October 31, 2014
| Shares | Fair Value | |||||||
| COMMON STOCKS – 97.10% | ||||||||
| Consumer Discretionary – 11.44% | ||||||||
| 12,000 | Comcast Corp.– Class A | $ | 664,200 | |||||
| 6,300 | Hanesbrands, Inc. | 665,343 | ||||||
| 12,000 | Macy’s, Inc. | 693,840 | ||||||
| 7,500 | Magna International, Inc. | 740,325 | ||||||
| 10,000 | Royal Caribbean Cruises Ltd. | 679,700 | ||||||
| 4,700 | Whirlpool Corp. | 808,635 | ||||||
|
| |||||||
| 4,252,043 | ||||||||
|
| |||||||
| Consumer Staples – 9.58% | ||||||||
| 13,500 | Coca-Cola Enterprises, Inc. | 585,225 | ||||||
| 8,400 | CVS Caremark Corp. | 720,804 | ||||||
| 3,400 | Dr. Pepper Snapple Group, Inc. | 235,450 | ||||||
| 5,800 | Kimberly-Clark Corp. | 662,766 | ||||||
| 12,800 | Kroger Co./The | 713,088 | ||||||
| 16,000 | Tyson Foods, Inc. – Class A | 645,600 | ||||||
|
| |||||||
| 3,562,933 | ||||||||
|
| |||||||
| Energy – 8.90% | ||||||||
| 5,100 | Chevron Corp. | 611,745 | ||||||
| 7,900 | ConocoPhillips | 569,985 | ||||||
| 6,800 | Exxon Mobil Corp. | 657,628 | ||||||
| 6,993 | Halliburton Co. | 385,594 | ||||||
| 7,800 | Helmerich & Payne, Inc. | 677,196 | ||||||
| 4,100 | Schlumberger Ltd. | 404,506 | ||||||
|
| |||||||
| 3,306,654 | ||||||||
|
| |||||||
| Financials – 14.27% | ||||||||
| 4,800 | ACE Ltd. | 524,640 | ||||||
| 10,600 | Allstate Corp./The | 687,410 | ||||||
| 5,600 | Ameriprise Financial, Inc. | 706,552 | ||||||
| 10,600 | Discover Financial Services | 676,068 | ||||||
| 12,700 | Lincoln National Corp. | 695,452 | ||||||
| 6,900 | PNC Financial Services Group, Inc. | 596,091 | ||||||
| 19,000 | SunTrust Banks, Inc. | 743,660 | ||||||
| 12,700 | Wells Fargo & Co. | 674,243 | ||||||
|
| |||||||
| 5,304,116 | ||||||||
|
| |||||||
| Health Care – 13.87% | ||||||||
| 12,200 | AbbVie, Inc. | 774,212 | ||||||
| 9,000 | Aetna, Inc. | 742,590 | ||||||
| 4,700 | Amgen, Inc. | 762,246 | ||||||
| 6,300 | Gilead Sciences, Inc. * | 705,600 | ||||||
| 6,600 | Johnson & Johnson | 711,348 | ||||||
| 3,600 | McKesson Corp. | 732,276 | ||||||
| 7,000 | Universal Health Services, Inc. – Class B | 725,970 | ||||||
|
| |||||||
| 5,154,242 | ||||||||
|
| |||||||
| Industrials – 10.38% | ||||||||
| 5,200 | Boeing Co./The | 649,532 | ||||||
| 16,400 | Delta Air Lines, Inc. | 659,772 | ||||||
The accompanying notes are an integral part of these financial statements.
9
Schedule of Investments (continued)
October 31, 2014
| Shares | Fair Value | |||||||
| COMMON STOCKS – (continued) | ||||||||
| Industrials – 10.38% (continued) | ||||||||
| 6,000 | Raytheon Co. | $ | 623,280 | |||||
| 17,000 | Trinity Industries, Inc. | 607,070 | ||||||
| 5,800 | Union Pacific Corp. | 675,410 | ||||||
| 6,000 | United Technologies Corp. | 642,000 | ||||||
|
| |||||||
| 3,857,064 | ||||||||
|
| |||||||
| Information Technology – 18.53% | ||||||||
| 12,500 | Amdocs Ltd. | 594,250 | ||||||
| 6,900 | Apple, Inc. | 745,200 | ||||||
| 26,000 | Cisco Systems, Inc. | 636,220 | ||||||
| 11,400 | Hewlett-Packard Co. | 409,032 | ||||||
| 19,000 | Intel Corp. | 646,190 | ||||||
| 3,400 | International Business Machines Corp. | 558,960 | ||||||
| 15,000 | Oracle Corp. | 585,750 | ||||||
| 8,200 | QUALCOMM, Inc. | 643,782 | ||||||
| 10,641 | Seagate Technology PLC | 668,574 | ||||||
| 12,100 | Skyworks Solutions, Inc. | 704,704 | ||||||
| 11,349 | TE Connectivity Ltd. | 693,764 | ||||||
|
| |||||||
| 6,886,426 | ||||||||
|
| |||||||
| Materials – 3.34% | ||||||||
| 6,300 | Lyondellbasell Industries NV – Class A | 577,269 | ||||||
| 9,200 | Packaging Corp. of America | 663,136 | ||||||
|
| |||||||
| 1,240,405 | ||||||||
|
| |||||||
| Real Estate Investment Trusts – 1.54% | ||||||||
| 15,000 | Omega Healthcare Investors, Inc. | 572,400 | ||||||
|
| |||||||
| Telecommunication Services – 2.21% | ||||||||
| 11,600 | AT&T, Inc. | 404,144 | ||||||
|
8,300 |
| Verizon Communications, Inc. | 417,075 | ||||
|
| |||||||
| 821,219 | ||||||||
|
| |||||||
| Utilities – 3.04% | ||||||||
| 18,000 | CMS Energy Corp. | 588,060 | ||||||
| 16,200 | Xcel Energy, Inc. | 542,214 | ||||||
|
| |||||||
| 1,130,274 | ||||||||
|
| |||||||
| Total Common Stocks (Cost $30,806,866) | 36,087,776 | |||||||
|
| |||||||
| SHORT-TERM INVESTMENTS – 2.85% | ||||||||
| 1,058,103 | Fidelity Institutional Money Market Portfolio – Institutional Class, 0.080% (a) | 1,058,103 | ||||||
|
| |||||||
| Total Short-Term Investments (Cost $1,058,103) | 1,058,103 | |||||||
|
| |||||||
| Total Investments – 99.95% (Cost $31,864,969) | 37,145,879 | |||||||
|
| |||||||
| Other Assets in Excess of Liabilities – 0.05% | 17,161 | |||||||
|
| |||||||
| TOTAL NET ASSETS – 100.00% | $ | 37,163,040 | ||||||
|
| |||||||
| (a) | Rate disclosed is the seven day yield as of October 31, 2014. |
| * | Non-income producing security. |
The accompanying notes are an integral part of these financial statements.
10
Statement of Assets and Liabilities
October 31, 2014
Assets | ||||
Investments in securities at fair value (cost $31,864,969) | $ | 37,145,879 | ||
Receivable for fund shares sold | 252,776 | |||
Dividends receivable | 35,622 | |||
Prepaid expenses | 20,617 | |||
Total Assets | 37,454,894 | |||
Liabilities | ||||
Payable for investments purchased | 242,618 | |||
Payable to Adviser | 4,795 | |||
Payable for Distribution Fees | 6,022 | |||
Payable to administrator, fund accountant, and transfer agent | 10,883 | |||
Payable to custodian | 31 | |||
Payable to trustees and officers | 683 | |||
Other accrued expenses | 26,822 | |||
Total Liabilities | 291,854 | |||
Net Assets | $ | 37,163,040 | ||
Net Assets consist of: | ||||
Paid-in capital | $ | 29,502,313 | ||
Accumulated undistributed net investment income | 22,258 | |||
Accumulated undistributed net realized gain from investment transactions | 2,357,559 | |||
Net unrealized appreciation on investments | 5,280,910 | |||
Net Assets | $ | 37,163,040 | ||
Class N: | ||||
Net Assets | $ | 29,197,313 | ||
Shares outstanding | 1,574,594 | |||
Net asset value (“NAV”) and offering price per share | $ | 18.54 | ||
Minimum redemption price per share (NAV * 98%) (a) | $ | 18.17 | ||
Class A: | ||||
Net Assets | $ | 1,046,804 | ||
Shares outstanding | 56,567 | |||
Net asset value (“NAV”) per share | $ | 18.51 | ||
Maximum offering price per share (NAV/0.95) (b) | $ | 19.48 | ||
Minimum redemption price per share (NAV * 98%) (a) | $ | 18.14 | ||
Institutional Class: | ||||
Net Assets | $ | 6,918,923 | ||
Shares outstanding | 373,533 | |||
Net asset value (“NAV”) and offering price per share | $ | 18.52 | ||
Minimum redemption price per share (NAV * 98%) (a) | $ | 18.15 |
| (a) | The Fund charges a 2.00% redemption fee on shares redeemed within 60 days of purchase. Shares held longer than 60 days are redeemed at NAV. |
| (b) | Class A shares impose a maximum 5.00% sales charge on purchases. |
11
The accompanying notes are an integral part of these financial statements.
Statement of Operations
For the year ended October 31, 2014
Investment Income | ||||
Dividend income (net of foreign taxes withheld of $979) | $ | 527,897 | ||
Total investment income | 527,897 | |||
Expenses | ||||
Investment Adviser | 178,625 | |||
Distribution (12b-1): | ||||
Class N | 56,516 | |||
Class A | 2,427 | |||
Administration | 42,488 | |||
Fund accounting | 35,000 | |||
Transfer agent | 49,445 | |||
Legal | 14,534 | |||
Registration | 42,232 | |||
Custodian | 5,539 | |||
Audit | 17,130 | |||
Trustee | 4,335 | |||
Insurance | 2,258 | |||
Pricing | 2,407 | |||
Report printing | 15,820 | |||
24f-2 | 1,395 | |||
Miscellaneous | 14,812 | |||
Overdraft | 276 | |||
Total expenses | 485,239 | |||
Fees contractually waived and reimbursed by Adviser | (239,324 | ) | ||
Net operating expenses | 245,915 | |||
Net investment income | 281,982 | |||
Net Realized and Unrealized Gain on Investments | ||||
Net realized gain on investment securities transactions | 2,361,426 | |||
Net change in unrealized appreciation of investment securities | 1,169,791 | |||
Net realized and unrealized gain on investments | 3,531,217 | |||
Net increase in net assets resulting from operations | $ | 3,813,199 |
12
The accompanying notes are an integral part of these financial statements.
Statements of Changes in Net Assets
| For the Year Ended October 31, 2014 | For the Year Ended October 31, 2013 | |||||||
Increase in Net Assets due to: Operations: | ||||||||
Net investment income | $ | 281,982 | $ | 208,819 | ||||
Net realized gain on investment transactions | 2,361,426 | 1,297,323 | ||||||
Net change in unrealized appreciation of investments | 1,169,791 | 2,231,812 | ||||||
Net increase in net assets resulting from operations | 3,813,199 | 3,737,954 | ||||||
Distributions: | ||||||||
From net investment income, Class N | (229,577 | ) | (213,577 | ) | ||||
From net investment income, Class A | (10,075 | ) | (3,890 | ) | ||||
From net investment income, Class C | — | (139 | )(a) | |||||
From net investment income, Institutional Class | (22,020 | ) | — | |||||
From realized gain, Class N | (1,221,280 | ) | (74,911 | ) | ||||
From realized gain, Class A | (55,136 | ) | (1,602 | ) | ||||
From realized gain, Class C | — | (304 | )(a) | |||||
From realized gain, Institutional Class | (17,698 | ) | — | |||||
Total distributions | (1,555,786 | ) | (294,423 | ) | ||||
Capital Transactions – Class N: | ||||||||
Proceeds from shares sold | 11,857,787 | 3,559,617 | ||||||
Reinvestment of distributions | 1,343,916 | 276,526 | ||||||
Amount paid for shares redeemed | (4,169,188 | ) | (1,715,924 | ) | ||||
Proceeds from redemption fees (b) | 225 | — | ||||||
Total Class N | 9,032,740 | 2,120,219 | ||||||
Capital Transactions – Class A: | ||||||||
Proceeds from shares sold | 124,623 | 533,513 | ||||||
Proceeds from shares converted from Class C | — | 62,900 | ||||||
Reinvestment of distributions | 65,169 | 5,492 | ||||||
Amount paid for shares redeemed | (20,233 | ) | (540,288 | ) | ||||
Total Class A | 169,559 | 61,617 | ||||||
Capital Transactions – Class C (a): | ||||||||
Proceeds from shares sold | — | 33,000 | ||||||
Reinvestment of distributions | — | 443 | ||||||
Amount paid for shares redeemed | — | (52,323 | ) | |||||
Amount converted to Class A | — | (62,900 | ) | |||||
Total Class C | — | (81,780 | ) | |||||
Capital Transactions – Institutional Class: |
| |||||||
Proceeds from shares sold | 7,689,531 | 271,870 | (b) | |||||
Reinvestment of distributions | 34,586 | — | ||||||
Amount paid for shares redeemed | (1,398,420 | ) | — | |||||
Total Institutional Class | 6,325,697 | 271,870 | (b) | |||||
Net increase in net assets resulting from capital transactions | 15,527,996 | 2,371,926 | ||||||
Total Increase in Net Assets | 17,785,409 | 5,815,457 | ||||||
| (a) | For the period November 1, 2012 to August 19, 2013 (effective date of Class C shares conversion to Class A shares). |
| (b) | For the period October 29, 2013 (Institutional Class shares commenced operations) to October 31, 2013. |
13
The accompanying notes are an integral part of these financial statements.
Statements of Changes in Net Assets (continued)
| For the Year Ended October 31, 2014 | For the Year Ended October 31, 2013 | |||||||
Net Assets: | ||||||||
Beginning of year | 19,377,631 | 13,562,174 | ||||||
End of year | $ | 37,163,040 | $ | 19,377,631 | ||||
Accumulated net investment income included in net assets at end of year | $ | 22,258 | $ | — | ||||
Share Transactions – Class N: | ||||||||
Shares sold | 664,835 | 230,138 | ||||||
Shares issued in reinvestment of distributions | 80,043 | 18,834 | ||||||
Shares redeemed | (235,215 | ) | (107,298 | ) | ||||
Total Class N | 509,663 | 141,674 | ||||||
Share Transactions – Class A: | ||||||||
Shares sold | 7,269 | 31,099 | ||||||
Shares converted from Class C | — | 3,876 | ||||||
Shares issued in reinvestment of distributions | 3,889 | 387 | ||||||
Shares redeemed | (1,149 | ) | (37,550 | ) | ||||
Total Class A | 10,009 | (2,188 | ) | |||||
Share Transactions – Class C (a): | ||||||||
Shares sold | — | 2,126 | ||||||
Shares issued in reinvestment of distributions | — | 32 | ||||||
Shares redeemed | — | (2,973 | ) | |||||
Shares converted to Class A | — | (3,876 | ) | |||||
Total Class C | — | (4,691 | ) | |||||
Share Transactions – Institutional Class: | ||||||||
Shares sold | 430,805 | 15,862 | (b) | |||||
Shares issued in reinvestment of distributions | 1,994 | — | ||||||
Shares redeemed | (75,128 | ) | — | |||||
Total Institutional Class | 357,671 | 15,862 | (b) | |||||
| (a) | For the period November 1, 2012 to August 19, 2013 (effective date of Class C shares conversion to Class A shares). |
| (b) | For the period October 29, 2013 (Institutional Class shares commenced operations) to October 31, 2013. |
14
The accompanying notes are an integral part of these financial statements.
Dana Large Cap Equity Fund – Class N
Financial Highlights
Selected data for a share outstanding throughout each period.
| Years Ended October 31, | Period Ended October 31, 2010(a) | |||||||||||||||||||
| 2014 | 2013 | 2012 | 2011 | |||||||||||||||||
Net asset value, at | $17.19 | $13.88 | $12.50 | $11.83 | $10.00 | |||||||||||||||
|
|
|
|
|
|
|
|
|
| |||||||||||
Income from investment operations: | ||||||||||||||||||||
Net investment income (loss) | 0.19 | 0.21 | * | 0.14 | * | 0.09 | * | 0.06 | * | |||||||||||
Net realized and unrealized gain (loss) on investments | 2.46 | 3.40 | 1.51 | 0.67 | 1.81 | |||||||||||||||
|
|
|
|
|
|
|
|
|
| |||||||||||
Total from investment operations | 2.65 | 3.61 | 1.65 | 0.76 | 1.87 | |||||||||||||||
|
|
|
|
|
|
|
|
|
| |||||||||||
Distributions from: | ||||||||||||||||||||
Net investment income | (0.18 | ) | (0.22 | ) | (0.14 | ) | (0.09 | ) | (0.04 | ) | ||||||||||
Net realized gain | (1.12 | ) | (0.08 | ) | (0.13 | ) | — | — | ||||||||||||
|
|
|
|
|
|
|
|
|
| |||||||||||
Total from distributions | (1.30 | ) | (0.30 | ) | (0.27 | ) | (0.09 | ) | (0.04 | ) | ||||||||||
|
|
|
|
|
|
|
|
|
| |||||||||||
Redemption fees*** | — | — | — | — | — | |||||||||||||||
Net asset value, at | $18.54 | $17.19 | $13.88 | $12.50 | $11.83 | |||||||||||||||
|
|
|
|
|
|
|
|
|
| |||||||||||
Total Return** | 16.23 | % | 26.35 | % | 13.44 | % | 6.40 | % | 18.76 | %(b) | ||||||||||
Ratios/Supplemental Data: | ||||||||||||||||||||
Net assets at end of period (thousands) | $29,197 | $18,306 | $12,819 | $8,961 | $3,524 | |||||||||||||||
Before waiver | ||||||||||||||||||||
Ratio of expenses to average net assets | 1.93 | % | 1.99 | % | 2.30 | % | 3.50 | % | 9.63 | %(c) | ||||||||||
Ratio of net investment income (loss) to average net assets | 0.15 | % | 0.32 | % | 0.24 | % | (1.28 | )% | (7.32 | )%(c) | ||||||||||
After waiver | ||||||||||||||||||||
Ratio of expenses to average net assets | 0.98 | % | 0.98 | % | 1.50 | % | 1.50 | % | 1.50 | %(c) | ||||||||||
Ratio of net investment income (loss) to average net assets | 1.09 | % | 1.33 | % | 1.04 | % | 0.72 | % | 0.82 | %(c) | ||||||||||
Portfolio turnover | 57 | % | 70 | % | 54 | % | 53 | % | 32 | %(b) | ||||||||||
| (a) | The Dana Large Cap Equity Fund Class N commenced operations on March 1, 2010. |
| (b) | Not annualized |
| (c) | Annualized |
| * | Per share net investment income has been determined on the basis of average shares outstanding during the period. |
| ** | Total return in the above table represents the rate that the investor would have earned or lost on an investment in the Fund assuming reinvestment of dividends, and is not annualized for periods of less than one year. |
| *** | The amount is less than $0.005 per share. |
15
The accompanying notes are an integral part of these financial statements.
Dana Large Cap Equity Fund – Class A
Financial Highlights
Selected data for a share outstanding throughout each period.
| Years Ended October 31, | Period Ended October 31, 2010(a) | |||||||||||||||||||
| 2014 | 2013 | 2012 | 2011 | |||||||||||||||||
Net asset value, at | $17.17 | $13.92 | $12.52 | $11.84 | $10.95 | |||||||||||||||
|
|
|
|
|
|
|
|
|
| |||||||||||
Income from investment operations: | ||||||||||||||||||||
Net investment income (loss) | 0.20 | 0.13 | * | 0.14 | * | 0.08 | * | — | *,*** | |||||||||||
Net realized and unrealized gain (loss) on investments | 2.44 | 3.39 | 1.52 | 0.67 | 0.89 | |||||||||||||||
|
|
|
|
|
|
|
|
|
| |||||||||||
Total from investment operations | 2.64 | 3.52 | 1.66 | 0.75 | 0.89 | |||||||||||||||
|
|
|
|
|
|
|
|
|
| |||||||||||
Distributions from: | ||||||||||||||||||||
Net investment income | (0.18 | ) | (0.19 | ) | (0.13 | ) | (0.07 | ) | – | |||||||||||
Net realized gain | (1.12 | ) | (0.08 | ) | (0.13 | ) | – | – | ||||||||||||
|
|
|
|
|
|
|
|
|
| |||||||||||
Total from distributions | (1.30 | ) | (0.27 | ) | (0.26 | ) | (0.07 | ) | – | |||||||||||
|
|
|
|
|
|
|
|
|
| |||||||||||
Redemption fees*** | – | – | – | – | – | |||||||||||||||
Net asset value, at | $18.51 | $17.17 | $13.92 | $12.52 | $11.84 | |||||||||||||||
|
|
|
|
|
|
|
|
|
| |||||||||||
Total Return** | 16.24 | % | 25.67 | % | 13.54 | % | 6.36 | % | 8.13 | %(b) | ||||||||||
Ratios/Supplemental Data: |
| |||||||||||||||||||
Net assets at end of period (thousands) | $1,047 | $799 | $678 | $301 | $3 | |||||||||||||||
Before waiver: | ||||||||||||||||||||
Ratio of expenses to average net assets | 1.93 | % | 1.98 | % | 2.27 | % | 3.11 | % | 4.75 | %(c) | ||||||||||
Ratio of net investment income (loss) to average net assets | 0.15 | % | 0.35 | % | 0.22 | % | (0.95 | )% | (2.94 | )%(c) | ||||||||||
After waiver: | ||||||||||||||||||||
Ratio of expenses to average net assets | 0.98 | % | 1.49 | % | 1.50 | % | 1.50 | % | 1.50 | %(c) | ||||||||||
Ratio of net investment income (loss) to average net assets | 1.09 | % | 0.84 | % | 1.00 | % | 0.66 | % | 0.31 | %(c) | ||||||||||
Portfolio turnover | 57 | % | 70 | % | 54 | % | 53 | % | 32 | %(b) | ||||||||||
| (a) | The Dana Large Cap Equity Fund Class A commenced operations on July 28, 2010. |
| (b) | Not annualized |
| (c) | Annualized |
| * | Per share net investment income has been determined on the basis of average shares outstanding during the period. |
| ** | Total return in the above table represents the rate that the investor would have earned or lost on an investment in the Fund assuming reinvestment of dividends, excluding maximum sales charge, and is not annualized for periods of less than one year. |
| *** | The amount is less than $0.005 per share. |
16
The accompanying notes are an integral part of these financial statements.
Dana Large Cap Equity Fund - Institutional Class
Financial Highlights
Selected data for a share outstanding throughout each period.
| Year Ended October 31, 2014 | Period Ended October 31, 2013(a) | |||||||
Net asset value, at beginning of period | $17.19 | $17.14 | ||||||
|
|
|
| |||||
Income from investment operations: | ||||||||
Net investment income (loss) | 0.26 | – | * | |||||
Net realized and unrealized gain (loss) on investments | 2.44 | 0.05 | ||||||
|
|
|
| |||||
Total from investment operations | 2.70 | 0.05 | ||||||
|
|
|
| |||||
Distributions from: | ||||||||
Net investment income | (0.25 | ) | – | |||||
Net realized gain | (1.12 | ) | – | |||||
|
|
|
| |||||
Total from distributions | (1.37 | ) | – | |||||
|
|
|
| |||||
Net asset value, at end of period | $18.52 | $17.19 | ||||||
|
|
|
| |||||
Total Return ** | 16.60 | % | 0.29 | %(b) | ||||
Ratios/Supplemental Data: | ||||||||
Net assets at end of period (thousands) | $6,919 | $273 | ||||||
Before waiver: | ||||||||
Ratio of expenses to average net assets | 1.68 | % | 1.53 | %(c) | ||||
Ratio of net investment income (loss) to average net assets | 0.40 | % | (0.31 | )%(c) | ||||
After waiver: | ||||||||
Ratio of expenses to average net assets | 0.73 | % | 0.73 | %(c) | ||||
Ratio of net investment income (loss) to average net assets | 1.34 | % | 0.49 | %(c) | ||||
Portfolio turnover | 57 | % | 70 | %(b) | ||||
| (a) | The Dana Large Cap Equity Fund Institutional Class commenced operations on October 29, 2013. |
| (b) | Not annualized |
| (c) | Annualized |
| * | Per share net investment income has been determined on the basis of average shares outstanding during the period. The amount is less than $0.005 per share. |
| ** | Total return in the above table represents the rate that the investor would have earned or lost on an investment in the Fund assuming reinvestment of dividends, and is not annualized for periods of less than one year. |
17
The accompanying notes are an integral part of these financial statements.
Notes to the Financial Statements
October 31, 2014
NOTE 1. ORGANIZATION
The Dana Large Cap Equity Fund (the “Fund”) is an open-end diversified series of the Valued Advisers Trust (the “Trust”). The Trust is a management investment company established under the laws of Delaware by an Agreement and Declaration of Trust dated June 13, 2008 (the “Trust Agreement”). The Trust Agreement permits the Board of Trustees (“Board”) to issue an unlimited number of shares of beneficial interest of separate series without par value. The Fund is one of a series of funds currently authorized by the Board. The Fund’s investment adviser is Dana Investment Advisors, Inc. (the “Adviser”). The Fund seeks long-term growth of capital.
The Fund currently offers Class N shares, Class A shares, and Institutional Class shares. Each share represents an equal proportionate interest in the assets and liabilities belonging to the Fund and is entitled to such dividends and distributions out of income belonging to the Fund as declared by the Board. Class A currently has a maximum sales charge on purchases of 5.00% as a percentage of the original purchase price. All three share classes impose a 2.00% redemption fee on shares redeemed within 60 days of purchase.
The Fund was previously a series of the Epiphany Funds, an unaffiliated registered investment company and was named Dana Large Cap Core Fund. On October 22, 2013, shareholders of the Fund voted to reorganize the Fund into the Trust effective October 28, 2013.
NOTE 2. SIGNIFICANT ACCOUNTING POLICIES
The Fund is an investment company and follows accounting and reporting guidance under Financial Accounting Standards Board (“FASB”) Accounting Standards Codification (“ASC”) Topic 946, “Financial Services-Investment Companies”. The following is a summary of significant accounting policies followed by the Fund in the preparation of its financial statements. These policies are in conformity with the generally accepted accounting principles in the United States of America (“GAAP”).
Estimates – The preparation of financial statements in conformity with GAAP requires management to make estimates and assumptions that affect the reported amounts of assets and liabilities and disclosure of contingent assets and liabilities at the date of the financial statements and the reported amounts of increases and decreases in net assets from operations during the reporting period. Actual results could differ from those estimates.
Securities Valuation – All investments in securities are recorded at their estimated fair value as described in Note 3.
Federal Income Taxes – The Fund makes no provision for federal income or excise tax. The Fund intends to qualify each year as a regulated investment company (“RIC”) under subchapter M of the Internal Revenue Code of 1986, as amended, by complying with the requirements applicable to RICs and by distributing substantially all of its taxable income. The Fund also intends to distribute sufficient net investment income and net capital gains, if any, so that it will not be subject to excise tax on undistributed income and gains. If the required amount of net investment income or gains is not distributed, the Fund could incur a tax expense.
For the fiscal year ended October 31, 2014, the Fund did not have a liability for any unrecognized tax benefits. The Fund recognizes interest and penalties, if any, related to unrecognized tax benefits
18
Notes to the Financial Statements (continued)
October 31, 2014
as income tax expense in the statement of operations. The Fund is subject to examination by U.S. federal tax authorities for the last three tax year ends and the interim tax period since then.
Expenses – Expenses incurred by the Trust that do not relate to a specific fund of the Trust are allocated to the individual funds based on each fund’s relative net assets or other appropriate basis (as determined by the Board). Expenses attributable to any class are borne by that class. Income, realized gains and losses, unrealized appreciation and depreciation, and expenses are allocated to each class based on the net assets in relation to the relative net assets of the Fund.
Security Transactions and Related Income – The Fund follows industry practice and records security transactions on the trade date for financial reporting purposes. The specific identification method is used for determining gains or losses for financial statement and income tax purposes. Dividend income is recorded on the ex-dividend date and interest income is recorded on an accrual basis. Discounts and premiums on securities purchased are accreted or amortized using the effective interest method. Withholding taxes on foreign dividends have been provided for in accordance with the Fund’s understanding of the applicable country’s tax rules and rates.
Dividends and Distributions – Distributions to shareholders, which are determined in accordance with income tax regulations, are recorded on the ex-dividend date. The Fund intends to distribute substantially all of its net investment income on a quarterly basis. The Fund intends to distribute its net realized long-term and short-term capital gains, if any, on an annual basis. The treatment for financial reporting purposes of distributions made to shareholders during the year from net investment income or net realized capital gains may differ from their ultimate treatment for federal income tax purposes. These differences are caused primarily by differences in the timing of the recognition of certain components of income, expense or realized capital gain for federal income tax purposes. Where such differences are permanent in nature, they are reclassified in the components of the net assets based on their ultimate characterization for federal income tax purposes. Any such reclassifications will have no effect on net assets, results of operations or net asset values per share of the Fund. For the fiscal year ended October 31, 2014, the Fund made the following reclassifications to increase (decrease) the components of net assets:
| Paid in Capital | Accumulated Undistributed Net Investment Income | Accumulated Net Realized Gain from Investments | ||
$– | $1,948 | $(1,948) |
NOTE 3. SECURITIES VALUATION AND FAIR VALUE MEASUREMENTS
Fair value is defined as the price that a Fund would receive upon selling an investment in a timely transaction to an independent buyer in the principal or most advantageous market of the investment. GAAP establishes a three-tier hierarchy to maximize the use of observable market data and minimize the use of unobservable inputs and to establish classification of fair value measurements for disclosure purposes.
Inputs refer broadly to the assumptions that market participants would use in pricing the asset or liability, including assumptions about risk (the risk inherent in a particular valuation technique used to measure fair value including such a pricing model and/or the risk inherent in the inputs to the valuation technique). Inputs may be observable or unobservable. Observable inputs are inputs that reflect the assumptions market participants would use in pricing the asset or liability developed
19
Notes to the Financial Statements (continued)
October 31, 2014
based on market data obtained from sources independent of the reporting entity. Unobservable inputs are inputs that reflect the reporting entity’s own assumptions about the assumptions market participants would use in pricing the asset or liability developed based on the best information available in the circumstances.
Various inputs are used in determining the value of the Fund’s investments. These inputs are summarized in the three broad levels listed below.
| • | Level 1 – quoted prices in active markets for identical securities |
| • | Level 2 – other significant observable inputs (including, but not limited to, quoted prices for an identical security in an inactive market, quoted prices for similar securities, interest rates, prepayment speeds, credit risk, etc.) |
| • | Level 3 – significant unobservable inputs (including the Fund’s own assumptions in determining fair value of investments based on the best information available) |
The inputs used to measure fair value may fall into different levels of the fair value hierarchy. In such cases, for disclosure purposes, the level in the fair value hierarchy within which the fair value measurement falls in its entirety, is determined based, on the lowest level input that is significant to the fair value measurement in its entirety.
Equity securities, including common stocks, exchanged-traded funds and real estate investment trusts, are generally valued by using market quotations, but may be valued on the basis of prices furnished by a pricing service when the Adviser believes such prices more accurately reflect the fair value of such securities. Securities traded in the NASDAQ over-the-counter market are generally valued by a pricing service at the NASDAQ official closing price. Lacking a last sale price, an exchange security is generally valued by the pricing service at its last bid price.
When using the market quotations or close prices provided by a pricing service and when the market is considered active, the security is classified as a Level 1 security. Sometimes, an equity security owned by the Fund will be valued by the pricing service with factors other than market quotations or when the market is considered inactive. When this happens, the security is classified as a Level 2 security. When market quotations are not readily available, when the Adviser determines that the market quotation or the price provided by the pricing service does not accurately reflect the current fair value, or when restricted or illiquid securities are being valued, such securities are valued as determined in good faith by the Adviser, in conformity with guidelines adopted by and subject to review by the Board. These securities are generally categorized as Level 3 securities.
Investments in mutual funds, including money market mutual funds, are generally priced at the ending NAV provided by the service agent of the funds. These securities are categorized as Level 1 securities.
Short-term investments in fixed income securities, (those with maturities of less than 60 days when acquired, or which subsequently are within 60 days of maturity), are valued by using the amortized cost method of valuation, which the Board has determined represents fair value. These securities are classified as Level 2 securities.
In accordance with the Trust’s good faith pricing guidelines, the Adviser is required to consider all appropriate factors relevant to the value of securities for which it has determined other pricing sources are not available or reliable as described above. No single standard exists for determining
20
Notes to the Financial Statements (continued)
October 31, 2014
fair value, because fair value depends upon the circumstances of each individual case. As a general principle, the current fair value of an issue of securities being valued by the Adviser would appear to be the amount which the owner might reasonably expect to receive for them upon their current sale. Methods which are in accordance with this principle may, for example, be based on (i) a multiple of earnings; (ii) a discount from market of a similar freely traded security (including a derivative security or a basket of securities traded on other markets, exchanges or among dealers); or (iii) yield to maturity with respect to debt issues, or a combination of these and other methods. Good faith pricing is permitted if, in the Adviser’s opinion, the validity of market quotations appears to be questionable based on factors such as evidence of a thin market in the security based on a small number of quotations, a significant event occurs after the close of a market but before a Fund’s NAV calculation that may affect a security’s value, or the Adviser is aware of any other data that calls into question the reliability of market quotations. Good faith pricing may also be used in instances when the bonds the Fund invests in may default or otherwise cease to have market quotations readily available.
The following is a summary of the inputs used to value the Fund’s investments as of October 31, 2014:
| Valuation Inputs | ||||||||||||||||
| Assets | Level 1 Quoted Prices in Active Markets | Level 2 Other Significant Observable Inputs | Level 3 Significant Unobservable Inputs | Total | ||||||||||||
Common Stocks* | $ | 36,087,776 | $ | – | $ | – | $ | 36,087,776 | ||||||||
Short-Term Investments | 1,058,103 | – | – | 1,058,103 | ||||||||||||
Total | $ | 37,145,879 | $ | – | $ | – | $ | 37,145,879 | ||||||||
| * | Refer to Schedule of Investments for industry classifications. |
The Fund did not hold any investments at any time during the reporting period in which other significant observable inputs (Level 2) were used in determining fair value. The Fund did not hold any investments at any time during the reporting period in which significant unobservable inputs were used in determining fair value; therefore, no reconciliation of Level 3 securities is included for this reporting period.
The Trust recognizes transfers between fair value hierarchy levels at the reporting period end. There were no transfers between any levels as of October 31, 2014 and the previous reporting period end.
NOTE 4. FEES AND OTHER TRANSACTIONS WITH AFFILIATES
Under the terms of the management agreement between the Trust and the Adviser (the “Agreement”) for the Fund, the Adviser manages the Fund’s investments subject to oversight of the Board. As compensation for its management services, the Fund is obligated to pay the Adviser a fee computed and accrued daily and paid monthly at an annual rate of 0.70% of the average daily net assets of the Fund. For the fiscal year ended October 31, 2014, the Adviser earned fees of $178,625 from the Fund before the waivers described below. At October 31, 2014, the Fund owed the Adviser $4,795.
Beginning October 28, 2013, the Adviser contractually agreed to waive its management fee and/or reimburse certain operating expenses through February 28, 2017, but only to the extent necessary so that the Fund’s net expenses, excluding brokerage fees and commissions, borrowing costs (such as interest and dividend expenses on securities sold short), taxes, extraordinary expenses, fees and
21
Notes to the Financial Statements (continued)
October 31, 2014
expenses paid under a distribution plan adopted pursuant to Rule 12b-1, fees and expenses paid under a shareholder services plan, and indirect expenses (such as “acquired funds fees and expenses”) do not exceed 0.73% for Class N, Class A and Institutional shares.
Each waiver or reimbursement of an expense by the Adviser is subject to repayment by the Fund within the three fiscal years following the fiscal year in which the expense was incurred, provided that the Fund is able to make the repayment without exceeding the expense limitation. The contractual agreement is in effect through February 28, 2017. The expense cap may not be terminated prior to this date except by the Board. For the fiscal year ended October 31, 2014, the Adviser waived fees of $239,324 from the Fund.
The amounts subject to repayment by the Fund, pursuant to the aforementioned conditions are as follows:
| Amount | Recoverable through October 31, | |||
| $ 2,189 | 2016 | |||
| 239,324 | 2017 | |||
The Trust retains Huntington Asset Services, Inc. (“HASI”) to manage the Fund’s business affairs and to provide the Fund with administrative services, including all regulatory, reporting and necessary office equipment and personnel. For the fiscal year ended October 31, 2014, HASI earned fees of $42,488 from the Fund for administrative and compliance services provided to the Fund. At October 31, 2014, HASI was owed $3,583 from the Fund for administrative and compliance services. The Trust also retains HASI to act as the Fund’s transfer agent and to provide the Fund with fund accounting services. For the fiscal year ended October 31, 2014, HASI earned fees of $49,445 for transfer agent services and reimbursement for out-of-pocket expenses incurred in providing transfer agent services to the Fund. At October 31, 2014, HASI was owed $4,383 for transfer agent services and out-of-pocket expenses. For the fiscal year ended October 31, 2014, HASI earned fees of $35,000 from the Fund for fund accounting services. At October 31, 2014, HASI was owed $2,917 from the Fund for fund accounting services.
Certain officers and one Trustee of the Trust are members of management and/or employees of HASI. HASI operates as a wholly-owned subsidiary of Huntington Bancshares, Inc., the parent company of the Unified Financial Securities, Inc. (the “Distributor” or “Unified”) and Huntington National Bank, the custodian of the Fund’s investments (the “Custodian”). For the fiscal year ended October 31, 2014, the Custodian earned fees $5,539 for custody services. At October 31, 2014, the Custodian was owed $31 for custody services.
The Fund has adopted a Distribution Plan (the “Plan”) pursuant to Rule 12b-1 under the 1940 Act. The Plan provides that the Fund will pay the Distributor and/or any registered securities dealer, financial institution or any other person (a “Recipient”) a shareholder servicing fee aggregating up to 0.25% of the average daily net assets of the Class N and Class A shares in connection with the promotion and distribution of the Fund’s shares or the provision of personal services to shareholders, including, but not necessarily limited to, advertising, compensation to underwriters, dealers and selling personnel, the printing and mailing of prospectuses to other than current Fund shareholders, the printing and mailing of sales literature and servicing shareholder accounts. The Fund or the Adviser may pay all or a portion of these fees to any Recipient who renders assistance
22
Notes to the Financial Statements (continued)
October 31, 2014
in distributing or promoting the sale of shares, or who provides certain shareholder services, pursuant to a written agreement. The Plan is a compensation plan, which means that compensation is paid regardless of 12b-1 expenses actually incurred. It is anticipated that the Plan will benefit shareholders because an effective sales program typically is necessary in order for the Fund to reach and maintain a sufficient size to achieve efficiently its investment objectives and to realize economies of scale. For the fiscal year ended October 31, 2014, Class N shares 12b-1 expense incurred by the Fund was $56,516 and Class A shares 12b-1 expense incurred by the Fund was $2,427. The Fund owed $5,810 for Class N shares and $212 for Class A shares 12b-1 fees as of October 31, 2014.
Unified acts as the principal distributor of the Fund’s shares. During the fiscal year ended October 31, 2014, the Distributor received $7,388 from commissions earned on sales of Class A shares, of which $7,388 was re-allowed to intermediaries of the Fund. An officer of the Trust is an officer of the Distributor and such person may be deemed to be an affiliate of the Distributor.
NOTE 5. PURCHASES AND SALES OF SECURITIES
For the fiscal year ended October 31, 2014, purchases and sales of investment securities, other than short-term investments and short-term U.S. government obligations were as follows:
| Amount | ||||
Purchases | ||||
U.S. Government Obligations | $ | – | ||
Other | 28,053,463 | |||
Sales | ||||
U.S. Government Obligations | $ | – | ||
Other | 14,517,176 | |||
NOTE 6. BENEFICIAL OWNERSHIP
The beneficial ownership, either directly or indirectly, of more than 25% of the voting securities of a fund creates a presumption of control of a fund, under Section 2(a)(9) of the Investment Company Act of 1940. At October 31, 2014, Charles Schwab & Co. (“Schwab”) owned, as record shareholder, 26% of the outstanding shares of the Fund. It is not known whether Schwab, or any other underlying beneficial owners, owned or controlled 25% or more of the voting securities of the Fund.
NOTE 7. FEDERAL TAX INFORMATION
At October 31, 2014, the net unrealized appreciation (depreciation) of investments for tax purposes were as follows:
Gross Unrealized Appreciation | $ | 5,560,350 | ||
Gross Unrealized Depreciation | (282,844 | ) | ||
Net Unrealized Appreciation | $ | 5,277,506 |
At October 31, 2014, the aggregate cost of securities for federal income tax purposes was $31,868,373 for the Fund.
On December 19, 2014, the Fund paid an income distribution of $0.032689, $0.032550, and $0.038594 for Class N, Class A, and Institutional Class, respectively. The Fund also paid short-term
23
Notes to the Financial Statements (continued)
October 31, 2014
capital gain distribution of $0.113780 and a long-term capital gain distribution of $0.718068 per share to shareholders of record.
At October 31, 2014, the Fund’s most recent fiscal year end, the components of distributable earnings (accumulated losses) on a tax basis was as follows:
Undistributed Ordinary Income | $ | 344,239 | ||
Undistributed Long-Term Capital Gains | 2,038,982 | |||
Unrealized Appreciation (Depreciation)* | 5,277,506 | |||
Total Accumulated Earnings (Deficit) | $ | 7,660,727 |
| * | The difference between book basis and tax basis unrealized appreciation (depreciation) is attributable to the tax deferral of losses on wash sales and income from certain investments. |
The tax character of distributions for the fiscal years ended October 31, 2014 and October 31, 2013 were as follows:
| 2014 | 2013 | |||||||
Distributions paid from: | ||||||||
Ordinary Income | $ | 468,041 | 217,606 | |||||
Net Long-Term Capital Gains | 1,087,745 | 76,817 | ||||||
| $ | 1,555,786 | 294,423 | ||||||
NOTE 8. COMMITMENTS AND CONTINGENCIES
The Fund indemnifies its officers and trustees for certain liabilities that may arise from performance of their duties to the Fund. Additionally, in the normal course of business, the Fund enters into contracts that contain a variety of representations and warranties which provide general indemnifications. The Fund’s maximum exposure under these arrangements is unknown, as this would involve future claims that may be made against the Fund that have not yet occurred.
NOTE 9. SUBSEQUENT EVENTS
Management of the Fund has evaluated the need for disclosures and/or adjustments resulting from subsequent events through the date these financial statements were issued. A special meeting of the shareholders of the Trust was held on December 19, 2014, for the purpose of electing the Board of Trustees, the results of the meeting can be found in the Proxy Voting Results Note (below).
NOTE 10. PROXY VOTING RESULTS (Unaudited)
On December 19, 2014 a special meeting of the shareholders of the Trust was held at the offices of the Trust for the purpose of electing each nominee to the Board of Trustees.
Below are the voting results for all funds from the special meeting of the Trust:
To elect each nominee to the Board of Trustees:
| For | Against | Abstain | ||||||||||
Ira Cohen | 280,591,916 | 20,930,930 | – | |||||||||
Andrea N. Mullins | 296,332,857 | 5,189,989 | – | |||||||||
R. Jeffrey Young | 280,517,160 | 21,005,685 | – | |||||||||
24
Report of Independent Registered Public Accounting Firm
To the Shareholders of Dana Large Cap Equity Fund and
Board of Trustees of Valued Advisers Trust
We have audited the accompanying statement of assets and liabilities, including the schedule of investments, of Dana Large Cap Equity Fund (the “Fund”), a series of Valued Advisers Trust, as of October 31, 2014, and the related statement of operations for the year then ended, and the statements of changes in net assets and financial highlights for each of the two years in the period then ended. These financial statements and financial highlights are the responsibility of the Fund’s management. Our responsibility is to express an opinion on these financial statements and financial highlights based on our audits. The Fund’s financial highlights for the periods ended on or prior to October 31, 2012, were audited by other auditors whose report dated December 19, 2012, expressed an unqualified opinion on those financial highlights.
We conducted our audits in accordance with the standards of the Public Company Accounting Oversight Board (United States). Those standards require that we plan and perform the audit to obtain reasonable assurance about whether the financial statements and financial highlights are free of material misstatement. An audit includes examining, on a test basis, evidence supporting the amounts and disclosures in the financial statements. Our procedures included confirmation of securities owned as of October 31, 2014, by correspondence with the custodian and brokers. An audit also includes assessing the accounting principles used and significant estimates made by management, as well as evaluating the overall financial statement presentation. We believe that our audits provide a reasonable basis for our opinion.
In our opinion, the financial statements and financial highlights referred to above present fairly, in all material respects, the financial position of Dana Large Cap Equity Fund as of October 31, 2014, the results of its operations for the year then ended, and the changes in its net assets and financial highlights for each of the two years in the period then ended, in conformity with accounting principles generally accepted in the United States of America.

COHEN FUND AUDIT SERVICES, LTD.
Cleveland, Ohio
December 23, 2014
25
ADDITIONAL FEDERAL INCOME TAX INFORMATION (Unaudited)
The Form 1099-DIV you receive in January 2015 will show the tax status of all distributions paid to your account in calendar year 2014. Shareholders are advised to consult their own tax adviser with respect to the tax consequences of their investment in the Fund. As required by the Internal Revenue Code and/or regulations, shareholders must be notified regarding the status of qualified dividend income for individuals and the dividends received deduction for corporations.
Qualified Dividend Income. The Fund designates approximately 77% or up to the maximum amount of such dividends allowable pursuant to the Internal Revenue Code, as qualified dividend income eligible for the reduced tax rate of 15%.
Dividends Received Deduction. Corporate shareholders are generally entitled to take the dividends received deduction on the portion of the Fund’s dividend distribution that qualifies under tax law. For the Fund’s fiscal year 2014 ordinary income dividends, 79% qualifies for the corporate dividends received deduction.
For the year ended October 31, 2014, the Fund designated $1,087,745 as long-term capital gain distributions and $209,051 as short-term capital gain distributions.
26
Trustees and Officers (Unaudited)
The Board of Trustees supervises the business activities of the Trust. Each Trustee serves as a trustee until termination of the Trust unless the Trustee dies, resigns, retires or is removed.
The following tables provide information regarding the Trustees and Officers.
The following table provides information regarding each of the Independent Trustees.
| Name, Address*, (Age), Position with Trust**, Term of Position with Trust | Principal Occupation During Past 5 Years | Other Directorships | ||
Ira Cohen, 55, Independent Trustee, June 2010 to present. | Independent financial services consultant, since February 2005. | Trustee and Audit Committee Chairman, Griffin Institutional Access Real Estate Fund, since May 2014; Trustee for Angel Oak Funds Trust, since October 2014.
| ||
Andrea N. Mullins, 47, Independent Trustee, December 2013 to present. | Private investor; Independent Contractor, Seabridge Wealth Management, LLC, since April 2014; Principal Financial Officer, Treasurer and Secretary, Eagle Family of Funds (mutual fund family) and Vice President, Eagle Asset Management, Inc. (investment adviser) each from 2004 to 2010.
| None. |
| * | The address for each trustee and officer is 2960 N. Meridian St., Suite 300, Indianapolis, IN 46208. |
| ** | As of the date of this report, the Trust consists of 14 series. |
27
Trustees and Officers (Unaudited) (continued)
The following table provides information regarding the Trustee who is considered an “interested person” of the Trust, as that term is defined under the 1940 Act. Based on the experience of the Trustee, the Trust concluded that the individual described below should serve as a Trustee.
| Name, Address*, (Age), Position with Trust**, Term of Position with Trust | Principal Occupation During Past 5 Years | Other Directorships | ||
R. Jeffrey Young, 50, Trustee and Chairman, June 2010 to present; Principal Executive Officer and President, Valued Advisers Trust February 2010 to present. | Senior Vice President, Huntington Asset Services, Inc. since January 2010 and Director since May 2014; Director, Unified Financial Securities since May 2014; Chief Executive Officer, Huntington Funds since February 2010; Chief Executive Officer, The Huntington Strategy Shares since November 2010; President and Chief Executive Officer, Dreman Contrarian Funds, from March 2011 to February 2013; Trustee, Valued Advisers Trust, from August 2008 to January 2010; and Managing Director of WealthStone, from 2007 to 2010. | Trustee and Chairman, Capitol Series Trust, since September 2013. |
| * | The address for each trustee and officer is 2960 N. Meridian St., Suite 300, Indianapolis, IN 46208. |
| ** | As of the date of this report, the Trust consists of 14 series. |
28
Trustees and Officers (Unaudited) (continued)
The following table provides information regarding the Officers of the Trust:
| Name, Address*, (Age), Position with Trust,** Term of Position with Trust | Principal Occupation During Past 5 Years | Other Directorships | ||
R. Jeffrey Young, 50, Trustee and Chairman, June 2010 to present; Principal Executive Officer and President, Valued Advisers Trust since February 2010 to present. | Senior Vice President, Huntington Asset Services, Inc., since January 2010 and Director since May 2014; Director, Unified Securities, since May 2014; Chief Executive Officer, Huntington Funds, since February 2010; Chief Executive Officer, The Huntington Strategy Shares, since November 2010; President and Chief Executive Officer, Dreman Contrarian Funds, from March 2011 to February 2013; Trustee, Valued Advisers Trust, from August 2008 to January 2010; and Managing Director of WealthStone, from 2007 to 2010. | Trustee and Chairman, Capitol Series Trust, since September 2013. | ||
29
Trustees and Officers (Unaudited) (continued)
| Name, Address*, (Age), Position with Trust,** Term of Position with Trust | Principal Occupation During Past 5 Years | Other Directorships | ||
John C. Swhear, 53, Chief Compliance Officer, AML Officer and Vice President, August 2008 to present. | Vice President of Legal Administration and Compliance for Huntington Asset Services, Inc., the Trust’s administrator, since April 2007 and Director since May 2014; Chief Compliance Officer of Unified Financial Securities, Inc., the Trust’s distributor, since May 2007 and Director since May 2014; President, Unified Series Trust, since March 2012, and Senior Vice President from May 2007 to March 2012; Chief Compliance Officer and AML Officer, Capitol Series Trust, since September 2013; Secretary, Huntington Funds, from April 2010 to February 2012; President and Chief Executive Officer, Dreman Contrarian Funds, from March 2010 to March 2011, and Vice President and Acting Chief Executive Officer, from 2007 to March 2010. | None. | ||
Carol J. Highsmith, 50, Vice President, August 2008 to present; Secretary, March 2014 to present | Employed in various positions with Huntington Asset Services, Inc., the Trust’s administrator, since November 1994; currently Vice President of Legal Administration; Secretary, Cross Shore Discovery Fund since May 2014.
| None. | ||
30
Trustees and Officers (Unaudited) (continued)
| Name, Address*, (Age), Position with Trust,** Term of Position with Trust | Principal Occupation During Past 5 Years | Other Directorships | ||
Matthew J. Miller, 38, Vice President, December 2011 to present. | Employed in various positions with Huntington Asset Services, Inc., the Trust’s administrator, since July 1998; currently Vice President of Relationship Management; Vice President, Huntington Funds, since February 2010; President and Chief Executive Officer, Capitol Series Trust, since September 2013.
| None. | ||
Bryan W. Ashmus, 41, Treasurer and Principal Financial Officer, December 2013 to present. | Vice President, Financial Administration, Huntington Asset Services, Inc., the Trust’s administrator, since September 2013; Chief Financial Officer and Treasurer, The Huntington Strategy Shares and The Huntington Funds, since November 2013; Vice President, Treasurer Services, Citi Fund Services Ohio, Inc., from May 2005 to September 2013.
| None. | ||
| * | The address for each trustee and officer is 2960 N. Meridian St., Suite 300, Indianapolis, IN 46208. |
| ** | As of the date of this report, the Trust consists of 14 series. |
Other Information
The Fund’s Statement of Additional Information (“SAI”) includes additional information about the trustees and is available without charge, upon request. You may call toll-free at (855) 280-9648 to request a copy of the SAI or to make shareholder inquiries.
31
VALUED ADVISERS TRUST
PRIVACY POLICY
The following is a description of the policies of the Valued Advisers Trust (the “Trust”) regarding disclosure of nonpublic personal information that shareholders provide to a series of the Trust (each, a “Fund”) or that the Fund collects from other sources. In the event that a shareholder hold shares of a Fund through a broker-dealer or other financial intermediary, the privacy policy of the financial intermediary would govern how shareholder nonpublic personal information would be shared with nonaffiliated third parties.
Categories of Information A Fund May Collect. A Fund may collect the following nonpublic personal information about its shareholders:
| • | Information the Fund receives from a shareholder on applications or other forms, correspondence, or conversations (such as the shareholder’s name, address, phone number, social security number, and date of birth); and |
| • | Information about the shareholder’s transactions with the Fund, its affiliates, or others (such as the shareholder’s account number and balance, payment history, cost basis information, and other financial information). |
Categories of Information A Fund May Disclose. A Fund may not disclose any nonpublic personal information about its current or former shareholders to unaffiliated third parties, except as required or permitted by law. A Fund is permitted by law to disclose all of the information it collects, as described above, to its service providers (such as the Fund’s custodian, administrator, transfer agent, accountant and legal counsel) to process shareholder transactions and otherwise provide services to the shareholder.
Confidentiality and Security. Each Fund shall restrict access to shareholder nonpublic personal information to those persons who require such information to provide products or services to the shareholder. Each Fund shall maintain physical, electronic, and procedural safeguards that comply with federal standards to guard shareholder nonpublic personal information.
Disposal of Information. The Funds, through their transfer agent, have taken steps to reasonably ensure that the privacy of a shareholder’s nonpublic personal information is maintained at all times, including in connection with the disposal of information that is no longer required to be maintained by the Funds. Such steps shall include, whenever possible, shredding paper documents and records prior to disposal, requiring off-site storage vendors to shred documents maintained in such locations prior to disposal, and erasing and/or obliterating any data contained on electronic media in such a manner that the information can no longer be read or reconstructed.
32
PROXY VOTING
A description of the policies and procedures that the Fund uses to determine how to vote proxies relating to portfolio securities and information regarding how the Fund voted those proxies is available without charge upon request by (1) calling the Fund at (855) 280-9648 and (2) from Fund documents filed with the Securities and Exchange Commission (“SEC”) on the SEC’s website at www.sec.gov.
TRUSTEES
R. Jeffrey Young, Chairman
Ira Cohen
Andrea N. Mullins
OFFICERS
R. Jeffrey Young, Principal Executive Officer and President
Bryan W. Ashmus, Principal Financial Officer and Treasurer
John C. Swhear, Chief Compliance Officer, AML Officer and Vice-President
Carol J. Highsmith, Vice President and Secretary
Matthew J. Miller, Vice President
INVESTMENT ADVISER
Dana Investment Advisors, Inc.
15800 Bluemound Rd., Suite 250
Brookfield, WI 53005
DISTRIBUTOR
Unified Financial Securities, Inc.
2960 North Meridian Street, Suite 300
Indianapolis, IN 46208
INDEPENDENT REGISTERED PUBLIC ACCOUNTING FIRM
Cohen Fund Audit Services, Ltd.
1350 Euclid Avenue, Suite 800
Cleveland, OH 44115
LEGAL COUNSEL
The Law Offices of John H. Lively & Associates, Inc.,
A member firm of The 1940 Act Law GroupTM
11300 Tomahawk Creek Parkway, Suite 310
Leawood, KS 66211
CUSTODIAN
Huntington National Bank
41 S. High St.
Columbus, OH 43215
ADMINISTRATOR, TRANSFER AGENT AND FUND ACCOUNTANT
Huntington Asset Services, Inc.
2960 North Meridian Street, Suite 300
Indianapolis, IN 46208
This report is intended only for the information of shareholders or those who have received the Fund’s prospectus which contains information about the Fund’s management fee and expenses. Please read the prospectus carefully before investing.
Distributed by Unified Financial Securities, Inc.
Member FINRA/SIPC
| Item 2. | Code of Ethics. |
As of the end of the period covered by this report, the registrant has adopted a code of ethics that applies to the registrant’s principal executive officer, principal financial officer, principal accounting officer or controller, or persons performing similar functions, regardless of whether these individuals are employed by the registrant or a third party. Pursuant to Item 12(a)(1), a copy of registrant’s code of ethics is filed as an exhibit to this Form N-CSR. During the period covered by this report, the code of ethics has not been amended, and the registrant has not granted any waivers, including implicit waivers, from the provisions of the code of ethics.
| Item 3. | Audit Committee Financial Expert. |
(a)(1) The registrant’s Board of Trustees has determined that the registrant has at least one audit committee financial expert serving on its audit committee.
(a)(2) The audit committee financial expert is Andrea N. Mullins, who is “independent” for purposes of this Item 3 of Form N-CSR.
| Item 4. | Principal Accountant Fees and Services. |
| (a) | Audit Fees |
Granite Value Fund: | FY 2014 | $ | 12,500 | |||||
| FY 2013 | $ | 12,500 | ||||||
Sound Mind Investing Funds: | FY 2014 | $ | 40,500 | |||||
| FY 2013 | $ | 40,000 | ||||||
Green Owl Intrinsic Value Fund: | FY 2014 | $ | 12,500 | |||||
| FY 2013 | $ | 12,500 | ||||||
BRC Large Cap Focus Equity Fund: | FY 2014 | $ | 12,500 | |||||
| FY 2013 | $ | 12,500 | ||||||
Dreman Contrarian Small Cap Value Fund: | FY 2014 | $ | 13,500 | |||||
| FY 2013 | $ | 12,500 | ||||||
Dana Large Cap Equity Fund: | FY 2014 | $ | 13,500 | |||||
| FY 2013 | $ | 12,500 |
| (b) | Audit-Related Fees |
Registrant
Granite Value Fund: | FY 2014 | $ | 0 | |||||
| FY 2013 | $ | 0 | ||||||
Sound Mind Investing Funds: | FY 2014 | $ | 0 | |||||
| FY 2013 | $ | 0 | ||||||
Green Owl Intrinsic Value Fund: | FY 2014 | $ | 0 | |||||
| FY 2013 | $ | 0 | ||||||
BRC Large Cap Focus Equity Fund: | FY 2014 | $ | 0 | |||||
| FY 2013 | $ | 0 | ||||||
Dreman Contrarian Small Cap Value Fund: | FY 2014 | $ | 0 | |||||
| FY 2013 | $ | 0 | ||||||
Dana Large Cap Equity Fund: | FY 2014 | $ | 0 | |||||
| FY 2013 | $ | 0 |
-2-
| (c) | Tax Fees |
Granite Value Fund: | FY 2014 | $ | 2,500 | |||||
| FY 2013 | $ | 2,500 | ||||||
Sound Mind Investing Funds: | FY 2014 | $ | 7,500 | |||||
| FY 2013 | $ | 7,500 | ||||||
Green Owl Intrinsic Value Fund: | FY 2014 | $ | 2,500 | |||||
| FY 2013 | $ | 2,500 | ||||||
BRC Large Cap Focus Equity Fund: | FY 2014 | $ | 2,500 | |||||
| FY 2013 | $ | 2,500 | ||||||
Dreman Contrarian Small Cap Value Fund: | FY 2014 | $ | 2,500 | |||||
| FY 2013 | $ | 2,500 | ||||||
Dana Large Cap Equity Fund: | FY 2014 | $ | 2,500 | |||||
| FY 2013 | $ | 2,500 |
Nature of the fees: Preparation of the 1120 RIC and Excise review
-3-
| (d) | All Other Fees |
Granite Value Fund: | FY 2014 | $ | 0 | |||||
| FY 2013 | $ | 0 | ||||||
Sound Mind Investing Funds: | FY 2014 | $ | 0 | |||||
| FY 2013 | $ | 0 | ||||||
Green Owl Intrinsic Value Fund: | FY 2014 | $ | 0 | |||||
| FY 2013 | $ | 0 | ||||||
BRC Large Cap Focus Equity Fund: | FY 2014 | $ | 0 | |||||
| FY 2013 | $ | 0 | ||||||
Dreman Contrarian Small Cap Value Fund: | FY 2014 | $ | 0 | |||||
| FY 2013 | $ | 0 | ||||||
Dana Large Cap Equity Fund: | FY 2014 | $ | 0 | |||||
| FY 2013 | $ | 0 |
| (e) | (1) Audit Committee’s Pre-Approval Policies |
The Audit Committee Charter requires the Audit Committee to be responsible for the selection, retention or termination of auditors and, in connection therewith, to (i) evaluate the proposed fees and other compensation, if any, to be paid to the auditors, (ii) evaluate the independence of the auditors, (iii) pre-approve all audit services and, when appropriate, any non-audit services provided by the independent auditors to the Trust, (iv) pre-approve, when appropriate, any non-audit services provided by the independent auditors to the Trust’s investment adviser, or any entity controlling, controlled by, or under common control with the investment adviser and that provides ongoing services to the Trust if the engagement relates directly to the operations and financial reporting of the Trust, and (v) receive the auditors’ specific representations as to their independence;
| (2) | Percentages of Services Approved by the Audit Committee |
Registrant
Audit-Related Fees: | 0 | % | ||
Tax Fees: | 0 | % | ||
All Other Fees: | 0 | % |
(f) During audit of registrant’s financial statements for the most recent fiscal year, less than 50 percent of the hours expended on the principal accountant’s engagement were attributed to work performed by persons other than the principal accountant’s full-time, permanent employees.
-4-
(g) The aggregate non-audit fees billed by the registrant’s accountant for services rendered to the registrant, and rendered to the registrant’s investment adviser (not including any sub-adviser whose role is primarily portfolio management and is subcontracted with or overseen by another investment adviser), and any entity controlling, controlled by, or under common control with the adviser that provides ongoing services to the registrant:
| Registrant | Adviser | |||||||
FY 2014 | $ | 0 | $ | 0 | ||||
FY 2013 | $ | 0 | $ | 0 | ||||
(h) Not applicable. The auditor performed no services for the registrant’s investment adviser or any entity controlling, controlled by, or under common control with the investment adviser that provides ongoing services to the registrant.
| Item 5. | Audit Committee of Listed Companies. NOT APPLICABLE – applies to listed companies only |
| Item 6. | Schedule of Investments. Schedules filed with Item 1. |
| Item 7. | Disclosure of Proxy Voting Policies and Procedures for Closed-End Management Investment Companies. NOT APPLICABLE – applies to closed-end funds only |
| Item 8. | Portfolio Managers of Closed-End Investment Companies. NOT APPLICABLE – applies to closed-end funds only |
| Item 9. | Purchases of Equity Securities by Closed-End Management Investment Company and Affiliated Purchasers. NOT APPLICABLE – applies to closed-end funds only |
| Item 10. | Submission of Matters to a Vote of Security Holders. |
The guidelines applicable to shareholders desiring to submit recommendations for nominees to the Registrant’s board of trustees are contained in the statement of additional information of the Trust with respect to the Fund(s) for which this Form N-CSR is being filed.
| Item 11. | Controls and Procedures. |
(a) Based on their evaluation of the registrant’s disclosure controls and procedures (as defined in Rule 30a-3(c) under the Investment Company Act of 1940, as amended (the “Act”)) as of a date within 90 days of the filing date of this report, the registrant’s principal executive officer and principal financial officer have concluded that such disclosure controls and procedures are reasonably designed and are operating effectively to ensure that material information relating to the registrant is made known to them by others within those entities, particularly during the period in which this report is being prepared, and that the information required in filings on Form N-CSR is recorded, processed, summarized, and reported on a timely basis.
(b) There were no changes in the registrant’s internal control over financial reporting (as defined in Rule 30a-3(d) under the Investment Company Act of 1940) that occurred during the second fiscal quarter of the period covered by this report that have materially affected, or are reasonably likely to materially affect, the registrant’s internal control over financial reporting.
-5-
| Item 12. | Exhibits. |
(a) (1) Code is filed herewith.
| (2) | Certifications by the registrant’s principal executive officer and principal financial officer, pursuant to Section 302 of the Sarbanes- Oxley Act of 2002 and required by Rule 30a-2 under the Investment Company Act of 1940 are filed herewith. |
| (3) | Not Applicable |
| (b) | Certification pursuant to 18 U.S.C. Section 1350, as adopted pursuant to Section 906 of the Sarbanes-Oxley Act of 2002 is filed herewith. |
-6-
Pursuant to the requirements of the Securities Exchange Act of 1934 and the Investment Company Act of 1940, the registrant has duly caused this report to be signed on its behalf by the undersigned, thereunto duly authorized.
| (Registrant) Valued Advisers Trust | ||
| By * | /s/ R. Jeffrey Young | |
| R. Jeffrey Young, President and Principal Executive Officer | ||
| Date | 12/23/2014 | |
Pursuant to the requirements of the Securities Exchange Act of 1934 and the Investment Company Act of 1940, this report has been signed below by the following persons on behalf of the registrant and in the capacities and on the dates indicated.
| By * | /s/ R. Jeffrey Young | |
| R. Jeffrey Young, President and Principal Executive Officer | ||
| Date | 12/23/2014 | |
| By * | /s/ Bryan W. Ashmus | |
| Bryan W. Ashmus, Treasurer and Principal Financial Officer | ||
| Date | 12/23/2014 | |
-7-