UNITED STATES
SECURITIES AND EXCHANGE COMMISSION
WASHINGTON, D.C. 20549
FORM N-CSR
CERTIFIED SHAREHOLDER REPORT OF REGISTERED
MANAGEMENT INVESTMENT COMPANIES
Investment Company Act file number 811-22208
Valued Advisers Trust
(Exact name of registrant as specified in charter)
Huntington Asset Services, Inc. 2960 N. Meridian Street, Suite 300 Indianapolis, IN 46208
(Address of principal executive offices) (Zip code)
Capitol Services, Inc.
615 S. Dupont Hwy.
Dover, DE 19901
(Name and address of agent for service)
With a copy to:
John H. Lively, Esq.
The Law Offices of John H. Lively & Associates, Inc.
A member firm of The 1940 Act Law GroupTM
11300 Tomahawk Creek Parkway,
Suite 310
Leawood, KS 66221
Registrant’s telephone number, including area code: 317-917-7000
Date of fiscal year end: 1/31
Date of reporting period: 1/31/15
Item 1. Reports to Stockholders.

Golub Group Equity Fund
Annual Report
January 31, 2015
Fund Adviser:
Golub Group, LLC
1850 Gateway Drive, Suite 100
San Mateo, CA 94404
Toll Free (866) 954-6682
MANAGEMENT’S DISCUSSION OF FUND PERFORMANCE FOR THE FISCAL YEAR ENDING JANUARY 31, 2015 – (Unaudited)
The Golub Group Equity Fund (“Fund”) returned 8.74% for the fiscal year ending January 31, 2015. In comparison, our benchmark, the S&P 500 Index®*, gained 14.22% during the same period. Since inception on April 1, 2009, the Fund has returned 136.65% as compared to the 182.78% return of the benchmark.
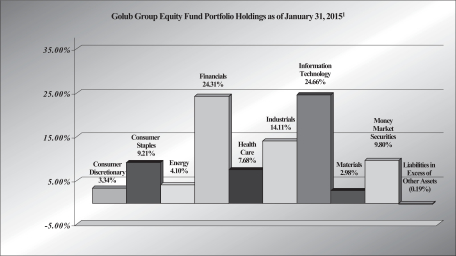
Performance for the period was led by strong returns from the Healthcare, Industrial, and Consumer Staples. Despite being underweight relative to the benchmark (9.9% of portfolio weight vs. 14.1% benchmark weight), the portfolio benefited most from its allocation to Healthcare, which was the second best performing sector in the S&P 500. Healthcare stocks returned 27% for the period paced by strong returns in Hospira and Teva Pharmaceuticals. Our overweight position in Industrials (16.0% of portfolio weight vs. 11.2% benchmark weight) was our second largest contributor to performance as the U.S. and global economy continue to show modest improvement. Consumer Staples (10.5% of portfolio) returned 14.8% outpacing the benchmark. Our Technology holdings continued their strong performance with our top performing stock, Apple, driving results. Apple, Hospira and Northrop Grumman, were the largest positive contributors and returned 67.4%, 45.0% and 41.5% respectively. Ebay ended the period as our largest holding followed by Bank of America, Microsoft and Citigroup.
Despite significantly reducing our exposure to the energy sector early in the year, the sector was the largest detractor to performance. In addition, the Fund’s underweight position in the Consumer Cyclical sector (6.8% of portfolio weight vs. 10.5% benchmark weight) acted as a drag as the Consumer Cyclical sector was a strong performer on rebounding consumer confidence and spending. Lastly, our cash position, which closed the period at 9.8% of the Fund and generated virtually no return for the year, acted as a drag on performance. National Oilwell Varco was our worst performing stock falling 16.2% during the period.
During the period, we added the following four (4) new positions to the Fund: CR Bard, Deere, Owens-Illinois, and Flowserve. During the period we sold the following eight (8) positions in their entirety: Chevron, Intel, Exxon, Cisco, Johnson and Johnson, and United Parcel Service.
In addition to the stock and security selection, Golub Group, LLC (the “Adviser”) continues to waive fees and reimburse expenses above the Fund’s expense limitation cap. Had the Adviser not waived and reimbursed these expenses, the performance of the Fund would have been lower.
1
We remain focused on our long term discipline of investing in high-quality, large-cap, dividend-paying businesses that trade at attractive valuations and are confident that our style of investing is particularly well-suited for the period ahead.
Sincerely,
Golub Group, LLC
* The S&P 500® Index is a widely recognized unmanaged index of equity prices and is representative of a broader market and range of securities than is found in the Fund’s portfolio. Individuals cannot invest directly in the Index; however, an individual can invest in exchange traded funds or other investment vehicles that attempt to track the performance of a benchmark index.
The views in the foregoing discussion were those of the Fund’s Adviser as of January 31, 2015 and may not reflect its views on the date this Annual Report is first published or anytime thereafter. These views are intended to assist shareholders in understanding their investment in the Fund and do not constitute investment advice.
The performance information quoted above represents past performance and past performance does not guarantee future results. Investment return and principal value of an investment will fluctuate so that an investor’s shares, when redeemed, may be worth more or less than their original cost. Current performance may be lower or higher than the performance data quoted. Performance data, current to the most recent month end, may be obtained by calling the Fund at 1-866-954-6682. Fee waivers and expense reimbursements have positively impacted Fund performance. An investor should consider the Fund’s investment objectives, risks, and charges and expenses carefully before investing. The Fund’s Prospectus contains this and other important information. For information on the Fund’s expense ratio, please see the Financial Highlights Table found within the accompanying Annual Report.
2
Investment Results – (Unaudited)
Total Returns*
(For the periods ended January 31, 2015)
| Average Annual | ||||||||||||||||
| 1 Year | 3 Year | 5 Year | Since Inception (April 1, 2009) | |||||||||||||
Golub Group Equity Fund | 8.74% | 14.99% | 12.84% | 15.90% | ||||||||||||
S&P 500® Index** | 14.22% | 17.47% | 15.60% | 19.49% | ||||||||||||
| Total annual operating expenses, as disclosed in the most recent supplement to the Fund’s prospectus, dated May 30, 2014, were 1.46% of average daily net assets (1.26% after fee waivers/expense reimbursements by the Adviser.) The Adviser has contractually agreed to waive or limit its fees and assume other expenses of the Fund until May 31, 2015, so that Total Annual Fund Operating Expenses do not exceed 1.25%. This contractual arrangement may only be terminated by mutual consent of the Adviser and the Fund, and it will automatically terminate upon the termination of the investment advisory agreement between the Fund and the Adviser. This operating expense limitation does not apply to: (i) interest, (ii) taxes, (iii) brokerage commissions, (iv) other expenditures which are capitalized in accordance with generally accepted accounting principles, (v) other extraordinary expenses not incurred in the ordinary course of the Fund’s business, (vi) dividend expense on short sales, (vii) expenses incurred under a plan of distribution under Rule 12b-1, and (viii) expenses that the Fund has incurred but did not actually pay because of an expense offset arrangement, if applicable, incurred by the Fund in any fiscal year. The operating expense limitation also excludes any “Fees and Expense of Acquired Funds,” which are the expenses indirectly incurred by the Fund as a result of investing in money market funds or other investment companies, including ETFs, that have their own expenses. The Adviser may recoup the sum of all fees previously waived or expenses reimbursed during any of the previous three (3) years, less any reimbursement previously paid, provided total expenses do not exceed the limitation set forth above or at the time of the original waiver, whichever is lower. | ||||||||||||||||
The performance quoted represents past performance, which does not guarantee future results. The investment return and principal value of an investment will fluctuate so that an investor’s shares, when redeemed, may be worth more or less than their original cost. The returns shown do not reflect deduction of taxes that a shareholder would pay on Fund distributions or the redemption of Fund shares. Current performance of the Fund may be lower or higher than the performance quoted. The Fund’s investment objectives, risks, charges and expenses must be considered carefully before investing. Performance data current to the most recent month end may be obtained by calling 1-866-954-6682.
* Return figures reflect any change in price per share and assume the reinvestment of all distributions. The Fund’s returns reflect any fee reductions during the applicable periods. If such fee reductions had not occurred, the quoted performance would have been lower.
** The S&P 500® Index is a widely recognized unmanaged index of equity securities and is representative of a broader domestic equity market and range of securities than is found in the Fund’s portfolio. Individuals cannot invest directly in the Index; however, an individual can invest in exchange traded funds or other investment vehicles that attempt to track the performance of a benchmark index.
The Fund’s investment objectives, strategies, risks, charges and expenses must be considered carefully before investing. The prospectus contains this and other important information about the Fund and may be obtained by calling the same number as above. Please read it carefully before investing.
The Fund is distributed by Unified Financial Securities, Inc., member FINRA.
3
Investment Results – (Unaudited) (continued)
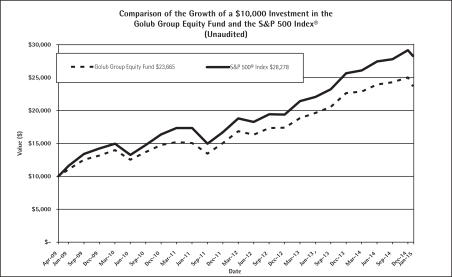
The chart above assumes an initial investment of $10,000 made on April 1, 2009 (commencement of Fund operations) and held through January 31, 2015. THE FUND’S RETURN REPRESENTS PAST PERFORMANCE AND DOES NOT GUARANTEE FUTURE RESULTS. The returns shown do not reflect deduction of taxes that a shareholder would pay on Fund distributions or the redemption of Fund shares. Investment returns and principal values will fluctuate so that your shares, when redeemed, may be worth more or less than their original purchase price.
Current performance may be lower or higher than the performance data quoted. For more information on the Fund, and to obtain performance data current to the most recent month end or to request a prospectus, please call 1-866-954-6682. You should carefully consider the investment objectives, potential risks, management fees, and charges and expenses of the Fund before investing. The Fund’s prospectus contains this and other information about the Fund, and should be read carefully before investing.
The Fund is distributed by Unified Financial Securities, Inc., member FINRA.
4
Fund Holdings – (Unaudited)
| 1 | As a percentage of net assets. |
The investment objective of the Golub Group Equity Fund is to provide long-term capital appreciation. A secondary objective is to provide current income.
Availability of Portfolio Schedule – (Unaudited)
The Fund files its complete schedule of portfolio holdings with the Securities and Exchange Commission (“SEC”) for the first and third quarters of each fiscal year on Form N-Q. The Fund’s Forms N-Q are available at the SEC’s website at www.sec.gov. The Fund’s Forms N-Q may be reviewed and copied at the SEC’s Public Reference Room in Washington DC. Information on the operation of the Public Reference Room may be obtained by calling 1-800-SEC-0330.
5
Summary of Fund’s Expenses – (Unaudited)
As a shareholder of a Fund, you incur two types of costs: (1) transaction costs, which may include sales charges (loads) on purchase payments, contingent deferred sales charges on redemptions; and (2) ongoing costs, including management fees, distribution and service fees; and other Fund expenses. These examples are intended to help you understand your ongoing costs (in dollars) of investing in the Fund and to compare these costs with the ongoing costs of investing in other mutual funds.
The Example is based on an investment of $1,000 invested at the beginning and held for the entire period from August 1, 2014 to January 31, 2015.
Actual Expenses
The “Actual” line of the table provide information about actual account values and actual expenses. You may use the information on this line for the class of shares you hold, together with the amount you invested, to estimate the expenses that you paid over the period. Simply divide your account value by $1,000.00 (for example, an $8,600.00 account value divided by $1,000.00 = 8.60), then multiply the result by the number in the “Actual” line under the heading entitled “Expenses Paid During Period” to estimate the expenses you paid on your account during this period.
Hypothetical Example for Comparison Purposes
The “Hypothetical” line of the table provide information about hypothetical account values and hypothetical expenses based on the Fund’s actual expense ratios for each class of shares and an assumed rate of return of 5% per year before expenses, which are not the Fund’s actual returns. The hypothetical account values and expenses may not be used to estimate the actual ending account balance or expenses you paid for the period. You may use this information to compare the ongoing costs of investing in the Fund and other funds. To do so, compare the 5% hypothetical examples with the 5% hypothetical examples that appear in the shareholder reports of other funds.
Please note that the expenses shown in the table are meant to highlight your ongoing costs only and do not reflect any transactional costs. Therefore, the “Actual” and “Hypothetical” lines of the table are useful in comparing ongoing costs only, and will not help you determine the relative total costs of owning different funds. In addition, if these transactional costs were included, your costs would have been higher.
| Beginning Account Value | Ending Account Value | Expenses Paid During the Period Ended | ||||||||||
| August 1, 2014 | January 31, 2015 | January 31, 2015 | ||||||||||
Golub Group Equity Fund | ||||||||||||
Actual* | $ | 1,000.00 | $ | 998.30 | $ | 6.30 | ||||||
Hypothetical** | $ | 1,000.00 | $ | 1,018.90 | $ | 6.36 | ||||||
| * | Expenses are equal to the Fund’s annualized net expense ratio of 1.25%, multiplied by the average account value over the period, multiplied by 184/365. |
| ** | Assumes a 5% return before expenses. |
6
Schedule of Investments
January 31, 2015
| Shares | Fair Value | |||||||
| Common Stocks – 90.39% | ||||||||
| Consumer Discretionary 3.34% | ||||||||
| 47,335 | General Motors Co. | $ | 1,544,068 | |||||
|
| |||||||
| Consumer Staples 9.21% | ||||||||
| 8,575 | Anheuser-Busch InBev NV ADR | 1,046,750 | ||||||
| 33,950 | Coca-Cola Co./The | 1,397,722 | ||||||
| 9,265 | Diageo PLC ADR | 1,094,474 | ||||||
| 7,670 | PepsiCo, Inc. | 719,293 | ||||||
|
| |||||||
| 4,258,239 | ||||||||
|
| |||||||
| Energy 4.10% | ||||||||
| 12,330 | Devon Energy Corp. | 743,129 | ||||||
| 21,215 | National Oilwell Varco, Inc. | 1,154,733 | ||||||
|
| |||||||
| 1,897,862 | ||||||||
|
| |||||||
| Financials 24.31% | ||||||||
| 41,170 | American International Group, Inc. | 2,011,978 | ||||||
| 148,900 | Bank of America Corp. | 2,255,835 | ||||||
| 48,420 | Bank of New York Mellon Corp./The | 1,743,120 | ||||||
| 13,050 | Berkshire Hathaway, Inc. – Class B* | 1,878,026 | ||||||
| 46,715 | Citigroup, Inc. | 2,193,269 | ||||||
| 22,350 | Wells Fargo & Co. | 1,160,412 | ||||||
|
| |||||||
| 11,242,640 | ||||||||
|
| |||||||
| Health Care 7.68% | ||||||||
| 5,835 | C.R. Bard, Inc. | 997,960 | ||||||
| 16,710 | Hospira, Inc.* | 1,059,915 | ||||||
| 26,300 | Teva Pharmaceutical Industries Ltd. ADR | 1,495,418 | ||||||
|
| |||||||
| 3,553,293 | ||||||||
|
| |||||||
| Industrials 14.11% | ||||||||
| 8,260 | Deere & Co. | 703,669 | ||||||
| 5,675 | FedEx Corp. | 959,699 | ||||||
| 25,110 | Flowserve Corp. | 1,368,244 | ||||||
| 74,935 | General Electric Co. | 1,790,197 | ||||||
| 6,300 | Northrop Grumman Corp. | 988,785 | ||||||
| 6,225 | United Technologies Corp. | 714,506 | ||||||
|
| |||||||
| 6,525,100 | ||||||||
|
| |||||||
| Information Technology 24.66% | ||||||||
| 13,250 | Apple, Inc. | 1,552,370 | ||||||
| 43,035 | eBay, Inc.* | 2,280,855 | ||||||
| 20,770 | Fiserv, Inc.* | 1,506,448 | ||||||
| 3,655 | Google, Inc. – Class A* | 1,964,745 | ||||||
| 1,050 | Google, Inc. – Class C* | 561,246 | ||||||
| 55,535 | Microsoft Corp. | 2,243,614 | ||||||
| 20,735 | QUALCOMM, Inc. | 1,295,108 | ||||||
|
| |||||||
| 11,404,386 | ||||||||
|
| |||||||
See accompanying notes which are an integral part of the financial statements.
7
Schedule of Investments (continued)
January 31, 2015
| Shares | Fair Value | |||||||
| Common Stocks – (continued) | ||||||||
| Materials 2.98% | ||||||||
| 58,995 | Owens-Illinois, Inc.* | $ | 1,377,533 | |||||
|
| |||||||
Total Common Stocks (Cost $34,042,822) | 41,803,121 | |||||||
|
| |||||||
| Money Market Securities – 9.80% | ||||||||
| 4,533,375 | Fidelity Institutional Money Market Portfolio – Institutional Class, 0.11%(a) | 4,533,375 | ||||||
|
| |||||||
Total Money Market Securities (Cost $4,533,375) | 4,533,375 | |||||||
|
| |||||||
Total Investments (Cost $38,576,197) 100.19% | 46,336,496 | |||||||
|
| |||||||
Liabilities in Excess of Other Assets (0.19)% | (87,400 | ) | ||||||
|
| |||||||
TOTAL NET ASSETS 100.00% | $ | 46,249,096 | ||||||
|
| |||||||
| (a) | Rate disclosed is the seven day yield as of January 31, 2015. |
| * | Non-income producing security. |
| ADR | – American Depositary Receipt |
See accompanying notes which are an integral part of the financial statements.
8
Statement of Assets and Liabilities
January 31, 2015
Assets | ||||
Investments in securities at fair value (cost $38,576,197) | $ | 46,336,496 | ||
Dividends receivable | 15,322 | |||
Prepaid expenses | 4,084 | |||
Total Assets | 46,355,902 | |||
Liabilities | ||||
Payable for fund shares redeemed | 19,550 | |||
Payable to Adviser | 33,135 | |||
Payable to administrator, fund accountant, transfer agent, and chief compliance officer | 27,623 | |||
Payable to custodian | 1,206 | |||
Payable to trustees | 647 | |||
Other accrued expenses | 24,645 | |||
Total Liabilities | 106,806 | |||
Net Assets | $ | 46,249,096 | ||
Net Assets consist of: | ||||
Paid-in capital | $ | 36,540,771 | ||
Accumulated undistributed net investment loss | (22,009 | ) | ||
Accumulated undistributed net realized gain from investments | 1,970,035 | |||
Net unrealized appreciation on investments | 7,760,299 | |||
Net Assets | $ | 46,249,096 | ||
Shares outstanding (unlimited number of shares authorized, no par value) | 2,571,630 | |||
Net asset value, offering and redemption price per share | $ | 17.98 |
9
See accompanying notes which are an integral part of the financial statements.
Statement of Operations
For the year ended January 31, 2015
Investment Income | ||||
Dividend income (net of foreign taxes withheld of $12,410) | $ | 728,346 | ||
Total investment income | 728,346 | |||
Expenses | ||||
Investment Adviser | 460,081 | |||
Administration | 45,095 | |||
Fund accounting | 25,000 | |||
Transfer agent | 35,244 | |||
Legal | 17,911 | |||
Registration | 6,448 | |||
Custodian | 7,520 | |||
Audit | 15,000 | |||
Trustee | 5,421 | |||
Printing | 15,445 | |||
Miscellaneous | 7,026 | |||
Total expenses | 640,191 | |||
Fees waived by Adviser | (64,918 | ) | ||
Net operating expenses | 575,273 | |||
Net investment income | 153,073 | |||
Net Realized and Unrealized Gain on Investments | ||||
Net realized gain on investment securities transactions | 4,334,747 | |||
Net change in unrealized appreciation/(depreciation) of investment securities | (868,271 | ) | ||
Net realized and unrealized gain on investments | 3,466,476 | |||
Net increase in net assets resulting from operations | $ | 3,619,549 |
10
See accompanying notes which are an integral part of the financial statements.
Statements of Changes in Net Assets
For the Year Ended January 31, 2015 | For the Year Ended January 31, 2014 | |||||||
Increase in Net Assets due to: Operations | ||||||||
Net investment income | $ | 153,073 | $ | 215,423 | ||||
Net realized gain on investment securities transactions | 4,334,747 | 2,997,985 | ||||||
Net change in unrealized appreciation (depreciation) of investments | (868,271 | ) | 3,420,746 | |||||
Net increase in net assets resulting from operations | 3,619,549 | 6,634,154 | ||||||
Distributions From: | ||||||||
Net investment income | (162,447 | ) | (220,112 | ) | ||||
Net realized gains | (3,625,526 | ) | (1,972,205 | ) | ||||
Total distributions | (3,787,973 | ) | (2,192,317 | ) | ||||
Capital Transactions | ||||||||
Proceeds from shares sold | 11,749,584 | 7,788,369 | ||||||
Reinvestment of distributions | 3,787,973 | 2,192,317 | ||||||
Amount paid for shares redeemed | (10,204,265 | ) | (5,855,754 | ) | ||||
Net increase in net assets resulting from | 5,333,292 | 4,124,932 | ||||||
Total Increase in Net Assets | 5,164,868 | 8,566,769 | ||||||
Net Assets | ||||||||
Beginning of year | 41,084,228 | 32,517,459 | ||||||
End of year | $ | 46,249,096 | $ | 41,084,228 | ||||
Accumulated undistributed net investment loss included in net assets at end of year | $ | (22,009 | ) | $ | (12,635 | ) | ||
Share Transactions | ||||||||
Shares sold | 602,198 | 438,267 | ||||||
Shares issued in reinvestment of distributions | 204,755 | 121,931 | ||||||
Shares redeemed | (525,320 | ) | (333,667 | ) | ||||
Net increase in share transactions | 281,633 | 226,531 | ||||||
11
See accompanying notes which are an integral part of the financial statements.
Financial Highlights
(For a share outstanding during each year)
| For the Year Ended January 31, | ||||||||||||||||||||
| 2015 | 2014 | 2013 | 2012 | 2011 | ||||||||||||||||
Selected Per Share Data |
| |||||||||||||||||||
Net asset value, beginning of year | $17.94 | $15.76 | $14.00 | $14.58 | $12.85 | |||||||||||||||
|
|
|
|
|
|
|
|
|
| |||||||||||
Investment operations: | ||||||||||||||||||||
Net investment income | 0.07 | 0.10 | (a) | 0.14 | (a) | 0.15 | (a) | 0.11 | (a) | |||||||||||
Net realized and unrealized gain on investments | 1.54 | 3.09 | 2.12 | 0.20 | 2.09 | |||||||||||||||
|
|
|
|
|
|
|
|
|
| |||||||||||
Total from investment operations | 1.61 | 3.19 | 2.26 | 0.35 | 2.20 | |||||||||||||||
|
|
|
|
|
|
|
|
|
| |||||||||||
Less distributions to shareholders: | ||||||||||||||||||||
From net investment income | (0.07 | ) | (0.10 | ) | (0.14 | ) | (0.14 | ) | (0.09 | ) | ||||||||||
From net realized gains | (1.50 | ) | (0.91 | ) | (0.36 | ) | (0.79 | ) | (0.38 | ) | ||||||||||
|
|
|
|
|
|
|
|
|
| |||||||||||
Total distributions | (1.57 | ) | (1.01 | ) | (0.50 | ) | (0.93 | ) | (0.47 | ) | ||||||||||
|
|
|
|
|
|
|
|
|
| |||||||||||
Net asset value, end of year | $17.98 | $17.94 | $15.76 | $14.00 | $14.58 | |||||||||||||||
|
|
|
|
|
|
|
|
|
| |||||||||||
Total Return(b) | 8.74 | % | 20.20 | % | 16.34 | % | 2.65 | % | 17.20 | % | ||||||||||
Ratios and Supplemental Data: |
| |||||||||||||||||||
Net assets, end of year (000) | $46,249 | $41,084 | $32,517 | $23,946 | $19,574 | |||||||||||||||
Ratio of expenses to average net assets after expense waiver and reimbursement | 1.25 | % | 1.25 | % | 1.25 | % | 1.25 | % | 1.25 | % | ||||||||||
Ratio of expenses to average net assets before expense waiver and reimbursement | 1.39 | % | 1.45 | % | 1.57 | % | 1.75 | % | 2.21 | % | ||||||||||
Ratio of net investment income to average net assets after expense waiver and reimbursement | 0.33 | % | 0.58 | % | 0.95 | % | 1.03 | % | 0.82 | % | ||||||||||
Ratio of net investment income to average net assets before expense waiver and reimbursement | 0.19 | % | 0.38 | % | 0.63 | % | 0.53 | % | (0.14 | )% | ||||||||||
Portfolio turnover rate | 34.45 | % | 29.83 | % | 16.79 | % | 27.33 | % | 23.15 | % | ||||||||||
| (a) | Net investment income per share is calculated by dividing net investment income by the average shares outstanding throughout the year. |
| (b) | Total return in the above table represents the rate that the investor would have earned or lost on an investment in the Fund, assuming reinvestment of distributions. |
12
See accompanying notes which are an integral part of the financial statements.
Notes to the Financial Statements
January 31, 2015
NOTE 1. ORGANIZATION
The Golub Group Equity Fund (the “Fund”) was organized as an open-end diversified series of the Valued Advisers Trust (the “Trust”) on April 1, 2009. The Trust is a management investment company established under the laws of Delaware by an Agreement and Declaration of Trust dated June 13, 2008 (the “Trust Agreement”). The Trust Agreement permits the Board of Trustees (the “Board”) to issue an unlimited number of shares of beneficial interest of separate series without par value. The Fund is one of a series of funds authorized by the Board. The Fund’s investment adviser is Golub Group, LLC (the “Adviser”). The investment objective of the Fund is to provide long-term capital appreciation. A secondary objective is to provide current income.
NOTE 2. SIGNIFICANT ACCOUNTING POLICIES
The Fund is an investment company and follows accounting and reporting guidance under Financial Accounting Standards Board (“FASB”) Accounting Standards Codification (“ASC”) Topic 946, “Financial Services-Investment Companies”. The following is a summary of significant accounting policies followed by the Fund in the preparation of its financial statements. These policies are in conformity with generally accepted accounting principles in the United States of America (“GAAP”).
Securities Valuation – All investments in securities are recorded at their estimated fair value as described in Note 3.
Federal Income Taxes – The Fund makes no provision for federal income or excise tax. The Fund intends to qualify each year as a regulated investment company (“RIC”) under subchapter M of the Internal Revenue Code of 1986, as amended, by complying with the requirements applicable to RICs and by distributing substantially all of its taxable income. The Fund also intends to distribute sufficient net investment income and net capital gains, if any, so that it will not be subject to excise tax on undistributed income and gains. If the required amount of net investment income or gains is not distributed, the Fund could incur a tax expense.
As of and during the fiscal year ended January 31, 2015, the Fund did not have a liability for any unrecognized tax benefits. The Fund recognizes interest and penalties, if any, related to unrecognized tax benefits as income tax expense in the statement of operations. During the year, the Fund did not incur any interest or penalties. The Fund is subject to examination by U.S. federal tax authorities for the last three tax year ends and the interim tax period since then.
Expenses – Expenses incurred by the Trust that do not relate to a specific fund of the Trust are allocated to the individual funds based on each fund’s relative net assets or another appropriate basis (as determined by the Board).
Security Transactions and Related Income - The Fund follows industry practice and records security transactions on the trade date for financial reporting purposes. The specific identification method is used for determining gains or losses for financial statement and income tax purposes. Dividend income is recorded on the ex-dividend date and interest income is recorded on an accrual basis. Discounts and premiums on securities purchased are accreted or amortized using the effective interest method. The ability of issuers of debt securities held by the Fund to meet their obligations may be affected by economic and political developments in a specific country or region.
13
Notes to the Financial Statements (continued)
January 31, 2015
Withholding taxes on foreign dividends have been provided for in accordance with the Fund’s understanding of the applicable country’s tax rules and rates.
Dividends and Distributions – The Fund intends to distribute all or substantially all of its net investment income, if any, as dividends to its shareholders on at least an annual basis. The Fund intends to distribute its net realized long term capital gains and its net realized short term capital gains, if any, at least once a year. Dividends to shareholders, which are determined in accordance with income tax regulations, are recorded on the ex-dividend date. The treatment for financial reporting purposes of distributions made to shareholders during the period from net investment income or net realized capital gains may differ from their ultimate treatment for federal income tax purposes. These differences are caused primarily by differences in the timing of the recognition of certain components of income, expense or realized capital gain for federal income tax purposes. Where such differences are permanent in nature, they are reclassified in the components of the net assets based on their ultimate characterization for federal income tax purposes. Any such reclassifications will have no effect on net assets, results of operations or net asset values per share of the Fund. There were no such material reclassifications made as of January 31, 2015.
NOTE 3. SECURITIES VALUATION AND FAIR VALUE MEASUREMENTS
Fair value is defined as the price that a Fund would receive upon selling an investment in an orderly transaction to an independent buyer in the principal or most advantageous market of the investment. GAAP establishes a three-tier hierarchy to maximize the use of observable market data and minimize the use of unobservable inputs and establish classification of fair value measurements for disclosure purposes.
Inputs refer broadly to the assumptions that market participants would use in pricing the asset or liability, including assumptions about risk, for example, the risk inherent in a particular valuation technique used to measure fair value including a pricing model and/or the risk inherent in the inputs to the valuation technique. Inputs may be observable or unobservable. Observable inputs are inputs that reflect the assumptions market participants would use in pricing the asset or liability developed based on market data obtained from sources independent of the reporting entity. Unobservable inputs are inputs that reflect the reporting entity’s own assumptions about the assumptions market participants would use in pricing the asset or liability developed based on the best information available in the circumstances.
Various inputs are used in determining the value of the Fund’s investments. These inputs are summarized in the three broad levels listed below.
| • | Level 1 – quoted prices in active markets for identical securities |
| • | Level 2 – other significant observable inputs (including, but not limited to, quoted prices for an identical security in an inactive market, quoted prices for similar securities, interest rates, prepayment speeds, credit risk, etc.) |
| • | Level 3 – significant unobservable inputs (including the Fund’s own assumptions in determining fair value of investments based on the best information available) |
The inputs used to measure fair value may fall into different levels of the fair value hierarchy. In such cases, for disclosure purposes, the level in the fair value hierarchy within which the fair value
14
Notes to the Financial Statements (continued)
January 31, 2015
measurement falls in its entirety, is determined based on the lowest level input that is significant to the fair value measurement in its entirety.
Equity securities, including common stocks, are generally valued by using market quotations, but may be valued on the basis of prices furnished by a pricing service when the Adviser believes such prices more accurately reflect the fair value of such securities. Securities that are traded on any stock exchange are generally valued by the pricing service at the last quoted sale price. Lacking a last sale price, an exchange traded security is generally valued by the pricing service at its last bid price. Securities traded in the NASDAQ over-the-counter market are generally valued by the pricing service at the NASDAQ Official Closing Price.
When using the market quotations or close prices provided by the pricing service and when the market is considered active, the security will be classified as a Level 1 security. Sometimes, an equity security owned by the Fund will be valued by the pricing service with factors other than market quotations or when the market is considered inactive. When this happens, the security will be classified as a Level 2 security. When market quotations are not readily available, when the Adviser determines that the market quotation or the price provided by the pricing service does not accurately reflect the current fair value, or when restricted or illiquid securities are being valued, such securities are valued as determined in good faith by the Adviser, in conformity with guidelines adopted by and subject to review by the Board. These securities are generally categorized as Level 3 securities.
Investments in mutual funds, including money market mutual funds, are generally priced at the ending net asset value (“NAV”) provided by the service agent of the funds. These securities are categorized as Level 1 securities.
In accordance with the Trust’s good faith pricing guidelines, the Adviser is required to consider all appropriate factors relevant to the value of securities for which it has determined other pricing sources are not available or reliable as described above. No single standard exists for determining fair value, because fair value depends upon the circumstances of each individual case. As a general principle, the current fair value of an issue of securities being valued by the Adviser would appear to be the amount which the owner might reasonably expect to receive for them upon their current sale. Methods which are in accordance with this principle may, for example, be based on (i) a multiple of earnings; (ii) a discount from market of a similar freely traded security (including a derivative security or a basket of securities traded on other markets, exchanges or among dealers); or (iii) yield to maturity with respect to debt issues, or a combination of these and other methods. Good faith pricing is permitted if, in the Adviser’s opinion, the validity of market quotations appears to be questionable based on factors such as evidence of a thin market in the security based on a small number of quotations, a significant event occurs after the close of a market but before a Fund’s NAV calculation that may affect a security’s value, or the Adviser is aware of any other data that calls into question the reliability of market quotations. Good faith pricing may also be used in instances when the bonds the Fund invests in may default or otherwise cease to have market quotations readily available. Any fair valuation pricing done outside the Fund’s approved pricing methods must be approved by the Pricing Committee of the Board.
15
Notes to the Financial Statements (continued)
January 31, 2015
The following is a summary of the inputs used to value the Fund’s investments as of January 31, 2015:
| Valuation Inputs | ||||||||||||||||
| Assets | Level 1 Quoted Prices in Active Markets | Level 2 Other Significant Observable Inputs | Level 3 Significant | Total | ||||||||||||
Common Stocks* | $ | 41,803,121 | $ | – | $ | – | $ | 41,803,121 | ||||||||
Money Market Securities | 4,533,375 | – | – | 4,533,375 | ||||||||||||
Total | $ | 46,336,496 | $ | – | $ | – | $ | 46,336,496 | ||||||||
| * | Refer to the Schedule of Investments for industry classifications. |
The Fund did not hold any investments at any time during the reporting period in which significant unobservable inputs were used in determining fair value; therefore, no reconciliation of Level 3 securities is included for this reporting period. The Fund did not hold any derivative instruments during the reporting period.
The Trust recognizes transfers between fair value hierarchy levels at the end of the reporting period. There were no transfers between any levels as of January 31, 2015 and the previous reporting period end.
NOTE 4. FEES AND OTHER TRANSACTIONS WITH AFFILIATES
Under the terms of the investment advisory agreement, on behalf of the Fund (the “Agreement”), the Adviser manages the Fund’s investments subject to oversight of the Board. As compensation for its services, the Fund is obligated to pay the Adviser a fee computed and accrued daily and paid monthly at an annual rate of 1.00% of the average daily net assets of the Fund. For the fiscal year ended January 31, 2015, the Adviser earned a fee of $460,081 from the Fund before the waivers described below. At January 31, 2015, the Fund owed the Adviser $33,135.
The Adviser has contractually agreed to waive or limit its fee and reimburse certain Fund operating expenses, until May 31, 2015, so that the ratio of total annual operating expenses does not exceed 1.25%. This operating expense limitation does not apply to interest, taxes, brokerage commissions, other expenditures which are capitalized in accordance with generally accepted accounting principles, other extraordinary expenses not incurred in the ordinary course of the Fund’s business, dividend expense on short sales, expenses incurred under a plan of distribution under Rule 12b-1, and expenses that the Fund has incurred but did not actually pay because of an expense offset arrangement, if applicable, incurred by the Fund in any fiscal year. The operating expense limitation also excludes any “Acquired Fund Fees and Expenses.” Acquired Fund Fees and Expenses represent the pro rata expense indirectly incurred by the Fund as a result of investing in other investment companies, including ETFs, closed-end funds and money market funds that have their own expenses. The Adviser may be entitled to the reimbursement of any fees waived or expenses reimbursed pursuant to the agreement provided overall expenses fall below the limitations set forth above. The Adviser may recoup the sum of all fees previously waived or expenses reimbursed during any of the previous three (3) years, less any reimbursement previously paid, provided total expenses do not exceed the limitation set forth above. For the year ended January 31, 2015, the Adviser waived fees of $64,918.
16
Notes to the Financial Statements (continued)
January 31, 2015
The amounts subject to repayment by the Fund, pursuant to the aforementioned conditions, at January 31, 2015 are as follows:
| Amount | Recoverable through January 31, | |||
| $91,129 | 2016 | |||
| $74,349 | 2017 | |||
| $64,918 | 2018 | |||
The Trust retains Huntington Asset Services, Inc. (“HASI”) to manage the Fund’s business affairs and provide the Fund with administrative and compliance services, including all regulatory reporting and necessary office equipment and personnel. For the fiscal year ended January 31, 2015, HASI earned fees of $45,095 for administrative and compliance services provided to the Fund. At January 31, 2015, HASI was owed $12,553 from the Fund for administrative and compliance services. Certain officers and one Trustee of the Trust are members of management and/or employees of HASI. HASI is a wholly-owned subsidiary of Huntington Bancshares, Inc., the parent company of Unified Financial Securities, Inc. (the “Distributor”) and Huntington National Bank, the custodian of the Fund’s investments (the “Custodian”). For the fiscal year ended January 31, 2015, the Custodian earned fees of $7,520 for custody services provided to the Fund. At January 31, 2015, the Custodian was owed $1,206 from the Fund for custody services.
The Trust also retains HASI to act as the Fund’s transfer agent and to provide fund accounting services. For the fiscal year ended January 31, 2015, HASI earned fees of $35,244 for transfer agent services to the Fund. At January 31, 2015, the Fund owed HASI $8,820 for transfer agent services. For the fiscal year ended January 31, 2015, HASI earned fees of $25,000 from the Fund for fund accounting services. At January 31, 2015, HASI was owed $6,250 from the Fund for fund accounting services.
The Fund has adopted a Distribution Plan pursuant to Rule 12b-1 under the 1940 Act (the “Plan”). The Plan provides that the Fund will pay the Distributor and/or any registered securities dealer, financial institution or any other person (the “Recipient”) a shareholder servicing fee of 0.25% of the average daily net assets of the Fund in connection with the promotion and distribution of the Fund’s shares or the provision of personal services to shareholders, including, but not necessarily limited to, advertising, compensation to underwriters, dealers and selling personnel, the printing and mailing of prospectuses to other than current Fund shareholders, the printing and mailing of sales literature and servicing shareholder accounts (“12b-1 Expenses”). The Fund or Distributor may pay all or a portion of these fees to any recipient who renders assistance in distributing or promoting the sale of shares, or who provides certain shareholder services, pursuant to a written agreement. The Plan is a compensation plan, which means that the Plan will benefit shareholders because an effective sales program typically is necessary in order for the Fund to reach and maintain a sufficient size to achieve efficiently its investment objectives and to realize economies of scale. The Plan is not active and will not be activated prior to May 31, 2015.
Unified Financial Securities, Inc. acts as the principal distributor of the Fund’s shares. There were no payments made by the Fund to the Distributor during the fiscal year ended January 31, 2015. An officer of the Trust is an officer of the Distributor and such person may be deemed to be an affiliate of the Distributor.
17
Notes to the Financial Statements (continued)
January 31, 2015
NOTE 5. PURCHASES AND SALES OF SECURITIES
For the fiscal year ended January 31, 2015, purchases and sales of investment securities, other than short-term investments and short-term U.S. government obligations, were as follows:
| Amount | ||||
Purchases | ||||
U.S. Government Obligations | $ | – | ||
Other | 15,865,603 | |||
Sales | ||||
U.S. Government Obligations | $ | – | ||
Other | 14,406,937 | |||
NOTE 6. ESTIMATES
The preparation of financial statements in conformity with GAAP requires management to make estimates and assumptions that affect the reported amounts of assets and liabilities and disclosure of contingent assets and liabilities at the date of the financial statements and the reported amounts of increases and decreases in net assets from operations during the reporting period. Actual results could differ from those estimates.
NOTE 7. BENEFICIAL OWNERSHIP
The beneficial ownership, either directly or indirectly, of 25% or more of the voting securities of a fund creates a presumption of control of a fund, under Section 2(a) (9) of the Investment Company Act of 1940. At January 31, 2015, Charles Schwab Corporation owned, as record shareholder, 94% of the outstanding shares of the Fund. It is not known whether Charles Schwab Corporation or any of the underlying beneficial owners owned or controlled 25% or more of the voting securities of the Fund.
NOTE 8. FEDERAL TAX INFORMATION
At January 31, 2015, the net unrealized appreciation (depreciation) of investments for tax purposes was as follows:
Gross Appreciation | $ | 8,445,438 | ||
Gross (Depreciation) | (685,658 | ) | ||
Net Appreciation (Depreciation) on Investments | $ | 7,759,780 |
At January 31, 2015, the aggregate cost of securities for federal income tax purposes was $38,576,716 for the Fund.
The tax characterization of distributions for the fiscal years ended January 31, 2015 and January 31, 2014, were as follows:
| 2015 | 2014 | |||||||
Distributions paid from: | ||||||||
Ordinary Income* | $ | 310,062 | $ | 463,691 | ||||
Long-Term Capital Gain | 3,477,911 | 1,728,626 | ||||||
| $ | 3,787,973 | $ | 2,192,317 | |||||
| * | Short-term capital gain distributions are treated as ordinary income for tax purposes. |
18
Notes to the Financial Statements (continued)
January 31, 2015
At January 31, 2015, the components of distributable earnings (accumulated losses) on a tax basis were as follows:
Undistributed Ordinary Income | $ | 18,625 | ||
Undistributed long-term capital gains | 1,951,929 | |||
Accumulated capital and other losses | (22,009 | ) | ||
Unrealized appreciation (depreciation) | 7,759,780 | |||
| $ | 9,708,325 |
At January 31, 2015, the difference between book basis and tax basis unrealized appreciation (depreciation) is attributable to the tax deferral of losses on wash sales in the amount of $519.
Under current tax law, net investment losses after December 31 and capital losses realized after October 31 of a Fund’s fiscal year may be deferred and treated as occurring on the first business day of the following fiscal year for tax purposes. The Fund deferred losses as follows:
Qualified Late Year |
| $22,009 |
NOTE 9. COMMITMENTS AND CONTINGENCIES
The Fund indemnifies its officers and trustees for certain liabilities that may arise from their performance of their duties to the Fund. Additionally, in the normal course of business, the Fund enters into contracts that contain a variety of representations and warranties which provide general indemnifications. The Fund’s maximum exposure under these arrangements is unknown, as this would involve future claims that may be made against the Fund that have not yet occurred.
NOTE 10. SUBSEQUENT EVENT
Management of the Fund has evaluated the need for disclosures and/or adjustments resulting from subsequent events through the date these financial statements were issued. Based upon this evaluation, management has determined there were no items requiring adjustment of the financial statements or additional disclosure.
NOTE 11. PROXY VOTING RESULTS (UNAUDITED)
On December 19, 2014 a special meeting of the shareholders of the Trust was held at the offices of the Trust for the purpose of electing each nominee to the Board of Trustees.
Below are the voting results for all funds from the special meeting of the Trust:
To elect each nominee to the Board of Trustees:
| For | Against | Abstain | ||||||||||
Ira Cohen | 280,591,916 | 20,930,930 | – | |||||||||
Andrea N. Mullins | 296,332,857 | 5,189,989 | – | |||||||||
R. Jeffrey Young | 280,517,160 | 21,005,685 | – | |||||||||
19
Report of Independent Registered Public Accounting Firm
To the Shareholders of Golub Group Equity Fund and
Board of Trustees of Valued Advisers Trust
We have audited the accompanying statement of assets and liabilities, including the schedule of investments, of Golub Group Equity Fund (the “Fund”), a series of Valued Advisers Trust, as of January 31, 2015, and the related statement of operations for the year then ended, the statements of changes in net assets for each of the two years in the period then ended, and the financial highlights for each of the four years in the period then ended. These financial statements and financial highlights are the responsibility of the Fund’s management. Our responsibility is to express an opinion on these financial statements and financial highlights based on our audits. The financial highlights for the periods ended prior to January 31, 2012, were audited by other auditors whose report dated March 22, 2011 expressed an unqualified opinion on those financial highlights.
We conducted our audits in accordance with the standards of the Public Company Accounting Oversight Board (United States). Those standards require that we plan and perform the audit to obtain reasonable assurance about whether the financial statements and financial highlights are free of material misstatement. An audit includes examining, on a test basis, evidence supporting the amounts and disclosures in the financial statements. Our procedures included confirmation of securities owned as of January 31, 2015, by correspondence with the custodian. An audit also includes assessing the accounting principles used and significant estimates made by management, as well as evaluating the overall financial statement presentation. We believe that our audits provide a reasonable basis for our opinion.
In our opinion, the financial statements and financial highlights referred to above present fairly, in all material respects, the financial position of Golub Group Equity Fund as of January 31, 2015, the results of its operations for the year then ended, the changes in its net assets for each of the two years in the period then ended, and the financial highlights for each of the four years in the period then ended, in conformity with accounting principles generally accepted in the United States of America.

COHEN FUND AUDIT SERVICES, LTD.
Cleveland, Ohio
March 30, 2015
20
Additional Federal Income Tax Information (Unaudited)
The Form 1099-DIV you received in January 2015 will show the tax status of all distributions paid to your account in calendar year 2014. Shareholders are advised to consult their own tax adviser with respect to the tax consequences of their investment in the Fund. As required by the Internal Revenue Code and/or regulations, shareholders must be notified regarding the status of qualified dividend income for individuals and the dividends received deduction for corporations.
Qualified Dividend Income. The Fund designates approximately 100% or up to the maximum amount of such dividends allowable pursuant to the Internal Revenue Code, as qualified dividend income eligible for the reduced tax rate of 15%.
Dividends Received Deduction. Corporate shareholders are generally entitled to take the dividends received deduction on the portion of the Fund’s dividend distribution that qualifies under tax law. For the Fund’s fiscal year 2015 ordinary income dividends, 100% qualifies for the corporate dividends received deduction.
For the year ended January 31, 2015, the Fund designated $3,477,911 as long-term capital gain distributions.
21
Trustees and Officers (Unaudited)
The Board of Trustees supervises the business activities of the Trust. Each Trustee serves as a trustee until termination of the Trust unless the Trustee dies, resigns, retires or is removed.
The following tables provide information regarding the Trustees and Officers.
The following table provides information regarding each of the Independent Trustees.
| Name, Address*, (Age), Position with Trust**, Term of Position with Trust | Principal Occupation During Past 5 Years | Other Directorships | ||
| Ira Cohen, 55, Independent Trustee, June 2010 to present. | Independent financial services consultant, since February 2005. | Trustee and Audit Committee Chairman, Griffin Institutional Access Real Estate Fund, since May 2014; Trustee for Angel Oak Funds Trust, since October 2014. | ||
| Andrea N. Mullins, 47, Independent Trustee, December 2013 to present. | Private investor; Independent Contractor, Seabridge Wealth Management, LLC, since April 2014; Principal Financial Officer and Treasurer, Eagle Family of Funds (mutual fund family) and Vice President, Eagle Asset Management, Inc. (investment adviser) each from 2004 to 2010. | None. | ||
| * | The address for each trustee and officer is 2960 N. Meridian St., Suite 300, Indianapolis, IN 46208. |
| ** | As of the date of this report, the Trust consists of 13 series. |
The following table provides information regarding the Trustee who is considered an “interested person” of the Trust, as that term is defined under the 1940 Act. Based on the experience of the Trustee, the Trust concluded that the individual described below should serve as a Trustee.
| Name, Address*, (Age), Position with Trust**, Term of Position with Trust | Principal Occupation During Past 5 Years | Other Directorships | ||
| R. Jeffrey Young, 50, Trustee and Chairman, June 2010 to present. | Principal Executive Officer and President, Valued Advisers Trust, since February 2010; Senior Vice President, Huntington Asset Services, Inc. since January 2010 and Director since May 2014; Director, Unified Financial Securities since May 2014; Chief Executive Officer, Huntington Funds since February 2010; Chief Executive Officer, The Huntington Strategy Shares since November 2010; President and Chief Executive Officer, Dreman Contrarian Funds, from March 2011 to February 2013; Trustee, Valued Advisers Trust, from August 2008 to January 2010; and Managing Director and Chief Operating Officer of Professional Planning Consultants, from 2007 to 2010. | Trustee and Chairman, Capitol Series Trust, since September 2013. | ||
| * | The address for each trustee and officer is 2960 N. Meridian St., Suite 300, Indianapolis, IN 46208. |
| ** | As of the date of this report, the Trust consists of 13 series. |
22
The following table provides information regarding the Officers of the Trust:
| Name, Address*, (Age), Position with Trust,** Term of Position with Trust | Principal Occupation During Past 5 Years | Other Directorships | ||
| R. Jeffrey Young, 50, Trustee and Chairman, June 2010 to present; Principal Executive Officer and President, Valued Advisers Trust since February 2010; | Senior Vice President, Huntington Asset Services, Inc., since January 2010 and Director since May 2014; Director, Unified Securities, since May 2014; Chief Executive Officer, Huntington Funds, since February 2010; Chief Executive Officer, The Huntington Strategy Shares, since November 2010; President and Chief Executive Officer, Dreman Contrarian Funds, from March 2011 to February 2013; Trustee, Valued Advisers Trust, from August 2008 to January 2010; and Managing Director and Chief Operating Officer of Professional Planning Consultants, from 2007 to 2010. | Trustee and Chairman, Capitol Series Trust, since September 2013. | ||
| John C. Swhear, 53, Chief Compliance Officer, AML Officer and Vice President, August 2008 to present. | Vice President of Legal Administration and Compliance for Huntington Asset Services, Inc., the Trust’s administrator, since April 2007 and Director since May 2014; Chief Compliance Officer of Unified Financial Securities, Inc., the Trust’s distributor, since May 2007 and Director since May 2014; President, Unified Series Trust, since March 2012, and Senior Vice President from May 2007 to March 2012; Chief Compliance Officer and AML Officer, Capitol Series Trust, since September 2013; Secretary, Huntington Funds, from April 2010 to February 2012; President and Chief Executive Officer, Dreman Contrarian Funds, from March 2010 to March 2011, and Vice President and Acting Chief Executive Officer, from 2007 to March 2010. | None. | ||
| Carol J. Highsmith, 49, Vice President, August 2008 to present; Secretary, March 2014 to present | Employed in various positions with Huntington Asset Services, Inc., the Trust’s administrator, since November 1994; currently Vice President of Legal Administration; Secretary, Cross Shore Discovery Fund since May 2014. | None. | ||
| Matthew J. Miller, 38, Vice President, December 2011 to present. | Employed in various positions with Huntington Asset Services, Inc., the Trust’s administrator, since July 1998; currently Vice President of Relationship Management; Vice President, Huntington Funds, since February 2010; President and Chief Executive Officer, Capitol Series Trust, since September 2013. | None. | ||
| Bryan W. Ashmus, 42, Treasurer and Principal Financial Officer, December 2013 to present. | Vice President, Financial Administration, Huntington Asset Services, Inc., the Trust’s administrator, since September 2013; Chief Financial Officer and Treasurer, The Huntington Strategy Shares and The Huntington Funds, since November 2013; Vice President, Treasurer Services, Citi Fund Services Ohio, Inc., from May 2005 to September 2013. | None. | ||
| * | The address for each trustee and officer is 2960 N. Meridian St., Suite 300, Indianapolis, IN 46208. |
| ** | As of the date of this report, the Trust consists of 13 series. |
OTHER INFORMATION
The Fund’s Statement of Additional Information (“SAI”) includes additional information about the trustees and is available without charge, upon request. You may call toll-free at (866) 954-6682 to request a copy of the SAI or to make shareholder inquiries.
23
VALUED ADVISERS TRUST
PRIVACY POLICY
The following is a description of the policies of the Valued Advisers Trust (the “Trust”) regarding disclosure of nonpublic personal information that shareholders provide to a series of the Trust (each, a “Fund”) or that the Fund collects from other sources. In the event that a shareholder holds shares of a Fund through a broker-dealer or other financial intermediary, the privacy policy of the financial intermediary would govern how shareholder nonpublic personal information would be shared with nonaffiliated third parties.
Categories of Information A Fund May Collect. A Fund may collect the following nonpublic personal information about its shareholders:
| • | Information the Fund receives from a shareholder on applications or other forms, correspondence, or conversations (such as the shareholder’s name, address, phone number, social security number, and date of birth); and |
| • | Information about the shareholder’s transactions with the Fund, its affiliates, or others (such as the shareholder’s account number and balance, payment history, cost basis information, and other financial information). |
Categories of Information A Fund May Disclose. A Fund may not disclose any nonpublic personal information about its current or former shareholders to unaffiliated third parties, except as required or permitted by law. A Fund is permitted by law to disclose all of the information it collects, as described above, to its service providers (such as the Fund’s custodian, administrator, transfer agent, accountant and legal counsel) to process shareholder transactions and otherwise provide services to the shareholder.
Confidentiality and Security. Each Fund shall restrict access to shareholder nonpublic personal information to those persons who require such information to provide products or services to the shareholder. Each Fund shall maintain physical, electronic, and procedural safeguards that comply with federal standards to guard shareholder nonpublic personal information.
Disposal of Information. The Funds, through their transfer agent, have taken steps to reasonably ensure that the privacy of a shareholder’s nonpublic personal information is maintained at all times, including in connection with the disposal of information that is no longer required to be maintained by the Funds. Such steps shall include, whenever possible, shredding paper documents and records prior to disposal, requiring off-site storage vendors to shred documents maintained in such locations prior to disposal, and erasing and/or obliterating any data contained on electronic media in such a manner that the information can no longer be read or reconstructed.
24
PROXY VOTING
A description of the policies and procedures that the Fund uses to determine how to vote proxies relating to portfolio securities and information regarding how the Fund voted those proxies is available without charge upon request by (1) calling the Fund at (866) 954-6682 and (2) from Fund documents filed with the Securities and Exchange Commission (“SEC”) on the SEC’s website at www.sec.gov.
Trustees
R. Jeffrey Young, Chairman
Ira Cohen
Andrea N. Mullins
Officers
R. Jeffrey Young, Principal Executive Officer and President
Bryan W. Ashmus, Principal Financial Officer and Treasurer
John C. Swhear, Chief Compliance Officer, AML Officer and Vice-President
Carol J. Highsmith, Vice President and Secretary
Matthew J. Miller, Vice President
Investment Adviser
Golub Group, LLC
1850 Gateway Drive, Suite 100
San Mateo, CA 94404
Distributor
Unified Financial Securities, Inc.
2960 North Meridian Street, Suite 300
Indianapolis, IN 46208
Independent Registered Public Accounting Firm
Cohen Fund Audit Services, Ltd.
1350 Euclid Avenue, Suite 800
Cleveland, OH 44115
Legal Counsel
The Law Offices of John H. Lively & Associates, Inc.,
A member firm of The 1940 Act Law GroupTM
11300 Tomahawk Creek Pkwy, Suite 310
Leawood, KS 66211
Custodian
Huntington National Bank
41 S. High St.
Columbus, OH 43215
Administrator, Transfer Agent And Fund Accountant
Huntington Asset Services, Inc.
2960 North Meridian Street, Suite 300
Indianapolis, IN 46208
This report is intended only for the information of shareholders or those who have received the Fund’s prospectus which contains information about the Fund’s management fee and expenses. Please read the prospectus carefully before investing.
Distributed by Unified Financial Securities, Inc.
Member FINRA/SIPC
ANNUAL REPORT
January 31, 2015

Angel Oak Multi-Strategy Income Fund
Angel Oak Capital Advisors, LLC
One Buckhead Plaza
3060 Peachtree Road NW
Suite 500
Atlanta, GA 30305
(404) 953-4900
2015 Outlook
The Angel Oak Multi-Strategy Income Fund (the “Fund”) delivered solid performance for the fiscal year ended January 31, 2015, with the Institutional shares (ANGIX) returning 4.60% and the A shares (ANGLX) returning 4.41%, while its benchmark, the Barclays U.S. Aggregate Bond Index1, returned 6.61% over the same time period.
In the face of the very different rate and duration-driven return environments of 2013 and 2014, ANGIX delivered consistent 3.9% to 7.8% total returns each year. In contrast, the Fund’s benchmark was down 2% in 2013, as interest rates increased. Conversely, during 2014’s interest rate declines, the Fund’s benchmark gained approximately 6%.
Throughout both periods, ANGIX demonstrated minimal correlation2 to interest rates, as its returns were driven by the low-volatility, high-current-income profile of its structured credit instruments.
Looking back to 2014
In 2014, the markets continued their focus on the Federal Reserve’s influence over interest rates. There was much debate over rate direction, with the 10-year U.S. Treasury note giving back the gain it had reached by the end of 2013. Depending on which way investors anticipated rates moving, fixed-income portfolios were affected differently. Investors that anticipated rates staying low in 2014 were the clear winners, but in our opinion, the bet on lower interest rates, meant investors assumed more risk.
Over the course of the past year, a number of economic perceptions began to diverge between the Fed and the marketplace. Viewing domestic economic growth, increasing employment and a housing recovery in optimistic terms, the Fed saw the proverbial glass as half full. On the other hand, the markets generally saw the glass as half empty due to weaker overseas growth prospects and a variety of vexing geopolitical problems. Periodic, positive data reports on employment, such as U.S. GDP growth, the housing market and consumption, were often overlooked by a marketplace more concerned with distant global challenges.
| 1 | The Barclays U.S. Aggregate Bond Index is comprised of securities from the Barclays Government/Corporate Bond Index, Mortgage Securities Index, and the Asset Based Index. Total return includes price appreciation/depreciation and income as a percentage of the original investment. Indices are rebalanced monthly by market capitalization. The index is unmanaged and, unlike the Fund, is not affected by cash flows. It is not possible to invest directly in an index. Investments cannot be made in an index. |
| 2 | Correlation measures how closely in tandem the values of a security move in relation to each other over time. A correlation of +1 indicates the two returns move perfectly together, 0 (zero) indicates the movements are entirely random, or not at all correlated, and -1 indicates equal movement in opposite directions. |
1
While we expect to see a comparable level of volatility continue through 2015, one welcome theme did begin emerging at year-end: the return of non-correlative behavior among asset classes and geographies after years of moving in lockstep.
Correlations finally breaking down
We saw the first signs of a breakdown in correlation toward the end of 2014, led by the massive decline in oil prices. The initial response to this drop was the knee-jerk reaction of the herd: High-yield bonds, equities and emerging markets, whether related to energy or not, all suffered in the immediate risk-off environment. Certain asset classes, however, such as non-agency Residential Mortgage-Backed Securities (“RMBS”) and Commercial Mortgage-Backed Securities (“CMBS”), held their ground. Within a couple of days, we saw markets isolating energy-related equities, bonds and geographies. Finally, other equities and asset classes came roaring back to life as the markets paid more attention to the underlying fundamentals across various sectors and geographies.
For 2015, we anticipate a continued shift away from the recent over-correlation of risk-on assets. Since the financial crisis of a half-decade ago, the correlation among different asset classes and geographies has grown especially strong. When the Fed and other central banks intervened in the markets with an unprecedented series of Quantitative Easing (“QE”) policies, investors generally followed the herd toward a risk-on stance involving all asset classes, including equities, commodities, high yield “junk” bonds and emerging market securities. At the first sign of trouble – whether it was the U.S. ratings downgrade, the Eurozone crisis of 2011 or Fed QE tapering in 2013 – the herd assumed a risk-off attitude and sold all asset classes indiscriminately. Soon the behaviors of most asset classes and countries grew closely correlated as year-over-year equities, commodities, high-yield bonds, emerging markets, CMBS and RMBS all outperformed or underperformed as a group, depending on global risk tolerance.
We believe returns will not be driven only by broad increases or decreases in macro-risk premiums and supply technical, as they have been since the crisis. Even as central banks diverge, with the Fed getting ready to start tightening just as the European Central Bank starts kicking its own monetary easing program into high gear, other regions around the globe are diverging in their growth patterns. Europe and Russia are both facing a major slowdown, for example, just as the U.S. and some emerging markets see continued growth. We further believe that more focus on fundamentals and differentiation within equity sectors, global and domestic markets and high-yield corporate bonds, RMBS, CMBS, and Collateralized Loan Obligations (“CLOs”) can be expected as well, based on their underlying credit exposures.
As this breakdown in correlation continues through 2015, we believe that active investment selection based on bottom-up, fundamental analysis will emerge as the primary driver behind investment performance.
2
All eyes on The Fed
The Fed’s extraordinarily accommodative monetary policy, particularly QE has been a historic volatility depressant in the current post-crisis period. As illustrated below, even though interest rate volatility fell to historic lows during the year, it began rising again in the fall of 2014, after the Fed’s historic QE program came to a close.
We believe volatility has increased because of one particular elephant in the interest rate room: the uncertainty surrounding the future supply and demand of agency mortgages.
As a result of QE, the Fed has become the largest single participant in the agency mortgage market over the past three years. Currently, the Fed owns approximately $2 trillion in agency mortgages, representing about 37% of the agency mortgage market. Based on current prepayment speeds, the Fed’s portfolio is paying down debt at a rate of approximately $20 billion per month, nearly enough to absorb all of the mortgage origination supply in the U.S.
With its enormous purchasing capacity, the Fed has distorted both the market for mortgages and, subsequently, volatility. By not hedging the optionality of the mortgage-backed securities it owns, the Fed has placed downward pressure on volatility. Moreover, for six years the Fed has been on hold at 0% with the one rate it does control directly, the federal funds target rate. The Fed has been very clear that it plans to keep its target rate and its overall monetary policy in an extraordinarily accommodative posture for a considerable time. The result is the Fed will continue to be cautious, selective and patient in its approach to raising rates.
While the lack of mortgage hedging and an ultra-accommodative target rate has caused volatility to plummet in the post-crisis period, in our view, this will likely change going forward.
Confused and complacent, the markets have correctly banked on Fed dovishness. We believe, however, that this period of extremes is coming to an end.
The Fed’s softer language, which counsels “patience,” may be setting the tone for a midyear interest rate hike. However, median fed funds projections have come down significantly. Even with a much more reasonable trajectory, there is a disparity in the dots, ranging from a 0.50% to a 4.00% fed funds rate by the end of 2016. The pace and trajectory of Fed hikes can help soften the blow of an initial rate move by forecasting a slower pace and potentially lowering the terminal fed funds rate.
Regardless of the disparity in rate hike projections, the Fed’s extraordinarily accommodative monetary policy appears to be working. The growth data ended 2014 with a bang. Driven in part by acceleration in consumer spending, the U.S. economy expanded at a 5% seasonally adjusted rate by the end of the third quarter, its strongest
3
pace since 2003. Having dropped approximately 13% in the third quarter, gasoline prices fell another 36% in the fourth quarter, providing additional spending resources to consumers for continued growth in the near term.
Despite the robust growth data, however, inflation data continued to bounce along the bottom. The core personal consumption expenditures price index (“PCE”), the Fed’s preferred inflation gauge, fell to 1.4% in November, from 1.6% in October. This marked the 31st straight month that the core PCE missed the Fed’s 2.0% target. Many market analysts in search of signs of impending Fed tightening have chosen to disregard the low inflation data in favor of focusing on the growth data. We think such pundits may be better served by recollecting the Fed’s dual mandate to hold employment to a maximum level and to maintain price stability. While the Fed appears to have made progress on the unemployment front, there clearly is more work to do on the inflation side.
The fundamentals of this recovery remain positive despite the lack of wage gains, relatively non-existent inflation and a 50% drop in gasoline prices over the past six months. We believe inflation data will begin to trend downward in 2015 because of the falling price of crude oil. We anticipate that the Fed will fail to adhere to its price stability mandate for an extended period, which will give it a tremendous amount of flexibility to attain maximum employment and rid the labor markets of its post-crisis slack.
Structured Credit still in favor for 2015
An overweight to the structured credit markets such as RMBS, CMBS and CLOs improved portfolio income for ANGIX in 2014. However, the Fund’s lower sensitivity to interest rates (duration3) relative to the benchmark proved negative to performance.
Non-agency RMBS were the portfolio’s best-performing asset class. Management’s decision to continue a major allocation of 55-70% to the sector throughout the year proved positive for performance, as the asset class’s price volatility remained muted, its correlation to interest rates stayed minimal and price appreciation added to total return in 2014.
For the remainder of the portfolio, an increased exposure to non-agency CMBS improved the Fund’s total return by more than 1.00%, which proved to be a major benefit for Fund shareholders.
Throughout the first half of 2014, the Fund decreased exposure to CLOs, but not for fundamental reasons. As an explosion of new CLOs dramatically increased supply, we
| 3 | Duration is a measure, expressed as a number of years, of the sensitivity of the price of a fixed-income investment to a change in interest rates. The larger the duration number, the greater the interest-rate risk or reward for bond prices. |
4
expected additional pressures to be placed on spreads while anticipating that investor demand would remain the same. Our decrease in allocation during this high-supply period contributed to the Fund’s performance.
| YTD 12/31/2014 | ||||||||||||
Asset Class | Allocation % | Total Return | Attribution To Fund | |||||||||
ABS Other | 2.69 | % | 9.99 | % | 0.27 | % | ||||||
CLO | 14.79 | % | 2.23 | % | 0.33 | % | ||||||
CMBS | 21.79 | % | 9.64 | % | 2.10 | % | ||||||
Corporated | 2.55 | % | 4.47 | % | 0.11 | % | ||||||
NA CMO | 68.15 | % | 7.53 | % | 5.13 | % | ||||||
Rate Hedge | -1.12 | % | ||||||||||
Net Total Return | 5.84 | % | ||||||||||
Data reflects estimated performance for the Angel Oak Multi Strategy Income Fund – Class I (ANGIX)
Looking forward to 2015, we will continue to position the Fund within the floating-rate structured credit category while maintaining caution toward higher-rate, longer-term durations in anticipation of an eventual return to a higher-interest-rate environment over the next two years. The key question for investors then might be “What should be done in an environment characterized by a modestly improving economy, interest rate volatility and the beginnings of some divergence in risk appetite?”
FOR ANGEL OAK, OUR ANSWER IS AS FOLLOWS:
® Overweight current income and cash flow through the volatility. We believe that anyone can be right about an interest rate call. (If they are not, just wait 15 minutes). Our preference is to avoid the noise and conjecture around rates and just endeavor to earn outsized income through the rate storm. That said, we intend to position the portfolio for eventually higher interest rates.
® Focus on value and fundamentals when valuations become less justifiable. Fundamentals are improving, but the market and media remain skeptical of the recovery in housing. This has the effect of setting low expectations on home prices, voluntary prepayments, the Millennial generation’s lack of household formation, wage growth and access to credit. On the other hand, it also represents a ripe environment for opportunity and a solid entry point in vintage mortgages, as well as new outside-the-box originations.
From the entry point perspective, the trading tone for structured credit has been rather listless for the past 12 months. While we have not seen any over exuberance in equities, emerging markets and high-yield bonds year over year, we believe that the weaker tone in structured credit during the third and fourth quarters of 2014 will set the stage for a stronger tone in the first half of 2015.
5
Structured credit’s current lower visibility and reduced liquidity, caused by a lack of participation from the “herd,” offers the potential for outsized opportunities throughout 2015. In addition to traditional structured credit, we continue to look at off-the-beaten-path opportunities, such as Corporate credit in the regional financial sector (Regional and Community Banks).
Legacy RMBS point to opportunity
The year 2015 should bring about continued expansion in mortgage credit. The overwhelming majority of legacy borrowers have been unable to access the mortgage market since 2007, creating higher pent-up demand among Alt-A, Option ARM and sub-prime borrowers.
The best prime borrowers have had access to mortgage credit for years, leading to sustained Voluntary Prepayment Rate4 (“VPR”) speeds well into the double digits. While we expect to see some burnout in these speeds in 2015, there is also a risk of adverse selection as the loan count in these pools continues to dwindle, bringing large extension risks into play.
Fixed rate deals tend to have lower Home Price Index (“HPI”) Loan-to-Value5 (“LTV”) ratios than other sectors, driven by a lower interest-only percentage. The amortizing mortgages here closely mirror the mortgages already available in today’s markets, which makes the economic benefits of refinancing clearer – since these bonds still trade at a discount to par.
Home Price Appreciation (“HPA”) growth is expected to slow down (3-4% per year by most forecasts) over the next few years. Despite this drop in the pace of appreciation, we do not anticipate that the dip will put a halt to the double-digit recovery that got underway in the 2011 to 2013 time frame. Instead, this slowdown will more than likely make home affordability still possible, allowing for the continued conversion of renters into owners.
HERE IS HOW WE WILL CONTINUE TO PURSUE OUTPERFORMANCE WITHIN THE SECTOR IN 2015:
1. Focus on bonds with greater upside potential from increasing VPRs. With the rate curve still very steep (though likely to flatten in 2015), the shortening from increased VPRs can have a material impact on price. Alt-A fixed rate collateral and floaters derived from fixed rate collateral provide similar upside to hybrids in a rising-rate
| 4 | Voluntary Prepayment Rate is a measure of the proportion of principal of a pool of loans that is assumed to be voluntarily paid off prematurely in a given period. |
| 5 | A Loan to Value ratio is a measure of lending risk used by financial institutions in consideration of approving a mortgage. Higher LTVs are generally seen as higher risk and therefore may carry a higher interest rate or other conditions. |
6
environment, even while they are backed by higher Weighted Average Coupon6 (WAC) borrowers with higher amortization components. We believe this should translate to a more immediate pull-through of mortgage credit expansion. These bonds also trade well below their projected principal recovery. The fixed rate bonds provide high current carry and offer enough of a credit play to be less sensitive to minor changes in rates than their prime counterparts.
2. Simplified Supervisory Formula Approach Plays. Banks are beginning to migrate from the traditional rating-agency-based approach to a more credit-based structural approach to risk weighting of credit assets. Pay Option Adjustable Rate Mortgages (POA) and sub-prime mortgages have favorable structures that will result in a number of below-investment-grade securities being treated favorably by this new approach. The potential for a new class of real-money buyers to (re)enter the space creates the opportunity for additional spread tightening in these profiles.
With the current allocation to non-Agency mortgages that have the highest potential to increase VPRs in 2015, the Fund has offset that position with a smaller allocation of non-agencies designed to outperform in the event VPRs remain low and produce very high current income. We believe this barbell positioning improves current carry while providing a hedge against the possibility of prepayment speeds remaining low throughout 2015.
Surge in new CLO issue volume
The surge in new issue volume was the main story for CLOs for 2014. Following a slow start due to Volcker Rule7-related uncertainty, the CLO market came roaring back in February 2014 and did not miss a beat for the entire year. Ending the year with $142 billion of global new issuance of which $122 billion was in U.S. dollars; CLOs eclipsed their pre-crisis record of $94 billion.
While most market participants agreed that CLO spreads were cheap versus those of comparable asset classes, the constant wave of supply pushed CLO spreads even wider over the course of 2014. The spread widening was apparent across all tranches8, but it
| 6 | Weighted Average Coupon is a weighted-average gross interest rate of a pool of mortgages underlying a Mortgage Backed Security (MBS) at the time the securities were issued. The weighted average is based on the principal balance of each underlying mortgage. |
| 7 | The so-called Volcker rule is a federal regulation that prohibits banks from conducting certain investment activities within their own accounts, and limits their ownership of hedge funds and private equity funds. The rule’s purpose is to prevent banks from making certain types of speculative investments that may have contributed to the 2008 financial crisis. |
| 8 | A tranche is one portion of several related securities that are offered at the same time but which have different risks, rewards and/or maturities. |
7
was most pronounced in the lower-rated part of the capital structure, including BBB, BB and single B ratings.
The higher-income nature of these bonds still allowed them, on average, to eke out a positive total return for the year despite price decreases. Our decision to reduce our CLO exposure early in the year and to focus purchases on higher coupon bonds, however, helped us outperform the broader CLO market for 2014. Recently, generic BBB CLO yields were approximately around Libor9+450, with BB yields around Libor+675.
Looking through 2015, we believe the fundamental backdrop for U.S. corporations remains favorable. A growing economy is positive for both earnings power and a company’s ability to service and refinance debt. We also expect defaults to remain low in 2015.
While lower oil prices could create problems for some of the more highly leveraged energy companies, any defaults within oil-and-energy related industries will be well contained within a majority of CLOs, given their diversification requirements and the lower weight of oil- and gas-related credits in CLOs. The oil and gas industry has an average weight of approximately 5% across all post-crisis CLOs versus a weight upwards of 16% in the high-yield bond universe. We believe both industry and issuer-level diversification and credit enhancement will enable CLOs to withstand isolated defaults without a meaningful impact on performance.
Bullish on CMBS
We remain bullish on CMBS spreads in 2015 despite the generally tightening spreads we experienced in 2014. While the sector is not as cheap as it once looked, we still believe that riskier credit spreads will tighten even more and the resulting credit curve10 from AAA to BBB- will continue to flatten.
HERE ARE THE FACTORS UNDERLYING OUR CMBS VIEWPOINT:
® Global economy. Continued improvement of the U.S. economy, along with lower energy costs, will be a net positive for the demands of the commercial real estate (CRE) market. However, accommodative central bank policies to keep rates reasonably lower in 2015 may force some investors to assume riskier credit positions to access incremental yield. If Treasury yields go higher, the effect could dampen some of the potential demand for CMBS.
| 9 | Libor refers to the London Interbank Offered Rate, a benchmark interest rate that some of the world’s leading banks charge each other for short-term loans. |
| 10 | A credit curve is a graphic representation of the risk of default of various bonds. When a curve is flat, it essentially indicates that the probability of default is more uniform across differently rated bonds. |
8
® CRE fundamentals. Improved fundamentals and the lack of new post-financial-crisis construction will be supportive for CRE prices. We expect this trend to continue through 2015, especially in secondary and tertiary locations and markets. Additionally, lower Treasury yields may prompt CRE borrowers to prepay their loans to lock in lower rates or monetize higher real estate values. Foreign investments, too, will contribute to this trend, especially among higher-quality properties in primary locations.
® Underwriting standards. With lending becoming more available across multiple sources, issuance is expected to be robust in 2015, perhaps well over $100 billion. We do not think that the impending “wall of maturities” from loans will prove to be a credit problem. However, we believe this competitive backdrop will only drive rating agency “stress” LTVs to higher levels. The additional supply will also force “tiering” across new issue deals in order to grow. Investors may become more selective across deals, which could contribute to unwanted spread volatility.
® Standard & Poor’s rating change? This will be the X factor of 2015 for CMBS. While still too early to predict, a pending SEC investigation can be of minor impact or potentially very damaging, especially if S&P is forced to withdraw ratings from all its rated CMBS bonds.
In the new issue sector, we currently favor BBB- bonds, especially from 2011-2012, which we believe are poised to benefit from increased refinancing activity and ultimately have a higher CE percentage. By adhering to our disciplined approach on 2013-2014 names, we believe our higher-tiered deals will outperform the cohort. In the legacy sector (bonds issued pre-crisis 2008), we favor senior mezzanine (AM) bonds in the legacy sector that were originally AAA rated and created with 20% CE, which should benefit from the increased refinancing activity we expect to see in 2015. These 1-2 year weighted average life11 (WAL) bonds will roll down each month methodically and should have good potential to trade much tighter, as the original last cash flow (LCF) AAA are now the current pay class.
New Opportunities
NEW ORIGINATION IN NON-PRIME NON-AGENCY MORTGAGES, GREATEST DISLOCATION IN YEARS
Echoing what we mentioned earlier in the legacy non-agency RMBS market, we believe 2015 should see continued expansion of the mortgage lending credit box. Generally only prime and superprime borrowers have been able to access credit since
| 11 | Weighted Average Life refers to the average number of years for which each dollar of unpaid principal on a loan or mortgage remains outstanding. Once calculated, WAL indicates how many years it will take to pay half of the outstanding principal. |
9
the financial crisis, while most near-prime (Alt-A) and non-prime borrowers continue to stand on the sidelines of the housing recovery.
The Alt-A and sub-prime market reached $200 billion-plus per year prior to the crisis, and while we do not anticipate a return to pre-crisis levels in the near term, we believe the market is vastly underserved and likely to grow at least by a few billion dollars in 2015.
In 2014, we observed the first signs of the credit box opening up ever so slightly by experienced non-bank mortgage originators, giving borrowers a chance to participate in the recovery. Due to the very tight credit parameters today, big banks no longer have the appetite or the skill set required to underwrite these mortgages. Instead, an opportunity has been created for non-bank lenders to offer credit to strong borrowers within very compelling risk/return parameters.
New origination in this space is driven by strong credit underwriting, higher coupons, and lower LTVs. Borrowers in this category tend to put more equity in their homes, and do not rely on property appreciation and a housing recovery — which makes for a very favorable risk profile with elevated returns.
Our team continues to see this trend picking up speed and greater volume through 2015. Our team has developed a proprietary Angel Oak Model for Prepayment and Default (AMPD), based on over 400,000 vintage home loans, that gives us a distinct perspective on estimating default rates, voluntary prepayments, and severities for these new loan originations and purchases.
With continued access to sourcing quality non-agency mortgages and committed capital for both equity and financing, we believe Angel Oak is particularly well positioned. We saw capital investments in the form of financing leverage and warehouse lines start to open up for qualified mortgage originators and investors in the second half of 2014, and we strongly believe this trend will continue in 2015 as the markets gain more comfort with the credit and performance of these loans.
We believe current investors will be rewarded by high current income from higher coupons as well as potential capital appreciation with broader market acceptance and the return of securitization in this space. As first movers, we may have an advantage of helping set acceptable credit standards and risk/return profiles while seizing a chance to grow with the market from zero to a reasonable size.
THE EMERGING ASSET CLASS OF CORPORATE CREDIT TO REGIONAL AND COMMUNITY BANKS
In 2014 we began ramping up our allocation to corporate credit to regional and community banks. This exposure includes everything from publicly rated offerings to unrated private placements. The subordinated debt offerings of community banks have clearly begun to emerge after a dearth of issuance during most of the post-crisis period.
10
For example, in 2014 issuance began in the summer and rose from $0 to approximately $1.8 billion within six months. Systemically important financial institutions (SIFI’s), all of which are household names, have been very active capital market participants since the darkest days of the credit crisis, utilizing their wholesale funding expertise by issuing a variety of forms of capital to weather the deflationary fallout from the credit crisis.
In contrast, community banks, due to their size and lack of capital markets expertise, had been mostly restricted to private or public equity and Troubled Asset Relief Program (TARP) in the post-crisis period. Prior to the credit crisis, community banks were actively issuing Trust Preferred Securities12 (TruPS) to bolster Tier 1 capital without diluting existing shareholders. Community bank TruPS issuance peaked at $140 billion in the pre-crisis period, of which approximately $100 billion remains outstanding. Issuance of TruPS, however, collapsed during the crisis as credit conditions and community bank performance deteriorated.
Moreover, the Dodd-Frank Act featured a provision that excluded TruPS from the regulatory capital of bank holding companies. Although community banks with assets of less than $15 billion are allowed to treat previously issued TruPS as Tier 1 capital, they are prevented from including future TruPS issuance in Tier 1. Going forward, community banks will have very few alternatives for Tier 1 and Tier 2 capital: common equity, preferred equity and subordinated debt. As credit conditions begin to thaw and Basel III capital requirements become clearer, these community banks will need to issue more subordinated debt to meet stricter capital requirements, to implement growth and acquisition plans, and to redeem legacy TruPS and TARP.
Subordinated debt represents an extremely attractive form of capital for community banks. Considered to belong in Tier 2 capital, subordinated debt doesn’t dilute existing shareholders and interest payments are tax deductible.
We think community bank subordinated debt represents a particularly attractive fixed income alternative for investors. On the surface, these unrated offerings can deter large investors and increase the liquidity premium. As new issuances without an active secondary market presence, they are also perceived as illiquid. However, while large investors may lack an understanding of the role of subordinated debt in small bank operations, we believe this is precisely what makes this somewhat-overlooked asset class so attractive.
| 12 | Trust Preferred Securities, or TruPS, are securities similar to debentures and preferreds that are generally longer term, include early redemption features, make quarterly fixed interest payments, and mature at face value. These securities are taxed like debt obligations but maintain the appearance of equities on a company’s financial statements. |
11
At Angel Oak, we look to exploit the same kind of ratings arbitrage strategies in this asset class that we employ on the structured credit side. We also have a keen understanding of the community banking industry, since many of the members of our team have either worked with, or managed, large and small community bank investment portfolios. We believe we have the skill set required to properly underwrite the credits, independent of rating agency opinions.
Further, due to the regulated nature of the industry, there is a tremendous amount of readily available financial information for even the smallest banks. The culture of risk aversion that pertains to these institutions due to their regulatory restrictions should also work to the benefit of debt holders.
We also favor subordinated debt because it can be cross-defaulted to other senior obligations of a bank. This means that despite the fact that subordinated debt is lower in a firm’s capital structure, the cross-default clause protects investors from banks’ potentially defaulting on the subordinated debt by mandating continued payments on the senior obligations.
From a top-down perspective, as is the case with the rest of our exposures, we believe banks are at a very different point in the credit cycle as they recover from the near-death experience of the credit crisis. By choice – or by decree – in wake of the 2007-2008 global economic downturn, we believe this sector is going to be far more stable than it was before. Never before have we seen so many restrictions on bank activity. Higher capital requirements, increased regulatory oversight and enhanced loan underwriting standards all contribute to a much more conservative approach to pursuing investment performance.
Asset quality, as measured by non-performing assets and charge-offs, continues to improve at many banks as we now rapidly approach pre-crisis levels of asset quality.
Bank balance sheet structures have also changed. Deposits have swelled since 2007 as banks have reshaped their liabilities to access more stable funding sources while substantially increasing allocation to shorter-term, more liquid assets over the past few years. While greater restrictions and more stringent balance sheet requirements may make equity investors nervous, these heightened regulatory impositions should prove very positive to debt holders.
Finally, banks will continue to benefit from the extraordinary reflationary policies of the Federal Open Market Committee (FOMC) of the Fed and from an increasingly robust climate for M&A activity in the coming years. This should only enhance our credits as larger banks continue to acquire smaller banks in order to achieve the much-needed scale required to survive in the new utility model of banking that regulators are encouraging – and mandating.
12
Closing Thoughts
We have often spoken and further anticipate more interest rate volatility in 2015, brought about by the timing uncertainty around monetary tightening and a huge (but less publicized) supply/demand technical in agency mortgages.
We’re delighted to see correlations in risk assets, and notably much of the structured credit that Angel Oak sources continues to march to the beat of its own drum (versus areas like high-yield corporates), and we expect this trend of macro risk insulation to continue in the coming year as we keep our eyes on fundamental credit improvement and allow valuations to catch up to this improvement over time.
Importantly, we foresee many new opportunities for income and total return in 2015 and pride ourselves on identifying some of those off-the-beaten-path opportunities, like subordinated bank debt. Still, we continue to gravitate toward legacy RMBS as the fundamentals and technicals favor the sector. We are not afraid to have such a confident view. Surprising to many, the average dollar price in ANGIX remains at $82, as we believe opportunities abound.
We remain steadfast in minimizing fund duration while achieving returns through deliberate credit investing. Interest rate gambles are not Angel Oak’s business. With that, we wish everyone a prosperous 2015.
Brad Friedlander
Head Portfolio Manager
Berkin Kologlu
Portfolio Manager
Ashish Negandhi
Portfolio Manager
Performance data represents past performance. Past performance does not guarantee future results. Current performance may be lower or higher than performance data quoted. The investment return and principal value of an investment in the Fund will fluctuate so that in investor’s shares, when redeemed, may be worth more or less than their original cost. Performance data current to the most recent month end may be obtained by calling 1-888-685-2915.
13
Investment Results – (Unaudited)
Total Returns*
(For the periods ended January 31, 2015)
| Average Annual Returns | ||||||||||||
| One Year | Three Year | Since Inception (June 28, 2011) | ||||||||||
Angel Oak Multi-Strategy Income Fund, Class A without load | 4.41 | % | 9.83 | % | 10.74 | % | ||||||
Angel Oak Multi-Strategy Income Fund, Class A with load | 2.06 | % | 7.69 | % | 8.93 | % | ||||||
Barclays Capital U.S. Aggregate Bond Index** | 6.61 | % | 3.07 | % | 4.03 | % | ||||||
Total annual operating expenses, as disclosed in the Fund’s prospectus dated May 30, 2014, were 1.92% of average daily net assets (1.69% after fee waivers/expense reimbursements by the Adviser. The Adviser has contractually agreed to waive or limit its fees and assume other expenses of the Fund until May 31, 2015, so that total annual fund operating expenses do not exceed 0.99%. This operating expense limitation does not apply to brokerage fees and commissions, borrowing costs (such as interest and dividend expenses on securities sold short), taxes, 12b-1 fees, extraordinary expenses and indirect expenses (such as “acquired fund fees and expenses”). This contractual arrangement may only be terminated by mutual consent of the Adviser and the Board of Trustees of the Fund, and it will automatically terminate upon the termination of the investment advisory agreement between the Fund and the Adviser.
Total Returns*
(For the periods ended January 31, 2015)
| Average Annual Returns | ||||||||
| One Year | Since Inception (March 14, 2012) | |||||||
Angel Oak Multi-Strategy Income Fund, Class C without load | 3.53 | % | 7.70 | % | ||||
Angel Oak Multi-Strategy Income Fund, Class C with load | 2.54 | % | 7.70 | % | ||||
Barclays Capital U.S. Aggregate Bond Index** | 6.61 | % | 3.35 | % | ||||
14
Investment Results – (Unaudited) (continued)
Total annual operating expenses, as disclosed in the Fund’s prospectus dated May 30, 2014, were 2.67% of average daily net assets (2.44% after fee waivers/expense reimbursements by the Adviser). The Adviser has contractually agreed to waive or limit its fees and assume other expenses of the Fund until May 31, 2015, so that total annual fund operating expenses do not exceed 0.99%. This operating expense limitation does not apply to brokerage fees and commissions, borrowing costs (such as interest and dividend expenses on securities sold short), taxes, 12b-1 fees, extraordinary expenses and indirect expenses (such as “acquired fund fees and expenses”). This contractual arrangement may only be terminated by mutual consent of the Adviser and the Board of Trustees of the Fund, and it will automatically terminate upon the termination of the investment advisory agreement between the Fund and the Adviser.
Total Returns*
(For the periods ended January 31, 2015)
| Average Annual Returns | ||||||||
| One Year | Since Inception (August 16, 2012) | |||||||
Angel Oak Multi-Strategy Income Fund, Institutional Class without load | 4.60 | % | 6.61 | % | ||||
Barclays Capital U.S. Aggregate Bond Index** | 6.61 | % | 2.97 | % | ||||
Total annual operating expenses, as disclosed in the Fund’s prospectus dated May 30, 2014, were 1.67% of average daily net assets (1.44% after fee waivers/expense reimbursements by the Adviser). The Adviser has contractually agreed to waive or limit its fees and assume other expenses of the Fund until May 31, 2015, so that total annual fund operating expenses do not exceed 0.99%. This operating expense limitation does not apply to brokerage fees and commissions, borrowing costs (such as interest and dividend expenses on securities sold short), taxes, 12b-1 fees, extraordinary expenses and indirect expenses (such as “acquired fund fees and expenses”). This contractual arrangement may only be terminated by mutual consent of the Adviser and the Board of Trustees of the Fund, and it will automatically terminate upon the termination of the investment advisory agreement between the Fund and the Adviser.
15
Investment Results – (Unaudited) continued
The performance quoted represents past performance, which does not guarantee future results. The investment return and principal value of an investment will fluctuate so that an investor’s shares, when redeemed, may be worth more or less than their original cost. The returns shown do not reflect deduction of taxes that a shareholder would pay on Fund distributions or the redemption of Fund shares. The Fund’s investment objectives, risks, charges and expenses must be considered carefully before investing. Current performance of a Fund may be lower or higher than the performance quoted. Performance data current to the most recent month end may be obtained by calling 1-877-625-3042.
The performance above reflects any fee reductions during the applicable period. If such fee reductions had not occurred, the quoted performance would have be lower.
* Return figures reflect any change in price per share and assume the reinvestment of all distributions. Total returns for Class A shares, with load, include the maximum 5.75% sales charge (effective May 30, 2013, the maximum sales charge was reduced to 2.25%). Total returns for Class C shares, with load, assume the deduction of the maximum 1.00% deferred sales charge as if redemption took place on the last business day of the reporting period.
** The Barclays U.S. Aggregate Bond Index measures the performance of the U.S. investment-grade, fixed-rate bond market, including government and credit securities, agency mortgage pass-through securities, asset-backed securities and commercial mortgage-backed securities. Performance figures include the change in value of the bonds in the index and the reinvestment of interest. The index return does not reflect expenses, which have been deducted from the Fund’s return. You cannot invest directly in an Index; however, an individual can invest in exchange-traded funds or other investment vehicles that attempt to track the performance of a benchmark index.
The Fund’s investment objective, strategies, risks, charges and expenses must be considered carefully before investing. The prospectus contains this and other important information about the investment company and may be obtained by calling 1-877-625-3042. Please read it carefully before investing.
The Fund is distributed by Unified Financial Securities, Inc., Member FINRA.
16
Investment Results – (Unaudited) (continued)
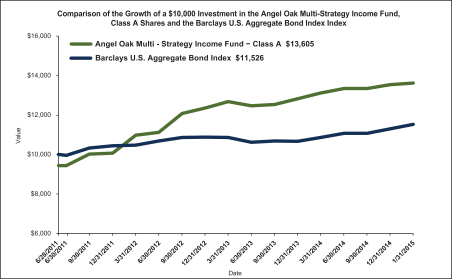
The chart above assumes an initial investment of $10,000 made on June 28, 2011 (commencement of operations) and held through January 31, 2015. THE FUND’S RETURN REPRESENTS PAST PERFORMANCE AND DOES NOT GUARANTEE FUTURE RESULTS. The returns shown do not reflect deduction of taxes that a shareholder would pay on the Fund’s distributions or the redemption of the Fund’s shares. Investment returns and principal values will fluctuate so that your shares, when redeemed, may be worth more or less than their original purchase price.
Current performance may be lower or higher than the performance data quoted. For more information on the Fund, and to obtain performance data current to the most recent month-end, or to request a prospectus, please call 1-877-625-3042. You should carefully consider the investment objective, strategies, potential risks, management fees, and charges and expenses of the Fund before investing. The Fund’s prospectus contains this and other information about the Fund, and should be read carefully before investing.
The Fund is distributed by Unified Financial Securities, Inc., member FINRA.
17
Portfolio Holdings – (Unaudited)
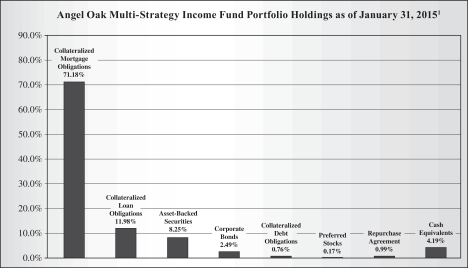
1As a percentage of total investments.
The investment objective of the Angel Oak Multi-Strategy Income Fund is current income.
Availability of Portfolio Schedule – (Unaudited)
The Fund files its complete schedule of portfolio holdings with the Securities and Exchange Commission (“SEC”) for the first and third quarters of each fiscal year on Form N-Q. The Fund’s Forms N-Q are available at the SEC’s website at www.sec.gov. The Fund’s Forms N-Q may be reviewed and copied at the SEC’s Public Reference Room in Washington DC. Information on the operation of the Public Reference Room may be obtained by calling 1-800-SEC-0330.
Summary of Fund’s Expenses – (Unaudited)
As a shareholder of a Fund, you incur two types of costs: (1) transaction costs, which may include sales charges (loads) on purchase payments, contingent deferred sales charges on redemptions; and (2) ongoing costs, including management fees, distribution and service fees; and other Fund expenses. These examples are intended to help you understand your ongoing costs (in dollars) of investing in the Fund and to compare these costs with the ongoing costs of investing in other mutual funds. This example is based on an investment of $1,000 invested at the beginning of the period, and held for the entire period from August 1, 2014 to January 31, 2015.
Actual Expenses
The “Actual” lines of the table provide information about actual account values and actual expenses. You may use the information on this line for the class of shares you
18
Summary of Fund’s Expenses – (Unaudited) (continued)
hold, together with the amount you invested, to estimate the expenses that you paid over the period. Simply divide your account value by $1,000 (for example, an $8,600 account value divided by $1,000 = $8.60), then multiply the result by the number in the “Actual” line under the heading entitled “Expenses Paid During Period” to estimate the expenses you paid on your account during this period.
Hypothetical Example for Comparison Purposes
The “Hypothetical” lines of the table provide information about hypothetical account values and hypothetical expenses based on the Fund’s actual expense ratios for each class of shares and an assumed rate of return of 5% per year before expenses, which are not the Fund’s actual returns. The hypothetical account values and expenses may not be used to estimate the actual ending account balance or expenses you paid for the period. You may use this information to compare the ongoing costs of investing in the Fund and other funds. To do so, compare this 5% hypothetical example with the 5% hypothetical examples that appear in the shareholder reports of the other funds.
Please note that the expenses shown in the table are meant to highlight your ongoing costs only and do not reflect any transactional costs. Therefore, the “Actual” and “Hypothetical” lines of the table below is useful in comparing ongoing costs only, and will not help you determine the relative total costs of owning different funds. In addition, if these transactional cost were included, your costs would have been higher.
| Angel Oak Multi-Strategy Income Fund | Beginning Account Value, August 1, 2014 | Ending Account Value, January 31, 2015 | Expenses Paid During Period(1) | Annualized Expense Ratio | ||||||||||||||
Class A | Actual | $ | 1,000.00 | $ | 1,011.70 | $ | 6.98 | 1.38 | % | |||||||||
| Hypothetical(2) | $ | 1,000.00 | $ | 1,018.27 | $ | 7.00 | 1.38 | % | ||||||||||
Class C | Actual | $ | 1,000.00 | $ | 1,007.30 | $ | 10.79 | 2.13 | % | |||||||||
| Hypothetical(2) | $ | 1,000.00 | $ | 1,014.45 | $ | 10.83 | 2.13 | % | ||||||||||
Institutional Class | Actual | $ | 1,000.00 | $ | 1,013.10 | $ | 5.76 | 1.13 | % | |||||||||
| Hypothetical(2) | $ | 1,000.00 | $ | 1,019.48 | $ | 5.78 | 1.13 | % | ||||||||||
(1) Expenses are equal to the Fund’s annualized expense ratios, multiplied by the average account value over the period, multiplied by 184/365 (to reflect the one-half year period). The annualized expense ratios reflect reimbursement of expenses by the Fund’s Adviser for the period August 1, 2014 through January 31, 2015. The “Financial Highlights” tables in the Fund’s financial statements, included in the report, also show the gross expense ratios, without such reimbursements.
| (2) Hypothetical | assumes 5% annual return before expenses. |
19
Angel Oak Multi-Strategy Income Fund
Schedule of Investments
January 31, 2015
| Principal Amount | Fair Value | |||||||
Collateralized Mortgage Obligations – 82.23% | ||||||||
Adjustable Rate Mortgage Trust, Series 2005-3, Class 7A1, 2.529%, 7/25/2035 (a) | $ | 1,876,577 | $ | 1,809,864 | ||||
Adjustable Rate Mortgage Trust, Series 2005-4, Class 3A1, 2.739%, 8/25/2035 (a) | 196,527 | 194,972 | ||||||
Adjustable Rate Mortgage Trust, Series 2005-8, Class 3A21, 2.595%, 11/25/2035 (a) | 12,129,914 | 10,418,189 | ||||||
Adjustable Rate Mortgage Trust, Series 2005-8, Class 3A1, 2.595%, 11/25/2035 (a)(b) | 17,577,294 | 15,096,856 | ||||||
Adjustable Rate Mortgage Trust, Series 2007-2, Class 1A21, 5.289%, 6/25/2037 (a) | 7,960,279 | 7,133,405 | ||||||
American Home Mortgage Assets Trust, Series 2006-2, Class XBJ, 2.647%, 9/25/2046 (I/O) (a) | 72,427,945 | 5,410,367 | ||||||
American Home Mortgage Investment Trust, Series 2004-3, Class 3A, 2.069%, 10/25/2034 (a) | 2,844,615 | 2,713,954 | ||||||
American Home Mortgage Investment Trust, Series 2005-2, Class 5A4C, 3.461%, 9/25/2035 (a) | 40,405,532 | 32,754,583 | ||||||
American Home Mortgage Investment Trust, Series 2005-2, Class 2A1, 1.738%, 9/25/2045 (a) | 1,474,906 | 1,241,424 | ||||||
American Home Mortgage Investment Trust, Series 2005-2, Class 1A1, 0.468%, 9/25/2045 (a) | 14,696,640 | 12,372,940 | ||||||
American Home Mortgage Investment Trust, Series 2005-4, Class 3A1, 0.468%, 11/25/2045 (a) | 18,093,046 | 14,609,610 | ||||||
Bank of America Alternative Loan Trust, Series 2004-3, Class 2A1, 6.000%, 4/25/2034 | 686,864 | 698,206 | ||||||
Bank of America Alternative Loan Trust, Series 2005-6, Class 5A2, 5.500%, 7/25/2035 | 2,628,342 | 2,439,220 | ||||||
Bank of America Alternative Loan Trust, Series 2005-6, Class 5A3, 5.500%, 7/25/2035 | 1,394,094 | 1,293,782 | ||||||
Bank of America Alternative Loan Trust, Series 2005-9, Class 1CB2, 5.500%, 10/25/2035 | 198,172 | 185,102 | ||||||
Bank of America Commercial Mortgage Trust, Series 2007-5, Class AJ, 5.990%, 2/10/2051 (a) | 5,000,000 | 5,128,103 | ||||||
Bank of America Commercial Mortgage Trust, Series 2007-3, Class AM, 5.591%, 6/10/2049 (a)(b) | 3,000,000 | 3,255,140 | ||||||
See accompanying notes which are an integral part of these financial statements.
20
Angel Oak Multi-Strategy Income Fund
Schedule of Investments – (continued)
January 31, 2015
| Principal Amount | Fair Value | |||||||
Collateralized Mortgage Obligations – (continued) |
| |||||||
Bank of America Funding Corp., Series 2004-C, Class 3A1, 2.876%, 12/20/2034 (a) | $ | 129,833 | $ | 116,311 | ||||
Bank of America Funding Corp., Series 2007-C, Class 4A2, 5.330%, 5/20/2036 (a) | 4,589,329 | 4,457,078 | ||||||
Bank of America Funding Corp., Series 2007-C, Class 4A3, 5.330%, 5/20/2036 (a)(b) | 27,272,131 | 26,486,230 | ||||||
Bank of America Funding Corp., Series 2006-5, Class 1A4, 6.000%, 9/25/2036 (b) | 11,504,952 | 10,338,200 | ||||||
Bank of America Funding Corp., Series 2007-D, Class 3A1, 5.561%, 6/20/2037 (a) | 322,533 | 307,571 | ||||||
Bank of America Funding Corp., Series 2007-D, Class 3A3, 5.561%, 6/20/2037 (a) | 5,462,787 | 5,209,384 | ||||||
Bank of America Mortgage Securities, Inc., Series 2004-I, Class 2A2, 2.707%, 10/25/2034 (a) | 371,799 | 373,413 | ||||||
Bank of America Mortgage Securities, Inc., Series 2005-E, Class 2A1, 2.674%, 6/25/2035 (a) | 1,268,581 | 1,223,552 | ||||||
Bank of America Mortgage Securities, Inc., Series 2005-I, Class 2A3, 2.671%, 10/25/2035 (a) | 213,909 | 193,042 | ||||||
Bank of America Mortgage Securities, Inc., Series 2005-I, Class 4A1, 4.983%, 10/25/2035 (a) | 6,373,360 | 6,155,254 | ||||||
Bank of America Mortgage Securities, Inc., Series 2006-2, Class A1, 6.000%, 7/25/2046 (a) | 7,672,267 | 7,242,382 | ||||||
Bayview Commercial Asset Trust, Series 2005-2A, Class A1, 0.478%, 8/25/2035 (a)(c) | 11,575,106 | 10,618,759 | ||||||
Bayview Commercial Asset Trust, Series 2005-4A, Class A2, 0.558%, 1/25/2036 (a)(c) | 2,940,509 | 2,608,269 | ||||||
Bayview Commercial Asset Trust, Series 2005-4A, Class A1, 0.468%, 1/25/2036 (a)(c) | 2,720,175 | 2,410,320 | ||||||
BCAP LLC Trust, Series 2006-AA2, Class A1, 0.338%, 1/25/2037 (a) | 7,045,437 | 5,644,212 | ||||||
Bear Stearns Adjustable Rate Mortgage Trust, Series 2005-1, Class 4A1, 4.315%, 3/25/2035 (a) | 2,238,313 | 2,199,613 | ||||||
Bear Stearns ALT-A Trust, Series 2005-5, Class 21A1, 2.395%, 7/25/2035 (a) | 4,675,517 | 4,542,117 | ||||||
See accompanying notes which are an integral part of these financial statements.
21
Angel Oak Multi-Strategy Income Fund
Schedule of Investments – (continued)
January 31, 2015
| Principal Amount | Fair Value | |||||||
Collateralized Mortgage Obligations – (continued) |
| |||||||
Bear Stearns ALT-A Trust, Series 2005-7, Class 22A1, 2.644%, 9/25/2035 (a) | $ | 21,939,084 | $ | 18,852,079 | ||||
Bear Stearns ALT-A Trust, Series 2005-8, | 19,112,504 | 17,038,874 | ||||||
Bear Stearns Asset Backed Securities Trust, Series 2005-AC5, Class 1A2, 0.668%, 8/25/2035 (a) | 4,841,927 | 4,014,141 | ||||||
Bear Stearns Commercial Mortgage Securities Trust, Series 2007-PW15, Class AM, | 10,270,000 | 10,666,704 | ||||||
Bear Stearns Commercial Mortgage Securities Trust, Series 2007-PW17, Class AJ, 5.898%, 6/11/2050 (a) | 5,000,000 | 5,159,565 | ||||||
Bear Stearns Mortgage Funding Trust, | 98,515,332 | 2,009,713 | ||||||
CD Commercial Mortgage Trust, Series 2006-CD3, Class AJ, 5.688%, 10/15/2048 | 4,580,000 | 4,526,961 | ||||||
CFCRE Commercial Mortgage Trust, Series 2011-C1, Class F, 5.000%, 4/15/2044 (a)(c) | 7,931,000 | 7,511,668 | ||||||
Chase Mortgage Finance Corp., Series 2005-A1, Class 1A1, 4.735%, 12/25/2035 (a) | 6,223,248 | 6,016,988 | ||||||
Chase Mortgage Finance Corp., Series 2005-A1, Class 3A1, 2.456%, 12/25/2035 (a) | 1,617,129 | 1,478,860 | ||||||
Chase Mortgage Finance Corp., Series 2007-A2, Class 7A1, 4.686%, 7/25/2037 (a) | 1,497,786 | 1,400,845 | ||||||
ChaseFlex Trust, Series 2006-1, Class A4, | 31,805,000 | 27,805,044 | ||||||
ChaseFlex Trust, Series 2006-2, Class A4, | 13,699,428 | 12,338,595 | ||||||
ChaseFlex Trust, Series 2007-1, Class 2A10, | 5,084,471 | 3,499,448 | ||||||
ChaseFlex Trust, Series 2007-1, Class 2A6, | 3,528,720 | 3,113,164 | ||||||
See accompanying notes which are an integral part of these financial statements.
22
Angel Oak Multi-Strategy Income Fund
Schedule of Investments – (continued)
January 31, 2015
| Principal Amount | Fair Value | |||||||
Collateralized Mortgage Obligations – (continued) |
| |||||||
Chevy Chase Mortgage Funding Corp., Series 2005-1A, Class A1, 0.318%, 1/25/2036 (a)(c) | $ | 10,586,663 | $ | 9,629,290 | ||||
Chevy Chase Mortgage Funding Corp., Series 2005-1A, Class A2, | 8,498,442 | 7,782,398 | ||||||
Chevy Chase Mortgage Funding Corp., Series 2005-4A, Class IO, 1.318%, 4/25/2037 (I/O) (a)(c) | 77,953,240 | 5,113,733 | ||||||
Citigroup Commercial Mortgage Trust, | 10,000,000 | 9,634,735 | ||||||
Citigroup Commercial Mortgage Trust, | 5,000,000 | 5,259,167 | ||||||
Citigroup Commercial Mortgage Trust, | 9,000,000 | 9,005,832 | ||||||
Citigroup Commercial Mortgage Trust, | 10,000,000 | 10,299,622 | ||||||
Citigroup Commercial Mortgage Trust, | 4,900,000 | 5,171,083 | ||||||
Citigroup Mortgage Loan Trust, Inc., Series 2005-2, Class 1A4, 2.535%, 5/25/2035 (a) | 758,368 | 733,984 | ||||||
Citigroup Mortgage Loan Trust, Inc., Series 2005-7, Class 2A2A, 2.773%, 9/25/2035 (a) | 9,839,069 | 9,120,521 | ||||||
Citigroup Mortgage Loan Trust, Inc., Series 2005-8, Class 1A4A, 4.724%, 10/25/2035 (a) | 552,448 | 502,942 | ||||||
Citigroup Mortgage Loan Trust, Inc., | 445,867 | 429,955 | ||||||
Citigroup Mortgage Loan Trust, Inc., | 4,535,639 | 4,273,756 | ||||||
CitiMortgage Alternative Loan Trust, Series 2006-A5, Class 1A8, 6.000%, 10/25/2036 | 1,423,659 | 1,270,635 | ||||||
See accompanying notes which are an integral part of these financial statements.
23
Angel Oak Multi-Strategy Income Fund
Schedule of Investments – (continued)
January 31, 2015
| Principal Amount | Fair Value | |||||||
Collateralized Mortgage Obligations – (continued) |
| |||||||
CitiMortgage Alternative Loan Trust, | $ | 690,915 | $ | 594,942 | ||||
Commercial Mortgage Loan Trust, Series 2008-LS1, Class AM, 6.046%, 12/10/2049 (a) | 14,985,000 | 15,382,627 | ||||||
Commercial Mortgage Trust, Series 2013-CR13, | 5,000,000 | 5,060,168 | ||||||
Commercial Mortgage Trust, Series 2013-WWP, | 4,875,000 | 5,185,881 | ||||||
Commercial Mortgage Trust, Series 2012-CR4, | 3,000,000 | 3,091,449 | ||||||
Commercial Mortgage Trust, Series 2013-CR6, | 6,146,000 | 5,410,222 | ||||||
Commercial Mortgage Trust, Series 2013-CR11, | 8,568,000 | 8,898,806 | ||||||
Commercial Mortgage Trust, Series 2013-CR12, | 5,000,000 | 5,165,988 | ||||||
Commercial Mortgage Trust, Series 2013-CR11, | 10,000,000 | 11,444,920 | ||||||
Commercial Mortgage Trust, Series 2014-CR14, Class D, 4.610%, 2/10/2047 (a)(c) | 11,250,000 | 11,365,318 | ||||||
Commercial Mortgage Trust, Series 2014-CR16, Class AM, 4.278%, 4/10/2047 (b) | 10,000,000 | 11,043,340 | ||||||
Commercial Mortgage Trust, Series 2014-LC15, Class AM, 4.198%, 4/10/2047 (b) | 5,000,000 | 5,500,672 | ||||||
Commercial Mortgage Trust, Series 2014-LC15, Class A4, 4.006%, 4/10/2047 (b) | 13,115,000 | 14,593,015 | ||||||
Commercial Mortgage Trust, Series 2014-CR17, Class D, 4.800%, 5/10/2047 (a)(c) | 8,250,000 | 8,240,240 | ||||||
Commercial Mortgage Trust, Series 2014-UBS3, Class A4, 3.819%, 6/10/2047 (b) | 10,000,000 | 10,971,730 | ||||||
Commercial Mortgage Trust, Series 2014-CR19, Class C, 4.721%, 8/10/2047 (a) | 5,837,000 | 6,276,751 | ||||||
Commercial Mortgage Trust, Series 2014-UBS4, Class C, 4.625%, 8/10/2047 (a) | 5,000,000 | 5,191,295 | ||||||
Commercial Mortgage Trust, Series 2014-UBS4, Class A5, 3.694%, 8/10/2047 (b) | 10,000,000 | 10,865,490 | ||||||
See accompanying notes which are an integral part of these financial statements.
24
Angel Oak Multi-Strategy Income Fund
Schedule of Investments – (continued)
January 31, 2015
| Principal Amount | Fair Value | |||||||
Collateralized Mortgage Obligations – (continued) |
| |||||||
Commercial Mortgage Trust, Series 2014-CR19, Class D, 4.721%, 8/10/2047 (a)(c) | $ | 5,000,000 | $ | 4,847,708 | ||||
Commercial Mortgage Trust, Series 2014-UBS5, Class C, 4.613%, 9/10/2047 (a) | 4,000,000 | 4,297,224 | ||||||
Commercial Mortgage Trust, Series 2014-UBS5, Class A4, 3.838%, 9/10/2047 (b) | 5,000,000 | 5,491,442 | ||||||
Commercial Mortgage Trust, Series 2014-LC17, Class D, 3.687%, 10/10/2047 (c) | 4,000,000 | 3,536,056 | ||||||
Commercial Mortgage Trust, Series 2014-UBS6, Class A5, 3.644%, 12/10/2047 | 5,000,000 | 5,407,687 | ||||||
Commercial Mortgage Trust, Series 2015-LC19, | 4,975,000 | 3,979,779 | ||||||
CountryWide Alternative Loan Trust, | 1,061,058 | 1,035,595 | ||||||
CountryWide Alternative Loan Trust, | 8,602,000 | 8,286,823 | ||||||
CountryWide Alternative Loan Trust, | 2,286,676 | 2,306,332 | ||||||
CountryWide Alternative Loan Trust, | 1,641,289 | 1,577,876 | ||||||
CountryWide Alternative Loan Trust, | 1,475,485 | 1,260,506 | ||||||
CountryWide Alternative Loan Trust, | 1,670,760 | 1,624,187 | ||||||
CountryWide Alternative Loan Trust, | 1,181,983 | 1,013,089 | ||||||
CountryWide Alternative Loan Trust, | 2,599,442 | 2,040,546 | ||||||
CountryWide Alternative Loan Trust, | 8,608,796 | 8,386,073 | ||||||
CountryWide Alternative Loan Trust, | 2,067,434 | 1,911,004 | ||||||
See accompanying notes which are an integral part of these financial statements.
25
Angel Oak Multi-Strategy Income Fund
Schedule of Investments – (continued)
January 31, 2015
| Principal Amount | Fair Value | |||||||
Collateralized Mortgage Obligations – (continued) |
| |||||||
CountryWide Alternative Loan Trust, | $ | 17,802,006 | $ | 15,375,112 | ||||
CountryWide Alternative Loan Trust, | 52,309,476 | 4,257,991 | ||||||
CountryWide Alternative Loan Trust, | 14,487,006 | 14,132,856 | ||||||
CountryWide Alternative Loan Trust, | 983,656 | 781,026 | ||||||
CountryWide Alternative Loan Trust, | 64,263,309 | 5,288,870 | ||||||
CountryWide Alternative Loan Trust, | 74,804,952 | 7,069,068 | ||||||
CountryWide Alternative Loan Trust, | 32,552,014 | 2,320,959 | ||||||
CountryWide Alternative Loan Trust, | 69,719,156 | 5,947,044 | ||||||
CountryWide Alternative Loan Trust, | 47,689,119 | 3,724,520 | ||||||
CountryWide Alternative Loan Trust, | 192,563,096 | 14,191,900 | ||||||
CountryWide Alternative Loan Trust, | 6,262,296 | 5,606,239 | ||||||
CountryWide Alternative Loan Trust, | 2,135,228 | 1,947,606 | ||||||
See accompanying notes which are an integral part of these financial statements.
26
Angel Oak Multi-Strategy Income Fund
Schedule of Investments – (continued)
January 31, 2015
| Principal Amount | Fair Value | |||||||
Collateralized Mortgage Obligations – (continued) |
| |||||||
CountryWide Alternative Loan Trust, | $ | 65,914,151 | $ | 5,727,940 | ||||
CountryWide Alternative Loan Trust, | 168,929,578 | 14,629,301 | ||||||
CountryWide Alternative Loan Trust, | 53,568,209 | 3,181,952 | ||||||
CountryWide Alternative Loan Trust, | 84,683,487 | 7,536,830 | ||||||
CountryWide Alternative Loan Trust, | 85,158,202 | 4,692,217 | ||||||
CountryWide Alternative Loan Trust, | 16,094,483 | 1,479,083 | ||||||
CountryWide Alternative Loan Trust, | 70,824,340 | 7,082,434 | ||||||
CountryWide Alternative Loan Trust, | 476,537 | 410,272 | ||||||
CountryWide Home Loan Mortgage Pass Through Trust, Series 2004-HYB3, Class 2A, | 1,529,477 | 1,461,577 | ||||||
CountryWide Home Loan Mortgage Pass Through Trust, Series 2004-11, Class 3A1, | 1,870,669 | 1,863,355 | ||||||
CountryWide Home Loan Mortgage Pass Through Trust, Series 2005-2, Class 2X, | 30,638,926 | 1,890,422 | ||||||
CountryWide Home Loan Mortgage Pass Through Trust, Series 2005-7, Class 3X, | 3,740,667 | 169,078 | ||||||
See accompanying notes which are an integral part of these financial statements.
27
Angel Oak Multi-Strategy Income Fund
Schedule of Investments – (continued)
January 31, 2015
| Principal Amount | Fair Value | |||||||
Collateralized Mortgage Obligations – (continued) |
| |||||||
CountryWide Home Loan Mortgage Pass Through Trust, Series 2005-9, Class 1X, | $ | 55,697,482 | $ | 3,692,743 | ||||
CountryWide Home Loan Mortgage Pass-Through Trust, Series 2005-HYB8, Class 3A1, | 772,175 | 669,544 | ||||||
CountryWide Home Loan Mortgage Pass-Through Trust, Series 2006-12, Class X, | 126,112,522 | 1,235,903 | ||||||
CountryWide Home Loan Mortgage Pass-Through Trust, Series 2007-9, Class A13, | 14,841,153 | 14,089,612 | ||||||
CountryWide Home Loan Mortgage Pass-Through Trust, Series 2006-OA2, Class X1, 6.404%, 5/20/2046 (I/O) (a) | 65,357,997 | 5,816,862 | ||||||
CountryWide Home Loan Mortgage Pass-Through Trust, Series 2006-OA2, Class X1P, | 85,914,103 | 7,465,936 | ||||||
Credit Suisse First Boston Mortgage Securities Corp., Series 2005-4, Class 2A7, | 1,757,978 | 1,484,257 | ||||||
Credit Suisse First Boston Mortgage Securities Corp., Series 2005-9, Class 2A1, | 1,454,108 | 1,412,076 | ||||||
Credit Suisse First Boston Mortgage Securities Corp., Series 2005-9, Class 4A2, | 3,236,847 | 2,699,676 | ||||||
Credit Suisse First Boston Mortgage Securities Corp., Series 2006-2, Class 6A8, | 3,351,474 | 3,068,047 | ||||||
Credit Suisse Mortgage Trust, Series 2006-6, Class 1A10, 6.000%, 7/25/2036 | 2,008,579 | 1,562,681 | ||||||
Credit Suisse Mortgage Trust, Series 2014-USA, Class A2, 3.953%, 9/15/2037 (b)(c) | 10,000,000 | 11,099,930 | ||||||
See accompanying notes which are an integral part of these financial statements.
28
Angel Oak Multi-Strategy Income Fund
Schedule of Investments – (continued)
January 31, 2015
| Principal Amount | Fair Value | |||||||
Collateralized Mortgage Obligations – (continued) |
| |||||||
Deutsche Alt-A Securities, Inc. Mortgage Loan Trust, Series 2005-4, Class A3, | $ | 11,156,977 | $ | 9,879,972 | ||||
Deutsche Alt-A Securities, Inc. Mortgage Loan Trust, Series 2005-5, Class 2A1, | 3,650,841 | 2,388,519 | ||||||
Deutsche Alt-A Securities, Inc. Mortgage Loan Trust, Series 2006-AB1, Class A2B, | 18,911,220 | 16,374,885 | ||||||
Deutsche Alt-A Securities, Inc. Mortgage Loan Trust, Series 2006-AR1, Class 2A1, | 83,060 | 67,138 | ||||||
Deutsche Alt-A Securities, Inc. Mortgage Loan Trust, Series 2006-AB1, Class A2C, | 12,032,447 | 10,390,680 | ||||||
Deutsche Alt-A Securities, Inc. Mortgage Loan Trust, Series 2006-AB1, Class A1A, | 406,668 | 349,343 | ||||||
Deutsche Alt-A Securities, Inc. Mortgage Loan Trust, Series 2006-AF1, Class A4, | 24,485,950 | 19,427,765 | ||||||
Deutsche Alt-A Securities, Inc. Mortgage Loan Trust, Series 2006-AB2, Class A1, | 1,273,474 | 1,028,609 | ||||||
Deutsche Alt-A Securities, Inc. Mortgage Loan Trust, Series 2006-AB2, Class A3, | 1,713,055 | 1,399,873 | ||||||
Deutsche Alt-A Securities, Inc. Mortgage Loan Trust, Series 2006-AB2, Class A2, | 5,949,516 | 4,860,903 | ||||||
Deutsche Alt-A Securities, Inc. Mortgage Loan Trust, Series 2006-AB3, Class A5B, | 818,623 | 631,823 | ||||||
Deutsche Alt-A Securities, Inc. Mortgage Loan Trust, Series 2006-AB3, Class A3, | 8,004,231 | 6,214,989 | ||||||
See accompanying notes which are an integral part of these financial statements.
29
Angel Oak Multi-Strategy Income Fund
Schedule of Investments – (continued)
January 31, 2015
| Principal Amount | Fair Value | |||||||
Collateralized Mortgage Obligations – (continued) |
| |||||||
Deutsche Alt-A Securities, Inc. Mortgage Loan Trust, Series 2006-AB3, Class A2, | $ | 8,437,941 | $ | 6,552,070 | ||||
Deutsche Alt-A Securities, Inc. Mortgage Loan Trust, Series 2006-AR3, Class A2, | 1,265,194 | 1,033,377 | ||||||
Deutsche Alt-A Securities, Inc. Mortgage Loan Trust, Series 2006-SR3, Class A6, | 1,816,407 | 1,315,996 | ||||||
Deutsche Alt-A Securities, Inc. Mortgage Loan Trust, Series 2006-AB4, Class A4C, | 12,982,904 | 10,890,151 | ||||||
Deutsche Alt-A Securities, Inc. Mortgage Loan Trust, Series 2006-AB4, Class A6A1, | 375,683 | 312,431 | ||||||
Deutsche Alt-A Securities, Inc. Mortgage Loan Trust, Series 2006-AB4, Class A6A2, | 375,683 | 312,721 | ||||||
Deutsche Alt-A Securities, Inc. Mortgage Loan Trust, Series 2006-AR5, Class 1A2, | 41,672,632 | 24,352,319 | ||||||
Deutsche Alt-A Securities, Inc. Mortgage Loan Trust, Series 2006-AB4, Class A1A, | 3,384,495 | 2,835,597 | ||||||
Deutsche Alt-A Securities, Inc. Mortgage Loan Trust, Series 2006-AB4, Class A4B, | 25,705,296 | 21,530,551 | ||||||
Deutsche Alt-A Securities, Inc. Mortgage Loan Trust, Series 2006-AR4, Class A2, | 27,220,282 | 16,649,258 | ||||||
Deutsche Bank Securities Mortgage Trust, | 5,000,000 | 5,484,132 | ||||||
DSLA Mortgage Loan Trust, Series 2004-AR2, Class X2, 1.997%, 11/19/2044 (I/O) (a) | 72,929,924 | 4,273,694 | ||||||
See accompanying notes which are an integral part of these financial statements.
30
Angel Oak Multi-Strategy Income Fund
Schedule of Investments – (continued)
January 31, 2015
| Principal Amount | Fair Value | |||||||
Collateralized Mortgage Obligations – (continued) |
| |||||||
DSLA Mortgage Loan Trust, Series 2005-AR2, Class 2A1A, 0.378%, 3/19/2045 (a) | $ | 4,663,511 | $ | 4,182,722 | ||||
DSLA Mortgage Loan Trust, Series 2005-AR1, Class X2, 2.623%, 3/19/2045 (I/O) (a) | 69,301,190 | 6,077,714 | ||||||
First Horizon Alternative Mortgage Securities Trust, Series 2005-FA8, Class 1A5, 5.125%, 11/25/2035 | 2,002,467 | 1,734,497 | ||||||
First Horizon Alternative Mortgage Securities Trust, Series 2005-FA8, Class 1A18, | 3,271 | 2,897 | ||||||
First Horizon Alternative Mortgage Securities Trust, Series 2005-AR5, Class 2A1, | 3,902,165 | 3,655,142 | ||||||
FREMF Mortgage Trust, Series 2014-K36, | 6,000,000 | 6,381,174 | ||||||
FREMF Mortgage Trust, Series 2014-K37, | 8,500,000 | 9,166,816 | ||||||
Fremont Home Loan Trust, Series 2006-C, Class 2A2, 0.318%, 10/25/2036 (a) | 39,938,385 | 19,871,323 | ||||||
GE Commercial Mortgage Corp. Trust, | 10,000,000 | 10,543,190 | ||||||
GMAC Mortgage Corp. Loan Trust, | 1,692,400 | 1,634,004 | ||||||
GMAC Mortgage Corp. Loan Trust, | 12,972,482 | 12,349,518 | ||||||
GMAC Mortgage Corp. Loan Trust, | 545,908 | 428,107 | ||||||
GMAC Mortgage Corp. Loan Trust, | 668,839 | 640,152 | ||||||
GMAC Mortgage Corp. Loan Trust, | 4,979,768 | 4,686,087 | ||||||
See accompanying notes which are an integral part of these financial statements.
31
Angel Oak Multi-Strategy Income Fund
Schedule of Investments – (continued)
January 31, 2015
| Principal Amount | Fair Value | |||||||
Collateralized Mortgage Obligations – (continued) |
| |||||||
GMAC Mortgage Corp. Loan Trust, | $ | 430,801 | $ | 412,762 | ||||
GreenPoint Mortgage Funding Trust, | 36,441,930 | 28,231,782 | ||||||
GreenPoint Mortgage Funding Trust, | 12,976,464 | 1,016,057 | ||||||
GreenPoint MTA Trust, Series 2005-AR1, | 59,241,017 | 4,040,237 | ||||||
GreenPoint MTA Trust, Series 2005-AR2, | 50,936,897 | 3,377,116 | ||||||
GreenPoint MTA Trust, Series 2005-AR3, | 15,564,160 | 13,225,629 | ||||||
GSAA Home Equity Trust, Series 2007-5, Class 1F4A, 6.032%, 3/25/2047 (a) | 8,933,897 | 6,174,038 | ||||||
GS Mortgage Securities Corp., Series 2014-5R, Class 3B, 0.318%, 2/26/2037 (a)(c) | 22,830,149 | 14,367,013 | ||||||
GS Mortgage Securities Corp. II, Series 2012-GCJ9, Class D, 4.854%, 11/10/2045 (a)(c) | 3,690,000 | 3,777,652 | ||||||
GS Mortgage Securities Corp. II, Series 2014-GC20, Class D, 4.867%, 4/10/2047 (a)(c) | 5,000,000 | 4,948,025 | ||||||
GS Mortgage Securities Trust, Series 2013-GC14, Class C, 4.772%, 8/10/2023 (a)(b)(c) | 6,600,000 | 7,238,527 | ||||||
GS Mortgage Securities Trust, Series 2013-GC14, Class D, 4.772%, 8/10/2023 (a)(c) | 7,260,000 | 7,345,363 | ||||||
GS Mortgage Securities Trust, Series 2011-GC3, Class D, 5.554%, 3/10/2044 (a)(c) | 10,000,000 | 11,064,440 | ||||||
GS Mortgage Securities Trust, Series 2012-GCJ7, Class C, 5.723%, 5/10/2045 (a) | 3,000,000 | 3,460,112 | ||||||
GS Mortgage Securities Trust, Series 2013-GC13, Class C, 4.071%, 7/10/2046 (a)(c) | 7,500,000 | 7,908,791 | ||||||
GS Mortgage Securities Trust, Series 2013-GC16, Class C, 5.315%, 11/10/2046 (a)(b) | 7,000,000 | 7,949,312 | ||||||
See accompanying notes which are an integral part of these financial statements.
32
Angel Oak Multi-Strategy Income Fund
Schedule of Investments – (continued)
January 31, 2015
| Principal Amount | Fair Value | |||||||
Collateralized Mortgage Obligations – (continued) |
| |||||||
GS Mortgage Securities Trust, Series 2013-GC16, Class A4, 4.271%, 11/10/2046 (b) | $ | 5,000,000 | $ | 5,660,470 | ||||
GS Mortgage Securities Trust, Series 2014-GC18, Class C, 4.948%, 1/10/2047 (a) | 5,000,000 | 5,542,502 | ||||||
GS Mortgage Securities Trust, Series 2014-GC18, Class A4, 4.074%, 1/10/2047 (b) | 10,990,000 | 12,244,915 | ||||||
GS Mortgage Securities Trust, Series 2014-GC22, Class D, 4.646%, 6/10/2047 (a)(c) | 5,000,000 | 4,776,085 | ||||||
GSR Mortgage Loan Trust, Series 2005-AR1, Class 4A1, 2.237%, 1/25/2035 (a) | 1,564,269 | 1,538,147 | ||||||
GSR Mortgage Loan Trust, Series 2005-AR2, Class 1A1, 2.682%, 4/25/2035 (a) | 2,583,727 | 2,445,042 | ||||||
GSR Mortgage Loan Trust, Series 2005-AR3, Class 4A1, 2.642%, 5/25/2035 (a) | 14,551,978 | 13,328,826 | ||||||
GSR Mortgage Loan Trust, Series 2005-AR3, Class 8A1, 4.893%, 5/25/2035 (a) | 6,672,569 | 6,491,952 | ||||||
GSR Mortgage Loan Trust, Series 2005-6F, | 521,143 | 516,954 | ||||||
GSR Mortgage Loan Trust, Series 2005-AR7, Class 4A1, 2.480%, 11/25/2035 (a) | 5,713,498 | 4,850,857 | ||||||
GSR Mortgage Loan Trust, Series 2005-AR7, Class 5A1, 4.793%, 11/25/2035 (a) | 3,408,462 | 3,140,144 | ||||||
GSR Mortgage Loan Trust, Series 2005-AR7, Class 6A1, 4.971%, 11/25/2035 (a) | 5,000,571 | 4,859,958 | ||||||
GSR Mortgage Loan Trust, Series 2005-14, Class 2A2, 0.418%, 12/25/2035 (a) | 1,111,864 | 844,113 | ||||||
GSR Mortgage Loan Trust, Series 2006-1, Class A2, 0.388%, 1/25/2036 (a) | 13,062,058 | 8,038,260 | ||||||
GSR Mortgage Loan Trust, Series 2006-1, Class A1, 0.258%, 1/25/2036 (a) | 2,100,306 | 1,272,349 | ||||||
GSR Mortgage Loan Trust, Series 2006-10, Class AF2, 5.825%, 6/25/2036 (a) | 3,192,332 | 1,933,200 | ||||||
GSR Mortgage Loan Trust, Series 2006-AR1, Class 3A1, 2.798%, 1/25/2036 (a) | 995,941 | 910,649 | ||||||
GSR Mortgage Loan Trust, Series 2006-2F, | 6,410,209 | 5,295,178 | ||||||
See accompanying notes which are an integral part of these financial statements.
33
Angel Oak Multi-Strategy Income Fund
Schedule of Investments – (continued)
January 31, 2015
| Principal Amount | Fair Value | |||||||
Collateralized Mortgage Obligations – (continued) |
| |||||||
GSR Mortgage Loan Trust, Series 2006-1F, | $ | 3,946,491 | $ | 3,755,749 | ||||
GSR Mortgage Loan Trust, Series 2006-1F, | 710,776 | 595,131 | ||||||
GSR Mortgage Loan Trust, Series 2007-3F, | 15,403,762 | 8,812,153 | ||||||
HarborView Mortgage Loan Trust, Series 2005-3, Class 2A1A, 0.408%, 6/19/2035 (a) | 1,609,245 | 1,410,701 | ||||||
HarborView Mortgage Loan Trust, Series 2005-3, Class X2, 2.112%, 6/19/2035 (I/O) (a) | 98,955,305 | 8,035,171 | ||||||
HarborView Mortgage Loan Trust, Series 2005-9, Class 2X, 1.827%, 6/20/2035 (I/O) (a)(c) | 25,924,319 | 1,957,974 | ||||||
HarborView Mortgage Loan Trust, Series 2005-12, Class 2A12, 0.918%, 10/19/2035 (a) | 17,576,445 | 15,158,805 | ||||||
HarborView Mortgage Loan Trust, Series 2005-10, Class X, 2.048%, 11/19/2035 (I/O) (a) | 19,040,472 | 1,226,206 | ||||||
HarborView Mortgage Loan Trust, Series 2006-1, Class X2A1, 1.073%, 3/19/2036 (I/O) (a) | 21,484,220 | 354,490 | ||||||
HarborView Mortgage Loan Trust, Series 2006-1, Class X1, 2.246%, 3/19/2036 (I/O) (a) | 173,979,942 | 12,770,128 | ||||||
HarborView Mortgage Loan Trust, Series 2006-10, Class 2A1A, 0.348%, 11/19/2036 (a) | 20,569,466 | 16,906,455 | ||||||
HarborView Mortgage Loan Trust, Series 2007-6, Class 2A1A, 0.358%, 8/19/2037 (a) | 21,575,418 | 18,183,244 | ||||||
HarborView Mortgage Loan Trust, Series 2007-5, Class A1A, 0.358%, 9/19/2037 (a) | 12,512,750 | 9,777,450 | ||||||
HarborView Mortgage Loan Trust, Series 2007-2, Class 2A1A, 0.328%, 5/25/2038 (a) | 29,521,956 | 22,013,844 | ||||||
HarborView Mortgage Loan Trust, Series 2005-11, Class X, 2.372%, 8/19/2045 (I/O) (a) | 51,547,784 | 3,165,034 | ||||||
HarborView Mortgage Loan Trust, Series 2005-15, Class X1P, 2.775%, 10/20/2045 (I/O) (a) | 19,013,215 | 1,403,175 | ||||||
HarborView Mortgage Loan Trust, Series 2006-5, Class X2, 3.079%, 7/19/2046 (I/O) (a) | 97,422,618 | 8,641,386 | ||||||
HarborView Mortgage Loan Trust, Series 2007-3, Class 2A1A, 0.368%, 5/19/2047 (a) | 33,537,895 | 28,943,572 | ||||||
See accompanying notes which are an integral part of these financial statements.
34
Angel Oak Multi-Strategy Income Fund
Schedule of Investments – (continued)
January 31, 2015
| Principal Amount | Fair Value | |||||||
Collateralized Mortgage Obligations – (continued) |
| |||||||
HomeBanc Mortgage Trust, Series 2005-1, | $ | 16,701,668 | $ | 15,043,059 | ||||
Hyatt Hotel Portfolio Trust, Series 2015-HYT, Class A, 1.408%, 11/15/2029 (a)(c)(d) | 3,975,000 | 3,971,273 | ||||||
IMPAC CMB Trust, Series 2005-4, Class 1A1A, 0.438%, 5/25/2035 (a) | 140,394 | 130,294 | ||||||
IMPAC CMB Trust, Series 2005-5, Class A4, 0.928%, 8/25/2035 (a) | 7,774,404 | 5,932,787 | ||||||
IMPAC CMB Trust, Series 2005-6, Class 1A1, 0.668%, 10/25/2035 (a) | 25,342,541 | 21,299,544 | ||||||
IMPAC CMB Trust, Series 2005-7, Class A1, 0.688%, 11/25/2035 (a) | 16,926,872 | 13,939,279 | ||||||
IMPAC Secured Assets Corp., Series 2005-2, | 6,388,647 | 4,666,364 | ||||||
IMPAC Secured Assets Corp., Series 2006-2, | 6,805,917 | 5,245,327 | ||||||
IMPAC Secured Assets Corp., Series 2006-2, Class 1A2B, 0.338%, 8/25/2036 (a) | 11,088,792 | 8,461,736 | ||||||
IMPAC Secured Assets Corp., Series 2006-4, Class A2B, 0.338%, 1/25/2037 (a) | 1,867,880 | 1,567,586 | ||||||
IMPAC Secured Assets Corp., Series 2006-4, | 9,956,623 | 6,884,507 | ||||||
IMPAC Secured Assets Corp., Series 2007-2, | 7,863,140 | 5,844,641 | ||||||
INDYMAC IMSC Mortgage Loan Trust, Series 2007-AR2, Class AX, | 78,149,096 | 5,587,660 | ||||||
INDYMAC Index Mortgage Loan Trust, | 1,300,544 | 1,194,810 | ||||||
INDYMAC Index Mortgage Loan Trust, | 7,243,078 | 7,309,555 | ||||||
INDYMAC Index Mortgage Loan Trust, | 4,777,897 | 4,724,169 | ||||||
See accompanying notes which are an integral part of these financial statements.
35
Angel Oak Multi-Strategy Income Fund
Schedule of Investments – (continued)
January 31, 2015
| Principal Amount | Fair Value | |||||||
Collateralized Mortgage Obligations – (continued) |
| |||||||
INDYMAC Index Mortgage Loan Trust, | $ | 23,435,286 | $ | 20,384,949 | ||||
INDYMAC Index Mortgage Loan Trust, Series 2005-A10, Class A3, 5.500%, 9/25/2035 | 5,183,590 | 4,489,051 | ||||||
INDYMAC Index Mortgage Loan Trust, Series 2005-AR15, Class A2, | 15,527,067 | 13,506,064 | ||||||
INDYMAC Index Mortgage Loan Trust, Series 2005-A11, Class 1A1, | 375,716 | 322,938 | ||||||
INDYMAC Index Mortgage Loan Trust, | 4,891,000 | 4,615,216 | ||||||
INDYMAC Index Mortgage Loan Trust, | 1,794,157 | 1,417,186 | ||||||
INDYMAC Index Mortgage Loan Trust, | 1,163,043 | 929,772 | ||||||
INDYMAC Index Mortgage Loan Trust, | 2,439,215 | 2,335,351 | ||||||
INDYMAC Index Mortgage Loan Trust, | 2,500,954 | 2,394,461 | ||||||
INDYMAC Index Mortgage Loan Trust, | 770,609 | 691,836 | ||||||
INDYMAC Index Mortgage Loan Trust, | 13,420,944 | 10,659,316 | ||||||
INDYMAC Index Mortgage Loan Trust, | 2,237,419 | 1,905,849 | ||||||
See accompanying notes which are an integral part of these financial statements.
36
Angel Oak Multi-Strategy Income Fund
Schedule of Investments – (continued)
January 31, 2015
| Principal Amount | Fair Value | |||||||
Collateralized Mortgage Obligations – (continued) |
| |||||||
INDYMAC Index Mortgage Loan Trust, | $ | 22,120,470 | $ | 16,427,590 | ||||
INDYMAC Index Mortgage Loan Trust, | 11,714,607 | 10,042,604 | ||||||
INDYMAC Index Mortgage Loan Trust, | 4,799,172 | 3,821,701 | ||||||
INDYMAC Index Mortgage Loan Trust, | 10,319,857 | 8,800,506 | ||||||
JP Morgan Alternative Loan Trust, | 679,560 | 619,754 | ||||||
JP Morgan Alternative Loan Trust, | 2,130,559 | 1,954,321 | ||||||
JP Morgan Alternative Loan Trust, | 43,740,000 | 30,796,590 | ||||||
JP Morgan Chase Commercial Mortgage Securities Trust, Series 2006-CB14, Class AJ, | 5,000,000 | 4,961,328 | ||||||
JP Morgan Chase Commercial Mortgage Securities Trust, Series 2013-C16, Class C, | 5,000,000 | 5,578,210 | ||||||
JP Morgan Chase Commercial Mortgage Securities Trust, Series 2013-C16, Class D, | 10,000,000 | 10,242,295 | ||||||
JP Morgan Chase Commercial Mortgage Securities Trust, Series 2007-CB18, Class AJ, | 10,000,000 | 10,079,725 | ||||||
JP Morgan Chase Commercial Mortgage Securities Trust, Series 2012-LC9, Class E, | 5,000,000 | 5,032,175 | ||||||
See accompanying notes which are an integral part of these financial statements.
37
Angel Oak Multi-Strategy Income Fund
Schedule of Investments – (continued)
January 31, 2015
| Principal Amount | Fair Value | |||||||
Collateralized Mortgage Obligations – (continued) |
| |||||||
JP Morgan Chase Commercial Mortgage Securities Trust, Series 2007-LDPX, | $ | 5,000,000 | $ | 5,207,642 | ||||
JP Morgan Chase Commercial Mortgage Securities Trust, Series 2007-LD11, | 5,000,000 | 5,286,155 | ||||||
JP Morgan Mortgage Acquisition Corp., | 2,898,573 | 1,759,527 | ||||||
JP Morgan Mortgage Trust, Series 2004-A2, | 1,553,491 | 1,531,897 | ||||||
JP Morgan Mortgage Trust, Series 2005-A8, | 293,351 | 284,867 | ||||||
JP Morgan Mortgage Trust, Series 2005-A8, | 1,547,806 | 1,483,136 | ||||||
JP Morgan Mortgage Trust, Series 2005-S3, | 5,371,320 | 5,186,001 | ||||||
JP Morgan Mortgage Trust, Series 2006-A1, | 752,065 | 684,610 | ||||||
JP Morgan Mortgage Trust, Series 2006-A1, | 1,035,830 | 928,603 | ||||||
JP Morgan Mortgage Trust, Series 2006-A5, | 1,122,842 | 1,044,137 | ||||||
JP Morgan Mortgage Trust, Series 2007-A2, | 2,066,761 | 1,800,066 | ||||||
JP Morgan Mortgage Trust, Series 2007-A2, | 1,871,753 | 1,628,186 | ||||||
JP Morgan Mortgage Trust, Series 2007-A4, | 6,734,010 | 6,214,737 | ||||||
JPMBB Commercial Mortgage Securities Trust, Series 2013-C15, Class A5, | 15,000,000 | 16,784,175 | ||||||
JPMBB Commercial Mortgage Securities Trust, Series 2013-C14, Class D, | 4,000,000 | 4,015,582 | ||||||
JPMBB Commercial Mortgage Securities Trust, Series 2013-C17, Class C, | 10,000,000 | 11,032,715 | ||||||
See accompanying notes which are an integral part of these financial statements.
38
Angel Oak Multi-Strategy Income Fund
Schedule of Investments – (continued)
January 31, 2015
| Principal Amount | Fair Value | |||||||
Collateralized Mortgage Obligations – (continued) |
| |||||||
JPMBB Commercial Mortgage Securities Trust, Series 2014-C22, Class A4, | $ | 20,000,000 | $ | 21,869,190 | ||||
JPMBB Commercial Mortgage Securities Trust, Series 2014-C22, Class D, | 8,000,000 | 7,590,500 | ||||||
JPMBB Commercial Mortgage Securities Trust, Series 2014-C24, Class D, | 900,000 | 822,414 | ||||||
JPMBB Commercial Mortgage Securities Trust, Series 2014-C26, Class A4, | 9,990,000 | 10,689,200 | ||||||
LB-UBS Commercial Mortgage Trust, | 5,037,346 | 4,449,641 | ||||||
Lehman XS Trust, Series 2006-4N, Class A2A, 0.388%, 4/25/2046 (a) | 11,900,098 | 8,780,749 | ||||||
LSTAR Securities Investment Trust, Series 2015-2, Class A, 2.168%, 1/1/2020 (a)(c) | 10,000,000 | 10,000,000 | ||||||
Luminent Mortgage Trust, Series 2007-2, Class 1A2, 0.448%, 5/25/2037 (a) | 12,961,606 | 9,789,758 | ||||||
Luminent Mortgage Trust, Series 2006-2, Class X, 2.325%, 2/25/2046 (I/O) (a) | 93,176,202 | 6,224,170 | ||||||
Luminent Mortgage Trust, Series 2006-6, Class A1, 0.368%, 10/25/2046 (a) | 27,901,418 | 24,009,394 | ||||||
MASTR Adjustable Rate Mortgages Trust, Series 2004-15, Class 2A2, | 46,022 | 44,175 | ||||||
MASTR Adjustable Rate Mortgages Trust, Series 2005-1, Class 9A1, 3.174%, 1/25/2035 (a) | 894,153 | 890,191 | ||||||
MASTR Adjustable Rate Mortgages Trust, Series 2005-2, Class 5A1, 2.512%, 3/25/2035 (a) | 3,252,313 | 3,246,621 | ||||||
MASTR Adjustable Rate Mortgages Trust, Series 2005-6, Class 7A1, 5.147%, 6/25/2035 (a) | 1,943,050 | 1,824,392 | ||||||
MASTR Adjustable Rate Mortgages Trust, Series 2005-6, Class 5A2, 2.275%, 7/25/2035 (a) | 591,022 | 511,921 | ||||||
See accompanying notes which are an integral part of these financial statements.
39
Angel Oak Multi-Strategy Income Fund
Schedule of Investments – (continued)
January 31, 2015
| Principal Amount | Fair Value | |||||||
Collateralized Mortgage Obligations – (continued) |
| |||||||
MASTR Adjustable Rate Mortgages Trust, Series 2005-8, Class 3A1, 6.000%, 12/25/2035 (a) | $ | 18,614,267 | $ | 14,584,408 | ||||
MASTR Adjustable Rate Mortgages Trust, Series 2006-OA2, Class X1, 0.900%, 12/25/2046 (I/O) | 115,970,268 | 6,134,827 | ||||||
MASTR Adjustable Rate Mortgages Trust, Series 2007-2, Class A1, 0.318%, 3/25/2047 (a) | 3,408,535 | 2,919,785 | ||||||
MASTR Alternative Loan Trust, Series 2005-3, Class 3A1, 6.500%, 4/25/2035 | 3,323,475 | 3,268,708 | ||||||
MASTR Alternative Loan Trust, Series 2006-2, Class 1A2, 6.000%, 3/25/2036 | 1,389,327 | 1,224,762 | ||||||
MASTR Asset Securitization Trust, Series 2007-2, Class A3, 6.250%, 1/25/2038 | 2,027,970 | 1,843,479 | ||||||
Merrill Lynch Alternative Note Asset Trust, Series 2007-AF1, Class 1AF4, 6.000%, 5/25/2037 | 4,637,584 | 3,710,392 | ||||||
Merrill Lynch Mortgage Investors Trust, Series 2005-A7, Class 2A1, | 20,573,737 | 18,937,734 | ||||||
Merrill Lynch-CFC Commercial Mortgage Trust, Series 2006-1, Class B, 5.568%, 2/12/2039 (a) | 2,500,000 | 2,428,708 | ||||||
Morgan Stanley Bank of America Merrill Lynch Trust, Series 2013-C7, Class D, 4.302%, 2/15/2046 (a)(c) | 10,000,000 | 9,896,735 | ||||||
Morgan Stanley Bank of America Merrill Lynch Trust, Series 2013-C9, Class D, 4.159%, 5/15/2046 (a)(c) | 6,500,000 | 6,360,185 | ||||||
Morgan Stanley Bank of America Merrill Lynch Trust, Series 2013-C12, Class C, 4.768%, 10/15/2046 (a) | 4,000,000 | 4,356,834 | ||||||
Morgan Stanley Bank of America Merrill Lynch Trust, Series 2013-C12, Class A4, 4.259%, 10/15/2046 (a)(b) | 8,000,000 | 9,062,212 | ||||||
Morgan Stanley Bank of America Merrill Lynch Trust, Series 2014-C14, Class D, 4.834%, 2/15/2047 (a)(c) | 7,500,000 | 7,587,000 | ||||||
See accompanying notes which are an integral part of these financial statements.
40
Angel Oak Multi-Strategy Income Fund
Schedule of Investments – (continued)
January 31, 2015
| Principal Amount | Fair Value | |||||||
Collateralized Mortgage Obligations – (continued) |
| |||||||
Morgan Stanley Bank of America Merrill Lynch Trust, Series 2014-C14, Class C, 4.834%, 2/15/2047 (a) | $ | 4,000,000 | $ | 4,408,960 | ||||
Morgan Stanley Bank of America Merrill Lynch Trust, Series 2014-C15, Class D, 4.898%, 4/15/2047 (a)(c) | 15,000,000 | 14,968,950 | ||||||
Morgan Stanley Bank of America Merrill Lynch Trust, Series 2014-C16, Class A5, 3.892%, 6/15/2047 (b) | 6,500,000 | 7,180,238 | ||||||
Morgan Stanley Bank of America Merrill Lynch Trust, Series 2014-C16, Class C, 4.758%, 6/15/2047 (a)(b) | 10,000,000 | 10,869,620 | ||||||
Morgan Stanley Bank of America Merrill Lynch Trust, Series 2014-C16, Class D, 4.758%, 6/15/2047 (a)(c) | 10,500,000 | 10,250,362 | ||||||
Morgan Stanley Bank of America Merrill Lynch Trust, Series 2014-C17, Class C, 4.453%, 8/15/2047 (a) | 10,000,000 | 10,471,370 | ||||||
Morgan Stanley Bank of America Merrill Lynch Trust, Series 2014-C17, Class A5, 3.741%, 8/15/2047 (b) | 8,000,000 | 8,737,392 | ||||||
Morgan Stanley Bank of America Merrill Lynch Trust, Series 2014-C19, Class A4, 3.526%, 12/15/2047 | 10,000,000 | 10,743,025 | ||||||
Morgan Stanley Capital I Trust, Series 2007-IQ14, Class AMFX, 5.703%, 4/15/2049 (a) | 9,700,000 | 10,145,749 | ||||||
Morgan Stanley Capital I Trust, Series 2007-IQ14, Class AM, 5.703%, 4/15/2049 (a) | 20,000,000 | 21,024,890 | ||||||
Morgan Stanley Mortgage Loan Trust, Series 2004-8AR, Class 4A5, | 397,777 | 347,685 | ||||||
Morgan Stanley Mortgage Loan Trust, Series 2006-3AR, Class 2A1, | 15,650,113 | 12,934,740 | ||||||
Morgan Stanley Mortgage Loan Trust, | 2,914,598 | 2,502,241 | ||||||
See accompanying notes which are an integral part of these financial statements.
41
Angel Oak Multi-Strategy Income Fund
Schedule of Investments – (continued)
January 31, 2015
| Principal Amount | Fair Value | |||||||
Collateralized Mortgage Obligations – (continued) |
| |||||||
Morgan Stanley Mortgage Loan Trust, Series 2007-1XS, Class 2A3, | $ | 17,545,819 | $ | 10,014,820 | ||||
Morgan Stanley Mortgage Loan Trust, Series 2007-1XS, Class 2A6, | 7,054,241 | 4,026,794 | ||||||
Morgan Stanley Mortgage Loan Trust, Series 2007-1XS, Class 2A2, | 18,289,994 | 10,440,880 | ||||||
Morgan Stanley Mortgage Loan Trust, Series 2007-3XS, Class 2A3S, 5.858%, 1/25/2047 (a) | 5,271,200 | 3,992,929 | ||||||
Morgan Stanley Mortgage Loan Trust, Series 2007-3XS, Class 2A4S, 5.963%, 1/25/2047 (a) | 11,579,458 | 8,770,501 | ||||||
Morgan Stanley Mortgage Loan Trust, Series 2007-10XS, Class A2, | 1,540,421 | 1,179,506 | ||||||
Mortgage IT Trust, Series 2006-1, Class 2A1A, 0.378%, 4/25/2036 (a) | 8,116,175 | 7,104,266 | ||||||
Nomura Asset Acceptance Corp. Alternative Loan Trust, Series 2005-AR4, Class 3A1, 2.871%, 8/25/2035 (a) | 7,919,507 | 7,699,713 | ||||||
Nomura Asset Acceptance Corp. Alternative Loan Trust, Series 2006-WF1, Class A6, 5.840%, 6/25/2036 (a) | 1,945,493 | 1,171,901 | ||||||
Nomura Asset Acceptance Corp. Alternative Loan Trust, Series 2006-AR4, Class A3, 0.338%, 12/25/2036 (a) | 551,216 | 427,630 | ||||||
Nomura Asset Acceptance Corp. Alternative Loan Trust, Series 2006-AR4, Class A1A, 0.338%, 12/25/2036 (a) | 15,795,554 | 12,254,096 | ||||||
PHH Alternative Mortgage Trust, Series 2007-1, Class 1A1, 0.328%, 2/25/2037 (a) | 6,937,539 | 5,639,172 | ||||||
PHH Alternative Mortgage Trust, Series 2007-2, Class 2A5, 0.718%, 5/25/2037 (a) | 13,299,444 | 9,317,258 | ||||||
See accompanying notes which are an integral part of these financial statements.
42
Angel Oak Multi-Strategy Income Fund
Schedule of Investments – (continued)
January 31, 2015
| Principal Amount | Fair Value | |||||||
Collateralized Mortgage Obligations – (continued) |
| |||||||
PHH Alternative Mortgage Trust, Series 2007-2, Class 1A3, 0.498%, 5/25/2037 (a) | $ | 7,188,836 | $ | 5,896,959 | ||||
Prime Mortgage Trust, Series 2005-4, Class 2A4, 0.668%, 10/25/2035 (a) | 140,062 | 123,824 | ||||||
RAIT Trust, Sense 2014-FL2, Class B, 2.317%, 5/15/2031 (a)(c) | 650,000 | 643,092 | ||||||
Residential Accredit Loans, Inc. Trust, Series 2005-QA4, Class A31, | 9,748,183 | 9,169,814 | ||||||
Residential Accredit Loans, Inc. Trust, Series 2005-QS9, Class A6, 5.500%, 6/25/2035 | 7,096,587 | 6,661,290 | ||||||
Residential Accredit Loans, Inc. Trust, Series 2005-QS7, Class AV, | 88,623,277 | 1,895,088 | ||||||
Residential Accredit Loans, Inc. Trust, Series 2005-QS11, Class A2, | 928,832 | 792,837 | ||||||
Residential Accredit Loans, Inc. Trust, Series 2005-QS12, Class A3, 5.500%, 8/25/2035 | 2,517,540 | 2,451,715 | ||||||
Residential Accredit Loans, Inc. Trust, Series 2005-QS12, Class A10, 1.518%, 8/25/2035 (a)(b) | 12,109,297 | 9,788,441 | ||||||
Residential Accredit Loans, Inc. Trust, Series 2005-QS12, Class A4, | 18,586,475 | 16,916,685 | ||||||
Residential Accredit Loans, Inc. Trust, Series 2005-QS14, Class 2A1, 6.000%, 9/25/2035 | 15,273,426 | 12,172,966 | ||||||
Residential Accredit Loans, Inc. Trust, Series 2006-QS1, Class A5, 1.078%, 1/25/2036 (a)(b) | 19,893,101 | 14,808,146 | ||||||
Residential Accredit Loans, Inc. Trust, Series 2006-QS2, Class 1A14, | 15,691,545 | 11,368,838 | ||||||
Residential Accredit Loans, Inc. Trust, Series 2006-QS2, Class 1A5, | 2,834,466 | 2,095,761 | ||||||
See accompanying notes which are an integral part of these financial statements.
43
Angel Oak Multi-Strategy Income Fund
Schedule of Investments – (continued)
January 31, 2015
| Principal Amount | Fair Value | |||||||
Collateralized Mortgage Obligations – (continued) |
| |||||||
Residential Accredit Loans, Inc. Trust, Series 2006-QS2, Class 1A9, 5.500%, 2/25/2036 | $ | 5,655,703 | $ | 4,829,004 | ||||
Residential Accredit Loans, Inc. Trust, Series 2006-QS3, Class 1A14, 6.000%, 3/25/2036 | 5,899,765 | 5,122,217 | ||||||
Residential Accredit Loans, Inc. Trust, Series 2006-QS3, Class 1A8, | 7,158,059 | 5,019,309 | ||||||
Residential Accredit Loans, Inc. Trust, Series 2006-QS3, Class 1A1, | 12,505,473 | 8,951,580 | ||||||
Residential Accredit Loans, Inc. Trust, Series 2006-QS4, Class A4, 6.000%, 4/25/2036 | 5,946,159 | 4,971,423 | ||||||
Residential Accredit Loans, Inc. Trust, Series 2006-QS4, Class A2, 6.000%, 4/25/2036 | 211,619 | 176,929 | ||||||
Residential Accredit Loans, Inc. Trust, Series 2006-QS4, Class A9, 6.000%, 4/25/2036 | 1,156,501 | 966,920 | ||||||
Residential Accredit Loans, Inc. Trust, Series 2006-QS5, Class A1, 6.000%, 5/25/2036 | 4,283,202 | 3,631,599 | ||||||
Residential Accredit Loans, Inc. Trust, Series 2006-QS5, Class A9, 6.000%, 5/25/2036 | 6,462,730 | 5,479,083 | ||||||
Residential Accredit Loans, Inc. Trust, Series 2006-QS6, Class 1A8, 6.000%, 6/25/2036 | 3,401,851 | 2,827,486 | ||||||
Residential Accredit Loans, Inc. Trust, Series 2006-QS7, Class A1, 6.000%, 6/25/2036 | 245,669 | 206,974 | ||||||
Residential Accredit Loans, Inc. Trust, Series 2006-QA5, Class 1A2, 0.348%, 7/25/2036 (a) | 6,711,119 | 4,374,113 | ||||||
Residential Accredit Loans, Inc. Trust, Series 2006-QS9, Class 1A10, 6.500%, 7/25/2036 | 6,106,469 | 5,115,707 | ||||||
Residential Accredit Loans, Inc. Trust, Series 2006-QA6, Class A3, 0.358%, 7/25/2036 (a) | 5,421,904 | 4,279,948 | ||||||
Residential Accredit Loans, Inc. Trust, Series 2006-QS9, Class 1A15, 7.000%, 7/25/2036 | 5,222,363 | 4,505,891 | ||||||
Residential Accredit Loans, Inc. Trust, Series 2006-QS11, Class 1A4, 6.500%, 8/25/2036 | 8,964,147 | 7,574,597 | ||||||
See accompanying notes which are an integral part of these financial statements.
44
Angel Oak Multi-Strategy Income Fund
Schedule of Investments – (continued)
January 31, 2015
| Principal Amount | Fair Value | |||||||
Collateralized Mortgage Obligations – (continued) |
| |||||||
Residential Accredit Loans, Inc. Trust, Series 2006-QS10, Class A4, 5.750%, 8/25/2036 | $ | 581,487 | $ | 486,055 | ||||
Residential Accredit Loans, Inc. Trust, Series 2006-QS11, Class 1A8, 6.000%, 8/25/2036 | 9,333,645 | 7,656,417 | ||||||
Residential Accredit Loans, Inc. Trust, Series 2006-QA7, Class 1A1, | 16,012,576 | 11,941,795 | ||||||
Residential Accredit Loans, Inc. Trust, Series 2006-QS8, Class A1, 6.000%, 8/25/2036 | 8,397,699 | 6,758,947 | ||||||
Residential Accredit Loans, Inc. Trust, Series 2006-QS10, Class A5, | 3,342,437 | 2,218,830 | ||||||
Residential Accredit Loans, Inc. Trust, Series 2006-QS10, Class A1, 6.000%, 8/25/2036 | 5,373,392 | 4,558,227 | ||||||
Residential Accredit Loans, Inc. Trust, Series 2006-QS8, Class A3, 6.000%, 8/25/2036 | 10,371,432 | 8,347,520 | ||||||
Residential Accredit Loans, Inc. Trust, Series 2006-QS12, Class 2A18, 5.750%, 9/25/2036 | 391,221 | 315,654 | ||||||
Residential Accredit Loans, Inc. Trust, Series 2006-QS12, Class 2A4, 6.000%, 9/25/2036 | 10,585,298 | 8,697,484 | ||||||
Residential Accredit Loans, Inc. Trust, Series 2006-QS12, Class 2A3, 6.000%, 9/25/2036 | 1,181,376 | 970,693 | ||||||
Residential Accredit Loans, Inc. Trust, Series 2006-QS14, Class A13, 6.500%, 11/25/2036 | 3,237,432 | 2,795,811 | ||||||
Residential Accredit Loans, Inc. Trust, Series 2006-QS14, Class A15, 0.468%, 11/25/2036 (a) | 6,167,078 | 3,995,076 | ||||||
Residential Accredit Loans, Inc. Trust, Series 2006-QS14, Class A1, 6.500%, 11/25/2036 | 1,517,028 | 1,310,089 | ||||||
Residential Accredit Loans, Inc. Trust, Series 2006-Q17, Class A7, 6.000%, 12/25/2036 | 8,507,771 | 7,042,112 | ||||||
Residential Accredit Loans, Inc. Trust, Series 2006-QS18, Class 1A4, 6.250%, 12/25/2036 | 9,497,895 | 8,011,246 | ||||||
See accompanying notes which are an integral part of these financial statements.
45
Angel Oak Multi-Strategy Income Fund
Schedule of Investments – (continued)
January 31, 2015
| Principal Amount | Fair Value | |||||||
Collateralized Mortgage Obligations – (continued) |
| |||||||
Residential Accredit Loans, Inc. Trust, Series 2007-QS2, Class A6, 6.250%, 1/25/2037 | $ | 8,143,035 | $ | 6,751,854 | ||||
Residential Accredit Loans, Inc. Trust, Series 2007-QS8, Class A13, 6.000%, 6/25/2037 | 2,293,645 | 1,895,952 | ||||||
Residential Accredit Loans, Inc. Trust, Series 2007-QS10, Class A1, 6.500%, 9/25/2037 | 2,657,654 | 2,069,922 | ||||||
Residential Asset Securitization Trust, Series 2005-A11, Class 1A3, 5.500%, 10/25/2035 | 6,086,286 | 5,717,439 | ||||||
Residential Asset Securitization Trust, | 7,812,478 | 6,955,988 | ||||||
Residential Funding Mortgage Securities I Trust, Series 2006-SA1, Class 1A1, 3.202%, 2/25/2036 (a) | 445,383 | 400,408 | ||||||
Residential Funding Mortgage Securities I Trust, Series 2006-S3, Class A7, 5.500%, 3/25/2036 | 791,002 | 725,440 | ||||||
Residential Funding Mortgage Securities I Trust, Series 2006-S6, Class A15, 6.000%, 7/25/2036 | 2,830,987 | 2,600,372 | ||||||
Residential Funding Mortgage Securities I Trust, Series 2006-S7, Class A7, 6.250%, 8/25/2036 | 268,687 | 245,167 | ||||||
Residential Funding Mortgage Securities I Trust, Series 2007-S6, Class 1A15, 6.000%, 6/25/2037 | 1,647,015 | 1,455,296 | ||||||
Residential Funding Mortgage Securities I Trust, Series 2007-S6, Class 2A5, 0.668%, 6/25/2037 (a) | 4,616,350 | 3,519,182 | ||||||
Residential Funding Mortgage Securities I Trust, Series 2007-S6, Class 1A10, 6.000%, 6/25/2037 | 206,713 | 182,651 | ||||||
Residential Funding Mortgage Securities I Trust, Series 2007-S6, Class 1A11, 6.000%, 6/25/2037 | 1,173,818 | 1,037,181 | ||||||
Sequoia Mortgage Trust, Series 2013-3, Class A2, 2.500%, 3/25/2043 (a)(b) | 9,397,002 | 9,204,261 | ||||||
Sequoia Mortgage Trust, Series 2007-1, Class 5A1, 5.038%, 10/20/2046 (a) | 9,780,739 | 9,152,180 | ||||||
Starwood Retail Property Trust, Series 2014-STAR, Class C, 2.667%, 11/15/2027 (a)(c) | 10,000,000 | 10,076,210 | ||||||
Store Master Funding LLC, Series 2012-1A, Class A, 5.770%, 8/20/2042 (c) | 6,328,186 | 6,761,034 | ||||||
See accompanying notes which are an integral part of these financial statements.
46
Angel Oak Multi-Strategy Income Fund
Schedule of Investments – (continued)
January 31, 2015
| Principal Amount | Fair Value | |||||||
Collateralized Mortgage Obligations – (continued) |
| |||||||
Store Master Funding LLC, Series 2013-3A, Class A2, 5.210%, 11/20/2043 (c) | $ | 14,740,726 | $ | 16,323,880 | ||||
Structured Adjustable Rate Mortgage Loan Trust, Series 2005-1, Class 5A2, 2.469%, 2/25/2035 (a) | 415,466 | 357,316 | ||||||
Structured Adjustable Rate Mortgage Loan Trust, Series 2005-1, Class 1A1, 2.518%, 2/25/2035 (a) | 8,211,290 | 7,940,310 | ||||||
Structured Adjustable Rate Mortgage Loan Trust, Series 2005-1, Class 4A2, 2.398%, 2/25/2035 (a) | 838,695 | 698,506 | ||||||
Structured Adjustable Rate Mortgage Loan Trust, Series 2005-4, Class 5A, 3.596%, 3/25/2035 (a) | 4,389,116 | 4,016,230 | ||||||
Structured Adjustable Rate Mortgage Loan Trust, Series 2005-9, Class AX, | 116,020,965 | 3,213,781 | ||||||
Structured Adjustable Rate Mortgage Loan Trust, Series 2005-11, Class 3A, 2.445%, 5/25/2035 (a) | 8,492,553 | 8,007,289 | ||||||
Structured Adjustable Rate Mortgage Loan Trust, Series 2005-15, Class 1A1, 2.543%, 7/25/2035 (a) | 7,389,866 | 6,097,526 | ||||||
Structured Adjustable Rate Mortgage Loan Trust, Series 2005-17, Class 5A1, 5.150%, 8/25/2035 (a) | 10,977,960 | 10,126,301 | ||||||
Structured Adjustable Rate Mortgage Loan Trust, Series 2005-18, Class 6A1, 2.491%, 9/25/2035 (a) | 2,621,737 | 2,357,119 | ||||||
Structured Adjustable Rate Mortgage Loan Trust, Series 2005-18, Class 7A3, 4.662%, 9/25/2035 (a) | 24,728,842 | 21,474,007 | ||||||
Structured Adjustable Rate Mortgage Loan Trust, Series 2005-20, Class 4A1, 5.354%, 10/25/2035 (a)(b) | 25,526,271 | 21,788,485 | ||||||
Structured Adjustable Rate Mortgage Loan Trust, Series 2005-21, Class 7A1, | 6,860,774 | 5,650,355 | ||||||
Structured Asset Mortgage Investments II Trust, Series 2005-AR4, Class X2, 0.767%, 12/25/2035 (I/O) (a) | 26,740,497 | 473,307 | ||||||
Structured Asset Mortgage Investments II Trust, Series 2006-AR5, Class 4X, 2.538%, 5/25/2046 (I/O) (a) | 29,154,712 | 3,274,074 | ||||||
See accompanying notes which are an integral part of these financial statements.
47
Angel Oak Multi-Strategy Income Fund
Schedule of Investments – (continued)
January 31, 2015
| Principal Amount | Fair Value | |||||||
Collateralized Mortgage Obligations – (continued) |
| |||||||
Structured Asset Securities Corp. Mortgage Loan Trust, Series 2005-10, Class 5A4, 5.750%, 12/25/2034 | $ | 741,061 | $ | 693,241 | ||||
Structured Asset Securities Corp. Mortgage Loan Trust, Series 2005-17, Class 5A1, 5.500%, 10/25/2035 | 4,245,064 | 3,764,854 | ||||||
Structured Asset Securities Corp. Mortgage Pass-Through Certificates, Series 2003-6A, Class 2A1, 2.369%, 3/25/2033 (a) | 73,528 | 73,290 | ||||||
Thornburg Mortgage Securities Trust, Series 2006-4, Class A2C, 5.399%, 7/25/2036 (a) | 8,183,106 | 3,742,507 | ||||||
UBS-Barclays Commercial Mortgage Trust, Series 2012-C4, Class E, | 5,000,000 | 4,492,753 | ||||||
UBS-Barclays Commercial Mortgage Trust, Series 2012-C3, Class C, | 2,000,000 | 2,218,481 | ||||||
UBS-Barclays Commercial Mortgage Trust, Series 2012-C2, Class F, 4.889%, 5/10/2063 (a)(c) | 7,000,000 | 6,478,598 | ||||||
Wachovia Bank Commercial Mortgage Trust, Series 2006-C26, Class AJ, 6.002%, 6/15/2045 (a) | 5,105,000 | 5,153,990 | ||||||
Wachovia Bank Commercial Mortgage Trust, Series 2007-C33, Class B, 5.943%, 2/15/2051 (a) | 5,000,000 | 5,137,010 | ||||||
Wachovia Mortgage Loan Trust LLC, | 177,816 | 176,105 | ||||||
Wachovia Mortgage Loan Trust LLC, Series 2006-ALT1, Class A1, | 3,786,548 | 2,787,653 | ||||||
Wachovia Mortgage Loan Trust LLC, Series 2006-ALT1, Class A2, | 4,585,117 | 3,402,574 | ||||||
Washington Mutual Mortgage Pass-Through Certificates, Series 2005-AR18, Class 3A1, 4.567%, 1/25/2036 (a) | 7,513,084 | 6,984,208 | ||||||
See accompanying notes which are an integral part of these financial statements.
48
Angel Oak Multi-Strategy Income Fund
Schedule of Investments – (continued)
January 31, 2015
| Principal Amount | Fair Value | |||||||
Collateralized Mortgage Obligations – (continued) |
| |||||||
Washington Mutual Mortgage Pass-Through Certificates, Series 2006-AR14, Class 1A1, 1.955%, 11/25/2036 (a) | $ | 2,806,861 | $ | 2,497,169 | ||||
Washington Mutual Mortgage Pass-Through Certificates, Series 2007-HY1, Class 3A3, 4.434%, 2/25/2037 (a) | 18,603,446 | 17,036,477 | ||||||
Washington Mutual Mortgage Pass-Through Certificates, Series 2007-HY5, Class 3A1, 4.582%, 5/25/2037 (a) | 6,573,664 | 6,304,049 | ||||||
Washington Mutual Mortgage Pass-Through Certificates, Series 2007-HY7, Class 4A1, 4.568%, 7/25/2037 (a)(b) | 17,356,369 | 16,225,393 | ||||||
Washington Mutual Mortgage Pass-Through Certificates, Series 2006-AR9, Class 1A, 1.114%, 8/25/2046 (a) | 26,549,613 | 22,529,709 | ||||||
Washington Mutual Mortgage Pass-Through Certificates, Series 2006-AR11, Class 1XPP, 0.567%, 9/25/2046 (I/O) (a) | 176,986,751 | 3,185,762 | ||||||
Washington Mutual Mortgage Pass-Through Certificates, Series 2006-AR15, Class 2XPP, 0.397%, 11/25/2046 (I/O) (a) | 58,865,904 | 1,012,494 | ||||||
Washington Mutual Mortgage Pass-Through Certificates WMALT, Series 2005-1, Class 1A1, 5.500%, 3/25/2035 | 599,111 | 603,936 | ||||||
Washington Mutual Mortgage Pass-Through Certificates WMALT, Series 2005-7, Class 2CB1, 5.500%, 8/25/2035 | 4,102,099 | 3,907,225 | ||||||
Washington Mutual Mortgage Pass-Through Certificates WMALT, Series 2005-AR1, Class A1A, 0.428%, 12/25/2035 (a) | 961,908 | 806,270 | ||||||
Washington Mutual Mortgage Pass-Through Certificates WMALT, Series 2005-11, Class A2, 5.750%, 1/25/2036 | 6,809,875 | 6,052,808 | ||||||
Washington Mutual Mortgage Pass-Through Certificates WMALT, Series 2006-AR1, Class X2, 1.414%, 2/25/2036 (I/O) (a) | 35,608,365 | 2,239,766 | ||||||
See accompanying notes which are an integral part of these financial statements.
49
Angel Oak Multi-Strategy Income Fund
Schedule of Investments – (continued)
January 31, 2015
| Principal Amount | Fair Value | |||||||
Collateralized Mortgage Obligations – (continued) |
| |||||||
Washington Mutual Mortgage Pass-Through Certificates WMALT, Series 2006-8, Class A1, 0.290%, 10/25/2036 (a) | $ | 18,817,981 | $ | 10,939,758 | ||||
Washington Mutual Mortgage Pass-Through Certificates WMALT, Series 2006-8, Class A5, 6.126%, 10/25/2036 (a) | 13,299,543 | 9,697,880 | ||||||
Washington Mutual Mortgage Pass-Through Certificates WMALT, Series 2006-8, Class A6, 5.768%, 10/25/2036 (a) | 13,738,280 | 10,021,773 | ||||||
Washington Mutual Mortgage Pass-Through Certificates WMALT, Series 2006-AR4, Class X2, 0.695%, 6/25/2046 (I/O) (a) | 71,312,306 | 1,611,658 | ||||||
Washington Mutual Mortgage Pass-Through Certificates WMALT, Series 2006-AR5, Class DXPP, 0.016%, 7/25/2046 (I/O) (a) | 64,710,992 | 2,060,314 | ||||||
Washington Mutual Mortgage Pass-Through Certificates WMALT, Series 2006-AR6, Class 2XPP, 0.633%, 8/25/2046 (I/O) (a) | 151,385,591 | 2,618,971 | ||||||
Washington Mutual Mortgage Pass-Through Certificates WMALT, Series 2006-AR8, | 54,176,823 | 2,822,612 | ||||||
Washington Mutual Mortgage Pass-Through Certificates WMALT, Series 2006-AR9, Class CX2P, 1.232%, 11/25/2046 (I/O) (a) | 56,086,977 | 2,804,349 | ||||||
Washington Mutual Mortgage Pass-Through Certificates WMALT, Series 2007-0A1, Class CX2P, 1.515%, 12/25/2046 (I/O) (a) | 189,033,780 | 11,417,640 | ||||||
Washington Mutual Mortgage Pass-Through Certificates WMALT, Series 2007-OA2, Class CX2P, 1.069%, 1/24/2047 (I/O) (a) | 167,311,622 | 6,290,917 | ||||||
Washington Mutual Mortgage Pass-Through Certificates WMALT, Series 2007-OC1, | 5,869,751 | 4,149,562 | ||||||
Wells Fargo Alternative Loan Trust, | 7,921,056 | 7,492,392 | ||||||
See accompanying notes which are an integral part of these financial statements.
50
Angel Oak Multi-Strategy Income Fund
Schedule of Investments – (continued)
January 31, 2015
| Principal Amount | Fair Value | |||||||
Collateralized Mortgage Obligations – (continued) |
| |||||||
Wells Fargo Alternative Loan Trust, | $ | 3,098,950 | $ | 2,931,219 | ||||
Wells Fargo Alternative Loan Trust, | 772,558 | 670,079 | ||||||
Wells Fargo Mortgage Backed Securities Trust, Series 2005-AR15, Class 1A1, 2.613%, 9/25/2035 (a) | 4,820,064 | 4,597,300 | ||||||
Wells Fargo Mortgage Backed Securities Trust, Series 2005-AR16, Class 7A2, 5.222%, 10/25/2035 (a) | 544,863 | 272,742 | ||||||
Wells Fargo Mortgage Backed Securities Trust, Series 2006-AR6, Class 7A1, | 74,173 | 73,806 | ||||||
Wells Fargo Mortgage Backed Securities Trust, Series 2006-5, Class 1A6, 5.250%, 4/25/2036 | 138,578 | 136,678 | ||||||
Wells Fargo Mortgage Backed Securities Trust, Series 2006-AR10, Class 4A1, 2.610%, 7/25/2036 (a) | 273,538 | 259,673 | ||||||
Wells Fargo Mortgage Backed Securities Trust, Series 2006-AR10, Class 5A6, 2.612%, 7/25/2036 (a) | 262,945 | 254,913 | ||||||
Wells Fargo Mortgage Backed Securities Trust, Series 2006-AR11, Class A1, | 855,033 | 819,654 | ||||||
Wells Fargo Mortgage Backed Securities Trust, Series 2006-AR14, Class 1A3, 5.915%, 10/25/2036 (a) | 5,446,557 | 5,312,038 | ||||||
Wells Fargo Mortgage Backed Securities Trust, Series 2006-AR19, Class A3, 5.469%, 12/25/2036 (a) | 699,820 | 683,330 | ||||||
Wells Fargo Mortgage Backed Securities Trust, Series 2007-8, Class 1A5, 6.000%, 7/25/2037 | 940,314 | 933,165 | ||||||
Wells Fargo Mortgage Backed Securities Trust, Series 2007-10, Class 1A19, 6.000%, 7/25/2037 | 728,756 | 718,704 | ||||||
Wells Fargo Mortgage Backed Securities Trust, Series 2007-15, Class A1, 6.000%, 11/25/2037 | 2,128,203 | 2,121,516 | ||||||
See accompanying notes which are an integral part of these financial statements.
51
Angel Oak Multi-Strategy Income Fund
Schedule of Investments – (continued)
January 31, 2015
| Principal Amount | Fair Value | |||||||
Collateralized Mortgage Obligations – (continued) |
| |||||||
WF-RBS Commercial Mortgage Trust, | $ | 8,704,568 | $ | 9,372,657 | ||||
WF-RBS Commercial Mortgage Trust, | 9,000,000 | 9,214,812 | ||||||
WF-RBS Commercial Mortgage Trust, Series 2013-C14, Class D, | 8,470,000 | 8,156,542 | ||||||
WF-RBS Commercial Mortgage Trust, Series 2013-C16, Class D, | 4,000,000 | 4,126,330 | ||||||
WF-RBS Commercial Mortgage Trust, Series 2013-C17, Class D, 5.126%, 12/15/2046 (a)(c) | 8,229,000 | 8,521,463 | ||||||
WF-RBS Commercial Mortgage Trust, Series 2014-C20, Class C, | 10,000,000 | 10,697,945 | ||||||
WF-RBS Commercial Mortgage Trust, Series 2014-C21, Class A5, | 8,000,000 | 8,698,264 | ||||||
|
| |||||||
TOTAL COLLATERALIZED MORTGAGE OBLIGATIONS (Cost $2,794,551,550) |
| 2,872,985,071 | ||||||
|
| |||||||
Collateralized Loan Obligations – 13.84% | ||||||||
Acis CLO Ltd., Series 2013-1A, Class E, 5.857%, 4/18/2024 (a)(c) | 12,000,000 | 10,674,000 | ||||||
Acis CLO Ltd., Series 2014-3A, Class E, 5.005%, 2/1/2026 (a)(c) | 4,500,000 | 3,692,700 | ||||||
Adams Mill CLO Ltd., Series 2014-1A, Class E1, 5.253%, 7/15/2026 (a)(c) | 3,000,000 | 2,557,200 | ||||||
ALM Loan Funding, Series 2014-14A, Class D, 5.106%, 7/28/2026 (a)(c) | 7,500,000 | 6,800,250 | ||||||
AMMC CLO IX Ltd., Series 2011-9A, Class E, 7.703%, 1/15/2022 (a)(c) | 1,000,000 | 1,002,300 | ||||||
AMMC CLO XV Ltd., Series 2014-15A, Class D, 4.436%, 12/9/2026 (a)(c) | 3,000,000 | 2,910,300 | ||||||
See accompanying notes which are an integral part of these financial statements.
52
Angel Oak Multi-Strategy Income Fund
Schedule of Investments – (continued)
January 31, 2015
| Principal Amount | Fair Value | |||||||
Collateralized Loan Obligations – (continued) | ||||||||
Ares XXVII CLO Ltd., Series 2013-2A, Class E, 5.106%, 7/28/2025 (a)(c) | $ | 5,500,000 | $ | 4,975,300 | ||||
Arrowpoint CLO Ltd., Series 2012-2A, Class E, 4.960%, 3/12/2026 (a)(c) | 6,000,000 | 5,149,200 | ||||||
Arrowpoint CLO Ltd., Series 2014-3A, Class E, 7.585%, 10/15/2026 (a)(c) | 3,600,000 | 3,577,320 | ||||||
Arrowpoint CLO Ltd., Series 2014-3A, Class D, 5.335%, 10/15/2026 (a)(b)(c) | 11,000,000 | 10,924,100 | ||||||
Babson CLO Ltd., Series 2013-IIA, Class C, 3.503%, 1/18/2025 (a)(c) | 4,500,000 | 4,193,550 | ||||||
Brookside Mill CLO Ltd., Series 2013-1A, Class E, 4.653%, 4/17/2025 (a)(c) | 7,500,000 | 6,324,000 | ||||||
Canyon Capital CLO Ltd., Series 2012-1A, Class D, 4.553%, 1/15/2024 (a)(c) | 3,000,000 | 2,975,400 | ||||||
Carlyle Global Market Strategies CLO Ltd., Series 2012-4A, Class E, | 2,850,000 | 2,687,550 | ||||||
Catamaran CLO Ltd., Series 2012-1A, Class D, 4.747%, 12/20/2023 (a)(c) | 8,750,000 | 8,750,000 | ||||||
CIFC Funding Ltd., Series 2012-2A, Class B3L, 7.235%, 12/5/2024 (a)(c) | 2,000,000 | 1,876,200 | ||||||
CIFC Funding Ltd., Series 2012-2A, Class B2L, 6.235%, 12/5/2024 (a)(c) | 3,630,000 | 3,522,915 | ||||||
CIFC Funding Ltd., Series 2012-3A, Class B2L, 6.253%, 1/29/2025 (a)(c) | 9,550,000 | 9,146,035 | ||||||
CIFC Funding Ltd., Series 2012-3A, Class B3L, 7.153%, 1/29/2025 (a)(c) | 1,000,000 | 932,700 | ||||||
CIFC Funding Ltd., Series 2013-1A, Class E, 6.379%, 4/16/2025 (a)(c) | 4,800,000 | 4,287,360 | ||||||
ColumbusNova CLO IV Ltd., Series 2007-2A, Class D, 4.753%, 10/15/2021 (a)(c) | 3,440,000 | 3,444,128 | ||||||
Crown Point CLO II Ltd., Series 2013-2A, Class B1L, 3.803%, 12/31/2023 (a) | 4,000,000 | 3,724,000 | ||||||
Crown Point CLO Ltd., Series 2012-1A, Class B1L, 5.232%, 11/21/2022 (a)(c) | 5,000,000 | 5,002,000 | ||||||
See accompanying notes which are an integral part of these financial statements.
53
Angel Oak Multi-Strategy Income Fund
Schedule of Investments – (continued)
January 31, 2015
| Principal Amount | Fair Value | |||||||
Collateralized Loan Obligations – (continued) | ||||||||
Crown Point CLO Ltd., Series 2012-1A, Class B2L, 6.732%, 11/21/2022 (a)(c) | $ | 6,625,000 | $ | 6,303,025 | ||||
Cutwater Ltd., Series 2014-2A, Class D, 6.088%, 1/15/2027 (a)(c) | 2,000,000 | 1,832,000 | ||||||
Cutwater Ltd., Series 2014-2A, Class C, 4.638%, 1/15/2027 (a)(c) | 4,000,000 | 3,912,000 | ||||||
Dryden XXVIII Senior Loan Fund, | 9,000,000 | 7,808,400 | ||||||
Dryden XXXI Senior Loan Fund, Series 2014-31A, Class E, 4.507%, 4/18/2026 (a)(c) | 2,500,000 | 2,141,000 | ||||||
Dryden XXXI Senior Loan Fund, Series 2014-31A, Class C, 3.107%, 4/18/2026 (a)(c) | 1,200,000 | 1,163,640 | ||||||
Dryden XXXVI Senior Loan Fund, | 2,500,000 | 2,459,250 | ||||||
Dryden XXXVI Senior Loan Fund, | 7,000,000 | 6,701,800 | ||||||
Emerson Park CLO Ltd., Series 2013-1A, Class E, 5.103%, 7/15/2025 (a)(c) | 3,000,000 | 2,724,600 | ||||||
Finn Square CLO Ltd., Series 2012-1A, Class C, 3.855%, 12/24/2023 (a)(c) | 3,000,000 | 2,887,200 | ||||||
Finn Square CLO Ltd., Series 2012-1A, Class D, 5.305%, 12/24/2023 (a)(c) | 4,600,000 | 4,240,280 | ||||||
Gallatin CLO IV Ltd., Series 2012-1A, Class E, 5.503%, 10/15/2023 (a)(c) | 3,000,000 | 2,785,500 | ||||||
Halcyon Loan Advisors Funding Ltd., | 3,000,000 | 2,661,600 | ||||||
Hildene CLO III Ltd., Series 2014-3A, Class E, 5.483%, 10/20/2026 (a)(c) | 2,000,000 | 1,764,800 | ||||||
ING IM CLO Ltd., Series 2012-1RA, Class ER, 6.741%, 3/14/2022 (a)(c) | 2,000,000 | 1,978,000 | ||||||
ING IM CLO Ltd., Series 2012-1RA, Class DR, 5.441%, 3/14/2022 (a)(c) | 1,750,000 | 1,723,400 | ||||||
ING IM CLO Ltd., Series 2014-1A, Class D, 5.157%, 4/18/2026 (a)(c) | 9,500,000 | 8,560,450 | ||||||
See accompanying notes which are an integral part of these financial statements.
54
Angel Oak Multi-Strategy Income Fund
Schedule of Investments – (continued)
January 31, 2015
| Principal Amount | Fair Value | |||||||
Collateralized Loan Obligations – (continued) | ||||||||
Jamestown CLO V Ltd., Series 2014-5A, Class D, 4.029%, 1/17/2027 (a)(c) | $ | 6,000,000 | $ | 5,617,200 | ||||
JFIN Revolver CLO Ltd., Series 2013-1A, Class D, 4.007%, 1/20/2021 (a)(b)(c) | 7,000,000 | 6,763,400 | ||||||
JFIN Revolver CLO Ltd., Series 2014-2A, Class C, 2.984%, 2/20/2022 (a)(c) | 5,000,000 | 4,891,000 | ||||||
JMP Credit Advisors CLO II Ltd., Series 2013-1A, Class E, 5.503%, 4/30/2023 (a)(c) | 8,200,000 | 7,407,880 | ||||||
JMP Credit Advisors CLO II Ltd., Series 2013-1A, Class D, 4.103%, 4/30/2023 (a)(c) | 4,000,000 | 3,813,600 | ||||||
JMP Credit Advisors CLO III Ltd., Series 2014-1A, Class D, 5.336%, 10/17/2025 (a)(b)(c) | 9,300,000 | 9,298,140 | ||||||
JMP Credit Advisors CLO III Ltd., Series 2014-1A, Class E, 7.584%, 10/17/2025 (a)(c) | 7,650,000 | 7,624,755 | ||||||
KCAP Senior Funding I LLC, Series 2013-1A, | 2,500,000 | 2,433,000 | ||||||
KVK CLO Ltd., Series 2012-1X, Class E, 6.503%, 7/15/2023 (a) | 3,700,000 | 3,493,540 | ||||||
Longfellow Place CLO Ltd., Series 2013-1A, | 9,000,000 | 8,758,800 | ||||||
Madison Park Funding XV Ltd., Series 2014-15A, Class D, 5.690%, 1/27/2026 (a)(c) | 5,000,000 | 4,454,500 | ||||||
Magnetite XI Ltd., Series 2014-11A, Class D, 5.385%, 1/18/2027 (a)(c) | 5,000,000 | 4,552,000 | ||||||
Neuberger Berman CLO XIII Ltd., Series 2012-13A, Class D, 4.756%, 1/23/2024 (a)(c) | 5,050,000 | 5,050,000 | ||||||
Neuberger Berman CLO XVIII Ltd., | 5,000,000 | 4,892,000 | ||||||
Neuberger Berman CLO XVIII Ltd., | 3,000,000 | 2,640,600 | ||||||
NewMark Capital Funding CLO Ltd., | 4,000,000 | 3,533,600 | ||||||
NewStar Clarendon Fund CLO LLC, | 7,465,000 | 7,283,600 | ||||||
See accompanying notes which are an integral part of these financial statements.
55
Angel Oak Multi-Strategy Income Fund
Schedule of Investments – (continued)
January 31, 2015
| Principal Amount | Fair Value | |||||||
Collateralized Loan Obligations – (continued) | ||||||||
Ocean Trails CLO IV, Series 2013-4A, Class A, 1.533%, 8/13/2025 (a)(b)(c) | $ | 25,000,000 | $ | 24,787,500 | ||||
Ocean Trails CLO IV, Series 2013-4A, Class D, 4.233%, 8/13/2025 (a)(c) | 4,000,000 | 3,847,600 | ||||||
Octagon Investment Partners XIV Ltd., | 6,300,000 | 5,804,820 | ||||||
Octagon Investment Partners XXI Ltd., | 8,500,000 | 8,420,100 | ||||||
Octagon Investment Partners XXII Ltd., Series 2014-1A, Class D1, 4.191%, 11/22/2025 (a)(c) | 4,250,000 | 4,063,000 | ||||||
Octagon Investment Partners XXII Ltd., Series 2014-1A, Class C1, 3.541%, 11/22/2025 (a)(c) | 4,000,000 | 3,936,400 | ||||||
OFSI Fund VII Ltd., Series 2014-7A, Class E, 7.625%, 10/18/2026 (a)(c) | 7,000,000 | 6,757,800 | ||||||
OFSI Fund VII Ltd., Series 2014-7A, Class D, 5.375%, 10/18/2026 (a)(b)(c) | 10,600,000 | 10,420,860 | ||||||
OHA Credit Partners VI Ltd., Series 2012-6A, | 3,000,000 | 3,000,300 | ||||||
OZLM IX Ltd., Series 2014-9A, Class D, 5.397%, 1/20/2027 (a)(c) | 5,000,000 | 4,367,500 | ||||||
OZLM IX Ltd., Series 2014-9A, Class C, 3.847%, 1/20/2027 (a)(c) | 5,000,000 | 4,639,500 | ||||||
Portola CLO Ltd., Series 2007-1A, Class E, 6.632%, 11/15/2021 (a)(c) | 2,747,252 | 2,747,802 | ||||||
Regatta V Funding Ltd., Series 2014-1A, Class D, 5.133%, 10/25/2026 (a)(c) | 5,000,000 | 4,434,500 | ||||||
Saranac CLO I Ltd., Series 2013-1A, Class D, 3.806%, 10/26/2024 (a)(c) | 4,000,000 | 3,699,600 | ||||||
Saratoga Investment Corp. CLO Ltd., | 13,100,000 | 11,290,890 | ||||||
See accompanying notes which are an integral part of these financial statements.
56
Angel Oak Multi-Strategy Income Fund
Schedule of Investments – (continued)
January 31, 2015
| Principal Amount | Fair Value | |||||||
Collateralized Loan Obligations – (continued) | ||||||||
Saratoga Investment Corp. CLO Ltd., | $ | 8,000,000 | $ | 7,478,400 | ||||
Seneca Park CLO Ltd., Series 2014-1A, Class D, 3.757%, 7/17/2026 (a)(c) | 3,000,000 | 2,836,500 | ||||||
Shackleton CLO Ltd., Series 2012-1A, Class D, 4.983%, 8/14/2023 (a)(c) | 6,000,000 | 6,000,600 | ||||||
Shackleton CLO Ltd., Series 2013-3A, Class D, 4.053%, 4/15/2025 (a)(c) | 3,000,000 | 2,847,000 | ||||||
Sound Harbor Loan Fund Ltd., Series 2014-1A, Class C, 4.993%, 10/30/2026 (a)(c) | 11,700,000 | 11,704,680 | ||||||
Sound Point CLO II Ltd., Series 2013-1A, Class B2L, 4.756%, 4/26/2025 (a)(c) | 7,000,000 | 6,072,500 | ||||||
Sound Point CLO III Ltd., Series 2014-3A, Class D, 3.885%, 1/23/2027 (a)(c) | 2,500,000 | 2,317,500 | ||||||
Sound Point CLO IV Ltd., Series 2013-3A, Class D, 3.756%, 1/21/2026 (a)(c) | 6,000,000 | 5,572,200 | ||||||
Steele Creek CLO Ltd., Series 2014-1A, Class E2, 7.184%, 8/21/2026 (a)(c) | 2,000,000 | 1,914,200 | ||||||
Steele Creek CLO Ltd., Series 2014-1A, Class D, 3.634%, 8/21/2026 (a)(c) | 2,000,000 | 1,792,400 | ||||||
Sudbury Mill CLO Ltd., Series 2013-1A, Class E, 5.007%, 1/17/2026 (a)(c) | 5,000,000 | 4,106,000 | ||||||
TICC CLO LLC, Series 2012-1A, Class D1, 5.983%, 8/25/2023 (a)(c) | 7,000,000 | 7,005,600 | ||||||
Tuolumne Grove CLO Ltd., Series 2014-1A, Class E, 5.006%, 4/25/2026 (a)(c) | 8,000,000 | 6,868,800 | ||||||
Vibrant CLO II Ltd., Series 2013-2A, Class C, 3.856%, 7/24/2024 (a)(c) | 3,000,000 | 2,809,500 | ||||||
Vibrant CLO II Ltd., Series 2013-2A, Class D, 5.156%, 7/24/2024 (a)(c) | 3,200,000 | 2,829,440 | ||||||
Vibrant CLO Ltd., Series 2012-1A, Class C, 4.757%, 7/17/2024 (a)(c) | 10,200,000 | 10,070,460 | ||||||
Voya CLO Ltd., Series 2014-3A, Class D, 5.256%, 7/25/2026 (a)(c) | 7,000,000 | 6,330,800 | ||||||
See accompanying notes which are an integral part of these financial statements.
57
Angel Oak Multi-Strategy Income Fund
Schedule of Investments – (continued)
January 31, 2015
| Principal Amount | Fair Value | |||||||
Collateralized Loan Obligations – (continued) | ||||||||
Washington Mill CLO Ltd., Series 2014-1A, Class D, 3.707%, 4/20/2026 (a)(c) | $ | 5,000,000 | $ | 4,575,500 | ||||
Washington Mill CLO Ltd., Series 2014-1A, Class E, 5.107%, 4/20/2026 (a)(c) | 5,000,000 | 4,175,500 | ||||||
West CLO Ltd., Series 2012-1A, Class D, 6.755%, 10/30/2023 (a)(c) | 5,000,000 | 4,743,000 | ||||||
Wind River CLO Ltd., Series 2012-1A, Class D, 5.253%, 1/15/2024 (a)(c) | 4,000,000 | 4,004,400 | ||||||
Wind River CLO Ltd., Series 2012-1A, Class E, 5.503%, 1/15/2024 (a)(c) | 5,000,000 | 4,602,000 | ||||||
Wind River CLO Ltd., Series 2014-1A, Class E, 5.203%, 4/18/2026 (a)(c) | 5,000,000 | 4,423,500 | ||||||
York CLO I Ltd., Series 2014-1A, Class D, 4.343%, 1/22/2027 (a)(c) | 3,000,000 | 2,877,600 | ||||||
|
| |||||||
TOTAL COLLATERALIZED LOAN OBLIGATIONS (Cost $491,812,526) |
| 483,459,320 | ||||||
|
| |||||||
Asset-Backed Securities 9.52% | ||||||||
321 Henderson Receivables LLC, Series 2014-1A, Class B, 4.940%, 3/16/2065 (b)(c) | 1,500,000 | 1,634,030 | ||||||
321 Henderson Receivables LLC, Series 2012-3A, Class A, 3.220%, 9/15/2065 (b)(c) | 11,884,740 | 12,427,397 | ||||||
321 Henderson Receivables LLC, Series 2012-3A, Class B, 6.170%, 9/15/2067 (b)(c) | 1,000,000 | 1,170,991 | ||||||
321 Henderson Receivables LLC, Series 2013-3A, Class A, 4.080%, 1/17/2073 (b)(c) | 4,703,061 | 5,227,657 | ||||||
321 Henderson Receivables LLC, Series 2014-2A, Class A, 3.610%, 1/17/2073 (b)(c) | 5,963,283 | 6,378,817 | ||||||
321 Henderson Receivables LLC, Series 2014-3A, Class A, 3.500%, 6/15/2077 (b)(c) | 9,973,137 | 10,556,082 | ||||||
ACE Securities Corp., Series 2006-HE2, Class A2C, 0.328%, 5/25/2036 (a) | 5,223,639 | 4,625,809 | ||||||
ACE Securities Corp., Series 2006-CW1, | 6,199,698 | 4,448,760 | ||||||
Avery Point III CLO Ltd., Series 2013-3A, Class E, 5.257%, 1/18/2025 (a)(c) | 8,000,000 | 6,922,400 | ||||||
See accompanying notes which are an integral part of these financial statements.
58
Angel Oak Multi-Strategy Income Fund
Schedule of Investments – (continued)
January 31, 2015
| Principal Amount | Fair Value | |||||||
Asset-Backed Securities – (continued) | ||||||||
Cajun Global LLC, Series 2011-1A, Class A2, 5.955%, 2/20/2041 (c) | $ | 7,004,489 | $ | 7,205,517 | ||||
Carlyle Global Market Strategies CLO Ltd., Series 2012-1A, Class F, | 5,000,000 | 4,822,000 | ||||||
Carrington Mortgage Loan Trust, Series 2006-NC3, Class A2, 0.268%, 8/25/2036 (a) | 10,646,877 | 9,145,582 | ||||||
Carrington Mortgage Loan Trust, Series 2006-NC5, Class A5, 0.228%, 1/25/2037 (a) | 6,804,334 | 5,169,123 | ||||||
Carrington Mortgage Loan Trust, Series 2006-NC5, Class A2, 0.278%, 1/25/2037 (a) | 4,733,678 | 3,572,536 | ||||||
Credit-Based Asset Servicing and Securitization LLC, Series 2006-CB4, Class AV3, 0.320%, 5/25/2036 (a) | 25,868,064 | 19,329,394 | ||||||
Credit-Based Asset Servicing and Securitization LLC, Series 2007-CB1, Class AF4, 4.103%, 1/25/2037 (a) | 2,181,253 | 1,202,649 | ||||||
Credit-Based Asset Servicing and Securitization LLC, Series 2007-CB1, Class AF3, 4.103%, 1/25/2037 (a) | 10,906,266 | 5,965,847 | ||||||
Credit-Based Asset Servicing and Securitization LLC, Series 2007-CB1, Class AF2, 4.103%, 1/25/2037 (a) | 16,058,386 | 8,778,060 | ||||||
Credit-Based Asset Servicing and Securitization LLC, Series 2007-CB1, Class AF6, 4.103%, 1/25/2037 (a) | 13,092,825 | 7,195,332 | ||||||
Credit-Based Asset Servicing and Securitization LLC, Series 2007-CB1, Class AF1B, 4.100%, 1/25/2037 (a) | 8,267,471 | 4,568,257 | ||||||
Drug Royalty II LP, Series 2014-1, Class A2, 3.484%, 7/15/2023 (c) | 9,362,319 | 9,470,538 | ||||||
Fieldstone Mortgage Investment Corp., | 12,290,450 | 8,050,024 | ||||||
Fieldstone Mortgage Investment Corp., | 16,683,295 | 11,263,226 | ||||||
See accompanying notes which are an integral part of these financial statements.
59
Angel Oak Multi-Strategy Income Fund
Schedule of Investments – (continued)
January 31, 2015
| Principal Amount | Fair Value | |||||||
Asset-Backed Securities – (continued) | ||||||||
Fortress Credit BSL II Ltd., Series 2013-2A, Class E, 5.407%, 10/19/2025 (a) | $ | 5,000,000 | $ | 4,364,000 | ||||
Fortress Credit BSL II Ltd., Series 2013-2A, Class D, 4.107%, 10/19/2025 (a)(b)(c) | 7,750,000 | 7,305,925 | ||||||
HOA Funding LLC, Series 2014-1A, Class A2, 4.846%, 8/20/2044 (c) | 4,975,000 | 5,003,499 | ||||||
INDYMAC Residential Asset Backed Trust, Series 2006-E, Class 2A2, 0.288%, 4/25/2037 (a) | 4,779,196 | 3,194,415 | ||||||
MASTR Asset Backed Securities Trust, Series 2005-NC2, Class A3, | 30,678,546 | 20,211,303 | ||||||
MASTR Asset Backed Securities Trust, Series 2006-NC3, Class A3, | 18,421,316 | 11,651,648 | ||||||
Morgan Stanley ABS Capital I, Inc. Trust, Series 2007-HE1, Class A2C, 0.318%, 11/25/2036 (a) | 17,369,924 | 11,080,361 | ||||||
Morgan Stanley ABS Capital I, Inc. Trust, Series 2007-HE1, Class A2B, 0.268%, 11/25/2036 (a) | 3,068,950 | 1,944,355 | ||||||
New Century Home Equity Loan Trust, | 9,103,966 | 6,898,394 | ||||||
Newcastle Mortgage Securities Trust, Series 2007-1, Class 1A1, 0.358%, 4/25/2037 (a) | 19,369,799 | 16,158,673 | ||||||
Nomura Home Equity Loan, Inc., Series 2006-HE3, Class 2A3, 0.318%, 7/25/2036 (a) | 13,034,102 | 11,230,183 | ||||||
OFSI Fund VI Ltd., Series 2014-6A, Class D, 5.103%, 3/20/2025 (a)(c) | 8,000,000 | 6,657,600 | ||||||
Option One Mortgage Loan Trust, Series 2007-3, Class 2A3, 0.408%, 4/25/2037 (a) | 4,371,903 | 2,643,296 | ||||||
Ownit Mortgage Loan Asset-Backed Certificates, Series 2006-1, Class AF2, 3.377%, 12/25/2036 (a) | 14,792,565 | 9,283,592 | ||||||
RAMP Trust, Series 2007-RS2, Class A2, 0.448%, 5/25/2037 (a) | 11,271,884 | 9,623,462 | ||||||
RASC Trust, Series 06-KS9, Class AI3, 0.328%, 11/25/2036 (a) | 9,521,213 | 8,056,432 | ||||||
See accompanying notes which are an integral part of these financial statements.
60
Angel Oak Multi-Strategy Income Fund
Schedule of Investments – (continued)
January 31, 2015
| Principal Amount | Fair Value | |||||||
Asset-Backed Securities – (continued) | ||||||||
Saxon Asset Securities Trust, Series 2007-4, | $ | 12,331,445 | $ | 10,037,870 | ||||
Securitized Asset Backed Receivables LLC, Series 2006-HE2, Class A2B, | 36,067,196 | 20,289,241 | ||||||
SolarCity LMC LLC, Series 2014-1, Class A, 4.590%, 4/20/2044 (c) | 2,162,903 | 2,278,815 | ||||||
Specialty Underwriting & Residential Finance Trust, Series 2006-BC5, Class A2C, 0.268%, 11/25/2037 (a) | 5,544,256 | 3,829,423 | ||||||
Trade MAPS 1 Ltd., Series 2013-1A, Class D, 5.166%, 12/10/2018 (a)(c) | 2,000,000 | 1,965,000 | ||||||
|
| |||||||
TOTAL ASSET-BACKED SECURITIES (Cost $331,882,072) | 332,837,515 | |||||||
|
| |||||||
Corporate Bonds – 2.87% | ||||||||
Financials 2.87% | ||||||||
Brand Group Holdings, Inc., 8.500%, 6/27/2024 (c)(e) | 10,000,000 | 10,000,000 | ||||||
Bremer Financial Corp., 5.200%, 12/30/2024 (c) | 5,000,000 | 5,000,000 | ||||||
Brookline Bancorp, Inc., 6.000%, 9/15/2029 (a) | 3,000,000 | 3,090,000 | ||||||
Eagle Bancorp, Inc., 5.750%, 9/1/2024 | 12,500,000 | 12,875,000 | ||||||
Heartland Financial USA, Inc., | 14,998,000 | 15,147,980 | ||||||
Luther Burbank Corp., 6.500%, 9/30/2024 (c) | 32,700,000 | 32,700,000 | ||||||
Presidio Bank, 8.000%, 9/30/2024 (c) | 5,000,000 | 5,000,000 | ||||||
United Financial Bancorp, Inc., 5.750%, 10/1/2024 | 16,200,000 | 16,605,000 | ||||||
|
| |||||||
TOTAL CORPORATE BONDS (Cost $99,398,000) | 100,417,980 | |||||||
|
| |||||||
Collateralized Debt Obligations – 0.87% | ||||||||
Tralee CDO III Ltd., Series 2014-3A, Class E, 7.231%, 7/20/2026 (a)(c) | 5,000,000 | 4,933,000 | ||||||
Venture CDO Ltd., Series 2012-11A, Class E, 6.733%, 11/14/2022 (a)(c) | 4,000,000 | 3,939,600 | ||||||
Venture X CDO Ltd., Series 2012-10X, Class E, 6.257%, 7/20/2022 (a) | 3,000,000 | 2,873,400 | ||||||
See accompanying notes which are an integral part of these financial statements.
61
Angel Oak Multi-Strategy Income Fund
Schedule of Investments – (continued)
January 31, 2015
| Shares or Principal Amount | Fair Value | |||||||
Collateralized Debt Obligations – (continued) | ||||||||
Venture X CDO Ltd., Series 2012-12A, Class E, 5.536%, 2/28/2024 (a)(c) | $ | 10,000,000 | $ | 9,291,000 | ||||
Venture XIX CDO Ltd., Series 2014-19A, Class D, 4.240%, 1/15/2027 (a)(c) | 10,000,000 | 9,536,000 | ||||||
|
| |||||||
TOTAL COLLATERALIZED DEBT OBLIGATIONS (Cost $31,167,824) |
| 30,573,000 | ||||||
|
| |||||||
Preferred Stocks – 0.20% | ||||||||
Financials – 0.20% | ||||||||
Bank of America Corp., Series X, 6.250%, Perpetual Maturity (a) | 994,000 | 1,021,444 | ||||||
Citigroup, Inc., 5.900%, Perpetual Maturity (a) | 995,000 | 998,731 | ||||||
Goldman Sachs Capital II, 4.000%, Perpetual Maturity (a) | 992,500 | 779,113 | ||||||
Morgan Stanley, Series A, 4.000% (a) | 130,497 | 2,658,224 | ||||||
Wachovia Capital Trust III, 5.570%, Perpetual Maturity (a) | 992,000 | 978,043 | ||||||
Wells Fargo & Co., Series P, 5.250% | 23,990 | 589,434 | ||||||
|
| |||||||
TOTAL PREFERRED STOCKS (Cost $7,180,185) | 7,024,989 | |||||||
|
| |||||||
Repurchase Agreements 1.14% | ||||||||
EJF Specialty Finance Opportunities Fund LLC, 6.000%, dated 1/22/15, due 2/23/2015, repurchase price $40,213,333 (collateralized by various corporate bonds (f), fair value $67,421,875) (e) | 40,000,000 | 40,000,000 | ||||||
|
| |||||||
TOTAL REPURCHASE AGREEMENTS (Cost $40,000,000) | 40,000,000 | |||||||
|
| |||||||
See accompanying notes which are an integral part of these financial statements.
62
Angel Oak Multi-Strategy Income Fund
Schedule of Investments – (continued)
January 31, 2015
| Shares | Fair Value | |||||||
Cash Equivalents 4.84% | ||||||||
Fidelity Institutional Money Market Portfolio – Institutional Class, 0.110% (g) | 169,145,435 | $ | 169,145,435 | |||||
|
| |||||||
TOTAL CASH EQUIVALENTS (Cost $169,145,435) | 169,145,435 | |||||||
|
| |||||||
TOTAL INVESTMENTS – 115.51% (Cost $3,965,137,592) | 4,036,443,310 | |||||||
|
| |||||||
Liabilities in Excess of Other Assets – (15.51)% | (542,062,294 | ) | ||||||
|
| |||||||
NET ASSETS – 100.00% | $ | 3,494,381,016 | ||||||
|
| |||||||
| (a) | Variable or floating rate security. Rate disclosed is as of January 31, 2015. |
| (b) | All or a portion of the security has been pledged as collateral in connection with open reverse repurchase agreements. On January 31, 2015 securities valued at $613,362,354 were pledged as collateral for reverse repurchase agreements. |
| (c) | Security exempt from registration under Rule 144A or Section 4(2) of the Securities Act of 1933. The security may be resold in transactions exempt from registration, normally to qualified institutional buyers. |
| (d) | Security is fair valued by the Adviser. |
| (e) | Illiquid security. Total fair value of illiquid securities held as of January 31, 2015 was $50,000,000 or 1.43% of net assets. |
| (f) | The fair value of securities held as collateral for the repurchase agreement as of January 31, 2015 was as follows: |
Security | Principal Amount | Fair Value | ||||||
Avenue Financial Holdings, 6.750%, 12/29/2024 | $ | 10,000,000 | $ | 10,000,000 | ||||
Brand Group Holdings, Inc., 8.500%, 6/27/2024 (c)(e) | 15,000,000 | 15,000,000 | ||||||
Pacific Enterprice Banco, 8.000%, 11/24/2024 | 13,000,000 | 13,000,000 | ||||||
Popular, Inc., 7.000%, 7/01/2019 | 7,500,000 | 7,546,875 | ||||||
Presidio Bank, 8.000%, 9/30/2024 | 5,000,000 | 5,000,000 | ||||||
VantageSouth Bancshares, 7.625%, 8/12/2023 | 15,000,000 | 16,875,000 | ||||||
|
| |||||||
Total | $ | 67,421,875 | ||||||
|
| |||||||
| (g) | Rate disclosed is the seven day yield as of January 31, 2015. |
I/O — Interest Only Security
See accompanying notes which are an integral part of these financial statements.
63
Angel Oak Multi-Strategy Income Fund
Schedule of Investments – (continued)
January 31, 2015
The value of Futures Contracts as of January 31, 2015 was as follows:
Long Futures Contracts | Number of Contracts | Underlying Face Amount at Fair Value | Unrealized Appreciation (Depreciation) | |||||||||
3 Month USD LIBOR Interest Rate Swap Futures expiring 12/17/2019 | 3,658 | $ | 349,024,412 | $ | (11,007,794) | |||||||
3 Month USD LIBOR Interest Rate Swap Futures expiring 3/18/2020 | 14 | 1,342,354 | (11,014) | |||||||||
3 Month USD LIBOR Interest Rate Swap Futures expiring 9/17/2021 | 189 | 17,280,402 | (931,228) | |||||||||
3 Month USD LIBOR Interest Rate Swap Futures expiring 12/17/2021 | 106 | 9,925,289 | (557,167) | |||||||||
3 Month USD LIBOR Interest Rate Swap Futures expiring 3/18/2022 | 53 | 4,990,083 | (137,350) | |||||||||
3 Month USD LIBOR Interest Rate Swap Futures expiring 9/17/2024 | 642 | 55,026,719 | (5,402,022) | |||||||||
3 Month USD LIBOR Interest Rate Swap Futures expiring 12/17/2024 | 3,889 | 344,679,348 | (30,868,014) | |||||||||
3 Month USD LIBOR Interest Rate Swap Futures expiring 3/18/2025 | 274 | 24,439,786 | (728,684) | |||||||||
|
|
|
| |||||||||
| 8,825 | $ | (49,643,273) | ||||||||||
|
|
|
| |||||||||
See accompanying notes which are an integral part of these financial statements.
64
Angel Oak Multi-Strategy Income Fund
Schedule of Investments – (continued)
January 31, 2015
Reverse repurchase agreements outstanding as of January 31, 2015 were as follows:
Counterparty | Interest Rate | Trade Date | Maturity Date | Net Closing Amount | Face Value | |||||||||||||||
Bank of America | 1.42 | % | 1/23/2015 | 2/25/2015 | $ | 8,771,403 | $ | 8,760,000 | ||||||||||||
BNP Paribas | 1.32 | % | 1/22/2015 | 2/23/2015 | 4,940,783 | 4,935,000 | ||||||||||||||
BNP Paribas | 1.32 | % | 1/22/2015 | 2/23/2015 | 7,209,438 | 7,201,000 | ||||||||||||||
Credit Suisse | 0.91 | % | 1/5/2015 | 2/4/2015 | 7,615,968 | 7,610,197 | ||||||||||||||
Credit Suisse | 1.41 | % | 1/23/2015 | 2/27/2015 | 8,533,535 | 8,521,853 | ||||||||||||||
Goldman Sachs | 1.77 | % | 1/2/2015 | 2/2/2015 | 8,418,794 | 8,406,000 | ||||||||||||||
Goldman Sachs | 1.07 | % | 1/6/2015 | 2/6/2015 | 3,855,542 | 3,852,000 | ||||||||||||||
JP Morgan | 1.39 | % | 11/24/2014 | 2/23/2015 | 5,116,864 | 5,099,000 | ||||||||||||||
JP Morgan | 1.39 | % | 11/24/2014 | 2/23/2015 | 8,180,561 | 8,152,000 | ||||||||||||||
JP Morgan | 1.39 | % | 11/24/2014 | 2/23/2015 | 7,036,567 | 7,012,000 | ||||||||||||||
JP Morgan | 1.39 | % | 11/24/2014 | 2/23/2015 | 6,599,039 | 6,576,000 | ||||||||||||||
JP Morgan | 1.39 | % | 11/24/2014 | 2/23/2015 | 8,042,077 | 8,014,000 | ||||||||||||||
JP Morgan | 1.39 | % | 11/24/2014 | 2/23/2015 | 5,538,336 | 5,519,000 | ||||||||||||||
JP Morgan | 0.77 | % | 1/20/2015 | 2/20/2015 | 15,076,971 | 15,067,000 | ||||||||||||||
Mizuho | 0.75 | % | 1/8/2015 | 2/19/2015 | 8,577,499 | 8,570,000 | ||||||||||||||
Mizuho | 0.75 | % | 1/8/2015 | 2/19/2015 | 9,053,915 | 9,046,000 | ||||||||||||||
Mizuho | 0.75 | % | 1/8/2015 | 2/19/2015 | 5,914,170 | 5,909,000 | ||||||||||||||
Mizuho | 0.75 | % | 1/8/2015 | 2/19/2015 | 8,898,780 | 8,891,000 | ||||||||||||||
Mizuho | 0.75 | % | 1/8/2015 | 2/19/2015 | 8,931,809 | 8,924,000 | ||||||||||||||
Mizuho | 0.75 | % | 1/8/2015 | 2/19/2015 | 7,196,291 | 7,190,000 | ||||||||||||||
Mizuho | 0.75 | % | 1/8/2015 | 2/19/2015 | 7,161,261 | 7,155,000 | ||||||||||||||
Mizuho | 0.85 | % | 1/8/2015 | 2/19/2015 | 1,296,284 | 1,295,000 | ||||||||||||||
Mizuho | 0.85 | % | 1/8/2015 | 2/19/2015 | 4,317,277 | 4,313,000 | ||||||||||||||
Mizuho | 0.85 | % | 1/8/2015 | 2/19/2015 | 858,851 | 858,000 | ||||||||||||||
Mizuho | 0.85 | % | 1/8/2015 | 2/19/2015 | 10,307,211 | 10,297,000 | ||||||||||||||
Mizuho | 0.75 | % | 1/8/2015 | 2/19/2015 | 7,484,543 | 7,478,000 | ||||||||||||||
Mizuho | 0.75 | % | 1/8/2015 | 2/19/2015 | 4,676,088 | 4,672,000 | ||||||||||||||
Mizuho | 0.75 | % | 1/8/2015 | 2/19/2015 | 4,523,955 | 4,520,000 | ||||||||||||||
Mizuho | 0.85 | % | 1/8/2015 | 2/19/2015 | 5,239,190 | 5,234,000 | ||||||||||||||
Mizuho | 0.85 | % | 1/8/2015 | 2/19/2015 | 8,749,668 | 8,741,000 | ||||||||||||||
Mizuho | 0.75 | % | 1/8/2015 | 2/19/2015 | 4,142,622 | 4,139,000 | ||||||||||||||
Mizuho | 0.75 | % | 1/28/2015 | 2/19/2015 | 4,220,934 | 4,219,000 | ||||||||||||||
Nomura | 1.19 | % | 10/3/2013 | 4/3/2015 | 23,493,864 | 23,075,625 | ||||||||||||||
RBC Capital Markets | 1.63 | % | 11/5/2014 | 2/5/2015 | 10,877,186 | 10,832,000 | ||||||||||||||
See accompanying notes which are an integral part of these financial statements.
65
Angel Oak Multi-Strategy Income Fund
Schedule of Investments – (continued)
January 31, 2015
Counterparty | Interest Rate | Trade Date | Maturity Date | Net Closing Amount | Face Value | |||||||||||||||
RBC Capital Markets | 1.63 | % | 11/5/2014 | 2/5/2015 | $ | 12,977,913 | $ | 12,924,000 | ||||||||||||
RBC Capital Markets | 1.63 | % | 11/5/2014 | 2/5/2015 | 11,586,131 | 11,538,000 | ||||||||||||||
RBC Capital Markets | 1.63 | % | 11/5/2014 | 2/5/2015 | 8,308,515 | 8,274,000 | ||||||||||||||
RBC Capital Markets | 1.63 | % | 11/5/2014 | 2/5/2015 | 7,708,021 | 7,676,000 | ||||||||||||||
RBC Capital Markets | 1.08 | % | 11/7/2014 | 2/5/2015 | 5,563,005 | 5,548,000 | ||||||||||||||
RBC Capital Markets | 1.08 | % | 11/7/2014 | 2/5/2015 | 6,125,523 | 6,109,000 | ||||||||||||||
RBC Capital Markets | 1.63 | % | 11/12/2014 | 2/12/2015 | 13,377,599 | 13,322,000 | ||||||||||||||
RBC Capital Markets | 1.63 | % | 11/12/2014 | 2/12/2015 | 16,366,019 | 16,298,000 | ||||||||||||||
RBC Capital Markets | 1.34 | % | 12/18/2014 | 3/18/2015 | 8,235,550 | 8,208,000 | ||||||||||||||
RBC Capital Markets | 0.77 | % | 1/15/2015 | 2/17/2015 | 9,695,808 | 9,689,000 | ||||||||||||||
RBC Capital Markets | 0.77 | % | 1/15/2015 | 2/17/2015 | 9,713,820 | 9,707,000 | ||||||||||||||
RBC Capital Markets | 0.77 | % | 1/15/2015 | 2/17/2015 | 18,974,322 | 18,961,000 | ||||||||||||||
RBC Capital Markets | 0.77 | % | 1/15/2015 | 2/17/2015 | 9,627,760 | 9,621,000 | ||||||||||||||
RBC Capital Markets | 0.77 | % | 1/15/2015 | 2/17/2015 | 9,189,452 | 9,183,000 | ||||||||||||||
RBC Capital Markets | 1.66 | % | 1/22/2015 | 4/22/2015 | 11,670,135 | 11,622,000 | ||||||||||||||
RBC Capital Markets | 1.66 | % | 1/22/2015 | 4/22/2015 | 7,537,088 | 7,506,000 | ||||||||||||||
RBC Capital Markets | 1.66 | % | 1/22/2015 | 4/22/2015 | 13,382,197 | 13,327,000 | ||||||||||||||
RBC Capital Markets | 1.66 | % | 1/22/2015 | 4/22/2015 | 10,530,435 | 10,487,000 | ||||||||||||||
See accompanying notes which are an integral part of these financial statements.
66
Angel Oak Multi-Strategy Income Fund
Schedule of Investments – (continued)
January 31, 2015
Counterparty | Interest Rate | Trade Date | Maturity Date | Net Closing Amount | Face Value | |||||||||||||||
RBC Capital Markets | 1.66 | % | 1/22/2015 | 4/22/2015 | $ | 15,668,628 | $ | 15,604,000 | ||||||||||||
RBC Capital Markets | 1.66 | % | 1/22/2015 | 4/22/2015 | 18,802,554 | 18,725,000 | ||||||||||||||
RBC Capital Markets | 1.66 | % | 1/22/2015 | 4/22/2015 | 15,424,621 | 15,361,000 | ||||||||||||||
UBS | 1.07 | % | 1/5/2015 | 2/4/2015 | 2,328,008 | 2,325,938 | ||||||||||||||
UBS | 1.32 | % | 1/12/2015 | 2/11/2015 | 3,880,817 | 3,876,563 | ||||||||||||||
|
| |||||||||||||||||||
| $ | 495,976,176 | |||||||||||||||||||
|
| |||||||||||||||||||
A reverse repurchase agreement, although structured as a sale and repurchase obligation, acts as a financing transaction under which the Fund will effectively pledge certain assets as collateral to secure a short-term loan. Generally the other party to the agreement makes the loan in an amount equal to at least 100% of the fair value of the pledged collateral. At the maturity of the reverse repurchase agreement, the Fund will be required to repay the loan and interest and correspondingly receive back its collateral. While used as collateral, the pledged assets continue to pay principal and interest which are for the benefit of the Fund.
See accompanying notes which are an integral part of these financial statements.
67
Angel Oak Multi-Strategy Income Fund
Statement of Assets and Liabilities
January 31, 2015
Assets | ||||
Investments in securities at fair value (cost $3,965,137,592) | $ | 4,036,443,310 | ||
Cash | 1,719,792 | |||
Cash due from broker (a) | 11,825,294 | |||
Cash held at broker (b) | 11,286,150 | |||
Receivable for fund shares sold | 8,256,507 | |||
Receivable for investments sold | 7,258,499 | |||
Dividends and interest receivable | 19,868,030 | |||
Prepaid expenses | 259,921 | |||
|
| |||
Total Assets | 4,096,917,503 | |||
|
| |||
Liabilities | ||||
Payable for reverse repurchase agreements | 495,976,176 | |||
Payable for fund shares redeemed | 14,854,934 | |||
Payable for investments purchased | 78,312,531 | |||
Payable for distributions to shareholders | 3,950,662 | |||
Interest payable for reverse repurchase agreements | 994,078 | |||
Payable to Adviser | 2,587,779 | |||
Payable to administrator, fund accountant, and transfer agent | 260,187 | |||
Payable to custodian | 51,253 | |||
Payable for net variation margin on futures contracts | 5,137,851 | |||
12b-1 fees accrued | 141,732 | |||
Other accrued expenses | 269,304 | |||
|
| |||
Total Liabilities | 602,536,487 | |||
|
| |||
Net Assets | $ | 3,494,381,016 | ||
|
| |||
Net Assets consist of: | ||||
Paid-in capital | $ | 3,517,971,313 | ||
Accumulated net investment loss | (174,920 | ) | ||
Accumulated net realized loss from investment transactions | (45,077,822 | ) | ||
Net unrealized appreciation on investments | 71,305,718 | |||
Net unrealized depreciation on futures contracts | (49,643,273 | ) | ||
|
| |||
Net Assets | $ | 3,494,381,016 | ||
|
| |||
| (a) | Margin claim to be received from broker. |
| (b) | Cash used as collateral for futures contract transactions. |
See accompanying notes which are an integral part of these financial statements.
68
Angel Oak Multi-Strategy Income Fund
Statement of Assets and Liabilities – (continued)
January 31, 2015
Class A: | ||||
Net Assets | $ | 376,374,323 | ||
|
| |||
Shares outstanding (unlimited number of shares authorized, | 31,165,038 | |||
|
| |||
Net asset value (“NAV”) per share | $ | 12.08 | ||
|
| |||
Offering price per share (NAV/0.9775) (c) | $ | 12.36 | ||
|
| |||
Class C: | ||||
Net Assets | $ | 72,975,479 | ||
|
| |||
Shares outstanding (unlimited number of shares authorized, | 6,063,624 | |||
|
| |||
Net asset value (“NAV”) and offering price per share | $ | 12.03 | ||
|
| |||
Minimum redemption price per share (NAV*0.99) (d) | $ | 11.91 | ||
|
| |||
Institutional Class: | ||||
Net Assets | $ | 3,045,031,214 | ||
|
| |||
Shares outstanding (unlimited number of shares authorized, | 252,356,395 | |||
|
| |||
Net asset value (“NAV”) and offering price per share | $ | 12.07 | ||
|
| |||
| (c) | Class A shares impose a maximum 2.25% sales charge on purchases. |
| (d) | A contingent deferred sales charge (“CDSC”) of 1.00% may be charged. |
See accompanying notes which are an integral part of these financial statements.
69
Angel Oak Multi-Strategy Income Fund
Statement of Operations
For the year ended January 31, 2015
Investment Income | ||||
Dividend income | $ | 307,060 | ||
Interest income | 179,992,710 | |||
|
| |||
Total Investment Income | 180,299,770 | |||
|
| |||
Expenses | ||||
Investment Advisory | 30,615,517 | |||
12b-1 – Class A | 1,539,085 | |||
12b-1 – Class C | 584,740 | |||
Administration | 840,994 | |||
Fund accounting | 237,743 | |||
Transfer agent | 338,553 | |||
Legal | 56,890 | |||
Registration | 299,359 | |||
Custodian | 365,457 | |||
Auditing | 62,500 | |||
Trustee | 21,385 | |||
Insurance | 21,293 | |||
Pricing | 193,063 | |||
Printing | 155,987 | |||
24f-2 | 133,130 | |||
Miscellaneous | 21,683 | |||
Interest on reverse repurchase agreements | 6,033,408 | |||
Line of credit | 263,309 | |||
|
| |||
Total Expenses | 41,784,096 | |||
|
| |||
Fees contractually waived by Adviser | (4,750,559 | ) | ||
|
| |||
Net operating expenses | 37,033,537 | |||
|
| |||
Net Investment Income | 143,266,233 | |||
|
| |||
Realized and Unrealized Gain (Loss) on Investments | ||||
Net realized gain on investment transactions | 22,147,910 | |||
Net realized loss on futures contracts | (29,737,945 | ) | ||
Net change in unrealized appreciation of investments | 31,983,925 | |||
Net change in unrealized depreciation on futures contracts | (45,405,648 | ) | ||
|
| |||
Net realized and unrealized loss on investments | (21,011,758 | ) | ||
|
| |||
Net increase in net assets resulting from operations | $ | 122,254,475 | ||
|
| |||
See accompanying notes which are an integral part of these financial statements.
70
Angel Oak Multi-Strategy Income Fund
Statement of Cash Flows
For the year ended January 31, 2015
| Increase/(Decrease) in Cash | ||||
Cash flows from operating activities: | ||||
Net increase in net assets resulting from operations | $ | 122,254,475 | ||
Adjustments to reconcile net increase in net assets from operations to net cash used in operating activities: | ||||
Accretion of discount/amortization of premium, net | (14,060,348 | ) | ||
Purchase of long-term securities | (2,978,525,002 | ) | ||
Proceeds from sales of long-term securities | 1,716,128,547 | |||
Net payment of variation margin on futures contracts | (70,703,827 | ) | ||
Purchases of short-term securities, net | (29,843,229 | ) | ||
Increase in dividends and interest receivable | (8,378,272 | ) | ||
Increase in receivable for investments sold | (4,310,999 | ) | ||
Increase in prepaid expenses | (74,329 | ) | ||
Increase in payable for variation margin on futures contracts | 4,310,445 | |||
Increase in payable to Adviser | 1,051,054 | |||
Increase in payable for investments purchased | 27,720,115 | |||
Increase in interest payable for reverse repurchase agreements | 425,423 | |||
Increase in accrued expenses and expenses payable | 130,858 | |||
Net realized losses on investment securities and futures | 7,590,035 | |||
Net gains on paydowns of mortgage-backed securities | (22,766,309 | ) | ||
Change in unrealized depreciation on investments and futures | 13,421,723 | |||
|
| |||
Net cash used in operating activities | (1,235,629,640 | ) | ||
|
| |||
Cash flows from financing activities: | ||||
Decrease in payable for reverse repurchase agreements | (47,860,985 | ) | ||
Proceeds from shares sold | 3,065,268,697 | |||
Amount paid for shares redeemed | (1,742,930,598 | ) | ||
Cash distributions paid | (34,921,428 | ) | ||
|
| |||
Net cash provided from financing activities | 1,239,555,686 | |||
|
| |||
Net change in cash | $ | 3,926,046 | ||
Cash balance beginning of year | $ | 20,905,190 | ||
|
| |||
Cash balance end of year | $ | 24,831,236 | ||
|
| |||
Non cash financing activities not included herein consist of receivable for fund shares sold of $8,256,507, payable for fund shares redeemed of $14,854,934, payable for distributions to shareholders of $3,950,662 and reinvestment of distributions of $118,144,559.
Supplemental Information | ||||
Interest paid | $ | 5,607,985 | ||
See accompanying notes which are an integral part of these financial statements.
71
Angel Oak Multi-Strategy Income Fund
Statements of Changes in Net Assets
| For the Year Ended January 31, 2015 | For the Year Ended January 31, 2014 | |||||||
Increase in Net Assets due to: | ||||||||
Operations | ||||||||
Net investment income | $ | 143,266,233 | $ | 77,697,243 | ||||
Net realized loss on investment transactions and futures contracts | (7,590,035 | ) | (23,937,489 | ) | ||||
Net change in unrealized appreciation (depreciation) of investments and futures contracts | (13,421,723 | ) | 8,573,890 | |||||
|
|
|
| |||||
Net increase in net assets resulting from operations | 122,254,475 | 62,333,644 | ||||||
|
|
|
| |||||
Distributions From: | ||||||||
Net investment income, Class A | (29,971,324 | ) | (30,301,416 | ) | ||||
Net investment income, Class C | (2,642,689 | ) | (1,545,459 | ) | ||||
Net investment income, Institutional Class | (122,687,419 | ) | (50,498,388 | ) | ||||
Net realized gains, Class A | - | (684,577 | ) | |||||
Net realized gains, Class C | - | (46,361 | ) | |||||
Net realized gains, Institutional Class | - | (1,341,331 | ) | |||||
|
|
|
| |||||
Total distributions | (155,301,432 | ) | (84,417,532 | ) | ||||
|
|
|
| |||||
Capital Transactions – Class A | ||||||||
Proceeds from shares sold | 499,668,422 | 757,804,040 | ||||||
Reinvestment of distributions | 28,194,975 | 25,380,973 | ||||||
Amount paid for shares redeemed | (912,092,537 | ) | (498,378,952 | ) | ||||
|
|
|
| |||||
Total Class A | (384,229,140 | ) | 284,806,061 | |||||
|
|
|
| |||||
Capital Transactions – Class C | ||||||||
Proceeds from shares sold | 40,364,744 | 29,188,997 | ||||||
Reinvestment of distributions | 1,932,353 | 1,240,310 | ||||||
Amount paid for shares redeemed | (13,168,317 | ) | (8,082,943 | ) | ||||
|
|
|
| |||||
Total Class C | 29,128,780 | 22,346,364 | ||||||
|
|
|
| |||||
Capital Transactions – Institutional Class | ||||||||
Proceeds from shares sold | 2,530,121,389 | 1,274,111,591 | ||||||
Reinvestment of distributions | 88,017,231 | 40,059,812 | ||||||
Amount paid for shares redeemed | (827,988,190 | ) | (461,314,303 | ) | ||||
|
|
|
| |||||
Total Institutional Class | 1,790,150,430 | 852,857,100 | ||||||
|
|
|
| |||||
Net increase in net assets resulting from capital transactions | 1,435,050,070 | 1,160,009,525 | ||||||
|
|
|
| |||||
Total Increase in Net Assets | 1,402,003,113 | 1,137,925,637 | ||||||
|
|
|
| |||||
Net Assets | ||||||||
Beginning of year | 2,092,377,903 | 954,452,266 | ||||||
|
|
|
| |||||
End of year | $ | 3,494,381,016 | $ | 2,092,377,903 | ||||
|
|
|
| |||||
Accumulated net investment loss included in net assets at end of year | $ | (174,920 | ) | $ | (172,283 | ) | ||
|
|
|
| |||||
See accompanying notes which are an integral part of these financial statements.
72
Angel Oak Multi-Strategy Income Fund
Statements of Changes in Net Assets – (continued)
| For the Year Ended January 31, 2015 | For the Year Ended January 31, 2014 | |||||||
Share Transactions – Class A | ||||||||
Shares sold | 41,003,845 | 62,096,058 | ||||||
Shares issued in reinvestment of distributions | 2,317,970 | 2,098,034 | ||||||
Shares redeemed | (74,588,494 | ) | (41,165,435 | ) | ||||
|
|
|
| |||||
Total Class A | (31,266,679 | ) | 23,028,657 | |||||
|
|
|
| |||||
Share Transactions – Class C | ||||||||
Shares sold | 3,319,581 | 2,387,418 | ||||||
Shares issued in reinvestment of distributions | 159,590 | 102,990 | ||||||
Shares redeemed | (1,085,304 | ) | (673,943 | ) | ||||
|
|
|
| |||||
Total Class C | 2,393,867 | 1,816,465 | ||||||
|
|
|
| |||||
Share Transactions – Institutional Class | ||||||||
Shares sold | 207,467,816 | 104,592,577 | ||||||
Shares issued in reinvestment of distributions | 7,255,528 | 3,317,550 | ||||||
Shares redeemed | (68,178,128 | ) | (38,176,686 | ) | ||||
|
|
|
| |||||
Total Institutional Class | 146,545,216 | 69,733,441 | ||||||
|
|
|
| |||||
Net increase in share transactions | 117,672,404 | 94,578,563 | ||||||
|
|
|
| |||||
See accompanying notes which are an integral part of these financial statements.
73
Angel Oak Multi-Strategy Income Fund - Class A
Financial Highlights
(For a share outstanding during each period)
| For the Year Ended January 31, 2015 | For the Year Ended January 31, 2014 | For the Year Ended January 31, 2013 | For the Period Ended January 31, 2012 (a) | |||||||||||||
Selected Per Share Data: | ||||||||||||||||
Net asset value, beginning of period | $ | 12.17 | $ | 12.35 | $ | 10.67 | $ | 10.00 | ||||||||
|
|
|
|
|
|
|
| |||||||||
Income from investment operations: | ||||||||||||||||
Net investment income | 0.62 | 0.54 | 0.60 | 0.26 | ||||||||||||
Net realized and unrealized gain (loss) on investments | (0.09) | (0.13) | 1.74 | 0.63 | ||||||||||||
|
|
|
|
|
|
|
| |||||||||
Total from investment operations | 0.53 | 0.41 | 2.34 | 0.89 | ||||||||||||
|
|
|
|
|
|
|
| |||||||||
Less distributions to shareholders: | ||||||||||||||||
From net investment income | (0.62) | (0.58) | (0.61) | (0.22) | ||||||||||||
From net realized gains | - | (0.01) | (0.05) | - | ||||||||||||
|
|
|
|
|
|
|
| |||||||||
Total distributions | (0.62) | (0.59) | (0.66) | (0.22) | ||||||||||||
|
|
|
|
|
|
|
| |||||||||
Net asset value, end of period | $ | 12.08 | $ | 12.17 | $ | 12.35 | $ | 10.67 | ||||||||
|
|
|
|
|
|
|
| |||||||||
Total Return (b) | 4.41% | 3.52% | 22.57% | 8.95% | (c) | |||||||||||
Ratios and Supplemental Data: | ||||||||||||||||
Net assets, end of period (000 omitted) | $ | 376,374 | $ | 760,039 | $ | 486,444 | $ | 26,255 | ||||||||
Ratio of expenses to average net assets | 1.46% | 1.68% | 1.60% | 2.45% | (d) | |||||||||||
| Ratio of expenses to average net assets (excluding interest expense) | 1.24% | 1.24% | 1.26% | 2.25% | (d) | |||||||||||
| Ratio of expenses to average net assets before waiver and reimbursement | 1.62% | 1.91% | 2.23% | 3.38% | (d) | |||||||||||
| Ratio of expenses to average net assets before waiver and reimbursement (excluding interest expense) | 1.40% | 1.47% | 1.90% | 3.18% | (d) | |||||||||||
| Ratio of net investment income to average net assets | 4.86% | 4.60% | 5.02% | 5.29% | (d) | |||||||||||
| Ratio of net investment income (loss) to average net assets before waiver and reimbursement | 4.69% | 4.36% | 4.39% | 4.36% | (d) | |||||||||||
Portfolio turnover rate | 54.36% | 61.70% | 54.56% | 17.85% | (c) | |||||||||||
| (a) | For the period June 28, 2011 (commencement of operations) to January 31, 2012. |
| (b) | Total return in the above table represents the rate that the investor would have earned or lost on an investment in the Fund, assuming reinvestment of dividends, and excludes the sales charge. |
| (c) | Not annualized |
| (d) | Annualized |
See accompanying notes which are an integral part of these financial statements.
74
Angel Oak Multi-Strategy Income Fund - Class C
Financial Highlights
(For a share outstanding during each period)
| For the Year Ended January 31, 2015 | For the Year Ended January 31, 2014 | For the Period Ended January 31, 2013 (a) | ||||||||||
Selected Per Share Data: | ||||||||||||
Net asset value, beginning of period | $ | 12.14 | $ | 12.31 | $ | 11.03 | ||||||
|
|
|
|
|
| |||||||
Income from investment operations: | ||||||||||||
Net investment income | 0.48 | 0.45 | 0.47 | |||||||||
Net realized and unrealized gain (loss) on investments | (0.06 | ) | (0.12 | ) | 1.30 | |||||||
|
|
|
|
|
| |||||||
Total from investment operations | 0.42 | 0.33 | 1.77 | |||||||||
|
|
|
|
|
| |||||||
Less distributions to shareholders: | ||||||||||||
From net investment income | (0.53 | ) | (0.49 | ) | (0.44 | ) | ||||||
From net realized gains | - | (0.01 | ) | (0.05 | ) | |||||||
|
|
|
|
|
| |||||||
Total distributions | (0.53 | ) | (0.50 | ) | (0.49 | ) | ||||||
|
|
|
|
|
| |||||||
Net asset value, end of period | $ | 12.03 | $ | 12.14 | $ | 12.31 | ||||||
|
|
|
|
|
| |||||||
Total Return (b) | 3.53% | 2.82% | 16.39% | (c) | ||||||||
Ratios and Supplemental Data: | ||||||||||||
Net assets, end of period (000 omitted) | $ | 72,975 | $ | 44,567 | $ | 22,821 | ||||||
Ratio of expenses to average net assets | 2.21% | 2.43% | 2.33% | (d) | ||||||||
| Ratio of expenses to average net assets (excluding interest expense) | 1.99% | 1.99% | 2.00% | (d) | ||||||||
| Ratio of expenses to average net assets before waiver and reimbursement | 2.37% | 2.66% | 2.91% | (d) | ||||||||
| Ratio of expenses to average net assets before waiver and reimbursement (excluding interest expense) | 2.15% | 2.22% | 2.56% | (d) | ||||||||
| Ratio of net investment income to average net assets | 4.04% | 3.83% | 4.12% | (d) | ||||||||
| Ratio of net investment income (loss) to average net assets before waiver and reimbursement | 3.87% | 3.60% | 3.55% | (d) | ||||||||
Portfolio turnover rate | 54.36% | 61.70% | 54.56% | (c) | ||||||||
| (a) | For the period March 14, 2012 (commencement of operations) to January 31, 2013. |
| (b) | Total return in the above table represents the rate that the investor would have earned or lost on an investment in the Fund, assuming reinvestment of dividends and excludes any contingent deferred sales charge. |
| (c) | Not annualized |
| (d) | Annualized |
See accompanying notes which are an integral part of these financial statements.
75
Angel Oak Multi-Strategy Income Fund - Institutional Class
Financial Highlights
(For a share outstanding during each period)
| For the Year Ended January 31, 2015 | For the Year Ended January 31, 2014 | For the Period Ended January 31, 2013 (a) | ||||||||||
Selected Per Share Data: | ||||||||||||
Net asset value, beginning of period | $ | 12.17 | $ | 12.34 | $ | 11.71 | ||||||
|
|
|
|
|
| |||||||
Income from investment operations: | ||||||||||||
Net investment income | 0.60 | 0.56 | 0.25 | |||||||||
Net realized and unrealized gain (loss) on investments | (0.05 | ) | (0.10 | ) | 0.65 | |||||||
|
|
|
|
|
| |||||||
Total from investment operations | 0.55 | 0.46 | 0.90 | |||||||||
|
|
|
|
|
| |||||||
Less distributions to shareholders: | ||||||||||||
From net investment income | (0.65 | ) | (0.62 | ) | (0.22 | ) | ||||||
From net realized gains | - | (0.01 | ) | (0.05 | ) | |||||||
|
|
|
|
|
| |||||||
Total distributions | (0.65 | ) | (0.63 | ) | (0.27 | ) | ||||||
|
|
|
|
|
| |||||||
Net asset value, end of period | $ | 12.07 | $ | 12.17 | $ | 12.34 | ||||||
|
|
|
|
|
| |||||||
Total Return (b) | 4.60% | 3.88% | 7.75% | (c) | ||||||||
Ratios and Supplemental Data: | ||||||||||||
Net assets, end of period (000 omitted) | $ | 3,045,031 | $ | 1,287,772 | $ | 445,187 | ||||||
Ratio of expenses to average net assets | 1.21% | 1.43% | 1.34% | (d) | ||||||||
| Ratio of expenses to average net assets (excluding interest expense) | 0.99% | 0.99% | 0.99% | (d) | ||||||||
| Ratio of expenses to average net assets before waiver and reimbursement | 1.37% | 1.66% | 1.89% | (d) | ||||||||
| Ratio of expenses to average net assets before waiver and reimbursement (excluding interest expense) | 1.15% | 1.22% | 1.54% | (d) | ||||||||
| Ratio of net investment income to average net assets | 5.01% | 4.81% | 5.07% | (d) | ||||||||
| Ratio of net investment income (loss) to average net assets before waiver and reimbursement | 4.84% | 4.58% | 4.52% | (d) | ||||||||
Portfolio turnover rate | 54.36% | 61.70% | 54.56% | (c) | ||||||||
| (a) | For the period August 16, 2012 (commencement of operations) to January 31, 2013. |
| (b) | Total return in the above table represents the rate that the investor would have earned or lost on an investment in the Fund, assuming reinvestment of dividends. |
| (c) | Not annualized |
| (d) | Annualized |
See accompanying notes which are an integral part of these financial statements.
76
Angel Oak Multi-Strategy Income Fund
Notes to the Financial Statements
January 31, 2015
NOTE 1. ORGANIZATION
The Angel Oak Multi-Strategy Income Fund (the “Fund”) is an open-end non-diversified series of the Valued Advisers Trust (the “Trust”). The Trust is a management investment company established under the laws of Delaware by an Agreement and Declaration of Trust dated June 13, 2008 (the “Trust Agreement”). The Trust Agreement permits the Trustees to issue an unlimited number of shares of beneficial interest of separate series without par value. The Fund is one of a series of funds authorized by the Trustees. The Fund’s investment adviser is Angel Oak Capital Advisors, LLC (the “Adviser”). The investment objective of the Fund is current income.
The Fund currently offers three share classes, Class A, Class C and Institutional Class. Class A shares commenced operations on June 28, 2011, Class C shares commenced operations on March 14, 2012 and the Institutional Class shares commenced operations on August 16, 2012. Effective December 1, 2014, the Class C shares are no longer available for purchase by existing or new investors. Each share represents an equal proportionate interest in the assets and liabilities belonging to the Fund and is entitled to such dividends and distributions out of income belonging to the Fund as are declared by the Board of Trustees. Class A currently has a maximum sales charge on purchases of 2.25% as a percentage of the original purchase price. Class C does not have an initial sales charge on purchases. The dealer of record receives a payment from the Fund’s distributor of 1.00% of the amount you invest in Class C shares. If you redeem your Class C shares within one year of purchase, you will be subject to a 1.00% contingent deferred sales charge (“CDSC”), based on the lower of the shares’ cost or current net asset value. Any shares acquired by reinvestment of distributions will be redeemed without a CDSC.
NOTE 2. SIGNIFICANT ACCOUNTING POLICIES
The Fund is an investment company and follows accounting and reporting guidance under Financial Accounting Standards Board (“FASB”) Accounting Standards Codification (“ASC”) Topic 946, “Financial Services – Investment Companies”. The following is a summary of significant accounting policies consistently followed by the Fund in the preparation of its financial statements. These policies are in conformity with the generally accepted accounting principles in the United States of America (“GAAP”).
Securities Valuation – All investments in securities are recorded at their estimated fair value as described in Note 3.
77
Angel Oak Multi-Strategy Income Fund
Notes to the Financial Statements - (continued)
January 31, 2015
NOTE 2. SIGNIFICANT ACCOUNTING POLICIES - (continued)
Federal Income Taxes – The Fund makes no provision for federal income or excise tax. The Fund intends to qualify each year as a regulated investment company (“RIC”) under subchapter M of the Internal Revenue Code of 1986, as amended, by complying with the requirements applicable to RICs and by distributing substantially all of its taxable income. The Fund also intends to distribute sufficient net investment income and net capital gains, if any, so that it will not be subject to excise tax on undistributed income and gains. If the required amount of net investment income or gains is not distributed, the Fund could incur a tax expense.
As of and during the fiscal year ended January 31, 2015, the Fund did not have a liability for any unrecognized tax benefits. The Fund recognizes interest and penalties, if any, related to unrecognized tax benefits as income tax expense in the statement of operations. During the period, the Fund did not incur any interest or penalties. The Fund is subject to examination by U.S. federal tax authorities for the last four year ends, including the most recent fiscal year end which has yet to be filed.
Expenses – Expenses incurred by the Trust that do not relate to a specific fund of the Trust are allocated to the individual funds based on each fund’s relative net assets or another appropriate basis (as determined by the Trustees). Expenses attributable to any class are borne by that class. Income, realized gains and losses, unrealized appreciation and depreciation, and expenses are allocated to each class based on the net assets in relation to the relative net assets of the Fund.
Security Transactions and Related Income – The Fund follows industry practice and records security transactions on the trade date for financial reporting purposes. The specific identification method is used for determining gains or losses for financial statement and income tax purposes. Dividend income is recorded on the ex-dividend date and interest income and expense is recorded on an accrual basis. Discounts and premiums on securities purchased are accreted or amortized using the effective interest method. The ability of issuers of debt securities held by the Fund to meet their obligations may be affected by economic and political developments in a specific country or region.
Dividends and Distributions – The Fund intends to distribute substantially all of its net investment income, if any, as dividends to its shareholders on a monthly basis. The Fund intends to distribute its net realized long term capital gains and its net realized short term capital gains, if any, at least once a year. Dividends to shareholders, which are determined in accordance with income tax regulations, are recorded on the ex-dividend date. The treatment for financial reporting purposes of distributions made to
78
Angel Oak Multi-Strategy Income Fund
Notes to the Financial Statements - (continued)
January 31, 2015
NOTE 2. SIGNIFICANT ACCOUNTING POLICIES - (continued)
shareholders during the period from net investment income or net realized capital gains may differ from their ultimate treatment for federal income tax purposes. These differences are caused primarily by differences in the timing of the recognition of certain components of income, expense or realized capital gain for federal income tax purposes. Where such differences are permanent in nature, they are reclassified in the components of the net assets based on their ultimate characterization for federal income tax purposes. Any such reclassifications will have no effect on net assets, results of operations or net asset values per share of the Fund. For the fiscal year ended January 31, 2015, the Fund made the following reclassifications to increase/(decrease) the components of net assets:
| Paid-in capital | Accumulated net investment loss | Accumulated net realized loss on investment transactions | ||
$– | $ 12,032,562 | $(12,032,562) |
Repurchase Agreements – Repurchase agreements are transactions by which the Fund purchases a security and simultaneously commits to resell that security to the seller (a bank or securities dealer) at an agreed upon price on an agreed upon date. The resale price reflects the purchase price plus an agreed upon market rate of interest which is unrelated to the coupon rate or date of maturity of the purchased security. Repurchase agreements involve certain risks not associated with direct investments in the underlying securities. In the event of a default or bankruptcy by the seller, the Fund will seek to liquidate such collateral. The exercise of the Fund’s right to liquidate such collateral could involve certain costs or delays and, to the extent that proceeds from any sale upon a default of the obligation to repurchase were less than the repurchase price, the Fund could suffer a loss.
Reverse Repurchase Agreements – A reverse repurchase agreement is the sale by the Fund of a security to a party for a specified price, with the simultaneous agreement by the Fund to repurchase that security from that party on a future date at a higher price. Securities sold under reverse repurchase agreements are reflected as a liability on the Statements of Assets and Liabilities. Interest payments made are recorded as a component of interest expense on the Statement of Operations. Reverse repurchase agreements involve the risk that the counterparty will become subject to bankruptcy or other insolvency proceedings or fail to return a security to the Fund. In such situations, the Fund may incur losses as a result of a possible decline in the value of the underlying security during the period while the Fund seeks to enforce its rights, a
79
Angel Oak Multi-Strategy Income Fund
Notes to the Financial Statements - (continued)
January 31, 2015
NOTE 2. SIGNIFICANT ACCOUNTING POLICIES - (continued)
possible lack of access to income on the underlying security during this period, or expenses of enforcing its rights.
Futures Contracts – The Fund may enter into futures contracts to hedge various investments for risk management. Initial margin deposits are made upon entering into futures contracts and can be either cash or securities. Secondary margin limits are required to be maintained while futures are held, as defined by each contract. Cash held at the broker as of January 31, 2015, noted on the Statement of Assets and Liabilities, is held for collateral for futures transactions.
During the period a futures contract is open, changes in the value of the contract are recognized as unrealized gains or losses by “marking-to-market” on a daily basis to reflect the fair value of the contract at the end of each day’s trading. Variation margin receivables or payables represent the difference between the change in unrealized appreciation and depreciation on the open contracts and the cash deposits made on the margin accounts. When the contract is closed, the Fund records a realized gain or loss equal to the difference between the proceeds from the closing transaction and the Fund’s cost of entering into a contract. The use of futures contracts involves the risk of illiquid markets or imperfect correlation between the value of the instruments and the underlying securities, or that the counterparty will fail to perform its obligations. Futures contracts are valued at the settlement price established each day by the board of trade or exchange on which they are traded. These securities will be classified as Level 1 securities as described in Note 3 below. Should market conditions move unexpectedly, the Fund may not achieve the anticipated benefits of the futures contract and may realize a loss. See Note 4 for information on futures contract activity during the fiscal year ended January 31, 2015.
Mortgage-Backed and Asset-Backed Securities Risks – Prepayment risk is associated with mortgage-backed and asset-backed securities, including collateralized loan obligations (“CLOs”). If interest rates fall, the underlying debt may be repaid ahead of schedule, reducing the value of the Fund’s investments. If interest rates rise, there may be fewer prepayments, which would cause the average bond maturity to rise, increasing the potential for the Fund to lose money. The value of these securities may be significantly affected by changes in interest rates, the market’s perception of issuers, and the creditworthiness of the parties involved. The ability of the Fund to successfully utilize these instruments may depend on the ability of the Fund’s Adviser to forecast interest rates and other economic factors correctly. These securities may have a structure that makes their reaction to interest rate changes and other factors difficult to predict, making their value highly volatile. Certain mortgage-backed securities may be
80
Angel Oak Multi-Strategy Income Fund
Notes to the Financial Statements - (continued)
January 31, 2015
NOTE 2. SIGNIFICANT ACCOUNTING POLICIES - (continued)
secured by pools of mortgages on single-family, multi-family properties, as well as commercial properties. Similarly, asset-backed securities may be secured by pools of loans, such as corporate loans, student loans, automobile loans and credit card receivables. The credit risk on such securities is affected by homeowners or borrowers defaulting on their loans. The values of assets underlying mortgage-backed and asset-backed securities, including CLOs, may decline and therefore may not be adequate to cover underlying investors. Mortgage-backed securities and other securities issued by participants in housing and commercial real estate finance, as well as other real estate-related markets have experienced extraordinary weakness and volatility in recent years. Possible legislation in the area of residential mortgages, credit cards, corporate loans and other loans that may collateralize the securities in which the Fund may invest could negatively impact the value of the Fund’s investments. To the extent the Fund focuses its investments in particular types of mortgage-backed or asset-backed securities, including CLOs, the Fund may be more susceptible to risk factors affecting such types of securities.
NOTE 3. SECURITIES VALUATION AND FAIR VALUE MEASUREMENTS
Fair value is defined as the price that a Fund would receive upon selling an investment in a timely transaction to an independent buyer in the principal or most advantageous market of the investment. GAAP establishes a three-tier hierarchy to maximize the use of observable market data and minimize the use of unobservable inputs and to establish classification of fair value measurements for disclosure purposes.
Inputs refer broadly to the assumptions that market participants would use in pricing the asset or liability, including assumptions about risk (the risk inherent in a particular valuation technique used to measure fair value, such as pricing models and/or the risk inherent in the inputs to the valuation technique). Inputs may be observable or unobservable. Observable inputs are inputs that reflect the assumptions market participants would use in pricing the asset or liability developed based on market data obtained from sources independent of the reporting entity. Unobservable inputs are inputs that reflect the reporting entity’s own assumptions about the assumptions market participants would use in pricing the asset or liability developed based on the best information available in the circumstances.
Various inputs are used in determining the value of the Fund’s investments. These inputs are summarized in the three broad levels listed below.
| • | Level 1 – quoted prices in active markets for identical securities |
81
Angel Oak Multi-Strategy Income Fund
Notes to the Financial Statements - (continued)
January 31, 2015
NOTE 3. SECURITIES VALUATION AND FAIR VALUE MEASUREMENTS - (continued)
| • | Level 2 – other significant observable inputs (including, but not limited to, quoted prices for an identical security in an inactive market, quoted prices for similar securities, interest rates, prepayment speeds, credit risk, etc.) |
| • | Level 3 – significant unobservable inputs (including the Fund’s own assumptions in determining fair value of investments based on the best information available) |
The inputs used to measure fair value may fall into different levels of the fair value hierarchy. In such cases, for disclosure purposes, the level in the fair value hierarchy within which the fair value measurement falls in its entirety is determined based on the level input that is most significant to the fair value measurement in its entirety.
Equity securities, including preferred stocks, are generally valued by using market quotations, but may be valued on the basis of prices furnished by a pricing service when the Adviser believes such prices more accurately reflect the fair value of such securities. Securities that are traded on any stock exchange are generally valued by the pricing service at the last quoted sale price. Lacking a last sale price, an exchange traded security is generally valued by the pricing service at its last bid price. Securities traded in the NASDAQ over-the-counter market are generally valued by the pricing service at the NASDAQ Official Closing Price. When using the market quotations or close prices provided by the pricing service and when the market is considered active, the security will be classified as a Level 1 security. Sometimes, an equity security owned by the Fund will be valued by the pricing service with factors other than market quotations or when the market is considered inactive. When this happens, the security will be classified as a Level 2 security. When market quotations are not readily available, when the Adviser determines that the market quotation or the price provided by the pricing service does not accurately reflect the current fair value, or when certain restricted or illiquid securities are being valued, such securities are valued as determined in good faith by the Adviser, in conformity with guidelines adopted by and subject to review by the Board of Trustees (the “Board”). These securities will generally be categorized as Level 3 securities.
Investments in mutual funds, including money market mutual funds, are generally priced at the ending net asset value (“NAV”) provided by the service agent of the funds. These securities will be categorized as Level 1 securities.
Fixed income securities, including collateralized mortgage obligations, collateralized loan obligations, collateralized debt obligations, corporate bonds, and asset-backed securities when valued using market quotations in an active market, will be categorized
82
Angel Oak Multi-Strategy Income Fund
Notes to the Financial Statements - (continued)
January 31, 2015
NOTE 3. SECURITIES VALUATION AND FAIR VALUE MEASUREMENTS - (continued)
as Level 1 securities when the market is active. However, they may be valued on the basis of prices furnished by a pricing service when the Fund believes such prices more accurately reflect the fair value of such securities. A pricing service utilizes electronic data processing techniques based on yield spreads relating to securities with similar characteristics to determine prices for normal institutional-size trading units of debt securities without regard to sale or bid prices. For these securities, the pricing service may also use prepayment speeds, consideration of collateral, unemployment rates, credit risk, foreclosures, and liquidations. These securities will generally be categorized as Level 2 securities. If the Adviser decides that a price provided by the pricing service does not accurately reflect the fair value of the securities, when prices are not readily available from a pricing service, or when restricted or illiquid securities are being valued, securities are valued at fair value as determined in good faith by the Adviser, in conformity with guidelines adopted by and subject to review of the Board. These securities will generally be categorized as Level 3 securities.
Reverse repurchase agreements and repurchase agreements are priced at their acquisition cost, which represents fair value. These securities will generally be categorized as Level 2 securities.
Short-term investments in fixed income securities (those with maturities of less than 60 days when acquired, or which subsequently are within 60 days of maturity), may be valued by using the amortized cost method of valuation, which the Board has determined will represent fair value. These securities will be classified as Level 2 securities.
In accordance with the Trust’s good faith pricing guidelines, the Adviser is required to consider all appropriate factors relevant to the value of securities for which it has determined other pricing sources are not available or reliable as described above. No single standard exists for determining fair value, because fair value depends upon the circumstances of each individual case. As a general principle, the current fair value of an issue of securities being valued by the Adviser would appear to be the amount which the owner might reasonably expect to receive for them upon their current sale. Methods which are in accordance with this principle may, for example, be based on (i) a multiple of earnings; (ii) a discount from market of a similar freely traded security (including a derivative security or a basket of securities traded on other markets, exchanges or among dealers); or (iii) yield to maturity with respect to debt issues, or a combination of these and other methods. Good faith pricing is permitted if, in the Adviser’s opinion, the validity of market quotations appears to be questionable based on factors such as evidence of a thin market in the security based on a small number of quotations, a significant event occurs after the close of a market but before a Fund’s
83
Angel Oak Multi-Strategy Income Fund
Notes to the Financial Statements - (continued)
January 31, 2015
NOTE 3. SECURITIES VALUATION AND FAIR VALUE MEASUREMENTS - (continued)
NAV calculation that may affect a security’s value, or the Adviser is aware of any other data that calls into question the reliability of market quotations. Good faith pricing may also be used in instances when the bonds the Fund invests in may default or otherwise cease to have market quotations readily available.
The following is a summary of the inputs used to value the Fund’s investments as of January 31, 2015:
| Valuation Inputs | ||||||||||||||||
| Assets | Level 1 Quoted Prices in Active Markets | Level 2 Other Significant Observable Inputs | Level 3 Significant Unobservable Inputs | Total | ||||||||||||
| Collateralized Mortgage Obligations | $ | – | $ | 2,872,985,071 | $ | – | $ | 2,872,985,071 | ||||||||
| Collateralized Loan Obligations | – | 483,459,320 | – | 483,459,320 | ||||||||||||
| Asset-Backed Securities | – | 332,837,515 | – | 332,837,515 | ||||||||||||
| Corporate Bonds | – | 100,417,980 | – | 100,417,980 | ||||||||||||
| Collateralized Debt Obligations | – | 30,573,000 | – | 30,573,000 | ||||||||||||
| Preferred Stocks | 7,024,989 | – | – | 7,024,989 | ||||||||||||
| Repurchase Agreements | 40,000,000 | – | 40,000,000 | |||||||||||||
| Cash Equivalents | 169,145,435 | – | – | 169,145,435 | ||||||||||||
| Long Futures Contracts* | (49,643,273 | ) | – | – | (49,643,273 | ) | ||||||||||
| Total | $ | 126,527,151 | $ | 3,860,272,886 | $ | – | $ | 3,986,800,037 | ||||||||
| Liabilities | ||||||||||||||||
| Reverse Repurchase Agreements | $ | – | $ | (495,976,176 | ) | $ | – | $ | (495,976,176 | ) | ||||||
| Total | $ | – | $ | (495,976,176 | ) | $ | – | $ | (495,976,176 | ) | ||||||
| * | The amount shown represents the gross unrealized appreciation/(depreciation) of the futures contracts. |
During the fiscal year ended January 31, 2015, the Fund had no transfers between Levels 1 and 2 at any time during the reporting period. The Fund’s transfers between
84
Angel Oak Multi-Strategy Income Fund
Notes to the Financial Statements - (continued)
January 31, 2015
NOTE 3. SECURITIES VALUATION AND FAIR VALUE MEASUREMENTS - (continued)
Level 3 and Level 2 are detailed in the table below. The Trust recognizes transfers between fair value hierarchy levels at the end of the reporting period.
| Collateralized Mortgage Obligations | Collateralized Loan Obligations | Asset Backed Securities | Collateralized Debt Obligation | Total Investments | ||||||||||||||||
Balance as of January 31, 2014 | $ | 30,673,322 | $ | 9,420,000 | $ | 37,149,498 | $ | 3,143,910 | $ | 80,386,730 | ||||||||||
Realized gain/(loss) | 415,067 | 33,386 | 345,058 | (20,796 | ) | 772,715 | ||||||||||||||
Accretion/ (amortization) | (39,239 | ) | 41,072 | 5,935 | 8,351 | 16,119 | ||||||||||||||
Change in unrealized appreciation (depreciation) | 1,081,562 | (296,758 | ) | 1,596,926 | 1,385 | 2,383,115 | ||||||||||||||
Purchases | 11,697,526 | – | – | – | 11,697,526 | |||||||||||||||
Sales | (26,040,820 | ) | (5,505,000 | ) | (22,773,537 | ) | (3,132,850 | ) | (57,452,207 | ) | ||||||||||
Transfers in to Level 3 | – | – | – | – | – | |||||||||||||||
Transfers out of Level 3 * | (17,787,418 | ) | (3,692,700 | ) | (16,323,880 | ) | – | (37,803,998 | ) | |||||||||||
|
|
|
|
|
|
|
|
|
| |||||||||||
Balance as of January 31, 2015 | $ | – | $ | – | $ | – | $ | – | $ | – | ||||||||||
|
|
|
|
|
|
|
|
|
| |||||||||||
| * | Transfers out of Level 3 were into Level 2 as a result of pricing sources beginning to price the securities on a daily basis. |
Balance Sheet Offsetting Information
The following table provides a summary of offsetting financial liabilities and derivatives and the effect of derivative instruments on the Statement of Assets and Liabilities as of January 31, 2015.
Gross Amounts Not Offset in Statement of Assets and Liabilities | ||||||||||||
Gross Amounts | Gross | Net Amounts | Financial | Cash Collateral | Net Amount | |||||||
Futures Contracts | $5,137,851 | $– | $5,137,851 | $– | $(5,137,851) | $– | ||||||
85
Angel Oak Multi-Strategy Income Fund
Notes to the Financial Statements - (continued)
January 31, 2015
NOTE 3. SECURITIES VALUATION AND FAIR VALUE MEASUREMENTS - (continued)
During the ordinary course of business, the Fund may enter into transactions subject to enforceable netting agreements or other similar arrangements (“netting agreements”). Generally, the right to offset in netting agreements allows the Fund to offset any exposure to a specific counterparty with any collateral received or delivered to that counterparty based on the terms of the agreement. Generally, the Fund manages its cash collateral and securities collateral on a counterparty basis. As of January 31, 2015, the Fund did enter into netting agreements.
NOTE 4. DERIVATIVE TRANSACTIONS
The following tables present a summary of the fair value of derivative instruments, not accounted for as hedging instruments as of January 31, 2015 and the effect of derivative instruments on the Statement of Operations for the fiscal year ended January 31, 2015.
At January 31, 2015:
Asset | Liability | |||||||
Derivatives | Type of | Statement of | Statement of | Variation | ||||
Futures Contracts | Interest Rate | Payable for net variation margin on futures contracts | $(5,137,851) |
The effect of Derivative Instruments on the Statement of Operations for the fiscal year ended January 31, 2015:
| Derivatives | Location of Gain/(Loss) on Derivatives on Statement of Operations | Contracts Opened | Contracts Closed | Realized on Derivatives | Change in on Derivatives | |||||
Long Futures Contracts | Net realized loss on futures contracts; Net change in unrealized depreciation on futures contracts | 10,701 | 1,876 | $(3,971,322) | $(49,643,273) |
86
Angel Oak Multi-Strategy Income Fund
Notes to the Financial Statements - (continued)
January 31, 2015
NOTE 4. DERIVATIVE TRANSACTIONS - (continued)
| Derivatives | Location of Gain/(Loss) on Derivatives on Statement of Operations | Contracts Sold Short | Contracts Closed | Realized Derivatives | Change in on Derivatives | |||||
Short Futures Contracts | Net realized loss on futures contracts/net change in unrealized appreciation on futures contracts | 23,218 | 27,640 | $(25,766,623) | $4,237,625 |
NOTE 5. FEES AND OTHER TRANSACTIONS WITH AFFILIATES
Under the terms of the management agreement, on behalf of the Fund (the “Agreement”), the Adviser manages the Fund’s investments subject to oversight of the Trustees. As compensation for its management services, the Fund is obligated to pay the Adviser a fee computed and accrued daily and paid monthly at an annual rate of 1.50% of the average daily net assets of the Fund on the first $200 million in assets, 1.25% for the next $300 million in assets and 1.00% for any assets in excess of $500 million. For the fiscal year ended January 31, 2015, the Adviser earned a fee of $30,615,517 from the Fund before the waiver described below. At January 31, 2015, the Fund owed the Adviser $2,587,779.
The Adviser has contractually agreed to waive or limit its fees and to assume other expenses of the Fund until May 31, 2015, so that Total Annual Fund Operating Expenses does not exceed 0.99%. This operating expense limitation does not apply to brokerage fees and commissions, borrowing costs (such as interest and dividend expenses on securities sold short), taxes, 12b-1 fees; extraordinary expenses and indirect expenses (such as “acquired funds fees and expenses”). For the fiscal year ended January 31, 2015, the Adviser contractually waived fees of $4,750,559.
The waiver and/or reimbursement by the Adviser with respect to the Fund is subject to repayment by the Fund within the three fiscal years following the fiscal year in which that particular waiver and/or reimbursement occurred, provided that the Fund is able to make the repayment without exceeding the expense limitations described above. The
87
Angel Oak Multi-Strategy Income Fund
Notes to the Financial Statements - (continued)
January 31, 2015
NOTE 5. FEES AND OTHER TRANSACTIONS WITH AFFILIATES - (continued)
amounts subject to repayment by the Fund, pursuant to the aforementioned conditions, at January 31, 2015 are as follows:
Amount | Recoverable through January 31, | |
$1,319,337 | 2016 | |
$3,869,799 | 2017 | |
$4,750,559 | 2018 |
The Trust retains Huntington Asset Services, Inc. (“HASI”) to manage the Fund’s business affairs and provide the Fund with administrative services and chief compliance services, including all regulatory reporting and necessary office equipment and personnel. For the fiscal year ended January 31, 2015, HASI earned fees of $840,994 for administrative and compliance services provided to the Fund. At January 31, 2015, HASI was owed $161,666 from the Fund for administrative and compliance services. Certain officers and one Trustee of the Trust are members of management and/or employees of HASI. HASI is a wholly-owned subsidiary of Huntington Bancshares, Inc., the parent company of Unified Financial Securities, Inc. (the “Distributor”) and Huntington National Bank, the custodian of the Fund’s investments (the “Custodian”). For the fiscal year ended January, 31, 2015, the Custodian earned fees of $365,457 for custody services provided to the Fund. At January 31, 2015, the Custodian was owed $51,253 from the Fund for custody services.
The Trust also retains HASI to act as the Fund’s transfer agent and to provide fund accounting services. For the fiscal year ended January 31, 2014, HASI earned fees of $338,553 for transfer agent services and reimbursement for out-of-pocket expenses incurred in providing transfer agent services to the Fund. At January 31, 2015, the Fund owed HASI $53,545 for transfer agent services and out-of-pocket expenses.
For the fiscal year ended January 31, 2015, HASI earned fees of $237,743 from the Fund for fund accounting services. At January 31, 2015, HASI was owed $44,976 from the Fund for fund accounting services.
The Fund has adopted a Distribution Plan (the “Plan”) pursuant to Rule 12b-1 under the 1940 Act. The Plan provides that the Fund will pay the Distributor and/or any registered securities dealer, financial institution or any other person (the “Recipient”) a shareholder servicing fee of 0.25% (Class A shares) and 1.00% (Class C shares) of each share classes’ respective average daily net assets of the Fund in connection with
88
Angel Oak Multi-Strategy Income Fund
Notes to the Financial Statements - (continued)
January 31, 2015
NOTE 5. FEES AND OTHER TRANSACTIONS WITH AFFILIATES - (continued)
the promotion and distribution of the Fund’s shares or the provision of personal services to shareholders, including, but not necessarily limited to, advertising, compensation to underwriters, dealers and selling personnel, the printing and mailing of prospectuses to other than current Fund shareholders, the printing and mailing of sales literature and servicing shareholder accounts. The Fund or Adviser may pay all or a portion of these fees to any Recipient who renders assistance in distributing or promoting the sale of shares, or who provides certain shareholder services, pursuant to a written agreement. The Plan is a compensation plan, which means that compensation is paid regardless of 12b-1 expenses actually incurred. It is anticipated that the Plan will benefit shareholders because an effective sales program typically is necessary in order for the Fund to reach and maintain a sufficient size to achieve efficiently its investment objectives and to realize economies of scale. For the fiscal year ended January 31, 2015, Class A shares 12b-1 expense incurred by the Fund was $1,539,085 and Class C shares 12b-1 expense incurred was $584,740. The Fund owed $79,517 for Class A shares and $62,215 for Class C shares 12b-1 fees as of January 31, 2015.
Unified Financial Securities, Inc. (“Unified”) acts as the principal distributor of the Fund’s shares. During the fiscal year ended January 31, 2015, the Distributor received $308,598 from commissions earned on sales of Class A shares, of which $279,787 was re-allowed to intermediaries of the Fund, and $3,151 from contingent deferred sales charges on Class C shares held for less than one year. An officer of the Trust is an officer of the Distributor and such person may be deemed to be an affiliate of the Distributor.
NOTE 6. INVESTMENT TRANSACTIONS
For the fiscal year ended January 31, 2015, purchases and sales of investment securities, other than short-term investments and short-term U.S. government obligations, were as follows:
| Purchases | Sales | |||||||
U.S. Government Obligations | $ | – | $ | – | ||||
Other | 2,978,525,002 | 1,716,128,547 | ||||||
NOTE 7. ESTIMATES
The preparation of financial statements in conformity with GAAP requires management to make estimates and assumptions that affect the reported amounts of
89
Angel Oak Multi-Strategy Income Fund
Notes to the Financial Statements - (continued)
January 31, 2015
NOTE 7. ESTIMATES - (continued)
assets and liabilities and disclosure of contingent assets and liabilities at the date of the financial statements and the reported amounts of increases and decreases in net assets from operations during the reporting period. Actual results could differ from those estimates.
NOTE 8. BENEFICIAL OWNERSHIP
The beneficial ownership, either directly or indirectly, of 25% or more of the voting securities of a fund creates a presumption of control of a fund, under Section 2(a)(9) of the Investment Company Act of 1940. At January 31, 2015, UBS owned, as record shareholder 32%, of the outstanding shares of Fund. It is not known whether UBS or any other underlying beneficial owners owned or controlled 25% or more of the voting securities of the Fund.
NOTE 9. FEDERAL TAX INFORMATION
At January 31, 2015, the unrealized appreciation (depreciation) of investments, excluding futures contracts, for tax purposes, was as follows:
Gross Unrealized Appreciation | $ | 113,081,226 | ||
Gross Unrealized (Depreciation) | (41,775,508 | ) | ||
|
| |||
Net Unrealized Appreciation on Investments | $ | 71,305,718 | ||
|
|
At January 31, 2015, the aggregate cost of securities for federal income tax purposes was $3,965,137,592 for the Fund.
The tax characterization of distributions paid for the fiscal years ended January 31, 2015 and January 31, 2014 were as follows:
| 2015 | 2014 | |||||||
Distributions paid from: | ||||||||
Ordinary Income | $ | 153,065,988 | $ | 82,564,518 | ||||
Net Long-Term Capital Gain | – | 137,797 | ||||||
|
|
|
| |||||
| $ | 153,065,988 | $ | 82,702,315 | |||||
|
|
|
| |||||
90
Angel Oak Multi-Strategy Income Fund
Notes to the Financial Statements - (continued)
January 31, 2015
NOTE 9. FEDERAL TAX INFORMATION - (continued)
At January 31, 2015, the components of distributable earnings (accumulated losses) on a tax basis was as follows:
Undistributed ordinary income | $ | 3,778,631 | ||
Undistributed long-term capital gains | – | |||
Distributions payable | (3,950,662 | ) | ||
Accumulated capital and other losses | (94,723,984 | ) | ||
Unrealized appreciation | 71,305,718 | |||
|
| |||
| $ | (23,590,297 | ) | ||
|
|
As of January 31, 2015, the Fund has available for federal tax purposes an unused capital loss carryforward of $50,871,174, which is available for offset against future taxable net capital gains. To the extent that these carryforwards are used to offset future gains, it is probable that the amount offset will not be distributed to shareholders. The carryforward expires as follows:
No expiration short-term | $ | 30,927,914 | ||
No expiration long-term | 19,943,259 | |||
|
| |||
| $ | 50,871,173 | |||
|
|
Certain capital losses incurred after October 31 and within the current taxable year, are deemed to arise on the on the first business day of the Fund’s following taxable year. For the tax year ended January 31, 2015 the Fund deferred post October capital losses in the amount of $43,849,921.
NOTE 10. COMMITMENTS AND CONTINGENCIES
The Fund indemnifies its officers and trustees for certain liabilities that may arise from performance of their duties to the Fund. Additionally, in the normal course of business, the Fund enters into contracts that contain a variety of representatives and warranties which provide general indemnifications. The Fund’s maximum exposure under these arrangements is unknown, as this would involve future claims that may be made against the Fund that have not yet occurred.
Unfunded Repurchase Agreement Commitment
At January 31, 2015, unfunded repurchase agreement for the Fund was as follows:
Borrower | Unfunded Commitment | |||
EJF specialty Finance Opportunities Fund, LLC | $ | 12,535,000 | ||
91
Angel Oak Multi-Strategy Income Fund
Notes to the Financial Statements - (continued)
January 31, 2015
NOTE 11. RESTRICTED SECURITIES
Restricted securities are securities that may only be resold upon registration under federal securities laws or in transactions exempt from such registration. In some cases, the issuer of restricted securities has agreed to register such securities for resale, at the issuer’s expense, either upon demand or in connection with another registered offering of the securities. Many restricted securities may be resold in the secondary market in transactions exempt from registration. Such restricted securities may be determined by the Fund to be liquid. The Fund does not anticipate incurring any registration costs upon such resale. The Fund’s restricted securities are valued at the price provided by pricing service or dealers in the secondary market or, if no market prices are available, at the fair value price as determined by the Fund’s Adviser or pursuant to the Fund’s fair value policies and procedures. The Fund has acquired securities, the sale of which is restricted under Rule 144A of the Securities Act of 1933. It is possible that the fair value price may differ significantly from the amount that may ultimately be realized in the near term, and the difference could be material. At January 31, 2015, the Fund held restricted securities representing 31.6% of net assets, as listed below:
| Issuer Description | Acquisition Date | Principal Amount | Amortized Cost | Fair Value | ||||||||||
| 321 Henderson Receivables LLC, Series 2012-3A, Class A, 3.220%, 8/15/2041 | 2/11/2013* | $ | 11,884,740 | $ | 12,004,137 | $ | 12,427,397 | |||||||
| 321 Henderson Receivables LLC, Series 2012-3A, Class B, 6.170%, 8/15/2041 | 11/9/2012 | 1,000,000 | 999,985 | 1,170,991 | ||||||||||
| 321 Henderson Receivables LLC, Series 2013-3A, Class A, 4.080%, 1/17/2073 | 10/10/2013 | 4,703,061 | 4,699,346 | 5,227,657 | ||||||||||
| 321 Henderson Receivables LLC, Series 2014-1A, Class B, 4.940%, 3/16/2065 | 2/10/2014 | 1,500,000 | 1,498,819 | 1,634,030 | ||||||||||
| 321 Henderson Receivables LLC, Series 2014-2A, Class A, 3.610%, 1/17/2073 | 7/16/2014 | 5,963,283 | 5,959,429 | 6,378,817 | ||||||||||
| 321 Henderson Receivables LLC, Series 2014-3A, Class A, 3.500%, 6/15/2077 | 11/18/2014 | 9,973,137 | 9,968,665 | 10,556,082 | ||||||||||
| Acis CLO Ltd., Series 2013-1A, Class E, 5.857%, 4/18/2024 | 5/16/2013* | 12,000,000 | 11,470,324 | 10,674,000 | ||||||||||
| Acis CLO Ltd., Series 2014-3A, Class E, 5.005%, 2/1/2026 | 1/16/2014 | 4,500,000 | 3,989,530 | 3,692,700 | ||||||||||
92
Angel Oak Multi-Strategy Income Fund
Notes to the Financial Statements - (continued)
January 31, 2015
NOTE 11. RESTRICTED SECURITIES - (continued)
| Issuer Description | Acquisition Date | Principal Amount | Amortized Cost | Fair Value | ||||||||||
| Adams Mill CLO Ltd., Series 2014-1A, Class E1, 5.253%, 7/15/2026 | 7/1/2014 | $ | 3,000,000 | $ | 2,766,525 | $ | 2,557,200 | |||||||
| ALM Loan Funding, Series 2014-14A, Class D, 5.106%, 7/28/2026 | 6/6/2014 | 7,500,000 | 6,846,857 | 6,800,250 | ||||||||||
| AMMC CLO IX Ltd., Series 2011-9A, Class E, 7.703%, 1/15/2022 | 5/10/2013 | 1,000,000 | 1,013,811 | 1,002,300 | ||||||||||
| AMMC CLO XV Ltd., Series 2014-15A, Class D, 4.436%, 12/9/2026 | 11/5/2014 | 3,000,000 | 2,866,187 | 2,910,300 | ||||||||||
| Ares XXVII CLO Ltd., Series 2013-2A, Class E, 5.106%, 7/28/2025 | 1/17/2014 | 5,500,000 | 5,217,150 | 4,975,300 | ||||||||||
| Arrowpoint CLO Ltd., Series 2012-2A, Class E, 4.960%, 3/12/2026 | 2/6/2014 | 6,000,000 | 5,431,981 | 5,149,200 | ||||||||||
| Arrowpoint CLO Ltd., Series 2014-3A, Class D, 5.335%, 10/15/2026 | 8/14/2014 | 11,000,000 | 11,000,000 | 10,924,100 | ||||||||||
| Arrowpoint CLO Ltd., Series 2014-3A, Class E, 7.585%, 10/15/2026 | 8/14/2014 | 3,600,000 | 3,600,000 | 3,577,320 | ||||||||||
| Avery Point III CLO Ltd., Series 2013-3A, Class E, 5.257%, 1/18/2025 | 11/21/2014* | 8,000,000 | 7,271,381 | 6,922,400 | ||||||||||
| Babson CLO Ltd., Series 2013-IIA, Class C, 3.503%, 1/18/2025 | 1/9/2015 | 4,500,000 | 4,191,837 | 4,193,550 | ||||||||||
| Bayview Commercial Asset Trust, Series 2005-2A, Class A1, 0.478%, 8/25/2035 | 4/1/2013* | 11,575,106 | 9,703,854 | 10,618,759 | ||||||||||
| Bayview Commercial Asset Trust, Series 2005-4A, Class A1, 0.468%, 1/25/2036 | 4/29/2013 | 2,720,175 | 2,323,610 | 2,410,320 | ||||||||||
| Bayview Commercial Asset Trust, Series 2005-4A, Class A2, 0.558%, 1/25/2036 | 5/3/2013 | 2,940,509 | 2,464,498 | 2,608,269 | ||||||||||
Brand Group Holdings, Inc. 8.500%, 6/27/2024 | 6/27/2014 | 10,000,000 | 10,000,000 | 10,000,000 | ||||||||||
| Bremer Financial Corp., 5.200%, 12/30/2024 | 12/29/2014 | 5,000,000 | 5,000,000 | 5,000,000 | ||||||||||
93
Angel Oak Multi-Strategy Income Fund
Notes to the Financial Statements - (continued)
January 31, 2015
NOTE 11. RESTRICTED SECURITIES - (continued)
| Issuer Description | Acquisition Date | Principal Amount | Amortized Cost | Fair Value | ||||||||||
| Brookside Mill CLO Ltd., Series 2013-1A, Class E, 4.653%, 4/17/2025 | 4/25/2013* | $ | 7,500,000 | $ | 6,858,603 | $ | 6,324,000 | |||||||
| Cajun Global LLC, Series 2011-1A, Class A2, 5.955%, 2/20/2041 | 10/18/2013* | 7,004,489 | 7,307,011 | 7,205,517 | ||||||||||
| Canyon Capital CLO Ltd., Series 2012-1A, Class D, 4.553%, 1/15/2024 | 2/12/2013 | 3,000,000 | 3,005,618 | 2,975,400 | ||||||||||
| Carlyle Global Market Strategies CLO Ltd., Series 2012-1A, Class F, 7.507%, 4/20/2022 | 9/10/2014 | 5,000,000 | 4,909,834 | 4,822,000 | ||||||||||
| Carlyle Global Market Strategies CLO Ltd., Series 2012-4A, Class E, 5.757%, 1/20/2025 | 5/20/2013 | 2,850,000 | 2,855,119 | 2,687,550 | ||||||||||
| Catamaran CLO Ltd., Series 2012-1A, Class D, 4.747%, 12/20/2023 | 5/1/2013 | 8,750,000 | 8,802,850 | 8,750,000 | ||||||||||
| CFCRE Commercial Mortgage Trust, Series 2011-C1, Class F, 5.000%, 4/15/2044 | 5/14/2013 | 7,931,000 | 6,862,488 | 7,511,668 | ||||||||||
| Chevy Chase Mortgage Funding Corp., Series 2005-1A, Class A1, 0.318%, 1/25/2036 | 7/23/2013* | 10,586,663 | 9,049,964 | 9,629,290 | ||||||||||
| Chevy Chase Mortgage Funding Corp., Series 2005-1A, Class A2, 0.368%, 1/25/2036 | 11/20/2013 | 8,498,442 | 7,446,615 | 7,782,398 | ||||||||||
| Chevy Chase Mortgage Funding Corp., Series 2005-4A, Class IO, 1.318%, 4/25/2037 | 5/14/2014 | 77,953,240 | 4,965,901 | 5,113,733 | ||||||||||
| CIFC Funding Ltd., Series 2012-2A, Class B2L, 6.235%, 12/5/2024 | 4/30/2013* | 3,630,000 | 3,630,000 | 3,522,915 | ||||||||||
| CIFC Funding Ltd., Series 2012-2A, Class B3L, 7.235%, 12/5/2024 | 1/9/2014 | 2,000,000 | 2,000,000 | 1,876,200 | ||||||||||
| CIFC Funding Ltd., Series 2012-3A, Class B2L, 6.253%, 1/29/2025 | 12/24/2013* | 9,550,000 | 9,534,265 | 9,146,035 | ||||||||||
| CIFC Funding Ltd., Series 2012-3A, Class B3L, 7.153%, 1/29/2025 | 2/3/2014 | 1,000,000 | 995,314 | 932,700 | ||||||||||
| CIFC Funding Ltd., Series 2013-1A, Class E, 6.379%, 4/16/2025 | 12/24/2013* | 4,800,000 | 4,573,815 | 4,287,360 | ||||||||||
94
Angel Oak Multi-Strategy Income Fund
Notes to the Financial Statements - (continued)
January 31, 2015
NOTE 11. RESTRICTED SECURITIES - (continued)
| Issuer Description | Acquisition Date | Principal Amount | Amortized Cost | Fair Value | ||||||||||
| Citigroup Commercial Mortgage Trust, Series 2013-375P, Class A, 3.251%, 5/10/2035 | 2/19/2014* | $ | 5,000,000 | $ | 5,129,573 | $ | 5,259,167 | |||||||
| Citigroup Commercial Mortgage Trust, Series 2014-GC19, Class D, 4.900%, 3/10/2047 | 2/28/2014* | 9,000,000 | 8,330,608 | 9,005,832 | ||||||||||
| Citigroup Commercial Mortgage Trust, Series 2014-GC23, Class D, 4.508%, 7/10/2024 | 7/17/2014 | 10,000,000 | 9,405,108 | 9,634,735 | ||||||||||
| ColumbusNova CLO IV Ltd., Series 2007-2A, Class D, 4.753%, 10/15/2021 | 2/11/2014 | 3,440,000 | 3,447,691 | 3,444,128 | ||||||||||
| Commercial Mortgage Trust, Series 2012-CR4, Class D, 4.576%, 10/15/2045 | 9/23/2014 | 3,000,000 | 2,972,300 | 3,091,449 | ||||||||||
| Commercial Mortgage Trust, Series 2013-CR11, Class D, 5.171%, 10/10/2046 | 8/7/2014 | 8,568,000 | 8,451,137 | 8,898,806 | ||||||||||
| Commercial Mortgage Trust, Series 2013-CR12, Class D, 5.085%, 10/10/2046 | 11/5/2014 | 5,000,000 | 4,862,123 | 5,165,988 | ||||||||||
| Commercial Mortgage Trust, Series 2013-CR13, Class D, 4.755%, 12/10/2023 | 10/14/2014 | 5,000,000 | 4,889,758 | 5,060,168 | ||||||||||
| Commercial Mortgage Trust, Series 2013-CR6, Class E, 4.175%, 3/10/2046 | 6/4/2013 | 6,146,000 | 4,997,429 | 5,410,222 | ||||||||||
| Commercial Mortgage Trust, Series 2013-WWP, Class A2, 3.424%, 3/10/2031 | 1/5/2015* | 4,875,000 | 5,055,261 | 5,185,881 | ||||||||||
| Commercial Mortgage Trust, Series 2014-CR14, Class D, 4.610%, 2/10/2047 | 5/13/2014* | 11,250,000 | 10,736,131 | 11,365,318 | ||||||||||
| Commercial Mortgage Trust, Series 2014-CR17, Class D, 4.800%, 5/10/2047 | 4/29/2014* | 8,250,000 | 7,769,120 | 8,240,240 | ||||||||||
| Commercial Mortgage Trust, Series 2014-CR19, Class D, 4.721%, 8/10/2047 | 10/6/2014 | 5,000,000 | 4,557,464 | 4,847,708 | ||||||||||
95
Angel Oak Multi-Strategy Income Fund
Notes to the Financial Statements - (continued)
January 31, 2015
NOTE 11. RESTRICTED SECURITIES - (continued)
| Issuer Description | Acquisition Date | Principal Amount | Amortized Cost | Fair Value | ||||||||||
| Commercial Mortgage Trust, Series 2014-LC17, Class D, 3.687%, 10/10/2047 | 9/18/2014 | $ | 4,000,000 | $ | 3,317,350 | $ | 3,536,056 | |||||||
| Commercial Mortgage Trust, Series 2015-LC19, Class D, 2.867%, 2/10/2048 | 1/26/2015 | 4,975,000 | 3,979,779 | 3,979,779 | ||||||||||
| CountryWide Alternative Loan Trust, Series 2005-58R, Class A, 2.201%, 12/20/2035 | 3/6/2013* | 192,563,096 | 12,521,840 | 14,191,900 | ||||||||||
| CountryWide Alternative Loan Trust, Series 2005-59R, Class A, 2.190%, 12/20/2035 | 10/14/2014 | 47,689,119 | 3,320,070 | 3,724,520 | ||||||||||
| Credit Suisse Mortgage Trust, Series 2014-USA, Class A2, 3.953%, 9/15/2037 | 9/22/2014 | 10,000,000 | 10,291,422 | 11,099,930 | ||||||||||
| Crown Point CLO Ltd., Series 2012-1A, Class B1L, 5.232%, 11/21/2022 | 5/8/2013 | 5,000,000 | 5,042,641 | 5,002,000 | ||||||||||
| Crown Point CLO Ltd., Series 2012-1A, Class B2L, 6.732%, 11/21/2022 | 5/15/2013* | 6,625,000 | 6,657,631 | 6,303,025 | ||||||||||
| Cutwater Ltd., Series 2014-2A, Class C, 4.638%, 1/15/2027 | 12/11/2014 | 4,000,000 | 3,846,394 | 3,912,000 | ||||||||||
| Cutwater Ltd., Series 2014-2A, Class D, 6.088%, 1/15/2027 | 12/11/2014 | 2,000,000 | 1,797,854 | 1,832,000 | ||||||||||
| Deutsche Bank Securities Mortgage Trust, Series 2011-LC2A, Class D, 5.458%, 7/10/2044 | 9/5/2014 | 5,000,000 | 5,322,983 | 5,484,132 | ||||||||||
| Drug Royalty II LP, Series 2014-1, Class A2, 3.484%, 7/15/2023 | 6/18/2014 | 9,362,319 | 9,362,187 | 9,470,538 | ||||||||||
| Dryden XXVIII Senior Loan Fund, Series 2013-28A, Class B6L, 4.132%, 8/15/2025 | 5/31/2013* | 9,000,000 | 7,786,421 | 7,808,400 | ||||||||||
| Dryden XXXI Senior Loan Fund, Series 2014-31A, Class C, 3.107%, 4/18/2026 | 1/14/2015 | 1,200,000 | 1,161,091 | 1,163,640 | ||||||||||
| Dryden XXXI Senior Loan Fund, Series 2014-31A, Class E, 4.507%, 4/18/2026 | 12/3/2014 | 2,500,000 | 2,168,114 | 2,141,000 | ||||||||||
96
Angel Oak Multi-Strategy Income Fund
Notes to the Financial Statements - (continued)
January 31, 2015
NOTE 11. RESTRICTED SECURITIES - (continued)
| Issuer Description | Acquisition Date | Principal Amount | Amortized Cost | Fair Value | ||||||||||
| Dryden XXXVI Senior Loan Fund, Series 2014-36A, Class C, 3.282%, 11/9/2025 | 11/7/2014 | $ | 2,500,000 | $ | 2,440,573 | $ | 2,459,250 | |||||||
| Dryden XXXVI Senior Loan Fund, Series 2014-36A, Class D, 3.982%, 11/9/2025 | 11/7/2014 | 7,000,000 | 6,652,474 | 6,701,800 | ||||||||||
| Emerson Park CLO Ltd., Series 2013-1A, Class E, 5.103%, 7/15/2025 | 7/19/2013* | 3,000,000 | 2,743,523 | 2,724,600 | ||||||||||
| Finn Square CLO Ltd., Series 2012-1A, Class C, 3.855%, 12/24/2023 | 2/20/2013 | 3,000,000 | 2,961,875 | 2,887,200 | ||||||||||
| Finn Square CLO Ltd., Series 2012-1A, Class D, 5.305%, 12/24/2023 | 1/17/2014 | 4,600,000 | 4,441,102 | 4,240,280 | ||||||||||
| Fortress Credit BSL II Ltd., Series 2013-2A, Class D, 4.107%, 10/19/2025 | 4/3/2014 | 7,750,000 | 7,402,051 | 7,305,925 | ||||||||||
| Fortress Credit BSL II Ltd., Series 2013-2A, Class E, 5.407%, 10/19/2025 | 10/25/2013 | 5,000,000 | 4,488,737 | 4,364,000 | ||||||||||
| FREMF Mortgage Trust, Series 2014-K36, Class C, 4.362%, 12/25/2046 | 2/6/2014* | 6,000,000 | 5,585,320 | 6,381,174 | ||||||||||
| FREMF Mortgage Trust, Series 2014-K37, Class C, 4.558%, 1/25/2047 | 3/12/2014* | 8,500,000 | 8,244,623 | 9,166,816 | ||||||||||
| Gallatin CLO IV Ltd., Series 2012-1A, Class E, 5.503%, 10/15/2023 | 12/6/2013 | 3,000,000 | 2,848,622 | 2,785,500 | ||||||||||
| GS Mortgage Securities Corp. II, Series 2012-GCJ9, Class D, 4.854%, 11/10/2045 | 9/25/2014 | 3,690,000 | 3,706,932 | 3,777,652 | ||||||||||
| GS Mortgage Securities Corp. II, Series 2014-GC20, Class D, 4.867%, 4/10/2047 | 3/27/2014 | 5,000,000 | 4,525,857 | 4,948,025 | ||||||||||
| GS Mortgage Securities Corp., Series 2014-5R, Class 3B, 0.318%, 2/26/2037 | 12/3/2014 | 22,830,149 | 13,760,622 | 14,367,013 | ||||||||||
97
Angel Oak Multi-Strategy Income Fund
Notes to the Financial Statements - (continued)
January 31, 2015
NOTE 11. RESTRICTED SECURITIES - (continued)
| Issuer Description | Acquisition Date | Principal Amount | Amortized Cost | Fair Value | ||||||||||
| GS Mortgage Securities Trust, Series 2011-GC3, Class D, 5.554%, 3/10/2044 | 8/20/2014 | $ | 10,000,000 | $ | 10,699,177 | $ | 11,064,440 | |||||||
| GS Mortgage Securities Trust, Series 2013-GC13, Class C, 4.071%, 7/10/2046 | 9/26/2013 | 7,500,000 | 6,952,537 | 7,908,791 | ||||||||||
| GS Mortgage Securities Trust, Series 2013-GC14, Class C, 4.772%, 8/10/2023 | 8/14/2013 | 6,600,000 | 6,295,195 | 7,238,527 | ||||||||||
| GS Mortgage Securities Trust, Series 2013-GC14, Class D, 4.772%, 8/10/2023 | 8/14/2013* | 7,260,000 | 6,273,914 | 7,345,363 | ||||||||||
| GS Mortgage Securities Trust, Series 2014-GC22, Class D, 4.646%, 6/10/2047 | 6/5/2014 | 5,000,000 | 4,572,065 | 4,776,085 | ||||||||||
| Halcyon Loan Advisors Funding Ltd., Series 2012-2A, Class E, 5.647%, 12/20/2024 | 6/26/2013 | 3,000,000 | 2,756,104 | 2,661,600 | ||||||||||
| HarborView Mortgage Loan Trust, Series 2005-9, Class 2X, 1.827%, 6/20/2035 | 12/11/2014 | 25,924,319 | 1,583,591 | 1,957,974 | ||||||||||
| Heartland Financial USA, Inc., 5.750%, 12/30/2024 | 12/12/2014 | 14,998,000 | 14,998,000 | 15,147,980 | ||||||||||
| Hildene CLO III Ltd., Series 2014-3A, Class E, 5.483%, 10/20/2026 | 11/14/2014 | 2,000,000 | 1,741,810 | 1,764,800 | ||||||||||
| HOA Funding LLC, Series 2014-1A, Class A2, 4.846%, 8/20/2044 | 7/22/2014 | 4,975,000 | 4,975,000 | 5,003,499 | ||||||||||
| Hyatt Hotel Portfolio Trust, Series 2015-HYT, Class A, 1.408%, 11/15/2029 | 1/22/2015 | 3,975,000 | 3,971,273 | 3,971,273 | ||||||||||
| ING IM CLO Ltd., Series 2012-1RA, Class DR, 5.441%, 3/14/2022 | 3/6/2014 | 1,750,000 | 1,750,000 | 1,723,400 | ||||||||||
| ING IM CLO Ltd., Series 2012-1RA, Class ER, 6.741%, 3/14/2022 | 3/6/2014 | 2,000,000 | 2,000,000 | 1,978,000 | ||||||||||
| ING IM CLO Ltd., Series 2014-1A, Class D, 5.157%, 4/18/2026 | 2/5/2014 | 9,500,000 | 9,006,111 | 8,560,450 | ||||||||||
| Jamestown CLO V Ltd., Series 2014-5A, Class D, 4.029%, 1/17/2027 | 11/10/2014 | 6,000,000 | 5,607,965 | 5,617,200 | ||||||||||
98
Angel Oak Multi-Strategy Income Fund
Notes to the Financial Statements - (continued)
January 31, 2015
NOTE 11. RESTRICTED SECURITIES - (continued)
| Issuer Description | Acquisition Date | Principal Amount | Amortized Cost | Fair Value | ||||||||||
| JFIN Revolver CLO Ltd., Series 2013-1A, Class D, 4.007%, 1/20/2021 | 11/26/2013 | $ | 7,000,000 | $ | 6,678,298 | $ | 6,763,400 | |||||||
| JFIN Revolver CLO Ltd., Series 2014-2A, Class C, 2.984%, 2/20/2022 | 7/18/2014 | 5,000,000 | 4,799,029 | 4,891,000 | ||||||||||
| JMP Credit Advisors CLO II Ltd., Series 2013-1A, Class D, 4.103%, 4/30/2023 | 4/3/2013* | 4,000,000 | 3,763,494 | 3,813,600 | ||||||||||
| JMP Credit Advisors CLO II Ltd., Series 2013-1A, Class E, 5.503%, 4/30/2023 | 5/13/2013* | 8,200,000 | 7,650,621 | 7,407,880 | ||||||||||
| JMP Credit Advisors CLO III Ltd., Series 2014-1A, Class D, 5.336%, 10/17/2025 | 9/2/2014 | 9,300,000 | 9,243,045 | 9,298,140 | ||||||||||
| JMP Credit Advisors CLO III Ltd., Series 2014-1A, Class E, 7.584%, 10/17/2025 | 9/2/2014 | 7,650,000 | 7,604,757 | 7,624,755 | ||||||||||
| JP Morgan Chase Commercial Mortgage Securities Trust, Series 2012-LC9, Class E, 4.422%, 12/15/2047 | 9/23/2014 | 5,000,000 | 4,888,192 | 5,032,175 | ||||||||||
| JP Morgan Chase Commercial Mortgage Securities Trust, Series 2013-C16, Class D, 5.009%, 12/15/2046 | 1/7/2014* | 10,000,000 | 9,275,578 | 10,242,295 | ||||||||||
| JPMBB Commercial Mortgage Securities Trust, Series 2013-C14, Class D, 4.561%, 8/15/2046 | 8/2/2013 | 4,000,000 | 3,448,518 | 4,015,582 | ||||||||||
| JPMBB Commercial Mortgage Securities Trust, Series 2014-C22, Class D, 4.562%, 9/15/2047 | 8/7/2014 | 8,000,000 | 7,196,457 | 7,590,500 | ||||||||||
| JPMBB Commercial Mortgage Securities Trust, Series 2014-C24, Class D, 3.928%, 11/15/2047 | 12/9/2014 | 900,000 | 790,645 | 822,414 | ||||||||||
| KCAP Senior Funding I LLC, Series 2013-1A, Class D, 5.507%, 7/20/2024 | 5/6/2013 | 2,500,000 | 2,416,874 | 2,433,000 | ||||||||||
99
Angel Oak Multi-Strategy Income Fund
Notes to the Financial Statements - (continued)
January 31, 2015
NOTE 11. RESTRICTED SECURITIES - (continued)
| Issuer Description | Acquisition Date | Principal Amount | Amortized Cost | Fair Value | ||||||||||
| KVK CLO Ltd., Series 2012-1X, Class E, 6.503%, 7/15/2023 | 5/9/2013 | $ | 3,700,000 | $ | 3,720,212 | $ | 3,493,540 | |||||||
| Longfellow Place CLO Ltd., Series 2013-1A, Class D, 4.503%, 1/15/2024 | 1/15/2013* | 9,000,000 | 8,743,506 | 8,758,800 | ||||||||||
| LSTAR Securities Investment Trust, Series 2015-2, Class A, 2.168%, 1/1/2020 | 1/16/2015 | 10,000,000 | 9,851,709 | 10,000,000 | ||||||||||
| Luther Burbank Corp., 6.500%, 9/30/2024 | 9/19/2014 | 32,700,000 | 32,700,000 | 32,700,000 | ||||||||||
| Madison Park Funding XV Ltd., Series 2014-15A, Class D, 5.690%, 1/27/2026 | 12/12/2014 | 5,000,000 | 4,625,040 | 4,454,500 | ||||||||||
| Magnetite XI Ltd., Series 2014-11A, Class D, 5.385%, 1/18/2027 | 12/4/2014 | 5,000,000 | 4,557,600 | 4,552,000 | ||||||||||
| Morgan Stanley Bank of America Merrill Lynch Trust, Series 2013-C7, Class D, 4.302%, 2/15/2046 | 4/16/2014 | 10,000,000 | 9,177,458 | 9,896,735 | ||||||||||
| Morgan Stanley Bank of America Merrill Lynch Trust, Series 2013-C9, Class D, 4.159%, 5/15/2046 | 12/13/2013 | 6,500,000 | 5,546,458 | 6,360,185 | ||||||||||
| Morgan Stanley Bank of America Merrill Lynch Trust, Series 2014-C14, Class D, 4.834%, 2/15/2047 | 6/17/2014 | 7,500,000 | 7,101,535 | 7,587,000 | ||||||||||
| Morgan Stanley Bank of America Merrill Lynch Trust, Series 2014-C15, Class D, 4.898%, 4/15/2047 | 3/26/2014* | 15,000,000 | 13,782,529 | 14,968,950 | ||||||||||
| Morgan Stanley Bank of America Merrill Lynch Trust, Series 2014-C16, Class D, 4.758%, 6/15/2047 | 6/27/2014* | 10,500,000 | 9,950,018 | 10,250,362 | ||||||||||
| Neuberger Berman CLO XIII Ltd., Series 2012-13A, Class D, 4.756%, 1/23/2024 | 11/20/2012* | 5,050,000 | 4,867,933 | 5,050,000 | ||||||||||
| Neuberger Berman CLO XVIII Ltd., Series 2014-18A, Class B, 3.383%, 11/14/2025 | 11/17/2014 | 5,000,000 | 4,855,519 | 4,892,000 | ||||||||||
| Neuberger Berman CLO XVIII Ltd., Series 2014-18A, Class D, 5.483%, 11/14/2025 | 11/17/2014 | 3,000,000 | 2,663,100 | 2,640,600 | ||||||||||
100
Angel Oak Multi-Strategy Income Fund
Notes to the Financial Statements - (continued)
January 31, 2015
NOTE 11. RESTRICTED SECURITIES - (continued)
| Issuer Description | Acquisition Date | Principal Amount | Amortized Cost | Fair Value | ||||||||||
| NewMark Capital Funding CLO Ltd., Series 2013-1A, Class D, 3.024%, 6/2/2025 | 5/29/2013* | $ | 4,000,000 | $ | 3,606,330 | $ | 3,533,600 | |||||||
| NewStar Clarendon Fund CLO LLC, Series 2014-1A, Class D, 4.593%, 1/25/2027 | 12/16/2014 | 7,465,000 | 6,994,580 | 7,283,600 | ||||||||||
| Ocean Trails CLO IV, Series 2013-4A, Class A, 1.533%, 8/13/2025 | 9/26/2013 | 25,000,000 | 24,832,031 | 24,787,500 | ||||||||||
| Ocean Trails CLO IV, Series 2013-4A, Class D, 4.233%, 8/13/2025 | 7/25/2013 | 4,000,000 | 3,836,801 | 3,847,600 | ||||||||||
| Octagon Investment Partners XIV Ltd., Series 2012-1A, Class E, 6.753%, 1/15/2024 | 5/29/2013* | 6,300,000 | 6,282,907 | 5,804,820 | ||||||||||
| Octagon Investment Partners XXI Ltd., Series 2014-1A, Class D, 6.834%, 11/14/2026 | 9/24/2014 | 8,500,000 | 8,421,297 | 8,420,100 | ||||||||||
| Octagon Investment Partners XXII Ltd., Series 2014-1A, Class C1, 3.541%, 11/22/2025 | 11/12/2014 | 4,000,000 | 3,937,226 | 3,936,400 | ||||||||||
| Octagon Investment Partners XXII Ltd., Series 2014-1A, Class D1, 4.191%, 11/22/2025 | 11/12/2014 | 4,250,000 | 4,065,332 | 4,063,000 | ||||||||||
| OFSI Fund VI Ltd., Series 2014-6A, Class D, 5.103%, 3/20/2025 | 2/10/2014* | 8,000,000 | 7,108,434 | 6,657,600 | ||||||||||
| OFSI Fund VII Ltd., Series 2014-7A, Class D, 5.375%, 10/18/2026 | 8/5/2014 | 10,600,000 | 10,600,000 | 10,420,860 | ||||||||||
| OFSI Fund VII Ltd., Series 2014-7A, Class E, 7.625%, 10/18/2026 | 8/5/2014 | 7,000,000 | 7,000,000 | 6,757,800 | ||||||||||
| OHA Credit Partners VI Ltd., Series 2012-6A, Class D, 4.732%, 5/15/2023 | 2/7/2013 | 3,000,000 | 3,022,118 | 3,000,300 | ||||||||||
| OZLM IX Ltd., Series 2014-9A, Class C, 3.847%, 1/20/2027 | 11/21/2014 | 5,000,000 | 4,678,319 | 4,639,500 | ||||||||||
| OZLM IX Ltd., Series 2014-9A, Class D, 5.397%, 1/20/2027 | 11/21/2014 | 5,000,000 | 4,500,229 | 4,367,500 | ||||||||||
| Portola CLO Ltd., Series 2007-1A, Class E, 6.632%, 11/15/2021 | 4/15/2013 | 2,747,252 | 2,732,912 | 2,747,802 | ||||||||||
101
Angel Oak Multi-Strategy Income Fund
Notes to the Financial Statements - (continued)
January 31, 2015
NOTE 11. RESTRICTED SECURITIES - (continued)
| Issuer Description | Acquisition Date | Principal Amount | Amortized Cost | Fair Value | ||||||||||
| Presidio Bank, 8.000%, 9/30/2024 | 9/30/2014 | $ | 5,000,000 | $ | 5,000,000 | $ | 5,000,000 | |||||||
| RAIT Trust, Series 2014-FL2, Class B, 2.317%, 5/13/2031 | 5/22/2014 | 650,000 | 645,579 | 643,092 | ||||||||||
| Regatta V Funding Ltd., Series 2014-1A, Class D, 5.133%, 10/25/2026 | 10/8/2014 | 5,000,000 | 4,441,685 | 4,434,500 | ||||||||||
| Saranac CLO I Ltd., Series 2013-1A, Class D, 3.806%, 10/26/2024 | 11/7/2013 | 4,000,000 | 3,707,454 | 3,699,600 | ||||||||||
| Saratoga Investment Corp. CLO Ltd., Series 2013-1A, Class D, 3.757%, 10/20/2023 | 10/2/2013 | 8,000,000 | 7,516,590 | 7,478,400 | ||||||||||
| Saratoga Investment Corp. CLO Ltd., Series 2013-1A, Class E, 4.757%, 10/20/2023 | 10/2/2013 | 13,100,000 | 11,488,009 | 11,290,890 | ||||||||||
| Saxon Asset Securities Trust, Series 2007-4, Class A2, 1.918%, 12/25/2037 | 10/15/2014 | 12,331,445 | 10,084,747 | 10,037,870 | ||||||||||
| Seneca Park CLO Ltd., Series 2014-1A, Class D, 3.757%, 7/17/2026 | 12/31/2014 | 3,000,000 | 2,839,566 | 2,836,500 | ||||||||||
| Shackleton CLO Ltd., Series 2012-1A, Class D, 4.983%, 8/14/2023 | 2/7/2013 | 6,000,000 | 6,033,264 | 6,000,600 | ||||||||||
| Shackleton CLO Ltd., Series 2013-3A, Class D, 4.053%, 4/15/2025 | 3/20/2013 | 3,000,000 | 2,834,049 | 2,847,000 | ||||||||||
| SolarCity LMC LLC, Series 2014-1, Class A, 4.590%, 4/20/2044 | 4/2/2014* | 2,162,903 | 2,173,026 | 2,278,815 | ||||||||||
| Sound Harbor Loan Fund Ltd., Series 2014-1A, Class C, 4.993%, 10/30/2026 | 9/19/2014 | 11,700,000 | 11,527,084 | 11,704,680 | ||||||||||
| Sound Point CLO II Ltd., Series 2013-1A, Class B2L, 4.756%, 4/26/2025 | 5/6/2013* | 7,000,000 | 6,424,976 | 6,072,500 | ||||||||||
| Sound Point CLO III Ltd., Series 2014-3A, Class D, 3.885%, 1/23/2027 | 11/6/2014 | 2,500,000 | 2,258,747 | 2,317,500 | ||||||||||
Sound Point CLO IV Ltd., Series 2013-3A, Class D, 3.756%, 1/21/2026 | 10/21/2014 | 6,000,000 | 5,602,574 | 5,572,200 | ||||||||||
102
Angel Oak Multi-Strategy Income Fund
Notes to the Financial Statements - (continued)
January 31, 2015
NOTE 11. RESTRICTED SECURITIES - (continued)
| Issuer Description | Acquisition Date | Principal Amount | Amortized Cost | Fair Value | ||||||||||
| Starwood Retail Property Trust, Series 2014-STAR, Class C, 2.667%, 11/15/2027 | 11/7/2014 | $ | 10,000,000 | $ | 10,000,000 | $ | 10,076,210 | |||||||
| Steele Creek CLO Ltd., Series 2014-1A, Class D, 3.634%, 8/21/2026 | 7/18/2014 | 2,000,000 | 1,836,615 | 1,792,400 | ||||||||||
| Steele Creek CLO Ltd., Series 2014-1A, Class E2, 7.184%, 8/21/2026 | 7/18/2014 | 2,000,000 | 1,983,263 | 1,914,200 | ||||||||||
| Store Master Funding LLC, Series 2012-1A, Class A, 5.770%, 8/20/2042 | 8/17/2012* | 6,328,186 | 6,718,368 | 6,761,034 | ||||||||||
| Store Master Funding LLC, Series 2013-3A, Class A2, 5.210%, 11/20/2043 | 11/21/2013* | 14,740,726 | 14,838,635 | 16,323,880 | ||||||||||
| Sudbury Mill CLO Ltd., Series 2013-1A, Class E, 5.007%, 1/17/2026 | 11/14/2013 | 5,000,000 | 4,593,028 | 4,106,000 | ||||||||||
| TICC CLO LLC, Series 2012-1A, Class D1, 5.983%, 8/25/2023 | 11/9/2012* | 7,000,000 | 6,967,599 | 7,005,600 | ||||||||||
| Trade MAPS 1 Ltd., Series 2013-1A, Class D, 5.166%, 12/10/2018 | 12/6/2013 | 2,000,000 | 2,000,000 | 1,965,000 | ||||||||||
| Tralee CDO III Ltd., Series 2014-3A, Class E, 7.231%, 7/20/2026 | 12/30/2014 | 5,000,000 | 4,940,868 | 4,933,000 | ||||||||||
| Tuolumne Grove CLO Ltd., Series 2014-1A, Class E, 5.006%, 4/25/2026 | 2/28/2014* | 8,000,000 | 7,139,012 | 6,868,800 | ||||||||||
| UBS-Barclays Commercial Mortgage Trust, Series 2012-C2, Class F, 4.889%, 5/10/2063 | 5/7/2013 | 7,000,000 | 5,890,238 | 6,478,598 | ||||||||||
| UBS-Barclays Commercial Mortgage Trust, Series 2012-C3, Class C, 4.958%, 8/10/2049 | 8/28/2013 | 2,000,000 | 1,977,625 | 2,218,481 | ||||||||||
| UBS-Barclays Commercial Mortgage Trust, Series 2012-C4, Class E, 4.500%, 12/10/2045 | 5/13/2013 | 5,000,000 | 4,144,779 | 4,492,753 | ||||||||||
| Venture CDO Ltd., Series 2012-11A, Class E, 6.733%, 11/14/2022 | 4/17/2013* | 4,000,000 | 3,962,906 | 3,939,600 | ||||||||||
103
Angel Oak Multi-Strategy Income Fund
Notes to the Financial Statements - (continued)
January 31, 2015
NOTE 11. RESTRICTED SECURITIES - (continued)
| Issuer Description | Acquisition Date | Principal Amount | Amortized Cost | Fair Value | ||||||||||
| Venture X CDO Ltd., Series 2012-12A, Class E, 5.536%, 2/28/2024 | 5/20/2013* | $ | 10,000,000 | $ | 9,770,365 | $ | 9,291,000 | |||||||
| Venture XIX CDO Ltd., Series 2014-19A, Class D, 4.240%, 1/15/2027 | 12/12/2014 | 10,000,000 | 9,521,568 | 9,536,000 | ||||||||||
| Vibrant CLO II Ltd., Series 2013-2A, Class C, 3.856%, 7/24/2024 | 8/13/2013 | 3,000,000 | 2,839,399 | 2,809,500 | ||||||||||
| Vibrant CLO II Ltd., Series 2013-2A, Class D, 5.156%, 7/24/2024 | 8/13/2013 | 3,200,000 | 2,903,248 | 2,829,440 | ||||||||||
| Vibrant CLO Ltd., Series 2012-1A, Class C, 4.757%, 7/17/2024 | 5/20/2013 | 10,200,000 | 10,290,703 | 10,070,460 | ||||||||||
| Voya CLO Ltd., Series 2014-3A, Class D, 5.256%, 7/25/2026 | 7/10/2014* | 7,000,000 | 6,254,376 | 6,330,800 | ||||||||||
| Washington Mill CLO Ltd., Series 2014-1A, Class D, 3.707%, 4/20/2026 | 4/11/2014 | 5,000,000 | 4,791,306 | 4,575,500 | ||||||||||
| Washington Mill CLO Ltd., Series 2014-1A, Class E, 5.107%, 4/20/2026 | 4/11/2014 | 5,000,000 | 4,635,029 | 4,175,500 | ||||||||||
| West CLO Ltd., Series 2012-1A, Class D, 6.755%, 10/30/2023 | 5/6/2013 | 5,000,000 | 5,028,599 | 4,743,000 | ||||||||||
| WF-RBS Commercial Mortgage Trust, Series 2011-C4, Class E, 5.245%, 6/15/2044 | 8/29/2014 | 8,704,568 | 9,144,595 | 9,372,657 | ||||||||||
| WF-RBS Commercial Mortgage Trust, Series 2012-C9, Class D, 4.803%, 11/15/2045 | 12/6/2013* | 9,000,000 | 8,157,342 | 9,214,812 | ||||||||||
| WF-RBS Commercial Mortgage Trust, Series 2013-C14, Class D, 4.001%, 6/15/2046 | 7/25/2014 | 8,470,000 | 7,876,188 | 8,156,542 | ||||||||||
| WF-RBS Commercial Mortgage Trust, Series 2013-C16, Class D, 4.983%, 9/15/2046 | 1/3/2014 | 4,000,000 | 3,640,899 | 4,126,330 | ||||||||||
| WF-RBS Commercial Mortgage Trust, Series 2013-C17, Class D, 5.126%, 12/15/2046 | 6/17/2014 | 8,229,000 | 8,004,596 | 8,521,463 | ||||||||||
| Wind River CLO Ltd., Series 2012-1A, Class D, 5.253%, 1/15/2024 | 4/18/2013 | 4,000,000 | 4,009,465 | 4,004,400 | ||||||||||
104
Angel Oak Multi-Strategy Income Fund
Notes to the Financial Statements - (continued)
January 31, 2015
NOTE 11. RESTRICTED SECURITIES - (continued)
| Issuer Description | Acquisition Date | Principal Amount | Amortized Cost | Fair Value | ||||||||||
| Wind River CLO Ltd., Series 2012-1A, Class E, 5.503%, 1/15/2024 | 12/13/2013 | $ | 5,000,000 | $ | 4,730,755 | $ | 4,602,000 | |||||||
| Wind River CLO Ltd., Series 2014-1A, Class E, 5.203%, 4/18/2026 | 1/26/2015 | 5,000,000 | 4,382,794 | 4,423,500 | ||||||||||
| York CLO I Ltd., Series 2014-1A, Class D, 4.343%, 1/22/2027 | 12/17/2014 | 3,000,000 | 2,766,657 | 2,877,600 | ||||||||||
TOTAL | $ | 1,103,622,489 | ||||||||||||
| * | The security was purchased on multiple dates with the initial purchase date shown. |
NOTE 12. LINE OF CREDIT
The Fund participates in a short-term credit agreement (“Line of Credit”) with Huntington National Bank, an affiliate of HASI (“Huntington”) expiring on May 30, 2015. Under the terms of the agreement, the Fund may borrow up to $100 million at an interest rate of LIBOR plus 125 basis points. The purpose of the agreement is to meet temporary or emergency cash needs, including redemption requests that might otherwise require the untimely disposition of securities. Huntington receives an annual facility fee of 0.125% on $100 million as well as an additional annual fee of 0.125% on any unused portion of the credit facility, invoiced quarterly, for providing the Line of Credit. The Fund will not borrow money, except from: (a) a bank, provided that immediately after such borrowing there is an asset coverage of 300% for all borrowings of the Fund; or (b) a bank or other persons for temporary purposes only, provided that such temporary borrowings are in an amount not exceeding 5% of the Fund’s total assets at the time when the borrowing is made. This limitation does not preclude the Fund from entering into reverse repurchase transactions, provided that the Fund has an asset coverage of 300% for all borrowings and repurchase commitments of the Fund pursuant to reverse repurchase transactions. As of January 31, 2015, the Fund had no outstanding borrowings under this Line of Credit.
| Average Daily Loan Balance | Weighted Average Interest Rate | Number of Days Outstanding* | Interest Expense Incurred | Maximum Loan Outstanding | ||||||||||||
$5,000,000 | 1.40 | % | 1 | $ | 195 | $ | 5,000,000 | |||||||||
| * | Number of Days Outstanding represents the total days during the fiscal year ended January 31, 2015 that the Fund utilized the Line of Credit |
105
Angel Oak Multi-Strategy Income Fund
Notes to the Financial Statements - (continued)
January 31, 2015
NOTE 13. SUBSEQUENT EVENT
Management of the Fund has evaluated the need for disclosures and/or adjustments resulting from subsequent events through the date these financial statements were issued. On, or about, April 2, 2015, the Class C Shares of the Fund will be exchanged in whole for an equal value of Class A shares. A special meeting of the shareholders was held for the purpose of voting on the items below:
On December 9, 2014, the Trustees approved a Plan of Reorganization, subject to the approval by shareholders of record of the Fund as of December 19, 2014.
On March 12, 2015, a special meeting of the shareholders of the Angel Oak Multi-Strategy Income Fund was adjourned until March 19, 2015, and further adjourned until March 26, 2015, was held at the offices of the Trust for the purpose of reorganizing the Fund from a series of the Trust to a series of Angel Oak Funds Trust (“New Fund”) and approval of a “manager of managers” arrangement for the New Fund that would grant the New Fund and the Adviser greater flexibility with respect to the use of sub-advisers.
Below are the voting results from the special meeting of the Fund (Unaudited):
| For | Against | Abstain | ||||||||||
Agreement and Plan of Reorganization | 140,850,052 | 156,622 | 453,339 | |||||||||
To approve of a “manger of managers” arrangement for the New Fund | 94,794,679 | 46,221,339 | 443,997 | |||||||||
NOTE 14. PROXY VOTING RESULTS (Unaudited)
On December 19, 2014 a special meeting of the shareholders of the Trust was held at the offices of the Trust for the purpose of electing each nominee to the Board of Trustees.
Below are the voting results for all funds from the special meeting of the Trust:
| For | Against | Abstain | ||||||||||
Ira Cohen | 280,591,916 | 20,930,930 | – | |||||||||
Andrea N. Mullins | 296,332,857 | 5,189,989 | – | |||||||||
R. Jeffrey Young | 280,517,160 | 21,005,685 | – | |||||||||
106
REPORT OF INDEPENDENT REGISTERED PUBLIC ACCOUNTING FIRM
To the Shareholders of Angel Oak Multi-Strategy Income Fund and
Board of Trustees of Valued Advisers Trust
We have audited the accompanying statement of assets and liabilities, including the schedule of investments, of Angel Oak Multi-Strategy Income Fund (the “Fund”), a series of Valued Advisers Trust, as of January 31, 2015, and the related statements of operations and cash flows for the year then ended, the statements of changes in net assets for each of the two years in the period then ended, and the financial highlights for each of the four periods in the period then ended. These financial statements and financial highlights are the responsibility of the Fund’s management. Our responsibility is to express an opinion on these financial statements and financial highlights based on our audits.
We conducted our audits in accordance with the standards of the Public Company Accounting Oversight Board (United States). Those standards require that we plan and perform the audit to obtain reasonable assurance about whether the financial statements and financial highlights are free of material misstatement. An audit includes examining, on a test basis, evidence supporting the amounts and disclosures in the financial statements. Our procedures included confirmation of securities owned as of January 31, 2015, by correspondence with the custodian and brokers or by other appropriate auditing procedures where replies from brokers were not received. An audit also includes assessing the accounting principles used and significant estimates made by management, as well as evaluating the overall financial statement presentation. We believe that our audits provide a reasonable basis for our opinion.
In our opinion, the financial statements and financial highlights referred to above present fairly, in all material respects, the financial position of Angel Oak Multi-Strategy Income Fund as of January 31, 2015, the results of its operations and its cash flows for the year then ended, the changes in its net assets for each of the two years in the period then ended, and the financial highlights for each of the four periods in the period then ended, in conformity with accounting principles generally accepted in the United States of America.

COHEN FUND AUDIT SERVICES, LTD.
Cleveland, Ohio
April 1, 2015
107
Additional Federal Income Tax Information (Unaudited):
For the year ended January 31, 2015, certain dividends paid by the Fund may be subject to a maximum tax rate of 15% as provided for by the Jobs and Growth Tax Relief Reconciliation Act of 2003. The Fund intends to designate the maximum amount allowable as taxed at a maximum rate of 15%.
For the taxable year ended January 31, 2015, the Fund paid qualified dividend income of 0.11%.
For the taxable year ended January 31, 2015, the percentage of ordinary income dividends paid by the Fund that qualifies for the dividends received deduction available to corporations was 0.11%.
108
TRUSTEES AND OFFICERS – (unaudited)
The Board of Trustees supervises the business activities of the Trust. Each Trustee serves as a trustee until termination of the Trust unless the Trustee dies, resigns, retires or is removed.
The following tables provide information regarding the Trustees and Officers.
The following table provides information regarding each of the Independent Trustees.
| Name, Address*, (Age), Position with Trust**, Term of Position with Trust | Principal Occupation During Past 5 Years | Other Directorships | ||
| Ira Cohen, 55, Independent Trustee, June 2010 to present. | Independent financial services consultant, since February 2005. | Trustee and Audit Committee Chairman, Griffin Institutional Access Real Estate Fund, since May 2014; Trustee for Angel Oak Funds Trust, since October 2014. | ||
| Andrea N. Mullins, 47, Independent Trustee, December 2013 to present. | Private investor; Independent Contractor, Seabridge Wealth Management, LLC, since April 2014; Principal Financial Officer and Treasurer, Eagle Family of Funds (mutual fund family) and Vice President, Eagle Asset Management, Inc. (investment adviser) each from 2004 to 2010. | None. |
| * | The address for each trustee and officer is 2960 N. Meridian St., Suite 300, Indianapolis, IN 46208. |
| ** | As of the date of this report, the Trust consists of 13 series. |
109
The following table provides information regarding the Trustee who is considered an “interested person” of the Trust, as that term is defined under the 1940 Act. Based on the experience of the Trustee, the Trust concluded that the individual described below should serve as a Trustee.
| Name, Address*, (Age), Position with Trust**, Term of Position with Trust | Principal Occupation During Past 5 Years | Other Directorships | ||
| R. Jeffrey Young, 50, Trustee and Chairman, June 2010 to present. | Principal Executive Officer and President, Valued Advisers Trust, since February 2010; Senior Vice President, Huntington Asset Services, Inc. since January 2010 and Director since May 2014; Director, Unified Financial Securities since May 2014; Chief Executive Officer, Huntington Funds since February 2010; Chief Executive Officer, The Huntington Strategy Shares since November 2010; President and Chief Executive Officer, Dreman Contrarian Funds, from March 2011 to February 2013; Trustee, Valued Advisers Trust, from August 2008 to January 2010; and Managing Director and Chief Operating Officer of Professional Planning Consultants, from 2007 to 2010. | Trustee and Chairman, Capitol Series Trust, since September 2013. |
| * | The address for each trustee and officer is 2960 N. Meridian St., Suite 300, Indianapolis, IN 46208. |
| ** | As of the date of this report, the Trust consists of 13 series. |
The following table provides information regarding the Officers of the Trust:
| Name, Address*, (Age), Position with Trust,** Term of Position with Trust | Principal Occupation During Past 5 Years | Other Directorships | ||
| R. Jeffrey Young, 50, Trustee and Chairman, June 2010 to present; Principal Executive Officer and President, Valued Advisers Trust since February 2010; | Senior Vice President, Huntington Asset Services, Inc., since January 2010 and Director since May 2014; Director, Unified Securities, since May 2014; Chief Executive Officer, Huntington Funds, since February 2010; Chief Executive Officer, The Huntington Strategy Shares, since November 2010; President and Chief Executive Officer, Dreman Contrarian Funds, from March 2011 to February 2013; Trustee, Valued Advisers Trust, from August 2008 to January 2010; and Managing Director and Chief Operating Officer of Professional Planning Consultants, from 2007 to 2010. | Trustee and Chairman, Capitol Series Trust, since September 2013. |
110
| Name, Address*, (Age), Position with Trust,** Term of Position with Trust | Principal Occupation During Past 5 Years | Other Directorships | ||
| John C. Swhear, 53, Chief Compliance Officer, AML Officer and Vice President, August 2008 to present. | Vice President of Legal Administration and Compliance for Huntington Asset Services, Inc., the Trust’s administrator, since April 2007 and Director since May 2014; Chief Compliance Officer of Unified Financial Securities, Inc., the Trust’s distributor, since May 2007 and Director since May 2014; President, Unified Series Trust, since March 2012, and Senior Vice President from May 2007 to March 2012; Chief Compliance Officer and AML Officer, Capitol Series Trust, since September 2013; Secretary, Huntington Funds, from April 2010 to February 2012; President and Chief Executive Officer, Dreman Contrarian Funds, from March 2010 to March 2011, and Vice President and Acting Chief Executive Officer, from 2007 to March 2010. | None. | ||
| Carol J. Highsmith, 49, Vice President, August 2008 to present; Secretary, March 2014 to present | Employed in various positions with Huntington Asset Services, Inc., the Trust’s administrator, since November 1994; currently Vice President of Legal Administration; Secretary, Cross Shore Discovery Fund since May 2014. | None. | ||
| Matthew J. Miller, 38, Vice President, December 2011 to present. | Employed in various positions with Huntington Asset Services, Inc., the Trust’s administrator, since July 1998; currently Vice President of Relationship Management; Vice President, Huntington Funds, since February 2010; President and Chief Executive Officer, Capitol Series Trust, since September 2013. | None. | ||
| Bryan W. Ashmus, 42, Treasurer and Principal Financial Officer, December 2013 to present. | Vice President, Financial Administration, Huntington Asset Services, Inc., the Trust’s administrator, since September 2013; Chief Financial Officer and Treasurer, The Huntington Strategy Shares and The Huntington Funds, since November 2013; Vice President, Treasurer Services, Citi Fund Services Ohio, Inc., from May 2005 to September 2013. | None. |
| * | The address for each trustee and officer is 2960 N. Meridian St., Suite 300, Indianapolis, IN 46208. |
| ** | As of the date of this report, the Trust consists of 13 series. |
111
OTHER INFORMATION
The Fund’s Statement of Additional Information (“SAI”) includes additional information about the trustees and is available without charge, upon request. You may call toll-free at (877) 625-3042 to request a copy of the SAI or to make shareholder inquiries.
112
Management Agreement Renewal – (Unaudited)
At a meeting held on December 9 – 10, 2014, the Board of Trustees (the “Board”) considered the renewal of the Investment Advisory Agreement (the “Agreement”) between the Trust and Angel Oak Capital Advisors, LLC (the “Adviser”) with respect to the Angel Oak Multi-Strategy Income Fund (the “Fund”). Counsel noted that the 1940 Act requires the approval of the investment advisory agreement between the Trust and its investment adviser by the Board, including a majority of the Independent Trustees. The Board discussed the arrangements between the Adviser and the Trust with respect to the Fund. The Board reviewed a memorandum from Counsel, and addressed to the Trustees that summarized, among other things, the fiduciary duties and responsibilities of the Board in reviewing and approving the renewal of the Agreement. A copy of this memorandum was circulated to the Trustees in advance of the Meeting. Counsel discussed with the Trustees the types of information and factors that should be considered by the Board in order to make an informed decision regarding the approval of the renewal of the Agreement, including the following material factors: (i) the nature, extent, and quality of the services provided by the Adviser; (ii) the investment performance of the Fund; (iii) the costs of the services to be provided and profits to be realized by the Adviser from the relationship with the Fund; (iv) the extent to which economies of scale would be realized if the Fund grows and whether advisory fee levels reflect those economies of scale for the benefit of the Fund’s investors; and (v) the Adviser’s practices regarding possible conflicts of interest.
In assessing these factors and reaching its decisions, the Board took into consideration information furnished for the Board’s review and consideration throughout the year at regular Board meetings, as well as information specifically prepared and/or presented in connection with the annual renewal process, including information presented at the Meeting. The Board requested and was provided with information and reports relevant to the annual renewal of the Agreement, including: (i) reports regarding the services and support provided to the Fund and its shareholders by the Adviser; (ii) quarterly assessments of the investment performance of the Fund by personnel of the Adviser; (iii) commentary on the reasons for the performance; (iv) presentations by Fund management addressing the Adviser’s investment philosophy, investment strategy, personnel and operations used to manage the Fund; (v) compliance and audit reports concerning the Fund and the Adviser; (vi) disclosure information contained in the registration statement of the Trust and the Form ADV of the Adviser; (vii) information on relevant developments in the mutual fund industry and how the Fund and/or Adviser are responding to them; and (viii) a memorandum from Counsel, that summarized the fiduciary duties and responsibilities of the Board in reviewing and approving the Agreement, including the material factors set forth above and the types of information included in each factor that should be considered by the Board in order to make an informed decision. The Board also requested and received various informational materials including, without limitation: (i) documents containing information about the Adviser, including financial information, a description of personnel and the services provided to the Fund, information on investment advice, performance, summaries of Fund expenses, compliance program, current legal matters, and other general information; (ii) comparative expense and performance information
113
Management Agreement Renewal – (Unaudited) (continued)
for other mutual funds with strategies similar to the Fund; (iii) the anticipated effect of size on the Fund’s performance and expenses; and (iv) benefits to be realized by the Adviser from its relationship with the Fund. The Board did not identify any particular information that was most relevant to its consideration to approve the Agreement and each Trustee may have afforded different weight to the various factors.
1. The nature, extent, and quality of the services to be provided by the Adviser. In this regard, the Board considered the Adviser’s responsibilities under the Agreement. The Trustees considered the services being provided by the Adviser to the Fund including, without limitation: the quality of its investment advisory services (including research and recommendations with respect to portfolio securities), its process for formulating investment recommendations and assuring compliance with the Fund’s investment objectives and limitations, its coordination of services for the Fund among the Fund’s service providers, and its efforts to promote the Fund and grow its assets. The Trustees discussed the recent distribution and marketing efforts of the Adviser, noting that the Fund had been added to various platforms. The Trustees considered the Adviser’s continuity of, and commitment to retain, qualified personnel and the Adviser’s commitment to maintain and enhance its resources and systems, the commitment of the Adviser’s personnel to finding alternatives and options that allow the Fund to maintain its goals, and the Adviser’s continued cooperation with the Independent Trustees and Counsel for the Fund. The Trustees specifically discussed the Adviser’s willingness to retain additional personnel in order to maintain the level of services provided as the Fund grows, noting the recent additions of a General Counsel, President, Risk Officer and Managing Director in 2014. The Trustees considered the Adviser’s personnel, including the education and experience of the Adviser’s personnel. After considering the foregoing information and further information in the Meeting materials provided by the Adviser (including the Adviser’s Form ADV), the Board concluded that, in light of all the facts and circumstances, the nature, extent, and quality of the services provided by the Adviser were satisfactory and adequate for the Fund.
2. Investment Performance of the Fund and the Adviser. In considering the investment performance of the Fund and the Adviser, the Trustees compared the performance of the Fund with the performance of funds with similar objectives managed by other investment advisers, as well as with aggregated peer group data and the Fund’s benchmark. The Trustees also considered the consistency of the Adviser’s management of the Fund with its investment objective, strategies, and limitations. The Trustees considered the Fund’s performance relative to the performance of another account that is managed by the Adviser and has similar asset allocation as the Fund, although it was noted that the other account was not managed in a manner that was identical to the manner in which the Fund is managed. The Trustees noted that the Fund outperformed the Morningstar multi-sector bond category during the one-year and three-year periods ended September 30, 2014, and had significantly outperformed the category average during the period since inception of the Fund. The Trustees also noted that the Fund had outperformed its benchmark index during the relevant periods. After reviewing and discussing the investment performance of the Fund further, the Adviser’s
114
Management Agreement Renewal – (Unaudited) (continued)
experience managing the Fund, the Adviser’s historical performance, and other relevant factors, the Board concluded, in light of all the facts and circumstances, that the investment performance of the Fund and the Adviser was acceptable.
3. The costs of the services to be provided and profits to be realized by the Adviser from the relationship with the Fund. In considering the costs of services to be provided and the profits to be realized by the Adviser from the relationship with the Fund, the Trustees considered: (1) the Adviser’s financial condition; (2) asset level of the Fund; (3) the overall expenses of the Fund; and (4) the nature and frequency of advisory fee payments. The Trustees reviewed information provided by the Adviser regarding its profits associated with managing the Fund. The Trustees also considered potential benefits for the Adviser in managing the Fund. The Trustees then compared the fees and expenses of the Fund (including the management fee) to other comparable mutual funds. The Trustees observed that the Fund’s management fee and overall expense ratio tended to be higher than its peer group average. They also discussed the fact that the Fund’s investment strategy requires unique expertise and is a labor-intensive process. Based on the foregoing, the Board concluded that the fees to be paid to the Adviser by the Fund and the profits to be realized by the Adviser, in light of all the facts and circumstances, were fair and reasonable in relation to the nature and quality of the services provided by the Adviser.
4. The extent to which economies of scale would be realized as the Fund grows and whether advisory fee levels reflect these economies of scale for the benefit of the Fund’s investors. In this regard, the Board considered the Fund’s fee arrangements with the Adviser. The Board noted that the management fee structure contained breakpoints, but that the Fund’s assets were at the highest level in the breakpoint schedule. The Board noted that the Adviser had continued to maintain an expense limitation arrangement that would limit the expenses of the Fund should assets fall below the levels necessary to benefit from the breakpoint structure contained in the management fee structure. In light of the foregoing, the Board determined that the Fund’s fee arrangements, in light of all the facts and circumstances, were fair and reasonable in relation to the nature and quality of the services provided by the Adviser.
5. Possible conflicts of interest and benefits to the Adviser. In considering the Adviser’s practices regarding conflicts of interest, the Trustees evaluated the potential for conflicts of interest and considered such matters as the experience and ability of the advisory personnel assigned to the Fund; the basis of decisions to buy or sell securities for the Fund; and the substance and administration of the Adviser’s code of ethics. The Trustees considered that the Adviser may utilize soft dollars and its policies relating thereto. The Trustees also considered disclosure in the registration statement of the Trust relating to the Adviser’s potential conflicts of interest. In terms of other benefits to the Adviser, the Trustees considered the Adviser’s perspective that the Fund broadens the Adviser’s product offerings and investor universe to potential clients, including particularly those that may find the public nature and liquidity of the Fund appealing. Based on the foregoing, the Board determined that the Adviser’s standards and practices relating to the identification and mitigation of potential conflicts of interest were satisfactory.
115
VALUED ADVISERS TRUST
PRIVACY POLICY
The following is a description of the policies of the Valued Advisers Trust (the “Trust”) regarding disclosure of nonpublic personal information that shareholders provide to a series of the Trust (each, a “Fund”) or that the Fund collects from other sources. In the event that a shareholder holds shares of a Fund through a broker-dealer or other financial intermediary, the privacy policy of the financial intermediary would govern how shareholder nonpublic personal information would be shared with nonaffiliated third parties.
Categories of Information A Fund May Collect. A Fund may collect the following nonpublic personal information about its shareholders:
| • | Information the Fund receives from a shareholder on applications or other forms, correspondence, or conversations (such as the shareholder’s name, address, phone number, social security number, and date of birth); and |
| • | Information about the shareholder’s transactions with the Fund, its affiliates, or others (such as the shareholder’s account number and balance, payment history, cost basis information, and other financial information). |
Categories of Information A Fund May Disclose. A Fund may not disclose any nonpublic personal information about its current or former shareholders to unaffiliated third parties, except as required or permitted by law. A Fund is permitted by law to disclose all of the information it collects, as described above, to its service providers (such as the Fund’s custodian, administrator, transfer agent, accountant and legal counsel) to process shareholder transactions and otherwise provide services to the shareholder.
Confidentiality and Security. Each Fund shall restrict access to shareholder nonpublic personal information to those persons who require such information to provide products or services to the shareholder. Each Fund shall maintain physical, electronic, and procedural safeguards that comply with federal standards to guard shareholder nonpublic personal information.
Disposal of Information. The Funds, through their transfer agent, have taken steps to reasonably ensure that the privacy of a shareholder’s nonpublic personal information is maintained at all times, including in connection with the disposal of information that is no longer required to be maintained by the Funds. Such steps shall include, whenever possible, shredding paper documents and records prior to disposal, requiring off-site storage vendors to shred documents maintained in such locations prior to disposal, and erasing and/or obliterating any data contained on electronic media in such a manner that the information can no longer be read or reconstructed.
116
PROXY VOTING
A description of the policies and procedures that the Fund uses to determine how to vote proxies relating to portfolio securities and information regarding how the Fund voted those proxies during the most recent twelve month period ended June 30, is available without charge upon request by (1) calling the Fund at (877) 625-3042 and (2) from Fund documents filed with the Securities and Exchange Commission (“SEC”) on the SEC’s website at www.sec.gov.
TRUSTEES
R. Jeffrey Young, Chairman
Ira Cohen
Andrea N. Mullins
OFFICERS
R. Jeffrey Young, Principal Executive Officer and President
Bryan W. Ashmus, Principal Financial Officer and Treasurer
John C. Swhear, Chief Compliance Officer, AML Officer and Vice-President
Carol J. Highsmith, Vice President and Secretary
Matthew J. Miller, Vice President
INVESTMENT ADVISER
Angel Oak Capital Advisors, LLC
One Buckhead Plaza
3060 Peachtree Road NW
Suite 500
Atlanta, GA 30305
DISTRIBUTOR
Unified Financial Securities, Inc.
2960 North Meridian Street, Suite 300
Indianapolis, IN 46208
INDEPENDENT REGISTERED PUBLIC ACCOUNTING FIRM
Cohen Fund Audit Services, Ltd.
1350 Euclid Avenue, Suite 800
Cleveland, OH 44115
LEGAL COUNSEL
The Law Offices of John H. Lively & Associates, Inc.
A member firm of The 1940 Act Law Group TM
1130 Tomahawk Creek Parkway, Suite 310
Leawood, KS 66211
CUSTODIAN
Huntington National Bank
41 South High Street
Columbus, OH 43215
ADMINISTRATOR, TRANSFER AGENT AND FUND ACCOUNTANT
Huntington Asset Services, Inc.
2960 North Meridian Street, Suite 300
Indianapolis, IN 46208
This report is intended only for the information of shareholders or those who have received the Fund’s prospectus which contains information about the Fund’s management fee and expenses. Please read the prospectus carefully before investing.
Distributed by Unified Financial Securities, Inc.
Member FINRA/SIPC
Item 2. Code of Ethics.
As of the end of the period covered by this report, the registrant has adopted a code of ethics that applies to the registrant’s principal executive officer, principal financial officer, principal accounting officer or controller, or persons performing similar functions, regardless of whether these individuals are employed by the registrant or a third party. Pursuant to Item 12(a)(1), a copy of registrant’s code of ethics is filed as an exhibit to this Form N-CSR. During the period covered by this report, the code of ethics has not been amended, and the registrant has not granted any waivers, including implicit waivers, from the provisions of the code of ethics.
Item 3. Audit Committee Financial Expert.
(a)(1) The registrant’s Board of Trustees has determined that the registrant has at least one audit committee financial expert serving on its audit committee.
(a)(2) The audit committee financial expert is Andrea N. Mullins, who is “independent” for purposes of this Item 3 of Form N-CSR.
Item 4. Principal Accountant Fees and Services.
| (a) | Audit Fees | |||||
| Registrant | ||||||
| Golub Group Equity Fund: | FY 2015 | $13,000 | ||||
| FY 2014 | $12,500 | |||||
| Angel Oak Multi-Strategy Income Fund: | FY 2015 | $46,980 | ||||
| FY 2014 | $37,500 | |||||
| (b) | Audit-Related Fees | |||||
| Registrant | ||||||
| Golub Group Equity Fund: | FY 2015 | $0 | ||||
| FY 2014 | $0 | |||||
| Angel Oak Multi-Strategy Income Fund: | FY 2015 | $0 | ||||
| FY 2014 | $0 | |||||
| (c) | Tax Fees | |||||
| Registrant | ||||||
| Golub Group Equity Fund: | FY 2015 | $2,500 | ||||
| FY 2014 | $2,500 | |||||
| Angel Oak Multi-Strategy Income Fund: | FY 2015 | $2,500 | ||||
| FY 2014 | $2,500 | |||||
| Nature of the fees: Preparation of the 1120 RIC and Excise review | ||||||
| (d) | All Other Fees | |||||
| Registrant | ||||||
| Golub Group Equity Fund: | FY 2015 | $0 | ||||
| FY 2014 | $0 | |||||
| Angel Oak Multi-Strategy Income Fund: | FY 2015 | $0 | ||||
| FY 2014 | $0 | |||||
| (e) | (1) | Audit Committee’s Pre-Approval Policies | ||
| The Audit Committee Charter requires the Audit Committee to be responsible for the selection, retention or termination of auditors and, in connection therewith, to (i) evaluate the proposed fees and other compensation, if any, to be paid to the auditors, (ii) evaluate the independence of the auditors, (iii) pre-approve all audit services and, when appropriate, any non-audit services provided by the independent auditors to the Trust, (iv) pre-approve, when appropriate, any non-audit services provided by the independent auditors to the Trust’s investment adviser, or any entity controlling, controlled by, or under common control with the investment adviser and that provides ongoing services to the Trust if the engagement relates directly to the operations and financial reporting of the Trust, and (v) receive the auditors’ specific representations as to their independence; | ||||
| (2) | Percentages of Services Approved by the Audit Committee | |||
| Registrant | ||||||
| Audit-Related Fees: | 0 | % | ||||
| Tax Fees: | 0 | % | ||||
| All Other Fees: | 0 | % | ||||
(f) During audit of registrant’s financial statements for the most recent fiscal year, less than 50 percent of the hours expended on the principal accountant’s engagement were attributed to work performed by persons other than the principal accountant’s full-time, permanent employees.
(g) The aggregate non-audit fees billed by the registrant’s accountant for services rendered to the registrant, and rendered to the registrant’s investment adviser (not including any sub-adviser whose role is primarily portfolio management and is subcontracted with or overseen by another investment adviser), and any entity controlling, controlled by, or under common control with the adviser that provides ongoing services to the registrant:
| Registrant | Adviser | |||||||
| FY 2015 | $0 | $0 | ||||||
| FY 2014 | $0 | $0 |
(h) Not applicable. The auditor performed no services for the registrant’s investment adviser or any entity controlling, controlled by, or under common control with the investment adviser that provides ongoing services to the registrant.
Item 5. Audit Committee of Listed Companies. NOT APPLICABLE – applies to listed companies only
Item 6. Schedule of Investments. Schedules filed with Item 1.
Item 7. Disclosure of Proxy Voting Policies and Procedures for Closed-End Management Investment Companies. NOT APPLICABLE – applies to closed-end funds only
Item 8. Portfolio Managers of Closed-End Investment Companies. NOT APPLICABLE – applies to closed-end funds only
Item 9. Purchases of Equity Securities by Closed-End Management Investment Company and Affiliated Purchasers. NOT APPLICABLE – applies to closed-end funds only
Item 10. Submission of Matters to a Vote of Security Holders.
The guidelines applicable to shareholders desiring to submit recommendations for nominees to the Registrant’s board of trustees are contained in the statement of additional information of the Trust with respect to the Fund(s) for which this Form N-CSR is being filed.
Item 11. Controls and Procedures.
(a) Based on their evaluation of the registrant’s disclosure controls and procedures (as defined in Rule 30a-3(c) under the Investment Company Act of 1940, as amended (the “Act”)) as of a date within 90 days of the filing date of this report, the registrant’s principal executive officer and principal financial officer have concluded that such disclosure controls and procedures are reasonably designed and are operating effectively to ensure that material information relating to the registrant is made known to them by others within those entities, particularly during the period in which this report is being prepared, and that the information required in filings on Form N-CSR is recorded, processed, summarized, and reported on a timely basis.
(b) There were no changes in the registrant’s internal control over financial reporting (as defined in Rule 30a-3(d) under the Investment Company Act of 1940) that occurred during the second fiscal quarter of the period covered by this report that have materially affected, or are reasonably likely to materially affect, the registrant’s internal control over financial reporting.
Item 12. Exhibits.
| (a) | (1) Code is filed herewith. |
| (2) | Certifications by the registrant’s principal executive officer and principal financial officer, pursuant to Section 302 of the Sarbanes- Oxley Act of 2002 and required by Rule 30a-2 under the Investment Company Act of 1940 are filed herewith. |
| (3) | Not Applicable |
| (b) | Certification pursuant to 18 U.S.C. Section 1350, as adopted pursuant to Section 906 of the Sarbanes-Oxley Act of 2002 is filed herewith. |
Pursuant to the requirements of the Securities Exchange Act of 1934 and the Investment Company Act of 1940, the registrant has duly caused this report to be signed on its behalf by the undersigned, thereunto duly authorized.
| (Registrant) | Valued Advisers Trust | |||
| By | /s/ R. Jeffrey Young | |
| R. Jeffrey Young, President and Principal Executive Officer | ||
| Date | 4/02/2015 | |
Pursuant to the requirements of the Securities Exchange Act of 1934 and the Investment Company Act of 1940, this report has been signed below by the following persons on behalf of the registrant and in the capacities and on the dates indicated.
| By | /s/ R. Jeffrey Young | |
| R. Jeffrey Young, President and Principal Executive Officer | ||
| Date | 4/02/2015 | |
| By | /s/ Bryan W. Ashmus | |
| Bryan W. Ashmus, Treasurer and Principal Financial Officer | ||
| Date | 4/02/2015 | |